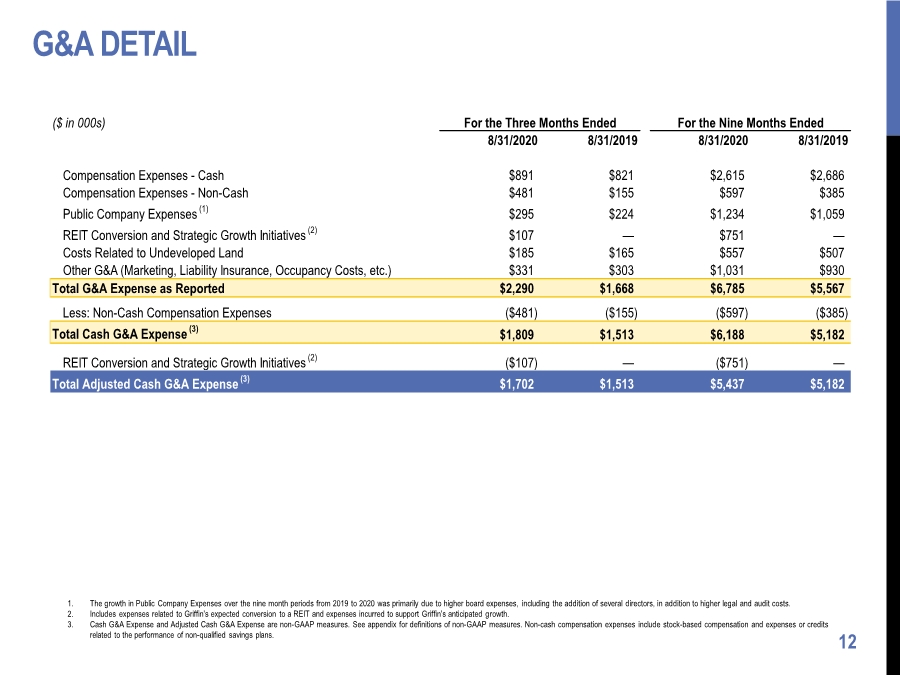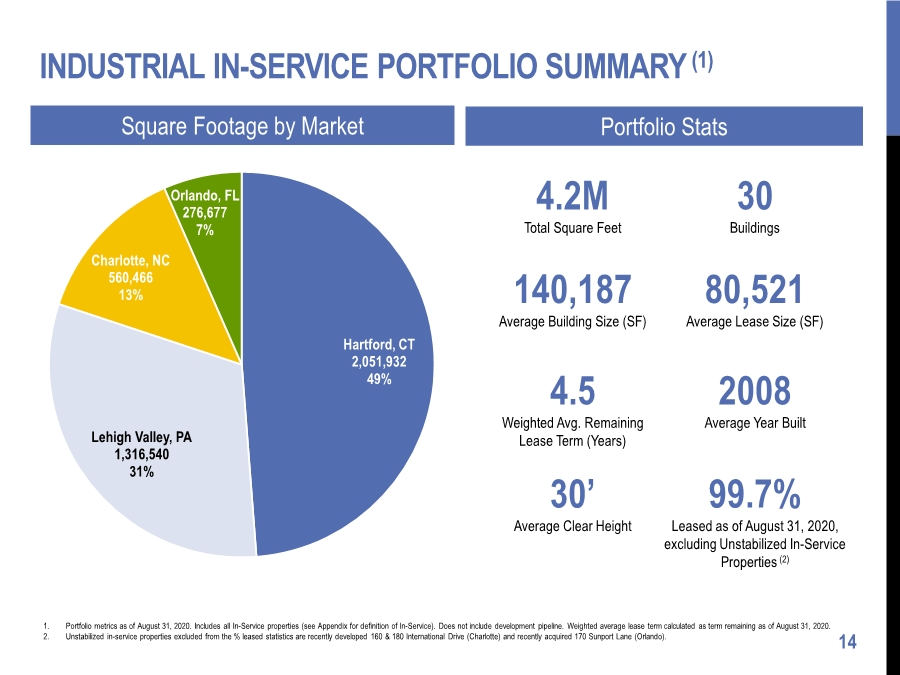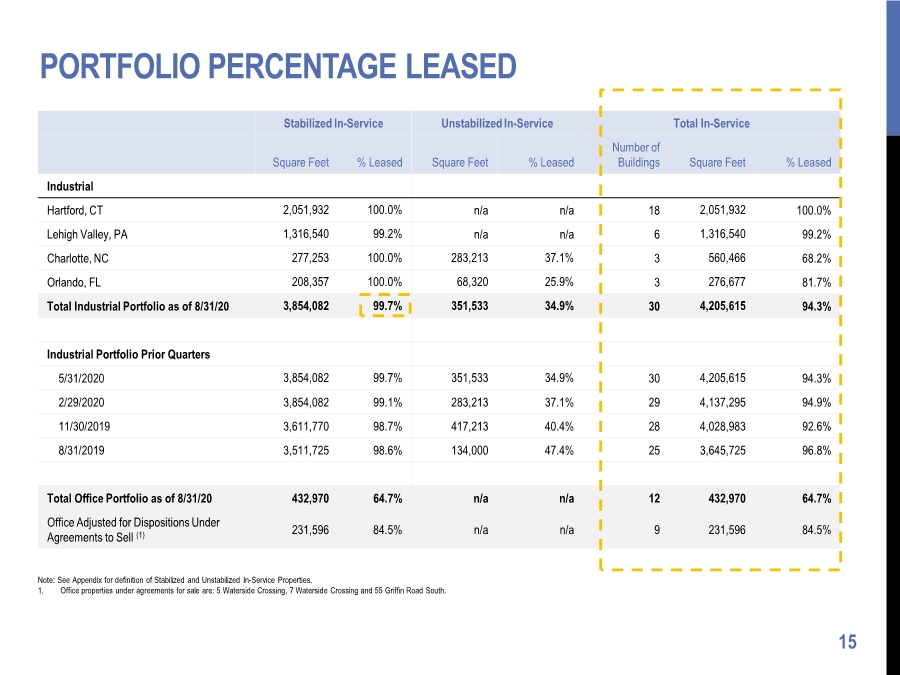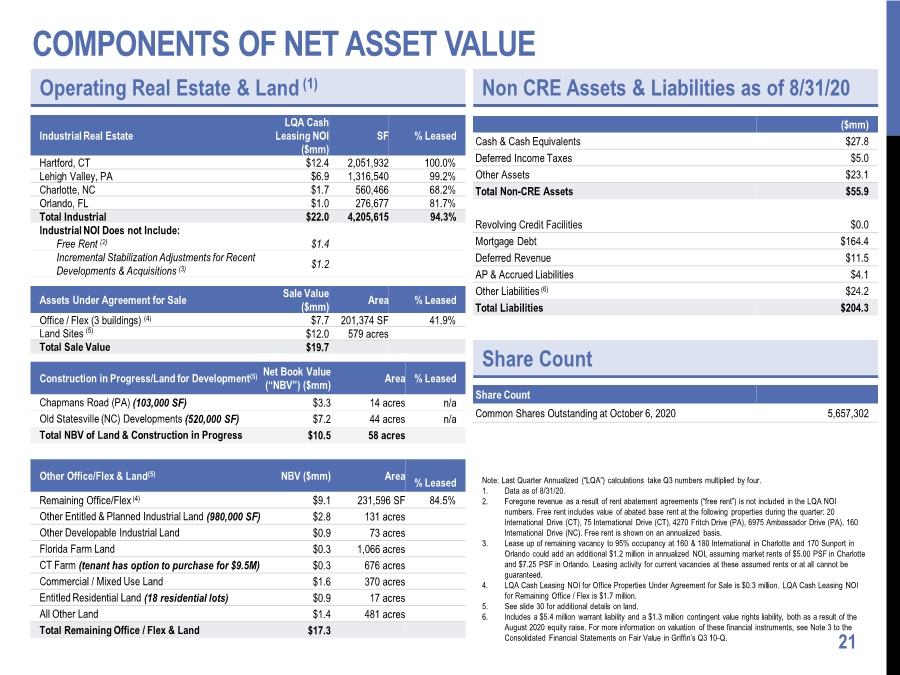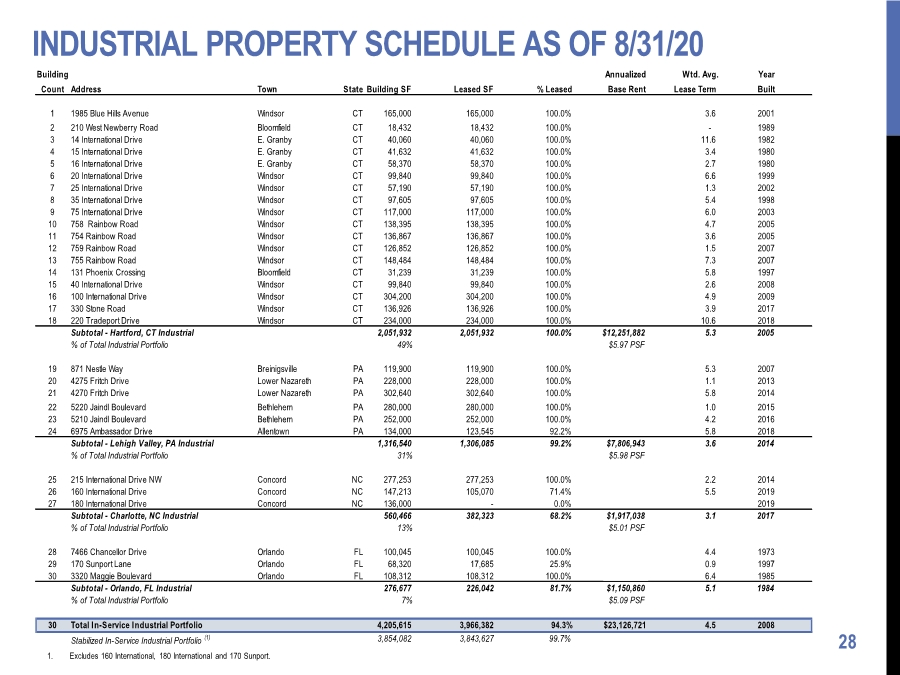
| INDUSTRIAL PROPERTY SCHEDULE AS OF 8/31/20 28 1. Excludes 160 International, 180 International and 170 Sunport. Building Annualized Wtd. Avg. Year Count Address Town State Building SF Leased SF % Leased Base Rent Lease Term Built 1 1985 Blue Hills Avenue Windsor CT 165,000 165,000 100.0% $1,278,750 3.6 2001 2 210 West Newberry Road Bloomfield CT 18,432 18,432 100.0% $0 - 1989 3 14 International Drive E. Granby CT 40,060 40,060 100.0% $220,330 11.6 1982 4 15 International Drive E. Granby CT 41,632 41,632 100.0% $218,007 3.4 1980 5 16 International Drive E. Granby CT 58,370 58,370 100.0% $350,815 2.7 1980 6 20 International Drive Windsor CT 99,840 99,840 100.0% $755,183 6.6 1999 7 25 International Drive Windsor CT 57,190 57,190 100.0% $340,587 1.3 2002 8 35 International Drive Windsor CT 97,605 97,605 100.0% $557,229 5.4 1998 9 75 International Drive Windsor CT 117,000 117,000 100.0% $632,760 6.0 2003 10 758 Rainbow Road Windsor CT 138,395 138,395 100.0% $822,052 4.7 2005 11 754 Rainbow Road Windsor CT 136,867 136,867 100.0% $792,303 3.6 2005 12 759 Rainbow Road Windsor CT 126,852 126,852 100.0% $751,281 1.5 2007 13 755 Rainbow Road Windsor CT 148,484 148,484 100.0% $939,067 7.3 2007 14 131 Phoenix Crossing Bloomfield CT 31,239 31,239 100.0% $152,591 5.8 1997 15 40 International Drive Windsor CT 99,840 99,840 100.0% $605,707 2.6 2008 16 100 International Drive Windsor CT 304,200 304,200 100.0% $1,688,310 4.9 2009 17 330 Stone Road Windsor CT 136,926 136,926 100.0% $801,410 3.9 2017 18 220 Tradeport Drive Windsor CT 234,000 234,000 100.0% $1,345,500 10.6 2018 Subtotal - Hartford, CT Industrial 2,051,932 2,051,932 100.0% $12,251,882 5.3 2005 % of Total Industrial Portfolio 49% $5.97 PSF 19 871 Nestle Way Breinigsville PA 119,900 119,900 100.0% $653,455 5.3 2007 20 4275 Fritch Drive Lower Nazareth PA 228,000 228,000 100.0% $1,374,840 1.1 2013 21 4270 Fritch Drive Lower Nazareth PA 302,640 302,640 100.0% $1,703,863 5.8 2014 22 5220 Jaindl Boulevard Bethlehem PA 280,000 280,000 100.0% $1,838,952 1.0 2015 23 5210 Jaindl Boulevard Bethlehem PA 252,000 252,000 100.0% $1,436,322 4.2 2016 24 6975 Ambassador Drive Allentown PA 134,000 123,545 92.2% $799,510 5.8 2018 Subtotal - Lehigh Valley, PA Industrial 1,316,540 1,306,085 99.2% $7,806,943 3.6 2014 % of Total Industrial Portfolio 31% $5.98 PSF 25 215 International Drive NW Concord NC 277,253 277,253 100.0% $1,313,455 2.2 2014 26 160 International Drive Concord NC 147,213 105,070 71.4% $603,583 5.5 2019 27 180 International Drive Concord NC 136,000 - 0.0% $0 2019 Subtotal - Charlotte, NC Industrial 560,466 382,323 68.2% $1,917,038 3.1 2017 % of Total Industrial Portfolio 13% $5.01 PSF 28 7466 Chancellor Drive Orlando FL 100,045 100,045 100.0% $540,243 4.4 1973 29 170 Sunport Lane Orlando FL 68,320 17,685 25.9% $112,379 0.9 1997 30 3320 Maggie Boulevard Orlando FL 108,312 108,312 100.0% $498,238 6.4 1985 Subtotal - Orlando, FL Industrial 276,677 226,042 81.7% $1,150,860 5.1 1984 % of Total Industrial Portfolio 7% $5.09 PSF 30 Total In-Service Industrial Portfolio 4,205,615 3,966,382 94.3% $23,126,721 4.5 2008 Stabilized In-Service Industrial Portfolio (1) 3,854,082 3,843,627 99.7% |