Exhibit 99.1


Supplemental Operating and Financial Data
for the Quarter Ended December 31, 2024
THE COMPANY
BXP, Inc. (NYSE: BXP) (formerly known as Boston Properties, Inc.) (“BXP” or the “Company”) is the largest publicly traded developer, owner, and manager of premier workplaces in the United States, concentrated in six dynamic gateway markets - Boston, Los Angeles, New York, San Francisco, Seattle, and Washington, DC. BXP has delivered places that power progress for our clients and communities for more than 50 years. BXP is a fully integrated real estate company, organized as a real estate investment trust (REIT). Including properties owned by joint ventures, BXP’s portfolio totals 53.3 million square feet and 185 properties, including 7 properties under construction/redevelopment. BXP’s properties include 163 office properties, 14 retail properties (including one retail property under construction), seven residential properties (including one residential property under construction) and one hotel. BXP is well-known for its in-house building management expertise and responsiveness to clients’ needs. BXP holds a superior track record of developing premium Central Business District (CBD) office buildings, successful mixed-use complexes, suburban office centers and build-to-suit projects for a diverse array of creditworthy clients. BXP actively works to promote its growth and operations in a sustainable and responsible manner. BXP has earned a twelfth consecutive GRESB “Green Star” recognition and the highest GRESB 5-star Rating and was named one of the world’s most sustainable companies by TIME Magazine. BXP, an S&P 500 company, was founded in 1970 by Mortimer B. Zuckerman and Edward H. Linde and became a public company in 1997.
FORWARD-LOOKING STATEMENTS
This Supplemental package contains “forward-looking statements” as defined in the Private Securities Litigation Reform Act of 1995. You can identify these statements by our use of the words “anticipates,” “believes,” “budgeted,” “could,” “estimates,” “expects,” “guidance,” “intends,” “may,” “might,” “plans,” “projects,” “should,” “will,” and similar expressions that do not relate to historical matters. These statements are based on our current plans, expectations, projections and assumptions about future events. You should exercise caution in interpreting and relying on forward-looking statements because they involve known and unknown risks, uncertainties and other factors which are, in some cases, beyond BXP’s control. If our underlying assumptions prove inaccurate, or known or unknown risks or uncertainties materialize, actual results could differ materially from those expressed or implied by the forward-looking statements. These factors include, without limitation, the risks and uncertainties related to the impact of changes in general economic and capital market conditions, including continued inflation, high interest rates, supply chain disruptions, labor market disruptions, dislocation and volatility in capital markets, potential longer-term changes in consumer and client behavior resulting from the severity and duration of any downturn in the U.S. or global economy, general risks affecting the real estate industry (including, without limitation, the inability to enter into or renew leases on favorable terms, changes in client preferences and space utilization, dependence on clients’ financial condition, and competition from other developers, owners and operators of real estate), the impact of geopolitical conflicts, the immediate and long-term impact of the outbreak of a highly infectious or contagious disease on our and our clients’ financial condition, results of operations and cash flows (including the impact of actions taken to contain the outbreak or mitigate its impact, the direct and indirect economic effects of the outbreak and containment measures on our clients, and the ability of our clients to successfully operate their businesses), the uncertainties of investing in new markets, the costs and availability of financing, the effectiveness of our interest rate hedging contracts, the ability of our joint venture partners to satisfy their obligations, the effects of local, national and international economic and market conditions, the effects of acquisitions, dispositions and possible impairment charges on our operating results, the impact of newly adopted accounting principles on the Company’s accounting policies and on period-to-period comparisons of financial results, the uncertainties of costs to comply with regulatory changes (including costs to comply with the Securities and Exchange Commission’s and California’s rules to standardize climate-related disclosures) and other risks and uncertainties detailed from time to time in the Company’s filings with the Securities and Exchange Commission. These forward-looking statements speak only as of the date of issuance of this report and are not guarantees of future results, performance or achievements. BXP does not undertake a duty to update or revise any forward-looking statement, whether as a result of new information, future events or otherwise, except as otherwise required by law.
NON-GAAP FINANCIAL MEASURES
This Supplemental package includes non-GAAP financial measures, which are accompanied by what the Company considers the most directly comparable financial measures calculated and presented in accordance with GAAP. Quantitative reconciliations of the differences between the most directly comparable GAAP financial measures and the non-GAAP financial measures presented are provided within this Supplemental package. Definitions of these non-GAAP financial measures and statements of the reasons why management believes the non-GAAP measures provide useful information to investors about the Company’s financial condition and results of operations, and, if applicable, the other purposes for which management uses the measures, can be found in the Definitions section of this Supplemental starting on page 57.
The Company also presents “BXP’s Share” of certain of these measures, which are non-GAAP financial measures that are calculated as the consolidated amount calculated in accordance with GAAP, plus the Company’s share of the amount from the Company’s unconsolidated joint ventures (calculated based upon the Company’s percentage ownership interest and, in some cases, after priority allocations), minus the Company’s partners’ share of the amount from the Company’s consolidated joint ventures (calculated based upon the partners’ percentage ownership interests and, in some cases, after income allocation to private REIT shareholders and their share of fees due to the Company). Management believes that presenting “BXP’s Share” of these measures provides useful information to investors regarding the Company’s financial condition and/or results of operations because the Company has several significant joint ventures and, in some cases, the Company exercises significant influence over, but does not control, the joint venture, in which case GAAP requires that the Company account for the joint venture entity using the equity method of accounting and the Company does not consolidate it for financial reporting purposes. In other cases, GAAP requires that the Company consolidate the venture even though the Company’s partner(s) owns a significant percentage interest. As a result, management believes that presenting BXP’s Share of various financial measures in this manner can help investors better understand the Company’s financial condition and/or results of operations after taking into account its true economic interest in these joint ventures. The Company cautions investors that the ownership percentages used in calculating “BXP’s Share” of these measures may not completely and accurately depict all of the legal and economic implications of holding an interest in a consolidated or unconsolidated joint venture. For example, in addition to partners’ interests in profits and capital, venture agreements vary in the allocation of rights regarding decision making (both routine and major decisions), distributions, transferability of interests, financings and guarantees, liquidations and other matters. As a result, presentations of “BXP’s Share” of a financial measure should not be considered a substitute for, and should only be considered together with and as a supplement to, the Company’s financial information presented in accordance with GAAP. Unless noted otherwise, reconciliations of “BXP’s Share” of these financial measures can be found in the Reconciliations section of this Supplemental package starting on page 61.
GENERAL INFORMATION
| Corporate Headquarters | Trading Symbol | Investor Relations | Inquiries | ||||||||
| 800 Boylston Street | BXP | BXP, Inc. | Inquiries should be directed to | ||||||||
| Suite 1900 | 800 Boylston Street, Suite 1900 | Helen Han | |||||||||
| Boston, MA 02199 | Stock Exchange Listing | Boston, MA 02199 | Vice President, Investor Relations | ||||||||
| www.bxp.com | New York Stock Exchange | investors.bxp.com | at 617.236.3429 or | ||||||||
| (t) 617.236.3300 | investorrelations@bxp.com | hhan@bxp.com | |||||||||
| (t) 617.236.3429 | |||||||||||
| Michael E. LaBelle | |||||||||||
| Executive Vice President, Chief Financial Officer | |||||||||||
| at 617.236.3352 or | |||||||||||
| mlabelle@bxp.com | |||||||||||
(Cover photo: Rendering of 725 12th Street, Washington, DC)
| Q4 2024 | ||||
| Table of contents | |||||
| Page | |||||
| OVERVIEW | |||||
| Company Profile | |||||
| Guidance and assumptions | |||||
| FINANCIAL INFORMATION | |||||
| Financial Highlights | |||||
| Consolidated Balance Sheets | |||||
| Consolidated Income Statements | |||||
| Funds From Operations (FFO) | |||||
| Funds Available for Distribution (FAD) | |||||
| Net Operating Income (NOI) | |||||
| Same Property Net Operating Income (NOI) by Reportable Segment | |||||
| Capital Expenditures, Tenant Improvement Costs and Leasing Commissions | |||||
| Acquisitions and Dispositions | |||||
| DEVELOPMENT ACTIVITY | |||||
| Construction in Progress | |||||
| Land Parcels and Purchase Options | |||||
| LEASING ACTIVITY | |||||
| Leasing Activity | |||||
| PROPERTY STATISTICS | |||||
| Portfolio Overview | |||||
| Residential and Hotel Performance | |||||
| In-Service Property Listing | |||||
| Top 20 Clients Listing and Portfolio Client Diversification | |||||
| Occupancy by Location | |||||
| DEBT AND CAPITALIZATION | |||||
| Capital Structure | |||||
| Debt Analysis | |||||
| Senior Unsecured Debt Covenant Compliance Ratios | |||||
Net Debt to EBITDAre | |||||
| Debt Ratios | |||||
| JOINT VENTURES | |||||
| Consolidated Joint Ventures | |||||
| Unconsolidated Joint Ventures | |||||
| LEASE EXPIRATION ROLL-OUT | |||||
| Total In-Service Properties | |||||
| Boston | |||||
| Los Angeles | |||||
| New York | |||||
| San Francisco | |||||
| Seattle | |||||
| Washington, DC | |||||
| CBD | |||||
| Suburban | |||||
| RESEARCH COVERAGE, DEFINITIONS AND RECONCILIATIONS | |||||
| Research Coverage | |||||
| Definitions | |||||
| Reconciliations | |||||
| Consolidated Income Statement - Prior Year | |||||
| Q4 2024 | ||||
| Company profile | |||||
SNAPSHOT
(as of December 31, 2024)
| Fiscal Year-End | December 31 | ||||
| Total Properties (includes unconsolidated joint ventures and properties under development/redevelopment) | 185 | ||||
| Total Square Feet (includes unconsolidated joint ventures and properties under development/redevelopment) | 53.3 million | ||||
Common shares outstanding, plus common units and LTIP units (other than unearned Multi-Year Long-Term Incentive Program (MYLTIP) Units) on an as-converted basis 1, 2 | 176.2 million | ||||
| Closing Price, at the end of the quarter | $74.36 per share | ||||
| Dividend - Quarter/Annualized | $0.98/$3.92 per share | ||||
| Dividend Yield | 5.3% | ||||
Consolidated Market Capitalization 2 | $29.3 billion | ||||
BXP’s Share of Market Capitalization 2, 3 | $29.3 billion | ||||
| Unsecured Senior Debt Ratings | BBB (S&P); Baa2 (Moody’s) | ||||
STRATEGY
BXP’s primary business objective is to maximize return on investment in an effort to provide its investors with the greatest possible total return in all points of the economic cycle. To achieve this objective, the key tenets of our business strategy are to:
•continue to embrace our leadership position in the premier workplace segment and leverage our strength in portfolio quality, client relationships, development skills, market penetration, and sustainability to profitably build market share;
•maintain a keen focus on select dynamic gateway markets that exhibit the strongest economic growth and investment characteristics over time - currently Boston, Los Angeles, New York, San Francisco, Seattle, and Washington, DC;
•invest in the highest quality buildings (primarily premier workplaces) with unique amenities and desirable locations that are able to maintain high occupancy rates and achieve premium rental rates through economic cycles;
•maintain scale and a full-service real estate capability (leasing, development, construction, marketing, legal, and property management) in our markets to ensure we (1) see all relevant investment deal flow, (2) maintain an ability to execute on all types of real estate opportunities, such as acquisitions, dispositions, repositioning and development, throughout the real estate investment cycle, (3) provide superior service to our clients and (4) develop and manage our assets in the most sustainable manner possible;
•pursue attractive asset class adjacencies where we have a track record of success, such as life sciences and residential development;
•maintain a leadership position in sustainability innovation to minimize emissions from BXP’s development and in-service portfolio, as well as to provide clients sustainable solutions for their space use needs;
•ensure a strong balance sheet to maintain consistent access to capital and the ability to make new investments at opportune times; and
•foster a culture and reputation of integrity, excellence and purposefulness, making us the employer of choice for talented real estate professionals, the landlord and developer of choice for our clients, as well as the counterparty of choice for real estate industry participants.
MANAGEMENT
| Board of Directors | ||||||||||||||
| Owen D. Thomas | Chairman of the Board | Owen D. Thomas | Chief Executive Officer | |||||||||||
| Douglas T. Linde | Douglas T. Linde | President | ||||||||||||
| Joel I. Klein | Lead Independent Director; | Raymond A. Ritchey | Senior Executive Vice President | |||||||||||
| Chair of Compensation Committee | Michael E. LaBelle | Executive Vice President, Chief Financial Officer and Treasurer | ||||||||||||
| Bruce W. Duncan | Chair of Audit Committee | Rodney C. Diehl | Executive Vice President, West Coast Regions | |||||||||||
| Carol B. Einiger | Donna D. Garesche | Executive Vice President, Chief Human Resources Officer | ||||||||||||
| Diane J. Hoskins | Chair of Sustainability Committee | Bryan J. Koop | Executive Vice President, Boston Region | |||||||||||
| Mary E. Kipp | Peter V. Otteni | Executive Vice President, Co-Head of the Washington, DC | ||||||||||||
| Matthew J. Lustig | Chair of Nominating & Corporate | Region | ||||||||||||
| Governance Committee | Hilary Spann | Executive Vice President, New York Region | ||||||||||||
| Timothy J. Naughton | John J. Stroman | Executive Vice President, Co-Head of the Washington, DC | ||||||||||||
| William H. Walton, III | Region | |||||||||||||
| Derek A. (Tony) West | Colin D. Joynt | Senior Vice President, Chief Information Officer | ||||||||||||
| Eric G. Kevorkian | Senior Vice President, Chief Legal Officer and Secretary | |||||||||||||
| Michael R. Walsh | Senior Vice President, Chief Accounting Officer | |||||||||||||
| James J. Whalen | Senior Vice President, Chief Technology Officer | |||||||||||||
___________________
1Common units and LTIP units are units of limited partnership interest in Boston Properties Limited Partnership, the entity through which the Company conducts substantially all of its business.
2For additional detail, see page 28.
3For the Company’s definitions and related disclosures, see the Definitions and Reconciliations sections of this Supplemental package starting on page 57.
1
| Q4 2024 | ||||
| Guidance and assumptions | |||||
GUIDANCE
BXP’s guidance for the first quarter and full year 2025 for diluted earnings per common share attributable to BXP, Inc. (EPS) and diluted funds from operations (FFO) per common share attributable to BXP, Inc. is set forth and reconciled below. Except as described below, the estimates reflect management’s view of current and future market conditions, including assumptions with respect to rental rates, occupancy levels, interest rates, the timing of the lease-up of available space, the timing of development cost outlays and development deliveries, and the earnings impact of the events referenced in the Company’s earnings release issued on January 28, 2025 and those referenced during the related conference call. The estimates do not include (1) possible future gains or losses or the impact on operating results from other possible future property acquisitions or dispositions, (2) the impacts of any other capital markets activity, (3) future write-offs or reinstatements of accounts receivable and accrued rent balances, or (4) future impairment charges. EPS estimates may fluctuate as a result of several factors, including changes in the recognition of depreciation and amortization expense, impairment losses on depreciable real estate, and any gains or losses associated with disposition activity. BXP is not able to assess at this time the potential impact of these factors on projected EPS. By definition, FFO does not include real estate-related depreciation and amortization, impairment losses on depreciable real estate, or gains or losses associated with disposition activities. For a complete definition of FFO and statements of the reasons why management believes it provides useful information to investors, see page 59. There can be no assurance that BXP’s actual results will not differ materially from the estimates set forth below.
| First Quarter 2025 | Full Year 2025 | |||||||||||||||||||||||||||||||
| Low | High | Low | High | |||||||||||||||||||||||||||||
| Projected EPS (diluted) | $ | 0.33 | $ | 0.35 | $ | 1.57 | $ | 1.75 | ||||||||||||||||||||||||
| Add: | ||||||||||||||||||||||||||||||||
| Projected Company share of real estate depreciation and amortization | 1.30 | 1.30 | 5.20 | 5.20 | ||||||||||||||||||||||||||||
| Projected Company share of (gains)/losses on sales of real estate, gain on investment from unconsolidated joint venture and impairments | — | — | — | — | ||||||||||||||||||||||||||||
| Projected FFO per share (diluted) | $ | 1.63 | $ | 1.65 | $ | 6.77 | $ | 6.95 | ||||||||||||||||||||||||
ASSUMPTIONS
(dollars in thousands)
| Full Year 2025 | |||||||||||||||||||||||||||||
| Low | High | ||||||||||||||||||||||||||||
| Operating property activity: | |||||||||||||||||||||||||||||
Average In-service portfolio occupancy 1 | 86.50 | % | 88.00 | % | |||||||||||||||||||||||||
| Change in BXP’s Share of Same Property net operating income (excluding termination income) | (1.00) | % | 0.50 | % | |||||||||||||||||||||||||
| Change in BXP’s Share of Same Property net operating income - cash (excluding termination income) | — | % | 1.50 | % | |||||||||||||||||||||||||
| BXP’s Share of Non Same Properties’ incremental contribution to net operating income over prior year (excluding asset sales) | $ | 19,000 | $ | 22,000 | |||||||||||||||||||||||||
| Taking Buildings Out-of-Service | $ | (11,300) | $ | (11,300) | |||||||||||||||||||||||||
| BXP’s Share of incremental net operating income related to asset sales over prior year | $ | — | $ | — | |||||||||||||||||||||||||
| BXP’s Share of straight-line rent and fair value lease revenue (non-cash revenue) | $ | 90,000 | $ | 115,000 | |||||||||||||||||||||||||
| Termination income | $ | 4,000 | $ | 8,000 | |||||||||||||||||||||||||
| Other revenue (expense): | |||||||||||||||||||||||||||||
| Development, management services and other revenue | $ | 32,000 | $ | 38,000 | |||||||||||||||||||||||||
General and administrative expense 2 | $ | (165,000) | $ | (159,000) | |||||||||||||||||||||||||
| Consolidated net interest expense | $ | (625,000) | $ | (610,000) | |||||||||||||||||||||||||
| Unconsolidated joint venture interest expense | $ | (80,000) | $ | (75,000) | |||||||||||||||||||||||||
| Noncontrolling interest: | |||||||||||||||||||||||||||||
| Noncontrolling interest in property partnerships’ share of FFO | $ | (165,000) | $ | (155,000) | |||||||||||||||||||||||||
_______________
1 Excludes development properties expected to be placed into service in 2025.
2 Excludes estimated changes in the market value of the Company’s deferred compensation plan and gains (losses) from investments in securities.
2
| Q4 2024 | ||||
| Financial highlights | |||||
(unaudited and in thousands, except ratios and per share amounts)
| Three Months Ended | ||||||||||||||
| 31-Dec-24 | 30-Sep-24 | |||||||||||||
Net income (loss) attributable to BXP, Inc. 1 | $ | (230,019) | $ | 83,628 | ||||||||||
| Net income (loss) attributable to BXP, Inc. per share - diluted | $ | (1.45) | $ | 0.53 | ||||||||||
FFO attributable to BXP, Inc. 2 | $ | 283,989 | $ | 286,858 | ||||||||||
Diluted FFO per share 2 | $ | 1.79 | $ | 1.81 | ||||||||||
| Dividends per common share | $ | 0.98 | $ | 0.98 | ||||||||||
Funds available for distribution to common shareholders and common unitholders (FAD) 3 | $ | 209,499 | $ | 219,130 | ||||||||||
| Selected items: | ||||||||||||||
| Revenue | $ | 858,571 | $ | 859,227 | ||||||||||
| Recoveries from clients | $ | 137,021 | $ | 137,891 | ||||||||||
| Service income from clients | $ | 2,539 | $ | 2,430 | ||||||||||
BXP’s Share of revenue 4 | $ | 831,378 | $ | 835,098 | ||||||||||
BXP’s Share of straight-line rent 4 | $ | 20,607 | $ | 25,433 | ||||||||||
BXP’s Share of fair value lease revenue 4, 5 | $ | 2,320 | $ | 2,294 | ||||||||||
BXP’s Share of termination income 4 | $ | 1,424 | $ | 12,179 | ||||||||||
| Ground rent expense | $ | 3,641 | $ | 3,690 | ||||||||||
| Capitalized interest | $ | 10,634 | $ | 11,625 | ||||||||||
| Capitalized wages | $ | 4,019 | $ | 4,233 | ||||||||||
Loss from unconsolidated joint ventures 1 | $ | (349,553) | $ | (7,011) | ||||||||||
BXP’s share of FFO from unconsolidated joint ventures 6 | $ | 12,882 | $ | 13,746 | ||||||||||
| Net income attributable to noncontrolling interests in property partnerships | $ | 17,233 | $ | 15,237 | ||||||||||
FFO attributable to noncontrolling interests in property partnerships 7 | $ | 37,138 | $ | 34,094 | ||||||||||
| Balance Sheet items: | ||||||||||||||
| Above-market rents (included within Prepaid Expenses and Other Assets) | $ | 7,436 | $ | 8,660 | ||||||||||
| Below-market rents (included within Other Liabilities) | $ | 28,793 | $ | 31,295 | ||||||||||
| Accrued rental income liability (included within Other Liabilities) | $ | 116,909 | $ | 108,234 | ||||||||||
| Ratios: | ||||||||||||||
Interest Coverage Ratio (excluding capitalized interest) 8 | 2.88 | 2.95 | ||||||||||||
Interest Coverage Ratio (including capitalized interest) 8 | 2.66 | 2.70 | ||||||||||||
Fixed Charge Coverage Ratio 7 | 2.34 | 2.44 | ||||||||||||
BXP’s Share of Net Debt to BXP’s Share of EBITDAre (Annualized) 9 | 7.65 | 7.59 | ||||||||||||
Change in BXP’s Share of Same Property Net Operating Income (NOI) (excluding termination income) 10 | (0.2) | % | (3.0) | % | ||||||||||
Change in BXP’s Share of Same Property NOI (excluding termination income) - cash 10 | 0.9 | % | (2.0) | % | ||||||||||
FAD Payout Ratio 3 | 82.48 | % | 78.86 | % | ||||||||||
| Operating Margins [(rental revenue - rental expense)/rental revenue] | 61.1 | % | 60.7 | % | ||||||||||
Occupancy % of In-Service Properties 11 | 87.5 | % | 87.0 | % | ||||||||||
Leased % of In-Service Properties 12 | 89.4 | % | 89.1 | % | ||||||||||
| Capitalization: | ||||||||||||||
| Consolidated Debt | $ | 16,220,499 | $ | 16,215,246 | ||||||||||
BXP’s Share of Debt 13 | $ | 16,241,896 | $ | 16,235,789 | ||||||||||
| Consolidated Market Capitalization | $ | 29,325,780 | $ | 30,395,758 | ||||||||||
| Consolidated Debt/Consolidated Market Capitalization | 55.31 | % | 53.35 | % | ||||||||||
BXP’s Share of Market Capitalization 13 | $ | 29,347,177 | $ | 30,416,301 | ||||||||||
BXP’s Share of Debt/BXP’s Share of Market Capitalization 13 | 55.34 | % | 53.38 | % | ||||||||||
_____________
1For the three months ended December 31, 2024, includes impairment charges totaling approximately $341.3 million related to the Company’s investments in three unconsolidated joint ventures.
2For a quantitative reconciliation of FFO attributable to BXP, Inc. and Diluted FFO per share, see page 7.
3For a quantitative reconciliation of FAD, see page 8. FAD Payout Ratio equals distributions to common shareholders and unitholders (excluding any special distributions) divided by FAD.
4See the Definitions and Reconciliations sections of this Supplemental package starting on page 57.
5Represents the net adjustment for above- and below-market leases that are amortized over the terms of the respective leases in place at the property acquisition dates.
6For a quantitative reconciliation for the three months ended December 31, 2024, see page 38.
7For a quantitative reconciliation for the three months ended December 31, 2024, see page 35.
8For a quantitative reconciliation for the three months ended December 31, 2024 and September 30, 2024, see page 33.
9For a quantitative reconciliation for the three months ended December 31, 2024 and September 30, 2024, see page 32.
3
| Q4 2024 | ||||
| Financial highlights (continued) | |||||
10For a quantitative reconciliation for the three months ended December 31, 2024 and September 30, 2024, see pages 11, 67 and 68.
11Represents signed leases for which revenue recognition has commenced in accordance with GAAP. Excludes hotel and residential properties.
12Represents signed leases for which revenue recognition has commenced in accordance with GAAP and signed leases for vacant space with future commencement dates. Excludes hotel and residential properties.
13For a quantitative reconciliation for December 31, 2024, see page 28.
4
| Q4 2024 | ||||
| Consolidated Balance Sheets | |||||
(unaudited and in thousands)
| 31-Dec-24 | 30-Sep-24 | |||||||||||||
| ASSETS | ||||||||||||||
| Real estate | $ | 26,391,933 | $ | 26,054,928 | ||||||||||
| Construction in progress | 764,640 | 812,122 | ||||||||||||
| Land held for future development | 714,050 | 690,774 | ||||||||||||
| Right of use assets - finance leases | 372,922 | 372,896 | ||||||||||||
| Right of use assets - operating leases | 334,767 | 339,804 | ||||||||||||
| Less accumulated depreciation | (7,528,057) | (7,369,545) | ||||||||||||
| Total real estate | 21,050,255 | 20,900,979 | ||||||||||||
| Cash and cash equivalents | 1,254,882 | 1,420,475 | ||||||||||||
| Cash held in escrows | 80,314 | 51,009 | ||||||||||||
| Investments in securities | 39,706 | 39,186 | ||||||||||||
| Tenant and other receivables, net | 107,453 | 99,706 | ||||||||||||
| Note receivable, net | 4,947 | 3,937 | ||||||||||||
| Related party note receivables, net | 88,779 | 88,788 | ||||||||||||
| Sales-type lease receivable, net | 14,657 | 14,429 | ||||||||||||
| Accrued rental income, net | 1,466,220 | 1,438,492 | ||||||||||||
| Deferred charges, net | 813,345 | 794,571 | ||||||||||||
| Prepaid expenses and other assets | 70,839 | 132,078 | ||||||||||||
Investments in unconsolidated joint ventures 1 | 1,093,583 | 1,421,886 | ||||||||||||
| Total assets | $ | 26,084,980 | $ | 26,405,536 | ||||||||||
| LIABILITIES AND EQUITY | ||||||||||||||
| Liabilities: | ||||||||||||||
| Mortgage notes payable, net | $ | 4,276,609 | $ | 4,275,155 | ||||||||||
| Unsecured senior notes, net | 10,645,077 | 10,642,033 | ||||||||||||
| Unsecured line of credit | — | — | ||||||||||||
| Unsecured term loans, net | 798,813 | 798,058 | ||||||||||||
| Unsecured commercial paper | 500,000 | 500,000 | ||||||||||||
| Lease liabilities - finance leases | 370,885 | 373,260 | ||||||||||||
| Lease liabilities - operating leases | 392,686 | 389,444 | ||||||||||||
| Accounts payable and accrued expenses | 401,874 | 444,288 | ||||||||||||
| Dividends and distributions payable | 172,486 | 172,191 | ||||||||||||
| Accrued interest payable | 128,098 | 121,360 | ||||||||||||
| Other liabilities | 450,796 | 407,441 | ||||||||||||
| Total liabilities | 18,137,324 | 18,123,230 | ||||||||||||
| Commitments and contingencies | — | — | ||||||||||||
| Redeemable deferred stock units | 9,535 | 10,696 | ||||||||||||
| Equity: | ||||||||||||||
| Stockholders’ equity attributable to BXP, Inc.: | ||||||||||||||
| Excess stock, $0.01 par value, 150,000,000 shares authorized, none issued or outstanding | — | — | ||||||||||||
| Common stock, $0.01 par value, 250,000,000 shares authorized, 158,253,895 and 158,058,798 issued and 158,174,995 and 157,979,898 outstanding at December 31, 2024 and September 30, 2024, respectively | 1,582 | 1,580 | ||||||||||||
| Additional paid-in capital | 6,836,093 | 6,822,489 | ||||||||||||
| Dividends in excess of earnings | (1,419,575) | (1,035,710) | ||||||||||||
| Treasury common stock at cost, 78,900 shares at December 31, 2024 and September 30, 2024 | (2,722) | (2,722) | ||||||||||||
| Accumulated other comprehensive loss | (2,072) | (26,428) | ||||||||||||
| Total stockholders’ equity attributable to BXP, Inc. | 5,413,306 | 5,759,209 | ||||||||||||
| Noncontrolling interests: | ||||||||||||||
| Common units of the Operating Partnership | 591,270 | 638,129 | ||||||||||||
| Property partnerships | 1,933,545 | 1,874,272 | ||||||||||||
| Total equity | 7,938,121 | 8,271,610 | ||||||||||||
| Total liabilities and equity | $ | 26,084,980 | $ | 26,405,536 | ||||||||||
_____________
1At December 31, 2024, the balance includes impairment charges totaling approximately $341.3 million related to the Company’s investments in three unconsolidated joint ventures.
5
| Q4 2024 | ||||
| Consolidated Income Statements | |||||
(unaudited and in thousands, except per share amounts)
| Three Months Ended | ||||||||||||||
| 31-Dec-24 | 30-Sep-24 | |||||||||||||
| Revenue | ||||||||||||||
| Lease | $ | 798,189 | $ | 799,471 | ||||||||||
| Parking and other | 33,135 | 34,255 | ||||||||||||
| Insurance proceeds | 921 | — | ||||||||||||
| Hotel revenue | 13,144 | 15,082 | ||||||||||||
| Development and management services | 8,784 | 6,770 | ||||||||||||
| Direct reimbursements of payroll and related costs from management services contracts | 4,398 | 3,649 | ||||||||||||
| Total revenue | 858,571 | 859,227 | ||||||||||||
| Expenses | ||||||||||||||
| Operating | 174,030 | 178,834 | ||||||||||||
| Real estate taxes | 148,901 | 148,809 | ||||||||||||
| Restoration expenses related to insurance claims | 427 | 254 | ||||||||||||
| Hotel operating | 9,601 | 9,833 | ||||||||||||
General and administrative 1 | 32,504 | 33,352 | ||||||||||||
| Payroll and related costs from management services contracts | 4,398 | 3,649 | ||||||||||||
| Transaction costs | 707 | 188 | ||||||||||||
| Depreciation and amortization | 226,043 | 222,890 | ||||||||||||
| Total expenses | 596,611 | 597,809 | ||||||||||||
| Other income (expense) | ||||||||||||||
Loss from unconsolidated joint ventures 2 | (349,553) | (7,011) | ||||||||||||
| Gain on sale of real estate | 85 | 517 | ||||||||||||
Gains (losses) from investments in securities 1 | (369) | 2,198 | ||||||||||||
| Unrealized gain (loss) on non-real estate investment | (2) | 94 | ||||||||||||
| Interest and other income (loss) | 20,452 | 14,430 | ||||||||||||
| Interest expense | (170,390) | (163,194) | ||||||||||||
| Net income (loss) | (237,817) | 108,452 | ||||||||||||
| Net (income) loss attributable to noncontrolling interests | ||||||||||||||
| Noncontrolling interest in property partnerships | (17,233) | (15,237) | ||||||||||||
Noncontrolling interest - common units of the Operating Partnership 3 | 25,031 | (9,587) | ||||||||||||
| Net income (loss) attributable to BXP, Inc. | $ | (230,019) | $ | 83,628 | ||||||||||
| INCOME PER SHARE OF COMMON STOCK (EPS) | ||||||||||||||
| Net income (loss) attributable to BXP, Inc. per share - basic | $ | (1.45) | $ | 0.53 | ||||||||||
| Net income (loss) attributable to BXP, Inc. per share - diluted | $ | (1.45) | $ | 0.53 | ||||||||||
_____________
1Includes $(0.4) million and $2.2 million for the three months ended December 31, 2024 and September 30, 2024, respectively, related to the Company’s deferred compensation plan.
2For the three months ended December 31, 2024, includes impairment charges totaling approximately $341.3 million related to the Company’s investments in three unconsolidated joint ventures.
3For additional detail, see page 7.
6
| Q4 2024 | ||||
Funds from operations (FFO) 1 | |||||
(unaudited and dollars in thousands, except per share amounts)
| Three Months Ended | ||||||||||||||
| 31-Dec-24 | 30-Sep-24 | |||||||||||||
| Net income (loss) attributable to BXP, Inc. | $ | (230,019) | $ | 83,628 | ||||||||||
| Add: | ||||||||||||||
| Noncontrolling interest - common units of the Operating Partnership | (25,031) | 9,587 | ||||||||||||
| Noncontrolling interests in property partnerships | 17,233 | 15,237 | ||||||||||||
| Net income (loss) | (237,817) | 108,452 | ||||||||||||
| Add: | ||||||||||||||
| Depreciation and amortization expense | 226,043 | 222,890 | ||||||||||||
Noncontrolling interests in property partnerships' share of depreciation and amortization 2 | (19,905) | (18,857) | ||||||||||||
BXP's share of depreciation and amortization from unconsolidated joint ventures 3 | 21,097 | 20,757 | ||||||||||||
| Corporate-related depreciation and amortization | (447) | (438) | ||||||||||||
| Non-real estate related amortization | 2,130 | 2,130 | ||||||||||||
| Impairment loss included within loss from unconsolidated joint ventures | 341,338 | — | ||||||||||||
| Less: | ||||||||||||||
| Gains on sales of real estate | 85 | 517 | ||||||||||||
| Unrealized gain (loss) on non-real estate investment | (2) | 94 | ||||||||||||
| Noncontrolling interests in property partnerships | 17,233 | 15,237 | ||||||||||||
| FFO attributable to the Operating Partnership (including BXP, Inc.) (Basic FFO) | 315,123 | 319,086 | ||||||||||||
| Less: | ||||||||||||||
| Noncontrolling interest - common units of the Operating Partnership’s share of FFO | 31,134 | 32,228 | ||||||||||||
| FFO attributable to BXP, Inc. | $ | 283,989 | $ | 286,858 | ||||||||||
| BXP, Inc.’s percentage share of Basic FFO | 90.12 | % | 89.90 | % | ||||||||||
| Noncontrolling interest’s - common unitholders percentage share of Basic FFO | 9.88 | % | 10.10 | % | ||||||||||
| Basic FFO per share | $ | 1.80 | $ | 1.82 | ||||||||||
| Weighted average shares outstanding - basic | 158,117 | 157,725 | ||||||||||||
| Diluted FFO per share | $ | 1.79 | $ | 1.81 | ||||||||||
| Weighted average shares outstanding - diluted | 158,525 | 158,213 | ||||||||||||
RECONCILIATION TO DILUTED FFO
| Three Months Ended | ||||||||||||||
| 31-Dec-24 | 30-Sep-24 | |||||||||||||
| Basic FFO | $ | 315,123 | $ | 319,086 | ||||||||||
| Add: | ||||||||||||||
| Effect of dilutive securities - stock-based compensation | — | — | ||||||||||||
| Diluted FFO | 315,123 | 319,086 | ||||||||||||
| Less: | ||||||||||||||
| Noncontrolling interest - common units of the Operating Partnership’s share of diluted FFO | 31,071 | 32,132 | ||||||||||||
| BXP, Inc.’s share of Diluted FFO | $ | 284,052 | $ | 286,954 | ||||||||||
RECONCILIATION OF SHARES/UNITS FOR DILUTED FFO
| Three Months Ended | ||||||||||||||
| 31-Dec-24 | 30-Sep-24 | |||||||||||||
| Shares/units for Basic FFO | 175,452 | 175,446 | ||||||||||||
| Add: | ||||||||||||||
| Effect of dilutive securities - stock-based compensation (shares/units) | 408 | 488 | ||||||||||||
| Shares/units for Diluted FFO | 175,860 | 175,934 | ||||||||||||
| Less: | ||||||||||||||
| Noncontrolling interest - common units of the Operating Partnership’s share of Diluted FFO (shares/units) | 17,335 | 17,721 | ||||||||||||
| BXP, Inc.’s share of shares/units for Diluted FFO | 158,525 | 158,213 | ||||||||||||
| BXP, Inc.’s percentage share of Diluted FFO | 90.14 | % | 89.93 | % | ||||||||||
_____________
1See the Definitions and Reconciliations sections of this Supplemental package starting on page 57.
2For a quantitative reconciliation for the three months ended December 31, 2024, see page 35.
3For a quantitative reconciliation for the three months ended December 31, 2024, see page 38.
7
| Q4 2024 | ||||
Funds available for distributions (FAD) 1 | |||||
(dollars in thousands)
| Three Months Ended | ||||||||||||||
| 31-Dec-24 | 30-Sep-24 | |||||||||||||
| Net income (loss) attributable to BXP, Inc. | $ | (230,019) | $ | 83,628 | ||||||||||
| Add: | ||||||||||||||
| Noncontrolling interest - common units of the Operating Partnership | (25,031) | 9,587 | ||||||||||||
| Noncontrolling interests in property partnerships | 17,233 | 15,237 | ||||||||||||
| Net income (loss) | (237,817) | 108,452 | ||||||||||||
| Add: | ||||||||||||||
| Depreciation and amortization expense | 226,043 | 222,890 | ||||||||||||
Noncontrolling interests in property partnerships’ share of depreciation and amortization 2 | (19,905) | (18,857) | ||||||||||||
BXP’s share of depreciation and amortization from unconsolidated joint ventures 3 | 21,097 | 20,757 | ||||||||||||
| Corporate-related depreciation and amortization | (447) | (438) | ||||||||||||
| Non-real estate related amortization | 2,130 | 2,130 | ||||||||||||
| Impairment loss included within loss from unconsolidated joint ventures | 341,338 | — | ||||||||||||
| Less: | ||||||||||||||
| Gains on sales of real estate | 85 | 517 | ||||||||||||
| Unrealized gain (loss) on non-real estate investment | (2) | 94 | ||||||||||||
| Noncontrolling interests in property partnerships | 17,233 | 15,237 | ||||||||||||
| Basic FFO | 315,123 | 319,086 | ||||||||||||
| Add: | ||||||||||||||
BXP’s Share of lease transaction costs that qualify as rent inducements 1, 4 | 4,039 | 5,070 | ||||||||||||
BXP’s Share of hedge amortization, net of costs 1 | 1,812 | 1,949 | ||||||||||||
BXP’s share of fair value interest adjustment 1 | 4,748 | 4,723 | ||||||||||||
BXP’s Share of straight-line ground rent expense adjustment 1, 5 | 868 | 679 | ||||||||||||
| Stock-based compensation | 4,059 | 4,031 | ||||||||||||
| Non-real estate depreciation and amortization | (1,683) | (1,692) | ||||||||||||
Unearned portion of capitalized fees from consolidated joint ventures 6 | 3,040 | 2,274 | ||||||||||||
| Non-cash losses from early extinguishments of debt | — | — | ||||||||||||
| Less: | ||||||||||||||
BXP’s Share of straight-line rent 1 | 20,607 | 25,433 | ||||||||||||
BXP’s Share of fair value lease revenue 1, 7 | 2,320 | 2,294 | ||||||||||||
BXP’s Share of 2nd generation tenant improvements and leasing commissions 1 | 74,864 | 70,457 | ||||||||||||
BXP’s Share of maintenance capital expenditures 1, 8 | 23,848 | 18,220 | ||||||||||||
BXP’s Share of amortization and accretion related to sales type lease 1 | 281 | 278 | ||||||||||||
| Hotel improvements, equipment upgrades and replacements | 587 | 308 | ||||||||||||
Funds available for distribution to common shareholders and common unitholders (FAD) (A) | $ | 209,499 | $ | 219,130 | ||||||||||
Distributions to common shareholders and unitholders (excluding any special distributions) (B) | 172,804 | 172,806 | ||||||||||||
FAD Payout Ratio1 (B÷A) | 82.48 | % | 78.86 | % | ||||||||||
_____________
1See the Definitions and Reconciliations sections of this Supplemental package starting on page 57.
2For a quantitative reconciliation for the three months ended December 31, 2024, see page 35.
3 For additional information for the three months ended December 31, 2024, see page 38.
4Consists of lease transaction costs that qualify as rent inducements in accordance with GAAP. Lease transaction costs are generally included in 2nd generation tenant improvements and leasing commissions in the period the lease commences.
5Includes the straight-line impact of the Company’s 99-year ground and air rights lease related to the Company’s 100 Clarendon Street garage and Back Bay Transit Station. The Company has allocated contractual ground lease payments aggregating approximately $39.0 million, which it expects to incur by the end of 2026 with no payments thereafter. The Company is recognizing this expense on a straight-line basis over the 99-year term of the ground and air rights lease, see page 3.
6See page 63 for additional information.
7Represents the net adjustment for above- and below-market leases that are amortized over the terms of the respective leases in place at the property acquisition dates.
8Maintenance capital expenditures do not include capital expenditures that are planned at the time of acquisition or capital expenditures incurred in connection with repositioning activities.
8
| Q4 2024 | ||||
| Reconciliation of net income (loss) attributable to BXP, Inc. to BXP’s Share of same property net operating income (NOI) | |||||
(in thousands)
| Three Months Ended | ||||||||||||||
| 31-Dec-24 | 31-Dec-23 | |||||||||||||
| Net income (loss) attributable to BXP, Inc. | $ | (230,019) | $ | 119,925 | ||||||||||
| Net (income) loss attributable to noncontrolling interests | ||||||||||||||
| Noncontrolling interest - common units of the Operating Partnership | (25,031) | 13,906 | ||||||||||||
| Noncontrolling interest in property partnerships | 17,233 | 19,324 | ||||||||||||
| Net income (loss) | (237,817) | 153,155 | ||||||||||||
| Add: | ||||||||||||||
| Interest expense | 170,390 | 155,080 | ||||||||||||
| Unrealized loss on non-real estate investment | 2 | 93 | ||||||||||||
| Loss from interest rate contracts | — | 79 | ||||||||||||
| Depreciation and amortization expense | 226,043 | 212,067 | ||||||||||||
| Transaction costs | 707 | 2,343 | ||||||||||||
| Payroll and related costs from management services contracts | 4,398 | 4,021 | ||||||||||||
| General and administrative expense | 32,504 | 38,771 | ||||||||||||
| Less: | ||||||||||||||
| Interest and other income (loss) | 20,452 | 20,965 | ||||||||||||
| Gains (losses) from investments in securities | (369) | 3,245 | ||||||||||||
| Gains on sales of real estate | 85 | — | ||||||||||||
| Income (loss) from unconsolidated joint ventures | (349,553) | 22,250 | ||||||||||||
| Direct reimbursements of payroll and related costs from management services contracts | 4,398 | 4,021 | ||||||||||||
| Development and management services revenue | 8,784 | 12,728 | ||||||||||||
| Net Operating Income (NOI) | 512,430 | 502,400 | ||||||||||||
| Add: | ||||||||||||||
BXP’s share of NOI from unconsolidated joint ventures 1 | 30,782 | 38,520 | ||||||||||||
| Less: | ||||||||||||||
Partners’ share of NOI from consolidated joint ventures (after income allocation to private REIT shareholders) 2 | 48,259 | 49,263 | ||||||||||||
| BXP’s Share of NOI | 494,953 | 491,657 | ||||||||||||
| Less: | ||||||||||||||
| Termination income | 914 | 10,485 | ||||||||||||
BXP’s share of termination income from unconsolidated joint ventures 1 | 521 | — | ||||||||||||
| Add: | ||||||||||||||
Partners’ share of termination income from consolidated joint ventures 2 | 11 | 135 | ||||||||||||
| BXP’s Share of NOI (excluding termination income) | $ | 493,529 | $ | 481,307 | ||||||||||
| Net Operating Income (NOI) | $ | 512,430 | $ | 502,400 | ||||||||||
| Less: | ||||||||||||||
| Termination income | 914 | 10,485 | ||||||||||||
NOI from non Same Properties (excluding termination income) 3 | 25,855 | 3,495 | ||||||||||||
| Same Property NOI (excluding termination income) | 485,661 | 488,420 | ||||||||||||
| Less: | ||||||||||||||
Partners’ share of NOI from consolidated joint ventures (excluding termination income and after income allocation to private REIT shareholders) 2 | 48,248 | 49,128 | ||||||||||||
| Add: | ||||||||||||||
Partners’ share of NOI from non Same Properties from consolidated joint ventures (excluding termination income and after income allocation to private REIT shareholders) 3 | 2,865 | — | ||||||||||||
BXP’s share of NOI from unconsolidated joint ventures (excluding termination income) 1 | 30,261 | 38,520 | ||||||||||||
| Less: | ||||||||||||||
BXP’s share of NOI from non Same Properties from unconsolidated joint ventures (excluding termination income) 3 | (636) | 5,898 | ||||||||||||
| BXP’s Share of Same Property NOI (excluding termination income) | $ | 471,175 | $ | 471,914 | ||||||||||
_____________
1For a quantitative reconciliation for the three months ended December 31, 2024, see page 66.
2For a quantitative reconciliation for the three months ended December 31, 2024, see pages 63-64.
3Pages 22-25 indicate by footnote the properties that are not included as part of Same Property NOI. In addition, Same Properties exclude properties that were sold prior to December 31, 2024 and therefore are no longer a part of the Company’s property portfolio.
9
| Q4 2024 | ||||
| Reconciliation of net income (loss) attributable to BXP, Inc. to BXP’s Share of same property net operating income (NOI) - cash | |||||
(in thousands)
| Three Months Ended | ||||||||||||||
| 31-Dec-24 | 31-Dec-23 | |||||||||||||
| Net income (loss) attributable to BXP, Inc. | $ | (230,019) | $ | 119,925 | ||||||||||
| Net (income) loss attributable to noncontrolling interests | ||||||||||||||
| Noncontrolling interest - common units of the Operating Partnership | (25,031) | 13,906 | ||||||||||||
| Noncontrolling interest in property partnerships | 17,233 | 19,324 | ||||||||||||
| Net income (loss) | (237,817) | 153,155 | ||||||||||||
| Add: | ||||||||||||||
| Interest expense | 170,390 | 155,080 | ||||||||||||
| Unrealized loss on non-real estate investment | 2 | 93 | ||||||||||||
| Loss from interest rate contracts | — | 79 | ||||||||||||
| Depreciation and amortization expense | 226,043 | 212,067 | ||||||||||||
| Transaction costs | 707 | 2,343 | ||||||||||||
| Payroll and related costs from management services contracts | 4,398 | 4,021 | ||||||||||||
| General and administrative expense | 32,504 | 38,771 | ||||||||||||
| Less: | ||||||||||||||
| Interest and other income (loss) | 20,452 | 20,965 | ||||||||||||
| Gains (losses) from investments in securities | (369) | 3,245 | ||||||||||||
| Gains on sales of real estate | 85 | — | ||||||||||||
| Income (loss) from unconsolidated joint ventures | (349,553) | 22,250 | ||||||||||||
| Direct reimbursements of payroll and related costs from management services contracts | 4,398 | 4,021 | ||||||||||||
| Development and management services revenue | 8,784 | 12,728 | ||||||||||||
| Net Operating Income (NOI) | 512,430 | 502,400 | ||||||||||||
| Less: | ||||||||||||||
| Straight-line rent | 19,732 | 29,235 | ||||||||||||
| Fair value lease revenue | 1,277 | 2,518 | ||||||||||||
| Amortization and accretion related to sales type lease | 254 | 238 | ||||||||||||
| Termination income | 914 | 10,485 | ||||||||||||
| Add: | ||||||||||||||
Straight-line ground rent expense adjustment 1 | 586 | 578 | ||||||||||||
Lease transaction costs that qualify as rent inducements 2 | 3,512 | 1,276 | ||||||||||||
| NOI - cash (excluding termination income) | 494,351 | 461,778 | ||||||||||||
| Less: | ||||||||||||||
NOI - cash from non Same Properties (excluding termination income) 3 | 38,239 | 1,825 | ||||||||||||
| Same Property NOI - cash (excluding termination income) | 456,112 | 459,953 | ||||||||||||
| Less: | ||||||||||||||
Partners’ share of NOI - cash from consolidated joint ventures (excluding termination income and after income allocation to private REIT shareholders) 4 | 49,077 | 44,606 | ||||||||||||
| Add: | ||||||||||||||
Partners’ share of NOI - cash from non Same Properties from consolidated joint ventures (excluding termination income and after income allocation to private REIT shareholders) 3 | 9,121 | — | ||||||||||||
BXP’s share of NOI - cash from unconsolidated joint ventures (excluding termination income) 5 | 29,808 | 33,704 | ||||||||||||
| Less: | ||||||||||||||
BXP’s share of NOI - cash from non Same Properties from unconsolidated joint ventures (excluding termination income) 3 | (1,264) | 5,881 | ||||||||||||
| BXP’s Share of Same Property NOI - cash (excluding termination income) | $ | 447,228 | $ | 443,170 | ||||||||||
_____________
1In light of the front-ended, uneven rental payments required by the Company’s 99-year ground and air rights lease for the 100 Clarendon Street garage and Back Bay Transit Station in Boston, MA, and to make period-to-period comparisons more meaningful to investors, the adjustment does not include the straight-line impact of approximately $146 and $(543) for the three months ended December 31, 2024 and 2023, respectively. As of December 31, 2024, the Company has remaining lease payments aggregating approximately $30.9 million, all of which it expects to incur by the end of 2026 with no payments thereafter. Under GAAP, the Company recognizes expense of $(111) per quarter on a straight-line basis over the term of the lease. However, unlike more traditional ground and air rights leases, the timing and amounts of the rental payments by the Company correlate to the uneven timing and funding by the Company of capital expenditures related to improvements at Back Bay Transit Station. As a result, the amounts excluded from the adjustment each quarter through 2026 may vary significantly.
2Consist of lease transaction costs that qualify as rent inducements in accordance with GAAP. Lease transaction costs are generally included in 2nd generation tenant improvements and leasing commissions in the Company’s FAD calculation on page 8.
3Pages 22-25 indicate by footnote the properties that are not included as part of Same Property NOI. In addition, Same Properties exclude properties that were sold prior to December 31, 2024 and therefore are no longer a part of the Company’s property portfolio.
4For a quantitative reconciliation for the three months ended December 31, 2024, see page 64.
5For a quantitative reconciliation for the three months ended December 31, 2024, see page 66.
10
| Q4 2024 | ||||
| Same property net operating income (NOI) by reportable segment | |||||
(dollars in thousands)
Office 1 | Hotel & Residential | ||||||||||||||||||||||||||||||||||||||||||||||
| Three Months Ended | $ | % | Three Months Ended | $ | % | ||||||||||||||||||||||||||||||||||||||||||
| 31-Dec-24 | 31-Dec-23 | Change | Change | 31-Dec-24 | 31-Dec-23 | Change | Change | ||||||||||||||||||||||||||||||||||||||||
Rental Revenue 2 | $ | 778,277 | $ | 780,713 | $ | 25,625 | $ | 23,627 | |||||||||||||||||||||||||||||||||||||||
| Less: Termination income | 914 | 10,485 | — | — | |||||||||||||||||||||||||||||||||||||||||||
Rental revenue (excluding termination income) 2 | 777,363 | 770,228 | $ | 7,135 | 0.9 | % | 25,625 | 23,627 | $ | 1,998 | 8.5 | % | |||||||||||||||||||||||||||||||||||
| Less: Operating expenses and real estate taxes | 301,667 | 290,796 | 10,871 | 3.7 | % | 15,660 | 14,639 | 1,021 | 7.0 | % | |||||||||||||||||||||||||||||||||||||
NOI (excluding termination income) 2, 3 | $ | 475,696 | $ | 479,432 | $ | (3,736) | (0.8) | % | $ | 9,965 | $ | 8,988 | $ | 977 | 10.9 | % | |||||||||||||||||||||||||||||||
Rental revenue (excluding termination income) 2 | $ | 777,363 | $ | 770,228 | $ | 7,135 | 0.9 | % | $ | 25,625 | $ | 23,627 | $ | 1,998 | 8.5 | % | |||||||||||||||||||||||||||||||
| Less: Straight-line rent and fair value lease revenue and amortization and accretion from sales-type lease | 33,231 | 30,113 | 3,118 | 10.4 | % | 145 | 148 | (3) | (2.0) | % | |||||||||||||||||||||||||||||||||||||
Add: Lease transaction costs that qualify as rent inducements 4 | 3,179 | 1,216 | 1,963 | 161.4 | % | 149 | — | 149 | 100.0 | % | |||||||||||||||||||||||||||||||||||||
| Subtotal | 747,311 | 741,331 | 5,980 | 0.8 | % | 25,629 | 23,479 | 2,150 | 9.2 | % | |||||||||||||||||||||||||||||||||||||
| Less: Operating expenses and real estate taxes | 301,667 | 290,796 | 10,871 | 3.7 | % | 15,660 | 14,639 | 1,021 | 7.0 | % | |||||||||||||||||||||||||||||||||||||
Add: Straight-line ground rent expense 5 | 499 | 578 | (79) | (13.7) | % | — | — | — | — | % | |||||||||||||||||||||||||||||||||||||
NOI - cash (excluding termination income) 2, 3 | $ | 446,143 | $ | 451,113 | $ | (4,970) | (1.1) | % | $ | 9,969 | $ | 8,840 | $ | 1,129 | 12.8 | % | |||||||||||||||||||||||||||||||
Consolidated Total 1 (A) | BXP’s share of Unconsolidated Joint Ventures (B) | ||||||||||||||||||||||||||||||||||||||||||||||
| Three Months Ended | $ | % | Three Months Ended | $ | % | ||||||||||||||||||||||||||||||||||||||||||
| 31-Dec-24 | 31-Dec-23 | Change | Change | 31-Dec-24 | 31-Dec-23 | Change | Change | ||||||||||||||||||||||||||||||||||||||||
Rental Revenue 2 | $ | 803,902 | $ | 804,340 | $ | 52,706 | $ | 51,888 | |||||||||||||||||||||||||||||||||||||||
| Less: Termination income | 914 | 10,485 | 521 | — | |||||||||||||||||||||||||||||||||||||||||||
Rental revenue (excluding termination income) 2 | 802,988 | 793,855 | $ | 9,133 | 1.2 | % | 52,185 | 51,888 | $ | 297 | 0.6 | % | |||||||||||||||||||||||||||||||||||
| Less: Operating expenses and real estate taxes | 317,327 | 305,435 | 11,892 | 3.9 | % | 21,288 | 19,266 | 2,022 | 10.5 | % | |||||||||||||||||||||||||||||||||||||
NOI (excluding termination income) 2, 3 | $ | 485,661 | $ | 488,420 | $ | (2,759) | (0.6) | % | $ | 30,897 | $ | 32,622 | $ | (1,725) | (5.3) | % | |||||||||||||||||||||||||||||||
Rental revenue (excluding termination income) 2 | $ | 802,988 | $ | 793,855 | $ | 9,133 | 1.2 | % | $ | 52,185 | $ | 51,888 | $ | 297 | 0.6 | % | |||||||||||||||||||||||||||||||
| Less: Straight-line rent and fair value lease revenue and amortization and accretion from sales-type lease | 33,376 | 30,261 | 3,115 | 10.3 | % | 277 | 4,764 | (4,487) | (94.2) | % | |||||||||||||||||||||||||||||||||||||
Add: Lease transaction costs that qualify as rent inducements 4 | 3,328 | 1,216 | 2,112 | 173.7 | % | 316 | (174) | 490 | 281.6 | % | |||||||||||||||||||||||||||||||||||||
| Subtotal | 772,940 | 764,810 | 8,130 | 1.1 | % | 52,224 | 46,950 | 5,274 | 11.2 | % | |||||||||||||||||||||||||||||||||||||
| Less: Operating expenses and real estate taxes | 317,327 | 305,435 | 11,892 | 3.9 | % | 21,288 | 19,266 | 2,022 | 10.5 | % | |||||||||||||||||||||||||||||||||||||
Add: Straight-line ground rent expense 5 | 499 | 578 | (79) | (13.7) | % | 136 | 139 | (3) | (2.2) | % | |||||||||||||||||||||||||||||||||||||
NOI - cash (excluding termination income) 2, 3 | $ | 456,112 | $ | 459,953 | $ | (3,841) | (0.8) | % | $ | 31,072 | $ | 27,823 | $ | 3,249 | 11.7 | % | |||||||||||||||||||||||||||||||
Partners’ share of Consolidated Joint Ventures (C) | BXP’s Share 2, 6 | ||||||||||||||||||||||||||||||||||||||||||||||
| Three Months Ended | $ | % | Three Months Ended | $ | % | ||||||||||||||||||||||||||||||||||||||||||
| 31-Dec-24 | 31-Dec-23 | Change | Change | 31-Dec-24 | 31-Dec-23 | Change | Change | ||||||||||||||||||||||||||||||||||||||||
Rental Revenue 2 | $ | 79,669 | $ | 81,441 | $ | 776,939 | $ | 774,787 | |||||||||||||||||||||||||||||||||||||||
| Less: Termination income | 11 | 135 | 1,424 | 10,350 | |||||||||||||||||||||||||||||||||||||||||||
Rental revenue (excluding termination income) 2 | 79,658 | 81,306 | $ | (1,648) | (2.0) | % | 775,515 | 764,437 | $ | 11,078 | 1.4 | % | |||||||||||||||||||||||||||||||||||
| Less: Operating expenses and real estate taxes | 34,275 | 32,178 | 2,097 | 6.5 | % | 304,340 | 292,523 | 11,817 | 4.0 | % | |||||||||||||||||||||||||||||||||||||
NOI (excluding termination income) 2, 3 | $ | 45,383 | $ | 49,128 | $ | (3,745) | (7.6) | % | $ | 471,175 | $ | 471,914 | $ | (739) | (0.2) | % | |||||||||||||||||||||||||||||||
Rental revenue (excluding termination income) 2 | $ | 79,658 | $ | 81,306 | $ | (1,648) | (2.0) | % | $ | 775,515 | $ | 764,437 | $ | 11,078 | 1.4 | % | |||||||||||||||||||||||||||||||
| Less: Straight-line rent and fair value lease revenue and amortization and accretion from sales-type lease | 5,216 | 4,686 | 530 | 11.3 | % | 28,437 | 30,339 | (1,902) | (6.3) | % | |||||||||||||||||||||||||||||||||||||
Add: Lease transaction costs that qualify as rent inducements 4 | (211) | 164 | (375) | (228.7) | % | 3,855 | 878 | 2,977 | 339.1 | % | |||||||||||||||||||||||||||||||||||||
| Subtotal | 74,231 | 76,784 | (2,553) | (3.3) | % | 750,933 | 734,976 | 15,957 | 2.2 | % | |||||||||||||||||||||||||||||||||||||
| Less: Operating expenses and real estate taxes | 34,275 | 32,178 | 2,097 | 6.5 | % | 304,340 | 292,523 | 11,817 | 4.0 | % | |||||||||||||||||||||||||||||||||||||
Add: Straight-line ground rent expense 5 | — | — | — | — | % | 635 | 717 | (82) | (11.4) | % | |||||||||||||||||||||||||||||||||||||
NOI - cash (excluding termination income) 2, 3 | $ | 39,956 | $ | 44,606 | $ | (4,650) | (10.4) | % | $ | 447,228 | $ | 443,170 | $ | 4,058 | 0.9 | % | |||||||||||||||||||||||||||||||
___________________
1Includes 100% share of consolidated joint ventures that are a Same Property.
2See the Definitions and Reconciliations sections of this Supplemental package starting on page 57.
3For a quantitative reconciliation of net income (loss) attributable to BXP, Inc. to net operating income (NOI) (excluding termination income) and NOI - cash (excluding termination income), see pages 9-10.
11
| Q4 2024 | ||||
| Same property net operating income (NOI) by reportable segment (continued) | |||||
4Consist of lease transaction costs that qualify as rent inducements in accordance with GAAP. Lease transaction costs are generally included in 2nd generation tenant improvements and leasing commissions in the Company’s FAD calculation on page 8.
5Excludes the straight-line impact of approximately $146 and $(543) for the three months ended December 31, 2024 and 2023, respectively, in connection with the Company’s 99-year ground and air rights lease at 100 Clarendon Street garage and Back Bay Transit Station.
6BXP’s Share equals (A) + (B) - (C).
12
| Q4 2024 | ||||
| Capital expenditures, tenant improvement costs and leasing commissions | |||||
(dollars in thousands, except PSF amounts)
CAPITAL EXPENDITURES
| Three Months Ended | ||||||||||||||
| 31-Dec-24 | 30-Sep-24 | |||||||||||||
| Maintenance capital expenditures | $ | 25,716 | $ | 21,481 | ||||||||||
| Planned capital expenditures associated with acquisition properties | 2,282 | 1,774 | ||||||||||||
| Repositioning capital expenditures | 26,126 | 19,301 | ||||||||||||
| Hotel improvements, equipment upgrades and replacements | 587 | 308 | ||||||||||||
| Subtotal | 54,711 | 42,864 | ||||||||||||
| Add: | ||||||||||||||
| BXP’s share of maintenance capital expenditures from unconsolidated joint ventures (JVs) | 289 | 66 | ||||||||||||
| BXP’s share of planned capital expenditures associated with acquisition properties from unconsolidated JVs | 263 | 577 | ||||||||||||
| BXP’s share of repositioning capital expenditures from unconsolidated JVs | — | — | ||||||||||||
| Less: | ||||||||||||||
| Partners’ share of maintenance capital expenditures from consolidated JVs | 2,157 | 3,327 | ||||||||||||
| Partners’ share of planned capital expenditures associated with acquisition properties from consolidated JVs | — | — | ||||||||||||
| Partners’ share of repositioning capital expenditures from consolidated JVs | (13) | (75) | ||||||||||||
BXP’s Share of Capital Expenditures 1 | $ | 53,119 | $ | 40,255 | ||||||||||
2nd GENERATION TENANT IMPROVEMENTS AND LEASING COMMISSIONS 2
| Three Months Ended | ||||||||||||||
| 31-Dec-24 | 30-Sep-24 | |||||||||||||
| Square feet | 967,303 | 1,190,695 | ||||||||||||
| Tenant improvements and lease commissions PSF | $ | 94.74 | $ | 74.93 | ||||||||||
___________________
1See the Definitions and Reconciliations sections of this Supplemental package starting on page 57.
2Includes 100% of unconsolidated joint ventures.
13
| Q4 2024 | ||||
| Acquisitions and dispositions | |||||
For the period from January 1, 2024 through December 31, 2024
(dollars in thousands)
ACQUISITIONS
| Investment | |||||||||||||||||||||||||||||||||||||||||||||||
| Property | Location | Date Acquired | Square Feet | Initial | Anticipated Future | Total | In-service Leased (%) | ||||||||||||||||||||||||||||||||||||||||
901 New York Avenue 1 | Washington, DC | January 8, 2024 | 523,939 | $ | 10,000 | $ | 25,000 | $ | 35,000 | 83.9 | % | ||||||||||||||||||||||||||||||||||||
725 12th Street 2 | Washington, DC | December 27, 2024 | 300,000 | 34,000 | 315,600 | 349,600 | N/A | ||||||||||||||||||||||||||||||||||||||||
| Total Acquisitions | 823,939 | $ | 44,000 | $ | 340,600 | $ | 384,600 | 83.9 | % | ||||||||||||||||||||||||||||||||||||||
DISPOSITIONS
| Property | Location | Date Disposed | Square Feet | Gross Sales Price | Net Cash Proceeds | Book Gain (Loss) 4 | ||||||||||||||||||||||||||||||||||||||
290 Binney Street (45% ownership) 3 | Cambridge, MA | March 21, 2024 | 566,000 | $ | 1,079,687 | $ | 141,822 | N/A | ||||||||||||||||||||||||||||||||||||
___________________
1The Company completed the acquisition of its joint venture partner’s 50% economic ownership interest. The property is encumbered by an approximately $207.1 million mortgage, which bears interest at 3.61% per annum and matures on January 5, 2025. Following the acquisition, the Company modified the mortgage loan to among other things provide for two loan extension options totaling five years of additional term, each subject to certain conditions. On December 20, 2024, the Company exercised the first loan extension option, which provides for a term of four years at a fixed interest rate of 5.0% per annum. In addition, following the acquisition, BXP extended the 214,000 square foot lease with anchor client, Finnegan Henderson Farabow Garrett & Dunner, LLP, through 2042 and agreed to complete approximately $25.0 million of building enhancements.
2 Upon acquisition, the Company executed a lease with McDermott Will & Emery LLP and commenced redevelopment, see page 15.
3The Company completed the previously announced sale of a 45% ownership interest to Norges Bank Investment Management (“NBIM”). NBIM’s investment in 290 Binney Street will reduce the Company’s share of the project’s estimated development spend over time by approximately $533.5 million, see page 15. At closing, NBIM paid approximately $142 million, of which $97 million was a special distribution to the Company and represented pre-formation costs, and NBIM will fund all capital calls until reaching 45% of invested capital. The Company retains a 55% ownership interest and provides development, property management, and leasing services for the venture. This transaction did not qualify as a sale of real estate for financial reporting purposes as the Company continues to effectively control the property and thus will continue to account for the property on a consolidated basis in its financial statements.
4Excludes approximately $0.6 million of gains on sales of real estate recognized during the year ended December 31, 2024 related to gain amounts from sales of real estate occurring in prior periods.
14
| Q4 2024 | ||||
| Construction in progress | |||||
as of December 31, 2024
(dollars in thousands)
CONSTRUCTION IN PROGRESS 1
| Actual/Estimated | BXP’s share | |||||||||||||||||||||||||||||||||||||||||||||||||||||||||||||||||||||||||||||||
| Initial Occupancy | Stabilization Date | Square Feet | Investment to Date 2 | Estimated Total Investment 2 | Total Financing | Amount Drawn at 12/31/2024 | Estimated Future Equity Requirement 2 | Percentage | Percentage placed in-service 4 | Net Operating Income (Loss) 5 (BXP’s share) | ||||||||||||||||||||||||||||||||||||||||||||||||||||||||||||||||||||||
| Construction Properties | Location | Leased 3 | ||||||||||||||||||||||||||||||||||||||||||||||||||||||||||||||||||||||||||||||
| Office | ||||||||||||||||||||||||||||||||||||||||||||||||||||||||||||||||||||||||||||||||
| 360 Park Avenue South (71% ownership) | Q4 2024 | Q4 2026 | New York, NY | 450,000 | $ | 359,688 | $ | 418,300 | $ | 156,470 | $ | 156,470 | $ | 58,612 | 23 | % | 30 | % | $ | (608) | ||||||||||||||||||||||||||||||||||||||||||||||||||||||||||||
| Reston Next Office Phase II | Q1 2025 | Q2 2026 | Reston, VA | 90,000 | 45,672 | 61,000 | — | — | 15,328 | 7 | % | 6 | % | (34) | ||||||||||||||||||||||||||||||||||||||||||||||||||||||||||||||||||
725 12th Street 6 | Q1 2029 | Q4 2030 | Washington, DC | 320,000 | 51,447 | 349,600 | — | — | 298,153 | 47 | % | — | % | N/A | ||||||||||||||||||||||||||||||||||||||||||||||||||||||||||||||||||
| Total Office Properties under Construction | 860,000 | 456,807 | 828,900 | 156,470 | 156,470 | 372,093 | 30 | % | 16 | % | (642) | |||||||||||||||||||||||||||||||||||||||||||||||||||||||||||||||||||||
| Lab/Life Sciences | ||||||||||||||||||||||||||||||||||||||||||||||||||||||||||||||||||||||||||||||||
| 651 Gateway (50% ownership) | Q1 2024 | Q3 2026 | South San Francisco, CA | 327,000 | 132,083 | 167,100 | — | — | 35,017 | 21 | % | 27 | % | 712 | ||||||||||||||||||||||||||||||||||||||||||||||||||||||||||||||||||
290 Binney Street (55% ownership) 7 | Q2 2026 | Q2 2026 | Cambridge, MA | 573,000 | 212,002 | 508,000 | — | — | 295,998 | 100 | % | — | % | N/A | ||||||||||||||||||||||||||||||||||||||||||||||||||||||||||||||||||
| Total Lab/Life Sciences Properties under Construction | 900,000 | 344,085 | 675,100 | — | — | 331,015 | 71 | % | 10 | % | 712 | |||||||||||||||||||||||||||||||||||||||||||||||||||||||||||||||||||||
| Residential | ||||||||||||||||||||||||||||||||||||||||||||||||||||||||||||||||||||||||||||||||
| 121 Broadway Street (439 units) | Q3 2027 | Q2 2029 | Cambridge, MA | 492,000 | 104,364 | 597,800 | — | — | 493,436 | — | % | — | % | N/A | ||||||||||||||||||||||||||||||||||||||||||||||||||||||||||||||||||
| Total Residential Properties under Construction | 492,000 | 104,364 | 597,800 | — | — | 493,436 | — | % | — | % | N/A | |||||||||||||||||||||||||||||||||||||||||||||||||||||||||||||||||||||
| Retail | ||||||||||||||||||||||||||||||||||||||||||||||||||||||||||||||||||||||||||||||||
| Reston Next Retail | Q4 2025 | Q4 2025 | Reston, VA | 33,000 | 24,427 | 26,600 | — | — | 2,173 | 13 | % | — | % | N/A | ||||||||||||||||||||||||||||||||||||||||||||||||||||||||||||||||||
| Total Retail Properties under Construction | 33,000 | 24,427 | 26,600 | — | — | 2,173 | 13 | % | — | % | N/A | |||||||||||||||||||||||||||||||||||||||||||||||||||||||||||||||||||||
| Total Properties Under Construction | 2,285,000 | $ | 929,683 | $ | 2,128,400 | $ | 156,470 | $ | 156,470 | $ | 1,198,717 | 50 | % | 9 | 10 | % | $ | 70 | ||||||||||||||||||||||||||||||||||||||||||||||||||||||||||||||
PROJECTS FULLY PLACED IN-SERVICE DURING 2024
| Actual/Estimated | BXP’s share | ||||||||||||||||||||||||||||||||||||||||||||||||||||||||||||||||||||||
Estimated Total Investment 2 | Amount Drawn at 12/31/2024 | Estimated Future Equity Requirement 2 | Net Operating Income (Loss) 5 (BXP’s share) | ||||||||||||||||||||||||||||||||||||||||||||||||||||||||||||||||||||
| Initial Occupancy | Stabilization Date | Investment to Date 2 | Total Financing | Percentage | |||||||||||||||||||||||||||||||||||||||||||||||||||||||||||||||||||
| Location | Square Feet | Leased 3 | |||||||||||||||||||||||||||||||||||||||||||||||||||||||||||||||||||||
| 760 Boylston Street (Redevelopment) | Q2 2024 | Q2 2024 | Boston, MA | 118,000 | $ | 33,809 | $ | 39,400 | $ | — | $ | — | $ | 5,591 | 100 | % | $ | 2,120 | |||||||||||||||||||||||||||||||||||||||||||||||||||||
| 180 CityPoint | Q4 2023 | Q2 2026 | Waltham, MA | 329,195 | 226,855 | 290,500 | — | — | 63,645 | 43 | % | 2,401 | |||||||||||||||||||||||||||||||||||||||||||||||||||||||||||
| 103 CityPoint | Q4 2025 | Q4 2026 | Waltham, MA | 112,841 | 92,364 | 115,100 | — | — | 22,736 | — | % | (338) | |||||||||||||||||||||||||||||||||||||||||||||||||||||||||||
300 Binney Street (Redevelopment) (55% ownership) 8 | Q4 2024 | Q4 2024 | Cambridge, MA | 239,908 | 88,858 | 106,000 | — | — | 17,142 | 100 | % | 3,493 | |||||||||||||||||||||||||||||||||||||||||||||||||||||||||||
| Skymark - Reston Next Residential (508 units) (20% ownership) | Q3 2024 | Q2 2026 | Reston, VA | 417,036 | 43,380 | 47,700 | 28,000 | 26,695 | 3,015 | 54 | % | 8 | |||||||||||||||||||||||||||||||||||||||||||||||||||||||||||
| Total Projects Fully Placed In-Service | 1,216,980 | $ | 485,266 | $ | 598,700 | $ | 28,000 | $ | 26,695 | $ | 112,129 | 62 | % | 9 | $ | 7,684 | |||||||||||||||||||||||||||||||||||||||||||||||||||||||
________________
1A project is classified as Construction in Progress when (1) construction or supply contracts have been signed, physical improvements have commenced or a lease has been signed and (2) capitalized interest has commenced.
2Includes income (loss) and interest carry on debt and equity investment.
3Represents percentage leased as of January 24, 2025, including leases with future commencement dates.
4Represents the portion of the project that no longer qualifies for capitalization of interest in accordance with GAAP.
5Amounts represent Net Operating Income (Loss) for the three months ended December 31, 2024. For partially owned properties, amount represents BXP’s share based on its ownership percentage. See the Definitions and Reconciliations sections of this supplemental package starting on page 57.
15
| Q4 2024 | ||||
| Construction in progress (continued) | |||||
6BXP acquired 725 12th Street, NW on December 27, 2024 for a gross purchase price of $34.0 million. Concurrently with the acquisition, a lease was executed with McDermott Will & Emery LLP for approximately 152,000 square feet of the redeveloped building.
7The project budget reflects the Company’s 55% share of joint venture costs related to 290 Binney Street. The Company has the sole obligation to construct an underground electrical vault for an estimated gross cost of $183.9 million. Upon completion, the Company has entered into a contract to sell the electrical vault to a third party for a fixed price of $84.1 million. The net investment of $99.8 million will be included in the Company’s outside basis in 290 Binney Street. The Company has invested $71.9 million for the vault as of December 31, 2024.
8 Norges Bank Investment Management (NBIM) funded approximately $212.9 million at closing for its investment in 300 Binney Street. The Company withdrew approximately $212.9 million at closing and will fund all future costs of the project.
9 Total percentage leased excludes Residential.
16
| Q4 2024 | ||||
| Land parcels and purchase options | |||||
as of December 31, 2024
OWNED LAND PARCELS AND PROPERTIES HELD FOR REDEVELOPMENT 1
| Location | Approximate Developable Square Feet 2 | |||||||
San Jose, CA 3 | 2,830,000 | |||||||
| Reston, VA | 2,229,000 | |||||||
| New York, NY (25% ownership) | 2,000,000 | |||||||
| Princeton, NJ | 1,723,000 | |||||||
| San Jose, CA (55% ownership) | 1,088,000 | |||||||
New York, NY (55% ownership) | 895,000 | |||||||
| San Francisco, CA | 850,000 | |||||||
| Lexington, MA | 767,000 | |||||||
| Waltham, MA | 700,000 | |||||||
| Santa Clara, CA | 632,000 | |||||||
| Springfield, VA | 576,000 | |||||||
| Washington, DC (50% ownership) | 520,000 | |||||||
| South San Francisco, CA (50% ownership) | 451,000 | |||||||
Rockville, MD 3 | 435,000 | |||||||
| Herndon, VA (50% ownership) | 350,000 | |||||||
| El Segundo, CA (50% ownership) | 275,000 | |||||||
| Dulles, VA | 150,000 | |||||||
| Total | 16,471,000 | |||||||
VALUE CREATION PIPELINE - LAND PURCHASE OPTIONS
| Location | Approximate Developable Square Feet 2 | |||||||
| Boston, MA | 1,300,000 | |||||||
Waltham, MA 4 | 1,200,000 | |||||||
| Cambridge, MA | 573,000 | |||||||
| Total | 3,073,000 | |||||||
__________________
1Includes properties that are no longer considered “in-service” because the occupancy percentage is below 50% and the Company is no longer actively leasing these properties in anticipation of future redevelopment. During the year ended December 31, 2024, approximately 717,000 net rentable square feet were removed from the Company’s in-service properties portfolio in anticipation of future redevelopment.
2Represents 100% of consolidated and unconsolidated projects.
3Excludes the existing square footage at in-service properties being held for future re-development as listed and noted on pages 22-25.
4The Company expects to be a 50% partner in the future development of these sites.
17
| Q4 2024 | ||||
| Leasing activity | |||||
for the three months ended December 31, 2024
ALL IN-SERVICE PROPERTIES
| Net (increase)/decrease in available space (SF) | Total | ||||
| Vacant space available at the beginning of the period | 6,321,509 | ||||
| Less: | |||||
| Property dispositions/properties taken out of service | — | ||||
| Add: | |||||
| Properties acquired vacant space | — | ||||
Properties placed (and partially placed) in-service 1 | 459,149 | ||||
| Leases expiring or terminated during the period | 647,734 | ||||
| Total space available for lease | 7,428,392 | ||||
| 1st generation leases | 339,015 | ||||
| 2nd generation leases with new clients | 605,897 | ||||
| 2nd generation lease renewals | 361,406 | ||||
| Total leases commenced during the period | 1,306,318 | ||||
| Vacant space available for lease at the end of the period | 6,122,074 | ||||
| Net (increase)/decrease in available space | 199,435 | ||||
Second generation leasing information: 2 | |||||
| Leases commencing during the period (SF) | 967,303 | ||||
| Weighted average lease term (months) | 88 | ||||
| Weighted average free rent period (days) | 182 | ||||
Total transaction costs per square foot 3 | $94.74 | ||||
Increase (decrease) in gross rents 4 | (1.94) | % | |||
Increase (decrease) in net rents 5 | (3.02) | % | |||
| All leases commencing occupancy (SF) | Incr (decr) in 2nd generation cash rents | Total square feet of leases executed in the quarter 7 | |||||||||||||||||||||||||||||||||
| 1st generation | 2nd generation | total 6 | gross 4, 6 | net 5, 6 | |||||||||||||||||||||||||||||||
| Boston | 225,667 | 204,261 | 429,928 | (0.30) | % | (0.33) | % | 681,891 | |||||||||||||||||||||||||||
| Los Angeles | — | 29,524 | 29,524 | (10.69) | % | (16.23) | % | 181,625 | |||||||||||||||||||||||||||
| New York | 102,542 | 472,653 | 575,195 | (3.44) | % | (5.85) | % | 574,265 | |||||||||||||||||||||||||||
| San Francisco | — | 105,611 | 105,611 | 9.35 | % | 13.17 | % | 383,291 | |||||||||||||||||||||||||||
| Seattle | — | 25,567 | 25,567 | (10.40) | % | (14.09) | % | 7,986 | |||||||||||||||||||||||||||
| Washington, DC | 10,806 | 129,687 | 140,493 | (8.05) | % | (11.55) | % | 494,495 | |||||||||||||||||||||||||||
| Total / Weighted Average | 339,015 | 967,303 | 1,306,318 | (1.94) | % | (3.02) | % | 2,323,553 | |||||||||||||||||||||||||||
_____________
1Total square feet of properties placed in-service in Q4 2024 consists of 3,858 at RTC Next - Block D Office, 102,542 at 360 Park Avenue South, 112,841 at 103 CityPoint and 239,908 at 300 Binney Street.
2Second generation leases are defined as leases for space that has previously been leased. Of the 967,303 square feet of second generation leases that commenced in Q4 2024, leases for 827,256 square feet were signed in prior periods.
3Total transaction costs include tenant improvements and leasing commissions, but exclude free rent concessions.
4Represents the increase/(decrease) in gross rent (base rent plus expense reimbursements) on the new vs. expired leases on the 496,883 square feet of second generation leases that had been occupied within the prior 12 months; excludes leases that management considers temporary because the client is not expected to occupy the space on a long-term basis.
5Represents the increase/(decrease) in net rent (gross rent less operating expenses) on the new vs. expired leases on the 496,883 square feet of second generation leases that had been occupied within the prior 12 months; excludes leases that management considers temporary because the client is not expected to occupy the space on a long-term basis.
6Represents leases for which rental revenue recognition commenced in accordance with GAAP during the quarter.
7Represents leases executed in the quarter for which the Company either (1) commenced rental revenue recognition in such quarter or (2) will commence rental revenue recognition in subsequent quarters, in accordance with GAAP, and includes leases at properties currently under development. The total square feet of leases executed in the current quarter for which the Company recognized rental revenue in the current quarter is 146,995.
18
| Q4 2024 | ||||
| Portfolio overview | |||||
for the three months ended December 31, 2024
(dollars in thousands)
Rentable square footage of in-service properties by location and unit type 1, 2
| Office | Retail | Residential | Hotel | Total | ||||||||||||||||||||||||||||
| Boston | 14,849,309 | 1,151,157 | 550,114 | 330,000 | 16,880,580 | |||||||||||||||||||||||||||
| Los Angeles | 2,184,505 | 123,534 | — | — | 2,308,039 | |||||||||||||||||||||||||||
| New York | 12,112,676 | 476,337 | — | — | 12,589,013 | |||||||||||||||||||||||||||
| San Francisco | 7,235,362 | 342,687 | 318,171 | — | 7,896,220 | |||||||||||||||||||||||||||
| Seattle | 1,504,624 | 13,171 | — | — | 1,517,795 | |||||||||||||||||||||||||||
| Washington, DC | 8,308,623 | 623,324 | 910,277 | — | 9,842,224 | |||||||||||||||||||||||||||
| Total | 46,195,099 | 2,730,210 | 1,778,562 | 330,000 | 51,033,871 | |||||||||||||||||||||||||||
| % of Total | 90.52 | % | 5.34 | % | 3.49 | % | 0.65 | % | 100.00 | % | ||||||||||||||||||||||
Rental revenue of in-service properties by unit type 1
| Office | Retail | Residential | Hotel 3 | Total | ||||||||||||||||||||||||||||
| Consolidated | $ | 759,112 | $ | 61,423 | $ | 11,806 | $ | 13,048 | $ | 845,389 | ||||||||||||||||||||||
| Less: | ||||||||||||||||||||||||||||||||
Partners’ share from consolidated joint ventures 4 | 73,185 | 9,729 | — | — | 82,914 | |||||||||||||||||||||||||||
| Add: | ||||||||||||||||||||||||||||||||
BXP’s share from unconsolidated joint ventures 5 | 49,269 | 2,554 | 3,050 | — | 54,873 | |||||||||||||||||||||||||||
BXP’s Share of Rental revenue 1 | $ | 735,196 | $ | 54,248 | $ | 14,856 | $ | 13,048 | $ | 817,348 | ||||||||||||||||||||||
| % of Total | 89.95 | % | 6.63 | % | 1.82 | % | 1.60 | % | 100.00 | % | ||||||||||||||||||||||
Percentage of BXP’s Share of net operating income (NOI) (excluding termination income) by location 1, 6
| CBD | Suburban | Total | |||||||||||||||
| Boston | 31.67 | % | 6.59 | % | 38.26 | % | |||||||||||
| Los Angeles | 3.49 | % | — | % | 3.49 | % | |||||||||||
| New York | 22.55 | % | 1.62 | % | 24.17 | % | |||||||||||
| San Francisco | 14.72 | % | 2.02 | % | 16.74 | % | |||||||||||
| Seattle | 2.12 | % | — | % | 2.12 | % | |||||||||||
Washington, DC 7 | 15.12 | % | 0.10 | % | 15.22 | % | |||||||||||
| Total | 89.67 | % | 10.33 | % | 100.00 | % | |||||||||||
_____________
1See the Definitions and Reconciliations sections of this Supplemental package starting on page 57.
2Includes 100% of the rentable square footage of the Company’s In-Service Properties. For additional detail relating to the Company’s In-Service Properties, see pages 22-25.
3Excludes approximately $96 of revenue from retail clients that is included in Retail.
4See page 64 for additional information.
5See page 66 for additional information.
6BXP’s Share of NOI (excluding termination income) is a non-GAAP financial measure. For a quantitative reconciliation of net income (loss) attributable to BXP, Inc. to BXP’s Share of NOI (excluding termination income), see page 9.
7During the first quarter of 2024, the Company reassessed the classifications of its assets as either CBD or Suburban and determined that certain assets such as those in Reston, Virginia are located in areas with characteristics that more closely align with our definition of CBD due to their diverse live, work, and play environment. As a result, these assets are classified as CBD.
19
| Q4 2024 | ||||
| Residential and hotel performance | |||||
(dollars in thousands, except rental rates)
RESULTS OF OPERATIONS
Residential 1 | Hotel | ||||||||||||||||||||||
| Three Months Ended | Three Months Ended | ||||||||||||||||||||||
| 31-Dec-24 | 30-Sep-24 | 31-Dec-24 | 30-Sep-24 | ||||||||||||||||||||
Rental Revenue 2 | $ | 12,481 | $ | 12,117 | $ | 13,144 | $ | 15,082 | |||||||||||||||
| Less: Operating expenses and real estate taxes | 6,059 | 5,988 | 9,601 | 9,833 | |||||||||||||||||||
Net Operating Income (NOI) 2 | 6,422 | 6,129 | 3,543 | 5,249 | |||||||||||||||||||
| Add: BXP’s share of NOI from unconsolidated joint ventures | 1,835 | 1,747 | N/A | N/A | |||||||||||||||||||
BXP’s Share of NOI 2 | $ | 8,257 | $ | 7,876 | $ | 3,543 | $ | 5,249 | |||||||||||||||
Rental Revenue 2 | $ | 12,481 | $ | 12,117 | $ | 13,144 | $ | 15,082 | |||||||||||||||
| Less: Straight line rent and fair value lease revenue | 147 | 149 | (2) | (2) | |||||||||||||||||||
| Add: Lease transaction costs that qualify as rent inducements | 149 | 149 | — | — | |||||||||||||||||||
| Subtotal | 12,483 | 12,117 | 13,146 | 15,084 | |||||||||||||||||||
| Less: Operating expenses and real estate taxes | 6,059 | 5,988 | 9,601 | 9,833 | |||||||||||||||||||
NOI - cash basis 2 | 6,424 | 6,129 | 3,545 | 5,251 | |||||||||||||||||||
| Add: BXP’s share of NOI-cash from unconsolidated joint ventures | 1,835 | 1,747 | N/A | N/A | |||||||||||||||||||
BXP’s Share of NOI - cash basis 2 | $ | 8,259 | $ | 7,876 | $ | 3,545 | $ | 5,251 | |||||||||||||||
RENTAL RATES AND OCCUPANCY - Year-over-Year
| Residential Units | Three Months Ended | Percent Change | |||||||||||||||||||||
| 31-Dec-24 | 31-Dec-23 | ||||||||||||||||||||||
| BOSTON | |||||||||||||||||||||||
Hub50House (50% ownership), Boston, MA 2 | 440 | ||||||||||||||||||||||
| Average Monthly Rental Rate | $ | 4,445 | $ | 4,331 | 2.63 | % | |||||||||||||||||
| Average Rental Rate Per Occupied Square Foot | $ | 6.09 | $ | 5.94 | 2.53 | % | |||||||||||||||||
| Average Physical Occupancy | 94.32 | % | 94.92 | % | (0.63) | % | |||||||||||||||||
| Average Economic Occupancy | 94.43 | % | 94.82 | % | (0.41) | % | |||||||||||||||||
Proto Kendall Square, Cambridge, MA 2, 3 | 280 | ||||||||||||||||||||||
| Average Monthly Rental Rate | $ | 3,244 | $ | 3,125 | 3.81 | % | |||||||||||||||||
| Average Rental Rate Per Occupied Square Foot | $ | 5.97 | $ | 5.74 | 4.01 | % | |||||||||||||||||
| Average Physical Occupancy | 94.29 | % | 95.60 | % | (1.37) | % | |||||||||||||||||
| Average Economic Occupancy | 93.88 | % | 94.91 | % | (1.09) | % | |||||||||||||||||
The Lofts at Atlantic Wharf, Boston, MA 2, 3 | 86 | ||||||||||||||||||||||
| Average Monthly Rental Rate | $ | 4,574 | $ | 4,400 | 3.95 | % | |||||||||||||||||
| Average Rental Rate Per Occupied Square Foot | $ | 5.17 | $ | 4.85 | 6.60 | % | |||||||||||||||||
| Average Physical Occupancy | 96.90 | % | 93.80 | % | 3.30 | % | |||||||||||||||||
| Average Economic Occupancy | 95.26 | % | 93.87 | % | 1.48 | % | |||||||||||||||||
Boston Marriott Cambridge (437 rooms), Cambridge, MA 3 | N/A | ||||||||||||||||||||||
| Average Occupancy | 74.30 | % | 70.80 | % | 4.94 | % | |||||||||||||||||
| Average Daily Rate | $ | 332.10 | $ | 326.03 | 1.86 | % | |||||||||||||||||
| Revenue Per Available Room | $ | 246.76 | $ | 230.92 | 6.86 | % | |||||||||||||||||
| SAN FRANCISCO | |||||||||||||||||||||||
The Skylyne, Oakland, CA 2, 3 | 402 | ||||||||||||||||||||||
| Average Monthly Rental Rate | $ | 3,289 | $ | 3,519 | (6.54) | % | |||||||||||||||||
| Average Rental Rate Per Occupied Square Foot | $ | 4.18 | $ | 4.44 | (5.86) | % | |||||||||||||||||
| Average Physical Occupancy | 91.29 | % | 87.56 | % | 4.26 | % | |||||||||||||||||
| Average Economic Occupancy | 88.86 | % | 85.93 | % | 3.41 | % | |||||||||||||||||
20
| Q4 2024 | ||||
| Residential and hotel performance (continued) | |||||
RENTAL RATES AND OCCUPANCY - Year-over-Year
| Residential Units | Three Months Ended | Percent Change | |||||||||||||||||||||
| 31-Dec-24 | 31-Dec-23 | ||||||||||||||||||||||
| WASHINGTON, DC | |||||||||||||||||||||||
Signature at Reston, Reston, VA 2, 3 | 508 | ||||||||||||||||||||||
| Average Monthly Rental Rate | $ | 2,899 | $ | 2,697 | 7.49 | % | |||||||||||||||||
| Average Rental Rate Per Occupied Square Foot | $ | 2.98 | $ | 2.78 | 7.19 | % | |||||||||||||||||
| Average Physical Occupancy | 94.88 | % | 95.54 | % | (0.69) | % | |||||||||||||||||
| Average Economic Occupancy | 94.97 | % | 95.37 | % | (0.42) | % | |||||||||||||||||
Skymark, Reston, VA 2, 4 | |||||||||||||||||||||||
| Average Monthly Rental Rate | 508 | $ | 1,913 | N/A | N/A | ||||||||||||||||||
| Average Rental Rate Per Occupied Square Foot | $ | 2.44 | N/A | N/A | |||||||||||||||||||
| Average Physical Occupancy | 32.48 | % | N/A | N/A | |||||||||||||||||||
| Average Economic Occupancy | 23.70 | % | N/A | N/A | |||||||||||||||||||
| Total In-Service Residential Units | 2,224 | ||||||||||||||||||||||
_____________
1Includes retail space.
2See the Definitions and Reconciliations sections of this Supplemental package starting on page 57.
3Excludes retail space.
4This property was completed and fully placed in-service on December 13, 2024 and is in its initial lease-up period with expected stabilization in the second quarter of 2026.
21
| Q4 2024 | ||||
| In-service property listing | |||||
| as of December 31, 2024 | |||||||||||||||||||||||||||||||||||||||||||||||
| Sub Market | Number of Buildings | Square Feet | Occupied % 1 | Leased % 2 | Annualized Rental Obligations Per Occupied SF 3 | ||||||||||||||||||||||||||||||||||||||||||
| CBD | |||||||||||||||||||||||||||||||||||||||||||||||
| BOSTON | |||||||||||||||||||||||||||||||||||||||||||||||
| Office | |||||||||||||||||||||||||||||||||||||||||||||||
| 200 Clarendon Street | CBD Boston MA | 1 | 1,728,956 | 97.8 | % | 99.4 | % | $ | 84.94 | ||||||||||||||||||||||||||||||||||||||
| 800 Boylston Street - The Prudential Center | CBD Boston MA | 1 | 1,274,927 | 96.4 | % | 98.1 | % | 72.43 | |||||||||||||||||||||||||||||||||||||||
| 100 Federal Street (55% ownership) | CBD Boston MA | 1 | 1,233,537 | 89.0 | % | 91.1 | % | 77.44 | |||||||||||||||||||||||||||||||||||||||
| 111 Huntington Avenue - The Prudential Center | CBD Boston MA | 1 | 860,446 | 100.0 | % | 100.0 | % | 78.57 | |||||||||||||||||||||||||||||||||||||||
| Atlantic Wharf Office (55% ownership) | CBD Boston MA | 1 | 793,024 | 95.4 | % | 100.0 | % | 88.41 | |||||||||||||||||||||||||||||||||||||||
100 Causeway Street (50% ownership) 4 | CBD Boston MA | 1 | 633,818 | 96.4 | % | 96.4 | % | 75.51 | |||||||||||||||||||||||||||||||||||||||
Prudential Center (retail shops) 6, 7 | CBD Boston MA | 1 | 601,552 | 89.5 | % | 95.8 | % | 95.61 | |||||||||||||||||||||||||||||||||||||||
| 101 Huntington Avenue - The Prudential Center | CBD Boston MA | 1 | 506,476 | 99.0 | % | 100.0 | % | 60.27 | |||||||||||||||||||||||||||||||||||||||
The Hub on Causeway - Podium (50% ownership) 4 | CBD Boston MA | 1 | 382,988 | 94.8 | % | 94.8 | % | 64.99 | |||||||||||||||||||||||||||||||||||||||
| 888 Boylston Street - The Prudential Center | CBD Boston MA | 1 | 363,320 | 100.0 | % | 100.0 | % | 83.22 | |||||||||||||||||||||||||||||||||||||||
Star Market at the Prudential Center 6 | CBD Boston MA | 1 | 60,015 | 100.0 | % | 100.0 | % | 63.00 | |||||||||||||||||||||||||||||||||||||||
| Subtotal | 11 | 8,439,059 | 95.6 | % | 97.5 | % | $ | 79.09 | |||||||||||||||||||||||||||||||||||||||
| 145 Broadway | East Cambridge MA | 1 | 490,086 | 99.6 | % | 99.6 | % | $ | 92.21 | ||||||||||||||||||||||||||||||||||||||
| 325 Main Street | East Cambridge MA | 1 | 415,512 | 91.2 | % | 94.5 | % | 117.24 | |||||||||||||||||||||||||||||||||||||||
125 Broadway 8 | East Cambridge MA | 1 | 271,000 | 100.0 | % | 100.0 | % | 148.36 | |||||||||||||||||||||||||||||||||||||||
| 355 Main Street | East Cambridge MA | 1 | 256,966 | 99.3 | % | 99.3 | % | 84.55 | |||||||||||||||||||||||||||||||||||||||
300 Binney Street 8, 9 | East Cambridge MA | 1 | 239,908 | 93.7 | % | 100.0 | % | 139.97 | |||||||||||||||||||||||||||||||||||||||
| 90 Broadway | East Cambridge MA | 1 | 223,771 | 100.0 | % | 100.0 | % | 78.81 | |||||||||||||||||||||||||||||||||||||||
| 255 Main Street | East Cambridge MA | 1 | 215,394 | 82.5 | % | 82.5 | % | 90.62 | |||||||||||||||||||||||||||||||||||||||
| 150 Broadway | East Cambridge MA | 1 | 177,226 | 100.0 | % | 100.0 | % | 101.25 | |||||||||||||||||||||||||||||||||||||||
| 105 Broadway | East Cambridge MA | 1 | 152,664 | 100.0 | % | 100.0 | % | 76.50 | |||||||||||||||||||||||||||||||||||||||
250 Binney Street 8 | East Cambridge MA | 1 | 67,362 | 100.0 | % | 100.0 | % | 82.04 | |||||||||||||||||||||||||||||||||||||||
| University Place | Mid-Cambridge MA | 1 | 195,282 | 100.0 | % | 100.0 | % | 59.32 | |||||||||||||||||||||||||||||||||||||||
| Subtotal | 11 | 2,705,171 | 96.6 | % | 97.6 | % | $ | 100.76 | |||||||||||||||||||||||||||||||||||||||
| Subtotal Boston CBD | 22 | 11,144,230 | 95.9 | % | 97.5 | % | $ | 84.45 | |||||||||||||||||||||||||||||||||||||||
| Residential | |||||||||||||||||||||||||||||||||||||||||||||||
Hub50House (440 units) (50% ownership) 4 | CBD Boston MA | 1 | 320,444 | ||||||||||||||||||||||||||||||||||||||||||||
| The Lofts at Atlantic Wharf (86 units) | CBD Boston MA | 1 | 87,096 | ||||||||||||||||||||||||||||||||||||||||||||
| Proto Kendall Square (280 units) | East Cambridge MA | 1 | 166,717 | ||||||||||||||||||||||||||||||||||||||||||||
| Subtotal | 3 | 574,257 | |||||||||||||||||||||||||||||||||||||||||||||
| Hotel | |||||||||||||||||||||||||||||||||||||||||||||||
| Boston Marriott Cambridge (437 rooms) | East Cambridge MA | 1 | 334,260 | ||||||||||||||||||||||||||||||||||||||||||||
| Subtotal | 1 | 334,260 | |||||||||||||||||||||||||||||||||||||||||||||
| LOS ANGELES | |||||||||||||||||||||||||||||||||||||||||||||||
| Office | |||||||||||||||||||||||||||||||||||||||||||||||
Colorado Center (50% ownership) 4 | West Los Angeles CA | 6 | 1,130,066 | 89.6 | % | 90.3 | % | $ | 76.67 | ||||||||||||||||||||||||||||||||||||||
Santa Monica Business Park 9 | West Los Angeles CA | 14 | 1,104,967 | 80.6 | % | 84.4 | % | 71.88 | |||||||||||||||||||||||||||||||||||||||
Santa Monica Business Park Retail 6, 9 | West Los Angeles CA | 7 | 73,006 | 77.2 | % | 88.2 | % | 77.16 | |||||||||||||||||||||||||||||||||||||||
| Subtotal | 27 | 2,308,039 | 84.9 | % | 87.4 | % | $ | 74.52 | |||||||||||||||||||||||||||||||||||||||
| NEW YORK | |||||||||||||||||||||||||||||||||||||||||||||||
| Office | |||||||||||||||||||||||||||||||||||||||||||||||
| 767 Fifth Avenue (The GM Building) (60% ownership) | Plaza District NY | 1 | 1,970,335 | 92.1 | % | 99.1 | % | $ | 167.17 | ||||||||||||||||||||||||||||||||||||||
| 601 Lexington Avenue (55% ownership) | Park Avenue NY | 1 | 1,670,502 | 95.7 | % | 99.3 | % | 99.56 | |||||||||||||||||||||||||||||||||||||||
| 399 Park Avenue | Park Avenue NY | 1 | 1,567,470 | 99.9 | % | 100.0 | % | 103.90 | |||||||||||||||||||||||||||||||||||||||
22
| Q4 2024 | ||||
| In-service property listing (continued) | |||||
| as of December 31, 2024 | |||||||||||||||||||||||||||||||||||||||||||||||
| Sub Market | Number of Buildings | Square Feet | Occupied % 1 | Leased % 2 | Annualized Rental Obligations Per Occupied SF 3 | ||||||||||||||||||||||||||||||||||||||||||
| 599 Lexington Avenue | Park Avenue NY | 1 | 1,106,335 | 95.8 | % | 96.6 | % | 88.39 | |||||||||||||||||||||||||||||||||||||||
| 7 Times Square (formerly Times Square Tower) (55% ownership) | Times Square NY | 1 | 1,238,599 | 80.7 | % | 86.4 | % | 74.80 | |||||||||||||||||||||||||||||||||||||||
| 250 West 55th Street | Times Square / West Side NY | 1 | 966,976 | 97.4 | % | 99.0 | % | 97.45 | |||||||||||||||||||||||||||||||||||||||
200 Fifth Avenue (26.69% ownership) 4 | Flatiron District NY | 1 | 855,059 | 100.0 | % | 100.0 | % | 101.95 | |||||||||||||||||||||||||||||||||||||||
Dock 72 (50% ownership) 4 | Brooklyn NY | 1 | 668,521 | 42.7 | % | 42.7 | % | 37.11 | |||||||||||||||||||||||||||||||||||||||
| 510 Madison Avenue | Fifth/Madison Avenue NY | 1 | 352,589 | 90.1 | % | 90.1 | % | 128.83 | |||||||||||||||||||||||||||||||||||||||
| Subtotal | 9 | 10,396,386 | 90.8 | % | 93.6 | % | $ | 108.54 | |||||||||||||||||||||||||||||||||||||||
| SAN FRANCISCO | |||||||||||||||||||||||||||||||||||||||||||||||
| Office | |||||||||||||||||||||||||||||||||||||||||||||||
| Salesforce Tower | CBD San Francisco CA | 1 | 1,420,682 | 98.0 | % | 98.0 | % | $ | 112.27 | ||||||||||||||||||||||||||||||||||||||
| Embarcadero Center Four | CBD San Francisco CA | 1 | 942,640 | 93.4 | % | 95.7 | % | 99.56 | |||||||||||||||||||||||||||||||||||||||
| Embarcadero Center One | CBD San Francisco CA | 1 | 837,522 | 69.6 | % | 70.2 | % | 95.50 | |||||||||||||||||||||||||||||||||||||||
| Embarcadero Center Two | CBD San Francisco CA | 1 | 801,498 | 88.3 | % | 88.9 | % | 84.73 | |||||||||||||||||||||||||||||||||||||||
| Embarcadero Center Three | CBD San Francisco CA | 1 | 785,911 | 83.1 | % | 83.1 | % | 92.37 | |||||||||||||||||||||||||||||||||||||||
| 680 Folsom Street | CBD San Francisco CA | 2 | 522,406 | 59.2 | % | 59.2 | % | 81.65 | |||||||||||||||||||||||||||||||||||||||
| 535 Mission Street | CBD San Francisco CA | 1 | 307,205 | 67.8 | % | 72.7 | % | 77.43 | |||||||||||||||||||||||||||||||||||||||
| 690 Folsom Street | CBD San Francisco CA | 1 | 26,080 | 100.0 | % | 100.0 | % | 111.90 | |||||||||||||||||||||||||||||||||||||||
| Subtotal | 9 | 5,643,944 | 84.3 | % | 85.2 | % | $ | 97.60 | |||||||||||||||||||||||||||||||||||||||
| Residential | |||||||||||||||||||||||||||||||||||||||||||||||
| The Skylyne (402 units) | CBD Oakland CA | 1 | 330,996 | ||||||||||||||||||||||||||||||||||||||||||||
| Subtotal | 1 | 330,996 | |||||||||||||||||||||||||||||||||||||||||||||
| SEATTLE | |||||||||||||||||||||||||||||||||||||||||||||||
| Office | |||||||||||||||||||||||||||||||||||||||||||||||
Safeco Plaza (33.67% ownership) 4 | CBD Seattle WA | 1 | 762,631 | 83.8 | % | 86.4 | % | $ | 48.09 | ||||||||||||||||||||||||||||||||||||||
| Madison Centre | CBD Seattle WA | 1 | 755,164 | 79.5 | % | 80.5 | % | 62.84 | |||||||||||||||||||||||||||||||||||||||
| Subtotal | 2 | 1,517,795 | 81.6 | % | 83.5 | % | $ | 55.22 | |||||||||||||||||||||||||||||||||||||||
WASHINGTON, DC 10 | |||||||||||||||||||||||||||||||||||||||||||||||
| Office | |||||||||||||||||||||||||||||||||||||||||||||||
901 New York Avenue 9 | East End Washington DC | 1 | 508,130 | 84.8 | % | 84.8 | % | $ | 69.82 | ||||||||||||||||||||||||||||||||||||||
Market Square North (50% ownership) 4 | East End Washington DC | 1 | 417,298 | 76.2 | % | 76.2 | % | 73.87 | |||||||||||||||||||||||||||||||||||||||
| 2100 Pennsylvania Avenue | CBD Washington DC | 1 | 475,849 | 94.2 | % | 94.2 | % | 79.06 | |||||||||||||||||||||||||||||||||||||||
| 2200 Pennsylvania Avenue | CBD Washington DC | 1 | 459,811 | 94.9 | % | 97.5 | % | 90.36 | |||||||||||||||||||||||||||||||||||||||
| 1330 Connecticut Avenue | CBD Washington DC | 1 | 252,262 | 92.3 | % | 95.6 | % | 70.97 | |||||||||||||||||||||||||||||||||||||||
| Sumner Square | CBD Washington DC | 1 | 208,797 | 95.6 | % | 95.6 | % | 48.97 | |||||||||||||||||||||||||||||||||||||||
500 North Capitol Street, N.W. (30% ownership) 4 | Capitol Hill Washington DC | 1 | 230,900 | 98.5 | % | 98.5 | % | 83.49 | |||||||||||||||||||||||||||||||||||||||
| Capital Gallery | Southwest Washington DC | 1 | 176,824 | 80.8 | % | 92.7 | % | 57.19 | |||||||||||||||||||||||||||||||||||||||
| Subtotal | 8 | 2,729,871 | 89.2 | % | 90.7 | % | $ | 74.51 | |||||||||||||||||||||||||||||||||||||||
| Reston Next | Reston VA | 2 | 1,063,284 | 92.1 | % | 97.9 | % | $ | 61.68 | ||||||||||||||||||||||||||||||||||||||
| South of Market | Reston VA | 3 | 624,387 | 99.6 | % | 100.0 | % | 56.39 | |||||||||||||||||||||||||||||||||||||||
| Fountain Square | Reston VA | 2 | 524,585 | 95.1 | % | 95.9 | % | 53.65 | |||||||||||||||||||||||||||||||||||||||
| One Freedom Square | Reston VA | 1 | 427,646 | 86.0 | % | 86.0 | % | 55.32 | |||||||||||||||||||||||||||||||||||||||
| Two Freedom Square | Reston VA | 1 | 423,222 | 99.8 | % | 99.8 | % | 53.15 | |||||||||||||||||||||||||||||||||||||||
| One and Two Discovery Square | Reston VA | 2 | 366,989 | 89.7 | % | 89.7 | % | 52.89 | |||||||||||||||||||||||||||||||||||||||
| One Reston Overlook | Reston VA | 1 | 319,519 | 91.3 | % | 100.0 | % | 49.67 | |||||||||||||||||||||||||||||||||||||||
| 17Fifty Presidents Street | Reston VA | 1 | 275,809 | 100.0 | % | 100.0 | % | 72.49 | |||||||||||||||||||||||||||||||||||||||
Reston Corporate Center 5 | Reston VA | 2 | 261,046 | 100.0 | % | 100.0 | % | 49.24 | |||||||||||||||||||||||||||||||||||||||
| Democracy Tower | Reston VA | 1 | 259,441 | 99.3 | % | 99.3 | % | 67.15 | |||||||||||||||||||||||||||||||||||||||
Fountain Square Retail 6 | Reston VA | 1 | 196,421 | 95.2 | % | 95.5 | % | 48.24 | |||||||||||||||||||||||||||||||||||||||
23
| Q4 2024 | ||||
| In-service property listing (continued) | |||||
| as of December 31, 2024 | |||||||||||||||||||||||||||||||||||||||||||||||
| Sub Market | Number of Buildings | Square Feet | Occupied % 1 | Leased % 2 | Annualized Rental Obligations Per Occupied SF 3 | ||||||||||||||||||||||||||||||||||||||||||
| Two Reston Overlook | Reston VA | 1 | 134,615 | 100.0 | % | 100.0 | % | 53.65 | |||||||||||||||||||||||||||||||||||||||
Avant Retail 6 | Reston VA | 1 | 26,179 | 100.0 | % | 100.0 | % | 62.11 | |||||||||||||||||||||||||||||||||||||||
| Subtotal | 19 | 4,903,143 | 94.9 | % | 96.9 | % | $ | 56.94 | |||||||||||||||||||||||||||||||||||||||
7750 Wisconsin Avenue (50% ownership) 4 | Bethesda/Chevy Chase MD | 1 | 735,573 | 100.0 | % | 100.0 | % | $ | 38.99 | ||||||||||||||||||||||||||||||||||||||
| Wisconsin Place Office | Montgomery County MD | 1 | 294,525 | 47.5 | % | 49.6 | % | 50.80 | |||||||||||||||||||||||||||||||||||||||
| Subtotal | 2 | 1,030,098 | 85.0 | % | 85.6 | % | $ | 40.88 | |||||||||||||||||||||||||||||||||||||||
| Subtotal Washington, DC CBD | 29 | 8,663,112 | 91.9 | % | 93.6 | % | $ | 60.52 | |||||||||||||||||||||||||||||||||||||||
| Residential | |||||||||||||||||||||||||||||||||||||||||||||||
| Signature at Reston (508 units) | Reston VA | 1 | 517,783 | ||||||||||||||||||||||||||||||||||||||||||||
Skymark (508 units) (20% ownership) 4, 9 | Reston VA | 1 | 417,036 | ||||||||||||||||||||||||||||||||||||||||||||
| Subtotal | 2 | 934,819 | |||||||||||||||||||||||||||||||||||||||||||||
| CBD Total | 105 | 41,847,838 | 90.9 | % | 12 | 92.8 | % | 12 | $ | 85.67 | 12 | ||||||||||||||||||||||||||||||||||||
| BXP’s Share of CBD | 91.2 | % | 12 | 92.9 | % | 12 | |||||||||||||||||||||||||||||||||||||||||
| SUBURBAN | |||||||||||||||||||||||||||||||||||||||||||||||
| BOSTON | |||||||||||||||||||||||||||||||||||||||||||||||
| Office | |||||||||||||||||||||||||||||||||||||||||||||||
| Bay Colony Corporate Center | Route 128 Mass Turnpike MA | 2 | 546,248 | 77.8 | % | 77.8 | % | $ | 48.49 | ||||||||||||||||||||||||||||||||||||||
| Reservoir Place | Route 128 Mass Turnpike MA | 1 | 526,215 | 36.6 | % | 47.6 | % | 46.31 | |||||||||||||||||||||||||||||||||||||||
| 140 Kendrick Street | Route 128 Mass Turnpike MA | 3 | 418,600 | 73.3 | % | 74.6 | % | 57.33 | |||||||||||||||||||||||||||||||||||||||
| Weston Corporate Center | Route 128 Mass Turnpike MA | 1 | 356,995 | 100.0 | % | 100.0 | % | 58.57 | |||||||||||||||||||||||||||||||||||||||
180 CityPoint 8,9 | Route 128 Mass Turnpike MA | 1 | 329,195 | 43.2 | % | 43.2 | % | 94.20 | |||||||||||||||||||||||||||||||||||||||
| Waltham Weston Corporate Center | Route 128 Mass Turnpike MA | 1 | 301,611 | 75.5 | % | 75.5 | % | 45.35 | |||||||||||||||||||||||||||||||||||||||
| 230 CityPoint | Route 128 Mass Turnpike MA | 1 | 296,720 | 97.7 | % | 97.7 | % | 47.22 | |||||||||||||||||||||||||||||||||||||||
200 West Street 8 | Route 128 Mass Turnpike MA | 1 | 273,365 | 86.1 | % | 86.1 | % | 89.12 | |||||||||||||||||||||||||||||||||||||||
880 Winter Street 8 | Route 128 Mass Turnpike MA | 1 | 243,618 | 100.0 | % | 100.0 | % | 101.88 | |||||||||||||||||||||||||||||||||||||||
| 10 CityPoint | Route 128 Mass Turnpike MA | 1 | 236,570 | 97.1 | % | 97.1 | % | 56.79 | |||||||||||||||||||||||||||||||||||||||
| 20 CityPoint | Route 128 Mass Turnpike MA | 1 | 211,476 | 98.1 | % | 98.1 | % | 57.93 | |||||||||||||||||||||||||||||||||||||||
| 77 CityPoint | Route 128 Mass Turnpike MA | 1 | 209,382 | 92.7 | % | 92.7 | % | 47.19 | |||||||||||||||||||||||||||||||||||||||
| 890 Winter Street | Route 128 Mass Turnpike MA | 1 | 180,159 | 70.6 | % | 91.0 | % | 47.89 | |||||||||||||||||||||||||||||||||||||||
153 & 211 Second Avenue 8 | Route 128 Mass Turnpike MA | 2 | 137,545 | 18.5 | % | 18.5 | % | 71.04 | |||||||||||||||||||||||||||||||||||||||
1265 Main Street (50% ownership) 4 | Route 128 Mass Turnpike MA | 1 | 120,681 | 100.0 | % | 100.0 | % | 57.21 | |||||||||||||||||||||||||||||||||||||||
103 CityPoint 9 | Route 128 Mass Turnpike MA | 1 | 112,841 | — | % | — | % | — | |||||||||||||||||||||||||||||||||||||||
| Reservoir Place North | Route 128 Mass Turnpike MA | 1 | 73,258 | 100.0 | % | 100.0 | % | 51.90 | |||||||||||||||||||||||||||||||||||||||
The Point 6 | Route 128 Mass Turnpike MA | 1 | 16,300 | 100.0 | % | 100.0 | % | 63.47 | |||||||||||||||||||||||||||||||||||||||
33 Hayden Avenue 8 | Route 128 Northwest MA | 1 | 80,876 | 100.0 | % | 100.0 | % | 78.64 | |||||||||||||||||||||||||||||||||||||||
| 32 Hartwell Avenue | Route 128 Northwest MA | 1 | 69,154 | 100.0 | % | 100.0 | % | 26.94 | |||||||||||||||||||||||||||||||||||||||
100 Hayden Avenue 8 | Route 128 Northwest MA | 1 | 55,924 | 100.0 | % | 100.0 | % | 64.30 | |||||||||||||||||||||||||||||||||||||||
| 92 Hayden Avenue | Route 128 Northwest MA | 1 | 31,100 | 100.0 | % | 100.0 | % | 46.49 | |||||||||||||||||||||||||||||||||||||||
| Subtotal | 26 | 4,827,833 | 75.6 | % | 77.7 | % | $ | 59.84 | |||||||||||||||||||||||||||||||||||||||
| NEW YORK | |||||||||||||||||||||||||||||||||||||||||||||||
| Office | |||||||||||||||||||||||||||||||||||||||||||||||
| 510 Carnegie Center | Princeton NJ | 1 | 234,160 | 65.6 | % | 72.4 | % | $ | 39.24 | ||||||||||||||||||||||||||||||||||||||
| 206 Carnegie Center | Princeton NJ | 1 | 161,763 | — | % | — | % | — | |||||||||||||||||||||||||||||||||||||||
| 210 Carnegie Center | Princeton NJ | 1 | 159,468 | 33.2 | % | 33.2 | % | 34.32 | |||||||||||||||||||||||||||||||||||||||
| 212 Carnegie Center | Princeton NJ | 1 | 148,942 | 82.4 | % | 82.4 | % | 37.49 | |||||||||||||||||||||||||||||||||||||||
| 214 Carnegie Center | Princeton NJ | 1 | 146,799 | 62.9 | % | 64.9 | % | 38.16 | |||||||||||||||||||||||||||||||||||||||
| 506 Carnegie Center | Princeton NJ | 1 | 139,050 | 77.2 | % | 77.2 | % | 40.46 | |||||||||||||||||||||||||||||||||||||||
| 508 Carnegie Center | Princeton NJ | 1 | 134,433 | 100.0 | % | 100.0 | % | 43.03 | |||||||||||||||||||||||||||||||||||||||
24
| Q4 2024 | ||||
| In-service property listing (continued) | |||||
| as of December 31, 2024 | |||||||||||||||||||||||||||||||||||||||||||||||
| Sub Market | Number of Buildings | Square Feet | Occupied % 1 | Leased % 2 | Annualized Rental Obligations Per Occupied SF 3 | ||||||||||||||||||||||||||||||||||||||||||
| 202 Carnegie Center | Princeton NJ | 1 | 134,068 | 71.9 | % | 80.0 | % | 39.27 | |||||||||||||||||||||||||||||||||||||||
| 804 Carnegie Center | Princeton NJ | 1 | 130,000 | 100.0 | % | 100.0 | % | 41.52 | |||||||||||||||||||||||||||||||||||||||
| 101 Carnegie Center | Princeton NJ | 1 | 122,791 | 82.6 | % | 100.0 | % | 40.00 | |||||||||||||||||||||||||||||||||||||||
| 504 Carnegie Center | Princeton NJ | 1 | 121,990 | 100.0 | % | 100.0 | % | 36.39 | |||||||||||||||||||||||||||||||||||||||
| 502 Carnegie Center | Princeton NJ | 1 | 121,460 | 98.6 | % | 98.6 | % | 39.07 | |||||||||||||||||||||||||||||||||||||||
| 701 Carnegie Center | Princeton NJ | 1 | 120,000 | 100.0 | % | 100.0 | % | 33.96 | |||||||||||||||||||||||||||||||||||||||
| 104 Carnegie Center | Princeton NJ | 1 | 102,930 | 35.6 | % | 48.3 | % | 40.72 | |||||||||||||||||||||||||||||||||||||||
| 103 Carnegie Center | Princeton NJ | 1 | 96,322 | 64.6 | % | 67.1 | % | 37.19 | |||||||||||||||||||||||||||||||||||||||
| 302 Carnegie Center | Princeton NJ | 1 | 64,926 | 100.0 | % | 100.0 | % | 36.24 | |||||||||||||||||||||||||||||||||||||||
| 211 Carnegie Center | Princeton NJ | 1 | 47,025 | — | % | — | % | — | |||||||||||||||||||||||||||||||||||||||
| 201 Carnegie Center | Princeton NJ | — | 6,500 | 100.0 | % | 100.0 | % | 33.83 | |||||||||||||||||||||||||||||||||||||||
| Subtotal | 17 | 2,192,627 | 69.5 | % | 72.5 | % | $ | 38.67 | |||||||||||||||||||||||||||||||||||||||
| SAN FRANCISCO | |||||||||||||||||||||||||||||||||||||||||||||||
| Office | |||||||||||||||||||||||||||||||||||||||||||||||
Gateway Commons (50% ownership) 4, 11 | South San Francisco CA | 5 | 785,457 | 70.5 | % | 72.8 | % | $ | 73.69 | ||||||||||||||||||||||||||||||||||||||
751 Gateway (49% ownership) 4, 8 | South San Francisco CA | 1 | 230,592 | 100.0 | % | 100.0 | % | 93.51 | |||||||||||||||||||||||||||||||||||||||
| Mountain View Research Park | Mountain View CA | 15 | 542,264 | 60.7 | % | 60.7 | % | 73.92 | |||||||||||||||||||||||||||||||||||||||
| 2440 West El Camino Real | Mountain View CA | 1 | 142,711 | 71.5 | % | 71.5 | % | 90.63 | |||||||||||||||||||||||||||||||||||||||
| 453 Ravendale Drive | Mountain View CA | 1 | 29,620 | 100.0 | % | 100.0 | % | 52.80 | |||||||||||||||||||||||||||||||||||||||
North First Business Park 13 | San Jose CA | 5 | 190,636 | 58.6 | % | 58.6 | % | 26.58 | |||||||||||||||||||||||||||||||||||||||
| Subtotal | 28 | 1,921,280 | 70.6 | % | 71.5 | % | $ | 74.11 | |||||||||||||||||||||||||||||||||||||||
| WASHINGTON, DC | |||||||||||||||||||||||||||||||||||||||||||||||
| Office | |||||||||||||||||||||||||||||||||||||||||||||||
| Kingstowne Two | Springfield VA | 1 | 156,005 | 55.8 | % | 55.8 | % | $ | 41.48 | ||||||||||||||||||||||||||||||||||||||
Kingstowne Retail 6 | Springfield VA | 1 | 88,288 | 100.0 | % | 100.0 | % | 31.56 | |||||||||||||||||||||||||||||||||||||||
| Subtotal | 2 | 244,293 | 71.8 | % | 71.8 | % | $ | 36.48 | |||||||||||||||||||||||||||||||||||||||
| Suburban Total | 73 | 9,186,033 | 73.0 | % | 75.0 | % | $ | 57.32 | |||||||||||||||||||||||||||||||||||||||
| BXP’s Share of Suburban | 72.6 | % | 74.7 | % | |||||||||||||||||||||||||||||||||||||||||||
| Total In-Service Properties: | 178 | 51,033,871 | 87.5 | % | 12 | 89.4 | % | 12 | $ | 81.21 | 12 | ||||||||||||||||||||||||||||||||||||
BXP’s Share of Total In-Service Properties: 3 | 87.3 | % | 12 | 89.2 | % | 12 | |||||||||||||||||||||||||||||||||||||||||
_____________
1Represents signed leases for which revenue recognition has commenced in accordance with GAAP.
2Represents signed leases for which revenue recognition has commenced in accordance with GAAP and signed leases for vacant space with future commencement dates. For additional detail, see pages 39-55.
3See the Definitions and Reconciliations sections of this Supplemental package starting on page 57.
4This is an unconsolidated joint venture property.
5Property was taken out of service on January 1, 2025.
6This is a retail property.
7Prudential Center (retail shops) includes 760 Boylston Street, an approximately 118,000 net rentable square feet redevelopment that was completed and fully placed in-service during the second quarter of 2024. 760 Boylston Street is not included in the Same Property analysis.
8Classified as a laboratory/life sciences property.
9Not included in the Same Property analysis.
10 During the first quarter of 2024, the Company reassessed the classifications of its assets as either CBD or Suburban and determined that certain assets such as those in Reston, Virginia are located in areas with characteristics that more closely align with our definition of CBD due to their diverse live, work, and play environment. As a result, these assets are classified as CBD.
11 Includes 681 Gateway, which is a laboratory/life sciences property.
12 Excludes hotel and residential properties. For additional detail, see pages 20-21.
13 Property held for redevelopment.
25
| Q4 2024 | ||||
| Top 20 clients listing and portfolio client diversification | |||||
as of December 31, 2024
TOP 20 CLIENTS
| No. | Client | BXP’s Share of Annualized Rental Obligations 1 | Weighted Average Remaining Lease Term (years) 2 | ||||||||||||||||||||
| 1 | Salesforce | 3.29 | % | 7.2 | |||||||||||||||||||
| 2 | 2.83 | % | 12.3 | ||||||||||||||||||||
| 3 | Biogen | 2.49 | % | 2.4 | |||||||||||||||||||
| 4 | Akamai Technologies | 2.13 | % | 9.8 | |||||||||||||||||||
| 5 | Kirkland & Ellis | 1.71 | % | 12.5 | |||||||||||||||||||
| 6 | Snap | 1.59 | % | 8.9 | |||||||||||||||||||
| 7 | Fannie Mae | 1.50 | % | 12.7 | |||||||||||||||||||
| 8 | Ropes & Gray | 1.36 | % | 12.2 | |||||||||||||||||||
| 9 | Millennium Management | 1.33 | % | 6.4 | |||||||||||||||||||
| 10 | Wellington Management | 1.18 | % | 11.5 | |||||||||||||||||||
| 11 | Weil Gotshal & Manges | 1.16 | % | 9.2 | |||||||||||||||||||
| 12 | Microsoft | 1.10 | % | 8.7 | |||||||||||||||||||
| 13 | Allen Overy Shearman Sterling | 1.02 | % | 16.7 | |||||||||||||||||||
| 14 | Arnold & Porter Kaye Scholer | 1.01 | % | 7.5 | |||||||||||||||||||
| 15 | Bain Capital | 0.90 | % | 7.1 | |||||||||||||||||||
| 16 | Morrison & Foerster | 0.90 | % | 5.8 | |||||||||||||||||||
| 17 | Wilmer Cutler Pickering Hale | 0.83 | % | 13.9 | |||||||||||||||||||
| 18 | Bank of America | 0.83 | % | 11.5 | |||||||||||||||||||
| 19 | Leidos | 0.82 | % | 8.6 | |||||||||||||||||||
| 20 | Aramis (Estee Lauder) | 0.80 | % | 15.3 | |||||||||||||||||||
| BXP’s Share of Annualized Rental Obligations | 28.79 | % | |||||||||||||||||||||
BXP’s Share of Square Feet 1 | 22.65 | % | |||||||||||||||||||||
| Weighted Average Remaining Lease Term (years) | 9.7 | ||||||||||||||||||||||
NOTABLE SIGNED DEALS 3
| Client | Property | Square Feet | ||||||||||||
| AstraZeneca | 290 Binney Street | 573,000 | ||||||||||||
| McDermott Will & Emery LLP | 725 12th Street, NW | 152,000 | ||||||||||||
CLIENT DIVERSIFICATION 2
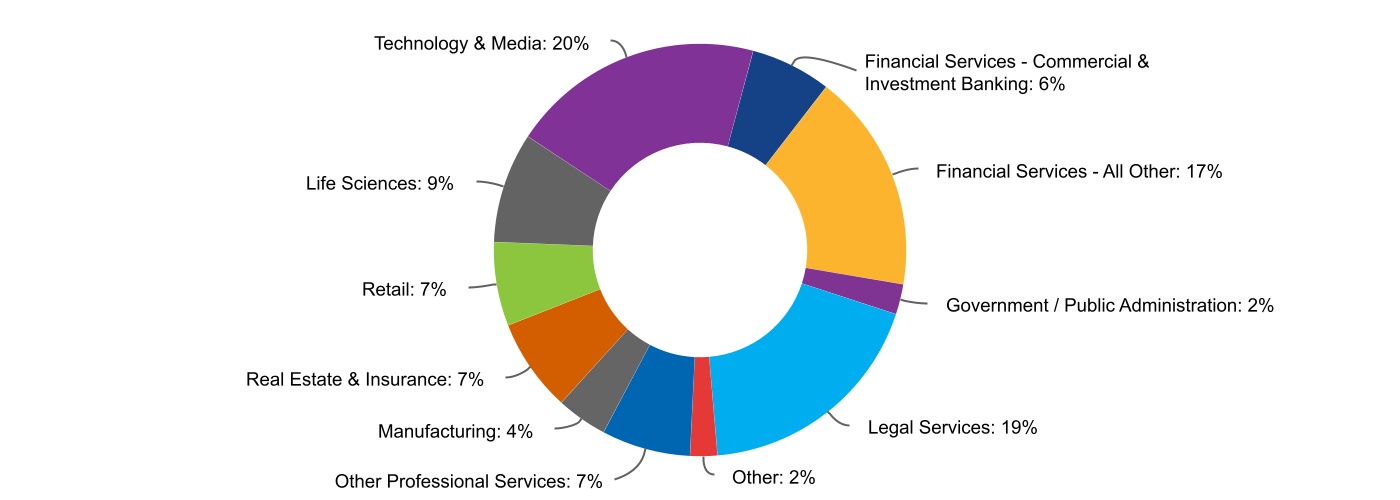
_____________
1See the Definitions and Reconciliations sections of this Supplemental package starting on page 57.
2Based on BXP’s Share of Annualized Rental Obligations.
3Represents leases signed with occupancy commencing in the future. The number of square feet is an estimate.
26
| Q4 2024 | ||||
| Occupancy by location | |||||
as of December 31, 2024
TOTAL IN-SERVICE OFFICE PROPERTIES 1 - Quarter-over-Quarter
| CBD | Suburban | Total | ||||||||||||||||||||||||||||||||||||
| Location | 31-Dec-24 | 30-Sep-24 | 31-Dec-24 | 30-Sep-24 | 31-Dec-24 | 30-Sep-24 | ||||||||||||||||||||||||||||||||
| Boston | 95.9 | % | 95.7 | % | 75.6 | % | 77.1 | % | 89.7 | % | 90.1 | % | ||||||||||||||||||||||||||
| Los Angeles | 84.9 | % | 84.9 | % | — | % | — | % | 84.9 | % | 84.9 | % | ||||||||||||||||||||||||||
| New York | 90.8 | % | 88.9 | % | 69.5 | % | 67.3 | % | 87.1 | % | 85.1 | % | ||||||||||||||||||||||||||
| San Francisco | 84.3 | % | 84.2 | % | 70.6 | % | 71.2 | % | 80.8 | % | 80.9 | % | ||||||||||||||||||||||||||
| Seattle | 81.6 | % | 80.2 | % | — | % | — | % | 81.6 | % | 80.2 | % | ||||||||||||||||||||||||||
| Washington, DC | 91.9 | % | 91.4 | % | 71.8 | % | 82.6 | % | 91.4 | % | 91.2 | % | ||||||||||||||||||||||||||
| Total Portfolio | 90.9 | % | 90.1 | % | 73.0 | % | 73.6 | % | 87.5 | % | 87.0 | % | ||||||||||||||||||||||||||
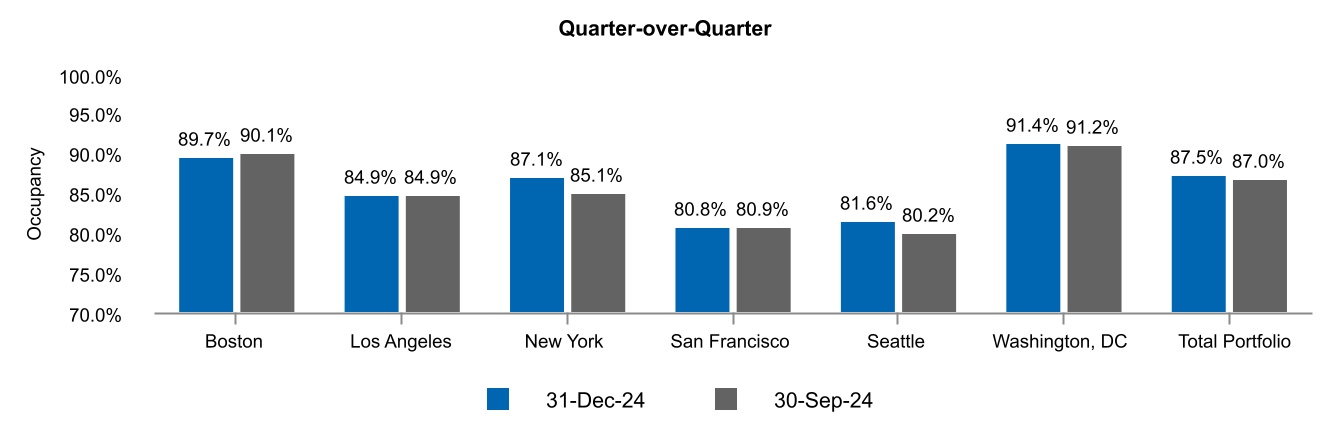
SAME PROPERTY OFFICE PROPERTIES 1, 2, 3 - Year-over-Year
| CBD | Suburban | Total | ||||||||||||||||||||||||||||||||||||
| Location | 31-Dec-24 | 31-Dec-23 | 31-Dec-24 | 31-Dec-23 | 31-Dec-24 | 31-Dec-23 | ||||||||||||||||||||||||||||||||
| Boston | 95.9 | % | 95.9 | % | 80.0 | % | 82.0 | % | 91.3 | % | 91.9 | % | ||||||||||||||||||||||||||
| Los Angeles | 89.6 | % | 87.8 | % | — | % | — | % | 89.6 | % | 87.8 | % | ||||||||||||||||||||||||||
| New York | 90.8 | % | 91.8 | % | 69.5 | % | 81.8 | % | 87.1 | % | 90.1 | % | ||||||||||||||||||||||||||
| San Francisco | 84.3 | % | 87.4 | % | 70.6 | % | 77.3 | % | 80.8 | % | 84.9 | % | ||||||||||||||||||||||||||
| Seattle | 81.6 | % | 81.8 | % | — | % | — | % | 81.6 | % | 81.8 | % | ||||||||||||||||||||||||||
| Washington, DC | 92.4 | % | 89.6 | % | 71.8 | % | 85.6 | % | 91.8 | % | 89.4 | % | ||||||||||||||||||||||||||
| Total Portfolio | 91.2 | % | 91.3 | % | 75.1 | % | 81.0 | % | 88.2 | % | 89.4 | % | ||||||||||||||||||||||||||
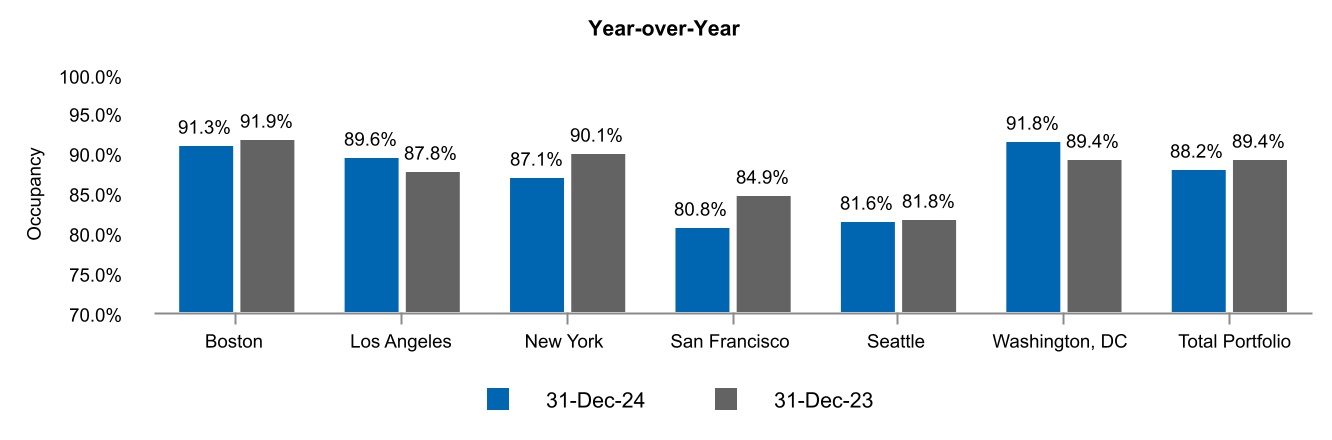
_____________
1Represents signed leases for which revenue recognition has commenced in accordance with GAAP. Includes 100% of joint venture properties. Does not include residential units and hotel.
2During the first quarter of 2024, the Company reassessed the classifications of its assets as either CBD or Suburban and determined that certain assets such as those in Reston, Virginia are located in areas with characteristics that more closely align with our definition of CBD due to their diverse live, work, and play environment. As a result, these assets are classified as CBD. Comparative period has been updated to reflect the same presentation.
3 See the Definitions and Reconciliations sections of this Supplemental package starting on page 57.
27
| Q4 2024 | ||||
| Capital structure | |||||
(in thousands, except percentages)
CONSOLIDATED DEBT
| Aggregate Principal | |||||
| Mortgage Notes Payable | $ | 4,302,313 | |||
| Unsecured Line of Credit | — | ||||
| Unsecured Term Loans | 800,000 | ||||
| Unsecured Commercial Paper | 500,000 | ||||
| Unsecured Senior Notes, at face value | 10,700,000 | ||||
| Outstanding Principal | 16,302,313 | ||||
| Discount on Unsecured Senior Notes | (10,885) | ||||
| Deferred Financing Costs, Net | (69,271) | ||||
| Fair Value Debt Adjustment | (1,658) | ||||
| Consolidated Debt | $ | 16,220,499 | |||
MORTGAGE NOTES PAYABLE
| Interest Rate | ||||||||||||||||||||||||||
| Property | Maturity Date | GAAP 1 | Stated 2 | Outstanding Principal | ||||||||||||||||||||||
901 New York Avenue 3 | January 5, 2029 | 7.69% | 3.61% | $ | 202,313 | |||||||||||||||||||||
| Santa Monica Business Park | October 8, 2028 | 6.65% | 4.05% | 200,000 | ||||||||||||||||||||||
| 767 Fifth Avenue (The GM Building) (60% ownership) | June 9, 2027 | 3.64% | 3.43% | 2,300,000 | ||||||||||||||||||||||
| 90 Broadway, 325 Main Street, 355 Main Street and Kendall Center Green Garage | October 26, 2028 | 6.27% | 6.04% | 600,000 | ||||||||||||||||||||||
| 601 Lexington Avenue (55% ownership) | January 9, 2032 | 2.93% | 2.79% | 1,000,000 | ||||||||||||||||||||||
| Total | $ | 4,302,313 | ||||||||||||||||||||||||
BOSTON PROPERTIES LIMITED PARTNERSHIP UNSECURED SENIOR NOTES 4
| Maturity Date | Effective Yield (on issue date) | Coupon | Outstanding Principal | |||||||||||||||||||||||
7 Year Unsecured Senior Notes 5 | January 15, 2025 | 3.35% | 3.20% | $ | 850,000 | |||||||||||||||||||||
| 10 Year Unsecured Senior Notes | February 1, 2026 | 3.77% | 3.65% | 1,000,000 | ||||||||||||||||||||||
| 10 Year Unsecured Senior Notes | October 1, 2026 | 3.50% | 2.75% | 1,000,000 | ||||||||||||||||||||||
| 5 Year Unsecured Senior Notes (“green bonds”) | December 1, 2027 | 6.92% | 6.75% | 750,000 | ||||||||||||||||||||||
| 10 Year Unsecured Senior Notes (“green bonds”) | December 1, 2028 | 4.63% | 4.50% | 1,000,000 | ||||||||||||||||||||||
| 10 Year Unsecured Senior Notes (“green bonds”) | June 21, 2029 | 3.51% | 3.40% | 850,000 | ||||||||||||||||||||||
| 10.5 Year Unsecured Senior Notes | March 15, 2030 | 2.98% | 2.90% | 700,000 | ||||||||||||||||||||||
| 10.75 Year Unsecured Senior Notes | January 30, 2031 | 3.34% | 3.25% | 1,250,000 | ||||||||||||||||||||||
| 11 Year Unsecured Senior Notes (“green bonds”) | April 1, 2032 | 2.67% | 2.55% | 850,000 | ||||||||||||||||||||||
| 12 Year Unsecured Senior Notes (“green bonds”) | October 1, 2033 | 2.52% | 2.45% | 850,000 | ||||||||||||||||||||||
| 10.7 Year Unsecured Senior Notes (“green bonds”) | January 15, 2034 | 6.62% | 6.50% | 750,000 | ||||||||||||||||||||||
| 10 Year Unsecured Senior Notes | January 15, 2035 | 5.84% | 5.75% | 850,000 | ||||||||||||||||||||||
| $ | 10,700,000 | |||||||||||||||||||||||||
CAPITALIZATION
| Shares/Units | Common Stock | ||||||||||||||||||||||
| Outstanding | Equivalents | Equivalent Value 6 | |||||||||||||||||||||
| Common Stock | 158,175 | 158,175 | $ | 11,761,893 | |||||||||||||||||||
| Common Operating Partnership Units | 18,066 | 18,066 | 1,343,388 | ||||||||||||||||||||
| Total Equity | 176,241 | $ | 13,105,281 | ||||||||||||||||||||
Consolidated Debt (A) | $ | 16,220,499 | |||||||||||||||||||||
Add: BXP’s share of unconsolidated joint venture debt 7 | 1,383,764 | ||||||||||||||||||||||
Less: Partners’ share of consolidated debt 8 | 1,362,367 | ||||||||||||||||||||||
BXP’s Share of Debt 9 (B) | $ | 16,241,896 | |||||||||||||||||||||
Consolidated Market Capitalization (C) | $ | 29,325,780 | |||||||||||||||||||||
BXP’s Share of Market Capitalization 9 (D) | $ | 29,347,177 | |||||||||||||||||||||
Consolidated Debt/Consolidated Market Capitalization (A÷C) | 55.31 | % | |||||||||||||||||||||
BXP’s Share of Debt/BXP’s Share of Market Capitalization 9 (B÷D) | 55.34 | % | |||||||||||||||||||||
_____________
1The GAAP interest rate differs from the stated interest rate due to the inclusion of the amortization of financing charges, the effects of hedging transactions and adjustments required to reflect loans and swaps at their fair values upon consolidation.
28
| Q4 2024 | ||||
| Capital structure (continued) | |||||
2The stated interest rate includes the effects of hedging transactions.
3On December 20, 2024 the Company exercised an extension option for a term of four years and a fixed interest rate of 5.0% per annum beginning January 5, 2025. The loan has a one-year extension option remaining, subject to certain conditions.
4All unsecured senior notes are rated BBB (negative), and Baa2 (stable) by S&P and Moody’s, respectively.
5On January 15, 2025, the Company repaid $850.0 million in aggregate principal amount of its 3.200% unsecured senior notes.
6Values are based on the December 31, 2024 closing price of $74.36 per share of BXP common stock.
7Amount is calculated based on the Company’s percentage ownership interest in the unconsolidated joint venture entities. For additional detail, see page 36.
8Amount is calculated based on the outside partners’ percentage ownership interest in the consolidated joint venture entities. For additional detail, see page 34.
9See the Definitions and Reconciliations sections of this Supplemental package starting on page 57.
29
| Q4 2024 | ||||
Debt analysis 1 | |||||
as of December 31, 2024
(dollars in thousands)
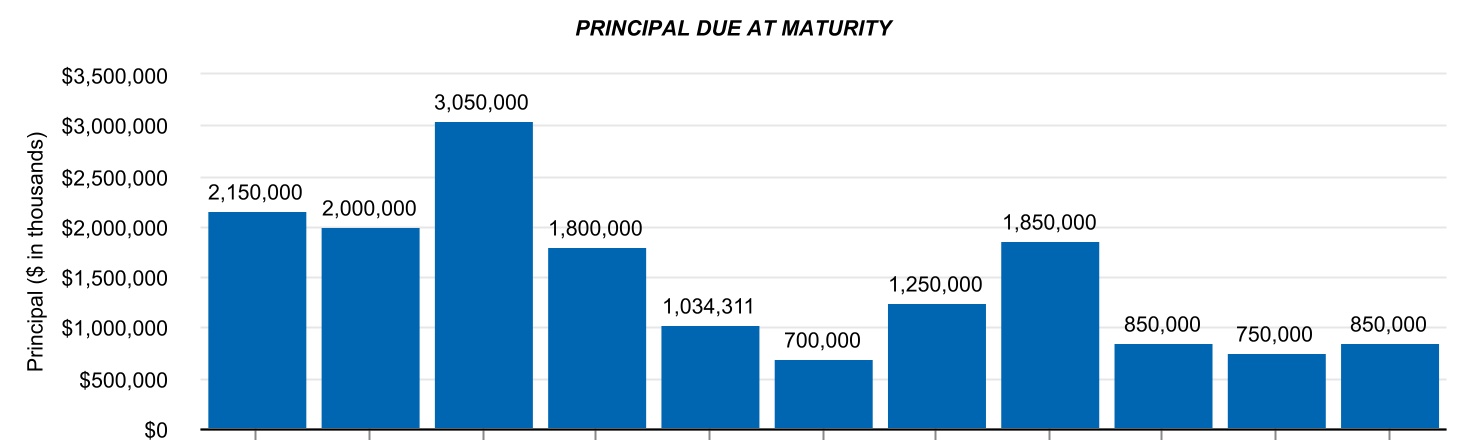
2025 2 | 2026 | 2027 | 2028 | 2029 | 2030 | 2031 | 2032 | 2033 | 2034 | 2035 | ||||||||||||||||||||||||||||
UNSECURED CREDIT FACILITY - MATURES JUNE 15, 2026
| Facility | Outstanding at December 31, 2024 | Remaining Capacity at December 31, 2024 | ||||||||||||||||||
| Unsecured Line of Credit | $ | 2,000,000 | $ | — | $ | 2,000,000 | ||||||||||||||
| Less: | ||||||||||||||||||||
Unsecured Commercial Paper 3 | 500,000 | |||||||||||||||||||
| Letters of Credit | 5,393 | |||||||||||||||||||
| Total Remaining Capacity | $ | 1,494,607 | ||||||||||||||||||
UNSECURED TERM LOANS
| Maturity Date | Facility | Outstanding Principal | ||||||||||||||||||
| 2023 Unsecured Term Loan | May 16, 2025 | $ | 700,000 | $ | 700,000 | |||||||||||||||
2024 Unsecured Term Loan 4 | September 26, 2025 | $ | 100,000 | 100,000 | ||||||||||||||||
| $ | 800,000 | |||||||||||||||||||
UNSECURED AND SECURED DEBT ANALYSIS
| Weighted Average | ||||||||||||||||||||||||||
| % of Total Debt | Stated Rates | GAAP Rates 5 | Maturity (years) | |||||||||||||||||||||||
Unsecured Debt 2 | 73.63 | % | 4.11 | % | 4.23 | % | 4.4 | |||||||||||||||||||
| Secured Debt | 26.37 | % | 3.68 | % | 4.17 | % | 3.8 | |||||||||||||||||||
Consolidated Debt 2 | 100.00 | % | 4.00 | % | 4.21 | % | 4.3 | |||||||||||||||||||
FLOATING AND FIXED RATE DEBT ANALYSIS
| Weighted Average | ||||||||||||||||||||||||||
| % of Total Debt | Stated Rates | GAAP Rates 5 | Maturity (years) | |||||||||||||||||||||||
Floating Rate Debt 3 | 7.39 | % | 5.34 | % | 5.47 | % | 0.2 | |||||||||||||||||||
Fixed Rate Debt 2, 4, 6 | 92.61 | % | 3.89 | % | 4.11 | % | 4.6 | |||||||||||||||||||
Consolidated Debt 2 | 100.00 | % | 4.00 | % | 4.21 | % | 4.3 | |||||||||||||||||||
_____________
1Excludes unconsolidated joint ventures. For information on BXP’s share of unconsolidated joint venture debt, see page 36.
2Includes $850.0 million of unsecured senior notes that was due on January 15, 2025 and repaid upon maturity.
3The $500.0 million unsecured commercial paper program is backstopped by available capacity under the unsecured line of credit. As such, the Company intends to maintain, at a minimum, availability under its unsecured line of credit in an amount equal to the amount of commercial paper notes outstanding. The term of the notes issued under the unsecured commercial paper program vary but may not exceed one year from the date of issuance. The commercial paper notes are included in the Company’s floating rate debt statistics. The weighted average interest rate of the commercial paper notes outstanding at December 31, 2024 was approximately 4.79% per annum and have a weighted-average maturity of 38 days from the date of issuance.
4The $100.0 million 2024 Unsecured Term Loan is subject to an interest rate swap contract that effectively fix Daily Simple SOFR, the reference rate for the 2024 Unsecured Term Loan, at a fixed rate of 2.688% for the period ending on April 1, 2025. The $100.0 million unsecured term loan has three one-year extension options (subject to customary conditions).
5The GAAP interest rate differs from the stated interest rate due to the inclusion of the amortization of financing charges, the effects of hedging transactions and adjustments required to reflect loans and swaps at their fair values upon consolidation.
6The Fixed Rate Debt includes the effects of hedging transactions.
30
| Q4 2024 | ||||
| Senior unsecured debt covenant compliance ratios | |||||
In the fourth quarter of 2002, the Company’s Operating Partnership (Boston Properties Limited Partnership) received investment grade ratings on its senior unsecured debt securities and thereafter issued unsecured notes. The notes were issued under an indenture, dated as of December 13, 2002, by and between Boston Properties Limited Partnership and The Bank of New York Mellon Trust Company, N.A., as trustee, as supplemented from time to time (the “Indenture”), which, among other things, requires us to comply with the following limitations on incurrence of debt: Limitation on Outstanding Debt; Limitation on Secured Debt; Ratio of Annualized Consolidated EBITDA to Annualized Interest Expense; and Maintenance of Unencumbered Assets. Compliance with these restrictive covenants requires us to apply specialized terms the meanings of which are described in detail in our filings with the SEC, and to calculate ratios in the manner prescribed by the Indenture.
This section presents such ratios as of December 31, 2024 to show that the Company’s Operating Partnership was in compliance with the terms of the Indenture, which has been filed with the SEC. Management is not presenting these ratios for any other purpose or for any other period, and is not intending for these measures to otherwise provide information to investors about the Company’s financial condition or results of operations. Investors should not rely on these measures other than for purposes of testing our compliance with the Indenture.
COVENANT RATIOS AND RELATED DATA
| Senior Notes Issued Prior to December 4, 2017 | Senior Notes Issued On or After December 4, 2017 | ||||||||||||||||
| Test | Actual | ||||||||||||||||
Total Outstanding Debt/Total Assets 1 | Less than 60% | 48.7 | % | 45.6 | % | ||||||||||||
| Secured Debt/Total Assets | Less than 50% | 16.0 | % | 15.0 | % | ||||||||||||
| Interest Coverage (Annualized Consolidated EBITDA to Annualized Interest Expense) | Greater than 1.50x | 2.94 | 2.94 | ||||||||||||||
| Unencumbered Assets/ Unsecured Debt | Greater than 150% | 227.6 | % | 245.8 | % | ||||||||||||
_____________
1Capitalized Property Value for senior notes issued prior to December 4, 2017 is determined for each property and is the greater of (A) annualized EBITDA capitalized at an 8.0% rate for CBD properties and a 9.0% rate for non-CBD properties, and (B) the undepreciated book value as determined under GAAP. Capitalized property value for senior notes issued on or after December 4, 2017 is determined for each property and is the greater of (x) annualized EBITDA capitalized at 7.0% and (y) the undepreciated book value as determined under GAAP.
31
| Q4 2024 | ||||
Net Debt to EBITDAre | |||||
(dollars in thousands)
Reconciliation of BXP’s Share of EBITDAre and BXP’s Share of EBITDAre – cash 1
| Three Months Ended | ||||||||||||||
| 31-Dec-24 | 30-Sep-24 | |||||||||||||
| Net income (loss) attributable to BXP, Inc. | $ | (230,019) | $ | 83,628 | ||||||||||
| Add: | ||||||||||||||
| Noncontrolling interest - common units of the Operating Partnership | (25,031) | 9,587 | ||||||||||||
| Noncontrolling interest in property partnerships | 17,233 | 15,237 | ||||||||||||
| Net income (loss) | (237,817) | 108,452 | ||||||||||||
| Add: | ||||||||||||||
| Interest expense | 170,390 | 163,194 | ||||||||||||
| Depreciation and amortization expense | 226,043 | 222,890 | ||||||||||||
| Less: | ||||||||||||||
| Gains on sales of real estate | 85 | 517 | ||||||||||||
Loss from unconsolidated joint ventures 2 | (349,553) | (7,011) | ||||||||||||
| Add: | ||||||||||||||
BXP’s share of EBITDAre from unconsolidated joint ventures 3 | 31,733 | 33,081 | ||||||||||||
EBITDAre 1 | 539,817 | 534,111 | ||||||||||||
| Less: | ||||||||||||||
Partners’ share of EBITDAre from consolidated joint ventures 4 | 49,142 | 46,099 | ||||||||||||
BXP’s Share of EBITDAre 1 (A) | 490,675 | 488,012 | ||||||||||||
| Add: | ||||||||||||||
| Stock-based compensation expense | 4,059 | 4,031 | ||||||||||||
BXP’s Share of straight-line ground rent expense adjustment 1 | 868 | 679 | ||||||||||||
BXP’s Share of lease transaction costs that qualify as rent inducements 1 | 4,039 | 5,070 | ||||||||||||
| Less: | ||||||||||||||
BXP’s Share of straight-line rent 1 | 20,607 | 25,433 | ||||||||||||
BXP’s Share of fair value lease revenue 1 | 2,320 | 2,294 | ||||||||||||
BXP’s Share of amortization and accretion related to sales type lease 1 | 281 | 278 | ||||||||||||
BXP’s Share of EBITDAre – cash 1 | $ | 476,433 | $ | 469,787 | ||||||||||
BXP’s Share of EBITDAre (Annualized) 5 (A x 4) | $ | 1,962,700 | $ | 1,952,048 | ||||||||||
Reconciliation of BXP’s Share of Net Debt 1
| 31-Dec-24 | 30-Sep-24 | |||||||||||||
| Consolidated debt | $ | 16,220,499 | $ | 16,215,246 | ||||||||||
| Less: | ||||||||||||||
| Cash and cash equivalents | 1,254,882 | 1,420,475 | ||||||||||||
| Cash held in escrow for 1031 exchange | — | — | ||||||||||||
Net debt 1 | 14,965,617 | 14,794,771 | ||||||||||||
| Add: | ||||||||||||||
BXP’s share of unconsolidated joint venture debt 3 | 1,383,764 | 1,382,412 | ||||||||||||
| Partners’ share of cash and cash equivalents from consolidated joint ventures | 162,171 | 140,176 | ||||||||||||
| Less: | ||||||||||||||
| BXP’s share of cash and cash equivalents from unconsolidated joint ventures | 112,711 | 103,576 | ||||||||||||
Partners’ share of consolidated joint venture debt 4 | 1,362,367 | 1,361,869 | ||||||||||||
| BXP’s share of related party note receivables | 30,500 | 30,500 | ||||||||||||
BXP’s Share of Net Debt 1 (B) | $ | 15,005,974 | $ | 14,821,414 | ||||||||||
BXP’s Share of Net Debt to BXP’s Share of EBITDAre (Annualized) [B ÷ (A x 4)] | 7.65 | 7.59 | ||||||||||||
_____________
1See the Definitions and Reconciliations sections of this Supplemental package starting on page 57.
2For the three months ended December 31, 2024, includes impairment charges totaling approximately $341.3 million related to the Company’s investments in three unconsolidated joint ventures.
3For disclosures related to the calculation of BXP’s share from unconsolidated joint ventures for the three months ended December 31, 2024, see pages 36 and 65.
4For disclosures related to the calculation of Partners’ share from consolidated joint ventures for the three months ended December 31, 2024, see pages 34 and 63.
5BXP’s Share of EBITDAre (Annualized) is calculated as the product of such amount for the quarter multiplied by four (4).
32
| Q4 2024 | ||||
| Debt ratios | |||||
(in thousands, except for ratio amounts)
INTEREST COVERAGE RATIO 1
| Three Months Ended | ||||||||||||||
| 31-Dec-24 | 30-Sep-24 | |||||||||||||
BXP’s Share of interest expense 1 | $ | 177,237 | $ | 170,524 | ||||||||||
| Less: | ||||||||||||||
BXP’s Share of hedge amortization, net of costs 1 | 1,812 | 1,949 | ||||||||||||
BXP’s share of fair value interest adjustment 1 | 4,748 | 4,723 | ||||||||||||
BXP’s Share of amortization of financing costs 1 | 4,968 | 4,760 | ||||||||||||
Adjusted interest expense excluding capitalized interest (A) | 165,709 | 159,092 | ||||||||||||
| Add: | ||||||||||||||
BXP’s Share of capitalized interest 1 | 13,169 | 14,897 | ||||||||||||
Adjusted interest expense including capitalized interest (B) | $ | 178,878 | $ | 173,989 | ||||||||||
BXP’s Share of EBITDAre – cash 1, 2 (C) | $ | 476,433 | $ | 469,787 | ||||||||||
Interest Coverage Ratio (excluding capitalized interest) (C÷A) | 2.88 | 2.95 | ||||||||||||
Interest Coverage Ratio (including capitalized interest) (C÷B) | 2.66 | 2.70 | ||||||||||||
FIXED CHARGE COVERAGE RATIO 1
| Three Months Ended | ||||||||||||||
| 31-Dec-24 | 30-Sep-24 | |||||||||||||
BXP’s Share of interest expense 1 | $ | 177,237 | $ | 170,524 | ||||||||||
| Less: | ||||||||||||||
BXP’s Share of hedge amortization, net of costs 1 | 1,812 | 1,949 | ||||||||||||
BXP’s share of fair value interest adjustment 1 | 4,748 | 4,723 | ||||||||||||
BXP’s Share of amortization of financing costs 1 | 4,968 | 4,760 | ||||||||||||
| Add: | ||||||||||||||
BXP’s Share of capitalized interest 1 | 13,169 | 14,897 | ||||||||||||
BXP’s Share of maintenance capital expenditures 1 | 23,848 | 18,220 | ||||||||||||
| Hotel improvements, equipment upgrades and replacements | 587 | 308 | ||||||||||||
Total Fixed Charges (A) | $ | 203,313 | $ | 192,517 | ||||||||||
BXP’s Share of EBITDAre – cash 1, 2 (B) | $ | 476,433 | $ | 469,787 | ||||||||||
Fixed Charge Coverage Ratio (B÷A) | 2.34 | 2.44 | ||||||||||||
_____________
1See the Definitions and Reconciliations sections of this Supplemental package starting on page 57.
2For a quantitative reconciliation of BXP’s Share of EBITDAre – cash, see page 32.
33
| Q4 2024 | ||||
| Consolidated joint ventures | |||||
d
as of December 31, 2024
(unaudited and dollars in thousands)
BALANCE SHEET INFORMATION
| 767 Fifth Avenue | Total Consolidated | ||||||||||||||||||||||
| ASSETS | (The GM Building) 1 | Norges Joint Ventures 1, 2 | Joint Ventures | ||||||||||||||||||||
| Real estate, net | $ | 3,169,757 | $ | 3,192,554 | $ | 6,362,311 | |||||||||||||||||
| Cash and cash equivalents | 123,479 | 250,619 | 374,098 | ||||||||||||||||||||
| Other assets | 313,175 | 449,365 | 762,540 | ||||||||||||||||||||
| Total assets | $ | 3,606,411 | $ | 3,892,538 | $ | 7,498,949 | |||||||||||||||||
| LIABILITIES AND EQUITY | |||||||||||||||||||||||
| Liabilities: | |||||||||||||||||||||||
| Mortgage notes payable, net | $ | 2,291,484 | $ | 990,529 | $ | 3,282,013 | |||||||||||||||||
Other liabilities | 94,743 | 339,614 | 434,357 | ||||||||||||||||||||
| Total liabilities | 2,386,227 | 1,330,143 | 3,716,370 | ||||||||||||||||||||
| Equity: | |||||||||||||||||||||||
| BXP, Inc. | 733,657 | 1,115,272 | 1,848,929 | ||||||||||||||||||||
| Noncontrolling interests | 486,527 | 1,447,123 | 1,933,650 | 3 | |||||||||||||||||||
| Total equity | 1,220,184 | 2,562,395 | 3,782,579 | ||||||||||||||||||||
| Total liabilities and equity | $ | 3,606,411 | $ | 3,892,538 | $ | 7,498,949 | |||||||||||||||||
| BXP’s nominal ownership percentage | 60% | 55% | |||||||||||||||||||||
Partners’ share of cash and cash equivalents 4 | $ | 49,392 | $ | 112,779 | $ | 162,171 | |||||||||||||||||
Partners’ share of consolidated debt 4 | $ | 916,629 | 5 | $ | 445,738 | $ | 1,362,367 | ||||||||||||||||
_____________
1Certain balances contain amounts that eliminate in consolidation.
2Norges Joint Ventures include 7 Times Square (formerly Times Square Tower), 601 Lexington Avenue/One Five Nine East 53rd Street, 100 Federal Street, Atlantic Wharf Office, 343 Madison Avenue, 300 Binney Street, and 290 Binney Street.
3Amount excludes preferred shareholders’ capital.
4Amounts represent the partners’ share based on their respective ownership percentages.
5Amount adjusted for basis differentials.
34
| Q4 2024 | ||||
| Consolidated joint ventures (continued) | |||||
for the three months ended December 31, 2024
(unaudited and dollars in thousands)
RESULTS OF OPERATIONS
| 767 Fifth Avenue | Total Consolidated | |||||||||||||||||||
| (The GM Building) | Norges Joint Ventures 1 | Joint Ventures | ||||||||||||||||||
| Revenue | ||||||||||||||||||||
Lease 2 | $ | 76,791 | $ | 116,400 | $ | 193,191 | ||||||||||||||
| Straight-line rent | 5,353 | (7,045) | (1,692) | |||||||||||||||||
| Fair value lease revenue | (27) | — | (27) | |||||||||||||||||
| Termination income | — | 25 | 25 | |||||||||||||||||
| Total lease revenue | 82,117 | 109,380 | 191,497 | |||||||||||||||||
| Parking and other | 58 | 1,828 | 1,886 | |||||||||||||||||
Total rental revenue 3 | 82,175 | 111,208 | 193,383 | |||||||||||||||||
| Expenses | ||||||||||||||||||||
| Operating | 33,830 | 43,321 | 77,151 | |||||||||||||||||
| Net Operating Income (NOI) | 48,345 | 67,887 | 116,232 | |||||||||||||||||
| Other income (expense) | ||||||||||||||||||||
| Development and management services revenue | — | (1,318) | (1,318) | |||||||||||||||||
Losses from investments in securities | — | (20) | (20) | |||||||||||||||||
| Interest and other income | 1,272 | 2,424 | 3,696 | |||||||||||||||||
| Interest expense | (21,395) | (7,666) | (29,061) | |||||||||||||||||
| Depreciation and amortization expense | (17,494) | (27,194) | (44,688) | |||||||||||||||||
| General and administrative expense | (15) | (139) | (154) | |||||||||||||||||
| Total other income (expense) | (37,632) | (33,913) | (71,545) | |||||||||||||||||
| Net income | $ | 10,713 | $ | 33,974 | $ | 44,687 | ||||||||||||||
FUNDS FROM OPERATIONS (FFO)
| BXP’s nominal ownership percentage | 60% | 55% | ||||||||||||||||||
| 767 Fifth Avenue | Total Consolidated | |||||||||||||||||||
| Reconciliation of Partners’ share of FFO | (The GM Building) | Norges Joint Ventures 1 | Joint Ventures | |||||||||||||||||
| Net income | $ | 10,713 | $ | 33,974 | $ | 44,687 | ||||||||||||||
| Add: Depreciation and amortization expense | 17,494 | 27,194 | 44,688 | |||||||||||||||||
| Entity FFO | $ | 28,207 | $ | 61,168 | $ | 89,375 | ||||||||||||||
Noncontrolling interest in property partnerships (Partners’ NCI) 4 | $ | 3,253 | $ | 13,980 | $ | 17,233 | ||||||||||||||
Partners’ share of depreciation and amortization expense after BXP’s basis differential 4 | 7,347 | 12,558 | 19,905 | |||||||||||||||||
Partners’ share FFO 4 | $ | 10,600 | $ | 26,538 | $ | 37,138 | ||||||||||||||
| Reconciliation of BXP’s share of FFO | ||||||||||||||||||||
| BXP’s share of net income adjusted for partners’ NCI | $ | 7,460 | $ | 19,994 | $ | 27,454 | ||||||||||||||
| Depreciation and amortization expense - BXP’s basis difference | 58 | 395 | 453 | |||||||||||||||||
| BXP’s share of depreciation and amortization expense | 10,089 | 14,241 | 24,330 | |||||||||||||||||
| BXP’s share of FFO | $ | 17,607 | $ | 34,630 | $ | 52,237 | ||||||||||||||
_____________
1 Norges Joint Ventures include 7 Times Square (formerly Times Square Tower), 601 Lexington Avenue/One Five Nine East 53rd Street, 100 Federal Street, Atlantic Wharf Office, 343 Madison Avenue, 300 Binney Street, and 290 Binney Street.
2 Lease revenue includes recoveries from clients and service income from clients.
3 See the Definitions and Reconciliations sections of this Supplemental package starting on page 57.
4 Amounts represent the partners’ share based on their respective ownership percentages and are adjusted for basis differentials and the allocations of management and other fees and depreciation and amortization related to capitalized fees.
35
| Q4 2024 | ||||
Unconsolidated joint ventures 1 | |||||
as of December 31, 2024
(unaudited and dollars in thousands)
BALANCE SHEET INFORMATION
| BXP’s Nominal Ownership | Mortgage/Construction Loans Payable, Net | Interest Rate | ||||||||||||||||||||||||||||||||||||
| Property | Net Equity | Maturity Date | Stated | GAAP 2 | ||||||||||||||||||||||||||||||||||
| Boston | ||||||||||||||||||||||||||||||||||||||
100 Causeway Street | 50.00 | % | $ | 55,810 | $ | 166,592 | September 5, 2025 | 6.03 | % | 6.12 | % | |||||||||||||||||||||||||||
| The Hub on Causeway - Podium | 50.00 | % | 42,310 | 76,927 | September 8, 2025 | 7.35 | % | 7.75 | % | |||||||||||||||||||||||||||||
| Hub50House | 50.00 | % | 42,493 | 91,991 | June 17, 2032 | 4.43 | % | 4.51 | % | |||||||||||||||||||||||||||||
| Hotel Air Rights | 50.00 | % | 14,271 | — | — | — | — | % | ||||||||||||||||||||||||||||||
| 1265 Main Street | 50.00 | % | 3,476 | 16,753 | January 1, 2032 | 3.77 | % | 3.84 | % | |||||||||||||||||||||||||||||
| Los Angeles | ||||||||||||||||||||||||||||||||||||||
Colorado Center 3 | 50.00 | % | 65,000 | 274,768 | August 9, 2027 | 3.56 | % | 3.59 | % | |||||||||||||||||||||||||||||
| Beach Cities Media Center | 50.00 | % | 27,051 | — | — | — | % | — | % | |||||||||||||||||||||||||||||
| New York | ||||||||||||||||||||||||||||||||||||||
360 Park Avenue South 4, 5 | 71.11 | % | 74,592 | 155,151 | December 13, 2027 | 6.90 | % | 7.21 | % | |||||||||||||||||||||||||||||
| Dock 72 | 50.00 | % | (9,889) | 98,938 | December 18, 2025 | 6.84 | % | 7.12 | % | |||||||||||||||||||||||||||||
| 200 Fifth Avenue | 26.69 | % | 70,673 | 152,686 | November 24, 2028 | 4.34 | % | 5.60 | % | |||||||||||||||||||||||||||||
3 Hudson Boulevard 6 | 25.00 | % | 112,771 | 20,000 | August 7, 2024 | 12.53 | % | 12.53 | % | |||||||||||||||||||||||||||||
| San Francisco | ||||||||||||||||||||||||||||||||||||||
| Platform 16 | 55.00 | % | 56,265 | — | — | — | % | — | % | |||||||||||||||||||||||||||||
Gateway Commons 3 | 50.00 | % | 272,000 | — | — | — | % | — | % | |||||||||||||||||||||||||||||
| 751 Gateway | 49.00 | % | 99,701 | — | — | — | % | — | % | |||||||||||||||||||||||||||||
| Seattle | ||||||||||||||||||||||||||||||||||||||
Safeco Plaza 3 | 33.67 | % | — | 83,984 | September 1, 2026 | 4.82 | % | 6.68 | % | |||||||||||||||||||||||||||||
| Washington, DC | ||||||||||||||||||||||||||||||||||||||
| 7750 Wisconsin Avenue (Marriott International Headquarters) | 50.00 | % | 48,423 | 125,710 | April 26, 2025 | 5.75 | % | 5.90 | % | |||||||||||||||||||||||||||||
| 1001 6th Street | 50.00 | % | 45,903 | — | — | — | % | — | % | |||||||||||||||||||||||||||||
| 13100 & 13150 Worldgate Drive | 50.00 | % | 18,225 | — | — | — | % | — | % | |||||||||||||||||||||||||||||
| Market Square North | 50.00 | % | (11,924) | 62,402 | November 10, 2025 | 6.89 | % | 7.07 | % | |||||||||||||||||||||||||||||
| Wisconsin Place Parking Facility | 33.33 | % | 29,775 | — | — | — | % | — | % | |||||||||||||||||||||||||||||
500 North Capitol Street, N.W. 7 | 30.00 | % | (11,696) | 31,289 | June 5, 2026 | 6.83 | % | 7.16 | % | |||||||||||||||||||||||||||||
| Skymark - Reston Next Residential | 20.00 | % | 14,844 | 26,573 | May 13, 2026 | 6.55 | % | 6.87 | % | |||||||||||||||||||||||||||||
| 1,060,074 | ||||||||||||||||||||||||||||||||||||||
| Investments with deficit balances reflected within Other Liabilities | 33,509 | |||||||||||||||||||||||||||||||||||||
| Investments in Unconsolidated Joint Ventures | $ | 1,093,583 | ||||||||||||||||||||||||||||||||||||
| Mortgage/Construction Loans Payable, Net | $ | 1,383,764 | ||||||||||||||||||||||||||||||||||||
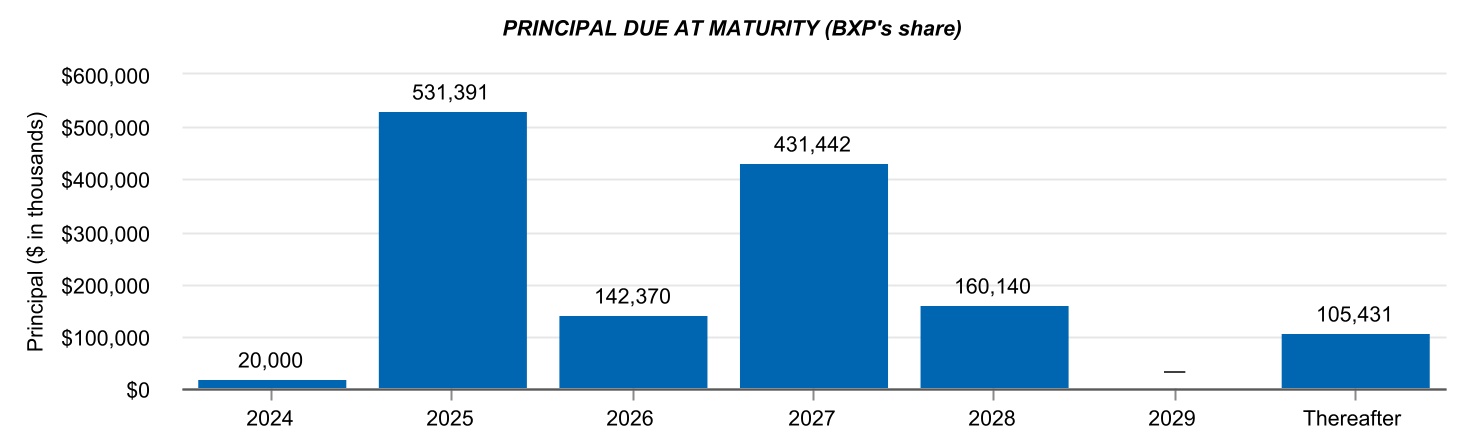
36
| Q4 2024 | ||||
Unconsolidated joint ventures (continued) 1 | |||||
FLOATING AND FIXED RATE DEBT ANALYSIS
| Weighted Average | ||||||||||||||||||||||||||
| % of Total Debt | Stated Rate | GAAP Rate 2 | Maturity (years) | |||||||||||||||||||||||
| Floating Rate Debt | 53.43 | % | 6.56 | % | 6.94 | % | 1.3 | |||||||||||||||||||
| Fixed Rate Debt | 46.57 | % | 4.49 | % | 4.87 | % | 6.0 | |||||||||||||||||||
| Total Debt | 100.00 | % | 5.60 | % | 5.98 | % | 3.5 | |||||||||||||||||||
_____________
1Amounts represent BXP’s share based on its ownership percentage.
2The GAAP interest rate differs from the stated interest rate due to the inclusion of the amortization of financing charges, which includes mortgage recording fees, the effects of hedging transactions (if any) and adjustments required under Accounting Standards Codification 805 “Business Combinations” to reflect loans at their fair values (if any).
3Includes a non-cash impairment charge related to the Company’s investment in this unconsolidated joint venture, see page 38.
4The Company’s partner will fund required capital until their aggregate investment is approximately 29% of all capital contributions; thereafter, the partners will fund required capital according to their percentage interests. See page 15 for more information.
5On December 13, 2024, the loan maturity date was extended to December 13, 2027. The property entered into an interest rate cap agreement during Q4 2024 that capped SOFR at 5.00%.
6The Company has provided $80.0 million of mortgage financing to the joint venture. The loan is reflected as Related Party Note Receivables, Net on the Company’s Consolidated Balance Sheets. As of December 31, 2024, the loan was in a maturity default and had an outstanding balance, including accrued and unpaid interest, and default interest, of approximately $120.0 million.
7The indebtedness consists of (x) a $70.0 million mortgage loan payable (Note A) which bears interest at a fixed rate of 6.23% per annum, and (y) a $35.0 million mortgage loan payable (Note B) which bears interest at a fixed rate of 8.03% per annum. The Company provided $10.5 million (or 30%) of the Note B mortgage financing to the joint venture. The loan is reflected as Related Party Note Receivables, Net on the Company’s Consolidated Balance Sheets.
37
| Q4 2024 | ||||
| Unconsolidated joint ventures (continued) | |||||
for the three months ended December 31, 2024
(unaudited and dollars in thousands)
RESULTS OF OPERATIONS 1
| Boston | Los Angeles | New York | San Francisco | Seattle | Washington, DC | Total Unconsolidated Joint Ventures | ||||||||||||||||||||||||||||||||||||||||||||||||||||||||||||||||||||||||||
| Revenue | ||||||||||||||||||||||||||||||||||||||||||||||||||||||||||||||||||||||||||||||||
Lease 2 | $ | 26,331 | $ | 18,264 | $ | 25,239 | $ | 18,132 | $ | 10,866 | $ | 21,247 | $ | 120,079 | ||||||||||||||||||||||||||||||||||||||||||||||||||||||||||||||||||
| Straight-line rent | 915 | (964) | (529) | 507 | (2,323) | (437) | (2,831) | |||||||||||||||||||||||||||||||||||||||||||||||||||||||||||||||||||||||||
| Fair value lease revenue | — | — | 1,538 | 15 | 1,222 | — | 2,775 | |||||||||||||||||||||||||||||||||||||||||||||||||||||||||||||||||||||||||
| Termination income | 43 | — | 1,871 | — | — | — | 1,914 | |||||||||||||||||||||||||||||||||||||||||||||||||||||||||||||||||||||||||
| Amortization and accretion related to sales type lease | 55 | — | — | — | — | — | 55 | |||||||||||||||||||||||||||||||||||||||||||||||||||||||||||||||||||||||||
| Total lease revenue | 27,344 | 17,300 | 28,119 | 18,654 | 9,765 | 20,810 | 121,992 | |||||||||||||||||||||||||||||||||||||||||||||||||||||||||||||||||||||||||
| Parking and other | 478 | 1,809 | (122) | 322 | 615 | 783 | 3,885 | |||||||||||||||||||||||||||||||||||||||||||||||||||||||||||||||||||||||||
Total rental revenue 3 | 27,822 | 19,109 | 27,997 | 18,976 | 10,380 | 21,593 | 125,877 | |||||||||||||||||||||||||||||||||||||||||||||||||||||||||||||||||||||||||
| Expenses | ||||||||||||||||||||||||||||||||||||||||||||||||||||||||||||||||||||||||||||||||
| Operating | 10,322 | 7,402 | 16,258 | 9,379 | 4,239 | 8,023 | 55,623 | |||||||||||||||||||||||||||||||||||||||||||||||||||||||||||||||||||||||||
| Net operating income/(loss) | 17,500 | 11,707 | 11,739 | 9,597 | 6,141 | 13,570 | 70,254 | |||||||||||||||||||||||||||||||||||||||||||||||||||||||||||||||||||||||||
| Other income/(expense) | ||||||||||||||||||||||||||||||||||||||||||||||||||||||||||||||||||||||||||||||||
| Development and management services revenue | — | — | 494 | 1 | — | 13 | 508 | |||||||||||||||||||||||||||||||||||||||||||||||||||||||||||||||||||||||||
| Interest and other income (loss) | 389 | 1,006 | 222 | (6) | 160 | 541 | 2,312 | |||||||||||||||||||||||||||||||||||||||||||||||||||||||||||||||||||||||||
| Interest expense | (10,656) | (5,052) | (15,080) | — | (4,177) | (9,923) | (44,888) | |||||||||||||||||||||||||||||||||||||||||||||||||||||||||||||||||||||||||
| Unrealized gain/loss on derivative instruments | — | — | 13,782 | 4 | — | — | — | 13,782 | ||||||||||||||||||||||||||||||||||||||||||||||||||||||||||||||||||||||||
| Transaction costs | (8) | — | (305) | — | (2) | (80) | (395) | |||||||||||||||||||||||||||||||||||||||||||||||||||||||||||||||||||||||||
| Depreciation and amortization expense | (8,413) | (5,345) | (9,794) | (7,171) | (5,675) | (5,457) | (41,855) | |||||||||||||||||||||||||||||||||||||||||||||||||||||||||||||||||||||||||
| General and administrative expense | — | — | (69) | (4) | — | — | (73) | |||||||||||||||||||||||||||||||||||||||||||||||||||||||||||||||||||||||||
| Total other income/(expense) | (18,688) | (9,391) | (10,750) | (7,180) | (9,694) | (14,906) | (70,609) | |||||||||||||||||||||||||||||||||||||||||||||||||||||||||||||||||||||||||
| Net income/(loss) | $ | (1,188) | $ | 2,316 | $ | 989 | $ | 2,417 | $ | (3,553) | $ | (1,336) | $ | (355) | ||||||||||||||||||||||||||||||||||||||||||||||||||||||||||||||||||
| Reconciliation of BXP’s share of Funds from Operations (FFO) | ||||||||||||||||||||||||||||||||||||||||||||||||||||||||||||||||||||||||||||||||
| BXP’s share of net income/(loss) | $ | (594) | $ | 1,154 | $ | (2,567) | $ | 1,090 | $ | (1,193) | $ | 303 | $ | (1,807) | ||||||||||||||||||||||||||||||||||||||||||||||||||||||||||||||||||
| Basis differential | ||||||||||||||||||||||||||||||||||||||||||||||||||||||||||||||||||||||||||||||||
| Straight-line rent | $ | — | $ | 91 | 5 | $ | 226 | 5 | $ | 7 | 5 | $ | — | $ | — | $ | 324 | |||||||||||||||||||||||||||||||||||||||||||||||||||||||||||||||
| Fair value lease revenue | — | 305 | 5 | 117 | 5 | (219) | 5 | — | — | 203 | ||||||||||||||||||||||||||||||||||||||||||||||||||||||||||||||||||||||
| Fair value interest adjustment | — | — | (499) | — | — | — | (499) | |||||||||||||||||||||||||||||||||||||||||||||||||||||||||||||||||||||||||
| Amortization of financing costs | — | — | 114 | — | — | — | 114 | |||||||||||||||||||||||||||||||||||||||||||||||||||||||||||||||||||||||||
| Unrealized gain/loss on derivative instruments | — | — | (3,678) | 4 | — | — | — | (3,678) | ||||||||||||||||||||||||||||||||||||||||||||||||||||||||||||||||||||||||
| Depreciation and amortization expense | (8) | (1,112) | 5 | (1,412) | 5 | (547) | 5 | 320 | (113) | (2,872) | ||||||||||||||||||||||||||||||||||||||||||||||||||||||||||||||||||||||
Impairment loss on investment 7 | — | (168,391) | — | (126,163) | (46,784) | — | (341,338) | |||||||||||||||||||||||||||||||||||||||||||||||||||||||||||||||||||||||||
Total basis differential 6 | (8) | (169,107) | 5 | (5,132) | 5 | (126,922) | 5 | (46,464) | (113) | (347,746) | ||||||||||||||||||||||||||||||||||||||||||||||||||||||||||||||||||||||
| Income/(loss) from unconsolidated joint ventures | (602) | (167,953) | (7,699) | (125,832) | (47,657) | 190 | (349,553) | |||||||||||||||||||||||||||||||||||||||||||||||||||||||||||||||||||||||||
| Add: | ||||||||||||||||||||||||||||||||||||||||||||||||||||||||||||||||||||||||||||||||
| BXP’s share of depreciation and amortization expense | 4,215 | 3,784 | 5,196 | 4,121 | 1,591 | 2,190 | 21,097 | |||||||||||||||||||||||||||||||||||||||||||||||||||||||||||||||||||||||||
Impairment loss on investment 7 | — | 168,391 | — | 126,163 | 46,784 | — | 341,338 | |||||||||||||||||||||||||||||||||||||||||||||||||||||||||||||||||||||||||
| BXP’s share of FFO | $ | 3,613 | $ | 4,222 | $ | (2,503) | $ | 4,452 | $ | 718 | $ | 2,380 | $ | 12,882 | ||||||||||||||||||||||||||||||||||||||||||||||||||||||||||||||||||
_____________
1 For information on the properties included for each region and the Company’s percentage ownership in each property, see pages 22-25.
2 Lease revenue includes recoveries from clients and service income from clients.
3 See the Definitions and Reconciliations sections of this Supplemental package starting on page 57.
4 The previous owner of 200 Fifth Avenue had not elected hedge accounting. Upon the Company acquiring an ownership interest in the property, it elected hedge accounting and any changes in value is recognized as a basis differential to the Company.
5 The Company’s purchase price allocation under ASC 805 for certain joint ventures differs from the historical basis of the venture.
6 Represents adjustments related to the carrying values and depreciation of certain of the Company’s investment in unconsolidated joint ventures.
7Represents the other-than-temporary decline in the fair values below the carrying values of certain of the Company’s investments in unconsolidated joint ventures.
38
| Q4 2024 | ||||
Lease expirations - All in-service properties1, 2, 3 | |||||
as of December 31, 2024
OFFICE
| BXP’s Share | |||||||||||||||||||||||||||||||||||||||||||||||
| Rentable Square Footage Subject to Expiring Leases | Rentable Square Footage Subject to Expiring Leases | Current Annualized Rental Obligations Under Expiring Leases | Annualized Rental Obligations Under Expiring Leases with future step-ups | ||||||||||||||||||||||||||||||||||||||||||||
| Year of Lease Expiration | Percentage of Total Square Feet | ||||||||||||||||||||||||||||||||||||||||||||||
| $ | $/PSF | $ | $/PSF | ||||||||||||||||||||||||||||||||||||||||||||
| 2024 | 390,623 | 386,245 | 23,251,856 | 60.20 | 23,251,856 | 60.20 | 0.96 | % | 4,5 | ||||||||||||||||||||||||||||||||||||||
| 2025 | 2,931,432 | 2,488,207 | 175,590,273 | 70.57 | 176,506,866 | 70.94 | 6.20 | % | |||||||||||||||||||||||||||||||||||||||
| 2026 | 1,747,611 | 1,533,474 | 117,511,290 | 76.63 | 120,550,301 | 78.61 | 3.82 | % | |||||||||||||||||||||||||||||||||||||||
| 2027 | 2,081,237 | 2,017,947 | 151,953,234 | 75.30 | 155,673,125 | 77.14 | 5.03 | % | |||||||||||||||||||||||||||||||||||||||
| 2028 | 3,469,402 | 2,697,464 | 232,820,891 | 86.31 | 247,527,904 | 91.76 | 6.72 | % | |||||||||||||||||||||||||||||||||||||||
| 2029 | 3,585,386 | 3,086,233 | 231,276,910 | 74.94 | 250,046,162 | 81.02 | 7.69 | % | |||||||||||||||||||||||||||||||||||||||
| 2030 | 2,567,019 | 2,449,474 | 191,435,198 | 78.15 | 209,086,830 | 85.36 | 6.11 | % | |||||||||||||||||||||||||||||||||||||||
| 2031 | 2,138,499 | 1,978,759 | 172,437,860 | 87.14 | 187,814,765 | 94.92 | 4.93 | % | |||||||||||||||||||||||||||||||||||||||
| 2032 | 2,784,399 | 2,508,042 | 191,931,310 | 76.53 | 229,694,675 | 91.58 | 6.25 | % | |||||||||||||||||||||||||||||||||||||||
| 2033 | 2,545,290 | 2,399,106 | 188,631,461 | 78.63 | 221,677,210 | 92.40 | 5.98 | % | |||||||||||||||||||||||||||||||||||||||
| Thereafter | 16,013,613 | 12,811,239 | 1,049,725,455 | 81.94 | 1,273,768,520 | 99.43 | 31.93 | % | |||||||||||||||||||||||||||||||||||||||
RETAIL
| BXP’s Share | |||||||||||||||||||||||||||||||||||||||||||||||
| Rentable Square Footage Subject to Expiring Leases | Rentable Square Footage Subject to Expiring Leases | Current Annualized Rental Obligations Under Expiring Leases | Annualized Rental Obligations Under Expiring Leases with future step-ups | ||||||||||||||||||||||||||||||||||||||||||||
| Year of Lease Expiration | Percentage of Total Square Feet | ||||||||||||||||||||||||||||||||||||||||||||||
| $ | $/PSF | $ | $/PSF | ||||||||||||||||||||||||||||||||||||||||||||
| 2024 | 224 | 224 | 172,360 | 769.46 | 172,360 | 769.46 | 0.01 | % | 4 | ||||||||||||||||||||||||||||||||||||||
| 2025 | 77,427 | 77,112 | 5,509,776 | 71.45 | 5,515,571 | 71.53 | 3.20 | % | |||||||||||||||||||||||||||||||||||||||
| 2026 | 116,565 | 100,088 | 19,036,684 | 190.20 | 19,632,004 | 196.15 | 4.16 | % | |||||||||||||||||||||||||||||||||||||||
| 2027 | 114,621 | 104,205 | 9,801,630 | 94.06 | 10,026,602 | 96.22 | 4.33 | % | |||||||||||||||||||||||||||||||||||||||
| 2028 | 100,827 | 99,050 | 11,132,039 | 112.39 | 11,489,817 | 116.00 | 4.12 | % | |||||||||||||||||||||||||||||||||||||||
| 2029 | 148,737 | 142,737 | 15,560,602 | 109.02 | 17,146,252 | 120.12 | 5.93 | % | |||||||||||||||||||||||||||||||||||||||
| 2030 | 168,776 | 133,476 | 12,584,612 | 94.28 | 13,670,918 | 102.42 | 5.55 | % | |||||||||||||||||||||||||||||||||||||||
| 2031 | 95,214 | 85,544 | 10,108,245 | 118.16 | 11,349,986 | 132.68 | 3.56 | % | |||||||||||||||||||||||||||||||||||||||
| 2032 | 101,253 | 99,544 | 7,517,624 | 75.52 | 8,634,610 | 86.74 | 4.14 | % | |||||||||||||||||||||||||||||||||||||||
| 2033 | 472,047 | 438,644 | 31,133,231 | 70.98 | 36,306,364 | 82.77 | 18.23 | % | |||||||||||||||||||||||||||||||||||||||
| Thereafter | 788,330 | 601,766 | 73,200,820 | 121.64 | 75,878,942 | 126.09 | 25.01 | % | |||||||||||||||||||||||||||||||||||||||
IN-SERVICE PROPERTIES
| BXP’s Share | |||||||||||||||||||||||||||||||||||||||||||||||
| Rentable Square Footage Subject to Expiring Leases | Rentable Square Footage Subject to Expiring Leases | Current Annualized Rental Obligations Under Expiring Leases | Annualized Rental Obligations Under Expiring Leases with future step-ups | ||||||||||||||||||||||||||||||||||||||||||||
| Year of Lease Expiration | Percentage of Total Square Feet | ||||||||||||||||||||||||||||||||||||||||||||||
| $ | $/PSF | $ | $/PSF | ||||||||||||||||||||||||||||||||||||||||||||
| 2024 | 390,847 | 386,469 | 23,424,216 | 60.61 | 23,424,216 | 60.61 | 0.91 | % | 4,5 | ||||||||||||||||||||||||||||||||||||||
| 2025 | 3,008,859 | 2,565,319 | 181,100,049 | 70.60 | 182,022,437 | 70.96 | 6.03 | % | |||||||||||||||||||||||||||||||||||||||
| 2026 | 1,864,176 | 1,633,562 | 136,547,974 | 83.59 | 140,182,305 | 85.81 | 3.84 | % | |||||||||||||||||||||||||||||||||||||||
| 2027 | 2,195,858 | 2,122,152 | 161,754,864 | 76.22 | 165,699,727 | 78.08 | 4.99 | % | |||||||||||||||||||||||||||||||||||||||
| 2028 | 3,570,229 | 2,796,514 | 243,952,930 | 87.23 | 259,017,721 | 92.62 | 6.58 | % | |||||||||||||||||||||||||||||||||||||||
| 2029 | 3,734,123 | 3,228,970 | 246,837,512 | 76.44 | 267,192,414 | 82.75 | 7.59 | % | |||||||||||||||||||||||||||||||||||||||
| 2030 | 2,735,795 | 2,582,950 | 204,019,810 | 78.99 | 222,757,748 | 86.24 | 6.07 | % | |||||||||||||||||||||||||||||||||||||||
| 2031 | 2,233,713 | 2,064,303 | 182,546,105 | 88.43 | 199,164,751 | 96.48 | 4.85 | % | |||||||||||||||||||||||||||||||||||||||
| 2032 | 2,885,652 | 2,607,586 | 199,448,934 | 76.49 | 238,329,285 | 91.40 | 6.13 | % | |||||||||||||||||||||||||||||||||||||||
| 2033 | 3,017,337 | 2,837,750 | 219,764,692 | 77.44 | 257,983,574 | 90.91 | 6.67 | % | |||||||||||||||||||||||||||||||||||||||
| Thereafter | 16,801,943 | 13,413,005 | 1,122,926,275 | 83.72 | 1,349,647,462 | 100.62 | 31.54 | % | |||||||||||||||||||||||||||||||||||||||
_____________
1For the Company’s definitions and related disclosures, see the Definitions section of this Supplemental package starting on page 57.
2Includes partially placed in-service leased space. Does not include residential units and hotel.
3Does not include data for leases expiring in a particular year when leases for the same space have already been signed with replacement clients with future commencement dates. In those cases, the data is included in the year in which the future lease expires.
4Includes square feet expiring on the last day of the current quarter.
5Includes 261,046 square feet related to Reston Corporate Center which was taken out of service on January 1, 2025.
39
| Q4 2024 | ||||
Lease expirations - Boston region in-service properties 1, 2, 3 | |||||
as of December 31, 2024
OFFICE
| BXP’s Share | |||||||||||||||||||||||||||||||||||||||||
| Rentable Square Footage Subject to Expiring Leases | Rentable Square Footage Subject to Expiring Leases | Current Annualized Rental Obligations Under Expiring Leases | Annualized Rental Obligations Under Expiring Leases with future step-ups | ||||||||||||||||||||||||||||||||||||||
| Year of Lease | |||||||||||||||||||||||||||||||||||||||||
| Expiration | $ | $/PSF | $ | $/PSF | |||||||||||||||||||||||||||||||||||||
| 2024 | 23,351 | 22,237 | 1,108,441 | 49.85 | 1,108,441 | 49.85 | 4 | ||||||||||||||||||||||||||||||||||
| 2025 | 977,867 | 945,031 | 54,989,087 | 58.19 | 55,142,114 | 58.35 | |||||||||||||||||||||||||||||||||||
| 2026 | 289,825 | 271,747 | 19,619,840 | 72.20 | 19,933,120 | 73.35 | |||||||||||||||||||||||||||||||||||
| 2027 | 609,787 | 601,987 | 44,991,867 | 74.74 | 46,731,705 | 77.63 | |||||||||||||||||||||||||||||||||||
| 2028 | 979,191 | 961,790 | 89,273,451 | 92.82 | 94,195,595 | 97.94 | |||||||||||||||||||||||||||||||||||
| 2029 | 1,278,132 | 1,144,646 | 74,652,019 | 65.22 | 81,785,409 | 71.45 | |||||||||||||||||||||||||||||||||||
| 2030 | 1,068,489 | 1,050,274 | 72,715,824 | 69.24 | 78,683,022 | 74.92 | |||||||||||||||||||||||||||||||||||
| 2031 | 620,194 | 553,357 | 37,381,999 | 67.55 | 40,510,208 | 73.21 | |||||||||||||||||||||||||||||||||||
| 2032 | 1,042,619 | 1,042,619 | 84,967,387 | 81.49 | 105,442,954 | 101.13 | |||||||||||||||||||||||||||||||||||
| 2033 | 377,297 | 366,546 | 24,122,708 | 65.81 | 27,737,732 | 75.67 | |||||||||||||||||||||||||||||||||||
| Thereafter | 5,848,581 | 4,798,144 | 405,117,007 | 84.43 | 498,813,458 | 103.96 | |||||||||||||||||||||||||||||||||||
RETAIL
| BXP’s Share | |||||||||||||||||||||||||||||||||||||||||
| Rentable Square Footage Subject to Expiring Leases | Rentable Square Footage Subject to Expiring Leases | Current Annualized Rental Obligations Under Expiring Leases | Annualized Rental Obligations Under Expiring Leases with future step-ups | ||||||||||||||||||||||||||||||||||||||
| Year of Lease | |||||||||||||||||||||||||||||||||||||||||
| Expiration | $ | $/PSF | $ | $/PSF | |||||||||||||||||||||||||||||||||||||
| 2024 | 224 | 224 | 172,360 | 769.46 | 172,360 | 769.46 | 4 | ||||||||||||||||||||||||||||||||||
| 2025 | 52,050 | 51,735 | 3,636,422 | 70.29 | 3,636,422 | 70.29 | |||||||||||||||||||||||||||||||||||
| 2026 | 26,632 | 26,632 | 5,624,791 | 211.20 | 5,707,426 | 214.31 | |||||||||||||||||||||||||||||||||||
| 2027 | 49,813 | 43,499 | 6,195,847 | 142.44 | 6,282,482 | 144.43 | |||||||||||||||||||||||||||||||||||
| 2028 | 46,655 | 46,655 | 7,026,475 | 150.60 | 7,239,051 | 155.16 | |||||||||||||||||||||||||||||||||||
| 2029 | 64,281 | 62,931 | 8,629,755 | 137.13 | 8,866,711 | 140.90 | |||||||||||||||||||||||||||||||||||
| 2030 | 101,802 | 66,502 | 6,292,807 | 94.63 | 6,762,681 | 101.69 | |||||||||||||||||||||||||||||||||||
| 2031 | 4,266 | 4,266 | 578,521 | 135.61 | 631,487 | 148.03 | |||||||||||||||||||||||||||||||||||
| 2032 | 65,011 | 64,420 | 4,985,896 | 77.40 | 5,652,341 | 87.74 | |||||||||||||||||||||||||||||||||||
| 2033 | 284,391 | 250,988 | 21,236,283 | 84.61 | 24,450,011 | 97.42 | |||||||||||||||||||||||||||||||||||
| Thereafter | 338,271 | 295,461 | 21,420,863 | 72.50 | 23,609,099 | 79.91 | |||||||||||||||||||||||||||||||||||
TOTAL PROPERTY TYPES
| BXP’s Share | |||||||||||||||||||||||||||||||||||||||||
| Rentable Square Footage Subject to Expiring Leases | Rentable Square Footage Subject to Expiring Leases | Current Annualized Rental Obligations Under Expiring Leases | Annualized Rental Obligations Under Expiring Leases with future step-ups | ||||||||||||||||||||||||||||||||||||||
| Year of Lease | |||||||||||||||||||||||||||||||||||||||||
| Expiration | $ | $/PSF | $ | $/PSF | |||||||||||||||||||||||||||||||||||||
| 2024 | 23,575 | 22,461 | 1,280,801 | 57.02 | 1,280,801 | 57.02 | 4 | ||||||||||||||||||||||||||||||||||
| 2025 | 1,029,917 | 996,766 | 58,625,509 | 58.82 | 58,778,536 | 58.97 | |||||||||||||||||||||||||||||||||||
| 2026 | 316,457 | 298,379 | 25,244,631 | 84.61 | 25,640,546 | 85.93 | |||||||||||||||||||||||||||||||||||
| 2027 | 659,600 | 645,486 | 51,187,714 | 79.30 | 53,014,187 | 82.13 | |||||||||||||||||||||||||||||||||||
| 2028 | 1,025,846 | 1,008,445 | 96,299,926 | 95.49 | 101,434,646 | 100.59 | |||||||||||||||||||||||||||||||||||
| 2029 | 1,342,413 | 1,207,577 | 83,281,774 | 68.97 | 90,652,120 | 75.07 | |||||||||||||||||||||||||||||||||||
| 2030 | 1,170,291 | 1,116,776 | 79,008,631 | 70.75 | 85,445,703 | 76.51 | |||||||||||||||||||||||||||||||||||
| 2031 | 624,460 | 557,623 | 37,960,520 | 68.08 | 41,141,695 | 73.78 | |||||||||||||||||||||||||||||||||||
| 2032 | 1,107,630 | 1,107,039 | 89,953,283 | 81.26 | 111,095,295 | 100.35 | |||||||||||||||||||||||||||||||||||
| 2033 | 661,688 | 617,534 | 45,358,991 | 73.45 | 52,187,743 | 84.51 | |||||||||||||||||||||||||||||||||||
| Thereafter | 6,186,852 | 5,093,605 | 426,537,870 | 83.74 | 522,422,557 | 102.56 | |||||||||||||||||||||||||||||||||||
_____________
1For the Company’s definitions and related disclosures, see the Definitions section of this Supplemental package starting on page 57.
2Includes partially placed in-service leased space. Does not include residential units and hotel.
3Does not include data for leases expiring in a particular year when leases for the same space have already been signed with replacement clients with future commencement dates. In those cases, the data is included in the year in which the future lease expires.
4Includes square feet expiring on the last day of the current quarter.
40
| Q4 2024 | ||||
Quarterly lease expirations - Boston region in-service properties 1, 2, 3 | |||||
as of December 31, 2024
OFFICE
| BXP’s Share | |||||||||||||||||||||||||||||||||||||||||
| Rentable Square Footage Subject to Expiring Leases | Rentable Square Footage Subject to Expiring Leases | Current Annualized Rental Obligations Under Expiring Leases | Annualized Rental Obligations Under Expiring Leases with future step-ups | ||||||||||||||||||||||||||||||||||||||
| Lease Expiration | |||||||||||||||||||||||||||||||||||||||||
| by Quarter | $ | $/PSF | $ | $/PSF | |||||||||||||||||||||||||||||||||||||
| Q1 2024 | — | — | — | — | — | — | |||||||||||||||||||||||||||||||||||
| Q2 2024 | — | — | — | — | — | — | |||||||||||||||||||||||||||||||||||
| Q3 2024 | — | — | — | — | — | — | |||||||||||||||||||||||||||||||||||
| Q4 2024 | 23,351 | 22,237 | 1,108,441 | 49.85 | 1,108,441 | 49.85 | 4 | ||||||||||||||||||||||||||||||||||
| Total 2024 | 23,351 | 22,237 | 1,108,441 | 49.85 | 1,108,441 | 49.85 | |||||||||||||||||||||||||||||||||||
| Q1 2025 | 71,954 | 70,013 | 3,780,624 | 54.00 | 3,780,624 | 54.00 | |||||||||||||||||||||||||||||||||||
| Q2 2025 | 608,415 | 596,664 | 33,424,423 | 56.02 | 33,425,026 | 56.02 | |||||||||||||||||||||||||||||||||||
| Q3 2025 | 81,187 | 81,187 | 4,297,965 | 52.94 | 4,375,193 | 53.89 | |||||||||||||||||||||||||||||||||||
| Q4 2025 | 216,311 | 197,167 | 13,486,075 | 68.40 | 13,561,271 | 68.78 | |||||||||||||||||||||||||||||||||||
| Total 2025 | 977,867 | 945,031 | 54,989,087 | 58.19 | 55,142,114 | 58.35 | |||||||||||||||||||||||||||||||||||
RETAIL
| BXP’s Share | |||||||||||||||||||||||||||||||||||||||||
| Rentable Square Footage Subject to Expiring Leases | Rentable Square Footage Subject to Expiring Leases | Current Annualized Rental Obligations Under Expiring Leases | Annualized Rental Obligations Under Expiring Leases with future step-ups | ||||||||||||||||||||||||||||||||||||||
| Lease Expiration | |||||||||||||||||||||||||||||||||||||||||
| by Quarter | $ | $/PSF | $ | $/PSF | |||||||||||||||||||||||||||||||||||||
| Q1 2024 | — | — | — | — | — | — | |||||||||||||||||||||||||||||||||||
| Q2 2024 | — | — | — | — | — | — | |||||||||||||||||||||||||||||||||||
| Q3 2024 | — | — | — | — | — | — | |||||||||||||||||||||||||||||||||||
| Q4 2024 | 224 | 224 | 172,360 | 769.46 | 172,360 | 769.46 | 4 | ||||||||||||||||||||||||||||||||||
| Total 2024 | 224 | 224 | 172,360 | 769.46 | 172,360 | 769.46 | |||||||||||||||||||||||||||||||||||
| Q1 2025 | 21,332 | 21,017 | 993,467 | 47.27 | 993,467 | 47.27 | |||||||||||||||||||||||||||||||||||
| Q2 2025 | 25,350 | 25,350 | 1,820,173 | 71.80 | 1,820,173 | 71.80 | |||||||||||||||||||||||||||||||||||
| Q3 2025 | 5,047 | 5,047 | 802,064 | 158.92 | 802,064 | 158.92 | |||||||||||||||||||||||||||||||||||
| Q4 2025 | 321 | 321 | 20,718 | 64.54 | 20,718 | 64.54 | |||||||||||||||||||||||||||||||||||
| Total 2025 | 52,050 | 51,735 | 3,636,422 | 70.29 | 3,636,422 | 70.29 | |||||||||||||||||||||||||||||||||||
TOTAL PROPERTY TYPES
| BXP’s Share | |||||||||||||||||||||||||||||||||||||||||
| Rentable Square Footage Subject to Expiring Leases | Rentable Square Footage Subject to Expiring Leases | Current Annualized Rental Obligations Under Expiring Leases | Annualized Rental Obligations Under Expiring Leases with future step-ups | ||||||||||||||||||||||||||||||||||||||
| Lease Expiration | |||||||||||||||||||||||||||||||||||||||||
| by Quarter | $ | $/PSF | $ | $/PSF | |||||||||||||||||||||||||||||||||||||
| Q1 2024 | — | — | — | — | — | — | |||||||||||||||||||||||||||||||||||
| Q2 2024 | — | — | — | — | — | — | |||||||||||||||||||||||||||||||||||
| Q3 2024 | — | — | — | — | — | — | |||||||||||||||||||||||||||||||||||
| Q4 2024 | 23,575 | 22,461 | 1,280,801 | 57.02 | 1,280,801 | 57.02 | 4 | ||||||||||||||||||||||||||||||||||
| Total 2024 | 23,575 | 22,461 | 1,280,801 | 57.02 | 1,280,801 | 57.02 | |||||||||||||||||||||||||||||||||||
| Q1 2025 | 93,286 | 91,030 | 4,774,091 | 52.45 | 4,774,091 | 52.45 | |||||||||||||||||||||||||||||||||||
| Q2 2025 | 633,765 | 622,014 | 35,244,596 | 56.66 | 35,245,199 | 56.66 | |||||||||||||||||||||||||||||||||||
| Q3 2025 | 86,234 | 86,234 | 5,100,029 | 59.14 | 5,177,257 | 60.04 | |||||||||||||||||||||||||||||||||||
| Q4 2025 | 216,632 | 197,488 | 13,506,793 | 68.39 | 13,581,989 | 68.77 | |||||||||||||||||||||||||||||||||||
| Total 2025 | 1,029,917 | 996,766 | 58,625,509 | 58.82 | 58,778,536 | 58.97 | |||||||||||||||||||||||||||||||||||
_____________
1For the Company’s definitions and related disclosures, see the Definitions section of this Supplemental package starting on page 57.
2Includes partially placed in-service leased space. Does not include residential units and hotel.
3Does not include data for leases expiring in a particular year when leases for the same space have already been signed with replacement clients with future commencement dates. In those cases, the data is included in the year in which the future lease expires.
4Includes square feet expiring on the last day of the current quarter.
41
| Q4 2024 | ||||
Lease expirations - Los Angeles region in-service properties 1, 2, 3 | |||||
as of December 31, 2024
OFFICE
| BXP’s Share | |||||||||||||||||||||||||||||||||||||||||
| Rentable Square Footage Subject to Expiring Leases | Rentable Square Footage Subject to Expiring Leases | Current Annualized Rental Obligations Under Expiring Leases | Annualized Rental Obligations Under Expiring Leases with future step-ups | ||||||||||||||||||||||||||||||||||||||
| Year of Lease | |||||||||||||||||||||||||||||||||||||||||
| Expiration | $ | $/PSF | $ | $/PSF | |||||||||||||||||||||||||||||||||||||
| 2024 | — | — | — | — | — | — | |||||||||||||||||||||||||||||||||||
| 2025 | 236,990 | 236,990 | 16,418,523 | 69.28 | 16,821,189 | 70.98 | |||||||||||||||||||||||||||||||||||
| 2026 | 4,573 | 4,573 | 324,833 | 71.03 | 342,108 | 74.81 | |||||||||||||||||||||||||||||||||||
| 2027 | 29,618 | 29,618 | 1,893,725 | 63.94 | 2,061,519 | 69.60 | |||||||||||||||||||||||||||||||||||
| 2028 | 249,093 | 151,296 | 12,611,088 | 83.35 | 13,928,457 | 92.06 | |||||||||||||||||||||||||||||||||||
| 2029 | 415,771 | 240,815 | 17,038,464 | 70.75 | 19,139,431 | 79.48 | |||||||||||||||||||||||||||||||||||
| 2030 | 19,977 | 19,977 | 1,234,579 | 61.80 | 1,431,215 | 71.64 | |||||||||||||||||||||||||||||||||||
| 2031 | 7,311 | 7,311 | 478,139 | 65.40 | 587,755 | 80.39 | |||||||||||||||||||||||||||||||||||
| 2032 | 237,933 | 118,967 | 10,135,567 | 85.20 | 12,581,803 | 105.76 | |||||||||||||||||||||||||||||||||||
| 2033 | 186,894 | 93,447 | 6,267,128 | 67.07 | 10,968,762 | 117.38 | |||||||||||||||||||||||||||||||||||
| Thereafter | 494,641 | 494,641 | 37,191,251 | 75.19 | 45,700,441 | 92.39 | |||||||||||||||||||||||||||||||||||
RETAIL
| BXP’s Share | |||||||||||||||||||||||||||||||||||||||||
| Rentable Square Footage Subject to Expiring Leases | Rentable Square Footage Subject to Expiring Leases | Current Annualized Rental Obligations Under Expiring Leases | Annualized Rental Obligations Under Expiring Leases with future step-ups | ||||||||||||||||||||||||||||||||||||||
| Year of Lease | |||||||||||||||||||||||||||||||||||||||||
| Expiration | $ | $/PSF | $ | $/PSF | |||||||||||||||||||||||||||||||||||||
| 2024 | — | — | — | — | — | — | |||||||||||||||||||||||||||||||||||
| 2025 | — | — | — | — | — | — | |||||||||||||||||||||||||||||||||||
| 2026 | 19,188 | 9,594 | 135,600 | 14.13 | 135,600 | 14.13 | |||||||||||||||||||||||||||||||||||
| 2027 | — | — | — | — | — | — | |||||||||||||||||||||||||||||||||||
| 2028 | — | — | — | — | — | — | |||||||||||||||||||||||||||||||||||
| 2029 | 38,118 | 38,118 | 2,255,700 | 59.18 | 2,490,720 | 65.34 | |||||||||||||||||||||||||||||||||||
| 2030 | 11,364 | 11,364 | 2,012,063 | 177.06 | 2,141,761 | 188.47 | |||||||||||||||||||||||||||||||||||
| 2031 | — | — | — | — | — | — | |||||||||||||||||||||||||||||||||||
| 2032 | — | — | — | — | — | — | |||||||||||||||||||||||||||||||||||
| 2033 | — | — | — | — | — | — | |||||||||||||||||||||||||||||||||||
| Thereafter | 25,820 | 15,824 | 916,880 | 57.94 | 883,759 | 55.85 | |||||||||||||||||||||||||||||||||||
TOTAL PROPERTY TYPES
| BXP’s Share | |||||||||||||||||||||||||||||||||||||||||
| Rentable Square Footage Subject to Expiring Leases | Rentable Square Footage Subject to Expiring Leases | Current Annualized Rental Obligations Under Expiring Leases | Annualized Rental Obligations Under Expiring Leases with future step-ups | ||||||||||||||||||||||||||||||||||||||
| Year of Lease | |||||||||||||||||||||||||||||||||||||||||
| Expiration | $ | $/PSF | $ | $/PSF | |||||||||||||||||||||||||||||||||||||
| 2024 | — | — | — | — | — | — | |||||||||||||||||||||||||||||||||||
| 2025 | 236,990 | 236,990 | 16,418,523 | 69.28 | 16,821,189 | 70.98 | |||||||||||||||||||||||||||||||||||
| 2026 | 23,761 | 14,167 | 460,433 | 32.50 | 477,708 | 33.72 | |||||||||||||||||||||||||||||||||||
| 2027 | 29,618 | 29,618 | 1,893,725 | 63.94 | 2,061,519 | 69.60 | |||||||||||||||||||||||||||||||||||
| 2028 | 249,093 | 151,296 | 12,611,088 | 83.35 | 13,928,457 | 92.06 | |||||||||||||||||||||||||||||||||||
| 2029 | 453,889 | 278,933 | 19,294,164 | 69.17 | 21,630,151 | 77.55 | |||||||||||||||||||||||||||||||||||
| 2030 | 31,341 | 31,341 | 3,246,642 | 103.59 | 3,572,976 | 114.00 | |||||||||||||||||||||||||||||||||||
| 2031 | 7,311 | 7,311 | 478,139 | 65.40 | 587,755 | 80.39 | |||||||||||||||||||||||||||||||||||
| 2032 | 237,933 | 118,967 | 10,135,567 | 85.20 | 12,581,803 | 105.76 | |||||||||||||||||||||||||||||||||||
| 2033 | 186,894 | 93,447 | 6,267,128 | 67.07 | 10,968,762 | 117.38 | |||||||||||||||||||||||||||||||||||
| Thereafter | 520,461 | 510,465 | 38,108,131 | 74.65 | 46,584,200 | 91.26 | |||||||||||||||||||||||||||||||||||
_____________
1For the Company’s definitions and related disclosures, see the Definitions section of this Supplemental package starting on page 57.
2Includes partially placed in-service leased space.
3Does not include data for leases expiring in a particular year when leases for the same space have already been signed with replacement clients with future commencement dates. In those cases, the data is included in the year in which the future lease expires.
42
| Q4 2024 | ||||
Quarterly lease expirations - Los Angeles region in-service properties 1, 2, 3 | |||||
as of December 31, 2024
OFFICE
| BXP’s Share | |||||||||||||||||||||||||||||||||||||||||
| Rentable Square Footage Subject to Expiring Leases | Rentable Square Footage Subject to Expiring Leases | Current Annualized Rental Obligations Under Expiring Leases | Annualized Rental Obligations Under Expiring Leases with future step-ups | ||||||||||||||||||||||||||||||||||||||
| Lease Expiration | |||||||||||||||||||||||||||||||||||||||||
| by Quarter | $ | $/PSF | $ | $/PSF | |||||||||||||||||||||||||||||||||||||
| Q1 2024 | — | — | — | — | — | — | |||||||||||||||||||||||||||||||||||
| Q2 2024 | — | — | — | — | — | — | |||||||||||||||||||||||||||||||||||
| Q3 2024 | — | — | — | — | — | — | |||||||||||||||||||||||||||||||||||
| Q4 2024 | — | — | — | — | — | — | |||||||||||||||||||||||||||||||||||
| Total 2024 | — | — | — | — | — | — | |||||||||||||||||||||||||||||||||||
| Q1 2025 | 63,791 | 63,791 | 3,552,300 | 55.69 | 3,552,300 | 55.69 | |||||||||||||||||||||||||||||||||||
| Q2 2025 | 7,421 | 7,421 | 73,946 | 9.96 | 73,946 | 9.96 | |||||||||||||||||||||||||||||||||||
| Q3 2025 | — | — | — | — | — | — | |||||||||||||||||||||||||||||||||||
| Q4 2025 | 165,778 | 165,778 | 12,792,277 | 77.17 | 13,194,943 | 79.59 | |||||||||||||||||||||||||||||||||||
| Total 2025 | 236,990 | 236,990 | 16,418,523 | 69.28 | 16,821,189 | 70.98 | |||||||||||||||||||||||||||||||||||
RETAIL
| BXP’s Share | |||||||||||||||||||||||||||||||||||||||||
| Rentable Square Footage Subject to Expiring Leases | Rentable Square Footage Subject to Expiring Leases | Current Annualized Rental Obligations Under Expiring Leases | Annualized Rental Obligations Under Expiring Leases with future step-ups | ||||||||||||||||||||||||||||||||||||||
| Lease Expiration | |||||||||||||||||||||||||||||||||||||||||
| by Quarter | $ | $/PSF | $ | $/PSF | |||||||||||||||||||||||||||||||||||||
| Q1 2024 | — | — | — | — | — | — | |||||||||||||||||||||||||||||||||||
| Q2 2024 | — | — | — | — | — | — | |||||||||||||||||||||||||||||||||||
| Q3 2024 | — | — | — | — | — | — | |||||||||||||||||||||||||||||||||||
| Q4 2024 | — | — | — | — | — | — | |||||||||||||||||||||||||||||||||||
| Total 2024 | — | — | — | — | — | — | |||||||||||||||||||||||||||||||||||
| Q1 2025 | — | — | — | — | — | — | |||||||||||||||||||||||||||||||||||
| Q2 2025 | — | — | — | — | — | — | |||||||||||||||||||||||||||||||||||
| Q3 2025 | — | — | — | — | — | — | |||||||||||||||||||||||||||||||||||
| Q4 2025 | — | — | — | — | — | — | |||||||||||||||||||||||||||||||||||
| Total 2025 | — | — | — | — | — | — | |||||||||||||||||||||||||||||||||||
TOTAL PROPERTY TYPES
| BXP’s Share | |||||||||||||||||||||||||||||||||||||||||
| Rentable Square Footage Subject to Expiring Leases | Rentable Square Footage Subject to Expiring Leases | Current Annualized Rental Obligations Under Expiring Leases | Annualized Rental Obligations Under Expiring Leases with future step-ups | ||||||||||||||||||||||||||||||||||||||
| Lease Expiration | |||||||||||||||||||||||||||||||||||||||||
| by Quarter | $ | $/PSF | $ | $/PSF | |||||||||||||||||||||||||||||||||||||
| Q1 2024 | — | — | — | — | — | — | |||||||||||||||||||||||||||||||||||
| Q2 2024 | — | — | — | — | — | — | |||||||||||||||||||||||||||||||||||
| Q3 2024 | — | — | — | — | — | — | |||||||||||||||||||||||||||||||||||
| Q4 2024 | — | — | — | — | — | — | |||||||||||||||||||||||||||||||||||
| Total 2024 | — | — | — | — | — | — | |||||||||||||||||||||||||||||||||||
| Q1 2025 | 63,791 | 63,791 | 3,552,300 | 55.69 | 3,552,300 | 55.69 | |||||||||||||||||||||||||||||||||||
| Q2 2025 | 7,421 | 7,421 | 73,946 | 9.96 | 73,946 | 9.96 | |||||||||||||||||||||||||||||||||||
| Q3 2025 | — | — | — | — | — | — | |||||||||||||||||||||||||||||||||||
| Q4 2025 | 165,778 | 165,778 | 12,792,277 | 77.17 | 13,194,943 | 79.59 | |||||||||||||||||||||||||||||||||||
| Total 2025 | 236,990 | 236,990 | 16,418,523 | 69.28 | 16,821,189 | 70.98 | |||||||||||||||||||||||||||||||||||
_____________
1For the Company’s definitions and related disclosures, see the Definitions section of this Supplemental package starting on page 57.
2Includes partially placed in-service leased space.
3Does not include data for leases expiring in a particular year when leases for the same space have already been signed with replacement clients with future commencement dates. In those cases, the data is included in the year in which the future lease expires.
43
| Q4 2024 | ||||
Lease expirations - New York region in-service properties 1, 2, 3 | |||||
as of December 31, 2024
OFFICE
| BXP’s Share | |||||||||||||||||||||||||||||||||||||||||
| Rentable Square Footage Subject to Expiring Leases | Rentable Square Footage Subject to Expiring Leases | Current Annualized Rental Obligations Under Expiring Leases | Annualized Rental Obligations Under Expiring Leases with future step-ups | ||||||||||||||||||||||||||||||||||||||
| Year of Lease | |||||||||||||||||||||||||||||||||||||||||
| Expiration | $ | $/PSF | $ | $/PSF | |||||||||||||||||||||||||||||||||||||
| 2024 | — | — | — | — | — | — | |||||||||||||||||||||||||||||||||||
| 2025 | 825,620 | 518,660 | 45,730,038 | 88.17 | 45,665,682 | 88.05 | |||||||||||||||||||||||||||||||||||
| 2026 | 453,716 | 413,687 | 25,003,577 | 60.44 | 26,229,920 | 63.41 | |||||||||||||||||||||||||||||||||||
| 2027 | 410,755 | 370,856 | 24,577,467 | 66.27 | 22,477,395 | 60.61 | |||||||||||||||||||||||||||||||||||
| 2028 | 635,565 | 441,142 | 41,011,091 | 92.97 | 42,175,058 | 95.60 | |||||||||||||||||||||||||||||||||||
| 2029 | 925,223 | 841,724 | 74,962,393 | 89.06 | 77,973,180 | 92.64 | |||||||||||||||||||||||||||||||||||
| 2030 | 843,302 | 778,175 | 71,341,887 | 91.68 | 76,528,347 | 98.34 | |||||||||||||||||||||||||||||||||||
| 2031 | 370,727 | 319,093 | 23,491,945 | 73.62 | 24,888,356 | 78.00 | |||||||||||||||||||||||||||||||||||
| 2032 | 258,101 | 167,888 | 12,254,061 | 72.99 | 12,723,746 | 75.79 | |||||||||||||||||||||||||||||||||||
| 2033 | 347,701 | 311,439 | 34,460,472 | 110.65 | 37,497,152 | 120.40 | |||||||||||||||||||||||||||||||||||
| Thereafter | 5,445,574 | 3,817,935 | 369,297,659 | 96.73 | 425,671,081 | 111.49 | |||||||||||||||||||||||||||||||||||
RETAIL
| BXP’s Share | |||||||||||||||||||||||||||||||||||||||||
| Rentable Square Footage Subject to Expiring Leases | Rentable Square Footage Subject to Expiring Leases | Current Annualized Rental Obligations Under Expiring Leases | Annualized Rental Obligations Under Expiring Leases with future step-ups | ||||||||||||||||||||||||||||||||||||||
| Year of Lease | |||||||||||||||||||||||||||||||||||||||||
| Expiration | $ | $/PSF | $ | $/PSF | |||||||||||||||||||||||||||||||||||||
| 2024 | — | — | — | — | — | — | |||||||||||||||||||||||||||||||||||
| 2025 | 4,894 | 4,894 | 510,000 | 104.21 | 510,000 | 104.21 | |||||||||||||||||||||||||||||||||||
| 2026 | 24,539 | 21,918 | 10,896,293 | 497.13 | 11,362,079 | 518.39 | |||||||||||||||||||||||||||||||||||
| 2027 | — | — | — | — | — | — | |||||||||||||||||||||||||||||||||||
| 2028 | 2,424 | 647 | 201,123 | 310.87 | 210,828 | 325.87 | |||||||||||||||||||||||||||||||||||
| 2029 | 9,577 | 5,671 | 1,763,102 | 310.90 | 1,955,286 | 344.78 | |||||||||||||||||||||||||||||||||||
| 2030 | 1,023 | 1,023 | 309,000 | 302.05 | 368,962 | 360.67 | |||||||||||||||||||||||||||||||||||
| 2031 | 20,784 | 14,468 | 4,994,959 | 345.25 | 5,660,508 | 391.25 | |||||||||||||||||||||||||||||||||||
| 2032 | 12,182 | 11,064 | 1,016,366 | 91.86 | 1,238,857 | 111.97 | |||||||||||||||||||||||||||||||||||
| 2033 | 19,279 | 19,279 | 4,237,621 | 219.81 | 4,798,230 | 248.88 | |||||||||||||||||||||||||||||||||||
| Thereafter | 293,964 | 163,327 | 43,158,959 | 264.25 | 42,331,076 | 259.18 | |||||||||||||||||||||||||||||||||||
TOTAL PROPERTY TYPES
| BXP’s Share | |||||||||||||||||||||||||||||||||||||||||
| Rentable Square Footage Subject to Expiring Leases | Rentable Square Footage Subject to Expiring Leases | Current Annualized Rental Obligations Under Expiring Leases | Annualized Rental Obligations Under Expiring Leases with future step-ups | ||||||||||||||||||||||||||||||||||||||
| Year of Lease | |||||||||||||||||||||||||||||||||||||||||
| Expiration | $ | $/PSF | $ | $/PSF | |||||||||||||||||||||||||||||||||||||
| 2024 | — | — | — | — | — | — | |||||||||||||||||||||||||||||||||||
| 2025 | 830,514 | 523,554 | 46,240,038 | 88.32 | 46,175,682 | 88.20 | |||||||||||||||||||||||||||||||||||
| 2026 | 478,255 | 435,605 | 35,899,870 | 82.41 | 37,591,999 | 86.30 | |||||||||||||||||||||||||||||||||||
| 2027 | 410,755 | 370,856 | 24,577,467 | 66.27 | 22,477,395 | 60.61 | |||||||||||||||||||||||||||||||||||
| 2028 | 637,989 | 441,789 | 41,212,214 | 93.28 | 42,385,886 | 95.94 | |||||||||||||||||||||||||||||||||||
| 2029 | 934,800 | 847,395 | 76,725,495 | 90.54 | 79,928,466 | 94.32 | |||||||||||||||||||||||||||||||||||
| 2030 | 844,325 | 779,198 | 71,650,887 | 91.95 | 76,897,309 | 98.69 | |||||||||||||||||||||||||||||||||||
| 2031 | 391,511 | 333,561 | 28,486,904 | 85.40 | 30,548,864 | 91.58 | |||||||||||||||||||||||||||||||||||
| 2032 | 270,283 | 178,952 | 13,270,427 | 74.16 | 13,962,603 | 78.02 | |||||||||||||||||||||||||||||||||||
| 2033 | 366,980 | 330,718 | 38,698,093 | 117.01 | 42,295,382 | 127.89 | |||||||||||||||||||||||||||||||||||
| Thereafter | 5,739,538 | 3,981,262 | 412,456,618 | 103.60 | 468,002,157 | 117.55 | |||||||||||||||||||||||||||||||||||
_____________
1For the Company’s definitions and related disclosures, see the Definitions section of this Supplemental package starting on page 57.
2Includes partially placed in-service leased space.
3Does not include data for leases expiring in a particular year when leases for the same space have already been signed with replacement clients with future commencement dates. In those cases, the data is included in the year in which the future lease expires.
44
| Q4 2024 | ||||
Quarterly lease expirations - New York region in-service properties 1, 2, 3 | |||||
as of December 31, 2024
OFFICE
| BXP’s Share | |||||||||||||||||||||||||||||||||||||||||
| Rentable Square Footage Subject to Expiring Leases | Rentable Square Footage Subject to Expiring Leases | Current Annualized Rental Obligations Under Expiring Leases | Annualized Rental Obligations Under Expiring Leases with future step-ups | ||||||||||||||||||||||||||||||||||||||
| Lease Expiration | |||||||||||||||||||||||||||||||||||||||||
| by Quarter | $ | $/PSF | $ | $/PSF | |||||||||||||||||||||||||||||||||||||
| Q1 2024 | — | — | — | — | — | — | |||||||||||||||||||||||||||||||||||
| Q2 2024 | — | — | — | — | — | — | |||||||||||||||||||||||||||||||||||
| Q3 2024 | — | — | — | — | — | — | |||||||||||||||||||||||||||||||||||
| Q4 2024 | — | — | — | — | — | — | |||||||||||||||||||||||||||||||||||
| Total 2024 | — | — | — | — | — | — | |||||||||||||||||||||||||||||||||||
| Q1 2025 | 416,775 | 144,296 | 14,648,429 | 101.52 | 14,648,429 | 101.52 | |||||||||||||||||||||||||||||||||||
| Q2 2025 | 148,196 | 123,997 | 11,407,331 | 92.00 | 11,510,876 | 92.83 | |||||||||||||||||||||||||||||||||||
| Q3 2025 | 59,292 | 59,292 | 5,514,587 | 93.01 | 5,170,175 | 87.20 | |||||||||||||||||||||||||||||||||||
| Q4 2025 | 201,357 | 191,075 | 14,159,692 | 74.11 | 14,336,202 | 75.03 | |||||||||||||||||||||||||||||||||||
| Total 2025 | 825,620 | 518,660 | 45,730,038 | 88.17 | 45,665,682 | 88.05 | |||||||||||||||||||||||||||||||||||
RETAIL
| BXP’s Share | |||||||||||||||||||||||||||||||||||||||||
| Rentable Square Footage Subject to Expiring Leases | Rentable Square Footage Subject to Expiring Leases | Current Annualized Rental Obligations Under Expiring Leases | Annualized Rental Obligations Under Expiring Leases with future step-ups | ||||||||||||||||||||||||||||||||||||||
| Lease Expiration | |||||||||||||||||||||||||||||||||||||||||
| by Quarter | $ | $/PSF | $ | $/PSF | |||||||||||||||||||||||||||||||||||||
| Q1 2024 | — | — | — | — | — | — | |||||||||||||||||||||||||||||||||||
| Q2 2024 | — | — | — | — | — | — | |||||||||||||||||||||||||||||||||||
| Q3 2024 | — | — | — | — | — | — | |||||||||||||||||||||||||||||||||||
| Q4 2024 | — | — | — | — | — | — | |||||||||||||||||||||||||||||||||||
| Total 2024 | — | — | — | — | — | — | |||||||||||||||||||||||||||||||||||
| Q1 2025 | 715 | 715 | 30,000 | 41.96 | 30,000 | 41.96 | |||||||||||||||||||||||||||||||||||
| Q2 2025 | — | — | — | — | — | — | |||||||||||||||||||||||||||||||||||
| Q3 2025 | 4,179 | 4,179 | 480,000 | 114.86 | 480,000 | 114.86 | |||||||||||||||||||||||||||||||||||
| Q4 2025 | — | — | — | — | — | — | |||||||||||||||||||||||||||||||||||
| Total 2025 | 4,894 | 4,894 | 510,000 | 104.21 | 510,000 | 104.21 | |||||||||||||||||||||||||||||||||||
TOTAL PROPERTY TYPES
| BXP’s Share | |||||||||||||||||||||||||||||||||||||||||
| Rentable Square Footage Subject to Expiring Leases | Rentable Square Footage Subject to Expiring Leases | Current Annualized Rental Obligations Under Expiring Leases | Annualized Rental Obligations Under Expiring Leases with future step-ups | ||||||||||||||||||||||||||||||||||||||
| Lease Expiration | |||||||||||||||||||||||||||||||||||||||||
| by Quarter | $ | $/PSF | $ | $/PSF | |||||||||||||||||||||||||||||||||||||
| Q1 2024 | — | — | — | — | — | — | |||||||||||||||||||||||||||||||||||
| Q2 2024 | — | — | — | — | — | — | |||||||||||||||||||||||||||||||||||
| Q3 2024 | — | — | — | — | — | — | |||||||||||||||||||||||||||||||||||
| Q4 2024 | — | — | — | — | — | — | |||||||||||||||||||||||||||||||||||
| Total 2024 | — | — | — | — | — | — | |||||||||||||||||||||||||||||||||||
| Q1 2025 | 417,490 | 145,011 | 14,678,429 | 101.22 | 14,678,429 | 101.22 | |||||||||||||||||||||||||||||||||||
| Q2 2025 | 148,196 | 123,997 | 11,407,331 | 92.00 | 11,510,876 | 92.83 | |||||||||||||||||||||||||||||||||||
| Q3 2025 | 63,471 | 63,471 | 5,994,587 | 94.45 | 5,650,175 | 89.02 | |||||||||||||||||||||||||||||||||||
| Q4 2025 | 201,357 | 191,075 | 14,159,692 | 74.11 | 14,336,202 | 75.03 | |||||||||||||||||||||||||||||||||||
| Total 2025 | 830,514 | 523,554 | 46,240,038 | 88.32 | 46,175,682 | 88.20 | |||||||||||||||||||||||||||||||||||
_____________
1For the Company’s definitions and related disclosures, see the Definitions section of this Supplemental package starting on page 57.
2Includes partially placed in-service leased space.
3Does not include data for leases expiring in a particular year when leases for the same space have already been signed with replacement clients with future commencement dates. In those cases, the data is included in the year in which the future lease expires.
45
| Q4 2024 | ||||
Lease expirations - San Francisco region in-service properties 1, 2, 3 | |||||
as of December 31, 2024
OFFICE
| BXP’s Share | |||||||||||||||||||||||||||||||||||||||||
| Rentable Square Footage Subject to Expiring Leases | Rentable Square Footage Subject to Expiring Leases | Current Annualized Rental Obligations Under Expiring Leases | Annualized Rental Obligations Under Expiring Leases with future step-ups | ||||||||||||||||||||||||||||||||||||||
| Year of Lease | |||||||||||||||||||||||||||||||||||||||||
| Expiration | $ | $/PSF | $ | $/PSF | |||||||||||||||||||||||||||||||||||||
| 2024 | 106,226 | 102,962 | 9,289,711 | 90.23 | 9,289,711 | 90.23 | 4 | ||||||||||||||||||||||||||||||||||
| 2025 | 554,677 | 516,095 | 41,359,901 | 80.14 | 41,643,233 | 80.69 | |||||||||||||||||||||||||||||||||||
| 2026 | 610,493 | 519,401 | 51,553,165 | 99.26 | 52,403,661 | 100.89 | |||||||||||||||||||||||||||||||||||
| 2027 | 566,171 | 555,207 | 54,550,973 | 98.25 | 57,014,807 | 102.69 | |||||||||||||||||||||||||||||||||||
| 2028 | 661,135 | 631,100 | 57,353,967 | 90.88 | 61,624,331 | 97.65 | |||||||||||||||||||||||||||||||||||
| 2029 | 479,179 | 418,976 | 39,198,377 | 93.56 | 43,712,803 | 104.33 | |||||||||||||||||||||||||||||||||||
| 2030 | 423,074 | 411,461 | 34,868,009 | 84.74 | 39,796,178 | 96.72 | |||||||||||||||||||||||||||||||||||
| 2031 | 943,366 | 916,660 | 99,723,783 | 108.79 | 109,116,748 | 119.04 | |||||||||||||||||||||||||||||||||||
| 2032 | 347,782 | 314,764 | 25,234,017 | 80.17 | 30,643,340 | 97.35 | |||||||||||||||||||||||||||||||||||
| 2033 | 650,156 | 650,156 | 68,189,615 | 104.88 | 77,450,865 | 119.13 | |||||||||||||||||||||||||||||||||||
| Thereafter | 584,842 | 467,240 | 42,101,949 | 90.11 | 57,335,309 | 122.71 | |||||||||||||||||||||||||||||||||||
RETAIL
| BXP’s Share | |||||||||||||||||||||||||||||||||||||||||
| Rentable Square Footage Subject to Expiring Leases | Rentable Square Footage Subject to Expiring Leases | Current Annualized Rental Obligations Under Expiring Leases | Annualized Rental Obligations Under Expiring Leases with future step-ups | ||||||||||||||||||||||||||||||||||||||
| Year of Lease | |||||||||||||||||||||||||||||||||||||||||
| Expiration | $ | $/PSF | $ | $/PSF | |||||||||||||||||||||||||||||||||||||
| 2024 | — | — | — | — | — | — | |||||||||||||||||||||||||||||||||||
| 2025 | 5,799 | 5,799 | 364,015 | 62.77 | 364,506 | 62.86 | |||||||||||||||||||||||||||||||||||
| 2026 | 10,259 | 10,259 | 765,264 | 74.59 | 806,938 | 78.66 | |||||||||||||||||||||||||||||||||||
| 2027 | 11,002 | 11,002 | 417,729 | 37.97 | 454,883 | 41.35 | |||||||||||||||||||||||||||||||||||
| 2028 | 19,286 | 19,286 | 1,395,794 | 72.37 | 1,457,191 | 75.56 | |||||||||||||||||||||||||||||||||||
| 2029 | 3,403 | 3,403 | 319,849 | 93.99 | 348,627 | 102.45 | |||||||||||||||||||||||||||||||||||
| 2030 | 18,656 | 18,656 | 1,544,081 | 82.77 | 1,765,171 | 94.62 | |||||||||||||||||||||||||||||||||||
| 2031 | 30,155 | 26,801 | 1,688,642 | 63.01 | 1,915,101 | 71.46 | |||||||||||||||||||||||||||||||||||
| 2032 | 6,357 | 6,357 | 437,197 | 68.77 | 490,576 | 77.17 | |||||||||||||||||||||||||||||||||||
| 2033 | 21,063 | 21,063 | 2,038,164 | 96.77 | 2,251,047 | 106.87 | |||||||||||||||||||||||||||||||||||
| Thereafter | — | — | — | — | — | — | |||||||||||||||||||||||||||||||||||
TOTAL PROPERTY TYPES
| BXP’s Share | |||||||||||||||||||||||||||||||||||||||||
| Rentable Square Footage Subject to Expiring Leases | Rentable Square Footage Subject to Expiring Leases | Current Annualized Rental Obligations Under Expiring Leases | Annualized Rental Obligations Under Expiring Leases with future step-ups | ||||||||||||||||||||||||||||||||||||||
| Year of Lease | |||||||||||||||||||||||||||||||||||||||||
| Expiration | $ | $/PSF | $ | $/PSF | |||||||||||||||||||||||||||||||||||||
| 2024 | 106,226 | 102,962 | 9,289,711 | $ | 90.22 | 9,289,711 | 90.22 | 4 | |||||||||||||||||||||||||||||||||
| 2025 | 560,476 | 521,894 | 41,723,916 | 79.95 | 42,007,739 | 80.49 | |||||||||||||||||||||||||||||||||||
| 2026 | 620,752 | 529,660 | 52,318,429 | 98.78 | 53,210,599 | 100.46 | |||||||||||||||||||||||||||||||||||
| 2027 | 577,173 | 566,209 | 54,968,702 | 97.08 | 57,469,690 | 101.50 | |||||||||||||||||||||||||||||||||||
| 2028 | 680,421 | 650,386 | 58,749,761 | 90.33 | 63,081,522 | 96.99 | |||||||||||||||||||||||||||||||||||
| 2029 | 482,582 | 422,379 | 39,518,226 | 93.56 | 44,061,430 | 104.32 | |||||||||||||||||||||||||||||||||||
| 2030 | 441,730 | 430,117 | 36,412,090 | 84.66 | 41,561,349 | 96.63 | |||||||||||||||||||||||||||||||||||
| 2031 | 973,521 | 943,461 | 101,412,425 | 107.49 | 111,031,849 | 117.69 | |||||||||||||||||||||||||||||||||||
| 2032 | 354,139 | 321,121 | 25,671,214 | 79.94 | 31,133,916 | 96.95 | |||||||||||||||||||||||||||||||||||
| 2033 | 671,219 | 671,219 | 70,227,779 | 104.63 | 79,701,912 | 118.74 | |||||||||||||||||||||||||||||||||||
| Thereafter | 584,842 | 467,240 | 42,101,949 | 90.11 | 57,335,309 | 122.71 | |||||||||||||||||||||||||||||||||||
_____________
1For the Company’s definitions and related disclosures, see the Definitions section of this Supplemental package starting on page 57.
2Includes partially placed in-service leased space.
3Does not include data for leases expiring in a particular year when leases for the same space have already been signed with replacement clients with future commencement dates. In those cases, the data is included in the year in which the future lease expires.
4Includes square feet expiring on the last day of the current quarter.
46
| Q4 2024 | ||||
Quarterly lease expirations - San Francisco region in-service properties 1, 2, 3 | |||||
as of December 31, 2024
OFFICE
| BXP’s Share | |||||||||||||||||||||||||||||||||||||||||
| Rentable Square Footage Subject to Expiring Leases | Rentable Square Footage Subject to Expiring Leases | Current Annualized Rental Obligations Under Expiring Leases | Annualized Rental Obligations Under Expiring Leases with future step-ups | ||||||||||||||||||||||||||||||||||||||
| Lease Expiration | |||||||||||||||||||||||||||||||||||||||||
| by Quarter | $ | $/PSF | $ | $/PSF | |||||||||||||||||||||||||||||||||||||
| Q1 2024 | — | — | — | — | — | — | |||||||||||||||||||||||||||||||||||
| Q2 2024 | — | — | — | — | — | — | |||||||||||||||||||||||||||||||||||
| Q3 2024 | — | — | — | — | — | — | |||||||||||||||||||||||||||||||||||
| Q4 2024 | 106,226 | 102,962 | 9,289,711 | 90.23 | 9,289,711 | 90.23 | 4 | ||||||||||||||||||||||||||||||||||
| Total 2024 | 106,226 | 102,962 | 9,289,711 | 90.23 | 9,289,711 | 90.23 | |||||||||||||||||||||||||||||||||||
| Q1 2025 | 70,606 | 67,815 | 5,660,575 | 83.47 | 5,660,575 | 83.47 | |||||||||||||||||||||||||||||||||||
| Q2 2025 | 115,341 | 101,786 | 8,784,458 | 86.30 | 8,799,789 | 86.45 | |||||||||||||||||||||||||||||||||||
| Q3 2025 | 269,442 | 256,115 | 18,584,973 | 72.57 | 18,726,707 | 73.12 | |||||||||||||||||||||||||||||||||||
| Q4 2025 | 99,288 | 90,381 | 8,329,895 | 92.16 | 8,456,163 | 93.56 | |||||||||||||||||||||||||||||||||||
| Total 2025 | 554,677 | 516,095 | 41,359,901 | 80.14 | 41,643,233 | 80.69 | |||||||||||||||||||||||||||||||||||
RETAIL
| BXP’s Share | |||||||||||||||||||||||||||||||||||||||||
| Rentable Square Footage Subject to Expiring Leases | Rentable Square Footage Subject to Expiring Leases | Current Annualized Rental Obligations Under Expiring Leases | Annualized Rental Obligations Under Expiring Leases with future step-ups | ||||||||||||||||||||||||||||||||||||||
| Lease Expiration | |||||||||||||||||||||||||||||||||||||||||
| by Quarter | $ | $/PSF | $ | $/PSF | |||||||||||||||||||||||||||||||||||||
| Q1 2024 | — | — | — | — | — | — | |||||||||||||||||||||||||||||||||||
| Q2 2024 | — | — | — | — | — | — | |||||||||||||||||||||||||||||||||||
| Q3 2024 | — | — | — | — | — | — | |||||||||||||||||||||||||||||||||||
| Q4 2024 | — | — | — | — | — | — | |||||||||||||||||||||||||||||||||||
| Total 2024 | — | — | — | — | — | — | |||||||||||||||||||||||||||||||||||
| Q1 2025 | 1 | 1 | 21,920 | 21,920.16 | 21,920 | 21,920.16 | |||||||||||||||||||||||||||||||||||
| Q2 2025 | 1,821 | 1,821 | 30,000 | 16.47 | 30,000 | 16.47 | |||||||||||||||||||||||||||||||||||
| Q3 2025 | 3,557 | 3,557 | 293,292 | 82.45 | 293,292 | 82.45 | |||||||||||||||||||||||||||||||||||
| Q4 2025 | 420 | 420 | 18,803 | 44.77 | 19,294 | 45.94 | |||||||||||||||||||||||||||||||||||
| Total 2025 | 5,799 | 5,799 | 364,015 | 62.77 | 364,506 | 62.86 | |||||||||||||||||||||||||||||||||||
TOTAL PROPERTY TYPES
| BXP’s Share | |||||||||||||||||||||||||||||||||||||||||
| Rentable Square Footage Subject to Expiring Leases | Rentable Square Footage Subject to Expiring Leases | Current Annualized Rental Obligations Under Expiring Leases | Annualized Rental Obligations Under Expiring Leases with future step-ups | ||||||||||||||||||||||||||||||||||||||
| Lease Expiration | |||||||||||||||||||||||||||||||||||||||||
| by Quarter | $ | $/PSF | $ | $/PSF | |||||||||||||||||||||||||||||||||||||
| Q1 2024 | — | — | — | — | — | — | |||||||||||||||||||||||||||||||||||
| Q2 2024 | — | — | — | — | — | — | |||||||||||||||||||||||||||||||||||
| Q3 2024 | — | — | — | — | — | — | |||||||||||||||||||||||||||||||||||
| Q4 2024 | 106,226 | 102,962 | 9,289,711 | 90.22 | 9,289,711 | 90.22 | 4 | ||||||||||||||||||||||||||||||||||
| Total 2024 | 106,226 | 102,962 | 9,289,711 | 90.22 | 9,289,711 | 90.22 | |||||||||||||||||||||||||||||||||||
| Q1 2025 | 70,607 | 67,816 | 5,682,495 | 83.79 | 5,682,495 | 83.79 | |||||||||||||||||||||||||||||||||||
| Q2 2025 | 117,162 | 103,607 | 8,814,458 | 85.08 | 8,829,789 | 85.22 | |||||||||||||||||||||||||||||||||||
| Q3 2025 | 272,999 | 259,672 | 18,878,265 | 72.70 | 19,019,999 | 73.25 | |||||||||||||||||||||||||||||||||||
| Q4 2025 | 99,708 | 90,801 | 8,348,698 | 91.95 | 8,475,457 | 93.34 | |||||||||||||||||||||||||||||||||||
| Total 2025 | 560,476 | 521,894 | 41,723,916 | 79.95 | 42,007,739 | 80.49 | |||||||||||||||||||||||||||||||||||
_____________
1For the Company’s definitions and related disclosures, see the Definitions section of this Supplemental package starting on page 57.
2Includes partially placed in-service leased space.
3Does not include data for leases expiring in a particular year when leases for the same space have already been signed with replacement clients with future commencement dates. In those cases, the data is included in the year in which the future lease expires.
4Includes square feet expiring on the last day of the current quarter.
47
| Q4 2024 | ||||
Lease expirations - Seattle region in-service properties 1, 2, 3 | |||||
as of December 31, 2024
OFFICE
| BXP’s Share | |||||||||||||||||||||||||||||||||||||||||
| Rentable Square Footage Subject to Expiring Leases | Rentable Square Footage Subject to Expiring Leases | Current Annualized Rental Obligations Under Expiring Leases | Annualized Rental Obligations Under Expiring Leases with future step-ups | ||||||||||||||||||||||||||||||||||||||
| Year of Lease | |||||||||||||||||||||||||||||||||||||||||
| Expiration | $ | $/PSF | $ | $/PSF | |||||||||||||||||||||||||||||||||||||
| 2024 | — | — | — | — | — | — | |||||||||||||||||||||||||||||||||||
| 2025 | 134,144 | 80,467 | 4,942,672 | 61.42 | 4,961,755 | 61.66 | |||||||||||||||||||||||||||||||||||
| 2026 | 66,610 | 65,742 | 4,023,440 | 61.20 | 4,161,600 | 63.30 | |||||||||||||||||||||||||||||||||||
| 2027 | 77,785 | 74,224 | 4,448,651 | 59.94 | 4,635,712 | 62.46 | |||||||||||||||||||||||||||||||||||
| 2028 | 592,670 | 293,733 | 16,728,155 | 56.95 | 17,688,475 | 60.22 | |||||||||||||||||||||||||||||||||||
| 2029 | 209,607 | 189,549 | 10,440,598 | 55.08 | 10,825,671 | 57.11 | |||||||||||||||||||||||||||||||||||
| 2030 | 33,054 | 33,054 | 2,047,766 | 61.95 | 2,257,566 | 68.30 | |||||||||||||||||||||||||||||||||||
| 2031 | 4,742 | 1,597 | 91,717 | 57.44 | 106,150 | 66.48 | |||||||||||||||||||||||||||||||||||
| 2032 | 64,737 | 51,388 | 3,864,087 | 75.19 | 4,559,063 | 88.72 | |||||||||||||||||||||||||||||||||||
| 2033 | — | — | — | — | — | — | |||||||||||||||||||||||||||||||||||
| Thereafter | 40,529 | 13,646 | 962,285 | 70.52 | 1,208,814 | 88.58 | |||||||||||||||||||||||||||||||||||
RETAIL
| BXP’s Share | |||||||||||||||||||||||||||||||||||||||||
| Rentable Square Footage Subject to Expiring Leases | Rentable Square Footage Subject to Expiring Leases | Current Annualized Rental Obligations Under Expiring Leases | Annualized Rental Obligations Under Expiring Leases with future step-ups | ||||||||||||||||||||||||||||||||||||||
| Year of Lease | |||||||||||||||||||||||||||||||||||||||||
| Expiration | $ | $/PSF | $ | $/PSF | |||||||||||||||||||||||||||||||||||||
| 2024 | — | — | — | — | — | — | |||||||||||||||||||||||||||||||||||
| 2025 | — | — | — | — | — | — | |||||||||||||||||||||||||||||||||||
| 2026 | 3,686 | 1,241 | 95,390 | 76.86 | 95,390 | 76.86 | |||||||||||||||||||||||||||||||||||
| 2027 | — | — | — | — | — | — | |||||||||||||||||||||||||||||||||||
| 2028 | 945 | 945 | 52,787 | 55.86 | 57,229 | 60.56 | |||||||||||||||||||||||||||||||||||
| 2029 | 1,121 | 377 | 7,306 | 19.36 | 7,306 | 19.36 | |||||||||||||||||||||||||||||||||||
| 2030 | — | — | — | — | — | — | |||||||||||||||||||||||||||||||||||
| 2031 | 3,048 | 3,048 | 194,836 | 63.92 | 223,274 | 73.25 | |||||||||||||||||||||||||||||||||||
| 2032 | — | — | — | — | — | — | |||||||||||||||||||||||||||||||||||
| 2033 | — | — | — | — | — | — | |||||||||||||||||||||||||||||||||||
| Thereafter | — | — | — | — | — | — | |||||||||||||||||||||||||||||||||||
TOTAL PROPERTY TYPES
| BXP’s Share | |||||||||||||||||||||||||||||||||||||||||
| Rentable Square Footage Subject to Expiring Leases | Rentable Square Footage Subject to Expiring Leases | Current Annualized Rental Obligations Under Expiring Leases | Annualized Rental Obligations Under Expiring Leases with future step-ups | ||||||||||||||||||||||||||||||||||||||
| Year of Lease | |||||||||||||||||||||||||||||||||||||||||
| Expiration | $ | $/PSF | $ | $/PSF | |||||||||||||||||||||||||||||||||||||
| 2024 | — | — | — | — | — | — | |||||||||||||||||||||||||||||||||||
| 2025 | 134,144 | 80,467 | 4,942,672 | 61.42 | 4,961,755 | 61.66 | |||||||||||||||||||||||||||||||||||
| 2026 | 70,296 | 66,983 | 4,118,830 | 61.49 | 4,256,990 | 63.55 | |||||||||||||||||||||||||||||||||||
| 2027 | 77,785 | 74,224 | 4,448,651 | 59.94 | 4,635,712 | 62.46 | |||||||||||||||||||||||||||||||||||
| 2028 | 593,615 | 294,678 | 16,780,942 | 56.95 | 17,745,704 | 60.22 | |||||||||||||||||||||||||||||||||||
| 2029 | 210,728 | 189,926 | 10,447,904 | 55.01 | 10,832,977 | 57.04 | |||||||||||||||||||||||||||||||||||
| 2030 | 33,054 | 33,054 | 2,047,766 | 61.95 | 2,257,566 | 68.30 | |||||||||||||||||||||||||||||||||||
| 2031 | 7,790 | 4,645 | 286,553 | 61.69 | 329,424 | 70.92 | |||||||||||||||||||||||||||||||||||
| 2032 | 64,737 | 51,388 | 3,864,087 | 75.19 | 4,559,063 | 88.72 | |||||||||||||||||||||||||||||||||||
| 2033 | — | — | — | — | — | — | |||||||||||||||||||||||||||||||||||
| Thereafter | 40,529 | 13,646 | 962,285 | 70.52 | 1,208,814 | 88.58 | |||||||||||||||||||||||||||||||||||
_____________
1For the Company’s definitions and related disclosures, see the Definitions section of this Supplemental package starting on page 57.
2Includes partially placed in-service leased space. Does not include residential units.
3Does not include data for leases expiring in a particular year when leases for the same space have already been signed with replacement clients with future commencement dates. In those cases, the data is included in the year in which the future lease expires.
48
| Q4 2024 | ||||
Quarterly lease expirations - Seattle region in-service properties 1, 2, 3 | |||||
as of December 31, 2024
OFFICE
| BXP’s Share | |||||||||||||||||||||||||||||||||||||||||
| Rentable Square Footage Subject to Expiring Leases | Rentable Square Footage Subject to Expiring Leases | Current Annualized Rental Obligations Under Expiring Leases | Annualized Rental Obligations Under Expiring Leases with future step-ups | ||||||||||||||||||||||||||||||||||||||
| Lease Expiration | |||||||||||||||||||||||||||||||||||||||||
| by Quarter | $ | $/PSF | $ | $/PSF | |||||||||||||||||||||||||||||||||||||
| Q1 2024 | — | — | — | — | — | — | |||||||||||||||||||||||||||||||||||
| Q2 2024 | — | — | — | — | — | — | |||||||||||||||||||||||||||||||||||
| Q3 2024 | — | — | — | — | — | — | |||||||||||||||||||||||||||||||||||
| Q4 2024 | — | — | — | — | — | — | |||||||||||||||||||||||||||||||||||
| Total 2024 | — | — | — | — | — | — | |||||||||||||||||||||||||||||||||||
| Q1 2025 | — | — | — | — | — | — | |||||||||||||||||||||||||||||||||||
| Q2 2025 | 19,854 | 6,685 | 330,395 | 49.42 | 330,395 | 49.42 | |||||||||||||||||||||||||||||||||||
| Q3 2025 | — | — | — | — | — | — | |||||||||||||||||||||||||||||||||||
| Q4 2025 | 114,290 | 73,782 | 4,612,277 | 62.51 | 4,631,360 | 62.77 | |||||||||||||||||||||||||||||||||||
| Total 2025 | 134,144 | 80,467 | 4,942,672 | 61.42 | 4,961,755 | 61.66 | |||||||||||||||||||||||||||||||||||
RETAIL
| BXP’s Share | |||||||||||||||||||||||||||||||||||||||||
| Rentable Square Footage Subject to Expiring Leases | Rentable Square Footage Subject to Expiring Leases | Current Annualized Rental Obligations Under Expiring Leases | Annualized Rental Obligations Under Expiring Leases with future step-ups | ||||||||||||||||||||||||||||||||||||||
| Lease Expiration | |||||||||||||||||||||||||||||||||||||||||
| by Quarter | $ | $/PSF | $ | $/PSF | |||||||||||||||||||||||||||||||||||||
| Q1 2024 | — | — | — | — | — | — | |||||||||||||||||||||||||||||||||||
| Q2 2024 | — | — | — | — | — | — | |||||||||||||||||||||||||||||||||||
| Q3 2024 | — | — | — | — | — | — | |||||||||||||||||||||||||||||||||||
| Q4 2024 | — | — | — | — | — | — | |||||||||||||||||||||||||||||||||||
| Total 2024 | — | — | — | — | — | — | |||||||||||||||||||||||||||||||||||
| Q1 2025 | — | — | — | — | — | — | |||||||||||||||||||||||||||||||||||
| Q2 2025 | — | — | — | — | — | — | |||||||||||||||||||||||||||||||||||
| Q3 2025 | — | — | — | — | — | — | |||||||||||||||||||||||||||||||||||
| Q4 2025 | — | — | — | — | — | — | |||||||||||||||||||||||||||||||||||
| Total 2025 | — | — | — | — | — | — | |||||||||||||||||||||||||||||||||||
TOTAL PROPERTY TYPES
| BXP’s Share | |||||||||||||||||||||||||||||||||||||||||
| Rentable Square Footage Subject to Expiring Leases | Rentable Square Footage Subject to Expiring Leases | Current Annualized Rental Obligations Under Expiring Leases | Annualized Rental Obligations Under Expiring Leases with future step-ups | ||||||||||||||||||||||||||||||||||||||
| Lease Expiration | |||||||||||||||||||||||||||||||||||||||||
| by Quarter | $ | $/PSF | $ | $/PSF | |||||||||||||||||||||||||||||||||||||
| Q1 2024 | — | — | — | — | — | — | |||||||||||||||||||||||||||||||||||
| Q2 2024 | — | — | — | — | — | — | |||||||||||||||||||||||||||||||||||
| Q3 2024 | — | — | — | — | — | — | |||||||||||||||||||||||||||||||||||
| Q4 2024 | — | — | — | — | — | — | |||||||||||||||||||||||||||||||||||
| Total 2024 | — | — | — | — | — | — | |||||||||||||||||||||||||||||||||||
| Q1 2025 | — | — | — | — | — | — | |||||||||||||||||||||||||||||||||||
| Q2 2025 | 19,854 | 6,685 | 330,395 | 49.42 | 330,395 | 49.42 | |||||||||||||||||||||||||||||||||||
| Q3 2025 | — | — | — | — | — | — | |||||||||||||||||||||||||||||||||||
| Q4 2025 | 114,290 | 73,782 | 4,612,277 | 62.51 | 4,631,360 | 62.77 | |||||||||||||||||||||||||||||||||||
| Total 2025 | 134,144 | 80,467 | 4,942,672 | 61.42 | 4,961,755 | 61.66 | |||||||||||||||||||||||||||||||||||
_____________
1For the Company’s definitions and related disclosures, see the Definitions section of this Supplemental package starting on page 57.
2Includes partially placed in-service leased space. Does not include residential units.
3Does not include data for leases expiring in a particular year when leases for the same space have already been signed with replacement clients with future commencement dates. In those cases, the data is included in the year in which the future lease expires.
49
| Q4 2024 | ||||
Lease expirations - Washington, DC region in-service properties 1, 2, 3 | |||||
as of December 31, 2024
OFFICE
| BXP’s Share | |||||||||||||||||||||||||||||||||||||||||
| Rentable Square Footage Subject to Expiring Leases | Rentable Square Footage Subject to Expiring Leases | Current Annualized Rental Obligations Under Expiring Leases | Annualized Rental Obligations Under Expiring Leases with future step-ups | ||||||||||||||||||||||||||||||||||||||
| Year of Lease | |||||||||||||||||||||||||||||||||||||||||
| Expiration | $ | $/PSF | $ | $/PSF | |||||||||||||||||||||||||||||||||||||
| 2024 | 261,046 | 261,046 | 12,853,704 | 49.24 | 12,853,704 | 49.24 | 4,5 | ||||||||||||||||||||||||||||||||||
| 2025 | 202,134 | 190,964 | 12,150,052 | 63.62 | 12,272,893 | 64.27 | |||||||||||||||||||||||||||||||||||
| 2026 | 322,394 | 258,324 | 16,986,435 | 65.76 | 17,479,892 | 67.67 | |||||||||||||||||||||||||||||||||||
| 2027 | 387,121 | 386,055 | 21,490,551 | 55.67 | 22,751,987 | 58.93 | |||||||||||||||||||||||||||||||||||
| 2028 | 351,748 | 218,403 | 15,843,139 | 72.54 | 17,915,988 | 82.03 | |||||||||||||||||||||||||||||||||||
| 2029 | 277,474 | 250,523 | 14,985,059 | 59.82 | 16,609,668 | 66.30 | |||||||||||||||||||||||||||||||||||
| 2030 | 179,123 | 156,533 | 9,227,133 | 58.95 | 10,390,502 | 66.38 | |||||||||||||||||||||||||||||||||||
| 2031 | 192,159 | 180,741 | 11,270,277 | 62.36 | 12,605,548 | 69.74 | |||||||||||||||||||||||||||||||||||
| 2032 | 833,227 | 812,416 | 55,476,191 | 68.29 | 63,743,769 | 78.46 | |||||||||||||||||||||||||||||||||||
| 2033 | 983,242 | 977,518 | 55,591,538 | 56.87 | 68,022,699 | 69.59 | |||||||||||||||||||||||||||||||||||
| Thereafter | 3,599,446 | 3,219,633 | 195,055,304 | 60.58 | 245,039,417 | 76.11 | |||||||||||||||||||||||||||||||||||
RETAIL
| BXP’s Share | |||||||||||||||||||||||||||||||||||||||||
| Rentable Square Footage Subject to Expiring Leases | Rentable Square Footage Subject to Expiring Leases | Current Annualized Rental Obligations Under Expiring Leases | Annualized Rental Obligations Under Expiring Leases with future step-ups | ||||||||||||||||||||||||||||||||||||||
| Year of Lease | |||||||||||||||||||||||||||||||||||||||||
| Expiration | $ | $/PSF | $ | $/PSF | |||||||||||||||||||||||||||||||||||||
| 2024 | — | — | — | — | — | — | |||||||||||||||||||||||||||||||||||
| 2025 | 14,684 | 14,684 | 999,339 | 68.06 | 1,004,643 | 68.42 | |||||||||||||||||||||||||||||||||||
| 2026 | 32,261 | 30,444 | 1,519,346 | 49.91 | 1,524,571 | 50.08 | |||||||||||||||||||||||||||||||||||
| 2027 | 53,806 | 49,704 | 3,188,054 | 64.14 | 3,289,237 | 66.18 | |||||||||||||||||||||||||||||||||||
| 2028 | 31,517 | 31,517 | 2,455,860 | 77.92 | 2,525,518 | 80.13 | |||||||||||||||||||||||||||||||||||
| 2029 | 32,237 | 32,237 | 2,584,890 | 80.18 | 3,477,602 | 107.88 | |||||||||||||||||||||||||||||||||||
| 2030 | 35,931 | 35,931 | 2,426,661 | 67.54 | 2,632,343 | 73.26 | |||||||||||||||||||||||||||||||||||
| 2031 | 36,961 | 36,961 | 2,651,287 | 71.73 | 2,919,616 | 78.99 | |||||||||||||||||||||||||||||||||||
| 2032 | 17,703 | 17,703 | 1,078,165 | 60.90 | 1,252,836 | 70.77 | |||||||||||||||||||||||||||||||||||
| 2033 | 147,314 | 147,314 | 3,621,163 | 24.58 | 4,807,076 | 32.63 | |||||||||||||||||||||||||||||||||||
| Thereafter | 130,275 | 127,154 | 7,704,118 | 60.59 | 9,055,008 | 71.21 | |||||||||||||||||||||||||||||||||||
TOTAL PROPERTY TYPES
| BXP’s Share | |||||||||||||||||||||||||||||||||||||||||
| Rentable Square Footage Subject to Expiring Leases | Rentable Square Footage Subject to Expiring Leases | Current Annualized Rental Obligations Under Expiring Leases | Annualized Rental Obligations Under Expiring Leases with future step-ups | ||||||||||||||||||||||||||||||||||||||
| Year of Lease | |||||||||||||||||||||||||||||||||||||||||
| Expiration | $ | $/PSF | $ | $/PSF | |||||||||||||||||||||||||||||||||||||
| 2024 | 261,046 | 261,046 | 12,853,704 | 49.24 | 12,853,704 | 49.24 | 4,5 | ||||||||||||||||||||||||||||||||||
| 2025 | 216,818 | 205,648 | 13,149,391 | 63.94 | 13,277,536 | 64.56 | |||||||||||||||||||||||||||||||||||
| 2026 | 354,655 | 288,768 | 18,505,781 | 64.09 | 19,004,463 | 65.81 | |||||||||||||||||||||||||||||||||||
| 2027 | 440,927 | 435,759 | 24,678,605 | 56.63 | 26,041,224 | 59.76 | |||||||||||||||||||||||||||||||||||
| 2028 | 383,265 | 249,920 | 18,298,999 | 73.22 | 20,441,506 | 81.79 | |||||||||||||||||||||||||||||||||||
| 2029 | 309,711 | 282,760 | 17,569,949 | 62.14 | 20,087,270 | 71.04 | |||||||||||||||||||||||||||||||||||
| 2030 | 215,054 | 192,464 | 11,653,794 | 60.55 | 13,022,845 | 67.66 | |||||||||||||||||||||||||||||||||||
| 2031 | 229,120 | 217,702 | 13,921,564 | 63.95 | 15,525,164 | 71.31 | |||||||||||||||||||||||||||||||||||
| 2032 | 850,930 | 830,119 | 56,554,356 | 68.13 | 64,996,605 | 78.30 | |||||||||||||||||||||||||||||||||||
| 2033 | 1,130,556 | 1,124,832 | 59,212,701 | 52.64 | 72,829,775 | 64.75 | |||||||||||||||||||||||||||||||||||
| Thereafter | 3,729,721 | 3,346,787 | 202,759,422 | 60.58 | 254,094,425 | 75.92 | |||||||||||||||||||||||||||||||||||
_____________
1For the Company’s definitions and related disclosures, see the Definitions section of this Supplemental package starting on page 57.
2Includes partially placed in-service leased space. Does not include residential units.
3Does not include data for leases expiring in a particular year when leases for the same space have already been signed with replacement clients with future commencement dates. In those cases, the data is included in the year in which the future lease expires.
4Includes square feet expiring on the last day of the current quarter.
5Includes 261,046 square feet related to Reston Corporate Center which was taken out of service on January 1, 2025.
50
| Q4 2024 | ||||
Quarterly lease expirations - Washington, DC region in-service properties 1, 2, 3 | |||||
as of December 31, 2024
OFFICE
| BXP’s Share | |||||||||||||||||||||||||||||||||||||||||
| Rentable Square Footage Subject to Expiring Leases | Rentable Square Footage Subject to Expiring Leases | Current Annualized Rental Obligations Under Expiring Leases | Annualized Rental Obligations Under Expiring Leases with future step-ups | ||||||||||||||||||||||||||||||||||||||
| Lease Expiration | |||||||||||||||||||||||||||||||||||||||||
| by Quarter | $ | $/PSF | $ | $/PSF | |||||||||||||||||||||||||||||||||||||
| Q1 2024 | — | — | — | — | — | — | |||||||||||||||||||||||||||||||||||
| Q2 2024 | — | — | — | — | — | — | |||||||||||||||||||||||||||||||||||
| Q3 2024 | — | — | — | — | — | — | |||||||||||||||||||||||||||||||||||
| Q4 2024 | 261,046 | 261,046 | 12,853,704 | 49.24 | 12,853,704 | 49.24 | 4,5 | ||||||||||||||||||||||||||||||||||
| Total 2024 | 261,046 | 261,046 | 12,853,704 | 49.24 | 12,853,704 | 49.24 | |||||||||||||||||||||||||||||||||||
| Q1 2025 | 37,719 | 34,954 | 2,251,006 | 64.40 | 2,251,006 | 64.40 | |||||||||||||||||||||||||||||||||||
| Q2 2025 | 76,493 | 73,035 | 4,296,438 | 58.83 | 4,307,133 | 58.97 | |||||||||||||||||||||||||||||||||||
| Q3 2025 | 73,414 | 71,264 | 4,941,542 | 69.34 | 5,037,399 | 70.69 | |||||||||||||||||||||||||||||||||||
| Q4 2025 | 14,508 | 11,712 | 661,066 | 56.45 | 677,354 | 57.84 | |||||||||||||||||||||||||||||||||||
| Total 2025 | 202,134 | 190,964 | 12,150,052 | 63.62 | 12,272,893 | 64.27 | |||||||||||||||||||||||||||||||||||
RETAIL
| BXP’s Share | |||||||||||||||||||||||||||||||||||||||||
| Rentable Square Footage Subject to Expiring Leases | Rentable Square Footage Subject to Expiring Leases | Current Annualized Rental Obligations Under Expiring Leases | Annualized Rental Obligations Under Expiring Leases with future step-ups | ||||||||||||||||||||||||||||||||||||||
| Lease Expiration | |||||||||||||||||||||||||||||||||||||||||
| by Quarter | $ | $/PSF | $ | $/PSF | |||||||||||||||||||||||||||||||||||||
| Q1 2024 | — | — | — | — | — | — | |||||||||||||||||||||||||||||||||||
| Q2 2024 | — | — | — | — | — | — | |||||||||||||||||||||||||||||||||||
| Q3 2024 | — | — | — | — | — | — | |||||||||||||||||||||||||||||||||||
| Q4 2024 | — | — | — | — | — | — | |||||||||||||||||||||||||||||||||||
| Total 2024 | — | — | — | — | — | — | |||||||||||||||||||||||||||||||||||
| Q1 2025 | — | — | — | — | — | — | |||||||||||||||||||||||||||||||||||
| Q2 2025 | 12,690 | 12,690 | 779,148 | 61.40 | 779,148 | 61.40 | |||||||||||||||||||||||||||||||||||
| Q3 2025 | — | — | — | — | — | — | |||||||||||||||||||||||||||||||||||
| Q4 2025 | 1,994 | 1,994 | 220,190 | 110.43 | 225,495 | 113.09 | |||||||||||||||||||||||||||||||||||
| Total 2025 | 14,684 | 14,684 | 999,339 | 68.06 | 1,004,643 | 68.42 | |||||||||||||||||||||||||||||||||||
TOTAL PROPERTY TYPES
| BXP’s Share | |||||||||||||||||||||||||||||||||||||||||
| Rentable Square Footage Subject to Expiring Leases | Rentable Square Footage Subject to Expiring Leases | Current Annualized Rental Obligations Under Expiring Leases | Annualized Rental Obligations Under Expiring Leases with future step-ups | ||||||||||||||||||||||||||||||||||||||
| Lease Expiration | |||||||||||||||||||||||||||||||||||||||||
| by Quarter | $ | $/PSF | $ | $/PSF | |||||||||||||||||||||||||||||||||||||
| Q1 2024 | — | — | — | — | — | — | |||||||||||||||||||||||||||||||||||
| Q2 2024 | — | — | — | — | — | — | |||||||||||||||||||||||||||||||||||
| Q3 2024 | — | — | — | — | — | — | |||||||||||||||||||||||||||||||||||
| Q4 2024 | 261,046 | 261,046 | 12,853,704 | 49.24 | 12,853,704 | 49.24 | 4,5 | ||||||||||||||||||||||||||||||||||
| Total 2024 | 261,046 | 261,046 | 12,853,704 | 49.24 | 12,853,704 | 49.24 | |||||||||||||||||||||||||||||||||||
| Q1 2025 | 37,719 | 34,954 | 2,251,006 | 64.40 | 2,251,006 | 64.40 | |||||||||||||||||||||||||||||||||||
| Q2 2025 | 89,183 | 85,725 | 5,075,586 | 59.21 | 5,086,281 | 59.33 | |||||||||||||||||||||||||||||||||||
| Q3 2025 | 73,414 | 71,264 | 4,941,542 | 69.34 | 5,037,399 | 70.69 | |||||||||||||||||||||||||||||||||||
| Q4 2025 | 16,502 | 13,706 | 881,256 | 64.30 | 902,849 | 65.87 | |||||||||||||||||||||||||||||||||||
| Total 2025 | 216,818 | 205,648 | 13,149,391 | 63.94 | 13,277,536 | 64.56 | |||||||||||||||||||||||||||||||||||
_____________
1For the Company’s definitions and related disclosures, see the Definitions section of this Supplemental package starting on page 57.
2Includes partially placed in-service leased space. Does not include residential units.
3Does not include data for leases expiring in a particular year when leases for the same space have already been signed with replacement clients with future commencement dates. In those cases, the data is included in the year in which the future lease expires.
4Includes square feet expiring on the last day of the current quarter.
5Includes 261,046 square feet related to Reston Corporate Center which was taken out of service on January 1, 2025.
51
| Q4 2024 | ||||
Lease expirations - CBD properties 1, 2, 3 | |||||
as of December 31, 2024
Boston
| BXP’s Share | |||||||||||||||||||||||||||||||||||||||||
| Rentable Square Footage Subject to Expiring Leases | Rentable Square Footage Subject to Expiring Leases | Current Annualized Rental Obligations Under Expiring Leases | Annualized Rental Obligations Under Expiring Leases with future step-ups | ||||||||||||||||||||||||||||||||||||||
| Year of Lease | |||||||||||||||||||||||||||||||||||||||||
| Expiration | $ | $/PSF | $ | $/PSF | |||||||||||||||||||||||||||||||||||||
| 2024 | 2,452 | 1,338 | 229,360 | 171.42 | 229,360 | 171.42 | 4 | ||||||||||||||||||||||||||||||||||
| 2025 | 282,120 | 248,969 | 18,834,968 | 75.65 | 18,885,492 | 75.85 | |||||||||||||||||||||||||||||||||||
| 2026 | 164,410 | 146,332 | 14,624,058 | 99.94 | 14,802,063 | 101.15 | |||||||||||||||||||||||||||||||||||
| 2027 | 439,486 | 425,371 | 38,017,747 | 89.38 | 39,391,622 | 92.61 | |||||||||||||||||||||||||||||||||||
| 2028 | 782,533 | 765,132 | 82,718,461 | 108.11 | 87,052,933 | 113.78 | |||||||||||||||||||||||||||||||||||
| 2029 | 828,029 | 693,193 | 57,566,197 | 83.04 | 61,843,005 | 89.21 | |||||||||||||||||||||||||||||||||||
| 2030 | 998,184 | 944,669 | 69,428,045 | 73.49 | 75,548,922 | 79.97 | |||||||||||||||||||||||||||||||||||
| 2031 | 52,535 | 46,039 | 3,876,066 | 84.19 | 4,312,820 | 93.68 | |||||||||||||||||||||||||||||||||||
| 2032 | 868,000 | 867,409 | 69,990,758 | 80.69 | 87,921,843 | 101.36 | |||||||||||||||||||||||||||||||||||
| 2033 | 430,141 | 385,987 | 31,181,095 | 80.78 | 35,789,820 | 92.72 | |||||||||||||||||||||||||||||||||||
| Thereafter | 5,681,963 | 4,588,716 | 393,828,527 | 85.83 | 483,139,323 | 105.29 | |||||||||||||||||||||||||||||||||||
Los Angeles
| BXP’s Share | |||||||||||||||||||||||||||||||||||||||||
| Rentable Square Footage Subject to Expiring Leases | Rentable Square Footage Subject to Expiring Leases | Current Annualized Rental Obligations Under Expiring Leases | Annualized Rental Obligations Under Expiring Leases with future step-ups | ||||||||||||||||||||||||||||||||||||||
| Year of Lease | |||||||||||||||||||||||||||||||||||||||||
| Expiration | $ | $/PSF | $ | $/PSF | |||||||||||||||||||||||||||||||||||||
| 2024 | — | — | — | — | — | — | |||||||||||||||||||||||||||||||||||
| 2025 | 236,990 | 236,990 | 16,418,523 | 69.28 | 16,821,189 | 70.98 | |||||||||||||||||||||||||||||||||||
| 2026 | 23,761 | 14,167 | 460,433 | 32.50 | 477,708 | 33.72 | |||||||||||||||||||||||||||||||||||
| 2027 | 29,618 | 29,618 | 1,893,725 | 63.94 | 2,061,519 | 69.60 | |||||||||||||||||||||||||||||||||||
| 2028 | 249,093 | 151,296 | 12,611,088 | 83.35 | 13,928,457 | 92.06 | |||||||||||||||||||||||||||||||||||
| 2029 | 453,889 | 278,933 | 19,294,164 | 69.17 | 21,630,151 | 77.55 | |||||||||||||||||||||||||||||||||||
| 2030 | 31,341 | 31,341 | 3,246,641 | 103.59 | 3,572,976 | 114.00 | |||||||||||||||||||||||||||||||||||
| 2031 | 7,311 | 7,311 | 478,139 | 65.4 | 587,755 | 80.39 | |||||||||||||||||||||||||||||||||||
| 2032 | 237,933 | 118,967 | 10,135,567 | 85.2 | 12,581,803 | 105.76 | |||||||||||||||||||||||||||||||||||
| 2033 | 186,894 | 93,447 | 6,267,128 | 67.07 | 10,968,762 | 117.38 | |||||||||||||||||||||||||||||||||||
| Thereafter | 520,461 | 510,465 | 38,108,130 | 74.65 | 46,584,200 | 91.26 | |||||||||||||||||||||||||||||||||||
New York
| BXP’s Share | |||||||||||||||||||||||||||||||||||||||||
| Rentable Square Footage Subject to Expiring Leases | Rentable Square Footage Subject to Expiring Leases | Current Annualized Rental Obligations Under Expiring Leases | Annualized Rental Obligations Under Expiring Leases with future step-ups | ||||||||||||||||||||||||||||||||||||||
| Year of Lease | |||||||||||||||||||||||||||||||||||||||||
| Expiration | $ | $/PSF | $ | $/PSF | |||||||||||||||||||||||||||||||||||||
| 2024 | — | — | — | — | — | — | |||||||||||||||||||||||||||||||||||
| 2025 | 673,763 | 366,803 | 40,007,028 | 109.07 | 39,938,883 | 108.88 | |||||||||||||||||||||||||||||||||||
| 2026 | 169,798 | 127,149 | 23,209,090 | 182.54 | 24,661,251 | 193.96 | |||||||||||||||||||||||||||||||||||
| 2027 | 199,050 | 159,151 | 16,512,122 | 103.75 | 14,200,192 | 89.22 | |||||||||||||||||||||||||||||||||||
| 2028 | 575,313 | 379,113 | 38,832,286 | 102.43 | 39,898,947 | 105.24 | |||||||||||||||||||||||||||||||||||
| 2029 | 737,810 | 650,405 | 69,691,693 | 107.15 | 72,464,806 | 111.41 | |||||||||||||||||||||||||||||||||||
| 2030 | 786,578 | 721,451 | 69,426,149 | 96.23 | 74,535,741 | 103.31 | |||||||||||||||||||||||||||||||||||
| 2031 | 229,746 | 171,796 | 21,858,433 | 127.24 | 23,603,701 | 137.39 | |||||||||||||||||||||||||||||||||||
| 2032 | 214,973 | 123,642 | 11,183,006 | 90.45 | 11,681,598 | 94.48 | |||||||||||||||||||||||||||||||||||
| 2033 | 347,549 | 311,287 | 37,953,228 | 121.92 | 41,472,793 | 133.23 | |||||||||||||||||||||||||||||||||||
| Thereafter | 5,471,831 | 3,713,555 | 402,052,560 | 108.27 | 456,158,649 | 122.84 | |||||||||||||||||||||||||||||||||||
52
| Q4 2024 | ||||
Lease expirations - CBD properties (continued) 1, 2, 3 | |||||
as of December 31, 2024
San Francisco
| BXP’s Share | |||||||||||||||||||||||||||||||||||||||||
| Rentable Square Footage Subject to Expiring Leases | Rentable Square Footage Subject to Expiring Leases | Current Annualized Rental Obligations Under Expiring Leases | Annualized Rental Obligations Under Expiring Leases with future step-ups | ||||||||||||||||||||||||||||||||||||||
| Year of Lease | |||||||||||||||||||||||||||||||||||||||||
| Expiration | $ | $/PSF | $ | $/PSF | |||||||||||||||||||||||||||||||||||||
| 2024 | 99,697 | 99,697 | 9,026,283 | 90.54 | 9,026,283 | 90.54 | 4 | ||||||||||||||||||||||||||||||||||
| 2025 | 223,635 | 223,635 | 20,025,376 | 89.54 | 20,107,885 | 89.91 | |||||||||||||||||||||||||||||||||||
| 2026 | 434,367 | 434,367 | 42,320,193 | 97.43 | 43,037,344 | 99.08 | |||||||||||||||||||||||||||||||||||
| 2027 | 448,981 | 448,981 | 46,138,081 | 102.76 | 48,346,615 | 107.68 | |||||||||||||||||||||||||||||||||||
| 2028 | 553,216 | 553,216 | 54,032,613 | 97.67 | 57,968,451 | 104.78 | |||||||||||||||||||||||||||||||||||
| 2029 | 322,311 | 322,311 | 34,240,693 | 106.23 | 38,102,736 | 118.22 | |||||||||||||||||||||||||||||||||||
| 2030 | 326,685 | 326,685 | 29,938,341 | 91.64 | 34,518,129 | 105.66 | |||||||||||||||||||||||||||||||||||
| 2031 | 913,399 | 913,399 | 99,765,419 | 109.22 | 109,095,817 | 119.44 | |||||||||||||||||||||||||||||||||||
| 2032 | 288,102 | 288,102 | 23,563,531 | 81.79 | 28,756,468 | 99.81 | |||||||||||||||||||||||||||||||||||
| 2033 | 671,219 | 671,219 | 70,227,779 | 104.63 | 79,701,912 | 118.74 | |||||||||||||||||||||||||||||||||||
| Thereafter | 354,250 | 354,250 | 31,536,734 | 89.02 | 43,389,688 | 122.48 | |||||||||||||||||||||||||||||||||||
Seattle, WA
| BXP’s Share | |||||||||||||||||||||||||||||||||||||||||
| Rentable Square Footage Subject to Expiring Leases | Rentable Square Footage Subject to Expiring Leases | Current Annualized Rental Obligations Under Expiring Leases | Annualized Rental Obligations Under Expiring Leases with future step-ups | ||||||||||||||||||||||||||||||||||||||
| Year of Lease | |||||||||||||||||||||||||||||||||||||||||
| Expiration | $ | $/PSF | $ | $/PSF | |||||||||||||||||||||||||||||||||||||
| 2024 | — | — | — | — | — | — | |||||||||||||||||||||||||||||||||||
| 2025 | 134,144 | 80,467 | 4,942,672 | 61.42 | 4,961,755 | 61.66 | |||||||||||||||||||||||||||||||||||
| 2026 | 70,296 | 66,983 | 4,118,830 | 61.49 | 4,256,990 | 63.55 | |||||||||||||||||||||||||||||||||||
| 2027 | 77,785 | 74,224 | 4,448,651 | 59.94 | 4,635,712 | 62.46 | |||||||||||||||||||||||||||||||||||
| 2028 | 593,615 | 294,678 | 16,780,942 | 56.95 | 17,745,703 | 60.22 | |||||||||||||||||||||||||||||||||||
| 2029 | 210,728 | 189,926 | 10,447,904 | 55.01 | 10,832,977 | 57.04 | |||||||||||||||||||||||||||||||||||
| 2030 | 33,054 | 33,054 | 2,047,766 | 61.95 | 2,257,566 | 68.30 | |||||||||||||||||||||||||||||||||||
| 2031 | 7,790 | 4,645 | 286,552 | 61.70 | 329,424 | 70.93 | |||||||||||||||||||||||||||||||||||
| 2032 | 64,737 | 51,388 | 3,864,087 | 75.19 | 4,559,063 | 88.72 | |||||||||||||||||||||||||||||||||||
| 2033 | — | — | — | — | — | — | |||||||||||||||||||||||||||||||||||
| Thereafter | 40,529 | 13,646 | 962,285 | 70.52 | 1,208,814 | 88.58 | |||||||||||||||||||||||||||||||||||
Washington, DC
| BXP’s Share | |||||||||||||||||||||||||||||||||||||||||
| Rentable Square Footage Subject to Expiring Leases | Rentable Square Footage Subject to Expiring Leases | Current Annualized Rental Obligations Under Expiring Leases | Annualized Rental Obligations Under Expiring Leases with future step-ups | ||||||||||||||||||||||||||||||||||||||
| Year of Lease | |||||||||||||||||||||||||||||||||||||||||
| Expiration | $ | $/PSF | $ | $/PSF | |||||||||||||||||||||||||||||||||||||
| 2024 | 261,046 | 261,046 | 12,853,704 | 49.24 | 12,853,704 | 49.24 | 4,5 | ||||||||||||||||||||||||||||||||||
| 2025 | 186,767 | 175,597 | 11,893,356 | 67.73 | 11,999,518 | 68.34 | |||||||||||||||||||||||||||||||||||
| 2026 | 336,690 | 270,803 | 17,764,481 | 65.60 | 18,241,044 | 67.36 | |||||||||||||||||||||||||||||||||||
| 2027 | 425,351 | 420,183 | 23,855,682 | 56.77 | 25,208,782 | 59.99 | |||||||||||||||||||||||||||||||||||
| 2028 | 380,690 | 247,345 | 18,087,871 | 73.13 | 20,216,600 | 81.73 | |||||||||||||||||||||||||||||||||||
| 2029 | 307,058 | 280,107 | 17,466,838 | 62.36 | 19,970,946 | 71.30 | |||||||||||||||||||||||||||||||||||
| 2030 | 191,069 | 168,479 | 10,633,617 | 63.12 | 11,969,081 | 71.04 | |||||||||||||||||||||||||||||||||||
| 2031 | 226,850 | 215,432 | 13,795,320 | 64.04 | 15,388,932 | 71.43 | |||||||||||||||||||||||||||||||||||
| 2032 | 850,930 | 830,119 | 56,554,355 | 68.13 | 64,996,604 | 78.30 | |||||||||||||||||||||||||||||||||||
| 2033 | 1,058,812 | 1,053,088 | 57,426,463 | 54.53 | 71,025,097 | 67.44 | |||||||||||||||||||||||||||||||||||
| Thereafter | 3,721,259 | 3,338,325 | 202,431,972 | 60.64 | 253,687,110 | 75.99 | |||||||||||||||||||||||||||||||||||
_____________
1For the Company’s definitions and related disclosures, see the Definitions section of this Supplemental package starting on page 57.
2Includes partially placed in-service leased space. Does not include residential units and hotel.
3Does not include data for leases expiring in a particular year when leases for the same space have already been signed with replacement clients with future commencement dates. In those cases, the data is included in the year in which the future lease expires.
4Includes square feet expiring on the last day of the current quarter.
5Includes 261,046 square feet related to Reston Corporate Center which was taken out of service on January 1, 2025.
53
| Q4 2024 | ||||
Lease expirations - Suburban properties 1, 2, 3 | |||||
as of December 31, 2024
Boston
| BXP’s Share | |||||||||||||||||||||||||||||||||||||||||
| Rentable Square Footage Subject to Expiring Leases | Rentable Square Footage Subject to Expiring Leases | Current Annualized Rental Obligations Under Expiring Leases | Annualized Rental Obligations Under Expiring Leases with future step-ups | ||||||||||||||||||||||||||||||||||||||
| Year of Lease | |||||||||||||||||||||||||||||||||||||||||
| Expiration | $ | $/PSF | $ | $/PSF | |||||||||||||||||||||||||||||||||||||
| 2024 | 21,123 | 21,123 | 1,051,441 | 49.78 | 1,051,441 | 49.78 | 4 | ||||||||||||||||||||||||||||||||||
| 2025 | 747,797 | 747,797 | 39,790,540 | 53.21 | 39,893,043 | 53.35 | |||||||||||||||||||||||||||||||||||
| 2026 | 152,047 | 152,047 | 10,620,573 | 69.85 | 10,838,483 | 71.28 | |||||||||||||||||||||||||||||||||||
| 2027 | 220,114 | 220,114 | 13,169,967 | 59.83 | 13,622,566 | 61.89 | |||||||||||||||||||||||||||||||||||
| 2028 | 243,313 | 243,313 | 13,581,465 | 55.82 | 14,381,713 | 59.11 | |||||||||||||||||||||||||||||||||||
| 2029 | 514,384 | 514,384 | 25,715,577 | 49.99 | 28,809,116 | 56.01 | |||||||||||||||||||||||||||||||||||
| 2030 | 172,107 | 172,107 | 9,580,586 | 55.67 | 9,896,781 | 57.50 | |||||||||||||||||||||||||||||||||||
| 2031 | 571,925 | 511,585 | 34,084,454 | 66.63 | 36,828,875 | 71.99 | |||||||||||||||||||||||||||||||||||
| 2032 | 239,630 | 239,630 | 19,962,525 | 83.31 | 23,173,451 | 96.71 | |||||||||||||||||||||||||||||||||||
| 2033 | 231,547 | 231,547 | 14,177,896 | 61.23 | 16,397,923 | 70.82 | |||||||||||||||||||||||||||||||||||
| Thereafter | 504,889 | 504,889 | 32,709,343 | 64.79 | 39,283,234 | 77.81 | |||||||||||||||||||||||||||||||||||
New York
| BXP’s Share | |||||||||||||||||||||||||||||||||||||||||
| Rentable Square Footage Subject to Expiring Leases | Rentable Square Footage Subject to Expiring Leases | Current Annualized Rental Obligations Under Expiring Leases | Annualized Rental Obligations Under Expiring Leases with future step-ups | ||||||||||||||||||||||||||||||||||||||
| Year of Lease | |||||||||||||||||||||||||||||||||||||||||
| Expiration | $ | $/PSF | $ | $/PSF | |||||||||||||||||||||||||||||||||||||
| 2024 | — | — | — | — | — | — | |||||||||||||||||||||||||||||||||||
| 2025 | 156,751 | 156,751 | 6,233,011 | 39.76 | 6,236,798 | 39.79 | |||||||||||||||||||||||||||||||||||
| 2026 | 308,457 | 308,457 | 12,690,780 | 41.14 | 12,930,747 | 41.92 | |||||||||||||||||||||||||||||||||||
| 2027 | 211,705 | 211,705 | 8,065,345 | 38.10 | 8,277,203 | 39.10 | |||||||||||||||||||||||||||||||||||
| 2028 | 62,676 | 62,676 | 2,379,927 | 37.97 | 2,486,939 | 39.68 | |||||||||||||||||||||||||||||||||||
| 2029 | 196,990 | 196,990 | 7,033,803 | 35.71 | 7,463,660 | 37.89 | |||||||||||||||||||||||||||||||||||
| 2030 | 57,747 | 57,747 | 2,224,737 | 38.53 | 2,361,568 | 40.90 | |||||||||||||||||||||||||||||||||||
| 2031 | 161,765 | 161,765 | 6,628,471 | 40.98 | 6,945,163 | 42.93 | |||||||||||||||||||||||||||||||||||
| 2032 | 55,310 | 55,310 | 2,087,421 | 37.74 | 2,281,006 | 41.24 | |||||||||||||||||||||||||||||||||||
| 2033 | 19,431 | 19,431 | 744,865 | 38.33 | 822,589 | 42.33 | |||||||||||||||||||||||||||||||||||
| Thereafter | 267,707 | 267,707 | 10,404,057 | 38.86 | 11,843,507 | 44.24 | |||||||||||||||||||||||||||||||||||
San Francisco
| BXP’s Share | |||||||||||||||||||||||||||||||||||||||||
| Rentable Square Footage Subject to Expiring Leases | Rentable Square Footage Subject to Expiring Leases | Current Annualized Rental Obligations Under Expiring Leases | Annualized Rental Obligations Under Expiring Leases with future step-ups | ||||||||||||||||||||||||||||||||||||||
| Year of Lease | |||||||||||||||||||||||||||||||||||||||||
| Expiration | $ | $/PSF | $ | $/PSF | |||||||||||||||||||||||||||||||||||||
| 2024 | 6,529 | 3,265 | 263,428 | 80.69 | 263,428 | 80.69 | 4 | ||||||||||||||||||||||||||||||||||
| 2025 | 336,841 | 298,259 | 21,698,540 | 72.75 | 21,899,855 | 73.43 | |||||||||||||||||||||||||||||||||||
| 2026 | 186,385 | 95,293 | 9,998,236 | 104.92 | 10,173,255 | 106.76 | |||||||||||||||||||||||||||||||||||
| 2027 | 128,192 | 117,228 | 8,830,622 | 75.33 | 9,123,076 | 77.82 | |||||||||||||||||||||||||||||||||||
| 2028 | 127,205 | 97,170 | 4,717,148 | 48.55 | 5,113,070 | 52.62 | |||||||||||||||||||||||||||||||||||
| 2029 | 160,271 | 100,068 | 5,277,533 | 52.74 | 5,958,695 | 59.55 | |||||||||||||||||||||||||||||||||||
| 2030 | 115,045 | 103,432 | 6,473,749 | 62.59 | 7,043,220 | 68.10 | |||||||||||||||||||||||||||||||||||
| 2031 | 60,122 | 30,061 | 1,647,006 | 54.79 | 1,936,031 | 64.40 | |||||||||||||||||||||||||||||||||||
| 2032 | 66,037 | 33,019 | 2,107,682 | 63.83 | 2,377,448 | 72.00 | |||||||||||||||||||||||||||||||||||
| 2033 | — | — | — | — | — | — | |||||||||||||||||||||||||||||||||||
| Thereafter | 230,592 | 112,990 | 10,565,215 | 93.51 | 13,945,621 | 123.42 | |||||||||||||||||||||||||||||||||||
54
| Q4 2024 | ||||
Lease expirations - Suburban properties (continued) 1, 2, 3 | |||||
as of December 31, 2024
Washington, DC
| BXP’s Share | |||||||||||||||||||||||||||||||||||||||||
| Rentable Square Footage Subject to Expiring Leases | Rentable Square Footage Subject to Expiring Leases | Current Annualized Rental Obligations Under Expiring Leases | Annualized Rental Obligations Under Expiring Leases with future step-ups | ||||||||||||||||||||||||||||||||||||||
| Year of Lease | |||||||||||||||||||||||||||||||||||||||||
| Expiration | $ | $/PSF | $ | $/PSF | |||||||||||||||||||||||||||||||||||||
| 2024 | — | — | — | — | — | — | |||||||||||||||||||||||||||||||||||
| 2025 | 30,051 | 30,051 | 1,256,034 | 41.80 | 1,278,018 | 42.53 | |||||||||||||||||||||||||||||||||||
| 2026 | 17,965 | 17,965 | 741,299 | 41.26 | 763,419 | 42.49 | |||||||||||||||||||||||||||||||||||
| 2027 | 15,576 | 15,576 | 822,924 | 52.83 | 832,443 | 53.44 | |||||||||||||||||||||||||||||||||||
| 2028 | 2,575 | 2,575 | 211,129 | 81.99 | 224,905 | 87.34 | |||||||||||||||||||||||||||||||||||
| 2029 | 2,653 | 2,653 | 103,110 | 38.87 | 116,324 | 43.85 | |||||||||||||||||||||||||||||||||||
| 2030 | 23,985 | 23,985 | 1,020,177 | 42.53 | 1,053,765 | 43.93 | |||||||||||||||||||||||||||||||||||
| 2031 | 2,270 | 2,270 | 126,244 | 55.61 | 136,232 | 60.01 | |||||||||||||||||||||||||||||||||||
| 2032 | — | — | — | — | — | — | |||||||||||||||||||||||||||||||||||
| 2033 | 71,744 | 71,744 | 1,786,238 | 24.90 | 1,804,678 | 25.15 | |||||||||||||||||||||||||||||||||||
| Thereafter | 8,462 | 8,462 | 327,449 | 38.70 | 407,315 | 48.13 | |||||||||||||||||||||||||||||||||||
_____________
1For the Company’s definitions and related disclosures, see the Definitions section of this Supplemental package starting on page 57.
2Includes partially placed in-service leased space. Does not include residential units and hotel.
3Does not include data for leases expiring in a particular year when leases for the same space have already been signed with replacement clients with future commencement dates. In those cases, the data is included in the year in which the future lease expires.
4Includes square feet expiring on the last day of the current quarter.
55
| Q4 2024 | ||||
| Research coverage | |||||
With the exception of Green Street Advisors, an independent research firm, the equity analysts listed below are those analysts that, according to Thomson Reuters Corporation, have published research material on the Company and are listed as covering the Company. Please note that any opinions, estimates or forecasts regarding the Company’s performance made by the analysts listed below do not represent the opinions, estimates or forecasts of the Company or its management. The Company does not by its reference below imply its endorsement of or concurrence with any information, conclusions or recommendations made by any of such analysts.
| Equity Research Coverage | |||||||||||
| Bank of America Merrill Lynch | Jeffrey Spector | 646.855.1363 | |||||||||
| Barclays | Brendan Lynch | 212.526.9428 | |||||||||
| BMO Capital | John Kim | 212.885.4115 | |||||||||
| BTIG | Tom Catherwood | 212.738.6140 | |||||||||
| Citi | Nicholas Joseph / Michael Griffin | 212.816.1909 / 212.816.5871 | |||||||||
| Compass Point Research & Trading, LLC | Floris van Dijkum | 646.757.2621 | |||||||||
| Deutsche Bank | Omotayo Okusanya | 212.250.9284 | |||||||||
| Evercore ISI | Steve Sakwa | 212.446.9462 | |||||||||
| Goldman Sachs | Caitlin Burrows | 212.902.4736 | |||||||||
| Green Street Advisors | Dylan Burzinski | 949.640.8780 | |||||||||
| J.P. Morgan Securities | Anthony Paolone | 212.622.6682 | |||||||||
| Keybanc Capital Market | Todd Thomas/Upal Rana | 917.368.2286 / 917.368.2316 | |||||||||
| Mizuho Securities | Vikram Malhotra | 212.209.9300 | |||||||||
| Morgan Stanley | Ronald Kamdem | 212.296.8319 | |||||||||
| Piper Sandler Companies | Alexander Goldfarb | 212.466.7937 | |||||||||
| Scotiabank GBM | Nicholas Yulico | 212.225.6904 | |||||||||
| Truist Securities | Michael Lewis | 212.319.5659 | |||||||||
| UBS US Equity Research | Michael Goldsmith | 212.713.2951 | |||||||||
| Wedbush | Richard Anderson | 212.938.9949 | |||||||||
| Wells Fargo Securities | Blaine Heck | 410.662.2556 | |||||||||
| Wolfe Research | Andrew Rosivach | 646.582.9250 | |||||||||
| Debt Research Coverage | |||||||||||
| Barclays | Srinjoy Banerjee | 212.526.3521 | |||||||||
| J.P. Morgan Securities | Mark Streeter | 212.834.5086 | |||||||||
| US Bank | Bill Stafford | 877.558.2605 | |||||||||
| Wells Fargo | Kevin McClure | 704.410.1100 | |||||||||
| Rating Agencies | |||||||||||
| Moody’s Investors Service | Christian Azzi | 212.553.7718 | |||||||||
| Standard & Poor’s | Michael Souers | 212.438.2508 | |||||||||
56
| Q4 2024 | ||||
| Definitions | |||||
This section contains definitions of certain non-GAAP financial measures and other terms that the Company uses in this Supplemental report and, if applicable, the reasons why management believes these non-GAAP financial measures provide useful information to investors about the Company’s financial condition and results of operations and the other purposes for which management uses the measures. Additional detail can be found in the Company’s most recent annual report on Form 10-K and quarterly report on Form 10-Q, as well as other documents the Company files or furnishes to the SEC from time to time.
The Company also presents “BXP’s Share” of certain of these measures, which are non-GAAP financial measures that are calculated as the consolidated amount calculated in accordance with GAAP, plus the Company’s share of the amount from the Company’s unconsolidated joint ventures (calculated based upon the Company’s percentage ownership interest and, in some cases, after priority allocations), minus the Company’s partners’ share of the amount from the Company’s consolidated joint ventures (calculated based upon the partners’ percentage ownership interests and, in some cases, after income allocation to private REIT shareholders and their share of fees due to the Company). Management believes that presenting “BXP’s Share” of these measures provides useful information to investors regarding the Company’s financial condition and/or results of operations because the Company has several significant joint ventures and, in some cases, the Company exercises significant influence over, but does not control, the joint venture, in which case GAAP requires that the Company account for the joint venture entity using the equity method of accounting and the Company does not consolidate it for financial reporting purposes. In other cases, GAAP requires that the Company consolidate the venture even though the Company’s partner(s) owns a significant percentage interest. As a result, management believes that presenting BXP’s Share of various financial measures in this manner can help investors better understand the Company’s financial condition and/or results of operations after taking into account its true economic interest in these joint ventures. The Company cautions investors that the ownership percentages used in calculating “BXP’s Share” of these measures may not completely and accurately depict all of the legal and economic implications of holding an interest in a consolidated or unconsolidated joint venture. For example, in addition to partners’ interests in profits and capital, venture agreements vary in the allocation of rights regarding decision making (both routine and major decisions), distributions, transferability of interests, financings and guarantees, liquidations and other matters. As a result, presentations of “BXP’s Share” of a financial measure should not be considered a substitute for, and should only be considered together with and as a supplement to, the Company’s financial information presented in accordance with GAAP. Unless noted otherwise, reconciliations of “BXP’s Share” of these financial measures can be found in the Reconciliations section of this Supplemental package starting on page 61.
The Company may also present "BXP's Share" of certain operating metrics, such as occupancy and leased percentages based upon square footage. Amounts are calculated based on our consolidated portfolio square feet, plus our share of the square feet from the unconsolidated joint venture properties (calculated based on our ownership percentage), minus our partners’ share of square feet from our consolidated joint venture properties (calculated based upon the partners’ percentage ownership interests).
Annualized Rental Obligations
Annualized Rental Obligations is defined as monthly Rental Obligations, as of the last day of the reporting period, multiplied by twelve (12).
Average Economic Occupancy
Average Economic Occupancy is defined as (1) total possible revenue less vacancy loss divided by (2) total possible revenue, expressed as a percentage. Total possible revenue is determined by valuing average occupied units at contract rates and average vacant units at Market Rents. Vacancy loss is determined by valuing vacant units at current Market Rents. By measuring vacant units at their Market Rents, Average Economic Occupancy takes into account the fact that units of different sizes and locations within a residential property have different economic impacts on a residential property’s total possible gross revenue.
Average Monthly Rental Rates
Average Monthly Rental Rates are calculated by the Company as the average of the quotients obtained by dividing (A) rental revenue as determined in accordance with GAAP by (B) the number of occupied units for each month within the applicable fiscal period.
Average Physical Occupancy
Average Physical Occupancy is defined as (1) the average number of occupied units divided by (2) the total number of units, expressed as a percentage.
Debt to Market Capitalization Ratio
Consolidated Debt to Consolidated Market Capitalization Ratio is a measure of leverage commonly used by analysts in the REIT sector that equals the quotient of (A) the Company’s Consolidated Debt divided by (B) the Company’s Consolidated Market Capitalization, presented as a percentage. Consolidated Market Capitalization is the sum of (x) the Company’s Consolidated Debt plus (y) the market value of the Company’s outstanding equity securities calculated using the closing price per share of common stock of the Company, as reported by the New York Stock Exchange, multiplied by the sum of (1) outstanding shares of common stock of the Company, (2) outstanding common units of limited partnership interest in Boston Properties Limited Partnership (excluding common units held by the Company), (3) common units issuable upon conversion of all outstanding LTIP Units, assuming all conditions have been met for the conversion of the LTIP Units, (4) common units issuable upon conversion of 2012 OPP Units that were issued in the form of LTIP Units, and (5) common units issuable upon conversion of 2013-2021 MYLTIP Units that were issued in the form of LTIP Units. The calculation of Consolidated Market Capitalization does not include LTIP Units issued in the form of MYLTIP Awards unless and until certain performance thresholds are achieved and they are earned. Because their three-year performance periods have not yet ended, 2022, 2023 and 2024 MYLTIP Units are not included.
The Company also presents BXP’s Share of Market Capitalization, which is calculated in a similar manner, except that BXP’s Share of Debt is utilized instead of the Company’s Consolidated Debt in both the numerator and the denominator. The Company presents these ratios because its degree of leverage could affect its ability to obtain additional financing for working capital, capital expenditures, acquisitions, development or other general corporate purposes and because different investors and lenders consider one or both of these ratios. Investors should understand that these ratios are, in part, a function of the market price of the common stock of the Company, and as such will fluctuate with changes in such price and do not necessarily reflect the Company’s capacity to incur additional debt to finance its activities or its ability to manage its existing debt obligations. However, for a company like BXP, Inc., whose assets are primarily income-producing real estate, these ratios may provide investors with an alternate indication of leverage, so long as they are evaluated along with the ratio of indebtedness to other measures of asset value used by financial analysts and other financial ratios, as well as the various components of the Company’s outstanding indebtedness.
57
| Q4 2024 | ||||
| Definitions (continued) | |||||
Earnings Before Interest, Taxes, Depreciation and Amortization for Real Estate (EBITDAre)
Pursuant to the definition of Earnings Before Interest, Taxes, Depreciation and Amortization for Real Estate adopted by the Board of Governors of the National Association of Real Estate Investment Trusts (“Nareit”), the Company calculates EBITDAre as net income (loss) attributable to BXP, Inc, the most directly comparable GAAP financial measure, plus net (income) loss attributable to noncontrolling interests, interest expense, losses (gains) from early extinguishments of debt, depreciation and amortization expense, impairment loss and adjustments to reflect the Company’s share of EBITDAre from unconsolidated joint ventures less gains (losses) on sales of real estate and sales-type leases. EBITDAre is a non-GAAP financial measure. The Company uses EBITDAre internally as a performance measure and believes EBITDAre provides useful information to investors regarding its financial condition and results of operations at the corporate level because, when compared across periods, EBITDAre reflects the impact on operations from trends in occupancy rates, rental rates, operating costs, general and administrative expenses and acquisition and development activities on an unleveraged basis, providing perspective not immediately apparent from net income (loss) attributable to BXP, Inc.
In some cases the Company also presents (A) BXP’s Share of EBITDAre – cash, which is BXP’s Share of EBITDAre after eliminating the effects of straight-line rent (excluding the impact related to deferred revenue related to improvements to long-lived assets paid for by a client), fair value lease revenue, amortization and accretion of sales type lease receivable, non-cash termination income adjustment (fair value lease amounts) and non-cash gains (losses) from early extinguishment of debt and adding straight-line ground rent expense (excluding prepaid ground rent expense), stock-based compensation expense and lease transaction costs that qualify as rent inducements, and (B) Annualized EBITDAre, which is EBITDAre for the applicable fiscal quarter ended multiplied by four (4). Presenting BXP’s Share of EBITDAre – cash allows investors to compare EBITDAre across periods without taking into account the effect of certain non-cash rental revenues, ground rent expense and stock based compensation expense. Similar to depreciation and amortization, because of historical cost accounting, fair value lease revenue may distort operating performance measures at the property level. Additionally, presenting EBITDAre excluding the impact of straight-line rent provides investors with an alternative view of operating performance at the property level that more closely reflects rental revenue generated at the property level without regard to future contractual increases in rental rates. In addition, the Company’s management believes that the presentation of Annualized EBITDAre provides useful information to investors regarding the Company’s results of operations because it enables investors to more easily compare quarterly EBITDAre to EBITDAre from full fiscal years.
The Company’s computation of EBITDAre may not be comparable to EBITDAre reported by other REITs or real estate companies that do not define the term in accordance with the current Nareit definition or that interpret the current Nareit definition differently. The Company believes that in order to facilitate a clear understanding of its operating results, EBITDAre should be examined in conjunction with net income (loss) attributable to BXP, Inc. as presented in the Company’s consolidated financial statements. EBITDAre should not be considered a substitute to net income (loss) attributable to BXP, Inc. in accordance with GAAP or any other GAAP financial measures and should only be considered together with and as a supplement to the Company’s financial information prepared in accordance with GAAP.
Fixed Charge Coverage Ratio
Fixed Charge Coverage Ratio equals BXP’s Share of EBITDAre – cash divided by Total Fixed Charges. BXP’s Share of EBITDAre – cash is a non-GAAP financial measure equal to BXP’s Share of EBITDAre after eliminating the effects of straight-line rent (excluding the impact related to deferred revenue related to improvements to long-lived assets paid for by a client), fair value lease revenue, amortization and accretion related to sales type lease receivable, non-cash termination income adjustment (fair value lease amounts) and non-cash gains (losses) from early extinguishment of debt and adding straight-line ground rent expense, stock-based compensation expense and lease transaction costs that qualify as rent inducements. Total Fixed Charges is also a non-GAAP financial measure equal to the sum of BXP’s Share of interest expense, capitalized interest, maintenance capital expenditures, hotel improvements, equipment upgrades and replacements and preferred dividends/distributions less hedge amortization and amortization of financing costs. The Company believes that the presentation of its Fixed Charge Coverage Ratio provides investors with useful information about the Company’s financial performance as it relates to overall financial flexibility and balance sheet management. Furthermore, the Company believes that the Fixed Charge Coverage Ratio is frequently used by analysts, rating agencies and other interested parties in the evaluation of the Company’s performance as a REIT and, as a result, by presenting the Fixed Charge Coverage Ratio the Company assists these parties in their evaluations. The Company’s calculation of its Fixed Charge Coverage Ratio may not be comparable to the ratios reported by other REITs or real estate companies that define the term differently and should only be considered together with and as a supplement to the Company’s financial information prepared in accordance with GAAP. For clarification purposes, this ratio does not include gains (losses) from early extinguishments of debt.
Funds Available for Distribution (FAD) and FAD Payout Ratio
In addition to FFO, which is defined on the following page, the Company presents Funds Available for Distribution to common shareholders and common unitholders (FAD), which is a non-GAAP financial measure that is calculated by (1) adding to FFO lease transaction costs that qualify as rent inducements, non-real estate depreciation and amortization, non-cash losses (gains) from early extinguishments of debt, stock-based compensation expense, partners’ share of consolidated and unconsolidated joint venture 2nd generation tenant improvement and leasing commissions (included in the period in which the lease commences) and unearned portion of capitalized fees, (2) eliminating the effects of straight-line rent, straight-line ground rent expense adjustment (excluding prepaid ground rent expense), hedge amortization, fair value interest adjustment, fair value lease revenue and amortization and accretion related to sales type lease receivable, and (3) subtracting maintenance capital expenditures, hotel improvements, equipment upgrades and replacements, 2nd generation tenant improvement and leasing commissions (included in the period in which the lease commences), non-cash termination income adjustment (fair value lease amounts) and impairments of non-depreciable real estate. The Company believes that the presentation of FAD provides useful information to investors regarding the Company’s results of operations because FAD provides supplemental information regarding the Company’s operating performance that would not otherwise be available and may be useful to investors in assessing the Company’s operating performance. Additionally, although the Company does not consider FAD to be a liquidity measure, as it does not make adjustments to reflect changes in working capital or the actual timing of the payment of income or expense items that are accrued in the period, the Company believes that FAD may provide investors with useful supplemental information regarding the Company’s ability to generate cash from its operating performance and the impact of the Company’s operating performance on its ability to make distributions to its shareholders. Furthermore, the Company believes that FAD is frequently used by analysts, investors and other interested parties in the evaluation of its performance as a REIT and, as a result, by presenting FAD the Company is assisting these parties in their evaluation. FAD should not be considered as a substitute for net income (loss) attributable to BXP, Inc.’s co determined in accordance with GAAP or any other GAAP financial measures and should only be considered together with and as a supplement to the Company’s financial information prepared in accordance with GAAP.
FAD Payout Ratio is defined as distributions to common shareholders and unitholders (excluding any special distributions) divided by FAD.
58
| Q4 2024 | ||||
| Definitions (continued) | |||||
Funds from Operations (FFO)
Pursuant to the revised definition of Funds from Operations adopted by the Board of Governors of Nareit, the Company calculates Funds from Operations, or “FFO,” by adjusting net income (loss) attributable to BXP, Inc. (computed in accordance with GAAP) for gains (or losses) from sales of properties or a change in control, impairment losses on depreciable real estate consolidated on the Company’s balance sheet, impairment losses on its investments in unconsolidated joint ventures driven by a measurable decrease in the fair value of depreciable real estate held by the unconsolidated joint ventures and real estate-related depreciation and amortization. FFO is a non-GAAP financial measure, but the Company believes the presentation of FFO, combined with the presentation of required GAAP financial measures, has improved the understanding of operating results of REITs among the investing public and has helped make comparisons of REIT operating results more meaningful. Management generally considers FFO and FFO per share to be useful measures for understanding and comparing the Company’s operating results because, by excluding gains and losses related to sales or a change in control of previously depreciated operating real estate assets, impairment losses and real estate asset depreciation and amortization (which can differ across owners of similar assets in similar condition based on historical cost accounting and useful life estimates), FFO and FFO per share can help investors compare the operating performance of a company’s real estate across reporting periods and to the operating performance of other companies.
The Company’s computation of FFO may not be comparable to FFO reported by other REITs or real estate companies that do not define the term in accordance with the current Nareit definition or that interpret the current Nareit definition differently. In order to facilitate a clear understanding of the Company’s operating results, FFO should be examined in conjunction with net income (loss) attributable to BXP, Inc. as presented in the Company’s consolidated financial statements. FFO should not be considered as a substitute for net income (loss) attributable to BXP, Inc. (determined in accordance with GAAP) or any other GAAP financial measures and should only be considered together with and as a supplement to the Company’s financial information prepared in accordance with GAAP.
In-Service Properties
The Company treats a property as being “in-service” upon the earlier of (1) lease-up and completion of tenant improvements or (2) one year after cessation of major construction activity as determined under GAAP. The determination as to when an entire property should be treated as “in-service” involves a degree of judgment and is made by management based on the relevant facts and circumstances of the particular property. For portfolio operating and occupancy statistics, the Company specifies a single date for treating a property as “in-service,” which is generally later than the date the property is partially placed in-service under GAAP. Under GAAP, a property may be placed in-service in stages as construction is completed and the property is held available for occupancy. In addition, under GAAP, when a portion of a property has been substantially completed and either occupied or held available for occupancy, the Company ceases capitalizing costs on that portion, even though it may not treat the property as being “in-service,” and continues to capitalize only those costs associated with the portion still under construction. In-service properties include properties held by the Company’s unconsolidated joint ventures. A property will no longer be considered “in-service” when the occupied percentage is below 50% and the Company is no longer actively leasing the property in anticipation of a future development/redevelopment.
Interest Coverage Ratio
Interest Coverage Ratio, calculated including and excluding capitalized interest, is a non-GAAP financial measure equal to BXP’s Share of EBITDAre – cash divided by Adjusted interest expense. BXP’s Share of EBITDAre – cash is a non-GAAP financial measure equal to BXP’s Share of EBITDAre after eliminating the effects of straight-line rent (excluding the impact related to deferred revenue related to improvements to long-lived assets paid for by a client), fair value lease revenue, amortization and accretion related to sales type lease receivable, non-cash termination income adjustment (fair value lease amounts) and non-cash gains (losses) from early extinguishment of debt and adding straight-line ground rent expense (excluding prepaid ground rent expense), stock-based compensation expense and lease transaction costs that qualify as rent inducements. Adjusted interest expense excluding capitalized interest is equal to BXP’s Share of interest expense less (1) BXP’s Share of hedge amortization, (2) BXP’s Share of fair value interest adjustment and (3) BXP’s Share of amortization of financing costs. Adjusted interest expense including capitalized interest is calculated in the same manner but adds back BXP’s Share of capitalized interest. The Company believes that the presentation of its Interest Coverage Ratio provides useful information about the Company’s financial condition because it provides investors additional information on the Company’s ability to meet its debt obligations and incur additional indebtedness. In addition, by analyzing interest coverage ratios over a period of time, trends may emerge that provide investors a better sense of whether a company’s financial condition is improving or declining. The ratios may also be used to compare the financial condition of different companies, which can help when making an investment decision. The Company presents its Interest Coverage Ratio in two ways - including capitalized interest and excluding capitalized interest. GAAP requires the capitalization of interest expense during development. Therefore, for a company like BXP, Inc. that is an active developer of real estate, presenting the Interest Coverage Ratio (excluding capitalized interest) provides an alternative measure of financial condition that may be more indicative of the Company’s ability to meet its interest expense obligations and therefore its overall financial condition. For clarification purposes, this ratio does not include gains (losses) from early extinguishments of debt.
Market Rents
Market Rents used by the Company in calculating Average Economic Occupancy are based on the current market rates set by the managers of the Company’s residential properties based on their experience in renting their residential property’s units and publicly available market data. Trends in market rents for a region as reported by others could therefore vary materially. Market Rents for a period are based on the average Market Rents during that period and do not reflect any impact for cash concessions.
Net Debt
Net Debt is equal to (A) the Company’s consolidated debt plus special dividends payable (if any) less (B) cash and cash equivalents and cash held in escrow for potential Section 1031 like kind exchange(s) (if any). The Company believes that the presentation of Net Debt provides useful information to investors because the Company reviews Net Debt as part of the management of its overall financial flexibility, capital structure and leverage. In particular, Net Debt is an important component of the Company’s ratio of BXP’s Share of Net Debt to BXP’s Share of EBITDAre. BXP’s Share of Net Debt is calculated in a similar manner to Net Debt, except that (1) BXP’s Share of Debt is utilized instead of the Company’s consolidated debt after eliminating BXP’s Share of the related party note receivable and (2) BXP’s Share of cash is utilized instead of consolidated cash. The Company believes BXP’s Share of Net Debt to BXP’s Share of EBITDAre is useful to investors because it provides an alternative measure of the Company’s financial flexibility, capital structure and leverage based on its percentage ownership interest in all of its assets. Furthermore, certain debt rating agencies, creditors and credit analysts monitor the Company’s Net Debt as part of their assessments of its business. The Company may utilize a considerable portion of its cash and cash equivalents at any given time for purposes other than debt reduction. In addition, cash and cash equivalents and cash held in escrow for potential Section 1031 like kind exchange(s) may not be solely controlled by the Company. The deduction of these items from consolidated debt in the calculation of Net Debt therefore should not be understood to mean that these items are available exclusively for debt reduction at any given time.
59
| Q4 2024 | ||||
| Definitions (continued) | |||||
Net Operating Income/(Loss) (NOI)
Net operating income (NOI) is a non-GAAP financial measure equal to net income (loss) attributable to BXP, Inc., the most directly comparable GAAP financial measure, plus (1) net (income) loss attributable to noncontrolling interests, corporate general and administrative expense, payroll and related costs from management services contracts, transaction costs, depreciation and amortization expense, loss from interest rate contracts, and interest expense, less (2) development and management services revenue, direct reimbursements of payroll and related costs from management services contracts, income (loss) from unconsolidated joint ventures, gains on sales of real estate, gains (losses) from investments in securities, unrealized gain (loss) on non-real estate investment, and interest and other income (loss). In some cases, the Company also presents (1) NOI – cash, which is NOI after eliminating the effects of straight-line rent (excluding the impact related to deferred revenue related to improvements to long-lived assets paid for by a client), fair value lease revenue, amortization and accretion related to sales type lease, straight-line ground rent expense adjustment (excluding prepaid ground rent), prepaid ground rent expense and lease transaction costs that qualify as rent inducements in accordance with GAAP, and (2) NOI and NOI – cash, in each case excluding termination income.
The Company uses these measures internally as performance measures and believes they provide useful information to investors regarding the Company’s results of operations and financial condition because, when compared across periods, they reflect the impact on operations from trends in occupancy rates, rental rates, operating costs and acquisition and development activity on an unleveraged basis, providing perspective not immediately apparent from net income. For example, interest expense is not necessarily linked to the operating performance of a real estate asset and is often incurred at the corporate level as opposed to the property level. Similarly, interest expense may be incurred at the property level even though the financing proceeds may be used at the corporate level (e.g., used for other investment activity). In addition, depreciation and amortization expense because of historical cost accounting and useful life estimates, may distort operating performance measures at the property level. Presenting NOI – cash allows investors to compare NOI performance across periods without taking into account the effect of certain non-cash rental revenues, amortization and accretion related to sales type lease receivable and ground rent expenses. Similar to depreciation and amortization expense, fair value lease revenues, because of historical cost accounting, may distort operating performance measures at the property level. Additionally, presenting NOI excluding the impact of the straight-lining of rent and amortization and accretion related to sale type lease receivable provides investors with an alternative view of operating performance at the property level that more closely reflects net cash generated at the property level on an unleveraged basis. Presenting NOI measures that exclude termination income provides investors with additional information regarding operating performance at a property level that allows them to compare operating performance between periods without taking into account termination income, which can distort the results for any given period because they generally represent multiple months or years of a client’s rental obligations that are paid in a lump sum in connection with a negotiated early termination of the client’s lease and are not reflective of the core ongoing operating performance of the Company’s properties.
Rental Obligations
Rental Obligations is defined as the contractual base rents (but excluding percentage rent) and budgeted reimbursements from clients under existing leases. These amounts exclude rent abatements.
Rental Revenue
Rental Revenue is equal to Total revenue, the most directly comparable GAAP financial measure, less development and management services revenue and direct reimbursements of payroll and related costs from management services contracts. The Company uses Rental Revenue internally as a performance measure and in calculating other non-GAAP financial measures (e.g., NOI), which provides investors with information regarding our performance that is not immediately apparent from the comparable non-GAAP measures and allows investors to compare operating performance between periods. The Company also presents Rental Revenue (excluding termination income) because termination income can distort the results for any given period because it generally represents multiple months or years of a client’s rental obligations that are paid in a lump sum in connection with a negotiated early termination of the client’s lease and does not reflect the core ongoing operating performance of the Company’s properties.
Same Properties
In the Company’s analysis of NOI, particularly to make comparisons of NOI between periods meaningful, it is important to provide information for properties that were in-service and owned by the Company throughout each period presented. The Company refers to properties acquired or placed in-service prior to the beginning of the earliest period presented and owned by the Company through the end of the latest period presented as “Same Properties.” “Same Properties” therefore exclude properties placed in-service, acquired, repositioned or in or held for development or redevelopment after the beginning of the earliest period presented or disposed of prior to the end of the latest period presented. Accordingly, it takes at least one year and one quarter after a property is acquired or treated as “in-service” for that property to be included in “Same Properties.” Pages 22 - 25 indicate by footnote the “In-Service Properties” that are not included in “Same Properties.”
60
| Q4 2024 | ||||
| Reconciliations | |||||
(unaudited and in thousands)
| BXP’s Share of select items | |||||||||||
| Three Months Ended | |||||||||||
| 31-Dec-24 | 30-Sep-24 | ||||||||||
| Revenue | $ | 858,571 | $ | 859,227 | |||||||
| Partners’ share of revenue from consolidated joint ventures (JVs) | (82,321) | (79,196) | |||||||||
| BXP’s share of revenue from unconsolidated JVs | 55,128 | 55,067 | |||||||||
| BXP’s Share of revenue | $ | 831,378 | $ | 835,098 | |||||||
| Straight-line rent | $ | 19,732 | $ | 29,578 | |||||||
| Partners’ share of straight-line rent from consolidated JVs | 1,029 | (5,544) | |||||||||
| BXP’s share of straight-line rent from unconsolidated JVs | (154) | 1,399 | |||||||||
| BXP’s Share of straight-line rent | $ | 20,607 | $ | 25,433 | |||||||
Fair value lease revenue 1 | $ | 1,277 | $ | 1,298 | |||||||
Partners’ share of fair value lease revenue from consolidated JVs 1 | 11 | 11 | |||||||||
BXP’s share of fair value lease revenue from unconsolidated JVs 1 | 1,032 | 985 | |||||||||
BXP’s Share of fair value lease revenue 1 | $ | 2,320 | $ | 2,294 | |||||||
| Lease termination income | $ | 914 | $ | 12,120 | |||||||
| Partners’ share of termination income from consolidated JVs | (11) | (18) | |||||||||
| BXP’s share of termination income from unconsolidated JVs | 521 | 77 | |||||||||
| BXP’s Share of termination income | $ | 1,424 | $ | 12,179 | |||||||
| Non-cash termination income adjustment (fair value lease amounts) | $ | — | $ | — | |||||||
| Partners’ share of non-cash termination income adjustment (fair value lease amounts) from consolidated JVs | — | — | |||||||||
| BXP’s share of non-cash termination income adjustment (fair value lease amounts) from unconsolidated JVs | — | — | |||||||||
| BXP’s Share of non-cash termination income adjustment (fair value lease amounts) | $ | — | $ | — | |||||||
| Parking and other revenue | $ | 34,056 | $ | 34,255 | |||||||
| Partners’ share of parking and other revenue from consolidated JVs | (846) | (636) | |||||||||
| BXP’s share of parking and other revenue from unconsolidated JVs | 1,794 | 2,127 | |||||||||
| BXP’s Share of parking and other revenue | $ | 35,004 | $ | 35,746 | |||||||
| Hedge amortization, net of costs | $ | 1,590 | $ | 1,590 | |||||||
| Partners’ share of hedge amortization, net of costs from consolidated JVs | (144) | (144) | |||||||||
| BXP’s share of hedge amortization, net of costs from unconsolidated JVs | 366 | 503 | |||||||||
| BXP’s Share of hedge amortization, net of costs | $ | 1,812 | $ | 1,949 | |||||||
| Straight-line ground rent expense adjustment | $ | 732 | $ | 541 | |||||||
| Partners’ share of straight-line ground rent expense adjustment from consolidated JVs | — | — | |||||||||
| BXP’s share of straight-line ground rent expense adjustment from unconsolidated JVs | 136 | 138 | |||||||||
| BXP’s Share of straight-line ground rent expense adjustment | $ | 868 | $ | 679 | |||||||
| Depreciation and amortization | $ | 226,043 | $ | 222,890 | |||||||
| Noncontrolling interests in property partnerships’ share of depreciation and amortization | (19,905) | (18,857) | |||||||||
| BXP’s share of depreciation and amortization from unconsolidated JVs | 21,097 | 20,757 | |||||||||
| BXP’s Share of depreciation and amortization | $ | 227,235 | $ | 224,790 | |||||||
Lease transaction costs that qualify as rent inducements 2 | $ | 3,512 | $ | 4,983 | |||||||
Partners’ share of lease transaction costs that qualify as rent inducements from consolidated JVs 2 | 211 | 87 | |||||||||
BXP’s share of lease transaction costs that qualify as rent inducements from unconsolidated JVs 2 | 316 | — | |||||||||
BXP’s Share of lease transaction costs that qualify as rent inducements 2 | $ | 4,039 | $ | 5,070 | |||||||
| 2nd generation tenant improvements and leasing commissions | $ | 80,202 | $ | 88,099 | |||||||
| Partners’ share of 2nd generation tenant improvements and leasing commissions from consolidated JVs | (8,392) | (18,202) | |||||||||
| BXP’s share of 2nd generation tenant improvements and leasing commissions from unconsolidated JVs | 3,054 | 560 | |||||||||
| BXP’s Share of 2nd generation tenant improvements and leasing commissions | $ | 74,864 | $ | 70,457 | |||||||
61
| Q4 2024 | ||||
| Reconciliations (continued) | |||||
Maintenance capital expenditures 3 | $ | 25,716 | $ | 21,481 | |||||||
Partners’ share of maintenance capital expenditures from consolidated JVs 3 | (2,157) | (3,327) | |||||||||
BXP’s share of maintenance capital expenditures from unconsolidated JVs 3 | 289 | 66 | |||||||||
BXP’s Share of maintenance capital expenditures 3 | $ | 23,848 | $ | 18,220 | |||||||
| Interest expense | $ | 170,390 | $ | 163,194 | |||||||
| Partners’ share of interest expense from consolidated JVs | (12,004) | (12,005) | |||||||||
| BXP’s share of interest expense from unconsolidated JVs | 18,851 | 19,335 | |||||||||
| BXP’s Share of interest expense | $ | 177,237 | $ | 170,524 | |||||||
| Capitalized interest | $ | 10,634 | $ | 11,625 | |||||||
| Partners’ share of capitalized interest from consolidated JVs | (33) | (32) | |||||||||
| BXP’s share of capitalized interest from unconsolidated JVs | 2,568 | 3,304 | |||||||||
| BXP’s Share of capitalized interest | $ | 13,169 | $ | 14,897 | |||||||
| Amortization of financing costs | $ | 5,034 | $ | 4,820 | |||||||
| Partners’ share of amortization of financing costs from consolidated JVs | (498) | (498) | |||||||||
| BXP’s share of amortization of financing costs from unconsolidated JVs | 432 | 438 | |||||||||
| BXP’s Share of amortization of financing costs | $ | 4,968 | $ | 4,760 | |||||||
| Fair value interest adjustment | $ | 4,249 | $ | 4,224 | |||||||
| Partners’ share of fair value of interest adjustment from consolidated JVs | — | — | |||||||||
| BXP’s share off fair value interest adjustment from unconsolidated JVs | 499 | 499 | |||||||||
| BXP’s Share of fair value interest adjustment | $ | 4,748 | $ | 4,723 | |||||||
| Amortization and accretion related to sales type lease | $ | 254 | $ | 250 | |||||||
| Partners’ share of amortization and accretion related to sales type lease from consolidated JVs | — | — | |||||||||
| BXP’s share off amortization and accretion related to sales type lease from unconsolidated JVs | 27 | 28 | |||||||||
| BXP’s Share of amortization and accretion related to sales type lease | $ | 281 | $ | 278 | |||||||
_____________
1Represents the net adjustment for above- and below-market leases that are being amortized over the terms of the respective leases in place at the property acquisition dates.
2Consists of lease transaction costs that qualify as rent inducements in accordance with GAAP. Lease transaction costs are generally included in 2nd generation tenant improvements and leasing commissions in the period the lease commences.
3Maintenance capital expenditures do not include planned capital expenditures related to acquisitions and repositioning capital expenditures.
62
| Q4 2024 | ||||
| Reconciliations (continued) | |||||
for the three months ended December 31, 2024
(unaudited and dollars in thousands)
| CONSOLIDATED JOINT VENTURES | |||||||||||||||||||||||
| 767 Fifth Avenue | Total Consolidated | ||||||||||||||||||||||
| (The GM Building) | Norges Joint Ventures 1 | Joint Ventures | |||||||||||||||||||||
| Revenue | |||||||||||||||||||||||
Lease 2 | $ | 76,791 | $ | 116,400 | $ | 193,191 | |||||||||||||||||
| Straight-line rent | 5,353 | (7,045) | (1,692) | ||||||||||||||||||||
| Fair value lease revenue | (27) | — | (27) | ||||||||||||||||||||
| Termination income | — | 25 | 25 | ||||||||||||||||||||
| Total lease revenue | 82,117 | 109,380 | 191,497 | ||||||||||||||||||||
| Parking and other | 58 | 1,828 | 1,886 | ||||||||||||||||||||
Total rental revenue 3 | 82,175 | 111,208 | 193,383 | ||||||||||||||||||||
| Expenses | |||||||||||||||||||||||
| Operating | 33,830 | 43,321 | 77,151 | ||||||||||||||||||||
| Net Operating Income (NOI) | 48,345 | 67,887 | 116,232 | ||||||||||||||||||||
| Other income (expense) | |||||||||||||||||||||||
| Development and management services revenue | — | (1,318) | (1,318) | ||||||||||||||||||||
Losses from investments in securities | — | (20) | (20) | ||||||||||||||||||||
| Interest and other income | 1,272 | 2,424 | 3,696 | ||||||||||||||||||||
| Interest expense | (21,395) | (7,666) | (29,061) | ||||||||||||||||||||
| Depreciation and amortization expense | (17,494) | (27,194) | (44,688) | ||||||||||||||||||||
| General and administrative expense | (15) | (139) | (154) | ||||||||||||||||||||
| Total other income (expense) | (37,632) | (33,913) | (71,545) | ||||||||||||||||||||
| Net income | $ | 10,713 | $ | 33,974 | $ | 44,687 | |||||||||||||||||
| BXP’s nominal ownership percentage | 60% | 55% | |||||||||||||||||||||
Partners’ share of NOI (after income allocation to private REIT shareholders) 4 | $ | 18,654 | $ | 29,605 | $ | 48,259 | |||||||||||||||||
| BXP’s share of NOI (after income allocation to private REIT shareholders) | $ | 29,691 | $ | 38,282 | $ | 67,973 | |||||||||||||||||
Unearned portion of capitalized fees 5 | $ | 890 | $ | 2,150 | $ | 3,040 | |||||||||||||||||
Partners’ share of select items 4 | |||||||||||||||||||||||
| Partners’ share of parking and other revenue | $ | 23 | $ | 823 | $ | 846 | |||||||||||||||||
| Partners’ share of hedge amortization | $ | 144 | $ | — | $ | 144 | |||||||||||||||||
| Partners’ share of amortization of financing costs | $ | 346 | $ | 152 | $ | 498 | |||||||||||||||||
| Partners’ share of depreciation and amortization related to capitalized fees | $ | 373 | $ | 498 | $ | 871 | |||||||||||||||||
| Partners’ share of capitalized interest | $ | — | $ | 33 | $ | 33 | |||||||||||||||||
| Partners’ share of lease transactions costs which will qualify as rent inducements | $ | — | $ | 211 | $ | 211 | |||||||||||||||||
| Partners’ share of management and other fees | $ | 686 | $ | 981 | $ | 1,667 | |||||||||||||||||
| Partners’ share of basis differential depreciation and amortization expense | $ | (23) | $ | (178) | $ | (201) | |||||||||||||||||
| Partners’ share of basis differential interest and other adjustments | $ | (4) | $ | 8 | $ | 4 | |||||||||||||||||
Reconciliation of Partners’ share of EBITDAre 6 | |||||||||||||||||||||||
| Partners’ NCI | $ | 3,253 | $ | 13,980 | $ | 17,233 | |||||||||||||||||
| Add: | |||||||||||||||||||||||
| Partners’ share of interest expense after BXP’s basis differential | 8,554 | 3,450 | 12,004 | ||||||||||||||||||||
| Partners’ share of depreciation and amortization expense after BXP’s basis differential | 7,347 | 12,558 | 19,905 | ||||||||||||||||||||
Partners’ share of EBITDAre | $ | 19,154 | $ | 29,988 | $ | 49,142 | |||||||||||||||||
63
| Q4 2024 | ||||
| Reconciliations (continued) | |||||
for the three months ended December 31, 2024
(unaudited and dollars in thousands)
| CONSOLIDATED JOINT VENTURES | ||||||||||||||||||||
| 767 Fifth Avenue | Total Consolidated | |||||||||||||||||||
Reconciliation of Partners’ share of Net Operating Income (Loss) (NOI) 6 | (The GM Building) | Norges Joint Ventures 1 | Joint Ventures | |||||||||||||||||
Rental revenue 3 | $ | 32,870 | $ | 50,044 | $ | 82,914 | ||||||||||||||
| Less: Termination income | — | 11 | 11 | |||||||||||||||||
Rental revenue (excluding termination income) 3 | 32,870 | 50,033 | 82,903 | |||||||||||||||||
| Less: Operating expenses (including partners’ share of management and other fees) | 14,216 | 20,470 | 34,686 | |||||||||||||||||
| Income allocation to private REIT shareholders | — | (31) | (31) | |||||||||||||||||
| NOI (excluding termination income and after income allocation to private REIT shareholders) | $ | 18,654 | $ | 29,594 | $ | 48,248 | ||||||||||||||
Rental revenue (excluding termination income) 3 | $ | 32,870 | $ | 50,033 | $ | 82,903 | ||||||||||||||
| Less: Straight-line rent | 2,141 | (3,170) | (1,029) | |||||||||||||||||
| Fair value lease revenue | (11) | — | (11) | |||||||||||||||||
| Add: Lease transaction costs that qualify as rent inducements | — | (211) | (211) | |||||||||||||||||
| Subtotal | 30,740 | 52,992 | 83,732 | |||||||||||||||||
| Less: Operating expenses (including partners’ share of management and other fees) | 14,216 | 20,470 | 34,686 | |||||||||||||||||
| Income allocation to private REIT shareholders | — | (31) | (31) | |||||||||||||||||
| NOI - cash (excluding termination income and after income allocation to private REIT shareholders) | $ | 16,524 | $ | 32,553 | $ | 49,077 | ||||||||||||||
Reconciliation of Partners’ share of Revenue 4 | ||||||||||||||||||||
Rental revenue 3 | $ | 32,870 | $ | 50,044 | $ | 82,914 | ||||||||||||||
| Add: Development and management services revenue | — | (593) | (593) | |||||||||||||||||
| Revenue | $ | 32,870 | $ | 49,451 | $ | 82,321 | ||||||||||||||
_________
1Norges Joint Ventures include 7 Times Square (formerly Times Square Tower), 601 Lexington Avenue/One Five Nine East 53rd Street, 100 Federal Street, Atlantic Wharf Office, 343 Madison Avenue, 300 Binney Street, and 290 Binney Street.
2 Lease revenue includes recoveries from clients and service income from clients.
3See the Definitions and Reconciliations sections of this Supplemental package starting on page 57.
4Amounts represent the partners’ share based on their respective ownership percentage.
5Capitalized fees are eliminated in consolidation and recognized over the life of the asset as depreciation and amortization are added back to the Company’s net income.
6Amounts represent the partners’ share based on their respective ownership percentages and are adjusted for basis differentials and the allocations of management and other fees and depreciation and amortization related to capitalized fees.
64
| Q4 2024 | ||||
| Reconciliations (continued) | |||||
for the three months ended December 31, 2024
(unaudited and dollars in thousands)
UNCONSOLIDATED JOINT VENTURES 1
| Boston | Los Angeles | New York | San Francisco | Seattle | Washington, DC | Total Unconsolidated Joint Ventures | ||||||||||||||||||||||||||||||||||||||||||||||||||||||||||||||||||||||||||
| Revenue | ||||||||||||||||||||||||||||||||||||||||||||||||||||||||||||||||||||||||||||||||
Lease 2 | $ | 26,331 | $ | 18,264 | $ | 25,239 | $ | 18,132 | $ | 10,866 | $ | 21,247 | $ | 120,079 | ||||||||||||||||||||||||||||||||||||||||||||||||||||||||||||||||||
| Straight-line rent | 915 | (964) | (529) | 507 | (2,323) | (437) | (2,831) | |||||||||||||||||||||||||||||||||||||||||||||||||||||||||||||||||||||||||
| Fair value lease revenue | — | — | 1,538 | 15 | 1,222 | — | 2,775 | |||||||||||||||||||||||||||||||||||||||||||||||||||||||||||||||||||||||||
| Termination income | 43 | — | 1,871 | — | — | — | 1,914 | |||||||||||||||||||||||||||||||||||||||||||||||||||||||||||||||||||||||||
| Amortization and accretion related to sales type lease | 55 | — | — | — | — | — | 55 | |||||||||||||||||||||||||||||||||||||||||||||||||||||||||||||||||||||||||
| Total lease revenue | 27,344 | 17,300 | 28,119 | 18,654 | 9,765 | 20,810 | 121,992 | |||||||||||||||||||||||||||||||||||||||||||||||||||||||||||||||||||||||||
| Parking and other | 478 | 1,809 | (122) | 322 | 615 | 783 | 3,885 | |||||||||||||||||||||||||||||||||||||||||||||||||||||||||||||||||||||||||
Total rental revenue 3 | 27,822 | 19,109 | 27,997 | 18,976 | 10,380 | 21,593 | 125,877 | |||||||||||||||||||||||||||||||||||||||||||||||||||||||||||||||||||||||||
| Expenses | ||||||||||||||||||||||||||||||||||||||||||||||||||||||||||||||||||||||||||||||||
| Operating | 10,322 | 7,402 | 16,258 | 4 | 9,379 | 4,239 | 8,023 | 55,623 | ||||||||||||||||||||||||||||||||||||||||||||||||||||||||||||||||||||||||
| Net operating income/(loss) | 17,500 | 11,707 | 11,739 | 9,597 | 6,141 | 13,570 | 70,254 | |||||||||||||||||||||||||||||||||||||||||||||||||||||||||||||||||||||||||
| Other income/(expense) | ||||||||||||||||||||||||||||||||||||||||||||||||||||||||||||||||||||||||||||||||
| Development and management services revenue | — | — | 494 | 1 | — | 13 | 508 | |||||||||||||||||||||||||||||||||||||||||||||||||||||||||||||||||||||||||
| Interest and other income (loss) | 389 | 1,006 | 222 | (6) | 160 | 541 | 2,312 | |||||||||||||||||||||||||||||||||||||||||||||||||||||||||||||||||||||||||
| Interest expense | (10,656) | (5,052) | (15,080) | — | (4,177) | (9,923) | (44,888) | |||||||||||||||||||||||||||||||||||||||||||||||||||||||||||||||||||||||||
| Unrealized gain/loss on derivative instruments | — | — | 13,782 | — | — | — | 13,782 | |||||||||||||||||||||||||||||||||||||||||||||||||||||||||||||||||||||||||
| Transaction costs | (8) | — | (305) | — | (2) | (80) | (395) | |||||||||||||||||||||||||||||||||||||||||||||||||||||||||||||||||||||||||
| Depreciation and amortization expense | (8,413) | (5,345) | (9,794) | (7,171) | (5,675) | (5,457) | (41,855) | |||||||||||||||||||||||||||||||||||||||||||||||||||||||||||||||||||||||||
| General and administrative expense | — | — | (69) | (4) | — | — | (73) | |||||||||||||||||||||||||||||||||||||||||||||||||||||||||||||||||||||||||
| Total other income/(expense) | (18,688) | (9,391) | (10,750) | (7,180) | (9,694) | (14,906) | (70,609) | |||||||||||||||||||||||||||||||||||||||||||||||||||||||||||||||||||||||||
| Net income/(loss) | $ | (1,188) | $ | 2,316 | $ | 989 | $ | 2,417 | $ | (3,553) | $ | (1,336) | $ | (355) | ||||||||||||||||||||||||||||||||||||||||||||||||||||||||||||||||||
| BXP’s share of select items: | ||||||||||||||||||||||||||||||||||||||||||||||||||||||||||||||||||||||||||||||||
| BXP’s share of parking and other revenue | $ | 239 | $ | 905 | $ | (20) | $ | 161 | $ | 207 | $ | 302 | $ | 1,794 | ||||||||||||||||||||||||||||||||||||||||||||||||||||||||||||||||||
| BXP’s share of amortization of financing costs | $ | 171 | $ | 23 | $ | 92 | $ | — | $ | 28 | $ | 118 | $ | 432 | ||||||||||||||||||||||||||||||||||||||||||||||||||||||||||||||||||
| BXP’s share of hedge amortization, net of costs | $ | — | $ | — | $ | — | $ | — | $ | 366 | $ | — | $ | 366 | ||||||||||||||||||||||||||||||||||||||||||||||||||||||||||||||||||
| BXP’s share of fair value interest adjustment | $ | — | $ | — | $ | 499 | $ | — | $ | — | $ | — | $ | 499 | ||||||||||||||||||||||||||||||||||||||||||||||||||||||||||||||||||
| BXP’s share of capitalized interest | $ | — | $ | — | $ | 2,448 | $ | — | $ | — | $ | 120 | $ | 2,568 | ||||||||||||||||||||||||||||||||||||||||||||||||||||||||||||||||||
| BXP’s share of amortization and accretion related to sales type lease | $ | 27 | $ | — | $ | — | $ | — | $ | — | $ | — | $ | 27 | ||||||||||||||||||||||||||||||||||||||||||||||||||||||||||||||||||
Reconciliation of BXP’s share of EBITDAre | ||||||||||||||||||||||||||||||||||||||||||||||||||||||||||||||||||||||||||||||||
| Income/(loss) from unconsolidated joint ventures | $ | (602) | $ | (167,953) | $ | (7,699) | $ | (125,832) | $ | (47,657) | $ | 190 | $ | (349,553) | ||||||||||||||||||||||||||||||||||||||||||||||||||||||||||||||||||
| Add: | ||||||||||||||||||||||||||||||||||||||||||||||||||||||||||||||||||||||||||||||||
| BXP’s share of interest expense | 5,328 | 2,526 | 5,515 | — | 1,406 | 4,076 | 18,851 | |||||||||||||||||||||||||||||||||||||||||||||||||||||||||||||||||||||||||
| BXP’s share of depreciation and amortization expense | 4,215 | 3,784 | 5 | 5,196 | 4,121 | 5 | 1,591 | 2,190 | 21,097 | |||||||||||||||||||||||||||||||||||||||||||||||||||||||||||||||||||||||
Impairment loss on investment 6 | — | 168,391 | — | 126,163 | 46,784 | — | 341,338 | |||||||||||||||||||||||||||||||||||||||||||||||||||||||||||||||||||||||||
BXP’s share of EBITDAre | $ | 8,941 | $ | 6,748 | 5 | $ | 3,012 | $ | 4,452 | 5 | $ | 2,124 | $ | 6,456 | $ | 31,733 | ||||||||||||||||||||||||||||||||||||||||||||||||||||||||||||||||
65
| Q4 2024 | ||||
| Reconciliations (continued) | |||||
UNCONSOLIDATED JOINT VENTURES 1 | ||||||||||||||||||||||||||||||||||||||||||||||||||||||||||||||||||||||||||||||||
| Reconciliation of BXP’s share of Net Operating Income/(Loss) | Boston | Los Angeles | New York | San Francisco | Seattle | Washington, DC | Total Unconsolidated Joint Ventures | |||||||||||||||||||||||||||||||||||||||||||||||||||||||||||||||||||||||||
BXP’s share of rental revenue 3 | $ | 13,912 | $ | 9,951 | 5 | $ | 8,940 | 5 | $ | 9,216 | 5 | $ | 3,495 | $ | 9,359 | $ | 54,873 | |||||||||||||||||||||||||||||||||||||||||||||||||||||||||||||||
| BXP’s share of operating expenses | 5,161 | 3,702 | 5,942 | 4,754 | 1,420 | 3,112 | 24,091 | |||||||||||||||||||||||||||||||||||||||||||||||||||||||||||||||||||||||||
| BXP’s share of net operating income/(loss) | 8,751 | 6,249 | 5 | 2,998 | 5 | 4,462 | 5 | 2,075 | 6,247 | 30,782 | ||||||||||||||||||||||||||||||||||||||||||||||||||||||||||||||||||||||
| Less: | ||||||||||||||||||||||||||||||||||||||||||||||||||||||||||||||||||||||||||||||||
| BXP’s share of termination income | 22 | — | 499 | — | — | — | 521 | |||||||||||||||||||||||||||||||||||||||||||||||||||||||||||||||||||||||||
| BXP’s share of net operating income/(loss) (excluding termination income) | 8,729 | 6,249 | 2,499 | 4,462 | 2,075 | 6,247 | 30,261 | |||||||||||||||||||||||||||||||||||||||||||||||||||||||||||||||||||||||||
| Less: | ||||||||||||||||||||||||||||||||||||||||||||||||||||||||||||||||||||||||||||||||
| BXP’s share of straight-line rent | 458 | (391) | 5 | 458 | 5 | 254 | 5 | (782) | (151) | (154) | ||||||||||||||||||||||||||||||||||||||||||||||||||||||||||||||||||||||
| BXP’s share of fair value lease revenue | — | 305 | 5 | 527 | 5 | (211) | 5 | 411 | — | 1,032 | ||||||||||||||||||||||||||||||||||||||||||||||||||||||||||||||||||||||
| BXP’s share of amortization and accretion related to sales type lease | 27 | — | — | — | — | — | 27 | |||||||||||||||||||||||||||||||||||||||||||||||||||||||||||||||||||||||||
| Add: | ||||||||||||||||||||||||||||||||||||||||||||||||||||||||||||||||||||||||||||||||
| BXP’s share of straight-line ground rent expense adjustment | — | — | 136 | — | — | — | 136 | |||||||||||||||||||||||||||||||||||||||||||||||||||||||||||||||||||||||||
| BXP’s share of lease transaction costs that qualify as rent inducements | — | — | 308 | — | — | 8 | 316 | |||||||||||||||||||||||||||||||||||||||||||||||||||||||||||||||||||||||||
| BXP’s share of net operating income/(loss) - cash (excluding termination income) | $ | 8,244 | $ | 6,335 | 5 | $ | 1,958 | 5 | $ | 4,419 | 5 | $ | 2,446 | $ | 6,406 | $ | 29,808 | |||||||||||||||||||||||||||||||||||||||||||||||||||||||||||||||
| Reconciliation of BXP’s share of Revenue | ||||||||||||||||||||||||||||||||||||||||||||||||||||||||||||||||||||||||||||||||
BXP’s share of rental revenue 3 | $ | 13,912 | $ | 9,951 | 5 | $ | 8,940 | 5 | $ | 9,216 | 5 | $ | 3,495 | $ | 9,359 | $ | 54,873 | |||||||||||||||||||||||||||||||||||||||||||||||||||||||||||||||
| Add: | ||||||||||||||||||||||||||||||||||||||||||||||||||||||||||||||||||||||||||||||||
| BXP’s share of development and management services revenue | — | — | 247 | 1 | — | 7 | 255 | |||||||||||||||||||||||||||||||||||||||||||||||||||||||||||||||||||||||||
| BXP’s share of revenue | $ | 13,912 | $ | 9,951 | 5 | $ | 9,187 | 5 | $ | 9,217 | 5 | $ | 3,495 | $ | 9,366 | $ | 55,128 | |||||||||||||||||||||||||||||||||||||||||||||||||||||||||||||||
_____________
1 For information on the properties included for each region and the Company’s percentage ownership in each property, see pages 22-25.
2 Lease revenue includes recoveries from clients and service income from clients.
3 See the Definitions and Reconciliations sections of this Supplemental package starting on page 57.
4 Includes approximately $272 of straight-line ground rent expense.
5 The Company’s purchase price allocation under ASC 805 for certain joint ventures differs from the historical basis of the venture.
6Represents the other-than-temporary decline in the fair values below the carrying values of certain of the Company’s investments in unconsolidated joint ventures.
66
| Q4 2024 | ||||
| Reconciliations (continued) | |||||
Reconciliation of Net income (loss) attributable to BXP, Inc. to
BXP’s Share of same property net operating income (NOI)
(dollars in thousands)
| Three Months Ended | ||||||||||||||
| 30-Sep-24 | 30-Sep-23 | |||||||||||||
| Net income (loss) attributable to BXP, Inc. | $ | 83,628 | $ | (111,826) | ||||||||||
| Net (income) loss attributable to noncontrolling interests | ||||||||||||||
| Noncontrolling interest - common units of the Operating Partnership | 9,587 | (12,626) | ||||||||||||
| Noncontrolling interest in property partnerships | 15,237 | 20,909 | ||||||||||||
| Net income (loss) | 108,452 | (103,543) | ||||||||||||
| Add: | ||||||||||||||
| Interest expense | 163,194 | 147,812 | ||||||||||||
| Loss from unconsolidated joint ventures | 7,011 | 247,556 | ||||||||||||
| Depreciation and amortization expense | 222,890 | 207,435 | ||||||||||||
| Transaction costs | 188 | 751 | ||||||||||||
| Payroll and related costs from management services contracts | 3,649 | 3,906 | ||||||||||||
| General and administrative expense | 33,352 | 31,410 | ||||||||||||
| Less: | ||||||||||||||
| Interest and other income (loss) | 14,430 | 20,715 | ||||||||||||
| Unrealized gain (loss) on non-real estate investment | 94 | (51) | ||||||||||||
| Gains on sales of real estate | 517 | 517 | ||||||||||||
| Gains (losses) from investments in securities | 2,198 | (925) | ||||||||||||
| Direct reimbursements of payroll and related costs from management services contracts | 3,649 | 3,906 | ||||||||||||
| Development and management services revenue | 6,770 | 9,284 | ||||||||||||
| Net Operating Income (NOI) | 511,078 | 501,881 | ||||||||||||
| Add: | ||||||||||||||
| BXP’s share of NOI from unconsolidated joint ventures | 31,919 | 39,165 | ||||||||||||
| Less: | ||||||||||||||
| Partners’ share of NOI from consolidated joint ventures (after income allocation to private REIT shareholders) | 44,487 | 50,047 | ||||||||||||
| BXP’s Share of NOI | 498,510 | 490,999 | ||||||||||||
| Less: | ||||||||||||||
| Termination income | 12,120 | 2,564 | ||||||||||||
| BXP’s share of termination income from unconsolidated joint ventures | 77 | 500 | ||||||||||||
| Add: | ||||||||||||||
| Partners’ share of termination income from consolidated joint ventures | 18 | 129 | ||||||||||||
| BXP’s Share of NOI (excluding termination income) | $ | 486,331 | $ | 488,064 | ||||||||||
| Net Operating Income (NOI) | $ | 511,078 | $ | 501,881 | ||||||||||
| Less: | ||||||||||||||
| Termination income | 12,120 | 2,564 | ||||||||||||
| NOI from non Same Properties (excluding termination income) | 20,883 | 910 | ||||||||||||
| Same Property NOI (excluding termination income) | 478,075 | 498,407 | ||||||||||||
| Less: | ||||||||||||||
| Partners’ share of NOI from consolidated joint ventures (excluding termination income and after income allocation to private REIT shareholders) | 44,469 | 49,918 | ||||||||||||
| Add: | ||||||||||||||
| Partners’ share of NOI from non Same Properties from consolidated joint ventures (excluding termination income and after income allocation to private REIT shareholders) | — | — | ||||||||||||
| BXP’s share of NOI from unconsolidated joint ventures (excluding termination income) | 31,842 | 38,665 | ||||||||||||
| Less: | ||||||||||||||
| BXP’s share of NOI from non Same Properties from unconsolidated joint ventures (excluding termination income) | 1,555 | 8,768 | ||||||||||||
| BXP’s Share of Same Property NOI (excluding termination income) | $ | 463,893 | $ | 478,386 | ||||||||||
| Change in BXP’s Share of Same Property NOI (excluding termination income) | $ | (14,493) | ||||||||||||
| Change in BXP’s Share of Same Property NOI (excluding termination income) | (3.0) | % | ||||||||||||
67
| Q4 2024 | ||||
| Reconciliations (continued) | |||||
Reconciliation of Net income (loss) attributable to BXP, Inc. to
BXP’s Share of same property net operating income (NOI) - cash
(dollars in thousands)
| Three Months Ended | ||||||||||||||
| 30-Sep-24 | 30-Sep-23 | |||||||||||||
| Net income (loss) attributable to BXP, Inc. | $ | 83,628 | $ | (111,826) | ||||||||||
| Net (income) loss attributable to noncontrolling interests | ||||||||||||||
| Noncontrolling interest - common units of the Operating Partnership | 9,587 | (12,626) | ||||||||||||
| Noncontrolling interest in property partnerships | 15,237 | 20,909 | ||||||||||||
| Net income (loss) | 108,452 | (103,543) | ||||||||||||
| Add: | ||||||||||||||
| Interest expense | 163,194 | 147,812 | ||||||||||||
| Loss from unconsolidated joint ventures | 7,011 | 247,556 | ||||||||||||
| Depreciation and amortization expense | 222,890 | 207,435 | ||||||||||||
| Transaction costs | 188 | 751 | ||||||||||||
| Payroll and related costs from management services contracts | 3,649 | 3,906 | ||||||||||||
| General and administrative expense | 33,352 | 31,410 | ||||||||||||
| Less: | ||||||||||||||
| Interest and other income (loss) | 14,430 | 20,715 | ||||||||||||
| Unrealized gain (loss) on non-real estate investment | 94 | (51) | ||||||||||||
| Gains on sales of real estate | 517 | 517 | ||||||||||||
| Gains (losses) from investments in securities | 2,198 | (925) | ||||||||||||
| Direct reimbursements of payroll and related costs from management services contracts | 3,649 | 3,906 | ||||||||||||
| Development and management services revenue | 6,770 | 9,284 | ||||||||||||
| Net Operating Income (NOI) | 511,078 | 501,881 | ||||||||||||
| Less: | ||||||||||||||
| Straight-line rent | 29,578 | 19,139 | ||||||||||||
| Fair value lease revenue | 1,298 | 2,981 | ||||||||||||
| Amortization and accretion related to sales type lease | 250 | 233 | ||||||||||||
| Termination income | 12,120 | 2,564 | ||||||||||||
| Add: | ||||||||||||||
Straight-line ground rent expense adjustment 1 | 585 | 578 | ||||||||||||
Lease transaction costs that qualify as rent inducements 2 | 4,983 | (5,943) | ||||||||||||
| NOI - cash (excluding termination income) | 473,400 | 471,599 | ||||||||||||
| Less: | ||||||||||||||
| NOI - cash from non Same Properties (excluding termination income) | 18,304 | 670 | ||||||||||||
| Same Property NOI - cash (excluding termination income) | 455,096 | 470,929 | ||||||||||||
| Less: | ||||||||||||||
| Partners’ share of NOI - cash from consolidated joint ventures (excluding termination income and after income allocation to private REIT shareholders) | 38,849 | 44,090 | ||||||||||||
| Add: | ||||||||||||||
| Partners’ share of NOI - cash from non Same Properties from consolidated joint ventures (excluding termination income and after income allocation to private REIT shareholders) | — | — | ||||||||||||
| BXP’s share of NOI - cash from unconsolidated joint ventures (excluding termination income) | 29,568 | 34,524 | ||||||||||||
| Less: | ||||||||||||||
| BXP’s share of NOI - cash from non Same Properties from unconsolidated joint ventures (excluding termination income) | 1,093 | 7,397 | ||||||||||||
| BXP’s Share of Same Property NOI - cash (excluding termination income) | $ | 444,722 | $ | 453,966 | ||||||||||
| Change in BXP’s Share of Same Property NOI - cash (excluding termination income) | $ | (9,244) | ||||||||||||
| Change in BXP’s Share of Same Property NOI - cash (excluding termination income) | (2.0) | % | ||||||||||||
_____________
1In light of the front-ended, uneven rental payments required by the Company’s 99-year ground and air rights lease for the 100 Clarendon Street garage and Back Bay Transit Station in Boston, MA, and to make period-to-period comparisons more meaningful to investors, the adjustment does not include the straight-line impact of approximately $(44) and $135 for the three months ended September 30, 2024 and 2023, respectively. As of September 30, 2024, the Company has remaining lease payments aggregating approximately $31.0 million, all of which it expects to incur by the end of 2026 with no payments thereafter. Under GAAP, the Company recognizes expense of $(112) per quarter on a straight-line basis over the term of the lease. However, unlike more traditional ground and air rights leases, the timing and amounts of the rental payments by the Company correlate to the uneven timing and funding by the Company of capital expenditures related to improvements at Back Bay Transit Station. As a result, the amounts excluded from the adjustment each quarter through 2026 may vary significantly.
2Consists of lease transaction costs that qualify as rent inducements in accordance with GAAP.
68
| Q4 2024 | ||||
| Consolidated Income Statement - prior year | |||||
(unaudited and in thousands, except per share amounts)
| Three Months Ended | ||||||||||||||
| 31-Dec-23 | 30-Sep-23 | |||||||||||||
| Revenue | ||||||||||||||
| Lease | $ | 768,884 | $ | 767,181 | ||||||||||
| Parking and other | 30,676 | 29,649 | ||||||||||||
| Insurance proceeds | 821 | 779 | ||||||||||||
| Hotel revenue | 11,803 | 13,484 | ||||||||||||
| Development and management services | 12,728 | 9,284 | ||||||||||||
| Direct reimbursements of payroll and related costs from management services contracts | 4,021 | 3,906 | ||||||||||||
| Total revenue | 828,933 | 824,283 | ||||||||||||
| Expenses | ||||||||||||||
| Operating | 160,360 | 159,304 | ||||||||||||
| Real estate taxes | 140,477 | 140,368 | ||||||||||||
| Restoration expenses related to insurance claim | 574 | 520 | ||||||||||||
| Hotel operating | 8,373 | 9,020 | ||||||||||||
| General and administrative | 38,771 | 31,410 | ||||||||||||
| Payroll and related costs from management services contracts | 4,021 | 3,906 | ||||||||||||
| Transaction costs | 2,343 | 751 | ||||||||||||
| Depreciation and amortization | 212,067 | 207,435 | ||||||||||||
| Total expenses | 566,986 | 552,714 | ||||||||||||
| Other income (expense) | ||||||||||||||
| Income (loss) from unconsolidated joint ventures | 22,250 | (247,556) | ||||||||||||
| Gains on sales of real estate | — | 517 | ||||||||||||
| Gains (losses) from investments in securities | 3,245 | (925) | ||||||||||||
| Interest and other income (loss) | 20,965 | 20,715 | ||||||||||||
| Losses from interest rate contracts | (79) | — | ||||||||||||
| Unrealized loss on non-real estate investment | (93) | (51) | ||||||||||||
| Interest expense | (155,080) | (147,812) | ||||||||||||
| Net income (loss) | 153,155 | (103,543) | ||||||||||||
| Net (income) loss attributable to noncontrolling interests | ||||||||||||||
| Noncontrolling interest in property partnerships | (19,324) | (20,909) | ||||||||||||
| Noncontrolling interest - common units of the Operating Partnership | (13,906) | 12,626 | ||||||||||||
| Net income (loss) attributable to BXP, Inc. | $ | 119,925 | $ | (111,826) | ||||||||||
| INCOME PER SHARE OF COMMON STOCK (EPS) | ||||||||||||||
| Net income (loss) attributable to BXP, Inc. per share - basic | $ | 0.76 | $ | (0.71) | ||||||||||
| Net income (loss) attributable to BXP, Inc. per share - diluted | $ | 0.76 | $ | (0.71) | ||||||||||
69