Exhibit 99.1
Arch Coal, Inc. Investor Presentation February 2010 |
Forward-Looking Information This presentation contains “forward-looking statements” — that is, statements related to future, not past, events. In this context, forward-looking statements often address our expected future business and financial performance, and often contain words such as “expects,” “anticipates,” “intends,” “plans,” “believes,” “seeks,” or “will.” Forward-looking statements by their nature address matters that are, to different degrees, uncertain. For us, particular uncertainties arise from changes in the demand for our coal by the domestic electric generation industry; from legislation and regulations relating to the Clean Air Act and other environmental initiatives; from operational, geological, permit, labor and weather-related factors; from fluctuations in the amount of cash we generate from operations; from future integration of acquired businesses; and from numerous other matters of national, regional and global scale, including those of a political, economic, business, competitive or regulatory nature. These uncertainties may cause our actual future results to be materially different than those expressed in our forward-looking statements. We do not undertake to update our forward-looking statements, whether as a result of new information, future events or otherwise, except as may be required by law. For a description of some of the risks and uncertainties that may affect our future results, you should see the risk factors described from time to time in the reports we file with the Securities and Exchange Commission. This presentation includes certain non-GAAP financial measures, including Adjusted EBITDA. These non-GAAP financial measures are not measures of financial performance in accordance with generally accepted accounting principles and may exclude items that are significant in understanding and assessing our financial results. Therefore, these measures should not be considered in isolation or as an alternative to net income from operations, cash flows from operations, earnings per fully-diluted share or other measures of profitability, liquidity or performance under generally accepted accounting principles. You should be aware that our presentation of these measures may not be comparable to similarly-titled measures used by other companies. A reconciliation of these financial measures to the most comparable measures presented in accordance with generally accepted accounting principles has been included at the end of this presentation. |
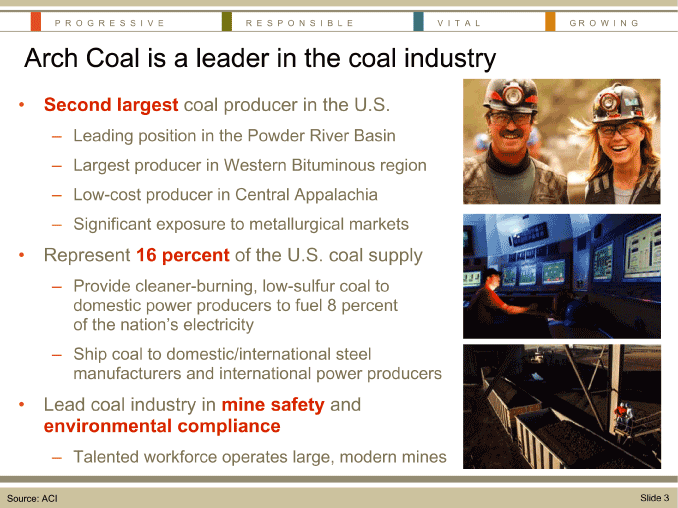
PROGRESSIVE RESPONSIBLE VITAL GROWING Arch Coal is a leader in the coal industry• Second largest coal producer in the U.S. — Leading position in the Powder River Basin — Largest producer in Western Bituminous region — Low-cost producer in Central Appalachia — Significant exposure to metallurgical markets• Represent 16 percent of the U.S. coal supply — Provide cleaner-burning, low-sulfur coal to domestic power producers to fuel 8 percent of the nation’s electricity — Ship coal to domestic/international steel manufacturers and international power producers• Lead coal industry in mine safety and environmental compliance — Talented workforce operates large, modern mines Source: ACI Slide 3 |
PROGRESSIVE RESPONSIBLE VITAL GROWING State of Coal Markets Slide 4 |
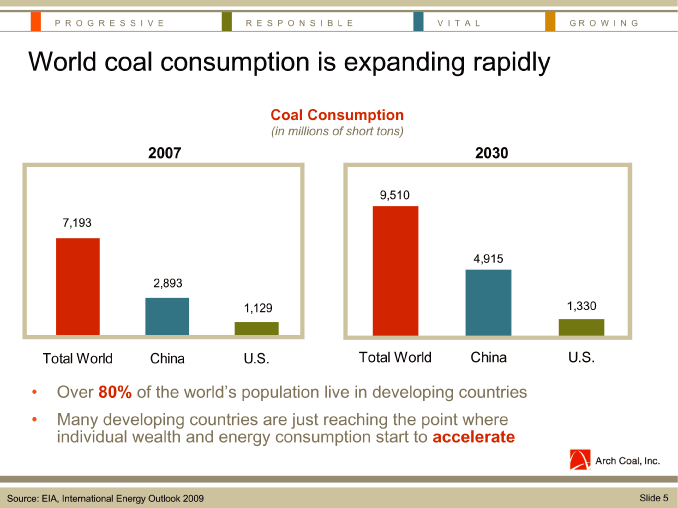
PROGRESSIVE RESPONSIBLE VITAL GROWING World coal consumption is expanding rapidly Coal Consumption (in millions of short tons) 2007 2030 9,510 7,193 4,915 2,893 1,129 1,330 Total World China U.S. Total World China U.S.• Over 80% of the world’s population live in developing countries• Many developing countries are just reaching the point where individual wealth and energy consumption start to accelerate Source: EIA, International Energy Outlook 2009 Slide 5 |
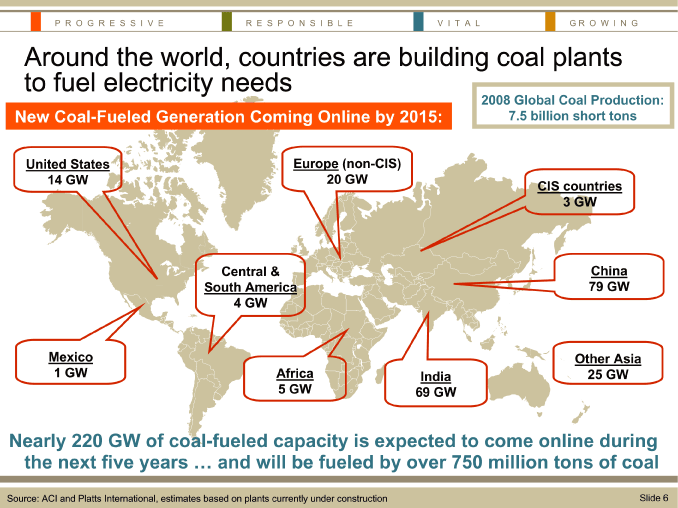
PROGRESSIVE RESPONSIBLE VITAL GROWING Around the world, countries are building coal plants to fuel electricity needs 2008 Global Coal Production: New Coal-Fueled Generation Coming Online by 2015: 7.5 billion short tons United States Europe (non-CIS) 14 GW 20 GW CIS countries 3 GW Central & China South America 79 GW 4 GW Mexico Other Asia 1 GW Africa India 25 GW 5 GW 69 GW Nearly 220 GW of coal-fueled capacity is expected to come online during the next five years ... and will be fueled by over 750 million tons of coal Source: ACI and Platts International, estimates based on plants currently under construction Slide 6 |
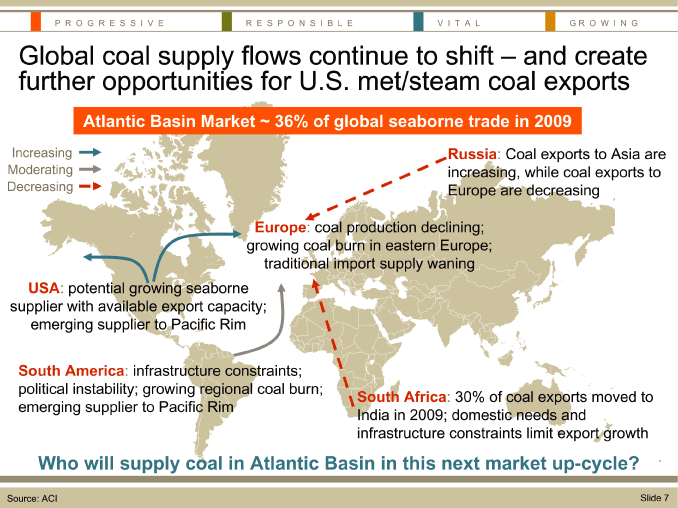
PROGRESSIVE RESPONSIBLE VITAL GROWING Global coal supply flows continue to shift — and create further opportunities for U.S. met/steam coal exports Atlantic Basin Market ~ 36% of global seaborne trade in 2009 Increasing Russia: Coal exports to Asia are Moderating increasing, while coal exports to Decreasing Europe are decreasing Europe: coal production declining; growing coal burn in eastern Europe; traditional import supply waning USA: potential growing seaborne supplier with available export capacity; emerging supplier to Pacific Rim South America: infrastructure constraints; political instability; growing regional coal burn; South Africa: 30% of coal exports moved to emerging supplier to Pacific Rim India in 2009; domestic needs and infrastructure constraints limit export growth Who will supply coal in Atlantic Basin in this next market up-cycle? Source: ACI Slide 7 |
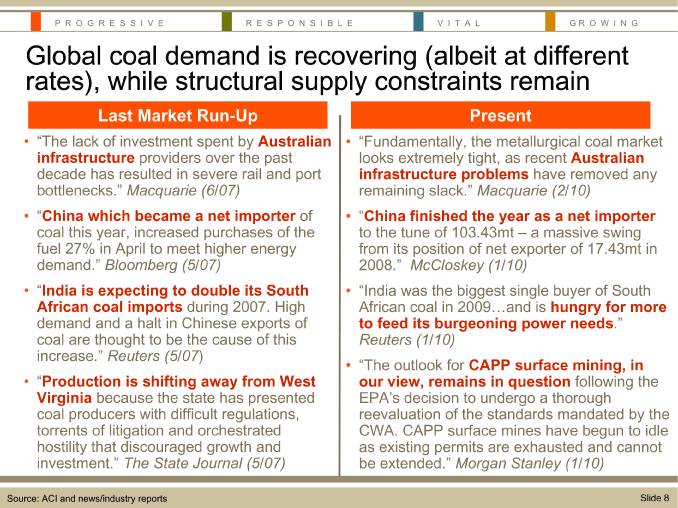
PROGRESSIVE RESPONSIBLE VITAL GROWING Global coal demand is recovering (albeit at different rates), while structural supply constraints remain Last Market Run-Up Present• “The lack of investment spent by Australian• “Fundamentally, the metallurgical coal market infrastructure providers over the past looks extremely tight, as recent Australian decade has resulted in severe rail and port infrastructure problems have removed any bottlenecks.” Macquarie (6/07) remaining slack.” Macquarie (2/10)• “China which became a net importer of• “China finished the year as a net importer coal this year, increased purchases of the to the tune of 103.43mt — a massive swing fuel 27% in April to meet higher energy from its position of net exporter of 17.43mt in demand.” Bloomberg (5/07) 2008.” McCloskey (1/10)• “India is expecting to double its South• “India was the biggest single buyer of South African coal imports during 2007. High African coal in 2009...and is hungry for more demand and a halt in Chinese exports of to feed its burgeoning power needs.” coal are thought to be the cause of this Reuters (1/10) increase.” Reuters (5/07)• “The outlook for CAPP surface mining, in• “Production is shifting away from West our view, remains in question following the Virginia because the state has presented EPA’s decision to undergo a thorough coal producers with difficult regulations, reevaluation of the standards mandated by the torrents of litigation and orchestrated CWA. CAPP surface mines have begun to idle hostility that discouraged growth and as existing permits are exhausted and cannot investment.” The State Journal (5/07) be extended.” Morgan Stanley (1/10) Source: ACI and news/industry reports Slide 8 |
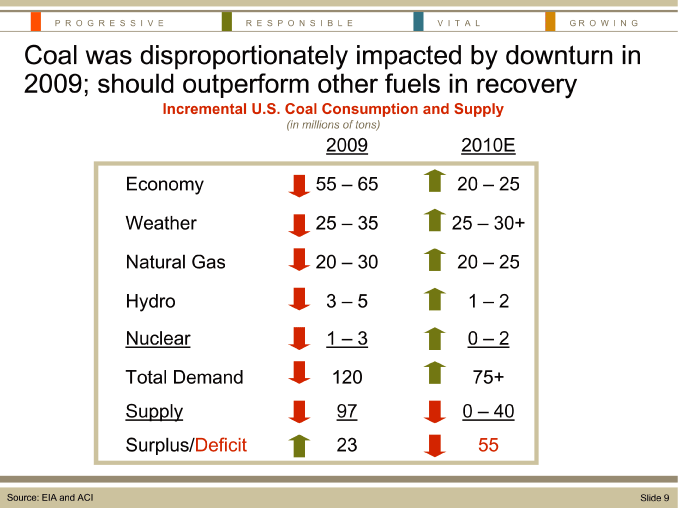
PROGRESSIVE RESPONSIBLE VITAL GROWING Coal was disproportionately impacted by downturn in 2009; should outperform other fuels in recovery Incremental U.S. Coal Consumption and Supply (in millions of tons) 2009 2010E Economy 55 — 65 20 — 25 Weather 25 — 35 25 — 30+ Natural Gas 20 — 30 20 — 25 Hydro 3 — 5 1 — 2 Nuclear 1 — 3 0 — 2 Total Demand 120 75+ Supply 97 0 — 40 Surplus/Deficit 23 55 Source: EIA and ACI Slide 9 |
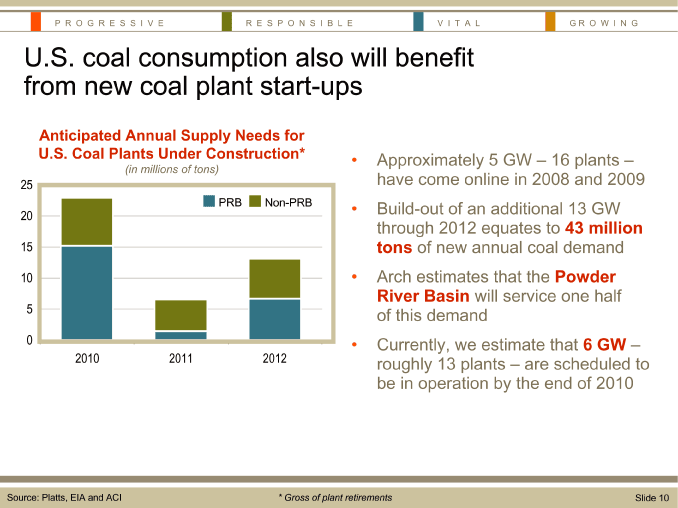
PROGRESSIVE RESPONSIBLE VITAL GROWING U.S. coal consumption also will benefit from new coal plant start-ups Anticipated Annual Supply Needs for U.S. Coal Plants Under Construction*• Approximately 5 GW — 16 plants — (in millions of tons) 25 have come online in 2008 and 2009 PRB Non-PRB• Build-out of an additional 13 GW 20 through 2012 equates to 43 million 15 tons of new annual coal demand 10• Arch estimates that the Powder River Basin will service one half 5 of this demand 0• Currently, we estimate that 6 GW —2010 2011 2012 roughly 13 plants — are scheduled to be in operation by the end of 2010 Source: Platts, EIA and ACI * Gross of plant retirements Slide 10 |
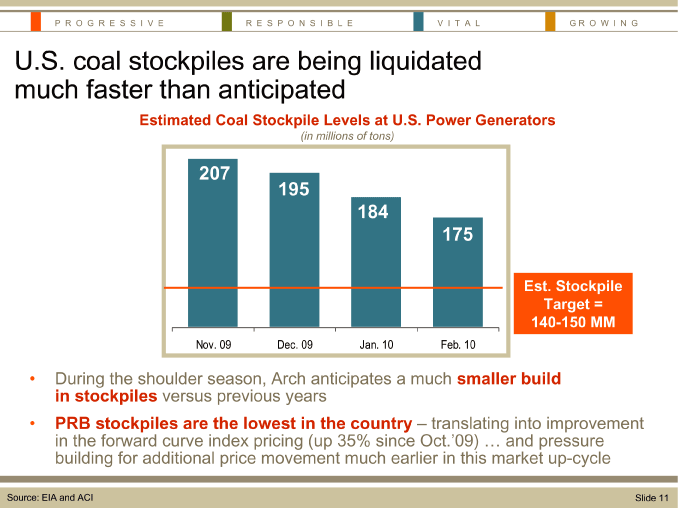
PROGRESSIVE RESPONSIBLE VITAL GROWING U.S. coal stockpiles are being liquidated much faster than anticipated Estimated Coal Stockpile Levels at U.S. Power Generators (in millions of tons) 207 195 200 184 175 Est. Stockpile Target = 140-150 MM Nov. 09 Dec. 09 Jan. 10 Feb. 10• During the shoulder season, Arch anticipates a much smaller build in stockpiles versus previous years• PRB stockpiles are the lowest in the country — translating into improvement in the forward curve index pricing (up 35% since Oct.’09) ... and pressure building for additional price movement much earlier in this market up-cycle Source: EIA and ACI Slide 11 |
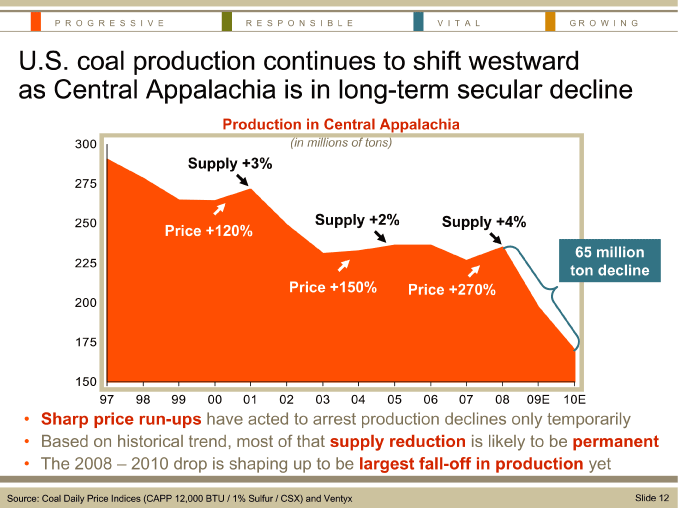
PROGRESSIVE RESPONSIBLE VITAL GROWING U.S. coal production continues to shift westward as Central Appalachia is in long-term secular decline Production in Central Appalachia 300 (in millions of tons) Supply +3% 275 250 Supply +2% Supply +4% Price +120% 65 million 225 ton decline Price +150% Price +270% 200 175 150 97 98 99 00 01 02 03 04 05 06 07 08 09E 10E• Sharp price run-ups have acted to arrest production declines only temporarily• Based on historical trend, most of that supply reduction is likely to be permanent• The 2008 — 2010 drop is shaping up to be largest fall-off in production yet Source: Coal Daily Price Indices (CAPP 12,000 BTU / 1% Sulfur / CSX) and Ventyx Slide 12 |
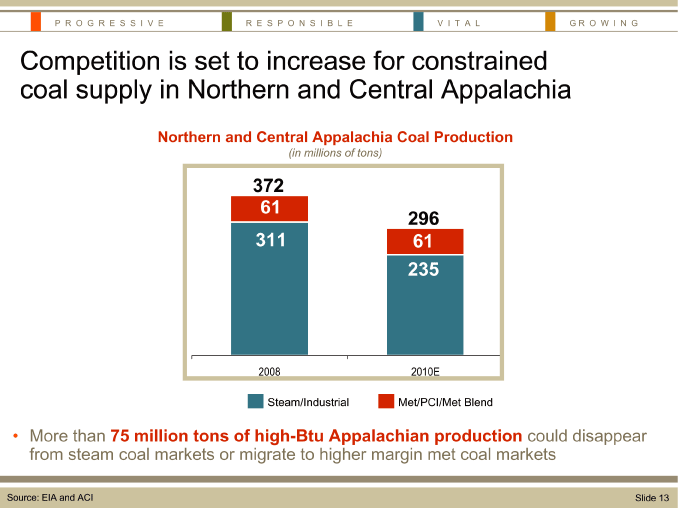
PROGRESSIVE RESPONSIBLE VITAL GROWING Competition is set to increase for constrained coal supply in Northern and Central Appalachia Northern and Central Appalachia Coal Production (in millions of tons) 372 61 296 311 61 120 235 2008 2010E Steam/Industrial Met/PCI/Met Blend• More than 75 million tons of high-Btu Appalachian production could disappear from steam coal markets or migrate to higher margin met coal markets Source: EIA and ACI Slide 13 |
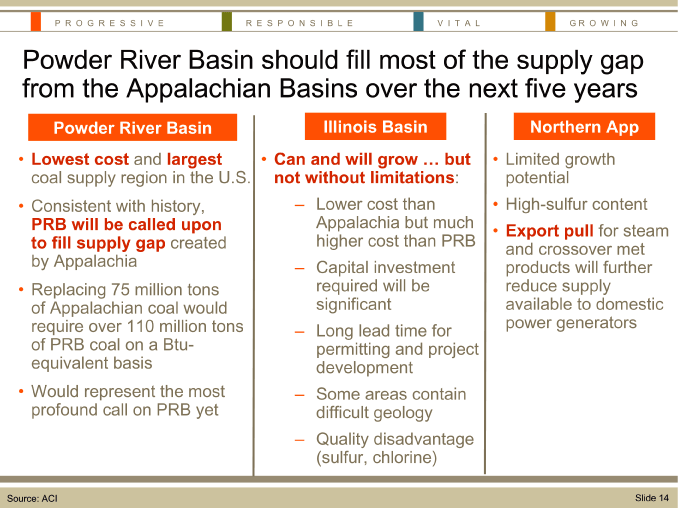
PROGRESSIVE RESPONSIBLE VITAL GROWING Powder River Basin should fill most of the supply gap from the Appalachian Basins over the next five years Powder River Basin Illinois Basin Northern App• Lowest cost and largest• Can and will grow ... but• Limited growth coal supply region in the U.S. not without limitations: potential• Consistent with history, — Lower cost than• High-sulfur content PRB will be called upon Appalachia but much• Export pull for steam to fill supply gap created higher cost than PRB and crossover met by Appalachia — Capital investment products will further• Replacing 75 million tons required will be reduce supply of Appalachian coal would significant available to domestic require over 110 million tons power generators — Long lead time for of PRB coal on a Btu- permitting and project equivalent basis development• Would represent the most — Some areas contain profound call on PRB yet difficult geology — Quality disadvantage (sulfur, chlorine) Source: ACI Slide 14 |
PROGRESSIVE RESPONSIBLE VITAL GROWING Energy, the environment and clean coal technologies Slide 15 |
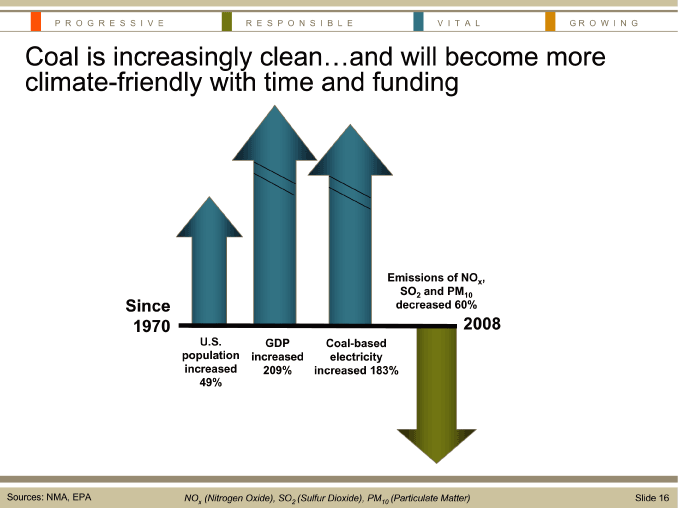
PROGRESSIVE RESPONSIBLE VITAL GROWING Coal is increasingly clean...and will become more climate-friendly with time and fundingEmissions of NOx, SO2and PM10 Since decreased 60% 1970 2008 U.S. GDP Coal-based population increased electricity increased 209% increased 183% 49% Sources: NMA, EPA Slide 16NOx(Nitrogen Oxide), SO2(Sulfur Dioxide), PM10(Particulate Matter) |
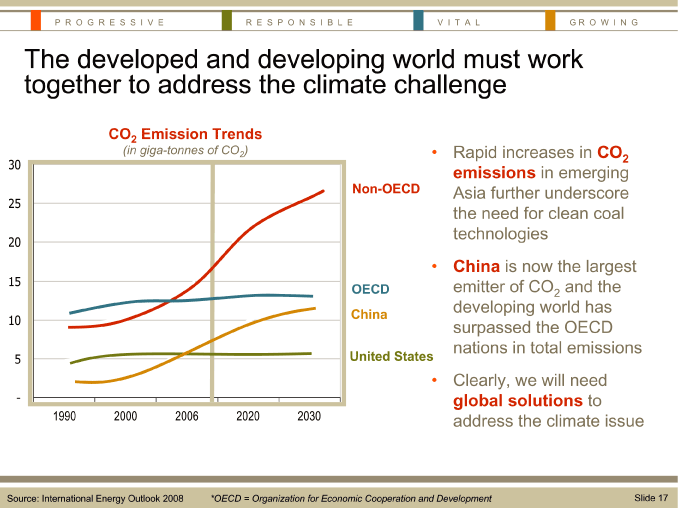
PROGRESSIVE RESPONSIBLE VITAL GROWING The developed and developing world must work together to address the climate challengeCO2Emission Trends (in giga-tonnes of CO2)• Rapid increases inCO2 30 emissions in emerging Non-OECD Asia further underscore 25 the need for clean coal technologies 20• China is now the largest 15 OECDemitter of CO2and thedeveloping world has 10 China surpassed the OECD nations in total emissions 5 United States• Clearly, we will need — global solutions to 1990 2000 2006 2020 2030 address the climate issue Source: International Energy Outlook 2008 *OECD = Organization for Economic Cooperation and Development Slide 17 |
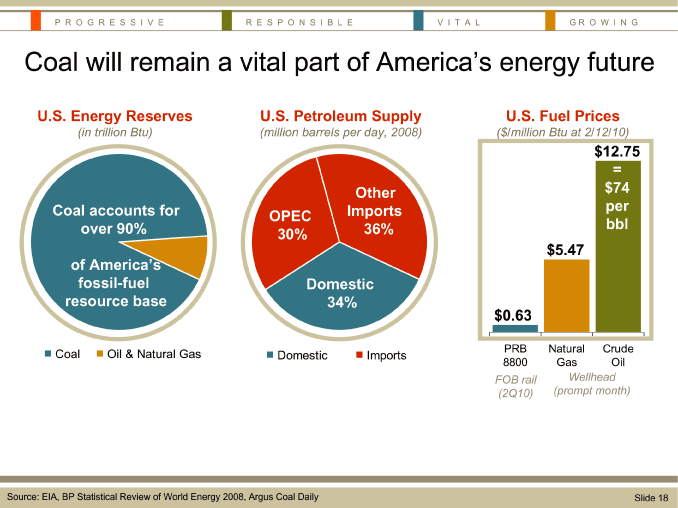
PROGRESSIVE RESPONSIBLE VITAL GROWING Coal will remain a vital part of America’s energy future U.S. Energy Reserves U.S. Petroleum Supply U.S. Fuel Prices (in trillion Btu) (million barrels per day, 2008) ($/million Btu at 2/12/10) $12.75 = Other $74 Coal accounts for Imports per OPEC over 90% 36% bbl 30% $5.47 of America’s fossil-fuel Domestic resource base 34% $0.63 Coal Oil & Natural Gas PRB Natural Crude Domestic Imports 8800 Gas Oil FOB rail Wellhead (2Q10) (prompt month) Source: EIA, BP Statistical Review of World Energy 2008, Argus Coal Daily Slide 18 |
PROGRESSIVE RESPONSIBLE VITAL GROWING Arch Coal Overview Slide 19 |
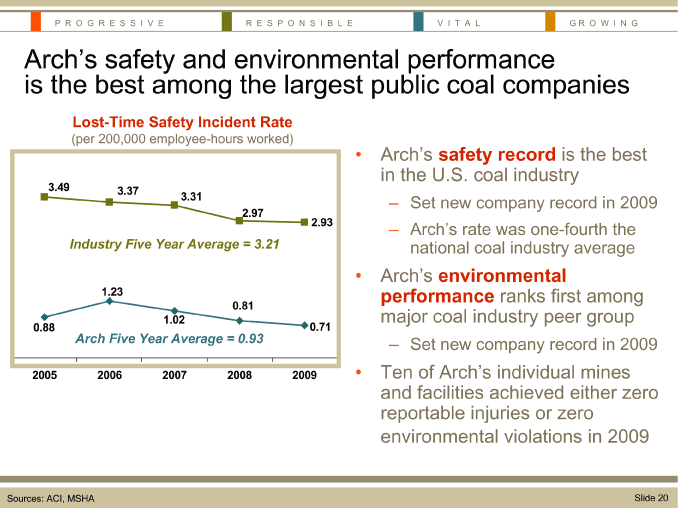
PROGRESSIVE RESPONSIBLE VITAL GROWING Arch’s safety and environmental performance is the best among the largest public coal companies Lost-Time Safety Incident Rate (per 200,000 employee-hours worked)• Arch’s safety record is the best in the U.S. coal industry 3.49 3.37 3.31 — Set new company record in 2009 2.97 2.93 — Arch’s rate was one-fourth the Industry Five Year Average = 3.21 national coal industry average• Arch’s environmental 1.23 performance ranks first among 0.81 1.02 major coal industry peer group 0.88 0.71 Arch Five Year Average = 0.93 — Set new company record in 2009 2005 2006 2007 2008 2009• Ten of Arch’s individual mines and facilities achieved either zero reportable injuries or zero environmental violations in 2009 Sources: ACI, MSHA Slide 20 |
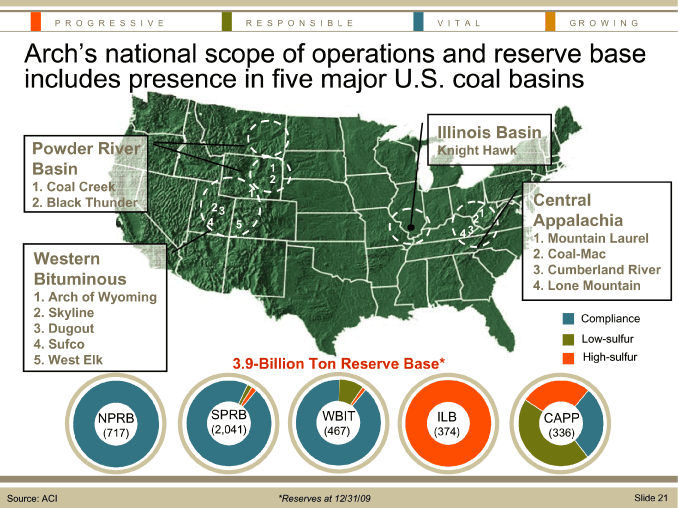
PROGRESSIVE RESPONSIBLE VITAL GROWING Arch’s national scope of operations and reserve base includes presence in five major U.S. coal basins Illinois Basin Powder River Knight Hawk Basin 1 2 1. Coal Creek 1 Central 2. Black Thunder2 3 4 21 Appalachia 5 4 3 1. Mountain Laurel Western 2. Coal-Mac 3. Cumberland River Bituminous 4. Lone Mountain 1. Arch of Wyoming 2. Skyline Compliance 3. Dugout 4. Sufco Low-sulfur 5. West Elk 3.9-Billion Ton Reserve Base* High-sulfur NPRB SPRB WBIT ILB CAPP (717) (2,041) (467) (374) (336) Source: ACI *Reserves at 12/31/09 Slide 21 |
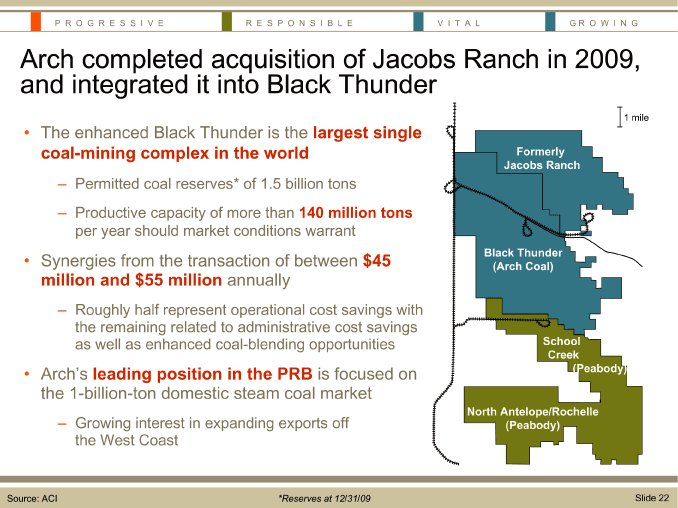
PROGRESSIVE RESPONSIBLE VITAL GROWING Arch completed acquisition of Jacobs Ranch in 2009, and integrated it into Black Thunder 1 mile• The enhanced Black Thunder is the largest single coal-mining complex in the world Formerly Jacobs Ranch — Permitted coal reserves* of 1.5 billion tons — Productive capacity of more than 140 million tons per year should market conditions warrant• Synergies from the transaction of between $45 Black Thunder (Arch Coal) million and $55 million annually — Roughly half represent operational cost savings with the remaining related to administrative cost savings as well as enhanced coal-blending opportunities School Creek• Arch’s leading position in the PRB is focused on (Peabody) the 1-billion-ton domestic steam coal market North Antelope/Rochelle — Growing interest in expanding exports off (Peabody) the West Coast Source: ACI *Reserves at 12/31/09 Slide 22 |
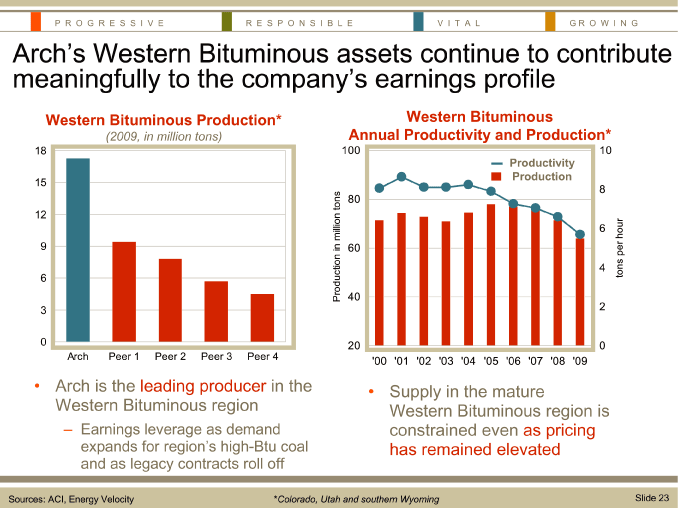
PROGRESSIVE RESPONSIBLE VITAL GROWING Arch’s Western Bituminous assets continue to contribute meaningfully to the company’s earnings profile Western Bituminous Production* Western Bituminous (2009, in million tons) Annual Productivity and Production* 18 100 10 Productivity Production 15 8 80 12 6 9 in million tons 60 Production 4 tons per hour 6 40 3 2 0 20 0 Arch Peer 1 Peer 2 Peer 3 Peer 4 ‘00 ‘01 ‘02 ‘03 ‘04 ‘05 ‘06 ‘07 ‘08 ‘09• Arch is the leading producer in the• Supply in the mature Western Bituminous region Western Bituminous region is — Earnings leverage as demand constrained even as pricing expands for region’s high-Btu coal has remained elevated and as legacy contracts roll off Sources: ACI, Energy Velocity *Colorado, Utah and southern Wyoming Slide 23 |
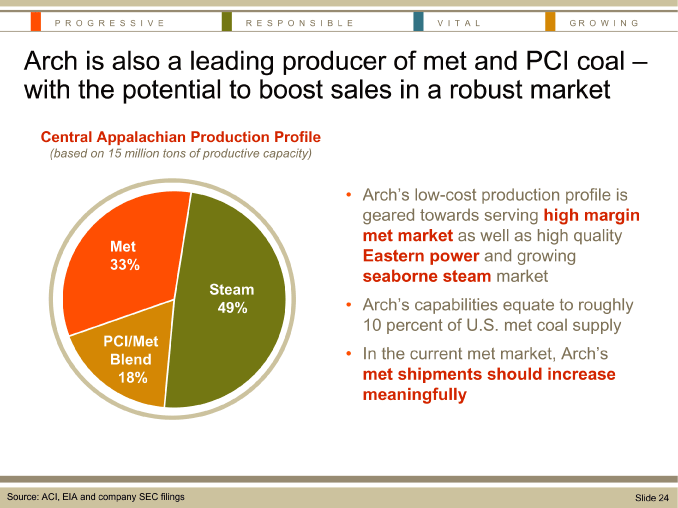
PROGRESSIVE RESPONSIBLE VITAL GROWING Arch is also a leading producer of met and PCI coal —with the potential to boost sales in a robust market Central Appalachian Production Profile (based on 15 million tons of productive capacity)• Arch’s low-cost production profile is geared towards serving high margin met market as well as high quality Met Eastern power and growing 33% seaborne steam market Steam 49%• Arch’s capabilities equate to roughly 10 percent of U.S. met coal supply PCI/Met Blend• In the current met market, Arch’s 18% met shipments should increase meaningfully Source: ACI, EIA and company SEC filings Slide 24 |
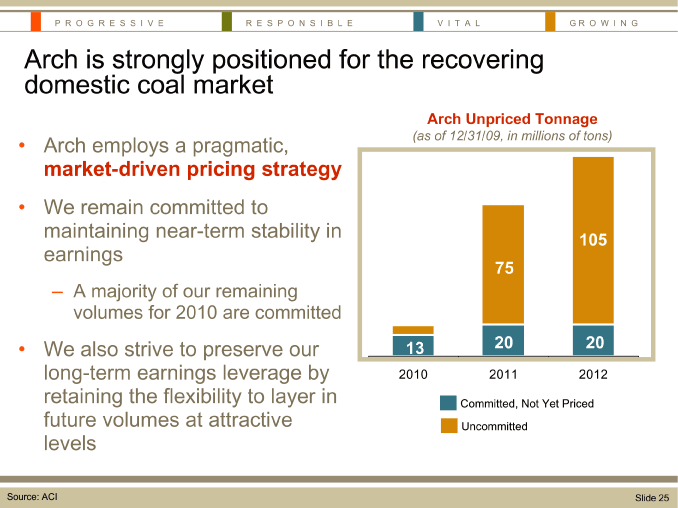
PROGRESSIVE RESPONSIBLE VITAL GROWING Arch is strongly positioned for the recovering domestic coal market Arch Unpriced Tonnage• Arch employs a pragmatic, (as of 12/31/09, in millions of tons) market-driven pricing strategy 9%• We remain committed to maintaining near-term stability in 105 earnings 87% 75 — A majority of our remaining volumes for 2010 are committed• We also strive to preserve our 13 20 20 long-term earnings leverage by 2010 2011 2012 retaining the flexibility to layer in Committed, Not Yet Priced future volumes at attractive Uncommitted levels Source: ACI Slide 25 |
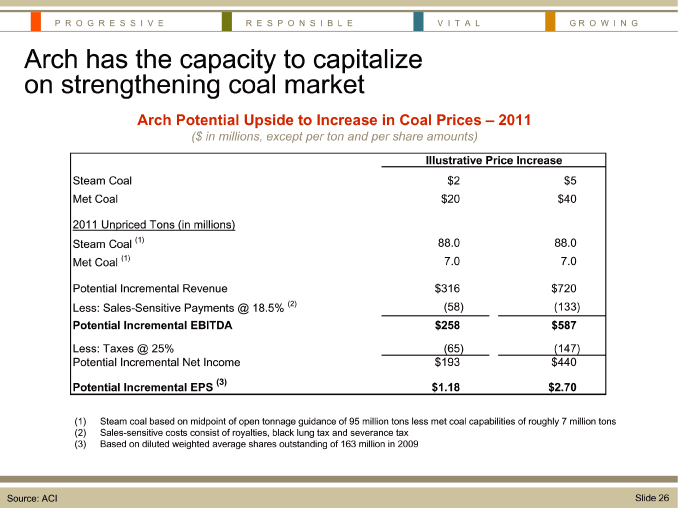
PROGRESSIVE RESPONSIBLE VITAL GROWING Arch has the capacity to capitalize on strengthening coal market Arch Potential Upside to Increase in Coal Prices — 2011 ($ in millions, except per ton and per share amounts) Illustrative Price Increase Steam Coal $2 $5 Met Coal $20 $40 2011 Unpriced Tons (in millions) Steam Coal(1) 88.0 88.0 Met Coal(1) 7.0 7.0 Potential Incremental Revenue $316 $720 Less: Sales-Sensitive Payments @ 18.5%(2) (58) (133) Potential Incremental EBITDA $258 $587 Less: Taxes @ 25% (65) (147) Potential Incremental Net Income $193 $440 Potential Incremental EPS(3) $1.18 $2.70 (1) Steam coal based on midpoint of open tonnage guidance of 95 million tons less met coal capabilities of roughly 7 million tons (2) Sales-sensitive costs consist of royalties, black lung tax and severance tax (3) Based on diluted weighted average shares outstanding of 163 million in 2009 Source: ACI Slide 26 |
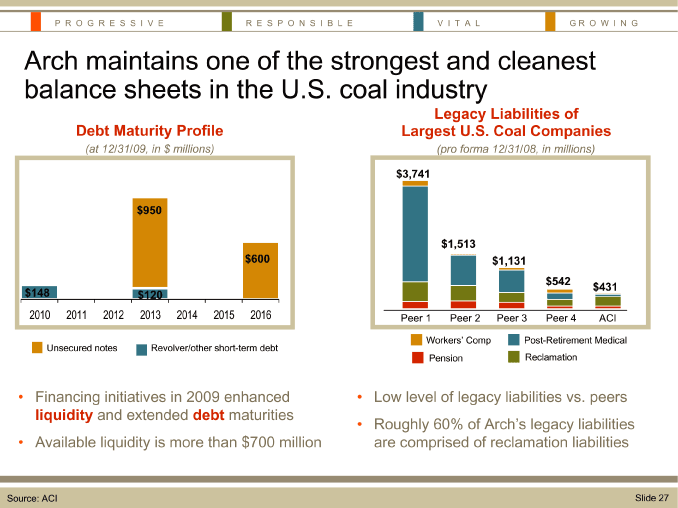
PROGRESSIVE RESPONSIBLE VITAL GROWING Arch maintains one of the strongest and cleanest balance sheets in the U.S. coal industry Legacy Liabilities of Debt Maturity Profile Largest U.S. Coal Companies (at 12/31/09, in $ millions) (pro forma 12/31/08, in millions) $3,741 $950 $1,513 $600 $1,131 $542 $431 $148 $120 2010 2011 2012 2013 2014 2015 2016 Peer 1 Peer 2 Peer 3 Peer 4 ACI Workers’ Comp Post-Retirement Medical Unsecured notes Revolver/other short-term debt Pension Reclamation• Financing initiatives in 2009 enhanced• Low level of legacy liabilities vs. peers liquidity and extended debt maturities• Roughly 60% of Arch’s legacy liabilities• Available liquidity is more than $700 million are comprised of reclamation liabilities Source: ACI Slide 27 |
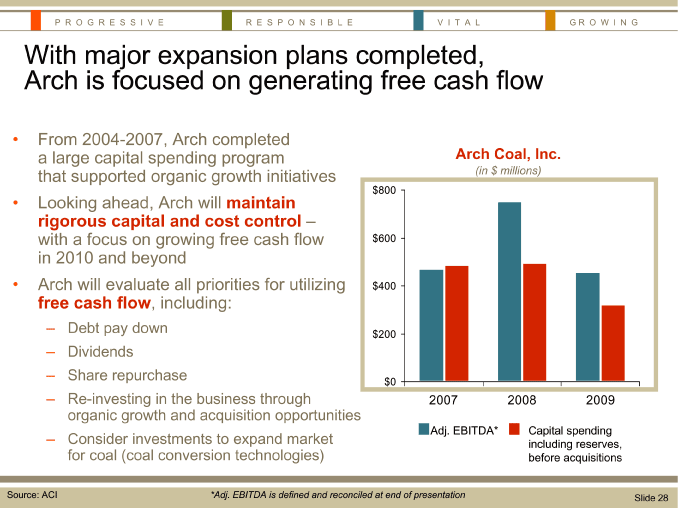
PROGRESSIVE RESPONSIBLE VITAL GROWING With major expansion plans completed, Arch is focused on generating free cash flow• From 2004-2007, Arch completed a large capital spending program Arch Coal, Inc. that supported organic growth initiatives (in $ millions) $800• Looking ahead, Arch will maintain rigorous capital and cost control —with a focus on growing free cash flow $600 in 2010 and beyond• Arch will evaluate all priorities for utilizing $400 free cash flow, including: — Debt pay down $200 — Dividends — Share repurchase $0 — Re-investing in the business through 2007 2008 2009 organic growth and acquisition opportunities Adj. EBITDA* Capital spending — Consider investments to expand market including reserves, for coal (coal conversion technologies) before acquisitions Source: ACI *Adj. EBITDA is defined and reconciled at end of presentation Slide 28 |
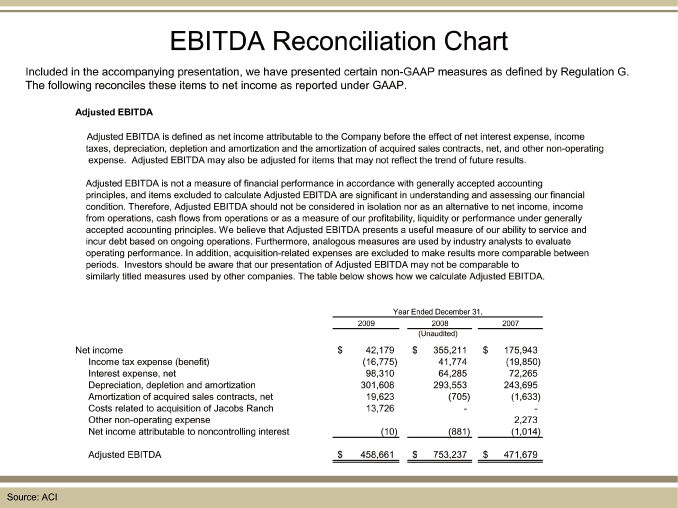
EBITDA Reconciliation Chart Included in the accompanying presentation, we have presented certain non-GAAP measures as defined by Regulation G. The following reconciles these items to net income as reported under GAAP. Adjusted EBITDA Adjusted EBITDA is defined as net income attributable to the Company before the effect of net interest expense, income taxes, depreciation, depletion and amortization and the amortization of acquired sales contracts, net, and other non-operating expense. Adjusted EBITDA may also be adjusted for items that may not reflect the trend of future results. Adjusted EBITDA is not a measure of financial performance in accordance with generally accepted accounting principles, and items excluded to calculate Adjusted EBITDA are significant in understanding and assessing our financial condition. Therefore, Adjusted EBITDA should not be considered in isolation nor as an alternative to net income, income from operations, cash flows from operations or as a measure of our profitability, liquidity or performance under generally accepted accounting principles. We believe that Adjusted EBITDA presents a useful measure of our ability to service and incur debt based on ongoing operations. Furthermore, analogous measures are used by industry analysts to evaluate operating performance. In addition, acquisition-related expenses are excluded to make results more comparable between periods. Investors should be aware that our presentation of Adjusted EBITDA may not be comparable to similarly titled measures used by other companies. The table below shows how we calculate Adjusted EBITDA. Year Ended December 31, 2009 2008 2007 (Unaudited) Net income $42,179 $355,211 $175,943 Income tax expense (benefit) (16,775) 41,774 (19,850) Interest expense, net 98,310 64,285 72,265 Depreciation, depletion and amortization 301,608 293,553 243,695 Amortization of acquired sales contracts, net 19,623 (705) (1,633) Costs related to acquisition of Jacobs Ranch 13,726 — -Other non-operating expense 2,273 Net income attributable to noncontrolling interest (10) (881) (1,014) Adjusted EBITDA $458,661 $753,237 $471,679 Source: ACI |