Exhibit 99.1
| 2010 Arch Coal Analyst Day Black Thunder Mine Wyoming September 2010 |
| Forward-Looking Information This presentation contains “forward-looking statements” — that is, statements related to future, not past, events. In this context, forward-looking statements often address our expected future business and financial performance, and often contain words such as “expects,” “anticipates,” “intends,” “plans,” “believes,” “seeks,” or “will.” Forward-looking statements by their nature address matters that are, to different degrees, uncertain. For us, particular uncertainties arise from changes in the demand for our coal by the domestic electric generation industry; from legislation and regulations relating to the Clean Air Act and other environmental initiatives; from operational, geological, permit, labor and weather-related factors; from fluctuations in the amount of cash we generate from operations; from future integration of acquired businesses; and from numerous other matters of national, regional and global scale, including those of a political, economic, business, competitive or regulatory nature. These uncertainties may cause our actual future results to be materially different than those expressed in our forward-looking statements. We do not undertake to update our forward-looking statements, whether as a result of new information, future events or otherwise, except as may be required by law. For a description of some of the risks and uncertainties that may affect our future results, you should see the risk factors described from time to time in the reports we file with the Securities and Exchange Commission. This presentation includes certain non-GAAP financial measures, including Adjusted EBITDA and Adjusted Net Income. These non-GAAP financial measures are not measures of financial performance in accordance with generally accepted accounting principles and may exclude items that are significant in understanding and assessing our financial results. Therefore, these measures should not be considered in isolation or as an alternative to net income from operations, cash flows from operations, earnings per fully-diluted share or other measures of profitability, liquidity or performance under generally accepted accounting principles. You should be aware that our presentation of these measures may not be comparable to similarly-titled measures used by other companies. A reconciliation of these financial measures to the most comparable measures presented in accordance with generally accepted accounting principles has been included at the end of this presentation. |
| 2010 Arch Coal Analyst Day Black Thunder Mine STEVE LEER Chairman and CEO, Arch Coal, Inc. Wyoming September 2010 |
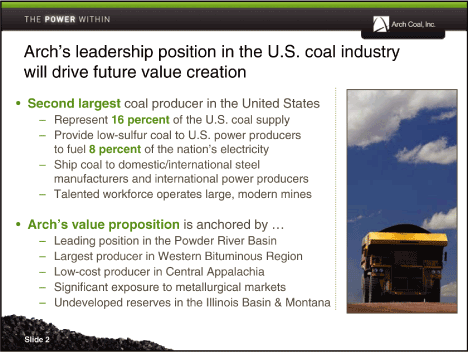
| Arch’s leadership position in the U.S. coal industry will drive future value creation• Second largest coal producer in the United States — Represent 16 percent of the U.S. coal supply — Provide low-sulfur coal to U.S. power producers to fuel 8 percent of the nation’s electricity — Ship coal to domestic/international steel manufacturers and international power producers — Talented workforce operates large, modern mines• Arch’s value proposition is anchored by ... — Leading position in the Powder River Basin — Largest producer in Western Bituminous Region — Low-cost producer in Central Appalachia — Significant exposure to metallurgical markets — Undeveloped reserves in the Illinois Basin & Montana |
| U.S. Coal Markets: A Case Study of the 2000s |
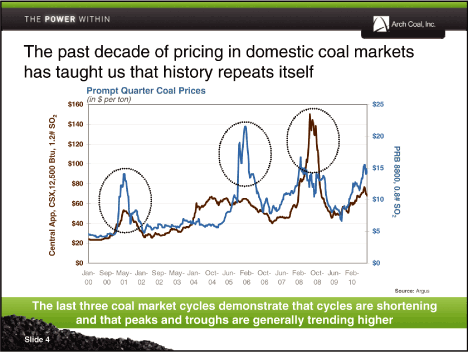
| The past decade of pricing in domestic coal markets has taught us that history repeats itself Prompt Quarter Coal Prices The last three coal market cycles demonstrate that cycles are shortening and that peaks and troughs are generally trending higher Slide 4 |
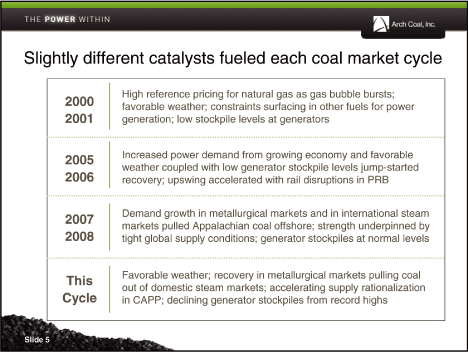
| Slightly different catalysts fueled each coal market cycle High reference pricing for natural gas as gas bubble bursts; 2000 favorable weather; constraints surfacing in other fuels for power 2001 generation; low stockpile levels at generators 2005 Increased power demand from growing economy and favorable weather coupled with low generator stockpile levels jump-started 2006 recovery; upswing accelerated with rail disruptions in PRB 2007 Demand growth in metallurgical markets and in international steam markets pulled Appalachian coal offshore; strength underpinned by 2008 tight global supply conditions; generator stockpiles at normal levels This Favorable weather; recovery in metallurgical markets pulling coal out of domestic steam markets; accelerating supply rationalization Cycle in CAPP; declining generator stockpiles from record highs Slide 5 |
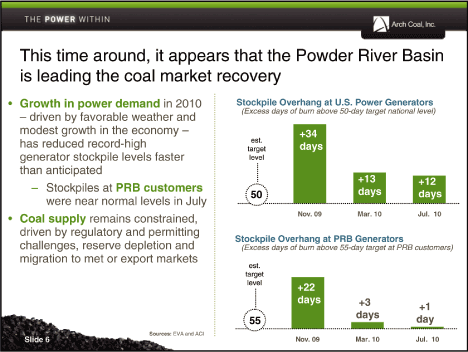
| This time around, it appears that the Powder River Basin is leading the coal market recovery Stockpile Overhang at U.S. Power Generators (Excess days of burn above 50-day target national level)• Growth in power demand in 2010 — driven by favorable weather and modest growth in the economy —has reduced record-high generator stockpile levels faster than anticipated — Stockpiles at PRB customers were near normal levels in July• Coal supply remains constrained, driven by regulatory and permitting challenges, reserve depletion and migration to met or export markets Sources: EVA and ACI Slide 6 |
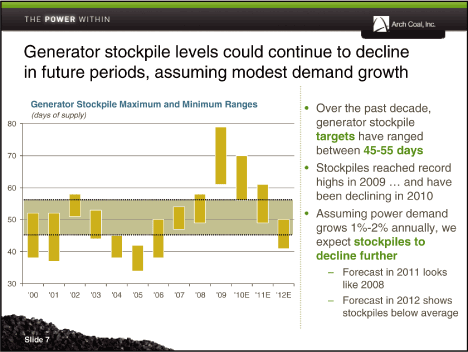
| Generator stockpile levels could continue to decline in future periods, assuming modest demand growth Generator Stockpile Maximum and Minimum Ranges (days of supply)• Over the past decade, generator stockpile targets have ranged between 45-55 days• Stockpiles reached record highs in 2009 ... and have been declining in 2010• Assuming power demand grows 1%-2% annually, we expect stockpiles to decline further — Forecast in 2011 looks like 2008 — Forecast in 2012 shows stockpiles below average Slide 7 |

| Arch Is Ready To Excel |
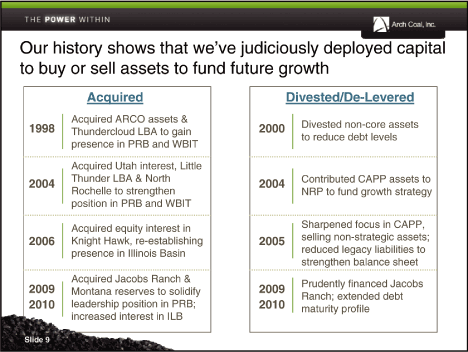
| Our history shows that we’ve judiciously deployed capital to buy or sell assets to fund future growth Acquired Divested/De-Levered Acquired ARCO assets & 1998 2000 Divested non-core assets Thundercloud LBA to gain to reduce debt levels presence in PRB and WBIT Acquired Utah interest, Little 2004 Thunder LBA & North 2004 Contributed CAPP assets to Rochelle to strengthen NRP to fund growth strategy position in PRB and WBIT Acquired equity interest in Sharpened focus in CAPP, 2006 Knight Hawk, re-establishing 2005 selling non-strategic assets; presence in Illinois Basin reduced legacy liabilities to strengthen balance sheet Acquired Jacobs Ranch & 2009 2009 Prudently financed Jacobs Montana reserves to solidify Ranch; extended debt 2010 leadership position in PRB; 2010 maturity profile increased interest in ILB Slide 9 |
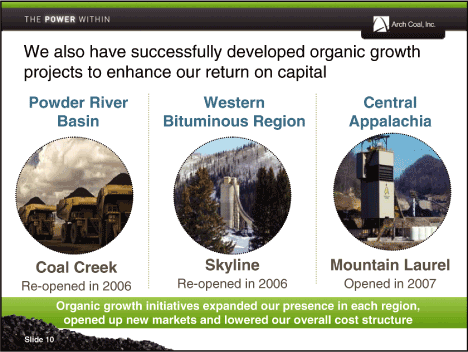
| We also have successfully developed organic growth projects to enhance our return on capital Powder River Western Central Basin Bituminous Region Appalachia Coal Creek Skyline Mountain Laurel Re-opened in 2006 Re-opened in 2006 Opened in 2007 Organic growth initiatives expanded our presence in each region, opened up new markets and lowered our overall cost structure Slide 10 |
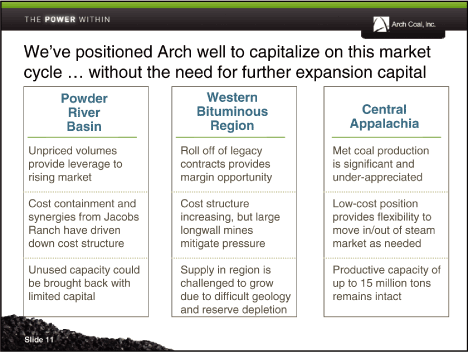
| We’ve positioned Arch well to capitalize on this market cycle ... without the need for further expansion capital Powder Western River Bituminous Central Basin Region Appalachia Unpriced volumes Roll off of legacy Met coal production provide leverage to contracts provides is significant and rising market margin opportunity under-appreciated Cost containment and Cost structure Low-cost position synergies from Jacobs increasing, but large provides flexibility to Ranch have driven longwall mines move in/out of steam down cost structure mitigate pressure market as needed Unused capacity could Supply in region is Productive capacity of be brought back with challenged to grow up to 15 million tons limited capital due to difficult geology remains intact and reserve depletion Slide 11 |

| Future of Coal Markets |
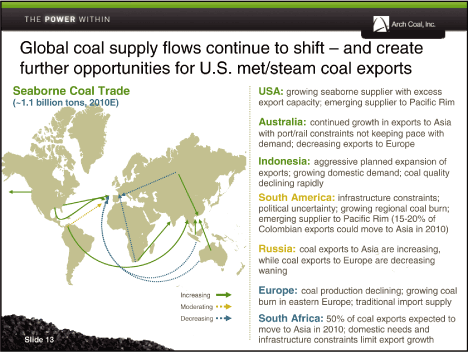
| Global coal supply flows continue to shift — and create further opportunities for U.S. met/steam coal exports Seaborne Coal Trade (~1.1 billion tons, 2010E) USA: growing seaborne supplier with excess export capacity; emerging supplier to Pacific Rim Australia: continued growth in exports to Asia with port/rail constraints not keeping pace with demand; decreasing exports to Europe Indonesia: aggressive planned expansion of exports; growing domestic demand; coal quality declining rapidly South America: infrastructure constraints; political uncertainty; growing regional coal burn; emerging supplier to Pacific Rim (15-20% of Colombian exports could move to Asia in 2010) Russia: coal exports to Asia are increasing, while coal exports to Europe are decreasing waning Europe: coal production declining; growing coal burn in eastern Europe; traditional import supply South Africa: 50% of coal exports expected to move to Asia in 2010; domestic needs and infrastructure constraints limit export growth Increasing Moderating Decreasing Slide 13 |

| Around the world, countries are building coal plants to fuel electricity needs New Coal-Fueled Generation Coming Online by 2015 (Capacity under construction, in GW) Under 227 GW Construction 728 million tons Total 396 GW 1.3 billion tons Europe United States Mexico Central & South America Africa CIS countries China India Other Asia Sources: ACI and Platts International, estimates based on plants currently under construction or planned 396 GW of coal-fueled capacity is planned to come online by 2015 ... and will be fueled by more than 1 billion tons of coal Slide 14 |
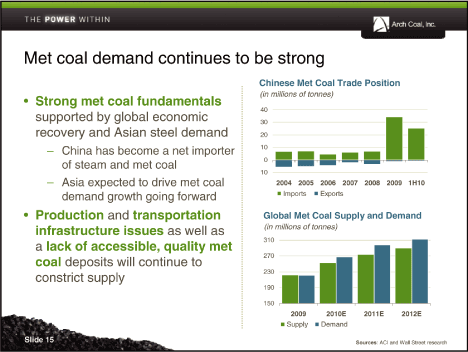
| Met coal demand continues to be strong• Strong met coal fundamentals supported by global economic recovery and Asian steel demand — China has become a net importer of steam and met coal — Asia expected to drive met coal demand growth going forward• Production and transportation infrastructure issues as well as a lack of accessible, quality met coal deposits will continue to constrict supply Chinese Met Coal Trade Position (in millions of tonnes) Slide 15 Sources: ACI and Wall Street research |
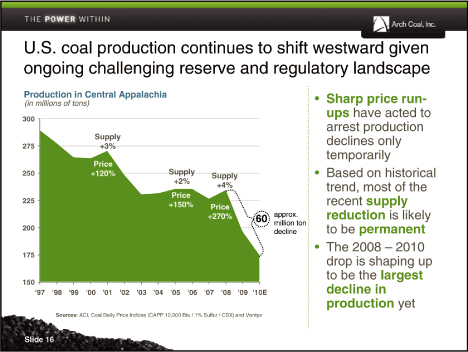
| U.S. coal production continues to shift westward given ongoing challenging reserve and regulatory landscape Production in Central Appalachia (in millions of tons)• Sharp price run-ups have acted to arrest production declines only temporarily• Based on historical trend, most of the recent supply reduction is likely to be permanent• The 2008 — 2010 drop is shaping up to be the largest decline in production yet Sources: ACI, Coal Daily Price Indices (CAPP 12,000 Btu / 1% Sulfur / CSX) and Ventyx Slide 16 |
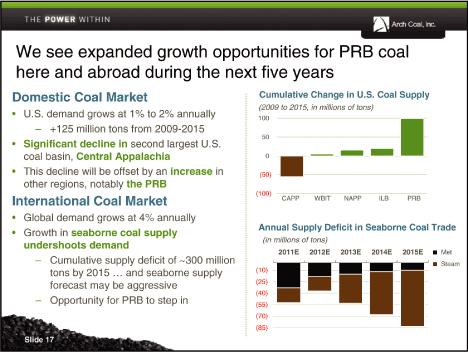
| We see expanded growth opportunities for PRB coal here and abroad during the next five years Domestic Coal Market• U.S. demand grows at 1% to 2% annually — +125 million tons from 2009-2015• Significant decline in second largest U.S. coal basin, Central Appalachia• This decline will be offset by an increase in other regions, notably the PRB International Coal Market• Global demand grows at 4% annually• Growth in seaborne coal supply undershoots demand — Cumulative supply deficit of ~300 million tons by 2015 ... and seaborne supply forecast may be aggressive — Opportunity for PRB to step in Cumulative Change in U.S. Coal Supply (2009 to 2015, in millions of tons) Slide 17 |

| Arch’s Growth Opportunities: The Next Decade |
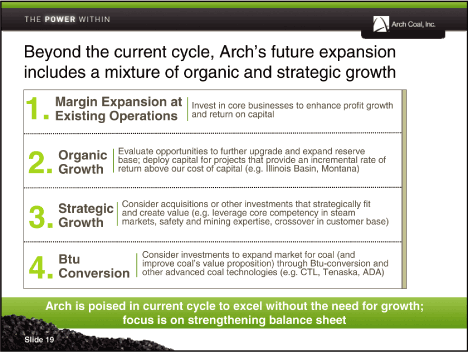
| Beyond the current cycle, Arch’s future expansion includes a mixture of organic and strategic growth Margin Expansion at Invest in core businesses to enhance profit growth 1. Existing Operations and return on capital Organic Evaluate opportunities to further upgrade and expand reserve base; deploy capital for projects that provide an incremental rate of 2. Growth return above our cost of capital (e.g. Illinois Basin, Montana) Strategic Consider acquisitions or other investments that strategically fit and create value (e.g. leverage core competency in steam 3. Growth markets, safety and mining expertise, crossover in customer base) Btu Consider investments to expand market for coal (and improve coal’s value proposition) through Btu-conversion and 4. Conversion other advanced coal technologies (e.g. CTL, Tenaska, ADA) Arch is poised in current cycle to excel without the need for growth; focus is on strengthening balance sheet Slide 19 |

| Over time, we expect coal’s value proposition to expand as the value inherent in a Btu converges• Expect EBITDA multiples to expand as full earnings power is realized — Non-producing coal reservesCoal accounts for OPEC not over factored into current90% of 30% valuations America’s• New technologies fossil-fuel that can transform coal are not considered resource base — Reference pricing for other fossil fuels is still very favorable ACI Valuation (EV/one year consensus forward EBITDA multiple) Future Range? Current Range U.S. Fuel Prices (prompt month delivery, $ per million Btu at 9/10/10) Slide 20 Sources: ACI, ThomsonReuters and Argus Coal Daily |
| 2010 Arch Coal Analyst Day Black Thunder Mine JOHN EAVES President and COO, Arch Coal, Inc. Wyoming September 2010 |

| Arch’s Marketing Platform |
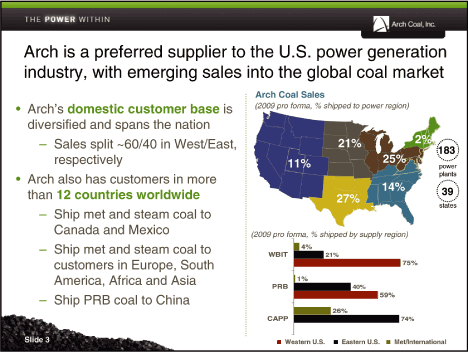
| Arch is a preferred supplier to the U.S. power generation industry, with emerging sales into the global coal market• Arch’s domestic customer base is diversified and spans the nation — Sales split ~60/40 in West/East, respectively• Arch also has customers in more than 12 countries worldwide — Ship met and steam coal to Canada and Mexico — Ship met and steam coal to customers in Europe, South America, Africa and Asia — Ship PRB coal to China Arch Coal Sales (2009 pro forma, % shipped to power region) Slide 3 |

| Arch has a balanced transportation platform with which to service customers• Arch is a major shipper on four Class I railroads — Diversity grants delivery options to customers — Can move between carriers at some mines to take advantage of market opportunities• Arch Coal Terminal on the Big Sandy River grants flexibility to deliver via barge and provides market intelligence for our trading business Arch Coal Shipments (2009 pro forma) Slide 4 |
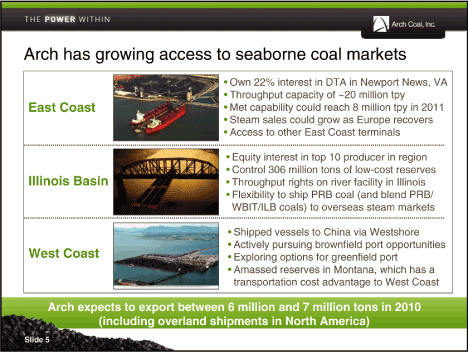
| Arch has growing access to seaborne coal markets East Coast Illinois Basin West Coast• Own 22% interest in DTA in Newport News, VA• Throughput capacity of ~20 million tpy• Met capability could reach 8 million tpy in 2011• Steam sales could grow as Europe recovers• Access to other East Coast terminals• Equity interest in top 10 producer in region• Control 306 million tons of low-cost reserves• Throughput rights on river facility in Illinois• Flexibility to ship PRB coal (and blend PRB/ WBIT/ILB coals) to overseas steam markets• Shipped vessels to China via Westshore• Actively pursuing brownfield port opportunities• Exploring options for greenfield port• Amassed reserves in Montana, which has a transportation cost advantage to West Coast Arch expects to export between 6 million and 7 million tons in 2010 (including overland shipments in North America) Slide 5 |
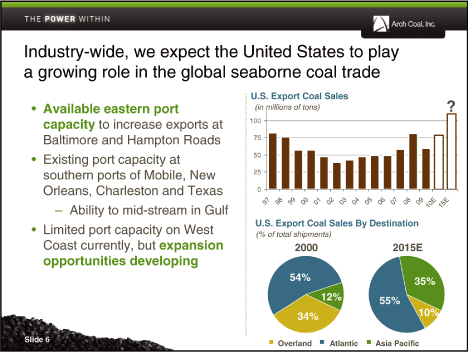
| Industry-wide, we expect the United States to play a growing role in the global seaborne coal trade• Available eastern port capacity to increase exports at Baltimore and Hampton Roads• Existing port capacity at southern ports of Mobile, New Orleans, Charleston and Texas — Ability to mid-stream in Gulf• Limited port capacity on West Coast currently, but expansion opportunities developing U.S. Export Coal Sales (in millions of tons) Slide 6 |
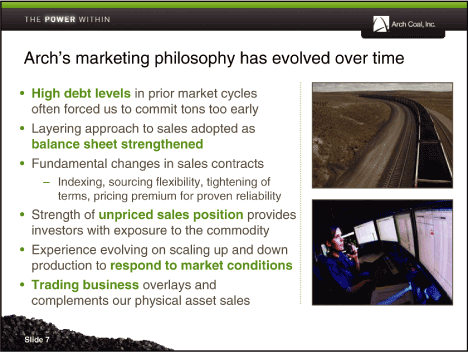
| Arch’s marketing philosophy has evolved over time• High debt levels in prior market cycles often forced us to commit tons too early• Layering approach to sales adopted as balance sheet strengthened• Fundamental changes in sales contracts — Indexing, sourcing flexibility, tightening of terms, pricing premium for proven reliability• Strength of unpriced sales position provides investors with exposure to the commodity• Experience evolving on scaling up and down production to respond to market conditions• Trading business overlays and complements our physical asset sales Slide 7 |
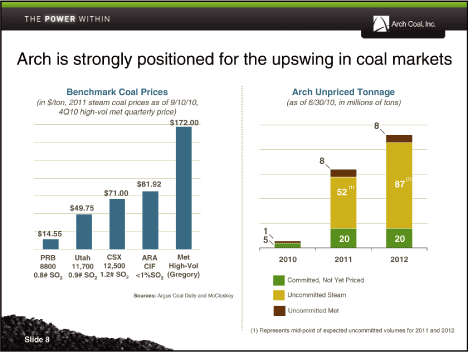
| Arch is strongly positioned for the upswing in coal markets Benchmark Coal Prices (in $/ton, 2011 steam coal prices as of 9/10/10, 4Q10 high-vol met quarterly price) Arch Unpriced Tonnage (as of 6/30/10, in millions of tons) Committed, Not Yet Priced Uncommitted Steam Uncommitted Met (1) Represents mid-point of expected uncommitted volumes for 2011 and 2012 Slide 8 |
| Outlook for Our Core Operating Regions |
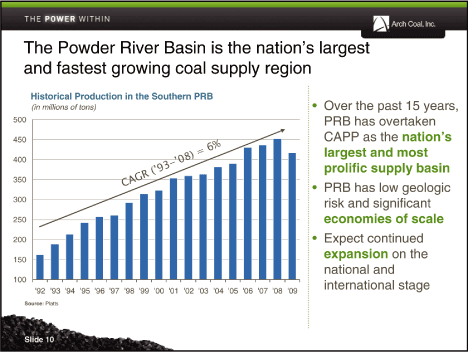
| The Powder River Basin is the nation’s largest and fastest growing coal supply region Historical Production in the Southern PRB (in millions of tons)• Over the past 15 years, PRB has overtaken CAPP as the nation’s largest and most prolific supply basin• PRB has low geologic risk and significant economies of scale• Expect continued expansion on the national and international stage Source: Platts Slide 10 |
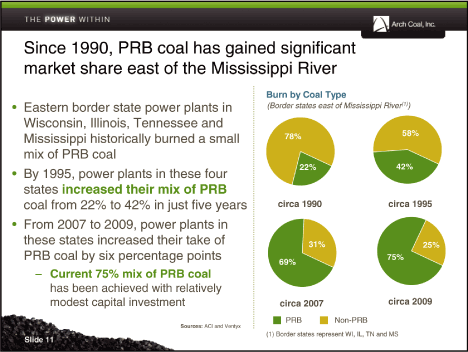
| Since 1990, PRB coal has gained significant market share east of the Mississippi River• Eastern border state power plants in Wisconsin, Illinois, Tennessee and Mississippi historically burned a small mix of PRB coal• By 1995, power plants in these four states increased their mix of PRB coal from 22% to 42% in just five years• From 2007 to 2009, power plants in these states increased their take of PRB coal by six percentage points — Current 75% mix of PRB coal has been achieved with relatively modest capital investment Sources: ACI and Ventyx (1) Border states represent WI, IL, TN and MS Slide 11 |
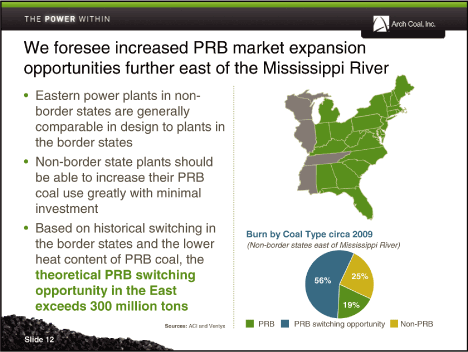
| We foresee increased PRB market expansion opportunities further east of the Mississippi River• Eastern power plants in non-border states are generally comparable in design to plants in the border states• Non-border state plants should be able to increase their PRB coal use greatly with minimal investment• Based on historical switching in the border states and the lower heat content of PRB coal, the theoretical PRB switching opportunity in the East exceeds 300 million tons Sources: ACI and Ventyx Burn by Coal Type circa 2009 (Non-border states east of Mississippi River) Slide 12 |
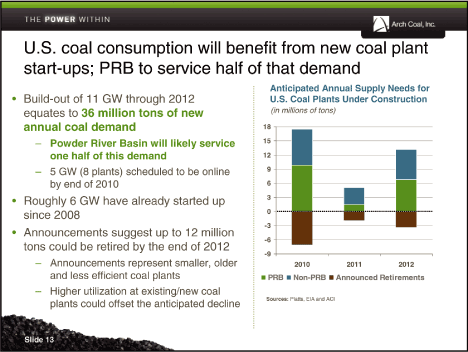
| U.S. coal consumption will benefit from new coal plant start-ups; PRB to service half of that demand• Build-out of 11 GW through 2012 equates to 36 million tons of new annual coal demand — Powder River Basin will likely service one half of this demand — 5 GW (8 plants) scheduled to be online by end of 2010• Roughly 6 GW have already started up since 2008• Announcements suggest up to 12 million tons could be retired by the end of 2012 — Announcements represent smaller, older and less efficient coal plants — Higher utilization at existing/new coal plants could offset the anticipated decline Anticipated Annual Supply Needs for U.S. Coal Plants Under Construction (in millions of tons) Sources: Platts, EIA and ACI Slide 13 |
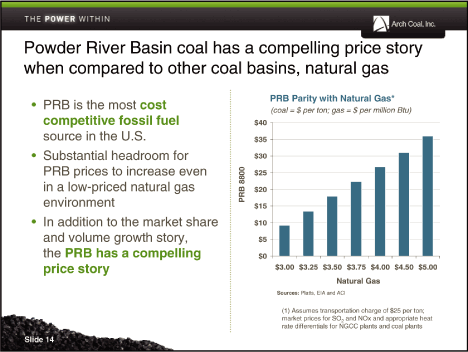
| Powder River Basin coal has a compelling price story when compared to other coal basins, natural gas• PRB is the most cost competitive fossil fuel source in the U.S.• Substantial headroom for PRB prices to increase even in a low-priced natural gas environment• In addition to the market share and volume growth story, the PRB has a compelling price story PRB Parity with Natural Gas* (coal = $ per ton; gas = $ per million Btu) Natural Gas Sources: Platts, EIA and ACI (1) Assumes transportation charge of $25 per ton; market prices for SO 2 and NOx and appropriate heat rate differentials for NGCC plants and coal plants Slide 14 |
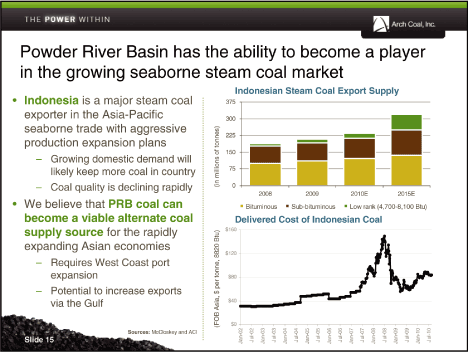
| Powder River Basin has the ability to become a player in the growing seaborne steam coal market Indonesian Steam Coal Export Supply• Indonesia is a major steam coal exporter in the Asia-Pacific seaborne trade with aggressive production expansion plans — Growing domestic demand will likely keep more coal in country — Coal quality is declining rapidly• We believe that PRB coal can become a viable alternate coal supply source for the rapidly expanding Asian economies — Requires West Coast port expansion — Potential to increase exports via the Gulf Indonesian Steam Coal Export Supply Delivered Cost of Indonesian Coal 160 Sources: McCloskey and ACI Slide 15 |
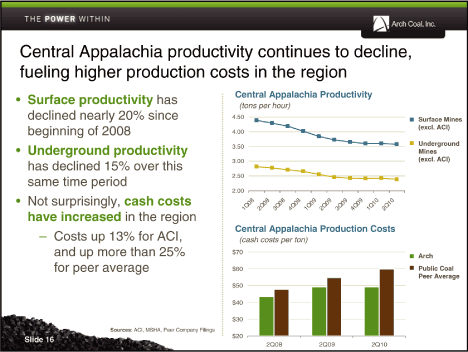
| Central Appalachia productivity continues to decline, fueling higher production costs in the region• Surface productivity has declined nearly 20% since beginning of 2008• Underground productivity has declined 15% over this same time period• Not surprisingly, cash costs have increased in the region — Costs up 13% for ACI, and up more than 25% for peer average Central Appalachia Productivity (tons per hour) Surface Mines (excl. ACI) Underground Mines (excl. ACI) Arch Public Coal Peer Average Sources: ACI, MSHA, Peer Company Filings Slide 16 |
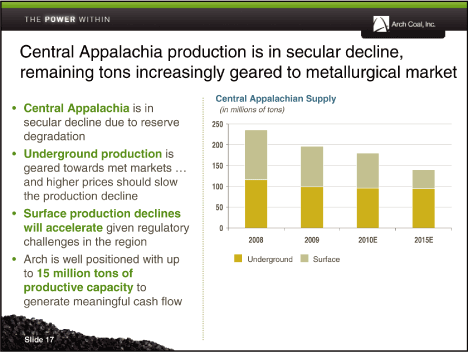
| Central Appalachia production is in secular decline, remaining tons increasingly geared to metallurgical market• Central Appalachia is in secular decline due to reserve degradation• Underground production is geared towards met markets ... and higher prices should slow the production decline• Surface production declines will accelerate given regulatory challenges in the region• Arch is well positioned with up to 15 million tons of productive capacity to generate meaningful cash flow Central Appalachian Supply (in millions of tons) Slide 17 |
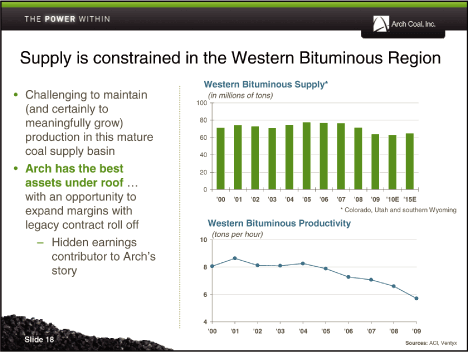
| Supply is constrained in the Western Bituminous Region• Challenging to maintain (and certainly to meaningfully grow) production in this mature coal supply basin• Arch has the best assets under roof ... with an opportunity to expand margins with legacy contract roll off — Hidden earnings contributor to Arch’s story Western Bituminous Supply* (in millions of tons) Western Bituminous Productivity (tons per hour) Slide 18 |

| Illinois Basin production should grow, but expect net increase to be modest• While production in the Illinois Basin is set to expand, coal quality issues and competition from other basins could limit growth• Planned additions could well prove overly ambitious; additions will likely be offset by significant depletions — Additions also include 6 million tons for captive Prairie State power plant• Arch is strategically positioned for growth in the Illinois Basin with an equity interest in Knight Hawk, and a large undeveloped reserve base of high-Btu, low-chlorine coal Illinois Basin Supply Cumulative Production Changes through 2015 (2010-2015, in millions of tons) Slide 19 |
| Arch’s value proposition is unique• Expect growing free cash flow generation• Experienced workforce and corporate culture committed to operating the safest, most environmentally responsible mines in the nation• Large-scale, diverse and low-cost operations that are flexible in response to market demand• Strategic reserve base well-positioned to meet America’s — and the world’s — growing energy needs• Strong balance sheet provides the company with financial flexibility• Focused on advancing clean-coal technologies to expand market for coal beyond electricity generation• Building a world-class energy company that can deliver shareholder value over the long term Slide 20 |
| 2010 Arch Coal Analyst Day Black Thunder Mine JOHN DREXLER Senior Vice President and CFO, Arch Coal, Inc. Wyoming September 2010 |
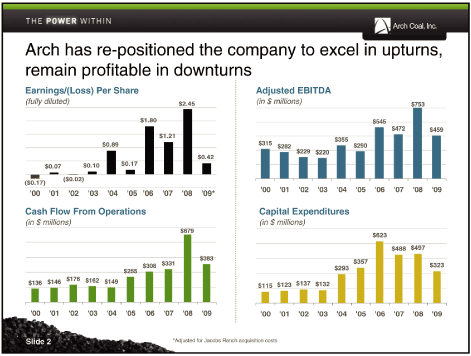
| Arch has re-positioned the company to excel in upturns, remain profitable in downturns Earnings/(Loss) Per Share Adjusted EBITDA (fully diluted) $2.45 (in $ millions) $753 Slide 2 *Adjusted for Jacobs Ranch acquisition costs |

| Maintaining a Strong Balance Sheet Slide 3 |
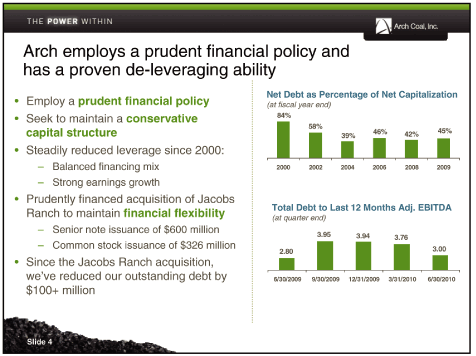
| Arch employs a prudent financial policy and has a proven de-leveraging ability• Employ a prudent financial policy• Seek to maintain a conservative capital structure• Steadily reduced leverage since 2000: — Balanced financing mix — Strong earnings growth• Prudently financed acquisition of Jacobs Ranch to maintain financial flexibility — Senior note issuance of $600 million — Common stock issuance of $326 million• Since the Jacobs Ranch acquisition, we’ve reduced our outstanding debt by $100+ million Net Debt as Percentage of Net Capitalization (at fiscal year end) Slide 4 |
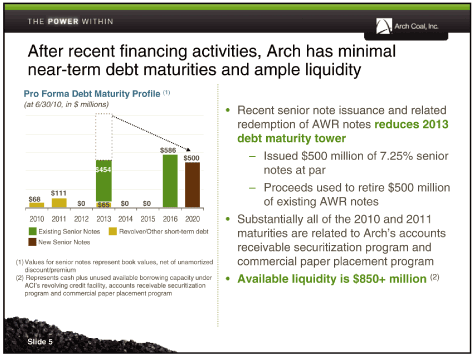
| After recent financing activities, Arch has minimal near-term debt maturities and ample liquidity Pro Forma Debt Maturity Profile (1) (at 6/30/10, in $ millions) (1) Values for senior notes represent book values, net of unamortized discount/premium (2) Represents cash plus unused available borrowing capacity under ACI’s revolving credit facility, accounts receivable securitization program and commercial paper placement program• Recent senior note issuance and related redemption of AWR notes reduces 2013 debt maturity tower — Issued $500 million of 7.25% senior notes at par — Proceeds used to retire $500 million of existing AWR notes• Substantially all of the 2010 and 2011 maturities are related to Arch’s accounts receivable securitization program and commercial paper placement program• Available liquidity is $850+ million (2) Slide 5 |
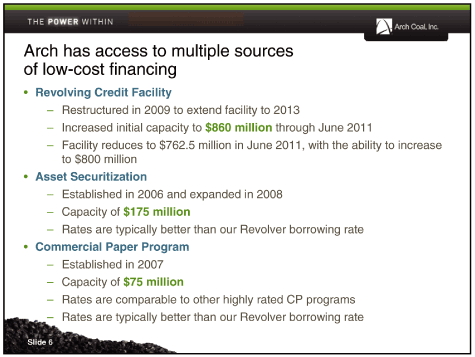
| Arch has access to multiple sources of low-cost financing• Revolving Credit Facility — Restructured in 2009 to extend facility to 2013 — Increased initial capacity to $860 million through June 2011 — Facility reduces to $762.5 million in June 2011, with the ability to increase to $800 million• Asset Securitization — Established in 2006 and expanded in 2008 — Capacity of $175 million — Rates are typically better than our Revolver borrowing rate• Commercial Paper Program — Established in 2007 — Capacity of $75 million — Rates are comparable to other highly rated CP programs — Rates are typically better than our Revolver borrowing rate Slide 6 |
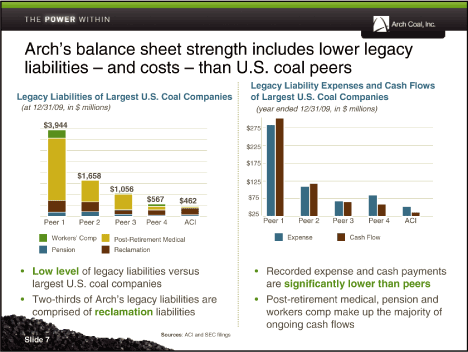
| Arch’s balance sheet strength includes lower legacy liabilities — and costs — than U.S. coal peers Legacy Liabilities of Largest U.S. Coal Companies (at 12/31/09, in $ millions) Legacy Liability Expenses and Cash Flows of Largest U.S. Coal Companies (year ended 12/31/09, in $ millions)• Low level of legacy liabilities versus largest U.S. coal companies• Two-thirds of Arch’s legacy liabilities are comprised of reclamation liabilities• Recorded expense and cash payments are significantly lower than peers• Post-retirement medical, pension and workers comp make up the majority of ongoing cash flows Sources: ACI and SEC filings Slide 7 |
| Arch diligently manages risk at an operational and corporate level• Corporate Level — Manage risk in our trading business by using VAR, sensitivity and scenario analysis — Manage price risk using financial swaps — Maximize our open position using options — Use purchased coal to maximize profit• Operational Level — Hedge consumable costs at operations• Diesel fuel example: ratable hedge program in place to lock in 60+% of the 50 million to 60 million gallons of consumption annually• Thinking is evolving on future opportunities to protect against cost inflation, but participate in cost deflation Slide 8 |

| Our Earnings Platform |
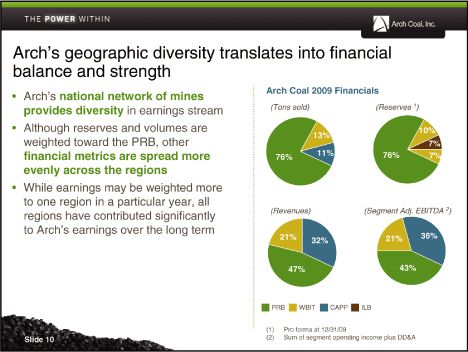
| Arch’s geographic diversity translates into financial balance and strength• Arch’s national network of mines provides diversity in earnings stream• Although reserves and volumes are weighted toward the PRB, other financial metrics are spread more evenly across the regions• While earnings may be weighted more to one region in a particular year, all regions have contributed significantly to Arch’s earnings over the long term Arch Coal 2009 Financials Arch Coal 2009 Financials Slide 10 |
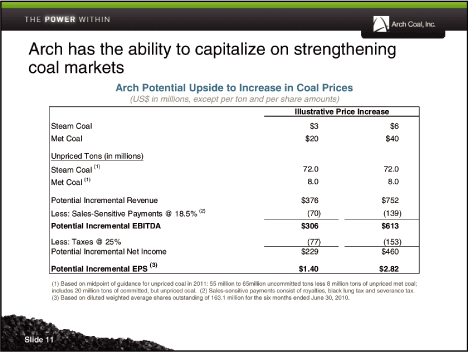
| Arch has the ability to capitalize on strengthening coal markets Arch Potential Upside to Increase in Coal Prices (US$ in millions, except per ton and per share amounts) Illustrative Price Increase Steam Coal $3 $6 Met Coal $20 $40 Unpriced Tons (in millions) Steam Coal (1) 72.0 72.0 Met Coal (1) 8.0 8.0 Potential Incremental Revenue $376 $752 Less: Sales-Sensitive Payments @ 18.5% (2) (70) (139) Potential Incremental EBITDA $306 $613 Less: Taxes @ 25% (77) (153) Potential Incremental Net Income $229 $460 Potential Incremental EPS (3) $1.40 $2.82 (1) Based on midpoint of guidance for unpriced coal in 2011: 55 million to 65million uncommitted tons less 8 million tons of unpriced met coal; includes 20 million tons of committed, but unpriced coal. (2) Sales-sensitive payments consist of royalties, black lung tax and severance tax. (3) Based on diluted weighted average shares outstanding of 163.1 million for the six months ended June 30, 2010. Slide 11 |
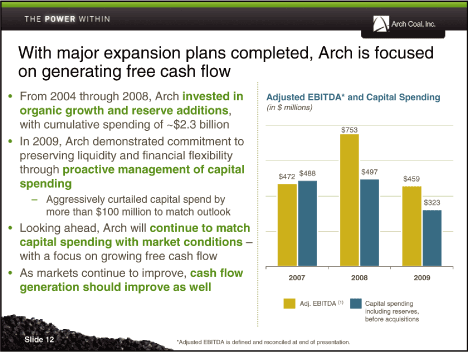
| With major expansion plans completed, Arch is focused on generating free cash flow• From 2004 through 2008, Arch invested in organic growth and reserve additions, with cumulative spending of ~$2.3 billion• In 2009, Arch demonstrated commitment to preserving liquidity and financial flexibility through proactive management of capital spending — Aggressively curtailed capital spend by more than $100 million to match outlook• Looking ahead, Arch will continue to match capital spending with market conditions —with a focus on growing free cash flow• As markets continue to improve, cash flow generation should improve as well Adjusted EBITDA* and Capital Spending (in $ millions) Slide 12 *Adjusted EBITDA is defined and reconciled at end of presentation. |
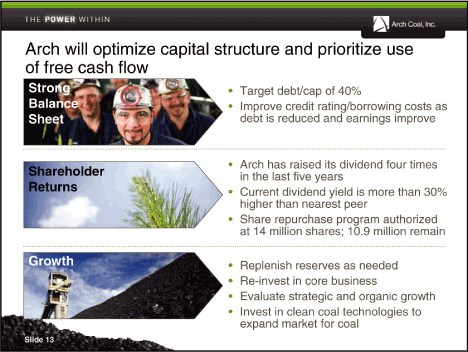
| Arch will optimize capital structure and prioritize use of free cash flow Strong Balance Sheet Shareholder Returns Growth• Target debt/cap of 40%• Improve credit rating/borrowing costs as debt is reduced and earnings improve• Arch has raised its dividend four times in the last five years• Current dividend yield is more than 30% higher than nearest peer• Share repurchase program authorized at 14 million shares; 10.9 million remain• Replenish reserves as needed• Re-invest in core business• Evaluate strategic and organic growth• Invest in clean coal technologies to expand market for coal Slide 13 |
| 2010 Arch Coal Analyst Day Black Thunder Mine JOHN DREXLER Senior Vice President and CFO, Arch Coal, Inc. Wyoming September 2010 |
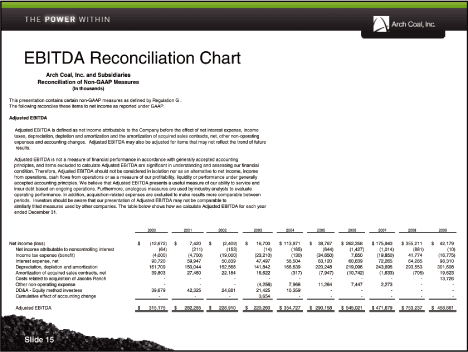
| EBITDA Reconciliation Chart Arch Coal, Inc. and Subsidiaries Reconciliation of Non-GAAP Measures (In thousands) This presentation contains certain non-GAAP measures as defined by Regulation G . The following reconciles these items to net income as reported under GAAP. Adjusted EBITDA Adjusted EBITDA is defined as net income attributable to the Company before the effect of net interest expense, income taxes, depreciation, depletion and amortization and the amortization of acquired sales contracts, net, other non-operating expenses and accounting changes. Adjusted EBITDA may also be adjusted for items that may not reflect the trend of future results. Adjusted EBITDA is not a measure of financial performance in accordance with generally accepted accounting principles, and items excluded to calculate Adjusted EBITDA are significant in understanding and assessing our financial condition. Therefore, Adjusted EBITDA should not be considered in isolation nor as an alternative to net income, income from operations, cash flows from operations or as a measure of our profitability, liquidity or performance under generally accepted accounting principles. We believe that Adjusted EBITDA presents a useful measure of our ability to service and incur debt based on ongoing operations. Furthermore, analogous measures are used by industry analysts to evaluate operating performance. In addition, acquisition-related expenses are excluded to make results more comparable between periods. Investors should be aware that our presentation of Adjusted EBITDA may not be comparable to similarly titled measures used by other companies. The table below shows how we calculate Adjusted EBITDA for each year ended December 31. 2000 2001 2002 2003 2004 2005 2006 2007 2008 2009 Net income (loss) $ (12,672) $7,420 $ (2,409) $16,700 $ 113,871 $38,767 $262,358 $175,943 $355,211 $42,179 Net income attributable to noncontrolling interest (64) (211) (153) (14) (165) (644) (1,427) (1,014) (881) (10) Income tax expense (benefit) (4,000) (4,700) (19,000) (23,210) (130) (34,650) 7,650 (19,850) 41,774 (16,775) Interest expense, net 90,720 59,947 50,839 47,497 56,504 63,120 60,639 72,265 64,285 98,310 Depreciation, depletion and amortization 161,709 150,044 152,568 141,842 166,639 220,248 219,096 243,695 293,553 301,608 Amortization of acquired sales contracts, net 39,803 27,460 22,184 16,622 (317) (7,947) (10,742) (1,633) (705) 19,623 Costs related to acquisition of Jacobs Ranch — - — - — - — - — 13,726 Other non-operating expense — - — (4,256) 7,966 11,264 7,447 2,273 — -DD&A — Equity method investees 39,679 42,325 24,881 21,425 10,359 — - — - -Cumulative effect of accounting change — - — 3,654 — - - - — - — Adjusted EBITDA $315,175 $282,285 $228,910 $220,260 $354,727 $290,158 $545,021 $ 471,679 $753,237 $458,661 Slide 15 |
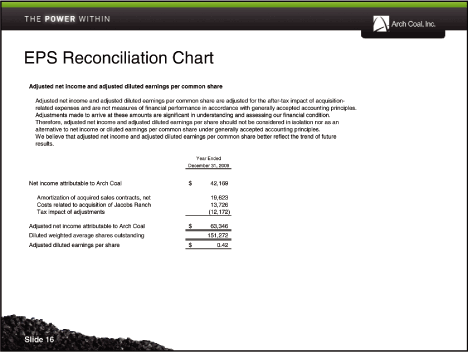
| EPS Reconciliation Chart Adjusted net income and adjusted diluted earnings per common share Adjusted net income and adjusted diluted earnings per common share are adjusted for the after-tax impact of acquisition-related expenses and are not measures of financial performance in accordance with generally accepted accounting principles. Adjustments made to arrive at these amounts are significant in understanding and assessing our financial condition. Therefore, adjusted net income and adjusted diluted earnings per share should not be considered in isolation nor as an alternative to net income or diluted earnings per common share under generally accepted accounting principles. We believe that adjusted net income and adjusted diluted earnings per common share better reflect the trend of future results. Year Ended December 31, 2009 Net income attributable to Arch Coal $ 42,169 Amortization of acquired sales contracts, net 19,623 Costs related to acquisition of Jacobs Ranch 13,726 Tax impact of adjustments (12,172) Adjusted net income attributable to Arch Coal $ 63,346 Diluted weighted average shares outstanding 151,272 Adjusted diluted earnings per share $0.42 Slide 16 |
| 2010 Arch Coal Analyst Day Black Thunder Mine DECK SLONE Vice President , Government, Investor and Public Affairs |

| Legislative and Regulatory Update |

| Federal climate legislation is unlikely before 2013 ... and it’s not clear the odds will get any better then |
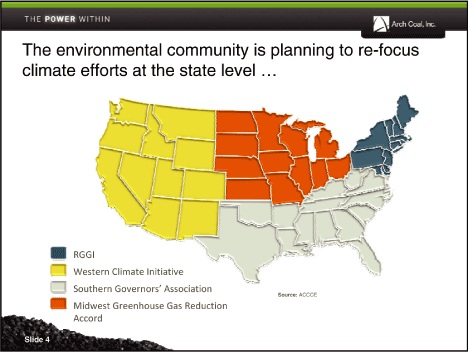
| The environmental community is planning to re-focus climate efforts at the state level ... |
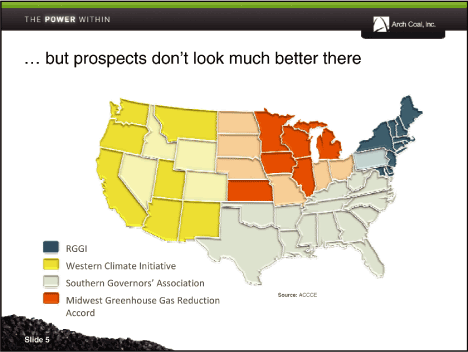
| ... but prospects don’t look much better there |
| The real threat to coal-based generation is the so-called “regulatory train wreck” that has already started to unfold |

| • Endangerment Finding• Transport Rule• Coal Ash• NAAQS• MACT Rule |
| Competing Fuels for Power Generation |
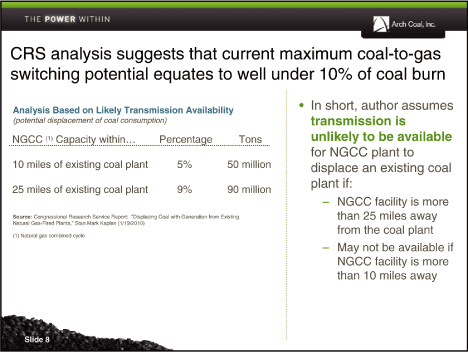
| CRS analysis suggests that current maximum coal-to-gas switching potential equates to well under 10% of coal burn• In short, author assumes transmission is unlikely to be available for NGCC plant to displace an existing coal plant if: — NGCC facility is more than 25 miles away from the coal plant — May not be available if NGCC facility is more than 10 miles away |
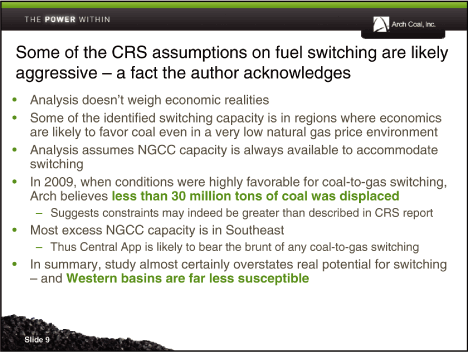
| Some of the CRS assumptions on fuel switching are likely aggressive — a fact the author acknowledges• Analysis doesn’t weigh economic realities• Some of the identified switching capacity is in regions where economics are likely to favor coal even in a very low natural gas price environment• Analysis assumes NGCC capacity is always available to accommodate switching• In 2009, when conditions were highly favorable for coal-to-gas switching, Arch believes less than 30 million tons of coal was displaced — Suggests constraints may indeed be greater than described in CRS report• Most excess NGCC capacity is in Southeast — Thus Central App is likely to bear the brunt of any coal-to-gas switching• In summary, study almost certainly overstates real potential for switching — and Western basins are far less susceptible |
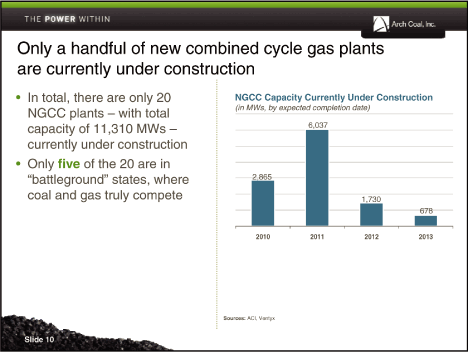
| Only a handful of new combined cycle gas plants are currently under construction• In total, there are only 20 NGCC plants — with total235 capacity of 11,310 MWs —currently under construction• Only five of the 20 are in “battleground” states, where coal and gas truly compete |

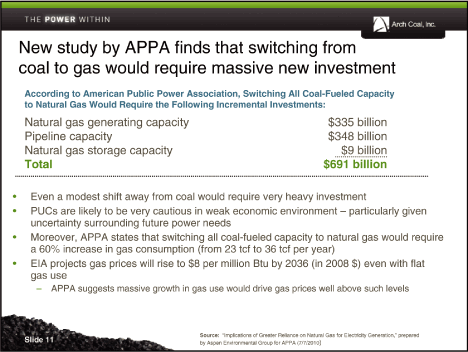
| New study by APPA finds that switching from coal to gas would require massive new investment According to American Public Power Association, Switching All Coal-Fueled Capacity to Natural Gas Would Require the Following Incremental Investments: Natural gas generating capacity $335 billion Pipeline capacity $348 billion Natural gas storage capacity $9 billion Total $691 billion• Even a modest shift away from coal would require very heavy investment• PUCs are likely to be very cautious in weak economic environment — particularly given uncertainty surrounding future power needs• Moreover, APPA states that switching all coal-fueled capacity to natural gas would require a 60% increase in gas consumption (from 23 tcf to 36 tcf per year)• EIA projects gas prices will rise to $8 per million Btu by 2036 (in 2008 $) even with flat gas use — APPA suggests massive growth in gas use would drive gas prices well above such levels |
| Outlook for Coal Use in the U.S. |
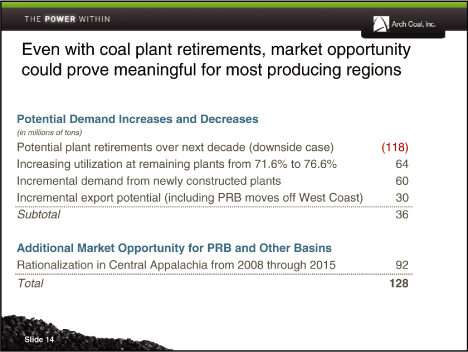
| While some coal plants will close in face of tightening regulations, coal consumption should remain robust “Some of my colleagues have talked about 30,000 or 40,000 megawatts of coal-fired generation being off line. ... The fact is baseload generation will be needed. The existing plants will be needed, and the EPA rules will be adjusted to the reality of the economy. In the next 2-3 years as the U.S. economy struggles going forward, I can’t imagine a scenario where those laws and rules will be implemented to the extent that some think they will.”Mike Morris, Chairman and CEO of AEP, 2Q Earnings Call, 8/2/10 |
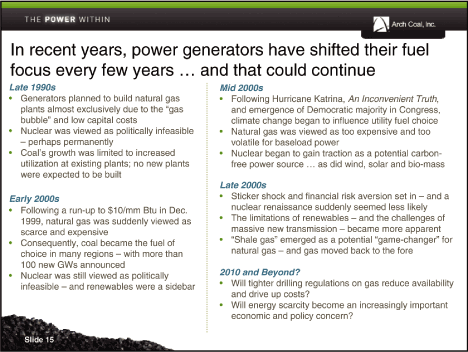
| Even with coal plant retirements, market opportunity could prove meaningful for most producing regions Potential Demand Increases and Decreases(in millions of tons)Potential plant retirements over next decade (downside case) (118) Increasing utilization at remaining plants from 71.6% to 76.6% 64 Incremental demand from newly constructed plants 60 Incremental export potential (including PRB moves off West Coast) 30Subtotal36 Additional Market Opportunity for PRB and Other Basins Rationalization in Central Appalachia from 2008 through 2015 92Total128 |
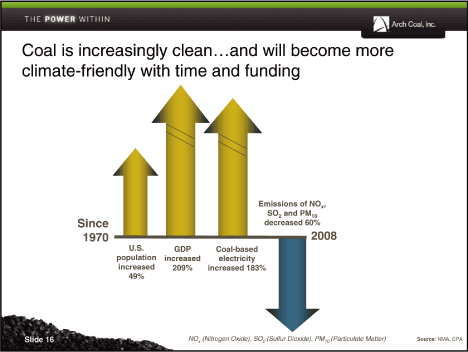
| In recent years, power generators have shifted their fuel focus every few years ... and that could continueLate 1990s• Generators planned to build natural gas plants almost exclusively due to the “gas bubble” and low capital costs• Nuclear was viewed as politically infeasible — perhaps permanently• Coal’s growth was limited to increased utilization at existing plants; no new plants were expected to be builtEarly 2000s• Following a run-up to $10/mm Btu in Dec. 1999, natural gas was suddenly viewed as scarce and expensive• Consequently, coal became the fuel of choice in many regions — with more than 100 new GWs announced• Nuclear was still viewed as politically infeasible — and renewables were a sidebarMid 2000s• Following Hurricane Katrina,An Inconvenient Truth, and emergence of Democratic majority in Congress, climate change began to influence utility fuel choice• Natural gas was viewed as too expensive and too volatile for baseload power• Nuclear began to gain traction as a potential carbon-free power source ... as did wind, solar and bio-massLate 2000s• Sticker shock and financial risk aversion set in — and a nuclear renaissance suddenly seemed less likely• The limitations of renewables — and the challenges of massive new transmission — became more apparent• “Shale gas” emerged as a potential “game-changer” for natural gas — and gas moved back to the fore2010 and Beyond?• Will tighter drilling regulations on gas reduce availability and drive up costs?• Will energy scarcity become an increasingly important economic and policy concern? |
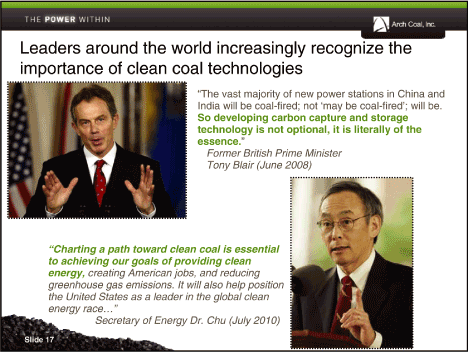
| Coal is increasingly clean...and will become more climate-friendly with time and funding |
| Leaders around the world increasingly recognize the importance of clean coal technologies“Charting a path toward clean coal is essential to achieving our goals of providing clean energy, creating American jobs, and reducing greenhouse gas emissions. It will also help position the United States as a leader in the global clean energy race...” Secretary of Energy Dr. Chu (July 2010) |
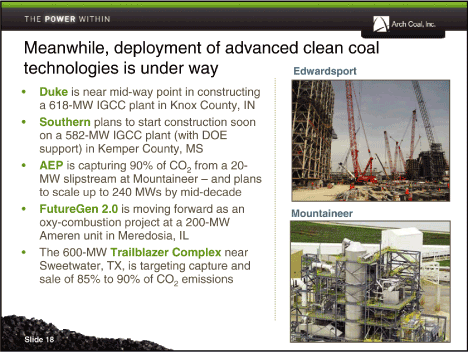
| Meanwhile, deployment of advanced clean coal technologies is under way Edwardsport• Duke is near mid-way point in constructing a 618-MW IGCC plant in Knox County, IN• Southern plans to start construction soon on a 582-MW IGCC plant (with DOE support) in Kemper County, MS• AEPis capturing 90% of CO2from a 20-MW slipstream at Mountaineer — and plans to scale up to 240 MWs by mid-decade• FutureGen 2.0 is moving forward as an oxy-combustion project at a 200-MW Ameren unit in Meredosia, IL• The 600-MW Trailblazer Complex near Sweetwater, TX, is targeting capture andsale of 85% to 90% of CO2emissions |
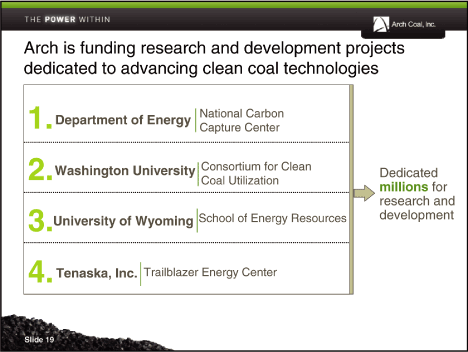
| Arch is funding research and development projects dedicated to advancing clean coal technologies |

| 2010 Arch Coal Analyst Day Black Thunder Mine |
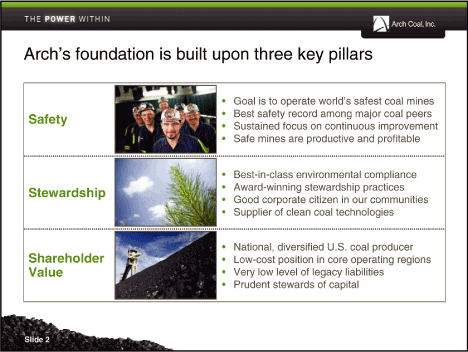
| Arch’s foundation is built upon three key pillars• Goal is to operate world’s safest coal mines• Best safety record among major coal peers• Sustained focus on continuous improvement• Safe mines are productive and profitable• Best-in-class environmental compliance• Award-winning stewardship practices• Good corporate citizen in our communities• Supplier of clean coal technologies• National, diversified U.S. coal producer• Low-cost position in core operating regions• Very low level of legacy liabilities• Prudent stewards of capital |

| Industry Safety Leader |
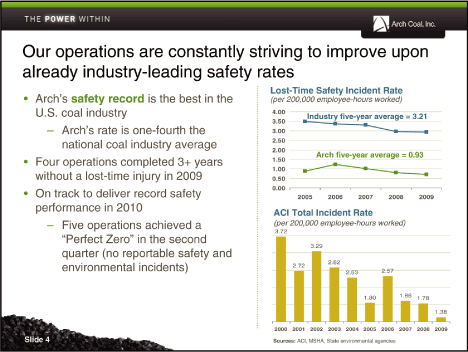
| Our operations are constantly striving to improve upon already industry-leading safety rates• Arch’s safety record is the best in the U.S. coal industry — Arch’s rate is one-fourth the national coal industry average• Four operations completed 3+ years without a lost-time injury in 2009• On track to deliver record safety performance in 2010 — Five operations achieved a “Perfect Zero” in the second quarter (no reportable safety and environmental incidents) |
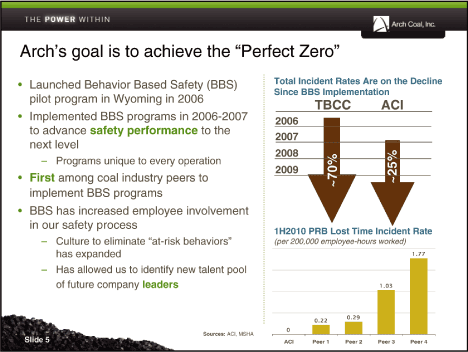
| Arch’s goal is to achieve the “Perfect Zero”• Launched Behavior Based Safety (BBS) pilot program in Wyoming in 2006• Implemented BBS programs in 2006-2007 to advance safety performance to the next level — Programs unique to every operation• First among coal industry peers to implement BBS programs• BBS has increased employee involvement in our safety process — Culture to eliminate “at-risk behaviors” has expanded — Has allowed us to identify new talent pool of future company leaders |
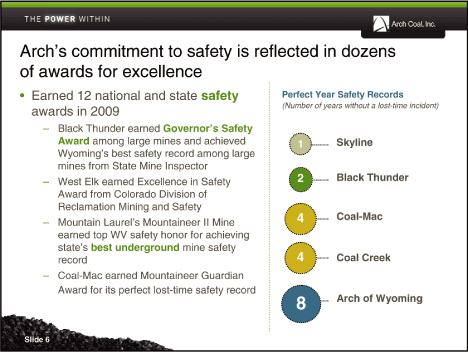
| Arch’s commitment to safety is reflected in dozens of awards for excellence• Earned 12 national and state safety awards in 2009 — Black Thunder earned Governor’s Safety Award among large mines and achieved Wyoming’s best safety record among large mines from State Mine Inspector — West Elk earned Excellence in Safety Award from Colorado Division of Reclamation Mining and Safety — Mountain Laurel’s Mountaineer II Mine earned top WV safety honor for achieving state’s best underground mine safety record — Coal-Mac earned Mountaineer Guardian Award for its perfect lost-time safety record |
| Industry Environmental Performance Leader |
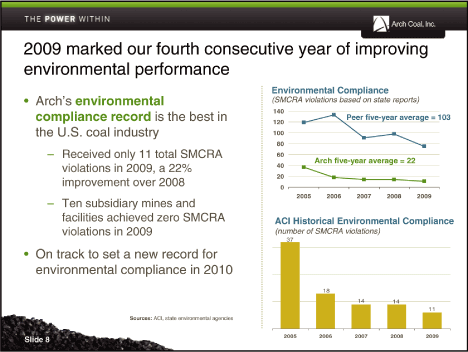
| 2009 marked our fourth consecutive year of improving environmental performance• Arch’s environmental compliance record is the best in the U.S. coal industry — Received only 11 total SMCRA violations in 2009, a 22% improvement over 2008 — Ten subsidiary mines and facilities achieved zero SMCRA violations in 2009• On track to set a new record for environmental compliance in 2010 |
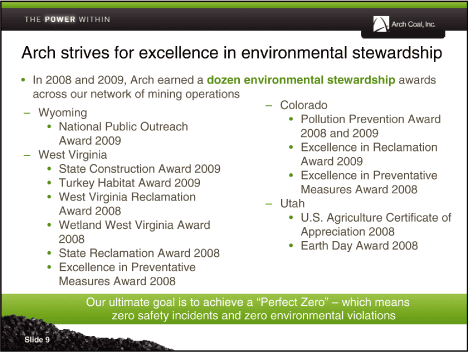
| Arch strives for excellence in environmental stewardship• In 2008 and 2009, Arch earned a dozen environmental stewardship awards across our network of mining operations — Wyoming• National Public Outreach Award 2009 — West Virginia• State Construction Award 2009• Turkey Habitat Award 2009• West Virginia Reclamation Award 2008• Wetland West Virginia Award 2008• State Reclamation Award 2008• Excellence in Preventative Measures Award 2008• Pollution Prevention Award 2008 and 2009• Excellence in Reclamation Award 2009• Excellence in Preventative Measures Award 2008 — Utah• U.S. Agriculture Certificate of Appreciation 2008• Earth Day Award 2008 |

| Delivering Shareholder Value |
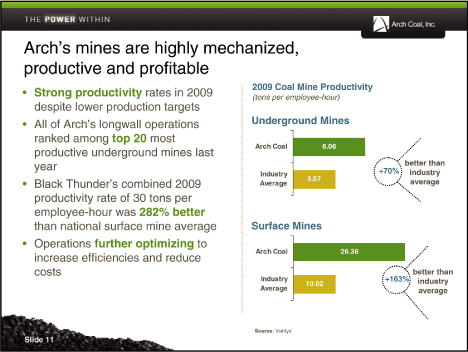
| Arch’s mines are highly mechanized, productive and profitable• Strong productivity rates in 2009 despite lower production targets• All of Arch’s longwall operations ranked among top 20 most productive underground mines last year• Black Thunder’s combined 2009 productivity rate of 30 tons per employee-hour was 282% better than national surface mine average• Operations further optimizing to increase efficiencies and reduce costs |

| Arch’s reputation as a good corporate citizen addsvaluefor its shareholders• Acting responsibly and with integrity is the right thing to do — for us and for future generations — and it’s a central tenet for our long-term success• A strong history of safety and environmental compliance will ultimately be a competitive advantage for Arch• Good governance provides the foundation for ethical practices and promotes corporate sustainability and shareholder trust |
| Operations Overview |
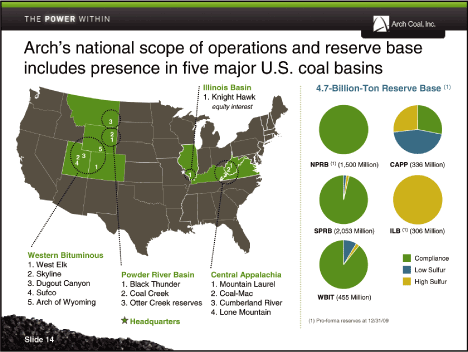
| Arch’s national scope of operations and reserve base includes presence in five major U.S. coal basins |
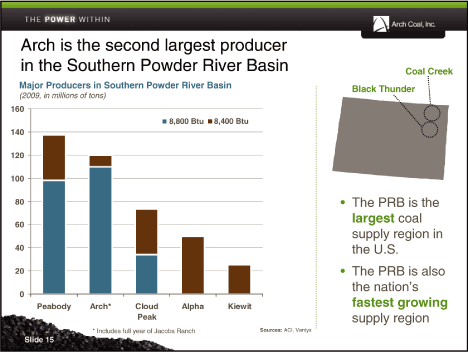
| Arch is the second largest producer in the Southern Powder River Basin Major Producers in Southern Powder River Basin(2009, in millions of tons)• The PRB is the largest coal supply region in the U.S.• The PRB is also the nation’s fastest growing supply region |
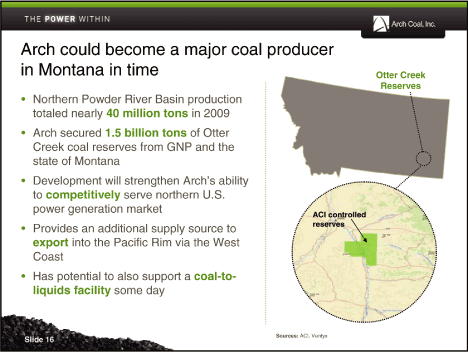
| Arch could become a major coal in Montana in time• Northern Powder River Basin production totaled nearly 40 million tons in 2009• Arch secured 1.5 billion tons of Otter Creek coal reserves from GNP and the state of Montana• Development will strengthen Arch’s ability to competitively serve northern U.S. power generation market• Provides an additional supply source to export into the Pacific Rim via the West Coast• Has potential to also support a coal-to-liquids facility some day |
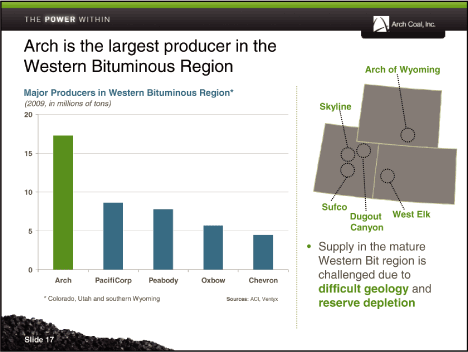
| Arch is the largest producer in the Western Bituminous Region Major Producers in Western Bituminous Region*(2009, in millions of tons)• Supply in the mature Western Bit region is challenged due to difficult geology and reserve depletion |
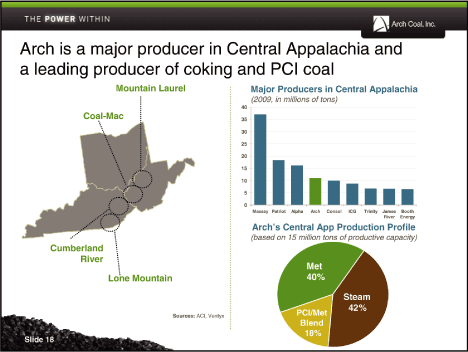
| Arch is a major producer in Central Appalachia and a leading producer of coking and PCI coal |
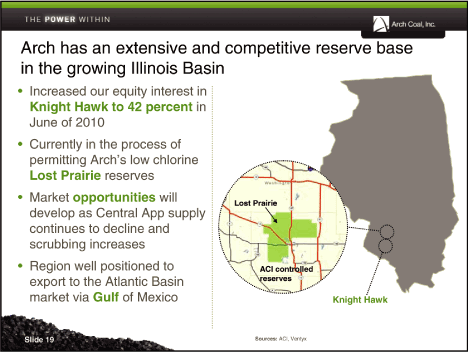
| Arch has an extensive and in the growing Illinois Basin• Increased our equity interest in Knight Hawk to 42 percent in June of 2010• Currently in the process of permitting Arch’s low chlorine Lost Prairie reserves• Market opportunities will develop as Central App supply continues to decline and scrubbing increases• Region well positioned to export to the Atlantic Basin market via Gulf of Mexico |

| Cost Control |
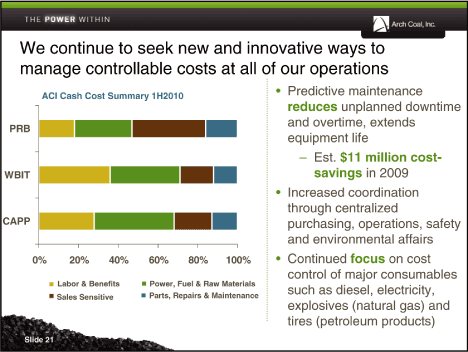
| We continue to seek new and innovative ways to manage controllable costs at all of our operations• Predictive maintenance reduces unplanned downtime and overtime, extends equipment life — Est. $11 million cost-savings in 2009• Increased coordination through centralized purchasing, operations, safety and environmental affairs• Continued focus on cost control of major consumables such as diesel, electricity, explosives (natural gas) and tires (petroleum products) |
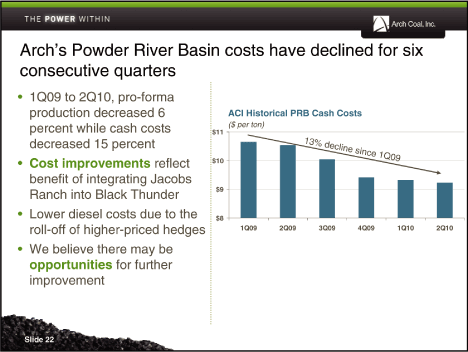
| Arch’s Powder River Basin consecutive quarters• 1Q09 to 2Q10, pro-forma production decreased 6 percent while cash costs $ decreased 15 percent• Cost improvements reflect $ benefit of integrating Jacobs Ranch into Black Thunder $• Lower diesel costs due to the $ roll-off of higher-priced hedges• We believe there may be opportunities for further improvement |
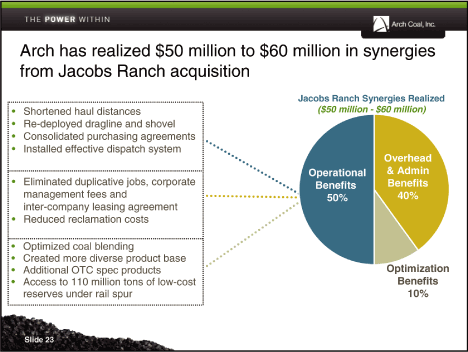
| Arch has realized $50 million to $60 million in synergies from Jacobs Ranch acquisition• Shortened haul distances• Re-deployed dragline and shovel• Consolidated purchasing agreements• Installed effective dispatch system• Eliminated duplicative jobs, corporate management fees and inter-company leasing agreement• Reduced reclamation costs• Optimized coal blending• Created more diverse product base• Additional OTC spec products• Access to 110 million tons of low-cost reserves under rail spur |
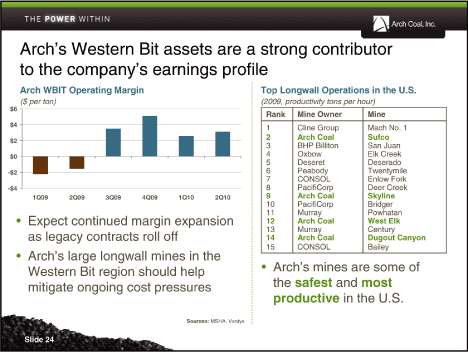
| Arch’s Western Bit assets are a strong contributor to the company’s earnings profile Top Longwall Operations in the U.S.(2009, productivity tons per hour)Rank Mine Owner Mine 1 Cline Group Mach No. 1 2 Arch Coal Sufco 3 BHP Billiton San Juan 4 Oxbow Elk Creek 5 Deseret Deserado 6 Peabody Twentymile 7 CONSOL Enlow Fork 8 PacifiCorp Deer Creek 9 Arch Coal Skyline 10 PacifiCorp Bridger 11 Murray Powhatan 12 Arch Coal West Elk 13 Murray Century 14 Arch Coal Dugout Canyon 15 CONSOL Bailey• Arch’s mines are some of the safest and most productive in the U.S. |
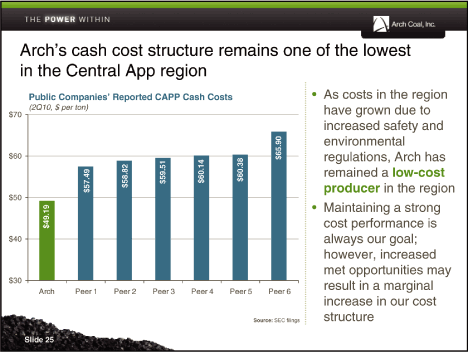
| Arch’s cash cost structure remains one of the lowest in the Central App region• As costs in the region have grown due to increased safety and environmental regulations, Arch has remained a low-cost producer in the region• Maintaining a strong cost performance is always our goal; however, increased met opportunities may result in a marginal increase in our cost structure |
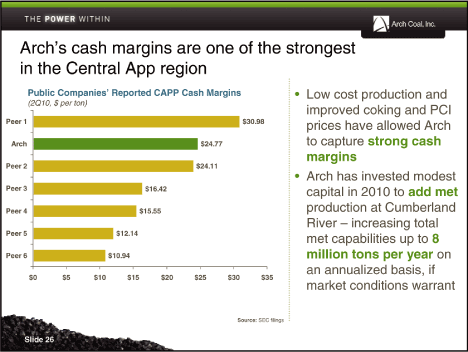
| Arch’s cash margins are one of the strongest in the Central App region• Low cost production and improved coking and PCI prices have allowed Arch to capture strong cash margins• Arch has invested modest capital in 2010 to add met production at Cumberland River — increasing total met capabilities up to 8 million tons per year on an annualized basis, if market conditions warrant |
| 2010 Arch Coal Analyst Day Black Thunder Mine |
| Powder River Basin |
| Powder River Basin |
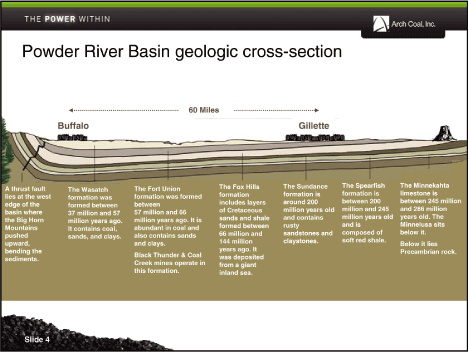
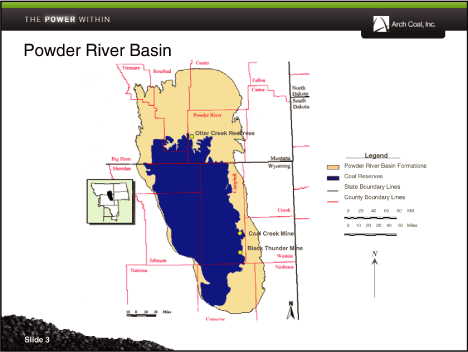
| Powder River Basin geologic cross-section The Fox Hills The Sundance The Spearfish The Minnekahta A thrust fault The Wasatch The Fort Union formation formation is formation is limestone is lies at the west formation was formation was formed includes layers around 200 between 200 between 245 million edge of the formed between between of Cretaceous million years old million and 245 and 286 million basin where 37 million and 57 57 million and 66 sands and shale and contains million years old years old. The the Big Horn million years ago. million years ago. It is formed between rusty and is Minnelusa sits Mountains It contains coal, abundant in coal and 66 million and sandstones and composed of below it. pushed sands, and clays. also contains sands 144 million claystones. soft red shale. upward, and clays. Below it lies bending the years ago. It Precambrian rock. Black Thunder & Coal was deposited sediments. Creek mines operate in from a giant this formation. inland sea. |
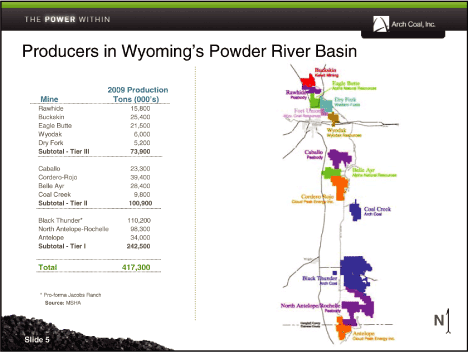
| Producers in Wyoming’s 2009 Production Mine Tons (000’s) Rawhide 15,800 Buckskin 25,400 Eagle Butte 21,500 Wyodak 6,000 Dry Fork 5,200 Subtotal — Tier III 73,900 Caballo 23,300 Cordero-Rojo 39,400 Belle Ayr 28,400 Coal Creek 9,800 Subtotal — Tier II 100,900 Black Thunder* 110,200 North Antelope-Rochelle 98,300 Antelope 34,000 Subtotal — Tier I 242,500 Total 417,300 * Pro-forma Jacobs Ranch Source: MSHA |
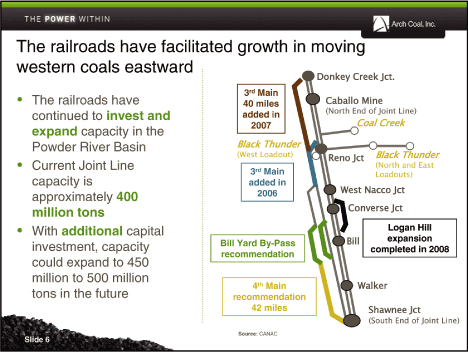
| The railroads have facilitated growth in moving western coals eastward• The railroads have continued to invest and expand capacity in the Powder River Basin• Current Joint Line capacity is approximately 400 million tons• With additional capital investment, capacity could expand to 450 million to 500 million tons in the future |
| Black Thunder Mine Overview |
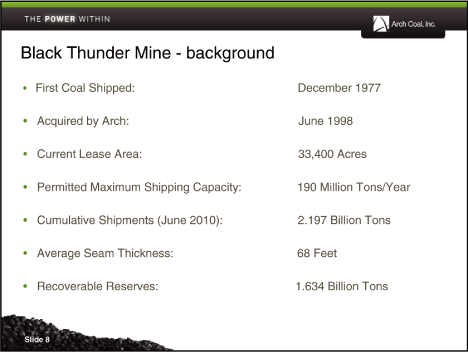
| Black Thunder Mine — background• First Coal Shipped: December 1977• Acquired by Arch: June 1998• Current Lease Area: 33,400 Acres• Permitted Maximum Shipping Capacity: 190 Million Tons/Year• Cumulative Shipments (June 2010): 2.197 Billion Tons• Average Seam Thickness: 68 Feet• Recoverable Reserves: 1.634 Billion Tons |
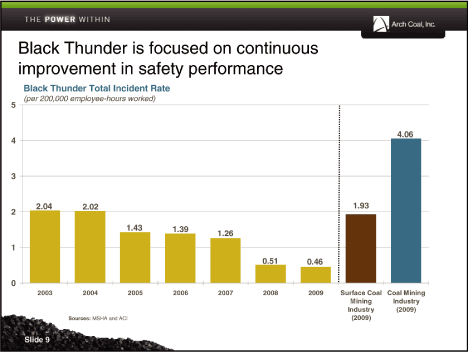
| Black Thunder is focused on continuous improvement in safety performance Black Thunder Total Incident Rate(per 200,000 employee-hours worked)5 |
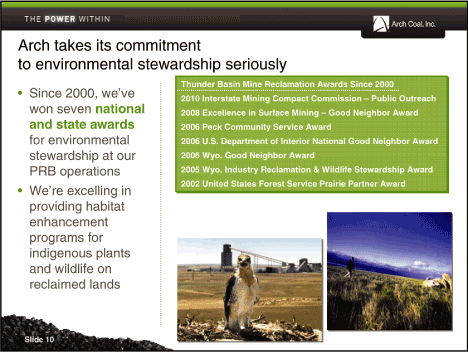
| • Since 2000, we’ve won seven national and state awards for environmental stewardship at our PRB operations• We’re excelling in providing habitat enhancement programs for indigenous plants and wildlife on reclaimed lands Thunder Basin Mine Reclamation Awards Since 2000 2010 Interstate Mining Compact Commission — —Public Outreach 2008 Excellence in Surface Mining — —Good Neighbor Award 2006 Peck Community Service Award 2006 U.S. Department of Interior National Good Neighbor Award U.S. 2006 Wyo. Good Neighbor Award . 2005 Wyo. Industry Reclamation & Wildlife Stewardship Award . & 2002 United States Forest Service Prairie Partner Award |
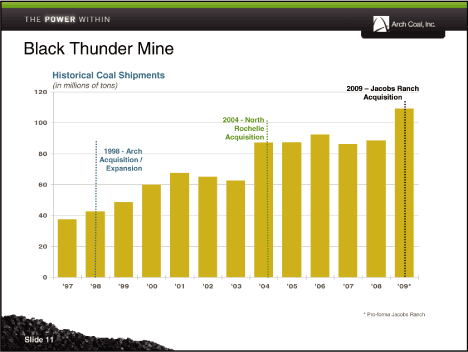
| Black Thunder Mine Historical Coal Shipments(in millions of tons)120 |
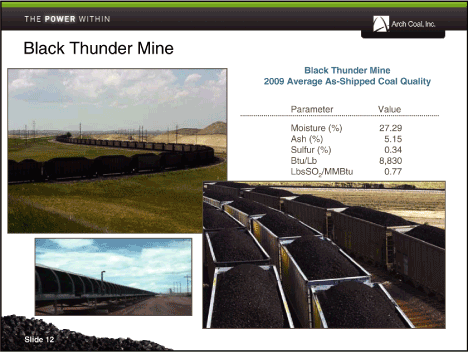
| Black Thunder Mine Black Thunder Mine 2009 Average As-Shipped Coal Quality Parameter Value Moisture (%) 27.29 Ash (%) 5.15 Sulfur (%) 0.34 Btu/Lb 8,830LbsSO2/MMBtu 0.77 |
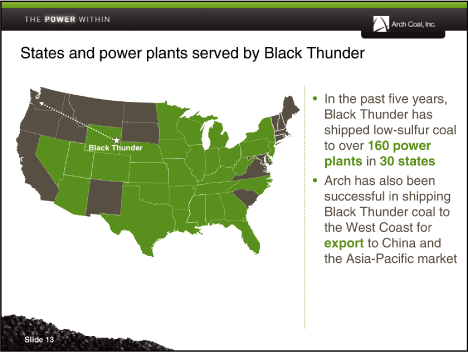
| • In the past five years, Black Thunder has shipped low-sulfur coal to over 160 power plants in 30 states• Arch has also been successful in shipping Black Thunder coal to the West Coast for export to China and the Asia-Pacific market |

| Arch has successfully integrated Jacobs Ranch into Black Thunder post Oct. 1, 2009 Key Synergies Obtained• A substantial reduction in warehouse inventory has been achieved (~$20 million)• Staff optimization and reduction (~$9 million)• Mine plan optimization includes gains for cast blasting, recovery of additional coal seams and improved dragline productivity (~$30 million) |
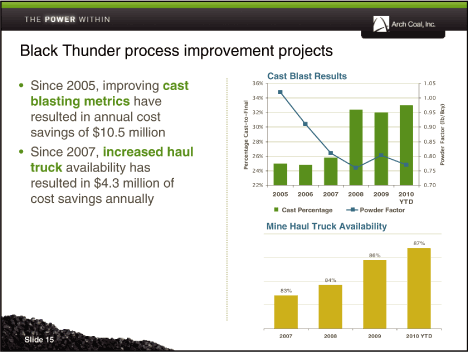
| • Since 2005, improving cast blasting metrics have resulted in annual cost savings of $10.5 million• Since 2007, increased haul truck availability has resulted in $4.3 million of cost savings annually |
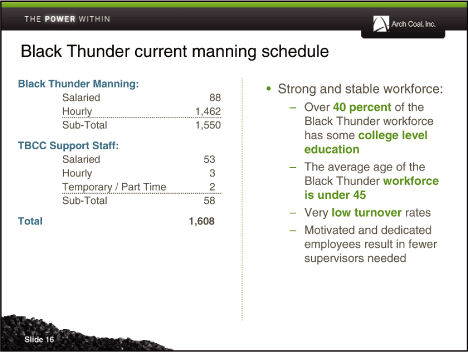
| Black Thunder current manning schedule• Strong and stable workforce: — Over 40 percent of the Black Thunder workforce has some college level education — The average age of the Black Thunder workforce is under 45 — Very low turnover rates — Motivated and dedicated employees result in fewer supervisors needed |

| Surface Mining 101 |
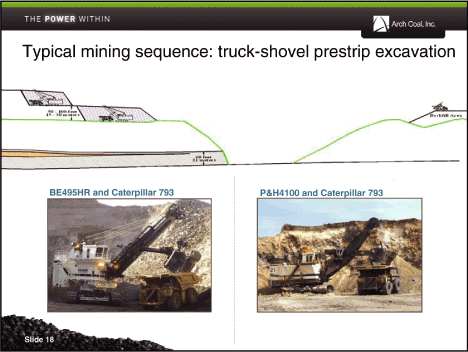
| Typical mining sequence: truck-shovel prestrip excavation |
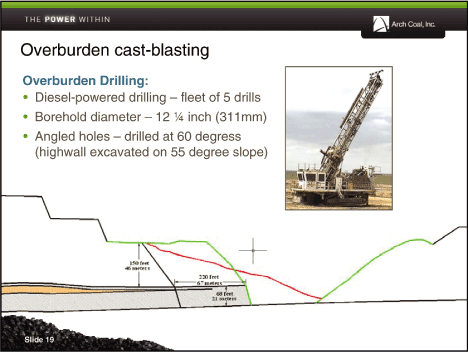
| Overburden cast-blasting Overburden Drilling:• Diesel-powered drilling — fleet of 5 drills• Borehold diameter — 121/4 inch (311mm)• Angled holes — drilled at 60 degress (highwall excavated on 55 degree slope) |
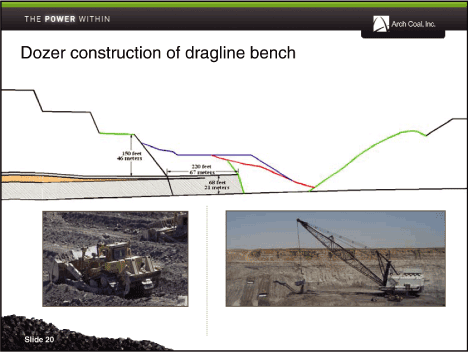
| Dozer construction of dragline bench |
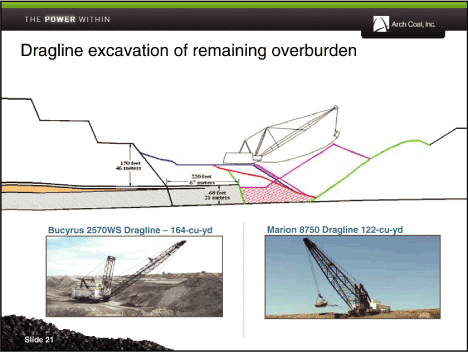
| Dragline excavation of remaining overburden |

| Coal loading and topsoil replacement |
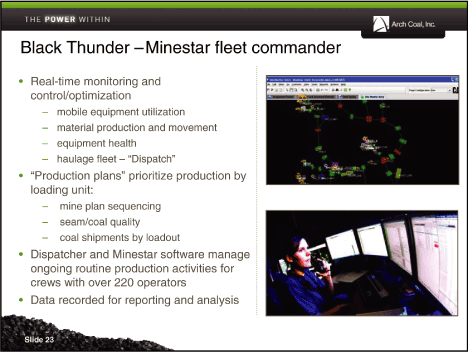
| Black Thunder —Minestar fleet commander• Real-time monitoring and control/optimization — mobile equipment utilization — material production and movement — equipment health — haulage fleet — “Dispatch”• “Production plans” prioritize production by loading unit: — mine plan sequencing — seam/coal quality — coal shipments by loadout• Dispatcher and Minestar software manage ongoing routine production activities for crews with over 220 operators• Data recorded for reporting and analysis |
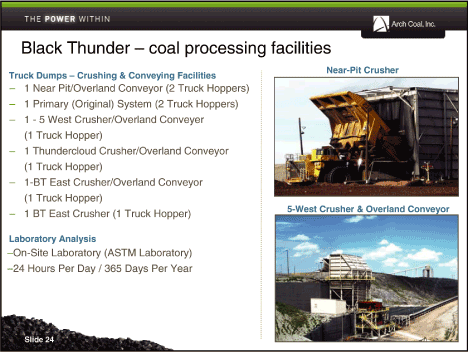
| Black Thunder — coal processing facilities Truck Dumps — Crushing & Conveying Facilities — 1 Near Pit/Overland Conveyor (2 Truck Hoppers) — 1 Primary (Original) System (2 Truck Hoppers) — 1 — 5 West Crusher/Overland Conveyer (1 Truck Hopper) — 1 Thundercloud Crusher/Overland Conveyor (1 Truck Hopper) — 1-BT East Crusher/Overland Conveyor (1 Truck Hopper) — 1 BT East Crusher (1 Truck Hopper) Laboratory Analysis —On-Site Laboratory (ASTM Laboratory) —24 Hours Per Day / 365 Days Per Year |
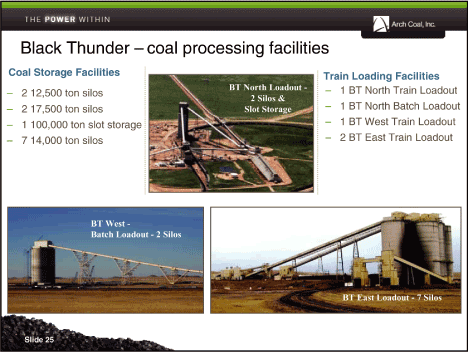
| Black Thunder — coal processing facilities Train Loading Facilities — 1 BT North Train Loadout — 1 BT North Batch Loadout — 1 BT West Train Loadout — 2 BT East Train Loadout |
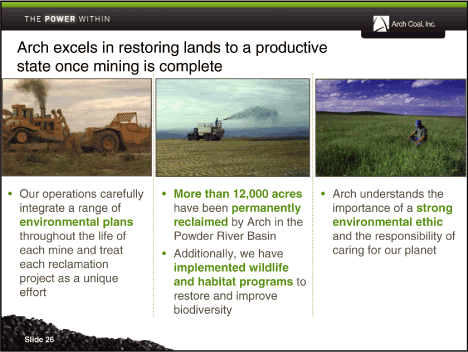
| Arch excels in restoring lands to a productive state once mining is complete• Our operations carefully• More than 12,000 acres• Arch understands the integrate a range of have been permanently importance of a strong environmental plans reclaimed by Arch in the environmental ethic throughout the life of Powder River Basin and the responsibility of each mine and treat• Additionally, we have caring for our planet each reclamation implemented wildlife project as a unique and habitat programs to effort restore and improve biodiversity |