UNITED STATES
SECURITIES AND EXCHANGE COMMISSION
Washington, D.C. 20549
FORM N-CSR
CERTIFIED SHAREHOLDER REPORT OF REGISTERED
MANAGEMENT INVESTMENT COMPANIES
Investment Company Act file number | 811-08189 |
|
J.P. Morgan Fleming Mutual Fund Group, Inc. |
(Exact name of registrant as specified in charter) |
|
522 Fifth Avenue
New York, NY | | 10036 |
(Address of principal executive offices) | | (Zip code) |
|
Stephen M. Benham
522 Fifth Avenue
New York, NY 10036 |
(Name and address of agent for service) |
|
Registrant’s telephone number, including area code: | (800) 480-4111 | |
|
Date of fiscal year end: | December 31, 2005 | |
|
Date of reporting period: | January 1, 2005 to June 30, 2005 | |
| | | | | | | | | |
Form N-CSR is to be used by management investment companies to file reports with the Commission not later than 10 days after the transmission to stockholders of any report that is required to be transmitted to stockholders under Rule 30e-1 under the Investment Company Act of 1940 (17 CFR 270.30e-1). The Commission may use the information provided on Form N-CSR in its regulatory, disclosure review, inspection, and policymaking roles.
A registrant is required to disclose the information specified by Form N-CSR, and the Commission will make this information public. A registrant is not required to respond to the collection of information contained in Form N-CSR unless the Form displays a currently valid Office of Management and Budget (“OMB”) control number. Please direct comments concerning the accuracy of the information collection burden estimate and any suggestions for reducing the burden to Secretary, Securities and Exchange Commission, 450 Fifth Street, NW, Washington, DC 20549-0609. The OMB has reviewed this collection of information under the clearance requirements of 44 U.S.C. Section 3507.
ITEM 1. REPORTS TO STOCKHOLDERS.
The following is a copy of the report transmitted to shareholders pursuant to Rule 30e-1 under the Investment Company Act of 1940 (17 CFR 270.30e-1).
SEMI-ANNUAL REPORT
SIX MONTHS ENDED JUNE 30, 2005 (UNAUDITED)
JPMorgan Funds
U.S. Equity
Mid/Small Cap
Funds
Capital Growth Fund
Dynamic Small Cap Fund
Mid Cap Equity Fund
Mid Cap Growth Fund
Mid Cap Value Fund
Small Cap Core Fund
Small Cap Equity Fund
U.S. Small Company Fund

CONTENTS
| President's Letter | | | 1 | | |
|
| Fund Characteristics: | |
|
| Capital Growth Fund | | | 3 | | |
|
| Dynamic Small Cap Fund | | | 5 | | |
|
| Mid Cap Equity Fund | | | 7 | | |
|
| Mid Cap Growth Fund | | | 9 | | |
|
| Mid Cap Value Fund | | | 11 | | |
|
| Small Cap Core Fund | | | 13 | | |
|
| Small Cap Equity Fund | | | 15 | | |
|
| U.S. Small Company Fund | | | 17 | | |
|
| Schedules of Portfolio Investments | | | 19 | | |
|
| Financial Statements | | | 64 | | |
|
| Financial Highlights | | | 84 | | |
|
| Notes to Financial Statements | | | 102 | | |
|
| Trustees | | | 116 | | |
|
| Officers | | | 118 | | |
|
Schedule of Shareholder
Expenses | | | 120 | | |
|
Highlights
• U.S. equities experienced sporadic volatility over the six-month period
• Interest-rate increases and rising oil prices were mainstays in economic news
• Investors felt more encouraged about the FOMC tightening cycle toward the end of the period
• Mid- and small-capitalization stocks were positive as opposed to their large-capitalization counterparts
Investments in a Fund are not bank deposits or obligations of, or guaranteed or endorsed by, any bank and are not insured or guaranteed by the FDIC, the Federal Reserve Board or any other government agency. You could lose money if you sell when the Fund's share price is lower than when you invested.
Past performance is no guarantee for future performance. The general market views expressed in this report are opinions based on current market conditions and are subject to change without notice. These views are not intended to predict the future performance of a Fund or the securities markets. References to specific securities and their issuers are for illustrative purposes only and are not intended to be, and should not be interpreted as, recommendations to purchase or sell such securities. Such views are not meant as investment advice and may not be relied on as an indication of trading intent on behalf of any Fund.
Prospective investors should refer to the Fund's prospectus for a discussion of the Fund's investment objective, strategies and risks. Call JPMorgan Funds Service Center at (800) 480-4111 for a prospectus containing more complete information about a Fund, including management fees and other expenses. Please read it carefully before investing.
JPMorgan
U.S. Equity Mid and Small Cap Funds
PRESIDENT'S LETTER JULY 11, 2005
Dear Shareholder:
We are pleased to present this semi-annual report for the JPMorgan U.S. Equity Mid and Small Cap Funds. Inside, you'll find information detailing the performance of the Funds for the six months ended June 30, 2005.
Markets wrestle with intermittent volatility
U.S. equities experienced sporadic volatility over the period - particularly in the first quarter of 2005 - due primarily to concerns about inflation and economic growth. Even as employment gains, merger activity and corporate spending gained momentum, the challenges of increasing interest rates and rising oil prices seemed to loom in the background.
Interest-rate increases by the Federal Open Market Committee (FOMC), in particular, were a mainstay in economic news due to a relatively consistent schedule of 25-basis point (bp) hikes. This interest-rate activity became a source of great consternation for investors, as speculation abounded regarding its underlying catalyst - to keep inflation under control, to discourage speculative risk taking, etc. Furthermore, this environment of uncertainty was often underscored by mixed economic data. Meanwhile, oil prices garnered its share of attention, with the West Texas Intermediate (WTI) rising more than 39% over the past six months and the price per barrel exceeding $60 at times.
Encouragement, however, surfaced toward the end of the period, as investors felt hopeful that the FOMC would finish its tightening cycle earlier than expected due to signs of moderating growth and easing inflation pressures. Weakness in manufacturing was offset by strength in the economy's consumer and housing segments. In addition, employment news continued to improve at a slow but steady, incremental pace.
Index performance
The markets showed an erratic ebb and flow during the period. Major large-capitalization stock indexes were negative for the six-month period, with many small- and mid-capitalization stock indexes reporting positive returns. Mid-capitalization stocks were the clear winners, as the Russell Midcap Index returned 3.92%. In addition, small-capitalization stocks made modest gains, with the Russell 2500 Index up 1.24% for the period. Large-capitalization stocks disappointed, as indicated by the S&P 500 Index, which reported a negative 0.81% for the six-month period.
Outlook
As we enter the second half of 2005, the economy continues on a path of moderate expansion. The combined potency of rising labor costs and high commodity prices have emerged as potential obstacles to the economy's progress. However, the weakness in manufacturing appears to be showing signs of an impending rebound. Moreover, inflation reports have been much more benign than we expected. We believe that the FOMC will continue on its tightening cycle until evidence of a more decisive slowdown presents itself.
"As we enter the second half of 2005, the economy continues on a path of moderate expansion."

JPMorgan
U.S. Equity Mid and Small Cap Funds
CONTINUED
On behalf of us all at JPMorgan Asset Management, thank you for your business. We appreciate the trust you have placed in us, and look forward to serving your investment needs for many years to come. Should you have any questions, please feel free to contact the JPMorgan Funds Service Center at 1-800-480-4111.
Sincerely yours,

George C. W. Gatch
President
JPMorgan Funds
(Unaudited)
JPMorgan U.S. Equity Mid/Small Cap Funds2
JPMorgan
Capital Growth Fund
AS OF JUNE 30, 2005 (Unaudited)
FUND CHARACTERISTICS
| FUND FACTS | |
| Fund Inception | | 9/23/87 | |
| Fiscal Year End | | December 31 | |
Net Assets as of 6/30/2005
(In Millions) | | $ | 714.2 | | |
| Primary Benchmark | | Russell Midcap
Growth Index | |
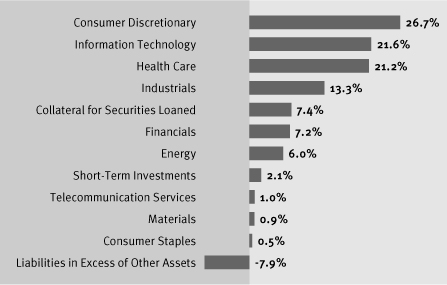
COMPOSITION OF TOTAL NET ASSETS*
TOP TEN EQUITY HOLDINGS
OF THE PORTFOLIO* | |
| | 1. | | | Amphenol Corp., Class A | | | 1.9 | % | |
| | 2. | | | Brunswick Corp. | | | 1.8 | % | |
| | 3. | | | NCR Corp. | | | 1.6 | % | |
| | 4. | | | Fisher Scientific
International, Inc. | | | 1.6 | % | |
| | 5. | | | AmeriCredit Corp. | | | 1.5 | % | |
| | 6. | | | Manor Care, Inc. | | | 1.5 | % | |
| | 7. | | | International Speedway
Corp., Class A | | | 1.5 | % | |
| | 8. | | | DaVita, Inc. | | | 1.5 | % | |
| | 9. | | | Royal Caribbean Cruises Ltd. (Liberia) | | | 1.4 | % | |
| | 10. | | | Medco Health Solutions, Inc. | | | 1.4 | % | |
Top 10 equity holdings comprised 15.7% of the Portfolio's Net Assets ($714,177 in thousands). As of June 30, 2005 the Fund held 107 equity holdings. Portfolio holdings are subject to change at any time.
* Percentages indicated are based on net assets as of June 30, 2005. The portfolio's composition is subject to change.
JPMorgan U.S. Equity Mid/Small Cap Funds3
JPMorgan
Capital Growth Fund
CONTINUED
(Unaudited)
| | | TOTAL RETURNS
AS OF JUNE 30, 2005 | | AVERAGE ANNUAL TOTAL RETURNS
AS OF JUNE 30, 2005 | |
| | | 6 MONTHS | | 1 YEAR | | 5 YEARS | | 10 YEARS | |
| CLASS A SHARES | | | |
| Without Sales Charge | | | 2.34 | % | | | 10.14 | % | | | 3.74 | % | | | 9.69 | % | |
| With Sales Charge* | | | (3.03 | %) | | | 4.35 | % | | | 2.63 | % | | | 9.11 | % | |
| CLASS B SHARES | | | |
| Without CDSC | | | 2.10 | % | | | 9.59 | % | | | 3.23 | % | | | 9.26 | % | |
| With CDSC** | | | (2.90 | %) | | | 4.81 | % | | | 2.93 | % | | | 9.26 | % | |
| CLASS C SHARES | | | |
| Without CDSC | | | 2.13 | % | | | 9.58 | % | | | 3.19 | % | | | 9.05 | % | |
| With CDSC*** | | | 1.10 | % | | | 8.63 | % | | | 3.19 | % | | | 9.05 | % | |
| SELECT CLASS SHARES | | | 2.50 | % | | | 10.51 | % | | | 4.25 | % | | | 10.14 | % | |
* Sales charge for class A shares is 5.25%.
** Assumes 5% CDSC (contingent deferred sales charge) for the one year period, 3% CDSC for the three year period, 2% CDSC for the five year period and 0% CDSC for the ten year period.
*** Assumes a 1% CDSC for the one year period and 0% CDSC thereafter.
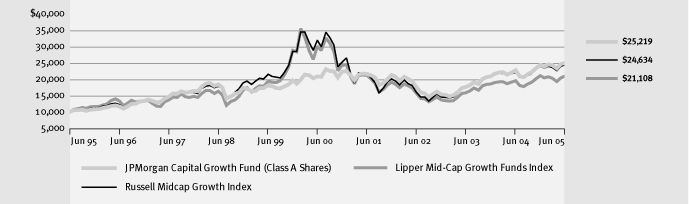
TEN YEAR PERFORMANCE (06/30/95 TO 06/30/05)
Source: Lipper, Inc. The performance quoted is past performance and is not a guarantee of future results. Mututal funds are subject to certain market risk. Investment returns and principal value of an investment will fluctuate so that an investor's shares, when redeemed, may be worth more or less than their original cost. Current performance may be higher or lower than the performance data shown. For up-to-date month-end performance information please call 1-800-480-4111.
The Fund commenced operations on 9/23/87.
Returns for the Select Class Shares prior to 1/25/96 (offering date of the Select Class Shares) are calculated using the historical expenses of the Class A Shares, which are higher than the expenses of the Select Shares.
Returns for the Class C Shares prior to 1/2/98 (offering date of the Class C Shares) are calculated using the historical expenses of the Class A Shares, which are lower than the expenses of the Class C Shares.
The graph illustrates comparative performance for $10,000 invested in Class A Shares of the JPMorgan Capital Growth Fund, Russell MidCap Growth Index, and Lipper Mid-Cap Growth Funds Index from June 30, 1995 to June 30, 2005. The performance of the Fund assumes reinvestment of all dividends and capital gains and includes a sales charge. The performance of the indices does not include a sales charge and has been adjusted to reflect reinvestment of all dividends and capital gains of the securities included in the benchmark. The Russell MidCap Growth Index measures the performance of those Russell MidCap companies with higher price-to-book ratios and higher financial growth values. The Lipper Mid-Cap Growth Funds Index represents the total returns of the funds in the indicated category, as defined by Lipper, Inc. Investors cannot invest directly in an index.
Class A shares have a $1,000 minimum initial investment and carry a 5.25% sales charge.
Performance may reflect the waiver and reimbursement of the Fund's fees/expenses for certain periods since the inception date. Without these waivers and reimbursements performance would have been lower. Also, performance shown in this section does not reflect the deduction of taxes that a shareholder would pay on fund distributions or redemptions of fund shares.
JPMorgan U.S. Equity Mid/Small Cap Funds4
JPMorgan
Dynamic Small Cap Fund
AS OF JUNE 30, 2005 (Unaudited)
FUND CHARACTERISTICS
| FUND FACTS | | | |
| Fund Inception | | 5/19/97 | |
| Fiscal Year End | | December 31 | |
Net Assets as of 6/30/2005
(In Millions) | | $ | 174.0 | | |
| Primary Benchmark | | Russell 2000 Growth Index | |
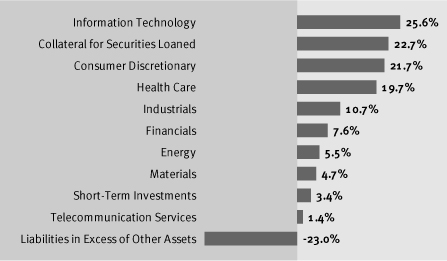
COMPOSITION OF TOTAL NET ASSETS*
TOP TEN EQUITY HOLDINGS
OF THE PORTFOLIO* | |
| | 1. | | | Brigham Exploration Co. | | | 1.7 | % | |
| | 2. | | | Arch Coal, Inc. | | | 1.6 | % | |
| | 3. | | | Lions Gate Entertainment
Corp. (Canada) | | | 1.4 | % | |
| | 4. | | | Arthrocare Corp. | | | 1.4 | % | |
| | 5. | | | La Quinta Corp. | | | 1.4 | % | |
| | 6. | | | DSP Group, Inc. | | | 1.3 | % | |
| | 7. | | | GameStop Corp. | | | 1.3 | % | |
| | 8. | | | MarineMax, Inc. | | | 1.3 | % | |
| | 9. | | | Educate, Inc. | | | 1.3 | % | |
| | 10. | | | Eagle Materials, Inc. | | | 1.3 | % | |
Top 10 equity holdings comprised 14.0% of the Portfolio's Net Assets ($174,020 in thousands). As of June 30, 2005 the Fund held 116 equity holdings. Portfolio holdings are subject to change at any time.
* Percentages indicated are based on net assets as of June 30, 2005. The portfolio's composition is subject to change.
JPMorgan U.S. Equity Mid/Small Cap Funds5
JPMorgan
Dynamic Small Cap Fund
CONTINUED
(Unaudited)
| | | TOTAL RETURNS
AS OF JUNE 30, 2005 | | AVERAGE ANNUAL TOTAL RETURNS
AS OF JUNE 30, 2005 | |
| | | 6 MONTHS | | 1 YEAR | | 5 YEARS | | SINCE
INCEPTION
(5/19/97) | |
| CLASS A SHARES | | | |
| Without Sales Charge | | | (1.73 | %) | | | 3.13 | % | | | (2.51 | %) | | | 10.04 | % | |
| With Sales Charge* | | | (6.88 | %) | | | (2.26 | %) | | | (3.56 | %) | | | 9.32 | % | |
| CLASS B SHARES | | | |
| Without CDSC | | | (2.00 | %) | | | 2.51 | % | | | (3.12 | %) | | | 9.34 | % | |
| With CDSC** | | | (6.90 | %) | | | (2.49 | %) | | | (3.44 | %) | | | 9.34 | % | |
| CLASS C SHARES | | | |
| Without CDSC | | | (2.01 | %) | | | 2.52 | % | | | (3.12 | %) | | | 9.32 | % | |
| With CDSC*** | | | (2.99 | %) | | | 1.52 | % | | | (3.12 | %) | | | 9.32 | % | |
| SELECT CLASS SHARES | | | (1.54 | %) | | | 3.51 | % | | | (2.11 | %) | | | 10.36 | % | |
* Sales charge for class A shares is 5.25%.
** Assumes 5% CDSC (contingent deferred sales charge) for the one year period, 3% CDSC for the three year period, 2% CDSC for the five year period and 0% CDSC for the period since inception.
*** Assumes a 1% CDSC for the one year period and 0% CDSC thereafter.
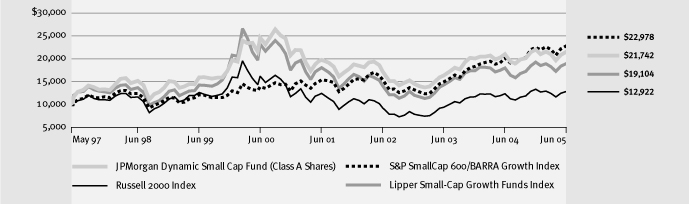
LIFE OF FUND PERFORMANCE (05/19/97 TO 06/30/05)
Source: Lipper, Inc. The performance quoted is past performance and is not a guarantee of future results. Mututal funds are subject to certain market risk. Investment returns and principal value of an investment will fluctuate so that an investor's shares, when redeemed, may be worth more or less than their original cost. Current performance may be higher or lower than the performance data shown. For up-to-date month-end performance information please call 1-800-480-4111.
The Fund commenced operations on 5/19/97.
Returns for the Select Class Shares prior to 4/5/99 (offering date of the Select Class Shares) are calculated using the historical expenses of the Class A Shares, which are higher than the expenses of the Select Shares. Returns for the Class C Shares prior to 1/7/98 (offering date of the Class C Shares) are calculated using the historical expenses of the Class B Shares, which are lower than the expenses of the Class C Shares.
The graph illustrates comparative performance for $10,000 invested in Class A Shares of the JPMorgan Dynamic Small Cap Fund, Russell 2000 Index, S&P SmallCap 600/BARRA Growth Index, and Lipper Small-Cap Growth Funds Index from May 19, 1997 to June 30, 2005. The performance of the Fund assumes reinvestment of all dividends and capital gains and includes a sales charge. The performance of the indices reflects an initial investment at the end of the month following the Fund's inception. The performance of the indices does not include a sales charge and has been adjusted to reflect reinvestment of all dividends and capital gains of the securities included in the benchmark. The Russell 2000 Index is an unmanaged, capitalization weighted price only index, which is comprised of 2000 of the smallest stocks (on the basis of capitalization) in the Russell 3000 Index. The S& ;P SmallCap 600/ BARRA Growth Index is a capitalization-weighted index of all the stocks in the S&P SmallCap 600 Index with higher price-to-book ratios. The Lipper Small-Cap Growth Funds Index represents the total returns of the funds in the indicated category, as defined by Lipper, Inc. Investors cannot invest directly in an index.
Class A Shares have a $1,000 minimum initial investment and carry a 5.25% sales charge.
Performance may reflect the waiver and reimbursement of the Fund's fees/
expenses for certain periods since the inception date. Without these waivers and reimbursements performance would have been lower. Also, performance shown in this section does not reflect the deduction of taxes that a shareholder would pay on fund distributions or redemptions of fund shares.
JPMorgan U.S. Equity Mid/Small Cap Funds6
JPMorgan
Mid Cap Equity Fund
AS OF JUNE 30, 2005 (Unaudited)
FUND CHARACTERISTICS
| FUND FACTS | | | |
| Fund Inception | | 1/1/97 | |
| Fiscal Year End | | December 31 | |
Net Assets as of 6/30/2005
(In Millions) | | $ | 249.3 | | |
| Primary Benchmark | | Russell Midcap Equity Index | |
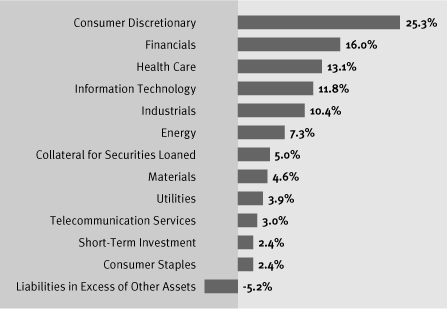
COMPOSITION OF TOTAL NET ASSETS*
TOP TEN EQUITY HOLDINGS
OF THE PORTFOLIO* | |
| | 1. | | | Coventry Health Care, Inc. | | | 1.5 | % | |
| | 2. | | | V.F. Corp. | | | 1.4 | % | |
| | 3. | | | Kinder Morgan, Inc. | | | 1.3 | % | |
| | 4. | | | Assurant, Inc. | | | 1.2 | % | |
| | 5. | | | Manor Care, Inc. | | | 1.2 | % | |
| | 6. | | | AutoZone, Inc. (a) | | | 1.2 | % | |
| | 7. | | | TJX Cos., Inc. | | | 1.1 | % | |
| | 8. | | | North Fork Bancorp, Inc. | | | 1.1 | % | |
| | 9. | | | Devon Energy Corp. | | | 1.0 | % | |
| | 10. | | | Alltel Corp. | | | 1.0 | % | |
Top 10 equity holdings comprised 12.0% of the Portfolio's Net Assets ($249,325 in thousands). As of June 30, 2005 the Fund held 195 equity holdings. Portfolio holdings are subject to change at any time.
* Percentages indicated are based on net assets as of June 30, 2005. The portfolio's composition is subject to change.
JPMorgan U.S. Equity Mid/Small Cap Funds7
JPMorgan
Mid Cap Equity Fund
CONTINUED
(Unaudited)
| | | TOTAL RETURN
AS OF JUNE 30, 2005 | | AVERAGE ANNUAL TOTAL RETURNS
AS OF JUNE 30, 2005 | |
| | | 6 MONTHS | | 1 YEAR | | 5 YEARS | | 10 YEARS | |
| SELECT CLASS SHARES | | | 3.79 | % | | | 14.22 | % | | | 7.95 | % | | | 11.85 | % | |
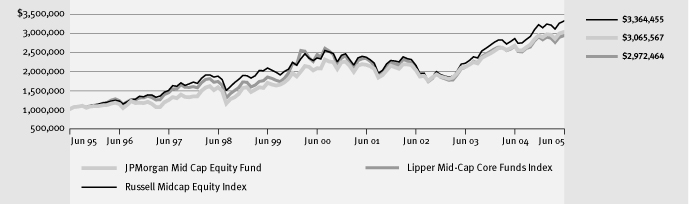
TEN YEAR FUND PERFORMANCE (06/30/95 TO 06/30/05)
Source: Lipper, Inc. The performance quoted is past performance and is not a guarantee of future results. Mututal funds are subject to certain market risk. Investment returns and principal value of an investment will fluctuate so that an investor's shares, when redeemed, may be worth more or less than their original cost. Current performance may be higher or lower than the performance data shown. For up-to-date month-end performance information please call 1-800-480-4111.
The Fund commenced operations on 1/1/97.
Returns for the Fund prior to 1/1/97 (offering date of the Select Class Shares) are calculated using the historical expenses at the level indicated (absent reimbursements) in the Expense Summary for the Fund as disclosed in the Prospectus. The account was not registered with the SEC and was not subject to investment restrictions of registered mutual funds. If the account had been registered, performance may have been adversely affected.
The graph illustrates comparative performance for $1,000,000 invested in the JPMorgan Mid Cap Equity Fund, Russell MidCap Equity Index, and Lipper Mid-Cap Core Funds Index from June 30, 1995 to June 30, 2005. The performance of the Fund assumes reinvestment of all dividends and capital gains. The performance of the indices has been adjusted to reflect reinvestment of all dividends and capital gains of the securities included in the benchmark. The Russell MidCap Equity Index measures the performance of the smallest 800 companies of the Russell 1000 Index, which represents approximately 25% of the total market capitalization of the Russell 1000 Index. The Lipper Mid-Cap Core Funds Index represents the total returns of the funds in the indicated category, as defined by Lipper, Inc. Investors cannot invest directly in an Index.
Select Class Shares have a $1,000,000 minimum initial investment and carry no sales charge.
Performance may reflect the waiver and reimbursement of the Fund's fees/expenses for certain periods since the inception date. Without these waivers and reimbursements performance would have been lower. Also, performance shown in this section does not reflect the deduction of taxes that a shareholder would pay on fund distributions or redemptions of fund shares.
JPMorgan U.S. Equity Mid/Small Cap Funds8
JPMorgan
Mid Cap Growth Fund
AS OF JUNE 30, 2005 (Unaudited)
FUND CHARACTERISTICS
| FUND FACTS | | | |
| Fund Inception | | 10/29/99 | |
| Fiscal Year End | | December 31 | |
Net Assets as of 6/30/2005
(In Millions) | | $ | 52.2 | | |
| Primary Benchmark | | Russell Midcap Growth Index | |
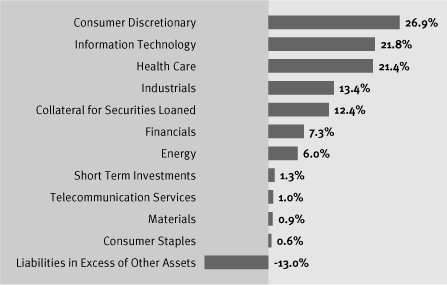
COMPOSITION OF TOTAL NET ASSETS*
TOP TEN EQUITY HOLDINGS
OF THE PORTFOLIO* | |
| | 1. | | | Amphenol Corp., Class A | | | 1.9 | % | |
| | 2. | | | Brunswick Corp. | | | 1.8 | % | |
| | 3. | | | NCR Corp. | | | 1.6 | % | |
| | 4. | | | Fisher Scientific
International, Inc. | | | 1.6 | % | |
| | 5. | | | AmeriCredit Corp. | | | 1.6 | % | |
| | 6. | | | Manor Care, Inc. | | | 1.5 | % | |
| | 7. | | | International Speedway
Corp., Class A | | | 1.5 | % | |
| | 8. | | | DaVita, Inc. | | | 1.5 | % | |
| | 9. | | | Royal Caribbean Cruises Ltd. (Liberia) | | | 1.4 | % | |
| | 10. | | | Medco Health Solutions, Inc. | | | 1.4 | % | |
Top 10 equity holdings comprised 15.8% of the Portfolio's Net Assets ($52,249 in thousands). As of June 30, 2005 the Fund held 107 equity holdings. Portfolio holdings are subject to change at any time.
* Percentages indicated are based on net assets as of June 30, 2005. The portfolio's composition is subject to change.
JPMorgan U.S. Equity Mid/Small Cap Funds9
JPMorgan
Mid Cap Growth Fund
CONTINUED
(Unaudited)
| | | TOTAL RETURNS
AS OF JUNE 30, 2005 | | AVERAGE ANNUAL TOTAL RETURNS
AS OF JUNE 30, 2005 | |
| | | 6 MONTHS | | 1 YEAR | | 5 YEARS | | SINCE
INCEPTION
(10/29/99) | |
| CLASS A SHARES | | | |
| Without Sales Charge | | | 2.26 | % | | | 9.93 | % | | | (14.79 | %) | | | (8.60 | %) | |
| With Sales Charge* | | | (3.14 | %) | | | 4.08 | % | | | (15.70 | %) | | | (9.46 | %) | |
| CLASS B SHARES | | | |
| Without CDSC | | | 1.99 | % | | | 9.28 | % | | | (15.37 | %) | | | (9.22 | %) | |
| With CDSC** | | | (3.01 | %) | | | 4.28 | % | | | (15.70 | %) | | | (9.38 | %) | |
* Sales charge for class A shares is 5.25%.
** Assumes 5% CDSC (contingent deferred sales charge) for the one year period, 3% CDSC for the three year period, 2% CDSC for the five year period and 0% CDSC for the period since inception.
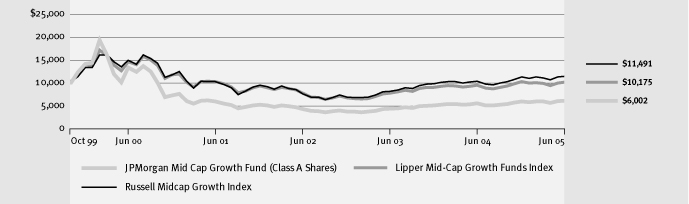
LIFE OF FUND PERFORMANCE (10/29/99 TO 06/30/05)
Source: Lipper, Inc. The performance quoted is past performance and is not a guarantee of future results. Mututal funds are subject to certain market risk. Investment returns and principal value of an investment will fluctuate so that an investor's shares, when redeemed, may be worth more or less than their original cost. Current performance may be higher or lower than the performance data shown. For up-to-date month-end performance information please call 1-800-480-4111.
The JPMorgan MidCap Growth Fund commenced operations on 10/29/99.
The graph illustrates comparative performance for $10,000 invested in Class A Shares of the JPMorgan Mid Cap Growth Fund, Russell MidCap Growth Index, and Lipper Mid-Cap Growth Funds Index from October 29, 1999 to June 30, 2005. The performance of the Fund assumes reinvestment of all dividends and capital gains and assumes a sales charge. The performance of the indices reflects an initial investment at the end of the month following the Fund's inception. The performance of the indices does not include a sales charge and has been adjusted to reflect reinvestment of all dividends and capital gains of the securities included in the benchmark. The Russell MidCap Growth Index measures the performance of those Russell MidCap companies with higher price to-book ratios and higher forecasted growth values. The Lipper Mid-Cap Growth Funds Index represents the total returns of the funds in the in dicated category, as defined by Lipper, Inc. Investors cannot invest directly in an index.
Class A Shares have a $1,000 minimum initial investment and carry a 5.25% sales charge.
Performance may reflect the waiver and reimbursement of the Fund's fees/
expenses for certain periods since the inception date. Without these waivers and reimbursements performance would have been lower. Also, performance shown in this section does not reflect the deduction of taxes that a shareholder would pay on fund distributions or redemptions of fund shares.
JPMorgan U.S. Equity Mid/Small Cap Funds10
JPMorgan
Mid Cap Value Fund
AS OF JUNE 30, 2005 (Unaudited)
FUND CHARACTERISTICS
| FUND FACTS | | | |
| Fund Inception | | 11/13/97 | |
| Fiscal Year End | | December 31 | |
Net Assets as of 6/30/2005
(In Millions) | | $ | 6,211.4 | | |
| Primary Benchmark | | Russell Midcap Value Index | |
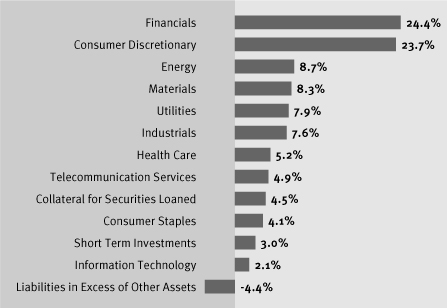
COMPOSITION OF TOTAL NET ASSETS*
TOP TEN EQUITY HOLDINGS
OF THE PORTFOLIO* | |
| | 1. | | | V.F. Corp. | | | 2.7 | % | |
| | 2. | | | Assurant, Inc. | | | 2.4 | % | |
| | 3. | | | Kinder Morgan, Inc. | | | 2.4 | % | |
| | 4. | | | AutoZone, Inc. | | | 2.3 | % | |
| | 5. | | | North Fork Bancorp, Inc. | | | 2.2 | % | |
| | 6. | | | Devon Energy Corp. | | | 2.1 | % | |
| | 7. | | | Alltel Corp. | | | 2.1 | % | |
| | 8. | | | Golden West Financial Corp. | | | 2.0 | % | |
| | 9. | | | CenturyTel, Inc. | | | 1.9 | % | |
| | 10. | | | Coventry Health Care, Inc. | | | 1.9 | % | |
Top 10 equity holdings comprised 22.0% of the Portfolio's Net Assets ($6,211,417 in thousands). As of June 30, 2005 the Fund held 98 equity holdings. Portfolio holdings are subject to change at any time.
* Percentages indicated are based on net assets as of June 30, 2005. The portfolio's composition is subject to change.
JPMorgan U.S. Equity Mid/Small Cap Funds11
JPMorgan
Mid Cap Value Fund
CONTINUED
(Unaudited)
| | | TOTAL RETURNS
AS OF JUNE 30, 2005 | | AVERAGE ANNUAL TOTAL RETURNS
AS OF JUNE 30, 2005 | |
| | | 6 MONTHS | | 1 YEAR | | 5 YEARS | | SINCE
INCEPTION
(11/13/97) | |
| CLASS A SHARES | |
| Without Sales Charge | | | 4.94 | % | | | 17.55 | % | | | 17.94 | % | | | 18.17 | % | |
| With Sales Charge* | | | (0.56 | %) | | | 11.37 | % | | | 16.67 | % | | | 17.35 | % | |
| CLASS B SHARES | |
| Without CDSC | | | 4.66 | % | | | 16.84 | % | | | 17.27 | % | | | 17.73 | % | |
| With CDSC** | | | (0.34 | %) | | | 11.84 | % | | | 17.06 | % | | | 17.73 | % | |
| CLASS C SHARES | |
| Without CDSC | | | 4.65 | % | | | 16.81 | % | | | 17.31 | % | | | 17.76 | % | |
| With CDSC*** | | | 3.65 | % | | | 15.81 | % | | | 17.31 | % | | | 17.76 | % | |
| SELECT CLASS SHARES | | | 5.09 | % | | | 17.86 | % | | | 18.22 | % | | | 18.36 | % | |
| INSTITUTIONAL CLASS SHARES | | | 5.20 | % | | | 18.15 | % | | | 18.44 | % | | | 18.50 | % | |
* Sales charge for class A shares is 5.25%.
** Assumes 5% CDSC (contingent deferred sales charge) for the one year period, 3% CDSC for the three year period, 2% CDSC for the five year period and 0% CDSC for the period since inception.
*** Assumes a 1% CDSC for the one year period and 0% CDSC thereafter.
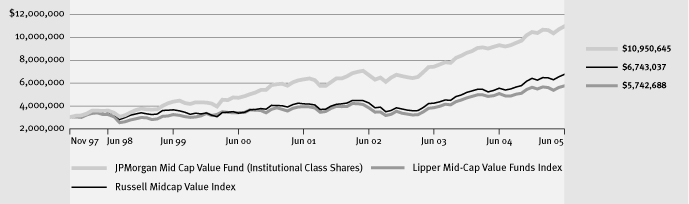
LIFE OF FUND PERFORMANCE (11/13/97 TO 06/30/05)
Source: Lipper, Inc. The performance quoted is past performance and is not a guarantee of future results. Mututal funds are subject to certain market risk. Investment returns and principal value of an investment will fluctuate so that an investor's shares, when redeemed, may be worth more or less than their original cost. Current performance may be higher or lower than the performance data shown. For up-to-date month-end performance information please call 1-800-480-4111.
The Fund commenced operations on 11/13/97.
Returns for the Select Class Shares prior to 10/31/01 (offering date of the Select Class Shares) are calculated using the historical expenses of the Institutional Class Shares, which are lower than the expenses of the Select Class Shares.
Returns for the Class A, Class B, and Class C Shares prior to 4/30/01 (offering date of the Class A, Class B, and Class C Shares) are calculated using the historical expenses of the Institutional Class Shares, which are lower than the expenses of the Class A Shares, Class B and C Shares.
The graph illustrates comparative performance for $3,000,000 invested in Institutional Class Shares of the JPMorgan Mid Cap Value Fund, Russell MidCap Value Index, and Lipper Mid-Cap Value Funds Index from November 13, 1997 to June 30, 2005. The performance of the Fund assumes reinvestment of all dividends and capital gains. The performance of the indices reflects an initial investment at the end of the month following the Fund's inception. The performance of the indices does not include a sales charge and has been adjusted to reflect reinvestment of all dividends and capital gains of the securities included in the benchmark. The Russell MidCap Value Index is an unmanaged, capitalization weighted, price only index that measures the performance of those companies included in the Russell MidCap Index that have lower price-to-book ratios and lower forecasted growth rates. The Lipper Mid-Cap Va lue Funds Index represents the total returns of the funds in the indicated category, as defined by Lipper, Inc. Investors cannot invest directly in an index.
Institutional Class Shares have a $3,000,000 minimum initial investment and carry no sales charge.
Performance may reflect the waiver and reimbursement of the Fund's fees/expenses for certain periods since the inception date. Without these waivers and reimbursements performance would have been lower. Also, performance shown in this section does not reflect the deduction of taxes that a shareholder would pay on fund distributions or redemptions of fund shares.
JPMorgan U.S. Equity Mid/Small Cap Funds12
JPMorgan
Small Cap Core Fund
AS OF JUNE 30, 2005 (Unaudited)
FUND CHARACTERISTICS
| FUND FACTS | | | |
| Fund Inception | | 1/1/97 | |
| Fiscal Year End | | December 31 | |
Net Assets as of 6/30/2005
(In Millions) | | $ | 814.6 | | |
| Primary Benchmark | | Russell 2000 Index | |
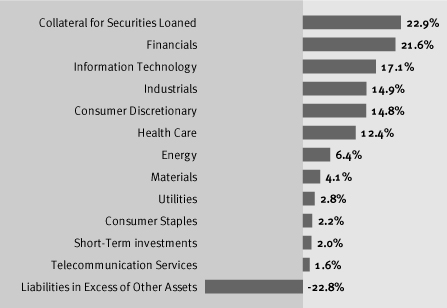
COMPOSITION OF TOTAL NET ASSETS*
TOP TEN EQUITY HOLDINGS
OF THE PORTFOLIO* | |
| | 1. | | | Applied Industrial
Technologies, Inc. | | | 1.1 | % | |
| | 2 | | | Southwestern Energy Co. | | | 1.1 | % | |
| | 3 | | | Aaron Rents, Inc. | | | 1.0 | % | |
| | 4 | | | Houston Exploration Co. | | | 0.9 | % | |
| | 5 | | | Moog, Inc., Class A | | | 0.9 | % | |
| | 6 | | | Delphi Financial Group, Inc. | | | 0.8 | % | |
| | 7 | | | Universal Forest
Products, Inc. | | | 0.8 | % | |
| | 8 | | | Mid-America Apartment
Communities, Inc. (REIT) | | | 0.8 | % | |
| | 9 | | | CarrAmerica Realty Corp.
(REIT) | | | 0.7 | % | |
| | 10 | | | Zenith National Insurance
Corp. | | | 0.7 | % | |
Top 10 equity holdings comprised 8.8% of the Portfolio's Net Assets ($814,569 in thousands). As of June 30, 2005 the Fund held 727 equity holdings. Portfolio holdings are subject to change at any time.
* Percentages indicated are based on net assets as of June 30, 2005. The portfolio's composition is subject to change.
JPMorgan U.S. Equity Mid/Small Cap Funds13
JPMorgan
Small Cap Core Fund
CONTINUED
(Unaudited)
| | | TOTAL RETURN
AS OF JUNE 30, 2005 | | AVERAGE ANNUAL TOTAL RETURNS
AS OF JUNE 30, 2005 | |
| | | 6 MONTHS | | 1 YEAR | | 5 YEARS | | 10 YEARS | |
| SELECT CLASS SHARES | | | (0.37 | %) | | | 9.74 | % | | | 5.72 | % | | | 7.83 | % | |
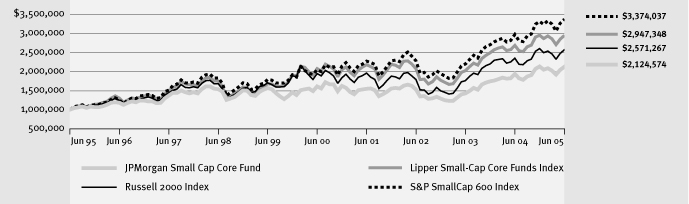
TEN YEAR FUND PERFORMANCE (06/30/95 TO 06/30/05)
Source: Lipper, Inc. The performance quoted is past performance and is not a guarantee of future results. Mututal funds are subject to certain market risk. Investment returns and principal value of an investment will fluctuate so that an investor's shares, when redeemed, may be worth more or less than their original cost. Current performance may be higher or lower than the performance data shown. For up-to-date month-end performance information please call 1-800-480-4111.
The Fund commenced operations on 1/1/97.
Returns for the Fund prior to 1/1/97 (offering date of the Select Class Shares) are calculated using the historical expenses at the level indicated (absent reimbursements) in the Expense Summary for the Fund as disclosed in the Prospectus. The account was not registered with the SEC and was not subject to investment restrictions of registered mutual funds. If the account had been registered, performance may have been adversely affected.
The graph illustrates comparative performance for $1,000,000 invested in the JPMorgan Small Cap Core Fund, Russell 2000 Index, S&P SmallCap 600 Index and Lipper Small-Cap Core Funds Index from June 30, 1995 to June 30, 2005. The performance of the Fund assumes reinvestment of all dividends and capital gains. During the year ended December 31, 2004, the Fund changed its benchmark from the S&P SmallCap 600 Index to the Russell 2000 Index.
The performance of the indices does not include a sales charge and has been adjusted to reflect reinvestment of all dividends and capital gains of the securities included in the benchmark. The Russell 2000 Index is an unmanaged, capitalization weighted price only index, which is comprised of 2000 of the smallest stocks (on the basis of capitalization) in the Russell 3000 Index. The S&P SmallCap 600 Index includes 600 stocks of small U.S. Companies chosen for market size, liquidity, and industry group representation. The Lipper Small-Cap Core Funds Index represents the total returns of the funds in the indicated category, as defined by Lipper, Inc. Investor's cannot invest directly in an index.
Select Class Shares have a $1,000,000 minimum initial investment and carry no sales charge.
Performance may reflect the waiver and reimbursement of the Fund's fees/expenses for certain periods since the inception date. Without these waivers and reimbursements performance would have been lower. Also, performance shown in this section does not reflect the deduction of taxes that a shareholder would pay on fund distributions or redemptions of fund shares.
JPMorgan U.S. Equity Mid/Small Cap Funds14
JPMorgan
Small Cap Equity Fund
AS OF JUNE 30, 2005 (Unaudited)
FUND CHARACTERISTICS
| FUND FACTS | | | |
| Fund Inception | | 12/20/94 | |
| Fiscal Year End | | December 31 | |
Net Assets as of 6/30/2005
(In Millions) | | $ | 384.3 | | |
| Primary Benchmark | | Russell 2000 Index | |
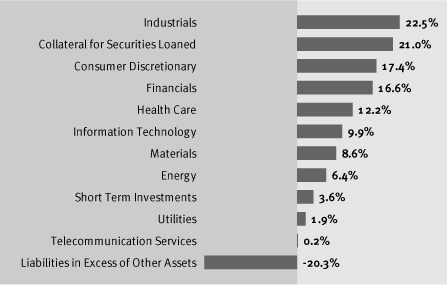
COMPOSITION OF TOTAL NET ASSETS*
TOP TEN EQUITY HOLDINGS
OF THE PORTFOLIO* | |
| Jarden Corp. | | | 2.3 | % | |
| Hudson Highland Group, Inc. | | | 2.3 | % | |
| United Bancshares, Inc. | | | 2.1 | % | |
Scotts Miracle-Gro Co. (The),
Class A | | | 2.1 | % | |
| ProAssurance Corp. | | | 1.9 | % | |
| Waste Connections, Inc. | | | 1.8 | % | |
| Applebees International, Inc. | | | 1.7 | % | |
| St. Mary Land & Exploration Co. | | | 1.7 | % | |
| General Cable Corp. | | | 1.6 | % | |
| Landstar System, Inc. | | | 1.6 | % | |
Top 10 equity holdings comprised 19.1% of the Portfolio's Net Assets ($384,346 in thousands). As of June 30, 2005 the Fund held 101 equity holdings. Portfolio holdings are subject to change at any time.
* Percentages indicated are based on net assets as of June 30, 2005. The portfolio's composition is subject to change.
JPMorgan U.S. Equity Mid/Small Cap Funds15
JPMorgan
Small Cap Equity Fund
CONTINUED
(Unaudited)
| | | TOTAL RETURNS
AS OF JUNE 30, 2005 | | AVERAGE ANNUAL TOTAL RETURNS
AS OF JUNE 30, 2005 | |
| | | 6 MONTHS | | 1 YEAR | | 5 YEARS | | 10 YEARS | |
| CLASS A SHARES | | | | | | | |
| Without Sales Charge | | | 3.10 | % | | | 18.22 | % | | | 6.77 | % | | | 12.99 | % | |
| With Sales Charge* | | | (2.33 | %) | | | 12.01 | % | | | 5.62 | % | | | 12.38 | % | |
| CLASS B SHARES | | | | | | | |
| Without CDSC | | | 2.83 | % | | | 17.46 | % | | | 5.97 | % | | | 12.32 | % | |
| With CDSC** | | | (2.17 | %) | | | 12.46 | % | | | 5.67 | % | | | 12.32 | % | |
| CLASS C SHARES | | | | | | | |
| Without CDSC | | | 2.79 | % | | | 17.42 | % | | | 5.97 | % | | | 12.16 | % | |
| With CDSC*** | | | 1.79 | % | | | 16.42 | % | | | 5.97 | % | | | 12.16 | % | |
| SELECT CLASS SHARES | | | 3.36 | % | | | 18.81 | % | | | 7.33 | % | | | 13.50 | % | |
* Sales charge for Class A Shares is 5.25%.
** Assumes 5% CDSC (contingent deferred sales charge) for the one year period, 3% CDSC for the three year period, 2% CDSC for the five year period and 0% CDSC for the ten year period since inception.
*** Assumes a 1% CDSC for the one year period and 0% CDSC thereafter.
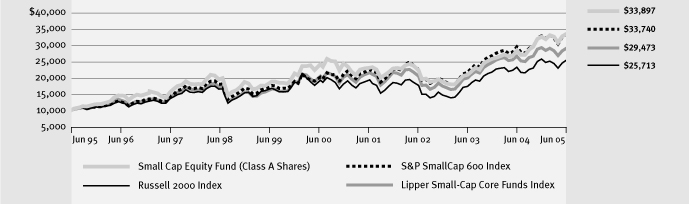
TEN YEAR PERFORMANCE (6/30/95 TO 06/30/05)
Source: Lipper, Inc. The performance quoted is past performance and is not a guarantee of future results. Mututal funds are subject to certain market risk. Investment returns and principal value of an investment will fluctuate so that an investor's shares, when redeemed, may be worth more or less than their original cost. Current performance may be higher or lower than the performance data shown. For up-to-date month-end performance information please call 1-800-480-4111.
The Fund commenced operations on 12/20/94.
Returns for the Select Class Shares prior to 5/7/96 (offering date of the Select Class Shares) are calculated using the historical expenses of the Class A Shares, which are higher than the expenses of the Select Class Shares.
Returns for the Class B Shares prior to 3/28/95 (offering date of the Class B Shares) are calculated using the historical expenses of the Class A Shares, which are lower than the expenses of the Class B Shares.
Returns for the Class C Shares prior to 2/19/05 (offering date of the Class C Shares) are calculated using the historical expenses of the Class B Shares, which are lower than the expenses of the Class C Shares.
The graph illustrates comparative performance for $10,000 invested in Class A Shares of the JPMorgan Small Cap Equity Fund, Russell 2000 Index, S&P SmallCap 600 Index and Lipper Small-Cap Core Funds Index from June 30, 1995 to June 30, 2005.
The performance of the Fund assumes reinvestment of all dividends and capital gains and includes a sales charge. The performance of the indices does not include a sales charge and has been adjusted to reflect reinvestment of all dividends and capital gains of the securities included in the benchmark. The Russell 2000 Index is an unmanaged, capitalization weighted price only index, which is comprised of 2000 of the smallest stocks (on the basis of capitalization) in the Russell 3000 Index. The S&P SmallCap 600 Index includes 600 stocks of small U.S. Companies chosen for market size, liquidity and industry group representation. The Lipper Small-Cap Core Funds Index represents the total returns of the funds in the indicated category, as defined by Lipper, Inc. Investors cannot invest directly in an index.
Class A Shares have a $1,000 minimum initial investment and carry a 5.25% sales charge.
Performance may reflect the waiver and reimbursement of the Fund's fees/expenses for certain periods since the inception date. Without these waivers and reimbursements performance would have been lower. Also, performance shown in this section does not reflect the deduction of taxes that a shareholder would pay on fund distributions or redemptions of fund shares.
JPMorgan U.S. Equity Mid/Small Cap Funds16
JPMorgan
U.S. Small Company Fund
AS OF JUNE 30, 2005 (Unaudited)
FUND CHARACTERISTICS
| FUND FACTS | | | |
| Fund Inception | | 11/4/93 | |
| Fiscal Year End | | December 31 | |
Net Assets as of 6/30/2005
(In Millions) | | $ | 177.8 | | |
| Primary Benchmark | | Russell 2000 Index | |
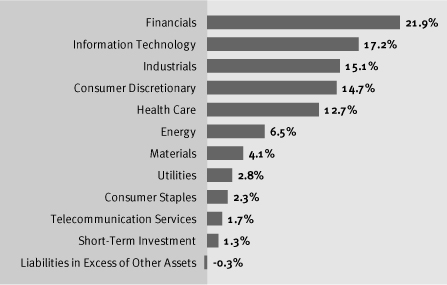
COMPOSITION OF TOTAL NET ASSETS*
TOP TEN EQUITY HOLDINGS
OF THE PORTFOLIO* | |
| Southwestern Energy Co. | | | 1.1 | % | |
Applied Industrial
Technologies, Inc. | | | 1.1 | % | |
| Aaron Rents, Inc. | | | 1.0 | % | |
| Houston Exploration Co. | | | 0.9 | % | |
| Moog, Inc., Class A | | | 0.9 | % | |
| Delphi Financial Group, Inc. | | | 0.8 | % | |
| Universal Forest Products, Inc. | | | 0.8 | % | |
Mid-America Apartment
Communities, Inc. (REIT) | | | 0.8 | % | |
| CarrAmerica Realty Corp. (REIT) | | | 0.7 | % | |
| Landry's Restaurants, Inc. | | | 0.7 | % | |
Top 10 equity holdings comprised 8.8% of the Portfolio's Net Assets ($177,769 in thousands). As of June 30, 2005 the Fund held 750 equity holdings. Portfolio holdings are subject to change at any time.
* Percentages indicated are based on net assets as of June 30, 2005. The portfolio's composition is subject to change.
JPMorgan U.S. Equity Mid/Small Cap Funds17
JPMorgan
U.S. Small Company Fund
CONTINUED
(Unaudited)
| | | TOTAL RETURNS
AS OF JUNE 30, 2005 | | AVERAGE ANNUAL TOTAL RETURNS
AS OF JUNE 30, 2005 | |
| | | 6 MONTHS | | 1 YEAR | | 5 YEARS | | 10 YEARS | |
| SELECT CLASS SHARES | | | (0.36 | %) | | | 11.79 | % | | | 0.59 | % | | | 8.87 | % | |
| INSTITUTIONAL CLASS SHARES | | | (0.22 | %) | | | 11.88 | % | | | 0.75 | % | | | 9.02 | % | |
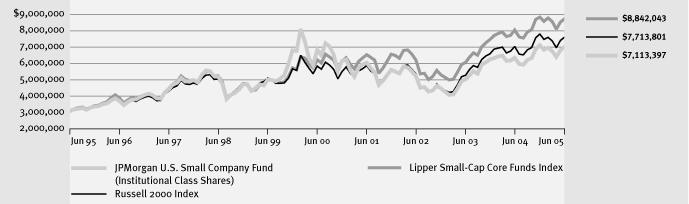
TEN YEAR FUND PERFORMANCE (06/30/95 TO 06/30/05)
Source: Lipper, Inc. The performance quoted is past performance and is not a guarantee of future results. Mututal funds are subject to certain market risk. Investment returns and principal value of an investment will fluctuate so that an investor's shares, when redeemed, may be worth more or less than their original cost. Current performance may be higher or lower than the performance data shown. For up-to-date month-end performance information please call 1-800-480-4111.
The Fund commenced operations on 11/4/93.
Returns for the Institutional Class Shares prior to 9/10/01 (offering date of the Institutional Class Shares) are calculated using the historical expenses of the J.P. Morgan Institutional U.S. Small Company Fund, which are similar to the expenses of the Institutional Class Shares.
Returns for the Select Class Shares prior to 9/10/01 (offering date of the Select Class Shares) are calculated using the historical expenses of the J.P. Morgan U.S. Small Company Fund, which are similar to the expenses of the Select Class Shares.
The graph illustrates comparative performance for $3,000,000 invested in Institutional Class Shares of the JPMorgan U.S. Small Company Fund, Russell 2000 Index, and Lipper Small-Cap Core Funds Index from June 30, 1995 to June 30, 2005.
The performance of the Fund assumes reinvestment of all dividends and capital gains and does not include a sales charge. The performance of the indices does not include a sales charge and has been adjusted to reflect reinvestment of all dividends and capital gains of the securities included in the benchmark. The Russell 2000 Index is an unmanaged, capitalization weighted price only index, which is comprised of 2000 of the smallest stocks (on the basis of capitalization) in the Russell 3000 Index. The Lipper Small-Cap Core Funds Index represents the total returns of the funds in the indicated category, as defined by Lipper, Inc. Investors cannot invest directly in an index.
Institutional Class Shares have a $3,000,000 minimum initial investment and carry no sales charge.
Performance may reflect the waiver and reimbursement of the Fund's fees/expenses for certain periods since the inception date. Without these waivers and reimbursements performance would have been lower. Also, performance shown in this section does not reflect the deduction of taxes that a shareholder would pay on fund distributions or redemptions of fund shares.
JPMorgan U.S. Equity Mid/Small Cap Funds18
JPMorgan Capital Growth Fund
SCHEDULE OF PORTFOLIO INVESTMENTS AS OF JUNE 30, 2005
(Amounts in thousands)
(Unaudited)
| SHARES | | SECURITY DESCRIPTION | | VALUE | |
| | Long-Term Investments - 98.4% | | | | |
| | | | | Common Stocks - 98.4% | |
| | | | | Aerospace & Defense - 2.4% | |
| | 65 | | | L-3 Communications Holdings, Inc. | | $ | 4,955 | | |
| | 87 | | | Precision Castparts Corp. | | | 6,773 | | |
| | 118 | | | Rockwell Collins, Inc. | | | 5,619 | | |
| | | | 17,347 | | |
| | | | | Airlines - 0.7% | | | |
| | 361 | | | Southwest Airlines Co. | | | 5,026 | | |
| | | | | Auto Components - 0.8% | | | |
| | 134 | | | Autoliv, Inc. | | | 5,858 | | |
| | | | | Biotechnology - 3.0% | | | |
| | 103 | | | Celgene Corp. (a) (c) | | | 4,183 | | |
| | 144 | | | Genzyme Corp. (a) | | | 8,629 | | |
| | 64 | | | Invitrogen Corp. (a) (c) | | | 5,314 | | |
| | 74 | | | OSI Pharmaceuticals, Inc. (a) | | | 3,006 | | |
| | | | 21,132 | | |
| | | | | Capital Markets - 2.2% | | | |
| | 376 | | | Ameritrade Holding Corp. (a) | | | 6,994 | | |
| | 89 | | | Investors Financial Services Corp. (c) | | | 3,381 | | |
| | 88 | | | T. Rowe Price Group, Inc. | | | 5,531 | | |
| | | | 15,906 | | |
| | | | | Commercial Banks - 0.8% | | | |
| | 75 | | | Zions Bancorp | | | 5,529 | | |
| | | | | Commercial Services & Supplies - 3.0% | | | |
| | 83 | | | Dun & Bradstreet Corp. (a) | | | 5,142 | | |
| | 149 | | | HNI Corp. | | | 7,626 | | |
| | 221 | | | West Corp. (a) | | | 8,479 | | |
| | | | 21,247 | | |
| | | | | Communications Equipment - 0.5% | | | |
| | 115 | | | Harris Corp. | | | 3,602 | | |
| | | | | Computers & Peripherals - 3.4% | | | |
| | 335 | | | NCR Corp. (a) | | | 11,748 | | |
| | 224 | | | Network Appliance, Inc. (a) | | | 6,327 | | |
| | 350 | | | Seagate Technology (Cayman Islands) (a) | | | 6,146 | | |
| | | | 24,221 | | |
| SHARES | | SECURITY DESCRIPTION | | VALUE | |
| | | | | Construction & Engineering - 1.3% | | | |
| | 161 | | | Jacobs Engineering Group, Inc. (a) | | $ | 9,030 | | |
| | | | | Consumer Finance - 1.5% | | | |
| | 436 | | | AmeriCredit Corp. (a) | | | 11,105 | | |
| | | | | Diversified Financial Services - 2.0% | | | |
| | 164 | | | CIT Group, Inc. | | | 7,052 | | |
| | 308 | | | Lazard Ltd. (Bermuda), Class A (a) | | | 7,154 | | |
| | | | 14,206 | | |
| | | | | Electrical Equipment - 0.9% | | | |
| | 131 | | | Rockwell Automation, Inc. | | | 6,357 | | |
| | | | | Electronic Equipment & Instruments - 3.8% | | | |
| | 335 | | | Amphenol Corp., Class A | | | 13,469 | | |
| | 201 | | | Arrow Electronics, Inc. (a) | | | 5,454 | | |
| | 264 | | | Jabil Circuit, Inc. (a) | | | 8,103 | | |
| | | | 27,026 | | |
| | | | | Energy Equipment & Services - 2.5% | | | |
| | 216 | | | Grant Prideco, Inc. (a) | | | 5,721 | | |
| | 97 | | | Nabors Industries Ltd. (Bermuda) (a) | | | 5,871 | | |
| | 99 | | | Noble Corp. (Cayman Islands) | | | 6,114 | | |
| | | | 17,706 | | |
| | | | | Health Care Equipment & Supplies - 5.7% | | | |
| | 105 | | | Bausch & Lomb, Inc. | | | 8,740 | | |
| | 79 | | | Beckman Coulter, Inc. | | | 5,051 | | |
| | 73 | | | Biomet, Inc. | | | 2,541 | | |
| | 172 | | | Fisher Scientific International, Inc. (a) | | | 11,179 | | |
| | 99 | | | Millipore Corp. (a) | | | 5,611 | | |
| | 163 | | | Nektar Therapeutics (a) | | | 2,741 | | |
| | 66 | | | Zimmer Holdings, Inc. (a) | | | 4,989 | | |
| | | | 40,852 | | |
| | | | | Health Care Providers & Services - 11.5% | | | |
| | 92 | | | Aetna, Inc. | | | 7,603 | | |
| | 129 | | | Caremark Rx, Inc. (a) | | | 5,725 | | |
| | 97 | | | Coventry Health Care, Inc. (a) | | | 6,870 | | |
| | 233 | | | DaVita, Inc. (a) | | | 10,610 | | |
| | 103 | | | Laboratory Corp. of America Holdings (a) | | | 5,132 | | |
| | 79 | | | LifePoint Hospitals, Inc. (a) | | | 3,971 | | |
SEE NOTES TO FINANCIAL STATEMENTS.
JPMorgan U.S. Equity Mid/Small Cap Funds19
JPMorgan Capital Growth Fund
SCHEDULE OF PORTFOLIO INVESTMENTS AS OF JUNE 30,2005
(Amounts in thousands)
(CONTINUED)
(Unaudited)
| SHARES | | SECURITY DESCRIPTION | | VALUE | |
| | Long-Term Investments - continued | | | | |
| | | | | Health Care Providers & Services - Continued | |
| | 277 | | | Manor Care, Inc. | | $ | 10,989 | | |
| | 130 | | | McKesson Corp. | | | 5,836 | | |
| | 184 | | | Medco Health Solutions, Inc. (a) | | | 9,824 | | |
| | 198 | | | Omnicare, Inc. | | | 8,384 | | |
| | 137 | | | Triad Hospitals, Inc. (a) | | | 7,497 | | |
| | | | 82,441 | | |
| | | | | Hotels, Restaurants & Leisure - 8.1% | | | |
| | 245 | | | Applebees International, Inc. | | | 6,477 | | |
| | 177 | | | Brinker International, Inc. (a) | | | 7,093 | | |
| | 88 | | | Harrah's Entertainment, Inc. | | | 6,353 | | |
| | 229 | | | Hilton Hotels Corp. | | | 5,469 | | |
| | 190 | | | International Speedway Corp., Class A | | | 10,706 | | |
| | 87 | | | Marriott International, Inc., Class A | | | 5,956 | | |
| | 214 | | | Royal Caribbean Cruises Ltd. (Liberia) (c) | | | 10,330 | | |
| | 79 | | | Station Casinos, Inc. | | | 5,265 | | |
| | | | 57,649 | | |
| | | | | Household Durables - 0.6% | | | |
| | 57 | | | Harman International Industries, Inc. | | | 4,646 | | |
| | | | | Household Products - 0.5% | | | |
| | 62 | | | Energizer Holdings, Inc. (a) | | | 3,830 | | |
| | | | | Insurance - 0.7% | | | |
| | 72 | | | AMBAC Financial Group, Inc. | | | 5,012 | | |
| | | | | Internet Software & Services - 0.5% | | | |
| | 138 | | | VeriSign, Inc. (a) | | | 3,969 | | |
| | | | | IT Services - 1.8% | | | |
| | 177 | | | Alliance Data Systems Corp. (a) (c) | | | 7,187 | | |
| | 165 | | | CheckFree Corp. (a) | | | 5,603 | | |
| | | | 12,790 | | |
| | | | | Leisure Equipment & Products - 1.8% | | | |
| | 292 | | | Brunswick Corp. | | | 12,632 | | |
| | | | | Machinery - 2.8% | | | |
| | 121 | | | Harsco Corp. | | | 6,617 | | |
| | 83 | | | ITT Industries, Inc. | | | 8,118 | | |
| SHARES | | SECURITY DESCRIPTION | | VALUE | |
| | | | | Machinery - Continued | |
| | 66 | | | Oshkosh Truck Corp. | | $ | 5,135 | | |
| | | | 19,870 | | |
| | | | | Media - 1.3% | | | |
| | 67 | | | Getty Images, Inc. (a) | | | 5,005 | | |
| | 120 | | | XM Satellite Radio Holdings, Inc.,
Class A (a) (c) | | | 4,049 | | |
| | | | 9,054 | | |
| | | | | Metals & Mining - 0.9% | | | |
| | 118 | | | Consol Energy, Inc. | | | 6,309 | | |
| | | | | Multiline Retail - 0.6% | |
| | 217 | | | Dollar General Corp. | | | 4,426 | | |
| | | | | Office Electronics - 1.7% | |
| | 367 | | | Xerox Corp. (a) | | | 5,059 | | |
| | 156 | | | Zebra Technologies Corp., Class A (a) | | | 6,841 | | |
| | | | 11,900 | | |
| | | | | Oil, Gas & Consumable Fuels - 3.5% | | | |
| | 87 | | | EOG Resources, Inc. | | | 4,964 | | |
| | 93 | | | Murphy Oil Corp. | | | 4,837 | | |
| | 146 | | | Newfield Exploration Co. (a) | | | 5,820 | | |
| | 138 | | | Range Resources Corp. | | | 3,710 | | |
| | 148 | | | Talisman Energy, Inc. (Canada) | | | 5,543 | | |
| | | | 24,874 | | |
| | | | | Pharmaceuticals - 1.0% | | | |
| | 119 | | | Sepracor, Inc. (a) (c) | | | 7,138 | | |
| | | | | Road & Rail - 1.2% | |
| | 444 | | | Hunt (J.B.) Transport Services, Inc. | | | 8,562 | | |
| | | | | Semiconductors &
Semiconductor Equipment - 5.3% | |
| | 131 | | | Broadcom Corp., Class A (a) | | | 4,666 | | |
| | 114 | | | KLA-Tencor Corp. | | | 4,986 | | |
| | 176 | | | Lam Research Corp. (a) | | | 5,102 | | |
| | 233 | | | Linear Technology Corp. | | | 8,562 | | |
| | 288 | | | Microchip Technology, Inc. | | | 8,520 | | |
SEE NOTES TO FINANCIAL STATEMENTS.
JPMorgan U.S. Equity Mid/Small Cap Funds20
SEMI-ANNUAL REPORT JUNE 30
2005
SCHEDULE OF PORTFOLIO INVESTMENTS AS OF JUNE 30,2005
(Amounts in thousands)
(Unaudited)
| SHARES | | SECURITY DESCRIPTION | | VALUE | |
| | Long-Term Investments - continued | | | | |
| | | | | Semiconductors &
Semiconductor Equipment - Continued | |
| | 223 | | | Nvidia Corp. (a) (c) | | $ | 5,969 | | |
| | | | 37,805 | | |
| | | | | Software - 4.6% | | | |
| | 284 | | | Adobe Systems, Inc. | | | 8,128 | | |
| | 339 | | | Citrix Systems, Inc. (a) | | | 7,345 | | |
| | 218 | | | Cognos, Inc. (Canada) (a) | | | 7,458 | | |
| | 227 | | | Computer Associates International, Inc. | | | 6,226 | | |
| | 91 | | | Mercury Interactive Corp. (a) | | | 3,498 | | |
| | | | 32,655 | | |
| | | | | Specialty Retail - 12.7% | | | |
| | 118 | | | Abercrombie & Fitch Co. | | | 8,100 | | |
| | 151 | | | Advance Auto Parts, Inc. (a) (c) | | | 9,757 | | |
| | 215 | | | Bed Bath & Beyond, Inc. (a) | | | 8,962 | | |
| | 275 | | | CarMax, Inc. (a) (c) | | | 7,321 | | |
| | 248 | | | Circuit City Stores, Inc. | | | 4,291 | | |
| | 266 | | | Foot Locker, Inc. | | | 7,230 | | |
| | 139 | | | Michaels Stores, Inc. | | | 5,750 | | |
| | 259 | | | Pacific Sunwear of California, Inc. (a) | | | 5,947 | | |
| | 242 | | | Petco Animal Supplies, Inc. (a) | | | 7,101 | | |
| | 235 | | | Ross Stores, Inc. (c) | | | 6,797 | | |
| | 156 | | | Sherwin-Williams Co. (The) | | | 7,355 | | |
| | 208 | | | TJX Cos., Inc. | | | 5,060 | | |
| | 141 | | | Weight Watchers International, Inc. (a) (c) | | | 7,298 | | |
| | | | 90,969 | | |
| | | | | Textiles, Apparel & Luxury Goods - 0.7% | | | |
| | 121 | | | Polo Ralph Lauren Corp. | | | 5,221 | | |
| | | | | Trading Companies & Distributors - 1.1% | | | |
| | 230 | | | MSC Industrial Direct Co. | | | 7,752 | | |
| | | | | Wireless Telecommunication Services - 1.0% | | | |
| | 113 | | | NII Holdings, Inc. (a) | | | 7,244 | | |
| | | | | (Cost $602,134) | | | Total Common Stocks
702,898 | | |
| | Total Long-Term Investments
(Cost $602,134) | | | | | | 702,898 | | |
| SHARES | | SECURITY DESCRIPTION | | VALUE | |
| | Short-Term Investment - 2.1% | | | | |
| | | | | Investment Company - 2.1% | |
| | 14,906 | | | JPMorgan Prime Money
Market Fund (b) (m)
(Cost $14,906) | | $ | 14,906 | | |
| | Investments of Cash Collateral for Securities Loaned - 7.4% | | | | |
| | | | | Investment Companies - 1.1% | |
| | 4,726 | | | BGI Prime Money Market Fund | | | 4,726 | | |
| | 3,313 | | | Morgan Stanley Intitutional
Liquidity Funds | | | 3,313 | | |
| | | | 8,039 | | |
PRINCIPAL
AMOUNT | | | | | |
| | | | | Repurchase Agreements - 6.3% | | | |
| $ | 45,000 | | | Credit Suisse First Boston LLC,
3.46%, dated 06/30/05, due 07/01/05,
repurchase price $45,004, collateralized
by U.S. Agency Mortgages | | | 45,000 | | |
| | | | | Total Investments of Cash Collateral for
Securities Loaned
(Cost $53,039) | | | 53,039 | | |
| | | | | Total Investments - 107.9% | | $ | 770,843 | | |
| | | | | (Cost $670,079) | | | | | |
| | | | | Liabilities in excess of
other assets - (7.9)% | | | (56,666 | ) | |
| | | | | NET ASSETS - 100.0% | | $ | 714,177 | | |
Percentages indicated are based on net assets.
SEE NOTES TO FINANCIAL STATEMENTS.
JPMorgan U.S. Equity Mid/Small Cap Funds21
JPMorgan Dynamic Small Cap Fund
SCHEDULE OF PORTFOLIO INVESTMENTS AS OF JUNE 30, 2005
(Amounts in thousands)
(Unaudited)
| SHARES | | SECURITY DESCRIPTION | | VALUE | |
| Long-Term Investments - 96.9% | |
| | | | | Common Stocks - 96.9% | | | |
| | | | | Aerospace & Defense - 1.9% | | | |
| | 44 | | | Argon St., Inc. (a) | | $ | 1,545 | | |
| | 50 | | | Engineered Support Systems, Inc. | | | 1,805 | | |
| | | | 3,350 | | |
| | | | | Air Freight & Logistics - 0.6% | | | |
| | 16 | | | UTI Worldwide, Inc. (c) | | | 1,079 | | |
| | | | | Airlines - 0.6% | |
| | 61 | | | Skywest, Inc. | | | 1,113 | | |
| | | | | Banks - 0.1% | |
| | 5 | | | Western Alliance Bancorp (a) | | | 132 | | |
| | | | | Biotechnology - 4.2% | |
| | 40 | | | Alexion Pharmaceuticals, Inc. (a) (c) | | | 928 | | |
| | 41 | | | Cubist Pharmaceuticals, Inc. (a) (c) | | | 539 | | |
| | 23 | | | CV Therapeutics, Inc. (a) (c) | | | 504 | | |
| | 45 | | | Idenix Pharmaceuticals, Inc. (a) (c) | | | 981 | | |
| | 129 | | | Inc.yte Corp. (a) (c) | | | 923 | | |
| | 63 | | | Nabi Biopharmaceuticals (a) (c) | | | 963 | | |
| | 49 | | | Rigel Pharmaceuticals, Inc. (a) (c) | | | 966 | | |
| | 39 | | | Telik, Inc. (a) | | | 633 | | |
| | 18 | | | United Therapeutics Corp. (a) (c) | | | 848 | | |
| | | | 7,285 | | |
| | | | | Building Products - 0.7% | | | |
| | 42 | | | Simpson Manufacturing Co., Inc. (c) | | | 1,286 | | |
| | | | | Capital Markets - 0.9% | |
| | 37 | | | Greenhill & Co., Inc. (c) | | | 1,483 | | |
| | | | | Commercial Banks - 2.8% | |
| | 47 | | | East-West Bancorp, Inc. (c) | | | 1,591 | | |
| | 57 | | | EuroBancshares, Inc. (a) | | | 916 | | |
| | 61 | | | Texas Capital Bancshares, Inc. (a) (c) | | | 1,199 | | |
| | 8 | | | West Coast Bancorp (c) | | | 195 | | |
| | 17 | | | Wintrust Financial Corp. | | | 906 | | |
| | | | 4,807 | | |
| | | | | Commercial Services & Supplies - 5.4% | | | |
| | 53 | | | Chemed Corp. | | | 2,179 | | |
| | 159 | | | Educate, Inc. (a) | | | 2,251 | | |
| SHARES | | SECURITY DESCRIPTION | | VALUE | |
| | | | | Commercial Services & Supplies - Continued | |
| | 80 | | | LECG Corp. (a) (c) | | $ | 1,704 | | |
| | 59 | | | Morningstar Inc. (a) | | | 1,658 | | |
| | 49 | | | Universal Technical Institute, Inc. (a) (c) | | | 1,629 | | |
| | | | 9,421 | | |
| | | | | Communications Equipment - 5.2% | | | |
| | 215 | | | Atheros Communications, Inc. (a) (c) | | | 1,736 | | |
| | 64 | | | Avocent Corp. (a) | | | 1,679 | | |
| | 15 | | | F5 Networks, Inc. (a) | | | 720 | | |
| | 107 | | | Packeteer, Inc. (a) | | | 1,512 | | |
| | 172 | | | Symmetricom, Inc. (a) (c) | | | 1,785 | | |
| | 79 | | | ViaSat, Inc. (a) (c) | | | 1,596 | | |
| | | | 9,028 | | |
| | | | | Computers & Peripherals - 1.1% | | | |
| | 36 | | | Avid Technology, Inc. (a) | | | 1,931 | | |
| | | | | Construction Materials - 1.3% | |
| | 24 | | | Eagle Materials, Inc. (c) | | | 2,194 | | |
| | | | | Diversified Financial Services - 1.0% | |
| | 85 | | | Marlin Business Services, Inc. (a) (c) | | | 1,717 | | |
| | | | | Diversified Telecommunication Services - 0.4% | |
| | 27 | | | NeuStar, Inc. (a) | | | 701 | | |
| | | | | Electrical Equipment - 1.2% | |
| | 139 | | | General Cable Corp. (a) (c) | | | 2,061 | | |
| | | | | Electronic Equipment & Instruments - 3.5% | |
| | 197 | | | Aeroflex, Inc. (a) | | | 1,656 | | |
| | 46 | | | Global Imaging Systems, Inc. (a) (c) | | | 1,472 | | |
| | 28 | | | Scansource, Inc. (a) (c) | | | 1,202 | | |
| | 50 | | | Tech Data Corp. (a) | | | 1,820 | | |
| | | | 6,150 | | |
| | | | | Energy Equipment & Services - 2.8% | | | |
| | 115 | | | Pioneer Drilling Co. (a) | | | 1,752 | | |
| | 85 | | | Superior Energy Services, Inc. (a) | | | 1,513 | | |
| | 43 | | | Universal Compression Holdings, Inc. (a) | | | 1,562 | | |
| | | | 4,827 | | |
SEE NOTES TO FINANCIAL STATEMENTS.
JPMorgan U.S. Equity Mid/Small Cap Funds22
SEMI-ANNUAL REPORT JUNE 30
2005
SCHEDULE OF PORTFOLIO INVESTMENTS AS OF JUNE 30, 2005
(Amounts in thousands)
(Unaudited)
| SHARES | | SECURITY DESCRIPTION | | VALUE | |
| | Long-Term Investments - continued | | | | |
| | | | | Health Care Equipment & Supplies - 4.2% | |
| | 44 | | | Abaxis, Inc. (a) (c) | | $ | 481 | | |
| | 22 | | | Advanced Medical Optics, Inc. (a) (c) | | | 862 | | |
| | 69 | | | Arthrocare Corp. (a) (c) | | | 2,420 | | |
| | 12 | | | Cooper Cos., Inc. (The) | | | 700 | | |
| | 45 | | | Kyphon, Inc. (a) (c) | | | 1,571 | | |
| | 144 | | | TriPath Imaging, Inc. (a) (c) | | | 1,232 | | |
| | | | 7,266 | | |
| | | | | Health Care Providers & Services - 7.6% | | | |
| | 59 | | | Amedisys, Inc. (a) (c) | | | 2,152 | | |
| | 39 | | | Covance, Inc. (a) | | | 1,763 | | |
| | 90 | | | Gentiva Health Services, Inc. (a) | | | 1,602 | | |
| | 37 | | | Psychiatric Solutions, Inc. (a) | | | 1,819 | | |
| | 36 | | | Sunrise Senior Living, Inc. (a) (c) | | | 1,965 | | |
| | 78 | | | Symbion, Inc. (a) | | | 1,860 | | |
| | 40 | | | United Surgical Partners
International, Inc. (a) | | | 2,086 | | |
| | | | 13,247 | | |
| | | | | Hotels, Restaurants & Leisure - 6.4% | | | |
| | 43 | | | Gaylord Entertainment Co. (a) (c) | | | 1,980 | | |
| | 255 | | | La Quinta Corp. (a) | | | 2,375 | | |
| | 42 | | | Orient-Express Hotels Ltd. (Bermuda) | | | 1,340 | | |
| | 62 | | | Rare Hospitality International, Inc. (a) | | | 1,891 | | |
| | 49 | | | Speedway Motorsports, Inc. | | | 1,806 | | |
| | 54 | | | WMS Industries, Inc. (a) (c) | | | 1,814 | | |
| | | | 11,206 | | |
| | | | | Household Durables - 1.0% | | | |
| | 176 | | | Champion Enterprises, Inc. (a) (c) | | | 1,754 | | |
| | | | | Insurance - 1.9% | | | |
| | 70 | | | Direct General Corp. (c) | | | 1,303 | | |
| | 47 | | | ProAssurance Corp. (a) (c) | | | 1,954 | | |
| | | | 3,257 | | |
| | | | | Internet Software & Services - 2.5% | | | |
| | 137 | | | Digitas, Inc. (a) | | | 1,563 | | |
| | 43 | | | Equinix, Inc. (a) (c) | | | 1,859 | | |
| | 36 | | | WebEx Communications, Inc. (a) (c) | | | 956 | | |
| | | | 4,378 | | |
| SHARES | | SECURITY DESCRIPTION | | VALUE | |
| | | | | IT Services - 3.7% | |
| | 53 | | | Alliance Data Systems Corp. (a) | | $ | 2,164 | | |
| | 34 | | | CACI International, Inc., Class A (a) | | | 2,128 | | |
| | 262 | | | Sapient Corp. (a) (c) | | | 2,077 | | |
| | | | 6,369 | | |
| | | | | Leisure Equipment & Products - 3.4% | | | |
| | 120 | | | K2, Inc. (a) (c) | | | 1,525 | | |
| | 73 | | | MarineMax, Inc. (a) (c) | | | 2,291 | | |
| | 61 | | | SCP Pool Corp. | | | 2,139 | | |
| | | | 5,955 | | |
| | | | | Machinery - 1.1% | | | |
| | 24 | | | Oshkosh Truck Corp. | | | 1,859 | | |
| | | | | Media - 2.2% | |
| | 242 | | | Lions Gate Entertainment Corp.
(Canada) (a) (c) | | | 2,479 | | |
| | 65 | | | Salem Communications Corp., Class A (a) | | | 1,290 | | |
| | | | 3,769 | | |
| | | | | Metals & Mining - 3.4% | | | |
| | 69 | | | Allegheny Technologies, Inc. | | | 1,518 | | |
| | 28 | | | Alpha Natural Resources, Inc. (a) | | | 678 | | |
| | 51 | | | Arch Coal, Inc. (c) | | | 2,753 | | |
| | 52 | | | Century Aluminum Co. (a) (c) | | | 1,059 | | |
| | | | 6,008 | | |
| | | | | Oil, Gas & Consumable Fuels - 2.7% | | | |
| | 318 | | | Brigham Exploration Co. (a) (c) | | | 2,900 | | |
| | 37 | | | Newfield Exploration Co. (a) | | | 1,472 | | |
| | 8 | | | Remington Oil & Gas Corp. (a) | | | 297 | | |
| | | | 4,669 | | |
| | | | | Pharmaceuticals - 2.5% | | | |
| | 106 | | | Adolor Corp. (a) | | | 977 | | |
| | 54 | | | AtheroGenics, Inc. (a) (c) | | | 867 | | |
| | 258 | | | AVANIR Pharmaceuticals, Class A (a) | | | 721 | | |
| | 79 | | | Cypress Bioscience, Inc. (a) (c) | | | 1,037 | | |
| | 44 | | | Theravance, Inc. (a) | | | 754 | | |
| | | | 4,356 | | |
| | | | | Real Estate - 0.5% | | | |
| | 25 | | | Global Signal, Inc. (REIT) (c) (m) | | | 922 | | |
SEE NOTES TO FINANCIAL STATEMENTS.
JPMorgan U.S. Equity Mid/Small Cap Funds23
JPMorgan Dynamic Small Cap Fund
SCHEDULE OF PORTFOLIO INVESTMENTS AS OF JUNE 30, 2005
(Amounts in thousands)
(CONTINUED)
(Unaudited)
| SHARES | | SECURITY DESCRIPTION | | VALUE | |
| Long-Term Investments - continued | |
| | | | | Road & Rail - 0.3% | | | |
| | 64 | | | Sirva, Inc. (a) (c) | | $ | 542 | | |
| | | | | Semiconductors & Semiconductor
Equipment - 4.0% | |
| | 21 | | | ATMI, Inc. (a) (c) | | | 598 | | |
| | 125 | | | Credence Systems Corp. (a) (c) | | | 1,128 | | |
| | 97 | | | DSP Group, Inc. (a) | | | 2,324 | | |
| | 97 | | | Mattson Technology, Inc. (a) (c) | | | 695 | | |
| | 60 | | | Microsemi Corp. (a) | | | 1,134 | | |
| | 30 | | | Varian Semiconductor Equipment
Associates, Inc. (a) | | | 1,102 | | |
| | | | 6,981 | | |
| | | | | Software - 5.6% | | | |
| | 148 | | | Epicor Software Corp. (a) | | | 1,960 | | |
| | 46 | | | Hyperion Solutions Corp. (a) | | | 1,853 | | |
| | 27 | | | Kronos, Inc. (a) (c) | | | 1,093 | | |
| | 77 | | | Serena Software, Inc. (a) | | | 1,478 | | |
| | 133 | | | VeriFone Holdings, Inc. (a) | | | 2,160 | | |
| | 39 | | | Verint Systems, Inc. (a) (c) | | | 1,241 | | |
| | | | 9,785 | | |
| | | | | Specialty Retail - 6.5% | | | |
| | 59 | | | Aaron Rents, Inc. | | | 1,471 | | |
| | 59 | | | Bebe Stores, Inc. (c) | | | 1,572 | | |
| | 26 | | | Children's Place, Inc. (a) | | | 1,190 | | |
| | 25 | | | DSW, Inc. (a) | | | 616 | | |
| | 71 | | | GameStop Corp. (a) (c) | | | 2,309 | | |
| | 44 | | | Genesco, Inc. (a) (c) | | | 1,649 | | |
| | 22 | | | Guitar Center, Inc. (a) (c) | | | 1,264 | | |
| | 61 | | | New York & Co., Inc. (a) | | | 1,293 | | |
| | | | 11,364 | | |
| | | | | Textiles, Apparel & Luxury Goods - 2.2% | | | |
| | 115 | | | Skechers U.S.A., Inc., Class A (a) | | | 1,644 | | |
| | 92 | | | Warnaco Group, Inc. (The) (a) (c) | | | 2,133 | | |
| | | | 3,777 | | |
| | | | | Thrifts & Mortgage Finance - 0.5% | | | |
| | 49 | | | R&G Financial Corp., Class B | | | 872 | | |
| SHARES | | SECURITY DESCRIPTION | | VALUE | |
| | | | | Wireless Telecommunication Services - 1.0% | |
| | 72 | | | Nextel Partners, Inc. (a) | | $ | 1,806 | | |
| | | | | Total Common Stocks
(Cost $155,048) | | |
168,707 | | |
| | | | | Total Long-Term Investments
(Cost $155,048) | | |
168,707 | | |
| Short-Term Investment - 3.4% | |
| | | | | Investment Company - 3.4% | | | |
| | 5,923 | | | JPMorgan Prime Money Market Fund (b)
(Cost $5,923) | | | 5,923 | | |
| Investments of Cash Collateral for Securities Loaned - 22.7% | |
| | | | | Investment Companies - 4.3% | | | |
| | 4,299 | | | BGI Prime Money Market Fund | | | 4,299 | | |
| | 3,107 | | | Morgan Stanley Institutional
Liquidity Funds | | | 3,107 | | |
| | | | 7,406 | | |
PRINCIPAL
AMOUNT | | | | | |
| | | | | Repurchase Agreements - 18.4% | |
| $ | 32,000 | | | Credit Suisse First Boston LLC, 3.46%,
dated 06/30/05, due 07/01/05,
repurchase price $32,003, collateralized
by U.S. Agency Mortgages | | | 32,000 | | |
| | | | | Total Investments of Cash Collateral
for Securities Loaned
(Cost $39,406) | | | 39,406 | | |
| | | | | Total Investments - 123.0% | | $ | 214,036 | | |
| | | | | (Cost $200,377) | | | | | |
| | | | | Liabilities in excess of
other assets - (23.0)% | | | (40,016 | ) | |
| | | | | Net Assets - 100.0% | | $ | 174,020 | | |
Percentages indicated are based on net assets.
SEE NOTES TO FINANCIAL STATEMENTS.
JPMorgan U.S. Equity Mid/Small Cap Funds24
JPMorgan Mid Cap Equity Fund
SCHEDULE OF PORTFOLIO INVESTMENTS AS OF JUNE 30, 2005
(Amounts in thousands)
(Unaudited)
| SHARES | | SECURITY DESCRIPTION | | VALUE | |
| Long-Term Investments - 97.9% | |
| | | | | Common Stocks - 97.9% | | | |
| | | | | Aerospace & Defense - 1.2% | | | |
| | 11 | | | L-3 Communications Holdings, Inc. | | $ | 862 | | |
| | 15 | | | Precision Castparts Corp. | | | 1,176 | | |
| | 20 | | | Rockwell Collins, Inc. | | | 975 | | |
| | | | 3,013 | | |
| | | | | Airlines - 0.4% | | | |
| | 63 | | | Southwest Airlines Co. | | | 873 | | |
| | | | | Auto Components - 0.8% | |
| | 23 | | | Autoliv, Inc. | | | 1,016 | | |
| | 18 | | | BorgWarner, Inc. | | | 950 | | |
| | | | 1,966 | | |
| | | | | Beverages - 0.4% | | | |
| | 16 | | | Brown-Forman Corp., Class B | | | 947 | | |
| | | | | Biotechnology - 1.5% | |
| | 18 | | | Celgene Corp. (a) (c) | | | 726 | | |
| | 25 | | | Genzyme Corp. (a) | | | 1,499 | | |
| | 11 | | | Invitrogen Corp. (a) (c) | | | 925 | | |
| | 13 | | | OSI Pharmaceuticals, Inc. (a) | | | 521 | | |
| | | | 3,671 | | |
| | | | | Building Products - 0.4% | | | |
| | 22 | | | American Standard Cos., Inc. | | | 910 | | |
| | | | | Capital Markets - 2.5% | |
| | 65 | | | Ameritrade Holding Corp. (a) | | | 1,215 | | |
| | 16 | | | Investors Financial Services Corp. | | | 586 | | |
| | 12 | | | Legg Mason, Inc. | | | 1,218 | | |
| | 26 | | | Northern Trust Corp. | | | 1,204 | | |
| | 32 | | | T. Rowe Price Group, Inc. | | | 2,025 | | |
| | | | 6,248 | | |
| | | | | Chemicals - 2.0% | | | |
| | 43 | | | Albemarle Corp. | | | 1,550 | | |
| | 35 | | | International Flavors & Fragrances, Inc. | | | 1,264 | | |
| | 19 | | | PPG Industries, Inc. | | | 1,205 | | |
| | 17 | | | Sigma-Aldrich Corp. | | | 941 | | |
| | | | 4,960 | | |
| SHARES | | SECURITY DESCRIPTION | | VALUE | |
| | | | | Commercial Banks - 3.5% | | | |
| | 15 | | | Cullen/Frost Bankers, Inc. | | $ | 729 | | |
| | 22 | | | M&T Bank Corp. | | | 2,313 | | |
| | 95 | | | North Fork Bancorp, Inc. | | | 2,673 | | |
| | 33 | | | TCF Financial Corp. | | | 864 | | |
| | 32 | | | Wilmington Trust Corp. | | | 1,160 | | |
| | 13 | | | Zions Bancorp | | | 960 | | |
| | | | 8,699 | | |
| | | | | Commercial Services & Supplies - 2.0% | | | |
| | 15 | | | Dun & Bradstreet Corp. (a) | | | 894 | | |
| | 26 | | | HNI Corp. | | | 1,325 | | |
| | 3 | | | Pitney Bowes, Inc. | | | 131 | | |
| | 34 | | | Republic Services, Inc. | | | 1,231 | | |
| | 38 | | | West Corp. (a) (c) | | | 1,471 | | |
| | | | 5,052 | | |
| | | | | Communications Equipment - 0.3% | | | |
| | 20 | | | Harris Corp. | | | 626 | | |
| | | | | Computers & Peripherals - 2.0% | | | |
| | 12 | | | Lexmark International, Inc., Class A (a) | | | 752 | | |
| | 58 | | | NCR Corp. (a) | | | 2,039 | | |
| | 39 | | | Network Appliance, Inc. (a) | | | 1,098 | | |
| | 61 | | | Seagate Technology (Cayman Islands) (a) | | | 1,067 | | |
| | | | 4,956 | | |
| | | | | Construction & Engineering - 0.6% | | | |
| | 28 | | | Jacobs Engineering Group, Inc. (a) (c) | | | 1,567 | | |
| | | | | Construction Materials - 0.9% | | | |
| | 33 | | | Vulcan Materials Co. | | | 2,171 | | |
| | | | | Consumer Finance - 0.8% | | | |
| | 76 | | | AmeriCredit Corp. (a) (c) | | | 1,928 | | |
| | | | | Containers & Packaging - 1.0% | | | |
| | 28 | | | Ball Corp. | | | 1,003 | | |
| | 65 | | | Pactiv Corp. (a) | | | 1,403 | | |
| | | | 2,406 | | |
SEE NOTES TO FINANCIAL STATEMENTS.
JPMorgan U.S. Equity Mid/Small Cap Funds25
JPMorgan Mid Cap Equity Fund
SCHEDULE OF PORTFOLIO INVESTMENTS AS OF JUNE 30, 2005
(Amounts in thousands)
(CONTINUED)
(Unaudited)
| SHARES | | SECURITY DESCRIPTION | | VALUE | |
| Long-Term Investments - continued | |
| | | | | Distributors - 0.3% | | | |
| | 19 | | | Genuine Parts Co. | | $ | 772 | | |
| | | | | Diversified Financial Services - 1.3% | |
| | 29 | | | CIT Group, Inc. | | | 1,225 | | |
| | 53 | | | Lazard Ltd. (Bermuda), Class A (a) | | | 1,242 | | |
| | 20 | | | Principal Financial Group | | | 851 | | |
| | | | 3,318 | | |
| | | | | Diversified Telecommunication Services - 2.0% | | | |
| | 41 | | | Alltel Corp. | | | 2,560 | | |
| | 70 | | | CenturyTel, Inc. | | | 2,420 | | |
| | | | 4,980 | | |
| | | | | Electric Utilities - 1.4% | | | |
| | 35 | | | DPL, Inc. | | | 966 | | |
| | 21 | | | PPL Corp. | | | 1,235 | | |
| | 51 | | | Westar Energy, Inc. | | | 1,226 | | |
| | | | 3,427 | | |
| | | | | Electrical Equipment - 1.3% | | | |
| | 25 | | | Ametek, Inc. | | | 1,026 | | |
| | 18 | | | Cooper Industries Ltd. (Bermuda), Class A | | | 1,150 | | |
| | 23 | | | Rockwell Automation, Inc. | | | 1,103 | | |
| | | | 3,279 | | |
| | | | | Electronic Equipment & Instruments - 1.9% | | | |
| | 58 | | | Amphenol Corp., Class A | | | 2,338 | | |
| | 35 | | | Arrow Electronics, Inc. (a) | | | 947 | | |
| | 46 | | | Jabil Circuit, Inc. (a) | | | 1,407 | | |
| | | | 4,692 | | |
| | | | | Energy Equipment & Services - 1.2% | | | |
| | 38 | | | Grant Prideco, Inc. (a) | | | 993 | | |
| | 17 | | | Nabors Industries Ltd. (Bermuda) (a) | | | 1,019 | | |
| | 17 | | | Noble Corp. (Cayman Islands) | | | 1,061 | | |
| | | | 3,073 | | |
| | | | | Food Products - 1.4% | | | |
| | 39 | | | Dean Foods Co. (a) | | | 1,374 | | |
| | 70 | | | Del Monte Foods Co. (a) | | | 750 | | |
| | 38 | | | Hormel Foods Corp. | | | 1,109 | | |
| | 7 | | | TreeHouse Foods, Inc. (a) | | | 201 | | |
| | | | 3,434 | | |
| SHARES | | SECURITY DESCRIPTION | | VALUE | |
| | | | | Gas Utilities - 0.7% | | | |
| | 26 | | | AGL Resources, Inc. | | $ | 1,009 | | |
| | 27 | | | UGI Corp. | | | 764 | | |
| | | | 1,773 | | |
| | | | | Health Care Equipment & Supplies - 3.2% | | | |
| | 18 | | | Bausch & Lomb, Inc. | | | 1,519 | | |
| | 26 | | | Beckman Coulter, Inc. | | | 1,640 | | |
| | 13 | | | Biomet, Inc. | | | 442 | | |
| | 30 | | | Fisher Scientific International, Inc. (a) | | | 1,940 | | |
| | 18 | | | Millipore Corp. (a) | | | 993 | | |
| | 28 | | | Nektar Therapeutics (a) (c) | | | 476 | | |
| | 11 | | | Zimmer Holdings, Inc. (a) | | | 864 | | |
| | | | 7,874 | | |
| | | | | Health Care Providers & Services - 8.0% | | | |
| | 16 | | | Aetna, Inc. | | | 1,321 | | |
| | 22 | | | Caremark Rx, Inc. (a) | | | 995 | | |
| | 51 | | | Coventry Health Care, Inc. (a) | | | 3,626 | | |
| | 41 | | | DaVita, Inc. (a) | | | 1,843 | | |
| | 18 | | | Laboratory Corp. of America Holdings (a) | | | 891 | | |
| | 14 | | | LifePoint Hospitals, Inc. (a) | | | 690 | | |
| | 16 | | | Magellan Health Services, Inc. (a) | | | 575 | | |
| | 75 | | | Manor Care, Inc. | | | 2,980 | | |
| | 23 | | | McKesson Corp. | | | 1,012 | | |
| | 32 | | | Medco Health Solutions, Inc. (a) | | | 1,705 | | |
| | 59 | | | Omnicare, Inc. (c) | | | 2,482 | | |
| | 12 | | | Quest Diagnostics | | | 629 | | |
| | 24 | | | Triad Hospitals, Inc. (a) | | | 1,300 | | |
| | | | 20,049 | | |
| | | | | Hotels, Restaurants & Leisure - 5.1% | | | |
| | 79 | | | Applebees International, Inc. | | | 2,102 | | |
| | 31 | | | Brinker International, Inc. (a) | | | 1,232 | | |
| | 16 | | | Harrah's Entertainment, Inc. | | | 1,135 | | |
| | 40 | | | Hilton Hotels Corp. | | | 949 | | |
| | 33 | | | International Speedway Corp., Class A | | | 1,859 | | |
| | 15 | | | Marriott International, Inc., Class A | | | 1,034 | | |
| | 38 | | | Outback Steakhouse, Inc. | | | 1,737 | | |
| | 37 | | | Royal Caribbean Cruises Ltd. (Liberia) | | | 1,794 | | |
| | 14 | | | Station Casinos, Inc. | | | 913 | | |
| | | | 12,755 | | |
SEE NOTES TO FINANCIAL STATEMENTS.
JPMorgan U.S. Equity Mid/Small Cap Funds26
SEMI-ANNUAL REPORT JUNE 30
2005
SCHEDULE OF PORTFOLIO INVESTMENTS AS OF JUNE 30, 2005
(Amounts in thousands)
(Unaudited)
| SHARES | | SECURITY DESCRIPTION | | VALUE | |
| Long-Term Investments - continued | |
| | | | | Household Durables - 1.3% | | | |
| | 18 | | | Fortune Brands, Inc. | | $ | 1,563 | | |
| | 10 | | | Harman International Industries, Inc. | | | 805 | | |
| | 10 | | | Mohawk Industries, Inc. (a) | | | 825 | | |
| | | | 3,193 | | |
| | | | | Household Products - 0.6% | | | |
| | 16 | | | Clorox Co. | | | 903 | | |
| | 11 | | | Energizer Holdings, Inc. (a) | | | 696 | | |
| | | | 1,599 | | |
| | | | | Industrial Conglomerates - 0.6% | | | |
| | 22 | | | Carlisle Cos., Inc. | | | 1,510 | | |
| | | | | Insurance - 4.6% | |
| | 12 | | | AMBAC Financial Group, Inc. | | | 869 | | |
| | 83 | | | Assurant, Inc. | | | 2,993 | | |
| | 23 | | | CInc.innati Financial Corp. | | | 900 | | |
| | 42 | | | IPC Holdings Ltd. (Bermuda) | | | 1,644 | | |
| | 88 | | | Old Republic International Corp. | | | 2,234 | | |
| | 15 | | | PartnerRe Ltd. (Bermuda) | | | 966 | | |
| | 21 | | | Safeco Corp. | | | 1,152 | | |
| | 19 | | | Willis Group Holdings Ltd. (Bermuda) | | | 635 | | |
| | | | 11,393 | | |
| | | | | Internet Software & Services - 0.3% | | | |
| | 24 | | | VeriSign, Inc. (a) | | | 689 | | |
| | | | | IT Services - 1.3% | |
| | 22 | | | Affiliated Computer Services, Inc.,
Class A (a) | | | 1,145 | | |
| | 31 | | | Alliance Data Systems Corp. (a) (c) | | | 1,247 | | |
| | 29 | | | CheckFree Corp. (a) (c) | | | 972 | | |
| | | | 3,364 | | |
| | | | | Leisure Equipment & Products - 0.9% | | | |
| | 51 | | | Brunswick Corp. | | | 2,194 | | |
| | | | | Machinery - 2.6% | |
| | 38 | | | Crane Co. | | | 1,005 | | |
| | 43 | | | Harsco Corp. | | | 2,348 | | |
| | 14 | | | ITT Industries, Inc. | | | 1,411 | | |
| | 11 | | | Oshkosh Truck Corp. (c) | | | 893 | | |
| | 15 | | | Parker-Hannifin Corp. | | | 936 | | |
| | | | 6,593 | | |
| SHARES | | SECURITY DESCRIPTION | | VALUE | |
| | | | | Media - 3.1% | |
| | 52 | | | Dex Media, Inc. | | $ | 1,267 | | |
| | 26 | | | E.W. Scripps Co., Class A | | | 1,257 | | |
| | 27 | | | Gannett Co., Inc. | | | 1,906 | | |
| | 12 | | | Getty Images, Inc. (a) (c) | | | 869 | | |
| | 39 | | | Interactive Data Corp. (a) | | | 810 | | |
| | 10 | | | Knight Ridder, Inc. | | | 601 | | |
| | 1 | | | Washington Post Co. (The), Class B | | | 418 | | |
| | 21 | | | XM Satellite Radio Holdings, Inc.,
Class A (a) (c) | | | 704 | | |
| | | | 7,832 | | |
| | | | | Metals & Mining - 0.4% | | | |
| | 20 | | | Consol Energy, Inc. | | | 1,096 | | |
| | | | | Multi-Utilities - 1.8% | |
| | 31 | | | Energen Corp. | | | 1,079 | | |
| | 37 | | | Energy East Corp. | | | 1,061 | | |
| | 16 | | | Questar Corp. | | | 1,048 | | |
| | 32 | | | SCANA Corp. | | | 1,345 | | |
| | | | 4,533 | | |
| | | | | Multiline Retail - 1.5% | | | |
| | 38 | | | Dollar General Corp. | | | 769 | | |
| | 53 | | | Family Dollar Stores, Inc. | | | 1,383 | | |
| | 16 | | | May Department Stores Co. (The) | | | 634 | | |
| | 26 | | | Tuesday Morning Corp. | | | 829 | | |
| | | | 3,615 | | |
| | | | | Office Electronics - 0.8% | | | |
| | 64 | | | Xerox Corp. (a) | | | 878 | | |
| | 27 | | | Zebra Technologies Corp., Class A (a) | | | 1,202 | | |
| | | | 2,080 | | |
| | | | | Oil, Gas & Consumable Fuels - 6.1% | | | |
| | 19 | | | Ashland, Inc. | | | 1,366 | | |
| | 39 | | | Burlington Resources, Inc. | | | 2,127 | | |
| | 51 | | | Devon Energy Corp. | | | 2,570 | | |
| | 15 | | | EOG Resources, Inc. | | | 863 | | |
| | 37 | | | Kinder Morgan, Inc. | | | 3,053 | | |
| | 20 | | | Marathon Oil Corp. | | | 1,046 | | |
| | 16 | | | Murphy Oil Corp. | | | 841 | | |
| | 25 | | | Newfield Exploration Co. (a) | | | 1,011 | | |
| | 18 | | | Pioneer Natural Resources Co. | | | 774 | | |
SEE NOTES TO FINANCIAL STATEMENTS.
JPMorgan U.S. Equity Mid/Small Cap Funds27
JPMorgan Mid Cap Equity Fund
SCHEDULE OF PORTFOLIO INVESTMENTS AS OF JUNE 30, 2005
(Amounts in thousands)
(CONTINUED)
(Unaudited)
| SHARES | | SECURITY DESCRIPTION | | VALUE | |
| | Long-Term Investments - continued | | | | |
| | | | | Oil, Gas & Consumable Fuels - continued | |
| | 24 | | | Range Resources Corp. (c) | | $ | 644 | | |
| | 26 | | | Talisman Energy, Inc. (Canada) | | | 962 | | |
| | | | 15,257 | | |
| | | | | Paper & Forest Products - 0.3% | | | |
| | 29 | | | MeadWestvaco Corp. | | | 808 | | |
| | | | | Personal Products - 0.4% | | | |
| | 25 | | | Estee Lauder Cos., Inc., Class A | | | 978 | | |
| | | | | Pharmaceuticals - 0.5% | | | |
| | 21 | | | Sepracor, Inc. (a) | | | 1,239 | | |
| | | | | Real Estate - 1.4% | | | |
| | 43 | | | Brookfield Properties Co. (Canada) | | | 1,244 | | |
| | 8 | | | Forest City Enterprises, Inc. | | | 568 | | |
| | 14 | | | PS Business Parks, Inc., Class A (REIT) | | | 618 | | |
| | 20 | | | Rayonier, Inc. (REIT) | | | 1,072 | | |
| | | | 3,502 | | |
| | | | | Road & Rail - 0.6% | | | |
| | 77 | | | Hunt (J.B.) Transport Services, Inc. | | | 1,486 | | |
| | | | | Semiconductors & Semiconductor
Equipment - 2.6% | | | |
| | 23 | | | Broadcom Corp., Class A (a) | | | 811 | | |
| | 20 | | | KLA-Tencor Corp. | | | 865 | | |
| | 31 | | | Lam Research Corp. (a) | | | 886 | | |
| | 41 | | | Linear Technology Corp. | | | 1,486 | | |
| | 50 | | | Microchip Technology, Inc. | | | 1,479 | | |
| | 39 | | | Nvidia Corp. (a) | | | 1,037 | | |
| | | | 6,564 | | |
| | | | | Software - 2.6% | | | |
| | 49 | | | Adobe Systems, Inc. | | | 1,411 | | |
| | 59 | | | Citrix Systems, Inc. (a) | | | 1,275 | | |
| | 38 | | | Cognos, Inc. (Canada) (a) (c) | | | 1,295 | | |
| | 70 | | | Computer Associates International, Inc. | | | 1,928 | | |
| | 16 | | | Mercury Interactive Corp. (a) | | | 608 | | |
| | | | 6,517 | | |
| SHARES | | SECURITY DESCRIPTION | | VALUE | |
| | | | | Specialty Retail - 9.6% | | | |
| | 20 | | | Abercrombie & Fitch Co. | | $ | 1,405 | | |
| | 26 | | | Advance Auto Parts, Inc. (a) | | | 1,694 | | |
| | 49 | | | Autonation, Inc. (a) | | | 999 | | |
| | 32 | | | AutoZone, Inc. (a) | | | 2,913 | | |
| | 37 | | | Bed Bath & Beyond, Inc. (a) | | | 1,556 | | |
| | 48 | | | CarMax, Inc. (a) | | | 1,271 | | |
| | 43 | | | Circuit City Stores, Inc. (c) | | | 745 | | |
| | 46 | | | Foot Locker, Inc. | | | 1,255 | | |
| | 24 | | | Michaels Stores, Inc. | | | 999 | | |
| | 45 | | | Pacific Sunwear of California, Inc. (a) | | | 1,032 | | |
| | 42 | | | Petco Animal Supplies, Inc. (a) (c) | | | 1,233 | | |
| | 41 | | | Ross Stores, Inc. (c) | | | 1,180 | | |
| | 53 | | | Sherwin-Williams Co. (The) | | | 2,510 | | |
| | 36 | | | Tiffany & Co. | | | 1,173 | | |
| | 110 | | | TJX Cos., Inc. | | | 2,688 | | |
| | 25 | | | Weight Watchers International, Inc. (a) (c) | | | 1,267 | | |
| | | | 23,920 | | |
| | | | | Textiles, Apparel & Luxury Goods - 2.3% | | | |
| | 31 | | | Columbia Sportswear Co. (a) | | | 1,507 | | |
| | 21 | | | Polo Ralph Lauren Corp. | | | 914 | | |
| | 59 | | | V.F. Corp. | | | 3,370 | | |
| | | | 5,791 | | |
| | | | | Thrifts & Mortgage Finance - 1.9% | | | |
| | 39 | | | Golden West Financial Corp. | | | 2,511 | | |
| | 18 | | | MGIC Investment Corp. | | | 1,200 | | |
| | 23 | | | Webster Financial Corp. | | | 1,069 | | |
| | | | 4,780 | | |
| | | | | Trading Companies & Distributors - 0.7% | | | |
| | 13 | | | Hughes Supply, Inc. | | | 357 | | |
| | 40 | | | MSC Industrial Direct Co. (c) | | | 1,346 | | |
| | | | 1,703 | | |
| | | | | Wireless Telecommunication Services - 1.0% | | | |
| | 20 | | | NII Holdings, Inc. (a) | | | 1,261 | | |
| | 14 | | | Telephone & Data Systems, Inc. | | | 555 | | |
| | 15 | | | Telephone & Data Systems, Inc. | | | 571 | | |
| | | | 2,387 | | |
| | | Total Common Stocks
(Cost $196,818) | | | 244,042 | | |
| | | Total Long-Term Investments
(Cost $196,818) | | | 244,042 | | |
SEE NOTES TO FINANCIAL STATEMENTS.
JPMorgan U.S. Equity Mid/Small Cap Funds28
SEMI-ANNUAL REPORT JUNE 30
2005
SCHEDULE OF PORTFOLIO INVESTMENTS AS OF JUNE 30, 2005
(Amounts in thousands)
(Unaudited)
| SHARES | | SECURITY DESCRIPTION | | VALUE | |
| Short-Term Investment- 2.4% | |
| | | | | Investment Company - 2.4% | | | |
| | 5,894 | | | JPMorgan Prime Money
Market Fund (b) (m)
(Cost $5,894) | | $ | 5,894 | | |
| Investments of Cash Collateral for Securities Loaned - 5.0% | |
| | | | | Investment Companies - 5.0% | | | |
| | 3,948 | | | Morgan Stanley Intitutional
Liquidity Funds | | | 3,948 | | |
| | 8,472 | | | BGI Prime Money Market Fund | | | 8,472 | | |
| | | Total Investments of Cash Collateral
for Securities Loaned
(Cost $12,420) | | | 12,420 | | |
| | | | | Total Investments - 105.2%
(Cost $215,132) | | | 262,356 | | |
| | | | | Liabilities in excess of
other assets - (5.2)% | | | (13,031 | ) | |
| | | Net Assets - 100.0% | | $ | 249,325 | | |
Percentages indicated are based on net assets.
SEE NOTES TO FINANCIAL STATEMENTS.
JPMorgan U.S. Equity Mid/Small Cap Funds29
JPMorgan Mid Cap Growth Fund
SCHEDULE OF PORTFOLIO INVESTMENTS AS OF JUNE 30, 2005
(Amounts in thousands)
(Unaudited)
| SHARES | | SECURITY DESCRIPTION | | VALUE | |
| Long-Term Investments - 99.3% | |
| | | | | Common Stocks - 99.3% | | | |
| | | | | Aerospace & Defense - 2.5% | | | |
| | 5 | | | L-3 Communications Holdings, Inc. | | $ | 368 | | |
| | 6 | | | Precision Castparts Corp. | | | 498 | | |
| | 9 | | | Rockwell Collins, Inc. | | | 415 | | |
| | | | 1,281 | | |
| | | | | Airlines - 0.7% | | | |
| | 27 | | | Southwest Airlines Co. | | | 371 | | |
| | | | | Auto Components - 0.8% | |
| | 10 | | | Autoliv, Inc. | | | 431 | | |
| | | | | Biotechnology - 3.0% | |
| | 8 | | | Celgene Corp. (a) (c) | | | 308 | | |
| | 11 | | | Genzyme Corp. (a) | | | 637 | | |
| | 5 | | | Invitrogen Corp. (a) (c) | | | 391 | | |
| | 5 | | | OSI Pharmaceuticals, Inc. (a) | | | 223 | | |
| | | | 1,559 | | |
| | | | | Capital Markets - 2.2% | | | |
| | 28 | | | Ameritrade Holding Corp. (a) | | | 516 | | |
| | 7 | | | Investors Financial Services Corp. | | | 251 | | |
| | 7 | | | T. Rowe Price Group, Inc. | | | 407 | | |
| | | | 1,174 | | |
| | | | | Commercial Banks - 0.8% | | | |
| | 6 | | | Zions Bancorp | | | 412 | | |
| | | | | Commercial Services & Supplies - 3.0% | |
| | 6 | | | Dun & Bradstreet Corp. (a) | | | 379 | | |
| | 11 | | | HNI Corp. | | | 563 | | |
| | 16 | | | West Corp. (a) (c) | | | 626 | | |
| | | | 1,568 | | |
| | | | | Communications Equipment - 0.5% | | | |
| | 9 | | | Harris Corp. | | | 265 | | |
| | | | | Computers & Peripherals - 3.4% | |
| | 25 | | | NCR Corp. (a) | | | 868 | | |
| | 17 | | | Network Appliance, Inc. (a) | | | 466 | | |
| | 26 | | | Seagate Technology (Cayman Islands) (a) | | | 454 | | |
| | | | 1,788 | | |
| SHARES | | SECURITY DESCRIPTION | | VALUE | |
| | | | | Construction & Engineering - 1.3% | | | |
| | 12 | | | Jacobs Engineering Group, Inc. (a) | | $ | 667 | | |
| | | | | Consumer Finance - 1.6% | | | |
| | 32 | | | AmeriCredit Corp. (a) (c) | | | 820 | | |
| | | | | Diversified Financial Services - 2.0% | | | |
| | 12 | | | CIT Group, Inc. | | | 520 | | |
| | 23 | | | Lazard Ltd. (Bermuda), Class A (a) | | | 527 | | |
| | | | 1,047 | | |
| | | | | Electrical Equipment - 0.9% | | | |
| | 10 | | | Rockwell Automation, Inc. | | | 470 | | |
| | | | | Electronic Equipment & Instruments - 3.8% | | | |
| | 25 | | | Amphenol Corp., Class A | | | 994 | | |
| | 15 | | | Arrow Electronics, Inc. (a) | | | 402 | | |
| | 19 | | | Jabil Circuit, Inc. (a) | | | 598 | | |
| | | | 1,994 | | |
| | | | | Energy Equipment & Services - 2.5% | | | |
| | 16 | | | Grant Prideco, Inc. (a) | | | 422 | | |
| | 7 | | | Nabors Industries Ltd. (Bermuda) (a) | | | 433 | | |
| | 7 | | | Noble Corp. (Cayman Islands) | | | 452 | | |
| | | | 1,307 | | |
| | | | | Health Care Equipment & Supplies - 5.8% | | | |
| | 8 | | | Bausch & Lomb, Inc. | | | 643 | | |
| | 6 | | | Beckman Coulter, Inc. | | | 372 | | |
| | 5 | | | Biomet, Inc. | | | 187 | | |
| | 13 | | | Fisher Scientific International, Inc. (a) | | | 824 | | |
| | 7 | | | Millipore Corp. (a) | | | 420 | | |
| | 12 | | | Nektar Therapeutics (a) (c) | | | 202 | | |
| | 5 | | | Zimmer Holdings, Inc. (a) | | | 370 | | |
| | | | 3,018 | | |
| | | | | Health Care Providers & Services - 11.6% | | | |
| | 7 | | | Aetna, Inc. | | | 563 | | |
| | 10 | | | Caremark Rx, Inc. (a) | | | 423 | | |
| | 7 | | | Coventry Health Care, Inc. (a) | | | 506 | | |
| | 17 | | | DaVita, Inc. (a) | | | 783 | | |
| | 8 | | | Laboratory Corp. of America Holdings (a) | | | 379 | | |
| | 6 | | | LifePoint Hospitals, Inc. (a) | | | 293 | | |
SEE NOTES TO FINANCIAL STATEMENTS.
JPMorgan U.S. Equity Mid/Small Cap Funds 30
SEMI-ANNUAL REPORT JUNE 30
2005
SCHEDULE OF PORTFOLIO INVESTMENTS AS OF JUNE 30, 2005
(Amounts in thousands)
(Unaudited)
| SHARES | | SECURITY DESCRIPTION | | VALUE | |
| | Long-Term Investments - continued | | | | |
| | | | | Health Care Providers & Services - Continued | |
| | 20 | | | Manor Care, Inc. | | $ | 811 | | |
| | 10 | | | McKesson Corp. | | | 430 | | |
| | 14 | | | Medco Health Solutions, Inc. (a) | | | 726 | | |
| | 15 | | | Omnicare, Inc. (c) | | | 619 | | |
| | 10 | | | Triad Hospitals, Inc. (a) | | | 555 | | |
| | | | 6,088 | | |
| | | | | Hotels, Restaurants & Leisure - 8.2% | | | |
| | 18 | | | Applebees International, Inc. | | | 478 | | |
| | 13 | | | Brinker International, Inc. (a) | | | 523 | | |
| | 7 | | | Harrah's Entertainment, Inc. | | | 478 | | |
| | 17 | | | Hilton Hotels Corp. | | | 404 | | |
| | 14 | | | International Speedway Corp., Class A | | | 791 | | |
| | 6 | | | Marriott International, Inc., Class A | | | 440 | | |
| | 16 | | | Royal Caribbean Cruises Ltd. (Liberia) (c) | | | 762 | | |
| | 6 | | | Station Casinos, Inc. | | | 388 | | |
| | | | 4,264 | | |
| | | | | Household Durables - 0.7% | | | |
| | 4 | | | Harman International Industries, Inc. | | | 342 | | |
| | | | | Household Products - 0.5% | | | |
| | 5 | | | Energizer Holdings, Inc. (a) | | | 286 | | |
| | | | | Insurance - 0.7% | | | |
| | 5 | | | AMBAC Financial Group, Inc. | | | 370 | | |
| | | | | Internet Software & Services - 0.6% | | | |
| | 10 | | | VeriSign, Inc. (a) | | | 293 | | |
| | | | | IT Services - 1.8% | | | |
| | 13 | | | Alliance Data Systems Corp. (a) (c) | | | 531 | | |
| | 12 | | | CheckFree Corp. (a) (c) | | | 414 | | |
| | | | 945 | | |
| | | | | Leisure Equipment & Products - 1.8% | | | |
| | 22 | | | Brunswick Corp. | | | 931 | | |
| | | | | Machinery - 2.8% | | | |
| | 9 | | | Harsco Corp. | | | 488 | | |
| | 6 | | | ITT Industries, Inc. | | | 600 | | |
| SHARES | | SECURITY DESCRIPTION | | VALUE | |
| | | | | Machinery - Continued | | | |
| | 5 | | | Oshkosh Truck Corp. (c) | | $ | 380 | | |
| | | | 1,468 | | |
| | | | | Media - 1.3% | | | |
| | 5 | | | Getty Images, Inc. (a) (c) | | | 368 | | |
| | 9 | | | XM Satellite Radio Holdings, Inc.,
Class A (a) (c) | | | 299 | | |
| | | | 667 | | |
| | | | | Metals & Mining - 0.9% | | | |
| | 9 | | | Consol Energy, Inc. | | | 466 | | |
| | | | | Multiline Retail - 0.6% | | | |
| | 16 | | | Dollar General Corp. | | | 327 | | |
| | | | | Office Electronics - 1.7% | | | |
| | 27 | | | Xerox Corp. (a) | | | 373 | | |
| | 12 | | | Zebra Technologies Corp., Class A (a) | | | 512 | | |
| | | | 885 | | |
| | | | | Oil, Gas & Consumable Fuels - 3.5% | | | |
| | 7 | | | EOG Resources, Inc. | | | 369 | | |
| | 7 | | | Murphy Oil Corp. | | | 358 | | |
| | 11 | | | Newfield Exploration Co. (a) | | | 429 | | |
| | 10 | | | Range Resources Corp. | | | 274 | | |
| | 11 | | | Talisman Energy, Inc. (Canada) | | | 410 | | |
| | | | 1,840 | | |
| | | | | Pharmaceuticals - 1.0% | | | |
| | 9 | | | Sepracor, Inc. (a) | | | 528 | | |
| | | | | Road & Rail - 1.2% | | | |
| | 33 | | | Hunt (J.B.) Transport Services, Inc. | | | 632 | | |
| | | | | Semiconductors & Semiconductor Equipment - 5.3% | | | |
| | 10 | | | Broadcom Corp., Class A (a) | | | 346 | | |
| | 8 | | | KLA-Tencor Corp. | | | 367 | | |
| | 13 | | | Lam Research Corp. (a) | | | 376 | | |
| | 17 | | | Linear Technology Corp. | | | 631 | | |
| | 21 | | | Microchip Technology, Inc. | | | 630 | | |
| | 17 | | | Nvidia Corp. (a) | | | 441 | | |
| | | | 2,791 | | |
SEE NOTES TO FINANCIAL STATEMENTS.
JPMorgan U.S. Equity Mid/Small Cap Funds 31
JPMorgan Mid Cap Growth Fund
SCHEDULE OF PORTFOLIO INVESTMENTS AS OF JUNE 30, 2005
(Amounts in thousands)
(CONTINUED)
(Unaudited)
| SHARES | | SECURITY DESCRIPTION | | VALUE | |
| | Long-Term Investments - continued | | | | |
| | | | | Software - 4.6% | |
| | 21 | | | Adobe Systems, Inc. | | $ | 599 | | |
| | 25 | | | Citrix Systems, Inc. (a) | | | 543 | | |
| | 16 | | | Cognos, Inc. (Canada) (a) (c) | | | 550 | | |
| | 17 | | | Computer Associates International, Inc. | | | 459 | | |
| | 7 | | | Mercury Interactive Corp. (a) | | | 259 | | |
| | | | 2,410 | | |
| | | | | Specialty Retail - 12.9% | | | |
| | 9 | | | Abercrombie & Fitch Co. | | | 598 | | |
| | 11 | | | Advance Auto Parts, Inc. (a) | | | 720 | | |
| | 16 | | | Bed Bath & Beyond, Inc. (a) | | | 662 | | |
| | 20 | | | CarMax, Inc. (a) | | | 540 | | |
| | 18 | | | Circuit City Stores, Inc. (c) | | | 316 | | |
| | 20 | | | Foot Locker, Inc. | | | 534 | | |
| | 10 | | | Michaels Stores, Inc. | | | 424 | | |
| | 19 | | | Pacific Sunwear of California, Inc. (a) | | | 439 | | |
| | 18 | | | Petco Animal Supplies, Inc. (a) | | | 525 | | |
| | 17 | | | Ross Stores, Inc. (c) | | | 502 | | |
| | 12 | | | Sherwin-Williams Co. (The) | | | 544 | | |
| | 16 | | | TJX Cos., Inc. | | | 377 | | |
| | 10 | | | Weight Watchers International, Inc. (a) (c) | | | 539 | | |
| | | | 6,720 | | |
| | | | | Textiles, Apparel & Luxury Goods - 0.7% | | | |
| | 9 | | | Polo Ralph Lauren Corp. | | | 388 | | |
| | | | | Trading Companies & Distributors - 1.1% | | | |
| | 17 | | | MSC Industrial Direct Co. (c) | | | 572 | | |
| | | | | Wireless Telecommunication Services - 1.0% | | | |
| | 8 | | | NII Holdings, Inc. (a) | | | 534 | | |
| | | | | Total Common Stocks
(Cost $43,260) | | | 51,919 | | |
| | | | | Total Long-Term Investments
(Cost $43,260) | | | 51,919 | | |
| SHARES | | SECURITY DESCRIPTION | | VALUE | |
| Short-Term Investment - 1.3% | |
| | | Investment Company - 1.3% | |
| | 668 | | | JPMorgan Prime Money
Market Fund (b) (m)
(Cost $668) | | $ | 668 | | |
PRINCIPAL
AMOUNT | | | | | |
| | | Investment of Cash Collateral for Securities
Loaned - 12.4% | |
| | | Repurchase Agreement - 12.4% | |
| $ | 6,470 | | | Banc of America Securities LLC, 3.45%,
dated 06/30/05, due 07/01/05,
repurchase price $6,471, collateralized
by U.S. Agency Mortgages
(Cost $6,470) | | | 6,470 | | |
| | | Total Investments - 113.0% | | $ | 59,057 | | |
| | | (Cost $50,398) | | | | | |
| | | Liabilities in excess of
other assets - (13.0)% | | | (6,808 | ) | |
| | | Net Assets - 100.0% | | $ | 52,249 | | |
SEE NOTES TO FINANCIAL STATEMENTS.
JPMorgan U.S. Equity Mid/Small Cap Funds 32
JPMorgan Mid Cap Value Fund
SCHEDULE OF PORTFOLIO INVESTMENTS AS OF JUNE 30, 2005
(Amounts in thousands)
(Unaudited)
| SHARES | | SECURITY DESCRIPTION | | VALUE | |
| Long-Term Investments - 96.9% | |
| | | | | Common Stocks - 96.9% | | | |
| | | | | Auto Components - 0.7% | | | |
| | 861 | | | BorgWarner, Inc. | | $ | 46,221 | | |
| | | | | Beverages - 0.8% | |
| | 779 | | | Brown-Forman Corp., Class B | | | 47,118 | | |
| | | | | Building Products - 0.7% | |
| | 1,104 | | | American Standard Cos., Inc. | | | 46,280 | | |
| | | | | Capital Markets - 2.8% | |
| | 578 | | | Legg Mason, Inc. (c) | | | 60,202 | | |
| | 1,326 | | | Northern Trust Corp. | | | 60,470 | | |
| | 838 | | | T. Rowe Price Group, Inc. | | | 52,440 | | |
| | | | 173,112 | | |
| | | | | Chemicals - 3.9% | | | |
| | 2,118 | | | Albemarle Corp. | | | 77,254 | | |
| | 1,725 | | | International Flavors & Fragrances, Inc. | | | 62,494 | | |
| | 978 | | | PPG Industries, Inc. | | | 61,392 | | |
| | 784 | | | Sigma-Aldrich Corp. (c) | | | 43,947 | | |
| | | | 245,087 | | |
| | | | | Commercial Banks - 6.2% | | | |
| | 781 | | | Cullen/Frost Bankers, Inc. | | | 37,205 | | |
| | 1,086 | | | M&T Bank Corp. | | | 114,246 | | |
| | 4,771 | | | North Fork Bancorp, Inc. | | | 134,019 | | |
| | 1,707 | | | TCF Financial Corp. | | | 44,182 | | |
| | 1,555 | | | Wilmington Trust Corp. | | | 56,003 | | |
| | | | 385,655 | | |
| | | | | Commercial Services & Supplies - 1.1% | | | |
| | 151 | | | Pitney Bowes, Inc. | | | 6,589 | | |
| | 1,682 | | | Republic Services, Inc. | | | 60,562 | | |
| | | | 67,151 | | |
| | | | | Computers & Peripherals - 0.6% | | | |
| | 545 | | | Lexmark International, Inc., Class A (a) | | | 35,345 | | |
| | | | | Construction Materials - 1.7% | |
| | 1,656 | | | Vulcan Materials Co. (c) | | | 107,649 | | |
| SHARES | | SECURITY DESCRIPTION | | VALUE | |
| | | | | Containers & Packaging - 2.0% | | | |
| | 1,415 | | | Ball Corp. | | $ | 50,898 | | |
| | 3,306 | | | Pactiv Corp. (a) (c) | | | 71,339 | | |
| | | | 122,237 | | |
| | | | | Distributors - 0.6% | | | |
| | 957 | | | Genuine Parts Co. | | | 39,307 | | |
| | | | | Diversified Financial Services - 0.7% | | | |
| | 1,006 | | | Principal Financial Group (c) | | | 42,135 | | |
| | | | | Diversified Telecommunication Services - 4.0% | | | |
| | 2,062 | | | Alltel Corp. | | | 128,446 | | |
| | 3,464 | | | CenturyTel, Inc. (c) | | | 119,948 | | |
| | | | 248,394 | | |
| | | | | Electric Utilities - 2.8% | | | |
| | 1,789 | | | DPL, Inc. | | | 49,103 | | |
| | 1,059 | | | PPL Corp. (c) | | | 62,895 | | |
| | 2,592 | | | Westar Energy, Inc. | | | 62,278 | | |
| | | | 174,276 | | |
| | | | | Electrical Equipment - 1.8% | | | |
| | 1,265 | | | Ametek, Inc. (c) | | | 52,932 | | |
| | 911 | | | Cooper Industries Ltd. (Bermuda),
Class A | | | 58,181 | | |
| | | | 111,113 | | |
| | | | | Food Products - 2.6% | | | |
| | 1,844 | | | Dean Foods Co. (a) | | | 64,990 | | |
| | 3,428 | | | Del Monte Foods Co. (a) | | | 36,917 | | |
| | 1,812 | | | Hormel Foods Corp. | | | 53,146 | | |
| | 333 | | | TreeHouse Foods, Inc. (a) | | | 9,505 | | |
| | | | 164,558 | | |
| | | | | Gas Utilities - 1.4% | | | |
| | 1,328 | | | AGL Resources, Inc. (c) | | | 51,312 | | |
| | 1,349 | | | UGI Corp. | | | 37,648 | | |
| | | | 88,960 | | |
| | | | | Health Care Equipment & Supplies - 0.6% | | | |
| | 589 | | | Beckman Coulter, Inc. | | | 37,443 | | |
SEE NOTES TO FINANCIAL STATEMENTS.
JPMorgan U.S. Equity Mid/Small Cap Funds 33
JPMorgan Mid Cap Value Fund
SCHEDULE OF PORTFOLIO INVESTMENTS AS OF JUNE 30, 2005
(Amounts in thousands)
(CONTINUED)
(Unaudited)
| SHARES | | SECURITY DESCRIPTION | | VALUE | |
| | Long-Term Investments - continued | | | | |
| | | | | Health Care Providers & Services - 4.6% | |
| | 1,692 | | | Coventry Health Care, Inc. (a) | | $ | 119,688 | | |
| | 802 | | | Magellan Health Services, Inc. (a) | | | 28,322 | | |
| | 1,372 | | | Manor Care, Inc. | | | 54,521 | | |
| | 1,228 | | | Omnicare, Inc. (c) | | | 52,113 | | |
| | 551 | | | Quest Diagnostics (c) | | | 29,330 | | |
| | | | 283,974 | | |
| | | | | Hotels, Restaurants & Leisure - 2.2% | | | |
| | 1,828 | | | Applebees International, Inc. | | | 48,416 | | |
| | 1,888 | | | Outback Steakhouse, Inc. | | | 85,395 | | |
| | | | 133,811 | | |
| | | | | Household Durables - 1.9% | | | |
| | 864 | | | Fortune Brands, Inc. (c) | | | 76,723 | | |
| | 486 | | | Mohawk Industries, Inc. (a) (c) | | | 40,112 | | |
| | | | 116,835 | | |
| | | | | Household Products - 0.7% | | | |
| | 796 | | | Clorox Co. (c) | | | 44,336 | | |
| | | | | Industrial Conglomerates - 1.2% | | | |
| | 1,076 | | | Carlisle Cos., Inc. | | | 73,818 | | |
| | | | | Insurance - 8.3% | | | |
| | 4,107 | | | Assurant, Inc. (c) | | | 148,245 | | |
| | 1,060 | | | Cincinnati Financial Corp. (c) | | | 41,917 | | |
| | 1,994 | | | IPC Holdings Ltd. (Bermuda) | | | 78,986 | | |
| | 4,377 | | | Old Republic International Corp. | | | 110,689 | | |
| | 743 | | | PartnerRe Ltd. (Bermuda) (c) | | | 47,877 | | |
| | 1,051 | | | Safeco Corp. | | | 57,128 | | |
| | 888 | | | Willis Group Holdings Ltd. (Bermuda) (c) | | | 29,068 | | |
| | | | 513,910 | | |
| | | | | IT Services - 0.9% | | | |
| | 1,078 | | | Affiliated Computer Services, Inc.,
Class A (a) (c) | | | 55,060 | | |
| | | | | Machinery - 2.5% | | | |
| | 1,939 | | | Crane Co. (c) | | | 50,995 | | |
| | 1,102 | | | Harsco Corp. | | | 60,098 | | |
| | 746 | | | Parker-Hannifin Corp. | | | 46,241 | | |
| | | | 157,334 | | |
| SHARES | | SECURITY DESCRIPTION | | VALUE | |
| | | | | Media - 4.9% | | | |
| | 2,621 | | | Dex Media, Inc. | | $ | 63,971 | | |
| | 1,270 | | | E.W. Scripps Co., Class A (c) | | | 61,963 | | |
| | 1,313 | | | Gannett Co., Inc. (c) | | | 93,394 | | |
| | 1,835 | | | Interactive Data Corp. (a) | | | 38,121 | | |
| | 484 | | | Knight Ridder, Inc. (c) | | | 29,664 | | |
| | 25 | | | Washington Post Co. (The), Class B | | | 20,542 | | |
| | | | 307,655 | | |
| | | | | Multi-Utilities - 3.6% | | | |
| | 1,568 | | | Energen Corp. | | | 54,955 | | |
| | 1,862 | | | Energy East Corp. | | | 53,946 | | |
| | 808 | | | Questar Corp. | | | 53,247 | | |
| | 1,474 | | | SCANA Corp. | | | 62,968 | | |
| | | | 225,116 | | |
| | | | | Multiline Retail - 2.2% | | | |
| | 2,512 | | | Family Dollar Stores, Inc. | | | 65,566 | | |
| | 781 | | | May Department Stores Co. (The) | | | 31,361 | | |
| | 1,195 | | | Tuesday Morning Corp. (c) | | | 37,657 | | |
| | | | 134,584 | | |
| | | | | Oil, Gas & Consumable Fuels - 8.7% | | | |
| | 950 | | | Ashland, Inc. (a) | | | 68,255 | | |
| | 1,896 | | | Burlington Resources, Inc. (c) | | | 104,724 | | |
| | 2,576 | | | Devon Energy Corp. (c) | | | 130,531 | | |
| | 1,781 | | | Kinder Morgan, Inc. (c) | | | 148,179 | | |
| | 972 | | | Marathon Oil Corp. | | | 51,849 | | |
| | 937 | | | Pioneer Natural Resources Co. | | | 39,429 | | |
| | | | 542,967 | | |
| | | | | Paper & Forest Products - 0.6% | | | |
| | 1,438 | | | MeadWestvaco Corp. | | | 40,324 | | |
| | | | | Personal Products - 0.8% | | | |
| | 1,228 | | | Estee Lauder Cos., Inc., Class A | | | 48,059 | | |
| | | | | Real Estate - 2.7% | | | |
| | 2,099 | | | Brookfield Properties Co. (Canada) | | | 60,448 | | |
| | 421 | | | Forest City Enterprises, Inc. (c) | | | 29,863 | | |
| | 552 | | | PS Business Parks, Inc.,
Class A (REIT) (c) | | | 24,527 | | |
SEE NOTES TO FINANCIAL STATEMENTS.
JPMorgan U.S. Equity Mid/Small Cap Funds 34
SEMI-ANNUAL REPORT JUNE 30
2005
SCHEDULE OF PORTFOLIO INVESTMENTS AS OF JUNE 30, 2005
(Amounts in thousands)
(Unaudited)
| SHARES | | SECURITY DESCRIPTION | | VALUE | |
| Long-Term Investments - continued | |
| | | | | Real Estate - Continued | | | |
| | 971 | | | Rayonier, Inc. (REIT) (c) | | $ | 51,470 | | |
| | | | 166,308 | | |
| | | | | Software - 0.7% | | | |
| | 1,551 | | | Computer Associates International, Inc. | | | 42,611 | | |
| | | | | Specialty Retail - 6.5% | |
| | 2,348 | | | Autonation, Inc. (a) | | | 48,189 | | |
| | 1,552 | | | AutoZone, Inc. (a) | | | 143,507 | | |
| | 1,287 | | | Sherwin-Williams Co. (The) | | | 60,600 | | |
| | 1,753 | | | Tiffany & Co. | | | 57,412 | | |
| | 3,757 | | | TJX Cos., Inc. | | | 91,474 | | |
| | | | 401,182 | | |
| | | | | Textiles, Apparel & Luxury Goods - 3.9% | | | |
| | 1,465 | | | Columbia Sportswear Co. (a) (c) | | | 72,366 | | |
| | 2,944 | | | V.F. Corp. | | | 168,433 | | |
| | | | 240,799 | | |
| | | | | Thrifts & Mortgage Finance - 3.8% | | | |
| | 1,925 | | | Golden West Financial Corp. (c) | | | 123,900 | | |
| | 906 | | | MGIC Investment Corp. | | | 59,076 | | |
| | 1,125 | | | Webster Financial Corp. | | | 52,526 | | |
| | | | 235,502 | | |
| | | | | Trading Companies & Distributors - 0.3% | | | |
| | 625 | | | Hughes Supply, Inc. (c) | | | 17,555 | | |
| | | | | Wireless Telecommunication Services - 0.9% | |
| | 1,471 | | | Telephone & Data Systems, Inc. (c) | | | 58,038 | | |
| | | | | Total Common Stocks
(Cost $5,434,887) | | | 6,021,819 | | |
| | | | | Total Long-Term Investments
(Cost $5,434,887) | | | 6,021,819 | | |
| SHARES | | SECURITY DESCRIPTION | | VALUE | |
| | | | | Investment Company - 3.0% | | | | | |
| | 183,523 | | | JPMorgan Prime Money Market
Fund (b) (m) | | | $183,523
(Cost $183,523) | | |
| | Investments of Cash Collateral for Securities Loaned - 4.5% | | | | |
| | | | | Investment Company - 0.0% (g) | |
| | 1,115 | | | BGI Prime Money Market Fund | | | 1,115 | | |
PRINCIPAL
AMOUNT | |
| | | | | Repurchase Agreements - 4.5% | |
| $ | 187,000 | | | Credit Suisse First Boston LLC, 3.46%,
dated 06/30/05, due 07/01/05,
repurchase price $187,018,
collateralized by U.S. Agency Mortgages | | | 187,000 | | |
| | 92,410 | | | UBS Securities LLC, 3.40%,
dated 06/30/05, due 07/01/05,
repurchase price $92,419,
collateralized by U.S. Agencies | | | 92,410 | | |
| | | | 279,410 | | |
| | | | | Total Investments of Cash Collateral
for Securities Loaned
(Cost $280,525) | | | 280,525 | | |
| | | | | Total Investments - 104.4% | | $ | 6,485,867 | | |
| | | | | (Cost $5,898,935) | | | | | |
| | | | | Liabilities in excess of
other assets - (4.4)% | | | (274,450 | ) | |
| | | | | NET ASSETS - 100.0% | | $ | 6,211,417 | | |
SEE NOTES TO FINANCIAL STATEMENTS.
JPMorgan U.S. Equity Mid/Small Cap Funds 35
JPMorgan Small Cap Core Fund
SCHEDULE OF PORTFOLIO INVESTMENTS AS OF JUNE 30, 2005
(Amounts in thousands)
(Unaudited)
| SHARES | | SECURITY DESCRIPTION | | VALUE | |
| | Long-Term Investments - 97.9% | | | | |
| | | | | Common Stocks - 97.9% | |
| | | | | Aerospace & Defense - 2.2% | |
| | 28 | | | Armor Holdings, Inc. (a) (c) | | $ | 1,089 | | |
| | 76 | | | Aviall, Inc. (a) | | | 2,410 | | |
| | 52 | | | BE Aerospace, Inc. (a) (c) | | | 811 | | |
| | 11 | | | Curtiss-Wright Corp. (c) | | | 572 | | |
| | 81 | | | Esterline Technologies Corp. (a) | | | 3,254 | | |
| | 34 | | | Heico Corp. (c) | | | 794 | | |
| | 21 | | | Hexcel Corp. (a) | | | 352 | | |
| | 43 | | | Kaman Corp., Class A | | | 778 | | |
| | 225 | �� | | Moog, Inc., Class A (a) (c) | | | 7,071 | | |
| | 40 | | | Orbital Sciences Corp. (a) (c) | | | 399 | | |
| | | | 17,530 | | |
| | | | | Air Freight & Logistics - 0.1% | | | |
| | 19 | | | Hub Group, Inc., Class A (a) | | | 478 | | |
| | | | | Airlines - 0.8% | | | |
| | 126 | | | America West Holdings Corp.,
Class B (a) (c) | | | 753 | | |
| | 62 | | | Delta Air Lines, Inc. (a) (c) | | | 233 | | |
| | 175 | | | ExpressJet Holdings, Inc. (a) (c) | | | 1,493 | | |
| | 101 | | | Mesa Air Group, Inc. (a) (c) | | | 678 | | |
| | 159 | | | Pinnacle Airlines Corp. (a) (c) | | | 1,367 | | |
| | 88 | | | Skywest, Inc. | | | 1,603 | | |
| | | | 6,127 | | |
| | | | | Auto Components - 0.6% | | | |
| | 28 | | | American Axle & Manufacturing
Holdings, Inc. (c) | | | 708 | | |
| | 59 | | | ArvinMeritor, Inc. | | | 1,053 | | |
| | 71 | | | Hayes Lemmerz International, Inc. (a) | | | 503 | | |
| | 14 | | | Sauer-Danfoss, Inc. | | | 245 | | |
| | 19 | | | Stoneridge, Inc. (a) | | | 125 | | |
| | 122 | | | Tenneco Automotive, Inc. (a) (c) | | | 2,033 | | |
| | | | 4,667 | | |
| | | | | Automobiles - 0.4% | | | |
| | 59 | | | Fleetwood Enterprises, Inc. (a) (c) | | | 601 | | |
| | 73 | | | Thor Industries, Inc. (c) | | | 2,301 | | |
| | 12 | | | Winnebago Industries, Inc. (c) | | | 393 | | |
| | | | 3,295 | | |
| SHARES | | SECURITY DESCRIPTION | | VALUE | |
| | | | | Biotechnology - 2.8% | |
| | 32 | | | Abgenix, Inc. (a) (c) | | $ | 270 | | |
| | 121 | | | Alexion Pharmaceuticals, Inc. (a) (c) | | | 2,783 | | |
| | 35 | | | Applera Corp. - Celera Genomics
Group (a) | | | 384 | | |
| | 42 | | | Cell Genesys, Inc. (a) (c) | | | 226 | | |
| | 34 | | | Corixa Corp. (a) | | | 148 | | |
| | 122 | | | Cubist Pharmaceuticals, Inc. (a) (c) | | | 1,607 | | |
| | 22 | | | CV Therapeutics, Inc. (a) (c) | | | 502 | | |
| | 24 | | | Diversa Corp. (a) (c) | | | 125 | | |
| | 71 | | | Encysive Pharmaceuticals, Inc. (a) | | | 770 | | |
| | 32 | | | Enzon Pharmaceuticals, Inc. (a) | | | 209 | | |
| | 12 | | | Exelixis, Inc. (a) | | | 91 | | |
| | 321 | | | Genelabs Technologies (a) | | | 160 | | |
| | 24 | | | ICOS Corp. (a) (c) | | | 514 | | |
| | 239 | | | Incyte Corp. (a) (c) | | | 1,712 | | |
| | 49 | | | Ligand Pharmaceuticals, Inc.,
Class B (a) (c) | | | 342 | | |
| | 38 | | | Lifecell Corp. (a) | | | 603 | | |
| | 26 | | | Martek Biosciences Corp. (a) | | | 977 | | |
| | 70 | | | Myriad Genetics, Inc. (a) (c) | | | 1,096 | | |
| | 103 | | | Nabi Biopharmaceuticals (a) (c) | | | 1,572 | | |
| | 42 | | | OSI Pharmaceuticals, Inc. (a) | | | 1,733 | | |
| | 30 | | | Renovis, Inc. (a) | | | 455 | | |
| | 100 | | | Rigel Pharmaceuticals, Inc. (a) (c) | | | 1,998 | | |
| | 55 | | | Seattle Genetics, Inc. (a) (c) | | | 294 | | |
| | 2 | | | Tanox, Inc. (a) (c) | | | 19 | | |
| | 45 | | | Telik, Inc. (a) (c) | | | 735 | | |
| | 13 | | | Transkaryotic Therapies, Inc. (a) (c) | | | 483 | | |
| | 49 | | | United Therapeutics Corp. (a) (c) | | | 2,371 | | |
| | 15 | | | Vicuron Pharmaceuticals, Inc. (a) | | | 430 | | |
| | | | 22,609 | | |
| | | | | Building Products - 1.9% | | | |
| | 31 | | | ElkCorp (c) | | | 891 | | |
| | 18 | | | Griffon Corp. (a) | | | 406 | | |
| | 107 | | | Jacuzzi Brands, Inc. (a) (c) | | | 1,146 | | |
| | 144 | | | Lennox International, Inc. (c) | | | 3,044 | | |
| | 48 | | | NCI Building Systems, Inc. (a) (c) | | | 1,562 | | |
| | 153 | | | Universal Forest Products, Inc. | | | 6,325 | | |
| | 51 | | | York International Corp. | | | 1,919 | | |
| | | | 15,293 | | |
SEE NOTES TO FINANCIAL STATEMENTS.
JPMorgan U.S. Equity Mid/Small Cap Funds 36
SEMI-ANNUAL REPORT JUNE 30
2005
SCHEDULE OF PORTFOLIO INVESTMENTS AS OF JUNE 30, 2005
(Amounts in thousands)
(Unaudited)
| SHARES | | SECURITY DESCRIPTION | | VALUE | |
| Long-Term Investments - continued | |
| | | | | Capital Markets - 0.2% | | | |
| | 23 | | | National Financial Partners Corp. | | $ | 888 | | |
| | 35 | | | Waddell & Reed Financial, Inc. | | | 642 | | |
| | | | 1,530 | | |
| | | | | Chemicals - 1.6% | | | |
| | 3 | | | Cytec Industries, Inc. | | | 103 | | |
| | 77 | | | FMC Corp. (a) | | | 4,340 | | |
| | 77 | | | Georgia Gulf Corp. | | | 2,403 | | |
| | 10 | | | H.B. Fuller Co. | | | 323 | | |
| | 27 | | | Headwaters, Inc. (a) (c) | | | 914 | | |
| | 84 | | | Hercules, Inc. (a) | | | 1,189 | | |
| | 28 | | | Kronos Worldwide, Inc. (c) | | | 830 | | |
| | 29 | | | NewMarket Corp. (a) | | | 423 | | |
| | 130 | | | PolyOne Corp. (a) | | | 859 | | |
| | 39 | | | Terra Industries, Inc. (a) | | | 266 | | |
| | 104 | | | W.R. Grace & Co. (a) (c) | | | 812 | | |
| | 54 | | | Wellman, Inc. | | | 549 | | |
| | | | 13,011 | | |
| | | | | Commercial Banks - 5.8% | | | |
| | 15 | | | ABC Bancorp (c) (m) | | | 264 | | |
| | 33 | | | Amcore Financial, Inc. (c) | | | 980 | | |
| | 7 | | | AmericanWest Bancorp (a) (c) | | | 130 | | |
| | 4 | | | BancFirst Corp. (c) | | | 374 | | |
| | 77 | | | Bank of the Ozarks, Inc. | | | 2,532 | | |
| | 10 | | | Capital Corp. of the West (c) | | | 284 | | |
| | 26 | | | Capitol Bancorp Ltd. (c) | | | 860 | | |
| | 14 | | | Center Financial Corp. (c) | | | 338 | | |
| | 38 | | | Central Pacific Financial Corp. (c) | | | 1,339 | | |
| | 21 | | | Chemical Financial Corp. (c) | | | 701 | | |
| | 14 | | | City Holding Co. (c) | | | 511 | | |
| | 23 | | | Columbia Banking System, Inc. (c) | | | 556 | | |
| | 104 | | | Community Bank System, Inc. (c) | | | 2,532 | | |
| | 17 | | | Community Trust Bancorp, Inc. | | | 549 | | |
| | 92 | | | EuroBancshares, Inc. (a) | | | 1,475 | | |
| | 58 | | | First Bancorp (c) | | | 2,317 | | |
| | 25 | | | First Republic Bank | | | 883 | | |
| | 73 | | | First State Bancorp, Inc. | | | 1,416 | | |
| | 26 | | | Glacier Bancorp, Inc. | | | 691 | | |
| | 66 | | | Gold Banc Corp., Inc. | | | 960 | | |
| | 39 | | | Greater Bay Bancorp (c) | | | 1,039 | | |
| | 10 | | | Hanmi Financial Corp. | | | 162 | | |
| SHARES | | SECURITY DESCRIPTION | | VALUE | |
| | | | | Commercial Banks - Continued | |
| | 54 | | | IBERIABANK Corp. (c) | | $ | 3,352 | | |
| | 50 | | | Independent Bank Corp. | | | 1,419 | | |
| | 102 | | | Irwin Financial Corp. (c) | | | 2,255 | | |
| | 6 | | | Macatawa Bank Corp. (c) | | | 220 | | |
| | 15 | | | MB Financial, Inc. | | | 582 | | |
| | 9 | | | Mercantile Bank Corp. (c) | | | 387 | | |
| | 24 | | | Nara Bancorp, Inc. | | | 349 | | |
| | 40 | | | Oriental Financial Group (c) | | | 613 | | |
| | 10 | | | Pacific Capital Bancorp | | | 354 | | |
| | 12 | | | Peoples Bancorp, Inc. | | | 321 | | |
| | 85 | | | PrivateBancorp, Inc. (c) | | | 3,007 | | |
| | 72 | | | Republic Bancorp, Inc. (c) | | | 1,076 | | |
| | 5 | | | Republic Bancorp, Inc., Class A (c) | | | 112 | | |
| | 12 | | | Simmons First National Corp., Class A | | | 312 | | |
| | 9 | | | Southwest Bancorp, Inc. | | | 174 | | |
| | 6 | | | State Financial Services Corp. | | | 226 | | |
| | 22 | | | Sterling Bancorp (c) | | | 468 | | |
| | 113 | | | Sterling Bancshares, Inc. (c) | | | 1,760 | | |
| | 110 | | | Summit Bancshares, Inc. | | | 1,894 | | |
| | 19 | | | Sun Bancorp, Inc. (a) | | | 383 | | |
| | 6 | | | Taylor Capital Group, Inc. (c) | | | 220 | | |
| | 12 | | | TriCo Bancshares | | | 261 | | |
| | 20 | | | Umpqua Holdings Corp. | | | 468 | | |
| | 61 | | | West Coast Bancorp (c) | | | 1,487 | | |
| | 59 | | | Westamerica Bancorp | | | 3,100 | | |
| | 5 | | | Western Sierra Bancorp (a) | | | 183 | | |
| | 33 | | | Wilshire Bancorp, Inc. (c) | | | 470 | | |
| | 15 | | | Wintrust Financial Corp. (c) | | | 780 | | |
| | | | 47,126 | | |
| | | | | Commercial Services & Supplies - 3.1% | | | |
| | 120 | | | Angelica Corp. (c) | | | 2,941 | | |
| | 13 | | | Banta Corp. | | | 567 | | |
| | 19 | | | Coinstar, Inc. (a) | | | 436 | | |
| | 116 | | | Corinthian Colleges, Inc. (a) (c) | | | 1,480 | | |
| | 5 | | | CRA International, Inc. (a) (c) | | | 291 | | |
| | 27 | | | DiamondCluster International, Inc. (a) | | | 300 | | |
| | 35 | | | Duratek, Inc. (a) (c) | | | 818 | | |
| | 8 | | | General Binding Corp. (a) (c) | | | 173 | | |
| | 33 | | | Geo Group, Inc. (The) (a) | | | 814 | | |
| | 7 | | | Gevity HR, Inc. (c) | | | 136 | | |
| | 74 | | | Heidrick & Struggles, Inc. (a) | | | 1,919 | | |
SEE NOTES TO FINANCIAL STATEMENTS.
JPMorgan U.S. Equity Mid/Small Cap Funds 37
JPMorgan Small Cap Core Fund
SCHEDULE OF PORTFOLIO INVESTMENTS AS OF JUNE 30, 2005
(Amounts in thousands)
(CONTINUED)
(Unaudited)
| SHARES | | SECURITY DESCRIPTION | | VALUE | |
| Long-Term Investments - continued | |
| | | | | Commercial Services & Supplies - Continued | | | |
| | 287 | | | IKON Office Solutions, Inc. | | $ | 2,729 | | |
| | 20 | | | Imagistics International, Inc. (a) (c) | | | 566 | | |
| | 21 | | | Interpool, Inc. | | | 449 | | |
| | 56 | | | John H. Harland Co. | | | 2,124 | | |
| | 18 | | | Korn/Ferry International (a) | | | 311 | | |
| | 72 | | | Labor Ready, Inc. (a) | | | 1,681 | | |
| | 77 | | | Navigant Consulting, Inc. (a) | | | 1,353 | | |
| | 19 | | | Pre-Paid Legal Services, Inc. (c) | | | 866 | | |
| | 30 | | | SOURCECORP, Inc. (a) | | | 587 | | |
| | 45 | | | Spherion Corp. (a) (c) | | | 298 | | |
| | 111 | | | TeleTech Holdings, Inc. (a) (c) | | | 901 | | |
| | 23 | | | Tetra Tech, Inc. (a) (c) | | | 306 | | |
| | 46 | | | United Rentals, Inc. (a) (c) | | | 924 | | |
| | 28 | | | United Stationers, Inc. (a) | | | 1,365 | | |
| | 6 | | | Vertrue, Inc. (a) | | | 218 | | |
| | 14 | | | Waste Connections, Inc. (a) | | | 526 | | |
| | | | 25,079 | | |
| | | | | Communications Equipment - 2.6% | | | |
| | 143 | | | 3Com Corp. (a) | | | 519 | | |
| | 36 | | | Ariba, Inc. (a) (c) | | | 206 | | |
| | 106 | | | Arris Group, Inc. (a) | | | 927 | | |
| | 84 | | | Aspect Communications Corp. (a) (c) | | | 940 | | |
| | 15 | | | Audiovox Corp. (a) (c) | | | 236 | | |
| | 47 | | | Avocent Corp. (a) | | | 1,223 | | |
| | 18 | | | Bel Fuse, Inc., Class B (c) | | | 562 | | |
| | 31 | | | Black Box Corp. (c) | | | 1,108 | | |
| | 62 | | | C-COR, Inc. (a) (c) | | | 426 | | |
| | 50 | | | CIENA Corp. (a) | | | 105 | | |
| | 58 | | | CommScope, Inc. (a) (c) | | | 1,013 | | |
| | 13 | | | Comtech Telecommunications
Corp. (a) (c) | | | 437 | | |
| | 21 | | | Ditech Communications Corp. (a) | | | 139 | | |
| | 24 | | | Echelon Corp. (a) | | | 167 | | |
| | 73 | | | Extreme Networks, Inc. (a) | | | 300 | | |
| | 30 | | | Finisar Corp. (a) (c) | | | 31 | | |
| | 64 | | | Foundry Networks, Inc. (a) | | | 549 | | |
| | 7 | | | Glenayre Technologies, Inc. (a) | | | 28 | | |
| | 42 | | | Harmonic, Inc. (a) (c) | | | 205 | | |
| | 110 | | | Inter-Tel, Inc. (c) | | | 2,038 | | |
| | 10 | | | Interdigital Communications
Corp. (a) (c) | | | 170 | | |
| SHARES | | SECURITY DESCRIPTION | | VALUE | |
| | | | | Communications Equipment - Continued | |
| | 119 | | | MRV Communications, Inc. (a) (c) | | $ | 259 | | |
| | 34 | | | Netgear, Inc. (a) (c) | | | 630 | | |
| | 89 | | | Plantronics, Inc. | | | 3,225 | | |
| | 15 | | | Polycom, Inc. (a) | | | 228 | | |
| | 13 | | | Powerwave Technologies, Inc. (a) | | | 132 | | |
| | 28 | | | Redback Networks, Inc. (a) (c) | | | 177 | | |
| | 43 | | | SafeNet, Inc. (a) (c) | | | 1,451 | | |
| | 116 | | | Symmetricom, Inc. (a) (c) | | | 1,198 | | |
| | 50 | | | Tekelec (a) (c) | | | 843 | | |
| | 48 | | | Terayon Communication
Systems, Inc. (a) | | | 147 | | |
| | 109 | | | Utstarcom, Inc. (a) (c) | | | 819 | | |
| | 72 | | | Westell Technologies, Inc. (a) (c) | | | 432 | | |
| | | | 20,870 | | |
| | | | | Computers & Peripherals - 1.7% | | | |
| | 130 | | | Adaptec, Inc. (a) (c) | | | 503 | | |
| | 35 | | | Advanced Digital Information Corp. (a) | | | 268 | | |
| | 221 | | | Brocade Communications
Systems, Inc. (a) | | | 858 | | |
| | 26 | | | Dot Hill Systems Corp. (a) (c) | | | 138 | | |
| | 12 | | | Electronics for Imaging, Inc. (a) (c) | | | 259 | | |
| | 83 | | | Gateway, Inc. (a) (c) | | | 274 | | |
| | 59 | | | Hutchinson Technology, Inc. (a) (c) | | | 2,253 | | |
| | 25 | | | Hypercom Corp. (a) (c) | | | 164 | | |
| | 51 | | | Imation Corp. | | | 1,990 | | |
| | 52 | | | Intergraph Corp. (a) (c) | | | 1,778 | | |
| | 57 | | | Komag, Inc. (a) (c) | | | 1,623 | | |
| | 180 | | | Maxtor Corp. (a) (c) | | | 935 | | |
| | 33 | | | PalmOne, Inc. (a) (c) | | | 985 | | |
| | 109 | | | Quantum Corp. (a) (c) | | | 323 | | |
| | 183 | | | Silicon Graphics, Inc. (a) (c) | | | 130 | | |
| | 7 | | | Stratasys, Inc. (a) | | | 225 | | |
| | 24 | | | Synaptics, Inc. (a) (c) | | | 517 | | |
| | 17 | | | UNOVA, Inc. (a) (c) | | | 461 | | |
| | | | 13,684 | | |
| | | | | Construction & Engineering - 0.4% | | | |
| | 17 | | | Dycom Industries, Inc. (a) | | | 333 | | |
| | 69 | | | MasTec, Inc. (a) (c) | | | 606 | | |
| | 38 | | | Quanta Services, Inc. (a) (c) | | | 338 | | |
| | 20 | | | URS Corp. (a) | | | 743 | | |
SEE NOTES TO FINANCIAL STATEMENTS.
JPMorgan U.S. Equity Mid/Small Cap Funds 38
SEMI-ANNUAL REPORT JUNE 30
2005
SCHEDULE OF PORTFOLIO INVESTMENTS AS OF JUNE 30, 2005
(Amounts in thousands)
(Unaudited)
| SHARES | | SECURITY DESCRIPTION | | VALUE | |
| | Long-Term Investments - continued | | | | |
| | | | | Construction & Engineering - Continued | |
| | 29 | | | Washington Group International,
Inc. (a) (c) | | $ | 1,498 | | |
| | | | 3,518 | | |
| | | | | Construction Materials - 0.4% | | | |
| | 15 | | | Ameron International Corp. (c) | | | 557 | | |
| | 23 | | | Eagle Materials, Inc. (c) | | | 2,083 | | |
| | 18 | | | Texas Industries, Inc. | | | 990 | | |
| | | | 3,630 | | |
| | | | | Consumer Finance - 1.2% | | | |
| | 15 | | | ACE Cash Express, Inc. (a) (c) | | | 373 | | |
| | 18 | | | Advanta Corp. (c) | | | 504 | | |
| | 20 | | | Asta Funding, Inc. (c) | | | 561 | | |
| | 197 | | | Cash America International, Inc. | | | 3,958 | | |
| | 50 | | | CompuCredit Corp. (a) (c) | | | 1,728 | | |
| | 7 | | | Credit Acceptance Corp. (a) (c) | | | 109 | | |
| | 69 | | | Metris Cos., Inc. (a) | | | 993 | | |
| | 5 | | | United PanAm Financial Corp. (a) | | | 130 | | |
| | 55 | | | World Acceptance Corp. (a) | | | 1,638 | | |
| | | | 9,994 | | |
| | | | | Containers & Packaging - 0.5% | | | |
| | 26 | | | Crown Holdings, Inc. (a) | | | 367 | | |
| | 23 | | | Greif, Inc., Class A | | | 1,375 | | |
| | 48 | | | Silgan Holdings, Inc. | | | 2,694 | | |
| | | | 4,436 | | |
| | | | | Distributors - 0.2% | | | |
| | 42 | | | Handleman Co. (c) | | | 697 | | |
| | 38 | | | WESCO International, Inc. (a) | | | 1,180 | | |
| | | | 1,877 | | |
| | | | | Diversified Financial Services - 0.6% | | | |
| | 7 | | | Encore Capital Group, Inc. (a) (c) | | | 126 | | |
| | 15 | | | eSpeed, Inc. (a) (c) | | | 131 | | |
| | 81 | | | GATX Corp. (c) | | | 2,781 | | |
| | 48 | | | Knight Capital Group, Inc. (a) | | | 364 | | |
| | 17 | | | Nasdaq Stock Market, Inc. (a) | | | 311 | | |
| | 100 | | | Technology Investment Capital Corp. | | | 1,486 | | |
| | | | 5,199 | | |
| SHARES | | SECURITY DESCRIPTION | | VALUE | |
| | | | | Diversified Telecommunication Services - 1.1% | |
| | 40 | | | Broadwing Corp. (a) (c) | | $ | 185 | | |
| | 468 | | | Cincinnati Bell, Inc. (a) | | | 2,012 | | |
| | 63 | | | CT Communications, Inc. (c) | | | 817 | | |
| | 80 | | | ITC Deltacom, Inc. (a) | | | 68 | | |
| | 454 | | | Premiere Global Services, Inc. (a) (c) | | | 5,120 | | |
| | 107 | | | Primus Telecom Group (a) (c) | | | 67 | | |
| | 30 | | | Talk America Holdings, Inc. (a) | | | 302 | | |
| | 76 | | | Time Warner Telecom, Inc., Class A (a) (c) | | | 451 | | |
| | | | 9,022 | | |
| | | | | Electric Utilities - 0.8% | | | |
| | 24 | | | Black Hills Corp. (c) | | | 892 | | |
| | 55 | | | El Paso Electric Co. (a) | | | 1,114 | | |
| | 18 | | | Idacorp, Inc. | | | 548 | | |
| | 5 | | | MGE Energy, Inc. | | | 175 | | |
| | 54 | | | PNM Resources, Inc. | | | 1,550 | | |
| | 5 | | | UIL Holdings Corp. (c) | | | 291 | | |
| | 74 | | | Unisource Energy Corp. | | | 2,288 | | |
| | | | 6,858 | | |
| | | | | Electrical Equipment - 0.1% | | | |
| | 20 | | | Encore Wire Corp. (a) (c) | | | 236 | | |
| | 11 | | | Evergreen Solar, Inc. (a) (c) | | | 69 | | |
| | 14 | | | General Cable Corp. (a) | | | 205 | | |
| | 23 | | | Power-One, Inc. (a) (c) | | | 142 | | |
| | 30 | | | Valence Technology, Inc. (a) (c) | | | 85 | | |
| | | | 737 | | |
| | | | | Electronic Equipment & Instruments - 2.2% | | | |
| | 60 | | | Aeroflex, Inc. (a) | | | 500 | | |
| | 84 | | | Agilysis, Inc. (c) | | | 1,314 | | |
| | 85 | | | Anixter International, Inc. (a) | | | 3,141 | | |
| | 8 | | | BEI Technologies, Inc. (c) | | | 200 | | |
| | 7 | | | Bell Microproducts, Inc. (a) | | | 69 | | |
| | 53 | | | Benchmark Electronics, Inc. (a) | | | 1,600 | | |
| | 27 | | | Brightpoint, Inc. (a) (c) | | | 590 | | |
| | 29 | | | Checkpoint Systems, Inc. (a) (c) | | | 510 | | |
| | 59 | | | CTS Corp. (c) | | | 719 | | |
| | 24 | | | Electro Scientific Industries, Inc. (a) (c) | | | 426 | | |
| | 7 | | | Faro Technologies, Inc. (a) (c) | | | 183 | | |
| | 81 | | | Global Imaging Systems, Inc. (a) (c) | | | 2,590 | | |
| | 36 | | | Itron, Inc. (a) | | | 1,604 | | |
SEE NOTES TO FINANCIAL STATEMENTS.
JPMorgan U.S. Equity Mid/Small Cap Funds 39
JPMorgan Small Cap Core Fund
SCHEDULE OF PORTFOLIO INVESTMENTS AS OF JUNE 30, 2005
(Amounts in thousands)
(CONTINUED)
(Unaudited)
| SHARES | | SECURITY DESCRIPTION | | VALUE | |
| Long-Term Investments - continued | |
| | | | | Electronic Equipment & Instruments - Continued | | | |
| | 25 | | | Lexar Media, Inc. (a) (c) | | $ | 124 | | |
| | 13 | | | MTS Systems Corp. (c) | | | 437 | | |
| | 16 | | | Planar Systems, Inc. (a) (c) | | | 118 | | |
| | 28 | | | Radisys Corp. (a) (c) | | | 444 | | |
| | 25 | | | Rofin-Sinar Technologies, Inc. (a) | | | 813 | | |
| | 53 | | | Sypris Solutions, Inc. (c) | | | 656 | | |
| | 28 | | | Trimble Navigation Ltd. (a) | | | 1,099 | | |
| | 88 | | | TTM Technologies, Inc. (a) | | | 672 | | |
| | 3 | | | Zygo Corp. (a) | | | 25 | | |
| | | | 17,834 | | |
| | | | | Energy Equipment & Services - 2.2% | | | |
| | 199 | | | Grey Wolf, Inc. (a) | | | 1,475 | | |
| | 15 | | | Gulf Island Fabrication, Inc. | | | 304 | | |
| | 13 | | | Gulfmark Offshore, Inc. (a) | | | 342 | | |
| | 46 | | | Hanover Compressor Co. (a) (c) | | | 524 | | |
| | 22 | | | Hydril (a) | | | 1,174 | | |
| | 213 | | | Key Energy Services, Inc. (a) (c) | | | 2,570 | | |
| | 44 | | | Lone Star Technologies, Inc. (a) | | | 2,002 | | |
| | 9 | | | Lufkin Industries, Inc. (c) | | | 327 | | |
| | 68 | | | Oceaneering International, Inc. (a) | | | 2,613 | | |
| | 30 | | | Offshore Logistics, Inc. (a) | | | 985 | | |
| | 29 | | | Oil States International, Inc. (a) | | | 727 | | |
| | 30 | | | Parker Drilling Co. (a) | | | 208 | | |
| | 144 | | | Todco, Class A (a) | | | 3,696 | | |
| | 44 | | | Veritas DGC, Inc. (a) | | | 1,229 | | |
| | | | 18,176 | | |
| | | | | Food & Staples Retailing - 0.5% | | | |
| | 31 | | | Great Atlantic & Pacific Tea Co., Inc. (a) (c) | | | 892 | | |
| | 13 | | | Nash Finch Co. (c) | | | 481 | | |
| | 65 | | | Pantry, Inc. (The) (a) | | | 2,518 | | |
| | 32 | | | Pathmark Stores, Inc. (a) | | | 280 | | |
| | | | 4,171 | | |
| | | | | Food Products - 1.2% | | | |
| | 161 | | | Chiquita Brands International, Inc. (c) | | | 4,407 | | |
| | 76 | | | Corn Products International, Inc. | | | 1,808 | | |
| | 13 | | | Flowers Foods, Inc. (c) | | | 463 | | |
| | 14 | | | J & J Snack Foods Corp. (c) | | | 712 | | |
| | 53 | | | Sanderson Farms, Inc. (c) | | | 2,404 | | |
| | | | 9,794 | | |
| SHARES | | SECURITY DESCRIPTION | | VALUE | |
| | | | | Gas Utilities - 1.4% | |
| | 32 | | | Atmos Energy Corp. | | $ | 907 | | |
| | 59 | | | New Jersey Resources Corp. | | | 2,852 | | |
| | 7 | | | Nicor, Inc. | | | 280 | | |
| | 28 | | | Northwest Natural Gas Co. (c) | | | 1,059 | | |
| | 17 | | | South Jersey Industries, Inc. | | | 1,064 | | |
| | 96 | | | Southern Union Co. (a) | | | 2,359 | | |
| | 68 | | | Southwest Gas Corp. | | | 1,724 | | |
| | 46 | | | WGL Holdings, Inc. | | | 1,541 | | |
| | | | 11,786 | | |
| | | | | Health Care Equipment & Supplies - 3.0% | | | |
| | 19 | | | Abiomed, Inc. (a) (c) | | | 159 | | |
| | 46 | | | Align Technology, Inc. (a) (c) | | | 342 | | |
| | 3 | | | Analogic Corp. (c) | | | 166 | | |
| | 32 | | | Animas Corp. (a) (c) | | | 645 | | |
| | 22 | | | Arrow International, Inc. | | | 689 | | |
| | 38 | | | Arthrocare Corp. (a) (c) | | | 1,321 | | |
| | 5 | | | Bio-Rad Laboratories, Inc.,
Class A (a) | | | 320 | | |
| | 23 | | | Biosite, Inc. (a) | | | 1,237 | | |
| | 84 | | | Conmed Corp. (a) (c) | | | 2,579 | | |
| | 31 | | | Diagnostic Products Corp. | | | 1,462 | | |
| | 176 | | | Encore Medical Corp. (a) (c) | | | 975 | | |
| | 13 | | | EPIX Pharmaceuticals, Inc. (a) (c) | | | 119 | | |
| | 15 | | | Immucor, Inc. (a) | | | 444 | | |
| | 31 | | | Integra LifeSciences Holdings
Corp. (a) (c) | | | 896 | | |
| | 16 | | | Inverness Medical Innovations,
Inc. (a) (c) | | | 429 | | |
| | 75 | | | Kyphon, Inc. (a) (c) | | | 2,613 | | |
| | 38 | | | Mentor Corp. (c) | | | 1,568 | | |
| | 36 | | | Nektar Therapeutics (a) | | | 613 | | |
| | 50 | | | Neurometrix, Inc. (a) (c) | | | 999 | | |
| | 14 | | | Palomar Medical Technologies,
Inc. (a) (c) | | | 332 | | |
| | 41 | | | PolyMedica Corp. (c) | | | 1,473 | | |
| | 8 | | | Regeneration Technologies,
Inc. (a) (c) | | | 51 | | |
| | 114 | | | Steris Corp. | | | 2,927 | | |
| | 53 | | | SurModics, Inc. (a) (c) | | | 2,286 | | |
| | | | 24,645 | | |
SEE NOTES TO FINANCIAL STATEMENTS.
JPMorgan U.S. Equity Mid/Small Cap Funds 40
SEMI-ANNUAL REPORT JUNE 30
2005
SCHEDULE OF PORTFOLIO INVESTMENTS AS OF JUNE 30, 2005
(Amounts in thousands)
(Unaudited)
| SHARES | | SECURITY DESCRIPTION | | VALUE | |
| Long-Term Investments - continued | |
| | | | | Health Care Providers & Services - 5.0% | | | |
| | 40 | | | Alderwoods Group, Inc. (a) | | $ | 573 | | |
| | 130 | | | Alliance Imaging, Inc. (a) (c) | | | 1,359 | | |
| | 20 | | | America Service Group, Inc. (a) | | | 315 | | |
| | 77 | | | Andrx Corp. (a) | | | 1,568 | | |
| | 51 | | | Apria Healthcare Group, Inc. (a) | | | 1,774 | | |
| | 80 | | | Centene Corp. (a) (c) | | | 2,680 | | |
| | 75 | | | Computer Programs & Systems,
Inc. (c) | | | 2,799 | | |
| | 10 | | | Dendrite International, Inc. (a) (c) | | | 135 | | |
| | 25 | | | Genesis HealthCare Corp. (a) (c) | | | 1,171 | | |
| | 118 | | | Kindred Healthcare, Inc. (a) (c) | | | 4,670 | | |
| | 52 | | | LCA Vision, Inc. (c) | | | 2,510 | | |
| | 77 | | | OCA, Inc. (a) (c) | | | 145 | | |
| | 80 | | | Owens & Minor, Inc. | | | 2,581 | | |
| | 51 | | | Pediatrix Medical Group, Inc. (a) | | | 3,780 | | |
| | 79 | | | Per-Se Technologies, Inc. (a) (c) | | | 1,665 | | |
| | 131 | | | PSS World Medical, Inc. (a) (c) | | | 1,628 | | |
| | 46 | | | Res-Care, Inc. (a) | | | 620 | | |
| | 38 | | | Sierra Health Services (a) | | | 2,701 | | |
| | 166 | | | Stewart Enterprises, Inc. (c) | | | 1,085 | | |
| | 38 | | | Symbion, Inc. (a) | | | 897 | | |
| | 57 | | | Trizetto Group (a) | | | 799 | | |
| | 73 | | | United Surgical Partners
International, Inc. (a) (c) | | | 3,823 | | |
| | 70 | | | Ventiv Health, Inc. (a) (c) | | | 1,350 | | |
| | | | 40,628 | | |
| | | | | Hotels, Restaurants & Leisure - 2.4% | | | |
| | 76 | | | Ameristar Casinos, Inc. | | | 1,983 | | |
| | 29 | | | Argosy Gaming Co. (a) | | | 1,333 | | |
| | 12 | | | CEC Entertainment, Inc. (a) (c) | | | 505 | | |
| | 98 | | | CKE Restaurants, Inc. (c) | | | 1,367 | | |
| | 32 | | | Jack in the Box, Inc. (a) | | | 1,195 | | |
| | 176 | | | Landry's Restaurants, Inc. (c) | | | 5,305 | | |
| | 49 | | | Multimedia Games, Inc. (a) (c) | | | 543 | | |
| | 59 | | | Navigant International, Inc. (a) (c) | | | 873 | | |
| | 22 | | | O'Charley's, Inc. (a) | | | 381 | | |
| | 50 | | | Pinnacle Entertainment, Inc. (a) (c) | | | 974 | | |
| | 25 | | | Rare Hospitality International, Inc. (a) | | | 771 | | |
| | 89 | | | Ruby Tuesday, Inc. (c) | | | 2,297 | | |
| | 123 | | | Ryan's Restaurant Group, Inc. (a) (c) | | | 1,723 | | |
| | | | 19,250 | | |
| SHARES | | SECURITY DESCRIPTION | | VALUE | |
| | | | | Household Durables - 1.3% | |
| | 21 | | | American Greetings, Class A (c) | | $ | 546 | | |
| | 1 | | | CSS Industries, Inc. | | | 28 | | |
| | 50 | | | Furniture Brands International, Inc. (c) | | | 1,078 | | |
| | 16 | | | Meritage Homes Corp. (a) (c) | | | 1,280 | | |
| | 34 | | | Stanley Furniture Co., Inc. | | | 825 | | |
| | 103 | | | Technical Olympic USA, Inc. (c) | | | 2,505 | | |
| | 107 | | | Tupperware Corp. (c) | | | 2,510 | | |
| | 50 | | | WCI Communities, Inc. (a) (c) | | | 1,595 | | |
| | | | 10,367 | | |
| | | | | Industrial Conglomerates - 0.3% | | | |
| | 55 | | | Walter Industries, Inc. (c) | | | 2,203 | | |
| | | | | Insurance - 2.6% | |
| | 6 | | | American Physicians Capital, Inc. (a) | | | 223 | | |
| | 36 | | | Argonaut Group, Inc. (a) (c) | | | 840 | | |
| | 150 | | | Delphi Financial Group, Inc. (c) | | | 6,605 | | |
| | 34 | | | Direct General Corp. (c) | | | 633 | | |
| | 31 | | | LandAmerica Financial Group, Inc. (c) | | | 1,834 | | |
| | 10 | | | Midland Co. (The) | | | 348 | | |
| | 2 | | | Navigators Group, Inc. (a) (c) | | | 76 | | |
| | 218 | | | PMA Capital Corp., Class A (a) (c) | | | 1,928 | | |
| | 30 | | | Selective Insurance Group (c) | | | 1,467 | | |
| | 33 | | | Stewart Information Services Corp. | | | 1,390 | | |
| | 14 | | | United Fire & Casualty Co. | | | 604 | | |
| | 1 | | | Vesta Insurance Group, Inc. | | | 3 | | |
| | 80 | | | Zenith National Insurance Corp. | | | 5,436 | | |
| | | | 21,387 | | |
| | | | | Internet & Catalog Retail - 0.2% | | | |
| | 18 | | | 1-800-Flowers.com, Inc., Class A (a) (c) | | | 124 | | |
| | 21 | | | GSI Commerce, Inc. (a) (c) | | | 345 | | |
| | 44 | | | Insight Enterprises, Inc. (a) | | | 888 | | |
| | 9 | | | J. Jill Group, Inc. (The) (a) (c) | | | 125 | | |
| | 12 | | | Nutri/System, Inc. (a) | | | 176 | | |
| | | | 1,658 | | |
| | | | | Internet Software & Services - 2.4% | | | |
| | 2 | | | aQuantive, Inc. (a) | | | 34 | | |
| | 60 | | | AsiaInfo Holdings, Inc. (a) (c) | | | 329 | | |
| | 30 | | | Autobytel, Inc. (a) | | | 145 | | |
| | 5 | | | Blue Coat Systems, Inc. (a) (c) | | | 138 | | |
SEE NOTES TO FINANCIAL STATEMENTS.
JPMorgan U.S. Equity Mid/Small Cap Funds 41
JPMorgan Small Cap Core Fund
SCHEDULE OF PORTFOLIO INVESTMENTS AS OF JUNE 30, 2005
(Amounts in thousands)
(CONTINUED)
(Unaudited)
| SHARES | | SECURITY DESCRIPTION | | VALUE | |
| Long-Term Investments - continued | |
| | | | | Internet Software & Services - Continued | | | |
| | 339 | | | CMGI, Inc. (a) (c) | | $ | 640 | | |
| | 123 | | | CNET Networks, Inc. (a) | | | 1,444 | | |
| | 25 | | | Digital Insight Corp. (a) (c) | | | 605 | | |
| | 29 | | | Digital River, Inc. (a) (c) | | | 908 | | |
| | 109 | | | Digitas, Inc. (a) | | | 1,248 | | |
| | 116 | | | DoubleClick, Inc. (a) (c) | | | 977 | | |
| | 292 | | | EarthLink, Inc. (a) | | | 2,525 | | |
| | 17 | | | Equinix, Inc. (a) (c) | | | 741 | | |
| | 175 | | | Homestore, Inc. (a) (c) | | | 356 | | |
| | 43 | | | Infospace, Inc. (a) (c) | | | 1,419 | | |
| | 49 | | | Internet Security Systems (a) | | | 998 | | |
| | 6 | | | Interwoven, Inc. (a) (c) | | | 43 | | |
| | 37 | | | Ipass, Inc. (a) (c) | | | 221 | | |
| | 31 | | | j2 Global Communications, Inc. (a) | | | 1,064 | | |
| | 34 | | | Jupitermedia Corp. (a) (c) | | | 589 | | |
| | 132 | | | Looksmart Ltd. (a) | | | 98 | | |
| | 38 | | | Openwave Systems, Inc. (a) (c) | | | 618 | | |
| | 130 | | | SupportSoft, Inc. (a) | | | 672 | | |
| | 75 | | | United Online, Inc. | | | 812 | | |
| | 67 | | | ValueClick, Inc. (a) (c) | | | 830 | | |
| | 44 | | | WebEx Communications, Inc. (a) (c) | | | 1,149 | | |
| | 22 | | | webMethods, Inc. (a) | | | 123 | | |
| | 17 | | | Websense, Inc. (a) (c) | | | 812 | | |
| | | | 19,538 | | |
| | | | | IT Services - 1.4% | | | |
| | 106 | | | Acxiom Corp. | | | 2,222 | | |
| | 166 | | | BearingPoint, Inc. (a) (c) | | | 1,213 | | |
| | 4 | | | BISYS Group, Inc. (The) (a) | | | 61 | | |
| | 122 | | | Ciber, Inc. (a) (c) | | | 971 | | |
| | 11 | | | Covansys Corp. (a) | | | 141 | | |
| | 37 | | | CSG System International,
Inc. (a) (c) | | | 704 | | |
| | 39 | | | Euronet Worldwide, Inc. (a) (c) | | | 1,143 | | |
| | 47 | | | Gartner, Inc., Class A (a) (c) | | | 501 | | |
| | 18 | | | Intrado, Inc. (a) (c) | | | 268 | | |
| | 41 | | | Lionbridge Technologies (a) (c) | | | 280 | | |
| | 48 | | | ManTech International Corp.,
Class A (a) (c) | | | 1,502 | | |
| | 83 | | | Perot Systems Corp., Class A (a) | | | 1,183 | | |
| | 14 | | | Safeguard Scientifics, Inc. (a) | | | 17 | | |
| | 30 | | | Startek, Inc. (c) | | | 486 | | |
| SHARES | | SECURITY DESCRIPTION | | VALUE | |
| | | | | IT Services - 1.4%- Continued | |
| | 77 | | | SYKES Enterprises, Inc. (a) (c) | | $ | 729 | | |
| | 30 | | | Tyler Technologies, Inc. (a) (c) | | | 223 | | |
| | | | 11,644 | | |
| | | | | Leisure Equipment & Products - 0.8% | | | |
| | 111 | | | JAKKS Pacific, Inc. (a) (c) | | | 2,123 | | |
| | 45 | | | K2, Inc. (a) | | | 572 | | |
| | 33 | | | MarineMax, Inc. (a) (c) | | | 1,015 | | |
| | 57 | | | RC2 Corp. (a) | | | 2,123 | | |
| | 28 | | | Steinway Musical Instruments,
Inc. (a) (c) | | | 816 | | |
| | | | 6,649 | | |
| | | | | Machinery - 3.2% | | | |
| | 66 | | | AGCO Corp. (a) (m) | | | 1,260 | | |
| | 48 | | | Astec Industries, Inc. (a) | | | 1,111 | | |
| | 58 | | | Barnes Group, Inc. (c) | | | 1,910 | | |
| | 50 | | | Briggs & Stratton Corp. (c) | | | 1,741 | | |
| | 31 | | | Cascade Corp. (c) | | | 1,319 | | |
| | 44 | | | Crane Co. | | | 1,165 | | |
| | 8 | | | ESCO Technologies, Inc. (a) (c) | | | 836 | | |
| | 50 | | | Flowserve Corp. (a) | | | 1,516 | | |
| | 31 | | | Greenbrier Cos., Inc. | | | 832 | | |
| | 54 | | | JLG Industries, Inc. (c) | | | 1,495 | | |
| | 36 | | | Joy Global, Inc. | | | 1,211 | | |
| | 57 | | | Lincoln Electric Holdings, Inc. (c) | | | 1,886 | | |
| | 50 | | | Manitowoc Co., Inc. | | | 2,030 | | |
| | 6 | | | Middleby Corp. (a) | | | 295 | | |
| | 26 | | | NACCO Industries, Inc., Class A (c) | | | 2,745 | | |
| | 40 | | | Reliance Steel & Aluminum Co. | | | 1,479 | | |
| | 13 | | | Tecumseh Products Co., Class A | | | 346 | | |
| | 25 | | | Valmont Industries, Inc. (c) | | | 653 | | |
| | 38 | | | Wabash National Corp. | | | 921 | | |
| | 38 | | | Watts Water Technologies, Inc.,
Class A (c) | | | 1,256 | | |
| | | | 26,007 | | |
| | | | | Media - 2.3% | | | |
| | 15 | | | Advo, Inc. | | | 465 | | |
| | 31 | | | Arbitron, Inc. (c) | | | 1,326 | | |
| | 16 | | | Carmike Cinemas, Inc. | | | 491 | | |
| | 27 | | | Catalina Marketing Corp. (c) | | | 681 | | |
SEE NOTES TO FINANCIAL STATEMENTS.
JPMorgan U.S. Equity Mid/Small Cap Funds 42
SEMI-ANNUAL REPORT JUNE 30
2005
SCHEDULE OF PORTFOLIO INVESTMENTS AS OF JUNE 30, 2005
(Amounts in thousands)
(Unaudited)
| SHARES | | SECURITY DESCRIPTION | | VALUE | |
| Long-Term Investments - continued | |
| | | | | Media - Continued | | | |
| | 225 | | | Charter Communications, Inc.,
Class A (a) (c) | | $ | 265 | | |
| | 6 | | | Emmis Communications Corp.,
Class A (a) | | | 105 | | |
| | 222 | | | Gemstar-TV Guide International, Inc. (a) | | | 798 | | |
| | 33 | | | Gray Television, Inc. (c) | | | 399 | | |
| | 31 | | | Insight Communications Co., Inc.,
Class A (a) | | | 345 | | |
| | 5 | | | Journal Register Co. (a) (c) | | | 86 | | |
| | 146 | | | Lodgenet Entertainment Corp. (a) | | | 2,417 | | |
| | 23 | | | Media General, Inc., Class A | | | 1,470 | | |
| | 197 | | | Mediacom Communications
Corp., Class A (a) (c) | | | 1,354 | | |
| | 289 | | | Primedia, Inc. (a) (c) | | | 1,172 | | |
| | 49 | | | ProQuest Co. (a) (c) | | | 1,593 | | |
| | 132 | | | Radio One, Inc., Class D (a) | | | 1,691 | | |
| | 21 | | | RCN Corp. (a) | | | 473 | | |
| | 20 | | | Saga Communications, Inc., Class A (a) | | | 274 | | |
| | 42 | | | Scholastic Corp. (a) | | | 1,627 | | |
| | 30 | | | Valassis Communications, Inc. (a) | | | 1,119 | | |
| | 70 | | | World Wrestling Entertainment, Inc. | | | 797 | | |
| | | | 18,948 | | |
| | | | | Metals & Mining - 1.5% | | | |
| | 32 | | | AK Steel Holding Corp. (a) (c) | | | 208 | | |
| | 159 | | | Commercial Metals Co. | | | 3,785 | | |
| | 13 | | | Metal Management, Inc. (c) | | | 242 | | |
| | 30 | | | NN, Inc. (c) | | | 378 | | |
| | 23 | | | Oregon Steel Mills, Inc. (a) (c) | | | 399 | | |
| | 84 | | | Quanex Corp. | | | 4,477 | | |
| | 62 | | | Ryerson Tull, Inc. (c) | | | 879 | | |
| | 57 | | | Steel Dynamics, Inc. (c) | | | 1,501 | | |
| | | | 11,869 | | |
| | | | | Multi-Utilities - 0.7% | | | |
| | 47 | | | Avista Corp. | | | 866 | | |
| | 79 | | | Energen Corp. | | | 2,752 | | |
| | 6 | | | NorthWestern Corp. | | | 201 | | |
| | 177 | | | Sierra Pacific Resources (a) (c) | | | 2,207 | | |
| | | | 6,026 | | |
| SHARES | | SECURITY DESCRIPTION | | VALUE | |
| | | | | Multiline Retail - 0.2% | |
| | 74 | | | ShopKo Stores, Inc. (a) | | $ | 1,799 | | |
| | | | | Oil, Gas & Consumable Fuels - 3.9% | |
| | 31 | | | ATP Oil & Gas Corp. (a) (c) | | | 714 | | |
| | 17 | | | Callon Petroleum Co. (a) (c) | | | 253 | | |
| | 41 | | | Cimarex Energy Co. (a) | | | 1,595 | | |
| | 7 | | | Clayton Williams Energy, Inc. (a) | | | 218 | | |
| | 23 | | | Comstock Resources, Inc. (a) | | | 582 | | |
| | 38 | | | Energy Partners Ltd. (a) (c) | | | 983 | | |
| | 14 | | | Giant Industries, Inc. (a) (c) | | | 515 | | |
| | 145 | | | Houston Exploration Co. (a) | | | 7,681 | | |
| | 39 | | | Mission Resources Corp. (a) | | | 316 | | |
| | 14 | | | Penn Virginia Corp. (c) | | | 630 | | |
| | 187 | | | Southwestern Energy Co. (a) | | | 8,799 | | |
| | 53 | | | St. Mary Land & Exploration Co. | | | 1,542 | | |
| | 35 | | | Stone Energy Corp. (a) | | | 1,687 | | |
| | 31 | | | Swift Energy Co. (a) | | | 1,100 | | |
| | 55 | | | Tesoro Corp. | | | 2,558 | | |
| | 70 | | | Vintage Petroleum, Inc. | | | 2,136 | | |
| | 34 | | | World Fuel Services Corp. | | | 798 | | |
| | | | 32,107 | | |
| | | | | Paper & Forest Products - 0.1% | | | |
| | 22 | | | Schweitzer-Mauduit International, Inc. (c) | | | 672 | | |
| | | | | Personal Products - 0.1% | |
| | 43 | | | Playtex Products, Inc. (a) | | | 467 | | |
| | | | | Pharmaceuticals - 1.6% | |
| | 31 | | | Able Laboratories, Inc. (a) (c) | | | 108 | | |
| | 137 | | | Adolor Corp. (a) (c) | | | 1,264 | | |
| | 16 | | | Antigenics, Inc. (a) (c) | | | 84 | | |
| | 99 | | | AtheroGenics, Inc. (a) (c) | | | 1,574 | | |
| | 40 | | | Auxilium Pharmaceuticals, Inc. (a) (c) | | | 191 | | |
| | 583 | | | AVANIR Pharmaceuticals, Class A (a) | | | 1,632 | | |
| | 251 | | | Cypress Bioscience, Inc. (a) (c) | | | 3,317 | | |
| | 38 | | | Impax Laboratories, Inc. (a) (c) | | | 590 | | |
| | 82 | | | Medicis Pharmaceutical Corp., Class A (c) | | | 2,605 | | |
| | 51 | | | Palatin Technologies, Inc. (a) (c) | | | 90 | | |
| | 8 | | | Par Pharmaceutical Cos, Inc. (a) | | | 267 | | |
| | 86 | | | Theravance, Inc. (a) | | | 1,454 | | |
| | | | 13,176 | | |
SEE NOTES TO FINANCIAL STATEMENTS.
JPMorgan U.S. Equity Mid/Small Cap Funds 43
JPMorgan Small Cap Core Fund
SCHEDULE OF PORTFOLIO INVESTMENTS AS OF JUNE 30, 2005
(Amounts in thousands)
(CONTINUED)
(Unaudited)
| SHARES | | SECURITY DESCRIPTION | | VALUE | |
| Long-Term Investments - continued | |
| | | | | Real Estate - 8.0% | | | |
| | 89 | | | Affordable Residential Communities
(REIT) (c) (m) | | $ | 1,183 | | |
| | 60 | | | American Financial Realty Trust (REIT) | | | 917 | | |
| | 101 | | | American Home Mortgage
Investment Corp. (REIT) (c) | | | 3,524 | | |
| | 103 | | | Anthracite Capital, Inc. (REIT) (c) | | | 1,218 | | |
| | 11 | | | Ashford Hospitality Trust, Inc. | | | 122 | | |
| | 18 | | | Boykin Lodging Co. (REIT) (a) | | | 234 | | |
| | 56 | | | Capital Automotive REIT (REIT) | | | 2,145 | | |
| | 162 | | | CarrAmerica Realty Corp. (REIT) | | | 5,854 | | |
| | 43 | | | Entertainment Properties Trust (REIT) | | | 1,978 | | |
| | 93 | | | Equity Inns, Inc. (REIT) | | | 1,240 | | |
| | 100 | | | FelCor Lodging Trust, Inc. (REIT) (a) | | | 1,441 | | |
| | 46 | | | Gables Residential Trust (REIT) | | | 1,984 | | |
| | 46 | | | Glimcher Realty Trust (REIT) (c) | | | 1,271 | | |
| | 153 | | | Government Properties Trust, Inc.
(REIT) (c) | | | 1,482 | | |
| | 42 | | | Impac Mortgage Holdings, Inc.
(REIT) (c) | | | 780 | | |
| | 203 | | | Innkeepers USA Trust (REIT) | | | 3,036 | | |
| | 9 | | | Jones Lang LaSalle, Inc. (a) | | | 394 | | |
| | 8 | | | Kilroy Realty Corp. (REIT) | | | 389 | | |
| | 24 | | | LaSalle Hotel Properties (REIT) | | | 797 | | |
| | 51 | | | Levitt Corp., Class A | | | 1,535 | | |
| | 97 | | | Lexington Corp. Properties Trust (REIT) | | | 2,348 | | |
| | 123 | | | LTC Properties, Inc. (REIT) (c) | | | 2,540 | | |
| | 110 | | | Maguire Properties, Inc. (REIT) | | | 3,123 | | |
| | 155 | | | Meristar Hospitality
Corp. (REIT) (a) (c) | | | 1,329 | | |
| | 95 | | | MFA Mortgage Investments,
Inc. (REIT) | | | 704 | | |
| | 135 | | | Mid-America Apartment
Communities, Inc. (REIT) | | | 6,113 | | |
| | 14 | | | National Health Investors,
Inc. (REIT) (c) | | | 404 | | |
| | 34 | | | Novastar Financial, Inc. (REIT) (c) | | | 1,319 | | |
| | 91 | | | Pennsylvania Real Estate Investment
Trust (REIT) (c) | | | 4,337 | | |
| | 110 | | | Prentiss Properties Trust (REIT) | | | 3,994 | | |
| | 129 | | | RAIT Investment Trust (REIT) (c) | | | 3,867 | | |
| | 62 | | | Saul Centers, Inc. (REIT) (c) | | | 2,250 | | |
| | 34 | | | Taubman Centers, Inc. (REIT) (c) | | | 1,173 | | |
| | | | 65,025 | | |
| SHARES | | SECURITY DESCRIPTION | | VALUE | |
| | | | | Road & Rail - 1.6% | | | |
| | 17 | | | Amerco, Inc. (a) | | $ | 900 | | |
| | 25 | | | Arkansas Best Corp. | | | 798 | | |
| | 61 | | | Dollar Thrifty Automotive Group,
Inc. (a) (c) | | | 2,313 | | |
| | 77 | | | Genesee & Wyoming, Inc., Class A (a) | | | 2,098 | | |
| | 16 | | | Old Dominion Freight Line (a) | | | 424 | | |
| | 32 | | | Overnite Corp. | | | 1,375 | | |
| | 80 | | | RailAmerica, Inc. (a) (c) | | | 956 | | |
| | 100 | | | SCS Transportation, Inc. (a) | | | 1,785 | | |
| | 19 | | | Swift Transportation Co., Inc. (a) (c) | | | 450 | | |
| | 53 | | | U.S. Xpress Enterprises, Inc., Class A (a) | | | 627 | | |
| | 80 | | | Werner Enterprises, Inc. | | | 1,561 | | |
| | | | 13,287 | | |
| | | | | Semiconductors & Semiconductor
Equipment - 4.5% | | | |
| | 24 | | | Actel Corp. (a) (c) | | | 335 | | |
| | 32 | | | ADE Corp. (a) (c) (m) | | | 889 | | |
| | 66 | | | Advanced Energy Industries, Inc. (a) | | | 519 | | |
| | 99 | | | AMIS Holdings, Inc. (a) | | | 1,321 | | |
| | 154 | | | Amkor Technology, Inc. (a) (c) | | | 692 | | |
| | 106 | | | Applied Micro Circuits Corp. (a) | | | 272 | | |
| | 27 | | | Asyst Technologies, Inc. (a) (c) | | | 118 | | |
| | 299 | | | Atmel Corp. (a) | | | 708 | | |
| | 18 | | | ATMI, Inc. (a) (c) | | | 511 | | |
| | 40 | | | August Technology Corp. (a) | | | 465 | | |
| | 136 | | | Axcelis Technologies, Inc. (a) | | | 934 | | |
| | 51 | | | Brooks Automation, Inc. (a) (c) | | | 762 | | |
| | 37 | | | Cabot Microelectronics Corp. (a) (c) | | | 1,067 | | |
| | 75 | | | Cirrus Logic, Inc. (a) | | | 400 | | |
| | 8 | | | Cohu, Inc. (c) | | | 168 | | |
| | 146 | | | Conexant Systems, Inc. (a) (c) | | | 235 | | |
| | 54 | | | Credence Systems Corp. (a) (c) | | | 484 | | |
| | 42 | | | Cymer, Inc. (a) (c) | | | 1,094 | | |
| | 125 | | | Cypress Semiconductor Corp. (a) | | | 1,572 | | |
| | 23 | | | Diodes, Inc. (a) (c) | | | 702 | | |
| | 23 | | | DSP Group, Inc. (a) | | | 549 | | |
| | 21 | | | Exar Corp. (a) | | | 305 | | |
| | 58 | | | Fairchild Semiconductor International,
Inc. (a) | | | 861 | | |
| | 17 | | | Genesis Microchip, Inc. (a) (c) | | | 310 | | |
| | 35 | | | Integrated Circuit Systems, Inc. (a) | | | 716 | | |
SEE NOTES TO FINANCIAL STATEMENTS.
JPMorgan U.S. Equity Mid/Small Cap Funds 44
SEMI-ANNUAL REPORT JUNE 30
2005
SCHEDULE OF PORTFOLIO INVESTMENTS AS OF JUNE 30, 2005
(Amounts in thousands)
(Unaudited)
| SHARES | | SECURITY DESCRIPTION | | VALUE | |
| | Long-Term Investments - continued | | | | |
| | | | | Semiconductors & Semiconductor
Equipment - Continued | |
| | 27 | | | Integrated Silicon Solutions,
Inc. (a) (c) | | $ | 196 | | |
| | 43 | | | IXYS Corp. (a) | | | 614 | | |
| | 24 | | | Kopin Corp. (a) (c) | | | 121 | | |
| | 48 | | | Lattice Semiconductor Corp. (a) | | | 211 | | |
| | 56 | | | LTX Corp. (a) | | | 277 | | |
| | 62 | | | Mattson Technology, Inc. (a) (c) | | | 446 | | |
| | 84 | | | Micrel, Inc. (a) | | | 970 | | |
| | 62 | | | Microsemi Corp. (a) | | | 1,169 | | |
| | 29 | | | Mindspeed Technologies, Inc. (a) (c) | | | 36 | | |
| | 66 | | | MIPS Technologies, Inc. (a) | | | 472 | | |
| | 18 | | | MKS Instruments, Inc. (a) (c) | | | 311 | | |
| | 54 | | | Mykrolis Corp. (a) | | | 760 | | |
| | 68 | | | Omnivision Technologies, Inc. (a) (c) | | | 920 | | |
| | 319 | | | ON Semiconductor Corp. (a) (c) | | | 1,468 | | |
| | 69 | | | Photronics, Inc. (a) (c) | | | 1,617 | | |
| | 68 | | | Pixelworks, Inc. (a) (c) | | | 583 | | |
| | 69 | | | PMC-Sierra, Inc. (a) | | | 641 | | |
| | 18 | | | Power Integrations, Inc. (a) (c) | | | 380 | | |
| | 47 | | | Rambus, Inc. (a) (c) | | | 634 | | |
| | 180 | | | RF Micro Devices, Inc. (a) (c) | | | 975 | | |
| | 44 | | | Semitool, Inc. (a) | | | 417 | | |
| | 74 | | | Semtech Corp. (a) | | | 1,232 | | |
| | 41 | | | Sigmatel, Inc. (a) (c) | | | 710 | | |
| | 87 | | | Silicon Image, Inc. (a) | | | 892 | | |
| | 38 | | | Silicon Laboratories, Inc. (a) | | | 1,001 | | |
| | 139 | | | Silicon Storage Technology, Inc. (a) (c) | | | 559 | | |
| | 124 | | | Skyworks Solutions, Inc. (a) | | | 915 | | |
| | 12 | | | Supertex, Inc. (a) (c) | | | 217 | | |
| | 83 | | | Transmeta Corp. (a) (c) | | | 50 | | |
| | 9 | | | Ultratech, Inc. (a) (c) | | | 156 | | |
| | 23 | | | Varian Semiconductor Equipment
Associates, Inc. (a) (c) | | | 833 | | |
| | 211 | | | Vitesse Semiconductor Corp. (a) (c) | | | 441 | | |
| | 26 | | | Zoran Corp. (a) | | | 347 | | |
| | | | 36,560 | | |
| | | | | Software - 2.3% | | | |
| | 7 | | | Ansoft Corp. (a) | | | 164 | | |
| | 22 | | | Ansys, Inc. (a) (c) | | | 792 | | |
| | 52 | | | Aspen Technology, Inc. (a) (c) | | | 269 | | |
| SHARES | | SECURITY DESCRIPTION | | VALUE | |
| | | | | Software - Continued | | | |
| | 63 | | | Borland Software Corp. (a) | | $ | 429 | | |
| | 61 | | | E.piphany, Inc. (a) (c) | | | 213 | | |
| | 31 | | | Epicor Software Corp. (a) | | | 408 | | |
| | 26 | | | EPIQ Systems, Inc. (a) (c) | | | 422 | | |
| | 24 | | | Factset Research Systems, Inc. (c) | | | 848 | | |
| | 15 | | | Filenet Corp. (a) (c) | | | 385 | | |
| | 44 | | | Informatica Corp. (a) (c) | | | 367 | | |
| | 7 | | | Intervideo, Inc. (a) | | | 96 | | |
| | 13 | | | InterVoice, Inc. (a) | | | 109 | | |
| | 33 | | | JDA Software Group, Inc. (a) | | | 377 | | |
| | 12 | | | Kronos, Inc. (a) (c) | | | 485 | | |
| | 30 | | | Macrovision Corp. (a) | | | 672 | | |
| | 37 | | | Magma Design Automation, Inc. (a) (c) | | | 308 | | |
| | 29 | | | Manhattan Associates, Inc. (a) (c) | | | 555 | | |
| | 56 | | | Mentor Graphics Corp. (a) (c) | | | 572 | | |
| | 18 | | | MicroStrategy, Inc. (a) (c) | | | 965 | | |
| | 30 | | | MRO Software, Inc. (a) (c) | | | 443 | | |
| | 273 | | | Parametric Technology Corp. (a) | | | 1,739 | | |
| | 20 | | | Pegasystems, Inc. (a) (c) | | | 117 | | |
| | 42 | | | Phoenix Technologies Ltd. (a) | | | 325 | | |
| | 22 | | | Portal Software, Inc. (a) (c) | | | 43 | | |
| | 89 | | | Progress Software Corp. (a) | | | 2,689 | | |
| | 7 | | | Quality Systems, Inc. (a) (c) | | | 322 | | |
| | 23 | | | Quest Software, Inc. (a) | | | 307 | | |
| | 133 | | | Secure Computing Corp. (a) | | | 1,447 | | |
| | 6 | | | SPSS, Inc. (a) (c) | | | 107 | | |
| | 9 | | | SS&C Technologies, Inc. (c) | | | 269 | | |
| | 17 | | | Talx Corp. | | | 502 | | |
| | 38 | | | TIBCO Software, Inc. (a) | | | 250 | | |
| | 11 | | | TradeStation Group, Inc. (a) | | | 97 | | |
| | 46 | | | Transaction Systems Architechs, Inc. (a) | | | 1,123 | | |
| | 53 | | | Wind River Systems, Inc. (a) | | | 824 | | |
| | | | 19,040 | | |
| | | | | Specialty Retail - 5.2% | | | |
| | 326 | | | Aaron Rents, Inc. | | | 8,117 | | |
| | 83 | | | Aeropostale, Inc. (a) | | | 2,802 | | |
| | 95 | | | Asbury Automotive Group, Inc. (a) | | | 1,459 | | |
| | 20 | | | Big 5 Sporting Goods Corp. | | | 553 | | |
| | 43 | | | Brookstone, Inc. (a) (c) | | | 804 | | |
| | 21 | | | Build-A-Bear Workshop, Inc. (a) | | | 485 | | |
| | 17 | | | Building Material Holding Corp. | | | 1,206 | | |
SEE NOTES TO FINANCIAL STATEMENTS.
JPMorgan U.S. Equity Mid/Small Cap Funds 45
JPMorgan Small Cap Core Fund
SCHEDULE OF PORTFOLIO INVESTMENTS AS OF JUNE 30, 2005
(Amounts in thousands)
(CONTINUED)
(Unaudited)
| SHARES | | SECURITY DESCRIPTION | | VALUE | |
| Long-Term Investments - continued | |
| | | | | Specialty Retail - Continued | | | |
| | 60 | | | Burlington Coat Factory Warehouse
Corp. (c) | | $ | 2,541 | | |
| | 322 | | | Charming Shoppes, Inc. (a) | | | 3,007 | | |
| | 39 | | | Children's Place, Inc. (a) (c) | | | 1,834 | | |
| | 21 | | | Dress Barn, Inc. (a) | | | 482 | | |
| | 10 | | | Electronics Boutique Holdings
Corp. (a) (c) | | | 641 | | |
| | 65 | | | Genesco, Inc. (a) (c) | | | 2,411 | | |
| | 35 | | | Guess?, Inc. (a) (c) | | | 585 | | |
| | 35 | | | HOT Topic, Inc. (a) (c) | | | 660 | | |
| | 49 | | | Lithia Motors, Inc., Class A (c) | | | 1,405 | | |
| | 19 | | | Movie Gallery, Inc. (c) | | | 500 | | |
| | 47 | | | Pacific Sunwear of California, Inc. (a) | | | 1,078 | | |
| | 52 | | | Petco Animal Supplies, Inc. (a) | | | 1,525 | | |
| | 106 | | | Rent-A-Center, Inc. (a) | | | 2,457 | | |
| | 47 | | | Select Comfort Corp. (a) (c) | | | 1,007 | | |
| | 20 | | | Sonic Automotive, Inc. | | | 430 | | |
| | 13 | | | Sports Authority, Inc. (The) (a) (c) | | | 413 | | |
| | 10 | | | Stage Stores, Inc. (a) (c) | | | 419 | | |
| | 99 | | | Stein Mart, Inc. (c) | | | 2,174 | | |
| | 89 | | | Too, Inc. (a) | | | 2,089 | | |
| | 20 | | | Trans World Entertainment Corp. (a) (c) | | | 237 | | |
| | 24 | | | United Auto Group, Inc. (c) | | | 724 | | |
| | | | 42,045 | | |
| | | | | Textiles, Apparel & Luxury Goods - 1.2% | | | |
| | 18 | | | Brown Shoe Co., Inc. (c) | | | 713 | | |
| | 18 | | | DHB Industries, Inc. (a) (c) | | | 155 | | |
| | 25 | | | Fossil, Inc. (a) (c) | | | 558 | | |
| | 70 | | | K-Swiss, Inc., Class A | | | 2,277 | | |
| | 41 | | | Kellwood Co. | | | 1,095 | | |
| | 43 | | | Kenneth Cole Productions, Inc., Class A | | | 1,341 | | |
| | 37 | | | Movado Group, Inc. (c) | | | 697 | | |
| | 21 | | | Russell Corp. (c) | | | 435 | | |
| | 70 | | | Skechers U.S.A., Inc., Class A (a) | | | 991 | | |
| | 36 | | | Unifirst Corp. | | | 1,476 | | |
| | | | 9,738 | | |
| | | | | Thrifts & Mortgage Finance - 3.1% | | | |
| | 44 | | | Accredited Home Lenders
Holding Co. (a) (c) | | | 1,949 | | |
| | 161 | | | Bank Atlantic Bancorp, Inc., Class A (c) | | | 3,055 | | |
| SHARES | | SECURITY DESCRIPTION | | VALUE | |
| | | | | Thrifts & Mortgage Finance - Continued | |
| | 19 | | | Commercial Capital Bancorp, Inc. (c) | | $ | 322 | | |
| | 86 | | | Corus Bankshares, Inc. | | | 4,783 | | |
| | 21 | | | Dime Community Bancshares | | | 312 | | |
| | 77 | | | First Niagara Financial Group, Inc. (c) | | | 1,121 | | |
| | 3 | | | First Place Financial Corp. | | | 52 | | |
| | 3 | | | FirstFed Financial Corp. (a) | | | 197 | | |
| | 47 | | | Flagstar Bancorp, Inc. (c) | | | 892 | | |
| | 60 | | | Fremont General Corp. (c) | | | 1,469 | | |
| | 29 | | | Gibraltar Industries, Inc. (c) | | | 534 | | |
| | 14 | | | ITLA Capital Corp. (a) | | | 733 | | |
| | 44 | | | Partners Trust Financial Group, Inc. (c) | | | 465 | | |
| | 98 | | | Provident Bancorp, Inc. (a) (c) | | | 1,190 | | |
| | 140 | | | R&G Financial Corp., Class B | | | 2,475 | | |
| | 38 | | | Sterling Financial Corp.(a) | | | 1,421 | | |
| | 261 | | | W Holding Co., Inc. | | | 2,670 | | |
| | 29 | | | WSFS Financial Corp. | | | 1,581 | | |
| | | | 25,221 | | |
| | | | | Tobacco - 0.5% | | | |
| | 172 | | | Alliance One International, Inc. (c) | | | 1,033 | | |
| | 64 | | | Universal Corp. | | | 2,793 | | |
| | | | 3,826 | | |
| | | | | Trading Companies & Distributors - 1.4% | | | |
| | 273 | | | Applied Industrial Technologies,
Inc. (c) | | | 8,801 | | |
| | 84 | | | Hughes Supply, Inc. | | | 2,346 | | |
| | 16 | | | Nuco2, Inc. (a) (c) | | | 418 | | |
| | | | 11,565 | | |
| | | | | Wireless Telecommunication Services - 0.5% | | | |
| | 79 | | | Centennial Communications Corp. (a) | | | 1,102 | | |
| | 423 | | | Dobson Communications Corp. (a) | | | 1,800 | | |
| | 24 | | | InPhonic, Inc. (a) (c) | | | 375 | | |
| | 4 | | | Remec, Inc. (a) (c) | | | 28 | | |
| | 75 | | | US Unwired, Inc. (a) | | | 438 | | |
| | | | 3,743 | | |
| | | | | Total Common Stocks
(Cost $747,661) | | | 797,421 | | |
| | | | | Total Long-Term Investments
(Cost $747,661) | | | 797,421 | | |
SEE NOTES TO FINANCIAL STATEMENTS.
JPMorgan U.S. Equity Mid/Small Cap Funds 46
SEMI-ANNUAL REPORT JUNE 30
2005
SCHEDULE OF PORTFOLIO INVESTMENTS AS OF JUNE 30, 2005
(Amounts in thousands)
(Unaudited)
| SHARES | | SECURITY DESCRIPTION | | VALUE | |
| | Short-Term Investments - 2.0% | | | | |
| | | | | Investment Company - 1.6% | |
| | 12,739 | | | JPMorgan Prime Money Market
Fund (b) (m) | | $ | 12,739 | | |
PRINCIPAL
AMOUNT | | | | | |
| | | | | U.S. Treasury Obligation - 0.4% | | | |
| $ | 3,350 | | | U.S. Treasury Note, 1.88%,
11/30/05 (k) | | | 3,331 | | |
| | | | | Total Short-Term Investments
(Cost $16,065) | | |
16,070 | | |
| SHARES | |
| Investments of Cash Collateral for Securities Loaned - 22.9% | |
| | | | | Investment Companies - 0.8% | | | |
| | 2,926 | | | BGI Prime Money Market Fund | | | 2,926 | | |
| | 3,557 | | | Morgan Stanley Intitutional
Liquidity Funds | | | 3,557 | | |
| | | | 6,483 | | |
PRINCIPAL
AMOUNT | | SECURITY DESCRIPTION | | VALUE | |
| | | Repurchase Agreements - 22.1% | | | | | |
| $ | 180,000 | | | Credit Suisse First Boston LLC, 3.46%,
dated 06/30/05, due 07/01/05,
repurchase price $180,018,
collateralized by
U.S. Agency Mortgages | | $ | 180,000 | | |
| | | Total Investments of Cash Collateral
for Securities Loaned
(Cost $186,483) | | | 186,483 | | |
| | | Total Investments - 122.8% | | $ | 999,974 | | |
| | | (Cost $950,209) | | | | | |
| | | Liabilities in excess of
other assets - (22.8)% | | | (185,405 | ) | |
| | | Net Assets - 100.0% | | $ | 814,569 | | |
Percentages indicated are based on net assets.
Futures Contracts
(Amounts in thousands, except number of contracts)
NUMBER OF
CONTRACTS | | DESCRIPTION | | EXPIRATION DATE | | NOTIONAL
VALUE AT
06/30/05 | | UNREALIZED
APPRECIATION | |
| | 47 | | | Russell 2000 Index | | September, 2005 | | $ | 15,113 | | | $ | 353 | | |
SEE NOTES TO FINANCIAL STATEMENTS.
JPMorgan U.S. Equity Mid/Small Cap Funds 47
JPMorgan Small Cap Equity Fund
SCHEDULE OF PORTFOLIO INVESTMENTS AS OF JUNE 30, 2005
(Amounts in thousands)
(Unaudited)
| SHARES | | SECURITY DESCRIPTION | | VALUE | |
| | Long-Term Investments - 95.7% | | | | |
| | | | | Common Stocks - 95.7% | |
| | | | | Aerospace & Defense - 1.7% | |
| | 56 | | | Alliant Techsystems, Inc. (a) | | $ | 3,979 | | |
| | 67 | | | Esterline Technologies Corp. (a) (c) | | | 2,665 | | |
| | | | 6,644 | | |
| | | | | Automobiles - 0.7% | | | |
| | 77 | | | Winnebago Industries, Inc. (c) | | | 2,528 | | |
| | | | | Banks - 0.1% | | | |
| | 11 | | | Western Alliance Bancorp (c) | | | 285 | | |
| | | | | Biotechnology - 0.2% | | | |
| | 43 | | | ICOS Corp. (a) (c) | | | 904 | | |
| | | | | Chemicals - 5.5% | | | |
| | 187 | | | Airgas, Inc. | | | 4,601 | | |
| | 152 | | | Albemarle Corp. | | | 5,558 | | |
| | 98 | | | Georgia Gulf Corp. (c) | | | 3,046 | | |
| | 112 | | | Scotts Miracle-Gro Co. (The), Class A (a) | | | 8,004 | | |
| | | | 21,209 | | |
| | | | | Commercial Banks - 8.8% | | | |
| | 69 | | | Alabama National Bancorp (c) | | | 4,478 | | |
| | 45 | | | Bank of the Ozarks, Inc. (c) | | | 1,478 | | |
| | 49 | | | Boston Private Financial Holdings, Inc. | | | 1,243 | | |
| | 85 | | | East-West Bancorp, Inc. (c) | | | 2,838 | | |
| | 45 | | | First Community Bancorp, Inc. | | | 2,142 | | |
| | 102 | | | Hancock Holding Co. (c) | | | 3,519 | | |
| | 32 | | | MB Financial, Inc. (c) | | | 1,255 | | |
| | 127 | | | SY Bancorp, Inc. (c) | | | 2,904 | | |
| | 104 | | | Texas Regional Bancshares, Inc. (c) | | | 3,182 | | |
| | 231 | | | United Bancshares, Inc. (c) | | | 8,240 | | |
| | 48 | | | Wintrust Financial Corp. (c) | | | 2,523 | | |
| | | | 33,802 | | |
| | | | | Commercial Services & Supplies - 6.5% | | | |
| | 121 | | | Brady Corp., Class A (c) | | | 3,748 | | |
| | 560 | | | Hudson Highland Group, Inc. (a) (c) | | | 8,737 | | |
| | 71 | | | Morningstar, Inc. (a) | | | 1,999 | | |
| | 76 | | | School Specialty, Inc. (a) (c) | | | 3,555 | | |
| | 187 | | | Waste Connections, Inc. (a) | | | 6,981 | | |
| | | | 25,020 | | |
| SHARES | | SECURITY DESCRIPTION | | VALUE | |
| | | | | Communications Equipment - 1.3% | |
| | 111 | | | Avocent Corp. (a) | | $ | 2,904 | | |
| | 107 | | | Inter-Tel, Inc. (c) | | | 1,982 | | |
| | | | 4,886 | | |
| | | | | Computers & Peripherals - 1.1% | | | |
| | 126 | | | Intergraph Corp. (a) (c) | | | 4,349 | | |
| | | | | Containers & Packaging - 1.9% | |
| | 70 | | | AptarGroup, Inc. (c) | | | 3,576 | | |
| | 68 | | | Silgan Holdings, Inc. | | | 3,825 | | |
| | | | 7,401 | | |
| | | | | Diversified Telecommunication Services - 0.2% | | | |
| | 24 | | | NeuStar, Inc. (a) | | | 625 | | |
| | | | | Electrical Equipment - 1.6% | |
| | 426 | | | General Cable Corp. (a) (c) | | | 6,316 | | |
| | | | | Electronic Equipment & Instruments - 1.7% | |
| | 110 | | | Anixter International, Inc. (a) (c) | | | 4,070 | | |
| | 59 | | | Scansource, Inc. (a) (c) | | | 2,542 | | |
| | | | 6,612 | | |
| | | | | Energy Equipment & Services - 2.6% | | | |
| | 84 | | | FMC Technologies, Inc. (a) (c) | | | 2,695 | | |
| | 86 | | | Maverick Tube Corp. (a) (c) | | | 2,575 | | |
| | 134 | | | Universal Compression
Holdings, Inc. (a) (c) | | | 4,870 | | |
| | | | 10,140 | | |
| | | | | Gas Utilities - 1.1% | | | |
| | 71 | | | Atmos Energy Corp. (c) | | | 2,057 | | |
| | 48 | | | New Jersey Resources Corp. (c) | | | 2,335 | | |
| | | | 4,392 | | |
| | | | | Health Care Equipment & Supplies - 5.4% | | | |
| | 79 | | | Advanced Medical Optics, Inc. (a) | | | 3,128 | | |
| | 59 | | | Cooper Cos., Inc. (The) | | | 3,607 | | |
| | 41 | | | Datascope Corp. (c) | | | 1,357 | | |
| | 41 | | | Idexx Laboratories, Inc. (a) (c) | | | 2,556 | | |
| | 76 | | | Invacare Corp. (c) | | | 3,363 | | |
SEE NOTES TO FINANCIAL STATEMENTS.
JPMorgan U.S. Equity Mid/Small Cap Funds 48
SEMI-ANNUAL REPORT JUNE 30
2005
SCHEDULE OF PORTFOLIO INVESTMENTS AS OF JUNE 30, 2005
(Amounts in thousands)
(Unaudited)
| SHARES | | SECURITY DESCRIPTION | | VALUE | |
| | Long-Term Investments - continued | | | | |
| | | | | Health Care Equipment & Supplies - Continued | |
| | 57 | | | Respironics, Inc. (a) | | $ | 2,073 | | |
| | 122 | | | Sybron Dental Specialties, Inc. (a) | | | 4,605 | | |
| | | | 20,689 | | |
| | | | | Health Care Providers & Services - 6.6% | | | |
| | 412 | | | Alderwoods Group, Inc. (a) (c) | | | 5,915 | | |
| | 70 | | | AMERIGROUP Corp. (a) (c) | | | 2,818 | | |
| | 119 | | | Kindred Healthcare, Inc. (a) (c) | | | 4,725 | | |
| | 89 | | | LifePoint Hospitals, Inc. (a) | | | 4,517 | | |
| | 327 | | | PSS World Medical, Inc. (a) (c) | | | 4,072 | | |
| | 62 | | | Sunrise Senior Living, Inc. (a) (c) | | | 3,363 | | |
| | | | 25,410 | | |
| | | | | Hotels, Restaurants & Leisure - 5.8% | | | |
| | 250 | | | Applebees International, Inc. | | | 6,628 | | |
| | 232 | | | La Quinta Corp. (a) | | | 2,166 | | |
| | 128 | | | Lone Star Steakhouse & Saloon, Inc. | | | 3,905 | | |
| | 176 | | | Orient-Express Hotels Ltd. (Bermuda) (c) | | | 5,571 | | |
| | 100 | | | Papa John's International, Inc. (a) (c) | | | 3,977 | | |
| | | | 22,247 | | |
| | | | | Household Durables - 2.3% | | | |
| | 163 | | | Jarden Corp. (a) (c) | | | 8,789 | | |
| | | | | Insurance - 3.7% | | | |
| | 103 | | | American Physicians Capital, Inc. (a) | | | 3,841 | | |
| | 95 | | | Platinum Underwriters
Holdings Ltd. (Bermuda) | | | 3,023 | | |
| | 173 | | | ProAssurance Corp. (a) (c) | | | 7,208 | | |
| | | | 14,072 | | |
| | | | | Internet Software & Services - 0.9% | | | |
| | 296 | | | Digitas, Inc. (a) | | | 3,373 | | |
| | | | | IT Services - 1.3% | | | |
| | 80 | | | CACI International, Inc., Class A (a) | | | 5,072 | | |
| | | | | Leisure Equipment & Products - 0.4% | | | |
| | 31 | | | Polaris Industries, Inc. (c) | | | 1,663 | | |
| SHARES | | SECURITY DESCRIPTION | | VALUE | |
| | | | | Machinery - 5.7% | |
| | 146 | | | Kaydon Corp. (c) | | $ | 4,060 | | |
| | 126 | | | Lincoln Electric Holdings, Inc. (c) | | | 4,164 | | |
| | 128 | | | Manitowoc Co., Inc. | | | 5,246 | | |
| | 64 | | | Oshkosh Truck Corp. | | | 4,979 | | |
| | 84 | | | Toro Co. | | | 3,243 | | |
| | | | 21,692 | | |
| | | | | Media - 3.2% | | | |
| | 171 | | | Catalina Marketing Corp. (c) | | | 4,338 | | |
| | 109 | | | Entercom Communications Corp. (a) | | | 3,625 | | |
| | 105 | | | Lee Enterprises, Inc. | | | 4,193 | | |
| | | | 12,156 | | |
| | | | | Metals & Mining - 1.2% | | | |
| | 194 | | | Commercial Metals Co. | | | 4,631 | | |
| | | | | Multi-Utilities - 0.8% | |
| | 98 | | | NorthWestern Corp. (c) | | | 3,098 | | |
| | | | | Oil, Gas & Consumable Fuels - 3.8% | |
| | 6 | | | Atlas America, Inc. (a) (c) | | | 223 | | |
| | 58 | | | Inergy Holdings LP (a) (c) | | | 1,586 | | |
| | 54 | | | Plains Exploration & Production Co. (a) | | | 1,919 | | |
| | 94 | | | Southwestern Energy Co. (a) (c) | | | 4,421 | | |
| | 222 | | | St. Mary Land & Exploration Co. (c) | | | 6,419 | | |
| | | | 14,568 | | |
| | | | | Real Estate - 4.0% | | | |
| | 49 | | | Alexandria Real Estate
Equities, Inc. (REIT) | | | 3,562 | | |
| | 45 | | | EastGroup Properties (REIT) | | | 1,908 | | |
| | 43 | | | First Potomac Realty Trust (REIT) | | | 1,066 | | |
| | 108 | | | Jones Lang LaSalle, Inc. (a) (c) | | | 4,795 | | |
| | 90 | | | Mid-America Apartment
Communities, Inc. (REIT) | | | 4,101 | | |
| | | | 15,432 | | |
| | | | | Road & Rail - 2.3% | | | |
| | 84 | | | Arkansas Best Corp. (c) | | | 2,675 | | |
| | 209 | | | Landstar System, Inc. (a) | | | 6,307 | | |
| | | | 8,982 | | |
SEE NOTES TO FINANCIAL STATEMENTS.
JPMorgan U.S. Equity Mid/Small Cap Funds 49
JPMorgan Small Cap Equity Fund
SCHEDULE OF PORTFOLIO INVESTMENTS AS OF JUNE 30, 2005
(Amounts in thousands)
(CONTINUED)
(Unaudited)
| SHARES | | SECURITY DESCRIPTION | | VALUE | |
| | Long-Term Investments - continued | | | | |
| | | | | Semiconductors & Semiconductor
Equipment - 2.5% | |
| | 36 | | | Cymer, Inc. (a) (c) | | $ | 941 | | |
| | 155 | | | FSI International, Inc. (a) | | | 575 | | |
| | 57 | | | International Rectifier Corp. (a) | | | 2,725 | | |
| | 83 | | | Standard Microsystems Corp. (a) (c) | | | 1,940 | | |
| | 96 | | | Varian Semiconductor Equipment
Associates, Inc. (a) | | | 3,537 | | |
| | | | 9,718 | | |
| | | | | Software - 1.0% | | | |
| | 89 | | | Micros Systems, Inc. (a) | | | 3,987 | | |
| | | | | Specialty Retail - 4.2% | | | |
| | 102 | | | Finish Line, Inc., Class A (c) | | | 1,922 | | |
| | 89 | | | Genesco, Inc. (a) (c) | | | 3,299 | | |
| | 61 | | | Lithia Motors, Inc., Class A (c) | | | 1,749 | | |
| | 120 | | | Men's Wearhouse, Inc. (a) | | | 4,132 | | |
| | 235 | | | New York & Co., Inc. (a) (c) | | | 4,951 | | |
| | | | 16,053 | | |
| | | | | Textiles, Apparel & Luxury Goods - 0.9% | | | |
| | 86 | | | Timberland Co., Class A (a) | | | 3,314 | | |
| | | | | Trading Companies & Distributors - 4.7% | | | |
| | 217 | | | Hughes Supply, Inc. (c) | | | 6,086 | | |
| | 242 | | | Nuco2, Inc. (a) (c) | | | 6,210 | | |
| | 132 | | | Watsco, Inc. (c) | | | 5,623 | | |
| | | | 17,919 | | |
| | | | | Total Common Stocks
(Cost $294,463) | | | 367,978 | | |
| | | | | Total Long-Term Investments
(Cost $294,463) | | | 367,978 | | |
| | Short-Term Investment - 3.6% | | | | |
| | | | | Investment Company - 3.6% | |
| | 13,742 | | | JPMorgan Prime Money
Market Fund (b) (m)
(Cost $13,742) | | | 13,742 | | |
| SHARES | | SECURITY DESCRIPTION | | VALUE | |
| Investments of Cash Collateral for Securities Loaned - 21.0% | |
| | | Investment Company - 0.2% | |
| | 606 | | | BGI Prime Money Market Fund | | $ | 606 | | |
PRINCIPAL
AMOUNT | | | | | |
| | | Repurchase Agreement - 20.8% | |
| $79,855 | | UBS Securities LLC,
3.40%, dated 06/30/05,
due 07/01/05, repurchase
price $79,862, collateralized
by U.S. Agencies | | | 79,855 | | |
| | | Total Investments of Cash
Collateral for Securities Loaned
(Cost $80,461) | | | 80,461 | | |
| | | Total Investments - 120.3% | | $ | 462,181 | | |
| | | (Cost $388,666) | | | | | |
| | | Liabilities in excess of
other assets - (20.3)% | | | (77,835 | ) | |
| | | NET ASSETS - 100.0% | | $ | 384,346 | | |
Percentages indicated are based on net assets.
SEE NOTES TO FINANCIAL STATEMENTS.
JPMorgan U.S. Equity Mid/Small Cap Funds 50
JPMorgan U.S. Small Company Fund
SCHEDULE OF PORTFOLIO INVESTMENTS AS OF JUNE 30, 2005
(Amounts in thousands)
(Unaudited)
| SHARES | | SECURITY DESCRIPTION | | VALUE | |
| | Long-Term Investments - 99.0% | | | | |
| | | | | Common Stocks - 99.0% | |
| | | | | Aerospace & Defense - 2.2% | |
| | 6 | | | Armor Holdings, Inc. (a) | | $ | 230 | | |
| | 17 | | | Aviall, Inc. (a) | | | 537 | | |
| | 12 | | | BE Aerospace, Inc. (a) | | | 180 | | |
| | 3 | | | Curtiss-Wright Corp. | | | 135 | | |
| | 18 | | | Esterline Technologies Corp. (a) | | | 714 | | |
| | 7 | | | Heico Corp. | | | 173 | | |
| | 4 | | | Hexcel Corp. (a) | | | 71 | | |
| | 10 | | | Kaman Corp., Class A | | | 175 | | |
| | 49 | | | Moog, Inc., Class A (a) | | | 1,549 | | |
| | 9 | | | Orbital Sciences Corp. (a) | | | 88 | | |
| | 1 | | | Triumph Group, Inc. (a) | | | 29 | | |
| | | | 3,881 | | |
| | | | | Air Freight & Logistics - 0.1% | | | |
| | 4 | | | Hub Group, Inc., Class A (a) | | | 105 | | |
| | | | | Airlines - 0.8% | | | |
| | 28 | | | America West Holdings Corp., Class B (a) | | | 166 | | |
| | 1 | | | Continental Airlines, Inc., Class B (a) | | | 12 | | |
| | 13 | | | Delta Air Lines, Inc. (a) | | | 50 | | |
| | 39 | | | ExpressJet Holdings, Inc. (a) | | | 328 | | |
| | 21 | | | Mesa Air Group, Inc. (a) | | | 144 | | |
| | 2 | | | Northwest Airlines Corp. (a) | | | 10 | | |
| | 35 | | | Pinnacle Airlines Corp. (a) | | | 301 | | |
| | 19 | | | Skywest, Inc. | | | 345 | | |
| | | | 1,356 | | |
| | | | | Auto Components - 0.6% | | | |
| | 6 | | | American Axle & Manufacturing
Holdings, Inc. | | | 157 | | |
| | 13 | | | ArvinMeritor, Inc. | | | 230 | | |
| | 16 | | | Hayes Lemmerz International, Inc. (a) | | | 110 | | |
| | 3 | | | Sauer-Danfoss, Inc. | | | 60 | | |
| | 4 | | | Stoneridge, Inc. (a) | | | 27 | | |
| | 27 | | | Tenneco Automotive, Inc. (a) | | | 443 | | |
| | | | 1,027 | | |
| | | | | Automobiles - 0.4% | | | |
| | 13 | | | Fleetwood Enterprises, Inc. (a) | | | 131 | | |
| | 16 | | | Thor Industries, Inc. | | | 506 | | |
| | 3 | | | Winnebago Industries, Inc. | | | 92 | | |
| | | | 729 | | |
| SHARES | | SECURITY DESCRIPTION | | VALUE | |
| | | | | Biotechnology - 2.8% | |
| | 7 | | | Abgenix, Inc. (a) | | $ | 58 | | |
| | 27 | | | Alexion Pharmaceuticals, Inc. (a) | | | 613 | | |
| | 8 | | | Applera Corp. - Celera Genomics Group (a) | | | 82 | | |
| | 9 | | | Cell Genesys, Inc. (a) | | | 48 | | |
| | 7 | | | Corixa Corp. (a) | | | 31 | | |
| | 27 | | | Cubist Pharmaceuticals, Inc. (a) | | | 355 | | |
| | 5 | | | CV Therapeutics, Inc. (a) | | | 110 | | |
| | 5 | | | Diversa Corp. (a) | | | 27 | | |
| | 16 | | | Encysive Pharmaceuticals, Inc. (a) | | | 171 | | |
| | 7 | | | Enzon Pharmaceuticals, Inc. (a) | | | 44 | | |
| | 3 | | | Exelixis, Inc. (a) | | | 23 | | |
| | 86 | | | Genelabs Technologies (a) | | | 43 | | |
| | 5 | | | ICOS Corp. (a) | | | 114 | | |
| | 52 | | | Incyte Corp. (a) | | | 372 | | |
| | 10 | | | Ligand Pharmaceuticals Inc., Class B (a) | | | 72 | | |
| | 8 | | | Lifecell Corp. (a) | | | 132 | | |
| | 6 | | | Martek Biosciences Corp. (a) | | | 215 | | |
| | 15 | | | Myriad Genetics, Inc. (a) | | | 241 | | |
| | 23 | | | Nabi Biopharmaceuticals (a) | | | 343 | | |
| | 9 | | | OSI Pharmaceuticals, Inc. (a) | | | 380 | | |
| | 7 | | | Renovis, Inc. (a) | | | 101 | | |
| | 22 | | | Rigel Pharmaceuticals, Inc. (a) | | | 444 | | |
| | 12 | | | Seattle Genetics, Inc. (a) | | | 63 | | |
| | - | (h) | | Tanox, Inc. (a) | | | 5 | | |
| | 10 | | | Telik, Inc. (a) | | | 165 | | |
| | 3 | | | Transkaryotic Therapies, Inc. (a) | | | 110 | | |
| | 11 | | | United Therapeutics Corp. (a) | | | 526 | | |
| | 4 | | | Vicuron Pharmaceuticals, Inc. (a) | | | 98 | | |
| | | | 4,986 | | |
| | | | | Building Products - 1.9% | | | |
| | 7 | | | ElkCorp | | | 194 | | |
| | 4 | | | Griffon Corp. (a) | | | 89 | | |
| | 23 | | | Jacuzzi Brands, Inc. (a) | | | 250 | | |
| | 32 | | | Lennox International, Inc. | | | 669 | | |
| | 11 | | | NCI Building Systems, Inc. (a) | | | 348 | | |
| | 33 | | | Universal Forest Products, Inc. | | | 1,388 | | |
| | 11 | | | York International Corp. | | | 422 | | |
| | | | 3,360 | | |
| | | | | Capital Markets - 0.2% | | | |
| | 5 | | | National Financial Partners Corp. | | | 192 | | |
| | 8 | | | Waddell & Reed Financial, Inc. | | | 140 | | |
| | | | 332 | | |
SEE NOTES TO FINANCIAL STATEMENTS.
JPMorgan U.S. Equity Mid/Small Cap Funds 51
JPMorgan U.S. Small Company Fund
SCHEDULE OF PORTFOLIO INVESTMENTS AS OF JUNE 30, 2005
(Amounts in thousands)
(CONTINUED)
(Unaudited)
| SHARES | | SECURITY DESCRIPTION | | VALUE | |
| Long-Term Investments - continued | |
| | | | | Chemicals - 1.6% | | | |
| | 1 | | | Cytec Industries, Inc. | | $ | 24 | | |
| | 17 | | | FMC Corp. (a) | | | 966 | | |
| | 17 | | | Georgia Gulf Corp. | | | 531 | | |
| | 2 | | | H.B. Fuller Co. | | | 68 | | |
| | 6 | | | Headwaters, Inc. (a) | | | 193 | | |
| | 19 | | | Hercules, Inc. (a) | | | 262 | | |
| | 3 | | | Kronos Worlwide, Inc. | | | 81 | | |
| | 6 | | | NewMarket Corp. (a) | | | 90 | | |
| | 29 | | | PolyOne Corp. (a) | | | 191 | | |
| | 9 | | | Terra Industries, Inc. (a) | | | 58 | | |
| | 23 | | | W.R. Grace & Co. (a) | | | 179 | | |
| | 12 | | | Wellman, Inc. | | | 124 | | |
| | | | 2,767 | | |
| | | | | Commercial Banks - 6.0% | | | |
| | 4 | | | ABC Bancorp (m) | | | 64 | | |
| | 7 | | | Amcore Financial, Inc. | | | 209 | | |
| | 1 | | | AmericanWest Bancorp (a) | | | 26 | | |
| | 1 | | | BancFirst Corp. | | | 96 | | |
| | 17 | | | Bank of the Ozarks, Inc. | | | 565 | | |
| | 3 | | | Capital Corp. of the West | | | 70 | | |
| | 5 | | | Capitol Bancorp Ltd. | | | 182 | | |
| | 3 | | | Center Financial Corp. | | | 79 | | |
| | 8 | | | Central Pacific Financial Corp. | | | 296 | | |
| | 4 | | | Chemical Financial Corp. | | | 147 | | |
| | 3 | | | City Holding Co. | | | 113 | | |
| | 5 | | | Columbia Banking System, Inc. | | | 116 | | |
| | 23 | | | Community Bank System, Inc. | | | 551 | | |
| | 4 | | | Community Trust Bancorp, Inc. | | | 125 | | |
| | 20 | | | EuroBancshares, Inc. (a) | | | 319 | | |
| | 13 | | | First Bancorp | | | 502 | | |
| | 6 | | | First Republic Bank | | | 196 | | |
| | 16 | | | First State Bancorp, Inc. | | | 317 | | |
| | - | (h) | | Fulton Financial Corp. | | | 5 | | |
| | 6 | | | Glacier Bancorp, Inc. | | | 145 | | |
| | 14 | | | Gold Banc Corp., Inc. | | | 202 | | |
| | 9 | | | Greater Bay Bancorp | | | 232 | | |
| | 2 | | | Hanmi Financial Corp. | | | 34 | | |
| | 14 | | | IBERIABANK Corp. | | | 863 | | |
| | 11 | | | Independent Bank Corp. | | | 316 | | |
| | 22 | | | Irwin Financial Corp. | | | 490 | | |
| | 2 | | | Macatawa Bank Corp. | | | 56 | | |
| SHARES | | SECURITY DESCRIPTION | | VALUE | |
| | | | | Commercial Banks - Continued | | | |
| | 4 | | | MB Financial, Inc. | | $ | 143 | | |
| | 5 | | | Mercantile Bank Corp. | | | 220 | | |
| | 5 | | | Nara Bancorp, Inc. | | | 75 | | |
| | 9 | | | Oriental Financial Group | | | 130 | | |
| | 2 | | | Pacific Capital Bancorp | | | 79 | | |
| | 3 | | | Peoples Bancorp, Inc. | | | 72 | | |
| | 19 | | | PrivateBancorp, Inc. | | | 662 | | |
| | 16 | | | Republic Bancorp, Inc. | | | 237 | | |
| | 1 | | | Republic Bancorp, Inc., Class A | | | 25 | | |
| | 3 | | | Simmons First National Corp., Class A | | | 70 | | |
| | 2 | | | Southwest Bancorp, Inc. | | | 41 | | |
| | 1 | | | State Financial Services Corp. | | | 56 | | |
| | 5 | | | Sterling Bancorp | | | 100 | | |
| | 25 | | | Sterling Bancshares, Inc. | | | 383 | | |
| | 25 | | | Summit Bancshares, Inc. | | | 436 | | |
| | 4 | | | Sun Bancorp, Inc. (a) | | | 81 | | |
| | 1 | | | Taylor Capital Group, Inc. | | | 55 | | |
| | 3 | | | TriCo Bancshares | | | 60 | | |
| | 4 | | | Umpqua Holdings Corp. | | | 99 | | |
| | 13 | | | West Coast Bancorp | | | 324 | | |
| | 13 | | | Westamerica Bancorp | | | 676 | | |
| | 1 | | | Western Sierra Bancorp (a) | | | 47 | | |
| | 7 | | | Wilshire Bancorp, Inc. | | | 96 | | |
| | 4 | | | Wintrust Financial Corp. | | | 188 | | |
| | | | 10,671 | | |
| | | | | Commercial Services & Supplies - 3.2% | | | |
| | 27 | | | Angelica Corp. | | | 657 | | |
| | 3 | | | Banta Corp. | | | 141 | | |
| | 4 | | | Coinstar, Inc. (a) | | | 93 | | |
| | 26 | | | Corinthian Colleges, Inc. (a) | | | 327 | | |
| | 1 | | | CRA International, Inc. (a) | | | 75 | | |
| | 6 | | | DiamondCluster International, Inc. (a) | | | 63 | | |
| | 6 | | | Dollar Financial Corp. (a) | | | 64 | | |
| | 8 | | | Duratek, Inc. (a) | | | 178 | | |
| | 2 | | | General Binding Corp. (a) | | | 42 | | |
| | 7 | | | Geo Group, Inc. (The) (a) | | | 173 | | |
| | 2 | | | Gevity HR, Inc. | | | 34 | | |
| | 16 | | | Heidrick & Struggles, Inc. (a) | | | 425 | | |
| | 63 | | | IKON Office Solutions, Inc. | | | 602 | | |
| | 4 | | | Imagistics International, Inc. (a) | | | 120 | | |
| | 5 | | | Interpool, Inc. | | | 100 | | |
SEE NOTES TO FINANCIAL STATEMENTS.
JPMorgan U.S. Equity Mid/Small Cap Funds 52
SEMI-ANNUAL REPORT JUNE 30
2005
SCHEDULE OF PORTFOLIO INVESTMENTS AS OF JUNE 30, 2005
(Amounts in thousands)
(Unaudited)
| SHARES | | SECURITY DESCRIPTION | | VALUE | |
| Long-Term Investments - continued | |
| | | | | Commercial Services & Supplies - Continued | | | |
| | 12 | | | John H. Harland Co. | | $ | 467 | | |
| | 4 | | | Korn/Ferry International (a) | | | 67 | | |
| | 16 | | | Labor Ready, Inc. (a) | | | 371 | | |
| | 17 | | | Navigant Consulting, Inc. (a) | | | 300 | | |
| | 4 | | | Pre-Paid Legal Services, Inc. | | | 192 | | |
| | 6 | | | SOURCECORP, Inc. (a) | | | 125 | | |
| | 10 | | | Spherion Corp. (a) | | | 67 | | |
| | 25 | | | TeleTech Holdings, Inc. (a) | | | 200 | | |
| | 5 | | | Tetra Tech, Inc. (a) | | | 62 | | |
| | 10 | | | United Rentals, Inc. (a) | | | 204 | | |
| | 6 | | | United Stationers, Inc. (a) | | | 290 | | |
| | 1 | | | Vertrue, Inc. (a) | | | 55 | | |
| | 3 | | | Waste Connections, Inc. (a) | | | 127 | | |
| | | | 5,621 | | |
| | | | | Communications Equipment - 2.6% | | | |
| | 31 | | | 3Com Corp. (a) | | | 114 | | |
| | 8 | | | Ariba, Inc. (a) | | | 45 | | |
| | 24 | | | Arris Group, Inc. (a) | | | 209 | | |
| | 19 | | | Aspect Communications Corp. (a) | | | 208 | | |
| | 4 | | | Audiovox Corp. (a) | | | 57 | | |
| | 10 | | | Avocent Corp. (a) | | | 269 | | |
| | 4 | | | Bel Fuse, Inc., Class B | | | 119 | | |
| | 7 | | | Black Box Corp. | | | 244 | | |
| | 13 | | | C-COR, Inc. (a) | | | 92 | | |
| | 11 | | | CIENA Corp. (a) | | | 23 | | |
| | 13 | | | CommScope, Inc. (a) | | | 223 | | |
| | 3 | | | Comtech Telecommunications Corp. (a) | | | 103 | | |
| | 5 | | | Ditech Communications Corp. (a) | | | 31 | | |
| | 5 | | | Echelon Corp. (a) | | | 36 | | |
| | 11 | | | Enterasys Networks, Inc. (a) | | | 10 | | |
| | 16 | | | Extreme Networks, Inc. (a) | | | 66 | | |
| | 6 | | | Finisar Corp. (a) | | | 7 | | |
| | 14 | | | Foundry Networks, Inc. (a) | | | 121 | | |
| | 2 | | | Glenayre Technologies, Inc. (a) | | | 6 | | |
| | 10 | | | Harmonic, Inc. (a) | | | 46 | | |
| | 24 | | | Inter-Tel, Inc. | | | 452 | | |
| | 2 | | | Interdigital Communications Corp. (a) | | | 38 | | |
| | 26 | | | MRV Communications, Inc. (a) | | | 57 | | |
| | 7 | | | Netgear, Inc. (a) | | | 136 | | |
| | - | (h) | | Network Equipment Technologies, Inc. (a) | | | 2 | | |
| | 20 | | | Plantronics, Inc. | | | 713 | | |
| SHARES | | SECURITY DESCRIPTION | | VALUE | |
| | | | | Communications Equipment - Continued | | | |
| | 3 | | | Polycom, Inc. (a) | | $ | 51 | | |
| | 3 | | | Powerwave Technologies, Inc. (a) | | | 30 | | |
| | 6 | | | Redback Networks, Inc. (a) | | | 39 | | |
| | 10 | | | SafeNet, Inc. (a) | | | 324 | | |
| | 25 | | | Symmetricom, Inc. (a) | | | 261 | | |
| | 11 | | | Tekelec (a) | | | 186 | | |
| | 11 | | | Terayon Communication Systems, Inc. (a) | | | 34 | | |
| | - | (h) | | Tollgrade Communications, Inc. (a) | | | 2 | | |
| | 24 | | | Utstarcom, Inc. (a) | | | 180 | | |
| | 16 | | | Westell Technologies, Inc. (a) | | | 96 | | |
| | | | 4,630 | | |
| | | | | Computers & Peripherals - 1.7% | | | |
| | 28 | | | Adaptec, Inc. (a) | | | 109 | | |
| | 8 | | | Advanced Digital Information Corp. (a) | | | 58 | | |
| | 49 | | | Brocade Communications Systems, Inc. (a) | | | 189 | | |
| | 1 | | | Concurrent Computer Corp. (a) | | | 2 | | |
| | 5 | | | Dot Hill Systems Corp. (a) | | | 27 | | |
| | 3 | | | Electronics for Imaging, Inc. (a) | | | 63 | | |
| | 18 | | | Gateway, Inc. (a) | | | 60 | | |
| | 13 | | | Hutchinson Technology, Inc. (a) | | | 485 | | |
| | 5 | | | Hypercom Corp. (a) | | | 35 | | |
| | 11 | | | Imation Corp. | | | 435 | | |
| | 1 | | | Innovex, Inc. (a) | | | 2 | | |
| | 11 | | | Intergraph Corp. (a) | | | 389 | | |
| | 13 | | | Komag, Inc. (a) | | | 357 | | |
| | 40 | | | Maxtor Corp. (a) | | | 206 | | |
| | 5 | | | McData Corp. (a) | | | 19 | | |
| | 7 | | | PalmOne, Inc. (a) | | | 208 | | |
| | 25 | | | Quantum Corp. (a) | | | 73 | | |
| | 40 | | | Silicon Graphics, Inc. (a) | | | 28 | | |
| | 2 | | | Stratasys, Inc. (a) | | | 59 | | |
| | 5 | | | Synaptics, Inc. (a) | | | 113 | | |
| | 4 | | | UNOVA, Inc. (a) | | | 99 | | |
| | | | 3,016 | | |
| | | | | Construction & Engineering - 0.4% | | | |
| | 4 | | | Dycom Industries, Inc. (a) | | | 69 | | |
| | 15 | | | MasTec, Inc. (a) | | | 133 | | |
| | 8 | | | Quanta Services, Inc. (a) | | | 73 | | |
| | 4 | | | URS Corp. (a) | | | 157 | | |
| | 6 | | | Washington Group International, Inc. (a) | | | 322 | | |
| | | | 754 | | |
SEE NOTES TO FINANCIAL STATEMENTS.
JPMorgan U.S. Equity Mid/Small Cap Funds 53
JPMorgan U.S. Small Company Fund
SCHEDULE OF PORTFOLIO INVESTMENTS AS OF JUNE 30, 2005
(Amounts in thousands)
(CONTINUED)
(Unaudited)
| SHARES | | SECURITY DESCRIPTION | | VALUE | |
| Long-Term Investments - continued | |
| | | | | Construction Materials - 0.4% | | | |
| | 4 | | | Ameron International Corp. | | $ | 134 | | |
| | 5 | | | Eagle Materials, Inc. | | | 454 | | |
| | 4 | | | Texas Industries, Inc. | | | 214 | | |
| | | | 802 | | |
| | | | | Consumer Finance - 1.2% | | | |
| | 3 | | | ACE Cash Express, Inc. (a) | | | 87 | | |
| | 4 | | | Advanta Corp. | | | 110 | | |
| | 5 | | | Asta Funding, Inc. | | | 125 | | |
| | 42 | | | Cash America International, Inc. | | | 851 | | |
| | 11 | | | CompuCredit Corp. (a) | | | 381 | | |
| | 1 | | | Credit Acceptance Corp. (a) | | | 21 | | |
| | 15 | | | Metris Cos., Inc. (a) | | | 218 | | |
| | 1 | | | United PanAm Financial Corp. (a) | | | 29 | | |
| | 12 | | | World Acceptance Corp. (a) | | | 352 | | |
| | | | 2,174 | | |
| | | | | Containers & Packaging - 0.6% | | | |
| | 6 | | | Crown Holdings, Inc. (a) | | | 81 | | |
| | 5 | | | Greif, Inc., Class A | | | 305 | | |
| | 11 | | | Silgan Holdings, Inc. | | | 601 | | |
| | | | 987 | | |
| | | | | Distributors - 0.2% | | | |
| | 9 | | | Handleman Co. | | | 155 | | |
| | 8 | | | WESCO International, Inc. (a) | | | 254 | | |
| | | | 409 | | |
| | | | | Diversified Financial Services - 0.7% | | | |
| | 2 | | | Encore Capital Group, Inc. (a) | | | 32 | | |
| | 4 | | | eSpeed, Inc. (a) | | | 32 | | |
| | 18 | | | GATX Corp. | | | 611 | | |
| | 11 | | | Knight Capital Group, Inc. (a) | | | 84 | | |
| | 4 | | | Nasdaq Stock Market, Inc. | | | 70 | | |
| | 26 | | | Technology Investment Capital Corp. | | | 385 | | |
| | | | 1,214 | | |
| | | | | Diversified Telecommunication Services - 1.1% | | | |
| | 9 | | | Broadwing Corp. (a) | | | 43 | | |
| | 102 | | | Cincinnati Bell, Inc. (a) | | | 438 | | |
| | 14 | | | CT Communications, Inc. | | | 178 | | |
| | 51 | | | ITC Deltacom, Inc. (a) | | | 43 | | |
| SHARES | | SECURITY DESCRIPTION | | VALUE | |
| | | | | Diversified Telecommunication
Services - Continued | |
| | 99 | | | Premiere Global Services, Inc. (a) | | $ | 1,118 | | |
| | 23 | | | Primus Telecom Group (a) | | | 15 | | |
| | 7 | | | Talk America Holdings, Inc. (a) | | | 65 | | |
| | 17 | | | Time Warner Telecom, Inc., Class A (a) | | | 101 | | |
| | | | 2,001 | | |
| | | | | Electric Utilities - 0.8% | | | |
| | 5 | | | Black Hills Corp. | | | 192 | | |
| | 12 | | | El Paso Electric Co. (a) | | | 241 | | |
| | 4 | | | Idacorp, Inc. | | | 116 | | |
| | 1 | | | MGE Energy, Inc. | | | 44 | | |
| | 12 | | | PNM Resources, Inc. | | | 337 | | |
| | 1 | | | UIL Holdings Corp. | | | 70 | | |
| | 17 | | | Unisource Energy Corp. | | | 517 | | |
| | | | 1,517 | | |
| | | | | Electrical Equipment - 0.1% | | | |
| | 5 | | | Encore Wire Corp. (a) | | | 53 | | |
| | 3 | | | Evergreen Solar, Inc. (a) | | | 16 | | |
| | 3 | | | General Cable Corp. (a) | | | 46 | | |
| | 5 | | | Power-One, Inc. (a) | | | 29 | | |
| | 6 | | | Valence Technology, Inc. (a) | | | 17 | | |
| | | | 161 | | |
| | | | | Electronic Equipment & Instruments - 2.2% | | | |
| | 13 | | | Aeroflex, Inc. (a) | | | 108 | | |
| | 19 | | | Agilysis, Inc. | | | 290 | | |
| | 19 | | | Anixter International, Inc. (a) | | | 688 | | |
| | 2 | | | BEI Technologies, Inc. | | | 51 | | |
| | 2 | | | Bell Microproducts, Inc. (a) | | | 14 | | |
| | 12 | | | Benchmark Electronics, Inc. (a) | | | 350 | | |
| | 6 | | | Brightpoint, Inc. (a) | | | 124 | | |
| | 6 | | | Checkpoint Systems, Inc. (a) | | | 110 | | |
| | 13 | | | CTS Corp. | | | 155 | | |
| | 5 | | | Electro Scientific Industries, Inc. (a) | | | 91 | | |
| | 2 | | | Faro Technologies, Inc. (a) | | | 46 | | |
| | 18 | | | Global Imaging Systems, Inc. (a) | | | 570 | | |
| | 8 | | | Itron, Inc. (a) | | | 353 | | |
| | 5 | | | Lexar Media, Inc. (a) | | | 26 | | |
| | 3 | | | MTS Systems Corp. | | | 101 | | |
| | 3 | | | Planar Systems, Inc. (a) | | | 25 | | |
| | 6 | | | Radisys Corp. (a) | | | 94 | | |
SEE NOTES TO FINANCIAL STATEMENTS.
JPMorgan U.S. Equity Mid/Small Cap Funds 54
SEMI-ANNUAL REPORT JUNE 30
2005
SCHEDULE OF PORTFOLIO INVESTMENTS AS OF JUNE 30, 2005
(Amounts in thousands)
(Unaudited)
| SHARES | | SECURITY DESCRIPTION | | VALUE | |
| | Long-Term Investments - continued | | | | |
| | | | | Electronic Equipment & Instruments - Continued | |
| | 5 | | | Rofin-Sinar Technologies, Inc. (a) | | $ | 174 | | |
| | 12 | | | Sypris Solutions, Inc. | | | 142 | | |
| | 6 | | | Trimble Navigation Ltd. (a) | | | 245 | | |
| | 19 | | | TTM Technologies, Inc. (a) | | | 144 | | |
| | 1 | | | Zygo Corp. (a) | | | 7 | | |
| | | | 3,908 | | |
| | | | | Energy Equipment & Services - 2.2% | | | |
| | 44 | | | Grey Wolf, Inc. (a) | | | 325 | | |
| | 4 | | | Gulf Island Fabrication, Inc. | | | 71 | | |
| | 3 | | | Gulfmark Offshore, Inc. (a) | | | 76 | | |
| | 10 | | | Hanover Compressor Co. (a) | | | 113 | | |
| | 5 | | | Hydril (a) | | | 245 | | |
| | 46 | | | Key Energy Services, Inc. (a) | | | 558 | | |
| | 10 | | | Lone Star Technologies, Inc. (a) | | | 450 | | |
| | 2 | | | Lufkin Industries, Inc. | | | 72 | | |
| | 15 | | | Oceaneering International, Inc. (a) | | | 576 | | |
| | 6 | | | Offshore Logistics, Inc. (a) | | | 210 | | |
| | 6 | | | Oil States International, Inc. (a) | | | 156 | | |
| | 7 | | | Parker Drilling Co. (a) | | | 46 | | |
| | 32 | | | Todco, Class A (a) | | | 811 | | |
| | 10 | | | Veritas DGC, Inc. (a) | | | 275 | | |
| | | | 3,984 | | |
| | | | | Food & Staples Retailing - 0.5% | | | |
| | 7 | | | Great Atlantic & Pacific Tea Co., Inc. (a) | | | 198 | | |
| | 3 | | | Nash Finch Co. | | | 117 | | |
| | 1 | | | NeighborCare, Inc. (a) | | | 33 | | |
| | 14 | | | Pantry, Inc. (The) (a) | | | 546 | | |
| | 7 | | | Pathmark Stores, Inc. (a) | | | 58 | | |
| | | | 952 | | |
| | | | | Food Products - 1.2% | | | |
| | 35 | | | Chiquita Brands International, Inc. | | | 974 | | |
| | 17 | | | Corn Products International, Inc. | | | 399 | | |
| | 3 | | | Flowers Foods, Inc. | | | 110 | | |
| | 3 | | | J & J Snack Foods Corp. | | | 173 | | |
| | 11 | | | Sanderson Farms, Inc. | | | 513 | | |
| | | | 2,169 | | |
| | | | | Gas Utilities - 1.4% | | | |
| | 7 | | | Atmos Energy Corp. | | | 196 | | |
| SHARES | | SECURITY DESCRIPTION | | VALUE | |
| | | | | Gas Utilities - Continued | |
| | 13 | | | New Jersey Resources Corp. | | $ | 622 | | |
| | 2 | | | Nicor, Inc. | | | 70 | | |
| | 6 | | | Northwest Natural Gas Co. | | | 233 | | |
| | 4 | | | South Jersey Industries, Inc. | | | 232 | | |
| | 21 | | | Southern Union Co. (a) | | | 513 | | |
| | 15 | | | Southwest Gas Corp. | | | 378 | | |
| | 10 | | | WGL Holdings, Inc. | | | 340 | | |
| | | | 2,584 | | |
| | | | | Health Care Equipment & Supplies - 3.2% | | | |
| | 4 | | | Abiomed, Inc. (a) | | | 33 | | |
| | 10 | | | Align Technology, Inc. (a) | | | 74 | | |
| | 1 | | | Analogic Corp. | | | 35 | | |
| | 7 | | | Animas Corp. (a) | | | 141 | | |
| | 5 | | | Arrow International, Inc. | | | 144 | | |
| | 8 | | | Arthrocare Corp. (a) | | | 294 | | |
| | 1 | | | Bio-Rad Laboratories, Inc., Class A (a) | | | 77 | | |
| | 5 | | | Biosite, Inc. (a) | | | 269 | | |
| | 18 | | | Conmed Corp. (a) | | | 566 | | |
| | 7 | | | Diagnostic Products Corp. | | | 312 | | |
| | 39 | | | Encore Medical Corp. (a) | | | 216 | | |
| | 4 | | | EPIX Pharmaceuticals, Inc. (a) | | | 31 | | |
| | 3 | | | Immucor, Inc. (a) | | | 99 | | |
| | 7 | | | Integra LifeSciences Holdings Corp. (a) | | | 190 | | |
| | 4 | | | Inverness Medical Innovations, Inc. (a) | | | 98 | | |
| | 16 | | | Kyphon, Inc. (a) | | | 571 | | |
| | 8 | | | Mentor Corp. | | | 348 | | |
| | 8 | | | Nektar Therapeutics (a) | | | 135 | | |
| | 29 | | | Neurometrix, Inc. (a) | | | 583 | | |
| | 3 | | | Palomar Medical Technologies, Inc. (a) | | | 79 | | |
| | 9 | | | PolyMedica Corp. | | | 325 | | |
| | 2 | | | Regeneration Technologies, Inc. (a) | | | 11 | | |
| | 25 | | | Steris Corp. | | | 649 | | |
| | 12 | | | SurModics, Inc. (a) | | | 499 | | |
| | | | 5,779 | | |
| | | | | Health Care Providers & Services - 5.0% | | | |
| | 9 | | | Alderwoods Group, Inc. (a) | | | 129 | | |
| | 29 | | | Alliance Imaging, Inc. (a) | | | 299 | | |
| | 4 | | | America Service Group, Inc. (a) | | | 67 | | |
| | 17 | | | Andrx Corp. (a) | | | 345 | | |
| | 11 | | | Apria Healthcare Group, Inc. (a) | | | 391 | | |
SEE NOTES TO FINANCIAL STATEMENTS.
JPMorgan U.S. Equity Mid/Small Cap Funds 55
JPMorgan U.S. Small Company Fund
SCHEDULE OF PORTFOLIO INVESTMENTS AS OF JUNE 30, 2005
(Amounts in thousands)
(CONTINUED)
(Unaudited)
| SHARES | | SECURITY DESCRIPTION | | VALUE | |
| Long-Term Investments - continued | |
| | | | | Health Care Providers & Services - Continued | | | |
| | 18 | | | Centene Corp. (a) | | $ | 596 | | |
| | 17 | | | Computer Programs & Systems, Inc. | | | 618 | | |
| | 2 | | | Dendrite International, Inc. (a) | | | 30 | | |
| | 5 | | | Genesis HealthCare Corp. (a) | | | 250 | | |
| | 26 | | | Kindred Healthcare, Inc. (a) | | | 1,030 | | |
| | 11 | | | LCA Vision, Inc. | | | 548 | | |
| | 16 | | | OCA, Inc. (a) | | | 31 | | |
| | 18 | | | Owens & Minor, Inc. | | | 566 | | |
| | 11 | | | Pediatrix Medical Group, Inc. (a) | | | 833 | | |
| | 18 | | | Per-Se Technologies, Inc. (a) | | | 370 | | |
| | 28 | | | PSS World Medical, Inc. (a) | | | 352 | | |
| | 10 | | | Res-Care, Inc. (a) | | | 136 | | |
| | 8 | | | Sierra Health Services (a) | | | 593 | | |
| | 36 | | | Stewart Enterprises, Inc. | | | 237 | | |
| | 8 | | | Symbion, Inc. (a) | | | 191 | | |
| | 12 | | | Trizetto Group (a) | | | 171 | | |
| | 16 | | | United Surgical Partners
International, Inc. (a) | | | 849 | | |
| | 15 | | | Ventiv Health, Inc. (a) | | | 297 | | |
| | | | 8,929 | | |
| | | | | Hotels, Restaurants & Leisure - 2.4% | | | |
| | 17 | | | Ameristar Casinos, Inc. | | | 443 | | |
| | 6 | | | Argosy Gaming Co. (a) | | | 280 | | |
| | - | (h) | | Bally Total Fitness Holding Corp. (a) | | | 1 | | |
| | 3 | | | CEC Entertainment, Inc. (a) | | | 122 | | |
| | 21 | | | CKE Restaurants, Inc. | | | 294 | | |
| | 7 | | | Jack in the Box, Inc. (a) | | | 265 | | |
| | 39 | | | Landry's Restaurants, Inc. | | | 1,159 | | |
| | 11 | | | Multimedia Games, Inc. (a) | | | 119 | | |
| | 13 | | | Navigant International, Inc. (a) | | | 189 | | |
| | 4 | | | O'Charley's, Inc. (a) | | | 78 | | |
| | 11 | | | Pinnacle Entertainment, Inc. (a) | | | 219 | | |
| | 5 | | | Rare Hospitality International, Inc. (a) | | | 165 | | |
| | 20 | | | Ruby Tuesday, Inc. | | | 508 | | |
| | 27 | | | Ryan's Restaurant Group, Inc. (a) | | | 377 | | |
| | | | 4,219 | | |
| | | | | Household Durables - 1.3% | | | |
| | 5 | | | American Greetings, Class A | | | 122 | | |
| | - | (h) | | CSS Industries, Inc. | | | 7 | | |
| | 11 | | | Furniture Brands International, Inc. | | | 240 | | |
| SHARES | | SECURITY DESCRIPTION | | VALUE | |
| | | | | Household Durables - Continued | |
| | 4 | | | Meritage Homes Corp. (a) | | $ | 278 | | |
| | 7 | | | Stanley Furniture Co., Inc. | | | 179 | | |
| | 23 | | | Technical Olympic USA, Inc. | | | 553 | | |
| | 24 | | | Tupperware Corp. | | | 554 | | |
| | 11 | | | WCI Communities, Inc. (a) | | | 349 | | |
| | | | 2,282 | | |
| | | | | Industrial Conglomerates - 0.3% | | | |
| | 12 | | | Walter Industries, Inc. | | | 473 | | |
| | | | | Insurance - 2.6% | |
| | 1 | | | American Physicians Capital, Inc. (a) | | | 51 | | |
| | 8 | | | Argonaut Group, Inc. (a) | | | 184 | | |
| | 33 | | | Delphi Financial Group, Inc. | | | 1,457 | | |
| | 7 | | | Direct General Corp. | | | 135 | | |
| | - | (h) | | FBL Financial Group, Inc., Class A | | | 8 | | |
| | 7 | | | LandAmerica Financial Group, Inc. | | | 398 | | |
| | 2 | | | Midland Co. (The) | | | 78 | | |
| | 1 | | | Navigators Group, Inc. (a) | | | 21 | | |
| | 48 | | | PMA Capital Corp., Class A (a) | | | 426 | | |
| | 6 | | | Selective Insurance Group | | | 307 | | |
| | 7 | | | Stewart Information Services Corp. | | | 294 | | |
| | 3 | | | United Fire & Casualty Co. | | | 142 | | |
| | - | (h) | | Vesta Insurance Group, Inc. | | | 1 | | |
| | 17 | | | Zenith National Insurance Corp. | | | 1,140 | | |
| | | | 4,642 | | |
| | | | | Internet & Catalog Retail - 0.2% | | | |
| | 4 | | | 1-800-Flowers.com, Inc., Class A (a) | | | 30 | | |
| | 5 | | | GSI Commerce, Inc. (a) | | | 75 | | |
| | 10 | | | Insight Enterprises, Inc. (a) | | | 196 | | |
| | 2 | | | J. Jill Group, Inc. (The) (a) | | | 27 | | |
| | 3 | | | Nutri/System, Inc. | | | 38 | | |
| | | | 366 | | |
| | | | | Internet Software & Services - 2.4% | | | |
| | - | (h) | | aQuantive, Inc. (a) | | | 7 | | |
| | 13 | | | AsiaInfo Holdings, Inc. (a) | | | 69 | | |
| | 6 | | | Autobytel, Inc. (a) | | | 31 | | |
| | 1 | | | Blue Coat Systems, Inc. (a) | | | 27 | | |
| | 74 | | | CMGI, Inc. (a) | | | 139 | | |
| | 27 | | | CNET Networks, Inc. (a) | | | 311 | | |
SEE NOTES TO FINANCIAL STATEMENTS.
JPMorgan U.S. Equity Mid/Small Cap Funds 56
SEMI-ANNUAL REPORT JUNE 30
2005
SCHEDULE OF PORTFOLIO INVESTMENTS AS OF JUNE 30, 2005
(Amounts in thousands)
(Unaudited)
| SHARES | | SECURITY DESCRIPTION | | VALUE | |
| | Long-Term Investments - continued | | | | |
| | | | | Internet Software & Services - Continued | |
| | 5 | | | Digital Insight Corp. (a) | | $ | 129 | | |
| | 6 | | | Digital River, Inc. (a) | | | 191 | | |
| | 24 | | | Digitas, Inc. (a) | | | 274 | | |
| | 26 | | | DoubleClick, Inc. (a) | | | 214 | | |
| | 64 | | | EarthLink, Inc. (a) | | | 551 | | |
| | 4 | | | Equinix, Inc. (a) | | | 165 | | |
| | 38 | | | Homestore, Inc. (a) | | | 77 | | |
| | 9 | | | Infospace, Inc. (a) | | | 310 | | |
| | 11 | | | Internet Security Systems (a) | | | 223 | | |
| | 1 | | | Interwoven, Inc. (a) | | | 7 | | |
| | 8 | | | Ipass, Inc. (a) | | | 47 | | |
| | 7 | | | j2 Global Communications, Inc. (a) | | | 227 | | |
| | 8 | | | Jupitermedia Corp. (a) | | | 130 | | |
| | 31 | | | Looksmart Ltd. (a) | | | 23 | | |
| | 9 | | | Openwave Systems, Inc. (a) | | | 139 | | |
| | 28 | | | SupportSoft, Inc. (a) | | | 143 | | |
| | 17 | | | United Online, Inc. | | | 181 | | |
| | 14 | | | ValueClick, Inc. (a) | | | 176 | | |
| | 10 | | | WebEx Communications, Inc. (a) | | | 256 | | |
| | 4 | | | webMethods, Inc. (a) | | | 22 | | |
| | 4 | | | Websense, Inc. (a) | | | 178 | | |
| | | | 4,247 | | |
| | | | | IT Services - 1.4% | | | |
| | 24 | | | Acxiom Corp. | | | 491 | | |
| | 37 | | | BearingPoint, Inc. (a) | | | 268 | | |
| | 1 | | | BISYS Group, Inc. (The) (a) | | | 12 | | |
| | 26 | | | Ciber, Inc. (a) | | | 207 | | |
| | 2 | | | Covansys Corp. (a) | | | 31 | | |
| | 8 | | | CSG System International, Inc. (a) | | | 156 | | |
| | 9 | | | Euronet Worldwide, Inc. (a) | | | 253 | | |
| | 10 | | | Gartner, Inc., Class A (a) | | | 110 | | |
| | 4 | | | Intrado, Inc. (a) | | | 58 | | |
| | 9 | | | Lionbridge Technologies (a) | | | 61 | | |
| | 11 | | | ManTech International Corp., Class A (a) | | | 335 | | |
| | 18 | | | Perot Systems Corp., Class A (a) | | | 262 | | |
| | 3 | | | Safeguard Scientifics, Inc. (a) | | | 4 | | |
| | 6 | | | Startek, Inc. | | | 102 | | |
| | 17 | | | SYKES Enterprises, Inc. (a) | | | 161 | | |
| | 6 | | | Tyler Technologies, Inc. (a) | | | 48 | | |
| | | | 2,559 | | |
| SHARES | | SECURITY DESCRIPTION | | VALUE | |
| | | | | Leisure Equipment & Products - 0.8% | | | |
| | 25 | | | JAKKS Pacific, Inc. (a) | | $ | 478 | | |
| | 10 | | | K2, Inc. (a) | | | 128 | | |
| | 7 | | | MarineMax, Inc. (a) | | | 213 | | |
| | 12 | | | RC2 Corp. (a) | | | 466 | | |
| | 6 | | | Steinway Musical Instruments, Inc. (a) | | | 173 | | |
| | | | 1,458 | | |
| | | | | Machinery - 3.2% | | | |
| | 15 | | | AGCO Corp. (a) | | | 277 | | |
| | 10 | | | Astec Industries, Inc. (a) | | | 242 | | |
| | 13 | | | Barnes Group, Inc. | | | 414 | | |
| | 11 | | | Briggs & Stratton Corp. | | | 384 | | |
| | 7 | | | Cascade Corp. | | | 286 | | |
| | 10 | | | Crane Co. | | | 258 | | |
| | 2 | | | ESCO Technologies, Inc. (a) | | | 181 | | |
| | 11 | | | Flowserve Corp. (a) | | | 327 | | |
| | 7 | | | Greenbrier Cos., Inc. | | | 179 | | |
| | 12 | | | JLG Industries, Inc. | | | 327 | | |
| | 8 | | | Joy Global, Inc. | | | 262 | | |
| | 12 | | | LInc.oln Electric Holdings, Inc. | | | 411 | | |
| | 11 | | | Manitowoc Co., Inc. | | | 451 | | |
| | 1 | | | Middleby Corp. | | | 68 | | |
| | 5 | | | NACCO Industries, Inc., Class A | | | 579 | | |
| | 9 | | | Reliance Steel & Aluminum Co. | | | 336 | | |
| | 3 | | | Tecumseh Products Co., Class A | | | 77 | | |
| | 5 | | | Valmont Industries, Inc. | | | 137 | | |
| | 9 | | | Wabash National Corp. | | | 206 | | |
| | 8 | | | Watts Water Technologies, Inc., Class A | | | 278 | | |
| | | | 5,680 | | |
| | | | | Media - 2.3% | | | |
| | 4 | | | Advo, Inc. | | | 115 | | |
| | 7 | | | Arbitron, Inc. | | | 283 | | |
| | 4 | | | Carmike Cinemas, Inc. | | | 114 | | |
| | 6 | | | Catalina Marketing Corp. | | | 147 | | |
| | 48 | | | Charter Communications, Inc., Class A (a) | | | 57 | | |
| | 3 | | | Digital Generation Systems (a) | | | 3 | | |
| | 1 | | | Emmis Communications Corp., Class A (a) | | | 23 | | |
| | 49 | | | Gemstar-TV Guide International, Inc. (a) | | | 176 | | |
| | 7 | | | Gray Television, Inc. | | | 84 | | |
| | 7 | | | Insight Communications Co., Inc., Class A (a) | | | 76 | | |
| | 1 | | | Journal Register Co. (a) | | | 20 | | |
SEE NOTES TO FINANCIAL STATEMENTS.
JPMorgan U.S. Equity Mid/Small Cap Funds 57
JPMorgan U.S. Small Company Fund
SCHEDULE OF PORTFOLIO INVESTMENTS AS OF JUNE 30, 2005
(Amounts in thousands)
(CONTINUED)
(Unaudited)
| SHARES | | SECURITY DESCRIPTION | | VALUE | |
| | Long-Term Investments - continued | | | | |
| | | | | Media - Continued | |
| | 31 | | | Lodgenet Entertainment Corp. (a) | | $ | 516 | | |
| | 5 | | | Media General, Inc., Class A | | | 324 | | |
| | 44 | | | Mediacom
Communications Corp., Class A (a) | | | 300 | | |
| | 65 | | | Primedia, Inc. (a) | | | 264 | | |
| | 11 | | | ProQuest Co. (a) | | | 351 | | |
| | 29 | | | Radio One, Inc., Class D (a) | | | 372 | | |
| | 5 | | | RCN Corp. (a) | | | 104 | | |
| | 4 | | | Saga Communications, Inc., Class A (a) | | | 56 | | |
| | 9 | | | Scholastic Corp. (a) | | | 358 | | |
| | 7 | | | Valassis Communications, Inc. (a) | | | 241 | | |
| | 15 | | | World Wrestling Entertainment, Inc. | | | 169 | | |
| | | | 4,153 | | |
| | | | | Metals & Mining - 1.5% | | | |
| | 7 | | | AK Steel Holding Corp. (a) | | | 45 | | |
| | 35 | | | Commercial Metals Co. | | | 835 | | |
| | 3 | | | Metal Management, Inc. | | | 58 | | |
| | 6 | | | NN, Inc. | | | 80 | | |
| | 5 | | | Oregon Steel Mills, Inc. (a) | | | 88 | | |
| | 19 | | | Quanex Corp. | | | 986 | | |
| | 13 | | | Ryerson Tull, Inc. | | | 187 | | |
| | 13 | | | Steel Dynamics, Inc. | | | 331 | | |
| | | | 2,610 | | |
| | | | | Multi-Utilities - 0.8% | | | |
| | 10 | | | Avista Corp. | | | 193 | | |
| | 17 | | | Energen Corp. | | | 610 | | |
| | 1 | | | NorthWestern Corp. | | | 46 | | |
| | 39 | | | Sierra Pacific Resources (a) | | | 488 | | |
| | | | 1,337 | | |
| | | | | Multiline Retail - 0.2% | | | |
| | 16 | | | ShopKo Stores, Inc. (a) | | | 396 | | |
| | | | | Oil, Gas & Consumable Fuels - 4.0% | | | |
| | 7 | | | ATP Oil & Gas Corp. (a) | | | 157 | | |
| | 4 | | | Callon Petroleum Co. (a) | | | 56 | | |
| | 9 | | | Cimarex Energy Co. (a) | | | 352 | | |
| | 2 | | | Clayton Williams Energy, Inc. (a) | | | 48 | | |
| | 5 | | | Comstock Resources, Inc. (a) | | | 124 | | |
| | 8 | | | Energy Partners Ltd. (a) | | | 217 | | |
| SHARES | | SECURITY DESCRIPTION | | VALUE | |
| | | | | Oil, Gas & Consumable Fuels - Continued | |
| | 3 | | | Giant Industries, Inc. (a) | | $ | 115 | | |
| | 32 | | | Houston Exploration Co. (a) | | | 1,682 | | |
| | 8 | | | Mission Resources Corp. (a) | | | 67 | | |
| | 3 | | | Penn Virginia Corp. | | | 152 | | |
| | 1 | | | Quicksilver Resources, Inc. (a) | | | 64 | | |
| | 41 | | | Southwestern Energy Co. (a) | | | 1,945 | | |
| | 12 | | | St. Mary Land & Exploration Co. | | | 339 | | |
| | 7 | | | Stone Energy Corp. (a) | | | 356 | | |
| | 7 | | | Swift Energy Co. (a) | | | 244 | | |
| | - | (h) | | TEL Offshore Trust | | | - | (h) | |
| | 12 | | | Tesoro Corp. | | | 572 | | |
| | 15 | | | Vintage Petroleum, Inc. | | | 463 | | |
| | 7 | | | World Fuel Services Corp. | | | 173 | | |
| | | | 7,126 | | |
| | | | | Paper & Forest Products - 0.1% | | | |
| | 5 | | | Schweitzer-Mauduit International, Inc. | | | 143 | | |
| | | | | Personal Products - 0.1% | |
| | 10 | | | Playtex Products, Inc. (a) | | | 103 | | |
| | | | | Pharmaceuticals - 1.7% | |
| | 7 | | | Able Laboratories, Inc. (a) | | | 24 | | |
| | 30 | | | Adolor Corp. (a) | | | 278 | | |
| | 4 | | | Antigenics, Inc. (a) | | | 19 | | |
| | 22 | | | AtheroGenics, Inc. (a) | | | 344 | | |
| | 23 | | | Auxilium Pharmaceuticals, Inc. (a) | | | 110 | | |
| | 128 | | | AVANIR Pharmaceuticals, Class A (a) | | | 359 | | |
| | 55 | | | Cypress Bioscience, Inc. (a) | | | 726 | | |
| | 8 | | | Impax Laboratories, Inc. (a) | | | 129 | | |
| | 18 | | | Medicis Pharmaceutical Corp., Class A | | | 574 | | |
| | 11 | | | Palatin Technologies, Inc. (a) | | | 18 | | |
| | 2 | | | Par Pharmaceutical Cos, Inc. (a) | | | 64 | | |
| | 19 | | | Theravance, Inc. (a) | | | 319 | | |
| | | | 2,964 | | |
| | | | | Real Estate - 8.0% | | | |
| | 19 | | | Affordable Residential
Communities (REIT) (m) | | | 258 | | |
| | 13 | | | American Financial Realty Trust (REIT) | | | 201 | | |
| | 22 | | | American Home Mortgage
Investment Corp. (REIT) | | | 771 | | |
SEE NOTES TO FINANCIAL STATEMENTS.
JPMorgan U.S. Equity Mid/Small Cap Funds 58
SEMI-ANNUAL REPORT JUNE 30
2005
SCHEDULE OF PORTFOLIO INVESTMENTS AS OF JUNE 30, 2005
(Amounts in thousands)
(Unaudited)
| SHARES | | SECURITY DESCRIPTION | | VALUE | |
| | Long-Term Investments - continued | | | | |
| | | | | Real Estate - Continued | |
| | 22 | | | Anthracite Capital, Inc. (REIT) | | $ | 265 | | |
| | 3 | | | Ashford Hospitality Trust, Inc. | | | 28 | | |
| | 4 | | | Boykin Lodging Co. (REIT) (a) | | | 52 | | |
| | 12 | | | Capital Automotive REIT (REIT) | | | 463 | | |
| | 35 | | | CarrAmerica Realty Corp. (REIT) | | | 1,277 | | |
| | 10 | | | Entertainment Properties Trust (REIT) | | | 442 | | |
| | 21 | | | Equity Inns, Inc. (REIT) | | | 274 | | |
| | 22 | | | FelCor Lodging Trust, Inc. (REIT) (a) | | | 324 | | |
| | 10 | | | Gables Residential Trust (REIT) | | | 437 | | |
| | 10 | | | Glimcher Realty Trust (REIT) | | | 283 | | |
| | 34 | | | Government Properties Trust, Inc. (REIT) | | | 328 | | |
| | 9 | | | Impac Mortgage Holdings, Inc. (REIT) | | | 164 | | |
| | 44 | | | Innkeepers USA Trust (REIT) | | | 663 | | |
| | 2 | | | Jones Lang LaSalle, Inc. (a) | | | 84 | | |
| | 2 | | | Kilroy Realty Corp. (REIT) | | | 85 | | |
| | 5 | | | LaSalle Hotel Properties (REIT) | | | 171 | | |
| | 11 | | | Levitt Corp., Class A | | | 335 | | |
| | 21 | | | Lexington Corp. Properties Trust (REIT) | | | 509 | | |
| | 27 | | | LTC Properties, Inc. (REIT) | | | 551 | | |
| | 24 | | | Maguire Properties, Inc. (REIT) | | | 683 | | |
| | 34 | | | Meristar Hospitality Corp. (REIT) (a) | | | 290 | | |
| | 20 | | | MFA Mortgage Investments, Inc. (REIT) | | | 150 | | |
| | 30 | | | Mid-America Apartment
Communities, Inc. (REIT) | | | 1,340 | | |
| | 3 | | | National Health Investors, Inc. (REIT) | | | 95 | | |
| | 7 | | | Novastar Financial, Inc. (REIT) | | | 290 | | |
| | 20 | | | Pennsylvania Real Estate
Investment Trust (REIT) | | | 941 | | |
| | 24 | | | Prentiss Properties Trust (REIT) | | | 871 | | |
| | 28 | | | RAIT Investment Trust (REIT) | | | 845 | | |
| | 13 | | | Saul Centers, Inc. (REIT) | | | 487 | | |
| | 7 | | | Taubman Centers, Inc. (REIT) | | | 252 | | |
| | | | 14,209 | | |
| | | | | Road & Rail - 1.6% | | | |
| | 4 | | | Amerco, Inc. (a) | | | 198 | | |
| | 5 | | | Arkansas Best Corp. | | | 169 | | |
| | 13 | | | Dollar Thrifty Automotive Group, Inc. (a) | | | 501 | | |
| | 17 | | | Genesee & Wyoming, Inc., Class A (a) | | | 471 | | |
| | 4 | | | Old Dominion Freight Line (a) | | | 99 | | |
| | 7 | | | Overnite Corp. | | | 297 | | |
| | 18 | | | RailAmerica, Inc. (a) | | | 209 | | |
| SHARES | | SECURITY DESCRIPTION | | VALUE | |
| | | | | Road & Rail - Continued | |
| | 22 | | | SCS Transportation, Inc. (a) | | $ | 390 | | |
| | 4 | | | Swift Transportation Co., Inc. (a) | | | 98 | | |
| | 12 | | | U.S. Xpress Enterprises, Inc.,
Class A (a) | | | 141 | | |
| | 18 | | | Werner Enterprises, Inc. | | | 345 | | |
| | | | 2,918 | | |
| | | | | Semiconductors & Semiconductor
Equipment - 4.5% | | | |
| | 5 | | | Actel Corp. (a) | | | 71 | | |
| | 7 | | | ADE Corp. (a) (m) | | | 194 | | |
| | 15 | | | Advanced Energy Industries, Inc. (a) | | | 115 | | |
| | 22 | | | AMIS Holdings, Inc. (a) | | | 288 | | |
| | 34 | | | Amkor Technology, Inc. (a) | | | 153 | | |
| | 23 | | | Applied Micro Circuits Corp. (a) | | | 60 | | |
| | 6 | | | Asyst Technologies, Inc. (a) | | | 25 | | |
| | 66 | | | Atmel Corp. (a) | | | 156 | | |
| | 4 | | | ATMI, Inc. (a) | | | 110 | | |
| | 9 | | | August Technology Corp. (a) | | | 106 | | |
| | 30 | | | Axcelis Technologies, Inc. (a) | | | 204 | | |
| | 11 | | | Brooks Automation, Inc. (a) | | | 168 | | |
| | 8 | | | Cabot Microelectronics Corp. (a) | | | 235 | | |
| | - | (h) | | Ceva, Inc. (a) | | | 1 | | |
| | 17 | | | Cirrus Logic, Inc. (a) | | | 90 | | |
| | 2 | | | Cohu, Inc. | | | 37 | | |
| | 32 | | | Conexant Systems, Inc. (a) | | | 52 | | |
| | 12 | | | Credence Systems Corp. (a) | | | 105 | | |
| | 9 | | | Cymer, Inc. (a) | | | 240 | | |
| | 28 | | | Cypress Semiconductor Corp. (a) | | | 346 | | |
| | 5 | | | Diodes, Inc. (a) | | | 153 | | |
| | 5 | | | DSP Group, Inc. (a) | | | 117 | | |
| | 4 | | | Exar Corp. (a) | | | 64 | | |
| | 13 | | | Fairchild Semiconductor
International, Inc. (a) | | | 189 | | |
| | 4 | | | Genesis Microchip, Inc. (a) | | | 68 | | |
| | 8 | | | Integrated Circuit Systems, Inc. (a) | | | 157 | | |
| | 6 | | | Integrated Silicon Solutions, Inc. (a) | | | 42 | | |
| | 10 | | | IXYS Corp. (a) | | | 136 | | |
| | 5 | | | Kopin Corp. (a) | | | 26 | | |
| | 10 | | | Lattice Semiconductor Corp. (a) | | | 46 | | |
| | 12 | | | LTX Corp. (a) | | | 60 | | |
| | 14 | | | Mattson Technology, Inc. (a) | | | 97 | | |
SEE NOTES TO FINANCIAL STATEMENTS.
JPMorgan U.S. Equity Mid/Small Cap Funds 59
JPMorgan U.S. Small Company Fund
SCHEDULE OF PORTFOLIO INVESTMENTS AS OF JUNE 30, 2005
(Amounts in thousands)
(CONTINUED)
(Unaudited)
| SHARES | | SECURITY DESCRIPTION | | VALUE | |
| Long-Term Investments - continued | |
| | | | | Semiconductors & Semiconductor
Equipment - Continued | | | |
| | 19 | | | Micrel, Inc. (a) | | $ | 215 | | |
| | 13 | | | Microsemi Corp. (a) | | | 253 | | |
| | 6 | | | Mindspeed Technologies, Inc. (a) | | | 7 | | |
| | 14 | | | MIPS Technologies, Inc. (a) | | | 103 | | |
| | 4 | | | MKS Instruments, Inc. (a) | | | 66 | | |
| | 12 | | | Mykrolis Corp. (a) | | | 163 | | |
| | 15 | | | Omnivision Technologies, Inc. (a) | | | 202 | | |
| | 69 | | | ON Semiconductor Corp. (a) | | | 317 | | |
| | 15 | | | Photronics, Inc. (a) | | | 355 | | |
| | 15 | | | Pixelworks, Inc. (a) | | | 130 | | |
| | 15 | | | PMC-Sierra, Inc. (a) | | | 141 | | |
| | 4 | | | Power Integrations, Inc. (a) | | | 82 | | |
| | 11 | | | Rambus, Inc. (a) | | | 140 | | |
| | 39 | | | RF Micro Devices, Inc. (a) | | | 213 | | |
| | 10 | | | Semitool, Inc. (a) | | | 93 | | |
| | 16 | | | Semtech Corp. (a) | | | 271 | | |
| | 9 | | | Sigmatel, Inc. (a) | | | 156 | | |
| | 19 | | | Silicon Image, Inc. (a) | | | 197 | | |
| | 8 | | | Silicon Laboratories, Inc. (a) | | | 220 | | |
| | 30 | | | Silicon Storage Technology, Inc. (a) | | | 122 | | |
| | 27 | | | Skyworks Solutions, Inc. (a) | | | 200 | | |
| | 3 | | | Supertex, Inc. (a) | | | 53 | | |
| | 18 | | | Transmeta Corp. (a) | | | 11 | | |
| | 2 | | | Ultratech, Inc. (a) | | | 37 | | |
| | 5 | | | Varian Semiconductor Equipment
Associates, Inc. (a) | | | 181 | | |
| | 46 | | | Vitesse Semiconductor Corp. (a) | | | 96 | | |
| | 1 | | | White Electronic Designs Corp. (a) | | | 4 | | |
| | 6 | | | Zoran Corp. (a) | | | 73 | | |
| | | | 8,012 | | |
| | | | | Software - 2.4% | | | |
| | 2 | | | Ansoft Corp. (a) | | | 36 | | |
| | 5 | | | Ansys, Inc. (a) | | | 171 | | |
| | 11 | | | Aspen Technology, Inc. (a) | | | 58 | | |
| | 14 | | | Borland Software Corp. (a) | | | 93 | | |
| | 1 | | | Datastream Systems, Inc. (a) | | | 7 | | |
| | 12 | | | E.piphany, Inc. (a) | | | 43 | | |
| | 7 | | | Epicor Software Corp. (a) | | | 90 | | |
| | 5 | | | EPIQ Systems, Inc. (a) | | | 88 | | |
| | 5 | | | Factset Research Systems, Inc. | | | 190 | | |
| SHARES | | SECURITY DESCRIPTION | | VALUE | |
| | | | | Software - Continued | |
| | 4 | | | Filenet Corp. (a) | | $ | 93 | | |
| | 9 | | | Informatica Corp. (a) | | | 75 | | |
| | 2 | | | Intervideo, Inc. (a) | | | 25 | | |
| | 3 | | | InterVoice, Inc. (a) | | | 22 | | |
| | 7 | | | JDA Software Group, Inc. (a) | | | 77 | | |
| | 3 | | | Kronos, Inc. (a) | | | 117 | | |
| | 6 | | | Macrovision Corp. (a) | | | 142 | | |
| | 8 | | | Magma Design Automation, Inc. (a) | | | 68 | | |
| | 6 | | | Manhattan Associates, Inc. (a) | | | 117 | | |
| | 12 | | | Mentor Graphics Corp. (a) | | | 124 | | |
| | 4 | | | MicroStrategy, Inc. (a) | | | 217 | | |
| | 7 | | | MRO Software, Inc. (a) | | | 98 | | |
| | 59 | | | Parametric Technology Corp. (a) | | | 376 | | |
| | 4 | | | Pegasystems, Inc. (a) | | | 25 | | |
| | 9 | | | Phoenix Technologies Ltd. (a) | | | 72 | | |
| | 5 | | | Portal Software, Inc. (a) | | | 9 | | |
| | 19 | | | Progress Software Corp. (a) | | | 587 | | |
| | 2 | | | Quality Systems, Inc. (a) | | | 85 | | |
| | 5 | | | Quest Software, Inc. (a) | | | 65 | | |
| | 29 | | | Secure Computing Corp. (a) | | | 319 | | |
| | 1 | | | SPSS, Inc. (a) | | | 27 | | |
| | 2 | | | SS&C Technologies, Inc. | | | 63 | | |
| | 4 | | | Talx Corp. | | | 111 | | |
| | 3 | | | TradeStation Group, Inc. (a) | | | 22 | | |
| | 10 | | | Transaction Systems Architechs, Inc. (a) | | | 249 | | |
| | 8 | | | TIBCO Software, Inc. (a) | | | 55 | | |
| | 12 | | | Wind River Systems, Inc. (a) | | | 182 | | |
| | | | 4,198 | | |
| | | | | Specialty Retail - 5.2% | | | |
| | 71 | | | Aaron Rents, Inc. | | | 1,776 | | |
| | 18 | | | Aeropostale, Inc. (a) | | | 612 | | |
| | 20 | | | Asbury Automotive Group, Inc. (a) | | | 313 | | |
| | 4 | | | Big 5 Sporting Goods Corp. | | | 119 | | |
| | 9 | | | Brookstone, Inc. (a) | | | 176 | | |
| | 5 | | | Build-A-Bear Workshop, Inc. (a) | | | 106 | | |
| | 4 | | | Building Material Holding Corp. | | | 263 | | |
| | 13 | | | Burlington Coat Factory Warehouse Corp. | | | 554 | | |
| | 70 | | | Charming Shoppes, Inc. (a) | | | 655 | | |
| | 9 | | | Children's Place, Inc. (a) | | | 406 | | |
| | 5 | | | Dress Barn, Inc. (a) | | | 106 | | |
| | 2 | | | Electronics Boutique Holdings Corp. (a) | | | 152 | | |
SEE NOTES TO FINANCIAL STATEMENTS.
JPMorgan U.S. Equity Mid/Small Cap Funds 60
SEMI-ANNUAL REPORT JUNE 30
2005
SCHEDULE OF PORTFOLIO INVESTMENTS AS OF JUNE 30, 2005
(Amounts in thousands)
(Unaudited)
| SHARES | | SECURITY DESCRIPTION | | VALUE | |
| Long-Term Investments - continued | |
| | | | | Specialty Retail - Continued | | | |
| | 14 | | | Genesco, Inc. (a) | | $ | 530 | | |
| | 8 | | | Guess?, Inc. (a) | | | 129 | | |
| | 8 | | | HOT Topic, Inc. (a) | | | 143 | | |
| | 11 | | | Lithia Motors, Inc., Class A | | | 310 | | |
| | 4 | | | Movie Gallery, Inc. | | | 101 | | |
| | 11 | | | Pacific Sunwear of California, Inc. (a) | | | 241 | | |
| | 1 | | | Party City Corp. (a) | | | 7 | | |
| | 12 | | | Petco Animal Supplies, Inc. (a) | | | 337 | | |
| | 23 | | | Rent-A-Center, Inc. (a) | | | 540 | | |
| | 10 | | | Select Comfort Corp. (a) | | | 221 | | |
| | 4 | | | Sonic Automotive, Inc. | | | 92 | | |
| | 3 | | | Sports Authority, Inc. (The) (a) | | | 102 | | |
| | 2 | | | Stage Stores, Inc. (a) | | | 100 | | |
| | 21 | | | Stein Mart, Inc. | | | 469 | | |
| | 20 | | | Too, Inc. (a) | | | 456 | | |
| | 4 | | | Trans World Entertainment Corp. (a) | | | 47 | | |
| | 5 | | | United Auto Group, Inc. | | | 155 | | |
| | | | 9,218 | | |
| | | | | Textiles, Apparel & Luxury Goods - 1.2% | | | |
| | 4 | | | Brown Shoe Co., Inc. | | | 149 | | |
| | 4 | | | DHB Industries, Inc. (a) | | | 31 | | |
| | 5 | | | Fossil, Inc. (a) | | | 123 | | |
| | 16 | | | K-Swiss, Inc., Class A | | | 501 | | |
| | 9 | | | Kellwood Co. | | | 245 | | |
| | 10 | | | Kenneth Cole Productions, Inc., Class A | | | 299 | | |
| | 8 | | | Movado Group, Inc. | | | 153 | | |
| | 5 | | | Russell Corp. | | | 94 | | |
| | 15 | | | Skechers U.S.A., Inc., Class A (a) | | | 214 | | |
| | 8 | | | Unifirst Corp. | | | 324 | | |
| | | | 2,133 | | |
| | | | | Thrifts & Mortgage Finance - 3.1% | | | |
| | 10 | | | Accredited Home Lenders Holding Co. (a) | | | 436 | | |
| | 35 | | | Bank Atlantic Bancorp, Inc., Class A | | | 661 | | |
| | 4 | | | Commercial Capital Bancorp, Inc. | | | 69 | | |
| | 19 | | | Corus Bankshares, Inc. | | | 1,043 | | |
| | 4 | | | Dime Community Bancshares | | | 65 | | |
| | 17 | | | First Niagara Financial Group, Inc. | | | 255 | | |
| | 1 | | | First Place Financial Corp. | | | 11 | | |
| | 1 | | | FirstFed Financial Corp. (a) | | | 48 | | |
| | 10 | | | Flagstar Bancorp, Inc. | | | 195 | | |
| SHARES | | SECURITY DESCRIPTION | | VALUE | |
| | | | | Thrifts & Mortgage Finance - Continued | | | |
| | 13 | | | Fremont General Corp. | | $ | 324 | | |
| | 6 | | | Gibraltar Industries, Inc. | | | 111 | | |
| | 3 | | | ITLA Capital Corp. (a) | | | 178 | | |
| | 10 | | | Partners Trust Financial Group, Inc. | | | 103 | | |
| | 21 | | | Provident Bancorp, Inc. | | | 254 | | |
| | 31 | | | R&G Financial Corp., Class B | | | 541 | | |
| | 8 | | | Sterling Financial Corp.(a) | | | 316 | | |
| | 56 | | | W Holding Co., Inc. | | | 577 | | |
| | 6 | | | WSFS Financial Corp. | | | 339 | | |
| | | | 5,526 | | |
| | | | | Tobacco - 0.5% | | | |
| | 38 | | | Alliance One International, Inc. | | | 231 | | |
| | 14 | | | Universal Corp. | | | 600 | | |
| | | | 831 | | |
| | | | | Trading Companies & Distributors - 1.4% | | | |
| | 60 | | | Applied Industrial Technologies, Inc. | | | 1,935 | | |
| | 18 | | | Hughes Supply, Inc. | | | 517 | | |
| | 4 | | | Nuco2, Inc. (a) | | | 95 | | |
| | | | 2,547 | | |
| | | | | Wireless Telecommunication Services - 0.5% | | | |
| | 1 | | | Aether Systems, Inc. (a) | | | 2 | | |
| | 17 | | | Centennial Communications Corp. (a) | | | 239 | | |
| | 92 | | | Dobson Communications Corp. (a) | | | 392 | | |
| | 5 | | | InPhonic, Inc. (a) | | | 83 | | |
| | 1 | | | Remec, Inc. (a) | | | 5 | | |
| | 17 | | | US Unwired, Inc. (a) | | | 97 | | |
| | | | 818 | | |
| | | | | Total Common Stocks
(Cost $153,096) | | | 175,973 | | |
| | | | | Total Long-Term Investments
(Cost $153,096) | | | 175,973 | | |
| | Short-Term Investments - 1.3 | | | | |
| | | | | Investment Company - 1.1% | |
| | 1,935 | | | JPMorgan Prime Money
Market Fund (b) (m) | | | 1,935 | | |
SEE NOTES TO FINANCIAL STATEMENTS.
JPMorgan U.S. Equity Mid/Small Cap Funds 61
JPMorgan U.S. Small Company Fund
SCHEDULE OF PORTFOLIO INVESTMENTS AS OF JUNE 30, 2005
(Amounts in thousands)
(CONTINUED)
(Unaudited)
PRINCIPAL
AMOUNT | | SECURITY DESCRIPTION | | VALUE | |
| Short-Term Investments - continued | |
| | | U.S. Treasury Obligation - 0.2% | |
| $ | 425 | | | U.S. Treasury Bond,
1.88%, 11/30/05 (k) | | $ | 422 | | |
| | | Total Short-Term Investments | | | 2,357
(Cost $2,357) | | |
| | | Total Investments - 100.3% | | $ | 178,330 | | |
| | | (Cost $155,453) | | | | | |
| | | Liabilities in excess of
other assets - (0.3)% | | | (561 | ) | |
| | | NET ASSETS - 100.0% | | $ | 177,769 | | |
Percentages indicated are based on net assets.
Futures Contracts
(Amounts in thousands, except number of contracts)
NUMBER OF
CONTRACTS | | DESCRIPTION | | EXPIRATION DATE | | NOTIONAL
VALUE
AT 06/30/05 | | UNREALIZED
APPRECIATION | |
| | 7 | | | Russell 2000 Index | | September, 2005 | | $ | 2,251 | | | $ | 52 | | |
Abbrevations:
(a) Non-income producing security.
(b) Investment in affiliate. Money market fund registered under the Investment Company Act of 1940, as amended, and advised by JPMorgan Investment Management, Inc. or JPMorgan Investment Advisors, Inc.
(c) Security, or a portion of the security, has been delivered to a counterparty as part of a security lending transaction.
(h) Amount rounds to less than one thousand.
(k) Security is fully or partially segregated with the broker as collateral for futures or with brokers as initial margin for futures contracts.
(g) Amount rounds to less than 0.1%.
(m) All or a portion of this security is segregated for current or potential holdings of futures, swaps, options, TBA's, when issued, delayed delivery securities, and reverse repurchase agreements.
REIT Real Estate Investment Trust
SEE NOTES TO FINANCIAL STATEMENTS.
JPMorgan U.S. Equity Mid/Small Cap Funds 62
THIS PAGE IS INTENTIONALLY LEFT BLANK
JPMorgan U.S. Equity Mid/Small Cap Funds63
JPMorgan Funds
STATEMENT OF ASSETS
AND LIABILITIES AS OF JUNE 30, 2005
(Amounts in thousands, except per share amounts)
(Unaudited)
| | | Capital
Growth | | Dynamic
Small Cap | | Mid Cap
Equity | | Mid Cap
Growth | |
| ASSETS | | | |
| Investments in non-affiliates, at value | | $ | 755,937 | | | $ | 208,113 | | | $ | 256,462 | | | $ | 58,389 | | |
| Investments in affiliates, at value | | | 14,906 | | | | 5,923 | | | | 5,894 | | | | 668 | | |
| Total Investment securities, at value | | | 770,843 | | | | 214,036 | | | | 262,356 | | | | 59,057 | | |
| Cash | | | 20 | | | | - | | | | 10 | | | | - | | |
| Receivables: | |
| Investment securities sold | | | - | | | | 1,733 | | | | 137 | | | | - | | |
| Fund shares sold | | | 2,332 | | | | 1,658 | | | | 544 | | | | 11 | | |
| Interest and dividends | | | 155 | | | | 23 | | | | 194 | | | | 14 | | |
| Prepaid expenses and other assets | | | - | (b) | | | - | | | | - | | | | 10 | | |
| Total Assets | | | 773,350 | | | | 217,450 | | | | 263,241 | | | | 59,092 | | |
| LIABILITIES | | | |
| Payables: | |
| Due to custodian | | | - | | | | 563 | | | | - | | | | 1 | | |
| Dividends | | | - | | | | - | | | | 145 | | | | - | | |
| Investment securities purchased | | | 3,516 | | | | 1,283 | | | | 1,025 | | | | 258 | | |
Collateral for securities
lending program | | | 53,039 | | | | 39,406 | | | | 12,420 | | | | 6,470 | | |
| Fund shares redeemed | | | 1,591 | | | | 1,816 | | | | 96 | | | | 44 | | |
| Accrued liabilities: | |
| Investment advisory fees | | | 234 | | | | 91 | | | | 96 | | | | 22 | | |
| Administration fees | | | 62 | | | | 15 | | | | 20 | | | | 2 | | |
| Shareholder servicing fees | | | 146 | | | | 31 | | | | 51 | | | | 3 | | |
| Distribution fees | | | 121 | | | | 69 | | | | - | | | | 12 | | |
| Custodian and accounting fees | | | 23 | | | | 11 | | | | 6 | | | | 2 | | |
Trustees' fees - deferred
compensation plan | | | 37 | | | | 5 | | | | 5 | | | | 1 | | |
| Other | | | 404 | | | | 140 | | | | 52 | | | | 28 | | |
| Total Liabilities | | | 59,173 | | | | 43,430 | | | | 13,916 | | | | 6,843 | | |
| NET ASSETS | | $ | 714,177 | | | $ | 174,020 | | | $ | 249,325 | | | $ | 52,249 | | |
(b) Amount rounds to less than one thousand
SEE NOTES TO FINANCIAL STATEMENTS.
JPMorgan U.S. Equity Mid/Small Cap Funds64
SEMI-ANNUAL REPORT JUNE 30
2005
STATEMENT OF ASSETS
AND LIABILITIES AS OF JUNE 30, 2005
(Amounts in thousands, except per share amounts)
(Unaudited)
| | | Capital
Growth | | Dynamic
Small Cap | | Mid Cap
Equity | | Mid Cap
Growth | |
| NET ASSETS | | | |
| Paid in capital | | $ | 574,464 | | | $ | 152,964 | | | $ | 182,668 | | | $ | 293,240 | | |
Accumulated undistributed
(distributions in excess of)
net investment income and futures | | | (2,340 | ) | | | (1,204 | ) | | | (28 | ) | | | (248 | ) | |
Accumulated undistributed net realized
gains (losses) from investments
and futures | | | 41,289 | | | | 8,601 | | | | 19,461 | | | | (249,402 | ) | |
Net unrealized appreciation
(depreciation) from investments
and futures | | | 100,764 | | | | 13,659 | | | | 47,224 | | | | 8,659 | | |
| Total Net Assets | | $ | 714,177 | | | $ | 174,020 | | | $ | 249,325 | | | $ | 52,249 | | |
| Net Assets: | |
| Class A | | $ | 440,707 | | | $ | 65,961 | | | $ | - | | | $ | 49,463 | | |
| Class B | | $ | 38,165 | | | $ | 53,127 | | | $ | - | | | $ | 2,786 | | |
| Class C | | $ | 10,533 | | | $ | 36,963 | | | $ | - | | | $ | - | | |
| Select Class | | $ | 224,772 | | | $ | 17,969 | | | $ | 249,325 | | | $ | - | | |
| Total | | $ | 714,177 | | | $ | 174,020 | | | $ | 249,325 | | | $ | 52,249 | | |
Outstanding units of beneficial
interest (shares): | |
| Class A | | | 11,183 | | | | 3,636 | | | | - | | | | 8,421 | | |
| Class B | | | 1,046 | | | | 3,103 | | | | - | | | | 493 | | |
| Class C | | | 293 | | | | 2,163 | | | | - | | | | - | | |
| Select Class | | | 5,425 | | | | 966 | | | | 7,221 | | | | - | | |
| | | | 17,947 | | | | 9,868 | | | | 7,221 | | | | 8,914 | | |
| Class A - Redemption price per share | | $ | 39.41 | | | $ | 18.14 | | | $ | - | | | $ | 5.87 | | |
| Class B - Offering price per share (a) | | $ | 36.48 | | | $ | 17.12 | | | $ | - | | | $ | 5.65 | | |
| Class C - Offering price per share (a) | | $ | 35.95 | | | $ | 17.09 | | | $ | - | | | $ | - | | |
Select Class - Offering and redemption
price per share | | $ | 41.43 | | | $ | 18.60 | | | $ | 34.53 | | | $ | - | | |
Institutional Class - Offering and
redemption price per share | | $ | - | | | $ | - | | | $ | - | | | $ | - | | |
Class A Maximum Public Offering
Price Per Share (net asset value per
share/94.75%) | | $ | 41.59 | | | $ | 19.15 | | | $ | - | | | $ | 6.20 | | |
| Cost of investments | | $ | 670,079 | | | $ | 200,377 | | | $ | 215,132 | | | $ | 50,398 | | |
| Total market value of securities on loan | | $ | 51,733 | | | $ | 38,461 | | | $ | 12,273 | | | $ | 6,352 | | |
(a) Redemption price for Class B and Class C shares varies on the length of time the shares are held.
SEE NOTES TO FINANCIAL STATEMENTS.
JPMorgan U.S. Equity Mid/Small Cap Funds65
JPMorgan Funds
STATEMENT OF ASSETS
AND LIABILITIES (CONTINUED) AS OF JUNE 30, 2005
(Amounts in thousands, except per share amounts)
(Unaudited)
| | | Mid Cap
Value | | Small Cap
Core | | Small Cap
Equity | | U.S. Small
Company | |
| ASSETS | | | |
| Investments in non-affiliates, at value | | $ | 6,302,344 | | | $ | 987,235 | | | $ | 448,439 | | | $ | 176,395 | | |
| Investments in affiliates, at value | | | 183,523 | | | | 12,739 | | | | 13,742 | | | | 1,935 | | |
| Total Investment securities, at value | | | 6,485,867 | | | | 999,974 | | | | 462,181 | | | | 178,330 | | |
| Cash | | | 369 | | | | 17 | | | | 8 | | | | - | | |
| Receivables: | |
| Investment securities sold | | | 4,987 | | | | 19,362 | | | | 1,759 | | | | 4,247 | | |
| Fund shares sold | | | 26,702 | | | | 1,323 | | | | 4,776 | | | | 16 | | |
| Interest and dividends | | | 8,368 | | | | 764 | | | | 316 | | | | 167 | | |
Variation margin on futures
contracts | | | - | | | | 330 | | | | - | | | | 43 | | |
| Prepaid expenses and other assets | | | 64 | | | | 28 | | | | 2 | | | | - | | |
| Total Assets | | | 6,526,357 | | | | 1,021,798 | | | | 469,042 | | | | 182,803 | | |
| LIABILITIES | | | |
| Payables: | |
| Due to custodian | | | - | | | | - | | | | - | | | | 60 | | |
| Investment securities purchased | | | 23,402 | | | | 18,384 | | | | 2,788 | | | | 4,056 | | |
Collateral for securities lending
program | | | 280,525 | | | | 186,483 | | | | 80,461 | | | | - | | |
| Fund shares redeemed | | | 4,853 | | | | 1,793 | | | | 953 | | | | 705 | | |
| Accrued liabilities: | |
| Investment advisory fees | | | 2,887 | | | | 434 | | | | 204 | | | | 88 | | |
| Administration fees | | | 492 | | | | 64 | | | | 22 | | | | 9 | | |
| Shareholder servicing fees | | | 914 | | | | - | | | | 36 | | | | 18 | | |
| Distribution fees | | | 1,094 | | | | - | | | | 41 | | | | - | | |
| Custodian and accounting fees | | | 64 | | | | - | | | | 13 | | | | 20 | | |
Trustees' fees - deferred
compensation plan | | | 13 | | | | 15 | | | | 21 | | | | 2 | | |
| Other | | | 696 | | | | 56 | | | | 157 | | | | 76 | | |
| Total Liabilities | | | 314,940 | | | | 207,229 | | | | 84,696 | | | | 5,034 | | |
| NET ASSETS | | $ | 6,211,417 | | | $ | 814,569 | | | $ | 384,346 | | | $ | 177,769 | | |
SEE NOTES TO FINANCIAL STATEMENTS.
JPMorgan U.S. Equity Mid/Small Cap Funds66
SEMI-ANNUAL REPORT JUNE 30
2005
STATEMENT OF ASSETS
AND LIABILITIES AS OF JUNE 30, 2005
(Amounts in thousands, except per share amounts)
(Unaudited)
| | | Mid Cap
Value | | Small Cap
Core | | Small Cap
Equity | | U.S. Small
Company | |
| NET ASSETS | | | |
| Paid in capital | | $ | 5,468,430 | | | $ | 755,673 | | | $ | 266,172 | | | $ | 142,788 | | |
Accumulated undistributed
(distributions in excess of)
net investment income and futures | | | 13,505 | | | | 1,664 | | | | (574 | ) | | | 302 | | |
Accumulated undistributed net
realized gains (losses) from
investments and futures | | | 142,550 | | | | 7,114 | | | | 45,233 | | | | 11,750 | | |
Net unrealized appreciation
(depreciation) from investments
and futures | | | 586,932 | | | | 50,118 | | | | 73,515 | | | | 22,929 | | |
| Total Net Assets | | $ | 6,211,417 | | | $ | 814,569 | | | $ | 384,346 | | | $ | 177,769 | | |
| Net Assets: | |
| Class A | | $ | 2,383,157 | | | $ | - | | | $ | 158,657 | | | $ | - | | |
| Class B | | $ | 230,236 | | | $ | - | | | $ | 13,321 | | | $ | - | | |
| Class C | | $ | 792,600 | | | $ | - | | | $ | 2,841 | | | $ | - | | |
| Select Class | | $ | 1,153,809 | | | $ | 814,569 | | | $ | 209,527 | | | $ | 123,444 | | |
| Institutional Class | | $ | 1,651,615 | | | $ | - | | | $ | - | | | $ | 54,325 | | |
| Total | | $ | 6,211,417 | | | $ | 814,569 | | | $ | 384,346 | | | $ | 177,769 | | |
Outstanding units of beneficial
interest (shares): | |
| Class A | | | 102,991 | | | | - | | | | 5,820 | | | | - | | |
| Class B | | | 10,156 | | | | - | | | | 540 | | | | - | | |
| Class C | | | 34,894 | | | | - | | | | 115 | | | | - | | |
| Select Class | | | 49,507 | | | | 18,812 | | | | 7,249 | | | | 8,988 | | |
| Institutional Class | | | 70,414 | | | | - | | | | - | | | | 3,954 | | |
| | | | 267,962 | | | | 18,812 | | | | 13,724 | | | | 12,942 | | |
| Class A - Redemption price per share | | $ | 23.14 | | | $ | - | | | $ | 27.26 | | | $ | - | | |
| Class B - Offering price per share (a) | | $ | 22.67 | | | $ | - | | | $ | 24.69 | | | $ | - | | |
| Class C - Offering price per share (a) | | $ | 22.71 | | | $ | - | | | $ | 24.68 | | | $ | - | | |
Select Class - Offering and redemption
price per share | | $ | 23.31 | | | $ | 43.30 | | | $ | 28.90 | | | $ | 13.73 | | |
Institutional Class - Offering and
redemption price per share | | $ | 23.46 | | | $ | - | | | | - | | | $ | 13.74 | | |
Class A Maximum Public Offering
Price Per Share (net asset value per
share/94.75%) | | $ | 24.42 | | | $ | - | | | $ | 28.77 | | | $ | - | | |
| Cost of investments | | $ | 5,898,935 | | | $ | 950,209 | | | $ | 388,666 | | | $ | 155,453 | | |
| Total market value of securities on loan | | $ | 277,451 | | | $ | 182,040 | | | $ | 78,852 | | | $ | - | | |
(a) Redemption price for Class B and Class C shares varies on the length of time the shares are held.
SEE NOTES TO FINANCIAL STATEMENTS.
JPMorgan U.S. Equity Mid/Small Cap Funds67
JPMorgan Funds
STATEMENT OF
OPERATIONS FOR THE SIX MONTHS ENDED JUNE 30, 2005
(Amounts in thousands)
(Unaudited)
| | | Capital
Growth | | Dynamic
Small Cap | | Mid Cap
Equity | | Mid Cap
Growth | |
| INVESTMENT INCOME | | | |
| Dividends | | $ | 1,413 | | | $ | 219 | | | $ | 1,183 | | | $ | 114 | | |
| Dividend income from affiliates* | | | 182 | | | | 43 | | | | 83 | | | | 6 | | |
| Income from securities lending (net) | | | 19 | | | | 34 | | | | 2 | | | | 1 | | |
| Foreign taxes withheld | | | (4 | ) | | | (1 | ) | | | (2 | ) | | | - | (b) | |
| Total investment income | | | 1,610 | | | | 295 | | | | 1,266 | | | | 121 | | |
| EXPENSES | | | |
| Investment advisory fees | | | 1,363 | | | | 552 | | | | 770 | | | | 172 | | |
| Administrative fees | | | 404 | | | | 102 | | | | 141 | | | | 32 | | |
| Distribution fees | | | 724 | | | | 420 | | | | - | | | | 73 | | |
| Shareholder servicing fees | | | 852 | | | | 212 | | | | 296 | | | | 66 | | |
| Custodian and accounting fees | | | 53 | | | | 27 | | | | 29 | | | | 22 | | |
| Interest expense | | | - | | | | - | | | | 5 | | | | 1 | | |
| Professional fees | | | 32 | | | | 23 | | | | 21 | | | | 22 | | |
| Trustees' fees | | | 4 | | | | 1 | | | | 1 | | | | - | (b) | |
| Printing and mailing costs | | | 68 | | | | 33 | | | | 12 | | | | 20 | | |
| Registration and filing fees | | | 22 | | | | 24 | | | | 6 | | | | 9 | | |
| Transfer agent fees | | | 370 | | | | 141 | | | | 5 | | | | 28 | | |
| Other | | | 16 | | | | - | (b) | | | 9 | | | | 10 | | |
| Total expenses before waivers | | | 3,908 | | | | 1,535 | | | | 1,295 | | | | 455 | | |
| Less amounts waived | | | - | | | | (42 | ) | | | (221 | ) | | | (87 | ) | |
| Less earnings credits | | | - | | | | (1 | ) | | | (2 | ) | | | - | | |
| Less expense reimbursements | | | (1 | ) | | | - | | | | - | | | | - | | |
| Net expenses | | | 3,907 | | | | 1,492 | | | | 1,072 | | | | 368 | | |
| Net investment income (Loss) | | | (2,297 | ) | | | (1,197 | ) | | | 194 | | | | (247 | ) | |
SEE NOTES TO FINANCIAL STATEMENTS.
JPMorgan U.S. Equity Mid/Small Cap Funds68
SEMI-ANNUAL REPORT JUNE 30
2005
STATEMENT OF
OPERATIONS FOR THE SIX MONTHS ENDED JUNE 30, 2005
(Amounts in thousands)
(Unaudited)
| | | | | Capital
Growth | | Dynamic
Small Cap | | Mid Cap
Equity | | Mid Cap
Growth | |
REALIZED AND UNREALIZED
GAIN (LOSSES) ON INVESTMENTS
AND FUTURES | | | |
Net realized gain (loss) on
transactions from: | |
| Investments | | | | $ | 22,864 | | | $ | 12,557 | | | $ | 14,342 | | | $ | 4,133 | | |
| Futures | | | | | - | | | | - | | | | - | | | | - | | |
Change in net unrealized
appreciation (depreciation) of: | |
| Investments | | | | | (2,042 | ) | | | (15,147 | ) | | | (5,026 | ) | | | (2,785 | ) | |
| Futures | | | | | - | | | | - | | | | - | | | | - | | |
Net realized\unrealized gains (losses)
on investments and futures | | | | | 20,822 | | | | (2,590 | ) | | | 9,316 | | | | 1,348 | | |
Change in net assets resulting
from operations | | | | $ | 18,525 | | | $ | (3,787 | ) | | $ | 9,510 | | | $ | 1,101 | | |
* Includes reimbursements of
investment advisory and
adminstration fees: | | | | | $10 | | | | $3 | | | | $6 | | | | $-(b) | | |
(b) Rounds to less than $1,000.
SEE NOTES TO FINANCIAL STATEMENTS.
JPMorgan U.S. Equity Mid/Small Cap Funds69
JPMorgan Funds
STATEMENT OF
OPERATIONS (CONTINUED) FOR THE SIX MONTHS ENDED JUNE 30, 2005
(Amounts in thousands)
(Unaudited)
| | | Mid Cap
Value | | Small Cap
Core | | Small Cap
Equity | | U.S. Small
Company | |
| INVESTMENT INCOME | | | |
| Dividends | | $ | 39,290 | | | $ | 4,161 | | | $ | 1,249 | | | $ | 1,134 | | |
| Dividend income from affiliates* | | | 2,964 | | | | 222 | | | | 158 | | | | 42 | | |
| Interest income | | | - | | | | 31 | | | | - | | | | 5 | | |
| Income from securities lending (net) | | | 125 | | | | 297 | | | | 9 | | | | - | | |
| Foreign taxes withheld | | | (46 | ) | | | (5 | ) | | | - | | | | (1 | ) | |
| Total investment income | | | 42,333 | | | | 4,706 | | | | 1,416 | | | | 1,180 | | |
| EXPENSES | | | |
| Investment advisory fees | | | 16,464 | | | | 2,674 | | | | 1,190 | | | | 562 | | |
| Administrative fees | | | 2,896 | | | | 491 | | | | 217 | | | | 112 | | |
| Distribution fees | | | 5,573 | | | | - | | | | 226 | | | | - | | |
| Shareholder servicing fees | | | 5,141 | | | | 1,028 | | | | 458 | | | | 180 | | |
| Custodian and accounting fees | | | 129 | | | | 71 | | | | 13 | | | | 52 | | |
| Interest expense | | | 4 | | | | - | | | | 1 | | | | 1 | | |
| Professional fees | | | 75 | | | | 27 | | | | 28 | | | | 27 | | |
| Trustees' fees | | | 26 | | | | 4 | | | | 2 | | | | 1 | | |
| Printing and mailing costs | | | 251 | | | | 18 | | | | 38 | | | | 10 | | |
| Registration and filing fees | | | 311 | | | | 40 | | | | 21 | | | | 19 | | |
| Transfer agent fees | | | 1,434 | | | | 6 | | | | 96 | | | | 18 | | |
| Other | | | 145 | | | | 15 | | | | 12 | | | | 5 | | |
| Total expenses before waivers | | | 32,449 | | | | 4,374 | | | | 2,302 | | | | 987 | | |
| Less amounts waived | | | (3,617 | ) | | | (1,083 | ) | | | (319 | ) | | | (105 | ) | |
| Less earnings credits | | | (14 | ) | | | - | | | | (1 | ) | | | (1 | ) | |
| Net expenses | | | 28,818 | | | | 3,291 | | | | 1,982 | | | | 881 | | |
| Net investment income (Loss) | | | 13,515 | | | | 1,415 | | | | (566 | ) | | | 299 | | |
SEE NOTES TO FINANCIAL STATEMENTS.
JPMorgan U.S. Equity Mid/Small Cap Funds70
SEMI-ANNUAL REPORT JUNE 30
2005
STATEMENT OF
OPERATIONS FOR THE SIX MONTHS ENDED JUNE 30, 2005
(Amounts in thousands)
(Unaudited)
| | | | | Mid Cap
Value | | Small Cap
Core | | Small Cap
Equity | | U.S. Small
Company | |
REALIZED/UNREALIZED
GAINS (LOSSES) FROM INVESTMENTS
AND FUTURES: | | | |
Net realized gain (loss) on
transactions from: | |
| Investments | | | | $ | 121,450 | | | $ | 4,331 | | | $ | 30,327 | | | $ | 8,865 | | |
| Futures | | | | | - | | | | (1,388 | ) | | | - | | | | (58 | ) | |
Change in net unrealized
appreciation (depreciation) of: | |
| Investments | | | | | 137,094 | | | | (10,923 | ) | | | (17,531 | ) | | | (10,992 | ) | |
| Futures | | | | | - | | | | (293 | ) | | | - | | | | (71 | ) | |
Net realized\unrealized gains (losses)
on investments and futures | | | | | 258,544 | | | | (8,273 | ) | | | 12,796 | | | | (2,256 | ) | |
Change in net assets resulting
from operations | | | | $ | 272,059 | | | $ | (6,858 | ) | | $ | 12,230 | | | $ | (1,957 | ) | |
* Includes reimbursements of
investment advisory and
adminstration fees: | | | | $ | 196 | | | $ | 15 | | | $ | 11 | | | $ | 3 | | |
SEE NOTES TO FINANCIAL STATEMENTS.
JPMorgan U.S. Equity Mid/Small Cap Funds71
JPMorgan Funds
STATEMENT OF CHANGES
IN NET ASSETS FOR THE PERIODS INDICATED
(Amounts in thousands)
| | | Capital Growth | | Dynamic Small Cap | |
| | | Six Months
Ended
06/30/05
(Unaudited) | | Year Ended
12/31/04 | | Six Months
Ended
06/30/05
(Unaudited) | | Year Ended
12/31/04 | |
INCREASE (DECREASE) IN NET
ASSETS FROM OPERATIONS | |
| Net investment income (loss) | | $ | (2,297 | ) | | $ | (3,194 | ) | | $ | (1,197 | ) | | $ | (2,722 | ) | |
Net realized gain (loss) on
investments and futures | | | 22,864 | | | | 84,582 | | | | 12,557 | | | | 37,317 | | |
Change in net unrealized appreciation
(depreciation) of investments and futures | | | (2,042 | ) | | | (5,839 | ) | | | (15,147 | ) | | | (18,399 | ) | |
Increase (decrease) in net assets
from operations | | | 18,525 | | | | 75,549 | | | | (3,787 | ) | | | 16,196 | | |
DISTRIBUTIONS TO
SHAREHOLDERS | |
From net realized gains on investment
transactions | | | - | | | | (61,848 | ) | | | - | | | | - | | |
| Total distributions to shareholders | | | - | | | | (61,848 | ) | | | - | | | | - | | |
| CAPITAL SHARE TRANSACTIONS | |
| Increase (decrease) | | | 153,625 | | | | 47,795 | | | | (14,037 | ) | | | (15,717 | ) | |
| NET ASSETS | |
| Total increase (decrease) in net assets | | | 172,150 | | | | 61,496 | | | | (17,824 | ) | | | 479 | | |
| Beginning of period | | | 542,027 | | | | 480,531 | | | | 191,844 | | | | 191,365 | | |
| End of period | | $ | 714,177 | | | $ | 542,027 | | | $ | 174,020 | | | $ | 191,844 | | |
Accumulated undistributed
(distributions in excess of) net
investment income | | $ | (2,340 | ) | | $ | (43 | ) | | $ | (1,204 | ) | | $ | (7 | ) | |
SEE NOTES TO FINANCIAL STATEMENTS.
JPMorgan U.S. Equity Mid/Small Cap Funds72
SEMI-ANNUAL REPORT JUNE 30
2005
STATEMENT OF CHANGES
IN NET ASSETS FOR THE PERIODS INDICATED
(Amounts in thousands)
| | | Mid Cap Equity | | Mid Cap Growth | |
| | | Six Months
Ended
06/30/05
(Unaudited) | | Year Ended
12/31/04 | | Six Months
Ended
06/30/05
(Unaudited) | | Year Ended
12/31/04 | |
INCREASE (DECREASE) IN NET
ASSETS FROM OPERATIONS | | | |
| Net investment income (loss) | | $ | 194 | | | $ | 643 | | | $ | (247 | ) | | $ | (374 | ) | |
Net realized gain (loss) on investments
and futures | | | 14,342 | | | | 28,575 | | | | 4,133 | | | | 10,011 | | |
Change in net unrealized appreciation
(depreciation) of investments and futures | | | (5,026 | ) | | | 8,854 | | | | (2,785 | ) | | | (582 | ) | |
Increase (decrease) in net assets
from operations | | | 9,510 | | | | 38,072 | | | | 1,101 | | | | 9,055 | | |
DISTRIBUTIONS TO
SHAREHOLDERS | | | |
| From net investment income | | | (216 | ) | | | (627 | ) | | | - | | | | - | | |
From net realized gains on
investment transactions | | | - | | | | (23,640 | ) | | | - | | | | - | | |
| Total distributions to shareholders | | | (216 | ) | | | (24,267 | ) | | | - | | | | - | | |
| CAPITAL SHARE TRANSACTIONS | | | |
| Increase (decrease) | | | 12,924 | | | | 19,236 | | | | (6,234 | ) | | | (12,240 | ) | |
| NET ASSETS | | | |
| Total increase (decrease) in net assets | | | 22,218 | | | | 33,041 | | | | (5,133 | ) | | | (3,185 | ) | |
| Beginning of period | | | 227,107 | | | | 194,066 | | | | 57,382 | | | | 60,567 | | |
| End of period | | $ | 249,325 | | | $ | 227,107 | | | $ | 52,249 | | | $ | 57,382 | | |
Accumulated undistributed
(distributions in excess of) net
investment income | | $ | (28 | ) | | $ | (6 | ) | | $ | (248 | ) | | $ | (1 | ) | |
SEE NOTES TO FINANCIAL STATEMENTS.
JPMorgan U.S. Equity Mid/Small Cap Funds73
JPMorgan Funds
STATEMENT OF CHANGES
IN NET ASSETS (CONTINUED) FOR THE PERIODS INDICATED
(Amounts in thousands)
| | | Mid Cap Value | | Small Cap Core | |
| | | Six Months
Ended
06/30/05
(Unaudited) | | Year Ended
12/31/04 | | Six Months
Ended
06/30/05
(Unaudited) | | Year Ended
12/31/04 | |
INCREASE (DECREASE) IN NET
ASSETS FROM OPERATIONS | | | |
| Net investment income (loss) | | $ | 13,515 | | | $ | 8,301 | | | $ | 1,415 | | | $ | 920 | | |
Net realized gain (loss) on
investments and futures | | | 121,450 | | | | 68,273 | | | | 2,943 | | | | 100,058 | | |
Change in net unrealized appreciation
(depreciation) of investments and futures | | | 137,094 | | | | 344,403 | | | | (11,216 | ) | | | (27,707 | ) | |
Increase (decrease) in net assets
from operations | | | 272,059 | | | | 420,977 | | | | (6,858 | ) | | | 73,271 | | |
DISTRIBUTIONS TO
SHAREHOLDERS | | | |
| From net investment income | | | - | | | | (8,593 | ) | | | - | | | | (605 | ) | |
From net realized gains on
investment transactions | | | - | | | | (46,201 | ) | | | - | | | | (87,711 | ) | |
| Total distributions to shareholders | | | - | | | | (54,794 | ) | | | - | | | | (88,316 | ) | |
| CAPITAL SHARE TRANSACTIONS | | | |
| Increase (decrease) | | | 2,250,604 | | | | 2,466,242 | | | | (82,311 | ) | | | 532,830 | | |
| NET ASSETS | | | |
| Total increase (decrease) in net assets | | | 2,522,663 | | | | 2,832,425 | | | | (89,169 | ) | | | 517,785 | | |
| Beginning of period | | | 3,688,754 | | | | 856,329 | | | | 903,738 | | | | 385,953 | | |
| End of period | | $ | 6,211,417 | | | $ | 3,688,754 | | | $ | 814,569 | | | $ | 903,738 | | |
Accumulated undistributed
(distributions in excess of) net
investment income | | $ | 13,505 | | | $ | (10 | ) | | $ | 1,664 | | | $ | 249 | | |
SEE NOTES TO FINANCIAL STATEMENTS.
JPMorgan U.S. Equity Mid/Small Cap Funds74
SEMI-ANNUAL REPORT JUNE 30
2005
STATEMENT OF CHANGES
IN NET ASSETS FOR THE PERIODS INDICATED
(Amounts in thousands)
| | | Small Cap Equity | | U.S. Small Company | |
| | | Six Months
Ended
06/30/05
(Unaudited) | | Year Ended
12/31/04 | | Six Months
Ended
06/30/05
(Unaudited) | | Year Ended
12/31/04 | |
INCREASE (DECREASE) IN NET
ASSETS FROM OPERATIONS | | | |
| Net investment income (loss) | | $ | (566 | ) | | $ | (1,977 | ) | | $ | 299 | | | $ | (249 | ) | |
Net realized gain (loss) on
investments and futures | | | 30,327 | | | | 276,109 | | | | 8,807 | | | | 89,186 | | |
Change in net unrealized appreciation
(depreciation) of investments and futures | | | (17,531 | ) | | | (93,478 | ) | | | (11,063 | ) | | | (62,529 | ) | |
Increase (decrease) in net assets
from operations | | | 12,230 | | | | 180,654 | | | | (1,957 | ) | | | 26,408 | | |
DISTRIBUTIONS TO
SHAREHOLDERS | | | |
From net realized gains on
investment transactions | | | - | | | | (112,302 | ) | | | - | | | | (28,244 | ) | |
| Total distributions to shareholders | | | - | | | | (112,302 | ) | | | - | | | | (28,244 | ) | |
| CAPITAL SHARE TRANSACTIONS | | | |
| Increase (decrease) | | | 15,246 | | | | (457,947 | ) | | | (31,081 | ) | | | (126,815 | ) | |
| NET ASSETS | | | |
| Total increase (decrease) in net assets | | | 27,476 | | | | (389,595 | ) | | | (33,038 | ) | | | (128,651 | ) | |
| Beginning of period | | | 356,870 | | | | 746,465 | | | | 210,807 | | | | 339,458 | | |
| End of period | | $ | 384,346 | | | $ | 356,870 | | | $ | 177,769 | | | $ | 210,807 | | |
Accumulated undistributed
(distributions in excess of) net
investment income | | $ | (574 | ) | | $ | (8 | ) | | $ | 302 | | | $ | 3 | | |
SEE NOTES TO FINANCIAL STATEMENTS.
JPMorgan U.S. Equity Mid/Small Cap Funds75
JPMorgan Funds
STATEMENT OF CHANGES
IN NET ASSETS (CONTINUED) FOR THE PERIODS INDICATED
(Amounts in thousands)
| | | Capital Growth | | Dynamic Small Cap | |
| | | Six Months
Ended
06/30/05
(Unaudited) | | Year Ended
12/31/04 | | Six Months
Ended
06/30/05
(Unaudited) | | Year Ended
12/31/04 | |
| CAPITAL TRANSACTIONS | | | |
| Class A Shares | | | |
| Proceeds from shares issued | | $ | 39,250 | | | $ | 40,060 | | | $ | 8,185 | | | $ | 27,956 | | |
| Dividends reinvested | | | - | | | | 49,434 | | | | - | | | | - | | |
| Cost of shares redeemed | | | (49,869 | ) | | | (73,060 | ) | | | (25,818 | ) | | | (38,856 | ) | |
Change in net assets from Class A
capital transactions | | $ | (10,619 | ) | | $ | 16,434 | | | $ | (17,633 | ) | | $ | (10,900 | ) | |
| Class B Shares | | | |
| Proceeds from shares issued | | $ | 2,256 | | | $ | 3,364 | | | $ | 5,834 | | | $ | 11,257 | | |
| Dividends reinvested | | | - | | | | 5,878 | | | | - | | | | - | | |
| Cost of shares redeemed | | | (15,723 | ) | | | (20,517 | ) | | | (13,251 | ) | | | (16,973 | ) | |
Change in net assets from Class B
capital transactions | | $ | (13,467 | ) | | $ | (11,275 | ) | | $ | (7,417 | ) | | $ | (5,716 | ) | |
| Class C Shares | | | |
| Proceeds from shares issued | | $ | 3,568 | | | $ | 3,881 | | | $ | 10,283 | | | $ | 19,086 | | |
| Dividends reinvested | | | - | | | | 426 | | | | - | | | | - | | |
| Cost of shares redeemed | | | (569 | ) | | | (1,053 | ) | | | (7,067 | ) | | | (10,644 | ) | |
Change in net assets from Class C
capital transactions | | $ | 2,999 | | | $ | 3,254 | | | $ | 3,216 | | | $ | 8,442 | | |
| Select Class Shares | | | |
| Proceeds from shares issued | | $ | 188,710 | | | $ | 39,557 | | | $ | 10,030 | | | $ | 7,516 | | |
| Dividends reinvested | | | - | | | | 1,140 | | | | - | | | | - | | |
| Cost of shares redeemed | | | (13,998 | ) | | | (1,315 | ) | | | (2,233 | ) | | | (15,059 | ) | |
Change in net assets from Select Class
capital transactions | | $ | 174,712 | | | $ | 39,382 | | | $ | 7,797 | | | $ | (7,543 | ) | |
SEE NOTES TO FINANCIAL STATEMENTS.
JPMorgan U.S. Equity Mid/Small Cap Funds76
SEMI-ANNUAL REPORT JUNE 30
2005
STATEMENT OF CHANGES
IN NET ASSETS FOR THE PERIODS INDICATED
(Amounts in thousands)
| | | Mid Cap Equity | | Mid Cap Growth | |
| | | Six Months
Ended
06/30/05
(Unaudited) | | Year Ended
12/31/04 | | Six Months
Ended
06/30/05
(Unaudited) | | Year Ended
12/31/04 | |
| CAPITAL TRANSACTIONS | | | |
| Class A Shares | | | |
| Proceeds from shares issued | | $ | - | | | $ | - | | | $ | 1,094 | | | $ | 2,220 | | |
| Dividends reinvested | | | - | | | | - | | | | - | | | | - | | |
| Cost of shares redeemed | | | - | | | | - | | | | (7,200 | ) | | | (13,954 | ) | |
Change in net assets from Class A
capital transactions | | $ | - | | | $ | - | | | $ | (6,106 | ) | | $ | (11,734 | ) | |
| Class B Shares | | | |
| Proceeds from shares issued | | $ | - | | | $ | - | | | $ | 315 | | | $ | 194 | | |
| Dividends reinvested | | | - | | | | - | | | | - | | | | - | | |
| Cost of shares redeemed | | | - | | | | - | | | | (443 | ) | | | (700 | ) | |
Change in net assets from Class B
capital transactions | | $ | - | | | $ | - | | | $ | (128 | ) | | $ | (506 | ) | |
| Select Class | | | |
| Proceeds from shares issued | | $ | 63,171 | | | $ | 57,714 | | | $ | - | | | $ | - | | |
| Dividends reinvested | | | 32 | | | | 17,555 | | | | - | | | | - | | |
| Cost of shares redeemed | | | (50,279 | ) | | | (56,033 | ) | | | - | | | | - | | |
| Redemption in-kind | | | - | | | | - | | | | - | | | | - | | |
Change in net assets from Select Class
capital transactions | | $ | 12,924 | | | $ | 19,236 | | | $ | - | | | $ | - | | |
SEE NOTES TO FINANCIAL STATEMENTS.
JPMorgan U.S. Equity Mid/Small Cap Funds77
JPMorgan Funds
STATEMENT OF CHANGES
IN NET ASSETS (CONTINUED) FOR THE PERIODS INDICATED
(Amounts in thousands)
| | | Mid Cap Value | | Small Cap Core | |
| | | Six Months
Ended
06/30/05
(Unaudited) | | Year Ended
12/31/04 | | Six Months
Ended
06/30/05
(Unaudited) | | Year Ended
12/31/04 | |
| CAPITAL TRANSACTIONS | |
| Class A Shares | |
| Proceeds from shares issued | | $ | 1,111,678 | | | $ | 1,033,844 | | | $ | - | | | $ | - | | |
| Dividends reinvested | | | - | | | | 16,217 | | | | - | | | | - | | |
| Cost of shares redeemed | | | (162,851 | ) | | | (122,265 | ) | | | - | | | | - | | |
Change in net assets from Class A
capital transactions | | $ | 948,827 | | | $ | 927,796 | | | $ | - | | | $ | - | | |
| Class B Shares | |
| Proceeds from shares issued | | $ | 58,079 | | | $ | 93,272 | | | $ | - | | | $ | - | | |
| Dividends reinvested | | | - | | | | 1,863 | | | | - | | | | - | | |
| Cost of shares redeemed | | | (10,844 | ) | | | (9,647 | ) | | | - | | | | - | | |
Change in net assets from Class B
capital transactions | | $ | 47,235 | | | $ | 85,488 | | | $ | - | | | $ | - | | |
| Class C Shares | |
| Proceeds from shares issued | | $ | 300,859 | | | $ | 348,253 | | | | - | | | | - | | |
| Dividends reinvested | | | - | | | | 4,102 | | | | - | | | | - | | |
| Cost of shares redeemed | | | (24,289 | ) | | | (16,865 | ) | | | - | | | | - | | |
Change in net assets from Class C
capital transactions | | $ | 276,570 | | | $ | 335,490 | | | | - | | | | - | | |
| Select Class | |
| Proceeds from shares issued | | $ | 705,163 | | | $ | 405,562 | | | $ | 40,395 | | | $ | 640,372 | | |
| Dividends reinvested | | | - | | | | 4,698 | | | | - | | | | 76,052 | | |
| Cost of shares redeemed | | | (89,428 | ) | | | (43,384 | ) | | | (122,706 | ) | | | (183,594 | ) | |
| Redemption in-kind | | | - | | | | - | | | | - | | | | - | | |
Change in net assets from Select Class
capital transactions | | $ | 615,735 | | | $ | 366,876 | | | $ | (82,311 | ) | | $ | 532,830 | | |
| Institutional Class | |
| Proceeds from shares issued | | $ | 622,062 | | | $ | 848,157 | | | | - | | | | - | | |
| Dividends reinvested | | | - | | | | 14,335 | | | | - | | | | - | | |
| Cost of shares redeemed | | | (259,825 | ) | | | (111,900 | ) | | | - | | | | - | | |
Change in net assets from Institutional
Class capital transactions | | $ | 362,237 | | | $ | 750,592 | | | | - | | | | - | | |
SEE NOTES TO FINANCIAL STATEMENTS.
JPMorgan U.S. Equity Mid/Small Cap Funds78
SEMI-ANNUAL REPORT JUNE 30
2005
STATEMENT OF CHANGES
IN NET ASSETS FOR THE PERIODS INDICATED
(Amounts in thousands)
| | | Small Cap Equity | | U.S. Small Company | |
| | | Six Months
Ended
06/30/05
(Unaudited) | | Year Ended
12/31/04 | | Six Months
Ended
06/30/05
(Unaudited) | | Year Ended
12/31/04 | |
| CAPITAL TRANSACTIONS | | | |
| Class A Shares | | | |
| Proceeds from shares issued | | $ | 50,720 | | | $ | - | | | $ | - | | | $ | - | | |
| Dividends reinvested | | | - | | | | - | | | | - | | | | - | | |
| Cost of shares redeemed | | | (25,830 | ) | | | - | | | | - | | | | - | | |
Change in net assets from Class A
capital transactions | | $ | 24,890 | | | $ | - | | | $ | - | | | $ | - | | |
| Class B Shares | | | |
| Proceeds from shares issued | | $ | 2,562 | | | $ | - | | | $ | - | | | $ | - | | |
| Dividends reinvested | | | - | | | | - | | | | - | | | | - | | |
| Cost of shares redeemed | | | (6,370 | ) | | | - | | | | - | | | | - | | |
Change in net assets from Class B
capital transactions | | $ | (3,808 | ) | | $ | - | | | $ | - | | | $ | - | | |
| Class C Shares | | | |
| Proceeds from shares issued | | $ | 2,773 | | | | - | | | | - | | | | - | | |
| Dividends reinvested | | | - | | | | - | | | | - | | | | - | | |
| Cost of shares redeemed | | | (16 | ) | | | - | | | | - | | | | - | | |
Change in net assets from Class C
capital transactions | | $ | 2,757 | | | $ | - | | | $ | - | | | $ | - | | |
| Select Class | | | |
| Proceeds from shares issued | | $ | 54,761 | | | $ | 141,242 | | | $ | 31,654 | | | $ | 21,554 | | |
| Dividends reinvested | | | - | | | | 88,631 | | | | - | | | | 13,051 | | |
| Cost of shares redeemed | | | (63,354 | ) | | | (195,648 | ) | | | (28,441 | ) | | | (97,302 | ) | |
| Redemption in-kind | | | - | | | | (518,018 | ) | | | - | | | | - | | |
Change in net assets from Select Class
capital transactions | | $ | (8,593 | ) | | $ | (483,793 | ) | | $ | 3,213 | | | $ | (62,697 | ) | |
| Institutional Class | | | |
| Proceeds from shares issued | | $ | - | | | $ | - | | | $ | 12,331 | | | $ | 21,366 | | |
| Dividends reinvested | | | - | | | | - | | | | - | | | | 6,203 | | |
| Cost of shares redeemed | | | - | | | | - | | | | (46,625 | ) | | | (91,687 | ) | |
Change in net assets from Institutional
Class capital transactions | | $ | - | | | $ | - | | | $ | (34,294 | ) | | $ | (64,118 | ) | |
SEE NOTES TO FINANCIAL STATEMENTS.
JPMorgan U.S. Equity Mid/Small Cap Funds79
JPMorgan Funds
STATEMENT OF CHANGES
IN NET ASSETS (CONTINUED) FOR THE PERIODS INDICATED
(Amounts in thousands)
| | | Capital Growth | | Dynamic Small Cap | |
| | | Six Months
Ended
06/30/05
(Unaudited) | | Year Ended
12/31/04 | | Six Months
Ended
06/30/05
(Unaudited) | | Year Ended
12/31/04 | |
| SHARE TRANSACTIONS | | | |
| Class A Shares | | | |
| Issued | | | 1,028 | | | | 1,024 | | | | 464 | | | | 1,634 | | |
| Reinvested | | | - | | | | 1,303 | | | | - | | | | - | | |
| Redeemed | | | (1,302 | ) | | | (1,870 | ) | | | (1,472 | ) | | | (2,293 | ) | |
| Change in Class A Shares | | | (274 | ) | | | 457 | | | | (1,008 | ) | | | (659 | ) | |
| Class B Shares | | | |
| Issued | | | 64 | | | | 91 | | | | 351 | | | | 693 | | |
| Reinvested | | | - | | | | 167 | | | | - | | | | - | | |
| Redeemed | | | (445 | ) | | | (558 | ) | | | (795 | ) | | | (1,057 | ) | |
| Change in Class B Shares | | | (381 | ) | | | (300 | ) | | | (444 | ) | | | (364 | ) | |
| Class C Shares | | | |
| Issued | | | 101 | | | | 107 | | | | 623 | | | | 1,186 | | |
| Reinvested | | | - | | | | 12 | | | | - | | | | - | | |
| Redeemed | | | (16 | ) | | | (29 | ) | | | (427 | ) | | | (673 | ) | |
| Change in Class C Shares | | | 85 | | | | 90 | | | | 196 | | | | 513 | | |
| Select Class | | | |
| Issued | | | 4,724 | | | | 969 | | | | 570 | | | | 427 | | |
| Reinvested | | | - | | | | 29 | | | | - | | | | - | | |
| Redeemed | | | (352 | ) | | | (33 | ) | | | (125 | ) | | | (859 | ) | |
| Change in Select Class | | | 4,372 | | | | 965 | | | | 445 | | | | (432 | ) | |
SEE NOTES TO FINANCIAL STATEMENTS.
JPMorgan U.S. Equity Mid/Small Cap Funds80
SEMI-ANNUAL REPORT JUNE 30
2005
STATEMENT OF CHANGES
IN NET ASSETS FOR THE PERIODS INDICATED
(Amounts in thousands)
| | | Mid Cap Equity | | Mid Cap Growth | |
| | | Six Months
Ended
06/30/05
(Unaudited) | | Year Ended
12/31/04 | | Six Months
Ended
06/30/05
(Unaudited) | | Year Ended
12/31/04 | |
| SHARE TRANSACTIONS | | | |
| Class A Shares | | | |
| Issued | | | - | | | | - | | | | 192 | | | | 433 | | |
| Reinvested | | | - | | | | - | | | | - | | | | - | | |
| Redeemed | | | - | | | | - | | | | (1,263 | ) | | | (2,687 | ) | |
| Change in Class A Shares | | | - | | | | - | | | | (1,071 | ) | | | (2,254 | ) | |
| Class B Shares | | | |
| Issued | | | - | | | | - | | | | 57 | | | | 39 | | |
| Reinvested | | | - | | | | - | | | | - | | | | - | | |
| Redeemed | | | - | | | | - | | | | (81 | ) | | | (140 | ) | |
| Change in Class B Shares | | | - | | | | - | | | | (24 | ) | | | (101 | ) | |
| Select Class | | | |
| Issued | | | 1,902 | | | | 1,752 | | | | - | | | | - | | |
| Reinvested | | | 1 | | | | 536 | | | | - | | | | - | | |
| Redeemed | | | (1,501 | ) | | | (1,693 | ) | | | - | | | | - | | |
| Redemption in-kind | | | - | | | | - | | | | - | | | | - | | |
| Change in Select Class | | | 402 | | | | 595 | | | | - | | | | - | | |
SEE NOTES TO FINANCIAL STATEMENTS.
JPMorgan U.S. Equity Mid/Small Cap Funds81
JPMorgan Funds
STATEMENT OF CHANGES
IN NET ASSETS (CONTINUED) FOR THE PERIODS INDICATED
(Amounts in thousands)
| | | Mid Cap Value | | Small Cap Core | |
| | | Six Months
Ended
06/30/05
(Unaudited) | | Year Ended
12/31/04 | | Six Months
Ended
06/30/05
(Unaudited) | | Year Ended
12/31/04 | |
| SHARE TRANSACTIONS | |
| Class A Shares | |
| Issued | | | 49,851 | | | | 51,027 | | | | - | | | | - | | |
| Reinvested | | | - | | | | 746 | | | | - | | | | - | | |
| Redeemed | | | (7,307 | ) | | | (6,071 | ) | | | - | | | | - | | |
| Change in Class A Shares | | | 42,544 | | | | 45,702 | | | | - | | | | - | | |
| Class B Shares | |
| Issued | | | 2,660 | | | | 4,666 | | | | - | | | | - | | |
| Reinvested | | | - | | | | 87 | | | | - | | | | - | | |
| Redeemed | | | (496 | ) | | | (488 | ) | | | - | | | | - | | |
| Change in Class B Shares | | | 2,164 | | | | 4,265 | | | | - | | | | - | | |
| Class C Shares | |
| Issued | | | 13,750 | | | | 17,330 | | | | - | | | | - | | |
| Reinvested | | | - | | | | 192 | | | | - | | | | - | | |
| Redeemed | | | (1,108 | ) | | | (851 | ) | | | - | | | | - | | |
| Change in Class C Shares | | | 12,642 | | | | 16,671 | | | | - | | | | - | | |
| Select Class | |
| Issued | | | 31,615 | | | | 19,743 | | | | 976 | | | | 14,251 | | |
| Reinvested | | | - | | | | 215 | | | | - | | | | 1,769 | | |
| Redeemed | | | (3,978 | ) | | | (2,172 | ) | | | (2,960 | ) | | | (3,918 | ) | |
| Change in Select Class | | | 27,637 | | | | 17,786 | | | | (1,984 | ) | | | 12,102 | | |
| Institutional Class | |
| Issued | | | 27,616 | | | | 41,530 | | | | - | | | | - | | |
| Reinvested | | | - | | | | 652 | | | | - | | | | - | | |
| Redeemed | | | (11,675 | ) | | | (5,510 | ) | | | - | | | | - | | |
| Change in Institutional Class | | | 15,941 | | | | 36,672 | | | | - | | | | - | | |
SEE NOTES TO FINANCIAL STATEMENTS.
JPMorgan U.S. Equity Mid/Small Cap Funds82
SEMI-ANNUAL REPORT JUNE 30
2005
STATEMENT OF CHANGES
IN NET ASSETS FOR THE PERIODS INDICATED
(Amounts in thousands)
| | | Small Cap Equity | | U.S. Small Company | |
| | | Six Months
Ended
06/30/05
(Unaudited) | | Year Ended
12/31/04 | | Six Months
Ended
06/30/05
(Unaudited) | | Year Ended
12/31/04 | |
| SHARE TRANSACTIONS | |
| Class A Shares | |
| Issued | | | 1,936 | | | | - | | | | - | | | | - | | |
| Reinvested | | | - | | | | - | | | | - | | | | - | | |
| Redeemed | | | (984 | ) | | | - | | | | - | | | | - | | |
| Change in Class A Shares | | | 952 | | | | - | | | | - | | | | - | | |
| Class B Shares | |
| Issued | | | 107 | | | | - | | | | - | | | | - | | |
| Reinvested | | | - | | | | - | | | | - | | | | - | | |
| Redeemed | | | (267 | ) | | | - | | | | - | | | | - | | |
| Change in Class B Shares | | | (160 | ) | | | - | | | | - | | | | - | | |
| Class C Shares | |
| Issued | | | 116 | | | | - | | | | - | | | | - | | |
| Reinvested | | | - | | | | - | | | | - | | | | - | | |
| Redeemed | | | (1 | ) | | | - | | | | - | | | | - | | |
| Change in Class C Shares | | | 115 | | | | - | | | | - | | | | - | | |
| Select Class | |
| Issued | | | 1,986 | | | | 5,240 | | | | 2,541 | | | | 1,535 | | |
| Reinvested | | | - | | | | 3,235 | | | | - | | | | 962 | | |
| Redeemed | | | (2,296 | ) | | | (7,291 | ) | | | (2,189 | ) | | | (7,032 | ) | |
| Redemption in-kind | | | - | | | | (18,885 | ) | | | - | | | | - | | |
| Change in Select Class | | | (310 | ) | | | (17,701 | ) | | | 352 | | | | (4,535 | ) | |
| Institutional Class | |
| Issued | | | - | | | | - | | | | 958 | | | | 1,563 | | |
| Reinvested | | | - | | | | - | | | | - | | | | 458 | | |
| Redeemed | | | - | | | | - | | | | (3,672 | ) | | | (6,617 | ) | |
| Change in Institutional Class | | | - | | | | - | | | | (2,714 | ) | | | (4,596 | ) | |
SEE NOTES TO FINANCIAL STATEMENTS.
JPMorgan U.S. Equity Mid/Small Cap Funds83
JPMorgan Funds
FINANCIAL HIGHLIGHTS
Class A
| | | Per share operating performance: | |
| | | | | Investment operations: | | Distributions: | | | | | |
| |
Net asset
value,
beginning
of period | |
Net
investment
income
(loss) | | Net realized
and unrealized
gains
(losses) on
investments | |
Total from
investment
operations | |
Net
investment
income | |
Net
realized
gains | |
Total
distributions | |
Net asset
value, end
of period | |
Total
return
(excludes
sales charge) (f) | |
| CAPITAL GROWTH FUND(a) | |
| Six Months Ended 6/30/05 (Unaudited) | | $ | 38.51 | | | | (0.13 | ) | | | 1.03 | | | | 0.90 | | | | - | | | | - | | | | - | | | $ | 39.41 | | | | 2.34 | % | |
| Year Ended 12/31/04 | | $ | 37.47 | | | | (0.24 | )(d) | | | 6.49 | | | | 6.25 | | | | - | | | | (5.21 | ) | | | (5.21 | ) | | $ | 38.51 | | | | 16.90 | % | |
| Year Ended 12/31/03 | | $ | 28.60 | | | | (0.34 | )(d) | | | 10.61 | | | | 10.27 | | | | - | | | | (1.40 | ) | | | (1.40 | ) | | $ | 37.47 | | | | 36.10 | % | |
| Year Ended 12/31/02 | | $ | 40.10 | | | | (0.38 | )(d) | | | (10.86 | ) | | | (11.24 | ) | | | - | | | | (0.26 | ) | | | (0.26 | ) | | $ | 28.60 | | | | (28.04 | %) | |
| 11/1/01 Through 12/31/01(c) | | $ | 35.37 | | | | (0.03 | ) | | | 4.76 | | | | 4.73 | | | | - | | | | - | | | | - | | | $ | 40.10 | | | | 13.37 | % | |
| Year Ended 10/31/01 | | $ | 47.91 | | | | (0.19 | )(d) | | | (6.87 | ) | | | (7.06 | ) | | | - | | | | (5.48 | ) | | | (5.48 | ) | | $ | 35.37 | | | | (15.86 | %) | |
| Year Ended 10/30/00 | | $ | 42.85 | | | | (0.14 | )(d) | | | 10.11 | | | | 9.97 | | | | - | | | | 4.91 | | | | 4.91 | | | $ | 47.91 | | | | 25.81 | % | |
| DYNAMIC SMALL CAP FUND | |
| Six Months Ended 6/30/05 (Unaudited) | | $ | 18.46 | | | | 0.09 | | | | (0.41 | ) | | | (0.32 | ) | | | - | | | | - | | | | - | | | $ | 18.14 | | | | (1.73 | %) | |
| Year Ended 12/31/04 | | $ | 16.81 | | | | (0.19 | )(d) | | | 1.84 | | | | 1.65 | | | | - | | | | - | | | | - | | | $ | 18.46 | | | | 9.82 | % | |
| Year Ended 12/31/03 | | $ | 12.14 | | | | (0.16 | )(d) | | | 4.83 | | | | 4.67 | | | | - | | | | - | | | | - | | | $ | 16.81 | | | | 38.47 | % | |
| Year Ended 12/31/02 | | $ | 15.72 | | | | (0.18 | ) | | | (3.40 | ) | | | (3.58 | ) | | | - | | | | - | | | | - | | | $ | 12.14 | | | | (22.77 | %) | |
| 11/1/01 Through 12/31/01(c) | | $ | 14.21 | | | | (0.03 | ) | | | 1.54 | | | | 1.51 | | | | - | | | | - | | | | - | | | $ | 15.72 | | | | 10.63 | % | |
| Year Ended 10/31/01 | | $ | 24.54 | | | | (0.24 | ) | | | (6.71 | ) | | | (6.95 | ) | | | - | | | | (3.38 | ) | | | (3.38 | ) | | $ | 14.21 | | | | (30.60 | %) | |
| Year Ended 10/31/00 | | $ | 15.98 | | | | (0.22 | )(d) | | | 8.78 | | | | 8.56 | | | | - | | | | - | | | | - | | | $ | 24.54 | | | | 53.57 | % | |
| MID CAP GROWTH FUND | |
| Six Months Ended 6/30/05 (Unaudited) | | $ | 5.74 | | | | (0.03 | ) | | | 0.16 | | | | 0.13 | | | | - | | | | - | | | | - | | | $ | 5.87 | | | | 2.26 | % | |
| Year Ended 12/31/04 | | $ | 4.91 | | | | (0.03 | )(d) | | | 0.86 | | | | 0.83 | | | | - | | | | - | | | | - | | | $ | 5.74 | | | | 16.90 | % | |
| Year Ended 12/31/03 | | $ | 3.57 | | | | (0.04 | )(d) | | | 1.38 | | | | 1.34 | | | | - | | | | - | | | | - | | | $ | 4.91 | | | | 37.53 | % | |
| Year Ended 12/31/02 | | $ | 5.06 | | | | (0.05 | )(d) | | | (1.44 | ) | | | (1.49 | ) | | | - | | | | - | | | | - | | | $ | 3.57 | | | | (29.45 | %) | |
| 10/1/01 Through 12/31/01(g) | | $ | 4.27 | | | | (0.01 | ) | | | 0.80 | | | | 0.79 | | | | - | | | | - | | | | - | | | $ | 5.06 | | | | 18.50 | % | |
| Year Ended 9/30/01 | | $ | 12.51 | | | | (0.02 | )(d) | | | (8.06 | ) | | | (8.08 | ) | | | - | | | | (0.16 | ) | | | (0.16 | ) | | $ | 4.27 | | | | (65.10 | %) | |
| 10/29/99(b) Through 9/30/00 | | $ | 10.00 | | | | (0.09 | ) | | | 2.60 | | | | 2.51 | | | | - | | | | - | | | | - | | | $ | 12.51 | | | | 25.12 | % | |
(a) Prior to September 10, 2001, Capital Growth Fund invested all of its investable assets in the Capital Growth Portfolio. The portfolio turnover rate disclosed prior to September 10, 2001, is the turnover rate of Capital Growth Portfolio.
(b) Commencement of operations.
(c) The Fund changed its fiscal year end from 10/31 to 12/31.
(d) Calculated based upon average shares outstanding.
(e) Annualized for periods less than one year.
(f) Not annualized for periods less than one year.
(g) The Fund changed its fiscal year end from 9/30 to 12/31.
SEE NOTES TO FINANCIAL STATEMENTS.
JPMorgan U.S. Equity Mid/Small Cap Funds84
SEMI-ANNUAL REPORT JUNE 30
2005
FINANCIAL HIGHLIGHTS
| | | Ratios/Supplemental data: | |
| | | | | Ratios to average net assets: (e) | | | |
| |
Net assets,
end of
period
(million's) | |
Net
expenses | |
Net
investment
income
(loss) | |
Expenses
without waivers
reimbursements
and earnings credits | |
Portfolio
turnover
rate (f) | |
| CAPITAL GROWTH FUND(a) | |
| Six Months Ended 6/30/05 (Unaudited) | | $ | 441 | | | | 1.19 | % | | | (0.72 | %) | | | 1.19 | % | | | 63 | % | |
| Year Ended 12/31/04 | | $ | 441 | | | | 1.35 | % | | | (0.61 | %) | | | 1.37 | % | | | 122 | % | |
| Year Ended 12/31/03 | | $ | 412 | | | | 1.35 | % | | | (1.05 | %) | | | 1.46 | % | | | 68 | % | |
| Year Ended 12/31/02 | | $ | 330 | | | | 1.35 | % | | | (1.13 | %) | | | 1.38 | % | | | 93 | % | |
| 11/1/01 Through 12/31/01(c) | | $ | 495 | | | | 1.35 | % | | | (0.40 | %) | | | 1.35 | % | | | 2 | % | |
| Year Ended 10/31/01 | | $ | 426 | | | | 1.35 | % | | | (0.47 | %) | | | 1.37 | % | | | 43 | % | |
| Year Ended 10/30/00 | | $ | 523 | | | | 1.35 | % | | | (0.32 | %) | | | 1.35 | % | | | 66 | % | |
| DYNAMIC SMALL CAP FUND | |
| Six Months Ended 6/30/05 (Unaudited) | | $ | 66 | | | | 1.50 | % | | | (1.15 | %) | | | 1.57 | % | | | 54 | % | |
| Year Ended 12/31/04 | | $ | 86 | | | | 1.50 | % | | | (1.14 | %) | | | 1.73 | % | | | 112 | % | |
| Year Ended 12/31/03 | | $ | 89 | | | | 1.50 | % | | | (1.19 | %) | | | 1.86 | % | | | 55 | % | |
| Year Ended 12/31/02 | | $ | 82 | | | | 1.50 | % | | | (1.20 | %) | | | 1.82 | % | | | 52 | % | |
| 11/1/01 Through 12/31/01(c) | | $ | 125 | | | | 1.50 | % | | | (1.21 | %) | | | 1.63 | % | | | 8 | % | |
| Year Ended 10/31/01 | | $ | 120 | | | | 1.50 | % | | | (1.13 | %) | | | 1.64 | % | | | 57 | % | |
| Year Ended 10/31/00 | | $ | 154 | | | | 1.50 | % | | | (0.99 | %) | | | 1.76 | % | | | 87 | % | |
| MID CAP GROWTH FUND | |
| Six Months Ended 6/30/05 (Unaudited) | | $ | 49 | | | | 1.35 | % | | | (0.90 | %) | | | 1.69 | % | | | 58 | % | |
| Year Ended 12/31/04 | | $ | 54 | | | | 1.35 | % | | | (0.61 | %) | | | 1.79 | % | | | 118 | % | |
| Year Ended 12/31/03 | | $ | 58 | | | | 1.35 | % | | | (1.05 | %) | | | 1.77 | % | | | 69 | % | |
| Year Ended 12/31/02 | | $ | 53 | | | | 1.35 | % | | | (1.15 | %) | | | 1.62 | % | | | 39 | % | |
| 10/1/01 Through 12/31/01(g) | | $ | 101 | | | | 1.35 | % | | | (0.84 | %) | | | 1.35 | % | | | 135 | % | |
| Year Ended 9/30/01 | | $ | 94 | | | | 1.30 | % | | | (0.54 | %) | | | 1.30 | % | | | 159 | % | |
| 10/29/99(b) Through 9/30/00 | | $ | 33 | | | | 1.16 | % | | | (0.68 | %) | | | 1.20 | % | | | 147 | % | |
SEE NOTES TO FINANCIAL STATEMENTS.
JPMorgan U.S. Equity Mid/Small Cap Funds85
JPMorgan Funds
FINANCIAL HIGHLIGHTS
(CONTINUED)
Class A (continued)
| | | Per share operating performance: | |
| | | | | Investment operations: | | Distributions: | | | | | |
| | |
Net asset
value,
beginning
of period | | Net realized
Net
investment
income
(loss) | |
and unrealized
gains
(losses) on
investments | |
Total from
investment
operations | |
Net
investment
income | |
Net
realized
gains | |
Total
distributions | |
Net asset
value, end
of period | | Total
return
(excludes
sales charge) (f) | |
| MID CAP VALUE FUND | |
| Six Months Ended 6/30/05 (Unaudited) | | $ | 22.05 | | | | 0.04 | | | | 1.05 | | | | 1.09 | | | | - | | | | - | | | | - | | | $ | 23.14 | | | | 4.94 | % | |
| Year Ended 12/31/04 | | $ | 18.62 | | | | 0.07 | (d) | | | 3.71 | | | | 3.78 | | | | (0.04 | ) | | | (0.31 | ) | | | (0.35 | ) | | $ | 22.05 | | | | 20.32 | % | |
| Year Ended 12/31/03 | | $ | 14.44 | | | | 0.09 | (d) | | | 4.25 | | | | 4.34 | | | | (0.05 | ) | | | (0.11 | ) | | | (0.16 | ) | | $ | 18.62 | | | | 30.07 | % | |
| Year Ended 12/31/02 | | $ | 14.10 | | | | 0.07 | (d) | | | 0.31 | | | | 0.38 | | | | (0.03 | ) | | | (0.01 | ) | | | (0.04 | ) | | $ | 14.44 | | | | 2.68 | % | |
| 10/1/01 Through 12/31/01(a) | | $ | 13.43 | | | | 0.02 | (d) | | | 1.48 | | | | 1.50 | | | | (0.08 | ) | | | (0.75 | ) | | | (0.83 | ) | | $ | 14.10 | | | | 11.20 | % | |
| 4/30/01(c) Through 9/30/01 | | $ | 14.24 | | | | 0.04 | (d) | | | (0.85 | ) | | | (0.81 | ) | | | - | | | | - | | | | - | | | $ | 13.43 | | | | (5.69 | %) | |
| SMALL CAP EQUITY FUND | |
| Six Months Ended 6/30/05 (Unaudited) | | $ | 26.44 | | | | (0.07 | ) | | | 0.89 | | | | 0.82 | | | | - | | | | - | | | | - | | | $ | 27.26 | | | | 3.10 | % | |
| Year Ended 12/31/04 | | $ | 24.11 | | | | (0.17 | )(d) | | | 6.33 | | | | 6.16 | | | | - | | | | (3.83 | ) | | | (3.83 | ) | | $ | 26.44 | | | | 26.13 | % | |
| Year Ended 12/31/03 | | $ | 17.68 | | | | (0.15 | )(d) | | | 6.58 | | | | 6.43 | | | | - | | | | - | | | | - | | | $ | 24.11 | | | | 36.37 | % | |
| Year Ended 12/31/02 | | $ | 21.53 | | | | (0.15 | )(d) | | | (3.57 | ) | | | (3.72 | ) | | | - | | | | (0.13 | ) | | | (0.13 | ) | | $ | 17.68 | | | | (17.30 | %) | |
| 11/1/01 Through 12/31/01(b) | | $ | 19.64 | | | | (0.03 | )(d) | | | 1.92 | | | | 1.89 | | | | - | | | | - | | | | - | | | $ | 21.53 | | | | 9.62 | % | |
| Year Ended 10/31/01 | | $ | 27.89 | | | | (0.10 | ) | | | (4.26 | ) | | | (4.36 | ) | | | - | | | | (3.89 | ) | | | (3.89 | ) | | $ | 19.64 | | | | (16.62 | %) | |
| Year Ended 10/31/00 | | $ | 22.77 | | | | (0.20 | )(d) | | | 7.97 | | | | 7.77 | | | | - | | | | (2.65 | ) | | | (2.65 | ) | | $ | 27.89 | | | | 37.10 | % | |
(a) The Fund changed its fiscal year end from 9/30 to 12/31.
(b) The Fund changed its fiscal year end from 10/31 to 12/31.
(c) Commencement of offering of class of shares.
(d) Calculated based upon average shares outstanding.
(e) Annualized for periods less than one year.
(f) Not annualized for periods less than one year.
(g) Due to the size of net assets and fixed expenses, ratios may appear disproportionate.
SEE NOTES TO FINANCIAL STATEMENTS.
JPMorgan U.S. Equity Mid/Small Cap Funds86
SEMI-ANNUAL REPORT JUNE 30
2005
FINANCIAL HIGHLIGHTS
| | | Ratios/Supplemental data: | |
| | | | | Ratios to average net assets: (e) | | | |
| | |
Net assets,
end of
period
(million's) | |
Net
expenses | |
Net
investment
income
(loss) | |
Expenses
without waivers
reimbursements
and earnings credits | |
Portfolio
turnover
rate (f) | |
| MID CAP VALUE FUND | |
| Six Months Ended 6/30/05 (Unaudited) | | $ | 2,383 | | | | 1.25 | % | | | 0.45 | % | | | 1.39 | % | | | 16 | % | |
| Year Ended 12/31/04 | | $ | 1,333 | | | | 1.25 | % | | | 0.34 | % | | | 1.60 | % | | | 41 | % | |
| Year Ended 12/31/03 | | $ | 275 | | | | 1.25 | % | | | 0.51 | % | | | 1.65 | % | | | 32 | % | |
| Year Ended 12/31/02 | | $ | 26 | | | | 1.25 | % | | | 0.50 | % | | | 1.70 | % | | | 51 | % | |
| 10/1/01 Through 12/31/01(a) | | $ | 5 | | | | 1.25 | % | | | 0.47 | % | | | 3.72 | %(g) | | | 15 | % | |
| 4/30/01(c) Through 9/30/01 | | $ | 2 | | | | 1.30 | % | | | 0.71 | % | | | 15.30 | %(g) | | | 98 | % | |
| SMALL CAP EQUITY FUND | |
| Six Months Ended 6/30/05 (Unaudited) | | $ | 159 | | | | 1.36 | % | | | (0.58 | %) | | | 1.41 | % | | | 44 | % | |
| Year Ended 12/31/04 | | $ | 129 | | | | 1.38 | % | | | (0.66 | %) | | | 1.62 | % | | | 44 | % | |
| Year Ended 12/31/03 | | $ | 88 | | | | 1.38 | % | | | (0.75 | %) | | | 1.65 | % | | | 38 | % | |
| Year Ended 12/31/02 | | $ | 77 | | | | 1.38 | % | | | (0.74 | %) | | | 1.40 | % | | | 51 | % | |
| 11/1/01 Through 12/31/01(b) | | $ | 71 | | | | 1.38 | % | | | (0.81 | %) | | | 1.38 | % | | | 6 | % | |
| Year Ended 10/31/01 | | $ | 67 | | | | 1.39 | % | | | (0.80 | %) | | | 1.40 | % | | | 47 | % | |
| Year Ended 10/31/00 | | $ | 93 | | | | 1.44 | % | | | (0.77 | %) | | | 1.44 | % | | | 75 | % | |
SEE NOTES TO FINANCIAL STATEMENTS.
JPMorgan U.S. Equity Mid/Small Cap Funds87
JPMorgan Funds
FINANCIAL HIGHLIGHTS
(CONTINUED)
Class B
| | | Per share operating performance: | |
| | | | | Investment operations: | | Distributions: | | | | | |
| | | Net asset
value,
beginning
of period | | Net
investment
income
(loss) | | Net realized
and unrealized
gains
(losses) on
investments | | Total from
investment
operations | | Net
investment
income | | Net
realized
gains | | Total
distributions | | Net asset
value, end
of period | | Total
return
(excludes
sales charge) (f) | |
| CAPITAL GROWTH FUND(a) | |
| Six Months Ended 6/30/05 (Unaudited) | | $ | 35.73 | | | | (0.22 | ) | | | 0.97 | | | | 0.75 | | | | - | | | | - | | | | - | | | $ | 36.48 | | | | 2.10 | % | |
| Year Ended 12/31/04 | | $ | 35.27 | | | | (0.40 | )(d) | | | 6.07 | | | | 5.67 | | | | - | | | | (5.21 | ) | | | (5.21 | ) | | $ | 35.73 | | | | 16.31 | % | |
| Year Ended 12/31/03 | | $ | 27.13 | | | | (0.48 | )(d) | | | 10.02 | | | | 9.54 | | | | - | | | | (1.40 | ) | | | (1.40 | ) | | $ | 35.27 | | | | 35.37 | % | |
| Year Ended 12/31/02 | | $ | 38.24 | | | | (0.65 | )(d) | | | (10.20 | ) | | | (10.85 | ) | | | - | | | | (0.26 | ) | | | (0.26 | ) | | $ | 27.13 | | | | (28.39 | %) | |
| 11/1/01 Through 12/31/01(c) | | $ | 33.75 | | | | (0.06 | ) | | | 4.55 | | | | 4.49 | | | | - | | | | - | | | | - | | | $ | 38.24 | | | | 13.30 | % | |
| Year Ended 10/31/01 | | $ | 46.20 | | | | (0.38 | )(d) | | | (6.59 | ) | | | (6.97 | ) | | | - | | | | (5.48 | ) | | | (5.48 | ) | | $ | 33.75 | | | | (16.30 | %) | |
| Year Ended 10/31/00 | | $ | 41.07 | | | | (0.35 | )(d) | | | 9.79 | | | | 9.44 | | | | - | | | | 4.91 | | | | 4.91 | | | $ | 46.20 | | | | 25.21 | % | |
| DYNAMIC SMALL CAP FUND | |
| Six Months Ended 6/30/05 (Unaudited) | | $ | 17.47 | | | | (0.32 | ) | | | (0.03 | ) | | | (0.35 | ) | | | - | | | | - | | | | - | | | $ | 17.12 | | | | (2.00 | %) | |
| Year Ended 12/31/04 | | $ | 16.01 | | | | (0.28 | )(d) | | | 1.74 | | | | 1.46 | | | | - | | | | - | | | | - | | | $ | 17.47 | | | | 9.12 | % | |
| Year Ended 12/31/03 | | $ | 11.63 | | | | (0.24 | )(d) | | | 4.62 | | | | 4.38 | | | | - | | | | - | | | | - | | | $ | 16.01 | | | | 37.66 | % | |
| Year Ended 12/31/02 | | $ | 15.16 | | | | (0.27 | ) | | | (3.26 | ) | | | (3.53 | ) | | | - | | | | - | | | | - | | | $ | 11.63 | | | | (23.28 | %) | |
| 11/1/01 Through 12/31/01(c) | | $ | 13.72 | | | | (0.04 | ) | | | 1.48 | | | | 1.44 | | | | - | | | | - | | | | - | | | $ | 15.16 | | | | 10.50 | % | |
| Year Ended 10/31/01 | | $ | 23.96 | | | | (0.23 | ) | | | (6.63 | ) | | | (6.86 | ) | | | - | | | | (3.38 | ) | | | (3.38 | ) | | $ | 13.72 | | | | (31.02 | %) | |
| Year Ended 10/31/00 | | $ | 15.71 | | | | (0.40 | )(d) | | | 8.65 | | | | 8.25 | | | | - | | | | - | | | | - | | | $ | 23.96 | | | | 52.51 | % | |
| MID CAP GROWTH FUND(C) | |
| Six Months Ended 6/30/05 (Unaudited) | | $ | 5.54 | | | | (0.06 | ) | | | 0.17 | | | | 0.11 | | | | - | | | | - | | | | - | | | $ | 5.65 | | | | 1.99 | % | |
| Year Ended 12/31/04 | | $ | 4.77 | | | | (0.07 | )(d) | | | 0.84 | | | | 0.77 | | | | - | | | | - | | | | - | | | $ | 5.54 | | | | 16.14 | % | |
| Year Ended 12/31/03 | | $ | 3.49 | | | | (0.07 | )(d) | | | 1.35 | | | | 1.28 | | | | - | | | | - | | | | - | | | $ | 4.77 | | | | 36.68 | % | |
| Year Ended 12/31/02 | | $ | 4.99 | | | | (0.08 | )(d) | | | (1.42 | ) | | | (1.50 | ) | | | - | | | | - | | | | - | | | $ | 3.49 | | | | (30.06 | %) | |
| 10/1/01 Through 12/31/01(g) | | $ | 4.22 | | | | (0.02 | ) | | | 0.79 | | | | 0.77 | | | | - | | | | - | | | | - | | | $ | 4.99 | | | | 18.25 | % | |
| Year Ended 9/30/01 | | $ | 12.43 | | | | (0.07 | )(d) | | | (7.98 | ) | | | (8.05 | ) | | | - | | | | (0.16 | ) | | | (0.16 | ) | | $ | 4.22 | | | | (65.30 | %) | |
| 10/29/99(b) Through 9/30/00 | | $ | 10.00 | | | | (0.17 | ) | | | 2.60 | | | | 2.43 | | | | - | | | | - | | | | - | | | $ | 12.43 | | | | 24.31 | % | |
(a) Prior to September 10, 2001, Capital Growth Fund invested all of its investable assets in the Capital Growth Portfolio. The portfolio turnover rate disclosed prior to September 10, 2001, is the turnover rate of Capital Growth Portfolio.
(b) Commencement of operations.
(c) The Fund changed its fiscal year end from 10/31 to 12/31.
(d) Calculated based upon average shares outstanding.
(e) Annualized for periods less than one year.
(f) Not annualized for periods less than one year.
(g) The Fund changed its fiscal year end from 9/30 to 12/31.
SEE NOTES TO FINANCIAL STATEMENTS.
JPMorgan U.S. Equity Mid/Small Cap Funds88
SEMI-ANNUAL REPORT JUNE 30
2005
FINANCIAL HIGHLIGHTS
| | | Ratios/Supplemental data: | |
| | | | | Ratios to average net assets: (e) | | | |
| | | Net assets,
end of
period
(million's) | | Net
expenses | | Net
investment
income
(loss) | | Expenses
without waivers
reimbursements
and earnings credits | | Portfolio
turnover
rate (f) | |
| CAPITAL GROWTH FUND(a) | |
| Six Months Ended 6/30/05 (Unaudited) | | $ | 38 | | | | 1.70 | % | | | (1.23 | %) | | | 1.70 | % | | | 63 | % | |
| Year Ended 12/31/04 | | $ | 51 | | | | 1.85 | % | | | (1.10 | %) | | | 1.88 | % | | | 122 | % | |
| Year Ended 12/31/03 | | $ | 61 | | | | 1.85 | % | | | (1.55 | %) | | | 1.96 | % | | | 68 | % | |
| Year Ended 12/31/02 | | $ | 59 | | | | 1.85 | % | | | (1.64 | %) | | | 1.89 | % | | | 93 | % | |
| 11/1/01 Through 12/31/01(c) | | $ | 170 | | | | 1.85 | % | | | (0.93 | %) | | | 1.85 | % | | | 2 | % | |
| Year Ended 10/31/01 | | $ | 164 | | | | 1.85 | % | | | (0.97 | %) | | | 1.87 | % | | | 43 | % | |
| Year Ended 10/31/00 | | $ | 318 | | | | 1.85 | % | | | (0.82 | %) | | | 1.85 | % | | | 66 | % | |
| DYNAMIC SMALL CAP FUND | |
| Six Months Ended 6/30/05 (Unaudited) | | $ | 53 | | | | 2.05 | % | | | (1.70 | %) | | | 2.07 | % | | | 54 | % | |
| Year Ended 12/31/04 | | $ | 62 | | | | 2.12 | % | | | (1.76 | %) | | | 2.23 | % | | | 112 | % | |
| Year Ended 12/31/03 | | $ | 63 | | | | 2.12 | % | | | (1.81 | %) | | | 2.35 | % | | | 55 | % | |
| Year Ended 12/31/02 | | $ | 48 | | | | 2.12 | % | | | (1.82 | %) | | | 2.32 | % | | | 52 | % | |
| 11/1/01 Through 12/31/01(c) | | $ | 72 | | | | 2.12 | % | | | (1.83 | %) | | | 2.12 | % | | | 8 | % | |
| Year Ended 10/31/01 | | $ | 67 | | | | 2.13 | % | | | (1.75 | %) | | | 2.14 | % | | | 57 | % | |
| Year Ended 10/31/00 | | $ | 110 | | | | 2.20 | % | | | (1.69 | %) | | | 2.26 | % | | | 87 | % | |
| MID CAP GROWTH FUND(C) | |
| Six Months Ended 6/30/05 (Unaudited) | | $ | 3 | | | | 2.05 | % | | | (1.60 | %) | | | 2.19 | % | | | 58 | % | |
| Year Ended 12/31/04 | | $ | 3 | | | | 2.05 | % | | | (1.31 | %) | | | 2.29 | % | | | 118 | % | |
| Year Ended 12/31/03 | | $ | 3 | | | | 2.05 | % | | | (1.75 | %) | | | 2.33 | % | | | 69 | % | |
| Year Ended 12/31/02 | | $ | 3 | | | | 2.05 | % | | | (1.85 | %) | | | 2.32 | % | | | 39 | % | |
| 10/1/01 Through 12/31/01(g) | | $ | 5 | | | | 2.05 | % | | | (1.53 | %) | | | 2.05 | % | | | 135 | % | |
| Year Ended 9/30/01 | | $ | 6 | | | | 2.00 | % | | | (1.22 | %) | | | 2.00 | % | | | 159 | % | |
| 10/29/99(b) Through 9/30/00 | | $ | 25 | | | | 1.86 | % | | | (1.38 | %) | | | 1.91 | % | | | 147 | % | |
SEE NOTES TO FINANCIAL STATEMENTS.
JPMorgan U.S. Equity Mid/Small Cap Funds89
JPMorgan Funds
FINANCIAL HIGHLIGHTS
(CONTINUED)
Class B (continued)
| | | Per share operating performance: | |
| | | | | Investment operations: | | Distributions: | | | | | |
| | | Net asset
value,
beginning
of period | | Net
investment
income
(loss) | | Net realized
and unrealized
gains
(losses) on
investments | | Total from
investment
operations | | Net
investment
income | | Net
realized
gains | | Total
distributions | | Net asset
value, end
of period | | Total
return
(excludes
sales charge) (f) | |
| MID CAP VALUE FUND | |
| Six Months Ended 6/30/05 (Unaudited) | | $ | 21.66 | | | | - | (h) | | | 1.01 | | | | 1.01 | | | | - | | | | - | | | | - | | | $ | 22.67 | | | | 4.66 | % | |
| Year Ended 12/31/04 | | $ | 18.37 | | | | (0.06 | )(d) | | | 3.66 | | | | 3.60 | | | | - | | | | (0.31 | ) | | | (0.31 | ) | | $ | 21.66 | | | | 19.60 | % | |
| Year Ended 12/31/03 | | $ | 14.32 | | | | (0.03 | )(d) | | | 4.19 | | | | 4.16 | | | | - | | | | (0.11 | ) | | | (0.11 | ) | | $ | 18.37 | | | | 29.06 | % | |
| Year Ended 12/31/02 | | $ | 14.06 | | | | (0.04 | )(d) | | | 0.31 | | | | 0.27 | | | | - | | | | (0.01 | ) | | | (0.01 | ) | | $ | 14.32 | | | | 1.94 | % | |
| 10/1/01 Through 12/31/01(a) | | $ | 13.40 | | | | (0.01 | )(d) | | | 1.47 | | | | 1.46 | | | | (0.05 | ) | | | (0.75 | ) | | | (0.80 | ) | | $ | 14.06 | | | | 10.94 | % | |
| 4/30/01(c) Through 9/30/01 | | $ | 14.24 | | | | - | (d) | | | (0.84 | ) | | | (0.84 | ) | | | - | | | | - | | | | - | | | $ | 13.40 | | | | (5.90 | %) | |
| SMALL CAP EQUITY FUND | |
| Six Months Ended 6/30/05 (Unaudited) | | $ | 24.01 | | | | (0.14 | ) | | | 0.82 | | | | 0.68 | | | | - | | | | - | | | | - | | | $ | 24.69 | | | | 2.83 | % | |
| Year Ended 12/31/04 | | $ | 22.34 | | | | (0.34 | )(d) | | | 5.84 | | | | 5.50 | | | | - | | | | (3.83 | ) | | | (3.83 | ) | | $ | 24.01 | | | | 25.22 | % | |
| Year Ended 12/31/03 | | $ | 16.50 | | | | (0.27 | )(d) | | | 6.11 | | | | 5.84 | | | | - | | | | - | | | | - | | | $ | 22.34 | | | | 35.39 | % | |
| Year Ended 12/31/02 | | $ | 20.26 | | | | (0.29 | )(d) | | | (3.34 | ) | | | (3.63 | ) | | | - | | | | (0.13 | ) | | | (0.13 | ) | | $ | 16.50 | | | | (17.94 | %) | |
| 11/1/01 Through 12/31/01(b) | | $ | 18.50 | | | | (0.05 | )(d) | | | 1.81 | | | | 1.76 | | | | - | | | | - | | | | - | | | $ | 20.26 | | | | 9.51 | % | |
| Year Ended 10/31/01 | | $ | 26.73 | | | | (0.09 | ) | | | (4.25 | ) | | | (4.34 | ) | | | - | | | | (3.89 | ) | | | (3.89 | ) | | $ | 18.50 | | | | (17.37 | %) | |
| Year Ended 10/31/00 | | $ | 22.06 | | | | (0.37 | )(d) | | | 7.69 | | | | 7.32 | | | | - | | | | (2.65 | ) | | | (2.65 | ) | | $ | 26.73 | | | | 36.17 | % | |
(a) The Fund changed its fiscal year end from 9/30 to 12/31.
(b) The Fund changed its fiscal year end from 10/31 to 12/31.
(c) Commencement of offering of class of shares.
(d) Calculated based upon average shares outstanding.
(e) Annualized for periods less than one year.
(f) Not annualized for periods less than one year.
(g) Due to the size of net assets and fixed expenses, ratios may appear disproportionate.
(h) Amount less than $0.01.
SEE NOTES TO FINANCIAL STATEMENTS.
JPMorgan U.S. Equity Mid/Small Cap Funds90
SEMI-ANNUAL REPORT JUNE 30
2005
.
| | | Ratios/Supplemental data: | |
| | | | | Ratios to average net assets: (e) | | | |
| | | Net assets,
end of
period
(million's) | | Net
expenses | | Net
investment
income
(loss) | | Expenses
without waivers
reimbursements
and earnings credits | | Portfolio
turnover
rate (f) | |
| MID CAP VALUE FUND | |
| Six Months Ended 6/30/05 (Unaudited) | | $ | 230 | | | | 1.79 | % | | | (0.11 | %) | | | 1.89 | % | | | 16 | % | |
| Year Ended 12/31/04 | | $ | 173 | | | | 1.90 | % | | | (0.32 | %) | | | 2.10 | % | | | 41 | % | |
| Year Ended 12/31/03 | | $ | 68 | | | | 1.95 | % | | | (0.21 | %) | | | 2.19 | % | | | 32 | % | |
| Year Ended 12/31/02 | | $ | 14 | | | | 2.00 | % | | | (0.27 | %) | | | 2.49 | % | | | 51 | % | |
| 10/1/01 Through 12/31/01(a) | | $ | 3 | | | | 1.99 | % | | | (0.27 | %) | | | 4.47 | %(g) | | | 15 | % | |
| 4/30/01(c) Through 9/30/01 | | $ | 1 | | | | 2.03 | % | | | 0.01 | % | | | 16.00 | %(g) | | | 98 | % | |
| SMALL CAP EQUITY FUND | |
| Six Months Ended 6/30/05 (Unaudited) | | $ | 13 | | | | 1.90 | % | | | (1.14 | %) | | | 1.92 | % | | | 44 | % | |
| Year Ended 12/31/04 | | $ | 17 | | | | 2.12 | % | | | (1.43 | %) | | | 2.12 | % | | | 44 | % | |
| Year Ended 12/31/03 | | $ | 22 | | | | 2.12 | % | | | (1.49 | %) | | | 2.21 | % | | | 38 | % | |
| Year Ended 12/31/02 | | $ | 23 | | | | 2.12 | % | | | (1.50 | %) | | | 2.16 | % | | | 51 | % | |
| 11/1/01 Through 12/31/01(b) | | $ | 42 | | | | 2.12 | % | | | (1.55 | %) | | | 2.12 | % | | | 6 | % | |
| Year Ended 10/31/01 | | $ | 39 | | | | 2.13 | % | | | (1.54 | %) | | | 2.14 | % | | | 47 | % | |
| Year Ended 10/31/00 | | $ | 57 | | | | 2.17 | % | | | (1.50 | %) | | | 2.17 | % | | | 75 | % | |
SEE NOTES TO FINANCIAL STATEMENTS.
JPMorgan U.S. Equity Mid/Small Cap Funds91
JPMorgan Funds
FINANCIAL HIGHLIGHTS
(CONTINUED)
Class C
| | | Per share operating performance: | |
| | | | | Investment operations: | | Distributions: | | | | | |
| | | Net asset
value,
beginning
of period | | Net
investment
income
(loss) | | Net realized
and unrealized
gains
(losses) on
investments | | Total from
investment
operations | | Net
investment
income | | Net
realized
gains | | Total
distributions | | Net asset
value, end
of period | | Total
return
(excludes
sales charge) (f) | |
| CAPITAL GROWTH FUND(a) | |
| Six Months Ended 6/30/05 (Unaudited) | | $ | 35.20 | | | | (0.35 | ) | | | 1.10 | | | | 0.75 | | | | - | | | | - | | | | - | | | $ | 35.95 | | | | 2.13 | % | |
| Year Ended 12/31/04 | | $ | 34.81 | | | | (0.40 | )(d) | | | 6.00 | | | | 5.60 | | | | - | | | | (5.21 | ) | | | (5.21 | ) | | $ | 35.20 | | | | 16.32 | % | |
| Year Ended 12/31/03 | | $ | 26.83 | | | | (0.47 | )(d) | | | 9.85 | | | | 9.38 | | | | - | | | | (1.40 | ) | | | (1.40 | ) | | $ | 34.81 | | | | 35.17 | % | |
| Year Ended 12/31/02 | | $ | 37.82 | | | | (0.53 | )(d) | | | (10.20 | ) | | | (10.73 | ) | | | - | | | | (0.26 | ) | | | (0.26 | ) | | $ | 26.83 | | | | (28.39 | %) | |
| 11/1/01 Through 12/31/01(b) | | $ | 33.38 | | | | (0.05 | ) | | | 4.49 | | | | 4.44 | | | | - | | | | - | | | | - | | | $ | 37.82 | | | | 13.30 | % | |
| Year Ended 10/31/01 | | $ | 45.76 | | | | (0.37 | )(d) | | | (6.53 | ) | | | (6.90 | ) | | | - | | | | (5.48 | ) | | | (5.48 | ) | | $ | 33.38 | | | | (16.30 | %) | |
| Year Ended 10/30/00 | | $ | 41.31 | | | | 0.35 | (d) | | | 9.71 | | | | 9.36 | | | | - | | | | 4.91 | | | | 4.91 | | | $ | 45.76 | | | | 25.25 | % | |
| DYNAMIC SMALL CAP FUND | |
| Six Months Ended 6/30/05 (Unaudited) | | $ | 17.44 | | | | (0.13 | ) | | | (0.22 | ) | | | (0.35 | ) | | | - | | | | - | | | | - | | | $ | 17.09 | | | | (2.01 | %) | |
| Year Ended 12/31/04 | | $ | 15.98 | | | | (0.28 | )(d) | | | 1.74 | | | | 1.46 | | | | - | | | | - | | | | - | | | $ | 17.44 | | | | 9.14 | % | |
| Year Ended 12/31/03 | | $ | 11.61 | | | | (0.25 | )(d) | | | 4.62 | | | | 4.37 | | | | - | | | | - | | | | - | | | $ | 15.98 | | | | 37.64 | % | |
| Year Ended 12/31/02 | | $ | 15.13 | | | | (0.21 | ) | | | (3.31 | ) | | | (3.52 | ) | | | - | | | | - | | | | - | | | $ | 11.61 | | | | (23.26 | %) | |
| 11/1/01 Through 12/31/01(b) | | $ | 13.70 | | | | (0.04 | ) | | | 1.47 | | | | 1.43 | | | | - | | | | - | | | | - | | | $ | 15.13 | | | | 10.44 | % | |
| Year Ended 10/31/01 | | $ | 23.93 | | | | (0.23 | ) | | | (6.62 | ) | | | (6.85 | ) | | | - | | | | (3.38 | ) | | | (3.38 | ) | | $ | 13.70 | | | | (31.02 | %) | |
| Year Ended 10/31/00 | | $ | 15.69 | | | | (0.35 | )(d) | | | 8.59 | | | | 8.24 | | | | - | | | | - | | | | - | | | $ | 23.93 | | | | 52.52 | % | |
| MID CAP VALUE FUND | |
| Six Months Ended 6/30/05 (Unaudited) | | $ | 21.70 | | | | - | (h) | | | 1.01 | | | | 1.01 | | | | - | | | | - | | | | - | | | $ | 22.71 | | | | 4.65 | % | |
| Year Ended 12/31/04 | | $ | 18.41 | | | | (0.06 | )(d) | | | 3.66 | | | | 3.60 | | | | - | | | | (0.31 | ) | | | (0.31 | ) | | $ | 21.70 | | | | 19.56 | % | |
| Year Ended 12/31/03 | | $ | 14.35 | | | | (0.03 | )(d) | | | 4.20 | | | | 4.17 | | | | - | (h) | | | (0.11 | ) | | | (0.11 | ) | | $ | 18.41 | | | | 29.09 | % | |
| Year Ended 12/31/02 | | $ | 14.09 | | | | (0.04 | )(d) | | | 0.31 | | | | 0.27 | | | | - | | | | (0.01 | ) | | | (0.01 | ) | | $ | 14.35 | | | | 1.94 | % | |
| 10/1/01 Through 12/31/01(d) | | $ | 13.41 | | | | (0.01 | )(d) | | | 1.48 | | | | 1.47 | | | | (0.04 | ) | | | (0.75 | ) | | | (0.79 | ) | | $ | 14.09 | | | | 11.05 | % | |
| 4/30/01(c) Through 9/30/01 | | $ | 14.24 | | | | - | (d) | | | (0.83 | ) | | | (0.83 | ) | | | - | | | | - | | | | - | | | $ | 13.41 | | | | (5.83 | %) | |
| SMALL CAP EQUITY FUND | |
| 2/19/05(c) Through 6/30/05 (Unaudited) | | $ | 24.32 | | | | (0.03 | ) | | | 0.39 | | | | 0.36 | | | | - | | | | - | | | | - | | | $ | 24.68 | | | | 1.48 | % | |
(a) Prior to September 10, 2001, Capital Growth Fund invested all of its investable assets in the Capital Growth Portfolio. The portfolio turnover rate disclosed prior to September 10, 2001, is the turnover rate of Capital Growth Portfolio.
(b) The Fund changed its fiscal year end from 10/31 to 12/31.
(c) Commencement of offering of class of shares.
(d) Calculated based upon average shares outstanding.
(e) Annualized for periods less than one year.
(f) Not annualized for periods less than one year.
(g) The Fund changed its fiscal year end from 9/30 to 12/31.
(h) Amount less than $0.01.
(i) Due to the size of net assets and fixed expenses, ratios may appear disproportionate.
SEE NOTES TO FINANCIAL STATEMENTS.
JPMorgan U.S. Equity Mid/Small Cap Funds92
SEMI-ANNUAL REPORT JUNE 30
2005
FINANCIAL HIGHLIGHTS
| | | Ratios/Supplemental data: | |
| | | | | Ratios to average net assets: (e) | | | |
| | | Net assets,
end of
period
(million's) | | Net
expenses | | Net
investment
income
(loss) | | Expenses
without waivers
reimbursements
and earnings credits | | Portfolio
turnover
rate (f) | |
| CAPITAL GROWTH FUND(a) | |
| Six Months Ended 6/30/05 (Unaudited) | | $ | 11 | | | | 1.68 | % | | | (1.28 | ) | | | 1.68 | % | | | 63 | % | |
| Year Ended 12/31/04 | | $ | 7 | | | | 1.85 | % | | | (1.09 | %) | | | 1.87 | % | | | 122 | % | |
| Year Ended 12/31/03 | | $ | 4 | | | | 1.85 | % | | | (1.55 | %) | | | 1.96 | % | | | 68 | % | |
| Year Ended 12/31/02 | | $ | 3 | | | | 1.85 | % | | | (1.63 | %) | | | 1.88 | % | | | 93 | % | |
| 11/1/01 Through 12/31/01(b) | | $ | 5 | | | | 1.85 | % | | | (0.91 | %) | | | 1.85 | % | | | 2 | % | |
| Year Ended 10/31/01 | | $ | 4 | | | | 1.85 | % | | | (0.97 | %) | | | 1.87 | % | | | 43 | % | |
| Year Ended 10/30/00 | | $ | 5 | | | | 1.85 | % | | | (0.82 | %) | | | 1.85 | % | | | 66 | % | |
| DYNAMIC SMALL CAP FUND | |
| Six Months Ended 6/30/05 (Unaudited) | | $ | 37 | | | | 2.04 | % | | | (1.69 | %) | | | 2.06 | % | | | 54 | % | |
| Year Ended 12/31/04 | | $ | 34 | | | | 2.12 | % | | | (1.76 | %) | | | 2.23 | % | | | 112 | % | |
| Year Ended 12/31/03 | | $ | 23 | | | | 2.12 | % | | | (1.82 | %) | | | 2.35 | % | | | 55 | % | |
| Year Ended 12/31/02 | | $ | 10 | | | | 2.12 | % | | | (1.82 | %) | | | 2.32 | % | | | 52 | % | |
| 11/1/01 Through 12/31/01(b) | | $ | 11 | | | | 2.12 | % | | | (1.83 | %) | | | 2.12 | % | | | 8 | % | |
| Year Ended 10/31/01 | | $ | 10 | | | | 2.13 | % | | | (1.76 | %) | | | 2.14 | % | | | 57 | % | |
| Year Ended 10/31/00 | | $ | 14 | | | | 2.20 | % | | | (1.69 | %) | | | 2.26 | % | | | 87 | % | |
| MID CAP VALUE FUND | |
| Six Months Ended 6/30/05 (Unaudited) | | $ | 793 | | | | 1.78 | % | | | (0.09 | %) | | | 1.89 | % | | | 16 | % | |
| Year Ended 12/31/04 | | $ | 483 | | | | 1.90 | % | | | (0.31 | %) | | | 2.10 | % | | | 41 | % | |
| Year Ended 12/31/03 | | $ | 103 | | | | 1.95 | % | | | (0.19 | %) | | | 2.19 | % | | | 32 | % | |
| Year Ended 12/31/02 | | $ | 9 | | | | 2.00 | % | | | (0.28 | %) | | | 2.51 | % | | | 51 | % | |
| 10/1/01 Through 12/31/01(d) | | $ | 3 | | | | 1.99 | % | | | (0.30 | %) | | | 4.48 | %(i) | | | 15 | % | |
| 4/30/01(c) Through 9/30/01 | | $ | 2 | | | | 2.04 | % | | | 0.03 | % | | | 15.95 | %(i) | | | 98 | % | |
| SMALL CAP EQUITY FUND | |
| 2/19/05(c) Through 6/30/05 (Unaudited) | | $ | 3 | | | | 1.85 | % | | | (0.95 | %) | | | 1.89 | % | | | 44 | % | |
SEE NOTES TO FINANCIAL STATEMENTS.
JPMorgan U.S. Equity Mid/Small Cap Funds93
JPMorgan Funds
FINANCIAL HIGHLIGHTS
(CONTINUED)
Select Class
| | | Per share operating performance: | |
| | | | | Investment operations: | | Distributions: | | | | | |
| | | Net asset
value,
beginning
of period | | Net
investment
income
(loss) | | Net realized
and unrealized
gains
(losses) on
investments | | Total from
investment
operations | | Net
investment
income | | Net
realized
gains | | Total
distributions | | Net asset
value, end
of period | | Total
return
(excludes
sales charge) (f) | |
| CAPITAL GROWTH FUND(a) | |
| Six Months Ended 6/30/05 (Unaudited) | | $ | 40.42 | | | | (0.18 | ) | | | 1.19 | | | | 1.01 | | | | - | | | | - | | | | - | | | $ | 41.43 | | | | 2.50 | % | |
| Year Ended 12/31/04 | | $ | 38.95 | | | | (0.09 | )(d) | | | 6.77 | | | | 6.68 | | | | - | | | | (5.21 | ) | | | (5.21 | ) | | $ | 40.42 | | | | 17.37 | % | |
| Year Ended 12/31/03 | | $ | 29.57 | | | | (0.21 | )(d) | | | 10.99 | | | | 10.78 | | | | - | | | | (1.40 | ) | | | (1.40 | ) | | $ | 38.95 | | | | 36.64 | % | |
| Year Ended 12/31/02 | | $ | 41.26 | | | | (0.24 | )(d) | | | (11.19 | ) | | | (11.43 | ) | | | - | | | | (0.26 | ) | | | (0.26 | ) | | $ | 29.57 | | | | (27.71 | %) | |
| 11/1/01 Through 12/31/01(b) | | $ | 36.37 | | | | 0.01 | | | | 4.88 | | | | 4.89 | | | | - | | | | - | | | | - | | | $ | 41.26 | | | | 13.45 | % | |
| Year Ended 10/31/01 | | $ | 48.76 | | | | - | (c) | | | (6.91 | ) | | | (6.91 | ) | | | - | | | | (5.48 | ) | | | (5.48 | ) | | $ | 36.37 | | | | (15.20 | %) | |
| Year Ended 10/31/00 | | $ | 43.36 | | | | 0.04 | (d) | | | 10.27 | | | | 10.31 | | | | - | | | | 4.91 | | | | 4.91 | | | $ | 48.76 | | | | 26.34 | % | |
| DYNAMIC SMALL CAP FUND | |
| Six Months Ended 6/30/05 (Unaudited) | | $ | 18.89 | | | | (0.56 | ) | | | 0.27 | | | | (0.29 | ) | | | - | | | | - | | | | - | | | $ | 18.60 | | | | (1.54 | %) | |
| Year Ended 12/31/04 | | $ | 17.13 | | | | (0.13 | ) | | | 1.89 | | | | 1.76 | | | | - | | | | - | | | | - | | | $ | 18.89 | | | | 10.27 | % | |
| Year Ended 12/31/03 | | $ | 12.32 | | | | (0.11 | ) | | | 4.92 | | | | 4.81 | | | | - | | | | - | | | | - | | | $ | 17.13 | | | | 39.04 | % | |
| Year Ended 12/31/02 | | $ | 15.89 | | | | (0.08 | ) | | | (3.49 | ) | | | (3.57 | ) | | | - | | | | - | | | | - | | | $ | 12.32 | | | | (22.47 | %) | |
| 11/1/01 Through 12/31/01(b) | | $ | 14.37 | | | | (0.02 | ) | | | 1.54 | | | | 1.52 | | | | - | | | | - | | | | - | | | $ | 15.89 | | | | 10.58 | % | |
| Year Ended 10/31/01 | | $ | 24.65 | | | | (0.21 | ) | | | (6.69 | ) | | | (6.90 | ) | | | - | | | | (3.38 | ) | | | (3.38 | ) | | $ | 14.37 | | | | (30.20 | %) | |
| Year Ended 10/31/00 | | $ | 15.98 | | | | (0.13 | ) | | | 8.80 | | | | 8.67 | | | | - | | | | - | | | | - | | | $ | 24.65 | | | | 54.26 | % | |
| MID CAP EQUITY FUND | |
| Six Months Ended 6/30/05 (Unaudited) | | $ | 33.30 | | | | 0.03 | | | | 1.23 | | | | 1.26 | | | | (0.03 | ) | | | - | | | | (0.03 | ) | | $ | 34.53 | | | | 3.79 | % | |
| Year Ended 12/31/04 | | $ | 31.18 | | | | 0.14 | | | | 5.85 | | | | 5.99 | | | | (0.14 | ) | | | (3.73 | ) | | | (3.87 | ) | | $ | 33.30 | | | | 19.36 | % | |
| Year Ended 12/31/03 | | $ | 24.39 | | | | 0.13 | | | | 7.71 | | | | 7.84 | | | | (0.13 | ) | | | (0.92 | ) | | | (1.05 | ) | | $ | 31.18 | | | | 32.29 | % | |
| Year Ended 12/31/02 | | $ | 29.51 | | | | 0.13 | | | | (4.07 | ) | | | (3.94 | ) | | | (0.13 | ) | | | (1.05 | ) | | | (1.18 | ) | | $ | 24.39 | | | | (13.39 | %) | |
| 11/1/01 Through 12/31/01(b) | | $ | 26.17 | | | | 0.02 | | | | 3.43 | | | | 3.45 | | | | (0.02 | ) | | | (0.09 | ) | | | (0.11 | ) | | $ | 29.51 | | | | 13.20 | % | |
| Year Ended 10/31/01 | | $ | 37.85 | | | | 0.12 | | | | (5.30 | ) | | | (5.18 | ) | | | (0.12 | ) | | | (6.38 | ) | | | (6.50 | ) | | $ | 26.17 | | | | (15.27 | %) | |
| Year Ended 10/31/00 | | $ | 37.55 | | | | 0.17 | | | | 9.34 | | | | 9.51 | | | | (0.20 | ) | | | (9.01 | ) | | | (9.21 | ) | | $ | 37.85 | | | | 30.94 | % | |
(a) Prior to September 10, 2001, Capital Growth Fund invested all of its investable assets in the Capital Growth Portfolio. The portfolio turnover rate disclosed prior to September 10, 2001, is the turnover rate of Capital Growth Portfolio.
(b) The Fund changed its fiscal year end from 10/31 to 12/31.
(c) Amount less than $0.01.
(d) Calculated based upon average shares outstanding.
(e) Annualized for periods less than one year.
(f) Not annualized for periods less than one year.
(g) Due to the size of net assets and fixed expenses, ratios may appear disproportionate.
(h) Amount less than one million.
SEE NOTES TO FINANCIAL STATEMENTS.
JPMorgan U.S. Equity Mid/Small Cap Funds94
SEMI-ANNUAL REPORT JUNE 30
2005
FINANCIAL HIGHLIGHTS
| | | Ratios/Supplemental data: | |
| | | | | Ratios to average net assets: (e) | | | |
| | | Net assets,
end of
period
(million's) | | Net
expenses | | Net
investment
income
(loss) | | Expenses
without waivers
reimbursements
and earnings credits | | Portfolio
turnover
rate (f) | |
| CAPITAL GROWTH FUND(a) | |
| Six Months Ended 6/30/05 (Unaudited) | | $ | 225 | | | | 0.90 | % | | | (0.43 | %) | | | 0.90 | % | | | 63 | % | |
| Year Ended 12/31/04 | | $ | 43 | | | | 0.93 | % | | | (0.21 | %) | | | 1.30 | % | | | 122 | % | |
| Year Ended 12/31/03 | | $ | 4 | | | | 0.93 | % | | | (0.63 | %) | | | 1.54 | % | | | 68 | % | |
| Year Ended 12/31/02 | | $ | 2 | | | | 0.93 | % | | | (0.71 | %) | | | 1.26 | % | | | 93 | % | |
| 11/1/01 Through 12/31/01(b) | | $ | 3 | | | | 0.93 | % | | | 0.01 | % | | | 2.06 | % | | | 2 | % | |
| Year Ended 10/31/01 | | $ | 3 | | | | 0.93 | % | | | (0.01 | %) | | | 1.18 | % | | | 43 | % | |
| Year Ended 10/31/00 | | $ | 15 | | | | 0.94 | % | | | 0.09 | % | | | 1.06 | % | | | 66 | % | |
| DYNAMIC SMALL CAP FUND | |
| Six Months Ended 6/30/05 (Unaudited) | | $ | 18 | | | | 1.10 | % | | | (0.76 | %) | | | 1.28 | % | | | 54 | % | |
| Year Ended 12/31/04 | | $ | 10 | | | | 1.10 | % | | | (0.74 | %) | | | 1.32 | % | | | 112 | % | |
| Year Ended 12/31/03 | | $ | 16 | | | | 1.10 | % | | | (0.79 | %) | | | 1.28 | % | | | 55 | % | |
| Year Ended 12/31/02 | | $ | 12 | | | | 1.10 | % | | | (0.79 | %) | | | 1.22 | % | | | 52 | % | |
| 11/1/01 Through 12/31/01(b) | | $ | 8 | | | | 1.10 | % | | | (0.82 | %) | | | 10.33 | %(g) | | | 8 | % | |
| Year Ended 10/31/01 | | $ | - | (h) | | | 1.12 | % | | | (0.76 | %) | | | 12.21 | %(g) | | | 57 | % | |
| Year Ended 10/31/00 | | $ | - | (h) | | | 1.10 | % | | | (0.59 | %) | | | 15.48 | %(g) | | | 87 | % | |
| MID CAP EQUITY FUND | |
| Six Months Ended 6/30/05 (Unaudited) | | $ | 249 | | | | 0.90 | % | | | 0.17 | % | | | 1.09 | % | | | 53 | % | |
| Year Ended 12/31/04 | | $ | 227 | | | | 0.90 | % | | | 0.32 | % | | | 1.14 | % | | | 102 | % | |
| Year Ended 12/31/03 | | $ | 194 | | | | 0.90 | % | | | 0.48 | % | | | 1.14 | % | | | 62 | % | |
| Year Ended 12/31/02 | | $ | 139 | | | | 0.77 | % | | | 0.51 | % | | | 1.14 | % | | | 84 | % | |
| 11/1/01 Through 12/31/01(b) | | $ | 155 | | | | 0.60 | % | | | 0.38 | % | | | 1.15 | % | | | 2 | % | |
| Year Ended 10/31/01 | | $ | 133 | | | | 0.55 | % | | | 0.38 | % | | | 1.15 | % | | | 55 | % | |
| Year Ended 10/31/00 | | $ | 164 | | | | 0.41 | % | | | 0.52 | % | | | 1.14 | % | | | 84 | % | |
SEE NOTES TO FINANCIAL STATEMENTS.
JPMorgan U.S. Equity Mid/Small Cap Funds95
JPMorgan Funds
FINANCIAL HIGHLIGHTS
(CONTINUED)
Select Class (continued)
| | | Per share operating performance: | |
| | | | | Investment operations: | | Distributions: | | | | | |
| | | Net asset
value,
beginning
of period | | Net
investment
income
(loss) | | Net realized
and unrealized
gains
(losses) on
investments | | Total from
investment
operations | | Net
investment
income | | Net
realized
gains | | Total
distributions | | Net asset
value, end
of period | | Total
return
(excludes
sales charge) (f) | |
| MID CAP VALUE FUND | |
| Six Months Ended 6/30/05 (Unaudited) | | $ | 22.18 | | | | 0.06 | | | | 1.07 | | | | 1.13 | | | | - | | | | - | | | | - | | | $ | 23.31 | | | | 5.09 | % | |
| Year Ended 12/31/04 | | $ | 18.70 | | | | 0.12 | (d) | | | 3.74 | | | | 3.86 | | | | (0.07 | ) | | | (0.31 | ) | | | (0.38 | ) | | $ | 22.18 | | | | 20.67 | % | |
| Year Ended 12/31/03 | | $ | 14.48 | | | | 0.12 | (d) | | | 4.27 | | | | 4.39 | | | | (0.06 | ) | | | (0.11 | ) | | | (0.17 | ) | | $ | 18.70 | | | | 30.34 | % | |
| Year Ended 12/31/02 | | $ | 14.14 | | | | 0.14 | (d) | | | 0.27 | | | | 0.41 | | | | (0.06 | ) | | | (0.01 | ) | | | (0.07 | ) | | $ | 14.48 | | | | 2.90 | % | |
| 10/31/01(c) Through 12/31/01(a) | | $ | 13.48 | | | | 0.01 | (d) | | | 1.49 | | | | 1.50 | | | | (0.09 | ) | | | (0.75 | ) | | | (0.84 | ) | | $ | 14.14 | | | | 11.18 | % | |
| SMALL CAP CORE FUND | |
| Six Months Ended 6/30/05 (Unaudited) | | $ | 43.46 | | | | 0.08 | | | | (0.24 | ) | | | (0.16 | ) | | | - | | | | - | | | | - | | | $ | 43.30 | | | | (0.37 | %) | |
| Year Ended 12/31/04 | | $ | 44.39 | | | | 0.09 | | | | 9.51 | | | | 9.60 | | | | (0.07 | ) | | | (10.46 | ) | | | (10.53 | ) | | $ | 43.46 | | | | 22.31 | % | |
| Year Ended 12/31/03 | | $ | 33.35 | | | | 0.02 | | | | 11.70 | | | | 11.72 | | | | (0.01 | ) | | | (0.67 | ) | | | (0.68 | ) | | $ | 44.39 | | | | 35.20 | % | |
| Year Ended 12/31/02 | | $ | 40.46 | | | | 0.04 | | | | (6.86 | ) | | | (6.82 | ) | | | (0.03 | ) | | | (0.26 | ) | | | (0.29 | ) | | $ | 33.35 | | | | (16.94 | %) | |
| 11/1/01 Through 12/31/01(b) | | $ | 36.65 | | | | 0.01 | | | | 3.81 | | | | 3.82 | | | | (0.01 | ) | | | - | | | | (0.01 | ) | | $ | 40.46 | | | | 10.42 | % | |
| Year Ended 10/31/01 | | $ | 51.12 | | | | 0.10 | | | | (7.61 | ) | | | (7.51 | ) | | | (0.14 | ) | | | (6.82 | ) | | | (6.96 | ) | | $ | 36.65 | | | | (15.47 | %) | |
| Year Ended 10/31/00 | | $ | 47.66 | | | | 0.08 | | | | 12.44 | | | | 12.52 | | | | (0.08 | ) | | | (8.98 | ) | | | (9.06 | ) | | $ | 51.12 | | | | 30.16 | % | |
| SMALL CAP EQUITY FUND | |
| Six Months Ended 6/30/05 (Unaudited) | | $ | 27.96 | | | | (0.01 | ) | | | 0.95 | | | | 0.94 | | | | - | | | | - | | | | - | | | $ | 28.90 | | | | 3.36 | % | |
| Year Ended 12/31/04 | | $ | 25.18 | | | | (0.05 | )(d) | | | 6.66 | | | | 6.61 | | | | - | | | | (3.83 | ) | | | (3.83 | ) | | $ | 27.96 | | | | 26.81 | % | |
| Year Ended 12/31/03 | | $ | 18.37 | | | | (0.04 | )(d) | | | 6.85 | | | | 6.81 | | | | - | | | | - | | | | - | | | $ | 25.18 | | | | 37.07 | % | |
| Year Ended 12/31/02 | | $ | 22.25 | | | | (0.04 | )(d) | | | (3.71 | ) | | | (3.75 | ) | | | - | | | | (0.13 | ) | | | (0.13 | ) | | $ | 18.37 | | | | (16.87 | %) | |
| 11/1/01 Through 12/31/01(b) | | $ | 20.27 | | | | (0.01 | )(d) | | | 1.99 | | | | 1.98 | | | | - | | | | - | | | | - | | | $ | 22.25 | | | | 9.77 | % | |
| Year Ended 10/31/01 | | $ | 28.52 | | | | (0.10 | ) | | | (4.26 | ) | | | (4.36 | ) | | | - | | | | (3.89 | ) | | | (3.89 | ) | | $ | 20.27 | | | | (16.19 | %) | |
| Year Ended 10/31/00 | | $ | 23.10 | | | | (0.05 | )(d) | | | 8.12 | | | | 8.07 | | | | - | | | | (2.65 | ) | | | (2.65 | ) | | $ | 28.52 | | | | 37.94 | % | |
(a) The Fund changed its fiscal year end from 9/30 to 12/31.
(b) The Fund changed its fiscal year end from 10/31 to 12/31.
(c) Commencement of offering of class of shares.
(d) Calculated based upon average shares outstanding.
(e) Annualized for periods less than one year.
(f) Not annualized for periods less than one year.
(g) Due to the size of net assets and fixed expenses, ratios may appear disproportionate.
(h) Amount less than one million.
SEE NOTES TO FINANCIAL STATEMENTS.
JPMorgan U.S. Equity Mid/Small Cap Funds96
SEMI-ANNUAL REPORT JUNE 30
2005
FINANCIAL HIGHLIGHTS
| | | Ratios/Supplemental data: | |
| | | | | Ratios to average net assets: (e) | | | |
| | | Net assets,
end of
period
(million's) | | Net
expenses | | Net
investment
income
(loss) | | Expenses
without waivers
reimbursements
and earnings credits | | Portfolio
turnover
rate (f) | |
| MID CAP VALUE FUND | |
| Six Months Ended 6/30/05 (Unaudited) | | $ | 1,154 | | | | 1.00 | % | | | 0.74 | % | | | 1.10 | % | | | 16 | % | |
| Year Ended 12/31/04 | | $ | 485 | | | | 1.00 | % | | | 0.60 | % | | | 1.20 | % | | | 41 | % | |
| Year Ended 12/31/03 | | $ | 76 | | | | 1.00 | % | | | 0.74 | % | | | 1.24 | % | | | 32 | % | |
| Year Ended 12/31/02 | | $ | 14 | | | | 1.00 | % | | | 0.96 | % | | | 1.71 | % | | | 51 | % | |
| 10/31/01(c) Through 12/31/01(a) | | $ | - | (h) | | | 0.99 | % | | | 0.58 | % | | | 3.68 | %(g) | | | 15 | % | |
| SMALL CAP CORE FUND | |
| Six Months Ended 6/30/05 (Unaudited) | | $ | 815 | | | | 0.80 | % | | | 0.34 | % | | | 1.06 | % | | | 25 | % | |
| Year Ended 12/31/04 | | $ | 904 | | | | 0.64 | % | | | 0.25 | % | | | 1.12 | % | | | 170 | % | |
| Year Ended 12/31/03 | | $ | 386 | | | | 0.60 | % | | | 0.04 | % | | | 1.10 | % | | | 48 | % | |
| Year Ended 12/31/02 | | $ | 259 | | | | 0.51 | % | | | 0.10 | % | | | 1.11 | % | | | 52 | % | |
| 11/1/01 Through 12/31/01(b) | | $ | 317 | | | | 0.40 | % | | | 0.09 | % | | | 1.12 | % | | | 7 | % | |
| Year Ended 10/31/01 | | $ | 299 | | | | 0.34 | % | | | 0.28 | % | | | 1.13 | % | | | 50 | % | |
| Year Ended 10/31/00 | | $ | 380 | | | | 0.50 | % | | | 0.19 | % | | | 1.07 | % | | | 76 | % | |
| SMALL CAP EQUITY FUND | |
| Six Months Ended 6/30/05 (Unaudited) | | $ | 210 | | | | 0.85 | % | | | (0.08 | %) | | | 1.12 | % | | | 44 | % | |
| Year Ended 12/31/04 | | $ | 211 | | | | 0.85 | % | | | (0.17 | %) | | | 1.11 | % | | | 44 | % | |
| Year Ended 12/31/03 | | $ | 636 | | | | 0.85 | % | | | (0.22 | %) | | | 1.12 | % | | | 38 | % | |
| Year Ended 12/31/02 | | $ | 502 | | | | 0.85 | % | | | (0.22 | %) | | | 1.09 | % | | | 51 | % | |
| 11/1/01 Through 12/31/01(b) | | $ | 532 | | | | 0.88 | % | | | (0.31 | %) | | | 1.10 | % | | | 6 | % | |
| Year Ended 10/31/01 | | $ | 390 | | | | 0.88 | % | | | (0.30 | %) | | | 1.12 | % | | | 47 | % | |
| Year Ended 10/31/00 | | $ | 383 | | | | 0.88 | % | | | (0.20 | %) | | | 1.13 | % | | | 75 | % | |
SEE NOTES TO FINANCIAL STATEMENTS.
JPMorgan U.S. Equity Mid/Small Cap Funds97
JPMorgan Funds
FINANCIAL HIGHLIGHTS
(CONTINUED)
Select Class (continued)
| | | Per share operating performance: | |
| | | | | Investment operations: | | Distributions: | | | | | |
| | | Net asset
value,
beginning
of period | | Net
investment
income
(loss) | | Net realized
and unrealized
gains
(losses) on
investments | | Total from
investment
operations | | Net
investment
income | | Net
realized
gains | | Total
distributions | | Net asset
value, end
of period | | Total
return
(excludes
sales charge) (f) | |
| U.S. SMALL COMPANY FUND(a) | |
| Six Months Ended 6/30/05 (Unaudited) | | $ | 13.78 | | | | 0.02 | | | | (0.07 | ) | | | (0.05 | ) | | | - | | | | - | | | | - | | | $ | 13.73 | | | | (0.36 | %) | |
| Year Ended 12/31/04 | | $ | 13.90 | | | | (0.03 | )(d) | | | 1.91 | | | | 1.88 | | | | - | | | | (2.00 | ) | | | (2.00 | ) | | $ | 13.78 | | | | 13.73 | % | |
| Year Ended 12/31/03 | | $ | 9.97 | | | | 0.02 | (d) | | | 3.94 | | | | 3.96 | | | | (0.03 | ) | | | - | | | | (0.03 | ) | | $ | 13.90 | | | | 39.72 | % | |
| Year Ended 12/31/02 | | $ | 12.57 | | | | 0.03 | | | | (2.60 | ) | | | (2.57 | ) | | | (0.03 | ) | | | - | | | | (0.03 | ) | | $ | 9.97 | | | | (20.48 | %) | |
| 6/1/01 Through 12/31/01(b) | | $ | 13.43 | | | | 0.04 | (d) | | | (0.79 | ) | | | (0.75 | ) | | | (0.05 | ) | | | (0.06 | ) | | | (0.11 | ) | | $ | 12.57 | | | | (5.56 | %) | |
| Year Ended 5/31/01 | | $ | 14.45 | | | | 0.05 | | | | 0.04 | | | | 0.09 | | | | (0.03 | ) | | | (1.08 | ) | | | (1.11 | ) | | $ | 13.43 | | | | 0.75 | % | |
| Year Ended 5/31/00 | | $ | 11.49 | | | | - | | | | 2.97 | | | | 2.97 | | | | (0.01 | ) | | | - | | | | (0.01 | ) | | $ | 14.45 | | | | 25.90 | % | |
(a) Prior to the open of business on September 10, 2001, the class underwent a split of shares in connection with a Fund reorganization. Prior periods have been restated to reflect the split.
(b) The Fund changed its fiscal year end from 5/31 to 12/31.
(c) Prior to September 10, 2001, U.S. Small Company Fund invested all of its investable assets in The U.S. Small Company Portfolio. The portfolio turnover rate disclosed prior to September 10, 2001, is the turnover rate of U.S. Small Company Portfolio.
(d) Calculated based upon average shares outstanding.
(e) Annualized for periods less than one year.
(f) Not annualized for periods less than one year.
SEE NOTES TO FINANCIAL STATEMENTS.
JPMorgan U.S. Equity Mid/Small Cap Funds98
SEMI-ANNUAL REPORT JUNE 30
2005
FINANCIAL HIGHLIGHTS
| | | Ratios/Supplemental data: | |
| | | | | Ratios to average net assets: (e) | | | |
| | | Net assets,
end of
period
(million's) | | Net
expenses | | Net
investment
income
(loss) | | Expenses
without waivers
reimbursements
and earnings credits | | Portfolio
turnover
rate (f) | |
| U.S. SMALL COMPANY FUND(a) | |
| Six Months Ended 6/30/05 (Unaudited) | | $ | 123 | | | | 1.01 | % | | | 0.26 | % | | | 1.12 | % | | | 18 | % | |
| Year Ended 12/31/04 | | $ | 119 | | | | 1.01 | % | | | (0.18 | %) | | | 1.15 | % | | | 129 | % | |
| Year Ended 12/31/03 | | $ | 156 | | | | 1.01 | % | | | 0.15 | % | | | 1.11 | % | | | 78 | % | |
| Year Ended 12/31/02 | | $ | 199 | | | | 1.01 | % | | | 0.23 | % | | | 1.10 | % | | | 90 | % | |
| 6/1/01 Through 12/31/01(b) | | $ | 286 | | | | 1.01 | % | | | 0.39 | % | | | 1.04 | % | | | 48 | %(c) | |
| Year Ended 5/31/01 | | $ | 296 | | | | 1.01 | % | | | 0.35 | % | | | 1.01 | % | | | 110 | %(c) | |
| Year Ended 5/31/00 | | $ | 285 | | | | 1.00 | % | | | 0.05 | % | | | 1.00 | % | | | 104 | %(c) | |
SEE NOTES TO FINANCIAL STATEMENTS.
JPMorgan U.S. Equity Mid/Small Cap Funds99
JPMorgan Funds
FINANCIAL HIGHLIGHTS
(CONTINUED)
Institutional Class
| | | Per share operating performance: | |
| | | | | Investment operations: | | Distributions: | | | | | |
| | | Net asset
value,
beginning
of period | | Net
investment
income
(loss) | | Net realized
and unrealized
gains
(losses) on
investments | | Total from
investment
operations | | Net
investment
income | | Net
realized
gains | | Total
distributions | | Net asset
value, end
of period | | Total
return
(excludes
sales charge) (f) | |
| MID CAP VALUE FUND | |
| Six Months Ended 6/30/05 (Unaudited) | | $ | 22.30 | | | | 0.09 | | | | 1.07 | | | | 1.16 | | | | - | | | | - | | | | - | | | $ | 23.46 | | | | 5.20 | % | |
| Year Ended 12/31/04 | | $ | 18.77 | | | | 0.17 | (d) | | | 3.77 | | | | 3.94 | | | | (0.10 | ) | | | (0.31 | ) | | | (0.41 | ) | | $ | 22.30 | | | | 20.99 | % | |
| Year Ended 12/31/03 | | $ | 14.52 | | | | 0.17 | (d) | | | 4.27 | | | | 4.44 | | | | (0.08 | ) | | | (0.11 | ) | | | (0.19 | ) | | $ | 18.77 | | | | 30.62 | % | |
| Year Ended 12/31/02 | | $ | 14.14 | | | | 0.15 | (d) | | | 0.30 | | | | 0.45 | | | | (0.06 | ) | | | (0.01 | ) | | | (0.07 | ) | | $ | 14.52 | | | | 3.23 | % | |
| 10/1/01 Through 12/31/01(a) | | $ | 13.47 | | | | 0.03 | (d) | | | 1.48 | | | | 1.51 | | | | (0.09 | ) | | | (0.75 | ) | | | (0.84 | ) | | $ | 14.14 | | | | 11.30 | % | |
| Year Ended 9/30/01 | | $ | 13.06 | | | | 0.15 | (d) | | | 1.28 | | | | 1.43 | | | | (0.15 | ) | | | (0.87 | ) | | | (1.02 | ) | | $ | 13.47 | | | | 11.19 | % | |
| Year Ended 9/30/00 | | $ | 13.56 | | | | 0.11 | | | | 2.59 | | | | 2.70 | | | | (0.09 | ) | | | (3.11 | ) | | | (3.20 | ) | | $ | 13.06 | | | | 23.76 | % | |
| U.S. SMALL COMPANY FUND(c) | |
| Six Months Ended 6/30/05 (Unaudited) | | $ | 13.77 | | | | 0.04 | | | | (0.07 | ) | | | (0.03 | ) | | | - | | | | - | | | | - | | | $ | 13.74 | | | | (0.22 | %) | |
| Year Ended 12/31/04 | | $ | 13.88 | | | | - | (d) | | | 1.89 | | | | 1.89 | | | | - | | | | (2.00 | ) | | | (2.00 | ) | | $ | 13.77 | | | | 13.82 | % | |
| Year Ended 12/31/03 | | $ | 9.95 | | | | 0.04 | (d) | | | 3.94 | | | | 3.98 | | | | (0.05 | ) | | | - | | | | (0.05 | ) | | $ | 13.88 | | | | 40.03 | % | |
| Year Ended 12/31/02 | | $ | 12.57 | | | | 0.05 | | | | (2.61 | ) | | | (2.56 | ) | | | (0.06 | ) | | | - | | | | (0.06 | ) | | $ | 9.95 | | | | (20.36 | %) | |
| 6/1/01 Through 12/31/01(b) | | $ | 13.34 | | | | 0.05 | (d) | | | (0.78 | ) | | | (0.73 | ) | | | (0.04 | ) | | | - | | | | (0.04 | ) | | $ | 12.57 | | | | (5.50 | %) | |
| Year Ended 5/31/01 | | $ | 15.11 | | | | 0.08 | | | | 0.03 | | | | 0.11 | | | | (0.09 | ) | | | (1.79 | ) | | | (1.88 | ) | | $ | 13.34 | | | | 0.94 | % | |
| Year Ended 5/31/00 | | $ | 11.98 | | | | 0.04 | | | | 3.10 | | | | 3.14 | | | | (0.01 | ) | | | - | | | | (0.01 | ) | | $ | 15.11 | | | | 26.23 | % | |
(a) The Fund changed its fiscal year end from 9/30 to 12/31.
(b) The Fund changed its fiscal year end from 5/31 to 12/31.
(c) Prior to the open of business on September 10, 2001, the class underwent a split of shares in connection with a Fund reorganization. Prior periods have been restated to reflect the split.
(d) Calculated based upon average shares outstanding.
(e) Annualized for periods less than one year.
(f) Not annualized for periods less than one year.
(g) Due to the size of net assets and fixed expenses, ratios may appear disproportionate.
(h) Prior to September 10, 2001, U.S. Small Company Fund invested all of its investable assets in The U.S. Small Company Portfolio. The portfolio turnover rate disclosed prior to September 10, 2001, is the turnover rate of U.S. Small Company Portfolio.
SEE NOTES TO FINANCIAL STATEMENTS.
JPMorgan U.S. Equity Mid/Small Cap Funds100
SEMI-ANNUAL REPORT JUNE 30
2005
FINANCIAL HIGHLIGHTS
| | | Ratios/Supplemental data: | |
| | | | | Ratios to average net assets: (e) | | | |
| | | Net assets,
end of
period
(million's) | | Net
expenses | | Net
investment
income
(loss) | | Expenses
without waivers
reimbursements
and earnings credits | | Portfolio
turnover
rate (f) | |
| MID CAP VALUE FUND | |
| Six Months Ended 6/30/05 (Unaudited) | | $ | 1,652 | | | | 0.75 | % | | | 0.93 | % | | | 0.96 | % | | | 16 | % | |
| Year Ended 12/31/04 | | $ | 1,215 | | | | 0.75 | % | | | 0.83 | % | | | 1.05 | % | | | 41 | % | |
| Year Ended 12/31/03 | | $ | 334 | | | | 0.75 | % | | | 1.00 | % | | | 1.07 | % | | | 32 | % | |
| Year Ended 12/31/02 | | $ | 59 | | | | 0.75 | % | | | 1.01 | % | | | 1.22 | % | | | 51 | % | |
| 10/1/01 Through 12/31/01(a) | | $ | 4 | | | | 0.75 | % | | | 0.94 | % | | | 3.30 | %(g) | | | 15 | % | |
| Year Ended 9/30/01 | | $ | 4 | | | | 0.75 | % | | | 1.07 | % | | | 3.25 | %(g) | | | 98 | % | |
| Year Ended 9/30/00 | | $ | 5 | | | | 0.97 | % | | | 0.84 | % | | | 4.24 | %(g) | | | 99 | % | |
| U.S. SMALL COMPANY FUND(c) | |
| Six Months Ended 6/30/05 (Unaudited) | | $ | 54 | | | | 0.83 | % | | | 0.42 | % | | | 0.96 | % | | | 18 | % | |
| Year Ended 12/31/04 | | $ | 92 | | | | 0.83 | % | | | - | % | | | 0.97 | % | | | 129 | % | |
| Year Ended 12/31/03 | | $ | 183 | | | | 0.83 | % | | | 0.33 | % | | | 0.95 | % | | | 78 | % | |
| Year Ended 12/31/02 | | $ | 214 | | | | 0.83 | % | | | 0.41 | % | | | 0.93 | % | | | 90 | % | |
| 6/1/01 Through 12/31/01(b) | | $ | 269 | | | | 0.82 | % | | | 0.57 | % | | | 0.86 | % | | | 48 | %(h) | |
| Year Ended 5/31/01 | | $ | 410 | | | | 0.82 | % | | | 0.54 | % | | | 0.82 | % | | | 110 | %(h) | |
| Year Ended 5/31/00 | | $ | 358 | | | | 0.80 | % | | | 0.26 | % | | | 0.82 | % | | | 104 | %(h) | |
SEE NOTES TO FINANCIAL STATEMENTS.
JPMorgan U.S. Equity Mid/Small Cap Funds101
JPMorgan Funds
NOTES TO FINANCIAL
STATEMENTS
(Unaudited)
1. Organization
JPMorgan Trust I ("JPM I") was organized on November 5, 2004 as a Delaware statutory trust and is registered under the Investment Company Act of 1940, as amended (the "1940 Act") as an open-end management investment company.
JPMorgan Mid Cap Growth Fund is a series of J.P Morgan Mutual Fund Investment Trust ("JPMMFIT"), an open-end management investment company which was organized as a Massachusetts business trust on September 23, 1997. The Fund offers Class A and Class B.
JPMorgan Mid Cap Value Fund is a series of J.P. Morgan Fleming Mutual Fund Group, Inc. ("JPMFMFG"), an open-end management investment company which was organized as a Maryland corporation on August 19, 1997. The Fund offers Class A, Class B, Class C, Select Class and Institutional Class.
The following are the funds of JPM I, JPMMFIT and JPMFMFG (the "Trusts") (collectively, the "Funds") covered by this report:
| FUND | | CLASSES OFFERED | |
| Capital Growth Fund | | Class A, Class B, Class C and Select Class | |
| Dynamic Small Cap Fund | | Class A, Class B, Class C, and Select Class | |
| Mid Cap Equity Fund | | Select Class | |
| Mid Cap Growth Fund | | Class A and Class B | |
| Mid Cap Value Fund | | Class A, Class B, Class C, Select Class and Institutional Class | |
| Small Cap Core Fund | | Select Class | |
| Small Cap Equity Fund | | Class A, Class B, Class C and Select Class | |
| U.S. Small Company Fund | | Select Class and Institutional Class | |
Effective February 19, 2005, the Small Cap Core Fund was renamed from Trust Small Cap Equity Fund with the approval of the Board of Trustees.
Prior to February 19, 2005, U.S. Small Company Fund was a separate series of J.P. Morgan Institutional Funds, Dynamic Small Cap Fund and Small Cap Equity Fund were separate series of J.P. Morgan Mutual Fund Group and Mid Cap Equity Fund was a separate series of J.P. Morgan Mutual Fund Select Group. On August 19, 2004, the Boards of Trustees of the then existing Trusts each approved Agreements and Plans of Reorganization regarding the reorganization of each series of their respective Trust into a corresponding series of J.P. Morgan Mutual Fund Series ("JPMMFS").
At a special meeting of shareholders of the Funds held on January 20, 2005, and adjourned and reconvened on February 3, 2005, shareholders of each of the Funds, except for Mid Cap Growth Fund and Mid Cap Value Fund, approved the Agreement and Plan of Reorganization with respect to the Funds. Effective after the close of business on February 18, 2005 pursuant to the Agreement and Plan of Reorganization, the Funds were each reorganized, by means of a tax-free reorganization, each as a separate series of JPMMFS.
Additionally, the shareholders of JPMMFS approved an Agreement and Plan of Reorganization and Redomiciliation providing for the reorganization and redomiciliation of each series of JPMMFS as a corresponding series of JPMorgan Trust I, including those
JPMorgan U.S. Equity Mid/Small Cap Funds102
SEMI-ANNUAL REPORT JUNE 30
2005
NOTES TO FINANCIAL
STATEMENTS
(Unaudited)
series of JPMMFS such as the Funds which became a series of JPMMFS as of February 18, 2005. Therefore, effective after the close of business on February 18, 2005, pursuant to the Agreement and Plan of Reorganization and Redomiciliation, each Fund, except for Mid Cap Growth Fund and Mid Cap Value Fund, was reorganized and redomiciled, by means of a tax-free reorganization, as a separate series of JPMorgan Trust I.
As of the close of business on February 28, 2005, the Small Cap Core Fund and the U.S. Small Company Fund are publicly offered on a limited basis. Additionally, as of the close of business on March 31, 2005, the Mid Cap Value Fund is publicly offered on a limited basis.
Class A shares generally provide for a front-end sales charge while Class B and Class C shares provide for a contingent deferred sales charge. Class B shares automatically convert to Class A shares after eight years. No sales charges are assessed with respect to the Select Class and Institutional Class. All classes of shares have equal rights as to earnings, assets and voting privileges except that each class may bear different distribution and shareholder servicing fees and each class has exclusive voting rights with respect to its distribution plan and shareholder servicing agreements. Certain Class A shares, for which front-end sales charges have been waived, may be subject to redemption charges as described in the Fund's prospectus.
2. Significant Accounting Policies
The following is a summary of significant accounting policies followed by the Funds in preparation of their financial statements. The policies are in accordance with accounting principles generally accepted in the United States of America. The preparation of financial statements requires management to make estimates and assumptions that affect the reported amounts of assets and liabilities at the date of the financial statements and the reported amounts of income and expenses for the period. Actual results could differ from those estimates.
A. Valuation of Investments - Listed securities are valued at the last sale price on the exchange on which they are primarily traded. The value of National Market Systems equity securities quoted by the Nasdaq Stock Market shall generally be the Nasdaq Official Closing Price. Unlisted securities are valued at the last sale price provided by an independent pricing agent or principal market maker. Listed securities for which the latest sales prices are not available are valued at the mean of the latest bid and ask price as of the closing of the primary exchange where such securities are normally traded. Fixed income securities with a maturity of 61 days or more held by the Funds will be valued each day based on readily available market quotations received from third party broker-dealers o f comparable securities or independent or affiliated pricing services approved by the Board of Trustees. Such pricing services and broker-dealers will generally provide bid-side quotations. Short-term investments maturing in less than 61 days are valued at amortized cost, which approximates market value. Futures, options and other derivatives are valued on the basis of available market quotations. Investments in other open-end investment companies are valued at such investment company's current day closing net asset value per share.
Securities or other assets for which market quotations are not readily available or for which market quotations do not represent the value at the time of pricing (including certain illiquid securities) are fair valued in accordance with procedures established by and under the supervision and responsibility of the Trustees. Trading in securities on most foreign exchanges and over-the-counter markets is normally completed before the close of the domestic market and may also take place on days when the domestic market is closed. In accordance with procedures adopted by the Trustees, the Funds apply fair value pricing on a daily basis for all non-U.S. and non-Canadian equity securities held in their portfolios by utilizing the quotations of an independent
JPMorgan U.S. Equity Mid/Small Cap Funds103
JPMorgan Funds
NOTES TO FINANCIAL
STATEMENTS
(CONTINUED)
(Unaudited)
pricing service, unless a Fund's advisor determines that use of another valuation methodology is appropriate. The pricing service uses statistical analyses and quantitative models to adjust local market prices using factors such as subsequent movement and changes in the prices of indices, securities and exchange rate in other markets, in determining fair value as of the time a Fund calculates its net asset value.
B. Repurchase Agreements - The Funds may enter into repurchase agreement transactions with institutions that meet the advisor's credit guidelines. Each repurchase agreement is valued at amortized cost. The Funds require that the collateral received in a repurchase agreement transaction be transferred to a custodian in a manner sufficient to enable the Funds to obtain collateral in the event of a counterparty default. If the counterparty defaults and the fair value of the collateral declines, realization of the collateral by the Funds may be delayed or limited.
C. Futures Contracts - The Funds may enter into futures contracts for the delayed delivery of securities at a fixed price at some future date or for the change in the value of a specified financial index over a predetermined time period. Upon entering into a futures contract, the Funds are required to pledge to the broker an amount of cash, U.S. government securities, or other assets, equal to a certain percentage of the contract amount. This is known as the initial margin deposit. Subsequent payments, known as variation margin, are made or received by the Funds each day, depending on the daily fluctuations in fair value of the position. Variation margin is recorded as unrealized appreciation or depreciation until the contract is closed out, at which time the Funds realize a gain or los s equal to the variation margin.
Use of long futures contracts subjects the Funds to risk of loss in excess of the amounts shown on the Statement of Assets and Liabilities, up to the notional value of the futures contracts. Use of short futures contracts subjects the Funds to unlimited risk of loss. The Funds may enter into futures contracts only on exchanges or boards of trade. The exchange or board of trade acts as the
counterparty to each futures transaction; therefore, the Funds' credit risk is limited to failure of the exchange or board of trade.
As of June 30, 2005, the Small Cap Core Fund and U.S. Small Company Fund had outstanding futures contracts as listed on their Schedules of Portfolio Investments.
D. Securities Lending - To generate additional income, each Fund may lend up to 331/3% of its assets pursuant to agreements ("borrower agreements") requiring that the loan be continuously secured by cash or securities issued by the U.S. government or its agencies or its instrumentalities ("U.S. government securities"). JPMorgan Chase Bank, N.A. ("JPMCB"), an affiliate of the Funds, serves as lending agent to the Funds pursuant to a Securities Lending Agreement approved by the Board of Trustees (the "Securities Lending Agreement"). The Securities Lending Agreement was effective w ith respect to the Funds on October 15, 2002 and an amended and restated agreement was approved by the Board at a meeting held on August 11, 2005.
Under the Securities Lending Agreement, JPMCB acting as agent for the Funds, loans securities to approved borrowers pursuant to approved borrower agreements in exchange for collateral equal to at least 100% of the market value of the loaned securities plus accrued interest. During the term of the loan, the Funds receive payments from borrowers equivalent to the dividends and interest that would have been earned on securities lent while simultaneously seeking to earn income on the investment of cash collateral in accordance with investment guidelines contained in the Securities Lending Agreement. For loans secured by cash, the Funds retain the interest on cash collateral investments but are required to pay the borrower a rebate for the use of the cash collateral. For loans secured by U.S. government securities, the borrower pays a borrower fee to the lending agent on behalf of the Funds. The net income earned on the securities lending (after payment of rebates and the lending agent's fee) is included in the Statement of Operations as Securities lending (net).
JPMorgan U.S. Equity Mid/Small Cap Funds104
SEMI-ANNUAL REPORT JUNE 30
2005
NOTES TO FINANCIAL
STATEMENTS
(Unaudited)
Information on the investment of cash collateral is shown in the Schedule of Portfolio Investments.
Under the Securities Lending Agreement, JPMCB is entitled to a fee equal to (i) 0.05% (0.06% prior to January 31, 2005), calculated on an annualized basis and accrued daily, based upon the value of Collateral received from Borrowers for each Loan of U.S. Securities
outstanding during a given month under this Lending Agreement; and (ii) 0.10% (0.1142% prior to January 31, 2005), calculated on an annualized basis and accrued daily, based upon the value of Collateral received from Borrowers for each Loan of non-U.S. Securities outstanding during a given month under this Lending Agreement.
As of June 30, 2005, the following Funds had securities with the following market values on loan, received the following collateral and for the period then ended, these Funds paid the following amounts to related party affiliates (amounts in thousands):
| | | Lending
Agent
Fees Paid | | Market
Value of
Collateral* | | Market Value
of Loaned
Securities | |
| FUND | | | |
| Capital Growth Fund | | $ | 11 | | | $ | 53,039 | | | $ | 51,733 | | |
| Dynamic Small Cap Fund | | | 10 | | | | 39,406 | | | | 38,461 | | |
| Mid Cap Equity Fund | | | 3 | | | | 12,420 | | | | 12,273 | | |
| Mid Cap Growth Fund | | | 1 | | | | 6,470 | | | | 6,352 | | |
| Mid Cap Value Fund | | | 64 | | | | 280,525 | | | | 277,451 | | |
| Small Cap Core Fund | | | 44 | | | | 186,483 | | | | 182,040 | | |
| Small Cap Equity Fund | | | 4 | | | | 80,461 | | | | 78,852 | | |
| U.S. Small Company Fund | | | - | | | | - | | | | - | | |
* Includes securities and cash collateral.
Risks of delay in recovery of securities or even loss of rights in the securities may occur should the borrower of the securities fail financially. Risks may also arise to the extent that the value of the securities loaned increases above the value of the collateral received. JPMCB will indemnify the Funds from losses resulting from a borrower's failure to return a loaned security when due. Such indemnification does not extend to losses associated with declines in the value of cash collateral investments. Loans are subject to termination by the Funds or the borrower at any time, and are, therefore, not considered to be illiquid investments.
E. Security Transactions and Investment Income - Investment transactions are accounted for on the trade date (the date the order to buy or sell is executed). Securities gains and losses are calculated on a specifically identified cost basis. Interest income is determined on the basis of coupon interest accrued using the interest method adjusted for amortization of premiums and accretion of discounts. Dividend income less foreign taxes withheld (if any) is recorded on the ex-dividend date or when the Funds first learn of the dividend.
The Funds' record distributions received in excess of income from underlying investments as a reduction of
JPMorgan U.S. Equity Mid/Small Cap Funds105
JPMorgan Funds
NOTES TO FINANCIAL
STATEMENTS
(CONTINUED)
(Unaudited)
cost of investments and/or realized gain. Such amounts are based on estimates if actual amounts are not available and actual amounts of income, realized gain and return of capital may differ from the estimated amounts. The Funds adjust the estimated amounts of components of distributions (and consequently their net investment income) as necessary once the issuers provide information about the actual composition of the distributions.
F. Allocation of Income and Expenses - In calculating the net asset value per share of each class, investment income, realized and unrealized gains and losses and expenses other than class specific expenses are allocated daily to each class of shares based upon the proportion of net assets of each class at the beginning of each day. Expenses directly attributable to a Fund are charged directly to that Fund while the expenses attributable to more than one Fund of the Trusts are allocated among the respective Funds. Each class of shares bears its pro-rata portion of expenses attributable to its series, except that each class separately bears expenses related specifically to that class, such as distribution and shareholder servicing fees.
G. Federal Income Taxes - Each Fund is treated as a separate taxable entity for Federal income tax purposes. Each Fund's policy is to comply with the provisions of the Internal Revenue Code applicable to regulated investment companies and to distribute to shareholders all of its distributable net investment income and net realized gain on investments. Accordingly, no provision for Federal income tax is necessary.
H. Dividends and Distributions to Shareholders - Dividends and distributions paid to shareholders are recorded on the ex-dividend date. The amount of dividends and distributions from net investment income and net realized capital gains is determined in accordance with Federal income tax regulations, which may differ from accounting principles generally accepted in the United States of America. To the extent these "book/tax" differences are permanent in nature (i.e., that they result from other than timing of recognition - "temporary differences"), such amounts are reclassified within the capital accounts based on their Federal tax-basis treatment.
I. Foreign Taxes - The Funds may be subject to foreign taxes on income, gains on investments or currency repatriation, a portion of which may be recoverable. The Funds will accrue such taxes and recoveries as applicable, based upon their current interpretation of tax rules and regulations that exist in the markets in which they invest.
3. Fees and Other Transactions with Affiliates
A. Investment Advisory Fee - Pursuant to the Investment Advisory Agreement, J.P. Morgan Investment Management, Inc. (the "Advisor") acts as the investment advisor to the Funds. The Advisor is a wholly-owned subsidiary of J.P. Morgan Asset Management Holdings, Inc., which is a wholly-owned subsidiary of JPMorgan Chase & Co. ("JPMorgan"). The Advisor supervises the investments of each respective
JPMorgan U.S. Equity Mid/Small Cap Funds106
SEMI-ANNUAL REPORT JUNE 30
2005
NOTES TO FINANCIAL
STATEMENTS
(Unaudited)
Fund and for such services is paid a fee. The fee is accrued daily and paid monthly based on each Fund's respective average daily net assets. The annual fee rate for each Fund is as follows:
| | | Investment Advisory
Fee Rate (%) | |
| Capital Growth Fund | | | 0.40 | % | |
| Dynamic Small Cap Fund | | | 0.65 | % | |
| Mid Cap Equity Fund | | | 0.65 | % | |
| Mid Cap Growth Fund | | | 0.65 | % | |
| Mid Cap Value Fund* | | | 0.65 | % | |
| Small Cap Core Fund | | | 0.65 | % | |
| Small Cap Equity Fund | | | 0.65 | % | |
| U.S. Small Company Fund | | | 0.60 | % | |
* Prior to February 19, 2005, the investment advisory fee rate was 0.70%.
The Advisor waived Investment Advisory Fees and/or reimbursed expenses as outlined in Note 3.F.
The Funds may invest in one or more money market funds advised by the Advisor or its affiliates. Advisory, administrative and shareholder servicing fees are waived and/or reimbursed from the Funds in an amount sufficient to offset any doubling up of these fees related to each Fund's investment in an affiliated money market fund to the extent required by law.
B. Administration Fee - Effective February 19, 2005, pursuant to an Administration Agreement, JPMorgan Funds Management, Inc. (the "Administrator"), an indirect, wholly-owned subsidiary of JPMorgan, began providing certain administration services to the Funds. In consideration of these services, the Administrator receives a fee computed daily and paid monthly at the annual rate of 0.15% of the first $25 billion of the average daily net assets of all funds in the JPMorgan Fund Complex (excluding the money market funds; Investor Balanced Fund, Investor Conservative Growth Fund, Investor Growth Fund and Investor Growth &
Income Fund) and 0.075% of the average daily net assets in excess of $25 billion of all such funds.
Prior to February 19, 2005, JPMorgan Chase Bank, N.A. ("JPMCB") served as the Funds' Administrator subject to the same fee agreements.
JPMCB and the Administrator waived Administration fees and/or reimbursed expenses as outlined in Note 3.F.
Effective July 1, 2005, J.P. Morgan Investor Services, Co. ("JPMIS") began serving as the Funds' sub-administrator. For its services as sub-administrator, JPMIS receives a portion of the fees payable to the Administrator. Prior to July 1, 2005, BISYS Fund Services, L.P. ("BISYS") served as the Funds' sub-administrator. For its services as sub-administrator, BISYS received a portion of the fees paid to the Administrator.
C. Distribution Fees - Effective February 19, 2005, pursuant to a Distribution Agreement, JPMorgan Distribution Services, Inc. ("the Distributor"), a wholly-owned subsidiary of JPMorgan, began serving as the Trusts' exclusive underwriter and promotes and arranges for the sale of each Fund's shares.
JPMorgan U.S. Equity Mid/Small Cap Funds107
JPMorgan Funds
NOTES TO FINANCIAL
STATEMENTS
(CONTINUED)
(Unaudited)
Prior to February 19, 2005, J.P. Morgan Fund Distributors, Inc. ("JPMFD"), a wholly-owned subsidiary of The BISYS Group, Inc., served as the Funds' exclusive underwriter. JPMFD received no compensation in its capacity as the Funds' underwriter.
The Trustees have adopted a Distribution Plan (the "Distribution Plan") for Class A, Class B and Class C Shares of the Funds in accordance with Rule 12b-1 under the 1940 Act.
The Distribution Plan provides that each Fund shall pay distribution fees, including payments to the Distributor, at annual rates of the average daily net assets as shown in the table below:
| | | Distribution Fee Rate | |
| | | Class A | | Class B | | Class C | |
| Capital Growth Fund | | | 0.25 | % | | | 0.75 | % | | | 0.75 | % | |
| Dynamic Small Cap Fund | | | 0.25 | | | | 0.75 | | | | 0.75 | | |
| Mid Cap Equity Fund | | | n/a | | | | n/a | | | | n/a | | |
| Mid Cap Growth Fund | | | 0.25 | | | | 0.75 | | | | n/a | | |
| Mid Cap Value Fund | | | 0.25 | | | | 0.75 | | | | 0.75 | | |
| Small Cap Core Fund | | | n/a | | | | n/a | | | | n/a | | |
| Small Cap Equity Fund | | | 0.25 | | | | 0.75 | | | | 0.75 | | |
| U.S. Small Company Fund | | | n/a | | | | n/a | | | | n/a | | |
In addition, the Distributor is entitled to receive the front-end sales charges from purchases of Class A shares and the contingent deferred sales charges ("CDSC") from redemptions of Class B and Class C shares and certain
Class A shares for which front-end sales charges have been waived. For the period February 19, 2005 to June 30, 2005, the Distributor received the following amounts (in thousands):
| | | 12b-1 | | Front-end
Sales Charges | | CDSC | |
| Capital Growth Fund | | $ | 705 | | | $ | 102 | | | $ | 10 | | |
| Dynamic Small Cap Fund | | | 301 | | | | 15 | | | | 19 | | |
| Mid Cap Equity Fund | | | n/a | | | | n/a | | | | n/a | | |
| Mid Cap Growth Fund | | | 53 | | | | 17 | | | | - | (b) | |
| Mid Cap Value Fund | | | 4,385 | | | | 4,185 | | | | 185 | | |
| Small Cap Core Fund | | | n/a | | | | n/a | | | | n/a | | |
| Small Cap Equity Fund | | | 167 | | | | 218 | | | | 10 | | |
| U.S. Small Company Fund | | | n/a | | | | n/a | | | | n/a | | |
JPMFD and the Distributor waived Distribution Fees as outlined in Note 3.F.
(b) Amount rounds to less than one thousand
JPMorgan U.S. Equity Mid/Small Cap Funds108
SEMI-ANNUAL REPORT JUNE 30
2005
NOTES TO FINANCIAL
STATEMENTS
(Unaudited)
D. Shareholder Servicing Fees - Effective February 19, 2005, the Trusts, on behalf of the Funds, have entered into a Shareholder Servicing Agreement with the Distributor under which the Distributor provides account administration and personal account maintenance
services to the shareholders. For performing these services, the Distributor receives a fee that is computed daily and paid monthly equal to a percentage of the average daily net assets as shown in the table below (%):
| | | Shareholder Servicing
Fee Rate (%) | |
| | | Class A | | Class B | | Class C | | Select Class | | Institutional Class | |
| Capital Growth Fund | | | 0.25 | | | | 0.25 | | | | 0.25 | | | | 0.25 | | | n/a | |
| Dynamic Small Cap Fund | | | 0.25 | | | | 0.25 | | | | 0.25 | | | | 0.25 | | | n/a | |
| Mid Cap Equity Fund | | | n/a | | | | n/a | | | | n/a | | | | 0.25 | | | n/a | |
| Mid Cap Growth Fund | | | 0.25 | | | | 0.25 | | | | n/a | | | | n/a | | | n/a | |
| Mid Cap Value Fund | | | 0.25 | | | | 0.25 | | | | 0.25 | | | | 0.25 | | | 0.10 | |
| Small Cap Core Fund | | | n/a | | | | n/a | | | | n/a | | | | 0.25 | | | n/a | |
| Small Cap Equity Fund | | | 0.25 | | | | 0.25 | | | | 0.25 | | | | 0.25 | | | n/a | |
| U.S. Small Company Fund | | | n/a | | | | n/a | | | | n/a | | | | 0.25 | | | 0.10 | |
The Distributor has entered into shareholder services contracts with affiliated and unaffiliated financial intermediaries who provide shareholder services and other related services to their clients or customers who invest in the Funds under which the Distributor will pay all or a portion of fees earned to such financial intermediaries for performing such services.
Prior to February 19, 2005, JPMCB served as the Funds' Shareholder Servicing Agent. JPMCB was subject to the fee rates disclosed in the previous table.
JPMCB and the Distributor waived shareholder servicing fees as outlined in Note 3.F.
E. Custodian and Fund Accounting Fees - JPMCB provides portfolio custody and fund accounting services for the Funds. The amounts paid directly to JPMCB by the Funds for custody and fund accounting services are included in custodian and accounting fees in the Statement of Operations. The custodian fees may be reduced by credits earned by each Fund, based on uninvested cash balances held by the custodian. Such earnings credits are presented separately in the Statement of Operations.
F. Waivers and Reimbursements - The Advisor, Administrator and Distributor have contractually agreed to waive fees or reimburse the Funds to the extent that total operating expenses (excluding dividend expenses on short sales, interest, taxes, extraordinary expenses and expenses related to the Board of Trustees' deferred
JPMorgan U.S. Equity Mid/Small Cap Funds109
JPMorgan Funds
NOTES TO FINANCIAL
STATEMENTS
(CONTINUED)
(Unaudited)
compensation plan) exceed the percentages of the Funds' respective average daily net assets as shown in the table below:
| | | Class A | | Class B | | Class C | | Select Class | | Institutional Class | |
| Capital Growth Fund | | | 1.35 | % | | | 1.85 | % | | | 1.85 | % | | | 0.93 | % | | n/a | |
| Dynamic Small Cap Fund | | | 1.50 | | | | 2.12 | | | | 2.12 | | | | 1.10 | | | n/a | |
| Mid Cap Equity Fund | | | n/a | | | | n/a | | | | n/a | | | | 1.00 | | | n/a | |
| Mid Cap Growth Fund | | | 1.35 | | | | 2.05 | | | | n/a | | | | n/a | | | n/a | |
| Mid Cap Value Fund | | | 1.25 | | | | 2.00 | | | | 2.00 | | | | 1.00 | | | | 0.75 | % | |
| Small Cap Core Fund | | | n/a | | | | n/a | | | | n/a | | | | 0.80 | | | n/a | |
| Small Cap Equity Fund | | | 1.38 | | | | 2.12 | | | | 2.12 | | | | 0.85 | | | n/a | |
| U.S. Small Company Fund | | | n/a | | | | n/a | | | | n/a | | | | 1.01 | | | | 0.83 | | |
The contractual expense limitation agreements were in effect for the six months ended June 30, 2005. The expense limitation percentages in the table above are due to expire April 30, 2006.
For the six months ended June 30, 2005, the Funds' service providers waived fees and contractually reimbursed expenses for each of the Funds as follows (amounts in thousands). None of these parties expects the Funds to repay any such waived fees and reimbursed expenses in future years.
| | | Contractual Waivers | |
| | | Investment
Advisory | | Administration | | Shareholder
Servicing | | Distribution | | Total | |
| FUND | | | | | |
| Capital Growth Fund | | n/a | | | n/a | | | | n/a | | | n/a | | | n/a | | |
| Dynamic Small Cap Fund | | n/a | | $ | 15 | | | $ | 26 | | | n/a | | $ | 41 | | |
| Mid Cap Equity Fund | | n/a | | | 2 | | | | 103 | | | n/a | | | 105 | | |
| Mid Cap Growth Fund | | | 17 | | | | 20 | | | | 50 | | | n/a | | | 87 | | |
| Mid Cap Value Fund | | | 1,638 | | | | 438 | | | | 1,066 | | | n/a | | | 3,142 | | |
| Small Cap Core Fund | | n/a | | | 2 | | | | 259 | | | n/a | | | 261 | | |
| Small Cap Equity Fund | | n/a | | | 20 | | | | 290 | | | n/a | | | 310 | | |
| U.S. Small Company Fund | | n/a | | | 50 | | | | 55 | | | n/a | | | 105 | | |
| | | Voluntary Waivers | | | |
| | | Investment
Advisory | | Administration | | Shareholder
Servicing | | Total | | Contractual
Reimbursements | |
| FUND | | | | | | | | | |
| Capital Growth Fund | | n/a | | | n/a | | | n/a | | | n/a | | | $ | 1 | | |
| Dynamic Small Cap Fund | | n/a | | $ | 1 | | | n/a | | $ | 1 | | | n/a | |
| Mid Cap Equity Fund | | n/a | | | 42 | | | $ | 74 | | | | 116 | | | n/a | |
| Mid Cap Value Fund | | $ | 344 | | | | 131 | | | n/a | | | 475 | | | n/a | |
| Small Cap Core Fund | | n/a | | | 101 | | | | 721 | | | | 822 | | | n/a | |
| Small Cap Equity Fund | | n/a | | | 9 | | | n/a | | | 9 | | | n/a | |
JPMorgan U.S. Equity Mid/Small Cap Funds110
SEMI-ANNUAL REPORT JUNE 30
2005
NOTES TO FINANCIAL
STATEMENTS
(Unaudited)
G. Other - Certain officers of the Trust are affiliated with the Advisor, the Administrator and the Distributor. Such officers receive no compensation from the Funds for serving in their respective roles.
The Trusts adopted a Trustee Deferred Compensation Plan (the "Plan") which allows the independent Trustees to defer the receipt of all or a portion of compensation related to performance of their duties as a Trustee. The deferred fees are invested in various Funds until distribution in accordance with the Plan.
During the period, certain Funds may have purchased securities from an underwriting syndicate in which the
principal underwriter or members of the syndicate are affiliated with the Advisor.
The Funds may use related party broker/dealers. For the period ended June 30, 2005, the Funds did not incur any brokerage commissions with broker/dealers affiliated with the Advisor.
The SEC has granted an exemptive order permitting
the Funds to engage in principal transactions with
J.P. Morgan Securities, Inc., an affiliated broker, involving taxable money market instruments subject to certain conditions.
4. Class Specific Expenses
The Funds' class specific expenses for the six months ended June 30, 2005 are as follows (amounts in thousands):
| | | Distribution | | Shareholder
Servicing | | Transfer Agent* | |
| CAPITAL GROWTH FUND | | | |
| Class A | | $ | 533 | | | $ | 533 | | | | n/a | | |
| Class B | | | 161 | | | | 54 | | | | n/a | | |
| Class C | | | 30 | | | | 10 | | | | n/a | | |
| Select Class | | | n/a | | | | 255 | | | | n/a | | |
| | | | 724 | | | | 852 | | | | n/a | | |
| DYNAMIC SMALL CAP FUND | | | |
| Class A | | $ | 86 | | | $ | 86 | | | $ | 27 | | |
| Class B | | | 207 | | | | 69 | | | | 20 | | |
| Class C | | | 127 | | | | 42 | | | | 11 | | |
| Select Class | | | n/a | | | | 15 | | | | 2 | | |
| | | | 420 | | | | 212 | | | | 60 | | |
| MID CAP EQUITY FUND | | | |
| Select Class | | | n/a | | | | 296 | | | | 5 | | |
| MID CAP GROWTH FUND | | | |
| Class A | | $ | 63 | | | $ | 63 | | | $ | 10 | | |
| Class B | | | 10 | | | | 3 | | | | 1 | | |
| | | | 73 | | | | 66 | | | | 11 | | |
JPMorgan U.S. Equity Mid/Small Cap Funds111
JPMorgan Funds
NOTES TO FINANCIAL
STATEMENTS
(CONTINUED)
(Unaudited)
| | | Distribution | | Shareholder
Servicing | | Transfer Agent* | |
| MID CAP VALUE FUND | | | |
| Class A | | $ | 2,314 | | | $ | 2,314 | | | $ | 345 | | |
| Class B | | | 764 | | | | 254 | | | | 43 | | |
| Class C | | | 2,495 | | | | 832 | | | | 125 | | |
| Select Class | | | n/a | | | | 1,019 | | | | 4 | | |
| Institutional Class | | | n/a | | | | 722 | | | | 29 | | |
| | | | 5,573 | | | | 5,141 | | | | 546 | | |
| SMALL CAP CORE FUND | | | |
| Select | | | n/a | | | | 1,028 | | | | 6 | | |
| SMALL CAP EQUITY FUND | | | |
| Class A | | $ | 172 | | | $ | 172 | | | $ | 28 | | |
| Class B | | | 51 | | | | 17 | | | | 3 | | |
| Class C | | | 3 | | | | 1 | | | | n/a | | |
| Select Class | | | n/a | | | | 268 | | | | 1 | | |
| | | | 226 | | | | 458 | | | | 32 | | |
| U.S. SMALL COMPANY FUND | | | |
| Select Class | | | n/a | | | $ | 143 | | | $ | 6 | | |
| Institutional Class | | | n/a | | | | 37 | | | | 2 | | |
| | | | n/a | | | | 180 | | | | 8 | | |
* Effective February 19, 2005, the Funds no longer bear class specific charges relating to Transfer Agent fees. The amount in the table above relate to the fees charged to each specific class prior to February 19, 2005.
5. Class Specific Distributions
The Funds' class specific distributions from net investment income and realized gain on investment transactions for the six months ended June 30, 2005 and the year ended December 31, 2004 are as follows (amounts in thousands):
| | | June 30, 2005 | | December 31, 2004 | |
| | | Net Investment
Income | | Realized
Gains | | Net Investment
Income | | Realized
Gains | |
| CAPITAL GROWTH FUND | |
| Class A | | $ | - | | | $ | - | | | $ | - | | | $ | 53,171 | | |
| Class B | | | - | | | | - | | | | - | | | | 6,588 | | |
| Class C | | | - | | | | - | | | | - | | | | 947 | | |
| Select Class | | | - | | | | - | | | | - | | | $ | 1,142 | | |
| | | | - | | | | - | | | | - | | | | 61,848 | | |
| MID CAP EQUITY FUND | |
| Select Class | | $ | 216 | | | $ | - | | | $ | 627 | | | $ | 23,640 | | |
JPMorgan U.S. Equity Mid/Small Cap Funds112
SEMI-ANNUAL REPORT JUNE 30
2005
NOTES TO FINANCIAL
STATEMENTS
(Unaudited)
| | | June 30, 2005 | | December 31, 2004 | |
| | | Net Investment
Income | | Realized
Gains | | Net Investment
Income | | Realized
Gains | |
| MID CAP VALUE FUND | |
| Class A | | $ | - | | | $ | - | | | $ | 2,344 | | | $ | 16,897 | | |
| Class B | | | - | | | | - | | | | - | | | | 2,288 | | |
| Class C | | | - | | | | - | | | | - | | | | 6,079 | | |
| Select Class | | | - | | | | - | | | | 1,398 | | | | 5,785 | | |
| Institutional Class | | | - | | | | - | | | | 4,851 | | | | 15,152 | | |
| | | | - | | | | - | | | | 8,593 | | | | 46,201 | | |
| SMALL CAP CORE FUND | |
| Select Class | | $ | - | | | $ | - | | | $ | 605 | | | $ | 87,711 | | |
| SMALL CAP EQUITY FUND | |
| Class A | | $ | - | | | $ | - | | | $ | - | | | $ | 16,153 | | |
| Class B | | | - | | | | - | | | | - | | | | 2,612 | | |
| Class C | | | - | | | | - | | | | - | | | | - | | |
| Select Class | | | - | | | | - | | | | - | | | | 93,537 | | |
| | | | - | | | | - | | | | - | | | | 112,302 | | |
| U.S. SMALL COMPANY FUND | |
| Select Class | | $ | - | | | $ | - | | | $ | - | | | $ | 15,506 | | |
| Institutional Class | | | - | | | | - | | | | - | | | | 12,738 | | |
| | | | - | | | | - | | | | - | | | | 28,244 | | |
6. Investment Transactions
During the year ended June 30, 2005, purchases and sales of investments (excluding short-term investments) were as follows (amounts in thousands):
| | | Purchases | | Sales | |
| FUND | |
| Capital Growth Fund | | $ | 600,745 | | | $ | 414,333 | | |
| Dynamic Small Cap Fund | | | 92,172 | | | | 114,873 | | |
| Mid Cap Equity Fund | | | 137,725 | | | | 124,511 | | |
| Mid Cap Growth Fund | | | 30,994 | | | | 37,089 | | |
| Mid Cap Value Fund | | | 2,981,174 | | | | 787,633 | | |
| Small Cap Core Fund | | | 192,496 | | | | 222,346 | | |
| Small Cap Equity Fund | | | 184,645 | | | | 149,500 | | |
| U.S. Small Company Fund | | | 34,422 | | | | 64,012 | | |
JPMorgan U.S. Equity Mid/Small Cap Funds113
JPMorgan Funds
NOTES TO FINANCIAL
STATEMENTS
(CONTINUED)
(Unaudited)
7. Federal Income Tax Matters
For Federal income tax purposes, the cost and unrealized appreciation (depreciation) in value of the investment securities at June 30, 2005, were as follows (amounts in thousands):
| | | Aggregate
Cost | | Gross
unrealized
appreciation | | Gross
unrealized
depreciation | | Net Unrealized
appreciation
(depreciation) | |
| Capital Growth Fund | | $ | 670,079 | | | $ | 113,677 | | | $ | (12,913 | ) | | $ | 100,764 | | |
| Dynamic Small Cap Fund | | | 200,377 | | | | 22,344 | | | | (8,685 | ) | | | 13,659 | | |
| Mid Cap Equity Fund | | | 215,132 | | | | 49,969 | | | | (2,745 | ) | | | 47,224 | | |
| Mid Cap Growth Fund | | | 50,398 | | | | 9,500 | | | | (841 | ) | | | 8,659 | | |
| Mid Cap Value Fund | | | 5,898,935 | | | | 668,283 | | | | (81,351 | ) | | | 586,932 | | |
| Small Cap Core Fund | | | 950,209 | | | | 90,282 | | | | (40,517 | ) | | | 49,765 | | |
| Small Cap Equity Fund | | | 388,666 | | | | 79,280 | | | | (5,765 | ) | | | 73,515 | | |
| U.S. Small Company Fund | | | 155,453 | | | | 32,466 | | | | (9,589 | ) | | | 22,877 | | |
8. Borrowings
Effective February 19, 2005, the Funds began relying upon an exemptive order ("Order") permitting the establishment and operation of an Interfund Lending Facility ("Facility"). The Facility allows the Funds to directly lend and borrow money to or from any other fund relying upon the Order at rates beneficial to both the borrowing and lending funds. Advances under the Facility are taken primarily for temporary or emergency purposes, including the meeting of redemption requests that otherwise might require the untimely disposition of securities, and are subject to each Fund's borrowing restrictions. The Interfund Loan Rate is determined, as specified in the Order, by averaging the current repurchase agreement rate and the current bank loan rate. The Order was granted to JPMorgan Trust II (formerly One Group Mutual Funds) and may be relied upon by the Funds because they are investment companie s in the same "group of investment companies" (as defined in Section 12(d)(1)(G) of the Investment Company Act of 1940).
In addition, effective February 18, 2005, the Trusts and JPMCB have entered into a financing arrangement. Under this arrangement, JPMCB provides an unsecured,
uncommitted credit facility in the aggregate amount of $100 million to certain of the JPMorgan Funds including the Funds. Advances under the arrangement are taken primarily for temporary or emergency purposes, including the meeting of redemption requests that otherwise might require the untimely disposition of securities, and are subject to each Fund's borrowing restrictions. Interest on borrowings is payable at a rate determined by JPMCB at the time of borrowing.
Prior to February 18, 2005, the Funds were allowed to borrow money for temporary or emergency purposes, pursuant to a Line of Credit dated April 17, 2003. This agreement enabled the Funds to participate with other JPMorgan Funds in a line of credit with JPMCB, as administrative agent, and a syndicate of banks, which permitted borrowings up to $250 million, collectively. Interest was charged to each Fund based on its borrowings at an annual rate equal to the sum of the Federal Funds Rate plus 0.50%. The Funds also paid a commitment fee of 0.09% per annum on the average daily amount of the available commitment, which was allocated on a pro-rata basis to the Funds. This agreement was terminated as of February 18, 2005.
JPMorgan U.S. Equity Mid/Small Cap Funds114
SEMI-ANNUAL REPORT JUNE 30
2005
NOTES TO FINANCIAL
STATEMENTS
(Unaudited)
The outstanding borrowings from another fund or from the unsecured uncommitted credit facility and average borrowings for the period ended June 30, 2005, were as follows (in thousands):
| | | Outstanding
Balance at
June 30, 2005 | | Average
Borrowings | | Number of Days
Outstanding | | Interest
Paid | |
| FUND | | | |
| Mid Cap Growth Fund | | $ | - | | | $ | 16,842 | | | | 4 | | | $ | 1 | | |
| Mid Cap Value Fund | | | - | | | | 65,256 | | | | 3 | | | | 4 | | |
| Small Cap Equity | | | - | | | | 1,273 | | | | 1 | | | | - | (h) | |
(h) Amount rounds to less than one thousand
9. Concentrations and Indemnifications
In the normal course of business the Funds enter into contracts that contain a variety of representations which provide general indemnifications. Each Fund's maximum exposure under these arrangements is unknown, as this would involve future claims that may be made against each Fund that have not yet occurred. However, based on experience, the Funds expect the risk of loss to be remote.
From time to time, the Funds may have a concentration of several shareholders which may be a related party, holding a significant percentage of shares outstanding. Investment activities of these shareholders could have a material impact on the Funds.
10. Transfer-In-Kind
During the fiscal year ended December 31, 2004, certain shareholders of the Small Cap Equity Fund redeemed from the Select Class and the Fund paid the redemption proceeds primarily by means of a redemption in-kind of the Fund's portfolio securities. Cash and portfolio securities were transferred on the dates, at the market values listed, and gains for book purposes which resulted from the redemptions in-kind are listed below (amount in thousands):
| | | Date | | Market Value | | Realized Gain | | Type | |
| FUND | | | |
| | | | | | | | | Redemption | |
| Small Cap Equity | | 12/06/04 | | $ | 518,018 | | | $ | 159,702 | | | in-kind | |
11. Subsequent Events
The Board of Trustees of the Mid Cap Growth Fund approved changing the Fund's name to Growth Advantage Fund, as well as changing its investment objective, strategy and process, to be effective August 17, 2005. In addition, the Board approved a
change in benchmark from the Russell Mid Cap Growth Index to the Russell 3000 Growth Index.
As of the close of business on August 15, 2005, the Mid Cap Equity Fund will be publicly offered on a limited basis. Investors will not be eligible to purchase shares of the Fund unless they meet certain requirements.
JPMorgan U.S. Equity Mid/Small Cap Funds115
JPMorgan Funds
TRUSTEES
(Unaudited)
Name (Year of Birth);
Positions With
the Trusts (Since) | | Principal Occupations
During Past 5 Years | | Number of
Funds in Fund
Complex Overseen
by Trustee(1) | | Other Directorships Held
Outside Fund Complex | |
Independent Trustees
| William J. Armstrong (1941); Trustee of Trust since 2005; Trustee of heritage JPMorgan Funds since 1987. | | Retired; Vice President & Treasurer of Ingersoll-Rand Company (manufacturer of industrial equipment) (1972-2000). | | | 114 | | | None. | |
|
| Roland R. Eppley, Jr. (1932); Trustee of Trust since 2005; Trustee of heritage JPMorgan Funds since 1989. | | Retired; President & Chief Executive Officer, Eastern Sales Bankcard (1971-1988). | | | 114 | | | Director, Janel Hydro, Inc. (automotive) (1993-present). | |
|
John F. Finn
(1947); Trustee of Trust since 2005. Trustee of heritage One Group Mutual Funds since 1998. | | President and Chief Executive Officer of Gardner, Inc. (wholesale distributor to outdoor power equipment industry) (1979-present). | | | 113 | * | | Director, Cardinal Health, Inc (CAH) (1994-present). | |
|
| Dr. Matthew Goldstein (1941); Trustee of Trust since 2005; Trustee of heritage JPMorgan Funds since 2003. | | Chancellor of the City University of New York (1999-present); President, Adelphi University (New York) (1998-1999). | | | 114 | | | Trustee of Bronx-Lebanon Hospital Center (1992-present); Director of New Plan Excel Realty Trust, Inc. (real estate investment trust) (2000-present); Director of Lincoln Center Institute for the Arts in Education (1999-present). | |
|
Robert J. Higgins
(1945); Trustee of Trust since 2005; Trustee of heritage JPMorgan Funds since 2002. | | Retired; Director of Administration of the State of Rhode Island (2003-2004); President – Consumer Banking and Investment Services, Fleet Boston Financial (1971-2001). | | | 114 | | | Director of Providian Financial Corp. (banking) (2002-present). | |
|
Peter C. Marshall
(1942); Trustee of Trust since 2005. Trustee of heritage One Group Mutual Funds since 1985. | | Self-employed business consultant (2002-present); Senior Vice President, W.D. Hoard, Inc. (corporate parent of DCI Marketing, Inc.) (2000-2002); President, DCI Marketing, Inc. (1992-2000). | | | 113 | * | | None. | |
|
Marilyn McCoy
(1948); Trustee of Trust since 2005. Trustee of heritage One Group Mutual Funds since 1999. | | Vice President of Administration and Planning, Northwestern University (1985-present). | | | 113 | * | | Director, Mather LifeWays (1994-present); Director, Carleton College (2003-present). | |
|
| William G. Morton, Jr. (1937); Trustee of Trust since 2005; Trustee of heritage JPMorgan Funds since 2003. | | Retired; Chairman Emeritus (2001-2002), and Chairman and Chief Executive Officer, Boston Stock Exchange (1985- 2001). | | | 114 | | | Director of Radio Shack Corporation (electronics) (1987-present); Director of The National Football Foundation and College Hall of Fame (1994-present); Trustee of the Berklee College of Music (1998-present); Trustee of the Stratton Mountain School (2001-present). | |
|
| Robert A. Oden, Jr. (1946); Trustee of Trust since 2005. Trustee of heritage One Group Mutual Funds since 1997. | | President, Carleton College (2002-present); President, Kenyon College (1995-2002). | | | 113 | * | | Director, American University in Cairo. | |
|
JPMorgan U.S. Equity Mid/Small Cap Funds 116
SEMI-ANNUAL REPORT JUNE 30
2005
TRUSTEES
(Unaudited)
Name (Year of Birth);
Positions With
the Trusts (Since) | | Principal Occupations
During Past 5 Years | | Number of
Funds in Fund
Complex Overseen
by Trustee(1) | | Other Directorships Held
Outside Fund Complex | |
Independent Trustees (continued)
Fergus Reid, III
(1932); Trustee of Trust (Chairman) since 2005; Trustee (Chairman) of heritage JPMorgan Funds since 1987. | | Chairman of Lumelite Corporation (plastics manufacturing) (2003-present); Chairman and Chief Executive Officer of Lumelite Corporation (1985-2002). | | | 114 | | | Trustee of Morgan Stanley Funds (209 portfolios) (1995-present). | |
|
| Frederick W. Ruebeck (1939); Trustee of Trust since 2005. Trustee of heritage One Group Mutual Funds since 1990. | | Advisor, Jerome P. Green & Associates, LLC (broker-dealer) (2002-present); Investment Officer, Wabash College (2004-present); self-employed consultant (January 2000-present); Director of Investments, Eli Lilly and Company (1988-1999). | | | 113 | * | | Director, AMS Group (2001-present); Director, Wabash College (1988-present); Trustee, Seabury-Western Theological Seminary (1993-present); Chairman, Indianapolis Symphony Orchestra Foundation (1994-present). | |
|
| James J. Schonbachler (1943); Trustee of Trust since 2005; Trustee of heritage JPMorgan Funds since 2001. | | Retired; Managing Director of Bankers Trust Company (financial services) (1968-1998). | | | 114 | | | None. | |
|
Interested Trustee
| Leonard M. Spalding, Jr.** (1935); Trustee of Trust since 2005; Trustee of heritage JPMorgan Funds since 1998. | | Retired; Chief Executive Officer of Chase Mutual Funds (investment company) (1989-1998); President & Chief Executive Officer of Vista Capital Management (investment management) (1990-1998); Chief Investment Executive of Chase Manhattan Private Bank (investment management) (1990-1998). | | | 114 | | | None. | |
|
(1) A Fund Complex means two or more registered investment companies that hold themselves out to investors as related companies for purposes of investment and investor services or have a common investment adviser or have an investment adviser that is an affiliated person of the investment adviser of any of the other registered investment companies. The JPMorgan Funds Complex for which the Board of Trustees serves includes nine registered investment companies (114 funds) as of August 29, 2005.
* This Trustee does not oversee the UM Investment Trust II which is the registered investment company for the Undiscovered Managers Spinnaker Fund, and therefore oversees eight registered investment companies (113 funds) as of August 29, 2005.
** Mr. Spalding is deemed to be an "interested person" due to his ownership of JPMorgan Chase stock.
The contact address for each of the Trustees is 522 Fifth Avenue, New York, NY 10036.
JPMorgan U.S. Equity Mid/Small Cap Funds 117
JPMorgan Funds
OFFICERS
(Unaudited)
Name (Year of Birth),
Positions Held with
the Trusts (Since) | | Principal Occupations During Past 5 Years | |
| George C.W. Gatch (1962), President (2005) | | Managing Director of JPMorgan Investment Management Inc.; Director and President, JPMorgan Distribution Services, Inc. and JPMorgan Funds Management, Inc. since 2005. Mr. Gatch is CEO and President of JPMorgan Funds. Mr. Gatch has been an employee since 1986 and has held positions such as President and CEO of DKB Morgan, a Japanese mutual fund company which was a joint venture between J.P. Morgan and Dai-Ichi Kangyo Bank, as well as positions in business management, marketing and sales. | |
|
Robert L. Young
(1963), Senior Vice President (2005)* | | Director and Vice President of JPMorgan Distribution Services, Inc. and JPMorgan Funds Management, Inc.; Chief Operating Officer, JPMorgan Funds since 2005, and One Group Mutual Funds from 2001 until 2005. Mr. Young was Vice President and Treasurer, JPMorgan Funds Management, Inc. (formerly One Group Administrative Services) and Vice President and Treasurer, JPMorgan Distribution Services, Inc. (formerly One Group Dealer Services, Inc.) from 1999 to 2005. | |
|
| Patricia A. Maleski (1960), Vice President and Chief Administrative Officer (2005) | | Vice President, JPMorgan Funds Management, Inc.; previously, Treasurer, JPMorgan Funds and Head of Funds Administration and Board Liaison. Ms. Maleski was Vice President of Finance for the Pierpont Group, Inc., an independent company owned by the Board of Directors/Trustees of the JPMorgan Funds, prior to joining J.P. Morgan Chase & Co. in 2001. | |
|
| Stephanie J. Dorsey (1969), Treasurer (2005)* | | Vice President, JPMorgan Funds Management, Inc.; Director of Mutual Fund Administration, JPMorgan Funds Management, Inc. (formerly One Group Administrative Services), from 2004 to 2005; Ms. Dorsey worked for JP Morgan Chase & Co., (formerly Bank One Corporation) from 2003 to 2004; prior to joining Bank One Corporation, she was a Senior Manager specializing in Financial Services audits at PricewaterhouseCoopers LLP from 1992 through 2002. | |
|
| Stephen M. Ungerman (1953), Senior Vice President and Chief Compliance Officer (2005) | | Senior Vice President, JPMorgan Chase & Co.; Mr. Ungerman was head of Fund Administration – Pooled Vehicles from 2000 to 2004. Mr. Ungerman held a number of positions in Prudential Financial's asset management business prior to 2000. | |
|
Paul L. Gulinello
(1950), AML Compliance Officer (2005) | | Vice President and Anti Money Laundering Compliance Officer for JPMorgan Asset Management Americas, additionally responsible for personal trading and compliance testing since 2004; Treasury Services Operating Risk Management and Compliance Executive supporting all JPMorgan Treasury Services business units from July 2000 to 2004. | |
|
| Stephen M. Benham (1959), Secretary (2005) | | Vice President and Assistant General Counsel, JPMorgan Chase & Co. since 2004; Vice President (Legal Advisory) of Merrill Lynch Investment Managers, L.P. from 2000 to 2004; attorney associated with Kirkpatrick & Lockhart LLP from 1997 to 2000. | |
|
Elizabeth A. Davin
(1964), Assistant Secretary (2005)* | | Vice President and Assistant General Counsel, JPMorgan Chase & Co. since 2005;Senior Counsel, JPMorgan Chase & Co. (formerly Bank One Corporation) from 2004-2005; Assistant General Counsel and Associate General Counsel and Vice President, Gartmore Global Investments, Inc. from 1999 to 2004. | |
|
Jessica K. Ditullio
(1962), Assistant Secretary (2005)* | | Vice President and Assistant General Counsel, JPMorgan Chase & Co. since 2005; Ms. Ditullio has served as attorney with various titles for JP Morgan Chase & Co. (formerly Bank One Corporation) since 1990. | |
|
Nancy E. Fields
(1949), Assistant Secretary (2005)* | | Vice President, JPMorgan Funds Management, Inc. and JPMorgan Distribution Services, Inc.; From 1999 to 2005, Director, Mutual Fund Administration, JPMorgan Funds Management, Inc. (formerly One Group Administrative Services, Inc.) and Senior Project Manager, Mutual Funds, JPMorgan Distribution Services, Inc. (formerly One Group Dealer Services, Inc). | |
|
Ellen W. O'Brien
(1957), Assistant Secretary (2005)** | | Assistant Vice President, JPMorgan Investor Services, Co., responsible for Blue Sky registration. Ms. O'Brien has served in this capacity since joining the firm in 1991. | |
|
Suzanne E. Cioffi
(1967), Assistant Treasurer (2005) | | Vice President, JPMorgan Funds Management, Inc., responsible for mutual fund financial reporting. Ms. Cioffi has overseen various fund accounting, custody and administration conversion projects during the past five years. | |
|
JPMorgan U.S. Equity Mid/Small Cap Funds 118
SEMI-ANNUAL REPORT JUNE 30
2005
OFFICERS (CONTINUED)
(Unaudited)
Name (Year of Birth),
Positions Held with
the Trusts (Since) | | Principal Occupations During Past 5 Years | |
| Christopher D. Walsh (1965), Assistant Treasurer (2005) | | Vice President, JPMorgan Funds Management, Inc. Mr. Walsh has managed all aspects of institutional and retail mutual fund administration and vendor relationships within the mutual funds, commingled/ERISA funds, 3(c)(7) funds, hedge funds and LLC products. Mr. Walsh was a director of Mutual Fund Administration at Prudential Investments from 1996 to 2000. | |
|
Arthur A. Jensen
(1966), Assistant Treasurer (2005)* | | Vice President, JPMorgan Funds Management, Inc. since April 2005; formerly, Vice President of Financial Services of BISYS Fund Services, Inc. from 2001 until 2005; Mr. Jensen was Section Manager at Northern Trust Company and Accounting Supervisor at Allstate Insurance Company prior to 2001. | |
|
The contact address for each of the officers, unless otherwise noted, is 522 Fifth Avenue, New York, NY 10036.
* The contact address for the officer is 1111 Polaris Parkway, Columbus, OH 43271.
** The contact address for the officer is 73 Tremont Street, Floor 1, Boston MA 02108.
JPMorgan U.S. Equity Mid/Small Cap Funds 119
JPMorgan Funds
SCHEDULE OF SHAREHOLDER EXPENSES
Hypothetical $1,000 Investment at Beginning of Period
June 30, 2005
(Unaudited)
As a shareholder of the Funds, you incur two types of costs: (1) transaction costs, including sales charges (loads) on purchase payments and redemption fees and (2) ongoing costs, including investment advisory, administration fees, distribution fees and other Fund expenses. The examples below are intended to help you understand your ongoing costs (in dollars) of investing in the Funds and to compare these costs with the ongoing costs of investing in other mutual funds. The examples assume that you had a $1,000 investment in the Class at the beginning of the reporting period, January 1, 2005, and continued to hold your shares at the end of the reporting period, June 30, 2005.
Actual Expenses
For each Class of each Fund in the table below, the first line provides information about actual account values and actual expenses. You may use the information in this line, together with the amount you invested, to estimate the expenses that you paid over the period. Simply divide your account value by $1,000 (for example, an $8,600 account value divided by $1,000 = 8.6), then multiply the result by the number in the first line of each Class under the heading entitled "Expenses Paid During Period" to estimate the expenses you paid on your account during this period.
Hypothetical Example for Comparison Purposes
The second line of each Class in the table below provides information about hypothetical account values and hypothetical expenses based on the Class' actual expense ratio and an assumed rate of return of 5% per year before expenses, which is not the Class' actual return. The hypothetical account values and expenses may not be used to estimate the actual ending account balance or expenses you paid for the period. You may use this information to compare the ongoing costs of investing in the Class of the Fund and other funds. To do so, compare this 5% hypothetical example with the 5% hypothetical examples that appear in the shareholder reports of the other funds. Please note that the expenses shown in the table are meant to highlight your ongoing costs only and do not reflect any transaction costs, such as sales charges (loads) or redemption fees. Therefore, the second line for each Class in the table is useful in comparing ongoing costs only, and will not help you determine the relative total costs of owning different funds. In addition, if these transaction costs were included, your costs would have been higher. The examples also assume all dividends and distributions have been reinvested.
JPMorgan U.S. Equity Mid/Small Cap Funds 120
SEMI-ANNUAL REPORT JUNE 30
2005
SCHEDULE OF SHAREHOLDER EXPENSES
Hypothetical $1,000 Investment at Beginning of Period
June 30, 2005
(Unaudited)
| | | Beginning
Account Value | | Ending
Account Value,
June 30, 2005 | | Expenses Paid
During Period | | Annualized
Expense Ratio | |
| DYNAMIC SMALL CAP FUND | |
| Class A | |
| Actual** | | $ | 1,000 | | | $ | 982.70 | | | $ | 7.37 | | | | 1.50 | % | |
| Hypothetical** | | $ | 1,000 | | | $ | 1017.36 | | | $ | 7.50 | | | | 1.50 | % | |
| Class B | |
| Actual** | | $ | 1,000 | | | $ | 980.00 | | | $ | 10.06 | | | | 2.05 | % | |
| Hypothetical** | | $ | 1,000 | | | $ | 1,014.63 | | | $ | 10.24 | | | | 2.05 | % | |
| Class C | |
| Actual** | | $ | 1,000 | | | $ | 979.90 | | | $ | 10.01 | | | | 2.04 | % | |
| Hypothetical** | | $ | 1,000 | | | $ | 1,014.68 | | | $ | 10.19 | | | | 2.04 | % | |
| Select Class | |
| Actual** | | $ | 1,000 | | | $ | 984.10 | | | $ | 5.41 | | | | 1.10 | % | |
| Hypothetical** | | $ | 1,000 | | | $ | 1,019.34 | | | $ | 5.51 | | | | 1.10 | % | |
| MID CAP EQUITY FUND | |
| Select Class | |
| Actual** | | $ | 1,000 | | | $ | 1,037.9 | | | $ | 4.55 | | | | 0.90 | % | |
| Hypothetical** | | $ | 1,000 | | | $ | 1,020.33 | | | $ | 4.51 | | | | 0.90 | % | |
| SMALL CAP CORE FUND | |
| Select Class | |
| Actual** | | $ | 1,000 | | | $ | 996.30 | | | $ | 3.96 | | | | 0.80 | % | |
| Hypothetical** | | $ | 1,000 | | | $ | 1,020.83 | | | $ | 4.01 | | | | 0.80 | % | |
| CAPITAL GROWTH FUND | |
| Class A | |
| Actual** | | $ | 1,000 | | | $ | 1,023.40 | | | $ | 5.97 | | | | 1.19 | % | |
| Hypothetical** | | $ | 1,000 | | | $ | 1,018.89 | | | $ | 5.96 | | | | 1.19 | % | |
| Class B | |
| Actual** | | $ | 1,000 | | | $ | 1,021.00 | | | $ | 8.52 | | | | 1.70 | % | |
| Hypothetical** | | $ | 1,000 | | | $ | 1,016.36 | | | $ | 8.50 | | | | 1.70 | % | |
| Class C | |
| Actual** | | $ | 1,000 | | | $ | 1,021.00 | | | $ | 8.42 | | | | 1.68 | % | |
| Hypothetical** | | $ | 1,000 | | | $ | 1,016.46 | | | $ | 8.40 | | | | 1.68 | % | |
| Select Class | |
| Actual** | | $ | 1,000 | | | $ | 1,025.00 | | | $ | 4.52 | | | | 0.90 | % | |
| Hypothetical** | | $ | 1,000 | | | $ | 1,020.33 | | | $ | 4.51 | | | | 0.90 | % | |
JPMorgan U.S. Equity Mid/Small Cap Funds 121
JPMorgan Funds
SCHEDULE OF SHAREHOLDER EXPENSES
Hypothetical $1,000 Investment at Beginning of Period
June 30, 2005
(Unaudited)
| | | Beginning
Account Value | | Ending
Account Value,
June 30, 2005 | | Expenses Paid
During Period | | Annualized
Expense Ratio | |
| SMALL CAP EQUITY FUND | | | |
| Class A | | | |
| Actual** | | $ | 1,000 | | | $ | 1,031.00 | | | $ | 6.85 | | | | 1.36 | % | |
| Hypothetical** | | $ | 1,000 | | | $ | 1,018.05 | | | $ | 6.80 | | | | 1.36 | % | |
| Class B | | | |
| Actual** | | $ | 1,000 | | | $ | 1,028.30 | | | $ | 9.56 | | | | 1.90 | % | |
| Hypothetical** | | $ | 1,000 | | | $ | 1,015.37 | | | $ | 9.49 | | | | 1.90 | % | |
| Class C | | | |
| Actual* | | $ | 1,000 | | | $ | 1,027.90 | | | $ | 6.67 | | | | 1.86 | % | |
| Hypothetical** | | $ | 1,000 | | | $ | 1,015.57 | | | $ | 9.30 | | | | 1.86 | % | |
| Select Class | | | |
| Actual** | | $ | 1,000 | | | $ | 1,033.60 | | | $ | 4.29 | | | | 0.85 | % | |
| Hypothetical** | | $ | 1,000 | | | $ | 1,020.58 | | | $ | 4.26 | | | | 0.85 | % | |
| U.S.SMALL COMPANY FUND | | | |
| Select Class | | | |
| Actual** | | $ | 1,000 | | | $ | 997.10 | | | $ | 5.00 | | | | 1.01 | % | |
| Hypothetical** | | $ | 1,000 | | | $ | 1,019.79 | | | $ | 5.06 | | | | 1.01 | % | |
| Institutional Class | | | |
| Actual** | | $ | 1,000 | | | $ | 997.80 | | | $ | 4.11 | | | | 0.83 | % | |
| Hypothetical** | | $ | 1,000 | | | $ | 1,020.68 | | | $ | 4.16 | | | | 0.83 | % | |
| MID CAP GROWTH FUND | | | |
| Class A | | | |
| Actual** | | $ | 1,000 | | | $ | 1,022.60 | | | $ | 6.77 | | | | 1.35 | % | |
| Hypothetical** | | $ | 1,000 | | | $ | 1,018.10 | | | $ | 6.76 | | | | 1.35 | % | |
| Class B | | | |
| Actual** | | $ | 1,000 | | | $ | 1,019.90 | | | $ | 10.27 | | | | 2.05 | % | |
| Hypothetical** | | $ | 1,000 | | | $ | 1,014.63 | | | $ | 10.24 | | | | 2.05 | % | |
JPMorgan U.S. Equity Mid/Small Cap Funds 122
SEMI-ANNUAL REPORT JUNE 30
2005
SCHEDULE OF SHAREHOLDER EXPENSES
Hypothetical $1,000 Investment at Beginning of Period
June 30, 2005
(Unaudited)
| | | Beginning
Account Value | | Ending
Account Value,
June 30, 2005 | | Expenses Paid
During Period | | Annualized
Expense Ratio | |
| MID CAP VALUE FUND | | | |
| Class A | | | |
| Actual** | | $ | 1,000 | | | $ | 1,049.40 | | | $ | 6.35 | | | | 1.25 | % | |
| Hypothetical** | | $ | 1,000 | | | $ | 1,018.60 | | | $ | 6.26 | | | | 1.25 | % | |
| Class B | | | |
| Actual** | | $ | 1,000 | | | $ | 1,046.60 | | | $ | 9.08 | | | | 1.79 | % | |
| Hypothetical** | | $ | 1,000 | | | $ | 1,015.92 | | | $ | 8.95 | | | | 1.79 | % | |
| Class C | | | |
| Actual** | | $ | 1,000 | | | $ | 1,046.50 | | | $ | 9.03 | | | | 1.78 | % | |
| Hypothetical** | | $ | 1,000 | | | $ | 1,015.97 | | | $ | 8.90 | | | | 1.78 | % | |
| Select Class | | | |
| Actual** | | $ | 1,000 | | | $ | 1,050.90 | | | $ | 5.09 | | | | 1.00 | % | |
| Hypothetical** | | $ | 1,000 | | | $ | 1,019.84 | | | $ | 5.01 | | | | 1.00 | % | |
| Institutional Class | | | |
| Actual** | | $ | 1,000 | | | $ | 1,052.00 | | | $ | 3.82 | | | | 0.75 | % | |
| Hypothetical** | | $ | 1,000 | | | $ | 1,021.08 | | | $ | 3.76 | | | | 0.75 | % | |
* Beginning account value as of February 19, 2005 (commencement of offering of Classes A and C Shares) and expenses paid during the period from February 19, 2005 through June 30, 2005.
** Beginning account value as of January 1, 2005 and expenses paid during the period from January 1, 2005 through June 30, 2005.
JPMorgan U.S. Equity Mid/Small Cap Funds 123
THIS PAGE IS INTENTIONALLY LEFT BLANK
JPMorgan Funds are distributed by JPMorgan Distribution Services, Inc., which is an affiliate of JPMorgan Chase & Co. Affiliates of JPMorgan Chase & Co. receive fees for providing various services to the funds.
This report is submitted for the general information of the shareholders of the Funds. It is not authorized for distribution to prospective investors in the Funds unless preceded or accompanied by a prospectus.
The financial information in this report has been taken from the books and records of the Funds without examination by independent auditors, who express no opinion thereon.
Contact JPMorgan Funds Service Center at 1-800-480-4111 for a fund prospectus. You can also visit us at www.jpmorganfunds.com. Investors should carefully consider the investment objectives and risk as well as charges and expenses of the mutual fund before investing. The prospectus contains this and other information about the mutual fund. Read the prospectus carefully before investing.
No sooner than 30 days after the end of each month, each Fund will make available upon request a complete uncertified schedule of its portfolio holdings as of the last day of that month. Not later than 60 days after the end of each fiscal quarter, each Fund will make available a complete schedule of its portfolio holdings as of the last day of that quarter, as filed in a certified filing with the SEC. In addition to providing hard copies upon request, the Fund will post these quarterly schedules on the Funds' website at www.jpmorganfunds.com and on the SEC's website at www.sec.gov.
Shareholders may request portfolio holdings schedules at no charge by calling 1-800-480-4111.
A description of each Fund's policies and procedures with respect to the disclosure of each Fund's portfolio holdings is available in the Statement of Additional Information.
A copy of proxy policies and procedures are available without charge upon request by calling 1-800-480-4111 and on the SEC's website at www.sec.gov. The Trustees have delegated the authority to vote proxies for securities owned by the Fund to JPMIM. A copy of the Fund's voting record is available on the SEC's website at www.sec.gov or at the Fund's website at www.jpmorganfunds.com. The Fund's proxy voting record will include, among other things, a brief description of the matter voted on for each portfolio security, and will state how each vote was cast, for example, for or against the proposal.
PRSRT STD
U.S. POSTAGE
PAID
PERMIT 2891
KANSAS CITY, MO
SAN-SMC-605
JPMorgan Funds Fulfillment Center
6112 W. 73rd Street
Bedford Park, IL 60638
© J.P. Morgan Chase & Co., 2005 All rights reserved. August 2005.
ITEM 2. CODE OF ETHICS.
Disclose whether, as of the end of the period covered by the report, the registrant has adopted a code of ethics that applies to the registrant’s principal executive officer, principal financial officer, principal accounting officer or controller, or persons performing similar functions, regardless of whether these individuals are employed by the registrant or a third party. If the registrant has not adopted such a code of ethics, explain why it has not done so.
Not applicable to a semi-annual report.
ITEM 3. AUDIT COMMITTEE FINANCIAL EXPERT.
(a) (1) Disclose that the registrant’s board of directors has determined that the registrant either:
(i) Has at least one audit committee financial expert serving on its audit committee; or
(ii) Does not have an audit committee financial expert serving on its audit committee.
(2) If the registrant provides the disclosure required by paragraph (a)(1)(i) of this Item, it must disclose the name of the audit committee financial expert and whether that person is “independent.” In order to be considered “independent” for purposes of this Item, a member of an audit committee may not, other than in his or her capacity as a member of the audit committee, the board of directors, or any other board committee:
(i) Accept directly or indirectly any consulting, advisory, or other compensatory fee from the issuer; or
(ii) Be an “interested person” of the investment company as defined in Section 2(a)(19) of the Act (15 U.S.C. 80a-2(a)(19)).
(3) If the registrant provides the disclosure required by paragraph (a)(1)(ii) of this Item, it must explain why it does not have an audit committee financial expert.
Not applicable to a semi-annual report.
ITEM 4. PRINCIPAL ACCOUNTANT FEES AND SERVICES.
(a) Disclose, under the caption AUDIT FEES, the aggregate fees billed for each of the last two fiscal years for professional services rendered by the principal accountant for the audit of the registrant’s annual financial statements or services that are normally provided by the accountant in connection with statutory and regulatory filings or engagements for those fiscal years.
(b) Disclose, under the caption AUDIT-RELATED FEES, the aggregate fees billed in each of the last two fiscal years for assurance and related services by the principal accountant that are reasonably related to the performance of the audit of the registrant’s financial statements and are not reported under paragraph (a) of this Item. Registrants shall describe the nature of the services comprising the fees disclosed under this category.
(c) Disclose, under the caption TAX FEES, the aggregate fees billed in each of the last two fiscal years for professional services rendered by the principal accountant for tax compliance, tax advice, and tax planning. Registrants shall describe the nature of the services comprising the fees disclosed under this category.
(d) Disclose, under the caption ALL OTHER FEES, the aggregate fees billed in each of the last two fiscal years for products and services provided by the principal accountant, other than the services reported in paragraphs (a) through (c) of this Item. Registrants shall describe the nature of the services comprising the fees disclosed under this category.
(e) (1) Disclose the audit committee’s pre-approval policies and procedures described in paragraph (c)(7) of Rule 2-01 of Regulation S-X.
(2) Disclose the percentage of services described in each of paragraphs (b) through (d) of this Item that were approved by the audit committee pursuant to paragraph (c)(7)(i)(C) of Rule 2-01 of Regulation S-X.
(f) If greater than 50 percent, disclose the percentage of hours expended on the principal accountant’s engagement to audit the registrant’s financial statements for the most recent fiscal year that were attributed to work performed by persons other than the principal accountant’s full-time, permanent employees.
(g) Disclose the aggregate non-audit fees billed by the registrant’s accountant for services rendered to the registrant, and rendered to the registrant’s investment adviser (not including any sub-adviser whose role is primarily portfolio management and is subcontracted with or overseen by another investment adviser), and any entity controlling, controlled by, or under common control with the adviser that provides ongoing services to the registrant for each of the last two fiscal years of the registrant.
(h) Disclose whether the registrant’s audit committee of the board of directors has considered whether the provision of non-audit services that were rendered to the registrant’s investment adviser (not including any subadviser whose role is primarily portfolio management and is subcontracted with or overseen by another investment adviser), and any entity controlling, controlled by, or under common control with the investment adviser that provides ongoing services to the registrant that were not pre-approved pursuant to paragraph (c)(7)(ii) of Rule 2-01 of Regulation S-X is compatible with maintaining the principal accountant’s independence.
Not applicable to a semi-annual report.
ITEM 5. AUDIT COMMITTEE OF LISTED REGISTRANTS.
(a) If the registrant is a listed issuer as defined in Rule 10A-3 under the Exchange Act (17CFR 240.10A-3), state whether or not the registrant has a separately-designated standing audit committee established in accordance with Section 3(a)(58)(A) of the Exchange Act (15 U.S.C. 78c(a)(58)(A)). If the registrant has such a committee, however designated, identify each committee member. If the entire board of directors is acting as the registrant’s audit committee as specified in Section 3(a)(58)(B) of the Exchange Act (15 U.S.C. 78c(a)(58)(B)), so state.
(b)If applicable, provide the disclosure required by Rule 10A-3(d) under the Exchange Act (17CFR 240.10A-3(d)) regarding an exemption from the listing standards for all audit committees.
Not applicable to a semi-annual report.
ITEM 6. SCHEDULE OF INVESTMENTS
File Schedule I - Investments in securities of unaffiliated issuers as of the close of the reporting period as set forth in Section 210.12-12 of Regulation S-X, unless the schedule is included as part of the report to shareholders filed under Item 1 of this Form.
Included in Item 1.
ITEM 7. DISCLOSURE OF PROXY VOTING POLICIES AND PROCEDURES FOR CLOSED-END MANAGEMENT INVESTMENT COMPANIES.
A closed-end management investment company that is filing an annual report on this Form N-CSR must, unless it invests exclusively in non-voting securities, describe the policies and procedures that it uses to determine how to vote proxies relating to portfolio securities, including the procedures that the company uses when a vote presents a conflict between the interests of its shareholders, on the one hand, and those of the company’s investment adviser; principal underwriter; or any affiliated person (as defined in Section 2(a)(3) of the Investment Company Act of 1940 (15 U.S.C. 80a-2(a)(3)) and the rules thereunder) of the company, its investment adviser, or its principal underwriter, on the other. Include any policies and procedures of the company’s investment adviser, or any other third party, that the company uses, or that are used on the company’s behalf, to determine how to vote proxies relating to portfolio securities.
Not applicable.
ITEM 8. PORTFOLIO MANAGERS OF CLOSED-END MANAGEMENT INVESTMENT COMPANIES.
Not applicable.
ITEM 9. PURCHASE OF EQUITY SECURITIES BY CLOSED-END MANAGEMENT INVESTMENT COMPANY AND AFFILIATED PURCHASERS.
(a) If the registrant is a closed-end management investment company, provide the information specified in paragraph (b) of this Item with respect to any purchase made by or on behalf of the registrant or any “affiliated purchaser,” as defined in Rule 10b-18(a)(3) under the Exchange Act (17 CFR 240.10b-18(a)(3)), of shares or other units of any class of the registrant’s equity securities that is registered by the registrant pursuant to Section 12 of the Exchange Act (15 U.S.C. 781).
Not applicable.
ITEM 10. SUBMISSION OF MATTERS TO A VOTE OF SECURITY HOLDERS.
Describe any material changes to the procedures by which shareholders may recommend nominees to the registrant’s board of directors, where those changes were implemented after the registrant last provided disclosure in response to the requirements of Item 7(d)(2)(ii)(G) of Schedule 14A (17 CFR 240.14a-101), or this Item.
Not applicable.
ITEM 11. CONTROLS AND PROCEDURES.
(a) Disclose the conclusions of the registrant’s principal executive and principal financial officers, or persons performing similar functions, regarding the effectiveness of the registrant’s disclosure controls and procedures (as defined in Rule 30a-3(c) under the Act (17 CFR 270.30a-3(c))) as of a date within 90 days of the filing date of the report that includes the disclosure required by this paragraph, based on the evaluation of these controls and procedures required by Rule 30a-3(b) under the Act (17 CFR 270.30a-3(b)) and Rules 13a-15(b) or 15d-15(b) under the Exchange Act (17 CFR 240.13a-15(b) or 240.15d-15(b))
The Registrant’s principal executive and principal financial officers have concluded, based on their evaluation of the Registrant’s disclosure controls and procedures as of a date within 90 days of the filing date of this report, that the Registrant’s disclosure controls and procedures are reasonably designed to ensure that information required to be disclosed by the Registrant on Form N-CSR is recorded, processed, summarized and reported within the required time periods and that information required to be disclosed by the Registrant in the reports that it files or submits on Form N-CSR is accumulated and communicated to the Registrant’s management, including its principal executive and principal financial officers, as appropriate to allow timely decisions regarding required disclosure.
(b) Disclose any change in the registrant’s internal control over financial reporting (as defined in Rule 30a-3(d) under the Act (17 CFR 270.30a-3(d)) that occurred during the registrant’s second fiscal quarter of the period covered by this report that has materially affected, or is reasonably likely to materially affect, the registrant’s internal control over financial reporting.
J.P. Morgan Investors Services Co. began serving as the sub-administrator and, in such capacity, assisted with financial reporting for the period covered by this report. (JPMorgan Funds Management, Inc. (formerly known as One Group Administrative Services, Inc.) began serving as the Registrant’s Administrator effective February 19, 2005.) The Administrator and sub-administrator prepare financial reports and administrative filings on behalf of the Registrant. All pre-existing policies and procedures remain substantially the same.
ITEM 12. EXHIBITS.
(a) File the exhibits listed below as part of this Form. Letter or number the exhibits in the sequence indicated.
(a)(1) Any code of ethics, or amendment thereto, that is the subject of the disclosure required by Item 2, to the extent that the registrant intends to satisfy the Item 2 requirements through filing of an exhibit.
Not applicable.
(a)(2) A separate certification for each principal executive officer and principal financial officer of the registrant as required by Rule 30a-2(a) under the Act (17 CFR 270.30a-2).
Certifications pursuant to Rule 30a-2(a) under the Investment Company Act of 1940 are attached hereto.
(a)(3) Any written solicitation to purchase securities under Rule 23c-1 under the Act (17 CFR 270.23c-1) sent or given during the period covered by the report by or on behalf of the registrant to 10 or more persons.
Not applicable.
(b) A separate or combined certification for each principal executive officer and principal officer of the registrant as required by Rule 30a-2(b) under the Act of 1940.
Certifications pursuant to Rule 30a-2(b) under the Investment Company Act of 1940 are attached hereto.
SIGNATURES
Pursuant to the requirements of the Securities Exchange Act of 1934 and the Investment Company Act of 1940, the registrant has duly caused this report to be signed on its behalf by the undersigned, thereunto duly authorized.
J.P. Morgan Fleming Mutual Fund Group, Inc.
By: | /s/ George C.W. Gatch | |
| George C.W. Gatch |
| President and Principal Executive Officer |
| September 7, 2005 |
Pursuant to the requirements of the Securities Exchange Act of 1934 and the Investment Company Act of 1940, this report has been signed below by the following persons on behalf of the registrant and in the capacities and on the dates indicated.
By: | /s/ George C.W. Gatch | |
| George C.W. Gatch |
| President and Principal Executive Officer |
| September 7, 2005 |
By: | /s/ Stephanie J. Dorsey | |
| Stephanie J. Dorsey |
| Treasurer and Principal Financial Officer |
| September 7, 2005 |