UNITED STATES
SECURITIES AND EXCHANGE COMMISSION
Washington, D.C. 20549
FORM N-CSR
CERTIFIED SHAREHOLDER REPORT OF REGISTERED
MANAGEMENT INVESTMENT COMPANIES
Investment Company Act file number: 811-08189
J.P. Morgan Fleming Mutual Fund Group, Inc.
(Exact name of registrant as specified in charter)
270 Park Avenue
New York, NY 10017
(Address of principal executive offices) (Zip code)
Frank J. Nasta
270 Park Avenue
New York, NY 10017
(Name and Address of Agent for Service)
Registrant’s telephone number, including area code: (800) 480-4111
Date of fiscal year end: June 30
Date of reporting period: July 1, 2014 through June 30, 2015
Form N-CSR is to be used by management investment companies to file reports with the Commission not later than 10 days after the transmission to stockholders of any report that is required to be transmitted to stockholders under Rule 30e-1 under the Investment Company Act of 1940 (17 CFR 270.30e-1). The Commission may use the information provided on Form N-CSR in its regulatory, disclosure review, inspection, and policymaking roles.
A registrant is required to disclose the information specified by Form N-CSR, and the Commission will make this information public. A registrant is not required to respond to the collection of information contained in Form N-CSR unless the Form displays a currently valid Office of Management and Budget (“OMB”) control number. Please direct comments concerning the accuracy of the information collection burden estimate and any suggestions for reducing the burden to Secretary, Securities and Exchange Commission, 450 Fifth Street, NW, Washington, DC 20549-0609. The OMB has reviewed this collection of information under the clearance requirements of 44 U.S.C. Section 3507.
ITEM 1. REPORTS TO STOCKHOLDERS.
The following is a copy of the report transmitted to shareholders pursuant to Rule 30e-1 under the Investment Company Act of 1940 (17 CFR 270.30e-1).
Annual Report
J.P. Morgan Mid Cap/Multi-Cap Funds
June 30, 2015
JPMorgan Growth Advantage Fund
JPMorgan Mid Cap Equity Fund
JPMorgan Mid Cap Growth Fund
JPMorgan Mid Cap Value Fund
JPMorgan Multi-Cap Market Neutral Fund
JPMorgan Value Advantage Fund

CONTENTS
Investments in a Fund are not bank deposits or obligations of, or guaranteed or endorsed by, any bank and are not insured or guaranteed by the FDIC, the Federal Reserve Board or any other government agency. You could lose money if you sell when the Fund’s share price is lower than when you invested.
Past performance is no guarantee of future performance. The general market views expressed in this report are opinions based on market and other conditions through the end of the reporting period and are subject to change without notice. These views are not intended to predict the future performance of a Fund or the securities markets. References to specific securities and their issuers are for illustrative purposes only and are not intended to be, and should not be interpreted as, recommendations to purchase or sell such securities. Such views are not meant as investment advice and may not be relied on as an indication of trading intent on behalf of any Fund.
Prospective investors should refer to the Funds’ prospectus for a discussion of the Funds’ investment objectives, strategies and risks. Call J.P. Morgan Funds Service Center at 1-800-480-4111 for a prospectus containing more complete information about a Fund, including management fees and other expenses. Please read it carefully before investing.
CEO’S LETTER
July 27, 2015 (Unaudited)
Dear Shareholders,
While central banks continued to provide stimulus and support for financial markets and the global economy, a sharp and sustained decline in energy prices and a handful of distinct geopolitical crises marked the twelve months ended June 30, 2015. By late 2014, the U.S. economy was surging, even as growth stagnated in the European Union (EU) and Japan sank into recession.
| | |
 | | “While the challenges faced by financial markets and the global economy changed somewhat over the past twelve months, interest rates remained low and central banks continued to provide significant support for growth.” |
However, the U.S. economy cooled in early 2015 and extraordinary stimulus by central banks in the EU, Japan and China propped up domestic growth, as well as global financial markets. By the end of June, the consensus outlook for slow but continued global growth became clouded by investor worries about China and to a lesser degree, Greece.
After showing healthy growth for several quarters, U.S. gross domestic product (GDP) notched only 0.6% growth in the first quarter of 2015, partly due to severe winter weather and a labor dispute that slowed operations at vital West Coast ports. The manufacturing sector of the U.S. economy showed particular weakness in the first half of 2015 as a strong U.S. dollar hurt exports and weak oil prices curtailed energy sector projects. On the positive side, unemployment fell to 5.3% in June 2015 from 6.1% one year earlier.
Robust economic growth and steady gains in employment – though not reflected in wage growth – drove the U.S. Federal Reserve (“Fed”) to end its multibillion-dollar asset purchasing program in October 2014 and signal that it would begin to raise interest rates sometime in 2015.
U.S. equity markets produced increasing returns in 2014 before hitting a plateau around record highs in 2015. While the Standard & Poor’s 500 Index closed in record territory several times in the first half of 2015, the trading range was the narrowest since 1994, and the index produced a total return of just 1.2% for the six month period. However, gains from the latter half of 2014 put the total return at 7.4% for the twelve months ended June 30, 2015.
Amid the prospect of rising U.S. interest rates, bonds with longer maturities, including U.S. Treasuries, slumped in 2015. Though high yield debt (or “junk bonds”) rebounded in 2015, for the entire twelve month reporting period investment grade debt securities outperformed high yield bonds. For the twelve
months ended June 30, 2015, the Barclays U.S. Aggregate Index returned 1.9%, while the Barclays High Yield Index returned -0.4%.
In response to weak growth and a threat of price deflation in late 2014, the European Central Bank undertook a massive asset buying program and sought to reassure investors that it would take whatever actions necessary to sustain economic growth. These actions helped propel equity markets higher. For the first three months of 2015, GDP rose by 0.4% in the EU and unemployment dropped to its lowest level since March 2012, though it stubbornly remained above 11%. Indeed, mild improvement in economic data across Europe coupled with signs of slowing U.S. growth in 2015 increased the relative attractiveness of European equities to investors.
While negotiations to resolve the Greek debt crisis were the focus of daily news reports throughout the first half of the year, the drawn-out nature of the crisis meant that investors were braced for either a deal or default and financial markets had “priced in” those outcomes. Thus the crisis appeared to have little impact on financial markets and domestic economies outside of Greece itself.
Japanese equity markets also benefitted from a strong U.S. dollar (which made Japanese goods relatively cheaper), improved corporate governance and government equity purchases. Japanese stocks outperformed both U.S. and European equities in the latter half of the twelve month reporting period. The Nikkei 250 Index closed out June 2015 at an 18-year high.
Chinese equities produced strong returns for the twelve month reporting period, though volatility grew sharply in Shanghai, Shenzhen and Hong Kong markets in 2015. After reaching a peak on June 12th, Chinese equity prices fell nearly 30% in the subsequent weeks and ended the month 17.4% down from that peak. On June 27th, China’s central bank sought to bolster sagging equity prices by cutting interest rates and reducing the amount of required cash reserves at certain banks. When those efforts failed to halt the freefall, the Chinese government on June 29th granted local government pension funds permission to invest in the stock market, potentially funneling more than $160 billion into the equity market. Interestingly, by the end of June, about one-fourth of all companies listed on the Shanghai and Shenzhen stock exchanges had sought a suspension in trading of their shares rather than endure a further sell-off. It is notable that even after the June decline, the Shanghai Composite Index returned 32.2% for the first half of 2015.
While the global economy remained on a positive growth trajectory, the International Monetary Fund in July lowered its forecast for 2015 growth by 0.2% to 3.3%, citing slower growth in the U.S. Nevertheless, the U.S. economy continued to improve sufficiently to lead the Fed to signal it may raise interest rates in September for the first time since the 2008-09 financial crisis. While the challenges faced by financial markets
| | | | | | | | |
| | | |
| JUNE 30, 2015 | | J.P. MORGAN MID CAP/MULTI-CAP FUNDS | | | | | 1 | |
CEO’S LETTER
July 27, 2015 (Unaudited) (continued)
and the global economy changed somewhat over the past twelve months, interest rates remained low and central banks continued to provide significant support for growth. The changing investment climate and uncertainties about the pace of global economic expansion underscore the practicality of holding a properly diversified portfolio with long-range objectives.
On behalf of everyone at J.P. Morgan Asset Management, thank you for your continued support. We look forward to managing your investment needs for years to come. Should you have any questions, please visit www.jpmorganfunds.com or contact the J.P. Morgan Funds Service Center at 1-800-480-4111.
Sincerely yours,

George C.W. Gatch
CEO, Global Funds Management
J.P. Morgan Asset Management
| | | | | | |
| | | |
| 2 | | | | J.P. MORGAN MID CAP/MULTI-CAP FUNDS | | JUNE 30, 2015 |
J.P. Morgan Mid Cap/Multi-Cap Funds
MARKET OVERVIEW
TWELVE MONTHS ENDED JUNE 30, 2015 (Unaudited)
U.S equity markets performed strongly in the latter half of 2014 amid accommodative central bank policies, falling energy prices and steady overall improvement in the U.S. economy. In the first half of 2015, U.S. equity markets closed at several record highs but moved very little overall, remaining closer to flat than during any other six month period since reliable recordkeeping began in 1928.
Overall, U.S. large cap stocks only slightly outperformed mid cap and small cap stocks for the twelve months ended June 30, 2015. However, small cap growth stocks outperformed all other equity categories and growth stocks outperformed value stocks across all market cap categories. For the twelve month period, the S&P 500 Index returned 7.42%, while the Russell Midcap Index returned 6.63%, the Russell Midcap Growth Index returned 9.45% and the Russell Midcap Value Index returned 3.67%.
| | | | | | | | |
| | | |
| JUNE 30, 2015 | | J.P. MORGAN MID CAP/MULTI-CAP FUNDS | | | | | 3 | |
JPMorgan Growth Advantage Fund
FUND COMMENTARY
TWELVE MONTHS ENDED JUNE 30, 2015 (Unaudited)
| | | | |
| REPORTING PERIOD RETURN: | |
| Fund (Class A Shares, without a sales charge)* | | | 14.99% | |
| Russell 3000 Growth Index | | | 10.69% | |
| |
| Net Assets as of 6/30/2015 (In Thousands) | | $ | 5,188,280 | |
INVESTMENT OBJECTIVE**
The JPMorgan Growth Advantage Fund (the “Fund”) seeks to provide long-term capital growth.
WHAT WERE THE MAIN DRIVERS OF THE FUND’S PERFORMANCE?
The Fund (Class A Shares, without a sales charge) outperformed the Russell 3000 Growth Index (the “Benchmark”) for the twelve months ended June 30, 2015. The Fund’s security selection in the technology and health care sectors was a leading contributor to performance relative to the Benchmark, while the Fund’s security selection in the consumer discretionary and consumer staples sectors detracted from relative performance.
Leading individual contributors to relative performance included the Fund’s overweight positions in Valeant Pharmaceuticals International Inc., Regeneron Pharmaceuticals Inc. and Avago Technologies Inc. Shares of Valeant, a drug and medical device maker, rose on strong profit and revenue growth. Shares of Regeneron, a biopharmaceutical company, rose on accelerating sales of its eye drug, Eylea, and advances in the company’s pipeline of potential new drugs. Shares of
Avago, a Singapore maker of analog semiconductors, strengthened on increased demand for semiconductors and its $37 billion acquisition of Broadcom Corp.
Leading individual detractors from relative performance included the Fund’s overweight positions in Michael Kors Holdings Ltd. and Antero Resources Corp. and its underweight position in Apple Inc. Shares of Michael Kors, a luxury apparel brand, fell on investor concerns about growing inventory, margin growth and management’s ability to execute strategy. Shares of Antero Resources, an independent oil and gas exploration and production company, declined amid weakness in global oil prices. Shares of Apple, a consumer electronics company, rose on a string of positive earnings announcements.
HOW WAS THE FUND POSITIONED?
The Fund’s portfolio managers utilized a bottom-up approach to stock selection, researching individual companies across market capitalizations in an effort to construct portfolios of stocks that have strong fundamentals. The Fund’s portfolio managers sought to invest in high quality companies with durable franchises that, in their view, possessed the ability to generate strong future earnings growth.
| | | | | | | | |
| TOP TEN EQUITY HOLDINGS OF THE PORTFOLIO*** | |
| | 1. | | | Apple, Inc. | | | 3.8 | % |
| | 2. | | | Facebook, Inc., Class A | | | 3.7 | |
| | 3. | | | Gilead Sciences, Inc. | | | 2.8 | |
| | 4. | | | Google, Inc., Class C | | | 2.7 | |
| | 5. | | | UnitedHealth Group, Inc. | | | 2.5 | |
| | 6. | | | Amazon.com, Inc. | | | 2.3 | |
| | 7. | | | MasterCard, Inc., Class A | | | 2.1 | |
| | 8. | | | Valeant Pharmaceuticals International, Inc. | | | 2.1 | |
| | 9. | | | Acuity Brands, Inc. | | | 2.0 | |
| | 10. | | | Regeneron Pharmaceuticals, Inc. | | | 2.0 | |
| | | | |
PORTFOLIO COMPOSITION BY SECTOR*** | |
| Information Technology | | | 30.6 | % |
| Health Care | | | 20.5 | |
| Consumer Discretionary | | | 16.2 | |
| Industrials | | | 11.0 | |
| Financials | | | 9.1 | |
| Materials | | | 4.5 | |
| Energy | | | 2.5 | |
| Consumer Staples | | | 1.7 | |
| Short-Term Investment | | | 3.9 | |
| * | | The return shown is based on net asset values calculated for shareholder transactions and may differ from the return shown in the financial highlights, which reflects adjustments made to the net asset values in accordance with accounting principles generally accepted in the United States of America. |
| ** | | The adviser seeks to achieve the Fund’s objective. There can be no guarantee it will be achieved. |
| *** | | Percentages indicated are based on total investments as of June 30, 2015. The Fund’s portfolio composition is subject to change. |
| | | | | | |
| | | |
| 4 | | | | J.P. MORGAN MID CAP/MULTI-CAP FUNDS | | JUNE 30, 2015 |
| | | | | | | | | | | | | | |
AVERAGE ANNUAL TOTAL RETURNS AS OF JUNE 30, 2015 | |
| | | | |
| | | INCEPTION DATE OF
CLASS | | 1 YEAR | | | 5 YEAR | | | 10 YEAR | |
CLASS A SHARES | | October 29, 1999 | | | | | | | | | | | | |
Without Sales Charge | | | | | 14.99 | % | | | 20.60 | % | | | 11.38 | % |
With Sales Charge* | | | | | 8.95 | | | | 19.33 | | | | 10.77 | |
CLASS C SHARES | | May 1, 2006 | | | | | | | | | | | | |
Without CDSC | | | | | 14.43 | | | | 20.01 | | | | 10.76 | |
With CDSC** | | | | | 13.43 | | | | 20.01 | | | | 10.76 | |
CLASS R5 SHARES | | January 8, 2009 | | | 15.42 | | | | 21.09 | | | | 11.75 | |
CLASS R6 SHARES | | December 23, 2013 | | | 15.48 | | | | 21.12 | | | | 11.77 | |
SELECT CLASS SHARES | | May 1, 2006 | | | 15.14 | | | | 20.84 | | | | 11.61 | |
| * | | Sales Charge for Class A Shares is 5.25%. |
| ** | | Assumes a 1% CDSC for the one year period and 0% CDSC thereafter. |
TEN YEAR PERFORMANCE (6/30/05 TO 6/30/15)
The performance quoted is past performance and is not a guarantee of future results. Mutual funds are subject to certain market risks. Investment returns and principal value of an investment will fluctuate so that an investor’s shares, when redeemed, may be worth more or less than their original cost. Current performance may be higher or lower than the performance data shown. For up-to-date month-end performance information please call 1-800-480-4111.
As of August 17, 2005, the Fund changed its name, investment objective, certain investment policies and benchmark. Prior to that time, the Fund operated as JPMorgan Mid Cap Growth Fund. Although past performance is not necessarily an indication of how the Fund will perform in the future, in view of these changes, the Fund’s performance record prior to August 17, 2005 might be less pertinent for investors considering whether to purchase shares of the Fund. Returns for the Class C Shares prior to its inception date are based on the performance of Class B Shares, all of which converted to Class A Shares on June 19, 2015 and are no longer offered. The actual returns of Class C Shares would have been similar to those shown because Class C Shares had similar expenses to Class B Shares at the time of their inception. Returns for the Select Class Shares prior to its inception date are based on the performance of Class A Shares. During this period, the actual returns of Select Class Shares would have been different than those shown because Select Class Shares have different expenses than Class A Shares. Returns for Class R5 Shares prior to its inception date are based on the performance of Select Class Shares from May 1, 2006 to January 7, 2009 and Class A Shares prior to May 1, 2006. The actual returns of Class R5 Shares would have been different than those shown because Class R5 Shares have different expenses than Select Class and Class A Shares. Returns for Class R6 Shares prior to its inception date are based on the performance of Class R5 Shares from January 8, 2009 to December 23, 2013, Select Class Shares from May 1, 2006 to January 8, 2009 and Class A Shares prior to May 1, 2006. The actual returns of Class R6 Shares would have been different than those shown because Class R6 Shares have different expenses than the other classes.
The graph illustrates comparative performance for $10,000 invested in Class A Shares of the JPMorgan Growth Advantage Fund, the Russell 3000 Growth Index and the Lipper Multi-Cap Growth Funds Index from June 30, 2005 to June 30, 2015. The performance of the Fund assumes reinvestment of all dividends and capital gain distributions, if any, and includes a sales charge. The performance of the Russell 3000 Growth Index does not reflect the deduction of expenses or a sales charge associated with a mutual fund and has been adjusted to reflect reinvestment of all dividends and capital gain distributions of the securities included in the benchmark, if applicable. The performance of the Lipper Multi-Cap Growth Funds Index includes expenses associated with a mutual fund, such as investment management fees. These expenses are not identical to the expenses incurred by the Fund. The Russell 3000 Growth Index is an unmanaged index which measures the performance of those Russell 3000 companies (largest 3000 U.S. companies) with higher price-to-book ratios and higher forecasted growth values. The Lipper Multi-Cap Growth Funds Index is an index based on total returns of certain mutual funds within the Fund’s designated category as determined by Lipper, Inc. Investors cannot invest directly in an index.
Class A Shares have a $1,000 minimum initial investment and carry a 5.25% sales charge.
Fund performance may reflect the waiver of the Fund’s fees and reimbursement of expenses for certain periods since the inception date. Without these waivers and reimbursements, performance would have been lower. Also, performance shown in this section does not reflect the deduction of taxes that a shareholder would pay on Fund distributions or redemption of Fund shares.
The returns shown are based on net asset values calculated for shareholder transactions and may differ from the returns shown in the financial highlights, which reflect adjustments made to the net asset values in accordance with accounting principles generally accepted in the United States of America.
| | | | | | | | |
| | | |
| JUNE 30, 2015 | | J.P. MORGAN MID CAP/MULTI-CAP FUNDS | | | | | 5 | |
JPMorgan Mid Cap Equity Fund
FUND COMMENTARY
TWELVE MONTHS ENDED JUNE 30, 2015 (Unaudited)
| | | | |
| REPORTING PERIOD RETURN: | |
| Fund (Select Class Shares)* | | | 10.37% | |
| Russell Midcap Index | | | 6.63% | |
| |
| Net Assets as of 6/30/2015 (In Thousands) | | $ | 3,303,293 | |
INVESTMENT OBJECTIVE**
The JPMorgan Mid Cap Equity Fund (the “Fund”) seeks long-term capital growth.
WHAT WERE THE MAIN DRIVERS OF THE FUND’S PERFORMANCE?
The Fund (Select Class Shares) outperformed the Russell Midcap Index (the “Benchmark”) for the twelve months ended June 30, 2015. The Fund’s security selection in both the technology and materials & processing sectors was a leading contributor to performance relative to the Benchmark, while the Fund’s underweight position in the health care sector and its security selection in the utilities sector detracted from relative performance.
Leading individual contributors to relative performance included the Fund’s overweight positions in Humana Inc., Valeant Pharmaceuticals International Inc. and Mohawk Industries Inc. Shares of Humana, a health insurance provider, rose on news of a $33 billion takeover bid from Aetna Inc. Shares of Valeant, a drug and medical device maker not held in the Benchmark, rose on strong profit and revenue growth. Shares of Mohawk Industries, a maker of flooring for residential and commercial property, rose on strong earnings growth.
Leading individual detractors from relative performance included the Fund’s overweight positions in Michael Kors Holdings Ltd., Laredo Petroleum Holdings Inc. and Southwestern Energy Co. Shares of Michael Kors, a luxury apparel brand, fell on investor concerns about growing inventory, margin growth and management’s ability to execute strategy. Shares of Laredo Petroleum and Southwestern Energy, both oil and gas exploration and production companies, declined on global weakness in energy prices.
HOW WAS THE FUND POSITIONED?
The Fund’s portfolio managers employed a bottom-up approach to stock selection, constructing a portfolio based on company fundamentals, quantitative screening and proprietary fundamental analysis. The Fund’s portfolio managers sought to identify dominant franchises with predictable business models deemed capable of achieving, in their view, sustained growth, as well as undervalued companies with the potential to grow their intrinsic value per share.
| | | | | | | | |
| TOP TEN EQUITY HOLDINGS OF THE PORTFOLIO*** | |
| | 1. | | | Mohawk Industries, Inc. | | | 1.8 | % |
| | 2. | | | Sherwin-Williams Co. (The) | | | 1.5 | |
| | 3. | | | Humana, Inc. | | | 1.5 | |
| | 4. | | | Carlisle Cos., Inc. | | | 1.4 | |
| | 5. | | | Amphenol Corp., Class A | | | 1.3 | |
| | 6. | | | Acuity Brands, Inc. | | | 1.2 | |
| | 7. | | | CBRE Group, Inc., Class A | | | 1.1 | |
| | 8. | | | NXP Semiconductors N.V., (Netherlands) | | | 0.9 | |
| | 9. | | | Alliance Data Systems Corp. | | | 0.9 | |
| | 10. | | | Brookdale Senior Living, Inc. | | | 0.9 | |
| | | | |
PORTFOLIO COMPOSITION BY SECTOR*** | |
| Financials | | | 20.5 | % |
| Consumer Discretionary | | | 19.0 | |
| Information Technology | | | 16.9 | |
| Industrials | | | 12.6 | |
| Health Care | | | 11.6 | |
| Utilities | | | 4.3 | |
| Materials | | | 4.2 | |
| Consumer Staples | | | 4.2 | |
| Energy | | | 3.6 | |
| Short-Term Investment | | | 3.1 | |
| * | | The return shown is based on net asset values calculated for shareholder transactions and may differ from the return shown in the financial highlights, which reflects adjustments made to the net asset values in accordance with accounting principles generally accepted in the United States of America. |
| ** | | The adviser seeks to achieve the Fund’s objective. There can be no guarantee it will be achieved. |
| *** | | Percentages indicated are based on total investments as of June 30, 2015. The Fund’s portfolio composition is subject to change. |
| | | | | | |
| | | |
| 6 | | | | J.P. MORGAN MID CAP/MULTI-CAP FUNDS | | JUNE 30, 2015 |
| | | | | | | | | | | | | | |
AVERAGE ANNUAL TOTAL RETURNS AS OF JUNE 30, 2015 | |
| | | | |
| | | INCEPTION DATE OF
CLASS | | 1 YEAR | | | 5 YEAR | | | 10 YEAR | |
CLASS A SHARES | | November 2, 2009 | | | | | | | | | | | | |
Without Sales Charge | | | | | 9.97 | % | | | 18.85 | % | | | 9.68 | % |
With Sales Charge* | | | | | 4.19 | | | | 17.57 | | | | 9.09 | |
CLASS C SHARES | | November 2, 2009 | | | | | | | | | | | | |
Without CDSC | | | | | 9.44 | | | | 18.26 | | | | 9.37 | |
With CDSC** | | | | | 8.44 | | | | 18.26 | | | | 9.37 | |
CLASS R2 SHARES | | March 14, 2014 | | | 9.71 | | | | 18.77 | | | | 9.65 | |
CLASS R5 SHARES | | March 14, 2014 | | | 10.49 | | | | 19.30 | | | | 9.91 | |
CLASS R6 SHARES | | March 14, 2014 | | | 10.53 | | | | 19.31 | | | | 9.92 | |
SELECT CLASS SHARES | | January 1, 1997 | | | 10.37 | | | | 19.26 | | | | 9.89 | |
| * | | Sales Charge for Class A Shares is 5.25%. |
| ** | | Assumes a 1% CDSC (contingent deferred sales charge) for the one year period and 0% CDSC thereafter. |
TEN YEAR PERFORMANCE (6/30/05 TO 6/30/15)
The performance quoted is past performance and is not a guarantee of future results. Mutual funds are subject to certain market risks. Investment returns and principal value of an investment will fluctuate so that an investor’s shares, when redeemed, may be worth more or less than their original cost. Current performance may be higher or lower than the performance data shown. For up-to-date month-end performance information please call 1-800-480-4111.
Returns for Class A and Class C Shares prior to their inception date are based on the performance of Select Class Shares. The actual returns of Class A and Class C Shares would have been lower than those shown because Class A and Class C Shares have higher expenses than Select Class Shares. Returns for Class R2 Shares prior to their inception date are based of Class A Shares from November 2, 2009 to March 13, 2014 and Select Class Shares prior to November 2, 2009. The actual returns of Class R2 Shares would have been lower than those shown because Class R2 Shares have higher expenses than Class A and Select Class Shares. Returns for Class R5 and Class R6 Shares prior to their inception date are based on the performance of Select Class Shares. The actual returns of Class R5 and Class R6 Shares would have been different because Class R5 and Class R6 Shares have different expenses than Select Class Shares.
The graph illustrates comparative performance for $1,000,000 invested in the Select Class Shares of JPMorgan Mid Cap Equity Fund, the Russell Midcap Index, Lipper Mid-Cap Core Funds Index and the Lipper Mid-Cap Growth Funds Index from June 30, 2005 to June 30, 2015. The performance of the Fund
assumes reinvestment of all dividends and capital gain distributions, if any, and
does not include a sales charge. The performance of the Russell Midcap Index does not reflect the deduction of expenses or a sales charge associated with a mutual fund and has been adjusted to reflect reinvestment of all dividends and capital gain distributions of the securities included in the benchmark, if applicable. The performance of the Lipper Mid-Cap Core Funds Index and Lipper Mid-Cap Growth Funds Index includes expenses associated with a mutual fund, such as investment management fees. These expenses are not identical to the expenses incurred by the Fund. The Russell Midcap Index is an unmanaged index which measures the performance of the 800 smallest companies in the Russell 1000 Index. The Lipper Mid-Cap Core Funds Index and the Lipper Mid-Cap Growth Funds Index are indices based on total returns of certain mutual funds within the mid cap fund categories as determined by Lipper, Inc. Investors cannot invest directly in an index.
Select Class Shares have a $1,000,000 minimum initial investment.
Fund performance may reflect the waiver of the Fund’s fees and reimbursement of expenses for certain periods since the inception date. Without these waivers and reimbursements, performance would have been lower. Also, performance shown in this section does not reflect the deduction of taxes that a shareholder would pay on Fund distributions or redemption of Fund shares.
The returns shown are based on net asset values calculated for shareholder transactions and may differ from the returns shown in the financial highlights, which reflect adjustments made to the net asset values in accordance with accounting principles generally accepted in the United States of America.
| | | | | | | | |
| | | |
| JUNE 30, 2015 | | J.P. MORGAN MID CAP/MULTI-CAP FUNDS | | | | | 7 | |
JPMorgan Mid Cap Growth Fund
FUND COMMENTARY
TWELVE MONTHS ENDED JUNE 30, 2015 (Unaudited)
| | | | |
| REPORTING PERIOD RETURN: | |
| Fund (Select Class Shares)* | | | 12.72% | |
| Russell Midcap Growth Index | | | 9.45% | |
| |
| Net Assets as of 6/30/2015 (In Thousands) | | $ | 3,062,526 | |
INVESTMENT OBJECTIVE**
The JPMorgan Mid Cap Growth Fund (the “Fund”) seeks growth of capital.1
WHAT WERE THE MAIN DRIVERS OF THE FUND’S PERFORMANCE?
The Fund (Select Class Shares) outperformed the Russell Midcap Growth Index (the “Benchmark”) for the twelve months ended June 30, 2015. The Fund’s security selection and overweight position in the technology sector and its security selection in the producer durables sector were leading contributors to performance relative to the Benchmark, while the Fund’s underweight position in the consumer staples sector and its security selection in the health care sector were leading detractors from relative performance.
Leading individual contributors to relative performance included the Fund’s overweight positions in Valeant Pharmaceuticals International Inc., Avago Technologies Ltd. and Electronic Arts Inc. Shares of Valeant, a drug and medical device maker not held in the Benchmark, rose on strong profit and revenue growth. Shares of Avago, a Singapore maker of analog semiconductors, strengthened on increased demand for semiconductors and its $37 billion acquisition of Broadcom Corp. Shares of Electronic Arts, a maker of video games and software, rose on better-than-expected profit and revenue.
Leading individual detractors from relative performance included the Fund’s overweight positions in Michael Kors Holdings Ltd., Laredo Petroleum Holdings Inc. and Kirby Corp. Shares of Michael Kors, a luxury apparel brand, fell on investor concerns about growing inventory, margin growth and management’s ability to execute strategy. Shares of Laredo Petroleum, an independent oil and natural gas exploration and production company, fell amid weakness in global oil prices. Shares of Kirby, a tank and barge operator, fell on disappointing revenue and the lower revision to the company’s earnings forecast.
HOW WAS THE FUND POSITIONED?
The Fund’s portfolio managers utilized a bottom-up approach to stock selection, researching individual companies in an effort to construct a portfolio of stocks that have strong fundamentals. The Fund’s portfolio managers sought to invest in high quality companies with durable franchises that, in their view, possessed the ability to generate strong future earnings growth.
| | | | | | | | |
| TOP TEN EQUITY HOLDINGS OF THE PORTFOLIO*** | |
| | 1. | | | Acuity Brands, Inc. | | | 2.3 | % |
| | 2. | | | Sherwin-Williams Co. (The) | | | 2.3 | |
| | 3. | | | CBRE Group, Inc., Class A | | | 2.1 | |
| | 4. | | | Mohawk Industries, Inc. | | | 1.9 | |
| | 5. | | | NXP Semiconductors N.V., (Netherlands) | | | 1.9 | |
| | 6. | | | Alliance Data Systems Corp. | | | 1.8 | |
| | 7. | | | McGraw Hill Financial, Inc. | | | 1.7 | |
| | 8. | | | Delta Air Lines, Inc. | | | 1.7 | |
| | 9. | | | Monster Beverage Corp. | | | 1.7 | |
| | 10. | | | Carlisle Cos., Inc. | | | 1.6 | |
| | | | |
PORTFOLIO COMPOSITION BY SECTOR*** | |
| Information Technology | | | 24.7 | % |
| Consumer Discretionary | | | 18.9 | |
| Health Care | | | 16.4 | |
| Industrials | | | 15.5 | |
| Financials | | | 11.5 | |
| Materials | | | 3.3 | |
| Energy | | | 2.7 | |
| Consumer Staples | | | 2.6 | |
Short-Term Investment | | | 4.4 | |
| * | | The return shown is based on net asset values calculated for shareholder transactions and may differ from the return shown in the financial highlights, which reflects adjustments made to the net asset values in accordance with accounting principles generally accepted in the United States of America. |
| ** | | The adviser seeks to achieve the Fund’s objective. There can be no guarantee it will be achieved. |
| *** | | Percentages indicated are based on total investments as of June 30, 2015. The Fund’s portfolio composition is subject to change. |
| 1 | | Effective July 23, 2014, following approval from the Fund’s Board of Trustees, shareholders approved the change to the Fund’s investment objective. The current investment objective is stated above. Prior to July 23, 2014, the Fund’s investment objective was to seek growth of capital and secondarily, current income by investing primarily in equity securities. |
| | | | | | |
| | | |
| 8 | | | | J.P. MORGAN MID CAP/MULTI-CAP FUNDS | | JUNE 30, 2015 |
| | | | | | | | | | | | | | |
AVERAGE ANNUAL TOTAL RETURNS AS OF JUNE 30, 2015 | |
| | | | |
| | | INCEPTION DATE OF
CLASS | | 1 YEAR | | | 5 YEAR | | | 10 YEAR | |
CLASS A SHARES | | February 18, 1992 | | | | | | | | | | | | |
Without Sales Charge | | | | | 12.37 | % | | | 19.83 | % | | | 10.13 | % |
With Sales Charge* | | | | | 6.48 | | | | 18.53 | | | | 9.54 | |
CLASS C SHARES | | November 4, 1997 | | | | | | | | | | | | |
Without CDSC | | | | | 11.78 | | | | 19.22 | | | | 9.52 | |
With CDSC** | | | | | 10.78 | | | | 19.22 | | | | 9.52 | |
CLASS R2 SHARES | | June 19, 2009 | | | 12.18 | | | | 19.64 | | | | 9.96 | |
CLASS R5 SHARES | | November 1, 2011 | | | 12.87 | | | | 20.32 | | | | 10.51 | |
CLASS R6 SHARES | | November 1, 2011 | | | 12.96 | | | | 20.37 | | | | 10.53 | |
SELECT CLASS SHARES | | March 2, 1989 | | | 12.72 | | | | 20.19 | | | | 10.45 | |
| * | | Sales Charge for Class A Shares is 5.25%. |
| ** | | Assumes a 1% CDSC (contingent deferred sales charge) for the one year period and 0% CDSC thereafter. |
TEN YEAR PERFORMANCE (6/30/05 TO 6/30/15)
The performance quoted is past performance and is not a guarantee of future results. Mutual funds are subject to certain market risks. Investment returns and principal value of an investment will fluctuate so that an investor’s shares, when redeemed, may be worth more or less than their original cost. Current performance may be higher or lower than the performance data shown. For up-to-date month-end performance information please call 1-800-480-4111.
Returns for the Class R2, Class R5 and Class R6 Shares prior to their inception dates are based on the performance of Select Class Shares. Prior performance for Class R2 Shares has been adjusted to reflect the differences in expenses between classes. The actual returns of Class R5 and Class R6 Shares would have been different than those shown because Class R5 and Class R6 Shares have different expenses than Select Class Shares.
The graph illustrates comparative performance for $1,000,000 invested in Select Class Shares of the JPMorgan Mid Cap Growth Fund, the Russell Midcap Growth Index and the Lipper Mid-Cap Growth Funds Index from June 30, 2005 to June 30, 2015. The performance of the Fund assumes reinvestment of all dividends and capital gain distributions, if any, and does not include a sales charge. The performance of the Russell Midcap Growth Index does not reflect the deduction of expenses or a sales charge associated with a mutual fund and
has been adjusted to reflect reinvestment of all dividends and capital gain distributions of the securities included in the benchmark, if applicable. The performance of the Lipper Mid-Cap Growth Funds Index includes expenses associated with a mutual fund, such as investment management fees. These expenses are not identical to the expenses incurred by the Fund. The Russell Midcap Growth Index is an unmanaged index which measures the performance of those Russell Midcap companies with higher price-to-book ratios and higher forecasted growth values. The Lipper Mid-Cap Growth Funds Index is an index based on total returns of certain mutual funds as determined by Lipper, Inc. Investors cannot invest directly in an index.
Select Class Shares have a $1,000,000 minimum initial investment.
Fund performance may reflect the waiver of the Fund’s fees and reimbursement of expenses for certain periods since the inception date. Without these waivers and reimbursements, performance would have been lower. Also, performance shown in this section does not reflect the deduction of taxes that a shareholder would pay on Fund distributions or redemption of Fund shares.
The returns shown are based on net asset values calculated for shareholder transactions and may differ from the returns shown in the financial highlights, which reflect adjustments made to the net asset values in accordance with accounting principles generally accepted in the United States of America.
| | | | | | | | |
| | | |
| JUNE 30, 2015 | | J.P. MORGAN MID CAP/MULTI-CAP FUNDS | | | | | 9 | |
JPMorgan Mid Cap Value Fund
FUND COMMENTARY
TWELVE MONTHS ENDED JUNE 30, 2015 (Unaudited)
| | | | |
| REPORTING PERIOD RETURN: | |
| Fund (Institutional Class Shares)* | | | 8.19% | |
| Russell Midcap Value Index | | | 3.67% | |
| |
| Net Assets as of 6/30/2015 (In Thousands) | | $ | 15,959,073 | |
INVESTMENT OBJECTIVE**
The JPMorgan Mid Cap Value Fund (the “Fund”) seeks growth from capital appreciation.
WHAT WERE THE MAIN DRIVERS OF THE FUND’S PERFORMANCE?
The Fund (Institutional Class Shares) outperformed the Russell Midcap Value Index (the “Benchmark”) for the twelve months ended June 30, 2015. The Fund’s underweight position and security selection in the energy sector and its security selection and overweight position in the consumer discretionary sector were leading contributors to performance relative to the Benchmark, while the Fund’s underweight position in the health care sector and security selection in the utilities sector were leading detractors from relative performance.
Leading individual contributors to relative performance included the Fund’s overweight positions in Kroger Co., Expedia Inc. and Cigna Corp. Shares of Kroger, a supermarket chain not held in the Benchmark, rose on increased consumer spending in the U.S., an increase in its dividend and a share repurchase program. Shares of Expedia, an online travel service not held in the Benchmark, rose on growth in earnings and revenue. Shares of Cigna, a health insurer, rose on news of a $54 billion takeover offer from Anthem Inc.
Leading individual detractors from relative performance included the Fund’s overweight positions in Southwestern Energy Co. and MSC Industrial Direct Co. and its underweight position in HCA Holdings Inc. Shares of Southwestern Energy, an oil and gas exploration and production company, declined on global weakness in energy prices. Shares of MSC Industrial, a provider of metalworking products, fell after the company forecast sales and earnings below analysts’ estimates. Shares of HCA Holdings, an owner/operator of hospitals and other medical centers that was not held by the Fund, rose on the company’s improved forecast for earnings and revenue.
HOW WAS THE FUND POSITIONED?
The Fund’s portfolio managers utilized a bottom-up approach to stock selection and sought to identify durable franchises possessing the ability to generate, in their view, sustainable levels of free cash flow. Relative to the Benchmark, the Fund had an overweight position in consumer discretionary stocks during the twelve month reporting period. The Fund’s largest relative underweight position was in the health care sector.
| | | | | | | | |
| TOP TEN EQUITY HOLDINGS OF THE PORTFOLIO*** | |
| | 1. | | | Cigna Corp. | | | 1.7 | % |
| | 2. | | | Kohl’s Corp. | | | 1.7 | |
| | 3. | | | Mohawk Industries, Inc. | | | 1.6 | |
| | 4. | | | Energen Corp. | | | 1.6 | |
| | 5. | | | Humana, Inc. | | | 1.6 | |
| | 6. | | | Jack Henry & Associates, Inc. | | | 1.5 | |
| | 7. | | | Loews Corp. | | | 1.5 | |
| | 8. | | | Fifth Third Bancorp | | | 1.5 | |
| | 9. | | | Arrow Electronics, Inc. | | | 1.5 | |
| | 10. | | | Synopsys, Inc. | | | 1.4 | |
| | | | |
PORTFOLIO COMPOSITION BY SECTOR*** | |
| Financials | | | 29.5 | % |
| Consumer Discretionary | | | 18.7 | |
| Industrials | | | 9.4 | |
| Utilities | | | 8.6 | |
| Information Technology | | | 8.5 | |
| Health Care | | | 6.5 | |
| Consumer Staples | | | 5.7 | |
| Materials | | | 5.1 | |
Energy | | | 3.9 | |
Short-Term Investment | | | 4.1 | |
| * | | The return shown is based on net asset values calculated for shareholder transactions and may differ from the return shown in the financial highlights, which reflects adjustments made to the net asset values in accordance with accounting principles generally accepted in the United States of America. |
| ** | | The adviser seeks to achieve the Fund’s objective. There can be no guarantee it will be achieved. |
| *** | | Percentages indicated are based on total investments as of June 30, 2015. The Fund’s portfolio composition is subject to change. |
| | | | | | |
| | | |
| 10 | | | | J.P. MORGAN MID CAP/MULTI-CAP FUNDS | | JUNE 30, 2015 |
| | | | | | | | | | | | | | |
AVERAGE ANNUAL TOTAL RETURNS AS OF JUNE 30, 2015 | |
| | | | |
| | | INCEPTION DATE OF
CLASS | | 1 YEAR | | | 5 YEAR | | | 10 YEAR | |
CLASS A SHARES | | April 30, 2001 | | | | | | | | | | | | |
Without Sales Charge | | | | | 7.68 | % | | | 18.10 | % | | | 9.10 | % |
With Sales Charge* | | | | | 2.04 | | | | 16.83 | | | | 8.51 | |
CLASS C SHARES | | April 30, 2001 | | | | | | | | | | | | |
Without CDSC | | | | | 7.12 | | | | 17.50 | | | | 8.55 | |
With CDSC** | | | | | 6.12 | | | | 17.50 | | | | 8.55 | |
CLASS R2 SHARES | | November 3, 2008 | | | 7.38 | | | | 17.80 | | | | 8.91 | |
INSTITUTIONAL CLASS SHARES | | November 13, 1997 | | | 8.19 | | | | 18.69 | | | | 9.63 | |
SELECT CLASS SHARES | | October 31, 2001 | | | 7.92 | | | | 18.40 | | | | 9.37 | |
| * | | Sales Charge for Class A Shares is 5.25%. |
| ** | | Assumes a 1% CDSC (contingent deferred sales charge) for the one year period and 0% CDSC thereafter. |
TEN YEAR PERFORMANCE (6/30/05 TO 6/30/15)
The performance quoted is past performance and is not a guarantee of future results. Mutual funds are subject to certain market risks. Investment returns and principal value of an investment will fluctuate so that an investor’s shares, when redeemed, may be worth more or less than their original cost. Current performance may be higher or lower than the performance data shown. For up-to-date month-end performance information please call 1-800-480-4111.
Returns for Class R2 Shares prior to its inception date are based on the performance of Class A Shares. The actual returns of Class R2 Shares would have been lower than those shown because Class R2 Shares have higher expenses than Class A Shares.
The graph illustrates comparative performance for $3,000,000 invested in Institutional Class Shares of the JPMorgan Mid Cap Value Fund, the Russell Midcap Value Index, the Lipper Mid-Cap Value Funds Index and the Lipper Multi-Cap Core Funds Index from June 30, 2005 to June 30, 2015. The performance of the Fund assumes reinvestment of all dividends and capital gain distributions, if any, and does not include a sales charge. The performance of the Russell Midcap Value Index does not reflect the deduction of expenses or a sales charge associated with a mutual fund and has been adjusted to reflect reinvestment of all dividends and capital gain distributions of the securities included in the benchmark, if applicable. The performance of the Lipper
Mid-Cap Value Funds Index and the Lipper Multi-Cap Core Funds Index includes expenses associated with a mutual fund, such as investment management fees. These expenses are not identical to the expenses incurred by the Fund. The Russell Midcap Value Index is an unmanaged index which measures the performance of those Russell Midcap companies with lower price-to-book ratios and lower forecasted growth values. The Lipper Mid-Cap Value Funds Index and the Lipper Multi-Cap Core Funds Index are indices based on total returns of certain mutual funds within the mid cap and multi cap fund categories, respectively, as determined by Lipper, Inc. Investors cannot invest directly in an index.
Institutional Class Shares have a $3,000,000 minimum initial investment.
Fund performance may reflect the waiver of the Fund’s fees and reimbursement of expenses for certain periods since the inception date. Without these waivers and reimbursements, performance would have been lower. Also, performance shown in this section does not reflect the deduction of taxes that a shareholder would pay on Fund distributions or redemption of Fund shares.
The returns shown are based on net asset values calculated for shareholder transactions and may differ from the returns shown in the financial highlights, which reflect adjustments made to the net asset values in accordance with accounting principles generally accepted in the United States of America.
| | | | | | | | |
| | | |
| JUNE 30, 2015 | | J.P. MORGAN MID CAP/MULTI-CAP FUNDS | | | | | 11 | |
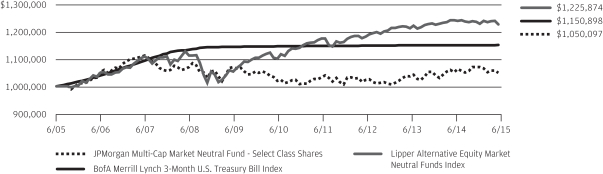
JPMorgan Multi-Cap Market Neutral Fund
FUND COMMENTARY
TWELVE MONTHS ENDED JUNE 30, 2015 (Unaudited)
| | | | |
| REPORTING PERIOD RETURN: | |
| Fund (Select Class Shares)* | | | -0.20% | |
| BofA Merrill Lynch 3-Month U.S. Treasury Bill Index | | | 0.02% | |
| |
| Net Assets as of 6/30/15 (In Thousands) | | $ | 290,680 | |
INVESTMENT OBJECTIVE**
The JPMorgan Multi-Cap Market Neutral Fund (the “Fund”) seeks long-term capital preservation and growth by using strategies designed to produce returns which have no correlation with general domestic market performance.
WHAT WERE THE MAIN DRIVERS OF THE FUND’S PERFORMANCE?
The Fund (Select Class Shares) underperformed the BofA Merrill Lynch 3-Month U.S. Treasury Bill Index (the “Benchmark”) for the twelve months ended June 30, 2015. The Fund’s security selection process produced positive returns in the energy and health care sectors and negative returns in the consumer discretionary and utilities sectors.
Leading individual detractors from Fund returns included its short positions in Nuance Communications Inc. and Electronic Arts Inc. and its long positions in Kate Spade & Co. Shares of Nuance Communications, a provider of voice recognition and related technologies, rose on strong quarterly earnings and positive trends in the industry. Shares of Electronic Arts, a developer of videogame software and content, rose on positive earnings announcements, strong industry fundamentals and popular new releases. Shares of Kate Spade, a brand name apparel maker, fell on slowing sales growth.
Leading individual contributors to Fund returns included its long position in McDermott International Inc. and its short positions in Rovi Corp. and Southwest Airlines Co. Shares of McDermott International, a provider of engineering and construction services to the energy industry, rose on news of an organizational restructuring and the winning of several large contracts. Shares of Rovi, a provider of television guide programs to cable TV companies, declined on investor worries about the company’s prospects for contract renewals and litigation over key technology patents. Shares of Southwest Airlines, a passenger airline operator, fell on weak growth in large markets and volatility in fuel prices.
HOW WAS THE FUND POSITIONED?
The Fund’s portfolio managers employed a bottom-up approach to stock selection, constructing a portfolio based on company fundamentals, quantitative screening and proprietary fundamental analysis. The Fund’s portfolio managers sought to identify dominant franchises with predictable business models deemed capable of achieving, in their view, sustained growth,
as well as undervalued companies with the potential to grow their intrinsic value per share. Companies that ranked lowest in the above factors were selected by the Fund’s portfolio managers for possible short sales.
| | | | | | | | |
| TOP TEN LONG POSITIONS OF THE PORTFOLIO*** | |
| | 1. | | | Nuance Communications, Inc. | | | 1.0 | % |
| | 2. | | | Apple, Inc. | | | 1.0 | |
| | 3. | | | Archer-Daniels-Midland Co. | | | 1.0 | |
| | 4. | | | eBay, Inc. | | | 1.0 | |
| | 5. | | | Intuit, Inc. | | | 1.0 | |
| | 6. | | | Darden Restaurants, Inc. | | | 1.0 | |
| | 7. | | | Target Corp. | | | 1.0 | |
| | 8. | | | Electronic Arts, Inc. | | | 1.0 | |
| | 9. | | | Lowe’s Cos., Inc. | | | 1.0 | |
| | 10. | | | ServiceMaster Global Holdings, Inc. | | | 1.0 | |
| | | | | | | | |
| TOP TEN SHORT POSITIONS OF THE PORTFOLIO**** | |
| | 1. | | | Brown-Forman Corp., Class B | | | 1.3 | % |
| | 2. | | | Estee Lauder Cos., Inc. (The), Class A | | | 1.2 | |
| | 3. | | | McCormick & Co., Inc. (Non-Voting) | | | 1.2 | |
| | 4. | | | Hain Celestial Group, Inc. (The) | | | 1.2 | |
| | 5. | | | Dominion Resources, Inc. | | | 1.2 | |
| | 6. | | | Team Health Holdings, Inc. | | | 1.1 | |
| | 7. | | | Tenet Healthcare Corp. | | | 1.1 | |
| | 8. | | | Cooper Cos., Inc. (The) | | | 1.1 | |
| | 9. | | | Markel Corp. | | | 1.1 | |
| | 10. | | | Acadia Healthcare Co., Inc. | | | 1.1 | |
| | | | |
LONG POSITION PORTFOLIO COMPOSITION BY SECTOR*** | |
| Information Technology | | | 23.3 | % |
| Industrials | | | 15.1 | |
| Consumer Discretionary | | | 13.2 | |
| Health Care | | | 11.3 | |
| Consumer Staples | | | 6.9 | |
| Energy | | | 4.2 | |
| Financials | | | 4.2 | |
| Materials | | | 3.9 | |
| Utilities | | | 2.9 | |
| Telecommunication Services | | | 1.8 | |
| Short-Term Investment | | | 13.2 | |
| | | | | | |
| | | |
| 12 | | | | J.P. MORGAN MID CAP/MULTI-CAP FUNDS | | JUNE 30, 2015 |
| | | | |
SHORT POSITION PORTFOLIO COMPOSITION BY SECTOR**** | |
| Information Technology | | | 23.8 | % |
| Industrials | | | 19.9 | |
| Consumer Discretionary | | | 15.1 | |
| Health Care | | | 12.0 | |
| Consumer Staples | | | 9.1 | |
| Financials | | | 5.8 | |
| Energy | | | 5.1 | |
| Materials | | | 4.1 | |
| Utilities | | | 3.2 | |
| Telecommunication Services | | | 1.9 | |
| * | | The return shown is based on net asset values calculated for shareholder transactions and may differ from the return shown in the financial highlights, which reflects adjustments made to the net asset values in accordance with accounting principles generally accepted in the United States of America. |
| ** | | The adviser seeks to achieve the Fund’s objective. There can be no guarantee it will be achieved. |
| *** | | Percentages indicated are based on total long investments as of June 30, 2015. The Fund’s portfolio composition is subject to change. |
| **** | | Percentages indicated are based on total short investments as of June 30, 2015. The Fund’s portfolio composition is subject to change. |
| | | | | | | | |
| | | |
| JUNE 30, 2015 | | J.P. MORGAN MID CAP/MULTI-CAP FUNDS | | | | | 13 | |
JPMorgan Multi-Cap Market Neutral Fund
FUND COMMENTARY
TWELVE MONTHS ENDED JUNE 30, 2015 (Unaudited) (continued)
| | | | | | | | | | | | | | |
AVERAGE ANNUAL TOTAL RETURNS AS OF JUNE 30, 2015 | |
| | | | |
| | | INCEPTION DATE OF
CLASS | | 1 YEAR | | | 5 YEAR | | | 10 YEAR | |
CLASS A SHARES | | May 23, 2003 | | | | | | | | | | | | |
Without Sales Charge | | | | | (0.40 | )% | | | 0.33 | % | | | 0.25 | % |
With Sales Charge* | | | | | (5.64 | ) | | | (0.75 | ) | | | (0.29 | ) |
CLASS C SHARES | | May 23, 2003 | | | | | | | | | | | | |
Without CDSC | | | | | (0.96 | ) | | | (0.32 | ) | | | (0.45 | ) |
With CDSC** | | | | | (1.96 | ) | | | (0.32 | ) | | | (0.45 | ) |
SELECT CLASS SHARES | | May 23, 2003 | | | (0.20 | ) | | | 0.57 | | | | 0.49 | |
| * | | Sales Charge for Class A Shares is 5.25%. |
| ** | | Assumes a 1% CDSC (contingent deferred sales charge) for the one year period and 0% CDSC thereafter. |
TEN YEAR PERFORMANCE (6/30/05 TO 6/30/15)
The performance quoted is past performance and is not a guarantee of future results. Mutual funds are subject to certain market risks. Investment returns and principal value of an investment will fluctuate so that an investor’s shares, when redeemed, may be worth more or less than their original cost. Current performance may be higher or lower than the performance data shown. For up-to-date month-end performance information please call 1-800-480-4111.
The graph illustrates comparative performance for $1,000,000 invested in Select Class Shares of the JPMorgan Multi-Cap Market Neutral Fund, the BofA Merrill Lynch 3-Month U.S. Treasury Bill Index and the Lipper Alternative Equity Market Neutral Funds Index from June 30, 2015 to June 30, 2015. Return information prior to October 31, 2005 for the Lipper Alternative Equity Market Neutral Funds Index is not provided by Lipper, Inc. The performance of the Fund assumes reinvestment of all dividends and capital gain distributions, if any, and does not include a sales charge. The performance of the indices reflects an initial investment at the end of the month following the Fund’s inception. The performance of the BofA Merrill Lynch 3-Month U.S. Treasury Bill Index does not reflect the deduction of expenses or a sales charge associated with a mutual fund and has been adjusted to reflect reinvestment of all dividends and capital gain distributions of the securities included in the benchmark, if applicable. The performance of the Lipper Alternative Equity Market Neutral Funds Index
includes expenses associated with a mutual fund, such as investment management fees. These expenses are not identical to the expenses incurred by the Fund. The BofA Merrill Lynch 3-Month U.S. Treasury Bill Index is comprised of a single issue purchased at the beginning of the month and held for a full month. Each month the index is rebalanced and the issue selected is the outstanding Treasury Bill that matures closest to, but not beyond, 3 months from the rebalancing date. The Lipper Alternative Equity Market Neutral Funds Index is an index based on total returns of certain mutual funds within the Fund’s designated category as determined by Lipper, Inc. Investors cannot invest directly in an index.
Select Class Shares have a $1,000,000 minimum initial investment.
Fund performance may reflect the waiver of the Fund’s fees and reimbursement of expenses for certain periods since the inception date. Without these waivers and reimbursements, performance would have been lower. Also, performance shown in this section does not reflect the deduction of taxes that a shareholder would pay on Fund distributions or redemption of Fund shares.
The returns shown are based on net asset values calculated for shareholder transactions and may differ from the returns shown in the financial highlights, which reflect adjustments made to the net asset values in accordance with accounting principles generally accepted in the United States of America.
| | | | | | |
| | | |
| 14 | | | | J.P. MORGAN MID CAP/MULTI-CAP FUNDS | | JUNE 30, 2015 |
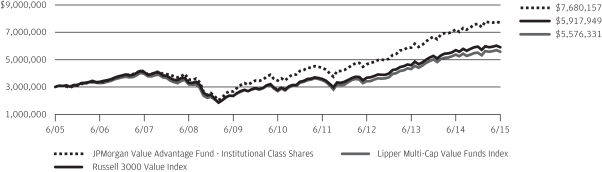
JPMorgan Value Advantage Fund
FUND COMMENTARY
TWELVE MONTHS ENDED JUNE 30, 2015 (Unaudited)
| | | | |
| REPORTING PERIOD RETURN: | | | |
| Fund (Institutional Class Shares)* | | | 6.36% | |
| Russell 3000 Value Index | | | 3.86% | |
| |
| Net Assets as of 6/30/2015 (In Thousands) | | $ | 11,294,507 | |
INVESTMENT OBJECTIVE**
The JPMorgan Value Advantage Fund (the “Fund”) seeks to provide long-term total return from a combination of income and capital gains.
WHAT WERE THE MAIN DRIVERS OF THE FUND’S PERFORMANCE?
The Fund (Institutional Class Shares) outperformed the Russell 3000 Value Index (the “Benchmark”) for the twelve months ended June 30, 2015. The Fund’s underweight position and security selection in the energy sector and its security selection and overweight position in the consumer discretionary sector were leading contributors to performance relative to the Benchmark, while the Fund’s underweight position in the health care sector and security selection in the financial services sector were leading detractors from relative performance.
Leading individual contributors to relative performance included the Fund’s underweight position in Chevron Corp. and its overweight positions in Valeant Pharmaceuticals International Inc. and Aetna Inc. Shares of Chevron, an integrated energy producer not held by the Fund, fell amid continued weakness in global energy prices. Shares of Valeant, a drug and medical device maker not held in the Benchmark, rose on strong profit and revenue growth. Shares of Aetna, a health insurer, rose after the company raised its earnings forecast.
Leading individual detractors from relative performance included the Fund’s overweight positions in Consol Energy Inc. and Southwestern Energy Co. and its underweight position in JPMorgan Chase & Co. Shares of both Consol Energy and Southwestern Energy, oil and gas exploration and production companies, fell amid continued weakness in global energy prices. Shares of J.P Morgan, a banking and financial services company that cannot be held by the Fund, rose on earnings and revenue growth.
HOW WAS THE FUND POSITIONED?
The Fund’s portfolio managers utilized a bottom-up approach to stock selection and sought to identify durable franchises possessing the ability to generate, in the portfolio managers’ view, significant levels of free cash flow. The Fund’s largest overweight position continued to be in the consumer discretionary sector, where the Fund’s portfolio managers found what they believed to be compelling investment opportunities.
The Fund’s largest underweight position was in the energy sector. In addition, the Fund’s relative performance was hindered by above-average cash holdings. The cash position accrued because the Fund’s portfolio managers believed valuations were stretched and did not want to invest in overvalued securities.
| | | | | | | | |
| TOP TEN EQUITY HOLDINGS OF THE PORTFOLIO*** | |
| | 1. | | | Wells Fargo & Co. | | | 3.8 | % |
| | 2. | | | Exxon Mobil Corp. | | | 2.2 | |
| | 3. | | | Pfizer, Inc. | | | 2.1 | |
| | 4. | | | Capital One Financial Corp. | | | 2.0 | |
| | 5. | | | Bank of America Corp. | | | 1.8 | |
| | 6. | | | Johnson & Johnson | | | 1.6 | |
| | 7. | | | Loews Corp. | | | 1.6 | |
| | 8. | | | American International Group, Inc. | | | 1.6 | |
| | 9. | | | Kohl’s Corp. | | | 1.5 | |
| | 10. | | | Merck & Co., Inc. | | | 1.4 | |
| | | | |
PORTFOLIO COMPOSITION BY SECTOR*** | |
| Financials | | | 32.8 | % |
| Consumer Discretionary | | | 14.7 | |
| Health Care | | | 8.8 | |
| Industrials | | | 7.4 | |
| Energy | | | 7.2 | |
| Utilities | | | 5.4 | |
| Consumer Staples | | | 4.8 | |
| Information Technology | | | 4.6 | |
| Materials | | | 3.7 | |
| Telecommunication Services | | | 1.5 | |
| Short-Term Investment | | | 9.1 | |
| * | | The return shown is based on net asset values calculated for shareholder transactions and may differ from the return shown in the financial highlights, which reflects adjustments made to the net asset values in accordance with accounting principles generally accepted in the United States of America. |
| ** | | The adviser seeks to achieve the Fund’s objective. There can be no guarantee it will be achieved. |
| *** | | Percentages indicated are based on total investments as of June 30, 2015. The Fund’s portfolio composition is subject to change. |
| | | | | | | | |
| | | |
| JUNE 30, 2015 | | J.P. MORGAN MID CAP/MULTI-CAP FUNDS | | | | | 15 | |
JPMorgan Value Advantage Fund
FUND COMMENTARY
TWELVE MONTHS ENDED JUNE 30, 2015 (Unaudited) (continued)
| | | | | | | | | | | | | | |
AVERAGE ANNUAL TOTAL RETURNS AS OF JUNE 30, 2015 | |
| | | | |
| | | INCEPTION DATE OF
CLASS | | 1 YEAR | | | 5 YEAR | | | 10 YEAR | |
CLASS A SHARES | | February 28, 2005 | | | | | | | | | | | | |
Without Sales Charge | | | | | 5.78 | % | | | 16.69 | % | | | 9.36 | % |
With Sales Charge* | | | | | 0.21 | | | | 15.44 | | | | 8.77 | |
CLASS C SHARES | | February 28, 2005 | | | | | | | | | | | | |
Without CDSC | | | | | 5.26 | | | | 16.11 | | | | 8.82 | |
With CDSC** | | | | | 4.26 | | | | 16.11 | | | | 8.82 | |
INSTITUTIONAL CLASS SHARES | | February 28, 2005 | | | 6.36 | | | | 17.28 | | | | 9.86 | |
SELECT CLASS SHARES | | February 28, 2005 | | | 6.05 | | | | 16.98 | | | | 9.64 | |
| * | | Sales Charge for Class A Shares is 5.25%. |
| ** | | Assumes a 1% CDSC (contingent deferred sales charge) for the one year period and 0% CDSC thereafter. |
TEN YEAR PERFORMANCE (6/30/05 TO 6/30/15)
The performance quoted is past performance and is not a guarantee of future results. Mutual funds are subject to certain market risks. Investment returns and principal value of an investment will fluctuate so that an investor’s shares, when redeemed, may be worth more or less than their original cost. Current performance may be higher or lower than the performance data shown. For up-to-date month-end performance information please call 1-800-480-4111.
The graph illustrates comparative performance for $3,000,000 invested in Institutional Class Shares of the JPMorgan Value Advantage Fund, the Russell 3000 Value Index and the Lipper Multi-Cap Value Funds Index from June 30, 2005 to June 30, 2015. The performance of the Fund assumes reinvestment of all dividends and capital gain distributions, if any, and does not include a sales charge. The performance of the Russell 3000 Value Index does not reflect the deduction of expenses or a sales charge associated with a mutual fund and has been adjusted to reflect reinvestment of all dividends and capital gain distributions of the securities included in the benchmark, if applicable. The performance of the Lipper Multi-Cap Value Funds Index includes expenses associated with a mutual fund, such as investment management fees.
These expenses are not identical to the expenses incurred by the Fund. The Russell 3000 Value Index is an unmanaged index which measures the performance of those Russell 3000 companies (largest 3000 U.S. companies) with lower price-to-book ratios and lower forecasted growth values. The Lipper Multi-Cap Value Funds Index is an index based on total returns of certain mutual funds within the Fund’s designated category as determined by Lipper, Inc. Investors cannot invest directly in an index.
Institutional Class Shares have a $3,000,000 minimum initial investment.
Fund performance may reflect the waiver of the Fund’s fees and reimbursement of expenses for certain periods since the inception date. Without these waivers and reimbursements, performance would have been lower. Also, performance shown in this section does not reflect the deduction of taxes that a shareholder would pay on Fund distributions or redemption of Fund shares.
The returns shown are based on net asset values calculated for shareholder transactions and may differ from the returns shown in the financial highlights, which reflect adjustments made to the net asset values in accordance with accounting principles generally accepted in the United States of America.
| | | | | | |
| | | |
| 16 | | | | J.P. MORGAN MID CAP/MULTI-CAP FUNDS | | JUNE 30, 2015 |
JPMorgan Growth Advantage Fund
SCHEDULE OF PORTFOLIO INVESTMENTS
AS OF JUNE 30, 2015
(Amounts in thousands)
| | | | | | | | |
| SHARES | | | SECURITY DESCRIPTION | | VALUE($) | |
| Common Stocks — 97.2% | |
| | | | Consumer Discretionary — 16.4% | | | | |
| | | | Automobiles — 1.1% | |
| | 220 | | | Tesla Motors, Inc. (a) | | | 58,937 | |
| | | | | | | | |
| | | | Hotels, Restaurants & Leisure — 2.3% | |
| | 1,858 | | | Hilton Worldwide Holdings, Inc. (a) | | | 51,182 | |
| | 1,246 | | | Starbucks Corp. | | | 66,826 | |
| | | | | | | | |
| | | | | | | 118,008 | |
| | | | | | | | |
| | | | Household Durables — 1.2% | |
| | 336 | | | Mohawk Industries, Inc. (a) | | | 64,047 | |
| | | | | | | | |
| | | | Internet & Catalog Retail — 6.0% | |
| | 277 | | | Amazon.com, Inc. (a) | | | 120,417 | |
| | 133 | | | Netflix, Inc. (a) | | | 87,373 | |
| | 57 | | | Priceline Group, Inc. (The) (a) | | | 65,052 | |
| | 988 | | | Wayfair, Inc., Class A (a) | | | 37,188 | |
| | | | | | | | |
| | | | | | | 310,030 | |
| | | | | | | | |
| | | | Multiline Retail — 0.8% | |
| | 518 | | | Dollar General Corp. | | | 40,293 | |
| | | | | | | | |
| | | | Specialty Retail — 4.4% | |
| | 1,044 | | | GameStop Corp., Class A | | | 44,842 | |
| | 859 | | | Home Depot, Inc. (The) | | | 95,416 | |
| | 405 | | | Ulta Salon Cosmetics & Fragrance, Inc. (a) | | | 62,521 | |
| | 662 | | | Urban Outfitters, Inc. (a) | | | 23,177 | |
| | | | | | | | |
| | | | | | | 225,956 | |
| | | | | | | | |
| | | | Textiles, Apparel & Luxury Goods — 0.6% | |
| | 1,146 | | | Wolverine World Wide, Inc. | | | 32,632 | |
| | | | | | | | |
| | | | Total Consumer Discretionary | | | 849,903 | |
| | | | | | | | |
| | | | Consumer Staples — 1.7% | | | | |
| | | | Beverages — 0.9% | |
| | 347 | | | Monster Beverage Corp. (a) | | | 46,492 | |
| | | | | | | | |
| | | | Food & Staples Retailing — 0.8% | |
| | 1,542 | | | Sprouts Farmers Market, Inc. (a) | | | 41,592 | |
| | | | | | | | |
| | | | Total Consumer Staples | | | 88,084 | |
| | | | | | | | |
| | | | Energy — 2.6% | | | | |
| | | | Energy Equipment & Services — 0.4% | |
| | 284 | | | Dril-Quip, Inc. (a) | | | 21,363 | |
| | | | | | | | |
| | | | Oil, Gas & Consumable Fuels — 2.2% | |
| | 582 | | | Concho Resources, Inc. (a) | | | 66,244 | |
| | 920 | | | Range Resources Corp. | | | 45,440 | |
| | | | | | | | |
| | | | | | | 111,684 | |
| | | | | | | | |
| | | | Total Energy | | | 133,047 | |
| | | | | | | | |
| | | | | | | | |
| SHARES | | | SECURITY DESCRIPTION | | VALUE($) | |
| | | | | | | | |
| | | | Financials — 9.2% | | | | |
| | | | Banks — 2.0% | |
| | 872 | | | East West Bancorp, Inc. | | | 39,088 | |
| | 437 | | | Signature Bank (a) | | | 63,928 | |
| | | | | | | | |
| | | | | | | 103,016 | |
| | | | | | | | |
| | | | Capital Markets — 3.5% | |
| | 321 | | | Affiliated Managers Group, Inc. (a) | | | 70,214 | |
| | 1,069 | | | Lazard Ltd., (Bermuda), Class A | | | 60,132 | |
| | 1,480 | | | TD Ameritrade Holding Corp. | | | 54,486 | |
| | | | | | | | |
| | | | | | | 184,832 | |
| | | | | | | | |
| | | | Diversified Financial Services — 1.5% | |
| | 757 | | | McGraw Hill Financial, Inc. | | | 76,071 | |
| | | | | | | | |
| | | | Insurance — 0.5% | |
| | 376 | | | AmTrust Financial Services, Inc. | | | 24,608 | |
| | | | | | | | |
| | | | Real Estate Management & Development — 1.7% | |
| | 2,375 | | | CBRE Group, Inc., Class A (a) | | | 87,886 | |
| | | | | | | | |
| | | | Total Financials | | | 476,413 | |
| | | | | | | | |
| | | | Health Care — 20.8% | | | | |
| | | | Biotechnology — 8.6% | |
| | 284 | | | Alexion Pharmaceuticals, Inc. (a) | | | 51,303 | |
| | 725 | | | Celgene Corp. (a) | | | 83,908 | |
| | 1,237 | | | Gilead Sciences, Inc. | | | 144,769 | |
| | 393 | | | Kite Pharma, Inc. (a) | | | 23,967 | |
| | 203 | | | Regeneron Pharmaceuticals, Inc. (a) | | | 103,352 | |
| | 311 | | | Vertex Pharmaceuticals, Inc. (a) | | | 38,427 | |
| | | | | | | | |
| | | | | | | 445,726 | |
| | | | | | | | |
| | | | Health Care Equipment & Supplies — 0.4% | |
| | 1,566 | | | Novadaq Technologies, Inc., (Canada) (a) | | | 18,968 | |
| | | | | | | | |
| | | | Health Care Providers & Services — 7.1% | | | | |
| | 811 | | | Acadia Healthcare Co., Inc. (a) | | | 63,549 | |
| | 1,056 | | | Envision Healthcare Holdings, Inc. (a) | | | 41,703 | |
| | 364 | | | Humana, Inc. (m) | | | 69,530 | |
| | 277 | | | McKesson Corp. | | | 62,228 | |
| | 1,079 | | | UnitedHealth Group, Inc. | | | 131,650 | |
| | | | | | | | |
| | | | | | | 368,660 | |
| | | | | | | | |
| | | | Health Care Technology — 0.7% | |
| | 1,245 | | | Veeva Systems, Inc., Class A (a) | | | 34,900 | |
| | | | | | | | |
| | | | Life Sciences Tools & Services — 1.9% | |
| | 703 | | | Fluidigm Corp. (a) | | | 17,008 | |
| | 388 | | | Illumina, Inc. (a) | | | 84,811 | |
| | | | | | | | |
| | | | | | | 101,819 | |
| | | | | | | | |
SEE NOTES TO FINANCIAL STATEMENTS.
| | | | | | | | |
| | | |
| JUNE 30, 2015 | | J.P. MORGAN MID CAP/MULTI-CAP FUNDS | | | | | 17 | |
JPMorgan Growth Advantage Fund
SCHEDULE OF PORTFOLIO INVESTMENTS
AS OF JUNE 30, 2015 (continued)
(Amounts in thousands)
| | | | | | | | |
| SHARES | | | SECURITY DESCRIPTION | | VALUE($) | |
| Common Stocks — continued | | | | |
| | | | Pharmaceuticals — 2.1% | |
| | 487 | | | Valeant Pharmaceuticals International, Inc. (a) | | | 108,187 | |
| | | | | | | | |
| | | | Total Health Care | | | 1,078,260 | |
| | | | | | | | |
| | | | Industrials — 11.1% | | | | |
| | | | Airlines — 1.0% | | | | |
| | 1,304 | | | Delta Air Lines, Inc. | | | 53,581 | |
| | | | | | | | |
| | | | Building Products — 2.6% | |
| | 285 | | | Advanced Drainage Systems, Inc. | | | 8,354 | |
| | 922 | | | Fortune Brands Home & Security, Inc. | | | 42,265 | |
| | 386 | | | Lennox International, Inc. | | | 41,568 | |
| | 833 | | | Trex Co., Inc. (a) | | | 41,160 | |
| | | | | | | | |
| | | | | | | 133,347 | |
| | | | | | | | |
| | | | Electrical Equipment — 2.0% | | | | |
| | 581 | | | Acuity Brands, Inc. | | | 104,586 | |
| | | | | | | | |
| | | | Industrial Conglomerates — 1.4% | | | | |
| | 750 | | | Carlisle Cos., Inc. | | | 75,100 | |
| | | | | | | | |
| | | | Machinery — 1.2% | | | | |
| | 488 | | | Pall Corp. | | | 60,669 | |
| | | | | | | | |
| | | | Road & Rail — 0.6% | | | | |
| | 441 | | | Old Dominion Freight Line, Inc. (a) | | | 30,265 | |
| | | | | | | | |
| | | | Trading Companies & Distributors — 2.3% | | | | |
| | 1,788 | | | HD Supply Holdings, Inc. (a) | | | 62,913 | |
| | 557 | | | Rush Enterprises, Inc., Class A (a) | | | 14,604 | |
| | 343 | | | Watsco, Inc. | | | 42,418 | |
| | | | | | | | |
| | | | | | | 119,935 | |
| | | | | | | | |
| | | | Total Industrials | | | 577,483 | |
| | | | | | | | |
| | | | Information Technology — 30.9% | | | | |
| | | | Communications Equipment — 1.6% | | | | |
| | 574 | | | Arista Networks, Inc. (a) | | | 46,911 | |
| | 219 | | | Palo Alto Networks, Inc. (a) | | | 38,329 | |
| | | | | | | | |
| | | | | | | 85,240 | |
| | | | | | | | |
| | | | Electronic Equipment, Instruments & Components — 1.0% | |
| | 907 | | | Amphenol Corp., Class A | | | 52,579 | |
| | | | | | | | |
| | | | Internet Software & Services — 8.1% | | | | |
| | 232 | | | CoStar Group, Inc. (a) | | | 46,632 | |
| | 664 | | | Dealertrack Technologies, Inc. (a) | | | 41,680 | |
| | 2,256 | | | Facebook, Inc., Class A (a) | | | 193,469 | |
| | 268 | | | Google, Inc., Class C (a) | | | 139,343 | |
| | | | | | | | |
| | | | | | | 421,124 | |
| | | | | | | | |
| | | | | | | | |
| SHARES | | | SECURITY DESCRIPTION | | VALUE($) | |
| | | | | | | | |
| | | | IT Services — 6.7% | | | | |
| | 239 | | | Alliance Data Systems Corp. (a) | | | 69,803 | |
| | 497 | | | Gartner, Inc. (a) | | | 42,590 | |
| | 1,176 | | | MasterCard, Inc., Class A | | | 109,932 | |
| | 1,145 | | | VeriFone Systems, Inc. (a) | | | 38,898 | |
| | 1,285 | | | Visa, Inc., Class A | | | 86,254 | |
| | | | | | | | |
| | | | | | | 347,477 | |
| | | | | | | | |
| | | | Semiconductors & Semiconductor Equipment — 3.5% | |
| | 467 | | | Avago Technologies Ltd., (Singapore) | | | 62,052 | |
| | 462 | | | Lam Research Corp. | | | 37,608 | |
| | 843 | | | NXP Semiconductors N.V., (Netherlands) (a) | | | 82,753 | |
| | | | | | | | |
| | | | | | | 182,413 | |
| | | | | | | | |
| | | | Software — 5.6% | |
| | 705 | | | Adobe Systems, Inc. (a) | | | 57,112 | |
| | 747 | | | Electronic Arts, Inc. (a) | | | 49,682 | |
| | 823 | | | Guidewire Software, Inc. (a) | | | 43,551 | |
| | 1,162 | | | Microsoft Corp. | | | 51,289 | |
| | 601 | | | Mobileye N.V., (Israel) (a) | | | 31,976 | |
| | 437 | | | ServiceNow, Inc. (a) | | | 32,481 | |
| | 291 | | | Workday, Inc., Class A (a) | | | 22,191 | |
| | | | | | | | |
| | | | | | | 288,282 | |
| | | | | | | | |
| | | | Technology Hardware, Storage & Peripherals — 4.4% | |
| | 1,605 | | | Apple, Inc. (m) | | | 201,276 | |
| | 953 | | | Nimble Storage, Inc. (a) | | | 26,744 | |
| | | | | | | | |
| | | | | | | 228,020 | |
| | | | | | | | |
| | | | Total Information Technology | | | 1,605,135 | |
| | | | | | | | |
| | | | Materials — 4.5% | |
| | | | Chemicals — 3.9% | |
| | 416 | | | Air Products & Chemicals, Inc. (m) | | | 56,976 | |
| | 636 | | | PPG Industries, Inc. | | | 72,927 | |
| | 263 | | | Sherwin-Williams Co. (The) | | | 72,413 | |
| | | | | | | | |
| | | | | | | 202,316 | |
| | | | | | | | |
| | | | Construction Materials — 0.6% | |
| | 433 | | | Eagle Materials, Inc. | | | 33,021 | |
| | | | | | | | |
| | | | Total Materials | | | 235,337 | |
| | | | | | | | |
| | | | Total Common Stocks
(Cost $3,612,927) | | | 5,043,662 | |
| | | | | | | | |
SEE NOTES TO FINANCIAL STATEMENTS.
| | | | | | |
| | | |
| 18 | | | | J.P. MORGAN MID CAP/MULTI-CAP FUNDS | | JUNE 30, 2015 |
| | | | | | | | |
| SHARES | | | SECURITY DESCRIPTION | | VALUE($) | |
| Short-Term Investment — 4.0% | |
| | | | Investment Company — 4.0% | |
| | 205,478 | | | JPMorgan Prime Money Market Fund, Institutional Class Shares,
0.050% (b) (l) (m)
(Cost $205,478) | | | 205,478 | |
| | | | | | | | |
| | | | Total Investments — 101.2%
(Cost $3,818,405) | | | 5,249,140 | |
| | | | Liabilities in Excess of
Other Assets — (1.2)% | | | (60,860 | ) |
| | | | | | | | |
| | | | NET ASSETS — 100.0% | | $ | 5,188,280 | |
| | | | | | | | |
Percentages indicated are based on net assets.
SEE NOTES TO FINANCIAL STATEMENTS.
| | | | | | | | |
| | | |
| JUNE 30, 2015 | | J.P. MORGAN MID CAP/MULTI-CAP FUNDS | | | | | 19 | |
JPMorgan Mid Cap Equity Fund
SCHEDULE OF PORTFOLIO INVESTMENTS
AS OF JUNE 30, 2015
(Amounts in thousands)
| | | | | | | | |
| SHARES | | | SECURITY DESCRIPTION | | VALUE($) | |
| Common Stocks — 96.6% | | | | |
| | | | Consumer Discretionary — 18.9% | | | | |
| | | | Automobiles — 0.9% | | | | |
| | 249 | | | Harley-Davidson, Inc. | | | 14,005 | |
| | 58 | | | Tesla Motors, Inc. (a) | | | 15,586 | |
| | | | | | | | |
| | | | | | | 29,591 | |
| | | | | | | | |
| | | | Distributors — 0.3% | |
| | 118 | | | Genuine Parts Co. | | | 10,592 | |
| | | | | | | | |
| | | | Hotels, Restaurants & Leisure — 2.1% | |
| | 911 | | | Hilton Worldwide Holdings, Inc. (a) | | | 25,109 | |
| | 131 | | | Marriott International, Inc., Class A | | | 9,752 | |
| | 399 | | | Norwegian Cruise Line Holdings Ltd. (a) | | | 22,348 | |
| | 153 | | | Starwood Hotels & Resorts Worldwide, Inc. | | | 12,412 | |
| | | | | | | | |
| | | | | | | 69,621 | |
| | | | | | | | |
| | | | Household Durables — 2.8% | |
| | 345 | | | Jarden Corp. (a) | | | 17,842 | |
| | 309 | | | Mohawk Industries, Inc. (a) | | | 58,897 | |
| | 389 | | | Toll Brothers, Inc. (a) | | | 14,863 | |
| | | | | | | | |
| | | | | | | 91,602 | |
| | | | | | | | |
| | | | Internet & Catalog Retail — 1.6% | |
| | 190 | | | Expedia, Inc. | | | 20,732 | |
| | 34 | | | Netflix, Inc. (a) | | | 22,533 | |
| | 107 | | | TripAdvisor, Inc. (a) | | | 9,315 | |
| | | | | | | | |
| | | | | | | 52,580 | |
| | | | | | | | |
| | | | Media — 1.6% | |
| | 194 | | | CBS Corp. (Non-Voting), Class B | | | 10,791 | |
| | 262 | | | DISH Network Corp., Class A (a) | | | 17,713 | |
| | 195 | | | Gannett Co., Inc. (a) | | | 2,723 | |
| | 389 | | | TEGNA, Inc. | | | 12,485 | |
| | 354 | | | Time, Inc. | | | 8,138 | |
| | | | | | | | |
| | | | | | | 51,850 | |
| | | | | | | | |
| | | | Multiline Retail — 2.5% | |
| | 368 | | | Big Lots, Inc. | | | 16,539 | |
| | 309 | | | Dollar General Corp. | | | 23,993 | |
| | 447 | | | Kohl’s Corp. | | | 27,962 | |
| | 183 | | | Nordstrom, Inc. | | | 13,654 | |
| | | | | | | | |
| | | | | | | 82,148 | |
| | | | | | | | |
| | | | Specialty Retail — 5.8% | |
| | 28 | | | AutoZone, Inc. (a) | | | 18,767 | |
| | 272 | | | Bed Bath & Beyond, Inc. (a) | | | 18,750 | |
| | 518 | | | Best Buy Co., Inc. | | | 16,879 | |
| | 387 | | | GameStop Corp., Class A | | | 16,643 | |
| | 516 | | | Gap, Inc. (The) | | | 19,698 | |
| | 312 | | | GNC Holdings, Inc., Class A | | | 13,860 | |
| | 207 | | | Tiffany & Co. | | | 18,970 | |
| | | | | | | | |
| SHARES | | | SECURITY DESCRIPTION | | VALUE($) | |
| | | | | | | | |
| | | | Specialty Retail — continued | |
| | 151 | | | Tractor Supply Co. | | | 13,608 | |
| | 158 | | | Ulta Salon Cosmetics & Fragrance, Inc. (a) | | | 24,434 | |
| | 461 | | | Urban Outfitters, Inc. (a) | | | 16,150 | |
| | 165 | | | Williams-Sonoma, Inc. | | | 13,548 | |
| | | | | | | | |
| | | | | | | 191,307 | |
| | | | | | | | |
| | | | Textiles, Apparel & Luxury Goods — 1.3% | |
| | 394 | | | Gildan Activewear, Inc., (Canada) | | | 13,109 | |
| | 131 | | | PVH Corp. | | | 15,100 | |
| | 70 | | | Ralph Lauren Corp. | | | 9,245 | |
| | 105 | | | V.F. Corp. | | | 7,339 | |
| | | | | | | | |
| | | | | | | 44,793 | |
| | | | | | | | |
| | | | Total Consumer Discretionary | | | 624,084 | |
| | | | | | | | |
| | | | Consumer Staples — 4.2% | |
| | | | Beverages — 1.6% | |
| | 109 | | | Constellation Brands, Inc., Class A | | | 12,685 | |
| | 187 | | | Dr. Pepper Snapple Group, Inc. | | | 13,607 | |
| | 207 | | | Monster Beverage Corp. (a) | | | 27,796 | |
| | | | | | | | |
| | | | | | | 54,088 | |
| | | | | | | | |
| | | | Food & Staples Retailing — 1.7% | |
| | 310 | | | Kroger Co. (The) | | | 22,472 | |
| | 1,977 | | | Rite Aid Corp. (a) | | | 16,509 | |
| | 576 | | | Sprouts Farmers Market, Inc. (a) | | | 15,541 | |
| | | | | | | | |
| | | | | | | 54,522 | |
| | | | | | | | |
| | | | Food Products — 0.4% | |
| | 150 | | | Hershey Co. (The) | | | 13,353 | |
| | | | | | | | |
| | | | Household Products — 0.5% | |
| | 130 | | | Energizer Holdings, Inc. | | | 17,159 | |
| | 13 | | | Energizer SpinCo, Inc. (a) (w) | | | 450 | |
| | | | | | | | |
| | | | | | | 17,609 | |
| | | | | | | | |
| | | | Total Consumer Staples | | | 139,572 | |
| | | | | | | | |
| | | | Energy — 3.6% | |
| | | | Energy Equipment & Services — 0.3% | |
| | 132 | | | Dril-Quip, Inc. (a) | | | 9,963 | |
| | | | | | | | |
| | | | Oil, Gas & Consumable Fuels — 3.3% | |
| | 202 | | | Concho Resources, Inc. (a) | | | 23,045 | |
| | 390 | | | Energen Corp. | | | 26,624 | |
| | 267 | | | EQT Corp. | | | 21,724 | |
| | 278 | | | PBF Energy, Inc., Class A | | | 7,888 | |
| | 283 | | | Range Resources Corp. | | | 13,950 | |
| | 731 | | | Southwestern Energy Co. (a) | | | 16,615 | |
| | | | | | | | |
| | | | | | | 109,846 | |
| | | | | | | | |
| | | | Total Energy | | | 119,809 | |
| | | | | | | | |
SEE NOTES TO FINANCIAL STATEMENTS.
| | | | | | |
| | | |
| 20 | | | | J.P. MORGAN MID CAP/MULTI-CAP FUNDS | | JUNE 30, 2015 |
| | | | | | | | |
| SHARES | | | SECURITY DESCRIPTION | | VALUE($) | |
| Common Stocks — continued | | | | |
| | | | Financials — 20.4% | | | | |
| | | | Banks — 4.5% | | | | |
| | 442 | | | Citizens Financial Group, Inc. | | | 12,079 | |
| | 126 | | | City National Corp. | | | 11,378 | |
| | 392 | | | East West Bancorp, Inc. | | | 17,570 | |
| | 1,083 | | | Fifth Third Bancorp | | | 22,556 | |
| | 175 | | | First Republic Bank | | | 11,033 | |
| | 550 | | | Huntington Bancshares, Inc. | | | 6,223 | |
| | 136 | | | M&T Bank Corp. | | | 17,025 | |
| | 157 | | | Signature Bank (a) | | | 22,939 | |
| | 515 | | | SunTrust Banks, Inc. | | | 22,155 | |
| | 168 | | | Zions Bancorporation | | | 5,346 | |
| | | | | | | | |
| | | | | | | 148,304 | |
| | | | | | | | |
| | | | Capital Markets — 4.4% | |
| | 126 | | | Affiliated Managers Group, Inc. (a) | | | 27,609 | |
| | 164 | | | Ameriprise Financial, Inc. | | | 20,429 | |
| | 381 | | | Invesco Ltd. | | | 14,292 | |
| | 411 | | | Lazard Ltd., (Bermuda), Class A | | | 23,092 | |
| | 169 | | | Legg Mason, Inc. | | | 8,727 | |
| | 152 | | | Northern Trust Corp. | | | 11,628 | |
| | 225 | | | T. Rowe Price Group, Inc. | | | 17,479 | |
| | 636 | | | TD Ameritrade Holding Corp. | | | 23,429 | |
| | | | | | | | |
| | | | | | | 146,685 | |
| | | | | | | | |
| | | | Consumer Finance — 0.4% | |
| | 534 | | | Ally Financial, Inc. (a) | | | 11,972 | |
| | | | | | | | |
| | | | Diversified Financial Services — 1.4% | |
| | 281 | | | McGraw Hill Financial, Inc. | | | 28,196 | |
| | 169 | | | Moody’s Corp. | | | 18,278 | |
| | | | | | | | |
| | | | | | | 46,474 | |
| | | | | | | | |
| | | | Insurance — 4.4% | |
| | 22 | | | Alleghany Corp. (a) | | | 10,465 | |
| | 148 | | | Chubb Corp. (The) | | | 14,118 | |
| | 441 | | | Hartford Financial Services Group, Inc. (The) | | | 18,347 | |
| | 636 | | | Loews Corp. | | | 24,491 | |
| | 392 | | | Marsh & McLennan Cos., Inc. | | | 22,205 | |
| | 500 | | | Old Republic International Corp. | | | 7,815 | |
| | 278 | | | Progressive Corp. (The) | | | 7,745 | |
| | 430 | | | Unum Group | | | 15,371 | |
| | 169 | | | W.R. Berkley Corp. | | | 8,780 | |
| | 459 | | | XL Group plc, (Ireland) | | | 17,066 | |
| | | | | | | | |
| | | | | | | 146,403 | |
| | | | | | | | |
| | | | Real Estate Investment Trusts (REITs) — 4.0% | |
| | 273 | | | American Campus Communities, Inc. | | | 10,288 | |
| | 105 | | | AvalonBay Communities, Inc. | | | 16,739 | |
| | | | | | | | |
| SHARES | | | SECURITY DESCRIPTION | | VALUE($) | |
| | | | | | | | |
| | | | Real Estate Investment Trusts (REITs) — continued | |
| | 80 | | | Boston Properties, Inc. | | | 9,704 | |
| | 549 | | | Brixmor Property Group, Inc. | | | 12,691 | |
| | 535 | | | General Growth Properties, Inc. | | | 13,720 | |
| | 695 | | | Kimco Realty Corp. | | | 15,667 | |
| | 286 | | | Outfront Media, Inc. | | | 7,220 | |
| | 370 | | | Rayonier, Inc. | | | 9,444 | |
| | 159 | | | Regency Centers Corp. | | | 9,362 | |
| | 171 | | | Vornado Realty Trust | | | 16,274 | |
| | 387 | | | Weyerhaeuser Co. | | | 12,202 | |
| | | | | | | | |
| | | | | | | 133,311 | |
| | | | | | | | |
| | | | Real Estate Management & Development — 1.1% | |
| | 947 | | | CBRE Group, Inc., Class A (a) | | | 35,050 | |
| | | | | | | | |
| | | | Thrifts & Mortgage Finance — 0.2% | |
| | 602 | | | Hudson City Bancorp, Inc. | | | 5,949 | |
| | | | | | | | |
| | | | Total Financials | | | 674,148 | |
| | | | | | | | |
| | | | Health Care — 11.5% | |
| | | | Biotechnology — 1.4% | |
| | 98 | | | BioMarin Pharmaceutical, Inc. (a) | | | 13,377 | |
| | 41 | | | Intercept Pharmaceuticals, Inc. (a) | | | 9,993 | |
| | 66 | | | Receptos, Inc. (a) | | | 12,467 | |
| | 99 | | | Vertex Pharmaceuticals, Inc. (a) | | | 12,225 | |
| | | | | | | | |
| | | | | | | 48,062 | |
| | | | | | | | |
| | | | Health Care Equipment & Supplies — 0.9% | |
| | 248 | | | Insulet Corp. (a) | | | 7,675 | |
| | 219 | | | Sirona Dental Systems, Inc. (a) | | | 21,992 | |
| | | | | | | | |
| | | | | | | 29,667 | |
| | | | | | | | |
| | | | Health Care Providers & Services — 6.3% | |
| | 287 | | | Acadia Healthcare Co., Inc. (a) | | | 22,442 | |
| | 169 | | | AmerisourceBergen Corp. | | | 17,955 | |
| | 865 | | | Brookdale Senior Living, Inc. (a) | | | 30,007 | |
| | 176 | | | Cigna Corp. | | | 28,498 | |
| | 635 | | | Envision Healthcare Holdings, Inc. (a) | | | 25,082 | |
| | 78 | | | Henry Schein, Inc. (a) | | | 11,071 | |
| | 254 | | | Humana, Inc. | | | 48,626 | |
| | 355 | | | Premier, Inc., Class A (a) | | | 13,642 | |
| | 67 | | | Universal Health Services, Inc., Class B | | | 9,585 | |
| | | | | | | | |
| | | | | | | 206,908 | |
| | | | | | | | |
| | | | Health Care Technology — 0.4% | |
| | 125 | | | Inovalon Holdings, Inc., Class A (a) | | | 3,482 | |
| | 420 | | | Veeva Systems, Inc., Class A (a) | | | 11,777 | |
| | | | | | | | |
| | | | | | | 15,259 | |
| | | | | | | | |
SEE NOTES TO FINANCIAL STATEMENTS.
| | | | | | | | |
| | | |
| JUNE 30, 2015 | | J.P. MORGAN MID CAP/MULTI-CAP FUNDS | | | | | 21 | |
JPMorgan Mid Cap Equity Fund
SCHEDULE OF PORTFOLIO INVESTMENTS
AS OF JUNE 30, 2015 (continued)
(Amounts in thousands)
| | | | | | | | |
| SHARES | | | SECURITY DESCRIPTION | | VALUE($) | |
| Common Stocks — continued | | | | |
| | | | Life Sciences Tools & Services — 0.8% | |
| | 117 | | | Illumina, Inc. (a) | | | 25,457 | |
| | | | | | | | |
| | | | Pharmaceuticals — 1.7% | |
| | 404 | | | Horizon Pharma plc, (Ireland) (a) | | | 14,031 | |
| | 103 | | | Jazz Pharmaceuticals plc, (Ireland) (a) | | | 18,118 | |
| | 44 | | | Perrigo Co. plc, (Ireland) | | | 8,169 | |
| | 67 | | | Valeant Pharmaceuticals International, Inc. (a) | | | 14,840 | |
| | | | | | | | |
| | | | | | | 55,158 | |
| | | | | | | | |
| | | | Total Health Care | | | 380,511 | |
| | | | | | | | |
| | | | Industrials — 12.6% | |
| | | | Airlines — 0.9% | |
| | 684 | | | Delta Air Lines, Inc. | | | 28,090 | |
| | | | | | | | |
| | | | Building Products — 1.9% | |
| | 270 | | | A.O. Smith Corp. | | | 19,442 | |
| | 618 | | | Fortune Brands Home & Security, Inc. | | | 28,307 | |
| | 146 | | | Lennox International, Inc. | | | 15,701 | |
| | | | | | | | |
| | | | | | | 63,450 | |
| | | | | | | | |
| | | | Commercial Services & Supplies — 0.9% | |
| | 126 | | | Stericycle, Inc. (a) | | | 16,813 | |
| | 255 | | | Waste Connections, Inc. | | | 12,016 | |
| | | | | | | | |
| | | | | | | 28,829 | |
| | | | | | | | |
| | | | Electrical Equipment — 2.6% | |
| | 215 | | | Acuity Brands, Inc. | | | 38,660 | |
| | 291 | | | AMETEK, Inc. | | | 15,944 | |
| | 178 | | | Hubbell, Inc., Class B | | | 19,299 | |
| | 167 | | | Regal Beloit Corp. | | | 12,087 | |
| | | | | | | | |
| | | | | | | 85,990 | |
| | | | | | | | |
| | | | Industrial Conglomerates — 1.4% | |
| | 475 | | | Carlisle Cos., Inc. | | | 47,564 | |
| | | | | | | | |
| | | | Machinery — 2.6% | �� |
| | 226 | | | IDEX Corp. | | | 17,760 | |
| | 160 | | | Middleby Corp. (The) (a) | | | 17,957 | |
| | 201 | | | Pall Corp. | | | 25,016 | |
| | 313 | | | Rexnord Corp. (a) | | | 7,492 | |
| | 99 | | | Snap-on, Inc. | | | 15,761 | |
| | | | | | | | |
| | | | | | | 83,986 | |
| | | | | | | | |
| | | | Professional Services — 0.5% | |
| | 184 | | | Equifax, Inc. | | | 17,905 | |
| | | | | | | | |
| | | | Trading Companies & Distributors — 1.8% | |
| | 655 | | | HD Supply Holdings, Inc. (a) | | | 23,053 | |
| | 252 | | | MSC Industrial Direct Co., Inc., Class A | | | 17,596 | |
| | | | | | | | |
| SHARES | | | SECURITY DESCRIPTION | | VALUE($) | |
| | | | | | | | |
| | | | Trading Companies & Distributors — continued | |
| | 156 | | | Watsco, Inc. | | | 19,322 | |
| | | | | | | | |
| | | | | | | 59,971 | |
| | | | | | | | |
| | | | Total Industrials | | | 415,785 | |
| | | | | | | | |
| | | | Information Technology — 16.8% | |
| | | | Communications Equipment — 2.3% | |
| | 194 | | | Arista Networks, Inc. (a) | | | 15,890 | |
| | 631 | | | Ciena Corp. (a) | | | 14,937 | |
| | 341 | | | CommScope Holding Co., Inc. (a) | | | 10,413 | |
| | 213 | | | Harris Corp. | | | 16,413 | |
| | 105 | | | Palo Alto Networks, Inc. (a) | | | 18,326 | |
| | | | | | | | |
| | | | | | | 75,979 | |
| | | | | | | | |
| | | | Electronic Equipment, Instruments & Components — 2.7% | |
| | 754 | | | Amphenol Corp., Class A | | | 43,728 | |
| | 433 | | | Arrow Electronics, Inc. (a) | | | 24,161 | |
| | 238 | | | Fitbit, Inc., Class A (a) | | | 9,099 | |
| | 109 | | | Zebra Technologies Corp., Class A (a) | | | 12,071 | |
| | | | | | | | |
| | | | | | | 89,059 | |
| | | | | | | | |
| | | | Internet Software & Services — 1.2% | |
| | 108 | | | CoStar Group, Inc. (a) | | | 21,796 | |
| | 246 | | | Dealertrack Technologies, Inc. (a) | | | 15,434 | |
| | 258 | | | Pandora Media, Inc. (a) | | | 4,015 | |
| | | | | | | | |
| | | | | | | 41,245 | |
| | | | | | | | |
| | | | IT Services — 2.9% | |
| | 105 | | | Alliance Data Systems Corp. (a) | | | 30,741 | |
| | 210 | | | Gartner, Inc. (a) | | | 18,040 | |
| | 398 | | | Jack Henry & Associates, Inc. | | | 25,765 | |
| | 585 | | | VeriFone Systems, Inc. (a) | | | 19,873 | |
| | | | | | | | |
| | | | | | | 94,419 | |
| | | | | | | | |
| | | | Semiconductors & Semiconductor Equipment — 3.7% | |
| | 242 | | | Analog Devices, Inc. | | | 15,556 | |
| | 946 | | | Applied Materials, Inc. | | | 18,184 | |
| | 122 | | | Avago Technologies Ltd., (Singapore) | | | 16,257 | |
| | 110 | | | KLA-Tencor Corp. | | | 6,170 | |
| | 208 | | | Lam Research Corp. | | | 16,896 | |
| | 316 | | | NXP Semiconductors N.V., (Netherlands) (a) | | | 31,031 | |
| | 433 | | | Xilinx, Inc. | | | 19,104 | |
| | | | | | | | |
| | | | | | | 123,198 | |
| | | | | | | | |
| | | | Software — 4.0% | |
| | 70 | | | Autodesk, Inc. (a) | | | 3,505 | |
| | 390 | | | Electronic Arts, Inc. (a) | | | 25,922 | |
| | 314 | | | Guidewire Software, Inc. (a) | | | 16,641 | |
| | 291 | | | Mobileye N.V., (Israel) (a) | | | 15,483 | |
SEE NOTES TO FINANCIAL STATEMENTS.
| | | | | | |
| | | |
| 22 | | | | J.P. MORGAN MID CAP/MULTI-CAP FUNDS | | JUNE 30, 2015 |
| | | | | | | | |
| SHARES | | | SECURITY DESCRIPTION | | VALUE($) | |
| Common Stocks — continued | | | | |
| | | | Software — continued | |
| | 104 | | | NetSuite, Inc. (a) | | | 9,560 | |
| | 200 | | | ServiceNow, Inc. (a) | | | 14,884 | |
| | 457 | | | Synopsys, Inc. (a) | | | 23,152 | |
| | 102 | | | Tableau Software, Inc., Class A (a) | | | 11,715 | |
| | 146 | | | Workday, Inc., Class A (a) | | | 11,168 | |
| | | | | | | | |
| | | | | | | 132,030 | |
| | | | | | | | |
| | | | Total Information Technology | | | 555,930 | |
| | | | | | | | |
| | | | Materials — 4.3% | |
| | | | Chemicals — 2.4% | |
| | 187 | | | Airgas, Inc. | | | 19,830 | |
| | 172 | | | Albemarle Corp. | | | 9,530 | |
| | 182 | | | Sherwin-Williams Co. (The) | | | 50,178 | |
| | | | | | | | |
| | | | | | | 79,538 | |
| | | | | | | | |
| | | | Construction Materials — 0.5% | |
| | 208 | | | Eagle Materials, Inc. | | | 15,892 | |
| | | | | | | | |
| | | | Containers & Packaging — 1.4% | |
| | 191 | | | Ball Corp. | | | 13,393 | |
| | 202 | | | Rock-Tenn Co., Class A | | | 12,170 | |
| | 356 | | | Silgan Holdings, Inc. | | | 18,758 | |
| | | | | | | | |
| | | | | | | 44,321 | |
| | | | | | | | |
| | | | Total Materials | | | 139,751 | |
| | | | | | | | |
| | | | Utilities — 4.3% | |
| | | | Electric Utilities — 1.3% | |
| | 229 | | | Edison International | | | 12,752 | |
| | 447 | | | Westar Energy, Inc. | | | 15,303 | |
| | 495 | | | Xcel Energy, Inc. | | | 15,927 | |
| | | | | | | | |
| | | | | | | 43,982 | |
| | | | | | | | |
| | | | | | | | |
| SHARES | | | SECURITY DESCRIPTION | | VALUE($) | |
| | | | | | | | |
| | | | Gas Utilities — 0.9% | |
| | 172 | | | National Fuel Gas Co. | | | 10,114 | |
| | 906 | | | Questar Corp. | | | 18,939 | |
| | | | | | | | |
| | | | | | | 29,053 | |
| | | | | | | | |
| | | | Multi-Utilities — 2.1% | |
| | 1,073 | | | CenterPoint Energy, Inc. | | | 20,422 | |
| | 480 | | | CMS Energy Corp. | | | 15,289 | |
| | 202 | | | NiSource, Inc. | | | 9,225 | |
| | 112 | | | Sempra Energy | | | 11,070 | |
| | 283 | | | WEC Energy Group, Inc. | | | 12,726 | |
| | | | | | | | |
| | | | | | | 68,732 | |
| | | | | | | | |
| | | | Total Utilities | | | 141,767 | |
| | | | | | | | |
| | | | Total Common Stocks
(Cost $2,359,100) | | | 3,191,357 | |
| | | | | | | | |
| Short-Term Investment — 3.1% | |
| | | | Investment Company — 3.1% | |
| | 102,329 | | | JPMorgan Prime Money Market Fund, Institutional Class Shares, 0.050% (b) (l) (m)
(Cost $102,329) | | | 102,329 | |
| | | | | | | | |
| | | | Total Investments — 99.7%
(Cost $2,461,429) | | | 3,293,686 | |
| | | | Other Assets in Excess of
Liabilities — 0.3% | | | 9,607 | |
| | | | | | | | |
| | | | NET ASSETS — 100.0% | | $ | 3,303,293 | |
| | | | | | | | |
Percentages indicated are based on net assets.
SEE NOTES TO FINANCIAL STATEMENTS.
| | | | | | | | |
| | | |
| JUNE 30, 2015 | | J.P. MORGAN MID CAP/MULTI-CAP FUNDS | | | | | 23 | |
JPMorgan Mid Cap Growth Fund
SCHEDULE OF PORTFOLIO INVESTMENTS
AS OF JUNE 30, 2015
(Amounts in thousands)
| | | | | | | | |
| SHARES | | | SECURITY DESCRIPTION | | VALUE($) | |
| Common Stocks — 96.4% | | | | |
| | | | Consumer Discretionary — 19.0% | | | | |
| | | | Automobiles — 1.8% | | | | |
| | 450 | | | Harley-Davidson, Inc. | | | 25,341 | |
| | 105 | | | Tesla Motors, Inc. (a) | | | 28,194 | |
| | | | | | | | |
| | | | | | | 53,535 | |
| | | | | | | | |
| | | | Hotels, Restaurants & Leisure — 2.9% | | | | |
| | 1,683 | | | Hilton Worldwide Holdings, Inc. (a) | | | 46,367 | |
| | 737 | | | Norwegian Cruise Line Holdings Ltd. (a) | | | 41,290 | |
| | | | | | | | |
| | | | | | | 87,657 | |
| | | | | | | | |
| | | | Household Durables — 2.8% | | | | |
| | 308 | | | Mohawk Industries, Inc. (a) | | | 58,797 | |
| | 721 | | | Toll Brothers, Inc. (a) | | | 27,531 | |
| | | | | | | | |
| | | | | | | 86,328 | |
| | | | | | | | |
| | | | Internet & Catalog Retail — 1.9% | | | | |
| | 62 | | | Netflix, Inc. (a) | | | 40,796 | |
| | 199 | | | TripAdvisor, Inc. (a) | | | 17,324 | |
| | | | | | | | |
| | | | | | | 58,120 | |
| | | | | | | | |
| | | | Multiline Retail — 2.4% | | | | |
| | 680 | | | Big Lots, Inc. | | | 30,607 | |
| | 569 | | | Dollar General Corp. | | | 44,203 | |
| | | | | | | | |
| | | | | | | 74,810 | |
| | | | | | | | |
| | | | Specialty Retail — 5.9% | | | | |
| | 717 | | | GameStop Corp., Class A | | | 30,802 | |
| | 577 | | | GNC Holdings, Inc., Class A | | | 25,683 | |
| | 280 | | | Tractor Supply Co. | | | 25,210 | |
| | 292 | | | Ulta Salon Cosmetics & Fragrance, Inc. (a) | | | 45,130 | |
| | 854 | | | Urban Outfitters, Inc. (a) | | | 29,894 | |
| | 305 | | | Williams-Sonoma, Inc. | | | 25,117 | |
| | | | | | | | |
| | | | | | | 181,836 | |
| | | | | | | | |
| | | | Textiles, Apparel & Luxury Goods — 1.3% | | | | |
| | 731 | | | Gildan Activewear, Inc., (Canada) | | | 24,304 | |
| | 127 | | | Ralph Lauren Corp. | | | 16,816 | |
| | | | | | | | |
| | | | | | | 41,120 | |
| | | | | | | | |
| | | | Total Consumer Discretionary | | | 583,406 | |
| | | | | | | | |
| | | | Consumer Staples — 2.6% | | | | |
| | | | Beverages — 1.7% | | | | |
| | 383 | | | Monster Beverage Corp. (a) | | | 51,316 | |
| | | | | | | | |
| | | | Food & Staples Retailing — 0.9% | | | | |
| | 1,067 | | | Sprouts Farmers Market, Inc. (a) | | | 28,774 | |
| | | | | | | | |
| | | | Total Consumer Staples | | | 80,090 | |
| | | | | | | | |
| | | | | | | | |
| SHARES | | | SECURITY DESCRIPTION | | VALUE($) | |
| | | | | | | | |
| | | | Energy — 2.8% | | | | |
| | | | Energy Equipment & Services — 0.6% | | | | |
| | 241 | | | Dril-Quip, Inc. (a) | | | 18,105 | |
| | | | | | | | |
| | | | Oil, Gas & Consumable Fuels — 2.2% | | | | |
| | 366 | | | Concho Resources, Inc. (a) | | | 41,707 | |
| | 511 | | | Range Resources Corp. | | | 25,243 | |
| | | | | | | | |
| | | | | | | 66,950 | |
| | | | | | | | |
| | | | Total Energy | | | 85,055 | |
| | | | | | | | |
| | | | Financials — 11.6% | | | | |
| | | | Banks — 2.2% | | | | |
| | 584 | | | East West Bancorp, Inc. | | | 26,161 | |
| | 285 | | | Signature Bank (a) | | | 41,692 | |
| | | | | | | | |
| | | | | | | 67,853 | |
| | | | | | | | |
| | | | Capital Markets — 4.5% | | | | |
| | 233 | | | Affiliated Managers Group, Inc. (a) | | | 50,890 | |
| | 758 | | | Lazard Ltd., (Bermuda), Class A | | | 42,628 | |
| | 1,175 | | | TD Ameritrade Holding Corp. | | | 43,274 | |
| | | | | | | | |
| | | | | | | 136,792 | |
| | | | | | | | |
| | | | Diversified Financial Services — 2.8% | | | | |
| | 518 | | | McGraw Hill Financial, Inc. (m) | | | 52,033 | |
| | 313 | | | Moody’s Corp. | | | 33,803 | |
| | | | | | | | |
| | | | | | | 85,836 | |
| | | | | | | | |
| | | | Real Estate Management & Development — 2.1% | |
| | 1,747 | | | CBRE Group, Inc., Class A (a) | | | 64,647 | |
| | | | | | | | |
| | | | Total Financials | | | 355,128 | |
| | | | | | | | |
| | | | Health Care — 16.5% | | | | |
| | | | Biotechnology — 2.9% | | | | |
| | 181 | | | BioMarin Pharmaceutical, Inc. (a) | | | 24,798 | |
| | 77 | | | Intercept Pharmaceuticals, Inc. (a) | | | 18,538 | |
| | 122 | | | Receptos, Inc. (a) | | | 23,129 | |
| | 179 | | | Vertex Pharmaceuticals, Inc. (a) | | | 22,140 | |
| | | | | | | | |
| | | | | | | 88,605 | |
| | | | | | | | |
| | | | Health Care Equipment & Supplies — 1.8% | | | | |
| | 442 | | | Insulet Corp. (a) | | | 13,695 | |
| | 405 | | | Sirona Dental Systems, Inc. (a) | | | 40,640 | |
| | | | | | | | |
| | | | | | | 54,335 | |
| | | | | | | | |
| | | | Health Care Providers & Services — 6.1% | | | | |
| | 529 | | | Acadia Healthcare Co., Inc. (a) | | | 41,468 | |
| | 900 | | | Brookdale Senior Living, Inc. (a) | | | 31,223 | |
| | 1,173 | | | Envision Healthcare Holdings, Inc. (a) | | | 46,318 | |
| | 226 | | | Humana, Inc. (m) | | | 43,214 | |
| | 658 | | | Premier, Inc., Class A (a) | | | 25,295 | |
| | | | | | | | |
| | | | | | | 187,518 | |
| | | | | | | | |
SEE NOTES TO FINANCIAL STATEMENTS.
| | | | | | |
| | | |
| 24 | | | | J.P. MORGAN MID CAP/MULTI-CAP FUNDS | | JUNE 30, 2015 |
| | | | | | | | |
| SHARES | | | SECURITY DESCRIPTION | | VALUE($) | |
| Common Stocks — continued | | | | |
| | | | Health Care Technology — 0.9% | | | | |
| | 230 | | | Inovalon Holdings, Inc., Class A (a) | | | 6,428 | |
| | 779 | | | Veeva Systems, Inc., Class A (a) | | | 21,828 | |
| | | | | | | | |
| | | | | | | 28,256 | |
| | | | | | | | |
| | | | Life Sciences Tools & Services — 1.5% | |
| | 211 | | | Illumina, Inc. (a) | | | 46,074 | |
| | | | | | | | |
| | | | Pharmaceuticals — 3.3% | |
| | 749 | | | Horizon Pharma plc, (Ireland) (a) | | | 26,010 | |
| | 190 | | | Jazz Pharmaceuticals plc, (Ireland) (a) | | | 33,506 | |
| | 82 | | | Perrigo Co. plc, (Ireland) | | | 15,211 | |
| | 124 | | | Valeant Pharmaceuticals International, Inc. (a) | | | 27,480 | |
| | | | | | | | |
| | | | | | | 102,207 | |
| | | | | | | | |
| | | | Total Health Care | | | 506,995 | |
| | | | | | | | |
| | | | Industrials — 15.6% | |
| | | | Airlines — 1.7% | |
| | 1,262 | | | Delta Air Lines, Inc. | | | 51,843 | |
| | | | | | | | |
| | | | Building Products — 3.1% | |
| | 499 | | | A.O. Smith Corp. | | | 35,947 | |
| | 650 | | | Fortune Brands Home & Security, Inc. | | | 29,797 | |
| | 270 | | | Lennox International, Inc. | | | 29,065 | |
| | | | | | | | |
| | | | | | | 94,809 | |
| | | | | | | | |
| | | | Commercial Services & Supplies — 1.7% | |
| | 232 | | | Stericycle, Inc. (a) | | | 31,130 | |
| | 473 | | | Waste Connections, Inc. | | | 22,293 | |
| | | | | | | | |
| | | | | | | 53,423 | |
| | | | | | | | |
| | | | Electrical Equipment — 2.3% | |
| | 396 | | | Acuity Brands, Inc. | | | 71,272 | |
| | | | | | | | |
| | | | Industrial Conglomerates — 1.7% | |
| | 508 | | | Carlisle Cos., Inc. | | | 50,901 | |
| | | | | | | | |
| | | | Machinery — 2.6% | |
| | 296 | | | Middleby Corp. (The) (a) | | | 33,209 | |
| | 363 | | | Pall Corp. | | | 45,225 | |
| | | | | | | | |
| | | | | | | 78,434 | |
| | | | | | | | |
| | | | Trading Companies & Distributors — 2.5% | |
| | 1,211 | | | HD Supply Holdings, Inc. (a) | | | 42,592 | |
| | 288 | | | Watsco, Inc. | | | 35,588 | |
| | | | | | | | |
| | | | | | | 78,180 | |
| | | | | | | | |
| | | | Total Industrials | | | 478,862 | |
| | | | | | | | |
| | | | Information Technology — 25.0% | |
| | | | Communications Equipment — 4.0% | |
| | 360 | | | Arista Networks, Inc. (a) | | | 29,410 | |
| | 1,168 | | | Ciena Corp. (a) | | | 27,661 | |
| | | | | | | | |
| SHARES | | | SECURITY DESCRIPTION | | VALUE($) | |
| | | | | | | | |
| | | | Communications Equipment — continued | |
| | 394 | | | Harris Corp. (m) | | | 30,295 | |
| | 194 | | | Palo Alto Networks, Inc. (a) | | | 33,909 | |
| | | | | | | | |
| | | | | | | 121,275 | |
| | | | | | | | |
| | | | Electronic Equipment, Instruments & Components — 2.9% | |
| | 857 | | | Amphenol Corp., Class A | | | 49,680 | |
| | 427 | | | Fitbit, Inc., Class A (a) | | | 16,332 | |
| | 202 | | | Zebra Technologies Corp., Class A (a) | | | 22,388 | |
| | | | | | | | |
| | | | | | | 88,400 | |
| | | | | | | | |
| | | | Internet Software & Services — 2.5% | |
| | 200 | | | CoStar Group, Inc. (a) | | | 40,292 | |
| | 441 | | | Dealertrack Technologies, Inc. (a) | | | 27,659 | |
| | 474 | | | Pandora Media, Inc. (a) | | | 7,367 | |
| | | | | | | | |
| | | | | | | 75,318 | |
| | | | | | | | |
| | | | IT Services — 4.1% | |
| | 194 | | | Alliance Data Systems Corp. (a) | | | 56,724 | |
| | 389 | | | Gartner, Inc. (a) | | | 33,377 | |
| | 1,082 | | | VeriFone Systems, Inc. (a) | | | 36,738 | |
| | | | | | | | |
| | | | | | | 126,839 | |
| | | | | | | | |
| | | | Semiconductors & Semiconductor Equipment — 4.9% | |
| | 1,750 | | | Applied Materials, Inc. | | | 33,631 | |
| | 221 | | | Avago Technologies Ltd., (Singapore) | | | 29,417 | |
| | 376 | | | Lam Research Corp. (m) | | | 30,579 | |
| | 583 | | | NXP Semiconductors N.V., (Netherlands) (a) | | | 57,251 | |
| | | | | | | | |
| | | | | | | 150,878 | |
| | | | | | | | |
| | | | Software — 6.6% | |
| | 127 | | | Autodesk, Inc. (a) | | | 6,359 | |
| | 720 | | | Electronic Arts, Inc. (a) (m) | | | 47,867 | |
| | 583 | | | Guidewire Software, Inc. (a) | | | 30,874 | |
| | 539 | | | Mobileye N.V., (Israel) (a) | | | 28,664 | |
| | 194 | | | NetSuite, Inc. (a) | | | 17,781 | |
| | 371 | | | ServiceNow, Inc. (a) | | | 27,554 | |
| | 189 | | | Tableau Software, Inc., Class A (a) | | | 21,746 | |
| | 271 | | | Workday, Inc., Class A (a) | | | 20,725 | |
| | | | | | | | |
| | | | | | | 201,570 | |
| | | | | | | | |
| | | | Total Information Technology | | | 764,280 | |
| | | | | | | | |
| | | | Materials — 3.3% | |
| | | | Chemicals — 2.3% | |
| | 259 | | | Sherwin-Williams Co. (The) | | | 71,230 | |
| | | | | | | | |
| | | | Construction Materials — 1.0% | | | | |
| | 386 | | | Eagle Materials, Inc. | | | 29,425 | |
| | | | | | | | |
| | | | Total Materials | | | 100,655 | |
| | | | | | | | |
| | | | Total Common Stocks
(Cost $2,166,064) | | | 2,954,471 | |
| | | | | | | | |
SEE NOTES TO FINANCIAL STATEMENTS.
| | | | | | | | |
| | | |
| JUNE 30, 2015 | | J.P. MORGAN MID CAP/MULTI-CAP FUNDS | | | | | 25 | |
JPMorgan Mid Cap Growth Fund
SCHEDULE OF PORTFOLIO INVESTMENTS
AS OF JUNE 30, 2015 (continued)
(Amounts in thousands)
| | | | | | | | |
| SHARES | | | SECURITY DESCRIPTION | | VALUE($) | |
| Short-Term Investment — 4.5% | |
| | | | Investment Company — 4.5% | |
| | 136,866 | | | JPMorgan Liquid Assets Money Market Fund, Institutional Class Shares, 0.080% (b) (l) (m)
(Cost $136,866) | | | 136,866 | |
| | | | | | | | |
| | | | Total Investments — 100.9%
(Cost $2,302,930) | | | 3,091,337 | |
| | | | Liabilities in Excess of
Other Assets — (0.9)% | | | (28,811 | ) |
| | | | | | | | |
| | | | NET ASSETS — 100.0% | | $ | 3,062,526 | |
| | | | | | | | |
Percentages indicated are based on net assets.
SEE NOTES TO FINANCIAL STATEMENTS.
| | | | | | |
| | | |
| 26 | | | | J.P. MORGAN MID CAP/MULTI-CAP FUNDS | | JUNE 30, 2015 |
JPMorgan Mid Cap Value Fund
SCHEDULE OF PORTFOLIO INVESTMENTS
AS OF JUNE 30, 2015
(Amounts in thousands)
| | | | | | | | |
| SHARES | | | SECURITY DESCRIPTION | | VALUE($) | |
| Common Stocks — 96.2% | |
| | | | Consumer Discretionary — 18.8% | |
| | | | Distributors — 0.6% | |
| | 1,143 | | | Genuine Parts Co. | | | 102,338 | |
| | | | | | | | |
| | | | Hotels, Restaurants & Leisure — 1.4% | |
| | 1,274 | | | Marriott International, Inc., Class A | | | 94,738 | |
| | 1,487 | | | Starwood Hotels & Resorts Worldwide, Inc. | | | 120,610 | |
| | | | | | | | |
| | | | | | | 215,348 | |
| | | | | | | | |
| | | | Household Durables — 2.7% | |
| | 3,377 | | | Jarden Corp. (a) | | | 174,770 | |
| | 1,370 | | | Mohawk Industries, Inc. (a) | | | 261,509 | |
| | | | | | | | |
| | | | | | | 436,279 | |
| | | | | | | | |
| | | | Internet & Catalog Retail — 1.3% | |
| | 1,946 | | | Expedia, Inc. | | | 212,814 | |
| | | | | | | | |
| | | | Media — 3.3% | |
| | 1,867 | | | CBS Corp. (Non-Voting), Class B | | | 103,624 | |
| | 2,521 | | | DISH Network Corp., Class A (a) | | | 170,693 | |
| | 2,171 | | | Gannett Co., Inc. (a) | | | 30,370 | |
| | 4,342 | | | TEGNA, Inc. | | | 139,235 | |
| | 3,340 | | | Time, Inc. | | | 76,843 | |
| | | | | | | | |
| | | | | | | 520,765 | |
| | | | | | | | |
| | | | Multiline Retail — 2.5% | |
| | 4,288 | | | Kohl’s Corp. | | | 268,460 | |
| | 1,774 | | | Nordstrom, Inc. | | | 132,185 | |
| | | | | | | | |
| | | | | | | 400,645 | |
| | | | | | | | |
| | | | Specialty Retail — 5.6% | |
| | 268 | | | AutoZone, Inc. (a) | | | 178,481 | |
| | 2,641 | | | Bed Bath & Beyond, Inc. (a) | | | 182,191 | |
| | 5,053 | | | Best Buy Co., Inc. | | | 164,794 | |
| | 4,933 | | | Gap, Inc. (The) | | | 188,309 | |
| | 1,978 | | | Tiffany & Co. | | | 181,562 | |
| | | | | | | | |
| | | | | | | 895,337 | |
| | | | | | | | |
| | | | Textiles, Apparel & Luxury Goods — 1.4% | |
| | 1,245 | | | PVH Corp. | | | 143,435 | |
| | 1,067 | | | V.F. Corp. | | | 74,439 | |
| | | | | | | | |
| | | | | | | 217,874 | |
| | | | | | | | |
| | | | Total Consumer Discretionary | | | 3,001,400 | |
| | | | | | | | |
| | | | Consumer Staples — 5.7% | |
| | | | Beverages — 1.6% | |
| | 1,061 | | | Constellation Brands, Inc., Class A | | | 123,067 | |
| | 1,886 | | | Dr. Pepper Snapple Group, Inc. | | | 137,516 | |
| | | | | | | | |
| | | | | | | 260,583 | |
| | | | | | | | |
| | | | | | | | |
| SHARES | | | SECURITY DESCRIPTION | | VALUE($) | |
| | | | | | | | |
| | | | Food & Staples Retailing — 2.2% | |
| | 3,007 | | | Kroger Co. (The) | | | 218,016 | |
| | 15,560 | | | Rite Aid Corp. (a) | | | 129,926 | |
| | | | | | | | |
| | | | | | | 347,942 | |
| | | | | | | | |
| | | | Food Products — 0.8% | |
| | 1,448 | | | Hershey Co. (The) | | | 128,600 | |
| | | | | | | | |
| | | | Household Products — 1.1% | |
| | 1,262 | | | Energizer Holdings, Inc. | | | 165,979 | |
| | 130 | | | Energizer SpinCo, Inc. (a) (w) | | | 4,410 | |
| | | | | | | | |
| | | | | | | 170,389 | |
| | | | | | | | |
| | | | Total Consumer Staples | | | 907,514 | |
| | | | | | | | |
| | | | Energy — 4.0% | |
| | | | Oil, Gas & Consumable Fuels — 4.0% | |
| | 3,791 | | | Energen Corp. | | | 258,952 | |
| | 2,596 | | | EQT Corp. | | | 211,159 | |
| | 2,622 | | | PBF Energy, Inc., Class A | | | 74,513 | |
| | 3,820 | | | Southwestern Energy Co. (a) | | | 86,825 | |
| | | | | | | | |
| | | | Total Energy | | | 631,449 | |
| | | | | | | | |
| | | | Financials — 29.6% | |
| | | | Banks — 7.1% | |
| | 4,319 | | | Citizens Financial Group, Inc. | | | 117,962 | |
| | 1,324 | | | City National Corp. | | | 119,647 | |
| | 11,271 | | | Fifth Third Bancorp | | | 234,666 | |
| | 1,965 | | | First Republic Bank | | | 123,872 | |
| | 5,177 | | | Huntington Bancshares, Inc. | | | 58,551 | |
| | 1,674 | | | M&T Bank Corp. | | | 209,128 | |
| | 5,028 | | | SunTrust Banks, Inc. | | | 216,321 | |
| | 1,631 | | | Zions Bancorporation | | | 51,746 | |
| | | | | | | | |
| | | | | | | 1,131,893 | |
| | | | | | | | |
| | | | Capital Markets — 4.6% | |
| | 1,655 | | | Ameriprise Financial, Inc. | | | 206,757 | |
| | 3,935 | | | Invesco Ltd. | | | 147,534 | |
| | 1,751 | | | Legg Mason, Inc. | | | 90,223 | |
| | 1,450 | | | Northern Trust Corp. | | | 110,892 | |
| | 2,309 | | | T. Rowe Price Group, Inc. | | | 179,514 | |
| | | | | | | | |
| | | | | | | 734,920 | |
| | | | | | | | |
| | | | Consumer Finance — 0.7% | |
| | 4,995 | | | Ally Financial, Inc. (a) | | | 112,042 | |
| | | | | | | | |
| | | | Insurance — 8.8% | |
| | 214 | | | Alleghany Corp. (a) | | | 100,285 | |
| | 1,449 | | | Chubb Corp. (The) | | | 137,880 | |
| | 4,279 | | | Hartford Financial Services Group, Inc. (The) | | | 177,866 | |
| | 6,215 | | | Loews Corp. | | | 239,342 | |
SEE NOTES TO FINANCIAL STATEMENTS.
| | | | | | | | |
| | | |
| JUNE 30, 2015 | | J.P. MORGAN MID CAP/MULTI-CAP FUNDS | | | | | 27 | |
JPMorgan Mid Cap Value Fund
SCHEDULE OF PORTFOLIO INVESTMENTS
AS OF JUNE 30, 2015 (continued)
(Amounts in thousands)
| | | | | | | | |
| SHARES | | | SECURITY DESCRIPTION | | VALUE($) | |
| Common Stocks — continued | |
| | | | Insurance — continued | |
| | 3,701 | | | Marsh & McLennan Cos., Inc. | | | 209,849 | |
| | 4,727 | | | Old Republic International Corp. | | | 73,877 | |
| | 2,582 | | | Progressive Corp. (The) | | | 71,865 | |
| | 4,150 | | | Unum Group | | | 148,360 | |
| | 1,610 | | | W.R. Berkley Corp. | | | 83,627 | |
| | 4,448 | | | XL Group plc, (Ireland) | | | 165,465 | |
| | | | | | | | |
| | | | | | | 1,408,416 | |
| | | | | | | | |
| | | | Real Estate Investment Trusts (REITs) — 8.0% | |
| | 2,601 | | | American Campus Communities, Inc. | | | 98,045 | |
| | 1,007 | | | AvalonBay Communities, Inc. | | | 161,043 | |
| | 763 | | | Boston Properties, Inc. | | | 92,295 | |
| | 5,251 | | | Brixmor Property Group, Inc. | | | 121,460 | |
| | 5,105 | | | General Growth Properties, Inc. | | | 130,989 | |
| | 6,696 | | | Kimco Realty Corp. | | | 150,919 | |
| | 2,720 | | | Outfront Media, Inc. | | | 68,663 | |
| | 3,520 | | | Rayonier, Inc. | | | 89,937 | |
| | 1,517 | | | Regency Centers Corp. | | | 89,470 | |
| | 1,636 | | | Vornado Realty Trust | | | 155,278 | |
| | 3,727 | | | Weyerhaeuser Co. | | | 117,400 | |
| | | | | | | | |
| | | | | | | 1,275,499 | |
| | | | | | | | |
| | | | Thrifts & Mortgage Finance — 0.4% | |
| | 6,261 | | | Hudson City Bancorp, Inc. | | | 61,860 | |
| | | | | | | | |
| | | | Total Financials | | | 4,724,630 | |
| | | | | | | | |
| | | | Health Care — 6.5% | |
| | | | Health Care Providers & Services — 6.5% | |
| | 1,747 | | | AmerisourceBergen Corp. | | | 185,726 | |
| | 3,627 | | | Brookdale Senior Living, Inc. (a) | | | 125,859 | |
| | 1,709 | | | Cigna Corp. | | | 276,815 | |
| | 727 | | | Henry Schein, Inc. (a) | | | 103,358 | |
| | 1,353 | | | Humana, Inc. | | | 258,893 | |
| | 639 | | | Universal Health Services, Inc., Class B | | | 90,774 | |
| | | | | | | | |
| | | | Total Health Care | | | 1,041,425 | |
| | | | | | | | |
| | | | Industrials — 9.4% | |
| | | | Building Products — 0.7% | |
| | 2,564 | | | Fortune Brands Home & Security, Inc. | | | 117,472 | |
| | | | | | | | |
| | | | Electrical Equipment — 2.8% | |
| | 2,818 | | | AMETEK, Inc. | | | 154,355 | |
| | 1,705 | | | Hubbell, Inc., Class B | | | 184,580 | |
| | 1,578 | | | Regal Beloit Corp. | | | 114,530 | |
| | | | | | | | |
| | | | | | | 453,465 | |
| | | | | | | | |
| | | | Industrial Conglomerates — 1.2% | |
| | 1,939 | | | Carlisle Cos., Inc. | | | 194,114 | |
| | | | | | | | |
| | | | | | | | |
| SHARES | | | SECURITY DESCRIPTION | | VALUE($) | |
| | | | | | | | |
| | | | Machinery — 2.5% | |
| | 2,179 | | | IDEX Corp. | | | 171,205 | |
| | 2,958 | | | Rexnord Corp. (a) | | | 70,715 | |
| | 954 | | | Snap-on, Inc. | | | 151,852 | |
| | | | | | | | |
| | | | | | | 393,772 | |
| | | | | | | | |
| | | | Professional Services — 1.1% | |
| | 1,782 | | | Equifax, Inc. | | | 173,033 | |
| | | | | | | | |
| | | | Trading Companies & Distributors — 1.1% | |
| | 2,433 | | | MSC Industrial Direct Co., Inc., Class A | | | 169,764 | |
| | | | | | | | |
| | | | Total Industrials | | | 1,501,620 | |
| | | | | | | | |
| | | | Information Technology — 8.5% | |
| | | | Communications Equipment — 0.6% | |
| | 3,270 | | | CommScope Holding Co., Inc. (a) | | | 99,760 | |
| | | | | | | | |
| | | | Electronic Equipment, Instruments & Components — 2.5% | |
| | 2,766 | | | Amphenol Corp., Class A | | | 160,320 | |
| | 4,182 | | | Arrow Electronics, Inc. (a) | | | 233,341 | |
| | | | | | | | |
| | | | | | | 393,661 | |
| | | | | | | | |
| | | | IT Services — 1.5% | |
| | 3,796 | | | Jack Henry & Associates, Inc. | | | 245,631 | |
| | | | | | | | |
| | | | Semiconductors & Semiconductor Equipment — 2.5% | |
| | 2,489 | | | Analog Devices, Inc. | | | 159,732 | |
| | 1,141 | | | KLA-Tencor Corp. | | | 64,114 | |
| | 4,064 | | | Xilinx, Inc. | | | 179,459 | |
| | | | | | | | |
| | | | | | | 403,305 | |
| | | | | | | | |
| | | | Software — 1.4% | |
| | 4,377 | | | Synopsys, Inc. (a) | | | 221,698 | |
| | | | | | | | |
| | | | Total Information Technology | | | 1,364,055 | |
| | | | | | | | |
| | | | Materials — 5.1% | |
| | | | Chemicals — 2.4% | |
| | 1,813 | | | Airgas, Inc. | | | 191,794 | |
| | 1,638 | | | Albemarle Corp. | | | 90,554 | |
| | 401 | | | Sherwin-Williams Co. (The) | | | 110,172 | |
| | | | | | | | |
| | | | | | | 392,520 | |
| | | | | | | | |
| | | | Containers & Packaging — 2.7% | |
| | 1,815 | | | Ball Corp. | | | 127,340 | |
| | 1,963 | | | Rock-Tenn Co., Class A | | | 118,144 | |
| | 3,450 | | | Silgan Holdings, Inc. | | | 182,012 | |
| | | | | | | | |
| | | | | | | 427,496 | |
| | | | | | | | |
| | | | Total Materials | | | 820,016 | |
| | | | | | | | |
| | | | Utilities — 8.6% | |
| | | | Electric Utilities — 2.7% | |
| | 2,239 | | | Edison International | | | 124,436 | |
SEE NOTES TO FINANCIAL STATEMENTS.
| | | | | | |
| | | |
| 28 | | | | J.P. MORGAN MID CAP/MULTI-CAP FUNDS | | JUNE 30, 2015 |
| | | | | | | | |
| SHARES | | | SECURITY DESCRIPTION | | VALUE($) | |
| Common Stocks — continued | |
| | | | Electric Utilities — continued | | | | |
| | 4,302 | | | Westar Energy, Inc. | | | 147,230 | |
| | 4,756 | | | Xcel Energy, Inc. | | | 153,037 | |
| | | | | | | | |
| | | | | | | 424,703 | |
| | | | | | | | |
| | | | Gas Utilities — 1.7% | |
| | 1,628 | | | National Fuel Gas Co. | | | 95,845 | |
| | 8,852 | | | Questar Corp. | | | 185,090 | |
| | | | | | | | |
| | | | | | | 280,935 | |
| | | | | | | | |
| | | | Multi-Utilities — 4.2% | |
| | 10,427 | | | CenterPoint Energy, Inc. | | | 198,421 | |
| | 4,664 | | | CMS Energy Corp. | | | 148,495 | |
| | 1,974 | | | NiSource, Inc. | | | 89,986 | |
| | 1,094 | | | Sempra Energy | | | 108,221 | |
| | 2,698 | | | WEC Energy Group, Inc. | | | 121,333 | |
| | | | | | | | |
| | | | | | | 666,456 | |
| | | | | | | | |
| | | | Total Utilities | | | 1,372,094 | |
| | | | | | | | |
| | | | Total Common Stocks
(Cost $10,059,772) | | | 15,364,203 | |
| | | | | | | | |
| | | | | | | | |
| SHARES | | | SECURITY DESCRIPTION | | VALUE($) | |
| Short-Term Investment — 4.1% | |
| | | | Investment Company — 4.1% | | | | |
| | 648,674 | | | JPMorgan Prime Money Market Fund, Institutional Class Shares, 0.050% (b) (l) (m)
(Cost $648,674) | | | 648,674 | |
| | | | | | | | |
| | | | Total Investments — 100.3%
(Cost $10,708,446) | | | 16,012,877 | |
| | | | Liabilities in Excess of
Other Assets — (0.3)% | | | (53,804 | ) |
| | | | | | | | |
| | | | NET ASSETS — 100.0% | | $ | 15,959,073 | |
| | | | | | | | |
Percentages indicated are based on net assets.
SEE NOTES TO FINANCIAL STATEMENTS.
| | | | | | | | |
| | | |
| JUNE 30, 2015 | | J.P. MORGAN MID CAP/MULTI-CAP FUNDS | | | | | 29 | |
JPMorgan Multi-Cap Market Neutral Fund
SCHEDULE OF PORTFOLIO INVESTMENTS
AS OF JUNE 30, 2015
(Amounts in thousands)
| | | | | | | | |
| SHARES | | | SECURITY DESCRIPTION | | VALUE($) | |
| Long Positions — 100.7% (j) | |
| Common Stocks — 87.4% | |
| | | | Consumer Discretionary — 13.3% | | | | |
| | | | Auto Components — 0.4% | | | | |
| | 54 | | | Dana Holding Corp. | | | 1,102 | |
| | | | | | | | |
| | | | Diversified Consumer Services — 1.2% | | | | |
| | 63 | | | Apollo Education Group, Inc. (a) | | | 811 | |
| | 78 | | | ServiceMaster Global Holdings, Inc. (a) | | | 2,837 | |
| | | | | | | | |
| | | | | | | 3,648 | |
| | | | | | | | |
| | | | Hotels, Restaurants & Leisure — 2.0% | | | | |
| | 40 | | | Darden Restaurants, Inc. | | | 2,856 | |
| | 39 | | | Restaurant Brands International, Inc., (Canada) | | | 1,476 | |
| | 14 | | | Vail Resorts, Inc. | | | 1,523 | |
| | | | | | | | |
| | | | | | | 5,855 | |
| | | | | | | | |
| | | | Household Durables — 1.0% | | | | |
| | 1 | | | NVR, Inc. (a) | | | 737 | |
| | 46 | | | PulteGroup, Inc. | | | 925 | |
| | 36 | | | Toll Brothers, Inc. (a) | | | 1,391 | |
| | | | | | | | |
| | | | | | | 3,053 | |
| | | | | | | | |
| | | | Internet & Catalog Retail — 0.9% | | | | |
| | 94 | | | Liberty Interactive Corp. QVC Group, Class A (a) | | | 2,613 | |
| | | | | | | | |
| | | | Media — 2.1% | | | | |
| | 16 | | | John Wiley & Sons, Inc., Class A | | | 872 | |
| | 64 | | | Live Nation Entertainment, Inc. (a) | | | 1,764 | |
| | 6 | | | Regal Entertainment Group, Class A | | | 127 | |
| | 379 | | | Sirius XM Holdings, Inc. (a) | | | 1,413 | |
| | 19 | | | Time Warner, Inc. | | | 1,685 | |
| | 8 | | | Time, Inc. | | | 185 | |
| | | | | | | | |
| | | | | | | 6,046 | |
| | | | | | | | |
| | | | Multiline Retail — 2.1% | | | | |
| | 18 | | | Dillard’s, Inc., Class A | | | 1,881 | |
| | 20 | | | Macy’s, Inc. | | | 1,316 | |
| | 35 | | | Target Corp. | | | 2,855 | |
| | | | | | | | |
| | | | | | | 6,052 | |
| | | | | | | | |
| | | | Specialty Retail — 2.7% | | | | |
| | 74 | | | Best Buy Co., Inc. | | | 2,405 | |
| | 42 | | | Lowe’s Cos., Inc. | | | 2,844 | |
| | 164 | | | Staples, Inc. | | | 2,505 | |
| | | | | | | | |
| | | | | | | 7,754 | |
| | | | | | | | |
| | | | Textiles, Apparel & Luxury Goods — 0.9% | | | | |
| | 5 | | | Carter’s, Inc. | | | 547 | |
| | 29 | | | Deckers Outdoor Corp. (a) | | | 2,107 | |
| | | | | | | | |
| | | | | | | 2,654 | |
| | | | | | | | |
| | | | Total Consumer Discretionary | | | 38,777 | |
| | | | | | | | |
| | | | | | | | |
| SHARES | | | SECURITY DESCRIPTION | | VALUE($) | |
| | | | | | | | |
| | | | | | | | |
| | | | Consumer Staples — 6.9% | | | | |
| | | | Beverages — 0.9% | | | | |
| | 39 | | | Molson Coors Brewing Co., Class B | | | 2,730 | |
| | | | | | | | |
| | | | Food & Staples Retailing — 1.2% | | | | |
| | 37 | | | Kroger Co. (The) | | | 2,718 | |
| | 9 | | | Walgreens Boots Alliance, Inc. | | | 766 | |
| | | | | | | | |
| | | | | | | 3,484 | |
| | | | | | | | |
| | | | Food Products — 3.4% | | | | |
| | 60 | | | Archer-Daniels-Midland Co. | | | 2,880 | |
| | 31 | | | Bunge Ltd. | | | 2,685 | |
| | 30 | | | Ingredion, Inc. | | | 2,368 | |
| | 90 | | | Pilgrim’s Pride Corp. | | | 2,063 | |
| | | | | | | | |
| | | | | | | 9,996 | |
| | | | | | | | |
| | | | Household Products — 0.9% | | | | |
| | 20 | | | Edgewell Personal Care Co. | | | 2,635 | |
| | | | | | | | |
| | | | Personal Products — 0.3% | | | | |
| | 14 | | | Herbalife Ltd. (a) | | | 753 | |
| | | | | | | | |
| | | | Tobacco — 0.2% | | | | |
| | 7 | | | Reynolds American, Inc. | | | 503 | |
| | | | | | | | |
| | | | Total Consumer Staples | | | 20,101 | |
| | | | | | | | |
| | | | Energy — 4.2% | | | | |
| | | | Energy Equipment & Services — 1.2% | | | | |
| | 39 | | | Cameron International Corp. (a) | | | 2,016 | |
| | 22 | | | Ensco plc, (United Kingdom), Class A | | | 482 | |
| | 51 | | | Superior Energy Services, Inc. | | | 1,080 | |
| | | | | | | | |
| | | | | | | 3,578 | |
| | | | | | | | |
| | | | Oil, Gas & Consumable Fuels — 3.0% | | | | |
| | 71 | | | Denbury Resources, Inc. | | | 453 | |
| | 24 | | | Devon Energy Corp. | | | 1,417 | |
| | 50 | | | Kosmos Energy Ltd. (a) | | | 423 | |
| | 21 | | | Marathon Oil Corp. | | | 546 | |
| | 20 | | | Newfield Exploration Co. (a) | | | 715 | |
| | 82 | | | Oasis Petroleum, Inc. (a) | | | 1,297 | |
| | 8 | | | Tesoro Corp. | | | 714 | |
| | 26 | | | Valero Energy Corp. | | | 1,612 | |
| | 21 | | | World Fuel Services Corp. | | | 987 | |
| | 39 | | | WPX Energy, Inc. (a) | | | 477 | |
| | | | | | | | |
| | | | | | | 8,641 | |
| | | | | | | | |
| | | | Total Energy | | | 12,219 | |
| | | | | | | | |
| | | | Financials — 4.2% | |
| | | | Banks — 0.6% | |
| | 46 | | | KeyCorp | | | 698 | |
SEE NOTES TO FINANCIAL STATEMENTS.
| | | | | | |
| | | |
| 30 | | | | J.P. MORGAN MID CAP/MULTI-CAP FUNDS | | JUNE 30, 2015 |
| | | | | | | | |
| SHARES | | | SECURITY DESCRIPTION | | VALUE($) | |
| Long Positions — continued | |
| Common Stocks — continued | |
| | | | Banks — continued | |
| | 35 | | | Popular, Inc., (Puerto Rico) (a) | | | 1,000 | |
| | | | | | | | |
| | | | | | | 1,698 | |
| | | | | | | | |
| | | | Capital Markets — 0.9% | |
| | 74 | | | E*TRADE Financial Corp. (a) | | | 2,218 | |
| | 23 | | | NorthStar Asset Management Group, Inc. | | | 426 | |
| | | | | | | | |
| | | | | | | 2,644 | |
| | | | | | | | |
| | | | Consumer Finance — 0.2% | |
| | 10 | | | Springleaf Holdings, Inc. (a) | | | 457 | |
| | | | | | | | |
| | | | Insurance — 0.8% | |
| | 13 | | | Aspen Insurance Holdings Ltd., (Bermuda) | | | 613 | |
| | 3 | | | Everest Re Group Ltd., (Bermuda) | | | 456 | |
| | 15 | | | Prudential Financial, Inc. | | | 1,326 | |
| | | | | | | | |
| | | | | | | 2,395 | |
| | | | | | | | |
| | | | Real Estate Investment Trusts (REITs) — 1.3% | |
| | 153 | | | NorthStar Realty Finance Corp. | | | 2,425 | |
| | 50 | | | RLJ Lodging Trust | | | 1,503 | |
| | | | | | | | |
| | | | | | | 3,928 | |
| | | | | | | | |
| | | | Thrifts & Mortgage Finance — 0.4% | |
| | 92 | | | MGIC Investment Corp. (a) | | | 1,051 | |
| | | | | | | | |
| | | | Total Financials | | | 12,173 | |
| | | | | | | | |
| | | | Health Care — 11.4% | |
| | | | Biotechnology — 2.6% | |
| | 10 | | | Amgen, Inc. | | | 1,478 | |
| | 21 | | | Gilead Sciences, Inc. | | | 2,511 | |
| | 7 | | | United Therapeutics Corp. (a) | | | 1,141 | |
| | 19 | | | Vertex Pharmaceuticals, Inc. (a) | | | 2,394 | |
| | | | | | | | |
| | | | | | | 7,524 | |
| | | | | | | | |
| | | | Health Care Equipment & Supplies — 2.0% | |
| | 22 | | | Alere, Inc. (a) | | | 1,170 | |
| | 70 | | | Hologic, Inc. (a) | | | 2,662 | |
| | 21 | | | Stryker Corp. | | | 1,966 | |
| | | | | | | | |
| | | | | | | 5,798 | |
| | | | | | | | |
| | | | Health Care Providers & Services — 5.8% | |
| | 19 | | | Aetna, Inc. | | | 2,390 | |
| | 17 | | | Anthem, Inc. | | | 2,827 | |
| | 32 | | | Cardinal Health, Inc. | | | 2,675 | |
| | 30 | | | Express Scripts Holding Co. (a) | | | 2,635 | |
| | 42 | | | Health Net, Inc. (a) | | | 2,669 | |
| | 7 | | | LifePoint Health, Inc. (a) | | | 650 | |
| | 8 | | | Molina Healthcare, Inc. (a) | | | 594 | |
| | 27 | | | Omnicare, Inc. | | | 2,559 | |
| | | | | | | | |
| | | | | | | 16,999 | |
| | | | | | | | |
| | | | | | | | |
| SHARES | | | SECURITY DESCRIPTION | | VALUE($) | |
| | | | | | | | |
| | | | | | | | |
| | | | Pharmaceuticals — 1.0% | |
| | 84 | | | Pfizer, Inc. | | | 2,832 | |
| | | | | | | | |
| | | | Total Health Care | | | 33,153 | |
| | | | | | | | |
| | | | Industrials — 15.2% | |
| | | | Aerospace & Defense — 3.1% | |
| | 35 | | | Curtiss-Wright Corp. | | | 2,524 | |
| | 12 | | | General Dynamics Corp. | | | 1,651 | |
| | 12 | | | Huntington Ingalls Industries, Inc. | | | 1,312 | |
| | 8 | | | Northrop Grumman Corp. | | | 1,255 | |
| | 39 | | | Spirit AeroSystems Holdings, Inc., Class A (a) | | | 2,135 | |
| | | | | | | | |
| | | | | | | 8,877 | |
| | | | | | | | |
| | | | Air Freight & Logistics — 1.0% | |
| | 31 | | | Expeditors International of Washington, Inc. | | | 1,429 | |
| | 9 | | | FedEx Corp. | | | 1,483 | |
| | | | | | | | |
| | | | | | | 2,912 | |
| | | | | | | | |
| | | | Airlines — 1.3% | |
| | 27 | | | Delta Air Lines, Inc. | | | 1,115 | |
| | 60 | | | Southwest Airlines Co. | | | 1,988 | |
| | 12 | | | United Continental Holdings, Inc. (a) | | | 619 | |
| | | | | | | | |
| | | | | | | 3,722 | |
| | | | | | | | |
| | | | Commercial Services & Supplies — 1.6% | |
| | 8 | | | Cintas Corp. | | | 698 | |
| | 30 | | | KAR Auction Services, Inc. | | | 1,104 | |
| | 121 | | | Pitney Bowes, Inc. | | | 2,512 | |
| | 22 | | | R.R. Donnelley & Sons Co. | | | 378 | |
| | | | | | | | |
| | | | | | | 4,692 | |
| | | | | | | | |
| | | | Construction & Engineering — 1.2% | |
| | 79 | | | AECOM (a) | | | 2,616 | |
| | 50 | | | KBR, Inc. | | | 966 | |
| | | | | | | | |
| | | | | | | 3,582 | |
| | | | | | | | |
| | | | Electrical Equipment — 0.6% | |
| | 54 | | | Babcock & Wilcox Co. (The) (a) | | | 1,755 | |
| | | | | | | | |
| | | | Machinery — 5.1% | |
| | 85 | | | Allison Transmission Holdings, Inc. | | | 2,496 | |
| | 43 | | | Crane Co. | | | 2,517 | |
| | 36 | | | IDEX Corp. | | | 2,813 | |
| | 30 | | | Illinois Tool Works, Inc. | | | 2,784 | |
| | 10 | | | Parker-Hannifin Corp. | | | 1,198 | |
| | 13 | | | SPX Corp. | | | 959 | |
| | 93 | | | Terex Corp. | | | 2,160 | |
| | | | | | | | |
| | | | | | | 14,927 | |
| | | | | | | | |
SEE NOTES TO FINANCIAL STATEMENTS.
| | | | | | | | |
| | | |
| JUNE 30, 2015 | | J.P. MORGAN MID CAP/MULTI-CAP FUNDS | | | | | 31 | |
JPMorgan Multi-Cap Market Neutral Fund
SCHEDULE OF PORTFOLIO INVESTMENTS
AS OF JUNE 30, 2015 (continued)
(Amounts in thousands)
| | | | | | | | |
| SHARES | | | SECURITY DESCRIPTION | | VALUE($) | |
| Long Positions — continued | |
| Common Stocks — continued | |
| | | | Professional Services — 0.9% | |
| | 22 | | | Dun & Bradstreet Corp. (The) | | | 2,663 | |
| | | | | | | | |
| | | | Road & Rail — 0.4% | |
| | 16 | | | Landstar System, Inc. | | | 1,056 | |
| | | | | | | | |
| | | | Total Industrials | | | 44,186 | |
| | | | | | | | |
| | | | Information Technology — 23.5% | |
| | | | Communications Equipment — 1.5% | |
| | 11 | | | ARRIS Group, Inc. (a) | | | 347 | |
| | 229 | | | Brocade Communications Systems, Inc. | | | 2,724 | |
| | 103 | | | Polycom, Inc. (a) | | | 1,175 | |
| | | | | | | | |
| | | | | | | 4,246 | |
| | | | | | | | |
| | | | Electronic Equipment, Instruments & Components — 0.3% | |
| | 76 | | | Vishay Intertechnology, Inc. | | | 888 | |
| | | | | | | | |
| | | | Internet Software & Services — 1.9% | |
| | 48 | | | eBay, Inc. (a) | | | 2,866 | |
| | 40 | | | VeriSign, Inc. (a) | | | 2,481 | |
| | | | | | | | |
| | | | | | | 5,347 | |
| | | | | | | | |
| | | | IT Services — 6.7% | |
| | 49 | | | Amdocs Ltd. | | | 2,670 | |
| | 50 | | | Broadridge Financial Solutions, Inc. | | | 2,505 | |
| | 38 | | | Computer Sciences Corp. | | | 2,473 | |
| | 68 | | | CoreLogic, Inc. (a) | | | 2,707 | |
| | 16 | | | International Business Machines Corp. | | | 2,521 | |
| | 67 | | | Leidos Holdings, Inc. | | | 2,696 | |
| | 40 | | | Teradata Corp. (a) | | | 1,481 | |
| | 124 | | | Western Union Co. (The) | | | 2,525 | |
| | | | | | | | |
| | | | | | | 19,578 | |
| | | | | | | | |
| | | | Semiconductors & Semiconductor Equipment — 2.5% | |
| | 55 | | | Broadcom Corp., Class A | | | 2,833 | |
| | 5 | | | Lam Research Corp. | | | 438 | |
| | 77 | | | NVIDIA Corp. | | | 1,551 | |
| | 124 | | | Teradyne, Inc. | | | 2,399 | |
| | | | | | | | |
| | | | | | | 7,221 | |
| | | | | | | | |
| | | | Software — 6.3% | |
| | 17 | | | Aspen Technology, Inc. (a) | | | 764 | |
| | 13 | | | CA, Inc. | | | 379 | |
| | 21 | | | Citrix Systems, Inc. (a) | | | 1,445 | |
| | 43 | | | Electronic Arts, Inc. (a) | | | 2,855 | |
| | 16 | | | Fortinet, Inc. (a) | | | 657 | |
| | 28 | | | Intuit, Inc. | | | 2,864 | |
| | 170 | | | Nuance Communications, Inc. (a) | | | 2,973 | |
| | 60 | | | PTC, Inc. (a) | | | 2,472 | |
| | 69 | | | Rovi Corp. (a) | | | 1,108 | |
| | | | | | | | |
| SHARES | | | SECURITY DESCRIPTION | | VALUE($) | |
| | | | | | | | |
| | | | | | | | |
| | | | Software — continued | |
| | 23 | | | SolarWinds, Inc. (a) | | | 1,066 | |
| | 75 | | | Symantec Corp. | | | 1,754 | |
| | | | | | | | |
| | | | | | | 18,337 | |
| | | | | | | | |
| | | | Technology Hardware, Storage & Peripherals — 4.3% | |
| | 23 | | | Apple, Inc. | | | 2,941 | |
| | 83 | | | Hewlett-Packard Co. | | | 2,484 | |
| | 63 | | | Lexmark International, Inc., Class A | | | 2,795 | |
| | 73 | | | NetApp, Inc. | | | 2,291 | |
| | 26 | | | Western Digital Corp. | | | 2,011 | |
| | | | | | | | |
| | | | | | | 12,522 | |
| | | | | | | | |
| | | | Total Information Technology | | | 68,139 | |
| | | | | | | | |
| | | | Materials — 4.0% | |
| | | | Chemicals — 1.1% | |
| | 9 | | | LyondellBasell Industries N.V., Class A | | | 901 | |
| | 38 | | | Mosaic Co. (The) | | | 1,770 | |
| | 8 | | | Scotts Miracle-Gro Co. (The), Class A | | | 485 | |
| | | | | | | | |
| | | | | | | 3,156 | |
| | | | | | | | |
| | | | Containers & Packaging — 1.3% | |
| | 55 | | | Sealed Air Corp. | | | 2,823 | |
| | 19 | | | Silgan Holdings, Inc. | | | 1,023 | |
| | | | | | | | |
| | | | | | | 3,846 | |
| | | | | | | | |
| | | | Metals & Mining — 0.6% | |
| | 33 | | | Steel Dynamics, Inc. | | | 693 | |
| | 44 | | | United States Steel Corp. | | | 913 | |
| | | | | | | | |
| | | | | | | 1,606 | |
| | | | | | | | |
| | | | Paper & Forest Products — 1.0% | |
| | 64 | | | Domtar Corp., (Canada) | | | 2,664 | |
| | 7 | | | International Paper Co. | | | 312 | |
| | | | | | | | |
| | | | | | | 2,976 | |
| | | | | | | | |
| | | | Total Materials | | | 11,584 | |
| | | | | | | | |
| | | | Telecommunication Services — 1.8% | |
| | | | Diversified Telecommunication Services — 1.8% | |
| | 42 | | | AT&T, Inc. | | | 1,496 | |
| | 75 | | | CenturyLink, Inc. | | | 2,217 | |
| | 291 | | | Frontier Communications Corp. | | | 1,441 | |
| | | | | | | | |
| | | | Total Telecommunication Services | | | 5,154 | |
| | | | | | | | |
| | | | Utilities — 2.9% | |
| | | | Electric Utilities — 0.9% | |
| | 36 | | | Entergy Corp. | | | 2,554 | |
| | | | | | | | |
SEE NOTES TO FINANCIAL STATEMENTS.
| | | | | | |
| | | |
| 32 | | | | J.P. MORGAN MID CAP/MULTI-CAP FUNDS | | JUNE 30, 2015 |
| | | | | | | | |
| SHARES | | | SECURITY DESCRIPTION | | VALUE($) | |
| Long Positions — continued | |
| Common Stocks — continued | |
| | | | Gas Utilities — 0.8% | |
| | 73 | | | UGI Corp. | | | 2,512 | |
| | | | | | | | |
| | | | Independent Power & Renewable Electricity
Producers — 0.7% | |
| | 148 | | | AES Corp. | | | 1,959 | |
| | | | | | | | |
| | | | Multi-Utilities — 0.5% | |
| | 37 | | | Public Service Enterprise Group, Inc. | | | 1,448 | |
| | | | | | | | |
| | | | Total Utilities | | | 8,473 | |
| | | | | | | | |
| | | | Total Common Stocks
(Cost $215,226) | | | 253,959 | |
| | | | | | | | |
| Short-Term Investment — 13.3% | | | | |
| | | | Investment Company — 13.3% | | | | |
| | 38,662 | | | JPMorgan Liquid Assets Money Market Fund, Institutional Class Shares,
0.080% (b) (l)
(Cost $38,662) | | | 38,662 | |
| | | | | | | | |
| | | | Total Investments — 100.7%
(Cost $253,888) | | | 292,621 | |
| | | | Liabilities in Excess of
Other Assets — (0.7)% (c) | | | (1,941 | ) |
| | | | | | | | |
| | | | NET ASSETS — 100.0% | | $ | 290,680 | |
| | | | | | | | |
| Short Positions — 86.9% | |
| Common Stocks — 86.9% | |
| | | | Consumer Discretionary — 13.1% | | | | |
| | | | Automobiles — 0.2% | |
| | 2 | | | Tesla Motors, Inc. (a) | | | 584 | |
| | | | | | | | |
| | | | Distributors — 0.9% | |
| | 91 | | | LKQ Corp. (a) | | | 2,760 | |
| | | | | | | | |
| | | | Hotels, Restaurants & Leisure — 2.9% | |
| | 61 | | | Aramark | | | 1,885 | |
| | 6 | | | McDonald’s Corp. | | | 529 | |
| | 12 | | | Panera Bread Co., Class A (a) | | | 2,036 | |
| | 28 | | | Starbucks Corp. | | | 1,524 | |
| | 24 | | | Wynn Resorts Ltd. | | | 2,378 | |
| | | | | | | | |
| | | | | | | 8,352 | |
| | | | | | | | |
| | | | Household Durables — 0.8% | |
| | 12 | | | Mohawk Industries, Inc. (a) | | | 2,348 | |
| | | | | | | | |
| | | | Internet & Catalog Retail — 1.0% | |
| | 3 | | | Amazon.com, Inc. (a) | | | 1,400 | |
| | 1 | | | Netflix, Inc. (a) | | | 657 | |
| | 5 | | | TripAdvisor, Inc. (a) | | | 431 | |
| | 29 | | | zulily, Inc., Class A (a) | | | 377 | |
| | | | | | | | |
| | | | | | | 2,865 | |
| | | | | | | | |
| | | | | | | | |
| SHARES | | | SECURITY DESCRIPTION | | VALUE($) | |
| | | | | | | | |
| | | | | | | | |
| | | | Media — 2.0% | |
| | 6 | | | AMC Entertainment Holdings, Inc., Class A | | | 174 | |
| | 5 | | | Charter Communications, Inc., Class A (a) | | | 788 | |
| | 87 | | | DreamWorks Animation SKG, Inc., Class A (a) | | | 2,290 | |
| | 32 | | | Madison Square Garden Co. (The), Class A (a) | | | 2,707 | |
| | | | | | | | |
| | | | | | | 5,959 | |
| | | | | | | | |
| | | | Specialty Retail — 4.3% | |
| | 40 | | | Ascena Retail Group, Inc. (a) | | | 670 | |
| | 51 | | | Cabela’s, Inc. (a) | | | 2,531 | |
| | 38 | | | CarMax, Inc. (a) | | | 2,488 | |
| | 20 | | | Restoration Hardware Holdings, Inc. (a) | | | 1,960 | |
| | 21 | | | Signet Jewelers Ltd., (Bermuda) | | | 2,631 | |
| | 24 | | | Tractor Supply Co. | | | 2,198 | |
| | | | | | | | |
| | | | | | | 12,478 | |
| | | | | | | | |
| | | | Textiles, Apparel & Luxury Goods — 1.0% | |
| | 86 | | | Kate Spade & Co. (a) | | | 1,855 | |
| | 11 | | | Under Armour, Inc., Class A (a) | | | 936 | |
| | | | | | | | |
| | | | | | | 2,791 | |
| | | | | | | | |
| | | | Total Consumer Discretionary | | | 38,137 | |
| | | | | | | | |
| | | | Consumer Staples — 7.9% | | | | |
| | | | Beverages — 1.9% | |
| | 9 | | | Boston Beer Co., Inc. (The), Class A (a) | | | 2,030 | |
| | 34 | | | Brown-Forman Corp., Class B | | | 3,387 | |
| | | | | | | | |
| | | | | | | 5,417 | |
| | | | | | | | |
| | | | Food & Staples Retailing — 1.1% | |
| | 27 | | | Sprouts Farmers Market, Inc. (a) | | | 740 | |
| | 40 | | | United Natural Foods, Inc. (a) | | | 2,526 | |
| | | | | | | | |
| | | | | | | 3,266 | |
| | | | | | | | |
| | | | Food Products — 3.5% | |
| | 93 | | | Darling Ingredients, Inc. (a) | | | 1,360 | |
| | 45 | | | Hain Celestial Group, Inc. (The) (a) | | | 2,982 | |
| | 19 | | | Hershey Co. (The) | | | 1,652 | |
| | 38 | | | McCormick & Co., Inc. (Non-Voting) | | | 3,106 | |
| | 23 | | | WhiteWave Foods Co. (The) (a) | | | 1,113 | |
| | | | | | | | |
| | | | | | | 10,213 | |
| | | | | | | | |
| | | | Household Products — 0.3% | |
| | 11 | | | Procter & Gamble Co. (The) | | | 887 | |
| | | | | | | | |
| | | | Personal Products — 1.1% | |
| | 36 | | | Estee Lauder Cos., Inc. (The), Class A | | | 3,110 | |
| | | | | | | | |
| | | | Total Consumer Staples | | | 22,893 | |
| | | | | | | | |
SEE NOTES TO FINANCIAL STATEMENTS.
| | | | | | | | |
| | | |
| JUNE 30, 2015 | | J.P. MORGAN MID CAP/MULTI-CAP FUNDS | | | | | 33 | |
JPMorgan Multi-Cap Market Neutral Fund
SCHEDULE OF PORTFOLIO INVESTMENTS
AS OF JUNE 30, 2015 (continued)
(Amounts in thousands)
| | | | | | | | |
| SHARES | | | SECURITY DESCRIPTION | | VALUE($) | |
| Short Positions — continued | |
| Common Stocks — continued | |
| | | | Energy — 4.4% | | | | |
| | | | Energy Equipment & Services — 1.0% | |
| | 273 | | | McDermott International, Inc. (a) | | | 1,457 | |
| | 30 | | | Patterson-UTI Energy, Inc. | | | 568 | |
| | 41 | | | RPC, Inc. | | | 561 | |
| | 34 | | | Seadrill Ltd., (Bermuda) | | | 350 | |
| | | | | | | | |
| | | | | | | 2,936 | |
| | | | | | | | |
| | | | Oil, Gas & Consumable Fuels — 3.4% | |
| | 33 | | | Cabot Oil & Gas Corp. | | | 1,055 | |
| | 7 | | | Chevron Corp. | | | 649 | |
| | 7 | | | Concho Resources, Inc. (a) | | | 757 | |
| | 75 | | | CONSOL Energy, Inc. | | | 1,633 | |
| | 23 | | | Golar LNG Ltd., (Bermuda) | | | 1,084 | |
| | 14 | | | Kinder Morgan, Inc. | | | 530 | |
| | 51 | | | Rice Energy, Inc. (a) | | | 1,065 | |
| | 49 | | | SM Energy Co. | | | 2,264 | |
| | 8 | | | Whiting Petroleum Corp. (a) | | | 267 | |
| | 11 | | | Williams Cos., Inc. (The) | | | 641 | |
| | | | | | | | |
| | | | | | | 9,945 | |
| | | | | | | | |
| | | | Total Energy | | | 12,881 | |
| | | | | | | | |
| | | | Financials — 5.0% | | | | |
| | | | Banks — 0.6% | |
| | 110 | | | People’s United Financial, Inc. | | | 1,781 | |
| | | | | | | | |
| | | | Capital Markets — 1.3% | | | | |
| | 48 | | | Artisan Partners Asset Management, Inc.,
Class A | | | 2,213 | |
| | 18 | | | T. Rowe Price Group, Inc. | | | 1,411 | |
| | | | | | | | |
| | | | | | | 3,624 | |
| | | | | | | | |
| | | | Insurance — 1.2% | |
| | 4 | | | Markel Corp. (a) | | | 2,822 | |
| | 124 | | | MBIA, Inc. (a) | | | 747 | |
| | | | | | | | |
| | | | | | | 3,569 | |
| | | | | | | | |
| | | | Real Estate Investment Trusts (REITs) — 1.6% | |
| | 57 | | | Plum Creek Timber Co., Inc. | | | 2,299 | |
| | 97 | | | Rayonier, Inc. | | | 2,483 | |
| | | | | | | | |
| | | | | | | 4,782 | |
| | | | | | | | |
| | | | Real Estate Management & Development — 0.2% | |
| | 14 | | | Realogy Holdings Corp. (a) | | | 665 | |
| | | | | | | | |
| | | | Thrifts & Mortgage Finance — 0.1% | |
| | 22 | | | Ocwen Financial Corp. (a) | | | 229 | |
| | | | | | | | |
| | | | Total Financials | | | 14,650 | |
| | | | | | | | |
| | | | | | | | |
| SHARES | | | SECURITY DESCRIPTION | | VALUE($) | |
| | | | | | | | |
| | | | | | | | |
| | | | Health Care — 10.4% | | | | |
| | | | Biotechnology — 1.2% | |
| | 5 | | | Alnylam Pharmaceuticals, Inc. (a) | | | 644 | |
| | 36 | | | Cepheid, Inc. (a) | | | 2,186 | |
| | 1 | | | Regeneron Pharmaceuticals, Inc. (a) | | | 676 | |
| | | | | | | | |
| | | | | | | 3,506 | |
| | | | | | | | |
| | | | Health Care Equipment & Supplies — 1.0% | |
| | 16 | | | Cooper Cos., Inc. (The) | | | 2,847 | |
| | | | | | | | |
| | | | Health Care Providers & Services — 4.1% | |
| | 36 | | | Acadia Healthcare Co., Inc. (a) | | | 2,816 | |
| | 66 | | | Envision Healthcare Holdings, Inc. (a) | | | 2,609 | |
| | 5 | | | Henry Schein, Inc. (a) | | | 639 | |
| | 44 | | | Team Health Holdings, Inc. (a) | | | 2,901 | |
| | 50 | | | Tenet Healthcare Corp. (a) | | | 2,880 | |
| | | | | | | | |
| | | | | | | 11,845 | |
| | | | | | | | |
| | | | Health Care Technology — 0.5% | |
| | 35 | | | Allscripts Healthcare Solutions, Inc. (a) | | | 480 | |
| | 10 | | | athenahealth, Inc. (a) | | | 1,115 | |
| | | | | | | | |
| | | | | | | 1,595 | |
| | | | | | | | |
| | | | Life Sciences Tools & Services — 0.6% | |
| | 18 | | | Bio-Techne Corp. | | | 1,728 | |
| | | | | | | | |
| | | | Pharmaceuticals — 3.0% | |
| | 58 | | | Akorn, Inc. (a) | | | 2,547 | |
| | 25 | | | Eli Lilly & Co. | | | 2,100 | |
| | 21 | | | Pacira Pharmaceuticals, Inc. (a) | | | 1,457 | |
| | 57 | | | Zoetis, Inc. | | | 2,744 | |
| | | | | | | | |
| | | | | | | 8,848 | |
| | | | | | | | |
| | | | Total Health Care | | | 30,369 | |
| | | | | | | | |
| | | | Industrials — 17.3% | | | | |
| | | | Aerospace & Defense — 2.5% | |
| | 45 | | | B/E Aerospace, Inc. | | | 2,450 | |
| | 55 | | | Hexcel Corp. | | | 2,753 | |
| | 11 | | | Precision Castparts Corp. | | | 2,116 | |
| | | | | | | | |
| | | | | | | 7,319 | |
| | | | | | | | |
| | | | Airlines — 0.6% | |
| | 9 | | | Copa Holdings S.A., (Panama), Class A | | | 704 | |
| | 16 | | | Spirit Airlines, Inc. (a) | | | 988 | |
| | | | | | | | |
| | | | | | | 1,692 | |
| | | | | | | | |
| | | | Building Products — 2.0% | |
| | 51 | | | Armstrong World Industries, Inc. (a) | | | 2,705 | |
| | 43 | | | Fortune Brands Home & Security, Inc. | | | 1,952 | |
| | 27 | | | Owens Corning | | | 1,130 | |
| | | | | | | | |
| | | | | | | 5,787 | |
| | | | | | | | |
SEE NOTES TO FINANCIAL STATEMENTS.
| | | | | | |
| | | |
| 34 | | | | J.P. MORGAN MID CAP/MULTI-CAP FUNDS | | JUNE 30, 2015 |
| | | | | | | | |
| SHARES | | | SECURITY DESCRIPTION | | VALUE($) | |
| Short Positions — continued | |
| Common Stocks — continued | |
| | | | Commercial Services & Supplies — 2.5% | |
| | 48 | | | Republic Services, Inc. | | | 1,875 | |
| | 21 | | | Stericycle, Inc. (a) | | | 2,752 | |
| | 58 | | | Waste Connections, Inc. | | | 2,726 | |
| | | | | | | | |
| | | | | | | 7,353 | |
| | | | | | | | |
| | | | Construction & Engineering — 0.9% | |
| | 89 | | | Quanta Services, Inc. (a) | | | 2,554 | |
| | | | | | | | |
| | | | Electrical Equipment — 0.3% | |
| | 15 | | | SolarCity Corp. (a) | | | 803 | |
| | | | | | | | |
| | | | Machinery — 2.5% | | | | |
| | 42 | | | CLARCOR, Inc. | | | 2,609 | |
| | 15 | | | Colfax Corp. (a) | | | 682 | |
| | 69 | | | Donaldson Co., Inc. | | | 2,482 | |
| | 39 | | | Oshkosh Corp. | | | 1,632 | |
| | | | | | | | |
| | | | | | | 7,405 | |
| | | | | | | | |
| | | | Marine — 0.2% | |
| | 8 | | | Kirby Corp. (a) | | | 596 | |
| | | | | | | | |
| | | | Professional Services — 0.6% | |
| | 22 | | | Verisk Analytics, Inc., Class A (a) | | | 1,633 | |
| | | | | | | | |
| | | | Road & Rail — 2.6% | |
| | 12 | | | Genesee & Wyoming, Inc., Class A (a) | | | 942 | |
| | 54 | | | Hertz Global Holdings, Inc. (a) | | | 984 | |
| | 30 | | | J.B. Hunt Transport Services, Inc. | | | 2,487 | |
| | 20 | | | Kansas City Southern | | | 1,794 | |
| | 15 | | | Ryder System, Inc. | | | 1,319 | |
| | | | | | | | |
| | | | | | | 7,526 | |
| | | | | | | | |
| | | | Trading Companies & Distributors — 2.6% | |
| | 60 | | | Fastenal Co. | | | 2,548 | |
| | 36 | | | MSC Industrial Direct Co., Inc., Class A | | | 2,517 | |
| | 11 | | | W.W. Grainger, Inc. | | | 2,568 | |
| | | | | | | | |
| | | | | | | 7,633 | |
| | | | | | | | |
| | | | Total Industrials | | | 50,301 | |
| | | | | | | | |
| | | | Information Technology — 20.7% | |
| | | | Communications Equipment — 0.9% | |
| | 43 | | | ViaSat, Inc. (a) | | | 2,614 | |
| | | | | | | | |
| | | | Electronic Equipment, Instruments & Components — 4.1% | |
| | 29 | | | Amphenol Corp., Class A | | | 1,706 | |
| | 34 | | | FEI Co. | | | 2,805 | |
| | 106 | | | Ingram Micro, Inc., Class A (a) | | | 2,646 | |
| | 99 | | | Knowles Corp. (a) | | | 1,794 | |
| | 94 | | | Trimble Navigation Ltd. (a) | | | 2,211 | |
| | 8 | | | Zebra Technologies Corp., Class A (a) | | | 858 | |
| | | | | | | | |
| | | | | | | 12,020 | |
| | | | | | | | |
| | | | | | | | |
| SHARES | | | SECURITY DESCRIPTION | | VALUE($) | |
| | | | | | | | |
| | | | | | | | |
| | | | Internet Software & Services — 4.9% | |
| | 11 | | | Akamai Technologies, Inc. (a) | | | 768 | |
| | 13 | | | CoStar Group, Inc. (a) | | | 2,556 | |
| | 7 | | | Facebook, Inc., Class A (a) | | | 566 | |
| | 9 | | | LinkedIn Corp., Class A (a) | | | 1,762 | |
| | 152 | | | Pandora Media, Inc. (a) | | | 2,355 | |
| | 49 | | | Twitter, Inc. (a) | | | 1,771 | |
| | 44 | | | Yelp, Inc. (a) | | | 1,907 | |
| | 28 | | | Zillow Group, Inc., Class A (a) | | | 2,420 | |
| | | | | | | | |
| | | | | | | 14,105 | |
| | | | | | | | |
| | | | IT Services — 4.3% | |
| | 30 | | | Fidelity National Information Services, Inc. | | | 1,832 | |
| | 17 | | | FleetCor Technologies, Inc. (a) | | | 2,637 | |
| | 38 | | | IGATE Corp. (a) | | | 1,829 | |
| | 41 | | | Jack Henry & Associates, Inc. | | | 2,632 | |
| | 54 | | | Paychex, Inc. | | | 2,523 | |
| | 9 | | | WEX, Inc. (a) | | | 1,006 | |
| | | | | | | | |
| | | | | | | 12,459 | |
| | | | | | | | |
| | | | Semiconductors & Semiconductor Equipment — 2.0% | |
| | 21 | | | Analog Devices, Inc. | | | 1,349 | |
| | 5 | | | Avago Technologies Ltd., (Singapore) | | | 628 | |
| | 30 | | | Cavium, Inc. (a) | | | 2,063 | |
| | 14 | | | Cree, Inc. (a) | | | 352 | |
| | 43 | | | Cypress Semiconductor Corp. (a) | | | 511 | |
| | 25 | | | SunEdison, Inc. (a) | | | 738 | |
| | | | | | | | |
| | | | | | | 5,641 | |
| | | | | | | | |
| | | | Software — 4.1% | |
| | 24 | | | Autodesk, Inc. (a) | | | 1,197 | |
| | 44 | | | CommVault Systems, Inc. (a) | | | 1,854 | |
| | 18 | | | FireEye, Inc. (a) | | | 881 | |
| | 28 | | | NetSuite, Inc. (a) | | | 2,536 | |
| | 9 | | | ServiceNow, Inc. (a) | | | 650 | |
| | 51 | | | Solera Holdings, Inc. | | | 2,283 | |
| | 16 | | | Ultimate Software Group, Inc. (The) (a) | | | 2,584 | |
| | | | | | | | |
| | | | | | | 11,985 | |
| | | | | | | | |
| | | | Technology Hardware, Storage & Peripherals — 0.4% | |
| | 36 | | | Stratasys Ltd. (a) | | | 1,255 | |
| | | | | | | | |
| | | | Total Information Technology | | | 60,079 | |
| | | | | | | | |
| | | | Materials — 3.6% | |
| | | | Chemicals — 2.6% | |
| | 17 | | | Air Products & Chemicals, Inc. | | | 2,317 | |
| | 49 | | | FMC Corp. | | | 2,572 | |
| | 22 | | | Praxair, Inc. | | | 2,630 | |
| | | | | | | | |
| | | | | | | 7,519 | |
| | | | | | | | |
SEE NOTES TO FINANCIAL STATEMENTS.
| | | | | | | | |
| | | |
| JUNE 30, 2015 | | J.P. MORGAN MID CAP/MULTI-CAP FUNDS | | | | | 35 | |
JPMorgan Multi-Cap Market Neutral Fund
SCHEDULE OF PORTFOLIO INVESTMENTS
AS OF JUNE 30, 2015 (continued)
(Amounts in thousands)
| | | | | | | | |
| SHARES | | | SECURITY DESCRIPTION | | VALUE($) | |
| Short Positions — continued | |
| Common Stocks — continued | |
| | | | Metals & Mining — 1.0% | |
| | 42 | | | Carpenter Technology Corp. | | | 1,617 | |
| | 24 | | | Freeport-McMoRan, Inc. | | | 450 | |
| | 30 | | | Southern Copper Corp., (Mexico) | | | 878 | |
| | | | | | | | |
| | | | | | | 2,945 | |
| | | | | | | | |
| | | | Total Materials | | | 10,464 | |
| | | | | | | | |
| | | | Telecommunication Services — 1.7% | |
| | | | Wireless Telecommunication Services — 1.7% | |
| | 355 | | | Sprint Corp. (a) | | | 1,618 | |
| | 79 | | | Telephone & Data Systems, Inc. | | | 2,322 | |
| | 24 | | | United States Cellular Corp. (a) | | | 915 | |
| | | | | | | | |
| | | | Total Telecommunication Services | | | 4,855 | |
| | | | | | | | |
| | | | | | | | |
| SHARES | | | SECURITY DESCRIPTION | | VALUE($) | |
| | | | | | | | |
| | | | | | | | |
| | | | Utilities — 2.8% | |
| | | | Electric Utilities — 0.6% | |
| | 41 | | | Southern Co. (The) | | | 1,700 | |
| | | | | | | | |
| | | | Multi-Utilities — 2.2% | |
| | 44 | | | Dominion Resources, Inc. | | | 2,910 | |
| | 36 | | | MDU Resources Group, Inc. | | | 703 | |
| | 59 | | | NiSource, Inc. | | | 2,707 | |
| | | | | | | | |
| | | | | | | 6,320 | |
| | | | | | | | |
| | | | Total Utilities | | | 8,020 | |
| | | | | | | | |
| | | | Total Securities Sold Short
(Proceeds $253,357) | | $ | 252,649 | |
| | | | | | | | |
Percentages indicated are based on net assets.
| | | | | | | | | | | | | | | | | | | | |
| Futures Contracts | |
NUMBER OF
CONTRACTS | | | DESCRIPTION | | EXPIRATION
DATE | | | TRADING
CURRENCY | | | NOTIONAL
VALUE AT
JUNE 30, 2015 | | | NET
UNREALIZED
APPRECIATION
(DEPRECIATION) | |
| | | | Short Futures Outstanding | | | | | | | | | | | | | | | | |
| | (7 | ) | | E-mini S&P 500 | | | 09/18/15 | | | | USD | | | $ | (719 | ) | | $ | 11 | |
| | (9 | ) | | S&P Mid Cap 400 | | | 09/18/15 | | | | USD | | | | (1,348 | ) | | | 25 | |
| | | | | | | | | | | | | | | | | | | | |
| | | | | | | | | | | | | | | | | | $ | 36 | |
| | | | | | | | | | | | | | | | | | | | |
SEE NOTES TO FINANCIAL STATEMENTS.
| | | | | | |
| | | |
| 36 | | | | J.P. MORGAN MID CAP/MULTI-CAP FUNDS | | JUNE 30, 2015 |
JPMorgan Value Advantage Fund
SCHEDULE OF PORTFOLIO INVESTMENTS
AS OF JUNE 30, 2015
(Amounts in thousands)
| | | | | | | | |
| SHARES | | | SECURITY DESCRIPTION | | VALUE($) | |
| Common Stocks — 90.6% | |
| | | | Consumer Discretionary — 14.7% | |
| | | | Distributors — 0.8% | |
| | 998 | | | Genuine Parts Co. | | | 89,351 | |
| | | | | | | | |
| | | | Hotels, Restaurants & Leisure — 0.7% | |
| | 1,709 | | | ClubCorp Holdings, Inc. | | | 40,805 | |
| | 1,860 | | | La Quinta Holdings, Inc. (a) | | | 42,505 | |
| | | | | | | | |
| | | | | | | 83,310 | |
| | | | | | | | |
| | | | Internet & Catalog Retail — 1.0% | |
| | 999 | | | Expedia, Inc. | | | 109,252 | |
| | | | | | | | |
| | | | Media — 5.0% | |
| | 857 | | | CBS Corp. (Non-Voting), Class B | | | 47,563 | |
| | 400 | | | Charter Communications, Inc., Class A (a) | | | 68,500 | |
| | 3,531 | | | Clear Channel Outdoor Holdings, Inc., Class A | | | 35,765 | |
| | 1,976 | | | DISH Network Corp., Class A (a) | | | 133,803 | |
| | 1,566 | | | Entercom Communications Corp., Class A (a) | | | 17,887 | |
| | 455 | | | Gannett Co., Inc. (a) | | | 6,361 | |
| | 2,168 | | | Media General, Inc. (a) | | | 35,819 | |
| | 567 | | | Omnicom Group, Inc. | | | 39,422 | |
| | 909 | | | TEGNA, Inc. | | | 29,166 | |
| | 714 | | | Time Warner, Inc. | | | 62,393 | |
| | 2,107 | | | Time, Inc. | | | 48,489 | |
| | 1,155 | | | Twenty-First Century Fox, Inc., Class B | | | 37,217 | |
| | | | | | | | |
| | | | | | | 562,385 | |
| | | | | | | | |
| | | | Multiline Retail — 1.4% | |
| | 2,621 | | | Kohl’s Corp. | | | 164,069 | |
| | | | | | | | |
| | | | Specialty Retail — 5.1% | |
| | 141 | | | AutoZone, Inc. (a) | | | 93,980 | |
| | 1,727 | | | Bed Bath & Beyond, Inc. (a) | | | 119,142 | |
| | 3,540 | | | Best Buy Co., Inc. | | | 115,424 | |
| | 2,501 | | | Gap, Inc. (The) | | | 95,467 | |
| | 749 | | | Home Depot, Inc. (The) | | | 83,193 | |
| | 714 | | | Tiffany & Co. | | | 65,508 | |
| | | | | | | | |
| | | | | | | 572,714 | |
| | | | | | | | |
| | | | Textiles, Apparel & Luxury Goods — 0.7% | |
| | 2,274 | | | Hanesbrands, Inc. | | | 75,770 | |
| | | | | | | | |
| | | | Total Consumer Discretionary | | | 1,656,851 | |
| | | | | | | | |
| | | | Consumer Staples — 4.7% | |
| | | | Beverages — 0.7% | |
| | 1,055 | | | Dr. Pepper Snapple Group, Inc. | | | 76,878 | |
| | | | | | | | |
| | | | Food & Staples Retailing — 1.5% | |
| | 888 | | | CVS Health Corp. | | | 93,155 | |
| | 1,055 | | | Kroger Co. (The) | | | 76,505 | |
| | | | | | | | |
| | | | | | | 169,660 | |
| | | | | | | | |
| | | | | | | | |
| SHARES | | | SECURITY DESCRIPTION | | VALUE($) | |
| | | | | | | | |
| | | | Food Products — 1.3% | |
| | 1,477 | | | Post Holdings, Inc. (a) | | | 79,634 | |
| | 849 | | | TreeHouse Foods, Inc. (a) | | | 68,809 | |
| | | | | | | | |
| | | | | | | 148,443 | |
| | | | | | | | |
| | | | Household Products — 1.2% | |
| | 387 | | | Energizer SpinCo, Inc. (a) (w) | | | 13,164 | |
| | 1,614 | | | Procter & Gamble Co. (The) | | | 126,303 | |
| | | | | | | | |
| | | | | | | 139,467 | |
| | | | | | | | |
| | | | Total Consumer Staples | | | 534,448 | |
| | | | | | | | |
| | | | Energy — 7.1% | |
| | | | Oil, Gas & Consumable Fuels — 7.1% | |
| | 3,153 | | | CONSOL Energy, Inc. | | | 68,553 | |
| | 1,356 | | | Devon Energy Corp. | | | 80,674 | |
| | 3,018 | | | Exxon Mobil Corp. | | | 251,073 | |
| | 1,056 | | | HollyFrontier Corp. | | | 45,099 | |
| | 1,002 | | | Kinder Morgan, Inc. | | | 38,474 | |
| | 1,072 | | | Marathon Petroleum Corp. | | | 56,097 | |
| | 2,311 | | | PBF Energy, Inc., Class A | | | 65,672 | |
| | 1,423 | | | Phillips 66 | | | 114,637 | |
| | 3,812 | | | Southwestern Energy Co. (a) | | | 86,656 | |
| | | | | | | | |
| | | | Total Energy | | | 806,935 | |
| | | | | | | | |
| | | | Financials — 32.7% | |
| | | | Banks — 13.0% | |
| | 12,072 | | | Bank of America Corp. | | | 205,460 | |
| | 2,427 | | | Citigroup, Inc. | | | 134,042 | |
| | 2,649 | | | Citizens Financial Group, Inc. | | | 72,330 | |
| | 3,959 | | | Fifth Third Bancorp | | | 82,419 | |
| | 1,107 | | | First Republic Bank | | | 69,798 | |
| | 429 | | | M&T Bank Corp. | | | 53,576 | |
| | 1,179 | | | National Bank Holdings Corp., Class A | | | 24,555 | |
| | 1,514 | | | PNC Financial Services Group, Inc. (The) | | | 144,824 | |
| | 2,850 | | | SunTrust Banks, Inc. | | | 122,594 | |
| | 2,958 | | | U.S. Bancorp | | | 128,382 | |
| | 7,603 | | | Wells Fargo & Co. | | | 427,565 | |
| | | | | | | | |
| | | | | | | 1,465,545 | |
| | | | | | | | |
| | | | Capital Markets — 2.9% | |
| | 481 | | | Ameriprise Financial, Inc. | | | 60,116 | |
| | 1,756 | | | Legg Mason, Inc. | | | 90,461 | |
| | 774 | | | Northern Trust Corp. | | | 59,197 | |
| | 1,517 | | | T. Rowe Price Group, Inc. | | | 117,919 | |
| | | | | | | | |
| | | | | | | 327,693 | |
| | | | | | | | |
| | | | Consumer Finance — 2.8% | |
| | 4,235 | | | Ally Financial, Inc. (a) | | | 94,982 | |
SEE NOTES TO FINANCIAL STATEMENTS.
| | | | | | | | |
| | | |
| JUNE 30, 2015 | | J.P. MORGAN MID CAP/MULTI-CAP FUNDS | | | | | 37 | |
JPMorgan Value Advantage Fund
SCHEDULE OF PORTFOLIO INVESTMENTS
AS OF JUNE 30, 2015 (continued)
(Amounts in thousands)
| | | | | | | | |
| SHARES | | | SECURITY DESCRIPTION | | VALUE($) | |
| Common Stocks — continued | |
| | | | Consumer Finance — continued | |
| | 2,534 | | | Capital One Financial Corp. | | | 222,872 | |
| | | | | | | | |
| | | | | | | 317,854 | |
| | | | | | | | |
| | | | Insurance — 9.4% | |
| | 90 | | | Alleghany Corp. (a) | | | 42,350 | |
| | 1,257 | | | Allied World Assurance Co. Holdings AG, (Switzerland) | | | 54,319 | |
| | 2,936 | | | American International Group, Inc. | | | 181,516 | |
| | 3,215 | | | CNO Financial Group, Inc. | | | 58,999 | |
| | 2,756 | | | Hartford Financial Services Group, Inc. (The) | | | 114,563 | |
| | 4,745 | | | Loews Corp. | | | 182,742 | |
| | 930 | | | Marsh & McLennan Cos., Inc. | | | 52,714 | |
| | 2,535 | | | Old Republic International Corp. | | | 39,624 | |
| | 1,283 | | | Prudential Financial, Inc. | | | 112,279 | |
| | 1,088 | | | Travelers Cos., Inc. (The) | | | 105,166 | |
| | 2,516 | | | Unum Group | | | 89,961 | |
| | 518 | | | W.R. Berkley Corp. | | | 26,921 | |
| | | | | | | | |
| | | | | | | 1,061,154 | |
| | | | | | | | |
| | | | Real Estate Investment Trusts (REITs) — 3.7% | |
| | 2,818 | | | American Homes 4 Rent, Class A | | | 45,206 | |
| | 2,067 | | | American Residential Properties, Inc. (a) | | | 38,248 | |
| | 3,387 | | | Brixmor Property Group, Inc. | | | 78,344 | |
| | 728 | | | EastGroup Properties, Inc. | | | 40,952 | |
| | 2,448 | | | Excel Trust, Inc. | | | 38,600 | |
| | 2,349 | | | Kimco Realty Corp. | | | 52,937 | |
| | 2,643 | | | Rayonier, Inc. | | | 67,529 | |
| | 2,018 | | | Weyerhaeuser Co. | | | 63,561 | |
| | | | | | | | |
| | | | | | | 425,377 | |
| | | | | | | | |
| | | | Real Estate Management & Development — 0.6% | |
| | 1,890 | | | Brookfield Asset Management, Inc., (Canada), Class A | | | 66,018 | |
| | | | | | | | |
| | | | Thrifts & Mortgage Finance — 0.3% | |
| | 3,518 | | | Hudson City Bancorp, Inc. | | | 34,759 | |
| | | | | | | | |
| | | | Total Financials | | | 3,698,400 | |
| | | | | | | | |
| | | | Health Care — 8.8% | |
| | | | Health Care Providers & Services — 3.2% | |
| | 920 | | | Aetna, Inc. | | | 117,225 | |
| | 946 | | | HCA Holdings, Inc. (a) | | | 85,830 | |
| | 480 | | | National HealthCare Corp. | | | 31,167 | |
| | 1,046 | | | UnitedHealth Group, Inc. | | | 127,661 | |
| | | | | | | | |
| | | | | | | 361,883 | |
| | | | | | | | |
| | | | Pharmaceuticals — 5.6% | |
| | 1,900 | | | Johnson & Johnson | | | 185,203 | |
| | 2,846 | | | Merck & Co., Inc. | | | 162,040 | |
| | 7,068 | | | Pfizer, Inc. | | | 236,980 | |
| | | | | | | | |
| SHARES | | | SECURITY DESCRIPTION | | VALUE($) | |
| | | | | | | | |
| | | | Pharmaceuticals — continued | |
| | 211 | | | Valeant Pharmaceuticals International, Inc. (a) | | | 46,918 | |
| | | | | | | | |
| | | | | | | 631,141 | |
| | | | | | | | |
| | | | Total Health Care | | | 993,024 | |
| | | | | | | | |
| | | | Industrials — 7.4% | |
| | | | Aerospace & Defense — 1.9% | |
| | 946 | | | Honeywell International, Inc. | | | 96,433 | |
| | 1,024 | | | United Technologies Corp. | | | 113,570 | |
| | | | | | | | |
| | | | | | | 210,003 | |
| | | | | | | | |
| | | | Airlines — 1.1% | |
| | 3,111 | | | Delta Air Lines, Inc. | | | 127,816 | |
| | | | | | | | |
| | | | Industrial Conglomerates — 1.0% | |
| | 1,101 | | | Carlisle Cos., Inc. | | | 110,245 | |
| | | | | | | | |
| | | | Machinery — 1.9% | |
| | 1,655 | | | Dover Corp. | | | 116,169 | |
| | 1,045 | | | Illinois Tool Works, Inc. | | | 95,893 | |
| | | | | | | | |
| | | | | | | 212,062 | |
| | | | | | | | |
| | | | Marine — 0.3% | |
| | 436 | | | Kirby Corp. (a) | | | 33,401 | |
| | | | | | | | |
| | | | Professional Services — 0.3% | |
| | 402 | | | Equifax, Inc. | | | 39,049 | |
| | | | | | | | |
| | | | Trading Companies & Distributors — 0.9% | |
| | 419 | | | W.W. Grainger, Inc. | | | 99,204 | |
| | | | | | | | |
| | | | Total Industrials | | | 831,780 | |
| | | | | | | | |
| | | | Information Technology — 4.6% | |
| | | | Communications Equipment — 1.6% | |
| | 4,073 | | | Cisco Systems, Inc. | | | 111,842 | |
| | 1,039 | | | QUALCOMM, Inc. | | | 65,101 | |
| | | | | | | | |
| | | | | | | 176,943 | |
| | | | | | | | |
| | | | Electronic Equipment, Instruments & Components — 0.7% | |
| | 1,543 | | | Arrow Electronics, Inc. (a) | | | 86,093 | |
| | | | | | | | |
| | | | Semiconductors & Semiconductor Equipment — 1.4% | |
| | 586 | | | Analog Devices, Inc. | | | 37,632 | |
| | 577 | | | KLA-Tencor Corp. | | | 32,416 | |
| | 1,799 | | | Texas Instruments, Inc. | | | 92,682 | |
| | | | | | | | |
| | | | | | | 162,730 | |
| | | | | | | | |
| | | | Software — 0.5% | |
| | 1,206 | | | Microsoft Corp. | | | 53,262 | |
| | | | | | | | |
| | | | Technology Hardware, Storage & Peripherals — 0.4% | |
| | 1,382 | | | Hewlett-Packard Co. | | | 41,482 | |
| | | | | | | | |
| | | | Total Information Technology | | | 520,510 | |
| | | | | | | | |
SEE NOTES TO FINANCIAL STATEMENTS.
| | | | | | |
| | | |
| 38 | | | | J.P. MORGAN MID CAP/MULTI-CAP FUNDS | | JUNE 30, 2015 |
| | | | | | | | |
| SHARES | | | SECURITY DESCRIPTION | | VALUE($) | |
| Common Stocks — continued | |
| | | | Materials — 3.7% | |
| | | | Chemicals — 0.8% | |
| | 1,819 | | | Mosaic Co. (The) | | | 85,239 | |
| | | | | | | | |
| | | | Construction Materials — 0.9% | |
| | 743 | | | Martin Marietta Materials, Inc. | | | 105,094 | |
| | | | | | | | |
| | | | Containers & Packaging — 1.6% | |
| | 1,178 | | | Ball Corp. | | | 82,616 | |
| | 1,550 | | | Rock-Tenn Co., Class A | | | 93,304 | |
| | | | | | | | |
| | | | | | | 175,920 | |
| | | | | | | | |
| | | | Paper & Forest Products — 0.4% | |
| | 2,047 | | | KapStone Paper & Packaging Corp. | | | 47,331 | |
| | | | | | | | |
| | | | Total Materials | | | 413,584 | |
| | | | | | | | |
| | | | Telecommunication Services — 1.5% | |
| | | | Diversified Telecommunication Services — 0.9% | |
| | 2,331 | | | Verizon Communications, Inc. | | | 108,653 | |
| | | | | | | | |
| | | | Wireless Telecommunication Services — 0.6% | |
| | 1,645 | | | T-Mobile US, Inc. (a) | | | 63,765 | |
| | | | | | | | |
| | | | Total Telecommunication Services | | | 172,418 | |
| | | | | | | | |
| | | | Utilities — 5.4% | |
| | | | Electric Utilities — 4.7% | |
| | 1,611 | | | American Electric Power Co., Inc. | | | 85,335 | |
| | 1,470 | | | Duke Energy Corp. | | | 103,790 | |
| | | | | | | | |
| SHARES | | | SECURITY DESCRIPTION | | VALUE($) | |
| | | | | | | | |
| | | | Electric Utilities — continued | |
| | 1,400 | | | Edison International | | | 77,836 | |
| | 1,418 | | | Eversource Energy | | | 64,396 | |
| | 1,030 | | | NextEra Energy, Inc. | | | 100,951 | |
| | 2,917 | | | Xcel Energy, Inc. | | | 93,869 | |
| | | | | | | | |
| | | | | | | 526,177 | |
| | | | | | | | |
| | | | Multi-Utilities — 0.7% | |
| | 861 | | | Sempra Energy | | | 85,148 | |
| | | | | | | | |
| | | | Total Utilities | | | 611,325 | |
| | | | | | | | |
| | | | Total Common Stocks
(Cost $8,587,866) | | | 10,239,275 | |
| | | | | | | | |
| Short-Term Investment — 9.1% | |
| | | | Investment Company — 9.1% | |
| | 1,024,973 | | | JPMorgan Prime Money Market Fund, Institutional Class Shares, 0.050% (b) (l) (m)
(Cost$1,024,973) | | | 1,024,973 | |
| | | | | | | | |
| | | | Total Investments — 99.7%
(Cost $9,612,839) | | | 11,264,248 | |
| | | | Other Assets in Excess of
Liabilities — 0.3% | | | 30,259 | |
| | | | | | | | |
| | | | NET ASSETS — 100.0% | | $ | 11,294,507 | |
| | | | | | | | |
Percentages indicated are based on net assets.
SEE NOTES TO FINANCIAL STATEMENTS.
| | | | | | | | |
| | | |
| JUNE 30, 2015 | | J.P. MORGAN MID CAP/MULTI-CAP FUNDS | | | | | 39 | |
J.P. Morgan Mid Cap/Multi-Cap Funds
NOTES TO SCHEDULES OF PORTFOLIO INVESTMENTS
AS OF JUNE 30, 2015
| | | | | | |
| USD | | — United States Dollar |
| |
| (a) | | — Non-income producing security. |
| (b) | | — Investment in affiliate. Money market fund registered under the Investment Company Act of 1940, as amended, and advised by J.P. Morgan Investment Management Inc. |
| (c) | | — Included in this amount is cash segregated as collateral for futures contracts. |
| (j) | | — All or a portion of these securities are segregated for short sales. |
| | | | | | |
| | The following approximates the aggregate amount of securities segregated for short sales (amounts in thousands): |
| | | | | | |
| | |
| | | Fund | | Value | |
| | Multi-Cap Market Neutral Fund | | $ | 48,829 | |
| | |
| |
| (l) | | — The rate shown is the current yield as of June 30, 2015. |
| (m) | | — All or a portion of this security is reserved and/or pledged with the custodian for current or potential holdings of futures, swaps, options, TBAs, when-issued securities, delayed delivery securities, reverse repurchase agreements, unfunded commitments and/or forward foreign currency exchange contracts. |
| (w) | | — When-issued security. |
SEE NOTES TO FINANCIAL STATEMENTS.
| | | | | | |
| | | |
| 40 | | | | J.P. MORGAN MID CAP/MULTI-CAP FUNDS | | JUNE 30, 2015 |
STATEMENTS OF ASSETS AND LIABILITIES
AS OF JUNE 30, 2015
(Amounts in thousands, except per share amounts)
| | | | | | | | | | | | |
| | | Growth
Advantage Fund | | | Mid Cap
Equity Fund | | | Mid Cap
Growth Fund | |
ASSETS: | | | | | | | | | | | | |
Investments in non-affiliates, at value | | $ | 5,043,662 | | | $ | 3,191,357 | | | $ | 2,954,471 | |
Investments in affiliates, at value | | | 205,478 | | | | 102,329 | | | | 136,866 | |
| | | | | | | | | | | | |
Total investment securities, at value | | | 5,249,140 | | | | 3,293,686 | | | | 3,091,337 | |
Cash | | | — | | | | — | (a) | | | 4 | |
Receivables: | | | | | | | | | | | | |
Investment securities sold | | | 71,347 | | | | 93,935 | | | | 169,777 | |
Fund shares sold | | | 20,869 | | | | 3,958 | | | | 6,169 | |
Dividends from non-affiliates | | | 1,363 | | | | 2,171 | | | | 533 | |
Dividends from affiliates | | | 10 | | | | 7 | | | | 9 | |
| | | | | | | | | | | | |
Total Assets | | | 5,342,729 | | | | 3,393,757 | | | | 3,267,829 | |
| | | | | | | | | | | | |
| | | |
LIABILITIES: | | | | | | | | | | | | |
Payables: | | | | | | | | | | | | |
Investment securities purchased | | | 146,569 | | | | 85,264 | | | | 199,313 | |
Fund shares redeemed | | | 3,176 | | | | 2,355 | | | | 3,107 | |
Accrued liabilities: | | | | | | | | | | | | |
Investment advisory fees | | | 2,741 | | | | 1,757 | | | | 1,579 | |
Administration fees | | | 348 | | | | 215 | | | | 185 | |
Distribution fees | | | 428 | | | | 64 | | | | 253 | |
Shareholder servicing fees | | | 539 | | | | 104 | | | | 313 | |
Custodian and accounting fees | | | 49 | | | | 34 | | | | 33 | |
Trustees’ and Chief Compliance Officer’s fees | | | 2 | | | | 2 | | | | 2 | |
Other | | | 597 | | | | 669 | | | | 518 | |
| | | | | | | | | | | | |
Total Liabilities | | | 154,449 | | | | 90,464 | | | | 205,303 | |
| | | | | | | | | | | | |
Net Assets | | $ | 5,188,280 | | | $ | 3,303,293 | | | $ | 3,062,526 | |
| | | | | | | | | | | | |
| (a) | Amount rounds to less than $1,000. |
SEE NOTES TO FINANCIAL STATEMENTS.
| | | | | | | | |
| | | |
| JUNE 30, 2015 | | J.P. MORGAN MID CAP/MULTI-CAP FUNDS | | | | | 41 | |
STATEMENTS OF ASSETS AND LIABILITIES
AS OF JUNE 30, 2015 (continued)
(Amounts in thousands, except per share amounts)
| | | | | | | | | | | | |
| | | Growth
Advantage Fund | | | Mid Cap
Equity Fund | | | Mid Cap
Growth Fund | |
NET ASSETS: | |
Paid-in-Capital | | $ | 3,628,313 | | | $ | 2,355,380 | | | $ | 2,158,462 | |
Accumulated undistributed (distributions in excess of) net investment income | | | (10,303 | ) | | | (25 | ) | | | (7,971 | ) |
Accumulated net realized gains (losses) | | | 139,535 | | | | 115,681 | | | | 123,628 | |
Net unrealized appreciation (depreciation) | | | 1,430,735 | | | | 832,257 | | | | 788,407 | |
| | | | | | | | | | | | |
Total Net Assets | | $ | 5,188,280 | | | $ | 3,303,293 | | | $ | 3,062,526 | |
| | | | | | | | | | | | |
| | | |
Net Assets: | | | | | | | | | | | | |
Class A | | $ | 1,174,260 | | | $ | 232,320 | | | $ | 984,262 | |
Class C | | | 321,500 | | | | 25,597 | | | | 75,494 | |
Class R2 | | | — | | | | 823 | | | | 9,868 | |
Class R5 | | | 58,686 | | | | 1,636 | | | | 164,713 | |
Class R6 | | | 2,414,333 | | | | 1,268,988 | | | | 265,905 | |
Select Class | | | 1,219,501 | | | | 1,773,929 | | | | 1,562,284 | |
| | | | | | | | | | | | |
Total | | $ | 5,188,280 | | | $ | 3,303,293 | | | $ | 3,062,526 | |
| | | | | | | | | | | | |
| | | |
Outstanding units of beneficial interest (shares) ($0.0001 par value; unlimited number of shares authorized): | | | | | | | | | | | | |
Class A | | | 74,582 | | | | 4,931 | | | | 35,519 | |
Class C | | | 22,608 | | | | 555 | | | | 3,292 | |
Class R2 | | | — | | | | 17 | | | | 329 | |
Class R5 | | | 3,612 | | | | 34 | | | | 5,269 | |
Class R6 | | | 148,353 | | | | 26,721 | | | | 8,487 | |
Select Class | | | 75,917 | | | | 37,366 | | | | 50,291 | |
| | | |
Net Asset Value (a): | | | | | | | | | | | | |
Class A — Redemption price per share | | $ | 15.74 | | | $ | 47.12 | | | $ | 27.71 | |
Class C — Offering price per share (b) | | | 14.22 | | | | 46.16 | | | | 22.93 | |
Class R2 — Offering and redemption price per share | | | — | | | | 46.98 | | | | 29.96 | |
Class R5 — Offering and redemption price per share | | | 16.25 | | | | 47.49 | | | | 31.26 | |
Class R6 — Offering and redemption price per share | | | 16.27 | | | | 47.49 | | | | 31.33 | |
Select Class — Offering and redemption price per share | | | 16.06 | | | | 47.47 | | | | 31.06 | |
Class A maximum sales charge | | | 5.25 | % | | | 5.25 | % | | | 5.25 | % |
Class A maximum public offering price per share
[net asset value per share/(100% — maximum sales charge)] | | $ | 16.61 | | | $ | 49.73 | | | $ | 29.25 | |
| | | | | | | | | | | | |
| | | |
Cost of investments in non-affiliates | | $ | 3,612,927 | | | $ | 2,359,100 | | | $ | 2,166,064 | |
Cost of investments in affiliates | | | 205,478 | | | | 102,329 | | | | 136,866 | |
| (a) | Per share amounts may not recalculate due to rounding of net assets and/or shares outstanding. |
| (b) | Redemption price for Class C Shares varies based upon length of time the shares are held. |
SEE NOTES TO FINANCIAL STATEMENTS.
| | | | | | |
| | | |
| 42 | | | | J.P. MORGAN MID CAP/MULTI-CAP FUNDS | | JUNE 30, 2015 |
| | | | | | | | | | | | |
| | | Mid Cap
Value Fund | | | Multi-Cap
Market
Neutral Fund | | | Value
Advantage Fund | |
ASSETS: | |
Investments in non-affiliates, at value | | $ | 15,364,203 | | | $ | 253,959 | | | $ | 10,239,275 | |
Investments in affiliates, at value | | | 648,674 | | | | 38,662 | | | | 1,024,973 | |
| | | | | | | | | | | | |
Total investment securities, at value | | | 16,012,877 | | | | 292,621 | | | | 11,264,248 | |
Cash | | | — | | | | 262 | | | | 23 | |
Deposits at broker for futures contracts | | | — | | | | 271 | | | | — | |
Deposits at broker for securities sold short | | | — | | | | 251,620 | | | | — | |
Receivables: | | | | | | | | | | | | |
Investment securities sold | | | — | | | | 1,891 | | | | 14,395 | |
Fund shares sold | | | 13,514 | | | | 101 | | | | 33,033 | |
Dividends from non-affiliates | | | 18,427 | | | | 272 | | | | 10,480 | |
Dividends from affiliates | | | 33 | | | | 2 | | | | 50 | |
| | | | | | | | | | | | |
Total Assets | | | 16,044,851 | | | | 547,040 | | | | 11,322,229 | |
| | | | | | | | | | | | |
| | | |
LIABILITIES: | | | | | | | | | | | | |
Payables: | | | | | | | | | | | | |
Securities sold short, at value | | | — | | | | 252,649 | | | | — | |
Dividend expense to non-affiliates on securities sold short | | | — | | | | 83 | | | | — | |
Investment securities purchased | | | 42,295 | | | | 3,216 | | | | 12,810 | |
Interest expense to non-affiliates on securities sold short | | | — | | | | 45 | | | | — | |
Fund shares redeemed | | | 28,133 | | | | 24 | | | | 5,273 | |
Variation margin on futures contracts | | | — | | | | 3 | | | | — | |
Accrued liabilities: | | | | | | | | | | | | |
Investment advisory fees | | | 8,394 | | | | 209 | | | | 5,529 | |
Administration fees | | | 1,098 | | | | — | | | | 615 | |
Distribution fees | | | 959 | | | | 6 | | | | 938 | |
Shareholder servicing fees | | | 1,163 | | | | 61 | | | | 965 | |
Custodian and accounting fees | | | 196 | | | | 10 | | | | 105 | |
Trustees’ and Chief Compliance Officer’s fees | | | 6 | | | | 1 | | | | 5 | |
Other | | | 3,534 | | | | 53 | | | | 1,482 | |
| | | | | | | | | | | | |
Total Liabilities | | | 85,778 | | | | 256,360 | | | | 27,722 | |
| | | | | | | | | | | | |
Net Assets | | $ | 15,959,073 | | | $ | 290,680 | | | $ | 11,294,507 | |
| | | | | | | | | | | | |
SEE NOTES TO FINANCIAL STATEMENTS.
| | | | | | | | |
| | | |
| JUNE 30, 2015 | | J.P. MORGAN MID CAP/MULTI-CAP FUNDS | | | | | 43 | |
STATEMENTS OF ASSETS AND LIABILITIES
AS OF JUNE 30, 2015 (continued)
(Amounts in thousands, except per share amounts)
| | | | | | | | | | | | |
| | | Mid Cap
Value Fund | | | Multi-Cap
Market
Neutral Fund | | | Value
Advantage Fund | |
NET ASSETS: | | | | | | | | | | | | |
Paid-in-Capital | | $ | 9,943,186 | | | $ | 310,114 | | | $ | 9,512,394 | |
Accumulated undistributed (distributions in excess of) net investment income | | | 41,285 | | | | (889 | ) | | | 39,348 | |
Accumulated net realized gains (losses) | | | 670,171 | | | | (58,022 | ) | | | 91,356 | |
Net unrealized appreciation (depreciation) | | | 5,304,431 | | | | 39,477 | | | | 1,651,409 | |
| | | | | | | | | | | | |
Total Net Assets | | $ | 15,959,073 | | | $ | 290,680 | | | $ | 11,294,507 | |
| | | | | | | | | | | | |
| | | |
Net Assets: | | | | | | | | | | | | |
Class A | | $ | 2,623,772 | | | $ | 6,273 | | | $ | 2,440,061 | |
Class C | | | 595,385 | | | | 6,760 | | | | 701,023 | |
Class R2 | | | 71,697 | | | | — | | | | — | |
Institutional Class | | | 10,320,516 | | | | — | | | | 5,058,172 | |
Select Class | | | 2,347,703 | | | | 277,647 | | | | 3,095,251 | |
| | | | | | | | | | | | |
Total | | $ | 15,959,073 | | | $ | 290,680 | | | $ | 11,294,507 | |
| | | | | | | | | | | | |
| | | |
Outstanding units of beneficial interest (shares) ($0.0001 par value; unlimited number of shares authorized): | | | | | | | | | | | | |
Class A | | | 70,949 | | | | 636 | | | | 81,765 | |
Class C | | | 16,635 | | | | 726 | | | | 23,584 | |
Class R2 | | | 2,006 | | | | — | | | | — | |
Institutional Class | | | 273,330 | | | | — | | | | 168,290 | |
Select Class | | | 62,834 | | | | 27,565 | | | | 103,205 | |
| | | |
Net Asset Value (a): | | | | | | | | | | | | |
Class A — Redemption price per share | | $ | 36.98 | | | $ | 9.87 | | | $ | 29.84 | |
Class C — Offering price per share (b) | | | 35.79 | | | | 9.31 | | | | 29.72 | |
Class R2 — Offering and redemption price per share | | | 35.73 | | | | — | | | | — | |
Institutional Class — Offering and redemption price per share | | | 37.76 | | | | — | | | | 30.06 | |
Select Class — Offering and redemption price per share | | | 37.36 | | | | 10.07 | | | | 29.99 | |
Class A maximum sales charge | | | 5.25 | % | | | 5.25 | % | | | 5.25 | % |
Class A maximum public offering price per share
[net asset value per share/(100% — maximum sales charge)] | | $ | 39.03 | | | $ | 10.42 | | | $ | 31.49 | |
| | | | | | | | | | | | |
| | | |
Cost of investments in non-affiliates | | $ | 10,059,772 | | | $ | 215,226 | | | $ | 8,587,866 | |
Cost of investments in affiliates | | | 648,674 | | | | 38,662 | | | | 1,024,973 | |
Proceeds from securities sold short | | | — | | | | 253,357 | | | | — | |
| (a) | Per share amounts may not recalculate due to rounding of net assets and/or shares outstanding. |
| (b) | Redemption price for Class C Shares varies based upon length of time the shares are held. |
SEE NOTES TO FINANCIAL STATEMENTS.
| | | | | | |
| | | |
| 44 | | | | J.P. MORGAN MID CAP/MULTI-CAP FUNDS | | JUNE 30, 2015 |
STATEMENTS OF OPERATIONS
FOR THE YEAR ENDED JUNE 30, 2015
(Amounts in thousands)
| | | | | | | | | | | | |
| | |
Growth
Advantage Fund | | | Mid Cap
Equity Fund | | | Mid Cap
Growth Fund | |
INVESTMENT INCOME: | |
Dividend income from non-affiliates | | $ | 25,211 | | | $ | 36,215 | | | $ | 13,432 | |
Dividend income from affiliates | | | 46 | | | | 38 | | | | 49 | |
| | | | | | | | | | | | |
Total investment income | | | 25,257 | | | | 36,253 | | | | 13,481 | |
| | | | | | | | | | | | |
| | | |
EXPENSES: | | | | | | | | | | | | |
Investment advisory fees | | | 27,504 | | | | 19,842 | | | | 15,943 | |
Administration fees | | | 3,479 | | | | 2,510 | | | | 2,017 | |
Distribution fees: | | | | | | | | | | | | |
Class A | | | 2,229 | | | | 473 | | | | 2,117 | |
Class B (a) | | | 17 | | | | — | | | | 30 | |
Class C | | | 1,559 | | | | 169 | | | | 416 | |
Class R2 | | | — | | | | 4 | | | | 24 | |
Shareholder servicing fees: | | | | | | | | | | | | |
Class A | | | 2,229 | | | | 473 | | | | 2,117 | |
Class B (a) | | | 5 | | | | — | | | | 10 | |
Class C | | | 520 | | | | 56 | | | | 139 | |
Class R2 | | | — | | | | 2 | | | | 12 | |
Class R5 | | | 180 | | | | — | (b) | | | 30 | |
Select Class | | | 2,697 | | | | 4,464 | | | | 3,357 | |
Custodian and accounting fees | | | 134 | | | | 89 | | | | 87 | |
Interest expense to affiliates | | | — | (b) | | | — | | | | — | |
Professional fees | | | 83 | | | | 71 | | | | 72 | |
Trustees’ and Chief Compliance Officer’s fees | | | 39 | | | | 28 | | | | 23 | |
Printing and mailing costs | | | 252 | | | | 376 | | | | 238 | |
Registration and filing fees | | | 429 | | | | 231 | | | | 138 | |
Transfer agent fees | | | 2,202 | | | | 3,279 | | | | 2,456 | |
Other | | | 224 | | | | 290 | | | | 35 | |
| | | | | | | | | | | | |
Total expenses | | | 43,782 | | | | 32,357 | | | | 29,261 | |
| | | | | | | | | | | | |
Less fees waived | | | (1,331 | ) | | | (5,513 | ) | | | (3,798 | ) |
Less earnings credits | | | — | | | | — | (b) | | | — | |
Less expense reimbursements | | | — | | | | (293 | ) | | | (12 | ) |
| | | | | | | | | | | | |
Net expenses | | | 42,451 | | | | 26,551 | | | | 25,451 | |
| | | | | | | | | | | | |
Net investment income (loss) | | | (17,194 | ) | | | 9,702 | | | | (11,970 | ) |
| | | | | | | | | | | | |
| | | |
REALIZED/UNREALIZED GAINS (LOSSES): | | | | | | | | | | | | |
Net realized gain (loss) on transactions from investments in non-affiliates | | | 172,792 | | | | 165,578 | | | | 173,141 | |
Change in net unrealized appreciation/depreciation of investments in non-affiliates | | | 461,167 | | | | 134,637 | | | | 150,704 | |
| | | | | | | | | | | | |
Net realized/unrealized gains (losses) | | | 633,959 | | | | 300,215 | | | | 323,845 | |
| | | | | | | | | | | | |
Change in net assets resulting from operations | | $ | 616,765 | | | $ | 309,917 | | | $ | 311,875 | |
| | | | | | | | | | | | |
| (a) | All remaining Class B Shares converted to Class A Shares on June 19, 2015. |
| (b) | Amount rounds to less than $1,000. |
SEE NOTES TO FINANCIAL STATEMENTS.
| | | | | | | | |
| | | |
| JUNE 30, 2015 | | J.P. MORGAN MID CAP/MULTI-CAP FUNDS | | | | | 45 | |
STATEMENTS OF OPERATIONS
FOR THE YEAR ENDED JUNE 30, 2015
(Amounts in thousands)
| | | | | | | | | | | | |
| | | Mid Cap
Value Fund | | | Multi-Cap
Market
Neutral Fund | | | Value
Advantage Fund | |
INVESTMENT INCOME: | | | | | | | | | | | | |
Dividend income from non-affiliates | | $ | 282,182 | | | $ | 5,549 | | | $ | 181,881 | |
Dividend income from affiliates | | | 196 | | | | 19 | | | | 287 | |
| | | | | | | | | | | | |
Total investment income | | | 282,378 | | | | 5,568 | | | | 182,168 | |
| | | | | | | | | | | | |
| | | |
EXPENSES: | | | | | | | | | | | | |
Investment advisory fees | | | 103,514 | | | | 4,516 | | | | 62,972 | |
Administration fees | | | 13,098 | | | | 297 | | | | 7,966 | |
Distribution fees: | | | | | | | | | | | | |
Class A | | | 6,927 | | | | 19 | | | | 5,282 | |
Class B (a) | | | 63 | | | | 1 | | | | — | |
Class C | | | 4,545 | | | | 58 | | | | 4,144 | |
Class R2 | | | 366 | | | | — | | | | — | |
Shareholder servicing fees: | | | | | | | | | | | | |
Class A | | | 6,927 | | | | 19 | | | | 5,282 | |
Class B (a) | | | 21 | | | | — | (b) | | | — | |
Class C | | | 1,515 | | | | 19 | | | | 1,381 | |
Class R2 | | | 183 | | | | — | | | | — | |
Institutional Class | | | 9,720 | | | | — | | | | 4,174 | |
Select Class | | | 6,867 | | | | 865 | | | | 7,123 | |
Custodian and accounting fees | | | 443 | | | | 36 | | | | 279 | |
Interest expense to affiliates | | | — | | | | — | (b) | | | — | |
Professional fees | | | 226 | | | | 55 | | | | 128 | |
Trustees’ and Chief Compliance Officer’s fees | | | 153 | | | | 4 | | | | 87 | |
Printing and mailing costs | | | 934 | | | | 6 | | | | 596 | |
Registration and filing fees | | | 581 | | | | 49 | | | | 924 | |
Transfer agent fees | | | 15,294 | | | | 52 | | | | 6,758 | |
Other | | | 809 | | | | 10 | | | | 408 | |
Dividend expense to non-affiliates on securities sold short | | | — | | | | 3,734 | | | | — | |
Interest expense to non-affiliates on securities sold short | | | — | | | | 612 | | | | — | |
| | | | | | | | | | | | |
Total expenses | | | 172,186 | | | | 10,352 | | | | 107,504 | |
| | | | | | | | | | | | |
Less fees waived | | | (24,286 | ) | | | (1,484 | ) | | | (12,627 | ) |
Less earnings credits | | | — | (b) | | | — | | | | — | |
Less expense reimbursements | | | (2,625 | ) | | | — | (b) | | | (436 | ) |
| | | | | | | | | | | | |
Net expenses | | | 145,275 | | | | 8,868 | | | | 94,441 | |
| | | | | | | | | | | | |
Net investment income (loss) | | | 137,103 | | | | (3,300 | ) | | | 87,727 | |
| | | | | | | | | | | | |
| | | |
REALIZED/UNREALIZED GAINS (LOSSES): | | | | | | | | | | | | |
Net realized gain (loss) on transactions from: | | | | | | | | | | | | |
Investments in non-affiliates | | | 1,096,684 | | | | 55,400 | | | | 148,940 | |
Futures | | | — | | | | 522 | | | | — | |
Securities sold short | | | — | | | | (52,926 | ) | | | — | |
Foreign currency transactions | | | — | | | | 2 | | | | — | |
| | | | | | | | | | | | |
Net realized gain (loss) | | | 1,096,684 | | | | 2,998 | | | | 148,940 | |
| | | | | | | | | | | | |
Change in net unrealized appreciation/depreciation of: | | | | | | | | | | | | |
Investments in non-affiliates | | | (12,168 | ) | | | (34,391 | ) | | | 322,296 | |
Futures | | | — | | | | 57 | | | | — | |
Securities sold short | | | — | | | | 35,440 | | | | — | |
| | | | | | | | | | | | |
Change in net unrealized appreciation/depreciation | | | (12,168 | ) | | | 1,106 | | | | 322,296 | |
| | | | | | | | | | | | |
Net realized/unrealized gains (losses) | | | 1,084,516 | | | | 4,104 | | | | 471,236 | |
| | | | | | | | | | | | |
Change in net assets resulting from operations | | $ | 1,221,619 | | | $ | 804 | | | $ | 558,963 | |
| | | | | | | | | | | | |
| (a) | All remaining Class B Shares converted to Class A Shares on June 19, 2015. |
| (b) | Amount rounds to less than $1,000. |
SEE NOTES TO FINANCIAL STATEMENTS.
| | | | | | |
| | | |
| 46 | | | | J.P. MORGAN MID CAP/MULTI-CAP FUNDS | | JUNE 30, 2015 |
STATEMENTS OF CHANGES IN NET ASSETS
FOR THE PERIODS INDICATED
(Amounts in thousands)
| | | | | | | | | | | | | | | | |
| | | Growth Advantage Fund | | | Mid Cap Equity Fund | |
| | | Year Ended
June 30, 2015 | | | Year Ended
June 30, 2014 | | | Year Ended
June 30, 2015 | | | Year Ended
June 30, 2014 | |
CHANGE IN NET ASSETS RESULTING FROM OPERATIONS: | |
Net investment income (loss) | | $ | (17,194 | ) | | $ | (7,964 | ) | | $ | 9,702 | | | $ | 4,036 | |
Net realized gain (loss) | | | 172,792 | | | | 223,546 | | | | 165,578 | | | | 135,142 | |
Distributions of capital gains received from investment company affiliates | | | — | | | | 3 | | | | — | | | | 1 | |
Change in net unrealized appreciation/depreciation | | | 461,167 | | | | 492,238 | | | | 134,637 | | | | 222,527 | |
| | | | | | | | | | | | | | | | |
Change in net assets resulting from operations | | | 616,765 | | | | 707,823 | | | | 309,917 | | | | 361,706 | |
| | | | | | | | | | | | | | | | |
| | | | |
DISTRIBUTIONS TO SHAREHOLDERS: | | | | | | | | | | | | | | | | |
Class A | | | | | | | | | | | | | | | | |
From net investment income | | | — | | | | — | | | | (81 | ) | | | (29 | ) |
From net realized gains | | | (32,469 | ) | | | (21,773 | ) | | | (8,089 | ) | | | (4,217 | ) |
Class B (a) | | | | | | | | | | | | | | | | |
From net realized gains | | | (98 | ) | | | (123 | ) | | | — | | | | — | |
Class C | | | | | | | | | | | | | | | | |
From net investment income | | | — | | | | — | | | | — | | | | — | |
From net realized gains | | | (7,969 | ) | | | (4,242 | ) | | | (990 | ) | | | (1,100 | ) |
Class R2 (b) | | | | | | | | | | | | | | | | |
From net investment income | | | — | | | | — | | | | — | | | | — | (c) |
From net realized gains | | | — | | | | — | | | | (30 | ) | | | — | |
Class R5 (b) | | | | | | | | | | | | | | | | |
From net investment income | | | — | | | | — | | | | (2 | ) | | | — | (c) |
From net realized gains | | | (1,758 | ) | | | (54,106 | ) | | | (26 | ) | | | — | |
Class R6 (b) (d) | | | | | | | | | | | | | | | | |
From net investment income | | | — | | | | — | | | | (3,446 | ) | | | (913 | ) |
From net realized gains | | | (73,271 | ) | | | — | | | | (46,736 | ) | | | — | |
Select Class | | | | | | | | | | | | | | | | |
From net investment income | | | — | | | | — | | | | (3,414 | ) | | | (3,282 | ) |
From net realized gains | | | (39,626 | ) | | | (49,152 | ) | | | (80,115 | ) | | | (90,616 | ) |
| | | | | | | | | | | | | | | | |
Total distributions to shareholders | | | (155,191 | ) | | | (129,396 | ) | | | (142,929 | ) | | | (100,157 | ) |
| | | | | | | | | | | | | | | | |
| | | | |
CAPITAL TRANSACTIONS: | | | | | | | | | | | | | | | | |
Change in net assets resulting from capital transactions | | | 1,161,499 | | | | 987,358 | | | | 363,135 | | | | 1,551,394 | |
| | | | | | | | | | | | | | | | |
| | | | |
NET ASSETS: | | | | | | | | | | | | | | | | |
Change in net assets | | | 1,623,073 | | | | 1,565,785 | | | | 530,123 | | | | 1,812,943 | |
Beginning of period | | | 3,565,207 | | | | 1,999,422 | | | | 2,773,170 | | | | 960,227 | |
| | | | | | | | | | | | | | | | |
End of period | | $ | 5,188,280 | | | $ | 3,565,207 | | | $ | 3,303,293 | | | $ | 2,773,170 | |
| | | | | | | | | | | | | | | | |
Accumulated undistributed (distributions in excess of) net investment income | | $ | (10,303 | ) | | $ | (7,786 | ) | | $ | (25 | ) | | $ | (535 | ) |
| | | | | | | | | | | | | | | | |
| (a) | All remaining Class B Shares converted to Class A Shares on June 19, 2015. |
| (b) | Commencement of offering of class of shares effective March 14, 2014 for Mid Cap Equity Fund. |
| (c) | Amount rounds to less than $1,000. |
| (d) | Commencement of offering of class of shares effective December 23, 2013 for Growth Advantage Fund. |
SEE NOTES TO FINANCIAL STATEMENTS.
| | | | | | | | |
| | | |
| JUNE 30, 2015 | | J.P. MORGAN MID CAP/MULTI-CAP FUNDS | | | | | 47 | |
STATEMENTS OF CHANGES IN NET ASSETS
FOR THE PERIODS INDICATED (continued)
(Amounts in thousands)
| | | | | | | | | | | | | | | | |
| | | Mid Cap Growth Fund | | | Mid Cap Value Fund | |
| | | Year Ended
June 30, 2015 | | | Year Ended
June 30, 2014 | | | Year Ended
June 30, 2015 | | | Year Ended
June 30, 2014 | |
CHANGE IN NET ASSETS RESULTING FROM OPERATIONS: | |
Net investment income (loss) | | $ | (11,970 | ) | | $ | (6,054 | ) | | $ | 137,103 | | | $ | 103,278 | |
Net realized gain (loss) | | | 173,141 | | | | 314,124 | | | | 1,096,684 | | | | 1,068,473 | |
Distributions of capital gains received from investment company affiliates | | | — | | | | — | (b) | | | — | | | | 6 | |
Change in net unrealized appreciation/depreciation | | | 150,704 | | | | 225,799 | | | | (12,168 | ) | | | 1,889,585 | |
| | | | | | | | | | | | | | | | |
Change in net assets resulting from operations | | | 311,875 | | | | 533,869 | | | | 1,221,619 | | | | 3,061,342 | |
| | | | | | | | | | | | | | | | |
| | | | |
DISTRIBUTIONS TO SHAREHOLDERS: | | | | | | | | | | | | | | | | |
Class A | | | | | | | | | | | | | | | | |
From net investment income | | | — | | | | — | | | | (15,287 | ) | | | (14,338 | ) |
From net realized gains | | | (80,615 | ) | | | (69,231 | ) | | | (197,218 | ) | | | (135,361 | ) |
Class B (a) | | | | | | | | | | | | | | | | |
From net realized gains | | | (608 | ) | | | (943 | ) | | | (668 | ) | | | (524 | ) |
Class C | | | | | | | | | | | | | | | | |
From net investment income | | | — | | | | — | | | | (1,024 | ) | | | (38 | ) |
From net realized gains | | | (6,222 | ) | | | (3,392 | ) | | | (45,175 | ) | | | (24,588 | ) |
Class R2 | | | | | | | | | | | | | | | | |
From net investment income | | | — | | | | — | | | | (331 | ) | | | (201 | ) |
From net realized gains | | | (345 | ) | | | (58 | ) | | | (5,603 | ) | | | (2,784 | ) |
Class R5 | | | | | | | | | | | | | | | | |
From net realized gains | | | (3,427 | ) | | | (2,276 | ) | | | — | | | | — | |
Class R6 | | | | | | | | | | | | | | | | |
From net realized gains | | | (7,943 | ) | | | (5,408 | ) | | | — | | | | — | |
Institutional Class | | | | | | | | | | | | | | | | |
From net investment income | | | — | | | | — | | | | (108,605 | ) | | | (69,637 | ) |
From net realized gains | | | — | | | | — | | | | (711,308 | ) | | | (318,626 | ) |
Select Class | | | | | | | | | | | | | | | | |
From net investment income | | | — | | | | — | | | | (19,269 | ) | | | (17,743 | ) |
From net realized gains | | | (119,065 | ) | | | (99,863 | ) | | | (172,337 | ) | | | (112,976 | ) |
| | | | | | | | | | | | | | | | |
Total distributions to shareholders | | | (218,225 | ) | | | (181,171 | ) | | | (1,276,825 | ) | | | (696,816 | ) |
| | | | | | | | | | | | | | | | |
| | | | |
CAPITAL TRANSACTIONS: | | | | | | | | | | | | | | | | |
Change in net assets resulting from capital transactions | | | 787,072 | | | | 251,309 | | | | 368,694 | | | | 18,077 | |
| | | | | | | | | | | | | | | | |
| | | | |
NET ASSETS: | | | | | | | | | | | | | | | | |
Change in net assets | | | 880,722 | | | | 604,007 | | | | 313,488 | | | | 2,382,603 | |
Beginning of period | | | 2,181,804 | | | | 1,577,797 | | | | 15,645,585 | | | | 13,262,982 | |
| | | | | | | | | | | | | | | | |
End of period | | $ | 3,062,526 | | | $ | 2,181,804 | | | $ | 15,959,073 | | | $ | 15,645,585 | |
| | | | | | | | | | | | | | | | |
Accumulated undistributed (distributions in excess of) net investment income | | $ | (7,971 | ) | | $ | (5,808 | ) | | $ | 41,285 | | | $ | 48,215 | |
| | | | | | | | | | | | | | | | |
| (a) | All remaining Class B Shares converted to Class A Shares on June 19, 2015. |
| (b) | Amount rounds to less than $1,000. |
SEE NOTES TO FINANCIAL STATEMENTS.
| | | | | | |
| | | |
| 48 | | | | J.P. MORGAN MID CAP/MULTI-CAP FUNDS | | JUNE 30, 2015 |
| | | | | | | | | | | | | | | | |
| | | Multi-Cap Market Neutral Fund | | | Value Advantage Fund | |
| | | Year Ended
June 30, 2015 | | | Year Ended
June 30, 2014 | | | Year Ended
June 30, 2015 | | | Year Ended
June 30, 2014 | |
CHANGE IN NET ASSETS RESULTING FROM OPERATIONS: | |
Net investment income (loss) | | $ | (3,300 | ) | | $ | (4,373 | ) | | $ | 87,727 | | | $ | 83,781 | |
Net realized gain (loss) | | | 2,998 | | | | 9,737 | | | | 148,940 | | | | 278,242 | |
Distributions of capital gains received from investment company affiliates | | | — | | | | — | (a) | | | — | | | | 5 | |
Change in net unrealized appreciation/depreciation | | | 1,106 | | | | (136 | ) | | | 322,296 | | | | 747,106 | |
| | | | | | | | | | | | | | | | |
Change in net assets resulting from operations | | | 804 | | | | 5,228 | | | | 558,963 | | | | 1,109,134 | |
| | | | | | | | | | | | | | | | |
| | | | |
DISTRIBUTIONS TO SHAREHOLDERS: | | | | | | | | | | | | | | | | |
Class A | | | | | | | | | | | | | | | | |
From net investment income | | | — | | | | — | | | | (18,586 | ) | | | (6,931 | ) |
From net realized gains | | | — | | | | — | | | | (49,085 | ) | | | (30,061 | ) |
Class C | | | | | | | | | | | | | | | | |
From net investment income | | | — | | | | — | | | | (2,882 | ) | | | (562 | ) |
From net realized gains | | | — | | | | — | | | | (12,315 | ) | | | (7,282 | ) |
Institutional Class | | | | | | | | | | | | | | | | |
From net investment income | | | — | | | | — | | | | (51,909 | ) | | | (19,755 | ) |
From net realized gains | | | — | | | | — | | | | (93,724 | ) | | | (54,303 | ) |
Select Class | | | | | | | | | | | | | | | | |
From net investment income | | | — | | | | — | | | | (31,036 | ) | | | (12,951 | ) |
From net realized gains | | | — | | | | — | | | | (67,644 | ) | | | (42,336 | ) |
| | | | | | | | | | | | | | | | |
Total distributions to shareholders | | | — | | | | — | | | | (327,181 | ) | | | (174,181 | ) |
| | | | | | | | | | | | | | | | |
| | | | |
CAPITAL TRANSACTIONS: | | | | | | | | | | | | | | | | |
Change in net assets resulting from capital transactions | | | (161,126 | ) | | | 101,988 | | | | 3,369,281 | | | | 3,061,568 | |
| | | | | | | | | | | | | | | | |
| | | | |
NET ASSETS: | | | | | | | | | | | | | | | | |
Change in net assets | | | (160,322 | ) | | | 107,216 | | | | 3,601,063 | | | | 3,996,521 | |
Beginning of period | | | 451,002 | | | | 343,786 | | | | 7,693,444 | | | | 3,696,923 | |
| | | | | | | | | | | | | | | | |
End of period | | $ | 290,680 | | | $ | 451,002 | | | $ | 11,294,507 | | | $ | 7,693,444 | |
| | | | | | | | | | | | | | | | |
Accumulated undistributed (distributions in excess of) net investment income | | $ | (889 | ) | | $ | (2,110 | ) | | $ | 39,348 | | | $ | 57,743 | |
| | | | | | | | | | | | | | | | |
| (a) | Amount rounds to less than $1,000. |
SEE NOTES TO FINANCIAL STATEMENTS.
| | | | | | | | |
| | | |
| JUNE 30, 2015 | | J.P. MORGAN MID CAP/MULTI-CAP FUNDS | | | | | 49 | |
STATEMENTS OF CHANGES IN NET ASSETS
FOR THE PERIODS INDICATED (continued)
(Amounts in thousands)
| | | | | | | | | | | | | | | | |
| | | Growth Advantage Fund | | | Mid Cap Equity Fund | |
| | | Year Ended
June 30, 2015 | | | Year Ended
June 30, 2014 | | | Year Ended
June 30, 2015 | | | Year Ended
June 30, 2014 | |
CAPITAL TRANSACTIONS: | | | | | | | | | | | | | | | | |
Class A | | | | | | | | | | | | | | | | |
Proceeds from shares issued | | $ | 548,977 | | | $ | 463,178 | | | $ | 93,435 | | | $ | 92,281 | |
Net assets acquired in Fund reorganization (See Note 8) | | | — | | | | — | | | | — | | | | 42,694 | |
Distributions reinvested | | | 31,822 | | | | 21,355 | | | | 8,101 | | | | 4,242 | |
Cost of shares redeemed | | | (222,820 | ) | | | (135,058 | ) | | | (35,536 | ) | | | (16,208 | ) |
Conversion from Class B Shares | | | 2,100 | | | | 34 | | | | — | | | | — | |
| | | | | | | | | | | | | | | | |
Change in net assets resulting from Class A capital transactions | | $ | 360,079 | | | $ | 349,509 | | | $ | 66,000 | | | $ | 123,009 | |
| | | | | | | | | | | | | | | | |
Class B (a) | | | | | | | | | | | | | | | | |
Proceeds from shares issued | | $ | 225 | | | $ | 342 | | | $ | — | | | $ | — | |
Distributions reinvested | | | 95 | | | | 118 | | | | — | | | | — | |
Cost of shares redeemed | | | (865 | ) | | | (565 | ) | | | — | | | | — | |
Conversion to Class A Shares | | | (2,100 | ) | | | (34 | ) | | | — | | | | — | |
| | | | | | | | | | | | | | | | |
Change in net assets resulting from Class B capital transactions | | $ | (2,645 | ) | | $ | (139 | ) | | $ | — | | | $ | — | |
| | | | | | | | | | | | | | | | |
Class C | | | | | | | | | | | | | | | | |
Proceeds from shares issued | | $ | 182,071 | | | $ | 101,473 | | | $ | 6,417 | | | $ | 11,105 | |
Net assets acquired in Fund reorganization (See Note 8) | | | — | | | | — | | | | — | | | | 1,648 | |
Distributions reinvested | | | 6,954 | | | | 3,500 | | | | 990 | | | | 1,100 | |
Cost of shares redeemed | | | (32,956 | ) | | | (18,573 | ) | | | (2,929 | ) | | | (1,925 | ) |
| | | | | | | | | | | | | | | | |
Change in net assets resulting from Class C capital transactions | | $ | 156,069 | | | $ | 86,400 | | | $ | 4,478 | | | $ | 11,928 | |
| | | | | | | | | | | | | | | | |
Class R2 (b) | | | | | | | | | | | | | | | | |
Proceeds from shares issued | | $ | — | | | $ | — | | | $ | 336 | | | $ | 51 | |
Net assets acquired in Fund reorganization (See Note 8) | | | — | | | | — | | | | — | | | | 632 | |
Distributions reinvested | | | — | | | | — | | | | 18 | | | | — | (c) |
Cost of shares redeemed | | | — | | | | — | | | | (251 | ) | | | (28 | ) |
| | | | | | | | | �� | | | | | | | |
Change in net assets resulting from Class R2 capital transactions | | $ | — | | | $ | — | | | $ | 103 | | | $ | 655 | |
| | | | | | | | | | | | | | | | |
Class R5 (b) | | | | | | | | | | | | | | | | |
Proceeds from shares issued | | $ | 77,457 | | | $ | 540,555 | | | $ | 1,637 | | | $ | 1 | |
Net assets acquired in Fund reorganization (See Note 8) | | | — | | | | — | | | | — | | | | 87 | |
Distributions reinvested | | | 1,758 | | | | 54,106 | | | | 28 | | | | — | (c) |
Cost of shares redeemed | | | (1,506,939 | ) | | | (225,926 | ) | | | (186 | ) | | | — | |
| | | | | | | | | | | | | | | | |
Change in net assets resulting from Class R5 capital transactions | | $ | (1,427,724 | ) | | $ | 368,735 | | | $ | 1,479 | | | $ | 88 | |
| | | | | | | | | | | | | | | | |
Class R6 (b) (d) | | | | | | | | | | | | | | | | |
Proceeds from shares issued | | $ | 1,928,585 | | | $ | 276,436 | | | $ | 369,933 | | | $ | 108,850 | |
Net assets acquired in Fund reorganization (See Note 8) | | | — | | | | — | | | | — | | | | 676,262 | |
Distributions reinvested | | | 70,979 | | | | — | | | | 49,924 | | | | 906 | |
Cost of shares redeemed | | | (53,688 | ) | | | (11,268 | ) | | | (35,342 | ) | | | (751 | ) |
| | | | | | | | | | | | | | | | |
Change in net assets resulting from Class R6 capital transactions | | $ | 1,945,876 | | | $ | 265,168 | | | $ | 384,515 | | | $ | 785,267 | |
| | | | | | | | | | | | | | | | |
Select Class | | | | | | | | | | | | | | | | |
Proceeds from shares issued | | $ | 361,358 | | | $ | 429,743 | | | $ | 345,873 | | | $ | 490,477 | |
Net assets acquired in Fund reorganization (See Note 8) | | | — | | | | — | | | | — | | | | 390,167 | |
Distributions reinvested | | | 23,846 | | | | 20,345 | | | | 60,746 | | | | 82,318 | |
Cost of shares redeemed | | | (255,360 | ) | | | (532,403 | ) | | | (500,059 | ) | | | (332,515 | ) |
| | | | | | | | | | | | | | | | |
Change in net assets resulting from Select Class capital transactions | | $ | 129,844 | | | $ | (82,315 | ) | | $ | (93,440 | ) | | $ | 630,447 | |
| | | | | | | | | | | | | | | | |
Total change in net assets resulting from capital transactions | | $ | 1,161,499 | | | $ | 987,358 | | | $ | 363,135 | | | $ | 1,551,394 | |
| | | | | | | | | | | | | | | | |
| (a) | All remaining Class B Shares converted to Class A Shares on June 19, 2015. Prior year amounts, related to the conversion of Class B Shares to Class A Shares, have been reclassified to conform to the current year presentation. |
| (b) | Commencement of offering of class of shares effective March 14, 2014 for Mid Cap Equity Fund. |
| (c) | Amount rounds to less than 1,000. |
| (d) | Commencement of offering of class of shares effective December 23, 2013 for Growth Advantage Fund. |
SEE NOTES TO FINANCIAL STATEMENTS.
| | | | | | |
| | | |
| 50 | | | | J.P. MORGAN MID CAP/MULTI-CAP FUNDS | | JUNE 30, 2015 |
| | | | | | | | | | | | | | | | |
| | | Growth Advantage Fund | | | Mid Cap Equity Fund | |
| | | Year Ended
June 30, 2015 | | | Year Ended
June 30, 2014 | | | Year Ended
June 30, 2015 | | | Year Ended
June 30, 2014 | |
SHARE TRANSACTIONS: | | | | | | | | | | | | | | | | |
Class A | | | | | | | | | | | | | | | | |
Issued | | | 36,907 | | | | 34,638 | | | | 2,053 | | | | 2,197 | |
Shares issued in connection with Fund reorganization (See Note 8) | | | — | | | | — | | | | — | | | | 995 | |
Reinvested | | | 2,270 | | | | 1,645 | | | | 188 | | | | 107 | |
Redeemed | | | (15,105 | ) | | | (10,120 | ) | | | (784 | ) | | | (381 | ) |
Conversion from Class B Shares | | | 131 | | | | 3 | | | | — | | | | — | |
| | | | | | | | | | | | | | | | |
Change in Class A Shares | | | 24,203 | | | | 26,166 | | | | 1,457 | | | | 2,918 | |
| | | | | | | | | | | | | | | | |
Class B (a) | | | | | | | | | | | | | | | | |
Issued | | | 17 | | | | 28 | | | | — | | | | — | |
Reinvested | | | 7 | | | | 10 | | | | — | | | | — | |
Redeemed | | | (64 | ) | | | (47 | ) | | | — | | | | — | |
Conversion to Class A Shares | | | (146 | ) | | | (3 | ) | | | — | | | | — | |
| | | | | | | | | | | | | | | | |
Change in Class B Shares | | | (186 | ) | | | (12 | ) | | | — | | | | — | |
| | | | | | | | | | | | | | | | |
Class C | | | | | | | | | | | | | | | | |
Issued | | | 13,414 | | | | 8,282 | | | | 144 | | | | 269 | |
Shares issued in connection with Fund reorganization (See Note 8) | | | — | | | | — | | | | — | | | | 39 | |
Reinvested | | | 547 | | | | 295 | | | | 23 | | | | 28 | |
Redeemed | | | (2,464 | ) | | | (1,524 | ) | | | (65 | ) | | | (46 | ) |
| | | | | | | | | | | | | | | | |
Change in Class C Shares | | | 11,497 | | | | 7,053 | | | | 102 | | | | 290 | |
| | | | | | | | | | | | | | | | |
Class R2 (b) | | | | | | | | | | | | | | | | |
Issued | | | — | | | | — | | | | 7 | | | | 2 | |
Shares issued in connection with Fund reorganization (See Note 8) | | | — | | | | — | | | | — | | | | 15 | |
Reinvested | | | — | | | | — | | | | — | (c) | | | — | (c) |
Redeemed | | | — | | | | — | | | | (6 | ) | | | (1 | ) |
| | | | | | | | | | | | | | | | |
Change in Class R2 Shares | | | — | | | | — | | | | 1 | | | | 16 | |
| | | | | | | | | | | | | | | | |
Class R5 (b) | | | | | | | | | | | | | | | | |
Issued | | | 5,216 | | | | 39,731 | | | | 35 | | | | — | (c) |
Shares issued in connection with Fund reorganization (See Note 8) | | | — | | | | — | | | | — | | | | 2 | |
Reinvested | | | 122 | | | | 4,065 | | | | 1 | | | | — | (c) |
Redeemed | | | (101,089 | ) | | | (15,945 | ) | | | (4 | ) | | | — | |
| | | | | | | | | | | | | | | | |
Change in Class R5 Shares | | | (95,751 | ) | | | 27,851 | | | | 32 | | | | 2 | |
| | | | | | | | | | | | | | | | |
Class R6 (b) (d) | | | | | | | | | | | | | | | | |
Issued | | | 128,407 | | | | 19,372 | | | | 8,126 | | | | 2,551 | |
Shares issued in connection with Fund reorganization (See Note 8) | | | — | | | | — | | | | — | | | | 15,676 | |
Reinvested | | | 4,909 | | | | — | | | | 1,145 | | | | 20 | |
Redeemed | | | (3,544 | ) | | | (791 | ) | | | (779 | ) | | | (18 | ) |
| | | | | | | | | | | | | | | | |
Change in Class R6 Shares | | | 129,772 | | | | 18,581 | | | | 8,492 | | | | 18,229 | |
| | | | | | | | | | | | | | | | |
Select Class | | | | | | | | | | | | | | | | |
Issued | | | 23,952 | | | | 31,913 | | | | 7,557 | | | | 11,736 | |
Shares issued in connection with Fund reorganization (See Note 8) | | | — | | | | — | | | | — | | | | 9,044 | |
Reinvested | | | 1,668 | | | | 1,541 | | | | 1,396 | | | | 2,060 | |
Redeemed | | | (16,966 | ) | | | (38,838 | ) | | | (10,866 | ) | | | (7,967 | ) |
| | | | | | | | | | | | | | | | |
Change in Select Class Shares | | | 8,654 | | | | (5,384 | ) | | | (1,913 | ) | | | 14,873 | |
| | | | | | | | | | | | | | | | |
| (a) | All remaining Class B Shares converted to Class A Shares on June 19, 2015. Prior year amounts, related to the conversion of Class B Shares to Class A Shares, have been reclassified to conform to the current year presentation. |
| (b) | Commencement of offering of class of shares effective March 14, 2014 for Mid Cap Equity Fund. |
| (c) | Amount rounds to less than $1,000. |
| (d) | Commencement of offering of class of shares effective December 23, 2013 for Growth Advantage Fund. |
SEE NOTES TO FINANCIAL STATEMENTS.
| | | | | | | | |
| | | |
| JUNE 30, 2015 | | J.P. MORGAN MID CAP/MULTI-CAP FUNDS | | | | | 51 | |
STATEMENTS OF CHANGES IN NET ASSETS
FOR THE PERIODS INDICATED (continued)
(Amounts in thousands)
| | | | | | | | | | | | | | | | |
| | | Mid Cap Growth Fund | | | Mid Cap Value Fund | |
| | | Year Ended
June 30, 2015 | | | Year Ended
June 30, 2014 | | | Year Ended
June 30, 2015 | | | Year Ended
June 30, 2014 | |
CAPITAL TRANSACTIONS: | | | | | | | | | | | | | | | | |
Class A | | | | | | | | | | | | | | | | |
Proceeds from shares issued | | $ | 274,574 | | | $ | 116,580 | | | $ | 394,792 | | | $ | 455,082 | |
Distributions reinvested | | | 76,907 | | | | 65,053 | | | | 195,292 | | | | 139,350 | |
Cost of shares redeemed | | | (162,077 | ) | | | (127,370 | ) | | | (1,360,678 | ) | | | (880,766 | ) |
Conversion from Class B Shares | | | 3,778 | | | | 890 | | | | 6,728 | | | | 781 | |
| | | | | | | | | | | | | | | | |
Change in net assets resulting from Class A capital transactions | | $ | 193,182 | | | $ | 55,153 | | | $ | (763,866 | ) | | $ | (285,553 | ) |
| | | | | | | | | | | | | | | | |
Class B (a) | | | | | | | | | | | | | | | | |
Proceeds from shares issued | | $ | 27 | | | $ | 60 | | | $ | 22 | | | $ | 98 | |
Distributions reinvested | | | 593 | | | | 905 | | | | 639 | | | | 502 | |
Cost of shares redeemed | | | (1,919 | ) | | | (2,663 | ) | | | (4,670 | ) | | | (6,624 | ) |
Conversion to Class A Shares | | | (3,778 | ) | | | (890 | ) | | | (6,728 | ) | | | (781 | ) |
| | | | | | | | | | | | | | | | |
Change in net assets resulting from Class B capital transactions | | $ | (5,077 | ) | | $ | (2,588 | ) | | $ | (10,737 | ) | | $ | (6,805 | ) |
| | | | | | | | | | | | | | | | |
Class C | | | | | | | | | | | | | | | | |
Proceeds from shares issued | | $ | 37,238 | | | $ | 14,903 | | | $ | 27,636 | | | $ | 27,504 | |
Distributions reinvested | | | 5,274 | | | | 2,860 | | | | 36,724 | | | | 19,472 | |
Cost of shares redeemed | | | (8,786 | ) | | | (5,376 | ) | | | (72,861 | ) | | | (66,037 | ) |
| | | | | | | | | | | | | | | | |
Change in net assets resulting from Class C capital transactions | | $ | 33,726 | | | $ | 12,387 | | | $ | (8,501 | ) | | $ | (19,061 | ) |
| | | | | | | | | | | | | | | | |
Class R2 | | | | | | | | | | | | | | | | |
Proceeds from shares issued | | $ | 8,894 | | | $ | 1,589 | | | $ | 16,445 | | | $ | 21,879 | |
Distributions reinvested | | | 345 | | | | 58 | | | | 5,637 | | | | 2,790 | |
Cost of shares redeemed | | | (1,635 | ) | | | (276 | ) | | | (21,709 | ) | | | (20,179 | ) |
| | | | | | | | | | | | | | | | |
Change in net assets resulting from Class R2 capital transactions | | $ | 7,604 | | | $ | 1,371 | | | $ | 373 | | | $ | 4,490 | |
| | | | | | | | | | | | | | | | |
Class R5 | | | | | | | | | | | | | | | | |
Proceeds from shares issued | | $ | 139,213 | | | $ | 11,177 | | | $ | — | | | $ | — | |
Distributions reinvested | | | 3,427 | | | | 2,276 | | | | — | | | | — | |
Cost of shares redeemed | | | (10,062 | ) | | | (8,354 | ) | | | — | | | | — | |
| | | | | | | | | | | | | | | | |
Change in net assets resulting from Class R5 capital transactions | | $ | 132,578 | | | $ | 5,099 | | | $ | — | | | $ | — | |
| | | | | | | | | | | | | | | | |
Class R6 | | | | | | | | | | | | | | | | |
Proceeds from shares issued | | $ | 185,884 | | | $ | 33,802 | | | $ | — | | | $ | — | |
Distributions reinvested | | | 7,291 | | | | 4,757 | | | | — | | | | — | |
Cost of shares redeemed | | | (26,514 | ) | | | (12,254 | ) | | | — | | | | — | |
| | | | | | | | | | | | | | | | |
Change in net assets resulting from Class R6 capital transactions | | $ | 166,661 | | | $ | 26,305 | | | $ | — | | | $ | — | |
| | | | | | | | | | | | | | | | |
Institutional Class | | | | | | | | | | | | | | | | |
Proceeds from shares issued | | $ | — | | | $ | — | | | $ | 2,898,688 | | | $ | 1,953,853 | |
Distributions reinvested | | | — | | | | — | | | | 686,825 | | | | 315,542 | |
Cost of shares redeemed | | | — | | | | — | | | | (1,786,837 | ) | | | (1,555,034 | ) |
| | | | | | | | | | | | | | | | |
Change in net assets resulting from Institutional Class capital transactions | | $ | — | | | $ | — | | | $ | 1,798,676 | | | $ | 714,361 | |
| | | | | | | | | | | | | | | | |
Select Class | | | | | | | | | | | | | | | | |
Proceeds from shares issued | | $ | 427,509 | | | $ | 235,397 | | | $ | 1,046,215 | | | $ | 551,560 | |
Distributions reinvested | | | 103,039 | | | | 84,914 | | | | 174,083 | | | | 120,569 | |
Cost of shares redeemed | | | (272,150 | ) | | | (166,729 | ) | | | (1,867,549 | ) | | | (1,061,484 | ) |
| | | | | | | | | | | | | | | | |
Change in net assets resulting from Select Class capital transactions | | $ | 258,398 | | | $ | 153,582 | | | $ | (647,251 | ) | | $ | (389,355 | ) |
| | | | | | | | | | | | | | | | |
Total change in net assets resulting from capital transactions | | $ | 787,072 | | | $ | 251,309 | | | $ | 368,694 | | | $ | 18,077 | |
| | | | | | | | | | | | | | | | |
| (a) | All remaining Class B Shares converted to Class A Shares on June 19, 2015. Prior year amounts, related to the conversion of Class B Shares to Class A Shares, have been reclassified to conform to the current year presentation. |
SEE NOTES TO FINANCIAL STATEMENTS.
| | | | | | |
| | | |
| 52 | | | | J.P. MORGAN MID CAP/MULTI-CAP FUNDS | | JUNE 30, 2015 |
| | | | | | | | | | | | | | | | |
| | | Mid Cap Growth Fund | | | Mid Cap Value Fund | |
| | | Year Ended
June 30, 2015 | | | Year Ended
June 30, 2014 | | | Year Ended
June 30, 2015 | | | Year Ended
June 30, 2014 | |
SHARE TRANSACTIONS: | | | | | | | | | | | | | | | | |
Class A | | | | | | | | | | | | | | | | |
Issued | | | 10,468 | | | | 4,511 | | | | 10,652 | | | | 13,252 | |
Reinvested | | | 3,166 | | | | 2,708 | | | | 5,494 | | | | 4,172 | |
Redeemed | | | (6,089 | ) | | | (4,940 | ) | | | (36,773 | ) | | | (25,729 | ) |
Conversion from Class B Shares | | | 136 | | | | 35 | | | | 178 | | | | 23 | |
| | | | | | | | | | | | | | | | |
Change in Class A Shares | | | 7,681 | | | | 2,314 | | | | (20,449 | ) | | | (8,282 | ) |
| | | | | | | | | | | | | | | | |
Class B (a) | | | | | | | | | | | | | | | | |
Issued | | | 1 | | | | 3 | | | | 1 | | | | 4 | |
Reinvested | | | 37 | | | | 53 | | | | 18 | | | | 15 | |
Redeemed | | | (106 | ) | | | (144 | ) | | | (128 | ) | | | (200 | ) |
Conversion to Class A Shares | | | (202 | ) | | | (49 | ) | | | (182 | ) | | | (23 | ) |
| | | | | | | | | | | | | | | | |
Change in Class B Shares | | | (270 | ) | | | (137 | ) | | | (291 | ) | | | (204 | ) |
| | | | | | | | | | | | | | | | |
Class C | | | | | | | | | | | | | | | | |
Issued | | | 1,668 | | | | 673 | | | | 779 | | | | 830 | |
Reinvested | | | 262 | | | | 140 | | | | 1,070 | | | | 602 | |
Redeemed | | | (396 | ) | | | (244 | ) | | | (2,021 | ) | | | (1,968 | ) |
| | | | | | | | | | | | | | | | |
Change in Class C Shares | | | 1,534 | | | | 569 | | | | (172 | ) | | | (536 | ) |
| | | | | | | | | | | | | | | | |
Class R2 | | | | | | | | | | | | | | | | |
Issued | | | 310 | | | | 58 | | | | 458 | | | | 654 | |
Reinvested | | | 13 | | | | 2 | | | | 164 | | | | 86 | |
Redeemed | | | (57 | ) | | | (10 | ) | | | (607 | ) | | | (599 | ) |
| | | | | | | | | | | | | | | | |
Change in Class R2 Shares | | | 266 | | | | 50 | | | | 15 | | | | 141 | |
| | | | | | | | | | | | | | | | |
Class R5 | | | | | | | | | | | | | | | | |
Issued | | | 4,578 | | | | 397 | | | | — | | | | — | |
Reinvested | | | 125 | | | | 86 | | | | — | | | | — | |
Redeemed | | | (334 | ) | | | (293 | ) | | | — | | | | — | |
| | | | | | | | | | | | | | | | |
Change in Class R5 Shares | | | 4,369 | | | | 190 | | | | — | | | | — | |
| | | | | | | | | | | | | | | | |
Class R6 | | | | | | | | | | | | | | | | |
Issued | | | 6,285 | | | | 1,187 | | | | — | | | | — | |
Reinvested | | | 266 | | | | 179 | | | | — | | | | — | |
Redeemed | | | (882 | ) | | | (432 | ) | | | — | | | | — | |
| | | | | | | | | | | | | | | | |
Change in Class R6 Shares | | | 5,669 | | | | 934 | | | | — | | | | — | |
| | | | | | | | | | | | | | | | |
Institutional Class | | | | | | | | | | | | | | | | |
Issued | | | — | | | | — | | | | 75,729 | | | | 55,438 | |
Reinvested | | | — | | | | — | | | | 18,860 | | | | 9,240 | |
Redeemed | | | — | | | | — | | | | (47,177 | ) | | | (44,220 | ) |
| | | | | | | | | | | | | | | | |
Change in Institutional Class Shares | | | — | | | | — | | | | 47,412 | | | | 20,458 | |
| | | | | | | | | | | | | | | | |
Select Class | | | | | | | | | | | | | | | | |
Issued | | | 14,507 | | | | 8,322 | | | | 27,961 | | | | 15,917 | |
Reinvested | | | 3,790 | | | | 3,204 | | | | 4,839 | | | | 3,571 | |
Redeemed | | | (9,299 | ) | | | (5,903 | ) | | | (48,879 | ) | | | (30,426 | ) |
| | | | | | | | | | | | | | | | |
Change in Select Class Shares | | | 8,998 | | | | 5,623 | | | | (16,079 | ) | | | (10,938 | ) |
| | | | | | | | | | | | | | | | |
| (a) | All remaining Class B Shares converted to Class A Shares on June 19, 2015. Prior year amounts, related to the conversion of Class B Shares to Class A Shares, have been reclassified to conform to the current year presentation. |
SEE NOTES TO FINANCIAL STATEMENTS.
| | | | | | | | |
| | | |
| JUNE 30, 2015 | | J.P. MORGAN MID CAP/MULTI-CAP FUNDS | | | | | 53 | |
STATEMENTS OF CHANGES IN NET ASSETS
FOR THE PERIODS INDICATED (continued)
(Amounts in thousands)
| | | | | | | | | | | | | | | | |
| | | Multi-Cap Market Neutral Fund | | | Value Advantage Fund | |
| | | Year Ended
June 30, 2015 | | | Year Ended
June 30, 2014 | | | Year Ended
June 30, 2015 | | | Year Ended
June 30, 2014 | |
CAPITAL TRANSACTIONS: | | | | | | | | | | | | | | | | |
Class A | | | | | | | | | | | | | | | | |
Proceeds from shares issued | | $ | 558 | | | $ | 2,518 | | | $ | 1,131,012 | | | $ | 931,606 | |
Distributions reinvested | | | — | | | | — | | | | 63,610 | | | | 34,685 | |
Cost of shares redeemed | | | (4,659 | ) | | | (6,487 | ) | | | (503,182 | ) | | | (255,314 | ) |
Conversion from Class B Shares | | | 79 | | | | 45 | | | | — | | | | — | |
| | | | | | | | | | | | | | | | |
Change in net assets resulting from Class A capital transactions | | $ | (4,022 | ) | | $ | (3,924 | ) | | $ | 691,440 | | | $ | 710,977 | |
| | | | | | | | | | | | | | | | |
Class B (a) | | | | | | | | | | | | | | | | |
Proceeds from shares issued | | $ | — | | | $ | 3 | | | $ | — | | | $ | — | |
Cost of shares redeemed | | | (129 | ) | | | (280 | ) | | | — | | | | — | |
Conversion to Class A Shares | | | (79 | ) | | | (45 | ) | | | — | | | | — | |
| | | | | | | | | | | | | | | | |
Change in net assets resulting from Class B capital transactions | | $ | (208 | ) | | $ | (322 | ) | | $ | — | | | $ | — | |
| | | | | | | | | | | | | | | | |
Class C | | | | | | | | | | | | | | | | |
Proceeds from shares issued | | $ | 522 | | | $ | 505 | | | $ | 341,265 | | | $ | 164,051 | |
Distributions reinvested | | | — | | | | — | | | | 12,024 | | | | 6,053 | |
Cost of shares redeemed | | | (2,310 | ) | | | (3,141 | ) | | | (65,697 | ) | | | (28,716 | ) |
| | | | | | | | | | | | | | | | |
Change in net assets resulting from Class C capital transactions | | $ | (1,788 | ) | | $ | (2,636 | ) | | $ | 287,592 | | | $ | 141,388 | |
| | | | | | | | | | | | | | | | |
Institutional Class | | | | | | | | | | | | | | | | |
Proceeds from shares issued | | $ | — | | | $ | — | | | $ | 2,416,260 | | | $ | 1,480,427 | |
Distributions reinvested | | | — | | | | — | | | | 134,005 | | | | 69,075 | |
Cost of shares redeemed | | | — | | | | — | | | | (641,266 | ) | | | (330,856 | ) |
| | | | | | | | | | | | | | | | |
Change in net assets resulting from Institutional Class capital transactions | | $ | — | | | $ | — | | | $ | 1,908,999 | | | $ | 1,218,646 | |
| | | | | | | | | | | | | | | | |
Select Class | | | | | | | | | | | | | | | | |
Proceeds from shares issued | | $ | 8,612 | | | $ | 114,928 | | | $ | 883,261 | | | $ | 1,276,857 | |
Distributions reinvested | | | — | | | | — | | | | 87,369 | | | | 49,543 | |
Cost of shares redeemed | | | (163,720 | ) | | | (6,058 | ) | | | (489,380 | ) | | | (335,843 | ) |
| | | | | | | | | | | | | | | | |
Change in net assets resulting from Select Class capital transactions | | $ | (155,108 | ) | | $ | 108,870 | | | $ | 481,250 | | | $ | 990,557 | |
| | | | | | | | | | | | | | | | |
Total change in net assets resulting from capital transactions | | $ | (161,126 | ) | | $ | 101,988 | | | $ | 3,369,281 | | | $ | 3,061,568 | |
| | | | | | | | | | | | | | | | |
| (a) | All remaining Class B Shares converted to Class A Shares on June 19, 2015. Prior year amounts, related to the conversion of Class B Shares to Class A Shares, have been reclassified to conform to the current year presentation. |
SEE NOTES TO FINANCIAL STATEMENTS.
| | | | | | |
| | | |
| 54 | | | | J.P. MORGAN MID CAP/MULTI-CAP FUNDS | | JUNE 30, 2015 |
| | | | | | | | | | | | | | | | |
| | | Multi-Cap Market Neutral Fund | | | Value Advantage Fund | |
| | | Year Ended
June 30, 2015 | | | Year Ended
June 30, 2014 | | | Year Ended
June 30, 2015 | | | Year Ended
June 30, 2014 | |
SHARE TRANSACTIONS: | | | | | | | | | | | | | | | | |
Class A | | | | | | | | | | | | | | | | |
Issued | | | 56 | | | | 257 | | | | 38,204 | | | | 34,698 | |
Reinvested | | | — | | | | — | | | | 2,177 | | | | 1,320 | |
Redeemed | | | (468 | ) | | | (663 | ) | | | (16,986 | ) | | | (9,483 | ) |
Conversion from Class B Shares | | | 8 | | | | 5 | | | | — | | | | — | |
| | | | | | | | | | | | | | | | |
Change in Class A Shares | | | (404 | ) | | | (401 | ) | | | 23,395 | | | | 26,535 | |
| | | | | | | | | | | | | | | | |
Class B (a) | | | | | | | | | | | | | | | | |
Issued | | | — | | | | 1 | | | | — | | | | — | |
Redeemed | | | (14 | ) | | | (31 | ) | | | — | | | | — | |
Conversion to Class A Shares | | | (8 | ) | | | (5 | ) | | | — | | | | — | |
| | | | | | | | | | | | | | | | |
Change in Class B Shares | | | (22 | ) | | | (35 | ) | | | — | | | | — | |
| | | | | | | | | | | | | | | | |
Class C | | | | | | | | | | | | | | | | |
Issued | | | 56 | | | | 54 | | | | 11,531 | | | | 6,062 | |
Reinvested | | | — | | | | — | | | | 414 | | | | 232 | |
Redeemed | | | (245 | ) | | | (338 | ) | | | (2,215 | ) | | | (1,062 | ) |
| | | | | | | | | | | | | | | | |
Change in Class C Shares | | | (189 | ) | | | (284 | ) | | | 9,730 | | | | 5,232 | |
| | | | | | | | | | | | | | | | |
Institutional Class | | | | | | | | | | | | | | | | |
Issued | | | — | | | | — | | | | 81,240 | | | | 54,588 | |
Reinvested | | | — | | | | — | | | | 4,545 | | | | 2,610 | |
Redeemed | | | — | | | | — | | | | (21,282 | ) | | | (12,230 | ) |
| | | | | | | | | | | | | | | | |
Change in Institutional Class Shares | | | — | | | | — | | | | 64,503 | | | | 44,968 | |
| | | | | | | | | | | | | | | | |
Select Class | | | | | | | | | | | | | | | | |
Issued | | | 848 | | | | 11,408 | | | | 29,705 | | | | 47,271 | |
Reinvested | | | — | | | | — | | | | 2,972 | | | | 1,877 | |
Redeemed | | | (16,074 | ) | | | (607 | ) | | | (16,492 | ) | | | (12,507 | ) |
| | | | | | | | | | | | | | | | |
Change in Select Class Shares | | | (15,226 | ) | | | 10,801 | | | | 16,185 | | | | 36,641 | |
| | | | | | | | | | | | | | | | |
| (a) | All remaining Class B Shares converted to Class A Shares on June 19, 2015. Prior year amounts, related to the conversion of Class B Shares to Class A Shares, have been reclassified to conform to the current year presentation. |
SEE NOTES TO FINANCIAL STATEMENTS.
| | | | | | | | |
| | | |
| JUNE 30, 2015 | | J.P. MORGAN MID CAP/MULTI-CAP FUNDS | | | | | 55 | |
FINANCIAL HIGHLIGHTS
FOR THE PERIODS INDICATED
| | | | | | | | | | | | | | | | | | | | | | | | | | | | |
| | | | | | Per share operating performance | |
| | | | | | Investment operations | | | Distributions | |
| | | Net asset
value,
beginning
of period | | | Net
investment
income
(loss) | | | Net realized
and unrealized
gains
(losses) on
investments | | | Total from
investment
operations | | | Net
investment
income | | | Net
realized
gain | | | Total
distributions | |
Growth Advantage Fund | | | | | | | | | | | | | | | | | | | | | | | | | | | | |
Class A | | | | | | | | | | | | | | | | | | | | | | | | | | | | |
Year Ended June 30, 2015 | | $ | 14.24 | | | $ | (0.10 | )(f) | | $ | 2.17 | | | $ | 2.07 | | | $ | — | | | $ | (0.57 | ) | | $ | (0.57 | ) |
Year Ended June 30, 2014 | | | 11.43 | | | | (0.07 | )(f) | | | 3.52 | | | | 3.45 | | | | — | | | | (0.64 | ) | | | (0.64 | ) |
Year Ended June 30, 2013 | | | 9.49 | | | | 0.01 | (f)(g) | | | 1.97 | | | | 1.98 | | | | (0.01 | ) | | | (0.03 | ) | | | (0.04 | ) |
Year Ended June 30, 2012 | | | 9.28 | | | | (0.03 | )(f)(h) | | | 0.24 | | | | 0.21 | | | | — | | | | — | | | | — | |
Year Ended June 30, 2011 | | | 6.76 | | | | (0.04 | )(f) | | | 2.56 | | | | 2.52 | | | | — | | | | — | | | | — | |
| | | | | | | |
Class C | | | | | | | | | | | | | | | | | | | | | | | | | | | | |
Year Ended June 30, 2015 | | | 12.98 | | | | (0.15 | )(f) | | | 1.96 | | | | 1.81 | | | | — | | | | (0.57 | ) | | | (0.57 | ) |
Year Ended June 30, 2014 | | | 10.51 | | | | (0.12 | )(f) | | | 3.23 | | | | 3.11 | | | | — | | | | (0.64 | ) | | | (0.64 | ) |
Year Ended June 30, 2013 | | | 8.77 | | | | (0.04 | )(f)(g) | | | 1.81 | | | | 1.77 | | | | — | | | | (0.03 | ) | | | (0.03 | ) |
Year Ended June 30, 2012 | | | 8.61 | | | | (0.07 | )(f)(h) | | | 0.23 | | | | 0.16 | | | | — | | | | — | | | | — | |
Year Ended June 30, 2011 | | | 6.31 | | | | (0.08 | )(f) | | | 2.38 | | | | 2.30 | | | | — | | | | — | | | | — | |
| | | | | | | |
Class R5 | | | | | | | | | | | | | | | | | | | | | | | | | | | | |
Year Ended June 30, 2015 | | | 14.63 | | | | (0.04 | )(f) | | | 2.23 | | | | 2.19 | | | | — | | | | (0.57 | ) | | | (0.57 | ) |
Year Ended June 30, 2014 | | | 11.68 | | | | (0.02 | )(f) | | | 3.61 | | | | 3.59 | | | | — | | | | (0.64 | ) | | | (0.64 | ) |
Year Ended June 30, 2013 | | | 9.69 | | | | 0.06 | (f)(g) | | | 2.01 | | | | 2.07 | | | | (0.05 | ) | | | (0.03 | ) | | | (0.08 | ) |
Year Ended June 30, 2012 | | | 9.44 | | | | 0.01 | (f)(h) | | | 0.24 | | | | 0.25 | | | | — | | | | — | | | | — | |
Year Ended June 30, 2011 | | | 6.86 | | | | — | (f)(i) | | | 2.58 | | | | 2.58 | | | | — | | | | — | | | | — | |
| | | | | | | |
Class R6 | | | | | | | | | | | | | | | | | | | | | | | | | | | | |
Year Ended June 30, 2015 | | | 14.64 | | | | (0.03 | )(f) | | | 2.23 | | | | 2.20 | | | | — | | | | (0.57 | ) | | | (0.57 | ) |
December 23, 2013(j) through June 30, 2014 | | | 13.86 | | | | (0.01 | )(f) | | | 0.79 | | | | 0.78 | | | | — | | | | — | | | | — | |
| | | | | | | |
Select Class | | | | | | | | | | | | | | | | | | | | | | | | | | | | |
Year Ended June 30, 2015 | | | 14.50 | | | | (0.07 | )(f) | | | 2.20 | | | | 2.13 | | | | — | | | | (0.57 | ) | | | (0.57 | ) |
Year Ended June 30, 2014 | | | 11.60 | | | | (0.04 | )(f) | | | 3.58 | | | | 3.54 | | | | — | | | | (0.64 | ) | | | (0.64 | ) |
Year Ended June 30, 2013 | | | 9.63 | | | | 0.04 | (f)(g) | | | 1.98 | | | | 2.02 | | | | (0.02 | ) | | | (0.03 | ) | | | (0.05 | ) |
Year Ended June 30, 2012 | | | 9.39 | | | | (0.02 | )(f)(h) | | | 0.26 | | | | 0.24 | | | | — | | | | — | | | | — | |
Year Ended June 30, 2011 | | | 6.83 | | | | (0.02 | )(f) | | | 2.58 | | | | 2.56 | | | | — | | | | — | | | | — | |
| (a) | Annualized for periods less than one year, unless otherwise noted. |
| (b) | Not annualized for periods less than one year. |
| (c) | Includes adjustments in accordance with accounting principles generally accepted in the United States of America and as such, the net asset values for financial reporting purposes and the returns based upon those net asset values may differ from the net asset values and returns for shareholder transactions. |
| (d) | Includes earnings credits and interest expense, if applicable, each of which is less than 0.01% unless otherwise noted. |
| (e) | Portfolio turnover is calculated by dividing the lesser of total purchases or sales of portfolio securities for the reporting period by the monthly average value of portfolio securities owned during the reporting period. Excluded from both the numerator and denominator are amounts relating to derivatives and securities whose maturities or expiration dates at the time of acquisition were one year or less. |
| (f) | Calculated based upon average shares outstanding. |
| (g) | Reflects special dividends paid out during the period by several of the Fund’s holdings. Had the Fund not received the special dividends, the net investment income (loss) per share would have been $(0.02), $(0.06), $0.03 and $0.01 for Class A, Class C, Class R5 and Select Class Shares, respectively, and the net investment income (loss) ratio would have been (0.17)%, (0.66)%, 0.27% and 0.09% for Class A, Class C, Class R5 and Select Class Shares, respectively. |
| (h) | Reflects a special dividend paid out during the period by one of the Fund’s holdings. Had the Fund not received the special dividend, the net investment income (loss) per share would have been $(0.05), $(0.09), $(0.01) and $(0.03) for Class A, Class C, Class R5 and Select Class Shares, respectively, and the net investment income (loss) ratio would have been (0.56)%, (1.03)%, (0.12)% and (0.37)% for Class A, Class C, Class R5 and Select Class Shares, respectively. |
| (i) | Amount rounds to less than $0.01. |
| (j) | Commencement of offering of class of shares. |
SEE NOTES TO FINANCIAL STATEMENTS.
| | | | | | |
| | | |
| 56 | | | | J.P. MORGAN MID CAP/MULTI-CAP FUNDS | | JUNE 30, 2015 |
| | | | | | | | | | | | | | | | | | | | | | | | | | |
| | | Ratios/Supplemental data | |
| | | | | | | | | | Ratios to average net assets (a) | | | | |
Net asset
value,
end of
period | | | Total return
(excludes
sales charge) (b)(c) | | | Net assets,
end of
period
(000’s) | | | Net
expenses (d) | | | Net
investment
income
(loss) | | | Expenses
without waivers,
reimbursements and
earnings credits | | | Portfolio
turnover
rate (b)(e) | |
| | | | | | | | | | | | | | | | | | | | | | | | | | |
| | | | | | | | | | | | | | | | | | | | | | | | | | |
| $ | 15.74 | | | | 14.99 | % | | $ | 1,174,260 | | | | 1.24 | % | | | (0.65 | )% | | | 1.35 | % | | | 46 | % |
| | 14.24 | | | | 30.69 | | | | 717,564 | | | | 1.24 | | | | (0.51 | ) | | | 1.31 | | | | 62 | |
| | 11.43 | | | | 20.95 | | | | 276,670 | | | | 1.24 | | | | 0.11 | (g) | | | 1.28 | | | | 76 | |
| | 9.49 | | | | 2.26 | | | | 194,911 | | | | 1.25 | | | | (0.37 | )(h) | | | 1.30 | | | | 86 | |
| | 9.28 | | | | 37.28 | | | | 176,492 | | | | 1.25 | | | | (0.45 | ) | | | 1.31 | | | | 96 | |
| | | | | | |
| | | | | | | | | | | | | | | | | | | | | | | | | | |
| | 14.22 | | | | 14.43 | | | | 321,500 | | | | 1.74 | | | | (1.14 | ) | | | 1.84 | | | | 46 | |
| | 12.98 | | | | 30.12 | | | | 144,229 | | | | 1.74 | | | | (1.01 | ) | | | 1.81 | | | | 62 | |
| | 10.51 | | | | 20.27 | | | | 42,655 | | | | 1.74 | | | | (0.38 | )(g) | | | 1.78 | | | | 76 | |
| | 8.77 | | | | 1.86 | | | | 27,469 | | | | 1.75 | | | | (0.84 | )(h) | | | 1.80 | | | | 86 | |
| | 8.61 | | | | 36.45 | | | | 20,676 | | | | 1.75 | | | | (0.95 | ) | | | 1.81 | | | | 96 | |
| | | | | | |
| | | | | | | | | | | | | | | | | | | | | | | | | | |
| | 16.25 | | | | 15.42 | | | | 58,686 | | | | 0.86 | | | | (0.25 | ) | | | 0.87 | | | | 46 | |
| | 14.63 | | | | 31.25 | | | | 1,453,864 | | | | 0.85 | | | | (0.11 | ) | | | 0.86 | | | | 62 | |
| | 11.68 | | | | 21.49 | | | | 835,233 | | | | 0.83 | | | | 0.55 | (g) | | | 0.84 | | | | 76 | |
| | 9.69 | | | | 2.65 | | | | 468,064 | | | | 0.85 | | | | 0.07 | (h) | | | 0.85 | | | | 86 | |
| | 9.44 | | | | 37.61 | | | | 179,677 | | | | 0.86 | | | | (0.05 | ) | | | 0.86 | | | | 96 | |
| | | | | | |
| | | | | | | | | | | | | | | | | | | | | | | | | | |
| | 16.27 | | | | 15.48 | | | | 2,414,333 | | | | 0.76 | | | | (0.17 | ) | | | 0.77 | | | | 46 | |
| | 14.64 | | | | 5.63 | | | | 271,958 | | | | 0.80 | | | | (0.15 | ) | | | 0.82 | | | | 62 | |
| | | | | | |
| | | | | | | | | | | | | | | | | | | | | | | | | | |
| | 16.06 | | | | 15.14 | | | | 1,219,501 | | | | 1.09 | | | | (0.48 | ) | | | 1.09 | | | | 46 | |
| | 14.50 | | | | 31.03 | | | | 975,175 | | | | 1.05 | | | | (0.30 | ) | | | 1.06 | | | | 62 | |
| | 11.60 | | | | 21.14 | | | | 842,783 | | | | 1.03 | | | | 0.37 | (g) | | | 1.03 | | | | 76 | |
| | 9.63 | | | | 2.56 | | | | 662,786 | | | | 1.05 | | | | (0.18 | )(h) | | | 1.05 | | | | 86 | |
| | 9.39 | | | | 37.48 | | | | 836,154 | | | | 1.06 | | | | (0.27 | ) | | | 1.06 | | | | 96 | |
SEE NOTES TO FINANCIAL STATEMENTS.
| | | | | | | | |
| | | |
| JUNE 30, 2015 | | J.P. MORGAN MID CAP/MULTI-CAP FUNDS | | | | | 57 | |
FINANCIAL HIGHLIGHTS
FOR THE PERIODS INDICATED (continued)
| | | | | | | | | | | | | | | | | | | | | | | | | | | | |
| | | | | | Per share operating performance | |
| | | | | | Investment operations | | | Distributions | |
| | | Net asset
value,
beginning
of period | | | Net
investment
income
(loss) | | | Net realized
and unrealized gains (losses) on
investments | | | Total from
investment
operations | | | Net
investment
income | | | Net
realized
gain | | | Total
distributions | |
Mid Cap Equity Fund | | | | | | | | | | | | | | | | | | | | | | | | | | | | |
Class A | | | | | | | | | | | | | | | | | | | | | | | | | | | | |
Year Ended June 30, 2015 | | $ | 44.91 | | | $ | (0.03 | )(f) | | $ | 4.32 | | | $ | 4.29 | | | $ | (0.02 | ) | | $ | (2.06 | ) | | $ | (2.08 | ) |
Year Ended June 30, 2014 | | | 38.10 | | | | (0.04 | )(f) | | | 10.25 | | | | 10.21 | | | | (0.02 | ) | | | (3.38 | ) | | | (3.40 | ) |
Year Ended June 30, 2013 | | | 30.97 | | | | 0.10 | (f)(g) | | | 7.36 | | | | 7.46 | | | | (0.07 | ) | | | (0.26 | ) | | | (0.33 | ) |
Year Ended June 30, 2012 | | | 31.29 | | | | 0.10 | (f)(g) | | | (0.34 | ) | | | (0.24 | ) | | | (0.08 | ) | | | — | | | | (0.08 | ) |
Year Ended June 30, 2011 | | | 22.95 | | | | 0.04 | (f) | | | 8.36 | | | | 8.40 | | | | (0.06 | ) | | | — | | | | (0.06 | ) |
| | | | | | | |
Class C | | | | | | | | | | | | | | | | | | | | | | | | | | | | |
Year Ended June 30, 2015 | | | 44.21 | | | | (0.25 | )(f) | | | 4.23 | | | | 3.98 | | | | — | | | | (2.03 | ) | | | (2.03 | ) |
Year Ended June 30, 2014 | | | 37.71 | | | | (0.24 | )(f) | | | 10.12 | | | | 9.88 | | | | — | | | | (3.38 | ) | | | (3.38 | ) |
Year Ended June 30, 2013 | | | 30.75 | | | | (0.07 | )(f)(g) | | | 7.29 | | | | 7.22 | | | | — | (j) | | | (0.26 | ) | | | (0.26 | ) |
Year Ended June 30, 2012 | | | 31.16 | | | | (0.05 | )(f)(g) | | | (0.35 | ) | | | (0.40 | ) | | | (0.01 | ) | | | — | | | | (0.01 | ) |
Year Ended June 30, 2011 | | | 22.93 | | | | (0.12 | )(f) | | | 8.37 | | | | 8.25 | | | | (0.02 | ) | | | — | | | | (0.02 | ) |
| | | | | | | |
Class R2 | | | | | | | | | | | | | | | | | | | | | | | | | | | | |
Year Ended June 30, 2015 | | | 44.87 | | | | (0.14 | )(f) | | | 4.30 | | | | 4.16 | | | | — | | | | (2.05 | ) | | | (2.05 | ) |
March 14, 2014(i) through June 30, 2014 | | | 42.92 | | | | (0.05 | )(f) | | | 2.01 | | | | 1.96 | | | | (0.01 | ) | | | — | | | | (0.01 | ) |
| | | | | | | |
Class R5 | | | | | | | | | | | | | | | | | | | | | | | | | | | | |
Year Ended June 30, 2015 | | | 45.15 | | | | 0.20 | (f) | | | 4.33 | | | | 4.53 | | | | (0.13 | ) | | | (2.06 | ) | | | (2.19 | ) |
March 14, 2014(i) through June 30, 2014 | | | 43.14 | | | | 0.04 | (f) | | | 2.02 | | | | 2.06 | | | | (0.05 | ) | | | — | | | | (0.05 | ) |
| | | | | | | |
Class R6 | | | | | | | | | | | | | | | | | | | | | | | | | | | | |
Year Ended June 30, 2015 | | | 45.15 | | | | 0.20 | (f) | | | 4.34 | | | | 4.54 | | | | (0.14 | ) | | | (2.06 | ) | | | (2.20 | ) |
March 14, 2014(i) through June 30, 2014 | | | 43.14 | | | | 0.04 | (f) | | | 2.02 | | | | 2.06 | | | | (0.05 | ) | | | — | | | | (0.05 | ) |
| | | | | | | |
Select Class | | | | | | | | | | | | | | | | | | | | | | | | | | | | |
Year Ended June 30, 2015 | | | 45.15 | | | | 0.13 | (f) | | | 4.34 | | | | 4.47 | | | | (0.09 | ) | | | (2.06 | ) | | | (2.15 | ) |
Year Ended June 30, 2014 | | | 38.22 | | | | 0.11 | (f) | | | 10.30 | | | | 10.41 | | | | (0.10 | ) | | | (3.38 | ) | | | (3.48 | ) |
Year Ended June 30, 2013 | | | 31.05 | | | | 0.20 | (f)(g) | | | 7.40 | | | | 7.60 | | | | (0.17 | ) | | | (0.26 | ) | | | (0.43 | ) |
Year Ended June 30, 2012 | | | 31.36 | | | | 0.19 | (f)(g) | | | (0.33 | ) | | | (0.14 | ) | | | (0.17 | ) | | | — | | | | (0.17 | ) |
Year Ended June 30, 2011 | | | 22.97 | | | | 0.14 | (f) | | | 8.37 | | | | 8.51 | | | | (0.12 | ) | | | — | | | | (0.12 | ) |
| (a) | Annualized for periods less than one year, unless otherwise noted. |
| (b) | Not annualized for periods less than one year. |
| (c) | Includes adjustments in accordance with accounting principles generally accepted in the United States of America and as such, the net asset values for financial reporting purposes and the returns based upon those net asset values may differ from the net asset values and returns for shareholder transactions. |
| (d) | Includes earnings credits and interest expense, if applicable, each of which is less than 0.01% unless otherwise noted. |
| (e) | Portfolio turnover is calculated by dividing the lesser of total purchases or sales of portfolio securities for the reporting period by the monthly average value of portfolio securities owned during the reporting period. Excluded from both the numerator and denominator are amounts relating to derivatives and securities whose maturities or expiration dates at the time of acquisition were one year or less. |
| (f) | Calculated based upon average shares outstanding. |
| (g) | Reflects special dividends paid out during the period by several of the Fund’s holdings. Had the Fund not received the special dividends, the net investment income (loss) per share would have been $0.03, $(0.14) and $0.14 for Class A, Class C and Select Class Shares, respectively, and the net investment income (loss) ratio would have been 0.09%, (0.39)% and 0.39% for Class A, Class C and Select Class Shares, respectively. |
| (h) | Reflects a special dividend paid out during the period by one of the Fund’s holdings. Had the Fund not received the special dividend the net investment income (loss) per share would have been $0.05, $(0.10) and $0.14 for Class A, Class C and Select Class Shares, respectively and the net investment income (loss) ratio would have been 0.18%, (0.33)% and 0.48% for Class A, Class C and Select Class Shares, respectively. |
| (i) | Commencement of offering of class of shares. |
| (j) | Amount rounds to less than $0.01. |
SEE NOTES TO FINANCIAL STATEMENTS.
| | | | | | |
| | | |
| 58 | | | | J.P. MORGAN MID CAP/MULTI-CAP FUNDS | | JUNE 30, 2015 |
| | | | | | | | | | | | | | | | | | | | | | | | | | |
| | | Ratios/Supplemental data | |
| | | | | | | | | | Ratios to average net assets (a) | | | | |
Net asset
value,
end of
period | | | Total return
(excludes
sales charge) (b)(c) | | | Net assets,
end of
period
(000’s) | | | Net
expenses (d) | | | Net
investment income
(loss) | | |
Expenses
without waivers,
reimbursements and
earnings credits | | | Portfolio
turnover
rate (b)(e) | |
| | | | | | | | | | | | | | | | | | | | | | | | | | |
| | | | | | | | | | | | | | | | | | | | | | | | | | |
| $ | 47.12 | | | | 9.99 | % | | $ | 232,320 | | | | 1.24 | % | | | (0.06 | )% | | | 1.44 | % | | | 41 | % |
| | 44.91 | | | | 27.96 | | | | 156,016 | | | | 1.24 | | | | (0.08 | ) | | | 1.41 | | | | 47 | |
| | 38.10 | | | | 24.23 | | | | 21,171 | | | | 1.24 | | | | 0.27 | (g) | | | 1.49 | | | | 67 | |
| | 30.97 | | | | (0.76 | ) | | | 6,965 | | | | 1.24 | | | | 0.34 | (h) | | | 1.54 | | | | 55 | |
| | 31.29 | | | | 36.60 | | | | 2,918 | | | | 1.24 | | | | 0.14 | | | | 1.53 | | | | 88 | |
| | | | | | |
| | | | | | | | | | | | | | | | | | | | | | | | | | |
| | 46.16 | | | | 9.44 | | | | 25,597 | | | | 1.74 | | | | (0.56 | ) | | | 1.91 | | | | 41 | |
| | 44.21 | | | | 27.34 | | | | 20,018 | | | | 1.74 | | | | (0.57 | ) | | | 1.93 | | | | 47 | |
| | 37.71 | | | | 23.60 | | | | 6,136 | | | | 1.74 | | | | (0.21 | )(g) | | | 2.00 | | | | 67 | |
| | 30.75 | | | | (1.29 | ) | | | 1,244 | | | | 1.75 | | | | (0.18 | )(h) | | | 2.03 | | | | 55 | |
| | 31.16 | | | | 35.98 | | | | 447 | | | | 1.74 | | | | (0.40 | ) | | | 2.06 | | | | 88 | |
| | | | | | |
| | | | | | | | | | | | | | | | | | | | | | | | | | |
| | 46.98 | | | | 9.71 | | | | 823 | | | | 1.49 | | | | (0.31 | ) | | | 1.69 | | | | 41 | |
| | 44.87 | | | | 4.56 | | | | 688 | | | | 1.47 | | | | (0.41 | ) | | | 1.60 | | | | 47 | |
| | | | | | |
| | | | | | | | | | | | | | | | | | | | | | | | | | |
| | 47.49 | | | | 10.49 | | | | 1,636 | | | | 0.79 | | | | 0.43 | | | | 0.88 | | | | 41 | |
| | 45.15 | | | | 4.77 | | | | 91 | | | | 0.78 | | | | 0.27 | | | | 0.91 | | | | 47 | |
| | | | | | |
| | | | | | | | | | | | | | | | | | | | | | | | | | |
| | 47.49 | | | | 10.53 | | | | 1,268,988 | | | | 0.74 | | | | 0.45 | | | | 0.80 | | | | 41 | |
| | 45.15 | | | | 4.78 | | | | 823,036 | | | | 0.73 | | | | 0.34 | | | | 0.86 | | | | 47 | |
| | | | | | |
| | | | | | | | | | | | | | | | | | | | | | | | | | |
| | 47.47 | | | | 10.35 | | | | 1,773,929 | | | | 0.89 | | | | 0.29 | | | | 1.16 | | | | 41 | |
| | 45.15 | | | | 28.45 | | | | 1,773,321 | | | | 0.89 | | | | 0.27 | | | | 1.18 | | | | 47 | |
| | 38.22 | | | | 24.64 | | | | 932,920 | | | | 0.89 | | | | 0.57 | (g) | | | 1.23 | | | | 67 | |
| | 31.05 | | | | (0.42 | ) | | | 813,125 | | | | 0.89 | | | | 0.64 | (h) | | | 1.30 | | | | 55 | |
| | 31.36 | | | | 37.09 | | | | 568,854 | | | | 0.89 | | | | 0.50 | | | | 1.27 | | | | 88 | |
SEE NOTES TO FINANCIAL STATEMENTS.
| | | | | | | | |
| | | |
| JUNE 30, 2015 | | J.P. MORGAN MID CAP/MULTI-CAP FUNDS | | | | | 59 | |
FINANCIAL HIGHLIGHTS
FOR THE PERIODS INDICATED (continued)
| | | | | | | | | | | | | | | | | | | | |
| | | | | | Per share operating performance | |
| | | | | | Investment operations | | | Distributions | |
| | | Net asset
value,
beginning
of period | | | Net
investment
income
(loss) | | | Net realized
and unrealized
gains
(losses) on
investments | | | Total from
investment
operations | | | Net
realized
gain | |
Mid Cap Growth Fund | | | | | | | | | | | | | | | | | | | | |
Class A | | | | | | | | | | | | | | | | | | | | |
Year Ended June 30, 2015 | | $ | 27.49 | | | $ | (0.18 | )(f) | | $ | 3.19 | | | $ | 3.01 | | | $ | (2.79 | ) |
Year Ended June 30, 2014 | | | 22.99 | | | | (0.13 | )(f)(g) | | | 7.42 | | | | 7.29 | | | | (2.79 | ) |
Year Ended June 30, 2013 | | | 19.52 | | | | (0.04 | )(f)(h) | | | 4.50 | | | | 4.46 | | | | (0.99 | ) |
Year Ended June 30, 2012 | | | 23.30 | | | | (0.05 | )(f)(i) | | | (1.72 | ) | | | (1.77 | ) | | | (2.01 | ) |
Year Ended June 30, 2011 | | | 16.35 | | | | (0.09 | )(f) | | | 7.04 | | | | 6.95 | | | | — | |
| | | | | |
Class C | | | | | | | | | | | | | | | | | | | | |
Year Ended June 30, 2015 | | | 23.35 | | | | (0.26 | )(f) | | | 2.63 | | | | 2.37 | | | | (2.79 | ) |
Year Ended June 30, 2014 | | | 19.97 | | | | (0.22 | )(f)(g) | | | 6.39 | | | | 6.17 | | | | (2.79 | ) |
Year Ended June 30, 2013 | | | 17.17 | | | | (0.12 | )(f)(h) | | | 3.91 | | | | 3.79 | | | | (0.99 | ) |
Year Ended June 30, 2012 | | | 20.88 | | | | (0.13 | )(f)(i) | | | (1.57 | ) | | | (1.70 | ) | | | (2.01 | ) |
Year Ended June 30, 2011 | | | 14.73 | | | | (0.18 | )(f) | | | 6.33 | | | | 6.15 | | | | — | |
| | | | | |
Class R2 | | | | | | | | | | | | | | | | | | | | |
Year Ended June 30, 2015 | | | 29.54 | | | | (0.24 | )(f) | | | 3.45 | �� | | | 3.21 | | | | (2.79 | ) |
Year Ended June 30, 2014 | | | 24.56 | | | | (0.20 | )(f)(g) | | | 7.97 | | | | 7.77 | | | | (2.79 | ) |
Year Ended June 30, 2013 | | | 20.83 | | | | (0.07 | )(f)(h) | | | 4.79 | | | | 4.72 | | | | (0.99 | ) |
Year Ended June 30, 2012 | | | 24.73 | | | | (0.07 | )(f)(i) | | | (1.82 | ) | | | (1.89 | ) | | | (2.01 | ) |
Year Ended June 30, 2011 | | | 17.38 | | | | (0.13 | )(f) | | | 7.48 | | | | 7.35 | | | | — | |
| | | | | |
Class R5 | | | | | | | | | | | | | | | | | | | | |
Year Ended June 30, 2015 | | | 30.52 | | | | (0.07 | )(f) | | | 3.60 | | | | 3.53 | | | | (2.79 | ) |
Year Ended June 30, 2014 | | | 25.15 | | | | (0.02 | )(f)(g) | | | 8.18 | | | | 8.16 | | | | (2.79 | ) |
Year Ended June 30, 2013 | | | 21.18 | | | | 0.06 | (f)(h) | | | 4.90 | | | | 4.96 | | | | (0.99 | ) |
November 1, 2011(j) through June 30, 2012 | | | 21.75 | | | | 0.04 | (f)(i) | | | 1.40 | | | | 1.44 | | | | (2.01 | ) |
| (a) | Annualized for periods less than one year, unless otherwise noted. |
| (b) | Not annualized for periods less than one year. |
| (c) | Includes adjustments in accordance with accounting principles generally accepted in the United States of America and as such, the net asset values for financial reporting purposes and the returns based upon those net asset values may differ from the net asset values and returns for shareholder transactions. |
| (d) | Includes earnings credits and interest expense, if applicable, each of which is less than 0.01% unless otherwise noted. |
| (e) | Portfolio turnover is calculated by dividing the lesser of total purchases or sales of portfolio securities for the reporting period by the monthly average value of portfolio securities owned during the reporting period. Excluded from both the numerator and denominator are amounts relating to derivatives and securities whose maturities or expiration dates at the time of acquisition were one year or less. |
| (f) | Calculated based upon average shares outstanding. |
| (g) | Reflects special dividends paid out during the period by several of the Fund’s holdings. Had the Fund not received the special dividends the net investment income (loss) per share would have been $(0.14), $(0.23), $(0.20), $(0.02), $(0.01) and $(0.06) for Class A, Class C, Class R2, Class R5, Class R6 and Select Class Shares, respectively, and the net investment income (loss) ratio would have been (0.53)%, (1.03)%, (0.73)%, (0.08)%, (0.03)% and (0.22)% for Class A, Class C, Class R2, Class R5, Class R6 and Select Class Shares, respectively. |
| (h) | Reflects special dividends paid out during the period by several of the Fund’s holdings. Had the Fund not received the special dividends, the net investment income (loss) per share would have been $(0.09), $(0.17), $(0.13), $0.01, $0.02 and $(0.02) for Class A, Class C, Class R2, Class R5, Class R6 and Select Class Shares, respectively, and the net investment income (loss) ratio would have been (0.42)%, (0.92)%, (0.57)%, 0.04%, 0.09% and (0.10)% for Class A, Class C, Class R2, Class R5, Class R6 and Select Class Shares, respectively. |
| (i) | Reflects a special dividend paid out during the period by one of the Fund’s holdings. Had the Fund not received the special dividend, the net investment income (loss) per share would have been $(0.09), $(0.17), $(0.12), less than $0.01, $0.03 and $(0.03) for Class A, Class C, Class R2, Class R5, Class R6 and Select Class Shares, respectively, and the net investment income (loss) ratio would have been (0.46)%, (0.97)%, (0.57)%, (0.03)%, 0.24% and (0.14)% for Class A, Class C, Class R2, Class R5, Class R6 and Select Class Shares, respectively. |
| (j) | Commencement of offering of class of shares. |
SEE NOTES TO FINANCIAL STATEMENTS.
| | | | | | |
| | | |
| 60 | | | | J.P. MORGAN MID CAP/MULTI-CAP FUNDS | | JUNE 30, 2015 |
| | | | | | | | | | | | | | | | | | | | | | | | | | |
| | | Ratios/Supplemental data | |
| | | | | | | | | | Ratios to average net assets (a) | | | | |
Net asset
value,
end of
period | | | Total return
(excludes
sales charge) (b)(c) | | |
Net assets,
end of
period
(000’s) | | | Net
expenses (d) | | | Net
investment
income
(loss) | | | Expenses
without waivers,
reimbursements and
earnings credits | | | Portfolio
turnover
rate (b)(e) | |
| | | | | | | | | | | | | | | | | | | | | | | | | | |
| | | | | | | | | | | | | | | | | | | | | | | | | | |
| $ | 27.71 | | | | 12.37 | % | | $ | 984,262 | | | | 1.23 | % | | | (0.68 | )% | | | 1.35 | % | | | 57 | % |
| | 27.49 | | | | 33.44 | | | | 765,310 | | | | 1.24 | | | | (0.51 | )(g) | | | 1.37 | | | | 69 | |
| | 22.99 | | | | 23.70 | | | | 586,787 | | | | 1.23 | | | | (0.17 | )(h) | | | 1.45 | | | | 70 | |
| | 19.52 | | | | (6.61 | ) | | | 538,323 | | | | 1.24 | | | | (0.23 | )(i) | | | 1.38 | | | | 70 | |
| | 23.30 | | | | 42.51 | | | | 696,334 | | | | 1.24 | | | | (0.44 | ) | | | 1.36 | | | | 79 | |
| | | | | | |
| | | | | | | | | | | | | | | | | | | | | | | | | | |
| | 22.93 | | | | 11.78 | | | | 75,494 | | | | 1.73 | | | | (1.19 | ) | | | 1.86 | | | | 57 | |
| | 23.35 | | | | 32.85 | | | | 41,047 | | | | 1.73 | | | | (1.01 | )(g) | | | 1.86 | | | | 69 | |
| | 19.97 | | | | 23.03 | | | | 23,745 | | | | 1.73 | | | | (0.67 | )(h) | | | 1.95 | | | | 70 | |
| | 17.17 | | | | (7.06 | ) | | | 22,190 | | | | 1.75 | | | | (0.75 | )(i) | | | 1.88 | | | | 70 | |
| | 20.88 | | | | 41.75 | | | | 29,187 | | | | 1.77 | | | | (0.97 | ) | | | 1.86 | | | | 79 | |
| | | | | | |
| | | | | | | | | | | | | | | | | | | | | | | | | | |
| | 29.96 | | | | 12.18 | | | | 9,868 | | | | 1.39 | | | | (0.85 | ) | | | 1.64 | | | | 57 | |
| | 29.54 | | | | 33.25 | | | | 1,852 | | | | 1.40 | | | | (0.71 | )(g) | | | 1.59 | | | | 69 | |
| | 24.56 | | | | 23.46 | | | | 320 | | | | 1.39 | | | | (0.32 | )(h) | | | 1.71 | | | | 70 | |
| | 20.83 | | | | (6.72 | ) | | | 230 | | | | 1.40 | | | | (0.35 | )(i) | | | 1.63 | | | | 70 | |
| | 24.73 | | | | 42.29 | | | | 121 | | | | 1.40 | | | | (0.59 | ) | | | 1.60 | | | | 79 | |
| | | | | | |
| | | | | | | | | | | | | | | | | | | | | | | | | | |
| | 31.26 | | | | 12.87 | | | | 164,713 | | | | 0.78 | | | | (0.25 | ) | | | 0.87 | | | | 57 | |
| | 30.52 | | | | 34.06 | | | | 27,454 | | | | 0.79 | | | | (0.06 | )(g) | | | 0.92 | | | | 69 | |
| | 25.15 | | | | 24.22 | | | | 17,848 | | | | 0.79 | | | | 0.28 | (h) | | | 1.00 | | | | 70 | |
| | 21.18 | | | | 7.71 | | | | 14,837 | | | | 0.78 | | | | 0.31 | (i) | | | 0.92 | | | | 70 | |
SEE NOTES TO FINANCIAL STATEMENTS.
| | | | | | | | |
| | | |
| JUNE 30, 2015 | | J.P. MORGAN MID CAP/MULTI-CAP FUNDS | | | | | 61 | |
FINANCIAL HIGHLIGHTS
FOR THE PERIODS INDICATED (continued)
| | | | | | | | | | | | | | | | | | | | |
| | | | | | Per share operating performance | |
| | | | | | Investment operations | | | Distributions | |
| | | Net asset
value,
beginning
of period | | | Net
investment
income
(loss) | | | Net realized
and unrealized
gains
(losses) on
investments | | | Total from
investment
operations | | | Net
realized
gain | |
Mid Cap Growth Fund (continued) | | | | | | | | | | | | | | | | | | | | |
Class R6 | | | | | | | | | | | | | | | | | | | | |
Year Ended June 30, 2015 | | $ | 30.57 | | | $ | (0.06 | )(f) | | $ | 3.61 | | | $ | 3.55 | | | $ | (2.79 | ) |
Year Ended June 30, 2014 | | | 25.17 | | | | — | (f)(g)(k) | | | 8.19 | | | | 8.19 | | | | (2.79 | ) |
Year Ended June 30, 2013 | | | 21.19 | | | | 0.08 | (f)(h) | | | 4.89 | | | | 4.97 | | | | (0.99 | ) |
November 1, 2011(j) through June 30, 2012 | | | 21.75 | | | | 0.08 | (f)(i) | | | 1.37 | | | | 1.45 | | | | (2.01 | ) |
| | | | | |
Select Class | | | | | | | | | | | | | | | | | | | | |
Year Ended June 30, 2015 | | | 30.39 | | | | (0.11 | )(f) | | | 3.57 | | | | 3.46 | | | | (2.79 | ) |
Year Ended June 30, 2014 | | | 25.08 | | | | (0.06 | )(f)(g) | | | 8.16 | | | | 8.10 | | | | (2.79 | ) |
Year Ended June 30, 2013 | | | 21.15 | | | | 0.03 | (f)(h) | | | 4.89 | | | | 4.92 | | | | (0.99 | ) |
Year Ended June 30, 2012 | | | 24.97 | | | | 0.02 | (f)(i) | | | (1.83 | ) | | | (1.81 | ) | | | (2.01 | ) |
Year Ended June 30, 2011 | | | 17.47 | | | | (0.03 | )(f) | | | 7.53 | | | | 7.50 | | | | — | |
| (a) | Annualized for periods less than one year, unless otherwise noted. |
| (b) | Not annualized for periods less than one year. |
| (c) | Includes adjustments in accordance with accounting principles generally accepted in the United States of America and as such, the net asset values for financial reporting purposes and the returns based upon those net asset values may differ from the net asset values and returns for shareholder transactions. |
| (d) | Includes earnings credits and interest expense, if applicable, each of which is less than 0.01% unless otherwise noted. |
| (e) | Portfolio turnover is calculated by dividing the lesser of total purchases or sales of portfolio securities for the reporting period by the monthly average value of portfolio securities owned during the reporting period. Excluded from both the numerator and denominator are amounts relating to derivatives and securities whose maturities or expiration dates at the time of acquisition were one year or less. |
| (f) | Calculated based upon average shares outstanding. |
| (g) | Reflects special dividends paid out during the period by several of the Fund’s holdings. Had the Fund not received the special dividends the net investment income (loss) per share would have been $(0.14), $(0.23), $(0.20), $(0.02), $(0.01) and $(0.06) for Class A, Class C, Class R2, Class R5, Class R6 and Select Class Shares, respectively, and the net investment income (loss) ratio would have been (0.53)%, (1.03)%, (0.73)%, (0.08)%, (0.03)% and (0.22)% for Class A, Class C, Class R2, Class R5, Class R6 and Select Class Shares, respectively. |
| (h) | Reflects special dividends paid out during the period by several of the Fund’s holdings. Had the Fund not received the special dividends, the net investment income (loss) per share would have been $(0.09), $(0.17), $(0.13), $0.01, $0.02 and $(0.02) for Class A, Class C, Class R2, Class R5, Class R6 and Select Class Shares, respectively, and the net investment income (loss) ratio would have been (0.42)%, (0.92)%, (0.57)%, 0.04%, 0.09% and (0.10)% for Class A, Class C, Class R2, Class R5, Class R6 and Select Class Shares, respectively. |
| (i) | Reflects a special dividend paid out during the period by one of the Fund’s holdings. Had the Fund not received the special dividend, the net investment income (loss) per share would have been $(0.09), $(0.17), $(0.12), less than $0.01, $0.03 and $(0.03) for Class A, Class C, Class R2, Class R5, Class R6 and Select Class Shares, respectively, and the net investment income (loss) ratio would have been (0.46)%, (0.97)%, (0.57)%, (0.03)%, 0.24% and (0.14)% for Class A, Class C, Class R2, Class R5, Class R6 and Select Class Shares, respectively. |
| (j) | Commencement of offering of class of shares. |
| (k) | Amount rounds to less than $0.01. |
SEE NOTES TO FINANCIAL STATEMENTS.
| | | | | | |
| | | |
| 62 | | | | J.P. MORGAN MID CAP/MULTI-CAP FUNDS | | JUNE 30, 2015 |
| | | | | | | | | | | | | | | | | | | | | | | | | | |
| | | Ratios/Supplemental data | |
| | | | | | | | | | Ratios to average net assets (a) | | | | |
Net asset
value,
end of
period | | | Total return
(excludes
sales charge) (b)(c) | | | Net assets,
end of
period
(000’s) | | | Net
expenses (d) | | | Net
investment
income
(loss) | | |
Expenses
without waivers,
reimbursements and
earnings credits | | | Portfolio
turnover
rate (b)(e) | |
| | | | | | | | | | | | | | | | | | | | | | | | | | |
| | | | | | | | | | | | | | | | | | | | | | | | | | |
| $ | 31.33 | | | | 12.92 | % | | $ | 265,905 | | | | 0.73 | % | | | (0.19 | )% | | | 0.78 | % | | | 57 | % |
| | 30.57 | | | | 34.16 | | | | 86,150 | | | | 0.74 | | | | (0.01 | )(g) | | | 0.86 | | | | 69 | |
| | 25.17 | | | | 24.26 | | | | 47,434 | | | | 0.74 | | | | 0.34 | (h) | | | 0.98 | | | | 70 | |
| | 21.19 | | | | 7.76 | | | | 13,982 | | | | 0.73 | | | | 0.58 | (i) | | | 0.87 | | | | 70 | |
| | | | | | |
| | | | | | | | | | | | | | | | | | | | | | | | | | |
| | 31.06 | | | | 12.68 | | | | 1,562,284 | | | | 0.92 | | | | (0.37 | ) | | | 1.12 | | | | 57 | |
| | 30.39 | | | | 33.91 | | | | 1,254,748 | | | | 0.93 | | | | (0.20 | )(g) | | | 1.12 | | | | 69 | |
| | 25.08 | | | | 24.06 | | | | 894,740 | | | | 0.93 | | | | 0.14 | (h) | | | 1.20 | | | | 70 | |
| | 21.15 | | | | (6.31 | ) | | | 827,306 | | | | 0.93 | | | | 0.09 | (i) | | | 1.13 | | | | 70 | |
| | 24.97 | | | | 42.93 | | | | 1,031,463 | | | | 0.93 | | | | (0.13 | ) | | | 1.10 | | | | 79 | |
SEE NOTES TO FINANCIAL STATEMENTS.
| | | | | | | | |
| | | |
| JUNE 30, 2015 | | J.P. MORGAN MID CAP/MULTI-CAP FUNDS | | | | | 63 | |
FINANCIAL HIGHLIGHTS
FOR THE PERIODS INDICATED (continued)
| | | | | | | | | | | | | | | | | | | | | | | | | | | | |
| | | Per share operating performance | |
| | | | | | Investment operations | | | Distributions | |
| | | Net asset
value,
beginning
of period | | | Net
investment
income
(loss) | | | Net realized
and unrealized
gains
(losses) on
investments | | | Total from
investment
operations | | | Net
investment
income | | | Net
realized
gain | | | Total
distributions | |
Mid Cap Value Fund | | | | | | | | | | | | | | | | | | | | | | | | | | | | |
Class A | | | | | | | | | | | | | | | | | | | | | | | | | | | | |
Year Ended June 30, 2015 | | $ | 37.25 | | | $ | 0.20 | (d) | | $ | 2.52 | | | $ | 2.72 | | | $ | (0.20 | ) | | $ | (2.79 | ) | | $ | (2.99 | ) |
Year Ended June 30, 2014 | | | 31.68 | | | | 0.15 | (d)(e) | | | 7.02 | | | | 7.17 | | | | (0.15 | ) | | | (1.45 | ) | | | (1.60 | ) |
Year Ended June 30, 2013 | | | 25.80 | | | | 0.19 | (d)(f) | | | 6.20 | | | | 6.39 | | | | (0.29 | ) | | | (0.22 | ) | | | (0.51 | ) |
Year Ended June 30, 2012 | | | 24.76 | | | | 0.20 | (d) | | | 1.00 | | | | 1.20 | | | | (0.16 | ) | | | — | | | | (0.16 | ) |
Year Ended June 30, 2011 | | | 18.91 | | | | 0.18 | (d) | | | 5.85 | | | | 6.03 | | | | (0.18 | ) | | | — | | | | (0.18 | ) |
| | | | | | | |
Class C | | | | | | | | | | | | | | | | | | | | | | | | | | | | |
Year Ended June 30, 2015 | | | 36.19 | | | | 0.01 | (d) | | | 2.44 | | | | 2.45 | | | | (0.06 | ) | | | (2.79 | ) | | | (2.85 | ) |
Year Ended June 30, 2014 | | | 30.84 | | | | (0.03 | )(d)(e) | | | 6.83 | | | | 6.80 | | | | — | (g) | | | (1.45 | ) | | | (1.45 | ) |
Year Ended June 30, 2013 | | | 25.14 | | | | 0.05 | (d)(f) | | | 6.03 | | | | 6.08 | | | | (0.16 | ) | | | (0.22 | ) | | | (0.38 | ) |
Year Ended June 30, 2012 | | | 24.13 | | | | 0.07 | (d) | | | 0.98 | | | | 1.05 | | | | (0.04 | ) | | | — | | | | (0.04 | ) |
Year Ended June 30, 2011 | | | 18.44 | | | | 0.07 | (d) | | | 5.69 | | | | 5.76 | | | | (0.07 | ) | | | — | | | | (0.07 | ) |
| | | | | | | |
Class R2 | | | | | | | | | | | | | | | | | | | | | | | | | | | | |
Year Ended June 30, 2015 | | | 36.14 | | | | 0.10 | (d) | | | 2.43 | | | | 2.53 | | | | (0.15 | ) | | | (2.79 | ) | | | (2.94 | ) |
Year Ended June 30, 2014 | | | 30.81 | | | | 0.06 | (d)(e) | | | 6.82 | | | | 6.88 | | | | (0.10 | ) | | | (1.45 | ) | | | (1.55 | ) |
Year Ended June 30, 2013 | | | 25.18 | | | | 0.12 | (d)(f) | | | 6.03 | | | | 6.15 | | | | (0.30 | ) | | | (0.22 | ) | | | (0.52 | ) |
Year Ended June 30, 2012 | | | 24.27 | | | | 0.14 | (d) | | | 0.97 | | | | 1.11 | | | | (0.20 | ) | | | — | | | | (0.20 | ) |
Year Ended June 30, 2011 | | | 18.63 | | | | 0.12 | (d) | | | 5.76 | | | | 5.88 | | | | (0.24 | ) | | | — | | | | (0.24 | ) |
| | | | | | | |
Institutional Class | | | | | | | | | | | | | | | | | | | | | | | | | | | | |
Year Ended June 30, 2015 | | | 37.99 | | | | 0.40 | (d) | | | 2.56 | | | | 2.96 | | | | (0.40 | ) | | | (2.79 | ) | | | (3.19 | ) |
Year Ended June 30, 2014 | | | 32.26 | | | | 0.32 | (d)(e) | | | 7.17 | | | | 7.49 | | | | (0.31 | ) | | | (1.45 | ) | | | (1.76 | ) |
Year Ended June 30, 2013 | | | 26.24 | | | | 0.34 | (d)(f) | | | 6.31 | | | | 6.65 | | | | (0.41 | ) | | | (0.22 | ) | | | (0.63 | ) |
Year Ended June 30, 2012 | | | 25.19 | | | | 0.32 | (d) | | | 1.01 | | | | 1.33 | | | | (0.28 | ) | | | — | | | | (0.28 | ) |
Year Ended June 30, 2011 | | | 19.22 | | | | 0.30 | (d) | | | 5.95 | | | | 6.25 | | | | (0.28 | ) | | | — | | | | (0.28 | ) |
| | | | | | | |
Select Class | | | | | | | | | | | | | | | | | | | | | | | | | | | | |
Year Ended June 30, 2015 | | | 37.61 | | | | 0.28 | (d) | | | 2.55 | | | | 2.83 | | | | (0.29 | ) | | | (2.79 | ) | | | (3.08 | ) |
Year Ended June 30, 2014 | | | 31.95 | | | | 0.23 | (d)(e) | | | 7.10 | | | | 7.33 | | | | (0.22 | ) | | | (1.45 | ) | | | (1.67 | ) |
Year Ended June 30, 2013 | | | 26.01 | | | | 0.27 | (d)(f) | | | 6.24 | | | | 6.51 | | | | (0.35 | ) | | | (0.22 | ) | | | (0.57 | ) |
Year Ended June 30, 2012 | | | 24.97 | | | | 0.26 | (d) | | | 1.01 | | | | 1.27 | | | | (0.23 | ) | | | — | | | | (0.23 | ) |
Year Ended June 30, 2011 | | | 19.07 | | | | 0.24 | (d) | | | 5.90 | | | | 6.14 | | | | (0.24 | ) | | | — | | | | (0.24 | ) |
| (a) | Includes adjustments in accordance with accounting principles generally accepted in the United States of America and as such, the net asset values for financial reporting purposes and the returns based upon those net asset values may differ from the net asset values and returns for shareholder transactions. |
| (b) | Includes earnings credits and interest expense, if applicable, each of which is less than 0.01% unless otherwise noted. |
| (c) | Portfolio turnover is calculated by dividing the lesser of total purchases or sales of portfolio securities for the reporting period by the monthly average value of portfolio securities owned during the reporting period. Excluded from both the numerator and denominator are amounts relating to derivatives and securities whose maturities or expiration dates at the time of acquisition were one year or less. |
| (d) | Calculated based upon average shares outstanding. |
| (e) | Reflects special dividends paid out during the period by several of the Fund’s holdings. Had the Fund not received the special dividends the net investment income (loss) per share would have been $0.14, $(0.03), $0.05, $0.32 and $0.23 for Class A, Class C, Class R2, Institutional Class and Select Class Shares, respectively and the net investment income (loss) ratio would have been 0.41%, (0.10)%, 0.16%, 0.90% and 0.66% for Class A, Class C, Class R2, Institutional Class and Select Class Shares, respectively. |
| (f) | Reflects special dividends paid out during the period by several of the Fund’s holdings. Had the Fund not received the special dividends the net investment income (loss) per share would have been $0.16, $0.01, $0.09, $0.31 and $0.23 for Class A, Class C, Class R2, Institutional Class and Select Class Shares, respectively and the net investment income (loss) ratio would have been 0.55%, 0.04%, 0.31%, 1.04% and 0.80% for Class A, Class C, Class R2, Institutional Class and Select Class Shares, respectively. |
| (g) | Amount rounds to less than $0.01. |
SEE NOTES TO FINANCIAL STATEMENTS.
| | | | | | |
| | | |
| 64 | | | | J.P. MORGAN MID CAP/MULTI-CAP FUNDS | | JUNE 30, 2015 |
| | | | | | | | | | | | | | | | | | | | | | | | | | |
| | | Ratios/Supplemental data | |
| | | | | | | | | | Ratios to average net assets | | | | |
Net asset
value,
end of
period | | | Total return
(excludes
sales charge) (a) | | | Net assets,
end of
period
(000’s) | | | Net
expenses (b) | | | Net
investment
income
(loss) | | | Expenses
without waivers,
reimbursements and
earnings credits | | | Portfolio
turnover
rate (c) | |
| | | | | | | | | | | | | | | | | | | | | | | | | | |
| | | | | | | | | | | | | | | | | | | | | | | | | | |
| $ | 36.98 | | | | 7.68 | % | | $ | 2,623,772 | | | | 1.23 | % | | | 0.53 | % | | | 1.38 | % | | | 18 | % |
| | 37.25 | | | | 23.25 | | | | 3,404,974 | | | | 1.23 | | | | 0.42 | (e) | | | 1.37 | | | | 25 | |
| | 31.68 | | | | 25.06 | | | | 3,157,503 | | | | 1.23 | | | | 0.67 | (f) | | | 1.38 | | | | 23 | |
| | 25.80 | | | | 4.92 | | | | 1,986,930 | | | | 1.24 | | | | 0.83 | | | | 1.41 | | | | 30 | |
| | 24.76 | | | | 31.96 | | | | 1,979,270 | | | | 1.23 | | | | 0.81 | | | | 1.39 | | | | 41 | |
| | | | | | |
| | | | | | | | | | | | | | | | | | | | | | | | | | |
| | 35.79 | | | | 7.12 | | | | 595,385 | | | | 1.74 | | | | 0.03 | | | | 1.84 | | | | 18 | |
| | 36.19 | | | | 22.63 | | | | 608,283 | | | | 1.74 | | | | (0.09 | )(e) | | | 1.87 | | | | 25 | |
| | 30.84 | | | | 24.43 | | | | 534,813 | | | | 1.74 | | | | 0.16 | (f) | | | 1.88 | | | | 23 | |
| | 25.14 | | | | 4.38 | | | | 370,781 | | | | 1.75 | | | | 0.32 | | | | 1.91 | | | | 30 | |
| | 24.13 | | | | 31.29 | | | | 373,415 | | | | 1.74 | | | | 0.30 | | | | 1.89 | | | | 41 | |
| | | | | | |
| | | | | | | | | | | | | | | | | | | | | | | | | | |
| | 35.73 | | | | 7.38 | | | | 71,697 | | | | 1.49 | | | | 0.28 | | | | 1.71 | | | | 18 | |
| | 36.14 | | | | 22.94 | | | | 71,958 | | | | 1.49 | | | | 0.17 | (e) | | | 1.62 | | | | 25 | |
| | 30.81 | | | | 24.71 | | | | 57,003 | | | | 1.49 | | | | 0.43 | (f) | | | 1.63 | | | | 23 | |
| | 25.18 | | | | 4.65 | | | | 14,824 | | | | 1.49 | | | | 0.59 | | | | 1.66 | | | | 30 | |
| | 24.27 | | | | 31.66 | | | | 6,500 | | | | 1.49 | | | | 0.50 | | | | 1.65 | | | | 41 | |
| | | | | | |
| | | | | | | | | | | | | | | | | | | | | | | | | | |
| | 37.76 | | | | 8.19 | | | | 10,320,516 | | | | 0.74 | | | | 1.05 | | | | 0.94 | | | | 18 | |
| | 37.99 | | | | 23.88 | | | | 8,581,992 | | | | 0.74 | | | | 0.92 | (e) | | | 0.97 | | | | 25 | |
| | 32.26 | | | | 25.68 | | | | 6,627,529 | | | | 0.74 | | | | 1.16 | (f) | | | 0.98 | | | | 23 | |
| | 26.24 | | | | 5.43 | | | | 3,543,900 | | | | 0.74 | | | | 1.33 | | | | 1.01 | | | | 30 | |
| | 25.19 | | | | 32.66 | | | | 2,812,296 | | | | 0.74 | | | | 1.29 | �� | | | 0.99 | | | | 41 | |
| | | | | | |
| | | | | | | | | | | | | | | | | | | | | | | | | | |
| | 37.36 | | | | 7.92 | | | | 2,347,703 | | | | 0.98 | | | | 0.75 | | | | 1.10 | | | | 18 | |
| | 37.61 | | | | 23.59 | | | | 2,967,759 | | | | 0.98 | | | | 0.67 | (e) | | | 1.12 | | | | 25 | |
| | 31.95 | | | | 25.35 | | | | 2,870,752 | | | | 0.98 | | | | 0.92 | (f) | | | 1.13 | | | | 23 | |
| | 26.01 | | | | 5.20 | | | | 1,836,012 | | | | 0.98 | | | | 1.09 | | | | 1.16 | | | | 30 | |
| | 24.97 | | | | 32.29 | | | | 1,513,926 | | | | 0.98 | | | | 1.05 | | | | 1.14 | | | | 41 | |
SEE NOTES TO FINANCIAL STATEMENTS.
| | | | | | | | |
| | | |
| JUNE 30, 2015 | | J.P. MORGAN MID CAP/MULTI-CAP FUNDS | | | | | 65 | |
FINANCIAL HIGHLIGHTS
FOR THE PERIODS INDICATED (continued)
| | | | | | | | | | | | | | | | |
| | | Per share operating performance | |
| | | | | | Investment operations | |
| | | Net asset
value,
beginning
of period | | | Net
investment
income
(loss) | | | Net realized
and unrealized
gains
(losses) on
investments | | | Total from
investment
operations | |
Multi-Cap Market Neutral Fund | | | | | | | | | | | | | | | | |
Class A | | | | | | | | | | | | | | | | |
Year Ended June 30, 2015 | | $ | 9.91 | | | $ | (0.11 | )(e) | | $ | 0.07 | | | $ | (0.04 | ) |
Year Ended June 30, 2014 | | | 9.79 | | | | (0.13 | )(e) | | | 0.25 | | | | 0.12 | |
Year Ended June 30, 2013 | | | 9.69 | | | | (0.11 | )(e)(f) | | | 0.21 | | | | 0.10 | |
Year Ended June 30, 2012 | | | 9.81 | | | | (0.14 | )(e) | | | 0.02 | | | | (0.12 | ) |
Year Ended June 30, 2011 | | | 9.71 | | | | (0.16 | )(e) | | | 0.26 | | | | 0.10 | |
| | | | |
Class C | | | | | | | | | | | | | | | | |
Year Ended June 30, 2015 | | | 9.40 | | | | (0.15 | )(e) | | | 0.06 | | | | (0.09 | ) |
Year Ended June 30, 2014 | | | 9.33 | | | | (0.17 | )(e) | | | 0.24 | | | | 0.07 | |
Year Ended June 30, 2013 | | | 9.30 | | | | (0.17 | )(e)(f) | | | 0.20 | | | | 0.03 | |
Year Ended June 30, 2012 | | | 9.48 | | | | (0.20 | )(e) | | | 0.02 | | | | (0.18 | ) |
Year Ended June 30, 2011 | | | 9.46 | | | | (0.23 | )(e) | | | 0.25 | | | | 0.02 | |
| | | | |
Select Class | | | | | | | | | | | | | | | | |
Year Ended June 30, 2015 | | | 10.09 | | | | (0.09 | )(e) | | | 0.07 | | | | (0.02 | ) |
Year Ended June 30, 2014 | | | 9.94 | | | | (0.11 | )(e) | | | 0.26 | | | | 0.15 | |
Year Ended June 30, 2013 | | | 9.82 | | | | (0.09 | )(e)(f) | | | 0.21 | | | | 0.12 | |
Year Ended June 30, 2012 | | | 9.91 | | | | (0.12 | )(e) | | | 0.03 | | | | (0.09 | ) |
Year Ended June 30, 2011 | | | 9.79 | | | | (0.14 | )(e) | | | 0.26 | | | | 0.12 | |
| (a) | Includes adjustments in accordance with accounting principles generally accepted in the United States of America and as such, the net asset values for financial reporting purposes and the returns based upon those net asset values may differ from the net asset values and returns for shareholder transactions. |
| (b) | Includes earnings credits and interest expense, if applicable, each of which is less than 0.01% or unless otherwise noted. |
| (c) | The net expenses and expenses without waivers, reimbursements and earnings credits (excluding dividend expense and interest expense for securities sold short) for Class A are 1.48% and 1.95% for the year ended June 30, 2015, 1.49% and 1.91% for the year ended June 30, 2014, 1.48% and 1.88% for the year ended June 30, 2013, 1.48% and 1.94% for 2012, and 1.49% and 1.95% for 2011; for Class C are 1.98% and 2.45% for the year ended June 30, 2015, 1.99% and 2.40% for the year ended June 30, 2014, 2.15% and 2.38% for the year ended June 30, 2013, 2.23% and 2.44% for 2012, 2.24% and 2.45% for 2011; for Select Class are 1.23% and 1.64% for the year ended June 30, 2015, 1.23% and 1.65% for the year ended June 30, 2014, 1.23% and 1.63% for the year ended June 30, 2013, 1.23% and 1.69% for 2012, and 1.24% and 1.70% for 2011, respectively. |
| (d) | Portfolio turnover is calculated by dividing the lesser of total purchases or sales of portfolio securities for the reporting period by the monthly average value of portfolio securities owned during the reporting period. Excluded from both the numerator and denominator are amounts relating to derivatives and securities whose maturities or expiration dates at the time of acquisition were one year or less. |
| (e) | Calculated based upon average shares outstanding. |
| (f) | Reflects special dividends paid out during the period by several of the Fund’s holdings. Had the Fund not received the special dividends, the net investment income (loss) per share would have been $(0.13), $(0.19) and $(0.11) for Class A, Class C and Select Class Shares, respectively, and the net investment income (loss) ratio would have been (1.38)%, (2.06)% and (1.16)% for Class A, Class C and Select Class Shares, respectively. |
SEE NOTES TO FINANCIAL STATEMENTS.
| | | | | | |
| | | |
| 66 | | | | J.P. MORGAN MID CAP/MULTI-CAP FUNDS | | JUNE 30, 2015 |
| | | | | | | | | | | | | | | | | | | | | | | | | | | | | | |
| | | Ratios/Supplemental data | |
| | | | | | | | | | Ratios to average net assets | | | | | | | |
Net asset
value,
end of
period | | | Total return
(excludes
sales charge) (a) | | | Net assets,
end of
period
(000’s) | | | Net expenses
(including
dividend and
interest
expense for
securities sold
short) (b)(c) | | | Net
investment
income
(loss) | | | Expenses
without waivers,
reimbursements and
earnings credits
(including dividend
and interest expense
for securities sold
short) (c) | | | Portfolio
turnover
rate (d) | | | Portfolio
turnover rate
(including short
sales) (d) | |
| | | | | | | | | | | | | | | | | | | | | | | | | | | | | | |
| | | | | | | | | | | | | | | | | | | | | | | | | | | | | | |
| $ | 9.87 | | | | (0.40 | )% | | $ | 6,273 | | | | 2.68 | % | | | (1.14 | )% | | | 3.15 | % | | | 74 | % | | | 204 | % |
| | 9.91 | | | | 1.23 | | | | 10,301 | | | | 2.78 | | | | (1.36 | ) | | | 3.20 | | | | 106 | | | | 227 | |
| | 9.79 | | | | 1.03 | | | | 14,101 | | | | 3.04 | | | | (1.13 | )(g) | | | 3.44 | | | | 94 | | | | 251 | |
| | 9.69 | | | | (1.22 | ) | | | 19,759 | | | | 2.86 | | | | (1.42 | ) | | | 3.32 | | | | 151 | | | | 316 | |
| | 9.81 | | | | 1.03 | | | | 29,216 | | | | 2.92 | | | | (1.65 | ) | | | 3.38 | | | | 145 | | | | 339 | |
| | | | | | | |
| | | | | | | | | | | | | | | | | | | | | | | | | | | | | | |
| | 9.31 | | | | (0.96 | ) | | | 6,760 | | | | 3.18 | | | | (1.62 | ) | | | 3.65 | | | | 74 | | | | 204 | |
| | 9.40 | | | | 0.75 | | | | 8,602 | | | | 3.28 | | | | (1.85 | ) | | | 3.70 | | | | 106 | | | | 227 | |
| | 9.33 | | | | 0.32 | | | | 11,181 | | | | 3.69 | | | | (1.81 | )(g) | | | 3.92 | | | | 94 | | | | 251 | |
| | 9.30 | | | | (1.90 | ) | | | 15,677 | | | | 3.61 | | | | (2.17 | ) | | | 3.82 | | | | 151 | | | | 316 | |
| | 9.48 | | | | 0.21 | | | | 22,094 | | | | 3.67 | | | | (2.46 | ) | | | 3.88 | | | | 145 | | | | 339 | |
| | | | | | | |
| | | | | | | | | | | | | | | | | | | | | | | | | | | | | | |
| | 10.07 | | | | (0.20 | ) | | | 277,647 | | | | 2.43 | | | | (0.89 | ) | | | 2.84 | | | | 74 | | | | 204 | |
| | 10.09 | | | | 1.51 | | | | 431,890 | | | | 2.52 | | | | (1.07 | ) | | | 2.94 | | | | 106 | | | | 227 | |
| | 9.94 | | | | 1.22 | | | | 317,974 | | | | 2.78 | | | | (0.90 | )(g) | | | 3.18 | | | | 94 | | | | 251 | |
| | 9.82 | | | | (0.91 | ) | | | 476,803 | | | | 2.61 | | | | (1.17 | ) | | | 3.07 | | | | 151 | | | | 316 | |
| | 9.91 | | | | 1.23 | | | | 491,653 | | | | 2.67 | | | | (1.39 | ) | | | 3.13 | | | | 145 | | | | 339 | |
SEE NOTES TO FINANCIAL STATEMENTS.
| | | | | | | | |
| | | |
| JUNE 30, 2015 | | J.P. MORGAN MID CAP/MULTI-CAP FUNDS | | | | | 67 | |
FINANCIAL HIGHLIGHTS
FOR THE PERIODS INDICATED (continued)
| | | | | | | | | | | | | | | | | | | | | | | | | | | | |
| | | Per share operating performance | |
| | | | | | Investment operations | | | Distributions | |
| | | Net asset
value,
beginning
of period | | | Net
investment
income
(loss) | | | Net realized
and unrealized
gains
(losses) on
investments | | | Total from
investment
operations | | | Net
investment
income | | | Net
realized
gain | | | Total
distributions | |
Value Advantage Fund | | | | | | | | | | | | | | | | | | | | | | | | | | | | |
Class A | | | | | | | | | | | | | | | | | | | | | | | | | | | | |
Year Ended June 30, 2015 | | $ | 29.15 | | | $ | 0.19 | (d) | | $ | 1.47 | | | $ | 1.66 | | | $ | (0.26 | ) | | $ | (0.71 | ) | | $ | (0.97 | ) |
Year Ended June 30, 2014 | | | 24.64 | | | | 0.34 | (d) | | | 5.03 | | | | 5.37 | | | | (0.16 | ) | | | (0.70 | ) | | | (0.86 | ) |
Year Ended June 30, 2013 | | | 19.96 | | | | 0.22 | (d) | | | 4.75 | | | | 4.97 | | | | (0.20 | ) | | | (0.09 | ) | | | (0.29 | ) |
Year Ended June 30, 2012 | | | 19.07 | | | | 0.25 | (d) | | | 0.84 | | | | 1.09 | | | | (0.20 | ) | | | — | | | | (0.20 | ) |
Year Ended June 30, 2011 | | | 15.22 | | | | 0.23 | (d) | | | 3.79 | | | | 4.02 | | | | (0.17 | ) | | | — | | | | (0.17 | ) |
| | | | | | | |
Class C | | | | | | | | | | | | | | | | | | | | | | | | | | | | |
Year Ended June 30, 2015 | | | 29.08 | | | | 0.04 | (d) | | | 1.47 | | | | 1.51 | | | | (0.16 | ) | | | (0.71 | ) | | | (0.87 | ) |
Year Ended June 30, 2014 | | | 24.61 | | | | 0.20 | (d) | | | 5.02 | | | | 5.22 | | | | (0.05 | ) | | | (0.70 | ) | | | (0.75 | ) |
Year Ended June 30, 2013 | | | 19.91 | | | | 0.11 | (d) | | | 4.74 | | | | 4.85 | | | | (0.06 | ) | | | (0.09 | ) | | | (0.15 | ) |
Year Ended June 30, 2012 | | | 19.01 | | | | 0.16 | (d) | | | 0.84 | | | | 1.00 | | | | (0.10 | ) | | | — | | | | (0.10 | ) |
Year Ended June 30, 2011 | | | 15.17 | | | | 0.14 | (d) | | | 3.77 | | | | 3.91 | | | | (0.07 | ) | | | — | | | | (0.07 | ) |
| | | | | | | |
Institutional Class | | | | | | | | | | | | | | | | | | | | | | | | | | | | |
Year Ended June 30, 2015 | | | 29.31 | | | | 0.34 | (d) | | | 1.50 | | | | 1.84 | | | | (0.38 | ) | | | (0.71 | ) | | | (1.09 | ) |
Year Ended June 30, 2014 | | | 24.74 | | | | 0.48 | (d) | | | 5.04 | | | | 5.52 | | | | (0.25 | ) | | | (0.70 | ) | | | (0.95 | ) |
Year Ended June 30, 2013 | | | 19.99 | | | | 0.34 | (d) | | | 4.75 | | | | 5.09 | | | | (0.25 | ) | | | (0.09 | ) | | | (0.34 | ) |
Year Ended June 30, 2012 | | | 19.11 | | | | 0.35 | (d) | | | 0.83 | | | | 1.18 | | | | (0.30 | ) | | | — | | | | (0.30 | ) |
Year Ended June 30, 2011 | | | 15.24 | | | | 0.32 | (d) | | | 3.79 | | | | 4.11 | | | | (0.24 | ) | | | — | | | | (0.24 | ) |
| | | | | | | |
Select Class | | | | | | | | | | | | | | | | | | | | | | | | | | | | |
Year Ended June 30, 2015 | | | 29.27 | | | | 0.27 | (d) | | | 1.48 | | | | 1.75 | | | | (0.32 | ) | | | (0.71 | ) | | | (1.03 | ) |
Year Ended June 30, 2014 | | | 24.72 | | | | 0.42 | (d) | | | 5.03 | | | | 5.45 | | | | (0.20 | ) | | | (0.70 | ) | | | (0.90 | ) |
Year Ended June 30, 2013 | | | 20.00 | | | | 0.28 | (d) | | | 4.75 | | | | 5.03 | | | | (0.22 | ) | | | (0.09 | ) | | | (0.31 | ) |
Year Ended June 30, 2012 | | | 19.12 | | | | 0.30 | (d) | | | 0.83 | | | | 1.13 | | | | (0.25 | ) | | | — | | | | (0.25 | ) |
Year Ended June 30, 2011 | | | 15.27 | | | | 0.28 | (d) | | | 3.79 | | | | 4.07 | | | | (0.22 | ) | | | — | | | | (0.22 | ) |
| (a) | Includes adjustments in accordance with accounting principles generally accepted in the United States of America and as such, the net asset values for financial reporting purposes and the returns based upon those net asset values may differ from the net asset values and returns for shareholder transactions. |
| (b) | Includes earnings credits and interest expense, if applicable, each of which is less than 0.01% unless otherwise noted. |
| (c) | Portfolio turnover is calculated by dividing the lesser of total purchases or sales of portfolio securities for the reporting period by the monthly average value of portfolio securities owned during the reporting period. Excluded from both the numerator and denominator are amounts relating to derivatives and securities whose maturities or expiration dates at the time of acquisition were one year or less. |
| (d) | Calculated based upon average shares outstanding. |
SEE NOTES TO FINANCIAL STATEMENTS.
| | | | | | |
| | | |
| 68 | | | | J.P. MORGAN MID CAP/MULTI-CAP FUNDS | | JUNE 30, 2015 |
| | | | | | | | | | | | | | | | | | | | | | | | | | |
| | | Ratios/Supplemental data | |
| | | | | | | | | | Ratios to average net assets | | | | |
Net asset
value,
end of
period | | | Total return
(excludes
sales charge) (a) | | | Net assets,
end of
period
(000’s) | | | Net
expenses (b) | | | Net
investment
income
(loss) | | | Expenses
without waivers,
reimbursements and
earnings credits | | | Portfolio
turnover
rate (c) | |
| | | | | | | | | | | | | | | | | | | | | | | | | | |
| | | | | | | | | | | | | | | | | | | | | | | | | | |
| $ | 29.84 | | | | 5.78 | % | | $ | 2,440,061 | | | | 1.24 | % | | | 0.64 | % | | | 1.41 | % | | | 17 | % |
| | 29.15 | | | | 22.19 | | | | 1,701,250 | | | | 1.24 | | | | 1.26 | | | | 1.33 | | | | 36 | |
| | 24.64 | | | | 25.09 | | | | 784,359 | | | | 1.24 | | | | 0.98 | | | | 1.33 | | | | 22 | |
| | 19.96 | | | | 5.83 | | | | 206,816 | | | | 1.25 | | | | 1.34 | | | | 1.41 | | | | 49 | |
| | 19.07 | | | | 26.45 | | | | 232,103 | | | | 1.24 | | | | 1.28 | | | | 1.34 | | | | 33 | |
| | | | | | |
| | | | | | | | | | | | | | | | | | | | | | | | | | |
| | 29.72 | | | | 5.26 | | | | 701,023 | | | | 1.73 | | | | 0.14 | | | | 1.83 | | | | 17 | |
| | 29.08 | | | | 21.58 | | | | 402,880 | | | | 1.74 | | | | 0.74 | | | | 1.83 | | | | 36 | |
| | 24.61 | | | | 24.45 | | | | 212,198 | | | | 1.74 | | | | 0.49 | | | | 1.83 | | | | 22 | |
| | 19.91 | | | | 5.32 | | | | 117,937 | | | | 1.75 | | | | 0.84 | | | | 1.91 | | | | 49 | |
| | 19.01 | | | | 25.82 | | | | 131,743 | | | | 1.74 | | | | 0.78 | | | | 1.84 | | | | 33 | |
| | | | | | |
| | | | | | | | | | | | | | | | | | | | | | | | | | |
| | 30.06 | | | | 6.36 | | | | 5,058,172 | | | | 0.74 | | | | 1.15 | | | | 0.90 | | | | 17 | |
| | 29.31 | | | | 22.77 | | | | 3,042,506 | | | | 0.74 | | | | 1.77 | | | | 0.93 | | | | 36 | |
| | 24.74 | | | | 25.73 | | | | 1,455,125 | | | | 0.74 | | | | 1.50 | | | | 0.93 | | | | 22 | |
| | 19.99 | | | | 6.36 | | | | 384,525 | | | | 0.75 | | | | 1.86 | | | | 1.01 | | | | 49 | |
| | 19.11 | | | | 27.06 | | | | 284,433 | | | | 0.74 | | | | 1.79 | | | | 0.94 | | | | 33 | |
| | | | | | |
| | | | | | | | | | | | | | | | | | | | | | | | | | |
| | 29.99 | | | | 6.05 | | | | 3,095,251 | | | | 0.99 | | | | 0.89 | | | | 1.05 | | | | 17 | |
| | 29.27 | | | | 22.49 | | | | 2,546,808 | | | | 0.99 | | | | 1.53 | | | | 1.08 | | | | 36 | |
| | 24.72 | | | | 25.38 | | | | 1,245,241 | | | | 0.99 | | | | 1.23 | | | | 1.08 | | | | 22 | |
| | 20.00 | | | | 6.09 | | | | 422,861 | | | | 1.00 | | | | 1.62 | | | | 1.16 | | | | 49 | |
| | 19.12 | | | | 26.75 | | | | 270,562 | | | | 0.99 | | | | 1.53 | | | | 1.09 | | | | 33 | |
SEE NOTES TO FINANCIAL STATEMENTS.
| | | | | | | | |
| | | |
| JUNE 30, 2015 | | J.P. MORGAN MID CAP/MULTI-CAP FUNDS | | | | | 69 | |
NOTES TO FINANCIAL STATEMENTS
AS OF JUNE 30, 2015
1. Organization
JPMorgan Trust I (“JPM I”) and JPMorgan Trust II (“JPM II”) were formed on November 12, 2004, as Delaware statutory trusts, pursuant to Declarations of Trust dated November 5, 2004 and are registered under the Investment Company Act of 1940, as amended (the “1940 Act”), as open-end management investment companies.
J.P. Morgan Mutual Fund Investment Trust (“JPMMFIT”), an open-end management investment company, was organized as a Massachusetts business trust on September 23, 1997.
J.P. Morgan Fleming Mutual Fund Group, Inc. (“JPMFMFG”, with JPM I, JPM II and JPMMFIT (the “Trusts”)), an open-end management investment company, was organized as a Maryland corporation on August 19, 1997.
The following are 6 separate funds of the Trusts (collectively, the “Funds”) covered by this report:
| | | | | | |
| | | Classes Offered | | Trust | | Diversified/Non-Diversified |
| Growth Advantage Fund | | Class A, Class C, Class R5, Class R6* and Select Class | | JPMMFIT | | Diversified |
| Mid Cap Equity Fund | | Class A, Class C, Class R2**, Class R5**, Class R6** and Select Class | | JPM I | | Diversified |
| Mid Cap Growth Fund | | Class A, Class C, Class R2, Class R5, Class R6 and Select Class | | JPM II | | Diversified |
| Mid Cap Value Fund | | Class A, Class C, Class R2, Institutional Class and Select Class | | JPMFMFG | | Diversified |
| Multi-Cap Market Neutral Fund | | Class A, Class C, and Select Class | | JPM II | | Diversified |
| Value Advantage Fund | | Class A, Class C, Institutional Class and Select Class | | JPM I | | Diversified |
| * | Class R6 Shares of Growth Advantage Fund commenced operations on December 23, 2013. |
| ** | Class R2, Class R5 and Class R6 Shares of Mid Cap Equity Fund commenced operations on March 14, 2014. |
The investment objective of Growth Advantage Fund and Mid Cap Equity Fund is to seek to provide long-term capital growth.
The investment objective of Mid Cap Growth Fund is to seek growth of capital.
The investment objective of Mid Cap Value Fund is to seek growth from capital appreciation.
The investment objective of Multi-Cap Market Neutral Fund is to seek long-term capital preservation and growth by using strategies designed to produce returns which have no correlation with general domestic market performance.
The investment objective of Value Advantage Fund is to seek to provide long-term total return from a combination of income and capital gains.
Effective as of the close of business on January 3, 2014, all share classes of the Mid Cap Equity Fund are publicly offered only on a limited basis. Investors are not eligible to purchase shares of the Fund unless they meet certain requirements as described in the Classes’ prospectuses.
Effective as of the close of business on February 22, 2013, all share classes of the Mid Cap Value Fund are publicly offered only on a limited basis. Investors are not eligible to purchase shares of the Fund unless they meet certain requirements as described in the Classes’ prospectuses.
Class A Shares generally provide for a front-end sales charge while Class C Shares provide for a contingent deferred sales charge (“CDSC”). No sales charges are assessed with respect to Class R2, Class R5, Class R6, Institutional Class and Select Class Shares. All classes of shares have equal rights as to earnings, assets and voting privileges, except that each class may bear different distribution and shareholder servicing fees and each class has exclusive voting rights with respect to its distribution plan and shareholder servicing agreements. Certain Class A Shares, for which front-end sales charges have been waived, may be subject to a CDSC as described in the Funds’ prospectus.
On June 19, 2015, all remaining Class B Shares converted to Class A Shares of the same Fund. Prior to June 19, 2015, Class B Shares automatically converted to Class A Shares after eight years and provided for a CDSC. Information relating to certain fees and other characteristics of the Class B Shares prior to June 19, 2015 is included in Note 3.
2. Significant Accounting Policies
The following is a summary of significant accounting policies followed by the Funds in the preparation of their financial statements. The Funds are investment companies and, accordingly, follow the investment company accounting and reporting guidance of the Financial Accounting Standards Board Accounting Standards Codification Topic 946 — Investment Companies, which is part of U.S. generally accepted accounting principles (“GAAP”). The preparation of financial statements in conformity with GAAP requires management to make estimates and assumptions that affect the reported amounts of assets and liabilities and disclosure of contingent assets and liabilities at the date of the financial statements and the reported amounts of increases and decreases in net assets from operations during the reporting period. Actual results could differ from those estimates.
A. Valuation of Investments — The valuation of the investments is in accordance with GAAP and the Funds’ valuation policies set forth by and under the supervision and responsibility of the Board of Trustees (the “Board”), which established the following approach to valuation, as described more fully below: (i) investments for which market quotations are readily available shall be valued at such unadjusted quoted prices and (ii) all other investments for which market quotations are not readily available shall be valued at their fair value as determined in good faith by the Board.
JPMorgan Funds Management, Inc. (the “Administrator”) has established the J.P. Morgan Asset Management Americas Valuation Committee (“AVC”) to assist the Board with the oversight and monitoring of the valuation of the Funds’ investments. The Administrator implements the valuation policies of the Funds’ investments, as directed by the Board. The AVC oversees and carries out the policies for the valuation of investments held in the
| | | | | | |
| | | |
| 70 | | | | J.P. MORGAN MID CAP/MULTI-CAP FUNDS | | JUNE 30, 2015 |
Funds. This includes monitoring the appropriateness of fair values based on results of ongoing valuation oversight, including but not limited to consideration of macro or security specific events, market events and pricing vendor and broker due diligence. The Administrator is responsible for discussing and assessing the potential impacts to the fair values on an ongoing basis, and at least on a quarterly basis with the AVC and the Board.
Equities and other exchange-traded instruments are valued at the last sale price or official market closing price on the primary exchange on which the instrument is traded before the net asset values (“NAV”) of the Funds are calculated on a valuation date. Investments in open-end investment companies excluding Exchange Traded Funds (“ETFs”) (the “Underlying Funds”), are valued at each Underlying Fund’s NAV per share as of the report date.
Futures are generally valued on the basis of available market quotations.
Valuations reflected in this report are as of the report date. As a result, changes in valuation due to market events and/or issuer related events after the report date and prior to issuance of the report are not reflected herein.
The various inputs that are used in determining the valuation of the Funds’ investments are summarized into the three broad levels listed below.
| • | | Level 1 — Unadjusted inputs using quoted prices in active markets for identical investments. |
| • | | Level 2 — Other significant observable inputs including, but are not limited to, quoted prices for similar investments, inputs other than quoted prices that are observable for investments (such as interest rates, prepayment speeds, credit risk, etc.) or other market corroborated inputs. |
| • | | Level 3 — Significant inputs based on the best information available in the circumstances, to the extent observable inputs are not available (including the Funds’ assumptions in determining the fair value of investments). |
A financial instrument’s level within the fair value hierarchy is based on the lowest level of any input, both individually and in the aggregate, that is significant to the fair value measurement. The inputs or methodology used for valuing instruments are not necessarily an indication of the risk associated with investing in those instruments.
The following tables represent each valuation input as presented on the Schedules of Portfolio Investments (“SOIs”) (amounts in thousands):
Growth Advantage Fund
| | | | | | | | | | | | | | | | |
| | | Level 1 Quoted prices | | | Level 2
Other significant
observable inputs | | | Level 3 Significant
unobservable inputs | | | Total | |
Total Investments in Securities (a) | | $ | 5,249,140 | | | $ | — | | | $ | — | | | $ | 5,249,140 | |
| | | | | | | | | | | | | | | | |
| | | | |
| Mid Cap Equity Fund | | | | | | | | | | | | | | | | |
| | | Level 1 Quoted prices | | | Level 2
Other significant
observable inputs | | | Level 3 Significant
unobservable inputs | | | Total | |
Total Investments in Securities (a) | | $ | 3,293,686 | | | $ | — | | | $ | — | | | $ | 3,293,686 | |
| | | | | | | | | | | | | | | | |
| | | | |
| Mid Cap Growth Fund | | | | | | | | | | | | | | | | |
| | | Level 1 Quoted prices | | | Level 2
Other significant
observable inputs | | | Level 3 Significant
unobservable inputs | | | Total | |
Total Investments in Securities (a) | | $ | 3,091,337 | | | $ | — | | | $ | — | | | $ | 3,091,337 | |
| | | | | | | | | | | | | | | | |
| | | | |
| Mid Cap Value Fund | | | | | | | | | | | | | | | | |
| | | Level 1 Quoted prices | | | Level 2
Other significant
observable inputs | | | Level 3 Significant
unobservable inputs | | | Total | |
Total Investments in Securities (a) | | $ | 16,012,877 | | | $ | — | | | $ | — | | | $ | 16,012,877 | |
| | | | | | | | | | | | | | | | |
| | | | |
| Multi-Cap Market Neutral Fund | | | | | | | | | | | | | | | | |
| | | Level 1
Quoted prices | | | Level 2
Other significant
observable inputs | | | Level 3 Significant
unobservable inputs | | | Total | |
Total Investments in Securities (a) | | $ | 292,621 | | | $ | — | | | $ | — | | | $ | 292,621 | |
| | | | | | | | | | | | | | | | |
Total Liabilities for Securities Sold Short (a) | | $ | (252,649 | ) | | $ | — | | | $ | — | | | $ | (252,649 | ) |
| | | | | | | | | | | | | | | | |
Appreciation in Other Financial Instruments | | | | | | | | | | | | | | | | |
Futures Contracts | | $ | 36 | | | $ | — | | | $ | — | | | $ | 36 | |
| | | | | | | | | | | | | | | | |
| | | | | | | | |
| | | |
| JUNE 30, 2015 | | J.P. MORGAN MID CAP/MULTI-CAP FUNDS | | | | | 71 | |
NOTES TO FINANCIAL STATEMENTS
AS OF JUNE 30, 2015 (continued)
Value Advantage Fund
| | | | | | | | | | | | | | | | |
| | | Level 1
Quoted prices | | | Level 2
Other significant
observable inputs | | | Level 3
Significant
unobservable inputs | | | Total | |
Total Investments in Securities (a) | | $ | 11,264,248 | | | $ | — | | | $ | — | | | $ | 11,264,248 | |
| | | | | | | | | | | | | | | | |
| (a) | All portfolio holdings designated as Level 1 are disclosed individually on the SOIs. Please refer to the SOIs for industry specifics of portfolio holdings. |
There were no transfers among any levels during the year ended June 30, 2015.
B. Short Sales — Multi-Cap Market Neutral Fund engages in short sales as part of its normal investment activities. In a short sale, the Fund sells securities it does not own in anticipation of a decline in the market value of those securities. In order to deliver securities to the purchaser, the Fund borrows securities from a broker. To close out a short position, the Fund delivers the same securities to the broker.
The Fund is required to pledge cash or securities to the broker as collateral for the securities sold short. Collateral requirements are calculated daily based on the current market value of the short positions. Cash collateral deposited with the broker is recorded as an asset on the Statements of Assets and Liabilities. Securities segregated as collateral are denoted on the SOIs. The Fund may receive or pay the net of the following amounts: (i) a portion of the income from the investment of cash collateral; (ii) the broker’s fee on the borrowed securities (calculated daily based upon the market value of each borrowed security and a variable rate that is dependent on availability of the security); and (iii) a financing charge for the difference between the market value of the short position and cash collateral deposited with the broker. The net income or fee is reported as interest income or interest expense, respectively, on securities sold short on the Statements of Operations.
The Fund is obligated to pay the broker dividends declared on short positions when a position is open on the record date. Dividends on short positions are reported on ex-dividend date on the Statements of Operations as dividend expense on securities sold short.
Liabilities for securities sold short are reported at market value on the Statements of Assets and Liabilities and the change in market value is recorded as change in net unrealized appreciation (depreciation) on the Statements of Operations. Short sale transactions may result in unlimited losses as the security’s price increases and the short position loses value. There is no upward limit on the price a borrowed security could attain. The Fund is also subject to risk of loss if the broker were to fail to perform its obligations under the contractual terms.
The Fund will record a realized loss if the price of the borrowed security increases between the date of the short sale and the date on which the Fund replaces the borrowed security. The Fund will record a realized gain if the price of the borrowed security declines between those dates.
As of June 30, 2015, the Fund had outstanding short sales as listed on its SOI.
C. Futures Contracts — Multi-Cap Market Neutral Fund used index futures contracts to gain or reduce exposure to the stock market, maintain liquidity and minimize transaction costs. The Fund also bought futures contracts to immediately invest incoming cash in the market or sold futures in response to cash outflows, thereby simulating an invested position in the underlying index while maintaining a cash balance for liquidity. The use of futures contracts exposes the Fund to equity price risk.
Futures contracts provide for the delayed delivery of the underlying instrument at a fixed price or are settled for a cash amount based on the change in the value of the underlying instrument at a specific date in the future. Upon entering into a futures contract, the Fund is required to deposit with the broker, cash or securities in an amount equal to a certain percentage of the contract amount, which is referred to as the initial margin deposit. Subsequent payments, referred to as variation margin, are made or received by the Fund periodically and are based on changes in the market value of open futures contracts. Changes in the market value of open futures contracts are recorded as Change in net unrealized appreciation/depreciation on the Statements of Operations. Realized gains or losses, representing the difference between the value of the contract at the time it was opened and the value at the time it was closed, are reported on the Statements of Operations at the closing or expiration of the futures contract. Securities deposited as initial margin are designated on the SOIs and cash deposited is recorded on the Statements of Assets and Liabilities. A receivable from and/or a payable to brokers for the daily variation margin is also recorded on the Statements of Assets and Liabilities.
The Fund may be subject to the risk that the change in the value of the futures contract may not correlate perfectly with the underlying instrument. Use of long futures contracts subjects the Fund to risk of loss in excess of the amounts shown on the Statements of Assets and Liabilities, up to the notional amount of the futures contracts. Use of short futures contracts subjects the Fund to unlimited risk of loss. The Fund may enter into futures contracts only on exchanges or boards of trade. The exchange or board of trade acts as the counterparty to each futures transaction; therefore, the Fund’s credit risk is limited to failure of the exchange or board of trade. Under some circumstances, futures exchanges may establish daily limits on the amount that the price of a futures contract can vary from the previous day’s settlement price, which could effectively prevent liquidation of positions.
| | | | | | |
| | | |
| 72 | | | | J.P. MORGAN MID CAP/MULTI-CAP FUNDS | | JUNE 30, 2015 |
The table below discloses the volume of the Fund’s futures contracts activity during the year ended June 30, 2015 (amounts in thousands):
| | | | |
| | | Multi-Cap Market
Neutral Fund | |
Futures Contracts: | | | | |
Average Notional Balance Long | | $ | 3,413 | (a) |
Average Notional Balance Short | | | 2,469 | |
Ending Notional Balance Long | | | — | |
Ending Notional Balance Short | | | 2,067 | |
| (a) | For the period March 1, 2015 through March 31, 2015. |
The Fund’s futures contracts are not subject to master netting arrangements (the right to close out all transactions traded with a counterparty and net amounts owed or due across transactions).
D. Security Transactions and Investment Income — Investment transactions are accounted for on the trade date (the date the order to buy or sell is executed). Securities gains and losses are calculated on a specifically identified cost basis. Interest income is determined on the basis of coupon interest accrued using the effective interest method which adjusts for amortization of premiums and accretion of discounts. Dividend income, net of foreign taxes withheld, if any, and dividend expense on securities sold short, are recorded on the ex-dividend date or when a Fund first learns of the dividend.
To the extent such information is publicly available, the Funds record distributions received in excess of income earned from underlying investments as a reduction of cost of investments and/or realized gain. Such amounts are based on estimates if actual amounts are not available and actual amounts of income, realized gain and return of capital may differ from the estimated amounts. The Funds adjust the estimated amounts of the components of distributions (and consequently their net investment income) as necessary once the issuers provide information about the actual composition of the distributions.
E. Allocation of Income and Expenses — Expenses directly attributable to a fund are charged directly to that fund, while the expenses attributable to more than one fund of the Trusts are allocated among the respective funds. In calculating the NAV of each class, investment income, realized and unrealized gains and losses and expenses, other than class specific expenses, are allocated daily to each class of shares based upon the proportion of net assets of each class at the beginning of each day.
F. Federal Income Taxes — Each Fund is treated as a separate taxable entity for Federal income tax purposes. Each Fund’s policy is to comply with the provisions of the Internal Revenue Code of 1986, as amended (the “Code”), applicable to regulated investment companies and to distribute to shareholders all of its distributable net investment income and net realized capital gains on investments. Accordingly, no provision for Federal income tax is necessary. Management has reviewed the Funds’ tax positions for all open tax years and has determined that as of June 30, 2015, no liability for income tax is required in the Funds’ financial statements for net unrecognized tax benefits. However, management’s conclusions may be subject to future review based on changes in, or the interpretation of, the accounting standards or tax laws and regulations. Each of the Funds’ Federal tax returns for the prior three fiscal years remains subject to examination by the Internal Revenue Service.
G. Distributions to Shareholders — Distributions from net investment income are generally declared and paid at least annually, except for the Mid Cap Equity Fund, Mid Cap Growth Fund and Multi-Cap Market Neutral Fund, for which distributions are generally declared and paid at least quarterly. Distributions are declared separately for each class of each Fund. No class has preferential dividend rights; differences in per share rates are due to differences in separate class expenses. Net realized capital gains, if any, are distributed by each Fund at least annually. The amount of distributions from net investment income and net realized capital gains is determined in accordance with Federal income tax regulations, which may differ from GAAP. To the extent these “book/tax” differences are permanent in nature (i.e., that they result from other than timing of recognition — “temporary differences”), such amounts are reclassified within the capital accounts based on their Federal tax-basis treatment.
The following amounts were reclassified within the capital accounts (amounts in thousands):
| | | | | | | | | | | | |
| | | Paid-in-Capital | | | Accumulated Undistributed (Distributions
in Excess of) Net Investment Income | | | Accumulated Net Realized Gains (Losses) | |
Growth Advantage Fund | | $ | (7,398 | ) | | $ | 14,677 | | | $ | (7,279 | ) |
Mid Cap Equity Fund | | | (6 | ) | | | (2,249 | ) | | | 2,255 | |
Mid Cap Growth Fund | | | (11 | ) | | | 9,807 | | | | (9,796 | ) |
Mid Cap Value Fund | | | (5,262 | ) | | | 483 | | | | 4,779 | |
Multi-Cap Market Neutral Fund | | | (4,597 | ) | | | 4,521 | | | | 76 | |
Value Advantage Fund | | | — | | | | (1,709 | ) | | | 1,709 | |
The reclassification for the Funds relate primarily to capital loss carryforwards, investments in partnerships, net operating losses and non-taxable dividends.
| | | | | | | | |
| | | |
| JUNE 30, 2015 | | J.P. MORGAN MID CAP/MULTI-CAP FUNDS | | | | | 73 | |
NOTES TO FINANCIAL STATEMENTS
AS OF JUNE 30, 2015 (continued)
3. Fees and Other Transactions with Affiliates
A. Investment Advisory Fee — Pursuant to the Investment Advisory Agreements, J.P. Morgan Investment Management, Inc. (the “Adviser” or “JPMIM”), an indirect, wholly-owned subsidiary of JPMorgan Chase & Co. (“JPMorgan”), supervises the investments of each Fund and for such services is paid a fee. The fee is accrued daily and paid monthly based on each Fund’s respective average daily net assets. The annual rate for each Fund is as follows:
| | | | |
Growth Advantage Fund | | | 0.65 | % |
Mid Cap Equity Fund | | | 0.65 | |
Mid Cap Growth Fund | | | 0.65 | |
Mid Cap Value Fund | | | 0.65 | |
Multi-Cap Market Neutral Fund | | | 1.25 | |
Value Advantage Fund | | | 0.65 | |
The Adviser waived Investment Advisory fees and/or reimbursed expenses as outlined in Note 3.F.
B. Administration Fee — Pursuant to an Administration Agreement, the Administrator, an indirect, wholly-owned subsidiary of JPMorgan, provides certain administration services to the Funds. In consideration of these services, the Administrator receives a fee accrued daily and paid monthly at an annual rate of 0.15% of the first $25 billion of the average daily net assets of all funds in the J.P. Morgan Funds Complex covered by the Administration Agreement (excluding certain funds of funds and money market funds) and 0.075% of the average daily net assets in excess of $25 billion of all such funds. For the year ended June 30, 2015, the effective rate was 0.08% of each Fund’s average daily net assets, notwithstanding any fee waivers and/or expense reimbursements.
The Administrator waived Administration fees as outlined in Note 3.F.
JPMorgan Chase Bank, N.A. (“JPMCB”), a wholly-owned subsidiary of JPMorgan, serves as the Funds’ sub-administrator (the “Sub-administrator”). For its services as Sub-administrator, JPMCB receives a portion of the fees payable to the Administrator.
C. Distribution Fees — Pursuant to a Distribution Agreement, JPMorgan Distribution Services, Inc. (the “Distributor”), a wholly-owned subsidiary of JPMorgan, serves as the Trusts’ exclusive underwriter and promotes and arranges for the sale of each Fund’s shares.
The Board has adopted a Distribution Plan (the “Distribution Plan”) for Class A, Class B, Class C and Class R2 Shares of the Funds, as applicable, in accordance with Rule 12b-1 under the 1940 Act. The Distribution Plan provides that each Fund shall pay distribution fees, including payments to the Distributor, at annual rates of the average daily net assets as shown in the table below:
| | | | | | | | | | | | | | | | |
| | | Class A | | | Class B | | | Class C | | | Class R2 | |
Growth Advantage Fund | | | 0.25 | % | | | 0.75 | % | | | 0.75 | % | | | n/a | |
Mid Cap Equity Fund | | | 0.25 | | | | n/a | | | | 0.75 | | | | 0.50 | % |
Mid Cap Growth Fund | | | 0.25 | | | | 0.75 | | | | 0.75 | | | | 0.50 | |
Mid Cap Value Fund | | | 0.25 | | | | 0.75 | | | | 0.75 | | | | 0.50 | |
Multi-Cap Market Neutral Fund | | | 0.25 | | | | 0.75 | | | | 0.75 | | | | n/a | |
Value Advantage Fund | | | 0.25 | | | | n/a | | | | 0.75 | | | | n/a | |
In addition, the Distributor is entitled to receive the front-end sales charges from purchases of Class A Shares and the CDSC from redemptions of Class B and Class C Shares and certain Class A Shares for which front-end sales charges have been waived. For the year ended June 30, 2015, the Distributor retained the following (amounts in thousands):
| | | | | | | | |
| | | Front-End Sales Charge | | | CDSC | |
Growth Advantage Fund | | $ | 767 | | | $ | 1 | |
Mid Cap Equity Fund | | | 203 | | | | — | |
Mid Cap Growth Fund | | | 99 | | | | 1 | |
Mid Cap Value Fund | | | 37 | | | | — | (a) |
Multi-Cap Market Neutral Fund | | | 1 | | | | — | |
Value Advantage Fund | | | 644 | | | | 3 | |
| (a) | Amount rounds to less than $1,000. |
| | | | | | |
| | | |
| 74 | | | | J.P. MORGAN MID CAP/MULTI-CAP FUNDS | | JUNE 30, 2015 |
D. Shareholder Servicing Fees — The Trusts, on behalf of the Funds, have entered into Shareholder Servicing Agreements with the Distributor under which the Distributor provides certain support services to the shareholders. The Class R6 Shares do not participate in the Shareholder Servicing Agreement. For performing these services, the Distributor receives a fee that is accrued daily and paid monthly equal to a percentage of the average daily net assets as shown in the table below:
| | | | | | | | | | | | | | | | | | | | | | | | | | | | |
| | | Class A | | | Class B | | | Class C | | | Class R2 | | | Class R5 | | | Institutional Class | | | Select Class | |
Growth Advantage Fund | | | 0.25 | % | | | 0.25 | % | | | 0.25 | % | | | n/a | | | | 0.05 | % | | | n/a | | | | 0.25 | % |
Mid Cap Equity Fund | | | 0.25 | | | | n/a | | | | 0.25 | | | | 0.25 | % | | | 0.05 | | | | n/a | | | | 0.25 | |
Mid Cap Growth Fund | | | 0.25 | | | | 0.25 | | | | 0.25 | | | | 0.25 | | | | 0.05 | | | | n/a | | | | 0.25 | |
Mid Cap Value Fund | | | 0.25 | | | | 0.25 | | | | 0.25 | | | | 0.25 | | | | n/a | | | | 0.10 | % | | | 0.25 | |
Multi-Cap Market Neutral Fund | | | 0.25 | | | | 0.25 | | | | 0.25 | | | | n/a | | | | n/a | | | | n/a | | | | 0.25 | |
Value Advantage Fund | | | 0.25 | | | | n/a | | | | 0.25 | | | | n/a | | | | n/a | | | | 0.10 | | | | 0.25 | |
The Distributor has entered into shareholder services contracts with affiliated and unaffiliated financial intermediaries who provide shareholder services and other related services to their clients or customers who invest in the Funds under which the Distributor will pay all or a portion of such fees earned to financial intermediaries for performing such services.
The Distributor waived Shareholder Servicing fees as outlined in Note 3.F.
E. Custodian and Accounting Fees — JPMCB provides portfolio custody and accounting services to the Funds. For these services, the Funds pay JPMCB transaction and asset-based fees that vary according to the number of transactions and positions, plus out-of-pocket expenses. The amounts paid directly to JPMCB by the Funds for custody and accounting services are included in Custodian and accounting fees on the Statements of Operations. Payments to the custodian may be reduced by credits earned by each Fund, based on uninvested cash balances held by the custodian. Such earnings credits, if any, are presented separately on the Statements of Operations.
Interest expense paid to the custodian related to cash overdrafts, if any, is included in Interest expense to affiliates on the Statements of Operations.
F. Waivers and Reimbursements — The Adviser, Administrator and Distributor have contractually agreed to waive fees and/or reimburse the Funds to the extent that total annual operating expenses (excluding acquired fund fees and expenses, dividend expenses related to short sales, interest, taxes, expenses related to litigation and potential litigation, extraordinary expenses and expenses related to the Board’s deferred compensation plan) exceed the percentages of the Funds’ respective average daily net assets as shown in the table below:
| | | | | | | | | | | | | | | | | | | | | | | | | | | | | | | | |
| | | Class A | | | Class B | | | Class C | | | Class R2 | | | Class R5 | | | Class R6 | | | Institutional Class | | | Select Class | |
Growth Advantage Fund | | | 1.25 | % | | | 1.75 | % | | | 1.75 | % | | | n/a | | | | 0.90 | % | | | 0.85 | %* | | | n/a | | | | 1.10 | % |
Mid Cap Equity Fund | | | 1.25 | | | | n/a | | | | 1.75 | | | | 1.50 | % | | | 0.80 | | | | 0.75 | | | | n/a | | | | 0.90 | |
Mid Cap Growth Fund | | | 1.24 | | | | 1.74 | | | | 1.74 | | | | 1.40 | | | | 0.79 | | | | 0.74 | | | | n/a | | | | 0.93 | |
Mid Cap Value Fund | | | 1.24 | | | | 1.75 | | | | 1.75 | | | | 1.50 | | | | n/a | | | | n/a | | | | 0.75 | % | | | 0.99 | |
Multi-Cap Market Neutral Fund | | | 1.50 | | | | 2.00 | | | | 2.00 | | | | n/a | | | | n/a | | | | n/a | | | | n/a | | | | 1.25 | |
Value Advantage Fund | | | 1.25 | | | | n/a | | | | 1.75 | | | | n/a | | | | n/a | | | | n/a | | | | 0.75 | | | | 1.00 | |
| * | Prior to January 1, 2015, the contractual expense limitation for Growth Advantage Fund Class R6 was 0.80%. |
The expense limitation agreements were in effect for the year ended June 30, 2015. The contractual expense limitation percentages in the table above are in place until at least October 31, 2015, except Mid Cap Equity Fund which is in place until October 31, 2016 and Class B Shares which are no longer operating. In addition, the Funds’ service providers have voluntarily waived fees during the year ended June 30, 2015. However, the Funds’ service providers are under no obligation to do so and may discontinue such voluntary waivers at any time.
For the year ended June 30, 2015, the Funds’ service providers waived fees and/or reimbursed expenses for each of the Funds as follows (amounts in thousands). None of these parties expect the Funds to repay any such waived fees and reimbursed expenses in future years.
| | | | | | | | | | | | | | | | | | | | |
| | | Contractual Waivers | | | | |
| | | Investment
Advisory | | | Administration | | | Shareholder
Servicing | | | Total | | | Contractual
Reimbursements | |
Growth Advantage Fund | | $ | 40 | | | $ | 3 | | | $ | 1,078 | | | $ | 1,121 | | | $ | — | |
Mid Cap Equity Fund | | | 923 | | | | 615 | | | | 3,776 | | | | 5,314 | | | | 293 | |
Mid Cap Growth Fund | | | 785 | | | | 517 | | | | 2,353 | | | | 3,655 | | | | 12 | |
Mid Cap Value Fund | | | 6,594 | | | | 4,303 | | | | 12,366 | | | | 23,263 | | | | 2,625 | |
Multi-Cap Market Neutral Fund | | | 1,107 | | | | 297 | | | | 9 | | | | 1,413 | | | | — | (a) |
Value Advantage Fund | | | 2,793 | | | | 1,830 | | | | 6,572 | | | | 11,195 | | | | 436 | |
| (b) | Amount rounds to less than $1,000. |
| | | | | | | | |
| | | |
| JUNE 30, 2015 | | J.P. MORGAN MID CAP/MULTI-CAP FUNDS | | | | | 75 | |
NOTES TO FINANCIAL STATEMENTS
AS OF JUNE 30, 2015 (continued)
Additionally, the Funds may invest in one or more money market funds advised by the Adviser or its affiliates. The Adviser, Administrator and Distributor, as shareholder servicing agent, waive fees in an amount sufficient to offset the respective fees each charges to the affiliated money market fund on the Funds’ investment in such affiliated money market fund. A portion of the waiver is voluntary.
The amount of waivers resulting from investments in these money market funds for the year ended June 30, 2015 was as follows (amounts in thousands):
| | | | |
Growth Advantage Fund | | $ | 210 | |
Mid Cap Equity Fund | | | 199 | |
Mid Cap Growth Fund | | | 143 | |
Mid Cap Value Fund | | | 1,023 | |
Multi-Cap Market Neutral Fund | | | 71 | |
Value Advantage Fund | | | 1,432 | |
G. Other — Certain officers of the Trusts are affiliated with the Adviser, the Administrator and the Distributor. Such officers, with the exception of the Chief Compliance Officer, receive no compensation from the Funds for serving in their respective roles.
The Board appointed a Chief Compliance Officer to the Funds in accordance with Federal securities regulations. Each Fund, along with other affiliated funds, makes reimbursement payments, on a pro-rata basis, to the Administrator for a portion of the fees associated with the Office of the Chief Compliance Officer. Such fees are included in Trustees’ and Chief Compliance Officer’s fees on the Statements of Operations.
The Trusts adopted a Trustee Deferred Compensation Plan (the “Plan”) which allows the Independent Trustees to defer the receipt of all or a portion of compensation related to performance of their duties as Trustees. The deferred fees are invested in various J.P. Morgan Funds until distribution in accordance with the Plan.
During the year ended June 30, 2015, the Funds may have purchased securities from an underwriting syndicate in which the principal underwriter or members of the syndicate are affiliated with the Adviser.
The Funds may use related party broker-dealers. For the year ended June 30, 2015, the Funds incurred brokerage commissions with broker-dealers affiliated with the Adviser as follows (amounts in thousands):
| | | | |
Growth Advantage Fund | | $ | 2 | |
Mid Cap Equity Fund | | | — | (a) |
Mid Cap Growth Fund | | | — | (a) |
The Securities and Exchange Commission (“SEC”) has granted an exemptive order permitting the Funds to engage in principal transactions with J.P. Morgan Securities, Inc., an affiliated broker, involving taxable money market instruments, subject to certain conditions.
4. Investment Transactions
During the year ended June 30, 2015, purchases and sales of investments (excluding short-term investments) were as follows (amounts in thousands):
| | | | | | | | | | | | | | | | |
| | | Purchases
(excluding U.S. Government) | | | Sales (excluding U.S. Government) | | | Securities
Sold Short | | | Covers on
Securities
Sold Short | |
Growth Advantage Fund | | $ | 2,787,395 | | | $ | 1,903,868 | | | $ | — | | | $ | — | |
Mid Cap Equity Fund | | | 1,430,107 | | | | 1,199,994 | | | | — | | | | — | |
Mid Cap Growth Fund | | | 1,875,012 | | | | 1,346,817 | | | | — | | | | — | |
Mid Cap Value Fund | | | 2,809,649 | | | | 3,580,977 | | | | — | | | | — | |
Multi-Cap Market Neutral Fund | | | 238,074 | | | | 398,530 | | | | 260,535 | | | | 414,404 | |
Value Advantage Fund | | | 4,181,677 | | | | 1,544,170 | | | | — | | | | — | |
During the year ended June 30, 2015, there were no purchases or sales of U.S. Government securities.
5. Federal Income Tax Matters
For Federal income tax purposes, the cost and unrealized appreciation (depreciation) in value of investment securities held at June 30, 2015 were as follows (amounts in thousands):
| | | | | | | | | | | | | | | | |
| | | Aggregate
Cost | | | Gross
Unrealized
Appreciation | | | Gross
Unrealized
Depreciation | | | Net Unrealized
Appreciation
(Depreciation) | |
Growth Advantage Fund | | $ | 3,827,543 | | | $ | 1,468,447 | | | $ | 46,850 | | | $ | 1,421,597 | |
Mid Cap Equity Fund | | | 2,471,328 | | | | 875,460 | | | | 53,102 | | | | 822,358 | |
Mid Cap Growth Fund | | | 2,307,026 | | | | 827,294 | | | | 42,983 | | | | 784,311 | |
| | | | | | |
| | | |
| 76 | | | | J.P. MORGAN MID CAP/MULTI-CAP FUNDS | | JUNE 30, 2015 |
| | | | | | | | | | | | | | | | |
| | | Aggregate
Cost | | | Gross
Unrealized
Appreciation | | | Gross
Unrealized
Depreciation | | | Net Unrealized
Appreciation
(Depreciation) | |
Mid Cap Value Fund | | $ | 10,728,989 | | | $ | 5,465,948 | | | $ | 182,060 | | | $ | 5,283,888 | |
Multi-Cap Market Neutral Fund | | | 255,039 | | | | 68,567 | | | | 30,985 | | | | 37,582 | |
Value Advantage Fund | | | 9,632,583 | | | | 1,850,545 | | | | 218,880 | | | | 1,631,665 | |
The difference between book and tax basis appreciation (depreciation) on investments is primarily attributed to investments in partnerships and wash sale loss deferrals.
The tax character of distributions paid during the year ended June 30, 2015 was as follows (amounts in thousands):
| | | | | | | | | | | | |
| | | Ordinary
Income | | | Net
Long-Term
Capital Gains | | | Total
Distributions
Paid | |
Growth Advantage Fund | | $ | 27,729 | | | $ | 127,462 | | | $ | 155,191 | |
Mid Cap Equity Fund | | | 39,516 | | | | 103,413 | | | | 142,929 | |
Mid Cap Growth Fund | | | 27,727 | | | | 190,498 | | | | 218,225 | |
Mid Cap Value Fund | | | 255,048 | | | | 1,021,777 | | | | 1,276,825 | |
Value Advantage Fund | | | 166,645 | | | | 160,536 | | | | 327,181 | |
The tax character of distributions paid during the year ended June 30, 2014 was as follows (amounts in thousands):
| | | | | | | | | | | | |
| | | Ordinary Income | | | Net Long Term Capital Gains | | | Total Distributions Paid | |
Growth Advantage Fund | | $ | 41,088 | | | $ | 88,308 | | | $ | 129,396 | |
Mid Cap Equity Fund | | | 33,507 | | | | 66,650 | | | | 100,157 | |
Mid Cap Growth Fund | | | 1,961 | | | | 179,210 | | | | 181,171 | |
Mid Cap Value Fund | | | 235,213 | | | | 461,603 | | | | 696,816 | |
Value Advantage Fund | | | 93,947 | | | | 80,234 | | | | 174,181 | |
As of June 30, 2015, the components of net assets (excluding paid-in-capital) on a tax basis were as follows (amounts in thousands):
| | | | | | | | | | | | | | | | |
| | | Current
Distributable
Ordinary
Income | | | Current
Distributable
Long-Term
Capital Gain | | | Tax Basis Capital
Loss Carryover | | | Unrealized
Appreciation
(Depreciation) | |
Growth Advantage Fund | | $ | — | | | $ | 163,952 | | | $ | — | | | $ | 1,421,597 | |
Mid Cap Equity Fund | | | 20,826 | | | | 104,754 | | | | — | | | | 822,358 | |
Mid Cap Growth Fund | | | 3,127 | | | | 124,596 | | | | — | | | | 784,311 | |
Mid Cap Value Fund | | | 56,281 | | | | 698,118 | | | | (22,101 | ) | | | 5,283,888 | |
Multi-Cap Market Neutral Fund | | | — | | | | — | | | | (16,117 | ) | | | 27,397 | |
Value Advantage Fund | | | 84,088 | | | | 68,931 | | | | — | | | | 1,629,140 | |
For the Funds, the cumulative timing differences primarily consist of post-October capital loss deferrals, late year ordinary loss deferrals, investments in partnerships and wash sale loss deferrals.
Under the Regulated Investment Company Modernization Act of 2010 (“the “Act”), net capital losses recognized by the Funds after June 30, 2011 are carried forward indefinitely, and retain their character as short-term and/or long-term losses. Prior to the Act, net capital losses incurred by the Funds were carried forward for eight years and treated as short-term losses. The Act requires that post-enactment net capital losses be used before pre-enactment net capital losses.
As of June 30, 2015, the Funds did not have post-enactment capital loss carryforwards.
As of June 30, 2015, the following Funds had pre-enactment net capital loss carryforwards, expiring during the years indicated, which are available to offset future realized gains (amounts in thousands):
| | | | | | | | | | | | | | | | |
| | | 2016 | | | 2017 | | | 2018 | | | Total | |
Mid Cap Value Fund | | $ | — | | | $ | — | | | $ | 22,101 | | | $ | 22,101 | * |
Multi-Cap Market Neutral Fund | | | 16,117 | | | | — | | | | — | | | | 16,117 | |
| * | Amount includes capital loss carryforwards from business combinations, which are limited in future years under Internal Revenue Code Sections 381 - 384. Excludes approximately $5,263,000 of losses no longer available due to merger limitations. |
| | | | | | | | |
| | | |
| JUNE 30, 2015 | | J.P. MORGAN MID CAP/MULTI-CAP FUNDS | | | | | 77 | |
NOTES TO FINANCIAL STATEMENTS
AS OF JUNE 30, 2015 (continued)
During the year ended June 30, 2015, the following Funds utilized capital loss carryforwards as follows (amounts in thousands):
| | | | |
| | | Pre-Enactment
Capital Loss
Carryforwards
Utilized | |
Mid Cap Growth Fund | | $ | 13,557 | |
Mid Cap Value Fund | | | 7,367 | |
Multi-Cap Market Neutral Fund | | | 13,495 | |
Late year ordinary losses incurred after December 31 as well as net capital losses incurred after October 31 and within the taxable year are deemed to arise on the first business day of the Funds’ next taxable year. For the year ended June 30, 2015, the following Funds deferred to July 1, 2016 late year ordinary losses and post-October capital losses of (amounts in thousands):
| | | | | | | | | | | | |
| | | Late Year Ordinary
Loss Deferral | | | Post-October Capital Loss Character | |
| | | | Short-Term | | | Long-Term | |
Growth Advantage Fund | | $ | 10,270 | | | $ | 15,279 | | | $ | — | |
Mid Cap Growth Fund | | | 7,877 | | | | — | | | | — | |
Multi-Cap Market Neutral Fund | | | 854 | | | | 29,825 | | | | — | |
6. Borrowings
The Funds rely upon an exemptive order granted by the SEC (the “Order”) permitting the establishment and operation of an Interfund Lending Facility (the “Facility”). The Facility allows the Funds to directly lend and borrow money to or from any other fund relying upon the Order at rates beneficial to both the borrowing and lending funds. Advances under the Facility are taken primarily for temporary or emergency purposes, including the meeting of redemption requests that otherwise might require the untimely disposition of securities, and are subject to each Fund’s borrowing restrictions. The Interfund loan rate is determined, as specified in the Order, by averaging the current repurchase agreement rate and the current bank loan rate. The Order was granted to JPM II and may be relied upon by the Funds because the Funds and the series of JPM II are all investment companies in the same “group of investment companies” (as defined in Section 12(d)(1)(G) of the 1940 Act).
In addition, the Trusts and JPMCB have entered into a financing arrangement. Under this arrangement, JPMCB provides an unsecured, uncommitted credit facility in the aggregate amount of $100 million to certain of the J.P. Morgan Funds, including the Funds. Advances under the arrangement are taken primarily for temporary or emergency purposes, including the meeting of redemption requests that otherwise might require the untimely disposition of securities, and are subject to each Fund’s borrowing restrictions. Interest on borrowings is payable at a rate determined by JPMCB at the time of borrowing. This agreement has been extended until November 9, 2015.
The Funds had no borrowings outstanding from another fund or from the unsecured, uncommitted credit facility at June 30, 2015. Average borrowings from the Facility for the year ended June 30, 2015, were as follows (amounts in thousands):
| | | | | | | | | | | | | | | | |
| | | Average
Borrowings | | | Average Interest Rate Paid | | | Number
of Days
Outstanding | | | Interest
Paid | |
Multi-Cap Market Neutral Fund | | $ | 21,128 | | | | 0.21 | % | | | 4 | | | $ | — | (a) |
| (a) | Amount rounds to less than $1,000. |
Interest expense paid as a result of borrowings from another fund or from the unsecured, uncommitted credit facility is included in Interest expense to affiliates on the Statements of Operations.
7. Risks, Concentrations and Indemnifications
In the normal course of business, the Funds enter into contracts that contain a variety of representations which provide general indemnifications. Each Fund’s maximum exposure under these arrangements is unknown. The amount of exposure would depend on future claims that may be made against each Fund that have not yet occurred. However, based on experience, the Funds expect the risk of loss to be remote.
One or more affiliates of the Adviser have investment discretion with respect to their clients’ holdings in the Funds, which collectively represent a significant portion of the Funds’ assets for each of the Growth Advantage Fund, Mid Cap Equity Fund and Mid Cap Growth Fund.
| | | | | | |
| | | |
| 78 | | | | J.P. MORGAN MID CAP/MULTI-CAP FUNDS | | JUNE 30, 2015 |
In addition, as of June 30, 2015, the J.P. Morgan Investor Funds and JPMorgan SmartRetirement Funds, which are affiliated funds of funds, own in the aggregate, more than 10% of the net assets of the following Funds as follows:
| | | | | | | | |
| | | J.P. Morgan
Investor Funds | | | JPMorgan
SmartRetirement
Funds | |
Growth Advantage Fund | | | — | | | | 40.6 | % |
Mid Cap Equity Fund | | | — | | | | 33.4 | |
Multi-Cap Market Neutral Fund | | | 89.9 | % | | | — | |
Value Advantage Fund | | | — | | | | 17.2 | |
Additionally, Mid Cap Value Fund and Value Advantage Fund each have one or more shareholders, each of which is an account maintained by a financial intermediary on behalf of its clients, that owns a significant portion of that Fund’s outstanding shares.
Significant shareholder transactions by these shareholders may impact the Funds’ performance.
As of June 30, 2015, the Multi-Cap Market Neutral Fund pledged substantially all of its assets for securities sold short to Citigroup Global Markets, Inc., who also held 100% of the Multi-Cap Market Neutral Fund’s cash proceeds for securities sold short.
8. Business Combinations
In November 2013, the Board of Trustees of JPM I approved management’s proposal to merge JPMorgan Mid Cap Core Fund (the “Target Fund”) into JPMorgan Mid Cap Equity Fund (the “Acquiring Fund”). The Agreement and Plan of Reorganization with respect to the Target Fund was approved by the Target Fund’s Board of Trustees on November 19-21, 2013. The purpose of the transaction was to combine two portfolios with comparable investment objectives and strategies. The reorganization was effective after the close of business on March 14, 2014. The Acquiring Fund acquired all of the assets and liabilities of the Target Fund as shown in the table below. The transaction was structured to qualify as a tax-free reorganization under the Code. Pursuant to the Agreement and Plan of Reorganization, shareholders of the Target Fund received a number of shares of the corresponding class in the Acquiring Fund, with a value equal to their holdings in the Target Fund as of the close of business on the date of the reorganization. The investment portfolio of the Target Fund, with a fair value of approximately $1,111,228,000 and identified cost of approximately $904,208,000 as of the date of the reorganization, was the principal asset acquired by the Acquiring Fund. For financial statement purposes, assets received and shares issued by the Acquiring Fund were recorded at fair value; however, the cost basis of the investments received from the Target Fund was carried forward to align ongoing reporting of the Acquiring Fund’s realized and unrealized gains and losses with amounts distributable to shareholders for tax purposes.
The following is a summary of Shares Outstanding, Net Assets, NAV and Net Unrealized Appreciation (Depreciation) immediately before and after the reorganization (amounts in thousands, except per share amounts):
| | | | | | | | | | | | | | | | |
| | | Shares
Outstanding | | | Net Assets | | | Net Asset
Value
Per Share | | | Net
Unrealized
Appreciation
(Depreciation) | |
Target Fund | | | | | | | | | | | | | | | | |
Mid Cap Core Fund | | | | | | | | | | | | | | $ | 207,020 | |
Class A | | | 1,967 | | | $ | 42,694 | | | $ | 21.70 | | | | | |
Class C | | | 77 | | | | 1,648 | | | | 21.48 | | | | | |
Class R2 | | | 29 | | | | 632 | | | | 21.60 | | | | | |
Class R5 | | | 4 | | | | 87 | | | | 21.87 | | | | | |
Class R6 | | | 30,932 | | | | 676,262 | | | | 21.86 | | | | | |
Select Class | | | 17,884 | | | | 390,167 | | | | 21.82 | | | | | |
| | | | |
Acquiring Fund | | | | | | | | | | | | | | | | |
Mid Cap Equity Fund | | | | | | | | | | | | | | | 407,160 | |
Class A | | | 1,999 | | | | 85,802 | | | | 42.92 | | | | | |
Class C | | | 386 | | | | 16,354 | | | | 42.32 | | | | | |
Select Class | | | 29,489 | | | | 1,272,165 | | | | 43.14 | | | | | |
| | | | | | | | |
| | | |
| JUNE 30, 2015 | | J.P. MORGAN MID CAP/MULTI-CAP FUNDS | | | | | 79 | |
NOTES TO FINANCIAL STATEMENTS
AS OF JUNE 30, 2015 (continued)
| | | | | | | | | | | | | | | | |
| | | Shares
Outstanding | | | Net Assets | | | Net Asset
Value
Per Share | | | Net
Unrealized
Appreciation
(Depreciation) | |
Post Reorganization | | | | | | | | | | | | | | | | |
Mid Cap Equity Fund | | | | | | | | | | | | | | $ | 614,180 | |
Class A | | | 2,994 | | | $ | 128,496 | | | $ | 42.92 | | | | | |
Class C | | | 425 | | | | 18,002 | | | | 42.32 | | | | | |
Class R2 | | | 15 | | | | 632 | | | | 42.92 | | | | | |
Class R5 | | | 2 | | | | 87 | | | | 43.14 | | | | | |
Class R6 | | | 15,676 | | | | 676,262 | | | | 43.14 | | | | | |
Select Class | | | 38,533 | | | | 1,662,333 | | | | 43.14 | | | | | |
Expenses related to reorganization were incurred by the Acquiring Fund. The Adviser, the Administrator and the Distributor waived their fees and/or reimbursed the Fund in an amount sufficient to offset costs incurred by the Fund relating to the reorganization, excluding brokerage fees and brokerage expenses related to the disposition and acquisition of Fund assets associated with the reorganization.
| | | | | | |
| | | |
| 80 | | | | J.P. MORGAN MID CAP/MULTI-CAP FUNDS | | JUNE 30, 2015 |
REPORT OF INDEPENDENT REGISTERED PUBLIC ACCOUNTING FIRM
To the Board of Trustees of J.P. Morgan Mutual Fund Investment Trust, J.P. Morgan Fleming Mutual Fund Group, Inc., JPMorgan Trust I and JPMorgan Trust II and the Shareholders of JPMorgan Growth Advantage Fund, JPMorgan Mid Cap Equity Fund, JPMorgan Mid Cap Growth Fund, JPMorgan Mid Cap Value Fund, JPMorgan Multi-Cap Market Neutral Fund and JPMorgan Value Advantage Fund:
In our opinion, the accompanying statements of assets and liabilities, including the schedules of portfolio investments, and the related statements of operations and of changes in net assets and the financial highlights present fairly, in all material respects, the financial position of JPMorgan Mid Cap Equity Fund and JPMorgan Value Advantage Fund (each a separate fund of JPMorgan Trust I), JPMorgan Mid Cap Growth Fund and JPMorgan Multi-Cap Market Neutral Fund (each a separate fund of JPMorgan Trust II), JPMorgan Growth Advantage Fund (a separate fund of J.P. Morgan Mutual Fund Investment Trust) and JPMorgan Mid Cap Value Fund (a separate fund of J.P. Morgan Fleming Mutual Fund Group, Inc.) (hereafter collectively referred to as the “Funds”) at June 30, 2015, the results of each of their operations for the year then ended, the changes in each of their net assets for each of the two years in the period then ended and the financial highlights for each of the five years in the period then ended, in conformity with accounting principles generally accepted in the United States of America. These financial statements and financial highlights (hereafter referred to as “financial statements”) are the responsibility of the Funds’ management. Our responsibility is to express an opinion on these financial statements based on our audits. We conducted our audits of these financial statements in accordance with the standards of the Public Company Accounting Oversight Board (United States). Those standards require that we plan and perform the audit to obtain reasonable assurance about whether the financial statements are free of material misstatement. An audit includes examining, on a test basis, evidence supporting the amounts and disclosures in the financial statements, assessing the accounting principles used and significant estimates made by management, and evaluating the overall financial statement presentation. We believe that our audits, which included confirmation of securities at June 30, 2015 by correspondence with the custodian, transfer agent and brokers, provide a reasonable basis for our opinion.
PricewaterhouseCoopers LLP
New York, New York
August 26, 2015
| | | | | | | | |
| | | |
| JUNE 30, 2015 | | J.P. MORGAN MID CAP/MULTI-CAP FUNDS | | | | | 81 | |
TRUSTEES
(Unaudited)
The Funds’ Statement of Additional Information includes additional information about the Funds’ Trustees and is available, without charge, upon request by calling 1-800-480-4111 or on the J.P. Morgan Funds’ website at www.jpmorganfunds.com.
| | | | | | |
Name (Year of Birth); Positions With the Funds (1) | | Principal Occupations During Past 5 Years | | Number of
Portfolios in Fund
Complex Overseen
by Trustee (2) | | Other Directorships Held Outside Fund Complex During Past 5 Years |
Independent Trustees | | |
| | | |
| John F. Finn (1947); Trustee of Trusts since 2005; Trustee of heritage One Group Mutual Funds since 1998. | | Chairman (1985-present), President and Chief Executive Officer, Gardner, Inc. (supply chain management company serving industrial and consumer markets) (1974-present). | | 153 | | Director, Greif, Inc. (GEF) (industrial package products and services) (2007-present); Trustee, Columbus Association for the Performing Arts (1988-present); Director, Cardinal Health, Inc. (CAH) (1994-2014). |
| | | |
| Dr. Matthew Goldstein (1941); Chairman since 2013; Trustee of Trusts since 2005; Trustee of heritage J.P. Morgan Funds since 2003. | | Chancellor Emeritus, City University of New York (2015-present); Professor, City University of New York (2013-present); Chancellor, City University of New York (1999-2013); President, Adelphi University (New York) (1998-1999). | | 153 | | Trustee, Museum of Jewish Heritage (2011-present). |
| | | |
| Robert J. Higgins (1945); Trustee of Trusts since 2005; Trustee of heritage J.P. Morgan Funds since 2002. | | Retired; Director of Administration of the State of Rhode Island (2003-2004); President — Consumer Banking and Investment Services, Fleet Boston Financial (1971-2001). | | 153 | | None |
| | | |
| Frankie D. Hughes (1952), Trustee of Trusts since 2008. | | President, Ashland Hughes Properties (property management) (2014-present); President and Chief Investment Officer, Hughes Capital Management, Inc. (fixed income asset management) (1993-2014). | | 153 | | Trustee, The Victory Portfolios
(2000-2008) (Investment companies). |
| | | |
| Peter C. Marshall (1942); Trustee of Trusts since 2005; Trustee of heritage One Group Mutual Funds since 1985. | | Self-employed business consultant
(2002-present). | | 153 | | None |
| | | |
| Mary E. Martinez (1960); Trustee of Trusts since 2013. | | Associate, Special Properties, a Christie’s International Real Estate Affiliate (2010-present); Managing Director, Bank of America (Asset Management) (2007-2008); Chief Operating Officer, U.S. Trust Asset Management, U.S. Trust Company (asset management) (2003-2007); President, Excelsior Funds (registered investment companies) (2004-2005). | | 153 | | None |
| | | |
| Marilyn McCoy* (1948); Trustee of Trusts since 2005; Trustee of heritage One Group Mutual Funds since 1999. | | Vice President of Administration and Planning, Northwestern University (1985-present). | | 153 | | Trustee, Carleton College
(2003-present). |
| | | |
| Mitchell M. Merin (1953); Trustee of Trusts since 2013. | | Retired; President and Chief Operating Officer, Morgan Stanley Investment Management, Member Morgan Stanley & Co. Management Committee (registered investment adviser) (1998-2005). | | 153 | | Director, Sun Life Financial (SLF) (2007-2013) (financial services and insurance); Trustee, Trinity College, Hartford, CT (2002-2010). |
| | | |
| William G. Morton, Jr. (1937); Trustee of Trusts since 2005; Trustee of heritage J.P. Morgan Funds since 2003. | | Retired; Chairman Emeritus (2001-2002), and Chairman and Chief Executive Officer, Boston Stock Exchange (1985-2001). | | 153 | | Director, Radio Shack Corp. (electronics) (1987-2008); Director, National Organization of Investment Professionals (2010-present); Trustee of the Stratton Mountain School (2001-present). |
| | | | | | |
| | | |
| 82 | | | | J.P. MORGAN MID CAP/MULTI-CAP FUNDS | | JUNE 30, 2015 |
| | | | | | |
Name (Year of Birth); Positions With the Funds (1) | | Principal Occupations During Past 5 Years | | Number of
Portfolios in Fund
Complex Overseen
by Trustee (2) | | Other Directorships Held Outside Fund Complex During Past 5 Years |
Independent Trustees (continued) | | |
| | | |
| Dr. Robert A. Oden, Jr. (1946); Trustee of Trusts since 2005; Trustee of heritage One Group Mutual Funds since 1997. | | Retired; President, Carleton College
(2002-2010); President, Kenyon College
(1995-2002). | | 153 | | Chairman, Dartmouth-Hitchcock Medical Center (2011-present); Trustee, American Schools of Oriental Research (2011-present); Trustee, American University in Cairo (1999-2014); Trustee, American Museum of Fly Fishing (2013-present). |
| | | |
| Marian U. Pardo** (1946); Trustee of Trusts since 2013. | | Managing Director and Founder, Virtual Capital Management LLC (Investment Consulting) (2007-present); Managing Director, Credit Suisse Asset Management (portfolio manager) (2003-2006). | | 153 | | Member, Board of Governors, Columbus Citizens Foundation (not-for-profit supporting philanthropic and cultural programs) (2006-present). |
| | | |
| Frederick W. Ruebeck (1939); Trustee of Trusts since 2005; Trustee of heritage One Group Mutual Funds since 1994. | | Consultant (2000-present); Adviser, JP Greene & Associates, LLC (broker-dealer)
(2000-2009); Chief Investment Officer, Wabash College (2004-present); Director of Investments, Eli Lilly and Company (pharmaceuticals) (1988-1999). | | 153 | | Trustee, Wabash College
(1988-present); Chairman, Indianapolis Symphony Foundation (1994-present). |
| | | |
| James J. Schonbachler (1943); Trustee of Trusts since 2005; Trustee of heritage J.P. Morgan Funds since 2001. | | Retired; Managing Director of Bankers Trust Company (financial services) (1968-1998). | | 153 | | None |
| (1) | The Trustees serve for an indefinite term, subject to the Trusts’ current retirement policy, which is age 78 for all Trustees. |
| (2) | A Fund Complex means two or more registered investment companies that hold themselves out to investors as related companies for purposes of investment and investor services or have a common investment adviser or have an investment adviser that is an affiliated person of the investment adviser of any of the other registered investment companies. The J.P. Morgan Funds Complex for which the Board of Trustees serves currently includes eleven registered investment companies (153 funds). |
| * | Two members of the Board of Trustees of Northwestern University are executive officers of registered investment advisers (not affiliated with JPMorgan) that are under common control with sub-advisers to certain J.P. Morgan Funds. |
| ** | In connection with prior employment with JPMorgan Chase, Ms. Pardo is the recipient of non-qualified pension plan payments from JPMorgan Chase in the amount of approximately $2,055 per month, which she irrevocably waived effective January 1, 2013, and deferred compensation payments from JPMorgan Chase in the amount of approximately $7,294 per year, which ended in January 2013. In addition, Ms. Pardo receives payments from a fully funded qualified plan, which is not an obligation of JPMorgan Chase. |
The contact address for each of the Trustees is 270 Park Avenue, New York, NY 10017.
| | | | | | | | |
| | | |
| JUNE 30, 2015 | | J.P. MORGAN MID CAP/MULTI-CAP FUNDS | | | | | 83 | |
OFFICERS
(Unaudited)
| | |
Name (Year of Birth), Positions Held with the Trusts (Since) | | Principal Occupations During Past 5 Years |
| |
Robert L. Young (1963),
President and Principal Executive Officer (2013)* | | Chief Operating Officer and Director, J.P. Morgan Investment Management. Inc. since 2010; Senior Vice President, J.P. Morgan Funds (2005-2010), Chief Operating Officer, J.P. Morgan Funds (2005-2010); Director and various officer positions for JPMorgan Funds Management, Inc. (formerly One Group Administrative Services) and JPMorgan Distribution Services, Inc. (formerly One Group Dealer Services, Inc.) from 1999 to present. Mr. Young has been with JPMorgan Chase & Co. (formerly Bank One Corporation) since 1997. |
| |
Laura M. Del Prato (1964),
Treasurer and Principal Financial Officer (2014) | | Managing Director, JPMorgan Funds Management, Inc. since 2014; Partner, Cohen Fund Audit Services, Ltd. (2012-2013); Partner (2004-2012) and various other titles (1990-2004) at KPMG, LLP. |
| |
Frank J. Nasta (1964),
Secretary (2008) | | Managing Director and Associate General Counsel, JPMorgan Chase since 2008; Previously, Director, Managing Director, General Counsel and Corporate Secretary, J. & W. Seligman & Co. Incorporated; Secretary of each of the investment companies of the Seligman Group of Funds and Seligman Data Corp.; Director and Corporate Secretary, Seligman Advisors, Inc. and Seligman Services, Inc. |
| |
Stephen M. Ungerman (1953),
Chief Compliance Officer (2005) | | Managing Director, JPMorgan Chase & Co.; Mr. Ungerman has been with JPMorgan Chase & Co. since 2000. |
| |
Elizabeth A. Davin (1964), Assistant Secretary (2005)* | | Executive Director and Assistant General Counsel, JPMorgan Chase since February 2012; formerly Vice President and Assistant General Counsel, JPMorgan Chase from 2005 to February 2012; Senior Counsel, JPMorgan Chase (formerly Bank One Corporation) from 2004 to 2005. |
| |
Jessica K. Ditullio (1962),
Assistant Secretary (2005)* | | Executive Director and Assistant General Counsel, JPMorgan Chase since February 2011; Ms. Ditullio has served as an attorney with various titles for JPMorgan Chase (formerly Bank One Corporation) since 1990. |
| |
John T. Fitzgerald (1975),
Assistant Secretary (2008) | | Executive Director and Assistant General Counsel, JPMorgan chase since February 2011; formerly, Vice President and Assistant General Counsel, JPMorgan Chase from 2005 to February 2011. |
| |
Carmine Lekstutis (1980),
Assistant Secretary (2011) | | Executive Director and Assistant General Counsel, JPMorgan Chase since February 2015; formerly Vice President and Assistant General Counsel, JPMorgan Chase from 2011 to February 2015; Associate, Skadden, Arps, Slate, Meagher & Flom LLP (law firm) from 2006 to 2011. |
| |
Gregory S. Samuels (1980),
Assistant Secretary (2010) | | Executive Director and Assistant General Counsel, JPMorgan Chase since 2014; formerly Vice President and Assistant General Counsel, JPMorgan Chase since 2010; Associate, Ropes & Gray (law firm) from 2008 to 2010; Associate, Clifford Chance LLP (law firm) from 2005 to 2008. |
| |
Pamela L. Woodley (1971),
Assistant Secretary (2012)** | | Vice President and Assistant General Counsel, JPMorgan Chase since November 2004. |
| |
Michael M. D’Ambrosio (1969),
Assistant Treasurer (2012) | | Managing Director, JPMorgan Funds Management, Inc. since May 2014; formerly Executive Director, JPMorgan Funds Management, Inc. from 2012 to May 2014; prior to joining JPMorgan Chase, Mr. D’Ambrosio was a Tax Director at PricewaterhouseCoopers LLP since 2006. |
| |
Joseph Parascondola (1963),
Assistant Treasurer (2011) | | Vice President, JPMorgan Funds Management, Inc. since August 2006. |
| |
Matthew J. Plastina (1970),
Assistant Treasurer (2011) | | Vice President, JPMorgan Funds Management, Inc. since August 2010; prior to August 2010, Vice President and Controller, Legg Mason Global Asset Management. |
| |
Julie A. Roach (1971),
Assistant Treasurer (2012)* | | Vice President, JPMorgan Funds Management, Inc. since August 2012; prior to joining JPMorgan Chase, Ms. Roach was a Senior Manager with Deloitte since 2001. |
| |
Gillian I. Sands (1969),
Assistant Treasurer (2012) | | Vice President, JPMorgan Funds Management, Inc. since September 2012; Assistant Treasurer, Wells Fargo Funds Management (2007-2009). |
The contact address for each of the officers, unless otherwise noted, is 270 Park Avenue, New York, NY 10017.
| * | The contact address for the officer is 460 Polaris Parkway, Westerville, OH 43082. |
| ** | The contact address for the officer is 4 New York Plaza, Floor 21, New York, NY 10004. |
| | | | | | |
| | | |
| 84 | | | | J.P. MORGAN MID CAP/MULTI-CAP FUNDS | | JUNE 30, 2015 |
SCHEDULE OF SHAREHOLDER EXPENSES
(Unaudited)
Hypothetical $1,000 Investment
As a shareholder of the Funds, you incur two types of costs: (1) transaction costs, including sales charges (loads) on purchase payments and (2) ongoing costs, including investment advisory fees, administration fees, distribution fees and other Fund expenses. The examples below are intended to help you understand your ongoing costs (in dollars) of investing in the Funds and to compare these ongoing costs with the ongoing costs of investing in other mutual funds. The examples assume that you had a $1,000 investment in each Class at the beginning of the reporting period, January 1, 2015, and continued to hold your shares at the end of the reporting period, June 30, 2015.
Actual Expenses
For each Class of each Fund in the table below, the first line provides information about actual account values and actual expenses. You may use the information in this line, together with the amount you invested, to estimate the expenses that you paid over the period. Simply divide your account value by $1,000 (for example, an $8,600 account value divided by $1,000 = 8.6), then multiply the result by the number in the first line of each Class under the heading entitled “Expenses Paid During the Period” to estimate the expenses you paid on your account during this period.
Hypothetical Example for Comparison Purposes
The second line of each Class in the table below provides information about hypothetical account values and hypothetical expenses based on the Class’ actual expense ratio and an assumed rate of return of 5% per year before expenses, which is not the Class’ actual return. The hypothetical account values and expenses may not be used to estimate the actual ending account balance or expenses you paid for the period. You may use this information to compare the ongoing costs of investing in the Class of the Fund and other funds. To do so, compare this 5% hypothetical example with the 5% hypothetical examples that appear in the shareholder reports of the other funds. Please note that the expenses shown in the table are meant to highlight your ongoing costs only and do not reflect any transaction costs, such as sales charges (loads) or redemption fees. Therefore, the second line for each Class in the table is useful in comparing ongoing costs only, and will not help you determine the relative total costs of owning different funds. In addition, if these transaction costs were included, your costs would have been higher. The examples also assume all dividends and distributions have been reinvested.
Expense Example
| | | | | | | | | | | | | | | | |
| | | Beginning
Account Value
January 1, 2015 | | | Ending
Account Value
June 30, 2015 | | | Expenses
Paid During
the Period* | | | Annualized
Expense
Ratio | |
Growth Advantage Fund | | | | | | | | | | | | | | | | |
Class A | | | | | | | | | | | | | | | | |
Actual | | $ | 1,000.00 | | | $ | 1,098.40 | | | $ | 6.45 | | | | 1.24 | % |
Hypothetical | | | 1,000.00 | | | | 1,018.65 | | | | 6.21 | | | | 1.24 | |
Class C | | | | | | | | | | | | | | | | |
Actual | | | 1,000.00 | | | | 1,096.40 | | | | 9.04 | | | | 1.74 | |
Hypothetical | | | 1,000.00 | | | | 1,016.17 | | | | 8.70 | | | | 1.74 | |
Class R5 | | | | | | | | | | | | | | | | |
Actual | | | 1,000.00 | | | | 1,100.20 | | | | 5.00 | | | | 0.96 | |
Hypothetical | | | 1,000.00 | | | | 1,020.38 | | | | 4.81 | | | | 0.96 | |
Class R6 | | | | | | | | | | | | | | | | |
Actual | | | 1,000.00 | | | | 1,100.80 | | | | 3.91 | | | | 0.75 | |
Hypothetical | | | 1,000.00 | | | | 1,021.08 | | | | 3.76 | | | | 0.75 | |
Select Class | | | | | | | | | | | | | | | | |
Actual | | | 1,000.00 | | | | 1,099.20 | | | | 5.78 | | | | 1.11 | |
Hypothetical | | | 1,000.00 | | | | 1,019.39 | | | | 5.56 | | | | 1.11 | |
| | | | |
Mid Cap Equity Fund | | | | | | | | | | | | | | | | |
Class A | | | | | | | | | | | | | | | | |
Actual | | | 1,000.00 | | | | 1,057.20 | | | | 6.32 | | | | 1.24 | |
Hypothetical | | | 1,000.00 | | | | 1,018.65 | | | | 6.21 | | | | 1.24 | |
Class C | | | | | | | | | | | | | | | | |
Actual | | | 1,000.00 | | | | 1,054.60 | | | | 8.86 | | | | 1.74 | |
Hypothetical | | | 1,000.00 | | | | 1,016.17 | | | | 8.70 | | | | 1.74 | |
Class R2 | | | | | | | | | | | | | | | | |
Actual | | | 1,000.00 | | | | 1,055.70 | | | | 7.59 | | | | 1.49 | |
Hypothetical | | | 1,000.00 | | | | 1,017.41 | | | | 7.45 | | | | 1.49 | |
| | | | | | | | |
| | | |
| JUNE 30, 2015 | | J.P. MORGAN MID CAP/MULTI-CAP FUNDS | | | | | 85 | |
SCHEDULE OF SHAREHOLDER EXPENSES
(Unaudited) (continued)
Hypothetical $1,000 Investment
| | | | | | | | | | | | | | | | |
| | | Beginning
Account Value
January 1, 2015 | | | Ending
Account Value
June 30, 2015 | | | Expenses
Paid During
the Period* | | | Annualized
Expense
Ratio | |
Mid Cap Equity Fund (continued) | | | | | | | | | | | | | | | | |
Class R5 | | | | | | | | | | | | | | | | |
Actual | | $ | 1,000.00 | | | $ | 1,059.60 | | | $ | 4.03 | | | | 0.79 | % |
Hypothetical | | | 1,000.00 | | | | 1,020.88 | | | | 3.96 | | | | 0.79 | |
Class R6 | | | | | | | | | | | | | | | | |
Actual | | | 1,000.00 | | | | 1,059.80 | | | | 3.78 | | | | 0.74 | |
Hypothetical | | | 1,000.00 | | | | 1,021.12 | | | | 3.71 | | | | 0.74 | |
Select Class | | | | | | | | | | | | | | | | |
Actual | | | 1,000.00 | | | | 1,058.80 | | | | 4.54 | | | | 0.89 | |
Hypothetical | | | 1,000.00 | | | | 1,020.38 | | | | 4.46 | | | | 0.89 | |
| | | | |
Mid Cap Growth Fund | | | | | | | | | | | | | | | | |
Class A | | | | | | | | | | | | | | | | |
Actual | | | 1,000.00 | | | | 1,102.20 | | | | 6.41 | | | | 1.23 | |
Hypothetical | | | 1,000.00 | | | | 1,018.70 | | | | 6.16 | | | | 1.23 | |
Class C | | | | | | | | | | | | | | | | |
Actual | | | 1,000.00 | | | | 1,099.20 | | | | 9.00 | | | | 1.73 | |
Hypothetical | | | 1,000.00 | | | | 1,016.22 | | | | 8.65 | | | | 1.73 | |
Class R2 | | | | | | | | | | | | | | | | |
Actual | | | 1,000.00 | | | | 1,101.10 | | | | 7.24 | | | | 1.39 | |
Hypothetical | | | 1,000.00 | | | | 1,017.90 | | | | 6.95 | | | | 1.39 | |
Class R5 | | | | | | | | | | | | | | | | |
Actual | | | 1,000.00 | | | | 1,104.60 | | | | 4.07 | | | | 0.78 | |
Hypothetical | | | 1,000.00 | | | | 1,020.93 | | | | 3.91 | | | | 0.78 | |
Class R6 | | | | | | | | | | | | | | | | |
Actual | | | 1,000.00 | | | | 1,104.70 | | | | 3.81 | | | | 0.73 | |
Hypothetical | | | 1,000.00 | | | | 1,021.17 | | | | 3.66 | | | | 0.73 | |
Select Class | | | | | | | | | | | | | | | | |
Actual | | | 1,000.00 | | | | 1,103.80 | | | | 4.80 | | | | 0.92 | |
Hypothetical | | | 1,000.00 | | | | 1,020.23 | | | | 4.61 | | | | 0.92 | |
| | | | |
Mid Cap Value Fund | | | | | | | | | | | | | | | | |
Class A | | | | | | | | | | | | | | | | |
Actual | | | 1,000.00 | | | | 1,014.00 | | | | 6.14 | | | | 1.23 | |
Hypothetical | | | 1,000.00 | | | | 1,018.70 | | | | 6.16 | | | | 1.23 | |
Class C | | | | | | | | | | | | | | | | |
Actual | | | 1,000.00 | | | | 1,011.30 | | | | 8.68 | | | | 1.74 | |
Hypothetical | | | 1,000.00 | | | | 1,016.17 | | | | 8.70 | | | | 1.74 | |
Class R2 | | | | | | | | | | | | | | | | |
Actual | | | 1,000.00 | | | | 1,012.50 | | | | 7.43 | | | | 1.49 | |
Hypothetical | | | 1,000.00 | | | | 1,017.41 | | | | 7.45 | | | | 1.49 | |
Institutional Class | | | | | | | | | | | | | | | | |
Actual | | | 1,000.00 | | | | 1,016.40 | | | | 3.70 | | | | 0.74 | |
Hypothetical | | | 1,000.00 | | | | 1,021.12 | | | | 3.71 | | | | 0.74 | |
Select Class | | | | | | | | | | | | | | | | |
Actual | | | 1,000.00 | | | | 1,015.20 | | | | 4.90 | | | | 0.98 | |
Hypothetical | | | 1,000.00 | | | | 1,019.93 | | | | 4.91 | | | | 0.98 | |
| | | | |
Multi-Cap Market Neutral Fund | | | | | | | | | | | | | | | | |
Class A | | | | | | | | | | | | | | | | |
Actual | | | 1,000.00 | | | | 980.10 | | | | 13.16 | | | | 2.68 | |
Hypothetical | | | 1,000.00 | | | | 1,011.50 | | | | 13.37 | | | | 2.68 | |
Class C | | | | | | | | | | | | | | | | |
Actual | | | 1,000.00 | | | | 976.90 | | | | 15.59 | | | | 3.18 | |
Hypothetical | | | 1,000.00 | | | | 1,009.03 | | | | 15.84 | | | | 3.18 | |
| | | | | | |
| | | |
| 86 | | | | J.P. MORGAN MID CAP/MULTI-CAP FUNDS | | JUNE 30, 2015 |
| | | | | | | | | | | | | | | | |
| | | Beginning
Account Value
January 1, 2015 | | | Ending
Account Value
June 30, 2015 | | | Expenses
Paid During
the Period* | | | Annualized
Expense
Ratio | |
Multi-Cap Market Neutral Fund (continued) | | | | | | | | | | | | | | | | |
Select Class | | | | | | | | | | | | | | | | |
Actual | | $ | 1,000.00 | | | $ | 980.50 | | | $ | 11.93 | | | | 2.43 | % |
Hypothetical | | | 1,000.00 | | | | 1,012.74 | | | | 12.13 | | | | 2.43 | |
| | | | |
Value Advantage Fund | | | | | | | | | | | | | | | | |
Class A | | | | | | | | | | | | | | | | |
Actual | | | 1,000.00 | | | | 1,005.70 | | | | 6.12 | | | | 1.23 | |
Hypothetical | | | 1,000.00 | | | | 1,018.70 | | | | 6.16 | | | | 1.23 | |
Class C | | | | | | | | | | | | | | | | |
Actual | | | 1,000.00 | | | | 1,003.40 | | | | 8.59 | | | | 1.73 | |
Hypothetical | | | 1,000.00 | | | | 1,016.22 | | | | 8.65 | | | | 1.73 | |
Institutional Class | | | | | | | | | | | | | | | | |
Actual | | | 1,000.00 | | | | 1,008.40 | | | | 3.64 | | | | 0.73 | |
Hypothetical | | | 1,000.00 | | | | 1,021.17 | | | | 3.66 | | | | 0.73 | |
Select Class | | | | | | | | | | | | | | | | |
Actual | | | 1,000.00 | | | | 1,007.10 | | | | 4.88 | | | | 0.98 | |
Hypothetical | | | 1,000.00 | | | | 1,019.93 | | | | 4.91 | | | | 0.98 | |
| * | Expenses are equal to each Class’ respective annualized expense ratio, multiplied by the average account value over the period, multiplied by 181/365 (to reflect the one-half year period). |
| | | | | | | | |
| | | |
| JUNE 30, 2015 | | J.P. MORGAN MID CAP/MULTI-CAP FUNDS | | | | | 87 | |
TAX LETTER
(Unaudited)
Certain tax information for the J.P. Morgan Funds is required to be provided to shareholders based upon the Funds’ income and distributions for the taxable year ended June 30, 2015. The information and distributions reported in this letter may differ from the information and taxable distributions reported to the shareholders for the calendar year ending December 31, 2015. The information necessary to complete your income tax returns for the calendar year ending December 31, 2015 will be provided under separate cover.
Dividends Received Deductions (DRD)
Each fund listed below had the following percentage, or maximum allowable percentage, of ordinary income distributions eligible for the 70% dividends received deductions for corporate shareholders for the fiscal year ended June 30, 2015:
| | | | |
| | | Dividends
Received
Deduction | |
Mid Cap Equity Fund | | | 100.00 | % |
Mid Cap Growth Fund | | | 100.00 | |
Mid Cap Value Fund | | | 100.00 | |
Value Advantage Fund | | | 100.00 | |
Long Term Capital Gain
Each fund listed below distributed the following amount, or maximum allowable amount, of long-term capital gain dividends for the fiscal year ended June 30, 2015 (amounts in thousands):
| | | | |
| | | Long-Term
Capital Gain
Distribution | |
Growth Advantage Fund | | $ | 127,462 | |
Mid Cap Equity Fund | | | 103,413 | |
Mid Cap Growth Fund | | | 190,499 | |
Mid Cap Value Fund | | | 1,021,777 | |
Value Advantage Fund | | | 160,536 | |
Qualified Dividend Income (QDI)
Each fund listed below had the following amount, or maximum allowable amount, of ordinary income distributions treated as qualified dividends for the fiscal year ended June 30, 2015 (amounts in thousands):
| | | | |
| | | Qualified
Dividend
Income | |
Growth Advantage Fund | | $ | 25,227 | |
Mid Cap Equity Fund | | | 38,478 | |
Mid Cap Growth Fund | | | 13,459 | |
Mid Cap Value Fund | | | 255,048 | |
Value Advantage Fund | | | 166,644 | |
| | | | | | |
| | | |
| 88 | | | | J.P. MORGAN MID CAP/MULTI-CAP FUNDS | | JUNE 30, 2015 |

Rev. January 2011
| | |
| FACTS | | WHAT DOES J.P. MORGAN FUNDS DO WITH YOUR PERSONAL INFORMATION? |
| | |
| Why? | | Financial companies choose how they share your personal information. Federal law gives consumers the right to limit some but not all sharing. Federal law also requires us to tell you how we collect, share, and protect your personal information. Please read this notice carefully to understand what we do. |
| | |
| What? | | The types of personal information we collect and share depend on the product or service you have with us. This information can include: ¡ Social Security number and account balances ¡ transaction history and account transactions ¡ checking account information and wire transfer instructions When you are no longer our customer, we continue to share your information as described in this notice. |
| | |
| How? | | All financial companies need to share customers’ personal information to run their everyday business. In the section below, we list the reasons financial companies can share their customers’ personal information; the reasons J.P. Morgan Funds chooses to share; and whether you can limit this sharing. |
| | | | |
| Reasons we can share your personal information | | Does J.P. Morgan
Funds share? | | Can you limit this
sharing? |
For our everyday business purposes — such as to process your transactions, maintain your account(s), respond to court orders and legal investigations, or report to credit bureaus | | Yes | | No |
For marketing purposes — to offer our products and services to you | | Yes | | No |
| For joint marketing with other financial companies | | No | | We don’t share |
For our affiliates’ everyday business purposes — information about your transactions and experiences | | No | | We don’t share |
For our affiliates’ everyday business purposes — information about your creditworthiness | | No | | We don’t share |
| For nonaffiliates to market to you | | No | | We don’t share |
| | |
| | |
| Questions? | | Call 1-800-480-4111 or go to www.jpmorganfunds.com |

| | |
| Who we are |
| Who is providing this notice? | | J.P. Morgan Funds |
| | |
| What we do |
| How does J.P. Morgan Funds protect my personal information? | | To protect your personal information from unauthorized access and use, we use security measures that comply with federal law. These measures include computer safeguards and secured files and buildings. We authorize our employees to access your information only when they need it to do their work and we require companies that work for us to protect your information. |
How does J.P. Morgan Funds collect my personal information? | | We collect your personal information, for example, when you: ¡ open an account or provide contact information ¡ give us your account information or pay us by check ¡ make a wire transfer We also collect your personal information from others, such as credit bureaus, affiliates and other companies. |
| Why can’t I limit all sharing? | | Federal law gives you the right to limit only ¡ sharing for affiliates’ everyday business purposes – information about your creditworthiness ¡ affiliates from using your information to market to you ¡ sharing for nonaffiliates to market to you State laws and individual companies may give you additional rights to limit sharing. |
| | |
| Definitions |
| Affiliates | | Companies related by common ownership or control. They can be financial and nonfinancial companies. ¡ J.P. Morgan Funds does not share with our affiliates. |
| Nonaffiliates | | Companies not related by common ownership or control. They can be financial and nonfinancial companies. ¡ J.P. Morgan Funds does not share with nonaffiliates so they can market to you. |
| Joint Marketing | | A formal agreement between nonaffiliated financial companies that together market financial products or services to you. ¡ J.P. Morgan Funds doesn’t jointly market. |
J.P. Morgan Funds are distributed by JPMorgan Distribution Services, Inc., which is an affiliate of JPMorgan Chase & Co. Affiliates of JPMorgan Chase & Co. receive fees for providing various services to the funds.
Contact JPMorgan Distribution Services, Inc. at 1-800-480-4111 for a fund prospectus. You can also visit us at www.jpmorganfunds.com. Investors should carefully consider the investment objectives and risk as well as charges and expenses of the mutual fund before investing. The prospectus contains this and other information about the mutual fund. Read the prospectus carefully before investing.
Investors may obtain information about the Securities Investor Protection Corporation (SIPC), including the SIPC brochure by visiting www.sipc.org or by calling SIPC at 202-371-8300.
Each Fund files a complete schedule of its fund holdings for the first and third quarters of its fiscal year with the SEC on Form N-Q. The Funds’ Forms N-Q are available on the SEC’s website at http://www.sec.gov and may be reviewed and copied at the SEC’s Public Reference Room in Washington, DC. Information on the operation of the SEC’s Public Reference Room may be obtained by calling 1-800-SEC-0330. Shareholders may request the Form N-Q without charge by calling 1-800-480-4111 or by visiting the J.P. Morgan Funds’ website at www.jpmorganfunds.com.
A description of each Fund’s policies and procedures with respect to the disclosure of each Fund’s holdings is available in the prospectus and Statement of Additional Information.
A copy of proxy policies and procedures is available without charge upon request by calling 1-800-480-4111 and on the Funds’ website at www.jpmorganfunds.com. A description of such policies and procedures is on the SEC’s website at www.sec.gov. The Trustees have delegated the authority to vote proxies for securities owned by the Funds to the Adviser. A copy of the Funds’ voting record for the most recent 12-month period ended June 30 is available on the SEC’s website at www.sec.gov or at the Funds’ website at www.jpmorganfunds.com no later than August 31 of each year. The Funds’ proxy voting record will include, among other things, a brief description of the matter voted on for each fund security, and will state how each vote was cast, for example, for or against the proposal.


J.P. Morgan Asset Management is the marketing name for the asset management business of JPMorgan Chase & Co. Those businesses include, but are not limited to, J.P. Morgan Investment Management Inc., Security Capital Research & Management Incorporated and J.P. Morgan Alternative Asset Management, Inc.
| | | | |
| | © JPMorgan Chase & Co., 2015. All rights reserved. June 2015. | | AN-MC-615 |
ITEM 2. CODE OF ETHICS.
Disclose whether, as of the end of the period covered by the report, the registrant has adopted a code of ethics that applies to the registrant’s principal executive officer, principal financial officer, principal accounting officer or controller, or persons performing similar functions, regardless of whether these individuals are employed by the registrant or a third party. If the registrant has not adopted such a code of ethics, explain why it has not done so.
The registrant must briefly describe the nature of any amendment, during the period covered by the report, to a provision of its code of ethics that applies to the registrant’s principal executive officer, principal financial officer, principal accounting officer or controller, or persons performing similar functions, regardless of whether these individuals are employed by the registrant or a third party, and that relates to any element of the code of ethics definition enumerated in paragraph (b) of this Item. The registrant must file a copy of any such amendment as an exhibit pursuant to Item 12(a)(1), unless the registrant has elected to satisfy paragraph (f) of this Item by positing its code of ethics on its website pursuant to paragraph (f)(2) of this Item, or by undertaking to provide its code of ethics to any person without charge, upon request, pursuant to paragraph (f)(3) of this Item.
If the registrant has, during the period covered by the report, granted a waiver, including an implicit waiver, from a provision of the code of ethics that applies to the registrant’s principal executive officer, principal financial officer, principal accounting officer or controller, or persons performing similar functions, regardless of whether these individuals are employed by the registrant or third party, that relates to one or more items set forth in paragraph (b) of this Item, the registrant must briefly describe the nature of the waiver, the name of the person to whom the waiver was granted, and the date of the waiver.
The Registrant has adopted a code of ethics that applies to the Registrant’s principal executive officer and principal financial officer. There were no amendments to the code of ethics or waivers granted with respect to the code of ethics in the period covered by the report.
ITEM 3. AUDIT COMMITTEE FINANCIAL EXPERT.
(a) (1) Disclose that the registrant’s board of directors has determined that the registrant either:
(i) Has at least one audit committee financial expert serving on its audit committee; or
(ii) Does not have an audit committee financial expert serving on its audit committee.
The Registrant’s Board of Trustees has determined that the Registrant has at least one audit committee financial expert serving on its audit committee. The Securities and Exchange Commission has stated that the designation or identification of a person as an audit committee financial expert pursuant to this Item 3 of Form N-CSR does not impose on such person any duties, obligations or liabilities that are greater than the duties, obligations and liabilities imposed on such person as a member of the Audit Committee and the Board of Trustees in the absence of such designation or identification.
(2) If the registrant provides the disclosure required by paragraph (a)(1)(i) of this Item, it must disclose the name of the audit committee financial expert and whether that person is “independent.” In order to be considered “independent” for purposes of this Item, a member of an audit committee may not, other than in his or her capacity as a member of the audit committee, the board of directors, or any other board committee:
(i) Accept directly or indirectly any consulting, advisory, or other compensatory fee from the issuer; or
(ii) Be an “interested person” of the investment company as defined in Section 2(a)(19) of the Act (15 U.S.C. 80a-2(a)(19)).
The audit committee financial expert is Mitchell Merin. He is not an “interested person” of the Registrant and is also “independent” as defined by the U.S. Securities and Exchange Commission for purposes of audit committee financial expert determinations.
(3) If the registrant provides the disclosure required by paragraph (a)(1)(ii) of this Item, it must explain why it does not have an audit committee financial expert.
Not applicable.
ITEM 4. PRINCIPAL ACCOUNTANT FEES AND SERVICES.
(a) Disclose, under the caption Audit Fees, the aggregate fees billed for each of the last two fiscal years for professional services rendered by the principal accountant for the audit of the registrant’s annual financial statements or services that are normally provided by the accountant in connection with statutory and regulatory filings or engagements for those fiscal years.
AUDIT FEES
2015 – $28,100
2014 – $27,150
(b) Disclose, under the caption Audit-Related Fees, the aggregate fees billed in each of the last two fiscal years for assurance and related services by the principal accountant that are reasonably related to the performance of the audit of the registrant’s financial statements and are not reported under paragraph (a) of this Item. Registrants shall describe the nature of the services comprising the fees disclosed under this category.
AUDIT-RELATED FEES
2015 – $5,500
2014 – $5,020
Audit-related fees consists of semi-annual financial statement reviews and security count procedures performed as required under Rule 17f-2 of the Investment Company Act of 1940 during the Registrant’s fiscal year.
(c) Disclose, under the caption Tax Fees, the aggregate fees billed in each of the last two fiscal years for professional services rendered by the principal accountant for tax compliance, tax advice, and tax planning. Registrants shall describe the nature of the services comprising the fees disclosed under this category.
TAX FEES
2015 – $10,035
2014 – $8,330
The tax fees consist of fees billed in connection with preparing the federal regulated investment company income tax returns for the Registrant for the tax years ended June 30, 2015 and 2014, respectively.
For the last fiscal year, no tax fees were required to be approved pursuant to paragraph (c)(7)(ii) of Rule 2-01 of Regulation S-X.
(d) Disclose, under the caption All Other Fees, the aggregate fees billed in each of the last two fiscal years for products and services provided by the principal accountant, other than the services reported in paragraphs (a) through (c) of this Item. Registrants shall describe the nature of the services comprising the fees disclosed under this category.
ALL OTHER FEES
2015 – Not applicable
2014 – Not applicable
(e) (1) Disclose the audit committee’s pre-approval policies and procedures described in paragraph (c)(7) of Rule 2-01 of Regulation S-X.
Pursuant to the Registrant’s Audit Committee Charter and written policies and procedures for the pre-approval of audit and non-audit services (the “Pre-approval Policy”), the Audit Committee pre-approves all audit and non-audit services performed by the Registrant’s independent public registered accounting firm for the Registrant. In addition, the Audit Committee pre-approves the auditor’s engagement for non-audit services with the Registrant’s investment adviser (not including a sub-adviser whose role is primarily portfolio management and is sub-contracted or overseen by another investment adviser) and any Service Affiliate in accordance with paragraph (c)(7)(ii) of Rule 2-01 of Regulation S-X, if the engagement relates directly to the operations and financial reporting of the Registrant. Proposed services may be pre-approved either 1) without consideration of specific case-by-case services or 2) require the specific pre-approval of the Audit Committee. Therefore, initially the Pre-approval Policy listed a number of audit and non-audit services that have been approved by the Audit Committee, or which were not subject to pre-approval under the transition provisions of Sarbanes-Oxley Act of 2002 (the “Pre-approval List”). The Audit Committee annually reviews and pre-approves the services included on the Pre-approval List that may be provided by the independent public registered accounting firm without obtaining additional specific pre-approval of individual services from the Audit Committee. The Audit Committee adds to, or subtracts from, the list of general pre-approved services from time to time, based on subsequent determinations. All other audit and non-audit services not on the Pre-approval List must be specifically pre-approved by the Audit Committee.
One or more members of the Audit Committee may be appointed as the Committee’s delegate for the purposes of considering whether to approve such services. Any pre-approvals granted by the delegate will be reported, for informational purposes only, to the Audit Committee at its next scheduled meeting. The Audit Committee’s responsibilities to pre-approve services performed by the independent public registered accounting firm are not delegated to management.
(2) Disclose the percentage of services described in each of paragraphs (b) through (d) of this Item that were approved by the audit committee pursuant to paragraph (c)(7)(i)(C) of Rule 2-01 of Regulation S-X.
2015 – 0.0%
2014 – 0.0%
(f) If greater than 50 percent, disclose the percentage of hours expended on the principal accountant’s engagement to audit the registrant’s financial statements for the most recent fiscal year that were attributed to work performed by persons other than the principal accountant’s full-time, permanent employees.
None.
(g) Disclose the aggregate non-audit fees billed by the registrant’s accountant for services rendered to the registrant, and rendered to the registrant’s investment adviser (not including any sub-adviser whose role is primarily portfolio management and is subcontracted with or overseen by another investment adviser), and any entity controlling, controlled by, or under common control with the adviser that provides ongoing services to the registrant for each of the last two fiscal years of the registrant.
The aggregate non-audit fees billed by the independent registered public accounting firm for services rendered to the Registrant, and rendered to Service Affiliates, for the last two calendar year ends were:
2014 – $30.6 million
2013 – $33.7million
(h) Disclose whether the registrant’s audit committee of the board of directors has considered whether the provision of non-audit services that were rendered to the registrant’s investment adviser (not including any subadviser whose role is primarily portfolio management and is subcontracted with or overseen by another investment adviser), and any entity controlling, controlled by, or under common control with the investment adviser that provides ongoing services to the registrant that were not pre-approved pursuant to paragraph (c)(7)(ii) of Rule 2-01 of Regulation S-X is compatible with maintaining the principal accountant’s independence.
The Registrant’s Audit Committee has considered whether the provision of the non-audit services that were rendered to Service Affiliates that were not pre-approved (not requiring pre-approval) is compatible with maintaining the independent public registered accounting firm’s independence. All services provided by the independent public registered accounting firm to the Registrant or to Service Affiliates that were required to be pre-approved were pre-approved as required.
ITEM 5. AUDIT COMMITTEE OF LISTED REGISTRANTS.
(a) If the registrant is a listed issuer as defined in Rule 10A-3 under the Exchange Act (17CFR 240.10A-3), state whether or not the registrant has a separately-designated standing audit committee established in accordance with Section 3(a)(58)(A) of the Exchange Act (15 U.S.C. 78c(a)(58)(A)). If the registrant has such a committee, however designated, identify each committee member. If the entire board of directors is acting as the registrant’s audit committee as specified in Section 3(a)(58)(B) of the Exchange Act (15 U.S.C. 78c(a)(58)(B)), so state.
(b) If applicable, provide the disclosure required by Rule 10A-3(d) under the Exchange Act (17CFR 240.10A-3(d)) regarding an exemption from the listing standards for all audit committees.
Not applicable.
ITEM 6. SCHEDULE OF INVESTMENTS.
File Schedule I – Investments in securities of unaffiliated issuers as of the close of the reporting period as set forth in Section 210.12-12 of Regulation S-X, unless the schedule is included as part of the report to shareholders filed under Item 1 of this Form.
Included in Item 1.
ITEM 7. DISCLOSURE OF PROXY VOTING POLICIES AND PROCEDURES FOR CLOSED-END MANAGEMENT INVESTMENT COMPANIES.
A closed-end management investment company that is filing an annual report on this Form N-CSR must, unless it invests exclusively in non-voting securities, describe the policies and procedures that it uses to determine how to vote proxies relating to portfolio securities, including the procedures that the company uses when a vote presents a conflict between the interests of its shareholders, on the one hand, and those of the company’s investment adviser; principal underwriter; or any affiliated person (as defined in Section 2(a)(3) of the Investment Company Act of 1940 (15 U.S.C. 80a-2(a)(3)) and the rules thereunder) of the company, its investment adviser, or its principal underwriter, on the other. Include any policies and procedures of the company’s investment adviser, or any other third party, that the company uses, or that are used on the company’s behalf, to determine how to vote proxies relating to portfolio securities.
Not applicable.
ITEM 8. PORTFOLIO MANAGERS OF CLOSED-END MANAGEMENT INVESTMENT COMPANIES.
Not applicable.
ITEM 9. PURCHASE OF EQUITY SECURITIES BY CLOSED-END MANAGEMENT INVESTMENT COMPANY AND AFFILIATED PURCHASERS.
(a) If the registrant is a closed-end management investment company, provide the information specified in paragraph (b) of this Item with respect to any purchase made by or on behalf of the registrant or any “affiliated purchaser,” as defined in Rule 10b-18(a)(3) under the Exchange Act (17 CFR 240.10b-18(a)(3)), of shares or other units of any class of the registrant’s equity securities that is registered by the registrant pursuant to Section 12 of the Exchange Act (15 U.S.C. 781).
Not applicable.
ITEM 10. SUBMISSION OF MATTERS TO A VOTE OF SECURITY HOLDERS.
Describe any material changes to the procedures by which shareholders may recommend nominees to the registrant’s board of directors, where those changes were implemented after the registrant last provided disclosure in response to the requirements of Item 7(d)(2)(ii)(G) of Schedule 14A (17 CFR 240.14a-101), or this Item.
No material changes to report.
ITEM 11. CONTROLS AND PROCEDURES.
(a) Disclose the conclusions of the registrant’s principal executive and principal financial officers, or persons performing similar functions, regarding the effectiveness of the registrant’s disclosure controls and procedures (as defined in Rule 30a-3(c) under the Act (17 CFR 270.30a-3(c))) as of a date within 90 days of the filing date of the report that includes the disclosure required by this paragraph, based on the evaluation of these controls and procedures required by Rule 30a-3(b) under the Act (17 CFR 270.30a-3(b)) and Rules 13a-15(b) or 15d-15(b) under the Exchange Act (17 CFR 240.13a-15(b) or 240.15d-15(b)).
The Registrant’s principal executive and principal financial officers have concluded, based on their evaluation of the Registrant’s disclosure controls and procedures as of a date within 90 days of the filing date of this report, that the Registrant’s disclosure controls and procedures are reasonably designed to ensure that information required to be disclosed by the Registrant on Form N-CSR is recorded, processed, summarized and reported within the required time periods and that information required to be disclosed by the Registrant in the reports that it files or submits on Form N-CSR is accumulated and communicated to the Registrant’s management, including its principal executive and principal financial officers, as appropriate to allow timely decisions regarding required disclosure.
(b) Disclose any change in the registrant’s internal control over financial reporting (as defined in Rule 30a-3(d) under the Act (17 CFR 270.30a-3(d)) that occurred during the registrant’s second fiscal quarter of the period covered by this report that has materially affected, or is reasonably likely to materially affect, the registrant’s internal control over financial reporting.
There were no changes in the Registrant’s internal control over financial reporting that occurred during the last fiscal quarter covered by this report that have materially affected, or are reasonably likely to materially affect, the Registrant’s internal control over financial reporting.
ITEM 12. EXHIBITS.
(a) File the exhibits listed below as part of this Form. Letter or number the exhibits in the sequence indicated.
(a)(1) Any code of ethics, or amendment thereto, that is the subject of the disclosure required by Item 2, to the extent that the registrant intends to satisfy the Item 2 requirements through filing of an exhibit.
Code of Ethics applicable to its Principal Executive and Principal Financial Officers pursuant to Section 406 of the Sarbanes-Oxley Act of 2002 attached hereto.
(a)(2) A separate certification for each principal executive officer and principal financial officer of the registrant as required by Rule 30a-2(a) under the Act (17 CFR 270.30a-2).
Certifications pursuant to Rule 30a-2(a) under the Investment Company Act of 1940 are attached hereto.
(a)(3) Any written solicitation to purchase securities under Rule 23c-1 under the Act (17 CFR 270.23c-1) sent or given during the period covered by the report by or on behalf of the registrant to 10 or more persons.
Not applicable.
(b) A separate or combined certification for each principal executive officer and principal officer of the registrant as required by Rule 30a-2(b) under the Act of 1940.
Certifications pursuant to Rule 30a-2(b) under the Investment Company Act of 1940 are attached hereto.
SIGNATURES
Pursuant to the requirements of the Securities Exchange Act of 1934 and the Investment Company Act of 1940, the registrant has duly caused this report to be signed on its behalf by the undersigned, thereunto duly authorized.
J.P. Morgan Fleming Mutual Fund Group, Inc.
| | |
| By: | | /s/ Robert L. Young |
| | Robert L. Young |
| | President and Principal Executive Officer |
| | September 3, 2015 |
Pursuant to the requirements of the Securities Exchange Act of 1934 and the Investment Company Act of 1940, this report has been signed below by the following persons on behalf of the registrant and in the capacities and on the dates indicated.
| | |
| By: | | /s/ Robert L. Young |
| | Robert L. Young |
| | President and Principal Executive Officer |
| | September 3, 2015 |
| |
| By: | | /s/ Laura M. Del Prato |
| | Laura M. Del Prato |
| | Treasurer and Principal Financial Officer |
| | September 3, 2015 |