UNITED STATES
SECURITIES AND EXCHANGE COMMISSION
Washington, D.C. 20549
FORM N-CSR
CERTIFIED SHAREHOLDER REPORT OF REGISTERED
MANAGEMENT INVESTMENT COMPANIES
Investment Company Act file number: 811-08189
J.P. Morgan Fleming Mutual Fund Group, Inc.
(Exact name of registrant as specified in charter)
277 Park Avenue
New York, NY 10172
(Address of principal executive offices) (Zip code)
Gregory S. Samuels
277 Park Avenue
New York, NY 10172
(Name and Address of Agent for Service)
Registrant’s telephone number, including area code: (800) 480-4111
Date of fiscal year end: June 30
Date of reporting period: July 1, 2021 through June 30, 2022
Form N-CSR is to be used by management investment companies to file reports with the Commission not later than 10 days after the transmission to stockholders of any report that is required to be transmitted to stockholders under Rule 30e-1 under the Investment Company Act of 1940 (17 CFR 270.30e-1). The Commission may use the information provided on Form N-CSR in its regulatory, disclosure review, inspection, and policymaking roles.
A registrant is required to disclose the information specified by Form N-CSR, and the Commission will make this information public. A registrant is not required to respond to the collection of information contained in Form N-CSR unless the Form displays a currently valid Office of Management and Budget (“OMB”) control number. Please direct comments concerning the accuracy of the information collection burden estimate and any suggestions for reducing the burden to Secretary, Securities and Exchange Commission, 450 Fifth Street, NW, Washington, DC 20549-0609. The OMB has reviewed this collection of information under the clearance requirements of 44 U.S.C. Section 3507.
ITEM 1. REPORTS TO STOCKHOLDERS.
a.) The following is a copy of the report transmitted to shareholders pursuant to Rule 30e-1 under the Investment Company Act of 1940 (17 CFR 270.30e-1).
b.) A copy of the notice transmitted to shareholders in reliance on Rule 30e-3 under the 1940 Act that contains disclosures specified by paragraph (c)(3) of that rule is included in the Annual Reports. Not Applicable. Notices do not incorporate disclosures from the
shareholder report.
Annual Report
J.P. Morgan Mid Cap/Multi-Cap Funds
June 30, 2022
JPMorgan Growth Advantage Fund |
JPMorgan Mid Cap Equity Fund |
JPMorgan Mid Cap Growth Fund |
JPMorgan Mid Cap Value Fund |
JPMorgan Value Advantage Fund |
CONTENTS
Investments in a Fund are not deposits or obligations of, or guaranteed or endorsed by, any bank and are not insured or guaranteed by the FDIC, the Federal Reserve Board or any other government agency. You could lose money if you sell when a Fund’s share price is lower than when you invested.
Past performance is no guarantee of future performance. The general market views expressed in this report are opinions based on market and other conditions through the end of the reporting period and are subject to change without notice. These views are not intended to predict the future performance of a Fund or the securities markets.
Prospective investors should refer to the Funds’ prospectuses for a discussion of the Funds’ investment objectives, strategies and risks. Call J.P. Morgan Funds Service Center at 1-800-480-4111 for a prospectus containing more complete information about a Fund, including management fees and other expenses. Please read it carefully before investing.
Letter to Shareholders
August 8, 2022 (Unaudited)
Dear Shareholder,
|
“It remains essential, in our view, that investors consider the potential benefits of portfolio diversification that adapts to near-term market conditions while cultivating long-term opportunities.” — Andrea L. Lisher
|
The global economic rebound that marked 2021 has been sapped of much of its strength in 2022 by accelerating inflation and rising interest rates, the conflict in Ukraine and the ongoing global impacts of the pandemic. The uncertain economic picture has proven to be particularly challenging for investors.
U.S. equity prices, which had largely led a decade-long rally in global equity, fell sharply in 2022 and turned in their worst first-half performance since 1970. In general, only select U.S. Treasury bonds and U.S. core fixed income saw increased investor demand amid the sell-off in equities.
In response to rising consumer and producer prices and tight labor markets, the U.S. Federal Reserve (the “Fed”) adopted an increasingly aggressive policy stance in 2022, raising its benchmark interest rate by 25 basis points in March, then by 50 basis points in May and by 75 basis points each in June and July. Meanwhile, U.S. gross domestic product fell by 1.6% in the first quarter of 2022 and by an estimated 0.9% in the second quarter.
However, corporate earnings and revenues have largely outpaced certain investor expectations in 2022 amid sustained strength in consumer demand and management efforts to hold down expenses and pass along higher input costs. Further economic resilience was seen in labor markets, where the jobless rate remained at 3.6% from February through June.
In 2022, investors are now facing economic and market circumstances unseen in decades. In the U.S., the highest inflation rate in 40 years and the Fed’s policy response have rattled both equity and fixed income markets. Concurrently, the conflict in Ukraine has constrained both energy supplies to Europe and grain shipments to a range of nations already under economic strain. The Fed and other leading central banks have acknowledged the risks of runaway inflation and have generally pledged to employ a flexible approach to counter those risks without squelching economic growth.
It remains essential, in our view, that investors consider the potential benefits of portfolio diversification that adapts to near-term market conditions, while cultivating long-term opportunities. J.P. Morgan Asset Management will seek to deliver superior client outcomes across a broad range of innovative solutions and risk management processes built on the same fundamental practices and principles that have driven our success for more than a century.
On behalf of J.P. Morgan Asset Management, thank you for entrusting us to manage your investment. Should you have any questions, please visit www.jpmorganfunds.com or contact the J.P. Morgan Funds Service Center at 1-800-480-4111.
Sincerely yours,
Andrea L. Lisher
Head of Americas, Client
J.P. Morgan Asset Management
| J.P. Morgan Mid Cap/Multi-Cap Funds | |
J.P. Morgan Mid Cap/Multi-Cap Funds
MARKET OVERVIEW
TWELVE MONTHS ENDED June 30, 2022 (Unaudited)
Equity markets rallied in the second half of 2021 on the back of low interest rates, record corporate earnings and the global economic rebound. However, equity markets in 2022 rendered their worst first-half performance since 1970.
By the end of June 2022, the S&P 500 had slumped into bear market territory – generally defined as a 20% or more decline since the last closing high. While bond markets largely underperformed equity markets throughout most of the twelve-month period, investor demand for U.S. Treasury bonds bolstered the Bloomberg U.S. Aggregate Index in the second half of the period.
U.S. equity generated positive returns and led developed markets equity to outperform both emerging markets equity and fixed income markets during the second half of 2021. U.S. equity prices were bolstered by continued monetary and fiscal support as well as strong consumer spending and record corporate profits.
A resurgence in the pandemic, particularly the emergence of the Omicron variant of Covid-19, in late 2021 and early 2022 failed to dent the U.S. economy. However, a number of nations reinstated social restrictions and China enacted a “Zero Covid” policy that led to severe lockdowns in several large cities, including Shanghai. The result was a sharp drop in manufacturing and other economic activity across China, which further strained on global supply chains and became a drag on the economies of other emerging market nations.
The S&P 500 reached a new closing high on January 3, 2022, bolstered by record high corporate earnings, sales, cash flows, share repurchases and dividends. However, investor sentiment began to sour as accelerating inflation started to erode consumer confidence and raise expectations for an increase in benchmark interest rates by the U.S. Federal Reserve.
Russia’s invasion of Ukraine at the end of February 2022 initiated a sell-off in global financial markets that was further fueled by the highest U.S. inflation rate in more than 40 years. Equity prices recovered somewhat in March 2022 amid better-than-expected corporate earnings. However, the general trend in global financial markets was downward.
While the S&P 500 had a positive total return of 11.7% in the second half of 2021, the index plummeted in the first half of 2022 and its total returns for the twelve-month period was -10.6%. Within U.S. equity markets, small cap and mid cap stocks generally declined more than large cap stocks and growth stocks declined more than value stocks.
| J.P. Morgan Mid Cap/Multi-Cap Funds | |
JPMorgan Growth Advantage Fund
FUND COMMENTARY
TWELVE MONTHS ENDED June 30, 2022 (Unaudited)
| |
Fund (Class A Shares, without a sales charge) * | |
Russell 3000 Growth Index | |
Net Assets as of 6/30/2022 (In Thousands) | |
INVESTMENT OBJECTIVE **
The JPMorgan Growth Advantage Fund (the “Fund”) seeks to provide long-term capital growth.
WHAT WERE THE MAIN DRIVERS OF THE FUND’S PERFORMANCE?
The Fund’s Class A Shares, without a sales charge, underperformed the Russell 3000 Growth Index (the “Benchmark”) for the twelve months ended June 30, 2022.
The Fund’s underweight position and security selection in the consumer staples sector and its security selection in the communication services sector were leading detractors from performance relative to the Benchmark, while its security selection in the health care sector and its overweight position in the energy sector were leading contributors to relative performance.
Leading individual detractors from relative performance included the Fund’s overweight position in Roku Inc. and its underweight positions in Apple Inc. and AbbVie Inc. Shares of Roku, a television streaming platform, fell after the company reported lower-than-expected revenue for the fourth quarter of 2022 and issued a weaker-than-expected forecast. Shares of Apple, a provider of computers, mobile devices and related services, rose amid record earnings and revenue in the second half of 2021 and continued strong demand for mobile phones. Shares of AbbVie, a pharmaceuticals maker, rose as the company reached settlements with various U.S. states to resolve legal claims against the company’s Allergan unit stemming from the opioid addiction epidemic.
Leading individual contributors to relative performance included the Fund’s overweight positions in Quanta Services Inc., EOG Resources Inc. and McKesson Corp. Shares of Quanta Services, an engineering and services provider to the energy and utilities sectors, rose after the company reported better-than-expected earnings and revenue for the first quarter of 2022. Shares of EOG Resources, a petroleum and natural gas producer, rose amid higher global energy prices and after the company reported better-than-expected earnings for the first quarter of 2022. Shares of McKesson, a provider of pharmaceuticals, health care products and services, rose as the company moved to settle state legal claims stemming from the opioid addiction epidemic and as investors sought defensive sectors, including consumer staples, in response to the market selloff in the first half of 2022.
HOW WAS THE FUND POSITIONED?
The Fund’s portfolio managers utilized a bottom-up approach to stock selection, researching individual companies across market capitalizations in an effort to construct portfolios of stocks that have strong fundamentals. The Fund’s portfolio managers sought to invest in high quality companies with durable franchises that, in their view, possessed the ability to
generate strong future earnings growth.
TOP TEN HOLDINGS OF THE
PORTFOLIO AS OF June 30, 2022 | PERCENT OF
TOTAL
INVESTMENTS |
| | |
| | |
| | |
| | |
| | |
| | |
| Mastercard, Inc., Class A | |
| | |
| | |
| Regeneron Pharmaceuticals, Inc. | |
PORTFOLIO COMPOSTION BY SECTOR
AS OF June 30, 2022 | PERCENT OF
TOTAL
INVESTMENTS |
| |
| |
| |
| |
| |
| |
| |
| |
| |
| |
*
The return shown is based on net asset values calculated for shareholder transactions and may differ from the return shown in the financial highlights, which reflects adjustments made to the net asset values in accordance with accounting principles generally accepted in the United States of America.
**
The adviser seeks to achieve the Fund’s objective. There can be no guarantee it will be achieved.
| J.P. Morgan Mid Cap/Multi-Cap Funds | |
JPMorgan Growth Advantage Fund
FUND COMMENTARY
TWELVE MONTHS ENDED June 30, 2022 (Unaudited) (continued)
AVERAGE ANNUAL TOTAL RETURNS AS OF June 30, 2022
|
| Sales Charge for Class A Shares is 5.25%. |
| Assumes a 1% CDSC (contingent deferred sales charge) for the one year period and 0% CDSC thereafter. |
TEN YEAR PERFORMANCE (6/30/12 TO 6/30/22)
The performance quoted is past performance and is not a guarantee of future results. Mutual funds are subject to certain market risks. Investment returns and principal value of an investment will fluctuate so that an investor’s shares, when redeemed, may be worth more or less than their original cost. Current performance may be higher or lower than the performance data shown. For up-to-date month-end performance information please call 1-800-480-4111.
Returns for Class R2 and Class R3 Shares prior to their inception dates are based on the performance of Class A Shares. The actual returns for Class R2 Shares would have been lower than those shown because Class R2 Shares have higher expenses than Class A Shares. The actual returns for Class R3 Shares would have been similar to those shown because Class R3 Shares have similar expenses to Class A Shares.
Returns for Class R4 Shares prior to their inception dates are based on the performance of Class I Shares. The actual returns of Class R4 Shares would have been different than those shown because Class R4 Shares have different expenses to Class I Shares.
Returns for Class R6 Shares prior to their inception date are based on the performance of Class R5 Shares. The actual returns of Class R6 Shares would have been different than those shown because Class R6 Shares have different expenses than Class R5 and Class I Shares.
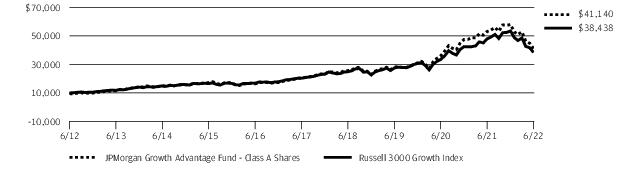
The graph illustrates comparative performance for $10,000 invested in Class A Shares of the JPMorgan Growth Advantage Fund and the Russell 3000 Growth Index from June 30, 2012 to June 30, 2022. The performance of the Fund
assumes reinvestment of all dividends and capital gain distributions, if any, and includes a sales charge. The performance of the Russell 3000 Growth Index does not reflect the deduction of expenses or a sales charge associated with a mutual fund and has been adjusted to reflect reinvestment of all dividends and capital gain distributions of the securities included in the benchmark, if applicable. The Russell 3000 Growth Index is an unmanaged index which measures the performance of those Russell 3000 companies (largest 3000 U.S. companies) with higher price-to-book ratios and higher forecasted growth values. Investors cannot invest directly in an index.
Class A Shares have a $1,000 minimum initial investment and carry a 5.25% sales charge.
Fund performance may reflect the waiver of the Fund’s fees and reimbursement of expenses for certain periods. Without these waivers and reimbursements, performance would have been lower. Also, performance shown in this section does not reflect the deduction of taxes that a shareholder would pay on Fund distributions or on gains resulting from redemptions of Fund shares.
Because Class C Shares automatically convert to Class A Shares after 8 years, the 10 year average annual total return shown above for Class C reflects Class A performance for the period after conversion.
The returns shown are based on net asset values calculated for shareholder transactions and may differ from the returns shown in the financial highlights, which reflect adjustments made to the net asset values in accordance with accounting principles generally accepted in the United States of America.
| J.P. Morgan Mid Cap/Multi-Cap Funds | |
JPMorgan Mid Cap Equity Fund
FUND COMMENTARY
TWELVE MONTHS ENDED June 30, 2022 (Unaudited)
| |
| |
| |
Net Assets as of 6/30/2022 (In Thousands) | |
INVESTMENT OBJECTIVE **
The JPMorgan Mid Cap Equity Fund (the “Fund”) seeks long-term capital growth.
WHAT WERE THE MAIN DRIVERS OF THE FUND’S PERFORMANCE?
The Fund’s Class I Shares outperformed the Russell Midcap Index (the “Benchmark”) for the twelve months ended June 30, 2022.
The Fund’s security selection in the financials and consumer discretionary sectors was a leading contributor to performance relative to the Benchmark, while the Fund’s underweight position in the energy sector and its overweight position in the communication services sector were leading detractors from relative performance.
Leading individual contributors to relative performance included the Fund’s overweight positions in Coterra Energy Inc., Diamondback Energy Inc. and AutoZone Inc. Shares of Coterra Energy, a petroleum and natural gas producer, rose after the company reported better-than-expected earnings for the first quarter of 2022, raised its quarterly dividend and maintained its share repurchase plan. Shares of Diamondback Energy, a petroleum and natural gas producer, rose after the company reported better-than-expected earnings and revenue for the first quarter of 2022, raised its quarterly dividend and maintained its share repurchase plan. Shares of AutoZone, an automotive parts retailer, rose amid consecutive quarters of better-than-expected earnings and revenue, and continued sales growth.
Leading individual detractors from relative performance included the Fund’s overweight positions in Roku Inc. and Gap Inc., and its underweight position in Occidental Petroleum Corp. Shares of Roku, a television streaming platform, fell after the company reported lower-than-expected revenue for the fourth quarter of 2022 and issued a weaker-than-expected forecast. Shares of Gap, a retailer of brand name apparel, fell amid general weakness in the apparel sector and weaker-than-expected results for several quarters. Shares of Occidental Petroleum, an oil and natural gas producer not held in the Fund, rose after the company reported better-than-expected earnings for the first quarter of 2022, and as influential investor Warren Buffet increased his stake in the company.
HOW WAS THE FUND POSITIONED?
The Fund’s portfolio managers employed a bottom-up approach to stock selection, constructing a portfolio based on company
fundamentals, quantitative screening and proprietary fundamental analysis. The Fund’s portfolio managers sought to identify dominant franchises with predictable business models they deemed capable of achieving, in their view, sustained growth, as well as undervalued companies with the potential to
grow their intrinsic value per share.
TOP TEN HOLDINGS OF THE
PORTFOLIO AS OF June 30, 2022 | PERCENT OF
TOTAL
INVESTMENTS |
| | |
| | |
| | |
| | |
| | |
| | |
| Laboratory Corp. of America Holdings | |
| | |
| | |
| | |
PORTFOLIO COMPOSTION BY SECTOR
AS OF June 30, 2022 | PERCENT OF
TOTAL
INVESTMENTS |
| |
| |
| |
| |
| |
| |
| |
| |
| |
| |
| |
| |
*
The return shown is based on net asset values calculated for shareholder transactions and may differ from the return shown in the financial highlights, which reflects adjustments made to the net asset values in accordance with accounting principles generally accepted in the United States of America.
**
The adviser seeks to achieve the Fund’s objective. There can be no guarantee it will be achieved.
| J.P. Morgan Mid Cap/Multi-Cap Funds | |
JPMorgan Mid Cap Equity Fund
FUND COMMENTARY
TWELVE MONTHS ENDED June 30, 2022 (Unaudited) (continued)
AVERAGE ANNUAL TOTAL RETURNS AS OF June 30, 2022
|
| Sales Charge for Class A Shares is 5.25%. |
| Assumes a 1% CDSC (contingent deferred sales charge) for the one year period and 0% CDSC thereafter. |
TEN YEAR PERFORMANCE (6/30/12 TO 6/30/22)
The performance quoted is past performance and is not a guarantee of future results. Mutual funds are subject to certain market risks. Investment returns and principal value of an investment will fluctuate so that an investor’s shares, when redeemed, may be worth more or less than their original cost. Current performance may be higher or lower than the performance data shown. For up-to-date month-end performance information please call 1-800-480-4111.
Returns for Class R2 Shares prior to their inception date are based on the performance of Class A Shares. The actual returns of Class R2 Shares would have been lower than those shown because Class R2 Shares have higher expenses than Class A Shares.
Returns for Class R5 and Class R6 Shares prior to their inception date are based on the performance of Class I Shares. The actual returns of Class R5 and Class R6 Shares would have been different than those shown because Class R5 and Class R6 Shares have different expenses than Class I Shares.
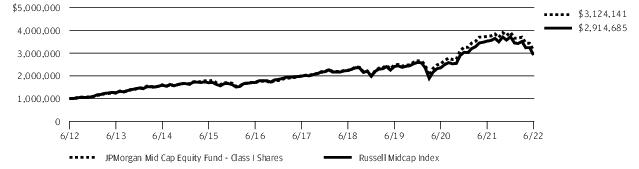
The graph illustrates comparative performance for $1,000,000 invested in the Class I Shares of JPMorgan Mid Cap Equity Fund and the Russell Midcap Index from June 30, 2012 to June 30, 2022. The performance of the Fund assumes reinvestment of all dividends and capital gain distributions, if any, and does not include a sales charge. The performance of the Russell Midcap Index does not
reflect the deduction of expenses or a sales charge associated with a mutual fund and has been adjusted to reflect reinvestment of all dividends and capital gain distributions of the securities included in the bench mark, if applicable. The Russell Midcap Index is an unmanaged index which measures the performance of the 800 smallest companies in the Russell 1000 Index. Investors cannot invest directly in an index.
Class I Shares have a $1,000,000 minimum initial investment.
Fund performance may reflect the waiver of the Fund’s fees and reimbursement of expenses for certain periods. Without these waivers and reimbursements, performance would have been lower. Also, performance shown in this section does not reflect the deduction of taxes that a shareholder would pay on Fund distributions or on gains resulting from redemptions of Fund shares.
Because Class C Shares automatically convert to Class A Shares after 8 years, the 10 year average annual total return shown above for Class C reflects Class A performance for the period after conversion.
The returns shown are based on net asset values calculated for shareholder transactions and may differ from the returns shown in the financial highlights, which reflect adjustments made to the net asset values in accordance with accounting principles generally accepted in the United States of America.
| J.P. Morgan Mid Cap/Multi-Cap Funds | |
JPMorgan Mid Cap Growth Fund
FUND COMMENTARY
TWELVE MONTHS ENDED June 30, 2022 (Unaudited)
| |
| |
Russell Midcap Growth Index | |
Net Assets as of 6/30/2022 (In Thousands) | |
INVESTMENT OBJECTIVE **
The JPMorgan Mid Cap Growth Fund (the “Fund”) seeks growth of capital.
WHAT WERE THE MAIN DRIVERS OF THE FUND’S PERFORMANCE?
The Fund’s Class I Shares outperformed the Russell Midcap Growth Index (the “Benchmark”) for the twelve months ended June 30, 2022.
The Fund’s security selection in the health care and consumer discretionary sectors was a leading contributor to performance relative to the Benchmark, while the Fund’s security selection in the information technology sector and its overweight position in the communication services sector were leading detractors from relative performance.
Leading individual contributors to relative performance included the Fund’s overweight positions in Quanta Services Inc., EOG Resources Inc. and McKesson Corp. Shares of Quanta Services, an engineering and services provider to the energy and utilities sectors, rose after the company reported better-than-expected earnings and revenue for the first quarter of 2022. Shares of EOG Resources, a petroleum and natural gas producer, rose amid higher global energy prices and after the company reported better-than-expected earnings for the first quarter of 2022. Shares of McKesson, a provider of pharmaceuticals, health care products and services, rose as the company moved to settle state legal claims stemming from the opioid addiction epidemic and as investors sought defensive sectors, including consumer staples, in response to the market selloff in the first half of 2022.
Leading individual detractors from relative performance included the Fund’s overweight positions in Roku Inc. and Teladoc Health Inc., and its underweight position in Fortinet Inc. Shares of Roku, a television streaming platform, fell after the company reported lower-than-expected revenue for the fourth quarter of 2022 and issued a weaker-than-expected forecast. Shares of Teladoc Health, a provider of remote health care services, fell after the company reported lower-than-expected earnings and revenue for the first quarter of 2022 and issued a weaker-than-expected forecast. Shares of Fortinet, a cybersecurity provider not held in the Fund, rose amid continued demand for its services and better-than-expected earnings and revenue for the first quarter of 2022.
HOW WAS THE FUND POSITIONED?
The Fund’s portfolio managers utilized a bottom-up approach to stock selection, researching individual companies in an effort
to construct a portfolio of stocks that have strong fundamentals. The Fund’s portfolio managers sought to invest in high quality companies with durable franchises that, in their view, possessed the ability to generate strong future earnings
growth.
TOP TEN HOLDINGS OF THE
PORTFOLIO AS OF June 30, 2022 | PERCENT OF
TOTAL
INVESTMENTS |
| | |
| | |
| | |
| | |
| Hilton Worldwide Holdings, Inc. | |
| Chipotle Mexican Grill, Inc. | |
| SolarEdge Technologies, Inc. | |
| Crowdstrike Holdings, Inc., Class A | |
| LPL Financial Holdings, Inc. | |
| | |
PORTFOLIO COMPOSTION BY SECTOR
AS OF June 30, 2022 | PERCENT OF
TOTAL
INVESTMENTS |
| |
| |
| |
| |
| |
| |
| |
| |
| |
| |
*
The return shown is based on net asset values calculated for shareholder transactions and may differ from the return shown in the financial highlights, which reflects adjustments made to the net asset values in accordance with accounting principles generally accepted in the United States of America.
**
The adviser seeks to achieve the Fund’s objective. There can be no guarantee it will be achieved.
| J.P. Morgan Mid Cap/Multi-Cap Funds | |
JPMorgan Mid Cap Growth Fund
FUND COMMENTARY
TWELVE MONTHS ENDED June 30, 2022 (Unaudited) (continued)
AVERAGE ANNUAL TOTAL RETURNS AS OF June 30, 2022
|
| Sales Charge for Class A Shares is 5.25%. |
| Assumes a 1% CDSC (contingent deferred sales charge) for the one year period and 0% CDSC thereafter. |
TEN YEAR PERFORMANCE (6/30/12 TO 6/30/22)
The performance quoted is past performance and is not a guarantee of future results. Mutual funds are subject to certain market risks. Investment returns and principal value of an investment will fluctuate so that an investor’s shares, when redeemed, may be worth more or less than their original cost. Current performance may be higher or lower than the performance data shown. For up-to-date month-end performance information please call 1-800-480-4111.
Returns for the Class R3 and Class R4 Shares prior to their inception dates are based on the performance of Class I Shares. Prior performance for Class R3 and Class R4 Shares has been adjusted to reflect the differences in expenses between classes.
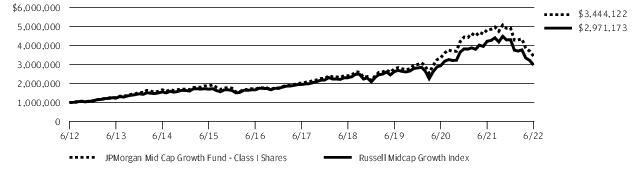
The graph illustrates comparative performance for $1,000,000 invested in Class I Shares of the JPMorgan Mid Cap Growth Fund and the Russell Midcap Growth Index from June 30, 2012 to June 30, 2022. The performance of the Fund assumes reinvestment of all dividends and capital gain distributions, if any, and does not include a sales charge. The performance of the Russell Midcap Growth Index does not reflect the deduction of expenses or a sales charge associated with a mutual fund and has been adjusted to reflect reinvestment of all dividends and capital gain distributions of the securities
included in the benchmark, if applicable. The Russell Midcap Growth Index is an unmanaged index which measures the performance of those Russell Midcap companies with higher price-to-book ratios and higher forecasted growth values. Investors cannot invest directly in an index.
Class I Shares have a $1,000,000 minimum initial investment.
Fund performance may reflect the waiver of the Fund’s fees and reimbursement of expenses for certain periods. Without these waivers and reimbursements, performance would have been lower. Also, performance shown in this section does not reflect the deduction of taxes that a shareholder would pay on Fund distributions or on gains resulting from redemptions of Fund shares.
Because Class C Shares automatically convert to Class A Shares after 8 years, the 10 year average annual total return shown above for Class C reflects Class A performance for the period after conversion.
The returns shown are based on net asset values calculated for shareholder transactions and may differ from the returns shown in the financial highlights, which reflect adjustments made to the net asset values in accordance with accounting principles generally accepted in the United States of America.
| J.P. Morgan Mid Cap/Multi-Cap Funds | |
JPMorgan Mid Cap Value Fund
FUND COMMENTARY
TWELVE MONTHS ENDED June 30, 2022 (Unaudited)
| |
| |
Russell Midcap Value Index | |
Net Assets as of 6/30/2022 (In Thousands) | |
INVESTMENT OBJECTIVE**
The JPMorgan Mid Cap Value Fund (the “Fund”) seeks growth from capital appreciation.
WHAT WERE THE MAIN DRIVERS OF THE FUND’S PERFORMANCE?
The Fund’s Class L Shares outperformed the Russell Midcap Value Index (the “Benchmark”) for the twelve months ended June 30, 2022.
The Fund’s security selection in the consumer staples and energy sectors was a leading detractor from performance relative to the Benchmark, while the Fund’s security selection in the financials and information technology sectors was a leading contributor to relative performance.
Leading individual contributors to relative performance included the Fund’s overweight positions in AutoZone Inc., Carlisle Cos. and AmerisourceBergen Corp. Shares of AutoZone, an automotive parts retailer, rose amid consecutive quarters of better-than-expected earnings and revenue and continued sales growth. Shares of Carlisle, a maker of industrial engineered products, rose after the company reported better-than-expected earnings and revenue for the first quarter of 2022. Shares of AmerisourceBergen, a distributor of health care products, rose after the company reported better-than-expected earnings and revenue for its second fiscal quarter and unveiled a $1 billion share repurchase plan.
Leading individual detractors from relative performance included the Fund’s overweight positions in Gap Inc. and Fortune Brands Home & Security Inc. and its underweight position in Dollar Tree Inc. Shares of Gap, a retailer of brand name apparel, fell amid general weakness in the apparel sector and weaker-than-expected results for several quarters. Shares of Fortune Brands Home & Security, a manufacturer of homebuilding and home security products, fell after the company reported lower-than-expected earnings for the fourth quarter of 2021. Shares of Dollar Tree, a discount retail chain that was not held in the Fund, rose after the company reported better-than-expected earnings and revenue for the first quarter of 2022.
HOW WAS THE FUND POSITIONED?
The Fund’s portfolio managers utilized a bottom-up approach to stock selection and sought to identify durable franchises possessing the ability to generate, in their view, sustainable
levels of free cash flow.
TOP TEN HOLDINGS OF THE
PORTFOLIO AS OF June 30, 2022 | PERCENT OF
TOTAL
INVESTMENTS |
| | |
| | |
| | |
| | |
| | |
| Laboratory Corp. of America Holdings | |
| | |
| | |
| | |
| Huntington Bancshares, Inc. | |
PORTFOLIO COMPOSTION BY SECTOR
AS OF June 30, 2022 | PERCENT OF
TOTAL
INVESTMENTS |
| |
| |
| |
| |
| |
| |
| |
| |
| |
| |
| |
| |
*
The return shown is based on net asset values calculated for shareholder transactions and may differ from the return shown in the financial highlights, which reflects adjustments made to the net asset values in accordance with accounting principles generally accepted in the United States of America.
**
The adviser seeks to achieve the Fund’s objective. There can be no guarantee it will be achieved.
| J.P. Morgan Mid Cap/Multi-Cap Funds | |
JPMorgan Mid Cap Value Fund
FUND COMMENTARY
TWELVE MONTHS ENDED June 30, 2022 (Unaudited) (continued)
AVERAGE ANNUAL TOTAL RETURNS AS OF June 30, 2022
|
| Sales Charge for Class A Shares is 5.25%. |
| Assumes a 1% CDSC (contingent deferred sales charge) for the one year period and 0% CDSC thereafter. |
TEN YEAR PERFORMANCE (6/30/12 TO 6/30/22)
The performance quoted is past performance and is not a guarantee of future results. Mutual funds are subject to certain market risks. Investment returns and principal value of an investment will fluctuate so that an investor’s shares, when redeemed, may be worth more or less than their original cost. Current performance may be higher or lower than the performance data shown. For up-to-date month-end performance information please call 1-800-480-4111.
Returns for Class R3 Shares prior to their inception dates are based on the performance of Class A Shares. The actual returns of Class R3 Shares would have been lower than those shown because Class R3 Shares have higher expenses than Class A Shares.
Returns for the Class R4 Shares prior to their inception date are based on the performance of Class I Shares. The actual returns of Class R4 Shares would have been lower because Class R4 Shares have higher expenses than Class I Shares.
Returns for the Class R5 and R6 Shares prior to their inception date are based on the performance of Class L Shares. The actual returns of Class R5 Shares would have been lower than those shown because Class R5 Shares have higher expenses than Class L Shares. The actual returns for Class R6 Shares would have been different than those shown because Class R6 Shares have different expenses to Class L Shares.
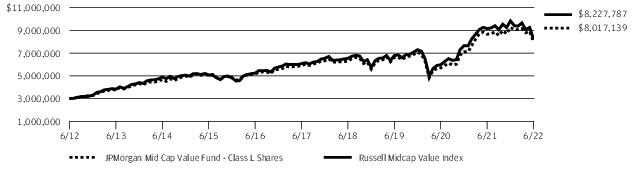
The graph illustrates comparative performance for $3,000,000 invested in Class L Shares of the JPMorgan Mid Cap Value Fund and the Russell Midcap
Value Index from June 30, 2012 to June 30, 2022. The performance of the Fund assumes reinvestment of all dividends and capital gain distributions, if any, and does not include a sales charge. The performance of the Russell Mid-cap Value Index does not reflect the deduction of expenses or a sales charge associated with a mutual fund and has been adjusted to reflect reinvestment of all dividends and capital gain distributions of the securities included in the benchmark, if applicable. The Russell Midcap Value Index is an unmanaged index which measures the performance of those Russell Midcap companies with lower price-to-book ratios and lower forecasted growth values. Investors cannot invest directly in an index.
Class L Shares have a $3,000,000 minimum initial investment.
Fund performance may reflect the waiver of the Fund’s fees and reimbursement of expenses for certain periods. Without these waivers and reimbursements, performance would have been lower. Also, performance shown in this section does not reflect the deduction of taxes that a shareholder would pay on Fund distributions or on gains resulting from redemptions of Fund shares.
Because Class C Shares automatically convert to Class A Shares after 8 years, the 10 year average annual total return shown above for Class C reflects Class A performance for the period after conversion.
The returns shown are based on net asset values calculated for shareholder transactions and may differ from the returns shown in the financial highlights, which reflect adjustments made to the net asset values in accordance with accounting principles generally accepted in the United States of America.
| J.P. Morgan Mid Cap/Multi-Cap Funds | |
JPMorgan Value Advantage Fund
FUND COMMENTARY
TWELVE MONTHS ENDED June 30, 2022 (Unaudited)
| |
| |
| |
Net Assets as of 6/30/2022 (In Thousands) | |
INVESTMENT OBJECTIVE**
The JPMorgan Value Advantage Fund (the “Fund”) seeks to provide long-term total return from a combination of income and capital gains.
WHAT WERE THE MAIN DRIVERS OF THE FUND’S PERFORMANCE?
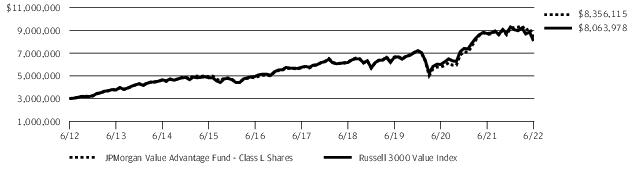
The Fund’s Class L Shares outperformed the Russell 3000 Value Index (the “Benchmark”) for the twelve months ended June 30, 2022.
The Fund’s security selection in the financials and industrials sectors was a leading contributor to performance relative to the Benchmark, while the Fund’s underweight positions in the utilities sector and consumer staples sector were leading detractors from relative performance.
Leading individual contributors to relative performance included the Fund’s overweight position in AutoZone Inc. and its out-of-Benchmark positions in Murphy USA Inc. and AbbVie Inc. Shares of AutoZone, an automotive parts retailer, rose amid consecutive quarters of better-than-expected earnings and revenue and continued sales growth. Shares of Murphy USA, a gas station convenience store chain, rose after the company reported consecutive quarters of better-than-expected earnings and revenue, raised its quarterly dividend and unveiled a $1 billion share repurchase plan. Shares of AbbVie, a pharmaceuticals maker, rose as the company reached settlements with various U.S. states to resolve legal claims against the company’s Allergan unit stemming from the opioid addiction epidemic.
Leading individual detractors from relative performance included the Fund’s overweight positions in Gap Inc. and Capital One Financial Corp., and its out-of-Benchmark position in CommScope Holding Co. Shares of Gap, a retailer of brand name apparel, fell amid general weakness in the apparel sector and weaker-than-expected results for several quarters. Shares of Capital One Financial, a financial services provider, fell amid general weakness in financial sector stocks as the U.S. economic growth slowed in the first half of 2022. Shares of CommScope Holding, a communications infrastructure provider, fell after the company reported lower-than-expected earnings and revenue for consecutive quarters amid rising costs.
HOW WAS THE FUND POSITIONED?
The Fund’s portfolio managers utilized a bottom-up approach to stock selection and sought to identify durable franchises possessing the ability to generate, in the portfolio managers’
view, significant levels of free cash flow.
TOP TEN HOLDINGS OF THE
PORTFOLIO AS OF June 30, 2022 | PERCENT OF
TOTAL
INVESTMENTS |
| | |
| Berkshire Hathaway, Inc., Class B | |
| | |
| | |
| | |
| | |
| Travelers Cos., Inc. (The) | |
| | |
| | |
| | |
PORTFOLIO COMPOSTION BY SECTOR
AS OF June 30, 2022 | PERCENT OF
TOTAL
INVESTMENTS |
| |
| |
| |
| |
| |
| |
| |
| |
| |
| |
| |
| |
*
The return shown is based on net asset values calculated for shareholder transactions and may differ from the return shown in the financial highlights, which reflects adjustments made to the net asset values in accordance with accounting principles generally accepted in the United States of America.
**
The adviser seeks to achieve the Fund’s objective. There can be no guarantee it will be achieved.
| J.P. Morgan Mid Cap/Multi-Cap Funds | |
JPMorgan Value Advantage Fund
FUND COMMENTARY
TWELVE MONTHS ENDED June 30, 2022 (Unaudited) (continued)
AVERAGE ANNUAL TOTAL RETURNS AS OF June 30, 2022
|
| Sales Charge for Class A Shares is 5.25%. |
| Assumes a 1% CDSC (contingent deferred sales charge) for the one year period and 0% CDSC thereafter. |
TEN YEAR PERFORMANCE (6/30/12 TO 6/30/22)
The performance quoted is past performance and is not a guarantee of future results. Mutual funds are subject to certain market risks. Investment returns and principal value of an investment will fluctuate so that an investor’s shares, when redeemed, may be worth more or less than their original cost. Current performance may be higher or lower than the performance data shown. For up-to-date month-end performance information please call 1-800-480-4111.
Returns for Class R2 and Class R3 Shares prior to their inception date are based on the performance of Class A Shares. The actual returns of Class R2 Shares would have been lower than those shown because Class R2 Shares have higher expenses than Class A Shares. Returns for Class R3 Shares would have been similar to those shown because Class R3 Shares have similar expenses to Class A Shares.
Returns for the Class R4 Shares prior to their inception date are based on the performance of Class I Shares. The actual returns of Class R4 Shares would have been similar to those shown because Class R4 Shares have similar expenses to Class I Shares.
Returns for the Class R5 and Class R6 Shares prior to their inception date are based on the performance of Class L Shares. The actual returns for Class R5 and Class R6 Shares would have been different than those shown because Class R5 and Class R6 Shares have different expenses to Class L Shares.
The graph illustrates comparative performance for $3,000,000 invested in Class L Shares of the JPMorgan Value Advantage Fund and the Russell 3000
Value Index from June 30, 2012 to June 30, 2022. The performance of the Fund assumes reinvestment of all dividends and capital gain distributions, if any, and does not include a sales charge. The performance of the Russell 3000 Value Index does not reflect the deduction of expenses or a sales charge associated with a mutual fund and has been adjusted to reflect reinvestment of all dividends and capital gain distributions of the securities included in the benchmark, if applicable. The Russell 3000 Value Index is an unmanaged index which measures the performance of those Russell 3000 companies (largest 3000 U.S. companies) with lower price-to-book ratios and lower forecasted growth values. Investors cannot invest directly in an index.
Class L Shares have a $3,000,000 minimum initial investment.
Fund performance may reflect the waiver of the Fund’s fees and reimbursement of expenses for certain periods. Without these waivers and reimbursements, performance would have been lower. Also, performance shown in this section does not reflect the deduction of taxes that a shareholder would pay on Fund distributions or on gains resulting from redemptions of Fund shares.
Because Class C Shares automatically convert to Class A Shares after 8 years, the 10 year average annual total return shown above for Class C reflects Class A performance for the period after conversion.
The returns shown are based on net asset values calculated for shareholder transactions and may differ from the returns shown in the financial highlights, which reflect adjustments made to the net asset values in accordance with accounting principles generally accepted in the United States of America.
| J.P. Morgan Mid Cap/Multi-Cap Funds | |
JPMorgan Growth Advantage Fund
SCHEDULE OF PORTFOLIO INVESTMENTS
AS OF June 30, 2022
| | |
|
|
| | |
|
| | |
|
| | |
| | |
| | |
|
Constellation Brands, Inc., Class A | | |
|
Alnylam Pharmaceuticals, Inc. * | | |
| | |
| | |
Horizon Therapeutics plc * | | |
| | |
Regeneron Pharmaceuticals, Inc. * | | |
| | |
|
| | |
|
| | |
| | |
Charles Schwab Corp. (The) | | |
| | |
| | |
Commercial Services & Supplies — 1.1% |
| | |
Communications Equipment — 0.8% |
| | |
Construction & Engineering — 1.9% |
| | |
Diversified Consumer Services — 0.5% |
Bright Horizons Family Solutions, Inc. * | | |
Electrical Equipment — 1.6% |
| | |
| | |
| | |
| | |
|
Electronic Equipment, Instruments & Components — 1.1% |
Keysight Technologies, Inc. * | | |
Zebra Technologies Corp., Class A * | | |
| | |
Energy Equipment & Services — 0.4% |
| | |
|
| | |
Health Care Equipment & Supplies — 3.0% |
| | |
| | |
| | |
Intuitive Surgical, Inc. * | | |
| | |
Health Care Providers & Services — 4.9% |
| | |
| | |
| | |
| | |
Hotels, Restaurants & Leisure — 2.4% |
| | |
| | |
Hilton Worldwide Holdings, Inc. | | |
Royal Caribbean Cruises Ltd. * | | |
| | |
Household Durables — 0.6% |
| | |
|
| | |
Interactive Media & Services — 6.0% |
Alphabet, Inc., Class C * | | |
Bumble, Inc., Class A * (a) | | |
| | |
Internet & Direct Marketing Retail — 4.0% |
| | |
|
| | |
| | |
SEE NOTES TO FINANCIAL STATEMENTS.
| J.P. Morgan Mid Cap/Multi-Cap Funds | |
JPMorgan Growth Advantage Fund
SCHEDULE OF PORTFOLIO INVESTMENTS
AS OF June 30, 2022 (continued)
| | |
Common Stocks — continued |
|
Mastercard, Inc., Class A | | |
| | |
| | |
Life Sciences Tools & Services — 1.5% |
Mettler-Toledo International, Inc. * | | |
Thermo Fisher Scientific, Inc. | | |
| | |
|
| | |
| | |
| | |
|
| | |
Oil, Gas & Consumable Fuels — 2.2% |
| | |
| | |
| | |
|
Estee Lauder Cos., Inc. (The), Class A | | |
|
| | |
Jazz Pharmaceuticals plc * | | |
Royalty Pharma plc, Class A | | |
| | |
Professional Services — 0.5% |
| | |
|
Old Dominion Freight Line, Inc. | | |
Semiconductors & Semiconductor Equipment — 7.2% |
Advanced Micro Devices, Inc. * | | |
| | |
| | |
| | |
| | |
SolarEdge Technologies, Inc. * | | |
| | |
| | |
| | |
| | |
|
|
Confluent, Inc., Class A * (a) | | |
Crowdstrike Holdings, Inc., Class A * | | |
| | |
| | |
| | |
Palo Alto Networks, Inc. * | | |
| | |
| | |
Trade Desk, Inc. (The), Class A * | | |
Zoom Video Communications, Inc., Class A * | | |
| | |
| | |
|
Burlington Stores, Inc. * | | |
| | |
| | |
National Vision Holdings, Inc. * | | |
| | |
Technology Hardware, Storage & Peripherals — 8.0% |
| | |
Textiles, Apparel & Luxury Goods — 0.9% |
| | |
Total Common Stocks
(Cost $8,268,517) | | |
Short Term Investments — 3.2% |
Investment Companies — 2.2% |
JPMorgan Prime Money Market Fund Class IM Shares, 1.54% (b) (c)
(Cost $269,719) | | |
SEE NOTES TO FINANCIAL STATEMENTS.
| J.P. Morgan Mid Cap/Multi-Cap Funds | |
| | |
Short Term Investments — continued |
Investment of Cash Collateral from Securities Loaned — 1.0% |
JPMorgan Securities Lending Money Market Fund Agency SL Class Shares, 1.50% (b) (c) | | |
JPMorgan U.S. Government Money Market Fund Class IM Shares, 1.38% (b) (c) | | |
Total Investment of Cash Collateral from Securities Loaned
(Cost $113,710) | | |
Total Short Term Investments
(Cost $383,429) | | |
Total Investments — 101.1%
(Cost $8,651,946) | | |
Liabilities in Excess of Other Assets — (1.1)% | | |
| | |
Percentages indicated are based on net assets. |
| Non-income producing security. |
| The security or a portion of this security is on loan at June 30, 2022. The total value of securities on loan at June 30, 2022 is $109,523. |
| Investment in an affiliated fund, which is registered under the Investment Company Act of 1940, as amended, and is advised by J.P. Morgan Investment Management Inc. |
| The rate shown is the current yield as of June 30, 2022. |
SEE NOTES TO FINANCIAL STATEMENTS.
| J.P. Morgan Mid Cap/Multi-Cap Funds | |
JPMorgan Mid Cap Equity Fund
SCHEDULE OF PORTFOLIO INVESTMENTS
AS OF June 30, 2022
| | |
|
Aerospace & Defense — 0.2% |
| | |
|
| | |
| | |
| | |
|
Citizens Financial Group, Inc. | | |
| | |
| | |
First Citizens BancShares, Inc., Class A | | |
| | |
Huntington Bancshares, Inc. | | |
| | |
| | |
| | |
| | |
| | |
|
Constellation Brands, Inc., Class A | | |
| | |
| | |
|
Alnylam Pharmaceuticals, Inc. * | | |
| | |
| | |
Horizon Therapeutics plc * | | |
| | |
Neurocrine Biosciences, Inc. * | | |
| | |
| | |
|
Advanced Drainage Systems, Inc. | | |
| | |
Fortune Brands Home & Security, Inc. | | |
| | |
| | |
|
Affiliated Managers Group, Inc. | | |
Ameriprise Financial, Inc. | | |
| | |
LPL Financial Holdings, Inc. | | |
| | |
|
Capital Markets — continued |
MarketAxess Holdings, Inc. | | |
| | |
| | |
| | |
Raymond James Financial, Inc. | | |
| | |
| | |
T. Rowe Price Group, Inc. | | |
Tradeweb Markets, Inc., Class A | | |
| | |
|
| | |
| | |
| | |
Commercial Services & Supplies — 0.7% |
| | |
Communications Equipment — 1.8% |
| | |
| | |
| | |
| | |
Construction & Engineering — 0.7% |
| | |
Construction Materials — 0.6% |
Martin Marietta Materials, Inc. | | |
|
Discover Financial Services | | |
Containers & Packaging — 1.3% |
Packaging Corp. of America | | |
| | |
| | |
|
| | |
| | |
| | |
Diversified Consumer Services — 0.2% |
Bright Horizons Family Solutions, Inc. * | | |
Diversified Financial Services — 0.4% |
| | |
SEE NOTES TO FINANCIAL STATEMENTS.
| J.P. Morgan Mid Cap/Multi-Cap Funds | |
| | |
Common Stocks — continued |
Electric Utilities — 2.6% |
| | |
| | |
| | |
| | |
Electrical Equipment — 2.9% |
| | |
| | |
| | |
| | |
| | |
Electronic Equipment, Instruments & Components — 2.9% |
| | |
| | |
| | |
Keysight Technologies, Inc. * | | |
| | |
| | |
Teledyne Technologies, Inc. * | | |
Zebra Technologies Corp., Class A * | | |
| | |
Energy Equipment & Services — 0.1% |
| | |
|
| | |
Take-Two Interactive Software, Inc. * | | |
| | |
Equity Real Estate Investment Trusts (REITs) — 6.8% |
American Homes 4 Rent, Class A | | |
AvalonBay Communities, Inc. | | |
| | |
Brixmor Property Group, Inc. | | |
Essex Property Trust, Inc. | | |
| | |
Host Hotels & Resorts, Inc. | | |
| | |
| | |
Mid-America Apartment Communities, Inc. | | |
| | |
| | |
Rexford Industrial Realty, Inc. | | |
| | |
| | |
|
Equity Real Estate Investment Trusts (REITs) — continued |
| | |
| | |
| | |
| | |
Food & Staples Retailing — 1.0% |
| | |
| | |
| | |
|
| | |
|
| | |
Health Care Equipment & Supplies — 2.9% |
| | |
| | |
| | |
IDEXX Laboratories, Inc. * | | |
| | |
| | |
Zimmer Biomet Holdings, Inc. | | |
| | |
Health Care Providers & Services — 5.1% |
Acadia Healthcare Co., Inc. * | | |
| | |
| | |
| | |
| | |
Laboratory Corp. of America Holdings | | |
| | |
Universal Health Services, Inc., Class B | | |
| | |
Hotels, Restaurants & Leisure — 2.4% |
| | |
| | |
Chipotle Mexican Grill, Inc. * | | |
| | |
| | |
Hilton Worldwide Holdings, Inc. | | |
Royal Caribbean Cruises Ltd. * | | |
| | |
SEE NOTES TO FINANCIAL STATEMENTS.
| J.P. Morgan Mid Cap/Multi-Cap Funds | |
JPMorgan Mid Cap Equity Fund
SCHEDULE OF PORTFOLIO INVESTMENTS
AS OF June 30, 2022 (continued)
| | |
Common Stocks — continued |
Household Durables — 1.7% |
| | |
| | |
Mohawk Industries, Inc. * | | |
| | |
| | |
Household Products — 0.3% |
| | |
|
| | |
Arch Capital Group Ltd. * | | |
Hartford Financial Services Group, Inc. (The) | | |
| | |
| | |
| | |
RenaissanceRe Holdings Ltd. (Bermuda) | | |
| | |
| | |
Interactive Media & Services — 1.0% |
| | |
| | |
| | |
Internet & Direct Marketing Retail — 0.2% |
Chewy, Inc., Class A * (a) | | |
|
FleetCor Technologies, Inc. * | | |
| | |
| | |
| | |
| | |
| | |
| | |
| | |
Life Sciences Tools & Services — 1.3% |
10X Genomics, Inc., Class A * | | |
Agilent Technologies, Inc. | | |
Maravai LifeSciences Holdings, Inc., Class A * | | |
Mettler-Toledo International, Inc. * | | |
| | |
|
| | |
| | |
|
|
| | |
| | |
Lincoln Electric Holdings, Inc. | | |
| | |
| | |
| | |
| | |
| | |
|
Liberty Broadband Corp., Class C * | | |
Liberty Media Corp.-Liberty SiriusXM, Class C * | | |
| | |
|
| | |
|
| | |
|
| | |
| | |
| | |
| | |
Oil, Gas & Consumable Fuels — 2.6% |
| | |
| | |
| | |
| | |
Williams Cos., Inc. (The) | | |
| | |
|
| | |
|
| | |
Jazz Pharmaceuticals plc * | | |
Royalty Pharma plc, Class A | | |
| | |
Professional Services — 0.8% |
| | |
| | |
| | |
SEE NOTES TO FINANCIAL STATEMENTS.
| J.P. Morgan Mid Cap/Multi-Cap Funds | |
| | |
Common Stocks — continued |
Real Estate Management & Development — 0.5% |
CBRE Group, Inc., Class A * | | |
|
Old Dominion Freight Line, Inc. | | |
Semiconductors & Semiconductor Equipment — 2.1% |
Advanced Micro Devices, Inc. * | | |
| | |
| | |
SolarEdge Technologies, Inc. * | | |
| | |
| | |
| | |
|
Cadence Design Systems, Inc. * | | |
Confluent, Inc., Class A * (a) | | |
Crowdstrike Holdings, Inc., Class A * | | |
| | |
| | |
Gitlab, Inc., Class A * (a) | | |
| | |
| | |
Palo Alto Networks, Inc. * | | |
Procore Technologies, Inc. * | | |
| | |
Trade Desk, Inc. (The), Class A * | | |
Zoom Video Communications, Inc., Class A * | | |
| | |
| | |
|
| | |
| | |
| | |
Burlington Stores, Inc. * | | |
| | |
| | |
National Vision Holdings, Inc. * | | |
| | |
| | |
Textiles, Apparel & Luxury Goods — 1.7% |
| | |
| | |
|
Textiles, Apparel & Luxury Goods — continued |
Lululemon Athletica, Inc. * | | |
| | |
| | |
| | |
Thrifts & Mortgage Finance — 0.4% |
| | |
Trading Companies & Distributors — 0.2% |
| | |
Total Common Stocks
(Cost $2,119,219) | | |
Short Term Investments — 4.0% |
Investment Companies — 3.7% |
JPMorgan Prime Money Market Fund Class IM Shares, 1.54% (b) (c)
(Cost $96,450) | | |
Investment of Cash Collateral from Securities Loaned — 0.3% |
JPMorgan Securities Lending Money Market Fund Agency SL Class Shares, 1.50% (b) (c) | | |
JPMorgan U.S. Government Money Market Fund Class IM Shares, 1.38% (b) (c) | | |
Total Investment of Cash Collateral from Securities Loaned
(Cost $9,503) | | |
Total Short Term Investments
(Cost $105,953) | | |
Total Investments — 100.3%
(Cost $2,225,172) | | |
Liabilities in Excess of Other Assets — (0.3)% | | |
| | |
Percentages indicated are based on net assets. |
| Non-income producing security. |
| The security or a portion of this security is on loan at June 30, 2022. The total value of securities on loan at June 30, 2022 is $9,131. |
| Investment in an affiliated fund, which is registered under the Investment Company Act of 1940, as amended, and is advised by J.P. Morgan Investment Management Inc. |
| The rate shown is the current yield as of June 30, 2022. |
SEE NOTES TO FINANCIAL STATEMENTS.
| J.P. Morgan Mid Cap/Multi-Cap Funds | |
JPMorgan Mid Cap Growth Fund
SCHEDULE OF PORTFOLIO INVESTMENTS
AS OF June 30, 2022
| | |
|
Aerospace & Defense — 0.7% |
| | |
|
| | |
|
| | |
| | |
| | |
| | |
|
Constellation Brands, Inc., Class A | | |
|
Alnylam Pharmaceuticals, Inc. * | | |
| | |
| | |
Horizon Therapeutics plc * | | |
| | |
Neurocrine Biosciences, Inc. * | | |
| | |
| | |
|
Advanced Drainage Systems, Inc. | | |
| | |
| | |
|
Affiliated Managers Group, Inc. | | |
| | |
LPL Financial Holdings, Inc. | | |
MarketAxess Holdings, Inc. | | |
| | |
| | |
| | |
Tradeweb Markets, Inc., Class A | | |
| | |
Commercial Services & Supplies — 1.9% |
| | |
Communications Equipment — 2.0% |
| | |
| | |
| | |
| | |
|
Construction & Engineering — 2.0% |
| | |
Diversified Consumer Services — 0.6% |
Bright Horizons Family Solutions, Inc. * | | |
Electrical Equipment — 2.1% |
| | |
| | |
| | |
Electronic Equipment, Instruments & Components — 2.8% |
Keysight Technologies, Inc. * | | |
| | |
Teledyne Technologies, Inc. * | | |
Zebra Technologies Corp., Class A * | | |
| | |
Energy Equipment & Services — 0.4% |
| | |
|
ROBLOX Corp., Class A * (a) | | |
Take-Two Interactive Software, Inc. * | | |
| | |
Health Care Equipment & Supplies — 6.1% |
| | |
| | |
| | |
IDEXX Laboratories, Inc. * | | |
| | |
| | |
| | |
Health Care Providers & Services — 4.7% |
Acadia Healthcare Co., Inc. * | | |
| | |
| | |
| | |
| | |
Hotels, Restaurants & Leisure — 5.3% |
| | |
| | |
Chipotle Mexican Grill, Inc. * | | |
Hilton Worldwide Holdings, Inc. | | |
Royal Caribbean Cruises Ltd. * | | |
| | |
SEE NOTES TO FINANCIAL STATEMENTS.
| J.P. Morgan Mid Cap/Multi-Cap Funds | |
| | |
Common Stocks — continued |
Household Durables — 1.4% |
| | |
| | |
| | |
|
| | |
Interactive Media & Services — 1.1% |
| | |
Internet & Direct Marketing Retail — 0.4% |
Chewy, Inc., Class A * (a) | | |
|
| | |
| | |
| | |
| | |
Remitly Global, Inc. * (a) | | |
| | |
Life Sciences Tools & Services — 3.6% |
10X Genomics, Inc., Class A * | | |
Agilent Technologies, Inc. | | |
Maravai LifeSciences Holdings, Inc., Class A * | | |
Mettler-Toledo International, Inc. * | | |
| | |
|
| | |
| | |
| | |
| | |
|
| | |
Oil, Gas & Consumable Fuels — 2.9% |
| | |
| | |
| | |
|
| | |
Jazz Pharmaceuticals plc * | | |
Royalty Pharma plc, Class A | | |
| | |
| | |
|
Professional Services — 0.8% |
| | |
|
Old Dominion Freight Line, Inc. | | |
Semiconductors & Semiconductor Equipment — 5.8% |
Advanced Micro Devices, Inc. * | | |
| | |
| | |
SolarEdge Technologies, Inc. * | | |
| | |
| | |
| | |
|
Cadence Design Systems, Inc. * | | |
Confluent, Inc., Class A * (a) | | |
Crowdstrike Holdings, Inc., Class A * | | |
| | |
| | |
Gitlab, Inc., Class A * (a) | | |
| | |
Palo Alto Networks, Inc. * | | |
Procore Technologies, Inc. * | | |
| | |
Trade Desk, Inc. (The), Class A * | | |
Zoom Video Communications, Inc., Class A * | | |
| | |
| | |
|
| | |
Burlington Stores, Inc. * | | |
| | |
National Vision Holdings, Inc. * | | |
| | |
| | |
Textiles, Apparel & Luxury Goods — 0.4% |
Lululemon Athletica, Inc. * | | |
Trading Companies & Distributors — 0.7% |
| | |
Total Common Stocks
(Cost $6,358,755) | | |
SEE NOTES TO FINANCIAL STATEMENTS.
| J.P. Morgan Mid Cap/Multi-Cap Funds | |
JPMorgan Mid Cap Growth Fund
SCHEDULE OF PORTFOLIO INVESTMENTS
AS OF June 30, 2022 (continued)
| | |
Short Term Investments — 4.6% |
Investment Companies — 3.7% |
JPMorgan Prime Money Market Fund Class IM Shares, 1.54% (b) (c)
(Cost $260,535) | | |
Investment of Cash Collateral from Securities Loaned — 0.9% |
JPMorgan Securities Lending Money Market Fund Agency SL Class Shares, 1.50% (b) (c) | | |
JPMorgan U.S. Government Money Market Fund Class IM Shares, 1.38% (b) (c) | | |
Total Investment of Cash Collateral from Securities Loaned
(Cost $60,742) | | |
Total Short Term Investments
(Cost $321,277) | | |
Total Investments — 101.1%
(Cost $6,680,032) | | |
Liabilities in Excess of Other Assets — (1.1)% | | |
| | |
Percentages indicated are based on net assets. |
| Non-income producing security. |
| The security or a portion of this security is on loan at June 30, 2022. The total value of securities on loan at June 30, 2022 is $58,035. |
| Investment in an affiliated fund, which is registered under the Investment Company Act of 1940, as amended, and is advised by J.P. Morgan Investment Management Inc. |
| The rate shown is the current yield as of June 30, 2022. |
SEE NOTES TO FINANCIAL STATEMENTS.
| J.P. Morgan Mid Cap/Multi-Cap Funds | |
JPMorgan Mid Cap Value Fund
SCHEDULE OF PORTFOLIO INVESTMENTS
AS OF June 30, 2022
| | |
|
|
| | |
|
Citizens Financial Group, Inc. | | |
| | |
First Citizens BancShares, Inc., Class A | | |
Huntington Bancshares, Inc. | | |
| | |
| | |
| | |
| | |
|
Constellation Brands, Inc., Class A | | |
| | |
| | |
|
| | |
Fortune Brands Home & Security, Inc. | | |
| | |
|
Ameriprise Financial, Inc. | | |
| | |
Raymond James Financial, Inc. | | |
| | |
T. Rowe Price Group, Inc. | | |
| | |
|
| | |
| | |
| | |
Communications Equipment — 1.7% |
| | |
Construction Materials — 0.9% |
Martin Marietta Materials, Inc. | | |
|
Discover Financial Services | | |
Containers & Packaging — 2.1% |
Packaging Corp. of America | | |
| | |
| | |
| | |
|
|
| | |
| | |
| | |
Diversified Financial Services — 0.6% |
| | |
Electric Utilities — 4.1% |
| | |
| | |
| | |
| | |
Electrical Equipment — 3.4% |
| | |
| | |
| | |
| | |
Electronic Equipment, Instruments & Components — 3.0% |
| | |
| | |
| | |
| | |
| | |
|
Take-Two Interactive Software, Inc. * | | |
Equity Real Estate Investment Trusts (REITs) — 10.6% |
American Homes 4 Rent, Class A | | |
AvalonBay Communities, Inc. | | |
| | |
Brixmor Property Group, Inc. | | |
Essex Property Trust, Inc. | | |
| | |
Host Hotels & Resorts, Inc. | | |
| | |
| | |
Mid-America Apartment Communities, Inc. | | |
| | |
| | |
Rexford Industrial Realty, Inc. | | |
| | |
| | |
SEE NOTES TO FINANCIAL STATEMENTS.
| J.P. Morgan Mid Cap/Multi-Cap Funds | |
JPMorgan Mid Cap Value Fund
SCHEDULE OF PORTFOLIO INVESTMENTS
AS OF June 30, 2022 (continued)
| | |
Common Stocks — continued |
Equity Real Estate Investment Trusts (REITs) — continued |
| | |
| | |
| | |
Food & Staples Retailing — 1.6% |
| | |
| | |
| | |
|
| | |
|
| | |
Health Care Equipment & Supplies — 1.1% |
Zimmer Biomet Holdings, Inc. | | |
Health Care Providers & Services — 5.3% |
| | |
| | |
Laboratory Corp. of America Holdings | | |
Universal Health Services, Inc., Class B | | |
| | |
Hotels, Restaurants & Leisure — 0.8% |
| | |
| | |
| | |
Household Durables — 1.9% |
Mohawk Industries, Inc. * | | |
| | |
| | |
Household Products — 0.4% |
| | |
|
| | |
Arch Capital Group Ltd. * | | |
Hartford Financial Services Group, Inc. (The) | | |
| | |
| | |
RenaissanceRe Holdings Ltd. (Bermuda) | | |
| | |
| | |
| | |
|
Interactive Media & Services — 0.9% |
| | |
|
FleetCor Technologies, Inc. * | | |
| | |
| | |
|
| | |
| | |
Lincoln Electric Holdings, Inc. | | |
| | |
| | |
| | |
| | |
|
Liberty Broadband Corp., Class C * | | |
Liberty Media Corp.-Liberty SiriusXM, Class C * | | |
| | |
|
| | |
|
| | |
|
| | |
| | |
| | |
| | |
Oil, Gas & Consumable Fuels — 2.4% |
| | |
| | |
Williams Cos., Inc. (The) | | |
| | |
|
| | |
|
Jazz Pharmaceuticals plc * | | |
Professional Services — 0.8% |
| | |
Real Estate Management & Development — 0.8% |
CBRE Group, Inc., Class A * | | |
SEE NOTES TO FINANCIAL STATEMENTS.
| J.P. Morgan Mid Cap/Multi-Cap Funds | |
| | |
Common Stocks — continued |
|
| | |
|
| | |
| | |
| | |
| | |
| | |
Textiles, Apparel & Luxury Goods — 2.4% |
| | |
| | |
| | |
| | |
Thrifts & Mortgage Finance — 0.6% |
| | |
Total Common Stocks
(Cost $9,099,882) | | |
Short Term Investments — 3.8% |
Investment Companies — 3.8% |
JPMorgan Prime Money Market Fund Class IM Shares, 1.54% (b) (c)
(Cost $515,126) | | |
Investment of Cash Collateral from Securities Loaned — 0.0% ^ |
JPMorgan Securities Lending Money Market Fund Agency SL Class Shares, 1.50% (b) (c) | | |
JPMorgan U.S. Government Money Market Fund Class IM Shares, 1.38% (b) (c) | | |
Total Investment of Cash Collateral from Securities Loaned
(Cost $3,252) | | |
Total Short Term Investments
(Cost $518,378) | | |
Total Investments — 100.0%
(Cost $9,618,260) | | |
Other Assets Less Liabilities — 0.0% ^ | | |
| | |
Percentages indicated are based on net assets. |
| Amount rounds to less than 0.1% of net assets. |
| Non-income producing security. | |
| The security or a portion of this security is on loan at June 30, 2022. The total value of securities on loan at June 30, 2022 is $3,211. | |
| Investment in an affiliated fund, which is registered under the Investment Company Act of 1940, as amended, and is advised by J.P. Morgan Investment Management Inc. | |
| The rate shown is the current yield as of June 30, 2022. | |
SEE NOTES TO FINANCIAL STATEMENTS.
| J.P. Morgan Mid Cap/Multi-Cap Funds | |
JPMorgan Value Advantage Fund
SCHEDULE OF PORTFOLIO INVESTMENTS
AS OF June 30, 2022
| | |
|
Aerospace & Defense — 2.8% |
| | |
| | |
Raytheon Technologies Corp. | | |
| | |
Air Freight & Logistics — 0.9% |
| | |
|
| | |
| | |
Citizens Financial Group, Inc. | | |
| | |
PNC Financial Services Group, Inc. (The) | | |
| | |
| | |
| | |
| | |
|
| | |
|
| | |
Regeneron Pharmaceuticals, Inc. * | | |
Vertex Pharmaceuticals, Inc. * | | |
| | |
|
| | |
Fortune Brands Home & Security, Inc. | | |
| | |
|
Charles Schwab Corp. (The) | | |
| | |
| | |
| | |
T. Rowe Price Group, Inc. | | |
| | |
|
Axalta Coating Systems Ltd. * | | |
Communications Equipment — 0.6% |
| | |
CommScope Holding Co., Inc. * | | |
| | |
| | |
|
Construction Materials — 0.9% |
Martin Marietta Materials, Inc. | | |
|
| | |
Capital One Financial Corp. | | |
| | |
Containers & Packaging — 1.4% |
Packaging Corp. of America | | |
| | |
| | |
Diversified Financial Services — 2.2% |
Berkshire Hathaway, Inc., Class B * | | |
Diversified Telecommunication Services — 1.6% |
Verizon Communications, Inc. | | |
Electric Utilities — 4.0% |
American Electric Power Co., Inc. | | |
| | |
| | |
| | |
| | |
| | |
| | |
Electrical Equipment — 0.5% |
| | |
Electronic Equipment, Instruments & Components — 0.7% |
| | |
|
| | |
Equity Real Estate Investment Trusts (REITs) — 6.8% |
American Homes 4 Rent, Class A | | |
Apple Hospitality REIT, Inc. | | |
Brixmor Property Group, Inc. | | |
| | |
| | |
| | |
Lamar Advertising Co., Class A | | |
Mid-America Apartment Communities, Inc. | | |
| | |
| | |
SEE NOTES TO FINANCIAL STATEMENTS.
| J.P. Morgan Mid Cap/Multi-Cap Funds | |
| | |
Common Stocks — continued |
Equity Real Estate Investment Trusts (REITs) — continued |
| | |
| | |
| | |
Food & Staples Retailing — 1.0% |
Albertsons Cos., Inc., Class A | | |
| | |
| | |
|
| | |
| | |
| | |
Health Care Equipment & Supplies — 0.9% |
| | |
Zimmer Biomet Holdings, Inc. | | |
| | |
Health Care Providers & Services — 5.1% |
| | |
| | |
| | |
| | |
Laboratory Corp. of America Holdings | | |
| | |
| | |
Hotels, Restaurants & Leisure — 0.8% |
| | |
| | |
| | |
Household Durables — 1.3% |
Mohawk Industries, Inc. * | | |
| | |
| | |
Household Products — 1.5% |
| | |
Procter & Gamble Co. (The) | | |
| | |
Industrial Conglomerates — 0.6% |
Honeywell International, Inc. | | |
|
| | |
| | |
|
|
American International Group, Inc. | | |
| | |
| | |
Fairfax Financial Holdings Ltd. (Canada) | | |
Hartford Financial Services Group, Inc. (The) | | |
| | |
Marsh & McLennan Cos., Inc. | | |
| | |
Travelers Cos., Inc. (The) | | |
| | |
Interactive Media & Services — 1.4% |
Alphabet, Inc., Class C * | | |
| | |
Meta Platforms, Inc., Class A * | | |
| | |
|
FleetCor Technologies, Inc. * | | |
International Business Machines Corp. | | |
| | |
|
| | |
| | |
| | |
Stanley Black & Decker, Inc. | | |
| | |
| | |
|
DISH Network Corp., Class A * | | |
Liberty Broadband Corp., Class C * | | |
Liberty Media Corp.-Liberty SiriusXM, Class C * | | |
Nexstar Media Group, Inc., Class A | | |
| | |
|
| | |
| | |
| | |
Oil, Gas & Consumable Fuels — 7.5% |
| | |
| | |
| | |
| | |
SEE NOTES TO FINANCIAL STATEMENTS.
| J.P. Morgan Mid Cap/Multi-Cap Funds | |
JPMorgan Value Advantage Fund
SCHEDULE OF PORTFOLIO INVESTMENTS
AS OF June 30, 2022 (continued)
| | |
Common Stocks — continued |
Oil, Gas & Consumable Fuels — continued |
| | |
| | |
| | |
Williams Cos., Inc. (The) | | |
| | |
|
| | |
|
| | |
| | |
| | |
| | |
| | |
Professional Services — 0.5% |
| | |
Real Estate Management & Development — 0.6% |
CBRE Group, Inc., Class A * | | |
|
| | |
Semiconductors & Semiconductor Equipment — 2.1% |
| | |
NXP Semiconductors NV (China) | | |
| | |
| | |
|
| | |
| | |
| | |
Dick's Sporting Goods, Inc. (a) | | |
| | |
| | |
| | |
| | |
Textiles, Apparel & Luxury Goods — 1.0% |
| | |
| | |
| | |
| | |
|
|
Philip Morris International, Inc. | | |
Wireless Telecommunication Services — 0.7% |
| | |
Total Common Stocks
(Cost $6,559,703) | | |
Short Term Investments — 4.1% |
Investment Companies — 3.5% |
JPMorgan Prime Money Market Fund Class IM Shares, 1.54% (b) (c)
(Cost $338,709) | | |
Investment of Cash Collateral from Securities Loaned — 0.6% |
JPMorgan Securities Lending Money Market Fund Agency SL Class Shares, 1.50% (b) (c) | | |
JPMorgan U.S. Government Money Market Fund Class IM Shares, 1.38% (b) (c) | | |
Total Investment of Cash Collateral from Securities Loaned
(Cost $53,312) | | |
Total Short Term Investments
(Cost $392,021) | | |
Total Investments — 100.8%
(Cost $6,951,724) | | |
Liabilities in Excess of Other Assets — (0.8)% | | |
| | |
Percentages indicated are based on net assets. |
| Non-income producing security. |
| The security or a portion of this security is on loan at June 30, 2022. The total value of securities on loan at June 30, 2022 is $51,393. |
| Investment in an affiliated fund, which is registered under the Investment Company Act of 1940, as amended, and is advised by J.P. Morgan Investment Management Inc. |
| The rate shown is the current yield as of June 30, 2022. |
SEE NOTES TO FINANCIAL STATEMENTS.
| J.P. Morgan Mid Cap/Multi-Cap Funds | |
STATEMENTS OF ASSETS AND LIABILITIES
AS OF June 30, 2022
(Amounts in thousands, except per share amounts)
| JPMorgan
Growth
Advantage Fund | JPMorgan
Mid Cap
Equity Fund | |
| | | |
Investments in non-affiliates, at value | | | |
Investments in affiliates, at value | | | |
Investments of cash collateral received from securities loaned, at value (See Note 2.B) | | | |
| | | |
Foreign currency, at value | | | |
| | | |
| | | |
Investment securities sold | | | |
| | | |
Dividends from non-affiliates | | | |
Dividends from affiliates | | | |
Securities lending income (See Note 2.B) | | | |
| | | |
| | | |
| | | |
| | | |
Investment securities purchased | | | |
Collateral received on securities loaned (See Note 2.B) | | | |
| | | |
| | | |
| | | |
| | | |
| | | |
| | | |
Custodian and accounting fees | | | |
Trustees’ and Chief Compliance Officer’s fees | | | |
| | | |
| | | |
| | | |
(a)
Amount rounds to less than one thousand.
SEE NOTES TO FINANCIAL STATEMENTS.
| J.P. Morgan Mid Cap/Multi-Cap Funds | |
STATEMENTS OF ASSETS AND LIABILITIES
AS OF June 30, 2022 (continued)
(Amounts in thousands, except per share amounts)
| JPMorgan Growth Advantage Fund | JPMorgan Mid Cap Equity Fund | |
| | | |
| | | |
Total distributable earnings (loss) | | | |
| | | |
| | | |
| | | |
| | | |
| | | |
| | | |
| | | |
| | | |
| | | |
| | | |
| | | |
Outstanding units of beneficial interest (shares)
($0.0001 par value; unlimited number of shares authorized): | | | |
| | | |
| | | |
| | | |
| | | |
| | | |
| | | |
| | | |
| | | |
| | | |
Class A — Redemption price per share | | | |
Class C — Offering price per share (b) | | | |
Class I — Offering and redemption price per share | | | |
Class R2 — Offering and redemption price per share | | | |
Class R3 — Offering and redemption price per share | | | |
Class R4 — Offering and redemption price per share | | | |
Class R5 — Offering and redemption price per share | | | |
Class R6 — Offering and redemption price per share | | | |
Class A maximum sales charge | | | |
Class A maximum public offering price per share
[net asset value per share/(100% – maximum sales charge)] | | | |
Cost of investments in non-affiliates | | | |
Cost of investments in affiliates | | | |
| | | |
Investment securities on loan, at value (See Note 2.B) | | | |
Cost of investment of cash collateral (See Note 2.B) | | | |
(a)
Per share amounts may not recalculate due to rounding of net assets and/or shares outstanding.
(b)
Redemption price for Class C Shares varies based upon length of time the shares are held.
SEE NOTES TO FINANCIAL STATEMENTS.
| J.P. Morgan Mid Cap/Multi-Cap Funds | |
| JPMorgan
Mid Cap
Value Fund | |
| | |
Investments in non-affiliates, at value | | |
Investments in affiliates, at value | | |
Investments of cash collateral received from securities loaned, at value (See Note 2.B) | | |
| | |
| | |
Investment securities sold | | |
| | |
Dividends from non-affiliates | | |
Dividends from affiliates | | |
Securities lending income (See Note 2.B) | | |
| | |
| | |
| | |
Investment securities purchased | | |
Collateral received on securities loaned (See Note 2.B) | | |
| | |
| | |
| | |
| | |
| | |
| | |
Custodian and accounting fees | | |
| | |
| | |
| | |
(a)
Amount rounds to less than one thousand.
SEE NOTES TO FINANCIAL STATEMENTS.
| J.P. Morgan Mid Cap/Multi-Cap Funds | |
STATEMENTS OF ASSETS AND LIABILITIES
AS OF June 30, 2022 (continued)
(Amounts in thousands, except per share amounts)
| JPMorgan Mid Cap Value Fund | |
| | |
| | |
Total distributable earnings (loss) | | |
| | |
| | |
| | |
| | |
| | |
| | |
| | |
| | |
| | |
| | |
| | |
| | |
Outstanding units of beneficial interest (shares)
($0.0001 par value; unlimited number of shares authorized): | | |
| | |
| | |
| | |
| | |
| | |
| | |
| | |
| | |
| | |
| | |
Class A — Redemption price per share | | |
Class C — Offering price per share (b) | | |
Class I — Offering and redemption price per share | | |
Class L — Offering and redemption price per share | | |
Class R2 — Offering and redemption price per share | | |
Class R3 — Offering and redemption price per share | | |
Class R4 — Offering and redemption price per share | | |
Class R5 — Offering and redemption price per share | | |
Class R6 — Offering and redemption price per share | | |
Class A maximum sales charge | | |
Class A maximum public offering price per share
[net asset value per share/(100% – maximum sales charge)] | | |
Cost of investments in non-affiliates | | |
Cost of investments in affiliates | | |
Investment securities on loan, at value (See Note 2.B) | | |
Cost of investment of cash collateral (See Note 2.B) | | |
(a)
Per share amounts may not recalculate due to rounding of net assets and/or shares outstanding.
(b)
Redemption price for Class C Shares varies based upon length of time the shares are held.
SEE NOTES TO FINANCIAL STATEMENTS.
| J.P. Morgan Mid Cap/Multi-Cap Funds | |
STATEMENTS OF OPERATIONS
FOR THE YEAR ENDED June 30, 2022
(Amounts in thousands)
| JPMorgan
Growth
Advantage Fund | JPMorgan
Mid Cap
Equity Fund | |
| | | |
Interest income from non-affiliates | | | |
Interest income from affiliates | | | |
Dividend income from non-affiliates | | | |
Dividend income from affiliates | | | |
Income from securities lending (net) (See Note 2.B) | | | |
| | | |
| | | |
| | | |
| | | |
| | | |
| | | |
| | | |
| | | |
| | | |
| | | |
| | | |
| | | |
| | | |
| | | |
| | | |
| | | |
| | | |
Custodian and accounting fees | | | |
| | | |
Trustees’ and Chief Compliance Officer’s fees | | | |
Printing and mailing costs | | | |
Registration and filing fees | | | |
Transfer agency fees (See Note 2.F) | | | |
| | | |
| | | |
| | | |
Less expense reimbursements | | | |
| | | |
Net investment income (loss) | | | |
(a)
Amount rounds to less than one thousand.
SEE NOTES TO FINANCIAL STATEMENTS.
| J.P. Morgan Mid Cap/Multi-Cap Funds | |
STATEMENTS OF OPERATIONS
FOR THE YEAR ENDED June 30, 2022 (continued)
(Amounts in thousands)
| JPMorgan Growth Advantage Fund | JPMorgan Mid Cap Equity Fund | |
REALIZED/UNREALIZED GAINS (LOSSES): | | | |
Net realized gain (loss) on transactions from: | | | |
Investments in non-affiliates | | | |
Investments in affiliates | | | |
Foreign currency transactions | | | |
| | | |
Change in net unrealized appreciation/depreciation on: | | | |
Investments in non-affiliates | | | |
Investments in affiliates | | | |
Foreign currency translations | | | |
Change in net unrealized appreciation/depreciation | | | |
Net realized/unrealized gains (losses) | | | |
Change in net assets resulting from operations | | | |
(a)
Amount rounds to less than one thousand.
SEE NOTES TO FINANCIAL STATEMENTS.
| J.P. Morgan Mid Cap/Multi-Cap Funds | |
| JPMorgan
Mid Cap
Value Fund | JPMorgan
Value
Advantage Fund |
| | |
Interest income from non-affiliates | | |
Dividend income from non-affiliates | | |
Dividend income from affiliates | | |
Income from securities lending (net) (See Note 2.B) | | |
| | |
| | |
| | |
| | |
| | |
| | |
| | |
| | |
| | |
| | |
| | |
| | |
| | |
| | |
| | |
| | |
| | |
| | |
Custodian and accounting fees | | |
| | |
Trustees’ and Chief Compliance Officer’s fees | | |
Printing and mailing costs | | |
Registration and filing fees | | |
Transfer agency fees (See Note 2.F) | | |
| | |
| | |
| | |
Less expense reimbursements | | |
| | |
Net investment income (loss) | | |
SEE NOTES TO FINANCIAL STATEMENTS.
| J.P. Morgan Mid Cap/Multi-Cap Funds | |
STATEMENTS OF OPERATIONS
FOR THE YEAR ENDED June 30, 2022 (continued)
(Amounts in thousands)
| JPMorgan Mid Cap Value Fund | JPMorgan Value Advantage Fund |
REALIZED/UNREALIZED GAINS (LOSSES): | | |
Net realized gain (loss) on transactions from: | | |
Investments in non-affiliates | | |
Investments in affiliates | | |
| | |
Change in net unrealized appreciation/depreciation on: | | |
Investments in non-affiliates | | |
Investments in affiliates | | |
Change in net unrealized appreciation/depreciation | | |
Net realized/unrealized gains (losses) | | |
Change in net assets resulting from operations | | |
SEE NOTES TO FINANCIAL STATEMENTS.
| J.P. Morgan Mid Cap/Multi-Cap Funds | |
STATEMENTS OF CHANGES IN NET ASSETS
FOR THE PERIODS INDICATED
(Amounts in thousands)
| JPMorgan Growth Advantage Fund | JPMorgan Mid Cap Equity Fund |
| | | | |
CHANGE IN NET ASSETS RESULTING FROM OPERATIONS: | | | | |
Net investment income (loss) | | | | |
| | | | |
Change in net unrealized appreciation/depreciation | | | | |
Change in net assets resulting from operations | | | | |
DISTRIBUTIONS TO SHAREHOLDERS: | | | | |
| | | | |
| | | | |
| | | | |
| | | | |
| | | | |
| | | | |
| | | | |
| | | | |
Total distributions to shareholders | | | | |
| | | | |
Change in net assets resulting from capital transactions | | | | |
| | | | |
| | | | |
| | | | |
| | | | |
SEE NOTES TO FINANCIAL STATEMENTS.
| J.P. Morgan Mid Cap/Multi-Cap Funds | |
STATEMENTS OF CHANGES IN NET ASSETS
FOR THE PERIODS INDICATED (continued)
(Amounts in thousands)
| JPMorgan Mid Cap Growth Fund | JPMorgan Mid Cap Value Fund |
| | | | |
CHANGE IN NET ASSETS RESULTING FROM OPERATIONS: | | | | |
Net investment income (loss) | | | | |
| | | | |
Change in net unrealized appreciation/depreciation | | | | |
Change in net assets resulting from operations | | | | |
DISTRIBUTIONS TO SHAREHOLDERS: | | | | |
| | | | |
| | | | |
| | | | |
| | | | |
| | | | |
| | | | |
| | | | |
| | | | |
| | | | |
Total distributions to shareholders | | | | |
| | | | |
Change in net assets resulting from capital transactions | | | | |
| | | | |
| | | | |
| | | | |
| | | | |
SEE NOTES TO FINANCIAL STATEMENTS.
| J.P. Morgan Mid Cap/Multi-Cap Funds | |
| JPMorgan Value Advantage Fund |
| | |
CHANGE IN NET ASSETS RESULTING FROM OPERATIONS: | | |
Net investment income (loss) | | |
| | |
Change in net unrealized appreciation/depreciation | | |
Change in net assets resulting from operations | | |
DISTRIBUTIONS TO SHAREHOLDERS: | | |
| | |
| | |
| | |
| | |
| | |
| | |
| | |
| | |
| | |
Total distributions to shareholders | | |
| | |
Change in net assets resulting from capital transactions | | |
| | |
| | |
| | |
| | |
SEE NOTES TO FINANCIAL STATEMENTS.
| J.P. Morgan Mid Cap/Multi-Cap Funds | |
STATEMENTS OF CHANGES IN NET ASSETS
FOR THE PERIODS INDICATED (continued)
(Amounts in thousands)
| JPMorgan Growth Advantage Fund | JPMorgan Mid Cap Equity Fund |
| | | | |
| | | | |
| | | | |
Proceeds from shares issued | | | | |
| | | | |
| | | | |
Change in net assets resulting from Class A capital transactions | | | | |
| | | | |
Proceeds from shares issued | | | | |
| | | | |
| | | | |
Change in net assets resulting from Class C capital transactions | | | | |
| | | | |
Proceeds from shares issued | | | | |
| | | | |
| | | | |
Change in net assets resulting from Class I capital transactions | | | | |
| | | | |
Proceeds from shares issued | | | | |
| | | | |
| | | | |
Change in net assets resulting from Class R2 capital transactions | | | | |
| | | | |
Proceeds from shares issued | | | | |
| | | | |
| | | | |
Change in net assets resulting from Class R3 capital transactions | | | | |
| | | | |
Proceeds from shares issued | | | | |
| | | | |
| | | | |
Change in net assets resulting from Class R4 capital transactions | | | | |
| | | | |
Proceeds from shares issued | | | | |
| | | | |
| | | | |
Change in net assets resulting from Class R5 capital transactions | | | | |
SEE NOTES TO FINANCIAL STATEMENTS.
| J.P. Morgan Mid Cap/Multi-Cap Funds | |
| JPMorgan Growth Advantage Fund | JPMorgan Mid Cap Equity Fund |
| | | | |
CAPITAL TRANSACTIONS: (continued) | | | | |
| | | | |
Proceeds from shares issued | | | | |
| | | | |
| | | | |
Change in net assets resulting from Class R6 capital transactions | | | | |
Total change in net assets resulting from capital transactions | | | | |
| | | | |
| | | | |
| | | | |
| | | | |
| | | | |
| | | | |
| | | | |
| | | | |
| | | | |
| | | | |
| | | | |
| | | | |
| | | | |
| | | | |
| | | | |
| | | | |
| | | | |
| | | | |
| | | | |
| | | | |
Change in Class R2 Shares | | | | |
| | | | |
| | | | |
| | | | |
| | | | |
Change in Class R3 Shares | | | | |
| | | | |
| | | | |
| | | | |
| | | | |
Change in Class R4 Shares | | | | |
SEE NOTES TO FINANCIAL STATEMENTS.
| J.P. Morgan Mid Cap/Multi-Cap Funds | |
STATEMENTS OF CHANGES IN NET ASSETS
FOR THE PERIODS INDICATED (continued)
(Amounts in thousands)
| JPMorgan Growth Advantage Fund | JPMorgan Mid Cap Equity Fund |
| | | | |
SHARE TRANSACTIONS: (continued) | | | | |
| | | | |
| | | | |
| | | | |
| | | | |
Change in Class R5 Shares | | | | |
| | | | |
| | | | |
| | | | |
| | | | |
Change in Class R6 Shares | | | | |
SEE NOTES TO FINANCIAL STATEMENTS.
| J.P. Morgan Mid Cap/Multi-Cap Funds | |
| JPMorgan Mid Cap Growth Fund | JPMorgan Mid Cap Value Fund |
| | | | |
| | | | |
| | | | |
Proceeds from shares issued | | | | |
| | | | |
| | | | |
Change in net assets resulting from Class A capital transactions | | | | |
| | | | |
Proceeds from shares issued | | | | |
| | | | |
| | | | |
Change in net assets resulting from Class C capital transactions | | | | |
| | | | |
Proceeds from shares issued | | | | |
| | | | |
| | | | |
Change in net assets resulting from Class I capital transactions | | | | |
| | | | |
Proceeds from shares issued | | | | |
| | | | |
| | | | |
Change in net assets resulting from Class L capital transactions | | | | |
| | | | |
Proceeds from shares issued | | | | |
| | | | |
| | | | |
Change in net assets resulting from Class R2 capital transactions | | | | |
| | | | |
Proceeds from shares issued | | | | |
| | | | |
| | | | |
Change in net assets resulting from Class R3 capital transactions | | | | |
| | | | |
Proceeds from shares issued | | | | |
| | | | |
| | | | |
Change in net assets resulting from Class R4 capital transactions | | | | |
| | | | |
Proceeds from shares issued | | | | |
| | | | |
| | | | |
Change in net assets resulting from Class R5 capital transactions | | | | |
SEE NOTES TO FINANCIAL STATEMENTS.
| J.P. Morgan Mid Cap/Multi-Cap Funds | |
STATEMENTS OF CHANGES IN NET ASSETS
FOR THE PERIODS INDICATED (continued)
(Amounts in thousands)
| JPMorgan Mid Cap Growth Fund | JPMorgan Mid Cap Value Fund |
| | | | |
CAPITAL TRANSACTIONS: (continued) | | | | |
| | | | |
Proceeds from shares issued | | | | |
| | | | |
| | | | |
Change in net assets resulting from Class R6 capital transactions | | | | |
Total change in net assets resulting from capital transactions | | | | |
| | | | |
| | | | |
| | | | |
| | | | |
| | | | |
| | | | |
| | | | |
| | | | |
| | | | |
| | | | |
| | | | |
| | | | |
| | | | |
| | | | |
| | | | |
| | | | |
| | | | |
| | | | |
| | | | |
| | | | |
| | | | |
| | | | |
| | | | |
| | | | |
| | | | |
Change in Class R2 Shares | | | | |
| | | | |
| | | | |
| | | | |
| | | | |
Change in Class R3 Shares | | | | |
SEE NOTES TO FINANCIAL STATEMENTS.
| J.P. Morgan Mid Cap/Multi-Cap Funds | |
| JPMorgan Mid Cap Growth Fund | JPMorgan Mid Cap Value Fund |
| | | | |
SHARE TRANSACTIONS: (continued) | | | | |
| | | | |
| | | | |
| | | | |
| | | | |
Change in Class R4 Shares | | | | |
| | | | |
| | | | |
| | | | |
| | | | |
Change in Class R5 Shares | | | | |
| | | | |
| | | | |
| | | | |
| | | | |
Change in Class R6 Shares | | | | |
SEE NOTES TO FINANCIAL STATEMENTS.
| J.P. Morgan Mid Cap/Multi-Cap Funds | |
STATEMENTS OF CHANGES IN NET ASSETS
FOR THE PERIODS INDICATED (continued)
(Amounts in thousands)
| JPMorgan Value Advantage Fund |
| | |
| | |
| | |
Proceeds from shares issued | | |
| | |
| | |
Change in net assets resulting from Class A capital transactions | | |
| | |
Proceeds from shares issued | | |
| | |
| | |
Change in net assets resulting from Class C capital transactions | | |
| | |
Proceeds from shares issued | | |
| | |
| | |
Change in net assets resulting from Class I capital transactions | | |
| | |
Proceeds from shares issued | | |
| | |
| | |
Change in net assets resulting from Class L capital transactions | | |
| | |
Proceeds from shares issued | | |
| | |
| | |
Change in net assets resulting from Class R2 capital transactions | | |
| | |
Proceeds from shares issued | | |
| | |
| | |
Change in net assets resulting from Class R3 capital transactions | | |
| | |
Proceeds from shares issued | | |
| | |
| | |
Change in net assets resulting from Class R4 capital transactions | | |
SEE NOTES TO FINANCIAL STATEMENTS.
| J.P. Morgan Mid Cap/Multi-Cap Funds | |
| JPMorgan Value Advantage Fund |
| | |
CAPITAL TRANSACTIONS: (continued) | | |
| | |
Proceeds from shares issued | | |
| | |
| | |
Change in net assets resulting from Class R5 capital transactions | | |
| | |
Proceeds from shares issued | | |
| | |
| | |
Change in net assets resulting from Class R6 capital transactions | | |
Total change in net assets resulting from capital transactions | | |
| | |
| | |
| | |
| | |
| | |
| | |
| | |
| | |
| | |
| | |
| | |
| | |
| | |
| | |
| | |
| | |
| | |
| | |
| | |
| | |
| | |
| | |
| | |
| | |
| | |
Change in Class R2 Shares | | |
(a)
Amount rounds to less than one thousand.
SEE NOTES TO FINANCIAL STATEMENTS.
| J.P. Morgan Mid Cap/Multi-Cap Funds | |
STATEMENTS OF CHANGES IN NET ASSETS
FOR THE PERIODS INDICATED (continued)
(Amounts in thousands)
| JPMorgan Value Advantage Fund |
| | |
SHARE TRANSACTIONS: (continued) | | |
| | |
| | |
| | |
| | |
Change in Class R3 Shares | | |
| | |
| | |
| | |
| | |
Change in Class R4 Shares | | |
| | |
| | |
| | |
| | |
Change in Class R5 Shares | | |
| | |
| | |
| | |
| | |
Change in Class R6 Shares | | |
SEE NOTES TO FINANCIAL STATEMENTS.
| J.P. Morgan Mid Cap/Multi-Cap Funds | |
THIS PAGE IS INTENTIONALLY LEFT BLANK
FINANCIAL HIGHLIGHTS
FOR THE PERIODS INDICATED
| Per share operating performance |
| | | |
| Net asset
value,
beginning
of period | Net
investment
income
(loss)(b) | Net realized
and unrealized
gains
(losses) on
investments | Total from
investment
operations | | | |
JPMorgan Growth Advantage Fund | | | | | | | |
| | | | | | | |
| | | | | | | |
| | | | | | | |
| | | | | | | |
| | | | | | | |
| | | | | | | |
| | | | | | | |
| | | | | | | |
| | | | | | | |
| | | | | | | |
| | | | | | | |
| | | | | | | |
| | | | | | | |
| | | | | | | |
| | | | | | | |
| | | | | | | |
| | | | | | | |
| | | | | | | |
| | | | | | | |
| | | | | | | |
| | | | | | | |
| | | | | | | |
| | | | | | | |
July 31, 2017 (f) through June 30, 2018 | | | | | | | |
| | | | | | | |
| | | | | | | |
| | | | | | | |
| | | | | | | |
| | | | | | | |
| | | | | | | |
| | | | | | | |
| | | | | | | |
| | | | | | | |
| | | | | | | |
| | | | | | | |
| | | | | | | |
| | | | | | | |
| | | | | | | |
| | | | | | | |
| | | | | | | |
| | | | | | | |
| | | | | | | |
SEE NOTES TO FINANCIAL STATEMENTS.
| J.P. Morgan Mid Cap/Multi-Cap Funds | |
| |
| | | Ratios to average net assets(a) |
Net asset
value,
end of
period | Total return
(excludes
sales charge)(c)(d) | Net assets,
end of
period
(000's) | | Net
investment
income
(loss) | Expenses without
waivers and reimbursements | |
| | | | | | |
| | | | | | |
| | | | | | |
| | | | | | |
| | | | | | |
| | | | | | |
| | | | | | |
| | | | | | |
| | | | | | |
| | | | | | |
| | | | | | |
| | | | | | |
| | | | | | |
| | | | | | |
| | | | | | |
| | | | | | |
| | | | | | |
| | | | | | |
| | | | | | |
| | | | | | |
| | | | | | |
| | | | | | |
| | | | | | |
| | | | | | |
| | | | | | |
| | | | | | |
| | | | | | |
| | | | | | |
| | | | | | |
| | | | | | |
| | | | | | |
| | | | | | |
| | | | | | |
| | | | | | |
| | | | | | |
| | | | | | |
| | | | | | |
| | | | | | |
| | | | | | |
| | | | | | |
| | | | | | |
| | | | | | |
| | | | | | |
SEE NOTES TO FINANCIAL STATEMENTS.
| J.P. Morgan Mid Cap/Multi-Cap Funds | |
FINANCIAL HIGHLIGHTS
FOR THE PERIODS INDICATED (continued)
| Per share operating performance |
| | | |
| Net asset
value,
beginning
of period | Net
investment
income
(loss)(b) | Net realized
and unrealized
gains
(losses) on
investments | Total from
investment
operations | | | |
JPMorgan Growth Advantage Fund (continued) | | | | | | | |
| | | | | | | |
| | | | | | | |
| | | | | | | |
| | | | | | | |
| | | | | | | |
| | | | | | | |
|
| Annualized for periods less than one year, unless otherwise noted. |
| Calculated based upon average shares outstanding. |
| Not annualized for periods less than one year. |
| Includes adjustments in accordance with accounting principles generally accepted in the United States of America and as such, the net asset values for financial reporting purposes and the returns based upon those net asset values may differ from the net asset values and returns for shareholder transactions. |
| Includes earnings credits and interest expense, if applicable, each of which is less than 0.005% unless otherwise noted. |
| Commencement of offering of class of shares. |
SEE NOTES TO FINANCIAL STATEMENTS.
| J.P. Morgan Mid Cap/Multi-Cap Funds | |
| |
| | | Ratios to average net assets(a) |
Net asset
value,
end of
period | Total return
(excludes
sales charge)(c)(d) | Net assets,
end of
period
(000's) | | Net
investment
income
(loss) | Expenses without
waivers and reimbursements | |
| | | | | | |
| | | | | | |
| | | | | | |
| | | | | | |
| | | | | | |
| | | | | | |
| | | | | | |
SEE NOTES TO FINANCIAL STATEMENTS.
| J.P. Morgan Mid Cap/Multi-Cap Funds | |
FINANCIAL HIGHLIGHTS
FOR THE PERIODS INDICATED
| Per share operating performance |
| | | |
| Net asset
value,
beginning
of period | Net
investment
income
(loss)(a) | Net realized
and unrealized
gains
(losses) on
investments | Total from
investment
operations | | | |
JPMorgan Mid Cap Equity Fund | | | | | | | |
| | | | | | | |
| | | | | | | |
| | | | | | | |
| | | | | | | |
| | | | | | | |
| | | | | | | |
| | | | | | | |
| | | | | | | |
| | | | | | | |
| | | | | | | |
| | | | | | | |
| | | | | | | |
| | | | | | | |
| | | | | | | |
| | | | | | | |
| | | | | | | |
| | | | | | | |
| | | | | | | |
| | | | | | | |
| | | | | | | |
| | | | | | | |
| | | | | | | |
| | | | | | | |
| | | | | | | |
| | | | | | | |
| | | | | | | |
| | | | | | | |
| | | | | | | |
| | | | | | | |
| | | | | | | |
| | | | | | | |
| | | | | | | |
| | | | | | | |
| | | | | | | |
| | | | | | | |
| | | | | | | |
|
| Calculated based upon average shares outstanding. |
| Includes adjustments in accordance with accounting principles generally accepted in the United States of America and as such, the net asset values for financial reporting purposes and the returns based upon those net asset values may differ from the net asset values and returns for shareholder transactions. |
| Includes earnings credits and interest expense, if applicable, each of which is less than 0.005% unless otherwise noted. |
| Amount rounds to less than $0.005. |
SEE NOTES TO FINANCIAL STATEMENTS.
| J.P. Morgan Mid Cap/Multi-Cap Funds | |
| |
| | | Ratios to average net assets |
Net asset
value,
end of
period | Total return
(excludes
sales charge)(b) | Net assets,
end of
period
(000's) | | Net
investment
income
(loss) | Expenses without
waivers and reimbursements | |
| | | | | | |
| | | | | | |
| | | | | | |
| | | | | | |
| | | | | | |
| | | | | | |
| | | | | | |
| | | | | | |
| | | | | | |
| | | | | | |
| | | | | | |
| | | | | | |
| | | | | | |
| | | | | | |
| | | | | | |
| | | | | | |
| | | | | | |
| | | | | | |
| | | | | | |
| | | | | | |
| | | | | | |
| | | | | | |
| | | | | | |
| | | | | | |
| | | | | | |
| | | | | | |
| | | | | | |
| | | | | | |
| | | | | | |
| | | | | | |
| | | | | | |
| | | | | | |
| | | | | | |
| | | | | | |
| | | | | | |
| | | | | | |
| | | | | | |
SEE NOTES TO FINANCIAL STATEMENTS.
| J.P. Morgan Mid Cap/Multi-Cap Funds | |
FINANCIAL HIGHLIGHTS
FOR THE PERIODS INDICATED
| Per share operating performance |
| | | |
| Net asset
value,
beginning
of period | Net
investment
income
(loss)(a) | Net realized
and unrealized
gains
(losses) on
investments | Total from
investment
operations | | | |
JPMorgan Mid Cap Growth Fund | | | | | | | |
| | | | | | | |
| | | | | | | |
| | | | | | | |
| | | | | | | |
| | | | | | | |
| | | | | | | |
| | | | | | | |
| | | | | | | |
| | | | | | | |
| | | | | | | |
| | | | | | | |
| | | | | | | |
| | | | | | | |
| | | | | | | |
| | | | | | | |
| | | | | | | |
| | | | | | | |
| | | | | | | |
| | | | | | | |
| | | | | | | |
| | | | | | | |
| | | | | | | |
| | | | | | | |
| | | | | | | |
| | | | | | | |
| | | | | | | |
| | | | | | | |
| | | | | | | |
| | | | | | | |
| | | | | | | |
| | | | | | | |
| | | | | | | |
| | | | | | | |
| | | | | | | |
| | | | | | | |
| | | | | | | |
| | | | | | | |
| | | | | | | |
| | | | | | | |
| | | | | | | |
| | | | | | | |
| | | | | | | |
SEE NOTES TO FINANCIAL STATEMENTS.
| J.P. Morgan Mid Cap/Multi-Cap Funds | |
| |
| | | Ratios to average net assets |
Net asset
value,
end of
period | Total return
(excludes
sales charge)(b) | Net assets,
end of
period
(000's) | | Net
investment
income
(loss) | Expenses without
waivers and reimbursements | |
| | | | | | |
| | | | | | |
| | | | | | |
| | | | | | |
| | | | | | |
| | | | | | |
| | | | | | |
| | | | | | |
| | | | | | |
| | | | | | |
| | | | | | |
| | | | | | |
| | | | | | |
| | | | | | |
| | | | | | |
| | | | | | |
| | | | | | |
| | | | | | |
| | | | | | |
| | | | | | |
| | | | | | |
| | | | | | |
| | | | | | |
| | | | | | |
| | | | | | |
| | | | | | |
| | | | | | |
| | | | | | |
| | | | | | |
| | | | | | |
| | | | | | |
| | | | | | |
| | | | | | |
| | | | | | |
| | | | | | |
| | | | | | |
| | | | | | |
| | | | | | |
| | | | | | |
| | | | | | |
| | | | | | |
| | | | | | |
| | | | | | |
SEE NOTES TO FINANCIAL STATEMENTS.
| J.P. Morgan Mid Cap/Multi-Cap Funds | |
FINANCIAL HIGHLIGHTS
FOR THE PERIODS INDICATED (continued)
| Per share operating performance |
| | | |
| Net asset
value,
beginning
of period | Net
investment
income
(loss)(a) | Net realized
and unrealized
gains
(losses) on
investments | Total from
investment
operations | | | |
JPMorgan Mid Cap Growth Fund (continued) | | | | | | | |
| | | | | | | |
| | | | | | | |
| | | | | | | |
| | | | | | | |
| | | | | | | |
| | | | | | | |
|
| Calculated based upon average shares outstanding. |
| Includes adjustments in accordance with accounting principles generally accepted in the United States of America and as such, the net asset values for financial reporting purposes and the returns based upon those net asset values may differ from the net asset values and returns for shareholder transactions. |
| Includes earnings credits and interest expense, if applicable, each of which is less than 0.005% unless otherwise noted. |
SEE NOTES TO FINANCIAL STATEMENTS.
| J.P. Morgan Mid Cap/Multi-Cap Funds | |
| |
| | | Ratios to average net assets |
Net asset
value,
end of
period | Total return
(excludes
sales charge)(b) | Net assets,
end of
period
(000's) | | Net
investment
income
(loss) | Expenses without
waivers and reimbursements | |
| | | | | | |
| | | | | | |
| | | | | | |
| | | | | | |
| | | | | | |
| | | | | | |
| | | | | | |
SEE NOTES TO FINANCIAL STATEMENTS.
| J.P. Morgan Mid Cap/Multi-Cap Funds | |
FINANCIAL HIGHLIGHTS
FOR THE PERIODS INDICATED
| Per share operating performance |
| | | |
| Net asset
value,
beginning
of period | Net
investment
income
(loss)(a) | Net realized
and unrealized
gains
(losses) on
investments | Total from
investment
operations | | | |
JPMorgan Mid Cap Value Fund | | | | | | | |
| | | | | | | |
| | | | | | | |
| | | | | | | |
| | | | | | | |
| | | | | | | |
| | | | | | | |
| | | | | | | |
| | | | | | | |
| | | | | | | |
| | | | | | | |
| | | | | | | |
| | | | | | | |
| | | | | | | |
| | | | | | | |
| | | | | | | |
| | | | | | | |
| | | | | | | |
| | | | | | | |
| | | | | | | |
| | | | | | | |
| | | | | | | |
| | | | | | | |
| | | | | | | |
| | | | | | | |
| | | | | | | |
| | | | | | | |
| | | | | | | |
| | | | | | | |
| | | | | | | |
| | | | | | | |
| | | | | | | |
| | | | | | | |
| | | | | | | |
| | | | | | | |
| | | | | | | |
| | | | | | | |
| | | | | | | |
| | | | | | | |
| | | | | | | |
| | | | | | | |
| | | | | | | |
| | | | | | | |
SEE NOTES TO FINANCIAL STATEMENTS.
| J.P. Morgan Mid Cap/Multi-Cap Funds | |
| |
| | | Ratios to average net assets |
Net asset
value,
end of
period | Total return
(excludes
sales charge)(b) | Net assets,
end of
period
(000's) | | Net
investment
income
(loss) | Expenses without
waivers and reimbursements | |
| | | | | | |
| | | | | | |
| | | | | | |
| | | | | | |
| | | | | | |
| | | | | | |
| | | | | | |
| | | | | | |
| | | | | | |
| | | | | | |
| | | | | | |
| | | | | | |
| | | | | | |
| | | | | | |
| | | | | | |
| | | | | | |
| | | | | | |
| | | | | | |
| | | | | | |
| | | | | | |
| | | | | | |
| | | | | | |
| | | | | | |
| | | | | | |
| | | | | | |
| | | | | | |
| | | | | | |
| | | | | | |
| | | | | | |
| | | | | | |
| | | | | | |
| | | | | | |
| | | | | | |
| | | | | | |
| | | | | | |
| | | | | | |
| | | | | | |
| | | | | | |
| | | | | | |
| | | | | | |
| | | | | | |
| | | | | | |
| | | | | | |
SEE NOTES TO FINANCIAL STATEMENTS.
| J.P. Morgan Mid Cap/Multi-Cap Funds | |
FINANCIAL HIGHLIGHTS
FOR THE PERIODS INDICATED (continued)
| Per share operating performance |
| | | |
| Net asset
value,
beginning
of period | Net
investment
income
(loss)(a) | Net realized
and unrealized
gains
(losses) on
investments | Total from
investment
operations | | | |
JPMorgan Mid Cap Value Fund (continued) | | | | | | | |
| | | | | | | |
| | | | | | | |
| | | | | | | |
| | | | | | | |
| | | | | | | |
| | | | | | | |
| | | | | | | |
| | | | | | | |
| | | | | | | |
| | | | | | | |
| | | | | | | |
| | | | | | | |
|
| Calculated based upon average shares outstanding. |
| Includes adjustments in accordance with accounting principles generally accepted in the United States of America and as such, the net asset values for financial reporting purposes and the returns based upon those net asset values may differ from the net asset values and returns for shareholder transactions. |
| Includes earnings credits and interest expense, if applicable, each of which is less than 0.005% unless otherwise noted. |
SEE NOTES TO FINANCIAL STATEMENTS.
| J.P. Morgan Mid Cap/Multi-Cap Funds | |
| |
| | | Ratios to average net assets |
Net asset
value,
end of
period | Total return
(excludes
sales charge)(b) | Net assets,
end of
period
(000's) | | Net
investment
income
(loss) | Expenses without
waivers and reimbursements | |
| | | | | | |
| | | | | | |
| | | | | | |
| | | | | | |
| | | | | | |
| | | | | | |
| | | | | | |
| | | | | | |
| | | | | | |
| | | | | | |
| | | | | | |
| | | | | | |
| | | | | | |
SEE NOTES TO FINANCIAL STATEMENTS.
| J.P. Morgan Mid Cap/Multi-Cap Funds | |
FINANCIAL HIGHLIGHTS
FOR THE PERIODS INDICATED
| Per share operating performance |
| | | |
| Net asset
value,
beginning
of period | Net
investment
income
(loss)(b) | Net realized
and unrealized
gains
(losses) on
investments | Total from
investment
operations | | | |
JPMorgan Value Advantage Fund | | | | | | | |
| | | | | | | |
| | | | | | | |
| | | | | | | |
| | | | | | | |
| | | | | | | |
| | | | | | | |
| | | | | | | |
| | | | | | | |
| | | | | | | |
| | | | | | | |
| | | | | | | |
| | | | | | | |
| | | | | | | |
| | | | | | | |
| | | | | | | |
| | | | | | | |
| | | | | | | |
| | | | | | | |
| | | | | | | |
| | | | | | | |
| | | | | | | |
| | | | | | | |
| | | | | | | |
| | | | | | | |
| | | | | | | |
| | | | | | | |
| | | | | | | |
| | | | | | | |
| | | | | | | |
July 31, 2017 (g) through June 30, 2018 | | | | | | | |
| | | | | | | |
| | | | | | | |
| | | | | | | |
| | | | | | | |
| | | | | | | |
| | | | | | | |
| | | | | | | |
| | | | | | | |
| | | | | | | |
| | | | | | | |
| | | | | | | |
| | | | | | | |
SEE NOTES TO FINANCIAL STATEMENTS.
| J.P. Morgan Mid Cap/Multi-Cap Funds | |
| |
| | | Ratios to average net assets(a) |
Net asset
value,
end of
period | Total return
(excludes
sales charge)(c)(d) | Net assets,
end of
period
(000's) | | Net
investment
income
(loss) | Expenses without
waivers and reimbursements | |
| | | | | | |
| | | | | | |
| | | | | | |
| | | | | | |
| | | | | | |
| | | | | | |
| | | | | | |
| | | | | | |
| | | | | | |
| | | | | | |
| | | | | | |
| | | | | | |
| | | | | | |
| | | | | | |
| | | | | | |
| | | | | | |
| | | | | | |
| | | | | | |
| | | | | | |
| | | | | | |
| | | | | | |
| | | | | | |
| | | | | | |
| | | | | | |
| | | | | | |
| | | | | | |
| | | | | | |
| | | | | | |
| | | | | | |
| | | | | | |
| | | | | | |
| | | | | | |
| | | | | | |
| | | | | | |
| | | | | | |
| | | | | | |
| | | | | | |
| | | | | | |
| | | | | | |
| | | | | | |
| | | | | | |
| | | | | | |
| | | | | | |
SEE NOTES TO FINANCIAL STATEMENTS.
| J.P. Morgan Mid Cap/Multi-Cap Funds | |
FINANCIAL HIGHLIGHTS
FOR THE PERIODS INDICATED (continued)
| Per share operating performance |
| | | |
| Net asset
value,
beginning
of period | Net
investment
income
(loss)(b) | Net realized
and unrealized
gains
(losses) on
investments | Total from
investment
operations | | | |
JPMorgan Value Advantage Fund (continued) | | | | | | | |
| | | | | | | |
| | | | | | | |
| | | | | | | |
| | | | | | | |
| | | | | | | |
| | | | | | | |
| | | | | | | |
| | | | | | | |
| | | | | | | |
| | | | | | | |
| | | | | | | |
| | | | | | | |
|
| Annualized for periods less than one year, unless otherwise noted. |
| Calculated based upon average shares outstanding. |
| Not annualized for periods less than one year. |
| Includes adjustments in accordance with accounting principles generally accepted in the United States of America and as such, the net asset values for financial reporting purposes and the returns based upon those net asset values may differ from the net asset values and returns for shareholder transactions. |
| Includes earnings credits and interest expense, if applicable, each of which is less than 0.005% unless otherwise noted. |
| Net investment income (loss) may appear disproportionate among the classes due to the timing of recognition of income and changes in the relative size of the classes. |
| Commencement of offering of class of shares. |
SEE NOTES TO FINANCIAL STATEMENTS.
| J.P. Morgan Mid Cap/Multi-Cap Funds | |
| |
| | | Ratios to average net assets(a) |
Net asset
value,
end of
period | Total return
(excludes
sales charge)(c)(d) | Net assets,
end of
period
(000's) | | Net
investment
income
(loss) | Expenses without
waivers and reimbursements | |
| | | | | | |
| | | | | | |
| | | | | | |
| | | | | | |
| | | | | | |
| | | | | | |
| | | | | | |
| | | | | | |
| | | | | | |
| | | | | | |
| | | | | | |
| | | | | | |
| | | | | | |
SEE NOTES TO FINANCIAL STATEMENTS.
| J.P. Morgan Mid Cap/Multi-Cap Funds | |
NOTES TO FINANCIAL STATEMENTS
AS OF June 30, 2022
(Dollar values in thousands)
1. Organization
JPMorgan Trust I (“JPM I") and JPMorgan Trust II (“JPM II") (collectively, the “Trusts”) were formed on November 12, 2004, as Delaware statutory trusts, pursuant to Declarations of Trust dated November 5, 2004 and are registered under the Investment Company Act of 1940, as amended (the “1940 Act”), as open-end management investment companies.
J.P. Morgan Mutual Fund Investment Trust (“JPMMFIT”) was organized as a Massachusetts business trust on September 23, 1997, as an open-end management investment company.
J.P. Morgan Fleming Mutual Fund Group, Inc. (“JPMFMFG,” and with JPM I, JPM II and JPMMFIT, collectively, the “Trusts”) was organized as a Maryland corporation on August 19, 1997, as an open-end management investment company.
The following are 5 separate funds of the Trust (each, a "Fund" and collectively, the "Funds") covered by this report:
| | | Diversification Classification |
JPMorgan Growth Advantage Fund | Class A, Class C, Class I, Class R2, Class R3, Class R4, Class R5 and Class R6 | | |
JPMorgan Mid Cap Equity Fund | Class A, Class C, Class I, Class R2, Class R5 and Class R6 | | |
JPMorgan Mid Cap Growth Fund | Class A, Class C, Class I, Class R2, Class R3, Class R4, Class R5 and Class R6 | | |
JPMorgan Mid Cap Value Fund | Class A, Class C, Class I, Class L, Class R2, Class R3, Class R4, Class R5 and Class R6 | | |
JPMorgan Value Advantage Fund | Class A, Class C, Class I, Class L, Class R2, Class R3, Class R4, Class R5 and Class R6 | | |
The investment objective of JPMorgan Growth Advantage Fund (“Growth Advantage Fund”) and JPMorgan Mid Cap Equity Fund (“Mid Cap Equity Fund”) is to seek to provide long-term capital growth.
The investment objective of JPMorgan Mid Cap Growth Fund (“Mid Cap Growth Fund”) is to seek growth of capital.
The investment objective of JPMorgan Mid Cap Value Fund (“Mid Cap Value Fund”) is to seek growth from capital appreciation.
The investment objective of JPMorgan Value Advantage Fund (“Value Advantage Fund”) is to seek to provide long-term total return from a combination of income and capital gains.
Class L Shares of Mid Cap Value Fund and Value Advantage Fund are publicly offered on a limited basis. Investors are not eligible to purchase Class L Shares of the Funds unless they meet certain requirements as described in the Funds’ prospectus.
Class A Shares generally provide for a front-end sales charge while Class C Shares provide for a contingent deferred sales charge ("CDSC"). No sales charges are assessed with respect to Class I, Class L, Class R2, Class R3, Class R4, Class R5 and Class R6 Shares. Certain Class A Shares, for which front-end sales charges have been waived, may be subject to a CDSC as described in the Funds' prospectus. Effective October 1, 2020, Class C Shares automatically convert to Class A Shares after eight years. Prior to October 1, 2020, Class C Shares automatically converted to Class A Shares after ten years. All classes of shares have equal rights as to earnings, assets and voting privileges, except that each class may bear different transfer agency, distribution and service fees and each class has exclusive voting rights with respect to its distribution plan and shareholder servicing agreements.
J.P. Morgan Investment Management Inc. (“JPMIM”), an indirect, wholly-owned subsidiary of JPMorgan Chase & Co. (“JPMorgan”), acts as Adviser (the “Adviser”) and Administrator (the “Administrator”) to the Funds.
2. Significant Accounting Policies
The following is a summary of significant accounting policies followed by the Funds in the preparation of their financial statements. The Funds are investment companies and, accordingly, follow the investment company accounting and reporting guidance of the Financial Accounting Standards Board (“FASB”) Accounting Standards Codification Topic 946 — Investment Companies, which is part of U.S. generally accepted accounting principles (“GAAP”). The preparation of financial statements in conformity with GAAP requires management to make estimates and assumptions that affect (i) the reported amounts of assets and liabilities, (ii) disclosure of contingent assets and liabilities at the date of the financial statements, and (iii) the reported amounts of increases and decreases in net assets from operations during the reporting period. Actual results could differ from those estimates.
| J.P. Morgan Mid Cap/Multi-Cap Funds | |
A. Valuation of Investments — Investments are valued in accordance with GAAP and the Funds' valuation policies set forth by, and under the supervision and responsibility of, the Boards of Trustees of the Trusts (the "Boards"), which established the following approach to valuation, as described more fully below: (i) investments for which market quotations are readily available shall be valued at their market value and (ii) all other investments for which market quotations are not readily available shall be valued at their fair value as determined in good faith by the Boards.
The Administrator has established the J.P. Morgan Asset Management Americas Valuation Committee (“AVC”) to assist the Boards with the oversight and monitoring of the valuation of the Funds' investments. The Administrator implements the valuation policies of the Funds' investments, as directed by the Boards. The AVC oversees and carries out the policies for the valuation of investments held in the Funds. This includes monitoring the appropriateness of fair values based on results of ongoing valuation oversight including, but not limited to, consideration of macro or security specific events, market events, and pricing vendor and broker due diligence. The Administrator is responsible for discussing and assessing the potential impacts to the fair values on an ongoing basis, and, at least on a quarterly basis, with the AVC and the Boards.
Equities and other exchange-traded instruments are valued at the last sale price or official market closing price on the primary exchange on which the instrument is traded before the net asset values (“NAV”) of the Funds are calculated on a valuation date.
Investments in open-end investment companies (“Underlying Funds”) are valued at each Underlying Fund’s NAV per share as of the report date.
Valuations reflected in this report are as of the report date. As a result, changes in valuation due to market events and/or issuer-related events after the report date and prior to issuance of the report are not reflected herein.
The various inputs that are used in determining the valuation of the Funds' investments are summarized into the three broad levels listed below.
•
Level 1 — Unadjusted inputs using quoted prices in active markets for identical investments.
•
Level 2 — Other significant observable inputs including, but not limited to, quoted prices for similar investments, inputs other than quoted prices that are observable for investments (such as interest rates, prepayment speeds, credit risk, etc.) or other market corroborated inputs.
•
Level 3 — Significant inputs based on the best information available in the circumstances, to the extent observable inputs are not available (including the Funds' assumptions in determining the fair value of investments).
A financial instrument’s level within the fair value hierarchy is based on the lowest level of any input, both individually and in the aggregate, that is significant to the fair value measurement. The inputs or methodology used for valuing instruments are not necessarily an indication of the risk associated with investing in those instruments.
The following tables represent each valuation input as presented on the Schedules of Portfolio Investments ("SOIs"):
| | | | |
| | Level 2
Other significant
observable inputs | Level 3
Significant
unobservable inputs | |
Total Investments in Securities (a) | | | | |
| | | | |
| | Level 2
Other significant
observable inputs | Level 3
Significant
unobservable inputs | |
Total Investments in Securities (a) | | | | |
| | | | |
| | Level 2
Other significant
observable inputs | Level 3
Significant
unobservable inputs | |
Total Investments in Securities (a) | | | | |
| | | | |
| | Level 2
Other significant
observable inputs | Level 3
Significant
unobservable inputs | |
Total Investments in Securities (a) | | | | |
| J.P. Morgan Mid Cap/Multi-Cap Funds | |
NOTES TO FINANCIAL STATEMENTS
AS OF June 30, 2022 (continued)
(Dollar values in thousands)
| | | | |
| | Level 2
Other significant
observable inputs | Level 3
Significant
unobservable inputs | |
Total Investments in Securities (a) | | | | |
|
| Please refer to the SOI for specifics of portfolio holdings. |
B. Securities Lending — The Funds are authorized to engage in securities lending in order to generate additional income. The Funds are able to lend to approved borrowers. Citibank N.A. (“Citibank”) serves as lending agent for the Funds, pursuant to a Securities Lending Agency Agreement (the “Securities Lending Agency Agreement”). Securities loaned are collateralized by cash equal to at least 100% of the market value plus accrued interest on the securities lent, which is invested in the Class IM Shares of the JPMorgan U.S. Government Money Market Fund and the Agency SL Class Shares of the JPMorgan Securities Lending Money Market Fund. The Funds retain the interest earned on cash collateral investments but are required to pay the borrower a rebate for the use of the cash collateral. In cases where the lent security is of high value to borrowers, there may be a negative rebate (i.e., a net payment from the borrower to the Funds). Upon termination of a loan, the Funds are required to return to the borrower an amount equal to the cash collateral, plus any rebate owed to the borrowers. The remaining maturities of the securities lending transactions are considered overnight and continuous. Loans are subject to termination by the Funds or the borrower at any time.
The net income earned on the securities lending (after payment of rebates and Citibank’s fee) is included on the Statements of Operations as Income from securities lending (net). The Funds also receive payments from the borrower during the period of the loan, equivalent to dividends and interest earned on the securities loaned, which are recorded as Dividend or Interest income, respectively, on the Statements of Operations.
Under the Securities Lending Agency Agreement, Citibank marks to market the loaned securities on a daily basis. In the event the cash received from the borrower is less than 102% of the value of the loaned securities (105% for loans of non-U.S. securities), Citibank requests additional cash from the borrower so as to maintain a collateralization level of at least 102% of the value of the loaned securities plus accrued interest (105% for loans of non-U.S. securities), subject to certain de minimis amounts.
The value of securities out on loan is recorded as an asset on the Statements of Assets and Liabilities. The value of the cash collateral received is recorded as a liability on the Statements of Assets and Liabilities and details of collateral investments are disclosed on the SOIs.
The Funds bear the risk of loss associated with the collateral investments and are not entitled to additional collateral from the borrower to cover any such losses. To the extent that the value of the collateral investments declines below the amount owed to a borrower, the Funds may incur losses that exceed the amount they earned on lending the security. Upon termination of a loan, the Funds may use leverage (borrow money) to repay the borrower for cash collateral posted if the Adviser does not believe that it is prudent to sell the collateral investments to fund the payment of this liability. Securities lending activity is subject to master netting arrangements.
The following table presents for each lending Fund, the value of the securities on loan with Citibank, net of amounts available for offset under the master netting arrangements and any related collateral received or posted by the Funds as of June 30, 2022.
| Investment Securities
on Loan, at value,
Presented on the
Statements of Assets
and Liabilities | Cash Collateral
Posted by Borrower* | Net Amount Due
to Counterparty
(not less than zero) |
| | | |
| | | |
| | | |
| | | |
| | | |
|
| Collateral posted reflects the value of securities on loan and does not include any additional amounts received from the borrower. |
Securities lending also involves counterparty risks, including the risk that the loaned securities may not be returned in a timely manner or at all. Subject to certain conditions, Citibank has agreed to indemnify the Funds from losses resulting from a borrower’s failure to return a loaned security.
| J.P. Morgan Mid Cap/Multi-Cap Funds | |
JPMIM voluntarily waived investment advisory fees charged to the Funds to reduce the impact of the cash collateral investment in the JPMorgan U.S. Government Money Market Fund from 0.13% to 0.06%. For the year ended June 30, 2022, JPMIM waived fees associated with the Funds' investment in the JPMorgan U.S. Government Money Market Fund as follows:
The above waiver is included in the determination of earnings on cash collateral investment and in the calculation of Citibank’s compensation and is included on the Statements of Operations as Income from securities lending (net).
C. Investment Transactions with Affiliates — The Funds invested in Underlying Funds which are advised by the Adviser. An issuer which is under common control with a Fund may be considered an affiliate. For the purposes of the financial statements, the Funds assume the issuers listed in the tables below to be affiliated issuers. Underlying Funds’ distributions may be reinvested into such Underlying Funds. Reinvestment amounts are included in the purchases at cost amounts in the tables below.
|
For the year ended June 30, 2022 |
| | | | | Change in
Unrealized
Appreciation/
(Depreciation) | | | | Capital Gain
Distributions |
JPMorgan Prime Money Market Fund Class IM Shares, 1.54% (a) (b) | | | | | | | | | |
JPMorgan Securities Lending Money Market Fund Agency SL Class Shares, 1.50% (a) (b) | | | | | | | | | |
JPMorgan U.S. Government Money Market Fund Class IM Shares, 1.38% (a) (b) | | | | | | | | | |
| | | | | | | | | |
|
| Investment in an affiliated fund, which is registered under the Investment Company Act of 1940, as amended, and is advised by J.P. Morgan Investment Management Inc. |
| The rate shown is the current yield as of June 30, 2022. |
| Amount is included on the Statement of Operations as Income from securities lending (net) (after payments of rebates and Citibank’s fee). |
|
For the year ended June 30, 2022 |
| | | | | Change in
Unrealized
Appreciation/
(Depreciation) | | | | Capital Gain
Distributions |
JPMorgan Prime Money Market Fund Class IM Shares, 1.54% (a) (b) | | | | | | | | | |
JPMorgan Securities Lending Money Market Fund Agency SL Class Shares, 1.50% (a) (b) | | | | | | | | | |
JPMorgan U.S. Government Money Market Fund Class IM Shares, 1.38% (a) (b) | | | | | | | | | |
| | | | | | | | | |
|
| Investment in an affiliated fund, which is registered under the Investment Company Act of 1940, as amended, and is advised by J.P. Morgan Investment Management Inc. |
| The rate shown is the current yield as of June 30, 2022. |
| Amount is included on the Statement of Operations as Income from securities lending (net) (after payments of rebates and Citibank’s fee). |
| J.P. Morgan Mid Cap/Multi-Cap Funds | |
NOTES TO FINANCIAL STATEMENTS
AS OF June 30, 2022 (continued)
(Dollar values in thousands)
|
For the year ended June 30, 2022 |
| | | | | Change in
Unrealized
Appreciation/
(Depreciation) | | | | Capital Gain
Distributions |
JPMorgan Prime Money Market Fund Class IM Shares, 1.54% (a) (b) | | | | | | | | | |
JPMorgan Securities Lending Money Market Fund Agency SL Class Shares, 1.50% (a) (b) | | | | | | | | | |
JPMorgan U.S. Government Money Market Fund Class IM Shares, 1.38% (a) (b) | | | | | | | | | |
| | | | | | | | | |
|
| Investment in an affiliated fund, which is registered under the Investment Company Act of 1940, as amended, and is advised by J.P. Morgan Investment Management Inc. |
| The rate shown is the current yield as of June 30, 2022. |
| Amount is included on the Statement of Operations as Income from securities lending (net) (after payments of rebates and Citibank’s fee). |
|
For the year ended June 30, 2022 |
| | | | | Change in
Unrealized
Appreciation/
(Depreciation) | | | | Capital Gain
Distributions |
JPMorgan Prime Money Market Fund Class IM Shares, 1.54% (a) (b) | | | | | | | | | |
JPMorgan Securities Lending Money Market Fund Agency SL Class Shares, 1.50% (a) (b) | | | | | | | | | |
JPMorgan U.S. Government Money Market Fund Class IM Shares, 1.38% (a) (b) | | | | | | | | | |
| | | | | | | | | |
|
| Investment in an affiliated fund, which is registered under the Investment Company Act of 1940, as amended, and is advised by J.P. Morgan Investment Management Inc. |
| J.P. Morgan Mid Cap/Multi-Cap Funds | |
| The rate shown is the current yield as of June 30, 2022. |
| Amount is included on the Statement of Operations as Income from securities lending (net) (after payments of rebates and Citibank’s fee). |
D. Foreign Currency Translation — The books and records of the Funds are maintained in U.S. dollars. Foreign currency amounts are translated into U.S. dollars at the prevailing exchange rates of such currencies against the U.S. dollar. The market value of investment securities and other assets and liabilities are translated at the exchange rate as of the valuation date. Purchases and sales of investment securities, income and expenses are translated at the exchange rate prevailing on the respective dates of such transactions.
The Funds do not isolate the effect of changes in foreign exchange rates from changes in market prices on securities held. Accordingly, such changes are included within Change in net unrealized appreciation/depreciation on investments in non-affiliates on the Statements of Operations.
Reported realized foreign currency gains and losses arise from the disposition of foreign currency, currency gains or losses realized between the trade and settlement dates on securities transactions, and the difference between the amounts of dividends, interest and foreign withholding taxes recorded on each Fund's books on the transaction date and the U.S. dollar equivalent of the amounts actually received or paid. These reported realized foreign currency gains and losses are included in Net realized gain (loss) on foreign currency transactions on the Statements of Operations. Unrealized foreign currency gains and losses arise from changes (due to changes in exchange rates) in the value of foreign currency and other assets and liabilities denominated in foreign currencies, which are held at year end and are included in Change in net unrealized appreciation/depreciation on foreign currency translations on the Statements of Operations.
E. Security Transactions and Investment Income — Investment transactions are accounted for on the trade date (the date the order to buy or sell is executed). Securities gains and losses are calculated on a specifically identified cost basis.
Dividend income is recorded on the ex-dividend date or when a Fund first learns of the dividend.
To the extent such information is publicly available, the Funds record distributions received in excess of income earned from underlying investments as a reduction of cost of investments and/or realized gain. Such amounts are based on estimates if actual amounts are not available and actual amounts of income, realized gain and return of capital may differ from the estimated amounts. The Funds adjust the estimated amounts of the components of distributions (and consequently their net investment income) as necessary, once the issuers provide information about the actual composition of the distributions.
F. Allocation of Income and Expenses— Expenses directly attributable to a Fund are charged directly to that Fund, while the expenses attributable to more than one fund of the Trusts are allocated among the applicable funds. Investment income, realized and unrealized gains and losses and expenses, other than class-specific expenses, are allocated daily to each class of shares based upon the proportion of net assets of each class at the beginning of each day.
Transfer agency fees are class-specific expenses. The amount of the transfer agency fees charged to each share class of the Funds for the year ended June 30, 2022 are as follows:
|
| Amount rounds to less than one thousand. |
| J.P. Morgan Mid Cap/Multi-Cap Funds | |
NOTES TO FINANCIAL STATEMENTS
AS OF June 30, 2022 (continued)
(Dollar values in thousands)
G. Federal Income Taxes — Each Fund is treated as a separate taxable entity for Federal income tax purposes. Each Fund's policy is to comply with the provisions of the Internal Revenue Code (the “Code”) applicable to regulated investment companies and to distribute to shareholders all of its distributable net investment income and net realized capital gains on investments. Accordingly, no provision for Federal income tax is necessary. Management has reviewed the Funds' tax positions for all open tax years and has determined that as of June 30, 2022, no liability for Federal income tax is required in the Funds' financial statements for net unrecognized tax benefits. However, management’s conclusions may be subject to future review based on changes in, or the interpretation of, the accounting standards or tax laws and regulations. Each Fund's Federal tax returns for the prior three fiscal years remain subject to examination by the Internal Revenue Service.
H. Distributions to Shareholders — Distributions from net investment income, if any, are generally declared and paid at least annually and are declared separately for each class. No class has preferential dividend rights; differences in per share rates are due to differences in separate class expenses. Net realized capital gains, if any, are distributed by each Fund at least annually. The amount of distributions from net investment income and net realized capital gains is determined in accordance with Federal income tax regulations, which may differ from GAAP. To the extent these “book/tax” differences are permanent in nature (i.e., that they result from other than timing of recognition — “temporary differences”), such amounts are reclassified within the capital accounts based on their Federal tax basis treatment.
The following amounts were reclassified within the capital accounts:
| | Accumulated
undistributed
(distributions in
excess of)
net investment
income | Accumulated
net realized
gains (losses) |
| | | |
| | | |
| | | |
| | | |
| | | |
The reclassifications for the Funds relate primarily to certain investments and tax equalization.
3. Fees and Other Transactions with Affiliates
A. Investment Advisory Fee — Pursuant to an Investment Advisory Agreement, the Adviser manages the investments of each Fund and for such services is paid a fee. The investment advisory fee is accrued daily and paid monthly at an annual rate based on each Fund's respective average daily net assets. The annual rate for each Fund is as follows:
The Adviser waived investment advisory fees and/or reimbursed expenses as outlined in Note 3.F.
B. Administration Fee — Pursuant to an Administration Agreement, the Administrator provides certain administration services to each Fund. In consideration of these services, the Administrator receives a fee accrued daily and paid monthly at an annual rate of 0.075% of the first $10 billion of each Fund's respective average daily net assets, plus 0.050% of each Fund's respective average daily net assets between $10 billion and $20 billion, plus 0.025% of each Fund's respective average daily net assets between $20 billion and $25 billion, plus 0.010% of each Fund's respective average daily net assets in excess of $25 billion. For the year ended June 30, 2022, the effective rate was 0.075% of each Fund's average daily net assets, notwithstanding any fee waivers and/or expense reimbursements.
The Administrator waived administration fees as outlined in Note 3.F.
JPMorgan Chase Bank, N.A. ("JPMCB"), a wholly-owned subsidiary of JPMorgan, serves as the Funds' sub-administrator (the “Sub-administrator”). For its services as Sub-administrator, JPMCB receives a portion of the fees payable to the Administrator.
| J.P. Morgan Mid Cap/Multi-Cap Funds | |
C. Distribution Fees — Pursuant to a Distribution Agreement, JPMorgan Distribution Services, Inc. (“JPMDS”), an indirect, wholly-owned subsidiary of JPMorgan, serves as each Fund's principal underwriter and promotes and arranges for the sale of each Fund's shares.
The Boards have adopted a Distribution Plan (the “Distribution Plan”) for Class A, Class C, Class R2 and Class R3 Shares of the Funds, as applicable, Fund pursuant to Rule 12b-1 under the 1940 Act. Class I, Class L, Class R4, Class R5 and Class R6 Shares of the Funds do not charge a distribution fee. The Distribution Plan provides that each Fund shall pay, with respect to the applicable share classes, distribution fees, including payments to JPMDS, at annual rates of the average daily net assets as shown in the table below:
In addition, JPMDS is entitled to receive the front-end sales charges from purchases of Class A Shares and the CDSC from redemptions of Class C Shares and certain Class A Shares for which front-end sales charges have been waived. For the year ended June 30, 2022, JPMDS retained the following:
|
| Amount rounds to less than one thousand. |
D. Service Fees — The Trusts, on behalf of the Funds, have entered into a Shareholder Servicing Agreement with JPMDS under which JPMDS provides certain support services to fund shareholders. For performing these services, JPMDS receives a fee with respect to all share classes, except Class R6 Shares which do not charge a service fee, that is accrued daily and paid monthly equal to a percentage of the average daily net assets as shown in the table below:
JPMDS has entered into shareholder services contracts with affiliated and unaffiliated financial intermediaries who provide shareholder services and other related services to their clients or customers who invest in the Funds. Pursuant to such contracts, JPMDS will pay all or a portion of such fees earned to financial intermediaries for performing such services.
JPMDS waived service fees as outlined in Note 3.F.
E. Custodian and Accounting Fees — JPMCB provides portfolio custody and accounting services to the Funds. For performing these services, the Funds pay JPMCB transaction and asset-based fees that vary according to the number of transactions and positions, plus out-of-pocket expenses. The amounts paid directly to JPMCB by the Funds for custody and accounting services are included in Custodian and accounting fees on the Statements of Operations.
Interest income earned on cash balances at the custodian, if any, is included in Interest income from affiliates on the Statements of Operations.
Interest expense paid to the custodian related to cash overdrafts, if any, is included in Interest expense to affiliates on the Statements of Operations.
| J.P. Morgan Mid Cap/Multi-Cap Funds | |
NOTES TO FINANCIAL STATEMENTS
AS OF June 30, 2022 (continued)
(Dollar values in thousands)
F. Waivers and Reimbursements — The Adviser, Administrator and/or JPMDS have contractually agreed to waive fees and/or reimburse the Funds to the extent that total annual operating expenses (excluding acquired fund fees and expenses other than certain money market fund fees as described below, dividend and interest expenses related to short sales, interest, taxes, expenses related to litigation and potential litigation, expenses related to trustee elections and extraordinary expenses) exceed the percentages of the Funds' respective average daily net assets as shown in the table below:
|
| Prior to November 1, 2021, the contractual expense limitation was 1.14%, 1.64%, 0.89%, 1.39%, 1.14%, n/a, n/a and n/a for Class A, Class C, Class I, Class R2, Class R3, Class R4, Class R5 and Class R6 Shares, respectively. |
| Prior to November 1, 2021, the contractual expense limitation was 1.24%, n/a, 0.93%, 1.49%, n/a, 0.99% and 0.74% for Class A, Class C, Class I, Class R2, Class R3, Class R4 and Class R6 Shares, respectively. |
| Prior to November 1, 2021, the contractual expense limitation was 1.24%, 1.75%, 0.99%, 1.50%, 1.25%, 1.00%, 0.85% and 0.73% for Class A, Class C, Class I, Class R2, Class R3, Class R4, Class R5 and Class R6 Shares, respectively. |
| Prior to November 1, 2021, the contractual expense limitation was 1.14%, 1.64%, 0.89%, 1.39%, 1.14%, 0.89%, 0.74% and 0.64% for Class A, Class C, Class I, Class R2, Class R3, Class R4, Class R5 and Class R6 Shares, respectively. |
The expense limitation agreements were in effect for the year ended June 30, 2022 and are in place until at least February 28, 2023.
For the year ended June 30, 2022, the Funds' service providers waived fees and/or reimbursed expenses for each of the Funds as follows. None of these parties expect the Funds to repay any such waived fees and/or reimbursed expenses in future years.
| | |
| | | | | Contractual
Reimbursements |
| | | | | |
| | | | | |
| | | | | |
| | | | | |
| | | | | |
Additionally, the Funds may invest in one or more money market funds advised by the Adviser (affiliated money market funds). The Adviser, Administrator and/or JPMDS, as shareholder servicing agent, have contractually agreed to waive fees and/or reimburse expenses in an amount sufficient to offset the respective net fees each collects from the affiliated money market fund on the applicable Fund's investment in such affiliated money market fund, except for investments of securities lending cash collateral. None of these parties expect the Funds to repay any such waived fees and/or reimbursed expenses in future years.
The amounts of these waivers resulting from investments in these money market funds for the year ended June 30, 2022 were as follows:
Effective January 1, 2022, JPMIM voluntarily agreed to reimburse the Funds for the Trustee Fees paid to one of the interested Trustees. For the period January 1, 2022 through June 30, 2022 the amount of these waivers were as follows:
| J.P. Morgan Mid Cap/Multi-Cap Funds | |
G. Other — Certain officers of the Trusts are affiliated with the Adviser, the Administrator and JPMDS. Such officers, with the exception of the Chief Compliance Officer, receive no compensation from the Funds for serving in their respective roles.
The Board designated and appointed a Chief Compliance Officer to the Funds pursuant to Rule 38a-1 under the 1940 Act. Each Fund, along with affiliated funds, makes reimbursement payments, on a pro-rata basis, to the Administrator for a portion of the fees associated with the office of the Chief Compliance Officer. Such fees are included in Trustees’ and Chief Compliance Officer’s fees on the Statements of Operations.
The Trusts adopted a Trustee Deferred Compensation Plan (the “Plan”) which allows the independent Trustees to defer the receipt of all or a portion of compensation related to performance of their duties as Trustees. The deferred fees are invested in various J.P. Morgan Funds until distribution in accordance with the Plan.
During the year ended June 30, 2022, Growth Advantage Fund, Mid Cap Equity Fund and Mid Cap Growth Fund purchased securities from an underwriting syndicate in which the principal underwriter or members of the syndicate were affiliated with the Adviser.
The Securities and Exchange Commission ("SEC") has granted an exemptive order permitting the Funds to engage in principal transactions with J.P. Morgan Securities LLC, an affiliated broker, involving taxable money market instruments, subject to certain conditions.
4. Investment Transactions
During the year ended June 30, 2022, purchases and sales of investments (excluding short-term investments) were as follows:
| Purchases
(excluding
U.S. Government) | Sales
(excluding
U.S. Government) |
| | |
| | |
| | |
| | |
| | |
During the year ended June 30, 2022, there were no purchases or sales of U.S. Government securities.
5. Federal Income Tax Matters
For Federal income tax purposes, the estimated cost and unrealized appreciation (depreciation) in value of investments held at June 30, 2022 were as follows:
| | Gross
Unrealized
Appreciation | Gross
Unrealized
Depreciation | Net Unrealized
Appreciation
(Depreciation) |
| | | | |
| | | | |
| | | | |
| | | | |
| | | | |
The difference between book and tax basis appreciation (depreciation) on investments is primarily attributed to wash sale loss deferrals.
| J.P. Morgan Mid Cap/Multi-Cap Funds | |
NOTES TO FINANCIAL STATEMENTS
AS OF June 30, 2022 (continued)
(Dollar values in thousands)
The tax character of distributions paid during the year ended June 30, 2022 was as follows:
| | Net
Long-Term
Capital Gains | |
| | | |
| | | |
| | | |
| | | |
| | | |
|
| Short-term gain distributions are treated as ordinary income for income tax purposes. |
The tax character of distributions paid during the year ended June 30, 2021 was as follows:
| | Net
Long-Term
Capital Gains | |
| | | |
| | | |
| | | |
| | | |
| | | |
|
| Short-term gain distributions are treated as ordinary income for income tax purposes. |
As of June 30, 2022, the estimated components of net assets (excluding paid-in-capital) on a tax basis were as follows:
| Current
Distributable
Ordinary
Income | Current
Distributable
Long-Term
Capital Gain
(Tax Basis Capital
Loss Carryover) | Unrealized
Appreciation
(Depreciation) |
| | | |
| | | |
| | | |
| | | |
| | | |
The cumulative timing differences primarily consist of certain investments, ordinary loss deferrals, post-October loss deferrals and wash sale loss deferrals.
As of June 30, 2022, the Funds did not have any net capital loss carryforwards.
Net capital losses (gains) and specified ordinary losses incurred after October 31 and late year ordinary losses incurred after December 31 and within the taxable year are deemed to arise on the first business day of the Funds' next taxable year. For the year ended June 30, 2022, the Funds deferred to July 1, 2022 the following net capital losses (gains), specified ordinary losses and late year ordinary losses of:
| Net Capital Losses (Gains)
Short-Term | |
| Late Year Ordinary Loss Deferral |
| | |
| | |
| | |
| | |
| J.P. Morgan Mid Cap/Multi-Cap Funds | |
6. Borrowings
The Funds rely upon an exemptive order granted by the SEC (the “Order”) permitting the establishment and operation of an Interfund Lending Facility (the “Facility”). The Facility allows the Funds to directly lend and borrow money to or from any other fund relying upon the Order at rates beneficial to both the borrowing and lending funds. Advances under the Facility are taken primarily for temporary or emergency purposes, including the meeting of redemption requests that otherwise might require the untimely disposition of securities, and are subject to each Fund's borrowing restrictions. The Interfund loan rate is determined, as specified in the Order, by averaging the current repurchase agreement rate and the current bank loan rate. The Order was granted to JPM II and may be relied upon by the Funds because the Funds and the series of JPM II are all investment companies in the same “group of investment companies” (as defined in Section 12(d)(1)(G) of the 1940 Act).
The Funds had no borrowings outstanding from another fund, or loans outstanding to another fund, during the year ended June 30, 2022.
The Trusts and JPMCB have entered into a financing arrangement. Under this arrangement, JPMCB provides an unsecured, uncommitted credit facility in the aggregate amount of $100 million to certain of the J.P. Morgan Funds, including the Funds. Advances under the arrangement are taken primarily for temporary or emergency purposes, including the meeting of redemption requests that otherwise might require the untimely disposition of securities, and are subject to each Funds' borrowing restrictions. Interest on borrowings is payable at a rate determined by JPMCB at the time of borrowing. This agreement has been extended until October 31, 2022.
The Funds had no borrowings outstanding from the unsecured, uncommitted credit facility during the year ended June 30, 2022.
The Trusts, along with certain other trusts for J.P. Morgan Funds (“Borrowers”), have entered into a joint syndicated senior unsecured revolving credit facility totaling $1.5 billion (“Credit Facility”) with various lenders and The Bank of New York Mellon, as administrative agent for the lenders. This Credit Facility provides a source of funds to the Borrowers for temporary and emergency purposes, including the meeting of redemption requests that otherwise might require the untimely disposition of securities. Under the terms of the Credit Facility, a borrowing fund must have a minimum of $25 million in adjusted net asset value and not exceed certain adjusted net asset coverage ratios prior to and during the time in which any borrowings are outstanding. If a fund does not comply with the aforementioned requirements, the fund must remediate within three business days with respect to the $25 million minimum adjusted net asset value or within one business day with respect to certain asset coverage ratios or the administrative agent at the request of, or with the consent of, the lenders may terminate the Credit Facility and declare any outstanding borrowings to be due and payable immediately.
Interest associated with any borrowing under the Credit Facility is charged to the borrowing fund at a rate of interest equal to 1.00% (the “Applicable Margin”), plus the greater of the federal funds effective rate or one month London Interbank Offered Rate ("LIBOR"). The annual commitment fee to maintain the Credit Facility is 0.15% and is incurred on the unused portion of the Credit Facility and is allocated to all participating funds pro rata based on their respective net assets. Effective August 9, 2022, the Credit Facility has been amended and restated for a term of 364 days, unless extended, and to include a change in the interest associated with any borrowing to the higher, on the day of the borrowing, of (a) the federal funds effective rate, or (b) the one-month Adjusted SOFR Rate plus the Applicable Margin.
The Funds did not utilize the Credit Facility during the year ended June 30, 2022.
7. Risks, Concentrations and Indemnifications
In the normal course of business, the Funds enter into contracts that contain a variety of representations which provide general indemnifications. Each Fund's maximum exposure under these arrangements is unknown. The amount of exposure would depend on future claims that may be brought against each Fund. However, based on experience, the Funds expect the risk of loss to be remote.
As of June 30, 2022, the Funds had individual shareholders and/or non-affiliated omnibus accounts each owning more than 10% of the respective Fund's outstanding shares as follows:
| Number of
Individual Shareholder
and/or Affiliated
Omnibus Accounts | | Number of
Individual Shareholder
and/or Non-Affiliated
Omnibus Accounts | |
| | | | |
| | | | |
| | | | |
| | | | |
| | | | |
Significant shareholder transactions by these shareholders may impact the Funds' performance and liquidity.
| J.P. Morgan Mid Cap/Multi-Cap Funds | |
NOTES TO FINANCIAL STATEMENTS
AS OF June 30, 2022 (continued)
(Dollar values in thousands)
As of June 30, 2022, the Funds owned in the aggregate, shares representing more than 10% of the net assets of the following Underlying Funds:
| JPMorgan
SmartRetirement
Funds |
| |
| |
Because Mid Cap Value Fund invests in Real Estate Investment Trusts (“REITs”), the Fund may be subject to certain risks similar to those associated with direct investments in real estate. REITs may be affected by changes in the value of their underlying properties and by defaults by tenants. REITs depend generally on their ability to generate cash flow to make distributions to shareholders, and certain REITs have self-liquidation provisions by which mortgages held may be paid in full and distributions of capital returns may be made at any time.
LIBOR is intended to represent the rate at which contributing banks may obtain short-term borrowings from each other in the London interbank market. On March 5, 2021, the U.K. Financial Conduct Authority ("FCA") publicly announced that (i) immediately after December 31, 2021, publication of the 1-week and 2-month U.S. Dollar LIBOR settings will permanently cease; (ii) immediately after June 30, 2023, publication of the overnight and 12-month U.S. Dollar LIBOR settings will permanently cease; and (iii) immediately after June 30, 2023, the 1-month, 3-month and 6-month U.S. Dollar LIBOR settings will cease to be provided or, subject to the FCA's consideration of the case, be provided on a synthetic basis and no longer be representative of the underlying market and economic reality they are intended to measure and that representativeness will not be restored. There is no assurance that the dates announced by the FCA will not change or that the administrator of LIBOR and/or regulators will not take further action that could impact the availability, composition or characteristics of LIBOR or the currencies and/or tenors for which LIBOR is published. In addition, certain regulated entities ceased entering into most new LIBOR contracts in connection with regulatory guidance or prohibitions. Public and private sector industry initiatives are currently underway to implement new or alternative reference rates to be used in place of LIBOR. There is no assurance that any such alternative reference rate will be similar to or produce the same value or economic equivalence as LIBOR or that it will have the same volume or liquidity as did LIBOR prior to its discontinuance, unavailability or replacement, all of which may affect the value, volatility, liquidity or return on certain of a Fund's loans, notes, derivatives and other instruments or investments comprising some or all of a Fund's investments and result in costs incurred in connection with changing reference rates used for positions closing out positions and entering into new trades. Certain of a Fund's investments may transition from LIBOR prior to the dates announced by the FCA. The transition from LIBOR to alternative reference rates may result in operational issues for a Fund or its investments. No assurances can be given as to the impact of the LIBOR transition (and the timing of any such impact) on a Fund and its investments.
The Funds are subject to infectious disease epidemics/pandemics risk. The worldwide outbreak of COVID-19 has negatively affected economies, markets and individual companies throughout the world. The effects of this COVID-19 pandemic to public health, and business and market conditions, including among other things, reduced consumer demand and economic output, supply chain disruptions and increased government spending may continue to have a significant negative impact on the performance of a Fund's investments, increase a Fund's volatility, exacerbate other pre-existing political, social and economic risks to the Funds and negatively impact broad segments of businesses and populations. In addition, governments, their regulatory agencies, or self-regulatory organizations have taken or may take actions in response to the pandemic that affect the instruments in which the Funds invest, or the issuers of such instruments, in ways that could also have a significant negative impact on a Fund’s investment performance. The duration and extent of COVID-19 and associated economic and market conditions and uncertainty over the long-term cannot be reasonably estimated at this time. The ultimate impact of COVID-19 and the extent to which the associated conditions impact a Fund will also depend on future developments, which are highly uncertain, difficult to accurately predict and subject to frequent changes.
| J.P. Morgan Mid Cap/Multi-Cap Funds | |
REPORT OF INDEPENDENT REGISTERED PUBLIC ACCOUNTING FIRM
To the Board of Trustees of J.P. Morgan Mutual Fund Investment Trust, J.P. Morgan Fleming Mutual Fund Group, Inc., JPMorgan Trust I and JPMorgan Trust II and Shareholders of JPMorgan Growth Advantage Fund, JPMorgan Mid Cap Value Fund, JPMorgan Mid Cap Equity Fund, JPMorgan Value Advantage Fund and JPMorgan Mid Cap Growth Fund
Opinions on the Financial Statements
We have audited the accompanying statements of assets and liabilities, including the schedules of portfolio investments, of JPMorgan Growth Advantage Fund (constituting J.P. Morgan Mutual Fund Investment Trust), JPMorgan Mid Cap Value Fund (constituting J.P. Morgan Fleming Mutual Fund Group, Inc.), JPMorgan Mid Cap Equity Fund and JPMorgan Value Advantage Fund (two of the funds constituting JPMorgan Trust I) and JPMorgan Mid Cap Growth Fund (one of the funds constituting JPMorgan Trust II) (hereafter collectively referred to as the "Funds") as of June 30, 2022, the related statements of operations for the year ended June 30, 2022, the statements of changes in net assets for each of the two years in the period ended June 30, 2022, including the related notes, and the financial highlights for each of the periods indicated therein (collectively referred to as the “financial statements”). In our opinion, the financial statements present fairly, in all material respects, the financial position of each of the Funds as of June 30, 2022, the results of each of their operations for the year then ended, the changes in each of their net assets for each of the two years in the period ended June 30, 2022 and each of the financial highlights for each of the periods indicated therein in conformity with accounting principles generally accepted in the United States of America.
Basis for Opinions
These financial statements are the responsibility of the Funds’ management. Our responsibility is to express an opinion on the Funds’ financial statements based on our audits. We are a public accounting firm registered with the Public Company Accounting Oversight Board (United States) (PCAOB) and are required to be independent with respect to the Funds in accordance with the U.S. federal securities laws and the applicable rules and regulations of the Securities and Exchange Commission and the PCAOB.
We conducted our audits of these financial statements in accordance with the standards of the PCAOB. Those standards require that we plan and perform the audit to obtain reasonable assurance about whether the financial statements are free of material misstatement, whether due to error or fraud.
Our audits included performing procedures to assess the risks of material misstatement of the financial statements, whether due to error or fraud, and performing procedures that respond to those risks. Such procedures included examining, on a test basis, evidence regarding the amounts and disclosures in the financial statements. Our audits also included evaluating the accounting principles used and significant estimates made by management, as well as evaluating the overall presentation of the financial statements. Our procedures included confirmation of securities owned as of June 30, 2022 by correspondence with the custodian, transfer agent and brokers; when replies were not received from brokers, we performed other auditing procedures. We believe that our audits provide a reasonable basis for our opinions.
/s/PricewaterhouseCoopers LLP
New York, New York
August 29, 2022
We have served as the auditor of one or more investment companies in the JPMorgan Funds complex since 1993.
| J.P. Morgan Mid Cap/Multi-Cap Funds | |
The Funds’ Statement of Additional Information includes additional information about the Funds’ Trustees and is available, without charge, upon request by calling 1-800-480-4111 or on the J.P. Morgan Funds’ website at www.jpmorganfunds.com.
Name (Year of Birth);
Positions With
the Funds (1) | Principal Occupation
During Past 5 Years | Number of
Funds in Fund
Complex Overseen
by Trustee (2) | Other Directorships Held
During the Past 5 Years |
| | | |
John F. Finn (1947); Chair
since 2020; Trustee since 1998. | Chairman, Gardner, Inc. (supply chain management company serving industrial and consumer markets) (serving in various roles 1974-present). | | Director, Greif, Inc. (GEF) (industrial package products and services) (2007-present); Trustee, Columbus Association for the Performing Arts (1988-present) |
Stephen P. Fisher (1959);
Trustee since 2018. | Retired; Chairman and Chief Executive Officer, NYLIFE Distributors LLC (registered brokerdealer) (serving in various roles 2008-2013); Chairman, NYLIM Service Company LLC (transfer agent) (2008-2017); New York Life Investment Management LLC (registered investment adviser) (serving in various roles 2005-2017); Chairman, IndexIQ Advisors LLC (registered investment adviser for ETFs) (2014-2017); President, MainStay VP Funds Trust (2007-2017), MainStay DefinedTerm Municipal Opportunities Fund (2011-2017) and MainStay Funds Trust (2007-2017) (registered investment companies). | | Honors Program Advisory Board Member, The Zicklin School of Business, Baruch College, The City University of New York (2017-present). |
Gary L. French (1951);
Trustee since 2014. | Real Estate Investor (2011-2020); Investment management industry Consultant and Expert Witness (2011-present); Senior Consultant for The Regulatory Fundamentals Group LLC (2011-2017). | | Independent Trustee, The China Fund, Inc. (2013-2019); Exchange Traded Concepts Trust II (2012-2014); Exchange Traded Concepts Trust I (2011-2014). |
Kathleen M. Gallagher (1958);
Trustee since 2018. | Retired; Chief Investment Officer — Benefit Plans, Ford Motor Company (serving in various roles 1985-2016). | | Non- Executive Director, Legal & General Investment Management (Holdings) (2018-present); Non-Executive Director, Legal & General Investment Management America U.S. Holdings (financial services and insurance) (2017-present); Advisory Board Member, State Street Global Advisors Total Portfolio Solutions (2017-present); Member, Client Advisory Council, Financial Engines, LLC (registered investment adviser) (2011-2016); Director, Ford Pension Funds Investment Management Ltd. (2007-2016). |
Robert J. Grassi (1957);
Trustee since 2014. | Sole Proprietor, Academy Hills Advisors LLC (2012-present); Pension Director, Corning Incorporated (2002-2012). | | |
| J.P. Morgan Mid Cap/Multi-Cap Funds | |
Name (Year of Birth); Positions With the Funds (1) | Principal Occupation During Past 5 Years | Number of Funds in Fund Complex Overseen by Trustee (2) | Other Directorships Held During the Past 5 Years |
Frankie D. Hughes (1952);
Trustee since 2008. | President, Ashland Hughes Properties (property management) (2014-present); President and Chief Investment Officer, Hughes Capital Management, Inc. (fixed income asset management) (1993-2014). | | |
Raymond Kanner (1953);
Trustee since 2017. | Retired; Managing Director & Chief Investment Officer, IBM Retirement Funds (2007-2016). | | Advisory Board Member, Penso Advisors LLC (2020-present); Advisory Board Member, Los Angeles Capital (2018-present); Advisory Board Member, State Street Global Advisors Total Portfolio Solutions (2017- present); Acting Executive Director, Committee on Investment of Employee Benefit Assets (CIEBA) (2016-2017); Advisory Board Member, Betterment for Business (robo advisor) (2016- 2017); Advisory Board Member, BlueStar Indexes (index creator) (2013-2017); Director, Emerging Markets Growth Fund (registered investment company) (1997-2016); Member, Russell Index Client Advisory Board (2001-2015). |
Thomas P. Lemke (1954);
Trustee since 2014. | | | (1) Independent Trustee of Advisors’ Inner Circle III fund platform, consisting of the following: (i) the Advisors’ Inner Circle Fund III, (ii) the Gallery Trust, (iii) the Schroder Series Trust, (iv) the Delaware Wilshire Private Markets Fund (since 2020), (v) Chiron Capital Allocation Fund Ltd., and (vi) formerly the Winton Diversified Opportunities Fund (2014-2018); and (2) Independent Trustee of the Symmetry Panoramic Trust (since 2018). |
Lawrence R. Maffia (1950);
Trustee since 2014. | Retired; Director and President, ICI Mutual Insurance Company (2006-2013). | | Director, ICI Mutual Insurance Company (1999-2013). |
Mary E. Martinez (1960); Vice
Chair since 2021; Trustee since 2013. | Associate, Special Properties, a Christie’s International Real Estate Affiliate (2010-present); Managing Director, Bank of America (asset management) (2007-2008); Chief Operating Officer, U.S. Trust Asset Management, U.S. Trust Company (asset management) (2003-2007); President, Excelsior Funds (registered investment companies) (2004-2005). | | |
Marilyn McCoy (1948); Trustee since 2005. | Vice President of Administration and Planning, Northwestern University (1985-present). | | |
| J.P. Morgan Mid Cap/Multi-Cap Funds | |
TRUSTEES
(Unaudited) (continued)
Name (Year of Birth); Positions With the Funds (1) | Principal Occupation During Past 5 Years | Number of Funds in Fund Complex Overseen by Trustee (2) | Other Directorships Held During the Past 5 Years |
Dr. Robert A. Oden, Jr. (1946); Trustee since 2005. | Retired; President, Carleton College (2002-2010); President, Kenyon College (1995-2002). | | Trustee, The Coldwater Conservation Fund (2017-present); Trustee, American Museum of Fly Fishing (2013-present); Trustee and Vice Chair, Trout Unlimited (2017-2021);Trustee, Dartmouth- Hitchcock MedicalCenter (2011-2020). |
Marian U. Pardo* (1946);
Trustee since 2013. | Managing Director and Founder, Virtual Capital Management LLC (investment consulting) (2007-present); Managing Director, Credit Suisse Asset Management (portfolio manager) (2003-2006). | | Board Chair and Member, Board of Governors, Columbus Citizens Foundation (not-for-profit supporting philanthropic and cultural programs) (2006-present). |
Emily A. Youssouf (1951);
Trustee since 2022. | Adjunct Professor (2011-present) and Clinical Professor (2009-2011), NYU Schack Institute of Real Estate; Board Member and Member of the Audit Committee (2013–present), Chair of Finance Committee (2019-present), Member of Related Parties Committee (2013-2018) and Member of the Enterprise Risk Committee (2015-2018), PennyMac Financial Services, Inc.; Board Member (2005-2018), Chair of Capital Committee (2006-2016), Chair of Audit Committee (2005-2018), Member of Finance Committee (2005-2018) and Chair of IT Committee (2016-2018), NYC Health and Hospitals Corporation. | | Trustee, NYC School Construction Authority (2009-present); Board Member, NYS Job Development Authority (2008-present); Trustee and Chair of the Audit Committee of the Transit Center Foundation (2015-2019). |
| | | |
| | | |
Robert F. Deutsch** (1957);
Trustee since 2014. | Retired; Head of the Global ETF Business for JPMorgan Asset Management (2013-2017); Head of the Global Liquidity Business for JPMorgan Asset Management (2003-2013). | | Treasurer and Director of the JUST Capital Foundation (2017-present). |
Nina O. Shenker** (1957);
Trustee since 2022. | Vice Chair (2017-2021), General Counsel and Managing Director (2008-2016), Associate General Counsel and Managing Director (2004-2008), J.P. Morgan Asset & Wealth Management. | | Director and Member of Legal and Human Resources Subcommittees, American Jewish Joint Distribution Committee(2018-present). |
|
| The year shown is the first year in which a Trustee became a member of any of the following: the Mutual Fund Board, the ETF Board, the heritage J.P. Morgan Funds or the heritage One Group Mutual Funds. Trustees serve an indefinite term, until resignation, retirement, removal or death. The Board’s current retirement policy sets retirement at the end of the calendar year in which the Trustee attains the age of 75, provided that any Board member who was a member of the Mutual Fund Board prior to January 1, 2022 and was born prior to January 1, 1950 shall retire from the Board at the end of the calendar year in which the Trustee attains the age of 78. | | |
| A Fund Complex means two or more registered investment companies that hold themselves out to investors as related companies for purposes of investment and investor services or have a common investment adviser or have an investment adviser that is an affiliated person of the investment adviser of any of the other registered investment companies. The J.P. Morgan Funds Complex for which the Board of Trustees serves currently includes nine registered investment companies (167 J.P. Morgan Funds). | | |
| J.P. Morgan Mid Cap/Multi-Cap Funds | |
| In connection with prior employment with JPMorgan Chase, Ms. Pardo was the recipient of non-qualified pension plan payments from JPMorgan Chase in the amount of approximately $2,055 per month, which she irrevocably waived effective January 1, 2013, and deferred compensation payments from JPMorgan Chase in the amount of approximately $7,294 per year, which ended in January 2013. In addition, Ms. Pardo receives payments from a fully-funded qualified plan, which is not an obligation of JPMorgan Chase. | | |
| Designation as an “Interested Trustee” is based on prior employment by the Adviser or an affiliate of the Adviser or interests in a control person of the Adviser. | | |
| The contact address for each of the Trustees is 277 Park Avenue, New York, NY 10172. | | |
| J.P. Morgan Mid Cap/Multi-Cap Funds | |
Name (Year of Birth),
Positions Held with
the Trust (Since) | Principal Occupations During Past 5 Years |
Brian S. Shlissel (1964),
President and Principal Executive
Officer (2016)* | Managing Director and Chief Administrative Officer for J.P. Morgan pooled vehicles, J.P. Morgan Investment Management Inc. since 2014. |
Timothy J. Clemens (1975),
Treasurer and Principal Financial
Officer (2018) | Executive Director, J.P. Morgan Investment Management Inc. since February 2016. Mr. Clemens has been with J.P. Morgan Investment Management Inc. since 2013. |
Gregory S. Samuels (1980),
Secretary (2019) (formerly Assistant
Secretary 2010-2019)** | Managing Director and Assistant General Counsel, JPMorgan Chase. Mr. Samuels has been with JPMorgan Chase since 2010. |
Stephen M. Ungerman (1953),
Chief Compliance Officer (2005) | Managing Director, JPMorgan Chase & Co.; Mr. Ungerman has been with JPMorgan Chase & Co. since 2000. |
Matthew Beck (1988),
Assistant Secretary (2021)*** | Vice President and Assistant General Counsel, JPMorgan Chase since May 2021; Senior Legal Counsel, Ultimus Fund Solutions from May 2018 through May 2021; General Counsel, The Nottingham Company from April 2014 through May 2018. |
Kiesha Astwood-Smith (1973),
Assistant Secretary (2021)** | Vice President and Assistant General Counsel, JPMorgan Chase since June 2021; Senior Director and Counsel, Equitable Financial Life Insurance Company (formerly, AXA Equitable Life Insurance Company) from 2015 to 2021. |
Elizabeth A. Davin (1964),
Assistant Secretary (2005)*** | Executive Director and Assistant General Counsel, JPMorgan Chase. Ms. Davin has been with JPMorgan Chase (formerly Bank One Corporation) since 2004. |
Jessica K. Ditullio (1962),
Assistant Secretary (2005)*** | Executive Director and Assistant General Counsel, JPMorgan Chase. Ms. Ditullio has been with JPMorgan Chase (formerly Bank One Corporation) since 1990. |
Anthony Geron (1971),
Assistant Secretary (2018)** | Vice President and Assistant General Counsel, JPMorgan Chase since September 2018; Lead Director and Counsel, AXA Equitable Life Insurance Company from 2015 to 2018 and Senior Director and Counsel, AXA Equitable Life Insurance Company from 2014 to 2015. |
Carmine Lekstutis (1980),
Assistant Secretary (2011)** | Executive Director and Assistant General Counsel, JPMorgan Chase. Mr. Lekstutis has been with JPMorgan Chase since 2011. |
Max Vogel (1990),
Assistant Secretary (2021)** | Vice President and Assistant General Counsel, JPMorgan Chase since June 2021; Associate, Proskauer Rose LLP (law firm) from March 2017 through June 2021; Associate, Stroock & Stroock & Lavan LLP (law firm) from October 2015 through March 2017. |
Zachary E. Vonnegut-Gabovitch
(1986),
Assistant Secretary (2017)** | Vice President and Assistant General Counsel, JPMorgan Chase since September 2016. |
Michael M. D’Ambrosio (1969),
Assistant Treasurer (2012) | Managing Director, J.P. Morgan Investment Management Inc. Mr. D’Ambrosio has been with J.P. Morgan Investment Management Inc. since 2012. |
Aleksandr Fleytekh (1972),
Assistant Treasurer (2019) | Vice President, J.P. Morgan Investment Management Inc. since February 2012. |
Shannon Gaines (1977),
Assistant Treasurer (2018)*** | Vice President, J.P. Morgan Investment Management Inc. since January 2014. |
Jeffrey D. House (1972),
Assistant Treasurer (2017)*** | Vice President, J.P. Morgan Investment Management Inc. since July 2006. |
Michael Mannarino (1985),
Assistant Treasurer (2020) | Vice President, J.P. Morgan Investment Management Inc. since 2014. |
Joseph Parascondola (1963),
Assistant Treasurer (2011)* | Executive Director, J.P. Morgan Investment Management, Inc. Mr. Parascondola has been with J.P. Morgan Investment Management Inc. since 2006. |
Gillian I. Sands (1969),
Assistant Treasurer (2012) | Executive Director, J.P. Morgan Investment Management Inc. Ms. Sands has been with J.P. Morgan Investment Management Inc. since 2012. |
| J.P. Morgan Mid Cap/Multi-Cap Funds | |
|
The contact address for each of the officers, unless otherwise noted, is 277 Park Avenue, New York, NY 10172. |
| The contact address for the officer is 575 Washington Boulevard, Jersey City, NJ 07310. |
| The contact address for the officer is 4 New York Plaza, New York, NY 10004. |
| The contact address for the officer is 1111 Polaris Parkway, Columbus, OH 43240. |
| J.P. Morgan Mid Cap/Multi-Cap Funds | |
SCHEDULE OF SHAREHOLDER EXPENSES
(Unaudited)
Hypothetical $1,000 Investment
As a shareholder of the Funds, you incur two types of costs: (1) transaction costs, including sales charges (loads) on purchase payments and (2) ongoing costs, including investment advisory fees, administration fees, distribution fees and other Fund expenses. The examples below are intended to help you understand your ongoing costs (in dollars) of investing in the Funds (not including expenses of the Underlying Funds and ETFs) and to compare these ongoing costs with the ongoing costs of investing in other mutual funds. The examples assume that you had a $1,000 investment in each Class at the beginning of the reporting period, January 1, 2022, and continued to hold your shares at the end of the reporting period, June 30, 2022.
Actual Expenses
For each Class of each Fund in the table below, the first line provides information about actual account values and actual expenses. You may use the information in this line, together with the amount you invested, to estimate the expenses that you paid over the period. Simply divide your account value by $1,000 (for example, an $8,600 account value divided by $1,000 = 8.6), then multiply the result by the number in the first line of each Class under the heading titled “Expenses Paid During the Period” to estimate the expenses you paid on your account during this period.
Hypothetical Example for Comparison Purposes
The second line of each Class in the table below provides information about hypothetical account values and hypothetical expenses based on the Class’ actual expense ratio and an assumed rate of return of 5% per year before expenses, which is not the Class’ actual return. The hypothetical account values and expenses may not be used to estimate the actual ending account balance or expenses you paid for the period. You may use this information to compare the ongoing costs of investing in the Class of the Funds and other funds. To do so, compare this 5% hypothetical example with the 5% hypothetical examples that appear in the shareholder reports of the other funds. Please note that the expenses shown in the table are meant to highlight your ongoing costs only and do not reflect any transaction costs, such as sales charges (loads), or redemption fees, and expenses of the Underlying Funds and ETFs. Therefore, the second line for each Class in the table is useful in comparing ongoing costs only, and will not help you determine the relative total costs of owning different funds. In addition, if these transaction costs were included, your costs would have been higher. The examples also assume all dividends and distributions have been reinvested.
| Beginning
Account Value
January 1, 2022 | Ending
Account Value
June 30, 2022 | Expenses
Paid During
the Period* | |
JPMorgan Growth Advantage Fund | | | | |
| | | | |
| | | | |
| | | | |
| | | | |
| | | | |
| | | | |
| | | | |
| | | | |
| | | | |
| | | | |
| | | | |
| | | | |
| | | | |
| | | | |
| | | | |
| | | | |
| | | | |
| | | | |
| | | | |
| | | | |
| | | | |
| | | | |
| | | | |
| | | | |
| J.P. Morgan Mid Cap/Multi-Cap Funds | |
| Beginning Account Value January 1, 2022 | Ending Account Value June 30, 2022 | Expenses Paid During the Period* | |
JPMorgan Mid Cap Equity Fund | | | | |
| | | | |
| | | | |
| | | | |
| | | | |
| | | | |
| | | | |
| | | | |
| | | | |
| | | | |
| | | | |
| | | | |
| | | | |
| | | | |
| | | | |
| | | | |
| | | | |
| | | | |
| | | | |
JPMorgan Mid Cap Growth Fund | | | | |
| | | | |
| | | | |
| | | | |
| | | | |
| | | | |
| | | | |
| | | | |
| | | | |
| | | | |
| | | | |
| | | | |
| | | | |
| | | | |
| | | | |
| | | | |
| | | | |
| | | | |
| | | | |
| | | | |
| | | | |
| | | | |
| | | | |
| | | | |
| | | | |
JPMorgan Mid Cap Value Fund | | | | |
| | | | |
| | | | |
| | | | |
| | | | |
| | | | |
| | | | |
| J.P. Morgan Mid Cap/Multi-Cap Funds | |
SCHEDULE OF SHAREHOLDER EXPENSES
(Unaudited) (continued)
Hypothetical $1,000 Investment
| Beginning Account Value January 1, 2022 | Ending Account Value June 30, 2022 | Expenses Paid During the Period* | |
JPMorgan Mid Cap Value Fund (continued) | | | | |
| | | | |
| | | | |
| | | | |
| | | | |
| | | | |
| | | | |
| | | | |
| | | | |
| | | | |
| | | | |
| | | | |
| | | | |
| | | | |
| | | | |
| | | | |
| | | | |
| | | | |
| | | | |
| | | | |
| | | | |
| | | | |
JPMorgan Value Advantage Fund | | | | |
| | | | |
| | | | |
| | | | |
| | | | |
| | | | |
| | | | |
| | | | |
| | | | |
| | | | |
| | | | |
| | | | |
| | | | |
| | | | |
| | | | |
| | | | |
| | | | |
| | | | |
| | | | |
| | | | |
| | | | |
| | | | |
| | | | |
| | | | |
| | | | |
| | | | |
| | | | |
| | | | |
|
| Expenses are equal to each Class’ respective annualized expense ratio, multiplied by the average account value over the period, multiplied by 181/365 (to reflect the one-half year period). |
| J.P. Morgan Mid Cap/Multi-Cap Funds | |
LIQUIDITY RISK MANAGEMENT PROGRAM
(Unaudited)
Each of the Funds covered in this report have adopted the J.P. Morgan Funds and J.P. Morgan Exchange-Traded Funds Amended and Restated Liquidity Risk Management Program (the “Program”) under Rule 22e-4 under the Investment Company Act of 1940, as amended (the “Liquidity Rule”). The Program seeks to assess, manage and review each Fund’s Liquidity Risk. “Liquidity Risk” is defined as the risk that a fund could not meet requests to redeem shares issued by the fund without significant dilution of remaining investors’ interests in the fund. Among other things, the Liquidity Rule requires that a written report be provided to the Board of Trustees (the “Board”) on an annual basis that addresses the operation of the Program and assesses the adequacy and effectiveness of its implementation, including the operation of any Highly Liquid Investment Minimum (“HLIM”), where applicable, and any material changes to the Program.
The Board has appointed J.P. Morgan Asset Management’s Liquidity Risk Forum to be the program administrator for the Program (the “Program Administrator”). In addition to regular reporting at each of its quarterly meetings, on February 8, 2022, the Board reviewed the Program Administrator’s annual written report (the “Report”) concerning the operation of the Program for the period from January 1, 2021 through December 31, 2021 (the “Program Reporting Period”). The Report addressed the operation of the Program and assessed its adequacy and effectiveness of implementation, including, where applicable, the operation of a Fund’s HLIM. During the Program Reporting Period, the Program was amended, pursuant to an exemptive order from the Securities and Exchange Commission, to permit the Funds to use liquidity definitions and classification methodologies that differ from the requirements under the Liquidity Rule in some respects. The
Report discussed the implementation of these changes. No other material changes were made to the Program during the Program Reporting Period.
The Report summarized the operation of the Program and the information and factors considered by the Program Administrator in assessing whether the Program has been adequately and effectively implemented with respect to each Fund. Such information and factors included, among other things: (1) the liquidity risk framework used to assess, manage, and periodically review each Fund’s Liquidity Risk and the results of this assessment; (2) the methodology and inputs for classifying the investments of a Fund into one of the required liquidity categories that reflect an estimate of the liquidity of those investments under current market conditions; (3) whether a Fund invested primarily in “Highly Liquid Investments” (as defined or modified under the Program), as well as whether an HLIM should be established for a Fund (and, for Funds that have adopted an HLIM, whether the HLIM continues to be appropriate or whether a Fund has invested below its HLIM) and the procedures for monitoring for any HLIM; (4) whether a Fund invested more than 15% of its assets in “Illiquid Investments” (as defined or modified under the Program) and the procedures for monitoring for this limit; and (5) specific liquidity events arising during the Program Reporting Period. The Report further summarized the conditions of the exemptive order.
Based on this review, the Report concluded that: (1) the Program continues to be reasonably designed to effectively assess and manage each Fund’s Liquidity Risk; and (2) the Program has been adequately and effectively implemented with respect to each Fund during the Program Reporting Period.
| J.P. Morgan Mid Cap/Multi-Cap Funds | |
TAX LETTER
(Unaudited)
(Dollar values in thousands)
Certain tax information for the J.P. Morgan Funds is required to be provided to shareholders based upon the Funds’ income and distributions for the taxable year ended June 30, 2022. The information and distributions reported in this letter may differ from the information and taxable distributions reported to the shareholders for the calendar year ending December 31, 2022. The information necessary to complete your income tax returns for the calendar year ending December 31, 2022 will be provided under separate cover.
Dividends Received Deduction (DRD)
Each Fund listed below had the following percentage, or maximum allowable percentage, of ordinary income distributions eligible for the dividends received deduction for corporate shareholders for the fiscal year ended June 30, 2022:
| Dividends
Received
Deduction |
JPMorgan Growth Advantage Fund | |
JPMorgan Mid Cap Equity Fund | |
JPMorgan Mid Cap Growth Fund | |
JPMorgan Mid Cap Value Fund | |
JPMorgan Value Advantage Fund | |
Long Term Capital Gain
Each Fund listed below distributed the following amount, or maximum allowable amount, of long-term capital gain dividends for the fiscal year ended June 30, 2022:
| Long-Term
Capital Gain
Distribution |
JPMorgan Growth Advantage Fund | |
JPMorgan Mid Cap Equity Fund | |
JPMorgan Mid Cap Growth Fund | |
JPMorgan Mid Cap Value Fund | |
JPMorgan Value Advantage Fund | |
Qualified Dividend Income (QDI)
Each Fund listed below had the following amount, or maximum allowable amount, of ordinary income distributions treated as qualified dividends for the fiscal year ended June 30, 2022:
| |
JPMorgan Growth Advantage Fund | |
JPMorgan Mid Cap Equity Fund | |
JPMorgan Mid Cap Growth Fund | |
JPMorgan Mid Cap Value Fund | |
JPMorgan Value Advantage Fund | |
Section 199A Income
The following funds had the following amount, or maximum allowable amount, of ordinary income distributions treated as 199A dividends for the fiscal year ended June 30, 2021.
JPMorgan Mid Cap Equity Fund | |
| J.P. Morgan Mid Cap/Multi-Cap Funds | |
Rev. January 2011
| WHAT DOES J.P. MORGAN FUNDS DO WITH YOUR PERSONAL INFORMATION? |
| Financial companies choose how they share your personal information. Federal law gives consumers the right to limit some but not all sharing. Federal law also requires us to tell you how we collect, share, and protect your personal information. Please read this notice carefully to understand what we do. |
| The types of personal information we collect and share depend on the product or service you have with us. This information can include: |
| ◾Social Security number and account balances |
| ◾transaction history and account transactions |
| ◾checking account information and wire transfer instructions |
| When you are no longer our customer, we continue to share your information as described in this notice. |
| All financial companies need to share customers’ personal information to run their everyday business. In the section below, we list the reasons financial companies can share their customers’ personal information; the reasons J.P. Morgan Funds chooses to share; and whether you can limit this sharing. |
Reasons we can share your personal information | Does J.P. Morgan
Funds share? | Can you limit this
sharing? |
For our everyday business purposes —
such as to process your transactions, maintain your account(s),respond to court orders and legal investigations, or report to credit bureaus | | |
For marketing purposes —
to offer our products and services to you | | |
For joint marketing with other financial companies | | |
For our affiliates’ everyday business purposes —
information about your transactions and experiences | | |
For our affiliates’ everyday business purposes —
information about your creditworthiness | | |
For nonaffiliates to market to you | | |
| Call 1-800-480-4111 or go to www.jpmorganfunds.com |
|
Who is providing this notice? | |
|
How does J.P. Morgan Funds protect my personal information? | To protect your personal information from unauthorized access and use, we use security measures that comply with federal law. These measures include computer safeguards and secured files and buildings. We authorize our employees to access your information only when they need it to do their work and we require companies that work for us to protect your information. |
How does J.P. Morgan Funds protect my personal information? | We collect your personal information, for example, when you: |
◾open an account or provide contact information |
◾give us your account information or pay us by check |
|
We also collect your personal information from others, such as credit bureaus, affiliates and other companies. |
Why can’t I limit all sharing? | Federal law gives you the right to limit only |
◾sharing for affiliates’ everyday business purposes – information about your creditworthiness |
◾affiliates from using your information to market to you |
◾sharing for nonaffiliates to market to you |
State laws and individual companies may give you additional rights to limit sharing. |
|
| Companies related by common ownership or control. They can be financial and nonfinancial companies. |
| ◾J.P. Morgan Funds does not share with our affiliates. |
| Companies not related by common ownership or control. They can be financial and nonfinancial companies. |
| ◾J.P. Morgan Funds does not share with nonaffiliates so they can market to you. |
| A formal agreement between nonaffiliated financial companies that together market financial products or services to you. |
| ◾J.P. Morgan Funds doesn’t jointly market. |
THIS PAGE IS INTENTIONALLY LEFT BLANK
THIS PAGE IS INTENTIONALLY LEFT BLANK
J.P. Morgan Funds are distributed by JPMorgan Distribution Services, Inc., which is an affiliate of JPMorgan Chase & Co. Affiliates of JPMorgan Chase & Co. receive fees for providing various services to the funds.
Contact JPMorgan Distribution Services, Inc. at 1-800-480-4111 for a fund prospectus. You can also visit us at www.jpmorganfunds.com. Investors should carefully consider the investment objectives and risk as well as charges and expenses of the mutual fund before investing. The prospectus contains this and other information about the mutual fund. Read the prospectus carefully before investing.
Investors may obtain information about the Securities Investor Protection Corporation (SIPC), including the SIPC brochure, by visiting www.sipc.org or by calling SIPC at 202-371-8300.
The Fund files a complete schedule of its fund holdings for the first and third quarters of its fiscal year with the SEC as an exhibit to its report on Form N-PORT. The Fund’s Form N-PORT reports are available on the SEC’s website at http://www.sec.gov. The Fund's quarterly holdings can be found by visiting the J.P. Morgan Funds’ website at www.jpmorganfunds.com.
A description of the Fund’s policies and procedures with respect to the disclosure of the Fund’s holdings is available in the prospectuses and Statement of Additional Information.
A copy of proxy policies and procedures is available without charge upon request by calling 1-800-480-4111 and on the Fund’s website at www.jpmorganfunds.com. A description of such policies and procedures is on the SEC’s website at www.sec.gov. The Trustees have delegated the authority to vote proxies for securities owned by the Fund to the Adviser. A copy of the Fund’s voting record for the most recent 12-month period ended June 30 is available on the SEC’s website at www.sec.gov or at the Fund’s website at www.jpmorganfunds.com no later than August 31 of each year. The Fund’s proxy voting record will include, among other things, a brief description of the matter voted on for each fund security, and will state how each vote was cast, for example, for or against the proposal.
J.P. Morgan Asset Management is the brand name for the asset management business of JPMorgan Chase & Co. and its affiliates worldwide.
© JPMorgan Chase & Co., 2022. All rights reserved. June 2022.
AN-MC-622
ITEM 2. CODE OF ETHICS.
Disclose whether, as of the end of the period covered by the report, the registrant has adopted a code of ethics that applies to the registrant’s principal executive officer, principal financial officer, principal accounting officer or controller, or persons performing similar functions, regardless of whether these individuals are employed by the registrant or a third party. If the registrant has not adopted such a code of ethics, explain why it has not done so.
The registrant must briefly describe the nature of any amendment, during the period covered by the report, to a provision of its code of ethics that applies to the registrant’s principal executive officer, principal financial officer, principal accounting officer or controller, or persons performing similar functions, regardless of whether these individuals are employed by the registrant or a third party, and that relates to any element of the code of ethics definition enumerated in paragraph (b) of this Item. The registrant must file a copy of any such amendment as an exhibit pursuant to Item 13(a)(1), unless the registrant has elected to satisfy paragraph (f) of this Item by positing its code of ethics on its website pursuant to paragraph (f)(2) of this Item, or by undertaking to provide its code of ethics to any person without charge, upon request, pursuant to paragraph (f)(3) of this Item.
If the registrant has, during the period covered by the report, granted a waiver, including an implicit waiver, from a provision of the code of ethics that applies to the registrant’s principal executive officer, principal financial officer, principal accounting officer or controller, or persons performing similar functions, regardless of whether these individuals are employed by the registrant or third party, that relates to one or more items set forth in paragraph (b) of this Item, the registrant must briefly describe the nature of the waiver, the name of the person to whom the waiver was granted, and the date of the waiver.
The Registrant has adopted a code of ethics that applies to the Registrant’s principal executive officer and principal financial officer. There were no amendments to the code of ethics or waivers granted with respect to the code of ethics in the period covered by the report.
ITEM 3. AUDIT COMMITTEE FINANCIAL EXPERT.
(a) (1) Disclose that the registrant’s board of directors has determined that the registrant either:
(i) Has at least one audit committee financial expert serving on its audit committee; or
(ii) Does not have an audit committee financial expert serving on its audit committee.
The Registrant’s Board of Trustees has determined that the Registrant has at least one audit committee financial expert serving on its audit committee. The Securities and Exchange Commission has stated that the designation or identification of a person as an audit committee financial expert pursuant to this Item 3 of Form N-CSR does not impose on such person any duties, obligations or liabilities that are greater than the duties, obligations and liabilities imposed on such person as a member of the Audit Committee and the Board of Trustees in the absence of such designation or identification.
(2) If the registrant provides the disclosure required by paragraph (a)(1)(i) of this Item, it must disclose the name of the audit committee financial expert and whether that person is “independent.” In order to be considered “independent” for purposes of this Item, a member of an audit committee may not, other than in his or her capacity as a member of the audit committee, the board of directors, or any other board committee:
(i) Accept directly or indirectly any consulting, advisory, or other compensatory fee from the issuer; or
(ii) Be an “interested person” of the investment company as defined in Section 2(a)(19) of the Act (15 U.S.C. 80a-2(a)(19)).
The Audit committee financial expert is Kathleen M. Gallagher. Ms. Gallagher is not an “interested person” of the Registrant and is also “independent” as defined by the U.S. Securities and Exchange Commission for the purposes of the audit committee financial expert determination.
(3) If the registrant provides the disclosure required by paragraph (a)(1)(ii) of this Item, it must explain why it does not have an audit committee financial expert.
Not applicable.
ITEM 4. PRINCIPAL ACCOUNTANT FEES AND SERVICES.
(a) Disclose, under the caption Audit Fees, the aggregate fees billed for each of the last two fiscal years for professional services rendered by the principal accountant for the audit of the registrant’s annual financial statements or services that are normally provided by the accountant in connection with statutory and regulatory filings or engagements for those fiscal years.
AUDIT FEES
2022 – $33,674
2021 – $33,448
(b) Disclose, under the caption Audit-Related Fees, the aggregate fees billed in each of the last two fiscal years for assurance and related services by the principal accountant that are reasonably related to the performance of the audit of the registrant’s financial statements and are not reported under paragraph (a) of this Item. Registrants shall describe the nature of the services comprising the fees disclosed under this category.
AUDIT-RELATED FEES
2022 – $5,495
2021 – $5,495
Audit-related fees consists of semi-annual financial statement reviews and security count procedures performed as required under Rule 17f-2 of the Investment Company Act of 1940 during the Registrant’s fiscal year.
(c) Disclose, under the caption Tax Fees, the aggregate fees billed in each of the last two fiscal years for professional services rendered by the principal accountant for tax compliance, tax advice, and tax planning. Registrants shall describe the nature of the services comprising the fees disclosed under this category.
TAX FEES
2022 – $10,460
2021 – $10,539
The tax fees consist of fees billed in connection with preparing the federal regulated investment company income tax returns for the Registrant for the tax years ended June 30, 2022 and 2021, respectively.
For the last fiscal year, no tax fees were required to be approved pursuant to paragraph (c)(7)(ii) of Rule 2-01 of Regulation S-X.
(d) Disclose, under the caption All Other Fees, the aggregate fees billed in each of the last two fiscal years for products and services provided by the principal accountant, other than the services reported in paragraphs (a) through (c) of this Item. Registrants shall describe the nature of the services comprising the fees disclosed under this category.
ALL OTHER FEES
2022 – Not applicable
2021 – Not applicable
(e) (1) Disclose the audit committee’s pre-approval policies and procedures described in paragraph (c)(7) of Rule 2-01 of Regulation S-X.
Pursuant to the Registrant’s Audit Committee Charter and written policies and procedures for the pre-approval of audit and non-audit services (the “Pre-approval Policy”), the Audit Committee pre-approves all audit and non-audit services performed by the Registrant’s independent public registered accounting firm for the Registrant. In addition, the Audit Committee pre-approves the auditor’s engagement for non-audit services with the Registrant’s investment adviser (not including a sub-adviser whose role is primarily portfolio management and is sub-contracted or overseen by another investment adviser) and any Service Affiliate in accordance with paragraph (c)(7)(ii) of Rule 2-01 of Regulation S-X, if the engagement relates directly to the operations and financial reporting of the Registrant. Proposed services may be pre-approved either 1) without consideration of specific case-by-case services or 2) require the specific pre-approval of the Audit Committee. Therefore, initially the Pre-approval Policy listed a number of audit and non-audit services that have been approved by the Audit Committee, or which were not subject to pre-approval under the transition provisions of Sarbanes-Oxley Act of 2002 (the “Pre-approval List”). The Audit Committee annually reviews and pre-approves the services included on the Pre-approval List that may be provided by the independent public registered accounting firm without obtaining additional specific pre-approval of individual services from the Audit Committee. The Audit Committee adds to, or subtracts from, the list of general pre-approved services from time to time, based on subsequent determinations. All other audit and non-audit services not on the Pre-approval List must be specifically pre-approved by the Audit Committee.
One or more members of the Audit Committee may be appointed as the Committee’s delegate for the purposes of considering whether to approve such services. Any pre-approvals granted by the delegate will be reported, for informational purposes only, to the Audit Committee at its next scheduled meeting. The Audit Committee’s responsibilities to pre-approve services performed by the independent public registered accounting firm are not delegated to management.
(2) Disclose the percentage of services described in each of paragraphs (b) through (d) of this Item that were approved by the audit committee pursuant to paragraph (c)(7)(i)(C) of Rule 2-01 of Regulation S-X.
2022 – 0.0%
2021 – 0.0%
(f) If greater than 50 percent, disclose the percentage of hours expended on the principal accountant’s engagement to audit the registrant’s financial statements for the most recent fiscal year that were attributed to work performed by persons other than the principal accountant’s full-time, permanent employees.
Not applicable - Less than 50%.
(g) Disclose the aggregate non-audit fees billed by the registrant’s accountant for services rendered to the registrant, and rendered to the registrant’s investment adviser (not including any sub-adviser whose role is primarily portfolio management and is subcontracted with or overseen by another investment adviser), and any entity controlling, controlled by, or under common control with the adviser that provides ongoing services to the registrant for each of the last two fiscal years of the registrant.
The aggregate non-audit fees billed by the independent registered public accounting firm for services rendered to the Registrant, and rendered to Service Affiliates, for the last two calendar year ends were:
2021—$30.5 million
2020—$30.0 million
(h) Disclose whether the registrant’s audit committee of the board of directors has considered whether the provision of non-audit services that were rendered to the registrant’s investment adviser (not including any subadviser whose role is primarily portfolio management and is subcontracted with or overseen by another investment adviser), and any entity controlling, controlled by, or under common control with the investment adviser that provides ongoing services to the registrant that were not pre-approved pursuant to paragraph (c)(7)(ii) of Rule 2-01 of Regulation S-X is compatible with maintaining the principal accountant’s independence.
The Registrant’s Audit Committee has considered whether the provision of the non-audit services that were rendered to Service Affiliates that were not pre-approved (not requiring pre-approval) is compatible with maintaining the independent public registered accounting firm’s independence. All services provided by the independent public registered accounting firm to the Registrant or to Service Affiliates that were required to be pre-approved were pre-approved as required.
(i) A registrant identified by the Commission pursuant to Section 104(i)(2)(A) of the Sarbanes-Oxley Act of 2002 (15 U.S.C. 7214(i)(2)(A)), as having retained, for the preparation of the audit report on its financial statements included in the Form NCSR, a registered public accounting firm that has a branch or office that is located in a foreign jurisdiction and that the Public Company Accounting Oversight Board has determined it is unable to inspect or investigate completely because of a position taken by an authority in the foreign jurisdiction must electronically submit to the Commission on a supplemental basis documentation that establishes that the registrant is not owned or controlled by a governmental entity in the foreign jurisdiction. The registrant must submit this documentation on or before the due date for this form. A registrant that is owned or controlled by a foreign governmental entity is not required to submit such documentation.
Not applicable.
(j) A registrant that is a foreign issuer, as defined in 17 CFR 240.3b-4, identified by the Commission pursuant to Section 104(i)(2)(A) of the Sarbanes-Oxley Act of 2002 (15 U.S.C. 7214(i)(2)(A)), as having retained, for the preparation of the audit report on its financial statements included in the Form N-CSR, a registered public accounting firm that has a branch or office that is located in a foreign jurisdiction and that the Public Company Accounting Oversight Board has determined it is unable to inspect or investigate completely because of a position taken by an authority in the foreign jurisdiction, for each year in which the registrant is so identified, must provide the below disclosures. Also, any such identified foreign issuer that uses a variable-interest entity or any similar structure that results in additional foreign entities being consolidated in the financial statements of the registrant is required to provide the below disclosures for itself and its consolidated foreign operating entity or entities. A registrant must disclose:
| | (1) | That, for the immediately preceding annual financial statement period, a registered public accounting firm that the PCAOB was unable to inspect or investigate completely, because of a position taken by an authority in the foreign jurisdiction, issued an audit report for the registrant; |
| | (2) | The percentage of shares of the registrant owned by governmental entities in the foreign jurisdiction in which the registrant is incorporated or otherwise organized; |
| | (3) | Whether governmental entities in the applicable foreign jurisdiction with respect to that registered public accounting firm have a controlling financial interest with respect to the registrant; |
| | (4) | The name of each official of the Chinese Communist Party who is a member of the board of directors of the registrant or the operating entity with respect to the registrant; and |
| | (5) | Whether the articles of incorporation of the registrant (or equivalent organizing document) contains any charter of the Chinese Communist Party, including the text of any such charter. |
Not applicable.
ITEM 5. AUDIT COMMITTEE OF LISTED REGISTRANTS.
(a) If the registrant is a listed issuer as defined in Rule 10A-3 under the Exchange Act (17CFR 240.10A-3), state whether or not the registrant has a separately-designated standing audit committee established in accordance with Section 3(a)(58)(A) of the Exchange Act (15 U.S.C. 78c(a)(58)(A)). If the registrant has such a committee, however designated, identify each committee member. If the entire board of directors is acting as the registrant’s audit committee as specified in Section 3(a)(58)(B) of the Exchange Act (15 U.S.C. 78c(a)(58)(B)), so state.
(b) If applicable, provide the disclosure required by Rule 10A-3(d) under the Exchange Act (17CFR 240.10A-3(d)) regarding an exemption from the listing standards for all audit committees.
Not applicable.
ITEM 6. INVESTMENTS.
File Schedule I – Investments in securities of unaffiliated issuers as of the close of the reporting period as set forth in Section 210.12-12 of Regulation S-X, unless the schedule is included as part of the report to shareholders filed under Item 1 of this Form.
Included in Item 1.
ITEM 7. DISCLOSURE OF PROXY VOTING POLICIES AND PROCEDURES FOR CLOSED-END MANAGEMENT INVESTMENT COMPANIES.
Not applicable.
ITEM 8. PORTFOLIO MANAGERS OF CLOSED-END MANAGEMENT INVESTMENT COMPANIES.
Not applicable.
ITEM 9. PURCHASE OF EQUITY SECURITIES BY CLOSED-END MANAGEMENT INVESTMENT COMPANY AND AFFILIATED PURCHASERS.
Not applicable.
ITEM 10. SUBMISSION OF MATTERS TO A VOTE OF SECURITY HOLDERS.
Describe any material changes to the procedures by which shareholders may recommend nominees to the registrant’s board of directors, where those changes were implemented after the registrant last provided disclosure in response to the requirements of Item 7(d)(2)(ii)(G) of Schedule 14A (17 CFR 240.14a-101), or this Item.
No material changes to report.
ITEM 11. CONTROLS AND PROCEDURES.
(a) Disclose the conclusions of the registrant’s principal executive and principal financial officers, or persons performing similar functions, regarding the effectiveness of the registrant’s disclosure controls and procedures (as defined in Rule 30a-3(c) under the Act (17 CFR 270.30a-3(c))) as of a date within 90 days of the filing date of the report that includes the disclosure required by this paragraph, based on the evaluation of these controls and procedures required by Rule 30a-3(b) under the Act (17 CFR 270.30a-3(b)) and Rules 13a-15(b) or 15d-15(b) under the Exchange Act (17 CFR 240.13a-15(b) or 240.15d-15(b)).
The Registrant’s principal executive and principal financial officers have concluded, based on their evaluation of the Registrant’s disclosure controls and procedures as of a date within 90 days of the filing date of this report, that the Registrant’s disclosure controls and procedures are reasonably designed to ensure that information required to be disclosed by the Registrant on Form N-CSR is recorded, processed, summarized and reported within the required time periods and that information required to be disclosed by the Registrant in the reports that it files or submits on Form N-CSR is accumulated and communicated to the Registrant’s management, including its principal executive and principal financial officers, as appropriate to allow timely decisions regarding required disclosure.
(b) Disclose any change in the registrant’s internal control over financial reporting (as defined in Rule 30a-3(d) under the Act (17 CFR 270.30a-3(d)) that occurred during the registrant’s second fiscal quarter of the period covered by this report that has materially affected, or is reasonably likely to materially affect, the registrant’s internal control over financial reporting.
There were no changes in the Registrant’s internal control over financial reporting that occurred during the last fiscal quarter covered by this report that have materially affected, or are reasonably likely to materially affect, the Registrant’s internal control over financial reporting.
ITEM 12. DISCLOSURE OF SECURITIES LENDING ACTIVITIES FOR CLOSED-END MANAGEMENT INVESTMENT COMPANIES.
Not applicable.
ITEM 13. EXHIBITS.
| | (a) | File the exhibits listed below as part of this Form. Letter or number the exhibits in the sequence indicated. |
(1) Any code of ethics, or amendment thereto, that is the subject of the disclosure required by Item 2, to the extent that the registrant intends to satisfy the Item 2 requirements through filing of an exhibit.
Code of Ethics applicable to its Principal Executive and Principal Financial Officers pursuant to Section 406 of the Sarbanes-Oxley Act of 2002 attached hereto.
Not applicable.
(2) A separate certification for each principal executive officer and principal financial officer of the registrant as required by Rule 30a-2(a) under the Act (17 CFR 270.30a-2(2) A separate certification for each principal executive officer and principal financial officer of the registrant as required by Rule 30a-2(a) under the Act (17 CFR 270.30a-2), exactly as set forth below:
Certifications pursuant to Rule 30a-2(a) under the Investment Company Act of 1940 are attached hereto.
(1) Any written solicitation to purchase securities under Rule 23c-1 under the Act (17 CFR 270.23c-1) sent or given during the period covered by the report by or on behalf of the registrant to 10 or more persons.
Not applicable.
(2) Change in the registrant’s independent public accountant. Provide the information called for by Item 4 of Form 8-K under the Exchange Act (17 CFR 249.308). Unless otherwise specified by Item 4, or related to and necessary for a complete understanding of information not previously disclosed, the information should relate to events occurring during the reporting period.
Not applicable.
| | (b) | A separate or combined certification for each principal executive officer and principal officer of the registrant as required by Rule 30a-2(b) under the Act of 1940. |
Certifications pursuant to Rule 30a-2(b) under the Investment Company Act of 1940 are attached hereto.
SIGNATURES
Pursuant to the requirements of the Securities Exchange Act of 1934 and the Investment Company Act of 1940, the registrant has duly caused this report to be signed on its behalf by the undersigned, thereunto duly authorized.
| | |
| J.P. Morgan Fleming Mutual Fund Group, Inc. |
| |
| By: | | /s/ Brian S. Shlissel |
| | Brian S. Shlissel |
| | President and Principal Executive Officer |
| | September 6, 2022 |
Pursuant to the requirements of the Securities Exchange Act of 1934 and the Investment Company Act of 1940, this report has been signed below by the following persons on behalf of the registrant and in the capacities and on the dates indicated.
| | |
| By: | | /s/ Brian S. Shlissel |
| | Brian S. Shlissel |
| | President and Principal Executive Officer |
| | September 6, 2022 |
| |
| By: | | /s/ Timothy J. Clemens |
| | Timothy J. Clemens |
| | Treasurer and Principal Financial Officer |
| | September 6, 2022 |