
2018 Reporting Changes April 2018

This presentation, and other statements that Jones Lang LaSalle Incorporated (“JLL”) may make, may contain forward-looking statements within the meaning of the Private Securities Litigation Reform Act of 1995, with respect to JLL’s future financial or business performance, strategies, or expectations. Forward-looking statements are typically identified by words or phrases such as “trend,” “potential,” “opportunity,” “pipeline,” “believe,” “comfortable,” “expect,” “anticipate,” “current,” “intention,” “estimate,” “position,” “assume,” “outlook,” “continue,” “remain,” “maintain,” “sustain,” “seek,” “achieve,” and similar expressions, or future or conditional verbs such as “will,” “would,” “should,” “could,” “may,” and similar expressions. Forward-looking statements in this presentation may involve, without limitation, known and unknown risks, uncertainties, and other factors which may cause JLL’s actual results, performance, achievements, plans and objectives, to be materially different from those expressed or implied by such forward-looking statements. Important factors that could cause actual results to differ from those in our forward-looking statements include, without limitation: 1) the effect of political, economic and market conditions and geopolitical events, 2) the logistical and other challenges inherent in operating in numerous different countries, 3) the actions and initiatives of current and potential competitors, 4) the level and volatility of real estate prices, interest rates, currency values and other market indices, 5) the outcome of pending litigation, and 6) the impact of current, pending and future legislation and regulation. Any forward-looking statements speak only as of the date of this release, and except to the extent required by applicable securities laws, we expressly disclaim any obligation or undertaking to publicly update or revise any forward-looking statements contained herein to reflect any change in our expectations or results, or any change in events. We caution investors not to rely unduly on any forward-looking statement and urge you to carefully consider the risks described in our most recent annual report on Form 10-K, quarterly reports on Form 10-Q, and current reports on Form 8-K, filed with the Securities and Exchange Commission (“SEC”). The following presentation reflects adjustments to certain historical financial results previously filed with the SEC, which may be identified by words or phrases such as “recast,” “adjustment,” “as adjusted,” and similar expressions. The historical results as adjusted for the items discussed in this presentation have not been audited as of April 30, 2018 and are additionally subject to management review in the ordinary course. However, any future adjustments to information included in this presentation are not expected to be material. The following presentation includes a discussion of certain non-GAAP financial measures. Information required by Regulation G with respect to such non-GAAP financial measures can be found in the Appendix and via the JLL website, www.JLL.com. Safe Harbor Statement 2© 2018 Jones Lang LaSalle IP, Inc. All rights reserved.

Introduction Louis Bowers Global Controller Grace Chang Corporate Finance & Investor Relations © 2018 Jones Lang LaSalle IP, Inc. All rights reserved. 3 Agenda Introduction ASC 606 Overview Regulatory and Non-GAAP Reporting Changes Consolidated Recast ASC 606 – “Gross Up” ASC 606 – “Revenue Timing” Non-GAAP Reporting Change – Fee Revenue ASC 606 – Balance Sheet Frequently Asked Questions Appendix
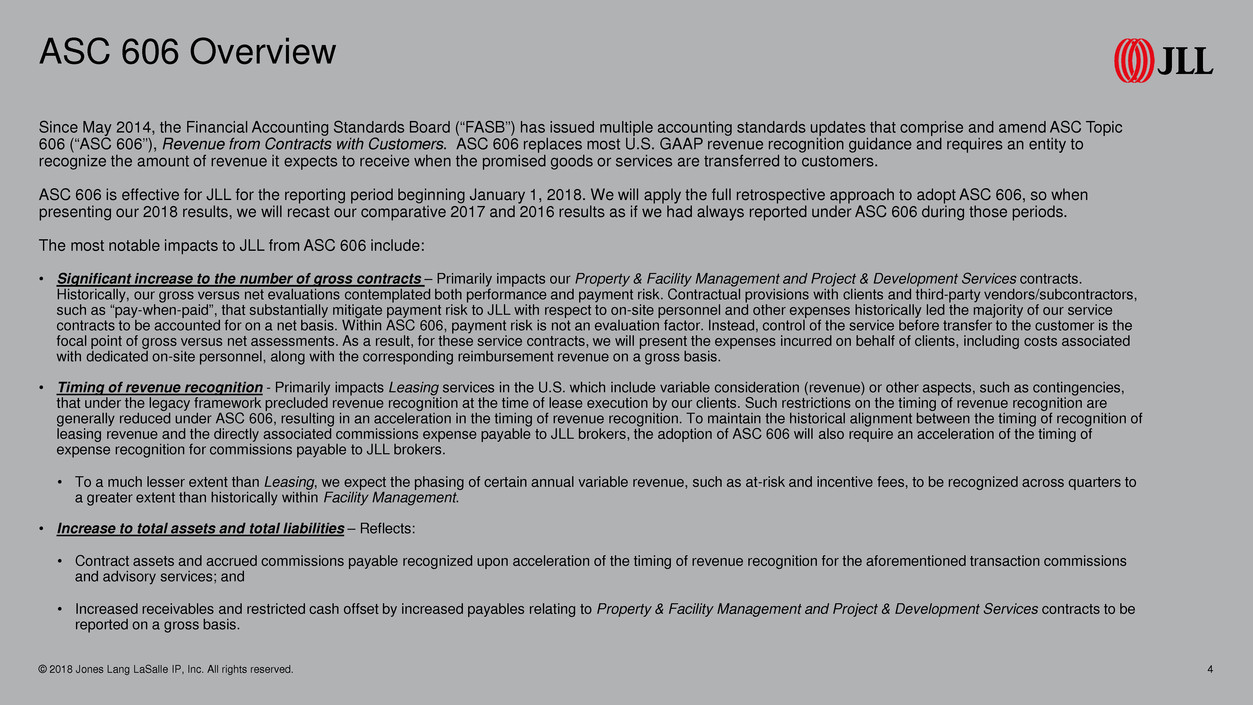
Since May 2014, the Financial Accounting Standards Board (“FASB”) has issued multiple accounting standards updates that comprise and amend ASC Topic 606 (“ASC 606”), Revenue from Contracts with Customers. ASC 606 replaces most U.S. GAAP revenue recognition guidance and requires an entity to recognize the amount of revenue it expects to receive when the promised goods or services are transferred to customers. ASC 606 is effective for JLL for the reporting period beginning January 1, 2018. We will apply the full retrospective approach to adopt ASC 606, so when presenting our 2018 results, we will recast our comparative 2017 and 2016 results as if we had always reported under ASC 606 during those periods. The most notable impacts to JLL from ASC 606 include: • Significant increase to the number of gross contracts – Primarily impacts our Property & Facility Management and Project & Development Services contracts. Historically, our gross versus net evaluations contemplated both performance and payment risk. Contractual provisions with clients and third-party vendors/subcontractors, such as “pay-when-paid”, that substantially mitigate payment risk to JLL with respect to on-site personnel and other expenses historically led the majority of our service contracts to be accounted for on a net basis. Within ASC 606, payment risk is not an evaluation factor. Instead, control of the service before transfer to the customer is the focal point of gross versus net assessments. As a result, for these service contracts, we will present the expenses incurred on behalf of clients, including costs associated with dedicated on-site personnel, along with the corresponding reimbursement revenue on a gross basis. • Timing of revenue recognition - Primarily impacts Leasing services in the U.S. which include variable consideration (revenue) or other aspects, such as contingencies, that under the legacy framework precluded revenue recognition at the time of lease execution by our clients. Such restrictions on the timing of revenue recognition are generally reduced under ASC 606, resulting in an acceleration in the timing of revenue recognition. To maintain the historical alignment between the timing of recognition of leasing revenue and the directly associated commissions expense payable to JLL brokers, the adoption of ASC 606 will also require an acceleration of the timing of expense recognition for commissions payable to JLL brokers. • To a much lesser extent than Leasing, we expect the phasing of certain annual variable revenue, such as at-risk and incentive fees, to be recognized across quarters to a greater extent than historically within Facility Management. • Increase to total assets and total liabilities – Reflects: • Contract assets and accrued commissions payable recognized upon acceleration of the timing of revenue recognition for the aforementioned transaction commissions and advisory services; and • Increased receivables and restricted cash offset by increased payables relating to Property & Facility Management and Project & Development Services contracts to be reported on a gross basis. ASC 606 Overview 4© 2018 Jones Lang LaSalle IP, Inc. All rights reserved.
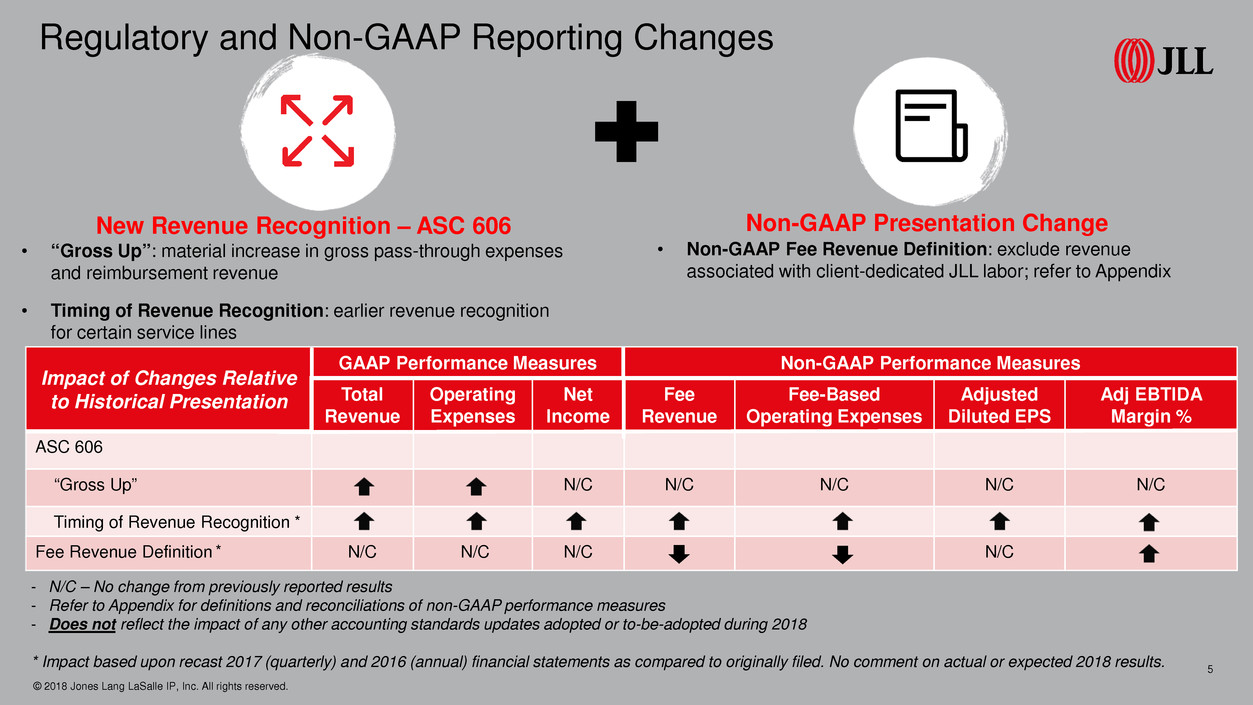
Regulatory and Non-GAAP Reporting Changes New Revenue Recognition – ASC 606 © 2018 Jones Lang LaSalle IP, Inc. All rights reserved. 5 • Non-GAAP Fee Revenue Definition: exclude revenue associated with client-dedicated JLL labor; refer to Appendix Non-GAAP Presentation Change Impact of Changes Relative to Historical Presentation GAAP Performance Measures Non-GAAP Performance Measures Total Revenue Operating Expenses Net Income Fee Revenue Fee-Based Operating Expenses Adjusted Diluted EPS Adj EBTIDA Margin % ASC 606 “Gross Up” N/C N/C N/C N/C N/C Timing of Revenue Recognition Fee Revenue Definition N/C N/C N/C N/C • “Gross Up”: material increase in gross pass-through expenses and reimbursement revenue • Timing of Revenue Recognition: earlier revenue recognition for certain service lines - N/C – No change from previously reported results - Refer to Appendix for definitions and reconciliations of non-GAAP performance measures - Does not reflect the impact of any other accounting standards updates adopted or to-be-adopted during 2018 * Impact based upon recast 2017 (quarterly) and 2016 (annual) financial statements as compared to originally filed. No comment on actual or expected 2018 results. * *
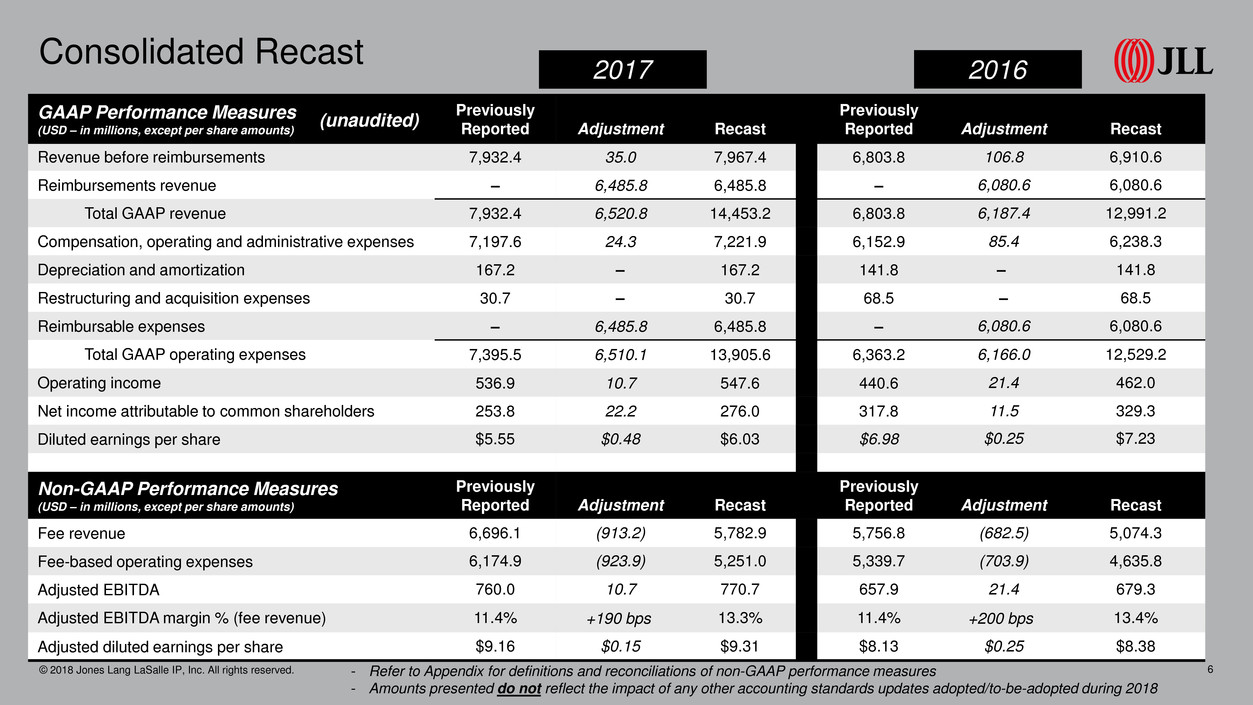
Consolidated Recast © 2018 Jones Lang LaSalle IP, Inc. All rights reserved. 6 2017 - Refer to Appendix for definitions and reconciliations of non-GAAP performance measures - Amounts presented do not reflect the impact of any other accounting standards updates adopted/to-be-adopted during 2018 GAAP Performance Measures (USD – in millions, except per share amounts) Previously Reported Adjustment Recast Previously Reported Adjustment Recast Revenue before reimbursements 7,932.4 35.0 7,967.4 6,803.8 106.8 6,910.6 Reimbursements revenue – 6,485.8 6,485.8 – 6,080.6 6,080.6 Total GAAP revenue 7,932.4 6,520.8 14,453.2 6,803.8 6,187.4 12,991.2 Compensation, operating and administrative expenses 7,197.6 24.3 7,221.9 6,152.9 85.4 6,238.3 Depreciation and amortization 167.2 – 167.2 141.8 – 141.8 Restructuring and acquisition expenses 30.7 – 30.7 68.5 – 68.5 Reimbursable expenses – 6,485.8 6,485.8 – 6,080.6 6,080.6 Total GAAP operating expenses 7,395.5 6,510.1 13,905.6 6,363.2 6,166.0 12,529.2 Operating income 536.9 10.7 547.6 440.6 21.4 462.0 Net income attributable to common shareholders 253.8 22.2 276.0 317.8 11.5 329.3 Diluted earnings per share $5.55 $0.48 $6.03 $6.98 $0.25 $7.23 Non-GAAP Performance Measures (USD – in millions, except per share amounts) Previously Reported Adjustment Recast Previously Reported Adjustment Recast Fee revenue 6,696.1 (913.2) 5,782.9 5,756.8 (682.5) 5,074.3 Fee-based operating expenses 6,174.9 (923.9) 5,251.0 5,339.7 (703.9) 4,635.8 Adjusted EBITDA 760.0 10.7 770.7 657.9 21.4 679.3 Adjusted EBITDA margin % (fee revenue) 11.4% +190 bps 13.3% 11.4% +200 bps 13.4% Adjusted diluted earnings per share $9.16 $0.15 $9.31 $8.13 $0.25 $8.38 2016 (unaudited)
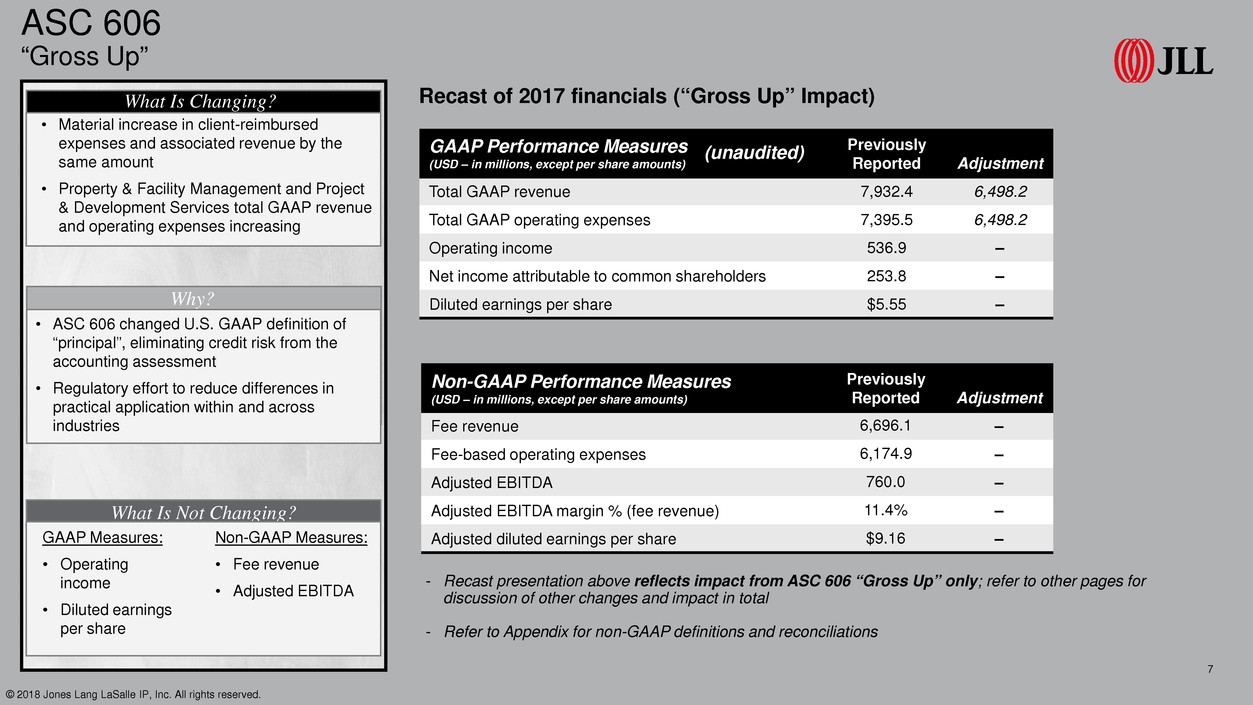
ASC 606 “Gross Up” © 2018 Jones Lang LaSalle IP, Inc. All rights reserved. 7 Why? What Is Not Changing? What Is Changing? • ASC 606 changed U.S. GAAP definition of “principal”, eliminating credit risk from the accounting assessment • Regulatory effort to reduce differences in practical application within and across industries GAAP Measures: • Operating income • Diluted earnings per share • Material increase in client-reimbursed expenses and associated revenue by the same amount • Property & Facility Management and Project & Development Services total GAAP revenue and operating expenses increasing - Recast presentation above reflects impact from ASC 606 “Gross Up” only; refer to other pages for discussion of other changes and impact in total - Refer to Appendix for non-GAAP definitions and reconciliations Non-GAAP Measures: • Fee revenue • Adjusted EBITDA Recast of 2017 financials (“Gross Up” Impact) GAAP Performance Measures (USD – in millions, except per share amounts) Previously Reported Adjustment Total GAAP revenue 7,932.4 6,498.2 Total GAAP operating expenses 7,395.5 6,498.2 Operating income 536.9 – Net income attributable to common shareholders 253.8 – Diluted earnings per share $5.55 – Non-GAAP Performance Measures (USD – in millions, except per share amounts) Previously Reported Adjustment Fee revenue 6,696.1 – Fee-based operating expenses 6,174.9 – Adjusted EBITDA 760.0 – Adjusted EBITDA margin % (fee revenue) 11.4% – Adjusted diluted earnings per share $9.16 – (unaudited)
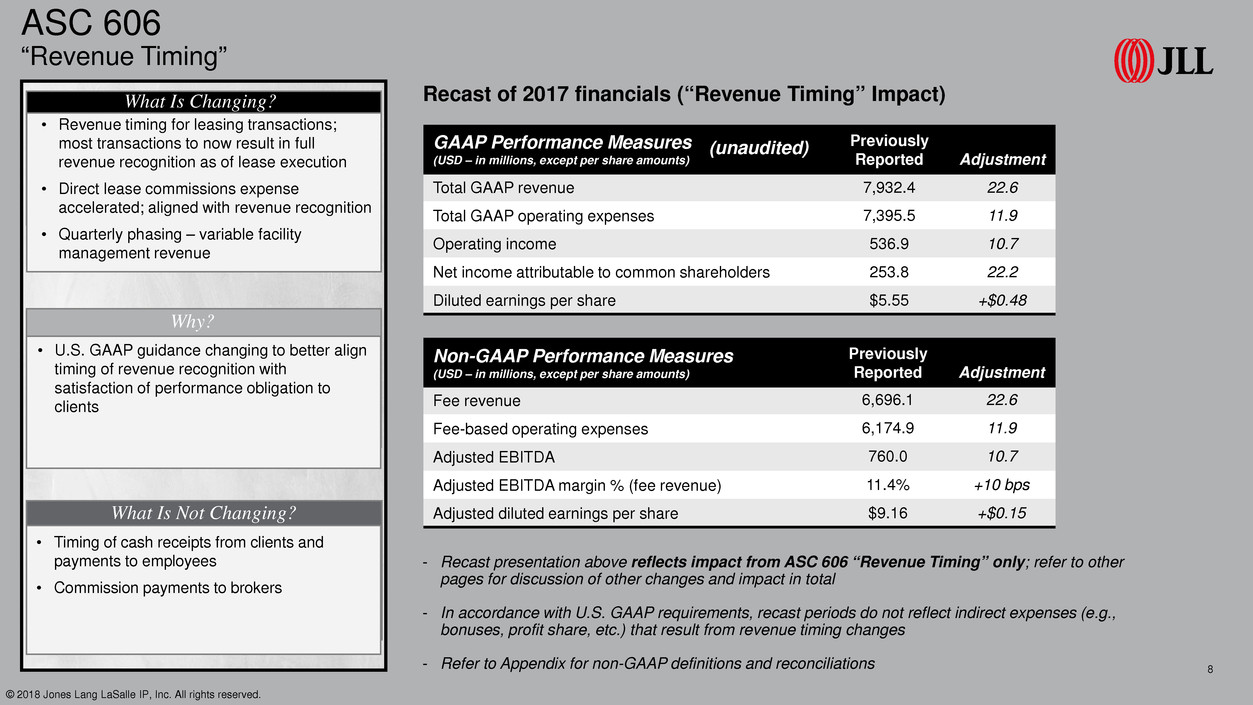
ASC 606 “Revenue Timing” © 2018 Jones Lang LaSalle IP, Inc. All rights reserved. 8 What Is Changing? - Recast presentation above reflects impact from ASC 606 “Revenue Timing” only; refer to other pages for discussion of other changes and impact in total - In accordance with U.S. GAAP requirements, recast periods do not reflect indirect expenses (e.g., bonuses, profit share, etc.) that result from revenue timing changes - Refer to Appendix for non-GAAP definitions and reconciliations Why? What Is Not Changing? What Is Changi ? • U.S. GAAP guidance changing to better align timing of revenue recognition with satisfaction of performance obligation to clients • Revenue timing for leasing transactions; most transactions to now result in full revenue recognition as of lease execution • Direct lease commissions expense accelerated; aligned with revenue recognition • Quarterly phasing – variable facility management revenue • Timing of cash receipts from clients and payments to employees • Commission payments to brokers Recast of 2017 financials (“Revenue Timing” Impact) GAAP Performance Measures (USD – in millions, except per share amounts) Previously Reported Adjustment Total GAAP revenue 7,932.4 22.6 Total GAAP operating expenses 7,395.5 11.9 Operating income 536.9 10.7 Net income attributable to common shareholders 253.8 22.2 Diluted earnings per share $5.55 +$0.48 Non-GAAP Performance Measures (USD – in millions, except per share amounts) Previously Reported Adjustment Fee revenue 6,696.1 22.6 Fee-based operating expenses 6,174.9 11.9 Adjusted EBITDA 760.0 10.7 Adjusted EBITDA margin % (fee revenue) 11.4% +10 bps Adjusted diluted earnings per share $9.16 +$0.15 (unaudited)
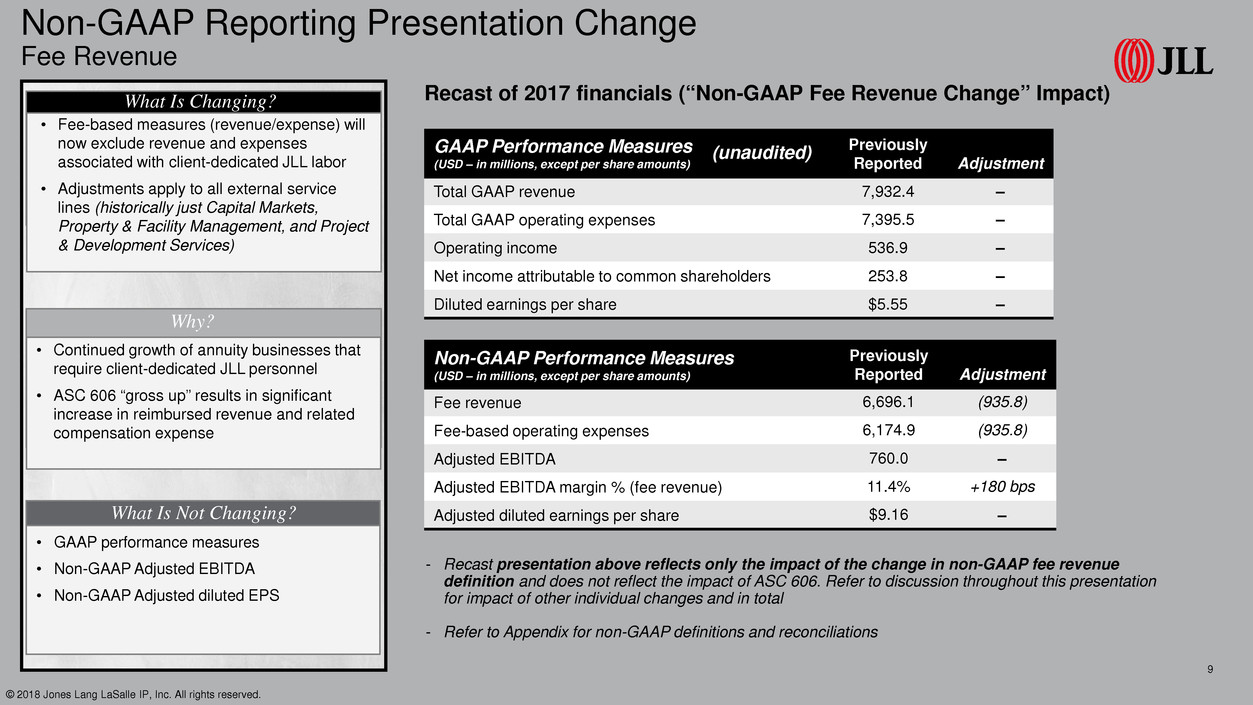
Non-GAAP Reporting Presentation Change Fee Revenue © 2018 Jones Lang LaSalle IP, Inc. All rights reserved. 9 - Recast presentation above reflects only the impact of the change in non-GAAP fee revenue definition and does not reflect the impact of ASC 606. Refer to discussion throughout this presentation for impact of other individual changes and in total - Refer to Appendix for non-GAAP definitions and reconciliations Why? What Is Not Changing? What Is Changing? • Continued growth of annuity businesses that require client-dedicated JLL personnel • ASC 606 “gross up” results in significant increase in reimbursed revenue and related compensation expense • Fee-based measures (revenue/expense) will now exclude revenue and expenses associated with client-dedicated JLL labor • Adjustments apply to all external service lines (historically just Capital Markets, Property & Facility Management, and Project & Development Services) • GAAP performance measures • Non-GAAP Adjusted EBITDA • Non-GAAP Adjusted diluted EPS Recast of 2017 financials (“Non-GAAP Fee Revenue Change” Impact) GAAP Performance Measures (USD – in millions, except per share amounts) Previously Reported Adjustment Total GAAP revenue 7,932.4 – Total GAAP operating expenses 7,395.5 – Operating income 536.9 – Net income attributable to common shareholders 253.8 – Diluted earnings per share $5.55 – Non-GAAP Performance Measures (USD – in millions, except per share amounts) Previously Reported Adjustment Fee revenue 6,696.1 (935.8) Fee-based operating expenses 6,174.9 (935.8) Adjusted EBITDA 760.0 – Adjusted EBITDA margin % (fee revenue) 11.4% +180 bps Adjusted diluted earnings per share $9.16 – (unaudited)

As of December 31, 2017 ASC 606 Balance Sheet © 2018 Jones Lang LaSalle IP, Inc. All rights reserved. 10 “Gross Up” • Increase in: • Reimbursement receivables • Reimbursable payables • Restricted cash • Reflects payment activity on behalf of Property & Facility Management and Project & Development Services clients • No change to cash and cash equivalents Revenue Timing • Contract assets – revenue recognized, but contractually not yet able to invoice clients • Increased accrued commissions payable (USD – in millions) Previously Reported Adjustment Recast Trade receivables, net 2,118.1 (378.7)* 1,739.4 Reimbursable receivables - 1,263.3 1,263.3 Contract assets - 236.0 236.0 Prepaid & other 257.7 131.5 389.2 Reimbursable payables - 1,022.6 1,022.6 Accrued compensation 1,309.0 110.1 1,419.1 Deferred tax liabilities, net 23.9 39.3 63.2 Retained earnings 2,552.8 96.2 2,649.0 - Balance sheet accounts shown above represent selected accounts impacted by the adoption of ASC 606. Table above presented in a summarized format and not fully inclusive of all financial statement captions or amounts - Classifications between current and long-term not reflected above * Decrease driven by the reclassification of reimbursable activity from Trade receivables, net, to Reimbursable receivables to conform to new presentation whereby reimbursable activity is separately classified on our Consolidated Balance Sheets. (unaudited)

Frequently Asked Questions © 2018 Jones Lang LaSalle IP, Inc. All rights reserved. 11
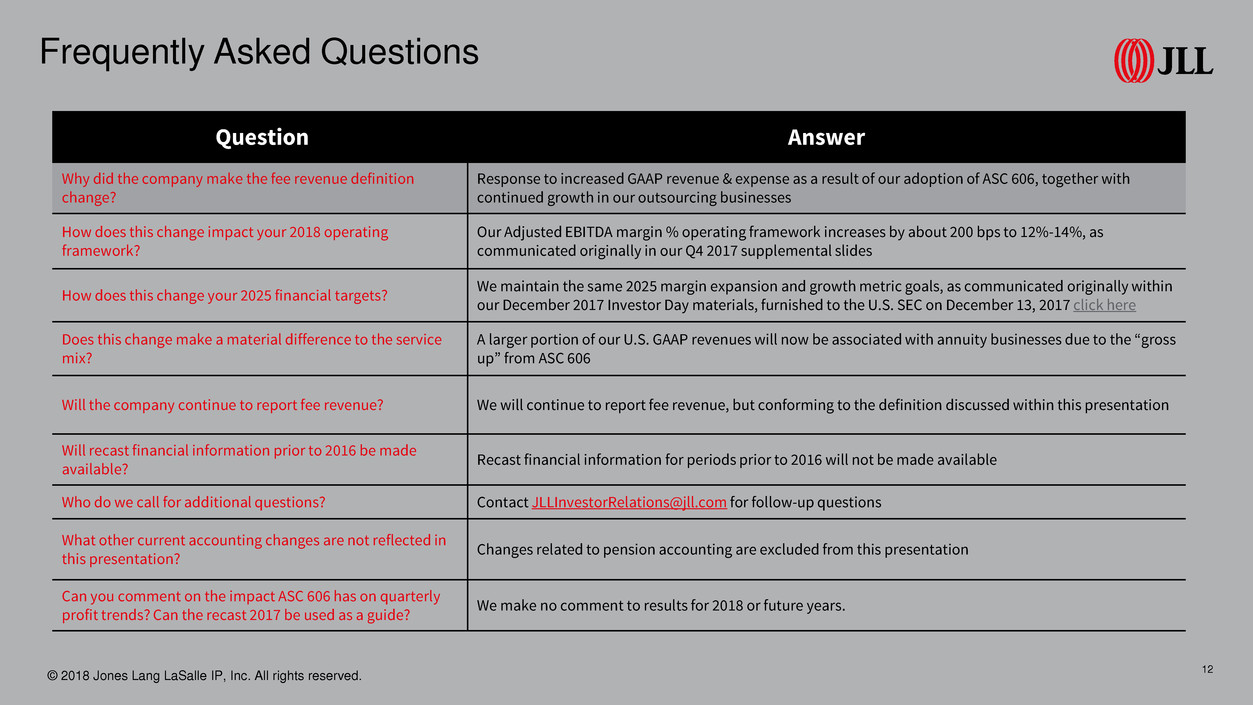
Frequently Asked Questions Question Answer Why did the company make the fee revenue definition change? Response to increased GAAP revenue & expense as a result of our adoption of ASC 606, together with continued growth in our outsourcing businesses How does this change impact your 2018 operating framework? Our Adjusted EBITDA margin % operating framework increases by about 200 bps to 12%-14%, as communicated originally in our Q4 2017 supplemental slides How does this change your 2025 financial targets? We maintain the same 2025 margin expansion and growth metric goals, as communicated originally within our December 2017 Investor Day materials, furnished to the U.S. SEC on December 13, 2017 click here Does this change make a material difference to the service mix? A larger portion of our U.S. GAAP revenues will now be associated with annuity businesses due to the “gross up” from ASC 606 Will the company continue to report fee revenue? We will continue to report fee revenue, but conforming to the definition discussed within this presentation Will recast financial information prior to 2016 be made available? Recast financial information for periods prior to 2016 will not be made available Who do we call for additional questions? Contact JLLInvestorRelations@jll.com for follow-up questions What other current accounting changes are not reflected in this presentation? Changes related to pension accounting are excluded from this presentation Can you comment on the impact ASC 606 has on quarterly profit trends? Can the recast 2017 be used as a guide? We make no comment to results for 2018 or future years. 12© 2018 Jones Lang LaSalle IP, Inc. All rights reserved.

Appendix © 2018 Jones Lang LaSalle IP, Inc. All rights reserved. 13
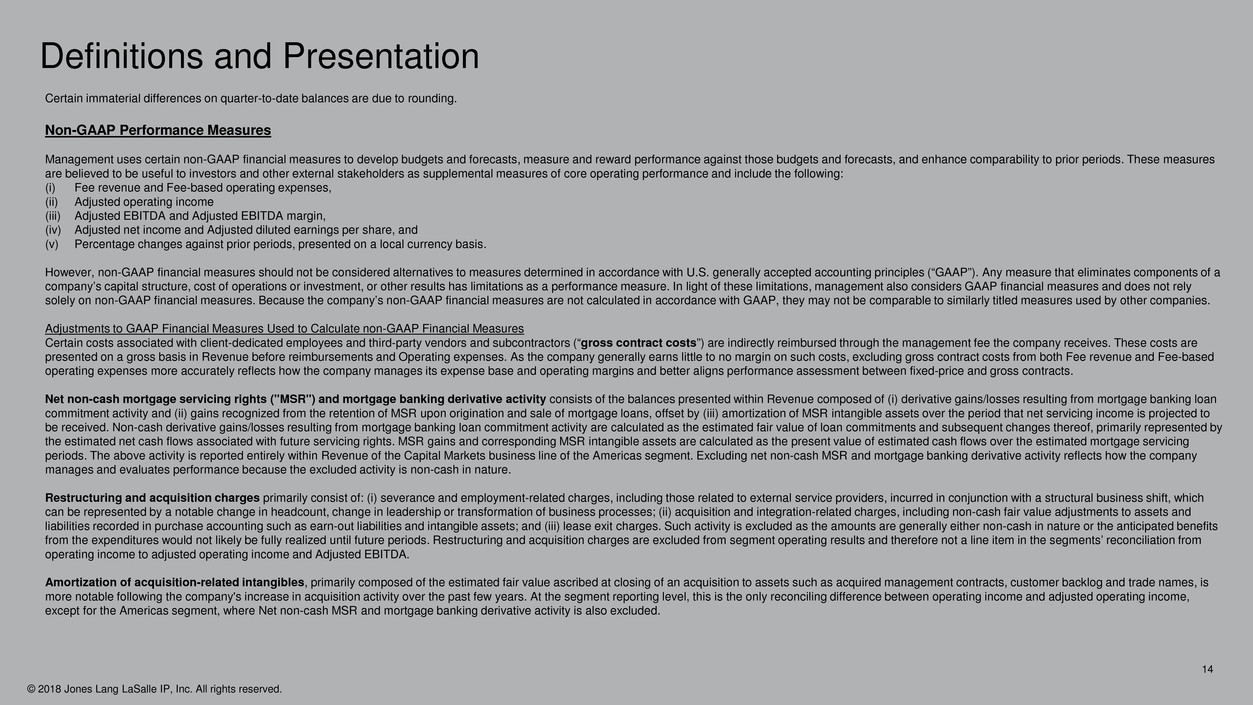
© 2018 Jones Lang LaSalle IP, Inc. All rights reserved. 14 Certain immaterial differences on quarter-to-date balances are due to rounding. Non-GAAP Performance Measures Management uses certain non-GAAP financial measures to develop budgets and forecasts, measure and reward performance against those budgets and forecasts, and enhance comparability to prior periods. These measures are believed to be useful to investors and other external stakeholders as supplemental measures of core operating performance and include the following: (i) Fee revenue and Fee-based operating expenses, (ii) Adjusted operating income (iii) Adjusted EBITDA and Adjusted EBITDA margin, (iv) Adjusted net income and Adjusted diluted earnings per share, and (v) Percentage changes against prior periods, presented on a local currency basis. However, non-GAAP financial measures should not be considered alternatives to measures determined in accordance with U.S. generally accepted accounting principles (“GAAP”). Any measure that eliminates components of a company’s capital structure, cost of operations or investment, or other results has limitations as a performance measure. In light of these limitations, management also considers GAAP financial measures and does not rely solely on non-GAAP financial measures. Because the company’s non-GAAP financial measures are not calculated in accordance with GAAP, they may not be comparable to similarly titled measures used by other companies. Adjustments to GAAP Financial Measures Used to Calculate non-GAAP Financial Measures Certain costs associated with client-dedicated employees and third-party vendors and subcontractors (“gross contract costs”) are indirectly reimbursed through the management fee the company receives. These costs are presented on a gross basis in Revenue before reimbursements and Operating expenses. As the company generally earns little to no margin on such costs, excluding gross contract costs from both Fee revenue and Fee-based operating expenses more accurately reflects how the company manages its expense base and operating margins and better aligns performance assessment between fixed-price and gross contracts. Net non-cash mortgage servicing rights ("MSR") and mortgage banking derivative activity consists of the balances presented within Revenue composed of (i) derivative gains/losses resulting from mortgage banking loan commitment activity and (ii) gains recognized from the retention of MSR upon origination and sale of mortgage loans, offset by (iii) amortization of MSR intangible assets over the period that net servicing income is projected to be received. Non-cash derivative gains/losses resulting from mortgage banking loan commitment activity are calculated as the estimated fair value of loan commitments and subsequent changes thereof, primarily represented by the estimated net cash flows associated with future servicing rights. MSR gains and corresponding MSR intangible assets are calculated as the present value of estimated cash flows over the estimated mortgage servicing periods. The above activity is reported entirely within Revenue of the Capital Markets business line of the Americas segment. Excluding net non-cash MSR and mortgage banking derivative activity reflects how the company manages and evaluates performance because the excluded activity is non-cash in nature. Restructuring and acquisition charges primarily consist of: (i) severance and employment-related charges, including those related to external service providers, incurred in conjunction with a structural business shift, which can be represented by a notable change in headcount, change in leadership or transformation of business processes; (ii) acquisition and integration-related charges, including non-cash fair value adjustments to assets and liabilities recorded in purchase accounting such as earn-out liabilities and intangible assets; and (iii) lease exit charges. Such activity is excluded as the amounts are generally either non-cash in nature or the anticipated benefits from the expenditures would not likely be fully realized until future periods. Restructuring and acquisition charges are excluded from segment operating results and therefore not a line item in the segments’ reconciliation from operating income to adjusted operating income and Adjusted EBITDA. Amortization of acquisition-related intangibles, primarily composed of the estimated fair value ascribed at closing of an acquisition to assets such as acquired management contracts, customer backlog and trade names, is more notable following the company's increase in acquisition activity over the past few years. At the segment reporting level, this is the only reconciling difference between operating income and adjusted operating income, except for the Americas segment, where Net non-cash MSR and mortgage banking derivative activity is also excluded. Definitions and Presentation
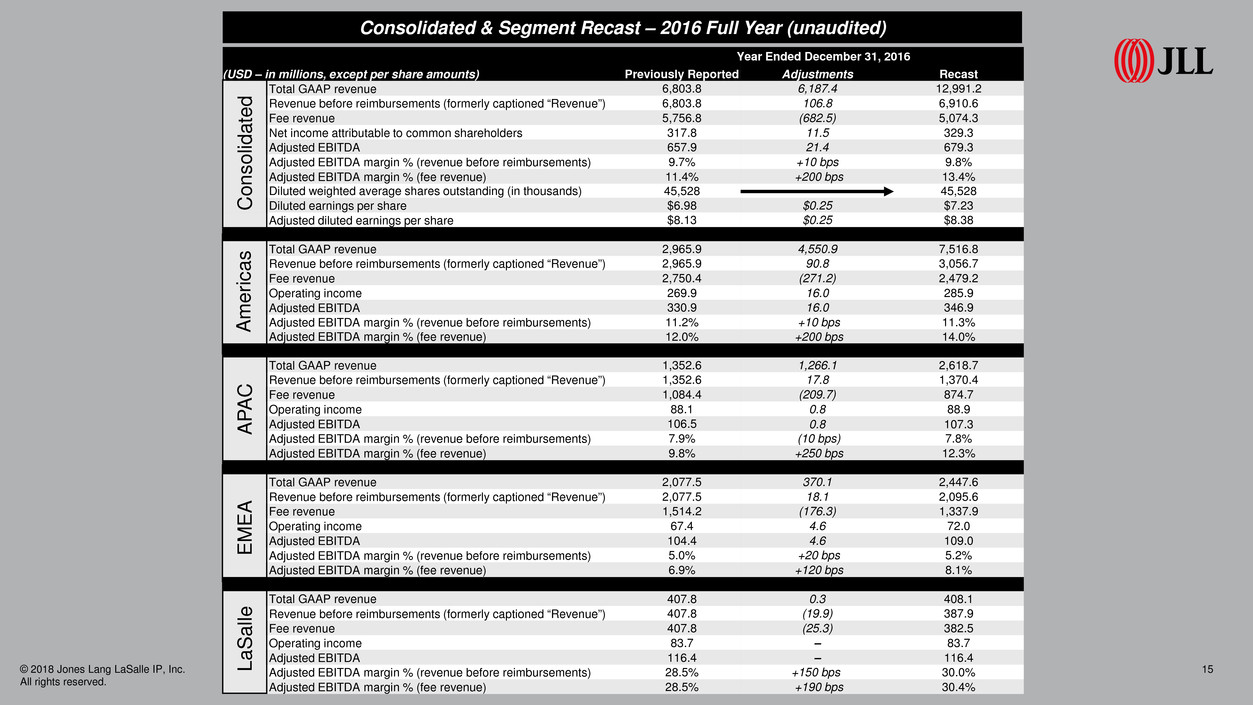
© 2018 Jones Lang LaSalle IP, Inc. All rights reserved. 15 Year Ended December 31, 2016 (USD – in millions, except per share amounts) Previously Reported Adjustments Recast Total GAAP revenue 6,803.8 6,187.4 12,991.2 Revenue before reimbursements (formerly captioned “Revenue”) 6,803.8 106.8 6,910.6 Fee revenue 5,756.8 (682.5) 5,074.3 Net income attributable to common shareholders 317.8 11.5 329.3 Adjusted EBITDA 657.9 21.4 679.3 Adjusted EBITDA margin % (revenue before reimbursements) 9.7% +10 bps 9.8% Adjusted EBITDA margin % (fee revenue) 11.4% +200 bps 13.4% Diluted weighted average shares outstanding (in thousands) 45,528 45,528 Diluted earnings per share $6.98 $0.25 $7.23 Adjusted diluted earnings per share $8.13 $0.25 $8.38 Total GAAP revenue 2,965.9 4,550.9 7,516.8 Revenue before reimbursements (formerly captioned “Revenue”) 2,965.9 90.8 3,056.7 Fee revenue 2,750.4 (271.2) 2,479.2 Operating income 269.9 16.0 285.9 Adjusted EBITDA 330.9 16.0 346.9 Adjusted EBITDA margin % (revenue before reimbursements) 11.2% +10 bps 11.3% Adjusted EBITDA margin % (fee revenue) 12.0% +200 bps 14.0% Total GAAP revenue 1,352.6 1,266.1 2,618.7 Revenue before reimbursements (formerly captioned “Revenue”) 1,352.6 17.8 1,370.4 Fee revenue 1,084.4 (209.7) 874.7 Operating income 88.1 0.8 88.9 Adjusted EBITDA 106.5 0.8 107.3 Adjusted EBITDA margin % (revenue before reimbursements) 7.9% (10 bps) 7.8% Adjusted EBITDA margin % (fee revenue) 9.8% +250 bps 12.3% Total GAAP revenue 2,077.5 370.1 2,447.6 Revenue before reimbursements (formerly captioned “Revenue”) 2,077.5 18.1 2,095.6 Fee revenue 1,514.2 (176.3) 1,337.9 Operating income 67.4 4.6 72.0 Adjusted EBITDA 104.4 4.6 109.0 Adjusted EBITDA margin % (revenue before reimbursements) 5.0% +20 bps 5.2% Adjusted EBITDA margin % (fee revenue) 6.9% +120 bps 8.1% Total GAAP revenue 407.8 0.3 408.1 Revenue before reimbursements (formerly captioned “Revenue”) 407.8 (19.9) 387.9 Fee revenue 407.8 (25.3) 382.5 Operating income 83.7 – 83.7 Adjusted EBITDA 116.4 – 116.4 Adjusted EBITDA margin % (revenue before reimbursements) 28.5% +150 bps 30.0% Adjusted EBITDA margin % (fee revenue) 28.5% +190 bps 30.4% C on so lid at ed A m er ic as A PA C E M E A La S al le Consolidated & Segment Recast – 2016 Full Year (unaudited)
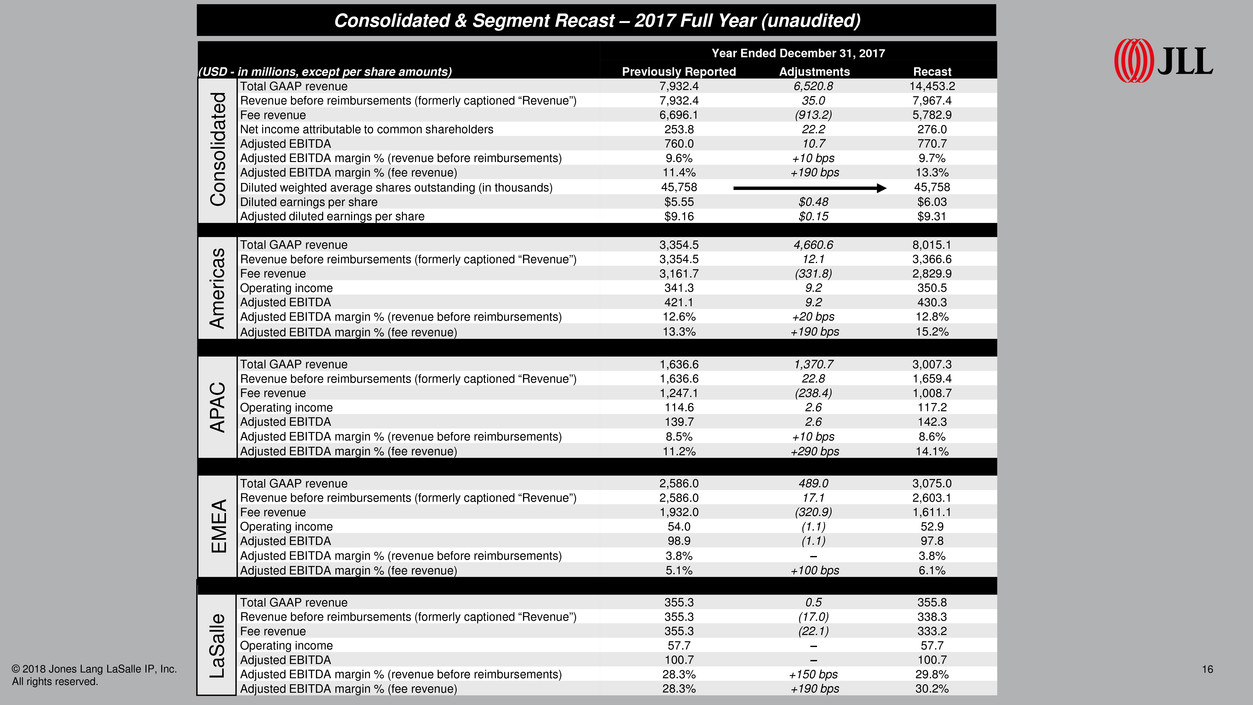
© 2018 Jones Lang LaSalle IP, Inc. All rights reserved. 16 (USD - in millions, except per share amounts) Year Ended December 31, 2017 Previously Reported Adjustments Recast Total GAAP revenue 7,932.4 6,520.8 14,453.2 Revenue before reimbursements (formerly captioned “Revenue”) 7,932.4 35.0 7,967.4 Fee revenue 6,696.1 (913.2) 5,782.9 Net income attributable to common shareholders 253.8 22.2 276.0 Adjusted EBITDA 760.0 10.7 770.7 Adjusted EBITDA margin % (revenue before reimbursements) 9.6% +10 bps 9.7% Adjusted EBITDA margin % (fee revenue) 11.4% +190 bps 13.3% Diluted weighted average shares outstanding (in thousands) 45,758 45,758 Diluted earnings per share $5.55 $0.48 $6.03 Adjusted diluted earnings per share $9.16 $0.15 $9.31 Total GAAP revenue 3,354.5 4,660.6 8,015.1 Revenue before reimbursements (formerly captioned “Revenue”) 3,354.5 12.1 3,366.6 Fee revenue 3,161.7 (331.8) 2,829.9 Operating income 341.3 9.2 350.5 Adjusted EBITDA 421.1 9.2 430.3 Adjusted EBITDA margin % (revenue before reimbursements) 12.6% +20 bps 12.8% Adjusted EBITDA margin % (fee revenue) 13.3% +190 bps 15.2% Total GAAP revenue 1,636.6 1,370.7 3,007.3 Revenue before reimbursements (formerly captioned “Revenue”) 1,636.6 22.8 1,659.4 Fee revenue 1,247.1 (238.4) 1,008.7 Operating income 114.6 2.6 117.2 Adjusted EBITDA 139.7 2.6 142.3 Adjusted EBITDA margin % (revenue before reimbursements) 8.5% +10 bps 8.6% Adjusted EBITDA margin % (fee revenue) 11.2% +290 bps 14.1% Total GAAP revenue 2,586.0 489.0 3,075.0 Revenue before reimbursements (formerly captioned “Revenue”) 2,586.0 17.1 2,603.1 Fee revenue 1,932.0 (320.9) 1,611.1 Operating income 54.0 (1.1) 52.9 Adjusted EBITDA 98.9 (1.1) 97.8 Adjusted EBITDA margin % (revenue before reimbursements) 3.8% – 3.8% Adjusted EBITDA margin % (fee revenue) 5.1% +100 bps 6.1% Total GAAP revenue 355.3 0.5 355.8 Revenue before reimbursements (formerly captioned “Revenue”) 355.3 (17.0) 338.3 Fee revenue 355.3 (22.1) 333.2 Operating income 57.7 – 57.7 Adjusted EBITDA 100.7 – 100.7 Adjusted EBITDA margin % (revenue before reimbursements) 28.3% +150 bps 29.8% Adjusted EBITDA margin % (fee revenue) 28.3% +190 bps 30.2% C on so lid at ed A m er ic as A PA C E M E A La S al le Consolidated & Segment Recast – 2017 Full Year (unaudited)
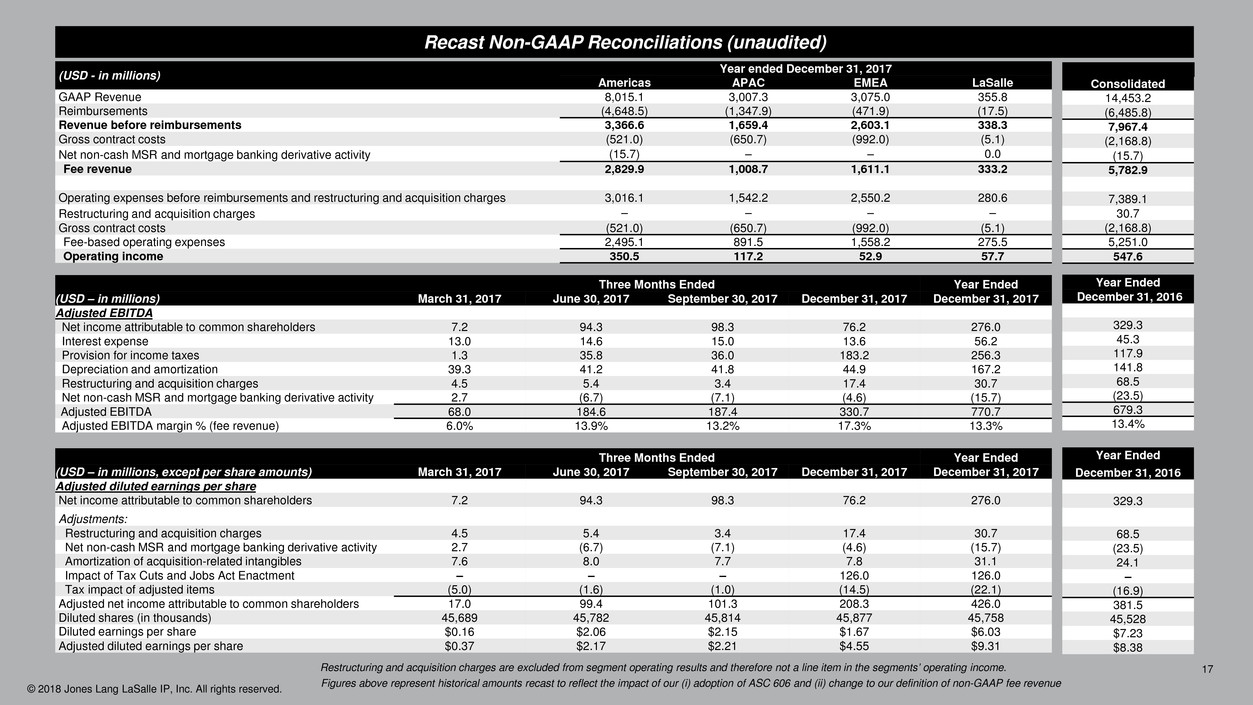
© 2018 Jones Lang LaSalle IP, Inc. All rights reserved. 17 Figures above represent historical amounts recast to reflect the impact of our (i) adoption of ASC 606 and (ii) change to our definition of non-GAAP fee revenue Three Months Ended Year Ended (USD – in millions) March 31, 2017 June 30, 2017 September 30, 2017 December 31, 2017 December 31, 2017 Adjusted EBITDA Net income attributable to common shareholders 7.2 94.3 98.3 76.2 276.0 Interest expense 13.0 14.6 15.0 13.6 56.2 Provision for income taxes 1.3 35.8 36.0 183.2 256.3 Depreciation and amortization 39.3 41.2 41.8 44.9 167.2 Restructuring and acquisition charges 4.5 5.4 3.4 17.4 30.7 Net non-cash MSR and mortgage banking derivative activity 2.7 (6.7) (7.1) (4.6) (15.7) Adjusted EBITDA 68.0 184.6 187.4 330.7 770.7 Adjusted EBITDA margin % (fee revenue) 6.0% 13.9% 13.2% 17.3% 13.3% Year Ended December 31, 2016 329.3 45.3 117.9 141.8 68.5 (23.5) 679.3 13.4% Recast Non-GAAP Reconciliations (unaudited) Three Months Ended Year Ended (USD – in millions, except per share amounts) March 31, 2017 June 30, 2017 September 30, 2017 December 31, 2017 December 31, 2017 Adjusted diluted earnings per share Net income attributable to common shareholders 7.2 94.3 98.3 76.2 276.0 Adjustments: Restructuring and acquisition charges 4.5 5.4 3.4 17.4 30.7 Net non-cash MSR and mortgage banking derivative activity 2.7 (6.7) (7.1) (4.6) (15.7) Amortization of acquisition-related intangibles 7.6 8.0 7.7 7.8 31.1 Impact of Tax Cuts and Jobs Act Enactment – – – 126.0 126.0 Tax impact of adjusted items (5.0) (1.6) (1.0) (14.5) (22.1) Adjusted net income attributable to common shareholders 17.0 99.4 101.3 208.3 426.0 Diluted shares (in thousands) 45,689 45,782 45,814 45,877 45,758 Diluted earnings per share $0.16 $2.06 $2.15 $1.67 $6.03 Adjusted diluted earnings per share $0.37 $2.17 $2.21 $4.55 $9.31 Year Ended December 31, 2016 329.3 68.5 (23.5) 24.1 – (16.9) 381.5 45,528 $7.23 $8.38 (USD - in millions) Year ended December 31, 2017 Americas APAC EMEA LaSalle GAAP Revenue 8,015.1 3,007.3 3,075.0 355.8 Reimbursements (4,648.5) (1,347.9) (471.9) (17.5) Revenue before reimbursements 3,366.6 1,659.4 2,603.1 338.3 Gross contract costs (521.0) (650.7) (992.0) (5.1) Net non-cash MSR and mortgage banking derivative activity (15.7) – – 0.0 Fee revenue 2,829.9 1,008.7 1,611.1 333.2 Operating expenses before reimbursements and restructuring and acquisition charges 3,016.1 1,542.2 2,550.2 280.6 Restructuring and acquisition charges – – – – Gross contract costs (521.0) (650.7) (992.0) (5.1) Fee-based operating expenses 2,495.1 891.5 1,558.2 275.5 Operating income 350.5 117.2 52.9 57.7 Consolidated 14,453.2 (6,485.8) 7,967.4 (2,168.8) (15.7) 5,782.9 7,389.1 30.7 (2,168.8) 5,251.0 547.6 Restructuring and acquisition charges are excluded from segment operating results and therefore not a line item in the segments’ operating income.
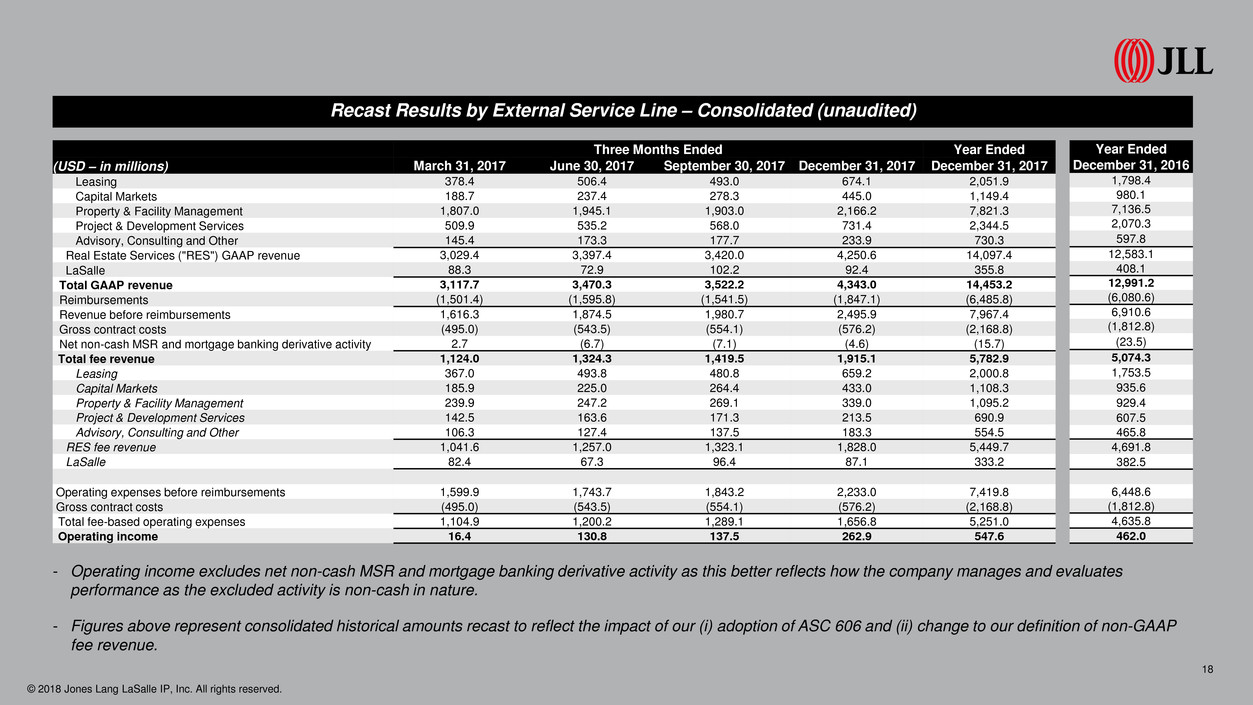
© 2018 Jones Lang LaSalle IP, Inc. All rights reserved. 18 Three Months Ended Year Ended (USD – in millions) March 31, 2017 June 30, 2017 September 30, 2017 December 31, 2017 December 31, 2017 Leasing 378.4 506.4 493.0 674.1 2,051.9 Capital Markets 188.7 237.4 278.3 445.0 1,149.4 Property & Facility Management 1,807.0 1,945.1 1,903.0 2,166.2 7,821.3 Project & Development Services 509.9 535.2 568.0 731.4 2,344.5 Advisory, Consulting and Other 145.4 173.3 177.7 233.9 730.3 Real Estate Services ("RES") GAAP revenue 3,029.4 3,397.4 3,420.0 4,250.6 14,097.4 LaSalle 88.3 72.9 102.2 92.4 355.8 Total GAAP revenue 3,117.7 3,470.3 3,522.2 4,343.0 14,453.2 Reimbursements (1,501.4) (1,595.8) (1,541.5) (1,847.1) (6,485.8) Revenue before reimbursements 1,616.3 1,874.5 1,980.7 2,495.9 7,967.4 Gross contract costs (495.0) (543.5) (554.1) (576.2) (2,168.8) Net non-cash MSR and mortgage banking derivative activity 2.7 (6.7) (7.1) (4.6) (15.7) Total fee revenue 1,124.0 1,324.3 1,419.5 1,915.1 5,782.9 Leasing 367.0 493.8 480.8 659.2 2,000.8 Capital Markets 185.9 225.0 264.4 433.0 1,108.3 Property & Facility Management 239.9 247.2 269.1 339.0 1,095.2 Project & Development Services 142.5 163.6 171.3 213.5 690.9 Advisory, Consulting and Other 106.3 127.4 137.5 183.3 554.5 RES fee revenue 1,041.6 1,257.0 1,323.1 1,828.0 5,449.7 LaSalle 82.4 67.3 96.4 87.1 333.2 Operating expenses before reimbursements 1,599.9 1,743.7 1,843.2 2,233.0 7,419.8 Gross contract costs (495.0) (543.5) (554.1) (576.2) (2,168.8) Total fee-based operating expenses 1,104.9 1,200.2 1,289.1 1,656.8 5,251.0 Operating income 16.4 130.8 137.5 262.9 547.6 - Operating income excludes net non-cash MSR and mortgage banking derivative activity as this better reflects how the company manages and evaluates performance as the excluded activity is non-cash in nature. - Figures above represent consolidated historical amounts recast to reflect the impact of our (i) adoption of ASC 606 and (ii) change to our definition of non-GAAP fee revenue. Recast Results by External Service Line – Consolidated (unaudited) Year Ended December 31, 2016 1,798.4 980.1 7,136.5 2,070.3 597.8 12,583.1 408.1 12,991.2 (6,080.6) 6,910.6 (1,812.8) (23.5) 5,074.3 1,753.5 935.6 929.4 607.5 465.8 4,691.8 382.5 6,448.6 (1,812.8) 4,635.8 462.0

© 2018 Jones Lang LaSalle IP, Inc. All rights reserved. 19 Three Months Ended Year Ended (USD – in millions) March 31, 2017 June 30, 2017 September 30, 2017 December 31, 2017 December 31, 2017 GAAP Revenue 1,799.9 1,932.4 1,920.6 2,362.2 8,015.1 Reimbursements (1,078.5) (1,110.0) (1,094.9) (1,365.1) (4,648.5) Revenue before reimbursements 721.4 822.4 825.7 997.1 3,366.6 Gross contract costs (131.8) (130.3) (124.9) (134.0) (521.0) Net non-cash MSR and mortgage banking derivative activity 2.7 (6.7) (7.1) (4.6) (15.7) Fee revenue 592.3 685.4 693.7 858.5 2,829.9 Leasing 289.9 378.7 360.8 441.8 1,471.2 Capital Markets 101.5 98.0 108.0 149.1 456.6 Property & Facility Management 95.7 95.7 105.9 122.0 419.3 Project & Development Services 76.3 82.0 82.0 101.9 342.2 Advisory, Consulting and Other 28.9 31.0 37.0 43.7 140.6 Operating expenses before reimbursements 689.1 726.2 734.3 866.5 3,016.1 Gross contract costs (131.8) (130.3) (124.9) (134.0) (521.0) Total fee-based operating expenses 557.3 595.9 609.4 732.5 2,495.1 Operating income 32.3 96.2 91.4 130.6 350.5 Adjusted EBITDA 58.4 113.3 108.3 150.3 430.3 Adjusted EBITDA margin % (fee revenue) 9.8% 16.5% 15.6% 17.5% 15.2% Figures above represent historical amounts for our Americas reporting segment recast to reflect the impact of our (i) adoption of ASC 606 and (ii) change to our definition of non-GAAP fee revenue Americas – Recast Results (unaudited) Year Ended December 31, 2016 7,516.8 (4,460.1) 3,056.7 (554.0) (23.5) 2,479.2 1,277.0 403.8 401.0 308.3 89.1 2,770.9 (554.0) 2,216.8 285.9 346.9 14.0%
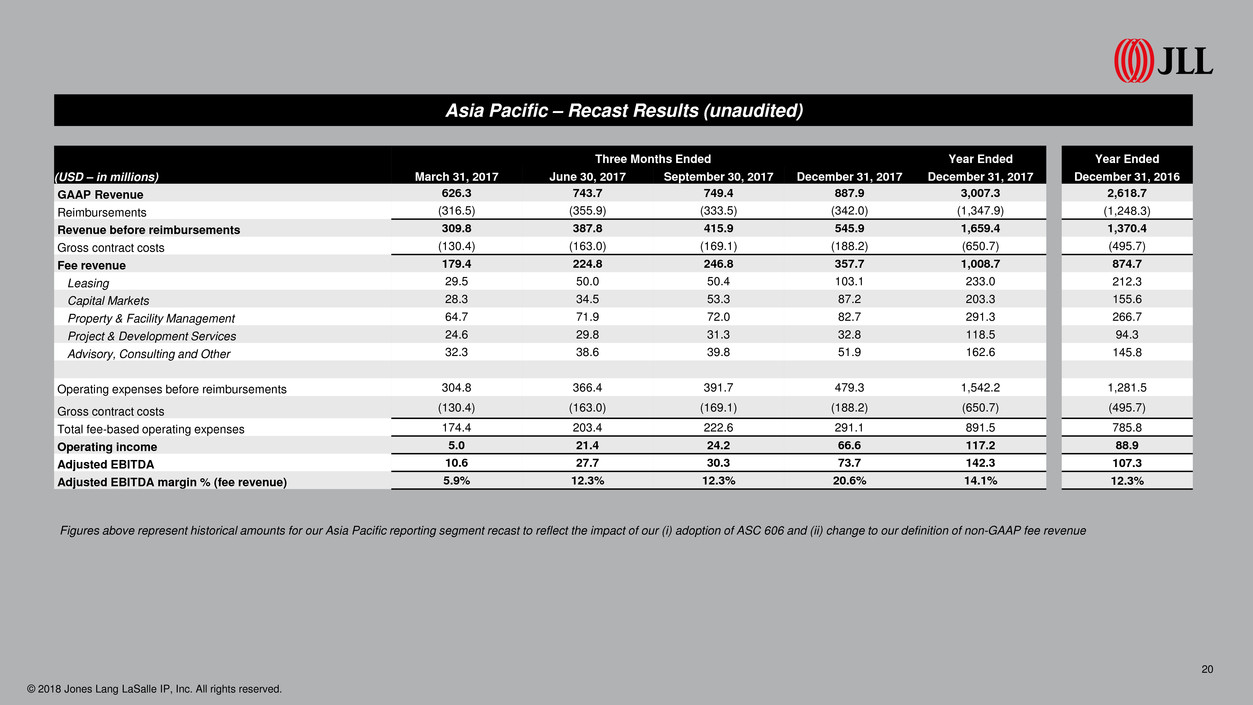
© 2018 Jones Lang LaSalle IP, Inc. All rights reserved. 20 Figures above represent historical amounts for our Asia Pacific reporting segment recast to reflect the impact of our (i) adoption of ASC 606 and (ii) change to our definition of non-GAAP fee revenue Asia Pacific – Recast Results (unaudited) Three Months Ended Year Ended (USD – in millions) March 31, 2017 June 30, 2017 September 30, 2017 December 31, 2017 December 31, 2017 GAAP Revenue 626.3 743.7 749.4 887.9 3,007.3 Reimbursements (316.5) (355.9) (333.5) (342.0) (1,347.9) Revenue before reimbursements 309.8 387.8 415.9 545.9 1,659.4 Gross contract costs (130.4) (163.0) (169.1) (188.2) (650.7) Fee revenue 179.4 224.8 246.8 357.7 1,008.7 Leasing 29.5 50.0 50.4 103.1 233.0 Capital Markets 28.3 34.5 53.3 87.2 203.3 Property & Facility Management 64.7 71.9 72.0 82.7 291.3 Project & Development Services 24.6 29.8 31.3 32.8 118.5 Advisory, Consulting and Other 32.3 38.6 39.8 51.9 162.6 Operating expenses before reimbursements 304.8 366.4 391.7 479.3 1,542.2 Gross contract costs (130.4) (163.0) (169.1) (188.2) (650.7) Total fee-based operating expenses 174.4 203.4 222.6 291.1 891.5 Operating income 5.0 21.4 24.2 66.6 117.2 Adjusted EBITDA 10.6 27.7 30.3 73.7 142.3 Adjusted EBITDA margin % (fee revenue) 5.9% 12.3% 12.3% 20.6% 14.1% Year Ended December 31, 2016 2,618.7 (1,248.3) 1,370.4 (495.7) 874.7 212.3 155.6 266.7 94.3 145.8 1,281.5 (495.7) 785.8 88.9 107.3 12.3%
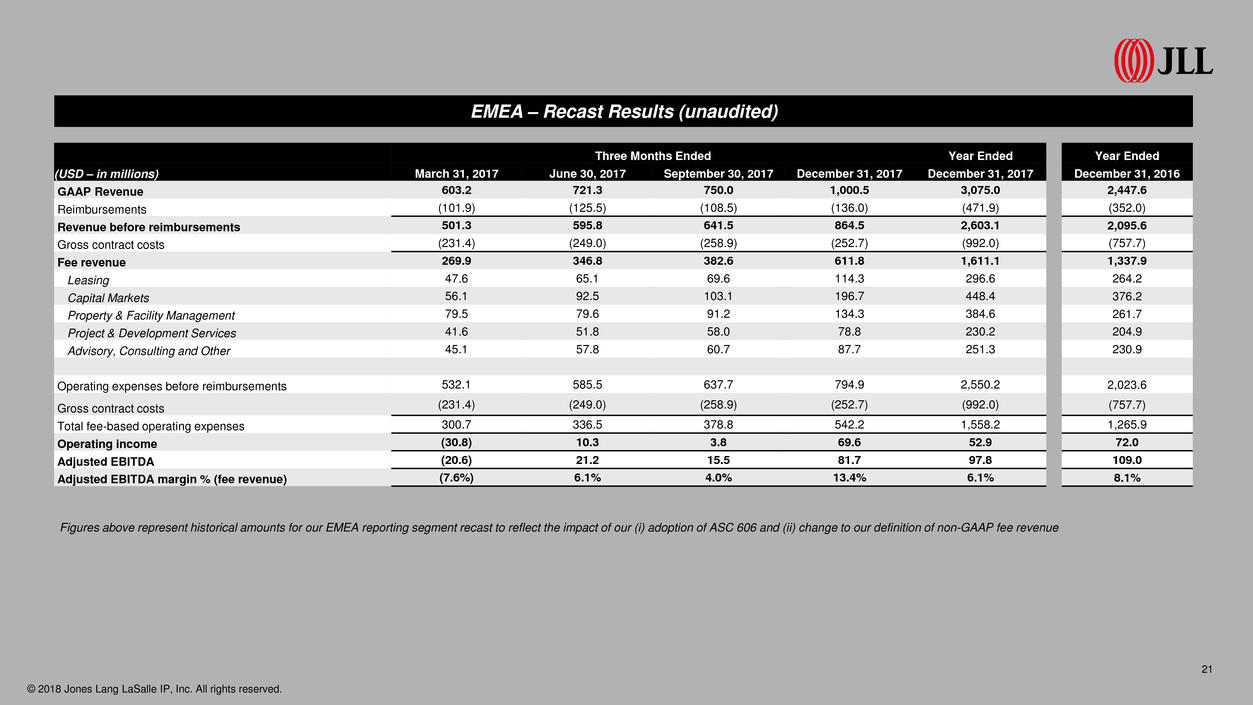
© 2018 Jones Lang LaSalle IP, Inc. All rights reserved. 21 EMEA – Recast Results (unaudited) Figures above represent historical amounts for our EMEA reporting segment recast to reflect the impact of our (i) adoption of ASC 606 and (ii) change to our definition of non-GAAP fee revenue Three Months Ended Year Ended (USD – in millions) March 31, 2017 June 30, 2017 September 30, 2017 December 31, 2017 December 31, 2017 GAAP Revenue 603.2 721.3 750.0 1,000.5 3,075.0 Reimbursements (101.9) (125.5) (108.5) (136.0) (471.9) Revenue before reimbursements 501.3 595.8 641.5 864.5 2,603.1 Gross contract costs (231.4) (249.0) (258.9) (252.7) (992.0) Fee revenue 269.9 346.8 382.6 611.8 1,611.1 Leasing 47.6 65.1 69.6 114.3 296.6 Capital Markets 56.1 92.5 103.1 196.7 448.4 Property & Facility Management 79.5 79.6 91.2 134.3 384.6 Project & Development Services 41.6 51.8 58.0 78.8 230.2 Advisory, Consulting and Other 45.1 57.8 60.7 87.7 251.3 Operating expenses before reimbursements 532.1 585.5 637.7 794.9 2,550.2 Gross contract costs (231.4) (249.0) (258.9) (252.7) (992.0) Total fee-based operating expenses 300.7 336.5 378.8 542.2 1,558.2 Operating income (30.8) 10.3 3.8 69.6 52.9 Adjusted EBITDA (20.6) 21.2 15.5 81.7 97.8 Adjusted EBITDA margin % (fee revenue) (7.6%) 6.1% 4.0% 13.4% 6.1% Year Ended December 31, 2016 2,447.6 (352.0) 2,095.6 (757.7) 1,337.9 264.2 376.2 261.7 204.9 230.9 2,023.6 (757.7) 1,265.9 72.0 109.0 8.1%
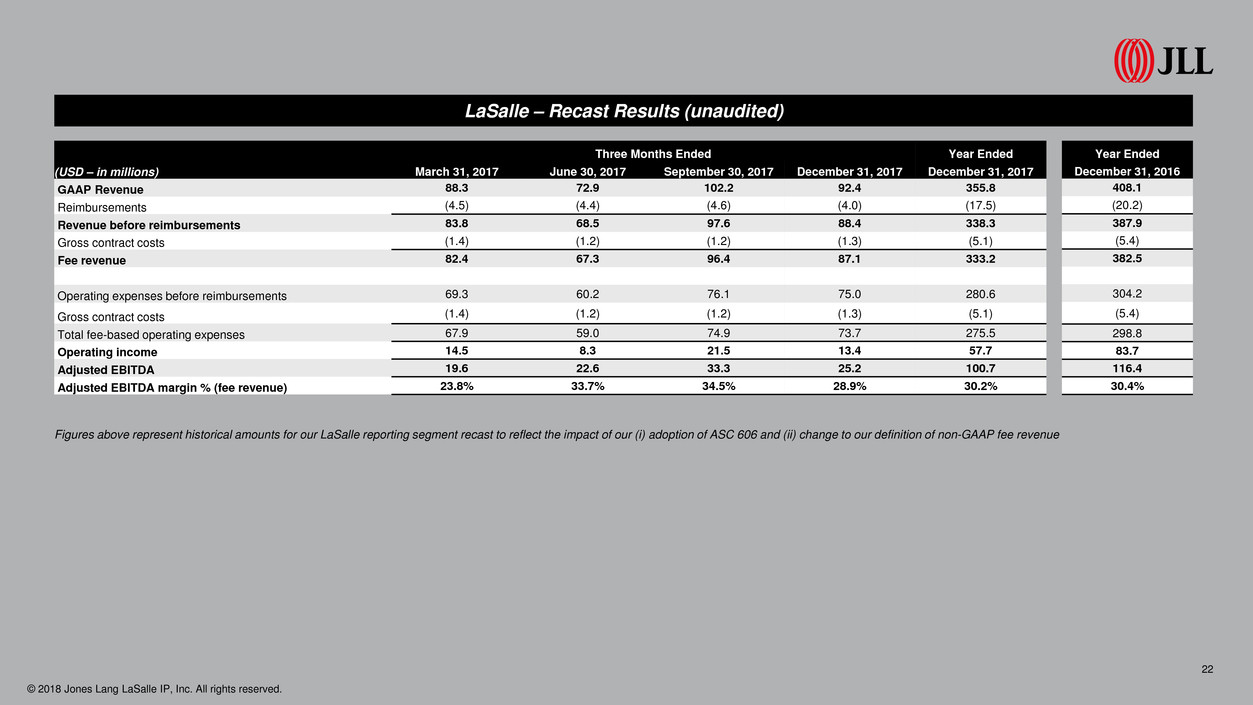
© 2018 Jones Lang LaSalle IP, Inc. All rights reserved. 22 Figures above represent historical amounts for our LaSalle reporting segment recast to reflect the impact of our (i) adoption of ASC 606 and (ii) change to our definition of non-GAAP fee revenue LaSalle – Recast Results (unaudited) Three Months Ended Year Ended (USD – in millions) March 31, 2017 June 30, 2017 September 30, 2017 December 31, 2017 December 31, 2017 GAAP Revenue 88.3 72.9 102.2 92.4 355.8 Reimbursements (4.5) (4.4) (4.6) (4.0) (17.5) Revenue before reimbursements 83.8 68.5 97.6 88.4 338.3 Gross contract costs (1.4) (1.2) (1.2) (1.3) (5.1) Fee revenue 82.4 67.3 96.4 87.1 333.2 Operating expenses before reimbursements 69.3 60.2 76.1 75.0 280.6 Gross contract costs (1.4) (1.2) (1.2) (1.3) (5.1) Total fee-based operating expenses 67.9 59.0 74.9 73.7 275.5 Operating income 14.5 8.3 21.5 13.4 57.7 Adjusted EBITDA 19.6 22.6 33.3 25.2 100.7 Adjusted EBITDA margin % (fee revenue) 23.8% 33.7% 34.5% 28.9% 30.2% Year Ended December 31, 2016 408.1 (20.2) 387.9 (5.4) 382.5 304.2 (5.4) 298.8 83.7 116.4 30.4%

Thank you © 2018 Jones Lang LaSalle IP, Inc. All rights reserved. 23


