
New Reporting Segments April 22, 2022

Cautionary Note Regarding Forward-Looking Statements Statements in this presentation regarding, among other things, future financial results and performance, achievements, plans, objectives and shares repurchases may be considered forward-looking statements within the meaning of the Private Securities Litigation Reform Act of 1995. Such statements involve known and unknown risks, uncertainties, and other factors, the occurrence of which are outside JLL's control, including but not limited to, the impact of the COVID-19 pandemic on JLL's business, which may cause JLL's actual results, performance, achievements, plans, and objectives to be materially different from those expressed or implied by such forward- looking statements. For additional information concerning risks, uncertainties, and other factors that could cause actual results to differ materially from those anticipated in forward-looking statements, and risks to JLL's business in general, please refer to those factors discussed under "Risk Factors," “Business,” “Management’s Discussion and Analysis of Financial Condition and Results of Operations,” “Quantitative and Qualitative Disclosures about Market Risk,” and elsewhere in JLL’s filed Annual Report on Form 10-K for the year ended December 31, 2021, and other reports filed with the Securities and Exchange Commission. Any forward-looking statements speak only as of the date of this release, and except to the extent required by applicable securities laws, JLL expressly disclaims any obligation or undertaking to publicly update or revise any forward-looking statements contained herein to reflect any change in expectations or results, or any change in events. © 2022 Jones Lang LaSalle IP, Inc. All rights reserved. No part of this publication may be reproduced by any means, whether graphically, electronically, mechanically or otherwise howsoever, including without limitation photocopying and recording on magnetic tape, or included in any information store and/or retrieval system without prior written permission of Jones Lang LaSalle IP, Inc.

Moving to Five Business Lines for Reporting Segments • As part of our Beyond strategy, we have aligned to global Business Lines that will serve as our new external reporting segments • This evolution is another step in our transformation to better leverage the strength of our global full-service platform and shape the future of real estate for a better world • Aligning around five global Business Lines will: New Reporting Segments: • Markets Advisory • Capital Markets • Work Dynamics • JLL Technologies • LaSalle JLL will report financial results using the new segment structure beginning in the first quarter of 2022 Enhance transparency into business line performance Accelerate our One JLL journey by formalizing how we work across services and deliver the best capabilities to our clients Strengthen global collaboration across the enterprise, streamlining and simplifying decision making

JLL’s New Segment Reporting • Shift reporting focus from geographic to business line Previous Markets Advisory Leasing Property Management Advisory, Consulting and Other Work Dynamics Workplace Management Project Management Portfolio Services and Other LaSalle (No Change) Advisory Fees Transaction Fees & other Incentive Fees JLL Technologies Capital Markets Investment Sales, Debt/Equity Advisory and Other Valuation Advisory Loan Servicing Americas EMEA Asia Pacific LaSalle (No Change) Leasing Capital Markets Property & Facilities Management Project & Development Services Advisory, Consulting and Other New Advisory Fees Transaction Fees & other Incentive Fees

Segment Mapping NewPrevious Leasing Capital Markets Property & Facility Management Property Management Facilities Management Project & Development Services Advisory Consulting & Other Valuations JLL Technologies Advisory & Consulting Sustainability Services LaSalle Markets Advisory Capital Markets Work Dynamics JLL Technologies LaSalle • New reporting segments effective January 1, 2022 • First reporting quarter with new segments in Q1 2022

Overview of Changes Change in Reporting Segments & Fee Revenue Refinement Adjacent table reflects the impact of the change in non-GAAP fee revenue presentation on consolidated performance measures Refer to Appendix for non-GAAP definitions, reconciliations and additional detail including recast of 2020 financials Consolidated GAAP performance measures Consolidated Adjusted EBITDA Adjusted diluted EPS Recast of 2021 Financials (“Non-GAAP Fee Revenue change” impact) GAAP Performance Measures (USD – in millions, except per share amounts) Previously Reported Adjustment Restated Revenue $19,367.0 – $19,367.0 Net income attributable to common shareholders 961.6 – 961.6 Diluted earnings per share $18.47 – $18.47 Non-GAAP Performance Measures (USD – in millions, except per share amounts) Previously Reported Adjustment Restated Fee revenue $8,104.8 (87.3) $8,017.5 Adjusted EBITDA 1,496.5 – 1,496.5 Adjusted EBITDA margin (fee revenue basis - USD) 18.5% +20 bps 18.7% Adjusted diluted earnings per share $19.47 – 19.47 External reporting segment financials Consolidated Fee Revenue Adjusted EBITDA margin (fee revenue basis) • External segments – see slide 3 • Fee revenue - we made minor refinements to the population of client-related expenses we consider Gross contract costs, which are deducted from Revenue to calculate Fee revenue What is Not Changing? Why?What is Changing?
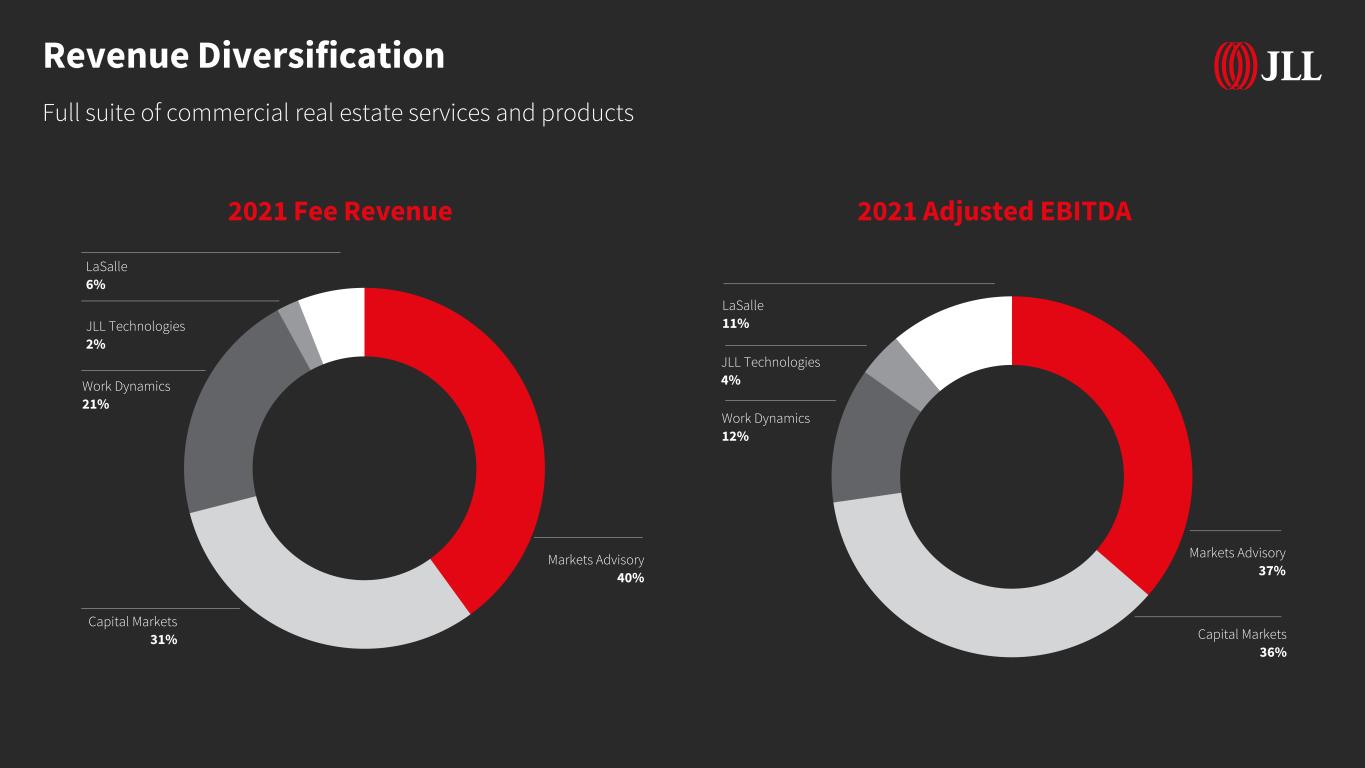
Markets Advisory 37% Capital Markets 36% Work Dynamics 12% JLL Technologies 4% LaSalle 11% Revenue Diversification Full suite of commercial real estate services and products 2021 Fee Revenue Markets Advisory 40% Capital Markets 31% Work Dynamics 21% JLL Technologies 2% LaSalle 6% 2021 Adjusted EBITDA

Business Segments

Markets Advisory A comprehensive range of services globally and across asset types, including leasing, property management and consulting. 15,200 agency leasing transactions representing 298 million square feet of space. 27,000 tenant representation transactions representing 722 million square feet of space. on-site property management services for properties totaling approximately 3.9 billion square feet 9 Leasing (Agency & Tenant Representation) 81% Property Management 15% Share of Markets Advisory 2021 Fee Revenue • Agency Leasing • Tenant Representation • Property Management • Advisory & Consulting Core Services Key Stats Note: The reported stats for year ended December 31, 2021 provided for informational purposes only and are estimated based on the Company’s internal database Advisory & Consulting 4% 40% Markets Advisory Share of Consolidated 2021 Fee Revenue
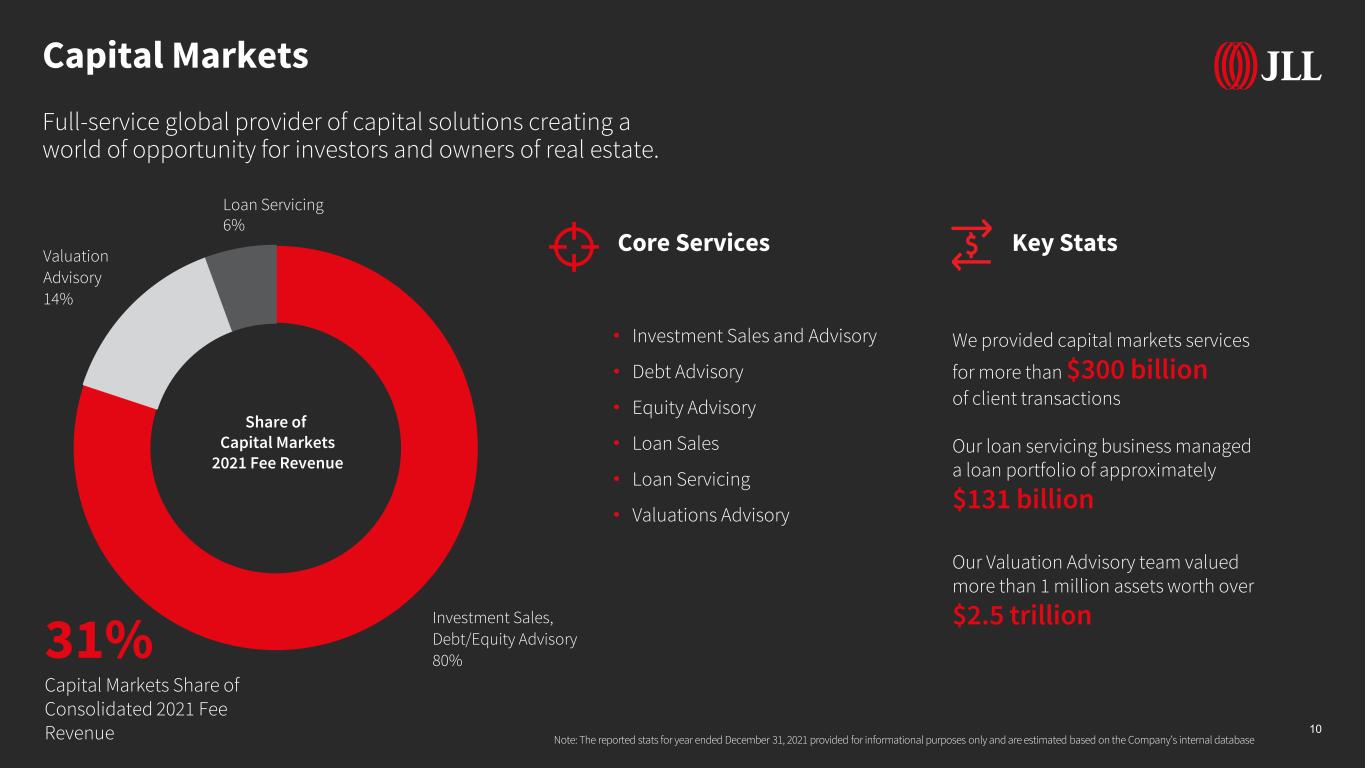
Capital Markets Full-service global provider of capital solutions creating a world of opportunity for investors and owners of real estate. 10 Share of Capital Markets 2021 Fee Revenue • Investment Sales and Advisory • Debt Advisory • Equity Advisory • Loan Sales • Loan Servicing • Valuations Advisory Core Services Key Stats Note: The reported stats for year ended December 31, 2021 provided for informational purposes only and are estimated based on the Company’s internal database We provided capital markets services for more than $300 billion of client transactions Our loan servicing business managed a loan portfolio of approximately $131 billion Our Valuation Advisory team valued more than 1 million assets worth over $2.5 trillion Loan Servicing 6% Investment Sales, Debt/Equity Advisory 80% Valuation Advisory 14% 31% Capital Markets Share of Consolidated 2021 Fee Revenue
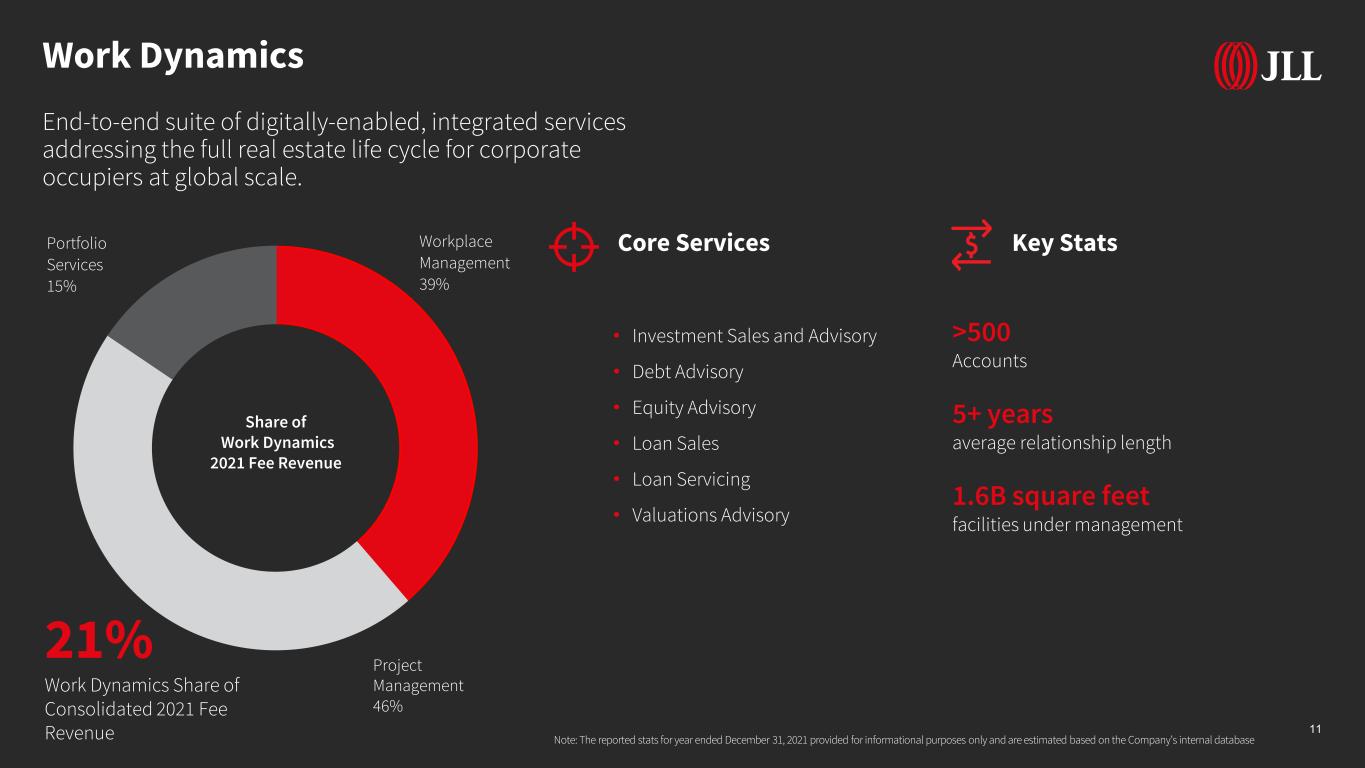
Work Dynamics End-to-end suite of digitally-enabled, integrated services addressing the full real estate life cycle for corporate occupiers at global scale. 11 Share of Work Dynamics 2021 Fee Revenue • Investment Sales and Advisory • Debt Advisory • Equity Advisory • Loan Sales • Loan Servicing • Valuations Advisory Core Services Key Stats 21% Work Dynamics Share of Consolidated 2021 Fee Revenue Note: The reported stats for year ended December 31, 2021 provided for informational purposes only and are estimated based on the Company’s internal database >500 Accounts 5+ years average relationship length 1.6B square feet facilities under management Workplace Management 39% Portfolio Services 15% Project Management 46%

JLLT, including the JLL Spark Venture Fund launched in 2017, has invested in more than 30 PropTech startups— from sustainability, smart buildings, future of work and more.Improve the ROI and efficiency of real estate portfolios Unlock data-driven insights & intelligence to streamline operations and cut costs Increase the utilization and experience of space JLLT delivers solutions that: Value of Investment Portfolio as of 12/31/21 $354M 12 • Software • Professional Services • Spark Venture & Investment Core Services Note: The reported stats for year ended December 31, 2021 provided for informational purposes only and are estimated based on the Company’s internal database JLL Technologies Helps organizations transform the way they acquire, manage, operate, and experience space. 2% JLL Technologies Share of Consolidated 2021 Fee Revenue
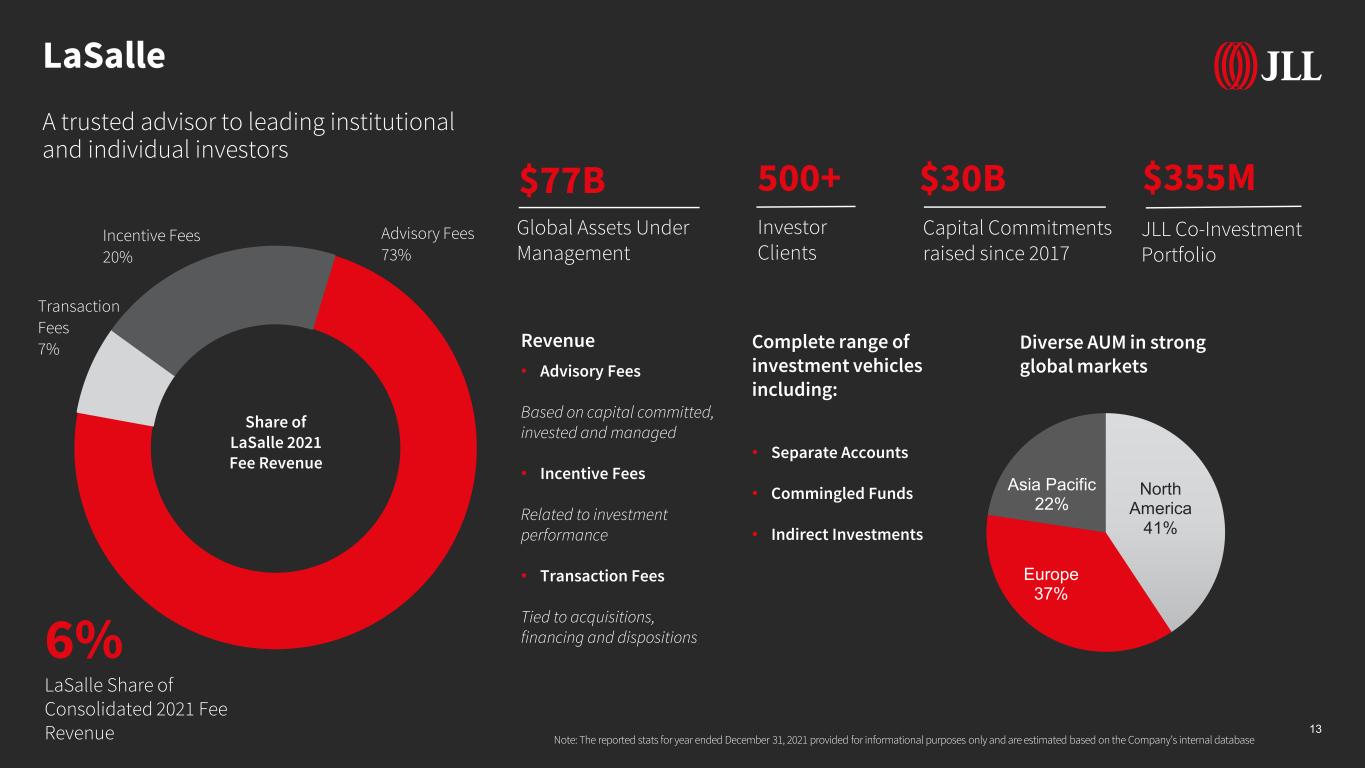
LaSalle A trusted advisor to leading institutional and individual investors 13 Note: The reported stats for year ended December 31, 2021 provided for informational purposes only and are estimated based on the Company’s internal database North America 41% Europe 37% Asia Pacific 22% $30B Capital Commitments raised since 2017 $355M JLL Co-Investment Portfolio 500+ Investor Clients $77B Global Assets Under Management Diverse AUM in strong global markets Revenue • Advisory Fees Based on capital committed, invested and managed • Incentive Fees Related to investment performance • Transaction Fees Tied to acquisitions, financing and dispositions Complete range of investment vehicles including: • Separate Accounts • Commingled Funds • Indirect Investments Share of LaSalle 2021 Fee Revenue 6% LaSalle Share of Consolidated 2021 Fee Revenue Advisory Fees 73% Transaction Fees 7% Incentive Fees 20%

Financial Appendix Available in excel format at ir.jll.com
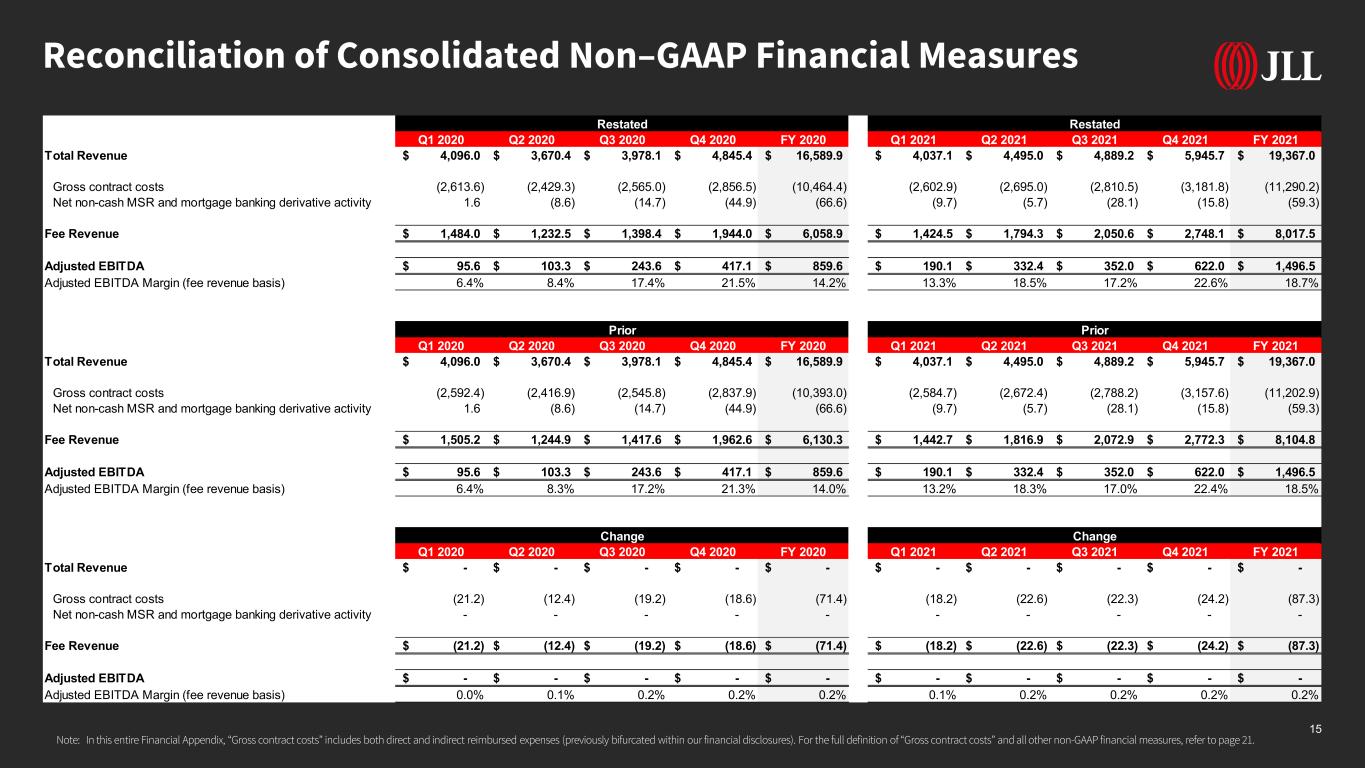
Reconciliation of Consolidated Non–GAAP Financial Measures 15 Note: In this entire Financial Appendix, “Gross contract costs” includes both direct and indirect reimbursed expenses (previously bifurcated within our financial disclosures). For the full definition of “Gross contract costs” and all other non-GAAP financial measures, refer to page 21. Q1 2020 Q2 2020 Q3 2020 Q4 2020 FY 2020 Q1 2021 Q2 2021 Q3 2021 Q4 2021 FY 2021 Total Revenue 4,096.0$ 3,670.4$ 3,978.1$ 4,845.4$ 16,589.9$ 4,037.1$ 4,495.0$ 4,889.2$ 5,945.7$ 19,367.0$ Gross contract costs (2,613.6) (2,429.3) (2,565.0) (2,856.5) (10,464.4) (2,602.9) (2,695.0) (2,810.5) (3,181.8) (11,290.2) Net non-cash MSR and mortgage banking derivative activity 1.6 (8.6) (14.7) (44.9) (66.6) (9.7) (5.7) (28.1) (15.8) (59.3) Fee Revenue 1,484.0$ 1,232.5$ 1,398.4$ 1,944.0$ 6,058.9$ 1,424.5$ 1,794.3$ 2,050.6$ 2,748.1$ 8,017.5$ Adjusted EBITDA 95.6$ 103.3$ 243.6$ 417.1$ 859.6$ 190.1$ 332.4$ 352.0$ 622.0$ 1,496.5$ Adjusted EBITDA Margin (fee revenue basis) 6.4% 8.4% 17.4% 21.5% 14.2% 13.3% 18.5% 17.2% 22.6% 18.7% Q1 2020 Q2 2020 Q3 2020 Q4 2020 FY 2020 Q1 2021 Q2 2021 Q3 2021 Q4 2021 FY 2021 Total Revenue 4,096.0$ 3,670.4$ 3,978.1$ 4,845.4$ 16,589.9$ 4,037.1$ 4,495.0$ 4,889.2$ 5,945.7$ 19,367.0$ Gross contract costs (2,592.4) (2,416.9) (2,545.8) (2,837.9) (10,393.0) (2,584.7) (2,672.4) (2,788.2) (3,157.6) (11,202.9) Net non-cash MSR and mortgage banking derivative activity 1.6 (8.6) (14.7) (44.9) (66.6) (9.7) (5.7) (28.1) (15.8) (59.3) Fee Revenue 1,505.2$ 1,244.9$ 1,417.6$ 1,962.6$ 6,130.3$ 1,442.7$ 1,816.9$ 2,072.9$ 2,772.3$ 8,104.8$ Adjusted EBITDA 95.6$ 103.3$ 243.6$ 417.1$ 859.6$ 190.1$ 332.4$ 352.0$ 622.0$ 1,496.5$ Adjusted EBITDA Margin (fee revenue basis) 6.4% 8.3% 17.2% 21.3% 14.0% 13.2% 18.3% 17.0% 22.4% 18.5% Q1 2020 Q2 2020 Q3 2020 Q4 2020 FY 2020 Q1 2021 Q2 2021 Q3 2021 Q4 2021 FY 2021 Total Revenue -$ -$ -$ -$ -$ -$ -$ -$ -$ -$ Gross contract costs (21.2) (12.4) (19.2) (18.6) (71.4) (18.2) (22.6) (22.3) (24.2) (87.3) Net non-cash MSR and mortgage banking derivative activity - - - - - - - - - - Fee Revenue (21.2)$ (12.4)$ (19.2)$ (18.6)$ (71.4)$ (18.2)$ (22.6)$ (22.3)$ (24.2)$ (87.3)$ Adjusted EBITDA -$ -$ -$ -$ -$ -$ -$ -$ -$ -$ Adjusted EBITDA Margin (fee revenue basis) 0.0% 0.1% 0.2% 0.2% 0.2% 0.1% 0.2% 0.2% 0.2% 0.2% Restated Restated PriorPrior Change Change

Q1 2020 Q2 2020 Q3 2020 Q4 2020 FY 2020 Q1 2021 Q2 2021 Q3 2021 Q4 2021 FY 2021 Revenue 810.4 661.1 763.5 952.0 3,187.0 792.7 951.3 1,079.9 1,364.8 4,188.7 Leasing 462.0 334.1 395.7 556.0 1,747.8 416.6 572.4 694.9 934.2 2,618.1 Property Management 324.6 314.2 326.5 352.6 1,317.9 347.6 347.8 351.3 391.2 1,437.9 Advisory, Consulting and Other 23.8 12.8 41.3 43.4 121.3 28.5 31.1 33.7 39.4 132.7 Gross contract costs (226.2) (197.4) (232.8) (233.1) (889.5) (240.1) (240.3) (242.9) (263.7) (987.0) Fee Revenue 584.2 463.7 530.7 718.9 2,297.5 552.6 711.0 837.0 1,101.1 3,201.7 Leasing 458.3 331.5 391.1 551.4 1,732.3 412.2 568.6 689.1 928.6 2,598.5 Property Management 106.7 108.3 112.5 125.9 453.4 114.3 114.7 115.9 133.8 478.7 Advisory, Consulting and Other 19.2 23.9 27.1 41.6 111.8 26.1 27.7 32.0 38.7 124.5 Compensation, operating and administrative expenses 734.0 627.2 671.8 822.8 2,855.8 726.6 839.9 931.8 1,150.0 3,648.3 Depreciation and amortization 16.5 17.3 16.3 17.9 68.0 15.9 16.7 16.4 20.4 69.4 Total segment operating expenses 750.5 644.5 688.1 840.7 2,923.8 742.5 856.6 948.2 1,170.4 3,717.7 Gross contract costs (226.2) (197.4) (232.8) (233.1) (889.5) (240.1) (240.3) (242.9) (263.7) (987.0) Total fee-based segment operating expenses 524.3 447.1 455.3 607.6 2,034.3 502.4 616.3 705.3 906.7 2,730.7 Segment operating income 59.9 16.6 75.4 111.3 263.2 50.2 94.7 131.7 194.4 471.0 Add: Equity earnings (losses) 12.6 0.5 1.3 (0.7) 13.7 0.4 0.1 0.1 0.1 0.7 Depreciation and amortization 16.5 17.3 16.3 17.9 68.0 15.9 16.7 16.4 20.4 69.4 Other income (expense) 0.7 5.5 3.1 8.9 18.2 (1.1) 1.7 0.6 1.4 2.6 Net loss (income) attributable to noncontrolling interest (12.3) 0.8 (2.8) (6.2) (20.5) 0.6 0.7 0.8 1.1 3.2 Adjustments: Gain on disposition - (4.8) - - (4.8) - - (0.4) - (0.4) Adjusted EBITDA 77.4 35.9 93.3 131.2 337.8 66.0 113.9 149.2 217.4 546.5 Adjusted EBITDA margin (fee revenue basis) 13.2% 7.7% 17.6% 18.3% 14.7% 11.9% 16.0% 17.8% 19.7% 17.1% 2020 USD in Millions 2021 USD in Millions Markets Advisory–Segment Financials 16 Note: In this entire Financial Appendix, “Gross contract costs” includes both direct and indirect reimbursed expenses (previously bifurcated within our financial disclosures). For the full definition of “Gross contract costs” and all other non-GAAP financial measures, refer to page 21.
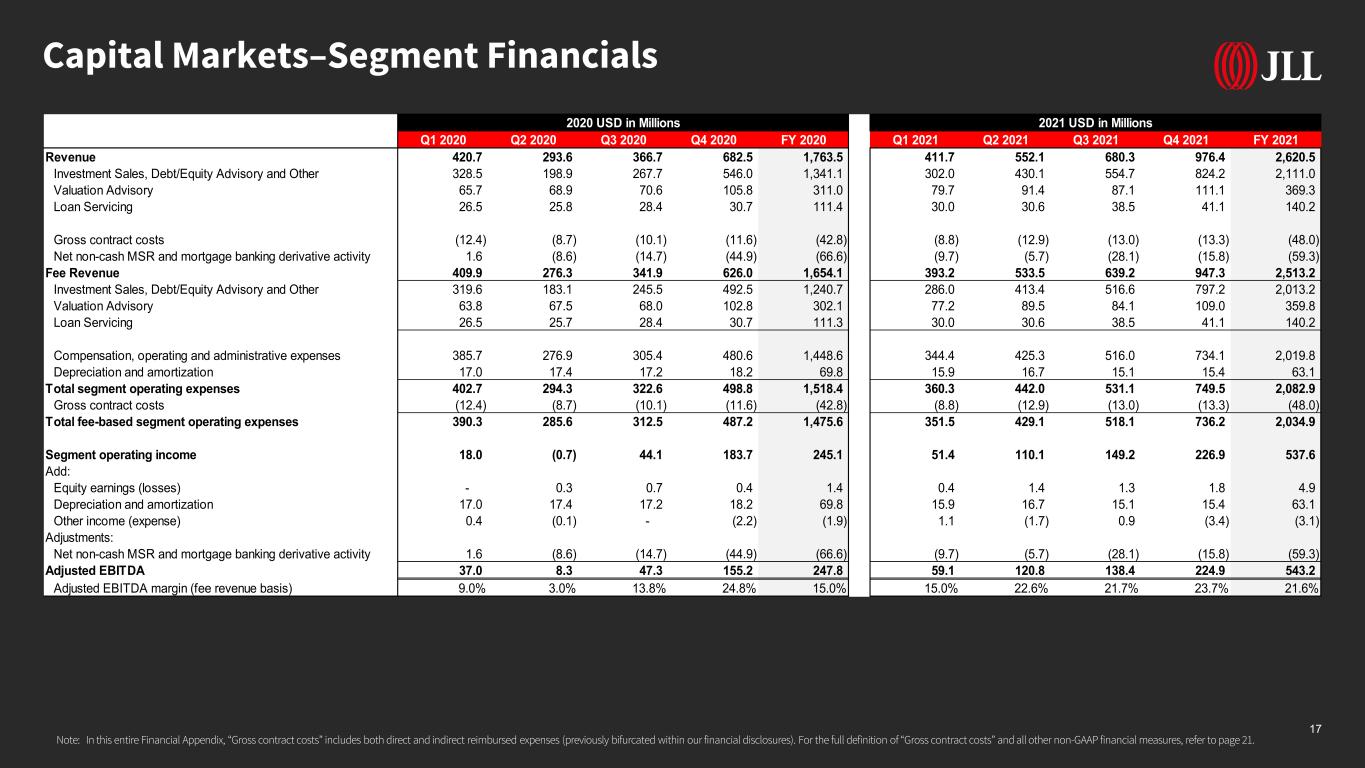
Capital Markets–Segment Financials 17 Note: In this entire Financial Appendix, “Gross contract costs” includes both direct and indirect reimbursed expenses (previously bifurcated within our financial disclosures). For the full definition of “Gross contract costs” and all other non-GAAP financial measures, refer to page 21. Q1 2020 Q2 2020 Q3 2020 Q4 2020 FY 2020 Q1 2021 Q2 2021 Q3 2021 Q4 2021 FY 2021 Revenue 420.7 293.6 366.7 682.5 1,763.5 411.7 552.1 680.3 976.4 2,620.5 Investment Sales, Debt/Equity Advisory and Other 328.5 198.9 267.7 546.0 1,341.1 302.0 430.1 554.7 824.2 2,111.0 Valuation Advisory 65.7 68.9 70.6 105.8 311.0 79.7 91.4 87.1 111.1 369.3 Loan Servicing 26.5 25.8 28.4 30.7 111.4 30.0 30.6 38.5 41.1 140.2 Gross contract costs (12.4) (8.7) (10.1) (11.6) (42.8) (8.8) (12.9) (13.0) (13.3) (48.0) Net non-cash MSR and mortgage banking derivative activity 1.6 (8.6) (14.7) (44.9) (66.6) (9.7) (5.7) (28.1) (15.8) (59.3) Fee Revenue 409.9 276.3 341.9 626.0 1,654.1 393.2 533.5 639.2 947.3 2,513.2 Investment Sales, Debt/Equity Advisory and Other 319.6 183.1 245.5 492.5 1,240.7 286.0 413.4 516.6 797.2 2,013.2 Valuation Advisory 63.8 67.5 68.0 102.8 302.1 77.2 89.5 84.1 109.0 359.8 Loan Servicing 26.5 25.7 28.4 30.7 111.3 30.0 30.6 38.5 41.1 140.2 Compensation, operating and administrative expenses 385.7 276.9 305.4 480.6 1,448.6 344.4 425.3 516.0 734.1 2,019.8 Depreciation and amortization 17.0 17.4 17.2 18.2 69.8 15.9 16.7 15.1 15.4 63.1 Total segment operating expenses 402.7 294.3 322.6 498.8 1,518.4 360.3 442.0 531.1 749.5 2,082.9 Gross contract costs (12.4) (8.7) (10.1) (11.6) (42.8) (8.8) (12.9) (13.0) (13.3) (48.0) Total fee-based segment operating expenses 390.3 285.6 312.5 487.2 1,475.6 351.5 429.1 518.1 736.2 2,034.9 Segment operating income 18.0 (0.7) 44.1 183.7 245.1 51.4 110.1 149.2 226.9 537.6 Add: Equity earnings (losses) - 0.3 0.7 0.4 1.4 0.4 1.4 1.3 1.8 4.9 Depreciation and amortization 17.0 17.4 17.2 18.2 69.8 15.9 16.7 15.1 15.4 63.1 Other income (expense) 0.4 (0.1) - (2.2) (1.9) 1.1 (1.7) 0.9 (3.4) (3.1) Adjustments: Net non-cash MSR and mortgage banking derivative activity 1.6 (8.6) (14.7) (44.9) (66.6) (9.7) (5.7) (28.1) (15.8) (59.3) Adjusted EBITDA 37.0 8.3 47.3 155.2 247.8 59.1 120.8 138.4 224.9 543.2 Adjusted EBITDA margin (fee revenue basis) 9.0% 3.0% 13.8% 24.8% 15.0% 15.0% 22.6% 21.7% 23.7% 21.6% 2020 USD in Millions 2021 USD in Millions
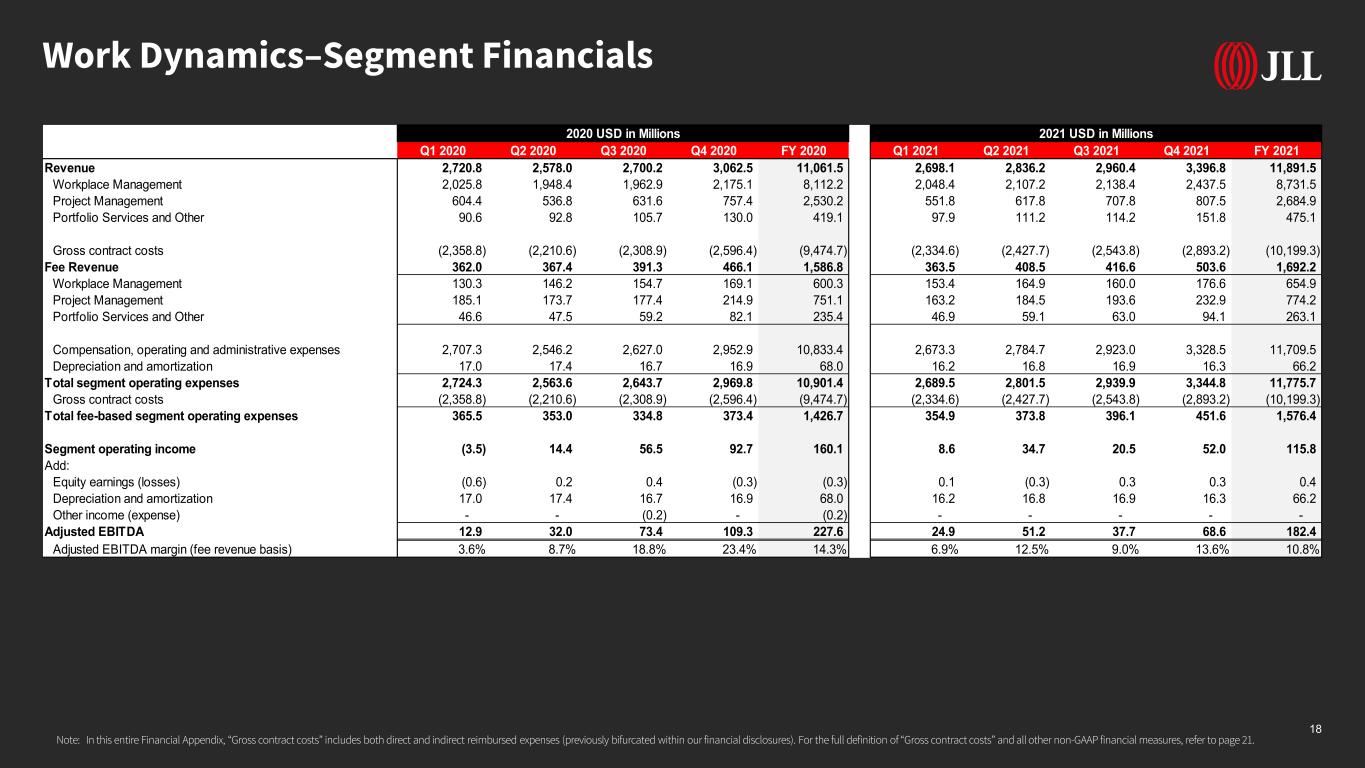
Work Dynamics–Segment Financials 18 Q1 2020 Q2 2020 Q3 2020 Q4 2020 FY 2020 Q1 2021 Q2 2021 Q3 2021 Q4 2021 FY 2021 Revenue 2,720.8 2,578.0 2,700.2 3,062.5 11,061.5 2,698.1 2,836.2 2,960.4 3,396.8 11,891.5 Workplace Management 2,025.8 1,948.4 1,962.9 2,175.1 8,112.2 2,048.4 2,107.2 2,138.4 2,437.5 8,731.5 Project Management 604.4 536.8 631.6 757.4 2,530.2 551.8 617.8 707.8 807.5 2,684.9 Portfolio Services and Other 90.6 92.8 105.7 130.0 419.1 97.9 111.2 114.2 151.8 475.1 Gross contract costs (2,358.8) (2,210.6) (2,308.9) (2,596.4) (9,474.7) (2,334.6) (2,427.7) (2,543.8) (2,893.2) (10,199.3) Fee Revenue 362.0 367.4 391.3 466.1 1,586.8 363.5 408.5 416.6 503.6 1,692.2 Workplace Management 130.3 146.2 154.7 169.1 600.3 153.4 164.9 160.0 176.6 654.9 Project Management 185.1 173.7 177.4 214.9 751.1 163.2 184.5 193.6 232.9 774.2 Portfolio Services and Other 46.6 47.5 59.2 82.1 235.4 46.9 59.1 63.0 94.1 263.1 Compensation, operating and administrative expenses 2,707.3 2,546.2 2,627.0 2,952.9 10,833.4 2,673.3 2,784.7 2,923.0 3,328.5 11,709.5 Depreciation and amortization 17.0 17.4 16.7 16.9 68.0 16.2 16.8 16.9 16.3 66.2 Total segment operating expenses 2,724.3 2,563.6 2,643.7 2,969.8 10,901.4 2,689.5 2,801.5 2,939.9 3,344.8 11,775.7 Gross contract costs (2,358.8) (2,210.6) (2,308.9) (2,596.4) (9,474.7) (2,334.6) (2,427.7) (2,543.8) (2,893.2) (10,199.3) Total fee-based segment operating expenses 365.5 353.0 334.8 373.4 1,426.7 354.9 373.8 396.1 451.6 1,576.4 Segment operating income (3.5) 14.4 56.5 92.7 160.1 8.6 34.7 20.5 52.0 115.8 Add: Equity earnings (losses) (0.6) 0.2 0.4 (0.3) (0.3) 0.1 (0.3) 0.3 0.3 0.4 Depreciation and amortization 17.0 17.4 16.7 16.9 68.0 16.2 16.8 16.9 16.3 66.2 Other income (expense) - - (0.2) - (0.2) - - - - - Adjusted EBITDA 12.9 32.0 73.4 109.3 227.6 24.9 51.2 37.7 68.6 182.4 Adjusted EBITDA margin (fee revenue basis) 3.6% 8.7% 18.8% 23.4% 14.3% 6.9% 12.5% 9.0% 13.6% 10.8% 2020 USD in Millions 2021 USD in Millions Note: In this entire Financial Appendix, “Gross contract costs” includes both direct and indirect reimbursed expenses (previously bifurcated within our financial disclosures). For the full definition of “Gross contract costs” and all other non-GAAP financial measures, refer to page 21.

JLL Technologies–Segment Financials 19 Q1 2020 Q2 2020 Q3 2020 Q4 2020 FY 2020 Q1 2021 Q2 2021 Q3 2021 Q4 2021 FY 2021 Revenue 39.2 37.8 37.4 41.7 156.1 43.4 39.6 38.8 44.4 166.2 Gross contract costs (9.9) (7.7) (8.7) (10.0) (36.3) (13.5) (6.8) (4.4) (4.3) (29.0) Fee Revenue 29.3 30.1 28.7 31.7 119.8 29.9 32.8 34.4 40.1 137.2 Compensation, operating and administrative expenses 49.6 45.9 47.7 51.7 194.9 64.0 57.3 56.8 75.5 253.6 Depreciation and amortization 2.2 2.5 2.4 4.2 11.3 2.9 2.2 2.2 3.2 10.5 Total segment operating expenses 51.8 48.4 50.1 55.9 206.2 66.9 59.5 59.0 78.7 264.1 Gross contract costs (9.9) (7.7) (8.7) (10.0) (36.3) (13.5) (6.8) (4.4) (4.3) (29.0) Total fee-based segment operating expenses 41.9 40.7 41.4 45.9 169.9 53.4 52.7 54.6 74.4 235.1 Segment operating loss (12.6) (10.6) (12.7) (14.2) (50.1) (23.5) (19.9) (20.2) (34.3) (97.9) Add: Equity earnings (losses) - 2.5 4.1 (0.9) 5.7 34.6 16.2 7.3 82.6 140.7 Depreciation and amortization 2.2 2.5 2.4 4.2 11.3 2.9 2.2 2.2 3.2 10.5 Other income (expense) - - - - - 12.0 - - 0.1 12.1 Net loss (income) attributable to noncontrolling interest - - - - - - - - - - Adjustments: Gain on disposition - - - - - (12.0) - - - (12.0) Adjusted EBITDA (10.4) (5.6) (6.2) (10.9) (33.1) 14.0 (1.5) (10.7) 51.6 53.4 Adjusted EBITDA margin (fee revenue basis) -35.5% -18.6% -21.6% -34.4% -27.6% 46.8% -4.6% -31.1% 128.7% 38.9% 2020 USD in Millions 2021 USD in Millions Note: In this entire Financial Appendix, “Gross contract costs” includes both direct and indirect reimbursed expenses (previously bifurcated within our financial disclosures). For the full definition of “Gross contract costs” and all other non-GAAP financial measures, refer to page 21.
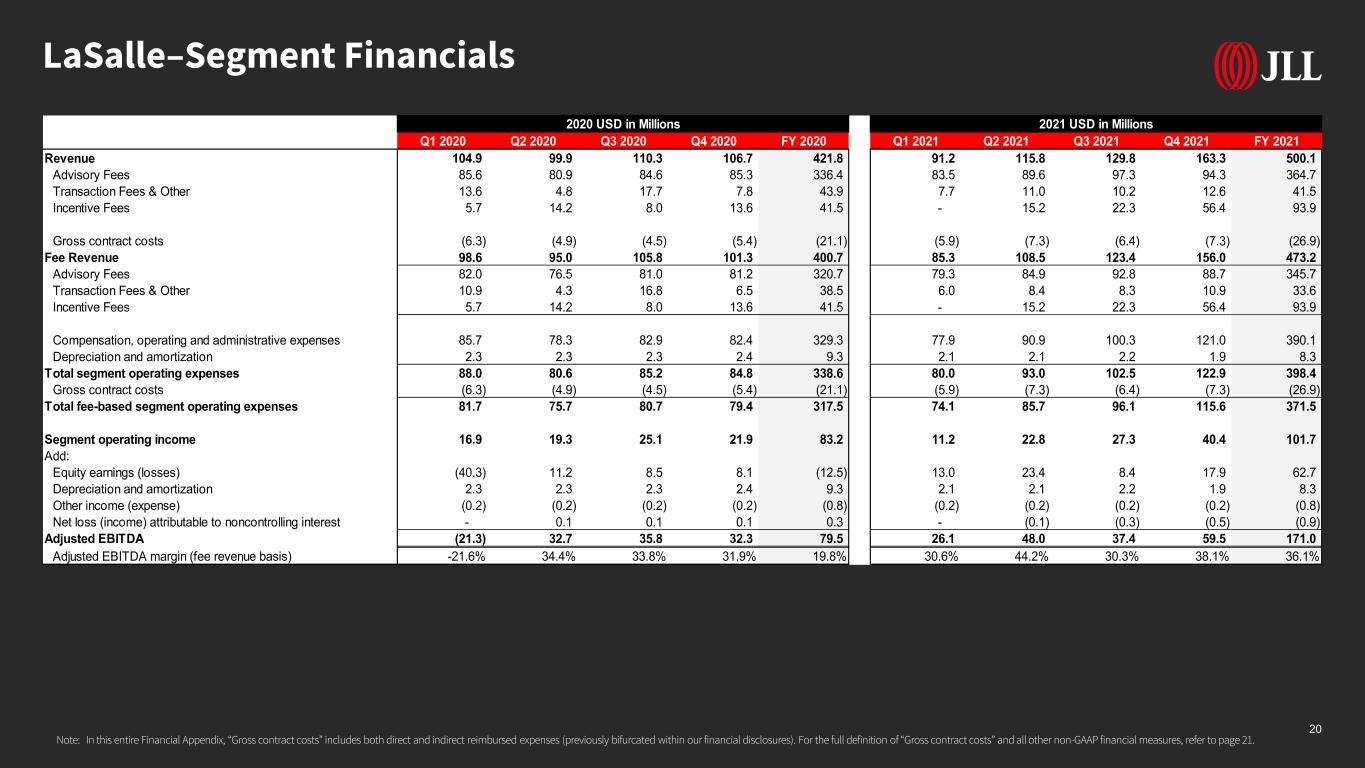
LaSalle–Segment Financials 20 Q1 2020 Q2 2020 Q3 2020 Q4 2020 FY 2020 Q1 2021 Q2 2021 Q3 2021 Q4 2021 FY 2021 Revenue 104.9 99.9 110.3 106.7 421.8 91.2 115.8 129.8 163.3 500.1 Advisory Fees 85.6 80.9 84.6 85.3 336.4 83.5 89.6 97.3 94.3 364.7 Transaction Fees & Other 13.6 4.8 17.7 7.8 43.9 7.7 11.0 10.2 12.6 41.5 Incentive Fees 5.7 14.2 8.0 13.6 41.5 - 15.2 22.3 56.4 93.9 Gross contract costs (6.3) (4.9) (4.5) (5.4) (21.1) (5.9) (7.3) (6.4) (7.3) (26.9) Fee Revenue 98.6 95.0 105.8 101.3 400.7 85.3 108.5 123.4 156.0 473.2 Advisory Fees 82.0 76.5 81.0 81.2 320.7 79.3 84.9 92.8 88.7 345.7 Transaction Fees & Other 10.9 4.3 16.8 6.5 38.5 6.0 8.4 8.3 10.9 33.6 Incentive Fees 5.7 14.2 8.0 13.6 41.5 - 15.2 22.3 56.4 93.9 Compensation, operating and administrative expenses 85.7 78.3 82.9 82.4 329.3 77.9 90.9 100.3 121.0 390.1 Depreciation and amortization 2.3 2.3 2.3 2.4 9.3 2.1 2.1 2.2 1.9 8.3 Total segment operating expenses 88.0 80.6 85.2 84.8 338.6 80.0 93.0 102.5 122.9 398.4 Gross contract costs (6.3) (4.9) (4.5) (5.4) (21.1) (5.9) (7.3) (6.4) (7.3) (26.9) Total fee-based segment operating expenses 81.7 75.7 80.7 79.4 317.5 74.1 85.7 96.1 115.6 371.5 Segment operating income 16.9 19.3 25.1 21.9 83.2 11.2 22.8 27.3 40.4 101.7 Add: Equity earnings (losses) (40.3) 11.2 8.5 8.1 (12.5) 13.0 23.4 8.4 17.9 62.7 Depreciation and amortization 2.3 2.3 2.3 2.4 9.3 2.1 2.1 2.2 1.9 8.3 Other income (expense) (0.2) (0.2) (0.2) (0.2) (0.8) (0.2) (0.2) (0.2) (0.2) (0.8) Net loss (income) attributable to noncontrolling interest - 0.1 0.1 0.1 0.3 - (0.1) (0.3) (0.5) (0.9) Adjusted EBITDA (21.3) 32.7 35.8 32.3 79.5 26.1 48.0 37.4 59.5 171.0 Adjusted EBITDA margin (fee revenue basis) -21.6% 34.4% 33.8% 31.9% 19.8% 30.6% 44.2% 30.3% 38.1% 36.1% 2020 USD in Millions 2021 USD in Millions Note: In this entire Financial Appendix, “Gross contract costs” includes both direct and indirect reimbursed expenses (previously bifurcated within our financial disclosures). For the full definition of “Gross contract costs” and all other non-GAAP financial measures, refer to page 21.
Non-GAAP Measures Management uses certain non-GAAP financial measures to develop budgets and forecasts, measure and reward performance against those budgets and forecasts, and enhance comparability to prior periods. These measures are believed to be useful to investors and other external stakeholders as supplemental measures of core operating performance and include the following: • Fee revenue and Fee-based operating expenses, • Adjusted EBITDA attributable to common shareholders ("Adjusted EBITDA") and Adjusted EBITDA margin, • Adjusted net income attributable to common shareholders and Adjusted diluted earnings per share, and • Percentage changes against prior periods, presented on a local currency basis. However, non-GAAP financial measures should not be considered alternatives to measures determined in accordance with U.S. generally accepted accounting principles (“GAAP”). Any measure that eliminates components of a company’s capital structure, cost of operations or investments, or other results has limitations as a performance measure. In light of these limitations, management also considers GAAP financial measures and does not rely solely on non-GAAP financial measures. Because the company's non-GAAP financial measures are not calculated in accordance with GAAP, they may not be comparable to similarly titled measures used by other companies. Adjustments to GAAP Financial Measures Used to Calculate non-GAAP Financial Measures Gross Contract Costs represent certain costs associated with client-dedicated employees and third-party vendors and subcontractors and are directly or indirectly reimbursed through the fees we receive. These costs are presented on a gross basis in Operating expenses with an equal amount of corresponding fees in Revenue. Excluding gross contract costs from both Fee revenue and Fee-based operating expenses more accurately reflects how the company manages its expense base and operating margins and also enables a more consistent performance assessment across a portfolio of contracts with varying payment terms and structures. Net Non-Cash Mortgage Servicing Rights ("MSR") and Mortgage Banking Derivative Activity consists of the balances presented within Revenue composed of (i) derivative gains/losses resulting from mortgage banking loan commitment and warehousing activity and (ii) gains recognized from the retention of MSR upon origination and sale of mortgage loans, offset by (iii) amortization of MSR intangible assets over the period that net servicing income is projected to be received. Non-cash derivative gains/losses resulting from mortgage banking loan commitment and warehousing activity are calculated as the estimated fair value of loan commitments and subsequent changes thereof, primarily represented by the estimated net cash flows associated with future servicing rights. MSR gains and corresponding MSR intangible assets are calculated as the present value of estimated cash flows over the estimated mortgage servicing periods. The above activity is reported entirely within Revenue of the Capital Markets service line of the Americas segment. Excluding net non-cash MSR and mortgage banking derivative activity reflects how the company manages and evaluates performance because the excluded activity is non-cash in nature. Restructuring and Acquisition Charges primarily consist of: (i) severance and employment-related charges, including those related to external service providers, incurred in conjunction with a structural business shift, which can be represented by a notable change in headcount, change in leadership or transformation of business processes; (ii) acquisition, transaction and integration-related charges, including fair value adjustments, which are generally non-cash in the periods such adjustments are made, to assets and liabilities recorded in purchase accounting such as earn-out liabilities and intangible assets; and (iii) lease exit charges. Such activity is excluded as the amounts are generally either non-cash in nature or the anticipated benefits from the expenditures would not likely be fully realized until future periods. Restructuring and acquisition charges are excluded from segment operating results and therefore not a line item in the segments’ reconciliation to Adjusted EBITDA. Amortization of Acquisition-Related Intangibles, primarily composed of the estimated fair value ascribed at closing of an acquisition to assets such as acquired management contracts, customer backlog and relationships, and trade name, is more notable following the company's increase in acquisition activity in recent years. Such non-cash activity is excluded as the change in period-over-period activity is generally the result of longer-term strategic decisions and therefore not necessarily indicative of core operating results. Gain on Disposition reflects the gain recognized on the sale of businesses. Given the low frequency of business disposals by the company historically, the gain directly associated with such activity is excluded as it is not considered indicative of core operating performance. In 2021, $12.0 million of the activity related to a JLL Technologies business disposition, with $0.4 million relating to a sold business within Markets Advisory, while activity in 2020 related to the sale of property management businesses in continental Europe.. 21

Thank you


