JLL Reports Financial Results for Fourth-Quarter and Full-Year 2024
Double-digit revenue growth and cost discipline throughout 2024 drove strong earnings per share expansion
CHICAGO, February 19, 2025 – Jones Lang LaSalle Incorporated (NYSE: JLL) today reported 2024 operating performance for the fourth quarter and full year. Transactional4 revenue growth again surpassed 20% and complemented Resilient4 business line revenues which delivered the fifth consecutive quarter of double-digit growth. For the fourth quarter, diluted earnings per share were $4.97, up $1.40 from the prior-year quarter; adjusted diluted earnings per share1 were $6.15, up $0.79. For the full year, diluted earnings per share were $11.30, up $6.63 from 2023, and adjusted diluted earnings per share1 were $14.01, up $3.62.
•Fourth-quarter revenue was $6.8 billion, up 16% in local currency1 with Transactional4 revenues up 22% and Resilient4 revenues up 13%
◦Capital Markets achieved 32% growth as momentum accelerated, notably in investment sales and debt advisory
◦Leasing, within Markets Advisory, increased 14% with broad-based growth across all asset classes
◦Work Dynamics delivered its fourth consecutive quarter of double-digit growth, led by Workplace Management and Project Management
•Revenue growth with continued cost discipline drove bottom-line and margin improvement for both the quarter and full year
•JLL generated $785 million of operating cash flows in 2024, an incremental $210 million over the prior year
"JLL delivered strong fourth-quarter and full-year 2024 financial results, led by an acceleration in transactional activity and sustained growth in resilient revenues. Throughout 2024, our focus on operating efficiency helped drive significant margin expansion and free cash flow generation,” said Christian Ulbrich, JLL CEO. “Clients continue to look to JLL for innovative real estate management solutions, industry expertise and data-driven insights. With our strong momentum amidst an improving real estate cycle, JLL’s talent and differentiated platform position us well to gain market share and drive profitable growth in 2025.”
| | | | | | | | | | | | | | | | | | | | | | | | | | | | | | | | | | | |
Summary Financial Results
($ in millions, except per share data, “LC” = local currency) | Three Months Ended December 31, | | Year Ended December 31, |
| 2024 | | 2023 | % Change in USD | % Change in LC | | 2024 | | 2023 | % Change in USD | % Change in LC |
| | | | | | | | | | | |
| Revenue | $ | 6,810.9 | | | $ | 5,881.4 | | 16 | % | 16 | % | | $ | 23,432.9 | | | $ | 20,760.8 | | 13 | % | 13 | % |
| | | | | | | | | | | |
| Net income attributable to common shareholders | $ | 241.2 | | | $ | 172.4 | | 40 | % | 44 | % | | $ | 546.8 | | | $ | 225.4 | | 143 | % | 149 | % |
Adjusted net income attributable to common shareholders1 | 298.3 | | | 259.1 | | 15 | | 18 | | | 677.5 | | | 501.8 | | 35 | | 38 | |
| | | | | | | | | | | |
| Diluted earnings per share | $ | 4.97 | | | $ | 3.57 | | 39 | % | 43 | % | | $ | 11.30 | | | $ | 4.67 | | 142 | % | 149 | % |
Adjusted diluted earnings per share1 | 6.15 | | | 5.36 | | 15 | | 17 | | | 14.01 | | | 10.39 | | 35 | | 38 | |
| | | | | | | | | | | |
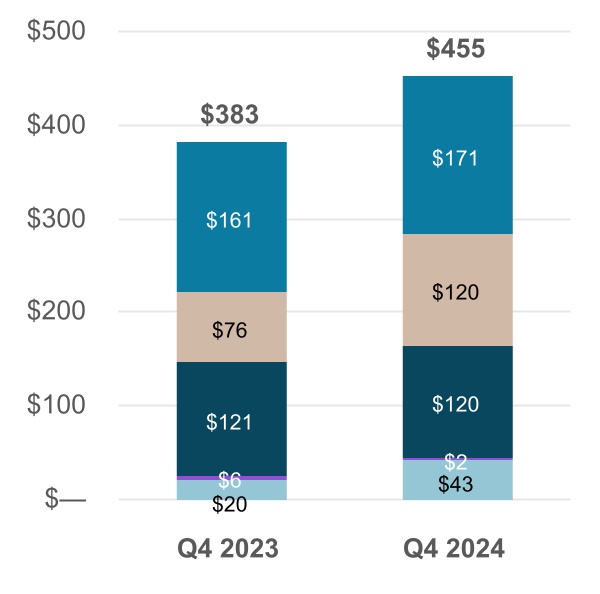
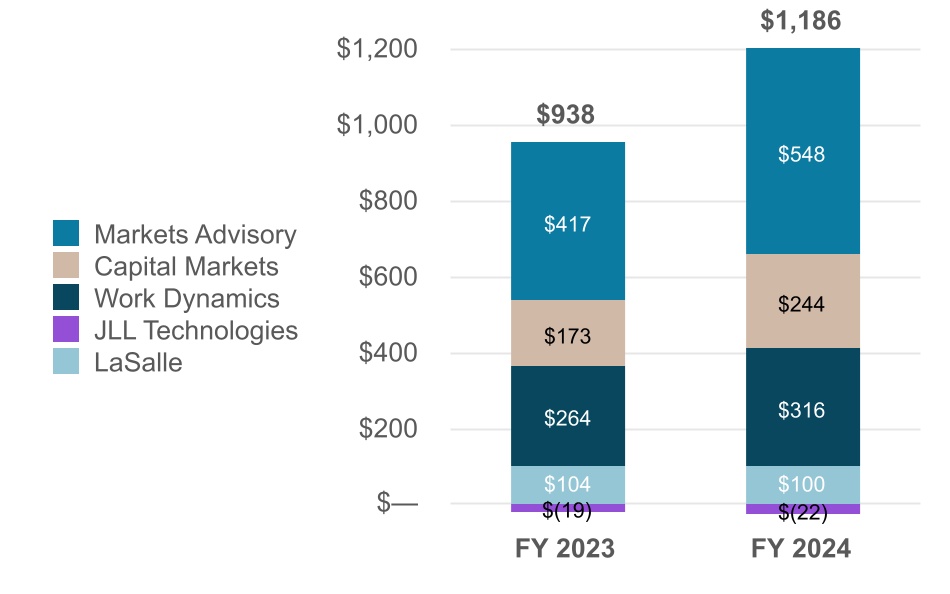
Adjusted EBITDA1 | $ | 454.8 | | | $ | 383.1 | | 19 | % | 20 | % | | $ | 1,186.3 | | | $ | 938.4 | | 26 | % | 28 | % |
| | | | | | | | | | | |
| Cash flows from operating activities | $ | 927.3 | | | $ | 729.4 | | 27 | % | n/a | | $ | 785.3 | | | $ | 575.8 | | 36 | % | n/a |
Free Cash Flow6 | 868.1 | | | 680.2 | | 28 | % | n/a | | 599.8 | | | 388.9 | | 54 | % | n/a |
Note: For discussion and reconciliation of non-GAAP financial measures, see the Notes following the Financial Statements in this news release.
JLL Reports Financial Results for Fourth-Quarter and Full-Year 2024 - Page 2
Consolidated 2024 Performance Highlights:
| | | | | | | | | | | | | | | | | | | | | | | | | | | | | | | | | | | | | | | | | | | | | | | |
Consolidated
($ in millions, “LC” = local currency)
| Three Months Ended December 31, | | % Change in USD | | % Change in LC | | Year Ended December 31, | | % Change in USD | | % Change in LC |
| 2024 | | 2023 | | | | 2024 | | 2023 | | |
| Markets Advisory | $ | 1,328.0 | | | $ | 1,197.4 | | | 11 | % | | 11 | % | | $ | 4,500.7 | | | $ | 4,121.6 | | | 9 | % | | 9 | % |
| Capital Markets | 706.4 | | | 537.1 | | | 32 | | | 32 | | | 2,040.4 | | | 1,778.0 | | | 15 | | | 15 | |
| Work Dynamics | 4,556.6 | | | 3,966.1 | | | 15 | | | 15 | | | 16,197.6 | | | 14,131.1 | | | 15 | | | 15 | |
| JLL Technologies | 59.3 | | | 65.5 | | | (9) | | | (9) | | | 226.3 | | | 246.4 | | | (8) | | | (8) | |
| LaSalle | 160.6 | | | 115.3 | | | 39 | | | 42 | | | 467.9 | | | 483.7 | | | (3) | | | (2) | |
| Total revenue | $ | 6,810.9 | | | $ | 5,881.4 | | | 16 | % | | 16 | % | | $ | 23,432.9 | | | $ | 20,760.8 | | | 13 | % | | 13 | % |
| Platform operating expenses | $ | 2,135.9 | | | $ | 1,859.7 | | | 15 | % | | 15 | % | | $ | 7,150.7 | | | $ | 6,707.7 | | | 7 | % | | 7 | % |
Gross contract costs6 | 4,283.1 | | | 3,709.7 | | | 15 | | | 16 | | | 15,391.0 | | | 13,375.9 | | | 15 | | | 15 | |
Restructuring and acquisition charges5 | 18.7 | | | 21.6 | | | (13) | | | (13) | | | 23.1 | | | 100.7 | | | (77) | | | (77) | |
| Total operating expenses | $ | 6,437.7 | | | $ | 5,591.0 | | | 15 | % | | 15 | % | | $ | 22,564.8 | | | $ | 20,184.3 | | | 12 | % | | 12 | % |
Net non-cash MSR and mortgage banking derivative activity1 | $ | 7.7 | | | $ | (8.7) | | | 189 | % | | 188 | % | | $ | (18.2) | | | $ | (18.2) | | | — | % | | — | % |
Adjusted EBITDA1 | $ | 454.8 | | | $ | 383.1 | | | 19 | % | | 20 | % | | $ | 1,186.3 | | | $ | 938.4 | | | 26 | % | | 28 | % |
| Note: For discussion and reconciliation of non-GAAP financial measures, see the Notes following the Financial Statements in this news release. Percentage variances in the Performance Highlights below are calculated and presented on a local currency basis, unless otherwise noted. |
JLL Reports Financial Results for Fourth-Quarter and Full-Year 2024 - Page 3
Revenue
Revenue increased 16% compared with the prior-year quarter. The collective 22% increase in Transactional revenue was led by (i) Investment Sales, Debt/Equity Advisory and Other, within Capital Markets, up 37% (excluding the impact of non-cash MSR and mortgage banking derivative activity), (ii) Project Management, within Work Dynamics, up 18%, and (iii) Leasing, within Markets Advisory, up 14%. Several businesses with Resilient revenues continued to deliver strong growth, collectively up 13%, highlighted by Workplace Management, within Work Dynamics, up 15%. Growth in these businesses meaningfully outpaced the 4% and 9% declines in LaSalle Advisory Fees and JLL Technologies, respectively.
On a full-year basis, revenue increased 13%. Resilient revenues grew 14% collectively, highlighted by Workplace Management, up 17%, and Property Management, within Markets Advisory, up 8%. Growth in these businesses outpaced declines in LaSalle Advisory Fees, down 7%, and JLL Technologies, down 8%. Fueled by a strong second half of 2024, Transactional revenues increased 11% collectively, led by (i) Leasing, up 11%, (ii) Investment Sales, Debt/Equity Advisory and Other, up 19% (excluding the impact of non-cash MSR and mortgage banking derivative activity), and (iii) Project Management, up 8%.
Refer to segment performance highlights for additional detail.
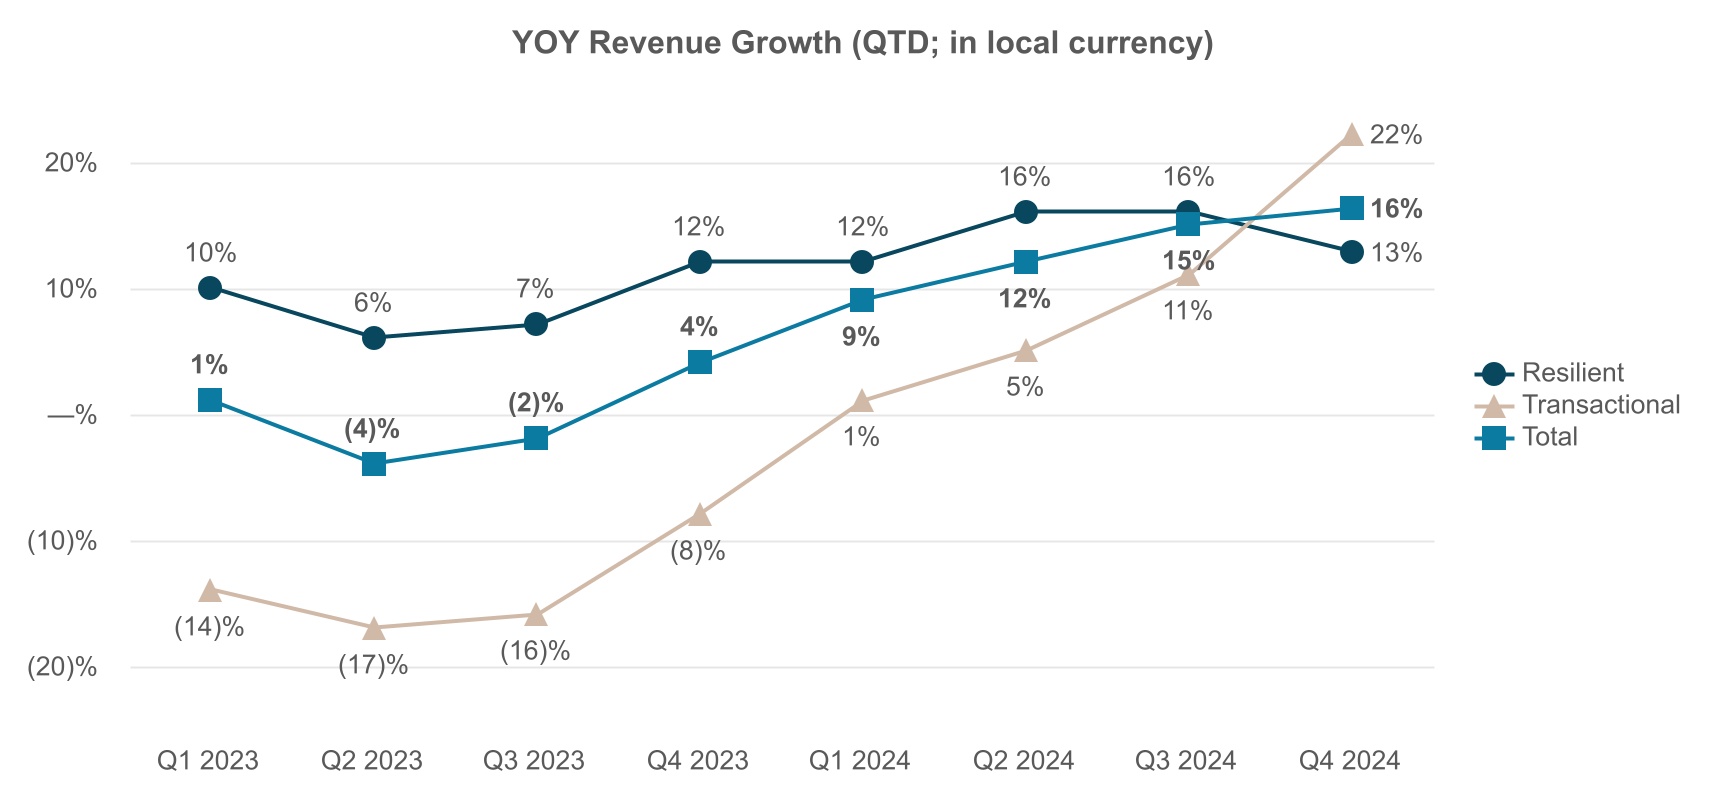
The following chart reflects the year-over-year change in revenue for each of the trailing eight quarters (QTD revenues, on a local currency basis). The chart shows the change in Transactional, Resilient and total revenue.
JLL Reports Financial Results for Fourth-Quarter and Full-Year 2024 - Page 4
Net income and Adjusted EBITDA
| | | | | | | | | | | | | | | | | | | | | | | | | | | | | | | | | | | |
($ in millions, except per share data, “LC” = local currency) | Three Months Ended December 31, | | Year Ended December 31, |
| 2024 | | 2023 | % Change in USD | % Change in LC | | 2024 | | 2023 | % Change in USD | % Change in LC |
| | | | | | | | | | | |
| Net income attributable to common shareholders | $ | 241.2 | | | $ | 172.4 | | 40 | % | 44 | % | | $ | 546.8 | | | $ | 225.4 | | 143 | % | 149 | % |
Adjusted net income attributable to common shareholders1 | 298.3 | | | 259.1 | | 15 | | 18 | | | 677.5 | | | 501.8 | | 35 | | 38 | |
| | | | | | | | | | | |
| Diluted earnings per share | $ | 4.97 | | | $ | 3.57 | | 39 | % | 43 | % | | $ | 11.30 | | | $ | 4.67 | | 142 | % | 149 | % |
Adjusted diluted earnings per share1 | 6.15 | | | 5.36 | | 15 | | 17 | | | 14.01 | | | 10.39 | | 35 | | 38 | |
| | | | | | | | | | | |
Adjusted EBITDA1 | $ | 454.8 | | | $ | 383.1 | | 19 | % | 20 | % | | $ | 1,186.3 | | | $ | 938.4 | | 26 | % | 28 | % |
| | | | | | | | | | | |
| Effective tax rate ("ETR") | 19.5 | % | | 19.6 | % | (10) bps | n/a | | 19.5 | % | | 10.2 | % | 930 bps | n/a |
For the fourth quarter, improved profit was largely driven by Transactional revenues (notably Investment Sales, Debt/Equity Advisory, Leasing and LaSalle incentive fees), partially offset by the impact of certain prior-year items including (i) the timing of incentive compensation accruals and (ii) an outsized actuarial benefit associated with U.S. medical self-insurance.
For the full year, profit expansion was primarily attributable to (i) higher revenues, both Transactional and certain Resilient revenue streams, including Workplace Management within Work Dynamics, and (ii) cost discipline and enhanced leverage of the company's platform. These drivers notably outpaced the $19.5 million expense associated with the Fannie Mae loan repurchase and the impact associated with an outsized prior-year actuarial benefit (noted in the quarterly highlights above). Refer to the segment performance highlights for additional detail.
The following charts reflect the aggregation of 2024 and 2023 segment Adjusted EBITDA for the fourth quarter and full year.
Aggregation of Segment Adjusted EBITDA (in millions)
JLL Reports Financial Results for Fourth-Quarter and Full-Year 2024 - Page 5
For the full year, the following items were the most notable year-over-year differences between net income and non-GAAP measures1:
•Total equity losses were $76.4 million in 2024, lower than the $201.7 million in 2023, primarily associated with JLL Technologies investments.
•Restructuring and acquisition charges were $77.6 million lower in 2024, compared with 2023, primarily due to (i) an expense credit in the third quarter of 2024 associated with a reduction to an acquisition-related earn-out and (ii) lower employment-related costs over the full year as significant cost-out actions were executed in 2023.
•The provision for income tax was $132.5 million in 2024, compared with $25.7 million in 2023. The 2023 ETR was unusually low due to relatively lower pre-tax earnings and the geographic mix of income, while the 2024 ETR reflects a more normal rate in JLL's recent history.
Cash Flows and Capital Allocation:
| | | | | | | | | | | | | | | | | | | | | | | | | | | | | |
($ in millions, except per share data, “LC” = local currency) | Three Months Ended December 31, | | Year Ended December 31, |
| 2024 | | 2023 | Change in USD | | 2024 | | 2023 | Change in USD |
| Cash flows from operating activities | $ | 927.3 | | | $ | 729.4 | | 27 | % | | $ | 785.3 | | | $ | 575.8 | | 36 | % |
Free Cash Flow6 | 868.1 | | | 680.2 | | 28 | % | | 599.8 | | | 388.9 | | 54 | % |
For the fourth quarter, higher cash flow performance was largely attributable to (i) improvements in Net reimbursables, (ii) higher commission and bonus accruals in the fourth quarter (versus payments made) and (iii) greater cash provided by earnings. These items were partially offset by an increase in receivables largely associated with year-over-year revenue growth.
For the full year, improved cash flow performance was primarily driven by (i) higher cash provided by earnings, (ii) higher commission and bonus accruals (versus payments made) and (iii) improvements in Net reimbursables. These were partially offset by an increase in receivables, $126.4 million of higher cash taxes paid and the repurchase of a loan from Fannie Mae.
Share repurchase activity is noted in the following table. As of December 31, 2024, $1,013.2 million remained authorized for repurchase.
| | | | | | | | | | | | | | | | | |
| Three Months Ended December 31, | | Year Ended December 31, 2024 |
| ($ in millions; shares in thousands) | 2024 | 2023 | | 2024 | 2023 |
| Total number of shares repurchased | 75.2 | | 147.8 | | | 373.1 | | 410.3 | |
| Total paid for shares repurchased | $ | 20.1 | | $ | 21.9 | | | $ | 80.4 | | $ | 62.0 | |
Net Debt, Leverage and Liquidity6:
| | | | | | | | | | | | | | | | | |
| December 31, 2024 | | September 30, 2024 | | December 31, 2023 |
| Total Net Debt (in millions) | $ | 800.6 | | | $ | 1,597.3 | | | $ | 1,150.3 | |
| Net Leverage Ratio | 0.7x | | 1.4x | | 1.2x |
| Corporate Liquidity (in millions) | $ | 3,616.3 | | | $ | 3,392.8 | | | $ | 3,085.0 | |
The decrease in Net Debt from September 30, 2024 reflected incremental cash flows from operating activities during the fourth quarter of 2024. The Net Debt reduction from December 31, 2023 was largely attributable to improved cash flows from operations in 2024 compared with 2023.
In addition to the Corporate Liquidity detailed above, the company maintains a commercial paper program (the "Program") with $2.5 billion authorized for issuance. As of December 31, 2024, there was $200.0 million outstanding under the Program.
JLL Reports Financial Results for Fourth-Quarter and Full-Year 2024 - Page 6
Markets Advisory 2024 Performance Highlights:
| | | | | | | | | | | | | | | | | | | | | | | | | | | | | | | | | | | | | | | | | | | | | | | |
Markets Advisory
($ in millions, “LC” = local currency)
| Three Months Ended December 31, | | % Change in USD | | % Change in LC | | Year Ended December 31, | | % Change in USD | | % Change in LC |
| 2024 | | 2023 | | | | 2024 | | 2023 | | |
| Revenue | $ | 1,328.0 | | | $ | 1,197.4 | | | 11 | % | | 11 | % | | $ | 4,500.7 | | | $ | 4,121.6 | | | 9 | % | | 9 | % |
| Leasing | 814.4 | | | 717.5 | | | 14 | | | 14 | | | 2,596.2 | | | 2,343.6 | | | 11 | | | 11 | |
| Property Management | 476.5 | | | 445.8 | | | 7 | | | 7 | | | 1,795.1 | | | 1,675.1 | | | 7 | | | 8 | |
| Advisory, Consulting and Other | 37.1 | | | 34.1 | | | 9 | | | 11 | | | 109.4 | | | 102.9 | | | 6 | | | 7 | |
| Segment operating expenses | $ | 1,175.0 | | | $ | 1,054.5 | | | 11 | % | | 12 | % | | $ | 4,020.7 | | | $ | 3,769.7 | | | 7 | % | | 7 | % |
| Segment platform operating expenses | 843.9 | | | 752.7 | | | 12 | | | 12 | | | 2,751.1 | | | 2,616.1 | | | 5 | | | 5 | |
Gross contract costs6 | 331.1 | | | 301.8 | | | 10 | | | 10 | | | 1,269.6 | | | 1,153.6 | | | 10 | | | 11 | |
Adjusted EBITDA1 | $ | 170.8 | | | $ | 160.5 | | | 6 | % | | 7 | % | | $ | 547.6 | | | $ | 416.6 | | | 31 | % | | 31 | % |
| Note: For discussion and reconciliation of non-GAAP financial measures, see the Notes following the Financial Statements in this news release. Percentage variances in the Performance Highlights below are calculated and presented on a local currency basis, unless otherwise noted. |
The broad-based increases in Markets Advisory revenue for the fourth quarter and full year were primarily driven by Leasing, led by the office sector. Many geographies achieved double-digit Leasing revenue growth for the quarter, most notably the U.S., India and Greater China2 (full-year growth leaders included the U.S., India and the UK). Globally, office leasing grew 20% over the prior quarter, outperforming market growth of 7% according to JLL Research. In addition, the number of large deals increased over the prior year in nearly all asset classes. Property Management revenue growth for the fourth quarter and full year was led by expansions in the U.S. and several countries in Asia Pacific, largely due to greater pass-through costs, as management fees were flat for the fourth quarter and increased low single-digits for the full year.
Higher fourth-quarter and full-year Adjusted EBITDA was largely driven by transactional revenue growth. The fourth-quarter increase in profit was adversely impacted by the timing of prior-year incentive compensation accruals. Compared with the quarter, full-year profit performance more meaningfully reflected greater platform leverage.
JLL Reports Financial Results for Fourth-Quarter and Full-Year 2024 - Page 7
Capital Markets 2024 Performance Highlights:
| | | | | | | | | | | | | | | | | | | | | | | | | | | | | | | | | | | | | | | | | | | | | | | |
Capital Markets
($ in millions, “LC” = local currency)
| Three Months Ended December 31, | | % Change in USD | | % Change in LC | | Year Ended December 31, | | % Change in USD | | % Change in LC |
| 2024 | | 2023 | | | | 2024 | | 2023 | | |
| Revenue | $ | 706.4 | | | $ | 537.1 | | | 32 | % | | 32 | % | | $ | 2,040.4 | | | $ | 1,778.0 | | | 15 | % | | 15 | % |
Investment Sales, Debt/Equity Advisory and Other, excluding Net non-cash MSR(a) | 547.7 | | | 400.0 | | | 37 | | | 37 | | | 1,524.4 | | | 1,279.8 | | | 19 | | | 19 | |
Net non-cash MSR and mortgage banking derivative activity (a) | 7.7 | | | (8.7) | | | 189 | | | 188 | | | (18.2) | | | (18.2) | | | — | | | — | |
| Value and Risk Advisory | 111.0 | | | 107.7 | | | 3 | | | 4 | | | 373.0 | | | 363.8 | | | 3 | | | 3 | |
| Loan Servicing | 40.0 | | | 38.1 | | | 5 | | | 5 | | | 161.2 | | | 152.6 | | | 6 | | | 6 | |
| Segment operating expenses | $ | 597.9 | | | $ | 487.8 | | | 23 | % | | 23 | % | | $ | 1,885.7 | | | $ | 1,696.9 | | | 11 | % | | 11 | % |
| Segment platform operating expenses | 586.2 | | | 474.2 | | | 24 | | | 24 | | | 1,837.1 | | | 1,649.4 | | | 11 | | | 11 | |
Gross contract costs6 | 11.7 | | | 13.6 | | | (14) | | | (14) | | | 48.6 | | | 47.5 | | | 2 | | | 3 | |
| Equity earnings | $ | 1.9 | | | $ | 0.6 | | | 217 | % | | 200 | % | | $ | 2.7 | | | $ | 6.7 | | | (60) | % | | (59) | % |
Adjusted EBITDA1 | $ | 119.9 | | | $ | 76.1 | | | 58 | % | | 60 | % | | $ | 244.4 | | | $ | 173.1 | | | 41 | % | | 42 | % |
| Note: For discussion and reconciliation of non-GAAP financial measures, see the Notes following the Financial Statements in this news release. Percentage variances in the Performance Highlights below are calculated and presented on a local currency basis, unless otherwise noted. |
| (a) Historically, net non-cash MSR and mortgage banking derivative activity was included in the Investment Sales, Debt/Equity Advisory and Other caption. Effective beginning Q2 2024, the net non-cash MSR and mortgage banking derivative activity revenue is separately presented in the above table and prior period financial information was recast to conform with this presentation. |
Capital Markets fourth-quarter and full-year top-line results were driven by Investment Sales, Debt/Equity Advisory and Other as investor sentiment and greater interest rate stability supported year-over-year accelerated activity. For the fourth quarter, this revenue growth was led by investment sales and debt advisory, most notably in the U.S. and Asia Pacific, across all asset classes, with residential and industrial leading the way. On a full-year basis, both investment sales and debt advisory achieved double-digit growth across most geographies. Investment sales in the U.S. grew approximately 60% for the quarter (approximately 30% for the full year), outperforming the broader market for U.S. investment sales, which grew 51% for the quarter (12% for the full year) according to JLL Research.
The Adjusted EBITDA improvement for the fourth quarter and full year was largely attributable to transactional revenue growth, described above, together with cost discipline. Full-year Adjusted EBITDA expansion was tempered by (i) the $19.5 million adverse impact associated with the August repurchase of a Fannie Mae loan, and (ii) $5.1 million higher non-cash expense attributable to the year-over-year change in loan loss credit reserves.
JLL Reports Financial Results for Fourth-Quarter and Full-Year 2024 - Page 8
Work Dynamics 2024 Performance Highlights:
| | | | | | | | | | | | | | | | | | | | | | | | | | | | | | | | | | | | | | | | | | | | | | | |
Work Dynamics
($ in millions, “LC” = local currency)
| Three Months Ended December 31, | | % Change in USD | | % Change in LC | | Year Ended December 31, | | % Change in USD | | % Change in LC |
| 2024 | | 2023 | | | | 2024 | | 2023 | | |
| Revenue | $ | 4,556.6 | | | $ | 3,966.1 | | | 15 | % | | 15 | % | | $ | 16,197.6 | | | $ | 14,131.1 | | | 15 | % | | 15 | % |
| Workplace Management | 3,472.3 | | | 3,018.5 | | | 15 | | | 15 | | | 12,529.7 | | | 10,706.2 | | | 17 | | | 17 | |
| Project Management | 936.1 | | | 798.3 | | | 17 | | | 18 | | | 3,151.9 | | | 2,924.8 | | | 8 | | | 8 | |
| Portfolio Services and Other | 148.2 | | | 149.3 | | | (1) | | | — | | | 516.0 | | | 500.1 | | | 3 | | | 3 | |
| Segment operating expenses | $ | 4,461.3 | | | $ | 3,866.0 | | | 15 | % | | 16 | % | | $ | 15,974.6 | | | $ | 13,947.3 | | | 15 | % | | 15 | % |
| Segment platform operating expenses | 533.4 | | | 482.1 | | | 11 | | | 11 | | | 1,944.7 | | | 1,815.9 | | | 7 | | | 7 | |
Gross contract costs6 | 3,927.9 | | | 3,383.9 | | | 16 | | | 16 | | | 14,029.9 | | | 12,131.4 | | | 16 | | | 16 | |
Adjusted EBITDA1 | $ | 120.0 | | | $ | 120.5 | | | — | % | | — | % | | $ | 316.3 | | | $ | 264.0 | | | 20 | % | | 20 | % |
| Note: For discussion and reconciliation of non-GAAP financial measures, see the Notes following the Financial Statements in this news release. Percentage variances in the Performance Highlights below are calculated and presented on a local currency basis, unless otherwise noted. |
Work Dynamics revenue growth for the fourth quarter and full year was led by continued strong performance in Workplace Management, largely from a balanced mix of client wins and mandate expansions, as well as incremental pass-through costs in the United States. For the fourth quarter, Project Management delivered double-digit revenue growth across geographies, as higher pass-through costs augmented management fee increases of nearly 10%. For the full year, Project Management revenue performance varied across geographies given shifts in business mix as management fees increased in the mid-single digits, supplemented by higher pass-through costs.
Adjusted EBITDA was flat for the fourth quarter as revenue growth was offset by (i) an approximately $13 million lower actuarial benefit associated with U.S. medical self-insurance compared with the prior-year quarter and (ii) incremental investments in our platform (including technology and artificial intelligence capabilities). Full-year Adjusted EBITDA expansion was driven by top-line performance, which more than overcame the fourth-quarter impacts described above as well as the U.S. state gross receipt tax expense reported in the third quarter of 2024.
JLL Reports Financial Results for Fourth-Quarter and Full-Year 2024 - Page 9
JLL Technologies 2024 Performance Highlights:
| | | | | | | | | | | | | | | | | | | | | | | | | | | | | | | | | | | | | | | | | | | | | | | |
JLL Technologies
($ in millions, “LC” = local currency)
| Three Months Ended December 31, | | % Change in USD | | % Change in LC | | Year Ended December 31, | | % Change in USD | | % Change in LC |
| 2024 | | 2023 | | | | 2024 | | 2023 | | |
| Revenue | $ | 59.3 | | | $ | 65.5 | | | (9) | % | | (9) | % | | $ | 226.3 | | | $ | 246.4 | | | (8) | % | | (8) | % |
| Segment operating expenses | $ | 64.8 | | | $ | 63.4 | | | 2 | % | | 3 | % | | $ | 276.1 | | | $ | 281.4 | | | (2) | % | | (2) | % |
| Segment platform operating expenses, excluding Carried interest | 64.9 | | | 64.3 | | | 1 | | | 1 | | | 267.9 | | | 280.7 | | | (5) | | | (5) | |
Carried interest (benefit) expense(a) | (1.6) | | | (4.4) | | | 64 | | | 64 | | | 2.7 | | | (13.8) | | | 120 | | | 120 | |
Gross contract costs6 | 1.5 | | | 3.5 | | | (57) | | | (55) | | | 5.5 | | | 14.5 | | | (62) | | | (62) | |
Adjusted EBITDA1 | $ | 1.5 | | | $ | 6.1 | | | (75) | % | | (72) | % | | $ | (22.3) | | | $ | (19.1) | | | (17) | % | | (15) | % |
| Note: For discussion and reconciliation of non-GAAP financial measures, see the Notes following the Financial Statements in this news release. Percentage variances in the Performance Highlights below are calculated and presented on a local currency basis, unless otherwise noted. |
| (a) Carried interest expense (benefit) is associated with equity earnings/losses on Spark Venture Funds investments. |
|
The fourth-quarter and full-year decreases in JLL Technologies revenue were due to lower contract signings in technology solutions over the past year, partially offset by modest growth in software services.
The fourth-quarter and full-year declines in Adjusted EBITDA were primarily attributable to lower revenue and the year-over-year change in carried interest expense/benefit.
JLL Reports Financial Results for Fourth-Quarter and Full-Year 2024 - Page 10
LaSalle 2024 Performance Highlights:
| | | | | | | | | | | | | | | | | | | | | | | | | | | | | | | | | | | | | | | | | | | | | | | |
LaSalle
($ in millions, “LC” = local currency)
| Three Months Ended December 31, | | % Change in USD | | % Change in LC | | Year Ended December 31, | | % Change in USD | | % Change in LC |
| 2024 | | 2023 | | | | 2024 | | 2023 | | |
| Revenue | $ | 160.6 | | | $ | 115.3 | | | 39 | % | | 42 | % | | $ | 467.9 | | | $ | 483.7 | | | (3) | % | | (2) | % |
| Advisory fees | 95.7 | | | 99.9 | | | (4) | | | (4) | | | 373.8 | | | 406.2 | | | (8) | | | (7) | |
| Transaction fees and other | 9.1 | | | 7.2 | | | 26 | | | 26 | | | 33.5 | | | 30.0 | | | 12 | | | 14 | |
| Incentive fees | 55.8 | | | 8.2 | | | 580 | | | 624 | | | 60.6 | | | 47.5 | | | 28 | | | 36 | |
| Segment operating expenses | $ | 120.0 | | | $ | 97.7 | | | 23 | % | | 25 | % | | $ | 384.6 | | | $ | 388.3 | | | (1) | % | | — | % |
| Segment platform operating expenses | 109.1 | | | 90.8 | | | 20 | | | 23 | | | 347.2 | | | 359.4 | | | (3) | | | (3) | |
Gross contract costs6 | 10.9 | | | 6.9 | | | 58 | | | 58 | | | 37.4 | | | 28.9 | | | 29 | | | 30 | |
Adjusted EBITDA1 | $ | 42.6 | | | $ | 19.9 | | | 114 | % | | 120 | % | | $ | 100.3 | | | $ | 103.8 | | | (3) | % | | 1 | % |
| Note: For discussion and reconciliation of non-GAAP financial measures, see the Notes following the Financial Statements in this news release. Percentage variances in the Performance Highlights below are calculated and presented on a local currency basis, unless otherwise noted. |
The fourth-quarter increase in LaSalle revenue was due to higher incentive fees earned on asset dispositions on behalf of clients in Asia Pacific. Lower fourth-quarter and full-year advisory fees reflected (i) reduced fees in Europe as a result of structural changes to a lower-margin business, as discussed in previous quarters, and (ii) declines in assets under management ("AUM") over the trailing twelve months. Revenue decreased on a full-year basis, as the decline in advisory fees was partially offset by the increased incentive fees.
The fourth-quarter increase in Adjusted EBITDA was driven by higher incentive fees, net of related variable compensation expense (included within segment platform operating expenses). On a full-year basis, Adjusted EBITDA was flat compared to the prior year, reflecting lower revenues and a few discrete, individually immaterial items, offset by (i) the 2024 benefit of cost management actions and (ii) an $8.2 million gain recognized in the second quarter of 2024 following the purchase of a controlling interest in a LaSalle-managed fund.
As of December 31, 2024, year-to-date AUM decreased nominally in USD (3% in local currency) while quarter-to-date AUM increased 5% in USD (2% in local currency). Changes in AUM are detailed in the tables below (in billions):
| | | | | | | | | | | | | | |
| Quarter-to-date | | Year-to-date |
| Beginning balance (September 30, 2024) | $ | 84.6 | | | Beginning balance (December 31, 2023) | $ | 89.0 | |
| Asset acquisitions/takeovers | 1.6 | | | Asset acquisitions/takeovers | 4.6 | |
| Asset dispositions/withdrawals | (1.1) | | | Asset dispositions/withdrawals | (5.3) | |
| Valuation changes | 1.2 | | | Valuation changes | (1.3) | |
| Foreign currency translation | 2.4 | | | Foreign currency translation | 2.4 | |
| Change in uncalled committed capital and cash held | 0.1 | | | Change in uncalled committed capital and cash held | (0.6) | |
| Ending balance (December 31, 2024) | $ | 88.8 | | | Ending balance (December 31, 2024) | $ | 88.8 | |
JLL Reports Financial Results for Fourth-Quarter and Full-Year 2024 - Page 11
About JLL
For over 200 years, JLL (NYSE: JLL), a leading global commercial real estate and investment management company, has helped clients buy, build, occupy, manage and invest in a variety of commercial, industrial, hotel, residential and retail properties. A Fortune 500® company with annual revenue of $23.4 billion and operations in over 80 countries around the world, our more than 112,000 employees bring the power of a global platform combined with local expertise. Driven by our purpose to shape the future of real estate for a better world, we help our clients, people and communities SEE A BRIGHTER WAYSM. JLL is the brand name, and a registered trademark, of Jones Lang LaSalle Incorporated. For further information, visit jll.com.
| | | | | | | | | | | |
| Live Webcast | | Conference Call |
Management will offer a live webcast for shareholders, analysts and investment professionals on Wednesday, February 19, 2025, at 9:00 a.m. Eastern. Following the live broadcast, an audio replay will be available. The link to the live webcast and audio replay can be accessed at the Investor Relations website: ir.jll.com. | | The conference call can be accessed live over the phone by dialing (888) 660-6392; the conference ID number is 5398158. Listeners are asked to please dial in 10 minutes prior to the call start time and provide the conference ID number to be connected. |
| | | |
| Supplemental Information | | Contact |
Supplemental information regarding the fourth quarter 2024 earnings call has been posted to the Investor Relations section of JLL's website: ir.jll.com. | | If you have any questions, please contact Brian Hogan, Interim Head of Investor Relations.
|
| Phone: | +1 312 252 8943 |
| Email: | JLLInvestorRelations@jll.com
|
| | | |
|
Cautionary Note Regarding Forward-Looking Statements
Statements in this news release regarding, among other things, future financial results and performance, achievements, plans, objectives and share repurchases may be considered forward-looking statements within the meaning of the Private Securities Litigation Reform Act of 1995. Such statements involve known and unknown risks, uncertainties, and other factors, the occurrence of which are outside JLL's control which may cause JLL's actual results, performance, achievements, plans, and objectives to be materially different from those expressed or implied by such forward-looking statements. For additional information concerning risks, uncertainties, and other factors that could cause actual results to differ materially from those anticipated in forward-looking statements, and risks to JLL's business in general, please refer to those factors discussed under "Risk Factors," “Business,” “Management’s Discussion and Analysis of Financial Condition and Results of Operations,” “Quantitative and Qualitative Disclosures about Market Risk,” and elsewhere in JLL's Annual Report on Form 10-K and other reports filed with the Securities and Exchange Commission. Any forward-looking statements speak only as of the date of this release, and except to the extent required by applicable securities laws, JLL expressly disclaims any obligation or undertaking to publicly update or revise any forward-looking statements contained herein to reflect any change in expectations or results, new information, developments or any change in events.
| | | | | | | | | | | | | | | | | | | | | | | |
| JONES LANG LASALLE INCORPORATED |
| Consolidated Statements of Operations (Unaudited) |
|
| Three Months Ended December 31, | | Year Ended December 31, |
| (in millions, except share and per share data) | 2024 | | 2023 | | 2024 | | 2023 |
| | | | | | | |
| Revenue | $ | 6,810.9 | | | $ | 5,881.4 | | | $ | 23,432.9 | | | $ | 20,760.8 | |
| | | | | | | |
| Operating expenses: | | | | | | | |
| Compensation and benefits | $ | 3,125.3 | | | $ | 2,666.1 | | | $ | 10,994.7 | | | $ | 9,770.7 | |
| Operating, administrative and other | 3,226.7 | | | 2,841.4 | | | 11,291.2 | | | 10,074.5 | |
| Depreciation and amortization | 67.0 | | | 61.9 | | | 255.8 | | | 238.4 | |
Restructuring and acquisition charges5 | 18.7 | | | 21.6 | | | 23.1 | | | 100.7 | |
| Total operating expenses | $ | 6,437.7 | | | $ | 5,591.0 | | | $ | 22,564.8 | | | $ | 20,184.3 | |
| | | | | | | |
| Operating income | $ | 373.2 | | | $ | 290.4 | | | $ | 868.1 | | | $ | 576.5 | |
| | | | | | | |
| Interest expense, net of interest income | 26.6 | | | 31.5 | | | 136.9 | | | 135.4 | |
| Equity losses | (50.8) | | | (76.8) | | | (70.8) | | | (194.1) | |
| Other income | 4.8 | | | 3.0 | | | 18.9 | | | 4.9 | |
| | | | | | | |
| Income before income taxes and noncontrolling interest | 300.6 | | | 185.1 | | | 679.3 | | | 251.9 | |
| Income tax provision | 58.7 | | | 12.7 | | | 132.5 | | | 25.7 | |
| Net income | 241.9 | | | 172.4 | | | 546.8 | | | 226.2 | |
| | | | | | | |
| Net income attributable to noncontrolling interest | 0.7 | | | — | | | — | | | 0.8 | |
| | | | | | | |
| Net income attributable to common shareholders | $ | 241.2 | | | $ | 172.4 | | | $ | 546.8 | | | $ | 225.4 | |
| | | | | | | |
| Basic earnings per common share | $ | 5.07 | | | $ | 3.63 | | | $ | 11.51 | | | $ | 4.73 | |
| Basic weighted average shares outstanding (in 000's) | 47,533 | | | 47,548 | | | 47,493 | | | 47,628 | |
| | | | | | | |
| Diluted earnings per common share | $ | 4.97 | | | $ | 3.57 | | | $ | 11.30 | | | $ | 4.67 | |
| Diluted weighted average shares outstanding (in 000's) | 48,534 | | | 48,324 | | | 48,372 | | | 48,288 | |
| | | | | | | |
| Please reference accompanying financial statement notes. |
| | | | | | | | | | | | | | | | | | | | | | | |
| JONES LANG LASALLE INCORPORATED |
| Selected Segment Financial Data (Unaudited) |
| Three Months Ended December 31, | | Year Ended December 31, |
| (in millions) | 2024 | | 2023 | | 2024 | | 2023 |
| MARKETS ADVISORY | | | | | | | |
| Revenue | $ | 1,328.0 | | | $ | 1,197.4 | | | $ | 4,500.7 | | | $ | 4,121.6 | |
| | | | | | | |
| Platform compensation and benefits | $ | 720.8 | | | $ | 639.6 | | | $ | 2,309.2 | | | $ | 2,178.2 | |
| Platform operating, administrative and other | 105.2 | | | 94.9 | | | 371.9 | | | 368.3 | |
| Depreciation and amortization | 17.9 | | | 18.2 | | | 70.0 | | | 69.6 | |
| Segment platform operating expenses | 843.9 | | | 752.7 | | | 2,751.1 | | | 2,616.1 | |
Gross contract costs6 | 331.1 | | | 301.8 | | | 1,269.6 | | | 1,153.6 | |
| Segment operating expenses | $ | 1,175.0 | | | $ | 1,054.5 | | | $ | 4,020.7 | | | $ | 3,769.7 | |
| Segment operating income | $ | 153.0 | | | $ | 142.9 | | | $ | 480.0 | | | $ | 351.9 | |
| Add: | | | | | | | |
| Equity earnings (losses) | 0.2 | | | (0.8) | | | 0.7 | | | (0.5) | |
Depreciation and amortization(a) | 17.0 | | | 17.1 | | | 66.2 | | | 65.6 | |
| Other income | 1.9 | | | 2.0 | | | 4.9 | | | 2.5 | |
| Net income attributable to noncontrolling interest | (0.3) | | | — | | | (0.8) | | | (0.8) | |
| Adjustments: | | | | | | | |
| Net (gain) loss on disposition | — | | | — | | | — | | | 0.9 | |
| Interest on employee loans, net of forgiveness | (1.0) | | | (0.7) | | | (3.4) | | | (3.0) | |
Adjusted EBITDA1 | $ | 170.8 | | | $ | 160.5 | | | $ | 547.6 | | | $ | 416.6 | |
| | | | | | | |
| (a) This adjustment excludes the noncontrolling interest portion of amortization of acquisition-related intangibles which is not attributable to common shareholders. |
| | | | | | | | | | | | | | | | | | | | | | | |
| JONES LANG LASALLE INCORPORATED |
| Selected Segment Financial Data (Unaudited) Continued |
| Three Months Ended December 31, | | Year Ended December 31, |
| (in millions) | 2024 | | 2023 | | 2024 | | 2023 |
| CAPITAL MARKETS | | | | | | | |
| Revenue | $ | 706.4 | | | $ | 537.1 | | | $ | 2,040.4 | | | $ | 1,778.0 | |
| | | | | | | |
| Platform compensation and benefits | $ | 497.7 | | | $ | 394.6 | | | $ | 1,491.9 | | | $ | 1,337.7 | |
| Platform operating, administrative and other | 72.0 | | | 62.5 | | | 278.4 | | | 246.1 | |
| Depreciation and amortization | 16.5 | | | 17.1 | | | 66.8 | | | 65.6 | |
| Segment platform operating expenses | 586.2 | | | 474.2 | | | 1,837.1 | | | 1,649.4 | |
Gross contract costs6 | 11.7 | | | 13.6 | | | 48.6 | | | 47.5 | |
| Segment operating expenses | $ | 597.9 | | | $ | 487.8 | | | $ | 1,885.7 | | | $ | 1,696.9 | |
| Segment operating income | $ | 108.5 | | | $ | 49.3 | | | $ | 154.7 | | | $ | 81.1 | |
| Add: | | | | | | | |
| Equity earnings | 1.9 | | | 0.6 | | | 2.7 | | | 6.7 | |
| Depreciation and amortization | 16.5 | | | 17.1 | | | 66.8 | | | 65.6 | |
| Other income | 1.5 | | | 1.0 | | | 4.5 | | | 2.5 | |
| Adjustments: | | | | | | | |
| Net non-cash MSR and mortgage banking derivative activity | (7.7) | | | 8.7 | | | 18.2 | | | 18.2 | |
| Interest on employee loans, net of forgiveness | (0.8) | | | (0.6) | | | (2.5) | | | (0.6) | |
| Gain on disposition | — | | | — | | | — | | | (0.4) | |
Adjusted EBITDA1 | $ | 119.9 | | | $ | 76.1 | | | $ | 244.4 | | | $ | 173.1 | |
| | | | | | | |
|
| | | | | | | | | | | | | | | | | | | | | | | |
| JONES LANG LASALLE INCORPORATED |
| Selected Segment Financial Data (Unaudited) Continued |
| Three Months Ended December 31, | | Year Ended December 31, |
| (in millions) | 2024 | | 2023 | | 2024 | | 2023 |
| WORK DYNAMICS | | | | | | | |
| Revenue | $ | 4,556.6 | | | $ | 3,966.1 | | | $ | 16,197.6 | | | $ | 14,131.1 | |
| | | | | | | |
| Platform compensation and benefits | $ | 383.4 | | | $ | 346.2 | | | $ | 1,385.8 | | | $ | 1,305.1 | |
| Platform operating, administrative and other | 125.2 | | | 115.6 | | | 467.8 | | | 431.6 | |
| Depreciation and amortization | 24.8 | | | 20.3 | | | 91.1 | | | 79.2 | |
| Segment platform operating expenses | 533.4 | | | 482.1 | | | 1,944.7 | | | 1,815.9 | |
Gross contract costs6 | 3,927.9 | | | 3,383.9 | | | 14,029.9 | | | 12,131.4 | |
| Segment operating expenses | $ | 4,461.3 | | | $ | 3,866.0 | | | $ | 15,974.6 | | | $ | 13,947.3 | |
| Segment operating income | $ | 95.3 | | | $ | 100.1 | | | $ | 223.0 | | | $ | 183.8 | |
| Add: | | | | | | | |
| Equity earnings | 0.1 | | | 0.1 | | | 2.2 | | | 1.4 | |
| Depreciation and amortization | 24.8 | | | 20.3 | | | 91.1 | | | 79.2 | |
| Net income attributable to noncontrolling interest | (0.2) | | | — | | | — | | | (0.4) | |
Adjusted EBITDA1 | $ | 120.0 | | | $ | 120.5 | | | $ | 316.3 | | | $ | 264.0 | |
| | | | | | | |
| | | | | | | | | | | | | | | | | | | | | | | |
| JONES LANG LASALLE INCORPORATED |
| Selected Segment Financial Data (Unaudited) Continued |
| Three Months Ended December 31, | | Year Ended December 31, |
| (in millions) | 2024 | | 2023 | | 2024 | | 2023 |
| JLL TECHNOLOGIES | | | | | | | |
| Revenue | $ | 59.3 | | | $ | 65.5 | | | $ | 226.3 | | | $ | 246.4 | |
| | | | | | | |
Platform compensation and benefits(a) | $ | 45.9 | | | $ | 45.4 | | | $ | 197.0 | | | $ | 200.7 | |
| Platform operating, administrative and other | 12.2 | | | 10.5 | | | 54.2 | | | 50.3 | |
| Depreciation and amortization | 5.2 | | | 4.0 | | | 19.4 | | | 15.9 | |
| Segment platform operating expenses | 63.3 | | | 59.9 | | | 270.6 | | | 266.9 | |
Gross contract costs6 | 1.5 | | | 3.5 | | | 5.5 | | | 14.5 | |
| Segment operating expenses | $ | 64.8 | | | $ | 63.4 | | | $ | 276.1 | | | $ | 281.4 | |
| Segment operating (loss) income | $ | (5.5) | | | $ | 2.1 | | | $ | (49.8) | | | $ | (35.0) | |
| Add: | | | | | | | |
| Depreciation and amortization | 5.2 | | | 4.0 | | | 19.4 | | | 15.9 | |
| Other income | 1.7 | | | — | | | 1.7 | | | — | |
| Net income attributable to noncontrolling interest | 0.1 | | | — | | | 0.1 | | | — | |
| Adjustments: | | | | | | | |
| Credit losses on convertible note investments | — | | | — | | | 6.3 | | | — | |
Adjusted EBITDA1 | $ | 1.5 | | | $ | 6.1 | | | $ | (22.3) | | | $ | (19.1) | |
| Equity losses | $ | (55.4) | | | $ | (75.0) | | | $ | (53.8) | | | $ | (177.0) | |
| (a) Included in Segment platform operating expenses is a carried interest benefit of $1.6 million for the three months ended December 31, 2024 and carried interest expense of $2.7 million for the twelve months ended December 31, 2024, and a carried interest benefit of $4.4 million and $13.8 million for the three and twelve months ended December 31, 2023. Carried interest expense (benefit) is associated with equity earnings/losses on Spark Venture Funds investments. |
|
| | | | | | | | | | | | | | | | | | | | | | | |
| JONES LANG LASALLE INCORPORATED |
| Selected Segment Financial Data (Unaudited) Continued |
| Three Months Ended December 31, | | Year Ended December 31, |
| (in millions) | 2024 | | 2023 | | 2024 | | 2023 |
| LASALLE | | | | | | | |
| Revenue | $ | 160.6 | | | $ | 115.3 | | | $ | 467.9 | | | $ | 483.7 | |
| | | | | | | |
| Platform compensation and benefits | $ | 88.8 | | | $ | 72.2 | | | $ | 268.9 | | | $ | 288.7 | |
| Platform operating, administrative and other | 17.7 | | | 16.3 | | | 69.8 | | | 62.6 | |
| Depreciation and amortization | 2.6 | | | 2.3 | | | 8.5 | | | 8.1 | |
| Segment platform operating expenses | 109.1 | | | 90.8 | | | 347.2 | | | 359.4 | |
Gross contract costs6 | 10.9 | | | 6.9 | | | 37.4 | | | 28.9 | |
| Segment operating expenses | $ | 120.0 | | | $ | 97.7 | | | $ | 384.6 | | | $ | 388.3 | |
| Segment operating income | $ | 40.6 | | | $ | 17.6 | | | $ | 83.3 | | | $ | 95.4 | |
| Add: | | | | | | | |
| Depreciation and amortization | 2.6 | | | 2.3 | | | 8.5 | | | 8.1 | |
| Other (expense) income | (0.3) | | | — | | | 7.8 | | | (0.1) | |
| Net (income) loss attributable to noncontrolling interest | (0.3) | | | — | | | 0.7 | | | 0.4 | |
Adjusted EBITDA1 | $ | 42.6 | | | $ | 19.9 | | | $ | 100.3 | | | $ | 103.8 | |
| Equity earnings (losses) | $ | 2.4 | | | $ | (1.7) | | | $ | (22.6) | | | $ | (24.7) | |
| | | | | | | | | | | | | | | | | | | | | | | | | | |
| JONES LANG LASALLE INCORPORATED |
| Consolidated Statement of Cash Flows |
| | | | | | | | |
| Year Ended December 31, | | | Year Ended December 31, |
| (in millions) | 2024 | | 2023 | | | 2024 | | 2023 |
| Cash flows from operating activities: | | | | | Cash flows from investing activities: | | | |
| Net income | $ | 546.8 | | | $ | 226.2 | | | Net capital additions – property and equipment | $ | (185.5) | | | $ | (186.9) | |
| Reconciliation of net income to net cash provided by operating activities: | | | | | Business acquisitions, net of cash acquired | (60.9) | | | (13.6) | |
| Depreciation and amortization | 255.8 | | | 238.4 | | | Capital contributions to investments | (88.6) | | | (109.4) | |
| Equity losses | 70.8 | | | 194.1 | | | Distributions of capital from investments | 19.2 | | | 23.7 | |
| Net loss on dispositions | — | | | 0.5 | | | Acquisition of controlling interest, net of cash acquired | 3.7 | | | — | |
| Distributions of earnings from investments | 17.7 | | | 12.4 | | | Other, net | (4.7) | | | (4.2) | |
| Provision for loss on receivables and other assets | 38.0 | | | 20.3 | | | Net cash used in investing activities | (316.8) | | | (290.4) | |
| Amortization of stock-based compensation | 97.4 | | | 78.3 | | | Cash flows from financing activities: | | | |
| Net non-cash mortgage servicing rights and mortgage banking derivative activity | 18.2 | | | 18.2 | | | Proceeds from borrowings under credit facility | 8,043.0 | | | 7,684.0 | |
| Accretion of interest and amortization of debt issuance costs | 5.5 | | | 4.3 | | | Repayments of borrowings under credit facility | (8,568.0) | | | (8,284.0) | |
| Other, net | 0.1 | | | 17.5 | | | Proceeds from issuance of commercial paper | 910.0 | | | — | |
| Change in: | | | | | Repayments of commercial paper | (710.0) | | | — | |
| Receivables | (207.9) | | | 11.1 | | | Proceeds from issuance of senior notes | — | | | 400.0 |
| Reimbursable receivables and reimbursable payables | (4.6) | | | (93.3) | | | Net proceeds from (repayments of) short-term borrowings | 2.9 | | | (24.8) | |
| Prepaid expenses and other assets | (81.6) | | | (24.0) | | | Payments of deferred business acquisition obligations and earn-outs | (7.4) | | | (26.6) | |
| Income taxes receivable, payable and deferred | (137.6) | | | (138.8) | | | Shares repurchased for payment of employee taxes on stock awards | (31.8) | | | (30.6) | |
| Accounts payable, accrued liabilities and other liabilities | 36.2 | | | 78.5 | | | Repurchase of common stock | (80.7) | | | (61.6) | |
| Accrued compensation (including net deferred compensation) | 130.5 | | | (67.9) | | | Noncontrolling interest distributions, net | (0.1) | | | (6.5) | |
| Net cash provided by operating activities | $ | 785.3 | | | $ | 575.8 | | | Other, net | (9.1) | | | (24.2) | |
| | | | | Net cash used in financing activities | (451.2) | | | (374.3) | |
| | | | | Effect of currency exchange rate changes on cash, cash equivalents and restricted cash | (28.0) | | | 6.3 | |
| | | | | Net change in cash, cash equivalents and restricted cash | $ | (10.7) | | | $ | (82.6) | |
| | | | | Cash, cash equivalents and restricted cash, beginning of the period | 663.4 | | | 746.0 | |
| | | | | Cash, cash equivalents and restricted cash, end of the period | $ | 652.7 | | | $ | 663.4 | |
| | | | | | | | |
| | | | | | | | |
| | | | | | | | |
| | | | | | | | |
| | | | | | | | |
| . | | | | | | | | |
| | | | | | | | |
| | | | | | | | |
| Please reference accompanying financial statement notes. |
| | | | | | | | |
| | | | | | | | | | | | | | | | | | | | | | | | | | | | | | | | | | | | | | | | |
| JONES LANG LASALLE INCORPORATED | | |
| Consolidated Balance Sheets | | |
| | |
| December 31, | | December 31, | | | December 31, | | December 31, | | |
| (in millions, except share and per share data) | 2024 | | 2023 | | | 2024 | | 2023 | | |
| ASSETS | | | | | LIABILITIES AND EQUITY | | | | | |
| Current assets: | | | | | Current liabilities: | | | | | |
| Cash and cash equivalents | $ | 416.3 | | | $ | 410.0 | | | | Accounts payable and accrued liabilities | $ | 1,322.7 | | | $ | 1,406.7 | | | |
| Trade receivables, net of allowance | 2,153.5 | | | 2,095.8 | | | | Reimbursable payables | 2,176.3 | | | 1,796.9 | | | |
| Notes and other receivables | 456.9 | | | 446.4 | | | | Accrued compensation and benefits | 1,768.5 | | | 1,698.3 | | | |
| Reimbursable receivables | 2,695.0 | | | 2,321.7 | | | | Short-term borrowings | 153.8 | | | 147.9 | | | |
| Warehouse receivables | 770.7 | | | 677.4 | | | | Commercial paper, net of debt issuance costs | 199.3 | | | — | | | |
| Short-term contract assets, net of allowance | 334.8 | | | 338.3 | | | | Short-term contract liability and deferred income | 203.8 | | | 226.4 | | | |
| Restricted cash, prepaid and other | 651.3 | | | 567.4 | | | | Warehouse facilities | 841.0 | | | 662.7 | | | |
| | Total current assets | 7,478.5 | | | 6,857.0 | | | | Short-term operating lease liability | 157.2 | | | 161.9 | | | |
| Property and equipment, net of accumulated depreciation | 598.1 | | | 613.9 | | | | Other | 321.9 | | | 345.3 | | | |
| Operating lease right-of-use asset | 743.1 | | | 730.9 | | | | | Total current liabilities | 7,144.5 | | | 6,446.1 | | | |
| Goodwill | 4,611.3 | | | 4,587.4 | | | Noncurrent liabilities: | | | | | |
| Identified intangibles, net of accumulated amortization | 724.1 | | | 785.0 | | | | Credit facility, net of debt issuance costs | 88.6 | | | 610.6 | | | |
| Investments | 812.7 | | | 816.6 | | | | Long-term debt, net of debt issuance costs | 756.7 | | | 779.3 | | | |
| Long-term receivables | 394.7 | | | 363.8 | | | | Long-term deferred tax liabilities, net | 45.6 | | | 44.8 | | | |
| Deferred tax assets, net | 518.2 | | | 497.4 | | | | Deferred compensation | 665.4 | | | 580.0 | | | |
| Deferred compensation plans | 664.0 | | | 604.3 | | | | Long-term operating lease liability | 748.8 | | | 754.5 | | | |
| Other | 219.1 | | | 208.5 | | | | Other | 419.1 | | | 439.6 | | | |
| | Total assets | $ | 16,763.8 | | | $ | 16,064.8 | | | | | Total liabilities | $ | 9,868.7 | | | $ | 9,654.9 | | | |
| | | | | | | | | | | | | | |
| | | | | | | | | | | | | | |
| | | | | | | |
| | | | | | | | | |
| | Company shareholders' equity | | | | | |
| | | Common stock | 0.5 | | | 0.5 | | | |
| | | Additional paid-in capital | 2,032.7 | | | 2,019.7 | | | |
| | | Retained earnings | 6,334.9 | | | 5,795.6 | | | |
| | | Treasury stock | (937.9) | | | (920.1) | | | |
| | | Shares held in trust | (11.8) | | | (10.4) | | | |
| | | Accumulated other comprehensive loss | (646.9) | | | (591.5) | | | |
| | | | Total company shareholders' equity | 6,771.5 | | | 6,293.8 | | | |
| | | Noncontrolling interest | 123.6 | | | 116.1 | | | |
| | | | Total equity | 6,895.1 | | | 6,409.9 | | | |
| | | | Total liabilities and equity | $ | 16,763.8 | | | $ | 16,064.8 | | | |
| | | | | | | | | | | | | | |
| Please reference accompanying financial statement notes. | | |
JONES LANG LASALLE INCORPORATED
Financial Statement Notes
1. Management uses certain non-GAAP financial measures to develop budgets and forecasts, measure and reward performance against those budgets and forecasts, and enhance comparability to prior periods. These measures are believed to be useful to investors and other external stakeholders as supplemental measures of core operating performance and include the following:
(i)Adjusted EBITDA attributable to common shareholders ("Adjusted EBITDA"),
(ii)Adjusted net income attributable to common shareholders and Adjusted diluted earnings per share,
(iii)Free Cash Flow (refer to Note 6),
(iv)Net Debt (refer to Note 6) and
(v)Percentage changes against prior periods, presented on a local currency basis.
However, non-GAAP financial measures should not be considered alternatives to measures determined in accordance with U.S. generally accepted accounting principles (“GAAP”). Any measure that eliminates components of a company’s capital structure, cost of operations or investments, or other results has limitations as a performance measure. In light of these limitations, management also considers GAAP financial measures and does not rely solely on non-GAAP financial measures. Because the company's non-GAAP financial measures are not calculated in accordance with GAAP, they may not be comparable to similarly titled measures used by other companies.
Effective January 1, 2024, the definitions of Adjusted EBITDA and Adjusted net income attributable to common shareholders were updated to exclude certain equity earnings/losses as further described below. Comparable periods have been recast to conform to the revised presentation.
Also effective with first-quarter 2024 reporting, the company no longer reports the non-GAAP measures "Fee revenue" and "Fee-based operating expenses" following the conclusion of a comment letter from the Securities and Exchange Commission Staff in February 2024.
Adjustments to GAAP Financial Measures Used to Calculate non-GAAP Financial Measures
Net Non-Cash Mortgage Servicing Rights ("MSR") and Mortgage Banking Derivative Activity consists of the balances presented within Revenue composed of (i) derivative gains/losses resulting from mortgage banking loan commitment and warehousing activity and (ii) gains recognized from the retention of MSR upon origination and sale of mortgage loans, offset by (iii) amortization of MSR intangible assets over the period that net servicing income is projected to be received. Non-cash derivative gains/losses resulting from mortgage banking loan commitment and warehousing activity are calculated as the estimated fair value of loan commitments and subsequent changes thereof, primarily represented by the estimated net cash flows associated with future servicing rights. MSR gains and corresponding MSR intangible assets are calculated as the present value of estimated cash flows over the estimated mortgage servicing periods. The above activity is reported entirely within Revenue of the Capital Markets segment. Excluding net non-cash MSR and mortgage banking derivative activity reflects how the company manages and evaluates performance because the excluded activity is non-cash in nature.
Restructuring and Acquisition Charges primarily consist of: (i) severance and employment-related charges, including those related to external service providers, incurred in conjunction with a structural business shift, which can be represented by a notable change in headcount, change in leadership or transformation of business processes; (ii) acquisition, transaction and integration-related charges, including fair value adjustments, which are generally non-cash in the periods such adjustments are made, to assets and liabilities recorded in purchase accounting such as earn-out liabilities and intangible assets; and (iii) lease exit charges. Such activity is excluded as the amounts are generally either non-cash in nature or the anticipated benefits from the expenditures would not likely be fully realized until future periods. Restructuring and acquisition charges are excluded from segment operating results and therefore are not line items in the segments’ reconciliation to Adjusted EBITDA.
Amortization of Acquisition-Related Intangibles is primarily associated with the fair value ascribed at closing of an acquisition to assets such as acquired management contracts, customer backlog and relationships, and trade name. Such activity is excluded as it is non-cash and the change in period-over-period activity is generally the result of longer-term strategic decisions and therefore not necessarily indicative of core operating results.
Gain or Loss on Disposition reflects the gain or loss recognized on the sale of businesses. Given the low frequency of business disposals by the company historically, the gain or loss directly associated with such activity is excluded as it is not considered indicative of core operating performance. In 2023, the $0.5 million net loss included $1.8 million of loss related to the disposition of a business in Markets Advisory, partially offset by a $1.3 million gain related to the disposition of a business in Markets Advisory and Capital Markets.
Interest on Employee Loans, Net of Forgiveness reflects interest accrued on employee loans less the amount of accrued interest forgiven. Certain employees (predominantly in our Leasing and Capital Markets businesses) receive cash payments structured as loans, with interest. Employees earn forgiveness of the loan based on performance, generally calculated as a percentage of revenue production. Such forgiven amounts are reflected in Compensation and benefits expense. Given the interest accrued on these employee loans and subsequent forgiveness are non-cash and the amounts perfectly offset over the life of the loan, the activity is not indicative of core operating performance and is excluded from non-GAAP measures.
Equity Earnings/Losses (JLL Technologies and LaSalle) primarily reflects valuation changes on investments reported at fair value. Investments reported at fair value are increased or decreased each reporting period by the change in the fair value of the investment. Where the measurement alternative has been elected, our investment is increased or decreased upon observable price changes. Such activity is excluded as the amounts are generally non‑cash in nature and not indicative of core operating performance.
Note: Equity earnings/losses in the remaining segments represent the results of unconsolidated operating ventures (not investments), and therefore the amounts are included in adjusted profit measures on both a segment and consolidated basis.
Credit Losses on Convertible Note Investments reflects credit impairments associated with pre-equity convertible note investments in early-stage proptech enterprises. Such losses are similar to the equity investment-related losses included in equity earnings/losses for JLL Technologies' investments and are therefore consistently excluded from adjusted measures.
Reconciliation of Non-GAAP Financial Measures
Below are (i) a reconciliation of Net income attributable to common shareholders to Adjusted EBITDA, (ii) a reconciliation to Adjusted net income and (iii) components of Adjusted diluted earnings per share.
| | | | | | | | | | | | | | | | | | | | | | | |
| Three Months Ended December 31, | | Year Ended December 31, |
| (in millions) | 2024 | | 2023 | | 2024 | | 2023 |
| | | | | | | |
| Net income attributable to common shareholders | $ | 241.2 | | | $ | 172.4 | | | $ | 546.8 | | | $ | 225.4 | |
| Add: | | | | | | | |
| Interest expense, net of interest income | 26.6 | | | 31.5 | | | 136.9 | | | 135.4 | |
| Income tax provision | 58.7 | | | 12.7 | | | 132.5 | | | 25.7 | |
Depreciation and amortization(a) | 66.1 | | | 60.8 | | | 252.0 | | | 234.4 | |
| Adjustments: | | | | | | | |
Restructuring and acquisition charges5 | 18.7 | | | 21.6 | | | 23.1 | | | 100.7 | |
| Net (gain) loss on disposition | — | | | — | | | — | | | 0.5 | |
| Net non-cash MSR and mortgage banking derivative activity | (7.7) | | | 8.7 | | | 18.2 | | | 18.2 | |
| Interest on employee loans, net of forgiveness | (1.8) | | | (1.3) | | | (5.9) | | | (3.6) | |
| Equity losses - JLL Technologies and LaSalle | 53.0 | | | 76.7 | | | 76.4 | | | 201.7 | |
| Credit losses on convertible note investments | — | | | — | | | 6.3 | | | — | |
| Adjusted EBITDA | $ | 454.8 | | | $ | 383.1 | | | $ | 1,186.3 | | | $ | 938.4 | |
| | | | | | | | | | | | | | | | | | | | | | | |
| Three Months Ended December 31, | | Year Ended December 31, |
| (In millions, except share and per share data) | 2024 | | 2023 | | 2024 | | 2023 |
| | | | | | | |
| Net income attributable to common shareholders | $ | 241.2 | | | $ | 172.4 | | | $ | 546.8 | | | $ | 225.4 | |
| Diluted shares (in thousands) | 48,534 | | | 48,324 | | | 48,372 | | | 48,288 | |
| Diluted earnings per share | $ | 4.97 | | | $ | 3.57 | | | $ | 11.30 | | | $ | 4.67 | |
| | | | | | | |
| Net income attributable to common shareholders | $ | 241.2 | | | $ | 172.4 | | | $ | 546.8 | | | $ | 225.4 | |
| Adjustments: | | | | | | | |
Restructuring and acquisition charges5 | 18.7 | | | 21.6 | | | 23.1 | | | 100.7 | |
| Net non-cash MSR and mortgage banking derivative activity | (7.7) | | | 8.7 | | | 18.2 | | | 18.2 | |
Amortization of acquisition-related intangibles(a) | 15.8 | | | 16.1 | | | 62.4 | | | 66.0 | |
| Net (gain) loss on disposition | — | | | — | | | — | | | 0.5 | |
| Interest on employee loans, net of forgiveness | (1.8) | | | (1.3) | | | (5.9) | | | (3.6) | |
| Equity losses - JLL Technologies and LaSalle | 53.0 | | | 76.7 | | | 76.4 | | | 201.7 | |
| Credit losses on convertible note investments | — | | | — | | | 6.3 | | | — | |
Tax impact of adjusted items(b) | (20.9) | | | (35.1) | | | (49.8) | | | (107.1) | |
| Adjusted net income attributable to common shareholders | $ | 298.3 | | | $ | 259.1 | | | $ | 677.5 | | | $ | 501.8 | |
| Diluted shares (in thousands) | 48,534 | | | 48,324 | | | 48,372 | | | 48,288 | |
| Adjusted diluted earnings per share | $ | 6.15 | | | $ | 5.36 | | | $ | 14.01 | | | $ | 10.39 | |
(a) This adjustment excludes the noncontrolling interest portion of amortization of acquisition-related intangibles which is not attributable to common shareholders.
(b) For the first half and fourth quarter of 2024 and all quarters of 2023, the tax impact of adjusted items was calculated using the applicable statutory rates by tax jurisdiction. For the third quarter of 2024, the tax impact of adjusted items was calculated using the consolidated effective tax rate, as this was deemed to approximate the tax impact of adjusted items calculated using applicable statutory tax rates.
Operating Results - Local Currency
In discussing operating results, the company refers to percentage changes in local currency, unless otherwise noted. Amounts presented on a local currency basis are calculated by translating the current period results of foreign operations to U.S. dollars using the foreign currency exchange rates from the comparative period. Management believes this methodology provides a framework for assessing performance and operations excluding the effect of foreign currency fluctuations.
The following table reflects the reconciliation to local currency amounts for consolidated (i) Revenue, (ii) Operating income and (iii) Adjusted EBITDA.
| | | | | | | | | | | | | | | | | | | | | | | |
| Three Months Ended December 31, | | Year Ended December 31, |
| ($ in millions) | 2024 | | % Change | | 2024 | | % Change |
| Revenue: | | | | | | | |
| At current period exchange rates | $ | 6,810.9 | | | 16 | % | | $ | 23,432.9 | | | 13 | % |
| Impact of change in exchange rates | 22.9 | | | n/a | | 52.5 | | | n/a |
| At comparative period exchange rates | $ | 6,833.8 | | | 16 | % | | $ | 23,485.4 | | | 13 | % |
| | | | | | | |
| Operating income: | | | | | | | |
| At current period exchange rates | $ | 373.2 | | | 29 | % | | $ | 868.1 | | | 51 | % |
| Impact of change in exchange rates | 8.9 | | | n/a | | 17.2 | | | n/a |
| At comparative period exchange rates | $ | 382.1 | | | 32 | % | | $ | 885.3 | | | 54 | % |
| | | | | | | |
| Adjusted EBITDA: | | | | | | | |
| At current period exchange rates | $ | 454.8 | | | 19 | % | | $ | 1,186.3 | | | 26 | % |
| Impact of change in exchange rates | 6.8 | | | n/a | | 14.7 | | | n/a |
| At comparative period exchange rates | $ | 461.6 | | | 20 | % | | $ | 1,201.0 | | | 28 | % |
2. n.m.: "not meaningful", represented by a percentage change of greater than 1,000%, favorable or unfavorable.
Greater China: China, Hong Kong, Macau and Taiwan.
3. As of December 31, 2024, LaSalle had $88.8 billion of real estate assets under management ("AUM"), composed of $47.1 billion invested in fund management vehicles, $38.2 billion invested in separate accounts and $3.5 billion invested in public securities. The geographic distribution was $28.9 billion in North America, $24.6 billion in Europe and $20.9 billion in Asia Pacific. The remaining $14.4 billion relates to Global Solutions which is a global business line.
Assets under management data for separate accounts and fund management amounts are reported on a one-quarter lag. In addition, LaSalle raised $1.1 billion in private equity capital for the quarter ended December 31, 2024.
4. The company defines "Resilient" revenue as (i) Property Management, within Markets Advisory, (ii) Value and Risk Advisory, and Loan Servicing, within Capital Markets, (iii) Workplace Management, within Work Dynamics, (iv) JLL Technologies and (v) Advisory Fees, within LaSalle.
The company defines "Transactional" revenue as (i) Leasing and Advisory, Consulting and Other, within Markets Advisory, (ii) Investment Sales, Debt/Equity Advisory and Other, within Capital Markets, (iii) Project Management and Portfolio Services and Other, within Work Dynamics and (iv) Incentive fees and Transaction fees and other, within LaSalle.
5. Restructuring and acquisition charges are excluded from the company's measure of segment operating results, although they are included within consolidated Operating income calculated in accordance with GAAP. For purposes of segment operating results, the allocation of Restructuring and acquisition charges to the segments is not a component of management’s assessment of segment performance. The table below shows Restructuring and acquisition charges.
| | | | | | | | | | | | | | | | | | | | | | | |
| Three Months Ended December 31, | | Year Ended December 31, |
| (in millions) | 2024 | | 2023 | | 2024 | | 2023 |
| Severance and other employment-related charges | $ | 9.3 | | | $ | 14.2 | | | $ | 27.1 | | | $ | 62.1 | |
| Restructuring, pre-acquisition and post-acquisition charges | 8.5 | | | 11.3 | | | 28.6 | | | 43.0 | |
| Fair value adjustments that resulted in a net (decrease) increase to earn-out liabilities from prior-period acquisition activity | 0.9 | | | (3.9) | | | (32.6) | | | (4.4) | |
| Total Restructuring and acquisition charges | $ | 18.7 | | | $ | 21.6 | | | $ | 23.1 | | | $ | 100.7 | |
6. "Gross contract costs" represent certain costs associated with client-dedicated employees and third-party vendors and subcontractors and are directly or indirectly reimbursed through the fees we receive. These costs are presented on a gross basis in Operating expenses (with the corresponding fees in Revenue).
"Net Debt" is defined as the sum of the (i) Credit facility, inclusive of debt issuance costs, (ii) Long-term debt, inclusive of debt issuance costs, (iii) Commercial paper, inclusive of debt issuance costs and (iv) Short-term borrowings liability balances less Cash and cash equivalents.
"Net Leverage Ratio" is defined as Net Debt divided by the trailing twelve-month Adjusted EBITDA.
Below is a reconciliation of total debt to Net Debt and the components of Net Leverage Ratio.
| | | | | | | | | | | | | | | | | |
| ($ in millions) | December 31, 2024 | | September 30, 2024 | | December 31, 2023 |
| | | | | |
| Total debt | $ | 1,216.9 | | | $ | 2,035.1 | | | $ | 1,560.3 | |
| Less: Cash and cash equivalents | 416.3 | | | 437.8 | | | 410.0 | |
| Net Debt | $ | 800.6 | | | $ | 1,597.3 | | | $ | 1,150.3 | |
| | | | | |
| Divided by: Trailing twelve-month Adjusted EBITDA | $ | 1,186.3 | | | $ | 1,114.6 | | | $ | 938.4 | |
| Net Leverage Ratio | 0.7x | | 1.4x | | 1.2x |
"Corporate Liquidity" is defined as the unused portion of the company's Credit facility plus cash and cash equivalents.
"Free Cash Flow" is defined as cash provided by operating activities less net capital additions - property and equipment.
Below is a reconciliation of net cash provided by operating activities to Free Cash Flow.
| | | | | | | | | | | |
| Year Ended December 31, |
| (in millions) | 2024 | | 2023 |
| | | |
| Net cash provided by operating activities | $ | 785.3 | | | $ | 575.8 | |
| Net capital additions - property and equipment | (185.5) | | | (186.9) | |
| Free Cash Flow | $ | 599.8 | | | $ | 388.9 | |
Appendix: Additional Segment Detail | | | | | | | | | | | | | | | | | | | | | | | | | | | | | | | | | | | | | | | | | | | | | | | | | | | | | | | | | | | | | | | | | | | | | | | |
| Three Months Ended December 31, 2024 |
| (in millions) | Markets Advisory | | Capital Markets | | Work Dynamics | | | | | | |
| Leasing | Property Mgmt | Advisory, Consulting and Other | | Total Markets Advisory | | Invt Sales, Debt/Equity Advisory and Other | Value and Risk Advisory | Loan Servicing | | Total Capital Markets | | Workplace Mgmt | Project Mgmt | Portfolio Services and Other | | Total Work Dynamics | | JLLT | | LaSalle | | Total |
| | | | | | | | | | | | | | | | | | | | | | | |
Revenue(a) | $ | 814.4 | | 476.5 | | 37.1 | | | $ | 1,328.0 | | | $ | 555.4 | | 111.0 | | 40.0 | | | $ | 706.4 | | | $ | 3,472.3 | | 936.1 | | 148.2 | | | $ | 4,556.6 | | | $ | 59.3 | | | $ | 160.6 | | | $ | 6,810.9 | |
Gross contract costs6 | $ | 5.6 | | 322.2 | | 3.3 | | | $ | 331.1 | | | $ | 8.0 | | 3.7 | | — | | | $ | 11.7 | | | $ | 3,209.3 | | 654.3 | | 64.3 | | | $ | 3,927.9 | | | $ | 1.5 | | | $ | 10.9 | | | $ | 4,283.1 | |
| Platform operating expenses | | | | | $ | 843.9 | | | | | | | $ | 586.2 | | | | | | | $ | 533.4 | | | $ | 63.3 | | | $ | 109.1 | | | $ | 2,135.9 | |
Adjusted EBITDA1 | | | | | $ | 170.8 | | | | | | | $ | 119.9 | | | | | | | $ | 120.0 | | | $ | 1.5 | | | $ | 42.6 | | | $ | 454.8 | |
(a) Included in Revenue is Net non-cash MSR and mortgage banking derivative activity of $7.7 million for the three months ended December 31, 2024 within Investment Sales, Debt/Equity Advisory and Other.
| | | | | | | | | | | | | | | | | | | | | | | | | | | | | | | | | | | | | | | | | | | | | | | | | | | | | | | | | | | | | | | | | | | | | | | |
| Three Months Ended December 31, 2023 |
| (in millions) | Markets Advisory | | Capital Markets | | Work Dynamics | | | | | | |
| Leasing | Property Mgmt | Advisory, Consulting and Other | | Total Markets Advisory | | Invt Sales, Debt/Equity Advisory and Other | Value and Risk Advisory | Loan Servicing | | Total Capital Markets | | Workplace Mgmt | Project Mgmt | Portfolio Services and Other | | Total Work Dynamics | | JLLT | | LaSalle | | Total |
| | | | | | | | | | | | | | | | | | | | | | | |
Revenue(a) | $ | 717.5 | | 445.8 | | 34.1 | | | $ | 1,197.4 | | | $ | 391.3 | | 107.7 | | 38.1 | | | $ | 537.1 | | | $ | 3,018.5 | | 798.3 | | 149.3 | | | $ | 3,966.1 | | | $ | 65.5 | | | $ | 115.3 | | | $ | 5,881.4 | |
Gross contract costs6 | $ | 8.2 | | 290.6 | | 3.0 | | | $ | 301.8 | | | $ | 9.0 | | 4.6 | | — | | | $ | 13.6 | | | $ | 2,778.6 | | 540.1 | | 65.2 | | | $ | 3,383.9 | | | $ | 3.5 | | | $ | 6.9 | | | $ | 3,709.7 | |
| Platform operating expenses | | | | | $ | 752.7 | | | | | | | $ | 474.2 | | | | | | | $ | 482.1 | | | $ | 59.9 | | | $ | 90.8 | | | $ | 1,859.7 | |
Adjusted EBITDA1 | | | | | $ | 160.5 | | | | | | | $ | 76.1 | | | | | | | $ | 120.5 | | | $ | 6.1 | | | $ | 19.9 | | | $ | 383.1 | |
(a) Included as a reduction to Revenue is Net non-cash MSR and mortgage banking derivative activity of $8.7 million for the three months ended December 31, 2023 within Investment Sales, Debt/Equity Advisory and Other.
Appendix: Additional Segment Detail (continued)
| | | | | | | | | | | | | | | | | | | | | | | | | | | | | | | | | | | | | | | | | | | | | | | | | | | | | | | | | | | | | | | | | | | | | | | |
| Year Ended December 31, 2024 |
| (in millions) | Markets Advisory | | Capital Markets | | Work Dynamics | | | | | | |
| Leasing | Property Mgmt | Advisory, Consulting and Other | | Total Markets Advisory | | Invt Sales, Debt/Equity Advisory and Other | Value and Risk Advisory | Loan Servicing | | Total Capital Markets | | Workplace Mgmt | Project Mgmt | Portfolio Services and Other | | Total Work Dynamics | | JLLT | | LaSalle | | Total |
| | | | | | | | | | | | | | | | | | | | | | | |
Revenue(a) | $ | 2,596.2 | | 1,795.1 | | 109.4 | | | $ | 4,500.7 | | | $ | 1,506.2 | | 373.0 | | 161.2 | | | $ | 2,040.4 | | | $ | 12,529.7 | | 3,151.9 | | 516.0 | | | $ | 16,197.6 | | | $ | 226.3 | | | $ | 467.9 | | | $ | 23,432.9 | |
Gross contract costs6 | $ | 20.8 | | 1,236.3 | | 12.5 | | | $ | 1,269.6 | | | $ | 35.6 | | 13.0 | | — | | | $ | 48.6 | | | $ | 11,593.8 | | 2,183.9 | | 252.2 | | | $ | 14,029.9 | | | $ | 5.5 | | | $ | 37.4 | | | $ | 15,391.0 | |
| Platform operating expenses | | | | | $ | 2,751.1 | | | | | | | $ | 1,837.1 | | | | | | | $ | 1,944.7 | | | $ | 270.6 | | | $ | 347.2 | | | $ | 7,150.7 | |
Adjusted EBITDA1 | | | | | $ | 547.6 | | | | | | | $ | 244.4 | | | | | | | $ | 316.3 | | | $ | (22.3) | | | $ | 100.3 | | | $ | 1,186.3 | |
(a) Included as a reduction to Revenue is Net non-cash MSR and mortgage banking derivative activity of $18.2 million for the nine months ended December 31, 2024 within Investment Sales, Debt/Equity Advisory and Other.
| | | | | | | | | | | | | | | | | | | | | | | | | | | | | | | | | | | | | | | | | | | | | | | | | | | | | | | | | | | | | | | | | | | | | | | |
| Year Ended December 31, 2023 |
| (in millions) | Markets Advisory | | Capital Markets | | Work Dynamics | | | | | | |
| Leasing | Property Mgmt | Advisory, Consulting and Other | | Total Markets Advisory | | Invt Sales, Debt/Equity Advisory and Other | Value and Risk Advisory | Loan Servicing | | Total Capital Markets | | Workplace Mgmt | Project Mgmt | Portfolio Services and Other | | Total Work Dynamics | | JLLT | | LaSalle | | Total |
| | | | | | | | | | | | | | | | | | | | | | | |
Revenue(a) | $ | 2,343.6 | | 1,675.1 | | 102.9 | | | $ | 4,121.6 | | | $ | 1,261.6 | | 363.8 | | 152.6 | | | $ | 1,778.0 | | | $ | 10,706.2 | | 2,924.8 | | 500.1 | | | $ | 14,131.1 | | | $ | 246.4 | | | $ | 483.7 | | | $ | 20,760.8 | |
Gross contract costs6 | $ | 21.3 | | 1,123.4 | | 8.9 | | | $ | 1,153.6 | | | $ | 34.8 | | 12.7 | | — | | | $ | 47.5 | | | $ | 9,899.8 | | 1,996.4 | | 235.2 | | | $ | 12,131.4 | | | $ | 14.5 | | | $ | 28.9 | | | $ | 13,375.9 | |
| Platform operating expenses | | | | | $ | 2,616.1 | | | | | | | $ | 1,649.4 | | | | | | | $ | 1,815.9 | | | $ | 266.9 | | | $ | 359.4 | | | $ | 6,707.7 | |
Adjusted EBITDA1 | | | | | $ | 416.6 | | | | | | | $ | 173.1 | | | | | | | $ | 264.0 | | | $ | (19.1) | | | $ | 103.8 | | | $ | 938.4 | |
(a) Included as a reduction to Revenue is Net non-cash MSR and mortgage banking derivative activity of $18.2 million for the nine months ended December 31, 2023 within Investment Sales, Debt/Equity Advisory and Other.