 Investor Presentation May 2011 ..40,000 employees….185 offices….60 countries….1 global platform.. Exhibit 99.1 |
 Forward looking statements 2 Statements in this presentation regarding, among other things, future financial results and performance, achievements, plans and objectives and dividend payments may be considered forward-looking statements within the meaning of the Private Securities Litigation Reform Act of 1995. Such statements involve known and unknown risks, uncertainties and other factors which may cause actual results, performance, achievements, plans and objectives of Jones Lang LaSalle to be materially different from those expressed or implied by such forward-looking statements. Factors that could cause actual results to differ materially include those discussed under “Business,” “Risk Factors,” “Management’s Discussion and Analysis of Financial Condition and Results of Operations,” “Quantitative and Qualitative Disclosures about Market Risk,” “Cautionary Note Regarding Forward-Looking Statements” and elsewhere in Jones Lang LaSalle’s Annual Report on Form 10-K for the year ended December 31, 2010 and in other reports filed with the Securities and Exchange Commission. There can be no assurance that future dividends will be declared since the actual declaration of future dividends, and the establishment of record and payment dates, remains subject to final determination by the Company’s Board of Directors. Statements speak only as of the date of this presentation. Jones Lang LaSalle expressly disclaims any obligation or undertaking to update or revise any forward-looking statements contained herein to reflect any change in Jones Lang LaSalle’s expectations or results, or any change in events. © Jones Lang LaSalle IP, Inc. 2011. All rights reserved. No part of this publication may be reproduced by any means, whether graphically, electronically, mechanically or otherwise howsoever, including without limitation photocopying and recording on magnetic tape, or included in any information store and/or retrieval system without prior written permission of Jones Lang LaSalle IP, Inc. |
 Table of Contents I. Company Description II. Financial Overview III. Market Environment IV. Global Growth Strategy V. 2011 Priorities 3 |
 Company Description |
 Jones Lang Wootton founded in London 1783 1968 1997 1999 LaSalle Partners founded, operating primarily in the Americas LaSalle Partners initial public offering LaSalle Partners and Jones Lang Wootton merge to create Jones Lang LaSalle Integrated global platform (NYSE ticker “JLL”) Jones Lang LaSalle Company history Present 2008 The Staubach Company and Jones Lang LaSalle combine operations Largest merger in JLL history transforms U.S. local markets position • Integrated global services platform • Industry-leading research • Superior client relationship management • Consistent service delivery • Innovative solutions to maximize value • Strong brand • Investment grade balance sheet 5 Leasing Capital Markets & Hotels Property & Facility Mgmt. Project & Development Services Advisory & Consulting Investment Management $2.9B 2010 Revenue |
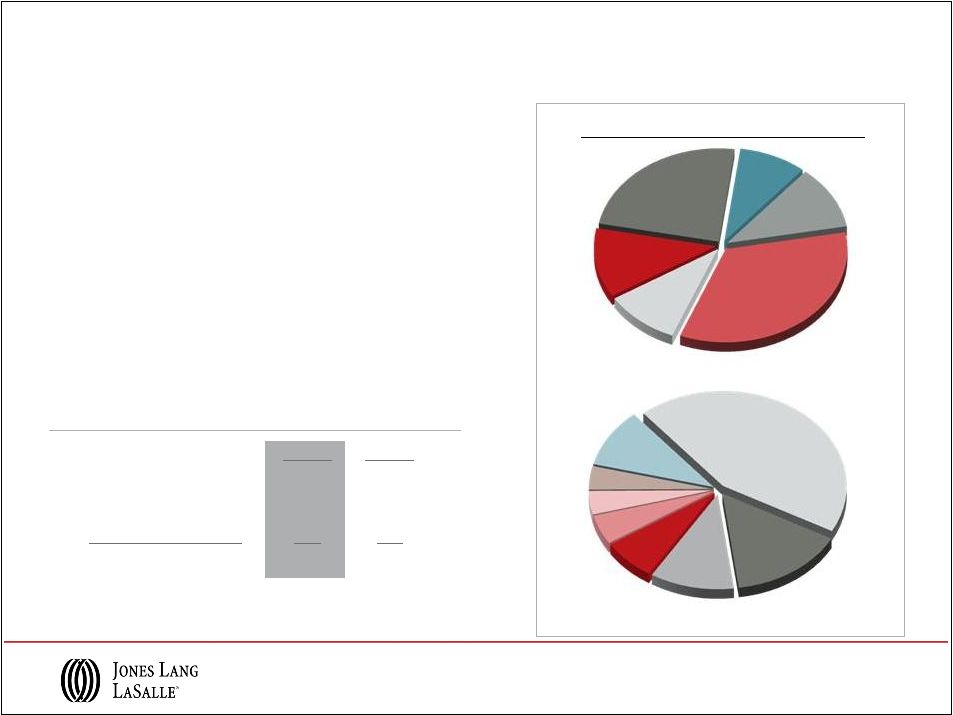 FY 2010 FY 2009 Americas 43% 42% EMEA 25% 26% Asia Pacific 23% 22% LaSalle Investment Mgmt. 9% 10% Consolidated 100% 100% Jones Lang LaSalle (1) Excludes equity losses 2010 Revenue = $2.9 billion … And Global Market Reach Diversified Service Lines… • Consolidator in a consolidating industry - more than 30 mergers and acquisitions since 2005 • Corporate Solutions driving growth and providing annuity revenue as outsourcing trend continues • LaSalle Investment Management - a premier global investment manager winning new mandates • Cash generating business model with investment grade balance sheet ` Revenue by Segment (1) Medium-term outlook continues to benefit from cyclical recovery 6 United States 44% United Kingdom 11% Continental Europe 15% Greater China 5% Developing & Other Countries 10% Japan 4% India 4% Australia 7% Property & Facility Management 24% Project & Development Services 12% LaSalle Inv. Mgmt. 9% Advisory Consulting & Other 11% Leasing 34% Capital Markets 10% |
 More than 30 acquisitions since 2005 Market Share and Service Line Expansion • Middle Market Corporate Solutions • Leasing • Capital Markets • Property Management • Project & Development Services • Retail • Industrial • Energy & Sustainability Services • Infrastructure • Hospital / Healthcare Market share growth Product and services expansion 7 EMEA Americas Asia Pacific RL Davis Leechiu Creer NSC Sallmanns Shore Industrial Meghraj Rogers Chapman Littman Partnership RSP Group Area Zero Hargreaves Goswell Troostwijk Makelaars KHK Group Camilli & Veiel GVA Upstream Tetris Creevy LLH Ltd. Brune Alkas Kemper’s Churston Heard Staubach Spaulding & Slye Zietsman Klatskin CRA Standard Group ECD HIA TCF Strengthening our platform and connecting our people Asset Realty Managers GGP PCA RECF |
 $40.6 B $49.7 B $46.2 B AUM ($ millions) $39.9 B 2005 to 2010 Advisory Fees: 13% Compound Annual Growth Rate LaSalle Investment Management A decade of accomplishments $41.3 B $29.8 B Global Financial Crisis Stabilized Advisory Fees Building Advisory Fees in Healthy Markets 8 • Global platform: More than 300 institutional clients worldwide - investor base greater than 90% institutional • Investment Expertise: Core, value add, opportunistic private investing across major property types • Consistent client service delivery system - worldwide • Fully integrated global management team, compensation linked to growth in high-margin advisory revenue • Results: Ability to weather global property cycles, annuity revenue growth financial stability, achieved scalable operations 2005 2006 2007 2008 2009 2010 $0 $50 $100 $150 $200 $250 $300 $127.8 $178.1 $245.1 $277.9 $242.2 $237.5 |
 Jones Lang LaSalle More than 40,000 employees driving growth across service lines LEED-accredited professionals 585 Property and corporate facilities under management (s.f.) 1.8B Investment assets under management $41B Tenant representation transactions (s.f.) 8,400 transactions 159M Agency leasing transactions (s.f.) 19,400 transactions 323M Annual energy savings for clients $125M Global JLL Hotels Activity $4.1B Property & Facility Management 24% Project & Development Services 12% LaSalle Inv. Mgmt. 9% Advisory Consulting & Other 11% Leasing 34% Capital Markets 10% Global JLL Capital Markets Activity $33B 9 Return to Table of Contents |
 Financial Overview |
 • Record revenue of $2.9 billion , up 18% over 2009 • Global Leasing revenue reaches $1 billion; up 28% over 2009 • Property & Facility Management currently 24% of global revenue • LaSalle Investment Management raised $5 billion in net capital commitments; AUM = $41 billion • Adjusted operating income margin of 9.1% vs. 6.6% in 2009 Demonstrating competitive strength Consolidated Earnings Scorecard 2010 Highlights FY 2010 FY 2009 Revenue $2.9B $2.5B % change 18% (8%) Net Income $154M ($4M) Adjusted Net Income (1) $166M $70M Earnings Per Share $3.48 ($0.11) Adjusted Earnings Per Share (1) $3.77 $1.75 Adjusted EBITDA $336M $238M Adjusted EBITDA margin 11.5% 9.6% Market Capitalization $3.6B $2.5B (1) Adjusted for restructuring and non-cash co-investment charges 11 |
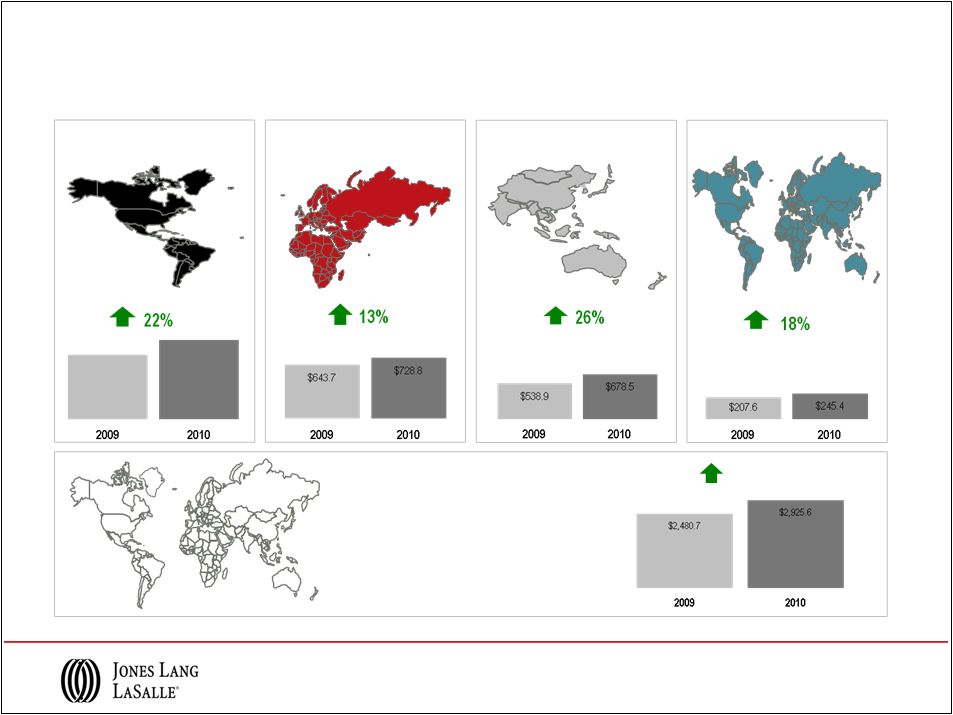 FY 2010 Revenue Performance Note: Equity losses of $58.9M and $11.4M in 2009 and 2010, respectively, are included in segment results, however, are excluded from Consolidated totals. ($ in millions) Americas EMEA Asia Pacific Consolidated 18% LaSalle $1,031.6 $1,261.5 12 |
 Asia Pacific Americas EMEA Leasing Capital Markets & Hotels Property & Facility Management Project & Development Services Advisory, Consulting & Other Total RES Operating Revenue $637.9 $84.1 $269.4 $158.9 $110.9 $1,261.2 28% 120% 19% 1% 1% 22% $202.6 $141.2 $142.9 $115.0 $127.2 $728.9 17% 32% 5% 6% 4% 13% $159.4 $80.4 $303.7 $63.5 $71.4 $678.4 42% 38% 14% 44% 17% 25% $999.9 $305.7 $716.0 $337.4 $309.5 $2,668.5 28% 50% 14% 8% 5% 20% Total RES Revenue Note: Segment and Consolidated Real Estate Services (“RES”) operating revenue exclude Equity earnings (losses). 2010 Real Estate Services Revenue ($ in millions) 13 |
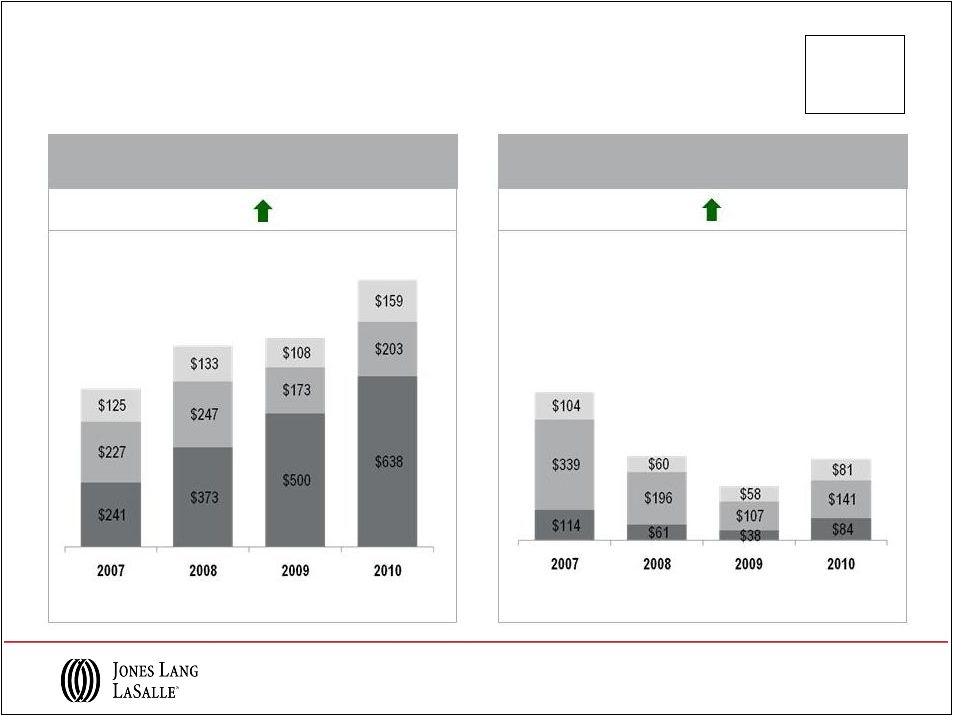 Q1 2011: 26% (1) $593 $781 $753 $557 $317 $203 ($ in millions) Q1 2011: 23% (1) Full Year Comparison (1) Compared to Q1 2010 Full Year Comparison ($ in millions) Leasing Capital Markets $1,000 $306 Local and Regional Real Estate Services Leasing and Capital Markets capturing incremental revenue Asia Pacific EMEA Americas 14 |
 Asia Pacific Americas EMEA Leasing Capital Markets & Hotels Property & Facility Management Project & Development Services Advisory, Consulting & Other Total RES Operating Revenue $143.1 $19.8 $66.7 $37.2 $20.7 $287.5 35% 108% 15% 18% 9% 26% $37.2 $28.7 $35.9 $38.4 $28.0 $168.2 4% 10% 4% 48% 8% 11% $29.8 $17.5 $83.9 $18.1 $16.2 $165.5 17% 5% 24% 69% 7% 22% $210.1 $66.0 $186.5 $93.7 $64.9 $621.2 23% 26% 16% 37% 21% Total RES Revenue 2% Q1 2011 Real Estate Services Revenue ($ in millions) Note: Segment and Consolidated Real Estate Services (“RES”) operating revenue exclude Equity earnings (losses). 15 |
 Solid Cash Flows and Balance Sheet ($ in millions) Positioned to drive growth and investment 2010 Free Cash Flow (1) (1) Free cash flow calculated as EBITDA plus non-cash charges and change in working capital Investment grade balance sheet Effective tax management (24% effective tax rate) Disciplined CapEx spending Opportunity to grow and invest in the business 16 $440 |
 Solid Cash Flows and Balance Sheet Position • Healthy position after Q1 2011 incentive compensation payments • Net debt repayment of $184 million over the last twelve months • Cash interest expense of $1.8 million, down 51% from Q1 2010 expense of $3.7 million • Investment grade ratings: Standard & Poor’s: BBB- (Outlook: Stable) Moody’s Investor Services: Baa2 (Outlook: Stable) Cash Flows Q1 2011 Q1 2010 Cash from Earnings $42 $46 Working Capital (239) (192) Cash used in Operations ($197) ($146) Primary Uses Capital Expenses (1) (17) (5) Acquisitions & Deferred Payment Obligations (25) (27) Co-Investment (2) (10) Dividends - - Net Cash Outflows ($44) ($42) Net Share Activity & Other Financing (4) (5) Net Bank Debt (Borrowings) / Repayments ($245) ($193) Balance Sheet Q1 2011 Q1 2010 Cash $101 $60 Short Term Borrowings 42 47 Credit Facility 278 335 Net Bank Debt $219 $322 Deferred Business Obligations 293 374 Total Net Debt $512 $696 ($ in millions) (1) Capital Expenditures for Q1 2011 and Q1 2010 net of tenant improvement allowances received were $16 million and $4 million, respectively Q1 2011 Highlights 17 Return to Table of Contents |
 Market Environment |
 Increasingly synchronized recovery Capital Markets Leading Real Estate Fundamentals Americas EMEA Asia Pacific As of Q1 2011 Capital Values Leasing Fundamentals The Jones Lang LaSalle Property Clocks SM 19 San Francisco, Singapore New York, San Francisco Singapore New York, Shanghai Moscow, Stockholm Beijing, Hong Kong, Washington DC Chicago Amsterdam, Dallas Sao Paulo, London Detroit Seoul Milan Berlin, Paris Brussels Mumbai, Tokyo Stockholm Dallas, Milan Detroit Seoul, Tokyo Brussels, Mumbai Capital Value growth slowing Capital Value falling Capital Value growth accelerating Capital Value bottoming out Rental growth slowing Rental growth falling Rental growth accelerating Rents bottoming out Sydney, Toronto Shanghai Beijing Toronto, Moscow Amsterdam, Hong Kong, Washington DC, Sao Paulo Chicago London Berlin, Paris, Sydney |
 % change Based on rents for Grade A space in CBD or equivalent. In local currency. Source: Jones Lang LaSalle, April 2011 Global Market Perspective Americas Europe Asia Pacific Q1 2010 – Q1 2011 rental change Prime Offices 20 |
 Global Markets Perspective Prime offices – projected value change in 2011 *New York – Midtown, London – West End. Nominal rates in local currency. Source: Jones Lang LaSalle, April 2011 Global Market Perspective Capital Values Rental Values + 10-20% + 5-10% + 0-5% - 0-5% - 5-10% + 20% - 10-20% Click here to see the JLL 2011 Real Estate Outlook, including our Top 10 trends for 2011 21 Return to Table of Contents Shanghai, Singapore, Washington DC San Francisco, London*, New York*, Toronto, Sao Paulo Paris, Mumbai Sydney Frankfurt, Amsterdam Chicago, Los Angeles Madrid Paris, Chicago Los Angeles, Mumbai Sydney, Frankfurt, Amsterdam, Mexico City Madrid Hong Kong, Moscow Dubai Dubai Hong Kong, Moscow San Francisco, Washington DC Brussels, Tokyo Mexico City Brussels, Tokyo Shanghai, Singapore New York*, Toronto Sao Paulo, London* |
 Global Growth Strategy |
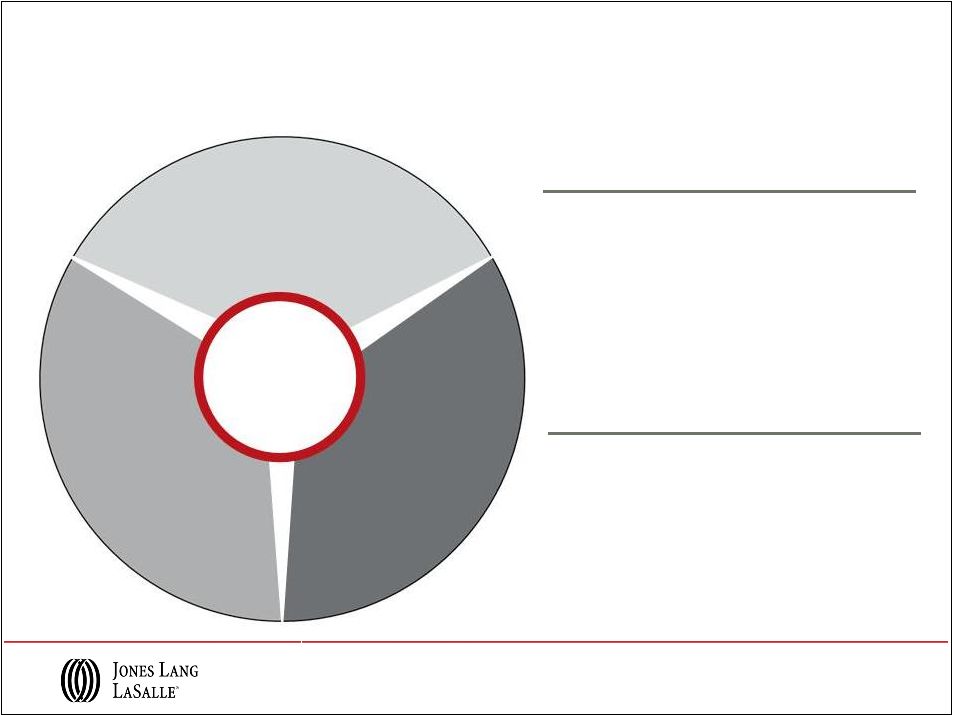
 Jones Lang LaSalle Global strategy for renewed growth G5 G1 G2 G4 G3 Build our leading local and regional market positions Grow our leading positions in Corporate Solutions Capture the leading share of global capital flows for investment sales Strengthen LaSalle Investment Management’s leadership position Connections: Differentiate by connecting across the firm, and with clients 23 |
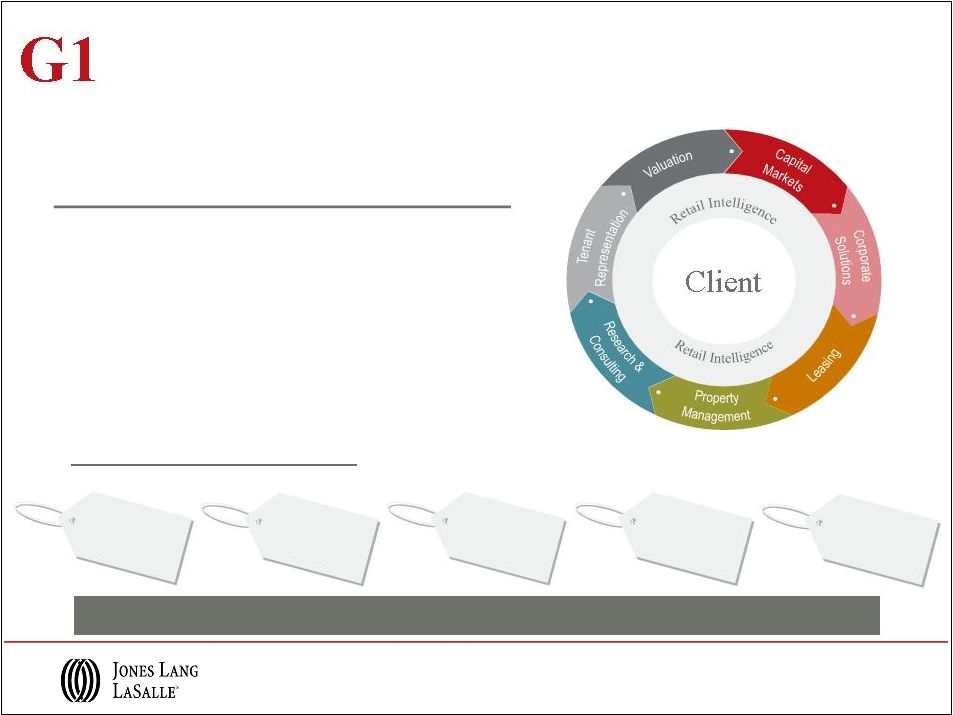
 Merger Impact: Tenant Representation Market Leadership • Reinforced JLL’s position as the high quality brand for occupier clients • Significantly improved our market position; 990 brokers in the field today; up more than 200% over 2007 • Attained a market leading tenant representation position in 27 markets (vs. 6 markets in 2007) • Built Industrial market presence; 220 professional brokers in 40 markets; #3 or better in top 8 markets Local and Regional Services G1 Staubach merger transforms U.S. local markets position 2007 Americas Leasing revenue growth of 29% in 2010 Southern California (excluding San Diego) Philadelphia Boston Atlanta Northern New Jersey Chicago Raleigh/Durham DC Metro San Francisco Silicon Valley Charlotte Dallas / Ft. Worth New York 2010 Silicon Valley San Francisco Seattle Sacramento West Palm Beach Orlando Tampa Westchester Richmond Baltimore Market Leader – #1-2-3 Offices As of Year End ‘10; Market share based on SF of completed deals of 10,000+ SF Source: JLL Research & CoStar 24 Raleigh/Durham Denver Atlanta Houston Los Angeles Orange County Phoenix Charlotte San Diego Suburban Maryland Dallas / Ft. Worth Philadelphia Boston CBD New York Northern New Jersey Chicago CBD Northern VA Chicago Suburbs Boston Suburbs/ Cambridge Ft Lauderdale Miami |
 Local and Regional Services European retail acquisitions providing scale in key markets • Managing 81 million sq ft of retail assets • Leasing 75 million sq ft of space in 200 shopping centers • Valuation of 450 shopping centres of 97 million sq ft • More than 1,000 dedicated retail staff across Europe • EMEA’s only dedicated regional retail capital markets team, with more than 80 professionals working in more than 12 markets Over €1.3bn in Multi Portfolio acquisition Over €513m in 2 acquisitions 3.6m sq ft 11 Shopping Centres Over €2.5 bn disposal advice EMEA Retail revenue = approximately 20% of Total EMEA revenue in 2010 Select EMEA Retail highlights: Approx. €2.5 bn valued quarterly 25 Fully integrated approach maximizing client value |
 Leading position with unique expertise across services & geographies • Accelerate new client wins and innovate for existing clients to broaden relationship - 60 new wins, 33 expansions and 32 renewals in 2010 - More than 700 million sq ft under management as of December 31, 2010; 18% compound annual growth rate over the past 5 years • Target new industry segments for continued market share growth - Replicate Financial/Pharma/IT success Global Corporate Solutions Integrated Facility Management Transaction Management Project Management Lease Administration Mobile Engineering Energy & Sustainable Services Strategic Consulting Corporate Finance / CMG Client Relationship Management G2 Corporate Retail Services 2010 Highlights • Property & Facility Management revenue up 14% vs. 2009 • Project & Development Services revenue up 8% vs. 2009; corporates starting to re-open capital expenditure budgets 26 |
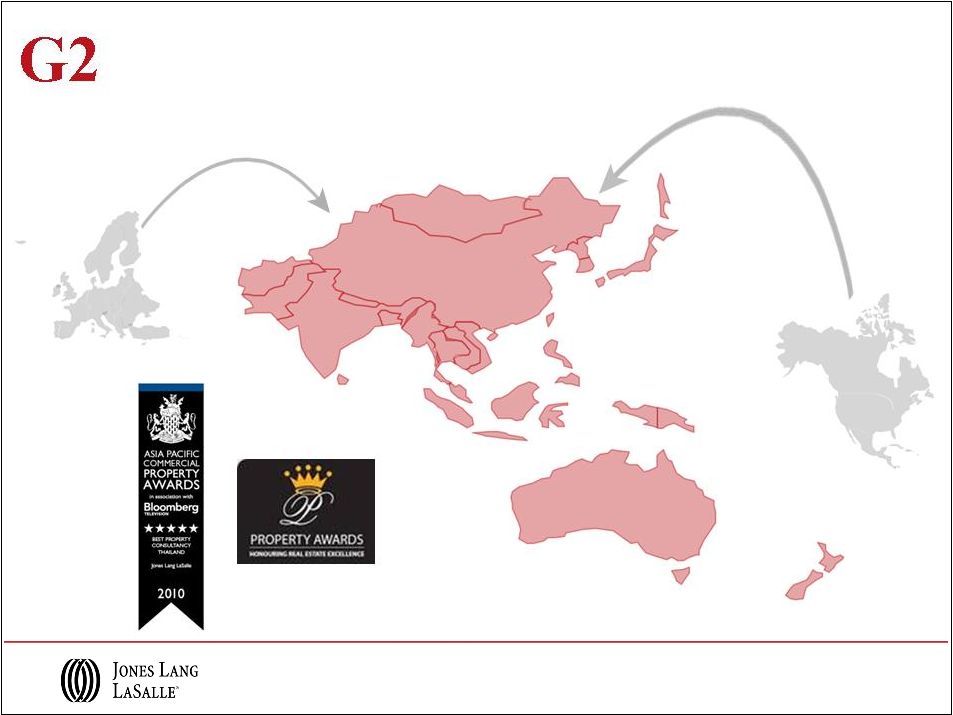 Asia Pacific gaining share with local and multinational corporates Global Corporate Solutions Alcatel-Lucent Philips Sanyo Wipro Infosys Sony Telestra AFP Centrelink Fonterra Citi Merck 27 |
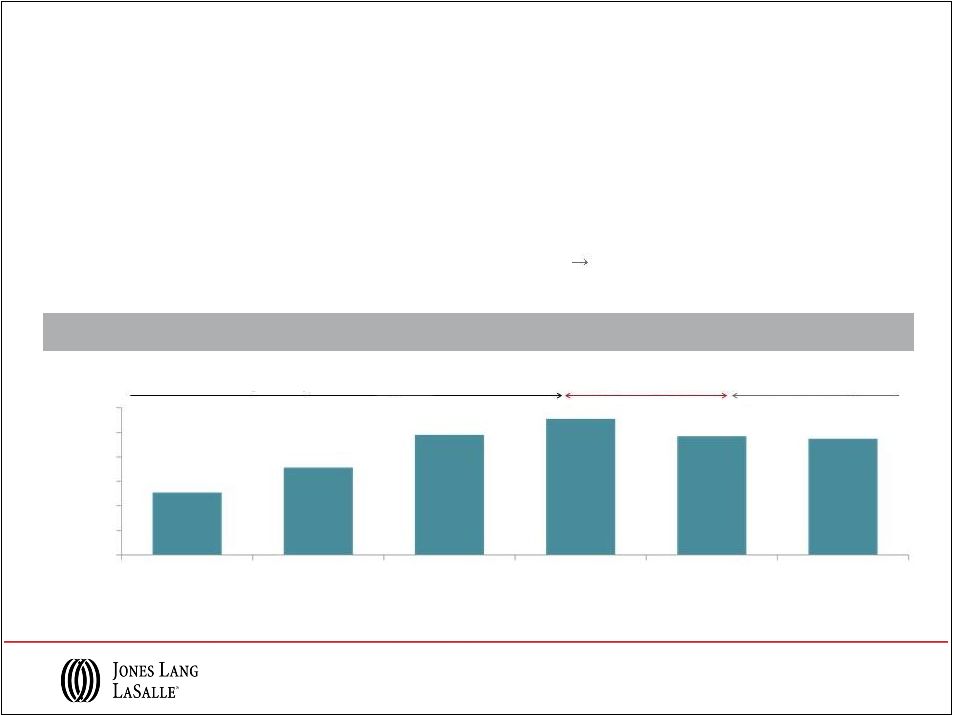
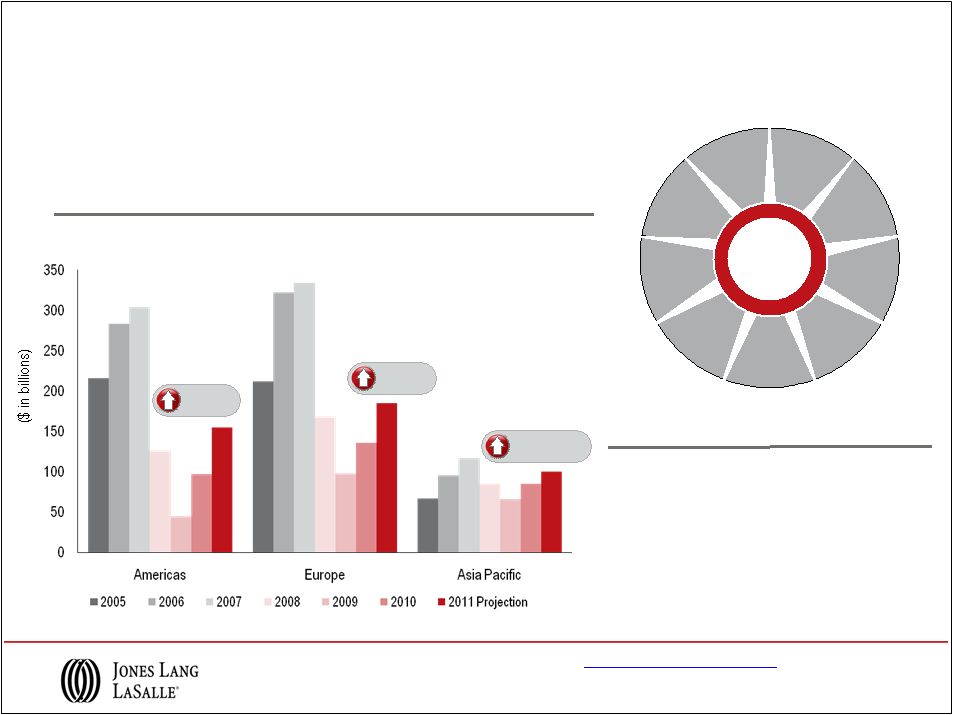 2010 Highlights Capture Global Capital Flows for Investment Sales Positioned to leverage leading share as markets recover G3 Source: Jones Lang LaSalle • Volumes continuing cyclical recovery • Demand high for core products; supply remains constrained • Global Hotels business gaining momentum; captured $4.1B of $24.3B total deal volume in 2010 2011 volumes expected to increase a further 35-40% Direct Commercial Real Estate Investment, 2005-2011 For more information on Jones Lang LaSalle Hotels, visit www.joneslanglasallehotels.com. 28 Leasing Receivership Services Development & Construction Management Property & Asset Management Loan Restructuring & Debt Advisory Research on Local Martkets Planning & Developing Strategic Review Investment Sales Leasing Receivership Services Development & Construction Management Property & Asset Management Loan Restructuring & Debt Advisory Research on Local Martkets Planning & Developing Strategic Review Leasing Receivership Services Development & Construction Management Property & Asset Management Loan Restructuring & Debt Advisory Research on Local Martkets Planning & Developing Strategic Review Leasing Receivership Services Development & Construction Management Property & Asset Management Loan Restructuring & Debt Advisory Research on Local Martkets Planning & Developing Strategic Review Investment Sales Connecting clients to innovative solutions Connecting clients to innovative solutions +60% +30% +15-20% |
 • $5 billion of net new capital raised in 2010, 2 nd best year in LaSalle history • Strong capital raising continues, $1.5 billion of net new capital commitments in Q1 2011 • Momentum continues with new separate account mandates New Business Activity Product Assets Under Management ($ in billions) Average Performance Private Equity U.K. $11.0 Above benchmark Continental Europe $4.3 Return: +1x equity North America $10.2 Above benchmark Asia Pacific $8.0 Return: +1x equity Public Securities $9.5 Above benchmark Total Q1 2011 AUM $43.0 B AUM by Fund type ($ in billions) A premier global investment manager LaSalle Investment Management G4 Note: AUM data reported on a one-quarter lag 29 |
 Connecting JLL to add value for clients JLL Brand Market Knowledge & Experience Thought Leadership & Research Colleagues Sharing Relationships Extensive Capabilities & Products Client First www.joneslanglasalle.com G5 Technology JLL OneView Connecting Across the Firm and With Clients Technology enabling value added connections 30 |
 Energy and Sustainability Services Energy conservation and cost savings a growing priority “I chose Ray Quartararo and Jones Lang LaSalle because of our successful history together taking on and figuring out difficult projects and the company’s deep sustainability expertise and track record.” --Anthony E. Malkin, Building Owner, Empire State Building Company • Nearly 600 LEED Accredited Professionals • 116 LEED projects globally, including • 1 st LEED Platinum high-rise; One Bryant Park, New York • 1 LEED building registered in India; Sohrabji Godrej Green • 1 LEED-EB O&M multi-tenant building in the U.S.; 550 W. Washington, Chicago • Documented over $125M in energy savings for clients • Reduced 563,000 tons of greenhouse gas emissions • Equivalent to the emissions of nearly 70 million gallons of gasoline consumed Making an Impact G5 31 Return to Table of Contents st st |
 2011 Priorities |
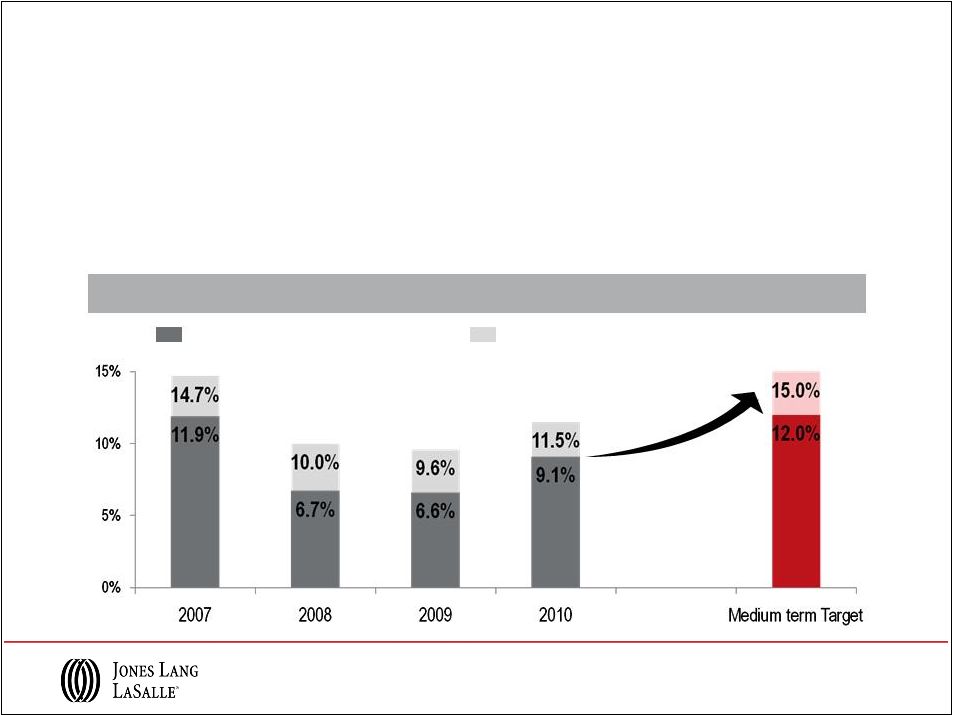 2011 Priorities Enhance margin and strengthen income quality Margin Performance • Leverage strengthening local markets positions • Continue growing scale in Corporate Solutions • Maintain LaSalle Investment Management’s stable advisory fee margins; enhance with transaction and incentive fees • Grow operating margin to medium term target of 12% Historic Adjusted Operating Income Margin Historic Adjusted EBITDA Margin Note: Adjusted Operating Income excludes restructuring charges, adjusted EBITDA excludes restructuring charges and non-cash co-investment charges. 2007 results have been adjusted to exclude significant advisory fees from one large corporate portfolio. 33 |
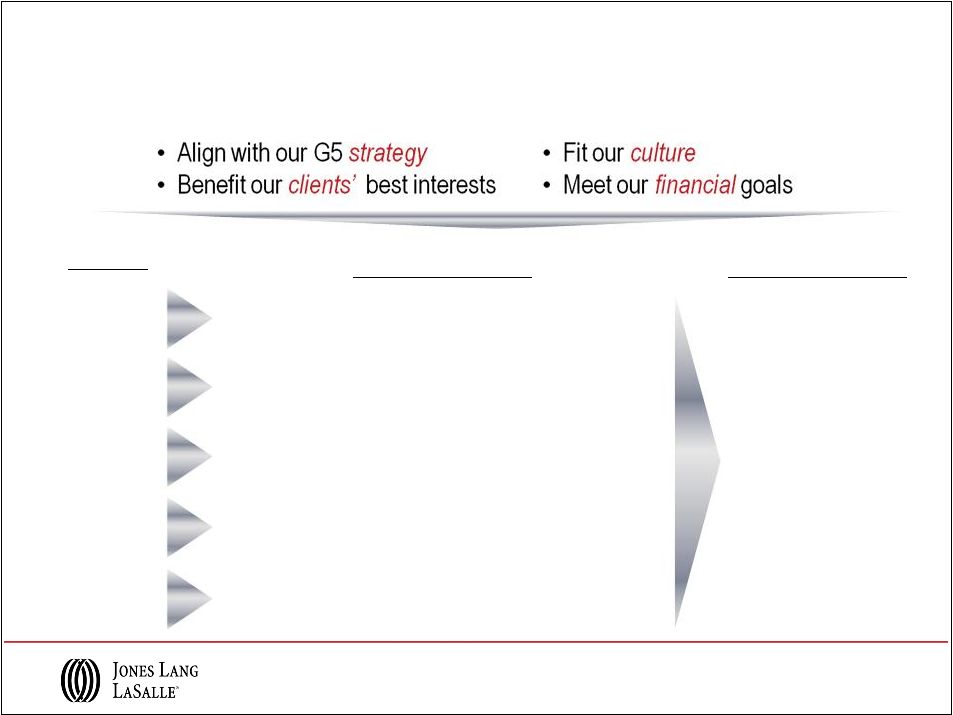 Opportunity Target Secure market leadership – Goal to be #1, #2 or #3 in targeted local and regional market services Provide specialized technical services to Corporate Solutions outsourcing clients Capture recovering cross-border capital flows and strengthen Hotels market Maximize opportunities created by financial regulatory legislation and financial crisis fallout Differentiate by connecting across the firm, and with clients Strategy G1 G2 G3 G4 G5 34 2011 Priorities and Consolidation Opportunities Capture opportunities reappearing in the marketplace Financial Objective • Major growth to shareholders • Accretive within 12-18 months • Maintain investment grade strength |
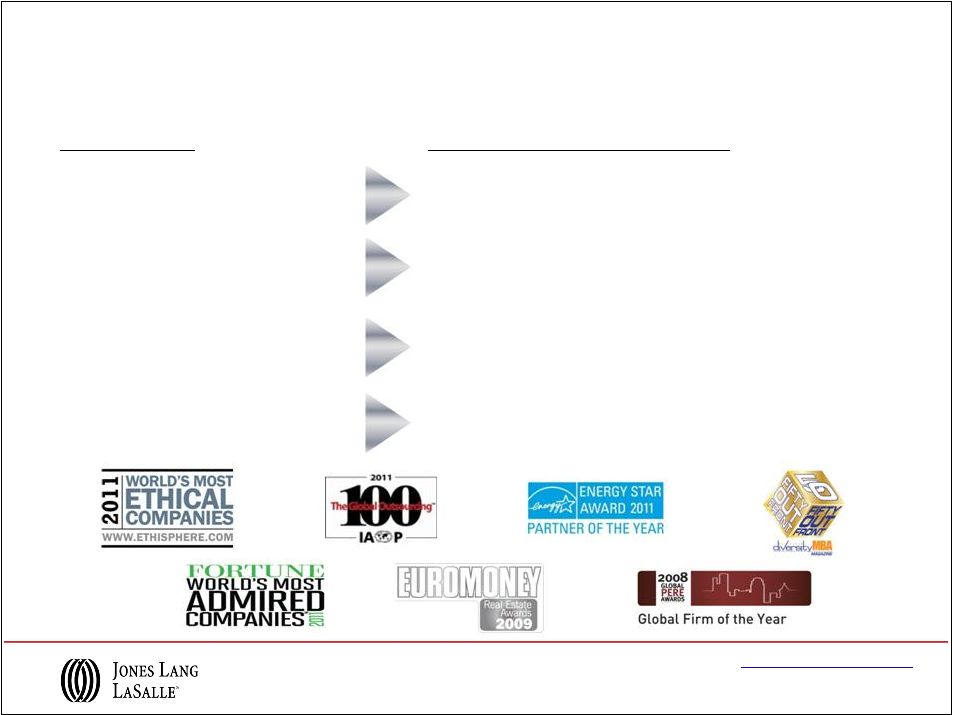 Market Trends Early stages of cyclical recovery Leverage leading global market positions for improved transactional revenue Jones Lang LaSalle Opportunity Outsourcing trend continuing and broadening across sectors Continue Corporate Solutions leadership; capture emerging sectors (e.g. Healthcare, Government and Infrastructure) Strongest real estate asset managers attracting capital LaSalle raised $5 billion of net new capital in 2010; strong reputation and good momentum entering 2011 Industry consolidation resuming Pursue growth within G5 strategy and financial objectives Jones Lang LaSalle Leading brand well positioned for growth 35 Return to Table of Contents |
 Appendix |
 FY 2010 FY 2009 GAAP net income (loss) $ 153.5 $ (4.1) Shares (in 000's) 44,084 38,543 GAAP earnings (loss) per share $ 3.48 $ (0.11) GAAP net income (loss) $ 153.5 $ (4.1) Restructuring, net of tax 4.9 35.6 Non-cash co-investment charges, net of tax 7.9 38.5 Adjusted net income $ 166.3 $ 70.0 Shares (in 000's) 44,084 40,106 Adjusted earnings per share $ 3.77 $ 1.75 ($ in millions) Reconciliation of GAAP Net Income (Loss) to Adjusted Net Income Note: Basic shares outstanding are used in the calculation of GAAP EPS for the twelve months ending December 31, 2009, as the use of dilutive shares outstanding would cause that EPS calculation to be anti-dilutive. Return to Consolidated Earnings Scorecard 37 Return to Table of Contents |
 ($ in millions) Reconciliation of GAAP Operating Income to Adjusted Operating Income and Net Income (Loss) to EBITDA and Adjusted EBITDA FY 2010 FY 2009 GAAP Operating Income $ 260.7 $ 116.4 Restructuring charges 6.4 47.4 Adjusted Operating Income $ 267.1 $ 163.8 Net income (loss) $ 153.5 $ (4.1) Interest expense, net of interest income 45.8 55.0 Provision (benefit) for income taxes 49.0 5.7 Depreciation and amortization 71.6 83.3 EBITDA $ 319.9 $ 139.9 Non-cash co-investment charges 10.4 51.3 Restructuring 6.4 47.4 Adjusted EBITDA $ 336.7 $ 238.6 Return to Consolidated Earnings Scorecard 38 Return to Table of Contents |
 FY 2010 FY 2009 Net Income (Loss) $154 ($4) Interest Expense, net of interest income 46 55 Provision (benefit) for income taxes 49 6 Depreciation and amortization 72 83 EBITDA $321 $140 Change in working capital 68 7 Deferred Compensation Amortization and non-cash co-investment charges 51 97 Free Cash Flow $440 $244 ($ in millions) Reconciliation of GAAP Net Income (Loss) to EBITDA and Free Cash Flows Return to Free Cash Flow Chart 39 Return to Table of Contents |