Exhibit 99.2
Supplemental Information
Fourth-Quarter 2012 Earnings Call

Market & Financial Overview
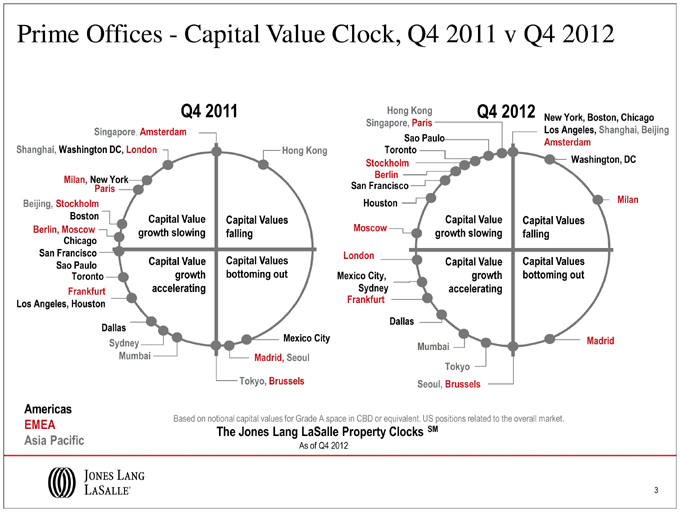
Prime Offices -Capital Value Clock, Q4 2011 v Q4 2012 Americas Based on notional capital values for Grade A space in CBD or equivalent. US positions related to the overall market. EMEA SM The Jones Lang LaSalle Property Clocks Asia Pacific As of Q4 2012
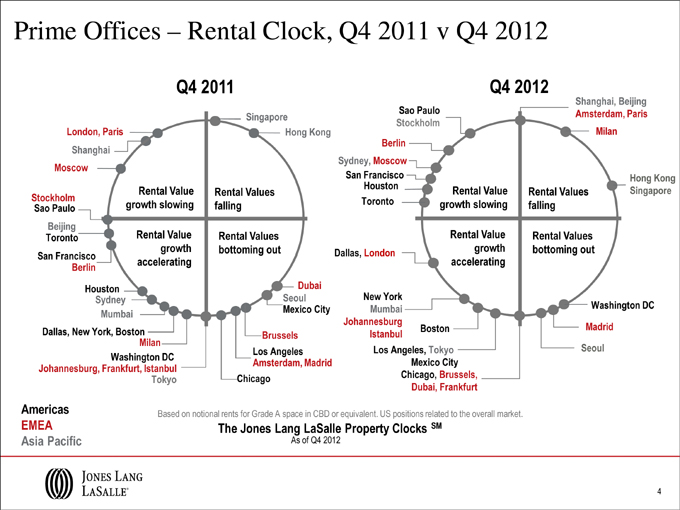
Prime Offices –Rental Clock, Q4 2011 v Q4 2012 Americas Based on notional rents for Grade A space in CBD or equivalent. US positions . market related to the overall EMEA The Jones Lang LaSalle Property Clocks SM Asia Pacific As of Q4 2012
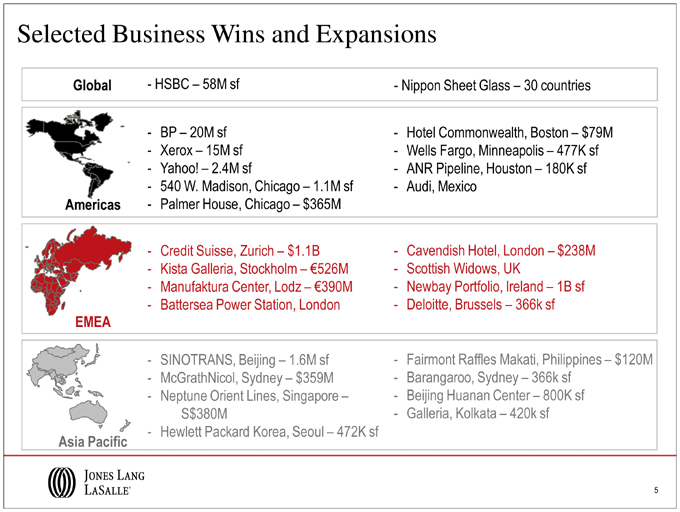
Selected Business Wins and Expansions Global -HSBC –58M sf -Nippon Sheet Glass – 30 countries - BP –20M sf - Hotel Commonwealth, Boston – $79M - Xerox –15M sf - Wells Fargo, Minneapolis –477K sf - Yahoo! –2.4M sf - ANR Pipeline, Houston – 180K sf - 540 W. Madison, Chicago –1.1M sf - Audi, Mexico Americas - Palmer House, Chicago –$365M - Credit Suisse, Zurich – $1.1B - Cavendish Hotel, London –$238M - Kista Galleria, Stockholm –€526M - Scottish Widows, UK - Manufaktura Center, Lodz –€390M - Newbay Portfolio, Ireland – 1B sf - Battersea Power Station, London - Deloitte, Brussels –366k sf EMEA - SINOTRANS, Beijing –1.6M sf - Fairmont Raffles Makati, Philippines – $120M - McGrathNicol, Sydney – $359M - Barangaroo, Sydney –366k sf - Neptune Orient Lines, Singapore – - Beijing HuananCenter –800K sf S$380M - Galleria, Kolkata –420k sf - Hewlett Packard Korea, Seoul – 472K sf Asia Pacific
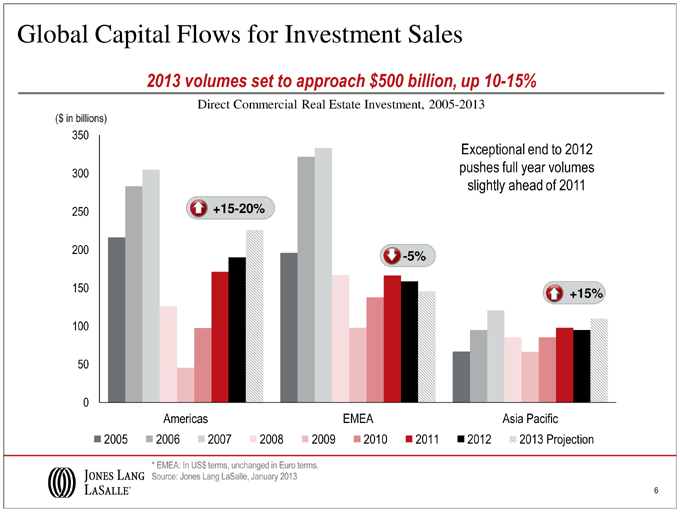
Global Capital Flows for Investment Sales 2013 volumes set to approach $500 billion, up 10-15% Direct Commercial Real Estate Investment, 2005-2013 Exceptional end to 2012 pushes full year volumes slightly ahead of 2011 * EMEA: In US$ terms, unchanged in Euro terms. Source: Jones Lang LaSalle, January 2013
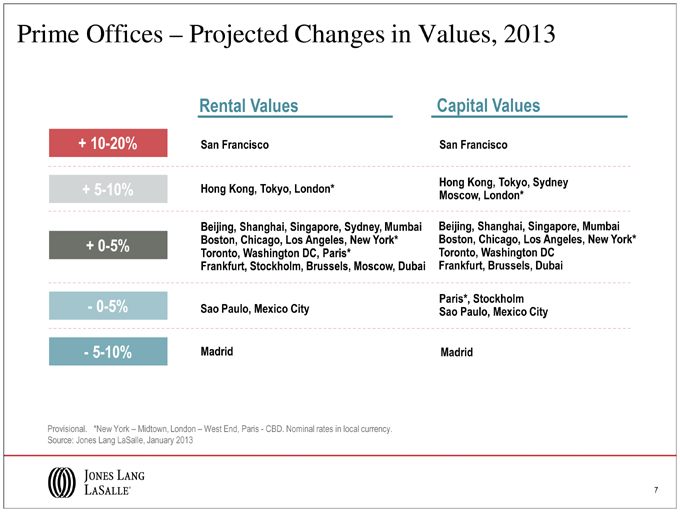
Prime Offices – Projected Changes in Values, 2013 Rental Values Capital Values + 10-20% San Francisco San Francisco Hong Kong, Tokyo, Sydney + 5-10% Hong Kong, Tokyo, London* Moscow, London* Beijing, Shanghai, Singapore, Sydney, Mumbai Beijing, Shanghai, Singapore, Mumbai + 0-5 % Boston, Chicago, Los Angeles, New York* Boston, Chicago, Los Angeles, New York* Toronto, Washington DC, Paris* Toronto, Washington DC Frankfurt, Stockholm, Brussels, Moscow, Dubai Frankfurt, Brussels, Dubai Paris*, Stockholm - 0-5 % Sao Paulo, Mexico City Sao Paulo, Mexico City - 5-10% Madrid Madrid Provisional. *New York – Midtown, London –West End, Paris - CBD. Nominal rates in local currency. Source: Jones Lang LaSalle, January 2013

Financial Information
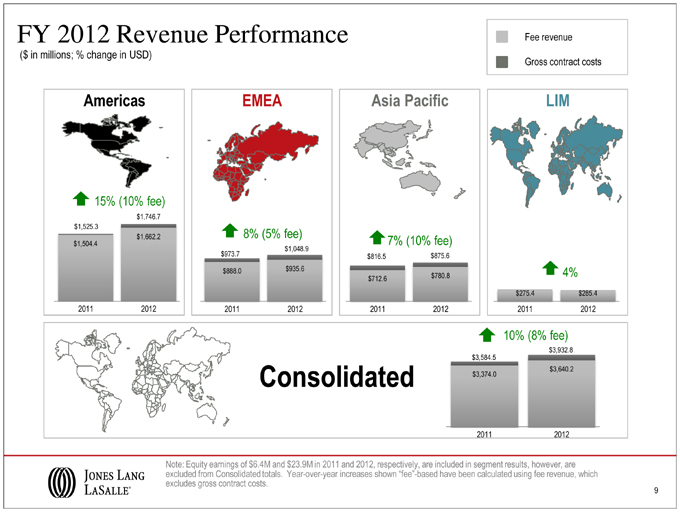
FY 2012 Revenue Performance ($ in millions; % change in USD) Fee revenue Gross contract costs Consolidated Note: Equity earnings of $6.4M and $23.9M in 2011 and 2012, respectively, are included in segment results, however, are excluded from Consolidated totals. Year-over-year increases shown “fee”-based have been calculated using fee revenue, which excludes gross contract costs.
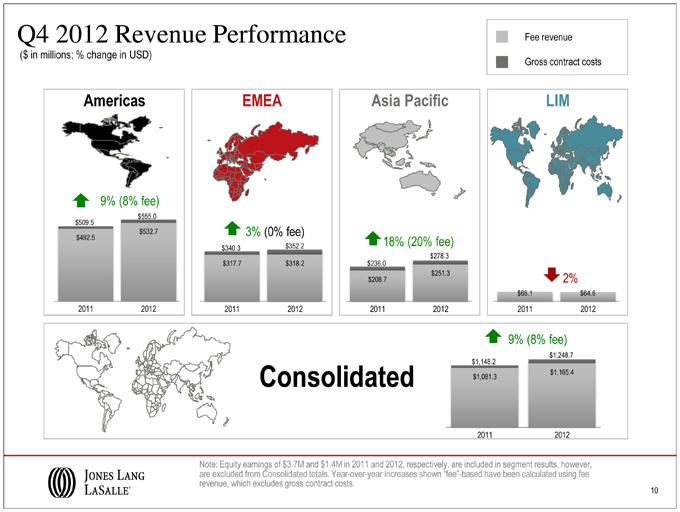
Q4 2012 Revenue Performance ($ in millions; % change in USD) Fee revenue Gross contract costs Consolidated Note: Equity earnings of $3.7M and $1.4M in 2011 and 2012, respectively, are included in segment results, however, are excluded from Consolidated totals. Year-over-year increases shown “fee”-based have been calculated using fee revenue, which excludes gross contract costs.
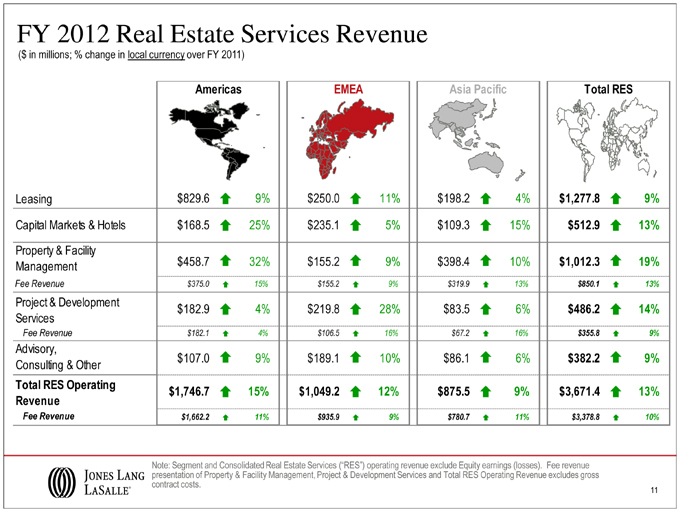
FY 2012 Real Estate Services Revenue ($ in millions; % change in local currency over FY 2011) Americas EMEA Asia Pacific Total RES Leasing $ 829.6 _ 9 % $ 250.0 _ 11 % $ 198.2 _ 4 % $ 1,277.8 _ 9 % Capital Markets & Hotels $ 168.5 _ 25 % $ 235.1 _ 5 % $ 109.3 _ 15 % $ 512.9 _ 13 % Property & Facility Management $ 458.7 _ 32 % $ 155.2 _ 9 % $ 398.4 _ 10 % $ 1,012.3 _ 19 % Fee Revenue $ 375.0 _ 15 % $ 155.2 _ 9 % $ 319.9 _ 13 % $ 850.1 _ 13 % Project & Development $ 182.9 _ 4 % $ 219.8 _ 28 % $ 83.5 _ 6 % $ 486.2 _ 14 % Services Fee Revenue $ 182.1 _ 4 % $ 106.5 _ 16 % $ 67.2 _ 16 % $ 355.8 _ 9 % Advisory, Consulting & Other $ 107.0 _ 9 % $ 189.1 _ 10 % $ 86.1 _ 6 % $ 382.2 _ 9 % Total RES Operating $ 1,746.7 _ 15 % $ 1,049.2 _ 12 % $ 875.5 _ 9 % $ 3,671.4 _ 13 % Revenue Fee Revenue $ 1,662.2 _ 11 % $ 935.9 _ 9 % $ 780.7 _ 11 % $ 3,378.8 _ 10 % Note: Segment and Consolidated Real Estate Services (“RES”) operating revenue exclude Equity earnings (losses). Fee revenue presentation of Property & Facility Management, Project & Development Services and Total RES Operating Revenue excludes gross contract costs.
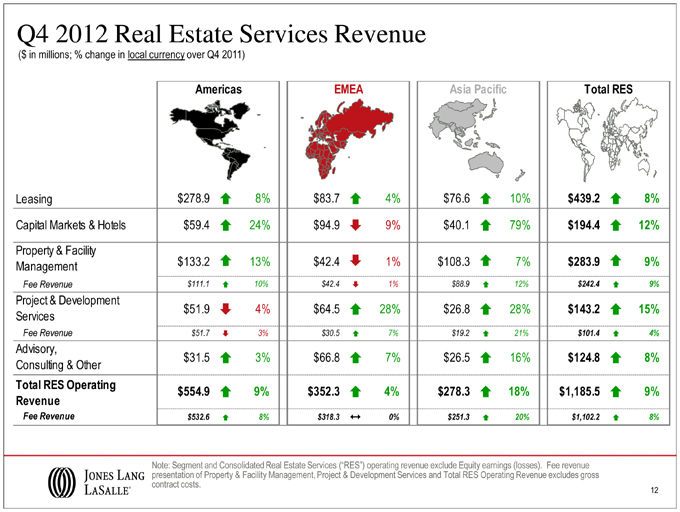
Q4 2012 Real Estate Services Revenue ($ in millions; % change in local currency over Q4 2011) Americas EMEA Asia Pacific Total RES Leasing $ 278.9 _ 8 % $ 83.7 _ 4 % $ 76.6 _ 10 % $ 439.2 _ 8 % Capital Markets & Hotels $ 59.4 _ 24 % $ 94.9 _ 9 % $ 40.1 _ 79 % $ 194.4 _ 12 % Property & Facility Management $ 133.2 _ 13 % $ 42.4 _ 1 % $ 108.3 _ 7 % $ 283.9 _ 9 % Fee Revenue $ 111.1 _ 10 % $ 42.4 _ 1 % $ 88.9 _ 12 % $ 242.4 _ 9 % Project & Development Services $ 51.9 _ 4 % $ 64.5 _ 28 % $ 26.8 _ 28 % $ 143.2 _ 15 % Fee Revenue $ 51.7 _ 3 % $ 30.5 _ 7 % $ 19.2 _ 21 % $ 101.4 _ 4 % Advisory, Consulting & Other $ 31.5 _ 3 % $ 66.8 _ 7 % $ 26.5 _ 16 % $ 124.8 _ 8 % Total RES Operating $ 554.9 _ 9 % $ 352.3 _ 4 % $ 278.3 _ 18 % $ 1,185.5 _ 9 % Revenue Fee Revenue $ 532.6 _ 8 % $ 318.3 _ 0 % $ 251.3 _ 20 % $ 1,102.2 _ 8 % Note: Segment and Consolidated Real Estate Services (“RES”) operating revenue exclude Equity earnings (losses). Fee revenue presentation of Property & Facility Management, Project & Development Services and Total RES Operating Revenue excludes gross contract costs.
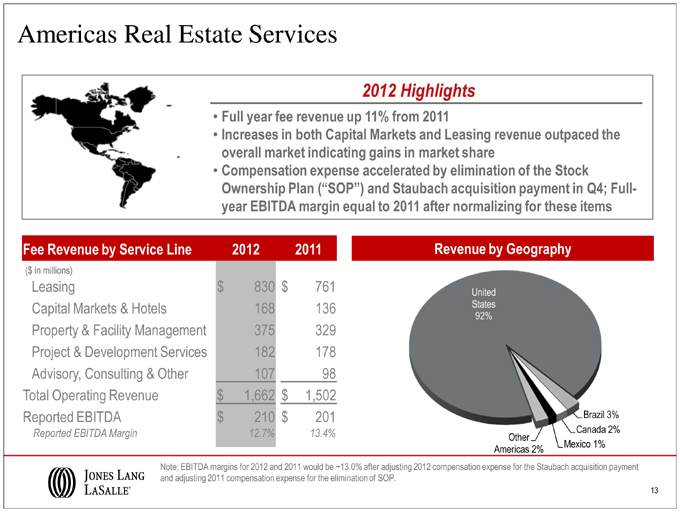
Americas Real Estate Services 2012 Highlights • Full year fee revenue up 11% from 2011 • Increases in both Capital Markets and Leasing revenue outpaced the overall market indicating gains in market share • Compensation expense accelerated by elimination of the Stock Ownership Plan (“SOP”) and Staubach acquisition payment in Q4; Full-year EBITDA margin equal to 2011 after normalizing for these items Fee Revenue by Service Line 2012 2011 ($ in millions) Leasing $ 830 $ 761 Capital Markets & Hotels 168 136 Property & Facility Management 375 329 Project & Development Services 182 178 Advisory, Consulting & Other 107 98 Total Operating Revenue $ 1,662 $ 1,502 Reported EBITDA $ 210 $ 201 Reported EBITDA Margin 12.7 % 13.4 % Revenue by Geography Note: EBITDA margins for 2012 and 2011 would be ~13.0% after adjusting 2012 compensation expense for the Staubach acquisition payment and adjusting 2011 compensation expense for the elimination of SOP.
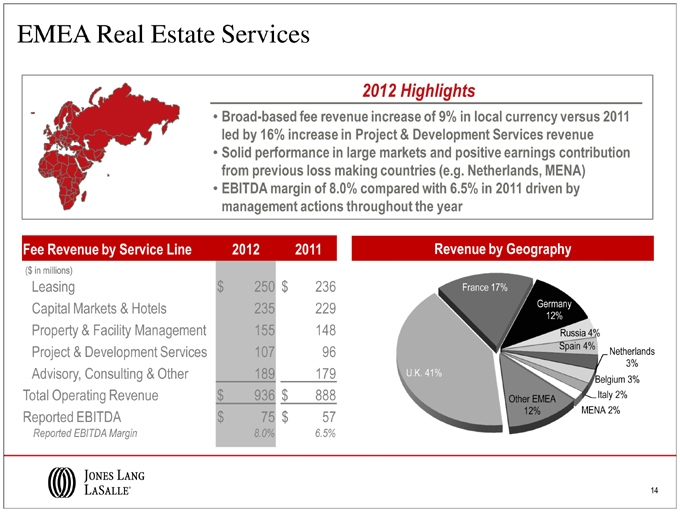
EMEA Real Estate Services 2012 Highlights • Broad-based fee revenue increase of 9% in local currency versus 2011 led by 16% increase in Project & Development Services revenue • Solid performance in large markets and positive earnings contribution from previous loss making countries (e.g. Netherlands, MENA) • EBITDA margin of 8.0% compared with 6.5% in 2011 driven by management actions throughout the year Fee Revenue by Service Line 2012 2011 ($ in millions) Leasing $ 250 $ 236 Capital Markets & Hotels 235 229 Property & Facility Management 155 148 Project & Development Services 107 96 Advisory, Consulting & Other 189 179 Total Operating Revenue $ 936 $ 888 Reported EBITDA $ 75 $ 57 Reported EBITDA Margin 8.0 % 6.5 % Revenue by Geography
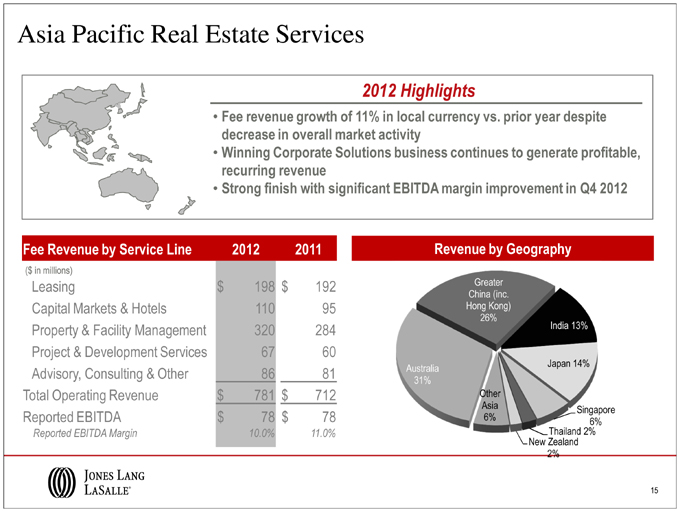
Asia Pacific Real Estate Services 2012 Highlights • Fee revenue growth of 11% in local currency vs. prior year despite decrease in overall market activity • Winning Corporate Solutions business continues to generate profitable, recurring revenue • Strong finish with significant EBITDA margin improvement in Q4 2012 Fee Revenue by Service Line 2012 2011 ($ in millions) Leasing $ 198 $ 192 Capital Markets & Hotels 110 95 Property & Facility Management 320 284 Project & Development Services 67 60 Advisory, Consulting & Other 86 81 Total Operating Revenue $ 781 $ 712 Reported EBITDA $ 78 $ 78 Reported EBITDA Margin 10.0 % 11.0 % Revenue by Geography
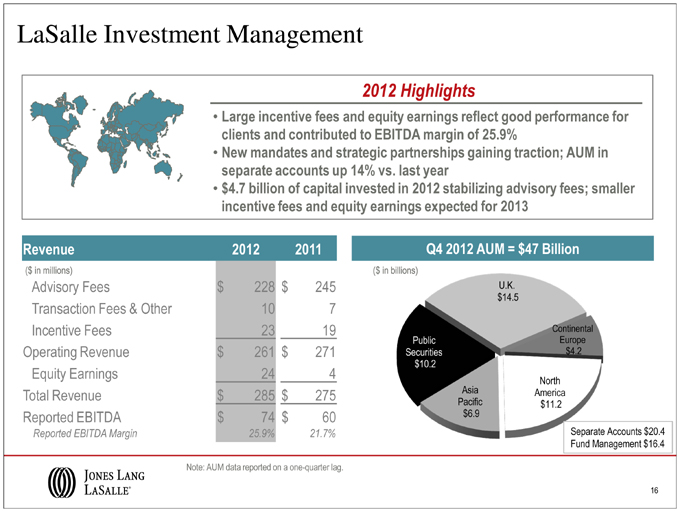
LaSalle Investment Management 2012 Highlights • Large incentive fees and equity earnings reflect good performance for clients and contributed to EBITDA margin of 25.9% • New mandates and strategic partnerships gaining traction; AUM in separate accounts up 14% vs. last year • $4.7 billion of capital invested in 2012 stabilizing advisory fees; smaller incentive fees and equity earnings expected for 2013 Revenue 2012 2011 ($ in millions) Advisory Fees $ 228 $ 245 Transaction Fees & Other 10 7 Incentive Fees 23 19 Operating Revenue $ 261 $ 271 Equity Earnings 24 4 Total Revenue $ 285 $ 275 Reported EBITDA $ 74 $ 60 Reported EBITDA Margin 25.9 % 21.7 % Q4 2012 AUM = $47 Billion Separate Accounts $20.4 Fund Management $16.4 Note: AUM data reported on a one-quarter lag.
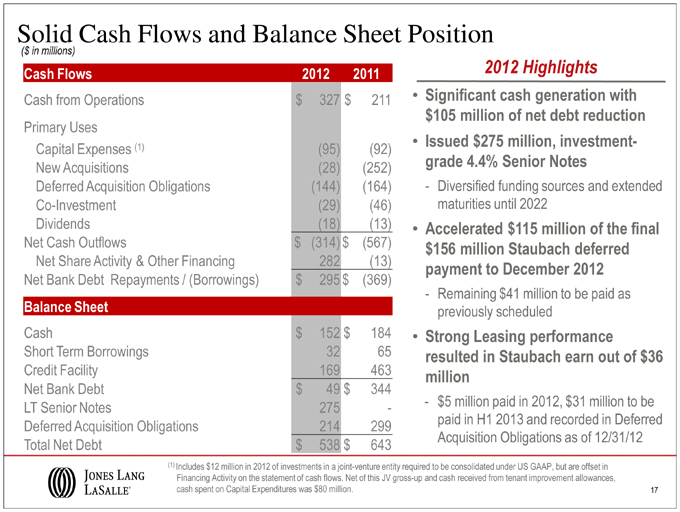
Solid Cash Flows and Balance Sheet Position ($ in millions) Cash Flows 2012 2011 Cash from Operations $ 327 $ 211 Primary Uses Capital Expenses (1) (95 ) (92 ) New Acquisitions (28 ) (252 ) Deferred Acquisition Obligations (144 ) (164 ) Co-Investment (29 ) (46 ) Dividends (18 ) (13 ) Net Cash Outflows $ (314 ) $ (567 ) Net Share Activity & Other Financing 282 (13 ) Net Bank Debt Repayments / (Borrowings) $ 295 $ (369 ) Balance Sheet Cash $ 152 $ 184 Short Term Borrowings 32 65 Credit Facility 169 463 Net Bank Debt $ 49 $ 344 LT Senior Notes 275 - Deferred Acquisition Obligations 214 299 Total Net Debt $ 538 $ 643 2012 Highlights • Significant cash generation with $105 million of net debt reduction • Issued $275 million, investment -grade 4.4% Senior Notes - Diversified funding sources and extended maturities until 2022 • Accelerated $115 million of the final $156 million Staubach deferred payment to December 2012 - Remaining $41 million to be paid as previously scheduled • Strong Leasing performance resulted in Staubach earn out of $36 million - $5 million paid in 2012, $31 million to be paid in H1 2013 and recorded in Deferred Acquisition Obligations as of 12/31/12 (1) Includes $12 million in 2012 of investments in a joint-venture entity required to be consolidated under US GAAP, but are offset in Financing Activity on the statement of cash flows. Net of this JV gross-up and cash received from tenant improvement allowances, cash spent on Capital Expenditures was $80 million.

Appendix

Fee Revenue / Expense Reconciliation • Reimbursable vendor, subcontractor and out-of-pocket costs reported as revenue and expense in JLL financial statements have been steadily increasing • Margins diluted as gross accounting requirements increase revenue and costs without corresponding profit • Business managed on a “fee” basis to focus on margin expansion in the base business Q4 Full Year ($ in millions) 2012 2011 2012 2011 Consolidated Revenue $ 1,248.7 $ 1,148.2 $ 3,932.8 $ 3,584.5 Consolidated Operating Expenses $ 1,084.8 $ 995.0 $ 3,598.0 $ 3,277.2 Adjusted Operating Income Margin 13.2 % 13.8 % 8.6 % 8.9 % Gross Contract Costs: Property & Facility Management 22.1 16.6 83.7 20.4 Americas Project & Development Services 0.2 0.4 0.8 0.5 Total Gross Contract Costs 22.3 17.0 84.5 20.9 Property & Facility Management - - - - EMEA Project & Development Services 34.0 22.6 113.3 85.7 Total Gross Contract Costs 34.0 22.6 113.3 85.7 Property & Facility Management 19.4 22.2 78.5 82.3 Asia Pacific Project & Development Services 7.6 5.1 16.3 21.6 Total Gross Contract Costs 27.0 27.3 94.8 103.9 Consolidated Fee Revenue $ 1,165.4 $ 1,081.3 $ 3,640.2 $ 3,374.0 Consolidated Fee-based Operating Expenses $ 1,001.5 $ 928.1 $ 3,305.4 $ 3,066.7 Adjusted Operating Income Margin (“fee”-based) 14.1 % 14.6 % 9.3 % 9.4 % Note: Consolidated revenue and fee revenue exclude equity earnings (losses). Restructuring and acquisition charges are excluded from operating expenses. Restructuring and acquisition charges as well as intangible amortization related to the King Sturge acquisition are excluded from operating expenses when calculating adjusted operating income margin.
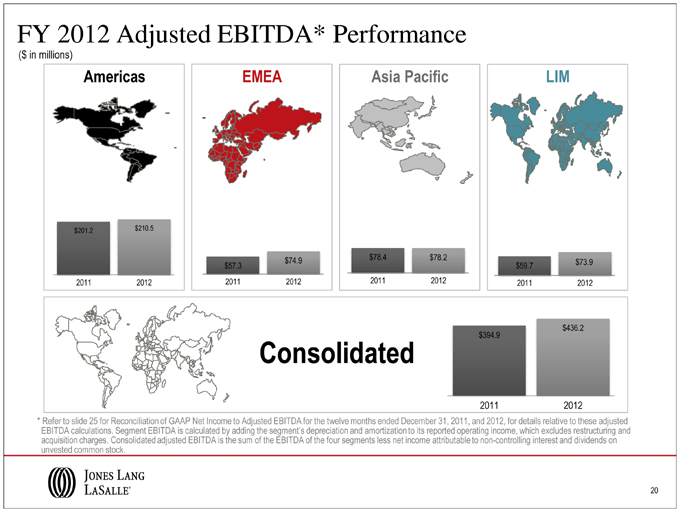
FY 2012 Adjusted EBITDA* Performance ($ in millions) * Refer to slide 25 for Reconciliation of GAAP Net Income to Adjusted EBITDA for the twelve months ended December 31, 2011, and 2012, for details relative to these adjusted EBITDA calculations. Segment EBITDA is calculated by adding the segment’s depreciation and amortization to its reported operating income, which excludes restructuring and acquisition charges. Consolidated adjusted EBITDA is the sum of the EBITDA of the four segments less net income attributable to non-controlling interest and dividends on unvested common stock.
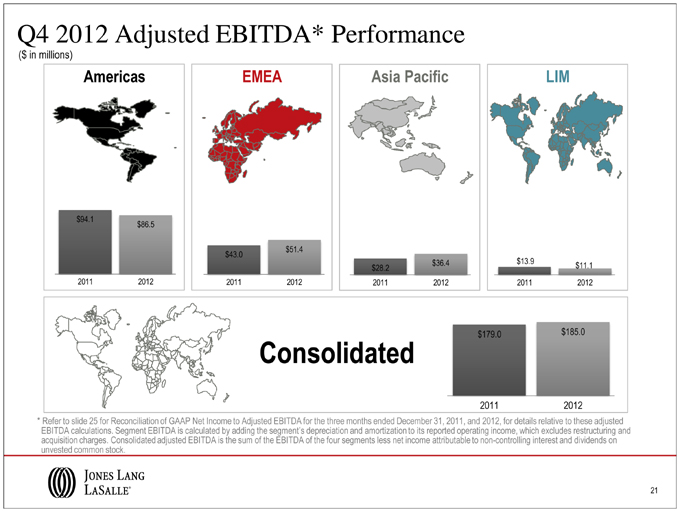
Q4 2012 Adjusted EBITDA* Performance ($ in millions) * Refer to slide 25 for Reconciliation of GAAP Net Income to Adjusted EBITDA for the three months ended December 31, 2011, and 2012, for details relative to these adjusted EBITDA calculations. Segment EBITDA is calculated by adding the segment’s depreciation and amortization to its reported operating income, which excludes restructuring and acquisition charges. Consolidated adjusted EBITDA is the sum of the EBITDA of the four segments less net income attributable to non-controlling interest and dividends on unvested common stock.
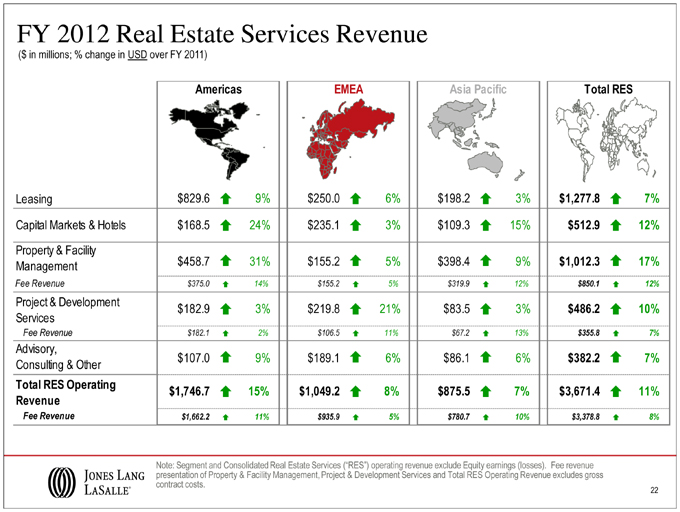
FY 2012 Real Estate Services Revenue ($ in millions; % change in USD over FY 2011) Americas EMEA Asia Pacific Total RES Leasing $ 829.6 _ 9 % $ 250.0 _ 6 % $ 198.2 _ 3 % $ 1,277.8 _ 7 % Capital Markets & Hotels $ 168.5 _ 24 % $ 235.1 _ 3 % $ 109.3 _ 15 % $ 512.9 _ 12 % Property & Facility Management $ 458.7 _ 31 % $ 155.2 _ 5 % $ 398.4 _ 9 % $ 1,012.3 _ 17 % Fee Revenue $ 375.0 _ 14 % $ 155.2 _ 5 % $ 319.9 _ 12 % $ 850.1 _ 12 % Project & Development $ 182.9 _ 3 % $ 219.8 _ 21 % $ 83.5 _ 3 % $ 486.2 _ 10 % Services Fee Revenue $ 182.1 _ 2 % $ 106.5 _ 11 % $ 67.2 _ 13 % $ 355.8 _ 7 % Advisory, Consulting & Other $ 107.0 _ 9 % $ 189.1 _ 6 % $ 86.1 _ 6 % $ 382.2 _ 7 % Total RES Operating $ 1,746.7 _ 15 % $ 1,049.2 _ 8 % $ 875.5 _ 7 % $ 3,671.4 _ 11 % Revenue Fee Revenue $ 1,662.2 _ 11 % $ 935.9 _ 5 % $ 780.7 _ 10 % $ 3,378.8 _ 8 % Note: Segment and Consolidated Real Estate Services (“RES”) operating revenue exclude Equity earnings (losses). Fee revenue presentation of Property & Facility Management, Project & Development Services and Total RES Operating Revenue excludes gross contract costs.
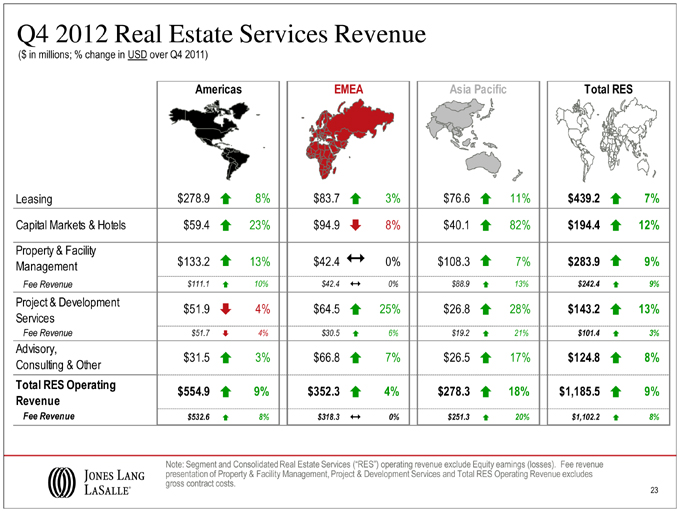
Q4 2012 Real Estate Services Revenue ($ in millions; % change in USD over Q4 2011) Americas EMEA Asia Pacific Total RES Leasing $ 278.9 _ 8 % $ 83.7 _ 3 % $ 76.6 _ 11 % $ 439.2 _ 7 % Capital Markets & Hotels $ 59.4 _ 23 % $ 94.9 _ 8 % $ 40.1 _ 82 % $ 194.4 _ 12 % Property & Facility Management $ 133.2 _ 13 % $ 42.4 _ 0 % $ 108.3 _ 7 % $ 283.9 _ 9 % Fee Revenue $ 111.1 _ 10 % $ 42.4 _ 0 % $ 88.9 _ 13 % $ 242.4 _ 9 % Project & Development $ 51.9 _ 4 % $ 64.5 _ 25 % $ 26.8 _ 28 % $ 143.2 _ 13 % Services Fee Revenue $ 51.7 _ 4 % $ 30.5 _ 6 % $ 19.2 _ 21 % $ 101.4 _ 3 % Advisory, Consulting & Other $ 31.5 _ 3 % $ 66.8 _ 7 % $ 26.5 _ 17 % $ 124.8 _ 8 % Total RES Operating $ 554.9 _ 9 % $ 352.3 _ 4 % $ 278.3 _ 18 % $ 1,185.5 _ 9 % Revenue Fee Revenue $ 532.6 _ 8 % $ 318.3 _ 0 % $ 251.3 _ 20 % $ 1,102.2 _ 8 % Note: Segment and Consolidated Real Estate Services (“RES”) operating revenue exclude Equity earnings (losses). Fee revenue presentation of Property & Facility Management, Project & Development Services and Total RES Operating Revenue excludes gross contract costs.
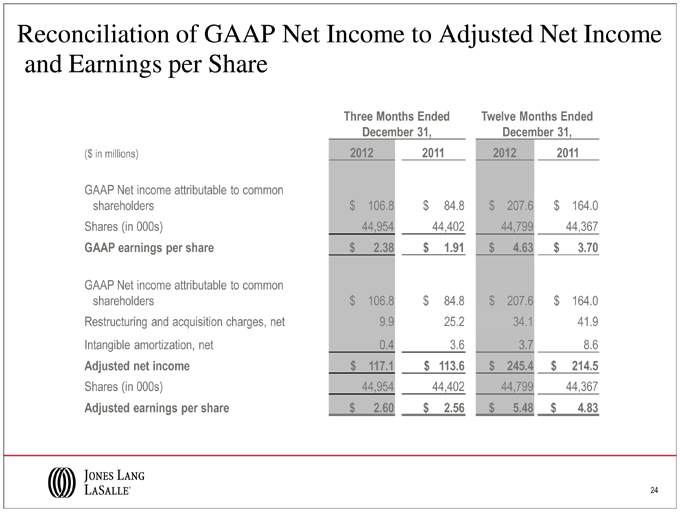
Reconciliation of GAAP Net Income to Adjusted Net Income and Earnings per Share Three Months Ended Twelve Months Ended December 31, December 31, ($ in millions) 2012 2011 2012 2011 GAAP Net income attributable to common shareholders $ 106.8 $ 84.8 $ 207.6 $ 164.0 Shares (in 000s) 44,954 44,402 44,799 44,367 GAAP earnings per share $ 2.38 $ 1.91 $ 4.63 $ 3.70 GAAP Net income attributable to common shareholders $ 106.8 $ 84.8 $ 207.6 $ 164.0 Restructuring and acquisition charges, net 9.9 25.2 34.1 41.9 Intangible amortization, net 0.4 3.6 3.7 8.6 Adjusted net income $ 117.1 $ 113.6 $ 245.4 $ 214.5 Shares (in 000s) 44,954 44,402 44,799 44,367 Adjusted earnings per share $ 2.60 $ 2.56 $ 5.48 $ 4.83
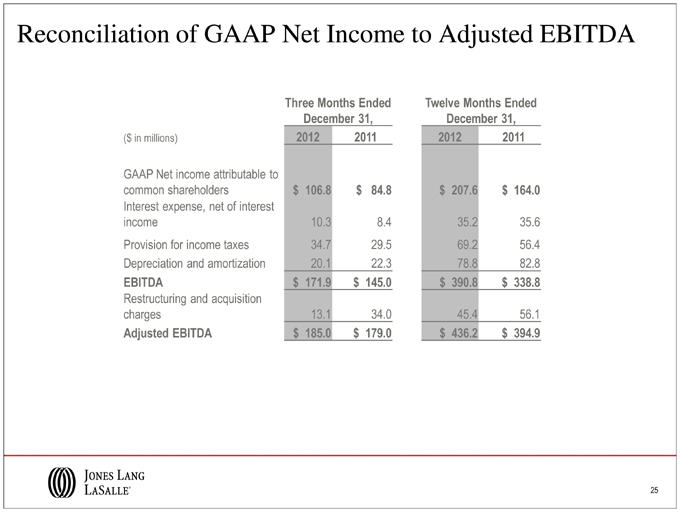
Reconciliation of GAAP Net Income to Adjusted EBITDA Three Months Ended Twelve Months Ended December 31, December 31, ($ in millions) 2012 2011 2012 2011 GAAP Net income attributable to common shareholders $ 106.8 $ 84.8 $ 207.6 $ 164.0 Interest expense, net of interest income 10.3 8.4 35.2 35.6 Provision for income taxes 34.7 29.5 69.2 56.4 Depreciation and amortization 20.1 22.3 78.8 82.8 EBITDA $ 171.9 $ 145.0 $ 390.8 $ 338.8 Restructuring and acquisition charges 13.1 34.0 45.4 56.1 Adjusted EBITDA $ 185.0 $ 179.0 $ 436.2 $ 394.9