Exhibit 99.2
Supplemental Information First-Quarter 2013 Earnings Call

Market & Financial Overview
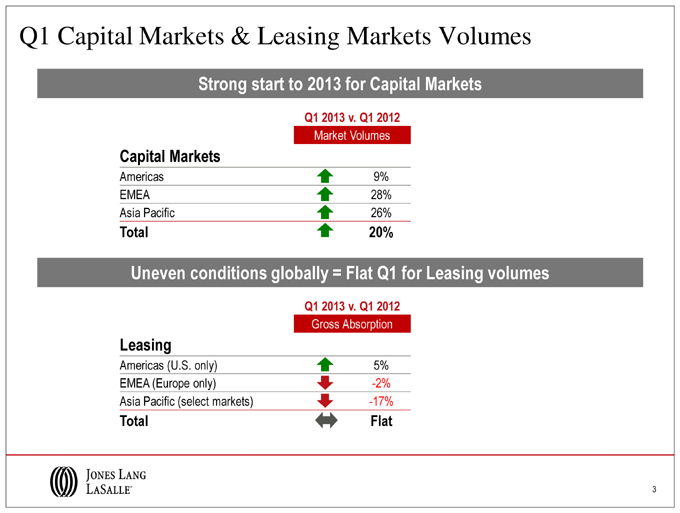
Q1 Capital Markets & Leasing Markets Volumes Strong start to 2013 for Capital Markets Q1 2013 v. Q1 2012 Market Volumes Capital Markets Americas 9% EMEA 28% Asia Pacific 26% Total 20% Uneven conditions globally = Flat Q1 for Leasing volumes Q1 2013 v. Q1 2012 Gross Absorption Leasing Americas (U.S. only) 5% EMEA (Europe only) -2% Asia Pacific (select markets) -17% Total Flat
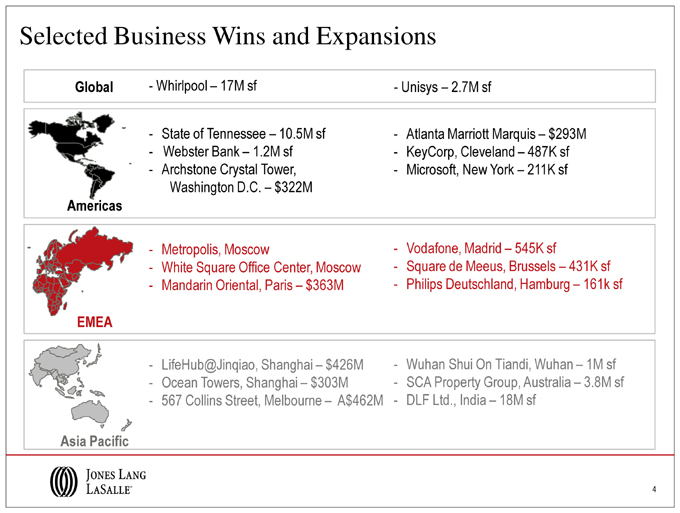
Selected Business Wins and Expansions Global—Whirlpool – 17M sf—Unisys – 2.7M sf—State of Tennessee – 10.5M sf—Atlanta Marriott Marquis – $293M—Webster Bank – 1.2M sf—KeyCorp, Cleveland – 487K sf—Archstone Crystal Tower,—Microsoft, New York – 211K sf Washington D.C. – $322M Americas—Metropolis, Moscow—Vodafone, Madrid – 545K sf—White Square Office Center, Moscow—Square de Meeus, Brussels – 431K sf—Mandarin Oriental, Paris – $363M—Philips Deutschland, Hamburg – 161k sf EMEA—LifeHub@Jinqiao, Shanghai – $426M—Wuhan Shui On Tiandi, Wuhan – 1M sf—Ocean Towers, Shanghai – $303M—SCA Property Group, Australia – 3.8M sf—567 Collins Street, Melbourne – A$462M—DLF Ltd., India – 18M sf Asia Pacific 4
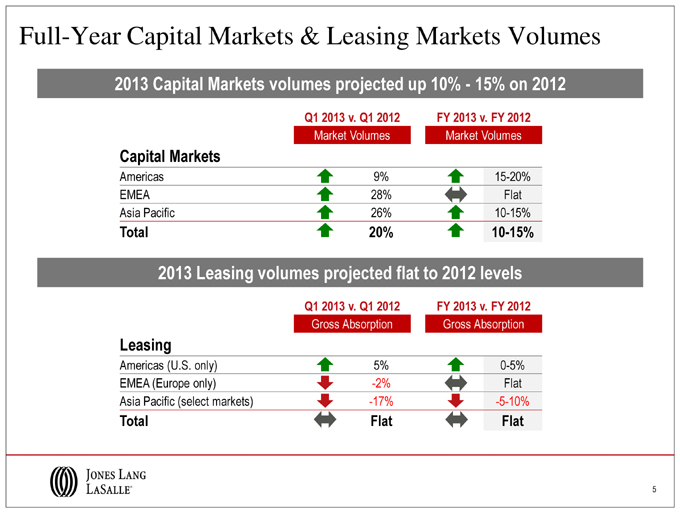
Full-Year Capital Markets & Leasing Markets Volumes 2013 Capital Markets volumes projected up 10%—15% on 2012 Q1 2013 v. Q1 2012 FY 2013 v. FY 2012 Market Volumes Market Volumes Capital Markets Americas 9% 15-20% EMEA 28% Flat Asia Pacific 26% 10-15% Total 20% 10-15% 2013 Leasing volumes projected flat to 2012 levels Q1 2013 v. Q1 2012 FY 2013 v. FY 2012 Gross Absorption Gross Absorption Leasing Americas (U.S. only) 5% 0-5% EMEA (Europe only) -2% Flat Asia Pacific (select markets) -17% -5-10% Total Flat Flat 5
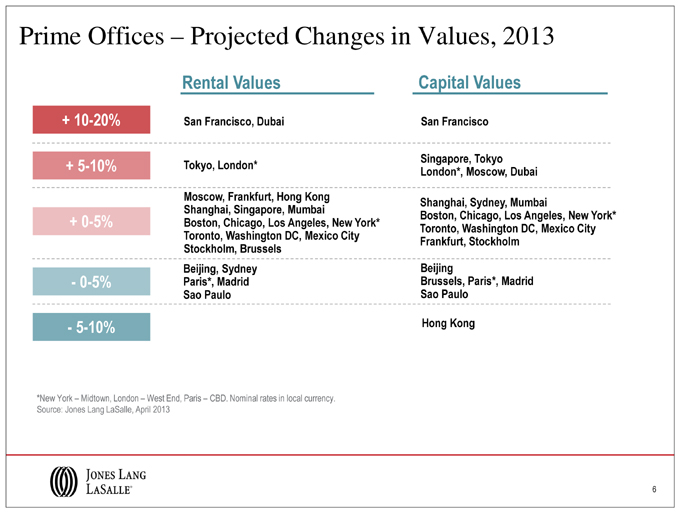
Prime Offices – Projected Changes in Values, 2013 Rental Values Capital Values + 10-20% San Francisco, Dubai San Francisco Singapore, Tokyo + 5-10% Tokyo, London* London*, Moscow, Dubai Moscow, Frankfurt, Hong Kong Shanghai, Sydney, Mumbai Shanghai, Singapore, Mumbai Boston, Chicago, Los Angeles, New York* + 0-5% Boston, Chicago, Los Angeles, New York* Toronto, Washington DC, Mexico City Toronto, Washington DC, Mexico City Frankfurt, Stockholm Stockholm, Brussels Beijing, Sydney Beijing—0-5% Paris*, Madrid Brussels, Paris*, Madrid Sao Paulo Sao Paulo—5-10% Hong Kong *New York – Midtown, London – West End, Paris – CBD. Nominal rates in local currency. Source: Jones Lang LaSalle, April 2013 6
Financial Information
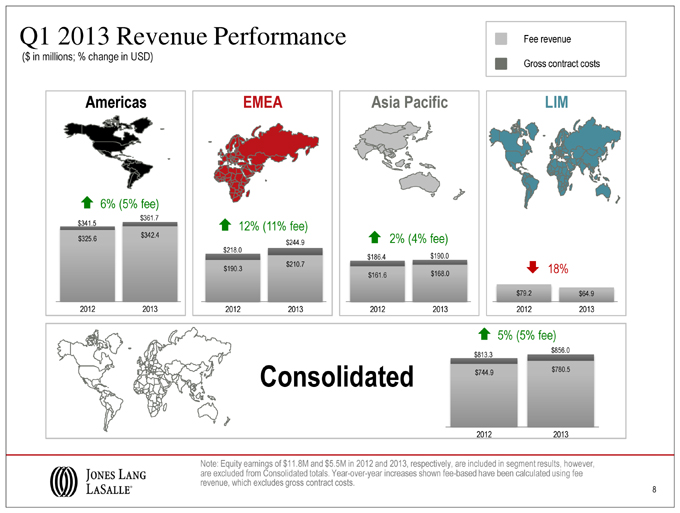
Q1 2013 Revenue Performance Fee revenue ($ in millions; % change in USD) Gross contract costs Americas EMEA Asia Pacific LIM 3 33 6% (5% fee) $361.7 $341.5 33 3 12% (11% fee) $342.4 $325.6 33 3 2% (4% fee) $244.9 $218.0 $186.4 $190.0 $210.7 $190.3 3 33 18% $161.6 $168.0 $79.2 $64.9 2012 2013 2012 2013 2012 2013 2012 2013 3 33 5% (5% fee) $856.0 $813.3 $780.5 Consolidated $744.9 2012 2013 Note: Equity earnings of $11.8M and $5.5M in 2012 and 2013, respectively, are included in segment results, however, are excluded from Consolidated totals. Year-over-year increases shown fee-based have been calculated using fee revenue, which excludes gross contract costs. 8
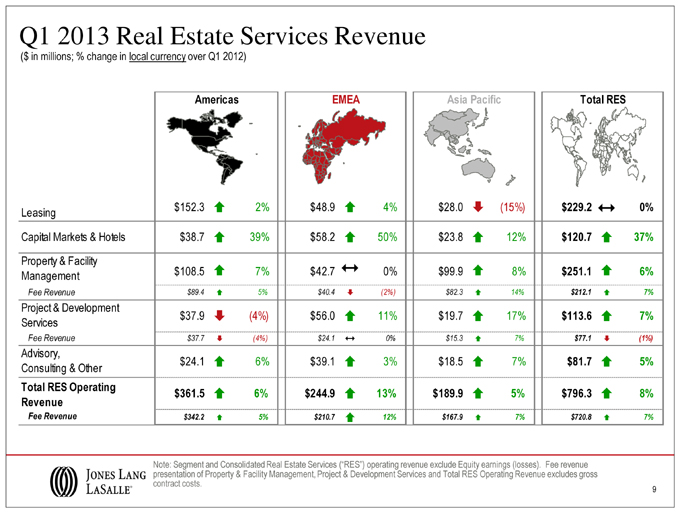
Q1 2013 Real Estate Services Revenue ($ in millions; % change in local currency over Q1 2012) Americas EMEA Asia Pacific Total RES $152.3 3 2% $48.9 3 4% $28.0 3 (15%) $229.2 3 0% Leasing Capital Markets & Hotels $38.7 3 39% $58.2 3 50% $23.8 3 12% $120.7 3 37% Property & Facility Management $108.5 3 7% $42.7 3 0% $99.9 3 8% $251.1 3 6% Fee Revenue $89.4 3 5% $40.4 3 (2%) $82.3 3 14% $212.1 3 7% Project & Development $37.9 3 (4%) $56.0 3 11% $19.7 3 17% $113.6 3 7% Services Fee Revenue $37.7 3 (4%) $24.1 3 0% $15.3 3 7% $77.1 3 (1%) Advisory, $24.1 3 6% $39.1 3 3% $18.5 3 7% $81.7 3 5% Consulting & Other Total RES Operating $361.5 3 6% $244.9 3 13% $189.9 3 5% $796.3 3 8% Revenue Fee Revenue $342.2 3 5% $210.7 3 12% $167.9 3 7% $720.8 3 7% Note: Segment and Consolidated Real Estate Services (“RES”) operating revenue exclude Equity earnings (losses). Fee revenue presentation of Property & Facility Management, Project & Development Services and Total RES Operating Revenue excludes gross contract costs. 9
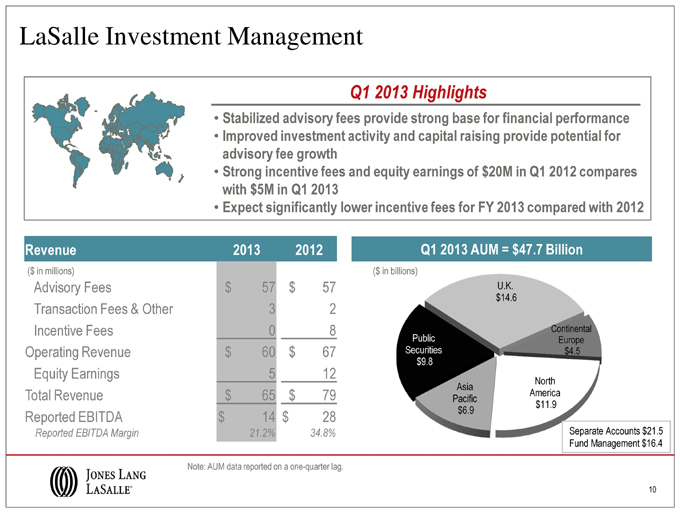
LaSalle Investment Management Q1 2013 Highlights • Stabilized advisory fees provide strong base for financial performance • Improved investment activity and capital raising provide potential for advisory fee growth • Strong incentive fees and equity earnings of $20M in Q1 2012 compares with $5M in Q1 2013 • Expect significantly lower incentive fees for FY 2013 compared with 2012 Revenue 2013 2012 Q1 2013 AUM = $47.7 Billion ($ in millions) ($ in billions) Advisory Fees $ 57 $ 57 U.K. $14.6 Transaction Fees & Other 3 2 Incentive Fees 0 8 Continental Public Europe Operating Revenue $ 60 $ 67 Securities $4.5 $9.8 Equity Earnings 5 12 North Asia Total Revenue $ 65 $ 79 America Pacific $11.9 $6.9 Reported EBITDA $ 14 $ 28 Reported EBITDA Margin 21.2% 34.8% Separate Accounts $21.5 Fund Management $16.4 Note: AUM data reported on a one-quarter lag. 10
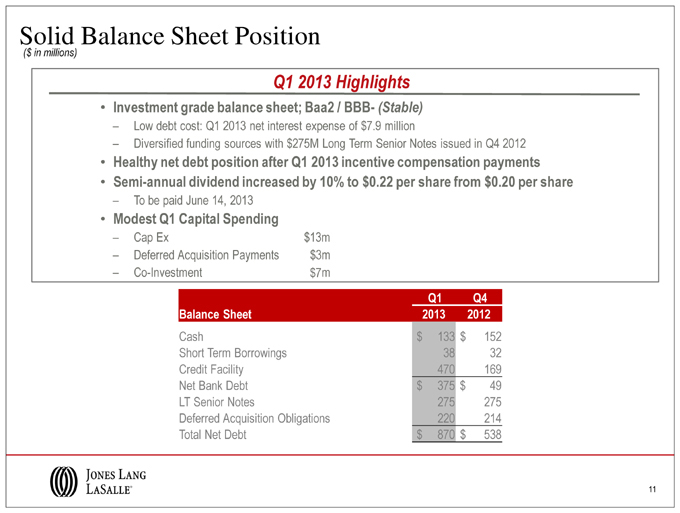
Solid Balance Sheet Position ($ in millions) Q1 2013 Highlights • Investment grade balance sheet; Baa2 / BBB- (Stable) – Low debt cost: Q1 2013 net interest expense of $7.9 million – Diversified funding sources with $275M Long Term Senior Notes issued in Q4 2012 • Healthy net debt position after Q1 2013 incentive compensation payments • Semi-annual dividend increased by 10% to $0.22 per share from $0.20 per share – To be paid June 14, 2013 • Modest Q1 Capital Spending – Cap Ex $13m – Deferred Acquisition Payments $3m – Co-Investment $7m Q1 Q4 Balance Sheet 2013 2012 Cash $ 133 $ 152 Short Term Borrowings 38 32 Credit Facility 470 169 Net Bank Debt $ 375 $ 49 LT Senior Notes 275 275 Deferred Acquisition Obligations 220 214 Total Net Debt $ 870 $ 538 11
Appendix
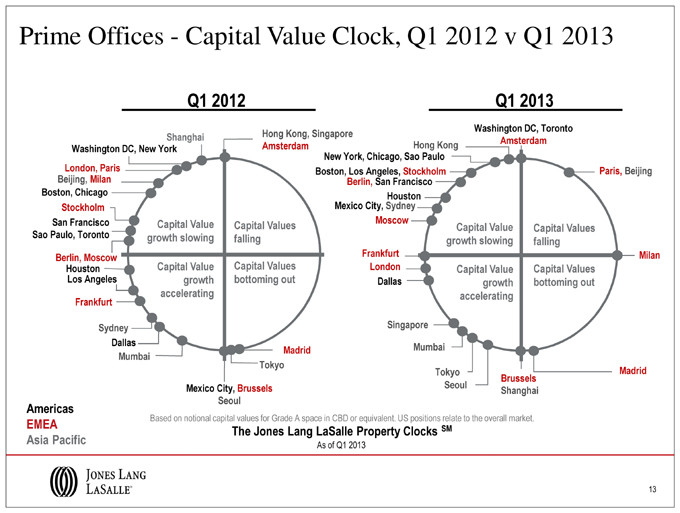
Prime Offices—Capital Value Clock, Q1 2012 v Q1 2013 Q1 2012 Q1 2013 Washington DC, Toronto Shanghai Hong Kong, Singapore Amsterdam Washington DC, New York Amsterdam Hong Kong New York, Chicago, Sao Paulo London, Paris Boston, Los Angeles, Stockholm Paris, Beijing Beijing, Milan Berlin, San Francisco Boston, Chicago Houston Stockholm Mexico City, Sydney San Francisco Capital Value Moscow Capital Values Capital Value Capital Values Sao Paulo, Toronto growth slowing falling growth slowing falling Frankfurt Milan Berlin, Moscow Houston Capital Value Capital Values London Capital Value Capital Values Los Angeles growth bottoming out Dallas growth bottoming out accelerating accelerating Frankfurt Sydney Singapore Dallas Madrid Mumbai Mumbai Tokyo Tokyo Madrid Brussels Mexico City, Brussels Seoul Shanghai Seoul Americas Based on notional capital values for Grade A space in CBD or equivalent. US positions relate to the overall market. EMEA The Jones Lang LaSalle Property Clocks SM Asia Pacific As of Q1 2013 13
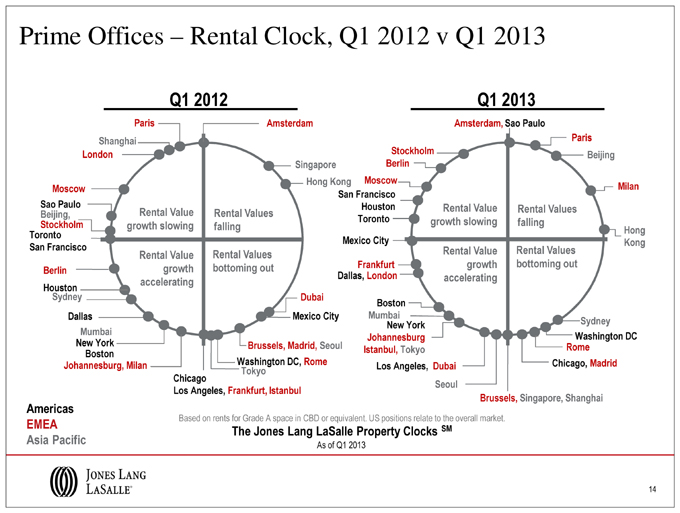
Prime Offices – Rental Clock, Q1 2012 v Q1 2013 Q1 2012 Q1 2013 Paris Amsterdam Amsterdam, Sao Paulo Shanghai Paris London Stockholm Beijing Singapore Berlin Hong Kong Moscow Moscow Milan San Francisco Sao Paulo Houston Rental Value Rental Value Rental Values Rental Values Beijing, Toronto growth slowing falling Stockholm growth slowing falling Hong Toronto Mexico City Kong San Francisco Rental Value Rental Values Rental Value Rental Values bottoming out Frankfurt growth bottoming out Berlin growth Dallas, London accelerating accelerating Houston Sydney Dubai Boston Dallas Mexico City Mumbai Sydney New York Mumbai Johannesburg Washington DC New York Brussels, Madrid, Seoul Istanbul, Tokyo Rome Boston Johannesburg, Milan Washington DC, Rome Chicago, Madrid Los Angeles, Dubai Tokyo Chicago Seoul Los Angeles, Frankfurt, Istanbul Brussels, Singapore, Shanghai Americas Based on rents for Grade A space in CBD or equivalent. US positions relate to the overall market. EMEA The Jones Lang LaSalle Property Clocks SM Asia Pacific As of Q1 2013 14
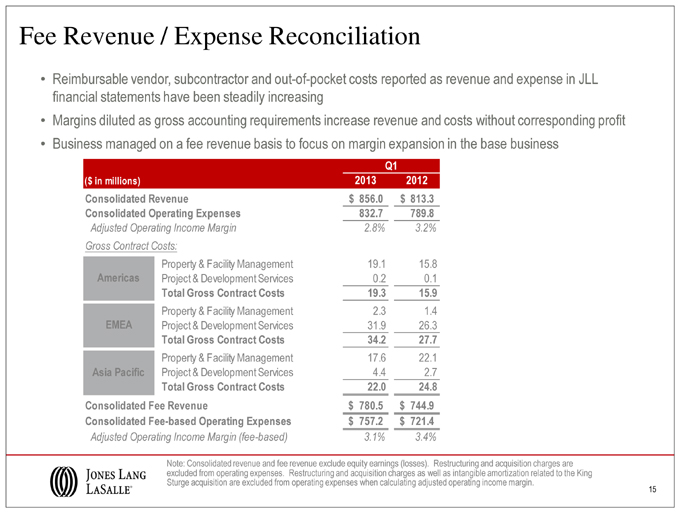
Fee Revenue / Expense Reconciliation • Reimbursable vendor, subcontractor and out-of-pocket costs reported as revenue and expense in JLL financial statements have been steadily increasing • Margins diluted as gross accounting requirements increase revenue and costs without corresponding profit • Business managed on a fee revenue basis to focus on margin expansion in the base business Q1 ($ in millions) 2013 2012 Consolidated Revenue $ 856.0 $ 813.3 Consolidated Operating Expenses 832.7 789.8 Adjusted Operating Income Margin 2.8% 3.2% Gross Contract Costs: Property & Facility Management 19.1 15.8 Americas Project & Development Services 0.2 0.1 Total Gross Contract Costs 19.3 15.9 Property & Facility Management 2.3 1.4 EMEA Project & Development Services 31.9 26.3 Total Gross Contract Costs 34.2 27.7 Property & Facility Management 17.6 22.1 Asia Pacific Project & Development Services 4.4 2.7 Total Gross Contract Costs 22.0 24.8 Consolidated Fee Revenue $ 780.5 $ 744.9 Consolidated Fee-based Operating Expenses $ 757.2 $ 721.4 Adjusted Operating Income Margin (fee-based) 3.1% 3.4% Note: Consolidated revenue and fee revenue exclude equity earnings (losses). Restructuring and acquisition charges are excluded from operating expenses. Restructuring and acquisition charges as well as intangible amortization related to the King Sturge acquisition are excluded from operating expenses when calculating adjusted operating income margin. 15
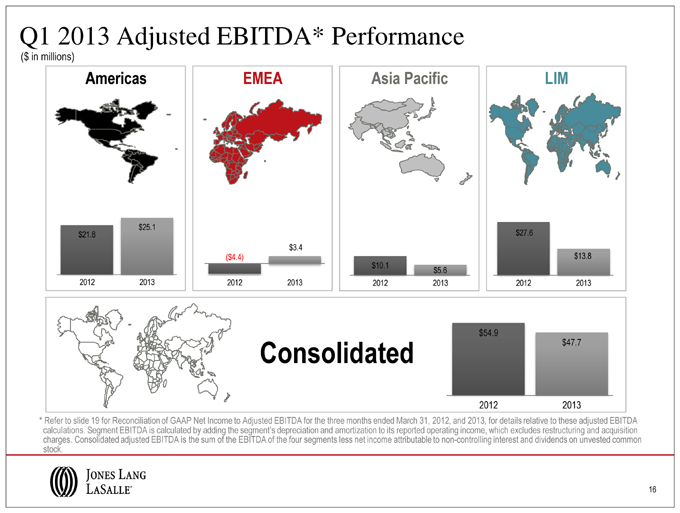
Q1 2013 Adjusted EBITDA* Performance ($ in millions) Americas EMEA Asia Pacific LIM $25.1 $21.8 $27.6 $3.4 ($ 4.4) $13.8 $10.1 $5.6 2012 2013 2012 2013 2012 2013 2012 2013 $54.9 Consolidated $47.7 2012 2013 * Refer to slide 19 for Reconciliation of GAAP Net Income to Adjusted EBITDA for the three months ended March 31, 2012, and 2013, for details relative to these adjusted EBITDA calculations. Segment EBITDA is calculated by adding the segment’s depreciation and amortization to its reported operating income, which excludes restructuring and acquisition charges. Consolidated adjusted EBITDA is the sum of the EBITDA of the four segments less net income attributable to non-controlling interest and dividends on unvested common stock. 16
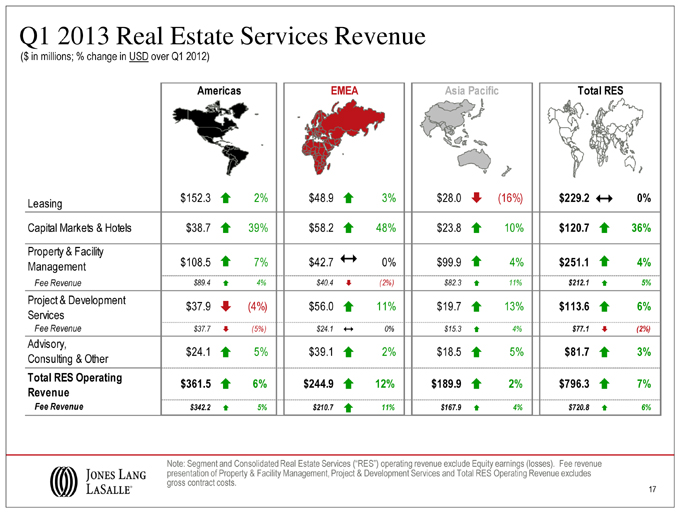
Q1 2013 Real Estate Services Revenue ($ in millions; % change in USD over Q1 2012) Americas EMEA Asia Pacific Total RES $152.3 3 2% $48.9 3 3% $28.0 3 (16%) $229.2 3 0% Leasing Capital Markets & Hotels $38.7 3 39% $58.2 3 48% $23.8 3 10% $120.7 3 36% Property & Facility Management $108.5 3 7% $42.7 3 0% $99.9 3 4% $251.1 3 4% Fee Revenue $89.4 3 4% $40.4 3 (2%) $82.3 3 11% $212.1 3 5% Project & Development $37.9 3 (4%) $56.0 3 11% $19.7 3 13% $113.6 3 6% Services Fee Revenue $37.7 3 (5%) $24.1 3 0% $15.3 3 4% $77.1 3 (2%) Advisory, $24.1 3 5% $39.1 3 2% $18.5 3 5% $81.7 3 3% Consulting & Other Total RES Operating $361.5 3 6% $244.9 3 12% $189.9 3 2% $796.3 3 7% Revenue Fee Revenue $342.2 3 5% $210.7 3 11% $167.9 3 4% $720.8 3 6% Note: Segment and Consolidated Real Estate Services (“RES”) operating revenue exclude Equity earnings (losses). Fee revenue presentation of Property & Facility Management, Project & Development Services and Total RES Operating Revenue excludes gross contract costs. 17
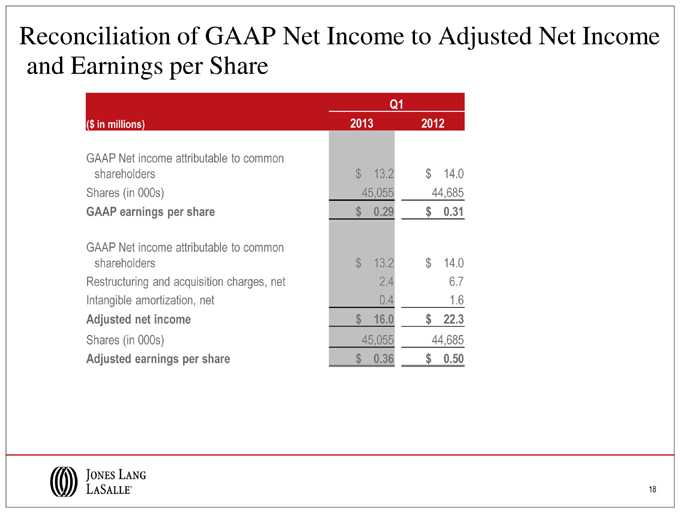
Reconciliation of GAAP Net Income to Adjusted Net Income and Earnings per Share Q1 ($ in millions) 2013 2012 GAAP Net income attributable to common shareholders $ 13.2 $ 14.0 Shares (in 000s) 45,055 44,685 GAAP earnings per share $ 0.29 $ 0.31 GAAP Net income attributable to common shareholders $ 13.2 $ 14.0 Restructuring and acquisition charges, net 2.4 6.7 Intangible amortization, net 0.4 1.6 Adjusted net income $ 16.0 $ 22.3 Shares (in 000s) 45,055 44,685 Adjusted earnings per share $ 0.36 $ 0.50 18
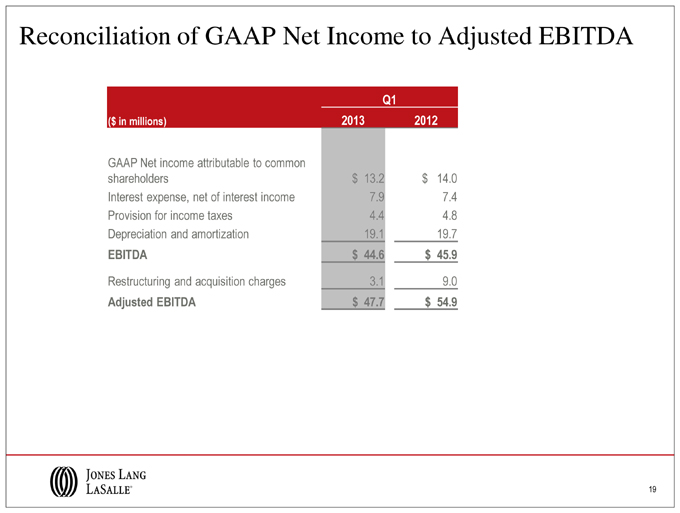
Reconciliation of GAAP Net Income to Adjusted EBITDA Q1 ($ in millions) 2013 2012 GAAP Net income attributable to common shareholders $ 13.2 $ 14.0 Interest expense, net of interest income 7.9 7.4 Provision for income taxes 4.4 4.8 Depreciation and amortization 19.1 19.7 EBITDA $ 44.6 $ 45.9 Restructuring and acquisition charges 3.1 9.0 Adjusted EBITDA $ 47.7 $ 54.9 19