Exhibit 15.1
Excerpt containing the pages and sections of the 2013 registration document that are incorporated by reference into the 2013 annual report on form 20-F(1)
(1) The following document contains certain pages and sections of the 2013 Registration Document which are being incorporated by reference into the 2013 Annual Report on Form 20-F of Orange. Where information within a subsection has been deleted, such deletion is indicated with a notation that such information has been redacted. |
2013 form 20-F /ORANGE –E-14
Orange is one of the world’s leading telecommunications operators with revenues of 41 billion euros in 2013 and 165,000 employees worldwide at December 31, 2013. Present in around 30 countries, the Group has a total customer base of more than 236 million customers at December 31, 2013. Orange is also a leading provider of telecommunication services to multinational companies, under the brand Orange Business Services.
Orange has been listed since 1997 on NYSE Euronext Paris (symbol: ORA) and on the New York Stock Exchange (symbol: ORAN).
History
Orange, formerly France Telecom, is France's incumbent telecommunications operator. The Group has its origins in the Ministry for Mail, Telegraphs and Telephone, later to become the General Directorate of Telecommunications, which in 1990 was accorded the status of independent public entity and, on January 1, 1991, renamed France Telecom. On December 31, 1996, France Telecom became a Société Anonyme (limited company) with the French State as its sole shareholder. In October 1997, France Telecom shares were listed on the Paris and New York stock exchanges allowing the French government to sell 25% of its shares to the public and Group employees. Subsequently, the government gradually reduced its holding to 53%. The Law of December 31, 2003 authorized the transfer of the Company to the private sector and between 2004 and 2008 the State sold a further 26% of the share capital. At December 31, 2013, the French State retained 26.94% of the shares, held either directly or jointly with Bpifrance.
Since the 1990s, France Telecom’s area of activity and its regulatory and competitive environment have undergone significant changes. In a context of increased deregulation and competition, between 1999 and 2002, the Group pursued a strategy of developing new services and accelerated its international growth with a number of strategic investments. These included, in particular, acquiring mobile operator Orange and the Orange brand, which had been created in 1994, and taking a stake in Poland's incumbent operator, Telekomunikacja Polska (renamed Orange Polska in 2013). Most of these investments could not be financed by share issues and therefore the Group’s debt substantially increased during this period.
At the end of 2002, France Telecom started a large-scale refinancing plan for its debt to reinforce its balance sheet, as well as an operational improvements program, the success of which has allowed the Group to develop a global integrated-operator strategy by anticipating changes in the telecommunications industry.
In 2005, France Telecom acquired 80% of Spanish mobile operator Amena, whose activities were then regrouped with the Group's fixed-line and internet operations in Spain into a single entity under the Orange brand. In 2008 and 2009, the Group acquired almost all the remaining capital of Orange España.
In parallel, the Group streamlined its asset portfolio by selling off non-strategic subsidiaries and holdings.
In 2006, Orange became the single brand of the Group for Internet, television and mobile services in most countries where the Group operates, and Orange Business Services the brand for services offered to businesses throughout the world.
Since 2007, Orange has pursued a selective acquisition policy mainly focused on emerging markets (in particular Africa and the Middle East), while attempting to grasp opportunities for consolidation in markets where the Group was already present. In 2010 this strategy notably led the Group to raise its stake in Egyptian operator ECMS (Mobinil) from 36% to 94%. It also resulted in the joint venture with Deutsche Telekom that combined UK business under the EE brand on April 1, 2010, as well as in the 2012 disposal of Orange Switzerland.
On July 1, 2013, the Company adopted the name Orange.
In July 2010, the Group launched a new strategic plan Conquest 2015. This initiative is simultaneously aimed at its employees, customers and shareholders, and more generally at the society in which the Company operates. For more information on Orange's strategy see Section 2.3 Orange’s Group strategy.
Business in 2013

(1) The EE customer base in the UK is 50% consolidated in the Orange customer base
ORANGE / 2013 REGISTRATION DOCUMENT - 6
At the end of 2013, the Orange Group grew its worldwide customer base by 2.4% year-on-year to 236.3 million, adding an additional 5.6 million customers, including 178.5 million mobile customers (excluding MVNOs) (up 3.5%) and 15.5 million broadband customers (up 3.8%).
This increase reflects the continued strength of growth in mobile phone services in Africa and the Middle East, where numbers rose 7.9% to 88 million customers at December 31, 2013, (an additional 6.4 million cell phone customers). In Africa, the Orange Money application had 8.9 million customers, from 5.6 million in 2013 (up 59%).
In France, mobile contracts, which make up over three-quarters of the mobile customer base at December 31, 2013 (20.9 million customers) rose 5.9%, thanks to the success of offerings targeting specific customer segments: Sosh, Open, and Origami.
In other geographical regions mobile contracts also grew strongly, by 6.1% on the year to 34.5 million customers at December 31, 2013, most notably in Spain, the UK, Poland and Romania, and made up 54% of the mobile customer base at December 31, 2013.
2013 also saw rapid growth in 4G high capacity mobile broadband: in France, where the target of one million customers was met with a coverage of 50% of the population; in Spain, where 4G now has 530,000 customers and a coverage of 30% of the population; in Poland; and in the UK, where Everything Everywhere had more than two million customers at the start of January 2014.
Fixed broadband had 15.5 million customers at December 31, 2013, a 3.8% increase on the year, i.e. 559,000 additional customers, including 297,000 in Spain, 215,000 in France and 29,000 in Slovakia. Fixed broadband connections at December 31, 2013 include 382,000 fiber-optic connections, 319,000 of which are in France (+81%), 59,000 in Slovakia and nearly 3,000 in Moldova.
The Group’s consolidated revenues for the year were 40.98 billion euros, down 5.8%. Price reductions linked to regulatory measures remain significant. Excluding regulatory measures, the fall in revenues is limited to 2.6% overall, with a 4.8% decline in France linked to a fall in average revenues per user (ARPU), and a 5.3% decline in the enterprise segment linked to an economic environment that remains difficult. However, revenues grew by 4.4% in Spain and 4.7% in Africa-Middle East.
The Group adapted in 2013 by cutting costs by 929 million euros (mostly in France) which offset nearly 40% of its fall in revenues.
At the same time, Orange maintained its development capacity by pursuing its investments, notably in high capacity mobile and fixed broadband (4G, fiber-optic and VDSL), which doubled in comparison to 2012. Total investments amounted to 5.631 billion euros in 2013, i.e. a rate of investment of 13.7% of revenues.
Group footprint in 2013

ORANGE / 2013 REGISTRATION DOCUMENT - 7
The chart below shows the main operating subsidiaries and investments of Orange SA as of December 31, 2013 (the complete list is available on the website orange.com). The holding percentages shown for each entity are the percentage of interest along with the percentage of control when these differ (3):

(1)
Company operating under the Orange brand.
(2)
Orange controls the Strategy Committee, which makes recommendations to the Board of Directors.
(3)
For further information on subsidiaries, see Note 17 List of main consolidated companies to the consolidated financial statements (Section 4.1.1).
ORANGE / 2013 REGISTRATION DOCUMENT - 9
ORANGE / 2013 REGISTRATION DOCUMENT - 11
This chapter contains forward-looking statements, particularly in Section 2.3 Orange’s group strategy. These forward-looking statements are subject to numerous risks and uncertainties that could cause actual results to differ materially from the results anticipated in the forward-looking statements. The most significant risks are detailed in Section 2.4 Risk factors. Please also consult the information under the heading Forward-looking information at the start of this document.
There was a slight upturn in the global market for information and communications technology (ICT) during 2013, which grew faster than global GDP for the first time (Figure 2). However, growth in ICT remains modest (+3.3%) despite strong expansion by the sector’s leading players (Apple, Samsung, Google and Facebook). There is still a correlation between the expansion of ICT markets and economic growth but it is less marked than in the past. In addition, the digital sector, long considered more resilient in tough times than other parts of the economy, now seems to have lost some of its immunity.
Within ICT, which chiefly comprises the computing, audiovisual, multimedia, internet and telecommunications sectors, the global telecoms services market grew at the same pace in 2013 as in 2012 (+2.7%), lagging global GDP. The long economic crisis has hit telecoms services in mature countries particularly hard.

Source: Idate
ORANGE / 2013 REGISTRATION DOCUMENT - 12

Source: Idate - IMF
Market growth by region
Europe
The European telecoms services market, having been stable at around 33% of the ICT sector for several years (Figure 1), shrank slightly in 2013. Most European countries also experienced a squeeze on prices and on operator’s margins over and above the effects of the economic crisis. This was linked to several factors:
■
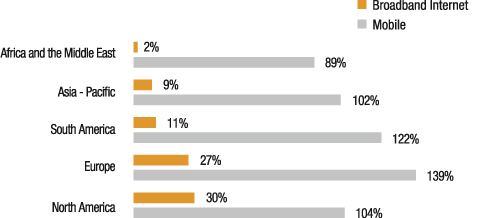
as internet access services have reached maturity volume growth has slowed. Mobile handset penetration in Europe is now 139%, the highest in the world (Figure 3);
■
despite an internal market of 510 million people, the European telecoms market is highly fragmented, split into 28 distinct markets with more than 150 fixed and mobile operators rather than the handful that dominate similar-sized Chinese and US markets. The European Commission estimates the cost of the lack of a single ICT market at 110 billion euros (source: EC, October 2013);
■
the wave of low-priced SIM-only offers, which gathered pace in Europe during 2013, has profoundly transformed the telecoms market, undermining the previous model of subsidized handsets and encouraging the emergence of new handset financing solutions. The rise of unlimited-use contracts and the success of IP applications (VoIP, instant messaging) have successfully generated volume growth but at the price of varying degrees of reduction in value.
The European telecoms market thus finds itself faced with slowing revenue growth at a time when it needs to invest in mobile and fixed infrastructure to keep pace with rising traffic and new technologies (building new generation networks - NGN). Average data transfer speeds in Europe are still only half those in the USA (source: Cisco VNI Forecast, 2013). Weaker revenues and margins among Europe’s operators are increasingly forcing them to rethink their business models and look at mergers, joint ventures and infrastructure sharing in particular.
USA
Telecoms services in the USA are still relatively dynamic. But despite a very mature market with high levels of consumption, their share of the overall ICT market is slightly smaller (28% in 2013) than elsewhere in the world (Figure 1).
Price pressures are less severe than in Europe and North American operators have managed to sustain margins while rolling out broadband. The TV component of multiplay offers is a particularly strong source of revenues. As a result, CAPEX is higher than in Europe and has given the Americans a lead in deploying 4G LTE networks, despite the United States having lagged behind Europe in the roll-out of 3G.
Rest of the World
Emerging markets (Asia Pacific, Africa, Middle East) have seen the growth rates of their economies slow, while still growing faster than mature markets, particularly in Europe. ICT markets, particularly the market for telecoms services, are growing faster than GDP albeit not at the double-digit rates of the mid-2000s (Figure 2). Telecoms services continue to take a high share of ICT spending as a whole in these markets (Figure 1).
Source: Idate
ORANGE / 2013 REGISTRATION DOCUMENT - 13
Key trends and developments
Fixed-line telephony
In developed countries, the migration of fixed-line toward all-IP networks and the replacement of fixed-line usage by mobile or instant messaging have driven a decline in traditional switched (PSTN) fixed-line telephony. Revenues from fixed-line telephony have been falling consistently for years as volumes and subscriptions fall.
For a number of years, the same trend has been seen in markets like China and India, which lost nearly 100 million fixed telephone lines between 2005 and 2012, around 25% of the installed base (source: Idate, July 2013). However, in most other emerging markets, such as African and Middle Eastern countries, the current installed capacity is holding steady or even growing.
Mobile broadband
Falling prices have helped make mobile telephony universally accessible. The ITU estimates that at end-2013 mobile networks had around 6.8 billion subscriptions, one for every person on the planet (source: ITU, 2013).
Driven by the explosion of data traffic to smartphones, tablets and other connected devices, itself related to the demand for video-heavy OTT applications, mobile broadband has become a major avenue of development, taking over from telephony. By the end of 2013, there were an estimated 2 billion subscriptions to mobile broadband, around 30% global penetration according to the ITU.
Fixed broadband
The number of households with internet access is rising across all regions of the world, but major disparities persist between mature and developing markets, reflecting the gap in IT equipment penetration. According to the ITU, at end-2012, nearly 80% of global households had a television, while 41% had a computer and 37% had internet access. At end-2013, nearly 40% of the world population, or close to 2.7 billion people, were connected to the internet including 31% of the population in developing markets (source: ITU, 2013). Idate estimates that the global penetration rate of fixed broadband was 11% at end-2013, around 30% in developed markets and around 7% in developing markets (Figure 3).
Access to high capacity broadband, meanwhile, varies by region. Europe has been slow to roll out fiber optic and average broadband speeds have therefore lagged behind the rest of the world, particularly Asia. In 2013, Asia and North America made up 82% of the market and are likely to retain this lead over the next few years. For instance, 58% of homes are fiber-connected in South Korea and 43% in Japan compared to just 5% in Europe (source: European Commission, October 2013).
A revolution in the value chain
The internet giants, which started life in the IT, handset or content sectors, and over-the-top (OTT) providers who deliver their services across the telecommunications network are revolutionizing the established business environment and value chains with which telecoms operators grew up. Value is now parceled out within a broader and increasingly open ecosystem where roles are split between telecoms operators, content providers, handset manufacturers and OTT service providers. OTT service providers have helped transform the reference offers, in many cases driving the market toward free or low-cost services, while the internet giants now offer the core services traditionally provided by telecoms operators, such as voice and messaging.
Outlook
According to Idate, the global telecom services market is set to grow at an annual average rate of 2.9% in 2013-2025. Growth in internet services over the next few years is likely to come mainly from the still relatively young video, social network and data transfer sectors. Specifically, video downloads and sharing, which demand exponentially increasing amounts of capacity, are expected to make up 69% of retail global internet traffic by 2017 (source: Cisco, VNI 2012). The already rapid convergence of different fixed and mobile services and of the communications infrastructures that support them is likely to gather pace. Finally, we can expect further redistribution within the ICT value chain. The slice taken by OTT services – 2.5% of Europe’s communication services revenues in 2012 – is expected to continue to grow and reach 6% by 2020 (source: Idate, December 2012).
ORANGE / 2013 REGISTRATION DOCUMENT - 14
Regulation of the telecommunications sector is largely harmonized in the EU member states where the Orange Group operates, with national regulatory authorities obliged to implement common EU rules at the national level, though some national differences remain.
This common regulatory framework is presented below with a detailed description for each major country in which the Orange Group operates.
For information concerning risks linked to the regulations of the telecommunications sector, see Section 2.4.2 Legal Risks.
The general EU legal framework for electronic communications consists of five main directives deriving from the 2002 Telecom Package.
■
Framework Directive 2002/21/EC of March 7, 2002, on a common regulatory framework for electronic communications networks and services;
■
Authorization Directive 2002/20/EC of March 7, 2002, on the authorization of electronic communications networks and services;
■
Access Directive 2002/19/EC of March 7, 2002, on access to, and interconnection of, electronic communications networks and associated facilities;
■
Universal Service Directive 2002/22/EC of March 7, 2002, on universal service and users’ rights relating to electronic communications networks and services;
■
Directive on Privacy and electronic communications 2002/58/EC of July 12, 2002, concerning the processing of personal data and the protection of privacy in the electronic communications sector.
The European Commission has identified the relevant markets for products and services which can be subject to ex ante regulation in a recommendation that is regularly updated. The latest version (recommendation 2007/879/EC of December 19, 2007) identifies seven relevant markets (1). This recommendation is currently under review. On January 24, 2014, the Commission published an amended draft recommendation, which proposed removing from the list of relevant markets the retail market for access to the public telephone network at a fixed location for residential and non-residential customers (M1) and the market for call origination on the public telephone network provided at a fixed location (M2). The Commission is also proposing to amend the definition of wholesale broadband access markets (M4 and M5) and the wholesale terminating segments of leased lines market (M6).
The wholesale fixed (M3) and mobile (M7) termination markets would be left unchanged. This recommendation is due to be adopted in the second half of 2014.
All five directives were reviewed in 2009 (2), with changes fully transposed by EU member states, and were subsequently placed under the oversight of the Body of European Regulators for Electronic Communications, BEREC (3).
This regulatory framework has been fleshed out with a number of additional texts.
Roaming
Regulation No. 531/2012, adopted on June 13, 2012 by the European Parliament and Council, on roaming on public mobile communications networks within the Union (Roaming III):
■
introduces, for the wholesale market, a regulated right of access to European roaming services for MVNOs and resellers;
■
extends the sliding cap on roaming rates to the retail data market;
■
introduces, as of July 1, 2014, two structural changes to increase competition in the retail market by separating domestic services and international roaming services;
■
expands, for customers using their cell phones outside the EU, pricing transparency requirements and bill shock prevention measures for European operators.
(1)
M1: access to the public telephone network at a fixed location for residential and non-residential customers.
M2: call origination on the public telephone network provided at fixed location.
M3: call termination on individual public telephone networks provided at fixed location.
M4: wholesale unbundled access.
M5: wholesale broadband access.
M6: wholesale terminating segments of leased lines.
M7: voice call termination on individual mobile networks.
(2)
Directive 2009/140/EC of the European Parliament and Council of November 25, 2009 amending the Framework, Access and Authorization Directives and Directive 2009/136/EC of November 25, 2009 amending the Universal Service and Privacy and Electronic Communications Directives.
(3)
Regulation (EC) No. 1211/2009 of the European Parliament and Council of November 25, 2009, creating BEREC.
ORANGE / 2013 REGISTRATION DOCUMENT - 15
Price caps (€ VAT excl.) | | Roaming III |
| July 1st, 2011 | July 1st, 2012 | July 1st, 2013 | July 1st, 2014 | July 1st, 2017 | July 1st, 2022 |
| Sent (retail) | 0.35 € | 0.29 € | 0.24 € | 0.19 € | withdrawal (1) |
Voice | Received (retail) | 0.11 € | 0.08 € | 0.07 € | 0.05 € | withdrawal (1) |
| Wholesale | 0.18 € | 0.14 € | 0.10 € | 0.05 € | withdrawal (1) |
| Sent (retail) | 0.11 € | 0.09 € | 0.08 € | 0.06 € | withdrawal (1) |
SMS | Received (retail) | 0.00 € | withdrawal (1) |
| Wholesale | 0.04 € | 0.03 € | 0.02 € | withdrawal (1) |
Data | Retail | | 0.70 € | 0.45 € | 0.20 € | withdrawal (1) |
| Wholesale | 0.50 € | 0.25 € | 0.15 € | 0.05 € | withdrawal (1) |
Voice: tariff per minute VAT excl. / sms: tariff per sms VAT excl. /data: tariff per Mb VAT excl. (1) Withdrawal subject to EC review in 2016 Source: Orange, based on data in EU regulation No. 531/2012 |
Call termination rates
On May 7, 2009, the European Commission adopted a recommendation regulating fixed-line and mobile call termination rates in the EU (2009/396/EC).
The Commission recommends that national authorities should apply the following principles:
■
symmetry in each country between the various operators’ fixed voice call termination rates and also between their mobile call termination rates, with the option of allowing a four-year transitional asymmetry on fixed or mobile call termination rates to benefit a new entrant;
■
call termination rates geared towards the avoidable cost of this service for an efficient operator (i.e. about 1 euro cent per minute for voice MTRs and a lower rate for voice FTRs).
The recommendation has been implemented as follows in the countries where the Orange Group operates:
Country | Introduction of a termination rate costing model based on
the avoidable cost of termination for an efficient operator |
| Mobile | Fixed-line |
France | 01/01/2013 | 01/01/2013 |
Belgium | 01/01/2013 | Undecided |
UK | 04/01/2013 | 01/01/2014 |
Poland | 07/01/2013 | Undecided - proposed for 2014 |
Spain | 07/01/2013 | Depends on result of ongoing market analysis |
Slovakia | 08/01/2013 | Different model adopted |
Romania | Undecided – proposed for 2014 | Undecided – proposed for 2014 |
Source: Cullen International December 2013. Figures are December tariffs at local level
Currency exchange rates used in this table are the latest month average rate of the period
ORANGE / 2013 REGISTRATION DOCUMENT - 16

Source: Cullen International December 2013. Figures are December tariffs at local level
Currency exchange rates used in this table are the latest month average rate of the period
Protecting Personal Data
A general directive (1995/46/EC) encompasses the processing of personal data in the European Union. It was followed by a directive specific to the electronic communications sector (2002/58/EC).
On January 25, 2012 the European Commission unveiled a major plan for updating the existing framework with a proposed Regulation that would replace the 1995 directive and stand alongside the sectorial directive. The new rules would increase harmonization between member states and strengthen legal rights. The legislative process is still ongoing.
Jan. 2013 | Rollout of broadband communication networks Revised guidelines governing the use of state aid to support rapid deployment of broadband communication networks. |
March 2013 | Draft rules on measures designed to cut the cost of rolling out broadband infrastructure for electronic communications |
Feb. 2013 | Draft recommendation by the European Commission on universal service obligations |
| Launch of the Connected Continent project by the European Commission |
Sept. 2013 | Connected Continent draft rules Recommendation on non-discrimination obligations and consistent costing methodologies Statement specifying the guidelines for the creation of a single market for telecommunications, which it argues is urgently needed |
| Connecting Europe Facility |
Dec. 2013 | The European Parliament and Council voted 33.2 billion euros to help develop Europe’s infrastructure in 2014-2020 (the Connecting Europe Facility). 1.14 billion euros of this will go on the telecoms sector |
(1)
Method for benchmarking fixed call termination rates:
Average rate per minute (in euro cents):
at local level, i.e. at the lowest interconnection point (the equivalent of ICAA in France);
during “peak” minutes only (as off-peak periods are not homogeneous from one operator to another).
ORANGE / 2013 REGISTRATION DOCUMENT - 17
Rollout of broadband communication networks
Guidelines governing the use of state aid to support rapid deployment of broadband communication networks
To keep pace with fast-changing technology and meet the aims of the Digital Agenda, the European Commission published new guidelines on state aid to the broadband sector (EU Official Journal, January 15, 2013).
Key changes were as follows:
■
technological neutrality: the new guidelines take into account that high capacity broadband (new generation access or NGA) networks can run on different technological platforms;
■
ultra-fast networks: the new guidelines allow public funding of NGA networks capable of delivering more than 100 Mbps in urban areas but subject to strict conditions;
■
private operator commitments: any public authority empowered to grant aid must carry out a public consultation to check that no private investor is planning to build a similar network in the near future. It can require the private investor to commit to making significant progress in rolling out the network in a short time-frame. If the investor fails to meet these commitments, the authority can then step in with public intervention plans;
■
the threshold notion: any state aid must lead to a threshold being exceeded in terms of connectivity, capacity and speed. In other words, any infrastructure supported by public funds must provide a substantial improvement on existing networks;
■
role of National Regulatory Authorities (NRA): The guidelines take the view that NRAs are best placed to oversee public authorities wishing to provide aid and must be consulted to define eligible areas and set rates and the terms of wholesale access;
■
transparency: new rules requiring transparency on aid grants.
Draft regulationon measures designed to cut the cost of rolling out broadband infrastructure for electronic communications
The European Commission proposed a draft regulation on March 26, 2013, to help cut the costs of deploying high-capacity broadband infrastructure in the European Union. This would give electronic communications operators the right to access the physical infrastructure of other network industries (e.g. the electricity grid, water and sewage networks, transport network, etc.) to deploy broadband networks.
This has raised issues for MEPs and the European Council about subsidiarity, proportionality and the choice of legal instrument. The European Parliament’s ITRE Committee filed its amendments on November 28, 2013, notably including the suggestion that the proposal should take the form of a European Directive to give countries greater flexibility in its implementation.
Universal Service
In November 2011 the European Commission published a statement presenting the key results of the third revision of the scope of universal service. It concluded that there is no reason to extend the obligations of universal service to mobile services or broadband Internet connection.
The Commission’s draft recommendation of February 18, 2013 had expressed reservations about making broadband part of the universal service obligation. In its report adopted on October 24, 2013, the European Parliament asked the Commission to reconsider its position on the inclusion of broadband Internet in the scope of universal service. The draft recommendation has not yet been approved.
Launch of the ConnectedContinent project by the European Commission (Digital Single Market)
On September 11, 2013, the Commission adopted several regulatory proposals aimed at making the single market for telecommunications a reality, including: (i) the Connected Continent draft regulations, (ii) a recommendation on non-discrimination obligations and consistent costing methodologies and (iii) plans for the creation of a single market for telecommunications, which it argues is urgently needed.
Connected Continent draft regulations
The proposed regulations for a single market adopted by the European Commission, currently before the European Parliament, mainly address the following points:
■
simplification of existing EU regulations for telecommunications operators, notably through the creation of a single authorization allowing operators to conduct their business across all 28 member states;
■
abolition of roaming charges and international call premiums within Europe: incoming call charges while traveling in the EU would be banned and prices aligned with national rates;
■
net neutrality: rules to preserve the open Internet. Internet traffic must be managed in a non-discriminatory, proportionate and transparent way. Operators would still be allowed to differentiate their offers (by speed for instance) allowing them to compete on service quality without degrading the service quality of Internet access;
ORANGE / 2013 REGISTRATION DOCUMENT - 18
■
consumer protection: new rights and harmonization of existing consumer rights across the EU, covering information to customers, a framework for customer contracts, greater rights to switch provider or contract, right to terminate contracts that fail to meet advertised access speeds, etc.;
■
radio spectrum and 4G: increased coordination of the calendar, duration and other conditions under which radio frequencies are assigned;
■
simplification of wholesale access products: standardized terms and characteristics for wholesale access to fixed networks.
Recommendation “on non-discrimination obligations and consistent costing methodologies to promote competition and enhance the broadband investment environment”
The recommendation adopted by the European Commission on September 12, 2013, seeks to:
■
strengthen rules on non-discrimination to provide equivalent access on new networks, publication of performance indicators and the application of technical replicability tests;
■
stabilize prices, at constant currency, for use of the copper network around the current average access price within the EU (8 to 10 euros at current rates excluding tax); and
■
allow greater flexibility in pricing high capacity broadband as national regulators have the option of not imposing a cost-based system where strengthened non-discrimination rules are in place and there is effective competition between platforms (copper, cable, mobile).
The European Parliament has voted in favor of the proposal for Regulation on April 3, 2014. A final agreement on the Regulation is expected from the European Commission before the end of 2014.
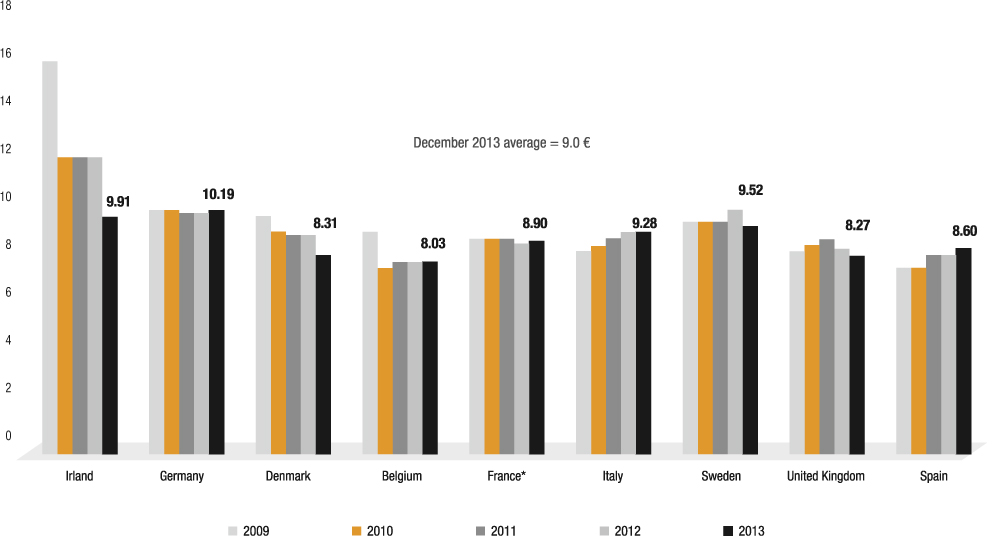
Source : Cullen International - December 2013. Figures are December tariffs at local level
Currency exchange rates used in this table are the latest month average rate of the period
* In France, rate of 9.02 euros as from February 1, 2014
ORANGE / 2013 REGISTRATION DOCUMENT - 19
Statement specifying the guidelines for the creation of a single market for telecommunications, which it argues is urgently needed
The statement issued by the Commission sets out policy guidelines for structuring issues not covered by the draft regulations or the recommendation. It stresses the challenges facing the EU, particularly the modernization of regulations, investment and the need to set rules that are fair to both operators and over-the-top (OTT) players.
Connecting Europe Facility
To help implement its Digital Agenda, the European Commission plans to invest up to 9.2 billion euros through its Connecting Europe Facility between 2014 and 2020 to expand broadband networks and set up pan-European digital services like cross-border online administration and e-health services. In December 2013, the European Parliament and Council allocated 1.14 billion euros to the telecommunications sector.
4G Frequency Band
The European Commission’s ambition for high-capacity broadband infrastructure, set out in its Connected Continent project, is a long way from being achieved. The Commission notes that the EU has lost time in rolling out 4G infrastructure due to the late and uncoordinated allocation of spectrum. It plans to take a firmer coordinating and harmonizing role on the timing and processes for allocating 4G spectrum.
First digital dividend: On May 6, 2010, the European Commission decided to allow the 800 MHz frequency band, previously used for terrestrial analog TV, to be repurposed for mobile communication services.
It also authorized the refarming of GSM spectrum for LTE use. In its decision 2009/766/EC of October 16, 2009, on the harmonization of the 900 MHz and 1,800 MHz frequency bands, amended on April 18, 2011, the European Commission asked member states to ensure these bands were technically neutral and so available for 4G services. In a complementary decision on November 5, 2012, the Commission required member states to introduce technological neutrality to the 2.1 GHz band (1,920-1,980 MHz/2,110-2,170 MHz) to allow the use of 4G (LTE) in this part of the spectrum before May 24, 2016.
Discussions are also underway to eventually create a second digital dividend in the 700 MHz band for mobile services. The World Radiocommunication Conference of 2012 decided in principle to open up the 700 MHz band in ITU region 1 (Europe and Africa) for mobile services. The next conference, to be held in late 2015, will lay down technical specifications and should then allocate bands for mobile services.
In preparation, the European Commissioner responsible for the Digital Agenda set up a high-level consultative group in January 2013, charged with reporting before July 2014 on how UHF (ultra high frequency) bandwidth can be best used to meet future needs.
Legal framework
The electronic communications sector is primarily governed by the French Postal and Electronic Communications Code (CPCE) as well as laws relating to e-commerce, the information society, consumer protection and data protection.
The French government transposed the European Telecoms Package, as amended in 2009, into national law via the Ministerial Order of August 24, 2011 and the Decree of March 12, 2012, implementing regulations.
The audiovisual communication services produced or distributed by the Orange Group come under the specific regulations governing this sector and are managed by the law of September 30, 1986.
For information concerning risks linked to the regulations of the telecommunications sector, see Section 2.4.2 Legal Risks.
Regulatory Authorities
The Postal and Electronic Communications Regulatory Authority (the Arcep) is an independent administrative body created by the law of July 26, 1996, and acts as French regulator for these sectors nationwide. The Arcep’s main missions in electronic communications are to set regulations (general or specific obligations) for operators within its jurisdiction. It has powers to sanction non-compliant operators and can rule on disputes between operators over technical and pricing conditions for network access and interconnection. The Arcep also allocates spectrum and numbering resources. Finally, it determines the size of contributions to fund the universal service obligation and oversees the mechanisms for delivering this funding.
On July 5, 2013, the Constitutional Court ruled that Article L. 36-11 of the CPCE, which grants the Arcep its powers of sanction, was unconstitutional. It found that the Arcep failed to separate its role as investigator and prosecutor of rule breaches from its role as judge of the same breaches. A law enabling the government to restore by Ministerial Order the Arcep’s powers of sanction in a way that was constitutional was passed on December 19, 2013. The Order was published in France’s Official Journal on March 14, 2014.
ORANGE / 2013 REGISTRATION DOCUMENT - 20
The French Competition Authority, established in March 2009 following the restructuring of the French Competition Council, is an independent government authority responsible for ensuring open market competition and compliance with public economic policy. It has jurisdiction over all business segments, including the electronic communications sector. It has sanction powers for anti-competitive practices, as well as consultative powers. It also specializes in overseeing mergers and acquisitions.
The ANFr (AgenceNationale des Fréquences - French national agency for frequencies) is responsible for planning, managing and controlling the usage of radio frequencies and for coordinating the establishment of certain radio transmission facilities. The frequency spectrum is covered by 11 controlling authorities: government ministries, the Arcep and the French Broadcasting Authority (CSA). The Arcep and the CSA are in turn responsible for allotting to users the frequencies they control.
TheCSA is an independent administrative body created by the law of January 17, 1989, tasked with protecting freedom of audiovisual communication by means of any electronic communications technology as regards radio and television in accordance with the Law of September 30, 1986. In July, 2013, the CSA was partly reformed and a Commission for the modernization of audiovisual broadcasting should be created and be given responsibility for the radio spectrum. It is expected that a draft law extending the powers of the CSA to the Internet and connected television will be brought forward in 2014.
2.2.2.2 Regulation of mobile telephony
Frequency spectrum management
Main blocks assigned in the mobile services spectrum
(800 MHz, 900��MHz, 2.1 GHz and 2.6 GHz)
800 MHz | ■ Authorizations were given to Bouygues Telecom, Orange France and SFR in January 2012 for 10 MHz each in the ■ Free Mobile obtained roaming access rights on the SFR network. |
900 MHz | ■ 2G and 3G operators were authorized to refarm the 900 MHz band for 3G in February 2008. ■ 2 x 5 MHz were sold back to Free Mobile by Orange France and SFR on January 1, 2013 for high-density areas, and by Bouygues Telecom in July 2011 for the remaining parts of the country. |
2.1 GHz | ■ Free Mobile was awarded the fourth 3G license, with a 2.1 GHz channel, in January 2010. ■ SFR and Orange France were each awarded two other channels in May 2010. |
2.6 GHz | ■ Authorizations were given to Orange France and Free Mobile in October 2011 for 20 MHz each, and to Bouygues Telecom and SFR for 15 MHz each. |
Deployment obligations of 3G operators in continental France
| Orange | SFR | Bouygues Telecom | Free Mobile |
3G population coverage obligation | 91% at end-2010 98% at end-2011 | 88% at end-2010, 98% at end-2011 and 99.3% at end-2013 | 75% at end-2010 | 90% at end-2017 |
At end-December 2013, Orange’s 3G coverage was 98.7% of the population and 89.5% of country.
Deployment obligations of 4G operators in continental France
In % of population | 11/10/2015 | 17/01/2017 | 11/10/2019 | 17/01/2022 | 11/10/2023 | 17/01/2024 | 17/01/2027 |
Inside priority deployment area
(18% of population and 63% of territory) | | 40% (800 MHz) | | 90% (800 MHz) | | | |
In each county (department) | | | | | | 90% (800 MHz) | 95% (800 MHz) |
Throughout the metropolitan territory | 25% (2.6 GHz) | | 60% (2.6 GHz) | | 75% (2.6 GHz) | 98% (800 MHz) | 99.6% (800 MHz) |
Source: Arcep | | | | | | | |
The 800 MHz band was assigned to Bouygues Telecom, Orange France and SFR.
The 2.6 GHz band was assigned to Bouygues Telecom, Free Mobile, Orange France and SFR.
ORANGE / 2013 REGISTRATION DOCUMENT - 21
Significant events in 2013 and the start of 2014
| |
Jan. 2013 | MVNO Competition Authority Opinion No. 13-A-02 on the position of mobile virtual network operators (MVNOs) in the French mobile telephony market |
| Mobile network sharing |
March 2013 | Competition Authority Opinion No. 13-A-08 on the conditions for mobile network sharing and roaming |
Jan. 2014 | Network sharing agreement concluded between SFR and Bouygues Telecom on the deployment of a shared mobile network |
| 4G – Refarming 1,800 MHz |
March 2013 | Arcep Decision No. 2013-0363 authorizing Bouygues Telecom to use 4G in the 1,800 MHz band as from October 1, 2013. |
July 2013 | Second digital dividend: The Ministry for the Economy, the Arcep and the Directorate-General for Cultural Media and Industry (DGMIC) have carried out consultations on the timing for freeing up and selling off the 700 MHz band. |
March 2013 | Arcep Decision No.2013-0520 on the specification of mobile operators’ obligations to account for and report costs |
| Regulation of mobile call terminations |
May 2013 | New round of analysis for the wholesale fixed and mobile voice and SMS call termination markets for the 2014-2016 period |
MVNO
Competition Authority Opinion No. 13-A-02 of January 21, 2013 on the position of mobile virtual network operators (MVNOs) in the French mobile telephony market
Acting on a request by the Alternative Mobile association to investigate the conditions under which MVNOs can continue to compete in the fast-changing mobile telephony market, the Competition Authority noted that MVNOs had helped stimulate the market and diversify choice therein. It considered that in the context of a changing market, MVNOs could find it hard to match the new offers of network operators and expressed reservations over some of the technical and pricing conditions that were available to them on the wholesale market.
Mobile network sharing
Competition Authority Opinion No. 13-A-08 of March 11, 2013 on the conditions for mobile network sharing and roaming
After the French government called upon it to report on how operators could share networks without impairing competition and on the roaming terms that Free Mobile enjoys, the Competition Authority noted that 3G roaming was necessary even though it should remain limited in time and that it had explicitly advocated this approach in the past. On mobile network sharing, it began by emphasizing the primacy of competition via infrastructure and went on to analyze the feasibility and scope of each possible type of sharing.
Network sharing agreement between SFR and Bouygues Telecom on the deployment of a shared mobile network
In July 2013, SFR and Bouygues Telecom revealed they were in negotiations to roll out a shared mobile network. An agreement was then signed on January 31, 2014. The agreement would affect 57% of the population in continental France (everywhere except the 32 urban areas with over 200,000 inhabitants and the white zones) and is based on two principles: 1) a joint venture to manage the assets of shared sites and 2) Ran sharing (shared radio access) between the two operators on their 2G, 3G and 4G technologies. The Arcep, in consultation with the Competition Authority, announced it would be taking an in-depth look at the agreement and checking whether it met certain conditions (strategic and commercial autonomy of operators, no squeezing out of competitors from the market and improved services for users).
4G rollout and 1,800 MHz spectrum refarming
On March 12, 2013, the Arcep published guidelines for the introduction of technological neutrality in the 1 800 MHz band.
On March 14, 2013, the Arcep authorized Bouygues Telecom to refarm, as from October 1, 2013, the 1,800 MHz band for non-GSM technologies in exchange for relinquishing a number of frequencies. The fees for the right to use the 1,800 MHz band once it was freed from technological specifications were amended by Decree No. 2013-238 of March 22, 2013.
On June 3, 2013, Orange filed a request with the French Administrative Supreme Court (Conseil d’Etat) challenging the legality of this decision on the grounds that the date of authorization of the implementation of the refarming made it impossible to apply competition rules.
The French President decided in May 2013 to allocate the whole of the 700 MHz band to electronic communications. The timetable for the switchover in this spectrum has yet to be specified.
In July 2013, the Ministry for the Economy, the Arcep and the Directorate-General for Cultural Media and Industry (DGMIC) carried out consultations on the timing for freeing up and selling off the frequencies. So far, no decision has been taken.
ORANGE / 2013 REGISTRATION DOCUMENT - 22
Regulation on mobile call terminations
| Market analysis - 1st round | Market analysis - 2nd round | Market analysis - 3rd round |
| | | | 1st price cap | 2nd price cap (decision dec. 2008) (1) | (March 2011 and July 2012 decisions) |
(Cent €/min) | 2005 | 2006 | 2007 | Jan. 08-
Jun. 09 | Jul. 09-
Jun. 10 | Jul. 10-
Dec. 10 | Jan. 11-
Jun. 11 | Jul. 11-
Dec. 11 | Jan. 12-
Jun. 12 | Jul. 12 (2)-
Dec. 12 | Jan. 13
-Jun. 13 | Jul. 13-
Dec. 13 |
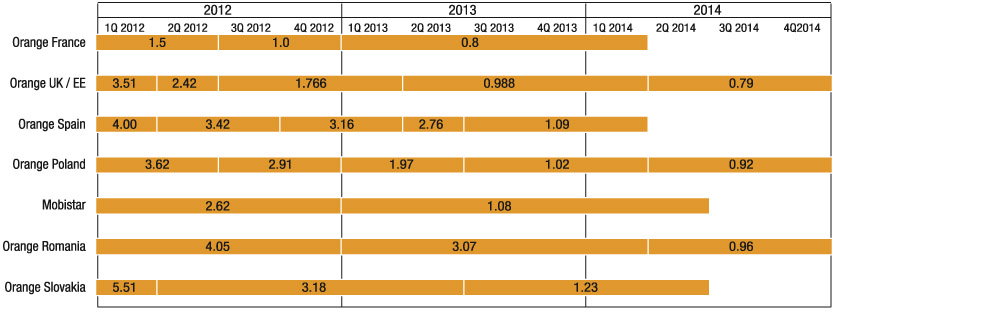
Orange France | 12.50 | 9.50 | 7.50 | 6.50 | 4.50 | 3.00 | 3.00 | 2.00 | 1.50 | 1.00 | 0.80 | 0.80 |
SFR | 12.50 | 9.50 | 7.50 | 6.50 | 4.50 | 3.00 | 3.00 | 2.00 | 1.50 | 1.00 | 0.80 | 0.80 |
Bouygues Télécom | 14.79 | 11.24 | 9.24 | 8.50 | 6.00 | 3.40 | 3.40 | 2.00 | 1.50 | 1.00 | 0.80 | 0.80 |
Free Mobile, full MVNOs (2) | | | | | | | | | 2.40 | 1.60 (3) | 1.10 (3) | 0.80 |
Asymmetry | 18% | 18% | 23% | 31% | 33% | 13% | 13% | 0% | 0% | 60% | 38% | 0% |
(1) For Bouygues Télécom, decision 2010-0211 of Feb 18, 2010 fixing the rate for 2H2010 at 3.40 € cents. (2) For Free Mobile and full MVNO’s Lycamobile et Oméa Telecom, decision of July 27,2012 with effect as of Aug. 2012 - maximum price for 1H 2012 (3) Excluding E1 connection Source: Orange, based on Arcep data |
On July 22, 2010, the Arcep adopted decision No. 2010-0898 on the analysis of wholesale markets for SMS call termination rates on French mobile networks, capping the price mobile operators could charge each other for SMS call termination:
Euro cents/SMS | 2009 | February 2010 | October 2010 | July 2011 | July 2012 |
Orange France | 3.00 | 2.00 | 2.00 | 1.50 | 1.00 |
SFR | 3.00 | 2.00 | 2.00 | 1.50 | 1.00 |
Bouygues | 3.50 | 2.17 | 2.17 | 1.50 | 1.00 |
The SMS termination rates paid by Free Mobile and full-MVNOs are governed by commercial agreements. |
Analysis of the wholesale mobile call termination markets
On May 28, 2013, the Arcep launched a public consultation beginning a new round of analysis of the wholesale fixed and mobile voice and SMS call termination markets in continental France and its overseas territories for the 2014-2016 period. The Authority decided that the 2014-2016 round should consider jointly the fixed-line voice call termination, mobile voice call termination and SMS termination markets.
Since July 2008, except for retail offerings for fixed telephony under universal service, all of Orange’s regulatory obligations concerning retail fixed telephony (access and communication) on the consumer and business markets have been lifted. Ex ante regulation of Orange’s fixed-line services relates to retail offerings under the universal service and wholesale offerings that are regulated to ensure effective competition in the retail markets (call origination and termination, wholesale line rental, unbundling, bitstream).
Orange’s obligations regarding cost accounting and accounting separation in the fixed-line business
The Arcep’s decision No. 06-1007 of December 7, 2006 sets forth Orange’s obligations as to cost accounting and accounting separation in the wholesale and retail businesses. When the retail activities use network resources that correspond to wholesale services subject to a separate accounting obligation, these resources are valued in the separate accounts at wholesale rates and not at cost. These obligations were first implemented in 2007 in respect of FY2006. The fiscal year was deemed compliant by the Arcep and has been extended to every year since.
Regulation of fiber optic networks
Regulatory framework governing very high capacity broadband offers:
■
no ex ante regulation on retail prices;
■
asymmetric regulation of civil engineering infrastructure which allows alternative operators to deploy their horizontal networks on Orange’s infrastructure: non-discriminatory access at a rate that reflects costs;
ORANGE / 2013 REGISTRATION DOCUMENT - 23
■
principle that the terminating segment of networks are mutualized between operators;
■
no asymmetric access obligation (unbundling or bitstream) for fiber optic in high-density areas, confirmed by Arcep decisions of June 14, 2011 on the analysis of markets 4 and 5;
■
symmetric regulation of access to network terminating segments, including outside high-density areas: same obligations to offer passive access to the terminating segment of FTTH networks on reasonable and non-discriminatory terms apply to all operators cabling buildings anywhere in France. This access must be made available from a sharing point in a reasonable location (Arcep Decision No. 2009-1106 of January 17, 2010). Charges must be compatible with the principles of efficiency, relevance, objectivity and non-discrimination.
The “SuperfastBroadband Program”
In November 2012 the French government created a Superfast Broadband Program to plan a 10-year rollout of superfast broadband.
The program helped develop a roadmap whose main points were announced in February 2013.
The aim is to have 100% of the French population eligible for very high capacity broadband by 2022, with an interim target of covering half the population and companies by 2017. FTTH is seen as the main way of achieving this, although other technologies are also expected to contribute (higher speed on copper as a transitional solution, satellite, LTE). At the annual conference of France’s Superfast Broadband Plan, held on February 6, 2014, the main lines of the plan were confirmed.
A total 20 billion euros of private and public investment is estimated to be needed to meet the 2022 target. This breaks down into three parts:
■
one third of investment by private operators who expect to use their own capital to deliver FTTH to 57% of French homes by 2022;
■
the remaining 43% of homes will be covered by the other two-thirds of investment, provided by government authorities to fund publicly organized networks. Half these homes are seen as profitable enough for a public/private partnership to be viable;
■
the last third relates to the most rural areas and will be co-funded 50/50 by central and local government.
A steering body for the rollout of high capacity broadband networks has been set up, and its role is notably to encourage and organize the rollout by operators and help harmonize the initiatives undertaken by regional authorities. A new law is planned to create the public body to follow up on the Superfast Broadband Program in 2014.
The eventual closure of the copper local loop is a major part of the process. The government has appointed Paul Champsaur to set out the conditions and timetable for the elimination of copper. He is due to report before the end of 2014.
Significant events in 2013 and the start of 2014
| |
March 2013 | Net neutrality Arcep Decision No. 2013-0004 of January 29, 2013 and introduction of measurement and monitoring processes for the service quality of fixed-line Internet access |
| VDSL2 |
April 2013 | An independent committee of copper experts reported in favor of introducing VDSL2 technology on Orange’s local copper loop network |
| Regulation of fixed-line call terminations |
May 2013 | New analysis round for the wholesale fixed and mobile voice and SMS markets in 2014-2016 |
| Fixed number portability |
June 2013 | Arcep Decision No. 2013-0830 specifying the way fixed number portability is implemented |
| Universal Service |
Oct. 2013 | Orange is allocated the universal telephony service for three years |
| Analysis of the fixed broadband and superfast fixed broadband markets |
Nov. 2013 | Public consultation by the Arcep on its draft decisions on the analysis of fixed broadband and superfast broadband markets in 2014-2017 |
Dec. 2013 | Reform of IFER (flat rate tax on network companies) |
| Completion of the regulatory framework for the rollout of fiber optic networks |
Jan. 2014 | Arcep recommendation to encourage mutualization ofFTTH networks for small buildings in high-density areas Amendments to the list of districts in very high-density areas |
| Analysis of relevant fixed-line telephony markets |
Feb. 2014 | Public consultation by the Arcep to launch the fourth round of analysis of fixed-line telephony markets (2014-2017) |
ORANGE / 2013 REGISTRATION DOCUMENT - 24
Internet Neutrality
In 2012, the Arcep began monitoring the interconnection and routing of data traffic with a view to informing users on the service quality of Internet access in France.
The Arcep uses two methods to simultaneously monitor:
■
the changing architectures of data traffic interconnection and routing between Internet access providers and Internet players by compiling half-yearly data (Arcep Decision No. 2012-0366 of March 29, 2012);
■
the quality of fixed-line Internet access services through a half-yearly survey; the aim being to make clear to the Arcep and web users the consequences for users of each operator’s practices (Arcep Decision No. 2013-0004 of January 29, 2013).
Authorization of the introduction of VDSL2 technology
The copper experts committee arrived at a consensus opinion, on April 26, 2013, in favor of introducing VDSL2 to Orange’s local copper loop from October 1, 2013.
VDSL2 is a copper wire based technology that can significantly increase speed as compared to ADSL of lines less than 1 km in length. Around five million lines (16% of the total) to homes and workplaces could have access to faster broadband using this technology, mostly in areas that will not be getting FTTH in the short term.
Regulation of fixed-line voice call terminations
Cut in fixed-line termination rates (FTRs)
In July 2011 the Arcep published its latest decision following its third round of analysis of the fixed-line telephony markets for the period 2011-2014, according to which Orange has to apply call termination rates that reflect the long-term incremental costs of a generic efficient operator of a new generation network (NGN). As part of this new analysis, the asymmetry of Call Termination Rates enjoyed by Orange’s competitors has been eliminated.
Caps in euro cents per minute | Orange FTR | Alternative operators’ FTR | Level of asymmetry |
year 2007 | 0.5486 | 1.088 | 98% |
Q1-Q2-Q3 2008 Change | 0.4935 (10.0%) | 1.088 0.0% | 120% |
Oct. 1, 2008 Change | 0.45 (8.8%) | 0.9 (17.3%) | 100% |
Oct. 1, 2009 Change | 0.425 (5.6%) | 0.7 (22.2%) | 65% |
Oct. 1, 2010 Change | 0.4 (5.9%) | 0.5 (28.6%) | 25% |
Oct. 1, 2011 Change | 0.3 (25%) | 0.3 (40%) | 0% |
July 1, 2012 Change | 0.15 (50%) | 0.15% (50%) | 0% |
Jan. 1, 2013 Change | 0.08 (46.6%) | 0.08 (46.6%) | 0% |
Source: Orange, based on Arcep data |
Analysis of the wholesale call termination markets
On May 28, 2013, the Arcep launched a public consultation beginning a new round of analysis of the wholesale fixed and mobile voice and SMS call termination markets in continental France and its overseas territories for the 2014-2016 period. The Authority decided that the 2014-2016 round should consider jointly the fixed-line voice call termination, mobile voice call termination and SMS termination markets.
Universal service in electronic communications
Following the universal service (telephony) tendering process for 2013-2016, Orange was appointed by the Ministerial Order of October 31, 2013, as the operator responsible for providing the telephony access and services components of the universal service under Article L. 35-1, 1 of the French Postal and Electronic Communications Code (CPCE).
Orange was also appointed, by an Order on February 14, 2012, as the operator responsible for the public telephony component of the electronic communications universal service.
ORANGE / 2013 REGISTRATION DOCUMENT - 25
Analysis of the fixed broadband and superfast fixed broadband markets
Following publication in July 2013 of the results of the Review and Prospects consultation on markets 4, 5 and 6 and on the decisions on symmetrical regulation of fiber optic, the Arcep published its draft decisions on the fixed broadband and superfast fixed broadband markets on November 27, 2013.
These relate to the wholesale physical network infrastructure access (market 4), the wholesale broadband access market (market 5) and the wholesale terminating segments of leased lines market (market 6).
Reform of flat rate tax on network enterprises (IFER)
The 2010 Finance Law eliminated the professional tax and introduced new taxes payable to local authorities.
■
business property tax (CFE);
■
corporate value added tax (CVAT).
On top of these, there is a flat rate tax on network enterprises (IFER) levied on network companies (energy, rail, telecommunications), paid to local authorities and levied on certain categories of assets, as follows:
■
tax on copper wires, making up around 20% of the total;
■
two taxes on switching equipment making up around 80% of the total.
IFER was reformed by Amended Finance Law No. 2013-1279 of December 29, 2013. In four years the components levied on switching equipment, which fall exclusively on Orange, will be transferred to the copper wires and so be shared among all operators via the wholesale offerings (mainly unbundling).
Completion of the regulatory framework for the rollout of fiber optic networks
On January 21, 2014, the Arcep adopted a recommendation on FTTH access for buildings with fewer than 12 residential or business premises in high-density areas, and outside low-density pockets. This expands on an earlier recommendation, issued June 14, 2011, and provides for the installation of concentration points of 100 single fiber lines to serve buildings of fewer than 12 homes, outside low-density pockets. To provide complete coverage, the Arcep recommends a prior consultation system is put in place to bring together all stakeholders, including local authorities.
Moreover, the Arcep’s decision of January 27, 2014 reduced the number of districts classed as in high-density areas from 148 to 106 districts. This decision was the subject of a public consultation from October 21 to November 18, 2013, and was then approved by the Minister responsible for electronic communications and published in the French Republic’s Official Journal of January 26, 2014.
New analysis of fixed-line telephony markets: fourth round of analysis on the 2014-2017 period:
In February 2014, the Arcep launched a public consultation to begin the fourth round of analysis of the fixed telephony market (2014-2017), covering the relevant markets access to the public telephone network at a fixed location for residential customers (market 1) and call origination on the public telephone network provided at a fixed location (market 2). As part of this consultation, the Arcep is submitting the following proposals to all stakeholders:
■
a gradual migration from straight carrier selection offers to wholesale line rental, VGAST offers;
■
lifting the asymmetrical regulation imposed on Orange in the call origination market for calls to value-added service (VAS) numbers, instead relying exclusively on the symmetrical framework established by Decision No. 2007-0213;
■
definitive withdrawal of the flat rate interconnection scheme for narrowband Internet access.
Regulation of fixed-line services wholesale offers
Rate changes for wholesale offerings subject to cost orientation (unbundling, analog and digital wholesale line rental, and call origination)
In 2013, Orange published new rates that include higher rates for unbundling and wholesale line rental, and lower rates for bitstream access.
For 2014, Orange announced another rise in full unbundling rates in accordance with the European Commission’s recommendation on non-discrimination obligations and consistent costing methodology, issued on September 12, 2013, as well as a rise in bitstream rates.
| | 2013 rates | 2014 rates |
Unbundling | Full | 8.90 € | 9.02 € |
| Partial | 1.64 € | 1.64 € |
Wholesale line rental | Analog WLR | 12.21 € | 12.19 € |
| Digital WLR | 18.61 € | 18.35 € |
Bitstream | DSL access | 4.09 € | 4.39 € |
| Naked DSL access | 12.21 € | 12.41 € |
ORANGE / 2013 REGISTRATION DOCUMENT - 26
Legal framework
The 2002 European Telecom Package was transposed into Spanish law by the general Telecommunications Act (law No. 32/2003 of November 3, 2003), Royal Decree No. 2296/2004 of December 10, 2004 on the electronic communications markets, network access and numbering, and Royal Decree No. 424/2005 of April 15, 2005 on the supply of electronic communications services, universal service obligations and user rights.
The 2009 Telecom Package was transposed into Spanish law by Royal Decree No. 726/2011 on universal service provision in May 2011 and royal decree No. 13/2012 of March 31, 2012.
The telecommunications sector is also covered by law No. 15/2007 of July 3, 2007 relating to the implementation of competition rules.
Law No. 34/2002 of July 11, 2002 relating to the information society and electronic commerce specifies the obligations and limits of responsibility applicable to service providers in the information society.
The regulatory framework applicable to data protection in Spain is based around law No. 15/1999 of December 13, 1999, relating to personal data protection and order No. 999/1999 relating to security measures. In the field of intellectual property rights protection, law No. 23/2006 of July 7, 2006 amends law No. 1/1996 of April 12, 1996 and transposes European directive 2001/29/EC relating to the harmonization of certain aspects of copyright and related rights in the information society.
Regulatory Authorities
Following government reforms begun in 2012, the telecommunications sector came under the responsibility of a number of different institutions in 2013:
■
Until the new authorities took over in October, the sector was overseen by the Secretariat of State for Telecommunications and the Information Society (Secretaría de Estado de Telecomunicaciones y para la Sociedad de la Información – SETSI), the Telecommunications Market Commission (Comisión del Mercado de las Telecomunicaciones – CMT) and the National Competition Commission (ComisiónNacional de la Competencia – CNC), charged with enforcing competition law in coordination with the sector authorities;
■
Since October 2013, the regulators for all the various sectors of the economy, including telecommunications, have been brought together under a new cross-industry entity, the National Commission for Markets and Competition (ComisiónNacional de los Mercados y la Competencia), set up by law No. 3/2013 of June 4, 2013, which also has responsibility for competition issues.
As a result the telecom industry is now overseen by both the new multi-industry regulator and Setsi as follows:
■
Setsi handles authorizations, spectrum attributions, telephone numbering, universal service cost approvals, service quality, and disputes between consumers and non-dominant operators;
■
the National Commission for Markets and Competition (ComisiónNacional de los Mercados y la Competencia – CNMC), conducts market analysis and handles disputes involving operators with significant market power.
Mobile call termination rates
Following a consultation in December 2011 on the wholesale mobile call termination market (market 7), the CMT issued a decision on May 10, 2012 proposing a gradual decrease of mobile call termination caps, reaching rate symmetry in July 2013. The proposed caps are as follows:
(In euro cents/minute) | 04/16/12-10/15/12 | 10/16/12-02/29/13 | 03/01/13-06/30/13 | From July 2013 |
Movistar, Vodafone, and Orange | 3.42 | 3.16 | 2.76 | 1.09 |
Yoigo | 4.07 | 3.36 | 2.86 | 1.09 |
Significant events in 2013 and the start of 2014
July 2013 | Extension of Orange licenses to 2030 (800 MHz and 1,800 MHz) |
August 2013 | Telefónica and Yoigo agreement |
ORANGE / 2013 REGISTRATION DOCUMENT - 27
Spectrum
In May 2011, the Spanish authorities allocated a 5 MHz duplex block in the 900 MHz spectrum to Orange Spain. The license, granted under the principle of technological neutrality, is valid until December 2030.
In July 2011, the Spanish authorities auctioned the 800 MHz, 900 MHz and 2.6 GHz frequency bands. The 800 MHz licenses, awarded in 2011, only become available from 2015. The same is true for the 900 MHz block allotted to Telefónica.
In July 2013, Orange Spain’s license for the 900 MHz band was extended from 2025 to 2030 and its 1,800 MHz license from 2023 to 2030.
Following these allocations, the Spanish spectrum is distributed as follows:
| 800 MHz | 900 MHz | 1,800 MHz | 2.1 GHz | 2.6 GHz |
| | | | FDD | TDD | FDD | TDD |
Orange | 2*10 MHz | 2*10 MHz | 2*20 MHz | 2*15 MHz | 5 MHz | 2*20 MHz | 10 MHz |
Vodafone | 2*10 MHz | 2*10 MHz | 2*20 MHz | 2*15 MHz | 5 MHz | 2*20 MHz | 20 MHz |
Telefónica | 2*10 MHz | 2*10 MHz | 2*20 MHz | 2*15 MHz | 5 MHz | 2*20 MHz | |
Yoigo | | | 2*15 MHz | 2*15 MHz | 5 MHz | | |
Telefónica and Yoigo agreement
In July 2013, Telefónica and Yoigo signed a deal allowing Telefónica to use Yoigo’s 4G frequencies and Yoigo to offer fixed and mobile convergence services across Telefónica’s broadband network.
Universal Service
The law on a sustainable economy approved in February 2011 stipulates that functional access to the Internet includes a 1 MB broadband connection. The new method for calculating the universal service cost was approved in December 2012 and includes broadband connections. Telefónica was again designated as the universal service provider beginning in January 2012.
The universal service net cost from 2006 to 2010 and Orange’s contribution are given in the following table:
(In millions of euros) | 2006 | 2007 | 2008 | 2009 | 2010 |
Universal service net cost | 75.34 | 71.09 | 74.85 | 46.78 | 43.57 |
Orange’s contribution | 8.03 | 7.46 | 7.61 | 4.7 | 4.75 |
Significant events in 2013 and the start of 2014
| |
February 2013 | Wholesale broadband market (markets 4 and 5/2007) Consultation on draft decisions on unbundling and bitstream offers |
| Orange and Vodafone agreement on FTTH |
March 2013 | Signature of a deal between Orange and Vodafone on the rollout of fiber optic |
| European Commission phase II investigation into fixed wholesale broadband offers |
June 2013 | The European Commission has challenged the draft decision of the CMT (pricing not strictly based on costs) |
| New pricing offer for local loop unbundling |
September 2013 | The CMT issued a decision in favor of increasing the full unbundling rate to 8.80 euros and reducing the partial unbundling rate to 1.30 euros |
| The European Commission asks for a new wholesale bitstream access offer |
October 2013 | The European Commission asked the CNMC to amend its wholesale offer for broadband access (NEBA) or withdraw its draft, taking account of cost-based pricing |
ORANGE / 2013 REGISTRATION DOCUMENT - 28
Wholesale broadband markets (markets 4 and 5/2007)
The CMT issued a decision on the wholesale broadband market in January 2009 that covers offers under 30 Mbps. A new round of analysis of this market began in 2013 and a decision is expected in 2014.
Following the consultation launched in February 2013 on unbundling and bitstream rates, and having taken account of comments by the European Commission and the BEREC, in September the CMT increased the full unbundling monthly rate from 8.32 euros to 8.60 euros and cut the partial unbundling tariff from 2.06 euros to 1.30 euros.
As regards bitstream rates, the CMT introduced provisional tariffs for new bitstream (NEBA) offers in July 2012, including a bitstream for fiber offer, which will eventually replace current technologies (GigADSL and ADSL-IP). These rates include an increased risk premium for wholesale superfast broadband offers.
In February 2013, the CMT proposed a new set of bitstream rates which the European Commission failed to approve. In June 2013, the Commission launched a phase II investigation and expressed serious doubts about these new offers, which were priced 50% above cost. At end-October 2013, at the conclusion of this procedure, the European Commission officially asked the CNMC to withdraw or amend its proposals to comply with cost-based pricing.
On January 30, 2014, the CNMC finally approved the following tariffs:
Bitstream Offers | Provisional monthly rates 2012 | Definitive rates 2014 |
Neba FTTH | 23.22 € | 19.93 € |
Neba DSL | 6.50 € | 6.48 € |
Naked DSL premium | 9.11 € | 8.60 € |
Aggregation offer (per Mbps) | 32.62 € | 14.56 € |
GigADSL and IP-ADSL (regional offer) at 10 Mbps | 12.50 € | 10.20 € |
IP-ADSL (national offer) at 10 Mbps | 16.67 € | 13.60 € |
Orange and Vodafone agreement to roll out fiber optic in Spain
In March 2013, Orange and Vodafone agreed to roll out fiber optic in more than 50 cities by 2017, giving coverage of around 40% of the population for an estimated total investment of 1 billion euros.
Under the agreement, which is open to any other operator wishing to co-invest, the vertical infrastructure will be shared pro-rata of costs incurred. Orange and Vodafone have opened a dispute resolution procedure before the regulator seeking to change the access conditions for the terminating segment of the fiber optic cable belonging to Telefónica. The agreement reached with Telefónica led the CMT to impose provisional measures in July 2013. As the tariff cuts obtained by the CMT were insufficient, Orange and Vodafone appealed the CMT’s decision seeking “reasonable” and non-discriminatory terms of access, particularly in light of the deal between Telefónica and Yoigo. The regulator’s final ruling is pending.
Changes to the procedure for reviewing Telefónica’s retail offers
In March 2013 the CMT notified the European Commission of its plans to modify the rules applicable to the method for the ex ante review of Telefónica’s retail offers for consumer customers purchasing telephone network and broadband (less than 30 Mbps) services. These changes introduce twice-yearly price squeeze tests per product line.
One-day fixed-line number portability
The CNMC confirmed that portability of a fixed-line number within a single working day would be effectively available as from November 11, 2013. This measure, originally planned for July 1, 2013, was pushed back to allow some players to make the necessary technical changes.
Legal framework
Orange Polska’s businesses are governed by the law of July 16, 2004 on telecommunications, transposing the 2002 European Telecom Package concerning electronic communications into Polish law, and by the law of February 16, 2007 concerning competition and consumer protection. The law of December 2012, transposing EU directives issued in 2009, came into force on January 21, 2013.
The law of May 7, 2010, on developing telecommunication networks and services, provides access to telecommunications and other technical infrastructures funded by public funds.
As regards e-commerce, the law of July 18, 2002 that governs provision of electronic services transposes European Directive 2000/31/EC concerning electronic commerce and defines electronic service supplier obligations.
ORANGE / 2013 REGISTRATION DOCUMENT - 29
The applicable framework concerning personal data protection is defined by the law of August 29, 1997 concerning personal data protection, as amended in 2002. The 2004 Telecommunications Act also defines certain rules applicable to data protection and storage.
For information concerning risks linked to the regulations of the telecommunications sector, see Section 2.4.2 Legal Risks.
Regulatory Authorities
The Ministry of Administration and Digitization, created in November 2011, is responsible for telecommunications.
The Office of Electronic Communications (UKE) is responsible, in particular, for telecommunications regulation and frequency management, as well as certain functions related to broadcasting services.
The Office of Competition and Consumer Protection (UOKiK) is responsible for the application of competition law, merger control and consumer protection.
Memorandum of Understanding between Orange Polska and the UKE
The MOU signed on October 22, 2009 between the UKE and Orange Polska on the creation of a stable telecommunications market included the following points: Orange Polska’s implementation of non-discrimination rules for alternative operators, major investments in broadband (1.2 million lines), the introduction of performance indicators and changing reference offers to commercial offers.
In January 2012, the UKE and Orange Polska extended the investment agreement until the end of March 2013, with a target of having 220,000 broadband lines (speeds of at least 30 Mbps) in place by that date.
The agreement duly expired at end-March 2013.
Significant events in 2013 and the start of 2014
March 2013 | Launch of a UOKiK investigation into alleged abuse by the three operators, Orange Polska, T-Mobile and Polkomtel, of their collectively dominant position in the retail mobile services market |
| Allocation of 1,800 MHz spectrum |
Feb. 2013 | Award of five national 2x5 MHz technology neutral licenses until December 31, 2027 |
| Allocation of 700 MHz spectrum |
July 2013 | Launch of a UKE consultation on whether to allocate the 700 MHz band to electronic communications |
| Allocation of 800 MHz and 2.6 GHz spectrum |
Dec. 2013 | Launch of UKE auction of 4G frequency band |
Mobile call termination rates
The UKE published seven decisions on December 14, 2012, ruling that Orange Polska, T-Mobile, Polkomtel, P4, CenterNet, Mobyland and Aero2 each had a dominant position in the mobile call termination market for the mobile numbers open to interconnection on their network (third round of market analysis). It also set symmetrical mobile voice call termination rates for all operators from January 1, 2013, and termination rates based on long run incremental costs as from July 1, 2013.
Date | January 1 to June 30, 2013 | July 1, 2013 (pure LRIC) |
Zlotys/min | 0.0826 | 0.0429 |
Euro cents/min | 1.94 | 1.01 |
Spectrum
In 2011, the UKE issued three decisions that introduce technological neutrality in the 900 MHz, 1,800 MHz, and 2,100 MHz frequency bands.
Orange Polska’s 1,800 MHz license, which expired in August 2012, was renewed in July 2012 for a further 15 years.
Also, five new 5 MHZ duplex blocks in the 1,800 MHz band were awarded to P4 and T-Mobile on February 13, 2013, for 15 years.
One new 5 MHz duplex block in the 800 MHz band was also awarded to Sferia on August 5, 2013, by the Ministry for Administration and Digitization.
In July 2013, the UKE published a consultation on whether to assign 700 MHz spectrum to electronic communications. No decision on this has yet been announced.
ORANGE / 2013 REGISTRATION DOCUMENT - 30
Finally, licenses for the 800 MHz (available after the switch-off of analog TV in July 2013) and 2.6 MHz bands are to be awarded in 2014, following the launch of an auction process in late December 2013 by the UKE. Because of an administrative error, the process was restarted on February 17, 2014, and following changes in auction conditions a new consultation was issued on April 4, 2014. At stake are five 5 MHz duplex blocks in the 800 MHz spectrum and fourteen 5 MHz duplex blocks in the 2.6 GHz spectrum. All licenses will run for 15 years.
Fixed-line call termination rates
Since the UKE’s decision of September 22, 2009, following its second round of market analysis, call termination rates must be based on cost, with no further details given.
The UKE reserves the right, however, to control rates by benchmarking or a retail minus formula and has indicated it intends to move towards symmetry in 2014.
The UKE is proposing the following changes to asymmetry levels:
Level of asymmetry | Jan. 2009 | July 2009 | Jan. 2010 | July 2010 | Jan. 2011 | July 2011 | Jan. 2012 | July 2012 | Jan. 2013 | July 2013 | Jan. 2014 |
Simple transit | 92% | 82% | 73% | 64% | 55% | 46% | 37% | 27% | 18% | 9% | 0% |
Double transit | 9% | 8% | 7% | 6% | 5% | 4% | 3% | 3% | 2% | 1% | 0% |
These asymmetry levels are used as benchmarks in the event of dispute resolution procedures.
Universal Service
In 2006, the UKE imposed universal service obligations on Orange Polska until May 9, 2011. Since then, the UKE has taken no further steps to appoint a new universal service provider. Under the new telecommunications law, which came into force in January 2013, universal service obligations could be specified at regional rather than national level. Further to a consultation on the designation of universal service providers in March 2014, the UKE has not yet issued any position.
For the whole period when Orange Polska was responsible for universal service (November 2006 to May 2011), Orange Polska estimated its cost amounted to1.1 billion zlotys whilst only 137 million zlotys were allotted in compensation by the UKE. Orange Polska has therefore appealed to have the UKE decisions reexamined.
Significant events in 2013 and the start of 2014
| |
Sept. 2013 | Analysis of the wholesale broadband market (market 5) The UKE withdrew the draft decision where it designated Orange Polska as an operator with significant market power in Poland, except for eleven districts, at the request of the European Commission |
| Access to passive infrastructure |
Sept. 2013 | UKE position on obligatory opening to third parties of passive infrastructure of alternative operators |
Dec. 2013 | UKE position on access to residential premises for the development of broadband services |
| Wholesale access offer |
Dec. 2013 | Draft reference offer for unbundled and bitstream wholesale access |
| Digital Poland |
Jan. 2014 | Government adopts action plan for extending national coverage of superfast broadband services |
Analysis of the wholesale broadband access market (market 5/2007)
In April 2011, the UKE issued its decision on the wholesale broadband access market (second round), where it designates Orange Polska as an operator having significant market power throughout Poland except in eleven cities (including Warsaw).
In February 2012, the UKE issued a new draft decision on this market, excluding only four, rather than the original eleven, cities from ex ante regulation (Warsaw, Wroclaw, Lublin and Torùn), and eliminating the cost-based tariff obligation for FTTH access rates. In November 2012, the UKE notified the European Commission a complementary draft decision that would exempt these municipalities from the regulatory obligations. The European Commission replied in December 2012 citing serious doubts about whether the UKE’s proposal is compatible with EU law, and requested that the UKE use current market data. The UKE abandoned its draft decision in September 2013 in light of the European Commission’s objections, and should issue a new proposal in 2014.
ORANGE / 2013 REGISTRATION DOCUMENT - 31
Access to passive infrastructure
In September 2013, the UKE published its position based on Article 139 of the Telecommunications law of July 16, 2004, on operators’ obligations to grant access to their passive infrastructure. This article allows access to infrastructure owned by telecommunications companies, including that of local authorities when they act as operators and that of collective ownership bodies, who are classed as telecommunications service providers. The UKE is responsible for settling disputes on the conditions for accessing such infrastructure.
Following the 2010 law on the development of telecommunications networks and services, which stated that building owners cannot in principle refuse to have a broadband network installed on their property, the UKE confirmed in December 2013 that collective ownership structures must provide open access to the passive infrastructure in residential premises to promote the development of broadband electronic communication services.
Reference offer on wholesale (unbundling and bitstream) markets
In December 2013, the UKE embarked on consultations aimed at amending the 2011 reference offer for unbundling (market 4) and bitstream (market 5) services. Under the consultation draft, the unbundling price would be unchanged at 22 zlotys.
Digital Poland
The government’s action plan to meet the targets of its digital strategy in Poland was passed in January 2014. The plan is budgeted at 2,665 million euros and aims to ensure that all households have at least 30 Mbps Internet access by 2020. Nearly half the funds are earmarked for broadband network construction projects.
The Polish government will contribute 409.4 million euros.
France is the country in which regulations have the most impact on Orange Business Services’ business. The Arcep, which focuses strongly on the replicability of retail offers to companies, checks that Orange’s wholesale offers are technically and economically appropriate.
Significant events in France in 2013 and the start of 2014
| |
May 2013 | Analysis of markets 4, 5 and 6 Arcep Decision No. 2013-0653 to extend for one year Decision No. 2010-0402 of April 8, 2010
on the definition of relevant markets for capacity services, the designation of operators with significant market power and the obligations imposed in consequence |
Nov. 2013 | Public consultation launched by the Arcep on its draft decisions regarding the analysis of fixed broadband
and superfast broadband markets in 2014-2017 |
Synchronization of rounds of analysis for markets 4, 5 and 6
Arcep Decision No. 2010-0402 of April 8, 2010 on the definition of relevant markets forwholesale terminating segments of leased lines (market 6) and Orange’s designation as an operator with significant market power in this market is valid for three years.
Given ongoing technological changes, the Arcep felt it necessary to synchronize, in 2014, the analyses of markets 4, 5 and 6, so as to conduct a wide-ranging analysis of all wholesale markets that allow alternative operators to build and offer data access in fixed locations, notably for non-residential end customers. Hence the decision to extend its existing decision until July 2014 by which time its analyses of markets 4 and 6 are due to have been reviewed (by June 2014).
Analysis of the fixed broadband and superfast fixed broadband markets
Following publication in July 2013 of the results of the Review and Prospects consultation on markets 4, 5 and 6 and on the decisions on symmetrical regulation of fiber optic, the Arcep published draft decisions on the fixed broadband and superfast fixed broadband markets on November 27, 2013, with a particular focus on wholesale terminating segments of leased lines (market 6).
ORANGE / 2013 REGISTRATION DOCUMENT - 32
Mobile termination rates
Mobistar’s mobile call termination rate is currently 1.18 euro cents/min. New termination rates should be up for discussion in 2014.
Wholesale broadband markets
The regulatory framework for access to the cable operators networks is governed by two decisions of the Belgian conference of electronic communications sector regulators (CRC) of July 1, 2011 and December 11, 2013. Pricing conditions follow a retail minus model and wholesale offers must be available within six months following a financial commitment by interested operators.
Mobile termination rates
Since February 1, 2014, mobile voice call termination rates for Orange Romania, and other local mobile operators, have been regulated. The regulator (ANCOM) has introduced a new calculation method that has cut mobile voice termination rates from 3.07 euro cents/min to 0.96 euro cents/min from April 2014.
Wholesale broadband markets
In 2010 the regulator issued a decision that imposed obligations on incumbent operator Romtelecom for access to its copper local loop but stopped short of regulating access to civil engineering.
Given the heavy competition from cable operators, the regulator opted not to regulate market 5. The two wholesale markets are due for review in 2014.
Because the Orange Group’s retail market operations outside the EU primarily involve providing mobile services, the main regulatory issue it faces in these countries is mobile call termination rates. The following table gives the national mobile call termination rate for each country concerned
Mobile call termination rate euro cents/min | 2011 | 2012 | 2013 | 2014 |
Kenya | 1.86 | 1.54 | 1.09 | 0.90 |
Jordan - Zain | 2.06 | 1.82 | 1.58 | 1.34 |
Jordan - Orange | 2.08 | 1.83 | 1.58 | 1.34 |
Jordan - Umniah | 2.47 | 2.09 | 1.72 | 1.34 |
Orange Tunisie | 4.59 | 2.61 | 1.56 | 0.95 |
Tunisia - Tunisiana | 3.64 | 2.32 | 1.38 | 0.95 |
Tunisia - Tunisie Telecom | 3.64 | 2.32 | 1.38 | 0.95 |
Morocco - IAM | 7.39 | 3.48 | 1.24 | 1.00 |
Morocco - Meditel | 8.86 | 4.01 | 1.24 | 1.00 |
Morocco - Inwi | 10.93 | 4.92 | 1.24 | 1.00 |
Egypt - Mobinil | 0.90 | 0.90 | 1.22 | 1.22 |
Egypt - Vodafone | 1.06 | 1.06 | 1.22 | 1.22 |
Egypt - Etisalat | 1.16 | 1.16 | 1.22 | 1.22 |
Mali | 4.50 | 3.35 | 2.56 | 2.56 |
Ivory Coast | 5.34 | 4.88 | 4.57 | 4.12 |
Senegal | 3.57 | 3.57 | 3.57 | 3.05 |
Madagascar | 4.08 | 4.08 | 4.08 | 4.08 |
Cameroon | 5.49 | 5.38 | 5.15 | 3.35 |
Niger | 5.34 | 5.34 | 5.34 | 5.34 |
Burkina Faso | 3.81 | 3.81 | 3.81 | 3.81 |
Iraq - Asiacell | 3.64 | 3.64 | 3.64 | 3.64 |
Iraq - Zain | 4.37 | 4.37 | 4.37 | 4.37 |
Democratic Republic of the Congo | - | 2.39 | 2.39 | 2.39 |
Botswana | 3.78 | 3.35 | 2.91 | 2.46 |
Uganda | 3.81 | 3.58 | 3.14 | 2.84 |
Mauritius | 1.44 | 1.44 | 1.44 | 1.44 |
Vanuatu | 2.20 | 6.60 | 6.60 | 6.60 |
Guinea Areeba (MTN) – Cellcom-Orange-Sotelgui | | 2.07 | 2.07 | 2.07 |
Guinea - Intercell | | 1.55 | 1.55 | 1.55 |
Source: Orange, based on data from national regulators |
ORANGE / 2013 REGISTRATION DOCUMENT - 33
Roaming
On November 8, 2012, Telecommunications Ministers from Southern African Development Community (SADC) countries—which include countries where Orange operates—approved a joint decision to regulate roaming rates in their countries. This decision involves:
■
the introduction of transparency measures to improve the information available to customers on rates and roaming as from June 30, 2013;
■
requiring operators to provide “Roam like a Local” services by May 2014, whereby roaming calls within the SADC region are charged at the same rate as international calls in the country where the call is being made.
Orange’s Conquest 2015 strategic project, launched on July 1, 2010 and created jointly by the Group’s various countries of operation and corporate functions, sets the Group’s direction and ambitions for each of its four main priorities: our people, customers, networks and international development.
In 2013, the Group continued to take the project forward in France and internationally, despite a challenging business, regulatory, competitive and technological environment.
The Business Environment
An adverse economic environment, mature markets in Europe, competition on many fronts and continuing strict regulation combined to put persistent pressure on the activity of most telecoms operators. The Group is adapting, not only to face these challenges, but to benefit from these transformations and the new growth opportunities they create.
Five key trends are especially salient for Orange’s market environment:
■
the economic environment remains unfavorable, particularly in Europe. Since the economic crisis broke, the traditional resilience of the telecommunications market seems to have been increasingly eroded. However, the position is better in the AMEA region where the Group has a strong presence. Economic growth in the countries where the Group operates averaged 4% in 2013;
■
market regulation has evolved to match the rapid transformations in the ICT sector, taking two forms:
■
traditional regulation of prices (wholesale rates and call termination), roaming and license renewals,
■
a new form of regulation whose impact is harder to gauge and which addresses issues like new generation access, consumer rights, the internet’s economic model, the digital economy, regulation in emerging markets, data protection and the single European market, this last one being a key regulatory issue for European players;
■
technological changes are happening faster and increasing in number as new players and new economic models emerge. There are opportunities to create value from new services such as contactless payments using mobile handsets (near field communication - NFC), integrated services Rich Communication Suite (RCS) and content storage and delivery via the cloud. Cloud-based services restore the value of connectivity and the network (fiber-optic and 4G), fast, secure networks being essential if users are to access confidential health or financial data, for instance, quickly and securely;
■
communications usages, particularly in the mass market, are changing and generating exponential growth in traffic. Driving the change is the growing demand for mobility, consumer concern over personal data, and the explosion in data traffic for applications such as HD video and online 3D;
■
competition is getting fiercer from Orange’s traditional rivals (telecommunications operators, cable operators), mainly seen in pricing, and now including 4G in France. However there is also an increasing challenge from OTT (over-the-top) players who are replacing traditional services such as voice and SMS. That said, markets where operators, IT service providers and internet players are all present also offer new opportunities for partnerships and growth.
The Conquest 2015 strategic project
The strategic priorities
The Conquest 2015 strategic project is based around four priorities: our people, networks, customers and international development.
The Group has set ambitious objectives in each of these areas:
ORANGE / 2013 REGISTRATION DOCUMENT - 34
■
promote well-being in the working environment,
■
develop well-trained managers empowered to take decisions,
■
adopt a proactive, responsible HR policy,
■
provide career and skills support for all employees;
■
boost bandwidth and coverage to meet demand,
■
improve service quality,
■
set pricing to maximize monetization and connectivity,
■
prepare to integrate new services;
■
streamline products and services and leverage knowledge of customers,
■
innovate to enhance customer relationships and experience and so boost loyalty,
■
offer ever more innovative services,
■
seek partnerships with content providers;
■
international development:
■
serve and support 300 million customers by 2015,
■
double revenues in emerging markets by 2015,
■
turn network coverage and innovation into competitive advantages,
■
be the leader or number 2 in every country.
The Operational Programs
Orange’s strategic plan aims to speed up the execution and roll-out of Conquest 2015 through targeted action programs, first launched in 2011. In 2013, the Group pressed ahead with these programs:
■
there is no economic performance without larbour performance, the hard-working men and women at Orange are the key to the Group’s success. To support their development, the Group introduced a new social contract in France in 2010. This was followed in 2011 by the Group-wide Orange People Charter. By the end of 2013, 23 countries and all Orange Business Services entities had introduced the Orange People Charter. More than 92% of employees questioned rated the quality of their working life as positive according to Orange’s employee survey in late 2013;
■
innovation is at the core of Orange’s strategy. It is increasingly critical to the Group’s ability to identify new growth areas, differentiate itself from the competition and deliver the digital revolution. The innovation chain has been overhauled with a unique model of managerial leadership to encourage the chain’s performance. The Nova+ program has been brought within the operational structure to encourage closer involvement with the countries and regions where Orange operates. Under its open innovation policy, the Group has struck partnerships with leading players in the digital market, start-ups and universities. In 2013, it launched the Orange Fab start-up accelerator (for further details, see Section 3.3. Research and innovation);
■
the Group’s drive to control and restructure costs centers on the ongoing Chrysalid program. Chrysalid identifies and gives the widest possible implementation to operational best practice and innovative business models to make sustainable and structural savings. At the end of 2013, Chrysalid had met its Group-wide targets, saving more than 1.8 billion euros so far. Operational efficiencies already identified by the Group’s countries for 2014-2015 are expected to take savings beyond the target of 3 billion euros over 2011-2015;
■
in the internet age, and as a way to differentiate itself from its competitors, Orange is digitizing customer relationships to make services more attractive, flexible, efficient and faster and to transform the customer experience.
Orange priorities 2014
Stabilizing EBITDA in 2014 is essential if the Group is to win market confidence, restore strategic flexibility and continue investing in the areas of the future: networks, customer excellence, new growth regions and taking the lead in innovation.
Orange’s strategic project serves its commitments and its ambition to become the leading telecommunications operator of the internet age. In 2014, the Group will focus on four priorities:
■
achieving ambitious commercial goals by delivering the best product line-up and excellent service to boost customer satisfaction and through proactive marketing across all geographical regions (France, Europe, AMEA, etc.);
■
a continuing drive to optimize the cost structure, with a target of trimming around 250 million euros off indirect costs in 2014, matching the savings already achieved in 2013;
■
constant adaptation of the Group’s economic model through:
■
accelerating cross-border network sharing through programs like Sirius in Europe and ANO in Africa and the Middle East, to boost operational efficiency and cut finance costs,
ORANGE / 2013 REGISTRATION DOCUMENT - 35
■
increased digitization of customer relationships to address two challenges: meeting customers’ expectations by making their daily lives easier, and improving customer satisfaction,
■
a proactive policy to manage the departure of the 30,000 Group employees due to retire by 2020, a third of the current workforce,
■
ongoing adaptation of the way Orange works and is organized, while respecting the social contract with employees.
The Group has identified three main drivers of value for 2014:
■
accelerated roll-out of high capacity fixed and mobile broadband:
■
4G take-up has been fast in the USA, Korea and Japan and the same pattern is likely to repeat itself in Europe, where the key challenge is to sustain premium pricing for 4G within the 3G/4G mix. Orange has already deployed 4G networks in eight European countries: France, Spain, Poland, the United Kingdom, Romania, Moldova, Luxembourg and Belgium. In Africa and the Middle East, the 3G network is in place in 17 countries,
■
on fiber optic, Orange’s target is to speed up the pace of new connections and have one million French customers connected by 2015, without eroding the value of other internet access modes;
■
developing bundled packages: Orange plans to profit from the forecast rapid penetration of bundled packages in Europe between now and 2016 by adapting offers that have already proved successful in France and Poland for every country in Europe. Prime targets are Spain, Belgium, Romania and Slovakia;
■
constant innovation: focused on enriching the offering in four areas:
■
cloud services for business and the mass market, which already counts 2.4 million users,
■
the entertainment offer centering on three key areas to meet customer expectations: music, video and games. Orange’s recent investment in G-cluster, a world leader in video game aggregation and streaming was part of this strategy. Cloud gaming is a major opportunity for Orange to extract value from its high capacity broadband networks, fiber optic and 4G by delivering an innovative video gaming experience to TV, PC, tablet or smartphone,
■
the mobile as means of payment: this is a field where Orange has ample experience. Nine million African customers already use its Orange money service. It will look to leverage this experience to develop a service tailored for Europe. The success of NFC, with nearly 9.2 million terminals, means banks, companies and government bodies can now dematerialize onto SIMs the payment services, transport passes and loyalty cards currently provided via physical cards or tickets,
■
health and well-being, in particular through connected devices (smarthome).
Orange is also planning to boost its capacity for innovation by expanding the Orange Fab program, launched by Orange Silicon Valley in 2013, to Poland, Israel and south-east Asia during 2014.
In addition to the information contained in the present Registration Document, investors should carefully consider the risks outlined below before deciding whether to invest. The Company's view at the date of this Registration Document is that these risks could have a negative impact on the business, financial position or profits of Orange and/or its subsidiaries. In addition, other risks and uncertainties, as yet unidentified or currently considered to be immaterial, could have similar negative impacts and investors could lose all or part of their investment.
The risks described in this chapter concern:
■
risks relating to Orange’s business activities (see Section 2.4.1);
■
risks of a legal nature (see Section 2.4.2);
■
financial risks (see Section 2.4.3).
In each section, risk factors are presented in diminishing order of importance, as determined by the Company at the date of filing the current Registration Document. Orange may change its view of their relative importance at any time, particularly if new external or internal facts come to light.
Several other sections of this present Registration Document also discuss risks in some detail:
■
for risks related to Orange's general strategy, see Section 2.3 Orange’s group strategy;
ORANGE / 2013 REGISTRATION DOCUMENT - 36
■
for risks relating to regulations and regulatory pressure, see Section 2.2 Regulations and Note 15 Litigation to the consolidated financial statements (Section 4.1);
■
for risks relating to litigation involving the Group, see Notes 15 Litigation to the consolidated financial statements as well as Section 4.4 Recent events ;
■
for risks relating to the vulnerability of the technical infrastructure and environmental risks, see Section 5.6.2 Environmental information;
■
for financial risks, see:
■
Notes 6, 7 and 9 to the consolidated financial statements on asset impairments,
■
Note 10.10 to the consolidated financial statements on derivatives instruments,
■
Note 11 Information on market risk and fair value of financial assets and liabilities to the consolidated financial statements for management of interest rate risk, currency risk, liquidity risk, covenants, credit risk, counterparty risk, and equity market risk, policy for managing interest rate, currency and liquidity risks is set by the Treasury and Financing Committee. See Section 5.2.3.3 Group governance committees;
■
for the insurance plan, see Section 5.4.2.1 Insurance;
■
more generally, policy for managing risk throughout the Orange Group is discussed in the Chairman’s Report on governance and internal control. See Section 5.4 Risk management.
Risks related to the sector, the economic environment and strategy
1.
Orange generates much of its revenues from mature countries and business activities where intense competition in the telecommunications sector could erode its profitability or its market share.
The main markets in which Orange operates are maturing and, in some cases, showing signs of saturation. Orange therefore faces extremely tough competition mainly in terms of pricing, particularly in the French mobile market where competition has intensified further following the entry of Free Mobile in January 2012. General falls in market prices since 2012 have an impact on Orange's profits and further falls would continue to do so.
Competition on price also threatens to weaken Orange's ability to maintain market share or effectively monetize new services to customers, including 4G and fiber-to-the-home (FTTH), which may undermine returns on its costly past and future investments. Furthermore, in European countries where it is primarily a mobile operator, Orange could find it impossible to compete against the rising tide of bundled packages.
Given the stiff competition and potential consolidation of the sector, notably in France, Orange's ability to sustain margins will depend in part on reducing the fixed costs in its cost base.
Should Orange’s ambitious and complex transformation and cost reduction program prove unsuccessful, or it fail to control the networks, technologies and the processes required to meet its customers’ needs, the Company could lose market share and/or be forced to reduce its margins, which could have a negative impact on its financial position and results.
For more information on competition, see Chapter 3 Overview of the Group’s business.
2.
The dire state of the economy in France and Europe could have a significant impact on Orange’s business and results.
Risks that the economy will stagnate or deteriorate remain high, notably in France. Governments have responded with economic and fiscal policies designed to cut debt and rebalance the budget. This could translate directly into a squeeze on household consumption and business activity, which could in turn significantly affect Orange's revenues and profits.
For further information on the impact of the economic situation on the Orange Group, see also financial risks in Section 4.3 below.
3.
As part of its strategy, Orange is exploring sources of growth in new countries and businesses. This may prove to be difficult or fruitless, or may be costly. In addition, investments already made may fail to bring the expected returns, and may even generate unexpected commitments and the Group could be faced with increased country risk. In all cases, the Group’s results and outlook could be impaired.
The Group’s growth depends heavily on its activities in fast-growing regions of the world. It has therefore invested in telecommunications companies in the Middle East and in Africa and could make new investments in these regions. Political instability or changes in the economic, legal or social landscape in these regions may call into question the outlook on profits held when these investments were made, or may become unforeseen liabilities, and the Group’s results could be impaired.
ORANGE / 2013 REGISTRATION DOCUMENT - 37
Moreover, these regions could present difficulties or specific risks in relation to internal controls or failure to comply with the applicable laws and regulations, such as anti-corruption laws (regulations that could also present risks in other regions where the Company operates, in particular due to its increased scope and restricting nature).
Finally, the Group’s growth also depends on a strategy for developing new businesses to cope with the rapid and extensive transformation of the electronic communications sector. This strategy rests on new businesses, particularly content aggregation, mobile payment, contactless services (NFC), Machine to Machine, or cloud computing, under the unique Orange brand. The pursuit of these goals requires resources, in particular regarding service integration and content development, however there is no guarantee that the use of these services and contents will grow or that they will be monetized at fair value and generate a profit on the corresponding costs or that current market shares can be maintained. Furthermore, the development of these new services could be hampered by regulatory changes or as a result of the economic environment.
If the expected growth in revenues from these new services was not achieved or if Orange was not able to render these new services profitable, the Group’s financial position and results could be impaired.
4.
The rapid growth in broadband use (fixed or mobile) allows service or content providers or terminal suppliers the opportunity to establish a direct link with telecommunications operators’ customers, thus depriving the latter, including Orange, of a share of their revenues and margins. If this phenomenon continues or intensifies, it could seriously impair the financial position and outlook of the operators.
The increased use of networks for value-added services has led to the emergence of new powerful players such as content and service providers (particularly VoIP or instant messaging, aggregators, search engines and terminal suppliers). Competition with these players to control customer relations is growing and could erode the operators’ market position. This direct relationship with customers is a source of value for operators and to lose part or all of it to new entrants could affect revenues, margins, the financial position and outlook of telecommunications operators like Orange.
In response, Orange has adopted a strategy aimed at:
■
making significant investments to increase the capacity of its transport and aggregation networks and to set itself apart based on the quality of the high-capacity broadband service offered; and
■
supplying more innovative and attractive communication services such as broadband voice or an integrated communication suite.
There is however no guarantee that this strategy, and particularly the investments made in the field of innovation, will be sufficient in the face of the pressure from new entrants. With no assurance of profitability on these investments, the financial position and outlook of Orange could be affected.
Risks relating to human resources
5.
In 2009, Orange was faced with a major workforce crisis in France. Since 2010, the Group has implemented an ambitious human resources program as part of its Conquests 2015 strategic plan to respond to this crisis. However, the economic context could hinder the implementation of this program and thus have a material impact on the Group’s image, operations, and results.
In 2008 and 2009, the Group was faced with a major crisis relating to psycho-social risks and anxiety at work, the effects of which continued into 2010. This crisis received widespread coverage in the French and international media following a number of employee suicides and had a major impact on the Group’s image. In response to this crisis, in 2010, the Group launched a new social Contract aimed at defining the Company’s professional practices and management culture and to provide long-term solutions to the risk factors identified (implementation of specific measures resulting from collective discussions, bases for renewal and agreements with trade union representatives). The Orange People Charter project was also launched throughout the entire Group in 2011. This project led in particular to the signing in March, 2011 of the Workforce and Skills Planning Management Program (Gestion Prévisionnelle des Emplois et des Compétences) agreement, the implementation of the Part-Time plans for Seniors (Temps-Partiel Senior) signed in 2009 and 2012, and the clarification of principles promoting the enhancement of professional careers and greater flexibility in employment as well as the launch of a set of employee satisfaction indicators to monitor the quality of employees' working life.
ORANGE / 2013 REGISTRATION DOCUMENT - 38
Although the Group believes that the cost of implementing such projects should be more than offset for by the benefits to the Company and its employees, this project could however come into conflict with certain cost-cutting plans. Moreover, in the event that the project does not achieve the expected results, this crisis may persist, affecting the Group’s image, its operations and its results for a long time.
Other operational risks
6.
Technical failures or the saturation of the telecommunications networks or the technical infrastructures or IT system could reduce traffic, erode revenues and damage the reputation of the operators or the sector as a whole.
There has already been damage to or interruptions to the service provided to customers and these may reoccur following outages (hardware or software), human errors or sabotage of critical hardware or software, cyber-attacks, failure or refusal of a critical supplier, or if the network in question does not have sufficient capacity to meet the growing usage needs. As a result of the rationalization of the network based on the implementation of all-IP technologies, the increase in the size of the service platforms and the relocation of equipment into fewer buildings, such service interruptions may in the future affect a greater number of customers and more than one country simultaneously. Although impossible to quantify, the impact of such interruptions affecting one or several countries would not only cause customer dissatisfaction, reduced traffic and an adverse effect on Orange revenues, but could also lead to intervention from the public authorities in the country or countries concerned.
Moreover, during the current period, the risk of failure of the internal Orange IT system has increased due to the accelerated implementation of new services or new applications relating notably to billing and customer relationship management. More specifically, incidents (including the possible loss of control over personal data) could occur during the implementation of new applications or software.
7.
The technical infrastructure belonging to telecommunications operators are vulnerable to damage or interruptions caused by natural disasters, fires, wars, acts of terrorism, intentional damage, malicious acts, or other similar events.
A natural disaster or other unforeseen incidents affecting Orange’s installations or any other damage or failure of the networks could cause significant damage generating high repair costs. In most cases, Orange has no insurance for damage to its aerial lines and must assume the full cost of the repairs itself. Furthermore, the damage caused by such major disasters may have more long-term consequences resulting in significant expense for Orange and which would harm its image. Moreover, international, community and national laws now recognize the existence of climate change. Weather phenomena associated with this climate change may increase the seriousness of disasters and of the damage caused.
8.
The scope of Orange activities and the interconnection of the networks mean that the Group is permanently exposed to the risk of fraud, which could reduce revenues and margins and damage its image.
Like any telecommunications operator, Orange runs the risk of falling victim to fraud where the fraudster aims to use the operator’s services without paying (possibly reselling these services) or to defraud the operator’s customers or the operator itself via the communications services offered by the latter. As technologies and networks become increasingly more complex, new types of fraud which are more difficult to detect or combat could also develop. Orange’s revenues, margins, service quality and reputation could be affected.
9.
Exposure to electromagnetic fields from telecommunications equipment raises concerns for possible health adverse effects. Perceptions of this risk could worsen or a deleterious effect may one day be scientifically established, which would have negative consequences for the business and results of operators such as Orange.
In certain countries, concerns have been raised regarding the possible health risks linked to exposure to electromagnetic fields from telecommunications equipment (mobile handsets, cell phone antennae, Wifi, etc.).
In May 2011, IARC, the WHO's international agency for research on cancer, classified electromagnetic fields from radiofrequency emissions as a 2B risk, i.e. "possibly carcinogenic to humans".
In the absence of scientific certainty, governments introduced strict regulations on the erection of cell phone antennae or the sale of equipment that emits electromagnetic fields, and health authorities have issued advices on various precautionary measures to reduce exposure to electromagnetic fields from mobile handsets. In certain cases, jurisdictions have ordered telephone operators to take down cell phone antennae and to compensate local residents. Similar decisions or tougher regulations cannot be ruled out in the future.
These regulatory and case law developments could lead to a reduction in coverage zones, deterioration of the service quality and customer dissatisfaction, as well as a slowdown in the roll-out of cell phone antennae and an increase in the costs of network roll-outs, which could have a significant impact on the Orange brand and the Group’s results and financial position.
ORANGE / 2013 REGISTRATION DOCUMENT - 39
The perception of risks by the public or employees could lead to a decrease in the number of customers and lower consumption by customers, as well as an increase in lawsuits or other consequences including, in particular, opposition to the construction of or even the existence of cell phone antennae.
Orange cannot predict the conclusions of future scientific research or studies by international organizations and scientific committees called upon to examine these issues. Such conclusions or studies and the different interpretations of these could lead to a decrease in the use of mobile telecommunication services, difficulties and additional costs in the roll-out of cell phone antennae and wireless networks, as well as an increased number of lawsuits, particularly if a health risk is eventually scientifically established.
For further information, see Section 5.6.2 Environmental information.
10.
Orange operates in highly regulated markets, where its flexibility to manage its business is limited. Orange’s business activities and results could be materially affected by legislative, regulatory or government policy changes.
In most countries in which it operates, Orange must comply with various regulatory obligations governing the provision of its products and services, primarily relating to obtaining and renewing licenses, as well as to oversight by authorities seeking to maintain effective competition in the electronic communications markets. Furthermore, in certain countries Orange faces regulatory constraints as a result of its historically dominant position in the fixed-line telecommunications market, in particular in France and Poland.
Orange believes that, on a general basis and in all countries in which it is present, it complies with all the specific regulations in force, as well the conditions governing its operator licenses. However, the Company is not able to predict the decisions of oversight and legal authorities who are regularly asked to rule on such issues.
Should Orange be ordered to pay damages or a fine due to the non-respect of a given regulation in force by the relevant authorities in a country in which it is present, the Group’s financial position and results could be adversely affected.
Orange’s business activities and operating income may be materially adversely affected by legislative, regulatory or government policy changes, and in particular by decisions taken by regulatory or competition authorities in connection with:
■
amendment or renewal on unfavorable conditions, or even withdrawal, of licenses to use broadcasting frequencies which are essential to the mobile business;
■
conditions governing network access;
■
the introduction of new taxes or increases to existing taxes for telecommunications companies;
■
consumerism legislation;
■
regulations governing data security;
■
regulations affecting operators of competing sectors, such as cable;
■
the European Commission Digital Agenda and the Connected Continent project;
Such decisions could materially affect the Group’s revenues and results.
For further information on regulations, see Section 2.2 Regulations.
11.
Orange is continually involved in legal proceedings and disputes with regulatory authorities, competitors, or other parties. The outcome of such proceedings is generally uncertain and could have a material impact on its results or financial position.
Orange’s position as the main operator and provider of network and telecommunications services, particularly in France and Poland, and one of the leading telecommunications operators worldwide, attracts the attention of competitors and competition authorities. Thus, Orange is involved in lawsuits or European Commission investigations regarding large amounts of state aid it is alleged to have received in France. In particular, the European Commission ruled that Orange should reimburse the French state some one billion euros that it received in state aid thanks to the special French business tax regime which it benefited from until 2003. In addition, Orange – particularly in France and Poland – is frequently involved in legal proceedings with its competitors and with the regulatory authorities due to its preeminent position in certain markets, and the complaints filed against Orange may be very substantial. Finally, the Group may be the object of substantial commercial lawsuits, worth tens of millions of euros, or, in extreme cases, hundreds of millions of euros, such as the one that gave rise to an amicable settlement between its Polish subsidiary (Orange Polska) and Danish company DPTG in January 2012 where Orange Polska paid compensation amounting to 550 million euros.
ORANGE / 2013 REGISTRATION DOCUMENT - 40
The outcome of lawsuits is inherently unpredictable.
In the case of proceedings involving European competition authorities, the maximum fine provided for by law is 10% of the consolidated revenues of the company at fault (or the group to which it belongs, as the case may be).
The main proceedings involving Orange are detailed in Notes 15 Litigation to the consolidated financial statements as well as Section 4.4 Recent events. Developments in or the results of some or all of the ongoing proceedings could have a material adverse impact on Orange's results or financial position.
12.
Like all electronic communications service providers, Orange may be held liable for the loss, release, disclosure to third parties or inappropriate modification of customer data. Its liability may also be triggered by its Internet access and hosting services.
Orange’s activities may also trigger the loss, release, disclosure to third parties or inappropriate modification of the data of its customers or the wider general public, which are stored on its infrastructures or carried by its networks. Such incidents could have a considerable impact on France Telecom-Orange’s reputation and its liability, including its criminal liability. Recourse to liability proceedings is facilitated in a number of countries by legislation increasing operators’ obligations. Moreover, Orange may in some countries be obliged to disclose personal data to third parties under legal regimes that fail to offer the same protection as France, which could damage Orange's reputation or even lead to litigation.
In most of the countries where Orange provides Internet access and hosting services, the Group is covered by a limited liability regime specific to technical Internet intermediaries, which is applicable in particular to content protected by copyright or similar laws. Certain professional organizations representing different categories of copyright holders are campaigning for increased obligations on Internet access providers, in particular in terms of blocking contentious sites, and for a review of the limited liability regime for hosting companies. If Orange’s obligations and liability regime should be changed, this could lead to increased claims against its liability and the Group would have to invest in the necessary technical systems.
13.
The profitability of certain investments and Orange’s strategy in certain countries could be affected by disagreements with its partners in companies that it does not control.
Orange operates some of its businesses through companies that it does not control. Articles of incorporation or agreements for some of these activities require that some major decisions, such as the approval of business plans or timing and size of dividends, need approval from different partners. Should Orange and its partners disagree regarding these decisions, the profitability of these investments, their contribution to Orange’s results and the strategy pursued by Orange in the countries in which these companies are located, could be adversely affected.
14.
Nearly 27% of Orange's capital is owned by the French public sector, which could, in practice, determine the outcome of votes at Shareholders' Meetings.
At December 31, 2013, the French public sector held close to 27% of Orange's capital: 13.4% of shares and 13.5% of the voting rights being held directly by the French Republic and 13.5% of shares and 13.6% of the voting rights by Bpifrance Participations (formerly the FSI). The French public sector has three representatives on the Board of Directors out of a total 15 members. On December 24, 2012, the French Republic and Bpifrance Participations signed a shareholders' agreement to act jointly. Since there are no other significant shareholder groups, the public sector could, in practice, determine the outcome of votes on issues that require a simple majority at Shareholders' Meetings and exercise a veto over issues requiring a two-thirds majority. Nevertheless, the Government does not have a golden share or any other special advantage, other than the right to have representativesx on the Board of Directors in proportion to its shareholding (see Section 6.2 Major shareholders).
Liquidity risk
15.
Orange's results and outlook could be affected if the terms of access to capital markets become difficult.
Orange raises most of its finance from capital markets (particularly the bond market), which are heavily influenced by the evolution of economic environment. For instance, a rise in government debt could revive the crisis of confidence in sovereign debt, which could contaminate the corporate bond market, making it harder for Orange to raise finance and/or significantly increasing the interest rate charged on its borrowings.
ORANGE / 2013 REGISTRATION DOCUMENT - 41
There are still concerns regarding the consequences of new regulations Basel III and Solvency II, which look to strengthen the equity of banks’ and insurance companies respectively. Banks are reducing their outstanding loans forcing companies to increase funding obtained on bond markets, which is Orange’s main source of financing. Stricter prudential control of the finance sector could reduce companies’ access to the financing or refinancing from the bond market or bank loans necessary for their business at prices and under terms which are considered reasonable, even for first-rate borrowers or issuers such as Orange. Any inability to access the markets and/or obtain financing on reasonable terms could have a material adverse effect on Orange. The Company could, in particular, be required to allocate a significant portion of its available cash to pay off debt, to the detriment of investment or returns for shareholders. In any case, Orange’s results, cash flow and, more generally, financial position and flexibility may be adversely affected.
See Note 11.3 Liquidity risk management to the consolidated financial statements, which sets out, in particular, different financing sources available to Orange, the maturity on its debt and changes to its rating, as well as Note 11.4 Management of covenants, which contains information on the limited commitments of the Orange Group in relation to financial ratios and in the event of bankruptcy or material adverse change.
Interest rate risk
16.
Orange’s business activities could be adversely affected by interest rate fluctuations.
In the normal course of its business, Orange obtains most of its funding from capital markets (particularly the bond market) and a small part from bank loans.
Since most of its debt is at fixed rate, Orange has a limited amount of exposure to increases in interest rates on the variable part of its debt. However, the Group is exposed to interest rate increases when refinancing.
To limit exposure to interest rate fluctuations, Orange from time to time makes use of financial instruments (derivatives) but cannot guarantee that these transactions will effectively or completely limit its exposure or that suitable financial instruments will be available at reasonable prices. In addition, hedging costs stemming from interest rate fluctuations could increase, generally, in line with market liquidity and banks’ circumstances.
In the event that Orange cannot use financial instruments or if its financial instrument strategy proves ineffective, cash flow and earnings may be adversely affected.
The management of interest rate risks and an analysis of the sensitivity of the Group’s position to changes in interest rates are set out in Note 11.1 Interest rate risk management to the consolidated financial statements.
Credit-rating risks
17.
If Orange’s debt rating is downgraded, placed under surveillance or revised by rating agencies, its borrowing costs could increase and in certain circumstances the Company’s access to the capital it needs could be limited (and thus have a material adverse effect on its results and financial position).
Orange’s financial rating is partly based on factors over which it has no control, namely conditions affecting the electronic communications industry in general or conditions affecting certain countries or regions in which it operates, and can be changed at any time by the rating agencies.
The Group’s financial rating and its outlook have been downgraded in 2012, 2013 and 2014. The rating may be revised again at any time in light of evolving economic circumstances, or following a downturn in the Company's results or performance or simply due to a change in rating agencies' perceptions of these factors.
Credit risk and/or counterparty risk on financial transactions
18.
The insolvency or deterioration in the financial position of a bank or other institution with which Orange has contractual relations may have a material adverse effect on the Company.
In the normal course of its business, Orange makes use of derivatives to manage exchange rate and interest rate risks, using financial institutions as counterparties. Cash collateral is lodged with the bank counterparties with which the derivatives are contracted. Nevertheless a residual credit risk may remain if one or more of these counterparties defaults on its commitments. Despite the major bond issues placed in January 2014 (see Note 16 Subsequent events to the consolidated financial statements), the diversification of its sources of finance, and its policy of staggering debt maturities, Orange may in future have difficulties renewing its financing - notably the 6 billion euro undrawn syndicated loan whose main maturity date is 2018 - if several of the banks with which the derivatives are contracted would face liquidity problems or could no longer meet their obligations.
Investments may also expose Orange to counterparty risk, if the financial institutions with which it has placed its investments fail. See Note 11.5 Credit risk and counterparty risk management to the consolidated financial statements.
The international banking system is such that financial institutions are interdependent. As a result, the collapse of a single institution (or even rumors regarding the financial position of one of them) may increase the risk for the other institutions, which would increase exposure to counterparty risk for Orange.
For customer-related credit and counterparty risk, see Note 11.5 and Note 3.3 Trade receivables to the consolidated financial statements.
ORANGE / 2013 REGISTRATION DOCUMENT - 42
Foreign exchange risk
19.
Orange’s results and cash position are exposed to exchange rate fluctuations.
In general, foreign exchange markets were more volatile in 2013, which could increase the risks linked to unfavorable fluctuations in exchange rates.
The main currencies in which Orange is exposed to a major foreign exchange risk are the Polish zloty, the Egyptian pound and the pound sterling. Fluctuations from one period to the next in the average exchange rate for a given currency could have a material effect on the revenues and expenses in this currency, which would in turn have a material effect on Orange’s results. In addition to the main currencies, Orange operates in other monetary zones, including certain emerging markets (African countries). A fall in the currencies of these countries would have an adverse effect on the Group’s consolidated revenues and results. Based on 2013 data, the theoretical impact of a 10% fall against the euro in the main currencies in which the Group’s subsidiaries operate would have cut consolidated revenues by 830 million euros (-2%) and Reported EBITDA by 218 million euros (-1.8%).
Finally, as a result of focusing its development strategy on emerging markets, the share of Group business exposed to currency risk is likely to rise in the future.
When preparing the Group’s consolidated financial statements, the assets and liabilities of foreign subsidiaries are translated into euros at the closing rate. This translation, which does not impact net income (except in the event of disposal of its subsidiaries) but rather other comprehensive income, could have an adverse effect on the consolidated balance sheet, assets and liabilities and equity, for potentially significant amounts. See Note 11.2 Foreign exchange risk management and Note 13 Equity to the consolidated financial statements.
Orange manages the foreign exchange risk on commercial transactions (stemming from operations) and financial transactions (stemming from financial debt) in the manner set out in Note 11.2 to the consolidated financial statements.
Notably, Orange makes use of derivatives to hedge its exposure to exchange rate risk but cannot guarantee that suitable hedging instruments will be available at reasonable prices.
To the extent that Orange had not used hedging instruments to hedge part of this risk, its cash flows and results could be affected.
See Notes 10.10 Derivatives instruments and 10.11 Cash flow hedges to the consolidated financial statements.
Risk of asset impairment
20.
Orange has recognized substantial amounts of goodwill as a result of acquisitions made since 1999. Under accounting standards, impairment losses have in the past and may again in the future be recorded against goodwill and other assets in Orange's accounts, including those of Orange SA, which could reduce its ability to pay dividends. Orange’s results and financial position could also be affected by the downturn in equity markets in relation to disposal of its subsidiaries.
Orange has recognized significant goodwill from its many acquisitions since 1999, notably the acquisitions of Orange Plc, Equant and Amena, and the stake taken in TP SA At December 31, 2013, the gross value of goodwill was 30.6 billion euros, not including goodwill from associates.
The values in use of the businesses, which are most of the recoverable amounts and which support the book values of long-term assets (including goodwill and equity interests on the parent company's balance sheet) are sensitive to the valuation method and the assumptions used in the models. They are also sensitive to any change in the business environment that is different to the assumptions used. Orange recognizes assets as impaired if events or circumstances occur that involve material adverse changes of a permanent nature affecting the economic climate or the assumptions and targets used at the time of the acquisition.
Over the past five years, Orange recognized significant impairment losses in respect of its interests in Poland, Egypt and Belgium, in particular. At December 31, 2013, the cumulative amount of impairment losses on continuing operations was 5.4 billion euros, not including impairment losses on the goodwill of associates.
New events or adverse circumstances could conduct Orange to review the present value of its assets and to recognize further substantial impairment losses that could have an adverse effect on its results.
In addition, in the case of disposals or introductions onto the market, the value of certain subsidiaries could be affected by changes in the stock and debt markets.
For further information on the impairment of goodwill and recoverable amounts (particularly key assumptions and sensitivity), see Notes 6 Impairment losses and goodwill, 7 Other intangible assets and property, plant and equipment and 9 Interests in associates to the consolidated financial statements and Section 4.3.2.2 From Group Reported EBITDA to operating income.
ORANGE / 2013 REGISTRATION DOCUMENT - 43
Equity risk
21.
Future public sector sales of Orange shares could affect the share price.
At December 31, 2013, the French public sector held close to 27% of Orange's shares: 13.4% held directly by the French State and 13.5% via Bpifrance Participations (formerly the FSI) (see Section 6.2 Major shareholders). If the public sector decided to reduce its stake in Orange, such a sale, or the perception that such a sale was imminent, could have an adverse effect on the share price.
ORANGE / 2013 REGISTRATION DOCUMENT - 44
ORANGE / 2013 REGISTRATION DOCUMENT - 45
This chapter contains forward-looking statements about Orange, particularly Section 3.1 Overview of Business. These forward-looking statements are subject to numerous risks and uncertainties that could cause actual results to differ materially from the results anticipated in the forward-looking statements. The most significant risks are described in Section 2.4 Risk factors. Please also consult information under the heading Forward-looking information at the start of this document.
The Group’s business is presented in the Registration Document under the following operating segments: France, Spain, Poland, Rest of Europe, Africa and Middle East, Enterprise Communication Services, International Carriers and Shared Services. Unless otherwise indicated, the market shares indicated in this chapter correspond to market shares in terms of volume.
| 2013 | 2012 | 2011 |
Population (in millions) | 65.5 | 65.3 | 64.9 |
Households (in millions) | N/A | 28.5 | 28.2 |
GDP growth (%) | +0.2% | +0.0% | +2.0% |
GDP per person (in dollars PPP) | 35,680 | 35,295 | 34,860 |
Change in household consumption (%) | +0.4% | -0.3% | 0.5% |
Sources: IMF October 2013 – INSEE |

Sources: Arcep (year-on-year cumulative to Q3 2013)

Source: Arcep (Q3 2013)
The French economy grew slightly in 2013, while consumer spending started to recover, growing by 0.4% after a decline in the previous year.
Telecommunications operators’ revenues amounted to 9.3 billion euros (over 12 rolling months to the third quarter of 2013), a decline of 8.2% compared with the third quarter of 2012 (source: Arcep, Q3 2013). While fixed-line revenues continued to fall in the wake of the continuing erosion of the number of lines, the decline in mobile services revenues dating back to 2011 continued, driven by falling prices in the retail market.
Fixed telephony
The number of subscriptions to fixed-line telephony services (39.1 million at September 30, 2013) fell at an annual rate of 1.7% from the start of 2013. Broadband telephone subscriptions (23.1 million) increased by 4 percentage points year-on-year, and accounted for nearly two-thirds of fixed-line subscriptions, while the decline in narrowband telephone subscriptions continued at a rate of about 2 million per year. Fixed lines on Voice over IP are growing steadily (+5 percentage points year-on-year), and are now in the majority (55%). Full unbundling (10.6 million lines at end-September 2013) benefited from this expansion, growing by nearly 900,000 lines year-on-year (source: Arcep, Q3 2013).
ORANGE / 2013 REGISTRATION DOCUMENT - 46
The number of broadband and high-capacity broadband (DSL, cable, fiber) Internet subscriptions was 24.6 million at September 30, 2013, an increase of 4.2%. Of this total, broadband represents 22.8 million subscriptions, and high-capacity broadband 1.8 million, an increase of 24.0% (source: Arcep, Q3 2013).
Revenues from fixed-line services are on a downward trend. Swift and persistent erosion of narrowband revenues (-12.5% compared with the third quarter of 2012) is no longer being offset by growth in revenues from broadband and high-capacity broadband fixed-line services, despite continued growth in this segment (source: Arcep, Q3 2013).
Confirming the trend initiated in 2012, 2013 showed that fixed and mobile convergent offers have become firmly rooted in the French market, with offers including fixed-line telephony, mobile, Internet and television services. The spread of Internet access has gone hand-in-hand with the type of Web use fostered by the growth of social networks, TV, as well as music and video downloads.
Mobile telephony
The number of SIM cards reached 75.5 million in the third quarter of 2013, representing a penetration rate of 115.2% of the population. The annual increase breaks down as 4.1 million new contract subscriptions and strong growth of 2.1 million year-on-year in the number of cards for communicating devices (M2M) (source: Arcep, Q3 2013).
Revenues from mobile services were down 13.8%, a pace comparable with the second quarter of 2013 (-13.2%), due notably to the launch of new low-cost packages and the steady migration of customers to SIM-only offers (source: Arcep, Q3 2013).
The volume of mobile calls reached 33.4 billion minutes in the third quarter of 2013, 3.9 billion more than in the third quarter of 2012. This represents an average increase of 17 minutes per customer every month compared with the third quarter of 2012 (2 hours and 50 minutes of calls on average in the third quarter of 2013). Traffic originating on mobiles has increased steadily since the beginning of 2012. It grew by 13.3% year-on-year in the third quarter of 2013 (source: Arcep, Q3 2013).
Mobile traffic continues to increase (+13.3% in the third quarter of 2013), and growth in the volume of mobile data continues at a rapid annual rate (approximately 60%). The number of subscribers to mobile broadband and high-capacity broadband also continues to grow rapidly.
The number of SMS exchanged continues to increase (+2.2% year-on-year in the third quarter of 2013), although at a much slower pace than in 2012 (+30% in 2012).
Fixed-line telephony and Internet

Source: Orange estimates (2012 data as of end-September)
Orange is the leader of the French broadband market, ahead of its competitors Free, SFR, Bouygues Telecom and Numericable. At end-September 2013, Orange’s market share was 40.8%, down slightly year-on-year (-0.8 percentage point). Orange is also the market leader in convergence offers, with nearly 4.8 million customers subscribed to its Open package at the end of 2013. Bouygues Telecom and, to a lesser extent, Numericable also offer their customers this type of package. SFR and Free have established a system of discounts given to customers purchasing a mobile plan and a fixed-line broadband package.
2013 saw the emergence of new entry-level Internet offers, including Orange’s Livebox Zen, the Bouygues dual play offer (without TV), and Free’s sale of the older-generation modems under the name Box Crystal.
High speed broadband
In high-capacity broadband, Orange is the leader in the rollout of fiber to the home (FTTH) networks, with nearly 2.6 million homes connectable at end-2013, and market share of 58% at end-September 2013 (source: Arcep, Q3 2013).
Mobile services

Source: Orange estimates (2013 data as of end-September)
Orange has remained its leadership in the French mobile market, ahead of competitors SFR, Bouygues Telecom, Free Mobile and the MVNOs. At end-September 2013, Orange had market share of 35.5% according to its own estimates, down 1.5 percentage points year-on-year.
ORANGE / 2013 REGISTRATION DOCUMENT - 47
The major event in 2013 for all operators was the arrival of 4G mobile broadband. All operators now offer 4G plans. Bouygues Telecom, which received permission to redeploy its 1,800 MHz spectrum, had the largest number of 4G towers at end-December 2013 (source: ANFR).
2013 also saw heightened market segmentation between entry-level offers dominated by SIM-only deals (no handset and no commitment) and the high end characterized by subsidies for the purchase of a handset and the offer of dedicated services. In the area of subsidized offers, operators have improved their services while adapting their pricing policy in response to the growth of SIM-only deals.
By contrast, the prepaid market contracted by nearly 13.9% in the first nine months of 2013 (source: Arcep Market Observatory, January 2014). The market for so-called community prepaid cards nevertheless remained very buoyant. Operators accordingly expanded their offers, launching unlimited top-ups and prepaid cards with unlimited validity.
Lastly, in the wholesale market, the establishment of Full MVNO agreements between network operators and virtual operators continued in 2013.
Fixed telephony and Internet activities
| 2013 | 2012 | 2011 |
Revenues (in billions of euros) | 11.1 | 11.6 | 12.2 |
Consumer Services | 6.9 | 7.4 | 7.8 |
Wholesale Services | 3.7 | 3.6 | 3.7 |
Other services | 0.5 | 0.6 | 0.6 |
Number of telephone lines (in millions) | 30.3 | 30.2 | 30.0 |
o/w retail lines | 17.1 | 17.6 | 18.5 |
o/w wholesale lines | 13.2 | 12.6 | 11.4 |
Number of Internet customers (in millions) | 10.2 | 10.0 | 9.8 |
o/w low-speed | 0.1 | 0.1 | 0.2 |
o/w broadband | 10.1 | 9.9 | 9.6 |
Voice over IP subscribers | 8.7 | 8.4 | 8.0 |
ADSL TV or satellite subscribers | 5.6 | 5.1 | 4.4 |
ARPU (in euros per month) | | | |
Broadband Internet | 33.8 | 34.7 | 35.1 |
Source: Orange |
Traditional fixed-line telephony services
Further to the rapid growth in full unbundling, wholesale subscriptions, and wholesale naked ADSL access to third-party Internet service providers, traditional telephone service business is on the decline. The downward trend has nevertheless stabilized in terms of both revenues and PSTN connections (down 12.8% and 11.1% respectively compared with end-December 2012), thanks to the aggressive marketing strategy implemented since 2012 to simplify offers while offering more comprehensive services.
Online Internet access, and Multimedia services
At end-December 2013, Orange had a total of 10.1 million Internet customers, an increase of 2.2% year-on-year. A total of 8.8 million Liveboxes were rented at end-December 2013, up 5% compared with end-December 2012. The growth of convergent offers continued in 2013, with the number of OPEN customers (fixed and mobile) reaching 4.8 million at end-2013 (+57% compared with December 2012).
With 8.7 million customers at end-December 2013, VoIP continued to grow at an annual rate of 4.2%, the same pace as in 2012 despite a persistently competitive environment.
Television by ADSL and satellite grew by 10.9%, with 5.6 million customers at end-December 2013. Since 2012, Orange has offered new services allowing users to control their TV via tablets or smartphones, and offering greater storage capacity for movies, photos and music in the cloud.
The broadband customer base increased by 2.2%, with Orange winning approximately 25% of new broadband and high-capacity broadband subscriptions over the year, thanks to the commercial success of the Open offers and the release of Livebox Play. By contrast, broadband ARPU fell by 2.7%, affected by the increasing penetration of Open quadruple play offers benefiting from rate discounts.
ORANGE / 2013 REGISTRATION DOCUMENT - 48
Orange simplified its range of offers in 2013, removing commitments. The Livebox Zen offer provides basic access to the Internet at a low price. The new Livebox Play offer is geared towards more intense Internet use (high-capacity connection via fiber, access to more content, service guaranteed within 24 hours).
Internet portals and advertising management business
The Group’s main Internet portal, Orange.fr, has multi-screen availability: web, mobile and tablet.
Orange.fr has the sixth-highest Web traffic in France, after Google, Facebook, Youtube, Microsoft and Wikipedia, with 19.8 million unique visitors, representing 42.6% of Web users connected at least once a month (source: Nielsen/NetRatings, France panel, December 2013). On mobile devices, Orange.fr ranks fifth in terms of audience, with 10.4 million unique visitors, behind Google, Youtube, Facebook and Yahoo (source: Médiamétrie/NetRatings official panel, December 2013).
With these audience figures and its e-advertising sales force, Orange generated 62 million euros of audience revenues in 2013, primarily on orange.fr, but also including partners.
Content-related activities
See the Content subsection of Section 3.1.8.2 Shared Services.
Carrier services
Carrier services include interconnection services for competing operators and unbundling and wholesale market services, regulated by Arcep. The growth in business on the wholesale market partially offsets the decline in interconnection service revenues.
Since 2006, naked bitstream has been added to full unbundling outside unbundled areas to allow alternative operators to extend their non-subscription broadband offers to the entire territory. Since then, this type of access has steadily increased.
Mobile telephony activities
| 2013 | 2012 | 2011 |
Revenues (in billions of euros) | 8.9 | 9.9 | 10.3 |
Total number of customers (in millions) | 27.0 | 27.2 | 27.1 |
o/w contracts | 20.9 | 19.7 | 19.5 |
o/w prepaid | 6.2 | 7.5 | 7.6 |
Number of MVNO customers | 1.6 | 2.3 | 3.4 |
Total ARPU (in euros per month) | 295 | 333 | 366 |
Contract ARPU | 372 | 428 | 465 |
Prepaid ARPU | 81 | 98 | 126 |
AUPU total (in minutes per month) | 224 | 206 | 193 |
Churn rate (%) | 28.0% | 28.7% | 27.5% |
Source: Orange |
The total number of mobile customers edged down by 0.6% to 27 million at end-2013 due to the significant decrease in prepaid offers, despite uninterrupted growth in the number of subscriptions. Orange increased its subscriber base to 20.9 million at end-December 2013 (+5.9% compared with 2012) thanks to the segmentation and restructuring of its offers and their improvement in terms of prices and services.
Orange is present in all market segments. It offers a range at very low prices available only on the Internet with no commitment and no handset under the Sosh brand (priced from 4.90 euros to 24.90 euros per month including unlimited calls from 9.90 euros and access to mobile broadband). Sosh had a total of 1.9 million customers at end-December 2013.
Orange had more than 1 million 4G subscribers at 31 December 2013. Orange launched 4G for retail customers in April 2013, with new Origami and Open 4G/H+ plans. At the same time, Orange simplified its Origami range, reducing the number of plans from eight to six, breaking down into three offers:
■
the Zen offer for customers who need only a small amount of Internet connectivity;
■
the new Origami Play offer suitable for intense mobile Internet use while providing a wide range of entertainment services;
■
the Origami Jet offers for customers wanting the best smartphones and services in France and abroad.
Concurrently, services and content were included in all 4G offers (multi-SIM, Cloud, music with Deezer Premium and Orange TV).
ORANGE / 2013 REGISTRATION DOCUMENT - 49
Orange pressed ahead with its family-based strategy through its flagship Open offer and the development of multi-line packages, while at the same time offering mobile Internet access at varying volumes and speeds depending on customer needs.
This refurbishment increased the volume of offers on the core Open and Origami ranges, and also helped to improve the customer premium mix in 2013, with growth of the contract customer mix (77.2% of customers at end-2013, compared with 72.5% at end-2012).
At the same time, the MVNO customer base hosted on the Orange network declined substantially (-31.8% year-on-year, the same pace as in 2012) due to the success of low-cost offers and heightened competition at the entry level.
Average revenues per user (ARPU) were down 11.5% in 2013 compared with 2012. This decline reflects the impact of price adjustments across all mobile plans, the penetration of low-cost offers, and the negative impact of an average fall of 50% in voice interconnection charges between French mobile operators. Adjusted for the impact of regulatory price cuts on inter-operator revenues, ARPU was down 8%.
Machine to Machine (M2M) SIM cards continued to grow, with an increase of 35% year-on-year to 1.8 million cards at end-2013. The M2M segment is one of Orange’s growth drivers.
In the business market, Orange continues to develop mobile data offers, focusing on smartphone/tablet or PC with Duo options and Performance Duo contracts. The Group also continues to expand convergence offers with its Open Pro range available on fiber-optic.
Orange is strengthening its role as a partner in the business market offering Cloud Pro applications and new on-demand services (such as IT and telephone support provided either remotely or on site).
Distribution

Source: Orange
Orange’s distribution and customer relationship channels consist of:
■
a network of retail stores throughout France. At end-2013, it comprised 579 directly owned retail outlets, including 19 flagships, as well as 523 exclusive partners (including 463 Orange franchises) and 4,000 outlets in the multi-operator network;
■
automated channels, primarily the Orange online store on Orange.fr. Customers can browse the devices, Internet, broadband multimedia and mobile offers available from Orange, and order directly online for delivery to their home. This distribution channel is poised to ramp up gradually, especially with the launch of the Sosh online only offers;
■
customer centers that customers can contact by phone:
■
by dialing 700 for mobile customer services,
■
by dialing 1014 for fixed-line services,
■
by dialing 3970 for services relating to the Open convergence offers,
■
by dialing 1013 for calls relating to the provision of universal service,
■
by dialing 3900 for customer service and remote support for fixed-line, Internet, fiber-optic and mobile products.
ORANGE / 2013 REGISTRATION DOCUMENT - 50
The Network
Fixed Network
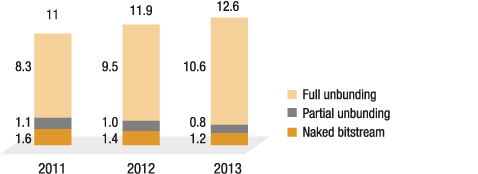
Sources: Arcep, Q3 2013
(as a% of the population) | 2013 | 2012 | 2011 |
< 512 kbps | 0.7% | 0.8% | 1.0% |
≥ 512 Kbit/s ≤ 2 Mbit/s | 10.3% | 10.5% | 10.6% |
> 2 Mbps | 89.0% | 88.7% | 88.3% |
Number of copper lines (in thousands) | 30,700 | 30,853 | 30,723 |
Number of FTTH-connectible households (in thousands) | 2,573.0 | 1,669.0 | 926.0 |
Number of NRA (in thousands) | 15.9 | 15.5 | 15.1 |
Number of Cross-Connection Points (in thousands) | 94.3 | 94.0 | 93.7 |
Number of VDSL NRA (in thousands) | 5.3 | - | - |
Source: Orange |
In 2013, Orange:
■
continued its multi-year deployment of FTTH at a steady pace so as to offer its customers high-speed broadband in high- and low-density areas alike. The first results of the 100% fiber experiment in Palaiseau allowed the fiber-driven transformation in usage to be tested across an entire city;
■
pursued the modernization of the copper network in addition to the deployment of fiber with the commercialization of VDSL2 to provide higher ADSL speeds on short lines and the launch of Digital Villages tests to improve fixed Internet flows in rural and mountain areas through LTE/4G technology;
■
delivered the growth needed in the VoIP network and changes in the IP interconnection offer;
■
generalized shared Wifi on Liveboxes;
■
commissioned a new-generation energy-efficient data center in Normandy to meet the growing needs in terms of data hosting and the growth of cloud computing.
ORANGE / 2013 REGISTRATION DOCUMENT - 51
Mobile Network
(as a % of the population) | 2013 | 2012 | 2011 |
GSM Voice/Edge | 99.9% | 99.9% | 99.8% |
3G (UMTS)/HSDPA | 98.7% | 98.7% | 98.0% |
4G | 50.0% | - | - |
Number of 2G radio sites (in thousands) | 20.7 | 20.3 | 19.8 |
Number of 3G radio sites (in thousands) | 18.1 | 17.5 | 16.2 |
Number of 4G radio sites (in thousands) | 3.9 | - | - |
Source: Orange |
2013 was marked by:
■
the deployment of UMTS 900 in dense areas to improve reception inside housing;
■
the continued rollout of H+ (42 Mbits/s), which now covers 75% of the French population;
■
the launch of 4G for retail customers (the launch for business customers was made in 2012) with the extension of 4G coverage to 50% of the French population in the space of only a year;
■
the expansion of core network capacity to support the growth in data traffic and 4G.
Cluster, Transmission, and Transport Network
The network architecture in place in terms of aggregation and the IP backbone has allowed growth in Internet traffic via capacity extensions.
2014 Outlook
For 2014, Orange France has set four priorities to stabilize its EBITDA:
■
achieve its business objectives through aggressive marketing and commercial action, with outstanding customer service;
■
continue to adapt to the increasing digitization of customer relations and manage the 30,000 retirements expected in France by 2020 (one-third of its workforce);
■
continue efforts on the direct and indirect cost bases;
■
continue to adapt modes of operation and organization in accordance with the social contract.
To achieve these objectives, Orange will use three main levers:
■
high-capacity fixed and mobile broadband:
■
anticipating rapid penetration of 4G with a focus on the 3G/4G mix and the need to maintain a premium price on 4G,
■
accelerating the number of fiber connections in 2014 in order to reach 1 million customers in France by 2015, while preserving the value of the copper network;
■
convergence, leveraging the position as the incumbent operator in this field so as to significantly increase customer loyalty;
■
innovation in services to make them a powerful tool in customer retention and a driver of revenue growth, with:
■
the cloud in the business and retail markets,
■
entertainment in music, video and video games,
■
mobile payment and financial services,
■
the well-being market (wellness, smarthome, health) with the development of connected objects.
ORANGE / 2013 REGISTRATION DOCUMENT - 52
Key macro-economic indicators
The year 2013 again bore the marks of the economic crisis, although there were tentative signs of recovery. GDP is estimated to have contracted by 1.3% in 2013 (compared with a decline of 1.6% in 2012), unemployment to have hit a record high of 26.7% and consumer spending to have fallen by roughly 2.1%.
| 2013 | 2012 | 2011 |
Population (in millions) | 46.1 | 46.2 | 46.1 |
Households (in millions) | N/A | 17.4 | 17.3 |
GDP growth (%) | -1.3% | -1.6% | 0.5% |
GDP per capita (PPA, $) | 30,128 | 30,058 | 30,060 |
Change in household consumption (%) | -2.1% | -2.8% | -1.2% |
Source: Eurostat, IMF, October 2013 |
Telecommunications industry revenues are expected to fall by 7.6%. Market has been characterized by a strong competition with a sharp reduction of prices for all segments driven by strong penetration of convergent offers, along with SIM only offers for mobile and the generalization of unlimited voice traffic for mobile offers.

Source: CMNC (Q4 estimates for 2013)

Source: CMNC (Q4 estimates for 2013)
Fixed-line telephony and Internet
The number of fixed telephone lines fell by 1.5% in 2013 as customers continued to abandon them in favor of mobile abundance or unlimited voice offers. Fixed-line telephony revenues accordingly fell by 13.4%, due both to cannibalization by mobiles and customer migration to cheaper bundled voice and Internet offers.
The number of Internet customers reached 12.1 million, an increase of 5.7%. However, Internet revenues fell by 2.3%, on a 7.5% decline in ARPU.
In 2013, the Spanish market was quick to adopt the prices offered by the major players for their convergence offers: competition between all operators is now focused on these offers, which have become the norm, either as bundled fixed and mobile or bundled telephone and Internet offers.
ADSL is still the most widespread technology in the fixed broadband segment, which enjoyed strong growth in 2013. Orange, Vodafone and Jazztel launched their FTTH projects in 2013, joining the cable operators and Telefónica in the world of high-capacity broadband.
Mobile services
The Spanish mobile market changed considerably in 2013. The change was underpinned by two factors: confirmation of the growth of convergence offers, and the replacement of traditional handset subsidies with SIM-only offers with different payment facilities for the purchase of a handset.
Alongside convergence and SIM-only offers, the market for abundance offers was also relatively buoyant in 2013. It includes unlimited voice offers, which have become the norm, increased use of mobile data services related to the adoption of 4G, and the multiplication of low-cost offers by MVNOs.
The number of customers fell by 1.4% to 55.2 million in 2013. The number of subscribers increased by 3.7% to 39.3 million, representing 71.2% of the total customer base, while the number of prepaid customers fell by 11.7% to 15.9 million.
Total revenues declined by 11%, mainly due to the fall in voice and SMS revenues. Total ARPU dropped by 9.9% due to the sharp decline in voice prices caused by heightened competition and the reduction in SMS, the impact of which was not offset by growth in data traffic stemming from the increased penetration of smartphones and the use of their applications.
ORANGE / 2013 REGISTRATION DOCUMENT - 53
Fixed-line telephony and Internet

Source: CMNC (Q4 estimates for 2013)
The Internet market is dominated by five main players representing over 90% of the market, with market shares of 47.4% for Telefónica, 12.7% for Ono, 14% for Orange, 11.9% for Jazztel and 7.9% for Vodafone.
In 2013, Orange gained 1.7 percentage points of market share, followed by Vodafone with 1.1 point and Jazztel with 0.2 point, at the expense of Ono and Telefónica, which lost 1.7 points and 1.3 point of market share respectively.
Mobile services
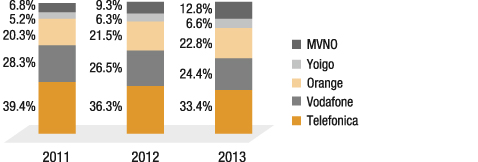
Source: CMNC (Q4 estimates for 2013)
The market is dominated by three main operators, which have a combined market share of roughly 80%: Telefónica (33.4%), Vodafone (24.4%) and Orange (22.8%). Yoigo (Telia Sonera) has a market share of 6.6%, while MVNOs together account for 12.8%.
The market share of MVNOs hosted by Orange and Yoigo (especially those offering convergence solutions) increased by 3.5, 1.3 and 0.3 percentage points respectively in 2013, at the expense of Vodafone and Telefónica, whose market shares fell by 2.1 to 2.9 percentage points respectively.
Fixed telephony and Internet activities
| 2013 | 2012 | 2011 |
Revenues (in millions of euros) | 851 | 765 | 707 |
Number of Internet customers (in millions) | 1.73 | 1.43 | 1.31 |
o/w low-speed | 0.04 | 0.04 | 0.05 |
o/w broadband | 1.69 | 1.40 | 1.27 |
ARPU (in euros per month) | 31.8 | 33.0 | 32.4 |
Broadband Internet | 31.8 | 33.0 | 32.4 |
Source: Orange |
In 2013, Orange’s strategy in terms of services in Spain was based on the new Canguro convergence offers, in which customers pay a flat fee for their fixed and mobile service. This helps cultivate their loyalty. The number of customers with convergence offers was 1.1 million at end-2013, 66% of the fixed broadband customer base.
The success of this offer enabled Orange to take first place in terms of net growth in Internet customers, increasing its broadband customer base by 21.2% and making it Spain’s second-largest operator. Fixed-line revenues climbed to 851 million euros, an increase of 11.3% compared with 2012.
ORANGE / 2013 REGISTRATION DOCUMENT - 54
Mobile telephony activities
| 2013 | 2012 | 2011 |
Revenues (in million euros) | 3,201 | 3,262 | 3,286 |
Total number of customers (in millions) | 12.4 | 11.8 | 11.7 |
o/w contracts | 8.9 | 8.1 | 7.6 |
o/w prepaid | 3.4 | 3.7 | 4.0 |
Number of MVNO customers | 2.09 | 1.79 | 1.48 |
ARPU total (in euros per month) | 18.2 | 21.0 | 22.1 |
Contracts ARPU | 23.4 | 28.2 | 30.7 |
Prepaid ARPU | 5.9 | 6.5 | 6.8 |
Voice ARPU | 12.0 | 15.5 | 17.3 |
Data ARPU | 6.3 | 5.5 | 4.8 |
AUPU total (in minutes per month) | 169.8 | 168.6 | 174.1 |
Churn rate (%) | -30.2% | -29.8% | -31.7% |
Source: Orange |
Orange’s mobile strategy aims to promote customer satisfaction and loyalty through quality offerings, including low-cost offers to meet the needs of all customer segments. Orange launched its new Canguro convergence offer in April, and completely recast its portfolio of offers in June, adding 4G data offers.
Orange España’s offers cover all market segments: convergence services with Canguro 35 and 45, the high- and mid-range with Delfin 16 and 25, and Ballena 23 and 35 for consumers of large amounts of data. The entry level is covered by Ardilla 4 and 7 and by prepaid offers. Lastly, a very cheap range is available only on the Internet under the Amena and Simyo brands.
New commercial initiatives enabled Orange to maintain its positive momentum in 2013, putting it in first place in terms of new customer acquisitions and allowing it to increase its subscriber base by 10.4% to 8.9 million. By contrast, the number of customers fell by 8.2% due to the intense pressure exerted by MVNOs (including those hosted by Orange) and the migration of prepaid customers to the cheapest contracts.
Total revenues decreased by 1.9% due to a 13.3% fall in ARPU prompted by falling prices and the reduction in July 2013 of mobile call termination rates. The decline in operating income was for the most part offset by a significant increase in sales of handsets spurred by the success of new staggered payment solutions.
Distribution

Source: Orange
The Orange retail distribution network consists of 2,992 points of sale including:
■
specialized shops under the Orange brand;
■
non-exclusive specialized shops;
Orange España also distributes its services through remote sales channels and its own online sales portal.
ORANGE / 2013 REGISTRATION DOCUMENT - 55
The Network
Fixed Network

Source: Orange
| 2013 | 2012 | 2011 |
Number of accessible copper lines (in millions) | 17.34 | 17.34 | 13.20 |
Number of households which can be connected by FTTH (in millions) | 0.09 | 0.09 | 0.06 |
Number of subscriber connection nodes (in thousands) | 1,011 | 1,011 | 615 |
Source: Orange |
Orange España continues to invest in its fixed-line network to improve customer service and sustain profitable growth in the fixed broadband segment. To this end, Orange signed an agreement with Vodafone in March 2013 for the deployment of FTTH. The goal is to have 6 million connected households in more than 50 cities by 2017.
In September 2013, Orange launched its new multimedia TV services, offering Internet access to over 25 pay HDTV channels and a video-on-demand service.
Mobile Network
| 2013 | 2012 | 2011 |
GSM Voice/Edge | 99.4% | 99.3% | 99.2% |
3G (UMTS)/HSDPA | 97.6% | 92.3% | 90.6% |
Number of 2G radio sites (in thousands) | 15.4 | 14.8 | 14.7 |
Number of 3G radio sites (in thousands) | 12.2 | 11.2 | 11.0 |
Source: Orange |
Orange España completed the renovation of its access network in 2013. More than 13,500 wireless network nodes were replaced with new multi-frequency equipment adaptable to 2G and 3G services. This program made it possible to increase network capacity and coverage by multiplying the number of distribution nodes located in the same places.
With regard to the plan to renovate the backhaul network, 8,900 nodes were connected in 2013, using high capacity broadband technologies offering full IP connectivity and transmission capacity consistent with customer requirements.
The two programs enabled Orange to launch its 4G offer in July 2013, initially in six cities, and subsequently extended to a further nine. In 2014, this offer will cover all provincial capitals, representing a total investment of 1.1 billion euros, an amount that includes specific investments for the 4G transmission networks.
2014 Outlook
According to IMF, in 2014, GDP would slightly increase at 0.6% YoY rate, and unemployment rate would reduce from 26.7% to 26.4%. In this scenario, Orange aims to continue improving its profitability by increasing its revenues while at the same time reducing costs.
From a strategic perspective, Orange España will continue its Conquest 2015 plan to bolster growth, with the following priorities:
ORANGE / 2013 REGISTRATION DOCUMENT - 56
■
reinforce its position as the leading alternative operator in Spain by strengthening its convergence offers, including the deployment of fiber optic, using 4G as a differentiator to provide a unique customer experience, and seizing growth opportunities in new markets, such as the low-cost segment with Amena.com and Simyo, or in related activities;
■
increase customer satisfaction by improving coordination between the various distribution channels, building on market segmentation, and improving loyalty programs;
■
attain a higher level of efficiency by streamlining and simplifying operating processes, pursuing the integration of computing platforms in a converged architecture, and exploiting opportunities for network sharing and the rationalization of purchases.
| 2013 | 2012 | 2011 |
Population (in millions) | 38.5 | 38.5 | 38.5 |
Households (in millions) | N/A | 13.7 | 13.6 |
GDP growth (%) | +1.3% | +1.9% | +4.5% |
GDP per capita (in dollars PPP) | 21,118 | 20,562 | 19,843 |
Change in household consumption (%) | +0.8% | +1.1% | +2.7% |
Source: Eurostat, IMF, October 2013 |

Source: Orange Polska estimates

Source: Orange Polska estimates
2013 saw the Polish economy enter a phase of growth that is expected to continue. At the same time, slower demand pushed the inflation rate down to 0.7% in 2013, while the unemployment rate reached 13.4%.
The value of the Polish telecommunications services market fell by 4.7% in 2013 (according to Orange Polska estimates). The main factors contributing to the decline were lower mobile termination rates, the implementation of SMS price regulation, and lower roaming charges. The market was also negatively affected by the launch of offers with unlimited SMS, MMS and calls to all networks. There is still a downward trend in the fixed-line voice segment.
Fixed telephony
The penetration of fixed lines continued to decline in 2013, accounting for 46.5% of households at year-end, compared with 48.6% at end-2012 (source: Orange Polska estimates).
In 2013, the number of fixed broadband lines in Poland grew by 1.8% (source: Orange Polska), a significant slowdown compared with the previous year. However the broadband market increased by 5.1% in value in 2013, compared with a 6.3% increase in 2012.
Mobile telephony
The mobile telephony market is stable. The number of mobile users increased by 4.1% in 2013, reaching 56.54 million at end-December 2013. The mobile penetration rate was accordingly 147% of the population in 2013 (compared with 141% in 2012).
ORANGE / 2013 REGISTRATION DOCUMENT - 57
Fixed-line telephony and Internet

Source: Orange Polska estimates
In the broadband market, Orange Polska is still under strong competitive pressure from cable television operators, whose market share is climbing steadily. It was estimated at 32% in terms of volume and 30% in terms of value at end-December 2012 (source: Orange Polska estimates). The commercial offers of these operators are backed by investment in infrastructure to deploy the DOCSIS 3.0 standard and expand fiber access. Their overall market position has been steadily growing, resulting mainly from high popularity of the bundles they can offer, using their advantageous position on the television market. Moreover, these operators are able to increase the speeds offered to customers for the same price, stimulating both average bandwidth per broadband access on the market and customers’ expectations in this respect. CATV is also expanding its offer towards SoHo and SME client segments.
Alternative operators, primarily Netia, still make use of wholesale BSA and LLU based services. However, the total volume of lines using bitstream access fell by 17,000 in 2013, and there were 172,000 unbundled lines at end-2013, compared with 185,000 a year earlier.
Mobile services

Source: Orange Polska estimates
Poland has four main mobile operators: Orange Polska, T-Mobile (wholly owned by Deutsche Telekom), Polkomtel (operating under the PLUS brand in combination with Cyfrowy Polsat, a TV broadcaster and operator of a satellite TV platform owned by Polish businessman Zygmunt Solorz-Zak) and P4 (owned by Tollerton Investments Ltd and Novator Telecom Poland SARL, operating under the PLAY brand).
The three main operators’ market share fell from 83% to 80% in 2013, with PLAY’s share increasing. Orange Polska’s estimated market share edged down by 0.3 percentage point to 27.3%.
However, growing differences in methodology between operators in the calculation of SIM cards make it increasingly difficult to compare the data presented by these operators.
Until the end of 2012, the Group published the results of its fixed and mobile operating segments showing flows between these two segments. However, increasing convergence in offers, the dependence of the mobile network on the fixed network, the merger of Telekomunikacja Polska SA (the key component of the fixed segment before 2013) and Polska Telefonica Komórkowa-Centertel Sp. zo.o (the key component of the mobile segment), and the unification of the organization have prompted the Group to change method. As such, from 2013, Orange Polska’s data represent mobile and fixed-line revenues and ARPU calculated from consolidated revenues excluding inter-segment flows. To facilitate comparisons, data adjusted for the new method are presented for 2011 and 2012.
ORANGE / 2013 REGISTRATION DOCUMENT - 58
Fixed telephony and Internet activities
| 2013 | 2012 (1) | 2011 (1) |
Revenues (in millions of zlotys) | 6,664 | 7,153 | 7,556 |
Number of consumer telephone lines | 4.8 | 5.1 | 5.7 |
o/w classic telephony | 4.3 | 4.7 | 5.6 |
o/w VoIP | 0.5 | 0.3 | 0.1 |
Wholesale lines sold (in millions) | 1.3 | 1.5 | 1.5 |
Number of Internet customers (in millions) | 2.3 | 2.3 | 2.3 |
Subscribers to ADSL or satellite TV offers | 0.7 | 0.7 | 0.6 |
Open Orange customers (in millions) | 0.3 | - | - |
ARPU (in zlotys per month) | | | |
Fixed telephone lines (PSTN/ISDN) | 44 | 46 | 47.5 |
Broadband Internet (2) | 60.3 | 56.2 | 55.9 |
Source: Orange Polska (2) Does not include BSA and CDMA offered by PTK |
Convergent solutions and bundles
Fostering the loyalty of its customers by offering bundles of attractive services is the main method used by Orange Polska to fight its competitors in the mobile and fixed-line markets. This is exemplified by the Orange Open convergence offer, which includes a comprehensive range of fixed and mobile services, and gives a progressive discount to customers buying fixed-line services (including VoIP, broadband and TV), mobile voice services and mobile broadband. The number of Open Orange customers was 286,000 at end-2013, an increase of 253,000 customers year-on-year. In addition, nearly 58% of Orange Open customers bought the additional fixed or mobile services included in the bundle.
Fixed voice
Orange Polska continues to slow the erosion of its fixed-line customer base by fostering the loyalty of its customers, primarily through sales of personalized offers and bundles (VoIP with broadband and TV). As such, the net loss of fixed voice customers (traditional PSTN telephone or VoIP) slowed each quarter, and was capped at 345,000 in 2013, compared with 590,000 in 2012. The number of consumer PSTN lines fell by 10.2% to 478,000 (less than the 15.8% drop recorded in 2012), partially offset by a 130,000 increase in the number of VoIP users to 466,000 at end-2013.
Broadband access
Despite fierce competition, mainly from cable operators, and competitive pressure from mobile broadband offers, Orange Polska increased its number of consumer broadband lines in 2013 (including CDMA and BSA lines). At the same time, consumer broadband ARPU also increased from 56.2 to 60.3 zlotys. This was achieved mainly by promoting bundled offers. Orange also continued to improve its offering at higher throughputs based on FTTH fiber optic, which has been rolled out in Warsaw to assess the demand for this type of service in major cities.
Mobile telephony activities
| 2013 | 2012 | 2011 |
Revenues (in millions of zlotys) | 6,259 | 6,988 | 7,200 |
Total customers (excl. MVNOs – in millions) | 15.4 | 15 | 14.7 |
o/w contracts | 7.2 | 6.9 | 7.0 |
o/w prepaid | 8.1 | 8.0 | 7.7 |
o/w broadband (3G) | 8.6 | 8.2 | 8.0 |
o/w broadband only (3G dongles) | 1.2 | 1.0 | 0.7 |
Number of MVNO customers | 0.1 | 0.1 | 0.1 |
ARPU (zlotys per month) | 34.5 | 39.2 | 40.9 |
ARPU Postpaid | 59.9 | 65.8 | 67.1 |
ARPU prepaid | 13.9 | 16.8 | 17.6 |
ARPU voice | 23.3 | 28.7 | 30.6 |
ARPU data | 11.2 | 10.5 | 10.2 |
AUPU (in minutes per month) | 172.3 | 162.9 | 161.7 |
Churn rate (%) | 39% | 41% | 40% |
o/w contracts | 14% | 14.1% | 14.7% |
o/w prepaid | 59.9% | 65.7% | 63.5% |
Source: Orange Polska |
ORANGE / 2013 REGISTRATION DOCUMENT - 59
Orange Polska had a total 15.3 million mobile customers at end-2013, an increase of 2.9% (compared with an increase of 1.6% in 2012). The number of subscription customers increased by 4.5%, and their proportion of the total customer base increased by 0.7 percentage point to 47.1% at end-2013. The decline in ARPU resulted primarily from the reduction in mobile termination and SMS rates imposed by the regulator, compounded by the price war dating back to 2012 and the ensuing proliferation of cheap unlimited voice offers.
The launch of the nju.mobile low-cost offer was the most important development in the consumer market in 2013. nju.mobile is designed to meet growing demand for cheap solutions and as a response to the price war in the mobile market. The end-April 2013 launch was a success, with 353,000 customers signed up in less than eight months.
Mobile data services
In 2013, Orange Polska continued sales of mobile broadband services under the Orange Free (with modem) and Orange Free Set (with netbook, tablets or laptops) offers, the latter accounting for 50% of sales.
Following its successful launch in 2012, the Smart Plan, which includes a large amount of data in addition to calls and SMS, has become particularly attractive for new customers, as well as a means of retaining existing customers. Customers of the Hello and Mix Smart Plans are protected against unexpected increases in their bills. Data transfer is charged on an ascending scale up to 1 Gbit (3 zlotys for 1 Mbit, 10 zlotys for 300 Mbits and 20 zlotys for 1 Gbit). Amounts above 1 Gbit are free, but throughput is capped at 16 Kbits/s.
Distribution
Actively focused on delivering excellent sales and aftersales service to individual and business customers Orange Polska operates various distribution channels. Three customer based sales units operate in Orange Polska: B2B sales, B2C and SOHO sales, and Prepaid sales.
B2B sales (professional and business customers) operate through different types of support and sales representatives. This distribution network provides sales services and assistance to business customers related to SIM card-based mobile products, mobile and fixed Internet subscriptions, fixed-line voice transmission, value-added services, as well as tailor-made telecom solutions.
The B2C and SOHO sales unit is made up of both passive and active sales channels. Passive distribution to individual and SoHo customers is carried out by Orange branded stores, which consist of approximately 920 directly owned and dealer points of sale. Active distribution is executed through active sales consultants (door to door sales force) who operate in direct selling centers spread throughout Poland. Distance selling centers operate via two additional channels – Telesales and inertenet. All channels offer a wide range of mobile services, mobile and fixed Internet subscriptions, TV packs, value-added services and fixed voice.
Prepaid sales, offering typical mobile services, employs a comprehensive net of sales points including Orange branded POS and distributors (convenience stores, kiosks, gas stations). Orange Prepaid starter sets are widely available at 32,500 points of sale, but can be recharged in more than 98,000 outlets.
The Network
Fixed Network
(in millions) | 2013 | 2012 | 2011 |
Total number of fixed lines | 5.510 | 6.160 | 7.039 |
Full unbundling | 172 | 185 | 186 |
Bitstream | 330 | 347 | 366 |
Source: Orange Polska |
At end-December 2013, Orange Polska provided services based on VDSL technology through its network of over 3,160 sites. At the same time, migration of the aggregation network from ATM to IP continued. By end-2013, nearly 66% of Neostrada customers were connected via the IP aggregation network.
An essential component of the development of transport infrastructure, the capacity of the IP backbone network was increased in 2013, bringing throughputs up to around 502 Gbits/s, and secured by protection mechanisms. In view of the increase in traffic, the backbone network has been sized to allow IP connections at 100 Gbits/s, some of which have already been commercialized in Warsaw and Poznan.
ORANGE / 2013 REGISTRATION DOCUMENT - 60
Mobile Network
| 2013 | 2012 | 2011 |
3G coverage (as a % of the population) | 90.2% | 69.0% | 62.4% |
4G coverage (as a % of the population) | 16.0% | - | - |
Source: Orange Polska |
In 2013, as part of the process of co-development of the mobile network with T-Mobile, a total of 305 towers (out of 363) were deployed. The shared 3G network (UMTS/HSPA) accordingly covered approximately 90% of the Polish population at end-2013. The development of 4G (LTE) in the 1,800 MHz band began in the second half of 2013, and its coverage had already reached 16% of the Polish population by year-end.
In September 2013, the radio access network sharing agreement was extended to include 4G technology. Under the agreement, the partners will invest jointly in the development of the LTE network, and Orange will acquire the right to use the frequencies in T-Mobile’s 1,800 MHz band, notably the 10MHz bandwidth attributed to T-Mobile by the regulator in June 2013 for a period of 14 and a half years.
2014 outlook
At the time of writing, Orange Polska was anticipating a slower decline in revenues in 2014 than in 2013. Given the fact that the first half will be impacted by reductions in mobile termination rates made in 2013, the decline in revenues is expected to slow in the second half of 2014.
Orange Polska also plans to continue cutting its costs in order to protect its EBTIDA margin (excluding the impact of exceptional risks and litigation).
At the same time, Orange Polska plans to reduce its CAPEX below 1.8 billion zlotys in 2014, excluding costs related to the renewal of the existing 3G spectrum or the acquisition of the 4G spectrum needed for its growth.
Cash flow generation in 2014 should be at least in line with the 2013 level. This expectation excludes certain exceptional items such as:
■
the renewal of existing frequency bands;
■
the possible acquisition of new spectrum;
■
the prospective payment of the fine of 128 million euros imposed by the European Union, or other potential litigation.
The Telecom Services Market
| 2013 | 2012 | 2011 |
Population (in millions) (1) | 11.1 | 11.1 | 11.0 |
Households (in millions) (2) | N/A | 4.6 | 4.7 |
Growth in GDP (%) (1) | +0.1% | -0.3% | +1.8% |
GDP per person (in dollars PPP) (1) | 37,843 | 37,459 | 37,236 |
Change in consumption per household (%) (2) | +0.7% | -0.3% | +0,2% |
Sources: |
ORANGE / 2013 REGISTRATION DOCUMENT - 61
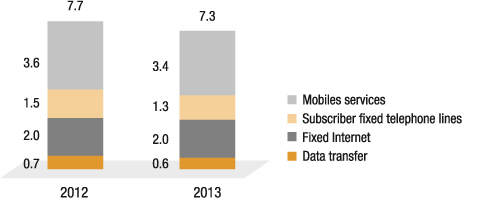
Source: Mobistar estimates
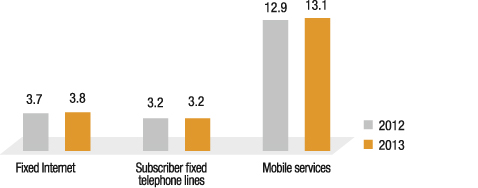
Source: Mobistar estimates
(1)
The reported figures now include Machine to Machine cards
The Belgian economy experienced slight growth in 2013, with most economic indicators showing improvement except for the unemployment rate and the number of bankruptcies, which continued to grow.
The telecommunications market contracted by 5% compared with the previous year, just like the mobile market.
Subscriber fixed telephone lines
Convergence offers are now the norm in the Belgian fixed-line telephony and Internet market. The market is dominated by the incumbent operator Belgacom and cable operators Telenet (Flanders and Brussels), VOO (Wallonia and Brussels) and Numericable (Brussels).
This duopoly leaves little room for new entrants. In May 2013, Mobistar announced the suspension of sales of its unprofitable offers, and Base made a tentative entry into the market in a commercial partnership with Belgacom.
Fixed-line operators made a very aggressive attack on mobile prices in 2013, playing on the profitability of bundled fixed-line, voice, Internet and television services.
Mobile services
| 2013 | 2012 | 2011 |
Revenues (in millions of euros) | 3,372 | 3,648 | 3,622 |
o/w subscriptions | 2,692 | 2,848 | 2,783 |
o/w prepaid | 680 | 801 | 839 |
Number of customers (in millions) (1) | 13.1 | 12.9 | 13.0 |
o/w subscriptions | 8.6 | 7.4 | 7.0 |
o/w prepaid | 4.5 | 5.5 | 6.0 |
Total ARPU (in euro per month) | 22.4 | 24.5 | 24.7 |
Source: Mobistar (1) The reported figures now include Machine to Machine cards |
2013 was an unusual year for the mobile market, with an unprecedented surge in the churn rate between different operators triggered by heightened competition. The price war came in the wake of the implementation of the Open telecommunications law enacted in October 2012, which allows customers to change operator free of charge after six months. Hostilities were unleashed by Telenet (a full MVNO hosted by Mobistar), forcing all mobile operators to respond.
A highly positive trend was seen in 2013, with very significant growth in the data market as Belgium caught up in terms of smartphone penetration, thanks to a targeted policy of handset subsidies adopted by all operators.
The Competitive Environment
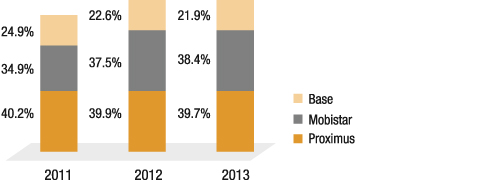
Source: Mobistar estimates
(1)
Including MVNOs and Machine to Machine cards
ORANGE / 2013 REGISTRATION DOCUMENT - 62
The mobile market is more evenly balanced than the fixed-line market, with three main players: Proximus (Belgacom’s mobile brand), Mobistar and Base.
Mobistar’s activities
| 2013 | 2012 | 2011 |
Number of subscribers (in millions) | | | |
Fixed-lines | 0.20 | 0.23 | 0.23 |
o/w Internet lines | 0.05 | 0.07 | 0.08 |
Mobile Customers | 3.17 | 3.4 | 3.5 |
Total ARPU (in euro per month) | 25 | 28 | 30 |
Source: Mobistar |
Orange operates in Belgium through Mobistar, which is listed on the Brussels Stock Exchange. The Orange Group holds 52.9% of the capital.
Mobistar ended 2013 with 5.1 million SIM cards connected to its network, an increase of 4.9% compared with 2012. This actually corresponds to a decline in the mobile customer base, largely offset by an increase in the number of M2M (Machine to Machine) cards and MVNO customers. Mobistar accordingly increased its market share in Belgium from 37.5% to 38.4%, putting it at the heels of Proximus, the incumbent operator, and ahead of Base, the third operator.
The number of active mobile customers fell by 7.6% year-on-year, from 3.4 million to 3.2 million. The lion’s share of the loss of customers was attributable to the number of prepaid customers, which fell by 13.3% year-on-year, in line with the segment as a whole in Belgium. Another factor was the significant 5% decline in the postpaid segment in 2013, contrary to the trend observed in 2012.
The loss of customers was prompted by the new Open telecommunications law, which encouraged churn to a large extent and resulted in heightened competition from convergence players on the consumer market, especially from cable operator Telenet (a full MVNO hosted by Mobistar), which became the unofficial fourth mobile operator in Belgium.
The share of subscriptions in the total customer base was 70.1% (excluding MVNOs) at end-2013, compared with 68.1% at end-2012.
The number of MVNO customers increased by 36%, from 21,890,000 in December 2012 to 1,210,000 in December 2013.
The number of Machine to Machine cards also grew strongly, rising from 518,000 in 2012 to 696,000 in 2013, a year-on-year increase of 34.3%, with especially strong growth at year-end.
Average revenues per user (ARPU) fell sharply in 2013 when packages were adjusted following the implementation of the Open Act. Mobistar has progressively included and bundled into its packages minutes for calls, SMS and data previously not included in its plans, resulting in a decline in revenues. ARPU was also impacted by the effects of the regulation, which saw further cuts to mobile termination and roaming rates.
The growing number of subscribers with a mobile data plan and the increased use of mobile Internet services on smartphones, tablets and PCs resulted in an increase in the share of mobile data in telephony revenues from 41.4% in 2012 to 46.4% at end-2013.
Mobistar’s offers
The value offered to Mobistar customers remains unchanged, and is based on a set of key principles: the guarantee of a clear portfolio, the absence of promotion or discrimination between old and new customers, and now the absence of commitment. Mobistar wants to build a lasting relationship with its customers and to offer them competitive prices.
The segmented offers of its Animal range (Ecureuil, Kangourou, Dauphin and Panthère), which meet customer needs, were updated in April 2013. Datas and storage on the Cloud offers were added. A storage capacity of 500Mo and 16Go were included in Dauphin and Panthère.
Mobistar has innovated by offering customers whose monthly fee is at least 25 euros unlimited calls to all other Mobistar customers.
In the Enterprise segment, Mobistar has the Mobistar Matrix Solutions range of bundled offers for fixed lines and mobiles, which are suited to customer needs.
ORANGE / 2013 REGISTRATION DOCUMENT - 63
Distribution
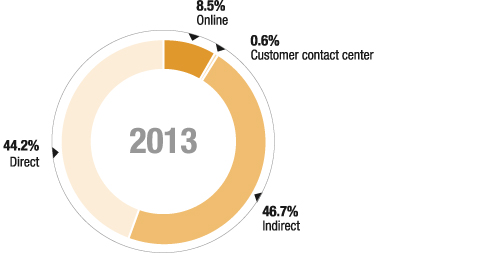
Source: Mobistar estimates
In 2013, Mobistar completely recast its distribution strategy, aiming to strike a better balance between Internet sales, direct channels and indirect channels. In 2013, it made 44.2% of its customer acquisitions through direct distribution, but online sales increased from 7.9% in the consumer segment in 2012 to 8.5% in 2013.
Mobistar also initiated the optimization of the number of its stores and its agent contracts. Lastly, Mobistar opened a new outlet in Liege in October 2013, using a totally new concept - bigger and offering a better customer experience- and also reduced the share of door-to-door sales.
At end-2013, Mobistar had 161 stores, including 45 directly owned stores (compared with a total of 163, of which 46 directly owned at end-2012).
The Network
(as a% of the population) | 2013 | 2012 | 2011 |
3G (UMTS)/HSDPA | 99% | 97% | 97% |
Number of 3G radio sites (in thousands) | 2.9 | 2.4 | 2.1 |
Source: Mobistar |
In 2013, Mobistar invested nearly 265 million euros in its network (including 120 million euros related to the acquisition of an 800 MHz spectrum), mainly for the expansion of its access and transmission network in order to improve service quality, throughput and coverage for all of its customers.
Indoor 3G coverage increased from 70% to 87% year-on-year. Web pages, images and videos now load at a maximum speed of 42 Mbits/s, and speed has been doubled in nearly 400 cities.
The acquisition of spectrum in the 800 MHz band in November 2013 allowed 4G tests to be conducted in 30 cities in December and to continue the deployment of 4G in Belgium.
Outlook
2014 offers Mobistar greater medium-term visibility, especially with the deployment of its 4G network and its possible return to the convergence market via the regulation of cable which occured mid-December 2013.
2014 will be a year of transition, with further progress on transformation projects undertaken in 2013 that will pay off fully in 2015.
Mobistar will pursue three main objectives in 2014:
■
give all Mobistar customers access to the “Discover high-speed data” program, with innovative offerings that can be implemented thanks to the high quality of the network. Mobistar will continue its efforts in terms of innovation by offering advanced services such as the Mobile Cloud and billing through the operator;
■
provide all customers with simple and transparent offers with easy-to-understand pricing. Mobistar will continue to perform proactive personalized check-ups to offer customers the most appropriate rates;
■
maintain Mobistar’s position as a benchmark for families in the mobile and convergence solutions segments.
| 2013 | 2012 | 2011 |
Population (in thousands) | 537.0 | 524.9 | 511.8 |
GDP growth (%) | +1.9% | -0.2% | +1.9% |
Sources: Eurostat – estimates for 2013 |
ORANGE / 2013 REGISTRATION DOCUMENT - 64
Competition in the mobile telephony market in Luxembourg is intense. Orange Communications Luxembourg ranks third in terms of market share, behind market leader Post Luxembourg, a subsidiary of the incumbent operator, and Tango, a subsidiary of Belgian operator Belgacom. Post Luxembourg also has the largest market share in the fixed-line and Internet market.
Orange Communications Luxembourg has strengthened its leadership in innovation by being the first operator to include roaming in its subscription packages. Orange has also offered 4G mobile plans since October 2013. Lastly, a partnership with Eltrona (market leading cable operator) enabled the launch of quadruple play offers in mid-November 2013.
The success enjoyed by consumer plans helped stabilize telephony revenues (excluding handset sales), which amounted to 65.3 million euros in 2013, despite the negative impact of roaming regulations. Total revenues were also stable at 75.6 million euros in 2013.
At end-2013, the Mobistar subsidiary had 141,331 active customers (including 31,800 Machine to Machine cards and 7,339 fixed line and Internet customers), an increase of 9.5% compared with 2012. Average monthly revenues per mobile user (ARPU) fell by 3.1% year-on-year from 51.9 euros in 2012 to 50.2 euros in 2013 due to the impact of roaming regulations.
The Telecom Services Market
| 2013 | 2012 | 2011 |
Population (in millions) (1) | 21.3 | 21.3 | 21.4 |
Households (in millions) (2) | N/A | 7.4 | 7.4 |
Growth in GDP (%) (1) | +2% | +0.7% | +2.2% |
GDP per capita (in dollars PPP) (1) | 13,179 | 12,722 | 12,390 |
Change in consumption per household (%) (2) | +0.9% | +1% | +1.2% |
Source: |
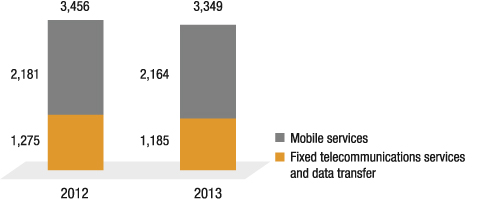
Sources: Ancom and Orange Romania estimates

Sources: Orange Romania estimates
In 2013, the Romanian economy performed well compared with other European Union countries, with GDP growth of about 2% based on the current estimates of the IMF and Eurostat. The main drivers of this growth were agriculture, as in 2011, and net exports, particularly in the automotive industry.
The telecommunications market continued to contract in 2013, in volume and value alike, but at a slower pace than in 2012. The loss of value in the telecommunications sector was 1%, with a further decline in revenues in fixed and mobile services stemming, for the latter, from lower call termination rates. Broadband data services were the only segment to report growth.
After a severe reduction in 2011, mainly due to the removal of inactive prepaid customers by all operators, the number of customers in the mobile market stabilized at about 26 million in 2013, the same level as in 2012.
ORANGE / 2013 REGISTRATION DOCUMENT - 65
The Competitive Environment
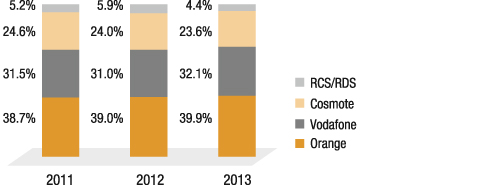
Source: Orange Romania estimates
Orange Romania further entrenched its leadership in 2013, with a market share of 39.9%, an increase of 0.9 percentage point. The gap with its main competitor, Vodafone Romania, which increased its market share by 1.5 percentage points during the same period, stabilized at around 2 million customers (Source: Orange). In third place, Cosmote lost 1 percentage point of market share compared with 2012.
Orange Romania’s activities
| 2013 | 2012 | 2011 |
Number of subscribers (in millions) | | | |
Mobile Customers | 10.4 | 10.3 | 10.3 |
o/w broadband | 4.0 | 3.5 | 3.4 |
ARPU (in euros per month) | 6.5 | 6.6 | 6.8 |
Source: Orange Romania |
Orange Romania has continued to expand the number of mobile subscribers on contracts, which reached 4.3 million in 2013 on a stable total customer base of 10.3 million, putting their proportion at 42%, compared with 40% in 2012.
The increase was attributable primarily to the ongoing success of the Animals offers in the consumer market and the growing penetration of smartphones in the customer base. It can also be attributed in part to Orange Care, which provides comprehensive support for customers acquiring their first smartphone while at the same time stimulating data revenues.
Orange Romania improved the segmentation of its contract subscriptions with a new Animal (Tiger) in order to meet growing demand for mobile data services, and launched new options in the prepaid market, using figurines (Millidge and Doig) that have become very popular through advertising.
2013 also saw the launch of an innovative convergence offer on the Romanian market, Orange TV, which should help foster the loyalty of the customer base and enrich the content of 4G services. The Orange TV package offers the highest number of HD channels in the market, and is built around three offers: Local HD, World HD and Universe HD.
Orange Romania customers benefit from a multi-screen experience, the signal being sent by DTH technology in partnership with satellite operator SES Astra, as well as through the Internet. With the Orange TV Go application, the channels included in their plan and a selection of movies and video clips are accessible to Orange customers wherever they are in the world, on their tablet or smartphone.
The international money transfer program, launched in partnership with Money Gram in Orange stores at the end of 2012, was extended in 2013, leading to growth in total transactions throughout the year.
Distribution

Source: Orange Romania
In 2013, Orange Romania continued to roll out franchise outlets, while optimizing the number and performance of its own sales outlets by relocating some of them and modernizing its image.
ORANGE / 2013 REGISTRATION DOCUMENT - 66
The Network
| 2013 | 2012 | 2011 |
3G (UMTS)/HSDPA | 99.8% | 99.8% | 87.8% |
Number of 3G radio sites (in thousands) | 4.1 | 3.7 | 2.6 |
Source: Orange Romania |
In the summer of 2013, Orange Romania signed a network sharing agreement with Vodafone Romania for a period of 16 years, coinciding with the period of validity of spectrum licenses granted in 2012.
During the first five years of its implementation, the agreement should provide significant benefits to both parties in terms of operating costs, and contribute to protecting the environment, while at the same time allowing the partners to speed up their investment on the latest technologies, such as 4G, as well as their coverage of rural areas. The project covers the whole country and all technologies, but excludes the frequency spectrum.
The creation of an asset-light company jointly owned by the two partners, which will act as a “black box” for the purposes of the agreement (avoiding the direct exchange of information between the parties), will not stop the two operators from being fully responsible for their respective market positioning and strategy. The two networks and the two operators will accordingly remain completely independent as regards competition.
In October 2013, Orange Romania became the first operator offering complete coverage of the capital, Bucharest, for 4G services.
2014 outlook
In 2014, Orange Romania will pursue the following objectives:
■
maintain its leadership of the Romanian mobile market, in both volume and value, building on the strength of its brand;
■
continue to offer its customers the best experience available, focusing on digital services and customization, applications under the Orange brand and the family operator concept;
■
prioritize the implementation of the TV program launched in 2013, ensuring the optimization of content;
■
maintain its leadership of the field for innovation, by introducing new services to the market;
■
continue to develop fourth-generation mobile services;
■
implement its network sharing agreement with Vodafone, which is the main pillar of its business transformation efforts.
The Telecom Services Market
| 2013 | 2012 | 2011 |
Population (in millions) (1) | 5.4 | 5.4 | 5.4 |
Households (in millions) (2) | N/A | 1.81 | 1.79 |
GDP growth (%) (1) | 0.8% | 2.0% | 3.2% |
GDP per capita (in dollars PPP) (1) | 24,664 | 24,142 | 23,308 |
Change in consumption per household (%) (2) | -0.1% | -0.2% | -0.5% |
Sources: |
ORANGE / 2013 REGISTRATION DOCUMENT - 67

Source: Orange Slovensko
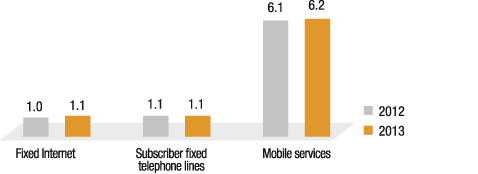
Source: Orange Slovensko
In 2013, the telecommunications services market continued the contraction initiated the previous year (falling by 7.0% in 2013, after a 3.8% decline in 2012), in an economic environment marked by moderate GDP growth of 0.8%.
As in previous years, the fixed-line telephone market (including VoIP) continued its decline in 2013 (1.5% drop in the number of customers), although VoIP helped limit the fall. The market for fixed Internet services grew by 2.9% in volume, but fell by 7.0% in value in 2013, with the customer base totaling 1.1 million at year-end.
Mobile services
In 2013, contract customers accounted for more than 70% of Orange Slovensko’s total customer base and 83% of its revenues (source: Orange Slovensko). The mobile penetration rate exceeds 100% (source: Orange Slovensko).
The Competitive Environment

Source: Orange Slovensko

Source: Orange Slovensko
Orange Slovensko competes against two other operators in the mobile market, Telefonica O2 and Slovak Telekom (51% owned by Deutsche Telekom). O2’s 2007 entry into the Slovak mobile market increased competition. In 2013, O2 continued to grow its market share by offering aggressively priced plans. This strategy contributed to the faster decline in average revenues per user (ARPU). Orange Slovensko nevertheless maintained its leading position in mobile telephony, with a market share of 44.8% in terms of volume.
Orange Slovensko’s Activities
| 2013 | 2012 | 2011 |
Number of subscribers (in millions) | | | |
Internet lines FTTH | 0.1 | 0.08 | 0.05 |
Mobile Customers | 2.8 | 2.9 | 2.9 |
o/w broadband | 1.8 | 1.9 | 2.1 |
Total ARPU (in euros per month) | 16.1 | 17.4 | 19.1 |
Source: Orange Slovensko |
ORANGE / 2013 REGISTRATION DOCUMENT - 68
In June 2013, Orange Slovensko launched a new range of Ideal offers, pitched as an offshoot of the WoW offers, reinforcing customer segmentation along the lines of the Animals concept. The new offers are built around four basic segments, with a simplification of the previous range. They offer unlimited options in each of these segments, in accordance with their specific needs. In late 2013, Orange Slovensko also introduced the first genuine convergence offer in the Slovak market, Orange Family, giving clients discounts if they combine several services (voice, data and fixed line).
Distribution

Source: Orange Slovensko
Orange Slovensko sells its products and services in Slovakia through various distribution channels:
■
148 retail outlets selling Orange products only, under franchise agreements, plus an Orange kiosk opened in October 2013;
■
sales teams attached to Orange stores (responsible for information and sales to VIP and business customers), and door-to-door sales specialists for FTTH products and services;
■
specialized distributors and retailers selling prepaid cards;
■
specialized spaces in Nay electronic appliance stores;
■
a specialized sales team under Orange Slovensko’s responsibility, dedicated to the acquisition and loyalty-building of business customers;
■
a customer service platform under Orange Slovensko’s direct management;
■
an online sales website (www.orange.sk/eshop/), where customers can buy Orange products, services and accessories.
The Network
| 2013 | 2012 | 2011 |
3G (UMTS)/HSDPA | 79.2% | 72.3% | 71.1% |
Number of 3G radio sites (in thousands) | 1.56 | 1.41 | 1.34 |
Source: Orange Slovensko |
Orange Slovensko’s investments in 2013 continued to focus on improving the quality of 3G coverage in urban areas (better coverage inside buildings, migration to HSDPA+) as well as in rural areas (UMTS in the 900 MHz band, due to the modernization of multimode equipment). At the same time, work was done to reduce operating expenses and modernize the transmission network (backhaul refresh) to cope with traffic growth and further improve bandwidth and reliability (FTTC project – fiber to the curb).
2014 outlook
Investments planned by Orange Slovensko in 2014 will continue to focus on improving the quality of 3G coverage in urban and rural areas, as well as increasing network capacity. The launch of LTE following the allocation of new licenses by tender in December 2013 will also be central to Orange’s priorities. Network transformation will continue on the heels of projects already underway, and a large proportion of spending will be devoted to maintaining Orange’s market share by value, with priority placed on the maintenance and evolution of existing assets.
The Telecom Services Market
| 2013 | 2012 | 2011 |
Population (in millions) | 3.6 | 3.6 | 3.6 |
GDP growth (%) | +4.0% | -0.8% | +6.4% |
GDP per person (in dollars PPP) | 3,562 | 3,378 | 3,347 |
Source: IMF, October 2013 |
ORANGE / 2013 REGISTRATION DOCUMENT - 69
Following muted growth in 2012, real GDP growth recovered and rose to 4% in 2013. The main driver was household consumption, buoyed by remittances and rising wages. Despite a significant increase, investment is still insufficient to drive economic growth.
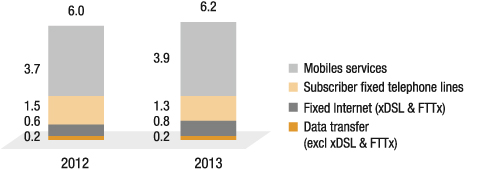
Source: ANRCETI
In a challenging economic environment characterized by a slow recovery, the Moldovan telecommunications market remained under pressure from regulatory measures (launch of portability of mobile numbers on July 1, 2013 and of fixed numbers on August 1, 2013; reduced call termination rates), resulting in a sluggish market recovery in 2013. Telecoms sector revenues in Moldova remained stable compared with 2012, at 6.1 billion lei. The sector’s strongest growth was in fixed Internet (+16%), although moderate growth was also recorded in the mobile segment (+3%).
Fixed-line telephony revenues fell by 16.9%. Moreover, the decline in fixed voice services was not offset by growth in fixed broadband. Fiber optic access is enjoying a more buoyant trend, and has dominated the market for several years.
The mobile market was hit hard by a price war in the second half of 2013 following the introduction of mobile number portability, which was accompanied by the launch of aggressive offers (unlimited plans).

Source: ANRCETI
The mobile telephony market is now mature, and had a penetration rate of 121% at the end of Q3 2013.
The total number of customers increased by 9% to 6.4 million (an additional 0.52 million) at end-2013. The biggest contributor to the increase was mobile telephony, where the three operators recorded 470,000 net additional subscribers in 2013. For its part the fixed Internet market grew by 53,000 users (or +13% year-on-year).
The Competitive Environment
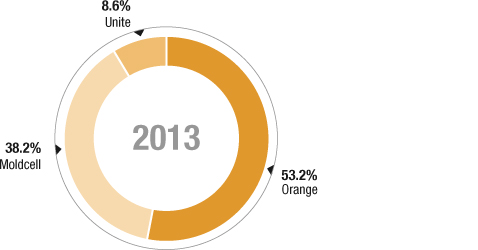
Source: ANRCETI
Despite fierce competition, Orange Moldova maintained its leading position in the mobile market, with a 53.2% market share. Moldcell (TeliaSonera Group) is Orange’s main competitor, with a market share of 38.23%, while Unite (the mobile brand of incumbent operator Moldtelecom), positioned as a low-cost operator offering unlimited offers, has less than 10% of the market.
After the introduction of number portability, Moldcell and Unite began offering very aggressively priced offers, focusing on the acquisition of new customers at the expense of value by lowering the cost of calls, both on and off their respective networks. Orange accordingly became a net recipient of calls from other operators.
Average revenues per user (ARPU) fell by 10.5% to 69.6 lei in the first nine months of 2013. The main reasons for the decline were lower prices, the introduction of unlimited offers by the three operators and the negative impacts of regulation.
ORANGE / 2013 REGISTRATION DOCUMENT - 70
Orange Moldova’s activities
| 2013 | 2012 | 2011 |
Number of subscribers (in millions) | 2.1 | 2.0 | 1.8 |
Mobile ARPU (in lei per month) (1) | 102.8 | 111.9 | 118.2 |
Source: Orange Moldova |
Despite number portability and the launch of unlimited offers, Orange Moldova’s revenues increased by 3.4% (+92 million lei) to 2.8 billion lei in 2013. Sales of equipment (phones and accessories) were the main growth driver (an additional 75 million lei compared with 2012), thanks mainly to the introduction of deferred payments. Revenues derived from incoming calls grew by 23 million lei compared with 2012 due to the combination of increased incoming calls from competitors (mainly Moldcell) and a positive currency impact.
Strategic initiatives for Orange Moldova:
■
reinforce its leadership position in mobiles (voice and data);
■
grow mobile broadband revenues through high penetration, the launch of more accessible offers and the development of 3G and 4G smartphone offers (4G already covers ten cities);
■
develop new growth activities such as M2M and new services (MID, MFS, etc.);
■
conduct business and transformation through migration to a convergent billing tool, the energy optimization of sites and the sharing of mobile installations;
■
expand Wifi access for Orange Moldova customers via nationwide coverage in public transport, all Orange sales outlets, universities and public spaces.
Outlook
Orange Moldova wishes to maintain and strengthen its leading position in the Moldovan telecoms market, thereby maintaining a robust operating margin. The company’s main objective in 2014 will be to maintain its market share in terms of value by increasing customer loyalty (being acknowledged as the operator of choice) and diversifying voice and data services (for new customers as well as existing customers). To pursue a solid commercial performance, in order to make it the benchmark digital operator in the market, it will focus on:
■
the renewal of mobile subscription offers;
■
transformation to an integrated operator model providing access to fixed broadband services and a review of all growth opportunities in broadband Internet;
■
delivery of the best customer experience in mobile Internet (3G +/LTE/Wifi).
The telecommunication services market and the competitive landscape
The Armenian telecommunications sector accounts for 3.6% of GDP. In turn, the mobile market accounts for 2.8%, and the fixed-line segment for 0.8% (split mainly between Beeline, Ucom and Rostelecom). At the end of the third quarter of 2013, the mobile penetration rate was 95% of the population.
At the end-the third quarter of 2013, estimated market share by value broke down as follows: Vivacell-MTS 64.1%, Beeline 19.3% and Orange Armenia 16.6% (source: regulator and Orange). Orange Armenia’s market share increased by 1.3 percentage points year-on-year, mainly due to its success in the market for contract subscribers. In addition, Orange Arménie remained the leader in mobile broadband Internet, with a market share of 58%.
Orange’s Activities in Armenia
Orange Arménie was granted a license to operate mobile communication services in the 900, 1,800, and 2,100 MHz bandwidths on November 19, 2008, for a period of 15 years. Commercial operations were launched in November 2009.
At end-2013, Orange Arménie had approximately 624,000 active mobile customers, mainly with prepaid packages (375,000), and 98,000 active mobile Internet customers. Hybrid consumer and business offerings enjoyed further success, with a total of 142,000 customers at end-2013, plus 8,300 M2M (Machine to Machine) cards.
In 2013, Orange Arménie focused on growing its sales and improving its operating profit (EBITDA). Its efforts also focused on promoting customer loyalty. Noteworthy events during the year included the overhaul of the range of voice offers, the launch of new offers for friends and family members, as well as a prepaid mobile Internet offer. Orange Arménie was also the first operator to launch dedicated offers for tablets in the Armenian market, with the My Orange application for customers using smartphones run on Android and iOS, as well as other special offers related to the improvement of service revenues.
Annual revenues grew by 14% compared with 2012, to 23 billion Armenian drams, and the company posted an operating profit (EBITDA) of 696 million drams for the year.
ORANGE / 2013 REGISTRATION DOCUMENT - 71
Distribution
Orange Arménie has an extensive distribution network with 77 stores under the Orange brand (of which 69 under franchise) and 850 indirect sales outlets. Over 6,000 sales outlets sell prepaid recharges (including Orange stores, scratch card sales outlets, banks, ATMs, electronic recharging outlets).
The Network
In 2013, 37 new radio sites were brought into service (including six dedicated to the coverage of “dead zones,” i.e. villages not covered by any operator, in compliance with a decision by the Armenian regulator), while the capacity of existing networks was increased in line with the growth in voice and data traffic.
2014 Outlook
In 2014, Orange Arménie will continue to focus on improving the ARPU of its existing customer base and on creating value by acquiring new mobile and Internet customers. Quality of service, close ties with customers and innovation remain central to its strategy for achieving these objectives in view the introduction of mobile number portability on April 1, 2014 in Armenia.
In accordance with the agreement signed on November 2013 between with Altice, Orange yields, Orange Dominicana on April 9 for an amoount of 1.42 billion dollars (i.e nearly 1.05 billion euros).
The Telecom Services Market
| 2013 | 2012 | 2011 |
Population (in millions) | 84.15 | 82.5 | 80.4 |
GDP growth (%) | +1.8% | +2.2% | +1.8% |
GDP per person (in dollars PPP) | 6,553 | 6,474 | 6,388 |
Source: IMF, October 2013 |
The pace of Egypt’s gross domestic product (GDP) growth was an estimated 1.8% at end-2013, 0.4 percentage point less than in 2012. The events that led to the change of political regime highlighted the economy’s structural weaknesses, such as rampant unemployment, income disparities and social problems.
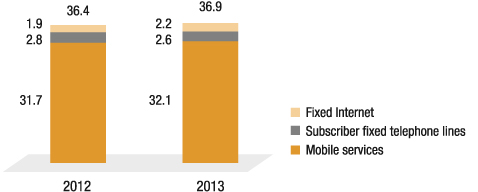
Source: Arab Advisors Group, Egypt Telecom Market Indicators & Projections, July 2013
(1) 1 Egyptian pound = 0.1044 euro
(in millions) | 2013 | 2012 | 2011 |
Mobile telephony (in millions) | 98.6 | 97.4 | 86.6 |
Penetration rate (as% of population) | 114.8% | 116.4% | 106.4% |
Broadband Internet (ADSL) (in millions) | 2.8 | 2.3 | 1.9 |
Penetration rate (as% of population) | 3.2% | 2.8% | 2.3% |
Fixed telephony (in millions) | 7.0 | 7.3 | 8.0 |
Penetration rate (as% of population) | 8.1% | 8.7% | 9.8% |
Source: Arab Advisors Group, Egypt Telecom Market Indicators & Projections, July 2013 |
ORANGE / 2013 REGISTRATION DOCUMENT - 72
Mobile Telephony
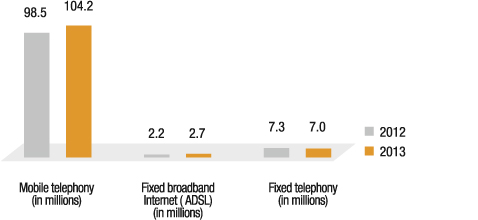
Source: Arab Advisors Group, Egypt Telecom Market Indicators & Projections, July 2013
The Egyptian mobile telephony market is comprised essentially of pre-paid customers. Operators are increasingly extending their offers into the lower end of the market, reducing connection charges, offering inexpensive handsets and allowing customers to recharge small amounts. This strategy is aimed to acquire middle-class and rural customers, and has resulted in a reduction of the average revenue per unit (ARPU). Political events had a big impact on the telecommunications market in 2013. The tourism sector saw a further sharp drop in activity, resulting in a substantial fall in roaming revenues.
While the penetration rate of fixed-line telephony continues to fall, and the development of the broadband Internet remains very limited, the mobile penetration rate continues to increase, offering the possibility of growth in the data and mobile Internet businesses. The mobile penetration rate reached 124% of the population at end-2013, with 104 millions of SIM cards in circulation (Source: GSMA, February 2014).
The Competitive Environment
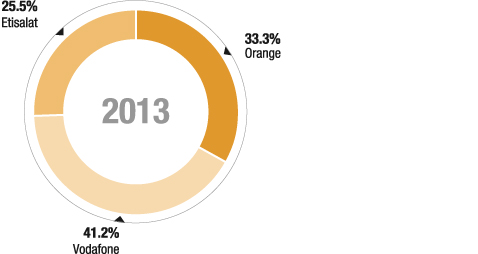
Source: GSMA, February 2014
The Egyptian market is characterized by an increasingly competitive environment. Most competition is between mobile operators, but is also moving increasingly into the Internet and B2B markets. At the same time, alliances and integrations are changing the shape of the telecommunications market and leading different players to move towards a convergence strategy.
ECMS was the first operator to launch mobile services in Egypt, which it did in 1998 under the Mobinil brand. Vodafone Egypt was the second operator to enter the market, also in 1998, under the ClickGSM brand. It has positioned itself in the high value-added customer segment by virtue of its 3G network, launched in 2006. Etisalat, a subsidiary of Etisalat U.A.E., entered the market in 2007 with an aggressive low-cost strategy.
Despite the highly competitive market, Mobinil managed to increase subscriber numbers in 2013 and maintain its number-two spot in with a 33% market share (source: Mobinil estimates). Vodafone remains the market leader, with market share of 41%, while Etisalat, the most recent entrant, ranks third, with 26%.
Mobinil activities
| 2013 | 2012 | 2011 |
Number of subscribers (in millions) | 34.8 | 33.8 | 32.9 |
o/w contracts | 4.5 | 2.7 | 0.9 |
o/w prepaid | 30 | 31 | 32 |
Total ARPU (in euros per month) | 2,5 | 3 | 3 |
Source: Mobinil |
Mobinil’s mobile customer base stood at 34.8 million as of end-2013, an increase of 2.4% compared with 2012; 87% of customers are in the prepaid segment. There was a marked change in the proportion of prepaid customers during the year due to the introduction of capped contracts.
Annual revenues totaled 10.6 billion Egyptian pounds in 2013, an increase of 2.3% compared with 2012. ARPU fell by a further 17% to 2,5 euros in 2013, due mainly to heightened competition between operators and the acquisition of new customers with less purchasing power.
ORANGE / 2013 REGISTRATION DOCUMENT - 73
Distribution
Mobinil sells products and services in Egypt through different distribution channels:
■
specialized distributors and retailers.
Network and licenses
ECMS has a GSM license and a 15-year UMTS-3G license obtained in 2007. A coverage plan detailed over five years accompanies the grant of the 3G license, and the Egyptian Telecommunication Regulatory Authority (NTRA) guaranteed to Mobinil the grant of other frequency bands, the possibility of applying a special rate to its customers for communications within the Mobinil network (on net mode), and the reservation of a new network code. Additional spectrum was acquired in 2013.
2014 outlook
The social and political situation remains tense in Egypt, threatening to delay the economic recovery. ECMS will pursue the action plans initiated in 2012 with a strategy focused on value creation and operational efficiency. ECMS’s management will continue to focus on cost-monitoring and profit margin improvements through major initiatives like a large transformation program. A unified license should be issued to current MNO in 2014, with Telecom Egypt to obtain at the same time a mobile license and become a fourth mobile operator in the market.
The Telecom Services Market
| 2013 | 2012 | 2011 |
Population (in millions) | 13.5 | 13.1 | 12.8 |
GDP growth (%) | +4.0% | +3.5% | +2.6% |
GDP per person (in dollars PPP) | 2,059 | 2,005 | 1,954 |
Source: IMF, October 2013 |
With a population of 13.5 million, Senegal is West Africa’s third-largest economy.
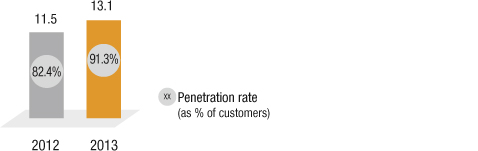
Source: GSMA, February 2014
The mobile market reached 13.1 million SIM cards in 2013, compared with 11.5 million in 2012, an increase of 14%. During this period, the mobile penetration rate increased from 82% to 91%, bolstered by ownership of multiple SIM cards, as well as the extension of operators’ coverage.
The Competitive Environment
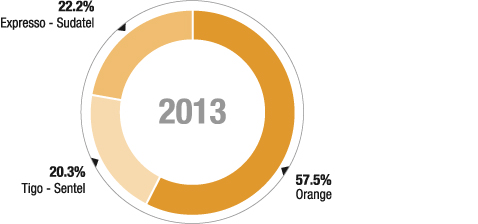
Source: GSMA, February 2014
ORANGE / 2013 REGISTRATION DOCUMENT - 74
There are three operators in the mobile market: Orange, Sentel, a subsidiary of Millicom International, and Sudatel. Competition continued to intensify in 2013, with the multiplication of unlimited plans. Growth in the subscriber base slowed in 2013 (+3%, compared with +17% in 2012). This was mainly due to new regulatory constraints on the identification of current subscribers. The strengthening of the club effect and the tightening of recruitment conditions stemming from the new identification constraints resulted in a sharp reduction in the customer base in the second half of 2013. Also noteworthy was the very strong growth in mobile data usage (more than 1 million users for Orange), prompted by improving service quality, expanding 3G coverage, enrichment of offers and the larger number of smartphones and Internet dongles in circulation
Orange Senegal’s activities
| 2013 | 2012 | 2011 |
Number of customers (in thousands) | 7,761 | 7,496 | 6,459 |
Fixed-lines | 291 | 282 | 283 |
Internet lines | 105 | 96 | 93 |
Mobile Customers | 7,365 | 7,118 | 6,083 |
Mobile ARPU (in euros per month) | 5,5 | 6 | 6,7 |
Source: Orange Senegal |
In 2013, Orange Senegal had a total of 7.4 million active mobile customers, an increase of 3.5% (compared with an increase of 17% in 2012). Around 99% of these customers are on prepaid plans. ARPU fell by - 8.3% in 2013, after a - 10% decline in 2012, due to the introduction of numerous unlimited plans and the acquisition of low-usage customers.
The number of fixed broadband Internet (ADSL) subscribers grew by 9.6% to 105,213 in 2013, thanks to the Illiminet and Pack ADSL Kheweul offers, as well as the targeted recruitment strategy that reduced mass terminations at the end of promotional campaigns. The customer base increased by 3.3% (or 9,165 subscribers) compared with 2012. Flagship commercial offers (Illiminet, Kheweul) and dual play formats (Voice + ADSL), combined with the enduringly robust penetration of CDMA (Yakhanal) in rural areas, are sustaining this growth despite strong competition from mobiles.
Orange Senegal’s mobile offers are dominated by prepaid plans, which were completely overhauled in 2013 around three plans: Diamono Classique, Diamono S’ Cool, and Diamono Door Waar. Orange has also partnered with Kirène for an MVNO-type offer known as Kirène avec Orange. The Orange Money mobile payment service continues to grow, and now has more than 1.5 million customers. A partnership was formed with Total in December 2013 to allow purchases in Total service stations to be paid for via Orange Money.
The development of Orange’s mobile Internet offer continues around the Internet Everywhere Pass launched in November 2010, with nearly 315,000 Internet dongles at end-2013, and more than 1 million users.
Distribution
The distribution network is made up of:
■
37 directly owned stores (Sonatel outlets), of which 11 in Dakar and 26 in other regions;
■
a network of more than 800 Orange sales outlets and special points of sale supplementing the network of Orange stores.
2014 outlook
Orange Senegal’s priorities in 2014 will be focused on:
■
maintaining leadership in the mobile market despite the pending arrival of a fourth operator in the market;
■
continuing to cultivate mobile data to make it a source of future growth;
■
maintaining the share of over 80% of the international wholesale market despite new capacity by competitors;
■
pursuing the development of Orange Money;
■
growing in the professional and SME market.
ORANGE / 2013 REGISTRATION DOCUMENT - 75
The Telecom Services Market
| 2013 | 2012 | 2011 |
Population (in millions) | 24.1 | 23.4 | 22.7 |
GDP growth (%) | +8.0% | +9.8% | -4.7% |
GDP per person (in dollars PPP) | 1,814 | 1,707 | 1,574 |
Source: IMF, October 2013 |
After the post-election crisis of 2011, 2012 saw the stabilization of the political situation in Ivory Coast, and 2013 was marked by the development of infrastructure projects (highways, bridges, energy, water, rehabilitation of universities, etc.). As such, the recession of 2011 gave way to economic growth of 9.8% and 8.0% in 2012 and 2013 respectively. The IMF is forecasting strong growth of 8.0% in 2014. The effects of this good economic performance should be reflected in improved living standards in 2014 (higher salaries for civil servants, universal healthcare insurance, etc.). These prospects are nevertheless undermined by security issues, with the intensification of insecurity on major roads posing a direct threat to household consumption.

Source: GSMA, February 2014
Ivory Coast’s mobile market grew from 18.1 million to 19.3 million SIM cards between 2012 and 2013, an increase of 6.8%. During the same period, the country’s mobile penetration rate rose from 90% to 93% of the population. This increase reflects continued expansion in the number of consumers with multiple SIM cards and the number of unlimited plans being offered, as well as falling communication prices and handset costs.
The Competitive Environment

Source: GSMA, February 2014
The market is characterized by a high level of competition linked to the presence of six operators, three of which have decisively adopted a low-cost strategy through an aggressive bonus policy. The most recent entrant, Niamoutié Telecom (trading as Café Mobile), remained hardly active on the market in 2013.
Orange’s market share increased slightly to 35.7% in 2013 (source: GSMA). It accordingly held on to its top spot, ahead of MTN, thanks to a healthy pace of innovation.
The market is characterized by very attractive price promotions for intra-network calls (Pass formulas), which have helped foster increased use. Promotions also fostered multi-equipment in SIM cards.
ORANGE / 2013 REGISTRATION DOCUMENT - 76
Côte d’Ivoire Telecom and Orange Côte d’Ivoire Activities
| 2013 | 2012 | 2011 |
Number of customers (in thousands) | 7,341 | 6,543 | 6,210 |
Fixed-lines | 287 | 290 | 290 |
Internet lines | 40 | 36 | 36 |
Mobile Customers | 7,014 | 6,217 | 5,884 |
Mobile ARPU (in euros per month) | 6,25 | 5,9 | 4,75 |
Source: Orange |
The number of Côte d’Ivoire Télécom fixed lines declined to 287,000 at end-2013, on the back of strong competition from mobiles attributable largely to multi-equipment. There was also strong growth in the broadband mobile market, with the arrival of 3G and close to 170,000 Orange Internet dongles at the end of 2013. Correspondingly, average revenues per user (ARPU) increased compared with 2011 and 2012. 2011 was an exceptionally low year due to the post-election events, while 2012 marked the beginning of a rebound in activity. However, 2013 was still down compared with 2010, mainly due to the increased number of low-income customers in rural areas.
At the end of 2013, Côte d’Ivoire Télécom had more than 40,000 ADSL broadband customers.
Distribution
Since the operational merger of Orange Côte d’Ivoire and Côte d’Ivoire Télécom in 2010, Orange has had the largest network of retail stores in the country’s telecom sector, a total of 115. Of these, 33 were directly owned and 82 were franchises at end-2013. Orange also distributes its services through a network of 14 exclusive partners. Lastly, more than 80,000 retailers offer Orange products.
In 2013, Orange Côte d’Ivoire continued to offer training to its partners, to help them build their business skills. The company also worked with its entire distribution network to promote the Orange Money service.
2014 outlook
Orange Côte d’Ivoire’s priorities in 2014 will be focused on:
■
continuing to differentiate its offers in terms of quality, with special emphasis on the B2B and broadband segments so as to mitigate the effects of the price war;
■
capturing the lion’s share of growth in mobile data (MMA), mobile money, B2B, and the students and young professionals market;
■
securing prepaid revenues and promoting customer loyalty.
The Telecom Services Market
| 2013 | 2012 | 2011 |
Population (in millions) | 6.5 | 6.4 | 6.3 |
GDP growth (%) | +3.3% | +2.8% | +2.6% |
GDP per person (in dollars PPP) | 6,116 | 5,977 | 5,846 |
Source: IMF, October 2013 |

Source: GSMA, February 2014
The mobile market grew from 9.0 million to 9.9 million SIM cards between 2012 and 2013, an increase of 10%. The mobile penetration rate is close to 140%. The increase was driven by competition, with abundance offers in data taking over from prepaid voice offers in 2013.
ORANGE / 2013 REGISTRATION DOCUMENT - 77

Source: GSMA, February 2014
Jordan has three major mobile operators. Orange ranks second in the mobile market, with a market share of 35.9% (source: GSMA). 2013 was marked by an intensification of competition in the range of 3G services, and by abundance offers in mass consumption.
Orange Jordan’s activities
| 2013 | 2012 | 2011 |
Number of customers (in thousands) | 3,881 | 3,820 | 3,342 |
Fixed-lines | 433 | 453 | 474 |
Internet lines | 192 | 182 | 174 |
Mobile Customers | 3,256 | 3,185 | 2,694 |
Mobile ARPU (in euros per month) | 4,1 | 5,4 | 5,9 |
Source: Orange Jordan |
Orange had 3.9 million customers at end-2013, an increase of 1.6% compared with 2012. Its growth was driven by targeted offers, such as that geared towards young customers (Prepaid Yalla Shabab), while ARPU declined due to falling prices in the market.
The number of Orange’s fixed Internet customers grew by 5.5% in 2013. Orange continued to deploy a full range of Internet services based on ADSL, VDSL (introduced at end-2013) and FTTH services.
2014 outlook
The market is expected to remain highly competitive in 2014. In this context, Orange will endeavor to offer competitive packages and to defend its market share.
Despite the political events that have marked Mali in recent months, the mobile market has continued to grow rapidly, with the penetration rate increasing from 24% at end-2008 to 122% at end 2013 (source: GSMA). Orange, the second company to join the mobile market, is now the leader in the mobile market with a 62.9% market share (source: Orange Mali estimates). Orange’s main competitor is the incumbent operator Sotelma, owned by Maroc Telecom, owned itself by Etisalat, which acquired Vivendi’s 53% stake. The government granted a third comprehensive license to the Planor-Monaco Telecom International consortium in January 2013; the consortium will operate through the Malian company Alpha Télécommunication Mali SA (Atel-SA).
At end-2013, Orange Mali’s mobile network covered about 85% of the population and 43% of the country, and Orange Mali had a total of 10.8 million active prepaid customers. The main mobile usage is voice and SMS, but mobile data and mobile broadband have developed rapidly since the launch in May 2010 of 3G. In June 2010, Orange Mali launched the Orange Money service, which allows users to carry out financial transactions from their cell phones. The service had over 1.3 million customers at the end of 2013.
The broadband Internet subscriber base totaled more than 66,400 by end-2013, an increase of over 100% due to the success of 3G+ Internet dongles.
In 2014, the two main challenges for Orange Mali will be to secure its revenues by promoting customer loyalty and developing new sources of growth, notably data and Orange Money revenues.
The mobile market had a penetration rate of 64.5% in 2013 (source: GSMA), with considerable disparity persisting between urban and rural areas. The market is also characterized by a high rate of multiple ownership of SIM cards (60%). The main mobile uses are voice and SMS; however, data usage has been growing significantly.
ORANGE / 2013 REGISTRATION DOCUMENT - 78
Orange ranks second in the mobile market, with a market share of 41%, behind MTN (source: GSMA). At end-2013, Orange had a total of 6.0 million active customers, an increase of 4% compared with 2012, of which 98% on prepaid plans. 2013 was marked by increased competition, resulting in multiplication of abundance offers and a significant drop in prices. Orange Cameroun’s network now covers 72% of the population, thanks to a 12% increase in the number of sites (121) in 2013. Launched in 2008, the Internet business is growing strongly thanks to migration to 16E technology, which offers higher speed and on the go connection to more than 80,000 customers.
At the end of 2013, Orange’s distribution network in Cameroon was made up of 10 branches, 175 Orange stores, 8,000 approved outlets, and a hundred distributors and partners.
The competitive landscape will change significantly in 2014, with the start of the operations of the third operator in the third quarter of 2014.
Orange Guinée was the fourth entrant of five operators in this highly competitive mobile market. In 2013, it became the leading operator, with a market share of over 47%, ahead of Areeba (MTN Group), Cellcom and Intercel (source: Orange estimates). Mobile use primarily includes voice. However, significant growth was seen in mobile data in 2013 thanks to significant investment in the ACE submarine cable and the 3G network, as well as successful commercial offers.
Orange had a total of 3.24 million active customers at end-2013, almost exclusively in the prepaid segment, an increase of 75.1% compared with 2012. Orange Guinée’s network is the most extensive among all the operators, with a coverage rate of over 80% of the country (source: Orange Guinée estimate).
Orange has a direct distribution network made up of two branches, six outlets in Conakry and three branches in the rest of the country (Labe, Kankan and Nzerekore). It also has an indirect distribution network.
The mobile market is still growing, despite a penetration rate of 160.9% of the population (source: GSMA). Orange is one of three operators that hold multi-service licenses with Mascom (an MTN subsidiary) and BTC, the incumbent operator.
In 2013, Orange cemented its number two ranking in the mobile market, with 880,000 active customers at year-end (source: Orange Botswana) and a market share of 32% (source: Botswana Telecommunication Authority). Mobile voice and SMS represent 73% of revenues, and new data services (data and content) are growing strongly (up 60% compared with 2012).
2013 was also marked by the launch of such innovative Orange Money services as Prepaid Electricity, DSTV and the association of a VISA debit card with an Orange Money account. Orange also continued the development of bundled voice and broadband packages, based primarily on the Group’s products, including the Livebox, the FlyBox and Internet Everywhere (GPRS/Edge/3G USB dongles).
Orange’s mobile network covers the vast majority of the population of Botswana. To support the growth of data, Orange Botswana significantly expanded its 3G coverage in 2013, adding 79 new sites offering speeds of between 21 and 42 Mbits/s.
Orange has a distribution network of 19 stores around the country, plus an indirect distribution network made up of retail chains and wholesalers.
Orange Botswana’s priorities for 2014 are as follows:
■
continued growth in the number of customers;
■
growth in data usages and content;
■
development of new services like M-Health and M-Agriculture;
■
increased market share within the Enterprise segment;
■
continued improvement in customer satisfaction.
With a population of about 45 million, Kenya has 32.3 million mobile customers, representing a penetration rate of 71.9% (source: GSMA).
The sole fixed-line operator, Telkom Kenya, in which the Orange Group has a 70% interest, faces three competitors in the mobile market: Safaricom, Airtel (operator of Indian group Bharti), and Yu (operator of Indian group Essar), as well as several competitors in the market for business data communications (Safaricom, Access Kenya, KDN, Wananchi).
Telkom Kenya confirmed its return to growth in 2013 (18% increase in the mobile customer base), expanding mobile data usage and services to large companies and SMEs. The company also reinforced its mobile offering with the overhaul of the voice rates of its flagship offering, Tujuane. Thanks to its investment to improve and expand its mobile network and upgrade its fixed network (transition from copper to fiber optic), Telkom Kenya was ranked Best Mobile Operator by the regulator for the second consecutive year. The company continued its transformation plan and the streamlining of its cost base to improve its margins.
The most recent entrant in the mobile market, Orange has a market share of 27%, an increase of three percentage points, second to Airtel and ahead of Moov and Sahelcom (source: GSMA). Its mobile subscriber base included 1.44 million active customers (Source: Orange). Orange Niger is the market leader in mobile broadband Internet. Orange Niger also ranks second behind Airtel for the coverage of its mobile network, with coverage of 75% of the population in 2013 and a network of over 437 2G sites and 67 3G sites (source: Orange Niger).
ORANGE / 2013 REGISTRATION DOCUMENT - 79
Orange Niger markets its products through a direct distribution network made up of six branches, supplemented by 89 distributors and 17,600 sales outlets located throughout the country.
In 2014, it aims to remain the country’s leading ISP and to consolidate its position in the mobile market, primarily by reinforcing its network in the country’s major cities and continuing to improve service quality.
The Democratic Republic of Congo has a population of 77 million, putting it in fourth place in Africa in terms of population (source: IMF, October 2013). However, the mobile penetration rate is only 43% (source: GSMA), much lower than in most neighboring countries.
In October 2011, Orange acquired 100% of mobile operator Congo Chine Télécoms (CCT), buying the 51% stake held by the Chinese telecommunications manufacturer ZTE and the remaining 49% from the Congolese State. CCT holds a national 2G and 3G license, and boasts excellent growth potential due to the country’s low mobile penetration rate. CCT was renamed Orange RDC and the Orange brand introduced on December 5, 2012. At end-December 2013, Orange RDC had 1.8 million customers (source: Orange Congo).
The country experienced a fifth consecutive year of economic and political crisis in 2013, resulting in an increase in the poverty rate and a contraction in the use of telecommunications.
The mobile penetration rate was estimated at 28% of the population at end-2013 (source: GSMA). Orange’s mobile customer base fell significantly in 2013, but Orange strengthened its position in the high-value segments: average revenues per user (ARPU) increased by 31% thanks to the development of mobile broadband Internet. Orange has more extensive 3G coverage than any other operator, covering Madagascar’s 100 largest cities as of December 2013.
Orange is the only operator to sell a smartphone for about 53 euros, which, combined with the capabilities of a 6,000 km high-throughput transmission network and connection to the Safe and Sat3 international cables via submarine cables LION1 and LION2, promotes the development of mobile Internet.
Orange has also rolled out 2,500 solar-energy-powered call points known as Tananaphone for people living in rural areas.
Lastly, Orange Money continued to attract new customers in 2013, bringing the total to nearly 1.1 million at December 31, 2013 (source: Orange).
For the distribution of its services, Orange has a network of 140 stores and 97 kiosks (local stores), 32 distributors and 22,000 retailers, as well as 1,500 deposit-withdrawal points for the Orange Money service.
Orange’s priorities for 2014 will focus on developing telecommunication services for the business and professional market, expanding Orange Money services, strengthening the indirect distribution network, extending mobile coverage in rural areas and developing the broadband transmission network.
The Ugandan mobile market is experiencing strong growth, with the penetration rate rising from 25% at end-2008 to 51% at end-2013 (source: GSMA). 2013 saw the consolidation of the market, with the acquisition of the third operator (Warid) by the second (Airtel). Mobile use primarily includes voice, SMS, data and broadband for mobiles. With a market share of 12%, Orange Uganda occupies third place in a highly competitive market due to the presence of five mobile operators (MTN, Airtel/Warid Telecom, Uganda Telecom Mobile and Smile Telecom), as well as ten Internet service providers (source: Orange Uganda).
Orange had a total of 618,000 active mobile customers at end-2013 (source: Orange Uganda), almost exclusively on prepaid plans. Orange launched mobile Internet services during the final quarter of 2009, and had 220,000 active customers at end-2013.
Orange’s direct distribution network includes 19 exclusive stores across the country, as well as an indirect distribution network (retail stores and traveling salespeople).
In 2013, Orange launched new products and offers including Orange Money and Bulk SMS via web portal. It was also the first operator to launch a 4G mobile network.
In 2014 the company plans to anchor its leadership position in the Internet market – despite the price war among several other operators – by maintaining high levels of service quality and increasing the speed of its network. To cope with the strategy of lowering prices adopted by its competitors, Orange plans to enhance the value it offers through offerings such as Bonus Program, Blackberry Prepaid and No credit beep.
Orange was the last of four mobile operators to enter the Central African market. At end-2013, Orange was ranked second, with a market share of about 30%, behind Telecel (source: Orange Centrafrique). The other two mobile operators are Moov and Azur (formerly Nationlink). Almost all of Orange Centrafrique’s mobile customers use prepaid plans, since very few people in the country have bank accounts, and wages are low. The growth of the telecommunications market is still being heavily handicapped by low purchasing power (compounded by high inflation, particularly for food products) and the lack of infrastructure, as well as the troubles experienced by the country in 2013. The mobile penetration rate remains low (25% in 2013), due to the very low population density, which limits possibilities in terms of network coverage. Orange Centrafrique nevertheless continues to invest in the mobile
ORANGE / 2013 REGISTRATION DOCUMENT - 80
network to enhance its coverage and quality of service. It has the second most extensive network in the country, with 83 sites (61 sites in 2G and 22 sites in 2G/3G), allowing it to offer mobile services in 51 towns. Orange Centrafrique’s distribution network comprised seven branches (four in Bangui, and one each in Berbérati, Bouar, and Bambari), one franchised Beloko store, plus 43 distributors and 4,500 retailers across the country.
The Telecom Services Market
In the United Kingdom, GDP grew 1.7% in 2013, marking the recovery in the British economy from the decline in 2012 (source: Office for National Statistics). The number of mobile subscribers grew 834,000 to 83 million (source: Ofcom, Q2 2013) and the mobile market improved in the third quarter of 2013 (source: Enders Analysis UK). The 4G license public auctions were completed by the regulator (Ofcom) in February 2013, with 4G licenses going to the four existing mobile operators and to BT. O2 and launched their 4G offers at end-2013, following EE’s 4G launch in October 2012.
The Competitive Environment
Fixed-line telephony and Internet
| 2013 | 2012 | 2011 |
BT Retail (including Plusnet) | 31% | 30.1% | 29.6% |
Virgin Media | 19.3% | 20.4% | 21.0% |
TalkTalk Group (TTG) | 18.1% | 18.6% | 19.7% |
BSkyB (including Be) | 22.3% | 22.1% | 29.6% |
EE | 3.2% | 3.4% | 3.4% |
Other | 6% | 5.4% | 5.7% |
Source: Enders Analysis |
BT Retail and BskyB remained the only two major broadband Internet providers to increase their market share in 2013. BSkyB acquired Be, O2’s broadband Internet business line, for 180 million pounds sterling in March 2013. BT launched its new BT Sport TV offering in August 2013 and invested massively in content with in excess of 1.6 billion pounds sterling spent on sports rights. BT’s Openreach division continued to roll out fiber optic services in the United Kingdom, extending cover to 18 million locations, with 2.4 million households and companies opting for the service as at the start of 2014. All the largest broadband providers offer fiber optic broadband. BT Retail owns the highest percentage of fiber optic on the Openreach network, accounting for 1.9 million fiber optic customers in early-2014 (i.e. 27% of the BT Retail broadband customer base).
Mobile services
| 2013 | 2012 | 2011 |
EE | 33.1% | 33.2% | 33.2% |
O2 | 27.2% | 27.3% | 29.0% |
Vodafone | 26.1% | 26.7% | 26.7% |
H3G | 10.7% | 9.9% | 8.2% |
Virgin | 3% | 3% | 2.9% |
Source: Enders Analysis |
Other than EE, there are currently three other network operators in the UK’s mobile telecommunications market: O2 UK (a subsidiary of Telefonica), Vodafone UK (a subsidiary of Vodafone Plc) and Three (held by Hutchison Whampoa). EE and Three combined their 3G networks in a joint venture, while O2 UK and Vodafone UK have also embarked on a network sharing process. EE is the leading mobile operator by market share, and maintained this position in 2013, while Vodafone lost 0.6 point to H3G (up 0.8 point).
ORANGE / 2013 REGISTRATION DOCUMENT - 81
There are a number of mobile virtual network operators (MVNOs) present in the British market: including Virgin Mobile (owned by Virgin Media) and Vectone, both of which use the EE network. The other major player is Tesco Mobile, a 50/50 joint venture with Telefonica O2 UK, which uses the Telefonica O2 UK network.
EE activities
Fixed telephony and Internet activities
| 2013 | 2012 | 2011 |
Number of customers (in millions) | 0.7 | 0.7 | 0.7 |
Source: EE |
Mobile telephony activities
| 2013 | 2012 | 2011 |
Number of customers (in millions) | 25.5 | 26.8 | 27.6 |
o/w subscriptions | 14.4 | 13.6 | 12.8 |
o/w prepaid | 10.4 | 12.6 | 14.0 |
ARPU (pound per month) | 19.2 | 18.6 | 19.1 |
Source: EE |
For more information on EE’s financial performance and results, please see Section 4.3.3.7, Analysis of the financial position and earnings.
EE’s offers
EE offers two 4G subscription plans, Single and Double Speed, with a three pound sterling difference between the two. As the name suggests, Double Speed offers double the speed and volume of data available on the Single plan and also includes roaming. Prices range from 17 to 75 pounds sterling per month and include value-added services, such as Deezer and Clone Phone (to back up mobile data on the cloud).
Services marketed under the Orange brand focus on abundance offers covering both minutes of communication and texts. They start at 22 pounds sterling per month and including benefits such as Orange Wednesdays.
Services marketed under the T-Mobile brand focus on data, with unlimited data offers starting at 17 pounds sterling per month.
Distribution
EE has close to 600 retail outlets, having closed 59 in 2013.
Within the indirect distribution channel, there are two main chain stores: The Carphone Warehouse (CPW) and Phone4u (P4U). This channel also comprises a number of supermarket chains stores enabling EE to offer its products and services to a significantly wider public and to satisfy those consumers who prefer to choose from a host of operators in one location.
The Network
Fixed Network
EE uses the BT broadband and fiber optic network (Openreach) under the terms of a wholesale agreement.
Mobile Network
In the UK, EE operates 4G, 3G and GSM mobile networks and has the largest holding of 4G frequencies since the close of the 4G auctions early in 2013. The GSM license is indefinite with a one-year notice of revocation, while the 3G license expires in December 2021 and the 4G license in February 2033. The 3G network is shared with Three UK through a joint venture: Mobile Broadband Networks Ltd (MBNL).
EE pioneered 4G services, launching them in October 2012, well ahead of either Vodafone or O2, which followed one year later in September 2013. EE reached the milestone of 2 million 4G customers at the end of 2013.
ORANGE / 2013 REGISTRATION DOCUMENT - 82
2014 Outlook
In 2014, EE will focus on:
■
maintaining network leadership by investing in voice coverage, quality and reliability, maintaining lead in 4G coverage and speeds and also continuing the network optimization process;
■
delivering great service, increasing the percentage of on-shore customer service agents, improving customer experience, opening stores in new locations;
■
plan to retain mobile service revenue leadership, achieve 25%+ adj. EBITDA margin and grow EBITDA minus CAPEX.
Mauritius Telecom – Orange is now the leading fixed-line (ahead of DCL) and mobile (ahead of Emtel and MTML) operator in Mauritius (source: GSMA). It offers a comprehensive range of voice and fixed, mobile and Internet data services, together with convergence packages (voice, IP and TV) through My T.
The number of customers increased for all Internet (+10%), mobile (+4%) and fixed-line (+2%) segments. There were approximately 160,000 broadband customers, 770,000 mobile customers and 360,000 fixed-line customers (source: Mauritius Telecom). This growth strengthened Mauritius Telecom - Orange’s leadership position in the market. In 2012, Orange was the first operator to launch 4G and the Orange Money mobile payment service, and remained the only telecommunications operator to offer this payment service in 2013. Mauritius Telecom – Orange successfully rolled out its mobile number change plan in 2013, increasing the number of digits from seven to eight, and launched its fiber optic offer (FTTH) delivering speeds of 10 to 30 Mbits/s. The Group also played an active role in the education sector, providing tablets with educational content.
The company delivers global connectivity via the SAT3/WASC/SAFE, LION and LION2, Eassy, and GIE fiber optic submarine cables. The Group also has a presence abroad through its investments in Orange Madagascar, and its stake in TVL, the incumbent operator in Vanuatu, which was increased from 50% to 90% in 2013.
In 2013, the telecommunications market in Morocco saw price reductions for mobile services (24% lower than in 2012 for the average outgoing voice call - source: ANRT), which significantly boosted average usage volume per subscriber, up 17% (source: ANRT, December 2013). The main mobile uses are voice and SMS but data and value-added services are developing rapidly.
The Orange Group subsidiary Médi Telecom had a 29% share of the mobile market at end-2013, with 12.4 million mobile subscribers at year-end (source: ANRT), and covers 99% of the population. Maroc Télécom is the market leader with 18.2 million subscribers (43% market share), and Inwi is in third position with 11.9 million mobile customers. The mobile subscriber base is mainly made up of prepaid customers (95% of customers), and the market has a high rate of multiple ownership of SIM cards.
Médi Telecom has a strong presence in the mobile Internet market with 2 million subscribers at end-2013 and 41% of the market (source: ANRT). 3G is the dominant Internet access mode in Morocco (accounting for 85% of the total Internet market, according to ANRT).
Médi Telecom has 57,000 sales outlets throughout the country for the distribution of its products and services.
In 2014, Médi Télécom will focus on:
■
increasing the capillarity of its distribution network and developing digital distribution;
■
continuing to develop the mobile data business;
■
reviving the B2B fixed business by extending coverage and intensifying sales efforts;
■
renewing a large part of the radio access network.
Orange Tunisie consolidated its market share in 2013, with 2.1 million subscribers (up from 1.9 million in December 2012). Orange Tunisie’s mobile market share also rose to 15%, compared with 53% for Tunisiana and 32% for Tunisia Telecom (source: GSMA).
With 1,280 sites at end-December 2013, Orange Tunisie’s coverage now extends to over 95% of the population for 2G and 86% for 3G.
As regards technical developments, 2013 was significant for the massive rollout of fiber optic to connect 80 radio sites in densely populated areas and of new metropolitan loops in a number of major cities.
Orange Tunisie is positioned as the cheapest operator in the market with its Allo lelkoll plan, and a range of voice, text and data options. The Nejma and Start packs offers are aimed at the premium segment of the market.
Orange Tunisie also markets Livebox and VoIP for residential and business customers, and has expanded its range of value-added services, such as SOS Crédit.
In 2014, Orange Tunisie will focus on continuing to roll out its mobile network and improving the quality of service on its voice and data network, so as to maintain its leadership position in the 3G market. The company intends to expand its services line-up to target high-value customers and to enhance its customer loyalty programs. It also plans to expand its direct and indirect distribution network to support its sales and marketing strategy.
ORANGE / 2013 REGISTRATION DOCUMENT - 83
Iraq had a population of 34.8 million people at end-2013 (source: IMF, October 2013). Iraq’s mobile penetration rate of 97% (source: GSMA) is lower than that of its neighboring countries. In 2011, the Orange Group acquired a minority 20% stake in the Iraqi operator, Korek Telecom, which holds the national 2G mobile license. In 2013, the company continued to expand throughout the country, extending network and sales coverage, and in December 2013 it reached 5.3 million subscribers.
The Orange Group operates under the brand name Orange Business Services (OBS), both in France and internationally, in the Business communication and IT services markets. This market is part of the Information and Communications Technologies (ICT) sector, which includes technologies used to process and send information. Worldwide this market represented approximately 1,200 billion euros in 2013, with telecommunications accounting for 40% of this total:

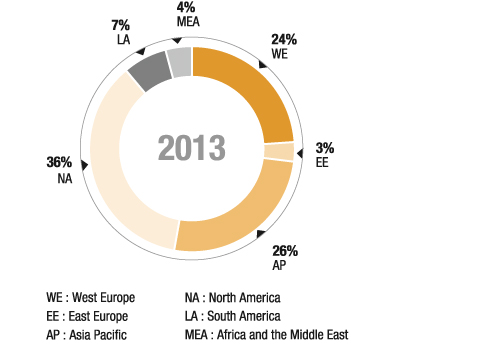
Sources: Gartner, Yankee Group Research
Orange Business Services offers a range of services to large corporates, local authorities and SMEs in France, as well as to multinationals around the world, supporting the implementation of their communication projects. To do so, OBS offers a full range of fixed-line (voice and data), IT and integrated services.
Global business markets contracted slightly in 2013 (by 0.7%), reflecting the severe impact of the deteriorating macro-economic environment:
■
the global connectivity market (voice and data, fixed and mobile) declined 0.2%. The slide in the conventional fixed-line voice and data markets accelerated to -10.5% and -16%, respectively, and was only partially offset by the growing demand for broadband and high-capacity broadband and mobile (driven up 6.4% essentially by data services, since mobile Voice demand remained stagnant);
■
the global IT and integration services market shrunk by 1%, despite the slight increase in professional services, particularly consulting and outsourcing, with growth of approximately 1% for each of these segments, primarily due to a foreign exchange impact in the Asia Pacific region. The market in Western Europe edged up 0.1%.
In France, the weak growth in the IT and integration services market only partially offset the erosion in the fixed-line data (networks and Internet) market and the decline in the fixed-line voice market in particular:
■
the French connectivity market declined 4.8%. The slide in the fixed-line voice market continued as the pick-up in VoIP was not sufficient to counterbalance the decline in traditional telephony, in terms of both volume and value. The downturn in the data market evident since the previous year intensified: the downward trend, in value, in leased lines and business legacy networks, as well as in mature IP-VPN networks, was not offset by the growth in broadband and high-capacity broadband markets;
■
in France, the IT and integration services market was sluggish, with anemic growth (0.6%) expected in 2013. The real upturn should come in 2014–2015.
Telecommunications operators are looking for new vectors for growth by orienting their business models towards IP services, in order to offset the drop in traditional communication revenues. This trend is being intensified by the uncertain economic climate and increasing customer demand for integrated, flexible solutions with prices suited to new usages:
■
in consequence, the boundaries between telecom operators and integrators are blurring due to the commoditization of networks and the convergence towards IP: Operators are offering advanced communication services that are increasingly integrated into businesses’ information systems, and are entering into direct competition with IP integrators and Internet companies. At the same time, Internet companies are enhancing their services with network solutions to take advantage of the rise in new usages such as cloud computing;
ORANGE / 2013 REGISTRATION DOCUMENT - 84
■
confronted with new business mobility-related usages (like BYOD, or Bring Your Own Device, both operators and integrators are updating their services line-up to meet customers’ needs for administration, data security, applications, and value-added services;
■
regional expansion is another growth driver, reflected in the increasing attention being paid to emerging countries (BT’s Prosperity Plan for Asia and Latin America and Telefónica’s large presence in Latin America, especially in Brazil), or the expansion into other regions of developed countries by NTT Communications and NTT Data (expansion in Europe with the acquisition of IT service providers in Spain, Northern Europe and Eastern Europe, and the opening of retail outlets), and in North America (with a specific focus on the cloud and data centers to support NTT’s global cloud computing development plan).
Companies may turn to acquisitions to speed their transition to new economic models (for example, NTT’s acquisition of integration companies and data center service providers continued through to the end of 2013).
Orange’s main competitors on the market are:
■
telecommunications operators:
■
SFR Business Team, which offers a range of fixed, mobile and Internet solutions,
■
alternative local loop operators like Colt and Numericable-Completel that can target French companies as well as multinationals,
■
global telecom service operators, such as BT Global Services, Verizon Business, AT&T Business Services, and T-Systems, which offer global distributed services for multinational companies. In addition to their international services, these operators can also carry local and national calls by using the Orange network’s interconnection services,
■
global operators from emerging countries (like Tata Communications, Reliance, and China Telecom) that set up hybrid solutions based on their own networks and combined with third-party operators’ solutions that they manage themselves,
■
incumbent operators in some countries;
■
network integrators and managed service providers with which Orange works in competition (a combination of cooperation and competition) — especially for companies that use a multi-provider approach such as NextiraOne, Spie Communication, and Dimension Data (NTT group);
■
major players like IBM Global Services, HP Enterprise Services, Atos Origin, and Cap Gemini that support companies through their IT transformation projects; the main service categories in which these companies are positioned include network integration, infrastructure management, outsourcing, third-party application maintenance (TPAM), consulting, and engineering;
■
Internet companies or niche market specialists that offer VoIP, messaging, and cloud computing services, such as Skype, Amazon Web Services, Google or Salesforce.com globally, and OVH in France;
■
major software suppliers that offer their applications online as services, like Microsoft, Oracle, and SAP.
Orange Business Services continues to invest in its traditional activities as a supplier of communications solutions, by supporting its network and voice customers in the international arena or by developing new line-ups based on unified communications and mobility. In addition to this core business, Orange Business Services is positioned in the IT infrastructure segment, notably in cloud computing and real-time applications services. Lastly, Orange Business Services provides its portfolio of products and services with a particularly close eye to the native security of its customers’ data and information systems, while providing the best service quality and customer experience in the market.
| 2013 | 2012 | 2011 |
France + International (number of accesses in thousands) | | | |
Number of IP-VPN accesses | 330 | 326 | 317 |
France (number of accesses in thousands) | | | |
business telephone lines (PSTN) | 3,355 | 3,681 | 4,032 |
permanent accesses to data networks | 353 | 349 | 344 |
o/w IP-VPN accesses | 286 | 281 | 277 |
XoIP | 72 | 67 | 59 |
Business Everywhere | 765 | 804 | 802 |
Source: Orange |
ORANGE / 2013 REGISTRATION DOCUMENT - 85
Name | Definitions | Product lines |
IPVPN access (France + International) | Number of IPVPN (IP virtual private network) accesses marketed by Orange Business Services in France and Internationally. These accesses allow companies to pool their applications and introduce new ways of using them (VoIP/IP Telephony). | IPVPN France, IPVPN International |
Business telephone lines (PSTN) | Access to the Switched Telephone Network (STN), from analog lines or digital lines. | Analog lines, basic access, primary accesses |
Permanent access to data networks | This indicator essentially covers IPVPN and some of the XoIP offer in France: ■ broadband Internet accesses combined with a set of ready-to-use services (Business Internet Office and Business Internet), mainly for SMEs; ■ broadband Internet and VoIP accesses (with or without Centrex, which exempts customers of telephone switchboard maintenance and management constraints) for businesses with independent sites; ■ accesses to businesses’ virtual private IP network in France. | Business Internet, Business Internet Office, Business Internet Voice, Business Internet Centrex, IPVPN France, Ethernet |
XoIP Offers | This indicator covers: ■ broadband accesses offering an IP service, with or without Centrex, for companies developing on independent sites; ■ managed telephony over IP solutions that use existing IPVPN access. These solutions are used for work station networking, voice transfer and IP-VPN connectivity. | Business Internet Voice, Business Internet Centrex, Business Talk IP, Business Talk IP Centrex |
Offers
Orange Business Services offers a wide range of products and services on the French market, from the market for professionals to business accounts, as well as for multinationals operating abroad.
Orange Business Services’ solutions, including packaged or tailor made and using different methods such as integrated, managed or cloud, are aimed at accompanying companies in their digital transformation. These solutions are based around five key challenges for businesses:
■
connecting people, sites and machines using a robust and secure high-performance network;
■
encouraging collaboration between Company employees through unified communication and collaboration services;
■
contributing to more dynamic Company operations and processes via innovative, enduring solutions;
■
offering free-flowing exchanges with business customers to ensure an exemplary customer experience;
■
working with an operator that is able to accompany the business in its development plans and objectives.
To meet these needs, Orange Business Services has structured its portfolio of offers around three main types of products and services:
■
telephony, IP transformation, Internet access, audio conference and customer relations services;
■
network offers, including certain levels of service guarantees (mobile and fixed-line connectivity; data transfer);
■
IT and integration solutions, including:
■
unified communication and collaboration services (interoperability between telephony, messaging and video conference solutions, and joint fixed-line and mobile offers, in triple- or quadruple play),
■
IT/Cloud solutions (virtualization, systems integration, APIs, M2M building blocks and big data),
■
managed or cloud security solutions (safe work environments and infrastructure, cyber-defense, management and governance),
■
consulting and customer services (analysis of needs, installation support and user training) in various areas: switching to “all IP”, virtualization, adopting Machine to Machine, supervising and managing service quality.
Cross-sector business line solutions are offered (health, finance, transport, geolocation and fleet management, dematerialized applications, etc.).
Lastly, products and services targeting the new work environment, connected applications and customer relations management are based on a secure network infrastructure and Orange cloud-ready services.
ORANGE / 2013 REGISTRATION DOCUMENT - 86
Distribution, operations and partnerships
The market comprises professionals, small companies, SMEs and companies with more than 50 employees (excluding large accounts), and is managed by a country-wide commercial branch network which, via sales personnel dedicated to a portfolio of customers and a network of telephone advisers, provide customers with information on offers, order status, service quality and incident resolution.
In the large corporate accounts market, Orange Business Services canvasses, advises and supports its customers providing a range of solutions and competencies to assist them in their development in France and worldwide. These customers are covered by departments that provide dedicated sales teams, for pre-sales, sales and services, and promote partnership-based approaches. Lastly, companies can manage their contracts and place orders in real time using the Orange website.
In addition to direct sales channels, Orange Business Services uses indirect sales channels run by domestic or regional telecommunications operators that want to meet their domestic customers’ international needs outside of their own region. Orange Business Services is working to build this type of partnership in the most developed markets, preferably with the leading operator or its direct competitor, like NTT Communications in Japan.
The Customer Service & Operations Division (CS&O) is responsible for the production and maintenance of solutions worldwide. Backed by its geographical reach, the CS&O supports customers in managing the rollout of their network and IT projects and in the daily operation of their services, including on-site call-outs. In some countries, CS&O uses local partners for local rollouts and to supply equipment. CS&O structures its operations using standardized processes and tools in order to monitor and support its customers round the clock: three Customer Service Units (CSU) for French customers, and five Major Service Centers (MSC) located in India, Egypt, Brazil, Mauritius and France serving international customers. This system, together with network redundancy, ensures service continuity for customers, especially in the case of exceptional events (natural disasters, political events, or a problem with submarine cables).
Orange Business Services works in close cooperation with major technology players, either bilaterally as with Cisco, Microsoft, Alcatel-Lucent, EMC, Avaya, Juniper, Polycom, Netapp, VMWare and Genesys, or with members of the mobile industry, such as Samsung, Apple and Blackberry. Orange Business Services also forms partnerships with service companies, such as Akamai or GFI, to develop a joint sales approach and offer innovative solutions to its customers.
2014 Outlook
In 2014, Orange Business Services will continue to evolve, focusing on increasing international sales, simplifying processes, optimizing performance and enriching the digital customer experience.
The Market
The global international voice market was estimated at 513 billion minutes in 2013. Its growth is being driven by the economic development of areas with high geographical density (principally South-East Asia, China and India), developments in mobile telephony (in particular in Africa), and the development of VoIP.
On this market, the share of international traffic that is channeled via a third-party operator, or wholesale traffic, includes the wholesale of voice and data traffic as well as the provision of transmission means. Wholesale traffic accounted for around 65% of the total international voice market in 2013 and was estimated at 334 billion minutes (source: Telegeography 2013).
There were 1,140 operators in the mobile market in 236 countries (source: GSM Association), including 222 open commercial 4G/LTE networks (source: GSA October 2013).
The Competitive Environment
Wholesale operators can be divided into three types—global wholesalers, multinational retail operators and regional and specialist players:
■
global wholesalers have the critical mass needed to obtain the most competitive rates and to pass them on to their customers; TATA, BICS and iBasis are the main global wholesalers;
■
multinational retail operators aim to optimize their end customers’ traffic and generate revenues and earnings in addition to those from their retail traffic. Orange, Vodafone, Telefónica, Deutsche Telekom, Telia Sonera, and Verizon are among the main ones;
■
regional and specialist players that focus on a particular geographic area or offer high-quality voice or data services at highly competitive rates. These primarily include Interoute, Primus, Citic, and Calltrade.
The wholesale market’s subscriber base comprises voice market specialists (call-shop, prepaid cards), domestic retail carriers (including MVNOs), and Internet Service Providers. International carriers also sell wholesale traffic to each other.
ORANGE / 2013 REGISTRATION DOCUMENT - 87
International carriers’ activity
Orange’s International Carriers activity is based on a major long-distance network infrastructure and offers a broad range of solutions on the international market.
Its presence in both the retail and wholesale markets means it can develop wholesale solutions that are particularly well adapted to the needs of the retail operators. Orange has more than 1,000 customers, which include fixed-line and mobile operators and Internet access and content providers.
The Orange Group is unique in that it is very involved in the design, construction and operation of submarine cables. With its ownership or co-ownership of several submarine cable systems, the Group ranks among the world’s largest owners of submarine lines. This has enabled it to satisfy the increase in transatlantic traffic.
The Group’s wholesale activity counts:
■
a seamless global network and an IPX protocol network supporting voice and data with presence points around the world;
■
a global network of dedicated IP routes with end users in more than 220 countries, connections to more than 200 Internet service providers worldwide, and connectivity in over 100 countries in a single IP network hop (Autonomous System);
■
99.99% network availability, 24/7 centralized network supervision.
The volume of voice traffic in the International Carriers business grew 6.2% in 2013, and there was also a sustained increase in data traffic.
Offers
Voice Services
Orange’s voice network has switched or all IP routes to over 400 operators, coverage in more than 1,000 destinations, and 24/7 technical support.
Services to Mobile Operators
Orange helps over 170 mobile operators worldwide by providing interconnection, roaming, SS7 signaling with value-added services, as well as GRX/IPX transport. Orange also supplies Roaming Hub and SMS Hub solutions and opened a new route to Myanmar (Burma) in 2013.
Mid-2013 saw the International Carriers Division launch a new LTE signaling service available through the Orange IPX network and based on the Diameter protocol. It will allow mobile operators to provide their customers with a 4G roaming service.
A major player in developing GSMA standards and a supporter of Open Connectivity principles, Orange has an ambitious program to extend LTE connectivity through direct connectivity and peering agreements.
Orange can also support its customers in the implementation of their mobile services by providing professional services.
Internet and Transmission Services
Orange’s adjustable solutions meet the specific needs of Internet service providers and content providers. The offer includes a wide range of connection options in Europe, the Americas and Asia based on a global network infrastructure. The Group’s services were enhanced in 2012 with the commissioning of the LION2 submarine cable (crossing the Indian Ocean) and the ACE cable.
Convergence Services
Orange provides IPX solutions through its Multiservice IP eXchange offer, which gives operators à la carte access to voice and mobile data services over a single connection. It can also improve service quality and network costs efficiency.
Anti-fraud Services
In 2012, the Group introduced @First Anti Fraud Interconnect Roaming and Security of Transactions, a comprehensive anti-fraud system for protecting traffic, improving service quality and boosting interconnection revenues.
Orange Marine
Orange Marine is a major player for laying and maintaining fiber optic submarine cables, using a fleet of five cable-laying vessels. It is thus able to supply all laying, landing end, and maintenance services for cables.
Orange has developed new growth activities related to its core business line, such as content broadcasting, audience and advertising, and healthcare activities.
Content rights
Orange is mainly focused on its role of aggregating content to offer increasingly attractive services, in line with its new strategy based on developing partnerships.
The Group is developing new services for its customers with a focus on multi-screen, interactivity and on-demand programs. Orange launched its new Livebox Play TV decoder in 2013 with a faster and more fluid interface, adding functions such as Full HD, Internet browsing and Deezer and Dailymotion applications. A partnership with HBO creating a new TV series channel (OCS City génération HBO) and the launch of the delinearized OCS Go channel reinforces its OCS line-up.
This strategy is also deployed in other countries where the Orange brand is present, such as Poland, Spain, the UK, Romania, Belgium, Slovakia, Mauritius, Senegal, and Ivory Coast. In 2013, Orange launched new TV services with native multi-screen, including many HD channels in Romania and Spain. For music content, Orange signed a partnership with Deezer in 2010. 2013 saw substantial growth in the number of subscribers and the service is now available in six countries (France, the United Kingdom, Poland, Romania, Mauritius and Senegal). In gaming, Orange’s strategy is based on multi-platform distribution (PC, mobile, tablets, and TV) in partnership with the leading video game publishers (EA, Ubisoft and Activision). In 2013, Orange continued its development in the AMEA region in five countries and launched a PC gaming portal with STAR AFRICA. In mobile services, Orange innovations included the launch of All You
ORANGE / 2013 REGISTRATION DOCUMENT - 88
Can Play in France (unlimited monthly gaming subscription for Android). The new PES 2014 game was launched on Cloud Gaming and on the same date it was made available for console. Finally, Orange has promoted the move to 4G in France by offering a range of content services since April 2013. Orange Ligue1, Deezer Premium+ or Orange Cloud services are included in all Origami 4G contracts.
Viaccess Orca
Viaccess Orca, a subsidiary of Orange, is widely recognized for its innovative solutions enabling distributors of digital content (pay TV, video on demand) to monetize premium content and the user experience in a multi-network and multi-screen environment. Its portfolio includes protection of content rights, service platforms, and introductory and recommended content solutions.
Audience and Advertising
Orange is positioned as a major European player across the media value chain, due to:
■
high audience figures (averaging 164.6 million unique visitors per month worldwide, taking into account Wirtualna Polska and Dailymotion) online, on mobile devices and on tablets;
■
alliances with major online players (such as Dailymotion and Deezer);
■
and its position as a telecoms operator, which gives it customer knowledge and control over networks.
Moreover, Orange’s global advertising network reaches 694.5 million unique visitors each month worldwide (source: Comscore 2012).
Orange has adopted a twofold approach:
■
direct monetization of the agencies and advertisers—essentially within the web and mobile audiences (either via its own audience or by monetizing the audience of the Orange Advertising publishers);
■
indirect monetization by marketing technology services and solutions to players in the media where the digitalization process is underway (like in television, outdoor, and cinema).
Health
An aging population, an increase in the number of people losing their independence and the number of patients suffering from chronic illnesses, coupled with a decrease in the number of doctors and medical desertification in rural areas make it all the more necessary for health professionals to turn to information and communication technologies. They help increase the efficiency of health professionals, reduce costs, improve illness management and strengthen the relationship between doctor and patient. Digital services also provide secure data access and transmission. Orange was the first telecommunications operator in France to be approved as a personal health data host.
Orange Healthcare, the Group’s Healthcare Division, draws on its know-how to develop a variety of services such as:
■
“Connected Hospital, Flexible Computing” services and shared medical imaging systems that allow hospitals, clinics and doctors’ offices share vital patient information. Thanks to these services, healthcare establishments can better coordinate their activities, collaborate more efficiently, and transfer data seamlessly;
■
services to facilitate prevention and daily well-being, via permanently accessible IT tools. These solutions are the result of the integration of services developed in partnership with major healthcare industry companies, and rely on the expertise of Orange Labs. These services are provided mainly in emerging countries, and involve healthline call centers and epidemiological data transmission services;
■
services to facilitate prevention and daily well-being, via permanently accessible IT tools. These offers are the result of the integration of services developed in partnership with major healthcare industry companies, and rely on the expertise of the Orange Labs. These offers are provided mainly in emerging countries, and involve call centers and epidemiological data transmission services.
In addition, Orange has joined the French government and major industry partners in the Silver Economy initiative,, which looks to meet the challenges presented by France’s ageing population through innovative digital solutions.
ORANGE / 2013 REGISTRATION DOCUMENT - 89
At the end of 2013, Orange operated networks in more than 30 countries to serve its customers in the consumer market and in approximately 200 countries or territories to serve its business customers.
Orange’s ambition is to achieve the convergence of its fixed-line and mobile networks through a unified architecture in accordance with three fundamental principles:
■
flexibility and responsiveness, to quickly assemble and deliver new services to meet market requirements;
■
the ability to support the strong growth and diversification of the services offered: voice services, Internet access services, animated image services, data services;
■
simplicity for customers in the use of these services.
The network architecture is broken down into:
■
access networks (fixed or mobile);
■
core domestic and international networks.
Analog access and ADSL broadband access
Analog access is made up of a pair of copper wires used for telephone communications by tens of millions of Group customers in France, Poland and throughout Africa.
Braodband ADSL access for Internet applications was available in France and in Poland at the end of 2013, with cover approaching 100% on the incumbent local loop. It was also available in different AMEA countries (Bahrain, Ivory Coast, Egypt, Equatorial Guinea, Mauritius, Jordan, Kenya, Senegal, Tunisia and Vanuatu).
In Spain and Belgium (on the business market), Orange provides fixed broadband access using these countries’ incumbent operators’ local loop, either through unbundling or through bitstream offers.
FTTx very-high Bandwidth Access
FTTx fiber optic access can extend the available broadband ADSL service offer to include upstream and downstream very high bandwidth (of 100 Mbps and more), with improved response time.
In France, Orange has for several years been deploying point-to-multipoint FTTH architecture that uses GPON technology, which can pool several very high bandwidth accesses on a single fiber without affecting each access point’s capacity for increasing speed.
FTTH roll-out started in 2007 in several major French cities (Paris and the Hauts-de-Seine, Lille, Lyon, Marseille, Poitiers, Toulouse). It was then expanded to other large cities. During the years 2011 and 2012, Orange entered into pooling agreements with other telecoms operators to speed fiber rollout. As at October 1, 2013, the Orange fiber network extended to 350 towns and cities and almost one-third of homes in France. Fiber is now available to 2.3 million households, and the number of subscribers to the service is over 250,000.
In June 2012 Orange announced its FTTH rollout project for Spain, which aims to connect 1.5 million households. This project represents an investment of 300 million euros over the next four years. The first households were connected up at end-2012 and 40,000 homes in Madrid were covered as of the end of June 2013. A Fiber To The Home (FTTH) network was also rolled out in Slovakia, connecting 60,000 households at end-2013, and a pilot FTTx network is being deployed in Poland.
Fixed Radio Access
In a number of different countries, fixed-line services are available through UMTS, Wimax (Romania and Africa), and CDMA (Poland and Senegal) radio access.
The GMS and UMTS access networks support faster data communication services of up to several Mbps that can be used to send and receive large files (audio, photo, video). The UMTS network capacity was extended in all the Group’s European countries, through 3G+ technology (HSDPA and HSUPA). Deployment of 3G/3G+ continued apace in the AMEA region and extended to 17 countries at end-July 2013.
Significant developments in 2013 included the commercial launch of 4G with LTE technology in France and in Spain, extension of cover in existing 4G countries, the start-up of technical rollout of 4G in Poland, and continued deployment in Belgium. As of the end of 2013, 4G was available to Orange customers in nine countries (Spain, France, Mauritius, Luxembourg, Moldova, Uganda, Dominican Republic, Romania and the United Kingdom).
Aggregation networks concentrate fixed and mobile traffic to the network core. These networks are traditionally made up of SDH/PDH technologies for mobiles and ATM technology for fixed aggregation, and are now evolving towards all-IP networks.
In 2013, the Group continued to roll out all-IP technologies, such as Gigabit Ethernet, hybrid packet-circuit microwaves and leased Ethernet lines. These technologies are used to optimize costs. They are also used to prepare for future replacement of ATM technology by layer-2 Ethernet technologies and layer-3 IP/MPLS technologies, which can
ORANGE / 2013 REGISTRATION DOCUMENT - 90
increase the volume of data sent over fixed and mobile networks.
Domestic Networks
This infrastructure is primarily made up of optical fibers, but it also contains microwave links, especially for alternative or purely mobile networks.
Optical links offer a bandwidth of up to 100 Gbit/s per wavelength, and dense wavelength division multiplexing technology (DWDM) makes it possible to have 80 wavelengths per fiber, a figure set to increase in the future. Orange is one of the world leaders in the use of advanced optical functions in order to have a more flexible transmission network. For example, the first of its kind worldwide, it deployed a 400 Gbit/s per wavelength optical link between Paris and Lyon.
Furthermore, Orange offers direct connections by optical fiber to business customers, providing them with very high bandwidth services.
Wide Long-Distance Domestic Optical Network (WELDON) in France
Rollout of the WELDON network (WidE Long distance Domestic Optical Network) began in April 2012 and aims to upgrade the entire existing long-distance network, while extending its scope to serve Frankfurt and London, submarine cable stations, and other areas neighboring France as needed in future.
WELDON uses the latest WDM technology and offers enhanced connectivity at speeds of at least 100 Gbps per wavelength.
International Transmission Network
The international network is based on the European Express Network (EEN), connecting 27 points of presence in 16 of Europe’s largest cities – five of which are in France, on the North American Backbone network interconnected with the two TAT-14 transatlantic cables for Internet traffic, and on the Asian Backbone Network in Singapore.
Satellites
Satellite communications are used by Orange to support global network connections for the French overseas territories, IP or voice connectivity with other carriers, and VSAT (Very Small Aperture Terminal) services for Orange Business Services terrestrial or maritime corporate customers. To provide those services, Orange purchases space segment from satellite operators (such as Eutelsat, Intelsat, SES, Arabsat and Spacecom).
Submarine Cables
In order to accommodate the increase in international telecommunications traffic, Orange has invested in a number of submarine cables through:
■
participation in a consortium to build a cable that Orange will co-own;
■
purchase of usage rights or transmission capacity leasing on other cables.
As with terrestrial networks, higher speeds systems on submarine cables are being implemented and 40 Gbps systems are already operational on several cables within the Orange Group.
Cable name | Start - End | Number of landing stations | Number of countries | Kilometers | Commissioned | Last upgrade |
TAT-14 | United States - Europe | 7 | 6 | 15,400 | July 01 | 2013 |
SAT 3-WASC-SAFE | Portugal - Malaysia | 17 | 15 | 27,850 | Apr. 02 | 2010 |
SEA-ME-WE 3 | Germany - Japan/Australia | 39 | 33 | 39,000 | Aug. 09 | 2009 |
SEA-ME-WE 4 | France - Singapore | 15 | 14 | 19,000 | Dec. 05 | 2012 |
Americas 2 | United States - Brazil | 11 | 9 | 8,300 | July 00 | 2013 |
ECFS | Tortola - Trinidad & Tobago | 14 | 10 | 1,600 | July 05 | 2013 |
LION | Mauritius - Madagascar | 3 | 3 | 1,050 | Nov. 09 | 2013 |
LION2 | LION extension to Mayotte and Kenya | 2 | 2 | 2,700 | Apr. 12 | 2013 |
CBUS | United States - United Kingdom | 3 | 2 | 3,200 | Sept. 09 | 2013 |
IMEWE | India - France | 10 | 8 | 12,000 | Dec. 10 | 2012 |
ACE (phase 1) | France - Gabon/Sao Tomé | 19 | 17 | 11,500 | Dec. 12 | |
ACE (phase 2) | ACE extension to South Africa | 4 | 4 | 5,500 | Sept. 15 | |
EASSy | South Africa - Sudan | 9 | 9 | 10,500 | July 10 | 2012 |
ORANGE / 2013 REGISTRATION DOCUMENT - 91
West Africa
Working as part of a consortium, Orange commissioned the first phase of the ACE (Africa Coast to Europe) cable in December 2012. Around 17,000 kilometers long, its potential capacity will reach 5.12 Tbps thanks to the use of 40 Gbps transmission technology. ACE currently extends from France to Gabon and Sao Tomé-et-Principe.

Indian Ocean
Orange is a co-owner of the LION (Lower Indian Ocean Network) cables connecting Madagascar to the global broadband network via Reunion and Mauritius, and LION2, the LION extension to Kenya serving Mayotte. To meet the sustained growth in traffic, the Group has invested in a capacity upgrade of both LION and LION2, which was operational at the end of 2013.
ORANGE / 2013 REGISTRATION DOCUMENT - 92
Atlantic Ocean
Orange is also active in the Caribbean where it has capacity on three major cables: Americas-II, ECFS, and CBUS. The Group took part in a capacity increase on the Americas-II and CBUS cables, to support the surge in broadband use in France’s overseas departments. The additional capacity was delivered in 2013.
Lastly, the requirements of Internet traffic between Europe and the United States has led the Group to make frequent investments to increase the capacity of the TAT-14 transatlantic cable and acquire additional usage rights on other transatlantic cables. The rollout of additional capacity on the TAT14 cable, made possible through the upgrade to 40 Gbps, which began in 2012, continued in 2013, bringing the Group’s total capacity for traffic between Europe and North America to almost 600 Gbps.

ORANGE / 2013 REGISTRATION DOCUMENT - 93
The International IP Network
Orange’s international IP network, known as Open Transit Internet (OTI), aims to provide global Internet connectivity to Group subsidiaries’ and operator customers’, Internet service providers’ (ISP) and content providers’ domestic IP networks. It is based on the latest IP transmission and switching technologies.
As of end-2103, the OTI connected 22 cities (12 in Europe, 2 in Asia, and 8 in North America) through broadband connections at speeds of 155 Mbps to 100 Gbps, with several hundred Gbps of traffic at peak times. Traffic hit 1.9 Tbit in 2013.

The International Voice Network
Voice Network
Orange has three international switching nodes in France (CTI 4G) to manage traffic to and from France in the fixed-line and mobile markets (TDM) for consumers, businesses and operators, and to centralize the transfer of international traffic for its subsidiaries. These exchanges have developed into hybrid NGN nodes to carry Voice over IP (VoIP) traffic. The architecture of the international voice network underwent major change in 2013 with the installation of five softswitches dedicated to Voice over IP (VoIP) to achieve the target of exceeding 55% of Orange’s international voice traffic carried by VoIP by 2015.
Outside France, Orange has two softswitches in the United States and a media gateway in Hong Kong to meet the needs of customers and operators in America and Asia via TDM or VoIP.
Signaling Network
Signaling system 7 (SS7) on the international network is managed by two Signal Transfer Points (STP), which support the signaling associated with voice traffic, roaming and SMS for Orange’s mobile operator customers and the majority of its mobile subsidiaries. A growing number of links serving the largest roaming and SMS customers are supported by SIGTRAN signaling over IP.
Several centralized platforms have been rolled out on the international transit points to provide value-added services to mobile operators.
X.25 networks
X.25 was taken off the market in mid-2010 and the technical aspects of the service were discontinued in June 2012.
However, X.25 still serves as a connection network in France and its overseas territories for several thousand payment points, connected with “intelligent network” services. Since the reintegration of this “intelligent network” function into an IP network is not expected before 2015, the X.25 network will be retained until then.
ORANGE / 2013 REGISTRATION DOCUMENT - 94
Frame Relay/ATM Networks
In France, the Frame Relay/ATM network is an access network used to support both business (particularly through the TDSL aggregation offers) and a layer 3 (X.25 and IP) services. It has been deployed in around 150 points of presence in mainland France, in the five overseas departments and in two overseas territories (New Caledonia and French Polynesia).
The activity on the FR/ATM network is declining, and businesses’ need for increased speed is increasingly met by the IP/MPLS services available on the “Network for Business Access to IP” (NBAIP).
Outside France, the AGN network (ATM Global Network) covers 1,000 points in approximately 200 countries. It supports X.25, Frame Relay or ATM services. However, as in France, it is mainly used today as an access network to IP services, because of its extensive worldwide footprint. It also provides a transport function for the IP network, but this function is diminishing as the native IP network develops.
The Network for Business Access to IP (RAEI) in France
The main purpose of the RAEI is to connect a company’s sites for internal data exchange (on the Virtual Private Network (VPN) and to provide it with Internet connectivity. It also provides Voice over IP transport for companies.
It is made up of a core infrastructure of around 60 transit routers called “P_Pass” that are interconnected by 10 Gbps links. This P_Pass backbone network also provides the interconnection with the Backbone and IP Aggregation Network (RBCI) for Internet traffic and for business aggregation traffic coming from NAS and BAS.
In addition, a ring of approximately 500 PE (Provider Edge) routers gives companies access to xDSL and Ethernet technologies, at speeds of 75 kbps to 1 Gbps, under standard offers. The routers are located in major cities and business areas.
This network is connected to an international IP network (IP Global Network) through three gateways (located in Paris and London) to connect international business customers.
With the takeover of the RTGE network, the number of IP presence points increased with 80 new sites added in 2013
The international MPLS/IP VPN network (IP Global Network IGN and AGN access network)
Like the IP network in France (NBAIP), this network is designed to supply virtual private network (VPN), Internet and Voice over IP services. The network comprises 934 points of presence (including partner MPLS networks) in 190 countries.
The network is made up of dozens of network core routers (P routers and similar) and several hundred access routers (PE routers) that make up multiservice platforms (Ethernet, DSL, FR/ATM). The services are offered either directly on the access routers, through the Frame Relay/ATM access network (AGN), or through partner networks under Network to Network Interface (NNI) agreements.
A program to expand the geographic coverage of the IGN (IGN+) network was launched to eventually offer “native IP” services everywhere and thus do away with the AGN aggregation layer.
The international business voice network (NEO)
NEO is a network supplying voice services for international businesses. Based on the international MPLS IP network (IGN), this business voice network has 54 points of presence in 38 countries, and is connected to some 50 operators worldwide. It allows calls to be aggregated and terminated with these operators, for customers connected to the Orange Business Services network over IP (H323 or SIP) or TDM.
At December 31, 2012, the real estate assets recorded in Orange’s balance sheet had a net book value of 2.9 billion euros, compared with 3.1 billion euros at December 31, 2012.
These assets include buildings used to host telecommunication equipment, research centers, customer service centers, commercial facilities and offices.
In France, the Real Estate Division is responsible for managing all properties. It follows a policy that involves optimizing the occupation of surface within premises by constantly adapting to the changing needs expressed by the Group’s various entities and business lines. It is involved in the deployment of new stores within the distribution network, especially for very large stores. It also works to meet needs related to changes in the telecommunications network by making sure that the necessary sites are available for launching new technologies.
The Real Estate Division contributes to improve Group employees’ working environment—in line with the Conquest 2015 objectives—and enhance the environmental performance of the Group’s properties in order to help it meet its sustainable development goals.
At end-2013, Orange occupied 25,560 sites (including 231 with a surface area greater than 5,000 sq.m.), covering a total area of 5.8 million sq.m., including 2.3 million sq.m. of leased space and 3.5 million sq.m of fully-owned space.
This confirms the Group’s trend of scaling back its real estate portfolio slightly. These premises consist of technical centers, most of which are owned (2.6 million sq.m., including 2.1 million sq.m. owned), offices, most of which are leased (2.3 million sq.m., including 1.4 million sq.m. leased), and stores.
ORANGE / 2013 REGISTRATION DOCUMENT - 95
In Poland, the properties held by Orange Poland at the end of 2013 represented 2 million sq.m. The total surface area of developed and undeveloped land represented 13 million sq.m.
In Spain, the premises occupied by the Group amounted to a little under 148,000 sq.m at the end of 2013, most of which was leased.
The information and communication technology (ICT) sector in recent years has gone through major changes in its value chain, significantly increasing the number of players. New economic models developed by large Web players are coming into existence, while manufacturers of consumer electronics are moving towards value-added services. In this context, innovation will be a major source of growth for Orange. In 2013, Orange continued its efforts in research and innovation and devoted 1.9% of its revenues, or 780 million euros, to it. These expenses totaled 812 million euros in 2012 and 819 million euros in 2011. These amounts include employee costs, operating and investment costs for research and innovation in new products and services.
Research and Innovation Network
In order to achieve its goals in research and innovation, Orange has established a network of expertise spanning four continents.
The Orange Labs carry out the Group’s technical research, design and deployment activities from their locations in nine countries around the world: France, the United Kingdom, China, Japan, Poland, Romania, Tunisia, India, and Egypt. Each Orange Lab is immersed in a specific environment that enables it to anticipate and take advantage of technological breakthroughs and changes in user patterns worldwide and to facilitate partnerships, thereby accelerating the Group’s capacity for innovation.
The Orange Labs network is supplemented by so-called Technocentres, located in France, the United Kingdom, Poland, Jordan, and the Ivory Coast. Their objective is to design and market new products and services that meet customer requirements as far as possible in all the countries where the Group is present. They are also tasked with ensuring consistent user interfaces for the Group’s various products and services (design strategy).
The new Innovation, Marketing and Technologies Division
Innovation in networks and in customer service and experience are core elements of Orange’s strategic plan Conquest 2015. They are key differentiation and value-creation levers. The introduction of new internal operating methods as part of the Nova+ project constituted a major step in improving both efficiency and innovation in the Group. To achieve the objective of providing a faster and more efficient responses to the needs of its customers, all Orange teams with competencies in innovation, customer experience and information systems are now grouped together in the Innovation, Marketing and Technologies Division (effective as of May 1, 2013), reporting to a single management team.
Open innovation
Orange aims to be a key player in open innovation, which is based on sharing and collaboration. The main pillars of this approach are:
■
supporting start-ups and SMEs. Orange launched a start-up accelerator initiative, known as Orange Fab, in March 2013 in Silicon Valley, before expanding it first to France and then to South East Asia in November of that year. Orange Fab provides guidance and support to selected start-ups, in addition to financial and logistical support. Also as part of this approach, Orange is a founding partner of NUMA, the major Paris-based digital and innovation hub opened in 2013. The Group is a also a member of three tech-industry co-working spaces, bringing together innovators and entrepreneurs (scientists, engineers, developers, ergonomics experts and designers) from a wide variety of backgrounds (start-ups, large companies, SMEs, universities);
■
the Orange Partner program, as part of which Orange opens its service platforms to developers to provide more innovative services to its customers. In 2013, Orange developed new programming interfaces (API) in its core services: enriched communications, cloud, high capacity broadband, connected objects, NFC and payment, multi-screen entertainment, open data;
■
a major player in the research and innovation ecosystem. Orange is a key player in research programs through various partnerships, at both the French level (FUI and ANR projects, and “Future Investments Program”) and at the European level (seventh European Commission Framework Program, EUREKA-CELTIC, Horizon 2020). As part of the “Future Investments Program”, the Group is a member of two Technology Research Institutes and chairs the B-com Technology Research Institute, which works on ultra-high-speed broadband fixed-line and mobile networks and the content of the future. It also contributes to the SystemX institute, which works in the area of digital systems engineering. In France, Orange participates in ten competitiveness centers in France, set up to foster local synergies for innovative projects. Notably, it chairs the Images et Réseaux (Image and Networks) center, where it is the lead for the augmented reality plan. Orange plays a role in several plans in the nouvelle France industrielle program,
ORANGE / 2013 REGISTRATION DOCUMENT - 96
unveiled by the French government in September 2013 to accelerate developments in research and innovation; and
■
a policy of strategic partnerships with universities and academic institutes in France (including Institut Mines-Télécom, CNRS, INRIA, Université de Rennes 1 and Supélec) and abroad (for example with LIRIMA in Yaoundé in Cameroon). The Orange group is also financing four Research Chairs. Lastly, the Orange Group has an active policy of forming strategic partnerships with leading industrial players worldwide, which allows it to quickly enhance its portfolio of products and services and open itself to new ecosystems.
Private Equity
Orange plays a key role in financing innovation in the IT industry, notably through investments in the following three types of vehicles:
■
mono-corporate ventures (fully-owned investment companies) such as:
■
French holding companies Orange Capital (OC) and Orange Capital Management (OCM), and the Chinese Orange Venture Capital Investment (OVCI) fund, and,
■
French holding company Orange Technologies Investissements (OTI), initially established to monetize Orange’s intellectual property in exchange for stakes in high-tech start-ups;
■
multi-corporate ventures (joint investment companies), typically set up with other industrial companies but occasionally also involving financial firms. These multi-corporate ventures include:
■
three Orange Publicis Ventures funds (Growth, Global, and Early-stage) set up through a partnership with Publicis and managed by Iris Capital Management, and in which the Group purchased a 24.5% stake,
■
the Ecomobilité Ventures fund set up with SNCF and Total,
■
the Technocom 2 fund, financed jointly with Alcatel-Lucent, SEB, Soitec, and France’s National Seed Money Fund (Fonds National d’Amorçage) and managed by Innovacom Gestion, and,
■
the Robolution Capital fund, financed jointly by BPI France, the European Investment Fund, EDF and Thalès, and managed by the Orkos Capital management company;
■
more traditional private equity funds attracting a wide range of investors (financial and non-financial companies as well as retail investors) and managed by independent asset management firms in Europe, the United States and Canada).
Outlook
Orange is engaged in research in a number of areas to prepare for the future:
■
content aggregation services. Research in this area focuses on services and technologies to enrich, monetize and distribute multimedia content (voice recognition and embedded text in audiovisual flows, browsing in radio podcasts by section and key word, processing media content in the cloud);
■
trusted and data services. The Lyrics collaborative research project is led by Orange, with the objective of offering contactless mobile services, while guaranteeing the security of transactions and the confidentiality of users’ personal data. Lyrics unveiled the first European mobile transport pass at the 2013 Cartes trade fair;
■
customer experience, led by Orange, 4EVER is a collaborative research project to advance research into the television of the future, based on ultra-high-definition TV and the HEVC standard. In 2013, the project was the first in the world to provide a live broadcast of the Roland Garros tournament in HEVC format. It won the international prize at the 2013 Loading the future awards presented by the Images et Réseaux (Images and Networks) competitiveness hub;
■
energy efficiency of network infrastructure Orange conducts research, independently or in collaboration with European projects, to substantially reduce the energy consumption of networks, Internet infrastructures (4G, Wifi, cloud) and terminals (smartphones, Livebox);
■
networks of the future. In the framework of the European Horizon 2020 initiative, Orange signed the European public-private partnership on 5G infrastructures in December 2013. Founded by Orange, ALU, Nokia Solutions and Networks, Ericsson and the satellite operator SES, the partnership aims to work together to define the solutions, infrastructures, technologies and standards required to create the future 5G communication infrastructure.
Valuation of patents
At the end of 2013, Orange had a portfolio of 7,482 patents in France and abroad (issued or filed) with the goal of protecting its innovations. In order to maximize their value, some of these patents are licensed through programs such as a program for “Turbocodes” technologies that covers 3G mobile networks, or through patent pools for patents corresponding to industry standards (MP3, MPEG Audio, DAB, DVB, W-CDMA, G729, IEEE802.11x, and ISDB-T in Japan). Value maximization also concerns software such as engineering tools for the mobile network.
ORANGE / 2013 REGISTRATION DOCUMENT - 97
276 new patents were filed in 2013. These patents mainly relate to the Orange Labs network in France.
Orange Horizons
In January 2013, Orange announced the creation of a new subsidiary called Orange Horizons, with the aim of seeking out new commercial opportunities in countries where the Group is not yet present as a consumer operator, without it being necessary to make major investments. These projects take advantage of the Orange brand’s worldwide reputation, as well as the Group’s existing strengths. A year after its launch, Orange Horizons’ first successes include (i) the launch of on-line shops specializing in the sale of telecommunications equipment and connected objects, rolled out in 19 countries, (ii) the opening of “corners” in partner stores in South Africa and Portugal, enabling such services as assistance to Orange customers abroad, (iii) the introduction of geolocalized content sites, which numbered 13 in early 2014, and since February 2014, (iv) an on-line solution for remote recharging of mobile phone credit for more than 350 operators in 100 countries. Future projects may include the launch of a Mobile Virtual Network Operator (MVNO) activity in certain countries and the development of flexible offers for travellers.
Orange brand
Most licensees operating under the Orange brand are affiliates of the Orange Group, having entered into a brand license agreement with Orange Brand Services Limited, an indirectly owned subsidiary of Orange SA, and the owner of the Orange brand (see Section 7.5 Transactions with parent companies).
There are however a limited number of licensees which are not Group’s affiliates:
■
pursuant to a brand license agreement dated September 14, 1998, Partner Communications Company Limited has operated a telecommunications network under the Orange brand in Israel since 1999. This brand license agreement predates the acquisition of the Orange Group by France Telecom SA, and has no expiration date. The Orange Group has no direct or indirect shareholding in Partner Communications Company Limited;
■
on February 29, 2012, Orange completed the sale of Orange Suisse (a group mainly comprising Orange’s mobile subsidiary in Switzerland) to Matterhorn Mobile SA On the same date, Orange Brand Services Limited entered into new brand license agreements with Orange Suisse for the continued use of the Orange brand in Switzerland and Liechtenstein;
■
on January 3, 2013, Orange sold its 35% stake in Orange Austria to a subsidiary of Hutchison Whampoa. Orange Austria continues to use the Orange brand, under the terms of the licensing agreement signed on October 3, 2007.
Moreover, under the terms of the agreement signed by Orange on November 26, 2013 with a view to the sale to Altice of Orange Dominicana, its subsidiary in the Dominican Republic, Orange Dominicana will continue to use the Orange brand. Accordingly, it will sign a new brand licensing contract with Orange Brand Services Limited on completion of the disposal.
See Note 2 to the consolidated financial statements, Changes in scope of consolidation.
ORANGE / 2013 REGISTRATION DOCUMENT - 98
Year ended December 31, 2013
(in millions of euros, except for per share data) | Note | 2013 | 2012 | 2011 |
Revenues | 3.1 | 40,981 | 43,515 | 45,277 |
External purchases | 4.1 | (17,965) | (19,100) | (19,638) |
Other operating income | 3.2 | 687 | 900 | 658 |
Other operating expense | 4.2 | (508) | (721) | (691) |
Labour expenses | 5.1 | (9,019) | (10,363) | (8,815) |
Operating taxes and levies | 8.1 | (1,717) | (1,857) | (1,772) |
Gain (losses) on disposal | 2 | 119 | 158 | 246 |
Restructuring costs and similar items | 4.3 | (343) | (37) | (136) |
Depreciation and amortization | 7.1 | (6,052) | (6,329) | (6,735) |
Reclassification of cumulative translation adjustment from liquidated entities | 13.5 | - | - | 642 |
Impairment of goodwill | 6.1 | (512) | (1,732) | (611) |
Impairment of fixed assets | 7.2 | (124) | (109) | (380) |
Share of profits (losses) of associates and joint ventures | 9.1 | (259) | (262) | (97) |
Operating Income | | 5,288 | 4,063 | 7,948 |
Cost of gross financial debt | 10.1 | (1,746) | (1,769) | (2,066) |
Gains (losses) on assets contributing to net financial debt | 10.1 | 59 | 101 | 125 |
Foreign exchange gains (losses) | 10.1 | (18) | (28) | (21) |
Other net financial expenses | 10.1 | (45) | (32) | (71) |
Finance costs, net | | (1,750) | (1,728) | (2,033) |
Income tax | 12.1 | (1,405) | (1,231) | (2,087) |
Consolidated net income after tax | | 2,133 | 1,104 | 3,828 |
Net income attributable to owners of the parent | | 1,873 | 820 | 3,895 |
Non-controlling interests | | 260 | 284 | (67) |
Earnings per share (in euros) attributable to owners of the parent | | | | |
| | 0.71 | 0.31 | 1.47 |
| | 0.71 | 0.31 | 1.46 |
(in millions of euros) | Note | 2013 | 2012 | 2011 |
Consolidated net income after tax | | 2,133 | 1,104 | 3,828 |
Actuarial gains and losses on post-employment benefits | 2 & 5.2 | 23 | (83) | (46) |
Income tax relating to items that will not be reclassified | 12.2 | (4) | 29 | (3) |
Share of other comprehensive income in associates and joint ventures that will not be reclassified | 9.1 | (31) | (41) | (2) |
Items that will not be reclassified to profit or loss (a) | | (12) | (95) | (51) |
Assets available for sale | 10.7 | 8 | 7 | (10) |
Cash flow hedges | 10.11 | (298) | (394) | (3) |
Net investment hedges | 10.13 | 41 | 99 | (14) |
Exchange differences on translating foreign operations | 13.5 | (453) | 264 | (1,053) |
Income tax relating to items that may be reclassified | 12.2 | 87 | 95 | 9 |
Share of other comprehensive income in associates and joint ventures that may be reclassified | 9.1 | (11) | 22 | (9) |
Items that may be reclassified subsequently to profit or loss (b) | | (626) | 93 | (1,080) |
Other comprehensive income for the year (a) + (b) | | (638) | (2) | (1,131) |
Total consolidated comprehensive income | | 1,495 | 1,102 | 2,697 |
Total comprehensive income attributable to owners of the parent | | 1,255 | 748 | 2,868 |
Non-controlling interests | | 240 | 354 | (171) |
ORANGE / 2013 REGISTRATION DOCUMENT - 100
(in millions of euros) | Note | December 31, 2013 | December 31, 2012 | December 31, 2011 |
ASSETS | | | | |
Goodwill | 6.2 | 24,988 | 25,773 | 27,340 |
Other Intangible assets | 7.3 | 11,744 | 11,818 | 11,343 |
Property, plant and equipment | 7.4 | 23,157 | 23,662 | 23,634 |
Interests in associates and joint ventures | 9.1 | 6,525 | 7,431 | 7,944 |
Assets available for sale | 10.7 | 103 | 139 | 89 |
Non-current loans and receivables | 10.2 | 1,837 | 1,003 | 994 |
Non-current financial assets at fair value through profit or loss | 10.9 | 95 | 159 | 114 |
Non-current hedging derivatives assets | 10.10 | 36 | 204 | 428 |
Other non-current assets | 3.5 | 15 | 70 | 94 |
Deferred tax assets | 12.3 | 3,251 | 3,594 | 3,551 |
Total non-current assets | | 71,751 | 73,853 | 75,531 |
Inventories | 4.4 | 637 | 586 | 631 |
Trade receivables | 3.3 | 4,360 | 4,635 | 4,905 |
Current loans and other receivables | 10.2 | 38 | 81 | 1,165 |
Current financial assets at fair value through profit or loss, excluding cash equivalents | 10.9 | 213 | 141 | 948 |
Current hedging derivatives assets | 10.10 | 101 | 3 | 66 |
Other current assets | 3.5 | 769 | 670 | 1,066 |
Operating taxes and levies receivables | 8.2 | 924 | 1,193 | 1,218 |
Current tax assets | 12.3 | 110 | 109 | 124 |
Prepaid expenses | 4.6 | 377 | 388 | 368 |
Cash equivalents | 10.2 | 4,330 | 7,116 | 6,733 |
Cash | 10.2 | 1,586 | 1,205 | 1,311 |
Total current assets | | 13,445 | 16,127 | 18,535 |
Assets held for sale (1) | 2 | 637 | - | 2,017 |
TOTAL ASSETS | | 85,833 | 89,980 | 96,083 |
EQUITY AND LIABILITIES | | | | |
Share capital | | 10,596 | 10,596 | 10,596 |
Additional paid-in capital | | 16,790 | 16,790 | 16,790 |
Retained earnings | | (3,037) | (3,080) | 187 |
Equity attributable to the owners of the parent | | 24,349 | 24,306 | 27,573 |
Non controlling interest | | 1,985 | 2,078 | 2,019 |
Total equity | 13 | 26,334 | 26,384 | 29,592 |
Non-current trade payables | 4.5 | 349 | 337 | 380 |
Non-current financial liabilities at amortized cost, excluding trade payables | 10.2 | 30,295 | 31,883 | 33,933 |
Non-current financial liabilities at fair value through profit or loss | 10.6 | 369 | 482 | 259 |
Non-current hedging derivatives liabilities | 10.10 | 1,133 | 542 | 277 |
Non-current employee benefits | 5.2 | 2,924 | 2,989 | 1,711 |
Non-current provisions for dismantling | 7.5 | 687 | 686 | 630 |
Non-current restructuring provisions | 4.3 | 155 | 98 | 125 |
Other non-current liabilities | 4.7 | 477 | 560 | 700 |
Deferred tax liabilities | 12.3 | 954 | 1,102 | 1,264 |
Total non-current liabilities | | 37,343 | 38,679 | 39,279 |
Current trade payables | 4.5 | 7,540 | 7,697 | 8,151 |
Current financial liabilities at amortized cost, excluding trade payables | 10.2 | 7,100 | 7,331 | 5,440 |
Current financial liabilities at fair value through profit or loss | 10.6 | 165 | 111 | 2,019 |
Current hedging derivatives liabilities | 10.10 | 3 | 5 | 3 |
Current employee benefits | 5.2 | 2,009 | 1,948 | 1,870 |
Current provisions for dismantling | 7.5 | 23 | 23 | 19 |
Current restructuring provisions | 4.3 | 157 | 55 | 277 |
Other current liabilities | 4.7 | 1,288 | 1,280 | 2,012 |
Operating taxes and levies payables | 8.2 | 1,200 | 1,475 | 1,434 |
Current tax payables | 12.3 | 592 | 2,794 | 2,625 |
Deferred income | 3.4 | 1,974 | 2,198 | 2,322 |
Total current liabilities | | 22,051 | 24,917 | 26,172 |
Liabilities related to assets held for sale (1) | 2 | 105 | - | 1,040 |
TOTAL EQUITY AND LIABILITIES | | 85,833 | 89,980 | 96,083 |
(1) Orange Dominicana in 2013 and Orange Suisse in 2011. |
ORANGE / 2013 REGISTRATION DOCUMENT - 101
| | Attributable to
owners of the parent | Attributable to non-controlling interests | |
(in millions of euros) | Note | Number of issued shares | Share capital | Additional paid-in capital and statutory reserve | Reserves | Other compre- hensive income | Total | Reserves | Other compre- hensive income | Total | Total Equity |
Balance at January 1, 2011 | | 2,648,858,606 | 10,595 | 16,777 | (161) | 1,890 | 29,101 | 2,172 | 276 | 2,448 | 31,549 |
Consolidated comprehensive income | | - | - | - | 3,895 | (1,027) | 2,868 | (67) | (104) | (171) | 2,697 |
Capital increase | 13.1 | 26,777 | 1 | - | - | - | 1 | - | - | - | 1 |
Share-based compensation | 5.3 | - | - | - | 19 | - | 19 | 2 | - | 2 | 21 |
Purchase of treasury shares | 13.2 | - | - | - | (223) | - | (223) | - | - | - | (223) |
Dividends | 13.4 13.6 | - | - | - | (3,703) | - | (3,703) | (687) | - | (687) | (4,390) |
Changes in ownership interests with no gain/ loss of control | 2 | - | - | - | (10) | - | (10) | (26) | - | (26) | (36) |
Other movements | | - | - | 13 | (493) | - | (480) | 453 | - | 453 | (27) |
Balance at December 31, 2011 | | 2,648,885,383 | 10,596 | 16,790 | (676) | 863 | 27,573 | 1,847 | 172 | 2,019 | 29,592 |
Consolidated comprehensive income | | - | - | - | 820 | (72) | 748 | 284 | 70 | 354 | 1,102 |
Share-based compensation | 5.3 | - | - | - | (11) | - | (11) | 4 | - | 4 | (7) |
Purchase of treasury shares | 13.2 | - | - | - | (49) | - | (49) | - | - | - | (49) |
Dividends | 13.4 13.6 | - | - | - | (3,632) | - | (3,632) | (579) | - | (579) | (4,211) |
Changes in ownership interests with no gain/ loss of control | 2 13.6 | - | - | - | (281) | - | (281) | 284 | - | 284 | 3 |
Other movements | | - | - | - | (42) | - | (42) | (4) | - | (4) | (46) |
Balance at December 31, 2012 | | 2,648,885,383 | 10,596 | 16,790 | (3,871) | 791 | 24,306 | 1,836 | 242 | 2,078 | 26,384 |
Consolidated comprehensive income | | - | - | - | 1,873 | (618) | 1,255 | 260 | (20) | 240 | 1,495 |
Share-based compensation | 5.3 | - | - | - | 2 | - | 2 | 4 | - | 4 | 6 |
Purchase of treasury shares | 13.2 | - | - | - | (25) | - | (25) | - | - | - | (25) |
Dividends | 13.4 13.6 | - | - | - | (1,314) | - | (1,314) | (359) | - | (359) | (1,673) |
Changes in ownership interests with no gain/ loss of control | 2 | - | - | - | 2 | - | 2 | 4 | - | 4 | 6 |
Other movements | | - | - | - | 123 | - | 123 | 18 | - | 18 | 141 |
Balance at December 31, 2013 | | 2,648,885,383 | 10,596 | 16,790 | (3,210) | 173 | 24,349 | 1,763 | 222 | 1,985 | 26,334 |
ORANGE / 2013 REGISTRATION DOCUMENT - 102
| Attributable to
owners of the parent | Attributable to
non-controlling interests | |
| Assets available for sale | Hedging instru- ments | Trans- lation adjust- ments | Actuarial gains and losses | Deferred taxes | Other compo- nents
of compre- hensive income of associates and joint ventures | Total | Hedging instru
ments | Trans- lation adjust- ments | Actuarial gains and losses | Deferred taxes | Total | Total other compre- hensive income |
Balance at January 1, 2011 | 42 | 440 | 1,689 | (254) | (53) | 26 | 1,890 | (1) | 305 | (36) | 8 | 276 | 2,166 |
Variation | (10) | (18) | (937) | (57) | 6 | (11) | (1,027) | 1 | (116) | 11 | - | (104) | (1,131) |
Balance at December 31, 2011 | 32 | 422 | 752 | (311) | (47) | 15 | 863 | - | 189 | (25) | 8 | 172 | 1,035 |
Variation | 7 | (292) | 189 | (82) | 125 | (19) | (72) | (3) | 75 | (1) | (1) | 70 | (2) |
Balance at December 31, 2012 | 39 | 130 | 941 | (393) | 78 | (4) | 791 | (3) | 264 | (26) | 7 | 242 | 1,033 |
Variation | 8 | (257) | (429) | 19 | 83 | (42) | (618) | (0) | (24) | 4 | (0) | (20) | (638) |
Balance at December 31, 2013 | 47 | (127) | 512 | (374) | 161 | (46) | 173 | (3) | 240 | (22) | 7 | 222 | 395 |
ORANGE / 2013 REGISTRATION DOCUMENT - 103
(in millions of euros) | Note | 2013 | 2012 | 2011 |
OPERATING ACTIVITIES | | | | |
Consolidated net income | | 2,133 | 1,104 | 3,828 |
Adjustments to reconcile net income (loss) to funds generated from operations | | | | |
Operating taxes and levies | 8 | 1,717 | 1,857 | 1,772 |
Gains (losses) on disposal | 2 | (119) | (158) | (246) |
Depreciation and amortization | 7.3-7.4 | 6,052 | 6,329 | 6,735 |
Change in provisions (1) | 3-4-5-7 | 82 | 743 | (348) |
Reclassification of cumulative translation adjustment from liquidated entities | 13.5 | - | - | (642) |
Impairment of goodwill | 6.2 | 512 | 1,732 | 611 |
Impairment of non-current assets | 7.2 | 124 | 109 | 380 |
Share of profits (losses) of associates and joint ventures | 9.1 | 259 | 262 | 97 |
Operational net foreign exchange and derivatives | | 5 | 52 | 44 |
Finance costs, net | 10.1 | 1,750 | 1,728 | 2,033 |
Income tax | 12.1 | 1,405 | 1,231 | 2,087 |
Share-based compensation | 5.1 | 8 | (5) | 21 |
Changes in working capital requirements | | | | |
Decrease (increase) in inventories, gross | | (81) | 53 | 45 |
Decrease (increase) in trade receivables, gross | | 118 | 331 | 596 |
Increase (decrease) in trade payables | | 51 | (244) | (41) |
Payment of DPTG litigation (2) | | - | (550) | - |
Changes in other assets and liabilities (3) | | (198) | (210) | (336) |
Other net cash out | | | | |
Operating taxes and levies paid | | (1,706) | (1,833) | (1,658) |
Dividends received | | 320 | 493 | 523 |
Interest paid and interest rates effects on derivatives, net | | (1,886) | (1,863) | (1,601) |
Income tax paid | 12.3 | (1,141) | (1,145) | (1,021) |
Tax litigation related to financial year 2005 | 12 | (2,146) | - | - |
Net cash provided by operating activities | | 7,259 | 10,016 | 12,879 |
INVESTING ACTIVITIES | | | | |
Purchases (sales) of property, plant and equipment and intangible assets | | | | |
Purchases of property, plant and equipment and intangible assets (4) | 7.3-7.4 | (6,117) | (6,763) | (6,711) |
Increase (decrease) in fixed assets payables | | 22 | (229) | 39 |
Proceeds from sales of property, plant and equipment and intangible assets | 7 | 98 | 148 | 74 |
Cash paid for investment securities, net of cash acquired | 2 | (69) | (49) | (217) |
Investments in associates and joint ventures, net of cash acquired | 2 | (2) | (45) | (392) |
Purchases of equity securities measured at fair value | 2 | (18) | (24) | - |
Proceeds from sales of Orange Suisse, net of cash transferred | 2 | - | 1,386 | - |
Other proceeds from sales of investment securities, net of cash transferred | 2 | 76 | 24 | 452 |
Decrease (increase) in securities and other financial assets | | | | |
Investments at fair value, excluding cash equivalents | | (39) | 591 | (67) |
Redemption of loan granted to EE | 10.8 | - | 222 | 511 |
Other | | 5 | 29 | 3 |
Net cash used in investing activities | | (6,044) | (4,710) | (6,308) |
ORANGE / 2013 REGISTRATION DOCUMENT - 104
(in millions of euros) | Note | 2013 | 2012 | 2011 |
FINANCING ACTIVITIES | | | | |
Long-term debt issuances | 10.4-10.5 | 3,209 | 2,769 | 4,331 |
Long-term debt redemptions and repayments | 10.4-10.5 | (4,001) | (3,139) | (1,717) |
Increase (decrease) of bank overdrafts and short-term borrowings | 10 | (151) | 1,001 | (570) |
Decrease (increase) of deposits and other debt-linked financial assets | 10 | (751) | (178) | 2 |
Exchange rates effects on derivatives, net | | (135) | 271 | (238) |
Purchase of treasury shares | 13.2 | (24) | (94) | (275) |
Purchase of ownership interests in Egypt with no gain of control | 2 | - | (1,489) | - |
Others changes in ownership interests with no gain / loss of control | | (11) | - | (8) |
Capital increase (decrease) - owners of the parent company | 13.1 | - | - | 1 |
Capital increase (decrease) - non-controlling interests | | - | 2 | - |
Dividends paid to non-controlling interests | 13.6 | (359) | (583) | (683) |
Dividends paid to owners of the parent company | 13.4 | (1,314) | (3,632) | (3,703) |
Net cash used in financing activities | | (3,537) | (5,072) | (2,860) |
Net change in cash and cash equivalents | | (2,322) | 234 | 3,711 |
Effect of exchange rates changes on cash and cash equivalents and other non-monetary effects | | (65) | 26 | (78) |
Cash and cash equivalents - opening balance | | 8,321 | 8,061 | 4,428 |
o/w cash | | 1,205 | 1,311 | 1,227 |
o/w cash equivalents | | 7,116 | 6,733 | 3,201 |
o/w discontinued operations | | - | 17 | - |
Cash and cash equivalents - closing balance | | 5,934 | 8,321 | 8,061 |
o/w cash | | 1,586 | 1,205 | 1,311 |
o/w cash equivalents | | 4,330 | 7,116 | 6,733 |
o/w discontinued operations | 2 | 18 | - | 17 |
(1) Mainly including depreciation of trade receivables (Note 3.3), depreciation of inventories (Note 4.4), provision for restructuring (Note 4.3), provision for litigations (Note 4.7), provision for employee benefits (Note 5) and provision for dismantling (Note 7.5). (2) Payment to DPTG by Orange Polska SA of 550 million euros in January 2012. (3) Excluding operating tax receivables and payables. (4) Investments in property, plant, equipment and intangible assets financed through finance leases amounting to 95 million euros (47 million euros at December 31, 2012 and 180 million euros at December 31, 2011) have no impact on the statement of cash flows at the time of acquisition. |
ORANGE / 2013 REGISTRATION DOCUMENT - 105
Segment information
(in millions of euros) | France | Spain | Poland | Rest of the World |
Revenues | 20,018 | 4,052 | 3,079 | 7,792 |
| 19,192 | 4,015 | 3,042 | 7,400 |
| 826 | 37 | 37 | 392 |
External purchases | (7,487) | (2,619) | (1,534) | (4,101) |
Other operating income | 994 | 122 | 76 | 134 |
Other operating expense | (668) | (151) | (102) | (294) |
Labor expenses | (4,868) | (218) | (464) | (747) |
Operating taxes and levies | (1,009) | (148) | (77) | (321) |
Gain (losses) on disposal | - | - | 4 | 68 |
Restructuring costs and similar items | (220) | - | (45) | (20) |
Reported EBITDA | 6,760 | 1,038 | 937 | 2,511 |
Depreciation and amortization | (2,534) | (578) | (734) | (1,371) |
Impairment of goodwill | - | - | - | (497) |
Impairment of fixed assets | (24) | - | (2) | (96) |
Share of profits (losses) of associates and joint ventures | (1) | - | - | (196) |
Operating income | 4,201 | 460 | 201 | 351 |
Finance costs, net | | | | |
Income tax | | | | |
Consolidated net income after tax | | | | |
Investments in property, plant and equipment and intangible assets | | | | |
■ excluding telecommunications licenses | 2,833 | 562 | 457 | 1,163 |
■ telecommunications licenses | 28 | 22 | 63 | 373 |
■ financed through finance leases | - | 4 | - | 6 |
TOTAL INVESTMENTS (3) | 2,861 | 588 | 520 | 1,542 |
(1) Including revenues of 4,556 million euros in France, 30 million euros in Spain, 14 million euros in Poland and 1,913 million euros in other countries. Including tangible and intangible assets of 239 million euros in France and 104 million euros in other countries. (2) Including revenues of 1,572 million euros in France and 130 million euros in other countries. Including tangible and intangible assets of 337 million euros in France and 21 million euros in other countries. (3) Including 1,942 million euros for other intangible assets and 4,270 million euros for other tangible assets. (4) Ex-Everything Everywhere. |
ORANGE / 2013 REGISTRATION DOCUMENT - 106
Enterprise (1) | International Carriers & Shared Services (2) | Eliminations | Total Orange | EE (100%) (4) |
6,513 | 1,702 | (2,175) | 40,981 | 7,632 |
6,118 | 1,214 | - | 40,981 | 7,632 |
395 | 488 | (2,175) | - | - |
(3,787) | (3,230) | 4,793 | (17,965) | (5,126) |
140 | 2,769 | (3,548) | 687 | 39 |
(171) | (52) | 930 | (508) | (262) |
(1,577) | (1,145) | - | (9,019) | (540) |
(92) | (70) | - | (1,717) | (134) |
3 | 44 | - | 119 | 33 |
(25) | (33) | - | (343) | (96) |
1,004 | (15) | - | 12,235 | 1,546 |
(352) | (483) | - | (6,052) | (1,539) |
- | (15) | - | (512) | - |
- | (2) | - | (124) | - |
(10) | (52) | - | (259) | (8) |
642 | (567) | - | 5,288 | (1) |
| | | (1,750) | (117) |
| | | (1,405) | 29 |
| | | 2,133 | (89) |
| | | | |
311 | 305 | - | 5,631 | 686 |
- | - | - | 486 | 731 |
32 | 53 | - | 95 | - |
343 | 358 | - | 6,212 | 1,417 |
ORANGE / 2013 REGISTRATION DOCUMENT - 107
(in millions of euros) | France | Spain | Poland | Rest of the World |
Revenues | 21,431 | 4,027 | 3,381 | 8,281 |
| 20,545 | 3,983 | 3,345 | 7,924 |
| 886 | 44 | 36 | 357 |
External purchases | (8,178) | (2,654) | (1,662) | (4,337) |
Other operating income | 1,039 | 73 | 115 | 140 |
Other operating expense | (603) | (165) | (124) | (238) |
Labor expenses | (5,850) | (195) | (486) | (764) |
Operating taxes and levies | (1,060) | (135) | (74) | (281) |
Gain (losses) on disposal | (1) | - | 4 | 95 |
Restructuring costs and similar items | (15) | - | 2 | (3) |
Reported EBITDA | 6,763 | 951 | 1,156 | 2,893 |
Depreciation and amortization | (2,431) | (774) | (769) | (1,515) |
Impairment of goodwill | - | - | (889) | (839) |
Impairment of fixed assets | (26) | (8) | (4) | (62) |
Share of profits (losses) of associates and joint ventures | - | - | 1 | (145) |
Operating income | 4,306 | 169 | (505) | 332 |
Finance costs, net | | | | |
Income tax | | | | |
Consolidated net income after tax | | | | |
Investments in property, plant and equipment and intangible assets | | | | |
■ excluding telecommunications licenses | 2,712 | 473 | 558 | 1,308 |
■ telecommunications licenses | 902 | 1 | - | 42 |
■ financed through finance leases | - | 8 | - | 3 |
TOTAL INVESTMENTS (3) | 3,614 | 482 | 558 | 1,353 |
(1) Including revenues of 4,901 million euros in France, 32 million euros in Spain, 15 million euros in Poland and 2,053 million euros in other countries. Including tangible and intangible assets of 242 million euros in France and 119 million euros in other countries. (2) Including revenues of 1,471 million euros in France and 152 million euros in other countries. Including tangible and intangible assets of 421 million euros in France and 21 million euros in other countries. (3) Including 2,472 million euros for other intangible assets and 4,338 million euros for other tangible assets. |
ORANGE / 2013 REGISTRATION DOCUMENT - 108
Enterprise (1) | International Carriers & Shared Services (2) | Eliminations | Total Orange | EE (100%) |
7,001 | 1,623 | (2,229) | 43,515 | 8,207 |
6,578 | 1,140 | - | 43,515 | 8,207 |
423 | 483 | (2,229) | - | - |
(4,044) | (3,203) | 4,978 | (19,100) | (5,690) |
161 | 3,098 | (3,726) | 900 | 47 |
(172) | (396) | 977 | (721) | (361) |
(1,674) | (1,394) | - | (10,363) | (570) |
(120) | (187) | - | (1,857) | (156) |
(1) | 61 | - | 158 | (1) |
(17) | (4) | - | (37) | (138) |
1,134 | (402) | - | 12,495 | 1,338 |
(363) | (477) | - | (6,329) | (1,545) |
(4) | - | - | (1,732) | - |
(7) | (2) | - | (109) | - |
3 | (121) | - | (262) | - |
763 | (1,002) | - | 4,063 | (207) |
| | | (1,728) | (99) |
| | | (1,231) | 72 |
| | | 1,104 | (235) |
| | | | |
352 | 415 | - | 5,818 | 751 |
- | - | - | 945 | - |
9 | 27 | - | 47 | (4) |
361 | 442 | - | 6,810 | 747 |
ORANGE / 2013 REGISTRATION DOCUMENT - 109
(in millions of euros) | France | Spain | Poland | Rest of
the World |
Revenues | 22,534 | 3,993 | 3,625 | 8,795 |
| 21,551 | 3,946 | 3,585 | 8,434 |
| 983 | 47 | 40 | 361 |
External purchases | (8,564) | (2,742) | (1,703) | (4,558) |
Other operating income | 1,142 | 68 | 100 | 140 |
Other operating expense | (611) | (157) | (256) | (258) |
Labor expenses | (4,817) | (181) | (495) | (817) |
Operating taxes and levies | (1,081) | (141) | (83) | (290) |
Gain (losses) on disposal | - | 1 | 201 | (8) |
Restructuring costs and similar items | (34) | (2) | (42) | (11) |
Reported EBITDA | 8,569 | 839 | 1,347 | 2,993 |
Depreciation and amortization | (2,327) | (1,005) | (902) | (1,570) |
Reclassification of cumulative translation adjustment from liquidated entities | - | - | - | - |
Impairment of goodwill | - | - | - | (611) |
Impairment of fixed assets | (1) | (2) | (2) | (212) |
Share of profits (losses) of associates and joint ventures | - | - | - | (5) |
Operating income | 6,241 | (168) | 443 | 595 |
Finance costs, net | | | | |
Income tax | | | | |
Consolidated net income after tax | | | | |
Investments in property, plant and equipment and intangible assets | | | | |
■ excluding telecommunications licenses | 2,619 | 405 | 627 | 1,409 |
■ telecommunications licenses | 293 | 580 | - | 68 |
■ financed through finance leases | - | 5 | - | - |
TOTAL INVESTMENTS (3) | 2,912 | 990 | 627 | 1,477 |
(1) Including revenues of 5,141 million euros in France, 34 million euros in Spain, 15 million euros in Poland and 1,911 million euros in other countries. Including tangible and intangible assets of 232 million euros in France and 111 million euros in other countries. (2) Including revenues of 1,450 million euros in France and 160 million euros in other countries. Including tangible and intangible assets of 532 million euros in France and 10 million euros in other countries. (3) Including 2,432 million euros for other intangible assets and 4,459 million euros for other tangible assets. |
ORANGE / 2013 REGISTRATION DOCUMENT - 110
Enterprise (1) | International Carriers & Shared Services (2) | Eliminations | Total Orange | EE (100%) |
7,101 | 1,610 | (2,381) | 45,277 | 7,817 |
6,660 | 1,101 | - | 45,277 | 7,817 |
441 | 509 | (2,381) | - | - |
(4,120) | (3,183) | 5,232 | (19,638) | (5,444) |
139 | 2,877 | (3,808) | 658 | 20 |
(176) | (190) | 957 | (691) | (299) |
(1,544) | (961) | - | (8,815) | (552) |
(109) | (68) | - | (1,772) | (104) |
- | 52 | - | 246 | (1) |
(15) | (32) | - | (136) | (88) |
1,276 | 105 | - | 15,129 | 1,349 |
(337) | (594) | - | (6,735) | (1,428)
|
-
| 642 | - | 642 | - |
- | - | - | (611) | - |
(1) | (162) | - | (380) | - |
2 | (94) | - | (97) | - |
940 | (103) | - | 7,948 | (78) |
| | | (2,033) | (52) |
| | | (2,087) | 10 |
| | | 3,828 | (120) |
| | | | |
343 | 367 | - | 5,770 | 633 |
- | - | - | 941 | - |
- | 175 | - | 180 | - |
343 | 542 | - | 6,891 | 633 |
ORANGE / 2013 REGISTRATION DOCUMENT - 111
(in millions of euros) | France | Spain | Poland | Rest of
the World |
Goodwill | 15,382 | 4,723 | 789 | 3,583 |
Other intangible assets | 3,694 | 1,301 | 743 | 1,945 |
Property, plant and equipment | 11,398 | 1,733 | 3,080 | 4,551 |
Interests in associates and joint ventures | 2 | 2 | - | 561 |
Non-current assets included in the calculation of net financial debt | | | | |
Other | 4 | - | - | - |
Total non-current assets | 30,480 | 7,759 | 4,612 | 10,640 |
Inventories | 311 | 62 | 48 | 143 |
Trade receivables | 1,617 | 590 | 296 | 1,042 |
Prepaid expenses | 64 | 38 | 21 | 59 |
Current assets included in the calculation of net financial debt | | | | |
Other | 674 | 39 | 20 | 364 |
Total current assets | 2,666 | 729 | 385 | 1,608 |
Assets held for sale (4) | - | - | - | 637 |
TOTAL ASSETS | 33,146 | 8,488 | 4,997 | 12,885 |
Equity | | | | |
Non-current trade payables | 111 | 2 | 222 | 14 |
Non-current employee benefits | 1,953 | - | 72 | 76 |
Non-current liabilities included in the calculation of net financial debt | | | | |
Other | 880 | 158 | 75 | 131 |
Total non-current liabilities | 2,944 | 160 | 369 | 221 |
Current trade payables | 3,217 | 1,068 | 469 | 1,647 |
Current employee benefits | 1,150 | 45 | 47 | 125 |
Deferred income | 1,226 | 80 | 109 | 302 |
Current liabilities included in the calculation of net financial debt | | | | |
Other | 786 | 76 | 266 | 621 |
Total current liabilities | 6,379 | 1,269 | 891 | 2,695 |
Liabilities related to assets held for sale (4) | - | - | - | 105 |
TOTAL EQUITY AND LIABILITIES | 9,323 | 1,429 | 1,260 | 3,021 |
(1) Some trade receivables generated by the Enterprise segment (approximately 228 million euros) are presented in the France segment, which is responsible for their collection. Including tangible and intangible assets of 518 million euros in France and 248 million euros in other countries. (2) Including tangible and intangible assets of 2,491 million euros in France and 67 million euros in other countries. Intangible assets also include the Orange brand for 3,133 million euros. (3) Non-allocated assets and liabilities mainly include external financial debt, external cash & cash equivalent, current and deferred tax assets and shareholders’ equity (see Note 18.1). (4) Relating to the sale of Orange Dominicana (see Note 2). |
ORANGE / 2013 REGISTRATION DOCUMENT - 112
Enterprise (1) | International Carriers & Shared Services (2) | Eliminations and unallocated items (3) | Total Orange | EE (100%) |
428 | 83 | - | 24,988 | 6,828 |
318 | 3,743 | - | 11,744 | 5,640 |
447 | 1,948 | - | 23,157 | 2,774 |
114 | 5,846 | - | 6,525 | 5 |
| | 1,203 | 1,203 | 58 |
9 | - | 4,121 | 4,134 | 210 |
1,316 | 11,620 | 5,324 | 71,751 | 15,515 |
26 | 47 | - | 637 | 102 |
657 | 863 | (705) | 4,360 | 916 |
107 | 103 | (15) | 377 | 453 |
| | 6,230 | 6,230 | 507 |
138 | 209 | 397 | 1,841 | 27 |
928 | 1,222 | 5,907 | 13,445 | 2,005 |
- | - | - | 637 | - |
2,244 | 12,842 | 11,231 | 85,833 | 17,520 |
| | 26,334 | 26,334 | 11,674 |
- | - | - | 349 | 22 |
225 | 598 | - | 2,924 | 145 |
| | 31,578 | 31,578 | 2,615 |
19 | 49 | 1,180 | 2,492 | 352 |
244 | 647 | 32,758 | 37,343 | 3,134 |
629 | 1,216 | (706) | 7,540 | 2,025 |
323 | 319 | - | 2,009 | 66 |
172 | 100 | (15) | 1,974 | 275 |
| | 7,268 | 7,268 | 55 |
189 | 487 | 835 | 3,260 | 291 |
1,313 | 2,122 | 7,382 | 22,051 | 2,712 |
- | - | - | 105 | - |
1,557 | 2,769 | 66,474 | 85,833 | 17,520 |
ORANGE / 2013 REGISTRATION DOCUMENT - 113
(in millions of euros) | France | Spain | Poland | Rest of the World |
Goodwill | 15,347 | 4,723 | 802 | 4,405 |
Other intangible assets | 3,740 | 1,292 | 720 | 2,001 |
Property, plant and equipment | 11,023 | 1,683 | 3,417 | 5,041 |
Interests in associates and joint ventures | 4 | 2 | 5 | 794 |
Non-current assets included in the calculation of net financial debt | | | | |
Other | 4 | - | - | 55 |
Total non-current assets | 30,118 | 7,700 | 4,944 | 12,296 |
Inventories | 242 | 75 | 48 | 148 |
Trade receivables | 1,924 | 428 | 345 | 1,151 |
Prepaid expenses | 73 | 37 | 17 | 61 |
Current assets included in the calculation of net financial debt | | | | |
Other | 994 | 26 | 27 | 387 |
Total current assets | 3,233 | 566 | 437 | 1,747 |
TOTAL ASSETS | 33,351 | 8,266 | 5,381 | 14,043 |
Equity | | | | |
Non current trade payables | 134 | 5 | 185 | 13 |
Non current employee benefits | 2,017 | 6 | 93 | 76 |
Non-current liabilities included in the calculation of net financial debt | | | | |
Other | 823 | 171 | 67 | 124 |
Total non-current liabilities | 2,974 | 182 | 345 | 213 |
Current trade payables | 3,175 | 987 | 545 | 1,904 |
Current employee benefits | 1,114 | 28 | 50 | 133 |
Deferred income | 1,372 | 92 | 133 | 321 |
Current liabilities included in the calculation of net financial debt | | | | |
Other | 986 | 69 | 273 | 605 |
Total current liabilities | 6,647 | 1,176 | 1,001 | 2,963 |
TOTAL EQUITY AND LIABILITIES | 9,621 | 1,358 | 1,346 | 3,176 |
(1) Some trade receivables generated by the Enterprise segment (approximately 232 million euros) are presented in the France segment, which is responsible for their collection. Including tangible and intangible assets of 530 million euros in France and 277 million euros in other countries. (2) Including tangible and intangible assets of 2,558 million euros in France and 65 million euros in other countries. Intangible assets also include the Orange brand for 3,133 million euros. (3) Non-allocated assets and liabilities mainly include external financial debt, external cash & cash equivalent, current and deferred tax assets and shareholders’ equity (see Note 18.1). |
ORANGE / 2013 REGISTRATION DOCUMENT - 114
Enterprise (1) | International Carriers & Shared Services (2) | Eliminations and unallocated items (3) | Total Orange | EE (100%) |
425 | 71 | - | 25,773 | 6,975 |
327 | 3,738 | - | 11,818 | 5,626 |
480 | 2,018 | - | 23,662 | 2,911 |
123 | 6,503 | - | 7,431 | 20 |
| | 661 | 661 | 30 |
9 | 1 | 4,439 | 4,508 | 340 |
1,364 | 12,331 | 5,100 | 73,853 | 15,902 |
30 | 43 | - | 586 | 156 |
743 | 575 | (531) | 4,635 | 956 |
119 | 102 | (21) | 388 | 464 |
| | 8,467 | 8,467 | 1,037 |
140 | 283 | 194 | 2,051 | 17 |
1,032 | 1,003 | 8,109 | 16,127 | 2,630 |
2,396 | 13,334 | 13,209 | 89,980 | 18,532 |
| | 26,384 | 26,384 | 12,657 |
- | - | - | 337 | - |
228 | 569 | - | 2,989 | 75 |
| | 32,681 | 32,681 | 2,598 |
8 | 143 | 1,336 | 2,672 | 500 |
236 | 712 | 34,017 | 38,679 | 3,173 |
628 | 990 | (532) | 7,697 | 2,020 |
329 | 294 | - | 1,948 | 53 |
201 | 100 | (21) | 2,198 | 291 |
| | 7,447 | 7,447 | 41 |
216 | 686 | 2,792 | 5,627 | 297 |
1,374 | 2,070 | 9,686 | 24,917 | 2,702 |
1,610 | 2,782 | 70,087 | 89,980 | 18,532 |
ORANGE / 2013 REGISTRATION DOCUMENT - 115
(in millions of euros) | France | Spain | Poland | Rest of the World |
Goodwill | 15,348 | 4,723 | 1,552 | 5,218 |
Other intangible assets | 2,826 | 1,495 | 642 | 2,340 |
Property, plant and equipment | 10,724 | 1,786 | 3,342 | 5,181 |
Interests in associates and joint ventures | 6 | 1 | 4 | 988 |
Non-current assets included in the calculation of net financial debt | | | | |
Other | 3 | 2 | (1) | 5 |
Total non-current assets | 28,907 | 8,007 | 5,539 | 13,732 |
Inventories | 247 | 90 | 48 | 158 |
Trade receivables | 2,459 | 468 | 340 | 1,089 |
Prepaid expenses | 63 | 31 | 17 | 72 |
Current assets included in the calculation of net financial debt | | | | |
Other | 1,012 | 30 | 51 | 402 |
Total current assets | 3,781 | 619 | 456 | 1,721 |
Assets held for sale (4) | | | | 2,017 |
TOTAL ASSETS | 32,688 | 8,626 | 5,995 | 17,470 |
Equity | | | | |
Non-current trade payables | 153 | 7 | 185 | 34 |
Non-current employee benefits | 1,043 | 2 | 65 | 66 |
Non-current liabilities included in the calculation of net financial debt | | | | |
Other | 848 | 186 | 72 | 121 |
Total non-current liabilities | 2,044 | 195 | 322 | 221 |
Current trade payables | 3,397 | 1,284 | 718 | 1,892 |
Current employee benefits | 1,017 | 27 | 54 | 159 |
Deferred income | 1,478 | 103 | 133 | 360 |
Current liabilities included in the calculation of net financial debt | | | | |
Other | 1,351 | 60 | 751 | 608 |
Total current liabilities | 7,243 | 1,474 | 1,656 | 3,019 |
Liabilities related to assets held for sale (4) | | | | 1,040 |
TOTAL EQUITY AND LIABILITIES | 9,287 | 1,669 | 1,978 | 4,280 |
(1) Some trade receivables generated by the Enterprise segment (approximately 192 million euros) are presented in the France segment, which is responsible for their collection. Including tangible and intangible assets of 512 million euros in France and 288 million euros in other countries. (2) Including tangible and intangible assets of 2,647 million euros in France and 3,194 million euros in other countries. (3) Non-allocated assets and liabilities mainly include external financial debt, external cash & cash equivalent, current and deferred tax assets and shareholders’ equity (see Note 18.1). (4) Relating to the sale of Orange Suisse (see Note 2). |
ORANGE / 2013 REGISTRATION DOCUMENT - 116
Enterprise (1) | International Carriers & Shared Services (2) | Eliminations and unallocated items (3) | Total Orange | EE (100%) |
429 | 70 | - | 27,340 | 6,815 |
338 | 3,702 | - | 11,343 | 6,460 |
462 | 2,139 | - | 23,634 | 2,656 |
26 | 6,919 | - | 7,944 | 2 |
| | 861 | 861 | |
10 | 74 | 4,316 | 4,409 | 289 |
1,265 | 12,904 | 5,177 | 75,531 | 16,222 |
37 | 51 | - | 631 | 152 |
750 | 818 | (1,019) | 4,905 | 1,051 |
96 | 105 | (16) | 368 | 450 |
| | 9,430 | 9,430 | 338 |
116 | 261 | 1,329 | 3,201 | 33 |
999 | 1,235 | 9,724 | 18,535 | 2,024 |
| | | 2,017 | - |
2,264 | 14,139 | 14,901 | 96,083 | 18,246 |
| | 29,592 | 29,592 | 13,468 |
1 | - | - | 380 | - |
160 | 375 | - | 1,711 | 50 |
| | 34,232 | 34,232 | 1,052 |
10 | 218 | 1,501 | 2,956 | 576 |
171 | 593 | 35,733 | 39,279 | 1,678 |
695 | 1,187 | (1,022) | 8,151 | 2,004 |
325 | 288 | - | 1,870 | 32 |
188 | 76 | (16) | 2,322 | 300 |
| | 7,126 | 7,126 | 470 |
187 | 379 | 3,367 | 6,703 | 294 |
1,395 | 1,930 | 9,455 | 26,172 | 3,100 |
| | | 1,040 | - |
1,566 | 2,523 | 74,780 | 96,083 | 18,246 |
ORANGE / 2013 REGISTRATION DOCUMENT - 117
Notes to the consolidated financial statements
ORANGE / 2013 REGISTRATION DOCUMENT - 118
Orange (previously named the France Telecom-Orange group and hereafter called “the Group”) provides consumers, businesses and other telecommunications operators with a wide range of services including fixed telephony and mobile telecommunications, data transmission, Internet and multimedia, and other value-added services.
The telecommunications operator activities are regulated and dependent upon the granting of licenses.
The consolidated financial statements were approved by the Board of Directors’ Meeting on March 5, 2014 and will be submitted for approval at the Shareholders’ Meeting on May 27, 2014.
In accordance with European regulation No. 1606/2002 dated July 19, 2002, the 2013 consolidated financial statements have been prepared in accordance with the International Financial Reporting Standards (IFRSs) as endorsed by the European Union (available on the website
http://ec.europa.eu/internal_market/accounting/ias/index_en.htm). Comparative figures are presented for 2012 and 2011 compiled using the same basis of preparation.
For the reported periods, the accounting standards and interpretations endorsed by the European Union are similar to the compulsory standards and interpretations published by the International Accounting Standards Board (IASB) with the exception of the carve-out of IAS 39 together with the standards and interpretations currently being endorsed, that have no effect on the Group accounts. Consequently, the Group financial statements are prepared in accordance with the IFRS standards and interpretations, as published by the IASB.
The principles applied to prepare financial data relating to the 2013 financial year are based on:
■
the new following standards in 2013:
Standard | Consequences for the Group |
IAS 28 (revised 2011)
Investments in Associates and Joint Ventures | The revision of the standard has no consequence on the financial statements. |
IFRS 10
Consolidated Financial Statements | The retrospective application of this standard on the scope of consolidation has no effect on the reported comparative periods. |
IFRS 11
Joint Arrangements | The retrospective application of this standard impacts only two entities BuyIn and Networks! Sp. z.o.o., which both qualify as joint operations under IFRS 11 instead of jointly controlled entities under IAS 31. The IFRS 11 application has no significant effect on the reported comparative periods. |
IFRS 12
Disclosure of Interest in Other Entities | The disclosures required by this standard were mostly provided at 2012 year-end. |
IFRS 13
Fair Value Measurement | This standard is applicable prospectively and has no effect on the fair value measurement scope. The clarifications provided by the standard have no effect on the measurement of fair value. In particular, the credit risk in the derivatives assessment to be taken into account has not led to any significant value adjustment. |
■
the recognition and measurement alternatives allowed by the IFRSs:
Standard | | Alternative used |
IAS 2 | Inventories | Measurement of inventories determined by the weighted average unit cost method |
IAS 16 | Property, Plant and Equipment | Measurement at amortized historical cost |
IAS 38 | Intangible Assets | Measurement at amortized historical cost |
ORANGE / 2013 REGISTRATION DOCUMENT - 119
■
the available exemptions regarding the retrospective application of IFRSs at the transition date (January 1, 2004 for the Group):
Standard | | IFRS 1 alternative used |
IFRS 2 | Share-based Payment | Retrospective application of the provisions of IFRS 2 to equity-settled and cash-settled plans, including those that were implemented prior to November 7, 2002 |
IFRS 3 | Business Combinations | Non-application of the IFRS 3 provisions to any business combinations prior to the transition date Additional ownership interest purchase accounted for as goodwill for the difference between the acquisition cost and the non-controlling interests’ share in net equity, with no remeasurement of the assets acquired and liabilities assumed |
IAS 16 and IAS 38 | Property, Plant and Equipment and Intangible Assets | Measurement of property, plant and equipment and intangible assets at historical cost, except for certain real estate assets held by Orange Polska and certain items of property, plant and equipment owned by Orange SA which were remeasured at fair value at the time of the change in company status and deregulation of the telecommunications market in 1996 |
IAS 21 | Effect of Changes in Foreign Exchange Rates | Transfer into retained earnings of all cumulative translation differences for all foreign operations at January 1, 2004 |
IAS 39 | Financial Instruments | Reclassification of certain financial instruments recognized prior to January 1, 2004 as financial assets and liabilities at fair value through profit or loss or as assets available for sale Prospective application as of January 1, 2004 of the fair value option relating to initial recognition of certain financial assets and liabilities |
■
accounting positions adopted by the Group in accordance with paragraphs 10 to 12 of IAS 8:
Topic | Note |
Presentation of consolidated financial statements | 18.1 |
Contribution of a business to a joint venture | 18.2 |
Operating taxes and levies | 18.8 |
Income taxes | 18.12 |
Non-controlling interests ■ change in ownership interest in a subsidiary ■ commitments to purchase non-controlling interests | 18.13 |
Lastly, in the absence of any accounting standard or interpretation, management uses its judgment to define and apply an accounting policy that will result in relevant and reliable information, such that the financial statements:
■
fairly present the Group’s financial position, financial performance and cash flows;
■
reflect the economic substance of transactions;
■
are prepared on a prudent basis; and
■
are complete in all material respects.
Among these standards and interpretations, the following might affect the Group’s future consolidated financial statements:
Standard / Interpretation
(application date for the Group) | Consequences for the Group |
IFRS 9
Financial Instruments
(no date specified) | This standard is the first of the three-part project that will supersede IAS 39 “Financial Instruments: Recognition and Measurement”. This first part deals with the classification and measurement of financial instruments. The effects of its application cannot be analyzed separately from the other two unpublished parts, which should retrospectively address the impairment methodology for financial assets and hedge accounting. |
IFRIC 21
Levies
(January 1, 2014) | This interpretation defines the obligating event that gives rise to a liability to pay a levy as the activity that triggers the payment of the levy, as identified by the relevant legislation. Other standards should be applied to decide whether the recognition of a liability to pay a levy gives rise to an asset or an expense. At this stage of the Group’s analysis, the application of this interpretation is not expected to have a material impact on equity or on annual and interim net income, the reason being that most of the levies are based on the activity of the reported period or on the producing assets and therefore contribute to the cost of the services rendered. Due to some diversity in applying IFRIC 21, the IFRS Interpretations Committee was seized of this issue by the Group. |
ORANGE / 2013 REGISTRATION DOCUMENT - 120
In preparing the Group’s consolidated financial statements, Orange’s management makes estimates, insofar as many elements included in the financial statements cannot be measured with precision. The management revises these estimates if the underlying circumstances evolve or in light of new information or more experience. Consequently, the estimates made at December 31, 2013 may be changed subsequently.
Group management also uses its judgment to define appropriate accounting policies to apply to certain transactions when the current IFRS standards and interpretations do not specifically deal with related accounting issues.
The underlying assumptions used for significant estimates are explained in Note 18 and in the following notes to the financial statements:
Estimate | | Nature of estimate |
Note 2 | Changes in scope of consolidation | Identifying intangible assets acquired through business combinations and selection of key measurement methods and assumptions Allocating goodwill to Cash-Generating Unit (CGU) Remeasuring at fair value the previously held equity interest due to a step-acquisition or loss of control with residual equity interest |
Note 3 | Revenue | Identifying separable components of a bundled offer based on the individual component’s relative fair value Period of straight-line recognition of revenue relating to invoiced service access fees depending on the nature of product and historical contractual relationship Report revenue on a net versus gross basis (depending on an analysis of the Group’s involvement as either principal or agent) |
Note 4 | Purchases and other expenses | Provision for claims and litigations: assumptions underlying legal assessment and risk measurement |
Note 5 | Employee benefits | Discount rate, inflation rate, salary increases, mortality table Participation rate of seniors to the specific plans (particularly the French part-time for seniors plan) |
Note 6 | Impairment losses and goodwill | Level of grouping of CGUs for goodwill impairment testing Key assumptions used to determine recoverable amounts: value in use (discount rate, perpetual growth rate, expected cash flows), market value (revenue and EBITDA multiples for comparable companies or transactions, cash flows) Assessment of the economic and financial environment of the countries in which the Group operates |
Note 7 | Property, plant and equipment, intangible assets other than goodwill | Assessing assets’ useful life based on assessment of the technological, legal or economic environments Provision for dismantling and restoring sites: dismantling timeframe, discount rate, expected cost Qualifying network, sites or equipment sharing among operators as joint operations TowerCos arrangements: elect the unit of account (tower or used space) and analyse the arrangements in order to determine whether they contain a lease |
Note 11 | Fair value of financial assets and liabilities | Models, selection of parameters, fair value hierarchy, non-performance risk assessment, unit of account relating to investments accounted for under the equity method |
Note 12 | Income tax | Assumptions used for recognition of deferred tax assets arising from the carryforward of unused tax losses Assessing technical merits of the tax legislation positions |
Of the items listed above, the key sources of variability of the Group’s net income due to these accounting judgments, assumptions and uncertainties are related to the following (without ranking in order of importance, which is not possible given the inherent uncertainty of the information):
■
the assessment (and quantification) of the risk of resources outflow linked to claims and litigations (Notes 4 and 15) and of the technical merits of tax legislative positions retained by Orange (Notes 8 and 12);
■
the measurement of the recoverable values for the impairment tests for which factors and sensitivity analysis are provided with respect to goodwill (Notes 6.3 and 6.4), tangible and intangible assets including the indefinite life Orange brand (Notes 7.2 and 7.3) and investments accounted for under the equity method (Note 9.1).
In addition, Note 5.2 provides an analysis of the sensitivity to discount rates of employee benefits and Note 11 provides an analysis of the various sensitivities linked to financial market risks: sensitivity to changes in interest rates of the Group’s financial expense, debt, cash flow hedge reserves (Note 11.1), exposure to foreign exchange of the Group’s financial debt, statement of financial position and income statement (Note 11.2), sensitivity of cash deposits to changes in market interest rates and exchange rates (Note 11.5).
ORANGE / 2013 REGISTRATION DOCUMENT - 121
The net gain on disposal was 119 million euros in 2013 compared to 158 and 246 million euros in 2012 and 2011 respectively. In 2013, the gain results mainly from the disposal of Orange Austria (73 million euros) and the sale of property assets (36 million euros). In 2012, the gain was mainly due to the disposal of Orange Suisse for 92 million euros and the disposal of property assets for 53 million euros. In 2011, the gain resulted mainly from the disposal of TP Emitel for 197 million euros and the disposal of property assets for 40 million euros.
Changes in scope of consolidation during 2013
Disposal of Orange Austria
On January 3, 2013, in accordance with the agreements signed on February 2, 2012 and after securing the competent regulatory and competition authorities, Mid Europa Partners completed the sale of 100% of Orange Austria to Hutchinson 3G Holdings, a subsidiary of Hutchinson Whampoa. Orange and Mid Europa Partners owned 35% and 65% of Orange Austria, respectively.
Orange sold its share in Orange Austria for 73 million euros, net of disposal costs and after price adjustment. This amount corresponds to the gain on disposal recognized in the income statement.
The net receipt amounted to 66 million euros at December 31, 2013; the remaining cash to be received has been deposited into an escrow account.
The divestment has ended the commitments between Orange and its partner Mid Europa Partners. Furthermore, the Group has granted usual guarantees in this type of transaction to the acquirer, Hutchison 3G Holdings.
Dailymotion takeover
On January 10, 2013, Orange purchased a 51% ownership interest in Dailymotion in accordance with the forward purchase agreement signed on July 2012 for a total amount of 61 million euros.
Following the first acquisition stake of 49% in April 2011 for a total consideration of 66 million euros, Dailymotion is now a wholly-owned subsidiary of the Group.
Goodwill has been recognized up to 69 milion euros, after allocating the purchase price to the assets acquired (mainly technical platform) and liabilities assumed.
Disposal of Sonaecom
Following the agreements signed on February 15, 2013 with Sonae, Orange has disposed its whole stake in Sonaecom (20%) for 105 million euros (after deducting 9 million euros relating to the dividend paid in 2013 in respect of the 2012 financial year).
This disposal has no effect on the income statement as the transfer value corresponds to the carrying amount.
The disposal consideration will be paid by Sonae on August 15, 2014.
Transaction in progress at 2013 year-end
Disposal of Orange Dominicana
On November 26, 2013, Orange and Altice entered into an agreement for the sale of 100% of Orange Dominicana shares, the wholly-owned subsidiary of Orange in the Dominican Republic. The parties agreed on an enterprise value of 1.4 billion US dollars, i.e. 1.1 billion euros.
The transaction has not yet received the final approvals from the competent regulatory and competition authorities.
Based on the enterprise value agreed by the parties, the selling price of Orange Dominicana’s shares will take into account usual adjustments, including consideration of the net debt and working capital of Orange Dominicana at the closing date.
The expected gain on disposal, net of taxes, is not material. The Group shall pay a capital gain tax to the Dominican tax administration which is currently being discussed with the competent authorities.
As at December 31, 2013, Orange Dominicana’s assets and liabilities are accounted for under two separate lines in the statement of financial position which are “assets held for sale” and “liabilities related to assets held for sale”, respectively.
ORANGE / 2013 REGISTRATION DOCUMENT - 122
The financial data related to Orange Dominicana are set out below:
Statement of financial position
(in millions of euros) | December 31, 2013 |
Goodwill | 261 |
Other intangible assets | 36 |
Property, plant and equipment | 232 |
Other non-current assets | 32 |
Current loans and cash | 18 |
Other current assets | 58 |
Total assets held for sale | 637 |
Other non-current liabilities | 3 |
Current trade payables | 50 |
Other current liabilities | 52 |
Total liabilities related to assets held for sale | 105 |
Income statement
(in millions of euros) | 2013 |
Revenues | 437 |
Operating income | 94 |
Finance costs, net | 1 |
Income tax | (25) |
Net income attributable to Orange Dominicana | 70 |
Statement of cash flows
(in millions of euros) | 2013 |
Net cash provided by operating activities | 142 |
Net cash used in investing activities | (111) |
Net cash used in financing activities | (35) |
Net change in cash and cash equivalents | (4) |
Changes in scope of consolidation during 2012
Egypt
Description of the transaction
On April 11, 2012, Orange and Orascom Telecom Media and Technology Holding S.A.E. (OTMT) signed agreements amending their 2010 agreements covering the partial disposal of ECMS shares held directly and indirectly by OTMT, the evolution of partnership between Orange and OTMT and the terms and conditions for OTMT’s future exit from ECMS.
On April 12, 2012, MT Telecom SCRL, a wholly-owned subsidiary of Orange, filed an application to launch a tender offer for 100% of the ECMS shares at a price of 202.5 Egyptian pounds per share. The Egyptian Financial Supervisory Authority (EFSA) approved this transaction on April 22, 2012 and the tender offer was carried out from April 24 to May 23, 2012. At the end of the tender offer period, MT Telecom acquired 93.92% of ECMS. The remainder of the shares is held by OTMT (which retains a 5% stake as provided for under the agreements) and the public that did not tender their shares to the offer (who retains 1.08%). In addition, the Group sold 28.75% of MT Telecom’s voting rights to OTMT, which continues to be represented on the Board of Directors of ECMS.
The Group granted OTMT a put option for the 5 million ECMS shares (representing 5% of the share capital) which OTMT still owns. This option is exercisable in one-third increments each year, from 2015 to 2017, during the period from January 1 to February 28 in each of those years. The exercise price per ECMS share will accrete over time, ranging from 33.69 euros in 2015 to 37.14 euros in 2017. The exercise of this option in its entirety will automatically lead to the disposal of OTMT’s 28.75 million voting rights in MT Telecom at accreting prices per voting right ranging from 1.68 euros in 2015 to 1.86 euros in 2017. OTMT also has a put option on its voting rights in MT Telecom in the event of termination of the shareholders’ agreement under the conditions provided in the agreement, as well as an exit right for all of its interests in ECMS and MT Telecom in the event that Orange transfers shares to a third party.
Furthermore, Orange has a call option covering all of OTMT’s interests in ECMS, which is exercisable from 2013 to 2017 during the period from January 1 to February 28, at a price to be determined under the same conditions as those applying to the put option granted by the Group to OTMT (from 30.56 euros per share in 2013 to 37.14 euros per share in
ORANGE / 2013 REGISTRATION DOCUMENT - 123
2017). Under the 2012 agreements, Orange also has a call option on the ECMS shares held by OTMT in the event of a change of control over OTMT, at a price based on the market value of ECMS. OTMT also granted Orange a right of first refusal over any sale by OTMT of its interest in ECMS.
In accordance with the 2012 agreements, the services contract between OTMT and ECMS has been assigned to Orange in consideration for payment to OTMT of a 110 million euros compensation during the last quarter of 2012.
Accounting effects in 2012
The accounting principles pertaining to transactions with non-controlling shareholders are described in Note 18.13 of the Group’s consolidated financial statements for the year ended December 31, 2013.
The 2012 agreements are considered as a transaction with non-controlling interests to be accounted for as an equity transaction.
The amount of the financial debts recognized under the terms of the 2010 agreements due to the put option granted to OTMT and the triggering of a public tender offer for the ECMS shares held by the free float (1,937 million euros at December 31, 2011) was revised as of the effective date of the 2012 agreements. The accounting principle applied by the Group is to recognize any change in the value of financial liabilities relating to the purchase commitments granted to the non-controlling interests against net financial income. Consequently, the revision of the financial parameters of the purchase price for the ECMS shares from OTMT and the free float resulted in a reduction in financial debts, with the recognition of financial income of 272 million euros in the first half of 2012, as of the date on which the 2012 agreements became effective.
The Group paid out 1,489 million euros (excluding the effects of foreign exchange hedges) for the purchase of the ECMS shares from OTMT and the free float, which was classified as cash used in financing activities in the consolidated statement of cash flows.
The Group’s net debt resulting from the commitments to the ECMS shares was reduced by 228 million euros in 2012, broken down into 272 million euros in respect of the revision of the 2010 agreements and (44) million euros in respect of the periodic revision of the commitment (price and foreign exchange effect).
An outstanding financial liability of 220 million euros was recognized due to the put option held by OTMT for its remaining interests in ECMS and MT Telecom as at December 31, 2012. During the last quarter of 2012, the Group also paid the 110 million euros compensation and related stamp duties of 6 million euros which were accounted for against operating income.
Disposal of Orange Suisse
Following the agreement signed on December 23, 2011 and the approval of all the regulatory authorizations, Orange sold 100% of Orange Communication SA (Orange Suisse) to Matterhorn Mobile SA on February 29, 2012.
Orange Suisse assets and liabilities were classified respectively as “assets held for sale” and “liabilities related to assets held for sale” in the statement of financial position as at December 31, 2011.
Based on an enterprise value of 2 billion Swiss francs, i.e 1.6 billion euros, the net cash amount received by Orange amounted to 1,482 million euros, including the acquisition-related costs (primarily mobile frequencies acquisition costs, granted in February 2012), and 1,386 million euros including the amount paid for the currency hedge settlement.
The gain recorded on the Orange Suisse disposal was 92 million euros on December 31, 2012 (after transaction costs revision and post-closing adjustment on net financial debt and working capital):
(in millions of euros) | | 2012 |
Fair value of interest in Orange Suisse | | 1,638 |
Mobile frequencies | | (115) |
Others transaction costs | | (41) |
Orange Suisse net value, excluding net debt | (a) | 1,482 |
Orange Suisse net debt due to Orange (1) | (b) | (413) |
Book value of Orange Suisse | (c) | 1,020 |
Reclassification adjustment of other comprehensive income in net income (2) | (d) | 43 |
Gain on disposal | (a) + (b) - (c) + (d) | 92 |
(1) This net debt was reimbursed to Orange on the closing date. (2) Including 167 million euros of cumulative translation adjustments, (96) million euros related to the amount paid for the currency hedge settlement, (39) million euros of actuarial losses and 11 million euros of income tax on those items. |
ORANGE / 2013 REGISTRATION DOCUMENT - 124
As a consequence of this transaction, the contractual commitment due to the possible application of common warranty clauses is capped at 200 million Swiss francs. These warranties expired on June 30, 2013, except for tax issues and guarantees upon capital property which will expire at the end of the regulatory limitation period, in 2017 (see Note 14.2).
In addition, Orange is likely to benefit from contingent additional considerations up to February 28, 2017 if, in the forthcoming years, Orange Suisse participates to a merger within the Swiss telecommunications market or is involved in a significant mobile access network sharing with its competitors.
Orange Cinéma Séries-OCS
In accordance with the partnership signed in November 2011, Canal+ Group acquired in April 2012 a 33.3% stake in Orange Cinéma Séries-OCS. This partnership includes commercial agreements for which the two groups are required to distribute Orange Cinéma Séries-OCS TV packages.
In application of the decision rendered by the French competition authority on July 23, 2012, Canal+ Group entered into a process of designation of two independent Board members, in place of its current members but will keep its stake in Orange Cinéma Series-OCS. These injunctions have no impact on the implementation of the distribution contracts.
Telkom Kenya
In August 2012, Orange acquired the 11% stake in Telkom Kenya held by Alcazar Capital Limited.
Furthermore, in December 2012, the Group entered into an agreement with the Kenyan government on the following main terms:
■
the shareholder loans of the Kenyan government and Orange, for respectively 7.1 billion Kenyan shillings (63 million euros) and 147 million euros, were converted into equity;
■
Orange wrote off the balance of its shareholder loan, i.e. 299 million euros;
■
the Kenyan government’s stake in Telkom Kenya decreased from 49% to 30%, thereby increasing Orange’s stake to 70% at December 31, 2012.
Lastly, the agreement included an option for the Kenyan government to increase its equity interest to 40% in consideration of a cash contribution of 2.4 billion Kenyan shillings (approximately 22 million euros) during the first half of 2013. Since this cash contribution has not been realized, Orange’s stake in Telkom Kenya is still 70% as of December 31, 2013.
In 2012, as a result of these transactions, (241) million euros of equity attributable to non-controlling interests were reclassified to equity attributable to the owners of the parent.
Changes in scope of consolidation during 2011
Dailymotion
In April 2011, the Group acquired a 49% stake in Dailymotion, an online video website, for a total consideration of 66 million euros, including acquisition-related costs and shareholder’s loan.
TP Emitel
On June 22, 2011, Orange Polska sold TP Emitel, a subsidiary dedicated to building, leasing and maintaining radio and TV broadcasting infrastructures, to a private investment fund for a consideration of 432 million euros, after transaction costs and excluding divested cash (22 million euros).
The gain on disposal attributable to the sale of TP Emitel amounted to 197 million euros. Based on Orange’s 50.21% ownership interest in the Orange Polska, the impact on the net income attributable to owners of the parent was 46 million euros.
Korek Telecom
On July 27, 2011, Orange and Agility acquired a 44% equity interest in Iraqi mobile operator Korek Telecom via a joint company owned 54% by Agility and 46% by Orange. Consequently, the Group holds a 20% indirect interest in Korek Telecom.
The cash out of 305 million euros comprised 177 million euros for the acquisition cost of the acquired stake, including acquisition-related costs, and 128 million euros for a shareholder’s loan.
As Orange exercises significant influence over Korek Telecom, the investment has been accounted for under the equity method.
The Group’s unrecognized contractual commitments with respect to the Korek Telecom shares are provided Note 14.2.
Compagnie Européenne de Téléphonie
On July 29, 2011, Orange acquired control over Compagnie Européenne de Téléphonie by increasing its ownership interest in the company to 100%. The cash out for this acquisition amounted to 61 million euros.
This transaction led to the recognition of 42 million euros of goodwill, after allocating the purchase price to the assets acquired (mainly leasehold rights) and liabilities assumed.
ORANGE / 2013 REGISTRATION DOCUMENT - 125
Orange RDC (ex-Congo Chine Telecom)
On October 20, 2011, Orange acquired 100% of Congo Chine Telecom, a mobile operator in the Democratic Republic of the Congo. After taking into consideration price adjustments of (23) million euros, the transaction cost amounted to 129 million euros.
The final goodwill recognized on acquisition amounted to 86 million euros, after adjustments to the opening balance sheet and identification of assets acquired and liabilities assumed.
(in millions of euros) | Fair value |
Other intangible assets (licenses) | 53 |
Property, plant and equipment | 77 |
Other non current assets | 1 |
Total non-current assets | 131 |
Total current assets | 8 |
Non-current financial liabilities at amortized cost excluding trade payables | 39 |
Total non-current liabilities | 39 |
Total current liabilities | 57 |
Net assets acquired | 43 |
Goodwill | 86 |
Purchase price consideration | 129 |
(in millions of euros) | 2013 | 2012 | 2011 |
France | 20,018 | 21,431 | 22,534 |
Mobile services | 8,348 | 9,305 | 9,828 |
Mobile equipment sales | 538 | 559 | 522 |
Fixed services | 10,613 | 11,004 | 11,544 |
Other revenues | 519 | 563 | 640 |
Spain | 4,052 | 4,027 | 3,993 |
Mobile Services | 2,843 | 3,092 | 3,166 |
Mobile equipment sales | 354 | 167 | 119 |
Fixed services | 842 | 749 | 684 |
Other revenues | 13 | 19 | 24 |
Poland | 3,079 | 3,381 | 3,625 |
Mobile services | 1,456 | 1,605 | 1,682 |
Mobile equipment sales | 35 | 34 | 36 |
Fixed services | 1,443 | 1,576 | 1,742 |
Other revenues | 145 | 166 | 165 |
Rest of the World | 7,792 | 8,281 | 8,795 |
Mobile services | 6,120 | 6,577 | 7,118 |
Mobile equipment sales | 374 | 355 | 337 |
Fixed services | 1,015 | 1,042 | 948 |
Other revenues | 283 | 307 | 392 |
Enterprise | 6,513 | 7,001 | 7,101 |
Legacy networks | 1,687 | 1,872 | 2,182 |
Mature networks | 2,730 | 2,895 | 2,782 |
Growing networks | 413 | 402 | 366 |
Services | 1,683 | 1,832 | 1,771 |
International Carriers & Shared Services | 1,702 | 1,623 | 1,610 |
International Carriers | 1,423 | 1,382 | 1,361 |
Shared Services | 279 | 241 | 249 |
Inter-segment eliminations | (2,175) | (2,229) | (2,381) |
TOTAL | 40,981 | 43,515 | 45,277 |
ORANGE / 2013 REGISTRATION DOCUMENT - 126
Revenues (excluding Enterprise and International Carriers & Shared Services) are presented by product line:
■
mobile services: including revenues generated by incoming and outgoing calls (voice, SMS and data) network access fees, value-added services, machine-to-machine, roaming revenues from customers of other networks (national and international roaming), revenues from mobile virtual network operators (MVNO) and from network sharing;
■
sale of mobile devices: including revenues from the sale of mobile devices include subsidized and unsubsidized sales, excluding sales of accessories;
■
fixed-line services: including revenues from traditional fixed-line telephony, fixed broadband services, networks and solutions (except the France operating segment for which networks and solutions are included in the Enterprise operating segment), and revenues from carrier services (national and international interconnections, unbundling and wholesale sales of telephone lines);
■
other revenues: including revenues from the sale and rental of fixed-line equipment, sales of mobile accessories and other miscellaneous revenues.
Enterprise operating segment product lines correspond to the following activities:
■
legacy networks comprise products and solutions provided to customers to ensure the continuity of their operations and to initiate their migration towards newer solutions;
■
mature networks comprise products and solutions that have reached a certain level of maturity, such as IPVPN, broadband and very high speed broadband or broadcasting;
■
growing networks comprise VoIP, image and videoconferencing ranges, and satellite access infrastructures, WiFi and fiber optics;
■
services include platform services (customer relationship management, messaging, hosting, cloud computing, machine-to-machine), collaborative services and sales of equipment associated with integration services.
Other operating income includes late-payment interests on trade receivables, proceeds from trade receivables that have been written off, income from universal service, income relating to line damages, penalties and reimbursements received as well as brand fees invoiced to several unconsolidated entities.
At December 31, 2012, other operating income included in particular the payment, by Euskaltel of a 204 million euros in damages to Orange.
Orange is committed to trade receivables securitization programs in France. As Orange SA retains the risks related to the securitized trade receivables, and in particular the credit risk, the conditions for derecognition are not met. Accordingly, these receivables (1,453 million euros at December 31, 2013) and the external liabilities of the securitization vehicles (782 million euros at December 31, 2013) remain in the statement of financial position.
At December 31, 2013, the financing ceiling of the securitization programs amounts to 825 million euros. Financing is assured for terms of 3 and 5 years.
Telecommunications services provided to governmental authorities as well as those to its various local and regional authorities are rendered on an arm’s length basis.
(in millions of euros) | December 31, 2013 | December 31,
2012 | December 31,
2011 |
Trade receivables depreciated according to their age | 914 | 1,000 | 1,000 |
Trade receivables depreciated according to other criteria | 451 | 472 | 321 |
Net trade receivables past due | 1,365 | 1,472 | 1,321 |
Not past due | 2,995 | 3,163 | 3,584 |
Net trade receivables | 4,360 | 4,635 | 4,905 |
ORANGE / 2013 REGISTRATION DOCUMENT - 127
The following table provides an aging balance of net trade receivables past due and depreciated according to their age:
(in millions of euros) | December 31, 2013 | December 31,
2012 | December 31,
2011 |
Past due - under 180 days | 634 | 734 | 730 |
Past due - 180 to 360 days | 128 | 92 | 123 |
Past due - over 360 days | 152 | 174 | 147 |
Total net trade receivables past due and depreciated according to their age | 914 | 1,000 | 1,000 |
The table below provides an analysis of the change in provision for trade receivables in the statement of financial position:
(in millions of euros) | 2013 | 2012 | 2011 |
Allowances on trade receivables - Opening balance | (748) | (775) | (835) |
Net addition with impact on income statement | (312) | (285) | (296) |
Losses on trade receivables | 270 | 365 | 343 |
Translation adjustment | (3) | (52) | 10 |
Reclassification to assets held for sale | 8 | (1) | 3 |
Allowances on trade receivables - Closing balance | (785) | (748) | (775) |
(in millions of euros) | December 31,
2013 | December 31,
2012 | December 31,
2011 |
Prepaid cards | 339 | 370 | 433 |
Service access fees | 721 | 757 | 769 |
Loyalty programs | 91 | 123 | 146 |
Other deferred revenue | 793 | 909 | 932 |
Other deferred operating income | 30 | 39 | 42 |
TOTAL | 1,974 | 2,198 | 2,322 |
(in millions of euros) | December 31,
2013 | December 31,
2012 | December 31,
2011 |
Advances and downpayments | 87 | 134 | 236 |
Submarine cable consortiums | 263 | 320 | 648 |
Other | 434 | 286 | 276 |
TOTAL | 784 | 740 | 1,160 |
o/w other non-current assets | 15 | 70 | 94 |
o/w other current assets | 769 | 670 | 1,066 |
Other assets relating to submarine cable consortiums are receivables from submarine cable consortium members when Orange is in charge of centralizing the payments to the equipment suppliers that build and manage these cables. These receivables are offset by liabilities in the same amount (see Note 4.7).
ORANGE / 2013 REGISTRATION DOCUMENT - 128
(in millions of euros) | 2013 | 2012 | 2011 |
Commercial expenses | (6,391) | (6,726) | (7,490) |
o/w costs of terminals and other equipment sold | (3,509) | (3,594) | (4,175) |
o/w advertising, promotional, sponsoring and rebranding costs | (952) | (1,047) | (1,054) |
Service fees and inter-operator costs | (4,934) | (5,496) | (5,883) |
Other network expenses, IT expenses | (2,883) | (2,922) | (2,752) |
Other external purchases | (3,757) | (3,956) | (3,513) |
o/w rental expenses | (1,221) | (1,240) | (1,185) |
TOTAL | (17,965) | (19,100) | (19,638) |
Other operating expense includes allowances and losses on trade receivables, universal service charges and the effects of litigations.
At December 31, 2012, other operating expense mainly includes the 110 million euros payment to OTMT related to the transaction in Egypt (see Note 2.2).
(in millions of euros) | 2013 | 2012 | 2011 |
Restructuring costs related to staff (1) | (109) | (40) | (118) |
Contents (2) | (87) | - | (19) |
Distribution channels (3) | (103) | - | - |
Other restructuring costs | (44) | 3 | 1 |
TOTAL | (343) | (37) | (136) |
(1) Mainly voluntary departure plans announced by Orange Polska about 2,950 employees in 2013 and 2,300 in 2011. (2) Onerous contracts in France. (3) Concerns the end of the relationship announced with some indirect distributors. |
(in millions of euros) | 2013 | 2012 | 2011 |
Restructuring provision - opening balance | 153 | 402 | 650 |
Additions with impact on income statement | 253 | 20 | 90 |
Reversals releases with impact on income statement | (4) | (7) | (5) |
Discounting with impact on income statement | 0 | 1 | 0 |
Utilizations without impact on income statement | (89) | (220) | (328) |
Changes in consolidation scope, reclassifications and translation adjustments | (1) | (42) | (3) |
Reclassification to assets held for sale | - | (1) | (2) |
Restructuring provision - closing balance | 312 | 153 | 402 |
o/w non-current provisions | 155 | 98 | 125 |
o/w current provisions | 157 | 55 | 277 |
ORANGE / 2013 REGISTRATION DOCUMENT - 129
(in millions of euros) | December 31,
2013 | December 31,
2012 | December 31,
2011 |
Handset inventories | 485 | 508 | 545 |
Other products/services sold | 21 | 25 | 34 |
Available broadcasting rights | 43 | 43 | 46 |
Other supplies | 134 | 71 | 75 |
Gross value | 683 | 647 | 700 |
Depreciation | (46) | (61) | (69) |
Provision | 637 | 586 | 631 |
The handset inventories include 85 million euros related to inventories treated as consignment with distributors in 2013 which for accounting purposes are qualified as agents in the sales of handsets bought with the Group.
(in millions of euros) | December 31,
2013 | December 31,
2012 | December 31,
2011 |
Fixed assets payables | 2,271 | 2,373 | 2,618 |
Trade payables | 5,618 | 5,661 | 5,913 |
TOTAL | 7,889 | 8,034 | 8,531 |
o/w non-current trade payables | 349 | 337 | 380 |
o/w current trade payables | 7,540 | 7,697 | 8,151 |
(in millions of euros) | December 31,
2013 | December 31,
2012 | December 31,
2011 |
Prepaid rentals and external purchases | 342 | 364 | 338 |
Other prepaid operating expenses | 35 | 24 | 30 |
TOTAL | 377 | 388 | 368 |
(in millions of euros) | December 31, 2013 | December 31,
2012 | December 31,
2011 |
Provisions for litigations | 414 | 487 | 994 |
Cable network access fees | 377 | 423 | 448 |
Submarine cable consortium (1) | 263 | 320 | 648 |
Other | 711 | 610 | 622 |
TOTAL | 1,765 | 1,840 | 2,712 |
o/w other non-current liabilities | 477 | 560 | 700 |
o/w other current liabilities | 1,288 | 1,280 | 2,012 |
|
ORANGE / 2013 REGISTRATION DOCUMENT - 130
(in millions of euros) | 2013 | 2012 | 2011 |
Provisions for litigations - opening balance | 487 | 994 | 831 |
Additions with impact on income statement | 95 | 112 | 227 |
Reversals with impact on income statement | (100) | (23) | (30) |
Discounting with impact on income statement | 4 | 3 | 1 |
Utilizations without impact on income statement | (68) | (586) | (46) |
Changes in consolidation scope, reclassifications and translation adjustments | (4) | (13) | 11 |
Reclassification to assets held for sale | - | - | - |
Provisions for litigations - closing balance | 414 | 487 | 994 |
o/w non-current provisions | 71 | 119 | 49 |
o/w current provisions | 343 | 368 | 945 |
The Group’s main litigations are described in Note 15.
(in millions of euros) | Note | 2013 | 2012 | 2011 |
Wages and employee benefit expenses | | (8,854) | (10,173) | (8,556) |
o/w wages and salaries | | (6,326) | (6,404) | (6,328) |
o/w social security charges (1) | | (2,317) | (2,368) | (2,169) |
o/w French part-time for seniors plans | 5.2 | (127) | (1,245) | 29 |
o/w capitalized costs (2) | | 665 | 639 | 637 |
o/w other labor expenses (3) | | (749) | (795) | (725) |
Employee profit sharing | | (157) | (196) | (215) |
Share-based compensation | 5.3 | (8) | 6 | (44) |
TOTAL | | (9,019) | (10,363) | (8,815) |
(1) Net of 79 million euros for competitiveness and employment tax credit for the Group in 2013. (2) Capitalized costs correspond to labor expenses included in the cost of assets produced by the Group. (3) Other labor expenses comprise other short-term allowances and benefits and payroll taxes. |
(in millions of euros) | December 31,
2013 | December 31,
2012 | December 31,
2011 |
Post-employment benefits | 835 | 816 | 666 |
Other long-term benefits | 2,384 | 2,442 | 1,251 |
o/w French part-time for seniors plans | 1,939 | 2,036 | 945 |
Provision for employment termination benefits | 2 | 1 | 25 |
Other employee-related payables and payroll taxes due | 1,668 | 1,639 | 1,600 |
Provision for social risks and litigations | 44 | 39 | 39 |
TOTAL | 4,933 | 4,937 | 3,581 |
o/w non-current employee benefits | 2,924 | 2,989 | 1,711 |
o/w current employee benefits | 2,009 | 1,948 | 1,870 |
ORANGE / 2013 REGISTRATION DOCUMENT - 131
| Statement of financial position at December 31, 2013 | Schedule of undiscounted future cash flows |
(in millions of euros) | Total | 2014 | 2015 | 2016 | 2017 | 2018 | from 2019 to 2023 |
Post-employment benefits | 835 | 51 | 46 | 48 | 54 | 60 | 333 |
Other long-term benefits | 2,384 | 314 | 358 | 437 | 500 | 445 | 518 |
o/w French part-time for seniors plans | 1,939 | 271 | 333 | 404 | 454 | 402 | 409 |
TOTAL | 3,219 | 365 | 404 | 485 | 554 | 505 | 851 |
Types of post-employment benefits and other long-term benefits
Depending on the laws and practices in force in the countries where it operates, the Group has obligations in terms of employee benefits, among others:
■
civil servant’s pension plans in France: civil servants employed by Orange SA are covered by the government sponsored civil and military pension plans, Orange SA’s obligation under these plans is limited to the payment of annual contributions (Act No. 96-660 dated July 26, 1996). Consequently, Orange SA has no obligation to fund future deficits of the pension plans covering its own civil servant employees or any other civil service plans;
■
retirement bonuses and other similar benefits: under the laws of some countries or contractual agreements, employees are entitled to certain lump-sum payments or bonuses either on retirement or subsequent to retirement, depending on their years of service and end of career salary;
■
benefits granted to retirees other than pensions: the Group offers retired employees certain benefits such as free telephone lines or coverage of certain medical expenses.
Other long-term benefits may be granted such as seniority awards, long-term compensated absences and French part-time for seniors plans (TPS).
The “part-time for seniors plans” are accessible to civil servants and employees under private contract from the French entities who are eligible for full retirement benefits within 3 or 5 years and who have at least 15 years’ service within the Group. Eligible employees are those who will retire by 2020.
It gives employees the opportunity to work 50% or 60% of a full-time job whilst receiving:
■
a base salary amounting to 80% of a full-time employment;
■
the retirement benefits of full-time employment (both the company’s and the employee’s contributions);
These plans last for a period of at least 18 months and no longer than 5 years.
The beneficiaries may decide to invest part of their base salary (5%, 10% or 15%) in a Time Savings Account (CET), with an additional Group contribution. The CET allows for a reduction in the amount of time worked.
The plan, signed in 2009, can be preceded by an “Intermediate part-time” arrangement (TPI) that enables eligible employees, prior to joining the part time for seniors plan, to work 60% while receiving 80% of their full-time compensation for a maximum period of two years.
The number of employees, who participate in the plans or will join them, is estimated at 23,000.
At December 31, 2013, a provision of 1,939 million euros has been booked for the plans.
The valuation of the obligation is sensitive to estimates of the potentially eligible population and to the sign-up rate for the plans (estimated at 66% for the two plans), and the trade-offs that the beneficiaries will ultimately make between the different schemes proposed. A 5 point variation in the sign-up rate for the plan would lead to a variation of the obligation of approximately 120 million euros.
ORANGE / 2013 REGISTRATION DOCUMENT - 132
Key assumptions used to calculate the amount of obligations
The actuarial assumptions used for the euro zone, which accounts for 87% of Orange’s pension and other long-term employee benefit obligations, are as follows:
| December 31, 2013 | December 31, 2012 | December 31, 2011 |
Higher than 10 years | 2.95% to 3.20% | 3.00% to 3.20% | 3.20% to 4% |
Lower than 10 years | 0.35% to 1.90% (1) | 0.40% to 3.25% | 2.05% to 2.60% |
(1) 0.7% and 1.3% rates have been used to value the obligation regarding the French part-time for senior plans. |
The discount rates used for euro zone are based on Bloomberg Corporate AA indices.
A 50 basis point decline in the discount rates used for each plan would lead to a 108 million euros increase in obligations (including a 31 million euros increase for the French part-time for senior plans).
Funded pension plans account for 14% of the Group’s benefit obligations.
Value of pension benefit obligations and plan assets
| Post-employment benefits | | | | |
(in millions of euros) | Annuity-based plans | Capital-based plans | Other post-
employment benefits | Long-term benefits | 2013 | 2012 | 2011 |
Total benefit obligations - opening balance | 500 | 596 | 83 | 2,442 | 3,621 | 2,139 | 2,351 |
Service cost | 5 | 35 | 0 | 70 | 110 | 152 | 95 |
Net interest on the defined benefit liability | 20 | 21 | 3 | 2 | 46 | 46 | 53 |
French part-time for senior plans | - | - | - | (98) (1) | (98) | 1,090 | (105) |
Actuarial losses/(gains) arising from changes of assumptions | 1 | (29) | 5 | (0) | (23) | 147 | 18 |
o/w arising from change in discount rate | 1 | (15) | (2) | 1 | (15) | 117 | - |
Actuarial losses/(gains) arising from experience | 4 | 13 | 0 | (1) | 16 | 5 | (28) |
Benefits paid | (19) | (19) | (4) | (30) | (72) | (76) | (73) |
Other | (7) | (2) | (1) | (1) | (11) | 119 | (20) |
Reclassification to assets held for sale | - | - | - | - | - | (1) | (152) |
Total benefit obligations - closing balance (a) | 504 | 615 | 86 | 2,384 | 3,589 | 3,621 | 2,139 |
o/w benefit obligations at the end of the year in respect of employee benefit plans that are wholly or partly funded | 504 | 1 | - | - | 505 | 502 | 332 |
o/w benefit obligations at the end of the year in respect of employee benefit plans that are wholly unfunded | 0 | 614 | 86 | 2,384 | 3,084 | 3,120 | 1,807 |
Weighted average duration of the plans | 14 | 14 | 15 | 3 | 7 | 8 | 8 |
(1) Including 146 million euros in additional obligations (120 million euros for service cost, 19 million euros for discounting cost and 7 million euros for actuarial gains and losses) and (244) million euros in obligations reversals for benefits paid during the year. |
ORANGE / 2013 REGISTRATION DOCUMENT - 133
| Post-employment benefits | | | | |
(in millions of euros) | Annuity-based plans | Capital-based plans | Other post-
employment benefits | Long-term benefits | 2013 | 2012 | 2011 |
Fair value of plan assets - opening balance | 389 | - | - | - | 389 | 231 | 370 |
Net interest on the defined benefit liability | 21 | - | - | - | 21 | 16 | 23 |
(Gain)/Losses arising from experience | 19 | - | - | - | 19 | 24 | (30) |
Employer contributions | 6 | - | - | - | 6 | 28 | 15 |
Benefits paid by the fund | (19) | - | - | - | (19) | (21) | (46) |
Other | (8) | - | - | - | (8) | 111 | 5 |
Reclassification to assets held for sale | - | - | - | - | - | (0) | (106) |
Fair value of plan assets - closing balance (b) | 408 | - | - | - | 408 | 389 | 231 |
The pension plan assets are primarily located in the United Kingdom (44%) and France (28%) and are broken down as follows:
| December 31,
2013 | December 31,
2012 | December 31,
2011 |
Plan assets | | | |
Equities | 35.2% | 30.9% | 38.2% |
Debt securities | 43.2% | 48.2% | 37.1% |
Money market assets | 3.3% | 5.8% | 2.3% |
Real estate | 17.0% | 14.2% | 22.4% |
Other | 1.3% | 0.9% | 0.0% |
TOTAL | 100.0% | 100.0% | 100.0% |
Employee benefits in the statement of financial position equal to benefit obligations minus fair value of plan assets:
| Post-employment benefits | | | | |
(in millions of euros) | Annuity-based plans | Capital-based plans | Other post-
employment benefits | Long-term benefits | 2013 | 2012 | 2011 |
Net unfunded status (a) - (b) | 96 | 615 | 86 | 2,384 | 3,181 | 3,232 | 1,908 |
Asset ceiling adjustment | 38 | - | - | - | 38 | 26 | 23 |
Other | - | - | - | - | - | - | (14) |
Employee benefits in the statement of financial position | 134 | 615 | 86 | 2,384 | 3,219 | 3,258 | 1,917 |
o/w current | 22 | 25 | 4 | 314 | 365 | 312 | 241 |
o/w non-current | 112 | 590 | 82 | 2,070 | 2,854 | 2,946 | 1,641 |
ORANGE / 2013 REGISTRATION DOCUMENT - 134
| Post-employment benefits | | | | |
(in millions of euros) | Annuity-based plans | Capital-based plans | Other post-
employment benefits | Long-term benefits | 2013 | 2012 | 2011 |
Employee benefits – opening balance | 137 | 596 | 83 | 2,442 | 3,258 | 1,917 | 1,960 |
Net period expense | 8 | 56 | 3 | 216 (1) | 283 | 1,451 | 101 |
Employer contributions | (6) | - | - | - | (6) | (28) | (15) |
Benefits directly paid by the employer | (0) | (19) | (4) | (274) (2) | (297) | (227) | (123) |
Actuarial (gains)/losses generated during the year (3) | (11) | (16) | 5 | (1) | (23) | 122 | 46 |
Other | 6 | (2) | (1) | 1 | 4 | 24 | (7) |
Reclassification to assets held for sale | - | - | - | - | - | (1) | (45) |
Employee benefits - closing balance | 134 | 615 | 86 | 2,384 | 3,219 | 3,258 | 1,917 |
(1) Including 146 million euros for the part-time for seniors plan at December 31, 2013 (1,263 million euros at December 31, 2012). (2) Including (244) million euros for the part-time for seniors plan. (3) Actuarial gains and losses are recognized in components of other comprehensive income. |
Total cumulative components of other comprehensive income at December 31, 2013 amounted to (396) million euros, including an asset ceiling adjustment of (38) million euros and actuarial losses of (358) million euros.
The following table discloses the net period expense of post-employment and other long-term benefits:
| Post-employment benefits | | | | |
(in millions of euros) | Annuity-based plans | Capital-based plans | Other post-
employment benefits | Long-term benefits | 2013 | 2012 | 2011 |
Service cost | (5) | (35) | (0) | (70) | (110) | (152) | (79) |
Net interest on the net defined benefit liability (1) | (3) | (21) | (3) | (2) | (29) | (30) | (30) |
Actuarial gains/(losses) | - | - | - | 1 | 1 | (5) | 3 |
French part-time for seniors plans | - | - | - | (146) (2) | (146) | (1,263) | 9 |
Other | - | - | - | 1 | 1 | (2) | (4) |
TOTAL | (8) | (56) | (3) | (216) | (283) | (1,451) | (101) |
(1) Items included in finance income. (2) Including (120) million euros for service cost, (19) million euros for discounting and (7) million euros for actuarial losses. |
Orange plans to pay 6 million euros during 2014 for its defined benefit plans.
Expense recognized under the terms of defined contribution plans amounted to 1,072 million euros in 2013, 1,073 million euros in 2012 and 982 million euros in 2011.
ORANGE / 2013 REGISTRATION DOCUMENT - 135
The Board of Directors of March 5, 2014 assessed that the performance condition of “Let’s share” plan (international free share award plan) is not achieved. The charge booked in 2011 was reversed at year-end 2012.
The following table summarizes the stock option plans granted to Orange group employees:
| 2013 | 2012 | 2011 |
STOCK OPTION PLANS | Number | Weighted average exercise price
(in euros) | Number | Weighted average exercise price
(in euros) | Number | Weighted average exercise price
(in euros) |
Orange SA shares (ex-France Telecom SA 2005/2007) | | | | | | |
Options outstanding at the beginning of the year | 19,893,547 | 22.68 | 19,923,667 | 22.68 | 20,472,734 | 22.68 |
Exercised | - | - | - | - | - | - |
Canceled, lapsed | (309,840) | 22.59 | (30,120) | 22.32 | (549,067) | 22.55 |
Options outstanding at the end of the year | 19,583,707 | 22.69 | 19,893,547 | 22.68 | 19,923,667 | 22.68 |
Orange SA shares (ex-Wanadoo) | | | | | | |
Options outstanding at the beginning of the year | 1,231,794 | 16.60 | 2,365,123 | 15.28 | 3,750,149 | 15.32 |
Exercised | - | - | - | - | (1,504) | 15.38 |
Canceled, lapsed | (1,231,794) | 16.60 | (1,133,329) | 13.85 | (1,383,522) | 15.39 |
Options outstanding at the end of the year | - | - | 1,231,794 | 16.60 | 2,365,123 | 15.28 |
Orange SA shares (ex-Orange) (1) | | | | | | |
Options outstanding at the beginning of the year | 2,829,182 | 16.62 | 5,106,260 | 15.64 | 16,282,925 | 20.13 |
Exercised | - | - | - | - | (25,275) | 14.24 |
Canceled, lapsed | (2,793,800) | 16.64 | (2,277,078) | 14.43 | (11,151,390) | 22.20 |
Options outstanding at the end of the year | 35,382 | 15.33 | 2,829,182 | 16.62 | 5,106,260 | 15.64 |
Orange Polska SA shares | | | | | | |
Options outstanding at the beginning of the year | 3,381,233 | 5.29 | 3,588,677 | 4.89 | 3,935,225 | 5.43 |
Exercised | - | - | - | - | - | - |
Canceled, lapsed | (285,003) | 5.14 (2) | (207,444) | 5.15 | (346,548) | 5.39 |
Options outstanding at the end of the year | 3,096,230 | 5.19 (3) | 3,381,233 | 5.29 | 3,588,677 | 4.89 |
(1) In 2013 accounts, the number and average exercise price are mentioned in equivalent of Orange SA shares. (2) Exchange rate used: average rate for the year. (3) Exchange rate used: closing rate at December 31, 2013. |
| December 31, 2013 |
Options exercisable at year-end | Number of unexercised and exercisable options at year-end | Weighted average residual vesting period (in months) | Exercise price range |
Orange SA shares (ex-France Telecom SA 2005/2007) | 19,583,707 | 30 | €21.61-€23.48 |
Orange SA shares (ex-Orange) | 35,382 | 10 | €14.24-€16.66 |
Orange Polska SA shares | 3,096,230 | 45 | €5.19 |
ORANGE / 2013 REGISTRATION DOCUMENT - 136
(in millions of euros) | 2013 | 2012 | 2011 |
Belgium | (408) | (76) | - |
Democratic Republic of the Congo | (89) | - | - |
Poland | - | (889) | - |
Egypt | - | (400) | (449) |
Romania | - | (359) | (156) |
Other | (15) | (8) | (6) |
TOTAL | (512) | (1,732) | (611) |
At December 31, 2013
In Belgium, the goodwill impairment of 408 million euros reflects the impact at short and medium term of increased competitive pressure (general decline in prices of all market players), of legal reduction of contractual term commitment and of proposals by Mobistar of convergent offers still limited. The carrying value tested was brought down to the recoverable amount of long-term assets and working capital at 100%, amounting to 1.6 billion euros.
In Democratic Republic of the Congo, the goodwill impairment of 89 million euros reflects a review of development prospects. The carrying value tested of Democratic Republic of the Congo at 100% and after impairment represents less than 0.5% of long-term assets and working capital of the Group.
At December 31, 2012
In Poland, the goodwill impairment of 889 million euros reflected the impact of increased competitive pressure expected on mobile and fixed line and a reduction in call termination rates. The carrying value tested was brought down to the recoverable amount of long-term assets and working capital at 100%, amounting to 5.3 billion euros.
In Egypt, the goodwill impairment of 400 million euros (fully attributed to the Group following the transaction described in Note 2) reflected the impact of political and economic conditions and of the performance in 2012 (commercial recoveries and growth in customer bases, but pricing pressure and drop in tourism significantly impacting roaming revenues), coupled with an increase in the discount rate (after tax) from 13.0% to 14.0%. The carrying value tested was brought down to the recoverable amount of long-term assets and working capital at 100%, amounting to 1.9 billion euros.
In Romania, the goodwill impairment of 359 million euros primarly reflected the impact of further reductions expected in call termination rate imposed by the regulatory authority in 2012 and a limited presence in multi-play. The carrying value tested was brought down to the recoverable amount of long-term assets and working capital at 100%, amounting to 1.8 billion euros.
In Belgium, the goodwill impairment of 76 million euros reflected the impact of a new competitor, leading to a price decrease, too limited convergent offerings so far, and a reduction in the growth rate to perpetuity from 1.5% to 0.5%. The carrying value tested was brought down to the recoverable amount of long-term assets and working capital at 100%, amounting to 2.3 billion euros.
At December 31, 2011
In Egypt, the goodwill impairment of 449 million euros (including 286 million euros attributable to the non-controlling interests) reflected the impact of a lesser performance in 2011 and of political and economic conditions on projected business results, as well as the fact that the discount rate (after tax) applied to future cash flows was increased from 11.8% to 13.0%. The carrying value tested was brought down to the recoverable amount of long-term assets and working capital at 100%, amounting to 2.3 billion euros.
In Romania, the goodwill impairment of 156 million euros reflected the impact of the domestic economic situation. The carrying value tested was brought down to the recoverable amount of long-term assets and working capital at 100%, amounting to 2.2 billion euros.
ORANGE / 2013 REGISTRATION DOCUMENT - 137
Goodwill is recognized in accordance with the accounting principles described in Note 18.6.
| December 31, 2013 | December 31, 2012 | December 31, 2011 |
(in millions of euros) | Gross value | Accumulated impairment losses | Net book value | Net book value | Net book value |
France | 15,395 | (13) | 15,382 | 15,347 | 15,348 |
Spain | 4,837 | (114) | 4,723 | 4,723 | 4,723 |
Poland | 2,959 | (2,170) | 789 | 802 | 1,552 |
Rest of the World: | | | | | |
Romania | 1,806 | (515) | 1,291 | 1,291 | 1,650 |
Egypt (1) | 1,161 | (1,079) | 82 | 94 | 507 |
Belgium | 1,006 | (484) | 522 | 930 | 1,006 |
Slovakia | 806 | - | 806 | 806 | 806 |
Ivory Coast | 417 | (42) | 375 | 375 | 375 |
Jordan | 231 | (45) | 186 | 193 | 197 |
Other | 571 | (250) | 321 | 716 | 677 |
Enterprise | 1,071 | (643) | 428 | 425 | 429 |
International Carriers & Shared Services | 98 | (15) | 83 | 71 | 70 |
Goodwill of continuing operations | 30,358 | (5,370) | 24,988 | 25,773 | 27,340 |
Goodwill of assets held for sale (2) | 261 | - | 261 | - | 821 |
(1) As a result of the transaction made in 2012 and described in Note 2, the share of goodwill for Egypt attributable to ECMS shareholders other than Orange was negligible at December 31, 2013 and at December 31, 2012 (256 million euros at December 31, 2011). (2) Orange Dominicana in 2013 and Orange Suisse in 2011. |
(in millions of euros) | Note | 2013 | 2012 | 2011 |
Gross value - opening balance | | 30,837 | 30,646 | 31,863 |
Acquisitions | 2 | 77 | - | 72 |
Disposals | 2 | (1) | (1) | (106) |
Translation adjustment | | (288) | 133 | (313) |
Reclassifications and other items | | (6) | 66 | (49) |
Reclassification to assets held for sale (1) | 2 | (261) | (7) | (821) |
Gross value - closing balance | | 30,358 | 30,837 | 30,646 |
Accumulated impairment losses - opening balance | | (5,064) | (3,306) | (2,830) |
Impairment | | (512) | (1,732) | (611) |
Translation adjustment | | 206 | (26) | 135 |
Accumulated impairment losses - closing balance | | (5,370) | (5,064) | (3,306) |
Net book value of continuing operations | | 24,988 | 25,773 | 27,340 |
(1) Orange Dominicana in 2013 and Orange Suisse in 2012 and 2011. |
ORANGE / 2013 REGISTRATION DOCUMENT - 138
The methods used to determine recoverable amounts are described in Note 18.6.
■
The same key operating assumptions have been used to determine the value in use of assets for all of the Group’s business activities. These assumptions include the following:
■
key revenues assumptions, which reflect market level, penetration rate of the offerings and market share, positioning of the competition’s offerings and their potential impact on market price levels and their transposition to the Group’s offerings bases, regulatory authority decisions on pricing of services to customers and on access and pricing of inter-operators services, technology migration of networks (e.g. extinction of copper local loops), decisions of competition authorities in terms of concentration or regulation of adjacent sectors such as cable;
■
key costs assumptions, on the level of marketing expenses required to renew product lines and keep up with competition, the ability to adjust costs to potential changes in revenues as part of the Chrysalid program or the effects of natural attrition and departures plans on staff already incurred;
■
key assumptions on the level of capital expenditures, which may be affected by the roll-out of new technologies, by decisions of regulatory authorities relating to licenses and spectrum allocation, deployment of fiber networks, mobile network coverage, sharing of network or obligations to open up networks to competitors.
These key operational assumptions reflect past experience and expected trends: unforeseen changes have in the past produced a significant effect on the expectations and may continue to do so in the future. In this respect, expectations were again revised in 2013, reducing some estimated recoverable amounts.
■
Discount rates and growth rates to perpetuity used to determine the values in use have been revised as follows in 2013:
■
discount rates used, which incorporate a specific premium reflecting a risk assessment for the implementation of certain business plans or country risks, generally recorded a decline; in the particular case of Egypt, a rate of 17.5% has been used for the first two years, 15.5% for the following two years and 14.0% beyond and for the terminal value, due to the political and economic environment;
■
growth rates to perpetuity used were maintained, on the whole, as in the Group’s assessment carried out at the end of 2013, the economic environment is not expected to lead to any change in the long-term outlook of its industry; in the particular case of Egypt, the growth rate to perpetuity of 4.0% has to be assessed considering the expected long-term inflation in the country: for 2018, IMF forecasted 6.2% in April 2013 and 12.5% in October 2013.
■
At December 31, 2013, the specific random factors that may affect the estimate of recoverable amounts were as follows:
–
the various potential outcomes of the financial and economic situation, particularly their impact on consumer behavior, on demand of governments and European policy of restoring states’ balances or on the behaviour of market interests rates linked to the policies of central banks;
–
the tradeoffs to be made by regulatory and competition authorities between reducing prices to consumers and stimulating business investments, or in terms of market concentration;
–
the Group’s ability to adjust costs and capital expenditures to potential changes in revenues.
■
in Middle East (Jordan, Egypt, Iraq), North Africa and other African countries (Mali, Democratic Republic of the Congo, Central African Republic), changes in the political situation and the ensuing economic impacts.
ORANGE / 2013 REGISTRATION DOCUMENT - 139
Other assumptions that affect the determination of recoverable amount of the main consolidated business are set forth below:
December 31, 2013 | France | Spain | Poland | Entreprise | Romania | Belgium | Egypt |
Basis of recoverable amount | Value in use |
Source used | Internal plan |
Methodology | Discounted cash flow |
Growth rate to perpetuity | 0.5% | 1.5% | 1.0% | 0.3% | 2.0% | 0.5% | 4.0% |
Post-tax discount rate | 7.0% | 8.5% | 8.8% | 8.5% | 10.0% | 7.0% | 17.5% - 14.0% |
Pre-tax discount rate | 11.0% | 11.2% | 10.2% | 13.6% | 11.4% | 10.0% | 20.2% - 16.7% |
December 31, 2012 | | | | | | | |
Basis of recoverable amount | Value in use |
Source used | Internal plan |
Methodology | Discounted cash flow |
Growth rate to perpetuity | 0.5% | 1.5% | 1.0% | 0.0% | 2.0% | 0.5% | 3.5% |
Post-tax discount rate | 7.5% | 9.3% | 9.8% | 8.5% | 10.8% | 8.5% | 14.0% |
Pre-tax discount rate | 11.7% | 12.4% | 11.3% | 13.4% | 12.4% | 12.3% | 16.7% |
December 31, 2011 | | | | | | | |
Basis of recoverable amount | Value in use |
Source used | Internal plan |
Methodology | Discounted cash flow |
Growth rate to perpetuity | 0.5% | 1.5% | 1.0% | 0.0% | 2.0% | 1.5% | 3.5% |
Post-tax discount rate | 7.8% | 9.0% | 10.4% | 8.5% | 11.3% | 8.5% | 13.0% |
Pre-tax discount rate | 12.3% | 11.6% | 12.3% | 13.2% | 13.0% | 11.8% | 15.1% |
The Group’s listed subsidiaries are Orange Polska SA (Warsaw Stock Exchange), Mobistar (Brussels Stock Exchange), Jordan Telecom (Amman Stock Exchange), ECMS (Cairo Stock Exchange) and Sonatel (Abidjan Stock Exchange). The contribution of these subsidiaries, which publish their own regulated information, is less than or equal to 20% of consolidated entities’ revenues, operating income and net income.
Because of the correlation between operating cash flow and investment capacity, sensitivity of net cash flow is used. Cash flow for the terminal year representing a significant portion of the recoverable amount, a change of plus or minus 10% of these cash flow is presented in case sensitivity.
(in billions of euros)
December 31, 2013 | France | Spain | Poland | Enterprise | Romania | Belgium | Egypt |
100% margin of the recoverable amount over the carrying value tested | 8.8 | 0.1 | 1.1 | 3.7 | 0.1 | 0.0 | 0.0 |
100% effect on the recoverable amount of a variation of: | | | | | | | |
10% in cash flow for terminal year | 2.8 | 0.6 | 0.4 | 0.3 | 0.1 | 0.2 | 0.1 |
1% in growth rate to perpetuity | 4.9 | 1.0 | 0.6 | 0.4 | 0.2 | 0.3 | 0.1 |
1% in post-tax discount rate | 5.8 | 1.2 | 0.8 | 0.6 | 0.3 | 0.3 | 0.2 |
Cash flow is cash provided by operating activities (excluding interest expense and including tax at a standard rate), after purchases of property, plant and equipment and intangible assets.
The other entities not presented above each account for less than 3% of recoverable amounts for the consolidated entities.
ORANGE / 2013 REGISTRATION DOCUMENT - 140
In 2013, amortization of intangible assets amounted to 1,878 million euros (see Note 7.3) and depreciation of property, plant and equipment amounted to 4,174 million euros (see Note 7.4).
(in millions of euros) | 2013 | 2012 | 2011 |
Kenya | (58) | (54) | (93) |
Uganda | (34) | (15) | (29) |
Other (1) | (32) | (40) | (258) |
TOTAL | (124) | (109) | (380) |
(1) Including, in 2011, (179) million euros related to TP brand depreciation (commercialization now under Orange brand). |
Key assumptions and sources of sensitivity of recoverable amounts of other intangible assets and property, plant and equipment are similar to those described in Note 6.3 for the consolidated business activities.
Kenya and Uganda carrying values tested at 100% and after impairment losses represent individually less than 0.5% of long-term assets and working capital of the Group.
(in millions of euros) | 2013 | 2012 | 2011 |
Net book value of other intangible assets in the opening balance | 11,818 | 11,343 | 11,302 |
Acquisitions of other intangible assets | 1,943 | 2,472 | 2,432 |
o/w licenses (1) | 486 | 945 | 941 |
Impact of changes in the scope of consolidation | 41 | (1) | 131 |
Disposals | (9) | (11) | (5) |
Depreciation and amortization | (1,878) | (1,969) | (2,175) |
Impairment | (43) | (57) | (225) |
Translation adjustment | (170) | (36) | (117) |
Reclassifications and other items | 78 | 82 | 140 |
Reclassifications to assets held for sale | (36) | (5) | (140) |
Net book value of other intangible assets in the closing balance | 11,744 | 11,818 | 11,343 |
(1) Mainly relating to the acquisition, in 2013, of licenses for 216 million euros in Romania and 120 million euros in Belgium, the acquisitions in 2012, of LTE license in France for 901 million euros, and the acquisitions in 2011 of licenses for 579 million euros in Spain and 291 million euros in France. |
| December 31, 2013 | December 31, 2012 | December 31, 2011 |
(in millions of euros) | Gross value | Accumulated depreciation and amortization | Accumulated impairment | Net book value | Net book value | Net book value |
Telecommunication licenses | 7,087 | (2,549) | (97) | 4,441 | 4,430 | 3,825 |
Orange brand | 3,133 | - | - | 3,133 | 3,133 | 3,133 |
Other brands | 1,009 | (36) | (907) | 66 | 83 | 132 |
Subscriber bases | 4,475 | (4,337) | (36) | 102 | 166 | 397 |
Software | 10,640 | (7,046) | (46) | 3,548 | 3,624 | 3,521 |
Other intangible assets | 1,169 | (510) | (205) | 454 | 382 | 335 |
TOTAL | 27,513 | (14,478) | (1,291) | 11,744 | 11,818 | 11,343 |
ORANGE / 2013 REGISTRATION DOCUMENT - 141
Information on telecommunication licenses at December 31, 2013
Orange’s commitments under licenses awarded are disclosed in Note 14.
(in millions of euros) | Gross value | Net book value | Residual useful life (1) |
LTE (2 licenses) | 1,225 | 1,182 | 17.8 |
UMTS (2 licenses) | 914 | 511 | 7.7 and 16.4 |
GSM | 276 | 131 | 7.5 |
France | 2,415 | 1,824 | |
LTE | 447 | 441 | 16.0 |
UMTS | 639 | 248 | 6.2 |
GSM (2 licenses) | 335 | 264 | 9.7 and 17.0 |
Spain | 1,421 | 953 | |
LTE | 55 | 54 | 14.0 |
UMTS (2 licenses) | 402 | 216 | 4.6 and 9.1 |
GSM (2 licenses) | 146 | - | - |
Poland | 603 | 270 | |
UMTS | 286 | 187 | 8.5 |
GSM (2 licenses) | 805 | 465 | 8.5 |
Egypt | 1,091 | 652 | |
LTE | 140 | 140 | 19.8 |
UMTS | 149 | 68 | 7.3 |
GSM (2 licenses) | 298 | 29 | 1.9 |
Belgium | 587 | 237 | |
Other | 970 | 505 | |
TOTAL | 7,087 | 4,441 | |
(1) In number of years, at December 31, 2013. |
ORANGE / 2013 REGISTRATION DOCUMENT - 142
Key assumptions and sensitivity of recoverable amount of Orange brand
Key assumptions and sources of sensitivity of recoverable amount of Orange brand are similar to those described in Note 6.3 for the consolidated business activities.
Other assumptions that affect the determination of the recoverable amount are as follows:
| December 31, 2013 |
Basis of recoverable amount | Value in use |
Source used | Internal plan |
Methodology | Discounted net fees |
Growth rate to perpetuity | 0.5% |
Post-tax discount rate | 8.3% |
Pre-tax discount rate | 10.3% |
(in billions of euros) | December 31, 2013 |
100% margin of the recoverable amount over the carrying value tested | 0.7 |
100% effect on the recoverable amount of a variation of: | |
10% in net fees for terminal year | 0.3 |
1% in growth rate to perpetuity | 0.4 |
1% in post-tax discount rate | 0.5 |
Capitalized expenditure during the year
(in millions of euros) | 2013 | 2012 | 2011 |
External purchases | 424 | 477 | 438 |
Labor expenses | 337 | 312 | 310 |
Other | - | - | 1 |
TOTAL | 761 | 789 | 749 |
ORANGE / 2013 REGISTRATION DOCUMENT - 143
(in millions of euros) | 2013 | 2012 | 2011 |
Net book value of property, plant and equipment in the opening balance | 23,662 | 23,634 | 24,756 |
Acquisitions of property, plant and equipment | 4,269 | 4,338 | 4,459 |
o/w finance leases | 95 | 47 | 180 |
Impact of changes in the scope of consolidation | 87 | 0 | 49 |
Disposals and retirements | (57) | (59) | (52) |
Depreciation and amortization | (4,174) | (4,360) | (4,560) |
Impairment | (81) | (52) | (155) |
Translation adjustment | (280) | 193 | (424) |
Reclassifications and other items | (37) | (17) | 148 |
Reclassifications to assets held for sale | (232) | (15) | (587) |
Net book value of property, plant and equipment in the closing balance (1) | 23,157 | 23,662 | 23,634 |
(1) Including the assets related to managed services contracts or network sharing between telecommunications operators. |
| December 31, 2013 | December 31, 2012 | December 31, 2011 |
(in millions of euros) | Gross value | Accumulated depreciation and amortization | Accumulated impairment | Net book value | Net book value | Net book value |
Land and buildings | 7,409 | (4,167) | (340) | 2,902 | 3,113 | 3,145 |
Networks and terminals | 74,341 | (54,935) | (394) | 19,012 | 19,149 | 18,947 |
IT equipment | 4,081 | (3,227) | (30) | 824 | 877 | 768 |
Other property, plant and equipment | 1,544 | (1,112) | (13) | 419 | 523 | 774 |
TOTAL | 87,375 | (63,441) | (777) | 23,157 | 23,662 | 23,634 |
Property, plant and equipment held under finance leases
| December 31, 2013 | December 31, 2012 | December 31, 2011 |
(in millions of euros) | Net book value | Net book value | Net book value |
Land and buildings | 605 | 643 | 657 |
Networks and terminals | 37 | 22 | 19 |
IT Equipment and other | 47 | 26 | 12 |
TOTAL | 689 | 691 | 688 |
Capitalized expenditure during the year
(in millions of euros) | 2013 | 2012 | 2011 |
External purchases | 664 | 672 | 758 |
Labor expenses | 347 | 341 | 340 |
Other | 1 | 2 | 2 |
TOTAL | 1,012 | 1,015 | 1,100 |
ORANGE / 2013 REGISTRATION DOCUMENT - 144
(in millions of euros) | 2013 | 2012 | 2011 |
Restoring mobile telephony antennae sites | 395 | 362 | 366 |
Dismantling telephone poles | 136 | 146 | 133 |
Treatment of electrical and electronic equipment waste | 111 | 126 | 81 |
Dismantling public telephone | 45 | 55 | 50 |
Other | 23 | 20 | 19 |
TOTAL | 710 | 709 | 649 |
(in millions of euros) | 2013 | 2012 | 2011 |
Dismantling provision - opening balance | 709 | 649 | 507 |
Reversals releases with impact on income statement | (1) | (1) | (7) |
Discounting with impact on income statement | 18 | 17 | 19 |
Utilizations without impact on income statement | (24) | (19) | (19) |
Additions with impact on assets | 12 | 57 | 222 |
Changes in consolidation scope, reclassifications and translation adjustments | (1) | 7 | (6) |
Reclassification to assets held for sale | (3) | (1) | (67) |
Dismantling provisions - closing balance | 710 | 709 | 649 |
o/w non-current provisions | 687 | 686 | 630 |
o/w current provisions | 23 | 23 | 19 |
ORANGE / 2013 REGISTRATION DOCUMENT - 145
(in millions of euros) | 2013 | 2012 | 2011 |
Territorial Economic Contribution and IFER | (786) | (927) | (810) |
Spectrum fees | (302) | (300) | (295) |
Levies on telecommunication services | (190) | (198) | (224) |
Other operating taxes and levies | (439) | (432) | (443) |
TOTAL | (1,717) | (1,857) | (1,772) |
The telecommunication service taxes, set up in Spain and in France, have been contested by the European Commission before the Court of Justice of the European Union (CJEU). On June 27, 2013, the CJEU held that these taxes are not incompatible with Community law. This negative decision has no impact on Orange’s accounts as these taxes have been taken over and paid each year.
Orange Polska SA was subject to a tax audit relating to the fiscal year 2009. Memorandum have been exchanged with the Tax Audit Office and the procedure is still in progress as at December 31, 2013. In its responses made so far, Orange Polska SA disputes the result of the tax audit and maintains its position as far as its estimates to have solid grounds for its defense in view of the points raised by the Administration.
(in millions of euros) | December 31, 2013 | December 31, 2012 | December 31, 2011 |
Value added tax | 854 | 1,122 | 1,148 |
Other operating taxes and levies | 70 | 71 | 70 |
Operating taxes and levies - Receivables | 924 | 1,193 | 1,218 |
Territorial Economic Contribution and IFER | (129) | (115) | (24) |
Spectrum fees | (53) | (50) | (47) |
Levies on telecommunication services | (110) | (95) | (91) |
Value added tax | (481) | (732) | (797) |
Other operating taxes and levies | (429) | (483) | (475) |
Operating taxes and levies - Payables | (1,200) | (1,475) | (1,434) |
Operating taxes and levies - Net | (277) | (282) | (216) |
(in millions of euros) | 2013 | 2012 | 2011 |
Net operating taxes and levies - opening balance | (282) | (216) | (79) |
Operating taxes and levies recognized in profit or loss | (1,717) | (1,857) | (1,772) |
Operating taxes and levies paid | 1,706 | 1,833 | 1,658 |
Changes in consolidation scope, reclassification and translation adjustments | 9 | (42) | (23) |
Reclassification to assets held for sale | 7 | - | - |
Net operating taxes and levies - closing balance | (277) | (282) | (216) |
ORANGE / 2013 REGISTRATION DOCUMENT - 146
(in millions of euros) | | | % interest | | | |
Company | Main activity | Main co-shareholders | December 31, 2013 | December 31, 2013 | December 31, 2012 | December 31, 2011 |
EE (1) | Telecommunications operator in the United Kingdom | Deutsche Telekom (50%) | 50% | 5,837 | 6,328 | 6,734 |
Other | | | | 104 | 106 | 129 |
Joint ventures | | 5,941 | 6,434 | 6,863 |
Médi Telecom | Telecommunications operator in Morocco | Groupe Caisse
de Dépôt et de Gestion (30%)
Groupe
FinanceCom (30%) | 40% | 329 (2) | 506 | 671 |
Korek Telecom | Telecommunications operator in Iraq | Agility (24%)
CS Ltd (56%) | 20% | 125 (3) | 165 | 169 |
Other | | | | 130 | 326 | 241 |
Associates | | 584 | 997 | 1,081 |
TOTAL | | | | 6,525 | 7,431 | 7,944 |
(1) EE contributes to “International Carriers & Shared Services” segment. Detailed financial information at 100% is provided in segment information. (2) Including a goodwill of 193 million euros. (3) Including a goodwill of 71 million euros. |
(in millions of euros) | 2013 | 2012 | 2011 |
Interests in associates and joint ventures opening balance | 7,431 | 7,944 | 8,176 |
Dividends | (308) | (504) | (521) |
Share of profits (losses) (1) | (73) | (106) | (50) |
Impairment | (186) | (156) | (47) |
Translation adjustment | (151) | 147 | 199 |
Change in components of other comprehensive income | (42) | (19) | (11) |
Acquisitions of shares (2) | 14 | 129 | 258 |
Disposals of investments (3) | (168) | - | (60) |
Reclassification and other items | 8 | (4) | - |
Interests in associates and joint ventures closing balance | 6,525 | 7,431 | 7,944 |
(1) Including EE for (45) million euros in 2013. (2) Including the investment in 44,4% of Cloudwatt for 100 million euros in 2012 and the acquisition of 20% of Korek Telecom for 177 million euros in 2011. (3) Including Sonaecom for (105) million euros and Dailymotion for (60) million euros in 2013 (see Note 2). |
Dividends mainly concern EE for 270 million euros in 2013, 450 million euros in 2012 and 494 million euros in 2011.
Impairment losses mainly include 148 million euros in 2013 and 141 million euros in 2012 related to Médi Telecom. In 2013, the impairment reflects increased competitive pressure heavily weighing on the price levels of offers. The basis of the recoverable value is the value in use.
ORANGE / 2013 REGISTRATION DOCUMENT - 147
Key assumptions and sensitivity of recoverable amounts of EE
Key assumptions and sources of sensitivity of recoverable amount of EE are similar to those described in Note 6.3 for the consolidated business activities.
Other assumptions that affect the determination of recoverable amount are as follows:
| December 31, 2013 | December 31, 2012 |
Basis of recoverable amount | Value in use | Value in use |
Source used | Internal plan | Internal plan |
Methodology | Discounted cash flow | Discounted cash flow |
Growth rate to perpetuity | 1.0% | 1.0% |
Post-tax discount rate | 7.8% | 8.0% |
Pre-tax discount rate | 9.0% | 9.7% |
Because of the correlation between operating cash flow and investment capacity, sensitivity of net cash flow is used. Cash flow for the terminal year representing a significant portion of the recoverable amount, a change of plus or minus 10% of these cash flow is presented in case sensitivity.
(in billions of euros) | December 31, 2013 |
Margin of the recoverable amount over the carrying value tested (share of the Group) | 1.2 |
Effect on the recoverable amount of a variation of (share of the Group): | |
10% in cash flows for terminal year | 0.3 |
1% in growth rate to perpetuity | 1.1 |
1% in post-tax discount rate | 1.3 |
EE
Except for share of profit (loss) and dividends, transactions between the Group and EE are in consolidated statement of financial position and in consolidated income statement as follows:
(in millions of euros) | December 31, 2013 | December 31, 2012 | December 31, 2011 |
Assets | | | |
Trade receivables | 55 | 74 | 60 |
Loans | - | - | 224 |
Other current assets | - | 1 | 4 |
Liabilities | | | |
Trade payables | (11) | (18) | (19) |
Advances from partners | (217) | (417) | (140) |
Income statement | | | |
Revenues | 34 | 44 | 51 |
Other operating income | 116 (1) | 146 | 141 |
Operating expenses | (19) | (30) | (37) |
Finance cost, net | - | 1 | 5 |
(1) Including 47 million euros invoiced for services and 60 million euros for brand fees. |
Other associates and joint ventures
At December 31, 2013, the Group has granted loans to Korek Telecom with a value of 185 million dollars (134 million euros).
The unrecognized contractual commitments entered by the Group relating to interests in associates and joint ventures are described in Note 14.
ORANGE / 2013 REGISTRATION DOCUMENT - 148
| Finance costs, net | Operating
income | Other comprehensive income |
(in millions of euros) | Cost of gross financial debt | Gains (losses) on assets contributing to net financial debt | Cost of net financial debt | Foreign exchange gains (losses) | Other net financial expenses | Finance costs, net | Foreign exchange gains (losses) | Other | Retained earnings |
2013 | | | | | | | | | |
Assets available for sale | - | - | - | - | 3 | | - | - | 8 |
Loans and receivables | - | 23 | 23 | (31) | 47 | | 6 | (241) (3) | - |
Financial assets at fair value through profit or loss, excluding derivatives | - | 36 | 36 | - | - | | - | - | - |
Liabilities at amortized cost (1) | (1,747) | - | (1,747) | 585 | - | | (13) | (1) | - |
Financial liabilities at fair value trough profit or loss, excluding derivatives | (27) | - | (27) | - | - | | - | - | - |
Derivatives | 28 | - | 28 | (572) | - | | 4 | - | (256) |
Discounting expense | - | - | - | - | (95) | | - | - | - |
TOTAL | (1,746) | 59 | (1,687) | (18) | (45) | (1,750) | (3) | (242) | (248) |
2012 | | | | | | | | | |
Assets available for sale | - | - | - | - | 3 | | - | - | 7 |
Loans and receivables | - | 26 | 26 | 42 | 49 | | 2 | (203) (4) | - |
Financial assets at fair value through profit or loss, excluding derivatives | - | 75 | 75 | (1) | - | | - | - | - |
Liabilities at amortized cost (1) | (1,975) | - | (1,975) | 169 | - | | (11) | (2) | - |
Financial liabilities at fair value trough profit or loss, excluding derivatives | 216 (2) | - | 216 | (16) | - | | - | - | - |
Derivatives | (10) | - | (10) | (222) | - | | (14) | - | (295) |
Discounting expense | - | - | - | - | (84) | | - | - | - |
TOTAL | (1,769) | 101 | (1,668) | (28) | (32) | (1,728) | (23) | (205) | (288) |
2011 | | | | | | | | | |
Assets available for sale | - | - | - | - | - | | - | - | (10) |
Loans and receivables | - | 50 | 50 | 121 | 37 | | 6 | (212) (5) | - |
Financial assets at fair value through profit or loss, excluding derivatives | - | 75 | 75 | (3) | - | | - | - | - |
Liabilities at amortized cost (1) | (1,891) | - | (1,891) | (563) | - | | (29) | 1 | - |
Financial liabilities at fair value trough profit or loss, excluding derivatives | (70) | - | (70) | (4) | - | | - | - | - |
Derivatives | (105) | - | (105) | 428 | - | | 81 | - | (17) |
Discounting expense | - | - | - | - | (108) | | - | - | - |
TOTAL | (2,066) | 125 | (1,941) | (21) | (71) | (2,033) | 58 | (211) | (27) |
(1) Including the change in fair value of hedged liabilities. (2) Including a financial gain of 272 million euros due to the revision of the financial parameters of the purchase price for the ECMS shares from OTMT and the free float which resulted in a reduction in financial debt as of the date on which the 2012 agreements became effective (see Note 2). (3) Mainly receivables written off for (270) million euros, (42) million euros from net changes in provisions for impairment of trade receivables, and various interest on receivables for 80 million euros. (4) Mainly receivables written off for (365) million euros, 79 million euros from net changes in provisions for impairment of trade receivables, and various interest on receivables for 85 million euros. (5) Mainly receivables written off for (343) million euros, 47 million euros from net changes in provisions for impairment of trade receivables, and various interest on receivables for 86 million euros. |
ORANGE / 2013 REGISTRATION DOCUMENT - 149
Net financial debt as defined and used by Orange corresponds to (a) financial liabilities excluding operating payables (translated at the year-end closing rate), less (b): (i) all derivative instruments carried in assets, (ii) cash collateral paid on derivative instruments, (iii) some deposits related to financing, (iv) cash, cash equivalents and financial assets at fair value, and (v) the loan granted by the Group to EE.
Financial instruments qualifying as cash flow hedge and net investment hedge are included in net financial debt but set up to hedge items that are not (future cash flows, net investment in foreign currencies). Therefore, the effective portion of cash flow hedges and the effective portion of net investment hedges (c) are added to net financial debt to offset this temporary difference.
Items in the statement of financial position included in the calculation of net financial debt
| December 31, 2013 | December 31, 2012 | December 31, 2011 |
(in millions of euros) | Statement of financial position | o/w included in calculation of net financial debt | Statement of
financial position | o/w included in calculation of net financial debt | Statement of
financial position | o/w included in calculation of net financial debt |
Non-current financial liabilities at amortized cost, excluding trade payables | 30,295 | 30,076 | 31,883 | 31,657 | 33,933 | 33,696 |
Current financial liabilities at amortized cost, excluding trade payables | 7,100 | 7,100 | 7,331 | 7,331 | 5,440 | 5,104 |
Total financial liabilities at amortized cost, except trade payables | 37,395 | 37,176 | 39,214 | 38,988 | 39,373 | 38,800 |
Non-current financial liabilities at fair value through profit or loss | 369 | 369 | 482 | 482 | 259 | 259 |
Current financial liabilities at fair value through profit or loss | 165 | 165 | 111 | 111 | 2,019 | 2,019 |
Total financial liabilities at fair value through profit or loss | 534 | 534 | 593 | 593 | 2,278 | 2,278 |
Non-current hedging derivatives liabilities | 1,133 | 1,133 | 542 | 542 | 277 | 277 |
Current hedging derivatives liabilities | 3 | 3 | 5 | 5 | 3 | 3 |
Liabilities included in the calculation of net financial debt (a) | | 38,846 | | 40,128 | | 41,358 |
Assets available for sale | 103 | - | 139 | - | 89 | - |
Non-current loans and receivables | 1,837 | 1,146 | 1,003 | 372 | 994 | 319 |
Current loans and receivables | 38 | - | 81 | 2 | 1,165 | 355 |
Cash | 1,586 | 1,586 | 1,205 | 1,205 | 1,311 | 1,328 |
Total loans and receivables, except trade receivables | 3,461 | 2,732 | 2,289 | 1,579 | 3,470 | 2,002 |
Non-current financial assets at fair value through profit or loss | 95 | 21 | 159 | 85 | 114 | 114 |
Current financial assets at fair value through profit or loss, excluding cash equivalents | 213 | 213 | 141 | 141 | 948 | 948 |
Cash equivalents | 4,330 | 4,330 | 7,116 | 7,116 | 6,733 | 6,733 |
Total financial assets at fait value through profit or loss | 4,638 | 4,564 | 7,416 | 7,342 | 7,795 | 7,795 |
Non-current hedging derivatives assets | 36 | 36 | 204 | 204 | 428 | 428 |
Current hedging derivatives assets | 101 | 101 | 3 | 3 | 66 | 66 |
Assets included in the calculation of net financial debt (b) | | 7,433 | | 9,128 | | 10,291 |
Retained earnings | (3,005) | (687) | (3,080) | (455) | 187 | (177) |
Of which effective portion of cash flow hedges | (706) | (706) | (433) | (433) | (56) | (56) |
Of which effective portion of net investment hedges | 19 | 19 | (22) | (22) | (121) | (121) |
Component of equity included in the calculation of net financial debt (c) | | (687) | | (455) | | (177) |
External net financial debt (a) - (b) + (c) | | 30,726 | | 30,545 | | 30,890 |
ORANGE / 2013 REGISTRATION DOCUMENT - 150
Analysis of net financial debt
(in millions of euros) | Note | December 31, 2013 | December 31, 2012 | December 31, 2011 |
TDIRA | 10.3 | 1,352 | 1,328 | 1,578 |
Bonds, excluding TDIRA | 10.4 | 30,822 | 32,531 | 32,720 |
Bank and multilateral lending institutions loans | 10.5 | 2,222 | 2,476 | 2,271 |
Finance lease liabilities | | 661 | 675 | 692 |
Securitization debt | | 782 | 852 | 593 |
Cash collateral received | | 88 | 66 | 314 |
Commercial papers | | 708 | 366 | 51 |
Bank overdrafts | | 175 | 101 | 188 |
Commitment to purchase Mobinil-ECMS shares | 2 | 232 | 220 | 1,937 |
Other commitments to purchase non-controlling interests | | 46 | 35 | 15 |
Other financial liabilities | | 393 | 620 | 414 |
Derivatives (liabilities) | 10.10 | 1,365 | 858 | 585 |
Liabilities included in the calculation of net financial debt (a) | | 38,846 | 40,128 | 41,358 |
Derivatives (assets) | 10.10 | 200 | 300 | 832 |
Gross financial debt after derivatives | | 38,646 | 39,828 | 40,526 |
Cash collateral paid | 10.8 | 1,146 | 372 | 317 |
Other deposits related to financing | 10.8 | - | 2 | 133 |
Loan granted to EE | 10.8 | - | - | 224 |
Other financial assets at fair value, excluding derivatives | 10.9 | 171 | 133 | 724 |
Cash equivalents | 10.9 | 4,330 | 7,116 | 6,733 |
Cash | | 1,586 | 1,205 | 1,328 |
Assets included in the calculation of net financial debt (b) | | 7,433 | 9,128 | 10,291 |
Effective portion of cash flow hedges (1) | | (706) | (433) | (56) |
Effective portion of net investment hedges | | 19 | (22) | (121) |
Components of equity included in the calculation of net financial debt (c) | | (687) | (455) | (177) |
External net financial debt (a) - (b) + (c) | | 30,726 | 30,545 | 30,890 |
(1) Excluding CFH borne by entities consolidated under equity method. |
Debt maturity schedules are presented in Note 11.3.
Analysis of net financial debt by currency
The table below provides an analysis of net financial debt by currency, after hedging derivatives set up to hedge items that are included in net financial debt.
(equivalent value in millions of euros at year-end closing rate) | EUR | USD | GBP | EGP | CHF | PLN | Other | Total |
Net debt by currency before derivatives (1) | 17,139 | 6,518 | 4,476 | 899 | 525 | 3 | 1,166 | 30,726 |
Effect of derivatives | 9,605 | (6,463) | (2,558) | - | (534) | 1,014 | (1,064) | - |
Net financial debt by currency after derivatives | 26,744 | 55 | 1,918 | 899 | (9) | 1,017 | 102 | 30,726 |
(1) Including the market value of derivatives in local currency. |
ORANGE / 2013 REGISTRATION DOCUMENT - 151
Analysis of net financial debt by entity
(in millions of euros) | December 31, 2013 | December 31, 2012 | December 31, 2011 |
Orange SA | 27,336 | 26,393 | 26,355 |
Orange Polska | 753 | 1,240 | 387 |
ECMS | 843 | 864 | 943 |
Securitization (Orange SA) | 772 | 843 | 581 |
Orange Espagne | 566 | 585 | 601 |
Commitment to purchase Mobinil-ECMS shares | 232 | 220 | 1,937 |
Loan granted to EE | - | - | (224) |
Other | 224 | 400 | 310 |
Net financial debt | 30,726 | 30,545 | 30,890 |
On March 3, 2003, under the terms of the settlement agreement signed in 2002 that ended the project to develop the mobile business in Germany, Orange SA issued perpetual bonds redeemable for shares (TDIRA), with a nominal value of 14,100 euros each, reserved for members of the banking syndicate (the “Bank tranche”) and for MobilCom’s suppliers (the “Supplier tranche”). The TDIRA are listed on Euronext Paris and were approved by the Commission des Opérations de Bourse (French Securities Regulator, renamed “Autorité des Marchés Financiers”) on February 24, 2003.
The TDIRA are redeemable for new Orange SA ordinary shares, at any time at the holders’ request or, under certain conditions as described in the appropriate information memorandum, at Orange SA’s initiative based on a ratio of 577.8638 shares to one TDIRA for the Bank Tranche (i.e. conversion price of 24,400 euros) and 465.6714 shares to one TDIRA for the Supplier Tranche (i.e. conversion price of 30.279 euros), as the initial ratio of 300 shares to one TDIRA has been adjusted several times to protect bondholders’ rights, and may be further adjusted under the terms and conditions set out in the information memorandum.
Since January 1, 2010, the interest rate on the TDIRA has been 3-month Euribor +2.5%.
On January 6, 2014, the General Assembly of the Bank tranche holders took decision on the following modifications:
■
alignment of the subordination level of the Bank tranche with Orange’s deeply subordinated bonds;
■
removal of the step-up clause (affecting the interest paid to investors according Orange’s credit rating);
■
the option for Orange to defer, at any time and at its sole discretion, payments of interest and apart from the mandatory payment of such interest in certain circumstances.
These modifications will have no effect on the amounts recognized in the financial statements.
Taking into account redemptions made since their issue, 103,582 TDIRA remained outstanding at December 31, 2013, including 89,398 for the Bank tranche and 14,184 for the Supplier tranche, for a nominal amount of 1,461 million euros.
The TDIRA are classified as hybrid instruments, with the following breakdown at December 31, 2013:
■
a liability component of 1,352 million euros recognized at amortized cost;
■
an equity component, before deferred taxes, of 351 million euros. This component, calculated at inception, does not vary over the lifetime of the instrument, with the exception of redemptions.
The difference between the total nominal amount of the TDIRA and the sum of the liability and equity components therefore equals the amortized cost adjustment on the liability component recognized since inception.
(in millions of euros) | December 31, 2013 | December 31, 2012 | December 31, 2011 |
Number | 103,582 | 104,297 | 125,616 |
Equity component before deferred taxes | 351 | 353 | 425 |
Original debt component (a) | 1,110 | 1,118 | 1,346 |
TDIRA nominal amount | 1,461 | 1,471 | 1,771 |
Amortized cost adjustment excluding accrued interest (b) | 232 | 200 | 215 |
Accrued interest (c) | 10 | 10 | 17 |
Total debt amount in statement of financial position (a) + (b) + (c) | 1,352 | 1,328 | 1,578 |
Effective interest rate on the liability component | 5.72% | 5.35% | 5.86% |
Paid interest | 40 | 62 | 68 |
ORANGE / 2013 REGISTRATION DOCUMENT - 152
Bonds or new tranches issued during 2013 are shown in italics.
Orange SA
| | | | Oustanding amount (in millions of euros) |
Notional currency | Initial nominal amount
(in millions of currency units) | Maturity | Nominal
interest rate (%) | December 31, 2013 | December 31, 2012 | December 31, 2011 |
Bonds matured before December 31, 2013 | | | 3,490 | 5,813 |
EUR | 1,000 | January 22, 2014 | 5.000 | 995 | 1,000 | 1,000 |
EUR | 200 | April 16, 2014 | 5.200 | 200 | 200 | 200 |
EUR | 750 | May 22, 2014 | 5.250 | 750 | 750 | 750 |
USD | 1,250 | July 8, 2014 | 4.375 | 881 | 947 | 966 |
CHF | 400 | December 4, 2014 | 3.500 | 326 | 331 | 329 |
EUR | 100 | January 19, 2015 | 3M Euribor + 0,62 | 100 | 100 | 100 |
EUR | 100 | January 29, 2015 | 3M Euribor + 0,63 | 100 | 100 | 100 |
HKD | 500 | February 4, 2015 | 2.950 | 47 | 49 | 50 |
EUR | 70 | February 9, 2015 | 3M Euribor + 0,62 | 70 | 70 | 70 |
JPY | 46,100 | June 29, 2015 | 1.230 | 319 | 406 | 460 |
JPY | 6,200 | June 29, 2015 | 3M JPY Libor+ 0,67 | 43 | 55 | 62 |
USD | 750 | September 16, 2015 | 2.125 | 544 | 568 | 580 |
EUR | 1,150 | October 14, 2015 | 3.625 | 1,150 | 1,150 | 1,150 |
GBP | 750 | May 12, 2016 | 5.000 | 900 | 919 | 898 |
CAD | 200 | June 23, 2016 | 5.500 | 136 | 152 | 151 |
USD | 1,000 | September 14, 2016 | 2.750 | 725 | 758 | 773 |
CHF | 250 | October 13, 2016 | 1.625 | 203 | 207 | 206 |
JPY | 44,300 | November 25, 2016 | 1.130 | 306 | 390 | 442 |
HKD | 340 | December 22, 2016 | 2.750 | 32 | 33 | 34 |
EUR | 1,900 | February 21, 2017 | 4.750 | 1,900 | 1,900 | 1,900 |
EUR | 100 | December 4, 2017 | 2.600 | 100 | 100 | 100 |
GBP | 500 | December 20, 2017 | 8.000 | 600 | 613 | 599 |
EUR | 1,550 | May 22, 2018 | 5.625 | 1,550 | 1,550 | 1,550 |
EUR | 465 | July 25, 2018 | EUR HICP + 3,00 (1) | 465 | 465 | 465 |
EUR | 850 | September 3, 2018 | 1.875 | 850 | - | - |
EUR | 50 | September 26, 2018 | 3M Euribor + 0,57 | 50 | - | - |
EUR | 750 | January 23, 2019 | 4.125 | 750 | 750 | 750 |
JPY | 7,500 | January 24, 2019 | 1.416 | 52 | 66 | - |
USD | 1,250 | July 8, 2019 | 5.375 | 906 | 947 | 966 |
EUR | 750 | October 2, 2019 | 1.875 | 750 | - | - |
EUR | 25 | February 10, 2020 | 4.200 | 25 | 25 | 25 |
EUR | 25 | February 10, 2020 | 10 Y CMS + 0,80 (2) | 25 | 25 | 25 |
EUR | 1,000 | April 9, 2020 | 3.875 | 1,000 | 1,000 | 1,000 |
GBP | 450 | November 10, 2020 | 7.250 | 539 | 551 | 539 |
EUR | 1,250 | January 14, 2021 | 3.875 | 1,250 | 1,250 | 1,250 |
USD | 1,000 | September 14, 2021 | 4.125 | 725 | 758 | 773 |
EUR | 255 | October 13, 2021 | 10 Y CMS + 0,69 | 255 | 255 | 255 |
EUR | 272 | December 21, 2021 | 10Y TEC + 0,50 | 272 | 272 | 272 |
EUR | 1,000 | June 15, 2022 | 3.000 | 1,000 | 1,000 | - |
EUR | 500 | September 16, 2022 | 3.375 | 500 | 500 | 500 |
EUR | 500 | March 1, 2023 | 2.500 | 500 | 500 | - |
HKD | 700 | October 6, 2023 | 3.230 | 65 | 68 | 70 |
HKD | 410 | December 22, 2023 | 3.550 | 38 | 40 | 41 |
EUR | 650 | January 9, 2024 | 3.125 | 650 | - | - |
GBP | 350 | December 5, 2025 | 5.250 | 420 | 429 | 419 |
EUR | 75 | November 30, 2026 | 4.125 | 75 | 75 | 75 |
ORANGE / 2013 REGISTRATION DOCUMENT - 153
| | | | Oustanding amount (in millions of euros) |
Notional currency | Initial nominal amount
(in millions of currency unit) | Maturity | Nominal
interest rate (%) | December 31, 2013 | December 31, 2011 | December 31, 2011 |
EUR | 50 | April 11, 2028 | 3.220 | 50 | - | - |
GBP | 500 | November 20, 2028 | 8.125 | 600 | 613 | 599 |
EUR | 150 | April 11, 2029 | 3.300 | 150 | - | - |
USD | 2,500 | March 1, 2031 | 8.500 (3) | 1,785 | 1,866 | 1,902 |
EUR | 50 | December 5, 2031 | 4.300 (zero coupon) | 54 | 52 | 50 |
EUR | 50 | December 8, 2031 | 4.350 (zero coupon) | 54 | 52 | 50 |
EUR | 50 | January 5, 2032 | 4.450 | 52 | 50 | - |
EUR | 1,500 | January 28, 2033 | 8.125 | 1,500 | 1,500 | 1,500 |
EUR | 55 | September 30, 2033 | 3.750 | 55 | - | - |
GBP | 500 | January 23, 2034 | 5.625 | 600 | 613 | 599 |
EUR | 50 | April 16, 2038 | 3.500 | 50 | - | - |
USD | 900 | January 13, 2042 | 5.375 | 652 | 682 | - |
GBP | 500 | November 22, 2050 | 5.375 | 600 | 613 | 599 |
Outstanding amount of bonds | | 29,341 | 30,855 | 31,007 |
Accrued interest | | 708 | 898 | 939 |
Other adjustments | | (109) | (127) | (147) |
TOTAL | | 29,940 | 31,626 | 31,799 |
(1) EUR HICP: Harmonized Index of Consumer Prices, an indicator of inflation and price stability calculated by the European Central Bank. (2) This bond is measured at fair value through profit or loss. In 2013, a profit of 0.4 million euros was recognized on the remeasurement of this bond. (3) Bond with a step-up clause (clause that triggers a change in interest payments if Orange’s credit rating from the rating agencies changes). This clause was triggered in 2013 and in early 2014: the coupon due in March 2014 will be computed on the basis of an interest rate of 8.75% and after that date, the bond will bear interest at the rate of 9%. |
As at December 31, 2013, Orange SA bonds were redeemable at maturity, and no specific guarantee has been given in relation to their issuance. Some bonds may be redeemed in advance, at the request of the issuer.
Orange Polska
| | | | Outstanding amount (in millions of euros) |
Notional currency | Initial nominal amount
(in millions of currency units) | Maturity | Nominal
interest rate (%) | December 31, 2013 | December 31, 2012 | December 31, 2011 |
Bonds matured before December 31, 2013 | | | - | - |
EUR | 700 | May 22, 2014 | 6.000 | 700 | 700 | 700 |
Outstanding amount of bonds | | | 700 | 700 | 700 |
Accrued interest | | | 26 | 26 | 26 |
Other adjustments | | | - | 2 | 3 |
TOTAL | | | 726 | 728 | 729 |
ECMS
| | | | Outstanding amount (in millions of euros) |
Notional currency | Initial nominal amount
(in millions of currency units) | Maturity | Nominal
interest rate (%) | December 31, 2013 | December 31, 2012 | December 31, 2011 |
Bonds matured before December 31, 2013 | | | - | - |
EGP | 1,500 | January 24, 2015 | 12.250 | 157 | 179 | 192 |
Outstanding amount of bonds | | | 157 | 179 | 192 |
Accrued interest | | | - | - | - |
Other adjustments | | | (1) | (2) | (3) |
TOTAL | | | | 156 | 177 | 189 |
ORANGE / 2013 REGISTRATION DOCUMENT - 154
(in millions of euros) | December 31, 2013 | December 31,
2012 | December 31,
2011 |
ECMS (1) | 667 | 784 | 860 |
Orange SA (1) | 110 | 77 | (14) |
Orange Polska (1) | 9 | 289 | - |
Other | 266 | 337 | 458 |
Bank loans | 1,052 | 1,487 | 1,304 |
Orange Espagne | 501 | 501 | 502 |
Orange Polska | 17 | 245 | 368 |
Orange SA | 500 | 100 | - |
Other | 152 | 143 | 97 |
Loans from multilateral lending institutions (2) | 1,170 | 989 | 967 |
TOTAL | 2,222 | 2,476 | 2,271 |
(1) Credit line drawdowns. (2) Primarily the European Investment Bank. |
(in millions of euros) | December 31, 2013 | December 31, 2012 | December 31, 2011 |
Bonds at fair value through profit or loss | 27 | 27 | 22 |
Derivatives held for trading (liabilities) | 229 | 311 | 304 |
Commitment to purchase Mobinil-ECMS shares | 232 | 220 | 1,937 |
Other commitments to purchase non controlling interests | 46 | 35 | 15 |
TOTAL | 534 | 593 | 2,278 |
(in millions of euros) | 2013 | 2012 | 2011 |
Assets available for sale - opening balance | 139 | 89 | 119 |
Change in fair value | 8 | 7 | (10) |
Other movements | (44) | 43 | (20) |
Assets available for sale - closing balance | 103 | 139 | 89 |
(in millions of euros) | 2013 | 2012 | 2011 |
Profit (loss) recognized in other comprehensive income during the period | 8 | 8 | (4) |
Reclassification in net income during the period | - | (1) | (6) |
TOTAL | 8 | 7 | (10) |
ORANGE / 2013 REGISTRATION DOCUMENT - 155
| December 31, 2013 | December 31,
2012 | December 31,
2011 |
(in millions of euros) | Cost | Depreciation | Net | Net | Net |
Cash collateral paid (1) | 1,146 | - | 1,146 | 372 | 317 |
Other deposits paid in connection with financing (1) | - | - | - | 2 | 133 |
Loan granted to EE (1) | - | - | - | - | 224 |
Receivables related to investments | 200 | (21) | 179 | 197 | 979 (2) |
Other (3) | 564 | (14) | 550 | 513 | 506 |
TOTAL | 1,910 | (35) | 1,875 | 1,084 | 2,159 |
(1) Items included in net financial debt (see Note 10.2). (2) Including the loan granted to Orange Suisse in a nominal amount of 917 million Swiss francs. (3) Mainly comprises security deposits and various loans. |
(in millions of euros) | December 31, 2013 | December 31, 2012 | December 31, 2011 |
Derivatives held for trading (assets) | 63 | 93 | 338 |
Investments at fair value | 171 | 133 | 724 |
Equity securities measured at fair value | 74 | 74 | - |
Other financial assets at fair value through profit or loss | 308 | 300 | 1,062 |
Cash equivalents | 4,330 | 7,116 | 6,733 |
TOTAL | 4,638 | 7,416 | 7,795 |
Items in the statement of financial position included in the derivatives portfolio
| December 31, 2013 | December 31, 2012 | December 31, 2011 |
(in millions of euros) | Statement of financial position | o/w derivatives | Statement of financial position | o/w derivatives | Statement of financial position | o/w derivatives |
Non-current financial liabilities at fair value through profit or loss | (369) | (126) | (482) | (236) | (259) | (238) |
Non-current hedging derivatives liabilities | (1,133) | (1,133) | (542) | (542) | (277) | (277) |
Current financial liabilities at fair value through profit or loss | (165) | (103) | (111) | (75) | (2,019) | (67) |
Current hedging derivatives liabilities | (3) | (3) | (5) | (5) | (3) | (3) |
Liabilities included in the derivatives portfolio | | (1,365) | | (858) | | (585) |
Non-current assets at fair value through profit or loss | 95 | 21 | 159 | 85 | 114 | 114 |
Non-current hedging derivatives assets | 36 | 36 | 204 | 204 | 428 | 428 |
Current financial asset at fair value through profit or loss, excluding cash equivalents | 213 | 42 | 141 | 8 | 948 | 224 |
Current hedging derivatives assets | 101 | 101 | 3 | 3 | 66 | 66 |
Assets included in the derivatives portfolio | | 200 | | 300 | | 832 |
Net derivatives | | (1,165) | | (558) | | 247 |
ORANGE / 2013 REGISTRATION DOCUMENT - 156
Analysis of market value of derivatives
| December 31, 2013 | December 31, 2012 | December 31,
2011 |
(in millions of euros) | Net | Net | Net |
Cash flow hedge derivatives | (1,009) | (367) | 318 |
Fair value hedge derivatives | 10 | 27 | 36 |
Net investment hedge derivatives | - | - | (140) |
Hedging derivatives | (999) | (340) | 214 |
Derivatives held for trading | (166) | (218) | 33 |
Net derivatives | (1,165) | (558) | 247 |
o/w foreign exchange effect | (365) | 62 | 538 |
o/w interest rate effect | (805) | (622) | (291) |
The net fair value of derivatives is partly offset by the effect of cash-collateral agreements described in Note 11.5.
Cash flow hedges negotiated by Orange aim at neutralizing currency risk on future cash flows (nominal, coupons) or switching floating-rate debt into fixed-rate debt. The main hedges are shown in the table below.
| | Notional amounts of hedging instruments (in millions of hedged currency units) |
Hedging instruments | Entity/Maturity | 2014 | 2015 | 2016 | 2017 | 2018 and beyond |
Cross currency swaps (1) | | | | | | |
Functional/hedged currency | | | | | | |
EUR/CAD | Orange SA | - | - | 200 | - | - |
EUR/CHF | Orange SA | 400 | - | 250 | - | - |
EUR/GBP | Orange SA | - | - | - | - | 1,650 (3) |
EUR/HKD | Orange SA | - | 500 | 340 | - | 1,110 (4) |
EUR/JPY | Orange SA | - | 52,300 | 44,300 | - | 7,500 (5) |
EUR/USD | Orange SA | - | 750 | 1,000 | - | 4,464 (6) |
Interest rate swaps (2) | | | | | | |
EUR | FT Immo H | - | - | - | - | 415 (7) |
EUR | Orange SA | - | 270 | 300 | 100 | 605 (8) |
(1) Hedging of interest rate risk and foreign exchange risk. (2) Hedging of interest rate risk. (3) 350 MGBP with a maturity of 2020, 450 MGBP with a maturity of 2028, 350 MGBP with a maturity of 2034 and 500 MGBP with a maturity of 2050. (4) 1,110 MHKD with a maturity of 2023. (5) 7,500 MJPY with a maturity of 2019. (6) 164 MUSD with a maturity of 2020, 1,000 MUSD with a maturity of 2021, 2,400 MUSD with a maturity of 2031 and 900 MUSD with a maturity of 2042. (7) 88 MEUR with a maturity of 2020, 116 MEUR with a maturity of 2021, 114 MEUR with a maturity of 2022, 36 MEUR with a maturity of 2023 and 62 MEUR with a maturity of 2024. (8) 350 MEUR with a maturity of 2018 and 255 MEUR with a maturity of 2021. |
For each hedging relationship, the hedged item affects profit or loss:
■
each year on interest payment dates;
■
each year on recognition of unrealized foreign exchange gains or losses upon remeasurement of the nominal amount up to the maturity date of the hedging instrument.
In order to hedge the exposure of some of their operating cash flows in foreign currencies, the entities of the Orange group have set up risk hedging policies. The main hedges are shown in the table below:
| | Notional amounts of hedging instruments (in millions of hedged currency units) |
Hedging instruments | Entity/Maturity | 2014 | 2015 | 2016 | 2017 | 2018 and beyond |
Purchased options | | | | | | |
Functional / hedged currency | | | | | | |
EUR/USD | Orange SA | (450) (1) | - | - | - | - |
(1) Hedging of the disposal of Orange Dominicana. |
For each hedging relationship, the hedged item will affect profit or loss in each year until the maturity date of the hedging relationship.
ORANGE / 2013 REGISTRATION DOCUMENT - 157
The change in the cash flow hedge reserve is analyzed as follows:
(in millions of euros) | 2013 | 2012 | 2011 |
Gain (loss) recognized in other comprehensive income during the period (1) | (301) | (361) | 28 |
Reclassification in net income for the period | (1) | (3) | (28) |
Reclassification in operating income for the period | - | (29) | 2 |
Reclassification in initial carrying amount of hedged item | 4 | (1) | (5) |
TOTAL | (298) | (394) | (3) |
(1) Mainly includes interest rate effect on cross-currency swaps. |
Furthermore, the foreign exchange impact of derivatives used to hedge foreign-currency denominated bonds generated a foreign exchange loss of 406 million euros which is recognized directly in profit or loss, thereby offsetting exposure arising from the remeasurement of these bonds in the statement of financial position.
The ineffective portion of cash flow hedges recognized in net income amounted to (5) million euros versus (25) million euros in 2012 and (5) million euros in 2011.
Fair value hedges negotiated by Orange aim at switching fixed-rate debt into floating-rate debt. The main hedges are shown in the table below.
| | Notional amounts of the hedging instruments
(in millions of hedged currency units) |
Hedging instruments | Entity/Maturity | 2014 | 2015 | 2016 | 2017 | 2018 and beyond |
Cross currency swaps (1) | | | | | | |
functional / hedged currency | | | | | | |
PLN/EUR | Orange Polska | 110 | - | - | - | - |
Interest rate swaps (2) | | | | | | |
EUR | Orange SA | - | - | - | - | 500 |
EUR | Orange Polska | 110 | - | - | - | - |
(1) Hedging of interest rate risk and foreign exchange risk. (2) Hedging of interest rate risk. |
Fair value hedges affect profit or loss as follows:
(in millions of euros) | 2013 | 2012 | 2011 |
Gain (loss) recognized on hedging instruments | 13 | (10) | (4) |
Change in accrued interest | 4 | (8) | (30) |
Gain (loss) recognized on hedging instruments (excluding accrued interest) | 9 | (2) | 26 |
Gain (loss) recognized on hedged items | (7) | 5 | (24) |
Ineffectiveness (finance costs, net) | 2 | 3 | 2 |
In 2013 and 2011, some fair value hedge relationships were discontinued. The fair value of the underlying debt at the hedge accounting termination date is amortized through profit or loss over the remaining term of the initial hedging relationship using an effective interest rate recalculated as of that date.
ORANGE / 2013 REGISTRATION DOCUMENT - 158
Since 2012, the foreign exchange component of some bonds in pound sterling has been qualified as a net investment hedge of the Group’s investment in the United Kingdom. As at December 31, 2013, the hedged amount of assets in pound sterling is 1,600 million pounds sterling.
The change in the net investment hedge reserve is analyzed as follows:
(in millions of euros) | 2013 | 2012 | 2011 |
Gain (loss) recognized in other comprehensive income during the period | 41 | (26) | (14) |
Reclassification in net income during the period | - | 125 | - |
TOTAL | 41 | 99 | (14) |
In 2013, no ineffective portion of net investment hedges was recognized in finance costs versus (7) million euros in 2012 and (4) million euros in 2011.
(in millions of euros) | December 31,
2013 | December 31,
2012 | December 31,
2011 |
Effective component of cash flow hedges | (661) | (383) | (20) |
Reserve to be amortized for discontinued hedges | 553 | 590 | 581 |
Effective component of net investment hedges | 19 | (22) | (121) |
Contribution of Orange SA | (89) | 185 | 440 |
Contribution of other entities | (41) | (58) | (18) |
TOTAL | (130) | 127 | 422 |
o/w share attributable to owners of the parent company | (127) | 130 | 422 |
o/w share attributable to non-controlling interests | (3) | (3) | - |
It is noted that the Group uses financial performance indicators that are not specifically defined by IFRS, such as EBITDA (see Note 18.1) and net financial debt (see Note 10.2).
Market risks are monitored by Orange’s Treasury and Financing Committee, which reports to the Group Management Committee. The committee is chaired by the Group’s Deputy Chief Executive Officer and Executive Director for Finance and Information Systems and meets on a quarterly basis.
It sets the guidelines for managing the Group’s debt, especially in respect of its interest rate, foreign exchange, liquidity and counterparty risks exposure in the months to come, and reviews past management (realized transactions, financial results).
Management of fixed-rate / variable-rate debt
Orange seeks to manage its fixed-rate / variable-rate exposure in euros in order to minimize interest costs by using firm and conditional interest rate derivatives such as swaps, futures, caps and floors within limits established by the Treasury and Financing Committee.
The fixed-rate component of gross debt was 87% as at December 31, 2013.
The fixed-rate component of net debt was 100% as at December 31, 2013 compared with 111% as at December 31, 2012 and 113% as at December 31, 2011.
ORANGE / 2013 REGISTRATION DOCUMENT - 159
Sensitivity analysis of the Group’s position to changes in interest rates
The sensitivity of the Group’s financial assets and liabilities to interest rate risk is analyzed only for components of net financial debt. Only these components are interest-bearing and therefore exposed to interest rate risk.
Sensitivity of financial expense
Based on a constant amount of debt and a constant management policy, a 1% rise in interest rates would result in an increase of 29 million euros in financial expense and a 1% fall in interest rates would result in a decrease of 32 million euros.
Sensitivity of financial debt
A 1% rise in interest rates would lead to a reduction in the market value of net financial debt after derivatives of approximately 1.74 billion euros, which represents 5.02% of its market value. A 1% fall in interest rates would lead to an increase of approximately 1.71 billion euros (4.94% of its market value).
Sensitivity of cash flow hedge reserves
A 1% rise in interest rates would increase the market value of derivatives designated as cash flow hedges and the associated cash flow hedge reserves by approximately 164 million euros. A 1% fall in interest rates would lead to a decrease in their market value and in the cash flow hedge reserves of approximately 198 million euros.
Operational foreign exchange risk
The Group’s foreign operations are carried out by entities that operate in their own country and mainly in their own currency. Their operational exposure to foreign exchange risk is therefore limited to some of their operating cash flows (equipment or network capacity purchases, purchases from suppliers or sales to customers, purchases from or sales to international operators).
To cover their exposure to these foreign exchange risks, the subsidiaries of Orange have set up hedging policies whenever possible (see Note 10.11).
Financial foreign exchange risk
Financial foreign exchange risk mainly relates to:
■
dividends paid to the parent company: in general, the Group’s policy is to economically hedge this risk as from the date of the relevant subsidiary’s Shareholders’ meeting;
■
financing of the subsidiaries: except in special cases, the subsidiaries are required to cover their funding needs in their functional currency;
■
Group financing: most of the Group’s debt is denominated in euros (92% of the Group’s bonds are denominated in euros). From time to time, Orange SA issues bonds in markets other than euro market (primarily the US dollar, pound sterling, Canadian dollar, Swiss franc and yen markets). If Orange SA does not have assets in these currencies, in most cases, the issues are translated into euros through cross-currency swaps. The debt allocation by currency also depends on the level of interest rates and particularly on the interest rate differential relative to the euro.
The following table provides details of the exposure to foreign exchange rate fluctuations of the net financial debt in foreign currencies of the entities with the highest exposure to foreign exchange risks, including internal transactions, which generate a net gain or loss recognized in the consolidated income statement. It also shows the sensitivity of these entities to a 10% change in the foreign exchange rates of the currencies to which they are exposed.
| Exposure in currency units | Sensitivity analysis |
(in millions of currency units) | EUR | GBP | PLN | EGP | CHF | USD | Total translated | 10% gain in euro or zloty | 10% loss in euro or zloty |
Orange SA | - | (34) | (4) | - | (28) | (28) | (84) | 8 | (9) |
Orange Polska | - | - | - | - | - | 3 | 2 | - | - |
Commitment to purchase ECMS shares | - | - | - | (218) | - | - | (23) | 2 | (3) |
TOTAL (CURRENCIES) | - | (34) | (4) | (218) | (28) | (25) | (105) | | |
TOTAL (EUROS) | - | (40) | (1) | (23) | (23) | (18) | (105) | | |
Translation risk
Due to its international presence, Orange’s statement of financial position is exposed to foreign exchange fluctuations, as these affect the translation of subsidiaries’ assets denominated in foreign currencies. The currencies concerned are mainly the pound sterling, the zloty, the Egyptian pound and the US dollar.
To hedge its largest foreign asset exposures, Orange has issued debt in the relevant currencies.
ORANGE / 2013 REGISTRATION DOCUMENT - 160
| Contribution to consolidated net assets | Sensitivity analysis |
(in millions of euros) | EUR | GBP | PLN | EGP | USD | Other currencies | Total | 10% gain in euro | 10% loss in euro |
Assets excluding net debt (a) (1) | 43,356 | 5,840 | 2,886 | 1,384 | 274 | 3,320 | 57,060 | (1,246) | 1,523 |
Net debt by currency including derivatives (b) (2) | 26,744 | 1,918 | 1,017 | 899 | 55 | 93 | 30,726 | (362) | 442 |
Net assets by currency (a) - (b) (3) | 16,612 | 3,922 | 1,869 | 485 | 219 | 3,227 | 26,334 | (884) | 1,081 |
(1) Net assets excluding net debt by currency do not include components of net financial debt. (3) Share of net assets attributable to owners of the parent company in zlotys amounts to 947 million euros. |
To limit the translation risk on the statement of financial position, since 2012, Orange hedge an amount of 1.6 billion pounds sterling through net investment hedges.
Due to its international presence, Orange group is exposed to risk arising from changes in average exchange rates in the conversion of income statements denominated in foreign currencies of its foreign subsidiaries.
| Contribution to consolidated financial income statement | Sensitivity analysis |
(in millions of euros) | EUR | GBP | PLN | EGP | USD | Other currencies | Total | 10% gain in euro | 10% loss in euro |
Revenues | 31,846 | 162 | 3,044 | 1,158 | 887 | 3,884 | 40,981 | (830) | 1,015 |
Reported EBITDA | 9,832 | (88) | 953 | 322 | 138 | 1,078 | 12,235 | (218) | 267 |
Operating income | 5,105 | (158) | 216 | (55) | (54) | 234 | 5,288 | (17) | 20 |
Diversified sources of funding
Orange has diversified sources of funding:
■
issues in the short-term securities markets;
■
regular issues in the bond markets;
■
in January 2011, Orange entered into a 5-year agreement with a large number of international banks for a 6 billion euros syndicated credit facility to refinance the previous facility. The margin on this syndicated credit facility has changed in 2013 following the downgrade of Orange’s credit rating. In December 2012, the maturity of the syndicated credit facility was extended after the consent of the lenders with the following terms: 5,655 million euros are now maturing in January 2018; 75 million euros are now maturing in January 2017, and in accordance with the initial schedule, 270 million euros are maturing in January 2016.
Liquidity of investments
Orange invests its cash surplus in negotiable debt securities, mutual funds (OPCVM) and term deposits. As liquidity is the main priority for these investments, most of them are invested for the short term.
Smoothing debt maturities
Debt maturities are spread consistently over the coming years, as evidenced by the average maturity of net debt excluding TDIRA, which was 9 years at the end of 2013 (as at the end of 2012 and 2011).
The following table shows undiscounted future cash flows for each financial liability shown on the statement of financial position. The key assumptions used in this schedule are:
■
amounts in foreign currencies are translated at the year-end closing rate;
■
future variable-rate interest is based on the last fixed coupon, except if a better estimate is available;
■
TDIRA being necessarily redeemable in new shares, no redemption is taken into account in the maturity analysis. In addition, from January 1, 2010, interest payable on the bonds has switched to a variable rate over an undetermined period of time (see Note 10.3). Accordingly, interest from that date other than for the first period is no longer included, as including interest payments for the other periods would not provide relevant information;
■
the maturity dates of revolving credit facilities are the contractual maturity dates;
■
non-cash items reconcile, for financial liabilities not accounted for at fair value in the statement of financial position, the breakdown of the nominal amounts, the accrued interest and the balance in the statement of financial position.
ORANGE / 2013 REGISTRATION DOCUMENT - 161
| | | 2014 |
(in millions of euros) |
Note | December 31, 2013 | Nominal amounts | Interest (1) |
TDIRA | 10.3 | 1,352 | - | 10 |
Bonds, excluding TDIRA | 10.4 | 30,822 | 3,852 | 2,144 |
Bank and lending institutions | 10.5 | 2,222 | 420 | 142 |
Finance lease liabilities (2) | 10.2 | 661 | 152 | 19 |
Securitization debt | 3.3 - 10.2 | 782 | 282 | 8 |
Cash collateral received | 10.2 | 88 | 88 | - |
Commercial paper | 10.2 | 708 | 708 | - |
Bank overdrafts | 10.2 | 175 | 175 | - |
Commitment to purchase ECMS shares | 10.2 - 10.6 | 232 | - | - |
Other commitments to purchase non-controlling interests | 10.6 | 46 | 46 | - |
Other financial liabilities | 10.2 | 393 | 259 | 7 |
Derivatives (liabilities) | 10.10 | 1,365 | 51 | 104 |
Derivatives (assets) | 10.10 | (200) | (117) | (30) |
Gross financial debt after derivatives | | 38,646 | 5,916 | 2,404 |
Deposits received from customers | | 219 | 219 | - |
Trade payables | 4.5 | 7,889 | 7,521 | 9 |
TOTAL FINANCIAL LIABILITIES
(including derivatives assets) | | 46,754 | 13,656 | 2,413 |
(1) Sum of accrued interest for 766 million euros and future interest. (2) Future interest on finance lease liabilities amount to 77 million euros. |
As at December 31, 2013, Orange’s liquidity position exceeds its 2014 net financial debt obligations.
(in millions of euros) | Note | December 31, 2013 |
Bank overdrafts | 10.2 | (175) |
Cash | | 1,586 |
Cash equivalents | 10.9 | 4,330 |
Other financial assets at fair value, excluding derivatives | 10.9 | 171 |
Available undrawn amount of credit facilities | | 6,341 |
Liquidity position | | 12,253 |
As regards constraints related to cash repatriation and exchange control of controlled entities, as at December 31, 2013, cash and cash equivalent are held mainly in France and in other countries of the European Union, which are not subject to restrictions on convertibility nor exchange control.
For associates and joint ventures, Orange does not govern the transfer of funds in the form of dividends.
The main joint venture, EE is based in the United Kingdom which does not apply any regulatory restriction on the transfer of funds.
As at December 31, 2013, Orange had access to credit facilities in the form of bilateral credit lines and syndicated credit lines. Most of these lines bear interest at floating rate.
(in millions of euros) | December 31, 2013 |
Orange SA | 6,150 |
Orange Espagne | 61 |
ECMS | 58 |
Orange Polska | 7 |
Other | 65 |
Available undrawn amount of credit facilities | 6,341 |
Any specific contingent commitments in respect of compliance with financial ratios are presented in Note 11.4.
ORANGE / 2013 REGISTRATION DOCUMENT - 162
2015 | 2016 | 2017 | 2018 | 2019 and beyond |
Nominal amounts | Interest | Nominal amounts | Interest | Nominal amounts | Interest | Nominal amounts | Interest | Nominal amounts | Interest | Non-cash items |
- | - | - | - | - | - | - | - | - | - | 1,342 |
2,529 | 1,209 | 2,303 | 1,148 | 2,600 | 1,070 | 2,915 | 928 | 16,002 | 8,048 | (111) |
160 | 81 | 469 | 72 | 298 | 55 | 216 | 32 | 662 | 18 | (22) |
40 | 17 | 42 | 16 | 47 | 11 | 63 | 6 | 317 | 9 | - |
- | - | 500 | - | - | - | - | - | - | - | - |
- | - | - | - | - | - | - | - | - | - | - |
- | - | - | - | - | - | - | - | - | - | - |
- | - | - | - | - | - | - | - | - | - | |
- | - | 232 | - | - | - | - | - | - | - | |
-
| - | - | - | - | - | - | - | - | - | - |
50 | 3 | 13 | 2 | 18 | 2 | 10 | 1 | 22 | 5 | 18 |
154 | 63 | 128 | 22 | 1 | (4) | 1 | 67 | 199 | (237) | |
(1) | (12) | (18) | (14) | - | (17) | - | (26) | (27) | (164) | |
2,932 | 1,361 | 3,669 | 1,246 | 2,964 | 1,117 | 3,205 | 1,008 | 17,175 | 7,679 | |
- | - | - | - | - | - | - | - | - | - | - |
42 | 12 | 39 | 14 | 39 | 17 | 38 | 10 | 102 | 106 | 107 |
2,974 | 1,373 | 3,708 | 1,260 | 3,003 | 1,134 | 3,243 | 1,018 | 17,277 | 7,785 | |
Orange’s debt ratings
Orange’s debt rating is an additional performance indicator used to assess the Group’s financial policy and risk management policy and, in particular, its solvency and liquidity risk, and is not a substitute for an analysis carried out by investors. Rating agencies revise the ratings they assign on a regular basis. Any change in the rating could produce an impact on the cost of future financing or restrict access to liquidity.
In addition, a change in Orange’s debt rating will, for certain outstanding financings, trigger step-up clauses affecting the interest paid to investors or result in the acceleration or the modification of the repayment schedule of those loans. One Orange SA’s bond (see Note 10.4) with an outstanding amount of 2.5 billion dollars equivalent of 1.8 billion euros as at December 31, 2013 is subject to step-up clauses. These clauses were triggered in 2013 and in early 2014.
The interest rate applied to the TDIRA’s Supplier tranche is also subject to change if Orange’s credit ratings are downgraded (see Note 10.3). On January 6, 2014, the General Assembly of the Bank tranche holders took decision to remove the step-up clause (see Note 10.3).
In addition, the margin on the 6 billion euros syndicated credit facility signed on January 27, 2011 has changed following the downgrade of Orange’s credit rating.
Lastly, Orange SA’s trade receivables securitization programs contain provisions for accelerated repayment or modification of the repayment schedule in the event that Orange’s long-term debt rating is downgraded to BB- by Standard & Poor’s or to Ba3 by Moody’s or if one of the relevant agencies ceases to publish its rating (see Note 11.4).
Regarding the changes in Orange’s debt ratings in 2013:
■
rating agency Standard & Poor’s revised the rating of Orange down to BBB+ on April 22, 2013. The outlook is stable;
■
rating agency Fitch Ratings revised its outlook from stable to negative, on November 7, 2013.
| Standard & Poor’s | Moody’s | Fitch Ratings |
Long-term debt | BBB+ | A3 | BBB+ |
Outlook | Stable | Negative | Negative |
Short-term debt | A2 | P2 | F2 |
ORANGE / 2013 REGISTRATION DOCUMENT - 163
Rating agency Moody’s revised, on January 14, 2014, the rating of Orange’s long-term debt down to Baa1, and revised its outlook from Negative to Stable while confirming Orange’s short-term debt rating at P2.
Rating agency Standard & Poor’s revised, on January 20, 2014, its outlook on Orange’s long-term debt from Stable to Negative, confirming Orange’s long-term debt rating at BBB+ as well as Orange’s short-term debt rating at A2.
Commitments with regard to financial ratios
Orange SA does not have any credit facility or borrowing subject to specific covenants with regard to financial ratios.
In respect of a bank guarantee contract signed in 2011, Orange Polska must comply with the following covenant:
■
a net debt to EBITDA ratio equal to or less than 3.5 (net debt and EBITDA as defined in the contract with the bank).
In respect of its 2005, 2007, 2008, 2009, 2011 and 2012 bank financing contracts, ECMS must comply with the following covenant:
■
a net senior debt to EBITDA ratio equal to or less than 3.00 (net senior debt and EBITDA as defined in the contracts with the banks).
As at December 31, 2013, these ratios were fully compliant.
Contractual clauses affecting interests paid according to Orange’s credit rating are described in Note 11.3.
Commitments with regard to structured financing contracts
Several repayment scenarios are possible for the Group’s trade receivables securitization programs, namely:
■
standard repayment on the contractual maturity date of the programs;
■
accelerated repayment or modification of the repayment schedule, notably in the event that Orange’s long-term rating is downgraded to BB- from Standard & Poor’s or Ba3 from Moody’s or if one of the relevant agencies ceases to publish its rating. In the case of accelerated or adjusted payment, the securitization special purpose vehicles cease to participate in financing new receivables, and cash received on receivables previously sold is used to repay progressively holders of beneficial interest.
Commitments related to instances of default or material adverse changes
Most of Orange’s financing agreements, including in particular the 6 billion euro syndicated credit facility set up on January 27, 2011, as well as bonds, are not subject to cross default or prepayment arrangements in the event of a material adverse change. Events of defaults in accelerated repayment clauses do not automatically lead to immediate repayment of other contracts.
Financial instruments that could potentially expose Orange to concentrations of counterparty risk consist primarily of trade receivables, cash and cash equivalents, investments and derivative financial instruments.
Orange considers that it has limited concentration in credit risk with respect to trade accounts receivables due to its large and diverse customer base (residential, professional and large business customers) operating in numerous industries and located in many French regions and foreign countries. In addition, the maximum value of the counterparty risk on these financial assets is equal to their recognized net book value. An analysis of net trade receivables past due is provided in Note 3.3. For loans and other receivables, amounts past due but not depreciated are not material.
Orange is exposed to bank counterparty risk through its investments and derivatives. Therefore, it performs a strict selection based on the credit rating of public, financial or industrial institutions in which it invests or with which it enters into derivatives agreements. In addition, limits are defined for each selected counterparty as follows:
■
limits are based on each financial institution’s rating and equity, as well as on periodic analyses carried out by the Treasury Department. The maximum commitment is then determined (i) for investments, based on maximum limits, and (ii) for derivatives, based on the notional amounts of interest rate and foreign exchange contracts outstanding, to which coefficients are applied that take into account the remaining duration of the operation and the type of transaction involved;
■
limits are monitored and reported on a daily basis to the Group treasurer and the head of the trading room. These limits are adjusted regularly depending on credit events;
■
counterparties’ ratings are monitored;
■
lastly, on derivatives, master agreements relating to financial instruments (French Banking Federation or International Swaps and Derivatives Association) are signed with all counterparties and provide for a net settlement of debts and receivables, in case of failure of one of the parties. These agreements include a cash collateral clause which can lead to either cash deposit or cash collection. These amounts of payments correspond to the change in market value of all derivative instruments (or, for a few counterparties, derivatives with a maturity greater than 3 months). Therefore the amount of cash collateral varies with all derivatives’ marked-to-market, depending on the variation of market data.
ORANGE / 2013 REGISTRATION DOCUMENT - 164
In addition, investments are negotiated with high-grade banks. By exception, subsidiaries may deal with counterparties with a lower rating; in such cases, the rating is essentially the highest available in the country concerned.
Netting effects on credit and counterparty risks
(in millions of euros) | December 31, 2013 | December 31, 2012 | December 31, 2011 |
Fair value of derivatives assets | 200 | 300 | 832 |
Fair value of derivatives liabilities | (1,365) | (858) | (585) |
Netting due to master agreements (a) | (1,165) | (558) | 247 |
Amount of cash collateral paid | 1,146 | 372 | 317 |
Amount of cash collateral received | (88) | (66) | (314) |
Netting due to cash collateral (b) | 1,058 | 306 | 3 |
Net amount (a) + (b) | (107) | (252) | 250 |
Variations in net cash collateral between 2012 and 2013 can be explained by changes in the portfolio as well as the foreign exchange impact of derivatives due to a gain of euro against other currencies including dollar and yen, and finally by a general increase of interest rates, especially in the dollar market.
The remaining exposure is mainly due to a time difference between the closing date and the last date on which the derivatives were valued to determine the amount of cash collateral.
Sensitivity analysis of cash deposits to changes in market interest rates and exchange rates
An increase of 1% in euro market rates would improve the market value of interest rate risk hedging derivatives and would result in a decrease in cash collateral paid of approximately 659 million euros. By symmetry, a decline of 1% in euro market rates would reduce the market value of derivatives and would result in an increase of cash collateral paid for a similar amount.
A 10% gain of euro against currencies in which hedged debts are denominated (mainly pound sterling and dollar) would reduce hedging derivatives’ market value and would result in an increase of cash collateral paid for about 984 million euros. By symmetry, a 10% loss of euro against currencies in which hedged debts are denominated would improve hedging derivatives’ market value and would result in a decrease of cash collateral paid for a similar amount.
As at December 31, 2013, Orange SA had no options to purchase its own shares; it had set-up forward purchases of 4,050,532 shares and held 23,367,136 treasury shares (of which 8,025,000 under the liquidity contract, see Note 13.2). Moreover, the Group’s exposure to market risk on shares of listed companies included in assets available for sale was not material given their volume and mutual funds investments (OPCVM) do not contain any equity component. Nevertheless, Orange is exposed to equity risk through certain retirement plan assets (see Note 5.2).
Lastly, the representation of Orange’s assets on the statement of financial position may be affected by the market value of its subsidiaries’ shares, which is one of the measurement variables used in impairment testing.
Orange manages its equity as part of a balanced financial policy, aiming to ensure flexible access to the capital markets, including for the purpose of selectively investing in development projects, and to provide a return to shareholders.
As regards dividends, the amount available to provide return to shareholders is calculated on the basis of the total net income and the retained earnings, under French GAAP, of the entity Orange SA, the parent company.
ORANGE / 2013 REGISTRATION DOCUMENT - 165
The definition of fair value levels and the description of calculation methods used by the Group are disclosed in Note 18.11.
| | December 31, 2013 |
(in millions of euros) | Note | Book value | Estimated fair value | Level 1 and cash | Level 2 | Level 3 |
Assets available for sale | 10.7 | 103 | 103 | 52 | - | 51 |
Listed investment securities | | 52 | 52 | 52 | - | - |
Other | | 51 | 51 | - | - | 51 |
Loans and receivables | 3.3-10.8 | 7,806 | 7,806 | 1,586 | 6,220 | - |
Trade receivables | | 4,360 | 4,360 | - | 4,360 | - |
Cash | | 1,586 | 1,586 | 1,586 | - | - |
Deposits and various items | | 1,146 | 1,146 | - | 1,146 | - |
Other | | 714 | 714 | - | 714 | - |
Assets at fair value through profit or loss, excluding derivatives | 10.9 | 4,575 | 4,575 | 4,366 | 208 | - |
Cash equivalents | | 4,330 | 4,330 | 4,330 | - | - |
Other | | 245 | 245 | 36 | 208 | - |
Financial liabilities at amortized cost | 10.2 | 45,284 | 48,889 | 30,940 | 17,949 | - |
Financial liabilities | | 37,176 | 40,842 | 30,940 | 9,902 | - |
Trade payables | | 7,889 | 7,828 | - | 7,828 | - |
Other | | 219 | 219 | - | 219 | - |
Financial liabilities at fair value through profit or loss, excluding derivatives | 10.6 | 305 | 305 | - | 259 | 46 |
Bonds at fair value | | 27 | 27 | - | 27 | - |
Commitment to purchase ECMS shares | | 232 | 232 | - | 232 | - |
Other commitments to purchase non-controlling interests | | 46 | 46 | - | - | 46 |
Net derivatives | 10.10 | 1,165 | 1,165 | - | 1,165 | - |
The market value of the net financial debt carried by Orange was 34,392 million euros as at December 31, 2013, for a carrying amount of 30,726 million euros.
The table below provides an analysis of the change in level 3 market values for financial assets and liabilities measured at fair value in the statement of financial position.
(in millions of euros) | Assets available for sale | Financial liabilities at fair value through profit or loss, excluding derivatives |
Level 3 fair values at December 31, 2012 | 91 | 35 |
Gains (losses) taken to profit or loss | 12 | 11 |
Gains (losses) taken to other comprehensive income | 3 | - |
Impact of changes in the scope of consolidation | (55) | - |
Level 3 fair values at December 31, 2013 | 51 | 46 |
ORANGE / 2013 REGISTRATION DOCUMENT - 166
| | December 31, 2012 |
(in millions of euros) | Note | Book value | Estimated fair value | Level 1 and cash | Level 2 | Level 3 |
Assets available for sale | 10.7 | 139 | 139 | 48 | - | 91 |
Listed investment securities | | 48 | 48 | 48 | - | - |
Unlisted investment securities | | 91 | 91 | - | - | 91 |
Other | | - | - | - | - | - |
Loans and receivables | 3.3-10.8 | 6,924 | 6,924 | 1,205 | 5,719 | - |
Trade receivables | | 4,635 | 4,635 | - | 4,635 | - |
Cash | | 1,205 | 1,205 | 1,205 | - | - |
Deposits and various items | | 374 | 374 | - | 374 | - |
Other | | 710 | 710 | - | 710 | - |
Assets at fair value through profit or loss, excluding derivatives | 10.9 | 7,323 | 7,323 | 7,232 | 91 | - |
Cash equivalents | | 7,116 | 7,116 | 7,116 | - | - |
Other | | 207 | 207 | 116 | 91 | - |
Financial liabilities at amortized cost | 10.2 | 47,249 | 52,019 | 34,768 | 17,251 | - |
Financial liabilities | | 38,988 | 43,740 | 34,768 | 8,972 | - |
Trade payables | | 8,034 | 8,052 | - | 8,052 | - |
Other | | 226 | 226 | - | 226 | - |
Financial liabilities at fair value through profit or loss, excluding derivatives | 10.6 | 282 | 282 | - | 247 | 35 |
Bonds at fair value | | 27 | 27 | - | 27 | - |
Commitment to purchase ECMS shares | | 220 | 220 | - | 220 | - |
Other commitments to purchase non-controlling interests | | 35 | 35 | - | - | 35 |
Net derivatives | 10.10 | 558 | 558 | - | 558 | - |
The market value of the net financial debt carried by Orange was 35,297 million euros as at December 31, 2012, for a carrying amount of 30,545 million euros.
| | December 31, 2011 |
(in millions of euros) | Note | Book value | Estimated fair value | Level 1 and cash | Level 2 | Level 3 |
Assets available for sale | 10.7 | 89 | 89 | 41 | - | 48 |
Listed investment securities | | 40 | 40 | 40 | - | - |
Unlisted investment securities | | 48 | 48 | - | - | 48 |
Other | | 1 | 1 | 1 | - | - |
Loans and receivables | 3.3-10.8 | 8,375 | 8,371 | 1,434 | 6,937 | - |
Trade receivables (1) | | 4,905 | 4,905 | - | 4,905 | - |
Cash | | 1,311 | 1,311 | 1,311 | - | - |
Deposits and various items | | 450 | 446 | 123 | 323 | - |
Other | | 1,709 | 1,709 | - | 1,709 | - |
Assets at fair value through profit or loss, excluding derivatives | 10.9 | 7,457 | 7,457 | 2,079 | 5,378 | - |
Cash equivalents | | 6,733 | 6,733 | 1,939 | 4,794 | - |
Other | | 724 | 724 | 140 | 584 | - |
Financial liabilities at amortized cost | 10.2 | 47,904 | 51,306 | 11,987 | 39,319 | - |
Financial liabilities | | 39,135 | 42,506 | 11,987 | 30,519 | - |
Trade payables | | 8,531 | 8,562 | - | 8,562 | - |
Other | | 238 | 238 | - | 238 | - |
Financial liabilities at fair value through profit or loss, excluding derivatives | 10.6 | 1,974 | 1,974 | - | 1,959 | 15 |
Bonds at fair value | | 22 | 22 | - | 22 | - |
Commitment to purchase Mobinil-ECMS shares | | 1,937 | 1,937 | - | 1,937 | - |
Other commitments to purchase non-controlling interests | | 15 | 15 | - | - | 15 |
Net derivatives | 10.10 | (247) | (247) | - | (247) | - |
(1) Trade receivables that were presented in level 3 in 2011 are now in level 2, consistently with trade payables. |
The market value of the net financial debt carried by Orange was 34,265 million euros as at December 31, 2011, for a carrying amount of 30,890 million euros.
ORANGE / 2013 REGISTRATION DOCUMENT - 167
(in millions of euros) | 2013 | 2012 | 2011 |
France tax group | (996) | (912) | (1,693) |
| (510) | (634) | (763) |
| (486) | (278) | (930) |
United Kingdom | (6) | (41) | (12) |
| (98) | (108) | (96) |
| 92 | 67 | 84 |
Spain | (74) | 122 | - |
| (74) | (31) | - |
| - | 153 | - |
Poland | (5) | (40) | 66 |
| (18) | (30) | (41) |
| 13 | (10) | 107 |
Other subsidiaries | (324) | (360) | (448) |
| (399) | (445) | (408) |
| 75 | 85 | (40) |
TOTAL | (1,405) | (1,231) | (2,087) |
| (1,099) | (1,248) | (1,308) |
| (306) | 17 | (779) |
France tax group
The income tax expense in 2013 reflects the impacts of the 2014 Finance Act adopted on December 29, 2013, which included the increase in the corporate tax rate raised to 38% for financial years 2013 and 2014 instead of 36.10% previously.
The current income tax expense mainly relates to income tax of the current year and is calculated on the basis of 50% of taxable income in 2012 and 2013 and 40% in 2011 due to the restricted utilization of tax losses carryforward.
The deferred tax expense mainly arises from the use of tax losses carryforward. In 2013, the change in the tax rate results in a deferred tax income of 52 million euros representing the update of the net deferred tax asset position at the beginning of the year (72 million euros in 2012 and 60 million euros in 2011). In 2012 the deferred tax charge included a deferred tax income of 381 million euros in relation with the new French part-time for seniors plan.
With respect to the tax audits relating to financial years 2000-2005, French tax authorities notified tax claims amounting to 1,735 million euros in 2011. On July 4, 2013, the Administrative Court of Montreuil ruled against Orange SA. This decision has triggered the payment of the remaining balance on principal and interests for late payment claimed by the Administration for a total amount of 2,146 million euros. Given that the tax liability was previously recognized, only an additional charge of 46 million euros was recorded in 2013 for late interests of the current period.
Orange SA considers it has solid legal arguments, particularly with respect to the enforceability of management decisions against Tax Administration and the statute of limitations for the years covered by the tax audit. So Orange SA appealed against the judgment before the Administrative Court of Appeal of Versailles on July 29, 2013.
Tax audits related to the two main companies of the French tax group, former France Telecom SA and former Orange France SA, were completed in 2013 for the financial years 2006-2009 and 2006-2010 respectively, without any material adjustments.
ORANGE / 2013 REGISTRATION DOCUMENT - 168
United Kingdom
The current income tax expense primarily reflects the taxation of brand activities.
The tax rate in the United Kingdom was reduced to 23% as from April 1, 2013 and will be gradually decreased to 21% as from April 1, 2014, then 20% as from April 1, 2015. As a result of the ongoing reductions in tax rate in the United Kingdom, the deferred tax income primarily relates to the adjustment of the deferred tax liability related to the Orange brand for 94 million euros in 2013, and respectively 63 and 93 million euros for the years 2012 and 2011.
Spain
In 2013 and 2012, the current income tax expense represents the obligation to pay a minimum tax calculated on the basis on 75% of taxable income due to restricted utilization of tax losses carried forward, applied to the local tax rate of 30%. In 2011, Spain did not book any current income tax expense and did not recognize any deferred tax asset in respect of tax losses for the year.
In 2012, the deferred tax income was mainly related to the reassessment of deferred tax assets amounting to 110 million euros due to business plans deemed favorable.
Poland
In 2011, the deferred tax reflected the revised amount of the deferred tax asset relating to the provision DPTG.
Other subsidiaries
In 2011, the tax rate in Egypt was increased to 25% instead of 20% previously. Accordingly, deferred taxes of Mobinil and ECMS included a deferred tax expense of 66 million euros mainly relating to the update of the net deferred tax liability position at the beginning of the year.
Group tax proof
(in millions of euros) | 2013 | 2012 | 2011 |
Net income before tax | 3,538 | 2,335 | 5,915 |
Statutory tax rate in France | 38.00% | 36.10% | 36.10% |
Theoretical income tax | (1,345) | (843) | (2,135) |
Reconciliation items: | | | |
Impairment of goodwill | (194) | (625) | (220) |
Share of profits (losses) of associates and joint ventures | (98) | (95) | (35) |
Adjustment of prior-year taxes | (16) | (102) | (151) |
Reassessment of deferred tax assets | (74) | 72 | (107) |
Difference in tax rates (1) | 232 | 238 | 149 |
Change in applicable tax rates | 146 | 135 | 142 |
Other reconciliation items (2) | (57) | (11) | 271 |
Effective income tax | (1,405) | (1,231) | (2,087) |
Effective tax rate | 39.71% | 52.72% | 35.28% |
(1) The Group’s presence in juridictions in which tax rates are different from the French tax rate, mainly United Kingdom (23% in 2013, 25% in 2012 and 26% in 2011), Spain (tax rate of 30%) and Poland (tax rate of 19%). (2) Of which the tax reversals from cumulative translation adjustments associated with discontinued operations in the United Kingdom for 232 million euros in 2011. |
| 2013 | 2012 | 2011 |
(in millions of euros) | Gross amount | Tax | Net amount | Gross amount | Tax | Net amount | Gross amount | Tax | Net amount |
Actuarial gains and losses on post-employment benefits | 23 | (4) | 19 | (84) | 29 | (55) | (46) | (3) | (49) |
Assets available for sale | 8 | - | 8 | 7 | - | 7 | (10) | - | (10) |
Cash flow hedges | (298) | 101 | (197) | (394) | 134 | (260) | (3) | 4 | 1 |
Net investment hedges | 41 | (14) | 27 | 99 | (34) | 65 | (14) | 5 | (9) |
Translation adjustments | (453) | - | (453) | 264 | - | 264 | (1,053) | - | (1,053) |
Other comprehensive income of associates and joint ventures | (42) | - | (42) | (18) | (5) | (23) | (11) | - | (11) |
TOTAL | (721) | 83 | (638) | (126) | 124 | (2) | (1,137) | 6 | (1,131) |
ORANGE / 2013 REGISTRATION DOCUMENT - 169
| December 31, 2013 | December 31, 2012 | December 31, 2011 |
(in millions of euros) | Asset | Liabilities | Net | Assets | Liabilities | Net | Assets | Liabilities | Net |
France tax group | | | | | | | | | |
| - | 256 | (256) | - | 2,423 | (2,423) | - | 2,221 | (2,221) |
| 2,368 | - | 2,368 | 2,693 | - | 2,693 | 2,829 | - | 2,829 |
United Kingdom | | | | | | | | | |
| - | 43 | (43) | - | 43 | (43) | - | 56 | (56) |
| - | 616 | (616) | - | 709 | (709) | - | 776 | (776) |
Spain | | | | | | | | | |
| 33 | - | 33 | 23 | - | 23 | 3 | - | 3 |
| 561 | 94 | 467 | 572 | 86 | 486 | 460 | 127 | 333 |
Poland | | | | | | | | | |
| - | 22 | (22) | - | 29 | (29) | - | 8 | (8) |
| 222 | - | 222 | 214 | - | 214 | 204 | - | 204 |
Other subsidiaries | | | | | | | | | |
| 77 | 271 | (194) | 86 | 299 | (213) | 121 | 340 | (219) |
| 100 | 244 | (144) | 115 | 307 | (192) | 58 | 361 | (303) |
TOTAL | | | | | | | | | |
| 110 | 592 | (482) | 109 | 2,794 | (2,685) | 124 | 2,625 | (2,501) |
| 3,251 | 954 | 2,297 | 3,594 | 1,102 | 2,492 | 3,551 | 1,264 | 2,287 |
(1) Of which effect of the tax audits covering financial years 2000 to 2005 including payment made in 2013 (see Note 12.1). (2) Of which deferred tax assets on tax losses carryforward indefinitely. (3) Of which deferred tax liabilities on the Orange brand. (4) Of which deferred tax assets on tax losses carryforward beyond 2018. |
Change in net current tax
(in millions of euros) | 2013 | 2012 | 2011 |
Net current tax - opening balance | (2,685) | (2,501) | (2,229) |
Cash tax payments | 1,141 | 1,145 | 1,021 |
Payment related to 2005 tax audit settlement | 2,146 | - | - |
Current income tax expense | (1,099) | (1,247) | (1,308) |
Changes in consolidation scope, reclassification and translation adjustments | 10 | (82) | 15 |
Reclassification to assets held for sale (1) | 5 | - | - |
Net current tax - closing balance | (482) | (2,685) | (2,501) |
(1) Orange Dominicana in 2013. |
Change in net deferred tax
(in millions of euros) | 2013 | 2012 | 2011 |
Net deferred taxes - opening balance | 2,492 | 2,287 | 3,159 |
Change in income statement | (306) | 17 | (779) |
Change in other comprehensive income | 83 | 129 | 6 |
Changes in consolidation scope, reclassification and translation adjustments | 59 | 59 | (28) |
Reclassification to assets held for sale (1) | (31) | - | (71) |
Net deferred taxes - closing balance | 2,297 | 2,492 | 2,287 |
(1) Orange Dominicana in 2013 and Orange Suisse in 2011. |
ORANGE / 2013 REGISTRATION DOCUMENT - 170
Deferred tax assets and liabilities by type
| December 31, 2013 | December 31, 2012 | December 31, 2011 |
(in millions of euros) | Assets | Liabilities | Income statement | Assets | Liabilities | Income statement | Assets | Liabilities | Income statement |
Provisions for employee benefit obligations | 943 | - | (12) | 959 | - | 390 | 525 | - | (64) |
Fixed assets | 1,153 | 1,149 | 157 | 1058 | 1,261 | 292 | 887 | 1,427 | 215 |
Tax losses carryforward | 5,517 | - | (349) | 5,824 | - | (415) | 6,257 | - | (468) |
Other temporary differences | 1,649 | 955 | (39) | 1,591 | 922 | (260) | 1,654 | 835 | (113) |
Deferred tax | 9,262 | 2,104 | (243) | 9,432 | 2,183 | 7 | 9,323 | 2,262 | (430) |
Unrecognized deferred tax assets | (4,861) | - | (63) | (4,757) | - | 10 | (4,774) | - | (349) |
Netting | (1,150) | (1,150) | - | (1,081) | (1,081) | - | (998) | (998) | - |
TOTAL | 3,251 | 954 | (306) | 3,594 | 1,102 | 17 | 3,551 | 1,264 | (779) |
Net deferred tax | 2,297 | | | 2,492 | | | 2,287 | | |
At December 31, 2013, tax losses carryforward mainly relate to France, Spain and Belgium.
In France and Spain, recognized tax losses are expected to be fully utilized by 2016 and 2018 respectively, but could be materially affected by changes in tax rules and changes in business plans.
As at December 31, 2013, unrecognized deferred tax assets mainly including tax losses carryforward are related to Spain for 2.3 billion euros and Belgium for 1.3 billion euros. Most of the tax losses carryforward for which no deferred tax assets are recognized will expire beyond 2018.
At December 31, 2013, Orange SA’s share capital, based on the number of issued shares at this date, amounted to 10,595,541,532 euros, comprising 2,648,885,383 ordinary shares with a par value of 4 euros each.
At that date, the French State owned 26.94% of Orange SA’s share capital and 27.18% of the voting rights either directly or jointly with Bpifrance Participations.
No new shares were issued during 2013.
As authorized by the Shareholders’ Meeting of May 28, 2013, the Board of Directors instituted a new share buyback program (the 2013 Buyback Program) and cancelled the 2012 Buyback Program, with immediate effect. The 2013 Buyback Program is described in the Orange Registration Document filed with the French Securities Regulator on March 27, 2013.
The only shares bought back by Orange during 2013 were shares bought back as part of the liquidity contract.
At December 31, 2013, Orange SA held 23,367,136 of its own shares (including 8,025,000 shares as part of the liquidity contract), compared with 21,481,241 at December 31, 2012 (including 6,135,000 shares as part of the liquidity contract) and 15,456,045 at December 31, 2011 (including 101,868 shares as part of the liquidity contract). Besides, Orange SA has a forward purchase contract for 4,050,532 shares.
ORANGE / 2013 REGISTRATION DOCUMENT - 171
(in millions of euros) | 2013 | 2012 | 2011 |
Net income of continuing operations used for calculating basic earnings per share | 1,873 | 820 | 3,895 |
Impact of dilutive instruments: | | | |
TDIRA | - | - | 57 |
Free share award plan | - | (1) | 0 |
Net income of continuing operations used for calculating diluted earnings per share | 1,873 | 819 | 3,952 |
(number of shares) | December 31, 2013 | December 31,
2012 | December 31,
2011 |
Weighted average number of ordinary shares outstanding - basic | 2,626,964,036 | 2,632,833,980 | 2,643,535,474 |
Impact of dilutive instruments: | | | |
TDIRA | - | - | 64,009,082 |
Orange SA stock option and related plans | - | - | 29,964 |
Free share award plan | - | 13,246,540 | 4,398,445 |
Forward purchase contract | - | 76,826 | - |
Weighted average number of shares outstanding - diluted | 2,626,964,036 | 2,646,157,346 | 2,711,972,965 |
The TDIRA, which were non-dilutive at December 31, 2013 and at December 31, 2012, were not included in the calculation of diluted earnings per share.
The free share award plan was not included in the calculation of diluted earnings per share regarding the assessment by the Board of Directors that the performance condition was not achieved (see Note 5.3).
Subscription options were not included in the calculation of diluted earnings per share, their exercise price was greater than the annual average share price, which amounted to 8.35 euros in 2013. Details of each plan are described in Note 5.3.
Full Year | Approved by | Description | Dividend
per share (in euros) | Payout date | How
paid | Total
(in millions of euros) |
2013 | Board of Directors Meeting on July 24, 2013 | 2013 interim dividend | 0.30 | December 11, 2013 | Cash | 788 |
| Shareholders’ Meeting on May 28, 2013 | Balance for 2012 | 0.20 | June 11, 2013 | Cash | 526 |
| | Total dividends paid in 2013 | | 1,314 |
2012 | Board of Directors Meeting on July 25, 2012 | 2012 interim dividend | 0.58 | September 12, 2012 | Cash | 1,528 |
| Shareholders’ Meeting on June 5, 2012 | Balance for 2011 | 0.80 | June 13, 2012 | Cash | 2,104 |
| | Total dividends paid in 2012 | | 3,632 |
2011 | Board of Directors Meeting on July 27, 2011 | 2011 interim dividend | 0.60 | September 8, 2011 | Cash | 1,585 |
| Shareholders’ Meeting on June 7, 2011 | Balance for 2010 | 0.80 | June 15, 2011 | Cash | 2,118 |
| | Total dividends paid in 2011 | | 3,703 |
2010 | Board of Directors Meeting on July 28, 2010 | 2010 interim dividend | 0.60 | September 2, 2010 | Cash | 1,589 |
(in millions of euros) | 2013 | 2012 | 2011 |
Profit (loss) recognized in other comprehensive income during the period | (450) | 431 | (411) |
Reclassification to net income for the period | (3) | (167) | (642) |
Total transaction adjustments for continuing operations | (453) | 264 | (1,053) |
In 2012, the reclassification of translation adjustments to net income for the period was due to transactions relating to the disposal of Orange Suisse.
In 2011, Orange terminated certain operations in the United Kingdom. This transaction generated an impact of 642 million euros on the income statement resulting from reclassification of the cumulative translation adjustment for these entities.
ORANGE / 2013 REGISTRATION DOCUMENT - 172
(in millions of euros) | December 31,
2013 | December 31,
2012 | December 31,
2011 |
Pound sterling | 460 | 601 | 441 |
Polish zloty | 900 | 952 | 608 |
Swiss franc | 1 | 1 | 160 |
Egyptian pound | (391) | (304) | (261) |
Slovakian crown | 220 | 221 | 221 |
Dominican Peso | (165) | (100) | (67) |
Other | (273) | (166) | (161) |
TOTAL | 752 | 1,205 | 941 |
o/w share attributable to owners of the parent company | 512 | 941 | 752 |
o/w share attributable to non-controlling interests | 240 | 264 | 189 |
In 2013, the cumulative translation adjustment of Orange Dominicana, for which the transaction is in progress, is presented in the line Dominican Peso. This cumulative translation adjustment will be reclassified in the net income of 2014 when the disposal of Orange Dominicana becomes effective.
(in millions of euros) | 2013 | 2012 | 2011 |
Credit part of net income attributable to non-controlling interests (a) | 336 | 434 | 497 |
o/w Orange Polska | 43 | 108 | 164 |
o/w Sonatel Group | 182 | 157 | 153 |
o/w Mobistar Group | 37 | 83 | 104 |
o/w Jordan Telecom Group | 24 | 41 | 39 |
Debit part of net income attributable to non-controlling interests (b) | (76) | (150) | (564) |
o/w Telkom Kenya | (41) | (93) | (144) |
o/w Egypt (1) | (8) | (27) | (388) |
Net income attributable to non-controlling interests (a) + (b) | 260 | 284 | (67) |
Credit part of comprehensive net income attributable to non-controlling interests (a) | 316 | 485 | 402 |
o/w Orange Polska | 37 | 160 | 60 |
o/w Sonatel Group | 179 | 160 | 153 |
o/w Mobistar Group | 37 | 83 | 104 |
o/w Jordan Telecom Group | 16 | 38 | 45 |
Debit part of comprehensive net income attributable to non-controlling interests (b) | (76) | (131) | (572) |
o/w Telkom Kenya | (40) | (76) | (150) |
o/w Egypt | (7) | (26) | (388) |
Comprehensive net income attributable to non-controlling interests (a) + (b) | 240 | 354 | (171) |
(1) Including (286) million euros in 2011 relating to the impairment loss attributable to non-controlling interests (see Note 6.1). |
(in millions of euros) | 2013 | 2012 | 2011 |
Dividends paid to minority shareholders | 359 | 579 | 687 |
o/w Orange Polska | 77 | 234 | 245 |
o/w Sonatel Group | 164 | 157 | 159 |
o/w Mobistar Group | 51 | 104 | 122 |
o/w Jordan Telecom Group | 43 | 48 | 48 |
o/w Egypt | - | - | 95 |
ORANGE / 2013 REGISTRATION DOCUMENT - 173
(in millions of euros) | December 31,
2013 | December 31,
2012 | December 31,
2011 |
Debit part of equity attributable to non-controlling interests (a) | 2,101 | 2,128 | 2,250 |
o/w Orange Polska | 1,018 | 1,082 | 1,186 |
o/w Sonatel Group | 561 | 515 | 513 |
o/w Mobistar Group | 157 | 170 | 191 |
o/w Jordan Telecom Group | 189 | 216 | 227 |
Credit part of equity attributable to non-controlling interests (b) | (116) | (50) | (231) |
o/w Telkom Kenya | (49) | (10) | (218) |
Total Equity attributable to non-controlling interests (a) + (b) | 1,985 | 2,078 | 2,019 |
For Telkom Kenya, the transactions described in Note 2.2 resulted in 2012 in the reclassification of (241) million euros from equity attributable to the non-controlling interests to equity attributable to the owners of the parent.
For Egypt, given OTMT’s option to sell its residual interests in ECMS and MT Telecom (see Note 2.2), the negative balance of non-controlling interests share in Egypt amounting to (7) million euros has been reclassified under equity attributable to the owners of the parent in the statement of financial position.
At December 31, 2013, Orange is not aware of having entered into any commitment involving entities controlled by the Group, that may have a material effect on its current or future financial position, other than the commitments described in this note.
(in millions of euros) | Total | Less than 1 year | 1-5 years | More than 5 years |
Operational activities commitments | 15,310 | 5,801 | 6,168 | 3,341 |
Operating leases | 5,558 | 1,003 | 2,695 | 1,860 |
Handsets purchases | 3,182 | 1,685 | 1,497 | - |
Transmission capacity purchases | 870 | 348 | 475 | 47 |
Other goods and services purchases | 2,791 | 1,221 | 930 | 640 |
Investment commitments | 1,614 | 1,402 | 212 | 1 |
Public-to-private service concession commitments | 644 | 81 | 126 | 437 |
Guarantees granted to third parties in the ordinary course of business | 651 | 61 | 233 | 356 |
ORANGE / 2013 REGISTRATION DOCUMENT - 174
Operating leases
Operating lease commitments mainly include property lease commitments. Other leases are leases in form of overhead (equipment, vehicles and other assets). Future finance lease payments are shown in Note 11.3.
(in millions of euros) | Discounted value of future lease payments | Minimum future lease payments |
Property lease commitments | 4,298 | 5,361 |
o/w technical activities | 2,650 | 3,337 |
o/w shops / offices activities | 1,648 | 2,024 |
Maturities are set forth below:
(in millions of euros) | Minimum future lease payments | Less than 1 year | 1-2 years | 2-3 years | 3-4 years | 4-5 years | More than 5 years |
Property lease commitments | 5,361 | 930 | 797 | 695 | 572 | 510 | 1,857 |
The operating leases correspond to the outstanding minimum future lease payments until the normal date of renewal of the leases or the earliest possible notice date. After periodic revaluation of the leases, these amounts are discounted. The discount rate corresponds to the weighted average cost of the Group bond debt.
The indefinite term leases amount to approximately 10% of the total of the property lease commitments.
The property lease commitments in France represent 60% of the total of the property lease commitments.
The Group may choose whether or not to renew these commercial leases upon expiration or replace them by other leases with renegotiated terms and conditions.
Handsets purchases
Following the signing of new handsets purchase contracts during the first half of the year 2013, total handsets purchase commitments amount to 3,182 million euros at the end of December 2013. These commitments are spread over 3 years.
Transmission capacity purchases
At December 31, 2013, purchase commitments of transmission capacity amount to 870 million euros, including 620 million euros related to the provision of satellite transmission capacity (comprising contracts with different commitment maturities up to 2020).
Other goods and services purchases
The Group’s most significant commitments at December 31, 2013 relate to the following:
■
the sites management service contracts (TowerCos) signed in Africa: these commitments amount to 555 million euros at the end of December 2013;
■
the maintenance of submarine cables for which Orange has joint ownership or user rights, for an estimated overall amount of 210 million euros;
■
the purchase of cinematographic works within the framework of an agreement signed by the Group with the CSA (French Broadcasting Authority) in December 2013 to support the film creation. The Group guarantees to the French and European cinema sector a 179 million euros investment over five years;
■
the purchase of broadcasting rights for 138 million euros;
■
the network maintenance for 139 million euros.
Investment commitments
The investment commitments presented below correspond to commitments made by the Group and will eventually be registered as assets in the consolidated statement of financial position. At the end of December 2013, they amount to 1,614 million euros.
In Spain, as part of the acquisition of a second block of 3G frequencies, Orange committed to invest 433 million euros over three years. At the end of December 2013, the total investment was realized. The bank guarantee relative to the initial commitments was released by the Spanish administration in the beginning of January 2014.
In Poland, Orange committed with the Polish Office for Electronic Communications (UKE) to realize 1.2 million broadband access lines until March 31, 2013. On December 31, 2013, the total investment was realized.
In Romania, in October 2012, Orange won blocks of frequencies in 800 MHz to 2.6 GHz bands for a total amount of 227 million euros in an auction process of 2G and 4G frequencies by Romanian telecom regulator ANCOM. A payment of 64 million euros was made in the end of December 2012, including 11 million euros for the extension of the 2G licenses and an advance of 53 million euros for the new 2G and 4G frequency blocks. In 2013, the balance of 163 million euros was paid.
ORANGE / 2013 REGISTRATION DOCUMENT - 175
In addition to these commitments, which are expressed in monetary terms, the Group made certain commitments to various administrative authorities such as ensuring a certain coverage and a certain quality level. These commitments, which have been undertaken primarily as part of license award processes, will require investment expenditure in future years to roll out and enhance the networks. They are not shown in the table above if they have not been expressed in monetary terms, which is usually the case. Such commitments have been made towards the French authorities for frequencies obtained in 2011 in the 2.6 GHz and 800 MHz bands and towards the Romanian authorities for frequencies obtained in 2012 in bands of 800 MHz to 2.6 GHz.
In France, the Group agreed to meet the following conditions:
■
an optional commitment to host mobile virtual network operators (MVNOs) on certain technical and pricing terms under full MVNO schemes;
■
an obligation to provide mobile coverage with theoretical maximum download speeds of at least 60 Mbps per user (25% of the country within 4 years and 75% within 12 years for the 2.6 GHz band, 98% of the country within 12 years and 99.6% within 15 years for the 800 MHz band), which can be met by using both the allocated frequencies and other frequencies;
■
more specifically, for the 800 MHz band, an obligation to provide coverage in priority areas (40% of the country within 5 years, 90% within 10 years) with no obligation to provide roaming services, an obligation to provide roaming in each département (90% within 12 years, 95% within 15 years) and an obligation to pool resources in communities covered by the “white area” program.
In Romania, the Group agreed to meet the following conditions:
■
an obligation to provide mobile coverage of at least 95% of the population within 225 of 732 localities with mobile communication services in UMTS or LTE technologies, for the 800 MHz and 900 MHz bands;
■
an obligation to provide voice services coverage of at least 98% of the population of inhabited areas, for 900 MHz and 1.8 GHz bands;
■
an obligation to provide Broadband data services of at least 60% of inhabited areas;
■
an obligation to provide voice mobile communication services coverage of 80% of the population by 5 April 2017 and Broadband data mobile communication services of 30% of the population by 5 April 2019, for 1.8 GHz and 2.6 GHz bands.
Non-compliance with these obligations could result in fines and other sanctions ultimately including the withdrawal of licenses awarded. Management believes that the Group has the ability to fulfill these commitments towards government authorities.
Public-to-private service concession commitments
As part of the deployment of the high and very high speed network in France, the Group entered into public-to-private service concession contracts. These contracts of construction and network operation, staggering until 2038, will be accounted for, as they are carried out, as 72 million euros intangible assets and as 572 million euros financial assets, in accordance with accounting principles described in Note 18.3.
Guarantees granted to third parties in the ordinary course of business
The main Group commitments on December 31, 2013 concern performance guarantees granted to certain Enterprise customers as part of the security of networks and remote access. At the end of December 2013, these commitments amount to 122 million euros.
Orange’s commitments towards Deutsche Telekom, granted as part of the compensation mechanism of the joint venture BuyIn, were settled in 2013.
The amount of guarantees granted by the Group to third parties (financial institutions, partners, customers and government agencies) to cover the execution of the contractual obligations of non-consolidated entities is not significant. Guarantees granted by the Group to cover the execution of the contractual obligations of the consolidated companies are not considered as unrecognized contractual commitments, as they would not increase the Group commitments in relation to the basic obligations of the consolidated entities.
Regarding individual training rights for employees of French entities of the Orange group, vested rights not yet used totaled approximately 10.8 million hours at December 31, 2013. In accordance with French accounting standards (CNC Urgent Issues Committee Opinion 2004-F on the recognition of individual rights to training for employees), the costs associated with rights are expensed over the period and do not give rise to a provision except in case of request submitted by the employee within the framework of a Personal Leave for Training, of a dismissal or of a resignation.
ORANGE / 2013 REGISTRATION DOCUMENT - 176
Asset and liability guarantees granted in relation to disposals
Under the terms of agreements between certain Group companies and the acquirers of certain assets, the Group is subject to standard warranty clauses relating to assets and liabilities. Nearly all material sale agreements provide for ceilings on these warranties.
At December 31, 2013, the main warranties in effect were the following:
■
warranties were granted to the joint venture EE at the time of the transfer of the United Kingdom operations, on the one hand related to the restructuring of interests and assets carried out prior to the contribution (uncapped warranties expiring in 2022), and on the other hand tax-related (warranty capped at 5 billion pounds sterling, or 5,997 million euros at December 31, 2013) expiring in 2017;
Moreover, as part of the merger of Orange and Deutsche Telekom operations in the United Kingdom, Orange counter-guaranteed up to 50% of the guarantee, capped at 750 million pounds sterling (900 million euros at December 31, 2013), granted by Deutsche Telekom to Hutchison 3G (H3G) in December 2007 to cover investment commitments made by its subsidiary T-Mobile (UK) towards the joint venture created with H3G as part of a 3G network sharing agreement (i.e. a guarantee capped at 375 million pounds sterling, or 450 million euros for Orange);
In addition, Orange retained certain compensation obligations in relation to the early unwinding of finance lease transactions relating to telecommunications equipment that was previously leased by Orange Personal Communications Services (now accounted for under the equity method). These compensation obligations are capped at 315 million pounds sterling, or 378 million euros, at December 31, 2013. These obligations will expire at the latest in February 2017;
■
tax-related warranties, capped at 400 million euros, granted to Deutsche Telekom as part of the disposal of the Group’s mobile and internet operations in the Netherlands in 2007. These warranties will expire at the end of the statutory limitation period, in 2019;
■
warranties capped at 91 million euros, granted as part of the disposal of Orange Denmark in 2004. This warranties will expire at the end of the statutory limitation period, in 2019;
■
standard warranties granted by the Group as part of Orange Austria disposal in 2013 (see Note 2.2). These warranties amount to 98 million euros and will expire at the end of the statutory limitation period, in 2015 and 2023;
■
tax-related warranty granted as part of Orange Suisse disposal in 2012. This warranty is not capped and will expire in 2017;
■
miscellaneous standard warranties granted to buyers of real estate sold by the Group.
Orange believes that the risk of these warranties being enforced is remote and that the potential consequences of their being called are not material with regard to the Group’s results and financial position.
Commitments relating to securities
Under the terms of agreements with third parties, Orange has made or received commitments to purchase or to sell securities. The purpose of this section is to describe those options that, if exercised, could have a material impact on the Group’s financial condition, excluding any commitments potentially arising from a change of control or from mechanisms arranging for the exit of a shareholder (preferential rights, rights of first refusal, etc.).
The commitments given and received by Orange under the agreements signed on April 11, 2012, concerning Mobinil in Egypt, are described in Note 2.2.
The other main agreements that include call options granted to the Group relate to Orange Tunisie, Médi Telecom and Korek Telecom. If the Group exercises these options, its partners may in turn exercise the put options they hold on these securities. If all of the options were exercised, the associated disbursements would total approximately 400 to 500 million euros to date. As the exercise price for these options is, in most cases, based on market values, this amount is subject to change depending on the contractual mechanisms for determining market value and on changes in the performance of the companies whose shares are covered by these options as well as in general market factors. The maturity dates of these options vary. Changes of control that may result from the exercise of such options may be subject to government authorization.
Orange Tunisie
Under the terms of the shareholders’ agreement with Investec dated May 20, 2009, Orange has a call option giving it the right, after a period of five years, to purchase at market value 1% of the share capital of Orange Tunisie plus one share. If this option was exercised, Investec would have the right to sell to Orange 15% of the share capital of Orange Tunisie at price equal to the market value.
Médi Telecom
As part of the December 2, 2010 acquisition of 40% of the share capital and voting rights in the Moroccan carrier Médi Telecom from the FinanceCom and Caisse de Dépôt et de Gestion groups, the parties agreed upon a certain number of provisions related to changes in the ownership structure of Médi Telecom. More specifically, Orange obtained a first call option on a maximum of 4% of the share capital, exercisable immediately prior to any initial public offering, at a price dependent on the stock market price, and a second call option exercisable between June 1 and November 30, 2014, on a maximum of 9% of the share capital less any percentage of capital acquired through exercise of the first option, at a price dependent on the stock market price if the company is listed at the time, or, if not, based on market value. The
ORANGE / 2013 REGISTRATION DOCUMENT - 177
possibility cannot be ruled out that, in the future, if it exercises the two call options, Orange could be required by the then-applicable Moroccan securities regulations to launch a public takeover bid for the remainder of the Médi Telecom shares.
Korek Telecom
Under the terms of the shareholders’ agreement dated March 10, 2011, the joint venture between Agility and Orange will have the right, during the year 2014, to exercise a call option that will enable it to increase its interest in Korek Telecom from 44% to 51%. Orange has a priority right to finance this acquisition and thereby to take direct control over the joint venture and indirect control over Korek Telecom by increasing its indirect interest therein to 27%.
If Orange does not exercise its priority right, Agility will have the right until December 31, 2014 to demand that Orange finance at least its share of the acquisition. Furthermore, if Orange has not taken indirect control over Korek at the latest on September 30, 2014, Agility will also have, during 12 months (from July 1, 2014 or January 1, 2015, depending on the situation) a call option on all shares held by Orange in the joint-venture.
If Orange exercises its priority right and more generally, if Orange acquires indirect control over Korek Telecom, Agility will further have the option to sell to Orange its interest in the joint company in two stages, which would increase Orange’s indirect interest in Korek Telecom up to 39% in 2014, and up to 51% from 2016.
The Group’s main commitments related to borrowings are set out in Note 11.
Orange has pledged certain investments and other assets to financial institutions or used them as collateral to cover bank borrowings and credit lines (see Note 11).
Guarantees granted to some lending institutions to finance consolidated subsidiaries are not set out below.
Assets covered by commitments
At December 31, 2013, Orange had not made any material pledges of shares of its subsidiaries
The table below shows to which extent Orange has full rights of use over its assets, at year-end:
(in millions of euros) | December 31, 2013 | December 31, 2012 | December 31, 2011 |
Assets held under finance leases | 688 | 690 | 689 |
Non-current pledged or mortgaged assets (1) | 103 | 128 | 57 |
Collateralized current assets | 65 | 76 | 115 |
Securitized receivables | 1,453 | 1,513 | 1,848 |
TOTAL | 2,309 | 2,407 | 2,709 |
(1) Non-current pledged or mortgaged assets are shown excluding cash collateral deposits, which are presented in Note 10.8. |
Non-current pledged or mortgaged assets comprise the following assets given as guarantees:
| December 31, 2013 |
(in millions of euros) | Total in statement of financial position (a) | Amount of asset pledged or mortgaged (b) | Percentage (a)/(b) |
Intangibles assets, net (excluding goodwill) | 11,744 | 89 | 1% |
Property, plant and equipment, net | 23,157 | 14 | 0% |
Non-current loans and receivables | 1,837 | - | - |
Other (1) | 35,013 | - | - |
TOTAL NON-CURRENT ASSETS | 71,751 | 103 | |
(1) This item includes net goodwill, interests in associates and joint ventures, assets available for sale and net deferred tax assets. |
ORANGE / 2013 REGISTRATION DOCUMENT - 178
As at December 31, 2013, the contingency reserves recorded by the Group for all the disputes (except tax litigation that are described in Notes 12.1 and 8.1) in which it is involved amounted to 414 million euros (versus 487 million euros at December 31, 2012 and 994 million euros at December 31, 2011). As a rule, Orange believes that any disclosure on a case-by-case basis could seriously harm its position, but provides details of the provisions recorded by categories of litigation such as reflected thereafter. The balance and overall movements on provision are presented on Note 4.7.
(in millions of euros) | Note | December 31, 2013 | December 31, 2012 | December 31, 2011 |
France Litigations (1) | 15.1 | 125 | 175 | 230 |
Spain Litigations | 15.2 | 40 | 47 | 38 |
Poland Litigations | 15.3 | 184 | 202 | 671 |
Other countries Litigations | 15.4 | 65 | 63 | 55 |
Group Other Litigations | 15.5 | - | - | - |
TOTAL | | 414 | 487 | 994 |
(1) Includes provisions affecting the France, Enterprise and International Carriers & Shared Services. |
A number of claims have been made against Orange by competitors for alleged anti-competitive behavior, for which the claimants generally seek a cease order or a sanction. If the claims are upheld, Orange may also be ordered to pay fines that in theory can reach up to 10% of the Group’s turnover. Competitors may also claim damages in civil or commercial proceedings for the harm they consider they have suffered because of these practices.
The proceedings which could significantly impact Orange’s financial position are described below.
Litigations related to competition law
Fixed networks and contents
■
The Numericable group initiated in 2010 before the Commercial Court of Paris and before the International Court of Arbitration of the International Chamber of Commerce of Paris, proceedings aimed at the compensation of the damage caused by an alleged de facto termination of the agreements signed with Orange giving Numericable the right to use, for its cable networks, Orange’s civil engineering installations. These agreements were entered into successively in 1999, 2001 and 2004 as part of the sale of certain cable networks. The claims lodged by Numericable total over 3.1 billion euros. On April 23, 2012, the Commercial Court of Paris dismissed all Numericable’s claims amounting to 2,583 million euros with respect to the 1999 and 2001 agreements. The Court held that the occupancy agreement had not been terminated. Numericable lodged an appeal. The ruling of the Paris Court of Appeal is expected during the first half of 2014. Orange believes that Numericable’s claims are totally unfounded. On February 25, 2013, the Court of Arbitration of the International Chamber of Commerce of Paris rejected definitively all claims from the Numericable group amounting to 542 million euros with respect to the 2004 agreements.
■
In 2010, Completel sued Orange before the Paris Commercial Court to claim compensation for damages allegedly suffered from practices engaged in by Orange on the wholesale broadband market between 2000 and 2002. On December 13, 2011, the Paris Commercial Court entirely dismissed Completel, holding that Completel could not have suffered any losses from these practices, considering its own strategy and its financial capacity at the time. Completel filed an appeal. Its claim amounts to 496 million euros. The ruling of the Paris Court of Appeal is expected in 2014.
■
On April 5, 2012, the French Competition Authority notified to Orange a statement of objections as part of the proceedings launched in 2007 following two complaints from Free regarding the rolling out of optic fiber networks in France. On July 25, 2013, a transaction was concluded with Free whereby Orange committed to change the condition of rolling out of its fiber networks in some municipalities in high density areas in order to enable third-party operators to accelerate the development of their own network. In return, Free waived its actions and committed to co-finance the rolling out of fiber in the concerned municipalities. The Authority took notice of this transaction and closed the case.
ORANGE / 2013 REGISTRATION DOCUMENT - 179
■
On December 9, 2009, SFR announced that it had filed a complaint with the French Competition Authority, claiming that Orange had engaged in anticompetitive practices on the market for the services leading to the reduction of zones in local communities not yet covered by a broadband network. Altitude Infrastructure filed a similar complaint in July 2009. These complaints challenge the time allowed and the tariffs set by Orange to provide its wholesale offer to operators that wish to respond to local communities, or the conditions in which Orange itself bids in response to tender offers issued by the local communities. The investigation is pending. In parallel, SFR brought an action for damages before the Paris Commercial Court on June 18, 2013. The total claims amounts provisionally to 50 million euros. At this stage and, in any case, as long as there is no decision of the French Competition Authority on the objected practices, Orange believes that these claims are unfounded.
■
On July 23, 2010, the European Commission informed Orange that it rejected the complaint submitted in March 2009 by Vivendi and Iliad (Free) with reference to certain market practices by Orange regarding wholesale access to local loop and broadband Internet access in France. The European Commission rejected all the plaintiffs’ allegations and concluded in a reasoned judgment that the European Union lacked interest in proceeding with the investigation. On October 16, 2013, the General Court of the European Union dismissed Vivendi’s appeal against the European Commission’s decision and confirmed it in its whole.
■
On February 3, 2010, SFR, then, on November 10, 2010, Verizon, summoned Orange to appear before the Commercial Court in Paris demanding the reimbursement of alleged overpayments on interconnection services provided by Orange in 2006 and 2007, the price of which allegedly did not reflect their cost. SFR claims more than 48 million euros and Verizon almost 37 million euros. Orange disputes the merits of these claims. On June 18 and 25, 2013, the Paris Commercial Court dismissed the claims of SFR and Verizon on, respectively, interconnection services provided by Orange in 2006 and 2007 for SFR and wholesale access or interconnection services provided by Orange from 2006 to 2010 for Verizon. However, it ordered Orange to pay Verizon 500,000 euros with respect to 2008. SFR and Verizon filed appeals against these decisions. A few days before these decisions were rendered, Colt, British Telecom France and Completel brought actions against Orange before the Paris Commercial Court on the same grounds as Verizon. The three operators’ claims amount provisionally to a total of 27 million euros. Orange believes these claims to be unfounded.
■
On April 24, 2012, SFR brought an action against Orange before the Paris Commercial Court denouncing its retail offers to the secondary residences market and claiming 218 million euros for the loss allegedly suffered. On February 12, 2014, the Court held that Orange has abused its dominant position by not allowing SFR to replicate its fixed line offers to the secondary residences market, and in tying its offers with fixed line offers to principal residences. It ordered Orange to pay 51 million euros in damages to SFR, the judgment being enforceable, which led Orange to recognize at December 31, 2013 this debt as “Other liabilities”. Orange believes that SFR claims are totally unfounded and will file an appeal against the decision before the Paris Court of Appeal.
■
In July 2013, the European Commission carried out search and seizure operations at the premises of Orange and other European operators as part of an investigation launched into the data connectivity on domestic access networks and the international transit business. Following a claim by Cogent on parameters close to those that lead the European Commission to open its investigation, the French Competition Authority already ruled on September 20, 2012, that there was no ground for notifying a statement of objections to Orange and that Orange was entitled to be paid by IP transit operators in case of significant imbalance in traffic exchange. This ruling was confirmed by the Paris Court of Appeal. On July 31, 2013, Orange filed an appeal before the General Court of the European Union in order to challenge the proportionality of the investigative measures carried out by the European Commission.
Mobile networks
■
On December 13, 2012, the French Competition Authority imposed a fine of 117 million euros against Orange and 66 million euros against SFR for having implemented as part of their unlimited offers launched in 2005 an excessive price discrimination between calls made within their own networks and calls made to their competitor’s network. This fine, that has been paid, was imposed at the end of an investigation started in 2006 upon Bouygues Telecom’s complaint. According to the Authority, Bouygues Telecom was compelled, because of its smaller subscriber base, to reply to the disputed offers with unlimited offers to all networks, that had the effect of lowering its margins. Orange believes this decision to be unfounded and appealed it on January 16, 2013 before the Paris Court of Appeal. The decision of the Court is expected during the second quarter of 2014.
Following the decision of the French Competition Authority, Bouygues Telecom, Oméa Telecom, Outremer Telecom and Euro-Information Telecom each brought in June 2013 an action against Orange before the Paris Commercial Court for damages allegedly suffered because of the sanctioned practices. The four operators’ claims amount provisionally to a total of 829 million euros. Orange believes no damages were suffered by these operators and asked the Court to stay the proceedings as long as a final decision is not rendered in the parallel procedure initiated by the Authority.
■
On April 14, 2008 and June 14, 2010, Bouygues Telecom, then, on August 9, 2010, SFR, filed complaints with the French Competition Authority objecting, on the B-to-B market for fixed-line and mobile services, to practices consisting in loyalty discounts, coupling, discriminatory terms and predatory prices on the part of Orange in France. Orange regards these allegations as unfounded. On December 9, 2010, search and seizure operations were nevertheless carried out by the Competition Authority in Orange premises. On May 15, 2012, the Paris Court of Appeal rejected the appeals against the orders authorizing these operations and recourses against the conditions in
ORANGE / 2013 REGISTRATION DOCUMENT - 180
which these operations took place. The Authority started to investigate the substance of the case in March 2013.
Concurrently to the ongoing investigation before the French Competition Authority, Bouygues Telecom brought an action before the Paris Commercial Court on June 13, 2013, for damages allegedly suffered because of these practices and provisionally estimated at 400 million euros. At this stage of the procedure, Orange believes that Bouygues Telecom’s claim is unfounded and was granted by the Court a stay of proceedings until the decision of the Competition Authority.
■
Digicel in July 2004 and Outremer Telecom in July 2005 brought claims before the French Competition Council, regarding practices of Orange Caraïbe and Orange SA in the mobile and fixed-to-mobile markets in the French Caribbean and in French Guyana. The Competition Authority joined the two proceedings in 2007 and, on December 9, 2009, ordered Orange to pay a fine of 63 million euros in total. Orange paid the fine but lodged an appeal against this decision before the Paris Court of Appeal, which, on September 23, 2010, reduced the fine by 3 million euros. Orange appealed to the Supreme Court against this decision by the Court of Appeal, as did the President of the French Competition Authority and Digicel. On January 31, 2012, the French Supreme Court reversed the Court of Appeal’s decision and remanded the case to the Paris Court of Appeal for new examination. On July 4, 2013, the Paris Court of Appeal confirmed its first decision ordering Orange to pay a fine of 60 million euros. Orange lodged a new appeal before the French Supreme Court as well as Digicel.
Concurrently to this procedure before the French Competition Authority, in March 2009 Digicel initiated before the Paris Commercial Court legal action for damages allegedly amounting to an estimated 329 million euros and stemming from these practices. Similarly, Outremer Telecom initiated a like action before the Paris Commercial Court on October 11, 2010, seeking compensation for an estimated 70 million euros damages. Orange Caraïbe and Orange SA believe that these claims are unfounded and that their amount appears in any event to be totally unjustified. On May 21, 2012, the Paris Commercial Court ordered a stay of proceedings until the decision of the Court of Appeal in the parallel procedure initiated by the Competition Authority. Following the decision of the Court of Appeal, Outremer Telecom’s action resumed its course.
■
In October 2012, SFR filed a complaint before the European Commission regarding the mobile roaming contract implemented in early 2012 between Free Mobile and Orange. SFR believes the contract to constitute a take-over of Free Mobile by the Orange group, jointly with the Iliad group. Thus, according to SFR, this joint takeover should have been notified to the Commission. In March 2013, the European Commission notified SFR a letter of pre-rejection of its action. In the absence of any response from SFR, this letter automatically became a definitive implicit rejection.
Other proceedings
■
In 2004, Suberdine, distributor of Orange offers in France from 1995 to 2003, and some of its shareholders initiated proceedings against Orange before the Paris Commercial Court. Suberdine, which was then jointly represented by both its court-appointed liquidator and its voluntary liquidator, claimed that Orange had suddenly terminated their business relationship and attributed to Orange the responsibility for its bankruptcy, which occurred at the end of 2003. In March 2006, the Court ordered Orange to pay Suberdine 12 million euros in damages and dismissed the shareholders’ claim. The court-appointed liquidator did not appeal the judgment. After two decisions from the Paris Court of Appeal holding the appeal from Suberdine’s voluntary liquidator to be inadmissible, and two partial annulments by the French Supreme Court, the Versailles Court of Appeal held on November 14, 2013, upon the motions of both liquidators that their actions were inadmissible due to the principle of res judicata attached to the judgment of the Paris Commercial Court. In its last pleas before the Court, the voluntary liquidator claimed up to 768 million euros in damages (including interests) for loss of profits and for the sudden termination of the Suberdine-Orange business relationship. Orange believes that these claims cannot be distinguished from the damages suffered by the Suberdine company itself, as claimed jointly by both liquidators and then definitely judged in 2006 by the Paris Commercial Court whose decision was implemented by Orange. In December 2013, both liquidators lodged a third appeal before the French Supreme Court.
■
On June 27, 2012, the Paris Court of Appeal, examining the case on remand after partial annulment of its former decision by the French Supreme Court, confirmed the rejection of all Lectiel’s and Groupadress claims aiming at the recognition of a prejudice valued at a minimum of 376 million euros, allegedly resulting from Orange’s refusal to deliver them without charge its directory database, together with daily updates. The Court had to determine whether Orange’s anticompetitive practices, as established by final judgment before 1999, had caused a prejudice to Lectiel and Groupadress, and if so, for what amount. The Court held that the claimants could not characterize any prejudice as they had unlawfully downloaded Orange’s data during the full considered period. On December 13, 2012, the court-appointed liquidator of Lectiel lodged a new appeal before the French Supreme Court. At December 31, 2013, the procedure is still pending.
■
In November 2000, the Société Nationale des Chemins de Fer (SNCF) brought proceedings with the Paris Administrative Court in which it claimed compensation from Orange for its use of SNCF railway infrastructure between 1992 and the end of 1996. In December 2010, SNCF increased the amount of its claim to 562 million euros. On May 21, 2013, Orange and SNCF signed a transaction, which provides for the payment to SNCF of a final contractual indemnity the amount of which was already recorded as a provision in the financial statements at December 31, 2012. In a decision dated June 5, 2013, the President of the Paris Administrative Court of Appeal took notice of the parties’ withdrawal. His decision put a final end to this procedure.
ORANGE / 2013 REGISTRATION DOCUMENT - 181
■
On December 20, 2012, following the conclusion of a sanction procedure against Telefonica, Vodafone and Orange the Spanish Competition Commission (CNC) ordered the three operators to pay a fine of 120 million euros, including 30 million euros for Orange, for abuse of dominant position of each operator in its own termination market and abuse of a collective dominant position by the three operators in the origination market and termination market. The CNC held that the three operators had abused their dominant position between 2000 and 2009 in fixing abnormally high tariffs for SMS. Orange believes this decision to be unfounded. Orange and the two other operators lodged appeals against it. At December 31, 2013, the appeals are pending before the courts.
■
Following a complaint lodged by British Telecom, the CNC opened in January 2011 a procedure aiming at the practices of Orange, Telefonica and Vodafone on the wholesale markets of the Spanish mobile phone sector. The objective of this procedure is to verify that the retail offers of these operators can be replicated by their MVNOs. On January 8, 2013, Orange received a statement of objections from the CNC. At December 31, 2013, the procedure is still pending. The CNC has until March 2014 to conduct its investigations.
■
On June 22, 2011, as part of a procedure initiated in April 2009, the European Commission imposed a fine of 128 million euros on Orange Polska (formerly TP) for an alleged abuse of dominant position on the broadband Internet access market in Poland. The Commission alleged that Orange Polska engaged in practices which aimed at preventing alternative operators from effectively accessing the market. On September 2, 2011, Orange Polska lodged an appeal against the Commission’s decision before the General Court of the European Union. On April 16, 2012, Netia initiated an amicable procedure before the Warsaw Commercial Court in order to obtain compensation from Orange Polska stemming from its practices on the wholesale broadband access market as sanctioned by the European Commission. Orange Polska refused the proposed settlement.
■
In September 2006 and February 2007 the Polish Office for Electronic Communications (UKE) imposed on Orange Polska two fines of 100 million zlotys and 339 million zlotys (106 million euros in total) for having, according to the UKE, established the tariffs of its Internet access offers (“Neostrada”) without observing the cost-orientation principle and without submitting them to its review before they took effect. In 2011, these two decisions were cancelled by the Polish Competition and Consumer Protection Court (SOKiK), whose rulings were confirmed by the Court of Appeal in 2012. By two decisions issued on March 6 and July 2, 2013, the Polish Supreme Court rejected the UKE’s appeal against these decisions, ending definitively these two procedures.
■
In September 2013, Magna Polonia initiated an amicable procedure before the Warsaw Commercial Court in order to obtain payment of a total 618 million zlotys (149 million euros) in damages from PTK Centertel and three other operators in relation to alleged concerted practices aiming at delaying the development of new services on the mobile television market. PTK Centertel refused the proposed settlement. Orange believes Magna Polonia’s claim to be unfounded.
■
On March 18, 2013, the Polish Office of Competition and Consumer Protection (UOKiK) opened an investigation of the country’s three main mobile operators, including PTK Centertel. The UOKiK indicated that it suspected an abuse of a dominant position from the three operators in relation with their interconnection rates. At this stage of the procedure, Orange is unable to assess the risk relating to this investigation.
■
On November 11, 2009, the Romanian Competition Authority carried out an inspection in the offices of Orange Romania. The Authority suspected infringement of competition law, in particular concerted practices or abuse of a dominant position on the part of the main operators on the interconnection market (fixed-mobile call terminations) and on the rates of mobile prepaid services. On February 15, 2011, the Competition Authority imposed a fine of 35 million euros on Orange Romania for abuse of a dominant position in refusing to conclude an interconnection agreement with Netmaster. Orange Romania was granted in summary proceedings a stay of execution of the decision, which it also appealed. In compliance with local rules and in view of the introduction of the appeal, 30% of the amount of the fine was deposited into an escrow account. On June 11, 2013, the Bucharest Court of Appeal upheld Orange Romania’s claims and cancelled the fine imposed by the Authority. An appeal was filed before the Romanian Supreme Court.
In addition, on April 5, 2011, the Romanian Competition Authority notified to Orange Romania the opening of a proceeding against all mobile operators for potential abuse of dominant position on their respective termination call market. The alleged practices are high price discriminations between calls made in within the same network and calls made to competitors’ networks, with no relation to the underlined cost of these two types of calls. Discussions are ongoing with the Authority in order to close the case through commitments to be made by Orange Romania.
ORANGE / 2013 REGISTRATION DOCUMENT - 182
■
In September 2008 and December 2009, the Egyptian Telecoms Regulatory Authority (NTRA), following a complaint filed by Telecom Egypt (TE), issued two decrees imposing a significant price decrease of contractual interconnection tariffs signed between TE and mobile phone network operators, among which Mobinil. In June 2010, the Administrative Court of the Egyptian State Council granted a stay of execution of these decrees until the issuance of a decision on the merits of the case. On May 25, 2013, the Administrative Supreme Court confirmed this stay of execution. The procedure on the merits is pending.
After Mobinil filed in September 2009 a claim before an arbitral tribunal aimed at forcing TE to abide by its interconnection agreement and claimed indemnification from the violation of this agreement, TE filed a counter-claim for damages in December 2010, arguing that Mobinil had violated the interconnection agreement as well as some rules governing international calls and leased-lines. At December 31, 2013, TE’s claims amounted to 10.6 billion Egyptian pounds (1.1 billion euros) and Mobinil’s claims amounted to 407 million Egyptian pounds (43 million euros). The arbitral award is expected during the first half of 2014.
■
Since 2007, Telkom Kenya has been subject to a class action initiated by former employees laid off in 2006 who contest their dismissal conditions and claim 27 million euros in damages. On October 25, 2013, the Nairobi Court of Appeal upheld former employees’ claims. Since November 2011, two other class actions have been filed by Telkom Kenya’s former employees also laid off in 2006 who claim 18 million euros in damages.
State aids
Two proceedings are currently pending before the Court of Justice of the European Union (CJEU) concerning alleged State aid from which Orange would have benefited:
■
In January 2003, the European Commission launched an investigation concerning the financial measures announced by the French State on December 4, 2002. On such date, the Government had announced that it was prepared to extend a shareholder’s loan to Orange in advance of its participation in a capital increase with private investors. This shareholder’s loan was never actually put in place. In 2004, the European Commission found that these financial measures were incompatible with the common market but did not require any repayment of State aid. The French State and Orange but also Bouygues Telecom and the French association of network operators and telecommunications services (AFORS Telecom) lodged appeals against the Commission’s decision before the General Court of the European Union (GCEU). On May 21, 2010 the GCEU annulled the decision of the European Commission judging that, although this government’s statement conferred, with other statements in support of Orange, a financial advantage to the latter, no public funds had been committed and that such statements did not represent State aid. But on March 19, 2013, the European Court of Justice (ECJ) cancelled the GCEU’s decision considering that, even though the shareholder’s loan had not been implemented, the announcement gave Orange an advantage granted through State resources as such a loan could potentially affect the state budget. The case was remanded to the GCEU for a new examination. The ECJ’s ruling does not contradict the effects of the European Commission’s decision that did not order any repayment of State aid. A hearing before the GCEU may be held during the first semester of 2014.
■
On May 20, 2008, the European Commission launched a formal in-depth investigation into the compliance with European regulations on State aid of the reform of the scheme relating to charges borne by Orange in connection with the retirement pensions for its civil servants, provided by the French law of July 26, 1996 when France Telecom became a public limited company. This investigation followed a complaint by Bouygues Telecom in 2002.
The 1996 reform provided for the end of the derogatory regime to which Orange had been submitted since the French law of July 2, 1990 on the organization of postal and telecommunication public services, and the payment by Orange to the French State of a one-time special contribution of 5.7 billion euros in 1997 and annual contributions in full discharge of its liabilities since then. These annual contributions aimed at equalizing the level of mandatory taxes and social charges based on salaries to be paid by Orange and its competitors for risks that are common to private employees and civil servants, but did not include payment by Orange of contributions linked to so-called “non-common risks” (not incurred by civil servants), i.e. contributions for unemployment risk and for risk of non-payment of salaries in case of company’s bankruptcy.
By a decision dated December 20, 2011, the European Commission ordered the French state to align the calculation of Orange’s social security contributions to its competitors’ calculation, including with respect to the non-common risks. According to the French authorities’ calculations, the methodology adopted by the Commission leads Orange to be liable to the new contributions on a monthly basis from January 12, 2012. Pending the implementation of the decision, Orange opened an escrow account on which the additional claimed contributions were paid each month, which effectively deprived it from enjoying the corresponding amounts.
ORANGE / 2013 REGISTRATION DOCUMENT - 183
Pursuant to the European Commission’s decision, an amendment to the Act of July 2, 1990, was passed on August 16, 2012 imposing on Orange the payment of contributions linked to non-common risks; this provision being retroactively applicable to the contributions due with respect to compensation paid in 2012. Following the publication on November 28, 2012, of the government decree implementing the Act, all the contributions due and placed on the escrow account were paid to the French State in December. Since December 2012, the contributions have been paid directly by Orange to the appropriate government agencies.
On March 2, 2012 and August 22, 2012 respectively, the French government and Orange appealed against the Commission’s decision before the GCEU. Orange believes that this decision creates a very strong structural disadvantage for the Company in relation to its competitors and contradicts a number of decisions previously adopted by the Commission itself, in particular the decision of 2007 regarding La Poste for which the reform was identical. These appeals are not suspensive. The GCEU’s decision may be rendered in 2014.
International litigations
■
Concurrently to the actions brought since 2003 by former MobilCom CEO Gerhardt Schmid and certain minority shareholders of MobilCom claiming indemnification for the prejudice, valued at several billion euros, allegedly suffered because of the withdrawal from the UMTS project in Germany, that were put to an end by the decision of the German Supreme Court dated April 23, 2012, a few shareholders of Freenet pursue a lawsuit against their company based on an alleged underestimation of MobilCom shares at the time of its merger with Freenet in 2007. This lawsuit would aim at compelling Freenet’s management to file a claim for damages against Orange. On August 16, 2013, the Court of Kiel rejected the shareholders’ claim, judging that they cannot challenge the merger based on an alleged debt due by Orange. The shareholders appealed the decision.
■
On May 24, 2013, the Paris Court of Appeal confirmed the inadmissibility of the claims of Messrs Mikati, minority shareholders of FTML, who filed suit against Orange SA in 2007 in the Paris Commercial Court, seeking payment of 97 million US dollars, FTML being also called in the trial. Messrs Mikati claim that Orange SA imposed upon its Lebanese sub-subsidiary and against the latter’s interests the settlement agreement of January 12, 2006 under which FTML and its majority shareholder FTMI resolved their disputes with the Lebanese government in connection with the BOT contract for a mobile telephone network in Lebanon, thereby allegedly depriving the minority shareholders of their share of the amount of 266 million US dollars awarded to FTML and FTMI by the arbitration rulings of January and April 2005. Messrs Mikati lodged an appeal before the French Supreme Court.
Other than proceedings that may be initiated in respect of tax audits and the dispute before the courts of the European Union concerning certain taxes levied by France and Spain on the telecom operators, as disclosed in Notes 12.1 and 8.1, there are no other administrative, legal or arbitration proceedings, including any proceedings that are pending or threatened, of which Orange is aware of, which may have or have had in the last twelve months a material impact on the Company’s and/or Group’s financial position or profitability.
ORANGE / 2013 REGISTRATION DOCUMENT - 184
Modification of TDIRA contractual terms
On January 6, 2014, the General Assembly of the Bank tranche holders accepted the modifications specified in Note 10.3.
Bond issue and redemption
Issue of deeply subordinated perpetual bonds
On January 29, 2014, Orange issued the equivalent of 2.8 billion euros of subordinated perpetual bonds denominated in euros and pounds sterling in three tranches: 1 billion euros bearing interest at 4.25%, 1 billion euros bearing interest at 5.25% and 650 million pounds, bearing interest at 5.875% (4.95% after conversion into euro). Orange has a call option on each tranche respectively after 6 years, 10 years and 8 years. Under IFRS, these bonds are recognized in equity.
United States bonds issue
On January 31, 2014, Orange has issued United States bonds for 1.6 billion dollars in two fixed-rate tranches: 750 million dollars maturing in 2019 and bearing interest at 2.75% and 850 million dollars maturing in 2044 and bearing interest at 5.50%.
Bond redemption
On January 22, 2014, Orange SA redeemed the balance of 1 billion euros bond at maturity.
Early redemption in March 2014 of 1.2 billion dollars bonds
On January 30, 2014, Orange has announced its intention to early redeem the remaining 1.2 billion dollars of bonds maturing in July 2014. Early redemption is scheduled in March, 2014.
Employee Share Offering
On March 5, 2014, the Board of Directors asked to the Management to examine the setting up of an Employee Share Offering designed to increase the employee share ownership. This Employee Offering would be proposed to employees located in France as part of the Group Savings Plan and would only relate to shares in treasury.
At December 31, 2013, the scope of consolidation has approximately 350 entities. The Group’s main consolidated entities are presented by segment in the table below.
The main changes in scope of consolidation for the year ended December 31, 2013 are set out in Note 2.2. Special-purpose entities included within the scope of consolidation are companies linked to securitization in France.
As regards subsidiaries with minority interests:
■
Orange Polska’s financial data are presented in segment information and its financial statements are published in Warsaw Stock Exchange;
■
financial statements for Sonatel Group, Jordan Group, Mobistar and ECMS are respectively published at the Regional Stock Exchange (BRVM), Amman Stock Exchange, Brussels Stock Exchange and Cairo Stock Exchange;
■
the others subsidiaries are not significant compared to Orange financial datas. Consequently, financial information is not presented for these subsidiaries in Orange’s consolidated financial statements.
ORANGE / 2013 REGISTRATION DOCUMENT - 185
COMPANY | | COUNTRY |
Orange SA | Parent company | France |
Main consolidated entities | | |
France Segment | % Interest | Country |
Orange SA - Business Unit France | 100.00 | France |
Orange Caraïbes | 100.00 | France |
Orange Réunion | 100.00 | France |
Spain Segment | % Interest | Country |
Orange Espagne | 100.00 | Spain |
Poland Segment | % Interest | Country |
Orange Polska | 50.67 | Poland |
Rest of the World Segment | % Interest | Country |
Orange Armenia | 100.00 | Armenia |
Mobistar | 52.91 | Belgium |
Orange Botswana | 73.68 | Botswana |
Orange Cameroon | 94.40 | Cameroon |
Orange Centre Afrique | 100.00 | Central African Republic |
Orange RDC | 100.00 | Democratic Republic Of the Congo |
Orange Dominicana (3) | 100.00 | Dominican Republic |
ECMS and its subsidiaries | 93.92 | Egypt |
Orange Guinée (2) | 37.83 | Guinea |
Orange Bissau (2) | 38.10 | Guinea-Bissau |
Orange Côte d’Ivoire | 85.00 | Ivory Coast |
Côte d’Ivoire Telecom (1) | 45.90 | Ivory Coast |
Jordan Telecom | 51.00 | Jordan |
Telkom Kenya | 70.00 | Kenya |
Orange Communications Luxembourg | 52.90 | Luxembourg |
Orange Madagascar | 71.79 | Madagascar |
Orange Mali (2) | 29.65 | Mali |
Orange Moldova | 94.31 | Moldova |
Orange Niger | 82.66 | Niger |
Orange Romania | 96.82 | Romania |
Sonatel (2) | 42.33 | Senegal |
Sonatel Mobiles (2) | 42.33 | Senegal |
Orange Slovensko | 100.00 | Slovakia |
Orange Uganda | 65.93 | Uganda |
Entreprise Segment | % Interest | Country |
Orange SA - Business Unit Entreprise | 100.00 | France |
GlobeCast Holding and its subsidiaries | 100.00 | France |
Network Related Services and its subsidiaries | 100.00 | France |
Orange Business Services Participations and its subsidiaries | 100.00 | United Kingdom |
International Carriers & Shared Services Segment | % Interest | Country |
Orange SA - Business Unit OI&SP | 100.00 | France |
FT IMMO H and its subsidiaries | 100.00 | France |
FT Marine and its subsidiaries | 100.00 | France |
Orange Studio and its subsidiaries | 100.00 | France |
Orange Cinéma Séries-OCS | 66.66 | France |
Dailymotion | 100.00 | France |
Securitization vehicles | 100.00 | France |
Orange Brand Services | 100.00 | United Kingdom |
(1) Orange SA owns and controls 90% of FCR Côte d’Ivoire, owns and controls 51% of Côte d’Ivoire Telecom. (2) Orange SA controls Sonatel and its subsidiaries, which are fully consolidated, under the terms of the shareholders’ agreement as supplemented by the Strategic Committee Charter dated July 13, 2005. Orange SA owns and controls 100% of FCR, which owns and controls 42.33% of Sonatel. (3) Orange Dominicana is presented as Held for sale as at December 31, 2013 (see Note 2). |
ORANGE / 2013 REGISTRATION DOCUMENT - 186
Presentation
Income statement
Expenses are presented in the income statement based on their nature.
Operating income corresponds to net income before:
■
income taxes (current and deferred taxes);
■
net income of discontinued operations or operations held for sale which represent a major line of business or geographical area of operations.
Statement of comprehensive income
This statement reconciles the consolidated net income to the comprehensive income for the period. Items in the other comprehensive income are reported based on whether they are potentially reclassifiable to profit or loss subsequently. The statement of comprehensive income presents other items of income and expense before tax (“components of other comprehensive income”) which are not recognized in consolidated net income for the period:
■
items that will not be reclassified to profit or loss:
■
remeasurement of actuarial gains or losses on defined benefit plans;
■
other comprehensive income of the entities accounted for under the equity method (post-tax);
■
items that may be reclassified to profit or loss subsequently:
■
remeasurement of assets held for sale;
■
remeasurement of cash flow hedge instruments;
■
remeasurement of net investment hedge instruments;
■
currency translation adjustment;
■
total amount of tax relating to the above items;
■
other comprehensive income of the entities accounted for under equity method (post-tax).
Statement of financial position
Current and non-current items are presented separately in the statement of financial position: assets and liabilities with a term of no more than twelve months are classified as current whereas, assets and liabilities with a term of more than twelve months are classified as non-current.
The investments that meet the conditions required by IAS 7 qualify as cash equivalents in the statement of financial position and in the statement of cash flows:
■
held for the purpose of meeting short-term cash commitments; and
■
short-term assets at the acquisition date, easily convertible into a determined cash amount and subject to a remote risk of change in value.
The management of these investments is described in Notes 11.3 and 11.5.
Assets and liabilities held for sale are reported on a separate line below the non-current items in the statement of financial position.
Statement of cash flows
The statement of cash flows is reported using the indirect method starting with the consolidated net income and is broken down into three categories:
■
cash flows arising from operating activities (including finance costs and income taxes);
■
cash flows arising from investing activities (notably the purchase and disposal of financial investments, intangibles and tangibles but excluding finance leases);
■
cash flows arising from financing activities (notably loan issuance and redemption, share buyback, dividends paid).
On the acquisition date, a finance lease has no effect on cash flows since the transaction is non-monetary. Lease payments over the financing period are separated between interest (cash flows from operating activities) and reimbursement of principal amount (cash flows arising from financing activities).
Segment reporting
The operating segments are components of the Group that engage in business activities and whose operating results based on the internal reporting are reviewed by the Chief Executive Officer (the chief operating decision-maker) in order to determine the allocation of resources and to assess of the operating segments’ performance.
The reported segments are:
■
the France, Poland, Spain, Enterprise operating segments, to which is added EE, the joint venture with Deutsche Telekom in the United Kingdom;
■
Rest of the World for the other operating segments formed by the telecommunications operator activities in other European countries, Africa and the Middle East;
ORANGE / 2013 REGISTRATION DOCUMENT - 187
■
International Carriers and Shared Services (IC & SS) which comprises certain resources, mainly in the areas of networks and information systems, research and development, and other shared competencies as well as the Orange brand.
The use of shared resources, mainly provided by IC & SS and by Orange France to Enterprise, is taken into account in segment results based either on the terms of contractual agreements between legal entities, or external benchmarks, or by allocating costs among all the segments. The supply of shared resources is included in other revenues of the service provider, and the use of the resources is included in expenses taken into account for the calculation of the service user’s EBITDA. The cost of shared resources may be affected by changes in contractual relationship or organization and may therefore impact the segment results disclosed from one year to another.
Unallocated assets and liabilities comprise mainly external net financial debt, external cash and cash equivalents, current and deferred tax assets and liabilities as well as equity. Inter-segments assets and liabilities are reported in each operating segment. The items of internal financial debt and financial investments are not reported in the segments.
EBITDA (Earnings Before Interest, Tax, Depreciation and Amortization, remeasurement resulting from business combinations, reclassification of cumulative translation adjustment from liquidated entities and share of profits (losses) of associates and joint ventures) is one of the key measures of operating profitability used by the Group internally to (i) manage and assess the results of its operating segments, (ii) implement its investments and resource allocation strategy, and (iii) assess the performance of the Group Executive Management. The Group’s management believes that EBITDA is meaningful for investors because it provides an analysis of its operating results and segment profitability using the same measure used by management. As a consequence and in accordance with IFRS 8 provisions, EBITDA is presented in the analysis by operating segment, in addition to operating income.
EBITDA is not a financial measure defined by IFRS as a measurement of financial performance and may not be comparable to other similarly-titled indicators used by other companies. EBITDA is provided as additional information only and should not be considered as a substitute for operating income or net cash provided by operating activities.
Foreign currencies
Determination of the functional currency and foreign operations
The functional currency of foreign operations located outside the euro area is usually the local currency, unless the major financing flows are performed by reference to another currency (such as the Orange entities in Romania and in the Democratic Republic of the Congo).
Transactions in foreign currencies are converted by the subsidiary into its functional currency at the exchange rate at the transaction date. Monetary assets and liabilities are remeasured at the year-end exchange rate at the end of each reporting period and the resulting translation differences are recorded in the income statement:
■
in operating income for commercial transactions;
■
in finance income or finance costs for financial transactions.
Both for transactions qualifying for fair value hedge accounting and for economic hedges, the change in fair value currency derivatives that can be attributed to changes in exchange rate is accounted for in operating income when the underlying hedged item is a commercial transaction and in finance income when the underlying hedged item is a receivable or a financial debt.
As the hedged item is not recognized in the statement of financial position for a cash flow hedge of a highly probable forecast transaction, the effective portion of change in fair value of the hedging instrument is booked in other comprehensive income and reclassified in:
■
profit or loss while following the above method with respect to financial assets and liabilities;
■
the initial cost of the hedged item with respect to the non-financial assets and liabilities.
Foreign exchange risk arising on net operating cash flows, less purchases of property, plant and equipment and intangible assets and proceeds from sales of property, plant and equipment and intangible assets of some entities, may be hedged by the Group. The impact of this hedge is recorded in the operating income.
Foreign operations’ financial statements translation
The financial statements of foreign operations whose functional currency is neither the euro nor the currency of a hyperinflationary economy are translated into euros (the Group’s presentation currency) as follows:
■
assets and liabilities are translated at the year-end rate;
■
items in the statement of income are translated at the average rate for the year;
■
the translation adjustment resulting from the use of these different rates is included in other comprehensive income.
Recycling of exchange differences recognized in other comprehensive income
The exchange differences are reclassified to profit or loss when the entity disposes or partially disposes (loss of control, loss of joint control, loss of significant influence) of its interest in a foreign operation through sale, liquidation, repayment of share capital or abandonment of all, or part of, that entity. The write-down of the carrying amount of a foreign operation, either because of its own losses of because of an impairment recognized, does not lead to a reclassification to profit or loss.
ORANGE / 2013 REGISTRATION DOCUMENT - 188
Exchange differences, reclassified from equity to profit or loss, are classified in the income statement within:
■
net income of discontinued operations, when a major line of business or geographical area is disposed;
■
gains (losses) on disposal of businesses and assets, when other businesses are disposed;
■
reclassification of cumulative translation adjustment in case some entities are liquidated or some operations discontinued.
Entities are fully consolidated if the Group has all the following:
■
power over the investee; and
■
exposure, or rights, to variable returns from its involvement with the investee; and
■
the ability to use its power over the investee to affect the amount of the investor’s returns.
Control is deemed to exist when the Group owns more than 50% of the voting rights of an entity, or has power:
■
over more than one half of the voting rights of the other entity by virtue of an agreement;
■
to govern the financial and operating policies of the other entity under a statute or agreement;
■
to appoint or remove the majority of the Members of the Board of Directors or equivalent governing body of the other entity; or
■
to cast the majority of votes at meetings of the Board of Directors or equivalent governing body of the other entity.
The entities set up in connection with the Group’s securitization programs are consolidated in accordance with the provisions hereabove.
Clarifications when the ownership interest does not imply a rebuttable presumption are provided in Note 17.
Joint ventures and companies over which the Group exercises significant influence (generally corresponding to an ownership interest of 20% to 50%) are accounted for using the equity method.
When assessing the level of control or significant influence exercised over a subsidiary or associate, the existence and effect of any exercisable or convertible potential voting rights at the reporting period ending date is taken into account.
Material intragroup transactions and balances are eliminated.
Takeovers (business combinations)
For agreements closed on or after January 1, 2010
Business combinations are accounted for applying the acquisition method:
■
the acquisition cost is measured at the acquisition date at the fair value of the consideration transferred, including all contingent consideration. Subsequent changes in contingent consideration are accounted for either through profit or loss or through other comprehensive income in accordance with the applicable standards;
■
goodwill is the difference between the consideration transferred and the fair value of the identifiable assets and liabilities assumed at the acquisition date and is recognized as an asset in the statement of financial position.
For each business combination with ownership interest below 100%, non-controlling interests are measured:
■
either at fair value: in this case, goodwill relating to non-controlling interests is recognized; or
■
at the non-controlling interest’s proportionate share of the acquiree’s identifiable net assets: in this case, goodwill is only recognized for the share acquired.
Acquisition-related costs are directly recognized in operating income in the period in which they are incurred.
When a business combination is achieved in stages, the previously held equity interest is remeasured at fair value at the acquisition date through operating income. The attributable other comprehensive income, if any, is fully reclassified in operating income.
For agreements closed between January 1, 2004 and December 31, 2009
For business combinations over this period, the main accounting treatment differences compared with the above described accounting treatment are:
■
acquisition-related costs are accounted for as acquisition cost;
■
non-controlling interests are measured at the non-controlling interest’s proportionate share of the acquiree’s identifiable net assets, i.e. with no recognition of goodwill;
■
when a business combination is achieved in stages, the previously held equity interest is remeasured at fair value against equity;
■
contingent consideration, if any, is recognized against the acquisition cost at the acquisition date if the adjustment is probable and can be reliably measured. Subsequent changes in contingent consideration are accounted for against goodwill.
ORANGE / 2013 REGISTRATION DOCUMENT - 189
Loss of control with residual equity interest
For agreements closed on or after January 1, 2010
Loss of control while retaining a residual equity interest is analyzed as a swap of assets, i.e. a disposal of a controlling interest in exchange for an acquisition of a non-controlling interest. Hence, the following occurs at the date when control is lost:
■
the recognition of a gain or loss on disposal which comprises:
■
a gain or loss resulting from the ownership interest disposed; and
■
a gain or loss resulting from the remeasurement at fair value of the ownership interest retained in the entity;
■
the reclassification in profit or loss of all related other comprehensive income balances.
For agreements closed before January 1, 2010
Loss of control while retaining a residual equity interest results in:
■
recognizing a gain or loss resulting only from the ownership interest actually disposed;
■
carrying at historical cost the previously held equity interest.
Internal transfer of consolidated entities
IFRSs do not address the accounting treatment for the transfer of consolidated shares within the Group resulting in changes in ownership interest. The Group applies the following accounting policy:
■
the transferred shares are carried at historical cost and the gain or loss on the transfer is fully eliminated in the acquirer’s accounts;
■
the non-controlling interests are adjusted to reflect the change in their share in the equity against Group retained earnings, with no impact on profit and loss and equity.
Revenue
Revenue from the Group’s activities is recognized and presented as follows, in accordance with IAS 18:
Separable components of bundled offers
Numerous service offers on the Group’s main markets include two components: an equipment component (e.g. a mobile handset) and a service component (e.g. a talk plan).
For the sale of multiple products or services, the Group analyzes all deliverables in the arrangement to determine whether they represent separate units of account. A delivered item (sold product or rendered service) is considered a separate unit of account if (i) it has value to the customer on a standalone basis and (ii) there is objective and reliable evidence of the fair value of the undelivered item(s). The total fixed or determinable amount of the arrangement is allocated to the separate units of account based on its relative fair value. However, when an amount allocated to a delivered item is contingent upon the delivery of additional items or meeting specified performance conditions, the amount allocated to that delivered item is limited to the non-contingent amount.
Hence, for bundled offers including a handset sold at a discounted price and a telecommunication service, revenue recognized for the handset sale is limited to the amount of the arrangement that is not contingent upon the rendering of telecommunication services, i.e. the amount paid by the customer for the handset: this amount is used to be the amount paid at the delivery, or the discounted amounts paid over a one or two-year period with respect to the offers paid by instalments which have been more recently placed on the market.
For offers that cannot be separated into identifiable components, revenues are recognized in full over the life of the contract. The main example is connection to the service: this does not represent a separately identifiable transaction from the subscription and communications, and connection fees are therefore recognized over the average expected life of the contractual relationship.
Provision of equipment
Where separable, revenue from equipment sales is recognized when the significant risks and rewards of ownership are transferred to the buyer. For instance, the provision of an internet box does not constitute a separable component from the Internet access service.
When equipment – associated with the subscription of telecommunication services - is sold by a third-party retailer who purchases it from the Group and receives a commission for signing up the customer, the related revenue is:
■
recognized when the equipment is sold to the end-customer;
■
assessed by the Group taking into account the best estimate of the retail price and any subsidies granted to the retailer at the time of the sale and passed on to the end-customer in the form of a rebate on the equipment.
Equipment for which a right of use is granted is analyzed in accordance with IFRIC 4 in order to determine whether IAS 17 is applicable. Equipment lease revenue is recognized on a straight-line basis over the life of the lease agreement, except in the case of finance leases which are accounted for as sales on credit.
ORANGE / 2013 REGISTRATION DOCUMENT - 190
Service revenue
With regards to the mass market and the corporate market, revenue from telephone service and Internet access is recognized on a straight-line basis over the subscription period and revenue from charges for incoming and outgoing telephone calls, international roaming or data exchange invoiced to the customers is recognized when the service is rendered.
With regards to the operators, wholesale connection subscriptions are recognized on a prorate basis as this represents the best estimate of the consumption of the service while wholesale voice or data transfers (ending on the Orange national network or carried through the Orange international network) are recognized when the service is rendered. Between the major international transit carriers, transfers of minute are invoiced gross (and often settled on a net basis) and transfers of data are not charged (free peering). Over-The-Top service providers (OTT) (like Google, Apple, Microsoft, etc.) are not charged for the data they send (free peering and net neutrality).
Revenue from the sale of transmission capacity on terrestrial and submarine cables as well as the one from local loop unbundling is recognized on a straight-line basis over the life of the contract.
Revenues from Internet advertising are recognized over the period during which the advertisement appears.
The gross or net accounting for revenue sharing arrangements and supply of content depends on the analysis of the facts and circumstances surrounding each transaction. Thus, revenue is recognized on a net basis when the provider is responsible for supplying the content provided to the end-customer and for setting the price. This principle is applied notably for revenue-sharing arrangements (Audiotel, premium rate number, special numbers, etc.) and for revenues from the sale or supply of content (audio, video, games, etc.) through the Group’s various communications systems (mobile, PC, TV, fixed line, etc.).
The Group offers customized solutions, in particular to its business customers. These arrangements are analyzed as multiple-element transactions (including management of the telecommunication network, access, voice and data transmission and migration). The contingent commercial discounts granted under these arrangements are recorded as a deduction from revenue based on the specific terms of each arrangement. Migration costs incurred by the Group under these arrangements are expensed when incurred except when the arrangements include an early termination penalty clause.
The Group’s commercial arrangements incorporate service level commitments (delivery time, service reinstatement time). These service level agreements cover commitments provided by the Group under the order, delivery, and after sales services process. If the Group fails to comply with one of these commitments, then it pays compensation to the end-customer, which is usually a tariff reduction deducted from revenue. Such penalties are recorded when it is likely that they will be paid.
Promotional offers and loyalty programs
Revenue is stated net of discounts. With respect to certain commercial offers where customers are offered a free service over a certain period in exchange for signing up for a fixed period (time-based incentives), the total revenue generated under the contract may be spread over the fixed non-cancellable period.
Loyalty points awarded to customers are considered as a separable component to be delivered in the transaction that triggered the acquisition of points. Part of the invoiced revenue is allocated to these points based on their fair value taking into account an estimated utilization rate, and deferred until the date on which the points are definitively converted into benefits. Fair value is defined as the excess price over the sales incentive that would be granted to any new customer. This principle is applied for both types of loyalty programs that exist within the Group, those with and those without a contractual renewal obligation.
Public-to-private service concession arrangements
The public-to-private service concession arrangements are accounted for in accordance with IFRIC 12. Revenue is recognized under the percentage of completion method in accordance with IAS 11 during the construction period and in accordance with IAS 18 during the operating and maintenance period.
The Group has a right to receive a consideration from either the public entity or the users of the public service in exchange for its operator’s activities. This right is accounted for as:
■
an intangible asset, if the Group has a right to charge users of the public service. This asset is measured at the infrastructure fair value and depreciated over the arrangement period;
■
a financial asset, if the Group has an unconditional right to receive payments from the public entity. This asset is measured at the infrastructure fair value and accounted for using the amortized cost.
ORANGE / 2013 REGISTRATION DOCUMENT - 191
Trade receivables
The trade receivables are mainly short-term with no stated interest rate and are measured at original invoice amount.
Impairment of trade receivables is based on two methods:
■
a statistical method: it is based on historical losses and leads to a separate impairment rate for each ageing balance category. This analysis is performed over an homogenous group of receivables with similar credit characteristics because they belong to a customer category (mass-market, small offices and home offices);
■
a stand-alone method: the assessment of impairment probability and its amount are based on a set of relevant factors (ageing of late payment, other balances with the counterpart, rating from independent agencies, geographical area). This method is used for carriers and operators (domestic and international), local, regional and national authorities and for large accounts of Enterprise Communication Services.
Impairment losses identified for a group of receivables represent the step preceding impairment identification for individual receivables. When information is available (clients in bankruptcy or subject to equivalent judicial proceedings), these receivables are then excluded from the statistical database and individually impaired.
Firm purchase commitments are disclosed as unrecognized contractual commitments.
External purchases, other operating expenses
Subscriber acquisition and retention costs
Subscriber acquisition and retention costs, other than loyalty programs costs, are recognized as an expense in the period in which they are incurred, that is to say on acquisition or renewal. In some cases, contractual clauses with retailers provide for a profit-sharing based on the recognized and paid revenue: the profit-sharing amount is expensed when the revenue is recognized.
Advertising and related costs
Advertising, promotion, sponsoring, communication and brand marketing costs are expensed as incurred.
Broadcasting rights and equipment inventories
Network maintenance equipment and equipment to be sold to customers are stated at the lower of cost or net realizable value, taking into account expected revenues from the sale of packages comprising a mobile handset and a subscription. The cost corresponds to the purchase or production cost determined by the weighted average cost method.
Film or sports broadcasting rights are recognized in the statement of financial position when they are available for exhibition and expensed when broadcast.
Trade payables
The trade payables are payables resulting from trading transactions, including those that have been financed by the supplier with or without notification for transfer to financial institutions when their terms are consistent with market practices. Current interest-free payables are booked at their nominal value.
Litigation
In the ordinary course of business, the Group is involved in a number of legal and arbitration proceedings and administrative actions.
The costs which may result from these proceedings are accrued at the reporting date when the Group has a present obligation towards a third party and it is probable that an outflow of resources embodying economic benefits will be required to settle the obligation and the amount of that liability can be quantified or estimated within a reasonable range. The amount of provision recorded is based on a case-by-case assessment of the risk level, and events arising during the course of legal proceedings may require a reassessment of this risk.
Restructuring
Provisions for restructuring costs are recognized only when the restructuring has been announced and the Group has drawn up or has started to implement a detailed formal plan prior to the end of the reporting period.
Contingent liabilities
Contingent liabilities are disclosed in the notes to the financial statements. They correspond to:
■
possible obligations that are not recognized because their existence will be confirmed only by the occurrence or non-occurrence of one or more uncertain future events not wholly within the Group’s control; or
■
present obligations arising from past events that are not recognized because it is not probable that an outflow of resources embodying economic benefits will be required to settle the obligation or because the amount of the obligation cannot be measured with sufficient reliability.
ORANGE / 2013 REGISTRATION DOCUMENT - 192
Post-employment benefits and other long-term benefits
Employee benefits are granted through:
■
mainly defined contribution plans: the contributions, paid to independent institutions which are in charge of their administrative and financial management, are expensed when service is rendered;
■
defined benefit plans: obligations under these plans are measured using the projected unit credit method:
■
their calculation is based on demographics (staff turnover, mortality, etc.) and financial assumptions (salary increase, inflation rate, etc.) defined at the level of each entity concerned;
■
the discount rate is defined by country or geographical area and by reference to market yields on high quality corporate bonds (or government bonds where no active market exists). Its computation is based on external indices commonly used as a reference, such as the Bloomberg AA index for the euro area;
■
actuarial gains and losses on defined benefit plans are fully recorded in other comprehensive income;
■
the Group’s defined benefit plans are generally not financed. In the rare cases where they are, hedging assets are set up by employer and employee contributions which are managed by separate legal entities whose investments are subjected to fluctuations in the financial markets. These entities are generally administrated by joint committees comprising representatives of the Group and of the beneficiaries. Each committee adopts its own investment strategy which is designed to strike the optimum strategies and is generally carried out by fund managers selected by the committees and depends on the market opportunities. Assets are measured at fair value, determined by reference to quoted price, since they are mostly invested in listed securities (shares, bonds, mutual funds) and the use of other asset categories is limited.
Other long-term benefits may be granted such as seniority awards, long-term compensated absences and French part-time senior plans (TPS). The calculation of the related commitments is based on actuarial assumptions including demographic, financial and discounting assumptions similar to those relating to post-employment benefits. The relevant actuarial gains and losses are recognized in profit or loss when they arise.
Termination benefits
The termination benefits are covered by provisions. For all commitments where termination of employment contracts would trigger payment of an indemnity, actuarial gains and losses are recognized in profit or loss for the period when the assumptions are revised.
Share-based compensation
Special employee shareholding plan
Following the sale of a portion of Orange’s capital by the French State, preferred subscription rights must be awarded to the Group’s current and former employees, in accordance with Article 11 of the 1986 French Privatization Act.
Compensation cost is estimated based on fair value at grant date of the shares awarded. As no vesting period applies, the amount is expensed directly against equity.
When appropriate, a discount for non-transferability is estimated by measuring the cost of a hedging strategy combining the forward sale of the non-transferable shares and the purchase of an equivalent number of transferable shares for cash, financed by borrowings, using a valuation model based on market data.
Other share-based payments
The fair value of stock-options and bonus shares is determined by reference to the exercise price, the life of the option, the current price of the underlying shares at the grant date, the expected share price volatility, expected dividends, and the risk-free interest rate over the option’s life. Vesting conditions other than market conditions are not part of the fair value assessment, but are part of the grant assumptions.
The determined amount is recognized in labour expenses on a straight-line basis over the vesting period against:
■
employee benefit liabilities for cash-settled plans, remeasured against profit or loss at each year-end; and
■
equity for equity-settled plans.
ORANGE / 2013 REGISTRATION DOCUMENT - 193
Goodwill recognized as an asset in the statement of financial position comprises:
■
for business combinations before January 1, 2010:
■
goodwill as the excess of the cost of the business combination over the acquirer’s interest in the acquiree’s identifiable net assets measured at fair value at the acquisition-date; and
■
goodwill relating to any additional purchase of non-controlling interests with no purchase price allocation;
■
for business combinations on or after January 1, 2010, goodwill is computed:
■
either on the equity interest acquired (with no subsequent changes if there are any additional purchases of non-controlling interests); or
■
on a 100% basis leading to the recognition of goodwill relating to the non-controlling interest share (which was the case for the ECMS business combination in 2010).
Goodwill is not amortized but tested for impairment at least annually or more frequently when there is an indication that it may be impaired. Therefore, the evolution of general economic and financial trends, the different levels of resilience of the telecommunication operators with respect to the decline of local economic environments, the changes in the market capitalization values of telecommunication companies, as well as actual economic performance compared to market expectations represent external indicators that are analyzed by the Group, together with internal performance indicators, in order to assess whether an impairment test should be performed more than once a year.
IAS 36 requires these tests to be performed at the level of each Cash Generating Unit (CGU) or groups of CGUs likely to benefit from acquisition-related synergies. De facto, it generally corresponds to the operating segment. This allocation is reviewed if the Group changes the level at which it monitors return on investment for goodwill testing purposes.
To determine whether an impairment loss should be recognized, the carrying value of the assets and liabilities of the CGUs or groups of CGUs is compared to recoverable amount. The recoverable amount of a CGU is the higher of its fair value less costs to sell and its value in use. Except in specific cases, the value in use retained by the Group is higher than the fair value less costs to sell.
Fair value less costs to sell is the best estimate of the amount obtainable from the sale of a CGU in an arm’s length transaction between knowledgeable, willing parties, less the costs of disposal. This estimate is determined, as of November 30, on the basis of available market information including: (i) the discounted present value of future cash flows over a three to five-year period, plus a terminal value, (ii) revenue and EBITDA based on quoted price multiples for comparable companies adjusted for a control premium, and (iii) revenue and EBITDA resulting from comparable transactions.
Value in use is the present value of the future cash flows expected to be derived from the CGUs. Cash flow projections are based on economic and regulatory assumptions, license renewal assumptions and forecast trading conditions drawn up by the Group’s management, as follows:
■
cash flow projections are based on three to five-year business plans;
■
cash flow projections beyond that timeframe may be extrapolated by applying a declining or flat growth rate over the next two years (for some CGUs), followed by a growth rate to perpetuity reflecting the expected long-term growth in the market;
■
the cash flows obtained are discounted using appropriate rates for the type of business and the countries concerned.
Carrying values of CGUs tested include goodwill, intangible assets with indefinite useful life arising from business combinations (except for the Orange trademark which is tested separately, see below) and assets with finite useful life (property, plant and equipment, intangible assets and net working capital, including intragroup balances).
If a CGU partially owned by the Group includes goodwill attributable to non-controlling interests, the impairment loss is allocated between the owners of the parent and the non-controlling interests on the same basis as that on which profit or loss is allocated (i.e. ownership interest).
Impairment loss for goodwill is recorded in operating income as a deduction from operating income and is never subsequently reversed.
Firm purchase commitments are disclosed as unrecognized contractual commitments less any prepayments which are recognized as prepaid expenses.
Intangible assets
Intangible assets consist mainly of trademarks, subscriber bases, licenses, content rights, indefeasible rights of use, patent and development costs, software as well as operating rights granted under certain public-to-private service concession arrangements.
Intangible assets are initially recognized at acquisition or production cost.
ORANGE / 2013 REGISTRATION DOCUMENT - 194
When intangible assets are acquired as part of a business combination, their cost is generally determined in connection with the purchase price allocation based on their respective fair market value. When their fair market value is not readily determinable, cost is determined using the generally accepted valuation methods based on revenues, costs or other appropriate criteria.
Internally generated trademarks and subscriber bases are not recognized as assets.
Library features and distribution rights are recognized at their acquisition cost as intangible assets when the content has been accepted technically and the rights have become valid. Film co-production rights are accounted for based on the stage of completion of the film.
Indefeasible Rights of Use (IRUs) acquired by the Group correspond to the right to use cable or capacity transmission cable (mainly submarine cables) granted for a fixed period. IRUs are recognized as an asset when the Group has the specific indefeasible right to use an identified portion of the underlying asset, generally optical fibers or dedicated wavelength bandwidth, and the duration of the right is for the major part of the underlying asset’s economic life.
The Group’s research and development projects mainly relate to: the upgrade of the network architecture or functionality, and the development of service platforms aimed at offering new services to the Group’s customers. These projects generally give rise to the development of software that does not form an integral part of the network’s tangible assets within the meaning of IAS 38. Development costs are expensed as incurred except those recognized as intangible assets when the following conditions are met:
■
the intention to complete the intangible asset and use or sell it and the ability of adequate technical and financial resources for this purpose;
■
the probability for the intangible asset to generate future economic benefits for the Group; and
■
the reliable measurement of the expenditure attributable to the intangible asset during its development.
The operating rights granted under certain public-to-private service concession arrangements are rights to charge users of the public service (see Note 18.3).
Property, plant and equipment
Property, plant and equipment mainly comprise network facilities and equipment.
The gross value of tangible assets corresponds to their acquisition or production cost, including costs directly attributable to bringing the asset to the location and condition necessary for it to be capable of operating in the manner intended by management. It also includes the initial estimate of the costs of dismantling and removing the item and restoring the site on which it is located, representing the obligation incurred by the Group.
The cost of networks includes design and construction costs, as well as capacity improvement costs. Maintenance and repair costs are expensed as incurred, except where they serve to increase the asset’s productivity or prolong its useful life.
When tangible assets are acquired in a business combination, their cost is determined in connection with the purchase price allocation based on their respective fair market value. When their fair market value is not readily determinable, cost is determined using generally accepted valuation methods.
The total cost of an asset is allocated among its different components and each component is accounted for separately when the components have different useful lives, or when the pattern in which their future economic benefits are expected to be consumed by the entity varies.
The arrangements relating to satellite capacity have been reviewed in light of the criteria set out in IFRIC 4. As no specific assets have been identified, these contracts are considered to be service contracts, which costs are expensed when the service is rendered.
Leases
Leases that transfer the risks and rewards of ownership to the Group (finance leases) are recorded as assets against a financial liability. The risks and rewards of ownership are considered as having been transferred to the Group notably when:
■
the lease transfers ownership of the asset to the lessee by the end of the lease term;
■
the Group has the option to purchase the asset at a price that is expected to be sufficiently lower than fair value at the date the option becomes exercisable; therefore for the Group to be reasonably certain, at the inception of the lease, that the option will be exercised;
■
the lease term is for the major part of the estimated economic life of the leased asset;
■
at the inception of the lease, the present value of the minimum lease payments amounts to at least substantially all of the fair value of the leased asset.
Most of the finance leases relate to network buildings.
Leases of premises and salespoint are generally qualified as operating leases and the future lease payments are disclosed as unrecognized contractual commitments.
The radio sites’ accommodation lands and buildings may be owned or leased by the Group (either though a finance lease or an operating lease).
Assets leased by the Group under leases that transfer the risks and rewards of ownership to third parties, are treated as having been sold.
ORANGE / 2013 REGISTRATION DOCUMENT - 195
Network sharing between telecommunications operators
In France, the regulatory framework governing the optical fiber network roll-out (Fiber To The Home – FTTH) organizes the access by commercial operators to the last mile of networks rolled-out by another operator on a co-funding basis (ab initio or a posteriori) or through a line access. The sharing of rights and obligations between co-financing operators is qualified as a joint operation in accordance with IFRS 11: the Group only recognizes as an asset its share of the network assets self-built or purchased to other co-financing operators.
The Group has entered into network sharing arrangements with other wireless operators on a reciprocal basis enabling the operators to narrow the overlap of radio sites and related facilities. Therefore, in Poland, the arrangements with Deutsche Telekom have been qualified as a joint operation: the radio access network infrastructures and related equipment are recognized as fixed assets up to the Group’s share of assets implemented by Orange or Deutsche Telekom in their own geographical area.
In some African countries, the Group has also entered into sharing arrangements with TowerCos (tower companies). These TowerCos enable wireless operators, including Orange, to share sites, passive infrastructure and related services (by managing the wireless operators’ sites and/or by acquiring or building sites). The unit of account and the specific features of each arrangement lead the Group to qualify these transactions as a lease or a service. The long-term commitments resulting from these arrangements are disclosed as unrecognized contractual commitments (see Note 14).
Government grants
The Group may receive non-repayable government grants in the form of direct or indirect funding for capital projects, mainly provided by local and regional authorities. These grants are deducted from the cost of the related assets and are recognized in the income statement, based on the pattern in which the related asset’s expected future economic benefits are consumed.
Borrowing costs
Borrowing costs directly attributable to the acquisition, construction or production of a qualifying asset shall be capitalized as part of the cost of that asset which requires a substantial period of time to get ready for its intended use or sale. In the Group’s assessment, the network roll-out does not generally require a substantial period of time.
As a consequence, the Group usually does not capitalize interest expense incurred during the period of construction and acquisition of property, plant and equipment and intangible assets.
Depreciation
Assets are depreciated to expense their cost (generally with no residual value) on a basis that reflects the pattern in which their future economic benefits are expected to be consumed. Therefore, the straight-line basis is usually applied. The useful lives are reviewed annually and are adjusted if current estimated useful lives differ from previous estimates: these changes in accounting estimates are recognized prospectively.
Main assets | Depreciation period (average) |
Trademarks | Up to 10 years, except for indefinite useful life |
Subscriber bases | Expected life of the commercial relationship; 3 to 7 years |
Mobile network licenses (1) | Period from the date when the network is technically ready and the service can be marketed |
Indefeasible rights of use of submarine
and terrestrial cables | Shorter of the expected period of use and the contractual period, generally less than 20 years |
Patents | 20 years maximum |
Software | 5 years maximum |
Research and development | 3 to 5 years |
Buildings and leasehold improvements | 10 to 30 years |
Switching, transmission and other network equipment |
5 to 10 years
|
Cables and civil works | 15 to 30 years |
Computer hardware | 3 to 5 years |
(1) The variable user fees are expensed as incurred. |
Impairment of non-current assets other than goodwill
Given the nature of its assets and activities, most of the Group’s individual assets do not generate cash flows that are independent of those from CGUs. The recoverable amount is therefore determined at the level of the CGU to which the asset belongs.
The Orange trademark has an indefinite useful life and is not amortized but tested for impairment at least annually. Its recoverable amount is assessed based on the royalties expected from the Group entities (and included in their business plan) discounted at perpetuity, less the attributable costs to the brand’s owner.
ORANGE / 2013 REGISTRATION DOCUMENT - 196
Dismantling and restoring sites
The Group is required to dismantle technical equipment and restore technical sites.
The provision is based on dismantling costs (on a per-unit basis for telephone poles, terminals and public phones, and on a per-site basis for mobile antennae) incurred by the Group to meet its environmental commitments and annual estimated asset dismantling and site restorations. The provision is assessed on the basis of the identified costs for the current financial year, extrapolated for future years using the best estimate of the commitment settlement. It is discounted at a risk-free rate. This estimate is revised annually and adjusted where appropriate against the asset to which it relates.
In France:
■
the Territorial Economic Contribution (CET) paid in France is accounted for as “Operating taxes and levies”;
■
the Research Tax Credit (CIR) represents a research and development government grant as defined under IAS 20 and is reported within “Operating income”;
■
the Competitiveness and Employment Tax Credit (CICE), which reduces the social security contributions, is reported as a reduction of “Personnel expenses”.
The carrying amount accounted for under equity method corresponds to the initial cost increased to recognize the investor’s share of the profit or loss of the investee subsequent to the acquisition date. If an associate incurs losses and the carrying amount of the investment is reduced to zero, the Group ceases to recognize the additional share of losses since it has no commitment beyond its investment.
An impairment test is performed at least annually and when there is objective evidence of impairment, for instance a decrease in quoted price when the investee is listed, significant financial difficulty of the investee, observable data indicating that there is a measurable decrease in the estimated future cash flows, or information about significant changes having an adverse effect over the investee. Any impairment is accounted for as “Share of profits (losses) of associates and joint ventures”.
An impairment loss is recorded when the recoverable amount is lower than the carrying amount, the recoverable amount being the higher of the value in use and the fair value less costs to sell (see Note 18.6). The unit of account is the whole investment. Impairment losses shall be reversed once the recoverable amount exceeds the carrying amount.
Financial assets and liabilities are recognized initially at fair value. They are subsequently measured either at fair value or amortized cost using the effective interest method, in accordance with the IAS 39 category they belong to.
The effective interest rate is the rate that discounts estimated future cash flows through the expected contractual term, or the most probable expected term of the financial instrument, to the net carrying amount of the financial asset or liability. This calculation includes all fees and points paid or received between the parties to the contract.
Recognition and measurement of financial assets
The Group does not hold any financial assets qualifying as held-to-maturity assets.
Available-for-sale assets
Available-for-sale assets consist mainly of shares in entities which are not consolidated and not accounted for using the equity method, marketable securities that do not fulfil the criteria for classification in any of the other categories of financial assets. They are recognized and subsequently measured at fair value.
Temporary changes in value are recorded as “Gains (losses) on financial assets available-for-sale” within other comprehensive income.
When there is objective evidence of impairment on available-for-sale assets or a decrease in fair value by a third or over twelve months, the cumulative impairment loss included in other comprehensive is definitely reclassified from equity to profit or loss within “Gain (losses) on disposal of businesses and assets”.
Loans and receivables
This category mainly includes trade receivables, cash, some cash collateral, as well as other loans and receivables. These instruments are recognized at fair value upon origination and are subsequently measured at amortized cost by the effective interest method. If there is any objective evidence of impairment of these assets, the value of the asset is reviewed at the end of each reporting period. An impairment is recognized in the income statement when the financial asset carrying amount is higher than its recoverable amount. Regarding trade receivables, this method is disclosed in Note 18.3.
ORANGE / 2013 REGISTRATION DOCUMENT - 197
Financial assets at fair value through profit or loss
Financial assets at fair value through profit or loss are:
■
assets held for trading that the Group acquired principally for the purpose of selling them in the near term;
■
assets that form a part of a portfolio of identified financial instruments that are managed together and for which there is evidence of a recent actual pattern of short-term profit taking;
■
derivative assets not qualifying for hedge accounting;
■
assets voluntarily classified at inception in this category because:
■
this classification allows the elimination or a significant reduction in the measurement or recognition inconsistency regarding recognition of assets or liabilities linked together, that would otherwise be assessed differently (for instance, a financial asset measured at fair value, linked to a financial liability measured at amortized cost);
■
a group of financial assets, financial liabilities or both is managed and its performance is valued on a fair value basis, in accordance with a documented risk management or investment strategy, and information about this group of financial instruments is provided internally on that basis to the Group’s key management personnel;
■
the Group decides not to separate from the host contract a separable embedded derivative. It should then assess the entire hybrid instrument at its fair value;
■
they are investments in associates held by venture capital organizations measured at fair value in accordance with IAS 28.
The Group can designate at fair value at inception cash and cash equivalents with high liquidity and low volatility investments such as negotiable debt securities, deposits and mutual funds (OPCVM).
Recognition and measurement of financial liabilities
Financial liabilities at amortized cost
With the exception of financial liabilities at fair value, borrowings and other financial liabilities are recognized upon origination at the fair value of the sums paid or received in exchange for the liability, and subsequently measured at amortized cost using the effective interest method. Transaction costs that are directly attributable to the acquisition or issue of the financial liability are deducted from the liability’s carrying value. The costs are subsequently amortized over the life of the debt, by the effective interest method.
Within the Group, some financial liabilities at amortized cost, including borrowings, are subject to hedge accounting. This relates mostly to fix rate borrowings hedged against changes in interest rate and currency value (fair value hedge) and to foreign currency borrowings in order to hedge to future cash flows against changes in currency value (cash flow hedges).
Compound instruments
Some financial instruments comprise both a liability component and an equity component. For the Group, they comprise perpetual bonds redeemable for shares (TDIRA). On initial recognition, the fair value of the liability component is the present value of the contractually determined stream of future cash flows discounted at the interest rate applied at that time by the market to instruments of comparable credit status and providing substantially the same cash flows, on the same terms, but without the conversion option.
The carrying amount of the equity component is determined by deducting the fair value of the financial liability from the fair value of the compound financial instrument as a whole. The equity component determined and accounted for at initial recognition shall not change throughout the existence of the instrument.
Financial liabilities at fair value through profit or loss
The abovementioned policies relating to financial assets at fair value through profit or loss are applicable to the financial liabilities of identical nature.
Recognition and measurement of derivative instruments
Derivative instruments are measured at fair value in the statement of financial position and presented according to their maturity date, regardless of whether they qualify for hedge accounting under IAS 39.
Derivatives are classified as financial assets or liabilities through profit or loss or as a separate line item in the statement of financial position when they qualify for hedge accounting.
Hedge accounting is applicable when:
■
at the inception of the hedge, there is a formal designation and documentation of the hedging relationship;
■
at the inception of the hedge and in subsequent periods, the hedge is expected to be highly effective in achieving offsetting changes in fair value attributable to the hedged risk during the period for which the hedge is designated (i.e. the actual results of the hedge are within a range of 80-125%).
Hedge accounting can be done in three different ways:
■
the fair value hedge is a hedge of the exposure to changes in fair value of a recognized asset or liability (or an identified portion of the asset or liability) that are attributable to a particular interest rate and/or currency risk and could affect profit or loss.
The hedged portion of these items is remeasured at fair value. Change in this fair value is booked in profit or loss and balanced by the symmetrical changes in the hedging financial instruments fair value to the limit of the hedge effectiveness;
■
the cash flow hedge is a hedge of the exposure to variability in cash flows that is attributable to a particular interest rate
ORANGE / 2013 REGISTRATION DOCUMENT - 198
and/or currency risk associated with a recognized asset or liability or a highly probable forecast transaction (such as a future purchase or sale) and could affect profit or loss.
As the hedged item is not recognized in the statement of financial position, the effective portion of change in fair value of the hedging instrument is booked in other comprehensive income. It is reclassified in profit or loss when the hedged item affects the profit or loss or in the initial cost of the hedged item when it relates to the hedge of a non-financial asset acquisition cost;
■
the net investment hedge is a hedge of the exposure to changes in values attributable to exchange risk of a net investment in a foreign operation, and could affect profit or loss on the disposal of the foreign operation.
The effective portion of the net investment hedge is recorded in other comprehensive income. It is reclassified in profit or loss upon the disposal of the net investment.
Hedge accounting can be terminated when the hedged item is no longer recognized, when the Group voluntarily revokes the designation of the hedging relationship, or when the hedging instrument is terminated or exercised. The accounting consequences are for:
■
fair value hedge: at the hedge accounting termination date, the adjustment of the debt fair value is based on a recalculated effective interest rate at the date amortization begins;
■
cash flow hedge: amounts recorded in other comprehensive income are immediately reclassified in profit or loss when the hedged item is no longer recognized or, in all other cases, when the hedged item affects profit or loss.
In both cases, subsequent changes in the value of the hedging instrument are recorded in profit or loss.
The definition of fair value used by the Group is the price that would be received to sell an asset or paid to transfer a liability in an orderly transaction between market participants at the measurement date.
The financial assets and liabilities measured at fair value in the statement of financial position have been ranked based on the three hierarchy levels:
■
level 1: quoted price (unadjusted) in active markets for identical assets or liabilities that the entity can access at the measurement date;
■
level 2: inputs that are observable for the asset or liability either directly or indirectly;
■
level 3: unobservable inputs for the asset or liability.
Available-for-sale assets
The fair value is the quoted price at year-end for listed securities and, for non-listed securities, a valuation technique determined according to the most appropriate financial criteria in each case (comparable transactions, multiples for comparable companies, discounted present value of future cash flows).
Loans and receivables
The Group considers the carrying amount of cash equivalents, trade receivables and various deposits as the best estimate of fair value, due to the high liquidity of these instruments.
Financial assets at fair value through profit or loss
With respect to the very short-term investments such as deposits, certificates of deposit, commercial paper or negotiable debt securities, the Group considers that the nominal value of the investment and the related accrued interest represents the best estimate of fair value.
The fair value of OPCVM is the latest settlement value.
Financial liabilities at amortized cost
The fair value of financial liabilities is determined using:
■
the quoted price for listed instruments (a detailed analysis is performed in the case of a material decrease to evidence whether the observed price corresponds to the fair value; otherwise the quoted price is adjusted);
■
the present value of estimated future cash flows, discounted using rates observed by the Group at the end of the period for other instruments. The results calculated using the internal valuation model are systematically benchmarked with the values provided by Bloomberg.
The Group considers the carrying value of trade payables and deposits received from customers as the best estimate of fair value, due to the high liquidity of these instruments.
The fair value of long-term trade payables is the value of future cash flows discounted at the interest rates observed by the Group at the end of the period.
Financial liabilities at fair value through profit or loss
The fair value of firm or contingent commitments to purchase non-controlling interests is measured in accordance with the provisions of the agreements. When the commitment is based on a fixed price, a discounted value is retained.
ORANGE / 2013 REGISTRATION DOCUMENT - 199
Derivative instruments
The fair value of derivative financial instruments traded over-the-counter is determined using the present value of estimated future cash flows, discounted using the interest rates observed by the Group at the end of the period. The results calculated using the internal valuation model are consistently benchmarked with the values provided by Bloomberg.
As regards the derivative instruments, the Group corporate treasury department systematically enters into FBF (Fédération Bancaire Française) or ISDA (International Swaps and Derivatives Association) arrangements with its bank counterparties. These arrangements include CSA (Credit Support Annex) clauses which enable cash collateral swaps on a monthly or weekly basis and with no threshold for all the derivative instruments. With regard to certain counterparties, these arrangements are only applicable to derivatives having a maturity of more than three months. These agreements trigger, with each counterparty, the receipt or the payment of the net variation in the fair value of the portfolio between two margin calls. Therefore, regarding Orange SA, the non-performance risk exposure corresponds to a succession of exposures over a maximum of a one-month period until the derivatives term. This is a risk of increase in the change in portfolio value which can be modelled by a range of options such as the purchase of a one month cap in accordance with the portfolio parameters (net nominal by counterparty, volatility, sensitivity). As a consequence, the non-performance risk is this exposure multiplied by the default probability until the derivative maturity and the loss when there is a default (0,6 is the market position).
When there are no reliable market data which identify the default probability, the CVA (Credit Value Adjustment) and the DVA (Debit Value Adjustment) are measured based on historical default charts and CDS (Credit Default Swap) evolutions. Counterparty default risk and the Group’s specific default risk are also continuously monitored based on the credit spread follow-up of the secondary market bonds and other market information. Given the implementation of collateralization, and based on counterparty policies and the management of indebtness and liquidity risk described in Note 11, CVA and DVA estimates are not material compared to the measurement of the related financial instruments.
Current tax is measured by the Group at the amount expected to be paid or recovered from the taxation authorities of each country, based on its interpretation with regard to the application of tax legislation. The Group calculates the tax assets, liabilities and accruals recognized in the statement of financial position based on the technical merits of the positions it defends versus that of the tax authorities.
Deferred taxes are recognized for all temporary differences between the book values of assets and liabilities and their tax basis, as well as for unused tax losses, using the liability method. Deferred tax assets are recognized only when their recovery is considered probable.
A deferred tax liability is recognized for all taxable temporary differences associated with investments in subsidiaries, interests in joint ventures and associates, except to the extent that both of the following conditions are satisfied:
■
the Group is able to control the timing of the reversal of the temporary difference (e.g. the payment of dividends); and
■
it is probable that the temporary difference will not reverse in the foreseeable future.
Accordingly, for fully consolidated companies, a deferred tax liability is only recognized in the amount of the taxes payable on planned dividend distributions by these companies.
Deferred tax assets and liabilities are not discounted.
At each period end, the Group reviews the recoverable amount of the deferred tax assets carried by certain tax entities with significant tax loss carryforwards. The recoverability of the deferred tax assets is assessed in the light of the business plans used for impairment testing. This plan may be adjusted for any tax specificities.
Deferred tax assets arising on these tax losses are not recognized under certain circumstances specific to each company/tax consolidation group concerned, and particularly where:
■
entities cannot assess the probability of the tax loss carryforwards being set off against future taxable profits, due to forecasts horizon and uncertainties as to the economic environment;
■
entities have not yet begun to use the tax loss carryforwards;
■
entities do not expect to use the losses within the timeframe allowed by tax regulations;
■
tax losses are uncertain to be used due to risks of differing interpretations with regard to the application of tax legislation.
Share issuance costs
External costs directly related to share issuances are deducted from the related premium (net of any tax savings). Other costs are expensed as incurred.
Treasury shares
Treasury shares are recorded as a deduction from equity, at cost. When shares are sold out of treasury shares, the resulting profit or loss is recorded in equity, net of tax.
ORANGE / 2013 REGISTRATION DOCUMENT - 200
Earnings per share
The Group discloses both basic earnings per share and diluted earnings per share for continuing operations and discontinued operations.
■
basic earnings per share are calculated by dividing net income for the year attributable to the equity holders outstanding during the year by the weighted average shares outstanding during the period;
■
diluted earnings per share are calculated based on earnings per share attributable to the equity holders of the Group, adjusted for the finance cost of dilutive debt instruments and their impact on employee profit-sharing, net of the related tax effect. The number of shares used to calculate diluted earnings per share takes into account the conversion into ordinary shares of potentially dilutive instruments outstanding during the period.
When earnings per share are negative, diluted earnings per share are identical to basic earnings per share. In the event of an issuance of shares at a price lower than the market price, and in order to ensure comparability of earnings per share information, the weighted average numbers of shares outstanding from current and previous periods are adjusted. Treasury shares deducted from consolidated equity are not taken into account in the calculation of basic or diluted earnings per share.
Non-controlling interests
Commitments to purchase non-controlling interests (put options)
When the Group grants firm or contingent commitments to purchase non-controlling interests, the carrying amount of non-controlling interests within equity is reclassified to financial debt.
Where the amount of the commitment exceeds the amount of the non-controlling interests, the difference is recorded as a reduction in shareholders’ equity attributable to the owners of the parent. Financial debt is remeasured at the end of each reporting period in accordance with the contractual arrangement (at fair value or at present value if fixed price) and, in the absence of any guidance provided by IFRSs, against finance income or expense.
The accounting treatment of put options granted to non-controlling shareholders is currently being analyzed by IASB.
Negative non-controlling interests
Profit or loss and each component of other comprehensive income are attributed to the owners of the parent and to the non-controlling interests. In accordance with IFRS 10, this could result in the non-controlling interests having a deficit balance.
Transactions with owners
From January 1, 2010, each agreement with non-controlling interests shareholders of a subsidiary, when not resulting in a loss of control, is accounted for as an equity transaction with no effect on the total comprehensive income.
Until 2009, the Group accounted for the difference between the acquisition cost of non-controlling interests and the non-controlling interest share in the net equity, with no purchase price allocation, as goodwill. The disposals that did not result in a loss of control were accounted for as a gain or loss on disposal relating to the equity interest actually disposed.
The following table shows the compensation disbursed by Orange SA and its controlled companies to persons who were members of Orange SA’s Board of Directors or Executive Committee at any time during the year or at the end of the year.
(in euros) | December 31, 2013 | December 31, 2012 | December 31, 2011 |
Short-term benefits excluding employer social security contributions (1) | (10,365,525) | (11,060,015) | (10,501,528) |
Short-term benefits: employer’s social security contributions | (2,948,130) | (3,277,791) | (3,036,939) |
Post-employment benefits (2) | (1,622,168) | (1,543,890) | (1,444,722) |
Termination benefits | - | - | (1,733,390) |
Share-based compensation (3) | - | 500 | (1,261) |
(1) Includes all compensation recognized (gross salaries including the variable component, bonuses, attendance fees and benefits in kind, incentive scheme and profit-sharing). (3) Expense recorded in the income statement in respect of free share award plan, stock option plans and employee shareholding plans. |
ORANGE / 2013 REGISTRATION DOCUMENT - 201
The total amount of retirement benefits (contractual retirement bonuses and defined benefit supplementary pension plan) provided for in the financial statements as at December 31, 2013 in respect of persons who were members of the Board of Directors or Executive Committee at the end of the year was 11,409,119 euros (20,636,625 euros in 2012 and 14,616,527 euros in 2011). The decrease of the total amount of retirement benefits is mainly due to the decrease of the members of the Executive Committee.
Executive Committee members’ contracts include a clause providing a contractual termination settlement not exceeding 15 months of their total gross annual compensation (including the contractual termination benefit). It is important to remember that Stéphane Richard has no employment contract and that Gervais Pellissier’s employment contract has been suspended. They will not receive deferred compensation in the event that it would put an end to their mandate.
As required by Decree no. 2008-1487 of December 30, 2008 supplementing Article R. 233-14 §17 of the Code de commerce, the following table shows the amount of auditor’s fees included in the Group’s consolidated income statement for the year, broken down into audit and certification fees for the consolidated financial statements and fees for advisory and other services rendered for procedures that are directly linked to the statutory audit of the consolidated financial statements. The fees shown for the subsidiaries apply to fully consolidated subsidiaries.
| Deloitte | Ernst & Young |
| Amount | % | Amount | % |
(in millions of euros) | 2013 | 2012 | 2011 | 2013 | 2012 | 2011 | 2013 | 2012 | 2011 | 2013 | 2012 | 2011 |
Audit | | | | | | | | | | | | |
- Statutory audit fees, certification, auditing of the accounts | 13.0 | 14.7 | 13.8 | 96% | 97% | 92% | 14.6 | 16.7 | 16.0 | 94% | 95% | 95% |
Issuer | 7.8 | 7.2 | 6.9 | 58% | 47% | 46% | 7.5 | 6.9 | 7.0 | 48% | 39% | 41% |
Subsidiaries | 5.2 | 7.5 | 6.9 | 38% | 50% | 46% | 7.1 | 9.8 | 9.0 | 46% | 56% | 54% |
- Ancillary assignments and services directly linked to the Statutory Auditors’ mission | 0.5 | 0.3 | 1.2 | 3% | 2% | 8% | 0.8 | 0.9 | 0.7 | 5% | 5% | 4% |
Issuer | 0.4 | 0.2 | 0.4 | 2% | 1% | 3% | - | 0.2 | 0.1 | - | 1% | 1% |
Subsidiaries | 0.1 | 0.1 | 0.8 | 1% | 1% | 5% | 0.8 | 0.7 | 0.6 | 5% | 4% | 3% |
Sub-total | 13.5 | 15.0 | 15.0 | 99% | 99% | 100% | 15.4 | 17.6 | 16.7 | 99% | 100% | 99% |
Other services rendered by auditors’ networks to fully-consolidated subsidiaries | | | | | | | | | | | | |
- Tax | - | - | - | - | - | - | - | - | 0.1 | - | - | 1% |
- Legal and personnel-related | - | - | - | - | - | - | - | - | - | - | - | - |
- Other | 0.1 | 0.1 | - | 1% | 1% | - | 0.1 | - | - | 1% | - | - |
Sub-total | 0.1 | 0.1 | - | 1% | 1% | - | 0.1 | - | 0.1 | 1% | - | 1% |
TOTAL | 13.6 | 15.1 | 15.0 | 100% | 100% | 100% | 15.5 | 17.6 | 16.8 | 100% | 100% | 100% |
All services provided by the Statutory Auditors in 2011, 2012 and 2013 were approved, in accordance with approving rules adopted by the Audit Committee in 2003 and updated in October 2013.
In accordance with the applicable rules in the European Union (EU), Orange (hereafter called the “Group”) prepares its consolidated financial statements in accordance with IFRS as published by the IASB, and bases its discussion and analysis of its financial condition and results of operations on these consolidated financial statements.
ORANGE / 2013 REGISTRATION DOCUMENT - 202
Basis of preparation
Although IFRS as issued by the IASB constitute a full set of accounting principles, it should nevertheless be noted that reported performance and comparability among companies reporting under IFRS can be affected by the following items:
■
exemptions under IFRS 1 to the retrospective application of IFRS when transitioning from previous local GAAPs to IFRS, such as electing not to restate business combinations prior to the transition date, recognition in equity of actuarial gains and losses on employee benefits measured at the transition date, transfer of all cumulative translation differences to other comprehensive income at the transition date;
■
alternatives allowed by various IFRS standards, such as: for each business combination since 2010, the measurement of the non-controlling interest in the acquiree either at fair value (full goodwill method) or at the non-controlling interest’s proportionate share of the acquiree’s identifiable net assets (goodwill only attributable to the controlling interest acquired);
■
IFRS do not have a specific standard or interpretation for the accounting of commitments to purchase non-controlling interests, mainly with respect to the accounting for the subsequent remeasurement of the carrying amount of the related financial liability. In such circumstances, the Group – like other preparers – has to define its own accounting policy in accordance with paragraphs 10 to 12 of IAS 8 until the issuance of new standards and interpretations by the IASB or the IFRS IC;
■
IFRS does not provide for detailed guidance as to the form and content of the consolidated income statement but does include a standard on financial statements presentation.
The Group’s reported financial condition and results of operations are thus sensitive to the selection and application of the accounting policies and the judgment and other uncertainties affecting the application of those policies.
Note 1.2 Basis of preparation of the 2013 consolidated financial statements and Note 18 Accounting policies of the consolidated financial statements describe in more detail the basis of preparation of the consolidated financial statements.
Use of estimates and judgment
The Group’s reported financial condition and results of operations are also sensitive to judgment, assumptions and uncertainties underlying the estimates made. These estimates may be revised if the underlying circumstances evolve or in light of new information or experience. Consequently, estimates made as of December 31, 2013 may be changed subsequently.
Note 1.4 Use of estimates and judgment of the consolidated financial statements describes in more detail the items that are the most affected by judgment, assumptions and uncertainties and refers to the notes which detail these judgment, assumptions and uncertainties and which provide some disclosures (if any) about the sensitivity underlying these estimates.
ORANGE / 2013 REGISTRATION DOCUMENT - 203
This section contains forward-looking indication about Orange. These forward-looking statements are subject to numerous risks and uncertainties that could cause actual results to differ materially from the results anticipated in the forward-looking statements. The most significant risks are presented in Section 2.4 Risk factors of the 2013 Registration Document. See also the indication provided under the heading Forward-looking indication at the beginning of the 2013 Registration Document.
The following comments are based on the consolidated financial statements prepared in accordance with IFRS (International Financial Reporting Standards), see Notes 1 and 18 to the consolidated financial statements.
The operating segments are described in Section 4.3.3 Analysis by operating segment. Unless otherwise specified, data on operating segments presented in the following sections are understood to be prior to elimination of inter-segment operating transactions.
The changes below are calculated based on data in thousands of euros, although displayed in millions of euros.
Reported EBITDA, restated EBITDA and CAPEX are financial aggregates not defined by IFRS. For further information on the calculation of these aggregates and the reasons why the Orange Group uses them, see Section 4.3.5.3 Financial aggregates not defined by IFRS and the Financial glossary appendix.
The transition from data on a historical basis to data on a comparable basis (see the Financial glossary appendix) for the 2011 and 2012 financial years is set out in Section 4.3.5.1 Transition from data on a historical basis to data on a comparable basis.
| Financial years ended December 31 |
(in millions of euros) | 2013 | 2012
Data on a comparable basis (1) | 2012
Data on a historical basis | Chg. (%)
Data on a comparable basis (1) | Chg. (%) Data on a historical basis | 2011
Data on a historical basis |
Revenues | 40,981 | 42,930 | 43,515 | (4.5)% | (5.8)% | 45,277 |
Reported EBITDA (2) | 12,235 | 12,289 | 12,495 | (0.4)% | (2.1)% | 15,129 |
Reported EBITDA/Revenues | 29.9% | 28.6% | 28.7% | | | 33.4% |
Operating income | 5,288 | 4,061 | 4,063 | 30.2% | 30.1% | 7,948 |
Operating income/Revenues | 12.9% | 9.5% | 9.3% | | | 17.6% |
CAPEX (2) | 5,631 | 5,744 | 5,818 | (2.0)% | (3.2)% | 5,770 |
CAPEX/Revenues | 13.7% | 13.4% | 13.4% | | | 12.7% |
Telecommunication licenses | 486 | 944 | 945 | (48.5)% | (48.5)% | 941 |
Investments financed through finance leases | 95 | 47 | 47 | 103.6% | 102.7% | 180 |
Average number of employees
(full-time equivalents) (3) | 159,515 | 163,540 | 163,545 | (2.5)% | (2.5)% | 165,533 |
Number of employees
(active employees at end of period) (3) | 165,488 | 170,596 | 170,531 | (3.0)% | (3.0)% | 171,949 |
(1) See Section 4.3.5.1 Transition from data on a historical basis to data on a comparable basis. (2) See Section 4.3.5.3 Financial aggregates not defined by IFRS and the Financial glossary appendix. (3) See the Financial glossary appendix. |
[REDACTED SECTION: CERTAIN TEXT THAT FOLLOWS HAS BEEN REDACTED]
| Financial years ended December 31 |
(in millions of euros) | 2013 | 2012
Data on a comparable basis (1) | 2012
Data on a historical basis | Chg. (%)
Data on a comparable basis (1) | Chg. (%)
Data on a historical basis | 2011
Data on a historical basis |
Restated EBITDA (2) | 12,649 | 13,670 | 13,785 | (7.5)% | (8.2)% | 15,083 |
Restated EBITDA/Revenues | 30.9% | 31.8% | 31.7% | - | - | 33.3% |
| | | | | | |
(1) See Section 4.3.5.1 Transition from data on a historical basis to data on a comparable basis. (2) See the Financial glossary appendix. |
ORANGE / 2013 REGISTRATION DOCUMENT - 205
| Financial years ended December 31 |
(in millions of euros) | 2013 | 2012
Data on a historical basis | 2011
Data on a historical basis |
Operating income | 5,288 | 4,063 | 7,948 |
Finance costs, net | (1,750) | (1,728) | (2,033) |
Income tax | (1,405) | (1,231) | (2,087) |
Consolidated net income after tax | 2,133 | 1,104 | 3,828 |
Net income attributable to owners of the parent | 1,873 | 820 | 3,895 |
Non-controlling interests | 260 | 284 | (67) |
| Financial years ended December 31 |
(in millions of euros) | 2013 | 2012
Data on a historical basis | 2011
Data on a historical basis |
Net financial debt (1) | 30,726 (2) | 30,545 | 30,890 (3) |
(1) See the Financial glossary appendix and Note 10 to the consolidated financial statements. (2) Excluding the settlement of the tax litigation relating to the 2005 financial year during the second half of 2013 in the amount of 2,146 million euros (see Section 4.3.1.4 Significant events), net financial debt would have totaled 28,580 million euros at December 31, 2013. (3) Taking into account for 2011 i) the 891 million euro payment for the acquisition of the 4G mobile license in the 800 MHz band in France (on January 19, 2012), and ii) the 550 million euro payment for the legal dispute between DPTG and Orange Polska in Poland (on January 13, 2012), net financial debt would have totaled 32,331 million euros at December 31, 2011. |
For further information on the risks relating to the Orange Group’s financial debt, see Section 2.4.1 Operating risks of the 2013 Registration Document.
[REDACTED SECTION: CERTAIN TEXT THAT FOLLOWS HAS BEEN REDACTED]
Between 2012 and 2013, net income attributable to owners of the parent more than doubled, to 1,873 million euros.
The positive sales momentum dating back to the previous quarters gathered pace in the fourth quarter of 2013:
■
the number of Group customers was 236.3 million at December 31, 2013, an increase of 2.4% over the year (5.6 million additional customers);
■
in high-capacity mobile broadband (4G) in France, the goal of 1 million 4G customers was reached; with over 4,200 sites, Orange covered 50% of the population at January 7, 2014. In Spain, 4G offers have 530,000 customers and more than 1,600 deployed sites, covering 30% of the population. In Poland, 4G technology has been launched in Warsaw, while in the United Kingdom, EE had over 2 million subscribers to its 4G offers in early January 2014;
■
in France, net sales of mobile contracts (excluding machine-to-machine) in the fourth quarter of 2013 were the highest of the year. Almost two-thirds were for premium Origami and Open offers. The development of fiber optic gained momentum in the fourth quarter, with the customer base growing by 17% in the space of three months to 319,000 customers at December 31, 2013;
■
in Spain, mobile plans (excluding machine-to-machine) also enjoyed strong growth (+9.6% year-on-year), with the rapid take-up of SIM-only offers (mobile contracts without a handset), while the fixed broadband customer base rose by 21.2%, driven by the success of convergent Canguro offers;
■
in Africa and the Middle East, the mobile customer base continued its sustained growth (+7.9% year-on-year), with 88.0 million customers at December 31, 2013 (including 3.4 million new customers in the fourth quarter). 3G technology is now available in 17 countries, and Orange Money had 8.9 million customers at December 31, 2013.
Revenues totaled 40,981 million euros in 2013, a decline of 5.8% compared with 2012 on a historical basis. On a comparable basis, more than 40% of the 4.5% drop in revenues was attributable to lower regulated prices. Excluding the effect of the fall in regulated prices, the decline worked out at 2.6% year-on-year on a comparable basis:
■
in France, the 4.8% drop in revenues stemmed largely from trends in mobile services, with mobile ARPU down 11.5% (8.0% excluding the effect of the fall in regulated prices);
■
in Spain, revenues were up 4.4%, driven by sales of mobile devices with staggered payments and fixed-line services;
■
in Poland, the decline in mobile services revenues was limited to 2.6%. Competitive pressure on prices was partly offset by the growth of the customer base;
ORANGE / 2013 REGISTRATION DOCUMENT - 206
■
in the Rest of the World reporting segment, revenues rose by 1.3% thanks to the momentum of the Africa and Middle East region, which grew by 4.7%, while Europe fell by 2.8%, marked by declines in Belgium and Slovakia;
■
Enterprise revenues fell by 5.3%, with increased pressure on prices in a challenging economic environment in Europe. IT services nevertheless enjoyed strong growth, particularly the Cloud (+23%).
The company demonstrated its adaptability and cost control, with a 929 million euro reduction in the operating expenses included in the calculation of adjusted EBITDA (of which 798 million euros in France), which made up for nearly half of the decline in revenues (1,949 million euros). Year-on-year, direct costs fell by 5.4% (583 million euros) and indirect costs by 1.9% (346 million euros).
Restated EBITDA (see Section 4.3.5.3 Financial aggregates not defined by IFRS and the Financial glossary appendix) totaled 12,649 million euros in 2013. The decline in the ratio of restated EBITDA to revenues (30.9% in 2013) was limited to 1.0 percentage point compared with 2012 on a comparable basis.
Operating income totaled 5,288 million euros in 2013, an increase of 1,225 million euros compared with 2012 on a historical basis. On a comparable basis, the 30.2% or 1,227 million euro increase in operating income between 2012 and 2013 was attributable mainly to:
■
the recognition in 2012 of an expense of 1,245 million euros on the “Part-Time for Seniors” plan in France, mainly due to new agreements on the employment of senior workers signed in December 2012 (see Section 4.3.1.4 Significant events);
■
the 1,138 million euro decline in the value of goodwill following the recognition of an impairment loss of 512 million euros in 2013 (chiefly in respect of Belgium and the Democratic Republic of Congo), compared with a decline of 1,650 million euros in 2012 (chiefly in respect of Poland, Egypt, Romania and Belgium);
■
partially offset by the 1,021 million euro decline in restated EBITDA.
Net income attributable to owners of the parent (1,873 million euros in 2013) more than doubled compared with the previous year (820 million euros in 2012). This improvement stemmed primarily from the significant reduction in goodwill impairment in 2013 compared with 2012.
CAPEX (see Section 4.3.5.3 Financial aggregates not defined by IFRS and the Financial glossary appendix) totaled 5,631 million euros in 2013, a ratio of CAPEX to revenues of 13.7%, up 0.4 percentage point compared with 2012 on both a historical and a comparable basis, strengthening Orange’s leading position in telecommunication networks, especially as regards investment in high-capacity mobile broadband (4G) and fixed lines (fiber optic and VDSL), which doubled compared with 2012.
[REDACTED SECTION: CERTAIN TEXT THAT FOLLOWS HAS BEEN REDACTED]
Net financial debt (see the Financial glossary appendix) stood at 30,726 million euros at December 31, 2013.
[REDACTED SECTION: CERTAIN TEXT THAT FOLLOWS HAS BEEN REDACTED]
A dividend of 0.80 euro per share in respect of 2013 financial year will be proposed to the Shareholders’ Meeting of May 27, 2014. Given the payment of an interim dividend of 0.30 euro per share on December 11, 2013, the balance, subject to approval by the Shareholders’ Meeting, amounts to 0.50 euro per share, and will be paid in cash on June 5, 2014.
Call termination and roaming prices continued to fall in 2013 in almost all European countries where the Group operates. In 2013, cuts in regulated prices reduced mobile and fixed-line telephony revenues by 840 million euros (916 million euros in 2012), and Reported EBITDA by 279 million euros (316 million euros in 2012).
The regulations governing the operations of the Orange Group are described in Section 2.2 Regulation of the 2013 Registration Document. For further information on the risks relating to regulations, see Section 2.4.2 Legal risks of the 2013 Registration Document.
In 2013, the macroeconomic environment in which the Group conducts its business remained very challenging in Europe, with muted growth or recession (particularly France and Spain) and the impact of the financial and economic crises on consumer behavior in Europe. Furthermore, the current environment is also characterized by a high regulatory burden, significant fiscal pressure and the impact of political upheavals in the Middle East and North Africa, as well as some countries in Sub-Saharan Africa.
ORANGE / 2013 REGISTRATION DOCUMENT - 207
The telecommunications environment has also been affected by a significant change in the mobile telephony market, on the back of heightened competitive pressure, particularly in France, with the arrival of a fourth mobile operator in 2012, but also in Poland and Belgium. Heightened competition has resulted in significant price cuts and a bipolarization of the market between entry-level offers on the one hand, and high-end offers incorporating additional services on the other.
In response to this situation, the Group continued its adaptation in 2013 by working on its commercial offers, disposing of non-strategic assets (disposals in Austria and Portugal, and a sale agreement in the Dominican Republic), investing in high-speed broadband networks (4G and fiber optic) and continuing its innovation programs. The Group also pressed ahead with its operational efficiency and cost-cutting program (with progress on the Chrysalid plan), the sharing of networks and the pooling of activities with other operators.
France Telecom becomes Orange
Following France Telecom’s change of name to Orange on July 1, 2013, the France Telecom-Orange Group is now called Orange, in line with the brand used by almost all of the Group’s commercial operations (fixed, mobile, Internet) worldwide.
In Poland, Telekomunikacja Polska (TP, fixed and Internet services), PTK Centertel (mobile services) and Orange Polska merged on December 31, 2013 into a single company called Orange Polska.
Continued sales momentum
In a difficult competitive environment, Orange recorded good sales performances in its main countries in 2013, notably thanks to the adaptation of its commercial offers. The segmented Animals offers were launched in eight of the nine European Union countries where the Group operates, and now have 11 million customers. Orange Money now has 8.9 million customers across 13 countries in Africa and the Middle East. Orange has launched 4G services in 10 countries.
Confirmation of the success of offers in France
In France, in a more competitive market resulting in continued price cuts, Orange continued to adapt its offerings for consumers: adjustment and broadening of the Sosh contract range, further development of the quadruple play Open offers, simplification the Origami range, marketing launch of consumer 4G offers, integration of technological innovations in offers (notably with the new Livebox Play range).
The Sosh brand offers have been adjusted and enriched, with the launch of a range of “Sosh mobile + Livebox” quadruple play contracts in June 2013, the release of the first Sosh smartphone in October 2013 and access to 4G technology in January 2014. The number of Sosh customers was multiplied by 2.3 over the year: the Sosh brand had nearly 1.9 million customers at December 31, 2013.
The quadruple play Open offers also confirmed their success in 2013, with 4.8 million customers at December 31, 2013 (1.7 million additional customers compared with December 31, 2012). These offers thereby demonstrated their aptness, both in terms of acquiring new customers and promoting the loyalty of existing ones.
With regard to high-capacity broadband, after the commercial launch of its first 4G offer for professional and business customers in November 2012, Orange announced the launch of 4G offers for consumers in April 2013. At December 31, 2013, Orange had more than 1 million 4G customers. Moreover, the number of customers with fiber optic was multiplied by 1.8 over the year to 319,000 customers at December 31, 2013.
More generally, the threshold of 10 million fixed broadband customers in France was crossed by the Group in the third quarter of 2013.
Good commercial performance in Spain and Poland
In Spain, Orange continued to adapt its offerings to consumers: launch of the Canguro bundled offer, combining mobile and Internet services, simplification of the range of Animals contracts, and launch of the joyn compatible handsets. Orange also began marketing its 4G offers in July 2013, and already had 530,000 4G customers in the country by December 31, 2013. Lastly, amena.com, the online site that since July 2012 has offered unlimited discounted and prepaid offers, had 117,000 customers at December 31, 2013.
In Poland, Orange launched its new online brand, nju.mobile, in April 2013. Available only on the Internet (for contracts), nju.mobile is aimed primarily at consumer customers seeking cost-effective solutions, with prepaid mobile offers and contracts, based on SIM-only offers (mobile offers without a handset). A total of 353,000 customers had subscribed to these new offers at December 31, 2013.
Success of high-capacity broadband (4G) offers in the United Kingdom
In the UK, 14 months after it started marketing its 4G offers in October 2012, EE, the joint venture owned by Orange and Deutsche Telekom, already had nearly 2 million 4G customers at December 31, 2013. At end-2013, 4G coverage by the joint venture’s network represented nearly 70% of the British population, with 160 cities covered. The threshold of 98% of the population should be reached in 2014.
ORANGE / 2013 REGISTRATION DOCUMENT - 208
Improving operational efficiency
In 2013, the Group continued to work on its operational efficiency and cost control program, network sharing and the pooling of activities with other operators.
Progress on Chrysalid
In 2011, the Group launched Chrysalid, its operational efficiency program running until 2015. The goal is to identify all areas in which the Group can improve its operational efficiency and optimize its practices, with a view to controlling growth in expenditure and to apply this change throughout the Group, by sharing best practices across countries. In October 2012, the Group decided to speed up implementation of this program. The current goal is to cut 3 billion euros from the projected increase in operational expenses compared with the 2010 cost base by 2015.
Since the program’s launch, in cumulative data from 2011, 2012 and 2013, 68% of the new goal of 3 billion euros has been achieved, i.e. a total of 2 billion euros (452 million euros in 2011, excluding Switzerland, 718 million euros in 2012 and 870 million in 2013), thereby exceeding the interim target of 1.8 billion euros by the end of 2013. In 2013, this amount related to both operational expenses included in Reported EBITDA (780 million euros in 2013) and CAPEX (90 million euros in 2013).
Sharing of passive infrastructure in Africa
After Uganda in 2012, new agreements on the sharing of passive infrastructure were concluded in 2013 with operators of mobile infrastructure in Africa, notably Ivory Coast and Cameroon. These agreements will help reduce operating expenses and investments in these countries, while improving the coverage and quality of the network.
Investment in networks
The rollout of networks providing broadband and high-capacity broadband Internet access remains one of the Group’s top priorities. After acquiring several 4G mobile licenses throughout the world, Orange has already rolled out high-capacity mobile networks (LTE, Long Term Evolution) in 10 countries. With regard to high-capacity fixed broadband networks (FTTH, Fiber To The Home), Orange signed numerous agreements and conventions in 2013 with a view to the deployment of fiber optic in France and in Spain (co-deployment) and in Poland.
Rollout of high-capacity broadband mobile networks (LTE) in Europe
In France, the deployment of 4G technology has been very swift. The rollout began in June 2012, and Orange now has over 4,200 sites in service, thereby covering 50% of the French population at January 7, 2014. Orange now also offers the highest theoretical maximum speed: 100 or 150 Mbit/s. This deployment comes on top of Orange’s H+ network, which covered 75% of the French population at end-2013.
In Spain, the 4G network already covered 18 major cities representing 30% of the population at December 31, 2013. The objective is to continue the rollout of 4G technology so as to cover the capitals of Spain’s 50 provinces in 2014.
In Poland, the deployment of the 4G network is underway (16% of the population covered by co-deployment at December 31, 2013), and Orange Polska will provide coverage for 50% of the population by mid-2014 on the 1,800 MHz frequency.
In Belgium, Mobistar has acquired a 4G license for 120 million euros and opened its 4G network in 30 towns and cities in November 2013. Early in 2014, Mobistar will add at least 40 towns and cities to its 4G network, and will launch its commercial offer. Mobistar is aiming for 4G coverage similar to current 2G coverage by 2015. In Luxembourg, the Group already covers more than 65% of the population with 4G technologies, and is continuing to broaden its coverage.
In the rest of Europe, deployments of 4G technologies are advancing swiftly, particularly in Romania, Moldova (first of the Group’s countries to have 4G) and Slovakia (acquisition of a 4G license in January 2014). Ultimately, all of the Group’s European countries will have access to 4G offers before the end of 2015.
Deployment of high-capacity fixed broadband networks (VDSL and FTTH) in Europe
In France, Orange stepped up its initiatives to optimize the coordination of private and public investment in the rollout of fiber optic, with the signing of several agreements with local authorities and institutions. The signing of these agreements and the sustained pace of deployment carried out by Orange in 2013 enabled the Group to count 2.6 million homes able to connect to fiber optic at December 31, 2013, an increase of 55% over the year. Furthermore, in order to give its customers (consumers and businesses) access to the best rates available on their line, Orange has offered VDSL2 in France since October 2013. For eligible customers, VDSL2 technology provides higher speeds than those offered by ADSL.
In Spain, Orange signed an agreement with Vodafone in March 2013 on a joint investment for the rollout of fiber optic (FTTH). Both partners have set themselves the goal of connecting 3 million homes by 2015, and 6 million by 2017, in more than 50 cities on the Iberian Peninsula. The agreement is open to other operators wishing to invest in this type of rollout, and Orange, Vodafone and Telefonica subsequently signed an agreement on the sharing of vertical fiber optic infrastructures in buildings in July 2013.
In Poland, the Group has invested in broadband and high-capacity broadband, with the continued rollout of VDSL to expand the geographical coverage of these offers, and, more selectively, the first deployment of fiber optic (FTTH).
ORANGE / 2013 REGISTRATION DOCUMENT - 209
Pursuit of the social contract in France
Between late 2012 and 2013, the signing of new agreements on employee profit-sharing, the employment of senior workers and the inter-generational contract (Orange is poised to see one-third of its French workforce retire by 2020) reflects the Group’s determination to combine economic performance and social responsibility consistent with Orange’s social contract, the gradual implementation of which has led to more peaceful labor relations since September 2010.
The new agreement on the employment of senior workers in France, signed with the unions in December 2012 for a period of three years (2013-2015), includes planning on the end of careers and the transition between work and retirement, in particular with the implementation of a new part-time system known as “Part-time for Seniors” (TPS, see Note 5 to the consolidated financial statements).
In addition, the new agreement on the inter-generational contract signed with the trade unions in October 2013 for the period from 2013 to 2015, foresees or reaffirms concrete and ambitious measures in four areas: i) the hiring of 3,000 young people on permanent contracts as part of a plan to recruit 4,000 permanent employees over three years, ii) the hiring of young people in training programs, with a specific plan to welcome 1,000 young people on combined work-study programs dedicated to high-capacity broadband (hired on permanent contracts by Orange or its partners) on top of the commitment to hire 5,000 young people per year on combined work-study programs, iii) the maintaining of senior workers in their jobs with adjustments to working hours, and iv) the transmission of knowledge and the hiring of young people within the Company.
Change in asset portfolio
After disposing of its operations in Switzerland in February 2012, the Group finalized the sale of its investments in Austria (Orange Austria) and Portugal (Sonaecom) in 2013, and also announced the signing of an agreement to sell its stake in the Dominican Republic (Orange Dominicana). Orange Polska also announced in October 2013 an agreement to sell 100% of its subsidiary Wirtualna Polska in Poland. These transactions reflect the strategy of optimizing the Group’s asset portfolio, announced in 2011.
Disposal of 35% of Orange Austria
In January 2013, Mid Europa Partners and Orange sold their respective stakes of 65% and 35% in Orange Austria. Orange sold its stake for 73 million euros, net of selling costs and after a price adjustment. This amount represents a loss on disposal recognized in the income statement. The amount received at December 31, 2013 was 66 million euros. The remaining payments are to be placed in an escrow account (see Note 2 to the consolidated financial statements).
Disposal of 20% of Sonaecom in Portugal
In September 2013, Orange sold its 20% stake in Sonaecom to Sonae for 105 million euros. As the carrying amount of the Sonaecom securities corresponded to the disposal value, there was no effect in terms of gain or loss on disposal. The disposal price will be paid by Sonae in August 2014 (see Note 2 to the consolidated financial statements).
Agreement on the sale of Orange Dominicana
In November 2013, Orange signed an agreement with Altice on the sale of 100% of Orange Dominicana, the Group’s subsidiary in the Dominican Republic. The parties agreed on a company value of 1.4 billion dollars, or 1.1 billion euros. The anticipated gain on disposal, net of tax, is not material (see Note 2 to the consolidated financial statements).
Acquisition of 51% of Dailymotion
Pursuant to a purchase contract concluded in July 2012, Orange acquired 51% of Dailymotion in January 2013 for 61 million euros, bringing the Group’s stake in Dailymotion to 100% (see Note 2 the consolidated financial statements).
Tax litigation relating to the 2005 financial year
In a judgment dated July 4, 2013, the Administrative Court of Montreuil rejected the arguments of the Group on a tax dispute in France resulting from a simplification of the scope of consolidation in 2005, triggering the payment of the balance of sums and default interest claimed by the tax administration in a total amount of 2,146 million euros. Given the amounts set aside previously, only an additional expense of 46 million euros was recognized as default interest for the period (see the Consolidated statement of cash flows of the consolidated financial statements and Note 12 to the consolidated financial statements).
Orange believes it has strong legal arguments, including the enforceability of the fiscal intangibility of the opening balance of the financial years submitted for review, and therefore filed on July 29, 2013 an application instituting proceedings with the Administrative Court of Appeal of Versailles.
Orange has invested in the Middle East, North Africa and Sub-Saharan Africa, and owns subsidiaries and investments in these regions. Some countries (including Egypt, Jordan, Iraq, Mali, Democratic Republic of Congo and the Central African Republic) continue to be afflicted by political or economic instability, which has affected the activity and results of the Group’s companies in these countries (see in particular Section 4.3.3.4 Rest of the World on the situation in Egypt and Note 6 to the consolidated financial statements).
ORANGE / 2013 REGISTRATION DOCUMENT - 210
In Europe, risk factors include the possible ramifications of the prevailing financial and economic situation, particularly in terms of consumer behavior, the impact on demand of governmental and European policies aimed at reducing public deficits, and the behavior of interest rate markets in response to central bank policies. Other risk factors include the decisions of sector regulators and competition authorities in terms of the trade-off between price reductions for consumers and the promotion of investment, and in respect of concentration.
For further information on the risks relating to these investments as well as the other risk factors, see Section 2.4 Risk Factors of the 2013 Registration Document.
| Financial years ended December 31 |
(in millions of euros) | 2013 | 2012
Data on a comparable basis (1) | 2012
Data on a historical basis | Chg. (%)
Data on a comparable basis (1) | Chg. (%) Data on a historical basis | 2011
Data on a historical basis |
Revenues | 40,981 | 42,930 | 43,515 | (4.5)% | (5.8)% | 45,277 |
External purchases (2) | (17,965) | (18,746) | (19,100) | (4.2)% | (5.9)% | (19,638) |
Other operating income and expense (2) | 179 | 187 | 179 | (4.8)% | (0.1)% | (33) |
Labor expenses (2) | (9,019) | (10,272) | (10,363) | (12.2)% | (13.0)% | (8,815) |
Operating taxes and levies (2) | (1,717) | (1,839) | (1,857) | (6.6)% | (7.5)% | (1,772) |
Gain (losses) on disposal | 119 | 65 | 158 | 82.4% | (24.6)% | 246 |
Restructuring cost and similar items | (343) | (36) | (37) | ns | ns | (136) |
Reported EBITDA | 12,235 | 12,289 | 12,495 | (0.4)% | (2.1)% | 15,129 |
(1) See Section 4.3.5.1 Transition from data on a historical basis to data on a comparable basis. (2) See the Financial glossary appendix. |
| Financial years ended December 31 |
REVENUES (2)
(in millions of euros) | 2013 | 2012
Data on a comparable basis (1) | 2012
Data on a historical basis | Chg. (%)
Data on a comparable basis (1) | Chg. (%)
Data on a historical basis | 2011
Data on a historical basis |
France | 20,018 | 21,425 | 21,431 | (6.6)% | (6.6)% | 22,534 |
Spain | 4,052 | 4,027 | 4,027 | 0.6% | 0.6% | 3,993 |
Poland | 3,079 | 3,369 | 3,381 | (8.6)% | (8.9)% | 3,625 |
Rest of the World | 7,792 | 7,829 | 8,281 | (0.5)% | (5.9)% | 8,795 |
Enterprise | 6,513 | 6,881 | 7,001 | (5.3)% | (7.0)% | 7,101 |
International Carriers & Shared Services | 1,702 | 1,618 | 1,623 | 5.2% | 4.9% | 1,610 |
Eliminations | (2,175) | (2,219) | (2,229) | | | (2,381) |
TOTAL GROUP | 40,981 | 42,930 | 43,515 | (4.5)% | (5.8)% | 45,277 |
(1) See Section 4.3.5.1 Transition from data on a historical basis to data on a comparable basis. (2) See Note 3 to the consolidated financial statements. |
2013 vs. 2012
The revenues of the Orange Group totaled 40,981 million euros in 2013, down 5.8% on a historical basis and 4.5% on a comparable basis compared with 2012.
On a historical basis, the 5.8% or 2,534 million euro fall in revenues between 2012 and 2013 includes i) the adverse impact of foreign exchange fluctuations, which was 356 million euros and mainly reflects the change in the value of the Egyptian pound against the euro in the amount of 192 million euros, ii) the adverse impact of changes in the scope of consolidation and other changes, which was 229 million euros and mainly reflects the impact of the disposal of Orange Suisse on February 29, 2012 in the amount of 161 million euros, and iii) organic change on a comparable basis, i.e. a decline of 1,949 million euros in revenues.
On a comparable basis, the 4.5% or 1,949 million euro decline in Group operating income between 2012 and 2013 was attributable mainly to:
■
the negative effect of the fall in regulated prices in the amount of 840 million euros, particularly in France, Poland, Spain, Belgium, Slovakia and Romania;
ORANGE / 2013 REGISTRATION DOCUMENT - 211
■
revenue trends in France (down 4.8% or 1,012 million euros excluding the effect of the fall in regulated prices). This trend is chiefly attributable to the effect of price reductions stemming from the recasting of the segmented Sosh, Open and Origami offers, and, to a lesser extent, the downward trend in legacy telephone services. Annual average revenues per user (ARPU, see the Financial glossary appendix) were down 11.5% in the mobile segment at December 31, 2013 compared with December 31, 2012 (down to 8.0% excluding the effect of the fall in regulated prices);
■
the 5.3% or 368 million euro decline in Enterprise revenues. This reflects the difficult economic environment, especially in Europe, with many deferrals of transformation projects among companies and increased price pressure during contract renewals;
■
and the 3.9% or 125 million euro decline in revenues in Poland (excluding the impact of lower regulated rates), which was attributable chiefly to the fall-off in traditional telephone services and heightened competitive pressure;
■
partially offset by i) by the 4.7% or 181 million euro increase in revenues in Africa and the Middle East (excluding the impact of the fall in regulated prices), with a good overall performance of African countries (mainly Ivory Coast, Guinea, Mali and Senegal) and sound revenues in Egypt, and ii) the growth of 4.4% or 169 million euros in revenues in Spain (excluding the impact of the fall in regulated prices), driven primarily by strong growth in sales of mobile devices and increased revenues from fixed-line services.
2012 vs. 2011
The revenues of the Orange Group totaled 43,515 million euros in 2012, down 3.9% on a historical basis and 2.7% on a comparable basis compared with 2011.
On a historical basis, the 3.9% or 1,762 million euro decline in Group revenues between 2011 and 2012 reflected:
■
i) the adverse impact of changes in the scope of consolidation and other changes, which was 787 million euros and mainly reflects the impact of the disposal of Orange Suisse on February 29, 2012 in the amount of 827 million euros, ii) partially offset by the positive effect of foreign exchange fluctuations, which was 213 million euros and mainly reflects change in the value of the US dollar (94 million euros) and the Egyptian pound (73 million euros) against the euro;
■
and organic change on a comparable basis, i.e. a 1,188 million euro decline in revenues.
On a comparable basis, the 2.7% or 1,188 million euro decline in Group revenues between 2011 and 2012 was attributable in large part to the negative effect of the fall in regulated prices (916 million euros), particularly in France, Spain, Poland and Belgium:
■
the change in revenues in France (down 5.0% or 1,129 million euros), was attributable mainly to the negative effect of the fall in regulated prices, the decline in traditional telephone services (subscriptions and calling services), and the heightened competition following the arrival of the fourth mobile operator. However, the success of the segmented offers strategy, the effects of the national roaming agreement signed with the fourth mobile operator, the increased use of smartphones, the growth of data services, and the increased number of fixed-line broadband customers and services made it possible to partially offset these negative effects in 2012;
■
in Spain, the change in revenues was favorably decorrelated with GDP and telecommunications market performance, growing 0.9% (38 million euros) year-on-year. The continuation of strong growth in fixed-line services, in connection with the development of broadband, offset decline in mobile services attributable to the fall in regulated prices;
■
the decline in revenues in Poland (down 4.1% or 145 million euros) was primarily attributable to the downward trend on the switched telephone network (subscriptions and calling services), the negative effect of the fall in regulated prices, heightened competitive pressure and the deterioration in the macroeconomic environment;
■
revenues from the Rest of the World were up 1.4% or 117 million euros year-on-year. This performance was attributable to higher revenues in Africa and the Middle East, with, in particular, a significant recovery in the Ivory Coast (due notably to political events in that country in 2011), and more broadly to a strong performance in African countries (especially Guinea, Cameroon and Niger). Conversely, the decline in revenues in Europe was the result of the negative effect of the fall in regulated prices (primarily in Belgium, Romania and Slovakia) and, to a lesser extent, the adverse business performance in Slovakia;
■
lastly, Enterprise revenues were down 2.7% or 195 million euros between 2011 and 2012, due to the accelerated decline in legacy networks. Between 2011 and 2012, this performance was only partially offset by the solid performance of mature networks, as well as increases in i) growing networks and ii) services.
ORANGE / 2013 REGISTRATION DOCUMENT - 212
| Financial years ended December 31 |
CUSTOMERS (2) (3)
(in millions, at end of period) | 2013 | 2012
Data on a comparable basis (1) | 2012
Data on a historical basis | Chg. (%
) Data on a comparable basis (1) | Chg. (%) Data on a historical basis | 2011
Data on a historical basis |
Number of mobile customers (3) (4) | 178.5 | 171.6 | 172.4 | 4.0% | 3.5% | 166.6 |
Number of contract customers | 61.7 | 56.5 | 57.0 | 9.3% | 8.3% | 54.2 |
Number of prepaid customers (4) | 116.8 | 115.2 | 115.4 | 1.4% | 1.2% | 112.4 |
Number of fixed-line telephony customers | 42.2 | 43.2 | 43.2 | (2.3)% | (2.3)% | 44.3 |
Number of Internet customers | 15.6 | 15.1 | 15.1 | 3.4% | 3.4% | 14.7 |
of which number of broadband Internet customers | 15.5 | 14.9 | 14.9 | 3.8% | 3.8% | 14.4 |
GROUP TOTAL (3) | 236.3 | 229.9 | 230.7 | 2.8% | 2.4% | 225.5 |
(1) See Section 4.3.5.1 Transition from data on a historical basis to data on a comparable basis. (2) The number of Orange Group customers is calculated i) in its entirety in the case of fully consolidated entities and ii) in proportion to the Group’s interest in the case of entities accounted for under the equity method (see Note 9 to the consolidated financial statements). (3) Excluding customers of mobile virtual network operators (MVNOs). (4) In 2012, Orange Spain adopted the definition of the CMT (Comisión del mercado de las telecomunicaciones - Spanish regulator) as regards the calculation of the number of prepaid customers. Data from previous years have been restated in accordance with the new definition. |
2013 vs. 2012
The Reported EBITDA of the Orange Group totaled 12,235 million euros in 2013, down 2.1% on a historical basis and 0.4% on a comparable basis compared with 2012. The ratio of Reported EBITDA to revenues was 29.9% in 2013, up 1.1 points on a historical basis and 1.2 points on a comparable basis compared with 2012.
On a historical basis, the decline of 2.1% or 260 million euros in Reported EBITDA between the 2012 and 2013 includes i) the negative impact of changes in the scope of consolidation and other changes, which was 136 million euros and mainly reflects the impact of the disposal of Orange Suisse on February 29, 2012 in the amount of 137 million euros, ii) the negative impact of foreign exchange fluctuations, which was 70 million euros and mainly reflects the change in the value of the Egyptian pound against the euro in the amount of 60 million euros, and iii) organic change on a comparable basis, i.e. a decline of 54 million euros in Reported EBITDA.
On a comparable basis, Group Reported EBITDA was down 0.4% or 54 million euros between 2012 and 2013.
The Group’s Reported EBITDA includes:
■
in 2013, in the negative amount of 414 million euros:
■
restructuring expenses relating primarily to the streamlining of distribution networks, the restructuring of content, the adaptation of the workforce and the optimization of property leases (see Note 4 to the consolidated financial statements) in the amount of 299 million euros,
■
156 million euros in labor expenses, primarily for the “Part-Time for Seniors” plan in France in a total amount of 127 million euros following the agreements on the employment of senior workers signed in November 2009 and in December 2012 (see Section 4.3.1.4 Significant events),
■
a 73 million euro gain on disposal from the disposal of Orange Austria (see Section 4.3.1.4 Significant events),
■
a net expense of 33 million euros on various legal disputes; and
■
in 2012, in a total negative amount of 1,289 million euros on a historical basis (and a negative amount of 1,381 million euros on a comparable basis):
■
1,293 million euros in labor expenses, primarily for the “Part-Time for Seniors” plan in France in a total amount of 1,245 million euros following the agreements on the employment of senior workers signed in November 2009 and December 2012 (see Section 4.3.1.4 Significant events),
■
a 116 million euro expense (including stamp duty) relating to the 110 million euros in compensation paid to OTMT for the transfer to Orange of the services contract between OTMT and ECMS (see Notes 2 and 4 to the consolidated financial statements),
■
a gain on disposal of 92 million euros on a historical basis (zero on a comparable basis, see Section 4.3.5.1 Transition from data on a historical basis to data on a comparable basis) on the disposal of Orange Suisse (see Note 2 to the consolidated financial statements); and,
■
a net gain of 27 million euros on various legal disputes.
To facilitate comparison of operational performance, these items are excluded from restated EBITDA. The following table shows the transition from Reported EBITDA to restated EBITDA.
ORANGE / 2013 REGISTRATION DOCUMENT - 213
| Financial years ended December 31 |
REPORTED EBITDA & RESTATED EBITDA – 2013 VS. 2012
(in millions of euros) | 2013 | 2012
Data on a comparable basis (1) | 2012
Data on a historical basis | Chg. (%) Data on a comparable basis (1) | Chg. (%) Data on a historical basis |
Reported EBITDA (a) | 12,235 | 12,289 | 12,495 | (0.4)% | (2.1)% |
As a % of revenues | 29.9% | 28.6% | 28.7% | - | - |
Expense for the “Part-time for Seniors” plans in France and other labor-related items (2) (3) | (156) | (1,292) | (1,293) | - | - |
Compensation paid to OTMT for the transfer to Orange of the services contract between OTMT and ECMS | - | (116) | (116) | - | - |
Net income (net expense) on various legal disputes | (33) | 27 | 27 | - | - |
Gain on disposal of Orange Austria (3) | 73 | - | - | - | - |
Gain on disposal of Orange Suisse | - | - | 92 | - | - |
Restructuring costs relating primarily to distribution networks, content, personnel and property (4) | (299) | - | - | - | - |
Total restated items (b) | (414) | (1,381) | (1,289) | - | - |
Restated EBITDA (a - b) | 12,649 | 13,670 | 13,785 | (7.5)% | (8.2)% |
As a % of revenues | 30.9% | 31.8% | 31.7% | - | - |
(1) See Section 4.3.5.1 Transition from data on a historical basis to data on a comparable basis. (2) Includes an expense of 127 million euros in 2013 and an expense of 1,245 million euros in 2012 for the “Part-Time for Seniors” plan in France following the agreements on the employment of senior workers signed in November 2009 and December 2012 (see Note 5 to the consolidated financial statements). (3) See Section 4.3.1.4 Significant events. (4) See Note 4 to the consolidated financial statements. |
On a comparable basis, and after factoring in items restated in 2012 and 2013, restated EBITDA (see above) fell by 7.5% or 1,021 million euros between 2012 and 2013, due to:
■
the decline of 4.5% or 1,949 million euros in revenues, of which 840 million euros attributable to the effect of the fall in regulated prices;
■
partially offset by a 3.2% or 929 million euro decline in operating expenses included in the calculation of restated EBITDA (of which 798 million euros in France), resulting mainly from:
■
the 8.3% or 449 million euro reduction in service fees and inter-operator costs (see Financial glossary appendix), the impact of higher traffic volumes being more than offset by the positive effect of the fall in regulated prices on interconnection costs in a total amount of 560 million euros,
■
the 3.0% or 198 million euro reduction in commercial expenses and content costs (see the Financial glossary appendix), mainly in France, reflecting the impact of the development of SIM-only offers (mobile offers without handsets), and control of customer acquisition and retention costs,
■
the 4.0% or 156 million euro decline in other external purchases (see the Financial glossary appendix), chiefly attributable to lower overheads (in all of the Group’s operating segments) and outsourcing expenses in respect of call centers,
■
the 1.2% or 107 million euro decline in labor expenses (see the Financial glossary appendix), largely attributable to the 2.5% decline in the average number of employees (full-time equivalent, see Financial glossary appendix), a reduction of 4,025 employees. Moreover, the change in labor expenses included the positive effect of the competitiveness and employment tax credit (Crédit d’Impôt pour la Compétitivité et l’Emploi – CICE) in the amount of 79 million in 2013 (see Note 5 to the consolidated financial statements).
After factoring in items restated in 2012 and 2013, the ratio of restated EBITDA (see above) to revenues would be 30.9% in 2013, down 1.0 percentage point on a comparable basis compared with 2012.
2012 vs. 2011
The Reported EBITDA of the Orange Group totaled 12,495 million euros in 2012, down 17.4% on a historical basis and 15.2% on a comparable basis compared with 2011. The ratio of Reported EBITDA to revenues was 28.7% in 2012, down 4.7 points on a historical basis and 4.2 points on a comparable basis compared with 2011.
ORANGE / 2013 REGISTRATION DOCUMENT - 214
On a historical basis, the 17.4% or 2,634 million euro decline in Group Reported EBITDA between 2011 and 2012 reflected:
■
i) the adverse impact of changes in the scope of consolidation and other changes, which was 435 million euros and mainly reflected the impact of the disposal of a) Orange Suisse on February 29, 2012 in the amount of 220 million euros, and b) of TP Emitel on June 22, 2011 in the amount of 220 million euros, ii) partially offset by the positive effect of foreign exchange fluctuations, which was 36 million euros;
■
and organic change on a comparable basis, i.e. a 2,235 million euro decline in Reported EBITDA.
On a comparable basis, Group Reported EBITDA was down 15.2% or 2,235 million euros between 2011 and 2012.
The Orange Group’s Reported EBITDA includes:
■
in 2012, for a total negative amount of 1,289 million euros on a historical basis:
■
1,293 million euros in labor expenses, primarily for the “Part-Time for Seniors” plan in France in a total amount of 1,245 million euros following the agreements on the employment of senior workers signed in November 2009 and December 2012 (see Section 4.3.1.4 Significant events),
■
a 116 million euro expense (including stamp duty) relating to the 110 million euros in compensation paid to OTMT for the transfer to Orange of the services contract between OTMT and ECMS (see Notes 2 and 4 to the consolidated financial statements),
■
a gain on disposal of 92 million euros on a historical basis from the disposal of Orange Suisse (see Note 2 to the consolidated financial statements),
■
a net gain of 27 million euros on various legal disputes; and
■
in 2011, for a total positive amount of 47 million euros on a historical basis (and for a negative amount of 150 million euros on a comparable basis):
■
a gain on disposal of 197 million euros on a historical basis (zero on a comparable basis, see Section 4.3.5.1 Transition from data on a historical basis to data on a comparable basis) on the disposal by Orange Polska of its subsidiary TP Emitel (see Note 2 to the consolidated financial statements),
■
a net expense of 123 million euros on various legal disputes,
■
an expense of 19 million euros covering the restructuring of the Orange sport and Orange cinéma séries (OCS) businesses in France (see Notes 2 and 4 to the consolidated financial statements); and,
■
8 million euros in labor expenses, primarily for the “Part-Time for Seniors” plan in France (see Note 5 to the consolidated financial statements).
To facilitate comparison of operational performance, these items are excluded from restated EBITDA. The following table shows the transition from Reported EBITDA to restated EBITDA.
| Financial years ended December 31 |
REPORTED EBITDA & RESTATED EBITDA – 2012 VS. 2011
(in millions of euros) | 2012 | 2011
Data on a comparable basis (1) | 2011
Data on a historical basis | Chg. (%)
Data on a comparable basis (1) | Chg. (%)
Data on a historical basis |
Reported EBITDA (a) | 12,495 | 14,730 | 15,129 | (15.2)% | (17.4)% |
As a % of revenues | 28.7% | 33.0% | 33.4% | | |
Expense for the “Part-time for Seniors” plans in France and other labor-related items (2) | (1,293) | (8) | (8) | | |
Compensation paid to OTMT for the transfer to Orange of the services contract between OTMT and ECMS | (116) | - | - | | |
Net income (net expense) on various legal disputes | 27 | (123) | (123) | | |
Gain on disposal of Orange Suisse | 92 | - | - | | |
Gain on disposal of TP Emitel in Poland | - | - | 197 | | |
Restructuring costs relating to the Orange sport and Orange cinéma séries (OCS) businesses | - | (19) | (19) | | |
Total restated items (b) | (1,289) | (150) | 47 | | |
Restated EBITDA (a - b) | 13,785 | 14,879 | 15,083 | (7.4)% | (8.6)% |
As a % of revenues | 31.7% | 33.3% | 33.3% | | |
(1) See Section 4.3.5.1 Transition from data on a historical basis to data on a comparable basis. (2) Includes an expense of 1,245 million euros in 2012 and a gain of 29 million euros in 2011 in respect of the “Part-Time for Seniors” plan in France following the agreements on the employment of senior workers signed in November 2009 and December 2012 (see Section 4.3.1.4 Significant events and Note 5 to the consolidated financial statements). |
ORANGE / 2013 REGISTRATION DOCUMENT - 215
On a comparable basis and after factoring in items restated in 2011 and 2012, restated EBITDA (see above) would have fallen 7.4% or 1,095 million euros between 2011 and 2012, mainly due to:
■
the decline of 2.7% or 1,188 million euros in revenues, attributable notably to the effect of the fall in regulated prices in the amount of 916 million euros, particularly in France, Spain, Poland and Belgium;
■
the 3.5% or 309 million euro increase in labor expenses (see the Financial glossary appendix) stemming from: i) the increase in wages and employee benefit expenses, linked to higher salaries and incentive bonuses, and the increase in the employer contribution in France (forfait social – contribution on certain items of compensation), ii) the recognition in 2012 of a 122 million euro expense for contributions for so-called “non-common risks” (primarily unemployment) for Orange civil servants in connection with the dispute between the Group and the European Commission regarding the latter’s December 2011 decision (see Note 15 to the consolidated financial statements), partially offset by iii) the positive impact of the lower average number of employees (full-time equivalents) and, to a lesser extent, the lower level of employee profit-sharing;
■
the 5.7% or 158 million euro increase in other network expenses and IT expenses, mainly resulting from i) the rise in subcontracting expenses for technical operation and maintenance (primarily due to higher energy costs), and ii) the increase in IT expenses (as a result of the transformation and convergence projects), chiefly in France; and
■
and the 3.2% or 124 million euro increase in other external purchases, due in particular to the increase in property costs (lease payments).
These negative items were partially offset by:
■
the 5.7% or 330 million euro reduction in service fees and inter-operator costs, the impact of higher traffic volumes being more than offset by the positive effect of the fall in regulated prices on interconnection costs totaling 600 million euros;
■
the 2.6% or 181 million euro decline in commercial expenses and content costs, mainly due to i) the reduction in commercial expenses, achieved through more selective handset subsidies, and ii) the lower level of content costs following the closure of Orange sport and the restructuring of Orange cinéma séries;
■
and the 74 million euro reduction in restructuring costs and similar items, and the 69 million euro reduction in other operating expense (net of other operating income).
After factoring in items restated in 2011 and 2012, the ratio of restated EBITDA (see above) to revenues would have been 31.7% in 2012, down 1.6 points on 2011 on a comparable basis.
| Financial years ended December 31 |
(in millions of euros) | 2013 | 2012
Data on a comparable basis (1) | 2012
Data on a historical basis | Chg. (%)
Data on a comparable basis (1) | Chg. (%)
Data on a historical basis | 2012
Data on a historical basis |
Reported EBITDA | 12,235 | 12,289 | 12,495 | (0.4)% | (2.1)% | 15,129 |
Depreciation and amortization | (6,052) | (6,239) | (6,329) | (3.0)% | (4.4)% | (6,735) |
Reclassification of cumulative translation adjustment from liquidated entities | - | - | - | - | - | 642 |
Impairment of goodwill | (512) | (1,650) | (1,732) | (69.0)% | (70.5)% | (611) |
Impairment of fixed assets | (124) | (81) | (109) | 53.0% | 14.0% | (380) |
Share of profits (losses) of associates and joint ventures | (259) | (258) | (262) | 0.4% | (1.5)% | (97) |
Operating income | 5,288 | 4,061 | 4,063 | 30.2% | 30.1% | 7,948 |
(1) See Section 4.3.5.1 Transition from data on a historical basis to data on a comparable basis. |
2013 vs. 2012
In 2013, the operating income of the Orange Group totaled 5,288 million euros, up 30.1% on a historical basis and 30.2% on a comparable basis compared with 2012.
On a historical basis, the increase of 30.1% or 1,225 million euros in Group revenues between 2012 and 2013 includes i) the negative impact of changes in the scope of consolidation and other changes, which was 110 million euros and mainly reflects the impact of the disposal of Orange Suisse on February 29, 2012 in the amount of 136 million euros, partially offset by the negative impact of foreign exchange fluctuations, which was 108 million euros and mainly reflects the change in the value of the Egyptian pound against the euro in the amount of 66 million euros, and ii) organic change on a comparable basis, i.e. a decline of 1,227 million euros in Group revenues.
ORANGE / 2013 REGISTRATION DOCUMENT - 216
On a comparable basis, the 30.2% or 1,227 million euro increase in Group operating income between 2012 and 2013 was attributable mainly to:
■
the 1,138 million euro increase in impairment of goodwill (see Note 6 to the consolidated financial statements), as a result of the recognition of:
■
in 2013, an impairment loss of 512 million euros, mainly on Belgium and the Democratic Republic of Congo. In Belgium, the impairment loss of 408 million euros reflected a more competitive environment in the short and medium terms (widespread deflation), the regulatory reduction in the term of contractual commitments and the small number of convergence offers marketed by Mobistar. In the Democratic Republic of Congo, the impairment loss of 89 million euros reflects a reassessment of growth prospects,
■
in 2012, an impairment loss of 1,650 million euros on a comparable basis primarily in connection with Poland, Egypt, Romania and, to a lesser extent, Belgium. In Poland, the goodwill impairment of 868 million euros on a comparable basis reflected the impact on projected cash flows of heightened competitive pressure on the mobile and fixed line markets and a reduction in call termination rates. In Egypt, the 339 million euros in goodwill impairment on a comparable basis (wholly attributed to the Group in light of the changes to the shareholders’ agreement relating to ECMS in 2012, see Note 2 to the consolidated financial statements) reflected the impact of the political and economic environment and the performance achieved in 2012 (business won back and customer base grown, but pricing pressure and a fall in tourism significantly impacting roaming revenues) associated with the fact that the discount rate (after tax) was raised from 13.0% to 14.0%. In Romania, the 359 million euros in impairment losses mainly reflected the impact on projected cash flows of i) a further reduction in mobile termination rates imposed by the regulator in 2012, and ii) a limited presence in the multiplay offers segment. In Belgium, the 76 million euros in goodwill impairment reflected the impact on future cash flows of i) a new entrant resulting in price cuts, ii) the persistent lack of bundled packages, as well as iii) the reduction in the perpetual growth rate from 1.5% to 0.5%;
■
and the 187 million euro reduction in amortization expense, primarily attributable to i) the end of amortization of contract customer bases in Spain in May 2012, ii) a decline in the accelerated depreciation of certain assets, particularly in Spain and Belgium, iii) partially offset by increased amortization expense in France in connection with the amortization of new 4G telecommunications licenses and the increase in investments over recent years;
■
partially offset by the 43 million euro increase in the impairment of fixed assets on a comparable basis (see Note 7.2 to the consolidated financial statements).
In 2013, the share of profits (losses) of associates represented an expense of 259 million euros, broadly stable compared with 2012, and primarily includes the impairment of Médi Télécom securities (mobile operator in Morocco) in the amount of 148 million euros in 2013, compared with 141 million euros in 2012 (see Note 9 to the consolidated financial statements).
2012 vs. 2011
In 2012, the operating income of the Orange Group totaled 4,063 million euros, down 48.9% on a historical basis and 41.9% on a comparable basis compared with 2011.
On a historical basis, the 48.9% or 3,885 million euro decline in Group operating income between 2011 and 2012 reflected:
■
the adverse impact of changes in the scope of consolidation and other changes, amounting to 929 million euros and mainly consisting of i) the effect of the reclassification of cumulative translation adjustment from liquidated entities in the United Kingdom in 2011 for 642 million euros (see Note 13.5 to the consolidated financial statements), ii) the impact of the disposal of TP Emitel on June 22, 2011 for 212 million euros, and iii) the impact of the disposal of Orange Suisse on February 29, 2012 for 64 million euros;
■
the adverse effect of foreign exchange fluctuations in the amount of 20 million euros;
■
and organic change on a comparable basis, i.e. a 2,936 million euro decline in operating income.
On a comparable basis, the 41.9% or 2,936 million euro decline in Group operating income between 2011 and 2012 was attributable mainly to:
■
the 2,235 million euro fall in Reported EBITDA;
■
the 1,114 million euro increase in impairment of goodwill (see Note 6 to the consolidated financial statements), as a result of the recognition of:
■
in 2012, an impairment loss of 1,732 million euros primarily in connection with Poland, Egypt, Romania and, to a lesser extent, Belgium. In Poland, the goodwill impairment of 889 million euros reflects the impact on projected cash flows of increased competitive pressure on mobile and fixed line and a reduction in call termination rates. In Egypt, the 400 million euros in goodwill impairment (wholly attributed to the Group in light of the changes to the shareholders’ agreement relating to ECMS in 2012, see Note 2 to the consolidated financial statements) reflected the impact of the political and economic environment and the performance achieved in 2012 (business won back and customer base grown, but pricing pressure and a fall in tourism significantly impacting roaming revenues) associated with the fact that the discount rate (after tax) was raised from 13.0% to 14.0%. In Romania, the 359 million euros in impairment losses mainly reflected the impact on projected cash flows of i) a further reduction in mobile termination rates imposed by the regulator in 2012, and ii) a limited
ORANGE / 2013 REGISTRATION DOCUMENT - 217
presence in the multiplay offers segment. In Belgium, the 76 million euros in goodwill impairment reflected the impact on future cash flows of i) a new entrant resulting in price cuts, ii) the persistent lack of bundled packages, as well as iii) the reduction in the perpetual growth rate from 1.5% to 0.5%,
■
in 2011, 618 million euros in impairment losses, on a comparable basis in respect of Egypt and Romania. In Egypt, the 456 million euros in goodwill impairment on a comparable basis (449 million euros on a historical basis, including 286 million euros attributable to minority shareholders) reflected the impact of i) a lower level of performance in 2011 and the effect of the political and economic backdrop on anticipated business volumes, as well as ii) the raising of the discount rate (after tax) of future cash flows from 11.8% to 13.0%. In Romania, the 156 million euros in goodwill impairment reflected the impact on projected cash flows of the country’s economic situation;
■
and the 164 million euro reduction in share of profits (losses) of associates (see Note 9 to the consolidated financial statements), attributable mainly to i) the impairment of shares in Médi Télécom (mobile telephony operator in Morocco) in 2012 for 141 million euros, ii) the 53 million euro increase in the share of losses of Everything Everywhere year-on-year, and iii) conversely, the recognition of 47 million euros in impairment on shares in Sonaecom (Portuguese telecommunications operator) in 2011.
These negative items were partially offset by:
■
the 298 million euro reduction in depreciation and amortization, attributable mainly to i) the lower level of amortization of customer bases, primarily in Spain, ii) the lesser scale of the accelerated depreciation of certain fixed assets, especially in Spain and Poland, and iii) the reduced effect of asset commissioning (net of retirements and end of lives) between 2011 and 2012;
■
and the 279 million euro reduction in impairment of fixed assets on a comparable basis, mainly due to i) the recognition of an impairment loss on the Subsidiary in Armenia in 2011, and ii) a reduction between 2011 and 2012 in impairment losses relating in particular to certain subsidiaries operating in East Africa (see Note 7.2 to the consolidated financial statements).
| Financial years ended December 31 |
(in millions of euros) | 2013 | 2012
Data on a historical basis | 2011
Data on a historical basis |
Operating income | 5,288 | 4,063 | 7,948 |
Cost of gross financial debt | (1,746) | (1,769) | (2,066) |
Gains (losses) on assets contributing to net financial debt | 59 | 101 | 125 |
Foreign exchange gains (losses) | (18) | (28) | (21) |
Other net financial expenses | (45) | (32) | (71) |
Finance costs, net | (1,750) | (1,728) | (2,033) |
Income tax | (1,405) | (1,231) | (2,087) |
Consolidated net income after tax | 2,133 | 1,104 | 3,828 |
Net income attributable to owners of the parent | 1,873 | 820 | 3,895 |
Non-controlling interests | 260 | 284 | (67) |
2013 vs. 2012
The consolidated net income after tax of the Orange Group totaled 2,133 million euros in 2013, compared with 1,104 million euros in 2012, an increase of 1,029 million euros.
Between 2012 and 2013, the 1,029 million euro increase in consolidated net income after tax of the Orange Group was attributable to the 1,225 million euro increase in operating income, partially offset by;
■
the 174 million euro increase in income tax expense (see Note 12 to the consolidated financial statements), mainly in France (increase of 84 million euros) and Spain (increase of 196 million euros):
■
in France, the increase in income tax expense was chiefly attributable to the fact that tax expense in respect of 2012 financial year was reduced by the recognition of deferred tax income of 381 million euros relating to the new “Part-Time for Seniors” plan signed in December 2012 (see Section 4.3.1.4 Significant events). This effect was partially offset by the decline in the tax expense stemming from the decline in taxable income,
ORANGE / 2013 REGISTRATION DOCUMENT - 218
■
in Spain, the change in income tax expense was primarily attributable to deferred tax income recorded in 2012 corresponding to the revaluation of deferred tax assets in the amount of 110 million euros taking into account business plans deemed favorable. Between the two periods, the increase in income tax expense was also attributable to an increase in taxable income;
■
and, to a lesser extent, the 22 million euro deterioration in finance costs, net. The positive effects, relating first to the effects of the reduction in the weighted average cost of gross financial debt (1) in the amount of 201 million euros, and second to the reduction in average gross financial debt in the amount of 71 million euros, were largely offset by the negative change in the fair value of commitments to purchase non-controlling interests in the amount of 249 million euros. This change is chiefly attributable to the recognition in 2012 of financial income of 272 million euros recognized as part of the review of the financial parameters of the acquisition price of shares in ECMS from OTMT and of the free float (see Notes 2 and 10 to the consolidated financial statements).
Net income attributable to non-controlling interests amounted to 260 million euros in 2013, compared with 284 million euros in 2012 (see Note 13.6 to the consolidated financial statements). After taking into account net income attributable to non-controlling interests, net income attributable to owners of the parent totaled 1,873 million euros in 2013, compared with 820 million euros in 2012, a rise of 1,053 million euros.
2012 vs. 2011
The consolidated net income after tax of the Orange Group totaled 1,104 million euros in 2012, compared with 3,828 million euros in 2011, a decline of 2,724 million euros.
Between 2011 and 2012, the 2,724 million euro decline in the consolidated net income after tax of the Orange Group was attributable to the 3,885 million euro decline in operating income, partially offset by:
■
the 856 million euro decline in income tax expense (see Note 12 to the consolidated financial statements), mainly in France (decline of 781 million euros) and Spain (decline of 122 million euros):
■
in France, the deferred tax expense, which mainly comprised the reversal of deferred tax assets on tax loss carryforwards, was reduced in 2012 by 381 million euros in deferred tax income relating to the new “Part-Time for Seniors” plan signed in December 2012 (see Section 4.3.1.4 Significant events). Between the two periods, the reduction in income tax expense was also attributable to a decline in taxable income,
■
in Spain, deferred tax income recognized in 2012 corresponded chiefly to the revaluation of deferred tax assets in the amount of 110 million euros taking into account business plans deemed to be favorable;
■
and the 305 million euro improvement in finance costs, net (see Note 10 to the consolidated financial statements). This change was attributable mainly to the review of the financial parameters of the acquisition price of shares in ECMS from OTMT and the free float, which had resulted in the recognition of 272 million euros in financial income in 2012 (see Notes 2 and 10 to the consolidated financial statements).
Net income attributable to non-controlling interests was a profit of 284 million euros in 2012, compared with a loss of 67 million euros in 2011 (see Note 13.6 to the consolidated financial statements). Between 2011 and 2012, this 351 million euro increase mainly stemmed from Egypt in the amount of 361 million euros, largely due to i) the goodwill impairment recognized in 2011, 286 million euros of which was attributable to Mobinil/ECMS minority shareholders (see Note 6 to the consolidated financial statements), and ii) the increase in the Group’s equity interest in ECMS in 2012, having reduced the non-controlling interests in ECMS from 63.64% at December 31, 2011 to 6.08% at December 31, 2012 (see Note 2 to the consolidated financial statements).
After taking into account the net income attributable to non-controlling interests, the net income attributable to owners of the parent totaled 820 million euros in 2012, compared with 3,895 million euros in 2011, down 3,075 million euros.
The transition from consolidated net income after tax to total comprehensive income for the year is detailed in the Consolidated statement of comprehensive income in the consolidated financial statements.
The main item explaining the transition from consolidated net income after tax to total comprehensive income for the year is the change in exchange differences on translating foreign operations (this reflects changes in exchange rates between the opening and closing dates on the net assets of subsidiaries consolidated in foreign currencies, see Note 13.5 to the consolidated financial statements).
(1)
Weighted average cost of gross financial debt: Cost calculated by dividing i) the cost of gross financial debt, adjusted for the change in the fair value of commitments to buy out non-controlling interests, by ii) the average outstanding gross financial debt over the period, adjusted for amounts not bearing interest (such as liabilities related to commitments to buy out non-controlling interests and accrued but unpaid interest)
ORANGE / 2013 REGISTRATION DOCUMENT - 219
| Financial years ended December 31 |
CAPITAL EXPENDITURES ON TANGIBLE AND INTANGIBLE ASSETS (2)
(in millions of euros) | 2013 | 2012
Data on a comparable basis (1) | 2012
Data on a historical basis | Chg. (%)
Data on a comparable basis (1) | Chg. (%)
Data on a historical basis | 2011
Data on a historical basis |
CAPEX | 5,631 | 5,744 | 5,818 | (2.0)% | (3.2)% | 5,770 |
Telecommunication licenses | 486 | 944 | 945 | (48.5)% | (48.5)% | 941 |
Investments financed through finance leases | 95 | 47 | 47 | 103.6% | 102.7% | 180 |
TOTAL GROUP | 6,212 | 6,735 | 6,810 | (7.8)% | (8.8)% | 6,891 |
(1) See Section 4.3.5.1 Transition from data on a historical basis to data on a comparable basis. (2) See Segment information in the consolidated financial statements. |
Financial investments (see the Financial glossary appendix) are described in Section 4.3.4.1 Liquidity and cash flows.
2013 vs. 2012
In 2013, the CAPEX of the Orange Group totaled 5,631 million euros, down 3.2% on a historical basis and 2.0% on a comparable basis compared with 2012. The ratio of CAPEX to revenues was 13.7% in 2013, up 0.4 point on a historical basis as on a comparable basis compared with 2012.
On a historical basis, the 3.2% or 187 million euro reduction in Group CAPEX between 2012 and 2013 includes i) the adverse impact of foreign exchange fluctuations, which was 61 million euros and mainly reflects the change in the value of the Egyptian pound against the euro in the amount of 39 million euros, ii) the adverse impact of changes in the scope of consolidation and other changes in the amount of 13 million euros, and iii) organic change on a comparable basis, i.e. a decline of 113 million euros in CAPEX.
On a comparable basis, the 2.0% or 113 million euro reduction in Group CAPEX between 2012 and 2013 was attributable mainly to:
■
the 133 million euro reduction in IT investment, mainly in Poland and France, after the significant efforts made in this area in 2012;
■
the 122 million euro reduction in capital expenditure on network property, stores and other, attributable chiefly to the acquisition of buildings in France in 2012;
■
and the 33 million euro reduction in investments on customer service platforms, after significant investments in this area in 2012 (notably for New TV in France and Poland).
Between the two periods, the decline in these capital expenditures was partly offset by:
■
the 134 million euro increase in network capital expenditures (excluding telecommunication licenses), primarily comprising:
■
the big increase in investment programs in the field of high-capacity mobile broadband (LTE, up 233 million euros) and high-capacity fixed broadband (FTTH and VDSL, up 98 million euros), mainly France and Spain, and to a lesser extent in Poland and the rest of Europe (see Section 4.3.1.4 Significant events and Section 4.3.2.5.3 Investment projects). In 2013, the rollout of fiber optic in France represented a gross investment of 331 million euros,
■
partially offset by i) the completion of mobile network access upgrade programs in 2013, mainly in Spain and Belgium, ii) the reduction in mobile network access investments in Africa (Democratic Republic of Congo, Egypt, Cameroon, Mali, etc.) after significant expenditure in these countries in 2012, iii) the end of the broadband network access deployment program in Poland in 2013, under the provisions of the memorandum of understanding signed with the regulator at the end of 2009, and iv) the completion of the LION2 (Lower Indian Ocean Network 2) and ACE (Africa Coast to Europe) submarine cables in April 2012 and December 2012 respectively;
■
and the 42 million euro increase in CAPEX relating to leased handsets, Liveboxes and equipment installed on customer premises, especially in France due to the launch of the new Livebox Play line in February 2013.
2012 vs. 2011
In 2012, the CAPEX of the Orange Group totaled 5,818 million euros, down 0.8% on a historical basis and 1.7% on a comparable basis compared with 2011. The ratio of CAPEX to revenues stood at 13.4% in 2012, up 0.6 points on 2011 on both a historical basis and a comparable basis.
On a historical basis, the 0.8% increase in Group CAPEX between 2011 and 2012, a modest 48 million euro increase, reflected:
ORANGE / 2013 REGISTRATION DOCUMENT - 220
■
i) the adverse impact of changes in the scope of consolidation and other changes, amounting to 82 million euros and mainly consisting of the 101 million euro effect of the disposal of Orange Suisse on February 29, 2012, ii) partially offset by the positive effect of foreign exchange fluctuations, representing some 32 million euros;
■
and organic change on a comparable basis, i.e. a 98 million euro increase in CAPEX.
On a comparable basis, the 1.7% or 98 million euro increase in Group CAPEX between 2011 and 2012 was attributable mainly to:
■
the 44 million euro increase in network capital expenditures (excluding telecommunication licenses), primarily comprising:
■
i) the ramp-up of investment programs in high capacity mobile (LTE) and fixed-line (FTTH) broadband in France, notably with the deployment of 4G technology in four cities in 2012 and the accelerated rollout of fiber optic, with 257 million euros invested in 2012, and ii) the acceleration of plans to upgrade mobile access networks in Europe (particularly in Spain) in order to meet capacity requirements, improve service quality and cut costs (especially energy),
■
partially offset by i) lower capital expenditures on transmission, and in particular on submarine cables, following significant outlay in this field in 2011 and the completion of the LION2 (Lower Indian Ocean Network 2) submarine cable in April 2012 and the ACE (Africa Coast to Europe) submarine cable in December 2012, ii) reduced capital expenditure in Poland following substantial outlay in 2011, under a memorandum of understanding signed with the regulator at end-2009, and iii) the lower level of capital expenditure in the Rest of the World, following the completion of certain network upgrade or expansion programs (in particular in Kenya and Niger);
■
the 53 million euro increase in capital expenditures on IT, primarily in France, with the continuation of the transformation programs in order to in particular achieve the goals of improving service quality and overhauling the distribution IT system;
■
and the 51 million euro increase in capital expenditures on customer service platforms, in connection in particular with the new growth drivers (Orange Money in Africa and the Middle East, New TV in France and Poland, etc.).
Between 2011 and 2012, the increase in these capital expenditures was partially offset by the 102 million euro reduction in capital expenditures on leased terminals, Liveboxes and equipment installed on customers’ premises, especially in France, as a result in particular of the optimization of Livebox costs (process improvement, recycling, etc.).
| Financial years ended December 31 |
ACQUISITION OF TELECOMMUNICATIONS LICENSES (2)
(in millions of euros) | 2013 | 2012
Data on a comparable basis (1) | 2012
Data on a historical basis | 2011
Data on a historical basis |
Romania | 216 | 17 | 17 | - |
Belgium | 120 | - | - | 20 |
Poland | 63 | - | - | - |
France | 28 | 902 | 902 | 293 |
Spain | 22 | 1 | 1 | 580 |
Slovakia | 17 | - | - | 43 |
Egypt | 14 | - | - | - |
Moldova | 4 | 10 | 10 | - |
Other | 2 | 14 | 15 | 5 |
TOTAL GROUP | 486 | 944 | 945 | 941 |
(1) See Section 4.3.5.1 Transition from data on a historical basis to data on a comparable basis. (2) See Note 7 to the consolidated financial statements. |
Acquisitions of telecommunication licenses totaled 486 million euros in 2013, and mainly included i) the acquisition of 4G licenses in the amount of 282 million euros, of which 120 million euros in Belgium, 73 million euros in Romania and 54 million euros in Poland (purchasing the right to use T-Mobile’s 1,800 MHz frequency), and ii) the acquisition of 2G licenses in the amount of 178 million euros, of which 143 million euros in Romania (renewal of licenses, see Note 14 to the consolidated financial statements).
Acquisitions of telecommunications licenses totaled 945 million euros in 2012, and mainly included i) the acquisition of 4G licenses for 912 million euros, including the acquisition in France of a second 10 MHz duplex 4G frequency block in the 800 MHz band for 901 million euros (including contributions to the French Spectrum Redevelopment Fund (Fonds de Réaménagement du Spectre – FRS), ii) the acquisition of 2G licenses in the amount of 19 million euros, and iii) the acquisition of 3G licenses in the amount of 9 million euros.
ORANGE / 2013 REGISTRATION DOCUMENT - 221
Acquisitions of telecommunication licenses totaled 941 million euros in 2011 and mainly included i) the acquisition of 4G licenses for 758 million euros, including 447 million euros in Spain, 291 million euros in France and 20 million euros in Belgium and ii) the acquisition of 2G licenses for 181 million euros, including 132 million euros in Spain and 43 million euros in Slovakia.
Investment commitments are set out in Note 14 to the consolidated financial statements.
The Group intends to maintain a significant level of investment in the future, particularly in areas of strategic importance to it. As such, its investment projects will focus primarily on the deployment of high-capacity networks (4G and fiber optic).
The acquisition of telecommunications licenses for 4G/LTE (Long Term Evolution) mobile networks, which began in 2011 in various countries, continued in some countries in 2013 (see Section 4.3.2.5.1 Capital expenditures), and should continue in 2014 in a number of countries (notably Poland and Slovakia). In addition to these acquisitions, Orange has already deployed high-capacity mobile networks in ten countries worldwide. In the coming years, the deployment of 4G networks will continue, particularly in European countries. Ultimately, all of the Group’s European countries will have access to 4G offers before the end of 2015 (see Section 4.3.1.4 Significant events).
The rollout of networks providing broadband and high-capacity broadband Internet access is one of the Group’s top priorities. In France, Orange is committed to investing approximately 2 billion euros over the 2010-2015 period to roll out fiber optic (FTTH) in 220 cities, including all large and medium-sized cities, i.e. nearly 60% of French households, by 2015. Orange is already present in all the metropolitan areas of 60 departments (350 cities, potentially 10 million households, or a third of French households) and has already made 2.6 million households eligible for fiber optic. For the remaining 40%, Orange is open to partnerships with local authorities, providing solutions through different technologies, including fiber optic (FTTH), increases in the rate of NRAs (subscriber connection nodes), VDSL2, high-capacity mobile broadband with the H+ and 4G technologies, and satellite for houses not within reach of other technologies. In Spain, Orange signed an agreement with Vodafone in March 2013 on a joint investment for the rollout of fiber optic (FTTH). Both partners have set themselves the goal of connecting 3 million homes by 2015, and 6 million by 2017, in more than 50 cities on the Iberian Peninsula. The agreement is open to other operators wishing to invest in this type of rollout, and Orange, Vodafone and Telefonica subsequently signed an agreement on the sharing of vertical fiber optic infrastructures in buildings in July 2013. In Poland, the Group has invested in broadband and high-capacity broadband, with the continued rollout of VDSL to expand the geographical coverage of these offers, and, more selectively, the first deployment of fiber optic (FTTH).
Presentation of operating segments
The operating segments are components of the Group whose operating results based on the internal reporting are reviewed by the Chief Executive Officer (the chief operating decision-maker) in order to determine the allocation of resources and to assess the operating segments’ performance.
The reported segments are the following: France, Spain, Poland, Rest of the World, Enterprise and International Carriers & Shared Services (IC & SS), complemented by EE, the joint venture with Deutsche Telekom in the United Kingdom:
■
the France operating segment covers mobile and fixed services (fixed-line services, Internet services and carrier services) in France;
■
the Spain operating segment covers mobile and fixed services (fixed-line services and Internet services) in Spain;
■
the Poland operating segment covers mobile and fixed services (fixed-line services, Internet services and carrier services) in Poland;
■
the Rest of the World reported segment covers mobile and fixed services (fixed-line services, Internet services and carrier services) in other countries in Europe, Africa and the Middle East, namely in Belgium, Botswana, Cameroon, Ivory Coast, Egypt, Guinea, Jordan, Kenya, Luxembourg, Madagascar, Mali, Moldova, Niger, Dominican Republic, Romania, Senegal, Slovakia and Switzerland (until February 29, 2012, the date of disposal of Orange Suisse, see Note 2 to the consolidated financial statements);
■
the Enterprise operating segment covers communication solutions and services for businesses in France and worldwide;
■
the International Carriers & Shared Services operating segment (hereinafter referred to as IC & SS) covers i) the roll-out of the international and long-distance network, installation and maintenance of submarine cables, and sales and services to international carriers, and ii) shared services including support and cross-divisional functions spanning the entire Group, the new growth operations (Content rights, Audience) and the Orange brand. For the most part, shared services are rebilled to other operating segments through brand royalties, Group services and special case-by-case rebilling. This operating segment also covers the share of net income from EE in the United Kingdom, accounted for under the equity method.
ORANGE / 2013 REGISTRATION DOCUMENT - 222
Each of the segments defined by the Group has its own resources, although they may also share certain resources, primarily in the areas of networks, information systems, research and development, and other shared competencies. The use of shared resources, mainly provided by International Carriers & Shared Services (IC & SS) and by France to Enterprise, is taken into account in segment results based either on the terms of contractual agreements between legal entities, or external benchmarks, or by reallocating costs. The provision of shared resources is recognized in other income of the service provider, and the use of said resources is included in the expenses used to calculate the service user’s Reported EBITDA. The cost of shared resources may be affected by changes in contractual relations or organization, and may therefore impact the segment results reported from one year to another.
See Segment Information in the consolidated financial statements and Note 18 to the consolidated financial statements.
Operating data by operating segment
The three tables below show the key operating data (financial data and workforce) for the Orange Group by operating segment for i) 2013, ii) 2012 on a comparable basis (compared with 2011) and on a historical basis, and iii) 2011 on a comparable basis (compared with 2010) and on a historical basis.
ORANGE / 2013 REGISTRATION DOCUMENT - 223
Financial years ended December 31
(in millions of euros)
2013 | France | Spain | Poland |
Revenues | 20,018 | 4,052 | 3,079 |
Reported EBITDA | 6,760 | 1,038 | 937 |
Operating income | 4,201 | 460 | 201 |
CAPEX | 2,833 | 562 | 457 |
Telecommunication licenses | 28 | 22 | 63 |
Average number of employees | 74,267 | 3,842 | 21,214 |
2012 - DATA ON A COMPARABLE BASIS (vs. 2013) (1) | | | |
Revenues | 21,425 | 4,027 | 3,369 |
Reported EBITDA | 6,668 | 951 | 1,155 |
Operating income | 4,238 | 169 | (485) |
CAPEX | 2,712 | 473 | 558 |
Telecommunication licenses | 902 | 1 | - |
Average number of employees | 76,684 | 3,406 | 23,096 |
2012 - DATA ON A HISTORICAL BASIS | | | |
Revenues | 21,431 | 4,027 | 3,381 |
Reported EBITDA | 6,763 | 951 | 1,156 |
Operating income | 4,306 | 169 | (505) |
CAPEX | 2,712 | 473 | 558 |
Telecommunication licenses | 902 | 1 | - |
Average number of employees | 76,753 | 3,406 | 22,700 |
2011 - DATA ON A COMPARABLE BASIS (vs. 2012) (1) | | | |
Revenues | 22,560 | 3,989 | 3,526 |
Reported EBITDA | 8,615 | 840 | 1,115 |
Operating income | 6,283 | (168) | 233 |
CAPEX | 2,620 | 405 | 610 |
Telecommunication licenses | 293 | 580 | - |
Average number of employees | 77,409 | 3,073 | 23,599 |
2011 - DATA ON A HISTORICAL BASIS | | | |
Revenues | 22,534 | 3,993 | 3,625 |
Reported EBITDA | 8,569 | 839 | 1,347 |
Operating income | 6,241 | (168) | 443 |
CAPEX | 2,619 | 405 | 627 |
Telecommunication licenses | 293 | 580 | - |
Average number of employees | 77,611 | 3,089 | 24,119 |
(1) See Section 4.3.5.1 Transition from data on a historical basis to data on a comparable basis. |
ORANGE / 2013 REGISTRATION DOCUMENT - 224
| Rest of the World | Enterprise | International Carriers & Shared Services | Eliminations | Total Group | EE joint venture (100%) |
| 7,792 | 6,513 | 1,702 | (2,175) | 40,981 | 7,632 |
| 2,511 | 1,004 | (15) | - | 12,235 | 1,546 |
| 351 | 642 | (567) | - | 5,288 | (1) |
| 1,163 | 311 | 305 | - | 5,631 | 686 |
| 373 | - | - | - | 486 | 731 |
| 26,147 | 20,859 | 13,186 | - | 159,515 | nc |
| | | | | | |
| 7,829 | 6,881 | 1,618 | (2,219) | 42,930 | nd |
| 2,664 | 1,139 | (288) | - | 12,289 | nd |
| 253 | 772 | (886) | - | 4,061 | nd |
| 1,238 | 347 | 416 | - | 5,744 | nd |
| 41 | - | - | - | 944 | nd |
| 25,955 | 21,118 | 13,281 | - | 163,540 | nd |
| | | | | | |
| 8,281 | 7,001 | 1,623 | (2,229) | 43,515 | 8,207 |
| 2,893 | 1,134 | (402) | - | 12,495 | 1,338 |
| 332 | 763 | (1,002) | - | 4,063 | (207) |
| 1,308 | 352 | 415 | - | 5,818 | 751 |
| 42 | - | - | - | 945 | - |
| 26,013 | 21,387 | 13,286 | - | 163,545 | nc |
| | | | | | |
| 8,164 | 7,196 | 1,585 | (2,317) | 44,703 | nd |
| 2,817 | 1,284 | 59 | - | 14,730 | nd |
| 492 | 937 | (778) | - | 6,999 | nd |
| 1,365 | 362 | 358 | - | 5,720 | nd |
| 68 | - | - | - | 941 | nd |
| 26,290 | 21,138 | 13,492 | - | 165,001 | nd |
| | | | | | |
| 8,795 | 7,101 | 1,610 | (2,381) | 45,277 | 7,817 |
| 2,993 | 1,276 | 105 | - | 15,129 | 1,349 |
| 595 | 940 | (103) | - | 7,948 | (78) |
| 1,409 | 343 | 367 | - | 5,770 | 633 |
| 68 | - | - | - | 941 | - |
| 26,650 | 21,114 | 12,950 | - | 165,533 | nc |
ORANGE / 2013 REGISTRATION DOCUMENT - 225
| Financial years ended December 31 |
FRANCE
(in millions of euros) | 2013 | 2012
Data on a comparable basis (1) | 2012
Data on a historical basis | Chg. (%)
Data on a comparable basis (1) | Chg. (%)
Data on a historical basis | 2011
Data on a historical basis |
Revenues | 20,018 | 21,425 | 21,431 | (6.6)% | (6.6)% | 22,534 |
Reported EBITDA | 6,760 | 6,668 | 6,763 | 1.4% | (0.0)% | 8,569 |
Reported EBITDA/Revenues | 33.8% | 31.1% | 31.6% | | | 38.0% |
Operating income | 4,201 | 4,238 | 4,306 | (0.9)% | (2.4)% | 6,241 |
Operating income/Revenues | 21.0% | 19.8% | 20.1% | | | 27.7% |
CAPEX | 2,833 | 2,712 | 2,712 | 4.5% | 4.5% | 2,619 |
CAPEX/Revenues | 14.1% | 12.7% | 12.7% | | | 11.6% |
Average number of employees | 74,267 | 76,684 | 76,753 | (3.2)% | (3.2)% | 77,611 |
(1) See Section 4.3.5.1 Transition from data on a historical basis to data on a comparable basis. |
2013 vs. 2012
In France, revenues totaled 20,018 million euros in 2013, down 6.6% compared with 2012 on both a historical and a comparable basis.
On a historical basis, the 6.6% or 1,413 million euro decline in revenues in France was attributable to i) the adverse impact of changes in the scope of consolidation (6 million euros) and above all ii) organic change on a comparable basis, i.e. 1,407 million euro decline in revenues.
On a comparable basis, the 6.6% or 1,407 million euro decline in revenues between 2012 and 2013, was mainly attributable to i) rate cuts in inter-operator mobile termination, in mobile data transmission from abroad, as well as in Internet access rates on wholesale markets to the benefit of alternative operators, and ii) heightened competition following the arrival of the fourth mobile operator on the French market.
Excluding the effect of the fall in regulated prices, revenues would have been down 4.8% between 2012 and 2013 on a comparable basis.
Mobile services – France
Revenues from Mobile services (see the Financial glossary appendix) in France totaled 8,348 million euros in 2013, down 10.3% compared with 2012 on both a historical and a comparable basis, representing a 957 million euro decline.
Excluding the effect of the fall in regulated prices, revenues from Mobile services would have been down 7.0% on both a historical and a comparable basis, attributable to i) the effect of price reductions stemming from the recasting of the segmented Sosh, Open and Origami offers, ii) partially offset by the growth in Internet browsing and the development of national roaming.
Mobile ARPU (see the Financial glossary appendix) was down 11.5% (8.0% excluding the effect of the fall in regulated prices) between 2012 and 2013.
The Mobile customer base stood at 27.0 million customers as of December 31, 2013, down slightly by 0.6% compared with 2012, due to the decline of prepaid offers. Offers with contracts totaled 20.9 million customers as of December 31, 2013, up 5.9% year-on-year, now representing 77.2% of the mobile customer base, versus 72.5% one year earlier.
Bipolarization of the market between entry-level offers and high-end offers continued, with rapid development of Sosh online offers (totaling 1.8 million customers as of December 31, 2013) and the Open quadruple play offers (which totaled 4.7 million customers as of the same date). In parallel, prepaid offers (6.1 million customers as of December 31, 2013) posted a decrease of 17.8% year-on year.
Fixed-line services – France
Revenues from Fixed-line services (see the Financial glossary appendix) in France totaled 10,613 million euros in 2013, down 3.6% compared with 2012 on both a historical and a comparable basis, representing a 391 million euro decline. Excluding the effect of the fall in regulated prices, revenues would have been down 2.9% between 2012 and 2013 on a comparable basis.
Consumer fixed-line services
Revenues from Fixed-line services totaled 6,923 million euros in 2013, down 5.9% compared with 2012 on both a historical and comparable basis, representing a 434 million euro decline.
Year-on-year, this decline was attributable to the 12.8% reduction in the Switched Telephone Network (STN) business, reflecting i) the downward trend in fixed-line telephony, as a result of the development of VoIP services and rate cuts, ii) partially offset by growth in fixed-line broadband services.
ORANGE / 2013 REGISTRATION DOCUMENT - 226
Between 2012 and 2013, the 0.3% negative trend in revenues from fixed-line broadband services was attributable to:
■
the 2.7% decline of fixed broadband ARPU (see the Financial glossary appendix) between 2012 and 2013, affected by the increasing penetration of quadruple play and Open which benefit from some of the rate cuts. In parallel, digital television (IPTV and satellite offers) that totaled 5.6 million customers as of December 31, 2013, and content consumption (VOD, SVOD) posted a raise, offsetting the decline of the out-of-bundle VoIP;
■
partially offset by the 2.2% growth of the fixed broadband customer base, up 215,000 year-on-year, totaling 10.1 million customers as of December 31, 2013, with an estimated conquest share around 24% on broadband and high-speed broadband in 2013, driven by good commercial performances of the Open offers (3.4 million offers in 2013) and by the launch of Livebox Play.
Fixed-line Carrier Services
Revenues from Fixed-line Carrier Services totaled 3,690 million euros in 2013, up 1.2% compared with 2012 on both a historical and a comparable basis. Excluding the effect of the fall in regulated prices, revenues would have been up 2.9% between 2012 and 2013, on both a historical and comparable basis, following a 6.0% increase year-on-year of the number of telephone lines sold to other operators.
2012 vs. 2011
On a historical basis, the 4.9% or 1,103 million euro decline in revenues in France between 2011 and 2012, was attributable i) to organic change on a comparable basis, namely a 1,129 million euro reduction in revenues, ii) partially offset by the positive effect of changes in the scope of consolidation and other changes, amounting to 26 million euros, mainly due to the full consolidation of Compagnie Européenne de Téléphonie (CET) / Générale de Téléphone (Photo Service and Photo Station distribution networks).
On a comparable basis, the 5% or 1,129 million euro decline in revenues in France between 2011 and 2012, was attributable to i) to a large extent to cuts in inter-operator mobile call termination rates and wholesale Internet access charges to the benefit of alternative operators; and ii) to the impact of various price adjustments as a result of heightened competition following the arrival of the 4th mobile operator (Free Mobile) in the French market. Excluding the effect of the fall in regulated prices, revenues would have been down 2.3% between 2011 and 2012 on a comparable basis.
Mobile services – France
In France, revenues from Mobile services totaled 9,305 million euros in 2012, down 5.4% compared with 2011, representing a decline of 526 million euros.
Network development and sales growth built on a strategy of segmented offers at the top-end of the market and entry-level made it possible to minimize the negative effects due in particular to i) reductions in, on the one hand, mobile Voice call termination rates in mid-2011 and again in January and July 2012 and, on the other hand, in SMS termination rates in mid-2011 and in 2012, ii) heightened competition following the arrival of the 4th mobile operator in the French market, and iii) the impact of various price revisions to consumer offers (Sosh, Open and Origami). These negative impacts are partially offset by revenues related to the national 2G and 3G mobile roaming agreement signed with Free Mobile in March 2011.
The share of contract customers in the overall customer mix amounted to 72.5% at December 31, 2012 compared with 71.8% a year earlier. This increase was driven by accelerated smartphone usage, the success of the Origami and Open offers (3 million customers on Open offers at December 31, 2012 compared with 1.2 million customers at December 31, 2011) and the success of the Sosh brand (794,000 customers at December 31, 2012 compared with 28,000 at December 31, 2011). In parallel, the share of prepaid offers edged down 0.7 points to 27.5%. At December 31, 2012 the number of Orange mobile customers edged up 0.4% year-on-year to 27,190 million customers, compared with 27,090 million at December 31, 2011. The commercial strategy built around offer segmentation made it possible to preserve the mobile customer base.
Excluding the effect of the fall in regulated prices, Mobile ARPU would have been down 0.4% between 2011 and 2012, affected by price adjustments as a result of heightened competition. The reduction in Voice mobile ARPU was partially offset by the increase in Non-Voice mobile ARPU, driven by the continued increase in offers combining voice and multimedia usage, in line with the development of 3G dongles and smartphones.
Fixed-line services – France
Revenues from Fixed-line services totaled 11,004 million euros in 2012, down 4.7% compared with 2011 on a comparable basis, representing a 543 million euro decline. Excluding the effect of the fall in regulated prices, revenues would have been down 3.6% between 2011 and 2012.
Consumer fixed-line services
Revenues from Consumer fixed-line services totaled 7,357 million euros in 2012, down 5.8% compared with 2011 on a comparable basis. This decline was attributable to the 14.4% reduction in the Switched Telephone Network (STN) business, reflecting i) the downward trend in fixed-line telephony as a result, on the one hand, of the development of VoIP services and, on the other, of rate cuts, ii) partially offset by continued growth in fixed-line broadband services.
ORANGE / 2013 REGISTRATION DOCUMENT - 227
Between 2011 and 2012, the growth in revenues of fixed-line broadband services was attributable to:
■
3.1% growth year-on-year in the number of fixed broadband customers, representing an increase of 295,000 new customers to 9.9 million customers as of December 31, 2012. The fixed broadband customer base notably includes 176,000 fiber optic customers as at December 31, 2012, up 81,000 year-on-year. Year-on-Year, fixed broadband ARPU was down 1.2% to 34.7 euros as at December 31, 2012, impacted by the increased penetration of the quadruple play and Open offers which benefit from some of the rate cuts;
■
and the growth in digital television (IPTV and satellite offers), with 5.1 million customers as of December 31, 2012, up 15.8% year-on-year.
Fixed-line Carrier Services
Revenues from fixed-line Carrier Services stood at 3,647 million euros in 2012, down 2.4% compared with 2011 on a comparable basis. This trend was attributable mainly to:
■
cuts to regulated wholesale rates in September 2011 and February 2012, the fall in interconnection traffic, and the slowdown in public-private partnerships and outsourced public service contracts;
■
offset by growth in the full unbundling of telephone lines, by the increased roll-out of AIRCOM (Accès Intégrés Réseaux Capillaires Opérateurs Mobiles, a collection service offer linking transmission services offered for certain portions of mobile operator networks) transmission links, as well as increased wholesale line rental.
2013 vs. 2012
In France, Reported EBITDA totaled 6,760 million euros in 2013 remaining stable on a historical basis, and up 1.4% on a comparable basis, compared with 2012.
On a historical basis, the 3 million euro reduction in Reported EBITDA in France includes i) the 95 million euro negative impact from the allocation to the France operating segment of the expense corresponding to the contributions for non-common risks (notably unemployment) for Orange civil servants, recognized in 2012 in the International Carriers & Shared Services segment, ii) organic change on a comparable basis, i.e. a 92 million euro increase in Reported EBITDA.
On a comparable basis, the 1.4% or 92 million euro increase in Reported EBITDA in France is mainly attributable to the fact that between 2012 and 2013 the 1,407 million euro decline in revenues was more than offset by the 1,498 decline in operating expenses included in Reported EBITDA. This sharp decline is mainly attributable:
■
to the 930 million euro reduction in the expense for the “Part-Time for Seniors” plan in France, to 130 million euros in 2013 from 1,060 million euros in 2012, mainly as a result of the new agreements signed in December 2012 on the employment of senior workers (see Section 4.3.1.4 Significant events);
■
to the 332 million euro reduction in commercial expenses and costs of content rights in connection with savings made thanks to, on the one hand, the policy aiming to optimize handset subsidies and commissions paid, and on the other, the development of the unsubsidized market;
■
to the 186 million euro reduction in service fees and inter-operator costs, mainly as a result of the positive effect of the fall in regulated prices on interconnection costs;
■
to optimizations of intervention and customer service processes leading to 250 million euro savings in labor expenses, in outsourcing (call centers, technical operation and maintenance) and in overhead costs;
■
partially reduced by the 205 million increase in restructuring costs.
2012 vs. 2011
On a historical basis, the 21.1% or 1,806 million euro reduction in Reported EBITDA in France between 2011 and 2012, reflected i) the positive impact of changes in the scope of consolidation and other changes, amounting to 46 million euros and mainly comprising the transfer of various functions to the International Carriers & Shared Services operating segment, and ii) organic change on a comparable basis, representing a reduction of 1,852 million euros in Reported EBITDA.
On a comparable basis, the 21.5% or 1,852 million euro reduction in Reported EBITDA in France between 2011 and 2012 is attributable to i) a 1,129 million euro decline in revenues, related to the negative effect of the fall in regulated prices and the decline in the Public Switched Telephone Network (PSTN) customer base, ii) a 1,002 million euro increase in the expense for the “Part-Time for Seniors” plan in France, mainly as a result of the new agreements signed in December 2012 on the employment of senior workers (see Section 4.3.1.4 Significant events, iii) partially offset by the 295 million euro decline in service fees and inter-operator costs (impact of higher traffic, in particular of SMSs, largely offset by the positive effect of the fall in regulated prices on interconnection costs), and to 134 million in savings in commercial expenses connected to the policy aiming to optimize handset subsidies.
ORANGE / 2013 REGISTRATION DOCUMENT - 228
2013 vs. 2012
In France, operating income totaled 4,201 million euros in 2013, down 2.4% on a historical basis and down 0.9% on a comparable basis.
On a historical basis, the 105 million euro decline in operating income in France is mainly attributable:
■
to the negative effect of changes in the scope of consolidation amounting to 68 million euros and mainly comprising i) the 95 million euro negative impact from the allocation to the France operating segment of the expense corresponding to the contributions for non-common risks (notably unemployment) for Orange civil servants, recognized in 2012 in the International Carriers & Shared Services segment, and ii) the 26 million euro positive impact due to the disposal of Cityvox on March 13, 2013;
■
organic change on a comparable basis, i.e. a 37 million euro decline in operating income.
On a comparable basis, the 0.9% or 37 million euro decline in operating income in France between 2012 and 2013 was attributable mainly i) to the 107 million euro increase in the depreciation and amortization expense, in connection with the higher CAPEX, and to the 21 million euro increase in the impairment of fixed assets, ii) partially offset by the 92 million euro increase in Reported EBITDA.
2012 vs. 2011
On a historical basis, the 31.0% or 1,935 million euro reduction in operating income in France between 2011 and 2012, reflected i) the positive impact of changes in the scope of consolidation and other changes, amounting to 42 million euros and mainly comprising the transfer of various functions to the International Carriers & Shared Services operating segment, and ii) organic change on a comparable basis, representing a reduction of 1,977 million euros in operating income.
On a comparable basis, the 31.5% or 1,977 million euro reduction in operating income in France between 2011 and 2012, was attributable mainly to the 1,852 million euro reduction in Reported EBITDA, and the 98 million euro increase in the depreciation and amortization expense in connection with the higher CAPEX.
2013 vs. 2012
In France, CAPEX totaled 2,833 million euros in 2013, up 4.5% compared with 2012 on both a historical and a comparable basis.
On both a historical basis and a comparable basis the 121 million euro growth in CAPEX stemmed from a significant increase in investment in networks, mainly due to the growing importance of investment programs in high capacity mobile (LTE) and fixed-line (FTTH) broadband, notably with over 4,200 sites covered by 4G covering 50% of the French population as at January 7, 2014 (see Sections 4.3.1.4 Significant events and 4.3.2.5.3 Investment projects).
2012 vs. 2011
On a historical basis, CAPEX in France rose 3.6% between 2011 and 2012.
On a comparable basis, the 3.5% or 92 million euro increase in CAPEX in France between 2011 and 2012 is attributable to:
■
a significant increase in investment in networks, mainly due to i) the growing importance of investment programs in high capacity mobile (LTE) and fixed-line (FTTH) broadband in France, with four cities covered by 4G (Marseilles, Nantes, Lille and Lyon) as at December 31, 2012, and ii) increased investments in mobile capacity;
■
an increase in capital expenditures on IT in order to in particular achieve the goals of improving service quality and upgrading the distribution IT system;
■
partially offset by the reduction in capital expenditures on leased terminals and Livebox, as a result in particular of the optimization of Livebox costs (process improvement, recycling).
Acquisitions of telecommunications licenses in France in 2013 totaled 28 million euros and mainly reflected the reorganization of spectrums due to the roll-out of 4G antennae.
Acquisitions of telecommunication licenses in France totaled 902 million euros in 2012, and mainly reflected the acquisition of a second 10 MHz duplex frequency block in the 800 MHz band, allocated to the high-speed mobile broadband network (4G).
Acquisitions of telecommunication licenses in France totaled 293 million euros in 2011, and mainly reflected the acquisition of a 20 MHz duplex frequency block in the 2.6 GHz band, allocated to the high-speed mobile broadband network (4G) for 291 million euros.
ORANGE / 2013 REGISTRATION DOCUMENT - 229
| Financial years ended December 31 |
FRANCE | 2013 | 2012
Data on a comparable basis (1) | 2012
Data on a historical basis | Chg. (%)
Data on a comparable basis (1) | Chg. (%)
Data on a historical basis | 2011
Data on a historical basis |
Revenues (2) (3) | 20,018 | 21,425 | 21,431 | (6.6)% | (6.6)% | 22,534 |
Mobile services | 8,348 | 9,305 | 9,305 | (10.3)% | (10.3)% | 9,828 |
Sales of mobile devices | 538 | 559 | 559 | (3.7)% | (3.7)% | 522 |
Fixed-line services | 10,613 | 11,004 | 11,004 | (3.6)% | (3.6)% | 11,544 |
Consumer fixed-line services | 6,923 | 7,357 | 7,357 | (5.9)% | (5.9)% | 7,806 |
Fixed-line Carrier Services | 3,690 | 3,647 | 3,647 | 1.2% | 1.2% | 3,738 |
Other revenues | 519 | 557 | 563 | (6.9)% | (7.9)% | 640 |
Mobile services | | | | | | |
Number of mobile customers (4) (5) | 27,014 | 27,190 | 27,190 | (0.6)% | (0.6)% | 27,090 |
Number of contract customers | 20,861 | 19,704 | 19,704 | 5.9% | 5.9% | 19,453 |
Number of prepaid customers | 6,153 | 7,486 | 7,486 | (17.8)% | (17.8)% | 7,638 |
Mobile ARPU (in euros) (3) | 295 | 333 | 333 | (11.4)% | (11.4)% | 366 |
Mobile AUPU (in minutes) (3) | 224 | 206 | 206 | 8.7% | 8.7% | 193 |
Fixed-line services | | | | | | |
Consumer fixed-line services | | | | | | |
Number of Consumer telephone lines (4) (6) | 17,126 | 17,623 | 17,623 | (2.8)% | (2.8)% | 18,548 |
o/w Number of naked ADSL accesses | 6,251 | 5,588 | 5,588 | 11.9% | 11.9% | 4,744 |
o/w Number of FTTH, Satellite and Other | 359 | 209 | 209 | 72.1% | 72.1% | 123 |
Number of broadband Internet customers (4) | 10,108 | 9,893 | 9,893 | 2.2% | 2.2% | 9,598 |
Number of VoIP service customers (4) | 8,722 | 8,366 | 8,366 | 4.2% | 4.2% | 8,030 |
Number of customers with IPTV and satellite offers (4) | 5,619 | 5,067 | 5,067 | 10.9% | 10.9% | 4,374 |
Fixed broadband ARPU (in euros) (3) | 33.8 | 34.7 | 34.7 | (2.6)% | (2.6)% | 35.1 |
Fixed-line Carrier Services | | | | | | |
Number of Carrier telephone lines (4) (6) | 13,161 | 12,577 | 12,577 | 4.6% | 4.6% | 11,428 |
o/w Number of fully unbundled telephone lines | 10,805 | 10,004 | 10,004 | 8.0% | 8.0% | 8,886 |
(1) See Section 4.3.5.1 Transition from data on a historical basis to data on a comparable basis. (2) In millions of euros. Breakdown of revenues in external data (see Financial glossary appendix). (3) See the Financial glossary appendix. (4) In thousands. At end of period. (5) Excluding customers of mobile virtual network operators (MVNOs). (6) This figure includes (i) standard analog lines (excluding fully unbundled lines) and Numeris (ISDN) channels, each Numeris channel being recognized as a line, (ii) lines without narrowband (naked ADSL) telephone subscriptions sold directly by Orange to its Consumer customers, and (iii) Fiber optic (FTTH), satellite and other accesses. |
| Financial years ended December 31 |
SPAIN
(in millions of euros) | 2013 | 2012
Data on a comparable basis (1) | 2012
Data on a historical basis | Chg. (%)
Data on a comparable basis (1) | Chg. (%)
Data on a historical basis | 2011
Data on a historical basis |
Revenues | 4,052 | 4,027 | 4,027 | 0.6% | 0.6% | 3,993 |
Reported EBITDA | 1,038 | 951 | 951 | 9.2% | 9.2% | 839 |
Reported EBITDA/Revenues | 25.6% | 23.6% | 23.6% | | | 21.0% |
Operating income | 460 | 169 | 169 | 172.2% | 172.2% | (168) |
Operating income/Revenues | 11.3% | 4.2% | 4.2% | | | (4.2)% |
CAPEX | 562 | 473 | 473 | 18.8% | 18.8% | 405 |
CAPEX/Revenues | 13.9% | 11.8% | 11.8% | | | 10.1% |
Average number of employees | 3,842 | 3,406 | 3,406 | 12.8% | 12.8% | 3,089 |
(1) See Section 4.3.5.1 Transition from data on a historical basis to data on a comparable basis. |
ORANGE / 2013 REGISTRATION DOCUMENT - 230
2013 vs. 2012
In Spain, revenues totaled 4,052 million euros in 2013, up 0.6% compared with 2012 on both a historical and a comparable basis.
Between 2012 and 2013, the 25 million euro increase in revenues in Spain, on both a historical and a comparable basis, was mainly attributable to i) the 112.5% or 187 million euro growth in sales of mobile devices, driven by the success of handset sales with staggered payments launched in the 2nd quarter of 2013 at the same time as the SIM-only offers (mobile offers without handsets), and ii) the 12.5% or 93 million euro increase in Fixed-line service revenues, iii) partially offset by the 249 million euro decrease in revenues from Mobile services, i.e. down 8.0%.
This improvement takes place against a backdrop of economic recession in Spain, with estimated GDP down 1.3% in 2013 (according to the IMF - the International Monetary Fund), and a telecommunications market down 8.1% in 2013 (according to estimates from the INE, the Spanish National Statistics Institute).
Excluding the effect of the fall in regulated prices, revenues would have been down 4.4% between 2012 and 2013 on both a historical and a comparable basis.
Mobile services – Spain
In Spain, revenues from Mobile Services totaled 2,843 million euros in 2013, down 8.0% compared with 2012 on both a historical and a comparable basis, representing a 249 million euro decline. Excluding the effect of the fall in regulated prices, Mobile service revenues would have been down 3.6% between 2012 and 2013 on both a historical and a comparable basis.
The 13.1% decline of mobile ARPU between December 31, 2012 and December 31, 2013 was attributable to the success of the SIM-only offers (mobile offers without handsets) and convergence offers such as Canguro.
At December 31, 2013, the mobile customer base stood at 12.4 million customers, up 4.5% compared with 2012. The share of contract customers stood at 72.3% of the mobile customer base as at December 31, 2013, up 10.4% compared with December 31, 2012.
Fixed-line services – Spain
In Spain, revenues from Fixed-line services totaled 842 million euros in 2013, up 12.5% compared with 2012 on both a historical and a comparable basis, representing a 93 million euro growth.
This improvement was driven by fixed-line broadband service revenues, which were up 10.3% year-on-year. The fixed broadband customer base reached 1.7 million customers as at December 31, 2013, up 21.2% year-on-year, in particular thanks to the net acquisition of new ADSL customers, up 127% compared with December 31, 2012.
At December 31, 2013, the convergence offers customers accounted for 67% of the fixed broadband customer base, against 38% in 2012, thanks to the launch of the Canguro convergence offers, associating mobile and ADSL.
2012 vs. 2011
On both a historical basis and a comparable basis, revenues in Spain rose 0.9% between 2011 and 2012. This improvement takes place against a backdrop of economic recession in Spain, GDP having dropped 1.6% in 2012 according to the International Monetary Fund (IMF). Excluding the effect of the fall in regulated prices, revenues in Spain would have risen 3.6% between 2011 and 2012 on both a historical and a comparable basis.
Mobile services – Spain
In Spain, revenues from Mobile Services totaled 3,092 million euros in 2012, down 2.4% compared with 2011 on both a historical and a comparable basis.
Excluding the effect of the fall in regulated prices, Mobile services rose 0.8% between 2011 and 2012 which reflects:
■
a 1.5% increase in the total number of customers over the year to 11.8 million customers at December 31, 2012. The increase was driven by year-on-year growth of 6.4%, or 0.5 million people, in the number of new contract customers;
■
growth in Non-Voice service revenues (excluding SMS and MMS), driven by the strong growth in Internet browsing for mobile telephony. The number of customers with mobile Internet offers increased 87.2% compared with December 31, 2011 to 4.5 million users at December 31, 2012. In total, revenues from Non-Voice services rose 17.7% between 2011 and 2012;
■
and the 20.9% year-on-year increase in the number of customers of hosted Mobile Virtual Network Operators (MVNO), which stood at 1.8 million customers at December 31, 2012.
Fixed-line services – Spain
In Spain, revenues from Fixed-line services totaled 749 million euros, up 9.4% between 2011 and 2012 on both a historical and a comparable basis, representing a 65 million euro growth. This increase resulted primarily from growth in fixed broadband service revenues, which increased by 14.1% year-on-year, driven by:
■
the sustained growth of the fixed broadband customer base, rising 10.3% between 2011 and 2012 (net increase of 131,000 customers) thanks to strong sales;
ORANGE / 2013 REGISTRATION DOCUMENT - 231
■
the increase in the penetration rate of unbundled services, which represented 67.7% of the total number of ADSL customers as at December 31, 2012, an increase of 6.3 points year-on-year;
■
and a 2.0% increase in fixed broadband ARPU to 33.0 euros at December 31, 2012. This increase was attributable to growth in the number of VoIP service customers.
2013 vs. 2012
In Spain, Reported EBITDA totaled 1,038 million euros in 2013, rising 9.2% on both a historical and a comparable basis, representing growth of 87 million euros compared with 2012.
The 87 million euro improvement in Reported EBITDA between 2012 and 2013 mainly arises from:
■
i) the 63 million euro reduction in other operating expense (net of other operating income), ii) the 57 million euro drop in service fees and inter-operator costs, and iii) the 25 million euro increase in revenues;
■
partially offset i) by the 23 million euro increase in labor expenses, ii) by a 18 million euro growth in commercial expenses, and iii) by a 13 million rise in operating taxes and levies.
2012 vs. 2011
On both a historical basis and a comparable basis, Reported EBITDA in Spain increased by 13.3% between 2011 and 2012 to 951 million euros in 2012. Year-on-year, this 111 million euro increase was attributable mainly to i) the 84 million euro reduction in external purchases, primarily due to a decrease in commercial expenses and a reduction in service fees and inter-operator costs, and ii) the 38 million euro increase in revenues.
2013 vs. 2012
In Spain, operating income stood at 460 million euros in 2013, an improvement of 291 million euros on both a historical and a comparable basis compared with 2012.
This 291 million euro improvement in operating income between 2012 and 2013 was mainly attributable to i) the 196 million euro reduction in depreciation and amortization, mainly due to the end of the amortization relating to the fall in the number of contract customers in May 2012 and ii) the 87 million euro increase in Reported EBITDA.
2012 vs. 2011
Operating income in Spain stood at 169 million euros in 2012, compared with (168) million euros in 2011 on both a historical and a comparable basis. This 337 million euro improvement year-on-year, was mainly attributable i) to the 111 million euro improvement in Reported EBITDA, as well as ii) the 230 million euro decrease in depreciation and amortization, mainly due to the end of contract customer bases in May 2012.
2013 vs. 2012
In Spain, CAPEX totaled 562 million euros in 2013, up 18.8%, compared with 2012 on both a historical and a comparable basis, representing an increase of 89 million euros.
This growth in CAPEX between 2012 and 2013 is mainly related to the accelerated roll out of high capacity broadband (4G and fiber optic) in Spain (see Sections 4.3.1.4 Significant events and 4.3.2.5.3 Investment projects).
2012 vs. 2011
On both a historical basis and a comparable basis, CAPEX in Spain increased by 68 million euros between 2011 and 2012 to 473 million euros. The sharp increase in CAPEX was designed to meet growing capacity requirements, through increasing network capacity and upgrading the wireless access network.
In 2013, acquisitions of telecommunication licenses in Spain totaled 22 million euros and mainly concerned the extension of the license for the 900 MHz frequency.
Acquisitions of telecommunication licenses in Spain totaled 1 million euros in 2012
Acquisitions of telecommunication licenses in Spain totaled 580 million euros in 2011. They reflected the acquisition of blocks of 10 MHz of frequencies in the 800 MHz band, of 5 MHz in the 900 MHz band, and of 10 MHz and 20 MHz in the 2.6 GHz band. These acquisitions were made in connection with the reallocation of the radio spectrum by the Spanish authorities through a public tender. The amount allocated to the high capacity-broadband mobile network (4G frequencies, i.e. 800 MHz and 2.6 GHz) totaled 447 million euros.
ORANGE / 2013 REGISTRATION DOCUMENT - 232
| Financial years ended December 31 |
SPAIN | 2013 | 2012
Data on a comparable basis (1) | 2012
Data on a historical basis | Chg. (%)
Data on a comparable basis (1) | Chg. (%)
Data on a historical basis | 2011
Data on a historical basis |
Revenues (2) (3) | 4,052 | 4,027 | 4,027 | 0.6% | 0.6% | 3,993 |
Mobile services | 2,843 | 3,092 | 3,092 | (8.0)% | (8.0)% | 3,166 |
Sales of mobile devices | 354 | 167 | 167 | 112.5% | 112.5% | 119 |
Fixed-line services | 842 | 749 | 749 | 12.5% | 12.5% | 684 |
Other revenues | 13 | 19 | 19 | (33.1)% | (33.1)% | 24 |
Mobile services | | | | | | |
Number of mobile customers (4) (5) (6) | 12,377 | 11,839 | 11,839 | 4.5% | 4.5% | 11,662 |
Number of contract customers | 8,945 | 8,100 | 8,100 | 10.4% | 10.4% | 7,616 |
Number of prepaid customers (6) | 3,433 | 3,739 | 3,739 | (8.2)% | (8.2)% | 4,046 |
Mobile ARPU (in euros) (3) (6) | 225 | 259 | 259 | (13.1)% | (13.1)% | 271 |
Mobile AUPU (in minutes) (3) (6) | 170 | 169 | 169 | 0.7% | 0.7% | 174 |
Fixed-line services | | | | | | |
Number of broadband Internet customers (4) | 1,693 | 1,396 | 1,396 | 21.2% | 21.2% | 1,265 |
Number of VoIP service customers (4) | 1,311 | 945 | 945 | 38.7% | 38.7% | 777 |
Number of customers with IPTV and satellite offers (4) | 76 | 71 | 71 | 7.7% | 7.7% | 68 |
Fixed broadband ARPU (in euros) (3) | 31.8 | 33.0 | 33.0 | (3.6)% | (3.6)% | 32.4 |
(1) See Section 4.3.5.1 Transition from data on a historical basis to data on a comparable basis. (2) In millions of euros. Breakdown of revenues in external data (see Financial glossary appendix). (3) See the Financial glossary appendix. (4) In thousands. At end of period. (5) Excluding customers of mobile virtual network operators (MVNOs). (6) In 2012, Orange Spain aligned itself the definition of the CMT (Comisión del mercado de las telecomunicaciones - Spanish regulator) as regards the calculation of the number of prepaid customers. Prior data has been restated to reflect this new definition, and mobile ARPU and mobile AUPU have been recalculated accordingly. |
| Financial years ended December 31 |
POLAND
(in millions of euros) | 2013 | 2012
Data on a comparable basis (1) | 2012
Data on a historical basis | Chg. (%)
Data on a comparable basis (1) | Chg. (%)
Data on a historical basis | 2011
Data on a historical basis |
Revenues | 3,079 | 3,369 | 3,381 | (8.6)% | (8.9)% | 3,625 |
Reported EBITDA | 937 | 1,155 | 1,156 | (18.9)% | (18.9)% | 1,347 |
Reported EBITDA/Revenues | 30.4% | 34.3% | 34.2% | | | 37.2% |
Operating income | 201 | (485) | (505) | na | na | 443 |
Operating income/Revenues | 6.5% | (14.4)% | (14.9)% | | | 12.2% |
CAPEX | 457 | 558 | 558 | (18.2)% | (18.1)% | 627 |
CAPEX/Revenues | 14.8% | 16.6% | 16.5% | | | 17.3% |
Average number of employees | 21,214 | 23,096 | 22,700 | (8.2)% | (6.5)% | 24,119 |
(1) See Section 4.3.5.1 Transition from data on a historical basis to data on a comparable basis. |
2013 vs. 2012
Poland’s revenues totaled 3,079 million euros in 2013, down 8.9% on a historical basis and 8.6% on a comparable basis compared with 2012.
On a historical basis, the 8.9% or 302 million euro drop in revenues year-on-year, was due to i) the negative effect of foreign exchange fluctuations, in the amount of 10 million euros, ii) the adverse impact of changes in the scope of consolidation and other changes, in the amount of 2 million euros, and iii) organic change on a comparable basis, i.e. a 290 million euro fall in revenues.
On a comparable basis, the 8.6% or 290 million euro fall in revenues in Poland between 2012 and 2013, was mainly due to the decline in traditional telephone services and to increased competitive pressure.
ORANGE / 2013 REGISTRATION DOCUMENT - 233
Excluding the effect of the fall in regulated prices, revenues in Poland would have been down 3.9% between 2012 and 2013 on a comparable basis.
Mobile services – Poland
Revenues from Mobile services in Poland totaled 1,456 million euros in 2013, down 9.3% on a historical basis and 10.8% on a comparable basis compared with 2012.
On a comparable basis, the fall in revenues from Mobile services in Poland between 2012 and 2013 amounted to 175 million euros. Excluding the effect of the fall in regulated prices, revenues from Mobile services would have dropped 2.6% year-on-year, attributable mainly to the reduction in prices for outgoing Voice services.
The mobile customer base stood at 15.3 million customers as at December 31, 2013, up 2.9% on December 31, 2012, driven by a 4.5% rise in prepaid offers with 7.2 million customers. At December 31, 2013, the number of multiplay Open offers reached 286,000 customers, while the nju.mobile brand online offers now reach 353,000 customers.
Fixed-line services – Poland
In Poland, revenues from Fixed-line services totaled 1,443 million euros in 2013, down 8.4% on a historical basis and 8.1% on a comparable basis compared with 2012.
On a comparable basis, the 127 million euro fall in revenues from Fixed-line services in Poland between 2012 and 2013 reflects the general downward trend in fixed narrowband services, down 16.4%. Excluding the effect of the fall in regulated prices, the revenues from Fixed-line services would have been down 6.4% between the two periods.
On a comparable basis, revenues from fixed broadband services grew 6.4% between 2012 and 2013, driven by the higher fixed broadband ARPU due to the growth in multiplay offers.
The number of VoIP service customers recorded a 25.6% growth over the year to 495,000 customers as at December 31, 2013. Moreover, digital TV customers (IPTV and satellite offers) totaled 707,000 at December 31, 2013. On the other hand, the fixed broadband customer base registered a 1.9% decrease year-on-year, totaling 2.3 million customers as at December 31, 2013.
2012 vs. 2011
On a historical basis, the 6.7% or 244 million euro decline in revenues in Poland between 2011 and 2012 comprises i) the negative effect of foreign exchange fluctuations, i.e. 56 million euros, in view of the Polish zloty’s appreciation against the euro, ii) the adverse impact of changes in the scope of consolidation and other changes, in the amount of 43 million euros and mainly relating to the effects of the disposal of TP Emitel on June 22, 2011, and iii) organic change on a comparable basis, i.e. a decline of 145 million euros in revenues.
On a comparable basis, the 4.1% or 145 million euro decline in revenues in Poland between 2011 and 2012 reflected i) the 137 million euro decline in the switched telephone network, ii) partially offset by the 35 million euro increase in revenues from integrated services and carrier services. Excluding the effect of the fall in regulated prices, revenues in Poland would have been down 2.5% between the two periods.
Mobile services – Poland
In 2012, revenues from Mobile services stood at 1,605 million euros in Poland, down 4.6% on a historical basis and 3.1% on a comparable basis compared with 2011.
On a comparable basis, the fall in revenues from Mobile services in Poland between 2011 and 2012 amounted to 51 million euros. Excluding the effect of the fall in regulated prices, revenues would have been up 0.3% between the two periods.
On a comparable basis, the 51 million euro decline in Mobile service revenues in Poland between 2011 and 2012 was attributable mainly i) to the 4.7% fall of mobile ARPU year-on-year, ii) to the 0.9% decrease in the number of contract customers, totaling 6.9 million as at December 31, 2012, i.e. 66,000 fewer than at December 31, 2011, iii) partially offset by the increase in data traffic, in the amount of 18 million euros.
Fixed-line services – Poland
In Poland, revenues form Fixed-line services totaled 1,576 million euros in 2012, down 9.5% on a historical basis and 6.4% on a comparable basis compared with 2011.
On a comparable basis, the fall in revenues from fixed-line services in Poland between 2011 and 2012 amounted to 107 million euros mainly attributable to:
■
the 18.0% decline in Voice revenues, on the back of the fall in the number of fixed-line telephony customers, down 877,000 customers between December 31, 2011 and December 31, 2012;
■
partially offset by i) the 2.1% increase in fixed broadband revenues, due to the increase in the fixed broadband ARPU, and ii) the 25 million euro increase in revenues from integrated services.
2013 vs. 2012
In Poland, Reported EBITDA totaled 937 million euros in 2013, down 18.9% compared with 2012 on both a historical and a comparable basis.
On a historical basis, the 219 million euro reduction in Reported EBITDA in Poland between 2012 and 2013 is due to i) the negative effect of foreign exchange fluctuations, i.e. 4 million euros, partially offset by the positive impact of changes in the scope of consolidation and other changes, in the amount of 3 million euros, and ii) organic change on a comparable basis, namely a decrease of 218 million euros in Reported EBITDA.
ORANGE / 2013 REGISTRATION DOCUMENT - 234
On a comparable basis, the 218 million euro decrease in Reported EBITDA in Poland between 2012 and 2013 is attributable mainly i) to the 290 million euro fall in revenues, ii) partially offset by the 124 million euro decrease in service fees and inter-operator costs due to the positive effect of the fall in regulated prices on interconnection costs.
2012 vs. 2011
On a historical basis, the 14.2% decline in Reported EBITDA in Poland between 2011 and 2012, representing a 191 million euro decrease, was attributable mainly to i) the adverse impact of changes in the scope of consolidation and other changes, totaling 219 million euros, and mainly included the disposal of TP Emitel on June 22, 2011 for 220 million euros, and to ii) the negative effect of foreign exchange fluctuations, amounting to 13 million euros, iii) partially offset by organic change on a comparable basis, i.e. growth of 41 million euros in Reported EBITDA.
On a comparable basis, the 41 million euro increase in Reported EBITDA in Poland between 2011 and 2012 was attributable mainly to:
■
i) the recognition, in 2011, of an additional provision of 115 million euros for the fine from the European Commission against Orange Polska for abuse of a dominant position on the wholesale market for broadband Internet access in Poland (see Note 15 to the consolidated financial statements), ii) 41 million euros in restructuring costs and similar items in 2011, and iii) the 31 million euro reduction in interconnection costs as a result of the cut in call termination rates in 2012;
■
partially offset by the 145 million euro decline in revenues, affected by the cut in call termination rates.
2013 vs. 2012
Operating income in Poland stood at 201 million euros in 2013, an increase of 706 million euros compared with 2012 on a historical basis and of 686 million on a comparable basis.
On a historical basis, the 706 million euro increase in operating income between 2012 and 2013 stemmed from i) the positive impact of foreign exchange fluctuations, representing 20 million euros, and ii) organic change on a comparable basis, i.e. an increase of 686 million euros in operating income.
On a comparable basis, the 686 million rise in operating income in Poland between 2012 and 2013 was attributable mainly to i) the recognition of a goodwill impairment loss of 868 million euros (see Note 6 to the consolidated financial statements) on a comparable basis, ii) partially offset by the 218 million euro decline in Reported EBITDA.
2012 vs. 2011
On a historical basis, the 948 million euro fall in operating income in Poland between 2011 and 2012, was attributable to i) the adverse impact of changes in the scope of consolidation and other changes, amounting to 211 million euros and mainly including the disposal of TP Emitel on June 22, 2011 for 212 million euros and ii) organic change on a comparable basis, representing a 738 million euro reduction in operating income.
On a comparable basis, the 738 million euro reduction in operating income in Poland between 2011 and 2012, was attributable mainly to i) the recognition of 889 million euros in impairment of goodwill in 2012 reflecting in particular the heightened competition in both the mobile and fixed-line markets (see Note 6 to the consolidated financial statements), ii) partially offset by the 111 million euro reduction in depreciation and amortization and the 41 million euro improvement in Reported EBITDA.
2013 vs. 2012
In Poland CAPEX amounted to 457 million euros in 2013, down 18.1% on a historical basis and down 18.2% on a comparable basis compared with 2012.
On both a historical and a comparable basis, the 101 million euro reduction in CAPEX between 2012 and 2013 in Poland reflects mainly i) a reduction in expenditure on IT investments, and ii) the end of the broadband network access deployment program in Poland in 2013, pursuant to the provisions of the memorandum of understanding signed with the regulator at the end of 2009.
2012 vs. 2011
On a historical basis, the 11.0% or 69 million euro reduction in CAPEX in Poland between 2011 and 2012 was attributable to i) the adverse impact of foreign exchange fluctuations, for an amount of 10 million euros, ii) the adverse impact of changes in the scope of consolidation and other changes, which totaled 7 million euros, and iii) organic change on a comparable basis, i.e. a reduction of 52 million euros.
On a comparable basis, the 8.5% or 52 million euroreduction in CAPEX in Poland between 2011 and 2012 was attributable mainly to:
■
the delaying of capital expenditures on access and transmission equipment installed on customers’ premises, in agreement with the Polish regulator (with which a memorandum of understanding was signed to this effect);
ORANGE / 2013 REGISTRATION DOCUMENT - 235
■
partially offset by an increase in capital expenditures on i) the acquisition of boxes installed on customers’ premises as a result of strong sales of the Funpack triple play offer, ii) the rebranding carried out in 2012 (all services are now under the Orange brand), iii) the 2012 UEFA European Football Championship (Euro 2012).
Acquisitions of telecommunication licenses in Poland totaled 63 million euros in 2013, mainly due to the purchase of the usage rights for the T- Mobile 1 800 MHz (4G) frequency.
No telecommunication licenses were acquired in Poland between 2011 and 2012.
4.3.3.3.6 Additional information – Poland
| Financial years ended December 31 |
POLAND | 2013 | 2012
Data on a comparable basis (1) | 2012
Data on a historical basis | Chg. (%)
Data on a comparable basis (1) | Chg. (%)
Data on a historical basis | 2011
Data on a historical basis |
Revenues (2) (3) | 3,079 | 3,369 | 3,381 | (8.6)% | (8.9)% | 3,625 |
Mobile services | 1,456 | 1,631 | 1,605 | (10.8)% | (9.3)% | 1,682 |
Sales of mobile devices | 35 | 34 | 34 | 5.7% | 5.3% | 36 |
Fixed-line services | 1,443 | 1,571 | 1,576 | (8.1)% | (8.4)% | 1,742 |
Other revenues | 145 | 133 | 166 | 8.0% | (13.4)% | 165 |
Mobile services | | | | | | |
Number of mobile customers (4) (5) | 15,325 | 14,895 | 14,895 | 2.9% | 2.9% | 14,658 |
Number of contract customers | 7,221 | 6,911 | 6,911 | 4.5% | 4.5% | 6,977 |
Number of prepaid customers | 8,104 | 7,984 | 7,984 | 1.5% | 1.5% | 7,681 |
Mobile ARPU (in zlotys) (3) | 414 | 470 | 470 | (11.9)% | (11.9)% | 483 |
Mobile AUPU (in minutes) (3) | 183 | 170 | 170 | 7.6% | 7.6% | 165 |
Fixed-line services | | | | | | |
Total number of fixed telephone lines (4) | 5,766 | 6,425 | 6,425 | (10.3)% | (10.3)% | 7,280 |
Number of broadband Internet customers (4) | 2,301 | 2,345 | 2,345 | (1.9)% | (1.9)% | 2,346 |
Number of VoIP service customers (4) | 495 | 394 | 394 | 25.6% | 25.6% | 165 |
Number of customers with IPTV and satellite offers (4) | 707 | 706 | 706 | 0.1% | 0.1% | 636 |
Fixed broadband ARPU (in euros) (3) | 60.3 | 56.2 | 56.2 | 7.3% | 7.3% | 55.8 |
(1) See Section 4.3.5.1 Transition from data on a historical basis to data on a comparable basis. (2) In millions of euros. Breakdown of revenues in external data (see Financial glossary appendix). (3) See the Financial glossary appendix. (4) In thousands. At end of period. (5) Excluding customers of mobile virtual network operators (MVNOs). |
| Financial years ended December 31 |
REST OF THE WORLD
(in millions of euros) | 2013 | 2012
Data on a comparable basis (1) | 2012
Data on a historical basis | Chg. (%)
Data on a comparable basis (1) | Chg. (%)
Data on a historical basis | 2011
Data on a historical basis |
Revenues | 7,792 | 7,829 | 8,281 | (0.5)% | (5.9)% | 8,795 |
Reported EBITDA | 2,511 | 2,664 | 2,893 | (5.8)% | (13.2)% | 2,993 |
Reported EBITDA/Revenues | 32.2% | 34.0% | 34.9% | | | 34.0% |
Operating income | 351 | 253 | 332 | 38.8% | 5.7% | 595 |
Operating income/Revenues | 4.5% | 3.2% | 4.0% | | | 6.8% |
CAPEX | 1,163 | 1,238 | 1,308 | (6.0)% | (11.1)% | 1,409 |
CAPEX/Revenues | 14.9% | 15.8% | 15.8% | | | 16.0% |
Average number of employees | 26,147 | 25,955 | 26,013 | 0.7% | 0.5% | 26,650 |
(1) See Section 4.3.5.1 Transition from data on a historical basis to data on a comparable basis. |
ORANGE / 2013 REGISTRATION DOCUMENT - 236
2013 vs. 2012
Revenues from the Rest of the World totaled 7,792 million euros in 2013, down 5.9% on a historical basis and 0.5% on a comparable basis compared with 2012.
On a historical basis, the 489 million euro decline in revenues from the Rest of the World was due to i) the adverse impact of foreign exchange fluctuations, in the amount of 290 million euros (of which 193 million euros attributable to the change in the value of the Egyptian pound against the euro), ii) the adverse impact of changes in the scope of consolidation and other changes, in the amount of 162 million euros (of which 168 million euros resulting from the disposal of Orange Suisse on February 29, 2012), and iii) organic change on a comparable basis, i.e. a 37 million euro decline in revenues.
On a comparable basis, revenues from the Rest of the World fell 0.5% between 2012 and 2013, a decline of 37 million euros. Excluding the effect of the fall in regulated prices, revenues would have been up 1.3% between the two periods.
Africa and the Middle East
On a comparable basis revenues in Africa and the Middle East were up 4.3% or 167 million euros between 2012 and 2013 (or up 4.7% excluding the effect of the fall in regulated prices). This performance results mainly from i) growth of respectively 61 million euros in the Ivory Coast, 43 million euros in Mali, 42 million euros in Guinea, 35 million euros in Senegal and 26 million euros in Egypt, ii) partially offset by negative growth in revenues in Jordan and Cameroon, of 51 million euros and 20 million euros respectively, which are experiencing heightened levels of competition.
Europe
On a comparable basis, revenues from Europe were down 6.2% between 2012 and 2013, a decline of 212 million euros. This negative growth was primarily due to the 12.0% or 191 million euro decline in revenues in Belgium, which stemmed from the effect of the fall in regulated prices, from the drop in mobile ARPU and from the 266,000 customer reduction in the mobile customer base.
Excluding the effect of the fall in regulated prices, revenues in Europe would have risen 2.8% between 2012 and 2013, due to strong growth in mobile Internet browsing and to a rise in the sales of handsets, partially offset by the price reductions linked to the restructuring of mobile service offers.
Europe’s mobile customer base totaled 20.0 million customers as at December 31, 2013, up 0.8% compared with December 31, 2012 (Excluding the effect of the disposal of Orange Austria), thanks to i) the 1.7% increase in contract offers (primarily in Romania), representing 160,000 new customers and ii) the performance in MRM contracts recording a 34.8% growth rate over the year, i.e. 244,000 new contracts.
2012 vs. 2011
On a historical basis, the 5.8% or 514 million euro decline in Rest of the World revenues between 2011 and 2012 reflected:
■
the adverse impact of changes in the scope of consolidation and other changes, which totaled 791 million euros and chiefly included the effect of the disposal of Orange Suisse on February 29, 2012 for 858 million euros;
■
partially offset by i) the positive effect of foreign exchange fluctuations in the amount of 160 million euros and ii) organic change on a comparable basis, i.e. a 117 million euro increase in revenues.
On a comparable basis, Rest of the World revenues increased by 1.4% or 117 million euros between 2011 and 2012. Excluding the effect of the fall in regulated prices, revenues would have been up 3.2% between the two periods.
Africa and the Middle East
On a comparable basis revenues from Africa and the Middle East rose 5.0% or 195 million euros between 2012 and 2013, (i.e. 5.3% excluding the effect of the fall in regulated prices). This growth was attributable mainly to i) the 106 million euro increase in the Ivory Coast’s revenues, as a result in particular of the recovery in 2012, following the crisis that dragged down revenues in 2011, ii) very good performances in Guinea and Cameroon with growth of 31 million euros and 21 million euros respectively, due to the increased number of customers in these countries, and iii) the return to growth in Egypt, with revenues up by 19 million euros, mostly due to an increased number of customers.
Europe
On a comparable basis, revenues in Europe were down 2.2% between 2011 and 2012, a 79 million euro decline. This negative growth was mainly a result of:
■
the 4.3% or 79 million euro fall in revenues in Central Europe. Year-on-year, this change was attributable mainly to i) the 61 million euro fall in revenues in Slovakia, notably due to the decrease in Voice revenues from contract customers and to the effect of the fall in regulated prices, and ii) the 30 million euro decline Romania’s revenues, also affected by the fall in regulated prices, in the amount of 37 million euros;
■
and stabilization of revenues in Western Europe. Between the two periods, this stagnation was a result i) of a 10 million euro growth in revenues in Luxembourg and 6 million euro growth in Switzerland, ii) partially offset by the 11 million euro decline in revenues in Belgium, mainly due to the effect of the fall in regulated prices, in the amount of 60 million euros.
ORANGE / 2013 REGISTRATION DOCUMENT - 237
Excluding the effect of the fall in regulated prices, revenues in Europe would have been up 1.3% between 2011 and 2012 on a comparable basis.
2013 vs. 2012
In 2013, Rest of the World Reported EBITDA stood at 2,511 million euros, down 13.2% on a historical basis and 5.8% on a comparable basis compared with 2012.
On a historical basis, the 13.2% or 382 million euro decline in Reported EBITDA in the Rest of the World was attributable mainly to i) the adverse impact of changes in the scope of consolidation and other changes, in the amount of 136 million euros, ii) the negative effect of foreign exchange fluctuations, in the amount of 93 million euros (of which 64 million euros attributable to the change in the value of the Egyptian pound against the euro), and iii) organic change on a comparable basis, i.e. a decline of 153 million euros in Reported EBITDA.
On a comparable basis, the 153 million euro drop in Reported EBITDA in the Rest of the World was attributable mainly i) to the increase in commercial expenses particularly in Romania and in Ivory Coast, ii) to the increase in other operating income and expense, chiefly attributable to the negative effect of reversals of provisions recorded in 2012 in Belgium and Slovakia in relation to universal service, iii) to higher operating taxes and levies, and iv) to the increase in external purchases in Egypt, where business was negatively affected by foreign exchange fluctuations and inflation (see Section 4.3.3.4.6 Additional information - Rest of the World), v) partially offset by the positive effect of the fall in regulated prices on interconnection costs.
2012 vs. 2011
On a historical basis, the 3.3% or 100 million euro reduction in Rest of the World Reported EBITDA between 2011 and 2012 reflected i) the adverse effect of changes in the scope of consolidation and other changes, amounting to 220 million euros, and mainly including the disposal of Orange Suisse on February 29, 2012 for 224 million euros, ii) partially offset by the positive impact of foreign exchange fluctuations, i.e. 44 million euros, as well as organic change on a comparable basis, i.e. a 76 million euro increase in Reported EBITDA.
On a comparable basis, the 2.7% or 76 million euro rise in Rest of the World Reported EBITDA between 2011 and 2012, was attributable mainly i) to the 117 million euro increase in revenues, despite the negative effect of the fall in regulated prices, ii) to the 92 million euro gain on the disposal of Orange Suisse in 2012, iii) partially offset by the 152 million euro increase in external purchases (commercial expenses up by 39 million euros in Belgium, external purchases up by 45 million euros and 37 million euros in Ivory Coast and Egypt respectively).
2013 vs. 2012
Operating income in the Rest of the World totaled 351 million euros in 2013, up 5.7% on a historical basis and 38.8% on a comparable basis compared with 2012.
On a historical basis, the 5.7% or 19 million euro increase in operating income in the Rest of the World between 2012 and 2013, comprises i) the adverse impact of changes in the scope of consolidation and other changes, amounting to 135 million euros from the disposal of Orange Suisse on February 29, 2012, ii) largely offset, on the one hand, by the positive effect of foreign exchange fluctuations, amounting to 56 million euros, and, on the other, by organic change on a comparable basis, i.e. an increase of 98 million euros in operating income.
On a comparable basis, the 38.8% or 98 million euro increase in operating income in the Rest of the World between 2012 and 2013 was attributable mainly to:
■
the recognition of 497 million euros in goodwill impairment in 2013 (see Note 6 to the consolidated financial statements) compared with 778 million euros in 2012 on a comparable basis, with:
■
an impairment loss of 408 million euros in Belgium in 2013, compared with an impairment loss of 76 million euros in 2012, reflecting the short- and medium-term effects of a more competitive environment (widespread deflation), the regulatory reduction in the term of contractual commitments and the still limited number of convergence offers marketed by Mobistar,
■
an impairment loss of 89 million euros in the Democratic Republic of Congo in 2013, reflecting the revised growth outlook,
■
and the recognition of impairment losses in Romania (amounting to 359 million euros) and Egypt (amounting to 339 million euros on a comparable basis);
■
the 61 million euro reduction in depreciation and amortization;
■
partially offset i) by the 153 million euro decrease in Reported EBITDA, ii) by the 53 million euro reduction in the share of profits (losses) of associates, and iii) by a 38 million euro increase in the impairment of fixed assets.
ORANGE / 2013 REGISTRATION DOCUMENT - 238
2012 vs. 2011
On a historical basis, the 263 million euro reduction in Rest of the World operating income between 2011 and 2012, was attributable to i) the adverse impact of changes in the scope of consolidation and other changes, amounting to 79 million euros and mainly comprising the effect of the disposal of Orange Suisse on February 29, 2012 for 67 million euros, ii) the negative effect of foreign exchange fluctuations, amounting to 24 million euros, as well as iii) organic change on a comparable basis, i.e. a 160 million euro fall in operating income.
On a comparable basis, the 160 million euro decline in Rest of the World operating income between 2011 and 2012 resulted mainly from:
■
the recognition of 839 million euros in goodwill impairment in 2012 (see Note 6 to the consolidated financial statements) compared with 618 million euros in 2011 on a comparable basis, with:
■
an impairment loss of 359 million euros in Romania in 2012, reflecting the mainly foreseen effects of i) a further reduction in mobile call termination rates imposed by the regulator in 2012, and ii) a limited presence in the multiplay offers segment, compared with a 156 million euro impairment loss in 2011,
■
a goodwill impairment of 76 million euros in Belgium in 2012, reflecting the foreseen effects of i) a new competitor, leading to a fall in prices, ii) still limited convergence offerings, as well as iii) a reduction in the growth rate to perpetuity,
■
and an impairment loss of 400 million euros in Egypt in 2012, reflecting the impact of the political and economic environment and the performance achieved in 2012 (winning back business and growing the customer base, but pricing pressure and a fall in tourism significantly impacted roaming revenues) associated with the fact that the discount rate was raised, versus a 456 million euro impairment loss in 2011 on a comparable basis;
■
the recognition in 2012 of a share of the losses of associates of 145 million euros, stemming mainly from the recognition of a 141 million euro impairment loss related to Médi Telecom (see Note 9 to the consolidated financial statements);
■
partially offset by the decrease in the impairment of fixed assets between the two periods (62 million euros in 2012 versus 223 million euros in 2011).
2013 vs. 2012
CAPEX in the Rest of the World stood at 1,163 million euros in 2013, down 11.1% on a historical basis and 6.0% on a comparable basis compared with 2012.
On a historical basis, the 11.1% or 145 million euro reduction in CAPEX in the Rest of the World between 2012 and 2013 was attributable i) to the adverse effect of foreign exchange fluctuations, i.e. 56 million euros, ii) to the negative effect of changes in the scope of consolidation and other changes, for 14 million euros, and iii) to organic change on a comparable basis, i.e. a 75 million euro decrease in CAPEX.
On a comparable basis, the 6% or 75 million euro decline in CAPEX in the Rest of the World was mainly a result of the 61 million euro decrease in CAPEX in Africa and the Middle East, notably in Egypt (down by 34 million euros), in the Democratic Republic of Congo (a decline of 30 million euros), in Cameroon and in Mali. This decline was a result of the reduction in investments in mobile access networks in Africa following significant outlay in these countries in 2012. However level of investment remained high, in particular in 3G networks in order to support the sharp growth in data traffic. At December 31, 2013, 17 out of 21 countries in Africa and the Middle-East were covered by 3G. Additionally, the roll-out of high capacity mobile broadband (4G) has already been launched in several European countries, including Luxembourg, Moldova and Romania (see Section 4.3.1.4 Significant events).
2012 vs. 2011
On a historical basis, the 7.2% decline in Rest of the World CAPEX between 2011 and 2012, amounting to 101 million euros, reflected:
■
i) the adverse effect of changes in the scope of consolidation and other changes, amounting to 79 million euros (corresponding to the impact of the disposal of Orange Suisse on February 29, 2012 for 105 million euros, offset in part by the effect of the acquisition of Congo China Telecom for 25 million euros), ii) partially offset by the positive effect of foreign exchange fluctuations for 35 million euros;
■
and by organic change on a comparable basis, i.e. a 57 million euro decline in CAPEX.
On a comparable basis, the 4.1% or 57 million euro reduction in Rest of the World CAPEX between 2011 and 2012 was attributable mainly to:
■
lower capital expenditures in certain countries, in particular in Kenya (55 million euros) as a result of the completion in 2011 of the network upgrade program, and in Niger (38 million euros) by virtue of the end of the extension program in 2011;
■
partially offset by the increase in recent investments in the Democratic Republic of Congo (37 million euros), and by the growth in CAPEX in Egypt (19 million euros), attributable, on the one hand, to the low level of capital expenditures in 2011 during the crisis in that country and, on the other, to the extension and densification of the network.
ORANGE / 2013 REGISTRATION DOCUMENT - 239
In 2013, acquisitions of telecommunications licenses in the Rest of the World totaled 373 million euros, and concerned mainly i) the payment of the 4G license and the renewal of the 2G/3G license in Romania for 216 million euros, and ii) the payment of the 4G license in Belgium for 120 million euros.
Acquisitions of telecommunications licenses in the Rest of the World totaled 42 million euros in 2012, and mainly related to i) a one-year extension of the license for the 900 MHz and 1,800 MHz frequencies and the renewal of the 2G license in Romania for 17 million euros, ii) the payment of a license allocated to the 4G mobile network in November 2012 in Moldova for 10 million euros, and iii) the acquisition of a license allocated to the 3G mobile network in the Ivory Coast for 9 million euros.
Acquisitions of telecommunication licenses in the Rest of the World totaled 68 million euros in 2011, and mainly included i) the extension of the 2G license in Slovakia for 43 million euros, and ii) the acquisition of a 20 MHz duplex frequency block in the 2.6 GHz band, allocated to the high capacity broadband mobile network (4G) in Belgium for 20 million euros.
| Financial years ended December 31 |
REST OF THE WORLD | 2013 | 2012
Data on a comparable basis (1) | 2012
Data on a historical basis | Chg. (%)
Data on a comparable basis (1) | Chg. (%)
Data on a historical basis | 2011
Data on a historical basis |
Revenues (2) | 7,792 | 7,829 | 8,281 | (0.5)% | (5.9)% | 8,795 |
Europe | 3,195 | 3,407 | 3,582 | (6.2)% | (10.8)% | 4,498 |
o/w Belgium | 1,402 | 1,593 | 1,593 | (12.0)% | (12.0)% | 1,604 |
o/w Romania | 934 | 918 | 913 | 1.8% | 2.3% | 937 |
Africa and the Middle East | 4,060 | 3,893 | 4,126 | 4.3% | (1.6)% | 3,746 |
o/w Egypt | 1,159 | 1,133 | 1,325 | 2.3% | (12.5)% | 1,233 |
Other | 554 | 548 | 593 | 1.2% | (6.5)% | 563 |
o/w Dominican Republic | 441 | 411 | 451 | 7.3% | (2.4)% | 419 |
Eliminations | (17) | (19) | (20) | (9.2)% | (11.7)% | (12) |
Mobile services | | | | | | |
Number of mobile customers (3) (4) | 111,386 | 104,626 | 105,406 | 6.5% | 5.7% | 99,741 |
Number of contract customers | 17,513 | 14,961 | 15,479 | 17.1% | 13.1% | 13,727 |
Number of prepaid customers | 93,873 | 86,665 | 89,927 | 4.7% | 4.4% | 86,014 |
Number of mobile customers (3) (4) | 111,386 | 104,626 | 105,406 | 6.5% | 5.7% | 99,741 |
Europe | 19,965 | 19,803 | 20,583 | 0.8% | (3.0)% | 22,028 |
o/w Belgium | 3,866 | 3,950 | 3,950 | (2.1)% | (2.1)% | 3,933 |
o/w Romania | 10,436 | 10,283 | 10,283 | 1.5% | 1.5% | 10,262 |
Africa and the Middle East | 87,993 | 81,582 | 81,582 | 7.9% | 7.9% | 74,557 |
o/w Egypt | 34,809 | 33,841 | 33,841 | 2.9% | 2.9% | 32,914 |
Other | 3,429 | 3,242 | 3,242 | 5.8% | 5.8% | 3,156 |
o/w Dominican Republic | 3,412 | 3,214 | 3,214 | 6.1% | 6.1% | 3,106 |
Fixed-line services | | | | | | |
Total number of fixed telephone lines (3) | 2,004 | 2,055 | 2,055 | (2.5)% | (2.5)% | 2,149 |
Europe | 681 | 682 | 682 | (0.1)% | (0.1)% | 683 |
Africa and the Middle East | 1,321 | 1,370 | 1,370 | (3.6)% | (3.6)% | 1,460 |
Other | 3 | 4 | 4 | (37.2)% | (37.2)% | 6 |
Number of broadband Internet customers (3) | 1,004 | 929 | 929 | 8.0% | 8.0% | 849 |
(1) See Section 4.3.5.1 Transition from data on a historical basis to data on a comparable basis. (3) In thousands. At end of period. (4) Excluding customers of mobile virtual network operators (MVNOs). |
The next section focuses specifically on the Group’s position in Egypt.
GDP growth in Egypt was estimated at 1.8% in 2013, down 0.4 point compared with 2012 according to the estimates of the International Monetary Fund (IMF) published in October 2013. The country is affected by an unstable political and economic context including a high unemployment rate, sharp inflation, income disparity, and social unrest.
Mobinil made great efforts to adapt to a challenging and uncertain market environment in order to preserve its margins. The Company is experiencing heightened expenditures due to inflation, devaluation of the Egyptian pound and shortage of foreign currencies, increasing prices for raw materials and an onerous tax burden.
ORANGE / 2013 REGISTRATION DOCUMENT - 240
On a comparable basis, between 2012 and 2013:
■
revenues in Egypt stood at 1,159 million euros in 2013, a 26 million euro increase compared with 2012. This performance was attributable mainly i) to the growth in revenues generated by international traffic, ii) to a significant increase in value-added services related to Non Voice mobile revenues, and iii) to constant growth in broadband, iv) partially offset by decreasing revenues in outgoing mobile Voice Consumer Services;
■
Reported EBITDA in Egypt stood at 332 million euros in 2013, a 28 million euro decline year-on-year. Between the two periods, this decline was attributable mainly to higher operating expenses being recognized in Reported EBITDA, including i) an increase in network expenses as a result of increased traffic, ii) a negative effect from the devaluation of the Egyptian pound (some services being indexed in foreign currencies); and iii) higher raw material prices, partially offset by growth in revenues;
■
Operating income in Egypt rose by 313 million euros between 2012 and 2013, due mainly to the impairment of goodwill recognized in 2012, i.e. 339 million euros (400 million euros on a historical basis, see Note 6 to the consolidated financial statements);
■
Egypt’s CAPEX decreased by 34 million euros between 2012 and 2013, as a result of the roll-out of investment projects slowing down and of a shortfall in foreign currencies.
| Financial years ended December 31 |
ENTERPRISE
(in millions of euros) | 2013 | 2012
Data on a comparable basis (1) | 2012
Data on a historical basis | Chg. (%)
Data on a comparable basis (1) | Chg. (%)
Data on a historical basis | 2011
Data on a historical basis |
Revenues | 6,513 | 6,881 | 7,001 | (5.3)% | (7.0)% | 7,101 |
Reported EBITDA | 1,004 | 1,139 | 1,134 | (11.9)% | (11.5)% | 1,276 |
Reported EBITDA/Revenues | 15.4% | 16.6% | 16.2% | | | 18.0% |
Operating income | 642 | 772 | 763 | (16.9)% | (16.0)% | 940 |
Operating income/Revenues | 9.9% | 11.2% | 12.9% | | | 13.2% |
CAPEX | 311 | 347 | 352 | (10.4)% | (11.7)% | 343 |
CAPEX/Revenues | 4.8% | 5.0% | 5.0% | | | 4.8% |
Average number of employees | 20,859 | 21,118 | 21,387 | (1.2)% | (2.5)% | 21,114 |
(1) See Section 4.3.5.1 Transition from data on a historical basis to data on a comparable basis. |
2013 vs. 2012
Enterprise revenues totaled 6,513 million euros in 2013, down 7% on a historical basis and 5.3% on a comparable basis compared with 2012.
On a historical basis, the decline of 488 million euros in Enterprise revenues from 2012 to 2013 was due to i) the negative impact of changes in the scope of consolidation and other changes, for 64 million euros, (ii) the adverse effect of foreign exchange fluctuations, totaling 56 million euros, and (iii) organic change on a comparable basis, totaling 368 million euros in revenues.
On a comparable basis, Enterprise revenues were down 368 million euros between 2012 to 2013 reflecting the intensified pressure on prices and the increasingly challenging economic environment in Europe.
Legacy networks
Legacy networks comprise products and solutions that Orange Business Service continues to provide to its customers to ensure the continuity of their operations and their migration towards newer solutions. They include traditional telephony and data services offerings such as PSTN, Frame Relay, Transrel, leased narrowband lines and some customer relation services.
Legacy network revenues amounted to 1,687 million euros in 2013, down 13.3% on a comparable basis versus 2012. The impact of price reductions persisted in 2013, together with i) the downward trend in fixed-line telephony and in legacy data services, and ii) the continued migration towards IP solutions.
Mature networks
The mature networks include traditional products and solutions that have reached a certain level of maturity, such as IP-VPN, some infrastructure products, such as broadband and very high-speed connections, broadcasting and Business Everywhere roaming services.
On a comparable basis, revenues from mature networks declined 2% year on year to 2,730 million euros in 2013 (compared with a rise of 1.8% in 2012 versus 2011, on a comparable basis). 2013 was marked by a 0.4% contraction in IP-VPN, related to price reductions, which partially offset increases in speed and continued growth, albeit at a slower pace, in the number of accesses. At the same time, broadcasting was down 4.7% and roaming offers (Business Everywhere) declined 25%, due in the main to migration towards other solutions marketed by the Group.
ORANGE / 2013 REGISTRATION DOCUMENT - 241
Growing networks
Growing networks include VoIP offers, image services, and data infrastructures, including satellite access, Wifi and fiber optics.
Growing networks revenues amounted to 413 million euros in 2013, up 3.5% on a comparable basis versus 2012. In a sluggish economic environment, VoIP and image services grew at a slower pace of 5.5% and 6.6%, respectively.
Services
Orange Business Service activities include platform services (customer relationship management, messaging, hosting, security solutions, infrastructure application management, cloud computing, machine-to-machine), collaborative services (consulting, integration, project management), and sales of equipment linked to integration services.
On a comparable basis, services revenues declined 3.9% to 1,683 million euros in 2013, compared with 2012. The falls of 8% for integration services, 14.5% for project management and 7.8% for infrastructure applications management, respectively, stemmed from the tough economic context, especially in Europe, which adversely affected business customers. On the other hand, security solutions posted growth of 14%, while the rise for Cloud services was 23% between the two periods. These high value-added services were reinforced with the acquisition of Inoven and Altenor at end-2013.
2012 vs. 2011
On a historical basis, the 1.4% or 100 million euro reduction in Enterprise revenues between 2011 and 2012, mainly reflected i) the positive impact of foreign exchange fluctuations, i.e. 106 million euros, ii) the adverse impact of changes in the scope of consolidation for 11 million euros as well as iii) organic change on a comparable basis, i.e. a 195 million euro reduction in revenues.
On a comparable basis, the 2.7% or 195 million euro reduction in Enterprise revenues between 2011 and 2012 (versus a decline of 1.6% in 2011 compared with 2010), was attributable mainly to the accelerated decline in legacy networks and the slowdown in service growth.
Legacy networks
On a comparable basis, revenues from legacy networks were down 13.4% between 2011 and 2012, and totaled 1,872 million euros. This performance was due primarily to the accelerated fall in revenues from legacy data networks, combined with the continued decline in revenues from Voice products.
Year-on-year, the 11.0% fall in fixed-line telephony revenues stemmed from:
■
the 8.7% fall in the number of telephone lines between 2011 and 2012 (similar to the 8.9% decline seen between 2010 and 2011), reflecting both the continued migration towards VoIP technologies and ongoing competitive pressure;
■
a 13.8% fall in the volume of enterprise calling services (on a like-for-like basis, downward trend in the fixed-line telephony market partially related to its substitution by other means of communication such as SMS and instant messaging), faster than the 13.2% decline seen between 2010 and 2011;
■
and the 12.1% decline in revenues from customer relations services (call centers), up on the 5.0% fall between 2010 and 2011, mainly due to these services being substituted by the Internet and the effect of the French Economic Modernization Act on premium rate numbers.
In parallel, revenues from legacy data networks were down 24.3% between 2011 and 2012. These services cover most legacy data solutions such as leased lines. The migration of these enterprise networks to more modern technologies was further accelerated in 2012, partly due to the progressive shutdown of X25 and the need to migrate customers to the Group’s more modern offers.
Mature networks
On a comparable basis, revenues from mature networks were up 1.8% between 2011 and 2012, and totaled 2,895 million euros. This increase was higher than the rise reported between 2010 to 2011 (up 0.4%).
IP-VPN revenues were up 3.9% year-on-year, driven by international operations (up 6.8%). The customer base is growing in particular in France, while international operations are seeing a strong increase in average revenue per connection as a result of customers switching to higher speeds. Conversely, the Broadcasting business saw revenues fall 1.9%, primarily as a result of the shutdown of legacy solutions (analog technology) and despite the revenues generated by the London Olympics. Finally, roaming solutions (Business Everywhere) were down 18.2% year on year, in line with what was seen between 2010 and 2011, mainly due to the decline in traditional fixed-line telephony networks and the migration to Internet solutions.
ORANGE / 2013 REGISTRATION DOCUMENT - 242
Growing networks
On a comparable basis, revenues from growing networks were up 6.9% between 2011 and 2012, and totaled 402 million euros in 2012. This growth was slower than the 14.2% increase seen between 2010 and 2011. VoIP services (access and traffic), which are benefiting from the migration of customers from traditional telephone services, were up 11.8%, which did not keep pace with the 20% growth recorded between 2010 and 2011. Furthermore, revenues from satellite access were up 7.8% between 2011 and 2012, while image services were affected by the repositioning of offers to a range more attuned to the realities of the market, as well as the slowdown thereof.
Services
On a comparable basis, services revenues were up 1.0% between 2011 and 2012 to 1,832 million euros in 2012, mainly due to integration services (up 3.8%), service management (7.5% growth) and customer relations services (up 13.7%).
This increase was nevertheless lower than the 6.4% recorded between 2010 and 2011. This slower growth was mainly due to i) equipment deliveries (down 3.7% in 2012, a high number of orders also having been filled in the US at the end of 2011), ii) the slowdown in integration services (from 8.6% between 2010 and 2011 to 3.8% from 2011 to 2012) and iii) infrastructure application management (hosting). Moreover, a lower level of customer acquisition had a negative effect on sales in 2012.
2013 vs. 2012
Enterprise Reported EBITDA totaled 1,004 million euros in 2013, down 11.5% compared with 2012 on a historical basis, and down 11.9% on a comparable basis.
On a historical basis, the 130 million euro slide in Enterprise Reported EBITDA between 2012 and 2013 includes i) the positive impact of foreign exchange fluctuations for 23 million euros, partially offset by the adverse effect of changes in the scope of consolidation and other changes for 18 million euros, and ii) organic change on a comparable basis, namely a contraction of 135 million euros in Reported EBITDA.
On a comparable basis, the 135 million euro reduction in Enterprise Reported EBITDA in between 2012 to 2013 stems primarily from the 368 million euro fall in revenues, partially offset by i) the 112 million euro decline in service fees and inter-operator costs, in line with the improved profitability of international operations and the lower business volumes of legacy data networks, ii) the 54 million euro drop in labor expenses, mainly due to the 41 million euro reduction in the expense for the Part-Time for Seniors plan in France (see Section 4.3.1.4 Significant events), iii) the 42 million euro reduction in other external expenses, overheads notably, and iv) the 14 million euro drop in commercial expense.
2012 vs. 2011
On a historical basis, the 11.2% or 142 million euro reduction in Enterprise Reported EBITDA between 2011 and 2012, was attributable mainly to organic change on a comparable basis amounting to a reduction of 150 million euros in Reported EBITDA, partially offset by a positive impact of foreign exchange fluctuations of 7 million euros.
On a comparable basis, the 11.7% or 150 million euro reduction in Enterprise Reported EBITDA between 2011 and 2012, was attributable mainly to:
■
the 195 million euro decline in revenues;
■
the 103 million euro increase in labor expenses, due to i) a 43 million euro increase in the expense for the “Part-Time for Seniors” plan in France, mainly as a result of the new agreements on the employment of senior workers signed in December 2012 (see Section 4.3.1.4 Significant events), and ii) a 21 million euro increase in labor expenses of service operations;
■
the change in the business mix between services and traditional communications solutions;
■
partially offset by the optimization of service fees and inter-operator costs, i.e. a reduction of 131 million euros year-on-year, in line with the improved profitability of international operations and the lower business volumes of legacy data networks.
2013 vs. 2012
Enterprise operating income totaled 642 million euros in 2013, a decline of 16% on a historical basis and of 16.9% on a comparable basis compared with 2012.
On a historical basis, the 121 million euro decline in Enterprise operating income between 2012 and 2013 includes i) the positive impact of foreign exchange fluctuations for 24 million euros, partially offset by the adverse effect of changes in the scope of consolidation and other changes for 15 million euros, and ii) organic change on a comparable basis, namely a contraction of 130 million euros in operating income.
On a comparable basis the 130 million euro contraction in Enterprise operating income between 2012 and 2013 stems primarily from the 135 million euro reduction in Reported EBITDA.
ORANGE / 2013 REGISTRATION DOCUMENT - 243
2012 vs. 2011
On a historical basis, Enterprise operating income fell 18.8% or 177 million euros between 2011 and 2012.
On a comparable basis, the 18.6% or 174 million euro reduction in Enterprise operating income between 2011 and 2012, was attributable mainly to the 150 million euro reduction in Reported EBITDA, and, to a lesser extent, the 14 million euro increase in the depreciation and amortization expense.
2013 vs. 2012
Enterprise CAPEX amounted to 311 million euros in 2013, down 11.7% on a historical basis compared with the previous year and down 10.4% on a comparable basis.
On both a historical and a comparable basis, the reduction in Enterprise CAPEX between 2012 and 2013, of 41 million euros and 36 million euros respectively, was due to the lower capital expenditure in line with business volumes.
2012 vs. 2011
On a historical basis, the 2.7% or 9 million euro increase in Enterprise CAPEX between 2011 and 2012 was due to I) the favorable impact of changes in the scope of consolidation and other changes, in the amount of 12 million euros, and II) the 7 million euro positive impact of foreign exchange fluctuations, partially offset by III) organic change on a comparable basis, i.e. a 10 million euro reduction in CAPEX.
On a comparable basis, Enterprise CAPEX was down 10 million euros or 2.6% between 2011 and 2012, as capital expenditure was brought into line with business volumes.
| Financial years ended December 31 |
ENTERPRISE | 2013 | 2012
Data on a comparable basis (1) | 2012
Data on a historical basis | Chg. (%)
Data on a comparable basis (1) | Chg. (%)
Data on a historical basis | 2011
Data on a historical basis |
Revenues (2) | 6,513 | 6,881 | 7,001 | (5.3)% | (7.0)% | 7,101 |
Legacy networks | 1,687 | 1,944 | 1,872 | (13.3)% | (9.9)% | 2,182 |
Mature networks | 2,730 | 2,786 | 2,895 | (2.0)% | (5.7)% | 2,782 |
Growing networks | 413 | 399 | 402 | 3.5% | 2.6% | 366 |
Services | 1,683 | 1,752 | 1,832 | (3.9)% | (8.1)% | 1,771 |
Number of Enterprise fixed telephone lines in France (3) | 3,355 | 3,681 | 3,681 | (8.9)% | (8.9)% | 4,032 |
Number of IP-VPN accesses worldwide (4) | 330 | 326 | 326 | 1.3% | 1.3% | 317 |
of which number of IP-VPN accesses in France | 286 | 281 | 281 | 1.7% | 1.7% | 277 |
(1) See Section 4.3.5.1 Transition from data on a historical basis to data on a comparable basis. (2) In millions of euros. Breakdown of revenues in external data (see Financial glossary appendix). (3) In thousands. At end of period. This figure includes standard analog lines (excluding fully unbundled lines) and Numeris (ISDN) channels, each Numeris channel being booked as a line. (4) In thousands. At end of period. Access of customers outside the Orange Group, not including operators market. |
| Financial years ended December 31 |
INTERNATIONAL CARRIERS & SHARED SERVICES
(in millions of euros) | 2013 | 2012
Data on a comparable basis (1) | 2012
Data on a historical basis | Chg. (%)
Data on a comparable basis (1) | Chg. (%)
Data on a historical basis | 2011
Data on a historical basis |
Revenues | 1,702 | 1,618 | 1,623 | 5.2% | 4.9% | 1,610 |
Reported EBITDA | (15) | (288) | (402) | 95.1% | 96.5% | 105 |
Reported EBITDA/Revenues | (0.8)% | (17.9)% | (24.7)% | | | 6.5% |
Operating income | (567) | (886) | (1,002) | 36.1% | 43.5% | (103) |
Operating income/Revenues | (33.3)% | (54.7)% | (61.8)% | | | (6.5)% |
CAPEX | 305 | 416 | 415 | (26.5)% | (26.4)% | 367 |
CAPEX/Revenues | 17.9% | 25.7% | 25.6% | | | 22.8% |
Average number of employees | 13,186 | 13,281 | 13,286 | (0.7)% | (0.8)% | 12,950 |
(1) See Section 4.3.5.1 Transition from data on a historical basis to data on a comparable basis. |
ORANGE / 2013 REGISTRATION DOCUMENT - 244
2013 vs. 2012
Revenues from International Carriers & Shared Services were up 4.9% on a historical basis and rose 5.2% on a comparable basis in 2013 to 1,702 million euros (including 1,214 million euros generated outside the Group), compared with 2012.
The 4.9% or 79 million euro increase in revenues from International Carriers & Shared Services on a historical basis in the period 2012 to 2013 reflects I) the adverse effect of changes in the scope of consolidation and other changes (3 million euros) and foreign exchange fluctuations (2 million euros), II) which was partially offset by organic change on a comparable basis, namely an increase in revenues of 84 million euros.
On a comparable basis, the 84 million euro or 5.2% increase in revenues from International Carriers & Shared Services was largely related to the 3% growth in revenues from International Carriers.
2012 vs. 2011
In 2012, International Carriers & Shared Services revenues totaled 1,623 million euros, including 1,141 million euros in non-Group revenues.
On a historical basis, the 0.8% or 13 million euro increase in International Carriers & Shared Services revenues between 2011 and 2012, was attributable mainly to I) organic change on a comparable basis, i.e. a 38 million euro increase in revenues, II) partially offset by the adverse impact of changes in the scope of consolidation and other changes, amounting to 29 million euros, and was mainly due to operations being transferred to the Enterprise operating segment.
On a comparable basis, International Carriers & Shared Services revenues were up 2.4% or 38 million euros between 2011 and 2012. International Carriers revenues stood at 1,382 million euros in 2012, up 3.8% or 51 million euros compared with 2011. This growth was attributable mainly to I) higher international voice revenues, due to the policy of integrating traffic from subsidiaries, especially in Sub-Saharan Africa and North Africa, as well as II) the increase in mobile data revenues. Shared Services revenues totaled 241 million euros in 2012, down 5.2% on 2011, mainly due to patent licenses granted in return for a final fee in 2011.
2013 vs. 2012
International Carriers & Shared Services Reported EBITDA was negative at (15) million euros in 2013, compared with (402) million euros in 2012 on a historical basis and (288) million euros on a comparable basis.
On a historical basis, the 387 million euro improvement in Reported EBITDA for International Carriers & Shared Services from 2012 to 2013 stems from I) the positive impact of changes in the scope of consolidation and other changes, for 111 million euros, chiefly attributable to the allocation to the France operating segment of the expense of 110 million euros corresponding to the non-common risks contributions (particularly unemployment) for civil servants of Orange, recognized in 2012 on the International Carriers and Shared Services segment, II) the positive impact of foreign exchange fluctuations in the amount of 3 million euros, and III) organic change on a comparable basis, i.e. an increase of 273 million euros in Reported EBITDA.
On a comparable basis, the 273 million euro improvement in International Carriers & Shared Services Reported EBITDA between 2012 and 2013 was attributable largely to:
■
the fall of 162 million euros in the expense for the “Part-Time for Seniors” plan in France to 20 million euros in 2013 from 182 million euros in 2012, mainly as a result of the new agreements signed in December 2012 on the employment of senior workers (see Section 4.3.1.4 Significant events);
■
the recognition in 2012 of an indemnity of 116 million euros (including registration fees) for compensation paid to OTMT for the transfer to Orange of the services contract between OTMT and ECMS (see Note 2 to the consolidated financial statements);
■
the 65 million euro increase in service fees and inter-operator costs, in line with the higher volume of international traffic;
■
partially offset by the 84 million euro increase in revenues.
2012 vs. 2011
International Carriers & Shared Services Reported EBITDA stood at (402) million euros in 2012 compared with 105 million euros in 2011 on a historical basis and 59 million euros on a comparable basis.
On a historical basis, the 507 million euro deterioration in International Carriers & Shared Services Reported EBITDA between 2011 and 2012 stemmed from I) the adverse impact of changes in the scope of consolidation and other changes, amounting to 44 million euros, primarily due to the transfer of various functions from the France operating segment, as well as II) organic change on a comparable basis, i.e. a 461 million euro reduction in Reported EBITDA.
ORANGE / 2013 REGISTRATION DOCUMENT - 245
On a comparable basis, the 461 million euro deterioration in International Carriers & Shared Services Reported EBITDA between 2011 and 2012 was attributable largely to:
■
the 271 million euro rise in the expense for the “Part-Time for Seniors” plan in France, to 182 million euros in 2012 from a gain of 89 million euros in 2011, mainly as a result of the new agreements signed in December 2012 on the employment of senior workers (see Section 4.3.1.4 Significant events);
■
the recognition in 2012 of an expense of 122 million euros for contributions for non-common risks (particularly unemployment) for Orange civil servants, following the European Commission’s decision of December 2011 (see Note 15 to the consolidated financial statements);
■
the payment in 2012 of an indemnity of 116 million euros (including registration fees) for compensation paid to OTMT for the transfer to Orange of the services contract between OTMT and ECMS (see Note 2 to the consolidated financial statements);
■
the recognition in 2012 of a net gain of 27 million euros on various legal disputes; and
■
rebranding costs in Poland (all services are now under the Orange brand) and expenses associated with the 2012 UEFA European Football Championship (Euro 2012);
■
partially offset by a net gain of 61 million euros related to the reorganization of new growth activities, notably with the closure of Orange sport and the opening of new distribution channels for Orange cinéma séries (OCS).
2013 vs. 2012
Operating income for International Carriers & Shared Services was negative at (567) million euros in 2013, an improvement year on year of 43.5% on a historical basis, and of 36.1% on a comparable basis.
On a historical basis, the 435 million euro year-on-year rise in operating income for International Carriers & Shared Services is attributable to I) the favorable impact of changes in the scope of consolidation and other changes of 118 million euros, chiefly due to the allocation to the France operating segment of the charge of 110 million euros for contributions for non-common risks (particularly unemployment) for Orange civil servants, recognized in 2012 in the International Carriers & Shared Services operating segment, II) the positive impact of foreign exchange fluctuations of 8 million euros, and III) organic changes on a comparable basis, i.e. a 319 million euro improvement in operating income.
On a comparable basis, the 319 million euro improvement in operating income for International Carriers & Shared Services results primarily from I) the 273 million euro improvement in Reported EBITDA, and II), to a lesser extent, the 66 million euro rise in income from associates (with an expense of 52 million euros in 2013, compared with an expense of 118 million euros in 2012).
2012 vs. 2011
International Carriers & Shared Services operating income was a negative (1,002) million euros in 2012, compared with a negative (103) million euros in 2011 on a historical basis and (778) million euros on a comparable basis.
The operating income of International Carriers & Shared Services declined 899 million euros on a historical basis from 2011 to 2012, due primarily to:
■
the unfavorable impact of changes in the scope of consolidation and other changes, totaling 671 million euros, mainly stemming from I) the discontinuation of financing activities in the United Kingdom in 2011, generating income of 642 million euros (see Note 13.5 to the consolidated financial statements) mostly made up by the reclassification of translation reserves from the entities involved in financing activities, and II), to a lesser extent, the transfer of a number of functions from the France operating segment;
■
organic change on a comparable basis, i.e. a 224 million euro decline in operating income.
The operating income of International Carriers & Shared Services declined 224 million euros on a comparable basis between 2011 and 2012, largely attributable to I) the 461 million euro contraction in Reported EBITDA, II) negative income from associates of (122) million euros in 2012, versus a negative income of (99) million euros one year earlier, III) partially offset, on the one hand, by the 157 million euro reduction of the impairment of fixed assets and, on the other, by the lowering of depreciation and amortization by 104 million euros.
Information on EE activities (main financial and operating indicators) is provided in Section 4.3.3.7 Information on EE activities.
ORANGE / 2013 REGISTRATION DOCUMENT - 246
2013 vs. 2012
International Carriers & Shared Services CAPEX amounted to 305 million euros in 2013, down 26.4% on a historical basis compared with the previous year and down 26.5% on a comparable basis.
On both a historical and a comparable basis the 110 million euro contraction in International Carriers & Shared Services CAPEX between 2012 and 2013 is primarily attributable to i) the lower capital expenditure on customer service platforms, following substantial investments in 2012, ii) the reduction in capital expenditure on network property, stores and other, chiefly due to the acquisition of buildings in France in 2012, iii) the reduction in IT investment, after the significant efforts made in this area in 2012, and iv) the completion of the LION2 (Lower Indian Ocean Network 2) and the ACE (Africa Coast to Europe) submarine cables in April 2013 and in December 2012 respectively.
2012 vs. 2011
On a historical basis, International Carriers & Shared Services CAPEX totaled 416 million euros in 2012, an increase of 48 million euros compared with 2011. The improvement stemmed from organic change on a comparable basis, i.e. a 57 million euro increase in CAPEX, counterbalanced by the adverse impact of changes in the scope of consolidation and other changes, amounting to 9 million euros between the two periods.
On a comparable basis, the 57 million euro increase in International Carriers & Shared Services CAPEX between 2011 and 2012 was attributable mainly to the increased investment in customer service platforms and the acquisition of property in France in 2012.
| Financial years ended December 31 |
INTERNATIONAL CARRIERS & SHARED SERVICES
(in millions of euros) | 2013 | 2012
Data on a comparable basis (1) | 2012
Data on a historical basis | Chg. (%)
Data on a comparable basis (1) | Chg. (%)
Data on a historical basis | 2011
Data on a historical basis |
Revenues (2) | 1,702 | 1,618 | 1,623 | 5.2% | 4.9% | 1,610 |
International Carriers | 1,423 | 1,381 | 1,382 | 3.0% | 3.0% | 1,361 |
Shared Services | 279 | 237 | 241 | 17.7% | 15.8% | 249 |
(1) See Section 4.3.5.1 Transition from data on a historical basis to data on a comparable basis. (2) In millions of euros. Breakdown of revenues in external data (see Financial glossary appendix). |
EE covers the mobile and fixed services (Internet services) of the Orange and T-Mobile joint venture in the United Kingdom. Owned 50/50 by Orange and Deutsche Telekom, the EE joint venture is recognized using the equity method. The share of profits (losses) of associates of EE in the United Kingdom is recognized in the International Carriers & Shared Services (IC & SS) operating segment.
The data presented below is fully-consolidated EE data in pounds sterling.
| Financial years ended December 31 |
EE
(100% and in millions of pounds sterling) | 2013 | 2012
Data on a comparable basis | 2012
Data on a historical basis | Chg. (%)
Data on a comparable basis | Chg. (%)
Data on a historical basis | 2011
Data on a historical basis |
Revenues | 6,482 | 6,657 | 6,657 | (2.6)% | (2.6)% | 6,784 |
Reported EBITDA | 1,313 | 1,105 | 1,085 | 18.8% | 21.0% | 1,171 |
Reported EBITDA/Revenues | 20.3% | 16.6% | 16.3% | | | 17.3% |
CAPEX (1) | 583 | 649 | 606 | (10.1)% | (3.8)% | 576 |
CAPEX/Revenues | 9.0% | 9.7% | 9.1% | | | 8.5% |
(1) Including investments financed through finance leases. |
2013 vs. 2012
On both a historical and a comparable basis, EE’s revenues fell by 2.6% between 2012 and 2013, reflecting the adverse effect of the reduction in regulated prices. Excluding the effect of the fall in regulated prices, the revenues from mobiles services would have been down slightly, 0.5% between the two periods. Between December 31, 2012 and December 31, 2013, the number of contract customers rose by 756,000, a 5.6% year-on-year increase. This growth also reflected an increase in the proportion of contract customers in the overall customer base, to a total of 58% at December 31, 2013, compared with 52% at December 31, 2012. The number of prepaid customers fell by 1.8 million year on year.
ORANGE / 2013 REGISTRATION DOCUMENT - 247
14 months after the launch of high-capacity broadband offers in October 2012, EE had almost 2 million 4G customers at December 31, 2013. The 4G network extended to almost 70% of the population in the UK by the end of 2013.
On a comparable basis, Reported EBITDA rose 18.8% year on year to 1,313 million pounds sterling in 2013, despite the impact of restructuring costs.
[REDACTED SECTION: CERTAIN TEXT THAT FOLLOWS HAS BEEN REDACTED]
In 2013, EE paid out 458 million pounds sterling in dividends to its shareholders, Orange and Deutsche Telekom.
2012 vs. 2011
On a comparable basis, EE’s revenues fell by 1.9% between 2011 and 2012, due to the adverse effect of the reduction in regulated prices. Excluding the effect of the fall in regulated prices, the revenues from mobile services rose 3% between 2011 and 2012. Between December 31, 2011 and December 31, 2012, the number of contract customers rose 700,000, a 5.9% year-on-year increase. This growth also reflected an increase in the proportion of contract customers in the overall customer base, to a total of 52% at December 31, 2012, compared with 48% at December 31, 2011. The number of prepaid customers declined 719,000 year-on-year.
On a comparable basis, EE’s Reported EBITDA fell by 7.3% between 2011 and 2012 to 1,085 million pounds sterling in 2012, due in particular to restructuring costs.
[REDACTED SECTION: CERTAIN TEXT THAT FOLLOWS HAS BEEN REDACTED]
In 2012, EE paid out 734 million pounds sterling in dividends to its shareholders, Orange and Deutsche Telekom.
| Financial years ended December 31 |
EE
(100%) | 2013 | 2012
Data on a comparable basis | 2012
Data on a historical basis | Chg. (%)
Data on a comparable basis | Chg. (%)
Data on a historical basis | 2011
Data on a historical basis |
Revenues (1) | 6,482 | 6,657 | 6,657 | (2.6)% | (2.6)% | 6,784 |
Revenues from mobile services (1) | 5,734 | 5,953 | 5,953 | (3.7)% | (3.7)% | 6,167 |
Mobile services | | | | | | |
Number of mobile customers (2) (3) | 24,774 | 26,148 | 26,148 | (5.3)% | (5.3)% | 26,834 |
Number of contract customers | 14,350 | 13,594 | 13,594 | 5.6% | 5.6% | 12,842 |
Number of prepaid customers | 10,424 | 12,554 | 12,554 | (17.0)% | (17.0)% | 13,992 |
Monthly mobile ARPU in the fourth quarter (in pounds sterling) | 19.2 | 18.6 | 18.6 | 3.2% | 3.2% | 19.1 |
Monthly mobile ARPU in the fourth quarter (in minutes) | 208 | 195 | 195 | 6.7% | 6.7% | 198 |
Fixed-line services | | | | | | |
Number of fixed-line telephony customers (2) | 730 | 698 | 698 | 4.6% | 4.6% | 729 |
(1) In millions of pounds sterling. (2) In thousands. At end of period. (3) Excluding machine-to-machine customers. |
| Financial years ended December 31 |
SIMPLIFIED CONSOLIDATED STATEMENT OF CASH FLOWS (1)
(in millions of euros) | 2013 | 2012
Data on a historical basis | 2011
Data on a historical basis |
Net cash provided by operating activities | 7,259 | 10,016 | 12,879 |
Net cash used in investing activities | (6,044) | (4,710) | (6,308) |
Net cash used in financing activities | (3,537) | (5,072) | (2,860) |
Net change in cash and cash equivalents | (2,322) | 234 | 3,711 |
Effect of exchange rate changes on cash and cash equivalents and other non-monetary impacts | (65) | 26 | (78) |
Cash and cash equivalents at beginning of period | 8,321 | 8,061 | 4,428 |
Cash and cash equivalents at end of period | 5,934 | 8,321 | 8,061 |
(1) For more detail, see Consolidated statement of cash flows in the consolidated financial statements. |
ORANGE / 2013 REGISTRATION DOCUMENT - 248
Net cash provided by operating activities was 7,259 million euros in 2013, versus 10,016 million euros in 2012 and 12,879 million euros in 2011. The 2,757 million euro fall in net cash provided by operating activities from 2012 to 2013 is attributable chiefly to the settlement in the second half of 2013 of the tax litigation relating to the 2005 financial year in the amount of 2,146 million euros (see Section 4.3.1.4 Significant events).
In 2013, the net cash flow provided by operating activities included 270 million euros from the dividends paid by the EE joint venture in the United Kingdom (450 million euros in 2012 and 494 million euros in 2011 – see Note 9 to the consolidated financial statements.)
2013 vs. 2012
CHANGE IN NET CASH PROVIDED BY OPERATING ACTIVITIES – 2013 VS. 2012
(in millions of euros) | Financial years ended December 31 |
Net cash provided by operating activities in 2012 | 10,016 |
Increase (decrease) in Reported EBITDA | (260) |
Change in working capital requirement (1) | 510 |
Settlement of the dispute between DPTG and Orange Polska in Poland (2) | 550 |
Other | (40) |
Decrease (increase) in net interest paid and interest rates effects on derivatives, net (net of dividends received) | (196) |
Decrease (increase) in income tax paid | 4 |
Tax litigation relating to the 2005 financial year (3) | (2,146) |
Other (mainly Change in the elimination of non-monetary effects included in Reported EBITDA) | (669) |
“Part-Time for Seniors” plan in France (3) (4) | (1,188) |
Other | 519 |
Net cash provided by operating activities in 2013 | 7,259 |
(1) See the Financial glossary appendix. (2) See the Consolidated statement of cash flows in the consolidated financial statements. (3) See Section 4.3.1.4 Significant events. (4) See Note 5 to the consolidated financial statements. |
2012 vs. 2011
CHANGE IN NET CASH PROVIDED BY OPERATING ACTIVITIES – 2012 VS. 2011
(in millions of euros) | Financial years ended December 31 |
Net cash provided by operating activities in 2011 | 12,879 |
Increase (decrease) in Reported EBITDA | (2,634) |
Change in working capital requirement | (884) |
Settlement of the dispute between DPTG and Orange Polska in Poland (1) | (550) |
Other | (334) |
Decrease (increase) in net interest paid and interest rates effects on derivatives, net (net of dividends received) | (292) |
Decrease (increase) in income tax paid | (124) |
Other (mainly Change in the elimination of non-monetary effects included in Reported EBITDA) | 1,071 |
Part-Time for Seniors plan in France (2) | 1,195 |
Other | (124) |
Net cash provided by operating activities in 2012 | 10,016 |
(1) See the Consolidated statement of cash flows in the consolidated financial statements. (2) See Section 4.3.1.4 Significant events and Note 5 to the consolidated financial statements. |
ORANGE / 2013 REGISTRATION DOCUMENT - 249
The net cash used in investing activities amounted to (6,044) million euros in 2013 as against (4,710) million euros in 2012, and (6,308) million euros in 2011.
| Financial years ended December 31 |
ACQUISITIONS AND PROCEEDS FROM SALES OF PROPERTY, PLANT AND EQUIPMENT AND INTANGIBLE ASSETS
(net of the change in amounts due to fixed asset suppliers)
(in millions of euros) | 2013 | 2012
Data on a historical basis | 2011
Data on a historical basis |
Acquisitions of property, plant and equipment and intangible assets (1) | (6,117) | (6,763) | (6,711) |
CAPEX | (5,631) | (5,818) | (5,770) |
Telecommunication licenses | (486) | (945) | (941) |
Increase (decrease) in fixed assets payables | 22 | (229) | 39 |
Proceeds from sales of property, plant and equipment and intangible assets | 98 | 148 | 74 |
TOTAL GROUP | (5,997) | (6,844) | (6,598) |
(1) Capital expenditures on tangible and intangible assets financed through finance leases have no effect on cash flows when acquired (see Section 4.3.2.5 Group capital expenditures, Segment Information in the consolidated financial statements and Note 7 to the consolidated financial statements). |
| Financial years ended December 31 |
ACQUISITIONS AND PROCEEDS FROM SALES OF INVESTMENT SECURITIES
(net of cash acquired or transferred) (1)
(in millions of euros) | 2013 | 2012
Data on a historical basis | 2011
Data on a historical basis |
Acquisitions of investment securities (net of cash acquired) | (89) | (118) | (609) |
Acquisition of Dailymotion (50.9% in 2013 and 49.1% in 2011) (2) | (57) | - | (66) |
Acquisition of 100% of Simyo | - | (48) | - |
Acquisition of 100% of Orange RDC (formerly Congo Chine Telecom) | - | 7 | (153) |
Acquisition of 20.2% of Korek Telecom | - | - | (305) |
Acquisition of 38.6% of Compagnie Européenne de Téléphonie (CET) | - | - | (61) |
Other acquisitions | (32) | (77) | (24) |
Proceeds from sales of investment securities (net of cash transferred) | 76 | 1,410 | 452 |
Proceeds from disposal of 100% of Orange Austria (2) | 63 | - | - |
Proceeds from disposal of 100% of Orange Suisse | - | 1,386 | - |
Proceeds from disposal of 100% of TP Emitel by Orange Polska | - | - | 410 |
Other proceeds from sales | 13 | 24 | 42 |
TOTAL GROUP | (13) | 1,292 | (157) |
(1) See Note 2 to the consolidated financial statements. (2) See Section 4.3.1.4 Significant events. |
| Financial years ended December 31 |
OTHER DECREASES (INCREASES) IN SECURITIES AND OTHER FINANCIAL ASSETS
(in millions of euros) | 2013 | 2012
Data on a historical basis | 2011
Data on a historical basis |
Investments at fair value (excluding cash equivalents) | (39) | 591 | (67) |
Redemption of loan granted to EE (1) | - | 222 | 511 |
Other | 5 | 29 | 3 |
TOTAL GROUP | (34) | 842 | 447 |
(1) Redemption of the 1,407 million euro loan (1,250 million pounds sterling) granted by the Group on April 1, 2010 to the EE joint venture (see Consolidated statement of cash flows in the consolidated financial statements and Note 10 to the consolidated financial statements). |
ORANGE / 2013 REGISTRATION DOCUMENT - 250
The net cash used in financing activities was (3,537) million euros in 2013, versus (5,072) million euros in 2012 and (2,860) million euros in 2011.
| Financial years ended December 31 |
NET CASH USED IN FINANCING ACTIVITIES
(in millions of euros) | 2013 | 2012
Data on a historical basis | 2011
Data on a historical basis |
Long-term debt issuances (1) | 3,209 | 2,769 | 4,331 |
Long-term debt redemptions and repayments (net of exchange rate effects on derivatives, net) (1) | (4,136) | (2,868) | (1,955) |
Increase (decrease) of bank overdrafts and short-term borrowings (1) | (151) | 1,001 | (570) |
Decrease (increase) of deposits and other debt-linked financial assets (1) | (751) | (178) | 2 |
Purchase of treasury shares (2) | (24) | (94) | (275) |
Changes in ownership interests with no gain or loss of control | (11) | (1,489) | (8) |
Acquisition of 57.6% of ECMS in Egypt (3) | - | (1,489) | - |
Other changes | (11) | - | (8) |
Changes in capital (2) | - | 2 | 1 |
Dividends paid (2) | (1,673) | (4,215) | (4,386) |
Dividends paid to owners of the parent (4) | (1,314) | (3,632) | (3,703) |
Dividends paid to non-controlling interests | (359) | (583) | (683) |
TOTAL GROUP | (3,537) | (5,072) | (2,860) |
(1) See Note 10 to the consolidated financial statements. (2) See Note 13 to the consolidated financial statements. (3) See Note 2 to the consolidated financial statements. (4) In 2013, payment of i) the balance of the dividend of 0.20 euro per share in respect of the 2012 financial year, and ii) of the interim dividend of 0.30 euro per share in respect of the 2013 financial year. In 2012, payment of i) the balance of the dividend of 0.80 euro per share in respect of 2011 financial year, and ii) the interim dividend of 0.58 euro per share in respect of 2012 financial year (see Note 13 to the consolidated financial statements). |
The management of covenants is described in Note 11 to the consolidated financial statements.
At December 31, 2013, the French State held 26.94% of the share capital of Orange SA, directly or jointly with Bpifrance Participations, (see Note 13 to the consolidated financial statements).
Changes in equity are described in the Consolidated statement of changes in shareholders’ equity in the consolidated financial statements, as well as in Note 13 to the consolidated financial statements.
For further information on the risks relating to the Orange Group’s financial debt, see Section 2.4.3 Financial risks of the 2013 Registration Document.
The Orange Group’s net financial debt (see the Financial glossary appendix and Note 10 to the consolidated financial statements) amounted to 30,726 million euros at December 31, 2013, compared with 30,545 million euros at December 31, 2012 and 30,890 million euros at December 31, 2011. At December 31, 2013 net financial debt was thus up 181 million euros compared with December 31, 2012.
| Financial years ended December 31 |
FINANCIAL DEBT
(in millions of euros) | 2013 | 2012
Data on a historical basis | 2011
Data on a historical basis |
Net financial debt | 30,726 (4) | 30,545 | 30,890 (5) |
Average maturity of net financial debt (1) | 9 years | 9 years | 9 years |
Average gross financial debt outstanding over the period (2) | 36,209 | 37,544 | 34,325 |
Weighted average cost of bond portfolio (3) | 4.83% | 5.25% | 5.28% |
(1) Excluding perpetual bonds redeemable for shares (TDIRAs). (2) Excludes amounts not bearing interest, such as debts relating to commitments to buy non-controlling equity stakes, and accrued but unpaid interest. (4) Excluding the settlement of the tax litigation relating to the 2005 financial year during the second half of 2013 in the amount of 2,146 million euros (see Section 4.3.1.4 Significant events), net financial debt would have totaled 28,580 million euros at December 31, 2013. (5) Taking into account for 2011 i) the 891 million euro payment for the acquisition of the 4G mobile license in the 800 MHz band in France (on January 19, 2012), and ii) the 550 million euro payment for the legal dispute between DPTG and Orange Polska in Poland (on January 13, 2012), net financial debt would have totaled 32,331 million euros at December 31, 2011. |
ORANGE / 2013 REGISTRATION DOCUMENT - 251
[REDACTED SECTION: CERTAIN TEXT THAT FOLLOWS HAS BEEN REDACTED]
2013 vs. 2012
CHANGE IN NET FINANCIAL DEBT – 2013 VS. 2012
(in millions of euros) | Financial years ended December 31 |
Net financial debt at December 31, 2012 | 30,545 |
Reported EBITDA | (12,235) |
CAPEX | 5,631 |
Decrease (increase) in amounts due to CAPEX suppliers | 15 |
Telecommunication licenses paid | 449 |
Proceeds from sales of property, plant and equipment and intangible assets | (98) |
Increase (decrease) in working capital requirement (1) | 110 |
Net interest paid and interest rates effects on derivatives, net (net of dividends received) | 1,566 |
Income tax paid | 1,141 |
Tax litigation relating to the 2005 financial year (2) | 2,146 |
Acquisitions and proceeds from sales of investment securities (net of cash acquired or transferred) and changes in ownership interests with no gain or loss of control | 24 |
Purchase of treasury shares | 24 |
Dividends paid to owners of the parent (3) | 1 314 |
Dividends paid to non-controlling interests | 359 |
Other items (4) | (265) |
Net financial debt at December 31, 2013 | 30,726 |
(1) See the Financial glossary appendix. (2) See Section 4.3.1.4 Significant events. (3) Balance of the dividend of 0.20 euro per share in respect of 2012, and the interim dividend of 0.30 euro per share in respect of 2013 (see Note 13 to the consolidated financial statements). (4) Including elimination of non-monetary effects included in Reported EBITDA. |
ORANGE / 2013 REGISTRATION DOCUMENT - 252
2012 vs. 2011
CHANGE IN NET FINANCIAL DEBT – 2012 VS. 2011
(in millions of euros) | Financial years ended December 31 |
Net financial debt at December 31, 2011 | 30,890 |
Reported EBITDA | (12,495) |
CAPEX | 5,818 |
Decrease (increase) in amounts due to CAPEX suppliers | (81) |
Telecommunication licenses paid | 1,255 |
Proceeds from sales of property, plant and equipment and intangible assets | (148) |
Increase (decrease) in working capital requirement | 620 |
Settlement of the dispute between DPTG and Orange Polska in Poland (1) | 550 |
Other | 70 |
Interest paid and interest rates effects on derivatives, net (net of dividends and interest income received) | 1,370 |
Income tax paid | 1,145 |
Net effect of the acquisition of 57.6% of ECMS and of changes to the shareholders’ agreement relating to ECMS (2) | (228) |
Disposal of 100% of Orange Suisse | (1,386) |
Other acquisitions and proceeds from sales of investment securities (net of cash acquired or transferred) and changes in ownership interests with no gain or loss of control | 94 |
Purchase of treasury shares | 94 |
Dividends paid to owners of the parent (3) | 3,632 |
Dividends paid to non-controlling interests | 583 |
Other items (4) | (618) |
Net financial debt at December 31, 2012 | 30,545 |
(1) See the Consolidated statement of cash flows in the consolidated financial statements. (2) Extinction of the commitment to buy ECMS shares for (1,937) million euros at December 31, 2011, partially offset by i) the acquisition of 57.6% of ECMS for 1,489 million euros, and by ii) the recognition of a new purchase commitment regarding the remaining ECMS shares for 220 million euros (see Notes 2 and 10 to the consolidated financial statements). (3) Balance of the dividend of 0.80 euro per share in respect of 2011, and the interim dividend of 0.58 euro per share in respect of 2012 (see Note 13 to the consolidated financial statements). (4) Including elimination of non-monetary effects included in Reported EBITDA. |
Financial assets, liabilities and finance costs-net are described in Notes 10 and 11 to the consolidated financial statements, along with information on market risk and the fair value of financial assets and liabilities.
In 2013, Orange continued to take advantage of its strong creditworthiness and of the favorable market environment to maintain a strong liquidity position and to optimize the maturity and cost of its net financial debt.
In 2013, Orange SA issued 2.6 billion euros in bonds, including i) 750 million euros maturing in 2019 at a rate of 1.875%, ii) 150 million euros maturing in 2029 at 3.30%, iii) an issue of 850 million euros maturing in 2018 at 1.875%, and iv) 650 million euros maturing in 2024 at a rate of 3.125%. Moreover, Orange SA redeemed i) in January 2013, the balance on maturity of a 3,076 million euro bond issued at a rate of 7.25%, as well as ii) in September 2013, the balance on maturity of a 500 million Swiss franc bond issued at 3.375%.
At December 31, 2013, the Group’s cash and cash equivalents stood at 5,916 million euros (excluding cash and cash equivalents of discontinued operations). At December 31, 2013, Orange’s liquidity position exceeded its 2014 net financial debt obligations. The Group’s liquidity position stood at 12,253 million euros at December 31, 2013 (see Note 11.3 to the consolidated financial statements).
In January 2014, the Group issued 2.8 billion euros in perpetual subordinated bonds with a view to strengthening its balance sheet, at a cost of 4.9% per year, which is in line with the average cost of its senior debt. In addition, as part of its active approach to managing its balance sheet, the Group completed a bond issue for 1.6 billion dollars in January 2014, the proceeds of which are earmarked for the early redemption of a 1,215 billion dollar bond issue maturing in July 2014 (see Note 16 to the consolidated financial statements).
Details of the main bond issues and redemptions and repayments as well as the main changes to credit facilities can be found in Note 10 to the consolidated financial statements.
In the course of its manufacturing and commercial activities, Orange is exposed to market risks arising from the management of its interest costs, operating expenses in foreign currencies, and the value of certain asset items denominated in foreign currencies, such as equity stakes in foreign companies. Based on an analysis of its overall risk exposure, which mainly stems from fluctuating interest and foreign exchange rates, Orange uses various financial instruments with the goal of optimizing its financing costs within the limits set by senior management with respect to their potential effects on earnings.
ORANGE / 2013 REGISTRATION DOCUMENT - 253
The management of interest rate risk, foreign exchange risk, liquidity risk, covenants, credit risk and counterparty risk as well as the management of stock market and equity risk plus the fair value hierarchy of financial assets and liabilities are described in Note 11 to the consolidated financial statements.
It is the policy of the Orange Group not to use derivatives for speculative purposes. For further information on risks relating to financial markets, see Section 2.4.3 Financial risks of the 2013 Registration Document.
Operational foreign exchange risk
The Group’s foreign operations are carried out by entities that operate in their own country and mainly in their own currency. Their operational exposure to foreign exchange risk is therefore limited to certain operational transactions (such as purchases of equipment or network capacity, purchases from suppliers or sales to customers, purchases or sales to international carriers).
To hedge the exposure to these foreign exchange risks, the Orange Group has established hedging policies whenever possible (see Note 10 to the consolidated financial statements.)
Financial foreign exchange risk
Financial foreign exchange risk mainly relates to dividends paid to the parent company, financing of the subsidiaries and Group financing (see Note 11.2 to the consolidated financial statements).
For further information on risks relating to financial markets, see Section 2.4.3 Financial risks of the 2013 Registration Document.
Orange’s debt rating is an additional performance indicator used to assess the Group’s financial policy and its risk, notably its solvency and liquidity risk, management policy; it is not a substitute for the investor’s own analysis. The credit rating agencies revise their ratings on a regular basis. Any change in the rating is liable to produce an impact on the cost of future financing or to restrict access to liquidity (see Section 2.4.3 Financial risks of the 2013 Registration Document and Note 11.3 to the consolidated financial statements). In addition, a change in Orange’s debt rating will, for certain outstanding financings, trigger step-up (1)(1) clauses affecting the interest paid to investors or result in the acceleration or the modification of the repayment schedule of the loan.
An Orange SA bond (see Note 10.4 to the consolidated financial statements) with an outstanding amount of 2.5 billion dollars, equivalent to 1.8 billion euros at December 31, 2013, includes a step-up clause in the event of a change to the Group’s rating. The clause was activated in 2013 and in early-2014.
Furthermore, perpetual bonds redeemable for shares (TDIRAs) bear interest at Euribor 3 months plus 2.5% (see Note 10.3 to the consolidated financial statements):
■
for the Supplier tranche, this interest rate may be increased to Euribor 3 months plus 3.0% should Orange’s rating be downgraded to BBB (by Standard & Poor’s) or Baa2 (by Moody’s). The interest rate would be restored to 3-month Euribor +2.5% when Orange’s rating moves back up above those thresholds;
■
for the Bank tranche, the bearer Registration Document, held on January 6, 2014, decided to eliminate the step-up clause subject to Orange’s rating.
Moreover, the spread on the 6 billion euro syndicated credit facility signed on January 27, 2011 (see Note 11.3 to the consolidated financial statements), was modified by the change in Orange’s rating in 2013. This credit facility had not been drawn down at December 31, 2013.
Lastly, Orange’s trade receivables securitization programs contain provisions for accelerated repayment or modification of the repayment schedule in the event that the Group’s long-term rating is downgraded to BB- (by Standard & Poor’s) or to Ba3 (by Moody’s), or that either of those rating agencies stopped rating the Company (see Note 11.4 to the consolidated financial statements).
Developments regarding Orange’s rating in 2013:
■
on April 22, 2013, Standard & Poor’s downgraded Orange’s rating to BBB+ with a Stable outlook;
■
on November 7, 2013, Fitch Ratings revised its outlook from Stable to Negative.
(1)
Step-up clause: clause that triggers an increase in the coupon interest rate on a loan, according to rules agreed in the contract, if Orange’s long-term credit rating is downgraded by the rating agencies. This clause may also stipulate a reduction in the coupon interest rate in the event of an upgrade, although the interest rate may not drop below the initial rate of the loan.
ORANGE / 2013 REGISTRATION DOCUMENT - 254
At December 31, 2013, Orange’s ratings were as follows:
| Standard & Poor’s | Moody’s | Fitch Ratings |
Long-term debt | BBB+ | A3 | BBB+ |
Outlook | Stable | Negative | Negative |
Short-term debt | A2 | P2 | F2 |
Developments regarding Orange’s rating at the start of 2014:
■
on January 14, 2014, Moody’s downgraded Orange’s long-term rating from A3 to Baa1, and adjusted its outlook from Negative to Stable, while confirming its P2 short-term rating;
■
on January 20, 2014, Standard & Poor’s revised its outlook on Orange’s long-term debt from Stable to Negative, while confirming its BBB+ rating for long-term debt, and A2 for short-term debt.
For further information on risks related to the financial markets and a history of the Company’s ratings, see Section 2.4.3 Financial risks of the 2013 Registration Document.
In order to allow investors to track the annual changes in the Group’s operations, data on a comparable basis are presented for the previous period. The transition from data on a historical basis to data on a comparable basis consists of keeping the results for the year ended and restating the previous year in order to present financial data with comparable methods, scope of consolidation and exchange rates over comparable periods. Orange provides the details of the impact of changes in method, scope of consolidation and exchange rates on its key operating indicators in order to isolate the intrinsic business impact. The method used is to apply to the data of the corresponding period of the preceding year the methods and the scope of consolidation for the period ended as well as the average exchange rates used for the statement of income for the period ended. Changes in data on a comparable basis better reflect organic business changes. Data on a comparable basis represents an additional comparison tool and is not intended to replace data on a historical basis for the year ended or the previous periods.
Data on a comparable basis for 2012 are comparable to data on a historical basis for 2013 in terms of method, scope and exchange rates.
ORANGE / 2013 REGISTRATION DOCUMENT - 255
The following table presents, for the Orange Group, the transition from data on a historical basis to data on a comparable basis for the 2012 financial year for the key operating data.
| For the year ended December 31, 2012 |
2012 / GROUP
(in millions of euros) | Revenues | Reported EBITDA | Operating income | CAPEX | Average number of employees |
Data on a historical basis | 43,515 | 12,495 | 4,063 | 5,818 | 163,545 |
Foreign exchange fluctuations (1) | (356) | (70) | 108 | (61) | - |
Egyptian Pound (EGP) | (192) | (60) | 66 | (39) | - |
Dominican peso (DOP) | (40) | (14) | (8) | (6) | - |
US dollar (USD) | (35) | (10) | (7) | (4) | - |
Jordanian dinar (JOD) | (14) | (5) | (3) | (1) | - |
Botswana pula (BWP) | (12) | (5) | (3) | (2) | - |
Moldovan leu (MDL) | (10) | (5) | (3) | (2) | - |
Polish zloty (PLN) | (10) | (3) | 20 | (2) | - |
Other | (43) | 32 | 46 | (5) | - |
Changes in the scope of consolidation and other changes | (229) | (136) | (110) | (13) | (5) |
Changes in scope of consolidation | (229) | (136) | (110) | (13) | (124) |
Disposal of Orange Suisse | (161) | (137) | (136) | (14) | (194) |
Disposal of Etrali Trading Solutions | (57) | (3) | - | (2) | (251) |
Other | (11) | 4 | 26 | 3 | 321 |
Other changes | - | - | - | - | 119 |
Data on a comparable basis | 42,930 | 12,289 | 4,061 | 5,744 | 163,540 |
(1) Foreign exchange fluctuations between the average exchange rates for the 2012 financial year and for the 2013 financial year. |
The changes included in the transition from data on a historical basis to data on a comparable basis for the 2012 financial year primarily include:
■
changes in the scope of consolidation, mainly:
■
the impact of the disposal of Orange Suisse (presented in Rest of the World segment) on February 29, 2012 (see Note 2 to the consolidated financial statements), effective on January 1, 2012, in data on a comparable basis,
■
and the impact of the disposal of Etrali Trading Solutions (Enterprise operating segment) on May 31 2013, effective on June 1, 2012, in the data on a comparable basis;
■
and the foreign exchange fluctuations between the average exchange rates for the 2012 financial year and for the 2013 financial year.
ORANGE / 2013 REGISTRATION DOCUMENT - 256
The following table presents, for each consolidated operating segment of the Orange Group, the transition from data on a historical basis to data on a comparable basis for the 2012 financial year for the key operating data.
| For the year ended December 31, 2012 |
2012 / OPERATING SEGMENTS
(in millions of euros) | Revenues | Reported EBITDA | Operating income | CAPEX | Average number of employees |
France | | | | | |
Data on a historical basis | 21,431 | 6,763 | 4,306 | 2,712 | 76,753 |
Foreign exchange fluctuations (1) | - | - | - | - | - |
Changes in the scope of consolidation and other changes | (6) | (95) | (68) | - | (69) |
Changes in scope of consolidation | (6) | 1 | 28 | - | (69) |
Other changes (2) | - | (96) | (96) | - | - |
Data on a comparable basis | 21,425 | 6,668 | 4,238 | 2,712 | 76,684 |
Spain | | | | | |
Data on a historical basis | 4,027 | 951 | 169 | 473 | 3,406 |
Foreign exchange fluctuations (1) | - | - | - | - | - |
Changes in the scope of consolidation and other changes (2) | - | - | - | - | - |
Data on a comparable basis | 4,027 | 951 | 169 | 473 | 3,406 |
Poland | | | | | |
Data on a historical basis | 3,381 | 1,156 | (505) | 558 | 22,700 |
Foreign exchange fluctuations (1) | (10) | (4) | 20 | (2) | - |
Changes in the scope of consolidation and other changes (2) | (2) | 3 | - | 2 | 396 |
Data on a comparable basis | 3,369 | 1,155 | (485) | 558 | 23,096 |
Rest of the World | | | | | |
Data on a historical basis | 8,281 | 2,893 | 332 | 1,308 | 26,013 |
Foreign exchange fluctuations (1) | (290) | (93) | 56 | (56) | - |
Changes in the scope of consolidation and other changes | (162) | (136) | (135) | (14) | (58) |
Disposal of Orange Suisse | (168) | (136) | (135) | (14) | (194) |
Other changes (2) | 6 | - | - | - | 136 |
Data on a comparable basis | 7,829 | 2,664 | 253 | 1,238 | 25,955 |
Enterprise | | | | | |
Data on a historical basis | 7,001 | 1,134 | 763 | 352 | 21,387 |
Foreign exchange fluctuations (1) | (56) | 23 | 24 | (3) | - |
Changes in the scope of consolidation and other changes | (64) | (18) | (15) | (2) | (269) |
Disposal of Etrali Trading Solutions | (57) | (3) | - | (2) | (251) |
Other changes (2) | (7) | (15) | (15) | - | (18) |
Data on a comparable basis | 6,881 | 1,139 | 772 | 347 | 21,118 |
International Carriers & Shared Services | | | | | |
Data on a historical basis | 1,623 | (402) | (1,002) | 415 | 13,286 |
Foreign exchange fluctuations (1) | (2) | 3 | 8 | - | - |
Changes in the scope of consolidation and other changes | (3) | 111 | 108 | 1 | (5) |
Changes in scope of consolidation | (3) | 1 | (2) | 1 | (5) |
Other changes (2) | - | 110 | 110 | - | - |
Data on a comparable basis | 1,618 | (288) | (886) | 416 | 13,281 |
(1) Foreign exchange fluctuations between the average exchange rates for the 2012 financial year and for the 2013 financial year. (2) Including the effect of internal reorganizations between operating segments which have no effect at Group level. |
ORANGE / 2013 REGISTRATION DOCUMENT - 257
Data on a comparable basis for 2011 are comparable to data on a historical basis for 2012 in terms of method, scope and exchange rates.
The following table presents, for the Orange Group, the transition from data on a historical basis to data on a comparable basis for the 2011 financial year for the key operating data.
| Financial year ended December 31, 2011 |
2011 / GROUP
(in millions of euros) | Revenues | Reported EBITDA | Operating income | CAPEX | Average number of employees |
Data on a historical basis | 45,277 | 15,129 | 7,948 | 5,770 | 165,533 |
Foreign exchange fluctuations (1) | 213 | 36 | (20) | 32 | - |
US dollar (USD) | 94 | 24 | 22 | 8 | - |
Egyptian Pound (EGP) | 73 | 23 | (9) | 14 | - |
Polish zloty (PLN) | (56) | (12) | 5 | (10) | - |
Jordanian dinar (JOD) | 34 | 13 | 8 | 3 | - |
Dominican peso (DOP) | 20 | 7 | 4 | 3 | - |
Pound sterling (GBP) | 12 | - | (5) | 1 | - |
Kenyan shilling (KES) | 10 | (5) | (27) | 9 | - |
Other | 26 | (14) | (18) | 4 | - |
Changes in the scope of consolidation and other changes | (787) | (435) | (929) | (82) | (532) |
Changes in scope of consolidation | (787) | (435) | (929) | (82) | (107) |
Disposal of Orange Suisse | (827) | (220) | (64) | (101) | (998) |
Acquisition of Orange RDC (formerly Congo Chine Telecom) | 62 | 6 | (9) | 25 | 624 |
Disposal of TP Emitel by Orange Polska | (39) | (23) | (15) | (7) | (470) |
Gain (loss) on the disposal of TP Emitel | - | (197) | (197) | - | - |
Full consolidation of Compagnie Européenne de Téléphonie (CET) / Générale de Téléphone | 23 | (9) | (12) | 1 | 791 |
Reclassification of cumulative translation adjustment from liquidated entities in the United Kingdom | - | - | (642) | - | - |
Other | (6) | 8 | 10 | - | (54) |
Other changes | - | - | - | - | (425) |
Data on a comparable basis | 44,703 | 14,730 | 6,999 | 5,720 | 165,001 |
(1) Foreign exchange fluctuations between the average exchange rates for the 2011 financial year and for the 2012 financial year. |
The changes included in the transition from data on a historical basis to data on a comparable basis for the 2011 financial year primarily include:
■
changes in the scope of consolidation, mainly:
■
the impact of the disposal of Orange Suisse (presented in Rest of the World segment) on February 29, 2012 (see Note 2 to the consolidated financial statements), effective on March 1, 2011, in data on a comparable basis,
■
the effect of the acquisition of the mobile telephony operator Orange RDC (formerly Congo Chine Telecom, rest of the World reportable segment) in the Democratic Republic of the Congo on October 20, 2011 (see Note 2 to the consolidated financial statements), which took effect on January 1, 2011 in the data on a comparable basis,
■
the impact of the disposal of TP Emitel (Poland operating segment) by Orange Polska on June 22, 2011 (see Note 2 to the consolidated financial statements), which took effect on January 1, 2011, in the data on a comparable basis. Consequently the gain (loss) on the disposal of TP Emitel has been eliminated in the data on a comparable basis,
■
the effect of the full consolidation of Compagnie Européenne de Téléphonie (CET) / Générale de Téléphone (France operating segment), following the acquisition of the remaining shares in that company on July 29, 2011 (see Note 2 to the consolidated financial statements), which took effect on January 1, 2011, in the data on a comparable basis,
■
and the elimination in the data on a comparable basis of the reclassification of cumulative translation adjustment from liquidated entities in the United Kingdom in 2011 (see Note 13.5 to the consolidated financial statements);
■
and the foreign exchange fluctuations between the average exchange rates for the 2011 financial year and for the 2012 financial year.
ORANGE / 2013 REGISTRATION DOCUMENT - 258
The following table presents, for each consolidated operating segment of the Orange Group, the transition from data on a historical basis to data on a comparable basis for the 2011 financial year for the key operating data.
| Financial year ended December 31, 2011 |
2011 / OPERATING SEGMENTS
(in millions of euros) | Revenues | Reported EBITDA | Operating income | CAPEX | Average number of employees |
France | | | | | |
Data on a historical basis | 22,534 | 8,569 | 6,241 | 2,619 | 77,611 |
Foreign exchange fluctuations (1) | - | - | - | - | - |
Changes in the scope of consolidation and other changes | 26 | 46 | 42 | 1 | (202) |
Full consolidation of Compagnie Européenne de Téléphonie (CET) / Générale de Téléphone | 23 | (2) | (5) | 1 | 791 |
Other changes (2) | 3 | 48 | 47 | - | (993) |
Data on a comparable basis | 22,560 | 8,615 | 6,283 | 2,620 | 77,409 |
Spain | | | | | |
Data on a historical basis | 3,993 | 839 | (168) | 405 | 3,089 |
Foreign exchange fluctuations (1) | - | - | - | - | - |
Changes in the scope of consolidation and other changes (2) | (4) | 1 | - | - | (16) |
Data on a comparable basis | 3,989 | 840 | (168) | 405 | 3,073 |
Poland | | | | | |
Data on a historical basis | 3,625 | 1,347 | 443 | 627 | 24,119 |
Foreign exchange fluctuations (1) | (56) | (13) | 1 | (10) | - |
Changes in the scope of consolidation and other changes | (43) | (219) | (211) | (7) | (520) |
Disposal of TP Emitel by Orange Polska | (39) | (23) | (15) | (7) | (470) |
Gain (loss) on the disposal of TP Emitel | - | (197) | (197) | - | - |
Other changes (2) | (4) | 1 | 1 | - | (50) |
Data on a comparable basis | 3,526 | 1,115 | 233 | 610 | 23,599 |
Rest of the World | | | | | |
Data on a historical basis | 8,795 | 2,993 | 595 | 1,409 | 26,650 |
Foreign exchange fluctuations (1) | 160 | 44 | (24) | 35 | - |
Changes in the scope of consolidation and other changes | (791) | (220) | (79) | (79) | (360) |
Disposal of Orange Suisse | (858) | (224) | (67) | (105) | (998) |
Acquisition of Orange RDC (formerly Congo Chine Telecom) | 62 | 3 | (11) | 25 | 624 |
Other changes (2) | 5 | 1 | (1) | 1 | 14 |
Data on a comparable basis | 8,164 | 2,817 | 492 | 1,365 | 26,290 |
Enterprise | | | | | |
Data on a historical basis | 7,101 | 1,276 | 940 | 343 | 21,114 |
Foreign exchange fluctuations (1) | 106 | 7 | 7 | 7 | - |
Changes in the scope of consolidation and other changes (2) | (11) | 1 | (10) | 12 | 24 |
Data on a comparable basis | 7,196 | 1,284 | 937 | 362 | 21,138 |
International Carriers & Shared Services | | | | | |
Data on a historical basis | 1,610 | 105 | (103) | 367 | 12,950 |
Foreign exchange fluctuations (1) | 4 | (2) | (4) | - | - |
Changes in the scope of consolidation and other changes | (29) | (44) | (671) | (9) | 542 |
Reclassification of cumulative translation adjustment from liquidated entities in the United Kingdom | - | - | (642) | - | - |
Other changes (2) | (29) | (44) | (29) | (9) | 542 |
Data on a comparable basis | 1,585 | 59 | (778) | 358 | 13,492 |
(1) Foreign exchange fluctuations between the average exchange rates for the 2011 financial year and for the 2012 financial year. (2) Including the effect of internal reorganizations between operating segments which have no effect at Group level. |
ORANGE / 2013 REGISTRATION DOCUMENT - 259
Unrecognized contractual commitments are described in Note 14 to the consolidated financial statements.
In this document, other than the financial aggregates reported in accordance with the International Financial Reporting Standards, Orange publishes financial aggregates that are not defined by IFRS. As described below, these figures are presented as additional information and are not meant to be substitutes for or to be confused with financial aggregates as defined by IFRS.
Reported EBITDA and restated EBITDA
Reported EBITDA
Operating income before depreciation and amortization, reclassification of cumulative translation adjustment from liquidated entities, impairment losses and share of profits (losses) of associates and joint ventures, referred to hereafter as “Reported EBITDA”, represents operating income before depreciation and amortization, reclassification of cumulative translation adjustment from liquidated entities, before impairment of goodwill and fixed assets, and before the share of profits (losses) of associates and joint ventures.
Reported EBITDA is one of the key measures of operating profitability used by the Group internally to i) manage and assess the results of its operating segments, ii) implement its investments and resource allocation strategy, and iii) assess the performance of the Group Executive Management. Orange’s management believes that Reported EBITDA is meaningful for investors because it provides an analysis of its operating results and segment profitability using the same measure used by management. As a consequence and in accordance with IFRS 8 provisions, Reported EBITDA is included in the analysis by operating segment, in addition to operating income.
Reported EBITDA also allows Orange to compare its profits / losses with those of other companies in the telecommunications sector. Reported EBITDA, or similar management indicators used by Orange’s competitors, are indicators that are often disclosed and widely used by analysts, investors and other players in the telecommunications industry.
The reconciliation between Reported EBITDA and consolidated net income after tax as presented in the Consolidated income statement is shown below.
| Financial years ended December 31 |
(in millions of euros) | 2013 | 2012
Data on a historical basis | 2011
Data on a historical basis |
Revenues | 40,981 | 43,515 | 45,277 |
External purchases | (17,965) | (19,100) | (19,638) |
Other operating income | 687 | 900 | 658 |
Other operating expense | (508) | (721) | (691) |
Labor expenses | (9,019) | (10,363) | (8,815) |
Operating taxes and levies | (1,717) | (1,857) | (1,772) |
Gain (losses) on disposal | 119 | 158 | 246 |
Restructuring cost and similar items | (343) | (37) | (136) |
Reported EBITDA | 12,235 | 12,495 | 15,129 |
Depreciation and amortization | (6,052) | (6,329) | (6,735) |
Reclassification of cumulative translation adjustment from liquidated entities | - | - | 642 |
Impairment of goodwill | (512) | (1,732) | (611) |
Impairment of fixed assets | (124) | (109) | (380) |
Share of profits (losses) of associates and joint ventures | (259) | (262) | (97) |
Operating income | 5,288 | 4,063 | 7,948 |
Finance costs, net | (1,750) | (1,728) | (2,033) |
Income tax | (1,405) | (1,231) | (2,087) |
Consolidated net income after tax | 2,133 | 1,104 | 3,828 |
Net income attributable to owners of the parent | 1,873 | 820 | 3,895 |
Non-controlling interests | 260 | 284 | (67) |
Reported EBITDA is not a financial aggregate defined by IFRS as a means of measuring financial performance and cannot be compared with similarly titled indicators from other companies. Reported EBITDA represents supplementary information and should not be considered a substitute for operating income.
ORANGE / 2013 REGISTRATION DOCUMENT - 260
Restated EBITDA
Restated EBITDA does not include certain items that are included in Reported EBITDA. These items are the following:
■
in 2013, in the negative amount of 414 million euros:
■
restructuring expenses relating primarily to the streamlining of distribution networks, the restructuring of content, the adaptation of the workforce and the optimization of property leases (see Note 4 to the consolidated financial statements) in the amount of 299 million euros,
■
156 million euros in labor expenses, primarily for the “Part-Time for Seniors” plan in France in a total amount of 127 million euros following the agreements on the employment of senior workers signed in November 2009 and in December 2012 (see Section 4.3.1.4 Significant events),
■
a 73 million euro gain on disposal from the disposal of Orange Austria (see Section 4.3.1.4 Significant events),
■
a net expense of 33 million euros on various legal disputes; and
■
in 2012, for a total negative amount of 1,289 million euros on a historical basis:
■
1,293 million euros in labor expenses, primarily for the “Part-Time for Seniors” plan in France in a total amount of 1,245 million euros following the agreements on the employment of senior workers signed in November 2009 and in December 2012 (see Section 4.3.1.4 Significant events),
■
a 116 million euro expense (including stamp duty) relating to the 110 million euros in compensation paid to OTMT for the transfer to Orange of the services contract between OTMT and ECMS (see Notes 2 and 4 to the consolidated financial statements),
■
a gain on disposal of 92 million euros from the disposal of Orange Suisse (see Note 2 to the consolidated financial statements),
■
a net gain of 27 million euros on various legal disputes;
■
in 2011, for a total positive amount of 47 million euros on a historical basis:
■
a gain of 197 million euros on the disposal by Orange Polska of its subsidiary TP Emitel (see Note 2 to the consolidated financial statements),
■
a net expense of 123 million euros on various legal disputes,
■
an expense of 19 million euros covering the restructuring of the Orange sport and Orange cinéma séries (OCS) businesses in France (see Notes 2 and 4 to the consolidated financial statements); and,
■
8 million euros in labor expenses, primarily for the “Part-Time for Seniors” plan in France (see Note 5 to the consolidated financial statements).
To facilitate comparison of operational performance, these items are excluded from restated EBITDA. The following table shows the transition from Reported EBITDA to restated EBITDA.
| Financial years ended December 31 |
(in millions of euros) | 2013 | 2012
Data on a historical basis | 2011
Data on a historical basis |
Reported EBITDA (a) | 12,235 | 12,495 | 15,129 |
Expense for the “Part-Time for Seniors” plan in France and other labor-related items | (156) | (1,293) | (8) |
Compensation paid to OTMT for the transfer to Orange of the services contract between OTMT and ECMS | - | (116) | - |
Net income (net expense) on various legal disputes | (33) | 27 | (123) |
Gain on disposal of Orange Austria | 73 | - | - |
Gain on disposal of Orange Suisse | - | 92 | - |
Gain on disposal of TP Emitel in Poland | - | - | 197 |
Restructuring costs relating primarily to distribution networks, content, personnel and property | (299) | - | - |
Restructuring costs relating to the Orange sport and Orange cinéma séries (OCS) businesses | - | - | (19) |
Total restated items (b) | (414) | (1,289) | 47 |
Restated EBITDA (a - b) | 12,649 | 13,785 | 15,083 |
Restated EBITDA does not constitute a financial aggregate defined by IFRS as an element of measurement of financial performance and cannot be compared with similarly titled indicators from other companies. Restated EBITDA represents supplementary information and should not be considered a substitute for operating income.
ORANGE / 2013 REGISTRATION DOCUMENT - 261
CAPEX
Capital expenditures on tangible and intangible assets excluding telecommunication licenses and investments financed through finance leases, hereinafter referred to as “CAPEX” represent the acquisitions of property, plant and equipment and intangible assets excluding telecommunication licenses as presented in the Consolidated statement of cash flows (capital expenditures on tangible and intangible assets financed through finance leases do not affect cash flows upon acquisition). The calculation below shows the transition from CAPEX to i) acquisitions of property, plant and equipment and intangible assets as presented in the Consolidated statement of cash flows, and ii) capital expenditures on tangible and intangible assets as presented in Segment Information in the consolidated financial statements.
| Financial years ended December 31 |
(in millions of euros) | 2013 | 2012
Data on a historical basis | 2011
Data on a historical basis |
CAPEX | (5,631) | (5,818) | (5,770) |
Telecommunication licenses | (486) | (945) | (941) |
Acquisitions of property, plant and equipment and intangible assets | (6,117) | (6,763) | (6,711) |
Investments financed through finance leases | (95) | (47) | (180) |
Investments in property, plant and equipment and intangible assets | (6,212) | (6,810) | (6,891) |
Orange Group management uses CAPEX to measure the operational efficiency of the use of investments for each of its operating segments. CAPEX does not include investments financed through finance leases (intangible item) and investments in telecommunications licenses, the acquisition of these licenses not being part of the daily monitoring of operational investments. CAPEX allows investors to follow investment expenditure linked to Orange’s business activities and to assess their performance in the short term. CAPEX are not a financial aggregate defined by IFRS and do not replace tangible and intangible assets. CAPEX, as per the definition used by Orange, may not be comparable to similarly titled indicators used by other companies.
[REDACTED SECTION: CERTAIN TEXT THAT FOLLOWS HAS BEEN REDACTED]
ORANGE / 2013 REGISTRATION DOCUMENT - 262
[REDACTED SECTION: CERTAIN TEXT THAT FOLLOWS HAS BEEN REDACTED]
The significant events that occurred between the balance sheet date and March 6, 2014, the date on which the 2013 financial statements were approved by the Board of Directors, are described in Note 16 Subsequent events to the consolidated financial statements.
■
On April 5, 2014, the Board of Directors of Vivendi announced that it had selected the offer from Altice/Numericable group to purchase its SFR subsidiary. This transaction will be subject to approval by the competition authorities. It will affect all the markets on which the new entity will operate in France, in particular the telecom and audiovisual markets, and could result in a major recomposition of players in the telecom sector in France. In this context, Orange will see that its business interests are protected. For more information on the competitive environment of the telecom market in France, see section 3.1.1.2.
■
On April 29, 2014, Orange published its first quarter 2014 financial information.
EBITDA in the first quarter of 2014 was impacted by a charge of 333 million euros (before tax) relating to recent developments, which occurred after March 6, 2014, in litigations and pre-litigations, in France and at Group level. These developments concern in particular certain litigations that are described in the 2013 financial statements and which have been concluded. This charge gave rise to a cash payment of 100 million euros at March 31, 2014 with the balance expected to be paid during 2014. Given its nature, this charge has no impact on restated EBITDA..
ORANGE / 2013 REGISTRATION DOCUMENT - 263
Despite persistent pressure on revenues, taking into account the continued significant efforts on cost, Orange expects that the restated EBITDA for 2014 (see Section 4.3.5.3 Financial aggregates not defined by IFRS) will be between 12 and 12.5 billion euros (after disposal of Orange Dominicana). This objective corresponds to a stabilization in the restated EBITDA margin compared to 2013. The Group will also maintain its ambitious investment program in very high-speed fixed and mobile networks.
With regards to Orange’s financial policy :
[REDACTED SECTION: CERTAIN TEXT THAT FOLLOWS HAS BEEN REDACTED]
■
[REDACTED SECTION: CERTAIN TEXT THAT FOLLOWS HAS BEEN REDACTED] the Group pursues a policy of selective acquisitions concentrating on markets in which it is already present;
■
payment of a dividend for 2014 of 0.60 euros per share (subject to the approval of the Annual General Meeting of shareholders). An interim dividend for 2014 of 0.20 euros per share will be paid in cash in December;
■
in addition, the Group confirms the payment of the balance of the dividend for 2013 of 0.50 euro per share which will be paid in cash on 5 June 2014.
These forward-looking statements are subject to numerous risks and uncertainties that could cause actual results to differ materially from the results anticipated in the forward-looking statements. The most significant risks are detailed in Section 2.4 Risk factors of the 2013 Registration Document. See also the information included under Forward-looking Information at the beginning of this Registration Document.
Orange paid a dividend of 0.78 euros per share in respect of the 2012 financial year.
A dividend of 0.80 euros per share in respect of 2013 will be proposed to the Combined Ordinary and Extraordinary Shareholders' Meeting of May 27, 2014. In view of the payment on December 11, 2013 of an interim dividend of 0.30 euros decided by the Board of Directors, the balance of the dividend will be, subject to shareholder approval, 0.50 euros per share and will be paid in cash on June 5, 2014. The ex-dividend date will be June 2, 2014.
In respect of 2014, the Board of Directors resolved, at its meeting of March 6, 2014, to recommend to the Shareholders' Meeting the payment of a dividend of 0.60 euros per share. The Board considered that this amount strikes a balance between the Group’s cash generation, the need to preserve the soundness of its balance sheet and the desire to offer an attractive return to shareholders.
The Board also announced its intention to pay an interim dividend of 0.20 euros per share in respect of 2014 in December 2014.
ORANGE / 2013 REGISTRATION DOCUMENT - 264
As of March 26, 2014, the date on which the Board of Directors approved the Chairman’s Report on corporate governance and internal control, the Board comprised 15 members: the Chairman, three directors representing the public sector, three directors elected by the employees, one director representing employee shareholders and seven independent directors.
| Date first appointed | Term ending |
Stéphane Richard | June 9, 2010 | Following the Shareholders’ Meeting of May 27, 2014 (1) |
(1) The Board Meeting held on March 26, 2014 resolved to propose a renewal of the term of office for a period of four years to the Shareholders’ Meetings. |
Stéphane Richard, born in 1961, has been Chairman and Chief Executive Officer of Orange since March 1, 2011. He joined the Orange Group in September 2009 and has successively occupied the positions of Deputy CEO in charge of French Operations, CEO Delegate, and CEO. Between 1992 and 2003, Stéphane Richard was successively deputy to the CFO of Compagnie Générale des Eaux, Chief Executive Officer of Compagnie Immobilière Phénix, and Chairman of CGIS (Compagnie Générale d’Immobilier et de Services), now Nexity. From 2003 to 2007, he was Deputy CEO of Veolia Environnement and CEO of Veolia Transport, as well as being a director of Orange. From 2007 to 2009, Stéphane Richard was Chief of Staff to the French Minister for the Economy, Industry, and Employment. He is a graduate of Ecole des Hautes Etudes Commerciales (HEC) and Ecole Nationale d’Administration. He is a French national.
| Date first appointed | Term ending |
Bernard Dufau | February 25, 2003 (1) | Following the 2015 Shareholders’ Meeting |
José-Luis Durán | February 5, 2008 (2) | Following the 2016 Shareholders’ Meeting |
Charles-Henri Filippi | February 5, 2008 (2) | Following the 2016 Shareholders’ Meeting |
Claudie Haigneré | May 21, 2007 (3) | Following the 2016 Shareholders’ Meeting |
Helle Kristoffersen | June 7, 2011 | Following the 2015 Shareholders’ Meeting |
Muriel Pénicaud | June 7, 2011 | Following the 2015 Shareholders’ Meeting |
Jean-Michel Severino | June 7, 2011 | Following the 2015 Shareholders’ Meeting |
(1) Term of office renewed at the Shareholders’ Meetings of April 22, 2005 and June 7, 2011. (2) Appointment ratified by the Shareholders’ Meeting of May 27, 2008, and followed by a new vote at the same meeting in line with the new Bylaws. Term of office renewed at the Shareholders’ Meeting of June 5, 2012. (3) Term of office renewed at the Shareholders’ Meeting of June 5, 2012. |
Bernard Dufau, born in 1941, joined IBM France as an engineer in 1966, then, until 1981, worked in various marketing and sales management positions in Paris and around France. After working as a consultant for IBM Corporation in the United States from 1981 to 1983, then as Sales Director (1983-1988) and Chief Operating Officer (1988-1993) of IBM France, in 1994 he became General Manager in charge of Retail for IBM Europe. From January 1, 1995 to April 1, 2001, Bernard Dufau was Chairman and CEO of IBM France. From July 2001 to December 2005, he worked as a corporate strategy consultant. A graduate of the Ecole supérieure d’électricité (“Supelec”), Bernard Dufau was formerly Chairman of the Amicale des ingénieurs Supelec (engineers’ alumni association). Bernard Dufau is a French national.
José-Luis Durán, born in 1964, is CEO of Devanlay SA and Chairman of Lacoste Holding. He began his career in 1987 at Arthur Andersen, after studying economics. He joined Pryca (a subsidiary of Carrefour) in 1991, where he held successive positions as management controller (1991-1994), management controller of Southern Europe (1994-1996), then management controller of North & South America until 1997. After his term as Chief Financial Officer of Pryca, he became Chief Financial Officer of Carrefour Spain in 1999. In April 2001, he was appointed General Manager for Finance, Management, Organization and Systems with Carrefour, joining the group’s Executive Committee. He was Chief Executive Officer of the Carrefour group and Chairman of the Management Board from 2005 to 2008. José-Luis Durán is a Spanish national.
Charles-Henri Filippi, born in 1952, has been Chairman of Citigroup France since January 1, 2011. He joined Crédit Commercial de France (CCF) in 1987 after several years in French government service and in ministerial offices.
ORANGE / 2013 REGISTRATION DOCUMENT - 314
He became Chief Executive Officer of CCF France in 1998, and was then appointed to the Senior Management of HSBC in 2001, in charge of the group’s Corporate and Institutional Banking business. He became Chairman and Chief Executive Officer of HSBC France in March 2004, then Non-Executive Chairman from August 2007 to December 31, 2008. He was also Senior Advisor at CVC Capital Partners France until December 31, 2010 and a Partner at Weinberg Capital Partners until December 31, 2011. He is also founder of asset management companies Octagones and Alfina and was their Chairman from 2008-2012. Charles-Henri Filippi is a French national.
Claudie Haigneré, born in 1957, has chaired Universcience (a public institution created by the partnership between the Palais de la découverte and the Cité des sciences et de l’industrie) since February 2010. A doctor by training, she is a rheumatologist and specialist in aeronautical medicine. She holds a doctorate in sciences and was an astronaut with the French space agency CNES, then with the ESA, flying a space mission to the MIR space station in 1996 and a second mission to the International Space Station (ISS) in 2001. She was appointed Minister for European Affairs from March 2004 to May 2005, after having been Minister for Research and New Technologies from June 2002 to March 2004. From 2005 to 2009, she was an advisor to the ESA (European Space Agency) Director General on European space policy. Claudie Haigneré also lends her support to several health associations: Maisons de Parents (accommodation for parents of hospitalized children), Alliance des Maladies Rares (Rare Illness Alliance) with Fondation Groupama and Kourir Association for children suffering from juvenile rheumatoid arthritis. She is also a sponsor of the Courtin-Arthritis foundation. Claudie Haigneré is also a Director of Fondation C-Génial, the Académie des Technologies, Fondation de France, L’Oréal’s corporate foundation, ENS Paris and PRES Hesam. She is a member of the Académie des Technologies, the Académie des Sports and of the Académie des Sciences et Technologies (Belgium) and of the International Academy of Astronautics (IAA). In 2006, she was awarded the Louise Weiss Prize for her European activities. Furthermore she is a sponsor of the Cité de l’Espace in Toulouse, the Institut de Myologie of Pitié-Salpétrière hospital set up by the Association Française contre les Myopathies (AFM), and of many schools and student graduate classes. Claudie Haigneré is a Grand Officer of the French Legion of Honor. She is a French national.
Helle Kristoffersen, born in 1964, was appointed Director of Strategy and Economic Intelligence of the Total group in January 2012, having been Deputy Director from January to December 2011. From 1994 onwards, she mainly worked for the Alcatel group (now Alcatel Lucent). After holding a number of positions within this group, she was Vice-President, Group Strategy between 2005 and 2008, and Senior Vice-President, Vertical Markets, between January 2009 and December 2010. Helle Kristoffersen is a graduate of the Ecole Normale Supérieure and Ecole Nationale de la Statistique et de l’Administration Economique (ENSAE). She is a Knight of the French Legion of Honor. Born in Denmark, Helle Kristoffersen is a French national.
Muriel Pénicaud, born in 1955, has been Chair of the National Council for Economic Education (CNEE) since February 2014, Chair of the Board of Directors of AgroParisTech since 2013 and Chair of the Board of Directors of Fonds Danone Ecosystème since 2009. Muriel Pénicaud began her career in 1976 as a local government administrator, before establishing and heading up two [non-governmental?] organizations. In 1985, she joined the French Employment and Training Ministry and held a number of positions in management and in the Minister’s office, and was also an advisor to the Minister. After working in international human resources management at Danone from 1993 to 2002, from 2002 to 2008 she was Deputy Chief Executive Officer at Dassault Systèmes and member of the Executive Committee in charge of organization, human resources and sustainable development. From 2008 to 2013, she was a member of Danone’s Executive Committee, Group Director of Human Resources and responsible for social innovation. In addition, she also carried out a number of general interest roles, including as Chair of the Board of Directors of the Institut National du Travail, de l’Emploi et de la Formation Professionnelle. She was also a member of the High Council for Social Dialogue. Muriel Pénicaud is co-author of the “Well-Being and Efficiency at Work” report (2010) for the Prime Minister, and is co-founder and Vice-Chairman of the Web TV platform Management et Droit des Affaires (Law and Business Administration). She is a graduate in psychology, history and education sciences as well as from INSEAD. She is a Knight of the French Legion of Honor. She is a French national.
Jean-Michel Severino, born in 1957, is Director of Investisseur et Partenaire, an asset management company specializing in investment in SMEs in sub-Saharan Africa. He is also a member of the Académie des Technologies. Until April 2010, he was CEO of the French International Development Agency (AFD), and was previously Vice-President of the World Bank for Asia. He is Inspector General at the French Finance Ministry, and a graduate of Ecole Nationale d’Administration. He is a French national.
| | Date first appointed | Term ending |
Antoine Saintoyant | Appointed by government decree | May 15, 2013 | May 14, 2017 |
Henri Serres | Appointed by government decree | February 18, 2013 | February 17, 2017 |
Bpifrance Participations (1)represented
by Jean-Yves Gilet | Appointed by
the Shareholders’ Meeting | May 28, 2013 | Following the 2017 Shareholders’ Meeting |
(1) Public financing and investment group for companies, resulting from the merger of OSEO, CDC Entreprises, FSI and FSI Régions. |
ORANGE / 2013 REGISTRATION DOCUMENT - 315
Antoine Saintoyant, born in 1977, has been Investment Director with the French Government Shareholding Agency (APE) since July 2013 and is also Deputy Director of Defense and Aeronautical Services. During his career he has been Deputy Chief of the Treasury’s Multilateral Affairs and Development Office and Economic Policy Office of the Ministry of Economy, Finance and Industry, Financial Services Adviser for France’s Permanent Representation to the EU (2007-2009), Chief of the Treasury’s Banking Affairs Office (2009-2012) and Head of the La Poste, Orange, Dexia, CNP unit at the French Government Shareholding Agency (APE) (2012-2013). Antoine Saintoyant is a graduate of the Ecole Nationale d’Administration, Bonn University (Germany) and the Institut d’études politiques de Paris. He is a French national.
Henri Serres, born in 1950, is an Ingénieur Général des Mines at the French High Council for the Economy, Industry, Energy and Technology (CGEIET) in the Ministry of the Economy and Finance since 2009. Over the course of his career, he has successively been Technical Director at the Defense Ministry (1981-1986), Director of Public Radiotelephony at Matra Communication (1986-1989), Director at the Directorate General for Industry, in charge of the Department of Communications and Services Industries (1989-1996). Henri Serres was then Vice-Chairman of CSC Peat Marwick (1996-2000), Central Director of IT Systems Security at the General Secretariat for National Defense (2000-2005) and Vice-Chairman of France’s High Council for Information Technology at the Ministry of Economy, Finance and Industry (2005-2006). Before being appointed to the CGEIET, he was Director General of Information and communication systems at the Defense Ministry since 2006. Henri Serres is a graduate of the Ecole Polytechnique and the Ecole Nationale Supérieure des Telecommunications (ENST). He is an Officer of the French Legion of Honor and a Commander of the French Order of Merit. He is a French national.
Jean-Yves Gilet, born in 1956, permanent representative of Bpifrance Participations, has been Senior Executive Vice-President of Bpifrance Investissements since July 2013. From September 2010 to July 2013, he was Director General of Fonds Stratégique d’Investissement (FSI) and a member of the Management Board of Caisse des Dépôts Group. During his career, he has been Deputy Director of the Inter-Departmental Industry Directorate for France’s Picardy Region at the Ministry of Industry (1981-1984), Head of the Industrial Operations Section and of the Industry Financing Office in the Directorate General for Industry (1984-1986), Chief of Staff to the Director General for Industry (1986-1987), Head of the Datar industrial team (1987-1988) and Chief of Staff to the Minister for Regional Development and Transformation (1988-1990). In 1990, he joined the Usinor group as Chief Strategy and Planning Officer, then Head of Strategy, Planning and International Affairs (1990-1993), before holding various executive positions in Usinor’s Stainless Steel division (1995-2002), in particular in Brazil from 1998 to 2001. In 2002, Jean-Yves Gilet was appointed Chief Executive Officer of Arcelor in charge of the Stainless Steel sector and in 2006 became Executive Vice-President with responsibility for the stainless steel business worldwide at ArcelorMittal. A graduate of the Ecole Polytechnique and a Corps des Mines engineer, Jean-Yves Gilet is a Knight of the French Legion of Honor and a Knight of the French Order of Merit. He is a French national.
| Date first appointed | Term ending |
Daniel Bertho | October 22, 2013 | December 2, 2017 |
Ghislaine Coinaud | December 3, 2009 (1) | December 2, 2017 |
Daniel Guillot | December 3, 2009 (2) | December 2, 2017 |
(1) Reelected on October 22, 2013. (2) Reelected on November 15, 2013. |
Daniel Bertho, born in 1956, is a project manager in a Response Unit in Val d’Oise. He was a member of the European Works Council from 2004 to 2011. He has been a representative of the SUD trade union federation on the Supervisory Boards of the “Dynamis Solidaire” and “Evolutis” funds. Daniel Bertho joined Orange in 1984 as a designer. He is a French national.
Ghislaine Coinaud, born in 1956, works for the Support Department. She joined Orange in 1977 as facilities operating agent at the main operating center in La Courneuve. From 1995 to 2005, Ghislaine Coinaud was a member of the Conseil Supérieur de la Fonction Publique. Until December 2009, she was deputy central labor delegate for the CGT labor union. She was previously a member of that union’s federal management Board. Ghislaine Coinaud is a French national.
Daniel Guillot, born in 1956, is Director of Relations with the Ain département local authority, at the Lyon Regional Division. He joined Orange in 1977 as telecommunications and postal controller. In 1986, Daniel Guillot became an Attaché at the Ministry of Telecommunications, Postal Services and Space, before becoming Chief Inspector in 1993. He held labor union responsibilities at the CFDT Culture Consulting Communication Federation since its foundation in 2005 as head of management staff and international affairs and finally, since 2007, as central labor representative in charge of the Orange Group. Until 2009, Daniel Guillot had a seat on the worldwide union UNI Télécom’s global Committee and chaired the European Telecommunications Social Dialogue Committee jointly with the employer representative. Daniel Guillot is IFA certified. He is a French national.
ORANGE / 2013 REGISTRATION DOCUMENT - 316
| On-Duty Date | Term ending |
Jean-Luc Burgain | July 25, 2012 | May 27, 2014 (1) |
(1) The candidacies of Jean-Luc Burgain and Patrice Brunet to the position of Director representing employee shareholders will be submitted to the Shareholders’ Meeting
of May 27, 2014. |
Jean-Luc Burgain, born in 1955, is a level 2 executive manager assigned to the Labor Relations Department. He joined Orange in 1974 as an operating agent before being promoted in-house to an executive position and becoming a senior executive in 1992. He has held various responsibilities in the Lorraine region in customer-facing agencies and regional departments, in particular internal communication, public relations and relations with local authorities. Since 2005, he has been a special project manager with the FO COM federation on issues relating to incentives and remuneration. He sits on the Supervisory Boards of most of the Orange savings plan employee investment funds (FCPE) and collective retirement plans. An auditor for the French Institute of Higher National Defense Studies (IHEDN), Jean-Luc Burgain also holds national positions in civil defense voluntary organizations. He is an Officer of the French Order of Merit and has a gold medal for voluntary services to national defense and a medal of honor for services to local authorities. He is a French national.
A representative of the Orange Central Works Council attends meetings of the Board of Directors.
Changes in the composition of the Board of Directors
Amongst the directors representing the public sector:
■
by order of the Minister of the Economy and Finance and the Minister for Industrial Renewal dated February 18, 2013, Henri Serres was appointed director representing the French State, to replace Pascal Faure;
■
Olivier Bourges resigned as director on March 5, 2013, after stepping down from this position with the French Government Shareholding Agency (APE). He was replaced by Antoine Saintoyant, who was appointed director representing the French State by order of the Minister of the Economy and Finance and the Minister for Industrial Renewal dated May 15, 2013;
■
the Combined Ordinary and Extraordinary Shareholders’ Meeting of May 28, 2013 appointed Fonds Stratégique d’Investissement (FSI) as a legal entity director. In July 2013, following the merger of OSEO, CDC Entreprises, FSI and FSI Régions within Bpifrance, the company name of FSI was changed to Bpifrance Participations. The French State informed the Company that in light of the current level of State shareholding, the French State will have two seats on the Board, with the public sector (French State and Bpifrance Participations) thereby continuing to have three representatives in total on the Board;
■
Pierre Graff resigned as director with effect from May 28, 2013.
Furthermore, following the elections organized in October and November 2013, Daniel Bertho was elected, and Ghislaine Coinaud and Daniel Guillot reelected, as directors representing Orange employees.
Chairman and Chief Executive Officer
On February 23, 2011, Stéphane Richard was appointed by the Board of Directors as Chairman and Chief Executive Officer with effect from March 1, 2011. His term of office will expire following the Shareholders’ Meeting of May 27, 2014. The Board Meeting held on March 26, 2014 resolved to propose a renewal of the term of his office for a period of four years to the Shareholders’ Meetings.
The biography of Stéphane Richard can be found in Section 5.1.1 Composition of the Board of Directors.
Chief Executive Officer Delegate
On October 26, 2011, the Board of Directors appointed Gervais Pellissier as Chief Executive Officer Delegate as from November 1, 2011 for a period expiring on November 1, 2014. Mr. Pellissier retained his responsibilities as Senior Executive Vice-President in charge of Finance, Information Systems and the EE joint venture.
Gervais Pellissier, born in 1959, has been Chief Executive Officer Delegate of Orange since November 1, 2011. He joined the Orange Group in October 2005 to supervise the integration of its business units in Spain and advise on geographical integration within the Group. In January 2006, he was appointed as a member of the Group’s General Management Committee, in charge of Finance and Operations in Spain, and in March 2009, he became Deputy CEO of Orange, with responsibility for Finance and Information Systems. After the Group’s Executive Committee was formed in early April 2010, Gervais Pellissier continued in his role as Deputy CEO of Orange, with responsibility for Finance and Information Systems. He was also in charge of the joint venture with T-Mobile in the UK. He retained all his pre-existing responsibilities when he became Chief Executive Officer Delegate. Gervais Pellissier joined Bull in 1983, and held a range of responsibilities in the areas of Finance and Controlling, in France, Africa, South America, and Eastern Europe. In 1994 Bull appointed him Finance Director of the Services and Systems Integration Division, then of the Outsourcing Division, then Director of Controlling, and in 1998,
ORANGE / 2013 REGISTRATION DOCUMENT - 317
Chief Financial Officer. Between April 2004 and February 2005, he was Deputy Chairman of the Board of Directors and Chief Executive Officer Delegate of Bull. From February 2005 to mid-2008, he was Vice-Chairman of the Board of Directors of Bull. Gervais Pellissier is a graduate of Ecole des Hautes Etudes Commerciales (HEC), Berkeley, and the University of Cologne. He is a Knight of the French Legion of Honor and an Officer of the French Order of Merit. He is a French national.
As of the date of this document, in addition to the Chairman and Chief Executive Officer, the Executive Committee is composed of 10 Senior Executives including a Chief Executive Officer Delegate, Gervais Pellissier, and three Deputy CEOs, Delphine Ernotte Cunci, Pierre Louette and Bruno Mettling.
Stéphane Richard | Chairman and Chief Executive Officer |
Gervais Pellissier | Chief Executive Officer Delegate
Finance, Information Systems, EE |
Delphine Ernotte Cunci | Deputy Chief Executive Officer
Orange France |
Pierre Louette | Deputy Chief Executive Officer
General Secretariat, French Carriers, Sourcing
and Chrysalid Program |
Bruno Mettling | Deputy Chief Executive Officer
Human Resources and Internal Communication |
Christine Albanel | Senior Executive Vice-President
Corporate Social Responsibility, Events, Partnerships
and Inclusiveness |
Thierry Bonhomme | Senior Executive Vice-President
Orange Business Services |
Mari-Noëlle Jégo-Laveissière | Senior Executive Vice-President
Innovation, Marketing and Technology |
Béatrice Mandine | Senior Executive Vice-President
Communication and Branding |
Marc Rennard | Senior Executive Vice-President
Operations in Africa, the Middle East and Asia (AMEA) |
Benoit Scheen | Senior Executive Vice-President
Operations in Europe (excl. France) |
Since March 1, 2014, Mari-Noëlle Jégo-Laveissière has been in charge of the Innovation, Marketing and Technology (IMT) Division, replacing Vivek Badrinath. In addition, Elie Girard, Executive Vice-President in charge of Group Strategy and Development, left the Group in April 2014.
The biographies of Stéphane Richard and Gervais Pellissier can be found in Sections 5.1.1 Composition of the Board of Directors and 5.1.2 Corporate officers.
Delphine Ernotte Cunci, born in 1966, is Deputy CEO in charge of Orange France since November 1, 2011, having been Deputy Executive Vice-President, French Operations and Senior Executive Vice-President, Operations Orange France. She started her career with Orange as Financial Analyst and then as Economics Engineer within the R&D Department. She then worked in distribution as Retail Director of the Paris stores and CEO of the SDR subsidiary from 2000 to 2004. In 2004, she was appointed Regional Director for Centre Val de Loire. In July 2006, Delphine Ernotte Cunci became Director of Sales Communication and Sponsorship for France. In May 2008, she was promoted to Sales Director France and in July 2009 she assumed the role of Consumer Director France. Delphine Ernotte Cunci is a director of Suez Environnement, the Ecole Centrale de Paris and Centquatre. She is a graduate of the Ecole Centrale Paris.
Pierre Louette, born in 1962, has been Deputy CEO in charge of the General Secretariat, Orange Wholesale France, Group Sourcing and Supply Chain, the Chrysalid operational efficiency program and of relations between the Orange and Group content stakeholders. He joined Orange in April 2010. In March 2012, he was elected Chairman of the Fédération Française des Télécoms, and in November 2013 was appointed Chairman of MEDEF’s Digital Transformation Committee. Pierre Louette was Technical Advisor on Communication, Youth and Sport in the Prime Minister’s office between 1993 and 1995, when he was particularly involved in developing new communications networks. He then became General Secretary and Communications Director for France Télévisions. He has been involved in developing the Internet in France since 1996, in particular as Head of Connectworld, the leader in online communication, and then as Director of Europatweb, an investment fund launched by Bernard Arnault. Pierre Louette was CEO of Agence France-Presse from 2003 to 2005, followed by Chairman and CEO from 2005 to 2010. He holds a degree in law and is a graduate of the Institut d’Etudes Politiques de Paris and the Ecole Nationale d’Administration. Pierre Louette is Master Counsel to the Court of Auditors. He is a Knight of the French Legion of Honor.
ORANGE / 2013 REGISTRATION DOCUMENT - 318
Bruno Mettling, born in 1958, is Deputy CEO in charge of Human Resources and internal communication. He joined Orange in April 2010 as Senior Executive Vice-President with special mandate to the CEO, in charge of Labor, Skills and Orange Campus, before being appointed Group Human Resources Director in October 2010. He began his career at the Budget Department of the Ministry of Finance. He then held a succession of financial posts at the Ministry of Labor, Social Affairs and Employment in 1988; Deputy Vice-President at the Ministry of Infrastructure, Housing, Transport and the Sea from 1988 to 1990; and Deputy Vice-President at the Ministry of Urbanism from 1990 to 1991. After working at the Finance Inspectorate in 1991, he joined the Ministry of the Economy and Finance. Bruno Mettling was then appointed Financial Controller and Deputy Vice-President Finance for La Poste Group. In October 1999 he joined Caisse Nationale des Caisses d’Epargne, where he reformed its Human Resources Department, before being given responsibility for sales development and then the Company’s strategic plan. He was then invited to join the Banque Populaire Group as Executive Vice-President, Banque Fédérale des Banques Populaires. On July 1, 2006, he was promoted to Deputy CEO. Bruno Mettling is a graduate of the Institut d’Etudes Politiques and of the Aix-en-Provence law school. He is a Knight of the French Legion of Honor and an Officer of the French Order of Merit.
Christine Albanel, born in 1955, is Senior Executive Vice-President in charge of Corporate Social Responsibility, Events, Partnerships and Inclusiveness. She is also Deputy Chair of the Orange Foundation and Chair of Orange Studio. Christine Albanel was Advisor to the French President on Education and Culture, Chair of the Etablissement Public de Versailles from 2003 to 2007,and was appointed Minister of Culture and Education from 2007 to 2009. Speechwriter for Jacques Chirac for many years, including authoring the famous Vel d’Hiv speech, Christine Albanel is a member of the French Council of State. She has a degree in modern literature.
Thierry Bonhomme, born in 1956, has been Senior Executive Vice-President responsible for Orange Business Services since May 1, 2013. His previous positions in the Group include serving as Director of Technical Operations for Paris North, Regional Director in Grenoble, then in Marseille, before becoming Director of the France Enterprise Market, then Director of Research and Development, and in 2010 Head of the Orange Labs Networks and Carriers Division. He was also director of IDATE from 1988 to 1990. Thierry Bonhomme is a graduate of the Ecole Polytechnique and the Ecole Nationale Supérieure des Télécommunications (ENST).
Mari-Noëlle Jégo-Laveissière, born in 1968, has been Senior Executive Vice-President in charge of the Innovation, Marketing and Technology (IMT) Division since March 1, 2014. Since joining the Orange Group in 1996, Mari-Noëlle Jégo-Laveissière has held a series of project and management positions: Director of International & Backbone Network Factory, merger between France Télécom and Orange France SA, Director of Group Research & Development, Head of the Consumer Marketing Department of Orange France and Regional Manager where she was responsible for technical and commercial services for consumers and enterprise customers. She has an engineering degree from the Ecole des Mines de Paris, a degree from the Ecole Normale Supérieure and a Doctorate in Quantum Chemistry from the University of Paris XI – Waterloo.
Béatrice Mandine, born in 1968, has been Senior Executive Vice-President in charge of Communication and the Brand since May 1, 2013. She joined Orange in May 2007 as Director of the Group’s Press Office. Béatrice Mandine was appointed Delegate Director of External Communication in November 2010, then Deputy Director of Communication responsible for External Communication alongside Xavier Couture, Senior Executive Vice President for Communication and Brand in July 2012. Ms. Mandine began her career in 1988 as a journalist at Le Figaro, Marie-Claire and the television channel La Cinq. At the end of 1990 she joined Alcatel as Head of Internal Communication. In 1992, she became Press Officer for Alcatel Radio Space & Defense and joined the press office at Alcatel Alsthom the following year. In 1998, she was appointed Media Director of Alcatel’s Consumer Division, and in 2000 she was appointed Director of Press and Public Relations for Alcatel’s mobile Telephony Division. In the middle of 2004, Béatrice Mandine joined the Faurecia group as head of press relations and corporate image. She is a graduate of the Ecole Supérieure de Journalisme (ESJ) and the Institut des Hautes Etudes Internationales (IHEI).
Marc Rennard, born in 1957, has been Senior Executive Vice-President in charge of International Operations in Africa, the Middle East and Asia (AMEA) since June 15, 2010. He joined Orange in 2003 as Chairman and Chief Executive Officer of one of its subsidiaries in Madrid. In 2004 he became Director of International Operations before being appointed to International Executive Vice-President in charge of AMEA (Africa, Middle East and Asia) in 2006. Marc Rennard is Chairman or director of several of the Group’s international subsidiaries, in particular Mobinil, Sonatel, Jordan Telecom, Côte d’Ivoire Télécom and Orange Côte d’Ivoire. He was head of a consulting company before spending several years as director of Société des Montagnes de l’Arc (Groupe Caisse des Dépôts) and then joining TDF as Deputy CEO until 2003. Marc Rennard is a graduate of the Ecole de Management in Lyon. He is a Knight of the French Legion of Honor.
Benoît Scheen, born in 1966, has been Senior Executive Vice-President in charge of Europe (excl. France) since September 1, 2011. Prior to this, he was CEO of Mobistar Belgium from 2008 to 2011, and also carried out a number of management roles at IBM, Compaq and HP. Benoît Scheen has a Master’s in information technology and a Bachelor’s degree in economics and social sciences from the University of Namur. Benoît Scheen is Belgian.
ORANGE / 2013 REGISTRATION DOCUMENT - 319
Stéphane Richard
Positions currently held | Other positions and offices held
over the past 5 years |
■ Chairman and Chief Executive Officer of Orange ■ Director of the Opéra National de Paris ■ Director of the Cinémathèque Française ■ Managing Partner of SCI du 18 rue Philippe-Hecht ■ Manager of SCI Carré Gabriel ■ Manager of SARL Carré Gabriel ■ Manager of EURL Rieutord Capital International ■ Permanent representative of Atlas Services Belgium
in Médi Telecom (1) | ■ Chief Executive Officer Delegate then Chief Executive Officer of Orange ■ Chairman and Chief Executive Officer of Orange France (1) ■ Member of the Supervisory Board of Atemi SAS ■ Member of the Supervisory Board of LBO France ■ Chief of Staff to the French Minister for the Economy, Industry, and Employment |
(1) Company in which Orange holds an interest. |
Gervais Pellissier
Positions currently held | Other positions and offices held
over the past 5 years |
■ Chief Executive Officer Delegate of Orange International ■ Director of Orange Polska (1) ■ Director of Orange Espagne (1) ■ Director of Médi Télécom (1) | ■ Member of the Supervisory Board of Voyages FRAM
(until January 2013) ■ Director of Sonaecom (2) (until March 2014) |
(1) Company in which Orange holds an interest. (2) Corporate office for a listed company. |
Daniel Bertho
Positions currently held | Other positions and offices held over the past 5 years |
■ Director of Orange, member of the Innovation
and Technology Committee | ■ Member of the Supervisory Boards of the Evolutis
and Dynamis Solidaire company savings plan mutual funds |
Jean-Luc Burgain
Positions currently held | Other positions and offices held
over the past 5 years |
■ Director of Orange, member of the Audit Committee ■ Chairman of the Supervisory Board of the Equilibris company savings plan mutual fund ■ Member of the Supervisory Boards of the Orange Actions, Dynamis Solidaire (principal) and Evolutis (alternate) company savings plan mutual funds ■ Member of the Supervisory Boards of the three company retirement plan mutual funds ■ President of the humanitarian associations Solidarité Lorraine Afrique and Unass Solidarité ■ National President of first aid associations | |
ORANGE / 2013 REGISTRATION DOCUMENT - 320
Ghislaine Coinaud
Positions currently held | Other positions and offices held
over the past 5 years |
■ Director of Orange, member of the Audit Committee | |
Bernard Dufau
Positions currently held | Other positions and offices held
over the past 5 years |
■ Director of Orange, Chairman of the Audit Committee | ■ Director of KESA Electricals (1) ■ Director of Néo Sécurité ■ Director of Dassault systèmes (1) (until May 2013) |
(1) Corporate office for a listed company. |
José-Luis Durán
Positions currently held | Other positions and offices held
over the past 5 years |
■ Chairman of Lacoste Holding (since January 2013) ■ Director of Orange, member of the Audit Committee ■ Director of Unibail-Rodamco (1) International ■ Chief Executive Officer of Devanlay | ■ Director of HSBC Holding Plc (1) |
(1) Corporate office for a listed company. |
Charles-Henri Filippi
Positions currently held | Other positions and offices held
over the past 5 years |
■ Chairman of Citigroup France ■ Director of Orange, member of the Governance and CSER Committee ■ Member of the Supervisory Board of EURIS ■ Member of the Supervisory Board of Femu Qui ■ Non-voting member of Nexity’s Board ■ Member of the International Advisory Board of Abertis
(since July 2013) | ■ Partner at Weinberg Capital Partners ■ Senior Advisor at CVC Capital Partners France ■ Chairman of the HSBC Private Bank France Supervisory Board ■ Director of HSBC Asset Management Holding ■ Director of HSBC Bank plc ■ Director of HSBC Private Banking Holdings Switzerland ■ Director of HSBC Trinkaus & Burkhardt AG ■ Chairman of Octagones SAS ■ Member of the Supervisory Board of Viveris REIM ■ Director of the Centre National d’Art et de Culture Georges Pompidou (until February 2013) |
(1) Corporate office for a listed company. |
ORANGE / 2013 REGISTRATION DOCUMENT - 321
Jean-Yves Gilet
Positions currently held | Other positions and offices held
over the past 5 years |
■ Executive Director of Bpifrance Investissements ■ Permanent representative of Bpifrance Participations on the Board of Directors of Orange, member of the Innovation and Technology Committee | ■ Executive Vice-President of Stainless Steel Worldwide
at ArcelorMittal ■ Director General of Fonds Stratégique d’Investissement (FSI) ■ Member of the Management Board of Caisse des Dépôts Group |
(1) Corporate office for a listed company. |
Daniel Guillot
Positions currently held | Other positions and offices held
over the past 5 years |
■ Director of relations with local authorities in the Ain
department for Orange ■ Director of Orange, member of the Governance and Corporate Social and environmental Responsibility Committee | |
Claudie Haigneré
Positions currently held | Other positions and offices held
over the past 5 years |
■ Chairperson of Universcience ■ Director of Orange, member of the Innovation and Technology Committee ■ Director of Sanofi-Aventis (1) ■ Director of the Ecole Normale Supérieure, Paris ■ Director of Fondation L’Oréal ■ Director of Fondation de France ■ Director of IHEST (Institut des Hautes Etudes Scientifiques et Techniques) | ■ Director and Chair of the Cité des sciences et de l’industrie ■ Chair of the Board of the Palais de la Découverte |
(1) Corporate office for a listed company. |
Helle Kristoffersen
Positions currently held | Other positions and offices held
over the past 5 years |
■ Director of Strategy and Economic Intelligence of the Total Group ■ Direc tor of Orange, Chair of the Innovation and
Technology Committee | ■ Deputy Director of Strategy and Economic Intelligence
of the Total Group ■ Senior Vice-President, Vertical Markets
of the Alcatel-Lucent group ■ Director of Valeo (1) (until June 2013) |
(1) Corporate office for a listed company. |
ORANGE / 2013 REGISTRATION DOCUMENT - 322
Muriel Pénicaud
Positions currently held | Other positions and offices held
over the past 5 years |
■ Chair of the National Council for Economic Education (CNEE) ■ Chair of the Board of Directors of AgroParisTech ■ Chair of the Board of Directors of the Danone Ecosystem Fund ■ Vice-Chair of the Web TV platform Management
et Droit des Affaires ■ Honorary Chair of ADAGE (French Association of Business Law and Corporate Management) ■ Director of Orange, Chair of the Governance and CSER Committee ■ Director of SNCF (since March 7, 2013) ■ Director of I&P Dev (Investisseurs & Partenaires Développement) | ■ Chair of the Board of Directors of the National Labor,
Employment and Professional Training Institute (INTEFP) ■ Member of the High Council for Social Dialogue ■ Deputy CEO of Dassault Systèmes ■ Group Director of Human Resources and member
of the Executive Committee of Danone |
Antoine Saintoyant
Positions currently held | Other positions and offices held
over the past 5 years |
■ Investment Director with the French Government Shareholding Agency (APE) ■ Director of Orange, member of the Audit Committee ■ Director of Société de Financement Local (SFIL) | ■ Director of Société de Prise de Participation de l’Etat (SPPE) |
Henri Serres
Positions currently held | Other positions and offices held
over the past 5 years |
■ Member of the French High Council for the Economy, Industry, Energy and Technology (CGEIET) in the Ministry of the Economy and Finance ■ Director of Orange, member of the Governance and CSER Committee ■ Director of Imprimerie Nationale ■ Director of La Française des Jeux (since March 8, 2013) | ■ Director General of Information and communication
systems at the Defense Ministry |
Jean-Michel Severino
Positions currently held | Other positions and offices held
over the past 5 years |
■ Manager of I&P (Investisseurs & Partenaires) ■ Chairman of Critical Ecosystem Partnership Fund (CEPF) ■ Director of Orange, member of the Audit Committee and the Governance and CSER Committee ■ Director of Danone (1), Chairman of the Audit Committee ■ Director of Africa Capacity Building Initiative ■ Director of the Grameen Crédit Agricole foundation | ■ Chief Executive Officer of the French International
Development Agency (AFD) ■ Vice-President of the World Bank for Asia |
(1) Corporate office for a listed company. |
ORANGE / 2013 REGISTRATION DOCUMENT - 323
Positions and offices held in 2013 by directors whose terms of office have ended since January 1, 2013
Pascal Faure (term of office ended February 18, 2013)
■ Director General of the Department of Competitiveness, Industry and Services ■ Vice-Chairman of the French High Council for the Economy, Industry, Energy and Technology ■ Director of La Française des Jeux ■ Director of BpIfrance Participations ■ Director of BpIfrance Investissement ■ Director of Institut Mines-Télécom ■ Director of the National Research Agency ■ Director of the Ecole Normale Supérieure, Paris ■ Director of the Ecole Polytechnique ■ Director of Mines Paris Tech (Ecole des Mines de Paris) ■ Member of the Executive Committee of Fondation Telecom |
(1) Corporate office for a listed company. |
Olivier Bourges (term of office ended March 5, 2013)
■ Deputy Director General of the Public Finances Directorate General ■ Deputy Director General of the French Government Shareholding Agency ■ Director of GDF Suez (1) ■ Director of Grand Port Maritime de Marseille International |
(1) Corporate office for a listed company. |
Pierre Graff (Position ended on May 28, 2013)
■ Deputy Chairman of the French National Tourism Board’s European and International Affairs section International |
Caroline Angeli (position ended on December 2, 2013)
The business address of all the directors and officers, in relation to their positions, is that of Orange SA’s registered office (see Section 5.1.4 Registered office, legal form and applicable law).
ORANGE / 2013 REGISTRATION DOCUMENT - 324
Number of Shares Held by Directors and Officers
The Shareholders’ Meeting of May 26, 2009 set at 1,000 the minimum number of shares to be held by each director appointed by the Shareholders’ Meeting, except the director representing employee shareholders, who is exempt in accordance with the law. Directors representing the French government and directors elected by employees are not required to hold any shares in the Company.
The following information was known to the Company as of the date of this Registration Document:
| | Number of shares |
| Stéphane Richard | 58,266 |
| Bernard Dufau | 6,692 |
| José-Luis Durán | 1,000 |
| Charles-Henri Filippi | 10,001 |
| Claudie Haigneré | 1,000 |
| Helle Kristoffersen | 1,747 |
| Muriel Pénicaud | 2,000 |
| Jean-Michel Severino | 1,000 |
■ Directors representing the public sector | Bpifrance Participations | 357,526,131 |
| Antoine Saintoyant | 0 |
| Henri Serres | 2,728 |
■ Directors elected by the employees | Ghislaine Coinaud | 80 |
| Daniel Bertho | 282 |
| Daniel Guillot | 475 |
■ Directors representing employee shareholders | Jean-Luc Burgain | 5,275 |
| Gervais Pellissier | 23,701 |
| | |
Transactions by Directors and Officers on Company securities
The following table details the transactions performed on Orange securities during the 2013 financial year by the persons referred to in article L. 621-18-2 of the French Monetary and Financial Code (Code monétaire et financier), and reported to the French Financial Markets Authority (AMF).
Name of officer | Security | Type of transaction | Date of transaction | Number of securities | Average unit price | Amount of transaction |
Gervais Pellissier | Shares in Orange Actions mutual fund | Dividend reinvestment | June 10 and December 9, 2013 | 211 | 8.41 | 1,773 € |
Gervais Pellissier | Shares | Sale | September 9, 2013 | 17,900 | 8.27 | 148,033 € |
Gervais Pellissier | Shares | Purchase | September 9, 2013 | 20,000 | 8.50 | 169,918 € |
To the Company’s knowledge, no transactions have taken place since the end of the reporting period.
Restrictions Regarding the Sale of Shares by Directors and Officers
Directors and officers holding shares under the Orange Group’s company savings plan through mutual funds that are invested in shares of the Company are subject to the lock-up rules applicable to investments in the savings plan under the provisions governing company savings plans.
Moreover, Article 16 of the Board of Directors’ Internal Guidelines prevents members from engaging in any transactions relating to the securities of the listed companies of the Group in the periods preceding the publication of results, and more generally, if they have knowledge of privileged information, as well as from directly or indirectly engaging in short sales with respect to such securities.
To the Company’s knowledge, none of the Company’s directors or officers has agreed any other restriction to his or her freedom to dispose without delay of his or her holding in the Company.
Court Rulings and Bankruptcy
To the Company’s knowledge, in the past five years:
■
no director or officer has been found guilty of fraud;
■
no director or officer has been involved in bankruptcy, receivership or liquidation proceedings;
ORANGE / 2013 REGISTRATION DOCUMENT - 325
■
On June 12, 2013, Stéphane Richard was charged in relation with the CDR-Tapie affair. No other charge or public sanction for an offense has been pronounced against a director or officer by a statutory or regulatory authority; and
■
no director or officer has been barred by a court from serving as a member of a management or supervisory body of a listed company or from being involved in the management or business operations of a listed company.
Family ties
To the Company’s knowledge, there are no family ties among Company directors or officers, or between the directors or officers and the Executive Committee members.
Conflicts of interest
Under Article 16 of the Internal Guidelines of the Board of Directors (see Section 5.2.2.4), directors must notify the Chairman of the Board of any situation concerning them liable to give rise to a conflict of interest with a Group company.
To the Company’s knowledge and as of the date of this Registration Document, there is no potential conflict of interest between the duties of directors or officers with regard to Orange and their private interests or other duties.
To the Company’s knowledge, there is no arrangement or agreement with a major shareholder, customer, supplier or any other third party under which any member of the Board of Directors or corporate officer was appointed to the Board of Directors or Company’s Management (respectively).
As of the date of this document, to the Company’s knowledge, the members of Orange’s Executive Committee, including Stéphane Richard and Gervais Pellissier, owned a total of 124,531 Orange shares, representing 0.005% of the share capital.
As of the date of this document, the members of the Executive Committee held a total of 252,880 stock options representing 0.01% of the share capital, which they were granted by the Board of Directors, of which 109,280 stock options were granted under the October 2005 and March 2006 plans, and 143,600 were granted under the May 2007 plan (see Section 5.6.1.2 Compensation).
Orange refers to the revised version of the Afep-Medef Corporate Governance Code for listed companies published in June 2013, which may be consulted on the Orange, Afep and Medef websites.
Implementation of the “Comply or Explain” rule
Pursuant to the “Comply or Explain” rule provided for in Article L. 225-37 of the French Commercial Code and in the Afep-Medef Code, the Company believes that as of the date of this document, its practices were fully compliant with the recommendations of the Afep-Medef Code.
Main differences between the rules followed by Orange and the New York Stock Exchange rules
Orange has endeavored to take the New York Stock Exchange (NYSE) corporate governance standards into account. However, since the Company is not a US company, most of these rules do not apply to it, and the Company is allowed to follow the rules applicable in France instead. Accordingly, Orange has elected to refer to the Afep-Medef Code, where the recommendations differ in some respects from the NYSE governance rules applicable to US companies listed on the NYSE.
In particular, Orange has chosen to follow the rules on independence specified by the Afep-Medef Code, which provides that, in controlled companies, one-third of the directors must be independent. In contrast, the NYSE rules provide that the Board of Directors must consist of a majority of independent directors, without it being possible to exclude from this calculation the directors representing employees or employee shareholders.
Orange believes that seven of the 15 members of its Board of Directors may be considered as independent according to the independence criteria of the Afep-Medef Code. Orange has not assessed the independence of its directors according to the NYSE rules.
Furthermore, Orange has elected to establish a single Governance and Corporate Social and Environmental Responsibility (CSER) Committee, responsible for appointments and compensation. This committee, which, as of the date of this document, consists of five directors, has three independent directors. The NYSE standards, however, provide for the establishment of two separate committees (a Nomination and Corporate Governance Committee, and a Compensation Committee) composed exclusively of independent directors.
ORANGE / 2013 REGISTRATION DOCUMENT - 326
The Board of Directors presides over all decisions relating to the Group’s major strategic, economic, employment, financial or technological policies and monitors the implementation of these policies by the Management.
Pursuant to Article 13 of the Bylaws, the Board of Directors consists of a minimum of 12 and a maximum of 22 members. The term of office for directors is four years.
In accordance with French Law no. 86-912 dated August 6, 1986 relating to the rules for implementation of the privatizations decided by French Law no. 86-793 dated July 2, 1986, it consists of at least two members representing the employees and one member representing the employee shareholders if the Board has fewer than 15 members, or three members representing the employees and one member representing the employee shareholders if the Board has 15 or more members.
Pursuant to the Decree-law of October 30, 1935, the Board of Directors also has directors representing the French State, appointed by Government decree.
The annual assessment of directors’ independence was carried out by the Board of Directors on March 5, 2014, on the basis of a proposal by the Governance and CSER Committee. In assessing directors’ independence, the Board took into account all of the Afep-Medef Corporate Governance Code criteria. These criteria state that a director, to be considered independent, must not:
■
be an employee or a corporate officer of the Company, an employee or a director of its parent company or of a consolidated subsidiary of the Company, nor have served in any of these capacities during the previous five years;
■
be a corporate officer of a company in which Orange, directly or indirectly, holds a position on the Board of Directors or in which an employee designated as such, or a person who is currently or was at any time in the previous five years a corporate officer of Orange, is a director;
■
be (nor have direct or indirect links with) a significant customer, supplier, commercial banker or investment banker of the Company or of the Group to which it belongs, nor be a customer, supplier, commercial banker or investment banker for which the Company or the Group to which it belongs represents a significant share of business;
■
have close family ties with a director or an officer;
■
have been a statutory auditor of the Company within the last five years;
■
have been a director of Orange for more than twelve years;
■
take part in controlling the Company as the representative of a major shareholder.
The Board of Directors discussed the assessment of the potential significance of the ties between directors and the Company or Group. In this respect, it examined in particular the position of Charles-Henri Filippi due to the business relations between the Orange Group and Citibank. It nevertheless found that, in light of the nature and extent of these relations and the declaration of independence by Charles-Henri Filippi in 2011, these relations were not significant either for Orange Group or for Citibank Group, and were not likely to impact the independence of Charles-Henri Filippi as Company director.
Following this review, Claudie Haigneré, Helle Kristoffersen, Muriel Pénicaud, Bernard Dufau, José-Luis Durán, Charles-Henri Filippi and Jean-Michel Severino were deemed to be independent by the Board of Directors, representing seven of its 15 members.
The three directors representing the public sector and the four directors representing employees and employee shareholders cannot, by definition, be deemed independent under the Afep-Medef Code. Stéphane Richard, the Chairman and Chief Executive Officer, is not considered an independent director because of the executive functions he holds within the Group.
Excluding the directors representing employees and employee shareholders who are no longer taken into account under the Afep-Medef Code for the purposes of calculating the proportion of independent directors, the Board thus has seven independent directors out of 11, i.e. close to two-thirds of the Board. This proportion is thus well within the recommendations of the Afep-Medef Code, which recommends that their proportion in controlled companies should be at least one-third.
The Board of Directors has a total of four women among its 15 members. Excluding the directors elected from among the employees, who are not taken into account by the French Law of January 27, 2011 on the balanced representation of women and men on Boards of Directors and Supervisory Boards and gender equality at work, the Company’s Board has three women out of 12 members, which exceeds the current target of 20% set by law and recommended in the Afep-Medef Code.
In 2003, the Board of Directors adopted Internal Guidelines which define the guiding principles and procedures for its operations and those of its committees. The Internal Guidelines may be consulted on the website www.orange.com under governance documentation.
ORANGE / 2013 REGISTRATION DOCUMENT - 327
The Internal Guidelines have been updated on a number of occasions by the Board of Directors to reflect changes in the Company’s governance. The most recent update was on March 26, 2014, notably in response to the new Afep-Medef Code of June 2013, and in order to introduce the ability to designate a Lead Director and to create an Innovation and Technology Committee.
The Internal Guidelines specify, among other details, the respective responsibilities of the Board of Directors, the Chairman and the Chief Executive Officer, stipulating limits to the latter’s powers, and define the rules governing the composition, powers and operating procedures of each Board committee.
They also provide information on the rules governing the information provided to directors and the meetings of the Board.
Article 1 of the Internal Guidelines of the Board of Directors specifies the role and duties of the Chairman.
The Chairman represents the Board of Directors and, except in unusual circumstances, is the only person authorized to act and speak in the Board’s name. He organizes and steers the work of the Board of Directors and ensures the efficient running of corporate bodies in line with the principles of good governance. He serves as a liaison between the Board of Directors and the Company’s shareholders, in coordination with the Management; he monitors the quality of the Company’s financial information. When the roles of Chairman of the Board of Directors and Chief Executive Officer are split, he may, in close coordination with the Management, represent the Company in its upper-level relations with the public authorities, the Group’s major partners and its major customers, both within France and internationally. In this case, he is briefed regularly by the Chief Executive Officer on the significant events and situations relating to Group operations, and he may seek any information from the CEO needed to inform the Board of Directors and its committees. The Chairman may meet with the Statutory Auditors in order to prepare the work of the Board of Directors and the Audit Committee. He may attend meetings of Board committees under the conditions provided for in the Internal Guidelines.
In accordance with Articles 29-1 and 29-2 of French Law no. 90-568 of July 2, 1990 (as amended), the Chairman of the Board of Directors also has the power to appoint and manage the civil servants employed by the Company.
Pursuant to the Company’s Bylaws, the Chairman of the Board of Directors can hold his position until the age of 70.
The Board of Directors is supported by expertise from three specialized committees. Their role is to provide informed input for the Board’s discussions and assist in preparing its decisions. These committees meet as often as is necessary. Their powers and operating procedures are set out in the Internal Guidelines of the Board of Directors. In accordance with the Afep-Medef Code on the corporate governance of listed companies, significant responsibilities are given to independent directors. Orange also believes that it is necessary that each committee benefit from the presence of at least one member who represents the public sector and at least one member representing employees.
| Year Created | Chairman | | Members | |
Audit Committee | 1997 | Bernard Dufau | (1) | Jean-Luc Burgain Ghislaine Coinaud José-Luis Durán Antoine Saintoyant Jean-Michel Severino | (1)(2) (1) |
Governance and Corporate Social and Environmental Responsibility Committee (Governance and CSER Committee) (3) | 2003 | Muriel Pénicaud | (1) | Charles-Henri Filippi Daniel Guillot Henri Serres Jean-Michel Severino | (1) (1) |
Innovation and Technology Committee | 2014 | Helle Kristoffersen | (1) | Daniel Bertho Claudie Haigneré Bpifrance Participation (Jean-Yves Gilet) | (1) |
(2) Committee’s financial expert. (3) Formerly the Compensation, Nominating and Governance Committee. | |
ORANGE / 2013 REGISTRATION DOCUMENT - 328
Audit Committee
In accordance with the Internal Guidelines of the Board of Directors, the Audit Committee has at least three members appointed by the Board. At least two-thirds of members must be independent (excluding directors representing employees and/or employee shareholders who are not taken into account). The Chairman of the Audit Committee is chosen from the independent directors.
The composition of the Audit Committee complies with the recommendations of the Afep-Medef Code, with three-quarters of its directors, excluding directors representing employees or employee shareholders, being independent, and with no corporate officer on the Committee. The composition of the Audit Committee also complies with the provisions of Article 14 of the Government Order of December 8, 2008 relating to the setting up of a specialized committee aimed at following-up questions relating to the preparation and control of accounting and financial information.
The characteristics and responsibilities of the Committee also comply with the recommendations of the Working Group set up by the AMF, as detailed in its final report on audit committees published in July 2010. In this context, the Committee ensures that the internal control and financial risk management systems exist and that their effectiveness is monitored. It also examines the financial statements and management reports and ensures that the information delivered to shareholders is both reliable and clear.
The responsibilities of the Audit Committee are detailed in Article 7 of the Internal Guidelines of the Board of Directors.
Financial Expertise within the Audit Committee
Member of the Audit Committee are required to have or to gain financial or accounting expertise. The Audit Committee must also have at least one member who is considered a financial expert.
On December 10, 2013, the Board of Directors chose José-Luis Durán to succeed Charles-Henri Filippi as the Audit Committee’s financial expert, in light of his past experience as management controller and CFO of a number of companies and his position as General Manager for Finance, Management, Organization and Systems at Carrefour.
Governance and Corporate Social and environmental Responsibility Committee
In accordance with the Internal Guidelines of the Board of Directors, the Governance and Corporate Social and Environmental Responsibility (CSER) Committee has at least three members appointed by the Board. At least one-half must be independent (excluding directors representing employees and/or employee shareholders who are not included).
With a majority of independent directors including the Committee Chair, its composition complies with the recommendations of the Afep-Medef Code.
The Committee has three major areas of responsibility, namely appointments and compensation, corporate social responsibility and governance. It notably exercises the powers of the specialized committees responsible for the appointment and compensation of directors and officers, the establishment of which is recommended in the Afep-Medef Code. In these areas, it is tasked in particular with making proposals to the Board of Directors, as well as to the Chairman and, where necessary, the Chief Executive Officer. Moreover, it is kept informed by the Chief Executive Officer of appointments to the Group’s Executive Committee and may, at the request of the Chief Executive Officer, issue an opinion on the methods used to determine their compensation.
The Committee also examines, in line with the Group’s strategy, the main thrust of the human resources and corporate social and environmental responsibility policies drawn up, based on discussions with the Group’s stakeholders. Once a year, it reviews the Ethics Committee’s report on the Group-wide actions to implement the ethical practices program.
Article 8 of the Internal Guidelines of the Board of Directors details the responsibilities of the Committee.
Innovation and Technology Committee
In accordance with the Internal Guidelines of the Board of Directors, the Innovation and Technology Committee, established by the Board of Directors on March 26, 2014, has at least three members appointed by the Board.
The Committee notably reviews the major technology partnerships entered into by the Group, the latter’s strategic policies in terms of innovation and technology and its performance in this respect.
Article 9 of the Internal Guidelines of the Board of Directors details the responsibilities of the Committee.
Ad hoc committees
The Internal Guidelines of the Board of Directors allow the Board to decide, on certain technical issues relating to the Company’s operations and/or issues that may involve conflicts of interest and on which the Board of Directors is expected to give its view or make a decision, to establish an ad hoc committee consisting of independent directors to review these matters in consultation with the Management.
ORANGE / 2013 REGISTRATION DOCUMENT - 329
The Internal Guidelines of the Board of Directors allow the Board to appoint a Lead Director from among the Independent Directors at the proposal of the Governance and CSER Committee. A Lead Director must be appointed if the same person is both Chairman and CEO.
Duties of the Lead Director
The main mission of the Lead Director is to ensure smooth relations between the Board of Directors and the Company’s Management. To this end, he/she is responsible for:
■
managing conflicts of interest: the Lead Director informs the Governance and CSER Committee and, where appropriate, the Board of Directors, of any potential or actual conflicts of interest affecting the directors and officers of which he/she becomes aware or which are reported to him/her. Where necessary, he/she makes recommendations on how to manage such conflicts;
■
crisis situations: at the request of the Board of Directors, the Lead Director ensures that corporate governance allows the Company to cope with any exceptional crisis situations which it might confront;
■
assessment of the Board of Directors: the Lead Director may be called on to comment during the Governance and CSER Committee’s assessment of the work of the Board of Directors and its committees;
■
report on activity: the Lead Director reports on the performance of his/her duties annually to the Board of Directors. At Shareholders’ Meetings, the Chairman of the Board of Directors may invite him/her to report on his/her work.
Powers of the Lead Director
The powers of the Lead Director are subject to the limits on those of the Board of Directors and its committees:
■
calling of Board meetings/Agenda: the Lead Director can ask the Chairman of the Board of Directors to call a Board meeting on a given agenda or propose additional agenda items to the Chairman. In addition, a Bylaws modification will be submitted to the Shareholders’ Meeting of May 27, 2014 in order to allow the Lead Director to call a Board meeting if the Chairman is unable to do so and to chair Board meetings when the Chairman is absent;
■
information for Directors: the Lead Director ensures that the Directors are able to carry out their duties in the best possible conditions, particularly that they have all necessary information ahead of Board meetings;
■
Board committees: the Lead Director is not barred from serving as Chairman of any Board committee. He/she may, on proposal of the committee’s Chairman, contribute to the work of the committees related to his/her duties;
■
resources: the Lead Director has access within Orange’s Management to all documents and information required to carry out his/her duties;
■
compensation: the Board of Directors determines, when the Lead Director is appointed, the amount of compensation he/she receives for this role. In addition, the Lead Director can be reimbursed, against receipts, for any expenses incurred in the execution of his/her duties, notably travel costs.
Board Activities
The Board of Directors met eleven times in 2013. These meetings had an attendance rate of 94%. Additional information on individual attendance at Board meetings is available in the section detailing the breakdown of attendance fees between the members. The average Board meeting lasts three hours.
Each meeting is generally preceded by a meeting of one or more of the Board’s committees with a view to preparing its deliberations. The issues discussed by the committees are accordingly reported on to the Board of Directors.
In addition to the regular events in the course of the Company’s operations (review of operational performance, quarterly results, half-year and annual financial statements, review of budget, of risk factors, etc.), the Board studied strategic development opportunities in various regions, as well as the bringing in of outside capital into the Dailymotion subsidiary, and the plan to dispose of the Orange Dominicana subsidiary. The Board also streamlined the structure of certain subsidiaries and submitted a resolution at the Shareholders’ Meeting to change the Company name to Orange.
The Board regularly reviewed employee satisfaction survey indicators. It also reviewed and discussed the Annual Report on equal pay and gender equality in the workplace.
In accordance with the provisions of the Internal Guidelines, a meeting of the Board of Directors was dedicated to examining the existence and monitoring the effectiveness of internal control and financial and non-financial risk management systems. This meeting was prepared by a joint meeting of the Audit Committee and the Governance and CSER Committee.
At a meeting in the first half, the Board of Directors was presented with the Group’s 2012 CSR Assessment, together with the comprehensive CSR Report. It also approved the information on the corporate social and environmental issues of the Group included in the Report of the Board of Directors to the Shareholders’ Meeting.
ORANGE / 2013 REGISTRATION DOCUMENT - 330
At its June 17, 2013 meeting, the Board of Directors discussed its Chairman’s situation concerning the CDR-Tapie affair and heard from the Governance and CSER Committee on the potential consequences for the Company’s governance. It decided to give its full backing to Stéphane Richard.
The Board entrusted Bernard Dufau, independent Director, with the specific mission of ensuring that corporate governance would allow the Company to cope with certain exceptional crisis situations which it might confront.
Finally, the Board of Directors included on its agenda the preparation of the assessment of its work and that of its committees (see Section 5.2.2.9 Periodic review of the work of the Board of Directors and its committees).
Committee activities
Audit Committee
The Audit Committee met eight times in 2013. These meetings had an attendance rate of 88%.
It met regularly with Orange’s Senior Management and the main managers of the Group’s Finance Department, in particular with the Head of the Group Audit and Risk Control and Management Department and the Statutory Auditors, in order to review with them their respective action plans and the implementation of these plans.
Financial Reporting
The Committee analyzed the non-consolidated and consolidated financial statements for the 2012 financial year and the first half of 2013, together with the first and third quarter results for 2013, and verified that the processes for producing financial and accounting information complied with regulatory and legal requirements, especially in terms of internal control. In this respect, the Committee reviewed the draft Management Reports and heard the Statutory Auditors’ Reports. It also examined the budget for the financial year and its update, significant risks and off-balance-sheet commitments and their accounting impact, as well as the results of the asset impairment tests.
In addition, the Committee reviewed all financial communications before their publication.
Internal Control and Risk Management
Before approving each set of financial statements, the Committee undertook a review of the significant litigation in which the Group is involved.
Moreover, the Committee examined in a joint meeting with the Governance and CSER Committee the results of the annual evaluation of the internal financial control system, which were presented to it by the Group Internal Control Department, and concluded that the system was effective (see Section 5.4.1.4 Summary of the work on internal control accomplished under Section 404 of the Sarbanes-Oxley Act).
Finally, the Committee examined the major risks with which the Group may or could be faced. It also ensured that the recommendations formulated by the Audit, Control and Risk Management Department after the internal audit assignments were correctly implemented. The findings of the audit assignments completed in 2013 as well as the agenda of the audit assignments to be undertaken during 2014 were also presented. A description of the main risks is given in Section 2.4 Risk factors, which is an integral part of the Management Report of the Board of Directors.
Management of Debt and Cash
The Committee regularly examined the Group’s policy on debt refinancing and cash management.
Plans for International Expansion
The Committee studied a number of strategic development opportunities in various territories as well as the disposal of the Orange Dominicana subsidiary.
Statutory Auditors
The Committee reviewed the fees for the Statutory Auditors for 2013 and the financial terms of their work during the year. It also updated the rules on Statutory Auditor independence and approval of their fees.
These internal rules are part of Orange’s policy of systematic prior approval of the audit and other services provided by the Statutory Auditors with the aim of maintaining their independence and objectivity. They seek to limit the volume of services other than audit (or directly related to audit) and include a list of non-audit services banned as posing a potential threat to the independence of the Statutory Auditors. These rules apply to all the networks of the Group’s Statutory Auditors and in all Group entities. They comply with European and US regulations and AMF recommendations.
Governance and Corporate Social and Environmental Responsibility Committee
The Governance and CSER Committee met eight times in 2013. These meetings had an attendance rate of 88%.
Compensation of directors and officers
The Committee determined the targets and calculation methods for the variable portion of the compensation of the Chairman and Chief Executive Officer and the CEO Delegate for 2013. The calculation of the variable portion of corporate officer compensation is based on a weighted average of four indicators that focus on the Group’s growth, profitability, service quality, and CSR performance. The indicators and their relative weighting are described in Section 5.3.1 Compensation of directors and officers.
The Committee also approved the calculation of these variable portions for the second half of 2012, based on the selected indicators.
ORANGE / 2013 REGISTRATION DOCUMENT - 331
Lastly, the Committee prepared the breakdown of attendance fees for directors and defined their allocation, as described in Section 5.3.1 Compensation of directors and officers.
Governance and operation of the Board
The Committee considered the Chairman’s 2012 report on governance and internal control.
It also reviewed, like every year, the Board members’ position in terms of the independence criteria set out in the Afep-Medef Code. This review allowed it to propose to the Board that it qualify seven directors as independent according to the Afep-Medef Code.
The Committee also steered and guided the launch of the periodic process of self-assessment of the work of the Board and of its committees, undertaken by the Board of Directors in December 2013 and which will continue in the first half of 2014. It launched a call for tender for an external consultant to assess the work of the Committee (see below, Section 5.2.2.9 Periodic review of the work of the Board of Directors and its committees).
Also, to further strengthen Group governance, the Committee decided to look into changes to the Board of Directors’ Internal Guidelines, particularly the creation of a new committee dedicated to innovation and technology and the power of the Board to appoint a Lead Director.
Nomination
The Committee discussed the composition of the Board of Directors and proposed that the Board table a resolution at the Shareholders’ Meeting to appoint Fonds Stratégique d’Investissement as a legal entity director.
CSR, ethics
The Committee reviewed the Group’s corporate social responsibility policies. It examined the major achievements and the 2012 summary of this work and monitored the implementation of the CSR reporting obligations introduced by the French Grenelle 2 law. The Committee reported to the Board of Directors on its work on this subject.
The Governance and CSER Committee devoted two meetings to reviewing major CSR issues for the Group, in particular radio waves, and reported thereon to the Board.
The Committee also examined the Ethics Committee’s Annual Report on the Group-wide actions to implement the ethical practices program (see Section 5.6 Corporate social and environmental responsibility - Ethics Committee).
An update on the roll-out within the Group of the program to prevent corruption was presented to the Committee and a report presented to the Board of Directors.
Labor
The Committee monitored changes in the half-year indicators of the employee satisfaction survey. The Annual Report on equal pay and gender equality in the workplace was presented in detail, and the Committee prepared the deliberations for the Board.
Strategy Committee
The Strategy Committee brought together all the members of the Board of Directors in July 2013 and then held a one-day seminar on strategy with all the members of the Executive Committee in December 2013. These meetings allowed members to view presentations on and discuss the Group’s financial, strategic, social and regulatory positions, as well as the results of actions undertaken in France and around the world. The major strategic issues in the Group’s markets were also presented and in-depth discussions ensued.
In order to mark this positive change in Orange’s governance, the Board of Directors, in connection with the revision of its Internal Guidelines in March 2014, called for a strategy seminar for its members to henceforth be held twice a year, formally replacing the Strategy Committee.
In December 2013, the Board of Directors reviewed the process for assessing its own work and the work of its committees.
For 2014, the Board of Directors has decided to continue using the self-assessment method used to assess its work in 2011/2012 based on a questionnaire guided by an external consultant and supplemented by a number of targeted interviews with the Chairman and Chief Executive Officer, the Chairs of the various committees and any director so wishing.
The terms and timing of the work of this consultant should allow the establishment of a schedule of the various stages of the assessment process with submissions and a report to the Governance and CSER Committee and to the Board of Directors at the end of the first half of 2014.
Following the selection process undertaken by the Governance and CSER Committee, the Board of Directors chose a firm with substantial experience, in-depth practical knowledge of the governance of CAC 40 companies and a sound methodology as regards the development of the assessment of the Board of Directors of Orange and of its committees. This firm had worked on the 2012 assessment and will thus be in a position to compare the recommendations made then with the situation in 2014.
The recommendations for the 2012-2013 period were as follows:
■
replace the integration and strategy presentation day by an annual strategy seminar, during which participants have the opportunity to hold in-depth discussions and enhance their understanding of the Group’s strategic challenges, competitors and business lines’ strategic positioning. The seminar should provide the Board with the opportunity to meet business line managers and get to know the General Management team. This recommendation has been implemented following the holding of a strategy seminar in December 2013;
ORANGE / 2013 REGISTRATION DOCUMENT - 332
■
examine the relevance of the Strategy Committee, and if necessary, redefine its roles and responsibilities. This recommendation was taken into account, with strategy-related discussions taking the form, in addition to the work of the Board of Directors, of a seminar involving all members of the Board of Directors and organized in accordance with the Board’s Internal Guidelines;
■
improve the flow of communication and information on the work of the Board and monitoring of such work, the implementation of earlier strategic decisions and the ex post facto assessment of the results of acquisitions or other transactions. These issues were covered at the December 2013 seminar. In addition, the revision of the Internal Guidelines in April 2014 has taken this recommendation into account;
■
reinforce coordination between the Governance and CSER Committee and the Audit Committee concerning risk management and determining economic objectives for the Company’s corporate officers. A joint meeting of the Audit Committee and the Governance and CSER Committee in April 2013 made it possible to make progress on these issues and to coordinate the work of the committees that respectively review the financial statements and propose the way in which the variable portions of compensation should be calculated.
The recommendations continued to be implemented throughout 2013 and early 2014, with the integration and training of directors and the organization of presentations and site visits, particularly to technical facilities (call centers, fiber network, 4G antennae). Some directors also undertook specialized training to enhance their expertise, particularly as regards governance.
On February 23, 2011, the Board of Directors decided to combine the roles of Chairman and Chief Executive Officer and to appoint Stéphane Richard as Chairman of the Board of Directors with responsibility for the General Management of the Company. It considered this management structure to be the most appropriate for the Company’s organization and operation, because it allows the Company to benefit from the business knowledge and experience of the Chief Executive Officer, while optimizing coordination of operations within the Group and facilitating agile decision-making. Against this background, the appointment of a Chief Executive Officer Delegate in November 2011 and frequent meetings of the Board of Directors (11 meetings in 2013) help ensure a balance of power. All directors were consulted on this point during the assessment process conducted in February 2012, and combining the roles of Chairman and CEO was considered to be adapted to the Company’s situation. A further such consultation will take place as part of the assessment of the Board in the first half of 2014.
The Chairman and Chief Executive Officer is invested with extensive powers to act in the Company’s name. He exercises his powers within the limits of the Company purpose and subject to those limits that the law and Internal Guidelines of the Board of Directors expressly reserve for the latter. He is supported in this task by the CEO Delegate and the Executive Committee.
Article 2 of the Internal Guidelines of the Board of Directors provides that the Chairman and Chief Executive Officer must obtain the Board’s prior authorization before committing the Company to:
■
investments or divestments exceeding 200 million euros per transaction falling within the scope of consolidation, and when the total consolidated exposure exceeds the Board’s prior authorization for such an investment; or
■
any new capital expenditure (excluding the acquisition of telecom spectrum) under the Group’s major multi-annual technology programs in its main territories (such as FTTH, 4G, etc.) in an average amount per annum exceeding 2.5% of the Group’s investments budgeted during the year in question.
In addition, the acquisition of telecom spectrum by the Group in the territories representing at least 10% of the consolidated revenues may be subject to prior presentation to the Board of Directors, with the latter setting a maximum auction price.
Investments or divestments remain, as the case may be, subject to independent review by the governing bodies of the subsidiaries in question.
Furthermore, any investment or divestment that falls outside the scope of the Company’s strategy and involves a transaction in excess of 20 million euros must first be approved by the Board of Directors. Where relevant, the Board of Directors must be kept informed of any significant new developments regarding such transactions.
The Chief Executive Officer or, as the case may be, the Chief Executive Officer Delegate, must also obtain annual authorization from the Board of Directors, within ceilings determined by it, to allow the Company to issue bonds or equivalent securities or arrange syndicated bank facilities.
ORANGE / 2013 REGISTRATION DOCUMENT - 333
Under the authority of the Chairman and Chief Executive Officer, the Executive Committee is responsible for managing the Group and coordinating the implementation of its strategy. It oversees the achievement of operational, labor relations and technical objectives, as well as of those relating to the allocation of financial resources. Its meetings are held weekly.
Stéphane Richard has delegated a whole series of powers and signing authority to each member of the Executive Committee, each of whom has applied them in their respective area of expertise.
Several specialized committees reporting to the Executive Committee were created to apply, or oversee, the implementation of its directives throughout the Group. The main committees that affect Group governance are the Investment Committee, the Treasury and Financing Committee, the Tax Committee, the Claims and Commitments Committee, the Risks Committee, the Employment and Skills Committee and the Disclosure Committee. They are also responsible for monitoring risk management with regard to financial liabilities, thereby limiting the Group’s overall exposure.
The Investment Committee, which operates under the authority of Orange’s Chairman and Chief Executive Officer, is chaired by the Chief Executive Officer Delegate. It includes the Deputy CEO in charge of the Group General Secretariat, the Senior Executive Vice-President in charge of Innovation and the Senior Executive Vice-President in charge of Group Strategy and Development. Its role is to review projects implying financial commitments, off-balance sheet commitments and extra-financial implications for the Group. The Committee has a decision-making power on investment projects in IT and service platforms as well as B2B customer deals exceeding 10 million euros, and on other investment projects exceeding 30 million euros (including in both cases implied operational expenses). It also has a recommendation-making power on mergers and acquisitions and on agreements with MVNOs or public-to-private service concessions. This committee meets as often as it deems necessary and in general once a week, as requested by one of the members of the Executive Committee.
The Treasury and Financing Committee, chaired by the CEO Delegate, sets the guidelines for managing the Group’s debt, especially in respect of its liquidity, interest rate, exchange rate and counterparty risks on financial transactions over the coming months. It also reviews past management (completed transactions and financial results). The Treasury and Financing Committee meets quarterly.
The Tax Committee, which operates under the authority of the CEO Delegate, is chaired by delegation by the Group Controller. Its role is to review the major tax issues in order to determine their accounting consequences, if any. The materiality threshold for tax matters that must be submitted to the Tax Committee is 10 million euros. This committee meets twice a year; however, the Committee may convene special meetings to assess and approve the tax options to be taken on issues that are particularly important for the Orange Group. The Tax Committee met twice in respect of 2013.
The Claims and Commitments Committee, which is chaired by the Deputy CEO in charge of the General Secretariat, examines the Group’s major lawsuits and commitments, in order to ensure, in particular, that the related risks are taken into consideration as accounting provisions. The Committee’s mandate also includes approving the information on major lawsuits and unrecognized commitments in the notes to the financial statements. The Committee met six times in 2013, as part of the closing process of the full-year, half-year and quarterly financial statements.
The Risks Committee is placed under the authority of Orange’s Chairman and CEO and chaired by the CEO Delegate. The Committee’s role is to review the Group’s principal risks and to propose to the Executive Committee all decisions regarding risk management and the quality of internal control, as well as to assist Senior Management in its risk management reporting to the Audit Committee and Board of Directors. The Committee also ensures that Internal Control and Internal Audit Plans are in line with these objectives. In this respect, it validates and monitors the execution of the annual internal audit program and ensures the monitoring of the implementation of audit recommendations and corrective action plans. It is also kept informed of the main internal control work. In 2013, the Committee met three times.
The Employment and Skills Committee, which is under the authority of Orange’s Chairman and CEO, is chaired, by delegation, by the Deputy CEO in charge of Human Resources. It is made up of members of the Executive Committee or, by delegation, of their representatives. The Committee plays a key role in implementing the Group’s employment policy. The Employment and Skills Committee examines restructuring projects that may have a significant impact on jobs and job outlook in the Group’s business lines, divisions and countries. It also looks at all plans for external hires in France. In this context, it prepares recommendations to be submitted for the approval of the Executive Committee, and, if necessary, to the employee representation bodies. The Committee generally meets once a week.
ORANGE / 2013 REGISTRATION DOCUMENT - 334
The Disclosure Committee is placed under the authority of the CEO Delegate. It is chaired, by delegation, by the Group Accounting Director, and includes the relevant directors within the accounting, legal, internal audit, controlling, investor relations and communications fields. It ensures integrity, accuracy, and compliance with applicable laws and regulations and recognized practices, and ensures the consistency and quality, of the Orange Group’s financial information. It carries out this mission within the procedural framework for the preparation and validation of financial information as defined by the Group. Accordingly, it examines all financial disclosures made by Orange SA, especially the consolidated financial statements, the Annual and half-yearly Financial Reports, the quarterly financial information, the Registration Document filed with the AMF, the Annual Report on Form 20-F filed with the SEC, and any press releases containing financial information. In addition, the Committee looks at financial communications from the principal listed subsidiaries. It met 18 times in 2013.
The Company refers to the Afep-Medef Corporate Governance Code for listed companies as a general baseline, in particular for compensation matters. The tables below follow the Code’s classification system.
Stéphane Richard
(in euros) | 2013 | 2012 |
Gross compensation in respect of financial year (detailed in Table 2) | 1,188,811 | 1,520,509 |
Valuation of options allocated throughout the year | 0 | 0 |
Valuation of performance shares allocated throughout the year | 0 | 0 |
TOTAL | 1,188,811 | 1,520,509 |
Gervais Pellissier
(in euros) | 2013 | 2012 |
Gross compensation in respect of financial year (detailed in Table 2) | 919,005 | 1,067,443 |
Valuation of options allocated throughout the year | 0 | 0 |
Valuation of performance shares allocated throughout the year | 0 | 0 |
TOTAL | 919,005 | 1,067,443 |
(1)
The tables are numbered in line with the AMF recommendation of December 22, 2008 on the information to be included in the Registration Documents relating to compensation paid to directors and officers.
ORANGE / 2013 REGISTRATION DOCUMENT - 335
Stéphane Richard
| 2013 | 2012 |
Gross amounts (in euros) | Amounts paid in respect of financial year | Amounts paid during the financial year | Amounts paid in respect of financial year | Amounts paid during the financial year |
Fixed compensation | 900,000 | 900,000 | 900,000 | 900,000 |
Variable compensation | 284,026 | 390,677 | 615,915 | 663,279 |
Multi-year variable compensation | 0 | 0 | 0 | 0 |
Exceptional compensation | 0 | 0 | 0 | 0 |
Attendance fees * | 0 | 0 | 0 | 0 |
Benefits in kind | 4,785 | 4,785 | 4,594 | 4,594 |
TOTAL | 1,188,811 | 1,295,462 | 1,520,509 | 1,567,873 |
* Stéphane Richard has waived his right to receive attendance fees. |
Gervais Pellissier
| 2013 | 2012 |
Gross amounts (in euros) | Amounts paid in respect of financial year | Amounts paid during the financial year | Amounts paid in respect of financial year | Amounts paid during the financial year |
Fixed compensation | 600,000 | 600,000 | 600,000 | 600,000 |
Variable compensation | 299,170 | 207,779 | 444,755 | 305,379 |
Multi-year variable compensation | 0 | 0 | 0 | 0 |
Exceptional compensation | 0 | 0 | 0 | 0 |
Attendance fees | NA | NA | NA | NA |
Benefits in kind | 19,835 | 19,835 | 22,688 | 22,688 |
TOTAL | 919,005 | 827,614 | 1,067,443 | 928,067 |
|
The compensation of the Chairman and Chief Executive Officer, and of the Chief Executive Officer Delegate, is set by the Board of Directors on the basis of a proposal by the Governance and CSER Committee.
Variable compensation
2013 marked a change in compensation of corporate officers with the switch from a half-yearly variable portion to an annual variable portion, in line with market practices and with the Group’s aim of adopting a longer-term approach to assessing the performance of senior managers.
The change was made without altering the structure of the variable compensation, which is based on a weighted average of four indicators, stressing Group growth, profitability, service quality and CSR performance. These indicators are:
■
revenue growth rate on a comparable basis (20%). For the Chairman and CEO, the target pro forma revenue growth is measured “excluding regulatory impact”. The criterion for the CEO Delegate is pro forma revenue growth;
■
restated EBITDA minus CAPEX (30%) – see Financial glossary appendix;
■
a composite indicator linked to the quality of service delivered to the Group’s Consumer and Enterprise customers (20%);
■
a composite CSR performance indicator (30%). The latter indicator reflects improvement measured by five human resources-related management indicators based on a semi-annual performance chart (50%) and five CSR categories measured by semi-annual surveys (also 50%).
If these objectives are reached, Stéphane Richard and Gervais Pellissier can receive a bonus equal to two-thirds of their fixed compensation, and should the objectives be surpassed, they could receive a variable portion of up to 100% of their fixed compensation.
The expected level of fulfillment of these objectives was precisely set by the Board in 2013, but remains confidential.
The Board of Directors’ meeting on March 5, 2014 granted bonuses to Stéphane Richard and Gervais Pellissier in respect of 2013 representing a substantial reduction on the prior year, in light of the Company’s results. Moreover, Stéphane Richard decided that Orange should not have to bear the cost of the 75% tax introduced by the 2014 French Finance Act and levied on 2013 income exceeding 1 million euros. The Board therefore granted Stéphane Richard variable compensation representing 31.56% of his fixed compensation (prior to his
ORANGE / 2013 REGISTRATION DOCUMENT - 336
decision, this was 47.93%). The variable compensation granted to Gervais Pellissier represented 49.86% of his fixed compensation.
The Chief Executive Officer and the CEO Delegate are not entitled to benefit from incentive agreements or employee profit-sharing agreements.
Benefits in kind
Stéphane Richard and Gervais Pellissier each have a company car with chauffeur and consulting firm services for personal legal assistance relating to their role capped at 100 hours a year for the Chief Executive Officer, and 20 hours for the CEO Delegate. They are also provided with a telephone line with unlimited calls, plus equipment, particularly computers, needed to perform their duties.
Miscellaneous
Stéphane Richard and Gervais Pellissier are enrolled in the Orange Group’s death and disability and supplemental health insurance plans, which is applicable to corporate officers.
Attendance fees
Directors | Amounts
paid in 2014
(in respect of the 2013 financial year) | Amounts
paid in 2013
(in respect of the 2012 financial year) | Amounts
paid in 2012
(in respect of the 2011 financial year) |
Daniel Bertho (1) | 5,778 | NA | NA |
Bpifrance Participations | 19,917 | NA | NA |
Jean-Luc Burgain | 50,000 | 21,333 | NA |
Ghislaine Coinaud (1) | 34,000 | 29,000 | 32,000 |
Bernard Dufau | 58,000 | 53,000 | 59,000 |
José-Luis Durán | 30,000 | 26,000 | 38,000 |
Charles-Henri Filippi | 46,000 | 45,000 | 51,000 |
Daniel Guillot (1) | 50,000 | 43,000 | 48,000 |
Claudie Haigneré | 34,000 | 27,000 | 27,000 |
Helle Kristoffersen | 32,000 | 29,000 | 13,667 |
Muriel Pénicaud | 58,000 | 39,000 | 21,667 |
Antoine Saintoyant (2) | 28,278 | NA | NA |
Henri Serres (2) | 37,694 | NA | NA |
Jean-Michel Severino | 46,000 | 33,000 | 15,667 |
Former directors | | | |
Caroline Angeli (1) | 42,194 | 35,000 | 35,000 |
Olivier Bourges (2) | 1,778 | 15,639 | NA |
Jean-Dominique Comolli (2) | NA | 25,361 | 45,000 |
Pascal Faure (2) | 1,278 | 30,000 | 38,000 |
Pierre Graff (2) | 10,083 | 24,000 | 22,000 |
Didier Lombard | NA | NA | 0 |
Marc Maouche | NA | 23,667 | 46,000 |
Henri Martre | NA | NA | 16,333 |
Marcel Roulet | NA | NA | 26,333 |
Jean Simonin | NA | NA | 21,333 |
TOTAL | 585,000 | 499,000 | 556,000 |
(1) Attendance fees paid, at the request of the directors concerned, to their trade union. (2) Attendance fees paid to the French Treasury Department. |
In accordance with the law, the maximum amount of attendance fees that can be paid annually to directors is set by the Annual Shareholders’ Meeting. The resolution approved remains valid until a new resolution is adopted. The Annual Shareholders’ Meeting of May 27, 2008 set this sum at 600,000 euros. The Board of Directors’ meeting of March 26, 2014 decided to propose to the Shareholder’s Meeting of May 27, 2014 to increase this amount to 750,000 euros, due notably to the increased work of the Board’s committees.
Within the limit decided by the Shareholders’ Meeting, and on a proposal from the Governance and CSER Committee, the Board of Directors decides at the start of each year on the amount of attendance fees that it will allot to its members for the past year and their allocation rules.
ORANGE / 2013 REGISTRATION DOCUMENT - 337
Directors receive a fixed annual amount (10,000 euros), and a variable amount based on their attendance at Board and Board committee meetings and on the functions that they perform within the committees. For the meetings attended in 2013, the directors received:
■
2,000 euros per meeting of the Board of Directors;
■
2,000 euros per meeting of the Audit Committee or the Governance and CSER Committee;
■
1,000 euros per meeting of the Strategy Committee;
■
1,000 additional euros per meeting of committees of which they are the Chair.
Attendance fees paid to directors representing the French government are paid to the French Treasury. In addition, the directors elected by the employees have requested that their attendance fees be paid to their trade union.
Other compensation
The table below shows the compensation paid to the directors elected by the employees and to the director elected by the Shareholders’ Meeting to represent the employee shareholders, excluding attendance fees (already mentioned above).
GROSS AMOUNTS (in euros) | Amounts
paid in 2013 | | Amounts
paid in 2012 | |
Caroline Angeli | 36,629 | (1) | 36,202 | |
Daniel Bertho | 2,614 | (2) | NA | |
Jean-Luc Burgain | 62,392 | | 21,977 | (3) |
Ghislaine Coinaud | 35,704 | | 35,062 | |
Daniel Guillot | 76,406 | | 75,912 | |
(1) Until December 2, 2013. (2) As of December 3, 2013. | |
In addition, Bernard Dufau received compensation amounting to 8,000 euros in respect of specific duties allocated to him in June 2013 by the Board of Directors (see Section 5.2.2.8 Board and committee activities during the financial year).
With the exception of this compensation, non-executive directors receive no other compensation apart from attendance fees.
Furthermore, there are no contracts linking any member of the Board of Directors to Orange SA or any one of its subsidiaries which provide for the granting of any benefits to this Director at the end of his term.
Orange did not implement any stock-option plan in 2013. As a result, during the 2013 financial year, neither Orange SA nor any other of the Group’s companies granted any option to buy existing shares or to subscribe for new shares to corporate officers.
Stéphane Richard has no option to purchase or subscribe for shares.
Gervais Pellissier, the only corporate officer to have received options, did not exercise any of them during the 2013 financial year (see Table 8 below).
During the 2013 financial year, neither Orange SA nor any other of the Group’s companies granted any performance shares to corporate officers.
None.
ORANGE / 2013 REGISTRATION DOCUMENT - 338
Stock options granted by Orange SA
(formerly France Telecom SA) | Plan October 2005 | Plan March 2006 | Plan
May 2007 | TOTAL |
Date of Shareholders’ Meeting authorizing the plan | 09/01/2004 | 09/01/2004 | 09/01/2004 | |
Date of Board Meeting granting the options | 10/26/2005 | 03/08/2006 | 05/21/2007 | |
Number of beneficiaries | 3,747 | 165 | 1,152 | |
Total number of options granted | 14,516,445 | 536,930 | 10,093,300 | 25,146,675 |
o/w options granted to Orange SA corporate officers: | | | | |
| 13,570 | 41,430 | 53,000 | 108,000 |
options granted to top ten beneficiary employees | 645,000 | 121,350 | 605,000 | 1,371,350 |
First possible vesting date | 10/26/2008 (1) | 03/08/2009 (1) | 05/21/2010 | |
Expiration date | 10/26/2015 | 03/08/2016 | 05/21/2017 | |
Stock option exercise price | €23.46 | €23.46 | €21.61 | |
Number of options exercised during the 2013 financial year | 0 | 0 | 0 | 0 |
Total number of options exercised at 12/31/2013 | 53,490 | 0 | 43,500 | 96,990 |
Total number of options canceled at 12/31/2013 | 3,353,818 | 266,960 | 1,845,200 | 5,465,978 |
Total number of options outstanding at 12/31/2013 | 11,109,137 | 269,970 | 8,204,600 | 19,583,707 |
(1) For non-French resident beneficiaries. |
Stock options granted by Wanadoo | Plans expired before January 1, 2013 | Plan 2003 | TOTAL |
Date of Shareholders’ Meeting authorizing the plan | | 06/22/2000 | |
Date of Board Meeting granting the options | | 11/26/2003 | |
Total number of options granted (1) | 13,114,798 | 2,107,115 | 15,221,913 |
o/w options granted to Orange SA corporate officers | 0 | 0 | 0 |
First possible vesting date | | 11/26/2006 | |
Expiration date | | 11/26/2013 | |
Stock option exercise price (1) | | €16.60 | |
Number of options exercised during the 2013 financial year | | 0 | 0 |
Total number of options exercised at 12/31/2013 (1) | 5,992,256 | 431,501 | 6,423,757 |
Total number of options canceled at 12/31/2013 (1) | 7,122,542 | 1,675,614 | 8,798,156 |
Total number of options outstanding at 12/31/2013 | 0 | 0 | 0 |
(1) After conversion to Orange (formerly France Telecom SA) options based on the exchange ratio of 7/18 and adjustment of the number of options and the exercise price following the September 26, 2005 Orange (formerly France Telecom SA) capital increase. |
Stock options granted by Orange (formerly Orange) | Plans expired before January 1, 2013 | Plan
May 2002 | Plan May 2003 (A) | TOTAL |
Date of Shareholders’ Meeting authorizing the plan | | 12/29/2000 | 12/29/2000 | |
Date of Board Meeting granting the options | | 05/15/2002 | 05/13/2003 | |
Total number of options granted (1) | 45,576,257 | 10,925,364 | 8,350,079 | 64,851,700 |
o/w options granted to Orange SA corporate officers | 0 | 0 | 0 | 0 |
First possible vesting date | | 10/01/2002 | 05/13/2004 | |
Expiration date | | 05/15/2012 (2) | 05/13/2013 (2) | |
Stock option exercise price (1) | | €14.24 | €16.66 | |
Number of options exercised during the 2013 financial year | 0 | 0 | 0 | 0 |
Total number of options exercised at 12/31/2013 (1) | 13,813,384 | 7,292,830 | 4,544,591 | 25,650,804 |
Total number of options canceled at 12/31/2013 (1) | 31,762,874 | 3,613,088 | 3,789,552 | 39,165,514 |
Total number of options outstanding at 12/31/2013 (1) | 0 | 19,446 (3) | 15,936 (3) | 35,382 |
(1) After conversion to Orange (formerly France Telecom SA) shares based on one Orange (formerly Orange) share for 0.446 of the Orange (formerly France Telecom SA) share. (2) Some beneficiaries in Switzerland and Slovakia have an additional two years to exercise their options. (3) Following the merger of Orange Holding SA (formerly Orange) and Orange SA (formerly France Telecom) effective on July 1, 2013, Orange SA made an undertaking to beneficiaries of options to allow them to receive an equivalent amount in cash. |
ORANGE / 2013 REGISTRATION DOCUMENT - 339
The various stock-option and share-purchase plans granted by Orange SA and its subsidiaries are also described in Note 5.3 to the consolidated financial statements.
Orange introduced a free share award plan on July 27, 2011 covering 16.7 million shares and approximately 150,000 employees in France and abroad who decided to take part. The Group’s corporate officers and members of the Executive Committee were not beneficiaries of this plan.
Final vesting of these shares was subject to:
■
a performance condition [REDACTED SECTION: CERTAIN TEXT THAT FOLLOWS HAS BEEN REDACTED]
■
a condition of employment in the Group during the term of the plan.
Subject to fulfillment of these conditions, the shares would have vested on July 27, 2015. The Board of Directors meeting on March 5, 2014 however confirmed that the performance criterion had not been fulfilled. Accordingly, the shares will not vest.
| Stéphane Richard | Gervais Pellissier |
Employment Contract | No (1) | No (2) |
Enrollment in a supplemental retirement plan | No (3) | No (4) |
Compensation or benefits due or likely to be due upon termination or change of office | No (5) | No (5) |
Compensation payable under a non-competition clause | No | No |
(1) Stéphane Richard’s employment contract was rescinded on March 1, 2010 when he was appointed as Chief Executive Officer. (2) Gervais Pellissier’s employment contract was suspended on November 1, 2011 when he was appointed as CEO Delegate. This suspension will end at the same time as his term as CEO Delegate. (3) Stéphane Richard is no longer eligible for the supplemental retirement plan set up for employees classified as “off the matrix”. (4) During his term, given the suspension of his employment contract, any entitlement of Gervais Pellissier to join the supplemental retirement plan set up for employees classified as “off the matrix”, is also suspended. (5) Stéphane Richard and Gervais Pellissier will not receive any deferred compensation should their terms as CEO or CEO Delegate be terminated. |
The total gross amount of compensation paid in respect of the 2013 financial year (on a pro rata basis in the event of departures and appointments midway through the year) by Orange SA and its controlled companies to all of the Orange Executive Committee members, excluding employer expenses, was 8,684,272 euros, compared to 10,094,153 euros in 2012, i.e. a decrease of around 14%.
This decline in the amount of compensation paid to the members of the Executive Committee was due in part to the significantly lower variable compensation paid and to the fact that there were fewer members on the Committee. Moreover, the freeze on the highest salaries in the Group, for unchanged responsibilities, introduced in 2012, also applied in 2013.
This amount includes all compensation paid in respect of the 2013 financial year: gross salaries, bonuses (including variable portions), benefits in kind, and profit-sharing. However, it does not include incentive bonuses and any employer contributions that will be made in relation to employee savings plans, as these amounts were not known at the time of writing (incentive bonuses and employer contributions paid in the first half of 2013 in respect of 2012 totaled 175,016 euros).
The members of the Executive Committee did not receive attendance fees for the positions they hold in Orange Group’s subsidiaries.
The employment contracts of the members of the Executive Committee include a clause providing for contractual severance pay up to a maximum of 15 months salary based on total annual gross salary (including any termination pay provided for by industry-wide collective agreements).
During the 2013 financial year, the members of the Executive Committee received no stock options or performance shares from Orange SA, nor from any other company within the Group.
Stock options granted to the top ten non-corporate officer employees and options exercised by them
During the 2013 financial year, neither Orange SA nor any other of the Group’s companies granted any option to buy existing shares or to subscribe for new shares to employees.
During the 2013 financial year, no options were exercised by employee beneficiaries (see above Table 8 – History of Stock Options Grants).
See Note 19 to the consolidated financial statements Executive Compensation (Section 4.1).
At December 31, 2013, no director or corporate officer was eligible for retirement benefits from Orange.
ORANGE / 2013 REGISTRATION DOCUMENT - 340
An ongoing process is implemented in order to continually improve internal control and risk management within Orange.
The risk management and internal control system consists of an organization, procedures and controls implemented by General Management and all staff under the Board of Directors’ responsibility, and is intended to provide reasonable assurance that operating targets are met, that current laws and regulations are complied with, and that the financial information is reliable. It is notably implemented in compliance with the US Sarbanes Oxley Act, the French Financial Security Act of July 17, 2003 and the Government Order of December 8, 2008 transposing the 8th European Directive. Policies and procedures relative to quality assurance, ethics, compliance and security also contribute to risk management policy.
In addition, the Group’s General Inspector, reporting directly to the Chairman may conduct, exclusively on his request, reviews or surveys that may cover any Group entity. It is informed about the work of General Control and Internal Audit and may request their input. The Group Inspector General sits on the Risks Committee.
In accordance with the provisions of 8th European Directive, the Audit Committee of the Board of Directors is, among others, in charge of monitoring the effectiveness of the internal control and risk management systems (see Section 5.2.2.6 Board Committees).
Orange’s internal control system relates to the Group governance committees (see Section 5.2.3.3 Executive Committee and Group Governance Committees), the support functions in charge of the Group’s control environment domains, and the operating functions.
Where the reliability of its financial information is concerned, Orange has an internal control organization based on the internationally recognized framework of the 1992 Committee of Sponsoring Organizations (COSO) of the Treadway Commission. Orange classifies the five component parts of the COSO under two headings:
■
control environment (overall policies and procedures); and
■
operating control (flows and processes).
The Group’s Audit, Control and Risk Management Department combines all audit, control and risk management functions (internal audit, general control, fraud and revenue assurance, internal control and credit management) in a single department, which reports to the Chief Executive Officer Delegate. The Group Accounting Department and Group Management Control Department, which also report to the Group’s CEO Delegate have a decisive influence over the system.
Internal Audit
The Group’s internal audit team consists of approximately 120 qualified auditors who work for all of the Group’s entities on a shared service basis, and are mainly located in France, Poland and Africa.
The joint operations with Deutsche Telekom (EE, Buyin) are subject to audits conducted jointly by the Group’s and Deutsche Telekom’s internal audit departments. The EE joint venture, created as part of the merger of Orange and Deutsche Telekom’s businesses in the United Kingdom, has its own internal audit team.
By means of its audit assignments, internal audit helps the Group to maintain an appropriate management control system by assessing its effectiveness and efficiency and by issuing recommendations for its on-going improvement.
The recommendations arising from internal audit assignments (167 assignments were completed in 2013) are systematically monitored, and lead in particular to action plans that are drawn up and implemented by the Group’s divisions and subsidiaries.
These assignments include among others checks performed at the request of the Group’s Internal Control Department as part of the systematic assessment of internal financial control, particularly tests of the operating effectiveness of the internal control system and cyclical audits performed on the internal control system of less significant subsidiaries.
For France and Poland, Orange’s internal audit is certified on an annual basis by IFACI Certification, based on the professional benchmark for internal audits (known as RPAI in French).
The internal audit process also supports the Group’s Operational Divisions in their own initiatives aimed at identifying their major risks.
General Control
General Control investigates cases of suspected fraud that may have an impact at Group level, notably at the request of Executive Committee members or their respective management committees. It carried out 14 engagements in 2013. Investigations with less impact are conducted at the country level by investigators who are in most cases dedicated full-time to this task. The network of investigators includes four geographical units in France, making it possible to cover the entire country. There are also investigative units in the major countries where the Company does business, including Poland and Spain.
Fraud and Revenue Assurance
Group Fraud and Revenue Assurance (GFRA) defines the Orange’s group strategy and approach to fraud prevention and detection, as well as to the assurance of the Group’s revenues. To support deployment of this strategy, GFRA works closely with both corporate and local entity teams.
ORANGE / 2013 REGISTRATION DOCUMENT - 341
Orange has adopted a risk-based approach to the management of fraud. GFRA constantly monitors existing and new fraud risks as well as any new fraud related legislation. This enables Orange to take into account changes in the fraud risk environment and to adapt its anti-fraud strategy accordingly. GFRA maintains the Group’s fraud risk map, which covers all anticipated risks in this domain (including, for example, risks of money laundering, corruption, VAT carousels and terrorist financing).
Orange has preventative controls in place to reduce the probability of frauds which may constitute a major risk. Since prevention cannot be 100% effective, the Group has also defined a control framework designed to detect instances of fraud. Any cases or suspicions identified through these controls are investigated and are processed in compliance with the law and our ethical standards.
Orange believes that in order to manage fraud risk and to assure revenues, the cost of fraud and revenue leakage must be manage at a local level and consolidated at Group level so that major incidents can be analyzed and treated, and any emerging trends identified. With regard to the production of Group financial information, the approach defined by GFRA includes such applicable risks as frauds committed by management or fraud within the financial statements.
Internal control
The Group Internal Control Department is charged with, among other tasks, ensuring overall management and assessing the quality of the internal financial control system for the whole Group. In this capacity, the Group Internal Control Department is responsible for managing the ongoing program to improve the internal financial control processes.
The Group Internal Control Department develops a methodology, the tools necessary to apply it, and a yearly work plan. It manages the roll-out of the internal control system and ensures its effectiveness with all Group managers, relying on the heads of the governance committees, the persons in charge of the control environment within the Group, and the Internal Control Departments of the operating entities. The department monitors the results of the work performed by the Group in order to meet the required quality level.
In this context, the Group Internal Control Department is in charge among others of:
■
coordinating the local internal control departments and the persons in charge of the control environment within the Group, and giving them the support and advice that they need to ensure the quality of their system and control it;
■
ensuring that the action plans presented to the Risk Committee and subsequently to the Audit Committee of the Board of Directors, if applicable, are implemented and monitored;
■
producing the reports required by regulations for shareholders and for financial market oversight authorities.
The role of the local internal control functions is to assist the operating managers of their entities, in order to help them structure and maintain an efficient internal control system, which meets both their own and the Group’s requirements.
In this context, the local internal control departments apply the directives issued by the Group’s Internal Control Department within their own entity, and ensure the smooth running of the system at their own level. They are in charge of applying the methodology, and providing training and support for operating staff, as well as monitoring the progress of the action plans.
Credit Management
The Group’s Credit Management Department is charged with minimizing the financial risks associated with the credit granted to our customers. Its purpose is to have a consolidated vision of the credit risks with our clients and partners and to implement tools that allow these risks to be managed. In order to do this, it depends on local teams or contacts and on the processes in place in each operational entity.
It disseminates the culture of credit management within the Group and allows information to be shared and circulated.
Accounting and Controlling
The Group Accounting and Group Management Controlling Divisions have the following key duties:
■
producing the Group’s consolidated financial statements and the non-consolidated financial statements of Orange SA and certain French subsidiaries within time frames that meet financial market requirements and legal obligations while guaranteeing that the statements provide a true and fair view of the Company in compliance with the accounting principles adopted by the Group;
■
preparing the management reports on the non-consolidated and consolidated financial statements and producing the necessary documentation for financial communication of results and the summary of management reporting for the Executive Committee;
■
managing the monthly and quarterly reporting cycle which allows management to measure the Group’s performance on a regular basis;
■
designing and implementing Group methods, procedures and standards frames for Accounting and management Controlling;
■
identifying and carrying out the necessary changes to the Group’s accounting and management information systems.
ORANGE / 2013 REGISTRATION DOCUMENT - 342
Identifying major risks
At least once per year, each of the Group’s Operational Divisions (France, Europe including Poland and Spain, AMEA, Enterprise) and functions identifies the major risks in its area. Risk identification is completed, where relevant, by a description of actions plans designed to hedge these risks and reinforce internal control, and since 2012, by an inventory of serious incidents.
The list of serious incidents, changes to the list of risks and monitoring of implementation of action plans are assessed during internal control reviews of each division.
In addition, each member of the Executive Committee is asked to outline their personal view of the major risks facing the Group, a process that helps to validate the risk assessment described under “Risk factors” in this document.
All of the above procedures are reviewed at least annually by the Group Risks Committee and presented to the joint Audit, Governance and CSR Committee.
A risk management charter, signed by all members of executive management, was disseminated at the end of 2011. A self-assessment questionnaire on the main provisions of the Charter is submitted to 125 subsidiaries and organizational entities.
Detecting and tackling internal fraud
Detecting Fraud is the responsibility of the management, which is assisted by the Group Fraud and Revenue Assurance Division and local fraud detection specialists in the Group entities.
A warning system is in place, in accordance with the Sarbanes-Oxley Act. This system allows any employee to use a dedicated email address to report any acts that may constitute an offense or fraud, or that may reveal instances of corruption, particularly in the areas of finance, and more specifically, accounting and payments. The defined procedure ensures that the alerts are treated confidentially and independently, outside of the chain of command, if necessary. It safeguards the protection of staff members as well as the rights of the individuals concerned by such reports.
When internal fraud is strongly suspected, investigations are generally entrusted to specialized services, in particular to the General Control Division. Investigation services are responsible for establishing the existence of facts. In the event of internal fraud, Company management determines the penalties. For all cases detected, (internal or external fraud), the civil, criminal, or legal consequences are considered after the recommendations of the Company’s Legal Division.
Fraud cases are analyzed by the Group’s Fraud and Insurance Revenues Division in order to assess control measures and therefore better prevent and detect similar fraud cases.
Development of self-assessment
of internal control
Self-assessment was initiated by Group Internal Control to assess the quality and maturity of internal control in the Group’s entities. This Corporate process is based on formal and benchmarked procedures and the results are banked in a centralized IT system. It is supplemented by the systems managed locally. The aim is to identify the main improvements required to the internal control system and to implement corrective actions.
Where necessary, internal audits are conducted to ensure the quality of the self-assessment findings and the relevance of the action plans.
Internal Control reviews
Internal Control Reviews are conducted annually to verify, for the Group’s main entities, efficient oversight of internal control, with particular emphasis on achieving the objectives agreed during the previous year’s review. A summary is presented by the management of the entity to the supervising Senior Executive Vice-President, in the presence of the Group Audit, and Control and Risk Management Department. It is generally structured as follows:
■
a recap on the challenges and goals of the entity’s internal control system for the previous year, and their translation into objectives for internal control personnel;
■
results achieved as compared to the previous year’s objectives, specifying opportunities for improvement and the reasons for actions not undertaken; and
■
comment on serious incidents and review of major recommendations;
■
the entity’s goals for the current year, and their translation into objectives for the entity and for the internal control personnel concerned.
The Group Accounting Department and Group Management Control Department, which also report to the Group’s CEO Delegate have a decisive influence over the system. The internal control of accounting and financial information is organized around the following elements:
■
the Disclosure Committee (see Section 5.2.3.3);
■
the Group Accounting and Controlling function;
■
unified Accounting and Management Reporting; and
■
Group-wide accounting standards and methods.
ORANGE / 2013 REGISTRATION DOCUMENT - 343
Unified accounting and management reporting
All of the Group’s entities participate in the Group’s management and steering cycle, which is composed of three basic components:
■
the forecasting process (plan, budget, and periodic internal provisions);
■
the process for producing corporate accounts and the Group’s consolidated financial statements; and
■
the Management Reporting process.
The forecasting process (plan, budget, and periodic internal provisions)
The Group budgeting process requires regular updates of projections and the management’s involvement. It is worked out by country and division, business unit, and Group subsidiary.
The budget must reflect the Group’s ambitions at each level of the organization. It includes a yearly goal based on year one of the multi-year plan and forecasts that are updated in May, including an updated second-half goal, and in October-November to evaluate target figures for year-end.
The budget dossier is composed of:
■
packages of financial data (including cash flow statements), along with comments summarizing, in particular, major actions;
■
capital expenditures by project; and
■
analysis of risks and opportunities.
As part of the budget process, the divisions establish and analyze the performance indicators. The budget and updated projections are established on a monthly basis to be used as a reference for the Group’s monthly reporting.
Moreover, the Group draws up a multi-year plan with the main Group entities, setting out the medium-term financial trajectories for the Group and its main entities.
Process of preparing the companies’ non-consolidated financial statements
and the Group’s consolidated financial statements
The financial statements of Orange are prepared in accordance with the following principles:
■
performing pre-closing accounts at the end of May and the end of November;
■
anticipating the use of estimates and of complex accounting operations processes; and
■
formalizing closing processes and schedules.
As such, documenting the processes leading to the production of financial information up to the filling of consolidation packages constitutes a common framework for all contributors, thus strengthening internal control within the accounting and management controlling function.
Instructions from the Management Controlling and Accounting Divisions specifying the process and agreed timeline for each closing are circulated within the Group, and then broken down by subsidiary.
Consolidation packages are created monthly by the Group’s entities according to IFRS principles and entered in the Group’s consolidation and reporting tool.
The Group’s principles, when they are compatible with the local rules applicable to the statutory income statements, prevail, in order to limit subsequent restatements. However, in the event that principles inconsistent with those of the Group are applied in an entity’s statutory income statement and have a significant impact on measuring earnings and assets, the entity restates those items for consistency.
The identification, regular measurement, and reconciliation of accounting methods used in the non-consolidated financial statements and Group standards are the responsibility of each entity and communicated to the teams responsible for the Group’s financial management.
The identification and assessment of off-balance sheet commitments are covered by a specific report drawn up annually and half-yearly by the Legal Division and the Finance Department, working in close collaboration.
Management reporting process
The reporting process is a major element in the control and financial information process. It is a major tool for monitoring, control, and direction for the Group’s Management. The reconciliation of accounting and forecast data used in the monthly review at each level of the Group contributes to the quality and accuracy of the information produced. This method, established by the Controlling and Accounting Departments, is repeated in all entities of the Group and at each level of the organization (business unit, division and Group).
The definition of Group report contents and media that are used to track the achievement of Group objectives is established on a regular and consistent basis. The financial data in reporting come primarily from the Group consolidation and reporting tool, and the reporting formats are standardized. The reports are validated by the country financial controllers.
This reporting is used to track the Group’s management and performance indicators, and is articulated around the following:
■
a monthly performance chart providing the Chairman and Chief Executive Officer and the Executive Committee with the key operating indicators for the Group and the major events and alerts of the month;
■
monthly reports broken down by published segment, line of business, and country; these include financial and operating indicators.
ORANGE / 2013 REGISTRATION DOCUMENT - 344
The Executive Committee’s business reviews are organized with each country under the authority of the CEO Delegate. Their purpose is to steer business and review the updated end-of-year forecast. These monthly reviews are attended by the Group Finance Department with the country’s Manager and finance function. The Chairman and Chief Executive Officer participates in the quarterly reviews. These reviews are based on a formalized report structure. Gathering of information for these reports is organized for each country according to the Group’s reporting instructions.
Group-wide accounting standards
and methods
In order to draw up projected and actual consolidated statements, the Group has opted for the unification principle which implies:
■
a uniform reference system, accounting standards and methods, and consolidation rules;
■
the standardization of recovery formats; and
■
the use of a common consolidation and reporting application within the Group.
The Group has a single reference system that standardizes all items in the consolidated reporting, including unrecognized commitments. This reference system is the responsibility of the Group’s Accounting Department. All of the Group’s consolidated companies have adopted this system.
Within the Group’s Accounting Department, the Department of Accounting Principles is responsible for defining and disseminating the Group’s accounting policies under IFRS standards. It also monitors standards and formalizes on a systemic and structured basis the IFRS Group accounting policies through the Group’s accounting manual, closing instructions, and information meetings.
This system is completed by the existence of accounting principles correspondents in the countries and divisions. It identifies accounting problems encountered locally, disseminates the Group’s accounting policies in divisions, countries, entities and accounts departments and ensures that the training needs of personnel with responsibility for the efficient application of the Group’s accounting policies are met.
ISO 9001 Quality Certification for the Accounting Department
In 2001, Orange SA obtained the ISO 9001 v2000 standard certification in the area of Quality Management for accounting services in France, issued by AFAQ/Afnor. Since 2007, all of the departments in the Group Accounting Division based in France have received ISO 9001 v2000 certification. It has been decided that, starting from 2010, the process for the ISO 9001 v2008 standard awarded by Afnor will be renewed for a new three-year certification cycle.
For each accounting process, this approach allows to look for ways of improving, simplifying, and adopting best practices, so that the financial statements can be produced in a timely manner and so that they meet the regulatory quality standards.
The management of the accounting function annually breaks down quality targets, namely improving performance and services provided, building its partners’ trust, and increasing the professional standards of all involved.
Because it is listed on the New York Stock Exchange, Orange is subject to the US Sarbanes-Oxley Act. In accordance with the provisions of Article 404 of the Act, the Chairman and Chief Executive Officer and the CEO Delegate must prepare a report, in which they make a statement about the effectiveness of internal controls in the production of the Group’s financial statements, prepared in accordance to IFRS standards, presented in the Annual Report (Form 20-F), that is filed with the Securities and Exchange Commission (SEC) in the United States. The Statutory Auditors make their own internal control evaluation. The Management and Statutory Auditors Reports appear annually in the Annual Report on Form 20-F.
To better meet the requirements of Article 404 of the Act, Orange, under the Group’s Internal Control Department, implements a permanent program to reinforce internal control culture across the entire Group.
By applying standards issued by the SEC, Orange has targeted its internal financial control system on significant risk areas, which has enabled it to be more relevant and more effective and to limit the Group’s assessments to the controls covering these risk areas.
The annual work program, which covers the control environment and operational control, is made up of the following main actions:
■
prescoping: identifying Group Governance Committees, as well as domains relevant to the control environment and grouping consolidated entities into homogeneous groups, in line with the audit of the accounts and according to the work to be done:
■
largest entities: evaluating the control environment and operational control,
■
medium-sized entities: evaluating the control environment;
■
scoping: identifying for each entity control environment domains as well as flows and information systems supporting these flows;
■
defining the system, based on a risk assessment;
■
documenting the segregation of duties and the management of application access rights as well as IT general controls;
ORANGE / 2013 REGISTRATION DOCUMENT - 345
■
evaluating the effectiveness of the internal control system implemented.
As part of the control environment, each domain is steered by a functional entity in charge of the Group’s policies in the area. As part of operational control, the entities conduct a risk assessment of the important flows covering the Group’s main financial data. All this work is scheduled over the year.
The information related to the internal financial control system of Orange is documented in a dedicated information system.
Evaluation of accomplishments in 2013
The internal financial control system is evaluated essentially by the Group’s internal control functions. Any issue is analyzed for its impact, and a corrective action plan is proposed. Furthermore, the Statutory Auditors carry out an independent evaluation of the financial internal control system.
The evaluation for the 2013 financial year did not reveal any major weakness. The Chairman and Chief Executive Officer and the CEO Delegate concluded that the internal control system that applies to the production of financial statements was operationally effective.
Orange has an insurance plan intended to cover its main risks. This plan is subscribed with major players in the insurance and reinsurance market and is made up of several policies. The plan is regularly renegotiated with specialized and qualified intermediaries (brokers) within the scope of tender offers.
The insurance policies reflect the nature of risks to which Orange is exposed and are adjusted in accordance with current offers on the insurance and reinsurance market for international groups of similar size and activity. In addition, the solvency of the players who cover risks and their financial ratings are regularly monitored, as part of contractual provisions specifying the level of rating required to maintain the partnership between insurers and insured.
The dedicated insurance plan for the protection of Orange is part of a policy which relies on an analysis aimed at optimizing the conditions for the transfer of the funding of these risks to the insurance and reinsurance market. It combines the streamlining of coverage management with the corresponding budget control. Actions are also taken to provide insurers and brokers with other types of information in order to round out their assessment of the risks regarding changes in the Group’s business lines and its environment and to continuously ensure that the insurance coverage is in line with the Company’s needs.
The insurance policies that make up the current plan are assigned to the protection of the following risks:
■
risks of damage to property and the consequential financial losses (business interruption);
■
third-party and customer civil liability risks incurred during the management of the Company and the performance of its activities;
■
risks associated with the Company’s vehicle fleets.
Specific programs to provide assistance for employees on business trips or who are expatriated, or site insurance programs covering real-estate or construction projects are included in the Group’s insurance plan.
The total cost of insurance cover provided by the Orange Group program in 2013 amounted to approximately 0.04% of revenues for the financial year.
A proactive insurance policy has led to the gradual integration of the French and international subsidiaries within various corporate insurance policies which cover almost all of the Group’s revenues. These actions take into account changes to the regulatory environment in those regions in which the Group’s assets and activities are located in order to optimize control of the associated risks.
For several years, the risk of damage to the telephone poles and open-wire lines of the fixed-line network due to natural disasters has remained self-insured as no insurance or reinsurance market player covers this risk. The self-insured share is linked to the risk of damage occurring. Since this persistent lack of coverage was observed, the amount of damage that has affected the aerial fixed-line network has not exceeded 11.5 million euros on average over the past ten years. In 2013, an analysis of alternative financing instruments did not demonstrate the relevance of exploring potential financing solutions for these types of risks, in view of the financial cost and damage statistics.
The Group’s process for managing its insurance policies is backed by a risk management system that includes regular visits to the Group’s main sites in France and abroad. These actions significantly enhance insurers’ knowledge of the Group’s risks and contribute to insurance cover negotiations.
The Group Insurance Department, working with the relevant departments, also contributes to documentary prevention actions in accordance with agreements concluded with customers and suppliers.
In addition, through its captive insurance brokerage firm, the Group designs programs to enrich the products and services offered to customers.
ORANGE / 2013 REGISTRATION DOCUMENT - 346
The Group Insurance Department’s management process, which involves various outside parties like consultants and brokers, encompasses the evaluation of internal controls—including the control environment, governance and ethics. Some of these areas have been assessed by the Group’s internal and external auditors to ensure that they comply with internal control procedures.
Against a backdrop of the growing number of laws, regulations and standards, and in view of the Company’s intention to reaffirm its commitment to its values, Orange decided to adopt an integrated and strengthened compliance approach to enhance protection against regulatory, financial and reputational risk.
In December 2013, the Chairman and CEO appointed a new Group Chief Compliance Officer reporting directly to the CEO Delegate. The Chief Compliance Officer is responsible for heading up an organization that guarantees the respect of compliance standards and rolling out of corresponding programs, with a view to continually developing the socially responsible manner in which the Group carries out its activities.
The Group Chief Compliance Officer co-chairs the Ethics Committee as part of his duties to prevent corruption. Issues may be referred directly between the Chairman and Chief Executive Officer and the Chief Compliance Officer.
The appointment reflects the Group’s desire to strengthen anticorruption governance, expanding on the prevention policy and program initiated in 2013.
In addition, the Group created a Group-wide network of Compliance Officers to coordinate compliance missions.
Anti-corruption policy
Orange has defined a proactive strategy to prevent corruption risks and mitigate eventual consequences. On December 21, 2012, the Chairman and Chief Executive Officer announced that the Group was stepping up its approach to preventing corruption with the publication of a policy, approved by the Group Ethics Committee, and a strengthened prevention program rolled out from Q1 2013. There is an established anti-corruption training program for employees which is regularly monitored. The Group’s corruption prevention policy can be consulted at www.orange.com under governance/documentation.
The Group Security Division (DSEC), reporting to the General Secretariat, leads and coordinates actions to continuously improve security throughout the Group.
The Orange Group has drawn up a Global Security Policy to structure the general framework (technical and organizational principles) to be applied and to define the organization, as well as the roles and responsibilities of all involved. The policy aims to improve security in the Company based on risk assessment and management and the mitigation of the impact of incidents and crises. The policy is updated on a regular basis, according to developments in the environment and threat levels.
The Global Security Policy applies throughout the Orange Group. It is designed to support operating activities by early identification and management of risk. In addition, the policy meets the legal and regulatory requirements in all countries in which the Group has a presence.
The concept of “Global security” comprises four dimensions:
■
information security (the security of our products and services and of our immaterial assets);
■
security of physical assets;
■
health and safety of people (customers, employees and other stakeholders);
Security risk mapping, specifying the Group’s priorities and related action plans, is presented annually to the Executive Committee.
Group security policy is monitored and rolled out in all business lines and entities, and security measures are coordinated throughout the scope of the Group.
ORANGE / 2013 REGISTRATION DOCUMENT - 347
[REDACTED SECTION: CERTAIN TEXT THAT FOLLOWS HAS BEEN REDACTED]
General changes in the number of Group employees
The process undertaken by the Group in previous years as part of the “Conquests 2015” five-year business plan continued in 2013.
Meanwhile, the telecommunications market underwent a number of changes, caused mainly by increased competitive and regulatory pressure, technological developments and changing usage patterns.
In this context, the Group saw an overall reduction in its internal workforce of around 5,000 full-time equivalent staff, or -3% (-2.8% in France and -3.3% outside of France), allowing it to adapt to its evolving business needs.
In France, the Group announced its ambition to recruit 4,400 permanent employees over the period 2013-2015, of whom 400 will be recruited as a result of the “generation contract” signed at the end of 2013, with the goal of further strengthening its skills set in very high speed networks and anticipating the impact of demographic changes due to the increase in the number of retirements. This increase began in 2013.
In Poland, the headcount at Orange Polska continued to decrease in 2013 by -1,592 employees on permanent contracts (data on a historical basis) and by -1,989 (on a pro forma basis), i.e. a reduction of 9.2%. The integration of the Network Spzoo subsidiary (+397 permanent employees) was completed in January 2013. The implementation of the social agreement signed early 2012 with the trade unions continued. This agreement combines a voluntary departures plan with an external hiring program for the period 2012-2013.
ORANGE / 2013 REGISTRATION DOCUMENT - 350
In Spain, the overall headcount remained stable in 2013 (3,957 employees on permanent or fixed-term contracts at end-2013, compared with 3,962 at end-2012), with 126 permanent external recruitments and 173 definitive departures of employees on permanent contracts.
Equant pursued its business positioning strategy in emerging countries, especially in India for Global Services and in Egypt, Mauritius and Russia for Sales & Marketing. Overall, Equant’s permanent headcount fell by 274 in 2013 (-2.5%).
Across the AMEA segment (Africa, Middle East and Asia), the number of permanent employees decreased slightly, by -146 (-1.0%), mainly as a result of voluntary departures plans in certain countries (Jordan, Egypt and Congo). Moreover, aside from the effects of a challenging economic climate, some countries in the region (particularly Egypt, Mali and the Central African Republic) experienced political tensions which had a direct impact on business.
In the European segment, the total number of permanent staff decreased by 108 (-1.3%):
■
business growth remains challenging in Romania, in a country hit by the economic crisis. The workforce on permanent contracts rose in 2013, due to in sourcing of activities for other Group entities;
■
in other countries, the crisis, combined with increasingly restrictive regulatory measures (especially in Belgium), led to cuts in the workforce, carried out with the goal of adapting it to changing business conditions;
■
in the Dominican Republic, negotiations on the sale of the business to an external partner were concluded in 2013, which will see this subsidiary removed from the scope of consolidation in 2014.
Number of employees – active employees
at end of period | | 2013 | 2012 | 2012
(pro forma) | 2011 |
Orange SA (1) | | 95,359 | 95,647 | 98,406 | 95,642 |
French subsidiaries (1) | | 6,713 | 9,392 | 6,389 | 9,608 |
France total (2) | | 102,072 | 105,039 | 104,795 | 105,250 |
International subsidiaries (3) | | 63,416 | 65,492 | 65,801 | 66,699 |
GROUP TOTAL | | 165,488 | 170,531 | 170,596 | 171,949 |
(1) Following the fusion of companies Orange, Orange France and Orange Distribution, the staff of Orange France and Orange Distribution (2 759 employees) were integrated into Orange SA respectively on July 1st, 2013 and October 1st, 2013. (2) Scope of financial consolidation: excludes companies with workforces in France but whose revenues are consolidated under “international” business. (3) Scope of financial consolidation: includes companies with workforces in France but whose revenues are consolidated under “international” business. Item reviewed by Deloitte: reasonable assurance. |
Employees by contract type | | 2013 | 2012 | 2012
(pro forma) | 2011 |
Permanent contracts | | 161,932 | 166,944 | 166,866 | 167,704 |
Temporary contracts | | 3,556 | 3,587 | 3,730 | 4,245 |
GROUP TOTAL | | 165,488 | 170,531 | 170,596 | 171,949 |
Item reviewed by Deloitte: reasonable assurance. |
Employees by business line | 2013 | 2012 | 2011 |
Sales & customer services | 48.7% | 49.1% | 48.8% |
Innovation & development | 2.4% | 2.4% | 2.4% |
Management & support | 12.8% | 13.0% | 12.9% |
Content & multimedia production | 0.6% | 0.6% | 0.6% |
IT & Information Systems | 9.1% | 8.8% | 8.4% |
Technical & networks | 24.5% | 24.7% | 24.3% |
Other | 1.9% | 1.4% | 2.6% |
GROUP TOTAL (1) | 100.0% | 100.0% | 100.0% |
(1) The Group’s reporting scope comprises all companies consolidated in the Group’s financial statements. |
Employees by gender | | 2013 | 2012 | 2011 |
Women | | 36.2% | 36.5% | 36.4% |
Men | | 63.8% | 63.5% | 63.6% |
GROUP TOTAL (1) | | 100% | 100% | 100% |
(1) The Group’s reporting scope comprises all companies consolidated in the Group’s financial statements. Item reviewed by Deloitte: reasonable assurance. |
ORANGE / 2013 REGISTRATION DOCUMENT - 351
Employees by age | | 2013 | 2012 | 2011 |
Under 30 | | 11.8% | 12.9% | 14.0% |
Between 30 and 50 | | 52.1% | 52.1% | 53.0% |
Over 50 | | 36.1% | 35.0% | 33.0% |
GROUP TOTAL (1) | | 100% | 100% | 100% |
(1) The Group’s reporting scope comprises all companies consolidated in the Group’s financial statements. Item reviewed by Deloitte: reasonable assurance. |
Employees by geographical region | | 2013 | 2012 | 2011 |
France (1) | | 62.1% | 62.0% | 61.6% |
Spain | | 2.4% | 2.3% | 1.9% |
Poland | | 12.4% | 13.0% | 13.7% |
Africa, Middle East, Asia | | 9.5% | 9.3% | 8.8% |
Europe | | 5.4% | 5.2% | 5.8% |
Orange Business Services | | 7.0% | 7.1% | 7.1% |
Rest of the World | | 1.2% | 1.1% | 1.1% |
GROUP TOTAL (2) | | 100.0% | 100.0% | 100.0% |
(1) Geographical scope: includes French companies with workforces in France but whose revenues are consolidated under “international” business. (2) The Group’s reporting scope comprises all companies consolidated in the Group’s financial statements. Item reviewed by Deloitte: reasonable assurance. |
In France, the most significant effects of changes in the scope of consolidation arose from the removal of Cityvox (-32 permanent employees and -2 employees on fixed-term contracts) and Etrali France (-210 permanent employees).
Outside of France, the Group perimeter increased following the consolidation of Network Spzoo in Poland (+397 permanent employees), the removal from the scope of consolidation of Etrali international (-226 permanent employees and -1 employee on a fixed-term contract) and Orange Luxembourg (-7 permanent employees), and the adjustment of employees on fixed-term contracts at Orange Dominicana at end-2012 (+146 employees on fixed-term contracts).
The decrease in the use of fixed-term contracts (-174 employees on fixed-term contracts on a proforma basis, or -4.7%) was the result of a reduction in France (-286 employees on fixed-term contracts, or -21.1%), which was partly offset by an increase outside of France (+112 permanent employees, or 4.7%), mainly in Europe and AMEA.
Recruitments and departures
Number of permanent external recruitments | | 2013 | 2012 | 2011 |
Orange SA | | 707 | 1,485 | 2,901 |
French subsidiaries | | 541 | 627 | 778 |
France total (1) | | 1,248 | 2,112 | 3,679 |
International subsidiaries (2) | | 4,725 | 6,091 | 6,445 |
GROUP TOTAL | | 5,973 | 8,203 | 10,124 |
(1) Scope of financial consolidation: excludes companies with workforces in France but whose revenues are consolidated under “international” business. (2) Scope of financial consolidation: includes companies with workforces in France but whose revenues are consolidated under “international” business. Item reviewed by Deloitte: reasonable assurance. |
In the France Group (scope of financial consolidation), there were 1,248 external hires in 2013 (1,266 on the geographical scope in France, including the Group’s French-based entities and those whose revenue is recognized under International business).
These recruitments are part of the new three-year plan announced by the Group, consisting of 4,400 recruitments in France over the period 2013-2015. After the completion of the previous program (10,000 recruitments over the period 2011-2013), they allow the Group to continue its efforts to strengthen its skills set in new technologies and anticipate the impact of demographic changes, particularly the projected increase in retirements (around 3,000 in 2013, compared with 900 in 2012).
External recruitments were mainly in networks (maintenance and networks engineering), sales (direct sales) and customer services (advising customers through call centers), business services, innovation, development of IT systems and multimedia.
Outside of France, the decrease in external recruitments (-1,366) was mainly driven by Spain (126 external hires in 2013 compared with 578 in 2012, a decrease of 452). However, the figure for 2012 was unusual, in that it resulted from the consolidation of the new subsidiary Orange Servicios de Telemarketing in Spain.
The downward trend was also seen in other countries and regions: Poland (991 in 2013, 170 fewer than in 2012), AMEA (1,303 in 2013, 40 fewer than in 2012), Europe (877 in 2013, 321 fewer than in 2012) and Equant (963 in 2013, 320 fewer than in 2012). These changes illustrate the efforts made by the entities to improve the management of these flows in order to adapt them to changing business conditions and focus them as a priority on activities directly related to the customer’s satisfaction.
ORANGE / 2013 REGISTRATION DOCUMENT - 352
Number of permanent employee resignations | | 2013 | 2012 | 2011 |
Orange SA | | 216 | 277 | 356 |
French subsidiaries | | 221 | 198 | 215 |
France total (1) | | 437 | 475 | 571 |
International subsidiaries (2) | | 3,129 | 3,413 | 4,014 |
GROUP TOTAL | | 3,566 | 3,888 | 4,585 |
(1) Scope of financial consolidation: excludes companies with workforces in France but whose revenues are consolidated under “international” business. (2) Scope of financial consolidation: includes companies with workforces in France but whose revenues are consolidated under “international” business. Item reviewed by Deloitte: reasonable assurance. |
Number of permanent employee dismissals | | 2013 | 2012 | 2011 |
Orange SA | | 44 | 45 | 48 |
French subsidiaries | | 38 | 28 | 45 |
France total (1) | | 82 | 73 | 93 |
International subsidiaries (2) | | 2,913 | 2,286 | 1,960 |
GROUP TOTAL | | 2,995 | 2,359 | 2,053 |
(1) Scope of financial consolidation: excludes companies with workforces in France but whose revenues are consolidated under “international” business. (2) Scope of financial consolidation: includes companies with workforces in France but whose revenues are consolidated under “international” business. Item reviewed by Deloitte: reasonable assurance. |
11,429 permanent employees left the Group in 2013, compared with 8,539 in 2012, an increase of 33.8%. This acceleration in turnover was seen both in France and internationally. In France, the number of definitive departures doubled, from 1,920 in 2012 to 4,007 in 2013. This increase was due to the increase in retirements as expected, in line with legislative and regulatory changes and with the demographics of the Company. (2,996 retirements in 2013, compared with 882 in 2012). Other departures, such as resignations and redundancies, remained stable overall.
Outside of the France, departures increased to a lesser extent, from 6,619 in 2012 to 7,422 in 2013, or 12.1%.
In Poland, the rise in departures was explained by the implementation of the voluntary departures plan (2,947 departures in 2013, of which 1,704 occurred under the plan). These voluntary departures were implemented in accordance with the commitments undertaken with the trade unions under the social agreement signed in early 2012.
Definitive departures also increased in the AMEA region in 2013 (+210 additional departures, or 16.7%). They included the impact of the voluntary redundancy plans implemented this year in Jordan (98 departures), Egypt (100 departures) and Congo (101 departures).
Definitive departures rose slightly in Europe (+98 additional departures, or 10.1%), due to the acceleration in turnover in some countries affected by the economic crisis, which led to adjustment of resources in line with the changing business conditions.
Professional integration of young people
Professional integration – Group in France | 2013 | 2012 | 2011 |
Number of intern students | 2,873 | 2,600 | 2,917 |
Number of work-based learning contracts signed during the year (1) | 3,362 | 3,491 | 3,106 |
(1) Apprenticeship and professional-track contracts. |
The Orange Group continued its proactive policy to support young people as part of, or in addition to, their initial training.
This commitment was reaffirmed by an agreement signed with the unions in February 2011. Under this agreement, the Group in France will, keep at least 4,500 work-based learning participants and take on around 2,500 interns every year. The integration of these young people into the Group’s priority business lines will also be favored, with at least 1,200 work-based learning participants awarded permanent contracts at the end of their training over the 2011-2013 period.
With more than 5,100 work-based learning contracts in effect as of December 31, 2013 (internships and professional-track contracts), making up 5.0% of the active workforce (the scope of the Group agreement in France), the Group met its targets.
It has exceeded the current legislative and regulatory quota regarding work-based training, which stands at 4% of the average headcount for companies with more than 250 employees.
ORANGE / 2013 REGISTRATION DOCUMENT - 353
In 2013, 254 work-based learning participants were hired on permanent contracts, giving a total of 1,441 over the last three years and exceeding the commitment undertaken by the Group in the agreement signed with the trade unions.
The Group continues to promote integration of young people with large intern programs every year (2,873 in 2013, 2,600 in 2012).
External workforce
Temporary employees – Group France | 2013 | 2012 | 2011 |
Amount of payments made to external companies for employee placement
(in millions of euros) | 30.85 | 24.44 | 34.49 |
Average monthly number of temporary employees (1) | 687.0 | 546.0 | 785.0 |
(1) Calculation of temporary employee expenses posted in Group France’s recorded income. |
Temporary work is used during temporary increases in activity, particularly the launch of new products and services, as well as sales campaigns and promotional offers.
The use of temporary staff is presented in full time equivalents (FTE) and as a monthly average over the year. It rose by 28.0% in France, from 546 FTEs at year-end 2012 to 687 FTEs at year-end 2013. This increase was caused by the Group’s decision to use temporary employees, instead of employees on fixed-term contracts, for assignments shorter than three months. This external labor represents 0.57% of the Group’s total workforce.
It is used mainly in commercial areas, particularly customer services and, to a lesser extent, sales and business services. In networks and information systems, it accounted for only a small volume.
Outsourcing
Outsourcing – Group France | 2013 | 2012 | 2011 |
Amount of subcontractors (in millions of euros) | 1,724.4 | 1,813.0 | 1,802.8 |
Full time equivalent workforce (monthly average) (1) | 24,055 | 25,880 | 26,313 |
(1) Calculation of subcontractor expenses posted in the companies’ corporate accounts under the Group France scope. |
The use of employees belonging to external companies takes the form of service contracts.
In France, it is used in the networks field, in relation to technical work (on networks and on customers’ premises), technical analysis, engineering, architecture and in the information systems area, regarding design, development and integration. It also occurs in call centers and on telephone hotlines in the field of customer relationship management and customer service.
Outsourcing represented 24,055 full-time equivalent staff (monthly average) at year-end 2013, i.e. 20.0% of the total Group France workforce (Orange SA and Group subsidiaries active in France).
This represents decrease in outsourcing (-7.2%) compared with 2012 (25,880 FTEs).
The analysis by domain shows a more contrasted situation, given developments in the business in France in 2013. Outsourcing for customer services in call centers declined overall. The use of external contractors for technical activities remained stable. Outsourcing continued to grow slightly for services to business customers, with the development of global services.
Compensation policy
In its compensation policy, Orange achieves a balance between economic performance and social performance under its Conquests 2015 strategy and People Charter (the social contract in France). Seeking to share value in all countries in which it operates, this policy aims to achieve the goal of becoming a benchmark employer in order to attract and retain the best talent and the skills the Group needs. Compensation policy is part of the Group’s Corporate Social Responsibility. Compensation policy is a fundamental component of management, designed to meet the Group’s strategic objectives and consistent with other HR policies (recruitment, career development, training and working conditions).
ORANGE / 2013 REGISTRATION DOCUMENT - 354
Group guidelines in this area closely mirror local conditions to encourage employees to endeavor individually and collectively to achieve business objectives, through their individual commitment and team spirit (1).
In France, studies carried out by the Internal Remuneration Survey showed consistency in the compensation practices across all of the Group’s companies, and compensation practices in line with the rest of the market.
In order to develop and cement a results-oriented culture, Orange rewards its employees for their contribution and performance through a dynamic compensation policy. In addition to changes in fixed salaries related to employees’ improved expertise in their position or a significant change in responsibilities, bonuses are awarded for achieving individual and group targets:
■
managers, who play a major role in mobilizing their staff, and supervisory staff benefit from variable half-yearly individual bonuses based on achieving the targets of the Group’s major programs and their own personal targets;
■
through corporate incentive agreements and the Group’s profit-sharing agreement in France, all employees receive additional compensation related to performance criteria or outcome.
Compensation - Orange SA | 2013 (1) | 2012 | 2011 |
Gross average monthly compensation (in euros) | 3,642 | 3,558 | 3,460 |
Men | 3,763 | 3,686 | 3,594 |
Women | 3,428 | 3,329 | 3,223 |
(1) The values indicated for 2013 are provisional. |
Incentives and profit-sharing agreements
Incentives
Incentive agreements are signed at individual company level in France and include the Company’s employees in its operating results. In 2013, 30 incentive agreements were signed in the Group’s companies in France. These agreements are based mostly on a financial indicator and operating priorities, including the quality of service provided to customers. When targets are achieved, the percentage of payroll paid out as the incentive bonus is usually around 4%.
Under the terms of the agreement signed in June 2012 with France Telecom SA covering 2012 to 2014, 70% of the incentive bonus is based on achieving an Operating Performance Indicator (OPI) and 30% is based on a Customer Service Quality Indicator.
The OPI is based on growth in sales, control of operating expenses and optimization of investments. It covers the fixed, mobile and Internet businesses on all markets.
The Customer Service Quality Indicator measures customer satisfaction across the value chain and in the consumer, business and key account markets.
For 2012, incentives representing 4.97% of wages, or an average of 2,200 euros, were paid in May 2013.
For 2013, a provision assessing Operating Performance and Service Quality ahead of targets was recognized at December 31, 2013.
(in millions of euros) | 2013 | 2012 | 2011 |
Orange SA incentives | 212 (1) | 204 (2) | 185 |
(1) Amount funded at December 31, 2013. |
Employee profit-sharing
A new employee profit-sharing agreement was signed with the trade unions in June 2013 in France, replacing the previous agreement signed in 1997. This agreement applies to the employees of Orange SA and its majority-owned French subsidiaries. As corporate officers, the Chairman and CEO do not benefit from profit-sharing.
Using a new dispensatory calculation formula, the special profit-sharing reserve of each company is now equal to 4% of its operating income (French standard), and the Group’s profit-sharing reserve amounts to the sum total of the positive special profit-sharing reserves of the companies that are party to the agreement.
The Group’s special profit-sharing reserve is distributed to eligible employees, 20% based on hours worked and 80% in proportion to their annual gross salary. Employees may choose whether their individual amounts are paid to them directly or deposited in a Group Savings Plan.
(1)
In light of the diversity of macro-economic environments and legal frameworks in the countries in which the Group is present, each entity develops a compensation policy appropriate for its specific context; the change in compensation indicator is not calculated for the scope of the Group as a whole.
ORANGE / 2013 REGISTRATION DOCUMENT - 355
The following table shows the amount of profit-sharing distributed over the last three years under the Group profit-sharing agreement.
(in millions of euros) | 2013 | 2012 | 2011 |
Special profit-sharing reserve of the Group | 173 (1) | 144 (2) | 197 |
(1) Amount funded at December 31, 2013, including 167 million euros funded in the Orange SA accounts. |
Share-based compensation
At its meeting on March 5, 2014, the Board of Directors noted that the performance condition under the “Let’s share” plan (the free share award plan for staff members) had not been met.
For further information on this plan, and on stock option plans, see Section 5.3.1 Compensation of directors and corporate officers.
Employee shareholding plan
At its meeting on March 5, 2014, the Board of Directors asked Senior Management to look at implementing an employee shareholding plan with the aim of strengthening the Group’s employee shareholding. This employee shareholding plan would be made available to employees in France under the Group Savings Plan and would only affect shares held in treasury by Orange.
[REDACTED SECTION: CERTAIN TEXT THAT FOLLOWS HAS BEEN REDACTED]
ORANGE / 2013 REGISTRATION DOCUMENT - 356
[REDACTED SECTION: CERTAIN TEXT THAT FOLLOWS HAS BEEN REDACTED]
Orange has taken a proactive approach to managing environmental risks and impacts, helping to preserve the environment and maintain the confidence of its stakeholders.
Initiated in 1996 with the signature of the European Telecommunication Network Operators (ETNO) Environmental Charter, the Group’s environmental policy has developed in three complementary areas:
■
reducing the environmental impact of our own operations, with an emphasis on:
■
reducing greenhouse gases and energy consumption,
ORANGE / 2013 REGISTRATION DOCUMENT - 363
■
monitoring the strategic impact of rare resources and critical materials, as well as the protection of biodiversity,
■
optimizing waste management;
■
reducing the environmental impact of the Group’s products on its customers through eco-design and promoting eco-responsible use;
■
developing innovative products and services enabling businesses and individuals to act responsibly.
More detailed information on these last two priorities is provided in the detailed Corporate Social Responsibility Report.
The Group has defined ambitious objectives for the period 2006-2020 to reduce its own impacts by:
■
reducing CO2 emissions by 20% by 2020 in comparison to the levels observed in 2006;
■
reducing energy consumption by 15% by 2020 in comparison to the levels observed in 2006;
■
producing 25% of energy from solar sources by 2015 for new, solar-compatible mobile sites in the Africa Middle-East and Asia region;
■
raising awareness of all employees on environmental issues by running “green gesture” campaigns in the various countries it operates in;
■
ensuring compliance with the RoHS Directive on hazardous substances for 100% of Group scope by 2015.
Orange has also committed to a robust increase in the collection and recycling of cell phone handsets and aims to increase the collection rate by 50% per year, from a baseline of 6.6% at the end of 2011.
An annually updated environmental roadmap sets out formal action plans for each country in order to meet the objective of significant efficiencies, while responding to the explosion in traffic and uses. The policy is monitored by the Executive Committee according to quarterly targets.
Environmental management system
In order to achieve its targets for reducing environmental impacts and risks the Group has been progressively rolling out ISO 14001 compliant Environmental Management Systems (EMS) in its main countries of operation. The ISO 14001 standard describes how companies should organize themselves to manage the environmental impact of their activities.
The Group’s certification rate was 35% at the end of 2013, tripling in five years. Action plans were introduced to increase the ISO 14001 certification to 60% in 2015.
The Group targets we set in 2012, gradually increasing the coverage rate of ISO 14001 certified activities from 20% to 60% in four years, were confirmed, but were delayed by six months owing to the reorganization of the EMS in France (40% in mid-2014, 50% in mid-2015 and in 60% in mid-2016).
Subsidiaries in countries in which the Group is present, which are either already ISO 14001 certified or in the process of establishing a management system compliant with this standard, now account for 90% of the Group’s revenues.
| | 2013 | 2012 | 2011 |
Proportion of scope certified | | 35% | 34% | 25% |
Item reviewed by Deloitte: reasonable assurance. |
Subsidiary | Scope |
Orange Poland | Mobile activities |
Orange Spain | All activities and sites (except the new data center established in July 2012) |
Orange Slovakia | All activities |
Mobinil (Egypt) | All activities |
Orange Marine | All installations and vessels |
Orange France | 6 business line processes and 12 priority sites |
Orange Moldova | All activities |
Orange Mali | All activities |
Orange Business Services | Cesson-Sévigné site, Cairo, and its main Parisian site, Orange Stadium |
Orange Romania | All activities |
Orange Senegal | All network technical sites |
ORANGE / 2013 REGISTRATION DOCUMENT - 364
Awareness-raising and training for people involved
Training and information is given to employees at several levels by the Group Environmental Department for local correspondents and by internal communications for other employees.
Initiatives for awareness raising and discussion thus encourage each employee to include the objectives of responsible growth in their daily activities. Particular emphasis is placed on raising the awareness of management, which play a key role as intermediaries to their teams. Dedicated training courses are delivered regularly.
An Orange Expert Community that brings together all Group experts on environmental issues was formed in 2012 as a forum for dialogue and sharing best practices and to develop professional skills on environmental challenges.
Environmental risk prevention
The Orange Group believes that its activities as a telecommunications operator do not pose a serious threat to the environment. The Group’s activities do not entail production processes with a severe impact on scarce or non-renewable resources, natural resources (water, air) or to biodiversity and, generally, do not pose lethal risks.
In Europe, Orange is not subject to authorization for its activities under the IPPC Directive (2001/78). However, the Orange Group uses certain equipment, products and substances that may be hazardous to the environment (even slightly), some of which are subject to specific regulations. This is the case for facilities classified for the protection of the environment (ICPE) in France.
These facilities are the subject of ongoing in-depth analyses by the Orange Group and have led to the adoption of action plans and prevention programs, as well as periodic inspections as required under French regulations.
In order to prevent health-related risks (legionellosis) and reduce water consumption, a major program to replace cooling towers with dry cooler systems has been ongoing since 2006.
Indicators | 2013 | 2012 | 2011 |
Number of sites including Classified Facilities (ICPE A or D) in France | 358 | 494 | 536 |
Number of water cooling towers in France | 23 | 25 | 24 |
Hazardous substances
Some facilities use regulated products or substances. These are chlorofluorocarbon or CFC gases or other refrigerants (more specifically HCFCs or HFCs) contained in air-conditioning installations.
Programs to eliminate the use of halon and replace it with less environmentally damaging FM 200 or FE 13 fire extinguishing gases or even inert Nitrogen or INERGEN gases in sprinkler systems have been in place since the end of 2003, in accordance with regulations.
Since 2012, the Group eliminated all electrical transformers containing polychlorinated biphenyls (PCBs), in line with French and European law.
Under the European REACH Regulation (Registration – Evaluation – Authorization and Restriction of Chemicals), the Group has undertaken to inform its customers of the presence of hazardous substances as defined by regulations. Appropriate procedures are being rolled out.
Provisions for environmental risk
Consistent with the explanation of environmental risks above, no provision for environmental risk has been made. However, provisions have been made for decommissioning and rehabilitating sites.
The obligation to decommission and rehabilitate sites is measured on the basis of:
■
dismantling costs (on a per-unit basis for telephone poles, terminals, and public phones, per site for cell phone antennae) incurred by Orange to meet its environmental commitments;
■
annual scheduled asset returns for telephone poles and public telephones;
■
estimated site closures for cell phone antennae.
These dismantling costs are calculated on the basis of the identified costs for the current financial year, extrapolated for future years using the best estimate (of future trends in prices, inflation, etc.), and are up-dated at a risk-free rate. Forecasts of estimated site departures or asset returns are revised in light of future changes in regulations or technological requirements.
In the Group’s financial statements for the year ending December 31, 2013, the provision for decommissioning and rehabilitating of sites mainly comprised the costs of:
■
rehabilitating sites of cell phone antennae at a cost of 395 million euros (including 225 million euros for Orange SA);
■
dismantling telephone poles at a cost of 136 million euros (including 103 million euros for Orange SA);
ORANGE / 2013 REGISTRATION DOCUMENT - 365
■
management of electrical and electronic equipment waste at a cost of 111 million euros (including 65 million euros for Orange SA);
■
dismantling public phones at a cost of 45 million euros (including 41 million euros for Orange SA).
Adapting to climate change
As a telecoms operator, Orange has no specific problems associated with climate change impacts, other than changes related to risks such as earthquakes and severe weather risks (floods, etc.). These risks are anticipated and wherever possible, buried cable solutions are developed.
Machine to Machine (M2M) technology developed by the Group provides warnings in the event of rising river water levels or flooding.
The Orange Group has committed to reducing its greenhouse gas emissions by 20% by 2020, and its energy consumption by 15%, based on 2006 figures:
■
by reducing energy consumption in its networks, information systems and buildings;
■
by reducing CO2 emissions related to its vehicle fleet and to business travel;
■
by increasing the share of renewable energy.
This commitment has resulted in the implementation of highly proactive action plans for making large savings designed to offset the impact of the increase in customer numbers and of new services.
The 2010 “Bilan Carbone®” assessment (carbon inventory, as per ADEME (the French Environment and Energy Management Agency) methodology) carried out on the Group’s activities in France and Belgium revealed ways to refine these action plans by identifying the main sources of emissions and carrying out impact assessments on the solutions available to cut the Group’s carbon footprint. The program continued in 2012 with carbon assessment in Spain and the start of another one in Poland.
In France, the Group published the report on its obligations pursuant to Article 75 of the Grenelle II environmental law on greenhouse gas emissions.
Network energy consumption
“Green ITN 2020”
A massive energy action plan was undertaken in 2008/2009 to reduce energy consumption related to the operation of networks and information systems, which account for two-thirds of the Group’s total consumption. This “Green ITN 2020” plan prioritizes the areas listed below.
At end-2013 it had been rolled out in 22 countries, representing more than 95% of the energy consumption by the Group’s networks and information systems. Several hundred GWhs have already been saved since 2009 by seven to eight countries, accounting for over 80% of the energy consumption of the Group’s networks and information systems.
Optimized ventilation to improve air conditioning
Optimized ventilation is a highly efficient air-conditioning system, delivering up to 80% energy savings, compared with traditional air-conditioning systems, while also eliminating the use of harmful refrigerants.
Optimization of data centers
Data centers (centers hosting IT servers) account for 10% of the Group’s energy consumption and 13% of network energy consumption.
The “Green data centers” project was initiated in 2007 to reduce energy consumption by improving the technical environment in the centers (with more efficient electrical equipment and optimized air circulation), replacing old servers with new ones that deliver up to four times the processing capacity of previous models, rationalizing information systems and virtualizing servers (concentrating a number of applications on one physical server).
Use of renewable energies
Orange’s track record in researching applications of renewables in its business dates back over 30 years. Its efforts are currently concentrated on powering cell phone radio stations in Africa and Southern Europe with solar energy. At year-end 2013, more than 2,300 solar base stations were installed in 19 countries, mainly in Africa. They generate over 15 GWh of solar power every year, saving the equivalent of 28 million liters of fuel oil and preventing the emission of 76,000 metric tons of CO2. Around 250 of these sites have been transferred to Tower Companies as part of the program to share our passive radio site infrastructures with other operators in the AMEA region.
Improving the energy efficiency of network equipment and infrastructures
Programs to replace older-generation equipment with more energy-efficient versions have been carried out for several years.
“Low-energy” functionalities are also gradually being introduced into the Group’s network equipment.
In addition, network infrastructures sharing is being developed in some of the Group’s major countries, which helps reduce energy consumption.
In order to develop new drivers of energy transition, Orange has undertaken innovation projects with its main suppliers aimed at creating telecommunications equipment that uses much less energy than the present generation. An initial partnership agreement with one of its suppliers, the first of its kind in the world, was signed in December 2013.
ORANGE / 2013 REGISTRATION DOCUMENT - 366
Tighter monitoring of energy consumption
Installation of smart meters
Starting in 2009, smart electrical meters have been gradually rolled out at the Group’s technical sites to provide more reliable measurements of energy consumption. The installation of these measuring systems continued in 2013, mainly in the Europe and AMEA regions, and around 1,000 sites have now been equipped.
Bilans Carbone® (Carbon inventory)
Orange was the first telecoms operator to assess the direct and indirect greenhouse gas emissions generated by its activities worldwide over the entire life cycle of its products and services, using the Bilan Carbone® (Carbon Assessment) tool developed by the French Environment and Energy Management Agency (ADEME). Following the 2010 assessments in France and Belgium another one was conducted in Spain in 2012. In addition to the Group’s direct carbon footprint (emissions from energy in buildings, vehicle fuel, network electricity), this method also identifies other upstream and downstream sources of CO2 emissions. These assessments substantially contributed to the action plans described above.
Reducing emissions from buildings
Buildings account for almost 10% of the Group’s energy consumption.
Under the auspices of the Group Real Estate Department (DIG), a group of countries which together account for more than 85% of the Group’s electricity consumption, implemented action plans.
The Energy Action Plan in France covers all building technical aspects, including heating, air conditioning, ventilation, lighting and plumbing. The installation of meters in the buildings was extended to 80 of the largest service sites (compared with 60 at end-2012), covering more than 900,000 sq.m. A facility performance assessment process was deployed to 94 buildings (261,000 sq.m.) and identified 630 actions in 2013, giving potential savings of 375,000 euros.
In 2013, following a pilot scheme in Slovakia, the countries in the Europe region undertook to roll out a tool in 2014 that will accurately measure the energy consumption of all data center and office equipment (i.e. 100,000 items of equipment generating consumption of around 50 GWh per year across the region). The implementation of this tool will help make the measurements more reliable, reduce wastage, optimize usage and identify changes that can reduce energy consumption in the field of information systems. A minimum saving of 4 GWh per year is estimated for the period 2014-2016.
Reducing transport emissions
The Group has a fleet of over 35,000 company vehicles in Europe and Africa, accounting for nearly 9% of its total CO2 emissions. The overall objective is to move towards average emissions of 130 g of CO2 per kilometer. In France, the average level of CO2 emissions for private cars is 108 g.
Several Group companies have introduced schemes to limit the use of private cars (company travel plans, carpooling, car-sharing, eco-driving training courses with 2,500 employees trained every year, etc.).
Employees have solutions allowing them to reduce business travel (videoconferencing, teleconferencing, collaborative remote working tools, etc.). Numerous telepresence rooms are available to staff in several countries.
Orange focuses on two major waste management issues:
■
optimizing the management of waste and end-of-life equipment generated internally, by implementing treatment processes suited to each category of waste and ensuring that they are traceable from end-to-end;
■
collecting and treating, with approved external partners or through joint channels, sold equipment nearing the end of its life, focusing in particular on the collection and recycling of mobile handsets;
As well as reducing its direct and indirect environmental impacts, the Group’s goal is to promote the development of new circular economy models. Naturally, this means that recycling must be developed, with suitable systems in countries that do not yet have structured waste treatment processes;
The Orange Group also plays an active role in international initiatives addressing the management of electronic waste in Africa, including those of the UN Environment Program (UNEP) and the International Telecommunication Union (ITU), to promote local collection and treatment solutions.
Optimization of treatment processes
Guidelines defined in 2007 structure the implementation of appropriate processes for handling each category of waste in each country, according to three main principles:
■
measure the quantities of waste generated by activities, drawing up inventories for each country based on the Group’s classifications;
■
ensure the waste goes through appropriate treatment processes taking into account the local environment;
■
ensure traceability of the source of this waste by progressively mapping the treatment processes in all countries.
Audits of WEEE (waste electrical and electronic equipment) processing channels, including network, IT, consumer and business customer equipment, were conducted in a number of European countries and demonstrated a high level of compliance with the WEEE Directive. Audits are being extended to countries in the AMEA region, in accordance with their regulatory frameworks;
ORANGE / 2013 REGISTRATION DOCUMENT - 367
Other waste, and especially hazardous waste (such as batteries and wooden poles) are processed through dedicated collection and recycling systems.
Teams trained to meet the challenges of end-of-life equipment
In 2013, more than 800 employees of Orange Business Services and Orange France took part in training aimed at helping the teams satisfy their customers’ environmental needs more effectively, in particular with regard to the end-of-life treatment of electronic equipment. This initiative was carried out in conjunction with the process for bringing the Group into compliance with new requirements concerning the management of professional WEEE, both for WEEE collected from business customers and that generated through upgrades to fixed-line and mobile networks (see 2013 data sheet below).
Increasing collection and recycling of cell phones
To reduce the impact of electronic waste on the environment, Orange strives to ensure devices are re-used or are dismantled for recycling, in accordance with environmental standards in force. The collection rate increased from 6.6% in 2011 to 11.6% in 2013. The Group is engaged in a proactive policy to meet its objective, conducting regular customer awareness campaigns and offering financial incentives in practically all the Group’s European entities.
Since 2010, Orange has teamed up with Emmaus International and Ateliers du Bocage, a company in the sheltered employment sector, to open cell phone collection and processing centers in Africa. Five centers have been opened, in Burkina Faso, Niger, Benin, Madagascar and Ivory Coast. The waste is sorted before being shipped to France and sent for recycling in Europe. Between 2010 and 2013, more than 120 metric tons of waste had been collected and 30 jobs created.
Given the nature of its business, the Orange Group has a limited impact on biodiversity, compared with industrial companies. Nonetheless, it is engaged in a range of environmental policy initiatives to reduce its internal impacts and to protect biodiversity, partnering NGOs such as the French bird protection association, the Ligue de protection des oiseaux (LPO) and the WWF.
Use of rare and critical resources
In addition to its commitment to environmentally responsible practices, the Group is aware that the protection of biodiversity is crucial for ensuring the long-term sustainability of its activities. Since 2011, Orange has applied a process aimed at taking into account issues associated with the rare and critical resources used in the Group’s products. A database, updated regularly and containing data sheets on each material, serves as the basis for carrying out risk analyses and seeking alternative resources. Discussions are held with suppliers to encourage them to limit the use of these resources and favor alternative and recycled resources.
Orange believes that the issue is about more than its own CSR policy and represents a major opportunity to create long-term jobs and protect the environment. For this reason, the Group has opened discussions with industrial operators in various sectors and public authorities to support the development of efficient channels to exploit the vast reserves of rare resources contained within WEEE - true “urban mines” that may contain up to 40 times more recoverable minerals than there are underground! As well as being economically advantageous, recycling the rare resources contained within electronic equipment would also ensure better preservation of ecosystems, given that the mining of rare metals is particularly harmful to biodiversity.
Impact on fauna and flora
In France, Orange has worked with the LPO in the framework of regional agreements for several years, placing caps on metal telephone poles and protecting cavernicolous species. 93% of metal poles in France have been capped.
Soil use
The Group does not extend its control to the soil, except for the buildings in which it operates (offices and data centers).
Incorporation of nuisance specific to the activities of a telecoms operator
Radio cell phone antennae can sometimes be visually challenging. In some countries (France and Egypt, amongst others), the Group has undertaken to integrate a number of the antennae into the environment and landscape by adapting them to the local context (painting, incorporation in buildings, etc.).
Paper consumption
For several years Orange has implemented programs to reduce paper consumption and to use FSC and/or recycled paper.
100% of sales documentation and 94% of office paper is printed on FSC and/or recycled paper in France, while 99.5% of paper purchased in Spain is either certified or recycled.
ORANGE / 2013 REGISTRATION DOCUMENT - 368
Water consumption
The Group began an assessment of its impact with regard to the consumption and supply of water. The current reporting criteria and systems do not allow reliable consolidated data to be produced concerning water consumption.
Releases into the air, soil and water
The only other substances released into the environment, with the exception of CO2 emissions, concern HCFCs used in cooling systems. Whenever possible, HCFCs are replaced with HFCs and systems such as optimized ventilation and free cooling are used to reduce consumption of air conditioners.
ORANGE / 2013 REGISTRATION DOCUMENT - 369
| | 2013 | Recap 2012 | Recap 2011 |
Environmental performance (energy) | Units | France (1) | Rest of the World | | Group values | Group values | Group values |
Facilities presenting a risk | | | | | | | |
Fuel tanks | units | 2,391 | 6,149 | | 8,540 | 7,901 | 5,666 |
Energy consumption - Scope 1 | | | | | | | |
Fuel oil (all buildings and all uses) | m3 | 13,532 | 74,594 | | 88,126 | 88,841 | 77,798 |
Gas | m3 | 15,915,478 | 3,735,098 | | 19,650,576 | 22,503,710 | 21,662,486 |
Coal | metric tons | na | 86 | | 86 | 100 | 87 |
Gasoline-LPG for company cars | liters | 27,486 | 3,883,428 | | 3,910,914 | 5,165,407 | 5,885,434 |
Diesel for company vehicles | liters | 27,682,945 | 14,332,929 | | 42,015,874 | 45,217,595 | 42,733,872 |
Total energy Scope 1 | GWh | 601 | 1,083 | | 1,684 | 1,766 | 1,610 |
CO2 emissions from fuel, gas and coal | metric tons of CO2 | 69,058 | 207,336 | | 276,394 | 284,149 | 253,491 |
CO2 emissions from vehicles | metric tons of CO2 | 76,194 | 48,658 | | 124,852 | 136,642 | 131,524 |
Scope 1 CO2 emissions (energy only) | metric tons of CO2 | 145,252 | 255,994 | | 401,246 | 420,791 | 385,015 |
Greenhouse gas CO2 emissions | metric tons CO2-eq | 2,136 | 14,644 | | 16,780 | 24,633 | 7,536 |
Scope 1 CO2 emissions | metric tons of CO2 | 147,388 | 270,638 | | 418,026 | 445,424 | 392,551 |
Energy consumption - Scope 2 | | | | | | | |
Electricity | GWh | 2,315 | 1,999 | | 4,314 | 4,169 | 3,984 |
incl. green energy | GWh | - | 179 | | 179 | 124 | 123 |
Scope 2 CO2 emissions | metric tons of CO2 | 138,901 | 901,343 | | 1,040,244 | 1,024,182 | 930,592 |
Total CO2 emission (Scope 1 + 2) | metric tons of CO2 | 286,289 | 1,171,981 | | 1,458,270 | 1,469,605 | 1,323,143 |
Energy consumption - Scope 3 | | | | | | | |
Flight distance for business trips | km | 155,158,114 | 88,296,247 | | 243,454,361 | 277,542,729 | 290,385,071 |
Train distances for business trips | km | 88,757,316 | 12,198,503 | | 100,955,819 | 112,256,755 | 113,164,635 |
Scope 3 CO2 emissions | metric tons of CO2 | 28,772 | 16,903 | | 45,675 | 52,076 | 54,139 |
Total CO2 emissions (Scope 1 + 2 + 3) | metric tons of CO2 | 315,061 | 1,188,884 | | 1,503,945 | 1,521,681 | 1,377,282 |
Environmental performance (waste) | | | | | | | |
Paper and cardboard: internal (office) and external (marketing, billing, directories, packaging, etc.) | metric tons | 10,371 | 6,188 | | 16,559 | 20,199 | 23,215 |
Internal evacuated waste | | | | | | | |
Internal WEEE (network and services) | metric tons | 982 | 1,878 | | 2,860 | 3,204 | 2,273 |
Recovery rate | % | 90% | 69% | | 76% | 92% | na |
Metal poles | metric tons | 1,318 | 53 | | 1,371 | 1,259 | 1,153 |
Recovery rate | % | 100% | 100% | | 100% | 100% | na |
Wooden poles | metric tons | 15,546 | 72 | | 15,618 | 14,329 | 11,903 |
Recovery rate | % | 100% | 44% | | 100% | 100% | na |
Cables | metric tons | 18,398 | 582 | | 18,980 | 16,329 | 8,968 |
Recovery rate | % | 78% | 89% | | 79% | 76% | na |
Batteries | metric tons | 1,341 | 1,598 | | 2,939 | 1,942 | 2,402 |
Recovery rate | % | 85% | 96% | | 91% | 87% | na |
Paper and cardboard | metric tons | 2,635 | 376 | | 3,011 | 3,180 | 3,482 |
Recovery rate | % | 100% | 96% | | 99% | 95% | na |
Other hazardous waste (PCB – printer cartridges – fluorescent tubes included) | metric tons | 462 | 37 | | 499 | 654 | 379 |
Recovery rate | % | 22% | 100% | | 28% | 21% | na |
Other non-hazardous waste | metric tons | 1,197 | 1,202 | | 2,399 | 1,007 | 1,052 |
Recovery rate (%) | % | 67% | 53% | | 60% | 58% | na |
Total internal evacuated waste | metric tons | 41,878 | 5,798 | | 47,676 | 41,903 | 31,613 |
Recovery rate (%) | % | 88% | 77% | | 87% | 87% | na |
Customer WEEE collected
(incl. batteries and rechargeable cells) | metric tons | 2,425 | 380 | | 2,805 | 2,416 | 3,121 |
Recovery rate (%) | % | 83% | 20% | | 75% | 78% | na |
nc: not communicated. na: not applicable. (1) The France scope covers Orange France, the Group’s headquarters, Orange Marine and Orange Business Services operating in French territory. Item reviewed by Deloitte: reasonable assurance. |
ORANGE / 2013 REGISTRATION DOCUMENT - 370
Note on methodology
Environmental reporting is based on the Indicia reporting tool. Only those countries consolidated in the Annual Report contributed to CSR reporting. There were no changes in the scope of consolidation compared with 2012.
The environmental data reporting process is based on quarterly reporting campaigns. The values for the fourth quarter are theoretically estimated by each country and adjusted the following year. The adjustments for 2012 were thus applied in the first quarter of 2013. The fourth quarter of 2013 has therefore been estimated, except for three countries in which the actual data is presented (France, Slovakia and Armenia). The application of the environmental indicator estimation methods at year-end on December 31 creates uncertainties regarding the consolidated annual data that do not exceed 5% of the value of each indicator.
The “fuel oil consumption (all buildings and all uses)” indicator comprises consumption (excluding vehicles) of domestic fuel oil, diesel and gasoline, as well as marine heavy fuel oil and diesel for Orange Marine’s fleet.
More than 80% of the data for train and air travel was provided by Carlson Wagon Lits, which measures the mileage traveled by employees. Distances traveled are estimated using the route orthodromique. Average CO2 emission rates for all air travel were calculated according to the GHG Protocol (180 g CO2/km passenger), and according to the “Bilan Carbone”™ for train travel, (100 g CO2/km passenger when information was not available). Local travel agencies, besides Carlson Wagon Lits, that provided reporting data are also taken into consideration, as well as the travel undertaken by families of expatriate employees.
The 2012 version of the GHG Protocol was used to calculate CO2 emissions for electricity, except for France, for which a revised estimate provided by the ADEME (60 g CO2/kWh) was used.
The reporting of refrigerant emissions, which are included in Scope 1 CO2 emissions, is not yet exhaustive. The Group is working on improving the monitoring of these emissions.
Reporting on waste incorporates the concept of Evacuated waste (i.e. waste that is no longer stored in the Group’s sites or under its direct control, but which has been disposed of to a service provider or an external body, with or without a related financial transaction), and Recovered waste (i.e. waste that has been recovered through re-use, material recovery or energy recovery.
Non-hazardous waste has not been included since 2012. Similarly, since 2012, fluorescent bulbs, PCB and printer cartridge waste has been accounted for under “Other hazardous waste”. In the AMEA region, owing to the ongoing efforts to identify and secure the waste collection and treatment channels, the reporting process is not exhaustive.
The “Size of ISO 14001 certified sites or activities” indicator in the Environmental Management System (EMS) is calculated based on the ratio of energy consumption of the scope covered by the ISO 14001 certification and total electricity consumption, except for France, for which the indicator is calculated based on the ratio of the number of employees covered by the certification and the total number of employees.
The monitoring of OBS indicators is limited to 11 countries of the 200 in which it operates. These 11 countries accounted for around 70.1% of the workforce at end-2013. A large part of the reporting, mainly concerning waste, is handled centrally rather than locally. Accordingly, some data may not represent the country’s actual values in full.
The Group also initiated an assessment of its impact with regard to the consumption and supply of water. The current reporting criteria and systems do not allow reliable consolidated data to be produced concerning water consumption.
[REDACTED SECTION: CERTAIN TEXT THAT FOLLOWS HAS BEEN REDACTED]
ORANGE / 2013 REGISTRATION DOCUMENT - 371
The Shareholders’ Meeting of May 28, 2013 renewed the share buyback program for 18 months with a limit of 10% of the share capital outstanding at the time of the Meeting. The Board Meeting held on March 26, 2014 decided to submit to the Shareholders’ Meeting of May 27, 2014 the renewal of this authorization under the same conditions.
A description of the program for 2014 appears in the report by the Board of Directors on the eleventh resolution submitted to the Shareholders’ Meeting of May 27, 2014 (see Section 6.4 Report of the Board of Directors’ on the resolutions).
In addition, the liquidity contract for its shares entered into by Orange on May 9, 2007 with an investment services provider was renewed on its anniversary date and is still ongoing. The initial resources allocated to the liquidity account amounted to 100 million euros. At December 31, 2013 this totaled 34.7 million euros.
The only shares bought back by Orange during 2013 were shares bought back as part of the liquidity contract.
OBJECTIVE OF
THE PURCHASES | Number of shares held at
12/31/2012 | Number of shares purchased | Gross weighted average price (in euros) | Number of shares sold | Gross weighted average price (in euros) | Number of shares held at
12/31/2013 | % capital |
Free share plan (1) | 13,246,540 | 0 | NA | 0 | NA | 13,242,435 (2) | 0.50% |
Stock options | 2,099,701 | 0 | NA | 0 | NA | 2,099,701 | 0.08% |
Liquidity contract | 6,135,000 | 45,308,442 | 8.76 | 43,418,442 | 8.60 | 8,025,000 | 0.30% |
TOTAL | 21,481,241 | 45,308,442 | | 43,418,442 | | 23,367,136 | 0.88% |
(2) 4,105 shares were allocated to the heirs of beneficiaries who died during the financial year pursuant to article L. 225-197-3 of the French Commercial Code. |
| December 31, 2013 | December 31, 2012 | December 31, 2011 |
Number
of shares | Holder | % of
the share capital | % of voting rights | Number
of shares | % of
the share capital | % of voting rights | Number
of shares | % of
the share capital | % of voting rights |
357,526,131 | Bpifrance Participations (1) | 13.50% | 13.62% | 357,526,131 | 13.50% | 13.61% | 357,526,131 | 13.50% | 13.58% |
356,194,433 | French government | 13.45% | 13.57% | 356,194,433 | 13.45% | 13.56% | 356,194,433 | 13.45% | 13.53% |
713,720,564 | Total Public Sector | 26.94% | 27.18% | 713,720,564 | 26.94% | 27.16% | 713,720,564 | 26.94% | 27.10% |
122,606,645 | Group Employees (2) | 4.63% | 4.67% | 122,529,706 | 4.63% | 4.66% | 127,437,554 | 4.81% | 4.84% |
23,367,136 | Treasury shares | 0.88% | 0.00% | 21,481,241 | 0.81% | - | 15,456,045 | 0.58% | - |
1,789,191,038 | Float | 67.55% | 68.15% | 1,791,153,872 | 67.62% | 68.17% | 1,792,271,220 | 67.66% | 68.00% |
2,648,885,383 | TOTAL | 100% | 100% | 2,648,885,383 | 100% | 100% | 2,648,885,383 | 100% | 100% |
(1) Public financing and investment group for companies, resulting from the merger of OSEO, CDC Entreprises, FSI and FSI Régions. (2) Includes shares held as part of a Group savings plan and those held following free share awards (see Section 5.6.2 Compensation); does not include bearer shares. |
To Orange’s knowledge, no shareholder other than the French State and Bpifrance Participations holds, directly or indirectly, more than 5% of the capital or voting rights on the date of this document.
Orange SA’s Bylaws do not provide for double voting rights. The major shareholders do not have different voting rights than other shareholders.
ORANGE / 2013 REGISTRATION DOCUMENT - 383
To Orange’s knowledge, the substantial changes in the shareholder base since January 1, 2011 result from the Company’s buyback of 23.4 million shares as part of the buyback program authorized by the Shareholders’ Meeting, to meet its obligations under its free share award and stock option plans or as part of the liquidity contract.
To Orange’s knowledge, there has been no major change in the distribution of the share capital and voting rights since December 31, 2013.
By letter received on December 27, 2012, the Autorité des Marchés Financiers was notified of the execution, on December 24, 2012, of a shareholders’ agreement between FSI and the French Republic to act jointly. This agreement replaces the previous shareholders’ agreement signed between the same parties on November 25, 2009. In July 2013, following the merger of OSEO, CDC Entreprises, FSI and FSI Régions within Bpifrance, the company name of FSI was changed to Bpifrance Participations.
The shareholders’ agreement stipulates that the parties agree to discuss and do their utmost to come to a shared position on resolutions voted by the Shareholders’ Meeting, without however being obliged to reach an agreement.
In the event of planned transactions involving shares and the crossing of thresholds, the agreement provides for:
■
a general information obligation between the parties before entering into any transaction involving the shares or voting rights of Orange SA;
■
an obligation to consult each other prior to:
■
an impending plan by the parties to dispose of shares, under which each party undertakes not to carry out such plans without having, to the extent possible, aligned its analysis regarding the value of Orange SA shares with the other party’s, and having coordinated, if possible, the practical details of the sale of said shares,
■
either party carrying out a transaction which would result in the parties exceeding an interest threshold likely to trigger an obligation to declare their intentions to Orange SA or the Autorité des Marchés Financiers;
■
an obligation to secure the prior approval by the other party if the transaction planned by one party would result in both parties jointly crossing a threshold which would trigger a mandatory public offering.
The agreement is concluded for two years, and can be extended by tacit renewal for two year periods.
Orange regularly identifies its shareholders via the “Identifiable Bearer Shares” (IBS) service. At December 31, 2013, institutional and other corporate investors held 60.7% of the share capital and individual investors 6.9%, almost the same as the previous year.
France: | 25% |
United Kingdom: | 15% |
Other European countries: | 25% |
EUROPE TOTAL: | 65% |
North America: | 27% |
Rest of the World: | 8% |
TOTAL | 100% |
Sources: IBS survey and analysis by Nasdaq OMX. |
ORANGE / 2013 REGISTRATION DOCUMENT - 384
As of the date of the present document, the public sector (the French State and Bpifrance Participations) has three representatives out of a total of 15 members of the Orange Board of Directors (see Section 5.1.1 Board of Directors).
The French Republic, in conjunction with Bpifrance Participations (see Section 6.2.1.3 Information on shareholders’ agreements), could, in practice, given the low attendance rate at Shareholders’ Meetings and the absence of other major shareholder blocks, determine the outcome of shareholder votes on issues that require a simple majority. Orange does not believe there is any risk of the State’s control being exercised in an improper way.
Excluding the French State and Bpifrance Participations, no individual or legal entity, directly or indirectly, alone, jointly or in concert, exercises or can exercise control over Orange.
To the best of Orange’s knowledge, there is no agreement which, if implemented, could, at a later date, entail a change in its control.
[REDACTED SECTION: CERTAIN TEXT THAT FOLLOWS HAS BEEN REDACTED]
ORANGE / 2013 REGISTRATION DOCUMENT - 385
[REDACTED SECTION: CERTAIN TEXT THAT FOLLOWS HAS BEEN REDACTED]
The Company’s corporate purpose, in France and abroad, specifically pursuant to the French Postal & Telecommunications Code, shall be:
■
to provide all electronic communication services in internal and international relations;
■
to carry out activities related to public service and, in particular, to provide, where applicable, a universal telecommunications service and other mandatory services;
■
to establish, develop and operate all electronic communications networks open to the public necessary for providing said services and to interconnect the same with other French and foreign networks open to the public;
■
to provide all other services, facilities, handset equipment, electronic communications networks, and to establish and operate all networks distributing audiovisual services, and especially radio, television and multimedia broadcasting services;
■
to set up, acquire, rent or manage all real estate or other assets and businesses, to lease, install and operate all structures, businesses, factories and workshops related to any of the purposes defined above;
ORANGE / 2013 REGISTRATION DOCUMENT - 403
■
to obtain, acquire, operate or transfer all processes and patents related to any of the purposes defined above;
■
to participate directly or indirectly in all transactions that may be related to any of the purposes defined above, through the creation of new companies or enterprises, the contribution, subscription or purchase of securities or corporate rights, acquisitions of interests, mergers, partnerships, or any other means; and
■
more generally, all industrial, commercial, Company and financial transactions, or transactions involving movable or fixed assets, that may be related directly or indirectly, in whole or in part, to any of the aforementioned corporate purposes, or to any similar or related purposes, or to any and all purposes that may enhance or develop the Company’s business.
Orange has only issued ordinary shares. Each share shall entitle its holder to a portion of the corporate profits and assets proportional to the amount of capital represented thereby. Furthermore, each share shall entitle its holder to vote and be represented in the Shareholders’ Meetings in accordance with provisions of the law and of the Bylaws. Ownership of one share implies, ipso jure, adherence to the Bylaws and the decisions of the Shareholders’ Meeting.
There is no clause in the Bylaws providing for double or multiple voting rights.
The shareholders shall be liable for losses within the limits of their contributions to the Company’s capital.
Payment of dividends
The terms and conditions for the payment of the dividends approved by the Shareholders’ Meeting are determined by the Shareholders’ Meeting, or in lieu, by the Board of Directors. However, cash dividends must be paid within a maximum of nine months after the close of the fiscal year, unless extended by court order. The Ordinary Shareholders’ Meeting may grant each shareholder, for all or part of the dividends to be distributed, an option between payment of the dividends in cash or in shares, subject to legal requirements.
Interim dividends may be distributed before the approval of the financial statements for the year when the balance sheet established during or at the end of a financial year and certified by an auditor, shows that the Company has made a profit since the close of the last financial year, after recognizing the necessary depreciation and provisions and after deducting prior losses, if any, and the sums to be allocated to reserves, as required by law or the Bylaws, and including any retained earnings. The amount of such interim dividends may not exceed the amount of the profit so defined.
Dividends not claimed within five years after the payment date shall be deemed to expire and revert to the French state.
Assignment and transfer of shares
Shares are freely negotiable, subject to applicable legal and regulatory provisions. They shall be registered in a share account and are transferred by means of a transfer order from account to account.
Shareholders’ rights may be modified as allowed by law. Only the Extraordinary Shareholders’ Meeting is authorized to amend any and all provisions of the Bylaws. It may not, however, increase shareholder commitments, except for properly executed transactions resulting from a share consolidation.
Access to, participation in and voting rights at Shareholders’ Meetings
Shareholders’ Meetings are composed of all shareholders whose shares are paid up and for whom a right to attend Shareholders’ Meetings has been established by registration of the shares in an account in the name either of the shareholder or of the intermediary holding their account where the shareholder is not resident in France, by 0.00 am (Paris time) on the third business day preceding the Meeting.
The shares must be registered within the time limit specified in the preceding paragraph either in an account in their own name maintained by the Company, or in the bearer share accounts maintained by the authorized intermediary.
If it sees fit to do so, the Board of Directors may distribute personalized admission cards to shareholders and require them to produce these cards at the Meeting.
Shareholders participating via video-conferencing or other means of telecommunications which meet legal and regulatory conditions and allow identification shall be deemed present for the calculation of quorum and majority of Shareholders’ Meetings. The Board of Directors organizes, in accordance with legal and regulatory requirements, the participation and vote of these shareholders at the Meeting, assuring, in particular, the effectiveness of the means of identification.
ORANGE / 2013 REGISTRATION DOCUMENT - 404
Any shareholder may, in accordance with legal and regulatory requirements, vote without attending the Meeting or grant a proxy to any other physical person or legal entity of his or her choice. Shareholders may, in accordance with legal and regulatory requirements, send their vote or proxy, either by hard copy or via means of telecommunications, until 3pm (Paris time) the day before the Meeting. Transmission methods are set forth by the Board of Directors in the notice of Meeting and the notice to attend.
Shareholders sending in their vote within the time limit specified under this section, by means of the form provided by the Company to shareholders, are deemed present or represented at the Meeting.
The forms for sending in a vote or a proxy, as well as the certificate of attendance, can be completed in electronic format duly signed in the conditions specified by the applicable laws and regulations. For this purpose, the recording of the electronic signature on the certificate can be made directly on the Internet site established by the organizer of the Meeting.
Shareholders who are not resident in France may be represented at a Shareholders’ Meeting by a registered intermediary who may participate subject to legal requirements.
Notice of Annual Shareholders’ Meetings
Shareholders’ Meetings are convened by the Board of Directors, or, failing that, by the auditors, or by any person empowered for this purpose. Meetings are held at the registered office or at any other location indicated in the notice to convene. Subject to exceptions provided by law, notices must be given at least 15 days before the date of the Meeting. When the Shareholders’ Meeting cannot deliberate due to the lack of the required quorum, the second Meeting and, if applicable, the second postponed Meeting, must be called at least ten days in advance in the same manner as used for the first notice.
Ordinary Shareholders’ Meeting
Ordinary Shareholders’ Meetings are those Meetings called to make any and all decisions that do not amend the Bylaws. An Ordinary Meeting shall be convened at least once a year within six months of the end of each fiscal year in order to approve the annual and consolidated accounts for the year in question or, in case of postponement, within the period established by court order. On the first convocation, the Meeting may validly deliberate only if the shareholders present or represented by proxy or voting by mail represent at least one-fifth of the shares entitled to vote. Upon the second convocation, no quorum is required. Decisions are made by a majority of votes held by the shareholders present, represented by proxy, or voting by mail.
Extraordinary Shareholders’ Meeting
Only the Extraordinary Shareholders’ Meeting is authorized to amend any and all provisions of the Bylaws. Subject to the legal provisions governing capital increases from reserves, profits or share premiums, the resolutions of the Extraordinary Meeting shall be valid only if the shareholders present, represented by proxy or voting by mail represent at least one-fourth of all shares entitled to vote when convened for the first time, or one-fifth when convened for the second time. If the latter quorum is not reached, the second Meeting may be postponed to a date no later than two months after the date for which it was called. Subject to the same condition, the second Meeting shall make decisions by a two-thirds majority of the shareholders present, represented by proxy, or voting by mail.
There are no statutory provisions which having the effect of delaying, deferring or preventing a change of control of the Company. Factors likely to have an impact in the event of a public offer, as set out in article L. 225-100-3 of the French Commercial Code, are described in Section 7.4.
In addition to the legal obligation to inform the Company and the Autorité des marchés financiers when thresholds of 5%, 10%, 15%, 20%, 25%, 30%, 33 1/3%, 50%, 66 2/3%, 90% and 95% of the capital and voting rights are crossed, any individual or legal entity, acting alone or jointly with others, who acquires directly or indirectly, as defined by articles L. 233-7 et seq. of the French Commercial Code, a number of shares, voting rights or securities representing shares equal to 0.5% of the capital or voting rights in Orange is required, within five trading days from the date of registration of the securities that result in reaching or crossing such threshold, to report to Orange by registered letter with return receipt, the total number of shares, voting rights and securities giving access to the share capital that such individual or entity holds.
This declaration must be repeated in accordance with the conditions indicated above each time a new 0.5% threshold is reached or crossed, whether crossing above or below, for any reason whatsoever, including beyond the 5% threshold.
In the event of failure to comply with any of the provisions set forth above, the shareholder or shareholders in question shall be deprived of the voting rights attached to any shares or securities in excess of the thresholds, subject to legal provisions and limits, if one or more shareholders holding at least 0.5% of the share capital or voting rights so requests at a Shareholders’ Meeting.
ORANGE / 2013 REGISTRATION DOCUMENT - 405
In accordance with article L. 225-100-3 of the French Commercial Code, this section describes the factors that may, to the Company’s knowledge, have an effect on the Orange shares in the event of a public offering:
Structure of the Company’s share capital
Bpifrance Participations and the French State jointly hold 27.18% of the voting rights of Orange. See Section 6.2.1 Distribution of share capital and voting rights.
The stock option plans implemented by the Company offer the option holders the choice of exercising in advance 50 to 100% of the options allocated under these plans in the event of a change of control resulting from a public tender or exchange offer. The exercising of all options issued remaining to be exercised would account for around 0.7% of the Company’s share capital, on a totally diluted basis, as at December 31, 2013.
Control mechanisms provided for
in any employee shareholding plan,
when rights of control are not exercised by employees
The regulations governing the mutual funds of the Group’s savings plan, which are invested in Orange shares, state that voting rights attached to shares held as fund assets are exercised by the Supervisory Boards of these funds. In the absence of an express reference in the regulations to the cases where the Supervisory Boards must gather the prior opinions of unit holders, the Supervisory Boards decide on the tender of shares held as fund assets to purchase or exchange offerings, in accordance with article L. 214-40 of the French Monetary and Financial Code. The mutual funds represented 4.15% of the Company’s share capital as at December 31, 2013.
Agreements between shareholders that the Company is aware of and which may cause restrictions on the transfer of shares and the exercising of voting rights
On December 24, 2012, the FSI and the French Government entered into a shareholders’ agreement to act jointly, notice of which was given to the Company and the Autorité des Marchés Financiers. See Section 6.2.1.3 Information on shareholders’ agreements.
Rules applicable to the appointment
and replacement of members
of the Board of Directors
See Section 5.2.2.2 Legal and statutory rules relating to the composition of the Board of Directors.
See Note 9.2. Transactions with associates and joint ventures and Note 19 Executive Compensation, to the consolidated financial statements (Section 4.1.1), and Note 8 Transaction with Related Companies and Parties to the annual financial statement of Orange SA (Section 4.7).
Orange SA has entered into agreements with some of its subsidiaries, including framework agreements, support and brand licensing agreements, as well as service-related agreements. In addition, cash management agreements exist between Orange SA and most of its subsidiaries. These agreements were entered into on an arm's-lenght basis.
On January 27, 2011, Orange agreed a six billion euro syndicated loan with 28 banks maturing in January 2016 as a partial refinancing of the eight billion euro credit line arranged on June 20, 2005. The margin of the syndicated loan was modified in 2013 following the evolution of the Group’s rating. In December 2012, the maturity of the syndicated loan was extended with the banks approval. In addition, Orange has made some significant acquisitions and disposals in the last few years (see Note 2 Gains and losses on disposal and main changes in scope of consolidation to the consolidated financial statements).
These aside, Orange has made no significant agreements other than those made in the normal course of its business.
ORANGE / 2013 REGISTRATION DOCUMENT - 406
4G: fourth generation of mobile telephony standards, successor of the 3G and 2G standards. Provides “very high-speed mobile broadband” connections (theoretical speeds of above 100 Mb/s) and uses voice over IP.
3G/3G+: See UMTS (3G) and HSDPA (3G+).
ADSL (Asymmetrical Digital Subscriber Line): broadband data transmission technology on the traditional telephone network. It enables broadband data transmission (first and foremost Internet access) via paired copper cable (the most common type of telephone line found in buildings).
API or Application Programming Interface: computer programming interface which enables programs to interact with one another, in a similar manner to a human-machine interface.
Arcep: Autorité de Régulation des Communications Electroniques et des Postes - French Telecommunications and Posts Regulator.
Asynchronous transfer mode (ATM): broadband transmission technique for multiplexing data flows in the form of packets (ATM standard packets) in connected mode with guaranteed service quality.
ATM (Asynchronous Transfer Mode): see Asynchronous transfer mode.
B to B or B2B: see Business to Business.
Backbone: fiber optic backbone transmission network for long distance and very high capacity. See DWDM and SDH.
Backhaul: connection for the transmission of voice or data, either to a backbone or to a point from which a connection is made.
BAS (Broadband Access Server): see Broadband Access Server.
Bit: abbreviation for BInary digiT. Elementary information unit with binary coding (0 or 1) used by digital systems.
Bitstream: wholesale offer enabling alternative operators to rent broadband access which has been activated by the incumbent operator. In this way they can offer retail broadband services in areas where they do not offer unbundled access.
BlackBerry: wireless technology developed by Research In Motion Limited allowing personal digital assistants to access and synchronize continuously with the user’s email.
Broadband: data transmission technology where modulation is used for the simultaneous passage of several independent channels on a single physical medium. Term used to designate broadband networks (speeds of at least several Mbits/s). ADSL is also included under the term broadband access (individual connection providing at least 128 Kbits/s downstream, from the switch to the user).
BSA (bitstream access): Bitstream access. See Bitstream.
Business to Business: all of a company’s activities (commercial dealings or transactions) for corporate customers.
Call termination (interconnection or termination rate): amount per minute paid by one telephone operator to another to transmit a telephone conversation over the network of the second operator to its destination. These rates are regulated.
Capacity services: services involving an operator providing transmission capacity dedicated to a user, ensuring transparency in relation to applications supported (example: leased line service).
CDMA (Code Division Multiple Access): process used in particular in mobile telephony, allowing several digital signals to be transmitted simultaneously on the same carrier frequency. It allows operators to offer their subscribers broadband Internet access services on their mobiles.
Centrex: service enabling one or more businesses to use a public automatic switch while benefiting from all the services available on a PABX (Private Automatic Branch Exchange).
Chat: See Instant messaging.
Cloud computing: concept that involves using remote servers for the storage and processing of electronic data traditionally located on local servers or the user’s workstation.
Cloud Gaming or games on demand: broadband streaming technology enabling users to play games that are stored on remote servers on their computer or television.
Dense Wavelength Division Multiplexing (DWDM): digital transmission technology based on multiplexing wavelengths over optical fiber, enabling very high bandwidth (up to 10 Gigabits per second) information transfers over long distance networks.
Distribution frames: telephone network equipment that allows lines or local loops dedicated to each subscriber to be concentrated in order to be sent back to the local telephone switch (or CAA).
ORANGE / 2013 REGISTRATION DOCUMENT - 408
Docsis or Data Over Cable Service Interface Specification: standard defining conditions for a communications interface for a high speed data transfer system to an existing cable television system. Docsis uses the TDMA (Time Division Multiple Access)/SCDMA (Synchronous Code Division Multiple Access) method.
DSL (Digital Subscriber Line): technologies enabling the use of copper cables connecting subscribers of “Switched Telephone Networks” (STN) so as to enable broadband transfers of digital packets. See ADSL, SDSL.
DSLAM (Digital Subscriber Line Access Multiplexer): DSL equipment for the demodulation of subscriber ADSL modems and the first level of aggregation for data transport on the IP network. The equipment is also used to filter voice and data. Installed close to local distribution frames, they generally manage between 100 and 2,000 subscribers.
Dual play: broadband subscriber package including two services: Internet access and IP Telephony. See multi-play.
DWDM: see Dense Wavelength Division Multiplexing.
Edge (Enhanced Data rates for GSM Evolution): radio technology representing the intermediary stage between GPRS and UMTS, which is based on using existing GSM radio frequencies to offer Internet and multimedia services, with nominal rates of up to 380 Kbits/s and effective rates up to four times faster than GPRS.
Efficient operator: concept used in relation to the regulation of prices for wholesale and retail services sold by an operator when the regulatory authority requires the operator to orient its prices towards the costs borne. If the actual costs of this operator turn out to be higher than they should be because of its inefficiency, the corresponding excess cost is excluded from the price base used to determine prices.
Ethernet: technology for local network connections originally developed by Xerox, with computers connected by a combination of network interface cards installed on each PC and by coaxial cables linking the workstations at a rate of 10 Mbits/s. In an Ethernet network, each workstation may initiate a transmission at any time.
FDD (Frequency Division Duplexing): method of allocating UMTS frequencies that consists of assigning a frequency band for each uplink (from the terminal to the base station) and downlink (from the base station to the terminal).
Frame relay: data transmission protocol, which only uses the first two layers of the model for the international OSI (“Open System Interconnection”) standard designed to standardize and facilitate network interconnection. It enables the simultaneous connection, through statistical multiplexing, of several communications using a single access at high speeds.
FTTB (Fiber To The Building): fiber optic to the building.
FTTC (Fiber To The Curb): fiber optic to the curb.
FTTH (Fiber To The Home): connection by optical fiber directly to the subscriber’s home ensuring very high-speed transmissions compatible with triple play packages.
FTTx (Fiber To The X): generic name for different forms of optical connections.
Full MVNO: MVNO that operates its own core network components and its own applications platforms. This entitles it to receive call termination payments. See MVNO.
Functional separation: confinement of some of an operator’s activities within a division with independent management and operating relations, while operational relations with the other divisions are identical to those it has with other operators. In the United Kingdom, BT’s local loop was subject to a functional separation, giving rise to the creation of the Openreach entity.
Gateway: equipment enabling two different networks to communicate. Some gateways are bi-directional, others unidirectional.
Gateway: see Gateway.
Gbits/s or Gigabits per second: billions of bits (109) transferred per second on a transmission network. See bit.
GPON or Gigabit Passive Optical Network: passive FTTH optical network architecture, not to be confused with the competing point to point FTTH architecture; it is used for on demand broadcasting such as video or VoIP (IPTV).
GPRS (General Packet Radio service): second-generation mobile communications system which adds a packet system to the GSM network allowing data exchange and reaching theoretical speeds of around 170 Kbits/s, and actual speeds of about 40 Kbits/s under optimal conditions.
GSM (Global System for Mobile Communications): European standard for second-generation mobile telephony networks which operates within the 900-1,800 MHz frequency bands.
Hotspot: Wifi access point situated in a busy public location (cafe, hotel, station, airport) providing mobile terminal users (laptops, PDAs) with wireless Internet access at speeds from 11 to 54 Mbits/s, depending on the Wifi standard used. See Wifi.
HSDPA (High Speed Downlink Package Access): improvement on the third generation (3G) UMTS mobile telephone standard, also known as 3.5G or 3G+. Through software developments, it offers performance ten times greater than 3G technology (UMTS), supporting broadband in packet mode downstream.
ORANGE / 2013 REGISTRATION DOCUMENT - 409
HSPA: see HSDPA.
HSUPA (High Speed Uplink Packet Access): equivalent to HSDPA, for sending data.
ICT - Information and Communication Technologies: technologies used to process and send information, mainly computing, Internet and telecoms.
IMS: standardized NGN (Next Generation Network) architecture for telephone operators, which enables the provision of fixed and mobile multimedia services. This system uses VoIP technology based on SIP standardized implementation. See SIP, NGN.
Instant messaging: quick exchange of text messages or files between several computers connected to the Internet. In contrast to e-mail, the messages appear almost in real-time and allow interactive dialog.
Integrated Service Digital Network (ISDN): digital network for the transmission of integrated information: data, voice and video. Orange trade name: Numéris.
Internet Protocol - IP: one of the two main communication protocols between networks (the other being ATM), used in particular on Internet and Intranet networks. IP is an Internet-specific transfer protocol based on the principle of packet switching.
Internet Service Provider - ISP: company providing Internet access to private users, professionals and businesses.
Intranet: local network using the same protocols and technologies as the Internet but which, unlike the Internet, connects computers privately, i.e. without being open to all Internet users. Examples: company Intranet, community Intranet, etc.
IP (Internet Protocol): see IP Protocol.
IP telephony: see VoIP.
IPTV (Internet Protocol Television): television and/or video distribution systems using broadband connections over IP.
IPVPN: see VPN.
IRU (Indefeasible Right of Use): long-term contract ensuring the temporary ownership over the duration of the contract of a portion of the capacities of an international cable.
ISDN: see Integrated Service Digital Network.
Joyn: RCS type unified communications service (voice, chat, video, document sharing) created within the GSM Association (GSMA) by major global operators such as AT&T, China Mobile, Deutsche Telekom, Orange, Telecom Italia, Telefonica and Vodafone. It aims to provide a standard alternative to unified communications that are largely licensed to major software publishers and Internet service providers such as Google, Microsoft, Apple or Skype.
Kbits/s or kilobits per second: thousands of bits (103) transferred per second on a transmission network. See bit.
LAN (Local Area Network): networks enabling workstations or PCs of the same entity on the same site to be interconnected with other local networks on other sites and be linked to the public network.
Livebox: terminal marketed by Orange that offers broadband modem, router and Wifi, and Bluetooth wireless access point functions, as well as providing Internet connection, television and Voice over IP via ADSL.
Local loop: part of the telephone network that connects the local telephone switch to subscribers’ individual households.
LRIC (Long Run Incremental Cost): see Long-run incremental cost.
LTE (Long Term Evolution): name given to a project developed within 3GPP and whose objective is to produce technical specifications for future fourth generation mobile network standards (4G). By extension, LTE also refers to so-called fourth generation mobile systems developed through this project.
M2M: see Machine to Machine.
Machine to Machine: exchange of information between machines that is established between the central control system (server) and any type of equipment, through one or several communication networks.
Mbits/s or Megabits per second: millions of bits (106) transferred per second on a transmission network. See bit.
M-Health or mobile: health: use of mobile devices (telephones, tablets, PDAs) in the health information and services field.
MHz: frequency measurement corresponding to one million cycles per second for an electric current (radio frequency), or a clock speed for microprocessors (computer).
MMS (Multimedia Messaging Service): multimedia messaging that is an extension of SMS and allows the routing of images and sound on GPRS and UMTS mobile telephone networks and terminals.
MPLS: see Multi Protocol Label Switching.
MSC (Mobile services Switching Center): mobile telephony equipment (GSM/2G), which is responsible for network voice switching, interconnection with other networks (traditional telephone network, for example) and call coordination.
Multiplay: access solution for multiple services (Internet, television, Voice over IP) through a single broadband access point. The Livebox is the multi-play solution marketed by Orange.
Multiplexing: technique to simultaneously transfer several communications on a single transmission channel.
ORANGE / 2013 REGISTRATION DOCUMENT - 410
Multi-Protocol Label Switching (MPLS): a standard proposed by the Internet Engineering Task Force (IETF), an international community open to operators and network designers whose goal is to coordinate the development of, and resolve architectural and protocol issues relating to the Internet. MPLS improves network speed and efficiency, allowing routers to transfer information along pre-defined paths depending on the level of quality required.
MVNO (Mobile Virtual Network Operator): mobile operators that use third-party network infrastructures to provide their own mobile telephone services.
NAS (Network Access Server): see Network Access Server.
Network Access Server – NAS: sideline IP network equipment for the concentration of PSTN telephone modem access and connection thereof to the IP network.
Next Generation Network - NGN: see NGN.
NFC (Near Field Communication): technology for short-range and high-frequency wireless communications, allowing the exchange of information between devices up to a distance of about 10 centimeters.
NGA: new generation access (NGA) network intended to support very high bandwidth Internet services.
NGN (New Generation Network, or Next Generation Network): generic concept referring to IP-based voice and data networks, making it possible to switch from a simple connectivity approach to a new approach of developing services for customers. See “IP Protocol”.
NRA: subscriber connection nodes or switches towards which subscriber telephone lines are directed.
Outsourcing: see Outsourcing.
Outsourcing: service contract agreed between a company and an operator and consisting of entrusting the latter with the management of its requirements in terms of telecommunications or IT.
PABX or PBX (Private Automatic Branch eXchange): private business switch.
Pay TV: refers to pay-TV, access to which is subject to payment by subscription or on a one-off basis.
PDA (Portable Digital Assistant): see Personal digital assistant.
Personal Digital Assistant: pocket-sized computer, equipped with a memory of up to several megabytes and touch screen that often uses a stylus for entering data.
PMT (Personal Mobile Television): technology for receiving television and digital services on mobile terminals, such as telephones, digital media players or stand-alone receivers for vehicles. Enables television programs to be viewed with optimum reception quality for mobile screen formats.
Price cap: ceiling price imposed by the regulator for a given period. The operator subject to a price cap may not apply prices above this ceiling.
Quadruple play: offer combining Internet, television, mobile telephony and fixed-line access.
RBCI: Backbone and IP Collection Network.
RCS or Rich Communication Suite: communications standard offering a rich user-friendly experience (enriched address book, videoconferencing, photo or video sharing, chat, SMS and MMS, with file transfer functionalities and the possibility of adding new functionalities).
Refarming: a process designed to authorize operators having frequency-usage rights to use their licenses for other purposes or with technologies other than those initially specified. Term used in particular to designate the reutilization, authorized by the European Commission at the end of 2007, of the 900 MHz band initially assigned to GSM for UMTS.
Replay TV: service offering viewers the chance to review a program on the Internet for a period of several days shortly after its premiere television broadcast.
RIM or Research In Motion Limited: See Blackberry.
Roaming: see Roaming.
Roaming: use of a mobile telephony service on the network of an operator other than that with whom the subscription is taken out. The typical example is the use of a mobile abroad on the network of another operator.
Router: interconnection gateway between several servers installed on a network node, designed to optimize data transmission and give users access to all available services on the network.
SDH (Synchronous Digital Hierarchy): see Synchronous Digital Hierarchy.
Signaling System 7 (SS7): information exchanges required for the management of a telephone communication (establishment and termination, maintenance and supervision, invoicing) and transferred in digital form by a network separate from that used for the communication itself.
Signaling Transfer Point: see STP.
SLA (Service-Level Agreement): agreement under which a telephone operator or Internet service provider contractually undertakes to provide a quality of service subject to financial penalties.
Smartphone: mobile handset with PDA features. Data is keyed in via a touch screen or keyboard. It provides such basic functionalities as: agenda, calendar, web browsing, e-mail, instant messaging and GPS.
ORANGE / 2013 REGISTRATION DOCUMENT - 411
SMS (Short Message Service): communication service based on short written messages on mobile telephone handsets and networks.
SOHO (Small Office, Home Office): refers to the computing market for very small companies (less than ten employees).
SS7: see Signaling System 7.
STN (Switched Telephone Networks): traditional circuit-switched telephone network for voice communications.
STP (Signal Transfer Point): routers of a signaling network that transmit signals between switches.
s-VOD: subscription to a Video On Demand service (VOD).
Switches: telephone call handling systems with three functions: interconnection (between an incoming junction and an outgoing junction), handling calls (establishing and disconnecting communication) and management controls (taxation, operation and maintenance).
Switched Telephone Network (STN): voice transport network consisting of handsets, subscriber lines, circuits and switches. It is also used to access some data services.
Synchronous Digital Hierarchy (SDH) transmission: standard over very high bandwidth fiber optic that allows data flows of different speeds to be transmitted securely, and facilitates their management.
Tbits/s or Terabits per second: trillions of bits (1,012) transferred per second on a transmission network. See bit.
TDD (Time Division Duplexing): method of allocating UMTS frequencies that consists of temporarily separating the two uplinks (from the terminal to the base station) and downlinks (from the base station to the terminal) on a single frequency band.
TDSL (Turbo Digital Subscriber Line): business-oriented ADSL offer.
TPAM: see Third Party Application Maintenance.
Triple play: broadband subscription package including Internet access, telephony and a package of television channels.
UMTS (Universal Mobile Telecommunications System): third-generation (3G) mobile telephony standard allowing broadband communication (up to 2 Mbits/s at theoretical symmetrical speed) over the 1.9 to 2.2 GHz frequency band.
Unbundling: obligation placed upon a local loop owner-operator to provide a third-party operator with bare copper pairs. The third-party operator remunerates the owner-operator for this usage and it installs its own transmission equipment at the end of the local loop in order to connect subscribers to its own network. An equipment collocation service is also offered to third-party operators in addition to unbundling. Partial unbundling and full unbundling are distinguished. Partial unbundling allows the third-party operator to offer a broadband service on the upper frequency band of the line, whilst the owner-operator continues to provide the subscription and the telephone service on the lower band. Full unbundling allows the third-party operator to connect the whole of a line to its own equipment and therefore to provide telephone as well as broadband services.
Universal service: one of the three components of public service in telecommunications, with the mandatory provision of electronic communications and tasks in the public interest. The only item to be financed by a sector fund. Divided into three parts: telephony services, universal directory and universal information service.
USB (Universal Serial Bus): standard for a serial transmission computer bus used to connect computer peripherals to a computer, allowing the user to connect to hot devices (a running computer), and benefiting from Plug-and-Play configuration (i.e. the system automatically recognizes the peripheral).
VDSL (Very high bit-rate DSL): network technology involving the creation of new network nodes, which are not the distribution frames for existing telephone lines, closer to end customers. These nodes, which are linked by optical fiber to the distribution frames, host the DSLAM and can receive VDSL modems. The final section going from these network nodes to subscribers is still made up of copper wires.
VDSL (Very high bit-rate DSL): technique based on the same technique as xDSL. VDSL signals are sent over a pair of copper wires, simultaneously and without interfering with voice telephony. This allows for very high speeds.
Video telephony: technique making it possible to call and view the person called on screen, displaying photos, videos and using MMS services, transmitting sound and images in real-time through a telephone line using a videophone. Orange’s video-telephony service is “MaLigne visio”.
VLAN or Virtual Local: Area Network: virtual local network ensuring logical and non-physical communication between different machines based on MAC addresses and port number criteria.
Voice over Internet Protocol - VoIP: transport of voice services using IP technologies.
VoIP: see Voice over IP.
VPABX: virtual PABX. See PABX.
VPN: See Virtual Private Network.
ORANGE / 2013 REGISTRATION DOCUMENT - 412
VSAT (Very Small Aperture Terminal): satellite communications technology that uses two-way satellite dishes with a diameter of less than three meters and requires few ground resources. VSAT is used to connect a small site to communication networks, either for telephony or Internet access.
WDM (Wavelength Division Multiplexing): see Dense Wavelength Division Multiplexing.
Wholesale line rental: wholesale of telephone subscriptions.
Wifi (Wireless-Fidelity): technology enabling the connection of wireless equipment using radio waves in the 2.4 GHz wavelength, at speeds of 11 Mbits/s (802.11b standard) or 54 Mbits/s (802.11g standard). By extending the Ethernet protocol to cover radio services, Wifi offers businesses and individuals the ability to wirelessly connect several computers or shared devices in a network over distances that may reach several dozen meters.
Wimax: wireless broadband transmission standard operating at 70 Mbits/s (802.16 standard), which enables several Wifi access points to connect to a fiber optic network and therefore increases the range of Wifi networks. With a nominal range of 50 kilometers, it should eventually enable the development of citywide networks (MAN) based on a single access point.
xDSL: see DSL.
ORANGE / 2013 REGISTRATION DOCUMENT - 413
Average number of employees (full-time equivalents): average number of active employees over the period, pro-rata to their working time, including permanent contracts and fixed-term contracts.
CAPEX: capital expenditures on tangible and intangible assets excluding telecommunication licenses and excluding investments financed through finance leases (see Section 4.3.5.3 Financial aggregates not defined by IFRS and Segment Information in the consolidated financial statements).
Capital expenditures on tangible and intangible assets: see CAPEX.
Change in working capital requirement: (i) change in gross inventories, plus ii) change in gross trade receivables, plus iii) change in trade payables (excluding fixed asset trade payables), plus iv) change in other assets and liabilities (excluding receivables and liabilities relating to operating taxes and levies).
Commercial expenses and content costs: see External purchases.
Data on a comparable basis: data with comparable methods, scope of consolidation and exchange rates are presented for the preceding period (see Section 4.3.5.1 Transition from data on a historical basis to data on a comparable basis). The transition from data on a historical basis to data on a comparable basis consists of keeping the results for the year ended and restating the previous year in order to present financial data with comparable methods, scope of consolidation and exchange rates over comparable periods. The method used is to apply to the data of the corresponding period of the preceding year the methods and the scope of consolidation for the period ended as well as the average exchange rates used for the statement of income for the period ended. Changes in data on a comparable basis reflect organic business changes. Data on a comparable basis is not intended to replace data on a historical basis for the year ended or the previous periods.
External data: data after elimination of internal flows between the scopes taken into consideration.
External purchases: external purchases include:
■
Commercial expenses and costs of content rights: purchases of handsets and other products sold, retail fees and commissions, advertising, promotional, sponsoring and rebranding costs, and content costs;
■
Service fees and inter-operator costs: network expenses and interconnection fees;
■
Other network expenses and IT expenses: outsourcing fees relating to technical operation and maintenance and IT expenses;
■
and Other external purchases: overheads, real estate fees, purchases of other services and service fees, purchases of equipment and other supplies held in inventory, call center outsourcing fees and other external services, net of capitalized goods and services produced.
Financial investment: acquisitions of investment securities (net of cash acquired) and changes in ownership interests with no gain of control.
Fixed broadband ARPU: the average monthly revenues per consumer broadband access (ADSL, FTTH, Satellite and Wimax) is calculated by dividing the revenues from consumer broadband services generated over the last 12 months by the weighted average number of accesses over the same period. The weighted average number of accesses is the average of monthly averages over the period in question. The monthly average is the arithmetic average of the number of accesses at the beginning and end of the month. The fixed broadband ARPU is expressed as the monthly revenues per access.
Fixed-line services: see Revenues.
Labor expenses: wages and expenses (net of capitalized costs), employee profit-sharing expenses, and expenses relating to share-based compensation.
Mobile ARPU: the annual Average Revenues Per User (ARPU) are calculated by dividing i) the revenues from incoming and outgoing calls (voice, SMS and data), network access fees, value-added services and international roaming revenues generated over the last 12 months by ii) the weighted average number of customers (excluding machine-to-machine customers) over the same period. The weighted average number of customers is the average of monthly averages over the period in question. The monthly average is the arithmetic average of the number of customers at the beginning and end of the month. Mobile ARPU is expressed in annual revenues per customer.
Mobile AUPU: the Average monthly Usage Per User (AUPU) is calculated by dividing the average monthly usage in minutes over the last 12 months (incoming calls, outgoing calls and roaming), excluding traffic from Mobile Virtual Network Operators - MVNO) by the weighted average number of customers over the same period. The mobile AUPU is expressed, in minutes, in monthly usage per customer.
Mobile services: see Revenues.
Net financial debt: net financial debt as defined and used by Orange (see Note 10 to the consolidated financial statements) corresponds to (A) financial liabilities excluding operating payables (translated at the year-end closing rate), less (B): (i) all derivative instruments carried in assets, (ii) cash collateral paid on derivative instruments, (iii) some deposits related to financing, (iv) cash, cash equivalents and financial assets at fair value, and (v) the loan granted by the Group to the EE joint venture. Financial instruments qualifying as cash flow hedge and net investment hedge are included in net financial debt but set up to hedge items that are not (future cash flows, net investment in foreign currencies). Thus, the effective portion of cash flow hedges and the effective portion of net investment hedges (C) are added to net financial debt to offset this temporary difference.
ORANGE / 2013 REGISTRATION DOCUMENT - 414
Number of employees (active employees at end of period): number of employees working on the last day of the period, including permanent contracts and fixed-term contracts.
Operating taxes and levies: taxes and levies including the Territorial Economic Contribution (CET) and the Flat-rate Tax on Network Enterprises (IFER) in France, fees for the use of frequencies and levies on telecommunication services.
Other external purchases: see External purchases.
Other network expenses and IT expenses: see External purchases.
Other operating expense (net of other operating income): see Other operating income and expense.
Other operating income and expense: other operating income and expense include:
■
Other operating income: other income including late-payment interests on trade receivables, proceeds from trade receivables that have been written off, income from universal service, income relating to line damages, penalties and reimbursements received as well as brand fees invoiced to certain unconsolidated entities;
■
and Other operating expense: other expenses including allowances and losses on trade receivables, universal service charges and the effects of litigations.
Other revenues: see Revenues.
Reported EBITDA: operating income before depreciation and amortization, before reclassification of cumulative translation adjustment from liquidated entities, before impairment of goodwill and fixed assets, and before share of profits (losses) of associates and joint ventures (see Section 4.3.5.3 Financial aggregates not defined by IFRS and Segment Information in the consolidated financial statements).
[REDACTED SECTION: CERTAIN TEXT THAT FOLLOWS HAS BEEN REDACTED]
Restated EBITDA: i) operating income before depreciation and amortization, before reclassification of cumulative translation adjustment from liquidated entities, before impairment of goodwill and fixed assets, and before share of profits (losses) of associates and joint ventures, ii) less non-recurring items (see Section 4.3.5.3 Financial aggregates not defined by IFRS).
Revenues: revenues include:
■
Mobile services: revenues from mobile services includes revenues from incoming and outgoing calls (voice, SMS and data), network access fees, value-added services, machine-to-machine (M2M), roaming revenues from customers on other networks (national and international roaming), revenues generated with mobile virtual network operators (MVNOs) and revenues from network sharing;
■
Sales of mobile devices: sales of subsidized and unsubsidized mobile devices, excluding sales of accessories;
■
Fixed-line services: revenues from fixed-line services includes the revenues from traditional fixed-line telephony, fixed-line broadband services, business solutions and networks (except for the France operating segment, for which business solutions and networks are carried by the Enterprise operating segment) and carrier services (national and international interconnection, unbundling and wholesale of telephone lines);
■
Other revenues: sales and rentals of fixed-line equipment, sales of mobile accessories and other miscellaneous revenues.
Sales of mobile devices: see Revenues.
Service fees and inter-operator costs: see External purchases.
Statutory data: data before elimination of internal flows between the scopes taken into consideration.
Wages and employee benefit expenses: see Labor expenses.
ORANGE / 2013 REGISTRATION DOCUMENT - 415