UNITED STATES
SECURITIES AND EXCHANGE COMMISSION
Washington, DC 20549
FORM 6-K |
REPORT OF FOREIGN PRIVATE ISSUER
PURSUANT TO RULE 13a-16 OR 15d-16 UNDER
THE SECURITIES EXCHANGE ACT OF 1934
February 18, 2021
Commission File Number 1-14712
ORANGE
(Translation of registrant’s name into English)
78, rue Olivier de Serres
75015 Paris, France
(Address of principal executive offices)
Indicate by check mark whether the Registrant files or will file
annual reports under cover Form 20-F or Form 40-F
Form 20-F |
| Form 40- F |
|
Indicate by check mark if the Registrant is submitting the
Form 6-K in paper as permitted by Regulation S-T Rule 101(b)(1):
Yes |
| No |
|
Indicate by check mark if the Registrant is submitting the
Form 6-K in paper as permitted by Regulation S-T Rule 101(b)(7):
Yes |
| No |
|
Indicate by check mark whether the Registrant, by furnishing the
information contained in this Form, is also thereby furnishing the information to the
Commission pursuant to Rule 12g3-2(b) under the Securities Exchange Act of 1934
Yes |
| No |
|
Consolidated financial statements
Year ended December 31, 2020
This document is a free translation into English of the yearly financial report prepared in French and is provided solely for the convenience of English speaking readers.

Significant events 2020
Covid-19 Health crisis | IFRS 16 Lease term | Tax dispute concerning fiscal years 2005-2006 | ||
The effect of the health crisis on the Group's business and performance, the judgments and assumptions made, as well as the main effects of the crisis on the Group's consolidated financial statements are presented in Note 3 "Impact of the health crisis linked to the Covid-19 pandemic". | In December 2019, IFRS IC issued its final decision on the determination of the enforceable period of leases. | On November 13, 2020, the Conseil d'État issued a favorable decision on a tax dispute in respect of the years 2005-2006. As at December 31, 2020, the current tax expense includes tax income of 2,246 million euros. | ||
Note 3 | Note 2.3.1 | Note 11.2 |
Table of contents
Financial statements
Consolidated statement of comprehensive income.
Consolidated statement of financial position.
Consolidated statements of changes in shareholders' equity.
Analysis of changes in shareholders' equity related to components of the other comprehensive income
Consolidated statement of cash flows.
Notes to the consolidated financial statements
Note 1... Segment information.
1.2 Segment revenue to consolidated net income in 2020.
1.3 Segment revenue to consolidated net income in 2019.
1.4 Segment revenue to segment operating income in 2018.
1.7 Segment equity and liabilities.
1.8 Simplified statement of cash flows on telecommunication and Mobile Financial Services activities
1.9 Definition of operating segments and performance indicators.
Note 2... Description of business and basis of preparation of the consolidated financial statements
2.2 Basis of preparation of the financial statements.
2.3 New standards and interpretations applied from January 1, 2020.
2.5 Accounting policies, use of judgment and estimates.
Note 3... Impact of the health crisis linked to the Covid-19 pandemic
3.1 Effects of the Covid-19 pandemic on Orange’s business and financial position
3.2 Main effects on the Consolidated Financial Statements at December 31, 2020
Note 4... Gains and losses on disposal and main changes in scope of consolidation
4.1 Gains (losses) on disposal of fixed assets, investments and activities
4.2 Main changes in the scope of consolidation.
5.4 Customer contract net assets and liabilities.
5.7 Related party transactions.
Note 6... Purchases and other expenses.
6.3 Restructuring and integration costs.
6.4 Broadcasting rights and equipment inventories.
6.8 Related party transactions.
Note 8... Impairment losses and goodwill
8.3 Key assumptions used to determine recoverable amounts.
8.4 Sensitivity of recoverable amounts.
9.1 Gains (losses) on disposal of fixed assets.
9.2 Depreciation and amortization.
9.3 Impairment of fixed assets.
9.5 Property, plant and equipment
11.1 Operating taxes and levies.
Note 12.. Interests in associates and joint ventures.
Note 13.. Financial assets, liabilities and financial results (telecom activities)
13.1 Financial assets and liabilities of telecom activities.
13.2 Profits and losses related to financial assets and liabilities.
13.6 Loans from development organizations and multilateral lending institutions
14.1 Interest rate risk management
14.2 Foreign exchange risk management
14.3 Liquidity risk management
14.5 Credit risk and counterparty risk management
14.8 Fair value of financial assets and liabilities.
15.6 Non-controlling interests.
Note 16.. Unrecognized contractual commitments (telecom activities)
16.1 Operating activities commitments.
16.2 Consolidation scope commitments.
Note 17.. Mobile Financial Services activities.
17.1 Financial assets and liabilities of Mobile Financial Services.
17.2 Information on market risk management with respect to Orange Bank activities
17.3 Orange Bank’s unrecognized contractual commitments.
Note 20.. Main consolidated entities.
Statutory auditors’ report on the consolidated financial statements
The accompanying notes form an integral part of the consolidated financial statements. The accounting principles are split within each note in gray areas.
Consolidated income statement
(in millions of euros, except for per share data) | Note | 2020 | 2019(1) | 2018 | ||
Revenue | 5.1 | 42,270 | 42,238 | 41,381 | ||
External purchases | 6.1 | (17,691) | (17,860) | (18,563) | ||
Other operating income | 5.2 | 604 | 720 | 580 | ||
Other operating expenses | 6.2 | (789) | (599) | (505) | ||
Labor expenses | 7.1 | (8,490) | (8,494) | (9,074) | ||
Operating taxes and levies | 11.1.1 | (1,924) | (1,827) | (1,840) | ||
Gains (losses) on disposal of fixed assets, investments and activities | 4.1 | 228 | 277 | 197 | ||
Restructuring costs | 6.3 | (25) | (132) | (199) | ||
Depreciation and amortization of fixed assets | 9.2 | (7,134) | (7,110) | (7,047) | ||
Depreciation and amortization of financed assets | 9.5 | (55) | (14) | - | ||
Depreciation and amortization of right-of-use assets | 10.1 | (1,384) | (1,274) | - | ||
Reclassification of translation adjustment from liquidated entities | - | 12 | 1 | |||
Impairment of goodwill | 8.1 | - | (54) | (56) | ||
Impairment of fixed assets | 9.3 | (30) | 73 | (49) | ||
Impairment of right-of-use assets | 10.1 | (57) | (33) | - | ||
Share of profits (losses) of associates and joint ventures | 12 | (2) | 8 | 3 | ||
Operating income | 5,521 | 5,930 | 4,829 | |||
Cost of gross financial debt excluding financed assets | (1,099) | (1,108) | (1,341) | |||
Interests on debts related to financed assets | (1) | (1) | - | |||
Gains (losses) on assets contributing to net financial debt | (1) | 5 | 9 | |||
Foreign exchange gain (loss) | (103) | 76 | (4) | |||
Interests on lease liabilities | (120) | (129) | - | |||
Other net financial expenses | 11 | 15 | 25 | |||
Effects resulting from BT stake | 13.7 | - | (119) | (51) | ||
Finance costs, net | 13.2 | (1,314) | (1,261) | (1,362) | ||
Income taxes | 11.2.1 | 848 | (1,447) | (1,309) | ||
Consolidated net income | 5,055 | 3,222 | 2,158 | |||
Net income attributable to owners of the parent company | 4,822 | 3,004 | 1,954 | |||
Non-controlling interests | 15.6 | 233 | 218 | 204 | ||
Earnings per share (in euros) attributable to parent company | 15.7 | |||||
Net income | ||||||
- | basic | 1.72 | 1.03 | 0.63 | ||
- | diluted | 1.71 | 1.02 | 0.62 | ||
(1) 2019 figures have been restated of the IFRS IC decision on lease term (see Note 2.3.1). | ||||||
Consolidated statement of comprehensive income
(in millions of euros) | Note | 2020 | 2019(1) | 2018 |
Consolidated net income | 5,055 | 3,222 | 2,158 | |
Remeasurements of the net defined benefit liability | 7.2 | (31) | (109) | 45 |
Assets at fair value | 13.7-17.1 | 94 | (25) | (22) |
Income tax relating to items that will not be reclassified | 11.2.2 | 6 | 30 | (6) |
Share of other comprehensive income in associates and joint ventures that will not be reclassified | - | - | - | |
Items that will not be reclassified to profit or loss (a) | 69 | (104) | 17 | |
Assets at fair value | 13.7-17.1 | 1 | 9 | (8) |
Cash flow hedges | 13.8.2 | 22 | 144 | (67) |
Translation adjustment gains and losses | 15.5 | (414) | 78 | (7) |
Income tax relating to items that are or may be reclassified | 11.2.2 | (10) | (47) | 18 |
Share of other comprehensive income in associates and joint ventures that are or may be reclassified | - | - | - | |
Items that are or may be reclassified subsequently to profit or loss (b) | (401) | 184 | (64) | |
Other consolidated comprehensive income (a) + (b) | (332) | 80 | (47) | |
Consolidated comprehensive income | 4,723 | 3,304 | 2,111 | |
Comprehensive income attributable to the owners of the parent company | 4,565 | 3,074 | 1,898 | |
Comprehensive income attributable to non-controlling interests | 158 | 230 | 213 | |
(1) 2019 figures have been restated of the IFRS IC decision on lease term (see Note 2.3.1). |
Consolidated statement of financial position
(in millions of euros) | Note | December 31, 2020 | December 31, 2019(1) | December 31, 2018 |
Assets | ||||
Goodwill | 8.2 | 27,596 | 27,644 | 27,174 |
Other intangible assets | 9.4 | 15,135 | 14,737 | 14,073 |
Property, plant and equipment | 9.5 | 29,075 | 28,423 | 27,693 |
Right-of-use assets | 10.1 | 7,009 | 6,700 | - |
Interests in associates and joint ventures | 12 | 98 | 103 | 104 |
Non-current financial assets related to Mobile Financial Services activities | 17.1 | 1,210 | 1,259 | 1,617 |
Non-current financial assets | 13.1 | 1,516 | 1,208 | 2,282 |
Non-current derivatives assets | 13.1 | 132 | 562 | 263 |
Other non-current assets | 5.6 | 136 | 125 | 129 |
Deferred tax assets | 11.2.3 | 731 | 992 | 1,366 |
Total non-current assets | 82,639 | 81,753 | 74,701 | |
Inventories | 6.4 | 814 | 906 | 965 |
Trade receivables | 5.3 | 5,620 | 5,320 | 5,295 |
Other customer contract assets | 5.4 | 1,236 | 1,209 | 1,166 |
Current financial assets related to Mobile Financial Services activities | 17.1 | 2,075 | 3,095 | 3,075 |
Current financial assets | 13.1 | 3,259 | 4,766 | 2,748 |
Current derivatives assets | 13.1 | 162 | 12 | 139 |
Other current assets | 5.6 | 1,701 | 1,258 | 1,152 |
Operating taxes and levies receivables | 11.1.2 | 1,104 | 1,090 | 1,027 |
Current taxes assets | 11.2.3 | 128 | 120 | 119 |
Prepaid expenses | 6.5 | 850 | 730 | 571 |
Cash and cash equivalents | 13.1 | 8,145 | 6,481 | 5,634 |
Total current assets | 25,094 | 24,987 | 21,891 | |
Total assets | 107,733 | 106,741 | 96,592 | |
(1) 2019 figures have been restated of the IFRS IC decision on lease term (see Note 2.3.1). | ||||
(in millions of euros) | Note | December 31, 2020 | December 31, 2019(1) | December 31, 2018 |
Equity and liabilities | ||||
Share capital | 10,640 | 10,640 | 10,640 | |
Share premiums and statutory reserve | 16,859 | 16,859 | 16,859 | |
Subordinated notes | 5,803 | 5,803 | 5,803 | |
Retained earnings | 1,092 | (1,577) | (2,633) | |
Equity attributable to the owners of the parent company | 34,395 | 31,725 | 30,669 | |
Non-controlling interests | 2,643 | 2,687 | 2,580 | |
Total equity | 15 | 37,038 | 34,412 | 33,249 |
Non-current financial liabilities | 13.1 | 30,089 | 33,148 | 26,749 |
Non-current derivatives liabilities | 13.1 | 844 | 487 | 775 |
Non-current lease liabilities | 10.2 | 5,875 | 5,593 | - |
Non-current fixed assets payables | 9.6 | 1,291 | 817 | 612 |
Non-current financial liabilities related to Mobile Financial Services activities | 17.1 | 0 | 0 | - |
Non-current employee benefits | 7.2 | 2,202 | 2,554 | 2,823 |
Non-current dismantling provisions | 9.7 | 885 | 812 | 765 |
Non-current restructuring provisions | 6.3 | 53 | 96 | 230 |
Other non-current liabilities | 6.7 | 307 | 353 | 462 |
Deferred tax liabilities | 11.2.3 | 855 | 703 | 631 |
Total non-current liabilities | 42,401 | 44,561 | 33,047 | |
Current financial liabilities | 13.1 | 5,170 | 3,925 | 7,270 |
Current derivatives liabilities | 13.1 | 35 | 22 | 133 |
Current lease liabilities | 10.2 | 1,496 | 1,339 | - |
Current fixed assets payables | 9.6 | 3,349 | 2,848 | 2,835 |
Trade payables | 6.6 | 6,475 | 6,682 | 6,736 |
Customer contract liabilities | 5.4 | 1,984 | 2,093 | 2,002 |
Current financial liabilities related to Mobile Financial Services activities | 17.1 | 3,128 | 4,279 | 4,835 |
Current employee benefits | 7.2 | 2,192 | 2,261 | 2,392 |
Current dismantling provisions | 9.7 | 16 | 15 | 11 |
Current restructuring provisions | 6.3 | 64 | 120 | 159 |
Other current liabilities | 6.7 | 2,267 | 2,095 | 1,788 |
Operating taxes and levies payables | 11.1.2 | 1,279 | 1,287 | 1,322 |
Current taxes payables | 11.2.3 | 673 | 748 | 755 |
Deferred income | 5.5 | 165 | 51 | 58 |
Total current liabilities | 28,294 | 27,767 | 30,296 | |
Total equity and liabilities | 107,733 | 106,741 | 96,592 | |
(1) 2019 figures have been restated of the IFRS IC decision on lease term (see Note 2.3.1). | ||||
Consolidated statements of changes in shareholders' equity
(in millions of euros) | Attributable to owners of the parent company | Attributable to non-controlling interests | Total equity | |||||||||||
Number of issued shares | Share capital | Share premiums and statutory reserve | Subor-dinated notes | Reserves | Other compre- hensive income | Total | Reserves | Other compre- hensive income | Total | |||||
Balance as of December 31, 2017 | 2,660,056,599 | 10,640 | 16,859 | 5,803 | (1,851) | (476) | 30,975 | 2,323 | 214 | 2,537 | 33,512 | |||
Effect of IFRS 9 application | - | - | - | - | 20 | (39) | (19) | (4) | - | (4) | (23) | |||
Balance as of January 1, 2018 after effect of IFRS 9 application | 2,660,056,599 | 10,640 | 16,859 | 5,803 | (1,831) | (515) | 30,956 | 2,319 | 214 | 2,533 | 33,489 | |||
Consolidated comprehensive income | - | - | - | - | 1,954 | (56) | 1,898 | 204 | 9 | 213 | 2,111 | |||
Share-based compensation | 7.3 | - | - | - | - | 46 | - | 46 | 4 | - | 4 | 50 | ||
Purchase of treasury shares | 15.2 | - | - | - | - | (98) | - | (98) | - | - | - | (98) | ||
Dividends | 15.3 | - | - | - | - | (1,860) | - | (1,860) | (246) | - | (246) | (2,106) | ||
Subordinated notes remuneration | 15.4 | - | - | - | - | (280) | - | (280) | - | - | - | (280) | ||
Changes in ownership interests with no gain/loss of control | 4.2 | - | - | - | - | (3) | - | (3) | (9) | - | (9) | (12) | ||
Changes in ownership interests with gain/loss of control | 4.2 | - | - | - | - | - | - | - | 11 | - | 11 | 11 | ||
Other movements | - | - | - | - | 10 | - | 10 | 74 | - | 74 | 84 | |||
Balance as of December 31, 2018 | 2,660,056,599 | 10,640 | 16,859 | 5,803 | (2,062) | (571) | 30,669 | 2,357 | 223 | 2,580 | 33,249 | |||
Effect of IFRS 16 application(1) | - | - | - | - | 2 | - | 2 | - | - | - | 2 | |||
Balance as of January 1, 2019 after effect of IFRS 16 application | 2,660,056,599 | 10,640 | 16,859 | 5,803 | (2,060) | (571) | 30,671 | 2,357 | 223 | 2,580 | 33,251 | |||
Consolidated comprehensive income(1) | - | - | - | - | 3,004 | 69 | 3,073 | 218 | 11 | 230 | 3,304 | |||
Share-based compensation | 7.3 | - | - | - | - | 52 | - | 52 | 3 | - | 3 | 55 | ||
Purchase of treasury shares | 15.2 | - | - | - | - | (34) | - | (34) | - | - | - | (34) | ||
Dividends | 15.3 | - | - | - | - | (1,857) | - | (1,857) | (248) | - | (248) | (2,105) | ||
Issues and purchases of subordinated notes | 15.4 | - | - | - | 0 | (81) | - | (81) | - | - | - | (81) | ||
Subordinated notes remuneration | 15.4 | - | - | - | - | (297) | - | (297) | - | - | - | (297) | ||
Changes in ownership interests with no gain/loss of control | 4.2 | - | - | - | - | 4 | - | 4 | 1 | - | 1 | 5 | ||
Changes in ownership interests with gain/loss of control | 4.2 | - | - | - | - | - | - | - | 2 | - | 2 | 2 | ||
Other movements(2) | - | - | - | - | 195 | - | 195 | 119 | - | 119 | 314 | |||
Balance as of December 31, 2019 | 2.3.1 | 2,660,056,599 | 10,640 | 16,859 | 5,803 | (1,075) | (502) | 31,725 | 2,452 | 234 | 2,687 | 34,412 | ||
Consolidated comprehensive income | - | - | - | - | 4,822 | (257) | 4,565 | 233 | (75) | 158 | 4,723 | |||
Share-based compensation | 7.3 | - | - | - | - | 16 | - | 16 | 7 | - | 7 | 23 | ||
Purchase of treasury shares | 15.2 | - | - | - | - | 7 | - | 7 | - | - | - | 7 | ||
Dividends | 15.3 | - | - | - | - | (1,595) | - | (1,595) | (225) | - | (225) | (1,820) | ||
Issues and purchases of subordinated notes | 15.4 | - | - | - | 0 | (12) | - | (12) | - | - | - | (12) | ||
Subordinated notes remuneration | 15.4 | - | - | - | - | (258) | - | (258) | - | - | - | (258) | ||
Changes in ownership interests with no gain/loss of control | 4.2 | - | - | - | - | (21) | - | (21) | 19 | - | 19 | (2) | ||
Other movements | - | - | - | - | (33) | - | (33) | (2) | - | (2) | (35) | |||
Balance as of December 31, 2020 | 2,660,056,599 | 10,640 | 16,859 | 5,803 | 1,852 | (759) | 34,395 | 2,484 | 159 | 2,643 | 37,038 | |||
(1) The effects of IFRS 16 application are described in Note 2.3.1 and Note 10. | ||||||||||||||
(2) Including in 2019 the effect of the cancellation of the promise to buy (put option) of the Orange Bank equity. | ||||||||||||||
Analysis of changes in shareholders' equity related to components of the other comprehensive income
(in millions of euros) | Attributable to owners of the parent company | Attributable to non-controlling interests | Total other compre- hensive income | ||||||||||||||
Assets available for sale | Assets at fair value | Hedging instruments | Translation adjustment | Actuarial gains and losses | Deferred tax | Other compre- hensive income of associates and joint ventures(3) | Total | Assets available for sale | Assets at fair value | Hedging instruments | Translation adjustment | Actuarial gains and losses | Deferred tax | Total | |||
Balance as of December 31, 2017 | 56 | - | (196) | 27 | (541) | 218 | (40) | (476) | (1) | - | (4) | 232 | (16) | 3 | 214 | (262) | |
Effect of IFRS 9 application | (56) | 17 | - | - | - | - | - | (39) | 1 | (1) | - | - | - | - | - | (39) | |
Balance as of January 1, 2018 after effect of IFRS 9 application | - | 17 | (196) | 27 | (541) | 218 | (40) | (515) | - | (1) | (4) | 232 | (16) | 3 | 214 | (301) | |
Variation | - | (27) | (68) | (12) | 37 | 14 | - | (56) | - | (3) | 1 | 5 | 8 | (2) | 9 | (47) | |
Balance as of December 31, 2018 | - | (10) | (264) | 15 | (504) | 232 | (40) | (571) | - | (4) | (3) | 237 | (8) | 1 | 223 | (348) | |
Effect of IFRS 16 application | - | - | - | - | - | - | - | - | - | - | - | - | - | - | - | - | |
Balance as of January 1, 2019 after effect of IFRS 16 application | - | (10) | (264) | 15 | (504) | 232 | (40) | (571) | - | (4) | (3) | 237 | (8) | 1 | 223 | (348) | |
Variation(1) | - | (18) | 147 | 64 | (107) | (16) | - | 69 | - | 3 | (3) | 14 | (2) | (1) | 11 | 80 | |
Balance as of December 31, 2019 | - | (28) | (117) | 78 | (611) | 216 | (40) | (502) | - | (2) | (6) | 251 | (10) | 1 | 234 | (268) | |
Variation(2) | - | 95 | 18 | (334) | (33) | (4) | - | (257) | - | (1) | 4 | (80) | 2 | (0) | (75) | (332) | |
Balance as of December 31, 2020 | - | 68 | (98) | (256) | (644) | 212 | (40) | (759) | - | (3) | (2) | 171 | (8) | 0 | 159 | (600) | |
(1) Including a 144 million euros change in hedging instruments (see Note 13.8.2) and a (109) million euros change in actuarial gains and losses (see Note 7.2.3). | |||||||||||||||||
(2) Including a (414) million euros change in actuarial gains and losses (see Note 15.5) and a 94 million euros change in assets available at fair value (see Note 14.8). | |||||||||||||||||
(3) Amounts excluding translation adjustment. | |||||||||||||||||
Consolidated statement of cash flows
(in millions of euros) | Note | 2020 | 2019(1) | 2018 | |
Operating activities | |||||
Consolidated net income | 5,055 | 3,222 | 2,158 | ||
Non-monetary items and reclassified items for presentation | 10,310 | 12,221 | 11,497 | ||
Operating taxes and levies | 11.1 | 1,924 | 1,827 | 1,840 | |
Gains (losses) on disposal of fixed assets, investments and activities | 4.1 | (228) | (277) | (197) | |
Other gains and losses | (23) | (9) | - | ||
Depreciation and amortization of fixed assets | 9.2 | 7,134 | 7,110 | 7,047 | |
Depreciation and amortization of financed assets | 9.5 | 55 | 14 | - | |
Depreciation and amortization of right-of-use assets | 10.1 | 1,384 | 1,275 | - | |
Changes in provisions | 5-6-7-9 | (504) | (484) | (17) | |
Reclassification of cumulative translation adjustment from liquidated entities | - | (12) | (1) | ||
Impairment of goodwill | 8.1 | - | 54 | 56 | |
Impairment of fixed assets | 9.3 | 30 | (73) | 49 | |
Impairment of right-of-use assets | 10.1 | 57 | 33 | - | |
Share of profits (losses) of associates and joint ventures | 12 | 2 | (8) | (3) | |
Operational net foreign exchange and derivatives | (11) | 9 | 2 | ||
Finance costs, net | 13.2 | 1,314 | 1,261 | 1,362 | |
Income tax | 11.2 | (848) | 1,447 | 1,309 | |
Share-based compensation | 7.3 | 23 | 55 | 50 | |
Changes in working capital and operating banking activities(2) | (640) | (934) | (236) | ||
Decrease (increase) in inventories, gross | 72 | 69 | (152) | ||
Decrease (increase) in trade receivables, gross | (488) | (45) | (97) | ||
Increase (decrease) in trade payables | (122) | (85) | 177 | ||
Changes in other customer contract assets and liabilities | (41) | (60) | 12 | ||
Changes in other assets and liabilities (3) | (62) | (813) | (176) | ||
Other net cash out | (2,028) | (4,319) | (3,913) | ||
Operating taxes and levies paid | (1,929) | (1,939) | (1,777) | ||
Dividends received | 6 | 17 | 51 | ||
Interest paid and interest rates effects on derivatives, net(4) | (1,264) | (1,318) | (1,259) | ||
Tax dispute for fiscal years 2005-2006 | 11.2 | 2,246 | - | - | |
Income tax paid excluding the effect of the tax litigation for years 2005-2006 | (1,086) | (1,079) | (928) | ||
Net cash provided by operating activities (a) | 12,697 | 10,190 | 9,506 | ||
Investing activities | |||||
Purchases and sales of property, plant and equipment and intangible assets | (7,176) | (7,582) | (7,692) | ||
Purchases of property, plant and equipment and intangible assets (5) | 9.4-9.5 | (8,546) | (8,422) | (7,642) | |
Increase (decrease) in fixed assets payables | 958 | 179 | (289) | ||
Investing donations received in advance | 39 | 32 | 47 | ||
Sales of property, plant and equipment and intangible assets(6) | 374 | 628 | 192 | ||
Cash paid for investment securities, net of cash acquired | (49) | (559) | (284) | ||
SecureLink | 4.2 | - | (371) | - | |
SecureData | 4.2 | - | (95) | - | |
Basefarm | 4.2 | - | - | (230) | |
Business & Decision | 4.2 | - | - | (36) | |
Other | (49) | (93) | (18) | ||
Investments in associates and joint ventures | (7) | (2) | (6) | ||
Purchases of equity securities measured at fair value | (67) | (44) | (104) | ||
Sales of BT | - | 543 | 53 | ||
Sales of other investment securities, net of cash transferred | 19 | (14) | 57 | ||
Decrease (increase) in securities and other financial assets | 13.7 | 1,716 | (1,711) | (576) | |
Investments at fair value, excluding cash equivalents | 1,568 | (2,025) | 55 | ||
Other(7) | 148 | 314 | (631) | ||
Net cash used in investing activities (b) | (5,564) | (9,370) | (8,552) | ||
(in millions of euros) | Note | 2020 | 2019(1) | 2018 | |
Financing activities | |||||
Medium and long-term debt issuances | 13.5-13.6 | 2,694 | 8,351 | 5,214 | |
Medium and long-term debt redemptions and repayments(8) | 13.5-13.6 | (3,476) | (4,650) | (4,095) | |
Repayments of lease liabilities | (1,398) | (1,429) | - | ||
Increase (decrease) of bank overdrafts and short-term borrowings | (413) | (945) | (43) | ||
including redemption of subordinated notes reclassified in 2019 as short-term borrowings | 15.4 | (500) | - | - | |
Decrease (increase) of cash collateral deposits | (747) | 590 | 208 | ||
Exchange rates effects on derivatives, net | 37 | 26 | 7 | ||
Subordinated notes issuances (purchases) and other related fees | 15.4 | (12) | 419 | - | |
Coupon on subordinated notes | 15.4 | (280) | (276) | (280) | |
Purchases of treasury shares - Orange Vision 2020 free share award plan | 15.2 | - | (27) | (101) | |
Other proceeds (purchases) from treasury shares | 15.2 | 7 | (7) | 3 | |
Capital increase (decrease) - non-controlling interests | 2 | 79 | 68 | ||
Changes in ownership interests with no gain / loss of control | (3) | (7) | (6) | ||
Dividends paid to owners of the parent company | 15.3 | (1,595) | (1,857) | (1,860) | |
Dividends paid to non-controlling interests | 15.6 | (226) | (243) | (246) | |
Net cash used in financing activities (c) | (5,410) | 24 | (1,131) | ||
Net change in cash and cash equivalents (a) + (b) + (c) | 1,724 | 844 | (177) | ||
Net change in cash and cash equivalents | |||||
Cash and cash equivalents in the opening balance | 6,481 | 5,634 | 5,810 | ||
Cash change in cash and cash equivalents | 1,724 | 844 | (177) | ||
Non-cash change in cash and cash equivalents | (59) | 3 | 1 | ||
o/w effect of exchange rates changes and other non-monetary effects | (59) | 3 | 1 | ||
Cash and cash equivalents in the closing balance | 8,145 | 6,481 | 5,634 | ||
(1) 2019 figures have been restated of the IFRS IC decision on lease term (see Note 2.3.1). | |||||
(2) Operating banking activities mainly include transactions with customers and credit institutions. They are presented in changes in other assets and liabilities. | |||||
(3) Excluding operating tax receivables and payables. | |||||
(4) Including interests paid on lease liabilities for (131) million euros in 2020 and (104) million euros in 2019 and interests paid on financed asset liabilities for (1) million euro in 2020 and 2019. | |||||
(5) Acquisitions of financed assets for 241 million euros in 2020 and 144 million euros in 2019 have no effect to the net cash used in investing activities. In 2018, acquisitions of property, plant, equipment and intangible assets financed through finance leases in the amount of 136 million euros had no effect to the net cash used in investing activities. | |||||
(6) Including proceeds from sale and lease-back transactions for 227 million euros in 2020 and 381 million euros in 2019. | |||||
(7) Including effects relating to the Digicel litigation of which in 2018 escrowed amount of (346) million euros and in 2020, reimbursement of 97 million euros received by Orange (see Note 18). In 2019, mainly included net repayments of debt securities of Orange Bank for 277 million euros (net acquisitions for (154) million euros in 2018, see Note 17.1.1). | |||||
(8) Including TDIRA buy-backs (see Note 13.4) | |||||
Note 1 Segment information
1.1 Segment revenue
(in millions of euros) | France | |||
Spain | Other European countries | Eliminations Europe | ||
December 31, 2020 | ||||
Revenue (3) | 18,461 | 4,951 | 5,638 | (9) |
Convergence services | 4,559 | 1,984 | 733 | - |
Mobile services only | 2,245 | 1,012 | 2,026 | - |
Fixed services only | 3,959 (4) | 471 | 611 | - |
IT & integration services | - | 8 | 301 | - |
Wholesale | 5,866 | 916 | 1,017 | (9) |
Equipment sales | 1,187 | 547 | 828 | - |
Other revenue | 644 | 12 | 122 | - |
External | 17,794 | 4,908 | 5,559 | - |
Inter-operating segments | 667 | 43 | 79 | (9) |
December 31, 2019 | ||||
Revenue (3) | 18,154 | 5,280 | 5,783 | (12) |
Convergence services | 4,397 | 2,092 | 623 | - |
Mobile services only | 2,324 | 1,161 | 2,143 | - |
Fixed services only | 4,086 (4) | 501 | 644 | - |
IT & integration services | - | 6 | 232 | - |
Wholesale | 5,487 | 901 | 1,071 | (12) |
Equipment sales | 1,351 | 620 | 898 | - |
Other revenue | 509 | 0 | 173 | - |
External | 17,492 | 5,230 | 5,695 | - |
Inter-operating segments | 662 | 50 | 88 | (12) |
December 31, 2018 | ||||
Revenue (3) | 18,211 | 5,349 | 5,687 | (13) |
Convergence services | 4,458 | 2,143 | 467 | - |
Mobile services only | 2,348 | 1,215 | 2,194 | - |
Fixed services only | 4,168 (4) | 496 | 697 | - |
IT & integration services | - | 1 | 158 | - |
Wholesale | 5,342 | 810 | 1,150 | (13) |
Equipment sales | 1,410 | 684 | 868 | - |
Other revenue | 485 | - | 153 | - |
External | 17,615 | 5,299 | 5,601 | - |
Inter-operating segments | 596 | 50 | 86 | (13) |
(1) Including, in 2020, revenue of 5,071 million euros in France, 13 million euros in Spain, 1,287 million euros in other European countries and 1,436 million euros in other countries. Including, in 2019, revenue of 5,233 million euros in France, 21 million euros in Spain, 1,077 million euros in other European countries and 1,489 million euros in other countries. Including, in 2018, revenue of 5,207 million euros in France, 21 million euros in Spain, 665 million euros in other European countries and 1,399 million euros in other countries. | ||||
(2) Including revenue of 1,305 million euros in France in 2020, 1,374 million euros in 2019 and 1,412 million euros in 2018. | ||||
(3) The description of different sources of revenue is presented in Note 5.1. | ||||
(4) Including, in 2020, fixed only broadband revenue of 2,748 million euros and fixed only narrowband revenue of 1,212 million euros. Including, in 2019, fixed only broadband revenue of 2,699 million euros and fixed only narrowband revenue of 1,387 million euros. Including, in 2018, fixed only broadband revenue of 2,565 million euros and fixed only narrowband revenue of 1,603 million euros. | ||||
(5) Including, in 2020, revenue of 1,237 million euros from voice services and revenue of 2,614 million euros from data services. Including, in 2019, revenue of 1,289 million euros from voice services and revenue of 2,674 million euros from data services. Including, in 2018, revenue of 1,385 million euros from voice services and revenue of 2,612 million euros from data services. | ||||
Europe | Africa & Middle-East | Enterpri- se(1) | International Carriers & Shared Services(2) | Eliminations | Total telecom activities | Mobile Financial Services | Eliminations telecom activities / mobile financial services | Orange consolidated financial statements | |
Total | |||||||||
10,580 | 5,834 | 7,807 | 1,450 | (1,855) | 42,277 | - | (7) | 42,270 | |
2,717 | - | - | - | - | 7,276 | - | - | 7,276 | |
3,038 | 4,420 | 649 | - | (35) | 10,317 | - | (0) | 10,317 | |
1,083 | 562 | 3,851(5) | - | (177) | 9,278 | - | (0) | 9,277 | |
310 | 25 | 3,086 | - | (164) | 3,256 | - | (4) | 3,252 | |
1,924 | 695 | 45 | 1,038 | (1,313) | 8,255 | - | - | 8,255 | |
1,375 | 89 | 175 | - | (5) | 2,821 | - | (0) | 2,821 | |
134 | 43 | - | 412 | (160) | 1,073 | - | (2) | 1,072 | |
10,467 | 5,660 | 7,405 | 944 | - | 42,270 | - | - | 42,270 | |
113 | 175 | 402 | 506 | (1,855) | 7 | - | (7) | - | |
11,051 | 5,646 | 7,820 | 1,498 | (1,926) | 42,242 | - | (4) | 42,238 | |
2,714 | - | - | - | - | 7,111 | - | - | 7,111 | |
3,304 | 4,230 | 727 | - | (40) | 10,545 | - | (0) | 10,544 | |
1,145 | 493 | 3,963(5) | - | (178) | 9,509 | - | (0) | 9,508 | |
239 | 14 | 2,909 | - | (155) | 3,006 | - | (3) | 3,004 | |
1,959 | 780 | 34 | 1,077 | (1,404) | 7,933 | - | - | 7,933 | |
1,518 | 96 | 187 | - | (6) | 3,146 | - | (0) | 3,146 | |
173 | 32 | - | 421 | (142) | 992 | - | (1) | 991 | |
10,925 | 5,430 | 7,437 | 955 | - | 42,238 | - | - | 42,238 | |
126 | 216 | 383 | 543 | (1,926) | 4 | - | (4) | - | |
11,023 | 5,190 | 7,292 | 1,534 | (1,866) | 41,384 | - | (3) | 41,381 | |
2,610 | - | - | - | - | 7,068 | - | - | 7,068 | |
3,409 | 3,809 | 743 | - | (37) | 10,272 | - | - | 10,272 | |
1,193 | 435 | 3,997(5) | - | (189) | 9,604 | - | - | 9,604 | |
159 | 21 | 2,312 | - | (141) | 2,351 | - | (2) | 2,349 | |
1,947 | 811 | 35 | 1,150 | (1,354) | 7,931 | - | - | 7,931 | |
1,552 | 85 | 205 | - | (7) | 3,245 | - | - | 3,245 | |
153 | 29 | - | 384 | (138) | 913 | - | (1) | 912 | |
10,900 | 4,980 | 6,914 | 972 | - | 41,381 | - | - | 41,381 | |
123 | 210 | 378 | 562 | (1,866) | 3 | - | (3) | - | |
1.2 Segment revenue to consolidated net income in 2020
(in millions of euros) | France | Europe | |||
Spain | Other European countries | Elimina- tions Europe | Total | ||
Revenue | 18,461 | 4,951 | 5,638 | (9) | 10,580 |
External purchases | (7,101) | (2,774) | (3,194) | 9 | (5,959) |
Other operating income | 1,303 | 141 | 153 | (0) | 293 |
Other operating expenses | (592) | (185) | (173) | 0 | (358) |
Labor expenses | (3,663) | (280) | (632) | - | (912) |
Operating taxes and levies | (955) | (148) | (90) | - | (238) |
Gains (losses) on disposal of fixed assets, investments and activities | - | - | - | - | - |
Restructuring costs | - | - | - | - | - |
Depreciation and amortization of financed assets | (55) | - | - | - | - |
Depreciation and amortization of right-of-use assets | (225) | (260) | (183) | - | (443) |
Impairment of right-of-use assets | - | - | - | - | - |
Interests on debts related to financed assets(3) | (1) | - | - | - | - |
Interests on lease liabilities(3) | (8) | (12) | (19) | - | (30) |
EBITDAaL (1) | 7,163 | 1,433 | 1,499 | - | 2,932 |
Significant litigations (1) | (199) | - | - | - | - |
Specific labour expenses (1) | (7) | - | 2 | - | 2 |
Fixed assets, investments and businesses portfolio review (1) | 21 | 22 | 14 | - | 36 |
Restructuring programs costs (1) | (5) | (0) | (2) | - | (2) |
Acquisition and integration costs (1) | (1) | - | (7) | - | (7) |
Depreciation and amortization of fixed assets | (3,157) | (1,059) | (1,129) | - | (2,187) |
Reclassification of translation adjustment from liquidated entities | - | - | - | - | - |
Impairment of goodwill | - | - | - | - | - |
Impairment of fixed assets | (15) | 0 | (8) | - | (8) |
Share of profits (losses) of associates and joint ventures | (1) | - | 0 | - | 0 |
Elimination of interests on debts related to financed assets(3) | 1 | - | - | - | - |
Elimination of interests on lease liabilities(3) | 8 | 12 | 19 | - | 30 |
Operating Income | 3,809 | 407 | 389 | - | 796 |
Cost of gross financial debt except financed assets | |||||
Interests on debts related to financed assets(3) | |||||
Gains (losses) on assets contributing to net financial debt | |||||
Foreign exchange gain (loss) | |||||
Interests on lease liabilities(3) | |||||
Other net financial expenses | |||||
Finance costs, net | |||||
Income Tax | |||||
Consolidated net income | |||||
(1) See Note 1.9. for EBITDAaL adjustments. | |||||
(2) Mobile Financial Services's net banking income is recognized in other operating income and amounts to 69 million euros in 2020. The cost of risk is included in other operating expenses and amounts to (31) million euros in 2020. | |||||
(3) Presentation adjustments allow the reallocation of the lines of specific items identified in the segment information to the operating revenue and expense lines presented in the consolidated income statement. Interests on debts related to financed assets and interests on lease liabilities are included in segment EBITDAaL. They are excluded from segment operating income and included in net finance costs presented in the consolidated income statement. | |||||
Africa & Middle-East | Enterprise | Interna- tional Carriers & Shared Services | Elimination telecom activities | Total telecom activities | Mobile Financial Services (2) | Elimina- tions telecom activities / mobile financial services | Total | Presenta- tion adjust- ments (3) | Orange consoli- dated financial statements | |
5,834 | 7,807 | 1,450 | (1,855) | 42,277 | - | (7) | 42,270 | - | 42,270 | |
(2,443) | (4,019) | (1,951) | 3,891 | (17,582) | (108) | 6 | (17,684) | (6) | (17,691) | |
76 | 161 | 2,076 | (3,371) | 539 | 75 | (9) | 604 | - | 604 | |
(212) | (646) | (51) | 1,335 | (524) | (47) | 11 | (560) | (229) | (789) | |
(514) | (2,027) | (1,274) | - | (8,390) | (75) | - | (8,465) | (25) | (8,490) | |
(552) | (102) | (75) | - | (1,923) | (1) | - | (1,924) | - | (1,924) | |
- | - | - | - | - | - | - | - | 228 | 228 | |
- | - | - | - | - | - | - | - | (25) | (25) | |
- | - | - | - | (55) | - | - | (55) | - | (55) | |
(158) | (145) | (410) | - | (1,380) | (3) | - | (1,384) | - | (1,384) | |
- | - | - | - | - | - | - | - | (57) | (57) | |
- | - | - | - | (1) | - | - | (1) | 1 | n/a | |
(67) | (5) | (9) | - | (120) | (0) | - | (120) | 120 | n/a | |
1,964 | 1,023 | (244) | - | 12,839 | (160) | 1 | 12,680 | 6 | n/a | |
- | - | (13) | - | (211) | - | - | (211) | 211 | n/a | |
(0) | 2 | (9) | - | (12) | (0) | - | (12) | 12 | n/a | |
6 | 14 | 151 | - | 228 | - | - | 228 | (228) | n/a | |
(5) | (9) | (59) | - | (80) | (3) | - | (83) | 83 | n/a | |
(2) | (6) | (15) | - | (32) | (5) | - | (37) | 37 | n/a | |
(1,011) | (410) | (342) | - | (7,106) | (28) | - | (7,134) | - | (7,134) | |
- | - | - | - | - | - | - | - | - | - | |
- | - | - | - | - | - | - | - | - | - | |
(0) | - | (7) | - | (30) | - | - | (30) | - | (30) | |
8 | 1 | (9) | - | (2) | - | - | (2) | - | (2) | |
- | - | - | - | 1 | - | - | 1 | (1) | n/a | |
67 | 5 | 9 | - | 120 | 0 | - | 120 | (120) | n/a | |
1,027 | 621 | (538) | - | 5,715 | (195) | 1 | 5,521 | - | 5,521 | |
(1,099) | ||||||||||
(1) | ||||||||||
(1) | ||||||||||
(103) | ||||||||||
(120) | ||||||||||
11 | ||||||||||
(1,314) | ||||||||||
848 | ||||||||||
5,055 | ||||||||||
1.3 Segment revenue to consolidated net income in 2019
(in millions of euros) | France | Europe | |||
Spain | Other European countries | Elimina- tions Europe | Total | ||
Revenue | 18,154 | 5,280 | 5,783 | (12) | 11,051 |
External purchases | (7,036) | (2,907) | (3,318) | 12 | (6,213) |
Other operating income | 1,392 | 221 | 148 | (0) | 369 |
Other operating expenses | (553) | (207) | (173) | 0 | (380) |
Labor expenses | (3,730) | (271) | (678) | - | (949) |
Operating taxes and levies | (893) | (160) | (84) | - | (244) |
Gains (losses) on disposal of fixed assets, investments and activities | - | - | - | - | - |
Restructuring costs | - | - | - | - | - |
Depreciation and amortization of financed assets | (14) | - | - | - | - |
Depreciation and amortization of right-of-use assets | (175) | (298) | (168) | - | (466) |
Impairment of right-of-use assets | - | - | - | - | - |
Interests on debts related to financed assets(3) | (1) | - | - | - | - |
Interests on lease liabilities(3) | (9) | (12) | (21) | - | (32) |
EBITDAaL (1) | 7,135 | 1,646 | 1,489 | - | 3,136 |
Significant litigations (1) | - | - | - | - | - |
Specific labour expenses (1) | (32) | - | 2 | - | 2 |
Fixed assets, investments and businesses portfolio review (1) | 4 | 56 | 63 | - | 120 |
Restructuring programs costs (1) | (45) | (12) | (55) | - | (67) |
Acquisition and integration costs (1) | - | - | (5) | - | (5) |
Depreciation and amortization of fixed assets | (3,179) | (1,076) | (1,119) | - | (2,195) |
Reclassification of translation adjustment from liquidated entities | - | - | - | - | - |
Impairment of goodwill | - | - | - | - | - |
Impairment of fixed assets | (1) | - | (15) | - | (15) |
Share of profits (losses) of associates and joint ventures | - | - | 1 | - | 1 |
Elimination of interests on debts related to financed assets(3) | 1 | - | - | - | - |
Elimination of interests on lease liabilities(3) | 9 | 12 | 21 | - | 32 |
Operating Income | 3,892 | 626 | 383 | - | 1,009 |
Cost of gross financial debt except financed assets | |||||
Interests on debts related to financed assets(3) | |||||
Gains (losses) on assets contributing to net financial debt | |||||
Foreign exchange gain (loss) | |||||
Interests on lease liabilities(3) | |||||
Other net financial expenses | |||||
Effects resulting from BT sale | |||||
Finance costs, net | |||||
Income Taxes | |||||
Consolidated net income | |||||
(1) See Note 1.9. for EBITDAaL adjustments. | |||||
(2) Mobile Financial Services's net banking income is recognized in other operating income and amounts to 40 million euros in 2019. The cost of risk is included in other operating expenses and amounts to (10) million euros in 2019. | |||||
(3) Presentation adjustments allow the reallocation of the lines of specific items identified in the segment information to the operating revenue and expense lines presented in the consolidated income statement. Interests on debts related to financed assets and interests on lease liabilities are included in segment EBITDAaL. They are excluded from segment operating income and included in net finance costs presented in the consolidated income statement. | |||||
Africa & Middle-East | Enterprise | Interna- tional Carriers & Shared Services | Elimina- tion telecom activities | Total telecom activities | Mobile Financial Services(2) | Elimina- tions telecom activities/ mobile financial services | Total | Presenta- tion adjust- ments(3) | Orange consoli- dated financial statements | |
5,646 | 7,820 | 1,498 | (1,926) | 42,242 | - | (4) | 42,238 | - | 42,238 | |
(2,451) | (3,991) | (2,041) | 3,962 | (17,769) | (96) | 5 | (17,860) | - | (17,860) | |
72 | 169 | 2,088 | (3,396) | 694 | 43 | (17) | 720 | - | 720 | |
(245) | (634) | (63) | 1,360 | (515) | (29) | 17 | (527) | (72) | (599) | |
(507) | (1,949) | (1,261) | - | (8,397) | (73) | - | (8,470) | (24) | (8,494) | |
(495) | (115) | (80) | - | (1,827) | (1) | - | (1,827) | - | (1,827) | |
- | - | - | - | - | - | - | - | 277 | 277 | |
- | - | - | - | - | - | - | - | (132) | (132) | |
- | - | - | - | (14) | - | - | (14) | - | (14) | |
(135) | (104) | (391) | - | (1,272) | (3) | - | (1,274) | - | (1,274) | |
- | - | - | - | - | - | - | - | (33) | (33) | |
- | - | - | - | (1) | - | - | (1) | 1 | n/a | |
(72) | (4) | (10) | - | (128) | - | - | (129) | 129 | n/a | |
1,814 | 1,191 | (261) | - | 13,015 | (160) | 1 | 12,856 | 144 | n/a | |
- | - | (49) | - | (49) | - | - | (49) | 49 | n/a | |
- | 1 | 6 | - | (23) | - | - | (23) | 23 | n/a | |
(19) | - | 172 | - | 277 | - | - | 277 | (277) | n/a | |
(4) | (16) | (31) | - | (163) | (2) | - | (165) | 165 | n/a | |
- | (11) | (8) | - | (24) | - | - | (24) | 24 | n/a | |
(972) | (399) | (340) | - | (7,086) | (24) | - | (7,110) | - | (7,110) | |
2 | - | 10 | - | 12 | - | - | 12 | - | 12 | |
(54) | - | - | - | (54) | - | - | (54) | - | (54) | |
89 | 1 | (1) | - | 73 | - | - | 73 | - | 73 | |
12 | 1 | (7) | - | 8 | - | - | 8 | - | 8 | |
- | - | - | - | 1 | - | - | 1 | (1) | n/a | |
72 | 4 | 10 | - | 128 | - | - | 129 | (129) | n/a | |
940 | 772 | (499) | - | 6,114 | (186) | 1 | 5,930 | - | 5,930 | |
(1,108) | ||||||||||
(1) | ||||||||||
5 | ||||||||||
76 | ||||||||||
(129) | ||||||||||
15 | ||||||||||
(119) | ||||||||||
(1,261) | ||||||||||
(1,447) | ||||||||||
3,222 | ||||||||||
1.4 Segment revenue to segment operating income in 2018
(in millions of euros) | Europe | ||||
France | Spain | Other European countries | Elimina- tions Europe | Total | |
December 31, 2018 | |||||
Revenue | 18,211 | 5,349 | 5,687 | (13) | 11,023 |
External purchases | (7,167) | (3,204) | (3,412) | 15 | (6,601) |
Other operating income | 1,377 | 155 | 130 | (2) | 283 |
Other operating expenses | (535) | (211) | (168) | - | (379) |
Labor expenses | (3,833) | (263) | (681) | - | (944) |
Operating taxes and levies | (977) | (161) | (93) | - | (254) |
Gains (losses) on disposal of fixed assets, investments and activities | - | 35 | 45 | - | 80 |
Restructuring and integration costs | - | - | - | - | - |
Adjusted EBITDA (1) | 7,076 | 1,700 | 1,508 | - | 3,208 |
Significant litigations | - | (31) | - | - | (31) |
Specific labour expenses | (614) | - | - | - | - |
Investments and businesses portfolio review | - | - | - | - | - |
Restructuring and integration costs | (114) | (9) | (6) | - | (15) |
Reported EBITDA (1) | 6,348 | 1,660 | 1,502 | - | 3,162 |
Depreciation and amortization | (3,148) | (1,105) | (1,164) | - | (2,269) |
Reclassification of cumulative translation adjustment from liquidated entities | - | - | - | - | - |
Impairment of goodwill | - | - | - | - | - |
Impairment of fixed assets | (2) | - | 1 | - | 1 |
Share of profits (losses) of associates and joint ventures | - | - | - | - | - |
Operating income | 3,198 | 555 | 339 | - | 894 |
(1) See Note 1.9. for EBITDA adjustments. | |||||
(2) Mobile Financial Services's net banking income is recognized in other operating income and amounts to 43 million euros in 2018. The cost of risk is included in other operating expenses and amounts to (7) million euros in 2018. | |||||
(3) Presentation adjustments allow the reallocation of the lines of specific items identified in the segment information to the operating revenue and expense lines presented in the consolidated income statement. | |||||
(4) In 2018, mainly related to the effect of the three-year extension of the 2015 French part-time for seniors plans (see Note 7.2). | |||||
Africa & Middle-East | Enterprise | International Carriers & Shared Services | Elimina- tion telecom activities | Total telecom activities | Mobile Financial Services (2) | Elimina- tions telecom activities/mobile financial services | Total | Presenta- tion adjust- ments (3) | Orange consolidated financial statements | |
5,190 | 7,292 | 1,534 | (1,866) | 41,384 | - | (3) | 41,381 | - | 41,381 | |
(2,521) | (3,696) | (2,469) | 3,975 | (18,479) | (87) | 3 | (18,563) | - | (18,563) | |
68 | 148 | 2,146 | (3,466) | 556 | 44 | (20) | 580 | - | 580 | |
(231) | (661) | (35) | 1,357 | (484) | (33) | 21 | (496) | (9) | (505) | |
(468) | (1,718) | (1,235) | - | (8,198) | (70) | - | (8,268) | (806) | (9,074) | |
(391) | (120) | (66) | - | (1,808) | (1) | - | (1,809) | (31) | (1,840) | |
20 | - | 80 | - | 180 | - | - | 180 | 17 | 197 | |
- | - | - | - | - | - | - | - | (199) | (199) | |
1,667 | 1,245 | (45) | - | 13,151 | (147) | 1 | 13,005 | (1,028) | ||
- | - | (2) | - | (33) | - | - | (33) | 33 | - | |
- | (68) | (129) | - | (811) | (1) | - | (812)(4) | 812 | - | |
- | - | 17 | - | 17 | - | - | 17 | (17) | - | |
(12) | (24) | (35) | - | (200) | - | - | (200) | 200 | - | |
1,655 | 1,153 | (194) | - | 12,124 | (148) | 1 | 11,977 | - | 11,977 | |
(906) | (387) | (316) | - | (7,026) | (21) | - | (7,047) | - | (7,047) | |
- | - | 1 | - | 1 | - | - | 1 | - | 1 | |
(56) | - | - | - | (56) | - | - | (56) | - | (56) | |
(46) | - | (2) | - | (49) | - | - | (49) | - | (49) | |
12 | (1) | (8) | - | 3 | - | - | 3 | - | 3 | |
659 | 765 | (519) | - | 4,997 | (169) | 1 | 4,829 | - | 4,829 | |
1.5 Segment investments
(in millions of euros) | France | |||
Spain | Other European countries | Elimina- tions Europe | ||
December 31, 2020 | ||||
eCapex (1) | 3,748 | 969 | 878 | - |
Elimination of proceeds from sales of property, plant and equipment and intangible assets | 136 | 75 | 22 | - |
Telecommunications licenses | 876 | 6 | 67 | - |
Financed assets | 241 | - | - | - |
Total investments (5) | 5,001 | 1,050 | 967 | - |
December 31, 2019 | ||||
eCapex (1) | 4,052 | 812 | 869 | - |
Elimination of proceeds from sales of property, plant and equipment and intangible assets | 95 | 185 | 103 | - |
Telecommunications licenses | 0 | 298 | 9 | - |
Financed assets | 144 | - | - | - |
Total investments (6) | 4,291 | 1,296 | 982 | - |
December 31, 2018 | ||||
Capex (2) | 3,656 | 1,120 | 953 | - |
Telecommunications licenses | (1) | 149 | 10 | - |
Finance leases | 1 | 70 | 32 | - |
Total investments (7) | 3,656 | 1,339 | 995 | - |
(1) See Note 1.9. for eCapex definition. | ||||
(2) See Note 1.9. for Capex definition. | ||||
(3) Including investments in intangible assets and property, plant and equipment in France for 218 million euros in 2020, 254 million euros in 2019 and 275 million euros in 2018. | ||||
(4) Including investments in intangible assets and property, plant and equipment in France for 303 million euros in 2020, 336 million euros in 2019 and 312 million euros in 2018. | ||||
(5) Including 2,940 million euros for other intangible assets and 5,848 million euros for tangible assets. | ||||
(6) Including 2,385 million euros for other intangible assets and 6,181 million euros for tangible assets. | ||||
(7) Including 1,895 million euros for other intangible assets and 5,883 million euros for tangible assets. | ||||
Europe | Africa & Middle-East | Enterprise (3) | International Carriers & Shared Services (4) | Eliminations telecom activities and unallocated items | Total telecom activities | Mobile Financial Services | Eliminations telecom activities/ mobile financial services | Orange consolidated financial statements | |
Total | |||||||||
1,847 | 1,036 | 339 | 133 | - | 7,102 | 30 | - | 7,132 | |
97 | 9 | 23 | 180 | - | 444 | - | - | 444 | |
73 | 20 | 0 | 0 | - | 969 | - | - | 969 | |
- | - | - | - | - | 241 | - | - | 241 | |
2,017 | 1,065 | 362 | 313 | - | 8,757 | 30 | - | 8,787 | |
1,681 | 987 | 404 | 141 | - | 7,265 | 28 | - | 7,293 | |
289 | 13 | 5 | 208 | - | 610 | - | - | 610 | |
308 | 212 | 0 | 0 | - | 519 | - | - | 519 | |
- | - | - | - | - | 144 | - | - | 144 | |
2,277 | 1,211 | 410 | 348 | - | 8,538 | 28 | - | 8,565 | |
2,073 | 1,008 | 353 | 316 | - | 7,406 | 36 | - | 7,442 | |
159 | 42 | - | - | - | 200 | - | - | 200 | |
102 | 2 | 31 | - | - | 136 | - | - | 136 | |
2,334 | 1,052 | 384 | 316 | - | 7,742 | 36 | - | 7,778 | |
1.6 Segment assets
(in millions of euros) | France | |||
Spain | Other European countries | Elimina- tions Europe | ||
December 31, 2020 | ||||
Goodwill | 14,364 | 6,872 | 2,640 | - |
Other intangible assets | 4,957 | 1,852 | 1,795 | - |
Property, plant and equipment | 16,038 | 3,750 | 3,903 | - |
Right-of-use assets | 1,523 | 1,129 | 1,052 | - |
Interests in associates and joint ventures | 9 | - | 5 | - |
Non-current assets included in the calculation of net financial debt | - | - | - | - |
Other | 9 | 17 | 25 | - |
Total non-current assets | 36,900 | 13,619 | 9,421 | - |
Inventories | 361 | 57 | 162 | - |
Trade receivables | 1,975 | 645 | 1,046 | (0) |
Other customer contract assets | 386 | 154 | 367 | - |
Prepaid expenses | 53 | 492 | 51 | - |
Current assets included in the calculation of net financial debt | - | - | - | - |
Other | 803 | 117 | 79 | - |
Total current assets | 3,578 | 1,465 | 1,705 | (0) |
Total assets | 40,477 | 15,085 | 11,126 | (0) |
December 31, 2019 | ||||
Goodwill | 14,364 | 6,872 | 2,665 | - |
Other intangible assets | 3,968 | 1,961 | 1,941 | - |
Property, plant and equipment | 15,308 | 3,673 | 4,109 | - |
Right-of-use assets | 1,174 | 1,123 | 1,068 | - |
Interests in associates and joint ventures | 3 | - | 5 | - |
Non-current assets included in the calculation of net financial debt | - | - | - | - |
Other | 10 | 17 | 22 | - |
Total non-current assets | 34,827 | 13,645 | 9,811 | - |
Inventories | 463 | 61 | 149 | - |
Trade receivables | 1,477 | 667 | 1,210 | 3 |
Other customer contract assets | 432 | 150 | 380 | - |
Prepaid expenses | 41 | 401 | 43 | - |
Current assets included in the calculation of net financial debt | - | - | - | - |
Other | 699 | 62 | 74 | - |
Total current assets | 3,113 | 1,341 | 1,855 | 3 |
Total assets | 37,940 | 14,986 | 11,666 | 3 |
December 31, 2018 | ||||
Goodwill | 14,364 | 6,840 | 2,581 | - |
Other intangible assets | 3,921 | 1,778 | 2,015 | - |
Property, plant and equipment | 14,306 | 3,730 | 4,150 | - |
Interests in associates and joint ventures | - | 1 | 4 | - |
Non-current assets included in the calculation of net financial debt | - | - | - | - |
Other | 11 | 17 | 15 | - |
Total non-current assets | 32,602 | 12,366 | 8,765 | - |
Inventories | 505 | 79 | 171 | - |
Trade receivables | 1,506 | 699 | 1,227 | 2 |
Other customer contract assets | 443 | 140 | 363 | - |
Prepaid expenses | 68 | 241 | 35 | - |
Current assets included in the calculation of net financial debt | - | - | - | - |
Other | 776 | 60 | 75 | (1) |
Total current assets | 3,298 | 1,219 | 1,871 | 1 |
Total assets | 35,900 | 13,585 | 10,636 | 1 |
(1) Including intangible and tangible assets for 573 million euros in France in 2020, 642 million euros in 2019 and 632 million euros in 2018. | ||||
(2) Including intangible and tangible assets for 1,731 million euros in France in 2020, 1,736 million euros in 2019 and 2,151 million euros in 2018. Intangible assets also include the Orange brand for 3,133 million euros. | ||||
Europe | Africa & Middle-East | Enterprise | International Carriers & Shared Services | Eliminations telecom activities and unallocated items | Total telecom activities | Mobile Financial Services | Eliminations telecom activities / mobile financial services | Orange consolidated financial statements | |
Total | |||||||||
9,512 | 1,443 | 2,225 | 18 | - | 27,561 | 35 | - | 27,596 | |
3,647 | 2,046 | 640 (1) | 3,753 (2) | - | 15,042 | 93 | - | 15,135 | |
7,653 | 3,751 | 488 (1) | 1,139 (2) | - | 29,069 | 6 | - | 29,075 | |
2,181 | 921 | 456 | 1,898 | - | 6,979 | 30 | - | 7,009 | |
5 | 70 | 2 | 12 | 0 | 98 | - | - | 98 | |
- | - | - | - | 774 | 774 | - | - | 774 | |
42 | 26 | 31 | 20 | 1,633 | 1,760 | 1,219 (4) | (27) | 2,952 | |
23,040 | 8,257 | 3,840 | 6,840 | 2,406 | 81,283 | 1,383 | (27) | 82,639 | |
219 | 77 | 57 | 100 | - | 814 | - | - | 814 | |
1,691 | 769 | 1,081 | 890 | (761) | 5,645 | 30 | (55) | 5,620 | |
521 | 13 | 317 | - | - | 1,236 | - | - | 1,236 | |
542 | 131 | 77 | 66 | (28) | 841 | 9 | (1) | 850 | |
- | - | - | - | 11,260 | 11,260 | - | - | 11,260 | |
197 | 1,196 | 200 | 386 | 155 | 2,937 | 2,381 (5) | (4) | 5,313 | |
3,170 | 2,185 | 1,733 | 1,442 | 10,627 | 22,734 | 2,421 | (61) | 25,094 | |
26,210 | 10,442 | 5,573 | 8,282 | 13,033 | 104,017 | 3,804 | (88) | 107,733 | |
9,537 | 1,481 | 2,245 | 18 | - | 27,644 | - | - | 27,644 | |
3,903 | 2,318 | 695 (1) | 3,766 (2) | - | 14,649 | 88 | - | 14,737 | |
7,782 | 3,674 | 526 (1) | 1,128 (2) | - | 28,418 | 5 | - | 28,423 | |
2,190 | 1,107 | 387 | 1,815 | - | 6,674 | 26 | - | 6,700 | |
5 | 84 | 1 | 10 | 0 | 103 | - | - | 103 | |
- | - | - | - | 685 | 685 | - | - | 685 | |
39 | 22 | 25 | 19 | 2,104 (3) | 2,219 | 1,268 (4) | (27) | 3,460 | |
23,456 | 8,686 | 3,878 | 6,757 | 2,789 | 80,394 | 1,387 | (27) | 81,753 | |
211 | 76 | 60 | 96 | - | 906 | - | - | 906 | |
1,879 | 720 | 1,067 | 974 | (773) | 5,343 | 1 | (24) | 5,320 | |
529 | 11 | 237 | - | - | 1,209 | - | - | 1,209 | |
444 | 87 | 143 | 26 | (16) | 725 | 5 | (0) | 730 | |
- | - | - | - | 10,820 | 10,820 | - | - | 10,820 | |
136 | 968 | 216 | 330 | 145 | 2,494 | 3,511 (5) | (3) | 6,002 | |
3,199 | 1,862 | 1,723 | 1,426 | 10,176 | 21,498 | 3,517 | (28) | 24,987 | |
26,655 | 10,549 | 5,601 | 8,182 | 12,965 | 101,892 | 4,904 | (55) | 106,741 | |
9,421 | 1,542 | 1,830 | 17 | - | 27,174 | - | - | 27,174 | |
3,793 | 2,106 | 388 (1) | 3,780 (2) | 1 | 13,989 | 84 | - | 14,073 | |
7,880 | 3,443 | 540 (1) | 1,519 (2) | - | 27,688 | 5 | - | 27,693 | |
5 | 82 | - | 17 | - | 104 | - | - | 104 | |
- | - | - | - | 816 | 816 | - | - | 816 | |
32 | 23 | 23 | 19 | 3,123 (3) | 3,231 | 1,637 (4) | (27) | 4,841 | |
21,131 | 7,196 | 2,781 | 5,352 | 3,940 | 73,002 | 1,726 | (27) | 74,701 | |
249 | 82 | 49 | 79 | - | 965 | - | - | 965 | |
1,928 | 761 | 821 | 946 | (633) | 5,329 | - | (34) | 5,295 | |
503 | 8 | 212 | - | - | 1,166 | - | - | 1,166 | |
276 | 89 | 71 | 82 | (17) | 569 | 2 | - | 571 | |
- | - | - | - | 7,886 | 7,886 | - | - | 7,886 | |
135 | 811 | 174 | 374 | 52 | 2,321 | 3,687 (5) | - | 6,008 | |
3,091 | 1,751 | 1,327 | 1,481 | 7,288 | 18,236 | 3,689 | (34) | 21,891 | |
24,222 | 8,947 | 4,108 | 6,833 | 11,228 | 91,238 | 5,415 | (61) | 96,592 | |
(3) Including BT shares in the amount of 659 million euros in 2018. All BT shares have been sold in 2019 (see Note 13.7). | |||||||||
(4) Including 1,210 million euros of non-current financial assets related to Mobile Financial Services in 2020, 1,259 million euros in 2019 and 1,617 million euros in 2018 (see Note 17.1.1). | |||||||||
(5) Including 2,077 million euros of current financial assets related to Mobile Financial Services in 2020 (of which 183 million euros related to trade receivables sold by Orange Spain), 3,098 million euros in 2019 and 3,075 million euros in 2018 (see Note 17.1.1). | |||||||||
1.7 Segment equity and liabilities
(in millions of euros) | France | |||
Spain | Other European countries | Elimina- tions Europe | ||
December 31, 2020 | ||||
Equity | - | - | - | - |
Non-current lease liabilities | 1,238 | 977 | 904 | - |
Non-current fixed assets payables | 613 | 339 | 186 | - |
Non-current employee benefits | 1,171 | 9 | 15 | - |
Non-current liabilities included in the calculation of net financial debt | - | - | - | - |
Other | 583 | 65 | 302 | - |
Total non-current liabilities | 3,606 | 1,389 | 1,407 | - |
Current lease liabilities | 240 | 277 | 186 | - |
Current fixed assets payables | 1,564 | 655 | 413 | - |
Trade payables | 2,646 | 987 | 880 | (0) |
Customer contracts liabilities | 940 | 103 | 303 | - |
Current employee benefits | 1,166 | 38 | 101 | - |
Deferred income | 2 | 114 | 5 | - |
Current liabilities included in the calculation of net financial debt | - | - | - | - |
Other | 670 | 131 | 242 | - |
Total current liabilities | 7,229 | 2,304 | 2,129 | (0) |
Total equity and liabilities | 10,835 | 3,692 | 3,536 | (0) |
December 31, 2019 | ||||
Equity | - | - | - | - |
Non-current lease liabilities | 961 | 945 | 902 | - |
Non-current fixed assets payables | 35 | 366 | 251 | - |
Non-current employee benefits | 1,461 | 17 | 34 | - |
Non-current liabilities included in the calculation of net financial debt | - | - | - | - |
Other | 574 | 80 | 301 | - |
Total non-current liabilities | 3,030 | 1,409 | 1,487 | - |
Current lease liabilities | 170 | 284 | 192 | - |
Current fixed assets payables | 1,144 | 563 | 407 | - |
Trade payables | 2,682 | 1,051 | 935 | 3 |
Customer contracts liabilities | 1,015 | 98 | 335 | - |
Current employee benefits | 1,224 | 33 | 110 | - |
Deferred income | 2 | - | 6 | - |
Current liabilities included in the calculation of net financial debt | - | - | - | - |
Other | 781 | 178 | 268 | - |
Total current liabilities | 7,017 | 2,207 | 2,252 | 3 |
Total equity and liabilities | 10,047 | 3,616 | 3,739 | 3 |
December 31, 2018 | ||||
Equity | - | - | - | - |
Non-current fixed assets payables | 48 | 119 | 291 | - |
Non-current employee benefits | 1,726 | 11 | 33 | - |
Non-current liabilities included in the calculation of net financial debt | - | - | - | - |
Other | 635 | 126 | 243 | - |
Total non-current liabilities | 2,409 | 256 | 567 | - |
Current fixed assets payables | 1,116 | 598 | 398 | - |
Trade payables | 2,598 | 1,055 | 926 | 2 |
Customer contracts liabilities | 1,091 | 66 | 322 | - |
Current employee benefits | 1,307 | 38 | 102 | - |
Deferred income | 2 | - | 3 | - |
Current liabilities included in the calculation of net financial debt | - | - | - | - |
Other | 846 | 148 | 253 | (1) |
Total current liabilities | 6,960 | 1,905 | 2,004 | 1 |
Total equity and liabilities | 9,369 | 2,161 | 2,571 | 1 |
(1) Including in 2020, 27 million euros of non-current financial liabilities, 101 million euros in 2019 and 90 million euros in 2018. | ||||
(2) Including in 2020, 3,128 million euros of current financial liabilities related to Mobile Financial Services activities, 4,280 million euros in 2019 and 4,835 million euros in 2018 (see Note 17.1). | ||||
Europe | Africa & Middle-East | Enterprise | International Carriers & Shared Services | Eliminations telecom activities and unallocated items | Total telecom activities | Mobile Financial Services | Eliminations telecom activities / mobile financial services | Orange consolidated financial statements | |
Total | |||||||||
- | - | - | - | 37,251 | 37,251 | (213) | - | 37,038 | |
1,881 | 825 | 346 | 1,553 | - | 5,843 | 31 | - | 5,875 | |
525 | 153 | - | - | - | 1,291 | - | - | 1,291 | |
23 | 72 | 242 | 684 | 0 | 2,194 | 8 | - | 2,202 | |
- | - | - | - | 30,858 | 30,858 | - | - | 30,858 | |
367 | 69 | 39 | 44 | 990 | 2,092 | 110 (1) | (27) | 2,175 | |
2,796 | 1,119 | 628 | 2,282 | 31,847 | 42,278 | 150 | (27) | 42,401 | |
463 | 141 | 118 | 529 | - | 1,491 | 5 | - | 1,496 | |
1,068 | 523 | 60 | 135 | (1) | 3,349 | - | - | 3,349 | |
1,867 | 1,066 | 745 | 848 | (761) | 6,411 | 120 | (55) | 6,475 | |
405 | 126 | 422 | 119 | (27) | 1,985 | - | (1) | 1,984 | |
138 | 72 | 415 | 374 | (0) | 2,166 | 27 | - | 2,192 | |
119 | 36 | 1 | 6 | (0) | 165 | - | - | 165 | |
- | - | - | - | 5,207 | 5,207 | - | (2) | 5,205 | |
373 | 1,435 | 257 | 900 | 80 | 3,714 | 3,715 (2) | (2) | 7,427 | |
4,432 | 3,398 | 2,019 | 2,911 | 4,498 | 24,488 | 3,867 | (61) | 28,294 | |
7,229 | 4,517 | 2,647 | 5,193 | 73,596 | 104,017 | 3,804 | (88) | 107,733 | |
- | - | - | - | 34,428 | 34,428 | (16) | - | 34,412 | |
1,847 | 979 | 288 | 1,490 | - | 5,564 | 29 | - | 5,593 | |
616 | 166 | - | - | - | 817 | - | - | 817 | |
51 | 68 | 264 | 702 | - | 2,544 | 9 | - | 2,554 | |
- | - | - | - | 33,562 | 33,562 | - | - | 33,562 | |
382 | 55 | 39 | 55 | 849 | 1,954 | 109 (1) | (27) | 2,035 | |
2,896 | 1,268 | 590 | 2,247 | 34,411 | 44,441 | 147 | (27) | 44,561 | |
477 | 157 | 110 | 422 | - | 1,335 | 4 | - | 1,339 | |
970 | 529 | 72 | 135 | (1) | 2,848 | - | - | 2,848 | |
1,989 | 1,136 | 784 | 763 | (773) | 6,581 | 125 | (24) | 6,682 | |
433 | 123 | 412 | 126 | (15) | 2,094 | - | (0) | 2,093 | |
142 | 71 | 407 | 411 | - | 2,254 | 6 | - | 2,261 | |
6 | 36 | 1 | 7 | (0) | 51 | - | - | 51 | |
- | - | - | - | 3,950 | 3,950 | - | (3) | 3,947 | |
446 | 1,211 | 283 | 846 | 341 | 3,908 | 4,638 (2) | (0) | 8,545 | |
4,461 | 3,264 | 2,068 | 2,711 | 3,501 | 23,021 | 4,773 | (28) | 27,767 | |
7,357 | 4,532 | 2,658 | 4,958 | 72,340 | 101,892 | 4,904 | (55) | 106,741 | |
- | - | - | - | 33,151 | 33,151 | 98 | - | 33,249 | |
410 | 154 | - | - | - | 612 | - | - | 612 | |
44 | 64 | 264 | 717 | - | 2,815 | 8 | - | 2,823 | |
- | - | - | - | 27,461 | 27,461 | - | - | 27,461 | |
369 | 59 | 46 | 180 | 791 | 2,080 | 98 (1) | (27) | 2,151 | |
823 | 277 | 310 | 897 | 28,252 | 32,968 | 106 | (27) | 33,047 | |
996 | 528 | 58 | 138 | (1) | 2,835 | - | - | 2,835 | |
1,983 | 1,081 | 689 | 917 | (633) | 6,635 | 135 | (34) | 6,736 | |
389 | 127 | 283 | 129 | (16) | 2,002 | - | - | 2,002 | |
140 | 68 | 398 | 471 | - | 2,384 | 8 | - | 2,392 | |
3 | 44 | 2 | 7 | - | 58 | - | - | 58 | |
- | - | - | - | 7,403 | 7,403 | - | - | 7,403 | |
400 | 1,069 | 273 | 833 | 382 | 3,803 | 5,067 (2) | - | 8,870 | |
3,911 | 2,917 | 1,703 | 2,495 | 7,135 | 25,120 | 5,210 | (34) | 30,296 | |
4,734 | 3,194 | 2,013 | 3,392 | 68,538 | 91,239 | 5,414 | (61) | 96,592 |
1.8 Simplified statement of cash flows on telecommunication and Mobile Financial Services activities
2020 | ||||
(in millions of euros) | Telecom activities | Mobile Financial Services | Eliminations telecom activities / mobile financial services | Orange consoli- dated financial statement |
Operating activities | ||||
Consolidated net income | 5,252 | (196) | - | 5,055 |
Non-monetary items and reclassified items for presentation | 10,238 | 70 | 1 | 10,309 |
Changes in working capital and operating banking activities | ||||
Decrease (increase) in inventories, gross | 72 | - | - | 72 |
Decrease (increase) in trade receivables, gross | (483) | (28) | 23 | (488) |
Increase (decrease) in trade payables | (85) | (14) | (22) | (122) |
Changes in other customer contract assets and liabilities | (40) | - | (1) | (41) |
Changes in other assets and liabilities | 36 | (98) | - | (62) |
Other net cash out | ||||
Operating taxes and levies paid | (1,931) | 2 | - | (1,929) |
Dividends received | 6 | - | - | 6 |
Interest paid and interest rates effects on derivatives, net | (1,265) (1) | 2 | (1) | (1,264) |
Tax dispute for fiscal years 2005-2006 | 2,246 | - | - | 2,246 |
Income tax paid excluding the effect of the fiscal litigation for years 2005-2006 | (1,085) | (1) | - | (1,086) |
Net cash provided by operating activities (a) | 12,961 (2) | (263) | (1) | 12,697 |
Investing activities | ||||
Purchases (sales) of property, plant and equipment and intangible assets (3) | (7,146) | (30) | - | (7,176) |
Purchases of property, plant and equipment and intangible assets | (8,516) | (30) | - | (8,546) |
Increase (decrease) in fixed assets payables | 958 | - | - | 958 |
Investing donations received in advance | 39 | - | - | 39 |
Sales of property, plant and equipment and intangible assets | 374 | - | - | 374 |
Cash paid for investment securities, net of cash acquired | (16) | (32) | - | (49) |
Investments in associates and joint ventures | (7) | - | - | (7) |
Purchases of equity securities measured at fair value | (65) | (1) | - | (67) |
Proceeds from sales of investment securities, net of cash transferred | 5 | 14 | - | 19 |
Decrease (increase) in securities and other financial assets | 1,596 | 121 | (2) | 1,716 |
Net cash used in investing activities (b) | (5,634) | 72 | (2) | (5,564) |
Financing activities | ||||
Cash flows from financing activities | ||||
Medium and long-term debt issuances | 2,694 | - | - | 2,694 |
Medium and long-term debt redemptions and repayments | (3,476) (4) | - | - | (3,476) |
Increase (decrease) of bank overdrafts and short-term borrowings | (299) (5) | (116) | 2 | (413) |
Decrease (increase) of cash collateral deposits | (749) | 1 | - | (747) |
Exchange rates effects on derivatives, net | 37 | - | - | 37 |
Other cash flows | ||||
Repayments of lease liabilities | (1,394) | (4) | - | (1,398) |
Subordinated notes issuances (purchases) | (12) | - | - | (12) |
Coupon and other fees on subordinated notes issuance | (280) | - | - | (280) |
Other proceeds (purchases) from treasury shares | 7 | - | - | 7 |
Capital increase (decrease) - non-controlling interests (6) | (195) | 197 | - | 2 |
Changes in ownership interests with no gain / loss of control | (3) | - | - | (3) |
Dividends paid to owners of the parent company | (1,595) | - | - | (1,595) |
Dividends paid to non-controlling interests | (225) | (1) | - | (226) |
Net cash used in financing activities (c) | (5,490) | 78 | 2 | (5,410) |
2020 | ||||
(in millions of euros) | Telecom activities | Mobile Financial Services | Eliminations telecom activities / mobile financial services | Orange consoli- dated financial statement |
Cash and cash equivalents in the opening balance | 6,112 | 369 | - | 6,481 |
Cash change in cash and cash equivalents (a) + (b) + (c) | 1,839 | (115) | - | 1,724 |
Effect of exchange rates changes on cash and cash equivalents and other non-monetary effects | (59) | - | - | (59) |
Cash and cash equivalents in the closing balance | 7,891 | 254 | - | 8,145 |
2019 | ||||
(in millions of euros) | Telecom activities | Mobile Financial Services | Eliminations telecom activities / mobile financial services | Orange consoli- dated financial statement |
Operating activities | ||||
Consolidated net income | 3,407 | (185) | - | 3,222 |
Non-monetary items and reclassified items for presentation | 12,128 | 91 | 1 | 12,221 |
Changes in working capital and operating banking activities | ||||
Decrease (increase) in inventories, gross | 69 | - | - | 69 |
Decrease (increase) in trade receivables, gross | (34) | (1) | (10) | (45) |
Increase (decrease) in trade payables | (92) | (3) | 10 | (85) |
Changes in other customer contract assets and liabilities | (59) | - | (0) | (60) |
Changes in other assets and liabilities | (87) | (726) | - | (813) |
Other net cash out | ||||
Operating taxes and levies paid | (1,939) | (0) | - | (1,939) |
Dividends received | 17 | - | - | 17 |
Interest paid and interest rates effects on derivatives, net | (1,317)(1) | (0) | (1) | (1,318) |
Income tax paid | (1,079) | 0 | - | (1,079) |
Net cash provided by operating activities (a) | 11,014 (2) | (824) | - | 10,190 |
Investing activities | ||||
Purchases (sales) of property, plant and equipment and intangible assets (3) | (7,555) | (28) | - | (7,582) |
Purchases of property, plant and equipment and intangible assets | (8,394) | (28) | - | (8,422) |
Increase (decrease) in fixed assets payables | 179 | (0) | - | 179 |
Investing donations received in advance | 32 | - | - | 32 |
Sales of property, plant and equipment and intangible assets | 628 | - | - | 628 |
Cash paid for investment securities, net of cash acquired | (559) | - | - | (559) |
Investments in associates and joint ventures | (2) | - | - | (2) |
Purchases of equity securities measured at fair value | (39) | (5) | - | (44) |
Sales of investment securities, net of cash transferred | 529 | - | - | 529 |
Decrease (increase) in securities and other financial assets | (2,082) | 368 | 3 | (1,711) |
Net cash used in investing activities (b) | (9,707) | 335 | 3 | (9,370) |
Financing activities | ||||
Cash flows from financing activities | ||||
Medium and long-term debt issuances | 8,351 | - | - | 8,351 |
Medium and long-term debt redemptions and repayments | (4,650) (4) | - | - | (4,650) |
Increase (decrease) of bank overdrafts and short-term borrowings | (1,082) | 140 | (3) | (945) |
Decrease (increase) of cash collateral deposits | 609 | (19) | - | 590 |
Exchange rates effects on derivatives, net | 26 | - | - | 26 |
2019 | ||||
(in millions of euros) | Telecom activities | Mobile Financial Services | Eliminations telecom activities / mobile financial services | Orange consoli- dated financial statement |
Other cash flows | ||||
Repayments of lease liabilities | (1,426) | (4) | - | (1,429) |
Subordinated notes issuances (purchases) and other related fees | 419 | - | - | 419 |
Coupon on subordinated notes | (276) | - | - | (276) |
Purchases of treasury shares - Orange Vision 2020 free share award plan | (27) | - | - | (27) |
Other proceeds (purchases) from treasury shares | (7) | - | - | (7) |
Capital increase (decrease) - non-controlling interests (6) | (108) | 187 | - | 79 |
Changes in ownership interests with no gain / loss of control | (7) | - | - | (7) |
Dividends paid to owners of the parent company | (1,857) | - | - | (1,857) |
Dividends paid to non-controlling interests | (243) | - | - | (243) |
Net cash used in financing activities (c) | (278) | 305 | (3) | 24 |
Cash and cash equivalents in the opening balance | 5,081 | 553 | - | 5,634 |
Cash change in cash and cash equivalents (a) + (b) + (c) | 1,029 | (185) | - | 844 |
Effect of exchange rates changes on cash and cash equivalents and other non-monetary effects | 3 | - | - | 3 |
Cash and cash equivalents in the closing balance | 6,112 | 369 | - | 6,481 |
2018 | ||||
(in millions of euros) | Telecom activities | Mobile Financial Services | Eliminations telecom activities / mobile financial services | Orange consoli- dated financial statement |
Operating activities | ||||
Consolidated net income | 2,326 | (168) | - | 2,158 |
Non-monetary items and reclassified items for presentation | 11,457 | 40 | - | 11,497 |
Changes in working capital and operating banking activities | ||||
Decrease (increase) in inventories, gross | (152) | - | - | (152) |
Decrease (increase) in trade receivables, gross | (122) | - | 25 | (97) |
Increase (decrease) in trade payables | 158 | 44 | (25) | 177 |
Changes in other customer contract assets and liabilities | 12 | - | - | 12 |
Changes in other assets and liabilities | (95) | (81) | - | (176) |
Other net cash out | ||||
Operating taxes and levies paid | (1,776) | (1) | - | (1,777) |
Dividends received | 51 | - | - | 51 |
Interest paid and interest rates effects on derivatives, net | (1,259) | - | - | (1,259) |
Income tax paid | (928) | - | - | (928) |
Net cash provided by operating activities (a) | 9,672(2) | (166) | - | 9,506 |
Investing activities | ||||
Purchases (sales) of property, plant and equipment and intangible assets(3) | (7,655) | (37) | - | (7,692) |
Purchases of property, plant and equipment and intangible assets | (7,606) | (36) | - | (7,642) |
Increase (decrease) in fixed assets payables | (288) | (1) | - | (289) |
Investing donations received in advance | 47 | - | - | 47 |
Sales of property, plant and equipment and intangible assets | 192 | - | - | 192 |
Cash paid for investment securities, net of cash acquired | (284) | - | - | (284) |
Investments in associates and joint ventures | (6) | - | - | (6) |
Purchases of equity securities measured at fair value | (90) | (14) | - | (104) |
Sales of investment securities, net of cash transferred | 110 | - | - | 110 |
Decrease (increase) in securities and other financial assets | (501) | 77 | (152) | (576) |
Net cash used in investing activities (b) | (8,426) | 26 | (152) | (8,552) |
2018 | ||||
(in millions of euros) | Telecom activities | Mobile Financial Services | Eliminations telecom activities / mobile financial services | Orange consoli- dated financial statement |
Financing activities | ||||
Cash flows from financing activities | ||||
Medium and long-term debt issuances | 5,214 | - | - | 5,214 |
Medium and long-term debt redemptions and repayments | (4,095)(4) | - | - | (4,095) |
Increase (decrease) of bank overdrafts and short-term borrowings | (251) | 56 | 152 | (43) |
Decrease (increase) of cash collateral deposits | 203 | 5 | - | 208 |
Exchange rates effects on derivatives, net | 7 | - | - | 7 |
Other cash flows | ||||
Coupon on subordinated notes | (280) | - | - | (280) |
Purchases of treasury shares - Orange Vision 2020 free share award plan | (101) | - | - | (101) |
Other proceeds (purchases) from treasury shares | 3 | - | - | 3 |
Capital increase (decrease) - non-controlling interests(6) | (87) | 155 | - | 68 |
Changes in ownership interests with no gain / loss of control | (6) | - | - | (6) |
Dividends paid to owners of the parent company | (1,860) | - | - | (1,860) |
Dividends paid to non-controlling interests | (246) | - | - | (246) |
Net cash used in financing activities (c) | (1,499) | 216 | 152 | (1,131) |
Cash and cash equivalents in the opening balance | 5,333 | 477 | - | 5,810 |
Cash change in cash and cash equivalents (a) + (b) + (c) | (253) | 76 | - | (177) |
Effect of exchange rates changes on cash and cash equivalents and other non-monetary effects | 1 | - | - | 1 |
Cash and cash equivalents in the closing balance | 5,081 | 553 | - | 5,634 |
(1) Including interests paid on lease liabilities for (131) million euros in 2020 and (104) million euros in 2019 and interests paid on financed asset liabilities for (1) million euro in 2020 and 2019. | ||||
(2) Including significant litigations paid and received for (2,217) million euros in 2020, 5 million euros in 2019 and (174) million euros in 2018. | ||||
(3) Including telecommunication licenses paid for (351) million euros in 2020, (334) million euros in 2019 and (422) million euros in 2018. | ||||
(4) Including repayments of debts relating to financed assets for (60) million euros in 2020 and (17) million euros in 2019. In 2018, included repayments of finance leases liabilities for (123) million euros. | ||||
(5) Including redemption of subordinated notes reclassified in 2019 as short-term borrowings of (500) million euros in 2020. | ||||
(6) Including 197 million euros in 2020, 122 million euros in 2019 and 101 million euros in 2018 in Orange Bank share capital invested by Orange. | ||||
The table below shows the reconciliation between net cash provided by operating activities (telecom activities), as shown in the simplified statement of cash flows, and organic cash flow from telecom activities.
2020 | 2019 | 2018 | |
Net cash provided by operating activities (telecom activities) (1) | 12,961 | 11,014 | 9,672 |
Purchases (sales) of property, plant and equipment and intangible assets | (7,146) | (7,555) | (7,655) |
Repayments of lease liabilities (1) | (1,394) | (1,426) | - |
Repayments of finance lease liabilities | - | - | (123) |
Repayments of debts relating to financed assets | (60) | (17) | - |
Elimination of telecommunication licenses paid | 351 | 334 | 422 |
Elimination of significant litigation paid (and received) (2) | (2,217) | (5) | 174 |
Organic cash flow from telecom activities | 2,494 | 2,345 | 2,490 |
(1) 2019 figures have been restated of the IFRS IC decision on lease term (see Note 2.3.1).
(2) Including the tax income received of 2,246 million euros relating to the tax dispute for fiscal years 2005-2006.
1.9 Definition of operating segments and performance indicators
Change in the presentation of segment information in 2020
The new organization of the Orange group’s Executive Committee, in place since September 1, 2020, led the Group to review the presentation of its segment information without modifying the definition of business segments and Cash Generating Units (CGUs).
In this context, Spain has been included in the Europe aggregate; the segment data presented for 2019 and 2018 take this change into account.
It should also be noted that the Orange Bank business segment has been renamed Mobile Financial Services to reflect the gradual integration of new activities within the segment.
The decisions regarding the allocation of resources and the performance assessment of the component parts of Orange (hereinafter referred to as "the Group") are made by the Chairman and Chief Executive Officer (main operational decision-maker) at business segment level, mainly consisting of the geographical establishments.
The business segments are:
− France (Enterprise excluded);
− Spain and each of the Other European countries (including the business segments Poland, Belgium and Luxembourg and each of the Central European countries). The Europe aggregate thus presents all the business segments in this region;
− the Sonatel subgroup (grouping together Sonatel in Senegal, Orange Mali, Orange Bissau, Orange in Guinea and Orange in Sierra Leone), the Côte d’Ivoire subgroup (including the Orange Côte d’Ivoire entities, Orange in Burkina Faso and Orange in Liberia) and each of the other countries in Africa and Middle East. The Africa and Middle East aggregate thus presents all the business segments in this region;
− Enterprise;
− the activities of International Carriers & Shared Services (IC&SS), which contain certain resources, mainly in the areas of networks, information systems, research and development and other shared Group activities, as well as the Orange brand;
− Mobile Financial Services.
The use of shared resources, mainly provided by IC&SS, is taken into account in segment results based either on the terms of contractual agreements between legal entities, external benchmarks or by reallocating costs among the segments. The supply of shared resources is included in other revenues of the service provider, and the use of these resources is included in expenses of the service user. The cost of shared resources may be affected by changes in contractual relationships or organization and may therefore impact the segment results disclosed from one year to another.
Accounting policies
Operating performance indicators
The Group has applied IFRS 16 "Leases" since January 1, 2019.
In 2019, this change in the standard led the Group to modify its key operating performance indicators and to define others: EBITDAaL ("EBITDA after Leases") and eCapex ("economic CAPEX").
Reported EBITDA, adjusted EBITDA and CAPEX remain the performance indicators used for prior periods.
Since 2019, these key operating performance indicators have accordingly been used by the Group to:
− manage and assess its operating and segment results; and
− implement its investment and resource allocation strategy.
The Group’s management believes that the presentation of these indicators is relevant as it provides readers with the same management indicators as those used internally.
EBITDAaL relates to operating income (loss) before depreciation and amortization of fixed assets, effects resulting from business combinations, reclassification of translation adjustment from liquidated entities, impairment of goodwill and fixed assets, share of profits (losses) of associates and joint ventures, and after interests on debts related to financed assets and on lease liabilities, adjusted for:
− significant litigation;
− specific labor expenses;
− fixed asset, investment and business portfolio review;
− restructuring program costs;
− acquisition and integration costs; and,
− where appropriate, other specific items.
This measurement indicator allows for the effects of certain specific factors to be isolated, irrespective of their recurrence and the type of income and expense, when they are linked to:
− significant litigation: significant litigation expenses relate to risk reassessments regarding various litigations. Associated procedures are based on third-party decisions (regulatory authority, court, etc.) and occur over a different period to the activities at the source of the litigation. Costs are by nature difficult to predict in terms of their source, amount and period;
− specific labor expenses: independent of any departure plans included in the costs of restructuring programs, certain employee working time adjustment programs have a negative impact on the period in which they are signed and implemented. Specific labor expenses primarily relate to changes in assumptions and experience effects for the various part-time for seniors plans in France;
− the fixed asset, investment and business portfolio review: the Group conducts an ongoing review of its portfolio of fixed assets, investments and businesses. In this context, decisions to exit or sell are implemented and, by their nature, have an impact on the period in which they take place;
− restructuring program costs: the adaptation of the Group’s activities to changes in the environment may generate costs related to the shutdown or major transformation of an activity. These costs, linked to the cessation or major transformation of an activity, mainly consist of employee departure plans, contract terminations and costs in respect of contracts that have become onerous;
− acquisition and integration costs: the Group incurs costs directly related to the acquisition of entities and their integration in the months following their acquisition. These are primarily legal and advisory fees, registration fees and earn-outs;
− where appropriate, other specific items that are systematically specified in relation to income and/or expenses.
EBITDAaL is not a financial indicator defined by IFRS and may not be comparable to similarly-titled indicators used by other groups. It is provided as additional information only and should not be considered as a substitute for operating income or cash flow provided by operating activities.
eCapex relates to acquisitions of property, plant and equipment and intangible assets excluding telecommunication licenses and financed assets, minus the disposal price of fixed assets. It is used internally as an indicator to allocate resources. eCAPEX is not a financial indicator defined by IFRS and may not be comparable to similarly-titled indicators used by other companies.
The Group uses organic cash flow from telecom activities as an operating performance measure for telecom activities as a whole. Organic cash flow from telecom activities relates to net cash provided by telecom activities minus (i) repayment of lease liabilities and debts related to financed assets, (ii) purchases and disposals of property, plant and equipment and intangible assets, net of the change in fixed asset payables, (iii) excluding the effect of telecommunication licenses paid and principal litigations paid (and received). Organic cash flow is not a financial indicator defined by IFRS and may not be comparable to similarly-titled indicators used by other groups.
Operating performance indicators used in 2018
Reported EBITDA related to operating income before depreciation and amortization, effects resulting from business combinations, reclassification of translation adjustment from liquidated entities, impairment of goodwill and fixed assets and share of profits (losses) of associates and joint ventures.
Adjusted EBITDA related to reported EBITDA, adjusted for significant litigation, specific labor expenses, investment and business portfolio review, restructuring and integration costs and, where appropriate, other specific items.
This measurement indicator allowed the effects of certain specific factors to be isolated from reported EBITDA, irrespective of their recurrence and the type of income or expense, when they were linked to:
− significant litigation: significant litigation expenses related to risk reassessments regarding various litigations. Associated procedures were based on third-party decisions (regulatory authority, court, etc.) and could occur over a different period to the activities at the source of the litigation. Costs were by nature difficult to predict in terms of their source, amount and period;
− specific labor expenses: independent of any departure plans included in the costs of restructuring programs, certain employee working time adjustment programs had a negative impact on the period in which they were signed and implemented. Specific labor expenses primarily related to changes in assumptions and experience effects for the various part-time for seniors plans in France;
− the investment and business portfolio review: the Group conducted an ongoing review of its investments and business portfolio. In this context, disposal decisions were implemented and, by their nature, had an impact on the period in which the disposal took place. The corresponding gains (losses) on disposal affected either reported EBITDA or consolidated net income of discontinued operations;
− restructuring and integration costs: the adaptation of the Group’s activities to changes in the environment may generate costs related to the discontinuation or major transformation of an activity. These costs, linked to the cessation or major transformation of an activity, mainly consist of employee departure plans, contract terminations and costs in respect of contracts that have become onerous;
− where appropriate, other specific items that are systematically specified in relation to income and/or expenses.
Adjusted EBITDA and reported EBITDA were not financial indicators as defined by IFRS and were not comparable to similarly-titled indicators used by other groups. They were provided as additional information only and should not be considered as a substitute for operating income or cash flow provided by operating activities.
CAPEX related to the acquisition of property plant and equipment and intangible assets excluding telecommunication licenses and investments financed through finance leases and were used internally as an indicator to allocate resources. CAPEX is not a financial indicator defined by IFRS and may not be comparable to similarly-titled indicators used by other companies.
Assets and liabilities
Inter-segment assets and liabilities are reported in each business segment.
Non-allocated assets and liabilities for telecom activities mainly include external financial debt, external cash and cash equivalents, current and deferred tax assets and liabilities, as well as equity. Financial debt and investments between these segments are presented as non-allocated elements.
For Mobile Financial Services, the line "other" includes the assets and liabilities listed above as well as loans and receivables and payables related to Mobile Financial Services transactions.
The other accounting policies are presented within each note to which they refer.
Note 2 Description of business and basis of preparation of the consolidated financial statements
2.1 Description of business
Orange provides B2C customers, businesses and other telecommunication operators with a wide range of services including fixed telephony and mobile telecommunications, data transmission and other value-added services, including mobile financial services. In addition to its role as a supplier of connectivity, the Group provides business services, primarily solutions in the fields of digital work, security and improvement of business line processes.
Telecommunication operator activities are regulated and dependent upon the granting of licenses, just as mobile financial service activities have their own regulations.
2.2 Basis of preparation of the financial statements
The consolidated financial statements were approved by the Board of Directors’ Meeting on February 17, 2021 and will be submitted for approval at the Shareholders’ Meeting on May 18, 2021.
The 2020 consolidated annual financial statements have been prepared in accordance with the International Financial Reporting Standards (IFRSs) as endorsed by the European Union. Comparative figures are presented for 2019 and 2018 using the same basis of preparation.
The data are presented in millions of euros, without a decimal. Rounding to the nearest million may in some cases lead to non-significant discrepancies in the totals and subtotals shown in the tables.
For the reported periods, the accounting standards and interpretations endorsed by the European Union are similar to the compulsory standards and interpretations published by the International Accounting Standards Board (IASB) with the exception of the texts currently being endorsed, that have no effect on the Group accounts. Consequently, the Group financial statements are prepared in accordance with the IFRS standards and interpretations, as published by the IASB.
The principles applied to prepare the 2020 financial data are based on:
− all the standards and interpretations endorsed by the European Union compulsory as of December 31, 2020;
− options taken relating to date and methods of first application (see 2.3 below);
− the recognition and measurement alternatives allowed by the IFRSs:
Standard | Alternative used | |
IAS 1 | Accretion expense on operating liabilities (employee benefits, environmental liabilities and licenses) | Classification as financial expenses |
IAS 2 | Inventories | Measurement of inventories determined by the weighted average unit cost method |
IAS 7 | Interest paid and received dividends | Classification as net operating cash flows |
IAS 16 | Property, plant and equipment | Measurement at amortized historical cost |
IAS 38 | Intangible assets | Measurement at amortized historical cost |
IFRS 3R | Non-controlling interests | At the acquisition date, measurement either at fair value or at the portion of the net identifiable asset of the acquired entity |
− accounting positions adopted by the Group in accordance with paragraphs 10 to 12 of IAS 8:
Topic | Note |
Presentation of consolidated financial statements | Financial statements and segment information |
Operating taxes and levies | 11.1 |
Income taxes | 11.2 |
Non-controlling interests: change in ownership interest in a subsidiary and transactions with owners | 4 and 15.6 |
In the absence of any accounting standard or interpretation, management uses its judgment to define and apply an accounting policy that will result in relevant and reliable information, such that the financial statements:
− fairly present the Group’s financial position, financial performance and cash flows;
− reflect the economic substance of transactions;
− are neutral;
− are prepared on a prudent basis; and
− are complete in all material respects.
2.3 New standards and interpretations applied from January 1, 2020
2.3.1 Interpretations and amendment of IFRS 16 "Leases"
The Group has applied IFRS 16 "Leases" since January 1, 2019. The accounting principles applied since 2019, and the disclosures regarding lease liabilities and right-of-use assets are described in Note 10.
IFRS IC decision on IFRS 16 lease term
The IFRS IC decision on the enforceable period of leases was implemented from December 31, 2020 for all leases falling within the scope of the final decision of the Interpretation Committee. This first-time application with retroactive effect to January 1, 2019 represents a change in accounting policy. The effect of this implementation is mainly limited to leases with indefinite terms and short notice periods and to contracts whose initial lease term was exceeded and in a situation of tacit renewal at the time of application of this conclusion of the IFRS IC.
The IFRS IC committee published a decision in December 2019 which specifies that it is not possible to use only the legal approach to determine the enforceable period of a contract, if the duration cannot be determined definitively at the origin of the contract. The committee considers that a lease contract remains enforceable as long as the lessee or the lessor would have to bear a loss or a more than insignificant penalty in case of termination of the contract. To determine the enforceable period of a lease, all economic aspects of the lease must be taken into account and not just contractual termination indemnities.
On the date of preparation of the 2019 consolidated annual financial statements, the Group had adopted, depending on the accounting positions and the implementation methods concerning assessment of the term of leases, a legal approach in a certain number of open-ended lease contracts with a notice period of less than 12 months, for which the Group applied the short-term exemption, in particular for leases of certain mobile sites.
In order to determine the reasonably certain terms to be applied to leases that are concerned by the IFRS IC decision, the Group has adopted a differentiated approach taking into account the nature of the underlying leased asset and/or the terms of the lease renewal for certain contracts.
For the majority of leases with indefinite terms benefiting from notice clauses of less than 12 months, the Group has adopted a period consistent with the time horizon in which the Group’s strategic investment decisions are made at the date of implementation of this IFRS IC decision. Where appropriate, the duration of these leases may be reassessed in order to take into account the Group’s strategic choices or technological developments related to the underlying assets covered by these leases.
Effects on the consolidated financial statements
The effects on the consolidated financial statements are presented in the tables below:
− Effects on the consolidated income statement:
(in millions of euros) | Historical data 2019 (1) | Effects of IFRS IC decision | Restated data 2019 |
Revenue | 42,238 | - | 42,238 |
External purchases | (17,897) | 37 | (17,860) |
Other operating income | 720 | - | 720 |
Other operating expenses | (599) | - | (599) |
Labor expenses | (8,494) | - | (8,494) |
Operating taxes and levies | (1,827) | - | (1,827) |
Gains (losses) on disposal of fixed assets, investments and activities | 277 | - | 277 |
Restructuring costs | (132) | - | (132) |
Depreciation and amortization of fixed assets | (7,110) | - | (7,110) |
Depreciation and amortization of financed assets | (14) | - | (14) |
Depreciation and amortization of right-of-use assets | (1,239) | (35) | (1,274) |
Reclassification of translation adjustment from liquidated entities | 12 | - | 12 |
Impairment of goodwill | (54) | - | (54) |
Impairment of fixed assets | 73 | - | 73 |
Impairment of financed assets | - | - | - |
Impairment of right-of-use assets | (33) | - | (33) |
Share of profits (losses) of associates and joint ventures | 8 | - | 8 |
Operating income | 5,927 | 2 | 5,930 |
Cost of gross financial debt excluding financed assets | (1,108) | - | (1,108) |
Interests on debts related to financed assets | (1) | - | (1) |
Gains (losses) on assets contributing to net financial debt | 5 | - | 5 |
Foreign exchange gain (loss) | 76 | - | 76 |
Interests on lease liabilities | (122) | (6) | (129) |
Other net financial expenses | 15 | - | 15 |
Effects resulting from BT stake | (119) | - | (119) |
Finance costs, net | (1,254) | (6) | (1,261) |
Income taxes | (1,447) | 1 | (1,447) |
Consolidated net income | 3,226 | (3) | 3,222 |
(1) Published data as of December 31, 2019
− Effects on the consolidated statement of financial position:
(in millions of euros) | December 31, 2018 historical data | Effects of IFRS 16 application | Effects of IFRS IC decision January 1,2019 | January 1, 2019 restated data | 2019 variation | Effects of IFRS IC decision on 2019 | December 31, 2019 restated data |
Assets | |||||||
Property, plant and equipment | 27,693 | (574) | - | 27,119 | 1,304 | - | 28,423 |
Right-of-use assets | - | 6,349 | 443 | 6,792 | (86) | (6) | 6,700 |
Deferred tax assets | 1,366 | 1,527 | - | 2,893 | (1,902) | 1 | 992 |
Total non-current assets | 74,701 | 7,303 | 443 | 82,446 | (688) | (5) | 81,753 |
Prepaid expenses | 571 | (36) | - | 536 | 195 | - | 730 |
Total current assets | 21,891 | (36) | - | 21,855 | 3,132 | - | 24,987 |
Total assets | 96,592 | 7,267 | 443 | 104,302 | 2,444 | (5) | 106,741 |
Liabilities | |||||||
o/w reserves | (2,062) | 2 | - | (2,060) | 987 | (2) | (1,075) |
o/w net income | 1,954 | - | - | 1,954 | 3,006 | (2) | 3,004 |
o/w translation adjustment | 15 | - | - | 15 | 64 | (0) | 79 |
Equity attributable to owners of the parent company | 30,669 | 2 | - | 30,671 | 1,056 | (2) | 31,725 |
o/w reserves | 2,357 | - | - | 2,357 | 97 | (2) | 2,452 |
o/w net income | 204 | - | - | 204 | 220 | (2) | 218 |
o/w translation adjustment | 237 | - | - | 237 | 14 | (0) | 251 |
Equity attributable to non-controlling interests | 2,580 | - | - | 2,580 | 108 | (2) | 2,686 |
Total Equity | 33,249 | 2 | - | 33,251 | 1,164 | (3) | 34,412 |
Non-current financial liabilities | 26,749 | (427) | - | 26,322 | 6,826 | - | 33,148 |
Non-current lease liabilities | - | 5,239 | 369 | 5,609 | (14) | (2) | 5,593 |
Non-current dismantling provisions | 765 | - | 1 | 766 | 45 | 0 | 812 |
Non-current restructuring provisions | 230 | (112) | - | 118 | (23) | - | 96 |
Deferred tax liabilities | 631 | 1,525 | - | 2,156 | (1,453) | - | 703 |
Current lease liabilities | 33,047 | 6,226 | 371 | 39,644 | 4,919 | (2) | 44,561 |
Current financial liabilities | 7,270 | (167) | - | 7,103 | (3,177) | - | 3,925 |
Current lease liabilities | - | 1,291 | 72 | 1,363 | (24) | - | 1,339 |
Trade payables | 6,736 | (39) | - | 6,697 | (15) | - | 6,682 |
Current restructuring provisions | 159 | (31) | - | 128 | (7) | - | 120 |
Other current liabilities | 1,788 | (15) | - | 1,774 | 321 | - | 2,095 |
Total current liabilities | 30,296 | 1,039 | 72 | 31,407 | (3,640) | - | 27,767 |
Total equity and liabilities | 96,592 | 7,267 | 443 | 104,302 | 2,444 | (5) | 106,741 |
− Effects on consolidated statement of cash flows:
(in millions of euros) | December 31, 2019 historical data | Effects of IFRS IC decision | December 31, 2019 restated data | ||
Operating activities | |||||
Consolidated net income | 3,226 | (3) | 3,222 | ||
Non-monetary items and reclassified items for presentation | |||||
Depreciation and amortization of right-of-use assets | 1,239 | 35 | 1,275 | ||
Finance costs, net | 1,254 | 6 | 1,261 | ||
Other net cash out | |||||
Interest paid and interest rates effects on derivatives, net | (1,312) | (6) | (1,318) | ||
Net cash provided by operating activities (a) | 10,159 | 31 | 10,190 | ||
Investing activities | |||||
Net cash used in investing activities (b) | (9,370) | - | (9,370) | ||
Financing activities | |||||
Repayments of lease liabilities | (1,398) | (31) | (1,429) | ||
Net cash used in financing activities (c) | 55 | (31) | 24 | ||
Net change in cash and cash equivalents (a) + (b) + (c) | 844 | - | 844 | ||
Net change in cash and cash equivalents | |||||
Cash and cash equivalents in the opening balance | 5,634 | - | 5,634 | ||
Cash change in cash and cash equivalents | 844 | - | 844 | ||
Non-cash change in cash and cash equivalents | 3 | - | 3 | ||
Cash and cash equivalents in the closing balance | 6,481 | - | 6,481 | ||
Accounting for rent adjustments granted by lessors in the context of Covid-19
On May 28, 2020, the IASB published an amendment to IFRS 16 relating to rent concessions in the context of the Covid-19 crisis, effective from June 1, 2020. The effect of this amendment, which gives tenants the possibility of recognizing eligible Covid-19-related rent concessions as if they were not lease modifications, is not significant for the Group.
2.3.2 Amendment to IFRS 3 "Definition of a business"
This amendment clarifies the definition of a business and aims to help those preparing financial statements to determine whether an acquisition should be recognized as a business combination or an asset acquisition. This amendment will apply to all acquisitions made from January 1, 2020. These changes relate to the definition of a business:
− the business must include inputs and a substantive process that together significantly contribute to the ability to create outputs;
− the scope is limited to goods and services provided to customers and to income from ordinary activities and not to dividends, cost reductions or any other direct economic benefits for investors and possibly other third parties.
This amendment had no effect on the Group’s consolidated financial statements at December 31, 2020 and the Group will take these new provisions into account when making future acquisitions.
2.3.3 Amendments to IAS 1 and IAS 8 "Materiality"
Amendments to IAS 1 and IAS 8, applicable since January 1, 2020, improve the definition of "material" in order to determine whether information should be provided in the financial statements, or whether the way in which it is communicated has the same effect as if it had not been communicated. The Group considers that the judgment applied in the choice of information provided in its notes to the consolidated financial statements meets the provisions of the amendments published by the IASB.
2.4 Main standards and interpretations compulsory after December 31, 2020 with no early application elected by the Group
2.4.1 Amendment to IAS 1: Classification of liabilities as current or non-current
The amendments to the standard clarify the current requirements of IAS 1 on the classification of liabilities in an entity’s balance sheet. These amendments are not expected to have a significant impact on the Group’s statement of financial position. However, the implementation of these amendments could lead to the reclassification of certain liabilities from current to non-current, and vice versa. The date of entry into force of these amendments is January 1, 2023.
2.4.2 Amendment to IAS 16: Proceeds before intended use
The amendment clarifies that an entity is not permitted to recognize any revenue from the sale of items produced as a deduction from the cost of the fixed asset while preparing the asset for its intended use. The proceeds from selling such items are recognized in profit or loss. The amendment is applicable from January 1, 2022.
2.4.3 Amendment to IAS 37: Onerous contracts - cost of fulfilling a contract
The clarifications provided by the amendment concern the incremental costs of fulfilling an onerous contract to be taken into account in the provision, namely the costs of direct labor and materials and the allocation of other costs directly related to the contract, for example the depreciation expense relating to a fixed asset used in fulfilling the contract. The amendment is applicable from January 1, 2022.
2.4.4 Amendment to IFRS 9, IAS 39, IFRS 7, IFRS 4 and IFRS 16 relating to interest rate benchmark reform phase 2
The amendments to the standards for this phase 2 provide in particular practical expedients for the modification of financial instruments or leases related to the IBOR reform. For debt instruments affected by the IBOR reform, it will not be necessary to apply the provisions of IFRS 9 to determine whether the modification of the instrument is substantial. These amendments propose that modifications to financial instruments related to the reform be treated prospectively as an update to the interest rate with no impact on profit or loss. With regard to hedge accounting, the amendments introduce an exemption allowing hedge accounting to be maintained despite the change in future cash flows impacted by the change in rates due to the reform.
The amendments add new disclosures on the effects of the change in rates on contractual cash flows impacting financial assets and liabilities, lease assets and liabilities and hedge accounting.
Discussions with the counterparties to negotiate the replacement of the indices with the new ones are ongoing. At December 31, 2020, the Group’s exposure to financial instruments indexed to variable rates and maturing after the reform’s implementation date is mainly summarized as follows:
− perpetual bonds redeemable for shares (French acronym TDIRA) for a nominal amount of 633 million euros;
− cross-currency swaps with a nominal value of 348 million euros; and
− interest rate swaps with a nominal value of 573 million euros.
The analysis of leases that may be affected by the reform is underway. The amendments are applicable from January 1, 2021.
2.5 Accounting policies, use of judgment and estimates
The accounting policies are presented within each note to which they refer. In summary:
Note | Topic | Accounting policies | Judgments and estimates(1) |
1 | Segment information | X | |
4 | Changes in the scope of consolidation, takeovers (business combinations), internal transfer of consolidated shares, assets held for sale | X | X |
5.1 | Revenue | X | X |
5.3 | Trade receivables | X | |
5.4 | Customer contract net assets and liabilities, costs of obtaining a contract and costs to fulfill a contract, unfulfilled performance obligations | X | |
5.6 | Submarine cable consortiums, Orange Money | X | |
5.7 | Related party transactions | X | |
6.1 | Advertising, promotion, sponsoring, communication and brand marketing costs | X | |
6.2 | Litigation, acquisition and integration costs | X | X |
6.3 | Restructuring costs | X | X |
6.4 | Broadcasting rights and equipment inventories | X | |
6.6 | Trade payables (goods and services) | X | X |
7.2 | Employee benefits | X | X |
7.3 | Employee share-based compensation | X | |
8 | Goodwill, impairment of goodwill | X | X |
9.2 | Depreciation and amortization | X | |
9.3 | Impairment of non-current assets | X | X |
9.4 | Other intangible assets | X | X |
9.5 | Property, plant and equipment financial liabilities | X | X |
9.6 | Fixed assets payables | X | X |
9.7 | Dismantling provisions | X | X |
10 | Leases | X | X |
10.1 | Right-of-use assets | X | |
10.2 | Lease liabilities | X | X |
11.1 | Operating taxes and levies | X | |
11.2 | Income taxes | X | X |
12 | Interests in associates and joint ventures | X | X |
13.3 | Net financial debt | X | X |
13.3 | Cash and cash equivalents, bonds, bank loans and loans from multilateral lending institutions | X | |
13.4 | Perpetual bonds redeemable for shares (TDIRA) | X | X |
13.7 | Financial assets (telecom activities) | X | X |
13.8 | Derivatives (telecom activities) | X | |
14.8 | Fair value of financial assets and liabilities (telecom activities) | X | X |
15.2 | Treasury shares | X | |
15.4 | Subordinated notes, equity component of perpetual bonds redeemable for shares (TDIRA) | X | X |
15.5 | Translation adjustments | X | |
15.6 | Non-controlling interests | X | |
15.7 | Earnings per share | X | |
17.1 | Financial assets and liabilities of Mobile Financial Services | X | |
17.1.1 | Financial assets related to Orange Bank activities | X | X |
17.2.5 | Fair value of financial assets and liabilities of Orange Bank | X | |
18 | Litigation | X | |
(1) See Notes 2.5.1 and 2.5.2 | |||
2.5.1 Use of judgment
In addition to the alternatives or accounting positions mentioned above in 2.2, Management exercises judgment in order to define the accounting policies for certain transactions:
Topic | Nature of accounting judgment | |
Notes 4 and 20 | Control | Requiring judgment in certain circumstances with respect to the existence or not of the control Continuous control assessment which can affect the scope of consolidation, as for instance when a shareholders’ agreement is revised or terminated, or when protective rights turn into substantive rights |
Note 5 | Revenue | Splitting transaction price between mobile and service Identification of distinct or non-distinct performance obligations |
Notes 6, 11 and 18 | Purchases and other expenses, tax and litigation | Litigation and tax: measurement of technical merits of the interpretations and legislative positions and qualification of the facts and circumstances Onerous supplier contracts: trigger event, nature of unavoidable costs |
Note 6 | Purchases and other expenses | Reverse factoring: distinguishing operating debt and financial debt |
Note 9 | Fixed assets | Qualifying network, sites or equipment sharing among operators as joint operations |
Note 10 | Leases | Determination of the non-cancellable lease term and assessment of the exercise or not of termination, extension and purchase option Separation of service and lease components of leases "TowerCos" arrangements: electing the unit of account (tower or used space) and analyzing the arrangements in order to determine whether they contain a lease |
Notes 13 and 15 | Financial assets and liabilities and net finance costs Equity | Distinguishing equity and debt: assessing specific contractual clauses |
2.5.2 Use of estimates
In preparing the Group’s consolidated annual financial statements, Orange’s management makes estimates, insofar as many elements included in the financial statements cannot be measured precisely. Management revises these estimates if the underlying circumstances evolve or in light of new information or more experience. Consequently, the estimates made at December 31, 2020 may subsequently be changed. The consequences of the health crisis on the economic environment have led the Group’s management to review some of its estimates (see Note 3).
Topic | Key sources of estimates on future income and/or cash flows | |
Note 5 | Revenue | Deciding duration of legally binding rights and obligations |
Notes 6, 11 and 18 | Risk of resources outflow linked to claims and litigation and to tax legislation Onerous contracts | Underlying assumptions of the assessment of legal and fiscal positions Identifying and releasing of uncertain legal and tax positions Underlying assumptions of the assessment |
Notes 8.3, 8.4, 9.3, 9.4, 9.5 and 12 | Measurement of the recoverable values for the impairment tests (goodwill, tangible and intangible assets, investments accounted for under the equity method) | Sensitivity to discount rates, perpetual growth rate and business plans’ assumptions which affect the expected cash flows (revenues, EBITDAaL and investments) Assessing the competitive, economic and financial environment of the countries where the Group operates |
Note 11.2 | Measurement of the recoverable value of deferred tax assets | Assessing the deferred tax assets’ recovery timeline when a tax entity reverts to profitability or when the tax legislation limits the use of tax loss carryforward |
Note 9 | Fixed assets | Assessing assets’ useful life according to the change in the technological, regulatory or economic environment (notably the migration from the copper local loop into fiber and other greater bandwidth technologies, radio technology migration) Provision for dismantling and restoring sites: dismantling timeframe, discount rate, expected cost |
Note 10 | Leases | Determination of the incremental borrowing rate of the lease when the implied interest rate is not identifiable in the lease Determination of the term of certain leases |
Note 7.2 | Employee benefits | Sensitivity to discount rates Sensitivity to sign-up rate senior plans |
Notes 14 and 17 | Fair value of financial assets and liabilities | Models, selection of parameters, fair value hierarchy, evaluation of non-performance risks |
Furthermore, aside from the elements linked to the level of activity, income and future cash flows are sensitive to changes in financial market risks, notably interest rate and foreign exchange risks (see Note 13).
Note 3 Impact of the health crisis linked to the Covid-19 pandemic
The aim of this note is to summarize the impacts of the health crisis on the Group’s business and performance, the judgments and assumptions made as well as the main effects of the crisis on the Group’s Consolidated Financial Statements.
3.1 Effects of the Covid-19 pandemic on Orange’s business and financial position
The Covid-19 pandemic that affected France and the world in 2020 prompted the Group to rapidly implement actions to protect its employees, suppliers, subcontractors and customers and, further afield, all of its stakeholders.
The implementation of these actions and the decisions taken by the governments of the countries in which the Group operates have affected Orange’s business and financial position. These consequences are not easily quantifiable as they are difficult to separate from other factors affecting the period
However, in 2020, the main effects of the Covid-19 pandemic on the Group’s revenue are as follows:
− a widespread and significant decline in revenues from international roaming (customers and visitors);
− a sharp decline in equipment sales;
− lower than expected growth in revenues from fixed-line services to operators;
− a slowdown in services to businesses;
− a general decline in sales activity.
With regard to the Group’s operating expenses, the main effects of the Covid-19 pandemic are:
− a rise in impairments and losses on trade receivables;
− an overall increase in external purchases, in particular due to the costs of arrangements introduced to safeguard health, additional costs related to the support measures for certain network service providers in France, as well as donations and sponsorship;
− the payment of specific bonuses to some employees in connection with the health crisis;
− a significant decrease in commercial expenses, equipment costs and overheads.
With regard to the Group’s investments, the main effects are a significant inflection in investments in the first half of the year, due to the slowdown or temporary postponement of a certain number of projects.
3.2 Main effects on the Consolidated Financial Statements at December 31, 2020
The main accounting estimates at December 31, 2020 during the preparation of the Orange group’s Consolidated Financial Statements concerned:
− impairment tests (see Note 8);
− deferred tax asset recoverability tests (see Note 11);
− impairment of trade receivables in accordance with IFRS 9 (see Notes 5.3 and 6.2);
− the Group’s exposure to credit, liquidity and market risks (see Note 14).
The use of estimates and judgments as well as the main assumptions made are detailed in each of the relevant notes.
At December 31, 2020, the main specific additional costs incurred by the management of the health crisis on operating income are described below.
In external purchases, the main incremental costs are as follows:
− costs related to arrangements introduced to safeguard health for (72) million euros, mainly at Orange SA;
− additional costs related to measures to support a number of network services in order to maintain the activity and offset a portion of the fixed costs of suppliers in France for (19) million euros (to which are added (24) million euros recorded in investments);
− (9) million euros in donations and sponsorships, in particular for the Middle East Africa region’s subsidiaries and Orange SA.
Labor expenses include the payment to certain employees of specific bonuses related to the health crisis for (10) million euros.
Other operating expenses also include increases in trade receivables impairment in accordance with IFRS 9 for (144) million euros of which (129) million euros related to telecom activities and (15) million euros related to Orange Bank activities.
Note 4 Gains and losses on disposal and main changes in scope of consolidation
4.1 Gains (losses) on disposal of fixed assets, investments and activities
(in millions of euros) | 2020 | 2019 | 2018 | |
Gains (losses) on disposal of fixed assets (see Note 9.1) | 221 | 303 | 180 | |
Gains (losses) on disposal of investments and activities | 7 | (26) | 17 | |
Gain (losses) on disposal of fixed assets, investments and activities | 228 | 277 | 197 |
The results of the disposal of BT shares in 2018 and in 2019 are presented in net finance costs in the income statement and detailed in Note 13.7.
4.2 Main changes in the scope of consolidation
Changes in the scope of consolidation during 2020
Squeeze-out offer on Business & Decision shares
On May 28, 2020, Orange Business Services launched a mandatory public buyout offer for all the shares of Business & Decision not yet held by the Group, representing 6.38% of the capital.
This offer closed on July 8 and was followed by the effective delisting of Business & Decision shares on July 13, 2020.
Following this public buyout offer and the acquisition of the remaining shares of capital over the second half of the year for an amount of (4) million euros, Orange now holds 100% of the shares of Business & Decision.
Changes in the scope of consolidation during 2019
Acquisitions of SecureLink and SecureData
On January 31, 2019, Orange acquired a 100% equity interest in SecureData, a provider of cyber security solutions in the United Kingdom for 100 million euros.
On July 8, 2019, the Group acquired 100% of SecureLink, an independent cyber security operator in Europe, for 377 million euros.
At acquisition date | SecureLink | SecureData |
(in millions of euros) | ||
Acquisition cost | 377 | 100 |
Cash acquired net of transaction costs | (6) | (5) |
Cash paid for investment securities, net of cash acquired | 371 | 95 |
Goodwill was recognized in the amount of 392 million euros as a result of the acquisition of Securelink and 97 million euros as a result of the acquisition of SecureData, after allocation of the purchase price to identifiable assets acquired and liabilities assumed.
At acquisition date | SecureLink | SecureData |
(in millions of euros) | ||
Acquisition cost (a) | 377 | 100 |
Net book value acquired | (153) | (32) |
Effects of fair value measurement: | ||
Customer relationship(1) | 181 | 43 |
Trademark | - | - |
Other intangibles | - | - |
Net deferred tax | (43) | (8) |
Net asset remeasured at fair value (b) | (15) | 3 |
Goodwill (a)-(b) | 392 | 97 |
(1) Depreciation between 12 and 16 years according to the type of clients.
Fair values were measured using the excess earnings method for the customer base. Goodwill was primarily related to the acquisition of future customers.
The SecureLink and SecureData acquisition effect on revenue, in 2019, amounted to 154 million euros and 47 million euros, respectively.
Business & Decision
Since December 31, 2018, Orange has acquired 5.4% of the capital of Business & Decision for 3 million euros. At December 31, 2019, Orange owned 93.6% of the capital of Business & Decision. This change in the percentage share held by Orange with no gain, or loss, of control, was shown in the financing flows in the statement of cash flows.
Sale of Orange Niger
On November 22, 2019, Orange sold its 95.5% holding in Orange Niger to Zamani Com S.A.S, a company that is wholly owned by Orange Niger minority shareholders. This sale had no material impact on the Group's financial statements.
Changes in the scope of consolidation during 2018
Basefarm acquisition
On August 14, 2018, the Group acquired 100% of Basefarm for an amount of 234 million euros.
(in millions of euros) | At acquisition date |
Acquisition cost | 234 |
Cash acquired net of transaction costs | (4) |
Cash paid for investment securities, net of cash acquired | 230 |
In accordance with IFRS 3R - Business Combinations, the fair value measurement of identifiable assets acquired and liabilities assumed was finalized during fiscal year 2019. The final allocation of the acquisition cost was as follow:
(in millions of euros) | At acquisition date |
Acquisition cost (a) | 234 |
Net book value acquired | (58) |
Effects of fair value measurement: | |
Customer relationship(1) | 58 |
Trademark (2) | 28 |
Other intangibles(3) | 7 |
Net deferred tax | (25) |
Net asset remeasured at fair value (b) | 10 |
Goodwill (a)-(b) | 224 |
(1) Depreciation over 15 years.
(2) Depreciation over 5 years.
(3) Depreciation over 7 years.
Fair value was measured using the relief from royalty method for the brand and the excess earnings method for the customer base.
Goodwill was primarily related to future technologies and acquisition of future customers.
This acquisition had no significant impact on revenue in 2018.
Acquisition of Business & Decision
Following the acquisition of Business & Decision on June 5, 2018 and the purchase of additional securities as part of the friendly tender offer finalized on July 19, 2018, the Group acquired a stake of 81.8% of the capital of Business & Decision at a price of 50 million euros. Furthermore, Orange signed an agreement to acquire 4.9% more of the capital.
(in millions of euros) | At acquisition date |
Acquisition cost 81.8% | 50 |
Cash acquired net of transaction costs | (18) |
Cash paid for investment securities, net of cash acquired | 32 |
Goodwill was recognized in the amount of 29 million euros, after allocation of the purchase price to identifiable assets acquired and liabilities assumed:
(in millions of euros) | At acquisition date |
Acquisition cost 81.8% | 50 |
Fair value of non-controlling interests | 12 |
Acquisition cost (a) | 62 |
Net book value acquired | 7 |
Effects of fair value measurement: | |
Customer relationship(1) | 18 |
Trademark (2) | 8 |
Other intangibles(3) | 4 |
Net deferred tax | (4) |
Net asset remeasured at fair value (b) | 33 |
Goodwill (a)-(b) | 29 |
(1) Depreciation over 10 years.
(2) Depreciation over 7 years.
(3) Specific technology depreciated over 9 years.
The residual goodwill was mainly related to workforce skills that could not be recognized separately.
The effect of the acquisition of Business & Decision on revenue in 2018 amounted to 108 million euros.
On July 19, 2018, Orange acquired 6.4% of the capital of Business & Decision for 4 million euros. As at December 31, 2018, Orange holds 88.2% of the capital of Business & Decision (93.1% including the shares under reciprocal promises).
4.3 On-going transactions
Signing agreement of Orange Romania to acquire a controlling stake in Telekom Romania Communications
Orange Romania has announced on November 9, 2020 the signing of a deal to acquire a controlling 54% stake in Telekom Romania Communications. This transaction aims at accelerating Orange’s ambitions to become a major convergent operator for customers in the Romanian market.
The transaction price amounts to 268 million euros (on a debt-free, cash-free basis and is subject to customary adjustments at closing of the transaction).
The closing of the transaction is subject to customary condition precedents, notably antitrust clearance by the European Commission and other relevant authorities and is a priori expected within the second half of 2021.
Orange Concessions
On January 22, 2021, Orange has entered into an exclusive agreement with La Banque des Territoires (Caisse des Dépôts), CNP Assurances and EDF Invest, for the sale of 50% of the capital and joint control of Orange Concessions. Subject to obtaining the agreement of the relevant antitrust authorities and all stakeholders, the closing of this transaction should be completed in the second half of 2021.
With regard to the disposal plan initiated by the Group and in accordance with the criteria established by the IFRS 5 standard, the Group considers that the criteria for classifying the related assets as "assets held for sale" are not met as of December 31, 2020.
Conditional voluntary public takeover offer on shares of Orange Belgium
On December 2, 2020, Orange has announced its intention to launch a conditional voluntary public tender offer on 47.09% of the capital of Orange Belgium, corresponding to the balance of the shares of Orange Belgium currently not held, at a price of 22 euros per share, in cash and without threshold conditions. It was submitted on January 21, 2021 for approval by the Financial Services and Markets Authority in Belgium (FSMA).
If conditions were met, this offer could then lead to the delisting of the shares of Orange Belgium.
Accounting policies
Changes in the scope of consolidation
Entities are fully consolidated if the Group has the following:
− power over the investee; and
− exposure, or rights, to variable returns from its involvement with the investee; and
− the ability to use its power over the investee to affect the amount of the investor’s returns.
When assessing control, IFRS 10 requires judgment and continuous assessment.
Clarifications of when the ownership interest does not imply a de facto presumption are provided in Note 20 which lists the main consolidated entities.
Joint ventures and companies over which the Group exercises significant influence (generally corresponding to an ownership interest of 20% to 50%) are accounted for using the equity method.
When assessing the level of control or significant influence exercised over a subsidiary or associate, the existence and effect of any exercisable or convertible potential voting rights at the closing date is taken into account.
Takeovers (business combinations)
Business combinations are accounted for using the acquisition method:
− the acquisition cost is measured at the fair value of the consideration transferred, including all contingent consideration, at the acquisition date. Subsequent changes in the fair value of contingent consideration are accounted for either through profit or loss or through other comprehensive income, in accordance with the applicable standards;
− goodwill is the difference between the consideration transferred and the fair value of the identifiable assets and liabilities assumed at the acquisition date, and is recognized as an asset in the statement of financial position. Considering the Group’s activity, the fair values of the identifiable assets relate mainly to licenses, customer bases and brands (which cannot be capitalized when developed in-house), generating induced deferred taxes. The fair value of these assets, which cannot be observed, is established using commonly adopted methods, such as those based on revenues or costs (e.g.: the "Greenfield" method for the valuation of licenses, the "relief from royalty" method for the valuation of brands and the "excess earnings" method for customer bases).
For each business combination with an ownership interest below 100%, non-controlling interest is measured:
− either at its fair value: in which case, goodwill is recognized for the portion relating to non-controlling interests;
− or proportionate to its share of the acquiree's identifiable net assets: in which case, goodwill is only recognized for the share acquired.
Acquisition-related costs are directly recognized in operating income in the period in which they are incurred.
When a business combination is achieved in stages, the previously held equity interest is re-measured at fair value at the acquisition date through operating income. The related other comprehensive income, if any, is fully reclassified to profit or loss.
Internal transfer of consolidated shares
IFRS do not address the accounting treatment for the transfer of consolidated shares within the Group resulting in changes in ownership interest. The Group applies the following accounting policy:
− the transferred shares are carried at historical cost and the gain or loss on the transfer is fully eliminated in the acquirer’s accounts;
− the non-controlling interests are adjusted to reflect the change in their share in the equity against Group retained earnings, with no impact on profit and loss and equity.
Assets held for sale
The Group qualifies an asset or group of assets as "held for sale" when:
− the management is committed to a plan to sell;
− the asset is available for immediate sale in its current state (subject to any conditions precedent that are usual in such disposals); and
− the sale is highly probable, within 12 months.
Thus, when the Group is committed to a plan to sell involving the loss of control or significant influence over one of its assets, it classifies all assets and liabilities of the entities concerned under a separate line in the statement of financial position: "Assets/Liabilities held for sale", at a value equal to the lower of the net carrying value and the fair value net of disposal costs.
In addition, when the asset or group of assets held for sale represents a major line of an operating segment, its contribution to the income statement is presented separately below "consolidated net income of continuing operations" and its cash flow contribution is presented in the statement of cash flows.
Note 5 Sales
5.1 Revenue
The presentation of revenue is disaggregated by category and segment in Note 1.1 "Segment information." The breakdown of revenue by type is as follows:
− Mobile-only services: mobile service revenue is generated by incoming and outgoing calls (voice, SMS and data), excluding convergent services (see below);
− Fixed-only services: revenue from fixed services includes fixed broadband and narrowband services, excluding convergent services (see below) and fixed network business solutions, including voice and data;
− Convergence packages (convergent services): these include revenue from convergence packages for the B2C market (Internet + Mobile products);
− Equipment sales: equipment sales include all sales of equipment (mobile handsets, broadband equipment, connected devices and accessories), excluding sales of equipment related to integration and information technology services and sales of equipment to external distributors and brokers, presented in "Other revenue";
− IT & integration services: these services include unified communication and collaboration services (LAN and telephony, consultancy, integration, project management), hosting and infrastructure services (including Cloud computing), application services (customer relations management and other application services), security services, video conferencing offers, as well as sales of equipment related to the above products and services;
− Services to carriers (wholesale): wholesale revenue includes roaming revenue from customers of other networks (national and international), revenue from Mobile Virtual Network Operators (MVNO) and from network sharing, among others;
− Other revenues: these include, in particular, equipment sales to external distributors and brokers, revenues from portals, online advertising and the Group’s cross-functional activities and other miscellaneous revenues.
Accounting policies
Most revenue falls within the application scope of IFRS 15 "Revenue from contracts with customers." Orange’s products and services are offered to customers under service-only contracts and contracts combining the equipment used to access services and/or other service offers. Revenue is recognized net of VAT and other taxes collected on behalf of governments.
− Standalone service offers (mobile-only services, fixed-only services, convergent services)
Orange offers its B2C and B2B customers a range of fixed and mobile telephony services, fixed and mobile Internet access offers and content offers (TV, video, media, added-value audio service, etc.). Some contracts are for a fixed term (generally twelve or twenty-four months), while others may be terminated at short notice (i.e. monthly arrangements or portions of services).
Service revenue is recognized when the service is provided, based on use (e.g. minutes of traffic or bytes of data processed) or the period (e.g. monthly service costs).
Under some content offers, Orange may act solely as an agent enabling the supply by a third-party of goods or services to the customer and not as a principal in the supply of the content. In such cases, revenue is recognized net of amounts transferred to the third-party.
Contracts with customers generally do not include a material right, as the price invoiced for contracts and the services purchased and consumed by the customer beyond the specific scope (e.g. additional consumption, options, etc.) generally reflect their standalone selling prices. There is no significant impact from contract modification for this type of service contract. Service obligations transferred to the customer at the same pace are treated as a single obligation.
When contracts include contractual clauses covering commercial discounts (initial discount on signature of the lease or conditional on attaining a consumption threshold) or free offers (e.g. three months of subscription free of charge), the Group spreads these discounts or free offers over the enforceable period of the contract (period during which the Group and the customer have a firm commitment). Where applicable, the consideration payable to the customer is recognized as a deduction from revenue in accordance with the specific terms and conditions of each contract.
If the performance obligations are not classified as distinct, the offer revenue is recognized on a straight-line basis over the contract term. One of the main applications of this method is the initial service connection in the context of a service contract and communication. It is not generally separable from the service contract and communication offer and is therefore recognized in income over the average term of the expected contractual relationship.
− Separate equipment sales
Orange offers its B2C and B2B customers several ways to buy their equipment (primarily mobile phones): equipment sales may be separate from or bundled with a service offer. When separate from a service offer, the amount invoiced is recognized in revenue on delivery and receivable immediately or in instalments over a period of up to 24 months. Where payment is received in instalments, the offer comprises a financial component and gives rise to the calculation of interest deducted from the amount invoiced and recognized over the payment period in net finance costs.
Where Orange purchases and sells equipment to indirect channels, the Group generally considers that Orange maintains control until resale to the end-customer (the distributor acts as an agent), even where ownership is transferred to the distributor. Sale proceeds are therefore recognized when the end-customer takes possession of the equipment (on activation).
− Bundled equipment and service offers
Orange proposes numerous offers to its B2C and B2B customers comprising equipment (e.g. a mobile handset) and services (e.g. a communication contract).
Equipment revenue is recognized separately from service revenue if the two components are distinct (i.e. if the customer can receive one or other of the services separately). Where one of the components in the offer is not at its separate selling price, revenue is allocated to each component in proportion to their individual selling prices. This is notably the case in offers combining the sale of a mobile phone at a reduced price, where the individual selling price of the mobile phone is considered equal to its purchase cost and logistics expenses plus a commercial margin based on market practice. The amount allocated to equipment sales is recognized under revenue on delivery in exchange for a contract asset, spread over the term of the service contract.
The provision of a Livebox® (proprietary Internet box) is neither a separate component of the Internet access service offer nor a lease, as Orange maintains control of the box.
− Services including a build and run phase
For business clients, some contracts have two phases: construction and then management (operation and maintenance) of assets built and delivered to customers. Revenue recognition requires an analysis of the facts and circumstances of each contract in order to determine whether distinct performance obligations exist. Under these contracts, if the construction phase is classified as separate, the Group recognizes the revenue of this phase according to the percentage of completion. However, if the Group does not have a certain right to payment and/or if there is no continuous transfer of control of the asset under construction, then revenue for this phase is recognized upon completion. These contracts are generally multi-year, with scalable offers. On each contract modification, we assess the scope of the modification or its impact on the contract price in order to determine whether the modification should be treated as a distinct contract, as though the existing contract were terminated and a new contract signed, or whether the modification should be considered as a change to the existing contract.
− Service offers to carriers (wholesale)
Three types of commercial agreements are entered into with Carrier customers for domestic wholesale activities and International carrier offers:
- pay-as-you-go model: contract generally applied to "legacy" regulated activities (bitstream call termination, local loop access, roaming and certain data solution contracts), where contract services are not covered by a firm volume commitment. Revenue is recognized as the services are provided (which relates to transfer of control) over the contractual term;
- send-or-pay model: contract where the price, volume and term are defined. The customer has a commitment to pay the amount indicated in the contract irrespective of actual traffic consumed over the commitment period. This contract category notably includes certain MVNO (Mobile Virtual Network Operator), IDD (International Direct Dialing) or hubbing (call free floating) contracts. Related revenue is recognized progressively based on actual traffic during the period, to reflect transfer of control to the customer;
- mix model: hybrid contract combining the "pay-as-you-go" and "send-or-pay" models, comprising a fixed entry fee paid by the customer providing access to preferential pricing conditions for a given volume ("send-or-pay" component). In addition to this entry fee, an amount is invoiced based on traffic consumption ("pay-as-you-go" component). The amount invoiced for the entry fee included in this type of commercial agreement is recognized progressively in revenue based on actual traffic over the period.
Current agreements between major transit carriers are not billed or cross-billed (free peering) and are therefore not recognized in revenue.
− Service level commitment clause
The contracts entered into by Group and its customers include service level commitments regarding the processing of orders, delivery and after sales support (delivery time, performance, service reinstatement time). If the Group fails to comply with one of these commitments, it then pays compensation to the customer, which is usually a tariff reduction. The projected amount of these penalties is recognized as a deduction from revenue whenever it is expected that the commitment will not be fulfilled.
− Public-private service concession arrangements
The Group rolls out and/or operates certain networks under service concessions, such as the public initiative networks implemented in France to roll out fiber-optic networks in less populated areas. Some contracts are analyzed in accordance with IFRIC 12 "Service concession arrangements." When the Group builds a network, construction revenue is recognized as counterparty to a right to receive a consideration from either a public entity or users of the public service. This right is accounted for as:
- an intangible asset in respect of the right to receive payments from public service users amounting to the fair value of the corresponding infrastructure. This asset is amortized over the term of the contract; and/or
- a financial receivable in respect of the unconditional right to receive royalties from the public entity, for the fair value of the consideration expected from the public entity. This receivable is recognized at amortized cost.
− Leases
Orange’s lease income is related either to its regulatory obligations to lease technical sites to its competitors, to the supply of equipment in certain contracts with business clients, or to the granting of rights of use meeting the criteria for leasing network equipment, i.e. occasional leases of surplus space in certain buildings to third parties.
Lease revenues are recognized on a straight-line basis over the contract term, except for certain equipment leases to business clients, which are classified as finance leases; in such cases the equipment is considered sold on credit.
5.2 Other operating income
(in millions of euros) | 2020 | 2019 | 2018 |
Income from client collection | 101 | 110 | 84 |
Net banking income (NBI) | 79 | 55 | 56 |
Rebilling of network sharing costs | 54 | 50 | 45 |
Tax credits and subsidies | 31 | 33 | 42 |
Income from universal service | 4 | 5 | 14 |
Other income | 336 | 466 | 339 |
Total | 604 | 720 | 580 |
Income from client collection mainly includes interest charged to customers for late payments and recovery of trade receivables previously recognized as loss.
Net banking income (NBI) represents the net balance between banking products (fees charged to customers, interest from loans, banking activities retail commissions and other income from banking operations) and expenses from banking operations (interest paid in respect of bank loans, commissions paid and other expenses from banking operations). It is prepared in accordance with accounting practices that are commonly used in France in the banking sector.
Other income is predominantly comprised of rebilling of network sharing costs and income relating to line damages.
5.3 Trade receivables
(in millions of euros) | 2020 | 2019 | 2018 |
Net book value of trade receivables in the opening balance | 5,320 | 5,295 | 5,175 |
IFRS 9 transition impact | - | - | (22) |
Net book value of trade receivables including IFRS 9 transition impact | 5,320 | 5,295 | 5,153 |
Business related variations | 379 | 1 | 65 |
Changes in the scope of consolidation | 4 | 50 | 90 |
Translation adjustment | (90) | 28 | (12) |
Reclassifications and other items | 7 | (53) | (1) |
Net book value of trade receivables in the closing balance | 5,620 | 5,320 | 5,295 |
Orange has set up non-recourse programs to sell its receivables due in instalments in several countries. These are no longer recorded on the balance sheet. The receivables sold mainly concern Spain, France and Poland and amounted to approximately 640 million euros in 2020, 690 million euros in 2019 and 615 million euros in 2018.
Orange Spain has set up a non-recourse program with Orange Bank for the sale of receivables due in instalments, replacing an existing program with a third-party bank. This program led to derecognize these receivables from the balance sheet of Orange Spain (within telecom activities) in order to present them as customer loans and receivables within Mobile Financial Services activities (see Note 17.1.1).
(in millions of euros) | December 31, 2020 | December 31, 2019 | December 31, 2018 |
Net trade receivables depreciated according to their age | 1,145 | 1,233 | 1,050 |
Net trade receivables depreciated according to other criteria | 400 | 579 | 600 |
Net trade receivables past due | 1,544 | 1,812 | 1,650 |
Not past due (1) | 4,076 | 3,508 | 3,645 |
Net trade receivables | 5,620 | 5,320 | 5,295 |
o/w short-term trade receivables | 5,382 | 5,044 | 4,995 |
o/w long-term trade receivables (2) | 238 | 276 | 300 |
o/w net trade receivables from telecom activities | 5,620 | 5,320 | 5,295 |
o/w net trade receivables from Mobile Financial Services | - | - | - |
(1) Not past due receivables are presented net of the balance of expected losses on trade receivables, which amounted to (56) million euros at December 31, 2020, (23) million euros at December 31, 2019 and (25) million euros at December 31, 2018.
(2) Includes receivables from sales of handsets with payment on instalments that are payable in more than 12 months and receivables from equipment financial lease offers for business (see accounting policies).
Shown below is the aging table of the net trade receivables which are past due and impaired according to their age:
(in millions of euros)
December 31, 2020 December 31, 2019 December 31, 2018
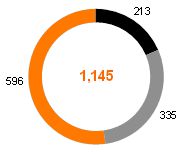

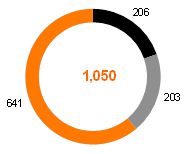
Past due - under 180 days | Past due - 180 to 360 days | Past due - over 360 days |
The Group assessed the risk of non-recovery of trade receivables at December 31, 2020 and recognized impairment and losses on trade receivables in the income statement for an amount of (383) million euros over the period, of which (129) million euros for telecom activities related to the effects of the health crisis.
The health crisis linked to the Covid-19 pandemic has resulted in the provision of economic support measures for companies and individuals in a number of countries. Such measures have helped to partially reduce the risk of non-recovery of trade receivables at December 31, 2020, but reduce visibility of the extent of the expected deterioration of the economic environment (in particular the risk of corporate default).
In view of the continuing uncertainty surrounding the economic environment, the Group has strengthened its monitoring of trade receivables in order to manage and adapt the recovery measures, which were gradually able to resume in 2020 in all customer segments in accordance with local legislation (having been temporarily suspended during the state of health emergency periods adopted in each country) and has sometimes granted a rescheduling of payment schedules to certain customers.
For Mobile Financial Services, the effects of the health crisis on bank credit risk are described in Note 17.2.3.
There is no change compared to December 31, 2019 in Orange’s belief that the concentration of counterparty risk related to customer accounts is limited due to the large number of customers, their diversity (residential, professional and large companies) and their various sectors of the economy, as well as their wide geographic distribution in France and abroad.
The table below provides an analysis of the change in impairment for trade receivables in the statement of financial position:
(in millions of euros) | 2020 | 2019 | 2018 |
Allowances on trade receivables - in the opening balance | (888) | (816) | (760) |
IFRS 9 transition impact | - | - | (22) |
Allowances on trade receivables - including IFRS 9 transition impact | (888) | (816) | (782) |
Net addition with impact on income statement (1) | (383) | (332) | (286) |
Losses on trade receivables | 275 | 271 | 255 |
Changes in the scope of consolidation | 0 | (1) | (2) |
Translation adjustment | 13 | (5) | (1) |
Reclassifications and other items | 0 | (5) | (0) |
Allowances on trade receivables - in the closing balance | (983) | (888) | (816) |
(1) The change in provision for expected losses, in accordance with IFRS 9, for the 2020 fiscal year amounts to (33) million euros in connection with the health crisis (it amounted to 2 million euros in 2019 and (3) million euros in 2018).
Accounting policies
Trade receivables are mainly short-term with no stated interest rate and are measured in the statement of financial position at original invoice amount, in accordance with IFRS 15. Those trade receivables which include deferred payment terms over 12 or 24 months for the benefit of customers buying a mobile telephone are discounted and classified as current items in the statement of financial position. Receivables from financial leases on equipment leased to companies are recognized as current operating receivables because they are acquired in the normal course of business.
In order to meet the requirements of IFRS 9, the impairment of trade receivables is based on three methods:
− a collective statistical method: this is based on historical losses and leads to a separate impairment rate for each aging balance category. This analysis is performed over a homogenous group of receivables with similar credit characteristics because they belong to a customer category (B2C, professionals);
− a stand-alone method: the assessment of impairment probability and its amount are based on a set of relevant qualitative factors (ageing of late payment, other balances with the counterpart, rating from independent agencies, geographical area). This method is mainly used for carrier customers (national and international), administrations and public authorities, as well as for large business service accounts;
− a provisioning method based on anticipated loss: IFRS 9 requires recognition of expected losses on receivables immediately upon recognition of the financial instruments. In addition to the p-existing provisioning system, the Group applies a simplified approach of anticipated impairment at the time the asset is recognized. The rate applied depends on the maximum revenue non-recoverability rate.
Identification of impairment losses for a group of receivables represents the step preceding identification of impairment for individual receivables. As soon as information is available (clients in bankruptcy or subject to equivalent judicial proceedings), these receivables are then excluded from the statistical impairment database and individually impaired.
The trade receivables may be part of non-recourse program. When they are sold to consolidated securitization mutual funds, they remain on the statement of financial position. Other sales to financial institutions may lead to their de-recognition in the event that legal ownership and almost all the risks and benefits of the receivables are transferred as described by IFRS 9.
5.4 Customer contract net assets and liabilities
(in millions of euros) | December 31, 2020 | December 31, 2019 | December 31, 2018 |
Customer contract net assets (1) | 709 | 771 | 784 |
Costs of obtaining a contract | 262 | 258 | 233 |
Costs to fulfill a contract | 265 | 181 | 149 |
Total customer contract net assets | 1,236 | 1,209 | 1,166 |
Prepaid telephone cards | (197) | (212) | (221) |
Connection fees | (589) | (665) | (706) |
Loyalty programs | (25) | (38) | (38) |
Other deferred revenue (2) | (1,158) | (1,163) | (1,025) |
Other customer contract liabilities | (15) | (15) | (12) |
Total deferred revenue related to customer contracts | (1,984) | (2,093) | (2,002) |
Total customer contract net assets and liabilities | (748) | (884) | (836) |
(1) Assets net of remaining performance obligations.
(2) Includes in particular subscription contracts.
The following tables give an analysis of the balances of customer contract net assets and the costs of acquiring and fulfilling them in the financial statements.
(in millions of euros) | 2020 | 2019 | 2018 |
Customer contract net assets - in the opening balance | 771 | 784 | 815 |
Business related variations(1) | (60) | (13) | (36) |
Changes in the scope of consolidation | - | - | - |
Translation adjustment | (3) | 1 | (1) |
Reclassifications and other items | (0) | 0 | 6 |
Customer contract net assets - in the closing balance | 709 | 771 | 784 |
(1) Mainly includes new contract assets net of related liabilities, transfer of net contract assets directly to trade receivables and impairment in the period.
Below is presented the change in deferred income on customer contracts (prepaid telephone cards, service access fees, loyalty programs and other unearned income) in the statement of financial position.
(in millions of euros) | 2020 | 2019 | 2018 |
Deferred revenue related to customer contracts - in the opening balance | 2,093 | 2,002 | 2,021 |
Business related variations | (73) | (20) | (18) |
Changes in the scope of consolidation (1) | - | 101 | 7 |
Translation adjustment | (31) | 13 | 2 |
Reclassifications and other items | (6) | (3) | (10) |
Deferred revenue related to customer contracts - in the closing balance | 1,984 | 2,093 | 2,002 |
(1) In 2019, the changes in the scope of consolidation mainly concerned maintenance services paid in advance as part of the implementation of solutions at SecureLink.
Accounting policies
Customer contract net assets and liabilities
The timing of revenue recognition may differ from customer invoicing.
Trade receivables presented in the consolidated statement of financial position represent an unconditional right to receive consideration (primarily cash), i.e. the services and goods promised to the customer have been transferred.
In contrast, contract assets mainly refer to amounts allocated under IFRS 15 as compensation for goods or services provided to customers, but for which the right to collect payment is subject to providing other services or goods under that same contract (or group of contracts). This is the case in a bundled offer combining the sale of a mobile phone and mobile communication services for a fixed period, where the mobile phone is invoiced at a reduced price leading to the reallocation of a portion of amounts invoiced for telephone communication services to the supply of the mobile phone. The excess of the amount allocated to the mobile phone over the price invoiced is recognized as a contract asset and transferred to trade receivables as the service is invoiced.
Contract assets, like trade receivables, are subject to impairment for credit risk. The recoverability of contract assets is also verified, especially to cover the risk of impairment should the contract be interrupted. Recoverability may also be impacted by a change in the legal environment governing offers.
Contract liabilities represent amounts paid by customers to Orange before receiving the goods and/or services promised in the contract. This is typically the case for advances received from customers or amounts invoiced and paid for goods or services not yet transferred, such as contracts payable in advance or prepaid contracts (previously recognized in deferred income).
Customer contract assets and liabilities are presented, respectively, in current assets and current liabilities since they are a normal part of the Group’s operations.
(in millions of euros) | 2020 | 2019 | 2018 |
Costs of obtaining a contract - in the opening balance | 258 | 233 | 250 |
Business related variations | 11 | 21 | (14) |
Changes in the scope of consolidation | - | 1 | - |
Translation adjustment | (7) | 1 | (3) |
Reclassifications and other items | - | 1 | 0 |
Costs of obtaining a contract - in the closing balance | 262 | 258 | 233 |
(in millions of euros) | 2020 | 2019 | 2018 |
Costs to fulfill a contract - in the opening balance | 181 | 149 | 140 |
Business related variations | 21 | 30 | 22 |
Changes in the scope of consolidation | - | - | - |
Translation adjustment | (12) | 2 | 3 |
Reclassifications and other items(1) | 75 | - | (16) |
Costs to fulfill a contract - in the closing balance | 265 | 181 | 149 |
(1) Mainly includes reclassifications from prepaid expenses to contract fulfilment costs.
Accounting policies
Cost of obtaining a contract
Where a telecommunication service contract is signed via a third-party distributor, this distributor may receive business provider remuneration, generally paid in the form of a commission for each contract or invoice-indexed commission. Where the Group considers the commission incremental and believes that it would not have been paid in the absence of the customer contract, the commission cost is estimated and capitalized in the balance sheet. It should be noted that the Group has adopted the simplification measure authorized by IFRS 15 to recognize the costs of obtaining contracts as an expense at the time they are incurred if the amortization period of the asset that the Group would have recognized in respect of them, does not exceed one year.
The costs of obtaining fixed-period mobile service contracts are capitalized and recognized prorata temporis over the enforceable period of the contract, as these costs are generally incurred each time a customer renews the fixed period. The costs of obtaining fixed-line contracts for a p-determined term for B2C market customers are expensed prorata temporis over the estimated period of the customer relationship. The costs of obtaining B2B and operator solution contracts are not material.
Costs to fulfill a contract
Contract fulfillment costs consist of all the initial contractual costs necessary to fulfill one or more performance obligations of a contract. These costs, when they are directly related to a contract, are capitalized and recognized prorata temporis over the enforceable period of the contract.
At Group level, these costs mainly concern contracts for business clients, with, for example, design, installation, connection and migration fees that relate to a future performance obligation of the contract.
The assumptions underlying the period over which the costs of fulfilling a contract are expensed are periodically reviewed and adjusted in line with observations; termination of the contractual relationship with the customer results in the immediate expensing of the remaining deferred costs. Where the carrying value of deferred costs exceeds the remaining consideration expected to be received for the transfer of the related goods and services, less expected costs relating directly to the transfer of these goods and services yet to be incurred, the excess amount is similarly immediately expensed.
The following table presents the transaction price assigned to unfulfilled performance obligations at December 31, 2020. Unfulfilled performance obligations are the services that the Group is obliged to provide to customers during the remaining fixed term of the contract. As allowed by the simplification procedure under IFRS 15, these disclosures are only related to performance obligations with an initial term greater than one year.
(in millions of euros) | December 31, 2020 |
Less than one year | 5,782 |
Between 1 and 2 years | 2,570 |
Between 2 and 3 years | 875 |
Between 3 and 4 years | 520 |
Between 4 and 5 years | 312 |
More than 5 years | 306 |
Total remaining performance obligations | 10,366 |
Accounting policies
Unfulfilled performance obligations
During allocation of the total contract transaction price to identified performance obligations, a portion of the total transaction price can be allocated to performance obligations that are unsatisfied or partially satisfied at the end of the reporting period. We have elected to apply certain available practical expedients when disclosing unfulfilled performance obligations, including the option to exclude expected revenues from unsatisfied obligations of contracts with an original expected duration of one year or less. These contracts are primarily monthly service contracts.
In addition, certain contracts offer customers the ability to purchase additional services. These additional services are not included in the transaction price and are recognized when the customer exercises the option (generally on a monthly basis). They are not therefore included in unfulfilled performance obligations.
Some multi-year service contracts with B2B and operator customers include fixed monthly costs and variable user fees. These variable user fees are excluded from the table of unfulfilled performance obligations.
5.5 Deferred income
(in millions of euros) | 2020 | 2019 | 2018 |
Deferred income in the opening balance | 51 | 58 | 76 |
Business related variations(1) | 115 | (0) | (42) |
Changes in the scope of consolidation | - | 0 | 2 |
Translation adjustment | (3) | (0) | - |
Reclassifications and other items | 1 | (6) | 22 |
Deferred income in the closing balance | 165 | 51 | 58 |
(1) Including deferred income in 2020 under a transmission capacity agreement for an FTTH network in Spain.
5.6 Other assets
(in millions of euros) | December 31, 2020 | December 31, 2019 | December 31, 2018 |
Advances and downpayments | 116 | 101 | 84 |
Submarine cable consortiums (1) | 258 | 168 | 130 |
Security deposits paid | 93 | 93 | 97 |
Orange Money - isolation of electronic money (1) | 825 | 613 | 497 |
Other (2) | 545 | 408 | 473 |
Total | 1,837 | 1,383 | 1,281 |
(1) These receivables are offset by the liabilities of the same amount (see accounting policies below and Note 6.7).
(2) Including in 2020 a receivable under a transmission capacity agreement for an FTTH network in Spain.
(in millions of euros) | 2020 | 2019 | 2018 |
Other assets in the opening balance | 1,383 | 1,281 | 1,204 |
Business related variations (1) | 495 | 97 | 74 |
Changes in the scope of consolidation | 0 | 0 | 7 |
Translation adjustment | (32) | 3 | 1 |
Reclassifications and other items | (9) | 2 | (5) |
Other assets in the closing balance | 1,837 | 1,383 | 1,281 |
o/w other non-current assets | 136 | 125 | 129 |
o/w other current assets | 1,701 | 1,258 | 1,152 |
(1) Including in 2020 a receivable under a transmission capacity agreement for an FTTH network in Spain.
Accounting policies
Other assets relating to "Submarine cable consortiums" are receivables from submarine cable consortium members when Orange is in charge of centralizing the payments to the equipment suppliers that build and manage these cables. These receivables are offset by the liabilities of the same amount (see Note 6.7).
Orange Money is a money transfer, payment and financial services solution provided via an electronic money ("e-money") account linked to an Orange mobile number.
Since 2016, the Orange group has become an Electronic Money Issuer ("EMI") in some of the countries in which it operates, via dedicated, approved, internal subsidiaries. Regulations state that EMIs, as last-resort guarantors for the reimbursement of e-money holders, are obliged to restrict the funds collected in exchange for the issue of e-money (obligation to protect holders). The e-money distribution model relies on Orange’s subsidiaries and third-party distributors. EMIs issue e-money (or units of value "UV") at the request of these distributors in exchange for funds collected therefrom. The distributors then transfer the e-money to end holders.
Within the Orange group, this restriction includes the protection of third-party holders (distributors and customers).
These transactions have no impact on the Group’s net financial debt and are listed under the following headings:
− assets restricted to an amount equal to the e-money in circulation outside of the Orange group (or UV in circulation);
− UV in circulation under liabilities, representing the obligation to reimburse the third-party holders (customers and third-party distributors).
These two headings are presented under "other assets" and "other liabilities" and under operating activities as "change in working capital requirement".
5.7 Related party transactions
The French State, either directly or through Bpifrance Participations, is one of the main shareholders of Orange SA. The communication services provided to the French State are done so as part of a competitive process held for each service according to the nature of the service. They have no material impact on consolidated revenues.
Transactions with associates and joint ventures are presented in Note 12.
Accounting policies
Orange group’s related parties are listed below:
− the Group’s key management personnel and their families (see Note 7);
− the French State, and its departments in Bpifrance Participations and central State departments (see Notes 11 and 15);
− associates, joint ventures and companies in which the Group holds a significant stake (see Note 12).
Note 6 Purchases and other expenses
6.1 External purchases
(in millions of euros) | 2020 | 2019 (1) | 2018 | |
Commercial, equipment expenses and content rights | (6,868) | (7,293) | (7,228) | |
o/w costs of terminals and other equipment sold | (3,575) | (4,042) | (4,123) | |
o/w advertising, promotional, sponsoring and rebranding costs | (736) | (823) | (850) | |
Service fees and inter-operator costs | (4,529) | (4,608) | (4,923) | |
o/w interconnexion costs | (3,186) | (3,212) | (3,335) | |
Other network expenses, IT expenses | (3,503) | (3,253) | (3,192) | |
Other external purchases | (2,791) | (2,706) | (3,220) | |
o/w rental expenses | (151) | (241) | (1,181) | |
Total | (17,691) | (17,860) | (18,563) | |
(1) 2019 figures have been restated of the IFRS IC decision on lease term (see Note 2.3.1).
Accounting policies
Firm purchase commitments are disclosed as unrecognized contractual commitments (see Note 16).
Advertising, promotion, sponsoring, communication and brand development costs are recorded as expenses during the period in which they are incurred.
At January 1, 2019, lease expenses include rental payments on leases with an enforceable period, with no option to extend, of 12 months or less, leases where the value, when new, of the underlying asset is less than approximately 5,000 euros, and variable lease payments which were not included in the measurement of the lease liability (see Note 10).
6.2 Other operating expenses
(in millions of euros) | 2020 | 2019 | 2018 |
Allowances and losses on trade receivables - telecom activities | (383) | (315) | (277) |
Litigation | (238) | (107) | (10) |
Cost of bank credit risk | (31) | (10) | (7) |
Expenses from universal service | (19) | (21) | (38) |
Acquisition and integration costs(1) | (18) | (17) | - |
Operating foreign exchange gains (losses) | 19 | (4) | 3 |
Other expenses | (119) | (124) | (176) |
Total | (789) | (599) | (505) |
(1) Since January 1, 2019, acquisition and integration costs are presented in other operating expenses. In 2018, those costs were presented in restructuring costs (see Note 6.3).
Impairment and losses on trade receivables from telecom activities are detailed in Note 5.3.
The cost of credit risk exclusively applies only to Mobile Financial Services and includes impairment charges and reversals on fixed-income securities, loans and receivables to customers as well as impairment charges and reversals relating to guarantee commitments given, losses on receivables and recovery of amortized debts. In the context of the health crisis, parameters used for the assessment of the credit risk have been updated (see Note 17.2.3).
Expenses for legal disputes for which provisions or immediate payment have been made include the reassessment of the risk related to various disputes.
(in millions of euros) | 2020 | 2019 | 2018 |
Provisions for litigation - in the opening balance | 643 | 572 | 779 |
Additions with impact on income statement | 119 | 99 | 35 |
Reversals with impact on income statement | (29) | (8) | (25) |
Discounting with impact on income statement | 0 | - | 3 |
Utilizations without impact on income statement(1) | (205) | (22) | (221) |
Changes in consolidation scope | - | 1 | 1 |
Translation adjustment | (2) | 0 | 3 |
Reclassifications and other items | - | 1 | (3) |
Provisions for litigation - in the closing balance | 525 | 643 | 572 |
o/w non-current provisions | 46 | 45 | 67 |
o/w current provisions | 479 | 598 | 505 |
(1) In 2020, mainly related to the Digicel litigation (see Note 18). In 2018, mainly related to the payment of the fine in Poland for 152 million euros.
Payments related to some litigation are directly recorded in other operating expenses. The Group’s significant litigations are described in Note 18.
Accounting policies
Litigation
In the ordinary course of business, the Group is involved in a number of legal and arbitration proceedings and administrative actions described in Note 18.
The costs which may result from these proceedings are accrued at the reporting date if the Group has a present obligation towards a third party resulting from a past event and it is probable that an outflow of resources embodying economic benefits will be required to settle the obligation and the amount of that liability can be quantified or estimated within a reasonable range. The amount of provision recorded is based on a case-by-case assessment of the risk level, and events arising during the course of legal proceedings may require a reassessment of this risk. Where appropriate, litigation cases may be analyzed as contingent liabilities, which correspond to:
− probable obligations arising from past events that are not recognized because their existence will be confirmed only by the occurrence or non-occurrence of one or more uncertain future events not wholly within the Company’s control; or
− present obligations arising from past events that are not recognized because it is not probable that an outflow of resources embodying economic benefits will be required to settle the obligation or because the amount of the obligation cannot be measured with sufficient reliability.
Acquisition and integration costs
Acquisition and integration costs are incurred at the time of acquisition of legal entities (costs linked to the acquisition of the entity, consultancy fees, training costs for new staff, migration costs associated with customer offers, labor expenses associated with the transition). They are incurred over a maximum period of 12 months following the acquisition date.
6.3 Restructuring and integration costs
(in millions of euros) | 2020 | 2019 | 2018 |
Restructuring costs | (25) | (132) | (189) |
Departure plans (1) | (15) | (68) | (30) |
Lease property restructuring (2) | 2 | 5 | (28) |
Distribution channels (3) | (5) | (26) | (11) |
Other | (8) | (43) | (120) |
Acquisition and integration costs (4) | - | - | (10) |
Acquisition costs of investments | - | - | (10) |
Total restructuring costs | (25) | (132) | (199) |
(1) Mainly voluntary departure plans of Orange Polska in 2019 (approximately 2,100 people).
(2) Essentially related to vacant leases in France.
(3) Essentially concerns the costs related to the end of the relationship with some distributors.
(4) From January, 1 2019, acquisition and integration costs are presented in "Other operating expenses".
Some restructuring and integration costs are directly recorded in operating income and are not included in the following movements of provisions:
(in millions of euros) | 2020 | 2019 | 2018 |
Restructuring provisions - in the opening balance | 216 | 389 | 377 |
Additions with impact on income statement | 12 | 97 | 162 |
Reversals releases with impact on income statement | (17) | (13) | (15) |
Discounting with impact on income statement | 4 | 1 | - |
Utilizations without impact on income statement | (95) | (124) | (143) |
Translation adjustment | (3) | 1 | (1) |
Reclassifications and other items (1) | - | (135) | 9 |
Restructuring provisions - in the closing balance | 117 | 216 | 389 |
o/w non-current provisions | 53 | 96 | 230 |
o/w current provisions | 64 | 120 | 159 |
(1) Starting January 1, 2019, following IFRS 16 application, restructuring provisions related to leases are presented in "Impairment of right-of-use assets". Only rental charges and taxes are presented in restructuring provisions.
Accounting policies
Restructuring costs
The adjustment of Group activities in line with changes in the business environment may also incur other types of transformation costs. These actions may have a negative effect on the period during which they are announced or implemented; for instance but not limited to, some of the transformation plans approved by the internal governance bodies.
Provisions are recognized only when the restructuring has been announced and the Group has drawn up or started to implement a detailed formal plan prior to the end of the reporting period.
The types of costs approved by the Group as restructuring costs primarily consist of:
− employee departure plans;
− indemnities resulting from termination of suppliers contracts linked to a fundamental reorganization (compensation paid to suppliers to terminate contracts, etc.);
− cost of vacant buildings (out of the scope of IFRS 16);
− transformation plans for communication network infrastructures;
− onerous contracts related to the termination or fundamental reorganization of business: during the course of a contract, when the economic circumstances that prevailed at inception change, some commitments towards the suppliers may become onerous, i.e. the unavoidable costs of meeting the obligations under the contract exceed the economic benefits expected to be received under it.
6.4 Broadcasting rights and equipment inventories
(in millions of euros) | December 31, 2020 | December 31, 2019 | December 31, 2018 |
Handset inventories (1) | 485 | 534 | 678 |
Other products/services sold | 75 | 78 | 41 |
Available broadcasting rights | 93 | 89 | 73 |
Other supplies | 223 | 270 | 242 |
Gross value | 874 | 970 | 1,034 |
Depreciation | (60) | (63) | (69) |
Net book value | 814 | 906 | 965 |
(1) Of which inventories treated as consignment with distributors amounting to 40 million euros as at December 31, 2020, 35 million euros as at December 31, 2019 and 49 million euros as at December 31, 2018.
(in millions of euros) | 2020 | 2019 | 2018 |
Net balance of inventories in the opening balance | 906 | 965 | 827 |
Business related variations(1) | (70) | (64) | 138 |
Changes in the scope of consolidation | - | 2 | 2 |
Translation adjustment | (8) | 2 | (1) |
Reclassifications and other items | (14) | 1 | (1) |
Net balance of inventories in the closing balance | 814 | 906 | 965 |
(1) Business related variations include depreciations on inventories.
Accounting policies
Network maintenance equipment and equipment intended for sale to customers are measured at the lower of cost or likely realizable value. The cost corresponds to the purchase or production cost determined by the weighted average cost method.
Handset inventories include inventories treated as consignment with distributors when these are qualified, for accounting purposes, as agents in the sales of handsets bought from the Group.
Film or sports broadcasting rights are recognized in the statement of financial position when they are available for exhibition and expensed when broadcast.
6.5 Prepaid expenses
(in millions of euros) | December 31, 2020 | December 31, 2019 | December 31, 2018 |
Prepaid external purchases | 651 | 678 | 522 |
Other prepaid operating expenses | 199 | 52 | 49 |
Total | 850 | 730 | 571 |
(in millions of euros) | 2020 | 2019 | 2018 |
Prepaid expenses in the opening balance | 730 | 571 | 455 |
Business related variations | 171 | 127 | 93 |
Changes in the scope of consolidation | 0 | 65 | 6 |
Translation adjustment | (12) | 5 | 0 |
Reclassifications and other items (1) | (40) | (38) | 17 |
Prepaid expenses in the closing balance | 850 | 730 | 571 |
(1) Including the effect of the reclassification of prepaid expenses as costs to fulfill contracts (see Note 5.4).
6.6 Trade payables
(in millions of euros) | 2020 | 2019 | 2018 |
Trade payables in the opening balance | 6,682 | 6,736 | 6,527 |
Business related variations | (122) | (85) | 189 |
Changes in the scope of consolidation | 1 | 36 | 18 |
Translation adjustment | (80) | 27 | 1 |
Reclassifications and other items | (6) | (32) | 1 |
Trade payables in the closing balance | 6,475 | 6,682 | 6,736 |
o/w trade payables from telecoms activities | 6,395 | 6,580 | 6,635 |
o/w trade payables from Mobile Financial Services | 80 | 102 | 101 |
Supplier payment terms are mutually agreed between the suppliers and Orange in accordance with the rules in force. Certain key suppliers and Orange have agreed to a flexible payment schedule which, for certain invoices, can be extended up to six months.
Trade payables for goods and services and fixed assets that were subject to a payment extension, and which had an impact on the change in working capital requirements at the end of the period, amounted to approximately 435 million euros at December 31, 2020, 525 million euros at the end of 2019 and 325 million euros at the end of 2018.
Accounting policies
Trade payables resulting from trade transactions and settled in the normal operating cycle are classified as current items. They include those that have been financed by the supplier (with or without notification of transfer to financial institutions) under direct or reverse factoring, and those for which the supplier proposed an extended payment period to Orange and for which Orange confirmed the payment arrangement under the agreed terms. Orange considers these financial liabilities to carry the characteristics of trade payables, in particular due to the ongoing trade relationship, the payment schedules ultimately consistent with the operational cycle of a telecommunications operator in particular for the purchase of primary infrastructures, the supplier’s autonomy in the anticipated relationship and a financial cost borne by Orange that corresponds to the compensation of the supplier for the extended payment schedule agreed.
For payables without specified interest rates, they are measured at nominal value if the interest component is negligible. For interest bearing payables, the measurement is at amortized cost.
6.7 Other liabilities
(in millions of euros) | December 31, 2020 | December 31, 2019 | December 31, 2018 |
Provisions for litigations (1) | 525 | 643 | 572 |
Cable network access fees (URI) | 59 | 103 | 152 |
Submarine cable consortium (2) | 258 | 168 | 130 |
Security deposits received | 134 | 147 | 160 |
Orange Money - units in circulation (2) | 823 | 613 | 497 |
Other | 775 | 774 | 739 |
Total | 2,574 | 2,448 | 2,250 |
o/w other non-current liabilities | 307 | 353 | 462 |
o/w other current liabilities | 2,267 | 2,095 | 1,788 |
(1) See Note 6.2.
(2) These liabilities are offset by the receivables of the same amount (see accounting policies in Note 5.6).
(in millions of euros) | 2020 | 2019 | 2018 |
Other liabilities in the opening balance | 2,448 | 2,250 | 2,456 |
Business related variations | 176 | 190 | (166) |
Changes in the scope of consolidation | - | 12 | 16 |
Translation adjustment | (35) | 4 | (2) |
Reclassifications and other items | (15) | (8) | (54) |
Other liabilities in the closing balance | 2,574 | 2,448 | 2,250 |
6.8 Related party transactions
Orange does not purchase goods or services from the French State (either directly or via Bpifrance Participations), except the use of spectrum resources. These resources are allocated after a competitive process.
Note 7 Employee benefits
7.1 Labor expenses
(in millions of euros) | Note | 2020 | 2019 | 2018 | |
Average number of employees (full-time equivalents)(1) | 133,787 | 135,619 | 135,943 | ||
Wages and employee benefit expenses | (8,331) | (8,240) | (8,828) | ||
o/w wages and salaries | (6,224) | (6,199) | (6,017) | ||
o/w social security charges (2) | (2,118) | (2,079) | (2,068) | ||
o/w French part-time for seniors plans | 7.2 | 23 | 6 | (773) | |
o/w capitalized costs (3) | 866 | 848 | 842 | ||
o/w other labor expenses (4) | (879) | (816) | (812) | ||
Employee profit sharing | (142) | (181) | (180) | ||
Share-based compensation | 7.3 | (18) | (73) | (66) | |
Total in operating income | (8,490) | (8,494) | (9,074) | ||
Net interest on the net defined liability in finance costs | (12) | (20) | (16) | ||
Actuarial (gains)/losses in other comprehensive income | (31) | (109) | 45 | ||
(1) Of whom 34% were Orange SA's French civil servants (36% at December 31, 2019 and 40% at December 31, 2018).
(2) Net of approximately 85 million euros for competitiveness and employment tax credit for 2018 in France.
(3) Capitalized costs correspond to labor expenses included in the cost of assets produced by the Group (see Notes 9.4 and 9.5).
(4) Other labor expenses comprise other short-term allowances and benefits, payroll taxes, post-employment benefits and other long term benefits (except French part-time for seniors plans).
7.2 Employee benefits
(in millions of euros) | December 31, 2020 | December 31, 2019 | December 31, 2018 | |
Post-employment benefits(1) | 1,149 | 1,105 | 989 | |
Other long-term benefits | 1,407 | 1,867 | 2,434 | |
o/w French part-time for seniors plans | 802 | 1,233 | 1,784 | |
Provisions for employment termination benefits | 1 | 2 | 3 | |
Other employee-related payables and payroll taxes due | 1,779 | 1,782 | 1,715 | |
Provisions for social risks and litigation | 58 | 59 | 74 | |
Total | 4,395 | 4,815 | 5,215 | |
o/w non-current employee benefits | 2,202 | 2,554 | 2,823 | |
o/w current employee benefits | 2,192 | 2,261 | 2,392 | |
(1) Does not include defined contribution plans.
The payments to be made in respect of post-employment benefits and other long-term benefits are presented below. These are estimated based on Group headcounts as at December 31, 2020, including rights acquired and not acquired at December 31, 2020, but for which it is assumed the rights will be acquired by the year 2040 approximately:
(in millions of euros) | Schedule of benefits to be paid, undiscounted | ||||||
2021 | 2022 | 2023 | 2024 | 2025 | 2026 and beyond | ||
Post-employment benefits | 68 | 50 | 38 | 50 | 54 | 2,622 | |
Other long-term benefits (1) | 386 | 279 | 244 | 138 | 31 | 27 | |
o/w French part-time for seniors plans | 305 | 215 | 192 | 90 | 15 | 5 | |
Total | 454 | 330 | 283 | 188 | 85 | 2,649 | |
(1) Provisions for Time Saving Account (CET) and long-term leave and long-term sick leave not included.
7.2.1 Types of post-employment benefits and other long-term benefits
In accordance with the laws and practices in force in the countries where it operates, the Group has obligations in terms of employee benefits:
− with regard to retirement, the majority of employees are covered by defined contribution plans required by law or under national agreements. In France, civil servants employed by Orange SA are covered by the French government sponsored civil and military pension plan. Orange SA’s obligation under the plan is limited to the payment of annual contributions (French law No. 96-660 dated July 26, 1996). Consequently, Orange SA has no obligation to fund future deficits of the pension plans covering its own civil servant employees or any other civil service plans. Expenses recognized under the terms of defined contribution pension plans amounted to (729) million euros in 2020 ((724) million euros in 2019 and (828) million euros in 2018);
− the Group is committed to a limited number of annuity-based defined-benefit plans: notably the Equant plans in the United Kingdom for 326 million euros and a plan for senior management staff in France for 196 million euros. Plan assets were transferred to these plans in the United Kingdom and in France. A few years ago, these plans were closed to new subscribers and also closed in the United Kingdom with regard to the acquisition of rights;
− the Group is also committed to capital-based defined benefit plans where, in accordance with the law or contractual agreements, employees are entitled to bonuses on retirement, depending on their years of service and end of career salary; this essentially relates to bonuses due upon retirement in France, particularly for employees under private-law contracts (909 million euros for Orange SA, equal to 84% of the capital-based plans) and for civil servants (27 million euros, equal to 3% of capital-based plans);
− other post-employment benefits are also granted to retired employees: these are benefits other than defined-benefit and defined-contribution plans;
− other long-term benefits may also be granted such as seniority awards, long-term compensated absences and French part-time for seniors plans (TPS) detailed below.
French part-time for seniors plans
The part-time for seniors plans are accessible to civil servants and employees under private contract from the French entities who are eligible for full retirement benefits within 3 to 5 years and who have at least 15 years service within the Group. Eligible employees are those who will retire no later than January 1, 2025.
These plans give employees the opportunity to work 50% or 60% of a full-time job whilst receiving:
− a base salary between 65% and 80% of full-time employment;
− the retirement entitlement benefits of full-time employment during the period in question (both the Company’s and the employee’s contributions);
− a minimum salary level.
These plans last for a period of at least 18 months and no longer than five years.
The beneficiaries may decide to invest part of their base compensation (5%, 10% or 15%) in a Time Savings Account (CET), with an additional Group contribution. The CET allows for a reduction in the amount of time worked.
At December 31, 2020 33,000 employees had signed up for TPS, 26,100 of whom have already passed through it. The number of employees who are or will be participating in the French part-time for seniors plans and thus included in the provision, is estimated approximately at 9,950 employees.
7.2.2 Key assumptions used to calculate the amount of obligations
The assessment of post-employment benefits and other long-term benefits is based on retirement age calculated in accordance with the provisions applicable to each plan and the necessary conditions to ensure entitlement to a full pension, both of which are often subject to legislative changes.
The valuation of the obligation of the French part-time for seniors plans is sensitive to estimates of the potentially eligible population and to the sign-up rate for the plans (estimated at 70% on average), and the trade-offs that the beneficiaries will ultimately make between the different plans proposed.
The discount rates used for the euro zone (which accounts for 86% of Orange’s pension and other long-term employee benefit obligations) are as follows:
December 31, 2020 | December 31, 2019 | December 31, 2018 | |
More than 10 years | 0.55% to 0.90% | 0.70% to 0.90% | 1.70% à 1.85% |
Less than 10 years | -0.35% to 0.70%(1) | -0.33% to 0.70% | -0.20% à 1.30% |
(1) A -0.25% rate has been used to value the obligation regarding the French part-time for seniors plans (-0.25% as at December 31, 2019).
The discount rates used for the euro zone are based on corporate bonds rated AA with a duration equivalent to the duration of the obligations.
The increase in annuities of the Equant plans in the United Kingdom is based on inflation (2.90% used) up to 5%.
The main capital-based defined benefit plan (retirement bonuses for employees under private-law contracts in France) is principally sensitive to employment policy assumptions (Orange has historically had high numbers of staff at retirement age). The estimated increase in the capital of this plan is based on a long-term inflation assumption of 2% associated with the effect of a higher "GVT" (acronym for Wage drift - Seniority - Job-skills). "Wage drift - Seniority - Job-skills" refers to annual change in total payroll costs independent of general or categorical increases in wages and salaries, due to in-grade promotions, out of grade promotions and the aging of existing staff.
The impacts on pension benefit obligations of changes in key assumptions would be as follows:
(in millions of euros) | ||||||||||||||||||||
Rate increase by 50 points | Rate decrease by 50 points | |||||||||||||||||||
Discount rates (1) | (111) | 123 | ||||||||||||||||||
Rate decrease by 5% | Rate increase by 5% | |||||||||||||||||||
Sign-up rates for French part-time for seniors plans (2) | (26) | 26 | ||||||||||||||||||
(1) Includes 7 million euros for the French part-time for seniors plans (short term duration).
(2) Sensitivity is performed on future entries in French part-time for seniors plans (TPS).
7.2.3 Commitments and plan assets
Post-employment benefits | Long-term benefits | 2020 | 2019 | 2018 | ||||||
(in millions of euros) | Annuity-based plans | Capital-based plans | Other | French part-time for seniors plans (TPS) | Other | |||||
Total benefit obligations in the opening balance | 543 | 1,003 | 17 | 1,233 | 634 | 3,430 | 3,837 | 3,727 | ||
Service cost | 1 | 60 | 0 | 32 | 57 | 150 | 146 | 786 | ||
Net interest on the defined benefit liability | 6 | 12 | 0 | (3) | 1 | 17 | 27 | 23 | ||
Actuarial losses/(gains) arising from changes of assumptions | 17 | 49 | - | 37 | (0) | 102 | 82 | (34) | ||
o/w arising from change in discount rate | 34 | 29 | - | (0) | 1 | 63 | 182 | (38) | ||
Actuarial losses/(gains) arising from experience | 1 | (11) | - | (92) (1) | (1) | (103) | 5 | 78 | ||
Benefits paid | (21) | (33) | (1) | (405) | (95) | (555) | (687) | (746) | ||
Translation adjustment and other | (18) | (4) | (0) | 0 | 10 | (11) | 20 | 3 | ||
Total benefit obligations in the closing balance (a) | 529 | 1,076 | 17 | 802 | 605 | 3,029 | 3,430 | 3,837 | ||
o/w benefit obligations in respect of employee benefit plans that are wholly or partly funded | 529 | 20 | - | - | - | 549 | 562 | 507 | ||
o/w benefit obligations in respect of employee benefit plans that are wholly unfunded | - | 1,056 | 17 | 802 | 605 | 2,480 | 2,868 | 3,330 | ||
Weighted average duration of the plans (in years) | 13 | 14 | 18 | 2 | 3 | 8 | 9 | 6 | ||
(1) In 2020, actuarial gains related to experience effects take into account a slowdown in the number of entries into the TPS plans.
Post-employment benefits | Long-term benefits | 2020 | 2019 | 2018 | |||||
(in millions of euros) | Annuity-based plans | Capital-based plans | Other | French part-time for seniors plans (TPS) | Other | ||||
Fair value of plan assets in the opening balance | 458 | 0 | - | - | - | 458 | 414 | 409 | |
Net interest on the defined benefit liability | 6 | 0 | - | - | - | 6 | 8 | 7 | |
(Gains)/Losses arising from experience | 25 | 0 | - | - | - | 25 | 26 | 2 | |
Employer contributions | 18 | - | - | - | - | 18 | 16 | 16 | |
Benefits paid by the fund | (18) | - | - | - | - | (18) | (19) | (17) | |
Translation adjustment and other | (16) | - | - | - | - | (16) | 13 | (3) | |
Fair value of plan assets in the closing balance (b) | 473 | 1 | - | - | - | 474 | 458 | 414 | |
Funded annuity-based plans represent 18% of Group social commitments.
The funded annuity-based plans are primarily located in the United Kingdom (63%) and France (36%) and their assets are broken down as follows:

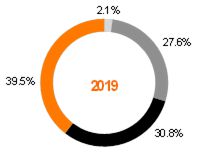
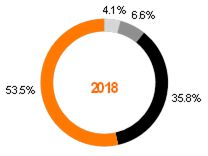
Debt securities | Equities | Money market assets | Other |
Employee benefits in the statement of financial position correspond to commitments less plan assets. These have not been subject to asset ceiling adjustment for the periods presented.
Post-employment benefits | Long-term benefits | 2020 | 2019 | 2018 | |||||
(in millions of euros) | Annuity-based plans | Capital-based plans | Other | French part-time for seniors plans (TPS) | Other | ||||
Employee benefits in the opening balance | 85 | 1,003 | 17 | 1,233 | 634 | 2,972 | 3,423 | 3,318 | |
Net expense for the period | 1 | 72 | 1 | (26) | 57 | 105 | 117 | 889 | |
Employer contributions | (18) | - | - | - | - | (18) | (16) | (16) | |
Benefits directly paid by the employer | (3) | (33) | (1) | (405) | (95) | (538) | (668) | (729) | |
Actuarial (gains)/losses generated during the year through other comprehensive income | (7) | 38 | - | - | - | 31 | 109 | (45) | |
Translation adjustment and other | (2) | (4) | (0) | 0 | 10 | 4 | 7 | 6 | |
Employee benefits in the closing balance - Net unfunded status (a) - (b) | 56 | 1,076 | 17 | 802 | 605 | 2,556 | 2,972 | 3,423 | |
o/w non-current | 34 | 1,031 | 16 | 497 | 596 | 2,174 | 2,397 | 2,722 | |
o/w current | 22 | 45 | 1 | 305 | 9 | 382 | 575 | 701 | |
The following table discloses the net expense:
Post-employment benefits | Long-term benefits | 2020 | 2019 | 2018 | |||||
(in millions of euros) | Annuity-based plans | Capital-based plans | Other | French part-time for seniors plans (TPS) | Other | ||||
Service cost | (1) | (60) | (0) | (32) | (57) | (151) | (146) | (786) | |
Net interest on the net defined benefit liability | (1) | (12) | (0) | 3 | (1) | (11) | (19) | (16) | |
Actuarial gains/(losses) | - | - | - | 55 | 1 | 57 | 48 | (87) | |
Total | (1) | (72) | (1) | 26 | (57) | (105) | (117) | (889) | |
o/w expenses in operating income | (1) | (60) | (0) | 23 | (56) | (94) | (98) | (873) | |
o/w net interest on the net defined liability in finance cost | (1) | (12) | (0) | 3 | (1) | (11) | (19) | (16) | |
Accounting policies
Post-employment benefits are granted through:
− defined contribution plans: the contributions, paid to independent institutions which are in charge of the administrative and financial management thereof, are recognized in the fiscal year during which the services are rendered;
− defined-benefit plans: the sum of future obligations under these plans are based on actuarial assumptions using the projected unit credit method:
- their calculation is based on demographic (employee turnover, mortality, gender parity, etc.) and financial assumptions (salary increases, rate of inflation, etc.) defined at the level of each entity concerned;
- the discount rate is defined by country or geographical area and by reference to market yields on high quality corporate bonds (or government bonds where no active market exists). Its computation is based on external indices commonly used as reference for the Eurozone;
- actuarial gains and losses on post-employment benefits are fully recorded in other comprehensive income;
- the Group’s defined benefit plans are generally not financed. In the rare cases where they are, hedging plan assets are set up by employer and employee contributions which are managed by separate legal entities whose investments are subject to fluctuations in the financial markets. These entities are generally administrated by joint committees comprising representatives of the Group and of the beneficiaries. Each committee adopts its own investment strategy which is designed to strike the optimum strategies to match assets and liabilities, based on specific studies performed by external experts. It is generally carried out by fund managers selected by the committees and depends on the market opportunities. Assets are measured at fair value, determined by reference to quoted prices, since they are mostly invested in listed securities (primarily shares and bonds) and the use of other asset categories is limited.
Other long-term benefits may be granted such as seniority awards, long-term compensated absences and French part-time for seniors plan (TPS) agreements. The calculation of the related commitments is based on actuarial assumptions (including demographic, financial and discounting assumptions) similar to those relating to post-employment benefits. The relevant actuarial gains and losses are recognized in profit or loss when they arise.
Termination benefits are subject to provisions (up to the related obligation). For all commitments where termination of employment contracts would trigger payment of an indemnity, actuarial gains and losses are recognized in profit or loss for the period when modifications take place.
7.3 Share-based payment
Free share award plans in force at December 31, 2020
The Board of Directors approved the implementation of free share award plans (Long Term Incentive Plan - LTIP) reserved for the Executive Committee, Corporate Officers, and Senior Management holding the positions of "Executives" and "Leaders".
Main characteristics
LTIP 2020 - 2022 | LTIP 2019 - 2021 | LTIP 2018 - 2020 | |
Implementation date by the Board of Directors | July 29, 2020 | July 24, 2019 | July 25, 2018 |
Number of free share units (1) | 1.7 million | 1.7 million | 1.7 million |
Estimated number of beneficiaries | 1,300 | 1,200 | 1,200 |
Acquisition date of the rights by the beneficiaries | December 31, 2022 | December 31, 2021 | December 31, 2020 |
Delivery date of the shares to the beneficiaries | March 31, 2023 | March 31, 2022 | March 31, 2021 |
(1) In countries where the regulations, tax codes or labor laws do not permit awards of stock, the beneficiaries of the plan will receive a cash value based on the exchange-traded price of Orange stock at the delivery date of the shares.
Condition of continued employment
The allocation of rights to beneficiaries is subject to a condition of continued employment:
LTIP 2020 - 2022 | LTIP 2019 - 2021 | LTIP 2018 - 2020 | |
Assessment of the employment continuation | From January 1, 2020 to December 31, 2022 | From January 1, 2019 to December 31, 2021 | From January 1, 2018 to December 31, 2020 |
Performance conditions
Depending on the plans, the allocation of rights to beneficiaries is subject to the achievement of internal and external performance conditions, namely:
− the organic cash flow from telecom activities internal performance condition, as defined in the plan regulations, assessed (i) annually against the budget for the LTIP 2019-2021 and 2018-2020, and (ii) at the end of the three years of the plan against the objective set by the Board of Directors for the LTIP 2020-2022;
− the Corporate Social Responsibility (CSR) internal performance condition, half of which relates to the change in the level of CO2 per customer use and half to the Group’s renewable electricity rate, assessed at the end of the three years of the plan in relation to the objectives set by the Board of Directors;
− the Total Shareholder Return (TSR) external performance condition. The performance of the TSR is assessed by comparing the change in the Orange TSR based on the relative performance of the total return for Orange shareholders over the three fiscal years, and the change in the TSR calculated on the average values of the benchmark Stoxx Europe 600 Telecommunications index or any other index having the same purpose and replacing it during the term of the plan.
Rights subject to the achievement of performance conditions (as a % of the total entitlement):
LTIP 2020 - 2022 | LTIP 2019 - 2021 | LTIP 2018 - 2020 | |
Organic cash-flow from telecom activities | 40% | 50% | 50% |
Total Shareholder Return (TSR) | 40% | 50% | 50% |
Corporate Social Responsability (CSR) | 20% | - | - |
All performance conditions have been met or are estimated to be met at the end of the three years of the plan, with the exception of the condition relating to organic cash flow from telecom activities for fiscal year 2018 and the condition relating to the TSR of the LTIP 2018 - 2020.
Valuation assumptions
LTIP 2020 - 2022 | LTIP 2019 - 2021 | LTIP 2018 - 2020 | |
Measurement date | July 29, 2020 | July 24, 2019 | July 25, 2018 |
Vesting date | December 31, 2022 | December 31, 2021 | December 31, 2020 |
Price of underlying instrument at measurement date | 10.47 euros | 13.16 euros | 13.98 euros |
Price of underlying instrument at closing date | 9.73 euros | 9.73 euros | 9.73 euros |
Expected dividends (% of the share price) | 6.7% | 5.3% | 5.0% |
Risk free yield | - 0.61% | - 0.70% | - 0.33% |
Fair value per share of benefit granted to employees | 6.06 euros | 7.80 euros | 11.23 euros |
o/w fair value of internal performance condition | 8.58 euros | 11.10 euros | 11.94 euros |
o/w fair value of external performance condition | 2.27 euros | 4.50 euros | 4.50 euros |
For the portion of the plan issued in the form of shares, fair value was determined based on the market price of Orange shares on the date of allocation and the expected dividends discounted to December 31, 2020. Fair value also takes into account the likelihood of achievement of the market performance conditions, determined on the basis of a model constructed using the Monte Carlo method. For the portion of the plan issued in cash, at December 31, 2020, fair value was determined based on the market price of Orange shares at the closing date.
Accounting effect
In 2020, an expense of (15) million euros (including social contributions) was recognized with corresponding entries in equity (13 million euros) and in social debts (2 million euros).
In 2019, an expense of (10) million euros (including social contributions) was recognized with corresponding entries in equity (8 million euros) and in social debts (2 million euros).
In 2018, an expense of (3) million euros (including social contributions) was recognized with corresponding entries in equity (3 million euros) and in social debts (0 million euros).
Orange Vision 2020 free share award plan and LTIP 2017 - 2019
In 2017, the Board of Directors approved the implementation of a free share award plan (AGA) reserved for employees, as well as a free share award plan (LTIP) reserved for the Executive Committee, Corporate Officers and Senior Management.
The shares were delivered to the beneficiaries on March 31, 2020, with the exception, for the LTIP 2017-2019, of Corporate Officers for whom delivery took place after the Company's Shareholders' Meeting of May 19, 2020.
Main characteristics
FSA 2017 - 2019 | LTIP 2017 - 2019 | |
Implementation date by the Board of Directors | October 26, 2017 | July 26, 2017 |
Maximum number of free share units (1) | 9.2 millions | 1.6 million |
Number of free share units delivered at delivery date (1) | 6.8 millions | 1.2 million |
Estimated number of beneficiaries (2) | 144,000 | 1,200 |
Acquisition date of the rights by the beneficiaries | December 31, 2019 | December 31, 2019 |
Delivery date of the shares to the beneficiaries | March 31, 2020 | March 31, 2020 |
(1) In countries where the regulations, tax codes or labor laws do not permit awards of stock, the beneficiaries of the plan received a cash value based on the exchange-traded price of Orange stock at the delivery date of the shares, on March 31, 2020.
(2) Present in 87 countries.
Condition of continued employment
The allocation of rights to beneficiaries was subject to a condition of continued employment:
FSA 2017 - 2019 | LTIP 2017 - 2019 | LTIP 2017 - 2019 | |
Beneficiaries | Employee members | Coporate officers and members of the Executive Committee | "Executives" and "Leaders" |
Assessment of the employment continuation | From September 1, 2017 to December 31, 2019 | From January 1, 2017 to December 31, 2019 | From July 15, 2017 to December 31, 2019 |
Performance conditions
Depending on the plans, the allocation of rights to beneficiaries was subject to the achievement of internal and external performance conditions, namely:
− the adjusted EBITDA internal performance condition, including banking activities;
− the organic cash flow from telecom activities internal performance condition, as defined in the plan regulations;
− the Total Shareholder Return (TSR) external performance condition. The performance of the TSR was assessed by comparing the change in the Orange TSR based on the relative performance of the total return for Orange shareholders over the three fiscal years, and the change in the TSR calculated on the average values of the benchmark Stoxx Europe 600 Telecommunications index or any other index having the same purpose and replacing it during the term of the plan.
Rights subject to the achievement of performance conditions (as a % of the total entitlement):
FSA 2017 - 2019 | LTIP 2017 - 2019 | |
Adjusted EBITDA includng banking activities | 50% | - |
Organic cash-flow from telecom activities | 50% | 50% |
Total Shareholder Return (TSR) | - | 50% |
Performance was assessed for the years 2017, 2018 and 2019 in relation to the budget for each of these three years, as approved in advance by the Board of Directors. All performance conditions were met except for the condition relating to organic cash flow from telecom activities for fiscal year 2018.
Hypothèses de valorisation
FSA 2017 - 2019 | LTIP 2017 - 2019 | |
Measurement date | October 26, 2017 | July 26, 2017 |
Vesting date | December 31, 2019 | December 31, 2019 |
Price of underlying instrument at measurement date | 13.74 euros | 14.33 euros |
Price of underlying instrument at vesting date | 13.12 euros | 13.12 euros |
Price of underlying instrument at delivery date | 11.14 euros | 11.14 euros |
Expected dividends (% of the share price) | 4.5% | 4.5% |
Risk free yield | -0.45% | -0.32% |
Fair value per share of benefit granted to employees | 12.45 euros | 9.55 euros |
o/w fair value of internal performance condition | 12.45 euros | 12.81 euros |
o/w fair value of external performance condition | - | 6.29 euros |
For the portion of the free share award plan issued in the form of shares, fair value was determined based on the market price of Orange shares on the date of award and the expected dividends discounted to December 31, 2019. The fair value also took into account the likelihood of achieving the market performance condition, determined on the basis of a model constructed using the Monte Carlo method. For that part of the plans remitted in the form of cash, the fair value was determined on the basis of the Orange share price at March 31, 2020.
Accounting effect
The cost of the plans including social security contributions is presented below:
(in millions of euros) | 2020 | 2019 | 2018 | 2017 |
FSA 2017 - 2019 (1) | 6 | (53) | (52) | (11) |
LTIP 2017 - 2019 (2) | 1 | (6) | (6) | (3) |
(1) With corresponding entries in equity for 87 million euros and in employee-related payables for 23 million euros settled on delivery of the shares in 2020.
(2) With corresponding entries in equity for 12 million euros and in employee-related payables for 2 million euros settled on delivery of the shares in 2020.
Other plans
The other share-based compensation and similar plans implemented in the Orange group are not material at Group level.
Accounting policies
Employee share-based compensation: the fair value of stock options and bonus shares is determined by reference to the exercise price, the life of the option, the current price of the underlying shares at the grant date, the expected share price volatility, expected dividends, and the risk-free interest rate over the option’s life. Vesting conditions other than market conditions are not part of the fair value assessment, but are part of the grant assumptions (employee turnover, probability of achieving performance criteria).
The determined amount is recognized in labor expenses on a straight-line basis over the vesting period, with as counterparty:
− employee benefit liabilities for cash-settled plans, re-measured against profit or loss at each year-end; and
− equity for equity-settled plans.
7.4 Executive compensation
The following table shows the compensation booked by Orange SA and its controlled companies to persons who were members of Orange SA’s Board of Directors or Executive Committee at any time during the year or at the end of the year.
(in millions of euros) | December 31, 2020 (4) | December 31, 2019 | December 31, 2018 |
Short-term benefits excluding employer social security contributions (1) | (16) | (13) | (15) |
Short-term benefits: employer's social security contributions | (5) | (4) | (5) |
Post-employment benefits (2) | (0) | (0) | (0) |
Share-based compensation (3) | (2) | (2) | (1) |
(1) Includes all compensation: gross salaries including the variable component, bonuses, attendance fees and benefits in kind, incentive scheme and profit-sharing, cash settled Long Term Incentive Plan (LTIP) in 2020 and 2018.
(2) Service cost.
(3) Includes employee shareholding plans and shares settled Long Term Incentive Plan (LTIP).
(4) In 2020, an amount of (2) million euros relating to termination benefits was paid. These termination benefits are not presented in the compensation table above.
The total amount of retirement benefits (contractual retirement bonuses and defined-benefit supplementary pension plan) provided in respect of persons who were members of the Board of Directors or Executive Committee at the end of the year was 4 million euros (6 million euros in 2019 and 6 million euros in 2018).
Executive Committee members’ contracts include a clause providing for a contractual termination settlement not exceeding 15 months of their total gross annual compensation (including the contractual termination benefit). Stéphane Richard, Chairman and Chief Executive Officer, has no employment contract, and the employment contracts of Deputy CEOs were suspended on the date of their appointment as corporate officers. These employment contracts may be reinstated at the end of their terms of office, with recovery of rights.
Orange has not acquired any other goods or services from persons who are or were at any time during the year or at the end of the fiscal year, members of the Board of Directors or Executive Committee of Orange SA (or any parties related thereto).
Note 8 Impairment losses and goodwill
8.1 Impairment losses
(in millions of euros) | December 31, 2020 | December 31, 2019 | December 31, 2018 |
Jordan | - | (54) | (56) |
Total of impairment of goodwill | - | (54) | (56) |
The impairment tests on Cash-Generating Units (CGUs) may result in impairment losses on goodwill and on fixed assets (see Note 9.3).
At December 31, 2020
At December 31, 2020, impairment tests did not result in the Group recognizing any impairment losses.
At December 31, 2019
In Jordan, the 54 million euros impairment of goodwill reflected, as it had in 2018, the effects of an uncertain political and economic climate and heavy competitive pressure on the fixed and mobile data markets. The net carrying value of tested assets was brought down to the value in use of current and long-term assets at 100% at December 31, 2019 (0.8 billion euros).
In Egypt, the reversal of 89 million euros of impairment on fixed assets primarily reflected an improvement in the country’s economic situation (see Note 9.3).
At December 31, 2018
In Jordan, the 56 million euros impairment of goodwill mostly reflected the effects of an uncertain political and economic climate and heavy competitive pressure on the fixed and mobile data markets. The net carrying value of tested assets was brought down to the value in use of current and long-term assets at 100% at December 31, 2018 (0.7 billion euros).
In Niger, the value of the telecommunication market continued to fall in a business environment that remained challenging. The economic and financial position of the Company led it, as a precaution, to recognize a fixed-asset impairment in the amount of 43 million euros to cover Orange’s exposure using our best current estimation.
8.2 Goodwill
December 31, 2020 | December 31, 2019 | December 31, 2018 | ||||
(in millions of euros) | Gross value | Accumulated impairment losses | Net book value | Net book value | Net book value | |
France | 14,377 | (13) | 14,364 | 14,364 | 14,364 | |
Europe | 13,463 | (3,951) | 9,512 | 9,537 | 9,420 | |
Spain | 6,986 | (114) | 6,872 | 6,872 | 6,840 | |
Romania | 1,806 | (570) | 1,236 | 1,236 | 1,236 | |
Slovakia | 806 | - | 806 | 806 | 806 | |
Belgium | 1,049 | (713) | 336 | 350 | 298 | |
Poland | 2,672 | (2,536) | 136 | 140 | 111 | |
Moldova | 76 | - | 76 | 83 | 79 | |
Luxembourg | 68 | (19) | 50 | 50 | 50 | |
Africa & Middle East | 2,510 | (1,066) | 1,443 | 1,481 | 1,542 | |
Burkina Faso | 428 | - | 428 | 428 | 428 | |
Côte d'Ivoire | 417 | (42) | 375 | 375 | 375 | |
Morocco | 253 | - | 253 | 257 | 251 | |
Sierra Leone | 118 | - | 118 | 134 | 152 | |
Jordan | 257 | (154) | 103 | 112 | 163 | |
Cameroon | 134 | (90) | 44 | 44 | 44 | |
Other | 903 | (781) | 122 | 131 | 129 | |
Enterprise | 2,871 | (647) | 2,225 | 2,245 | 1,830 | |
International Carriers & Shared Services | 18 | - | 18 | 18 | 18 | |
Mobile Financial Services | 35 | - | 35 | - | - | |
Goodwill | 33,273 | (5,678) | 27,596 | 27,644 | 27,174 | |
(in millions of euros) | Note | December 31, 2020 | December 31, 2019 | December 31, 2018 |
Gross value in the opening balance | 33,579 | 32,949 | 32,687 | |
Acquisitions | 26 | 520 | 353 | |
Disposals | - | (4) | (12) | |
Translation adjustment | (331) | 111 | (39) | |
Reclassifications and other items | - | 3 | (40) | |
Gross value in the closing balance | 33,273 | 33,579 | 32,949 | |
Accumulated impairment losses in the opening balance | (5,935) | (5,775) | (5,776) | |
Impairment | 8.1 | - | (54) | (56) |
Disposals | - | 4 | 12 | |
Translation adjustment | 257 | (110) | 45 | |
Accumulated impairment losses in the closing balance | (5,678) | (5,935) | (5,775) | |
Net book value of goodwill | 27,596 | 27,644 | 27,174 |
8.3 Key assumptions used to determine recoverable amounts
The key operational assumptions reflect past experience and expected trends: unforeseen changes have in the past affected, and could continue to significantly affect, these expectations. In this respect, the review of expectations could affect the margin of recoverable amounts over the carrying value tested (see Note 8.4) and result in impairment losses on goodwill and fixed assets.
In 2020, the Group updated its financial trajectories. The entire strategic plan will be updated in 2021.
The discount rates and growth rates to perpetuity used to determine the values in use were revised as follows at the end of December 2020:
− the discount rates, which may incorporate a specific premium reflecting an assessment of the performance risks of certain business plans or country risks, experienced the following changes:
- a fall in Europe due, on the one hand, to interest rates lowered by central banks in response to the crisis, and on the other hand, a fall in betas due to the minimal reaction of European telecom operators to changes in the indices,
- an increase in the Africa and Middle East region, where country risk premiums tend to increase as investors seek lower risk;
− perpetual growth rates increased slightly in the Africa and Middle East region, returning to the rates used in December 2018. In Europe, perpetual growth rates were maintained in most regions, with the assessment made at the end of December 2020 concluding that the effects of the economic situation would not lead to any change in the long-term outlook of the service markets offered by the Group.
At December 31, 2020, business plans and key operating assumptions were sensitive to the following:
− the consequences of the Covid-19 pandemic: a slowdown in sales activity, a decline in roaming and equipment sales and a delay in the assumption of a return to an economic situation deemed normal;
− the tradeoffs to be made by regulatory and competition authorities between reducing prices to consumers and stimulating business investment, or in terms of rules for awarding 5G operating licenses or market concentration;
− the fiercely competitive nature of the markets in which the Group operates, where price pressure is strong, particularly in Spain;
− the Group’s ability to adjust costs and capital expenditure to changes in revenue;
− specifically in the Middle East and the Maghreb (Jordan, Egypt, Tunisia) as well as in some African countries (Mali, Democratic Republic of the Congo, Central African Republic and Burkina Faso):
- changes in the political situation and security with their resulting negative economic impacts on the overall business climate.
The parameters used to determine the recoverable amount of the main consolidated activities or the activities most sensitive to the assumptions of the impairment tests are as follows:
December 31, 2020 | France | Spain | Poland | Enterprise | Belgium/ Luxembourg | Romania | Morocco |
Basis of recoverable amount | Value in use | Fair value | Value in use | ||||
Source used | Internal plan | NA | Internal plan | ||||
Methodology | Discounted cash flow | NA | Discounted cash flow | ||||
Perpetuity growth rate | 0.8 % | 1.5 % | 1.5 % | 0.3 % | NA | 2.3 % | 2.8 % |
Post-tax discount rate | 5.5 %(1) | 6.5 % | 7.3 % | 7.5 % | NA | 7.5 % | 7.3 % |
p-tax discount rate | 7.4 % | 8.1 % | 8.5 % | 10.2 % | NA | 8.5 % | 8.6 % |
December 31, 2019 | France | Spain | Poland | Enterprise | Belgium | Sierra Leone | Liberia |
Basis of recoverable amount | Value in use | ||||||
Source used | Internal plan | ||||||
Methodology | Discounted cash flow | ||||||
Perpetuity growth rate | 0.8 % | 1.5 % | 1.5 % | 0.3 % | 0.5 % | 3.8 % | 3.8 % |
Post-tax discount rate | 6.0 %(1) | 7.3 % | 8.3 % | 7.5 % | 7.5 % | 13.0 % | 13.0 % |
p-tax discount rate | 8.1 % | 9.1 % | 9.7 % | 10.0 % | 9.6 % | 15.9 % | 15.9 % |
December 31, 2018 | France | Spain | Poland | Enterprise | Belgium | Romania | Egypt |
Basis of recoverable amount | Value in use | ||||||
Source used | Internal plan | ||||||
Methodology | Discounted cash flow | ||||||
Perpetuity growth rate | 0.8 % | 1.5 % | 1.0 % | 0.3 % | 0.5 % | 2.3 % | 4.0 % |
Post-tax discount rate | 6.0 %(1) | 7.0 % | 8.0 % | 7.5 % | 6.8 % | 8.3 % | 13.8 % |
p-tax discount rate | 7.8 % | 8.8 % | 9.5 % | 10.2 % | 8.6 % | 9.3 % | 16.1 % |
(1) The after-tax discount rate for France includes a corporate tax reduction of 25.82% by 2022.
The fair value of the Belgium/Luxembourg entity was defined on the basis of the conditional voluntary public tender offer for the shares of Orange Belgium SA launched on January 21, 2021.
The Group’s listed subsidiaries are Orange Polska (Warsaw Stock Exchange), Orange Belgium (Brussels Stock Exchange), Jordan Telecom (Amman Stock Exchange) and Sonatel (Regional Stock Exchange (BRVM)). The aggregated share of these subsidiaries, which publish their own regulated information, is less than or equal to 20% of the consolidated revenue, operating income and net income.
8.4 Sensitivity of recoverable amounts
The correlation between operating cash flow and investment capacity means that the sensitivity of net cash flow is used. Cash flow for the terminal year forming a significant part of the recoverable amount, a change of plus or minus 10% in these cash flows is presented as a sensitivity assumption.
Cash flow is cash provided by operating activities net of acquisitions and disposals of property, plant and equipment and intangible assets (including tax at a standard rate, repayment of lease liabilities and debts related to financed assets, related interest expenses and excluding other interest expenses).
A sensitivity analysis was carried out on the main consolidated activities or the activities most sensitive to the assumptions of the impairment tests and is presented below to enable readers of the financial statements to estimate the effects of their own estimates. Changes in cash flow, perpetual growth rates or discount rates exceeding the sensitivity levels presented have been observed in the past.
Increase in discount rate in order for the recoverable amount to be equal to the net carrying value (in basis points) | Decrease in the perpetual growth rate in order for the recoverable amount to be equal to the net carrying value (in basis points) | Decrease in the discounted cash flows of the terminal value in order for the recoverable amount to be equal to the net carrying value (in %) | ||
December 31, 2020 | ||||
France | +141 bp | (124) bp | -28% | |
Spain | +1 bp | (1) bp | 0% | |
Poland | +189 bp | (151) bp | -23% | |
Enterprise | +1,067 bp | (1,691) bp | -82% | |
Romania | +49 bp | (49) bp | -9% | |
Morocco | +354 bp | (433) bp | -53% | |
Belgium | NA | NA | NA | |
December 31, 2019 | ||||
France | +252 bp | (243) bp | -34% | |
Spain | +54 bp | (63) bp | -11% | |
Poland | +200 bp | (178) bp | -24% | |
Enterprise | +1,130 bp | (1,783) bp | -74% | |
Belgium | +856 bp | (711) bp | -69% | |
Sierra Leone | +50 bp | (86) bp | -9% | |
Liberia | +83 bp | (154) bp | -15% | |
December 31, 2018 | ||||
France | +347 bp | (399) bp | -48% | |
Spain | +144 bp | (173) bp | -26% | |
Poland | +354 bp | (312) bp | -33% | |
Belgium | +301 bp | (324) bp | -38% | |
Enterprise | +1,299 bp | (3,573) bp | -88% | |
At December 31, 2020, the fair value of the Belgium/Luxembourg entity was defined in the context of the conditional voluntary public tender offer for all shares of Orange Belgium SA launched on January 21, 2021. Sensitivity analyzes, calculated on cash flows and financial parameters, are therefore not relevant for these CGUs at December 31, 2020. A change of one euro in the reference price per share used to calculate the fair value of the Belgium/Luxembourg entity would have an effect on the recoverable amount of 0.1 billion euros.
At December 31, 2020, the value in use of the Spain CGU was revised based on the key valuation assumptions established by the new local governance. This valuation exercise was carried out in a particularly competitive market, marked by an erosion in average revenue per user and the effects of the current health crisis. The revision of the assumptions resulted in a value in use equal to the carrying value of the assets tested, without however requiring any impairment.
A sensitivity analysis was carried out on each of the following criteria, taken individually:
− increase of 1% in the discount rate;
− decrease of 1% in the perpetual growth rate;
− decrease of 10% in cash flow in the terminal year.
This sensitivity analysis revealed a risk of impairment estimated at between 15% and 30% of the net value of goodwill according to the criteria retained taken individually.
The same analysis was carried out on:
− Romania and identified a risk of impairment of up to 15% of the net value of goodwill;
− Jordan and revealed an impairment risk estimated at approximately 20% of the net value of goodwill.
The other entities not listed above, with the exception of the Orange brand, presented in Note 9.3, each account for less than 3% of the recoverable amount of the consolidated entities.
Accounting policies
Goodwill recognized as an asset in the statement of financial position comprises the excess calculated:
− either on the basis of the equity interest acquired (and for business combinations after January 1, 2010, with no subsequent changes for any additional purchases of non-controlling interests); or
− on a 100% basis, leading to the recognition of goodwill relating to non-controlling interests.
Goodwill is not amortized. It is tested for impairment at least annually and more frequently when there is an indication that it may be impaired. Thus, changes in general economic and financial trends, the different levels of resilience of the telecommunication operators with respect to the deterioration of local economic environments, changes in the market capitalization of telecommunication operators, as well as financial performance compared to market expectations represent external impairment indicators that are analyzed by the Group, together with internal performance indicators, in order to assess whether an impairment test should be performed more than once a year.
These tests are performed at the level of each Cash-Generating Unit (CGU) (or group of CGUs). These generally correspond to business segments or to each country in the Africa and Middle East region and Europe. This is reviewed if the Group changes the level at which it monitors return on investment for goodwill testing purposes.
To determine whether an impairment loss should be recognized, the carrying value of the assets and liabilities of the CGUs or groups of CGUs is compared to their recoverable amount, for which Orange uses mostly the value in use.
Value in use is estimated as the present value of the expected future cash flows. Cash flow projections are based on economic and regulatory assumptions, license renewal assumptions and sales activity and investment forecasts drawn up by the Group’s management, as follows:
− cash flow projections are based on three-to-five-year business plans and include a tax cash flow calculated as EBIT (operating income) multiplied by the statutory tax rate (excluding the impact of deferred tax and unrecognized tax loss carryforwards at the date of valuation). In the case of recent acquisitions, longer-term business plans may be used;
− post-tax cash flow projections beyond that timeframe may be extrapolated by applying a declining or flat growth rate for the next year, and then a perpetual growth rate reflecting the expected long-term growth in the market;
− post-tax cash flows are subject to a post-tax discount rate, using rates which incorporate a relevant premium reflecting a risk assessment for the implementation of certain business plans or country risks. The value in use derived from these calculations is identical to the one that would result from discounting p-tax cash flows at p-tax discount rates.
The key operating assumptions used to determine the value in use are common across Group’s business segments. Key assumptions for most CGUs include:
− key revenue assumptions, which reflect market level, penetration rate of the offers and market share, positioning of the competition’s offers and their potential impact on market price levels and their transposition to the Group’s offer bases, regulatory authority decisions on pricing of services to customers and on access and pricing of inter-operator services, technology migration of networks (e.g. extinction of copper local loops), decisions of competition authorities in terms of concentration or regulation of adjacent sectors such as cable;
− key cost assumptions, on the level of marketing expenses required to deal with the pace of product line renewals and the positioning of the competition, the ability to adjust costs to potential changes in revenues or the effects of natural attrition and employee departure plans underway;
− key assumptions on the level of capital expenditure, which may be affected by the rollout of new technologies, by decisions of regulatory authorities relating to licenses and spectrum allocation, deployment of fiber networks, mobile network coverage, sharing of network elements or obligations to open up networks to competitors.
Tested net carrying values include goodwill, land and assets with finite useful lives (property, plant and equipment, intangible assets and net working capital requirements including intra-group balances). The Orange brand, an asset with an indefinite useful life, is subject to a specific test, see Note 9.3.
If an entity partially owned by the Group includes goodwill attributable to non-controlling interests, the impairment loss is allocated between the shareholders of Orange SA and the non-controlling interests on the same basis as that on which profit or loss is allocated (i.e. ownership interest).
Impairment loss for goodwill is recorded definitively in operating income.
Note 9 Fixed assets
9.1 Gains (losses) on disposal of fixed assets
(in millions of euros) | 2020 | 2019 | 2018 |
Transfer price | 444 | 610 | 224 |
Net book value of assets sold | (223) | (307) | (44) |
Proceeds from the disposal of fixed assets (1) | 221 | 303 | 180 |
(1) In 2020, the gains on disposal of fixed assets related to the sale and leaseback transactions amount to 143 million euros (195 million euros as December 31, 2019) and mainly comprise property asset disposals in France as well as mobile site disposals in Spain. These transactions fall within the context of the Group asset portfolio review.
9.2 Depreciation and amortization
(in millions of euros)
| Depreciation and amortization of property, plant and equipment | ||
Depreciation and amortization of intangible assets | |||

Depreciation and amortization of intangible assets
(in millions of euros)

Software | Telecommunications licenses | Customer bases | Brands | Other intangible assets |
Depreciation and amortization of property, plant and equipment
(in millions of euros)

Networks and terminals | IT equipment | Land and buildings | Other property, plant and equipment |
Accounting policies
Assets are amortized to expense their cost (generally with no residual value deducted) on a basis that reflects the pattern in which their future economic benefits are expected to be consumed. The straight-line basis is usually applied. The useful lives are reviewed annually and are adjusted if current estimated useful lives differ from previous estimates. This may be the case for outlooks on the implementation of new technologies (for example, the replacement of copper local loop by optical fiber). These changes in accounting estimates are recognized prospectively.

9.3 Impairment of fixed assets
(in millions of euros) | 2020 | 2019 | 2018 |
France | (15) | - | - |
International Carriers & Shared Services | (7) | - | - |
Poland | (7) | (12) | 1 |
Niger | - | - | (43) |
Egypt | 1 | 89 | (4) |
Other | (2) | (4) | (2) |
Total of impairment of fixed assets | (30) | 73 | (49) |
The impairment of fixed assets resulting from impairment tests on Cash-Generating Units (CGUs) are described in Note 8.1.
Key assumptions and sensitivity of the recoverable amount of the Orange brand
The key assumptions and sources of sensitivity used in the assessment of the recoverable amount of the Orange brand are similar to those used for the goodwill of consolidated activities (see Note 8.3), which affect the revenue base and potentially the level of brand royalties.
Other assumptions that affect the assessment of the recoverable amount are as follows:
December 31, 2020 | December 31, 2019 | December 31, 2018 | |
Basis of recoverable amount | Value in use | Value in use | Value in use |
Source used | Internal plan | Internal plan | Internal plan |
Methodology | Discounted net fees | Discounted net fees | Discounted net fees |
Perpetuity growth rate | 1.2% | 1.1% | 1.2% |
Post-tax discount rate | 6.9% | 7.4% | 7.4% |
p-tax discount rate | 8.3% | 8.8% | 8.8% |
The sensitivity analysis did not highlight any risk of impairment of the Orange brand.
Accounting policies
Given the nature of its assets and businesses, most of the Group’s individual assets do not generate cash flow independent of the cash flows generated by Cash-Generating Units. The recoverable amount is therefore determined at the level of the CGU (or group of CGUs) to which the assets belong, according to a method similar to that described for goodwill.
The Orange brand has an indefinite useful life and is not amortized but is tested for impairment at least annually. Its recoverable amount is assessed based on the expected contractual royalties (and included in the business plan) discounted in perpetuity, less the costs attributable to the brand’s owner.
9.4 Other intangible assets
December 31, 2020 | December 31, 2019 | December 31, 2018 | ||||
(in millions of euros) | Gross value | Accumulated depreciation and amortization | Accumulated impairment | Net book value | Net book value | Net book value |
Telecommunications licenses | 12,168 | (5,800) | (46) | 6,322 | 6,043 | 5,917 |
Software | 13,149 | (8,842) | (19) | 4,288 | 4,250 | 4,046 |
Orange brand | 3,133 | - | - | 3,133 | 3,133 | 3,133 |
Other brands | 1,099 | (121) | (899) | 78 | 88 | 89 |
Customer bases | 5,265 | (4,785) | (11) | 469 | 597 | 449 |
Other intangible assets | 2,564 | (1,543) | (177) | 844 | 626 | 439 |
Total | 37,378 | (21,090) | (1,152) | 15,135 | 14,737 | 14,073 |
(in millions of euros) | 2020 | 2019 | 2018 | |
Net book value of other intangible assets - in the opening balance | 14,737 | 14,073 | 14,339 | |
Acquisitions of other intangible assets | 2,935 | 2,385 | 1,895 | |
o/w telecommunications licenses(1) | 969 | 519 | 200 | |
Impact of changes in the scope of consolidation(2) | 31 | 328 | 69 | |
Disposals | (4) | (10) | (0) | |
Depreciation and amortization | (2,309) | (2,286) | (2,256) | |
Impairment(3) | (24) | 88 | (10) | |
Translation adjustment | (176) | 106 | 7 | |
Reclassifications and other items | (55) | 52 | 29 | |
Net book value of other intangible assets - in the closing balance | 15,135 | 14,737 | 14,073 | |
(1) Relates in 2020 to the acquisition of the 5G license for 875 million euros in France and in Slovakia for 37 million euros. In 2019, related to licenses for 296 million euros in Spain, for 119 million euros in Burkina Faso and for 82 million euros in Guinea. In 2018, related to the acquisition of the 5G license for 142 million euros in Spain.
(2) In 2019, mainly relates to the effects of SecureLink and SecureData acquisition (see Note 4.2).
(3) Includes impairment detailed in Note 8.1.
Internal costs capitalized as intangible assets
Internal costs capitalized as intangible assets relate to labor expenses and amounted to 405 million euros in 2020, 389 million euros in 2019 and 382 million euros in 2018.
Information on telecommunications licenses at December 31, 2020
Orange’s principal commitments under licenses awarded are disclosed in Note 16.
(in millions of euros) | Gross value | Net book value | Residual useful life (1) |
5G | 875 | 870 | 14.9 |
LTE (4 licenses) (2) | 2,180 | 1,596 | 10.8 to 15.9 |
UMTS (2 licenses) | 914 | 159 | 0.7 and 9.4 |
GSM | 266 | 3 | 0.5 |
France | 4,235 | 2,628 | |
5G (2 licenses) | 459 | 459 | 10.0 and 17.9 |
LTE (3 licenses) | 529 | 328 | 10.0 to 10.3 |
GSM (2 licenses) | 285 | 123 | 10.0 |
Spain | 1,273 | 910 | |
LTE (3 licenses) | 745 | 494 | 7.0 to 10.1 |
UMTS (2 licenses) | 365 | 43 | 3.0 |
GSM (2 licenses) | 131 | 45 | 6.6 and 8.5 |
Poland | 1,241 | 582 | |
LTE | 413 | 317 | 11.0 |
UMTS | 142 | 46 | 11.0 |
GSM (2 licenses) | 401 | 114 | 11.0 |
Egypt | 956 | 477 | |
LTE | 60 | 47 | 14.2 |
UMTS | 28 | 11 | 11.5 |
GSM | 744 | 170 | 10.3 |
Morocco | 832 | 228 | |
LTE | 184 | 101 | 8.3 |
UMTS | 91 | 50 | 8.3 |
GSM | 292 | 120 | 8.3 |
Romania | 567 | 271 | |
LTE | 82 | 51 | 9.4 |
UMTS (3 licenses) | 132 | 73 | 4.2 to 12.3 |
GSM | 177 | 87 | 8.0 |
Jordan | 391 | 211 | |
LTE (2 licenses) | 140 | 90 | 6.4 and 12.9 |
UMTS | 149 | 2 | 0.3 |
GSM | 76 | 2 | 0.2 |
Belgium | 365 | 94 | |
5G (2 licenses) | 37 | 37 | 4.5 and 19.5 |
LTE | 76 | 44 | 8.9 |
UMTS (2 licenses) | 46 | 12 | 1.6 to 5.4 |
GSM | 66 | 15 | 4.7 |
Slovensko | 225 | 108 | |
Other | 2,083 | 813 | |
Total | 12,168 | 6,322 |
(1) In number of years, at December 31, 2020.
(2) Comprises the 700 MHz license of which the spectrum is technologically neutral.
Accounting policies
Intangible assets mainly consist of acquired brands, acquired customer bases, telecommunications licenses and software, as well as operating rights granted under certain concession agreement.
Intangible assets are initially recognized at acquisition or production cost. The payments indexed to revenue, especially for some telecommunications licenses, are expensed in the relevant periods.
The operating rights granted under certain concession arrangements are booked under other intangible assets and give right to charge users of the public service (see Note 5.1).
9.5 Property, plant and equipment
December 31, 2020 | December 31, 2019 | December 31, 2018 | ||||
(in millions of euros) | Gross value | Accumulated depreciation and amortization | Accumulated impairment | Net book value | Net book value | Net book value |
Networks and terminals | 90,991 | (64,999) | (167) | 25,825 | 25,137 | 23,962 |
Land and buildings | 7,295 | (5,067) | (210) | 2,018 | 2,026 | 2,479 |
IT equipment | 3,942 | (3,140) | (0) | 801 | 803 | 817 |
Other property, plant and equipment | 1,687 | (1,251) | (6) | 431 | 456 | 435 |
Total property, plant and equipment | 103,915 | (74,456) | (384) | 29,075 | 28,423 | 27,693 |

Wireline access network | Wireless access network | Core & Transmission network | Terminals, CPEs & payphones |
(in millions of euros) | 2020 | 2019 | 2018 |
Net book value of property, plant and equipment - in the opening balance | 28,423 | 27,693 | 26,665 |
IFRS 16 transition impact (1) | - | (574) | - |
Net book value of property, plant and equipment - including IFRS 16 transition impact | 28,423 | 27,119 | 26,665 |
Acquisitions of property, plant and equipment | 5,848 | 6,181 | 5,883 |
o/w finance leases | - | - | 136 |
o/w financed assets | 241 | 144 | - |
Impact of changes in the scope of consolidation (2) | 0 | (52) | 63 |
Disposals and retirements | (154) | (164) | (44) |
Depreciation and amortization | (4,880) | (4,838) | (4,791) |
o/w fixed assets | (4,825) | (4,824) | (4,791) |
o/w financed assets | (55) | (14) | - |
Impairment (3) | (6) | (15) | (39) |
Translation adjustment | (319) | 115 | (27) |
Reclassifications and other items | 164 | 78 | (17) |
Net book value of property, plant and equipment - in the closing balance | 29,075 | 28,423 | 27,693 |
(1) Following IFRS 16 application as of January 1, 2019, financial lease contracts have been reclassified in right-of-use assets.
(2) Mainly relates in 2019 to the disposal of Orange Niger. In 2018, mainly related to Basefarm entities acquisition (see Note 4.2).
(3) Includes impairment detailed in Note 8.1.
Financed assets
Financed assets include as of December 31, 2020 the set-up boxes in France which are financed by an intermediary bank: they meet the standard criterion of a tangible asset according to IAS 16. The debts associated to these financed assets are presented in financial liabilities and are included in the definition of the net financial debt.
Property, plant and equipment held under finance leases
Property, plant and equipment held under finance leases amounted to 574 million euros at December 31, 2018, of which 423 million euros related to "Land and buildings", 115 million euros to "Networks and terminals" and 36 million euros related mainly to "IT equipment".
Internal costs capitalized as property, plant and equipment
Internal costs capitalized as property, plant and equipment relate to labor expenses and amounted to 462 million euros in 2020, 459 million euros in 2019 and 460 million euros in 2018.
Accounting policies
Property, plant and equipment are made up of tangible fixed assets and financed assets. They mainly comprise network facilities and equipment.
The gross value of property, plants and equipment is made up of their acquisition or production cost, which includes study and construction fees as well as enhancement costs that increase the capacity of equipment and facilities. Maintenance and repair costs are expensed as incurred, except where they serve to increase the asset’s productivity or extend its useful life.
The cost of property, plant and equipment also includes the estimated cost of dismantling, removing and restoring the site occupied due to the obligation incurred by the Group.
The roll-out of assets by stage, especially for network assets, in the Group’s assessment, does not generally require a substantial period of preparation. As a result, the Group does not generally capitalize the interest expense incurred during the construction and acquisition phase for its property, plant and equipment and intangible assets.
In France, the regulatory framework governing the optical fiber network roll-out (Fiber To The Home - FTTH) organizes the access by commercial operators to the last mile of networks rolled-out by another operator on a co-funding basis (ab initio or a posteriori) or through a line access. The sharing of rights and obligations between the various operators co-financing the terminal section of networks is classified as a joint operation in accordance with IFRS 11 "Partnerships": Orange only recognizes as an asset its share of the network assets self-built or purchased to other co-financing operators.
The Group has entered into network sharing arrangements with other mobile operators on a reciprocal basis, which may cover passive infrastructure sharing, active equipment or even spectrum.
As a reminder, before applying IFRS 16, the accounting principles related to the assets acquired in form of finance lease and in operating lease were the following:
The assets acquired in form of finance lease did not affect the cash flow on acquisition. However, the subsequent rental payments during the leasing period represented interest payments (cash flow on operating activities) and capital repayments (cash flow on financing activities).
The majority of the assets held under finance lease were office and network buildings. The land and buildings hosting radio sites could belong to the Group, or be held through a finance lease, or be available under an operating lease or be simply made available.
The lease agreements of office buildings and points of sale generally were qualified as operating leases and the future lease payments were disclosed as unrecognized contractual commitments.
Simultaneously the equipment, very often generic, of which the risks and rewards of ownership are transferred from the Group to third parties via a lease, was considered as sold.
9.6 Fixed assets payables
(in millions of euros) | 2020 | 2019 | 2018 |
Fixed assets payable in the opening balance | 3,665 | 3,447 | 3,656 |
Business related variations (1) | 1,002 | 200 | (230) |
Changes in the scope of consolidation | (0) | (14) | 0 |
Translation adjustment | (50) | 29 | 8 |
Reclassifications and other items | 23 | 3 | 13 |
Fixed assets payable in the closing balance | 4,640 | 3,665 | 3,447 |
o/w long-term fixed assets payable | 1,291 | 817 | 612 |
o/w short-term fixed assets payable | 3,349 | 2,848 | 2,835 |
(1) Includes 725 million euros in 2020 for the acquisition of the 5G license in France.
Accounting policies
These payables are generated from trading activities. The payment terms can be over several years in the case of infrastructure roll-out and license acquisition. The payables due in more than 12 months are presented in non-current items. For payables without specified interest rates, they are measured at nominal value if the interest component is immaterial. For interest bearing payables, the measurement is at amortized cost.
Trade payables also include those that the supplier may have sold with or without notifying financial institutions in a direct or reverse factoring arrangement (see Note 6.6).
Firm purchase commitments are disclosed as unrecognized contractual commitments (see Note 16), net of any prepayment, which are recognized as prepayment on fixed assets.
9.7 Dismantling provisions
The asset dismantling obligations mainly relate to restoration of mobile telephony antenna sites, dismantling of telephone poles, treatment of electrical and electronic equipment waste and dismantling of telephone booths.
(in millions of euros) | 2020 | 2019 (1) | 2018 |
Dismantling provisions - in the opening balance | 827 | 776 | 789 |
Provision reversal with impact on income statement | (0) | (0) | - |
Discounting with impact on income statement | 2 | 5 | 13 |
Utilizations without impact on income statement | (12) | (24) | (15) |
Changes in provision with impact on assets (2) | 79 | 67 | (19) |
Changes in the scope of consolidation | - | - | - |
Translation adjustment | (10) | 2 | (3) |
Reclassifications and other items | 16 | 2 | 11 |
Dismantling provisions - in the closing balance | 901 | 827 | 776 |
o/w non-current provisions | 885 | 812 | 765 |
o/w current provisions | 16 | 15 | 11 |
(1) 2019 figures have been restated of the IFRS IC decision on lease term (see Note 2.3.1).
(2) Included in 2018 extinctions of obligations for (66) million euros.
Accounting policies
The Group is required to dismantle technical equipment and restore technical sites.
When the obligation arises, a dismantlement asset is recognized in compensation for the dismantling provision.
The provision is based on dismantling costs (on a per-unit basis for telephone poles, terminals and telephone booths, and on a per-site basis for mobile antennas) incurred by the Group to meet its environmental commitments over the asset dismantling and site restoration planning. The provision is assessed on the basis of the identified costs for the current fiscal year, extrapolated for future years using the best estimate of the commitment settlement. This estimate is revised annually and adjusted where appropriate against the asset to which it relates. The provision is present-discounted at a rate set by geographical area and equal to the average rate of risk-free investments in 15-year State bonds.
In case of extinguishment of the obligation, the provision is reversed in compensation for the net carrying value of the dismantling asset and of the net carrying value of the underlying assets if the dismantling asset is less than the reversal of the provision.
Note 10 Lease agreements
In the course of its activities, the Group regularly enters into leases as a lessee. These leases concern the following asset categories:
− Land and buildings
− Networks and terminals
− IT equipment
− Other
Accounting policies
The main accounting positions relating to the IFRS IC Committee’s decision published in December 2019 on the terms of IFRS 16 leases are set out in Note 2.3.1.
As a reminder, the new IFRS 16 "Leases" has been mandatory since January 1, 2019.
The main effects of the implementation of IFRS 16 compared to the principles previously applied under IAS 17 (former standard) relate to the recognition of leases as lessee (see effects on the financial statements presented in Note 2.3.1). IFRS 16, which defines a lease as a contract that confers to the lessee the right to control the use of an identified asset, significantly changes the recognition of these contracts in the financial statements. Lease recognition rules for lessors are unchanged compared with IAS 17.
All leases are recognized in the balance sheet as an asset reflecting the right to use the leased assets and a corresponding liability reflecting the related lease liabilities (see Notes 10.1 and 10.2). In the consolidated income statement, depreciation of right-of-use assets (see Note 10.1) is presented separately from the interest expenses on lease liabilities. In the consolidated statement of cash flows, cash outflows relating to interest expenses impact operating cash flows, while repayments of the lease liability impact financing cash flows.
On first-time application, the Group adopted the simplified retrospective method and applied the following authorized practical expedients:
− the exclusion of initial direct costs from the measurement of the right-of-use asset at the date of first-time application;
− the identical classification of asset and liability balances for finance leases identified under IAS 17 in right-of-use assets and lease liabilities as provided for in the standard;
− the inclusion in the opening balance sheet of provisions for onerous contracts measured at December 31, 2018 pursuant to IAS 37, as an alternative to impairment testing of right-of-use assets in the opening balance sheet. Rent expenses already provisioned are presented in impairment of right-of-use assets.
When the Group carries out a transaction qualified as sale and leaseback in accordance with IFRS 16, a right-of-use asset is recognized in proportion to the previous carrying value of the asset corresponding to the right-of-use asset retained as counterparty to a lease liability. A gain (or loss) on disposal of fixed assets is recognized in the income statement in proportion to the rights transferred to the buyer-lessor. The adjustment of the gain (or loss) on disposal recognized in the income statement for the share on which the Group retains its user rights via the lease relates to the difference between the right-of-use asset and the lease liability recognized in the balance sheet.
Finally, the Group applies the two exemptions provided for in IFRS 16, concerning leases with a term of 12 months or less and leases where the value, when new, of the underlying asset is less than approximately 5,000 euros. Leases covered by either of these exemptions are presented in off-balance sheet commitments and an expense is recognized in external purchases in the consolidated income statement.
The Group classifies as a lease a contract that confers to the lessee the right to control the use of an identified asset for a given period, including a service contract if it contains a lease component.
The Group has defined four major categories of leases:
− land and buildings: these leases mainly concern commercial (point of sale) or service activity (office and head office) leases, as well as leases of technical buildings not owned by the Group. Real estate leases entered into in France generally have long terms (nine-year commercial leases with early termination options after three and six years, known as "3/6/9 leases") (see Note 10.2). However, depending on the geographical location of the leases, their legal term may vary and the Group may be required to adopt a specific enforceable period taking into account the local legal and economic environment;
− networks and terminals: the Group is required to lease a certain number of assets in connection with its mobile activities. This is notably the case of land on which to install antennas, mobile sites leased to third-party operators and certain "TowerCos" contracts (companies operating telecom towers). Leases are also entered into as part of fixed-line network activities. These leases mainly concern access to the local loop where the Orange group is a market challenger (total or partial unbundling), as well as the lease of land transmission cables;
− IT equipment: this asset category primarily comprises the lease of servers and hosting space in data centers;
− other: this asset category primarily comprises the lease of vehicles and technical equipment.
10.1 Right-of-use assets
December 31, 2020 | December 31, 2019 | ||||
(in millions of euros) | Gross value | Accumulated depreciation and amortization | Accumulated impairment | Net book value | Net book value |
Land and buildings | 7,035 | (1,937) | (233) | 4,865 | 4,959 |
Networks and terminals | 2,540 | (609) | - | 1,931 | 1,524 |
IT equipment | 120 | (90) | (0) | 30 | 29 |
Other right-of-use | 304 | (121) | (0) | 184 | 188 |
Total right-of-use assets | 9,999 | (2,757) | (233) | 7,009 | 6,700 |
(1) 2019 figures have been restated of the IFRS IC decision on lease term (see Note 2.3.1).
(in millions of euros) | 2020 | 2019(1) |
Net book value of right-of-use assets - in the opening balance | 6,700 | 6,790 |
Increase (new right-of-use assets) | 1,529 | 1,014 |
Impact of changes in the scope of consolidation | 1 | 18 |
Depreciation and amortization (2) | (1,384) | (1,274) |
Impairment(3) | (57) | (33) |
Impact of changes in the assessments | 331 | 187 |
Translation adjustment | (104) | 26 |
Reclassifications and other items | (7) | (28) |
Net book value of right-of-use assets - in the closing balance | 7,009 | 6,700 |
(1) 2019 figures have been restated of the IFRS IC decision on lease term (see Note 2.3.1).
(2) Including in 2020, right-of-use assets depreciation and amortization expenses of land and buildings for (947) million euros, networks and terminals for (358) million euros, IT equipment for (13) million euros and other right-of-use assets for (65) million euros. Including in 2019, right-of-use assets depreciation and amortization expenses of land and buildings for (908) million euros, networks and terminals for (301) million euros, IT equipment for (12) million euros and other right-of-use assets for (53) million euros.
(3) Impairment losses on right-of-use assets concern real estate leases qualified as onerous contracts.
In 2020, the rental expense recognized in external purchases in the income statement amounts to (151) million euros compared to (241) million euros in 2019. It includes lease payments on contracts of 12 months or less, contracts where the new value of the underlying asset is less than 5,000 euros, and variable lease payments which were not figured into the measurement of the lease liability.
Accounting policies
A right-of use is recognized as an asset, with a corresponding lease liability (see Note 10.2). This right-of-use asset is equal to the amount of the lease liability, plus any direct costs incurred under certain leases such as fees, lease negotiation expenses or administration costs and less rent-free period liabilities and lessor financial contributions.
Work performed by the lessee and modifications to the leased asset, as well as guarantee deposits, are not components of the right-of-use asset and are recognized in accordance with other standards.
Finally, the right-of-use asset is amortized in the consolidated income statement on a straight-line basis over the lease term adopted by the Group.
10.2 Lease liabilities
As of December 31, 2020, lease liabilities amount to 7,371 million euros, including non-current lease liabilities of 5,875 million euros and current lease liabilities of 1,496 million euros.
(in millions of euros) | 2020 | 2019(1) |
Lease liabilities - in the opening balance | 6,932 | 6,531 |
Increase with counterpart in right of use | 1,582 | 1,580 |
Impact of changes in the scope of consolidation | 1 | 18 |
Decrease in lease liabilities following rental payments | (1,400) | (1,429) |
Impact of changes in the assessments | 326 | 187 |
Translation adjustment | (96) | 24 |
Reclassifications and other items | 26 | 21 |
Lease liabilities - in the closing balance | 7,371 | 6,932 |
(1) 2019 figures have been restated of the IFRS IC decision on lease term (see Note 2.3.1).
The following table details the undiscounted future cash flows of lease liabilities:
(in millions of euros) | December 31, 2020 | 2021 | 2022 | 2023 | 2024 | 2025 | 2026 and beyond |
Undiscounted lease liabilities | 8,025 | 1,581 | 1,273 | 1,047 | 879 | 763 | 2,482 |
Accounting policies
The Group recognizes a liability (i.e. a lease liability) at the date the underlying asset is made available. This lease liability is equal to the present value of fixed and in-substance fixed payments not paid at that date, plus any amounts that Orange is reasonably certain to pay at the end of the lease, such as the exercise price of a purchase option (where it is reasonably certain to be exercised), or penalties payable to the lessor for terminating the lease (where such termination option is reasonably certain to be exercised).
The Group only takes the lease component into account when measuring the lease liability. For certain asset classes where leases include both service and lease components, the Group may recognize a single contract, classified as a lease (i.e. without distinguishing between the service and lease components).
Orange systematically determines the lease term as the period during which leases cannot be canceled, plus periods covered by any extension options that the lessee is reasonably certain to exercise and by any termination options that the lessee is reasonably certain not to exercise. In the case of "3/6/9" leases in France, the term adopted is assessed on a contract-by-contract basis.
This period is also defined taking into account any laws and practices specific to each jurisdiction and business sector regarding the firm lease commitment term granted by lessors. The Group nonetheless assesses the enforceable period, based on the circumstances of each lease, taking into account certain indicators such as the existence of more than insignificant penalties in the event of termination by the lessee. To determine the length of this enforceable period, the Group considers the economic importance of the leased asset and the assumptions made in its strategic plan.
When non-removable leasehold improvements have been made to leased assets, the Group assesses, on a case-by-case basis, whether these improvements provide an economic benefit when determining the enforceable period of the lease.
When a lease includes a purchase option, the Group considers the enforceable period to be equal to the useful life of the underlying asset where the Group is reasonably certain to exercise the purchase option.
For each lease, the discount rate used is determined based on the yield rate on government bonds in the lessee country, in accordance with the lease term and currency, to which the Group’s credit spread is added.
After the lease commencement date, the amount of the lease liability may be reassessed to reflect changes introduced in the following main cases:
− a change in term resulting from a contract amendment or a change in assessment of the reasonable certainty that a renewal option will be exercised or a termination option will not be exercised;
− a change in the amount of lease payments, for example following application of a new index or rate in the case of variable payments;
− a change in the assessment of whether a purchase option will be exercised;
− any other contractual change, for example a change to the scope of the lease or the underlying asset.
Note 11 Taxes
11.1 Operating taxes and levies
11.1.1 Operating taxes and levies recognized in the income statement
(in millions of euros) | 2020 | 2019 | 2018 |
Territorial Economic Contribution, IFER and similar taxes(1) | (795) | (758) | (820) |
Spectrum fees | (341) | (329) | (309) |
Levies on telecommunication services | (319) | (276) | (286) |
Other operating taxes and levies | (469) | (465) | (425) |
Total | (1,924) | (1,827) | (1,840) |
(1) Including (320) million euros regarding the company value-added contribution in 2020.
Although comprising a directly identifiable counterpart, the periodic spectrum fees are presented within the operating taxes and levies as they are set by and paid to the States and Local Authorities.
The breakdown of operating taxes and levies per geographical area is the following:
(in millions of euros)
2020 2019 �� 2018
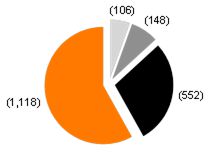


France | Africa and Middle-East | Spain | Other subsidiaries |
11.1.2 Operating taxes and levies in the statement of financial position
(in millions of euros) | December 31, 2020 | December 31, 2019 | December 31, 2018 |
Value added tax | 966 | 996 | 953 |
Other operating taxes and levies | 138 | 94 | 74 |
Operating taxes and levies - receivables | 1,104 | 1,090 | 1,027 |
Value added tax | (652) | (649) | (647) |
Territorial Economic Contribution, IFER and similar taxes(1) | (87) | (90) | (94) |
Spectrum fees | (21) | (22) | (29) |
Levies on telecommunication services | (128) | (118) | (113) |
Other operating taxes and levies | (391) | (408) | (439) |
Operating taxes and levies - payables | (1,279) | (1,287) | (1,322) |
Operating taxes and levies - net | (175) | (197) | (295) |
(1) Including (19) million euros regarding the company value-added contribution in 2020.
Developments in tax disputes and audits
In the same way as other telecom operators, the Group regularly deals with disagreements concerning the taxation of its network in various countries.
Orange in Spain is involved in various tax disputes related to local taxes on mobile and fixed services:
− regarding mobile services, in May 2016, the Supreme Court of Spain considered admissible some terms and conditions of taxation, based on the value of the use. Since then, some municipalities sent out tax bills in accordance with such Supreme Court sentence. In 2018, Orange has re-evaluated the risk in light of the course of the proceedings. There are no new developments in 2020 that would lead to a modification of the Group’s accounting position, Orange is awaiting the decision of the Supreme Court on the formulae that shall be used to calculate the value of the use;
− regarding fixed services, Orange received a favorable decision from the municipality of Madrid in June 2020 and carried out a new risk assessment in light of the decision. In January 2021, the European Union Court of Justice, in response to an interpretative question raised, has ruled on the charge on fixed services. At this stage, Orange estimates that it holds a strong position and that the decision does not lead to a modification of its accounting position. Furthermore, Orange wishes to appeal this decision.
Changes in operating taxes and levies
(in millions of euros) | 2020 | 2019 | 2018 |
Net operating taxes and levies (payables) in the opening balance | (197) | (295) | (217) |
Operating taxes and levies recognized in profit or loss | (1,924) | (1,827) | (1,840) |
Operating taxes and levies paid | 1,929 | 1,939 | 1,777 |
Changes in the scope of consolidation | - | 3 | (13) |
Translation adjustment | 20 | (16) | (3) |
Reclassifications and other items | (3) | (1) | 1 |
Net operating taxes and levies (payables) in the closing balance | (175) | (197) | (295) |
Accounting policies
VAT (Value Added Tax) receivables and payables correspond to the VAT collected or deductible from the various states. Collections and repayments to states have no impact on the income statement.
In the normal course of business, the Group regularly deals with differences of interpretation of tax law with the tax authorities, which can lead to tax reassessments or tax disputes.
Operating taxes and levies are measured by the Group at the amount expected to be paid or recovered from the tax authorities of each country, based on its interpretation with regard to the application of tax legislation. The Group calculates the tax assets, liabilities and accruals recognized in the statement of financial position based on the technical merits of the positions it defends versus that of the tax authorities.
11.2 Income taxes
11.2.1 Income taxes
(in millions of euros) | 2020 | 2019 | 2018 | ||
Orange SA tax group | 1,556 | (875) | (702) | ||
• Current tax | 1,801 | (559) | (595) | ||
• Deferred tax | (246) | (316) | (107) | ||
Spanish tax group | (146) | (123) | (164) | ||
• Current tax | (40) | (84) | (65) | ||
• Deferred tax | (106) | (39) | (99) | ||
Africa & Middle East | (341) | (296) | (255) | ||
• Current tax | (343) | (294) | (258) | ||
• Deferred tax | 2 | (1) | 3 | ||
United Kingdom | (137) | (66) | (66) | ||
• Current tax | (75) | (66) | (66) | ||
• Deferred tax | (63) | (0) | (0) | ||
Other subsidiaries | (83) | (86) | (122) | ||
• Current tax | (99) | (89) | (128) | ||
• Deferred tax | 16 | 3 | 6 | ||
Total Income taxes | 848 | (1,447) | (1,309) | ||
• Current tax | 1,245 | (1,093) | (1,112) | ||
• Deferred tax | (396) | (354) | (197) | ||
In 2020, the Orange group��s current tax amounted to 1,245 million euros and included tax income of 2,246 million euros related to the tax dispute in France for fiscal years 2005-2006. In the absence of this income, the tax expense for the Orange group would be (1,397) million euros (including (1,001) million euros in current tax), and the tax expense for the Orange SA tax group would be (690) million euros (including (444) million euros in current tax expense).
The breakdown of current tax by geographical area or by tax group (excluding the 2,246 million euros tax income related to the 2005-2006 tax dispute) is the following:
(in millions of euros)
2020 2019 2018
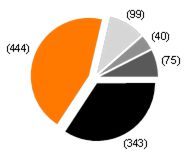
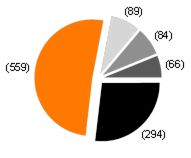
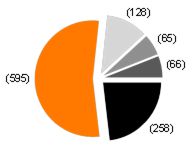
Orange SA tax group | Africa & Middle-East | United Kingdom | Spanish tax group | Other subsidiaries |
Orange SA tax group
The corporate income tax rate applicable for the 2020 fiscal year was 32.02%. The decrease in the tax rate in France resulted in a reduction in the current tax expense of (36) million euros in 2020.
In 2019, the tax rate was 34.43%. As part of the law enacted on July 11, 2019 concerning the creation of a digital services tax, the French government instituted an exceptional new measure maintaining the corporate income tax rate of 34.43% for the 2019 fiscal year instead of the 32.02% corporate tax rate originally planned. This measure resulted in an additional tax expense for the Group of (35) million euros in 2019.
In 2018, the tax rate was 34.43%.
Current tax expense
The current tax expense reflects the requirement to pay income tax calculated on the basis of 100% of taxable income due to the depletion of tax loss carry forwards.
In 2020, the current tax expense included tax income of 2,246 million euros, as a result of the decision issued by the Conseil d’État on November 13, 2020 in favor of Orange SA on a dispute in respect of the years 2005-2006.
Deferred tax expense
Deferred taxes are recorded at the tax rate expected at the time of their reversal.
The 2018 French Finance Act, that passed in late December 2017, included a gradual reduction in the corporate tax rate with an expected tax rate of 25.82% as of 2022 for the Group.
The 2021 Finance Law passed at the end of December 2020 confirms the trajectory initially planned, i.e. a rate of 28.41% in 2021 and a rate of 25.82% from 2022.
Developments in tax disputes and audits in France
Tax audits
Orange SA was subject to a tax audit covering fiscal years 2015 to 2016. An amending proposal was issued covering the calculation of trademark fees paid by Orange SA to the British company Orange Brand Services Ltd and deducted from its taxable income. The administration questions the inclusion of revenue from the roaming contract with Free and revenue from the fixed PSTN business. This rectification request is contested by Orange SA, which has requested the opening of out-of-court proceedings and arbitration between the French and British tax authorities. The additional tax charge would effectively result in double taxation that would fail to comply with the provisions of the Franco-British tax agreement and the European arbitration agreement.
Orange SA is currently subject to a tax audit covering fiscal years 2017 to 2018.
Disputes in progress concerning fiscal years 2000-2006
In the context of the absorption of Cogecom by Orange SA and pursuant to an adverse ruling by the Court of Montreuil on July 4, 2013 which triggered the payment of the amounts claimed by the Tax authority, Orange SA had to pay in 2013 the remaining balance on principal and late payment interest claimed for a total amount of 2.1 billion euros.
Over the last few years, the main developments in terms of legal proceedings brought before the Versailles Administrative Court of Appeal were the following:
− concerning fiscal years 2000-2004:
- in a ruling given on July 24, 2018, the Administrative Court of Appeal of Versailles upheld the request from Orange. As the Tax administration did not appeal in cassation, this litigation is now closed. The accounting consequences were taken into account in the 2018 consolidated financial statements with no material impact.
− concerning fiscal years 2005-2006:
- in a ruling of February 18, 2016, the Administrative Court of Appeal of Versailles upheld the judgment of July 4, 2013, despite the contrary conclusions of the appointed Rapporteur. The Group then appealed to the Conseil d’État on April 18, 2016 to rule on the substance of the case,
- in a ruling dated December 5, 2016, the Conseil d’État annulled the February 18, 2016 ruling by the Administrative Court of Appeal of Versailles and remanded the dispute to the same Court, on the grounds argued by the Group, i.e., the principle of intangibility of the opening balance sheet of the earliest fiscal year still subject to audit,
- in a ruling dated July 24, 2018, the Administrative Court of Appeal of Versailles made an adverse decision against Orange, despite the contrary conclusions of the appointed Rapporteur. The Group appealed in cassation to the Conseil d’État which was to render the final decision,
- in a ruling dated November 13, 2020, the Conseil d’État handed down a decision favorable to Orange SA on this tax dispute. This decision closes the procedure definitively. The accounting consequences are current tax income recognized in the 2020 financial statements for a total amount of 2,246 million euros (including 646 million euros of interests).
Spanish tax group
Current tax expense
The corporate tax rate applicable is 25% and the current income tax expense mainly represents the obligation to pay a minimum level of tax calculated on the basis of 75% of taxable income due to the 25% restriction on the utilization of tax loss carry forwards.
Deferred tax expense
In 2020, a deferred tax expense of (102) million euros was recognized to reflect the negative impact on the recoverable amount of deferred taxes of updated business plans projections (see Note 8).
In 2019, a deferred tax expense of (42) million euros was recognized to reflect evolution of future perspectives for the recoverability of the deferred tax assets.
In 2018, a deferred tax expense of (86) million euros was recognized in order to reflect the negative effect on the recoverable value of deferred tax assets of a strong competitive pressure.
Africa & Middle East
The main contributors to the income tax expense are Côte d’Ivoire, Mali, Senegal and Guinea:
− in Côte d’Ivoire, the corporate tax rate is 30% and the current tax expense stands at (77) million euros;
− in Mali, the corporate tax rate is 30% and the current tax expense stands at (62) million euros;
− in Senegal, the corporate tax rate is 30% and the current tax expense stands at (54) million euros;
− in Guinea, the corporate tax rate is 35% and the current tax expense stands at (47) million euros.
United Kingdom
Current tax expense
The current income tax expense primarily reflects the taxation of activities related to Orange’s brand activities. The corporate tax rate has been 19% since April 1, 2017.
Deferred tax expense
In 2020, the deferred tax expense includes an increase of (63) million euros in deferred tax liabilities recognized in the United Kingdom on the Orange brand. The British government canceled the tax reduction from 19% to 17% in 2020, provided for by the 2016 Finance Act, thus maintaining the rate at 19%. The deferred tax liabilities on the brand are now recorded at a 19% tax rate.
Group tax proof
(in millions of euros) | Note | 2020 | 2019 | 2018 | |
Profit before tax | 4,207 | 4,669 | 3,467 | ||
Statutory tax rate in France | 32.02 % | 34.43 % | 34.43 % | ||
Theoretical income tax | (1,347) | (1,608) | (1,194) | ||
Reconciling items: | |||||
Impairment of goodwill (1) | 8.1 | - | (19) | (19) | |
Impairment of BT shares | 13.7 | - | (34) | (30) | |
Share of profits (losses) of associates and joint ventures | (1) | 3 | 1 | ||
Adjustment of prior-year taxes | 1 | 10 | 23 | ||
Recognition / (derecognition) of deferred tax assets | (98) | (36) | (151) | ||
Difference in tax rates (2) | 157 | 192 | 189 | ||
Change in applicable tax rates (3) | (92) | 43 | (84) | ||
Tax income related to the 2005-2006 tax dispute (4) | 2,246 | - | - | ||
Other reconciling items | (18) | 2 | (44) | ||
Effective income tax | 848 | (1,447) | (1,309) | ||
Effective tax rate | (20.17) % | 30.99 % | 37.75 % | ||
(1) Reconciliation item calculated based on the tax rate applicable to the parent company of the Group. The difference between the tax rate of the parent company and the local tax rate of subsidiaries is presented below in "Difference in tax rates".
(2) The Group is present in jurisdictions in which tax rates are different from the French tax rate. This mainly includes the United Kingdom (tax rate of 19%) and Spain (tax rate of 25%).
(3) Takes into account the remeasurement of the deferred tax due to change of tax rate in tax legislation, as well as the impact of the booking over the period of deferred tax at tax rates that differ from the rate applicable in the current fiscal year.
(4) Relates to the tax income of 2,246 million euros (including interests) recognized in 2020 following the favorable decision handed down on November 13, 2020 by the Conseil d'Etat on the tax dispute in respect of fiscal years 2005-2006. The impact of this tax income on the effective tax rate is (53.3) basis points. Excluding this item, the Group effective tax rate would be 33.2%.
11.2.2 Income tax on other comprehensive income
2020 | 2019 | 2018 | ||||
(in millions of euros) | Gross amount | Deferred tax | Gross amount | Deferred tax | Gross amount | Deferred tax |
Actuarial gains and losses on post-employment benefits | (31) | 6 | (109) | 30 | 45 | (6) |
Assets at fair value | 94 | - | (16) | - | (30) | - |
Cash flow hedges | 22 | (10) | 144 | (47) | (67) | 18 |
Translation adjustment | (414) | - | 78 | - | (7) | - |
Other comprehensive income of associates and joint ventures | - | - | - | - | - | - |
Total presented in other comprehensive income | (328) | (4) | 97 | (17) | (59) | 12 |
11.2.3 Tax position in the statement of financial position
December 31, 2020 | December 31, 2019 | December 31, 2018 | ||||||||
(in millions of euros) | Assets | Liabi-lities | Net | Assets | Liabi-lities | Net | Assets | Liabi-lities | Net | |
Orange SA tax group | ||||||||||
• Current tax | - | 359 | (359) | - | 385 | (385) | - | 438 | (438) | |
• Deferred tax (1) | 384 | - | 384 | 633 | - | 633 | 977 | - | 977 | |
Spanish tax group | ||||||||||
• Current tax | 12 | - | 12 | - | 32 | (32) | - | 4 | (4) | |
• Deferred tax (2) | - | 95 | (95) | 11 | - | 11 | 50 | - | 50 | |
Africa & Middle East | ||||||||||
• Current tax | 45 | 228 | (183) | 43 | 212 | (168) | 32 | 182 | (150) | |
• Deferred tax | 103 | 55 | 48 | 92 | 55 | 37 | 84 | 42 | 42 | |
United Kingdom | ||||||||||
• Current tax | - | 4 | (4) | - | 30 | (30) | - | 34 | (34) | |
• Deferred tax (3) | - | 600 | (600) | 1 | 539 | (538) | - | 531 | (531) | |
Other subsidiaries | ||||||||||
• Current tax | 70 | 82 | (12) | 76 | 90 | (14) | 87 | 97 | (10) | |
• Deferred tax | 244 | 105 | 139 | 255 | 108 | 147 | 255 | 58 | 197 | |
Total | ||||||||||
• Current tax | 128 | 673 | (545) | 120 | 748 | (629) | 119 | 755 | (636) | |
• Deferred tax | 731 | 855 | (124) | 992 | 703 | 289 | 1,366 | 631 | 735 | |
(1) Mainly includes deferred tax assets on employee benefits.
(2) The recognized deferred tax assets are offset by the deferred tax liabilities on the goodwill which is tax deductible.
(3) Mainly deferred tax liabilities on the Orange brand.
Change in net current tax
(in millions of euros) | 2020 | 2019 | 2018 |
Net current tax assets / (liabilities) in the opening balance | (629) | (636) | (464) |
Cash tax payments(1) | (1,160) | 1,079 | 928 |
Change in income statement (2) | 1,245 | (1,093) | (1,116) |
Change in other comprehensive income | - | - | - |
Change in retained earnings(3) | (2) | 48 | 0 |
Changes in the scope of consolidation | (0) | (1) | 19 |
Translation adjustment | 4 | (1) | (3) |
Reclassification and other items | (4) | (24) | - |
Net current tax assets / (liabilities) in the closing balance | (545) | (629) | (636) |
(1) Includes in 2020 the reimbursement of 2,246 million euros in respect of the tax dispute for 2005-2006.
(2) Includes a tax income of 2,246 million euros in 2020 in respect of the tax dispute for 2005-2006.
(3) Mainly corresponds to the tax effect relating to the remeasurement of the portion of subordinated notes denominated in foreign currency and the tax effects of transaction costs and premium paid related to the refinancing of subordinated notes.
Change in net deferred tax
(in millions of euros) | 2020 | 2019 | 2018 |
Net deferred tax assets / (liabilities) in the opening balance | 289 | 735 | 931 |
Change in income statement | (396) | (354) | (197) |
Change in other comprehensive income | (4) | (17) | 12 |
Change in retained earnings | - | 4 | - |
Change in the scope of consolidation | (2) | (76) | (10) |
Translation adjustment | (10) | 0 | (7) |
Reclassification and other items | (2) | (3) | 6 |
Net deferred tax assets / (liabilities) in the closing balance | (124) | 289 | 735 |
Deferred tax assets and liabilities by type
December 31, 2020 | December 31, 2019(1) | December 31, 2018 | |||||||
(in millions of euros) | Assets | Liabilities | Income state-ment | Assets | Liabilities | Income state-ment | Assets | Liabilities | Income state-ment |
Provisions for employee benefit obligations | 556 | - | (154) | 704 | - | (169) | 833 | - | (25) |
Fixed assets | 552 | 1,275 | (111) | 614 | 1,216 | (68) | 721 | 1,123 | (26) |
Tax losses carryforward | 3,887 | - | 8 | 3,895 | - | 8 | 3,914 | - | (105) |
Other temporary differences | 2,690 | 2,821 | (71) | 2,812 | 2,858 | (83) | 1,245 | 1,146 | (42) |
Deferred tax | 7,685 | 4,096 | (327) | 8,025 | 4,074 | (312) | 6,713 | 2,269 | (198) |
Depreciation of deferred tax assets | (3,714) | - | (69) | (3,661) | - | (41) | (3,709) | - | 1 |
Netting | (3,241) | (3,241) | - | (3,372) | (3,372) | - | (1,638) | (1,638) | - |
Total | 731 | 855 | (396) | 992 | 703 | (354) | 1,366 | 631 | (197) |
(1) 2019 figures have been restated of the IFRS IC decision on lease term (see Note 2.3.1).
At December 31, 2020, the tax loss carryforwards mainly related to Spain and Belgium, the stock of tax loss carryforwards in France having been used up by 2018.
At December 31, 2020, the unrecognized deferred tax assets mainly related to Spain for 2.1 billion euros and Belgium (Belgian subsidiaries other than Orange Belgium) for 0.8 billion euros, and mostly included tax losses that can be carried forward indefinitely. In Spain, tax losses carryforwards for which a deferred tax asset has been recognized are expected to be fully utilized by 2025, unless affected by changes in tax rules and changes in business projections. The deferred tax assets recognized for Spain amounted to 0.5 billion euros at December 31, 2020.
Most of the other tax losses carryforwards for which no deferred tax assets have been recognized will expire beyond 2025.
Accounting policies
Current income tax and deferred tax are measured by the Group at the amount expected to be paid or recovered from the tax authorities of each country, based on its interpretation with regard to the application of tax legislation. The Group calculates the tax assets and liabilities recognized in the statement of financial position based on the technical merits of the positions it defends versus that of the tax authorities.
Deferred taxes are recognized for all temporary differences between the carrying values of assets and liabilities and their tax basis, as well as for unused tax losses, using the liability method. Deferred tax assets are recognized only when their recovery is considered probable.
A deferred tax liability is recognized for all taxable temporary differences associated with investments in subsidiaries, interests in joint ventures and associates, except to the extent that both of the following conditions are satisfied:
− the Group is able to control the timing of the reversal of the temporary difference (e.g. the payment of dividends); and
− it is probable that the temporary difference will not reverse in the foreseeable future.
Accordingly, for fully consolidated companies, a deferred tax liability is only recognized in the amount of the taxes payable on planned dividend distributions by the Group.
Deferred tax assets and liabilities are not discounted.
At each period end, the Group reviews the recoverable amount of the deferred tax assets carried by certain tax entities with significant tax losses carryforwards. The recoverability of the deferred tax assets is assessed in the light of the business plans used for impairment testing. This plan may be adjusted for any tax specificities.
Deferred tax assets arising on these tax losses are not recognized under certain circumstances specific to each company/tax consolidation group concerned, and particularly where:
− entities cannot assess the probability of the tax loss carryforwards being set off against future taxable profits, due to the horizon for forecasts based on business plans used for impairment testing and uncertainties as to the economic environment;
− entities have not yet begun to use the tax loss carryforwards;
− entities do not expect to use the losses within the timeframe allowed by tax regulations;
− it is estimated that tax losses are uncertain to be used due to risks of differing interpretations with regard to the application of tax legislation.
Note 12 Interests in associates and joint ventures
The table below shows the value of the main interests in associates and joint ventures:
(in millions of euros) | ||||||
Company | Main activity | Main co-shareholders | 2020 | 2020 | 2019 | 2018 |
Entities jointly controlled | ||||||
Mauritius Telecom | Telecommunications operator in Mauritius | Mauritius government (33%) | 40% | 70 | 83 | 81 |
Other | 10 | 5 | 2 | |||
Entities under significant influence | ||||||
Odyssey Music Group (Deezer) | Streaming platform | AI European Holdings SARL (45%) | 11% | 5 | 7 | 13 |
IRISnet | Telecommunications operator in Belgium | MRBC (53%) | 15% | 5 | 5 | 4 |
Other | 8 | 3 | 4 | |||
TOTAL | 98 | 103 | 104 | |||
The change in interests in associates and joint ventures is as follows:
(in millions of euros) | 2020 | 2019 | 2018 |
Interests in associates - in the opening balance | 103 | 104 | 77 |
Dividends | (4) | (2) | (3) |
Share of profits (losses) | (2) | 8 | 3 |
Impairment | (0) | (0) | - |
Change in components of other comprehensive income | - | - | - |
Changes in the scope of consolidation | 0 | 2 | (1) |
Translation adjustment | (12) | (4) | 5 |
Reclassifications and other items | 13 | (5) | 23 |
Interests in associates - in the closing balance | 98 | 103 | 104 |
The unrecognized contractual commitments entered into by the Group relating to the interests in associates and joint ventures are described in Note 15.
The operations performed between the Group and the interests in associates and joint ventures are reflected as follow in Orange's consolidated financial statements:
(in millions of euros) | December 31, 2020 | December 31, 2019 | December 31, 2018 |
Assets | |||
Non-current financial assets | 9 | - | (0) |
Trade receivables | 39 | 37 | 31 |
Current financial assets | 5 | 2 | (1) |
Other current assets | - | 1 | - |
Liabilities | |||
Current financial liabilities | 0 | - | 7 |
Trade payables | 5 | 10 | 9 |
Other current liabilities | 0 | 0 | 0 |
Customer contract liabilities | 3 | 0 | 0 |
Income statement | |||
Revenue | 14 | 10 | 13 |
External purchases and other operating expenses | (29) | (10) | (66) |
Other operating income | 8 | 7 | 8 |
Finance costs, net | 0 | 1 | - |
Accounting policies
The carrying amount accounted for under the equity method corresponds to the initial acquisition cost increased by the share of profit or loss in the period. If an associate incurs losses and the carrying amount of the investment is reduced to zero, the Group ceases to recognize the additional share of losses since it has no commitment beyond its investment.
An impairment test is performed at least annually and when there is objective evidence of impairment, for instance a decrease in the quoted price when the investee is listed, significant financial difficulty of the entity, observable data indicating that there is a measurable decrease in the estimated future cash flows, or information about significant changes having an adverse effect on the entity.
An impairment loss is recorded when the recoverable amount is lower than the carrying amount, the recoverable amount being the higher of the value in use and the fair value less costs to sell. The unit of account is the whole investment. Any impairment is recognized as "Share of profits (losses) of associates and joint ventures". Impairment losses shall be reversed once the recoverable amount exceeds the carrying amount.
Note 13 Financial assets, liabilities and financial results (telecom activities)
13.1 Financial assets and liabilities of telecom activities
In order to improve the readability of financial statements and to be able to distinguish the performance of telecom activities from the performance of the mobile financial services activities, the notes related to financial assets and liabilities as well as financial income or expenses are split to respect these two business areas.
Note 13 presents the financial assets, liabilities and related gains and losses specific to telecom activities and Note 17 concerns the activities of Mobile Financial Services with regard to its assets and liabilities, with net financial income being not material.
The following table reconciles the contributive balances of assets and liabilities for each of these two areas to the consolidated balance sheet (intra-group transactions between telecom activities and mobile financial services activities are not eliminated) with the consolidated statement of financial position as of December 31, 2020.
(in millions of euros) | Orange consolidated financial statements | O/w telecom activities | Note | O/w Mobile Financial Services | Note | O/w eliminations telecom activities / mobile financial services |
Non-current financial assets related to Mobile Financial Services activities | 1,210 | - | 1,210 | 17.1.1 | - | |
Non-current financial assets | 1,516 | 1,544 | 13.7 | - | (27) (1) | |
Non-current derivatives assets | 132 | 132 | 13.8 | - | 17.1.3 | - |
Current financial assets related to Mobile Financial Services activities | 2,075 | - | 2,077 | 17.1.1 | (2) | |
Current financial assets | 3,259 | 3,259 | 13.7 | - | - | |
Current derivatives assets | 162 | 162 | 13.8 | - | 17.1.3 | - |
Cash and cash equivalents | 8,145 | 7,891 | 14.3 | 254 | - | |
Non-current financial liabilities related to Mobile Financial Services activities | - | - | 27 | 17.1.2 | (27) (1) | |
Non-current financial liabilities | 30,089 | 30,089 | 13.3 | - | - | |
Non-current derivatives liabilities | 844 | 769 | 13.8 | 75 | 17.1.3 | - |
Current financial liabilities related to Mobile Financial Services activities | 3,128 | - | 3,128 | 17.1.2 | - | |
Current financial liabilities | 5,170 | 5,172 | 13.3 | - | (2) | |
Current derivatives liabilities | 35 | 35 | 13.8 | - | 17.1.3 | - |
(1) Loan granted by Orange SA to Orange Bank.
13.2 Profits and losses related to financial assets and liabilities
The cost of net financial debt consists of gains and losses related to the components of net financial debt (described in Note 13.3) during the period.
Foreign exchange gains and losses related to the components of net financial debt correspond mainly to the revaluation in euros of bonds denominated in foreign currencies (Note 13.5) as well as to the symmetrical revaluation of associated hedges.
The net foreign exchange financial loss mostly reflects the effect of revaluation of the economic hedges of foreign exchange risk on notional amounts of subordinated notes denominated in pounds sterling and recognized in equity at their historical value (see Note 15.4).
Other financial expenses mainly comprise interest on lease liabilities in the amount of (120) million euros in 2020 and (129) million euros in 2019 (see Note 10.2) and the impact of the Group’s investment in BT shares for (119) million euros corresponding to the impairment loss, net of the foreign exchange hedge and of the income related to BT dividends in 2019 compared to (51) million euros in 2018 (see Note 13.7).
Finally, other comprehensive income includes the revaluation of financial assets at fair value through other comprehensive income (Note 13.7) and cash flow hedges (Note 13.8.2).
Other gains and losses related to financial assets and liabilities are recognized in the operating income (foreign exchange gains and losses on trade receivables, trade payables and the associated derivative hedges) for 16 million euros in 2020, versus (7) million euros in 2019 and 3 million euros in 2018.
Finance costs, net | Other compre-hensive income | ||||||
(in millions of euros) | Cost of gross financial debt (1) | Gains (losses) on assets contributing to net financial debt | Cost of net financial debt | Foreign exchange gains (losses) | Other net financial expenses (2) | Finance costs, net | Reserves |
2020 | |||||||
Financial assets | - | (1) | (1) | (151) | 39 | 94 | |
Financial liabilities | (1,152) | - | (1,152) | 623 | (0) | - | |
Lease liabilities | - | - | - | - | (120) | - | |
Derivatives | 52 | - | 52 | (576) | 0 | 22 | |
Discounting expense | - | - | - | - | (29) | - | |
Total | (1,100) | (1) | (1,102) | (103) | (110) | (1,314) | 116 |
2019 (3) | |||||||
Financial assets | - | 5 | 5 | 31 | (65) | (25) | |
Financial liabilities | (1,255) | - | (1,255) | (351) | - | - | |
Lease liabilities | - | - | - | - | (129) | - | |
Derivatives | 146 | - | 146 | 397 | - | 144 | |
Discounting expense | - | - | - | - | (39) | - | |
Total | (1,109) | 5 | (1,104) | 76 | (233) | (1,261) | 119 |
2018 | |||||||
Financial assets | - | 9 | 9 | (17) | 16 | (22) | |
Financial liabilities | (1,395) | - | (1,395) | (353) | - | - | |
Derivatives | 54 | - | 54 | 366 | - | (67) | |
Discounting expense | - | - | - | - | (42) | - | |
Total | (1,341) | 9 | (1,332) | (4) | (26) | (1,362) | (89) |
(1) Include interests on debt relating to financed assets for (1) million euros in 2020 and 2019.
(2) Include interest on lease liabilities for (120) million euros in 2020 and (129) million euros in 2019 and effects related to the investment in BT for (119) million euros in 2019, and (51) million euros in 2018.
(3) 2019 figures have been restated of the IFRS IC decision on lease term (see Note 2.3.1).
13.3 Net financial debt
As a reminder, since January 1, 2019, the definition of the net financial debt excludes the lease liabilities included in the scope of IFRS 16 (see Note 10.2) and includes the debts relating to financed assets.
Net financial debt is one of the indicators of financial position used by the Group. This aggregate, not defined by IFRS, may not be comparable to similarly entitled indicators used by other companies. It is provided as additional information only and should not be considered as a substitute for an analysis of all the Group’s assets and liabilities.
Net financial debt as defined and used by Orange does not include mobile financial services activities for which the concept is not relevant.
It consists of (a) financial liabilities excluding operating payables (translated into euros at the year-end closing rate) including derivative instruments (assets and liabilities), less (b) cash collateral paid, cash, cash equivalents and financial assets at fair value.
Furthermore, financial instruments designated as cash flow hedges included in net financial debt are set up to hedge in particular items that are not included therein, such as future cash flows. As a consequence, the portion of these unmatured hedging instruments recorded in other comprehensive income is added to the gross financial debt to offset this temporary difference.
(in millions of euros) | Note | December 31, 2020 | December 31, 2019 | December 31, 2018 |
TDIRA | 13.4 | 636 | 822 | 822 |
Bonds | 13.5 | 29,848 | 30,893 | 27,070 |
Bank loans and from development organizations and multilateral lending institutions | 13.6 | 3,671 | 4,013 | 3,664 |
Debt relating to financed assets | 295 | 125 | - | |
Finance lease liabilities | - | - | 584 | |
Cash collateral received | 14.5 | 31 | 261 | 82 |
NEU Commercial Paper (1) | 555 | 158 | 1,116 | |
Bank overdrafts | 154 | 203 | 318 | |
Other financial liabilities | 70 | 602 (2) | 363 | |
Current and non-current financial liabilities (excluding derivatives) included in the calculation of net financial debt | 35,260 | 37,076 | 34,019 | |
Current and non-current Derivatives (liabilities) | 13.8 | 804 | 436 | 845 |
Current and non-current Derivatives (assets) | 13.8 | (294) | (573) | (385) |
Other comprehensive income components related to unmatured hedging instruments | 13.8 | (541) | (542) | (721) |
Gross financial debt after derivatives (a) | 35,229 | 36,397 | 33,758 | |
Cash collateral paid (3) | 14.5 | (642) | (123) | (553) |
Investments at fair value (4) | 14.3 | (3,206) | (4,696) | (2,683) |
Cash equivalents | 14.3 | (5,140) | (3,651) | (2,523) |
Cash | (2,751) | (2,462) | (2,558) | |
Assets included in the calculation of net financial debt (b) | (11,740) | (10,931) | (8,317) | |
Net financial debt (a) + (b) | 23,489 | 25,466 | 25,441 |
(1) Negotiable European Commercial Paper (formerly called "commercial paper").
(2) As of December 31, 2019, included 500 million euros of subordinated notes reclassified as a short term liability and redeemed on February 7, 2020 (first call date).
(3) Only cash collateral paid, included in non-current financial assets of the consolidated statement of financial position, are deducted from gross financial debt.
(4) Only investments at fair value, included in current financial assets of the consolidated statement of financial position, are deducted from gross financial debt (Note 14.3).
Net financial debt is mostly carried by Orange S.A. in the amount of 22,843 million euros, representing over 97% of the Group’s net financial debt.
Debt maturity schedules are presented in Note 14.3.
Changes in financial assets or financial liabilities whose cash flows are disclosed in financing activities in the cash-flow statement are the following (see Note 1.8):
(in millions of euros) | December 31, 2019 | Cash flows | Other changes with no impact on cash flows | December 31, 2020 | ||
Changes in the scope of consolidation | Foreign exchange movement | Other | ||||
TDIRA | 822 | (185) | - | - | (1) | 636 |
Bonds | 30,893 | (389) | - | (624) | (31) (1) | 29,848 |
Bank loans and from development organizations and multilateral lending institutions | 4,013 | (322) | - | (25) | 5 | 3,671 |
Debt relating to financed assets | 125 | (60) | - | - | 231 | 295 |
Cash collateral received | 261 | (230) | - | - | (0) | 31 |
NEU Commercial Paper | 158 | 397 | - | - | (0) | 555 |
Bank overdrafts | 203 | (37) | (0) | (12) | - | 154 |
Other financial liabilities | 602 | (484) | - | (2) | (46) | 70 |
Current and non-current financial liabilities (excluding derivatives) included in the calculation of net financial debt | 37,076 | (1,311) | (0) | (663) | 157 | 35,260 |
Net derivatives | (138) | 37 | - | 641 | (29) | 510 |
Cash collateral paid | (123) | (519) | - | 0 | - | (642) |
Cash flows from financing activities | (1,793) | |||||
(1) Mainly corresponding to changes in accrued interests not yet due.
(in millions of euros) | December 31, 2018 | Cash flows | Other changes with no impact on cash flows | December 31, 2019 | ||
Changes in the scope of consolidation | Foreign exchange movement | Other | ||||
TDIRA | 822 | - | - | - | - | 822 |
Bonds | 27,070 | 3,391 | 148 | 346 | (63)(1) | 30,893 |
Bank loans and from development organizations and multilateral lending institutions | 3,664 | 335 | (30) | 36 | 8 | 4,013 |
Finance lease liabilities | 584 | - | - | - | (584) | - |
Debt relating to financed assets | - | (17) | - | - | 143 | 125 |
Cash collateral received | 82 | 179 | - | - | (0) | 261 |
NEU Commercial Paper | 1,116 | (958) | - | - | (1) | 158 |
Bank overdrafts | 318 | (123) | (4) | 5 | 7 | 203 |
Other financial liabilities | 363 | (10) | 9 | 10 | 229 | 602 |
Current and non-current financial liabilities (excluding derivatives) included in the calculation of net financial debt | 34,019 | 2,797 | 123 | 398 | (261) | 37,076 |
Net derivatives | 460 | 26 | (2) | (376) | (246) | (138) |
Cash collateral paid | (555) | 430 | - | (0) | - | (123) |
Cash flows from financing activities | 3,253 | |||||
(1) Mainly corresponding to changes in accrued interests not yet due.
(in millions of euros) | December 31, 2017 | Cash flows | Other changes with no impact on cash flows | December 31, 2018 | ||
Changes in the scope of consolidation | Foreign exchange movement | Other | ||||
TDIRA | 1,234 | (443) | - | - | 31 | 822 |
Bonds | 25,703 | 1,136 | 5 | 321 | (95) (1) | 27,070 |
Bank loans and from development organizations and multilateral lending institutions | 2,961 | 613 | 14 | 20 | 56 | 3,664 |
Finance lease liabilities | 571 | (123) | 2 | (1) | 135 | 584 |
Cash collateral received | 21 | 61 | - | - | - | 82 |
NEU Commercial Paper | 1,358 | (243) | - | (0) | 1 | 1,116 |
Bank overdrafts | 193 | 82 | 38 | 5 | - | 318 |
Other financial liabilities | 434 | (153) | 135 | 8 | (61) | 363 |
Current and non-current financial liabilities (excluding derivatives) included in the calculation of net financial debt | 32,475 | 930 | 194 | 353 | 67 | 34,019 |
Net derivatives | 729 | 8 | - | (339) | 62 | 460 |
Cash collateral paid | (695) | 140 | - | - | - | (555) |
Cash flows from financing activities | 1,078 | |||||
(1) Mainly corresponding to changes in accrued interests not yet due.
Net financial debt by currency
The net financial debt by currency is presented in the table below, after foreign exchange effects of hedging derivatives (excluding instruments set up to hedge operational items).
(equivalent value in millions of euros at year-end closing rate) | EUR | USD | GBP | PLN | EGP | JOD | MAD | Other | Total |
Gross financial debt after derivatives | 24,822 | 4,342 | 3,331 | 35 | 201 | 139 | 485 | 1,875 | 35,229 |
Financial assets included in the calculation of net financial debt | (10,558) | (104) | (113) | (83) | (27) | (42) | (43) | (770) | (11,740) |
Net debt by currency before effect of foreign exchange derivatives (1) | 14,263 | 4,238 | 3,218 | (49) | 174 | 97 | 442 | 1,105 | 23,489 |
Effect of foreign exchange derivatives | 7,858 | (4,281) | (4,364) | 1,289 | - | - | - | (502) | - |
Net financial debt by currency after effect of foreign exchange derivatives | 22,121 | (43) | (1,146) | 1,240 | 174 | 97 | 442 | 603 | 23,489 |
(1) Including the market value of derivatives in local currency.
Accounting policies
Cash and cash equivalents
The Group classifies investments as cash equivalent in the statement of financial position and statement of cash flows when they comply with the conditions of IAS 7 (see cash management detailed in Notes 14.3 and 14.5):
− held in order to face short-term cash commitments; and
− short term and highly liquid assets at acquisition date, readily convertible into known amount of cash and not exposed to any material risk of change in value.
Bonds, bank loans and loans from multilateral lending institutions
Among financial liabilities, only commitments to redeem non-controlling interests are recognized at fair value in profit or loss.
Borrowings are recognized upon origination at the discounted value of the sums to be paid and subsequently measured at amortized cost using the effective interest rate method. Transaction costs that are directly attributable to the acquisition or issue of the financial liability are deducted from the liability’s carrying value. The costs are subsequently amortized over the life of the debt, using the effective interest rate method.
Some financial liabilities at amortized cost, mainly borrowings, are subject to hedging. This relates mostly to borrowings hedged against the exposure of their future cash flows to foreign exchange risk (cash flow hedge).
13.4 TDIRA
The perpetual bonds redeemable for shares ("TDIRAs") with a par value of 14,100 euros are listed on Euronext Paris. Their issuance was described in a securities note approved by the Commission des Opérations de Bourse (French Securities Regulator, renamed Autorité des Marchés Financiers (French Financial Markets Authority)) on February 24, 2003. As of December 31, 2020, taking into account redemptions made since their issuance, 44,880 TDIRAs remain outstanding for a total par value of 633 million euros.
The TDIRAs are redeemable in new Orange SA shares, at any time at the holders’ request or, under certain conditions as described in the appropriate prospectus, at Orange SA’s initiative based on a ratio of 590.600 shares to one TDIRA (i.e., conversion price of 23.874 euros), as the initial ratio of 300 shares to one TDIRA has been adjusted several times to protect bondholders’ rights, and may be further adjusted under the terms and conditions set out in the information memorandum.
Since January 1, 2010, the interest rate on the TDIRAs has been the three-month Euribor +2.5%.
The TDIRA are subject to split accounting between equity and liabilities. For the securities outstanding on December 31, 2020, the "equity" component before deferred tax stood at 152 million euros.
(in millions of euros) | December 31, 2020 | December 31, 2019 | December 31, 2018 |
Number of securities | 44,880 | 57,981 | 57,981 |
Equity component before deferred taxes | 152 | 196 | 196 |
Debt component | 636 | 822 | 822 |
o/w accrued interests not yet due | 3 | 4 | 4 |
Paid interest | 14 | 18 | 27 |
Accounting policies
Some Group financial instruments include both a liability component and an equity component. This relates to perpetual bonds redeemable for shares (TDIRA). On initial recognition, the liability component is measured at its market value, corresponding to the value of the contractually determined future cash flows discounted at the market rate applied at the date of issue to comparable instruments providing substantially the same conditions, but without the option to convert or redeem in shares. This liability component is subsequently recognized at amortized cost.
The carrying amount of the equity component is determined at inception by deducting the fair value of the financial liability from the notional value of the instrument. This does not change throughout the life of the instrument.
13.5 Bonds
In 2020, the Group carried out the following bond issues:
Notional currency | Initial nominal amount (in millions of currency) | Maturity | Interest rate (%) | Issuer | Type of operations | Amounts in millions of euros |
EUR | 750 | July 7, 2027 | 1.250 | Orange SA | Issuance | 750 |
XOF | 100,000 | July 15, 2027 | 6.500 | Sonatel | Issuance | 152 |
EUR | 500 | September 16, 2029 | 0.125 | Orange SA | Sustainable bond | 500 |
EUR | 750 | April 7, 2032 | 1.625 | Orange SA | Issuance | 750 |
Total of issuances | 2,152 | |||||
EUR | 25 | February 10, 2020 | 4.200 | Orange SA | Repayment at maturity | (25) |
EUR | 25 | February 10, 2020 | 10Y CMS + 0.80 | Orange SA | Repayment at maturity | (25) |
EUR | 1,000 | April 9, 2020 | 3.875 | Orange SA | Repayment at maturity | (1,000) |
GBP | 450 | November 10, 2020 | 7.250 | Orange SA | Repayment at maturity | (267) (1) |
EUR | 650 | January 15, 2022 | 0.500 | Orange SA | Partial repayment | (35) |
EUR | 150 | February 6, 2023 | EUR 3M + 5.5 | SecureLink | Early repayment | (150) |
EUR | 1,000 | June 15, 2022 | 3.000 | Orange SA | Early repayment | (1,000) |
MAD | 1,090 | December 18, 2025 | 3.970 | Médi Telecom | Regular annual basis repayment | (9) |
MAD | 720 | December 18, 2025 | 1Y BDT + 1.00 | Médi Telecom | Regular annual basis repayment | (14) |
MAD | 1,002 | December 10, 2026 | 3.400 | Médi Telecom | Regular annual basis repayment | (13) |
MAD | 788 | December 10, 2026 | 1Y BDT + 0.85 | Médi Telecom | Regular annual basis repayment | (10) |
Total of repayments | (2,548) | |||||
(1) On November 10, 2020, the Group redeemed the residual amount 238 million pounds sterling (267 million euros) on an original nominal amount of 450 million pounds sterling.
Unmatured bonds at December 31, 2020, presented below, were all issued by Orange SA, with the exception of two obligations (each with a fixed-rate tranche and a variable-rate tranche) denominated in Moroccan dirhams held by Médi Telecom, and one in CFA francs issued by Sonatel.
With the exception of the commitments made by Médi Telecom, which are redeemable on a regular annual basis, as of December 31, 2020, the bonds issued by the Group were redeemable at maturity. No specific guarantee had been given in relation to their issuance. Some bonds may be redeemed in advance, at the request of the issuer.
Notional currency | Initial nominal amount (in millions of currency units) | Maturity | Interest rate (%) | Outstanding amount (in millions of euros) | ||
December 31, 2020 | December 31, 2019 | December 31, 2018 | ||||
Bonds matured before December 31, 2020 | - | 2,479 | 6,715 | |||
EUR | 1,250 | January 14, 2021 | 3.875 | 1,250 | 1,250 | 1,250 |
GBP (1) | 517 | June 27, 2021 | 0.375 | 575 | 608 | 578 |
USD | 1,000 | September 14, 2021 | 4.125 | 815 | 890 | 873 |
EUR | 255 | October 13, 2021 | 10Y CMS + 0.69 | 255 | 255 | 255 |
EUR | 272 | December 21, 2021 | 10Y TEC + 0.50 | 272 | 272 | 272 |
EUR | 650 | January 15, 2022 | 0.500 | 615 | 650 | - |
EUR | 500 | September 16, 2022 | 3.375 | 500 | 500 | 500 |
EUR | 500 | March 1, 2023 | 2.500 | 500 | 500 | 500 |
EUR | 750 | September 11, 2023 | 0.750 | 750 | 750 | 750 |
HKD | 700 | October 6, 2023 | 3.230 | 74 | 80 | 78 |
HKD | 410 | December 22, 2023 | 3.550 | 43 | 47 | 46 |
EUR | 650 | January 9, 2024 | 3.125 | 650 | 650 | 650 |
EUR | 1,250 | July 15, 2024 | 1.125 | 1,250 | 1,250 | - |
EUR | 750 | May 12, 2025 | 1.000 | 750 | 750 | 750 |
EUR | 800 | September 12, 2025 | 1.000 | 800 | 800 | 800 |
NOK | 500 | September 17, 2025 | 3.350 | 48 | 51 | 50 |
CHF | 400 | November 24, 2025 | 0.200 | 370 | 369 | - |
GBP | 350 | December 5, 2025 | 5.250 | 292 | 308 | 293 |
MAD (2) | 1,090 | December 18, 2025 | 3.97 | 72 | 87 | 100 |
MAD (2) | 720 | December 18, 2025 | 1Y BDT + 1.00 | 47 | 57 | 66 |
EUR | 750 | September 4, 2026 | 0.000 | 750 | 750 | - |
EUR | 75 | November 30, 2026 | 4.125 | 75 | 75 | 75 |
MAD (2) | 1,002 | December 10, 2026 | 3.4 | 79 | 93 | - |
MAD (2) | 788 | December 10, 2026 | 1Y BDT + 0.85 | 62 | 73 | - |
EUR | 750 | February 3, 2027 | 0.875 | 750 | 750 | 750 |
EUR | 750 | July 7, 2027 | 1.250 | 750 | - | - |
XOF | 100,000 | July 15, 2027 | 6.500 | 152 | - | - |
EUR | 500 | September 9, 2027 | 1.500 | 500 | 500 | 500 |
EUR | 1,000 | March 20, 2028 | 1.375 | 1,000 | 1,000 | 1,000 |
EUR | 50 | April 11, 2028 | 3.220 | 50 | 50 | 50 |
NOK | 800 | July 24, 2028 | 2.955 | 76 | 81 | 80 |
GBP | 500 | November 20, 2028 | 8.125 | 556 | 588 | 559 |
EUR | 1,250 | January 15, 2029 | 2.000 | 1,250 | 1,250 | - |
EUR | 150 | April 11, 2029 | 3.300 | 150 | 150 | 150 |
CHF | 100 | June 22, 2029 | 0.625 | 93 | 92 | - |
EUR | 500 | September 16, 2029 | 0.125 | 500 | - | - |
EUR | 1,000 | January 16, 2030 | 1.375 | 1,000 | 1,000 | 1,000 |
EUR | 1,200 | September 12, 2030 | 1.875 | 1,200 | 1,200 | 1,200 |
EUR | 105 | September 17, 2030 | 2.600 | 105 | 105 | 105 |
(1) Exchangeable bonds in BT shares (see below).
(2) Bonds issued by Médi Telecom. Bonds bearing 1Y BDT rate corresponds to 52 weeks Moroccan treasury bonds rate (recalculated once a year).
Notional currency | Initial nominal amount (in millions of currency units) | Maturity | Interest rate (%) | Outstanding amount (in millions of euros) | ||
December 31, 2020 | December 31, 2019 | December 31, 2018 | ||||
EUR | 100 | November 6, 2030 | 0.091 (3) | 100 | 100 | 100 |
USD | 2,500 | March 1, 2031 | 9.000 (4) | 2,006 | 2,191 | 2,150 |
EUR | 300 | May 29, 2031 | 1.342 | 300 | 300 | - |
EUR | 50 | December 5, 2031 | 4.300 (zero coupon) | 72 | 69 | 67 |
EUR | 50 | December 8, 2031 | 4.350 (zero coupon) | 73 | 70 | 67 |
EUR | 50 | January 5, 2032 | 4.450 (zero coupon) | 71 | 68 | 65 |
GBP | 750 | January 15, 2032 | 3.250 | 834 | 882 | - |
EUR | 750 | April 7, 2032 | 1.625 | 750 | - | - |
EUR | 1,000 | September 4, 2032 | 0.500 | 1,000 | 1,000 | - |
EUR | 1,500 | January 28, 2033 | 8.125 | 1,500 | 1,500 | 1,500 |
EUR | 55 | September 30, 2033 | 3.750 | 55 | 55 | 55 |
GBP | 500 | January 23, 2034 | 5.625 | 556 | 588 | 559 |
HKD | 939 | June 12, 2034 | 3.070 | 99 | 107 | - |
EUR | 300 | July 11, 2034 | 1.200 | 300 | 300 | - |
EUR | 50 | April 16, 2038 | 3.500 | 50 | 50 | 50 |
USD | 900 | January 13, 2042 | 5.375 | 733 | 801 | 786 |
USD | 850 | February 6, 2044 | 5.500 | 693 | 757 | 742 |
EUR | 750 | September 4, 2049 | 1.375 | 750 | 750 | - |
GBP | 500 | November 22, 2050 | 5.375 | 556 | 588 | 559 |
Outstanding amount of bonds | 29,524 | 30,537 | 26,695 | |||
Accrued interest | 487 | 532 | 527 | |||
Amortized cost | (163) | (176) | (152) | |||
Total | 29,848 | 30,893 | 27,070 | |||
(3) Bond bearing interests at a fixed rate of 2% until 2017 and then at CMS 10 years x 166% (-0.45% until November 2021), but the variable rate is floored at 0% and capped at 4% until 2023 and at 5% beyond.
(4) Bond with a step-up clause (clause that triggers a change in interest payments of Orange's credit rating from the rating agencies changes, see Note 14.3).
As a reminder, in June 2017, the Group issued bonds exchangeable for BT securities for a notional amount of 517 million pounds sterling (i.e. 585 million euros at the ECB daily reference rate) bearing a coupon of 0.375% and having as underlying 133 million BT shares. The Bonds mature in June 2021 and have been redeemable on demand by investors since August 7, 2017, in cash, BT securities or a combination of the two, at Orange’s choice. Under IFRS, this operation was split between a financial liability at amortized cost and a derivative instrument (sale of call option) revalued at fair value through profit or loss. In the first half of 2019, Orange purchased call options with the same characteristics as the sale of call options included in the bonds exchangeable for BT securities. The purchase of calls offsets the sale of the initial call options, so the Group is no longer exposed to any change in value of BT securities linked to the bonds exchangeable for BT shares.
13.6 Loans from development organizations and multilateral lending institutions
(in millions of euros) | December 31, 2020 | December 31, 2019 | December 31, 2018 |
Sonatel | 292 | 380 | 343 |
Orange Mali | 227 | 203 | 200 |
Médi Telecom | 220 | 282 | 335 |
Orange Côte d'Ivoire | 172 | 237 | 225 |
Orange Egypt | 163 | 213 | 210 |
Orange Cameroon | 111 | 82 | 105 |
Orange Jordanie | 61 | 77 | 31 |
Orange Burkina Faso | 56 | 46 | - |
Other | 81 | 104 | 127 |
Bank loans | 1,384 | 1,625 | 1,574 |
Orange SA(1) | 2,288 | 2,356 | 2,023 |
Orange Espagne | - | 33 | 67 |
Loans from development organizations and multilateral lending institutions(2) | 2,288 | 2,389 | 2,090 |
Total | 3,671 | 4,013 | 3,664 |
(1) In 2020, Orange SA has redeemed at maturity a loan of 400 million euros and has negotiated with the European Investment Bank a new loan of 350 million euros (maturity in 2027). In 2019, Orange SA negotiated a loan of 350 million euros (maturity in 2026) and two loans in 2018 for a total notional of 650 million euros (maturity in 2025).
(2) Primarily the European Investment Bank.
13.7 Financial assets
The financial assets break down as follows:
(in millions of euros) | December 31, 2020 | December 31, 2019 | December 31, 2018 | ||
Non-current | Current | Total | Total | Total | |
Financial assets at fair value through other comprehensive income that will not be reclassified to profit or loss | 431 | - | 431 | 277 | 254 |
Investments securities | 431 | - | 431 | 277 | 254 |
Financial assets at fair value through profit or loss | 784 | 3,206 | 3,990 | 4,953 | 4,041 |
Investments at fair value (1) | - | 3,206 | 3,206 | 4,696 | 2,683 |
Investments securities | 141 | - | 141 | 133 | 805 |
Cash collateral paid (2) | 642 | - | 642 | 123 | 553 |
Financial assets at amortized cost | 329 | 53 | 382 | 772 | 762 |
Receivables related to investments (3) | 44 | 11 | 55 | 70 | 55 |
Other (4) | 285 | 42 | 327 | 702 | 707 |
Total financial assets | 1,544 | 3,259 | 4,803 | 6,001 | 5,057 |
(1) NEUCP and bonds only (see Note 14.3).
(2) See Note 14.5.
(3) Including loan from Orange SA to Orange Bank for 27 million euros.
(4) The escrowed amount of 346 million euros booked in 2018 in relation with the Digicel litigation has been fully paid in 2020 (see Note 18).
Investment securities
Investment securities measured at fair value through other comprehensive income that may not be reclassified to profit or loss
(in millions of euros) | 2020 | 2019 | 2018 |
Investment securities measured at fair value through other comprehensive income that may not be reclassified to profit or loss - in the opening balance | 277 | 254 | 208 |
Acquisitions | 81 | 52 | 75 |
Changes in fair value | 94 | (25) | (22) |
Sales | (20) | (2) | (7) |
Other movements | (2) | (2) | - |
Investment securities measured at fair value through other comprehensive income that may not be reclassified to profit or loss - in the closing balance | 431 | 277 | 254 |
Investment securities measured at fair value through other comprehensive income that may not be reclassified to profit or loss included numerous shares in companies held by investment funds.
Investment securities measured at fair value through profit or loss
(in millions of euros) | 2020 | 2019 | 2018 |
Investment securities measured at fair value through profit or loss - in the opening balance | 133 | 805 | 1,005 |
Changes in fair value | 8 | 17 | (101) |
Sale of BT shares | - | (659) | (53) |
Other movements | (0) | (29) | (46) |
Investment securities measured at fair value through profit or loss - in the closing balance | 141 | 133 | 805 |
BT shares
On January 29, 2016, following the sale of EE, Orange received 4% of the share capital of BT Group Plc (BT), i.e. approximately 399 million shares for the equivalent of 2,462 million euros.
In 2017, the Orange group sold, for a net amount of 433 million euros, 133 million shares with a fair value of 570 million euros at December 31, 2016. The impact on profit or loss related to securities sold amounted to (126) million euros.
In 2018, the Orange group sold, for a net amount of 53 million euros, 18 million shares with a fair value of 55 million euros at December 31, 2017. The impact on profit or loss in 2018 related to securities sold amounted to (2) million euros.
On June 28, 2019, the Group sold its residual stake of 2.49% in the share capital of BT Group Plc, i.e. a net amount of 543 million euros. At December 31, 2018 the fair value of these securities amounted to 659 million euros. The impact on the income statement in 2019 amounted to (119) million euros.
The impact on consolidated net finance costs of the investment in BT in 2018 and 2019 is detailed below:
(in millions of euros) | 2019 | 2018 |
Impact of 2018 sale | - | (2) |
Impact of 2019 sale | (119) | (93) |
Dividends received | - | 44 |
Effect in the consolidated financial net income of the investment in BT | (119) | (51) |
Accounting policies
Financial assets
− Financial assets at fair value through profit or loss (FVR)
Certain investment securities which are not consolidated or equity-accounted, and cash investments such as negotiable debt securities, deposits and mutual funds (UCITS), that are compliant with the Group’s risk management policy or investment strategy, may be designated by Orange as being recognized at fair value through profit or loss. These assets are recognized at fair value at inception and subsequently. All changes in fair value are recorded in net financial expenses.
− Financial assets at fair value through other comprehensive income that may not be reclassified to profit or loss (FVOCI)
Investment securities which are not consolidated or equity-accounted are, subject to exceptions, recognized as assets at fair value through other comprehensive income that may not be reclassified to profit/loss. They are recognized at fair value at inception and subsequently. Temporary changes in value and gains (losses) on disposals are recorded in other comprehensive income that may not be reclassified to profit/loss.
− Financial assets at amortized cost (AC)
This category mainly includes loans and receivables. These instruments are recognized at fair value at inception and are subsequently measured at amortized cost using the effective interest method. If there is any objective evidence of impairment of these assets, the value of the asset is reviewed at the end of each reporting period. An impairment loss is recognized in the income statement when impairment tests demonstrate that the financial asset carrying amount is higher than its recoverable amount. For theses financial assets, the provisioning system also covers expected losses according to IFRS 9.
13.8 Derivatives instruments
13.8.1 Market value of derivatives
December 31, 2020 | December 31, 2019 | December 31, 2018 | |
(in millions of euros) | Net | Net | Net |
Hedging derivatives | (311) | 324 | (162) |
Cash flow hedge derivatives | (311) | 328 | (160) |
Fair value hedge derivatives | (0) | (4) | (2) |
Derivatives held for trading (1) | (199) | (187) | (298) |
Net derivatives(2) | (510) | 138 | (460) |
(1) Mainly due to the foreign exchange effects of the economic hedges against the revaluation of subordinated notes denominated in pounds sterling (equity instruments recognized at their historical value - see Note 15.4) for (210) million euros in 2020, (136) million euros in 2019 and (246) million euros in 2018.
(2) Of which foreign exchange effects of the cross currency swaps (classified as hedging or held for trading) hedging foreign exchange risk on gross debt notional for 251 million euros in 2020, 822 million euros in 2019 and 512 million euros in 2018. The foreign exchange effects of the cross currency swaps is the difference between the notional converted at the closing rate and its notional converted at the opening rate (or at the trading day spot rate in case of new instrument).
The risks hedged by these derivative instruments are described in Note 14. These derivatives are associated with cash-collateral agreements, the effects of which are described in Note 14.5.
Accounting policies
Derivative instruments are measured at fair value in the statement of financial position and presented according to their maturity date, regardless of whether they qualify for hedge accounting under IFRS 9 (hedging instruments versus trading instruments).
Derivatives are classified as a separate line item in the statement of financial position.
Trading derivatives are non-qualified economic hedges. Changes in the value of these instruments are recognized directly in profit and loss.
Hedge accounting is applicable when:
− at the inception of the hedge, there is a formal designation and documentation of the hedging relationship;
− the effectiveness of the hedge is demonstrated at inception and it is expected to continue in subsequent periods: i.e. at inception and throughout its duration, the company expects changes in the fair value of the hedged element to be almost fully offset by changes in the fair value of the hedged instrument.
There are three types of hedge accounting:
− the fair value hedge is a hedge of the exposure to changes in fair value of a recognized asset or liability (or an identified portion of the asset or liability) that are attributable to a particular interest rate and/or currency risk and which could affect profit or loss.
The hedged portion of these items is re-measured at fair value in the statement of financial position. Change in this fair value is booked in the income statement and offset by symmetrical changes in the fair value hedging of financial hedging instruments up to the limit of the hedge effectiveness;
− the cash flow hedge is a hedge of the exposure to variability in cash flows that is attributable to a particular interest rate and/or currency risk associated with a recognized asset or liability or a highly probable forecast transaction (such as a future purchase or sale) and which could affect profit or loss. As the hedged item is not recognized in the statement of financial position, the effective portion of change in fair value of the hedging instrument is booked in other comprehensive income. It is reclassified in profit or loss when the hedged item (financial asset or liability) affects the profit or loss or in the initial cost of the hedged item when it relates to the hedge of a non-financial asset acquisition cost;
− the net investment hedge is a hedge of the exposure to changes in values attributable to exchange risk of a net investment in a foreign operation, and could affect profit or loss on the disposal of the foreign operation. The effective portion of the net investment hedge is recorded in other comprehensive income. It is reclassified in profit or loss upon the disposal of the net investment.
For transactions qualified as fair value hedges and economic hedges, the foreign exchange impact of changes in the fair value of derivatives is booked in operating income when the underlying hedged item results from operational transactions and in net finance costs when the underlying hedged item is a financial asset or liability.
Hedge accounting can be terminated when the hedged item is no longer recognized, i.e. when the Group revokes the designation of the hedging relationship or when the hedging instrument is terminated or exercised. The accounting consequences are as follows:
− fair value hedge: at the hedge accounting termination date, the adjustment of the fair value of the liability is amortized using an effective interest rate recalculated at this date. Should the item hedged disappear, the change in fair value is recognized in the income statement;
− cash flow hedge: amounts recorded in other comprehensive income are immediately reclassified in profit or loss when the hedged item is no longer recognized. In all other cases, amounts are reclassified in profit or loss, on a straight basis, throughout the remaining life of the original hedging relationship.
In both cases, subsequent changes in the value of the hedging instrument are recorded in profit or loss.
Concerning the effects of the Foreign Currency Basis Spread, cross-currency swaps designated as cash flow hedges, the Group has chosen to designate them as costs of hedge. This option enables recognizing these effects in comprehensive income and amortizing the cost of the Basis Spread to profit/loss over the period of the hedge.
13.8.2 Cash flow hedges
The Group’s cash flow hedges main goal is to neutralize foreign exchange risk on future cash flows (notional, coupons) or switch floating-rate debt to fixed-rate debt.
The ineffective portion of cash flow hedges recognized in net income is not significant during the periods presented. The main hedges unmatured at December 31, 2020, as well as their effects on the financial statements, are detailed in the table below.
(in millions of euros) | Hedged risk | |||
Total | Exchange and interest rate risk | Exchange risk | Interest rate risk | |
Hedging instruments | (311) | Cross Currency Swap | Forward FX swap Option | Interest rate swap Option |
Carrying amount - asset | 223 | 216 | 6 | 1 |
Carrying amount - liability | (534) | (502) | (1) | (31) |
Change in cash flow hedge reserve | 22 | 6 | 5 | 11 |
Gain (loss) recognized in other comprehensive income | 3 | (16) | 8 | 11 |
Reclassification in financial result | 21 | 22 | (1) | - |
Reclassification in operating income | 1 | - | 1 | - |
Reclassification in initial carrying amount of hedged item | (3) | - | (3) | - |
Cash flow hedge reserve | (100) | (91) | 2 | (11) |
o/w related to unmatured hedging instruments | (541) | (532) | 2 | (11) |
o/w related to discontinued hedges | 440 | 440 | - | 0 |
Hedged item | Bonds and credit lines | Purchases of handsets and equipment | Bonds and Lease liabilities | |
Balance sheet item | Current and non-current financial liabilities | Property, plant and equipment | Lease and Financial Liabilities - current and non-current | |
The main hedges unmatured at December 31, 2019, as well as their effects on the financial statements, are detailed in the table below.
(in millions of euros) | Hedged risk | |||
Total | Exchange and interest rate risk | Exchange risk | Interest rate risk | |
Hedging instruments | 328 | Cross Currency Swap | Forward FX swap Option | Interest rate swap Option |
Carrying amount - asset | 557 | 554 | 2 | 1 |
Carrying amount - liability | (229) | (190) | (3) | (36) |
Change in cash flow hedge reserve | 144 | 148 | (10) | 7 |
Gain (loss) recognized in other comprehensive income | 179 | 184 | (12) | 7 |
Reclassification in financial result | (38) | (36) | (1) | (1) |
Reclassification in operating income | 1 | - | 1 | - |
Reclassification in initial carrying amount of hedged item | 2 | - | 2 | - |
Cash flow hedge reserve | (123) | (95) | (6) | (22) |
o/w related to unmatured hedging instruments | (542) | (513) | (6) | (22) |
o/w related to discontinued hedges | 418 | 418 | - | - |
Hedged item | Bonds and credit lines | Purchases of handsets and equipment | Bonds and Lease liabilities | |
Balance sheet item | Current and non-current financial liabilities | Property, plant and equipment | Lease and Financial Liabilities - current and non-current | |
The change in the cash flow hedge reserve in 2018 was analyzed as follows:
(in millions of euros) | Hedged risk | |||
Total | Exchange and interest rate risk | Exchange risk | Interest rate risk | |
Hedging instruments | (160) | Cross Currency Swap | Forward FX swap Option | Interest rate swap |
Carrying amount - asset | 353 | 351 | 2 | - |
Carrying amount - liability | (513) | (479) | (0) | (34) |
Change in cash flow hedge reserve | (67) | (83) | (7) | 23 |
Gain (loss) recognized in other comprehensive income | (53) | (45) | (15) | 7 |
Reclassification in financial result | (22) | (38) | - | 16 |
Reclassification in operating income | (1) | - | (1) | - |
Reclassification in initial carrying amount of hedged item | 9 | - | 9 | - |
Cash flow hedge reserve | (267) | (245) | 3 | (25) |
o/w related to unmatured hedging instruments | (721) | (696) | 3 | (28) |
o/w related to discontinued hedges | 454 | 451 | 0 | 3 |
Hedged item | Bonds and credit lines | Purchases of handsets and equipment | Bonds and Finance Lease | |
Balance sheet item | Current and non-current financial liabilities | Property, plant and equipment | Current and non-current financial liabilities | |
The nominal amounts of the main cash flow hedges as of December 31, 2020 are presented below:
Notional amounts of hedging instruments per maturity (in millions of hedged currency units) | |||||
2021 | 2022 | 2023 | 2024 | 2025 and beyond | |
Orange SA | |||||
Cross currency swaps | |||||
CHF | - | - | - | - | 500 (1) |
GBP | 517 | - | - | - | 2,512 (2) |
HKD | - | - | 1,110 | - | 939 (3) |
NOK | - | - | - | - | 1,300 (4) |
USD | 1,000 | - | - | - | 4,200 (5) |
Interest rate swaps | |||||
EUR | 255 | - | - | - | 100 (6) |
FT Immo H | |||||
Interest rate swaps | |||||
EUR | 20 | 41 | - | 33 | - |
Orange Polska | |||||
Forwards | |||||
EUR | 141 | - | - | - | - |
(1) 400 million Swiss francs with a maturity 2025 and 100 million Swiss francs with a maturity 2029.
(2) 262 million pounds sterling with a maturity 2025, 500 million pounds sterling with a maturity 2028, 750 million pounds sterling with a maturity 2032, 500 million pounds sterling with a maturity 2034 and 500 million pounds sterling with a maturity 2050.
(3) 939 million Hong Kong dollars with a maturity 2034.
(4) 500 million Norwegian kroners with a maturity 2025 and 800 million Norwegian kroners with a maturity 2028.
(5) 2,450 million US dollars with a maturity 2031, 900 million US dollars with a maturity 2042 and 850 million US dollars with a maturity 2044.
(6) 100 million euros with a maturity 2030.
Note 14 Information on market risk and fair value of financial assets and liabilities (telecom activities)
The Group uses financial position or performance indicators that are not specifically defined by IFRS, such as EBITDAaL (see Note 1.9) and net financial debt (see Note 13.3).
Market risks are monitored by Orange’s Treasury and Financing Committee, which reports to the Executive Committee. The Committee is chaired by the Group’s Executive Committee Member in charge of Finance, Performance and Development and meets on a quarterly basis.
It sets the guidelines for managing the Group’s debt, especially in respect of its interest rate, foreign exchange, liquidity and counterparty risk exposure for the coming months, and reviews past management (transactions realized, financial results).
The health crisis has not called into question the risk management policy relating to financial instruments. The Group continued to set up and manage hedging instruments in order to limit its exposure to operational and financial foreign exchange and interest rate risks, while maintaining a diversified financing policy.
14.1 Interest rate risk management
Management of fixed-rate/variable-rate debt
Orange Group seeks to manage its fixed-rate/variable-rate exposure in euros in order to minimize interest costs by using firm and conditional interest rate derivatives such as swaps, futures, caps and floors.
The fixed-rate component of gross financial debt, excluding cash collateral received and agreements to buy back non-controlling interests, was estimated at 89% at December 31, 2020, 91% at December 31, 2019 and 87% at December 31, 2018.
Sensitivity analysis of the Group’s position to changes in interest rates
The sensitivity of the Group’s financial assets and liabilities to interest rate risk is only analyzed for the components of net financial debt that are interest-bearing and therefore exposed to interest rate risk.
Sensitivity of financial expenses
Based on a constant amount of debt and a constant management policy, a 1% rise in interest rates would reduce the annual cost of gross financial debt by 2 million euros, while a decrease of 1% would improve it by 2 million euros.
Sensitivity of cash flow hedge reserves
A 1% rise in euro interest rates would increase the market value of derivatives designated as cash flow hedges and the associated cash flow hedge reserves by approximately 1,282 million euros. A 1% fall in euro interest rates would lead to a decrease in their market value and in the cash flow hedge reserves of approximately 1,278 million euros.
14.2 Foreign exchange risk management
Operational foreign exchange risk
The Group’s foreign operations are carried out by entities that operate in their own country and mainly in their own currency. Their operational exposure to foreign exchange risk is therefore limited to certain types of flows: purchases of equipment or network capacity, purchases of terminals and equipment sold or leased to customers, purchases from or sales to international operators.
Whenever possible, the entities of the Orange Group have put in place policies to hedge this exposure (see Note 13.8).
Financial foreign exchange risk
Financial foreign exchange risk mainly relates to:
− dividends paid to the parent company: in general, the Group’s policy is to economically hedge this risk as from the date of the relevant subsidiary’s Shareholders’ Meeting;
− financing of the subsidiaries: except in special cases, the subsidiaries are required to cover their funding needs in their functional currency;
− Group financing: most of the Group’s bonds, after derivatives, are denominated in euros. From time to time, Orange SA issues bonds in markets other than euro markets (primarily the US dollar, pound sterling and Swiss franc). If Orange SA does not have assets in these currencies, in most cases, the issues are translated into euros through cross-currency swaps. The debt allocation by currency also depends on the level of interest rates and particularly on the interest rate differential relative to the euro.
Lastly, the Group economically hedges foreign exchange risk on its subordinated notes denominated in pound sterling that are recorded in equity at their historical value (see Note 15.4), with cross-currency swaps, for a notional amount of 988 million pounds sterling.
The table below shows the main exposures to foreign exchange fluctuations of the net financial debt in foreign currencies of Orange SA, excluding the hedging effects of the subordinated notes described above and of Orange Polska and also shows the sensitivity of the entity to a 10% change in the foreign exchange rates of the currencies to which it is exposed. Orange SA is the entity bearing the major foreign exchange risk, including internal operations which generate a net foreign exchange gain or loss in the consolidated annual financial statements.
Exposure in currency units (1) | Sensitivity analysis | ||||||
(in millions of currency units) | EUR | USD | GBP | PLN | Total translated | 10% gain in euro | 10% loss in euro |
Orange SA | - | 7 | 8 | 15 | 17 | (2) | 2 |
Orange Polska | (160) | (5) | - | - | (164) | 15 | (18) |
Total (euros) | (160) | 1 | 9 | 3 | (147) | ||
(1) Excluding FX hedge of subordinated notes denominated in pounds sterling.
Foreign exchange risk to assets
Due to its international presence, the Orange Group’s statement of financial position is exposed to foreign exchange fluctuations, as these affect the translation of subsidiaries’ assets and equity interests denominated in foreign currencies. The currencies concerned are mainly the pound sterling, the zloty, the Egyptian pound, the US dollar, the Jordanian dinar and the Moroccan dirham.
To hedge its largest foreign asset exposures, Orange has issued debt in the relevant currencies.
The amounts presented below take into account the activities of Mobile Financial Services (activities mainly in euros).
Contribution to consolidated net assets | Sensitivity analysis | |||||||||||
(in millions of euros) | EUR | USD | GBP | PLN | EGP | JOD | MAD | Other currencies | Total | 10% gain in euro | 10% loss in euro | |
Net assets excluding net debt (a) (1) | 51,679 | 165 | (1,053) | 3,195 | 933 | 519 | 948 | 4,141 | 60,527 | (804) | 983 | |
Net debt by currency including derivatives (b) (2) | (22,121) | 43 | 1,146(3) | (1,240) | (174) | (97) | (442) | (603) | (23,489) | 124 | (152) | |
Net assets by currency (a) + (b) | 29,558 | 209 | 93 | 1,955 (4) | 758 | 421 | 506 | 3,538 | 37,038 | (680) | 831 | |
(1) Excluding net debt by currency do not include components of net financial debt.
(2) The net financial debt as defined by Orange group does not include Mobile Financial Services activities for which this concept is not relevant (see Note 13.3).
(3) Of which economic hedge of subordinated note denominated in pounds sterling for 988 million pounds sterling (equivalent 1,099 million euros).
(4) Share of net assets attributable to owners of the parent company in zlotys amounts to 991 million euros.
Due to its international presence, the Orange Group income statement is also exposed to risk arising from changes in foreign exchange rates due to the conversion, in the consolidated financial statements, of its foreign subsidiaries’ financial statements.
Contribution to consolidated financial income statement | Sensitivity analysis | |||||||||||
(in millions of euros) | EUR | USD | GBP | PLN | EGP | JOD | MAD | Other currencies | Total | 10% gain in euro | 10% loss in euro | |
Revenue | 31,866 | 1,105 | 275 | 2,559 | 878 | 386 | 585 | 4,616 | 42,270 | (946) | 1,156 | |
EBITDAaL | 9,816 | 54 | 19 | 635 | 317 | 141 | 158 | 1,541 | 12,680 | (260) | 318 | |
Operating income | 4,257 | 15 | 1 | 91 | 128 | 57 | 18 | 954 | 5,521 | (115) | 140 | |
14.3 Liquidity risk management
Diversification of sources of funding
Orange has diversified sources of funding:
− regular issues in the bonds markets;
− occasional financing through loans from multilateral or development lending institutions;
− issues in the short-term securities markets under the NEU Commercial Paper program (Negotiable European Commercial papers);
− on December 21, 2016, Orange entered into a 6 billion euros syndicated loan with 24 international banks in order to refinance the previous syndicated loan maturing in January 2018. The new loan, with initial maturity in December 2021, includes two options to extend for one more year each, exercisable by Orange and subject to the banks’ approval. Orange exercised both of its options, the first one in 2017 and the second in 2018, allowing it, after agreement of the lenders, to extend the initial maturity first until December 2022 and then December 2023.
Liquidity of investments
Orange invests its cash surpluses in cash equivalents that meet IAS 7 cash equivalent criteria or in fair value investments (negotiable debt securities, bonds with a maturity of no more than two years, UCITS and term deposits). These investments prioritize minimizing the risk of capital loss over performance.
Cash, cash equivalents and fair value investments are held mainly in France and other European Union countries, which are not subject to restrictions on convertibility or exchange controls.
Smoothing debt maturities
The policy followed by Orange is to apportion the maturities of debt evenly over the years to come.
The following table shows undiscounted future cash flows for each financial liability shown on the statement of financial position. The key assumptions used in this schedule are:
− amounts in foreign currencies are translated into euro at the year- end closing rate;
− future variable-rate interest is based on the last fixed coupon, unless a better estimate is available;
− TDIRA being necessarily redeemable in new shares, no redemption is taken into account in the maturity analysis. In addition, interest payable on the bonds is due over an undetermined period of time (see Note 13.4) therefore, only interest payable for the first period is included (including interest payments for the other periods would not provide relevant information);
− the maturity dates of revolving credit facilities are the contractual maturity dates;
− the "Other items" (undated and non-cash items) reconcile, for financial liabilities not accounted for at fair value, the future cash flows and the balance in the statement of financial position.
(in millions of euros) | Note | December 31, 2020 | 2021 | 2022 | 2023 | 2024 | 2025 | 2026 and beyond | Other items (1) |
TDIRA | 13.4 | 636 | 3 | - | - | - | - | - | 633 |
Bonds | 13.5 | 29,848 | 3,701 | 1,152 | 1,450 | 1,984 | 2,337 | 19,388 | (163) |
Bank loans and from development organizations and multilateral lending institutions | 13.6 | 3,671 | 633 | 324 | 1,005 | 260 | 750 | 703 | (4) |
Debt relating to financed assets | 13.3 | 295 | 70 | 75 | 75 | 58 | 17 | - | - |
Cash collateral received | 13.3 | 31 | 31 | - | - | - | - | - | - |
NEU commercial papers (2) | 13.3 | 555 | 555 | - | - | - | - | - | - |
Bank overdrafts | 13.3 | 154 | 154 | - | - | - | - | - | - |
Other financial liabilities | 13.3 | 70 | 48 | 3 | 3 | 1 | 1 | 15 | - |
Derivatives (liabilities) | 13.3 | 804 | 15 | 133 | 99 | - | 34 | 39 | - |
Derivatives (assets) | 13.3 | (294) | (155) | - | (10) | (19) | (14) | (153) | - |
Other Comprehensive Income related to unmatured hedging instruments | 13.3 | (541) | - | - | - | - | - | - | - |
Gross financial debt after derivatives | 35,229 | 5,054 | 1,686 | 2,623 | 2,283 | 3,124 | 19,991 | 466 | |
Trade payables | 11,051 | 9,760 | 243 | 212 | 87 | 362 | 388 | - | |
Total financial liabilities (including derivatives assets) | 46,280 | 14,814 (3) | 1,929 | 2,834 | 2,370 | 3,486 | 20,379 | 466 | |
Future interests on financial liabilities (4) | - | 1,525 | 914 | 851 | 807 | 855 | 5,472 | - |
(1) Undated items: TDIRA notional. Non-cash items: amortized cost on bonds and bank loans, and discounting effect on long term trade payables.
(2) Negotiable European Commercial Papers (formerly called "commercial papers").
(3) Amounts presented for 2021 correspond to notional and accrued interests for 502 million euros.
(4) Mainly future interests on bonds for 9,712 million euros, on bank loans for 284 million euros and on derivatives instruments for (842) million euros.
The liquidity position is one of the indicators of financial position used by the Group. This aggregate, not defined by IFRS, may not be comparable to similarly entitled indicators used by other groups.
At December 31, 2020, the liquidity position of Orange’s telecom activities amounts to 17,243 million euros and exceeds the repayment obligations of its gross financial debt in 2021. It breaks down as follows:
Liquidity position
(in millions of euros)
| Available undrawn amount of credit facilities | ||
Investments at fair value | |||
Cash | |||
Cash equivalents | |||

At December 31, 2020, the Orange group’s telecom activities had access to credit facilities in the form of bilateral credit lines and syndicated credit lines. Most of these lines bear interest at variable rates. Available undrawn amount of credit facilities amounts to 6,146 million euros (including 6,000 million euros for Orange SA).
Cash equivalents amounted to 5,140 million euros, mainly at Orange SA for 4,329 million euros in UCITS, 450 million euros in term deposits and 170 million euros in negotiable debt securities.
Investments at fair value amounted to 3,206 million euros exclusively at Orange SA, with 3,105 million euros in NEU Commercial Paper and 101 million euros in bonds.
Any specific contingent commitments in terms of financial ratios are presented in Note 14.4.
Orange’s credit ratings
Orange’s credit rating is an additional performance indicator used to assess the Group’s financial policy and risk management policy and, in particular, its solvency and liquidity risk, and is not a substitute for an analysis carried out by investors. Rating agencies revise the ratings they assign on a regular basis. Any change in the rating could produce an impact on the cost of future financing or restrict access to liquidity.
In addition, a change in Orange’s credit rating will, for certain outstanding financing, affect the compensation paid to investors:
− one Orange SA bond (see Note 13.5) with an outstanding amount of 2.5 billion dollars maturing in 2031 (equivalent to 2.0 billion euros at December 31, 2020) is subject to a step-up clause in the event that Orange’s rating changes. This clause was triggered in 2013 and early 2014: the coupon due in March 2014 was thus computed on the basis of an interest rate of 8.75% and since then, the bond bears interest at the rate of 9%;
− the margin of the syndicated credit line of 6 billion euros signed on December 21, 2016 might be modified in light of changes to Orange’s credit rating, upwards or downwards. As at December 31, 2020, the credit facility was not drawn.
At December 31, 2020, neither Orange’s credit ratings nor the outlook had changed compared with December 31, 2019.
Standard & Poor’s | Moody's | Fitch Ratings | |
Long-term debt | BBB+ | Baa1 | BBB+ |
Outlook | Stable | Stable | Stable |
Short-term debt | A2 | P2 | F2 |
14.4 Financial ratios
Main commitments with regard to financial ratios
Orange SA does not have any credit line or loan subject to specific covenant with regard to financial ratios.
Certain subsidiaries of Orange SA are committed to comply with certain financial ratios related to indicators defined in the contracts with the banks. The breach of these ratios constitutes an event of default that can lead to early repayment of the line of credit or loan concerned.
The main obligations are as follows:
− Orange Egypt: in respect of bank financing contracts signed in 2018, of which the total nominal amount outstanding at December 31, 2020 was 3,150 million Egyptian pounds (i.e. 164 million euros), Orange Egypt must comply with a "net senior debt to reported EBITDA" ratio;
− Médi Telecom: in respect of its bank financing contracts signed in 2012, 2014 and 2015, of which the total nominal amount outstanding at December 31, 2020 was 2,396 million Moroccan dirhams (i.e. 220 million euros), Médi Telecom must comply with ratios relating to its "net financial debt" and "net equity";
− Orange Côte d’Ivoire: in respect of its bank financing contracts signed in 2016 and 2019, of which the total nominal amount outstanding at December 31, 2020 was 112 billion CFA francs (i.e. 170 million euros), Orange Côte d’Ivoire must comply with a "net debt to reported EBITDA" ratio;
− Orange Cameroon: in respect of its bank financing contracts signed in 2015 and 2018, of which the total nominal amount outstanding at December 31, 2020 was 72 billion CFA francs (i.e. 110 million euros), Orange Cameroon must comply with a "net debt to reported EBITDA" ratio.
These ratios were complied with at December 31, 2020.
Clauses related to instances of default or material adverse changes
Most of Orange’s financing agreements, including in particular the 6 billion euros syndicated credit facility set up on December 21, 2016, as well as bond issues, are not subject to early redemption obligations in the event of a material adverse change, or cross default provisions. Most of these contracts include cross acceleration provisions. Thus, the mere occurrence of events of default in other financing agreements would not automatically trigger an accelerated repayment under such contracts.
14.5 Credit risk and counterparty risk management
The Group could be exposed to a concentration of counterparty risk in respect of its trade receivables, cash and cash equivalents, investments and derivatives.
Orange considers that it has limited concentration in credit risk with respect to trade receivables due to its large and diverse customer base (residential, professional and large business customers) operating in numerous industries and located in many French regions and foreign countries. In addition, the maximum value of the counterparty risk on these financial assets is equal to their recognized net carrying value. An analysis of net trade receivables past due is provided in Note 5.3. For loans and other receivables, amounts past due but not provisioned are not material.
Orange SA is exposed to bank counterparty risk through its investments and derivatives. Therefore, it performs a strict selection based on the credit rating of public, financial or industrial institutions in which it invests or with which it enters into derivatives agreements.
− For each non-banking counterparty selected for investments, limits are based on ratings and maturities of the investments;
− For each counterparty bank selected for investments and derivatives, limits are based on equity, rating, CDS (Credit Default Swap, an accurate indicator of potential default risk) as well as on periodic analyses carried out by the Treasury Department;
− Theoretical limits and consumption limits are monitored and reported on a daily basis to the Group treasurer and the head of the trading room. These limits are adjusted regularly depending on credit events.
For derivatives, master agreements relating to financial instruments (French Banking Federation) are signed with all counterparties and provide for a net settlement of debts and receivables, in case of failure of one of the parties, as well as for calculation of a final balance to be received or paid. These agreements include a CSA (Credit Support Annex) cash collateral clause that can lead to either a deposit (collateral paid) or collection (collateral received), on a daily basis. These payment amounts correspond to the change in market value of all derivatives.
As a rule, investments are negotiated with high-grade banks. Exceptionally, subsidiaries occasionally deal with counterparties with the highest ratings available locally.
Effect of mechanisms to offset exposure to credit risk and counterparty risk of the derivatives
(in millions of euros) | December 31, 2020 | December 31, 2019 | December 31, 2018 |
Collateralised Derivatives (net) (a) | (520) | 144 | (455) |
Fair value of collateralised derivatives assets | 283 | 570 | 383 |
Fair value of collateralised derivatives liabilities | (803) | (426) | (838) |
Amount of cash collateral paid/(received) (b) | 611 | (138) | 471 |
Amount of cash collateral paid | 642 | 123 | 553 |
Amount of cash collateral received | (31) | (261) | (82) |
Residual exposure to counterparty risk (a) + (b) (1) | 91 | 7 | 16 |
Non collateralised Derivatives (net) | 10 | (6) | (5) |
Fair value of non collateralised derivatives assets | 11 | 3 | 2 |
Fair value of non collateralised derivatives liabilities | (1) | (10) | (7) |
(1) The residual exposure to counterparty risk is mainly due to a time difference between the valuation of derivatives at the closing date and the date on which the cash collateral exchanges were made.
Changes in net cash collateral between 2019 and 2020 stem mainly from the depreciation of the US dollar and the pound sterling against the euro.
Sensitivity analysis of cash collateral deposits to changes in market interest rates and exchange rates
A change in market rates (mainly euro) of +/-1% would affect the fair value of interest rate hedging derivatives as follows:
(in millions of euros) | ||||||||||||||||||||
Rate decrease of 1% | Rate increase of 1% | |||||||||||||||||||
Change of fair value of derivatives | (1,314) | 1,318 | ||||||||||||||||||
Rate decrease of 1% | Rate increase of 1% | |||||||||||||||||||
Amount of cash collateral received (paid) | 1,314 | (1,318) | ||||||||||||||||||
A change in the euro exchange rate of +/-10% against currencies of hedged financing (mainly the pound sterling and the US dollar) would impact the fair value of foreign exchange derivatives as follows:
(in millions of euros) | ||||||||||||||||||||
Change of fair value of derivatives | 10% loss in euro | 10% gain in euro | ||||||||||||||||||
1,536 | (1,257) | |||||||||||||||||||
10% loss in euro | 10% gain in euro | |||||||||||||||||||
Amount of cash collateral received (paid) | (1,536) | 1,257 | ||||||||||||||||||
14.6 Equity market risk
Orange SA had no options to purchase its own shares, no forward purchase of shares and at December 31, 2020, held 1,265,099 treasury shares. Orange SA owns subsidiaries listed on equity markets whose share value may be affected by general trends in these markets. In particular, the market value of these listed subsidiaries’ shares is one of the measurement variables used in impairment testing.
The mutual funds (UCITS) in which Orange invests for cash management purposes contain no equities.
Orange is also exposed to equity risk through certain retirement plan assets (see Note 7.2).
At December 31, 2020, the Group was not significantly exposed to market risk on the shares of listed companies. The Group’s prior exposure had been significantly reduced in 2019, with the disposal in June 2019 of its residual 2.49% stake in the share capital of BT (see Note 13.7).
14.7 Capital management
Orange SA and its non-financial subsidiaries are not subject to regulatory requirements related to equity (other than the usual standards applicable to any commercial company).
Its financial subsidiaries (like electronic money institutions) are subject to regulatory equity requirements specific to their sector and jurisdiction.
Like any company, Orange manages its financial resources (both equity and net financial debt) as part of a balanced financial policy, aiming to ensure flexible access to capital markets, including for the purpose of selectively investing in development projects, and to provide a return to shareholders.
In terms of net financial debt (see Note 13.3), this policy translates into liquidity management as described in Note 14.3 and a specific attention to credit ratings assigned by rating agencies.
This policy is also reflected, in some markets, by the presence of minority shareholders in the capital of subsidiaries controlled by Orange. This serves to limit the Group’s debt while providing a benefit from the presence of local shareholders.
14.8 Fair value of financial assets and liabilities
The market value of the net financial debt carried by Orange is estimated at 30.1 billion euros at December 31, 2020, for a carrying amount of 23.5 billion euros.
December 31, 2020 | |||||||
(in millions of euros) | Note | Classification under IFRS 9 (1) | Book value | Estimated fair value | Level 1 and cash | Level 2 | Level 3 |
Trade receivables | AC | 5,645 | 5,645 | - | 5,645 | - | |
Financial assets | 13.7 | 4,803 | 4,803 | 185 | 4,372 | 247 | |
Equity securities | FVOCI | 431 | 431 | 185 | - | 247 | |
Equity securities | FVR | 141 | 141 | - | 141 | - | |
Investments at fair value | FVR | 3,206 | 3,206 | - | 3,206 | - | |
Cash collateral paid | FVR | 642 | 642 | - | 642 | - | |
Financial assets at amortized cost | AC | 382 | 382 | - | 382 | - | |
Cash and Cash equivalents | 13.3 | 7,891 | 7,891 | 7,891 | - | - | |
Cash | AC | 2,751 | 2,751 | 2,751 | - | - | |
Cash equivalents | FVR | 5,140 | 5,140 | 5,140 | - | - | |
Trade payables | AC | (11,051) | (11,051) | - | (11,051) | - | |
Financial liabilities | 13.3 | (35,260) | (41,884) | (34,708) | (7,162) | (14) | |
Financial debts | AC | (35,247) | (41,870) | (34,708) | (7,162) | - | |
Other | FVR | (14) | (14) | - | - | (14) | |
Derivatives (net amount) (2) | 13.8 | (510) | (510) | - | (510) | - | |
(1) AC" stands for "amortized cost", "FVR " stands for "fair value through profit or loss", "FVOCI" stands for "fair value through other comprehensive income that will not be reclassified to profit or loss".
(2) IFRS 9 classification for derivatives instruments depends on their hedging qualification.
The table below provides an analysis of the change in level 3 market values for financial assets and liabilities measured at fair value in the statement of financial position.
(in millions of euros) | Equity securities | Financial liabilities at fair value through profit or loss, excluding derivatives |
Level 3 fair values at December 31, 2019 | 198 | (64) |
Gains (losses) taken to profit or loss | - | 50 |
Gains (losses) taken to other comprehensive income | (28) | - |
Acquisition (sale) of securities | 80 | - |
Other | (2) | - |
Level 3 fair values at December 31, 2020 | 247 | (14) |
The market value of the net financial debt carried by Orange was estimated at 30.8 billion euros as at December 31, 2019, for a carrying amount of 25.5 billion euros.
December 31, 2019 | |||||||
(in millions of euros) | Note | Classification under IFRS 9 | Book value | Estimated fair value | Level 1 and cash | Level 2 | Level 3 |
Trade receivables | AC | 5,343 | 5,343 | - | 5,343 | - | |
Financial assets | 13.7 | 6,001 | 6,002 | 79 | 5,725 | 198 | |
Equity securities | FVOCI | 277 | 277 | 79 | - | 198 | |
Equity securities | FVR | 133 | 134 | - | 134 | - | |
Investments at fair value | FVR | 4,696 | 4,696 | - | 4,696 | - | |
Cash collateral paid | FVR | 123 | 123 | - | 123 | - | |
Financial assets at amortized cost | AC | 772 | 772 | - | 772 | - | |
Cash and Cash equivalents | 13.3 | 6,112 | 6,112 | 6,112 | - | - | |
Cash | AC | 2,462 | 2,462 | 2,462 | - | - | |
Cash equivalents | FVR | 3,651 | 3,651 | 3,651 | - | - | |
Trade payables | AC | (10,246) | (10,246) | - | (10,246) | - | |
Financial liabilities | 13.3 | (37,076) | (42,455) | (34,554) | (7,837) | (64) | |
Financial debts | AC | (37,007) | (42,386) | (34,554) | (7,811) | (21) | |
Bonds at fair value | FVR | (26) | (26) | - | (26) | - | |
Other | FVR | (43) | (43) | - | - | (43) | |
Derivatives (net amount) | 13.8 | 138 | 138 | - | 138 | - | |
The market value of the net financial debt carried by Orange was estimated at 28.7 billion euros as at December 31, 2018, for a carrying amount of 25.4 billion euros.
December 31, 2018 | |||||||
(in millions of euros) | Note | Classification under IFRS 9 | Book value | Estimated fair value | Level 1 and cash | Level 2 | Level 3 |
Trade receivables | AC | 5,329 | 5,329 | - | 5,329 | - | |
Financial assets | 13.7 | 5,057 | 5,057 | 692 | 4,144 | 221 | |
Equity securities | FVOCI | 254 | 254 | 33 | - | 221 | |
Equity securities | FVR | 805 | 805 | 659 | 146 | - | |
Investments at fair value | FVR | 2,683 | 2,683 | - | 2,683 | - | |
Cash collateral paid | FVR | 553 | 553 | - | 553 | - | |
Financial assets at amortized cost | AC | 762 | 762 | - | 762 | - | |
Cash and Cash equivalents | 13.3 | 5,081 | 5,081 | 5,081 | - | - | |
Cash | AC | 2,558 | 2,558 | 2,558 | - | - | |
Cash equivalents | FVR | 2,523 | 2,523 | 2,523 | - | - | |
Trade payables | AC | (10,082) | (10,082) | - | (10,082) | - | |
Financial liabilities | 13.3 | (34,019) | (37,292) | (29,012) | (7,988) | (292) | |
Financial debts | (33,721) | (36,994) | (29,012) | (7,961) | (21) | ||
Bonds at fair value | FVR | (27) | (27) | - | (27) | - | |
Other | FVR | (271) | (271) | - | - | (271) | |
Derivatives (net amount) | 13.8 | (460) | (460) | - | (460) | - | |
Accounting policies
The financial assets and liabilities measured at fair value in the statement of financial position have been classified based on the three hierarchy levels:
− level 1: quoted prices (unadjusted) in active markets for identical assets or liabilities that the entity can access at the measurement date;
− level 2: inputs that are observable for the asset or liability, either directly or indirectly;
− level 3: unobservable inputs for the asset or liability.
The fair value of the financial assets at fair value through other comprehensive income ("FVOCI") is the quoted price at year-end for listed securities and, for non-listed securities, uses a valuation technique determined according to the most appropriate financial criteria in each case (comparable transactions, multiples for comparable companies, shareholders’ agreement, discounted present value of future cash flows).
For financial assets at amortized cost ("AC"), the Group considers that the carrying amount of cash, trade receivables and various deposits provide a reasonable approximation of fair value, due to the high liquidity of these elements.
Among financial assets at fair value through profit or loss ("FVR"), with respect to very short-term investments such as deposits, certificates of deposit, commercial paper or negotiable debt securities, the Group considers that the nominal value of the investment and any related accrued interest represent a reasonable approximation of fair value.
The fair value of mutual funds (UCITS) is the latest net asset value.
The fair value of investment securities is the quoted price at year-end for listed securities and, for non-listed securities, uses a valuation technique determined according to the most appropriate financial criteria in each case (comparable transactions, multiples for comparable companies, shareholders’ agreement, discounted present value of future cash flows).
For financial liabilities at amortized cost, the fair value of financial liabilities is determined using:
− the quoted price for listed instruments (a detailed analysis is performed in the case of a material decrease in liquidity to evidence whether the observed price corresponds to the fair value; otherwise the quoted price is adjusted);
− the present value of estimated future cash flows, discounted using rates observed by the Group at the end of the period for other instruments. The results calculated using the internal valuation model are systematically benchmarked with the values provided by Bloomberg.
The Group considers the carrying value of trade payables and deposits received from customers to be a reasonable approximation of fair value, due to the high liquidity of these elements.
The fair value of long-term trade payables is the value of future cash flows discounted at the interest rates observed by the Group at the end of the period.
Financial liabilities at fair value through profit or loss mainly concern firm or contingent commitments to purchase non-controlling interests. Their fair value is measured in accordance with the provisions of the contractual agreements. When the commitment is based on a fixed price, a discounted value is retained.
The fair value of derivatives, mostly traded over-the-counter, is determined using the present value of estimated future cash flows, discounted using the interest rates observed by the Group at the end of the period. The results calculated using the internal valuation model are consistently benchmarked with the values provided by bank counterparties and Bloomberg.
When there are no reliable market data which identify the probability of default, the CVA (Credit Value Adjustment) and the DVA (Debit Value Adjustment) are measured based on historical default charts and CDS (Credit Default Swap) trends. Counterparty credit risk and the Group’s own specific default risk are also continuously monitored based on the monitoring of debt security credit spreads on the secondary market and other market information. Given the implementation of collateralization, and based on counterparty policies and the management of indebtedness and liquidity risk described in Note 14, CVA and DVA estimates are not material compared to the measurement of the related financial instruments.
Note 15 Equity
At December 31, 2020, Orange SA’s share capital, based on the number of issued shares at this date, amounted to 10,640,226,396 euros, divided into 2,660,056,599 ordinary shares with a par value of 4 euros each.
At December 31, 2020, the share capital and voting rights of Orange SA broke down as follows:

Float | State, directly or in concert with Bpifrance Participations | ||
Treasury shares | Employees of the Group under the Group Savings Plan or in registered form |
15.1 Changes in share capital
No new shares were issued during the 2020 year.
15.2 Treasury shares
As authorized by the Shareholders’ Meeting of May 19, 2020, the Board of Directors instituted a new share buyback program (the 2020 Buyback Program) and canceled the 2019 Buyback Program, with immediate effect. This authorization is granted for a period of 18 months as from the aforementioned Shareholders’ Meeting. The 2020 Buyback Program is described in the Orange Universal Registration Document filed with the French Financial Markets Authority (Autorité des marchés financiers - AMF) on April 20, 2020.
During the year, Orange granted the majority of shares to the beneficiaries of the Orange Vision plan. At the same time, share buybacks were carried out by Orange mainly in respect of the free share award plans (Long Term Incentive Plan - LTIP) LTIP 2018-2020, 2019-2021 and 2020-2022 (see Note 7.3).
At December 31, 2020, the Company held 1,265,099 treasury shares (of which 170,000 shares in respect of the liquidity contract and 1,095,099 in respect of the LTIP 2018-2020, 2019-2021 and 2020-2022 free share award plans).
At December 31, 2019, the Company held 9,742,968 treasury shares (of which 853,500 shares in respect of the liquidity contract and 8,889,468 in respect of the Orange Vision 2020 and LTIP 2018-2020 and 2019-2021 free share award plans).
At December 31, 2018, the Company held 7,214,000 treasury shares (of which 309,609 shares in respect of the liquidity contract and 6,882,999 in respect of the Orange Vision 2020 and LTIP 2018-2020 free share award plans) and at December 31, 2017 it held 497,625 treasury shares (of which 476,000 in respect of the liquidity contract).
Accounting policies
Treasury shares are recorded as a deduction from equity, at acquisition cost. Gains and losses arising from the sale of treasury shares are recognized in consolidated reserves, net of tax.
15.3 Dividends
Full Year | Approved by | Description | Dividend per share (in euro) | Payout date | How paid | Total (in millions of euros) |
2020 | Board of Directors Meeting on October 28, 2020 | 2020 interim dividend | 0.40 | December 9, 2020 | Cash | 1,064 |
Shareholders' Meeting on May 19, 2020 | Balance for 2019 | 0.20 | June 4, 2020 | Cash | 532 | |
Total dividends paid in 2020 | 1,595 | |||||
2019 | Board of Directors Meeting on July 24, 2019 | 2019 interim dividend | 0.30 | December 4, 2019 | Cash | 796 |
Shareholders' Meeting on May 21, 2019 | Balance for 2018 | 0.40 | June 6, 2019 | Cash | 1,061 | |
Total dividends paid in 2019 | 1,857 | |||||
2018 | Board of Directors Meeting on July 25, 2018 | 2018 interim dividend | 0.30 | December 6, 2018 | Cash | 796 |
Shareholders' Meeting on May 4, 2018 | Balance for 2017 | 0.40 | June 7, 2018 | Cash | 1,064 | |
Total dividends paid in 2018 | 1,860 | |||||
2017 | Board of Directors Meeting on July 26, 2017 | 2017 interim dividend | 0.25 | December 7, 2017 | Cash | 665 |
Shareholders' Meeting on June 1, 2017 | Balance for 2016 | 0.40 | June 14, 2017 | Cash | 1,064 | |
Total dividends paid in 2017 | 1,729 | |||||
The amount available to provide a return to shareholders in the form of dividends is calculated on the basis of the total net income and retained earnings, under French GAAP, of the entity Orange SA, the Group’s parent company.
15.4 Subordinated notes
Nominal value of subordinated notes
Issues and purchases of subordinated notes are presented below:
Initial issue date | Initial nominal value (in millions of currency) | Initial nominal value (in millions of euros) | Initial currency | Rate | December 31, 2018 (in millions of euros) | Issue Redemption | December 31, 2019 (in millions of euros) | Issue Redemption | December 31, 2020 (in millions of euros) | Residual nominal value (in millions of currency) | |
2/7/2014 | 1,000 | 1,000 | EUR | 4.25% | 1,000 | (1,000) | - | - | - | - | |
2/7/2014 | 1,000 | 1,000 | EUR | 5.25% | 1,000 | - | 1,000 | - | 1,000 | 1,000 | |
2/7/2014 | 650 | 782 | GBP | 5.875% | 782 | - | 782 | (268) | 514 | 427 | |
10/1/2014 | 1,000 | 1,000 | EUR | 4.00% | 1,000 | (500) | 500 | (382) | 118 | 118 | |
10/1/2014 | 1,250 | 1,250 | EUR | 5.00% | 1,250 | - | 1,250 | - | 1,250 | 1,250 | |
10/1/2014 | 600 | 771 | GBP | 5.75% | 771 | - | 771 | (50) | 721 | 561 | |
4/15/2019 | 1,000 | 1,000 | EUR | 2.375% | - | 1,000 | 1,000 | - | 1,000 | 1,000 | |
9/19/2019 | 500 | 500 | EUR | 1.75% | - | 500 | 500 | - | 500 | 500 | |
10/15/2020 | 700 | 700 | EUR | 1.75% | - | - | - | 700 | 700 | 700 | |
Issues and purchases of subordinated notes | 5,803 | 5,803 | 5,803 | ||||||||
− On February 7, 2014, as part of its EMTN program, Orange issued the equivalent of 2.8 billion euros of deeply subordinated notes in three tranches. A revision of interest rates based on market conditions is provided for contractually on each call option exercise date.
Orange has a call option on each of these tranches respectively from February 7, 2020, February 7, 2024, and February 7, 2022 and upon the occurrence of certain contractually-defined events.
Step-up clauses provide for coupon adjustments of 0.25% in 2025 and an additional 0.75% in 2040 for the first tranche, 0.25% in 2024 and an additional 0.75% in 2044 for the second tranche, and 0.25% in 2027 and an additional 0.75% in 2042 for the third tranche.
On October 1, 2014, as part of its EMTN program, Orange issued the equivalent of 3 billion euros of deeply subordinated notes in three tranches. A revision of interest rates based on market conditions is provided for contractually on each call option exercise date.
Orange has a call option on each of these tranches respectively from October 1, 2021, October 1, 2026, and April 1, 2023 and upon the occurrence of certain contractually-defined events.
Step-up clauses provide for coupon adjustments of 0.25% in 2026 and an additional 0.75% in 2041 for the first tranche, 0.25% in 2026 and an additional 0.75% in 2046 for the second tranche, and 0.25% in 2028 and an additional 0.75% in 2043 for the third tranche.
Both issuances were the subject of a prospectus approved by the AMF under visa nos. 14-036 and 14-525.
Under IFRS, these instruments are recognized at their historical value. The tranches denominated in pounds sterling were recognized at the ECB fix rate on the issue date (0.8314 for the issue of February 7, 2014 and 0.7782 for the issue of October 1, 2014) and will not be re-measured through the life of the note.
− On April 15, 2019, as part of its EMTN program, Orange issued the equivalent of 1 billion euros of deeply subordinated notes. A revision of interest rates based on market conditions is provided for contractually on each call option exercise date.
Orange has a call option on this tranche from April 15, 2025 (first date for the revision of the rates of the tranche in question) and upon the occurrence of certain contractually-defined events.
Step-up clauses provide for a coupon adjustment of 0.25% in 2030 and an additional 0.75% in 2045.
On September 19, 2019, as part of its EMTN program, Orange issued the equivalent of 500 million euros of deeply subordinated notes. A revision of interest rates based on market conditions is provided for contractually on each call option exercise date.
Orange has a call option on this tranche from March 19, 2027 (first date for the revision of the rates of the tranche in question), and upon the occurrence of certain contractually-defined events.
Step-up clauses provide for a coupon adjustment of 0.25% in 2032 and an additional 0.75% in 2047.
These issuances were the subject of a prospectus approved by the AMF (under visa nos. 14-036, 14-525, 19-152 and 19-442 respectively).
On December 12, 2019, the Group announced its intention to exercise, on February 7, 2020, in accordance with contractual provisions, its call option concerning the remaining 500 million euros of the tranche with an initial nominal value of 1 billion euros, already partially bought back in April 2019. As a result of Orange’s commitment to buy back this last tranche, it was reclassified as a debt instrument and is therefore presented as a short-term financial liability at December 31, 2019. The coupons due relating to this tranche were recognized in other current liabilities for 21 million euros at December 31, 2020 and were paid in 2020.
− On October 15, 2020, as part of its EMTN program, Orange issued the equivalent of 700 million euros of deeply subordinated notes. A revision of interest rates based on market conditions is provided for contractually from October 15, 2028.
Orange has a call option on this tranche from July 15, 2028 (first date for the revision of the rates of the tranche in question), and upon the occurrence of certain contractually-defined events.
Step-up clauses provide for a coupon adjustment of 0.25% in 2033 and an additional 0.75% in 2048.
This issuance of subordinated notes was the subject of a prospectus approved by the AMF (visa no. 20-509).
All notes, listed on Euronext Paris, are deeply subordinated notes (senior compared to ordinary shares): the holders will only be remunerated (whether for the nominal, interest or any other amount) after all other creditors, including holders of participating loans and securities, simply subordinated or not, representing a claim on Orange.
At each interest payment date, settlement may be either paid or deferred, at the option of the issuer. Deferred coupons are capitalized and become due and payable in full under certain circumstances defined contractually and under the control of Orange.
Gains (losses) on disposal, premiums and issuance costs related to issues/redemptions of subordinated notes are presented under "reserves" in equity.
The Group understands that some rating agencies assign an "equity" component from 0 to 50% to capital instruments.
Subordinated notes remuneration
The remuneration of holders is recorded in equity five working days before the annual payment date, unless Orange exercises its right to defer the payment.
The tax impact relating to the remuneration of subordinated notes is recorded through profit or loss in the period.
Since their issuance, Orange has not exercised its right to defer the coupon payments related to subordinated notes.
The remuneration of subordinated notes is as follows:
2020 | 2019 | 2018 | |||||||||
Initial issue date | Initial nominal value (in millions of currency) | Initial nominal value (in millions of euros) | Initial currency | Rate | (in millions of currency) | (in millions of euros) | (in millions of currency) | (in millions of euros) | (in millions of currency) | (in millions of euros) | |
2/7/2014 | 1,000 | 1,000 | EUR | 4.25% | (21) | (21) | (46) | (46) | (42) | (42) | |
2/7/2014 | 1,000 | 1,000 | EUR | 5.25% | (53) | (53) | (52) | (52) | (52) | (52) | |
2/7/2014 | 650 | 782 | GBP | 5.88% | (47) | (55) | (38) | (44) | (38) | (44) | |
10/1/2014 | 1,000 | 1,000 | EUR | 4.00% | (21) | (21) | (31) | (31) | (40) | (40) | |
10/1/2014 | 1,250 | 1,250 | EUR | 5.00% | (63) | (63) | (63) | (63) | (63) | (63) | |
10/1/2014 | 600 | 771 | GBP | 5.75% | (36) | (39) | (35) | (39) | (35) | (39) | |
4/15/2019 | 1,000 | 1,000 | EUR | 2.38% | (24) | (24) | - | - | - | - | |
9/19/2019 | 500 | 500 | EUR | 1.75% | (4) | (4) | - | - | - | - | |
10/15/2020 | 700 | 700 | EUR | 1.75% | - | - | - | - | - | - | |
Subordinated notes remuneration paid | (279) | (276) | (280) | ||||||||
Coupons on subordinated notes reclassified as short-term borrowings at the end of 2019 and paid in 2020 | 21 | (21) | - | ||||||||
Subordinated notes remuneration classified in equity | (258) | (297) | (280) | ||||||||
The tax effects from the conversion of subordinated notes whose par value is denominated in pounds sterling, and from the gains and losses on disposal, premiums and issuance costs on subordinated notes that have been refinanced, are presented under "other movements" in the consolidated statement of changes in shareholders’ equity and amounted to (2) million euros in 2020, and 51 million euros in 2019 (including 25 million euros related to the conversion).
Accounting policies
Subordinated notes
The Group issued subordinated notes in several tranches.
These instruments have no maturity and the coupon settlement may be deferred at the option of the issuer. They are booked in equity.
As equity instruments are recognized at historical value, the tranche denominated in foreign currency is never re-measured. Where appropriate, a translation adjustment impact is booked in equity when a call option is exercised.
The remuneration of holders is recorded directly in equity at the time of the decision to pay the coupons.
The tax impact related to the remuneration is accounted for through profit or loss, and that related to the remeasurement of the foreign currency portion is accounted for in equity.
Equity component of perpetual bonds redeemable for shares (TDIRAs) (see Note 13.4)
The equity component is determined as the difference between the fair value of the instrument taken as a whole and the fair value of the debt component. The equity component thus determined and recognized at inception is not subsequently re-measured and remains in equity, even when the instrument is extinguished.
15.5 Translation adjustment
(in millions of euros) | 2020 | 2019 | 2018 |
Gain (loss) recognized in other comprehensive income during the period | (414) | 90 | (6) |
Reclassification to net income for the period | 0 | (12) | (1) |
Total translation adjustments | (414) | 78 | (7) |
(in millions of euros) | December 31, 2020 | December 31, 2019 | December 31, 2018 |
Polish zloty | 668 | 807 | 785 |
Egyptian pound | (503) | (455) | (532) |
Slovak koruna | 220 | 220 | 220 |
Leone | (143) | (120) | (95) |
Other | (327) | (123) | (126) |
Total translation adjustments | (85) | 329 | 252 |
o/w share attributable to the owners of the parent company | (256) | 78 | 15 |
o/w share attributable to non-controlling interests | 171 | 251 | 237 |
Accounting policies
The functional currency of foreign operations located outside the euro area is generally the local currency, unless the major cash flows are made with reference to another currency (such as the Orange entities in Romania - euros and in the Democratic Republic of the Congo - US dollars).
The financial statements of foreign operations whose functional currency is neither the euro nor the currency of a hyper-inflationary economy are translated into euros (the Group’s presentation currency) as follows:
− assets and liabilities are translated at the year-end rate;
− items in the income statement are translated at the average rate for the period;
− the translation adjustment resulting from the use of these different rates is included in other comprehensive income.
The translation adjustments are reclassified to profit or loss when the entity disposes or partially disposes (loss of control, loss of joint control, loss of significant influence) of its interest in a foreign operation through the sale, liquidation, repayment of capital or abandon of all, or part of, that activity. The reduction in the carrying value of a foreign operation, either because of its own losses or because of the recognition of an impairment loss, does not lead to a reclassification through profit or loss of the accumulated translation adjustments.
Recycling of translation adjustments is presented in profit or loss within:
− consolidated net income of discontinued operations, when a line of business or major geographical area is disposed of;
− gains (losses) on disposal of fixed assets, investments and activities, when other businesses are disposed of;
− reclassification of translation adjustment from liquidated entities, in the event of the liquidation or abandonment of an activity without disposal.
15.6 Non-controlling interests
The data presented below concern all entities of the following groups:
(in millions of euros) | 2020 | 2019(1) | 2018 |
Credit part of net income attributable to non-controlling interests (a) | 297 | 290 | 271 |
o/w Sonatel | 197 | 191 | 188 |
o/w Orange Belgium | 26 | 16 | 15 |
o/w Côte d'Ivoire | 43 | 36 | 25 |
o/w Jordan Telecom | 11 | 12 | 12 |
o/w Orange Polska | - | 11 | - |
Debit part of net income attributable to non-controlling interests (b) | (63) | (71) | (67) |
o/w Orange Bank | (51) | (65) | (59) |
o/w Orange Polska | (3) | - | (2) |
Total part of net income attributable to non-controlling interests (a) + (b) | 233 | 218 | 204 |
Credit part of comprehensive income attributable to non-controlling interests (a) | 256 | 299 | 297 |
o/w Sonatel | 176 | 181 | 195 |
o/w Orange Belgium | 25 | 16 | 15 |
o/w Côte d'Ivoire | 39 | 36 | 26 |
o/w Jordan Telecom | - | 15 | 20 |
o/w Orange Polska | - | 12 | - |
Debit part of comprehensive income attributable to non-controlling interests (b) | (98) | (69) | (84) |
o/w Orange Bank | (50) | (62) | (62) |
o/w Orange Polska | (35) | - | (17) |
o/w Jordan Telecom | (3) | - | - |
Total part of comprehensive income attributable to non-controlling interests (a) + (b) | 158 | 230 | 213 |
(1) 2019 figures have been restated of the IFRS IC decision on lease term (see Note 2.3.1).
(in millions of euros) | 2020 | 2019 | 2018 |
Dividends paid to minority shareholders | 225 | 248 | 246 |
o/w Sonatel | 165 | 192 | 190 |
o/w Médi Telecom | 24 | 22 | 20 |
o/w Orange Belgium | 14 | 14 | 14 |
o/w Jordan Telecom | 9 | 13 | 14 |
(in millions of euros) | December 31, 2020 | December 31, 2019(1) | December 31, 2018 |
Credit part of equity attributable to non-controlling interests (a) | 2,653 | 2,700 | 2,594 |
o/w Orange Polska | 953 | 986 | 973 |
o/w Sonatel | 755 | 736 | 744 |
o/w Orange Belgium | 285 | 275 | 273 |
o/w Jordan Telecom | 154 | 166 | 164 |
o/w Médi Telecom | 127 | 148 | 153 |
Debit part of equity attributable to non-controlling interests (b) | (10) | (13) | (14) |
Total equity attributable to non-controlling interests (a) + (b) | 2,643 | 2,687 | 2,580 |
(1) 2019 figures have been restated of the IFRS IC decision on lease term (see Note 2.3.1).
Accounting policies
Commitments to purchase non-controlling interests (put options)
When the Group grants firm or contingent commitments to purchase holdings from non-controlling shareholders, the carrying value of the non-controlling interests is reclassified to financial debt.
When the amount of the commitment exceeds the amount of the non-controlling interests, the difference is recorded as a reduction in equity attributable to the owners of the parent company. Financial debt is re-measured at each reporting period end in accordance with the contractual arrangements (at fair value or at present value if fixed price) and, in the absence of any guidance provided by IFRS, with a counterparty in net finance costs.
Non-controlling interests that are debtors
Total comprehensive income of a subsidiary is attributed to the owners of the parent company and to the non-controlling interests. In accordance with IFRS 10, this can result in the non-controlling interests having a deficit balance.
Transactions with owners
Each transaction with minority shareholders of an entity controlled by the Group, when not resulting in a loss of control, is accounted for as an equity transaction with no effect on consolidated comprehensive income.
15.7 Earnings per share
Net income
Net income, Group share, used for calculating basic and diluted earnings per share is determined according to the following method:
(in millions of euros) | 2020 | 2019 | 2018 | |
Net income - basic | 4,822 | 3,004 | 1,954 | |
Effect of subordinated notes | (255) | (268) | (293) | |
Net income attributable to the owners of the parent company - basic (adjusted) | 4,567 | 2,736 | 1,661 | |
Impact of dilutive instruments: | ||||
TDIRA | 9 | 12 | - | |
Net income attributable to the owners of the parent company - diluted | 4,577 | 2,747 | 1,661 | |
Number of shares
The weighted average number of shares used for calculating the basic and diluted earnings per share is presented below:
(number of shares) | 2020 | 2019 | 2018 |
Weighted average number of ordinary shares outstanding | 2,656,122,534 | 2,652,532,564 | 2,656,683,856 |
Impact of dilutive instruments on number of ordinary shares: | |||
TDIRA | 26,945,386 | 33,780,544 | - |
Free share award plan (LTIP) | 720,936 | 1,662,103 | 1,419,415 |
Weighted average number of shares outstanding - diluted | 2,683,788,856 | 2,687,975,211 | 2,658,103,271 |
The average market price of the Orange share in 2020 was higher than the fair value adopted under the LTIP 2019-2021 and 2020-2022 free share award plans (see Note 7.3). The number of shares corresponding to this difference is dilutive at December 31, 2020.
The average market price of the Orange share in 2019 and 2018 was higher than the fair value adopted under the Orange Vision 2020, LTIP 2018-2020 and 2019-2021 free share award plans (see Note 7.3). The number of shares corresponding to this difference was dilutive at December 31, 2019 and December 31, 2018.
The TDIRAs were included in the calculation of diluted net earnings per share at December 31, 2020 and Decemer 31, 2019, since they are dilutive.
Earnings per share
(in euros) | 2020 | 2019 | 2018 |
Earning per share - basic | 1.72 | 1.03 | 0.63 |
Earning per share diluted | 1.71 | 1.02 | 0.62 |
Accounting policies
Earnings per share
The Group discloses both basic earnings per share and diluted earnings per share for continuing operations and discontinued operations:
− basic earnings per share are calculated by dividing net income for the year attributable to the equity holders of the Group, after deduction of the remuneration net of the tax to holders of subordinated notes, by the weighted average number of ordinary shares outstanding during the period;
− diluted earnings per share are calculated based on the same net income, adjusted for the finance cost of dilutive debt instruments, net of the related tax effect. The number of shares used to calculate diluted earnings per share takes into account the conversion into ordinary shares of potentially dilutive instruments outstanding during the period. These instruments are considered to be dilutive when they have the effect of reducing earnings per share of continuing operations.
When basic earnings per share are negative, diluted earnings per share are identical to basic earnings per share. In the event of a capital increase at a price lower than the market price, and in order to ensure comparability of the reporting periods shown, the weighted average numbers of shares outstanding in current and previous periods are adjusted. Treasury shares owned, which are deducted from the consolidated equity, do not enter into the calculation of earnings per share.
Note 16 Unrecognized contractual commitments (telecom activities)
At December 31, 2020, Orange is not aware of having entered into any commitment involving entities controlled by the Group that may have a material effect on its current or future financial position, other than the commitments described in this note.
16.1 Operating activities commitments
(in millions of euros) | Total | Less than one year | From one to five years | More than five years |
Operating activities commitments | 13,720 | 4,007 | 4,695 | 5,018 |
Operating leases commitments | 489 | 66 | 191 | 233 |
Handsets purchase commitments | 568 | 557 | 9 | 2 |
Transmission capacity purchase commitments | 1,767 | 202 | 522 | 1,043 |
Other goods and services purchase commitments | 3,240 | 928 | 1,428 | 884 |
Investment commitments | 1,739 | 498 | 820 | 422 |
Public initiative networks commitments | 4,423 | 1,160 | 1,424 | 1,839 |
Guarantees granted to third parties in the ordinary course of business | 1,493 | 596 | 302 | 595 |
Lease commitments
Lease commitments include real estate leases relating to contracts for which the underlying asset will be available after December 31, 2020 and leases for which the Group applies the exemptions allowed by IFRS 16 (see Note 10).
(in millions of euros) | Minimum future lease payments |
Property lease commitments | 459 |
o/w technical activities | 21 |
o/w shops/offices activities | 438 |
Maturities are set forth below:
(in millions of euros) | Minimum future lease payments | Less than one year | 1-2 years | 2-3 years | 3-4 years | 4-5 years | More than five years |
Property lease commitments | 459 | 52 | 47 | 44 | 43 | 41 | 232 |
The lease commitments correspond to the outstanding minimum future lease payments until the normal date of renewal of the leases or the earliest possible termination date.
Real estate lease commitments in France represent 90% of all real estate lease commitments.
Transmission capacity purchase commitments
Transmission capacity purchase commitments as at December 31, 2020 represented 1,767 million euros. They included 408 million euros for the provision of satellite transmission capacity (the term of these commitments extends until 2029 depending on the contracts) as well as an agreement on the use of an FTTH network in Spain in the amount of 915 million euros.
Other goods and services purchase commitments
The Group’s other goods and services purchase commitments mainly relate to network maintenance and management, as well as the acquisition of content.
At December 31, 2020, these commitments include:
− the purchase of broadcasting rights for an amount of 670 million euros;
− site management service contracts ("TowerCos") signed in Africa: the amount of these commitments represents 365 million euros;
− the network maintenance for 298 million euros;
− energy purchase commitments for 279 million euros;
− hosting services for active equipment for mobile sites under a "Built-to-suit" agreement for 248 million euros;
− the maintenance of submarine cables for which Orange has joint ownership or user rights, for an overall amount of 197 million euros;
− commitments to partners in the field of sports for a total amount of 153 million euros.
Investment commitments
At the end of December 2020, investment commitments amounted to 1,739 million euros.
In addition to these commitments, which are expressed in monetary terms, the Group made certain commitments to the national regulatory authorities such as ensuring certain coverage of the population concerning by fixed or mobile networks, particularly in the context of assignment of licenses and quality of service. These commitments will require investment expenditure in future years to roll out and enhance the networks. They are not shown in the table above if they have not been expressed in monetary terms, which is usually the case. The Group has accordingly agreed to meet the following conditions:
In France:
− the obligations included in the authorization to use 5G frequencies in the 3.4-3.8 GHz band issued to Orange on November 12, 2020 are as follows:
- the rollout of sites (3,000 sites by the end of 2022, 8,000 sites by the end of 2024 and 10,500 sites by the end of 2025), of which 25% must be located in rural areas or industrial areas outside of very densely populated areas;
- widespread availability of a 5G service at all sites by the end of 2030, an obligation that may be met either with the 3.4-3.8 GHz band or another band;
- the provision of a speed of at least 240 Mbps per sector from 75% of sites by the end of 2022, 85% of sites by the end of 2024, 90% of sites by the end of 2025, and 100% of sites by the end of 2030;
- coverage of the main highways by the end of 2025, major roads by the end of 2027;
- the provision of differentiated services and activation of the IPv6 network protocol (Internet Protocol version 6).
In addition, the commitments made by Orange to participate in the first stage of the procedure and which made it possible to obtain 50 MHz at a reserve price became obligations in the authorization issued:
- from the end of 2023, Orange will have to provide a fixed offer from sites using the 3.5 GHz band and a fixed offer to cover the premises that benefit from fixed-access radio network services;
- Orange will have to meet reasonable requests for the provision of services from private sector companies and public sector structures, provide indoor coverage, offer hosting for mobile virtual network operators (MVNOs) and be transparent about network failures and planned rollouts.
− pursuant to the provisions of Article L.33-13 of the French Postal & Electronic Communications Code regarding coverage in lightly inhabited areas:
- Orange proposed that it commit to ensuring that, within its FTTH deployment scope in the AMII area, unless refused by third parties, that 100% of homes and professional premises would have access to FTTH sales offers by the end of 2020 (including a maximum 8% of premises connectable on demand) and that 100% of homes and professional premises would be made connectable by the end of 2022. Subsequent to the Arcep opinion, these proposals were accepted by the government in July 2018;
- Outside of the AMII area, Orange proposed that it make deployment commitments within the AMEL area the Vienne, Haute-Vienne, Deux-Sèvres and Lot-et-Garonne departments;
- Lastly, Orange proposed to make commitments outside of the AMII and AMEL areas in the following departments: Orne, Hautes-Pyrénées, Yvelines, Territoire-de-Belfort, Guadeloupe and Martinique.
− on January 14, 2018, the Orange Group and the other French mobile operators signed an agreement (the "New Deal") to ensure better mobile coverage of French territory, particularly rural areas. This agreement includes enhanced coverage obligations, which are included for the period 2018-2021 in our licenses in force in the bands 900 MHz, 1,800 MHz and 2,100 MHz, and for the post 2021 period, in the new licenses for 900 MHz, 1,800 MHz and 2,100 MHz awarded on November 15, 2018:
- targeted programs for the improvement of coverage, with the coverage of 5,000 areas by operators by 2029;
- the generalization of 4G by the end of 2020 on almost all existing mobile sites;
- the acceleration of the coverage of the transport routes, ensuring that the main road and rail routes have 4G coverage;
- the supply of a fixed 4G service and the extension of the service to 500 additional sites upon request from the government by 2020;
- the widespread use of telephone coverage inside buildings, proposing voice over Wi-Fi and SMS over Wi-Fi offers and offers involving the indoor coverage of buildings upon request;
- the improvement of reception quality throughout the country, particularly in rural areas, with good coverage (according to the Arcep decision No. 2016-1678 relative to publications giving information on mobile coverage) by 2024/2027.
− in 2015, in France, when the frequencies in the 700 MHz band were allocated:
- coverage obligations in "priority deployment areas" (40% of the country within 5 years, 92% within 12 years and 97.7% within 15 years) and in "white area" not yet covered by a broadband network (100% within 12 years), at the level of priority road routes (100% within 15 years) and at the level of the national rail network (60% within 7 years, 80% within 12 years and 90% within 15 years).
− in 2011, in France, when the frequencies in the 2.6 GHz and 800 MHz bands were allocated:
- an optional commitment to host mobile virtual network operators (MVNOs) on certain technical and pricing terms under Full MVNO schemes;
- an obligation to provide mobile coverage with theoretical maximum download speeds of at least 60 Mbps per user (25% of the country within 4 years and 75% within 12 years for the 2.6 GHz band, 98% of the country within 12 years and 99.6% within 15 years for the 800 MHz band) which can be met by using both the allocated frequencies and other frequencies;
- for the 800 MHz band, specifically: a coverage obligation in priority areas (40% of the country within 5 years, 90% within 10 years) with no obligation to provide roaming services, a coverage obligation in each department (90% within 12 years, 95% within 15 years) and an obligation to pool resources in communities covered by the "white area" program.
In Europe:
− when a 5G license in the 700 MHz band was awarded in Slovakia in 2020:
- an obligation to provide 5G services using a new radio access network within two years of the award;
- an obligation to cover 95% of the population of the regional capitals by the end of 2025, 90% of the population outside the regional capitals and 70% of the total population by the end of 2027.
In Africa & Middle-East:
− in 2016, in Senegal, when the 4G license was awarded and the license for mobile 2G and 3G was renewed:
- a coverage obligation of 90% of the population in 3 years;
- an obligation to cover in 5 years all territory in the inhabited border areas of Senegal whose number of inhabitants is equal to or greater than 200;
- a coverage obligation on national roads and highways in 2 years.
− in 2016, in Egypt, when the 4G license was granted, an obligation to provide 4G coverage of 11% of the population in one year, 42.5% in four years, 69.5% in six years and 70% within ten years.
− in 2020, in Burkina Faso, when the 4G license was granted and the 2G and 3G licenses renewed, an obligation to cover 60 new localities over eight years and roads over six years.
Non-compliance with these obligations could result in fines and other sanctions ultimately including the withdrawal of licenses awarded. Management believes that the Group has the ability to fulfill these commitments towards government authorities.
Commitments related to Public Initiative Networks
As part of the deployment of the High and Very High Speed network in France, the Group entered into contracts via Public Initiative Networks (mainly public service delegation and public-private partnerships contracts as well as public design, construction, operation and maintenance contracts). The commitments relating to these network construction, concession and operation contracts amounted to 4,423 million euros at December 31, 2020. In addition to the guarantees given by Orange on behalf of the Public Initiative Networks, the commitments will result in the recognition of 1,448 million euros of intangible assets, 2,420 million euros of expenses and 555 million euros of financial receivables. Maturities are staggered to 2043.
Guarantees granted to third parties in the ordinary course of business
Commitments made by the Group to third parties in the ordinary course of business represented 1,493 million euros at December 31, 2020. They include performance guarantees granted to some of its Enterprise customers, in particular in the context of network security and remote access, and also include 350 million euros in respect of the guarantee granted by the Group to the ARCEP corresponding to the reserve price of a 5G frequency block as part of the auction process in 2020.
The amount of guarantees granted by the Group to third parties (financial institutions, partners, customers and government agencies) to cover the performance of the contractual obligations of non-consolidated entities is not significant. Guarantees granted by the Group to cover the performance of the contractual obligations of the consolidated subsidiaries are not considered as unrecognized contractual commitments, as they would not increase the Group’s commitments in comparison to the underlying obligations of the consolidated subsidiaries.
16.2 Consolidation scope commitments
Asset and liability warranties granted in relation to disposals
Under the terms of agreements between certain Group companies and the acquirers of certain assets, the Group is subject to warranty clauses relating to assets and liabilities. Nearly all material sale agreements provide for ceilings on these warranties.
At December 31, 2020, the main warranties in effect were the following:
− the uncapped warranties granted to the EE joint venture when contributing the operations in the United Kingdom, concerning the restructuring of equity investments and assets done prior to the contribution expiring in 2022;
− a warranty given to BT as part of the EE sale, backed 50/50 by Orange Group and Deutsche Telekom as tax and operating warranties, except for events ascribable solely to one or the other, and capped at the contractually set disposal price of 5.1 billion pounds sterling (5,7 billion euros converted at the exchange rate at December 31, 2020) for Orange’s share, which will expire in 2023;
− standard uncapped warranties granted to Vivendi as part of the disposal of Dailymotion in 2015 (of which 90% took place in 2015 and the remaining 10% in 2017). These warranties will expire at the end of the statutory limitation period;
− miscellaneous standard warranties granted to buyers of real estate sold by the Group.
Orange believes that the risk of these warranties being enforced is remote and that the potential consequences of their being called are not material with respect to the Group’s results and financial position.
Commitments relating to securities
Under the terms of agreements with third parties, Orange can make or receive commitments to purchase or to sell securities. The on-going commitments at December 31, 2020 are not likely to have material impacts on the Group’s financial position.
Orange Tunisie
Under the terms of the shareholders’ agreement with Investec dated May 20, 2009, Orange has a call option giving it the right to purchase at market value 1% of the share capital of Orange Tunisie plus one share, subject to regulatory authorizations. If this option were to be exercised, Orange would take control of Orange Tunisie. Investec would then have the right to sell to Orange 15% of the share capital of Orange Tunisie at market value.
16.3 Financing commitments
The Group’s main commitments related to borrowings are set out in Note 14.
Orange has pledged (or given as guarantees) certain investment securities and other assets to financial institutions or used them as collateral to cover bank loans and credit facilities.
Guarantees granted to some lending institutions to finance consolidated subsidiaries are not set out below.
Assets covered by commitments
The items presented below do not include the impact of the regulation on the transferability of the assets or the possibility of contractual restrictions in network asset sharing agreements.
As of December 31, 2020 Orange has no material pledge on its subsidiaries’ securities.
(in millions of euros) | December 31, 2020 | December 31, 2019 | December 31, 2018 |
Assets held under finance leases | 716 | 636 | 574 |
Non-current pledged, mortgaged or receivership assets (1) | 20 | 366 | 453 |
Collateralized current assets | 2 | 2 | 21 |
Total | 739 | 1,004 | 1,048 |
(1) Non-current pledged, mortgaged or receivership assets are shown excluding cash collateral deposits, which are presented in Note 13.7.
Non-current pledged or mortgaged assets comprise the following assets given as guarantees:
December 31, 2020 | Total in statement of financial position (a) | Amount of asset pledged, mortgaged or receivership (b) | Percentage (b)/(a) |
(in millions of euros) | |||
Intangibles assets, net (excluding goodwill) | 15,042 | 18 | 0% |
Property, plant and equipment, net | 29,069 | 1 | 0% |
Non-current financial assets | 1,516 | - | - |
Other (1) | 35,627 | - | - |
Total | 81,255 | 20 | 0% |
(1) This item mainly includes net goodwill, interests in associates, net deferred tax assets, non-current derivatives assets and rights of use.
Note 17 Mobile Financial Services activities
17.1 Financial assets and liabilities of Mobile Financial Services
The financial statements of Mobile Financial Services activities were put into the format of Orange group's consolidated financial statements and therefore differ from a presentation that complies with the banking format.
In order to improve the readiness of financial statements and to be able to distinguish the performance of telecom activities from the performance of Mobile Financial Services, the notes related to financial assets and liabilities as well as financial income or expenses are split to respect these two business areas.
Note 13 presents the financial assets, liabilities and related gains and losses specific to telecom activities and Note 17 concerns the activities of Mobile Financial Services with regard to its assets and liabilities, with net financial income being not material.
The following table reconciles the contributive balances of assets and liabilities for each of these two areas (intra-group transactions between telecom activities and Mobile Financial Services activities are not eliminated) with the consolidated statement of financial position as of December 31, 2020.
(in millions of euros) | Orange consolidated financial statements | O/w telecom activities | Note | O/w Mobile Financial Services | Note | O/w eliminations telecom activities / mobile financial services |
Non-current financial assets related to Mobile Financial Services activities | 1,210 | - | 1,210 | 17.1.1 | - | |
Non-current financial assets | 1,516 | 1,544 | 13.7 | - | (27) (1) | |
Non-current derivatives assets | 132 | 132 | 13.8 | - | 17.1.3 | - |
Current financial assets related to Mobile Financial Services activities | 2,075 | - | 2,077 | 17.1.1 | (2) | |
Current financial assets | 3,259 | 3,259 | 13.7 | - | - | |
Current derivatives assets | 162 | 162 | 13.8 | - | 17.1.3 | - |
Cash and cash equivalents | 8,145 | 7,891 | 14.3 | 254 | - | |
Non-current financial liabilities related to Mobile Financial Services activities | - | - | 27 | 17.1.2 | (27) (1) | |
Non-current financial liabilities | 30,089 | 30,089 | 13.3 | - | - | |
Non-current derivatives liabilities | 844 | 769 | 13.8 | 75 | 17.1.3 | - |
Current financial liabilities related to Mobile Financial Services activities | 3,128 | - | 3,128 | 17.1.2 | - | |
Current financial liabilities | 5,170 | 5,172 | 13.3 | - | (2) | |
Current derivatives liabilities | 35 | 35 | 13.8 | - | 17.1.3 | - |
(1) Loan granted by Orange SA to Orange Bank.
The Mobile Financial Services segment includes Orange Bank and other entities. As the contribution of other entities to the statement of financial position of the Mobile Financial Services segment and a fortiori of the Group was not material, only Orange Bank data is presented in detail below.
Accounting policies
Since the concept of current or non-current is non-existent in bank accounting, financial assets and liabilities related to loans and borrowings to customers or credit institutions (the ordinary activities of a bank) are classified as current for all periods presented.
With regard to other financial assets and liabilities, classification as current and non-current has been made in light of both the original intention of management and the nature of the assets and liabilities in question. For instance, with regard to Orange Bank’s other financial assets, since investments are managed by portfolio, only the transaction portfolios (financial assets at fair value through profit or loss) have been recognized in current financial assets.
17.1.1 Financial assets related to Orange Bank transactions (excluding derivatives)
The financial assets in connection with the transactions of Orange Bank break down as follows:
(in millions of euros) | December 31, 2020 | December 31, 2019 | December 31, 2018 | ||
Non-current | Current | Total | Total | Total | |
Financial assets at fair value through other comprehensive income that will not be reclassified to profit or loss | 2 | - | 2 | 2 | 1 |
Investments securities | 2 | - | 2 | 2 | 1 |
Financial assets at fair value through other comprehensive income that may be reclassified to profit or loss | 538 | 3 | 540 | 656 | 925 |
Debt securities | 538 | 3 | 540 | 656 | 925 |
Financial assets at fair value through profit or loss | 94 | - | 94 | 179 | 152 |
Investments at fair value | - | - | - | 79 | 72 |
Cash collateral paid | 74 | - | 74 | 76 | 57 |
Other | 20 | - | 20 | 25 | 23 |
Financial assets at amortized cost | 577 | 2,074 | 2,651 | 3,519 | 3,614 |
Fixed-income securities | 577 | 2 | 579 | 506 | 614 |
Loans and receivables to customers | - | 2,000 | 2,000 | 1,937 | 2,000 |
Loans and receivables to credit institutions | - | 70 | 70 | 1,073 | 1,000 |
Other | - | 2 | 2 | 3 | - |
Total financial assets related to Orange Bank activities | 1,210 | 2,077 | 3,288 | 4,357 | 4,692 |
Debt securities at fair value through other comprehensive income that may be reclassified subsequently to profit or loss
(in millions of euros) | 2020 | 2019 | 2018 |
Debt securities measured at fair value through other comprehensive income that may be reclassified to profit or loss - in the opening balance | 656 | 925 | 786 |
Acquisitions | 386 | 165 | 487 |
Repayments and disposals | (500) | (442) | (333) |
Changes in fair value | 1 | 9 | (8) |
Other items | (3) | (1) | (7) |
Debt securities measured at fair value through other comprehensive income that may be reclassified to profit or loss - in the closing balance | 540 | 656 | 925 |
(in millions of euros) | 2020 | 2019 | 2018 |
Profit (loss) recognized in other comprehensive income during the period | 1 | 8 | (8) |
Reclassification in net income during the period | 0 | 1 | - |
Other comprehensive income related to Orange Bank | 1 | 9 | (8) |
Loans and receivables of Orange Bank
Loans and receivables of Orange Bank are composed of loans and receivables to customers and credit institutions.
In the context of adapting the bank’s accounts into the Group’s financial statements, the following have been considered as loans and advances to customers: clearing accounts and other amounts due, as well as amounts related to securities transactions on behalf of customers.
(in millions of euros) | December 31, 2020 | December 31, 2019 | December 31, 2018 |
Overdrafts | 802 | 869 | 910 |
Housing loans | 869 | 876 | 824 |
Investment loans | 129 | 163 | 206 |
Installment receivables (1) | 183 | - | - |
Current accounts | 10 | 17 | 21 |
Other | 7 | 12 | 39 |
Total loans and receivables to customers | 2,000(2) | 1,937 | 2,000 |
Overnight deposits and loans | - | 945 | 850 |
Loans and receivables | 52 | 85 | 85 |
Other | 18 | 43 | 65 |
Total loans and receivables to credit institutions | 70 | 1,073 | 1,000 |
(1) Purchase of Orange Spain receivables.
(2) At December 31, 2020, Orange Bank is engaged in a self-subscribed securitization program of a portfolio of French personal loans for approximately 600 million euros.
Accounting policies
Financial assets
− Financial assets at fair value through profit or loss (FVR)
Certain investment securities which are not consolidated or equity-accounted, and cash investments such as negotiable debt securities, deposits and mutual funds (UCITS), that are compliant with the Group’s risk management policy or investment strategy, may be designated by Orange Bank as being recognized at fair value through profit or loss. These assets are recognized at fair value at inception and subsequently. All changes in fair value are recorded in profit or loss.
− Financial assets at fair value through other comprehensive income that may not be reclassified to profit or loss (FVOCI)
Investment securities which are not consolidated or equity-accounted are, subject to exceptions, recognized as assets at fair value through other comprehensive income that may not be reclassified to profit or loss. They are recognized at fair value at inception and subsequently. Temporary changes in value and gains (losses) on disposals are recorded in other comprehensive income that may not be reclassified to profit or loss.
− Financial assets at fair value through other comprehensive income that are or may be reclassified subsequently to profit or loss (FVOCIR)
Assets at fair value through other comprehensive income that are or may be reclassified subsequently to profit or loss mainly include investments in debt securities. They are recognized at fair value at inception and subsequently. Temporary changes in value are recorded in other comprehensive income that are or may be reclassified subsequently to profit or loss. In case of disposal, the cumulative profit (or loss) recognized in other comprehensive income is reclassified to profit or loss.
− Financial assets at amortized cost (AC)
This category primarily comprises miscellaneous loans and receivables as well as fixed-income securities held with the aim of collecting contractual flows. These instruments are recognized at fair value at inception and are subsequently measured at amortized cost using the effective interest method. Impairment and provisions are recorded as soon as loans are granted or commitments are concluded, without waiting for the appearance of an objective indication of impairment. Impairment and provisions are updated as the credit risk evolves (see below "Impairment of financial assets").
Impairment of financial assets
In accordance with IFRS 9, debt instruments classified as financial assets at amortized cost or as financial assets at fair value through other comprehensive income, rental receivables, financing commitments and financial guarantees given are systematically subject to impairment or a provision for expected credit loss. These impairments and provisions are recorded as soon as loans are granted, commitments are concluded or bond securities are acquired, without waiting for the appearance of an objective indication of impairment.
To do this, the financial assets concerned are split into three categories according to the change in credit risk observed since their initial recognition and a depreciation is recorded on the amount outstanding of each of these categories as follows:
− performing loans: the calculation of losses expected is made on a 12-months basis, and the financial income (interest) is calculated on the basis of the instrument’s gross amount;
− impaired loans: if the credit risk has significantly worsened since the debt has been booked to the balance sheet, the expected losses, estimated over the duration of the loan, are recognized and the financial income (interest) is calculated based on the gross amount of the instrument;
− doubtful loans: the expected loss, estimated over the duration of the loan, is depreciated. The financial income is calculated on the basis of the amount of the instrument net of the depreciation.
17.1.2 Financial liabilities related to Orange Bank transactions (excluding derivatives)
(in millions of euros) | December 31, 2020 | December 31, 2019 | December 31, 2018 |
Payables to customers | 1,883(1) | 3,357 | 3,396 |
Debts with financial institutions | 885 | 448 | 1,103 |
Deposit certificate | 358 | 475 | 335 |
Other | 30 | 28 | 28 |
Total Financial liabilities related to Orange Bank activities(2) | 3,155 | 4,307 | 4,862 |
(1) The decrease on payables to customers is mainly due to the discontinuation of Groupama group companies’ account-holding activities.
(2) Including 28 million euros of non-current financial liabilities in 2020, 2019 and 2018.
Debts related to Orange Bank transactions are composed of customer deposits and bank debts with financial institutions.
(in millions of euros) | December 31, 2020 | December 31, 2019 | December 31, 2018 |
Current accounts | 949 | 2,546 | 2,538 |
Passbooks and special savings accounts | 908 | 781 | 776 |
Other | 26 | 30 | 82 |
Total payables to customers | 1,883 | 3,357 | 3,396 |
Term borrowings and advances | 615 | 448 | 467 |
Securities delivered under repurchase agreements | 270 | - | 636 |
Total debts with financial institutions | 885 | 448 | 1,103 |
17.1.3 Derivatives of Orange Bank
Derivatives qualified as fair value hedges
The main unmatured fair value hedges at the end of 2020 and set up by Orange Bank concern the following interest rate swaps:
− 502 million euros in notional value (of which 14 million euros maturing in 2021, 14 million euros maturing between one and five years and 474 million euros at more than five years), macro-hedging a portion of the real estate loan portfolio. The fair value of these derivatives at December 31, 2020 was (16) million euros;
− 210 million euros in notional value hedging a portfolio of French inflation-indexed fungible Treasury bonds (Obligations Assimilables du Trésor indexées sur l’inflation française - OATi) of the same amount and maturity, i.e. 2023. The fair value of these swaps at December 31, 2020 was (47) million euros;
− 182 million euros in notional value (of which 32 million euros maturing in 2021, 50 million euros maturing between one and two years and 100 million euros at more than five years), hedging a portfolio of French fungible Treasury bonds (Obligations Assimilables du Trésor - OAT) of the same amount and maturity. The fair value of these swaps at December 31, 2020 was (6) million euros;
− 20 million euros in notional value hedging a portfolio of OATi of the same amount and maturity, i.e. 2030. The fair value of these swaps at December 31, 2020 was (5) million euros;
− 5 million euros in notional value hedging a portfolio of securities maturing in 2028 whose fair value at December 31, 2020 was (1) million euros.
The ineffective portion of these hedges recognized in profit or loss in 2020 was not material.
Cash flow hedge derivatives
At January 1, 2020, Orange Bank had documented a micro-hedge of its issues with interest rate swaps which, at the end of 2020, represented:
− 242 million euros in notional value (of which 94 million euros maturing in 2021 and 148 million euros maturing between one and two years) hedging negotiable debt securities issued by the bank, the fair value of which at December 31, 2020 was almost zero.
Trading Derivatives
− Orange Bank has set up interest rate swaps as economic hedges (not designated as hedges under IFRS) of EIB securities for a total notional amount of 10 million euros maturing in 2029, the fair value of which was (1) million euros at December 31, 2020. The net effects of this hedging strategy on the income statement are not material;
− Orange Bank has a portfolio of trading swaps with a total notional value of 28 million euros (of which 18 million euros maturing between two and five years and 10 million euros at more than five years) and a total fair value at December 31, 2020 of (1) million euros. The net effects of this hedging strategy on the income statement are not material;
− Orange Bank has set up interest rate futures with a notional amount of 202 million euros. The notional amount of these derivatives gives only an indication of the volume of outstanding contracts on the financial instruments markets and does not reflect the market risks associated with such instruments or the nominal value of the hedged instruments. The net effects of this hedging strategy on profit or loss are not material.
17.2 Information on market risk management with respect to Orange Bank activities
Orange Bank has its own risk management system in accordance with banking regulations. In terms of banking regulation, Orange Bank is under the supervision of the French Prudential Supervision and Resolution Authority (Autorité de contrôle prudentiel et de résolution - ACPR) and must at all times comply with capital requirements in order to withstand the risks associated with its activities.
Orange Bank’s activities expose it to all of the risks defined by the ordinance of November 3, 2014, relating to the internal control of companies in the banking, payment services and investment services sector subject to the control of the ACPR:
− credit risk: risk of loss incurred in the event of the default of a counterparty or counterparties considered as the same beneficiary;
− market risk: risk of loss due to movements in market prices;
− operational risk: risk resulting from an inadequacy or a failure due to procedures, staff, IT systems or to outside events, including events that are unlikely to occur but that would imply a risk of material loss. Operational risk includes risks of internal and external fraud;
− interest rate risk: risk incurred in the event of changes in interest rates impacting on-balance sheet and off-balance sheet transactions, excluding, where applicable, transactions exposed to market risks;
− liquidity risk: risk that the company would not be able to meet its commitments or not be able to unwind or offset a position due to the market situation;
− inter-mediation risk on investment service providers: risk of default by a customer or counterparty in the context of a financial instrument transaction in which the company provides a performance guarantee.
The size of the bank and its moderate risk profile led to the choice of standard methods regarding the application of Regulation No. 575/2013 of the European Parliament and of the Council on June 26, 2013.
Orange Bank does not intervene on complex products. For market operations, the strategy defines, on one hand, the limits implemented and controlled and, on the other hand, the quality of the authorized signatories. In addition, the Bank has defined and regularly tests its business continuity system. The Bank has also undertaken, as comprehensively as possible, the identification and assessment of its operational risks, for which it also monitors occurrences.
In line with regulations, and in particular Titles IV and V of the Ordinance of November 3, 2014, the bank’s Executive Committee, upon recommendation of the Risk Management Department, sets the institution’s risk policy, in particular regarding selection of customers and risks, modalities and rules for granting loans, and delegations of authority.
The Risk Management Department analyzes and monitors risks, carries out the necessary controls and produces reports for various committees: the Credit Committee (management of counterparty risk), Risks and Audit Committee (management of operational risks), ALM Committee (management of market, interest rate and liquidity risks) and the Executive Committee.
17.2.1 Market risk management
Orange Bank does not carry out trading operations on its own behalf, its market activity only concerns investments to optimize liquidity management and purchases mainly of interest rate hedges.
Since the start of the health crisis, Orange Bank has noted an increase in credit risk for all counterparties issuing on the financial markets.
The rise in expected and unexpected loss during the health crisis has increased the average probability of default of the securities portfolio. To ensure the quality of the investments held by the bank, a stress test was carried out on the portfolio and the results showed good resistance to the various simulated shocks. Nevertheless, as a precautionary measure, the investment rules have been reviewed, in particular by reducing the limits on the sectors most affected by the pandemic, reviewing the maturities and reassessing the probability of default of each counterparty.
Market risk was characterized by increased volatility on all financial markets with a return to normal at the end of 2020. The absence of exposure to trading portfolios, the bank’s low exposure in terms of its investment portfolios and the fact that it has a significant proportion of low-risk government securities have made it possible to minimize the potential risks.
17.2.2 Liquidity risk management
The onset of the health crisis was characterized by difficulty in accessing liquidity on the financial markets. Orange Bank anticipated this situation by deciding to retain significant liquidity and continued to manage its liquidity prudently throughout the crisis.
At the end of December 2020, the LCR ratio (short-term liquidity ratio) was 435%, thus providing sufficient liquidity to cover any short-term needs. The Net Stable Funding Ratio (NSFR) was 150%. In order to anticipate future liquidity needs, Orange Bank intensified the diversification of its funding sources, notably with the launch of a securitization program and an increase in deposit receipts (unaudited regulatory ratios).
17.2.3 Credit risk management
Orange Bank has maintained a cautious provisioning policy. At the end of 2020, and in line with the requirements of IFRS 9 to take into account economic forecasts in estimating future losses, the bank reviewed the economic scenarios used to determine the provisions for credit risk relating to commitments to customers. Provisions have been increased to anticipate the expected increase in defaults in 2021.
The cost of credit risk amounted to (30) million euros (i.e. 1.6% of average outstandings), of which (15) million euros related to the health crisis (i.e. 0.8% of average outstandings).
In France, a provision of 6 million euros was recognized on consumer loans at December 31, 2020. It takes into account three scenarios (central, optimistic and pessimistic) weighted respectively at 70%, 20% and 10% on the provisioning model of the economic forecasts of GDP in France published by the Banque de France and the OECD.
For mortgage loans and other markets (large companies, professionals and private banking), Orange Bank recognized a provision of 5 million euros for sectors deemed vulnerable, such as hotels and commercial real estate. Despite the quality of borrowers and existing guarantees, the bank estimates that the health crisis could still lead to business failures.
In Spain, Orange Bank recognized a provision of 4 million euros to cover the impacts of the health crisis on the portfolio of installment receivables.
Orange Bank has also recorded a provision of 4 million euros on the consumer credit portfolio with the aim of taking into account the impact of the entry into force of the new definition of default from January 1, 2021.
In addition, and in response to the health crisis, Orange Bank has adapted its credit management practices by adhering to the FBF-ASF market protocol concerning deferral and rescheduling of loans to companies and professionals. At December 31, 2020, the total exposure related to customers whose payments had been deferred amounted to 15 million euros (1.8% of the portfolio) for mortgage loans, 22 million euros (2.7% of outstandings) for consumer loans and 66 million euros (25% of the portfolio) for company and professional portfolios. The majority of postponements have expired and the resumption of repayments took place without significant incidents.
17.2.4 Remaining term to maturity
The following table details the remaining terms of Orange Bank’s financial assets and liabilities, calculated on the basis of the contractual maturity dates:
− maturity-by-maturity for amortizable transactions;
− for roll-over loans, since renewals cannot be presumed, the renewal dates are taken to be the final maturity dates;
− since derivatives are interest rate swaps, they are not subject to any exchange of notional. Their fair value has been broken down by maturity.
(in millions of euros) | Note | December 31, 2020 | 2021 | 2022 to 2025 | 2026 and beyond |
Investments securities | 17.1.1 | 2 | - | 2 | - |
Debt securities | 17.1.1 | 540 | 161 | 359 | 20 |
Investments at fair value | 17.1.1 | - | - | - | - |
Fixed-income securities | 17.1.1 | 579 | 183 | 232 | 165 |
Loans and receivables to customers | 17.1.1 | 2,000 | 306 | 1,006 | 688 |
Loans and receivables to credit institutions | 17.1.1 | 70 | 70 | - | - |
Other financial assets and derivatives | 96 | 76 | 3 | 17 | |
Total financial assets | 3,288 | 796 | 1,602 | 890 | |
Payable to customers | 17.1.2 | 1,883 | 1,883 | - | - |
Debts with financial institutions | 17.1.2 | 885 | 278 | 606 | - |
Deposit certificate | 17.1.2 | 358 | 190 | 168 | - |
Other financial liabilities and derivatives | 105 | 1 | 52 | 52 | |
Total financial liabilities | 3,230 | 2,352 | 826 | 52 |
17.2.5 Fair value of financial assets and liabilities of Orange Bank
(in millions of euros) | December 31, 2020 | ||||||
Classification under IFRS 9(1) | Book value | Estimated fair value | Level 1 and cash | Level 2 | Level 3 | ||
Loans and receivables | 17.1.1 | AC | 2,070 | 2,070 | - | 2,070 | - |
Financial assets at amortized cost | 17.1.1 | AC | 581 | 580 | 580 | - | - |
Financial assets at fair value through profit or loss | 17.1.1 | FVR | 94 | 94 | 94 | - | - |
Debt securities | 17.1.1 | FVOCIR | 540 | 540 | 540 | - | - |
Investments securities | 17.1.1 | FVOCI | 2 | 2 | 2 | - | - |
Cash and cash equivalent(2) | 17.1 | AC | 254 | 254 | 254 | - | - |
Financial liabilities related to Orange Bank activities | 17.1.2 | AC | (3,155) | (3,155) | - | (3,155) | - |
Derivatives (net amount)(3) | 17.1.3 | (75) | (75) | - | (75) | - | |
(1) "AC" stands for "amortized cost", "FVR" stands for "fair value through profit or loss", "FVOCI" stands for "fair value through other comprehensive income that will not be reclassified to profit or loss", "FVOCIR" stands for "fair value through other comprehensive income that may be reclassified to profit or loss".
(2) Includes only cash.
(3) The classification for derivatives instruments depends on their hedging qualification.
(in millions of euros) | December 31, 2019 | ||||||
Classification under IFRS 9(1) | Book value | Estimated fair value | Level 1 and cash | Level 2 | Level 3 | ||
Loans and receivables | 17.1.1 | AC | 3,010 | 3,010 | - | 3,010 | - |
Financial assets at amortized cost | 17.1.1 | AC | 509 | 501 | 501 | - | - |
Financial assets at fair value through profit or loss | 17.1.1 | FVR | 179 | 179 | 179 | - | - |
Debt securities | 17.1.1 | FVOCIR | 656 | 656 | 628 | 28 | - |
Investments securities | 17.1.1 | FVOCI | 2 | 2 | 2 | - | - |
Cash and cash equivalent(2) | AC | 369 | 369 | 369 | - | - | |
Financial liabilities related to Orange Bank activities | 17.1.2 | AC | (4,307) | (4,307) | - | (4,307) | - |
Derivatives (net amount)(3) | (74) | (74) | - | (74) | - | ||
(1) "AC" stands for "amortized cost", "FVR" stands for "fair value through profit or loss", "FVOCI" stands for "fair value through other comprehensive income that will not be reclassified to profit or loss", "FVOCIR" stands for "fair value through other comprehensive income that may be reclassified to profit or loss".
(2) Includes only cash.
(3) The classification for derivatives instruments depends on their hedging qualification.
(in millions of euros) | December 31, 2018 | ||||||
Classification under IFRS 9 (1) | Book value | Estimated fair value | Level 1 and cash | Level 2 | Level 3 | ||
Loans and receivables | 17.1.1 | AC | 3,000 | 3,000 | - | 3,000 | - |
Financial assets at amortized cost | 17.1.1 | AC | 614 | 641 | 605 | 36 | - |
Financial assets at fair value through profit or loss | 17.1.1 | FVR | 152 | 152 | 152 | - | - |
Debt securities | 17.1.1 | FVOCIR | 925 | 925 | 862 | 63 | - |
Investments securities | 17.1.1 | FVOCI | 1 | 1 | 1 | - | - |
Cash and cash equivalent(2) | AC | 553 | 553 | 553 | - | - | |
Financial liabilities related to Orange Bank activities | 17.1.2 | AC | (4,862) | (4,862) | - | (4,862) | - |
Derivatives (net amount)(3) | (46) | (46) | - | (29) | (17) | ||
(1) "AC" stands for "amortized cost", "FVR" stands for "fair value through profit or loss", "FVOCI" stands for "fair value through other comprehensive income that will not be reclassified to profit or loss", "FVOCIR" stands for "fair value through other comprehensive income that may be reclassified to profit or loss".
(2) Includes only cash.
(3) The classification for derivatives instruments depends on their hedging qualification.
17.3 Orange Bank’s unrecognized contractual commitments
As at December 31, 2020, Orange Bank is not aware of having entered into any commitment that may have a material effect on its current or future financial position, other than the commitments mentioned below.
Commitments given
(in millions of euros) | December 31, 2020 | December 31, 2019 | December 31, 2018 |
Financing commitments (1) | 87 | 421 | 444 |
Guarantee commitments | 8 | 8 | 12 |
On behalf of financial institutions | 4 | 4 | 8 |
On behalf of customers | 3 | 4 | 4 |
Property lease commitments | - | 23 | 37 |
Total | 94 | 452 | 493 |
(1) Corresponds to credit commitments granted to customers, credits granted but not yet released and unused portion of financing granted. As at December 31, 2019, these commitments also included a financing commitment for Groupama of 320 million euros, a commitment which ended in 2020 due to the discontinuation of the account-keeping activity that Orange Bank provided with entities of the Groupama group.
Commitments received
(in millions of euros) | December 31, 2020 | December 31, 2019 | December 31, 2018 |
Received from financial institutions (1) | 770 | 747 | 681 |
Received from customers | 102 | 149 | 153 |
Total | 872 | 896 | 834 |
(1) Corresponds to guarantees received from Crédit Logement to counter-guarantee the mortgages distributed.
Assets covered by commitments
(in millions of euros) | December 31, 2020 | December 31, 2019 | December 31, 2018 |
Assets pledged as security to lending financial institutions as guarantees for bank loans | 1,160 | 1,126 | 715 |
Total | 1,160 | 1,126 | 715 |
Note 18 Litigation
This note presents all of the significant disputes in which the Group is involved with the exception of litigation relating to disputes between Orange and the tax or social administrations in relation to operational or income taxes or social contributions. These disputes are described, respectively, in Notes 11 and 7.2.
As at December 31, 2020, the provisions for risks recorded by the Group for all the disputes (except those presented in Notes 11 and 7.2) amounted to 525 million euros (versus 643 million euros at December 31, 2019 and 572 million euros at December 31, 2018). Orange believes that any disclosure on a case-by-case basis could seriously harm the Group’s position. The balance and overall movements on provisions are presented in Note 6.2.
France
Mobile services
− In parallel to the judicial inquiry for which a final ruling was handed down on December 17, 2015 a final verdict was reached by the French Competition Authority fining Orange 350 million euros for having implemented four anti-competitive practices in the "Enterprise" market segment and imposing injunctions, SFR brought an action on June 18, 2015, for damages suffered because of Orange’s practices. After several successive increases in April 2016 and September 2018, SFR raised its claim from the initial 512 million euros to 3 billion euros in July 2019. The Group believes this claim represents a risk. In the wake of this decision, Céleste and Adista also brought actions against Orange before the Paris Commercial Court for damages. To date, the overall claims of SFR, Céleste and Adista represent a total of 3.1 billion euros. These cases are currently being investigated by the courts and a decision of the Paris Commercial Court is expected by the end of the first quarter 2021 in the SFR case.
− Concurrently to their complaints filed with the French Competition Authority, regarding practices of Orange in the mobile and fixed-to-mobile markets in the French Caribbean and in French Guyana, for which Orange was definitively ordered to pay a fine of 63 million euros in December 2009 reduced to 60 million euros by the Paris Court of Appeal in July 2013, Digicel and Outremer Telecom initiated before the Paris Commercial Court respectively in March 2009 and October 2010, legal actions for alleged damages stemming from these practices, in an amount which Digicel had assessed at 329 million euros increased to 493 million euros in November 2015 and Outremer at 75 million euros. After it was ordered by the Paris Commercial Court in March 2015 that 8 million euros should be paid to Outremer Telecom, the Paris Court of Appeal decreased the amount of the fine to 3 million euros in May 2017, noting inter alia that the damages should be discounted at the statutory rate of interests. On December 18, 2017 the Paris Commercial Court ordered Orange to pay Digicel the sum of 180 million euros, to be discounted from March 2009 until the date of payment at a rate of interest higher than that adopted by the Paris Court of Appeal in the Outremer Telecom litigation, i.e. a total amount of 346 million euros. Orange filed an appeal and, at the same time, obtained from the Paris Court of Appeal on February 6, 2018, the right to escrow only the notional amount of the penalty until the court ruled on the merits of the case. On June 17, 2020, the Paris Court of Appeal overturned the discounting method applied to the damages set forth in the judgement rendered by the Paris Commercial Court on December 18, 2017, which ordered Orange to pay to Digicel 180 million euros in principal. Following this judgment, Orange was refunded 97 million euros. Orange appealed to the French Supreme Court and re-assessed the risk related to the possible reversal of the Court of Appeal’s judgment, which would return the parties to the situation following the first-instance court’s decision.
Fixed-line services
− In 2010, SFR and then Verizon summoned Orange SA to appear before the Paris Commercial Court demanding the reimbursement of alleged overpayments on interconnection services provided by Orange, the price of which allegedly did not reflect their cost. On June 18 and 25, 2013, the Paris Commercial Court dismissed their claims but ordered Orange to pay Verizon 1 million euros damages with respect to services provided in 2008. Orange paid this amount in 2013. SFR and Verizon filed appeals against these decisions. In December 2015, the Paris Court of Appeal dismissed in full the claims made by SFR and confirmed the first instance decision. In September 2017, the French Supreme Court rejected SFR's appeal. Furthermore, in April 2017, the Paris Court of Appeal dismissed Verizon completely and reversed the compensation of 1 million euros granted for services provided in 2008. On June 5, 2019, the French Supreme Court annulled the decision of the Paris Court of Appeal and restored the parties to the situation they were in following the first instance court's decision rendered on June 25, 2013. The proceedings are still ongoing.
− In 2012, SFR brought an action against Orange SA before the Paris Commercial Court denouncing its retail offers for the secondary residences market and claiming 218 million euros for losses allegedly suffered. In February 2014, the trial court ruled that Orange had abused its dominant position and ordered it to pay 51 million euros in damages to SFR. In October 2014, the Paris Court of Appeal annulled this decision which was then reversed by the French Supreme Court on April 12, 2016. Orange had then to pay 53 million euros to SFR pursuant to the trial court's ruling. SFR had raised its claims to 257 million euros before the Court of Appeal. On June 8, 2018, the Court of Appeal sentenced Orange to pay 54 million euros. Orange paid the balance following the cancellation of the previous ruling from the Court of Appeal and appealed to the French Supreme Court. On September 16, 2020, the French Supreme Court overturned the judgment handed down by the Court of Appeal and restored the parties to the situation they were in following the Paris Commercial Court’s decision. Orange applied to the Court of Appeal to have its conviction overturned and the return of the sums awarded.
Other proceedings in France
− In June 2018, Iliad brought summary proceedings against Orange SA before the presiding judge of the Paris Commercial Court, aiming to ban some of its mobile telephony offers proposing mobile handsets at attractive prices accompanied by a subscription package, on the grounds that they constituted consumer credit offers. The case is currently being investigated by the judges deciding on the merits of the case. On October 16, 2020, Iliad, for the first time, assessed its loss at 790 million euros.
− In December 2018 the administrators of former UK retailer Phones 4U, (which is in administration and no longer trading), filed a claim against the three main UK mobile network operators, including EE, and their respective existing or former parent companies including Orange. The claim (of an unquantified amount) is currently being disputed before the High Court of England and Wales. Orange challenges vigorously the allegations raised by Phones 4U which include collusion.
− Orange Bank is the object of two historic lawsuits whereby the plaintiffs claim in total about 350 million euros in financial damages that they allege to have suffered. As Orange Bank believes these claims to be without merit and is contesting them strongly, the Group has not recognized any financial liability.
− In August 2020, ASSIA brought proceedings against Orange SA before the Paris Civil Court for infringement of two dynamic xDSL line management patents. ASSIA claims a total of around 500 million euros for the financial damage it claims to have suffered. Orange SA considers its claims to be unfounded and challenges them. The proceedings are currently being examined by the judges deciding on the merits of the case.
− The Evaluation and Compensation Committee, set up as part of the France Telecom employee-related crisis trial, to examine individual claims submitted by individuals present in the company between 2007 and 2010 and their beneficiaries, extended the period for submitting files until December 31, 2020. This Committee is continuing to analyze and process the requests received. At the end of December 2020, around 1,700 individual requests had been received, about 470 of which had been closed subsequent to an agreement and the other requests are being processed.
Poland
− In 2011, the Polish Competition Authority (UOKiK) sanctioned the four major Polish mobile operators, including Orange Polska, for collusion to delay the development of new services in the mobile television market. This sanction was nullified in 2015 by the Court for the protection of competition and consumers. In 2017, the Court of Appeal dismissed the appeal of the UOKiK, who appealed to the Supreme Court. On November 26, 2016, the company Magna Polonia brought suit jointly and severally against the operators to the Warsaw Commercial Court and claimed 618 million zlotys (144 million euros) for the damages it allegedly sustained due to these practices. On February 9, 2018, the Warsaw Commercial Court examined the Magna Polonia claim and decided to postpone its ruling until after the Polish Supreme Court had come to a decision. On October 31, 2019, the Supreme Court confirmed the inexistence of collusive practices, thus rendering the claim made by Magna Polonia to the Warsaw Commercial Court without merits. In November 2019, Magna Polonia withdrew from the proceedings and, on December 13, 2019, the court interrupted the proceedings. The dispute is now closed.
− In 2013, the UOKiK opened an investigation on the country’s three main mobile operators, including Orange Polska, for abuse of a dominant position in relation with the retail rates imposed by these three operators on the calls made to the network of the polish P4 operator. On January 2, 2018, UOKIK suspended the proceedings against the three operators as there were no longer anti-competitive grounds. In addition, in 2015 P4 issued two claims for damages for a total amount of 630 million zlotys (138 million euros) against the three operators jointly, as compensation for the loss it alleged to have suffered in relation to the contested pricing practices. In 2018, the Court of First Instance dismissed in its entirety the first compensation claim in the amount of 316 million zlotys (70 million euros). P4 has appealed against this decision. On December 28, 2020, the Court of Appeal dismissed the judgment rendered by the Court of First Instance and referred the parties to the Court of First Instance. P4’s second claim for compensation for 314 million zlotys (69 million euros) has not yet been notified on Orange Polska.
Romania
− On March 29, 2016, investigators from the Romanian Competition Council made an investigation at the headquarters of Orange Romania, concerning possible discriminatory practices in the mobile payment and advertising markets. Following the investigation, the Competition Council fined Orange Romania 65 million leu (13 million euros) on December 18, 2018. Orange Romania was notified of this decision on April 15, 2019 and filed an appeal on May 9, 2019. The proceedings are ongoing.
Middle East and Africa
− A number of shareholder disputes are ongoing between the joint venture comprising Agility and Orange, on the one hand, and its Iraqi co-shareholder in the capital of the Iraqi operator Korek Telecom, on the other. These disputes, which concern various breaches of contractual documents, are the subject of p-contentious proceedings and arbitral and judicial proceedings in various countries. In addition, on March 19, 2019, following an administrative decree adopted by the Iraqi Ministry of Trade and Industry, the General Directorate of Companies in Erbil (Iraqi Kurdistan) implemented the 2014 decision of the Iraqi regulatory authority (CMC) to cancel the partnership dated March 2011 between the operator Korek Telecom, Agility and Orange and to restore the shareholding of Korek Telecom as it existed before Orange and Agility had acquired a stake. As a result, the registration of Korek Telecom shares in the name of the original shareholders was imposed without any compensation or reimbursement of the amounts invested. Orange thus considers that it was thus unlawfully expropriated of its investment and, on March 24, 2019, sent a notice of dispute to the Republic of Iraq based on the Bilateral lnvestment Treaty between France and Iraq. In the absence of an amicable settlement with the Iraqi State, Orange submitted a request for arbitration with the International Center for the Settlement of Investment Disputes (ICSID) on October 2, 2020.
− In Jordan, the telecom operator Zain, brought an action against Jordan Telecommunications Company (Orange Jordan) for failure to open geographical numbers allocated by the Jordanian regulator. Zain has estimated its damages at 250 million Jordanian dinars (288 million euros). An arbitration proceeding is ongoing. Orange Jordan considers that the amount of the claim is not justified.
In order to provide its telecommunication services, the Group sometimes uses fixed assets of other parties. Terms of use of these assets are not always formalized. The Group is sometimes subject of claims and might be subject to future claims in this respect, which could result in a cash outflow in the future. The amount of the potential obligations or future commitments cannot be measured with sufficient reliability due to legal complexities involved.
Other than proceedings that may be initiated in respect of tax and social audits (see Notes 7.2 and 11), there are no other administrative, legal or arbitration proceedings, including any proceedings that are pending, suspended or threatened, of which Orange is aware of, which may have or have had in the last 12 months a material impact on the Company’s and/or Group’s financial position or profitability.
Note 19 Subsequent events
Orange Concessions
On January 22, 2021, Orange has entered into an exclusive agreement with La Banque des Territoires (Caisse des Dépôts), CNP Assurances and EDF Invest, for the sale of 50% of the capital and joint control of Orange Concessions. Subject to obtaining the agreement of the relevant antitrust authorities and all stakeholders, the closing of this transaction should be completed in the second half of 2021 (see Note 4.3).
Note 20 Main consolidated entities
As at December 31, 2020, the scope of consolidation consisted of 418 entities.
The main changes in the scope of consolidation in 2020 are presented in Note 4.2.
Regarding subsidiaries with minority interests:
− financial statements for Orange Polska Group, Sonatel Group, Jordan Telecom Group and Orange Belgium Group are respectively published to the Warsaw Stock Exchange, the Regional Stock Exchange (BRVM), the Amman Stock Exchange and the Brussels Stock Exchange, those companies being quoted;
− the other subsidiaries are not significant compared to Orange’s financial data. Consequently, financial information is not presented for these subsidiaries in the notes to Orange’s consolidated financial statements.
Pursuant to ANC Regulation No. 2016-09 of December 2, 2016 of the French Accounting Standards Authority, the full list of the companies included in the scope of consolidation, the companies excluded from the scope of consolidation and the non-consolidated equity investments, is available on the Group’s website (https://gallery.orange.com/finance#lang=en&v=5c6a1b51-a537-454e-b2d3-6e4664be2c6a).
The list of the principal operating entities shown below was determined based on their contributions to the following financial indicators: revenue and EBITDAaL.
Company | Country | |
Orange SA | Parent company | France |
Main consolidated entities | ||
France | % Interest | Country |
Orange SA - Business Unit France | 100.00 | France |
Orange Caraïbe | 100.00 | France |
Générale de Téléphone | 100.00 | France |
Alliance Très Haut Débit | 100.00 | France |
Auvergne Très Haut Débit | 100.00 | France |
Gironde Très Haut Débit | 100.00 | France |
Europe | % Interest | Country |
Orange Belgium | 52.91 | Belgium |
Orange Communications Luxembourg | 52.91 | Luxembourg |
Orange Spain and its subsidiaries | 100.00 | Spain |
Orange Moldova | 94.41 | Moldova |
Orange Polska and its subsidiaries | 50.67 | Poland |
Orange Romania | 99.20 | Romania |
Orange Slovensko | 100.00 | Slovakia |
Africa & Middle-East | % Interest | Country |
Orange Burkina Faso | 85.80 | Burkina Faso |
Orange Cameroon | 94.40 | Cameroon |
Orange RDC | 100.00 | Congo |
Orange Côte d'Ivoire | 72.50 | Côte d'Ivoire |
Orange Egypt for Telecommunications and its subsidiaries | 99.96 | Egypt |
Orange Guinée (1) | 37.64 | Guinea |
Orange Bissau (1) | 38.04 | Guinea-Bissau |
Jordan Telecom and its subsidiaries | 51.00 | Jordan |
Orange Mali (1) | 29.37 | Mali |
Médi Telecom (2) | 49.00 | Morocco |
Sonatel (1) | 42.33 | Senegal |
Enterprise | % Interest | Country |
Orange SA - Business Unit Enterprise | 100.00 | France |
Globecast Holding and its subsidiaries | 100.00 | France |
Orange Business Services SA and its subsidiaries | 100.00 | France |
Business & Decision and its subsidiaries | 100.00 | France |
Basefarm and its subsidiaries | 100.00 | Norway |
Orange Business Services Participations and its subsidiaries | 100.00 | United Kingdom |
SecureData and its subsidiaries | 100.00 | United Kingdom |
SecureLink and its subsidiaries | 100.00 | Netherlands |
International Carriers & Shared Services | % Interest | Country |
Orange SA - Business Unit IC&SS | 100.00 | France |
FT IMMO H | 100.00 | France |
Orange Marine | 100.00 | France |
Orange Studio | 100.00 | France |
OCS | 66.67 | France |
Orange Brand Services | 100.00 | United Kingdom |
Mobile Financial Services | % Interest | Country |
Orange Bank | 75.86 | France |
(1) Orange SA controls Sonatel and its subsidiaries, which are fully consolidated, under the terms of the shareholders' agreement as supplemented by the Strategic Committee Charter dated July 13, 2005 (Orange SA owns and controls 100% of Orange MEA, which owns and controls 42.33% of Sonatel Group).
(2) Orange SA controls Medi Telecom and its subsidiaries, following the acquisition in December 2010 of 40% and the acquisition in July 2015 of additional interests for 9% and 1.1% of usufruct (Orange SA owns and controls 100% of Orange MEA, which owns and controls, via its subsidiary Atlas Country Support, 49% of Medi Telecom).
Note 21 Auditors’ fees
As required by Decree no. 2008-1487 of December 30, 2008, the following table shows the amount of fees of the auditors of the parent company and their partner firms in respect of the fully consolidated subsidiaries.
(in millions of euros) | Audit and related services | Other services rendered by auditors' networks to fully-consolidated subsidiaries | Total | |||||||
Statutory audit fees, certification, auditing of the accounts | Services required by the law | Sub-total | ||||||||
o/w issuer | o/w issuer | |||||||||
EY | ||||||||||
2020 | 10.0 | 5.2 | 0.0 | 0.0 | 10.1 | 0.4 | 10.5 | |||
% | 96 % | 50 % | 0 % | 0 % | 93 % | 4 % | 100 % | |||
2019 | 10.2 | 5.1 | 0.3 | - | 10.5 | 0.4 | 10.8 | |||
% | 94 % | 48 % | 3 % | 0 % | 97 % | 3 % | 100 % | |||
2018 | 10.6 | 5.4 | 0.3 | - | 10.8 | 0.4 | 11.3 | |||
% | 94 % | 48 % | 2 % | 0 % | 96 % | 4 % | 100 % | |||
KPMG | ||||||||||
2020 | 10.2 | 5.1 | 0.5 | 0.2 | 10.7 | 0.1 | 10.8 | |||
% | 94 % | 47 % | 5 % | 2 % | 99 % | 1 % | 100 % | |||
2019 | 9.8 | 5.1 | 0.4 | 0.2 | 10.2 | 0.1 | 10.3 | |||
% | 95 % | 49 % | 4 % | 2 % | 99 % | 1 % | 100 % | |||
2018 | 10.9 | 6.3 | 0.5 | 0.3 | 11.4 | 0.1 | 11.5 | |||
% | 95 % | 55 % | 4 % | 2 % | 99 % | 1 % | 100 % | |||
The services provided by the statutory auditors were authorized pursuant to the rules adopted by the Audit Committee and updated each year since October 2016. No fiscal services were provided by the statutory auditors.
Statutory auditors’ report on the consolidated financial statements
This is a translation into English of the auditors’ report on the financial statements of the Company issued in French and it is provided solely for the convenience of English speaking users.
This auditors’ report includes information required by European regulation and French law, such as information about the appointment of the statutory auditors or verification of the management report and other documents provided to shareholders.
This report should be read in conjunction with, and construed in accordance with, French law and professional auditing standards applicable in France.
Year ended December 31, 2020
To the Annual General Meeting of Orange S.A.
Opinion
In compliance with the engagement entrusted to us by your Annual General Meeting, we have audited the accompanying consolidated financial statements of Orange S.A. (hereinafter "the Company") for the year ended December 31, 2020.
In our opinion, the consolidated financial statements give a true and fair view of the assets and liabilities and the financial position of the Group as at December 31, 2020 and of the results of its operations for the year then ended, in accordance with International Financial Reporting Standards, as adopted by the European Union.
The opinion expressed above is consistent with the contents of our report to the Audit Committee.
Basis for Opinion
Accounting Framework
We conducted our audit in accordance with professional standards applicable in France. We believe that the audit evidence we have obtained is sufficient and appropriate to provide a basis for our opinion.
Our responsibilities under those standards are further described in the section "Statutory Auditors’ Responsibilities for the Audit of the Consolidated Financial Statements" section of this report.
Independence
We conducted our audit engagement in compliance with independence requirements of the French Commercial Code (code de commerce) and the French Code of Ethics (code de déontologie) for statutory auditors for the period from January 1, 2020 to the date of our report and specifically we did not provide any prohibited non-audit services referred to in Article 5(1) of Regulation (EU) No 537/2014.
Emphasis of Matter
We draw attention to the following matter described in Note 2.3.1 " Interpretations and amendment of IFRS 16 - Leases" to the consolidated financial statements, the Group has changed its method of accounting for leases, due to the adoption of IFRS IC decision published on December 2019 that clarifies lease terms determination in the scope of IFRS 16 "Leases", which impacts were accounted for, retrospectively on January 1, 2019. Our opinion is not modified in respect of this matter.
Justification of Assessments: Key Audit Matters
Due to the global crisis related to the Covid-19 pandemic, the financial statements of this period have been prepared and audited under specific conditions. Indeed, this crisis and the exceptional measures taken in the context of the state of sanitary emergency have had numerous consequences for companies, particularly on their operations and their financing, and have led to greater uncertainties on their future prospects. Those measures, such as travel restrictions and remote working, have also had an impact on the companies' internal organization and the performance of the audits.
It is in this complex and evolving context that, in accordance with the requirements of Articles L.823-9 and R.823-7 of the French Commercial Code (code de commerce) relating to the justification of our assessments, we inform you of the key audit matters relating to risks of material misstatement that, in our professional judgment, were of most significance in our audit of the consolidated financial statements of the current period, as well as how we addressed those risks.
These matters were addressed in the context of our audit of the consolidated financial statements as a whole, and in forming our opinion thereon, and we do not provide a separate opinion on specific items of the consolidated financial statements.
Key Audit Matters | Audit Response |
Revenue recognition for telecommunications activities (Notes 5.1 and 5.4 to the consolidated financial statements) The Company recognized in the consolidated income statement €42 270 million of revenue for the year ended December 31, 2020. The Company’s telecommunications business involves a wide range of frequently changing services and large volumes of data processing. This requires various revenue recognition methods according to the type of product or service sold, and complex IT systems for revenue recognition. Revenue recognition principles are disclosed in Note 5.1 to the consolidated financial statements. Revenue recognition of telecommunications business is a key audit matter due to the complexity of the associated IT systems. | For the telecommunications business, we gained insight into the accounting processes used to recognize various revenue streams, from contract signature and initial communication to invoicing and receiving payment. We took into account the high level of integration of the various IT systems involved in revenue recognition by including IT specialists in our audit team and testing the design, implementation and effectiveness of automated system controls affecting revenue recognition. As part of our work, we: − identified the main controls set up by Orange that are relevant to our audit; − tested the functionalities of business and commercial applications used to prepare accounting and financial information, the configuration and interfaces of accounting systems; − performed analytical procedures and tested a selection of manual entries at year end, by comparing our revenue estimates, based on a combination of internal data and publicly available external data, with revenue recorded. We have also assessed the appropriateness of the information presented in Notes 5.1 and 5.4 to the consolidated financial statements. |
Evaluation of goodwill, intangible assets and property, plant and equipment impairment analyses (Notes 8 and 9 to the consolidated financial statements) As at December 31, 2020, the total goodwill, intangible assets and property, plant and equipment balances were € 27,596 million, € 15,135 million and € 29,075 million respectively, as of December 31, 2020. As stated in Note 8.1, Orange performs some impairment testing when there is an indication of impairment, and at least once a year. These tests are performed at the level of each cash-generating unit (CGU) or group of CGUs, which generally correspond to the operating segment, or each country in Africa and the Middle East and in Europe. An impairment loss is recognized if the recoverable amount is lower than the carrying value. Orange mostly retains the value in use to determine the recoverable amount, which is the estimated present value of future expected cash flows. The assessment of the value in use required certain estimates and judgments, as described in Notes 2.5.2 and 8, in particular: the competitive, economic and financial environment of certain countries in which the Group operates, the ability to realize operating cash flows from strategic plans, the level of investment to be made, and the discount and perpetual growth rates used in calculating recoverable amounts As mentioned in Note 8.3, as at December 31, 2020, the business plans and key operational assumptions were sensitive to the Covid-19 pandemic consequences. We believe that the evaluation of those assets is a key audit matter, given their sensitivity to assumptions made by management, and the significance of goodwill and, other intangible and tangible assets in the consolidated financial statements. | We evaluated the design and tested the operating effectiveness of certain internal controls over the Group’s impairment assessment process, including controls related to the determination of the recoverable amount of the CGUs or groups of CGUs, and the development of the revenue growth rates and discount rate assumptions. To assess the reliability of data from the business plans that is used to calculate recoverable value, together with our valuation professionals with specialized skills and knowledge, we : − compared the 2020 business plans projections with business plans from prior financial years; − compared the business plans from prior financial years with actual results of the related years; − interviewed operational and finance managers at Orange to gain insight into the key assumptions used in business plans and assess assumptions based on the explanations obtained; − evaluated the Group’s forecasted revenue growth rates, by comparing the growth rate to the Group’s peer companies’ analyst reports and market research reports; − examined the sensitivity analyses performed by Orange and performed our own sensitivity analyses on key assumptions to assess the potential effect of a change in these assumptions on the conclusions of impairment tests (including operating cash flows, discount and perpetual growth rates); − reconciled the data included in the valuation models used by the Group in the determination of recoverable values to the plans submitted to those charged with governance. Relating to the models used for the determination of recoverable values, we involved our valuation professionals with specialized skills and knowledge, who assisted in evaluating the discount and growth rates used in the valuations by comparing them against rate ranges that were independently developed using publicly available market data for comparable entities. We have also assessed the appropriateness of the information presented in Notes 8 and 9 to the consolidated financial statements. |
Recognition of deferred tax assets associated with tax loss carryforwards (Notes 11.2.1 and 11.2.3 to the consolidated financial statements) At December 31, 2020, €731 million was recognized in the consolidated financial statements for deferred tax assets. At that date unrecognized deferred tax assets amounted to €3,714 million and mainly comprised tax losses that can be carried forward indefinitely. As stated in accounting principles of Note 11.2.3, deferred tax assets are only recognized when it is probable that the tax entity will have sufficient future taxable profit to recover them. The recoverability of deferred tax assets is assessed based on the business plans used for impairment testing, which may be adjusted for tax specificities related to each jurisdiction. We believe that the recognition of deferred tax assets associated with tax loss carryforwards is a key audit matter, given their sensitivity to assumptions made by the Group, particularly relating to Orange ability to achieve the performance forecasts in the business plans and to the feasibility of the Group tax planning assumptions. | We tested certain controls implemented by the Group on the deferred tax valuation process notably relating to assumptions used and applicable tax regulations for the determination of future taxable profit, which consisted in: − determining whether the tax loss carryforwards could be used before they expire to offset deferred tax liabilities in the same tax jurisdiction; and − determining the capacity of each entity to generate future taxable profit enabling the utilization of tax loss carryforwards. We analyzed the method used by the Group to assess tax loss carryforwards to be used in the future. To examined future taxable profit, we analyzed the reliability of the processes used to prepare the business plan to assess the probability of each entity recovering its deferred tax assets by: − analyzing the procedure used to develop and approve the latest business plans used for those estimates; − comparing forecast performance from previous years with actual results for the years concerned; − comparing revenue growth rate to the Group’s peer companies’ analyst reports and market research reports. − examining the consistency of assumptions made to assess deferred tax assets with those used for impairment testing (namely forecasted cash-flows and revenue growth rates); − involving tax professionals with specialized skills and knowledge, who assisted in assessing the Group’s application of the relevant tax regulations and evaluated the feasibility and viability of the Group’s tax-planning strategies. We also assessed the appropriateness of the information presented in Notes 11.2.1 and 11.2.3 to the consolidated financial statements. |
Evaluation of provisions for competition and regulatory disputes (Notes 6.2, 6.7 and 18 to the consolidated financial statements) Orange is involved in a number of legal disputes in France and abroad relating to competition issues and national and European Commission regulations. As stated in Note 6.2 to the consolidated financial statements, expenses arising from these proceedings are recorded when the Group has a present obligation towards a third party arising from a past event, and it is probable that an outflow of resources embodying economic benefits will be required to settle the obligation, which can be quantified or estimated on a reasonable basis. A provision of € 525 million was recorded, a portion of which relates to competition and regulatory disputes involving the Group as of December 31, 2020. Given the Company’s exposure to competition issues in the telecommunications sector and the high level of judgment required by Management to estimate risks relating to legal disputes, we have identified the subject as a key audit matter. | To assess the extent of risk of estimates used to record provisions for competition and regulatory disputes, our work included: − gaining insight into procedures implemented by Management to identify risk and where appropriate, record provisions; − testing certain controls set up by Management, which we believe to be the most relevant to our audit. That includes controls related to the assessment of data provided by the Legal Department and external counsels; − understanding the risk analyses performed by Management; − interviewing the Legal Department and the Secretary General of your Group and analyzing the documentation available (specifically the minutes of court hearings) to examine the basis of assumptions used to determine the provisions for litigation; − examining the responses to third party confirmations requests: legal opinions of external counsels and underlying information including ongoing proceedings and the probable financial consequences; − assessing whether any subsequent events to the reporting date for the year ended December 31, 2020 have been taken into account to estimate provisions and the information provided in the consolidated financial statements. − comparing historical provision estimates to actual amounts paid. We also assessed the appropriateness of the information presented in Notes 6.2, 6.7 and 18 to the consolidated financial statements. |
Specific Verifications
We have also performed, in accordance with professional standards applicable in France, the specific verifications required by laws and regulations of the Group’s information given in the management report of the Board of Directors.
We have no matters to report as to its fair presentation and its consistency with the consolidated financial statements.
We attest that the consolidated non-financial statement required by Article L.225-102-1 of the French Commercial Code (Code de commerce), is included in the Group’s management report, it being specified that, in accordance with the provisions of Article L. 823-10 of this Code, we have verified neither the fair presentation nor the consistency with the consolidated financial statements of the information contained therein and this information must be reported by an independent third party.
Report on Other Legal and Regulatory Requirements
Format of presentation of the consolidated financial statements intended to be included in the annual financial report
In accordance with Article 222-3, III of the AMF General Regulation, the Company’s management informed us of its decision to postpone the presentation of the consolidated financial statements in compliance with the European single electronic format as defined in the European Delegated Regulation N° 2019/815 of 17 December 2018 to years beginning on or after January 1st, 2021. Therefore, this report does not include a conclusion on the compliance with this format of the presentation of the consolidated financial statements intended to be included in the annual financial report mentioned in Article L.451-1-2,I of the French Monetary and Financial Code (code monétaire et financier).
Appointment of the Statutory Auditors
We were appointed statutory auditors of Orange S.A. by the Shareholders’ Meeting held on May 27, 2015 for KPMG S.A. and by the inter-ministerial decree of September 18, 1991 for Ernst & Young Audit.
As at December 31, 2020, KPMG S.A. were in the sixth year of their total uninterrupted engagement and Ernst & Young Audit were in their thirtieth year (of which twenty-four years since the Company’s securities were admitted to trading on a regulated market).
Responsibilities of Management and Those Charged with Governance for the Consolidated Financial Statements
Management is responsible for the preparation and fair presentation of the consolidated financial statements in accordance with International Financial Reporting Standards (IFRS). Management is also responsible for such internal control that it determines is necessary to enable the preparation of consolidated financial statements that are free from material misstatement, whether due to fraud or error.
In preparing the consolidated financial statements, management is responsible for assessing the company’s ability to continue as a going concern, disclosing, as applicable, matters related to going concern and using the going concern basis of accounting unless it is expected to liquidate the company or to cease operations.
The Audit Committee is responsible for monitoring the financial reporting process and the effectiveness of internal control and risk management systems and where applicable, internal audit, regarding the accounting and financial reporting procedures.
The consolidated financial statements have been approved by the Board of Directors.
Statutory Auditors’ Responsibilities for the Audit of the Consolidated Financial Statements
Objectives and audit approach
Our role is to issue a report on the consolidated financial statements. Our objective is to obtain reasonable assurance about whether the consolidated financial statements as a whole are free from material misstatement. Reasonable assurance is a high level of assurance but is not a guarantee that an audit conducted in accordance with professional standards will always detect a material misstatement when it exists. Misstatements can arise from fraud or error and are considered material if, individually or in the aggregate, they could reasonably be expected to influence the economic decisions of users taken on the basis of these financial statements.
As specified in Article L.823-10-1 of the French Commercial Code (Code de commerce), our statutory audit does not include assurance on the viability of the Company or the quality of management of the affairs of the Company.
As part of an audit conducted in accordance with professional standards applicable in France, the statutory auditor exercises professional judgment throughout the audit and furthermore:
− Identifies and assesses the risk of material misstatement of the consolidated financial statements, whether due to fraud or error, designs and performs audit procedures responsive to those risks, and obtains audit evidence considered to be sufficient and appropriate to provide a basis for the audit opinion. The risk of not detecting a material misstatement resulting from fraud is higher than for one resulting from error, as fraud may involve collusion, forgery, intentional omissions, misrepresentations, or the override of internal control;
− Obtains an understanding of internal control relevant to the audit in order to design audit procedures that are appropriate in the circumstances, but not for the purpose of expressing an opinion on the effectiveness of the internal control.
− Evaluates the appropriateness of accounting policies used and the reasonableness of accounting estimates and related disclosures made by management in the consolidated financial statements;
− Assesses the appropriateness of management’s use of the going concern basis of accounting and, based on the audit evidence obtained, whether a material uncertainty exists related to events or conditions that may cast significant doubt on the Company’s ability to continue as a going concern. This assessment is based on the audit evidence obtained up to the date of his audit report. However, future events or conditions may cause the company to cease to continue as a going concern. If the statutory auditor concludes that a material uncertainty exists, there is a requirement to draw attention in the audit report to the related disclosures in the financial statements or, if such disclosures are not provided or inadequate, to modify the opinion expressed therein;
− Evaluates the overall presentation of the consolidated financial statements and assesses whether the financial statements represent the underlying transactions and events in a manner that achieves fair presentation;
− With regard to the financial information on persons or entities included in the consolidation scope, the statutory auditor obtains audit evidence considered to be sufficient and appropriate to provide a basis for the audit opinion. The statutory auditor is responsible for managing, supervising and performing the audit of the consolidated financial statements as well as the opinion on the financial statements.
Report to the Audit Committee
We submit a report to the Audit Committee, which includes a description of the scope of the audit and the audit program implemented, as well as the results of our audit. We also report any significant deficiencies in internal control regarding the accounting and financial reporting procedures that we have identified.
Our report to the Audit Committee includes the risks of material misstatement that, in our professional judgment, were of most significance in the audit of the financial statements of the current period and which are therefore key audit matters we have the duty to describe in this report.
We also provide the Audit Committee with the declaration provided for in Article 6 of Regulation (EU) N° 537/2014, confirming our independence within the meaning of the rules applicable in France such as they are set out by Articles L.822-10 to L.822-14 of the French Commercial Code (Code de commerce) and in the French Code of Ethics (Code de déontologie) for statutory auditors. Where appropriate, we discuss with the Audit Committee the risks that may reasonably be thought to bear on our independence, and the related safeguards.
Paris La Défense, February 18, 2021
KPMG Audit a division of KPMG S.A. | ERNST & YOUNG Audit |
Jacques Pierre | Yvon Salaün |
Partner | Partner |
ORANGE | ||
Date: February 18, 2021 | By: | /S/ Patrice Lambert - de Diesbach |
Name: | Patrice Lambert - de Diesbach | |
Title: | Senior VP, Head of Investor Relations |