UNITED STATES
SECURITIES AND EXCHANGE COMMISSION
Washington, D.C. 20549
SCHEDULE 14A INFORMATION
Proxy Statement Pursuant to Section 14(a) of the
Securities Exchange Act of 1934
Filed by the Registrant ☒
Filed by a Party other than the Registrant ☐
| | |
Check the appropriate box: | | |
| |
☐ Preliminary Proxy Statement | | ☐ Confidential, for Use of the Commission Only (as permitted by Rule 14a-6(e)(2)) |
☐ Definitive Proxy Statement |
|
☒ Definitive Additional Materials |
|
☐ Soliciting Material Pursuant to § 240.14a-12 |
BLACKROCK MUNIHOLDINGS NEW YORK QUALITY FUND, INC.
(Name of Registrant as Specified In Its Charter)
(Name of Person(s) Filing Proxy Statement, if Other than the Registrant)
Payment of Filing Fee (Check the appropriate box):
| | ☐ | Fee paid previously with preliminary materials. |
| | ☐ | Fee computed on table in exhibit required by Item 25(b) per Exchange Act Rules 14a-6(i)(1) and 0-11. |
An updated copy of the materials filed on May 22, 2024 and May 28, 2024 is filed herewith.
BlackRock Closed-End Funds
Focused on the interests of all shareholders
Contested funds:
BlackRock California Municipal Income Trust (NYSE: BFZ) BlackRock New York Municipal Income Trust (NYSE: BNY)
BlackRock MuniHoldings New York Quality Fund, Inc. (NYSE: MHN)
BlackRock MuniYield Pennsylvania Quality Fund (NYSE: MPA)
BlackRock MuniYield New York Quality Fund, Inc. (NYSE: MYN) BlackRock Innovation and Growth Term Trust (NYSE: BIGZ) BlackRock Health Sciences Term Trust (NYSE: BMEZ) BlackRock Science and Technology Term Trust (NYSE: BSTZ) BlackRock Capital Allocation Term Trust (NYSE: BCAT) BlackRock ESG Capital Allocation Term Trust (NYSE: ECAT)
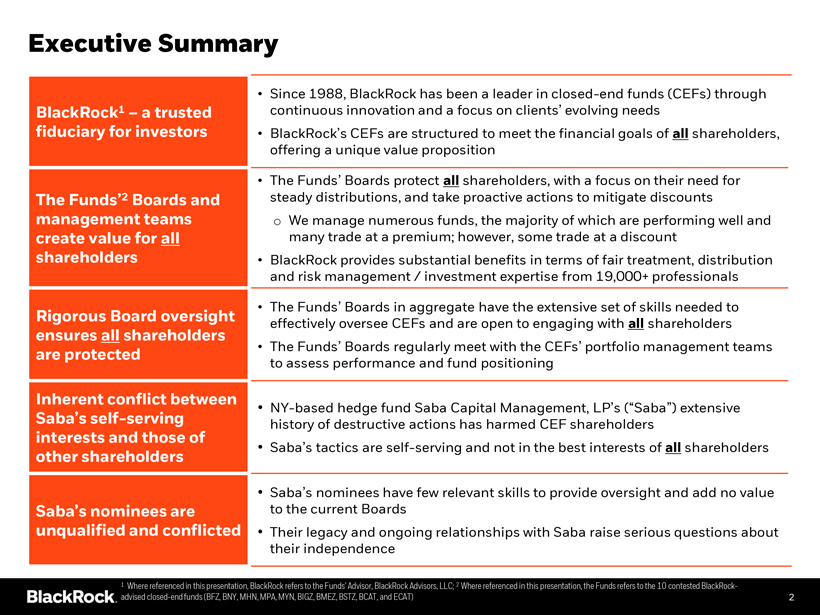
Executive Summary
BlackRock1 – a trusted fiduciary for investors
Since 1988, BlackRock has been a leader in closed-end funds (CEFs) through continuous innovation and a focus on clients’ evolving needs
BlackRock’s CEFs are structured to meet the financial goals of all shareholders, offering a unique value proposition
The Funds’2 Boards and management teams create value for all shareholders
The Funds’ Boards protect all shareholders, with a focus on their need for steady distributions, and take proactive actions to mitigate discounts
o We manage numerous funds, the majority of which are performing well and many trade at a premium; however, some trade at a discount
BlackRock provides substantial benefits in terms of fair treatment, distribution and risk management / investment expertise from 19,000+ professionals
Rigorous Board oversight ensures all shareholders are protected
The Funds’ Boards in aggregate have the extensive set of skills needed to effectively oversee CEFs and are open to engaging with all shareholders
The Funds’ Boards regularly meet with the CEFs’ portfolio management teams to assess performance and fund positioning
Inherent conflict between
Saba’s self-serving interests and those of other shareholders
NY-based hedge fund Saba Capital Management, LP’s (“Saba”) extensive history of destructive actions has harmed CEF shareholders
Saba’s tactics are self-serving and not in the best interests of all shareholders
Saba’s nominees are unqualified and conflicted
Saba’s nominees have few relevant skills to provide oversight and add no value to the current Boards
Their legacy and ongoing relationships with Saba raise serious questions about their independence
1 Where referenced in this presentation, BlackRock refers to the Funds’ Advisor, BlackRock Advisors, LLC; 2 Where referenced in this presentation, the Funds refers to the 10 contested BlackRock-advised closed-end funds (BFZ, BNY, MHN, MPA, MYN, BIGZ, BMEZ, BSTZ, BCAT, and ECAT) 2

BlackRock – a trusted fiduciary for investors
Overview of BlackRock CEFs: Designed for CEF shareholders
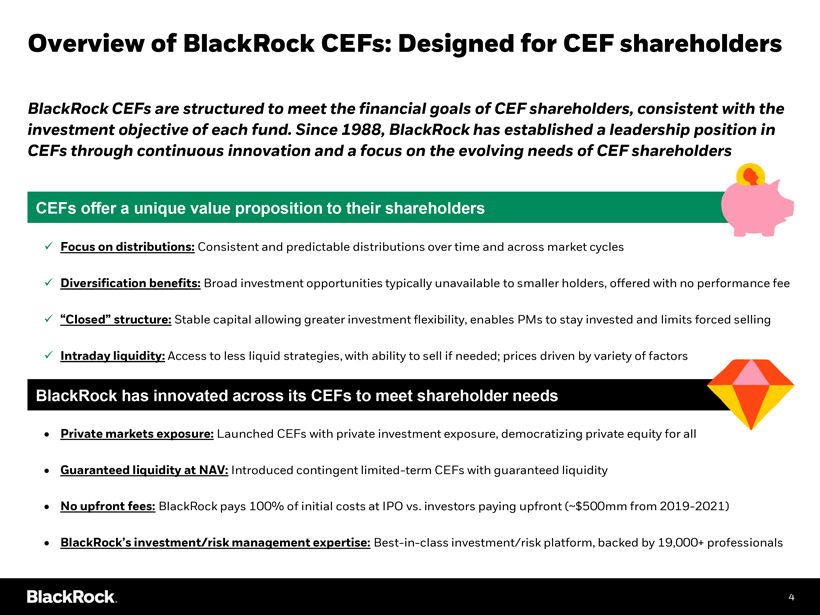
BlackRock CEFs are structured to meet the financial goals of CEF shareholders, consistent with the investment objective of each fund. Since 1988, BlackRock has established a leadership position in CEFs through continuous innovation and a focus on the evolving needs of CEF shareholders
CEFs offer a unique value proposition to their shareholders
Focus on distributions: Consistent and predictable distributions over time and across market cycles
Diversification benefits: Broad investment opportunities typically unavailable to smaller holders, offered with no performance fee
“Closed” structure: Stable capital allowing greater investment flexibility, enables PMs to stay invested and limits forced selling
Intraday liquidity: Access to less liquid strategies, with ability to sell if needed; prices driven by variety of factors
BlackRock has innovated across its CEFs to meet shareholder needs
• Private markets exposure: Launched CEFs with private investment exposure, democratizing private equity for all
• Guaranteed liquidity at NAV: Introduced contingent limited-term CEFs with guaranteed liquidity
• No upfront fees: BlackRock pays 100% of initial costs at IPO vs. investors paying upfront (~$500mm from 2019-2021)
• BlackRock’s investment/risk management expertise: Best-in-class investment/risk platform, backed by 19,000+ professionals
4
Characteristics of contested CEFs’ shareholders
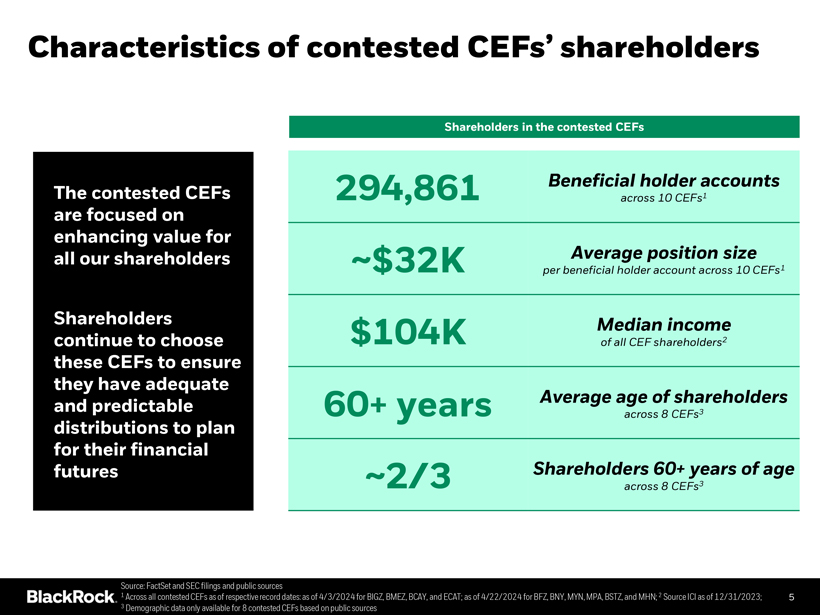
The contested CEFs are focused on enhancing value for all our shareholders
Shareholders continue to choose these CEFs to ensure they have adequate and predictable distributions to plan for their financial futures
Shareholders in the contested CEFs
Beneficial holder accounts
294,861 across 10 CEFs1
Average position size
~$32K per beneficial holder account across 10 CEFs1
Median income
$104K of all CEF shareholders2
Average age of shareholders
60+ years across 8 CEFs3
Shareholders 60+ years of age
~2/3 across 8 CEFs3
Source: FactSet and SEC filings and public sources
1 Across all contested CEFs as of respective record dates: as of 4/3/2024 for BIGZ, BMEZ, BCAY, and ECAT; as of 4/22/2024 for BFZ, BNY, MYN, MPA, BSTZ, and MHN; 2 Source ICI as of 12/31/2023; 5
3 Demographic data only available for 8 contested CEFs based on public sources
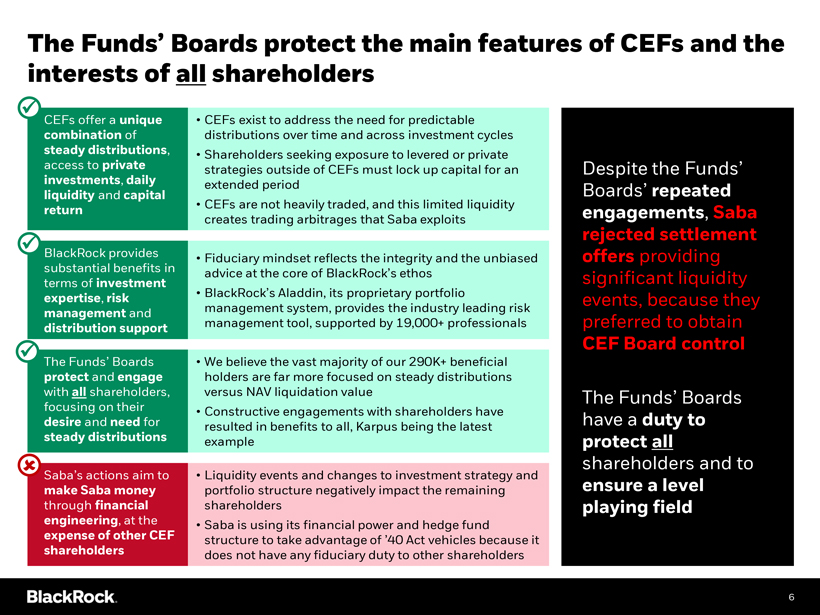
The Funds’ Boards protect the main features of CEFs and the interests of all shareholders
CEFs offer a unique combination of steady distributions, access to private investments, daily liquidity and capital return
CEFs exist to address the need for predictable distributions over time and across investment cycles
Shareholders seeking exposure to levered or private strategies outside of CEFs must lock up capital for an extended period
CEFs are not heavily traded, and this limited liquidity creates trading arbitrages that Saba exploits
BlackRock provides substantial benefits in terms of investment expertise, risk management and distribution support
Fiduciary mindset reflects the integrity and the unbiased advice at the core of BlackRock’s ethos
BlackRock’s Aladdin, its proprietary portfolio management system, provides the industry leading risk management tool, supported by 19,000+ professionals
The Funds’ Boards protect and engage with all shareholders, focusing on their desire and need for steady distributions
We believe the vast majority of our 290K+ beneficial holders are far more focused on steady distributions versus NAV liquidation value
Constructive engagements with shareholders have resulted in benefits to all, Karpus being the latest example
Saba’s actions aim to make Saba money through financial engineering, at the expense of other CEF shareholders
Liquidity events and changes to investment strategy and portfolio structure negatively impact the remaining shareholders
Saba is using its financial power and hedge fund structure to take advantage of ’40 Act vehicles because it does not have any fiduciary duty to other shareholders
Despite the Funds’ Boards’ repeated engagements, Saba rejected settlement offers providing significant liquidity events, because they preferred to obtain
CEF Board control
The Funds’ Boards have a duty to protect all shareholders and to ensure a level playing field
6
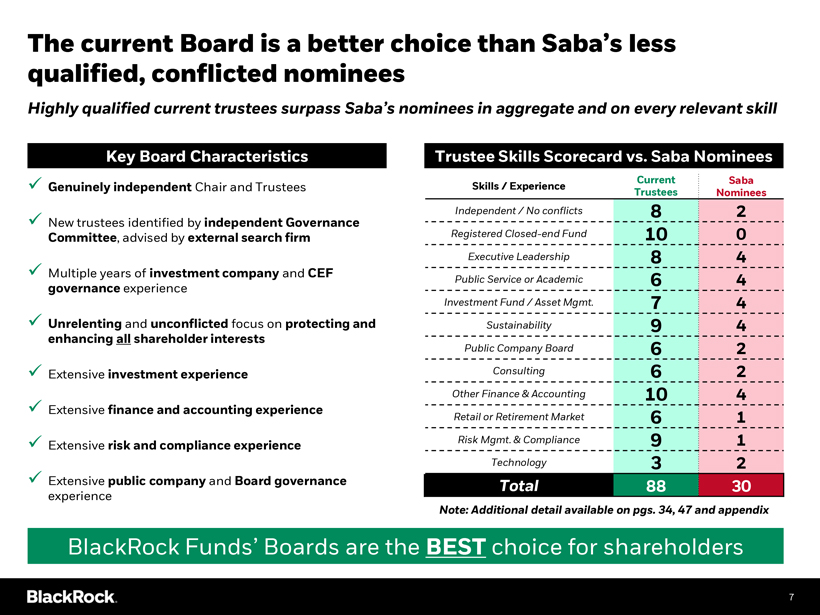
The current Board is a better choice than Saba’s less qualified, conflicted nominees
Highly qualified current trustees surpass Saba’s nominees in aggregate and on every relevant skill
Key Board Characteristics
Genuinely independent Chair and Trustees
New trustees identified by independent Governance
Committee, advised by external search firm
Multiple years of investment company and CEF governance experience
Unrelenting and unconflicted focus on protecting and enhancing all shareholder interests
Extensive investment experience
Extensive finance and accounting experience
Extensive risk and compliance experience
Extensive public company and Board governance experience
Trustee Skills Scorecard vs. Saba Nominees
Current Saba Skills / Experience Trustees Nominees
Independent / No conflicts 8 2 Registered Closed-end Fund 10 0 Executive Leadership 8 4 Public Service or Academic 6 4 Investment Fund / Asset Mgmt. 7 4 Sustainability 9 4 Public Company Board 6 2 Consulting 6 2 Other Finance & Accounting 10 4 Retail or Retirement Market 6 1 Risk Mgmt. & Compliance 9 1 Technology 3 2
Total 88 30
Note: Additional detail available on pgs. 34, 47 and appendix
BlackRock Funds’ Boards are the BEST choice for shareholders
7
The Funds’ Boards and management teams create value for all shareholders
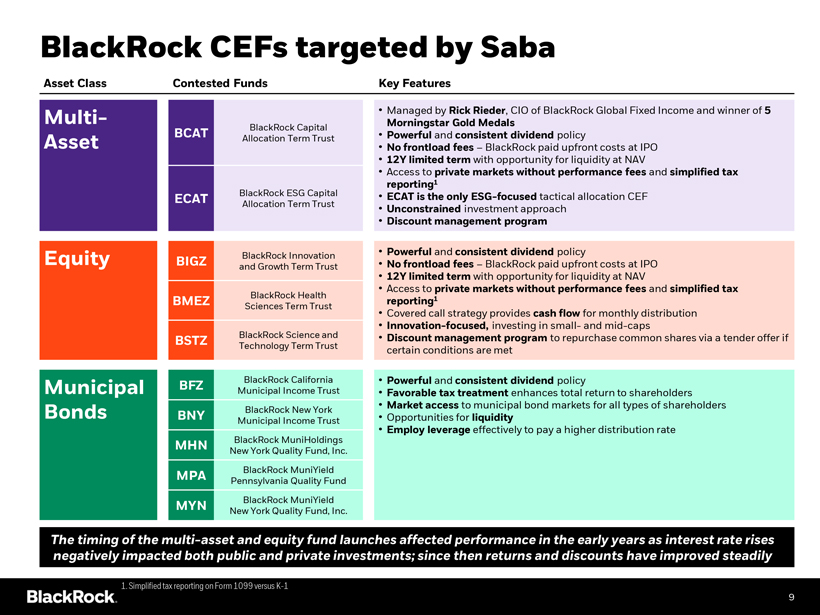
BlackRock CEFs targeted by Saba
Asset Class Contested Funds Key Features
Multi-
Asset
Equity
Municipal Bonds
BCAT
ECAT
BIGZ
BMEZ
BSTZ
BFZ
BNY
MHN
MPA
MYN
BlackRock Capital Allocation Term Trust
BlackRock ESG Capital Allocation Term Trust
BlackRock Innovation and Growth Term Trust
BlackRock Health Sciences Term Trust
BlackRock Science and Technology Term Trust
BlackRock California Municipal Income Trust
BlackRock New York Municipal Income Trust
BlackRock MuniHoldings New York Quality Fund, Inc.
BlackRock MuniYield Pennsylvania Quality Fund
BlackRock MuniYield New York Quality Fund, Inc.
Managed by Rick Rieder, CIO of BlackRock Global Fixed Income and winner of 5 Morningstar Gold Medals
Powerful and consistent dividend policy
No frontload fees – BlackRock paid upfront costs at IPO
12Y limited term with opportunity for liquidity at NAV
Access to private markets without performance fees and simplified tax reporting1
ECAT is the only ESG-focused tactical allocation CEF
Unconstrained investment approach
Discount management program
Powerful and consistent dividend policy
No frontload fees – BlackRock paid upfront costs at IPO
12Y limited term with opportunity for liquidity at NAV
Access to private markets without performance fees and simplified tax reporting1
Covered call strategy provides cash flow for monthly distribution
Innovation-focused, investing in small- and mid-caps
Discount management program to repurchase common shares via a tender offer if certain conditions are met
Powerful and consistent dividend policy
Favorable tax treatment enhances total return to shareholders
Market access to municipal bond markets for all types of shareholders
Opportunities for liquidity
Employ leverage effectively to pay a higher distribution rate
The timing of the multi-asset and equity fund launches affected performance in the early years as interest rate rises negatively impacted both public and private investments; since then returns and discounts have improved steadily
1. Simplified tax reporting on Form 1099 versus K-1
9
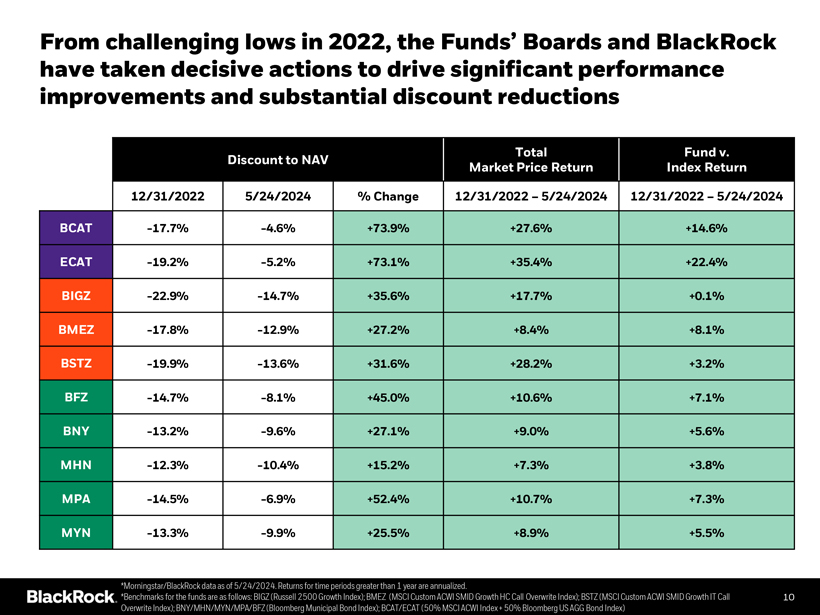
From challenging lows in 2022, the Funds’ Boards and BlackRock have taken decisive actions to drive significant performance improvements and substantial discount reductions
Discount to NAV
Total Market Price Return
Fund v. Index Return
12/31/2022
5/24/2024
% Change
12/31/2022 – 5/24/2024
12/31/2022 – 5/24/2024
BCAT -17.7% -4.6% +73.9% +27.6% +14.6% ECAT -19.2% -5.2% +73.1% +35.4% +22.4% BIGZ -22.9% -14.7% +35.6% +17.7% +0.1% BMEZ -17.8% -12.9% +27.2% +8.4% +8.1% BSTZ -19.9% -13.6% +31.6% +28.2% +3.2% BFZ -14.7% -8.1% +45.0% +10.6% +7.1% BNY -13.2% -9.6% +27.1% +9.0% +5.6% MHN -12.3% -10.4% +15.2% +7.3% +3.8% MPA -14.5% -6.9% +52.4% +10.7% +7.3% MYN -13.3% -9.9% +25.5% +8.9% +5.5%
*Morningstar/BlackRock data as of 5/24/2024. Returns for time periods greater than 1 year are annualized.
*Benchmarks for the funds are as follows: BIGZ (Russell 2500 Growth Index); BMEZ (MSCI Custom ACWI SMID Growth HC Call Overwrite Index); BSTZ (MSCI Custom ACWI SMID Growth IT Call 10 Overwrite Index); BNY/MHN/MYN/MPA/BFZ (Bloomberg Municipal Bond Index); BCAT/ECAT (50% MSCI ACWI Index + 50% Bloomberg US AGG Bond Index)

The Funds’ Boards and management have taken decisive steps to address the trading discounts
How does action help Multi-Asset Equity Municipal Bonds
Action taken reduce CEF discount? BCAT ECAT BIGZ BMEZ BSTZ BFZ BNY MHN MPA MYN
Inclusion in CEF index
Fund of funds agreement
Distribution rate increases
Managed / level-rate distribution plan
Open market share repurchase program
Discount management program
Limited term providing 100% liquidity at NAV
Events for financial advisors and end clients
Market insights and fund commentaries
Diligence materials and regular updates for CEF research analysts
Events for CEF research analysts and institutional investors
Increase CEF visibility/liquidity
Provides additional demand for CEFs
Increase payouts to shareholders
Enhances CEF yield stability
Repurchase CEF shares at discount
Repurchase up to 2.5% of CEF shares quarterly if trading at
>7.5% discount Liquidity at NAV
Increase CEF visibility and support shareholders
Increase CEF visibility and support shareholders
Keeps funds in good standing on platforms and increases visibility
Increase CEF visibility
Transparent and consistent information provided to CEF shareholders
Refer to appendix for additional detail on specific actions taken
11
BlackRock Capital Allocation Term Trust (BCAT)
Total Shareholder Return (TSR)
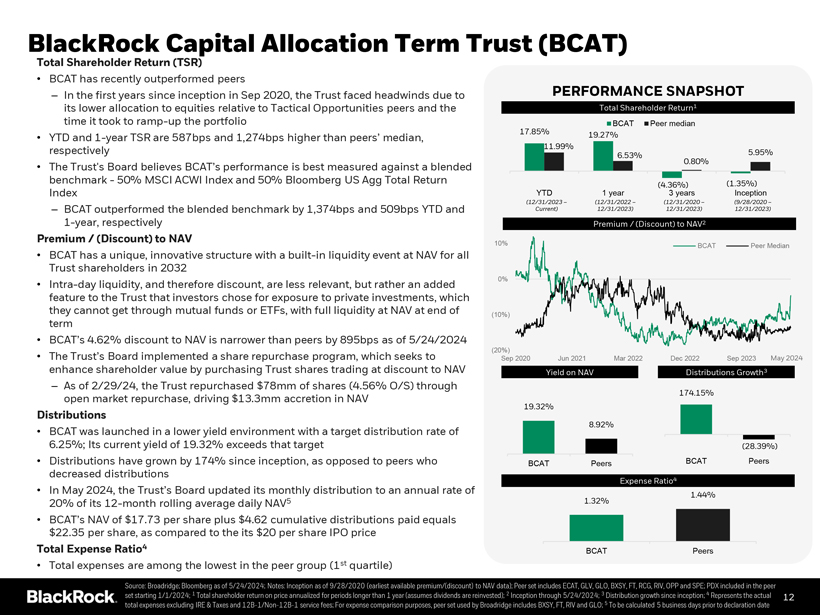
• BCAT has recently outperformed peers
– In the first years since inception in Sep 2020, the Trust faced headwinds due to its lower allocation to equities relative to Tactical Opportunities peers and the time it took to ramp-up the portfolio
• YTD and 1-year TSR are 587bps and 1,274bps higher than peers’ median, respectively
• The Trust’s Board believes BCAT’s performance is best measured against a blended benchmark—50% MSCI ACWI Index and 50% Bloomberg US Agg Total Return Index
– BCAT outperformed the blended benchmark by 1,374bps and 509bps YTD and
1-year, respectively
Premium / (Discount) to NAV
• BCAT has a unique, innovative structure with a built-in liquidity event at NAV for all Trust shareholders in 2032
• Intra-day liquidity, and therefore discount, are less relevant, but rather an added feature to the Trust that investors chose for exposure to private investments, which they cannot get through mutual funds or ETFs, with full liquidity at NAV at end of term
• BCAT’s 4.62% discount to NAV is narrower than peers by 895bps as of 5/24/2024
• The Trust’s Board implemented a share repurchase program, which seeks to enhance shareholder value by purchasing Trust shares trading at discount to NAV
– As of 2/29/24, the Trust repurchased $78mm of shares (4.56% O/S) through open market repurchase, driving $13.3mm accretion in NAV
Distributions
• BCAT was launched in a lower yield environment with a target distribution rate of
6.25%; Its current yield of 19.32% exceeds that target
• Distributions have grown by 174% since inception, as opposed to peers who decreased distributions
• In May 2024, the Trust’s Board updated its monthly distribution to an annual rate of
20% of its 12-month rolling average daily NAV5
• BCAT’s NAV of $17.73 per share plus $4.62 cumulative distributions paid equals
$22.35 per share, as compared to the its $20 per share IPO price
Total Expense Ratio4
• Total expenses are among the lowest in the peer group (1st quartile)
PERFORMANCE SNAPSHOT
Total Shareholder Return1
17.85% BCAT Peer median
19.27%
11.99%
6.53% 5.95%
0.80%
(4.36%) (1.35%)
YTD 1 year 3 years Inception
(12/31/2023 – (12/31/2022 – (12/31/2020 – (9/28/2020 –Current) 12/31/2023) 12/31/2023) 12/31/2023)
Premium / (Discount) to NAV2
10% BCAT Peer Median
0%
(10%)
(20%)
Sep 2020 Jun 2021 Mar 2022 Dec 2022 Sep 2023 May 2024
Yield on NAV Distributions Growth3
174.15%
19.32%
8.92%
(28.39%)
BCAT Peers BCAT Peers
Expense Ratio4
1.44%
1.32%
BCAT Peers
Source: Broadridge; Bloomberg as of 5/24/2024; Notes: Inception as of 9/28/2020 (earliest available premium/(discount) to NAV data); Peer set includes ECAT, GLV, GLO, BXSY, FT, RCG, RIV, OPP and SPE; PDX included in the peer set starting 1/1/2024; 1 Total shareholder return on price annualized for periods longer than 1 year (assumes dividends are reinvested); 2 Inception through 5/24/2024; 3 Distribution growth since inception; 4 Represents the actual 12 total expenses excluding IRE & Taxes and 12B-1/Non-12B-1 service fees; For expense comparison purposes, peer set used by Broadridge includes BXSY, FT, RIV and GLO; 5 To be calculated 5 business days prior to declaration date
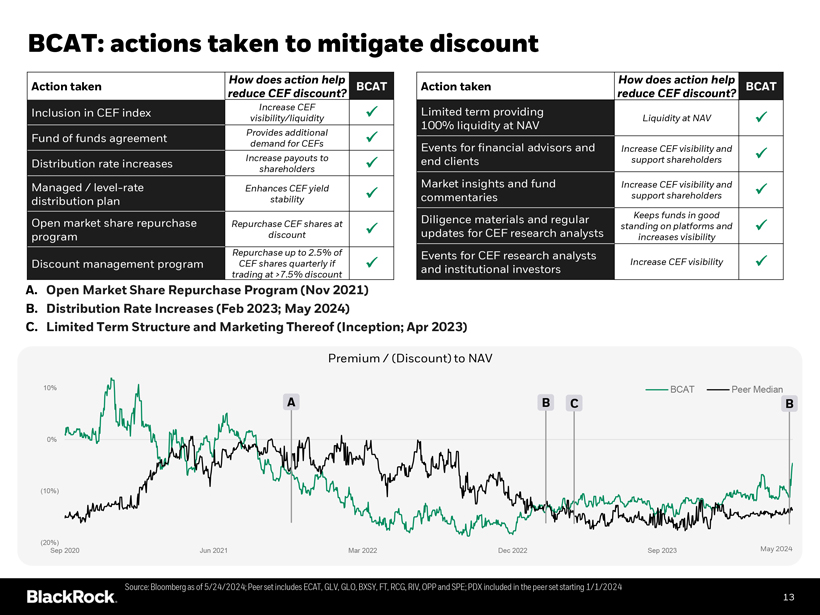
BCAT: actions taken to mitigate discount
How does action help
Action taken BCAT reduce CEF discount?
Inclusion in CEF index Increase CEF ? visibility/liquidity
Fund of funds agreement Provides additional ? demand for CEFs
Distribution rate increases Increase payouts to ? shareholders
Managed / level-rate Enhances CEF yield ? distribution plan stability Open market share repurchase Repurchase CEF shares at ? program discount Repurchase up to 2.5% of
Discount management program CEF shares quarterly if ? trading at >7.5% discount
How does action help
Action taken BCAT reduce CEF discount?
Limited term providing
Liquidity at NAV ?
100% liquidity at NAV
Events for financial advisors and Increase CEF visibility and ? end clients support shareholders
Market insights and fund Increase CEF visibility and ? commentaries support shareholders
Diligence materials and regular Keeps funds in good standing on platforms and ? updates for CEF research analysts increases visibility
Events for CEF research analysts
Increase CEF visibility ? and institutional investors
A. Open Market Share Repurchase Program (Nov 2021) B. Distribution Rate Increases (Feb 2023; May 2024)
C. Limited Term Structure and Marketing Thereof (Inception; Apr 2023)
Premium / (Discount) to NAV
BCAT Peer Median
Source: Bloomberg as of 5/24/2024; Peer set includes ECAT, GLV, GLO, BXSY, FT, RCG, RIV, OPP and SPE; PDX included in the peer set starting 1/1/2024
13
BlackRock ESG Capital Allocation Term Trust (ECAT)
Total Shareholder Return (TSR)
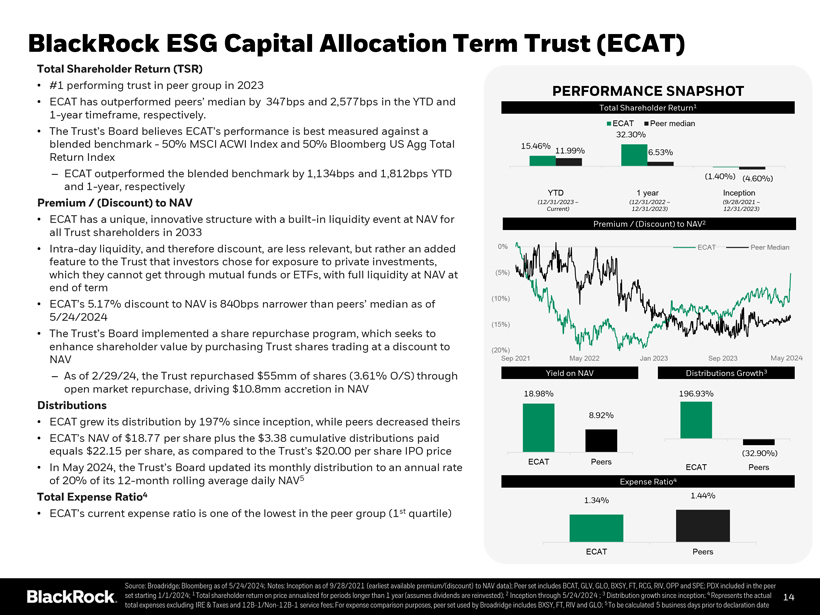
• #1 performing trust in peer group in 2023
• ECAT has outperformed peers’ median by 347bps and 2,577bps in the YTD and
1-year timeframe, respectively.
• The Trust’s Board believes ECAT’s performance is best measured against a blended benchmark—50% MSCI ACWI Index and 50% Bloomberg US Agg Total Return Index
– ECAT outperformed the blended benchmark by 1,134bps and 1,812bps YTD and 1-year, respectively
Premium / (Discount) to NAV
• ECAT has a unique, innovative structure with a built-in liquidity event at NAV for all Trust shareholders in 2033
• Intra-day liquidity, and therefore discount, are less relevant, but rather an added feature to the Trust that investors chose for exposure to private investments, which they cannot get through mutual funds or ETFs, with full liquidity at NAV at end of term
• ECAT’s 5.17% discount to NAV is 840bps narrower than peers’ median as of
5/24/2024
• The Trust’s Board implemented a share repurchase program, which seeks to enhance shareholder value by purchasing Trust shares trading at a discount to NAV
– As of 2/29/24, the Trust repurchased $55mm of shares (3.61% O/S) through open market repurchase, driving $10.8mm accretion in NAV
Distributions
• ECAT grew its distribution by 197% since inception, while peers decreased theirs
• ECAT’s NAV of $18.77 per share plus the $3.38 cumulative distributions paid equals $22.15 per share, as compared to the Trust’s $20.00 per share IPO price
• In May 2024, the Trust’s Board updated its monthly distribution to an annual rate of 20% of its 12-month rolling average daily NAV5
Total Expense Ratio4
• ECAT’s current expense ratio is one of the lowest in the peer group (1st quartile)
PERFORMANCE SNAPSHOT
Total Shareholder Return1
ECAT Peer median
32.30%
15.46%
11.99% 6.53%
(1.40%) (4.60%)
YTD 1 year Inception
(12/31/2023 – (12/31/2022 – (9/28/2021 –Current) 12/31/2023) 12/31/2023)
Premium / (Discount) to NAV2
0% ECAT Peer Median (5%) (10%) (15%)
(20%)
Sep 2021 May 2022 Jan 2023 Sep 2023 May 2024
Yield on NAV Distributions Growth3
18.98% 196.93%
8.92%
(32.90%)
ECAT Peers
ECAT Peers
Expense Ratio4
1.44%
1.34%
ECAT Peers
Source: Broadridge; Bloomberg as of 5/24/2024; Notes: Inception as of 9/28/2021 (earliest available premium/(discount) to NAV data); Peer set includes BCAT, GLV, GLO, BXSY, FT, RCG, RIV, OPP and SPE; PDX included in the peer set starting 1/1/2024; 1 Total shareholder return on price annualized for periods longer than 1 year (assumes dividends are reinvested); 2 Inception through 5/24/2024 ; 3 Distribution growth since inception; 4 Represents the actual 14 total expenses excluding IRE & Taxes and 12B-1/Non-12B-1 service fees; For expense comparison purposes, peer set used by Broadridge includes BXSY, FT, RIV and GLO; 5 To be calculated 5 business days prior to declaration date
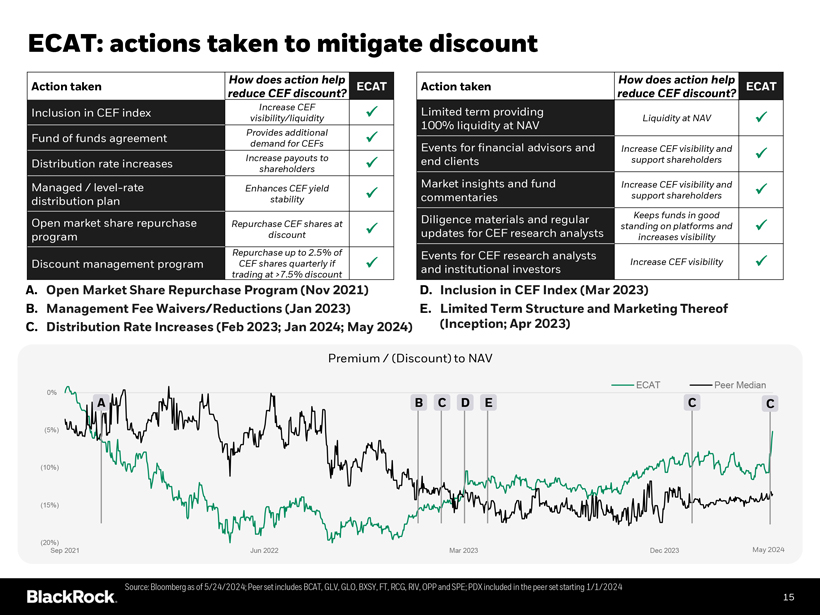
ECAT: actions taken to mitigate discount
How does action help
Action taken reduce CEF discount?
Inclusion in CEF index Increase CEF visibility/liquidity
Fund of funds agreement Provides additional demand for CEFs
Distribution rate increases Increase payouts to shareholders
Managed / level-rate Enhances CEF yield distribution plan stability Open market share repurchase Repurchase CEF shares at program discount Repurchase up to 2.5% of
Discount management program CEF shares quarterly if trading at >7.5% discount
ECAT
How does action help
Action taken reduce CEF discount?
Limited term providing
Liquidity at NAV
100% liquidity at NAV
Events for financial advisors and Increase CEF visibility and end clients support shareholders
Market insights and fund Increase CEF visibility and commentaries support shareholders
Diligence materials and regular Keeps funds in good standing on platforms and updates for CEF research analysts increases visibility
Events for CEF research analysts
Increase CEF visibility and institutional investors
ECAT
A. Open Market Share Repurchase Program (Nov 2021)
B. Management Fee Waivers/Reductions (Jan 2023)
C. Distribution Rate Increases (Feb 2023; Jan 2024; May 2024)
D. Inclusion in CEF Index (Mar 2023)
E. Limited Term Structure and Marketing Thereof (Inception; Apr 2023)
Premium / (Discount) to NAV
Source: Bloomberg as of 5/24/2024; Peer set includes BCAT, GLV, GLO, BXSY, FT, RCG, RIV, OPP and SPE; PDX included in the peer set starting 1/1/2024
15
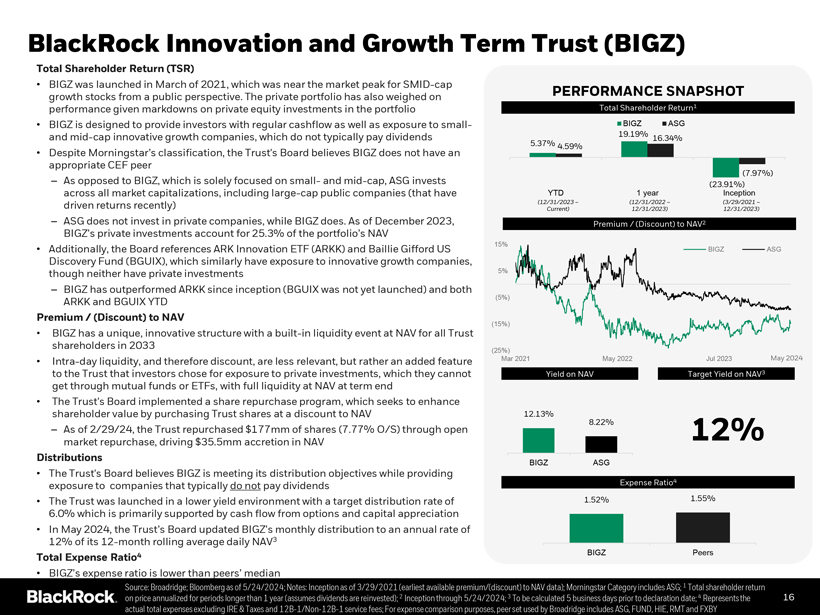
BlackRock Innovation and Growth Term Trust (BIGZ)
Total Shareholder Return (TSR)
• BIGZ was launched in March of 2021, which was near the market peak for SMID-cap growth stocks from a public perspective. The private portfolio has also weighed on performance given markdowns on private equity investments in the portfolio
• BIGZ is designed to provide investors with regular cashflow as well as exposure to small-and mid-cap innovative growth companies, which do not typically pay dividends
• Despite Morningstar’s classification, the Trust’s Board believes BIGZ does not have an appropriate CEF peer
– As opposed to BIGZ, which is solely focused on small- and mid-cap, ASG invests across all market capitalizations, including large-cap public companies (that have driven returns recently)
– ASG does not invest in private companies, while BIGZ does. As of December 2023,
BIGZ’s private investments account for 25.3% of the portfolio’s NAV
• Additionally, the Board references ARK Innovation ETF (ARKK) and Baillie Gifford US Discovery Fund (BGUIX), which similarly have exposure to innovative growth companies, though neither have private investments
– BIGZ has outperformed ARKK since inception (BGUIX was not yet launched) and both ARKK and BGUIX YTD
Premium / (Discount) to NAV
• BIGZ has a unique, innovative structure with a built-in liquidity event at NAV for all Trust shareholders in 2033
• Intra-day liquidity, and therefore discount, are less relevant, but rather an added feature to the Trust that investors chose for exposure to private investments, which they cannot get through mutual funds or ETFs, with full liquidity at NAV at term end
• The Trust’s Board implemented a share repurchase program, which seeks to enhance shareholder value by purchasing Trust shares at a discount to NAV
– As of 2/29/24, the Trust repurchased $177mm of shares (7.77% O/S) through open market repurchase, driving $35.5mm accretion in NAV
Distributions
• The Trust’s Board believes BIGZ is meeting its distribution objectives while providing exposure to companies that typically do not pay dividends
• The Trust was launched in a lower yield environment with a target distribution rate of
6.0% which is primarily supported by cash flow from options and capital appreciation
• In May 2024, the Trust’s Board updated BIGZ’s monthly distribution to an annual rate of
12% of its 12-month rolling average daily NAV3
Total Expense Ratio4
• BIGZ’s expense ratio is lower than peers’ median
PERFORMANCE SNAPSHOT
Total Shareholder Return1
BIGZ ASG
19.19%
16.34%
5.37% 4.59%
(7.97%) (23.91%)
YTD 1 year Inception
(12/31/2023 – (12/31/2022 – (3/29/2021 –Current) 12/31/2023) 12/31/2023)
Premium / (Discount) to NAV2
15%
BIGZ ASG 5% (5%) (15%)
(25%)
Mar 2021 May 2022 Jul 2023 May 2024
Yield on NAV Target Yield on NAV3
12.13% 8.22% 12%
BIGZ ASG
Expense Ratio4
1.52% 1.55%
BIGZ Peers
Source: Broadridge; Bloomberg as of 5/24/2024; Notes: Inception as of 3/29/2021 (earliest available premium/(discount) to NAV data); Morningstar Category includes ASG; 1 Total shareholder return on price annualized for periods longer than 1 year (assumes dividends are reinvested); 2 Inception through 5/24/2024; 3 To be calculated 5 business days prior to declaration date; 4 Represents the actual total expenses excluding IRE & Taxes and 12B-1/Non-12B-1 service fees; For expense comparison purposes, peer set used by Broadridge includes ASG, FUND, HIE, RMT and FXBY
16
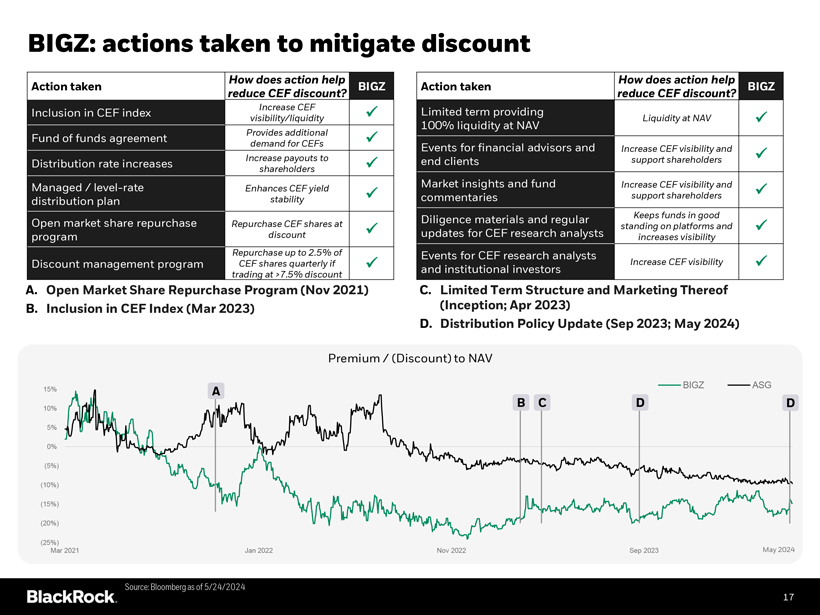
BIGZ: actions taken to mitigate discount
How does action help
Action taken reduce CEF discount?
Inclusion in CEF index Increase CEF visibility/liquidity
Fund of funds agreement Provides additional demand for CEFs
Distribution rate increases Increase payouts to shareholders
Managed / level-rate Enhances CEF yield distribution plan stability Open market share repurchase Repurchase CEF shares at program discount Repurchase up to 2.5% of
Discount management program CEF shares quarterly if trading at >7.5% discount
BIGZ
How does action help
Action taken reduce CEF discount?
Limited term providing
Liquidity at NAV
100% liquidity at NAV
Events for financial advisors and Increase CEF visibility and end clients support shareholders
Market insights and fund Increase CEF visibility and commentaries support shareholders
Diligence materials and regular Keeps funds in good standing on platforms and updates for CEF research analysts increases visibility
Events for CEF research analysts
Increase CEF visibility and institutional investors
BIGZ
A. Open Market Share Repurchase Program (Nov 2021)
B. Inclusion in CEF Index (Mar 2023)
C. Limited Term Structure and Marketing Thereof (Inception; Apr 2023)
D. Distribution Policy Update (Sep 2023; May 2024)
Premium / (Discount) to NAV
Source: Bloomberg as of 5/24/2024
17
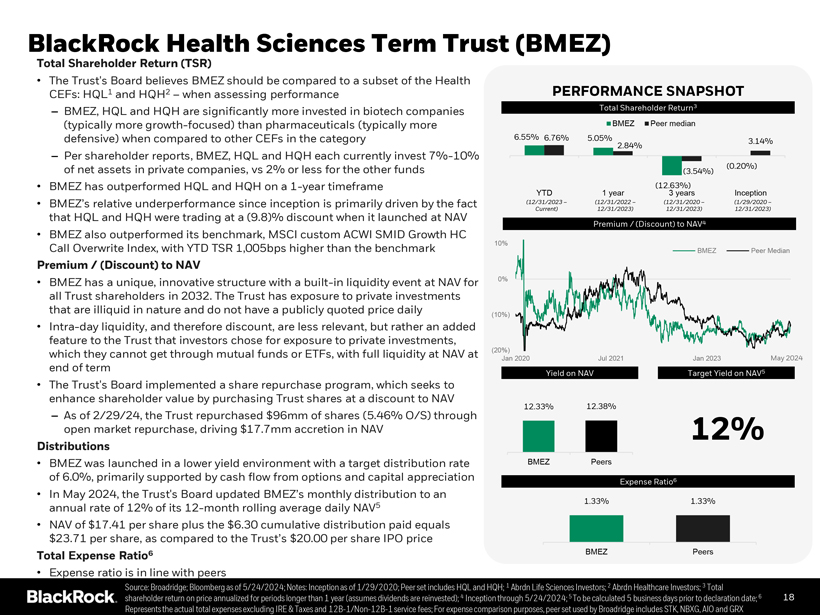
BlackRock Health Sciences Term Trust (BMEZ)
Total Shareholder Return (TSR)
• The Trust’s Board believes BMEZ should be compared to a subset of the Health CEFs: HQL1 and HQH2 – when assessing performance
– BMEZ, HQL and HQH are significantly more invested in biotech companies (typically more growth-focused) than pharmaceuticals (typically more defensive) when compared to other CEFs in the category
– Per shareholder reports, BMEZ, HQL and HQH each currently invest 7%-10% of net assets in private companies, vs 2% or less for the other funds
• BMEZ has outperformed HQL and HQH on a 1-year timeframe
• BMEZ’s relative underperformance since inception is primarily driven by the fact that HQL and HQH were trading at a (9.8)% discount when it launched at NAV
• BMEZ also outperformed its benchmark, MSCI custom ACWI SMID Growth HC Call Overwrite Index, with YTD TSR 1,005bps higher than the benchmark
Premium / (Discount) to NAV
• BMEZ has a unique, innovative structure with a built-in liquidity event at NAV for all Trust shareholders in 2032. The Trust has exposure to private investments that are illiquid in nature and do not have a publicly quoted price daily
• Intra-day liquidity, and therefore discount, are less relevant, but rather an added feature to the Trust that investors chose for exposure to private investments, which they cannot get through mutual funds or ETFs, with full liquidity at NAV at end of term
• The Trust’s Board implemented a share repurchase program, which seeks to enhance shareholder value by purchasing Trust shares at a discount to NAV
– As of 2/29/24, the Trust repurchased $96mm of shares (5.46% O/S) through open market repurchase, driving $17.7mm accretion in NAV
Distributions
• BMEZ was launched in a lower yield environment with a target distribution rate of 6.0%, primarily supported by cash flow from options and capital appreciation
• In May 2024, the Trust’s Board updated BMEZ’s monthly distribution to an annual rate of 12% of its 12-month rolling average daily NAV5
• NAV of $17.41 per share plus the $6.30 cumulative distribution paid equals
$23.71 per share, as compared to the Trust’s $20.00 per share IPO price
Total Expense Ratio6
• Expense ratio is in line with peers
PERFORMANCE SNAPSHOT
Total Shareholder Return3
BMEZ Peer median
6.55% 6.76% 5.05%
3.14%
2.84%
(0.20%)
(3.54%)
YTD 1 year (12.3 63%) years Inception
(12/31/2023 – (12/31/2022 – (12/31/2020 – (1/29/2020 –Current) 12/31/2023) 12/31/2023) 12/31/2023)
Premium / (Discount) to NAV4
10%
BMEZ Peer Median 0% (10%)
(20%)
Jan 2020 Jul 2021 Jan 2023 May 2024
Yield on NAV Target Yield on NAV5
12.33% 12.38% 12%
BMEZ Peers
Expense Ratio6
1.33% 1.33%
BMEZ Peers
Source: Broadridge; Bloomberg as of 5/24/2024; Notes: Inception as of 1/29/2020; Peer set includes HQL and HQH; 1 Abrdn Life Sciences Investors; 2 Abrdn Healthcare Investors; 3 Total shareholder return on price annualized for periods longer than 1 year (assumes dividends are reinvested); 4 Inception through 5/24/2024; 5 To be calculated 5 business days prior to declaration date; 6 Represents the actual total expenses excluding IRE & Taxes and 12B-1/Non-12B-1 service fees; For expense comparison purposes, peer set used by Broadridge includes STK, NBXG, AIO and GRX
18
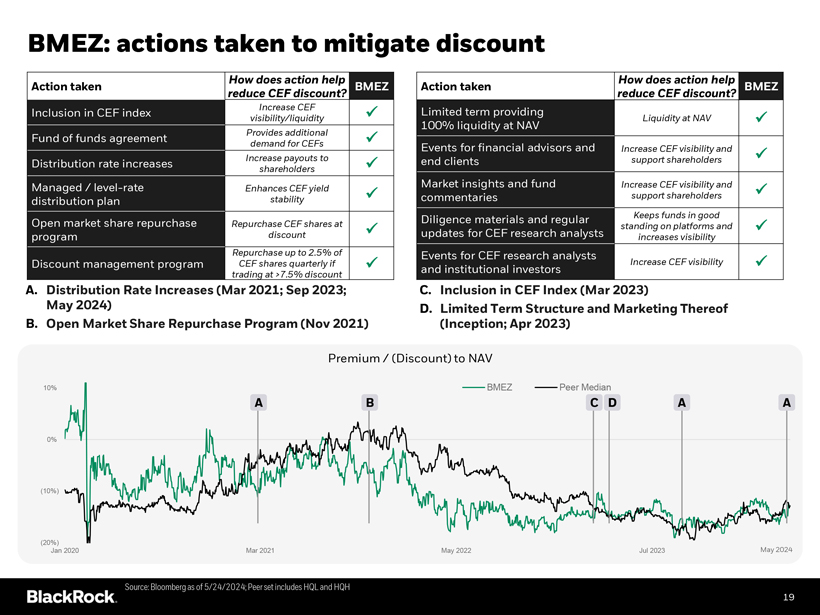
BMEZ: actions taken to mitigate discount
How does action help
Action taken reduce CEF discount?
Inclusion in CEF index Increase CEF visibility/liquidity
Fund of funds agreement Provides additional demand for CEFs
Distribution rate increases Increase payouts to shareholders
Managed / level-rate Enhances CEF yield distribution plan stability Open market share repurchase Repurchase CEF shares at program discount Repurchase up to 2.5% of
Discount management program CEF shares quarterly if trading at >7.5% discount
BMEZ
How does action help
Action taken reduce CEF discount?
Limited term providing
Liquidity at NAV
100% liquidity at NAV
Events for financial advisors and Increase CEF visibility and end clients support shareholders
Market insights and fund Increase CEF visibility and commentaries support shareholders
Diligence materials and regular Keeps funds in good standing on platforms and updates for CEF research analysts increases visibility Events for CEF research analysts
Increase CEF visibility and institutional investors
BMEZ
A. Distribution Rate Increases (Mar 2021; Sep 2023; May 2024)
B. Open Market Share Repurchase Program (Nov 2021)
C. Inclusion in CEF Index (Mar 2023)
D. Limited Term Structure and Marketing Thereof (Inception; Apr 2023)
Premium / (Discount) to NAV
Source: Bloomberg as of 5/24/2024; Peer set includes HQL and HQH
19
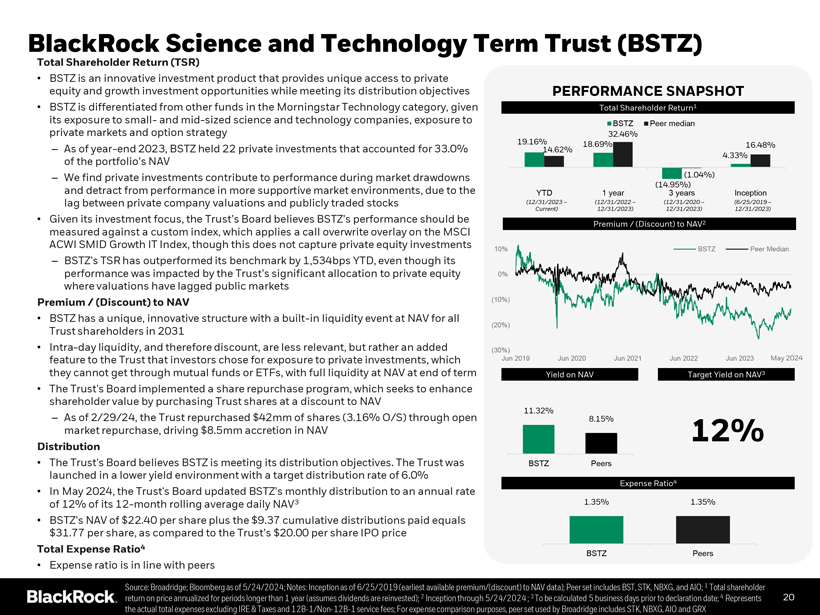
BlackRock Science and Technology Term Trust (BSTZ)
Total Shareholder Return (TSR)
• BSTZ is an innovative investment product that provides unique access to private equity and growth investment opportunities while meeting its distribution objectives
• BSTZ is differentiated from other funds in the Morningstar Technology category, given its exposure to small- and mid-sized science and technology companies, exposure to private markets and option strategy
– As of year-end 2023, BSTZ held 22 private investments that accounted for 33.0% of the portfolio’s NAV
– We find private investments contribute to performance during market drawdowns and detract from performance in more supportive market environments, due to the lag between private company valuations and publicly traded stocks
• Given its investment focus, the Trust’s Board believes BSTZ’s performance should be measured against a custom index, which applies a call overwrite overlay on the MSCI
ACWI SMID Growth IT Index, though this does not capture private equity investments
– BSTZ’s TSR has outperformed its benchmark by 1,534bps YTD, even though its performance was impacted by the Trust’s significant allocation to private equity where valuations have lagged public markets
Premium / (Discount) to NAV
• BSTZ has a unique, innovative structure with a built-in liquidity event at NAV for all Trust shareholders in 2031
• Intra-day liquidity, and therefore discount, are less relevant, but rather an added feature to the Trust that investors chose for exposure to private investments, which they cannot get through mutual funds or ETFs, with full liquidity at NAV at end of term
• The Trust’s Board implemented a share repurchase program, which seeks to enhance shareholder value by purchasing Trust shares at a discount to NAV
– As of 2/29/24, the Trust repurchased $42mm of shares (3.16% O/S) through open market repurchase, driving $8.5mm accretion in NAV
Distribution
• The Trust’s Board believes BSTZ is meeting its distribution objectives. The Trust was launched in a lower yield environment with a target distribution rate of 6.0%
• In May 2024, the Trust’s Board updated BSTZ’s monthly distribution to an annual rate of 12% of its 12-month rolling average daily NAV3
• BSTZ’s NAV of $22.40 per share plus the $9.37 cumulative distributions paid equals
$31.77 per share, as compared to the Trust’s $20.00 per share IPO price
Total Expense Ratio4
• Expense ratio is in line with peers
PERFORMANCE SNAPSHOT
Total Shareholder Return1
BSTZ Peer median
19.16% 32.46%
18.69% 16.48%
14.62%
4.33%
(1.04%) (14.95%)
YTD 1 year 3 years Inception
(12/31/2023 – (12/31/2022 – (12/31/2020 – (6/25/2019 –Current) 12/31/2023) 12/31/2023) 12/31/2023)
Premium / (Discount) to NAV2
10% BSTZ Peer Median 0% (10%) (20%)
(30%)
Jun 2019 Jun 2020 Jun 2021 Jun 2022 Jun 2023 May 2024
Yield on NAV Target Yield on NAV3
11.32% 8.15%
12%
BSTZ Peers
Expense Ratio4
1.35% 1.35%
BSTZ Peers
Source: Broadridge; Bloomberg as of 5/24/2024; Notes: Inception as of 6/25/2019 (earliest available premium/(discount) to NAV data); Peer set includes BST, STK, NBXG, and AIO; 1 Total shareholder return on price annualized for periods longer than 1 year (assumes dividends are reinvested); 2 Inception through 5/24/2024 ; 3 To be calculated 5 business days prior to declaration date; 4 Represents the actual total expenses excluding IRE & Taxes and 12B-1/Non-12B-1 service fees; For expense comparison purposes, peer set used by Broadridge includes STK, NBXG, AIO and GRX
20
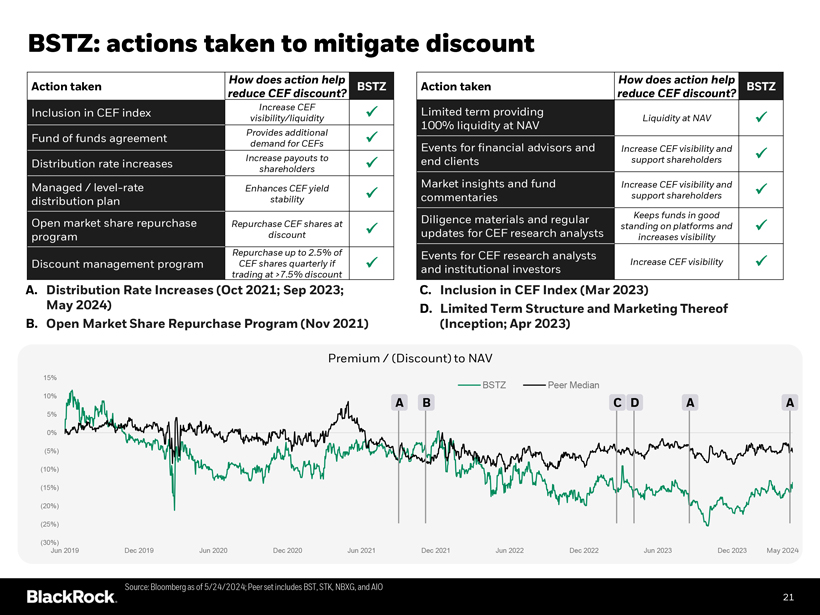
BSTZ: actions taken to mitigate discount
How does action help
Action taken reduce CEF discount?
Inclusion in CEF index Increase CEF visibility/liquidity
Fund of funds agreement Provides additional demand for CEFs
Distribution rate increases Increase payouts to shareholders
Managed / level-rate Enhances CEF yield distribution plan stability Open market share repurchase Repurchase CEF shares at program discount Repurchase up to 2.5% of
Discount management program CEF shares quarterly if trading at >7.5% discount
BSTZ
How does action help
Action taken reduce CEF discount?
Limited term providing
Liquidity at NAV
100% liquidity at NAV
Events for financial advisors and Increase CEF visibility and end clients support shareholders
Market insights and fund Increase CEF visibility and commentaries support shareholders
Diligence materials and regular Keeps funds in good standing on platforms and updates for CEF research analysts increases visibility
Events for CEF research analysts
Increase CEF visibility and institutional investors
BSTZ
A. Distribution Rate Increases (Oct 2021; Sep 2023; May 2024)
B. Open Market Share Repurchase Program (Nov 2021)
C. Inclusion in CEF Index (Mar 2023)
D. Limited Term Structure and Marketing Thereof (Inception; Apr 2023)
Source: Bloomberg as of 5/24/2024; Peer set includes BST, STK, NBXG, and AIO
21
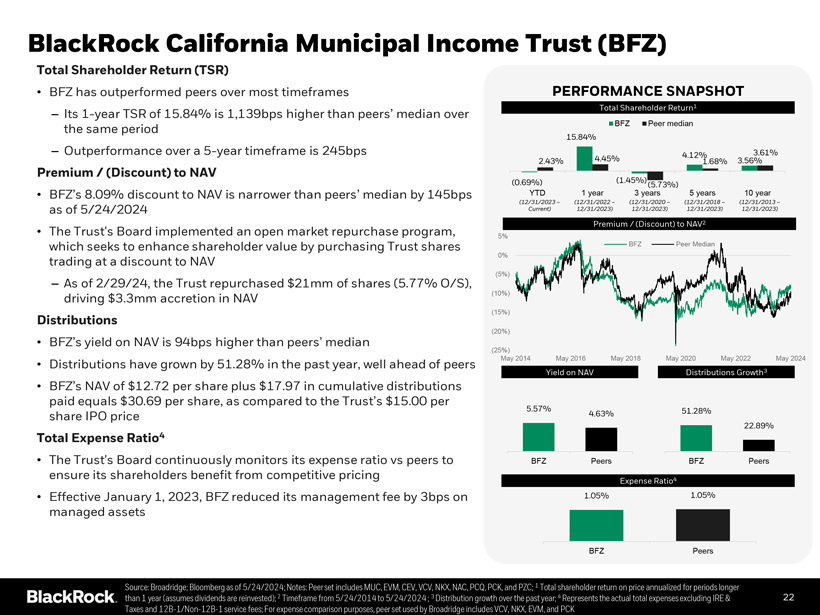
BlackRock California Municipal Income Trust (BFZ)
Total Shareholder Return (TSR)
• BFZ has outperformed peers over most timeframes
– Its 1-year TSR of 15.84% is 1,139bps higher than peers’ median over the same period
– Outperformance over a 5-year timeframe is 245bps
Premium / (Discount) to NAV
• BFZ’s 8.09% discount to NAV is narrower than peers’ median by 145bps as of 5/24/2024
• The Trust’s Board implemented an open market repurchase program, which seeks to enhance shareholder value by purchasing Trust shares trading at a discount to NAV
– As of 2/29/24, the Trust repurchased $21mm of shares (5.77% O/S), driving $3.3mm accretion in NAV
Distributions
• BFZ’s yield on NAV is 94bps higher than peers’ median
• Distributions have grown by 51.28% in the past year, well ahead of peers
• BFZ’s NAV of $12.72 per share plus $17.97 in cumulative distributions paid equals $30.69 per share, as compared to the Trust’s $15.00 per share IPO price
Total Expense Ratio4
• The Trust’s Board continuously monitors its expense ratio vs peers to ensure its shareholders benefit from competitive pricing
• Effective January 1, 2023, BFZ reduced its management fee by 3bps on managed assets
PERFORMANCE SNAPSHOT
Total Shareholder Return1
BFZ Peer median
15.84%
4.12% 3.61%
2.43% 4.45% 1.68% 3.56%
(0.69%) (1.45%)
(5.73%)
YTD 1 year 3 years 5 years 10 year
(12/31/2023 – (12/31/2022 – (12/31/2020 – (12/31/2018 – (12/31/2013 –Current) 12/31/2023) 12/31/2023) 12/31/2023) 12/31/2023)
Premium / (Discount) to NAV2
5%
BFZ Peer Median 0%
(5%) (10%) (15%) (20%)
(25%)
May 2014 May 2016 May 2018 May 2020 May 2022 May 2024
Yield on NAV Distributions Growth3
5.57% 51.28%
4.63%
22.89%
BFZ Peers BFZ Peers
Expense Ratio4
1.05% 1.05%
BFZ Peers
Source: Broadridge; Bloomberg as of 5/24/2024; Notes: Peer set includes MUC, EVM, CEV, VCV, NKX, NAC, PCQ, PCK, and PZC; 1 Total shareholder return on price annualized for periods longer than 1 year (assumes dividends are reinvested); 2 Timeframe from 5/24/2014 to 5/24/2024 ; 3 Distribution growth over the past year; 4 Represents the actual total expenses excluding IRE & Taxes and 12B-1/Non-12B-1 service fees; For expense comparison purposes, peer set used by Broadridge includes VCV, NKX, EVM, and PCK
22
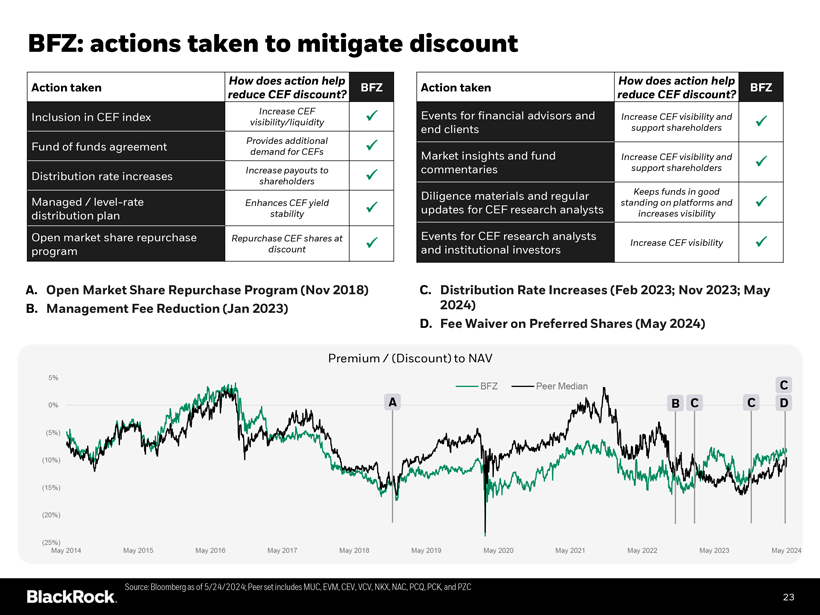
BFZ: actions taken to mitigate discount
How does action help
Action taken reduce CEF discount?
Inclusion in CEF index Increase CEF visibility/liquidity
Fund of funds agreement Provides additional demand for CEFs
Distribution rate increases Increase payouts to shareholders
Managed / level-rate Enhances CEF yield distribution plan stability Open market share repurchase Repurchase CEF shares at program discount
BFZ
How does action help
Action taken reduce CEF discount?
Events for financial advisors and Increase CEF visibility and end clients support shareholders
Market insights and fund Increase CEF visibility and commentaries support shareholders
Diligence materials and regular Keeps funds in good standing on platforms and updates for CEF research analysts increases visibility Events for CEF research analysts
Increase CEF visibility and institutional investors
BFZ
A. Open Market Share Repurchase Program (Nov 2018)
B. Management Fee Reduction (Jan 2023)
C. Distribution Rate Increases (Feb 2023; Nov 2023; May 2024)
D. Fee Waiver on Preferred Shares (May 2024)
Premium / (Discount) to NAV
Source: Bloomberg as of 5/24/2024; Peer set includes MUC, EVM, CEV, VCV, NKX, NAC, PCQ, PCK, and PZC
23
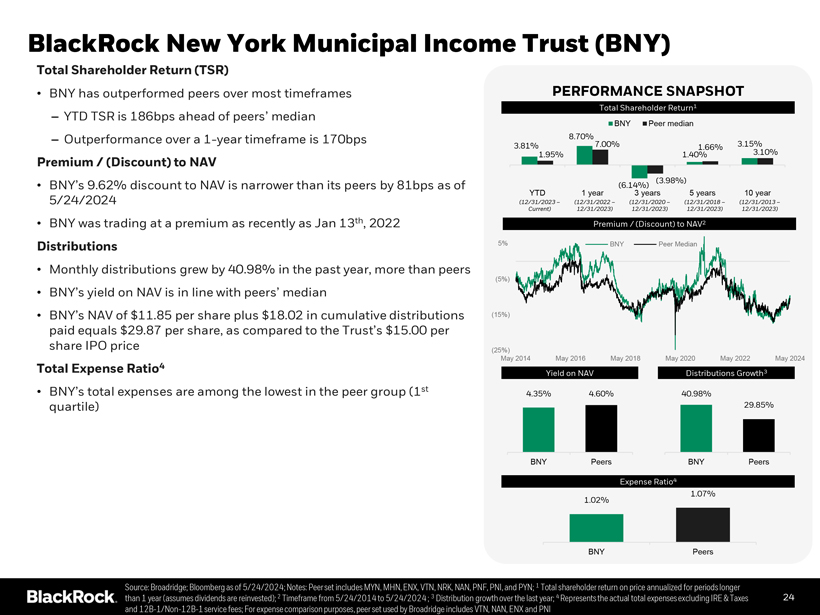
BlackRock New York Municipal Income Trust (BNY)
Total Shareholder Return (TSR)
• BNY has outperformed peers over most timeframes
– YTD TSR is 186bps ahead of peers’ median
– Outperformance over a 1-year timeframe is 170bps
Premium / (Discount) to NAV
• BNY’s 9.62% discount to NAV is narrower than its peers by 81bps as of
5/24/2024
• BNY was trading at a premium as recently as Jan 13th, 2022
Distributions
• Monthly distributions grew by 40.98% in the past year, more than peers
• BNY’s yield on NAV is in line with peers’ median
• BNY’s NAV of $11.85 per share plus $18.02 in cumulative distributions paid equals $29.87 per share, as compared to the Trust’s $15.00 per share IPO price
Total Expense Ratio4
• BNY’s total expenses are among the lowest in the peer group (1st quartile)
PERFORMANCE SNAPSHOT
Total Shareholder Return1
BNY Peer median
8.70% 7.00% 3.15%
3.81% 1.66%
1.95% 1.40% 3.10%
(3.98%)
(6.14%)
YTD 1 year 3 years 5 years 10 year
(12/31/2023 – (12/31/2022 – (12/31/2020 – (12/31/2018 – (12/31/2013 –Current) 12/31/2023) 12/31/2023) 12/31/2023) 12/31/2023)
Premium / (Discount) to NAV2
5% BNY Peer Median (5%) (15%)
(25%)
May 2014 May 2016 May 2018 May 2020 May 2022 May 2024
Yield on NAV Distributions Growth3
4.35% 4.60% 40.98%
29.85%
BNY Peers BNY Peers
Expense Ratio4
1.07%
1.02%
BNY Peers
Source: Broadridge; Bloomberg as of 5/24/2024; Notes: Peer set includes MYN, MHN, ENX, VTN, NRK, NAN, PNF, PNI, and PYN; 1 Total shareholder return on price annualized for periods longer than 1 year (assumes dividends are reinvested); 2 Timeframe from 5/24/2014 to 5/24/2024 ; 3 Distribution growth over the last year; 4 Represents the actual total expenses excluding IRE & Taxes and 12B-1/Non-12B-1 service fees; For expense comparison purposes, peer set used by Broadridge includes VTN, NAN, ENX and PNI
24
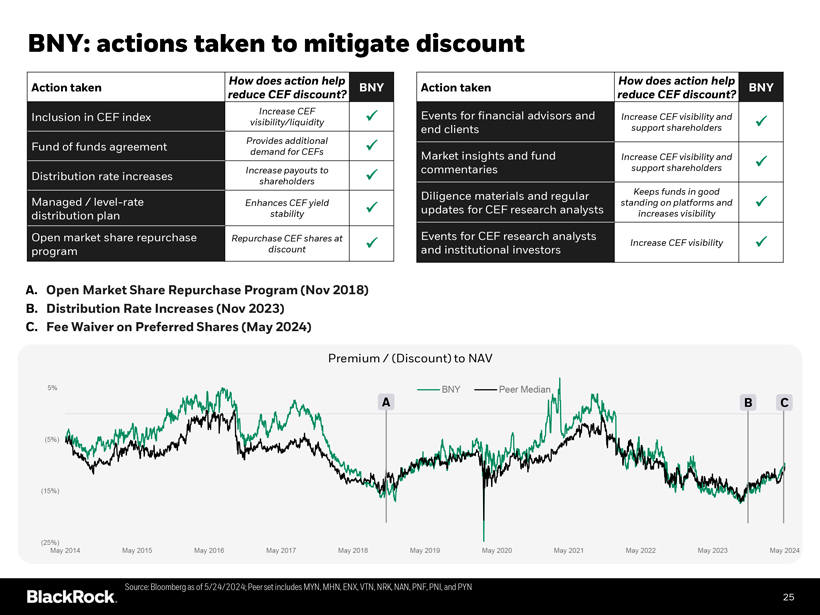
BNY: actions taken to mitigate discount
How does action help
Action taken BNY reduce CEF discount?
Inclusion in CEF index Increase CEF ? visibility/liquidity
Fund of funds agreement Provides additional ? demand for CEFs
Distribution rate increases Increase payouts to ? shareholders
Managed / level-rate Enhances CEF yield ? distribution plan stability Open market share repurchase Repurchase CEF shares at ? program discount
How does action help
Action taken BNY reduce CEF discount?
Events for financial advisors and Increase CEF visibility and ? end clients support shareholders
Market insights and fund Increase CEF visibility and ? commentaries support shareholders
Diligence materials and regular Keeps funds in good standing on platforms and ? updates for CEF research analysts increases visibility Events for CEF research analysts
Increase CEF visibility ? and institutional investors
A. Open Market Share Repurchase Program (Nov 2018) B. Distribution Rate Increases (Nov 2023) C. Fee Waiver on Preferred Shares (May 2024)
Premium / (Discount) to NAV
Source: Bloomberg as of 5/24/2024; Peer set includes MYN, MHN, ENX, VTN, NRK, NAN, PNF, PNI, and PYN
25
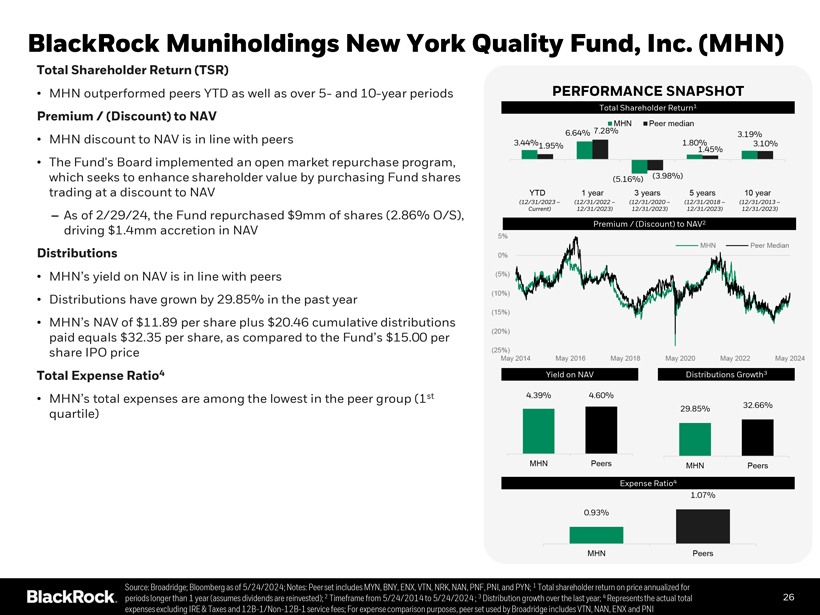
BlackRock Muniholdings New York Quality Fund, Inc. (MHN)
Total Shareholder Return (TSR)
• MHN outperformed peers YTD as well as over 5- and 10-year periods
Premium / (Discount) to NAV
• MHN discount to NAV is in line with peers
• The Fund’s Board implemented an open market repurchase program, which seeks to enhance shareholder value by purchasing Fund shares trading at a discount to NAV
– As of 2/29/24, the Fund repurchased $9mm of shares (2.86% O/S), driving $1.4mm accretion in NAV
Distributions
• MHN’s yield on NAV is in line with peers
• Distributions have grown by 29.85% in the past year
• MHN’s NAV of $11.89 per share plus $20.46 cumulative distributions paid equals $32.35 per share, as compared to the Fund’s $15.00 per share IPO price
Total Expense Ratio4
• MHN’s total expenses are among the lowest in the peer group (1st quartile)
PERFORMANCE SNAPSHOT
Total Shareholder Return1
7.28% MHN Peer median
6.64% 3.19%
3.44%1.95% 1.80% 3.10%
1.45%
(5.16%) (3.98%)
YTD 1 year 3 years 5 years 10 year
(12/31/2023 – (12/31/2022 – (12/31/2020 – (12/31/2018 – (12/31/2013 –Current) 12/31/2023) 12/31/2023) 12/31/2023) 12/31/2023)
Premium / (Discount) to NAV2
5%
MHN Peer Median 0%
(5%) (10%) (15%) (20%)
(25%)
May 2014 May 2016 May 2018 May 2020 May 2022 May 2024
Yield on NAV Distributions Growth3
4.39% 4.60%
29.85% 32.66%
MHN Peers MHN Peers
Expense Ratio4
1.07%
0.93%
MHN Peers
Source: Broadridge; Bloomberg as of 5/24/2024; Notes: Peer set includes MYN, BNY, ENX, VTN, NRK, NAN, PNF, PNI, and PYN; 1 Total shareholder return on price annualized for periods longer than 1 year (assumes dividends are reinvested); 2 Timeframe from 5/24/2014 to 5/24/2024 ; 3 Distribution growth over the last year; 4 Represents the actual total expenses excluding IRE & Taxes and 12B-1/Non-12B-1 service fees; For expense comparison purposes, peer set used by Broadridge includes VTN, NAN, ENX and PNI
26
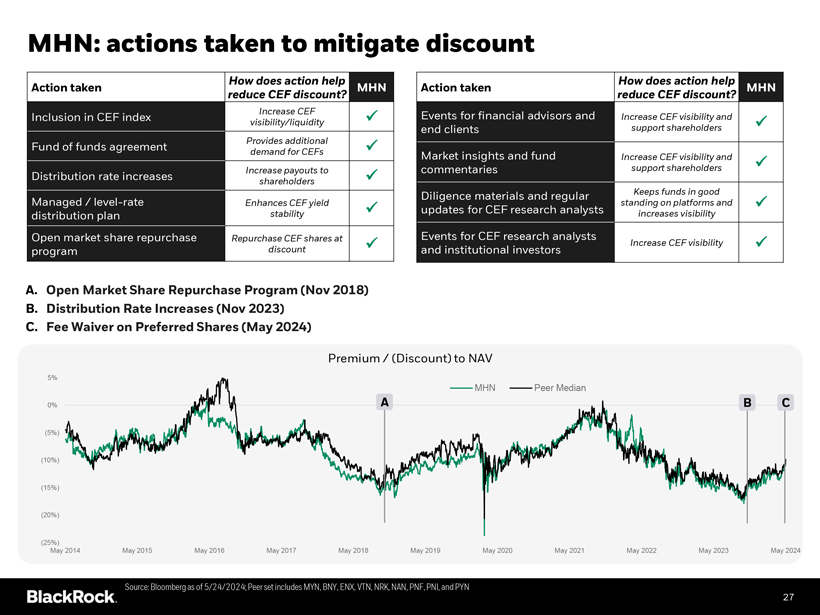
MHN: actions taken to mitigate discount
How does action help
Action taken MHN reduce CEF discount?
Inclusion in CEF index Increase CEF ? visibility/liquidity
Fund of funds agreement Provides additional ? demand for CEFs
Distribution rate increases Increase payouts to ? shareholders
Managed / level-rate Enhances CEF yield ? distribution plan stability Open market share repurchase Repurchase CEF shares at ? program discount
How does action help
Action taken MHN reduce CEF discount?
Events for financial advisors and Increase CEF visibility and ? end clients support shareholders
Market insights and fund Increase CEF visibility and ? commentaries support shareholders
Diligence materials and regular Keeps funds in good standing on platforms and ? updates for CEF research analysts increases visibility Events for CEF research analysts
Increase CEF visibility ? and institutional investors
A. Open Market Share Repurchase Program (Nov 2018)
B. Distribution Rate Increases (Nov 2023)
C. Fee Waiver on Preferred Shares (May 2024)
Premium / (Discount) to NAV
Source: Bloomberg as of 5/24/2024; Peer set includes MYN, BNY, ENX, VTN, NRK, NAN, PNF, PNI, and PYN
27
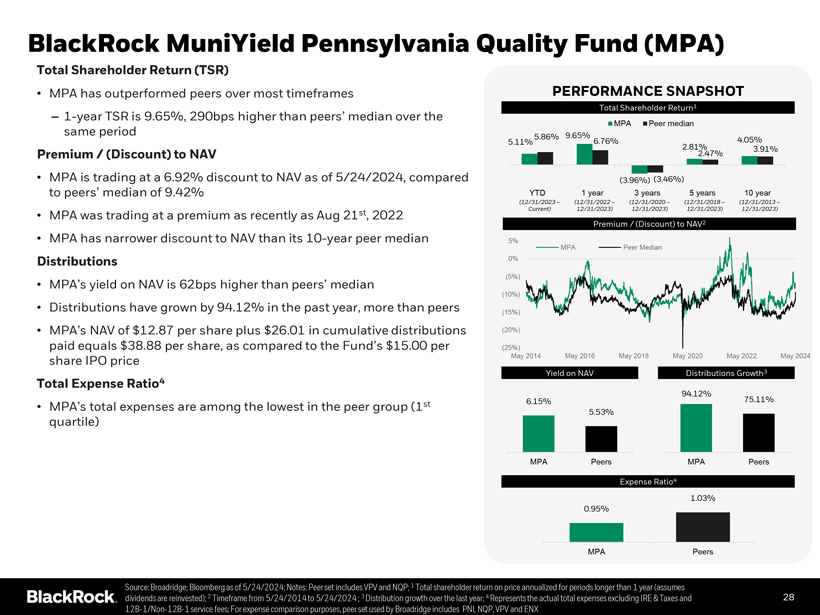
BlackRock MuniYield Pennsylvania Quality Fund (MPA)
Total Shareholder Return (TSR)
• MPA has outperformed peers over most timeframes
– 1-year TSR is 9.65%, 290bps higher than peers’ median over the same period
Premium / (Discount) to NAV
• MPA is trading at a 6.92% discount to NAV as of 5/24/2024, compared to peers’ median of 9.42%
• MPA was trading at a premium as recently as Aug 21st, 2022
• MPA has narrower discount to NAV than its 10-year peer median
Distributions
• MPA’s yield on NAV is 62bps higher than peers’ median
• Distributions have grown by 94.12% in the past year, more than peers
• MPA’s NAV of $12.87 per share plus $26.01 in cumulative distributions paid equals $38.88 per share, as compared to the Fund’s $15.00 per share IPO price
Total Expense Ratio4
• MPA’s total expenses are among the lowest in the peer group (1st quartile)
PERFORMANCE SNAPSHOT
Total Shareholder Return1
MPA Peer median
5.86% 9.65%
5.11% 6.76% 2.81% 4.05%
3.91%
2.47%
(3.96%) (3.46%)
YTD 1 year 3 years 5 years 10 year
(12/31/2023 – (12/31/2022 – (12/31/2020 – (12/31/2018 – (12/31/2013 –Current) 12/31/2023) 12/31/2023) 12/31/2023) 12/31/2023)
Premium / (Discount) to NAV2
5% MPA Peer Median 0%
(5%) (10%) (15%) (20%)
(25%)
May 2014 May 2016 May 2018 May 2020 May 2022 May 2024
Yield on NAV Distributions Growth3
94.12%
6.15% 75.11%
5.53%
MPA Peers MPA Peers
Expense Ratio4
1.03%
0.95%
MPA Peers
Source: Broadridge; Bloomberg as of 5/24/2024; Notes: Peer set includes VPV and NQP; 1 Total shareholder return on price annualized for periods longer than 1 year (assumes dividends are reinvested); 2 Timeframe from 5/24/2014 to 5/24/2024 ; 3 Distribution growth over the last year; 4 Represents the actual total expenses excluding IRE & Taxes and 12B-1/Non-12B-1 service fees; For expense comparison purposes, peer set used by Broadridge includes PNI, NQP, VPV and ENX
28
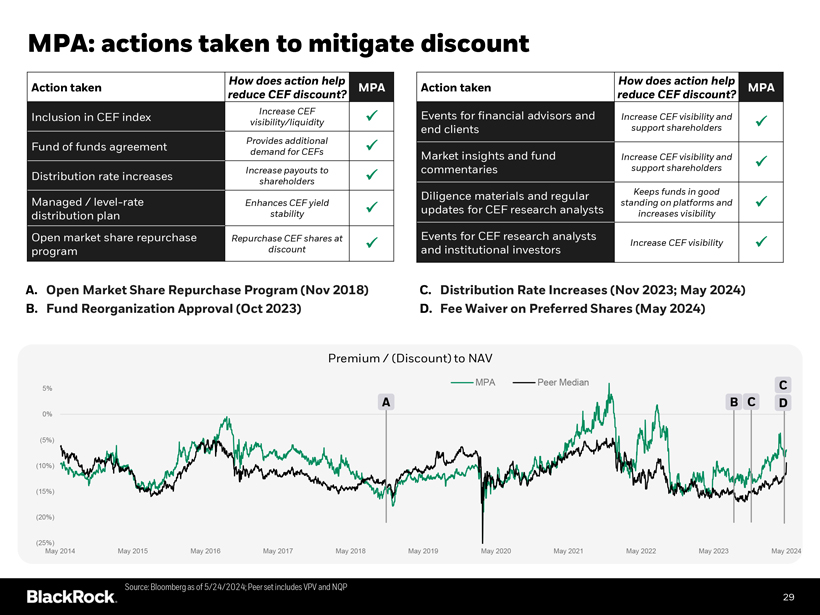
MPA: actions taken to mitigate discount
How does action help
Action taken MPA reduce CEF discount?
Inclusion in CEF index Increase CEF ? visibility/liquidity
Fund of funds agreement Provides additional ? demand for CEFs
Distribution rate increases Increase payouts to ? shareholders
Managed / level-rate Enhances CEF yield ? distribution plan stability Open market share repurchase Repurchase CEF shares at ? program discount
How does action help
Action taken MPA reduce CEF discount?
Events for financial advisors and Increase CEF visibility and ? end clients support shareholders
Market insights and fund Increase CEF visibility and ? commentaries support shareholders
Diligence materials and regular Keeps funds in good standing on platforms and ? updates for CEF research analysts increases visibility Events for CEF research analysts
Increase CEF visibility ? and institutional investors
A. Open Market Share Repurchase Program (Nov 2018)
B. Fund Reorganization Approval (Oct 2023)
C. Distribution Rate Increases (Nov 2023; May 2024)
D. Fee Waiver on Preferred Shares (May 2024)
Premium / (Discount) to NAV
Source: Bloomberg as of 5/24/2024; Peer set includes VPV and NQP
29
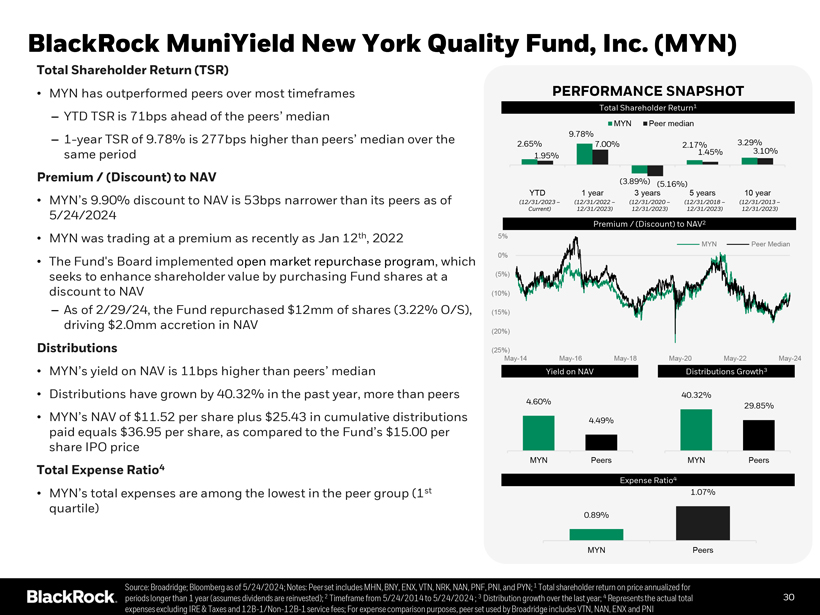
BlackRock MuniYield New York Quality Fund, Inc. (MYN)
Total Shareholder Return (TSR)
• MYN has outperformed peers over most timeframes
– YTD TSR is 71bps ahead of the peers’ median
– 1-year TSR of 9.78% is 277bps higher than peers’ median over the same period
Premium / (Discount) to NAV
• MYN’s 9.90% discount to NAV is 53bps narrower than its peers as of
5/24/2024
• MYN was trading at a premium as recently as Jan 12th, 2022
• The Fund’s Board implemented open market repurchase program, which seeks to enhance shareholder value by purchasing Fund shares at a discount to NAV
– As of 2/29/24, the Fund repurchased $12mm of shares (3.22% O/S), driving $2.0mm accretion in NAV
Distributions
• MYN’s yield on NAV is 11bps higher than peers’ median
• Distributions have grown by 40.32% in the past year, more than peers
• MYN’s NAV of $11.52 per share plus $25.43 in cumulative distributions paid equals $36.95 per share, as compared to the Fund’s $15.00 per share IPO price
Total Expense Ratio4
• MYN’s total expenses are among the lowest in the peer group (1st quartile)
PERFORMANCE SNAPSHOT
Total Shareholder Return1
MYN Peer median
9.78%
2.65% 7.00% 2.17% 3.29%
1.45% 3.10%
1.95%
(3.89%) (5.16%)
YTD 1 year 3 years 5 years 10 year
(12/31/2023 – (12/31/2022 – (12/31/2020 – (12/31/2018 – (12/31/2013 –Current) 12/31/2023) 12/31/2023) 12/31/2023) 12/31/2023)
Premium / (Discount) to NAV2
5%
MYN Peer Median 0%
(5%) (10%) (15%) (20%)
(25%)
May-14 May-16 May-18 May-20 May-22 May-24
Yield on NAV Distributions Growth3
40.32%
4.60%
29.85%
4.49%
MYN Peers MYN Peers
Expense Ratio4
1.07%
0.89%
MYN Peers
Source: Broadridge; Bloomberg as of 5/24/2024; Notes: Peer set includes MHN, BNY, ENX, VTN, NRK, NAN, PNF, PNI, and PYN; 1 Total shareholder return on price annualized for periods longer than 1 year (assumes dividends are reinvested); 2 Timeframe from 5/24/2014 to 5/24/2024 ; 3 Distribution growth over the last year; 4 Represents the actual total expenses excluding IRE & Taxes and 12B-1/Non-12B-1 service fees; For expense comparison purposes, peer set used by Broadridge includes VTN, NAN, ENX and PNI
30
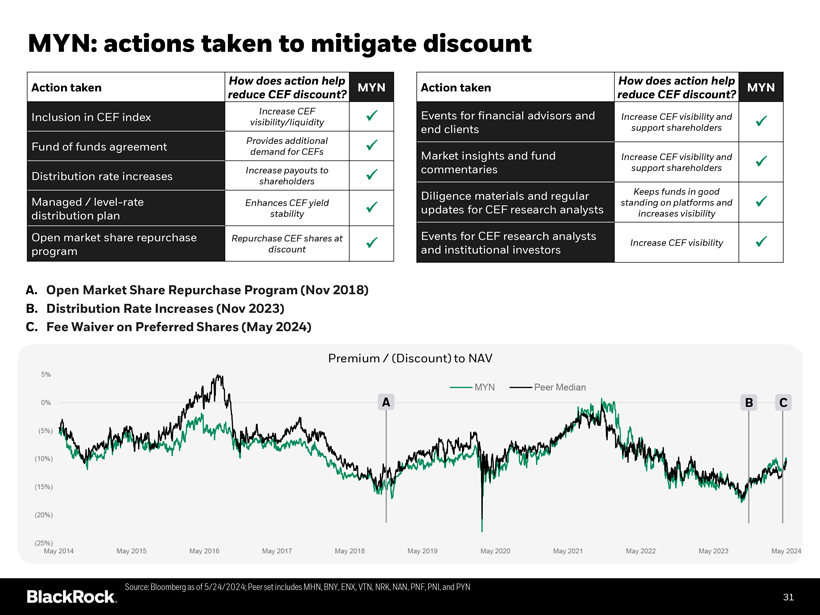
MYN: actions taken to mitigate discount
How does action help
Action taken MYN reduce CEF discount?
Inclusion in CEF index Increase CEF ? visibility/liquidity
Fund of funds agreement Provides additional ? demand for CEFs
Distribution rate increases Increase payouts to ? shareholders
Managed / level-rate Enhances CEF yield ? distribution plan stability Open market share repurchase Repurchase CEF shares at ? program discount
How does action help
Action taken MYN reduce CEF discount?
Events for financial advisors and Increase CEF visibility and ? end clients support shareholders
Market insights and fund Increase CEF visibility and ? commentaries support shareholders
Diligence materials and regular Keeps funds in good standing on platforms and ? updates for CEF research analysts increases visibility Events for CEF research analysts
Increase CEF visibility ? and institutional investors
A. Open Market Share Repurchase Program (Nov 2018)
B. Distribution Rate Increases (Nov 2023)
C. Fee Waiver on Preferred Shares (May 2024)
Premium / (Discount) to NAV
Source: Bloomberg as of 5/24/2024; Peer set includes MHN, BNY, ENX, VTN, NRK, NAN, PNF, PNI, and PYN
31
Rigorous Board oversight ensures all shareholders are protected
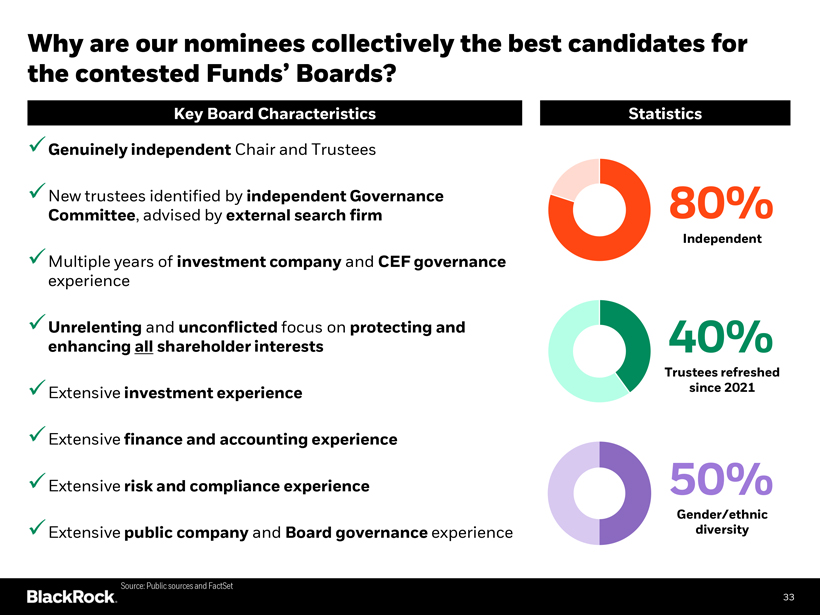
Why are our nominees collectively the best candidates for the contested Funds’ Boards?
Key Board Characteristics Statistics
Genuinely independent Chair and Trustees
New trustees identified by independent Governance Committee, advised by external search firm
Multiple years of investment company and CEF governance experience
Unrelenting and unconflicted focus on protecting and enhancing all shareholder interests
Extensive investment experience
Extensive finance and accounting experience
Extensive risk and compliance experience
Extensive public company and Board governance experience
80%
Independent
40%
Trustees refreshed since 2021
50%
Gender/ethnic diversity
Source: Public sources and FactSet
33
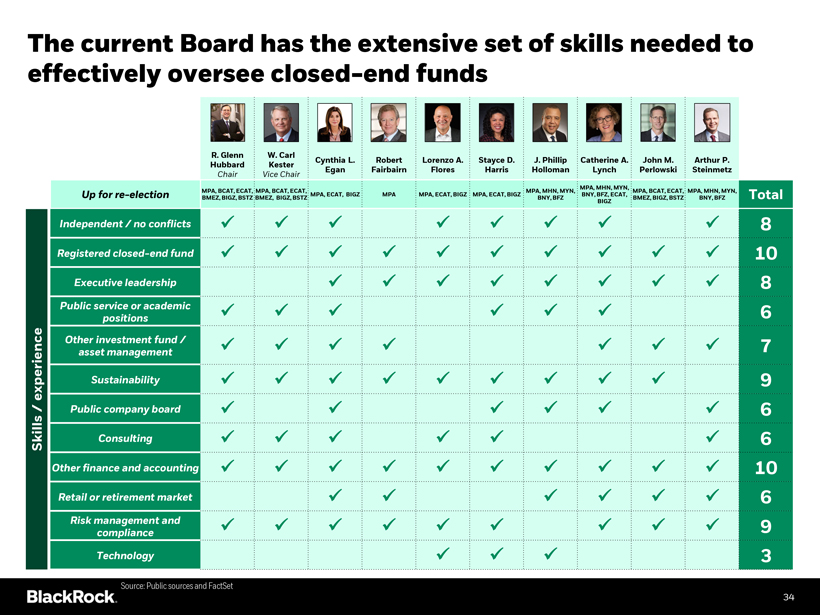
The current Board has the extensive set of skills needed to effectively oversee closed-end funds
R. Glenn W. Carl
Cynthia L. Robert Lorenzo A. Stayce D. J. Phillip Catherine A. John M. Arthur P. Hubbard Kester Egan Fairbairn Flores Harris Holloman Lynch Perlowski Steinmetz
Chair Vice Chair
MPA, MHN, MYN,
MPA, BCAT, ECAT, MPA, BCAT, ECAT, MPA, MHN, MYN, MPA, BCAT, ECAT, MPA, MHN, MYN,
Up for re-election MPA, ECAT, BIGZ MPA MPA, ECAT, BIGZ MPA, ECAT, BIGZ BNY, BFZ, ECAT, Total BMEZ, BIGZ, BSTZ BMEZ, BIGZ, BSTZ BNY, BFZ BMEZ, BIGZ, BSTZ BNY, BFZ
BIGZ
Independent / no conflicts Registered closed-end fund Executive leadership
Public service or academic positions Other investment fund / asset management
Sustainability Public company board Consulting Other finance and accounting Retail or retirement market
Risk management and compliance
Technology
Skills / experience
8 10 8 6 7 9 6 6 10 6 9 3
Source: Public sources and FactSet
34
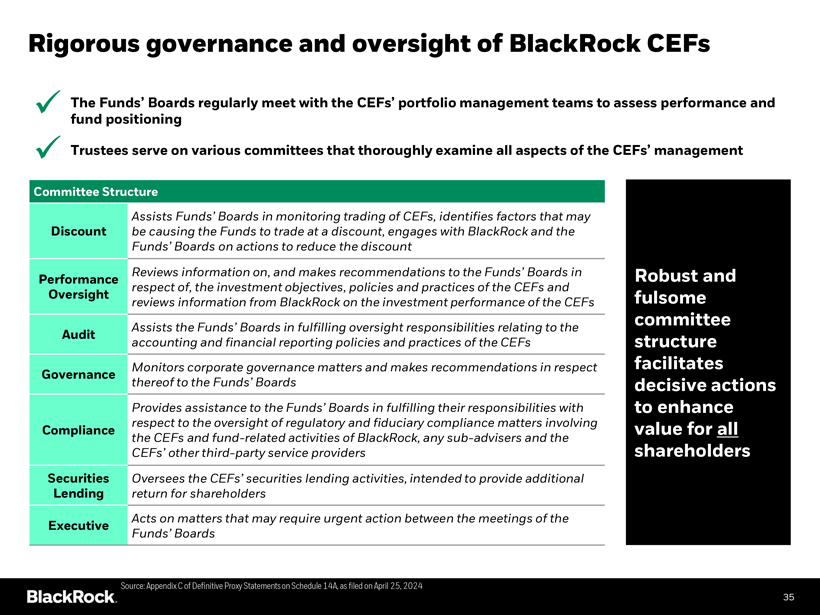
Rigorous governance and oversight of BlackRock CEFs
The Funds’ Boards regularly meet with the CEFs’ portfolio management teams to assess performance and fund positioning
Trustees serve on various committees that thoroughly examine all aspects of the CEFs’ management
Committee Structure
Assists Funds’ Boards in monitoring trading of CEFs, identifies factors that may
Discount be causing the Funds to trade at a discount, engages with BlackRock and the
Funds’ Boards on actions to reduce the discount
Reviews information on, and makes recommendations to the Funds’ Boards in
Performance respect of, the investment objectives, policies and practices of the CEFs and
Oversight reviews information from BlackRock on the investment performance of the CEFs
Assists the Funds’ Boards in fulfilling oversight responsibilities relating to the
Audit accounting and financial reporting policies and practices of the CEFs
Monitors corporate governance matters and makes recommendations in respect
Governance thereof to the Funds’ Boards
Provides assistance to the Funds’ Boards in fulfilling their responsibilities with respect to the oversight of regulatory and fiduciary compliance matters involving
Compliance the CEFs and fund-related activities of BlackRock, any sub-advisers and the CEFs’ other third-party service providers
Securities Oversees the CEFs’ securities lending activities, intended to provide additional
Lending return for shareholders
Acts on matters that may require urgent action between the meetings of the
Executive
Funds’ Boards
Robust and fulsome committee structure facilitates decisive actions to enhance value for all shareholders
Source: Appendix C of Definitive Proxy Statements on Schedule 14A, as filed on April 25, 2024
35
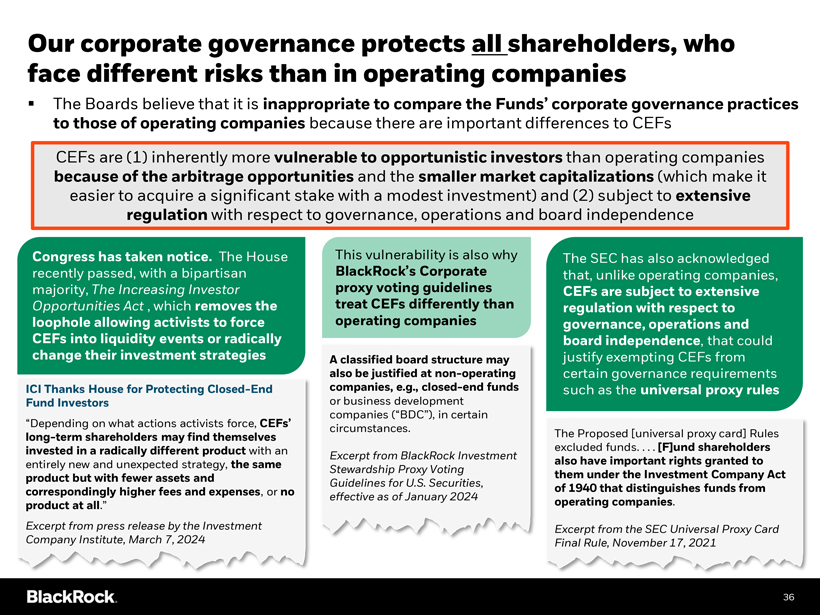
Our corporate governance protects all shareholders, who face different risks than in operating companies
? The Boards believe that it is inappropriate to compare the Funds’ corporate governance practices to those of operating companies because there are important differences to CEFs
CEFs are (1) inherently more vulnerable to opportunistic investors than operating companies because of the arbitrage opportunities and the smaller market capitalizations (which make it easier to acquire a significant stake with a modest investment) and (2) subject to extensive regulation with respect to governance, operations and board independence
Congress has taken notice. The House recently passed, with a bipartisan majority, The Increasing Investor Opportunities Act , which removes the loophole allowing activists to force CEFs into liquidity events or radically change their investment strategies
ICI Thanks House for Protecting Closed-End Fund Investors
“Depending on what actions activists force, CEFs’ long-term shareholders may find themselves invested in a radically different product with an entirely new and unexpected strategy, the same product but with fewer assets and correspondingly higher fees and expenses, or no product at all.”
Excerpt from press release by the Investment Company Institute, March 7, 2024
This vulnerability is also why
BlackRock’s Corporate proxy voting guidelines treat CEFs differently than operating companies
A classified board structure may also be justified at non-operating companies, e.g., closed-end funds or business development companies (“BDC”), in certain circumstances.
Excerpt from BlackRock Investment Stewardship Proxy Voting Guidelines for U.S. Securities, effective as of January 2024
The SEC has also acknowledged that, unlike operating companies,
CEFs are subject to extensive regulation with respect to governance, operations and board independence, that could justify exempting CEFs from certain governance requirements such as the universal proxy rules
The Proposed [universal proxy card] Rules excluded funds. . . . [F]und shareholders also have important rights granted to them under the Investment Company Act of 1940 that distinguishes funds from operating companies.
Excerpt from the SEC Universal Proxy Card Final Rule, November 17, 2021
36
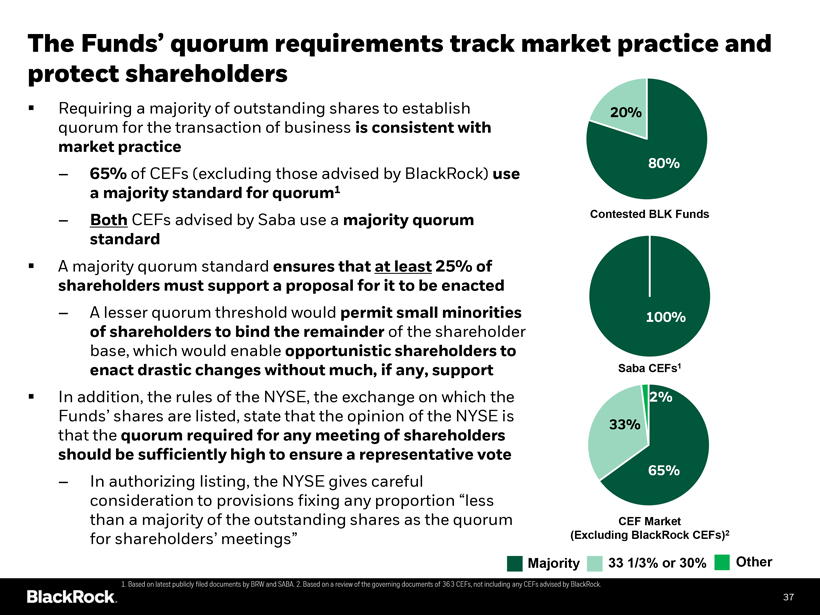
The Funds’ quorum requirements track market practice and protect shareholders
Requiring a majority of outstanding shares to establish quorum for the transaction of business is consistent with market practice
– 65% of CEFs (excluding those advised by BlackRock) use a majority standard for quorum1
– Both CEFs advised by Saba use a majority quorum standard
A majority quorum standard ensures that at least 25% of shareholders must support a proposal for it to be enacted
– A lesser quorum threshold would permit small minorities of shareholders to bind the remainder of the shareholder base, which would enable opportunistic shareholders to enact drastic changes without much, if any, support
In addition, the rules of the NYSE, the exchange on which the
Funds’ shares are listed, state that the opinion of the NYSE is that the quorum required for any meeting of shareholders should be sufficiently high to ensure a representative vote
– In authorizing listing, the NYSE gives careful consideration to provisions fixing any proportion “less than a majority of the outstanding shares as the quorum for shareholders’ meetings”
20%
80%
Contested CEFs Contested BLK Funds
100%
Saba CEFs1
2% 33%
65%
CEF Market
(Excluding BlackRock CEFs)2
Majority 33 1/3% or 30% Other
1. Based on latest publicly filed documents by BRW and SABA. 2. Based on a review of the governing documents of 363 CEFs, not including any CEFs advised by BlackRock.
37
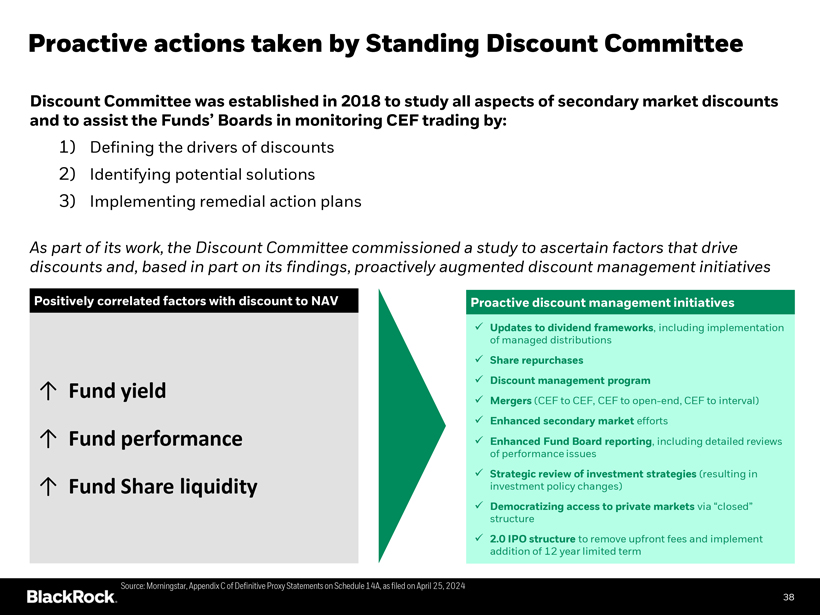
Proactive actions taken by Standing Discount Committee
Discount Committee was established in 2018 to study all aspects of secondary market discounts and to assist the Funds’ Boards in monitoring CEF trading by:
1) Defining the drivers of discounts
2) Identifying potential solutions
3) Implementing remedial action plans
As part of its work, the Discount Committee commissioned a study to ascertain factors that drive discounts and, based in part on its findings, proactively augmented discount management initiatives
Positively correlated factors with discount to NAV
↑ Fund yield
↑ Fund performance
↑ Fund Share liquidity
Proactive discount management initiatives
? Updates to dividend frameworks, including implementation of managed distributions
? Share repurchases
? Discount management program
? Mergers (CEF to CEF, CEF to open-end, CEF to interval)
? Enhanced secondary market efforts
? Enhanced Fund Board reporting, including detailed reviews of performance issues
? Strategic review of investment strategies (resulting in investment policy changes)
? Democratizing access to private markets via “closed” structure
? 2.0 IPO structure to remove upfront fees and implement addition of 12 year limited term
Source: Morningstar, Appendix C of Definitive Proxy Statements on Schedule 14A, as filed on April 25, 2024
38
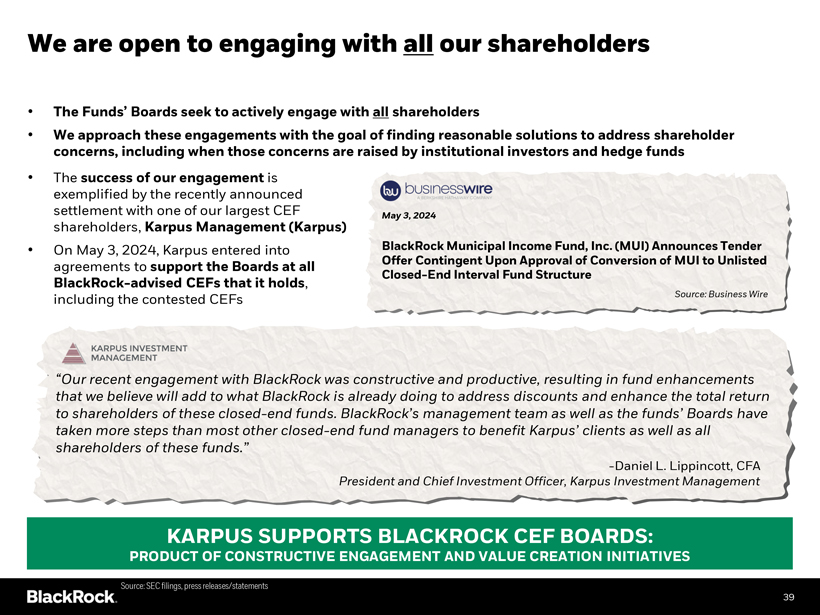
We are open to engaging with all our shareholders
• The Funds’ Boards seek to actively engage with all shareholders
• We approach these engagements with the goal of finding reasonable solutions to address shareholder concerns, including when those concerns are raised by institutional investors and hedge funds
The success of our engagement is exemplified by the recently announced settlement with one of our largest CEF shareholders, Karpus Management (Karpus)
On May 3, 2024, Karpus entered into agreements to support the Boards at all BlackRock-advised CEFs that it holds, including the contested CEFs
May 3, 2024
BlackRock Municipal Income Fund, Inc. (MUI) Announces Tender Offer Contingent Upon Approval of Conversion of MUI to Unlisted Closed-End Interval Fund Structure
Source: Business Wire
“Our recent engagement with BlackRock was constructive and productive, resulting in fund enhancements that we believe will add to what BlackRock is already doing to address discounts and enhance the total return to shareholders of these closed-end funds. BlackRock’s management team as well as the funds’ Boards have taken more steps than most other closed-end fund managers to benefit Karpus’ clients as well as all shareholders of these funds.”
-Daniel L. Lippincott, CFA
President and Chief Investment Officer, Karpus Investment Management
KARPUS SUPPORTS BLACKROCK CEF BOARDS:
PRODUCT OF CONSTRUCTIVE ENGAGEMENT AND VALUE CREATION INITIATIVES
Source: SEC filings, press releases/statements
39

Inherent conflict between Saba’s self-serving interests and those of other shareholders
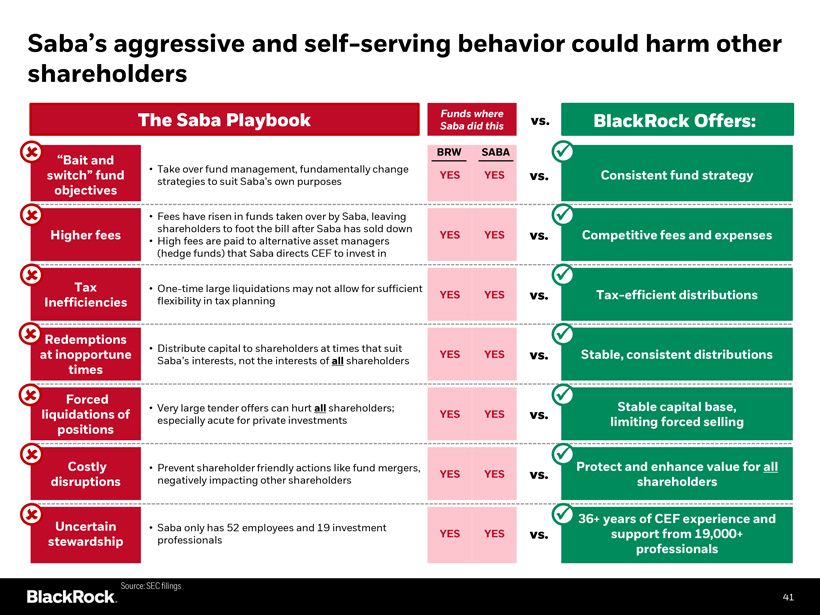
Saba’s aggressive and self-serving behavior could harm other shareholders
The Saba Playbook
Funds where Saba did this
“Bait and
switch” fund • Take over fund management, fundamentally change strategies to suit Saba’s own purposes
objectives
• Fees have risen in funds taken over by Saba, leaving shareholders to foot the bill after Saba has sold down
Higher fees YES YES vs.
• High fees are paid to alternative asset managers (hedge funds) that Saba directs CEF to invest in
BRW SABA
YES YES
Tax Inefficiencies
One-time large liquidations may not allow for sufficient
YES YES vs. flexibility in tax planning
Redemptions at inopportune times
• Distribute capital to shareholders at times that suit
YES YES vs.
Saba’s interests, not the interests of all shareholders
Forced liquidations of positions
Very large tender offers can hurt all shareholders; especially acute for private investments
YES YES vs.
Costly disruptions
Prevent shareholder friendly actions like fund mergers, negatively impacting other shareholders
YES YES vs.
Uncertain stewardship
Saba only has 52 employees and 19 investment professionals
YES YES vs.
BlackRock Offers:
Consistent fund strategy
Competitive fees and expenses
Tax-efficient distributions
Stable, consistent distributions
Stable capital base, limiting forced selling
Protect and enhance value for all shareholders
36+ years of CEF experience and support from 19,000+ professionals
Source: SEC filings
41
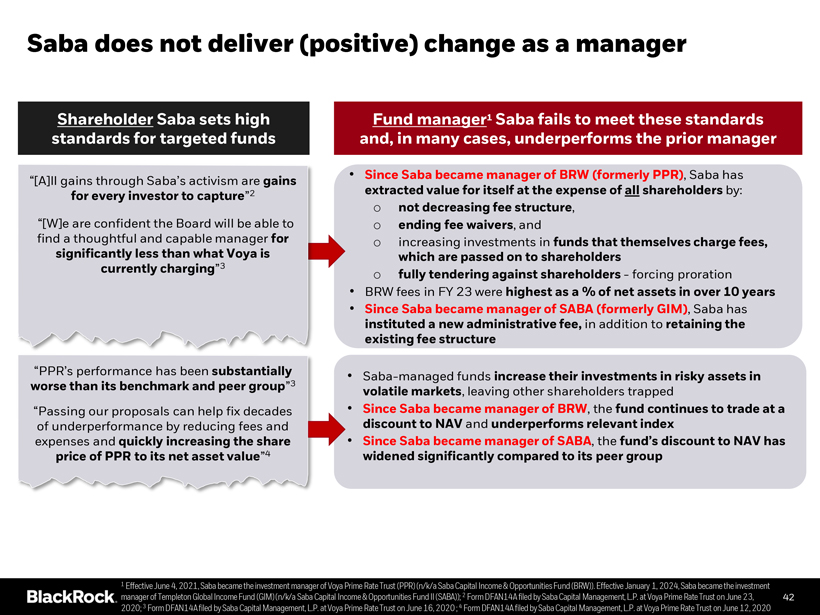
Saba does not deliver (positive) change as a manager
Shareholder Saba sets high standards for targeted funds
“[A]ll gains through Saba’s activism are gains for every investor to capture”2
“[W]e are confident the Board will be able to find a thoughtful and capable manager for significantly less than what Voya is currently charging”3
“PPR’s performance has been substantially worse than its benchmark and peer group”3
“Passing our proposals can help fix decades of underperformance by reducing fees and expenses and quickly increasing the share price of PPR to its net asset value”4
Fund manager1 Saba fails to meet these standards and, in many cases, underperforms the prior manager
• Since Saba became manager of BRW (formerly PPR), Saba has extracted value for itself at the expense of all shareholders by:
o not decreasing fee structure,
o ending fee waivers, and
o increasing investments in funds that themselves charge fees, which are passed on to shareholders
o fully tendering against shareholders - forcing proration
• BRW fees in FY 23 were highest as a % of net assets in over 10 years
• Since Saba became manager of SABA (formerly GIM), Saba has instituted a new administrative fee, in addition to retaining the existing fee structure
• Saba-managed funds increase their investments in risky assets in volatile markets, leaving other shareholders trapped
• Since Saba became manager of BRW, the fund continues to trade at a discount to NAV and underperforms relevant index
• Since Saba became manager of SABA, the fund’s discount to NAV has widened significantly compared to its peer group
1 Effective June 4, 2021, Saba became the investment manager of Voya Prime Rate Trust (PPR) (n/k/a Saba Capital Income & Opportunities Fund (BRW)). Effective January 1, 2024, Saba became the investment manager of Templeton Global Income Fund (GIM) (n/k/a Saba Capital Income & Opportunities Fund II (SABA)); 2 Form DFAN14A filed by Saba Capital Management, L.P. at Voya Prime Rate Trust on June 23, 2020; 3 Form DFAN14A filed by Saba Capital Management, L.P. at Voya Prime Rate Trust on June 16, 2020 ; 4 Form DFAN14A filed by Saba Capital Management, L.P. at Voya Prime Rate Trust on June 12, 2020
42
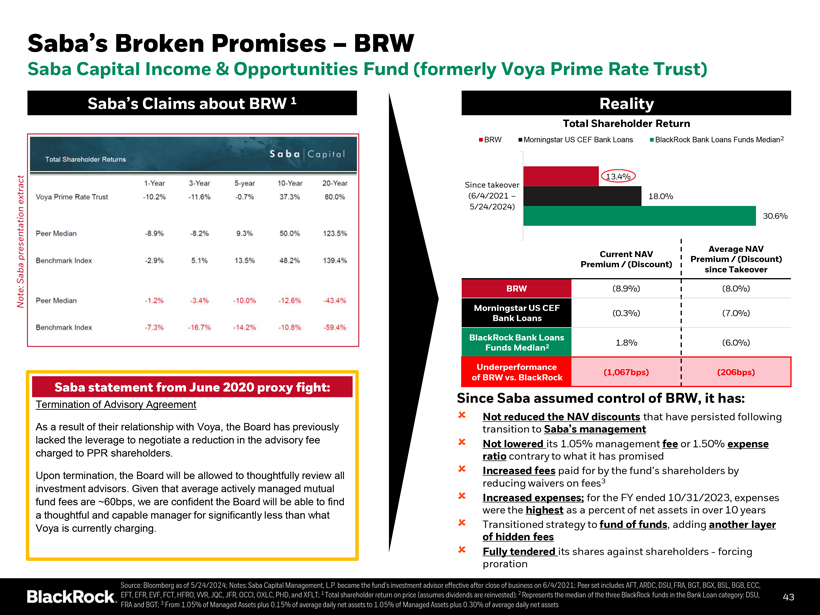
Saba’s Broken Promises – BRW Saba Capital Income & Opportunities Fund (formerly Voya Prime Rate Trust)
Saba’s Claims about BRW 1 Reality Note: Saba presentation extract
Total Shareholder Returns Saba Capital Voya Prime Rate Trust Peer Median Benchmark Index Peer Median Benchmark Index 1-Year 3-Year 5-Year 10-Year 20-Year Saba statement from June 2020 proxy fight: Termination of Advisory Agreement
As a result of their relationship with Voya, the Board has previously lacked the leverage to negotiate a reduction in the advisory fee charged to PPR shareholders. Upon termination, the Board will be allowed to thoughtfully review all investment advisors. Given that average actively managed mutual fund fees are ~60bps, we are confident the Board will be able to find a thoughtful and capable manager for significantly less than what Voya is currently charging. Reality Total Shareholder Return BRW Morningstar US CEF Bank Loans BlackRock Bank Loans Funds Median2 13.4% Since takeover (6/4/2021 – 18.0% 5/24/2024) 30.6% Average NAV Current NAV Premium / (Discount) Premium / (Discount) since Takeover BRW (8.9%) (8.0%) Morningstar US CEF (0.3%) (7.0%) Bank Loans BlackRock Bank Loans 1.8% (6.0%) Funds Median2 Underperformance (1,067bps) (206bps) of BRW vs. BlackRock
Since Saba assumed control of BRW, it has:
Not reduced the NAV discounts that have persisted following transition to Saba’s management
Not lowered its 1.05% management fee or 1.50% expense ratio contrary to what it has promised
Increased fees paid for by the fund’s shareholders by reducing waivers on fees3
Increased expenses; for the FY ended 10/31/2023, expenses were the highest as a percent of net assets in over 10 years? Transitioned strategy to fund of funds, adding another layer of hidden fees
Fully tendered its shares against shareholders – forcing proration
Source: Bloomberg as of 5/24/2024; Notes: Saba Capital Management, L.P. became the fund’s investment advisor effective after close of business on 6/4/2021; Peer set includes AFT, ARDC, DSU, FRA, BGT, BGX, BSL, BGB, ECC, EFT, EFR, EVF, FCT, HFRO, VVR, JQC, JFR, OCCI, OXLC, PHD, and XFLT; 1 Total shareholder return on price (assumes dividends are reinvested); 2 Represents the median of the three BlackRock funds in the Bank Loan category: DSU, 43 FRA and BGT; 3 From 1.05% of Managed Assets plus 0.15% of average daily net assets to 1.05% of Managed Assets plus 0.30% of average daily net assets
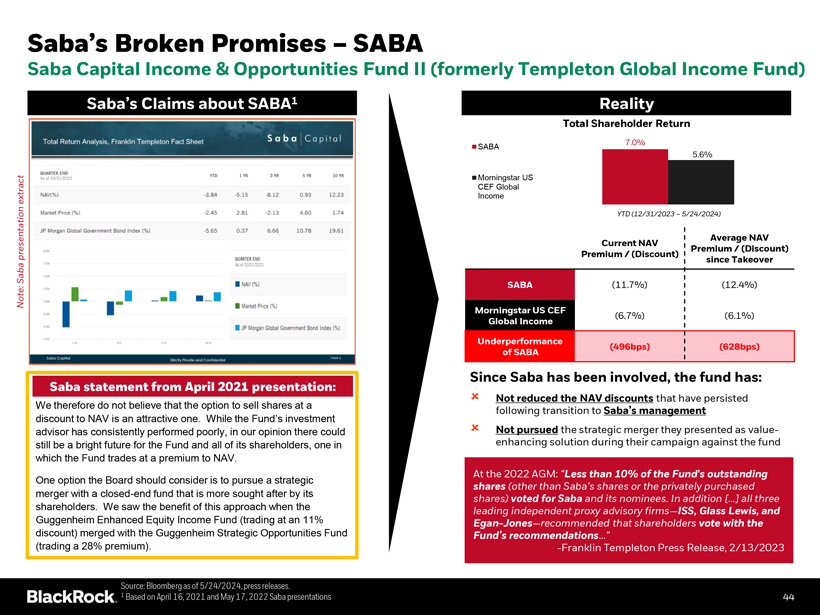
Saba’s Broken Promises – SABA Saba Capital Income & Opportunities Fund II (formerly Templeton Global Income Fund)
Saba’s Claims about SABA1 Total Return Analysis, Franklin Templeton Fact Sheet Saba Capital
Note: Saba presentation extract Saba statement from April 2021 presentation: We therefore do not believe that the option to sell shares at a discount to NAV is an attractive one. While the Fund’s investment advisor has consistently performed poorly, in our opinion there could still be a bright future for the Fund and all of its shareholders, one in which the Fund trades at a premium to NAV.
One option the Board should consider is to pursue a strategic merger with a closed-end fund that is more sought after by its
shareholders. We saw the benefit of this approach when the Guggenheim Enhanced Equity Income Fund (trading at an 11% discount) merged with the Guggenheim Strategic Opportunities Fund Reality Total Shareholder Return SABA Morningstar US CEF Global
Income YTD (12/31/2023 – 5/24/2024) Current NAV Premium / (Discount) Average NAV Premium / (Discount) since Takeover SABA (11.7%) (12.4%) Morningstar US CEF Global Income (6.7%) (6.1%) Underperformance of SABA (496bps) (628bps)
Since Saba has been involved, the fund has: Not reduced the NAV discounts that have persisted following transition to Saba’s management  Not pursued the strategic merger they presented as value enhancing solution during their campaign against the fund At the 2022 AGM: “Less than 10% of the Fund’s outstanding shares (other than Saba’s shares or the privately purchased
shares) voted for Saba and its nominees. In addition […] all three leading independent proxy advisory firms—ISS, Glass Lewis, and
Egan-Jones—recommended that shareholders vote with the Fund’s recommendations…” -Franklin Templeton Press Release, 2/13/2023 (trading a 28% premium). Source: Bloomberg as of 5/24/2024, press releases. 1 Based on April 16, 2021 and May 17, 2022 Saba presentations 44
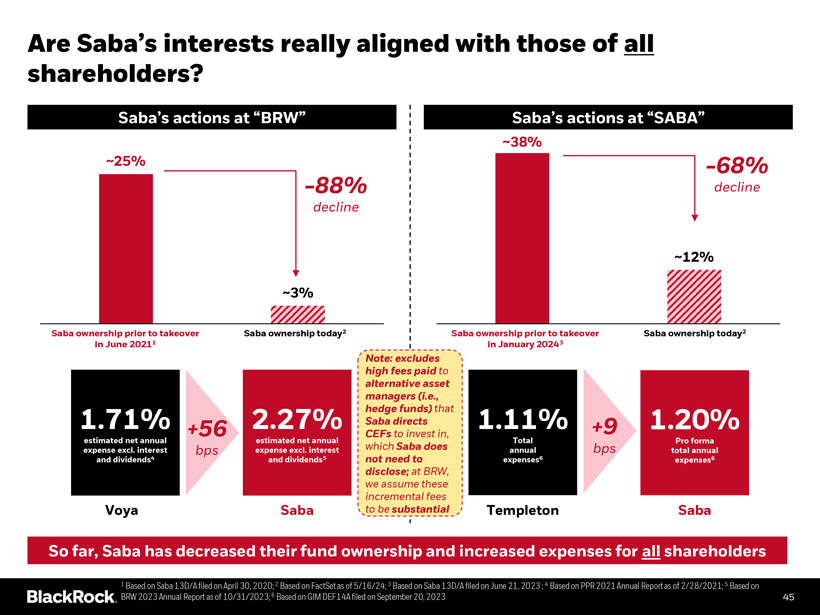
Are Saba’s interests really aligned with those of all shareholders? Saba’s actions at “BRW” Saba’s actions at “SABA” ~25% ~3%
Before After Are Saba’s interests really aligned with those of all shareholders? 45 Saba’s actions at “BRW” Saba’s actions at “SABA” 1.71% estimated net annual expense excl. interest and dividends4 2.27% estimated net annual expense excl. interest and dividends5 Saba ownership prior to takeover in June 20211 Saba ownership today2 1.71% estimated net annual expense excl. interest
and dividends4 +56 bps 2.27% estimated net annual expense excl. interest and dividends5 Note: excludes high fees paid to alternative asset managers (i.e., hedge funds) that Saba directs CEFs to invest in, which Saba does not need to disclose; at BRW, we assume these incremental fees to be substantial Voya Saba ~38% -68% decline ~12% Saba ownership prior to takeover in January 2024 Saba ownership today2 1.11% Total annual expenses +9 bps 1.20% Pro forma total annual expenses6 Templeton Saba So far, Saba has decreased their fund ownership and increased expenses for all shareholders 1 Based on Saba 13D/A filed on April 30, 2020; 2 Based on FactSet as of 5/16/24; 3 Based on Saba 13D/A filed on June 21, 2023 ; 4 Based on PPR 2021 Annual Report as of 2/28/2021; 5 Based on BRW 2023 Annual Report as of 10/31/2023; 6 Based on GIM DEF14A filed on September 20, 2023 45
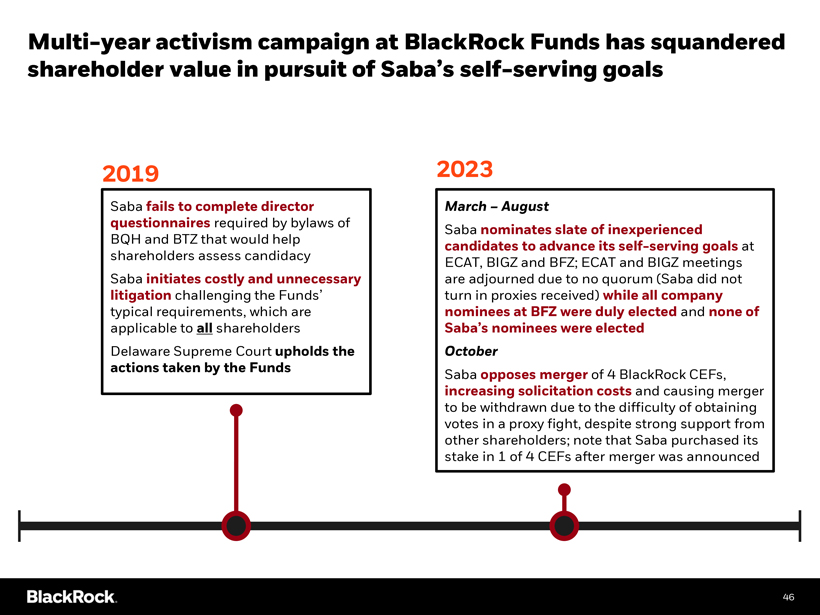
Multi-year activism campaign at BlackRock Funds has squandered shareholder value in pursuit of Saba’s self-serving goals 2019 2023 Saba fails to complete director March – August questionnaires required by bylaws of Saba nominates slate of inexperienced
BQH and BTZ that would help candidates to advance its self-serving goals at shareholders assess candidacy ECAT, BIGZ and BFZ; ECAT and BIGZ meetings Saba initiates costly and unnecessary are adjourned due to no quorum (Saba did not litigation challenging the Funds’ turn in proxies received) while all company typical requirements, which are nominees at BFZ were duly elected and none of applicable to all shareholders Saba’s nominees were elected Delaware Supreme Court upholds the October actions taken by the Funds Saba opposes merger of 4 BlackRock CEFs, increasing solicitation costs and causing merger to be withdrawn due to the difficulty of obtaining votes in a proxy fight, despite strong support from other shareholders; note that Saba purchased its stake in 1 of 4 CEFs after merger was announced 46
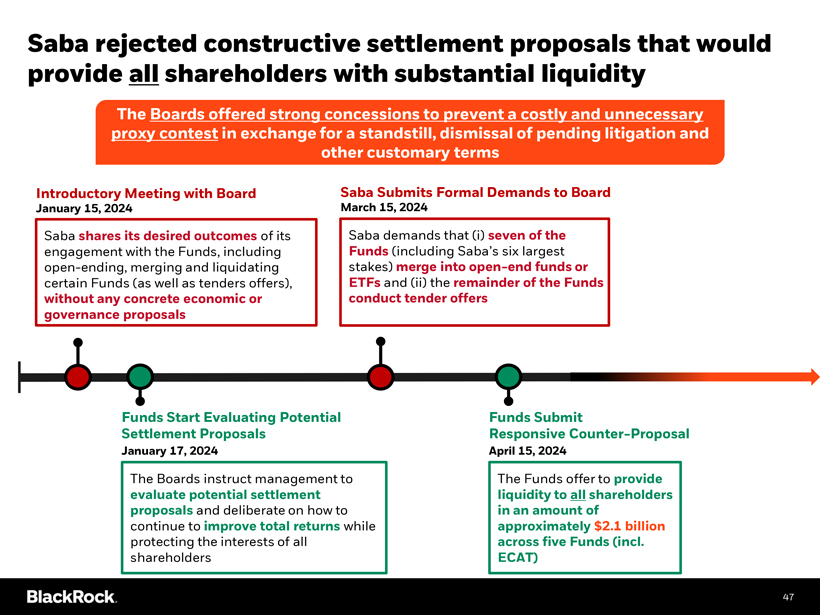
Saba rejected constructive settlement proposals that would provide all shareholders with substantial liquidity
The Boards offered strong concessions to prevent a costly and unnecessary proxy contest in exchange for a standstill, dismissal of pending litigation and other customary terms Introductory Meeting with Board Saba Submits Formal Demands to Board
January 15, 2024 March 15, 2024 Saba shares its desired outcomes of its Saba demands that (i) seven of the engagement with the Funds, including Funds (including Saba’s six largest open-ending, merging and liquidating stakes) merge into open-end funds or certain Funds (as well as tenders offers), ETFs and (ii) the remainder of the Funds without any concrete economic or conduct tender offers governance proposals Funds Start Evaluating Potential Funds Submit Settlement Proposals Responsive Counter-Proposal
January 17, 2024 April 15, 2024 The Boards instruct management to The Funds offer to provide evaluate potential settlement liquidity to all shareholders proposals and deliberate on how to in an amount of continue to improve total returns while approximately $2.1 billion protecting the interests of all across five Funds (incl. shareholders ECAT) 47
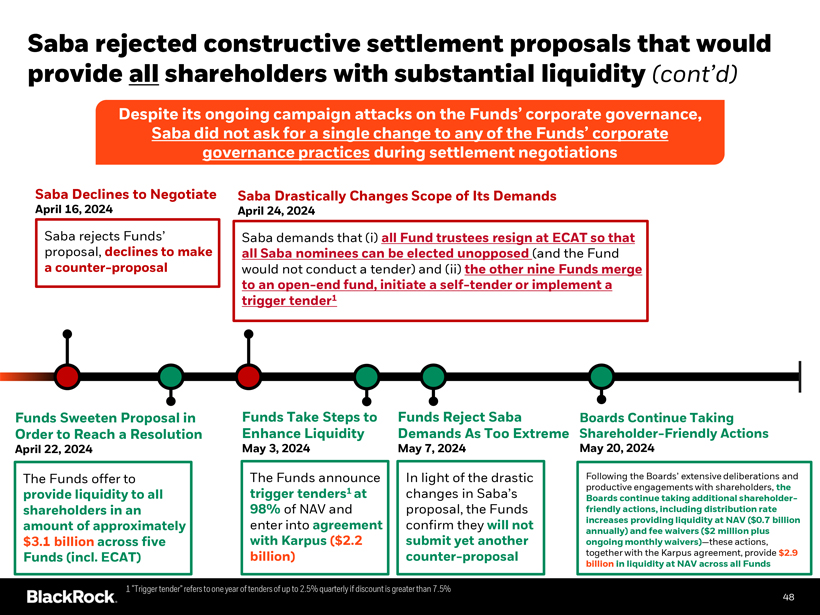
Saba rejected constructive settlement proposals that would provide all shareholders with substantial liquidity (cont’d)
Despite its ongoing campaign attacks on the Funds’ corporate governance, Saba did not ask for a single change to any of the Funds’ corporate governance practices during settlement negotiations Saba Declines to Negotiate Saba Drastically Changes Scope of Its Demands April 16, 2024 April 24, 2024 Saba rejects Funds’ Saba demands that (i) all Fund trustees resign at ECAT so that proposal, declines to make all Saba nominees can be elected unopposed (and the Fund a counter-proposal would not conduct a tender) and (ii) the other nine Funds merge to an open-end fund, initiate a self-tender or implement a trigger tender1
Funds Sweeten Proposal in Funds Take Steps to Funds Reject Saba Boards Continue Taking Order to Reach a Resolution Enhance Liquidity Demands As Too Extreme Shareholder-Friendly Actions April 22, 2024 May 3, 2024 May 7, 2024 May 20, 2024
The Funds offer to The Funds announce In light of the drastic Following the Boards’ extensive deliberations and
trigger tenders1 at changes in Saba’s productive engagements with shareholders, the provide liquidity to all Boards continue taking additional shareholder-shareholders in an 98% of NAV and proposal, the Funds friendly actions, including distribution rate amount of approximately enter into agreement confirm they will not increases providing liquidity at NAV ($0.7 billion annually) and fee waivers ($2 million plus $3.1 billion across five with Karpus ($2.2 submit yet another ongoing monthly waivers)—these actions, Funds (incl. ECAT) billion) counter-proposal together with the Karpus agreement, provide $2.9 billion in liquidity at NAV across all Funds
1 “Trigger tender” refers to one year of tenders of up to 2.5% quarterly if discount is greater than 7.5% 48
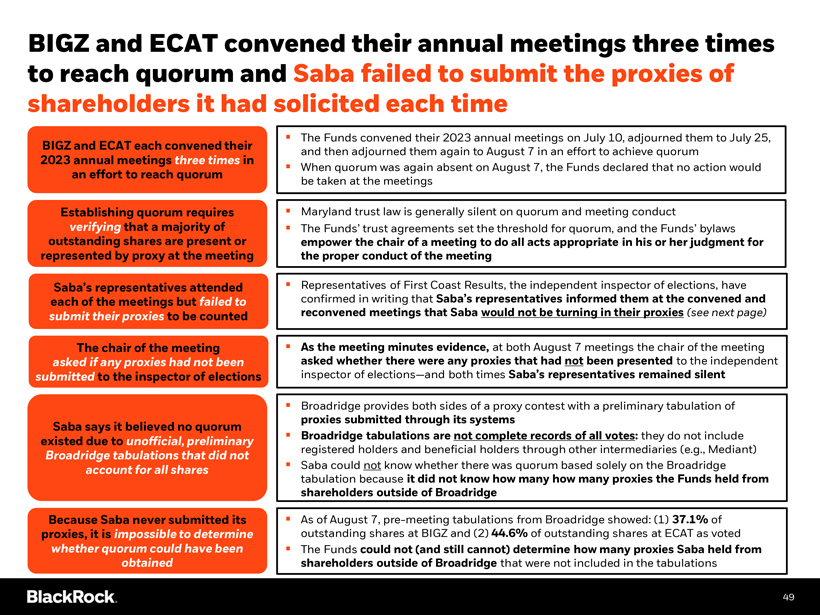
BIGZ and ECAT convened their annual meetings three times to reach quorum and Saba failed to submit the proxies of shareholders it had solicited each time The Funds convened their 2023 annual meetings on July 10, adjourned them to July 25, BIGZ and ECAT each convened their and then adjourned them again to August 7 in an effort to achieve quorum 2023 annual meetings three times in When quorum was again absent on August 7, the Funds declared that no action would an effort to reach quorum be taken at the meetings
Establishing quorum requires Maryland trust law is generally silent on quorum and meeting conduct verifying that a majority of The Funds’ trust agreements set the threshold for quorum, and the Funds’ bylaws outstanding shares are present or empower the chair of a meeting to do all acts appropriate in his or her judgment for represented by proxy at the meeting the proper conduct of the meeting
Saba’s representatives attended Representatives of First Coast Results, the independent inspector of elections, have each of the meetings but failed to confirmed in writing that Saba’s representatives informed them at the convened and submit their proxies to be counted reconvened meetings that Saba would not be turning in their proxies (see next page) The chair of the meeting As the meeting minutes evidence, at both August 7 meetings the chair of the meeting asked if any proxies had not been asked whether there were any proxies that had not been presented to the independent submitted to the inspector of elections inspector of elections—and both times Saba’s representatives remained silent Broadridge provides both sides of a proxy contest with a preliminary tabulation of proxies submitted through its systems Saba says it believed no quorum existed due to unofficial, preliminary Broadridge tabulations are not complete records of all votes: they do not include registered holders and beneficial holders through other intermediaries (e.g., Mediant) Broadridge tabulations that did not account for all shares Saba could not know whether there was quorum based solely on the Broadridge tabulation because it did not know how many how many proxies the Funds held from shareholders outside of Broadridge Because Saba never submitted its As of August 7, pre-meeting tabulations from Broadridge showed: (1) 37.1% of proxies, it is impossible to determine outstanding shares at BIGZ and (2) 44.6% of outstanding shares at ECAT as voted whether quorum could have been The Funds could not (and still cannot) determine how many proxies Saba held from obtained shareholders outside of Broadridge that were not included in the tabulations 49
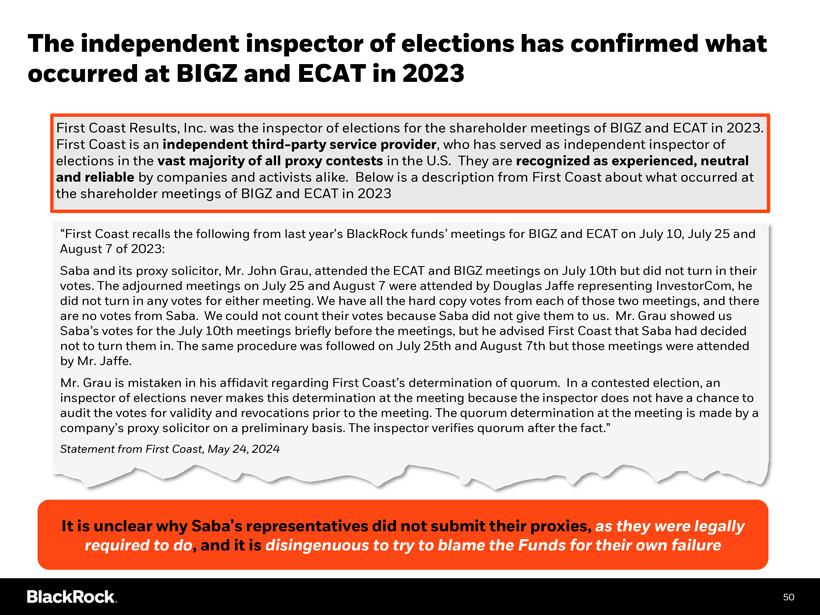
The independent inspector of elections has confirmed what occurred at BIGZ and ECAT in 2023 First Coast Results, Inc. was the inspector of elections for the shareholder meetings of BIGZ and ECAT in 2023. First Coast is an independent third-party service provider, who has served as independent inspector of elections in the vast majority of all proxy contests in the U.S. They are recognized as experienced, neutral and reliable by companies and activists alike. Below is a description from First Coast about what occurred at the shareholder meetings of BIGZ and ECAT in 2023 “First Coast recalls the following from last year’s BlackRock funds’ meetings for BIGZ and ECAT on July 10, July 25 and August 7 of 2023: Saba and its proxy solicitor, Mr. John Grau, attended the ECAT and BIGZ meetings on July 10th but did not turn in their votes. The adjourned meetings on July 25 and August 7 were attended by Douglas Jaffe representing InvestorCom, he did not turn in any votes for either meeting. We have all the hard copy votes from each of those two meetings, and there are no votes from Saba. We could not count their votes because Saba did not give them to us. Mr. Grau showed us Saba’s votes for the July 10th meetings briefly before the meetings, but he advised First Coast that Saba had decided not to turn them in. The same procedure was followed on July 25th and August 7th but those meetings were attended by Mr. Jaffe. Mr. Grau is mistaken in his affidavit regarding First Coast’s determination of quorum. In a contested election, an inspector of elections never makes this determination at the meeting because the inspector does not have a chance to audit the votes for validity and revocations prior to the meeting. The quorum determination at the meeting is made by a company’s proxy solicitor on a preliminary basis. The inspector verifies quorum after the fact.” Statement from First Coast, May 24, 2024 It is unclear why Saba’s representatives did not submit their proxies, as they were legally required to do, and it is disingenuous to try to blame the Funds for their own failure 50

Saba’s nominees are unqualified and conflicted
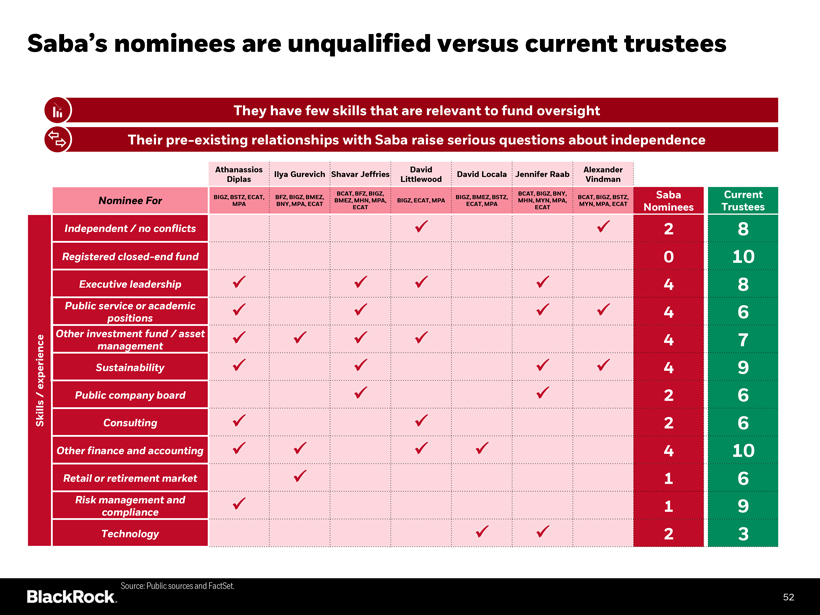
Saba’s nominees are unqualified versus current trustees They have fews that are relevant to fund oversight Their pre-existing relationships with Saba raise serious questions about independence Athanassios David Alexander Ilya Gurevich Shavar Jeffries David Locala Jennifer Raab Diplas Littlewood Vindman BCAT, BFZ, BIGZ, BCAT, BIGZ, BNY, Saba Current BIGZ, BSTZ, ECAT, BFZ, BIGZ, BMEZ, BIGZ, BMEZ, BSTZ, BCAT, BIGZ, BSTZ, Nominee For BMEZ, MHN, MPA, BIGZ, ECAT, MPA MHN, MYN, MPA, MPA BNY, MPA, ECAT ECAT, MPA MYN, MPA, ECAT ECAT ECAT Nominees Trustees Independent / no conflicts 2 8 Registered closed-end fund 0 10 Skills / experience Executive leadership 4 8 Public service or academic 4 6 positions Other investment fund / asset 4 7 management experience Sustainability 4 9 / Public company board 2 6 Consulting 2 6 Other finance and accounting 4 10 Retail or retirement market 1 6 Risk management and 1 9 compliance Technology 2 3 Source: Public sources and FactSet. 52
Saba nominees raise many unanswered questions…
• In response to Saba’s nominations, we asked to interview Saba’s director candidates, as we always do with potential directors
• Saba refused to allow us to interview their nominees
• As a result, we performed a review of the backgrounds of Saba’s nominees using public information. Many questions were
• We are flagging those questions here for our shareholders to be able to take them into account when they vote
Saba’s nominees raise many unanswered questions 53

How can Saba’s nominees be truly independent?
Saba nominees’ pre-existing relationships with Saba raise serious questions about independence
Athanassios David Diplas Locala
BOAZ WEINSTEIN
Ilya Gurevich Jennifer Raab
Shavar Jeffries
Connections to Boaz Weinstein / Saba
Mrs. Weinstein DA campaign financing or charitable contributions from Mr. & Mrs. Weinstein
Frequent social media interactions with Boaz
Boaz’s childhood Boaz’s former chess mate colleague
Source: Public sources and FactSet
54
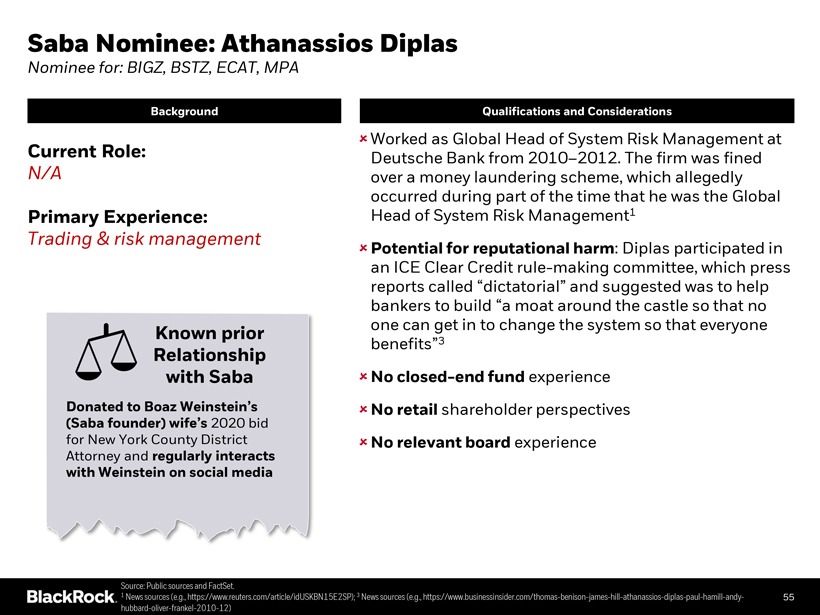
Saba Nominee: Athanassios Diplas
Nominee for: BIGZ, BSTZ, ECAT, MPA
Background Qualifications and Considerations
Worked as Global Head of System Risk Management at Current Role: Deutsche Bank from 2010–2012. The firm was fined N/A over a money laundering scheme, which allegedly occurred during part of the time that he was the Global Primary Experience: Head of System Risk Management1 Trading & risk management
Potential for reputational harm: Diplas participated in an ICE Clear Credit rule-making committee, which press reports called “dictatorial” and suggested was to help bankers to build “a moat around the castle so that no one can get in to change the system so that everyone benefits”3
No closed-end fund experience
No retail shareholder perspectives
No relevant board experience
Known prior Donated to Boaz Weinstein’s (Saba founder) wife’s 2020 bid for New York County District Attorney and regularly interacts with Weinstein on social media
Relationship with Saba
Source: Public sources and FactSet.
1 News sources (e.g., https://www.reuters.com/article/idUSKBN15E2SP); 3 News sources (e.g., https://www.businessinsider.com/thomas-benison-james-hill-athanassios-diplas-paul-hamill-andy- 55 hubbard-oliver-frankel-2010-12)
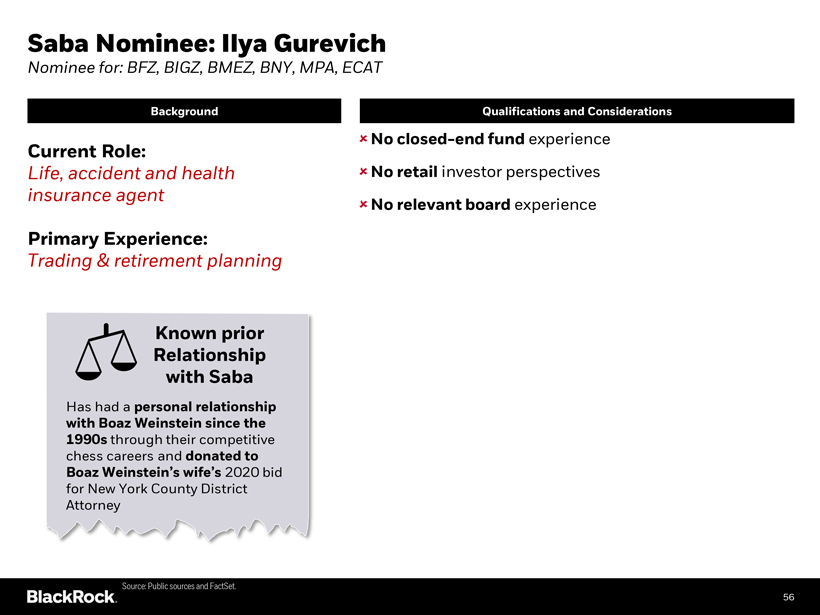
Saba Nominee: Ilya Gurevich
Nominee for: BFZ, BIGZ, BMEZ, BNY, MPA, ECAT
Background Qualifications and Considerations
No closed-end fund experience
Current Role:
Life, accident and health insurance agent
No retail investor perspectives
No relevant board experience
Primary Experience:
Trading & retirement planning
Known prior Relationship with Saba
Has had a personal relationship with Boaz Weinstein since the 1990s through their competitive chess careers and donated to Boaz Weinstein’s wife’s 2020 bid for New York County District Attorney
Source: Public sources and FactSet.
56
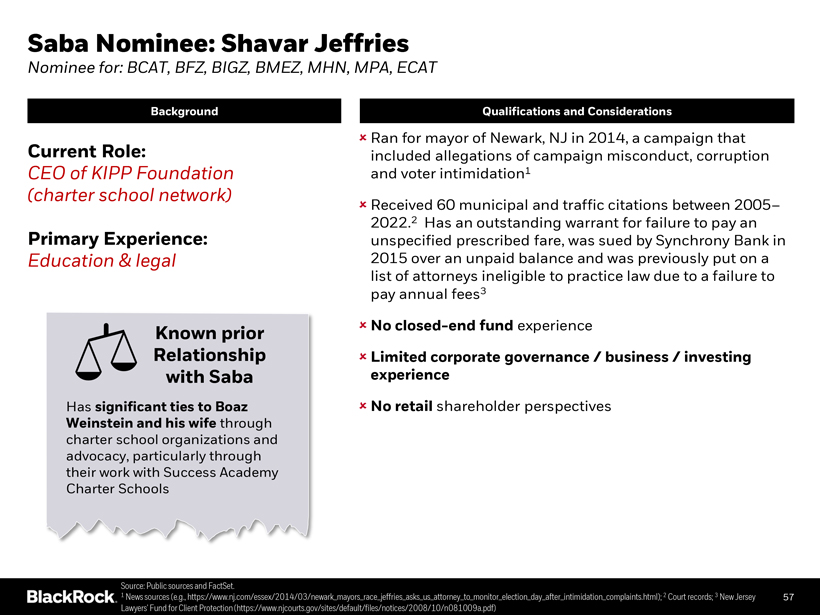
Saba Nominee: Shavar Jeffries
Nominee for: BCAT, BFZ, BIGZ, BMEZ, MHN, MPA, ECAT
Background Qualifications and Considerations
Ran for mayor of Newark, NJ in 2014, a campaign that included allegations of campaign misconduct, corruption and voter intimidation1
Current Role: CEO of KIPP Foundation (charter school network)
Received 60 municipal and traffic citations between 2005–2022.2 Has an outstanding warrant for failure to pay an unspecified prescribed fare, was sued by Synchrony Bank in 2015 over an unpaid balance and was previously put on a list of attorneys ineligible to practice law due to a failure to pay annual fees3
Primary Experience: Education & legal
No closed-end fund experience
Limited corporate governance / business / investing experience
No retail shareholder perspectives
Known prior Relationship with Saba
Has significant ties to Boaz Weinstein and his wife through charter school organizations and advocacy, particularly through their work with Success Academy Charter Schools
Source: Public sources and FactSet.
1 News sources (e.g., https://www.nj.com/essex/2014/03/newark_mayors_race_jeffries_asks_us_attorney_to_monitor_election_day_after_intimidation_complaints.html); 2 Court records; 3 New Jersey 57 Lawyers’ Fund for Client Protection (https://www.njcourts.gov/sites/default/files/notices/2008/10/n081009a.pdf)
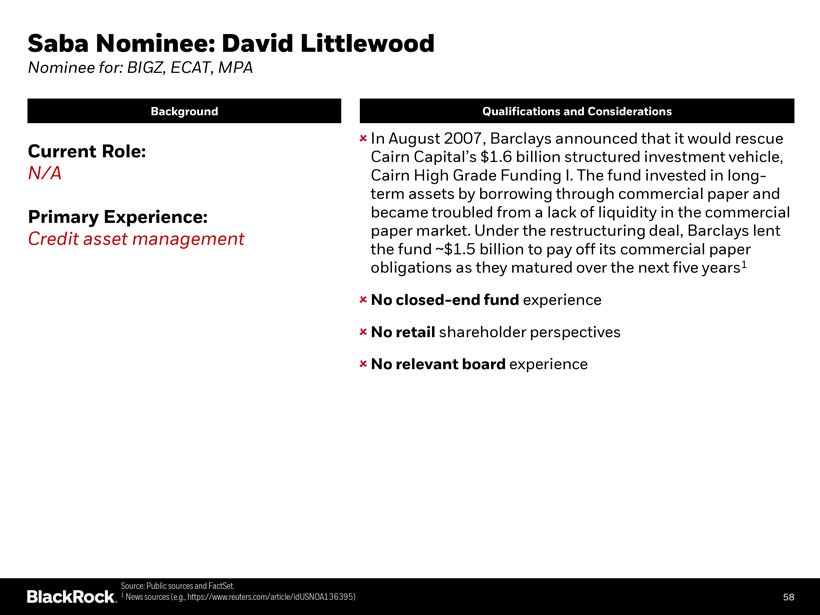
Saba Nominee: David Littlewood
Nominee for: BIGZ, ECAT, MPA
Background Qualifications and Considerations
In August 2007, Barclays announced that it would rescue
Cairn Capital’s $1.6 billion structured investment vehicle, Cairn High Grade Funding I. The fund invested in long-term assets by borrowing through commercial paper and became troubled from a lack of liquidity in the commercial paper market. Under the restructuring deal, Barclays lent the fund ~$1.5 billion to pay off its commercial paper obligations as they matured over the next five years1
Current Role: N/A
Primary Experience:
Credit asset management
No closed-end fund experience
No retail shareholder perspectives
No relevant board experience
Source: Public sources and FactSet.
1 News sources (e.g., https://www.reuters.com/article/idUSNOA136395) 58
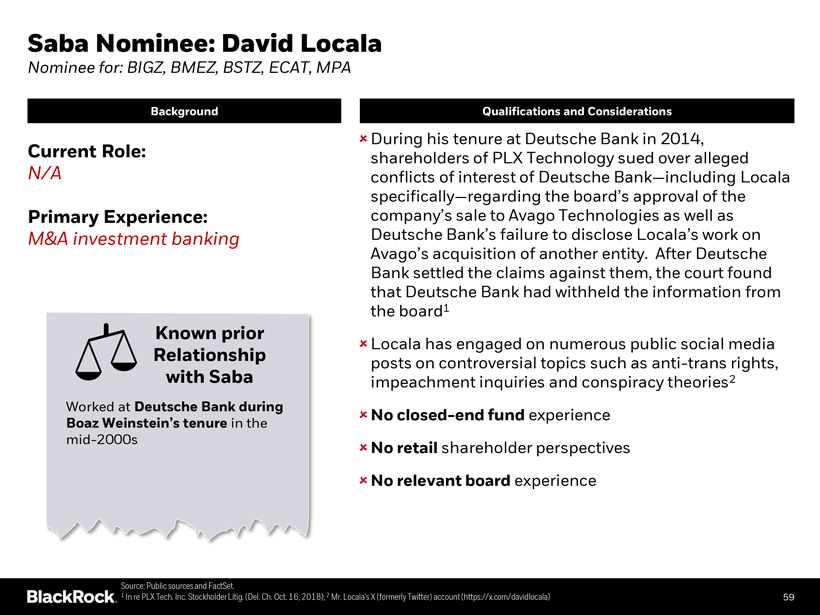
Saba Nominee: David Locala
Nominee for: BIGZ, BMEZ, BSTZ, ECAT, MPA
Background Qualifications and Considerations
During his tenure at Deutsche Bank in 2014, shareholders of PLX Technology sued over alleged N/A conflicts of interest of Deutsche Bank—including Locala specifically—regarding the board’s approval of the company’s sale to Avago Technologies as well as M&A investment banking Deutsche Bank’s failure to disclose Locala’s work on Avago’s acquisition of another entity. After Deutsche
Bank settled the claims against them, the court found that Deutsche Bank had withheld the information from the board1
Known prior Locala has engaged on numerous public social media posts on controversial topics such as anti-trans rights,
impeachment inquiries and conspiracy theories2 Worked at experience in the mid-2000s shareholder perspectives experience Source: Public sources and FactSet. 1 In re PLX Tech. Inc. Stockholder Litig. (Del. Ch. Oct. 16, 2018); 2 Mr. Locala’s X (formerly Twitter) account (https://x.com/davidlocala) 59
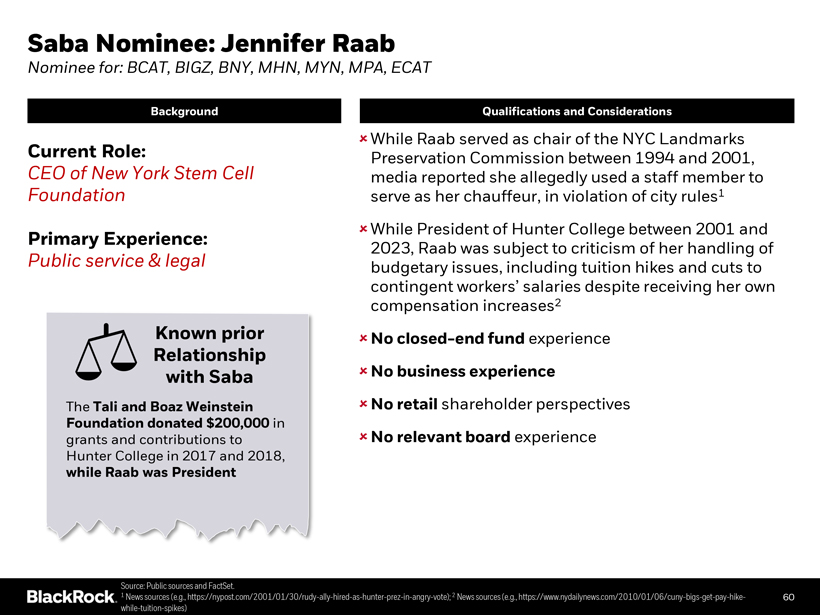
Saba Nominee: Jennifer Raab
Nominee for: BCAT, BIGZ, BNY, MHN, MYN, MPA, ECAT
Background Qualifications and Considerations
Current Role: CEO of New York Stem Cell Foundation
While Raab served as chair of the NYC Landmarks Preservation Commission between 1994 and 2001, media reported she allegedly used a staff member to serve as her chauffeur, in violation of city rules1
While President of Hunter College between 2001 and 2023, Raab was subject to criticism of her handling of budgetary issues, including tuition hikes and cuts to contingent workers’ salaries despite receiving her own compensation increases2
Primary Experience: Public service & legal
Known prior Relationship with Saba
The Tali and Boaz Weinstein Foundation donated $200,000 in grants and contributions to Hunter College in 2017 and 2018, while Raab was President
No closed-end fund business with Saba
No business experience
No retail shareholder perspectives
No relevant board experience
Source: Public sources and FactSet.
1 News sources (e.g., https://nypost.com/2001/01/30/rudy-ally-hired-as-hunter-prez-in-angry-vote); 2 News sources (e.g., https://www.nydailynews.com/2010/01/06/cuny-bigs-get-pay-hike- 60 while-tuition-spikes)

Saba Nominee: Alexander Vindman
Nominee for: BCAT, BIGZ, BSTZ, MYN , MPA, ECAT
Background Qualifications and Considerations
No closed-end fund experience
Current Role:
President of Here Right Matters
No governance, business or finance experience1
Foundation (Ukraine aid)
No retail shareholder perspectives
Primary Experience:
No relevant board experience
Military
Source: Public sources and FactSet.
1 See, e.g., https://www.kettering.org/alexander-vindman 61
The answer is clear – only the current Funds’ Boards have the best interests of all shareholders in mind and BlackRock is the right manager for these Funds
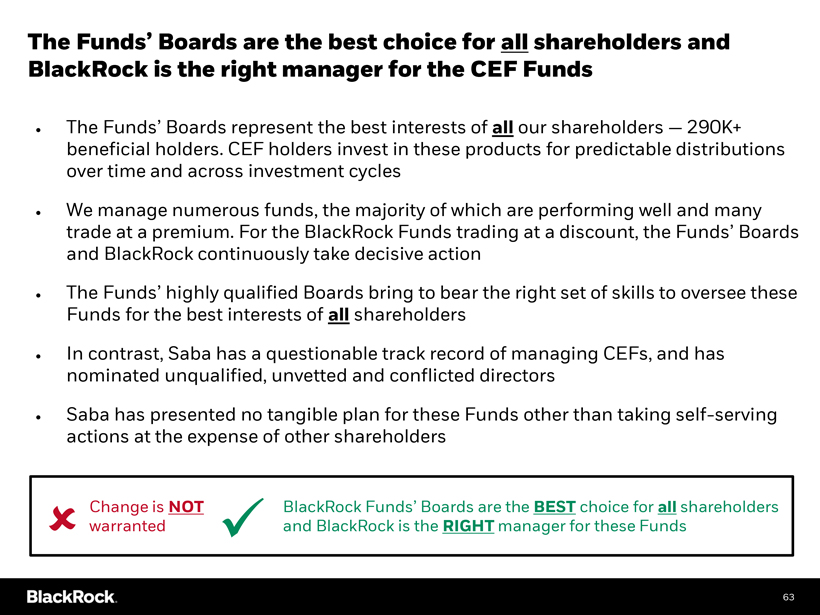
The Funds’ Boards are the best choice for all shareholders and BlackRock is the right manager for the CEF Funds
• The Funds’ Boards represent the best interests of all our shareholders — 290K+ beneficial holders. CEF holders invest in these products for predictable distributions over time and across investment cycles
• We manage numerous funds, the majority of which are performing well and many trade at a premium. For the BlackRock Funds trading at a discount, the Funds’ Boards and BlackRock continuously take decisive action
• The Funds’ highly qualified Boards bring to bear the right set of skills to oversee these
Funds for the best interests of all shareholders
• In contrast, Saba has a questionable track record of managing CEFs, and has nominated unqualified, unvetted and conflicted directors
• Saba has presented no tangible plan for these Funds other than taking self-serving actions at the expense of other shareholders
Change is NOT BlackRock Funds’ Boards are the BEST choice for all shareholders warranted and BlackRock is the RIGHT manager for these Funds
63
Appendix
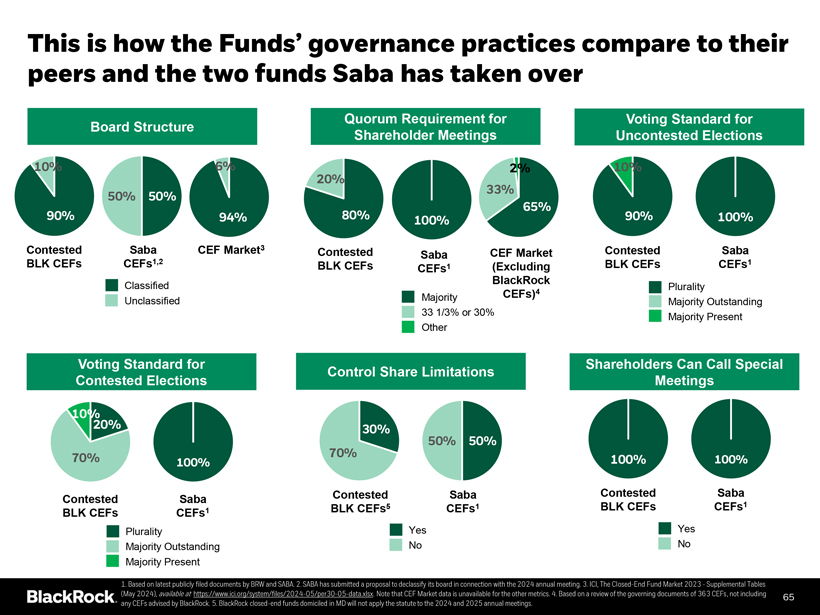
This is how the Funds’ governance practices compare to their peers and the two funds Saba has taken over
Quorum Requirement for Voting Standard for Board Structure Shareholder Meetings Uncontested Elections
10% 6% 2% 10% 20% 33% 50% 50% 65%
90% 94% 80% 100% 90% 100%
Contested Saba CEF Market3 Contested CEF Market Contested Saba Saba BLK CEFs CEFs1,2 BLK CEFs CEFs1 BLK CEFs CEFs1 (Excluding BlackRock
Classified Plurality
CEFs)4
Unclassified Majority Majority Outstanding
33 1/3% or 30% Majority Present Other
Voting Standard for Shareholders Can Call Special Control Share Limitations Contested Elections Meetings
10%
20% 30%
70% 50% 50%
70% 100% 100% 100%
Contested Saba Contested Saba Contested Saba BLK CEFs CEFs1 BLK CEFs5 CEFs1 BLK CEFs CEFs1
Plurality Yes Yes Majority Outstanding No No Majority Present
1. Based on latest publicly filed documents by BRW and SABA. 2. SABA has submitted a proposal to declassify its board in connection with the 2024 annual meeting. 3. ICI, The Closed-End Fund Market 2023—Supplemental Tables
(May 2024), available at https://www.ici.org/system/files/2024-05/per30-05-data.xlsx. Note that CEF Market data is unavailable for the other metrics. 4. Based on a review of the governing documents of 363 CEFs, not including 65 any CEFs advised by BlackRock. 5. BlackRock closed-end funds domiciled in MD will not apply the statute to the 2024 and 2025 annual meetings.
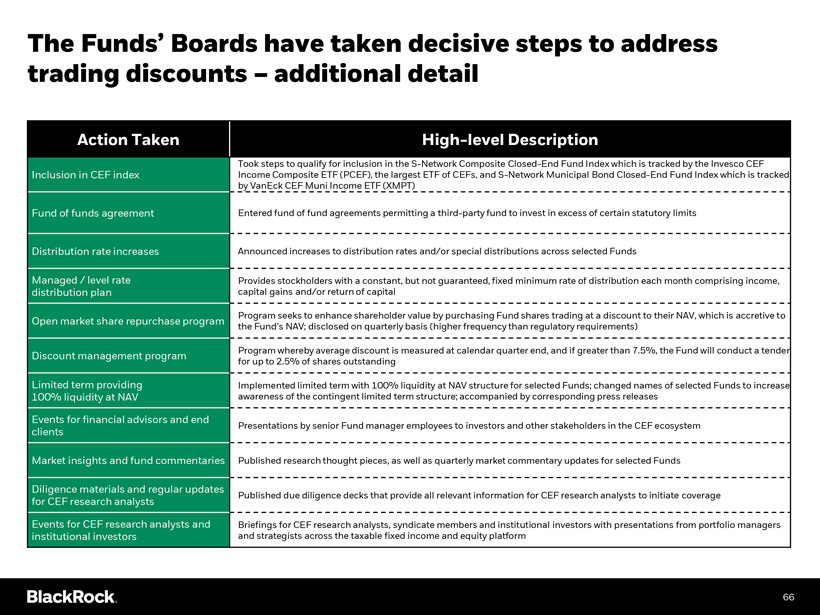
The Funds’ Boards have taken decisive steps to address trading discounts – additional detail
Action Taken High-level Description
Took steps to qualify for inclusion in the S-Network Composite Closed-End Fund Index which is tracked by the Invesco CEF Inclusion in CEF index Income Composite ETF (PCEF), the largest ETF of CEFs, and S-Network Municipal Bond Closed-End Fund Index which is tracked by VanEck CEF Muni Income ETF (XMPT) Fund of funds agreement Entered fund of fund agreements permitting a third-party fund to invest in excess of certain statutory limits
Distribution rate increases Announced increases to distribution rates and/or special distributions across selected Funds
Managed / level rate Provides stockholders with a constant, but not guaranteed, fixed minimum rate of distribution each month comprising income, distribution plan capital gains and/or return of capital
Program seeks to enhance shareholder value by purchasing Fund shares trading at a discount to their NAV, which is accretive to
Open market share repurchase program the Fund’s NAV; disclosed on quarterly basis (higher frequency than regulatory requirements)
Program whereby average discount is measured at calendar quarter end, and if greater than 7.5%, the Fund will conduct a tender
Discount management program for up to 2.5% of shares outstanding
Limited term providing Implemented limited term with 100% liquidity at NAV structure for selected Funds; changed names of selected Funds to increase 100% liquidity at NAV awareness of the contingent limited term structure; accompanied by corresponding press releases
Events for financial advisors and end
Presentations by senior Fund manager employees to investors and other stakeholders in the CEF ecosystem clients
Market insights and fund commentaries Published research thought pieces, as well as quarterly market commentary updates for selected Funds
Diligence materials and regular updates
Published due diligence decks that provide all relevant information for CEF research analysts to initiate coverage for CEF research analysts
Events for CEF research analysts and Briefings for CEF research analysts, syndicate members and institutional investors with presentations from portfolio managers institutional investors and strategists across the taxable fixed income and equity platform
66
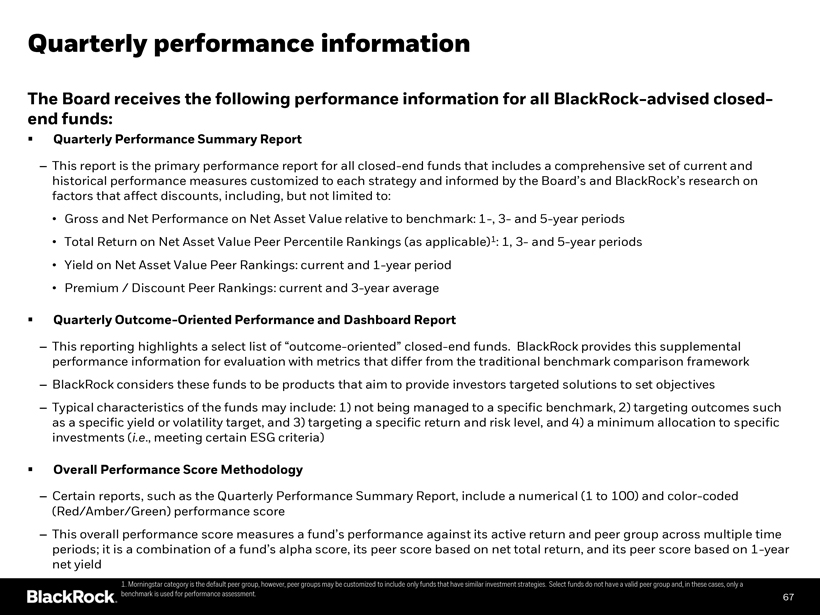
Quarterly performance information
The Board receives the following performance information for all BlackRock-advised closed-end funds:
? Quarterly Performance Summary Report
– This report is the primary performance report for all closed-end funds that includes a comprehensive set of current and historical performance measures customized to each strategy and informed by the Board’s and BlackRock’s research on factors that affect discounts, including, but not limited to:
• Gross and Net Performance on Net Asset Value relative to benchmark: 1-, 3- and 5-year periods
• Total Return on Net Asset Value Peer Percentile Rankings (as applicable)1: 1, 3- and 5-year periods
• Yield on Net Asset Value Peer Rankings: current and 1-year period
• Premium / Discount Peer Rankings: current and 3-year average
Quarterly Outcome-Oriented Performance and Dashboard Report
– This reporting highlights a select list of “outcome-oriented” closed-end funds. BlackRock provides this supplemental performance information for evaluation with metrics that differ from the traditional benchmark comparison framework
– BlackRock considers these funds to be products that aim to provide investors targeted solutions to set objectives
– Typical characteristics of the funds may include: 1) not being managed to a specific benchmark, 2) targeting outcomes such as a specific yield or volatility target, and 3) targeting a specific return and risk level, and 4) a minimum allocation to specific investments (i.e., meeting certain ESG criteria)
Overall Performance Score Methodology
– Certain reports, such as the Quarterly Performance Summary Report, include a numerical (1 to 100) and color-coded (Red/Amber/Green) performance score
– This overall performance score measures a fund’s performance against its active return and peer group across multiple time periods; it is a combination of a fund’s alpha score, its peer score based on net total return, and its peer score based on 1-year net yield
1. Morningstar category is the default peer group, however, peer groups may be customized to include only funds that have similar investment strategies. Select funds do not have a valid peer group and, in these cases, only a benchmark is used for performance assessment. 67
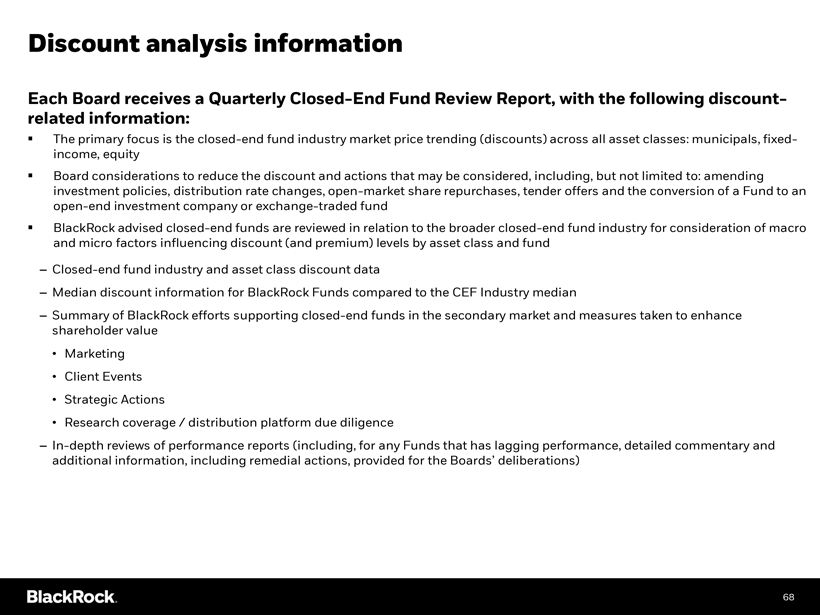
Discount analysis information
Each Board receives a Quarterly Closed-End Fund Review Report, with the following discount-related information:
The primary focus is the closed-end fund industry market price trending (discounts) across all asset classes: municipals, fixed-income, equity
Board considerations to reduce the discount and actions that may be considered, including, but not limited to: amending investment policies, distribution rate changes, open-market share repurchases, tender offers and the conversion of a Fund to an open-end investment company or exchange-traded fund
BlackRock advised closed-end funds are reviewed in relation to the broader closed-end fund industry for consideration of macro and micro factors influencing discount (and premium) levels by asset class and fund
– Closed-end fund industry and asset class discount data
– Median discount information for BlackRock Funds compared to the CEF Industry median
– Summary of BlackRock efforts supporting closed-end funds in the secondary market and measures taken to enhance shareholder value
• Marketing
• Client Events
• Strategic Actions
• Research coverage / distribution platform due diligence
– In-depth reviews of performance reports (including, for any Funds that has lagging performance, detailed commentary and additional information, including remedial actions, provided for the Boards’ deliberations)
68
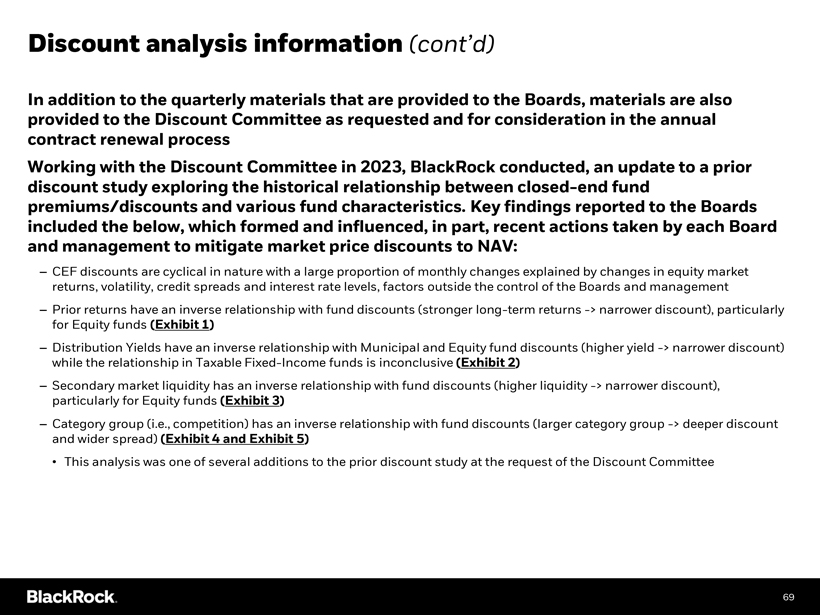
Discount analysis information (cont’d)
In addition to the quarterly materials that are provided to the Boards, materials are also provided to the Discount Committee as requested and for consideration in the annual contract renewal process Working with the Discount Committee in 2023, BlackRock conducted, an update to a prior discount study exploring the historical relationship between closed-end fund premiums/discounts and various fund characteristics. Key findings reported to the Boards included the below, which formed and influenced, in part, recent actions taken by each Board and management to mitigate market price discounts to NAV:
– CEF discounts are cyclical in nature with a large proportion of monthly changes explained by changes in equity market returns, volatility, credit spreads and interest rate levels, factors outside the control of the Boards and management
– Prior returns have an inverse relationship with fund discounts (stronger long-term returns -> narrower discount), particularly for Equity funds (Exhibit 1)
– Distribution Yields have an inverse relationship with Municipal and Equity fund discounts (higher yield -> narrower discount) while the relationship in Taxable Fixed-Income funds is inconclusive (Exhibit 2)
– Secondary market liquidity has an inverse relationship with fund discounts (higher liquidity -> narrower discount), particularly for Equity funds (Exhibit 3)
– Category group (i.e., competition) has an inverse relationship with fund discounts (larger category group -> deeper discount and wider spread) (Exhibit 4 and Exhibit 5)
• This analysis was one of several additions to the prior discount study at the request of the Discount Committee
69
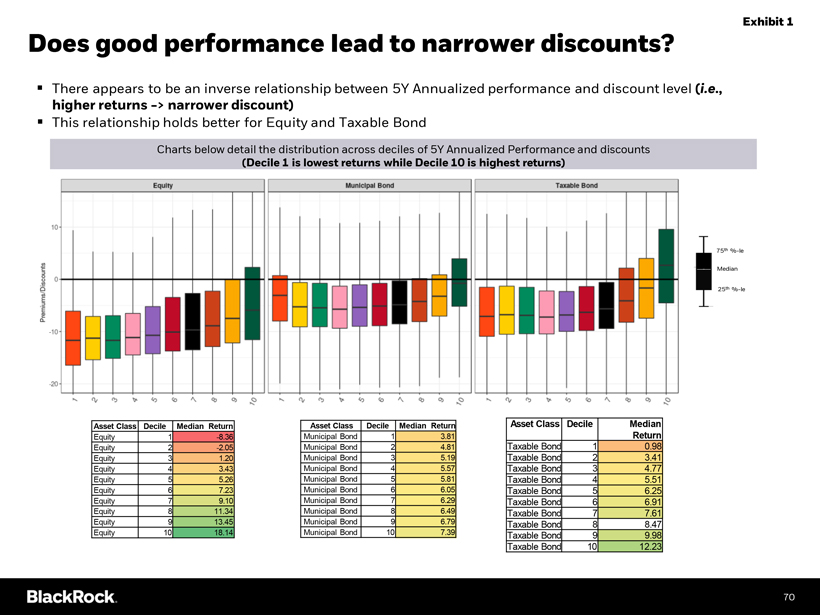
Exhibit 1
Does good performance lead to narrower discounts?
There appears to be an inverse relationship between 5Y Annualized performance and discount level (i.e., higher returns -> narrower discount)
This relationship holds better for Equity and Taxable Bond
Charts below detail the distribution across deciles of 5Y Annualized Performance and discounts
(Decile 1 is lowest returns while Decile 10 is highest returns)
75th %-le Med
ian 25th %-le
Asset Class Decile Median Return Asset Class Decile Median Return Asset Class Decile Median
Equity 1 -8.36 Municipal Bond 1 3.81 Return Equity 2 -2.05 Municipal Bond 2 4.81 Taxable Bond 1 0.98 Equity 3 1.20 Municipal Bond 3 5.19 Taxable Bond 2 3.41 Equity 4 3.43 Municipal Bond 4 5.57 Taxable Bond 3 4.77 Equity 5 5.26 Municipal Bond 5 5.81 Taxable Bond 4 5.51 Equity 6 7.23 Municipal Bond 6 6.05 Taxable Bond 5 6.25 Equity 7 9.10 Municipal Bond 7 6.29 Taxable Bond 6 6.91 Equity 8 11.34 Municipal Bond 8 6.49 Taxable Bond 7 7.61 Equity 9 13.45 Municipal Bond 9 6.79 Taxable Bond 8 8.47
Equity 10 18.14 Municipal Bond 10 7.39 Taxable Bond 9 9.98 70
Taxable Bond 10 12.23
70
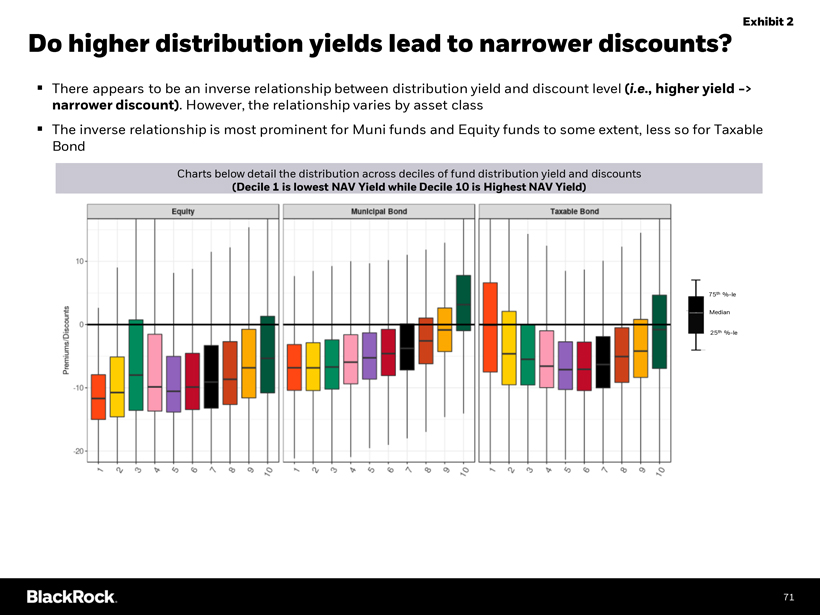
Exhibit 2
Do higher distribution yields lead to narrower discounts?
There appears to be an inverse relationship between distribution yield and discount level (i.e., higher yield -> narrower discount). However, the relationship varies by asset class
The inverse relationship is most prominent for Muni funds and Equity funds to some extent, less so for Taxable Bond
Charts below detail the distribution across deciles of fund distribution yield and discounts
(Decile 1 is lowest NAV Yield while Decile 10 is Highest NAV Yield)
75th %-le Median 25th %-le
71
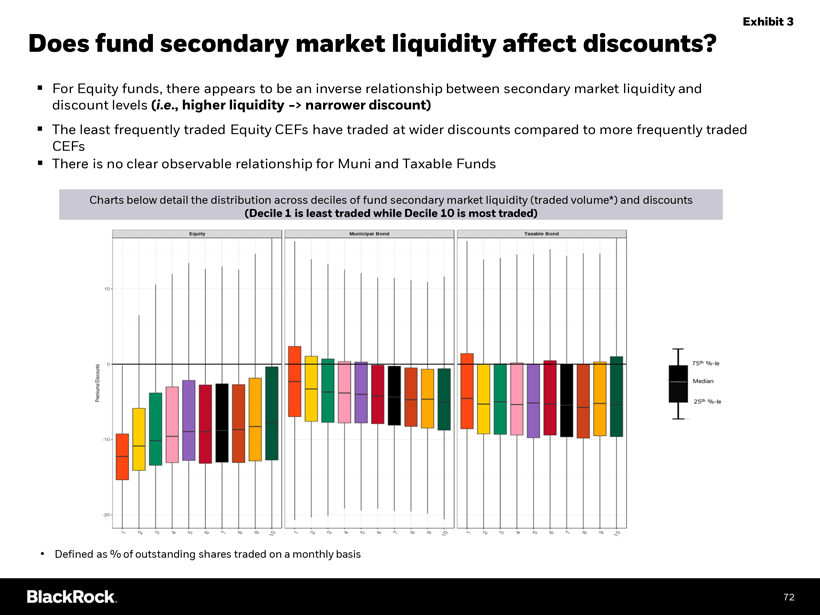
Exhibit 3
Does fund secondary market liquidity affect discounts?
For Equity funds, there appears to be an inverse relationship between secondary market liquidity and discount levels (i.e., higher liquidity -> narrower discount)
The least frequently traded Equity CEFs have traded at wider discounts compared to more frequently traded CEFs
There is no clear observable relationship for Muni and Taxable Funds
Charts below detail the distribution across deciles of fund secondary market liquidity (traded volume*) and discounts
(Decile 1 is least traded while Decile 10 is most traded)
75th %-le Median 25th %-le
• Defined as % of outstanding shares traded on a monthly basis 72
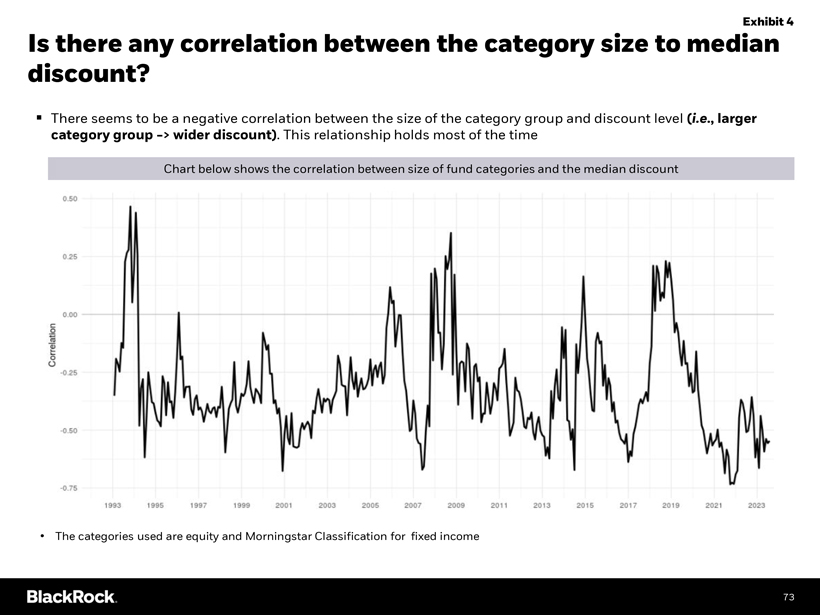
Exhibit 4
Is there any correlation between the category size to median discount?
There seems to be a negative correlation between the size of the category group and discount level (i.e., larger category group -> wider discount). This relationship holds most of the time
Chart below shows the correlation between size of fund categories and the median discount
• The categories used are equity and Morningstar Classification for fixed income
73
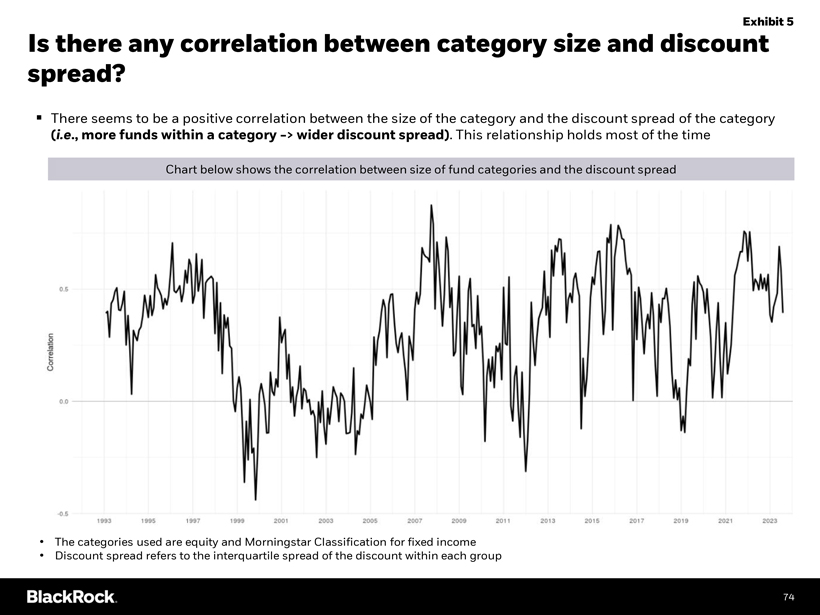
Exhibit 5
Is there any correlation between category size and discount spread?
There seems to be a positive correlation between the size of the category and the discount spread of the category
(i.e., more funds within a category -> wider discount spread). This relationship holds most of the time
Chart below shows the correlation between size of fund categories and the discount spread
• The categories used are equity and Morningstar Classification for fixed income
• Discount spread refers to the interquartile spread of the discount within each group
74
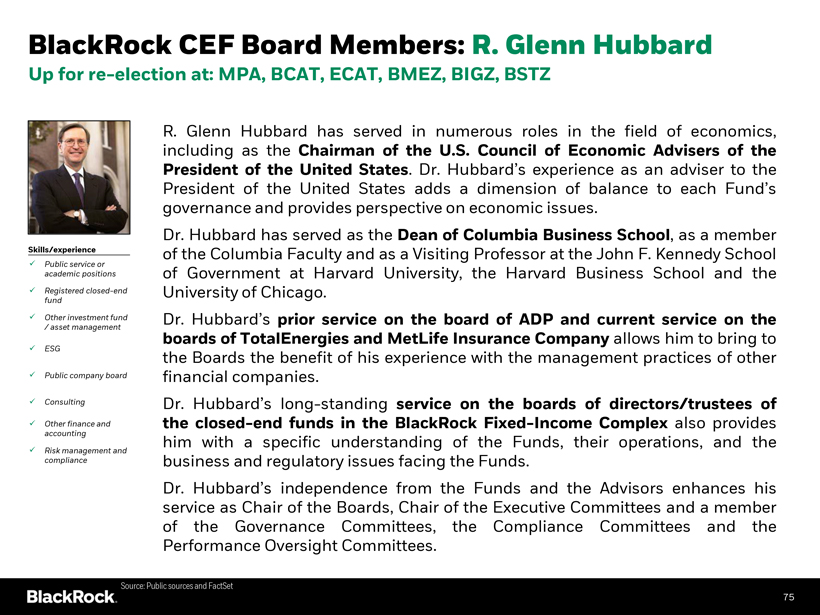
BlackRock CEF Board Members: R. Glenn Hubbard
Up for re-election at: MPA, BCAT, ECAT, BMEZ, BIGZ, BSTZ
R. Glenn Hubbard has served in numerous roles in the field of economics, including as the Chairman of the U.S. Council of Economic Advisers of the President of the United States. Dr. Hubbard’s experience as an adviser to the President of the United States adds a dimension of balance to each Fund’s governance and provides perspective on economic issues.
Dr. Hubbard has served as the Dean of Columbia Business School, as a member Skills/experience of the Columbia Faculty and as a Visiting Professor at the John F. Kennedy School
Public service or
academic positions of Government at Harvard University, the Harvard Business School and the
Registered closed-end University of Chicago. fund
Other investment fund / asset management Dr. Hubbard’s prior service on the board of ADP and current service on the
boards of TotalEnergies and MetLife Insurance Company allows him to bring to
ESG the Boards the benefit of his experience with the management practices of other
Public company board financial companies.
Consulting Dr. Hubbard’s long-standing service on the boards of directors/trustees of
Other finance and the closed-end funds in the BlackRock Fixed-Income Complex also provides accounting him with a specific understanding of the Funds, their operations, and the
Risk management and
compliance business and regulatory issues facing the Funds.
Dr. Hubbard’s independence from the Funds and the Advisors enhances his service as Chair of the Boards, Chair of the Executive Committees and a member of the Governance Committees, the Compliance Committees and the Performance Oversight Committees.
Source: Public sources and FactSet
75
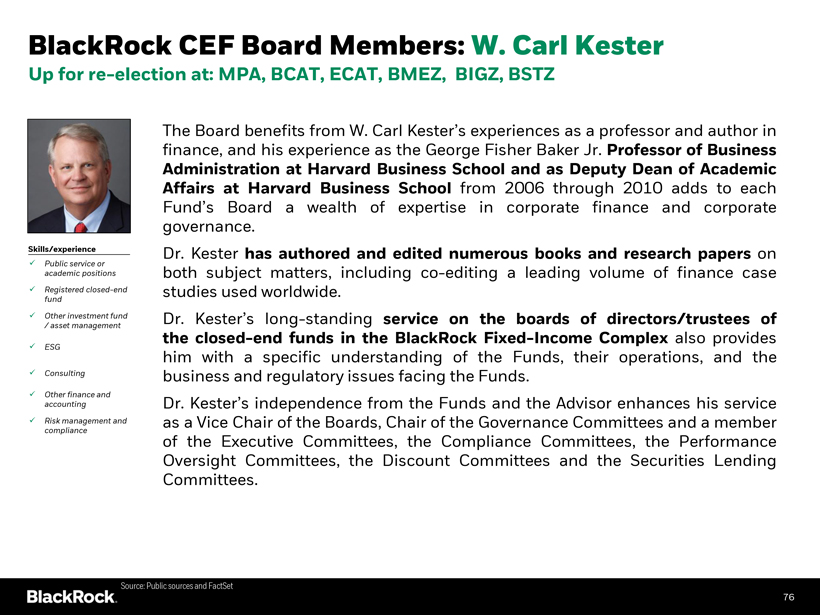
BlackRock CEF Board Members: W. Carl Kester
Up for re-election at: MPA, BCAT, ECAT, BMEZ, BIGZ, BSTZ
The Board benefits from W. Carl Kester’s experiences as a professor and author in finance, and his experience as the George Fisher Baker Jr. Professor of Business Administration at Harvard Business School and as Deputy Dean of Academic Affairs at Harvard Business School from 2006 through 2010 adds to each
Fund’s Board a wealth of expertise in corporate finance and corporate governance.
Skills/experience Dr. Kester has authored and edited numerous books and research papers on
Public service or
academic positions both subject matters, including co-editing a leading volume of finance case
Registered closed-end studies used worldwide. fund
Other investment fund Dr. Kester’s long-standing service on the boards of directors/trustees of
/ asset management
the closed-end funds in the BlackRock Fixed-Income Complex also provides
ESG
him with a specific understanding of the Funds, their operations, and the
Consulting business and regulatory issues facing the Funds.
Other finance and
accounting Dr. Kester’s independence from the Funds and the Advisor enhances his service
Risk management and as a Vice Chair of the Boards, Chair of the Governance Committees and a member
compliance
of the Executive Committees, the Compliance Committees, the Performance Oversight Committees, the Discount Committees and the Securities Lending Committees.
Source: Public sources and FactSet
76
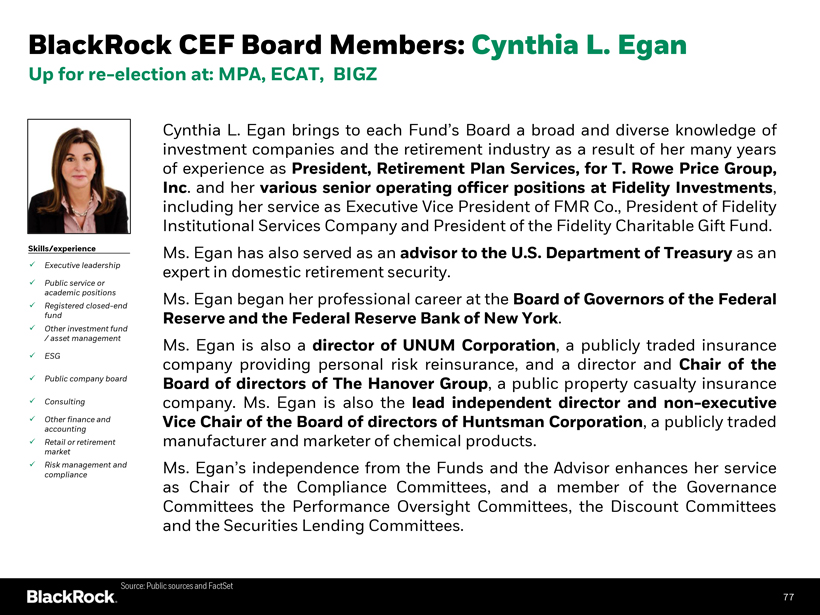
BlackRock CEF Board Members: Cynthia L. Egan
Up for re-election at: MPA, ECAT, BIGZ
Cynthia L. Egan brings to each Fund’s Board a broad and diverse knowledge of investment companies and the retirement industry as a result of her many years of experience as President, Retirement Plan Services, for T. Rowe Price Group, Inc. and her various senior operating officer positions at Fidelity Investments, including her service as Executive Vice President of FMR Co., President of Fidelity Institutional Services Company and President of the Fidelity Charitable Gift Fund.
Skills/experience Ms. Egan has also served as an advisor to the U.S. Department of Treasury as an
Executive leadership expert in domestic retirement security.
Public service or
academic positions Ms. Egan began her professional career at the Board of Governors of the Federal
Registered closed-end
fund Reserve and the Federal Reserve Bank of New York.
Other investment fund
/ asset management Ms. Egan is also a director of UNUM Corporation, a publicly traded insurance
ESG company providing personal risk reinsurance, and a director and Chair of the
Public company board Board of directors of The Hanover Group, a public property casualty insurance
Consulting company. Ms. Egan is also the lead independent director and non-executive
Other finance and Vice Chair of the Board of directors of Huntsman Corporation, a publicly traded
accounting
Retail or retirement manufacturer and marketer of chemical products.
market
Risk management and Ms. Egan’s independence from the Funds and the Advisor enhances her service compliance as Chair of the Compliance Committees, and a member of the Governance Committees the Performance Oversight Committees, the Discount Committees and the Securities Lending Committees.
Source: Public sources and FactSet
77
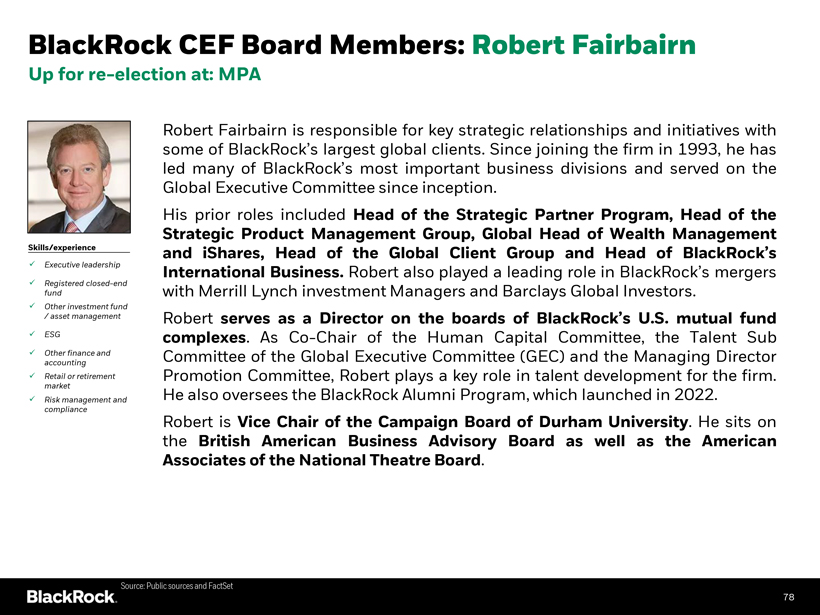
BlackRock CEF Board Members: Robert Fairbairn
Up for re-election at: MPA
Robert Fairbairn is responsible for key strategic relationships and initiatives with some of BlackRock’s largest global clients. Since joining the firm in 1993, he has led many of BlackRock’s most important business divisions and served on the Global Executive Committee since inception.
His prior roles included Head of the Strategic Partner Program, Head of the Strategic Product Management Group, Global Head of Wealth Management Skills/experience and iShares, Head of the Global Client Group and Head of BlackRock’s
? Executive leadership International Business. Robert also played a leading role in BlackRock’s mergers
? Registered closed-end
fund with Merrill Lynch investment Managers and Barclays Global Investors.
? Other investment fund
/ asset management Robert serves as a Director on the boards of BlackRock’s U.S. mutual fund
? ESG complexes. As Co-Chair of the Human Capital Committee, the Talent Sub
? Other finance and Committee of the Global Executive Committee (GEC) and the Managing Director
accounting
? Retail or retirement Promotion Committee, Robert plays a key role in talent development for the firm. market He also oversees the BlackRock Alumni Program, which launched in 2022.
? Risk management and
compliance Robert is Vice Chair of the Campaign Board of Durham University. He sits on the British American Business Advisory Board as well as the American Associates of the National Theatre Board.
Source: Public sources and FactSet
78
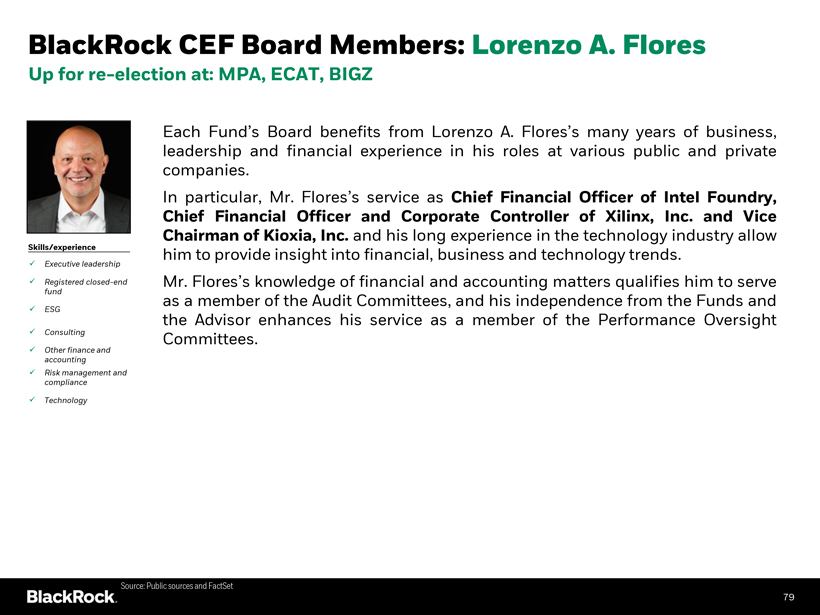
BlackRock CEF Board Members: Lorenzo A. Flores
Up for re-election at: MPA, ECAT, BIGZ
Each Fund’s Board benefits from Lorenzo A. Flores’s many years of business, leadership and financial experience in his roles at various public and private companies.
In particular, Mr. Flores’s service as Chief Financial Officer of Intel Foundry, Chief Financial Officer and Corporate Controller of Xilinx, Inc. and Vice Chairman of Kioxia, Inc. and his long experience in the technology industry allow Skills/experience him to provide insight into financial, business and technology trends.
Executive leadership
Registered closed-end Mr. Flores’s knowledge of financial and accounting matters qualifies him to serve
fund
as a member of the Audit Committees, and his independence from the Funds and
ESG
the Advisor enhances his service as a member of the Performance Oversight
Consulting Committees.
Other finance and accounting
Risk management and compliance
Technology
Source: Public sources and FactSet
79
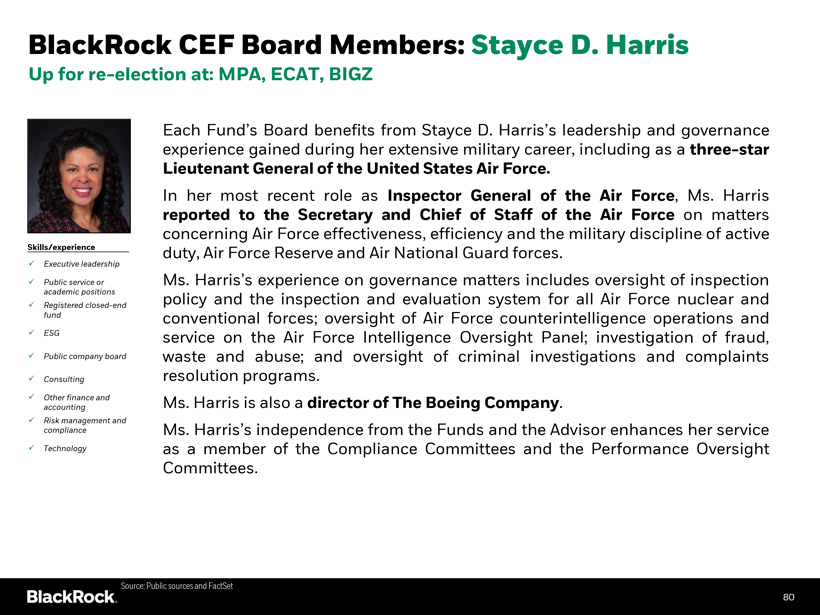
BlackRock CEF Board Members: Stayce D. Harris
Up for re-election at: MPA, ECAT, BIGZ
Each Fund’s Board benefits from Stayce D. Harris’s leadership and governance
experience gained during her extensive military career, including as a three-star
Lieutenant General of the United States Air Force.
In her most recent role as Inspector General of the Air Force, Ms. Harris
reported to the Secretary and Chief of Staff of the Air Force on matters
concerning Air Force effectiveness, efficiency and the military discipline of active
Skills/experience duty, Air Force Reserve and Air National Guard forces.
Executive leadership
Public service or Ms. Harris’s experience on governance matters includes oversight of inspection
academic positions policy and the inspection and evaluation system for all Air Force nuclear and
Registered closed-end
fund conventional forces; oversight of Air Force counterintelligence operations and
ESG service on the Air Force Intelligence Oversight Panel; investigation of fraud,
Public company board waste and abuse; and oversight of criminal investigations and complaints
Consulting resolution programs.
Other finance and Ms. Harris is also a director of The Boeing Company.
accounting
Risk management and
compliance Ms. Harris’s independence from the Funds and the Advisor enhances her service
Technology as a member of the Compliance Committees and the Performance Oversight
Committees.
Source: Public sources and FactSet
80
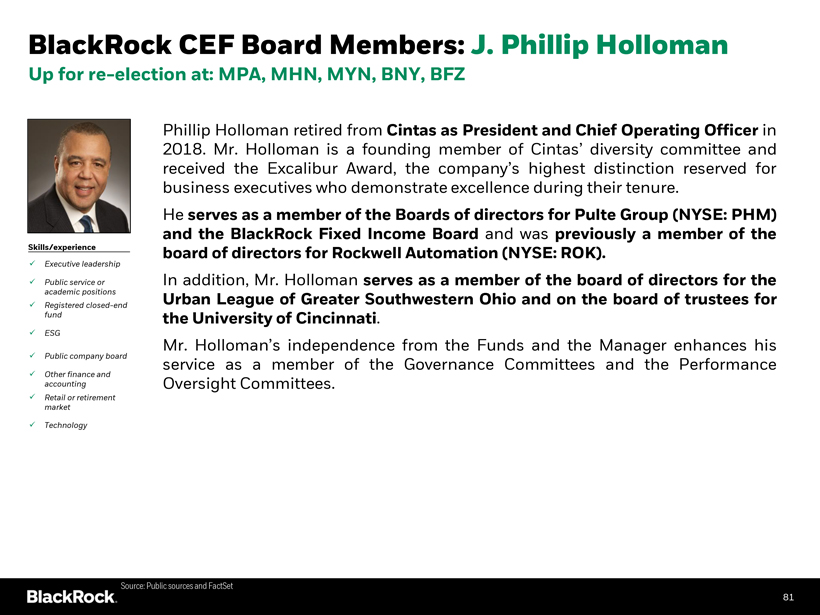
BlackRock CEF Board Members: J. Phillip Holloman
Up for re-election at: MPA, MHN, MYN, BNY, BFZ
Phillip Holloman retired from Cintas as President and Chief Operating Officer in 2018. Mr. Holloman is a founding member of Cintas’ diversity committee and received the Excalibur Award, the company’s highest distinction reserved for business executives who demonstrate excellence during their tenure.
He serves as a member of the Boards of directors for Pulte Group (NYSE: PHM) and the BlackRock Fixed Income Board and was previously a
member of the Skills/experience board of directors for Rockwell Automation (NYSE: ROK).
Executive leadership
Public service or In addition, Mr. Holloman serves as a member of the board of directors for the academic positions Urban League of Greater Southwestern Ohio and on the board of trustees for
Registered closed-end
fund the University of Cincinnati.
ESG
Mr. Holloman’s independence from the Funds and the Manager enhances his
Public company board service as a member of the Governance Committees and the Performance
Other finance and
accounting Oversight Committees.
Retail or retirement market
Technology
Source: Public sources and FactSet
81
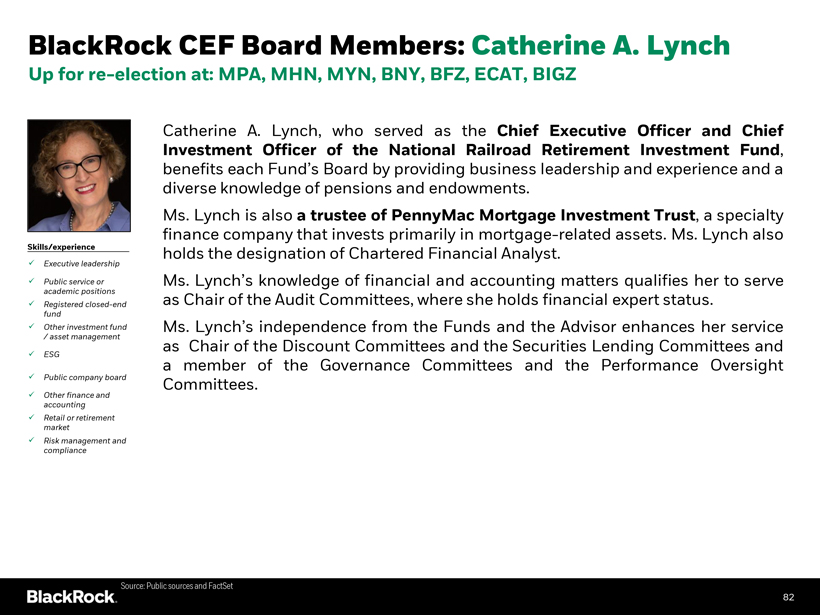
BlackRock CEF Board Members: Catherine A. Lynch
Up for re-election at: MPA, MHN, MYN, BNY, BFZ, ECAT, BIGZ
Catherine A. Lynch, who served as the Chief Executive Officer and Chief Investment Officer of the National Railroad Retirement Investment Fund, benefits each Fund’s Board by providing business leadership and experience and a diverse knowledge of pensions and endowments.
Ms. Lynch is also a trustee of PennyMac Mortgage Investment Trust, a specialty finance company that invests primarily in mortgage-related assets. Ms. Lynch also Skills/experience holds the designation of Chartered Financial Analyst.
Executive leadership
Public service or Ms. Lynch’s knowledge of financial and accounting matters qualifies her to serve academic positions as Chair of the Audit Committees, where she holds financial expert status.
Registered closed-end fund
Other investment fund Ms. Lynch’s independence from the Funds and the Advisor enhances her service
/ asset management
as Chair of the Discount Committees and the Securities Lending Committees and
ESG
a member of the Governance Committees and the Performance Oversight
Public company board Committees.
Other finance and accounting
Retail or retirement market
Risk management and compliance
Source: Public sources and FactSet
82
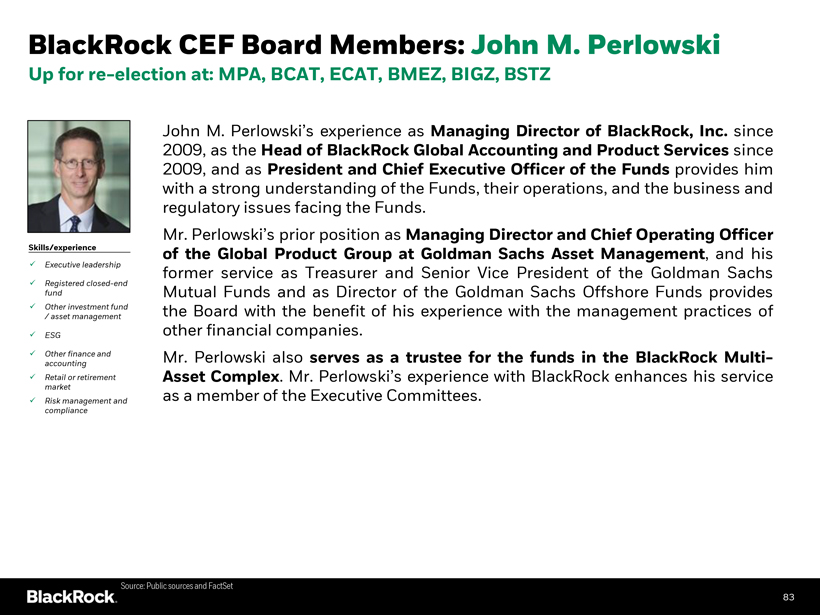
BlackRock CEF Board Members: John M. Perlowski
Up for re-election at: MPA, BCAT, ECAT, BMEZ, BIGZ, BSTZ
John M. Perlowski’s experience as Managing Director of BlackRock, Inc. since 2009, as the Head of BlackRock Global Accounting and Product Services since 2009, and as President and Chief Executive Officer of the Funds provides him with a strong understanding of the Funds,
their operations, and the business and regulatory issues facing the Funds.
Mr. Perlowski’s prior position as Managing Director and Chief Operating Officer Skills/experience of the Global Product Group at Goldman Sachs Asset Management, and his
Executive leadership former service as Treasurer and Senior Vice President of the Goldman Sachs
Registered closed-end
fund Mutual Funds and as Director of the Goldman Sachs Offshore Funds provides
Other investment fund the Board with the benefit of his experience with the management practices of
/ asset management
ESG other financial companies.
Other finance and Mr. Perlowski also serves as a trustee for the funds in the BlackRock Multi-
accounting
Retail or retirement Asset Complex. Mr. Perlowski’s experience with BlackRock enhances his service market as a member of the Executive Committees.
Risk management and compliance
Source: Public sources and FactSet
83
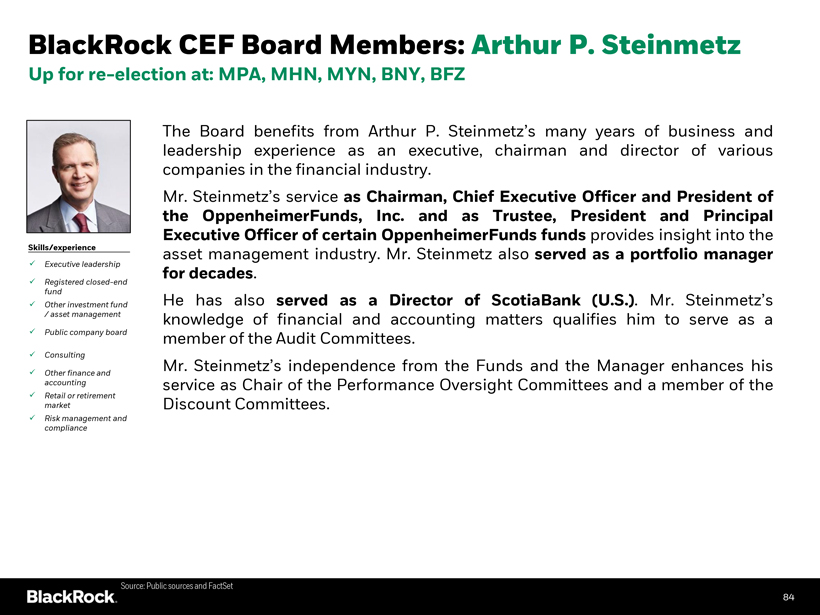
BlackRock CEF Board Members: Arthur P. Steinmetz
Up for re-election at: MPA, MHN, MYN, BNY, BFZ
The Board benefits from Arthur P. Steinmetz’s many years of business and leadership experience as an executive, chairman and director of various companies in the financial industry.
Mr. Steinmetz’s service as Chairman, Chief Executive Officer and President of the OppenheimerFunds, Inc. and as Trustee, President and Principal Executive Officer of certain OppenheimerFunds funds provides insight into the Skills/experience asset management industry. Mr. Steinmetz also served as a portfolio manager Executive leadership for decades.
Registered closed-end fund
Other investment fund He has also served as a Director of ScotiaBank (U.S.). Mr. Steinmetz’s
/ asset management knowledge of financial and accounting matters qualifies him to serve as a
Public company board member of the Audit Committees. Consulting
Other finance and Mr. Steinmetz’s independence from the Funds and the Manager enhances his accounting service as Chair of the Performance Oversight Committees and a member of the
Retail or retirement market Discount Committees.
Risk management and compliance
Source: Public sources and FactSet
84


