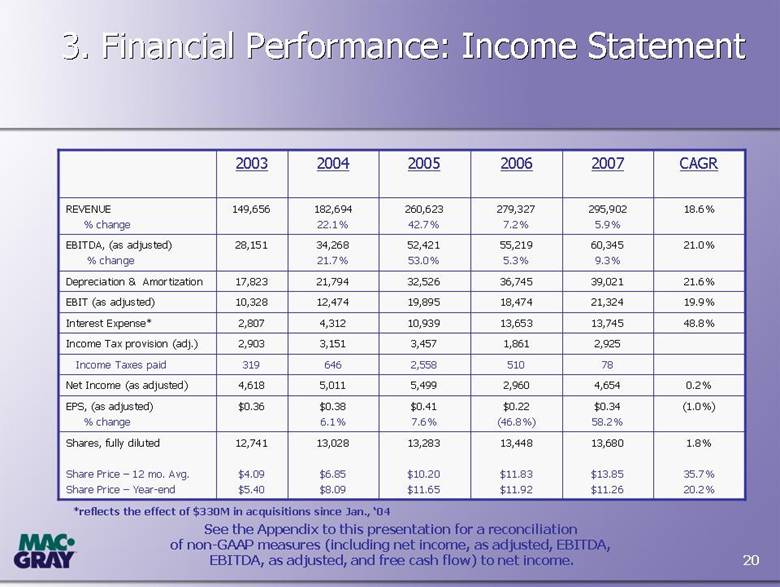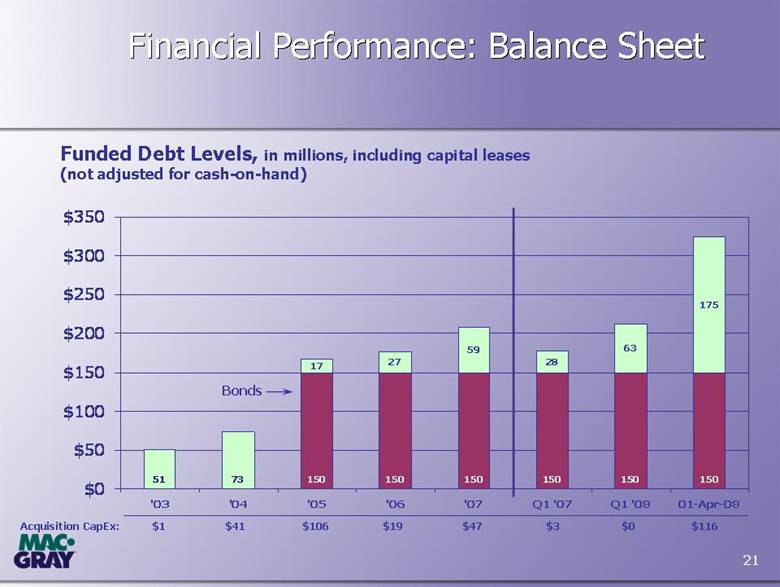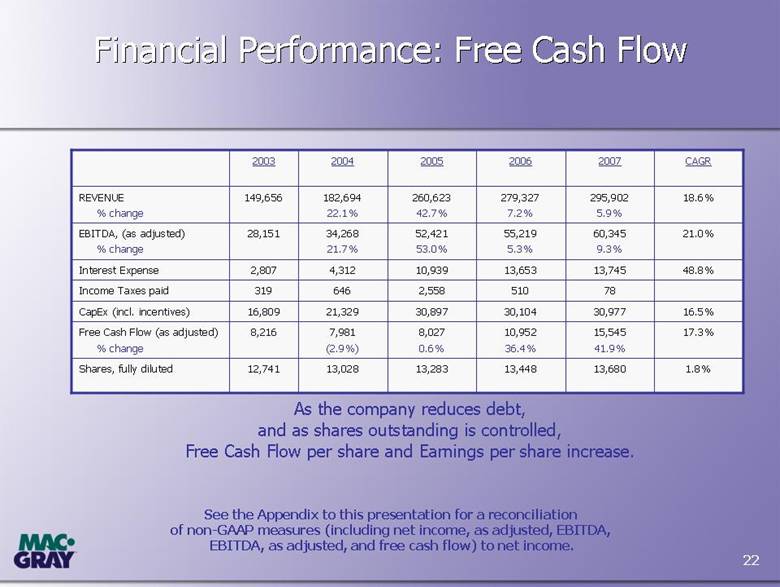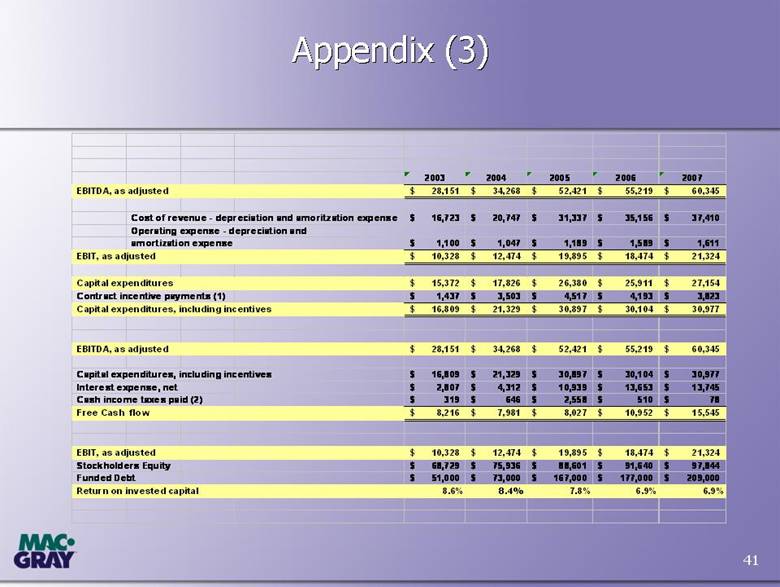
| 41 Appendix (3) Appendix (3) 2003 2004 2005 2006 2007 EBITDA, as adjusted 28,151 $ 34,268 $ 52,421 $ 55,219 $ 60,345 $ Cost of revenue - depreciation and amoritzation expense 16,723 $ 20,747 $ 31,337 $ 35,156 $ 37,410 $ Operating expense - depreciation and amortization expense 1,100 $ 1,047 $ 1,189 $ 1,589 $ 1,611 $ EBIT, as adjusted 10,328 $ 12,474 $ 19,895 $ 18,474 $ 21,324 $ Capital expenditures 15,372 $ 17,826 $ 26,380 $ 25,911 $ 27,154 $ Contract incentive payments (1) 1,437 $ 3,503 $ 4,517 $ 4,193 $ 3,823 $ Capital expenditures, including incentives 16,809 $ 21,329 $ 30,897 $ 30,104 $ 30,977 $ EBITDA, as adjusted 28,151 $ 34,268 $ 52,421 $ 55,219 $ 60,345 $ Capital expenditures, including incentives 16,809 $ 21,329 $ 30,897 $ 30,104 $ 30,977 $ Interest expense , net 2,807 $ 4,312 $ 10,939 $ 13,653 $ 13,745 $ Cash income taxes paid (2) 319 $ 646 $ 2,558 $ 510 $ 78 $ Free Cash flow 8,216 $ 7,981 $ 8,027 $ 10,952 $ 15,545 $ EBIT, as adjusted 10,328 $ 12,474 $ 19,895 $ 18,474 $ 21,324 $ Stockholders Equity 68,729 $ 75,936 $ 88,601 $ 91,640 $ 97,844 $ Funded Debt 51,000 $ 73,000 $ 167,000 $ 177,000 $ 209,000 $ Return on invested capital 8.6% 8.4% 7.8% 6.9% 6.9% |