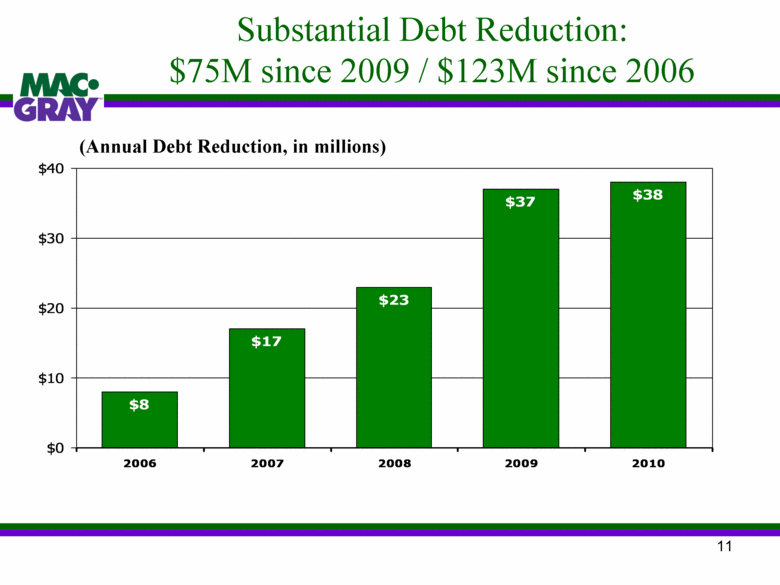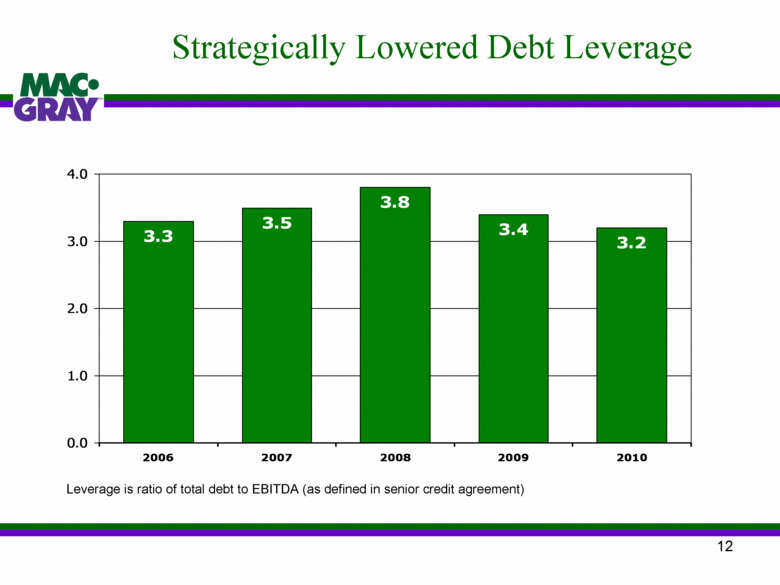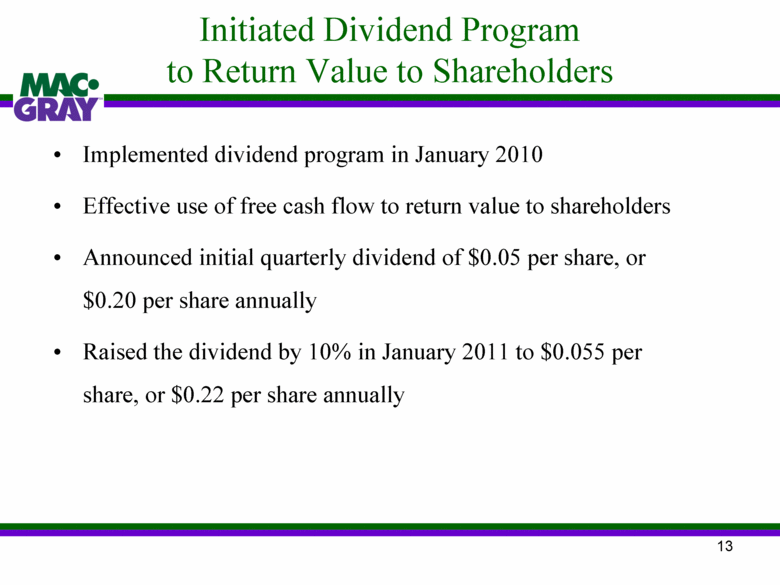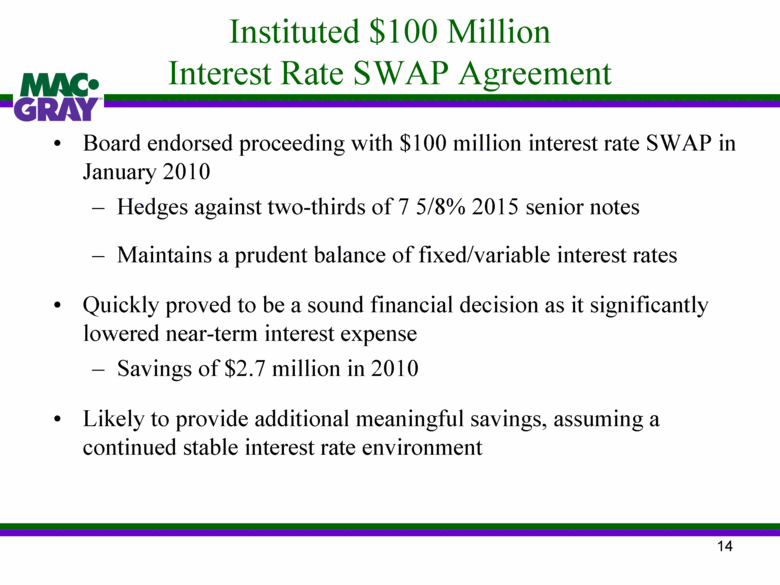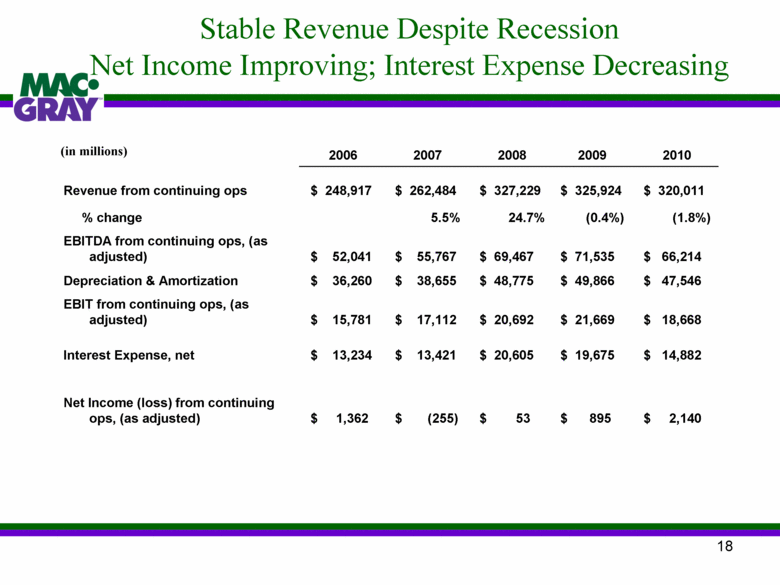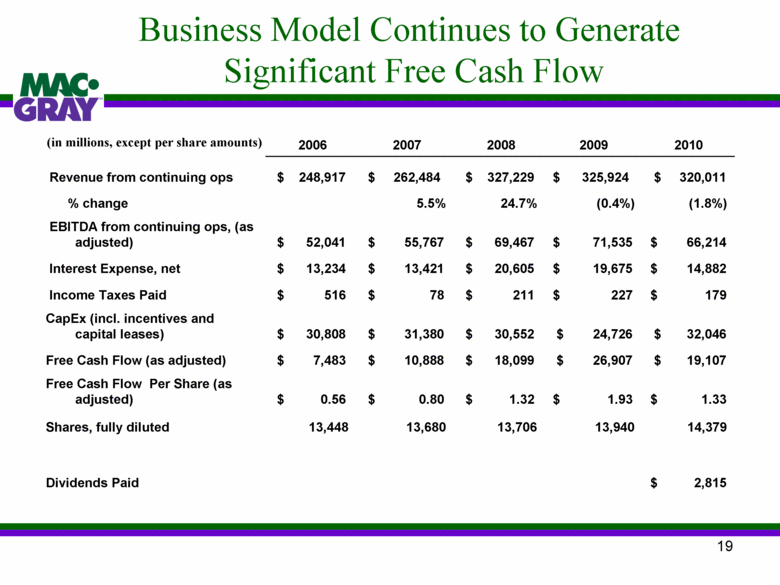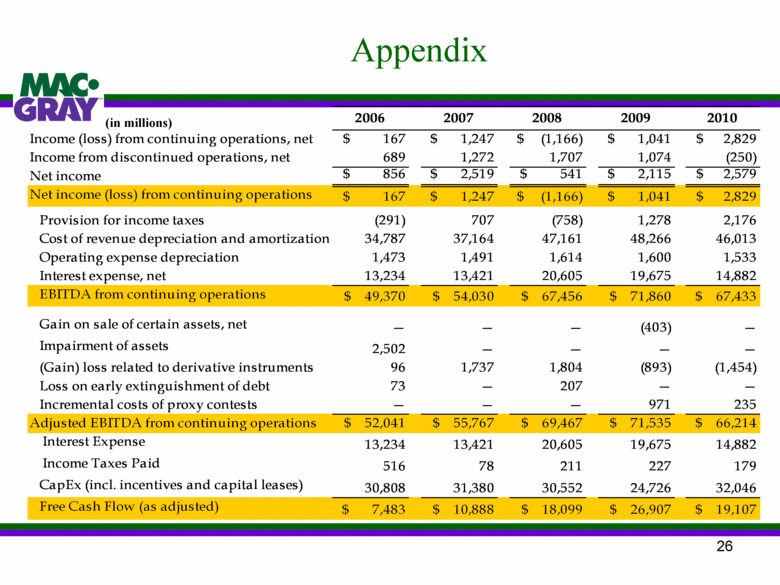
| 26 Appendix (in millions) Net income 2006 2007 2008 2009 2010 Income (loss) from continuing operations, net $ 167 $ 1,247 $ (1,166) $ 1,041 $ 2,829 Income from discontinued operations, net 689 1,272 1,707 1,074 (250) Net income $ 856 $ 2,519 $ 541 $ 2,115 $ 2,579 Net income (loss) from continuing operations $ 167 $ 1,247 $ (1,166) $ 1,041 $ 2,829 Provision for income taxes (291) 707 (758) 1,278 2,176 Cost of revenue depreciation and amortization 34,787 37,164 47,161 48,266 46,013 Operating expense depreciation 1,473 1,491 1,614 1,600 1,533 Interest expense, net 13,234 13,421 20,605 19,675 14,882 EBITDA from continuing operations $ 49,370 $ 54,030 $ 67,456 $ 71,860 $ 67,433 Gain on sale of certain assets, net — — — (403) — Impairment of assets 2,502 — — — — (Gain) loss related to derivative instruments 96 1,737 1,804 (893) (1,454) Loss on early extinguishment of debt 73 — 207 — — Incremental costs of proxy contests — — — 971 235 Adjusted EBITDA from continuing operations $ 52,041 $ 55,767 $ 69,467 $ 71,535 $ 66,214 Interest Expense 13,234 13,421 20,605 19,675 14,882 Income Taxes Paid 516 78 211 227 179 CapEx (incl. incentives and capital leases) 30,808 31,380 30,552 24,726 32,046 Free Cash Flow (as adjusted) $ 7,483 $ 10,888 $ 18,099 $ 26,907 $ 19,107 |
