
| 2006 Analyst Conference March 9, 2006 |

| Welcome - Meeting Agenda Frank Hopkins VP Investor Relations |

| Agenda Presenter General Session (7:30 am - 8:45 am) Meeting Agenda Frank Hopkins Strategy and Goals Scott Sheffield Capital Allocation and Financial Outlook Rich Dealy Operations Update Tim Dove Break (8:45 am - 9:00 am) Breakout Sessions and Lunch Mid Continent and Gulf Coast Danny Kellum / Lowell Waite / Chris Cheatwood Rockies and Canada Jay Still / Dennis Carlton / Todd Dillabough North America Projects and Exploration Ken Sheffield / Tom Spalding Africa Denny Bullard / David McManus / Tim Williams Schedule: Session 1: 9:00 am - 10:10 am Session 2: 10:15 am - 11:25 am Lunch: 11:30 am - 12:15 pm Session 3: 12:15 pm - 1:25 pm Session 4: 1:30 pm - 2:40 pm General Session (2:45 - end of Q&A) Closing Remarks and Q&A Scott Sheffield |
| Key Pricing Assumption Strip pricing in all presentations refers to January 2006 prices: Crude ($ / BBL) Gas ($ / MCF) 2006 67.66 9.31 2007 69.01 10.09 2008 67.29 9.66 2009 65.70 9.14 2010 64.75 8.54 2011 64.50 8.30 2012+ 63.30 8.30 |

| Forward-Looking Statements Except for historical information contained herein, the statements in this presentation are forward-looking statements that are made pursuant to the Safe Harbor Provisions of the Private Securities Litigation Reform Act of 1995. Forward- looking statements and the business prospects of Pioneer are subject to a number of risks and uncertainties that may cause Pioneer's actual results in future periods to differ materially from the forward-looking statements. These risks and uncertainties include, among other things, volatility of oil and gas prices, product supply and demand, competition, the ability to obtain environmental and other permits and the timing thereof, other government regulation or action, third party approvals, international operations and associated international political and economic instability, litigation, the costs and results of drilling and operations, availability of drilling equipment, Pioneer's ability to replace reserves, implement its business plans (including its plans to complete certain asset divestments and to repurchase stock), or complete its development projects as scheduled, access to and cost of capital, uncertainties about estimates of reserves, the assumptions underlying production forecasts, quality of technical data, environmental and weather risks, acts of war or terrorism. These and other risks are described in Pioneer's 10-K and 10-Q Reports and other filings with the Securities and Exchange Commission. Please see the Appendix to this presentation for certain definitions, reconciliations and other important information. |

| Strategy & Goals Scott Sheffield Chairman & CEO |

| Strategy Shift To Enhance Shareholder Value 2004 through mid-2005: Conducted portfolio / capital allocation review Decision to refocus portfolio onshore North America Acquired Evergreen Resources Second half 2005 through early 2006: Successful integration and continued development of Evergreen assets Successfully exited deepwater Gulf of Mexico and Argentina Completed $641 million of $1 billion share repurchase program Pioneer's focus today: Predictable, profitable double-digit organic growth from development activities only (principally oil developments) Additional production upside from North American resource plays Leveraging strong historical E&P expertise onshore North America Actively pursuing bolt-on acquisitions Maintaining a lower risk profile 2006 - 2010 Goals: Top quartile stock return, production and reserves per share growth |

| Exploration Drove Stock Performance 2001 - -2% 2002 31% 2003 26% 2004 10% 2005 46% Pioneer vs. Peer Group 5-Year Stock Price Performance* PXD Return Successful exploration strategy, particularly in deepwater GOM, led to strong performance Limited exploration success resulted in underperformance 160% vs. Peer Return of 133% * Peers include APA, APC, CHK, DVN, EOG, KMG, NBL, NFX, PPP, XTO |
| 2004 Through Early 2006 Portfolio Review Prolific Gulf of Mexico growth could not be repeated GOM contributed to ~30% annual growth for the Company from 2002 - 2004 GOM assets were expected to decline at an annual rate of ~30% from 2004 - 2007 High-impact exploration became more risky and costly with the shift to sub-salt plays Reserve replacement highly dependent on limited number of exploration wells encompassing 25+% of capital budget Volatile production from a few wells added uncertainty Argentina's low margins, government-controlled pricing and deep gas disappointment significantly eroded its long-term strategic value and production growth potential Resulting Company production outlook was flat to declining Increasing confidence in ability to deliver production growth from several development opportunities and emerging North America resource plays Recent Permian acquisitions Oooguruk and South Coast Gas approvals CBM projects and acreage in Rocky Mountains and Canada Emerging resource plays onshore U.S. Gulf Coast |
| Refocusing Pioneer Strategy Shift Divest deepwater GOM / Argentina (2006) Divest remaining GOM shelf assets by late 2006 / early 2007 Reallocate divestiture proceeds and future capital to North America lower-risk onshore drilling Delivering Strategic Initiatives $1 billion share repurchase program Completed $641 MM of initial $650 MM share repurchase program (12.4 MM shares) 21.4 MM shares repurchased since Evergreen merger in Q3'04 Initiate repurchase of remaining $359 MM Divestment of TDF (southern Argentina) Broadened previously announced plan to include all of Pioneer's Argentina assets due to strong interest Divestment of Deepwater GOM Refocusing Pioneer |
| Successful Argentina Divestiture Divestment rationale Low margins Government-controlled pricing Declining production Downward reserve revisions Sale price: $675 MM Proved reserves: 101 MMBOE ~65% gas / 35 % liquids Current production: ~33 MBOED Received high end of proved NAV range After-tax SEC PV10 of ~$630 MM assuming current oil export tax continues beyond legislated expiration date of February 2007 |

| Successful Deepwater GOM Divestiture Divestment rationale Escalating rig costs Opportunity to reduce exploration risk and production volatility Attractive market valuations for GOM assets Sale price: $1.3 billion New "high water" mark for GOM sales ($65 / proved BOE) Excludes Clipper discovery valued at ~$150 MM - $500 MM (25 - 90 MMBOE gross resource potential) Proved reserves: 20 MMBOE ~65% gas / 35% liquids Current production: ~40 MBOED Received high end of NAV range After-tax SEC PV10 of $589 MM |
| Strategy For Profitable Growth Focus on predictable oil and gas basins in North America that can deliver strong, consistent growth Represents 98% of reserve base Lowering risk profile by expanding unconventional resource plays and reducing exploration capital Building significant acreage positions in existing and new plays at attractive entry cost Adding to core area positions with low-risk bolt-on acquisitions in plays with extensive operating experience Continue to progress existing international opportunities with core area potential A Smaller, Focused Company with a Stronger Platform for Growth |
| Pioneer Today Dallas Denver Calgary T unis Cape T own Operating Areas Chinchaga Horseshoe Canyon Raton Hugoton Pawnee / Edwards West Panhandle Uinta & Piceance Spraberry Tunisia Nigeria Equatorial Guinea South Africa Sable / South Coast Gas Anchorage Alaska Cook Inlet North Slope Company Metrics Post Divestitures1 Company Metrics Post Divestitures1 Total Reserves1 865 MMBOE Pre-Tax PV10 $8.6 B % PDP 58% % Gas 55% R /P Ratio ~25 Years % North America 98% % Operated Production ~90% 1) Pioneer pro forma for Argentina and Gulf of Mexico divestitures expected to close in Q1 2005 No. LA and MS |
| Pioneer Can Deliver Improved Performance Strong North American core assets with multi-year development drilling inventories and the ability to grow production Spraberry • Raton • Pawnee • Horseshoe Canyon Attractive development projects and new resource plays with substantial upside potential Development projects - Oooguruk • South Coast Gas • Clipper New resource plays - Gulf Coast • Rockies • Canada • Tunisia Silurian No longer dependent on higher-risk exploration for growth Significant reserve potential (and returns) relative to minimal capital outlay Disciplined capital management Strong balance sheet Confidence in our people Proven technical capability in world class projects "Skin in the game" with employees owning ~4% of the company and compensation tied to Company performance |
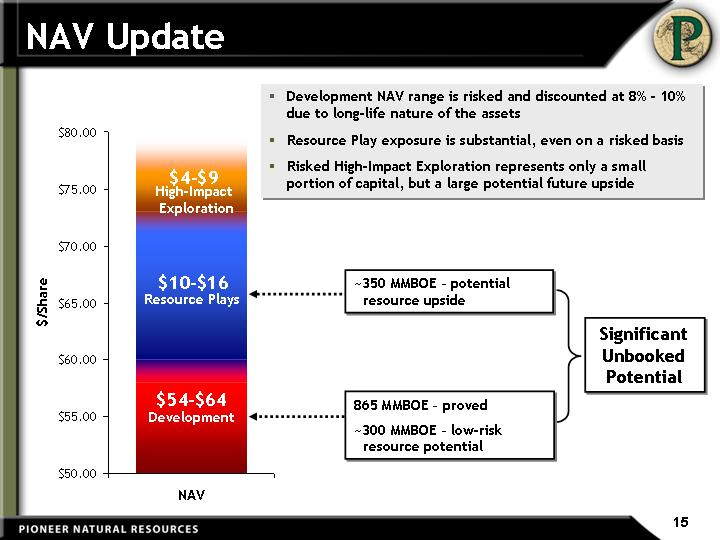
| NAV Update NAV 2P 58 Transition 2 Resource Plays 11 Transition 2 Traditional Exploration 3.5 Transition 3 Development NAV range is risked and discounted at 8% - 10% due to long-life nature of the assets Resource Play exposure is substantial, even on a risked basis Risked High-Impact Exploration represents only a small portion of capital, but a large potential future upside $54-$64 Development Resource Plays High-Impact Exploration $10-$16 $4-$9 Significant Unbooked Potential 865 MMBOE - proved ~300 MMBOE - low-risk resource potential ~350 MMBOE - potential resource upside 15 |
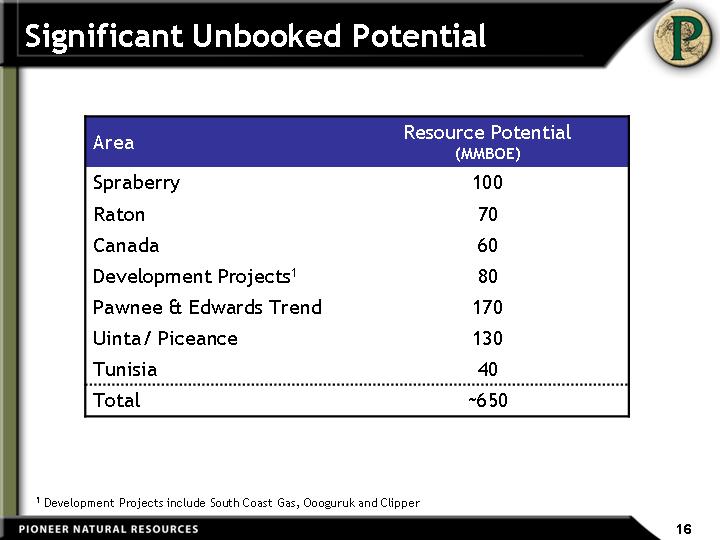
| Significant Unbooked Potential Area Resource Potential (MMBOE) Spraberry 100 Raton 70 Canada 60 Development Projects1 80 Pawnee & Edwards Trend 170 Uinta/ Piceance 130 Tunisia 40 Total ~650 1 Development Projects include South Coast Gas, Oooguruk and Clipper |
| 2005 Capital Allocation and NAV Impacts Development Acquisitions Resource Plays High-Impact Exploration East 50 13 11 26 High-Impact Exploration Added $300 - $650 MM in NAV (Clipper, Thunder Hawk) Lost NAV of $95 MM from dry holes (including seismic) and $80 MM from Argentina deep gas Resource Plays Added over 400,000 acres with significant upside value HSC added ~$200 MM in NAV Bolt-On Acquisitions Added over $150 MM in NAV from Spraberry and Pawnee acquisitions Development Projects Added $700 MM NAV with recent project sanctions Development Drilling Accelerated value recognition of long-lived reserves with larger capital budget Negative Raton revisions offset by price increases 49% 1% 13% 11% 26% Capital: $1.3 B |
| Evergreen Merger Adding Value HSC Development May 2004 Current Proved EVG 2.1 2.3 Cash Flow To Date 0.1 Raton Probables 0.2 Horseshoe Canyon 0.2 Uinta - Piceance 0.45 Pricing 1.7 Proved Component* After-Tax EVG NAV (Current NAV @ strip prices) U - P Risked Upside Raton Development $ Billions May 2004 Current Raton 130 148 U-P 5.5 6.3 Canada Conventional 8.8 11.7 Horseshoe Canyon 0 5 Production From EVG Assets (MMCEFPD) Raton Uinta - Piceance (U-P) Horseshoe Canyon (HSC) +19% Conventional Canada *Includes net cash flow to-date |
| 2006 Capital Allocation Development Resource Plays High-Impact East 924 247 137 20% 17% 53% 10% High-Impact Exploration Alaska • West Africa • Norphlet • Clipper Amplitudes 31% - 81% risked BTAX IRRs @ strip Resource Plays Edwards • U - P • Sand Wash • No. LA • Tunisia Silurian • Mannville 40% - 100+% risked BTAX IRRs @ strip Development Projects Oooguruk • SC Gas • Clipper 37% - 82% risked BTAX IRRs @ strip Development Drilling Spraberry • Hugoton • West Panhandle • Pawnee • Raton • Chinchaga • HSC 55% - 100+% BTAX IRRs @ strip Total Capital: $1.3 B |
| Reserve and Production Impacts Meaningful Impact Meaningful Impact Meaningful Impact Production Reserves Development Drilling 2006 & Beyond 2006 & Beyond Development Projects 2007 & Beyond 2006 & Beyond Resource Plays 2007 & Beyond 2007 & Beyond High-Impact Exploration 2008 - 2010 2007 - 2010 Business Development 2006 & Beyond 2006 & Beyond |
| Business Development Objectives Core area expansion via bolt-on acquisitions Capitalize on PXD's expertise and operating synergies Spent ~$600 MM on bolt-on acquisitions since 2000 Discovered resources Target undeveloped opportunities with critical mass and upside potential Unconventional resources Seek emerging opportunities with readily-available markets |

| Production (MMBOE) * Includes Edwards Trend, Uinta-Piceance and Tunisia Production Targets 2006 - 2010 CAGR Development 10% With Risked Resource Plays* up to 18% With Risked High-Impact Exploration up to 21% Company Target >10% Targeting Double-Digit Production Growth |
| Corporate Goals (2006 - 2010) Top quartile stock return Top quartile production and reserves per share growth Deliver double-digit compound annual production growth from development activities Additional production upside from: Moving lower-risk resource plays from appraisal to full-scale development Acquiring bolt-on assets High-impact exploration Maintain strong balance sheet Debt-to-book below 35% Continue to reduce share count Initiate $359 MM share repurchase program Buy back shares to offset creep Consider additional share repurchases when returns strongly outweigh investment alternatives |
| Capital Allocation & Financial Update Rich Dealy EVP & CFO |
| Capital Allocation Process Generation of Opportunities PEER REVIEW Project Approval Decision Execution Portfolio Modeling Evaluation of Results Disciplined approach to capital investment decisions Approach includes both quantitative and qualitative analysis Quality assurance controls are integrated into the process Adding NAV is the key driver |
| Capital Allocation Process Generation of Opportunities PEER REVIEW Project Approval Decision Execution Portfolio Modeling Evaluation of Results Generation of opportunities Identifying, screening and evaluating new opportunities within boundaries of corporate strategy Asset teams Business development Exploration/exploitation Peer review Technical (geoscience and engineering) Economic (financial and tax) Potential constraints (capital, people, services, infrastructure, materials, etc.) Projects with merit are advanced to portfolio modeling evaluation |
| Capital Allocation Process Generation of Opportunities PEER REVIEW Project Approval Decision Execution Portfolio Modeling Evaluation of Results Methodology Incorporates range of statistical (P10, P50, P90, Pfail) economic outcomes of each individual opportunity Monte Carlo simulation is used to generate a full range of outcomes Optimizes NAV within given constraints Creates an efficient frontier from which a set of value/risk tradeoff decisions can be made Key portfolio constraints Minimum annual production growth per share Minimum annual reserve replacement per share Limitation on indebtedness Limitation on exploration capital as % of total capital Goals Maximize NAV per dollar invested Identify the combinations of projects that achieve corporate goals Earmark projects for divestiture Evaluate incremental impact of new projects versus other alternative investments such as share repurchases |
| Capital Allocation Process Generation of Opportunities PEER REVIEW Project Approval Decision Execution Portfolio Modeling Evaluation of Results Considerations Strategic fit Core area Core competency Risk profile Development, extension or exploration Probability of economic success Political environment/stability of government Reserve potential The size of the prize Timing of reserve bookings Production impact Near-term versus long-term Commodity price analysis Value at strip prices Value at modified strip (revert to $45/Bbl & $6.50/Mcf after 5 years) Returns capital at stress case prices ($35/Bbl & $5.00/Mcf) Economic considerations After-tax DROI* / IRR NAV added per dollar invested Capital at risk prior to "go" / "no go" decision Timing * Discounted Return on Investment (DROI) is defined as present value of future cash flow discounted at 10% divided by discounted capital investment |
| Capital Allocation Process Generation of Opportunities PEER REVIEW Project Approval Decision Execution Portfolio Modeling Evaluation of Results Clearly defined goals pushed down to the asset teams Production Operating costs Capital Reserve replacement Health / Safety / Environmental Compensation linked to achievement of defined goals |
| Capital Allocation Process Generation of Opportunities PEER REVIEW Project Approval Decision Execution Portfolio Modeling Evaluation of Results Full-cycle evaluation of investment Did the project deliver the expected results? What changed and why? Was it controllable? Periodic, multi-year process Key issues and learnings Communicated to organization Applied to current projects |
| Summary of Portfolio Investment $45/Bbl & $6.50/Mcf1 $45/Bbl & $6.50/Mcf1 $45/Bbl & $6.50/Mcf1 $45/Bbl & $6.50/Mcf1 Strip Pricing1 Strip Pricing1 Strip Pricing1 Strip Pricing1 Investment Before Tax Before Tax After Tax After Tax Before Tax Before Tax After Tax After Tax Investment IRR DROI IRR DROI IRR DROI IRR DROI Development Spraberry 19% 1.4 14% 1.2 40% 2.2 31% 1.6 Raton 33% 2.4 25% 1.5 40% 2.8 35% 1.8 Pawnee 85% 2.2 65% 2.0 100+% 2.6 95% 2.4 Horseshoe Canyon 71% 3.0 55% 2.3 100+% 3.5 85% 2.6 South Coast Gas 24% 1.4 20% 1.2 38% 1.8 31% 1.5 Oooguruk 21% 1.5 16% 1.2 37% 2.4 28% 1.8 Clipper 44% 1.8 29% 1.4 82% 2.9 60% 2.1 Resource Plays Edwards Trend 50% 1.9 35% 1.7 60% 2.4 45% 2.0 Uinta/Piceance 30% 2.3 25% 1.5 40% 2.6 35% 2.0 Tunisia 100+% 5.2 100+% 2.8 100+% 7.0 100+% 3.5 High-Impact Exploration West Africa 23% 1.8 20% 1.4 31% 2.7 23% 1.6 Alaska 28% 1.8 23% 1.5 40% 2.5 28% 1.8 1 Assumes capital expenditures commensurate with current strip pricing environment |
| 70% development projects 20% lower-risk resource plays 10% high-impact exploration Capital Allocation and Returns Spraberry Raton Pawnee Horseshoe Canyon Oooguruk S. Coast Gas Clipper Edwards Trend Uinta / Piceance Tunisia W. Africa Alaska Miss. Development Drilling Development Projects Resource Plays High-Impact Exploration Projected A-Tax Estimated Share Repurchase DROI2 1 (Full Project Life) 1 Based on strip pricing 2 Based on development NAV (10%) of $54 per share assuming a $40 - $45 share price |
| Production (MMBOE) * Includes Edwards Trend, Uinta-Piceance and Tunisia Production Targets 2006 - 2010 CAGR Development 10% With Risked Resource Plays* up to 18% With Risked High-Impact Exploration up to 21% Company Target >10% Targeting Double-Digit Production Growth |
| Development (MMBOE) 1 Other includes Sable, Tunisia PDP, Pawnee, Hugoton and GOM Shelf Spraberry Raton West Panhandle Canada South Coast Gas Oooguruk Other1 Clipper Development Development 2006 Capital $920 MM 2006-2010 Operating Cash Flow $7.9 B 2006-2010 Capital $4.1 B |
| Resource Plays (MMBOE) Tunisia Edwards Trend Uinta / Piceance and Other Resource Plays Resource Plays 2006 Capital $250 MM 2006-2010 Operating Cash Flow $2.4 B 2006-2010 Capital $1.8 B |
| Long- Term Debt Objectives and Maturities A Amount currently drawn on $1.5 B, 5 - year revolving credit facility B Convertible notes assumed from EVG; if not converted prior to 12/06, Pioneer will redeem for cash at par Debt Objectives Maintain debt to book capitalization ratio at less than 35% Maintain Long-term Debt to EBITDAX ratio at less than 2x Target fixed/floating mix of approximately 75% fixed and 25% floating 2005 2006 2007 2008 2009 2010 2011 2012 2028 $32 MM 8 1/4% $350 MM 6 1/2% $0 MMA 5 - Yr Credit Facility $6 MM 5 7/8% $250 MM 7 1/5% 2016 $527 MM 5 7/8% 2021 $100 MM 4 3/4% B Expect conversion to occur prior to 12/06 for ~$80 MM cash & 2.3 MM PXD share issuance Senior Note and Credit Facility Maturities Long-Term Debt Objectives and Maturities |
| Pro Forma Capital Structure as of March 31 Expect Argentina and Deepwater Gulf of Mexico divestitures to close prior to March 31 Divestiture proceeds will used to: Fund a portion of the Company's 2006 & 2007 capital budgets Initiate the remaining $359 MM share repurchase program Retire short-term debt Strong balance sheet and financial flexibility to execute forward plan ($ Billions) 12/31/05 03/31/06 Total assets 7.3 6.3 Long-term debt (net of cash) 2.1 0.5 Other current and noncurrent liabilities 3.0 2.9 Stockholders' equity 2.2 2.9 |
| Remaining Hedge Positions as of 3/8/06 1) No hedges past 2008 2) % of developed production Gas Apr-Dec 2006 2007 20081 Swaps (MMBTUD) 73,885 24,195 - Hedge Price ($/MMBTU) $4.30 $4.30 - Collars (MMBTUD) 108,345 215,000 - Call Price ($/MMBTU) $15.00 $11.95 - Put Price ($/MMBTU) $6.95 $6.70 - % Hedged N American Gas2 55% 66% - % Hedged N American Gas (Swaps only) 2 22% 7% - Crude Swaps (BPD) 5,000 10,000 10,000 Hedge Price ($/BBL) $37.20 $30.96 $30.62 Collars (BPD) 7,335 2,000 - Call Price ($/BBL) $69.66 $89.50 - Put Price ($/BBL) $42.84 $50.00 - % Hedge Total Liquids2 34% 31% 22% % Hedged Total Liquids (Swaps only) 2 14% 26% 22% Total Equivalent % Hedged Total Equiv. 2 46% 50% 8% % Hedged Total Equiv. (Swaps only) 2 19% 14% 8% |

| Daily Production (MBOED) Pro Forma 2005 1Q 2006 2006 Exit Rate US 75.5 77.4 82.5 Canada 6.5 6.5 10.1 Africa 10 6.2 4.9 90-95 95-100 92 1 Pro-Forma for Argentina and Deepwater GOM divestitures and 9 MBOED of incremental 2006 VPP production sold in 2005 2 Africa production declining primarily due to Sable oil field 1 N.A. Growth Rate ~10% 2 |

| Q1 2006 Guidance Guidance Comments Daily Production (MBOED) 90-95 Excludes Argentina, Deepwater GOM and incremental volumes sold under VPP agreements Production Costs ($/BOE) $11-$12 VPP effect and Sable (declining production and largely fixed LOE) LOE $5.15-$5.55 VPP effect and Sable (declining production and largely fixed LOE) VPP effect $1.60-$1.80 VPP effect and Sable (declining production and largely fixed LOE) Transportation & Workovers $1.35-$1.65 Taxes (Ad Valorem & Severance) $2.90-$3.00 Exploration & Abandonment ($ MM) $50-$100 High-Impact* $25-$65 3 wells in Alaska and 1 well in Nigeria plus seismic purchases and acreage costs Resource Plays $10-$15 G&G/G&A and Other $15-$20 DD&A ($/BOE) $8.75-$9.25 G&A ($ MM) $32-$35 Includes $2-$3 MM for performance-based incentive awards Interest ($ MM) $32-$35 Assumes divestitures close by March 31 Cash Taxes ($ MM) $5-$15 Principally in Tunisia and U.S. Effective Tax Rate ($ MM) 40%-50% Higher effective state tax rates post-divestiture; could be up to 80% if Nigerian well is unsuccessful * Spending ~45% of 2006 High-Impact Exploration budget in Q1 |
| Capital Allocation & Financial Summary Disciplined approach to capital allocation 2006 capital focused on development and lower-risk resource plays 2006 investments set the stage for Pioneer to achieve double-digit growth over the next 5 years Dedicated to maintaining a strong balance sheet with financial flexibility Portfolio of projects has excellent returns and offers significant appreciation to NAV Committed to adding value for shareholders Capital Allocation & Financial Summary |
| Operations Update Tim Dove President & COO |
| Operating Momentum Began In 2005 Large additions to land positions in key resource plays >170,000 acres in South Texas > 150,000 acres in Rockies > 80,000 acres in MS / No. LA Redeployed technical staff to emerging resource plays and business development Go-forward sanction of two major development projects Development drilling has commenced on South Coast Gas First production anticipated in 2007 Drillsite preparation has commenced on Oooguruk First production anticipated in 2008 Attractive bolt-on acquisitions added to inventory 80 MMBOE acquired in Spraberry and South Texas Production from acquired assets doubled in less than six months Ramp up in development drilling in key basins Year-end rig count doubled relative to beginning of year |
| High-Return North American Opportunities Alaska Oooguruk construction underway Drilling 3 North Slope exploration wells Cosmopolitan 3-D seismic being evaluated Go forward decision by mid-year Chinchaga ~50 wells planned during winter drilling season Canada CBM Expanded Horseshoe Canyon program 4 horizontal Mannville CBM wells Permian Expanded drilling program in Spraberry Added 200 locations in major oil company JV Continuing to add acreage Gulf Coast Expanded drilling program in Edwards Onshore No. LA / MS Drilling in Hosston/Cotton Valley Norphlet test mid-year Continuing to add onshore acreage High-Return North American Opportunities Rockies Expanded drilling program in Raton Uinta Basin Castlegate horizontal CBM test Entrada gas test Piceance Basin Columbine Springs CBM pilots Sand Wash Basin Lay Creek CBM pilots Continuing to add acreage |
| Growth Opportunities in Africa Tunisia Acquired remaining interest in Jenein Nord Shooting additional seismic in Q1'06 in both Adam and Jenein Nord Expanded drilling program in 2006 West Africa Nigeria Block 256 well spud in January Nigeria Block 320 3-D seismic acquired in late 2005 South Africa First of 7 development wells for South Coast Gas Project spudded in February Sable production continues to exceed expectations Growth Opportunities in Africa |
| Continuing to Accelerate Low-Risk Drilling* 2004 2005 2006 110 1,060 *2004 well count pro forma for merger with Evergreen Resources, all years exclude Argentina and Gulf of Mexico 950 Low-Risk Drilling and Projects New Resource Plays 150 110 780 480 |
| Rig Strategy Steps Determine drilling requirements for acceleration of development drilling and testing of new plays Add rigs as successes emerge, ensuring that rigs are flexible enough to be redeployed in any number of areas Execute the plan Increasing wells drilled in 2006 by 35% with 17 additional rigs in North America by year-end 2006 compared to year-end 2005 Pioneer's expanding North American drilling program is a challenge in current tight rig market |
| Actively Implementing Rig Strategy First right of refusal on well-to-well rigs in many of our core areas Fit-for-purpose rigs in Raton and Alaska Ownership interest in six rigs New-build rigs in areas where ample opportunities exist 1,500 HP rigs can be used in many of the emerging plays across the Company Typically 2-3 year contracts required New build window typically 9-12 months from time of order |
| Rigs Secured To Execute Plan Rigs Added By Quarter North American Operated Growth Areas Requiring Additional Rigs YE 2005 Q1 Q2 Q3 Q4 YE 2006 YE 2007 Spraberry Contracted 10 - 4 1 - 15 15 Negotiating - - 3 1 - 4 4 Rigs Required 10 19 19 Edwards Contracted 2 1 1 1 - 5 7 Rigs Required 2 5 7 No. LA & MS Contracted - - - 2 - 2 2 Negotiating - - - - - - 2 Rigs Required - 2 4 U - P & Sand Wash Contracted - 1 1 - - 2 2 Owned - 1 - - - 1 1 Rigs Required - 3 3 Alaska Contracted 1 - - - - 1 2 Rigs Required 1 1 2 |
| Capital Cost Creep % Increase % Increase Item 2005 2006E Drilling Day Rate 40% 20% Fracs 70% 10% Cement 20% 20% Logging 100% 5% Casing 40% 10% Mud 50% 10% Pumping Units 100% 5% Commodity Increase 35% 0% Representative Industry Cost Recent leveling in commodity prices may lead to a tempering of capital cost increases in 2006 as compared to 2005 Day Work Rate ($ / FT Drilled) WTI Price ($ / barrel) WTI vs. Drilling Capital Correlation (Spraberry Example) |
| Protecting Operating Margins Big ticket items expected to rise ~10% relative to previous year Pioneer is continuing to find new ways to reduce costs SCADA systems in core areas reduce well downtime and associated well failure costs, and allow remote monitoring and control of compression Cathodic protection and external coatings on most new wells and pipelines protects casing from corrosion and extends field life Electrifying wells and compression to reduce more expensive fuel gas use Acquired interest in a prospective sand mine in Arizona to manage frac sand costs Purchased Chinese pumping units; confidence gained through high quality of Chinese pipe used in fields over the past two years Raton services migration into mid-continent areas |
| Unit Cost Structure Redeployed personnel from Deepwater to resource plays Reductions of $10 MM in Argentina G&A offset by sale of low cost production from Deepwater GOM and Argentina Operating costs and G&A per BOE will be reduced over time as new low-cost projects are added and production increases All-In Costs Per MCFE Q4 Run Rate* Pro Forma Divestitures Impact Peer Cost Review * Per JP Morgan Equity Research, unit costs include LOE, DD&A, G&A and Interest Expense; Capitalized G&A from Full Cost companies is excluded |

| 2006 Goals Goal Production (MMBOE) 33 - 37 Reserves Additions (MMBOE) >70 Replacement >200% Finding Costs ($ / BOE) $15 - $20 ~95% N.A. Core Areas ~5% Africa 50% - 60% N.A. Development Drilling 10% - 20% Development Projects 10% - 20% Resource Plays 0% - 30% Business Development Key Contributors Goals pushed down to individual divisions with compensation tied to performance |
| 2006 Goals - Operating Initiatives Drill 1,060 low-risk wells Progress key development projects according to established timelines and budgets Sanction Clipper project Evaluate go-forward decision on Cosmopolitan Complete testing and establish commerciality of existing resource plays as development projects Add acreage in core areas and new resource plays Actively pursue bolt-on acquisitions Prepare to enter 2007 with an expanded drilling campaign based on expected successes in 2006 |

| Mid Continent and Gulf Coast |
| Spraberry, Hugoton & W. Panhandle Danny Kellum EVP Domestic Operations |
| Spraberry Field Glasscock Reagan Upton Midland Martin Spraberry Trend Pioneer Acreage Discovered in 1948 One of the largest fields in the U.S. with over 900 million BOEs produced Large areal extent 7 West Texas counties, ~11,250 square miles Low natural decline rate ~5% annual decline Production from 6,700 to 10,500 feet Upper Spraberry, Lower Spraberry, Dean and Wolfcamp formations Pioneer is the largest operator in the Spraberry 4,200 active wells Over 95% operated Pioneer has substantial held by production (HBP) acreage position ~375,000 Spraberry/Dean acres Extensive deep rights below the Dean |
| Spraberry - At A Glance 2005 Operating Statistics 2005 Operating Statistics Project Category Development Project Type Oil & Associated Gas Gross Acres 375,000 (95% WI) Production 10 MMBOE Proved Reserves 403 MMBOE % Gas / % Liquids 21% / 79% % PUD 51% R / P 40 Development Capital $126 MM Acquisition Capital $148 MM Wells Drilled 188 2005 Financial Statistics 2005 Financial Statistics Rev / BOE $45.65 ($44.50 VPP adj) LOE / BOE $8.63 ($8.41 VPP adj) Base LOE / BOE $5.28 ($5.15 VPP adj) DD&A / BOE $3.54 ($3.45 VPP adj) Reserves Production PV10 Capital Dev Cap 41 16.1 27.7 22 % of 2005 Total Company Remaining Drilling Inventory Remaining Drilling Inventory PUD Locations 2,500 Probable Locations 700 EUR per well 0.1 MMBOE Resource opportunity 70 MMBOE |
| Spraberry Regional Geologic Setting Pioneer Units Top of Wolfcamp Structure Top of Wolfcamp Structure Spraberry Trend Growth Areas Open acreage expansion outside of mapped boundaries Regional Wolfcamp potential below existing units Deeper targets under existing Pioneer acreage Deeper targets under existing Pioneer acreage Deeper targets under existing Pioneer acreage Deeper targets under existing Pioneer acreage Deeper targets under existing Pioneer acreage Permian-Aged Rocks WOLFCAMP SPRABERRY |
| A Well Managed Machine Economies of scale reduce costs Large SCADA automation system Automated equipment control from remote locations reduces production downtime Pump off controllers reduce pump failures and associated costs Gathering and processing facilities are controlled by Pioneer Over 90% of Pioneer gas processed through two jointly-owned plants Rich associated gas (1,400 BTU) Provides additional revenue from 3rd party gas processing Cathodic protection and external coatings protect casing from corrosion and extend field life In-house training programs for operations personnel covering best practices for artificial lift and crude oil measurement Techniques established by Pioneer have been widely adopted by other industry players '95 '96 '97 '98 '99 '00 '01 '02 '03 '04 '05 # of failures 240 257 225 195 133 116 104 94 97 91 79 Months between failure 11.49192047 11.40904332 12.32929285 15.87412514 22.28371811 27.47805049 32.25604434 37.35079378 33.16850169 35.12689385 42.79390165 Avg Well Failures Per Year Avg Months Between Failures In a field of over 4,000 wells, PXD has set the industry standard for uptime |
| OXY Acquisition Lookback Acquisition completed in July 2005 Acquired 68 MMBOE for $145 MM, or $2.13 per BOE 715 PUDs ~$375 MM in development capital anticipated over the next four years Production expected to ramp up from 1,400 BOPD to ~9,000 BOPD by 2009 Post-acquisition activity Activated 113 wells that were previously shut in for mechanical reasons Increased gross production by over 1,000 BOPD without drilling a well Drilled 16 new wells Added additional 1,000 BOPD in less than 6 months 8/7/05 2/24/06 Gross Production (MBOEPD) 2,100 4,300 |
| Consistent Reserve Growth Through Time Reserve growth through a combination of step-out wells and bolt-on acquisitions Over $180 MM of bolt-on deals over the past three years at less than $3 per BOE Acquired over 50,000 acres in 2005 through a series of small transactions, adding over 11 MMBOE of proved reserves In 2006, entered into a 200 well JV with a major oil company Proved Reserves (MMBOE) |
| Spraberry Looking Ahead 2006 Capital Budget Working Interest Capital1 $MM Wells Planned Gross Per Well Metrics Cost - $MM IP - BOEPD Mean EUR - MBOE Gross Per Well Metrics Cost - $MM IP - BOEPD Mean EUR - MBOE Gross Per Well Metrics Cost - $MM IP - BOEPD Mean EUR - MBOE IRR (BTax)2 $45 / $6.50 Strip IRR (BTax)2 $45 / $6.50 Strip 95% $311 352 0.9 50 110 19% 40% 2006 and Beyond Increasing 2006 drilling count by nearly 100% from 188 to 352 wells Nearly 200% increase relative to the average over the past five years Evaluate deeper Wolfcamp potential Over 50% of existing acreage thought to be prospective in deeper Wolfcamp Majority of wells in 2006 to test this deeper potential Drill ~600 feet deeper at a cost of $100,000 - $200,000 per well Expected to increase reserves and production by 20 - 30% (not included in forecasts) Continue aggressive development pace 10 drilling rigs at present, moving to 18 by year-end (continuing for several years) Pursue acreage expansion program and bolt-on acquisitions 15 companies in the Spraberry trend with approximately 600 MMBOE of resource potential Continue to study deeper potential in light of commodity price increases Implement Spraberry waterflood in 2007 to increase EUR of field (not included in forecasts) Capital includes all gathering, facilities and other related capital costs in the area Risked IRRs calculated using $45 / $6.50 as well as the January 2006 strip prices |
| Spraberry Waterflood Potential Spraberry Waterflood Potential Increase from 2,500 BOPD to 5,000 BOPD Spraberry Driver Unit 1960s Waterflood Response Increase from 100 BOPD to 300 BOPD E.T. O'Daniel Unit 1990s Waterflood Response Current ultimate recovery in Spraberry estimated at 8% - 12% of original-oil-in place (OOIP) Estimated waterflood recovery as much as 5% - 10% of OOIP Documented benefit from water injection Rapid production response Upside resource potential on Pioneer acreage 50-75 MMBO Anticipate field implementation in 2007 |
| Spraberry - Production Outlook '00 '01 '02 '03 '04 '05 '06 '07 '08 '09 Historical Production 28.83333333 27.16666667 29.33333333 29 29.16666667 28.66666667 Production Outlook 21.5 25.332 30.467 33.832 VPP 0.73 9.851016895 11.06966849 7.915068493 7.487671233 6.832876712 3.747945205 3.509589041 Historical Wells 95 100 85 119 117 188 352 Net Production (MBOEPD) Number of Wells 5 Year Lookback CAGR* 2% Avg. Annual Wells 122 Future Plans ('05 - '09) CAGR* 9% * Includes VPP production in calculation; excludes waterflood and Wolfcamp impacts Development Case Well count back-end loaded |
| Spraberry - Cash Flow Expectations '00 '01 '02 '03 '04 '05 '06 '07 '08 '09 Historical Capital 53 126 26 64 76 277 Land 8 3 3 3 Exploration 1.001 0 0 0 Development 303 355 347 348 OCF (TAX) 100 169 144 211 273 387 233 337 414 456 Net Capital / OCF ($MM) 5 Year Lookback Cum. Capex $569 MM Cum. OCF $1,184 MM Future Plans ('06 - '09) Cum. Capex $1,371 MM Cum. OCF $1,440 MM 2P Case Spraberry incremental VPP volume impact |
| Mid-Continent Gas Fields Hugoton / West Panhandle Fields Most prolific gas basins in the U.S. Production dating back to the 1920s Over 115 TCF produced to date ~15 TCFE of remaining potential 2.6 BCFEPD of production Pioneer Operations 275,000 acres in Hugoton Field ~1,000 operated wells Production from Chase and Council Grove formations 250,000 acres in West Panhandle Field ~600 operated wells Production from Brown Dolomite, Red Cave and Granite Wash formations Own all gathering and processing facilities in both areas Hugoton West Panhandle |
| Mid-Continent Gas - At A Glance 2005 Operating Statistics 2005 Operating Statistics Project Category Development Project Type Gas, Associated Liquids & Helium Gross Acres 525,000 (96% WI) Production 43 BCFE Proved Reserves 747 BCFE % Gas / % Liquids 58% / 42% % PUD 4% R / P 18 Development Capital $41 MM Wells 59 2005 Financial Statistics 2005 Financial Statistics Rev / BOE $51.83 ($39.60 VPP adj) LOE / BOE $9.00 ($6.88 VPP adj) Base LOE / BOE $6.38 ($4.85 VPP adj) DD&A / BOE $6.94 ($5.30 VPP adj) Reserves Production PV10 Capital Dev Cap 13 11 17 3 % of 2005 Total Company |
| Drilling Operations Hugoton operations 15 - 20 replacement wells per year in the Chase and Council Grove over the past several years No further replacement plans in 2006; several new horizontal wells planned Infill Council Grove wells limited by spacing rules Field decline rate of ~10% West Panhandle operations 20 - 40 horizontal wells per year in Brown Dolomite over the past several years 18 wells planned in 2006 Additional Red Cave wells subject to field rules Field declines could be mitigated by Red Cave rule relief Could open up another 130 locations and associated net resources of 4 MMBOE Pursue bolt-on acquisitions given field rule relief Mid-Continent Geology |
| Mid-Continent - Production Outlook '00 '01 '02 '03 '04 '05 '06 '07 '08 '09 Historical Production 0 196 195 189 181 119 Production Outlook 116.1 108.69 103.185 97.214 VPP Production 36.65 33.53424658 32.50136986 30.08219178 27.49863014 Fain Gas Fire Loss 15 Historical Wells 0 36 37 112 97 58 Net Production (MMCFEPD) Number of Wells 5 Year Lookback CAGR* -6% Avg. Annual Wells 68 Future Plans ('05 - '09) CAGR* -8% * Includes VPP production and lost production associated with Fain gas fire in calculation Development Case Fain Gas Processing Plant Fire |
| Mid-Continent - Cash Flow Expectations '00 '01 '02 '03 '04 '05 '06 '07 '08 '09 Historical Capital 53 19 129 55 43 41 Land 1 Exploration 0.1 0.1 0.1 0.1 Development 42.9 28.7 15.4 15.4 Strip OCF (BTAX) 100 204 161 245 294 309 275.6 280.3 256.5 231 Net Capital / OCF ($MM) 5 Year Lookback Cum. Capex $287 MM Cum. OCF $1,213 MM Future Plans ('06 - '09) Cum. Capex $104 MM Cum. OCF $1,043 MM Development Case |
| Edwards Trend Lowell Waite Tech Specialist Geoscience |
| South Texas Edwards Trend Proven resource play Nearly 200 BCF of production by PXD to-date in Pawnee field Most active driller over the last several years Large and growing acreage position throughout the trend Two discoveries in late 2005 / early 2006 Major contributor to future growth Significant future reserve additions anticipated Additional opportunities in other horizons Rigs secured to execute 2006 plan San Antonio Houston Pawnee Edwards Trend |

| Edwards Trend - At A Glance 2005 Operating Statistics 2005 Operating Statistics Project Category Development / Exploration Project Type Tight Gas - Limestone Gross Acres 170,000 (80-100% WI) Net Production 14 BCF Proved Reserves 133 BCF % Gas / % Liquids 100% / 0% % PUD 10% R / P 10 Capital $41 MM Wells Drilled 15 Future Opportunity Future Opportunity Geologic risk Low EUR per well 4.0 BCFE Spacing 80 - 160 acres Resource opportunity 1 - 3 TCF Net Risked Resource 0.8 - 1.1 TCF 2005 Financial Statistics 2005 Financial Statistics Rev / MCFE $7.34 LOE / MCFE $0.65 Base LOE / MCFE $0.34 DD&A / MCFE $1.40 Reserves Production PV10 Capital East 2.2 3.5 3.7 3.2 % of 2005 Total Company |
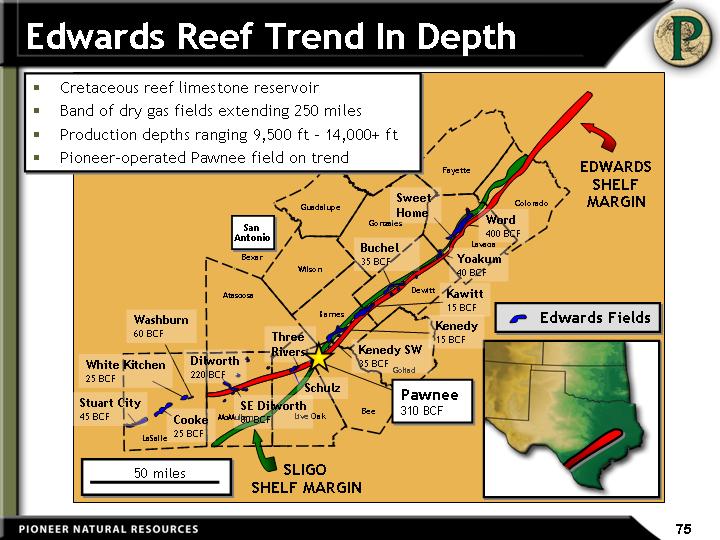
| Bee Goliad Live Oak Karnes McMullen LaSalle Atascosa Wilson Bexar San Antonio Guadalupe Gonzales Dewitt Lavaca Colorado Fayette Caldwell EDWARDS SHELF MARGIN SLIGO SHELF MARGIN 50 miles Edwards Reef Trend In Depth Edwards Fields Stuart City 45 BCF White Kitchen 25 BCF Washburn 60 BCF Cooke 25 BCF Dilworth 220 BCF SE Dilworth 80 BCF Three Rivers Schulz Kenedy SW 35 BCF Kenedy 15 BCF Kawitt 15 BCF Yoakum 40 BCF Word 400 BCF Sweet Home Pawnee 310 BCF Cretaceous reef limestone reservoir Band of dry gas fields extending 250 miles Production depths ranging 9,500 ft - 14,000+ ft Pioneer-operated Pawnee field on trend Buchel 35 BCF |
| North 15 km Analog: Belize Barrier Reef System (NASA: International Space Station) Reef Reef Apron & Shoals Back Reef / Lagoon Oceanic Basin Offshore Atoll Land Beach / Shoreline |
| Back reef lagoon Upper slope Forereef debris Paleo sea level SE NW 1 mile Reef complex 2-D Seismic Edwards Concept: Ancient Barrier Reef High-energy, Porous Shoal & Reef Facies Top Edwards Proprietary Seismic Excluded |
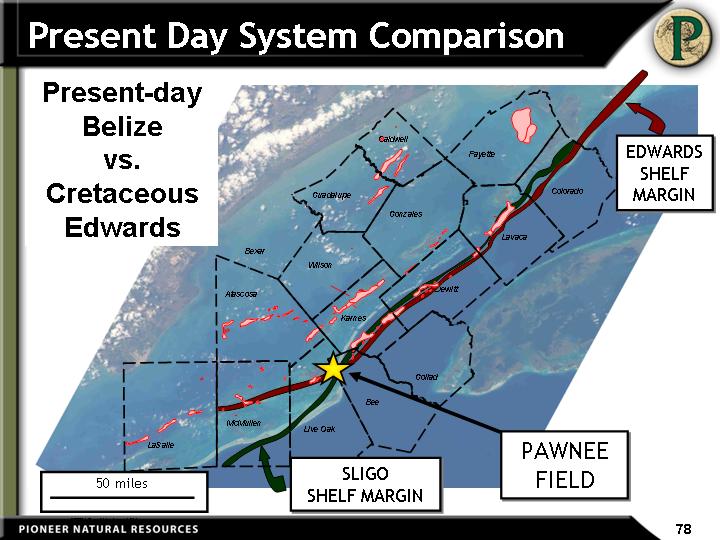
| 50 miles PETRA 7/14/2004 3:44:48 PM Present Day System Comparison Present-day Belize vs. Cretaceous Edwards Bee Goliad Live Oak Karnes McMullen LaSalle Atascosa Wilson Bexar Guadalupe Gonzales Dewitt Lavaca Colorado Fayette Caldwell EDWARDS SHELF MARGIN SLIGO SHELF MARGIN PAWNEE FIELD |
| Bee County, TX Edwards Structure Map Productive Limits of Field Limit of Structural Closure Laboratory: Pawnee Field 1 mile Discovered in 1961 ~5,500 acres, with 350' gas column Current EUR: 310 BCF, with cumulative production of 184 BCF PXD began 2-rig horizontal drilling program in 4Q 1999 80 wells (63 horizontal) drilled to-date Extensive 2-D seismic and 3-D seismic, core and engineering data available |

| Pawnee Field History 1985 2005 17 wells (no horizontals) 4,000 acres (160 - 320 ac. sp.) Producing 8.5 MMCFPD 80 wells (63 horizontals) 5,500 acres (80 ac. sp.) 3-D seismic coverage Producing 50 MMCFPD 3D-seismic coverage 1999 2000 2001 2002 2003 2004 2005 Gross Production 50 MMCFPD 2006 1998 1997 1996 1995 1994 1993 1992 1991 1990 1989 1988 1987 1986 1985 Aggressive horizontal infill program begins Vertical infills begin 1 5 10 50 100 |
| Drilling and Producing Advantage Improved technology: Specialized rigs, bits and mud systems Designed for 3,000 foot laterals and extreme temperatures and pressures Open-hole completions with low cost stimulations Infrastructure and gathering system in place for quick tie-in Drilling engineering team in place for the past five years '00 '01 '02 '03 '04 '01 '02 '03 '04 '05 Drill Days to Top Edwards 28 26 21 17 14 Best practice measures save drilling time (vertical days drilling cut in half from 28 to 14 days over past 5 years) resulting in lower well cost Days |
| The Field Keeps Getting Bigger '98 '99 '00 '01 '02 '03 '04 '05 Proved Reserves (BCFE) 56.712903 96.076514 86.610844 115.405135 104.330094 99.518719 109.349802 116.772621 124.9 EUR Estimates Through Time 138 140 160 233 245 257 286 310 Pawnee EUR estimates continue to increase as more wells are drilled BCFE |
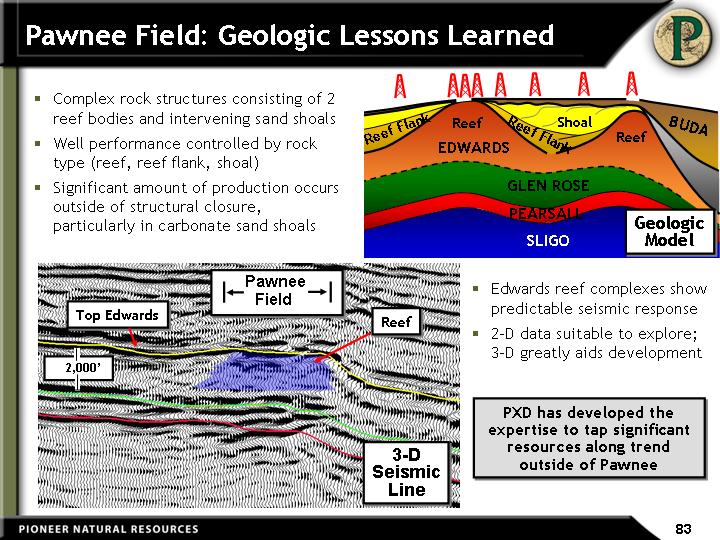
| Top Edwards 2,000' Reef Pawnee Field Pawnee Field: Geologic Lessons Learned GLEN ROSE PEARSALL SLIGO EDWARDS Reef Reef Reef Flank Reef Flank Shoal Geologic Model 3-D Seismic Line Complex rock structures consisting of 2 reef bodies and intervening sand shoals Well performance controlled by rock type (reef, reef flank, shoal) Significant amount of production occurs outside of structural closure, particularly in carbonate sand shoals Edwards reef complexes show predictable seismic response 2-D data suitable to explore; 3-D greatly aids development PXD has developed the expertise to tap significant resources along trend outside of Pawnee BUDA |
| Beyond Pawnee: Expansion Program Commenced "trend buy" in prioritized areas, followed by individual prospect leasing 170,000 gross acres leased and committed to-date (February 2006) Average lease cost of $110 per acre or $18 MM in total Explore along trend using existing well control and dense grid of 2-D seismic 24 leads identified to-date, more to follow Acquiring 3-D seismic in 2006 Optimize people and capital to test and develop multiple concepts Expanded group by 9 people over the past 12 months to a total of 12 people Continuing to evaluate potential of other plays Recent Wilcox discovery in Pawnee field Planning for processing plant expansion to support growth (currently at ~80% of capacity) Utilizing portable infrastructure until critical mass supports additional plant investment |
| Edwards Gas Field Current Prospects Bee Goliad Live Oak Karnes McMullen LaSalle Lavaca Colorado Fayette Dewitt PETRA 7/14/2004 3:44:48 PM Pawnee Mertz / NE Word SW Kenedy Washburn New PXD Trend Wells Identified Prospects PXD-Operated Production Schulz #1 Nichols #1 Prospect Map Excluded |
| Current Prospect Examples Stingray Bonita Buchel Field (EUR 50 BCF) Moray Key Seismic Indicators Isochron thinning (paleo-high) Amplitude dimming Barracuda Proprietary Seismic Excluded Key Geologic Risks Reservoir porosity development Updip seal (stratigraphic trap) Total height of gas column |

| 2006 Edwards Plans 2006 Drill total 20 - 30 wells Two rigs in-place Two new build rigs secured and on location by July; third new rig expected by year end 10 - 15 exploration wells planned Two prospects spud in February, six prospects drilled and evaluated by July Continue development drilling in established areas Determine remaining potential of other objectives in South Texas 2007 Commence larger scale development program 2006 Capital Budget Area WI % Capital1 $MM Wells Planned Gross Per Well Metrics2 Cost - $MM IP - MCFEPD Mean EUR - BCFE Gross Per Well Metrics2 Cost - $MM IP - MCFEPD Mean EUR - BCFE Gross Per Well Metrics2 Cost - $MM IP - MCFEPD Mean EUR - BCFE IRR (BTax)3 $45 / $6.50 Strip IRR (BTax)3 $45 / $6.50 Strip Edwards Dev. 100% 42 15 2.8 2,000 3.0 85% 100+% Edwards Expl. 80% -100% 73 10 3.5 3,000 4.0 50% 60% Capital includes all gathering, facilities and other related capital costs in the area Development includes Pawnee and Washburn wells targeting mature areas in the fields; exploration wells targeting high potential reef buildups Risked IRRs calculated using $45 / $6.50 as well as the January 2006 strip prices |
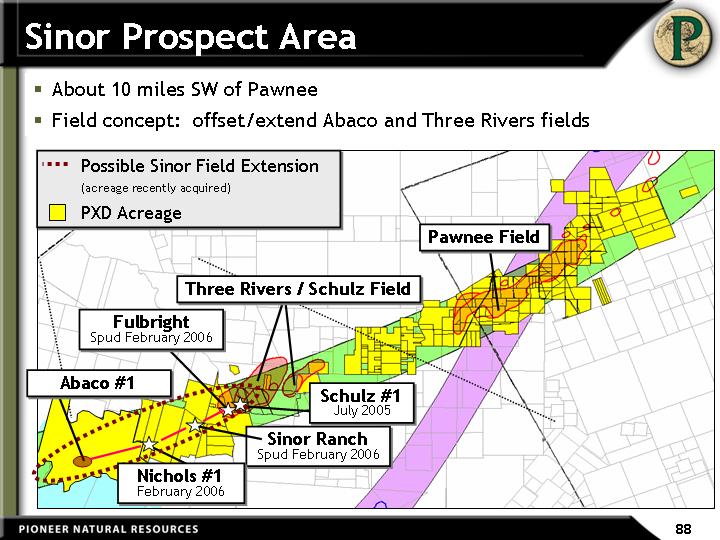
| Sinor Prospect Area About 10 miles SW of Pawnee Field concept: offset/extend Abaco and Three Rivers fields Sinor Ranch Spud February 2006 Three Rivers / Schulz Field Pawnee Field Possible Sinor Field Extension (acreage recently acquired) PXD Acreage Schulz #1 July 2005 Abaco #1 Nichols #1 February 2006 Fulbright Spud February 2006 |
| Top Chalk Top Buda Standard JV Isaacks #1 1957 IP 3 MMCFPD Abaco Oper USA #1 2003 1000 ft IP 2.6 MMCFPD PXD Nichols #1 2006 PXD Sinor Ranch #1 Spud Feb. 2006 PXD Fulbright #1 Spud Feb. 2006 PXD H. Schulz #1 2005 2.1 miles 2.4 miles 1.1 miles 0.5 miles REEF Top Edwards SHOAL Sinor Field Areal Extent OUTER SHELF IP 2.8 MMCFPD Cumulative distance between wells ~6 miles (about size of Pawnee) Contiguous Edwards pay Initial flow rates in excess of 2.5 MMCFPD Pawnee size resource potential |
| Edwards - Production Outlook '00 '01 '02 '03 '04 '05 '06 '07 '08 '09 Historical Production 20 31 33 32 32 37 Production Outlook 38.9 38.209 35.602 32.934 Production Outlook 2.927 19.13 70.701 132.041 Wells 8 8 7 7 14 15 25 Net Production (MMCFEPD) Number of Wells 5 Year Lookback CAGR 5% Avg. Annual Wells 10 Future Plans ('05 - '09) CAGR -3% Risked Upside CAGR 45% Development Case Risked Upside Potential |
| Edwards - Cash Flow Expectations '00 '01 '02 '03 '04 '05 '06 '07 '08 '09 Historical Capital 12 17 15 24 35 84 Land 17 0 0 0 Exploration 52.1 53.9 16.4 1.2 Development 54.3 94.7 201.5 197.1 Strip OCF (BTAX) 27 41 33 55 59 97.2 107 164.5 296.3 439.4 Net Capital / OCF ($MM) 5 Year Lookback Cum. Capex $175 MM Cum. OCF $285 MM Future Plans ('06 - '09) Cum. Capex $688 MM Cum. OCF $1,007 MM Risked Upside Potential |
| Edwards Key Takeways Edwards Trend is a proven play Over 1 Tcf of reserves produced to-date by all operators in the trend Pawnee field reserve expectations have continued to increase since 1998 Pawnee could ultimately be "the tip of the iceberg" 5,500 acres in Pawnee; 170,000 acres leased on trend in 2005 Trend resource potential: 1 - 3 TCF Additional upside in other zones Continue to leverage drilling expertise Rigs are secured to execute plan Increasing capital budget by 50% in 2006 3 new-build rigs coming into the trend by year end; supplement 2 rigs already active in the program Strong returns from new wells on trend |
| Louisiana & Mississippi Chris Cheatwood EVP Exploration |

| Why Is This Area Attractive? Stacked, multi-bcf in-place gas reservoirs exist in this area Tight gas found in many wells drilled in the 1960s - 1980s Many reservoirs were not developed or underdeveloped Today's technology and commodity prices allow attractive returns Geologic risk greatly reduced due to prior drilling proving presence of gas and modern seismic Multi-stage completions and fracs maximize rate and NPV Significant acreage is still available at low to moderate cost Focused multi-discipline team in place to execute the business plan and deliver predicted results |
| Extent of the Multiple Plays Stacked Play Overlay Map Excluded Kisatchie Wold AMI Net Production: 2 MMCFPD 79,000 gross acres Working Interest: 20-50% Partners: CHK, APC Currently Acquiring Acreage Now: 165,000 acres Goal: 250,000+ acres by 2007 Assessing field acquisitions |
| No. LA and MS Looking Ahead 2006 50% of capital budget allocated to drilling, remainder on land and seismic Over 20 extension wells planned (production impact not included in Company plan) Drilling primarily focused in Kisatchie Wold acreage Norphlet test late in the year 2007 and beyond Secure rig to focus on operated Hosston / Cotton Valley acreage Over 30 low-risk exploration wells identified on existing acreage Additional 20 extension wells remaining on Kisatchie Wold acreage Secure rig to continue to assess upside of Norphlet / Smackover trends Over 10 high-impact exploration wells identified on existing acreage Build into a core area by 2009 Area WI Capital1 $MM Wells Planned Gross Per Well Metrics Cost - $MM IP - MCFEPD Mean EUR - BCFE Gross Per Well Metrics Cost - $MM IP - MCFEPD Mean EUR - BCFE Gross Per Well Metrics Cost - $MM IP - MCFEPD Mean EUR - BCFE IRR (BTax)2 $45 / $6.50 Strip IRR (BTax)2 $45 / $6.50 Strip Hosston / C. Valley 30-40% $36 23 5.0 4,000 4.0 100+% 100+% Norphlet / Smackover 30-40% $7 1 18.0 31,000 24.0 23% 81% 2006 Capital Budget Capital includes all gathering, facilities and other related capital costs in the area Risked IRRs calculated using $45 / $6.50 as well as the January 2006 strip prices |
| Rockies and Canada |
| Raton Jay Still EVP Western Division |
| Western Division - 2006 Focus Denver Piceance Raton Uinta Douglas Creek Arch Complex Sand Wash Basin Raton Basin Infill / extension drilling Optimize gathering and compression facilities Increase production and reserves Uinta - Piceance Basin Test horizontal CBM wells Explore Entrada / Wingate with 3-D seismic Sanction CBM project(s) Sand Wash Basin Drill and test pilots in new CBM project Sanction by year end Add new prospective plays |
| Raton At A Glance 2005 Operating Statistics 2005 Operating Statistics Field Life Cycle Development Project Type CBM Gross Acres 310,000 (96% WI) Field Spacing 80 - 160 acres Net Production 142 MMCFPD Proved Reserves 1.5 TCFE % Gas / % Liquids 100% / 0% % PUD 40% R / P 28 Capital $129 MM Wells Drilled 289 Operated Wells 1,460 2005 Financial Statistics 2005 Financial Statistics Rev / MCFE $7.23 LOE / MCFE $1.72 Base LOE / MCFE $1.44 DD&A / MCFE $1.75 Reserves Production PV10 Capital East 25 21 26 10 Remaining Drilling Inventory Remaining Drilling Inventory PUD Locations ~900 Probable Locations ~750 EUR per well 0.8 BCF % of 2005 Total Company |
| Raton Field Raton CBM Average Depth 1,270 ft. Average # Seams 15 Cumulative Pay 34 ft. Vermejo CBM Average Depth 1,690 ft. Average # Seams 8 Cumulative Pay 20 ft. New Mexico Colorado Raton Basin A long-lived coalbed methane field that is a core asset and serves as a cornerstone for other Rockies ventures |
| Integrated Well Services Company-Owned and Operated Equipment 2 Drilling Rigs 1 Conventional Rig Fluid and air drilling rig 1 Coiled Tubing Drilling Rig Conventional and coil-tubing capabilities Small footprint (250 X 200 ft.) 4 Fracture Fleets 6 Workover Rigs 4 Cement Fleets 18 Water Trucks Pipeline and road construction equipment Benefits Controls costs Generates drilling and completions efficiencies Improves quality control Eliminates scheduling bottlenecks Supports timely entry into new resource plays |
| 2006 Well Service Plans Frac sand mine joint venture API grade 20 - 40 frac sand Security of supply for scarce frac sand Operational 2nd Qtr '07 Export of well service Fracing wells at West Pan and Spraberry Drilling wells in Lay Creek and Castlegate Contracting to 3rd parties Contracting 750 HP drilling rig for U - P 3rd party drilling company to operate Rig available May '06 |
| Drilling and Completion Costs Integrated well services drive cost efficiencies Controllable costs represent 55% of total for Raton vs. 10% for industry 2004 - 2006 average annual cost escalation Raton: ~10% Industry: ~20% Controllable vs. Non-Controllable Average Annual Capital Cost Increases 2004 2005 2006 2004 2005 2006 Raton Industry 3% 14% 16% 5% 25% 20 - 30% Controllable 55% Controllable 10% Raton Industry |
| 2005 Operational Achievements Increased wells drilled by 50% from approximately 200 to 300 wells Completed SCADA implementation Developed automated well permitting tracking system Implemented cost saving initiatives Cementing problems - $4 MM per year Pump failures - $1 MM per year Patented proprietary downhole frac tools Developed comprehensive training programs Supervisory, technical and safety Reduced annual field employee turnover rate from 30% to less than 5% Enhanced community relations Proactive landowner and community relations Pioneer awarded Business of the Year in Trinidad |
| 2005 Raton Production Production growth limited due to line pressure constraints of the CIG Pipeline CIG export line pressures increased by 15% from January to September During August and September, through a series of pipeline expansions, export capacity increased from 280 to 340 MMCFPD Production impact Production remained essentially flat from January through July at 140 MMCFPD Production increased to an average of 146 MMCFPD in 4Q as pressures decreased Resulted in an increase of 5% YOY for 2005 Current production rate of 149 MMCFPD Q1 Q2 Q3 Q4 East 140 138.5 141 146 Representative CIG line pressure Net Production (MMCFPD) 1,250 PSI 1,050 PSI |
| 2005 Technical Advances Applied reservoir characterization to the field Increased technical staff with engineering and geologic CBM expertise Developed detailed computer models of the reservoir Cored ten additional wells throughout the field Results Reduced original gas in place (OGIP) based on the following: Intrusions Thin coals along peripheries Variable gas contents based on cores taken in 2005 Identified areas for improved recoveries that are suitable for downspacing Eliminated poor quality development areas along periphery with intrusions Added 16 MMBOE through extension drilling Revised reserves downward by 23 MMBOE (9% of YE 2005 reserves) due to stronger PDP declines in downspaced areas and impact of intrusions on PUDs Identified areas for improved recovery factors (RF) through capital investments in downspacing, compression, polymer fracs and horizontal drilling |
| Raton Looking Ahead 2006 Objective: Focus on more efficiently recovering the resource Deliver 5 - 7% production growth $50 MM in capital to lower field pressure through wellhead / booster compression and additional pipelines Continue to refine reservoir characterization model to high-grade future drilling locations and optimize facilities to improve PDP production Test horizontal drilling in areas with thicker coal seams Continue to add prospective acreage Continue to actively manage costs via the integrated well service model 2006 Capital Budget WI % Capital1 $MM Wells Planned Gross Per Well Metrics Cost - $MM IP - MCFPD Mean EUR - BCFE Gross Per Well Metrics Cost - $MM IP - MCFPD Mean EUR - BCFE Gross Per Well Metrics Cost - $MM IP - MCFPD Mean EUR - BCFE IRR (BTax)2 $45 / $6.50 Strip IRR (BTax)2 $45 / $6.50 Strip 96% $195 330 0.4 100 0.8 33% 40% Capital includes all gathering, facilities and other related capital costs in the area Risked IRRs calculated using $45 / $6.50 as well as the January 2006 strip prices |
| Raton - Production Outlook '00 '01 '02 '03 '04 '05 '06 '07 '08 '09 Historical Production 53 84 107 124.7 134.6 141.4 Production Outlook 150.5 160.6 170.252 178.975 Historical Wells 100 145 161 160 200 289 330 Number of Wells Net Production (MMCFEPD) 5 Year Lookback CAGR 19% Avg. Annual Wells 191 Future Plans ('05 - '09) CAGR 6% Development Case |
| Raton - Cash Flow Expectations '00 '01 '02 '03 '04 '05 '06 '07 '08 '09 Historical Capital 53 105 96 100 138 129 Land 2 3 2.5 2 Exploration 1.2 0 0 0 Development 192 144.225 129.011 153.664 Strip OCF (BTAX) 100 93 77 166 205 285 333 402 416 418 Net Capital / OCF ($MM) 5 Year Lookback Cum. Capex $568 MM Cum. OCF $862 MM Future Plans ('06 - '09) Cum. Capex $630 MM Cum. OCF $1,569 MM Development Case |
| Raton Key Takeaways Raton production projected to grow at 5 - 7% per year Drilling inventory of ~1,650 locations Continuing to actively manage costs via the integrated well service model Leveraging well service model in other areas of the Company Utilizing Raton expertise to develop other emerging CBM projects Sand Wash 1+ TCF of Resource Potential Uinta - Piceance 1+ TCF Resource Potential Raton 2+ TCF Horseshoe Canyon 200+ Bcf of Resource Potential Well Service Execution / Cost Control Unconventional Resource Expertise |
| Uinta - Piceance & Lay Creek Dennis Carlton VP Exploration Western Division |
| Uinta Basin Piceance Basin Sand Wash Basin Douglas Creek Arch TD 4,500' TD 13,500' TD 11,500' TD 6,000' TD 12,000' TD 2,500' TD 2,000' Castlegate Main Canyon Columbine Springs Banta Ridge Lay Creek U-P / Sand Wash Basin Geologic Summary |
| Geological Concept to Resource Play Easterly prograding clastic shorelines with trailing back- swamps for coal development (modern example) Williams Fork Formation Major Coal Groups (50-150 ft) Iles Formation Minor Coal Groups (5-25 ft) Minor Coal Groups (5-25 ft) Minor Coal Groups (5-25 ft) Lay Creek CBM Lay Creek CBM Project Late Cretaceous Time Late Cretaceous Time |
| JURASSIC TRIASSIC U-P / Sand Wash Basins Play Detail CRETACEOUS Target Formations Depth (Feet)1 Thickness (Feet)1 EUR Per Well (BCFE)2 Mesaverde Group Williams Fork Coals 2,500 75 3.50 Neslen Coals 1,800 25 0.60 Castlegate Sands 2,700 30 0.35 Blackhawk Coals 3,500 50 0.80 Mancos Group Mancos "B" 3,700 250 0.35 Deep Mancos (BCG) 4,200 65 0.50 Dakota Group 7,500 100 0.75 Cedar Mountain 0.75 Morrison 9,000 100 0.75 Entrada 9,500 300 5.0 Wingate 10,000 400 5.0 1) Represents averages 2) Unrisked EUR per well |
| Key Events Following EVG Merger |
| Castlegate Banta Ridge Lay Creek Rulison Columbine Springs Emerging Resource Play Acreage Evergreen acreage 220,000 net acres Acreage added post-Evergreen 150,000 net acres Total acreage in U-P / Sand Wash 370,000 net acres Thunder/ Foundation Creek Main Canyon |
| Emerging CBM Acreage Shoreline Sands Coal Swamps Channels 150,000+ acres (net) prospective for CBM 35 CBM wells drilled / WOC / testing / WOPL 27 wells producing 50 CBM + 5 disposal wells to be drilled in 2006 1,500+ potential drilling locations Columbine Springs LEGEND PXD CBM Acreage 0 10 20 Miles CBM Fairway Banta Ridge Lay Creek Castlegate |
| 15-40 ft (Vermejo) 50-150 ft (Wms Fork) 50-75 ft (Blackhawk) 15-35 ft (Neslen) 650-4,500 ft 1,000-5,000 ft 3,800-5,000 ft 900-3,400 ft 325 scf/t 250 scf/t 350 scf/t 175 scf/t 6 - 15 BCF 15 - 45 BCF 25 - 33 BCF 2 - 8 BCF 310,000 acres 118,000 acres 42,000 acres 68,000 acres 2.5 - 3.0 TCF 1.3 - 3.7 TCF 0.5 - 1.4 TCF 0.2 - 0.5 TCF 100% 50% 100% 100% CBM Play Comparisons CBM potential in multiple basins Provides consistent production and reserve growth through low-risk, visible inventory Looking for the Next Raton Net Coal Thickness Drilling Depth Gas Content (ARB) GIP per Section Acreage (PXD gross) Gross Resource1 PXD WI Raton Lay Creek Castlegate Columbine Sprgs (Sand Wash) (Uinta) (Douglas Creek) 1Gross Resource Potential Range (includes prior production in Raton); on current PXD acreage only |
| CBM Project Comparisons Project Probability of Technical Success Castlegate Permeability Lay Creek Dewatering Columbine Springs Areal Extent 40% 60% 60% Opportunities/ Challenges P10 P90 RESOURCE SIZE (If a technical success) Lay Creek Raton Castlegate Columbine Springs ? ? ? ? RISK 4 TCF 0 TCF |
| 2006 Plans PXD Operator, 50% WI Expand leasehold position 118,000 acres increasing to over 200,000 acres Refracing / reworking wells in prior operator's pilots Isolating individual seams to establish effective fracture growth and well interference 3 new CBM pilots and development drilling planned Leveraging Raton technical capability and PXD coiled tubing drilling rig Streamlining permitting Majority of acreage outside of BLM lands on fee surface and minerals Evaluate pilot results for project sanction in late 2006 Greater than 1 TCF resource potential Lay Creek Objectives High pressure pipeline '06 Pilots 2 Existing Pilots Washakie Basin Sand Wash Basin WY CO Atlantic Rim Play |
| Columbine Springs Objectives 2006 Plans PXD Operator, 100% WI Expand limits of field Drill 2 strategically positioned CBM pilots and 2 stratigraphic tests Confirm coal thickness and characteristics throughout field Operational improvements Drill 3 water disposal wells Immediately increases sales volumes Optimize compression facilities Expand leasehold position 21,000 acre acquisition in late 2005 increased acreage to 68,000 Expect to expand to over 100,000 acres in prospect area Evaluate sanction of full field development by year-end 2006 Net Coal (feet) < 10 feet 10 - 20 feet > 20 feet PXD Acreage Pipelines North Douglas Creek Arch Producing Wells (several more waiting on completion) 2006 Pilot 2006 Coal Tests 2006 Pilot |
| Castlegate Objectives 2006 Plans PXD Operator, 100% WI Focus on increasing flow rates from 100 MCFPD to 300 - 500 MCFPD Create critical well-to-well interference (dewatering) by drilling 4 closely spaced (40 acre) vertical wells Drill 1 horizontal reentry well Drill 1 Aussie-style horizontal Utilizing PXD coiled tubing drilling rig Optimize operating costs Evaluate horizontal and vertical well results for project sanction decision by year-end 2006 Capture additional acreage if pilot is successful Coals Sand Water Producer Intersecting Laterals (alternatives) Aussie-Style Hz Drilling Pattern |

| Entrada / Wingate Play Dune Fields Resource potential - 0.5 TCF Five exploratory wells in 2006 Secured 750 HP drill rig Approximately 50,000 acres prospective for Entrada / Wingate Dune Sands Castlegate Columbine Springs Thunder / Foundation Creek LEGEND PXD Entrada Acreage 0 10 20 Miles Entrada Dune Fairway Banta Ridge Main Canyon |
| Dakota Entrada / Wingate Exploration Play Stacked aeolian dune complex Initial flow rates of ~3.5 MMCFPD P(g) of 30% 3-D seismic tool for porosity identification Fairway limits need further delineation Dakota Entrada Entrada Locations 3-D Seismic Extent Proprietary Seismic Excluded |
| U-P / Sand Wash Plays - Looking Ahead 2006 Capital Budget Play WI % Capital1 $MM Wells Planned Average Per Well Metrics (Gross) Cost - $MM IP-MCFEPD EUR-BCFE Average Per Well Metrics (Gross) Cost - $MM IP-MCFEPD EUR-BCFE Average Per Well Metrics (Gross) Cost - $MM IP-MCFEPD EUR-BCFE IRR (BTax)2 $45 / $6.50 Strip IRR (BTax)2 $45 / $6.50 Strip Castlegate 100% 5 6 0.8 300 0.8 23% 37% Columbine Springs 100% 20 23 0.4 225 0.6 24% 32% Lay Creek 50% 25 25 0.5 250 3.5 35% 38% Entrada 100% 30 5 1.35 3,500 5.0 34% 48% Capital includes all gathering, facilities and other related capital costs in the area (well counts include 5 water disposal wells) Risked IRRs calculated using $45 / $6.50 as well as the January 2006 strip prices |
| U-P / Sand Wash - Production Outlook '06 '07 '08 '09 Historical Production Production Outlook 6.934 11.825 17.015 19.736 Production Outlook 1.891 7.657 19.613 39.382 Net Production (MMCFPD) Future Plans ('06 - '09) CAGR 42% Risked Upside CAGR 89% Development Case Risked Upside Potential |
| U-P / Sand Wash - Cash Flow Expectations '06 '07 '08 '09 Historical Capital Land 7.6 10 3.9 2.3 Exploration 23.4 24.88 13.27 15.98 Development 57.1 99.52 119.43 143.82 Strip OCF (BTAX) 15.7 47.4 93 147.6 Net Capital / OCF ($MM) Future Plans ('06 - '09) Cum. Capex $521 MM Cum. OCF $304 MM Risked Upside Potential |
| U-P / Sand Wash Basin Key Takeaways Establish long-term viability of 3 new CBM plays by the end of 2006 Multi-TCF resource potential Entrada / Wingate exploratory drilling will test 3-D seismic on multiple prospects Prolific initial flow rates and multi-BCF potential per well Acreage position increased 150,000 acres in last 16 months and still expanding Building inventory of resource plays Some may not work, but geological risk is low Continuing to capture new greenfield opportunities Horizontal drilling technology will be utilized in deeper coals Western Division has been restructured and staff increased to meet production goals and reserve growth forecasts |
| Chinchaga, Horseshoe Canyon & Mannville Todd Dillabough President Pioneer Canada |
| Progressing Growth Opportunities in Canada Chinchaga Targeting shallower and deeper zones outside of traditional producing horizons Infrastructure in-place to deliver expected production growth 150 BCF of net resource potential with up to ~300 locations Horseshoe Canyon CBM Over 500 locations remaining in trend sweet spot Over 150 wells drilled in 2nd half of 2005 Continuing to expand company-owned infrastructure on pace with drilling 200 BCF of net resource potential Mannville CBM Establish coal pilots in 3 areas using successful practices observed in the Corbett Creek pilot operated by Trident 250 BCF of net resource potential Total net resource potential of 600 BCF |
| Chinchaga 100% WI in core area of field Multi-zone Triassic and Cretaceous-aged sandstones Substantial upside in shallow Notikewin section Winter access only drilling; helicopter access during summer months ~260 wells drilled to-date by Pioneer; production since 1994 SCADA in place throughout entire field Lowest pressure gathering system in the area Chinchaga Calgary Edmonton Notikewin Net Pay (Meters) < 5 M 5 - 10 M > 10 M PXD Acreage 5 miles |
| Chinchaga - At A Glance 2005 Operating Statistics 2005 Operating Statistics Field Life Cycle Extension Project Type Conventional Gas Gross Acres (WI%) 231,000 (74%) Net Production 9 BCF Proved Reserves 71 BCF % Gas / % Liquids 90% / 10% % PUD 17% R / P 8 Capital $51 MM Wells Drilled 48 Opportunity Opportunity OGIP Per Section 0.8 to 2.5 BCF EUR Per Well 0.4 to 1.0 BCF Spacing 128 to 640 acre Net Resource Potential 150 BCF 3-D Seismic Coverage ~60% Reserves Production PV10 Capital East 1 2 1.6 4 2005 Financial Statistics 2005 Financial Statistics Rev / MCFE $6.43 LOE / MCFE $2.06 Base LOE / MCFE $1.74 DD&A / MCFE $2.39 % of 2005 Total Company |
| Chinchaga Looking Ahead 2006: Drill ~60 wells with up to 30 recompletions Field wide compression and gathering system upgrade Currently running 1 rig (multi-year contract) 2007 and Beyond: Continue to drill current risked inventory of ~150 locations (96% Probable, 4% PUD) within field boundary More locations could be added as drilling and production results dictate; up to 300 unrisked locations identified 2006 Capital Budget Working Interest1 Capital2 $MM Wells Planned Gross Per Well Metrics Cost - $MM IP - MCFEPD Mean EUR - BCFE Gross Per Well Metrics Cost - $MM IP - MCFEPD Mean EUR - BCFE Gross Per Well Metrics Cost - $MM IP - MCFEPD Mean EUR - BCFE IRR (BTax)3 $45 / $6.50 Strip IRR (BTax)3 $45 / $6.50 Strip 96% $51 57 0.8 300 0.4 30% 55% Average working interest for 2006 drilling program Capital includes all gathering, facilities and other related capital costs in the area Risked IRRs calculated using $45 / $6.50 as well as the January 2006 strip prices |
| Horseshoe Canyon CBM - Key Metrics Opportunity Opportunity OGIP per Section 3.5 BCF EUR per Well 0.3 BCF Spacing 80 acres Net Resource Potential 200 BCF Coal Thickness (Meters) 10 - 18 4 - 8 < 4 PXD Leases Calgary Edmonton Horseshoe Canyon 2005 Operating Statistics 2005 Operating Statistics Field Life Cycle Development Project Type CBM Gross Acres (WI%) 70,000 (78%) Net Production 0.4 BCF Proved Reserves 36 BCF % Gas / % Liquids 100% / 0% % PUD 0% Capital $51 MM Wells Drilled 157 |
| Horseshoe Canyon CBM Play Overview Play trend discovered in 2000 Multiple upper Cretaceous dry coal seams 126 BCF produced to-date by industry; estimated 10 to 15 TCF remaining 3,800 producing wells at an average rate of 92 MCFPD per well Pioneer Operations Acquired majority of acreage through Evergreen transaction in September 2004 Drilled 157 wells in second half of 2005 ~60 tied in and producing as of year end at ~5 MMCFPD Batch completing wells in order to control costs Air drill wells in less than 24 hours with nitrogen fracs Staying ahead of the permitting curve Using quiet, camouflaged compressors and minimal disturbance timely permit approvals Pipeline right-of-way post construction Rowley central field compressor site |
| Horseshoe Canyon CBM Looking Ahead 2006 Drill 200 wells Continue drilling wells in less than a day with repeatable results Two rigs moving to the field in March Tie-in ~300 wells by year end (~100 from 2005; 200 from 2006) Continue buildout of 100% WI gas gathering system with gas plants at very low system pressures Monitor current compression and gathering system effectiveness Collect reservoir data to establish ultimate, optimized spacing for Horseshoe Canyon Pilot downspacing; other operators are beginning to apply for 40-acre spacing Could increase resource potential from 200 BCF to 250+BCF 2006 Capital Budget Working Interest1 Capital2 $MM Wells Planned Gross Per Well Metrics Cost - $MM IP - MCFEPD Mean EUR - BCFE Gross Per Well Metrics Cost - $MM IP - MCFEPD Mean EUR - BCFE Gross Per Well Metrics Cost - $MM IP - MCFEPD Mean EUR - BCFE IRR (BTax)3 $45 / $6.50 Strip IRR (BTax)3 $45 / $6.50 Strip 66% $47 200 0.4 100 0.3 71% 100+% Average working interest for 2006 drilling program Capital includes all gathering, facilities and other related capital costs in the area Risked IRRs calculated using $45 / $6.50 as well as the January 2006 strip prices |
| Alberta Mannville CBM - Key Metrics Calgary Edmonton Mannville Mannville Net Pay (Meters) < 4 M 4 - 8 M > 8 M PXD Acreage 2005 Operating Statistics 2005 Operating Statistics Field Life Cycle Exploratory Project Type CBM Gross Acres (WI%) 74,500 (89%) Opportunity Opportunity OGIP Per Section 3.5 BCF EUR Per Well 1.2 BCF Spacing 320 acres Net Resource Potential 250 BCF |
| Alberta Mannville CBM Play Overview Play trend discovered in 2001 Multiple Cretaceous wet coals; 2 to 8 meter coal sections Only ~1 BCF produced to-date by industry Commercially producing at Corbett Creek (Trident / Nexen) Estimated 150 - 170 TCF remaining gas in-place Horizontal drilling required due to depth of coals Efficient water handling required to make play work Water injection wells into deeper horizons Pioneer Operations Acquired majority of acreage through Evergreen transaction in September 2004 8 horizontal wells planned to test 3 different pilots Identifying drilling and completion techniques that allow commercial production rates following Trident techniques used at Corbett Creek - horizontal wellbores |
| Corbett Creek - Trident-Operated Pilot Drilled wells 9 Months 858 MMCPD Water Rate 133 BWPD 3 Months 654 MMCPD 0 9 months Best Well Corbett Creek - Trident-Operated Hz wells drilled: 102 Hz wells on production: 22 Hz wells Ave. Rate (6 mo): 263 MCFPD Hz Rate Range: 17 - 858 MCFPD WGR after 4 months: 610 BBL / MMCF Ave length: 2,800 FT Longest Hz: 6,800 FT Vertical Rates after 2 yrs: <50 MCFPD |

| Mannville CBM Looking Ahead 2006 Exploration Objectives: Drill up to 6 - 8 horizontal wells in 3 pilot areas Evaluate productivity of pilots Continue to evaluate drilling and completion techniques of other operators Collect reservoir data to further improve screening for prospective coals Understand production characteristics of pilots to optimize costs 2007 and Beyond: Over 100 follow-up locations over the next five years on existing lands if pilots are successful 2006 Capital Budget Working Interest1 Capital2 $MM Wells Planned Gross Per Well Metrics Cost - $MM IP - MCFEPD Mean EUR - BCFE Gross Per Well Metrics Cost - $MM IP - MCFEPD Mean EUR - BCFE Gross Per Well Metrics Cost - $MM IP - MCFEPD Mean EUR - BCFE IRR (BTax) $45 / $6.50 Strip IRR (BTax) $45 / $6.50 Strip 83% $8 6 1.6 300 1.2 N/A N/A Average working interest for 2006 drilling program Capital includes all gathering, facilities and other related capital costs in the area |
| Canada - Production Outlook '00 '01 '02 '03 '04 '05 '06 '07 '08 '09 Historical Production 43.7 39.5 30.1 28.8 41 Production Outlook 54.8 73.332 85.507 83.599 Production Outlook 8.969 15.662 22.957 Historical Wells 0 30 17 35 24 235 263 Number of Wells Net Production (MMCFEPD) 5 Year Lookback CAGR -2% Avg. Annual Wells 69 Future Plans ('06 - '09) CAGR 19% - - Excludes Mannville potential & additional Chinchaga infills Development Case |
| Canada - Cash Flow Expectations '00 '01 '02 '03 '04 '05 '06 '07 '08 '09 Historical Capital 0 18.5 21.5 18.9 20.1 131 Land 4.7 11.3 13.8 6.6 Exploration 7.1 11.4 13 11 Development 119.6 103.3 39.4 22 Chinchaga Infills 55 80 Strip OCF (BTAX) 0 27.7 22.6 31.8 29.5 80.2 106.4 219.3 244.7 221 Net Capital / OCF ($MM) 5 Year Lookback Cum. Capex $210 MM Cum. OCF $192 MM - Excludes discontinued operations Future Plans ('06 - '09) Cum. Capex $363 MM Cum. OCF $791 MM - - Excludes Mannville potential & additional Chinchaga infills Development Case Potential additional Chinchaga infills |
| North America Projects and Exploration |
| Alaska Development Projects Ken Sheffield President Pioneer Alaska |
| Alaska Investment Considerations Strengths Prolific petroleum system High-impact opportunities Attractive undeveloped discoveries Lightly explored over the past 20 years Favorable fiscal and political regime Long-lived oil reserves Ample capacity in current infrastructure (TAPS) Significantly improved margins over the past several years Challenges Complex regulatory process / environmentally sensitive Condensed winter exploratory drilling season Longer project cycle times High transportation costs Developing gas infrastructure |
| Pioneer Alaska Strategy Achieve a step change in the North Slope cost structure Independent mindset Challenge existing methods Bring in successful concepts from other areas Collaborate with contracting community Maintain balanced portfolio of near and longer-term prospects Decrease project cycle times Leverage existing infrastructure Engage the community Local and native communities State and federal regulatory agencies State and local governments Meet best-in-class health, safety and environmental standards Become partner of choice Goal: Become the best new project delivery team in Alaska |
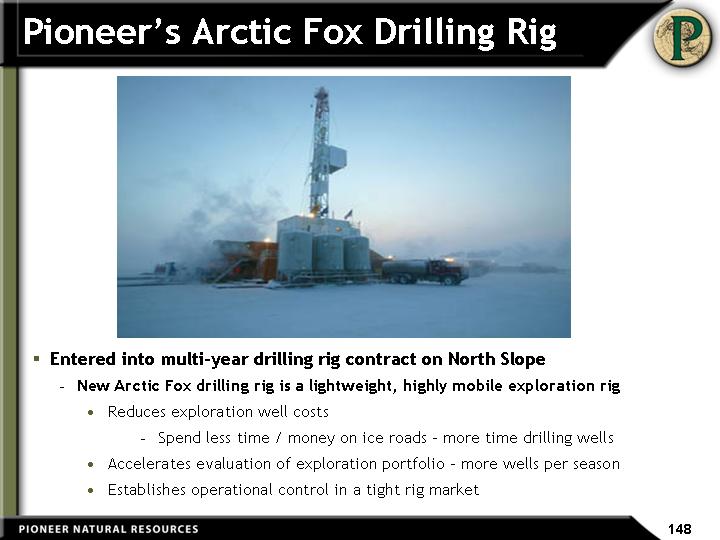
| Pioneer's Arctic Fox Drilling Rig Entered into multi-year drilling rig contract on North Slope New Arctic Fox drilling rig is a lightweight, highly mobile exploration rig Reduces exploration well costs Spend less time / money on ice roads - more time drilling wells Accelerates evaluation of exploration portfolio - more wells per season Establishes operational control in a tight rig market Establishes operational control in a tight rig market Establishes operational control in a tight rig market Establishes operational control in a tight rig market Establishes operational control in a tight rig market Establishes operational control in a tight rig market Establishes operational control in a tight rig market |
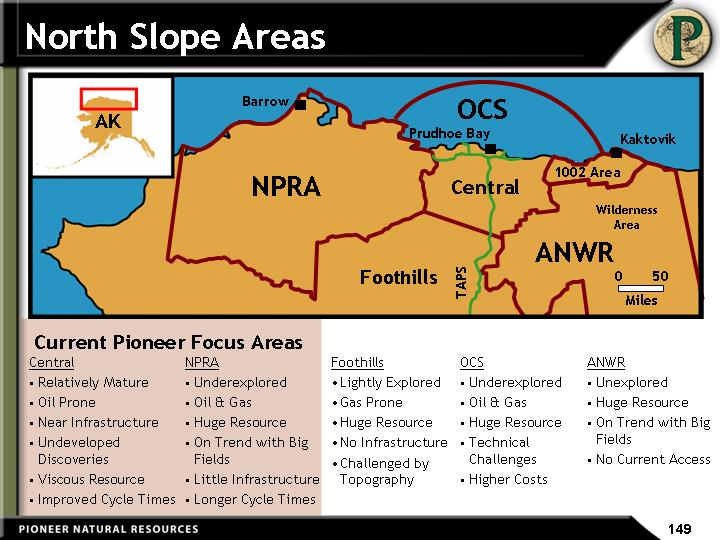
| North Slope Areas Foothills Lightly Explored Gas Prone Huge Resource No Infrastructure Challenged by Topography OCS Underexplored Oil & Gas Huge Resource Technical Challenges Higher Costs ANWR Unexplored Huge Resource On Trend with Big Fields No Current Access Current Pioneer Focus Areas NPRA OCS Central Foothills Barrow 1002 Area ANWR Wilderness Area 0 50 Miles AK Prudhoe Bay Kaktovik TAPS NPRA Underexplored Oil & Gas Huge Resource On Trend with Big Fields Little Infrastructure Longer Cycle Times Central Relatively Mature Oil Prone Near Infrastructure Undeveloped Discoveries Viscous Resource Improved Cycle Times |

| BEAUFORT SEA National Petroleum Reserve Alaska (NPRA) Pioneer's Alaska Acreage Storms Area Exploration PXD 50% WI (Op) 153,000 acres 1st well in 2006 NPRA Exploration PXD 20% - 30% WI 1.4 million acres Total Pioneer 1.7 million acres 1.7 million acres 1.7 million acres Anchorage Beaufort Sea Oooguruk Discovery PXD 70% WI (Op) 58,000 acres Prudhoe Bay 13 BBO Kuparuk River 2.5 BBO Cosmopolitan Discovery PXD 10% WI? option to 50% 25,000 acres in Cook Inlet TAPS Central North Slope Satellites Cronus - PXD 90% WI (Op) Antigua - PXD 33% WI 51,000 acres 1 well on each in 2006 Alpine 500 MMBO |
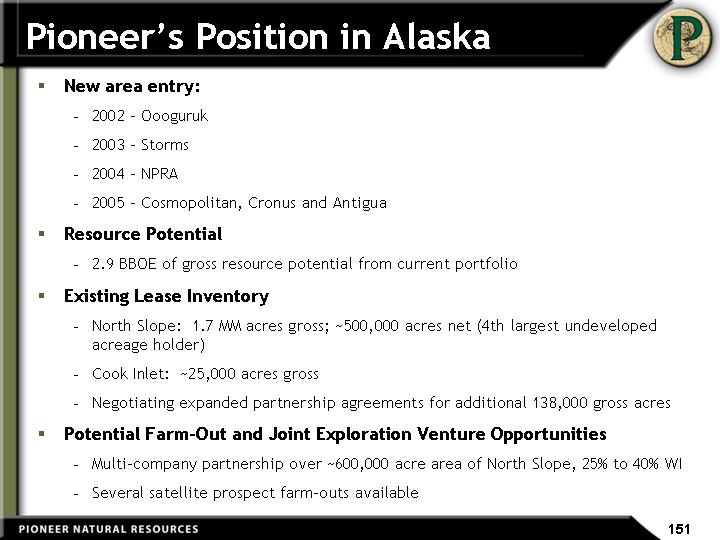
| Pioneer's Position in Alaska New area entry: 2002 - Oooguruk 2003 - Storms 2004 - NPRA 2005 - Cosmopolitan, Cronus and Antigua Resource Potential 2.9 BBOE of gross resource potential from current portfolio Existing Lease Inventory North Slope: 1.7 MM acres gross; ~500,000 acres net (4th largest undeveloped acreage holder) Cook Inlet: ~25,000 acres gross Negotiating expanded partnership agreements for additional 138,000 gross acres Potential Farm-Out and Joint Exploration Venture Opportunities Multi-company partnership over ~600,000 acre area of North Slope, 25% to 40% WI Several satellite prospect farm-outs available |
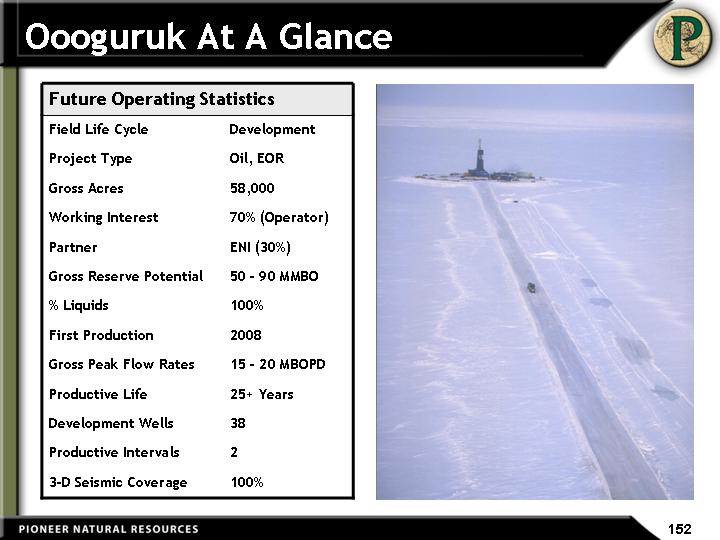
| Oooguruk At A Glance Future Operating Statistics Future Operating Statistics Field Life Cycle Development Project Type Oil, EOR Gross Acres 58,000 Working Interest 70% (Operator) Partner ENI (30%) Gross Reserve Potential 50 - 90 MMBO % Liquids 100% First Production 2008 Gross Peak Flow Rates 15 - 20 MBOPD Productive Life 25+ Years Development Wells 38 Productive Intervals 2 3-D Seismic Coverage 100% 3-D Seismic Coverage 100% |
| Oooguruk Overview History Discovered in 2003 - PXD drilled 3 exploration wells Ivik #1 tested 1,000+ BOPD from a fracture-stimulated vertical well Resource Description Reservoirs: Kuparuk C and Nuiqsut sands Nuiqsut sands thicker and extensive Similar to Alpine, but more viscous oil (~20 degrees API) Kup C sands analogous to Kuparuk River Unit pay Challenges Relatively tight Nuiqsut reservoir - offset with horizontal wells Pressure support from water and gas injection Arctic offshore environment Infrastructure 8 mile flowline to existing Kuparuk processing facilities |
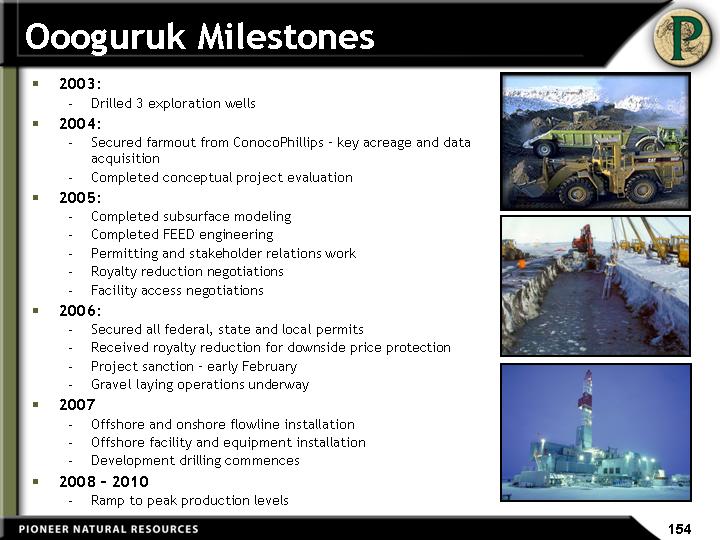
| Oooguruk Milestones 2003: Drilled 3 exploration wells 2004: Secured farmout from ConocoPhillips - key acreage and data acquisition Completed conceptual project evaluation 2005: Completed subsurface modeling Completed FEED engineering Permitting and stakeholder relations work Royalty reduction negotiations Facility access negotiations 2006: Secured all federal, state and local permits Received royalty reduction for downside price protection Project sanction - early February Gravel laying operations underway 2007 Offshore and onshore flowline installation Offshore facility and equipment installation Development drilling commences 2008 - 2010 Ramp to peak production levels |
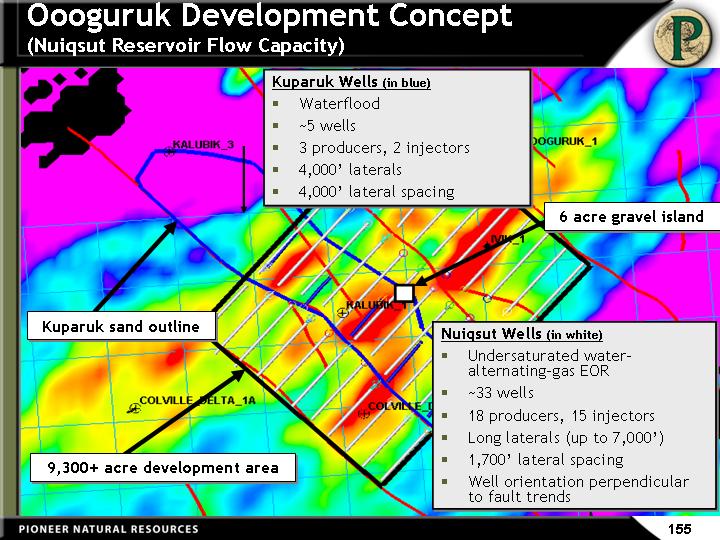
| Oooguruk Development Concept (Nuiqsut Reservoir Flow Capacity) 9,300+ acre development area Kuparuk sand outline 6 acre gravel island Kuparuk Wells (in blue) Waterflood ~5 wells 3 producers, 2 injectors 4,000' laterals 4,000' lateral spacing Nuiqsut Wells (in white) Undersaturated water- alternating-gas EOR ~33 wells 18 producers, 15 injectors Long laterals (up to 7,000') 1,700' lateral spacing Well orientation perpendicular to fault trends |
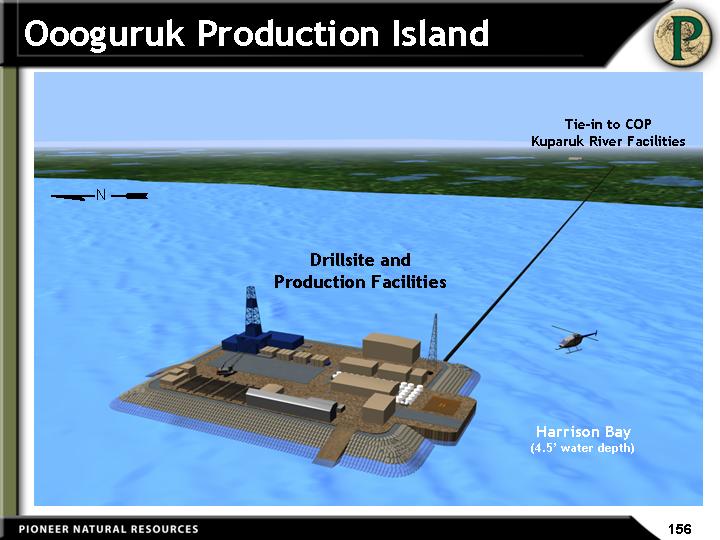
| Oooguruk Production Island Drillsite and Production Facilities Tie-in to COP Kuparuk River Facilities Harrison Bay (4.5' water depth) |
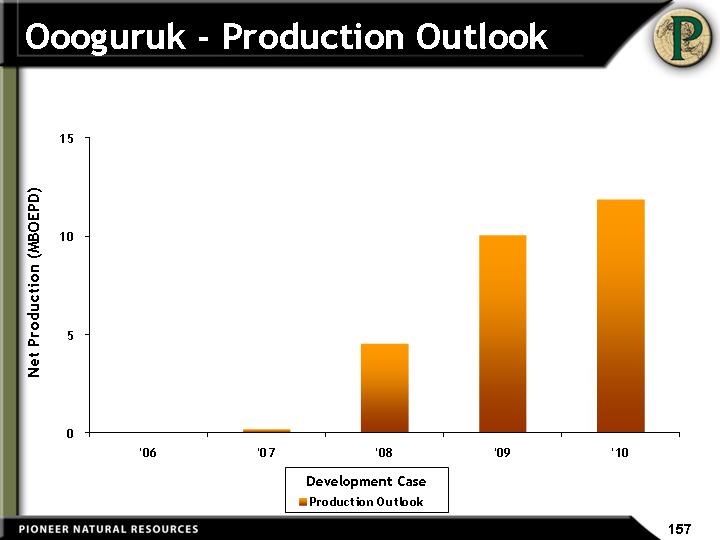
| Oooguruk - Production Outlook '06 '07 '08 '09 '10 '11 Historical Production Net Production (MBOEPD) Development Case |
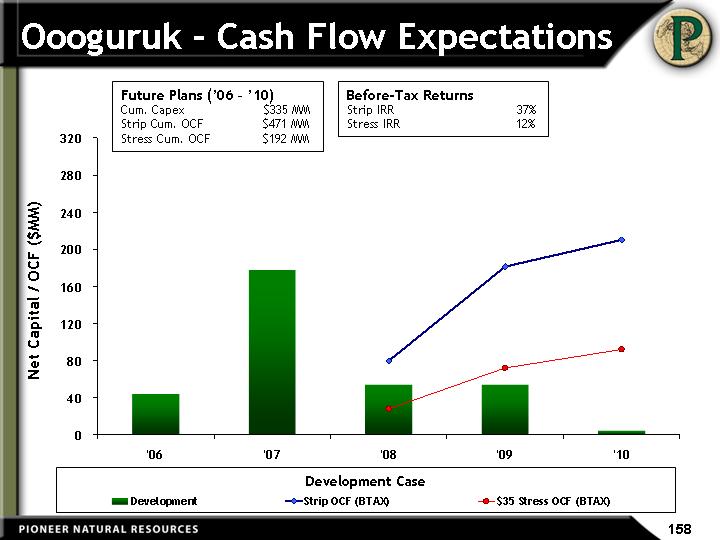
| Oooguruk - Cash Flow Expectations '06 '07 '08 '09 '10 '12 Development 44 178 54 54 4.6 Strip OCF (BTAX) 80 181 210 $35 Stress OCF (BTAX) 28 72 92 Net Capital / OCF ($MM) Future Plans ('06 - '10) Cum. Capex $335 MM Strip Cum. OCF $471 MM Stress Cum. OCF $192 MM Development Case Before-Tax Returns Strip IRR 37% Stress IRR 12% |
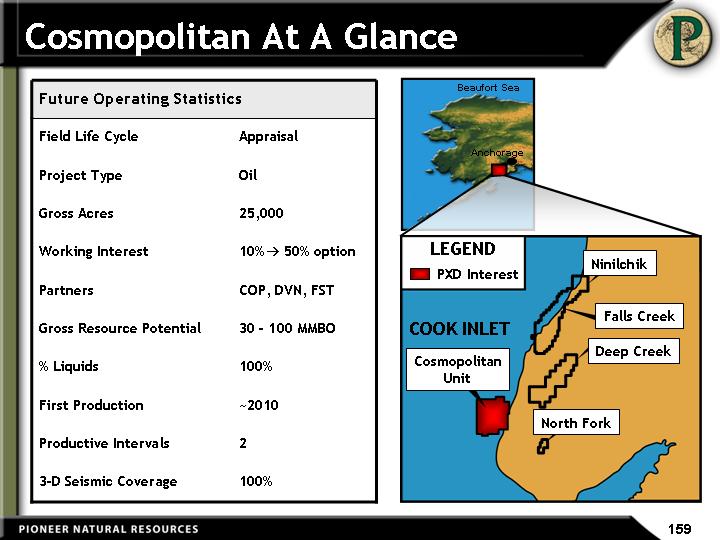
| Cosmopolitan At A Glance Future Operating Statistics Future Operating Statistics Field Life Cycle Appraisal Project Type Oil Gross Acres 25,000 Working Interest 10%? 50% option Partners COP, DVN, FST Gross Resource Potential 30 - 100 MMBO % Liquids 100% First Production ~2010 Productive Intervals 2 3-D Seismic Coverage 100% LEGEND PXD Interest Ninilchik Deep Creek Falls Creek Cosmopolitan Unit North Fork COOK INLET COOK INLET Anchorage Beaufort Sea |
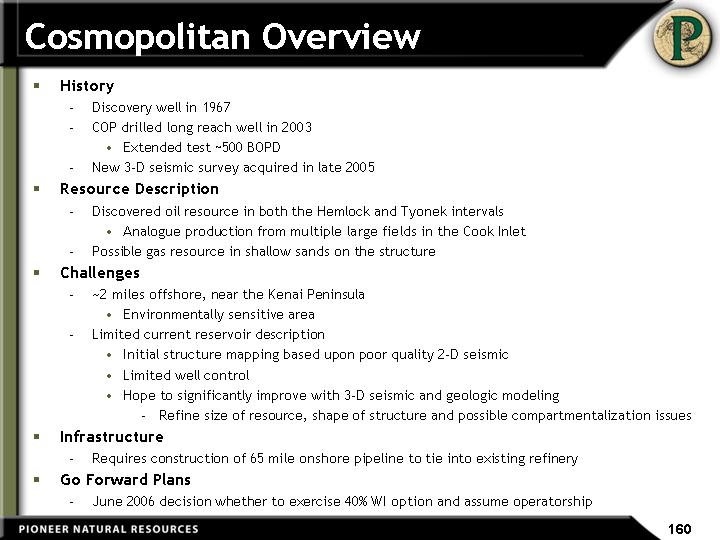
| Cosmopolitan Overview History Discovery well in 1967 COP drilled long reach well in 2003 Extended test ~500 BOPD New 3-D seismic survey acquired in late 2005 Resource Description Discovered oil resource in both the Hemlock and Tyonek intervals Analogue production from multiple large fields in the Cook Inlet Possible gas resource in shallow sands on the structure Challenges ~2 miles offshore, near the Kenai Peninsula Environmentally sensitive area Limited current reservoir description Initial structure mapping based upon poor quality 2-D seismic Limited well control Hope to significantly improve with 3-D seismic and geologic modeling Refine size of resource, shape of structure and possible compartmentalization issues Infrastructure Requires construction of 65 mile onshore pipeline to tie into existing refinery Go Forward Plans June 2006 decision whether to exercise 40% WI option and assume operatorship |
| Alaska Exploration & Clipper Project Tom Spalding VP North America Exploration |
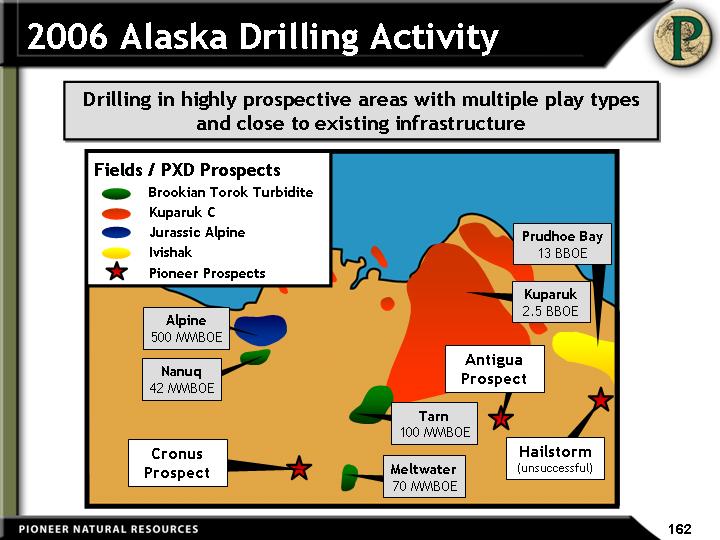
| 2006 Alaska Drilling Activity Fields / PXD Prospects Brookian Torok Turbidite Kuparuk C Jurassic Alpine Ivishak Pioneer Prospects Alpine 500 MMBOE Nanuq 42 MMBOE Tarn 100 MMBOE Kuparuk 2.5 BBOE Antigua Prospect Cronus Prospect Hailstorm (unsuccessful) Drilling in highly prospective areas with multiple play types and close to existing infrastructure Meltwater 70 MMBOE Prudhoe Bay 13 BBOE |

| Cronus Prospect Cronus Prospect: Multiple Stratigraphic Targets: Primary: Torok turbidite (~6,800 ft) PXD WI = 90% (Op) Resource potential: 50 - 120 MMBO (gross) Drill with PXD's Arctic Fox rig Possible fast-track development with 1st oil as early as 2008 Northstar Milne Point Kuparuk Alpine Tarn NPRA 0 20 Miles West Sak Prudhoe Bay Cronus Cronus Torok Sand Kup C Sand Jurassic "Alpine" Sand Kuparuk 2.8 BBOE NE SW |
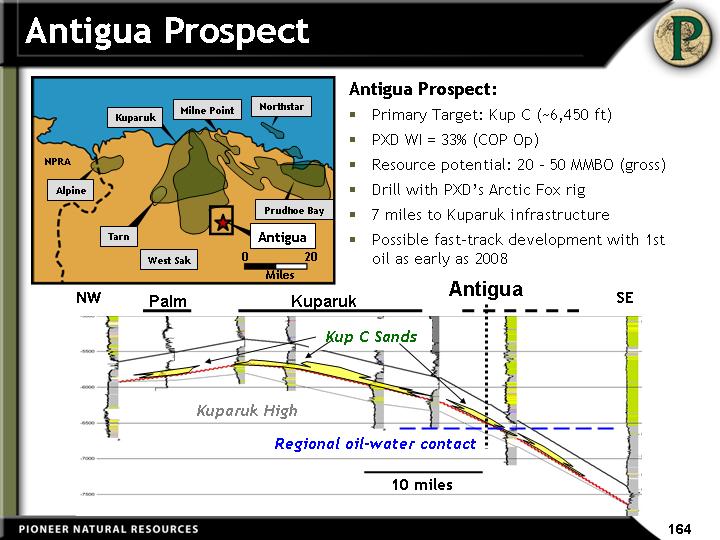
| Antigua Prospect Antigua Prospect: Primary Target: Kup C (~6,450 ft) PXD WI = 33% (COP Op) Resource potential: 20 - 50 MMBO (gross) Drill with PXD's Arctic Fox rig 7 miles to Kuparuk infrastructure Possible fast-track development with 1st oil as early as 2008 Northstar Milne Point Kuparuk Alpine Tarn NPRA 0 20 Miles West Sak Prudhoe Bay Palm Kuparuk Antigua Kuparuk High Regional oil-water contact Kup C Sands 10 miles NW SE Antigua |
| Storms Area Storms Area: PXD operates exploration phase (50% WI) Partnered with COP Directly adjacent to Prudhoe Bay Short tie-in to infrastructure (5 - 10 miles) Acquired new 300 sq. mile 3-D in 2005 Several proven play types Multiple prospects in each play First well - Hailstorm prospect (February 2006) Encountered non- commercial residual hydrocarbons in Ivishak Kuparuk River Field Prudhoe Bay Field Antigua #1 TAPS Hailstorm #1 Storms 3-D Survey Kup C Ivishak Lisburne Prospect Map Excluded |
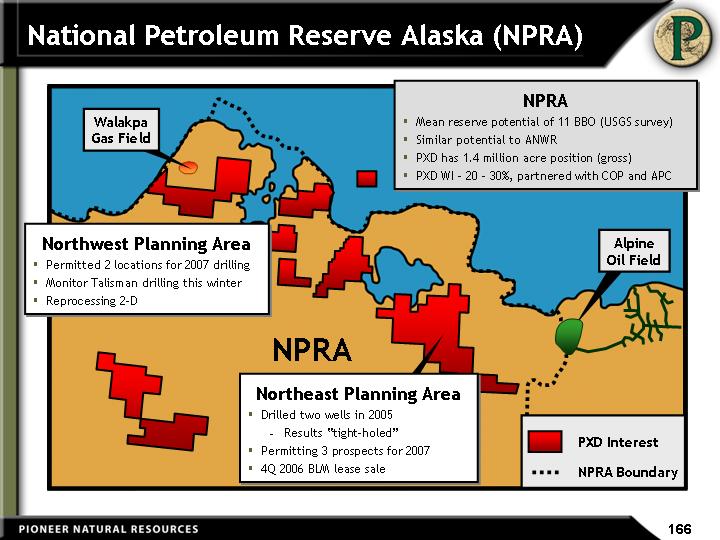
| National Petroleum Reserve Alaska (NPRA) NPRA Alpine Oil Field Northeast Planning Area Drilled two wells in 2005 Results "tight-holed" Permitting 3 prospects for 2007 4Q 2006 BLM lease sale PXD Interest NPRA Boundary Walakpa Gas Field Northwest Planning Area Permitted 2 locations for 2007 drilling Monitor Talisman drilling this winter Reprocessing 2-D NPRA Mean reserve potential of 11 BBO (USGS survey) Similar potential to ANWR PXD has 1.4 million acre position (gross) PXD WI - 20 - 30%, partnered with COP and APC |
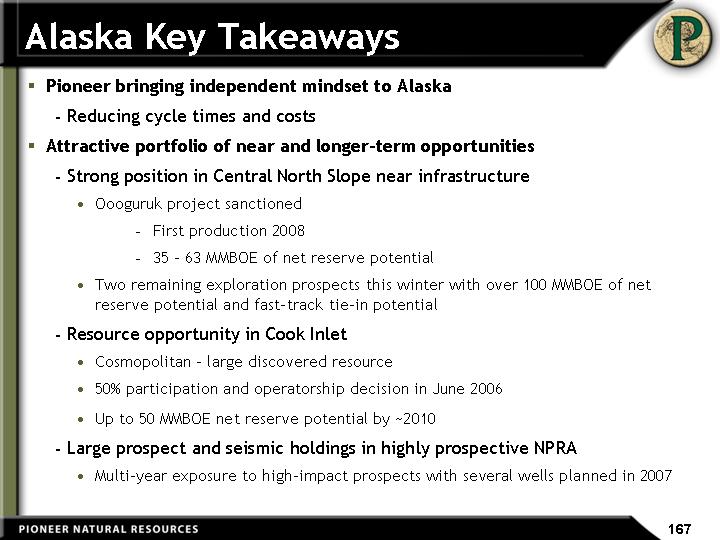
| Alaska Key Takeaways Pioneer bringing independent mindset to Alaska Reducing cycle times and costs Attractive portfolio of near and longer-term opportunities Strong position in Central North Slope near infrastructure Oooguruk project sanctioned First production 2008 35 - 63 MMBOE of net reserve potential Two remaining exploration prospects this winter with over 100 MMBOE of net reserve potential and fast-track tie-in potential Resource opportunity in Cook Inlet Cosmopolitan - large discovered resource 50% participation and operatorship decision in June 2006 Up to 50 MMBOE net reserve potential by ~2010 Large prospect and seismic holdings in highly prospective NPRA Multi-year exposure to high-impact prospects with several wells planned in 2007 |

| Clipper |
| Clipper Discovery C.I. = 200 ft. Onlaps Salt Onlaps Salt OWC Canyon Cut Seismic Line GC299 SSTVD Discovery Well Discovery well: June 2005 71' net oil pay, 27% porosity, penetrated OWC Gross reserve potential: Main amplitude: 25 - 50 MMBOE Drilling upside amplitudes could expand reserves up to 90 MMBOE SALT GC299 # 1 Discovery NW SE # 1 ST 1 Proprietary Seismic Excluded |
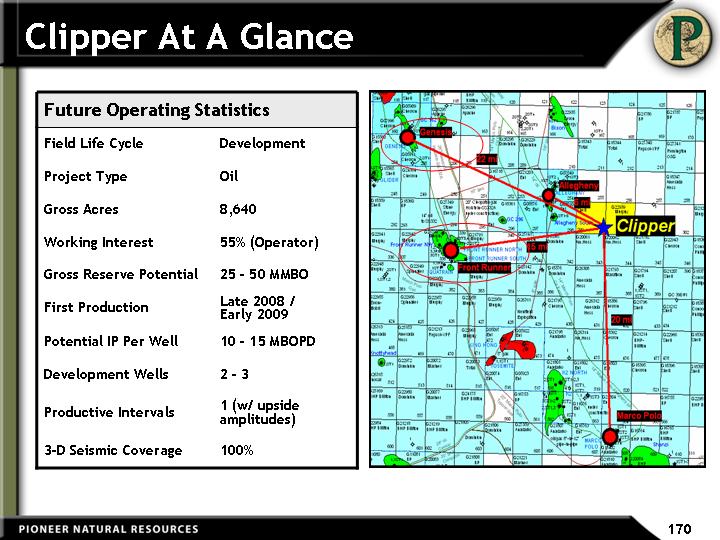
| Clipper At A Glance Future Operating Statistics Future Operating Statistics Field Life Cycle Development Project Type Oil Gross Acres 8,640 Working Interest 55% (Operator) Gross Reserve Potential 25 - 50 MMBO First Production Late 2008 / Early 2009 Potential IP Per Well 10 - 15 MBOPD Development Wells 2 - 3 Productive Intervals 1 (w/ upside amplitudes) 3-D Seismic Coverage 100% 3-D Seismic Coverage 100% |
| Clipper Project Excluded from Deepwater GOM divestiture Experience in similar deepwater developments 2 to 3 well development in main amplitude; several additional amplitudes (unrealized upside) Recent seismic reprocessing provides much clearer picture of Clipper field size and undrilled upside potential 2006 drilling Updip appraisal on original Clipper amplitude Two additional exploration amplitude tests In early 2005, rig contracted at half of current market rate |
| Clipper Commercialization Timetable Process, infrastructure and commercial discussions underway Ample export pipeline capacity in the area Depending on success, possible development scenarios include: Standalone facility Subsea tie-back to 3rd party host Development timetable: Standalone Subsea tie-back 2006: Exploration / appraisal drilling Exploration / appraisal drilling Project sanction Project sanction 2007: Development drilling/completions Development drilling / completions 2008: Engineering design Engineering design Standalone facility installation First Oil (Late 2008 / Early 2009) 2009: First Oil |
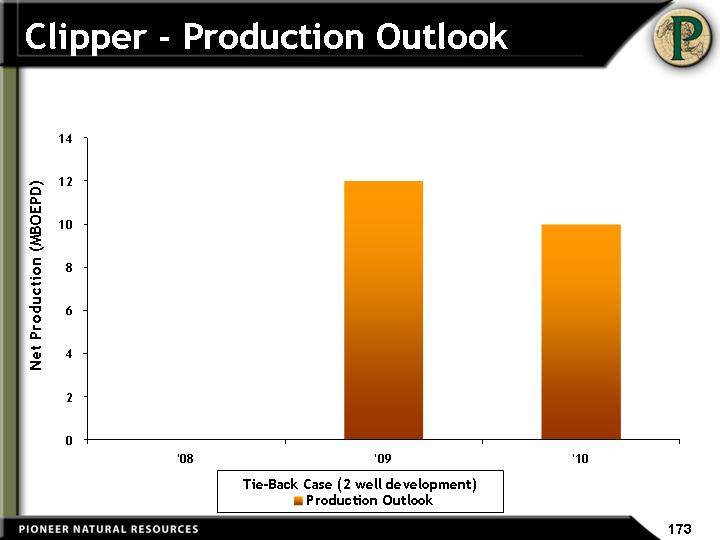
| Clipper - Production Outlook '00 '01 '02 '03 '04 '05 '06 '07 '08 '09 '10 '11 Historical Production 53 0 0 0 0 0 Production Outlook 0 0 0 12 10 5.4 Historical Wells 100 0 0 0 0 0 Net Production (MBOEPD) Tie-Back Case (2 well development) |
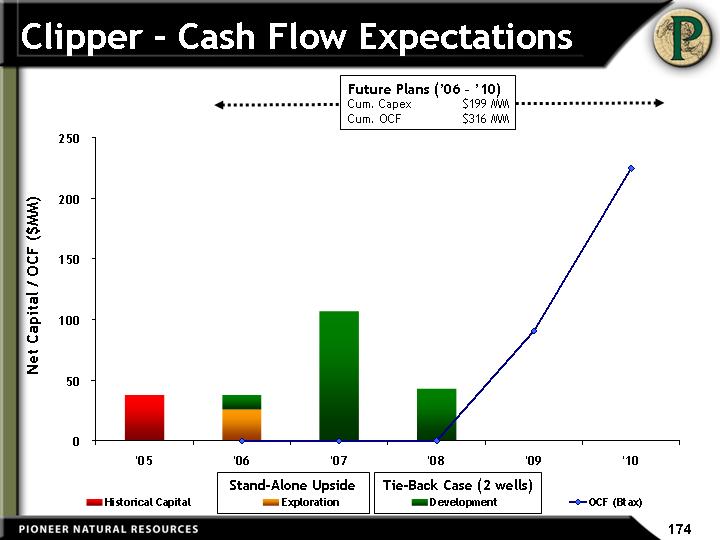
| Clipper - Cash Flow Expectations '00 '01 '02 '03 '04 '05 '06 '07 '08 '09 '10 '11 Historical Capital 38.125 Land 0 0 0 0 0 0 Exploration 26 0 0 0 0 Development 12 107 43 0 0 0 OCF (Btax) 0 0 0 91 225 89.7 Net Capital / OCF ($MM) Future Plans ('06 - '10) Cum. Capex $199 MM Cum. OCF $316 MM Tie-Back Case (2 wells) Stand-Alone Upside |
| Africa |
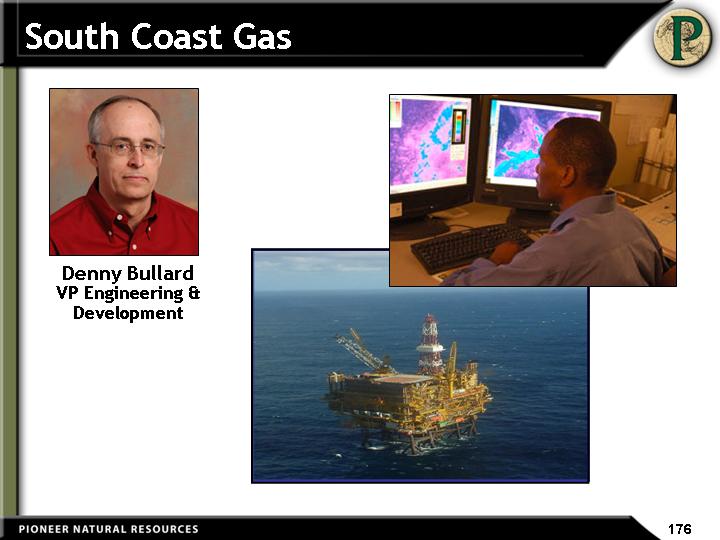
| South Coast Gas Denny Bullard VP Engineering & Development |
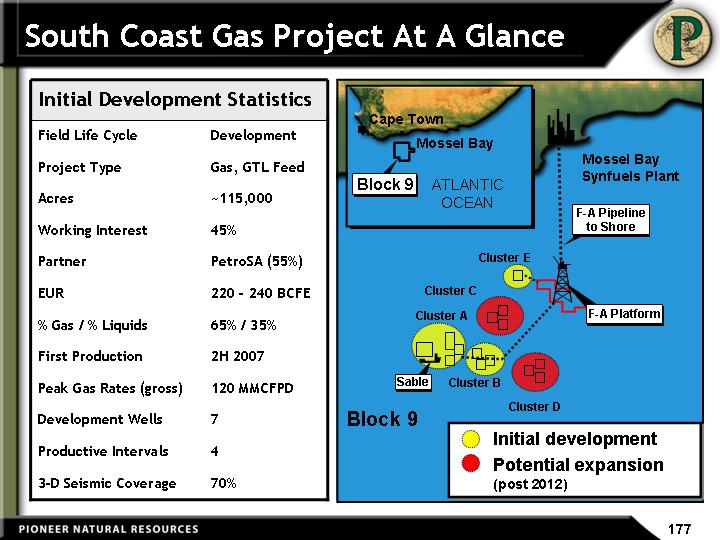
| South Coast Gas Project At A Glance Initial Development Statistics Initial Development Statistics Field Life Cycle Development Project Type Gas, GTL Feed Acres ~115,000 Working Interest 45% Partner PetroSA (55%) EUR 220 - 240 BCFE % Gas / % Liquids 65% / 35% First Production 2H 2007 Peak Gas Rates (gross) 120 MMCFPD Development Wells 7 Productive Intervals 4 3-D Seismic Coverage 70% Mossel Bay Synfuels Plant F-A Pipeline to Shore Sable F-A Platform ATLANTIC OCEAN Cape Town Mossel Bay Block 9 Cluster A Cluster B Cluster E Cluster D Cluster C Initial development Potential expansion (post 2012) Block 9 |
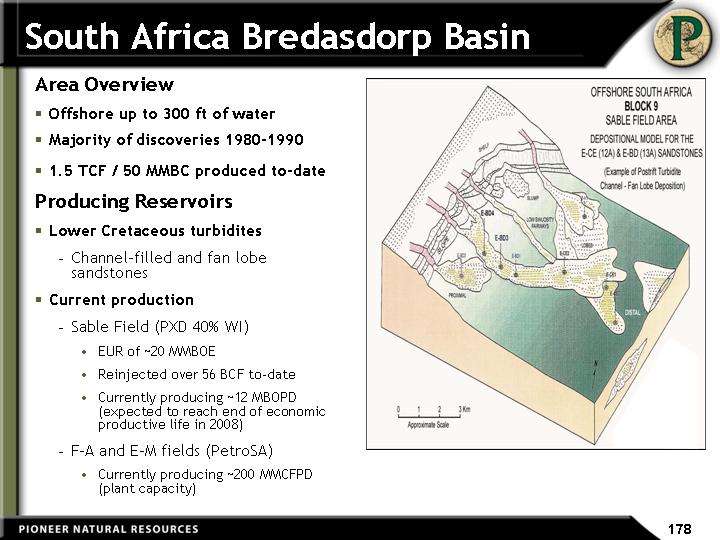
| South Africa Bredasdorp Basin Area Overview Offshore up to 300 ft of water Majority of discoveries 1980-1990 1.5 TCF / 50 MMBC produced to-date Producing Reservoirs Lower Cretaceous turbidites Channel-filled and fan lobe sandstones Current production Sable Field (PXD 40% WI) EUR of ~20 MMBOE Reinjected over 56 BCF to-date Currently producing ~12 MBOPD (expected to reach end of economic productive life in 2008) F-A and E-M fields (PetroSA) Currently producing ~200 MMCFPD (plant capacity) |
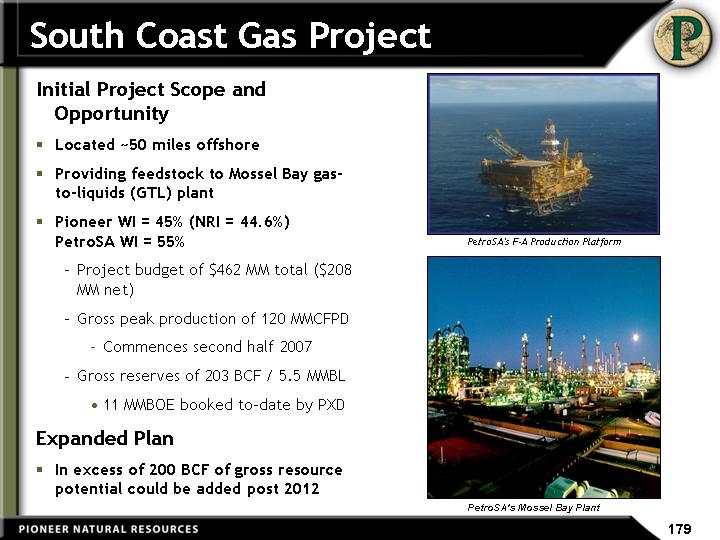
| South Coast Gas Project Initial Project Scope and Opportunity Located ~50 miles offshore Providing feedstock to Mossel Bay gas- to-liquids (GTL) plant Pioneer WI = 45% (NRI = 44.6%) PetroSA WI = 55% Project budget of $462 MM total ($208 MM net) Gross peak production of 120 MMCFPD Commences second half 2007 Gross reserves of 203 BCF / 5.5 MMBL 11 MMBOE booked to-date by PXD Expanded Plan In excess of 200 BCF of gross resource potential could be added post 2012 PetroSA's F-A Production Platform PetroSA's Mossel Bay Plant |
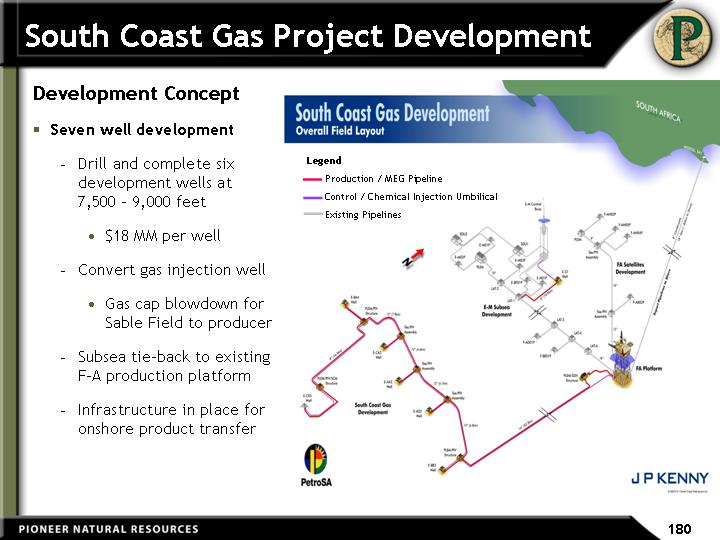
| South Coast Gas Project Development Development Concept Seven well development Drill and complete six development wells at 7,500 - 9,000 feet $18 MM per well Convert gas injection well Gas cap blowdown for Sable Field to producer Subsea tie-back to existing F-A production platform Infrastructure in place for onshore product transfer Legend Production / MEG Pipeline Control / Chemical Injection Umbilical Existing Pipelines Legend Production / MEG Pipeline Control / Chemical Injection Umbilical Existing Pipelines |

| South Coast Gas Project Timeline Achievements 2001 - 2003: Successfully developed Sable oil project 2004: Defined gas project scope Completed subsurface evaluation of gas accumulations Initiated technical study for FEED analysis 2005: Flow assurance and FEED study completed Agreement on base case gas development scenario Production performance and recovery agreement between parties Commercial agreement on gas and condensate prices tied to Brent crude Reserve booking of 11 MMBOE 2006: Drill and complete six wells 2007 Subsea infrastructure and well tie-ins First production - second half of 2007 |
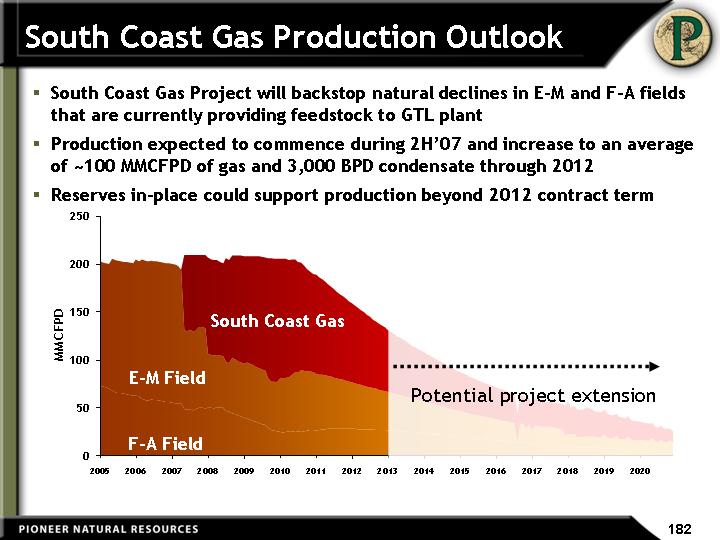
| South Coast Gas Production Outlook South Coast Gas Project will backstop natural declines in E-M and F-A fields that are currently providing feedstock to GTL plant Production expected to commence during 2H'07 and increase to an average of ~100 MMCFPD of gas and 3,000 BPD condensate through 2012 Reserves in-place could support production beyond 2012 contract term Potential project extension E-M Field F-A Field South Coast Gas |
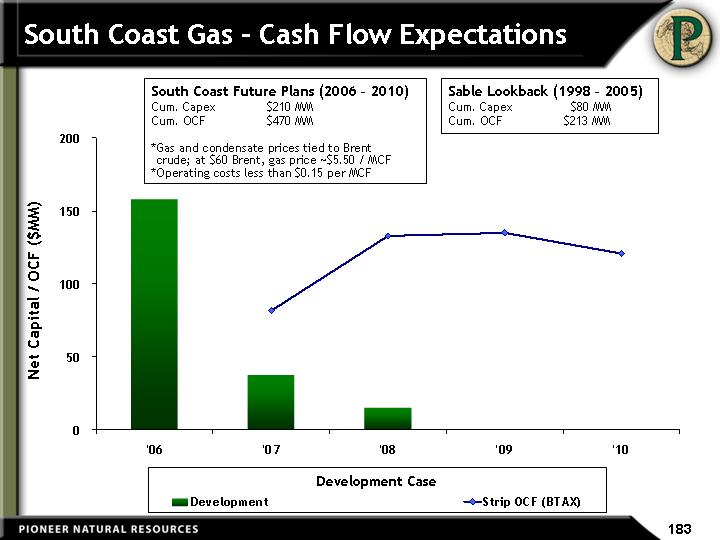
| '06 '07 '08 '09 '10 '11 '12 Historical Capital Facilities Exploration Development 158.1 37.4 14.9 Strip OCF (BTAX) 81.5 132.6 135 120.6 103.2 81.4 South Coast Gas - Cash Flow Expectations South Coast Future Plans (2006 - 2010) Cum. Capex $210 MM Cum. OCF $470 MM *Gas and condensate prices tied to Brent crude; at $60 Brent, gas price ~$5.50 / MCF *Operating costs less than $0.15 per MCF Net Capital / OCF ($MM) Development Case Sable Lookback (1998 - 2005) Cum. Capex $80 MM Cum. OCF $213 MM |
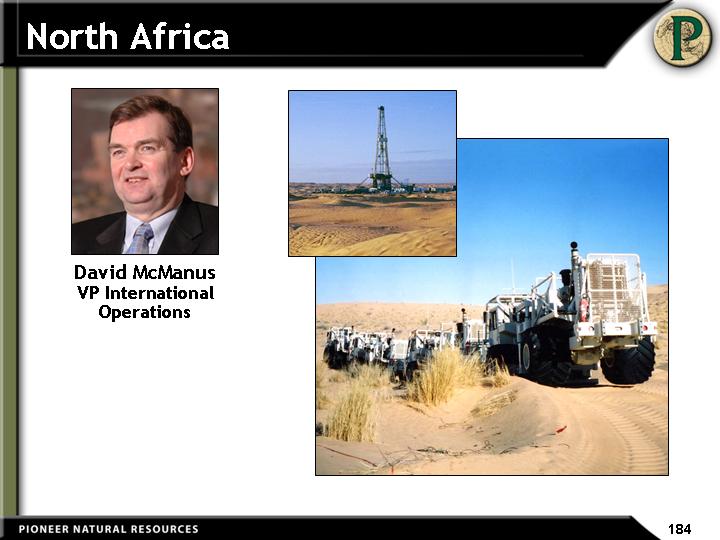
| North Africa David McManus VP International Operations |
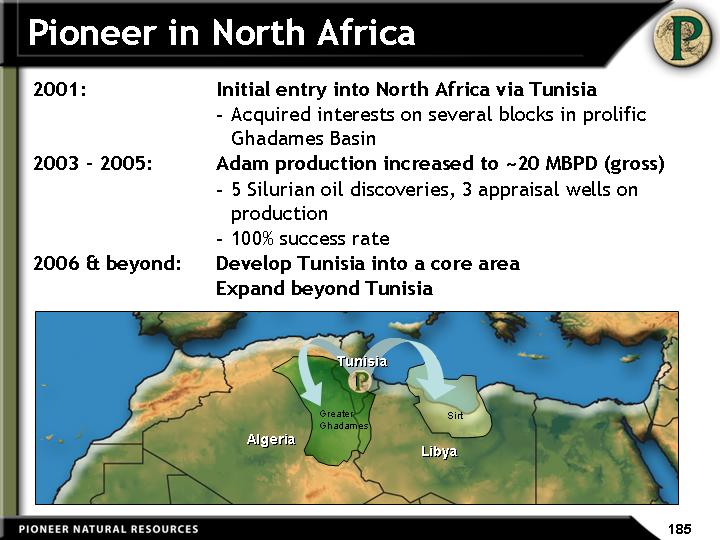
| Pioneer in North Africa 2001: Initial entry into North Africa via Tunisia Acquired interests on several blocks in prolific Ghadames Basin 2003 - 2005: Adam production increased to ~20 MBPD (gross) 5 Silurian oil discoveries, 3 appraisal wells on production 100% success rate 2006 & beyond: Develop Tunisia into a core area Expand beyond Tunisia Libya Sirt Algeria Greater Ghadames Tunisia |
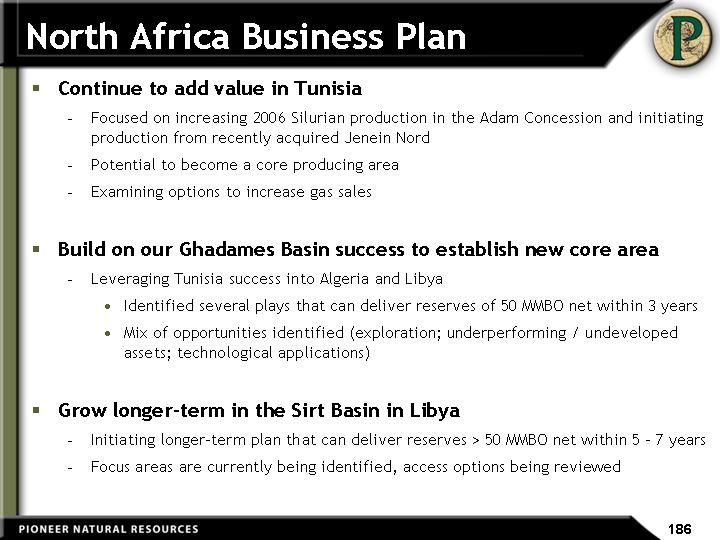
| Continue to add value in Tunisia Focused on increasing 2006 Silurian production in the Adam Concession and initiating production from recently acquired Jenein Nord Potential to become a core producing area Examining options to increase gas sales Build on our Ghadames Basin success to establish new core area Leveraging Tunisia success into Algeria and Libya Identified several plays that can deliver reserves of 50 MMBO net within 3 years Mix of opportunities identified (exploration; underperforming / undeveloped assets; technological applications) Grow longer-term in the Sirt Basin in Libya Initiating longer-term plan that can deliver reserves > 50 MMBO net within 5 - 7 years Focus areas are currently being identified, access options being reviewed North Africa Business Plan |

| Tunisia Activity Expanding in 2006 Adam Concession 3-D seismic operations began late January 750 km2 survey, covering 75% of the Adam Concession Extended 3-D acquisition into Jenein Nord acreage (350 km2 survey) Gas contract signed Agreement retroactive for gas delivered in 2005 (3.5 MMCFPD gross) Currently delivering 8 MMCFPD @ ~$5.50 / MCF Acquired Anadarko's remaining equity interest in Jenein Nord in February 2006 PXD to operate at 100% WI* Drilling 1 well in Borj El Khadra Block On trend with Adam and Jenein Nord Increasing drilling pace Adding a second rig for the Adam 2006 program in Q2 Planning third Tunisia rig to drill in Jenein Nord for second half 2006 Tunisia Algeria Libya El Hamra PXD 100% WI (Op) 1.3 MM gross acres Anaguid PXD 45% WI 1.2 MM gross acres Jenein Nord PXD 100% WI 0.3 MM gross acres Adam Concession PXD 20% WI 0.2 MM gross acres Borj El Khadra PXD 40% WI 1 MM gross acres * Subject to ETAP participation up to 50% WI |

| Multiple Zones in Adam and Jenein Nord Multiple Silurian Acacus pay zones throughout both areas Deeper Ordovician gas potential also present |
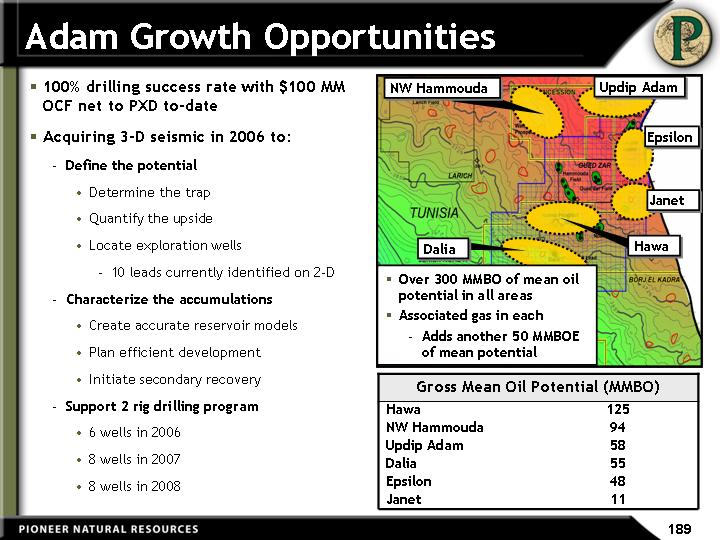
| Adam Growth Opportunities Gross Mean Oil Potential (MMBO) Gross Mean Oil Potential (MMBO) Hawa 125 NW Hammouda 94 Updip Adam 58 Dalia 55 Epsilon 48 Janet 11 Dalia NW Hammouda Hawa Updip Adam Janet Epsilon 100% drilling success rate with $100 MM OCF net to PXD to-date Acquiring 3-D seismic in 2006 to: Define the potential Determine the trap Quantify the upside Locate exploration wells 10 leads currently identified on 2-D Characterize the accumulations Create accurate reservoir models Plan efficient development Initiate secondary recovery Support 2 rig drilling program 6 wells in 2006 8 wells in 2007 8 wells in 2008 Over 300 MMBO of mean oil potential in all areas Associated gas in each Adds another 50 MMBOE of mean potential |
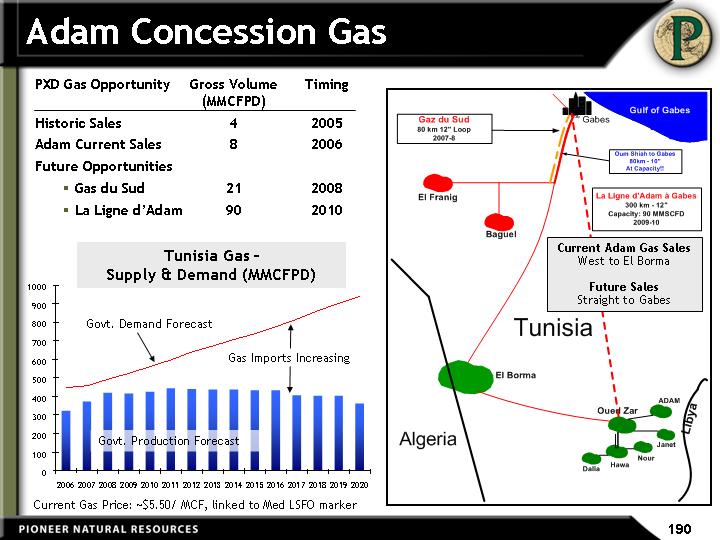
| Adam Concession Gas PXD Gas Opportunity Gross Volume Timing (MMCFPD) Historic Sales 4 2005 Adam Current Sales 8 2006 Future Opportunities Gas du Sud 21 2008 La Ligne d'Adam 90 2010 Current Gas Price: ~$5.50/ MCF, linked to Med LSFO marker Tunisia Gas - Supply & Demand (MMCFPD) Govt. Demand Forecast Govt. Production Forecast Gas Imports Increasing Current Adam Gas Sales West to El Borma Future Sales Straight to Gabes |
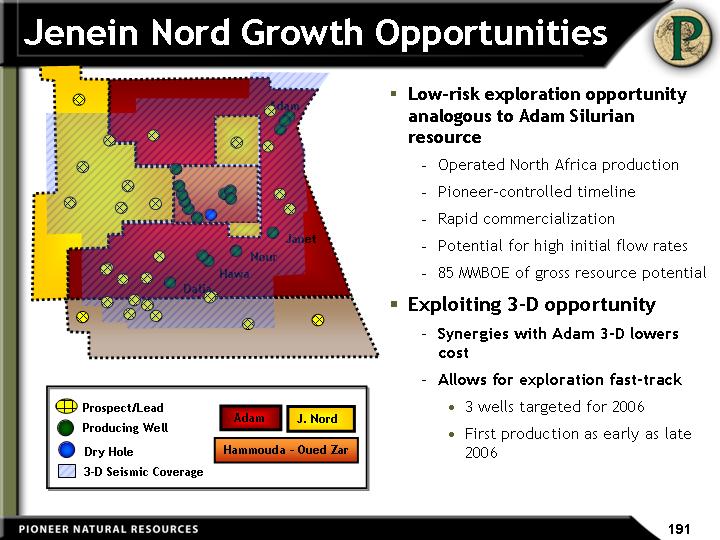
| Low-risk exploration opportunity analogous to Adam Silurian resource Operated North Africa production Pioneer-controlled timeline Rapid commercialization Potential for high initial flow rates 85 MMBOE of gross resource potential Exploiting 3-D opportunity Synergies with Adam 3-D lowers cost Allows for exploration fast-track 3 wells targeted for 2006 First production as early as late 2006 Jenein Nord Growth Opportunities Adam J. Nord Hammouda - Oued Zar Prospect/Lead Producing Well Dry Hole 3-D Seismic Coverage Dalia Hawa Nour Janet Adam |
| Other Tunisia Highlights Borj El Khadra Identified prospects are a continuation of Adam trend Northern portion of block to be covered by 3-D survey Drilling first exploration well on block in 2006 Large block (~5 times the size of Adam) with significant running room if successful El Hamra Drilled one unsuccessful well in 2005; granted 2 year extension Currently looking for a 50% partner to carry exploration risk Anaguid Drilled CEMSW-1 well in 2005 encountering tight, gas-bearing Ordovician reservoir; stimulation of SEA-1 discovery well unsuccessful Integrating 2005 results, CEM-1 Ordovician discovery well and regional data into a revised regional Ordovician model Evaluating gas and condensate marketing options Evaluating remaining Tagi and Silurian potential on block |
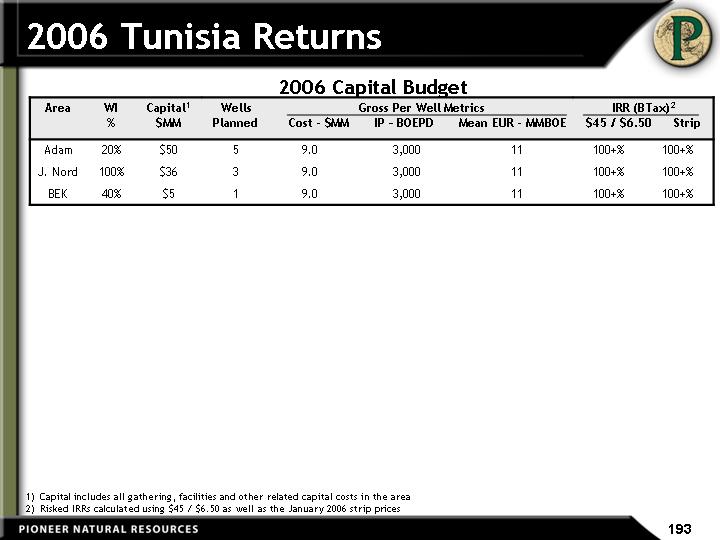
| 2006 Tunisia Returns 2006 Capital Budget Area WI % Capital1 $MM Wells Planned Gross Per Well Metrics Cost - $MM IP - BOEPD Mean EUR - MMBOE Gross Per Well Metrics Cost - $MM IP - BOEPD Mean EUR - MMBOE Gross Per Well Metrics Cost - $MM IP - BOEPD Mean EUR - MMBOE IRR (BTax)2 $45 / $6.50 Strip IRR (BTax)2 $45 / $6.50 Strip Adam 20% $50 5 9.0 3,000 11 100+% 100+% J. Nord 100% $36 3 9.0 3,000 11 100+% 100+% BEK 40% $5 1 9.0 3,000 11 100+% 100+% Capital includes all gathering, facilities and other related capital costs in the area Risked IRRs calculated using $45 / $6.50 as well as the January 2006 strip prices |

| Adam / Jenein Nord / BEK - Production Outlook '00 '01 '02 '03 '04 '05 '06 '07 '08 '09 Historical Production 0 0 0 0.636070137 2.314724493 3.477441014 Production Outlook 2.318 1.665 1.192 0.915 Production Outlook 0.565 6.538 10.955 7.917 Historical Wells 0 1 2 2 3 9 Net Production (MBOEPD) Number of Wells 5 Year Lookback 3 Yr. CAGR 134% Avg. Annual Wells 2 Future Plans ('05 - '09) CAGR -28% Risked Upside CAGR 26% Development Case Risked Upside Potential |
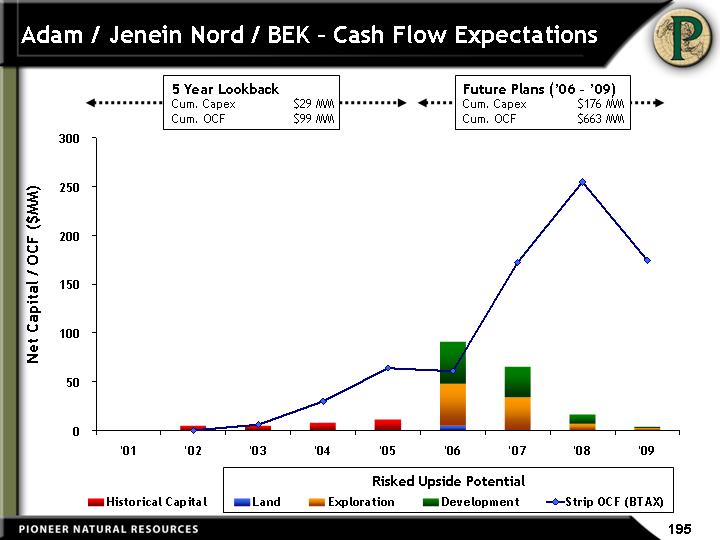
| Adam / Jenein Nord / BEK - Cash Flow Expectations '00 '01 '02 '03 '04 '05 '06 '07 '08 '09 Historical Capital 0 5 5 8 11 Land 5 0 0 0 Exploration 42.652 33.867 6.658 2.697 Development 43.396 31.455 9.618 1.02 Strip OCF (BTAX) 0 6 30 64 60.784 172.445 255.032 174.537 Net Capital / OCF ($MM) 5 Year Lookback Cum. Capex $29 MM Cum. OCF $99 MM Future Plans ('06 - '09) Cum. Capex $176 MM Cum. OCF $663 MM Risked Upside Potential |
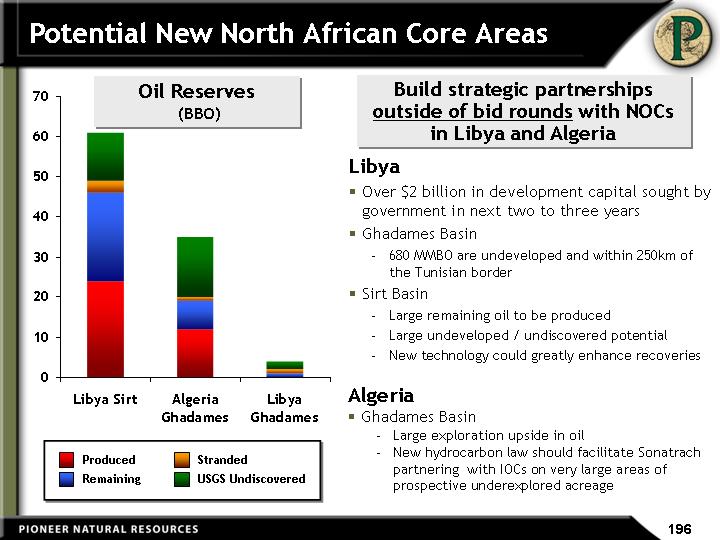
| Potential New North African Core Areas Libya Over $2 billion in development capital sought by government in next two to three years Ghadames Basin 680 MMBO are undeveloped and within 250km of the Tunisian border Sirt Basin Large remaining oil to be produced Large undeveloped / undiscovered potential New technology could greatly enhance recoveries Libya Sirt Algeria Ghadames Libya Ghadames East 24 12 West 22 7 1 North 3 1 1 12 15 2 Oil Reserves (BBO) Produced Remaining Stranded USGS Undiscovered Build strategic partnerships outside of bid rounds with NOCs in Libya and Algeria Algeria Ghadames Basin Large exploration upside in oil New hydrocarbon law should facilitate Sonatrach partnering with IOCs on very large areas of prospective underexplored acreage |
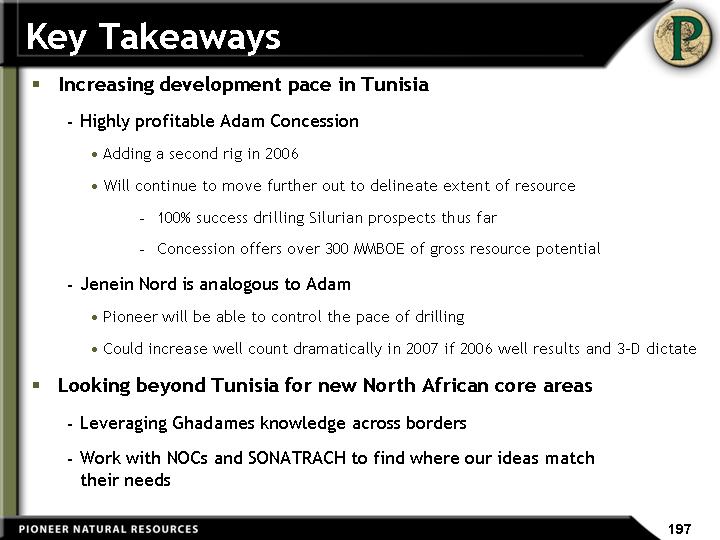
| Key Takeaways Increasing development pace in Tunisia Highly profitable Adam Concession Adding a second rig in 2006 Will continue to move further out to delineate extent of resource 100% success drilling Silurian prospects thus far Concession offers over 300 MMBOE of gross resource potential Jenein Nord is analogous to Adam Pioneer will be able to control the pace of drilling Could increase well count dramatically in 2007 if 2006 well results and 3-D dictate Looking beyond Tunisia for new North African core areas Leveraging Ghadames knowledge across borders Work with NOCs and SONATRACH to find where our ideas match their needs |
| West Africa Tim Williams VP International Exploration |
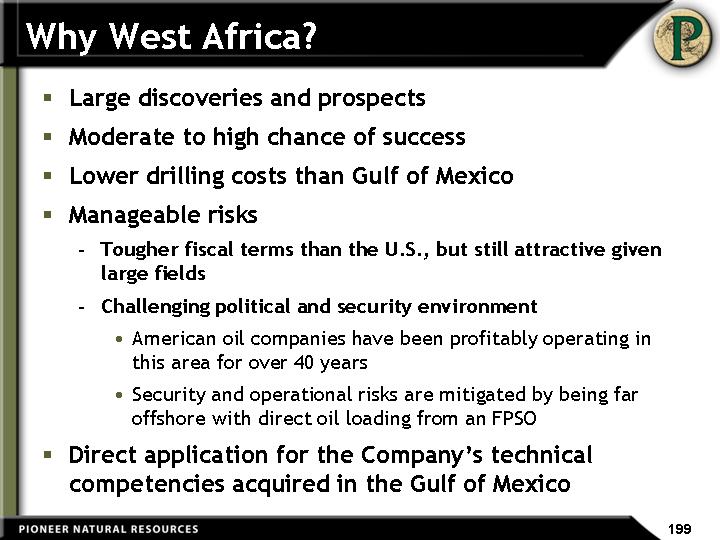
| Why West Africa? Large discoveries and prospects Moderate to high chance of success Lower drilling costs than Gulf of Mexico Manageable risks Tougher fiscal terms than the U.S., but still attractive given large fields Challenging political and security environment American oil companies have been profitably operating in this area for over 40 years Security and operational risks are mitigated by being far offshore with direct oil loading from an FPSO Direct application for the Company's technical competencies acquired in the Gulf of Mexico |

| Current West Africa Position First Gulf of Guinea entry in mid-2004 3 Blocks 1 in Equatorial Guinea 2 in Nigeria 1.3 million acres Equivalent to 225 GOM blocks Current inventory of 24 prospects in 4 plays Individual prospects have multi-hundred MMBO potential Gulf of Guinea PXD acreage Deepwater Blocks Total Recoverable Reserves 500 MM to 1 B Greater than 1 B |
| West Africa Plays 24 prospects are naturally grouped in families that are closely related both geographically and geologically In most cases, information on one well in a family of prospects (a play) will substantially change the probability of success of the other prospects within the play The prospects are generally close enough together to provide infrastructure synergies Decreases development and operating costs Substantially reduces the economic threshold size for a discovery to be commercial |
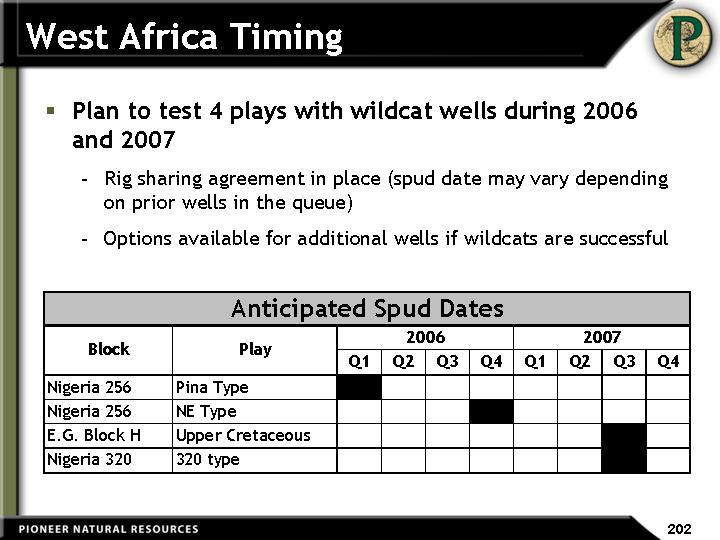
| West Africa Timing Plan to test 4 plays with wildcat wells during 2006 and 2007 Rig sharing agreement in place (spud date may vary depending on prior wells in the queue) Options available for additional wells if wildcats are successful |
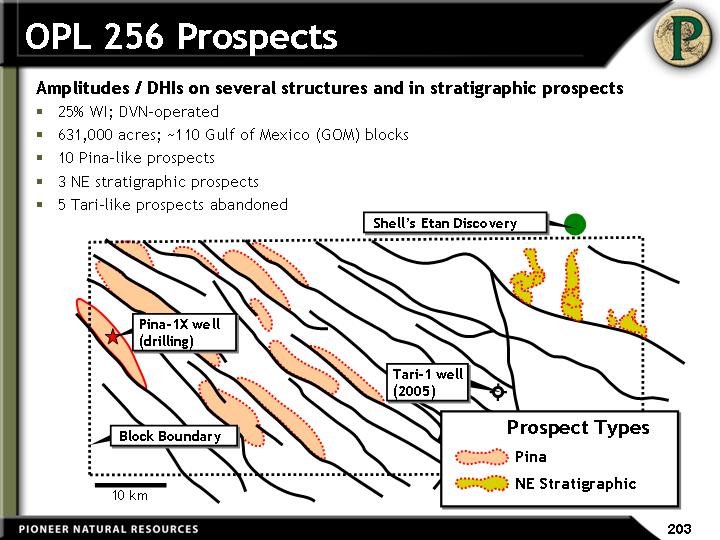
| OPL 256 Prospects Amplitudes / DHIs on several structures and in stratigraphic prospects 25% WI; DVN-operated 631,000 acres; ~110 Gulf of Mexico (GOM) blocks 10 Pina-like prospects 3 NE stratigraphic prospects 5 Tari-like prospects abandoned 10 km Pina-1X well (drilling) Tari-1 well (2005) Shell's Etan Discovery Prospect Types Pina NE Stratigraphic Block Boundary |
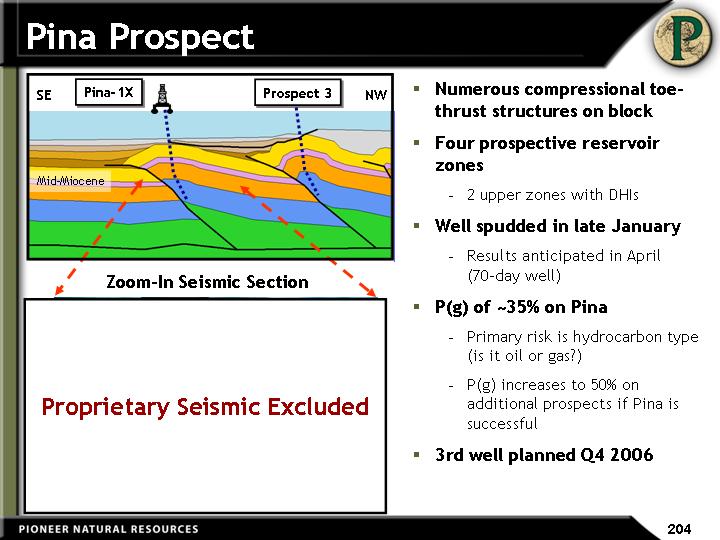
| Numerous compressional toe- thrust structures on block Four prospective reservoir zones 2 upper zones with DHIs Well spudded in late January Results anticipated in April (70-day well) P(g) of ~35% on Pina Primary risk is hydrocarbon type (is it oil or gas?) P(g) increases to 50% on additional prospects if Pina is successful 3rd well planned Q4 2006 Pina Prospect Pina-1X Mid-Miocene Prospect 3 NW SE Pina-1X Slope Channel Targets Zoom-In Seismic Section Proprietary Seismic Excluded |
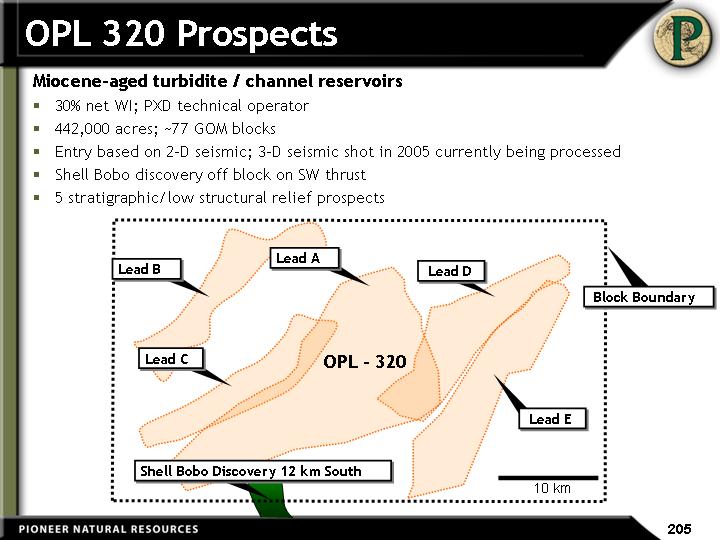
| OPL 320 Prospects Miocene-aged turbidite / channel reservoirs 30% net WI; PXD technical operator 442,000 acres; ~77 GOM blocks Entry based on 2-D seismic; 3-D seismic shot in 2005 currently being processed Shell Bobo discovery off block on SW thrust 5 stratigraphic/low structural relief prospects 10 km OPL - 320 Lead B Lead C Lead A Lead D Lead E Shell Bobo Discovery 12 km South Block Boundary |
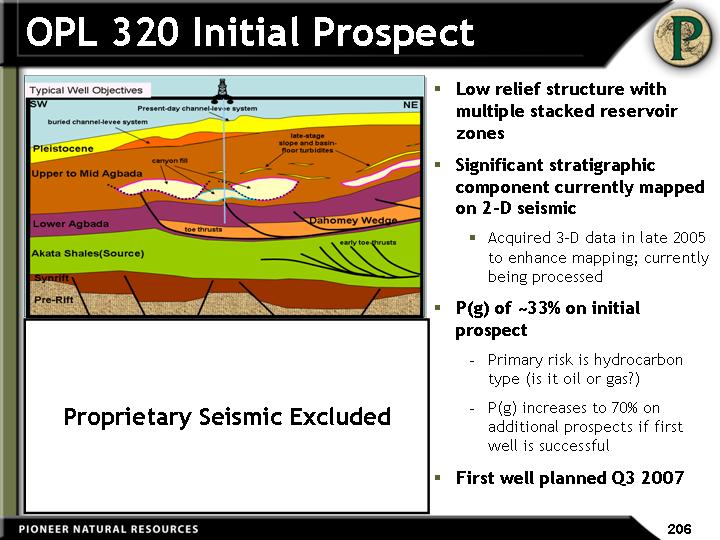
| OPL 320 Initial Prospect Low relief structure with multiple stacked reservoir zones Significant stratigraphic component currently mapped on 2-D seismic Acquired 3-D data in late 2005 to enhance mapping; currently being processed P(g) of ~33% on initial prospect Primary risk is hydrocarbon type (is it oil or gas?) P(g) increases to 70% on additional prospects if first well is successful First well planned Q3 2007 ~100 m Seismic Line over Initial Prospect 1250 Meters Proprietary Seismic Excluded |

| EG Block H Prospects 10 km Cretaceous-aged sandstone reservoirs (main play) 50% WI; option to become technical operator 248,000 acres; ~43 GOM blocks 5 Aleta-like prospects Bravo well (2004) condemned the shallower Tertiary-age play Aleta BLOCKS H15 / H16 Bravo -1 Block Boundary Aleta Prospect P-2 Discovery 40 km South |
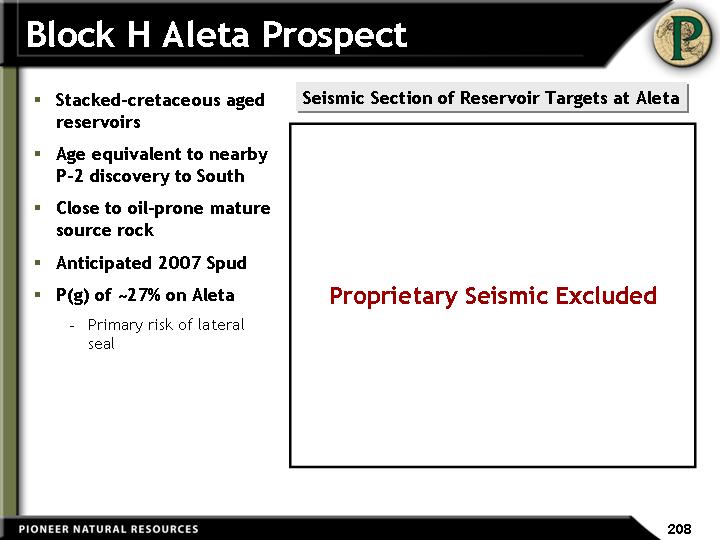
| Block H Aleta Prospect Stacked-cretaceous aged reservoirs Age equivalent to nearby P-2 discovery to South Close to oil-prone mature source rock Anticipated 2007 Spud P(g) of ~27% on Aleta Primary risk of lateral seal Seismic Section of Reservoir Targets at Aleta Bravo Tertiary Reservoir Shale Seal Section Aleta Prospect 4 Stacked Fans Updip pinchout trap (key risk) Sand Reservoirs Source Rock Proprietary Seismic Excluded |
| Program Metrics Four-well program has >50% chance of achieving at least one commercial success Mean success case for the program results in potential resource over 200 million barrels net to Pioneer First production post-2010 Exit West Africa if current prospects are unsuccessful |

| Closing Remarks and Q&A |
| Key Meeting Takeaways Delivered strategic initiatives focused on improving performance and enhancing shareholder value Focusing on lower-risk, predictable oil and gas basins in North America accounting for 98% of reserve base Strong platform for growth delivering double-digit CAGR from development activities Upside from low-risk emerging resource plays, high-impact exploration and bolt- on acquisitions Portfolio of projects has excellent returns and offers significant appreciation to NAV Gross resource exposure of >1 BBOE from emerging resource plays Maintaining strong balance sheet and financial flexibility We have the people, resources, inventory and technical expertise to deliver 2006 - 2010 Goal: Top quartile stock return, production and reserve per share growth |

| Question and Answer Session |
| Appendix |
| Net Asset Value Disclosure Pioneer does not consider "Net Asset Value" and "Net Asset Value Per Share" to be "non-GAAP financial measures," as defined in SEC rules. Pioneer uses Net Asset Value as an estimate of fair value. Net Asset Value and Net Asset Value Per Share should not be considered as alternatives to Standardized Measure, Stockholders Equity or per share statements of those measures. Pioneer's NAV calculation is based on numerous assumptions that may change as a result of future activities or circumstances. NAV is calculated using strip commodity prices as of January 2006 and is discounted at 10%, unless otherwise indicated. In the context of determining Pioneer's Net Asset Value Per Share, Pioneer adds other tangible assets adjusted for working capital and deducts long-term debt and other liabilities, including future income taxes and the impact of existing hedge positions. |
| Certain Reserve Information The U.S. Securities and Exchange Commission (the "SEC") permits oil and gas companies, in their filings with the SEC, to disclose only proved reserves that a company has demonstrated by actual production or conclusive formation tests to be economically and legally producible under existing economic and operating conditions. Pioneer uses certain terms in this presentation, such as "resource," "estimated ultimate recovery (EUR)," hydrocarbons "in place," "potential," "upside," "recoverable," or other descriptions of volumes of reserves potentially recoverable through additional drilling or recovery techniques that the SEC's guidelines prohibit Pioneer from including in filings with the SEC. These estimates are by their nature more speculative than estimates of proved reserves and accordingly are subject to substantially greater risk of being recovered by Pioneer. |
| Non-GAAP Financial Measures Pioneer from time to time discloses "EBITDAX," which is a "non-GAAP financial measure," as defined in SEC rules. EBITDAX represents earnings before depletion, depreciation and amortization expense; impairment of long-lived assets; exploration and abandonments; gain or loss on extinguishment of debt; accretion of discount on asset retirement obligations; interest expense; income taxes; gain or loss on disposition of assets; noncash effects from discontinued operations; commodity hedge related activity; amortization of stock-based compensation; amortization of deferred revenue; and other noncash items. EBITDAX is presented because of the wide acceptance of this measure by the investment community as a financial indicator of a company's ability to internally fund exploration and development activities and to service or incur debt. Pioneer also views the non-GAAP financial measure of EBITDAX as a useful tool for comparisons of Pioneer's financial indicators with those of peer companies that follow the full cost method of accounting. EBITDAX should not be considered as an alternative to net income or other cash flow presentations, as defined by Generally Accepted Accounting Principles ("GAAP"). |