Exhibit 99.1
Investor Presentation March 2008 |
Forward-Looking Statements Except for historical information contained herein, the statements, charts and graphs in this presentation are forward-looking statements that are made pursuant to the Safe Harbor Provisions of the Private Securities Litigation Reform Act of 1995. Forward- looking statements and the business prospects of Pioneer are subject to a number of risks and uncertainties that may cause Pioneer's actual results in future periods to differ materially from the forward-looking statements. These risks and uncertainties include, among other things, volatility of commodity prices, product supply and demand, competition, the ability to obtain environmental and other permits and the timing thereof, other government regulation or action, third party approvals, international operations and associated international political and economic instability, litigation, the costs and results of drilling and operations, access to and availability of drilling equipment and transportation, processing and refining facilities, Pioneer's ability to replace reserves, implement its business plans (including its plan to repurchase stock) or complete its development projects as scheduled, access to and cost of capital, uncertainties about estimates of reserves, the assumptions underlying production forecasts, quality of technical data, environmental and weather risks, and acts of war or terrorism. These and other risks are described in Pioneer's 10-K and 10- Q Reports and other filings with the Securities and Exchange Commission. In addition, Pioneer may be subject to currently unforeseen risks that may have a materially adverse impact on it. Pioneer undertakes no duty to publicly update these statements except as required by law. Please see the appendix slides included in this presentation for other important information. |
Investment Highlights Targeting >20% cash flow CAGR through 2011 2009 cash flow expected to double from 2007 Production growth primarily from high-margin, oil-related projects Includes benefit from legacy hedge expiration and reduced VPP obligation Positive free cash flow1 in 2008 and beyond Earnings from continuing operations expected to double in 2008 and triple in 2009 compared to 2007 On track to deliver 12+% production per share CAGR through 2011 Reflects 12+% absolute production growth and assumes no share repurchases Core onshore assets driving growth (Spraberry, Raton, Edwards and Tunisia) Q4 2007 up 18% vs. Q4 2006 Oooguruk project on schedule for first sales in mid-2008 Total resource of 1.75 billion BOE2 Low-risk drilling inventory with over 6,500 2P locations Continuing to expand core areas with attractive bolt-on acquisitions Attractive all-in finding costs and strong reserve replacement Cash flow from operations less capital expenditures Proved reserves plus resource potential |
2006 2007 2008 2009 2010 2011 East 0.756 0.85 1.25 1.8 1.9 2 Targeting >20% Cash Flow CAGR Cash flow from operations less capital expenditures Cash flow from operations reflects the divestiture of Canada in late 2007, March strip pricing and expected growth from development drilling and development projects Cash Flow2 ($ billions) 0.8 2011 2006 1.8 - 2.2 Cash flow growth driven by production growth (2/3) and legacy hedge expiration (1/3) 65% of revenue growth from oil-related production growth Positive free cash flow1 in 2008 and beyond ROCE from continuing operations expected to more than double to 15% - 18% in 2009 compared to 2007 Earnings from continuing operations expected to double in 2008 and triple in 2009 compared to 2007 >20% CAGR 2007 0.75 1.1 - 1.4 2008 1.6 - 2.0 2009 1.7 - 2.1 2010 |
2008 2009 2010 2011 2012 2013 Historical Production VPP Oil 8 7 7 4 4 0 VPP Gas 5 5 Legacy Hedges 10 Legacy Hedge Expirations Contribute Significant Cash Flow Improvement VPP Oil Obligation 12 Includes 6 MBOPD of unwound hedges for which the losses are locked in and 4 MBOPD hedged at $32 / BBL Cash flow improvements based on March strip pricing 23 7 4 Legacy Oil1 Hedges1 Incremental Pre-Tax Cash Flow vs.2008 ($MM)2 - 200 300 400 400 500 MBOEPD 5 10 VPP Gas Obligation 8 5 7 4 |
2005 2006 2007 2008 2009 2010 2011 Historical Production Production Outlook 30.9 33 36 41 45 52 54.8 1.9 6.3 9 12 Delivering 12+% Production Per Share CAGR1 Development Spraberry Raton Edwards Tunisia South Africa Oooguruk Barnett Shale Resource Play Upside Edwards Tunisia Rockies Barnett Shale Cosmopolitan MMBOE 33 31 Production pro forma for Deepwater GOM, Argentina and Canada divestitures; assumes 2005 and 2006 VPP volumes in place for all of 2005 12+% Per Share CAGR (assumes no share repurchases) Per Share CAGR: 16% 36 |
Strong Returns on 2008 Drilling Program1 $85/BBL & $8/MCF (NYMEX) Before Tax $85/BBL & $8/MCF (NYMEX) Before Tax $85/BBL & $8/MCF (NYMEX) Before Tax $95/BBL & $9/MCF (NYMEX) Before Tax $95/BBL & $9/MCF (NYMEX) Before Tax $70/BBL & $7/MCF2 (NYMEX) Before Tax $70/BBL & $7/MCF2 (NYMEX) Before Tax Cash Margin $/BOE IRR DROI3 IRR DROI3 IRR DROI3 Spraberry (West Texas Oil, NGLs & Gas) 55 40% 2.1 50% 2.3 30% 1.7 Raton (Colorado Gas) 30 40% 2.5 50% 2.9 35% 2.1 Edwards Trend (South Texas Gas) 40 40% 1.9 50% 2.2 30% 1.7 Tunisia (Oil & Gas) 75 >100% >3.0 >100% >3.0 >100% >3.0 Cash margins, IRRs and DROIs assume current costs and price differentials. Cash margins are pre-tax reflecting revenues less production costs. Assumes no reduction in costs or price differentials. Discounted Return on Investment (DROI) is defined as present value of future cash flow discounted at 10% divided by discounted capital investment. |
Reserves and Resource Potential1 YE '06 Proved Reserves (MMBOE) YE '07 Proved Reserves (MMBOE) Additional Net Resource Potential (MMBOE) Spraberry 440 481 145 Raton 250 266 125 Mid-Continent 113 111 20 Edwards Trend 27 38 100 Tunisia 6 21 110 Barnett Shale 0 16 90 Alaska 0 5 120 Other 38 26 80 Total 8742 964 ~790 2007 YE Metrics (Proved Reserves): Reserve mix 97% U.S. 51% gas / 49% liquids 62% PD / 38% PUD Reserves / Production Ratio - 23 years PV-10 of $13.4 billion3 (PD: $9.7 B; PUD: $3.7 B) All-in F&D of $15.40/BOE; 357% Reserve Replacement Reflects year-end pricing of $95.92/BBL and $6.80/MMBTU (NYMEX) Pro forma for Canada divestiture PV-10 approximately equivalent at $85/BBL and $8/MMBTU (NYMEX) 1.75 BBOE Total Resource |
5th largest oil field and 15th largest gas field in the U.S.1 Largest producing field in the Permian Basin1 EUR from existing wells has doubled to ~3.5 BBOE over the last 25 years2 Pioneer is the largest driller and producer in the field 869,000 gross acres (>75% HBP) and 5,300 active wells PDP PUD 1998 133 28 1999 162 41 2000 161 51 2001 164 72 2002 177 123 2003 180 154 2004 194 157 2005 199 205 2006 212 228 2007 233 248 Spraberry - A Premier Resource Play PXD Proved Reserves3 (MMBOE) Consistent reserve growth through a combination of infill and extension wells and bolt-on acquisitions PDP PUD 2006 2005 2004 2003 2001 2002 2000 1999 1998 440 404 351 334 236 300 212 203 160 481 2007 Source: Energy Information Administration Source: Nehring Associates Excludes 145 MMBOE of resource potential |
Spraberry Resource Play - Cornerstone of Growth Drilled ~350 wells in 2007, with a similar drilling program expected in 2008 100% success rate Continuing to pursue acreage expansion and bolt-on acquisitions Strong margins from sweet crude with ownership of midstream processing and well servicing Opportunities to capture additional resource upside: Drilling to deeper Wolfcamp zone where incremental reserves and production of ~20% being added to typical Spraberry well 20-acre infill drilling Secondary recovery Advances in completion technology 869 M gross acres 5,300 active wells (>95% operated) Largest operator >25% of 2007 Total Production Excludes 9 MBOEPD of VPP-related volumes ~50% of 2007 Total Proved Reserves 481 MMBOE - 50% PDP / 50% PUD Strong Returns: 40% IRR / 2.1 DROI @ $85 / bbl Multi-year Drilling Inventory ~4,300 2P Locations Additional Resource Potential: 145 MMBOE and growing MBOEPD 2005 2006 2007 2008 20 23.581 26.6 28.752 2 24 27 ~15% 2006 2007 2008 13% 20 21% 2005 |
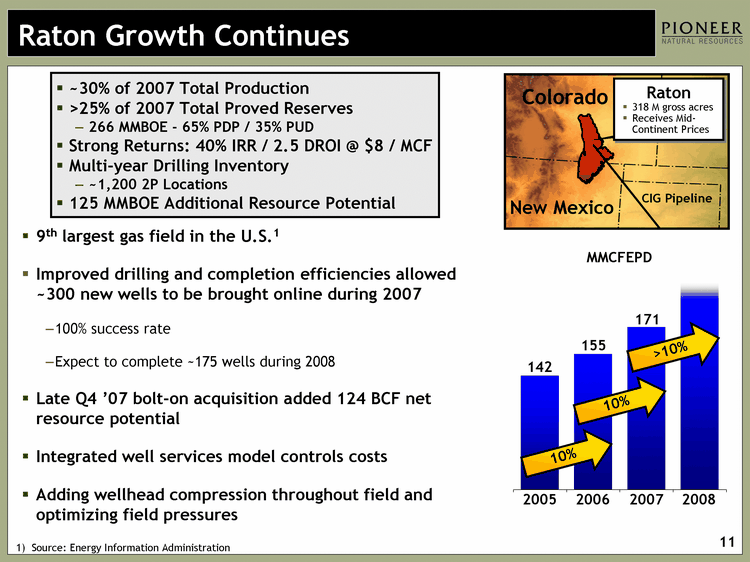
Raton Growth Continues New Mexico Colorado Raton 318 M gross acres Receives Mid- Continent Prices MMCFEPD 9th largest gas field in the U.S.1 Improved drilling and completion efficiencies allowed ~300 new wells to be brought online during 2007 100% success rate Expect to complete ~175 wells during 2008 Late Q4 '07 bolt-on acquisition added 124 BCF net resource potential Integrated well services model controls costs Adding wellhead compression throughout field and optimizing field pressures CIG Pipeline ~30% of 2007 Total Production >25% of 2007 Total Proved Reserves 266 MMBOE - 65% PDP / 35% PUD Strong Returns: 40% IRR / 2.5 DROI @ $8 / MCF Multi-year Drilling Inventory ~1,200 2P Locations 125 MMBOE Additional Resource Potential Raton 2005 2006 2007 2008 142 155 171 188 10 2006 2007 2008 155 171 >10% 10% 10% 142 2005 1) Source: Energy Information Administration |
Edwards Trend Success Continues Drilled 34 wells in 2007 (primarily development wells), with a similar drilling program expected in 2008 9 new field discoveries in the Trend to-date brings total discovered gross resource potential to 450 - 650 BCF One Q3 discovery now believed to be largest new field in Edwards Trend in last 30 years with gross resource potential of ~200 BCF >80% success rate on new field discoveries 3 recent wells tested 12 - 16 MMCFPD1 each 50% of >900 sq mi 3-D seismic shoot completed; remainder to be completed by year-end 2008 ~310 M gross acres 2005 2006 2007 2008 40 39 53.7 64.4 3 MMCFEPD 2006 2007 2008 39 54 40 >25% 38% 2005 Not indicative of expected stabilized production rate ~10% of 2007 Total Production 38 MMBOE Proved Reserves Strong Returns: 40% IRR / 1.9 DROI @ $8 / MCF 100 MMBOE Additional Resource Potential |
Barnett Shale - PXD To Commence Drilling Expansion / Tier 2 Area Tier 1 Core Ft. Worth 13 Built ~80,000 gross acreage position in 2007 Plan to drill ~20 wells in 2008 Participating in 6 wells with Devon (50% WI) in Wise County First PXD-operated rig has commenced drilling in Parker County Expect to ramp up drilling program during 2009 Targeting production growth from ~15 MMCFEPD today to 100 MMCFEPD by 2011 PXD Existing Acreage 16 MMBOE Proved Reserves Multi-year Drilling Inventory >450 2P Locations 90 MMBOE Additional Resource Potential |
Tunisia Success Continues Drilling program 9 discoveries and 2 successful appraisal wells during 2007 / early 2008 7 discoveries on PXD-operated Jenein Nord block; other discovery and appraisal wells in Adam and Borj El Khadra ~80% success rate Expect to drill 15 - 17 wells in 2008 Additional 3-D seismic acquisition completed in Jenein Nord and initial 3-D program commenced in Anaguid Jenein Nord production facilities Production commenced late Q4 '07 Will gradually increase during 2008 as wells tied in and gross facility capacity expanded from 5 MBOPD currently to 10 MBOPD by Q3 and 20 MBOPD by year end 2008 Actively pursuing project for increased gas sales Tunisia Algeria Libya ~3 MM gross acres in 5 concessions (20% - 50% interest1) 1) Assumes ETAP backs in for 50% of PXD working interest 2005 2006 2007 2008 2.585 2.585 4.264 8.1 1 MBOEPD 2006 2007 2008 3 4.5 80% - 90% 65% 3 2005 Highest Returns in Company >100% IRR / >3.0 DROI @ $85 / bbl 21 MMBOE Proved Reserves 110 MMBOE Additional Resource Potential |
South Africa Now Producing Oil & Gas Net production currently ~3.5 MBOEPD Includes Sable oil and gas & condensate from initial South Coast Gas wells Production from project's largest South Coast Gas well now planned for late 2008 / early 2009 Sable oil field life extended as a result of higher oil prices 90 MMCFPD Sable gas injection well (~90% of SCG reserves) was intended to commence production upon Sable oil field abandonment Anticipate producing Sable oil and gas simultaneously after facilities modifications completed in late 2008 / early 2009 Strong cash margins reflecting Brent-related pricing Mossel Bay Synfuels Plant F-A Pipeline to Shore Sable Oil Field F-A Platform ATLANTIC OCEAN Cape Town 380km Initial development Sable gas production (2008 / 2009) Block 9 |
Oooguruk Project On Schedule First independent operated project on the North Slope Discovery to first production in 5 years (record for North Slope) Production facilities and handling agreement in place Drilling underway Expect to drill 13 - 15 wells in 2008 Disposal well drilled; development drilling underway First production expected 1H 2008 with first sales mid-year Net sales expected to reach 3 - 4 MBOPD by year- end 2008 Peak gross production of 15 - 20 MBOPD in 2010 Peak gross production of 15 - 20 MBOPD in 2010 Peak gross production of 15 - 20 MBOPD in 2010 Peak gross production of 15 - 20 MBOPD in 2010 Peak gross production of 15 - 20 MBOPD in 2010 Peak gross production of 15 - 20 MBOPD in 2010 Peak gross production of 15 - 20 MBOPD in 2010 Peak gross production of 15 - 20 MBOPD in 2010 Peak gross production of 15 - 20 MBOPD in 2010 Peak gross production of 15 - 20 MBOPD in 2010 Peak gross production of 15 - 20 MBOPD in 2010 Peak gross production of 15 - 20 MBOPD in 2010 Peak gross production of 15 - 20 MBOPD in 2010 Peak gross production of 15 - 20 MBOPD in 2010 Peak gross production of 15 - 20 MBOPD in 2010 Peak gross production of 15 - 20 MBOPD in 2010 BEAUFORT SEA Oooguruk 70% WI (Operator) Prudhoe Bay Kuparuk River Alpine TAPS Strong Returns: 35% IRR / 1.7 DROI @ $85 / bbl 5 MMBOE Proved Reserves 70 - 90 MMBOE Additional Resource Potential Expansion opportunities |
Cosmopolitan Test Results Encouraging Cosmopolitan Test Results Encouraging Cosmopolitan Discovery 100% WI (Operator) Discovered oil resource in Cook Inlet 2 miles offshore Kenai Peninsula Resource potential: 30 - 50 MMBO 3-D seismic acquired Horizontal drilling from onshore pad Initial unstimulated well test results encouraging 600 BOPD from Hemlock zone (extended well test in 2003) 400-500 BOPD from Starichkof zone (extended well test in late 2007 / early 2008) Permitting and facilities planning during 2008; next well expected to be drilled in 2009 |
Investment Highlights Targeting >20% cash flow CAGR through 2011 2009 cash flow expected to double from 2007 Earnings from continuing operations expected to double in 2008 and triple in 2009 from 2007 Free cash flow positive in 2008 and beyond On track to deliver 12+% production per share CAGR through 2011 Total resource of 1.75 billion BOE1 1) Proved reserves plus resource potential |
Appendix |
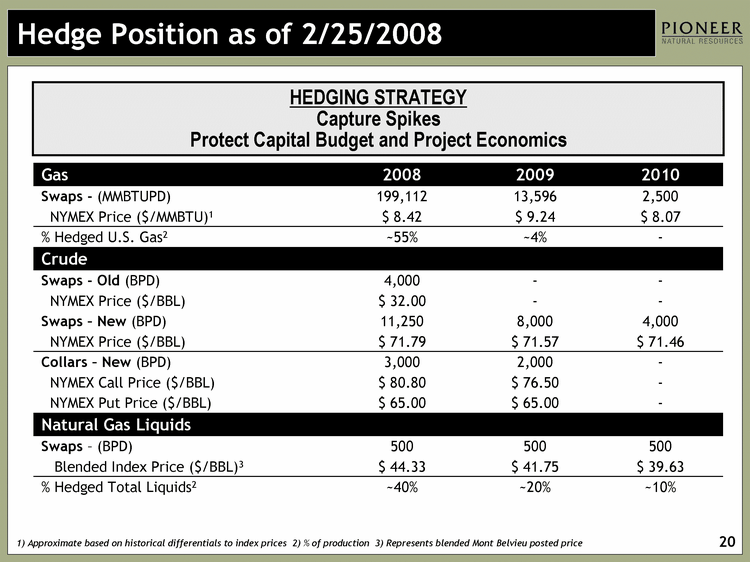
1) Approximate based on historical differentials to index prices 2) % of production 3) Represents blended Mont Belvieu posted price Gas 2008 2009 2010 Swaps - (MMBTUPD) 199,112 13,596 2,500 NYMEX Price ($/MMBTU)1 $ 8.42 $ 9.24 $ 8.07 % Hedged U.S. Gas2 ~55% ~4% - Crude Swaps - Old (BPD) 4,000 - - NYMEX Price ($/BBL) $ 32.00 - - Swaps - New (BPD) 11,250 8,000 4,000 NYMEX Price ($/BBL) $ 71.79 $ 71.57 $ 71.46 Collars - New (BPD) 3,000 2,000 - NYMEX Call Price ($/BBL) $ 80.80 $ 76.50 - NYMEX Put Price ($/BBL) $ 65.00 $ 65.00 - Natural Gas Liquids Swaps - (BPD) 500 500 500 Blended Index Price ($/BBL)3 $ 44.33 $ 41.75 $ 39.63 % Hedged Total Liquids2 ~40% ~20% ~10% Hedge Position as of 2/25/2008 HEDGING STRATEGY Capture Spikes Protect Capital Budget and Project Economics |
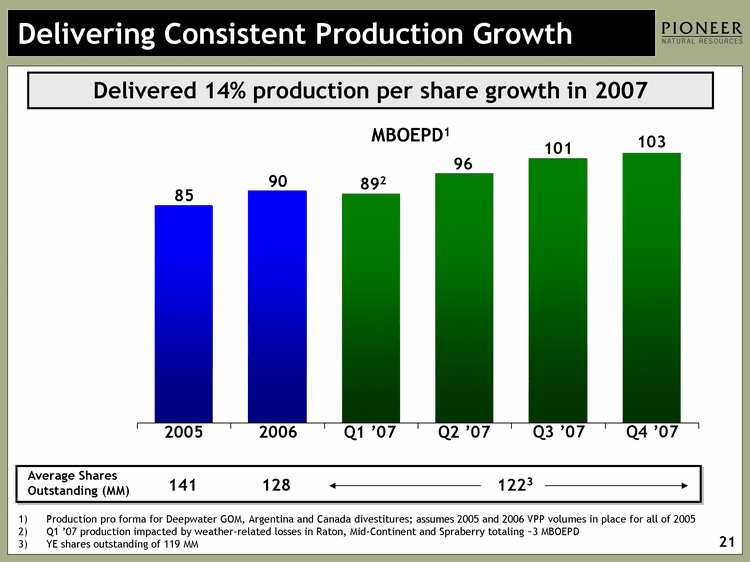
Delivering Consistent Production Growth 2005 2006 Q1 2007 Q2 2007 Q3 2007 Q4 2007 2008 East 85 90 89 96 101 103 109 90 103 892 1) Production pro forma for Deepwater GOM, Argentina and Canada divestitures; assumes 2005 and 2006 VPP volumes in place for all of 2005 Q1 '07 production impacted by weather-related losses in Raton, Mid-Continent and Spraberry totaling ~3 MBOEPD YE shares outstanding of 119 MM 2006 Q2 '07 MBOEPD1 Q1 '07 Q3 '07 96 101 Q4 '07 Delivered 14% production per share growth in 2007 Average Shares Outstanding (MM) 141 128 1223 85 2005 |
Production (MBOEPD)1 Q4 '06 Q1 '07 Q2 '07 Q3 '07 Q4 '07 Spraberry 25 25 26 27 28 Raton 27 25 28 29 31 Edwards 6 7 8 10 10 Mid-Continent 21 20 20 22 20 Other U.S. 6 6 6 6 6 Total N. America 85 832 88 94 95 Tunisia 3 4 5 5 3 S. Africa 4 2 3 2 5 Total 92 892 96 101 103 1) Restated to exclude Canada discontinued operations 2) Primarily reflects impact of weather-related production losses |
Q4 '07 Acquisition Metrics 3 acquisitions closed in Q4 2007 (Spraberry, Raton, Barnett Shale) $445 MM total cost >1,000 drilling locations added 140 MMBOE resource potential >150,000 gross acres Current value significantly exceeds $1 B @$85/bbl and $8/MCF Raton Permian Barnett Shale |
2008 Cash Flow Sensitivity ($MM) 850- 970 970 - 1,090 1,090 - 1,200 1,200 - 1,320 1,320 - 1,430 1,430 - 1,550 N Y M E X G A S NYMEX OIL Estimated cash flow at March strip pricing 24 |
2009 Cash Flow Sensitivity ($MM) 1,090- 1,310 1,310 - 1,540 1,540 - 1,770 1,770 - 1,990 1,990 - 2,220 2,220 - 2,450 N Y M E X G A S NYMEX OIL Projected cash flow using 2009 strip pricing as of March 2008 25 |
Spraberry Type Well Payout = 3 years (23.8 MBOE) 5 10 15 20 25 Spraberry Type Well Pricing: $85/BBL & $8.00/MCF BTax IRR: 40% BTax DROI: 2.1 Gross EUR: 100 MBOE Gross Cost: $1.1 MM 60% reserves = 11.6 years |
Raton Type Curve Years 2004 - 2006 Avg 0 100 1 150 2 157 3 153 4 140.5601195 5 130.0131103 6 120.257502 7 111.2339114 8 102.8874111 9 95.16719519 10 88.02627013 11 81.42116847 12 75.3116844 13 69.66062897 14 64.43360373 15 59.59879133 16 55.12676184 17 50.99029365 18 47.16420773 19 43.62521436 20 40.35177138 21 37.32395307 22 34.52332885 23 31.93285107 24 29.53675128 25 27.32044421 26 25.27043901 27 23.37425713 28 21.62035634 29 19.9980605 30 18.49749457 Years MCFPD Raton Type Curve reflects a combination of initial wells in a section and infill drilling Initial wells require dewatering; infill wells do not Avg. Working Interest: ~96% Avg. Net Revenue Interest: ~84% Mean EUR (Gross): 0.8 BCFE1 Drilling Cost: $0.45 MM / Well BTax IRR: 40% @ $8 / MCF (DROI: 2.5) Expected Avg. Well Life: 35 Years 1) Reflects average EUR for 2004 - 2007 drilling program, which included a mix of initial wells in a section and infill drilling. Similar mix and EURs expected from 2008 program. Dewatering Period |
1st Qtr 0 3000 1 2250 2 1687.5 3 1265.6 4 949.2 5 711.9 6 533.9 7 400.5 8 300.3 9 225.3 10 168.9 11 126.7 12 95 13 71.3 14 53.5 15 25 Tunisia Type Curve Silurian type curve based upon average well performance to-date Working Interest1: 20% - 50% Net Revenue Interest1: 17% - 44% Avg. EUR (Gross): 4.3 MMBO / well Additional upside from gas and condensate sales Drilling & Completion Cost: $9 - $10 MM / well BTax IRR: >100% @ $85 / BBL (DROI: >3.0) Expected Avg. Well Life: 15 years BOPD Years 1) Assumes ETAP backs in for 50% of PXD working interest |
(TAGI) Borj El Khadra (BEK) (20%; Non-Op)1 Adam (20%; Non-Op)1 Tunisia Holds Large Drilling Inventory Gas Pipeline Oil Pipeline Producing Prospect / Lead Existing 3-D Coverage 2007 Discovery OMV Jenein Sud Discoveries 1) All working interests assume ETAP 50% participation Jenein Nord (50%; Op)1 Anaguid (30%; Op)1 Planned 2008 3-D Coverage |
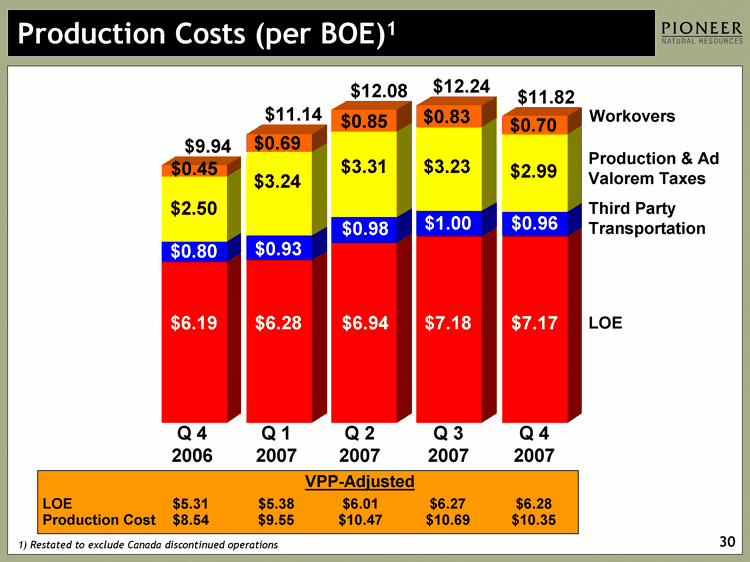
Q1 Q2 Q3 Q1 2000 Q2 2000 Q3 2000 Q4 2000 Q1 01 Q2 2001 Q3 01 Q4 01 Q1 02 Q2 02 Q3 02 Q4 02 Q1 03 Q2 03 Q3 03 Q4 03 Q1 04 Q2 04 Q3 04 Q4 04 Q1 05 Q2 05 Q3 05 Q4 05 Q1 06 Q2 06 Q3 06 Q4 06 Q1 2007 Q2 2007 Q3 2007 Q4 2007 LOE 2.99 2.42 2.47 2.18 2.05 2.2 2.33 2.36 2.58 2.89 3.19 3.29 2.88 2.63 2.68 3.02 3.3 3.29 3.44 3.43 3.71 3.81 4.22 4.8 5 5.63 4.81 6.15 6.23 5.61 6.19 6.28 6.94 7.18 7.17 Field Fuel 0.45 0.81 0.96 1.46 1.54 0.9 0.6 0.51 0.49 0.65 0.63 0.7 1 0.72 0.68 0.55 0.65 0.65 0.67 0.67 0.67 0.67 0.67 0.67 0.67 0.67 0.67 0.67 0.67 3rd Party FF 0.12 0.21 0.25 0.35 0.39 Transportation 0.33 0.34 0.33 0.15 0.4 0.48 0.52 0.57 0.54 0.55 0.54 0.55 0.48 0.38 0.37 0.37 0.47 0.47 0.49 0.25 0.88 1.19 1 1.04 1 1.2 0.79 0.8 0.93 0.98 1 0.96 Prod Taxes 0.27 0.38 0.37 0.67 0.67 0.79 0.93 1.08 0.76 0.61 0.53 0.5 0.63 0.6 0.43 0.84 0.59 0.55 0.56 0.59 0.59 0.59 0.77 2.23 2.54 2.72 3.32 2.96 3.28 3.5 2.5 3.24 3.31 3.23 2.99 Workover 0.05 0.1 0.16 0.28 0.06 0.11 0.16 0.21 0.16 0.16 0.14 0.3 0.28 0.26 0.17 0.2 0.11 0.15 0.13 0.23 0.28 0.17 0.29 0.62 0.57 0.54 0.56 0.72 0.74 0.81 0.45 0.69 0.85 0.83 0.7 Production Costs (per BOE)1 Production & Ad Valorem Taxes Q 4 2006 Q 1 2007 VPP-Adjusted $8.54 $9.55 Workovers LOE Third Party Transportation Q 2 2007 $5.38 Production Cost LOE $5.31 $9.94 $2.50 $0.80 $0.45 $6.19 $10.47 $6.01 Q 4 2007 $12.08 $3.31 $0.98 $0.85 $6.94 $10.69 $6.27 Q 3 2007 $11.14 $3.24 $0.93 $0.69 $6.28 $10.35 $6.28 $12.24 $3.23 $1.00 $0.83 $7.18 1) Restated to exclude Canada discontinued operations $11.82 $2.99 $0.96 $0.70 $7.17 |
VPP - Adjusted Production Costs Pioneer presents VPP-Adjusted Production Costs (per BOE) and VPP- Adjusted LOE (per BOE) to assist investors in considering the Company's costs in relation to the total BOEs (reported sales volumes plus VPP delivered volumes) in connection with which those costs were incurred. VPP-Production Costs (per BOE) and VPP-Adjusted LOE (per BOE) are calculated as follows: Q4 '06 Q1 '07 Q2 '07 Q3 '07 Q4 '07 Production costs as reported (thousands): LOE $ 52,470 $ 50,395 $ 60,555 $ 66,614 $ 68,161 Total $ 84,325 $ 89,448 $105,378 $113,554 $112,358 Production (MBOE): As reported 8,481 8,028 8,725 9,273 9,506 VPP deliveries 1,395 1,334 1,344 1,352 1,345 VPP-adjusted production 9,876 9,362 10,069 10,625 10,851 Production costs per BOE: As reported: LOE $ 6.19 $ 6.28 $ 6.94 $ 7.18 $ 7.17 Total $ 9.94 $ 11.14 $ 12.08 $ 12.24 $ 11.82 VPP-adjusted: LOE $ 5.31 $ 5.38 $ 6.01 $ 6.27 $ 6.28 Total $ 8.54 $ 9.55 $ 10.47 $ 10.69 $ 10.35 |
Op Cost G&A Interest DD&A PXD 11.85 3.62 3.63 9.98 PXD VPP-Adjusted 10.26 3.14 3.14 8.64 PEER AVG 10.18 2.65 2.25 12.32 CS Universe 11.04 3.72 2.98 13.61 9 Months 2007 All-in Costs vs. Peers Source: Credit Suisse 9 Months 2007 All-in Costs ($ / BOE)1 Includes production costs (including production taxes), G&A (excluding capitalized G&A for full-cost companies), DD&A and interest expense Pro forma for Canada divestiture CS Universe consists of 37 E&P companies $29.08 Production $31.35 3 G&A DD&A Interest $25.18 2 2 |
(MMBBLS) Q1 Q2 Q3 Q4 Total 2005 - - - - - 2006 0.8 0.8 0.8 0.8 3.2 2007 0.8 0.8 0.7 0.7 3.0 2008 0.7 0.7 0.7 0.8 2.9 2009 0.7 0.7 0.7 0.6 2.7 2010 0.6 0.6 0.6 0.7 2.5 2011 0.3 0.3 0.4 0.4 1.4 2012 0.3 0.3 0.3 0.3 1.2 (BCF) Q1 Q2 Q3 Q4 Total 2005 2.4 4.0 4.3 4.3 15.0 2006 3.7 3.7 3.6 3.5 14.5 2007 3.5 3.5 3.5 3.5 14.0 2008 2.7 2.7 2.8 2.8 11.0 2009 2.5 2.5 2.5 2.5 10.0 Impact of Volumetric Production Payments (VPP) Schedule of Oil VPP Volumes Schedule of Gas VPP Volumes |
($ Million) Q1 Q2 Q3 Q4 Total Gas / Oil Gas / Oil Gas / Oil Gas / Oil Gas / Oil 2005 11 / - 19 / - 21 / - 20 / - 71 / - 2006 16 / 27 20 / 28 19 / 28 18 / 29 73 / 112 2007 16 / 26 18 / 27 19 / 27 18 / 27 71 / 107 2008 11 / 25 14 / 25 14 / 26 13 / 26 52 / 102 2009 11 / 24 12 / 24 13 / 24 12 / 24 48 / 96 2010 - / 22 - / 22 - / 22 - / 22 - / 88 2011 - / 10 - / 10 - / 10 - / 11 - / 41 2012 - / 9 - / 10 - / 10 - / 10 - / 39 Total Proceeds & Other Comprehensive Income $900 Impact of Volumetric Production Payments (VPP) Amortization of VPP Deferred Revenue & Other Comprehensive Income1 1) Deferred revenue and other comprehensive income will be amortized over the term of the VPP as an increase to Oil and Gas Revenues. Pioneer retains responsibility for 100% of operating expenses. |
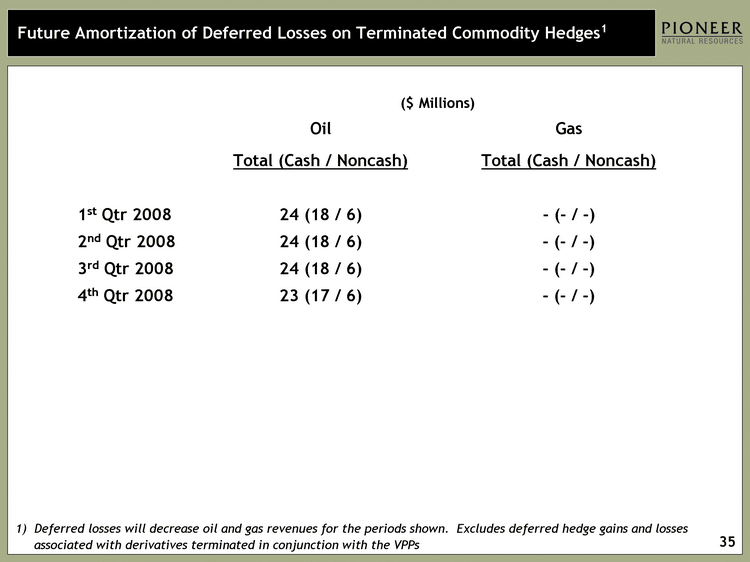
Future Amortization of Deferred Losses on Terminated Commodity Hedges1 1) Deferred losses will decrease oil and gas revenues for the periods shown. Excludes deferred hedge gains and losses associated with derivatives terminated in conjunction with the VPPs Oil Gas Total (Cash / Noncash) Total (Cash / Noncash) 1st Qtr 2008 24 (18 / 6) - (- / -) 2nd Qtr 2008 24 (18 / 6) - (- / -) 3rd Qtr 2008 24 (18 / 6) - (- / -) 4th Qtr 2008 23 (17 / 6) - (- / -) ($ Millions) |
2006 Quarterly Results Adjusted for Discontinued Operations ($ Millions) Q1 '06 Q2 '06 Q3 '06 Q4 '06 2006 Revenue and other income: Oil and gas $ 351 $ 374 $ 384 $ 350 $ 1,459 Interest and other 11 8 14 15 48 Loss on disposition on assets, net - (4) - (2) (6) 362 378 398 363 1,501 Cost and expenses Oil and gas production 84 92 89 84 349 Depletion, depreciation and amortization 75 76 82 81 314 Exploration and abandonments 79 38 41 92 250 General and administration 32 28 29 28 117 Accretion of discount on asset retirement obligations 1 1 1 1 4 Interest 36 23 24 24 107 Hurricane activity, net 38 - - (6) 32 Other 5 12 14 6 37 350 270 280 310 1,210 Income from continuing operations before income taxes: 12 108 118 53 291 Income tax provision (19) (56) (39) (27) (141) Income (loss) from continuing operations (7) 52 79 26 150 Income from discontinued operations, net of tax 550 36 2 2 590 Net income $ 543 $ 88 $ 81 $ 28 $ 740 |
2007 Quarterly Results Adjusted for Discontinued Operations ($ Millions) Q1 '07 Q2 '07 Q3 '07 Q4 '07 2007 Revenue and other income: Oil and gas $ 353 $ 420 $ 459 $ 509 $ 1,741 Interest and other 14 27 30 23 94 Gain (loss) on disposition on assets, net - (2) 1 (1) (2) 367 445 490 531 1,833 Cost and expenses Oil and gas production 90 105 114 112 421 Depletion, depreciation and amortization 79 88 114 106 387 Impairment of oil and gas properties - 18 (3) 11 26 Exploration and abandonments 72 64 34 109 279 General and administration 33 30 32 35 130 Accretion of discount on asset retirement obligations 1 2 2 2 7 Interest 28 31 35 41 135 Hurricane activity, net 13 47 - 1 61 Other 8 7 8 9 32 324 392 336 426 1,478 Income from continuing operations before income taxes: 43 53 154 105 355 Income tax provision (15) (17) (61) (20) (113) Income from continuing operations 28 36 93 85 242 Income from discontinued operations, net of tax 2 - 9 120 131 Net income $ 30 $ 36 $ 102 $ 205 $ 373 |
Senior Notes and Credit Facility as of 12/31/07 2007 2008 2009 2010 2011 2012 2028 $6 MM 5.875% $250 MM 7.20% 2016 $527 MM 5.875% 2018 $450 MM 6.875% $1,113 MM2 $1.5 B Credit Facility $4 MM 6.50% Maturities and Balances1 2017 $500 MM 6.65% Net debt: $2.8 B Net debt to book capitalization: 47% Excludes net discounts and hedge losses of ~$94 MM Subsequent to year-end, refinanced $500 MM of credit facility with 2.875% convertible senior notes due 2038, with a first put/call in 2013 |
Unaudited Reconciliation of PV-10 to Standardized Measure PV-10 is the estimated future net cash flows from proved reserves discounted at an annual rate of 10 percent before giving effect to income taxes. Standardized Measure is the after-tax estimated future cash flows from proved reserves discounted at an annual rate of 10 percent, determined in accordance with GAAP. Pioneer's management believes PV-10 is a useful measure for comparison of proved reserves among exploration and production companies because, unlike Standardized Measure, it excludes future income taxes, which can differ materially among various companies. Pioneer believes that securities analysts and rating agencies use PV-10 in similar ways. Below is a reconciliation of PV-10 to Standardized Measure (in millions): PV-10 at December 31, 2007 $13,364 Discounted Effect of Income Taxes (4,347) Standardized Measure at December 31, 2007 $9,017 |
F&D Costs, Reserve Replacement and Current Value "Finding and development costs per BOE," or "all-in finding and development costs per BOE," means total costs incurred divided by the summation of annual proved reserves, on a BOE basis, attributable to revisions of previous estimates, purchases of minerals-in-place and discoveries and extensions. Consistent with industry practice, future capital costs to develop proved undeveloped reserves are not included in costs incurred. "Reserve replacement" is the summation of annual proved reserves, on a BOE basis, attributable to revisions of previous estimates, purchases of minerals- in-place and discoveries and extensions divided by annual production of oil, NGLs and natural gas, on a BOE basis. The "current value" of Pioneer's fourth quarter acquisitions is an estimate of the pre-tax future net cash flows attributable to the resource potential (based on the indicated price assumptions), discounted at 10%. Pioneer's calculation of current value is based on numerous assumptions that may change as a result of future activities or circumstances. Current value should not be considered as an alternative to Standardized Measure. |
Certain Reserve Information Cautionary Note to U.S. Investors -- The U.S. Securities and Exchange Commission (the "SEC") permits oil and gas companies, in their filings with the SEC, to disclose only proved reserves that a company has demonstrated by actual production or conclusive formation tests to be economically and legally producible under existing economic and operating conditions. Pioneer uses certain terms in this presentation, such as "resource potential," "total resource," "EUR" or other descriptions of volumes of reserves potentially recoverable through additional drilling or recovery techniques that the SEC's guidelines strictly prohibit Pioneer from including in filings with the SEC. These estimates are by their nature more speculative than estimates of proved reserves and accordingly are subject to substantially greater risk of being recovered by Pioneer. U.S. investors are urged to consider closely the disclosure in our most recent Form 10-K, file No. 1-13245, available from us at Investor Relations, 5205 N. O'Connor Blvd., Suite 200, Irving, Texas 75039. You can also obtain this form from SEC by calling 1-800-SEC-0330. |