UNITED STATES
SECURITIES AND EXCHANGE COMMISSION
WASHINGTON, D.C. 20549
FORM N-CSR
CERTIFIED SHAREHOLDER REPORT OF REGISTERED MANAGEMENT
INVESTMENT COMPANIES
Investment Company Act file number: 811-08201
ALLIANCEBERNSTEIN GREATER CHINA ‘97 FUND, INC.
(Exact name of registrant as specified in charter)
| 1345 Avenue of the Americas, New York, New York | 10105 | |
| (Address of principal executive offices) | (Zip code) |
Joseph J. Mantineo
AllianceBernstein L.P.
1345 Avenue of the Americas
New York, New York 10105
(Name and address of agent for service)
Registrant’s telephone number, including area code: (800) 221-5672
Date of fiscal year end: July 31, 2007
Date of reporting period: July 31, 2007
| ITEM 1. | REPORTS TO STOCKHOLDERS. |
ANNUAL REPORT
AllianceBernstein Greater China ’97 Fund

July 31, 2007
Annual Report
Investment Products Offered
| • | Are Not FDIC Insured |
| • | May Lose Value |
| • | Are Not Bank Guaranteed |
The investment return and principal value of an investment in the Fund will fluctuate as the prices of the individual securities in which it invests fluctuate, so that your shares, when redeemed, may be worth more or less than their original cost. You should consider the investment objectives, risks, charges and expenses of the Fund carefully before investing. For a free copy of the Fund’s prospectus, which contains this and other information, visit our web site at www.alliancebernstein.com or call your financial advisor or AllianceBernstein® at (800) 227-4618. Please read the prospectus carefully before you invest.
You may obtain performance information current to the most recent month-end by visiting www.alliancebernstein.com.
This shareholder report must be preceded or accompanied by the Fund’s prospectus for individuals who are not current shareholders of the Fund.
You may obtain a description of the Fund’s proxy voting policies and procedures, and information regarding how the Fund voted proxies relating to portfolio securities during the most recent 12-month period ended June 30, without charge. Simply visit AllianceBernstein’s web site at www.alliancebernstein.com, or go to the Securities and Exchange Commission’s (the “Commission”) web site at www.sec.gov, or call AllianceBernstein at (800) 227-4618.
The Fund files its complete schedule of portfolio holdings with the Commission for the first and third quarters of each fiscal year on Form N-Q. The Fund’s Forms N-Q are available on the Commission’s web site at www.sec.gov. The Fund’s Forms N-Q may also be reviewed and copied at the Commission’s Public Reference Room in Washington, DC; information on the operation of the Public Reference Room may be obtained by calling (800) SEC-0330. AllianceBernstein publishes full portfolio holdings for the Fund monthly at www.alliancebernstein.com.
AllianceBernstein Investments, Inc. is an affiliate of AllianceBernstein L.P., the manager of the AllianceBernstein funds, and is a member of FINRA.
AllianceBernstein® and the AB Logo are registered trademarks and service marks used by permission of the owner, AllianceBernstein L.P.
September 18, 2007
Annual Report
This report provides management’s discussion of fund performance for AllianceBernstein Greater China ’97 Fund (the “Fund”) for the annual reporting period ended July 31, 2007.
Investment Objective and Policies
The Fund’s investment objective is long-term capital appreciation through investment of at least 80% of its total assets in equity securities of Greater China companies. Under normal circumstances, the Fund will invest at least 80%, and normally substantially all, of its net assets in equity securities of Greater China companies, which are companies in China, Hong Kong and Taiwan. Of these countries, the Fund expects to invest a significant portion of its assets, which may be greater than 50%, in Hong Kong companies and may invest all of its assets in Hong Kong companies or companies of either of the other Greater China countries. The Fund also may invest in convertible securities and equity-linked debt securities issued or guaranteed by Greater China companies or Greater China Governments, their agencies or instrumentalities.
Investment Results
The table on page 4 shows the Fund’s performance compared to its benchmark, the Morgan Stanley Capital International (MSCI) Golden Dragon Index (net and gross), as well as the Lipper China Region Funds Average (the “Lipper Average”), for the six- and 12-month periods ended July 31, 2007. The MSCI Golden Dragon Index is a composite index consisting of equity securities of companies based in China, Hong Kong and Taiwan.
These are the countries in which the great majority of the Fund’s securities are located. Funds in the Lipper Average have generally similar investment objectives to the Fund, although some may have different investment policies and sales and management fees.
The Fund’s Class A shares without sales charges outperformed its benchmark, the MSCI Golden Dragon Index (net and gross), for both the six- and 12-month periods ended July 31, 2007.
For the 12-month period under review, Fund outperformance was due primarily to an overweight in the health care and consumer sectors. Underweights in the information technology and utility sectors were also positive for Fund performance, but the underweight in the materials sector detracted from performance.
The Fund’s outperformance for the six-month period was primarily due to an overweight in the health care sector. Also positively contributing to relative Fund performance were the underweights in information technology and utility sectors. However, an underweight in the materials sector was negative for performance as was the overweight in the consumer sector.
Market Review and Investment Strategy
During the 12-month period ended July 31, 2007, stock markets in the Greater China region were strong as the economic and earnings outlook for the region was positive and revised
| ALLIANCEBERNSTEIN GREATER CHINA ’97 FUND • | 1 |
higher. After rallying strongly in the second half of 2006, volatility in the regional stock markets increased in the first six months of 2007, as the market became concerned about the strong gains of the Chinese domestic A-share market and the growing U.S. subprime-mortgage debt problems. However, with more details regarding the establishment of China’s Qualified Domestic Institutional Investor Program (QDII), interest in Hong Kong and China equities returned in the second quarter of 2007 and the markets registered further gains. Underpinning the strength in regional shares were positive earnings revisions, continued growth of household incomes in China and the strength of the Chinese Yuan. Performance of Taiwan banking and technology sector shares
continued to be mixed during the 12-month period under review.
Overweight positions were maintained in the Chinese health care and consumer sectors. History suggests that demand for private health care and consumer goods will remain strong with growing household incomes. Meanwhile, opportunities in the technology and utility sectors were limited and as such, underweights were maintained in both sectors. The Fund’s Global Emerging Market Growth Research Team (the “Team”) also favored positions in Chinese financials, as the expanding domestic capital markets presented opportunities for both banks and insurance companies.
| 2 | • ALLIANCEBERNSTEIN GREATER CHINA ’97 FUND |
HISTORICAL PERFORMANCE
An Important Note About the Value of Historical Performance
The performance shown on the following pages represents past performance and does not guarantee future results. Current performance may be lower or higher than the performance information shown. You may obtain performance information current to the most recent month-end by visiting www.alliancebernstein.com.
The investment return and principal value of an investment in the Fund will fluctuate, so that your shares, when redeemed, may be worth more or less than their original cost. You should consider the investment objectives, risks, charges and expenses of the Fund carefully before investing. For a free copy of the Fund’s prospectus, which contains this and other information, visit our website at www.alliancebernstein.com or call your financial advisor or AllianceBernstein Investments at 800.227.4618. You should read the prospectus carefully before you invest.
All fees and expenses related to the operation of the Fund have been deducted. NAV returns do not reflect sales charges; if sales charges were reflected, the Fund’s quoted performance would be lower. SEC returns reflect the applicable sales charges for each share class: a 4.25% maximum front-end sales charge for Class A shares; the applicable contingent deferred sales charge for Class B shares (4% year 1, 3% year 2, 2% year 3, 1% year 4); a 1% 1 year contingent deferred sales charge for Class C shares. Returns for the different share classes will vary due to different expenses associated with each class. Performance assumes reinvestment of distributions and does not account for taxes.
Benchmark Disclosure
The unmanaged Morgan Stanley Capital International (MSCI) Golden Dragon Index does not reflect fees and expenses associated with the active management of a mutual fund portfolio. The Index is an aggregate of the MSCI Hong Kong Index, the MSCI China Index and the MSCI Taiwan Index (at 65%) (the MSCI Taiwan Index has an inclusion weight at 65% of its market capitalization in the MSCI Index series). The Lipper China Region Funds Average (the “Lipper Average”) represents funds that invest in equity securities whose primary trading markets or operations are concentrated in the China region or in a single country within this region. For the six- and 12-month periods ended July 31, 2007, the Lipper Average consisted of 58 and 53 funds, respectively. These funds have generally similar investment objectives to the Fund, although some may have different investment policies and sales and management fees. An investor cannot invest directly in an index or average, and its results are not indicative of the performance for any specific investment, including the Fund.
The six- and 12-month returns for the MSCI Golden Dragon Index shown on the next page are net and gross returns. Growth of $10,000 values for the MSCI Golden Dragon Index are calculated using a blend of gross and net returns: gross returns from inception through December 31, 2000 and net returns from December 31, 2000 through July 31, 2007. In calculating net returns, the dividend is reinvested after deduction of withholding tax, applying the rate to non-resident individuals who do not benefit from double taxation treaties. In calculating gross returns, the amount of the dividend reinvested is the dividend distributed to individuals resident in the country of the company, but does not include tax credit.
A Word About Risk
Substantially all of the Fund’s assets will be invested in Greater China (People’s Republic of China (Mainland), Republic of China (Taiwan) and Hong Kong Special Administrative Region) company securities, and so the Fund is subject to greater risk than a fund with a more diversified portfolio. Since the Fund invests in foreign currency-denominated securities, fluctuations may be magnified by changes in foreign exchange rates. Foreign markets can be more volatile than the U.S. market due to increased risks of adverse issuer, political, regulatory, market or economic developments. While the Fund invests principally in common stocks and other equity securities, in order to achieve its investment objectives, the Fund may at times use certain types of investment derivatives, such as options, futures, forwards and swaps. These instruments involve risks different from, and in certain cases, greater than, the risks presented by more traditional investments. These risks are fully discussed in the Fund’s prospectus.
(Historical Performance continued on next page)
| ALLIANCEBERNSTEIN GREATER CHINA ’97 FUND • | 3 |
Historical Performance
HISTORICAL PERFORMANCE
(continued from previous page)
THE FUND VS. ITS BENCHMARK PERIODS ENDED JULY 31, 2007 | Returns | |||||
| 6 Months | 12 Months | |||||
AllianceBernstein Greater China ’97 Fund | ||||||
Class A | 24.66% | 69.53% | ||||
Class B | 24.26% | 68.40% | ||||
Class C | 24.21% | 68.34% | ||||
Advisor Class* | 24.87% | 70.01% | ||||
MSCI Golden Dragon Index (net) | 23.59% | 54.73% | ||||
MSCI Golden Dragon Index (gross) | 23.81% | 55.21% | ||||
Lipper China Region Funds Average | 34.92% | 77.70% | ||||
* Please note that this share class is for investors purchasing shares through accounts established under certain fee-based programs sponsored and maintained by certain broker-dealers and financial intermediaries, institutional pension plans and/or advisory clients of, and certain other persons associated with, the Adviser and its affiliates or the Funds. | ||||||
Please keep in mind that high double digit returns are highly unusual and cannot be sustained. | ||||||
GROWTH OF A $10,000 INVESTMENT IN THE FUND
9/3/97* TO 7/31/07
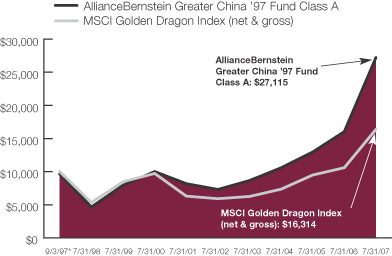
*Since inception of the Fund’s Class A shares on 9/3/97. Growth of $10,000 for the MSCI Golden Dragon Index (net and gross) is from the month-end closest to the Fund’s inception date. Daily data was not available for the MSCI Golden Dragon Index prior to 12/31/00.
This chart illustrates the total value of an assumed $10,000 investment in AllianceBernstein Greater China ’97 Fund Class A shares (from 9/3/97* to 7/31/07) as compared to the performance of the Fund’s benchmark, the MSCI Golden Dragon Index (net & gross). The chart reflects the deduction of the maximum 4.25% sales charge from the initial $10,000 investment in the Fund and assumes the reinvestment of dividends and capital gains distributions.
See Historical Performance and Benchmark disclosures on previous page.
(Historical Performance continued on next page)
| 4 | • ALLIANCEBERNSTEIN GREATER CHINA ’97 FUND |
Historical Performance
HISTORICAL PERFORMANCE
(continued from previous page)
| AVERAGE ANNUAL RETURNS AS OF JULY 31, 2007 | ||||||
| NAV Returns | SEC Returns | |||||
| Class A Shares | ||||||
1 Year | 69.53 | % | 62.31 | % | ||
5 Years | 30.04 | % | 28.90 | % | ||
Since Inception* | 11.07 | % | 10.59 | % | ||
| Class B Shares | ||||||
1 Year | 68.40 | % | 64.40 | % | ||
5 Years | 29.07 | % | 29.07 | % | ||
Since Inception(a)* | 10.40 | % | 10.40 | % | ||
| Class C Shares | ||||||
1 Year | 68.34 | % | 67.34 | % | ||
5 Years | 29.01 | % | 29.01 | % | ||
Since Inception* | 10.23 | % | 10.23 | % | ||
| Advisor Class Shares† | ||||||
1 Year | 70.01 | % | 70.01 | % | ||
5 Years | 30.41 | % | 30.41 | % | ||
Since Inception* | 11.41 | % | 11.41 | % | ||
The Fund’s current prospectus fee table shows the Fund’s total annual operating expense ratios as 2.14%, 2.89%, 2.87% and 1.85% for Class A, Class B, Class C and Advisor Class, respectively, gross of any fee waivers or expense reimbursements. Contractual fee waivers and/or expense reimbursements limit the Fund’s annual operating expense ratios to 1.99%, 2.74%, 2.71% and 1.69% for Class A, Class B, Class C and Advisor Class, respectively. These waivers/reimbursements extend through the Fund’s current fiscal year and may be extended by the Adviser for additional one-year terms. Absent reimbursements or waivers, performance would have been lower.
(a) | Assumes conversion of Class B shares into Class A shares after eight years. |
| * | Inception Date: 9/3/97 for Class A, Class B, Class C and Advisor Class shares. |
| † | This share class is offered at net asset value (NAV) to eligible investors and its SEC returns are the same as its NAV returns. Please note that this share class is for investors purchasing shares through accounts established under certain fee-based programs sponsored and maintained by certain broker-dealers and financial intermediaries, institutional pension plans and/or advisory clients of, and certain other persons associated with, the Adviser and its affiliates or the Funds. The inception date for this share class is listed above. |
See Historical Performance disclosures on page 3.
(Historical Performance continued on next page)
| ALLIANCEBERNSTEIN GREATER CHINA ’97 FUND • | 5 |
Historical Performance
HISTORICAL PERFORMANCE
(continued from previous page)
SEC AVERAGE ANNUAL RETURNS (WITH ANY APPLICABLE SALES CHARGES) AS OF THE MOST RECENT CALENDAR QUARTER-END (JUNE 30, 2007) |
| ||||
| SEC Returns | |||||
| Class A Shares | |||||
1 Year | 55.00 | % | |||
5 Years | 26.19 | % | |||
Since Inception* | 10.16 | % | |||
| Class B Shares | |||||
1 Year | 56.78 | % | |||
5 Years | 26.38 | % | |||
Since Inception(a)* | 9.97 | % | |||
| Class C Shares | |||||
1 Year | 59.70 | % | |||
5 Years | 26.32 | % | |||
Since Inception* | 9.79 | % | |||
| Advisor Class Shares† | |||||
1 Year | 62.37 | % | |||
5 Years | 27.70 | % | |||
Since Inception* | 10.97 | % | |||
(a) | Assumes conversion of Class B shares into Class A shares after eight years. |
| * | Inception Date: 9/3/97 for Class A, Class B, Class C and Advisor Class shares. |
| † | Please note that this share class is for investors purchasing shares through accounts established under certain fee-based programs sponsored and maintained by certain broker-dealers and financial intermediaries, institutional pension plans and/or advisory clients of, and certain other persons associated with, the Adviser and its affiliates or the Funds. The inception date for this share class is listed above. |
See Historical Performance disclosures on page 3.
| 6 | • ALLIANCEBERNSTEIN GREATER CHINA ’97 FUND |
Historical Performance
FUND EXPENSES
As a shareholder of the Fund, you incur two types of costs: (1) transaction costs, including sales charges (loads) on purchase payments, contingent deferred sales charges on redemptions and (2) ongoing costs, including management fees; distribution (12b-1) fees; and other Fund expenses. This example is intended to help you understand your ongoing costs (in dollars) of investing in the Fund and to compare these costs with the ongoing costs of investing in other mutual funds.
The Example is based on an investment of $1,000 invested at the beginning of the period and held for the entire period as indicated below.
Actual Expenses
The table below provides information about actual account values and actual expenses. You may use the information, together with the amount you invested, to estimate the expenses that you paid over the period. Simply divide your account value by $1,000 (for example, an $8,600 account value divided by $1,000 = 8.6), then multiply the result by the number under the heading entitled “Expenses Paid During Period” to estimate the expenses you paid on your account during this period.
Hypothetical Example for Comparison Purposes
The table below also provides information about hypothetical account values and hypothetical expenses based on the Fund’s actual expense ratio and an assumed annual rate of return of 5% before expenses, which is not the Fund’s actual return. The hypothetical account values and expenses may not be used to estimate the actual ending account balance or expenses you paid for the period. You may use this information to compare the ongoing costs of investing in the Fund and other funds by comparing this 5% hypothetical example with the 5% hypothetical examples that appear in the shareholder reports of other funds.
Please note that the expenses shown in the table are meant to highlight your ongoing costs only and do not reflect any transactional costs, such as sales charges (loads), or contingent deferred sales charges on redemptions. Therefore, the hypothetical example is useful in comparing ongoing costs only, and will not help you determine the relative total costs of owning different funds. In addition, if these transactional costs were included, your costs would have been higher.
| Beginning Account Value February 1, 2007 | Ending Account Value July 31, 2007 | Expenses Paid During Period* | ||||||||||||||||
| Actual | Hypothetical | Actual | Hypothetical** | Actual | Hypothetical | |||||||||||||
| Class A | $ | 1,000 | $ | 1,000 | $ | 1,246.62 | $ | 1,017.21 | $ | 8.52 | $ | 7.65 | ||||||
| Class B | $ | 1,000 | $ | 1,000 | $ | 1,242.63 | $ | 1,013.64 | $ | 12.51 | $ | 11.23 | ||||||
| Class C | $ | 1,000 | $ | 1,000 | $ | 1,242.09 | $ | 1,013.69 | $ | 12.45 | $ | 11.18 | ||||||
| Advisor Class | $ | 1,000 | $ | 1,000 | $ | 1,248.70 | $ | 1,018.74 | $ | 6.80 | $ | 6.11 | ||||||
| * | Expenses are equal to the classes’ annualized expense ratios of 1.53%, 2.25%, 2.24% and 1.22%, respectively, multiplied by the average account value over the period, multiplied by 181/365 (to reflect the one-half year period). |
| ** | Assumes 5% return before expenses. |
| ALLIANCEBERNSTEIN GREATER CHINA ’97 FUND • | 7 |
Fund Expenses
PORTFOLIO SUMMARY
July 31, 2007
PORTFOLIO STATISTICS
Net Assets ($mil): $130.7
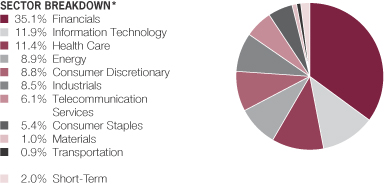
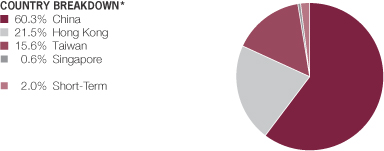
| * | All data are as of July 31, 2007. The Fund’s sector and country breakdowns are expressed as a percentage of total investments and may vary over time. |
| Please note: The sector classifications presented herein are based on the Global Industry Classification Standard (GICS) which was developed by Morgan Stanley Capital International and Standard and Poor’s. The components are divided into sector, industry group, and industry sub-indices as classified by the GICS for each of the market capitalization indices in the Broad Market. These sector classifications are broadly defined. The “Portfolio of Investments” section of the report reflects more specific industry information and is consistent with the investment restrictions discussed in the Fund’s prospectus. |
| 8 | • ALLIANCEBERNSTEIN GREATER CHINA ’97 FUND |
Portfolio Summary
TEN LARGEST HOLDINGS
July 31, 2007
| Company | U.S. $ Value | Percent of Net Assets | ||||
Shandong Weigao Group Medical Polymer Co. Ltd.-Class H | $ | 13,073,031 | 10.0 | % | ||
Industrial & Commercial Bank of China, Ltd.-Class H | 9,135,019 | 7.0 | ||||
China Mobile, Ltd. | 7,876,576 | 6.0 | ||||
China Life Insurance Co., Ltd.-Class H | 6,396,728 | 4.9 | ||||
China Construction Bank Corp.-Class H | 6,087,260 | 4.7 | ||||
HON HAI Precision Industry Co., Ltd. | 4,800,786 | 3.7 | ||||
Sun Hung Kai Properties, Ltd. | 4,463,887 | 3.4 | ||||
Esprit Holdings, Ltd. | 4,296,454 | 3.3 | ||||
China Mengniu Dairy Co., Ltd. | 3,971,832 | 3.0 | ||||
Taiwan Semiconductor Manufacturing Co., Ltd. | 3,881,601 | 3.0 | ||||
| $ | 63,983,174 | 49.0 | % | |||
| ALLIANCEBERNSTEIN GREATER CHINA ’97 FUND • | 9 |
Ten Largest Holdings
PORTFOLIO OF INVESTMENTS
July 31, 2007
| Company | Shares | U.S. $ Value | |||
COMMON STOCKS – 96.2% | |||||
Financials – 34.7% | |||||
Commercial Banks – 14.1% | |||||
China Construction Bank Corp.-Class H | 8,209,000 | $ | 6,087,260 | ||
China Merchants Bank Co., Ltd.-Class H | 425,500 | 1,522,882 | |||
Industrial & Commercial Bank of China, | 14,987,000 | 9,135,019 | |||
Wing Hang Bank Ltd. | 133,000 | 1,667,692 | |||
| 18,412,853 | |||||
Diversified Financial Services – 3.0% | |||||
Hong Kong Exchanges and Clearing Ltd. | 200,000 | 3,263,591 | |||
Jardine Matheson Holdings Ltd. | 30,000 | 720,402 | |||
| 3,983,993 | |||||
Insurance – 7.6% | |||||
Cathay Financial Holding Co., Ltd. | 1,317,831 | 3,421,039 | |||
Cathay Financial Holding Co., Ltd. (GDR)(a) | 4,408 | 119,016 | |||
China Life Insurance Co., Ltd.-Class H | 1,483,000 | 6,396,728 | |||
| 9,936,783 | |||||
Real Estate Management & | |||||
Cheung Kong Holdings Ltd. | 192,000 | 2,694,200 | |||
Shun Tak Holdings Ltd. | 1,310,000 | 2,022,564 | |||
Sino Land Co. | 986,775 | 2,197,592 | |||
Sun Hung Kai Properties Ltd. | 351,000 | 4,463,887 | |||
Swire Pacific Ltd. | 147,000 | 1,663,868 | |||
| 13,042,111 | |||||
| 45,375,740 | |||||
Information Technology – 11.8% | |||||
Communications Equipment – 0.3% | |||||
Delta Networks, Inc.(b) | 765,000 | 476,036 | |||
Computers & Peripherals – 1.5% | |||||
Foxconn Technology Co., Ltd. | 106,550 | 1,180,110 | |||
High Tech Computer Corp.(b) | 41,000 | 746,495 | |||
| 1,926,605 | |||||
Electronic Equipment & | |||||
AU Optronics Corp. | 1,385,912 | 2,347,572 | |||
HON HAI Precision Industry Co., Ltd. | 583,875 | 4,800,786 | |||
| 7,148,358 | |||||
Semiconductors & Semiconductor Equipment – 4.5% | |||||
Novatek Microelectronics Corp. Ltd. | 217,259 | 1,000,111 | |||
Pixart Imaging, Inc.(b) | 80,000 | 1,017,460 | |||
Taiwan Semiconductor Manufacturing Co., Ltd. | 1,976,792 | 3,881,601 | |||
| 5,899,172 | |||||
| 15,450,171 | |||||
| 10 | • ALLIANCEBERNSTEIN GREATER CHINA ’97 FUND |
Portfolio of Investments
| Company | Shares | U.S. $ Value | |||
Health Care – 11.3% | |||||
Health Care Equipment & Supplies – 10.0% | |||||
Shandong Weigao Group Medical Polymer Co., Ltd.-Class H | 5,264,000 | $ | 13,073,031 | ||
Pharmaceuticals – 1.3% | |||||
Simcere Pharmaceutical Group (ADR)(b) | 139,700 | 1,655,445 | |||
| 14,728,476 | |||||
Energy – 8.8% | |||||
Oil, Gas & Consumable Fuels – 8.8% | |||||
China Petroleum & Chemical Corp.-Class H | 2,658,000 | 2,820,410 | |||
China Shenhua Energy Co., Ltd.-Class H | 797,500 | 3,130,429 | |||
CNOOC Ltd. | 2,213,000 | 2,633,363 | |||
PetroChina Co., Ltd.-Class H | 2,008,000 | 2,960,275 | |||
| 11,544,477 | |||||
Consumer Discretionary – 8.8% | |||||
Automobiles – 1.3% | |||||
Great Wall Motor Co., Ltd.-Class H | 1,165,000 | 1,734,743 | |||
Distributors – 1.1% | |||||
Li & Fung Ltd. | 401,000 | 1,389,461 | |||
Multiline Retail – 1.2% | |||||
Lifestyle International Holdings Ltd. | 382,500 | 1,523,695 | |||
Specialty Retail – 5.2% | |||||
Esprit Holdings Ltd. | 321,500 | 4,296,454 | |||
GOME Electrical Appliances Holdings Ltd. | 1,551,000 | 2,497,074 | |||
| 6,793,528 | |||||
| 11,441,427 | |||||
Industrials – 8.4% | |||||
Electrical Equipment – 4.8% | |||||
Harbin Power Equipment-Class H | 1,000,000 | 1,710,919 | |||
Silitech Technology Corp. | 289,000 | 1,276,081 | |||
Zhuzhou CSR Times Electric Co., Ltd.-Class H | 1,692,000 | 3,353,538 | |||
| 6,340,538 | |||||
Industrial Conglomerates – 1.3% | |||||
Hutchison Whampoa Ltd. | 101,000 | 1,073,646 | |||
Melco International Development | 456,000 | 654,360 | |||
| 1,728,006 | |||||
Machinery – 1.4% | |||||
Yangzijiang Shipbuilding Holdings Ltd.(b) | 1,400,000 | 1,801,148 | |||
Transportation Infrastructure – 0.9% | |||||
Dalian Port PDA Co., Ltd.-Class H | 348,000 | 267,423 | |||
Hopewell Holdings | 203,000 | 876,501 | |||
| 1,143,924 | |||||
| 11,013,616 | |||||
| ALLIANCEBERNSTEIN GREATER CHINA ’97 FUND • | 11 |
Portfolio of Investments
| Company | Shares or Principal Amount (000) | U.S. $ Value | ||||
Telecommunication Services – 6.0% | ||||||
Wireless Telecommunication | ||||||
China Mobile Ltd. | 685,500 | $ | 7,876,576 | |||
Consumer Staples – 5.4% | ||||||
Food Products – 5.4% | ||||||
China Mengniu Dairy Co., Ltd. | 1,127,000 | 3,971,832 | ||||
China Yurun Food Group Ltd. | 2,863,000 | 3,048,326 | ||||
| 7,020,158 | ||||||
Materials – 1.0% | ||||||
Metals & Mining – 1.0% | ||||||
Aluminum Corp. of China Ltd.-Class H | 666,000 | 1,341,276 | ||||
Total Common Stocks | 125,791,917 | |||||
WARRANTS – 0.9% | ||||||
Industrials – 0.9% | ||||||
Transportation Infrastructure – 0.9% | ||||||
Shenzhen Expressway Co. Ltd., | 918,700 | 1,157,562 | ||||
SHORT-TERM INVESTMENTS – 2.0% | ||||||
Time Deposit – 2.0% | ||||||
HBOS 5.33%, 8/01/07 | $ | 2,600 | 2,600,000 | |||
Total Investments – 99.1% | 129,549,479 | |||||
Other assets less liabilities – 0.9% | 1,137,475 | |||||
Net Assets – 100.0% | $ | 130,686,954 | ||||
| (a) | Security is exempt from registration under Rule 144A of the Securities Act of 1933. These securities are considered liquid and may be resold in transactions exempt from registration, normally to qualified institutional buyers. At July 31, 2007, the aggregate market value of these securities amounted to $1,276,578 or 1.0% of net assets. |
| (b) | Non-income producing security. |
| Glossary: |
| ADR | – American Depositary Receipt |
| GDR | – Global Depositary Receipt |
| See notes to financial statements. |
| 12 | • ALLIANCEBERNSTEIN GREATER CHINA ’97 FUND |
Portfolio of Investments
STATEMENT OF ASSETS & LIABILITIES
July 31, 2007
| Assets | ||||
Investments in securities, at value (cost $71,665,651) | $ | 129,549,479 | ||
Cash | 33,448 | |||
Foreign cash, at value (cost $339,537) | 343,163 | |||
Receivable for investment securities sold | 733,194 | |||
Receivable for capital stock sold | 440,702 | |||
Interest and dividends receivable | 164,909 | |||
Total assets | 131,264,895 | |||
| Liabilities | ||||
Payable for capital stock redeemed | 302,087 | |||
Advisory fee payable | 82,949 | |||
Distribution fee payable | 65,180 | |||
Custody fee payable | 47,400 | |||
Legal fee payable | 33,970 | |||
Transfer Agent fee payable | 7,696 | |||
Accrued expenses | 38,659 | |||
Total liabilities | 577,941 | |||
Net Assets | $ | 130,686,954 | ||
| Composition of Net Assets | ||||
Capital stock, at par | $ | 5,189 | ||
Additional paid-in capital | 64,831,587 | |||
Accumulated net investment loss | (115,133 | ) | ||
Accumulated net realized gain on investment | 8,078,464 | |||
Net unrealized appreciation of investments | 57,886,847 | |||
| $ | 130,686,954 | |||
Net Asset Value Per Share—12 billion shares of capital stock authorized, $.001 par value
| Class | Net Assets | Shares Outstanding | Net Asset Value | ||||||
| A | $ | 62,613,603 | 2,428,662 | $ | 25.78 | * | |||
| B | $ | 26,697,151 | 1,092,931 | $ | 24.43 | ||||
| C | $ | 31,363,060 | 1,287,068 | $ | 24.37 | ||||
| Advisor | $ | 10,013,140 | 379,902 | $ | 26.36 | ||||
| * | The maximum offering price per share for Class A shares was $26.92 which reflects a sales charge of 4.25%. |
| See notes to financial statements. |
| ALLIANCEBERNSTEIN GREATER CHINA ’97 FUND • | 13 |
Statement of Assets & Liabilities
STATEMENT OF OPERATIONS
Year Ended July 31, 2007
| Investment Income | ||||||||
Dividends (net of foreign taxes withheld | $ | 1,603,305 | ||||||
Interest | 173,903 | $ | 1,777,208 | |||||
| Expenses | ||||||||
Advisory fee | 735,789 | |||||||
Distribution fee—Class A | 135,758 | |||||||
Distribution fee—Class B | 220,213 | |||||||
Distribution fee—Class C | 231,752 | |||||||
Transfer agency—Class A | 75,129 | |||||||
Transfer agency—Class B | 40,891 | |||||||
Transfer agency—Class C | 39,697 | |||||||
Transfer agency—Advisor Class | 12,369 | |||||||
Custodian | 194,175 | |||||||
Administrative | 83,000 | |||||||
Registration | 54,001 | |||||||
Printing | 48,377 | |||||||
Audit | 45,731 | |||||||
Legal | 45,497 | |||||||
Directors’ fees | 10,937 | |||||||
Miscellaneous | 16,575 | |||||||
Total expenses | 1,989,891 | |||||||
Less: expenses waived by the Adviser | ||||||||
(see Note B) | (83,000 | ) | ||||||
Less: expense offset arrangement | ||||||||
(see Note B) | (6,494 | ) | ||||||
Net expenses | 1,900,397 | |||||||
Net investment loss | (123,189 | ) | ||||||
| Realized and Unrealized Gain (Loss) on Investment and Foreign Currency Transactions | ||||||||
Net realized gain (loss) on: | ||||||||
Investment transactions | 9,760,541 | |||||||
Foreign currency transactions | (11,178 | ) | ||||||
Net change in unrealized | ||||||||
Investments | 39,256,529 | |||||||
Foreign currency denominated | 3,797 | |||||||
Net gain on investment and | 49,009,689 | |||||||
Net Increase in Net Assets | $ | 48,886,500 | ||||||
See notes to financial statements.
| 14 | • ALLIANCEBERNSTEIN GREATER CHINA ’97 FUND |
Statement of Operations
STATEMENT OF CHANGES IN NET ASSETS
Year Ended July 31, 2007 | Year Ended July 31, 2006 | |||||||
| Increase (Decrease) in Net Assets from Operations | ||||||||
Net investment income (loss) | $ | (123,189 | ) | $ | 239,916 | |||
Net realized gain on investments and | 9,749,363 | 3,058,727 | ||||||
Net change in unrealized | 39,260,326 | 7,404,043 | ||||||
Net increase in net assets from operations | 48,886,500 | 10,702,686 | ||||||
| Dividends and Distributions to Shareholders from | ||||||||
Net investment income | ||||||||
Class A | (181,916 | ) | (94,795 | ) | ||||
Advisor Class | (43,042 | ) | (10,577 | ) | ||||
Net realized gain on investment and foreign currency transactions | ||||||||
Class A | (1,994,164 | ) | (20,736 | ) | ||||
Class B | (1,166,302 | ) | (15,426 | ) | ||||
Class C | (1,106,598 | ) | (13,896 | ) | ||||
Advisor Class | (337,507 | ) | (1,481 | ) | ||||
| Capital Stock Transactions | ||||||||
Net increase | 24,483,341 | 1,096,452 | ||||||
Total increase | 68,540,312 | 11,642,227 | ||||||
| Net Assets | ||||||||
Beginning of period | 62,146,642 | 50,504,415 | ||||||
End of period (including accumulated net investment loss and undistributed net investment income of $(115,133) and $186,089, respectively) | $ | 130,686,954 | $ | 62,146,642 | ||||
See notes to financial statements.
| ALLIANCEBERNSTEIN GREATER CHINA ’97 FUND • | 15 |
Statement of Changes in Net Assets
NOTES TO FINANCIAL STATEMENTS
July 31, 2007
NOTE A
Significant Accounting Policies
AllianceBernstein Greater China ‘97 Fund, Inc. (the “Fund”) was organized as a Maryland corporation on April 30, 1997 and is registered under the Investment Company Act of 1940 as a diversified, open-end management investment company. The Fund offers Class A, Class B, Class C and Advisor Class shares. Class A shares are sold with a front-end sales charge of up to 4.25% for purchases not exceeding $1,000,000. With respect to purchases of $1,000,000 or more, Class A shares redeemed within one year of purchase may be subject to a contingent deferred sales charge of 1%. Class B shares are sold with a contingent deferred sales charge which declines from 4% to zero depending on the period of time the shares are held. Class B shares will automatically convert to Class A shares eight years after the end of the calendar month of purchase. Class C shares are subject to a contingent deferred sales charge of 1% on redemptions made within the first year after purchase. Advisor Class shares are sold without an initial or contingent deferred sales charge and are not subject to ongoing distribution expenses. Advisor Class shares are offered to investors participating in fee-based programs and to certain retirement plan accounts. All four classes of shares have identical voting, dividend, liquidation and other rights, except that the classes bear different distribution and transfer agency expenses. Each class has exclusive voting rights with respect to its distribution plan. The financial statements have been prepared in conformity with U.S. generally accepted accounting principles which require management to make certain estimates and assumptions that affect the reported amounts of assets and liabilities in the financial statements and amounts of income and expenses during the reporting period. Actual results could differ from those estimates. The following is a summary of significant accounting policies followed by the Fund.
1. Security Valuation
Portfolio securities are valued at their current market value determined on the basis of market quotations or, if market quotations are not readily available or are deemed unreliable, at “fair value” as determined in accordance with procedures established by and under the general supervision of the Fund’s Board of Directors.
In general, the market value of securities which are readily available and deemed reliable are determined as follows. Securities listed on a national securities exchange (other than securities listed on the NASDAQ Stock Market, Inc. (“NASDAQ”)) or on a foreign securities exchange are valued at the last sale price at the close of the exchange or foreign securities exchange. If there has been no sale on such day, the securities are valued at the mean of the closing bid and asked prices on such day. Securities listed on more than one exchange are valued by reference to the principal exchange on which the securities are traded; securities listed only on NASDAQ are valued in accordance with the NASDAQ Official Closing Price; listed put or call options are valued at the last sale price. If there has been no sale on that day, such securities will be valued at the closing
| 16 | • ALLIANCEBERNSTEIN GREATER CHINA ’97 FUND |
Notes to Financial Statements
bid prices on that day; open futures contracts and options thereon are valued using the closing settlement price or, in the absence of such a price, the most recent quoted bid price. If there are no quotations available for the day of valuation, the last available closing settlement price is used; securities traded in the over-the-counter market, (“OTC”) are valued at the mean of the current bid and asked prices as reported by the National Quotation Bureau or other comparable sources; U.S. Government securities and other debt instruments having 60 days or less remaining until maturity are valued at amortized cost if their original maturity was 60 days or less; or by amortizing their fair value as of the 61st day prior to maturity if their original term to maturity exceeded 60 days; fixed-income securities, including mortgage backed and asset backed securities, may be valued on the basis of prices provided by a pricing service or at a price obtained from one or more of the major broker/dealers. In cases where broker/dealer quotes are obtained, AllianceBernstein L.P. (the “Adviser”) may establish procedures whereby changes in market yields or spreads are used to adjust, on a daily basis, a recently obtained quoted price on a security; and OTC and other derivatives are valued on the basis of a quoted bid price or spread from a major broker/dealer in such security.
Securities for which market quotations are not readily available (including restricted securities) or are deemed unreliable are valued at fair value. Factors considered in making this determination may include, but are not limited to, information obtained by contacting the issuer, analysts, analysis of the issuer’s financial statements or other available documents. In addition, the Fund may use fair value pricing for securities primarily traded in non-U.S. markets because most foreign markets close well before the Fund values its securities at 4:00 p.m., Eastern Time. The earlier close of these foreign markets gives rise to the possibility that significant events, including broad market moves, may have occurred in the interim and may materially affect the value of those securities. To account for this, the Fund may frequently value many of its foreign equity securities using fair value prices based on third party vendor modeling tools to the extent available.
2. Currency Translation
Assets and liabilities denominated in foreign currencies and commitments under forward currency exchange contracts are translated into U.S. dollars at the mean of the quoted bid and asked prices of such currencies against the U.S. dollar. Purchases and sales of portfolio securities are translated into U.S. dollars at the rates of exchange prevailing when such securities were acquired or sold. Income and expenses are translated into U.S. dollars at rates of exchange prevailing when accrued.
Net realized gain or loss on foreign currency transactions represents foreign exchange gains and losses from sales and maturities of foreign fixed income investments, foreign currency exchange contracts, holding of foreign currencies, currency gains or losses realized between the trade and settlement dates on foreign
| ALLIANCEBERNSTEIN GREATER CHINA ’97 FUND • | 17 |
Notes to Financial Statements
investment transactions, and the difference between the amounts of dividends, interest and foreign withholding taxes recorded on the Fund’s books and the U.S. dollar equivalent amounts actually received or paid. Net unrealized currency gains and losses from valuing foreign currency denominated assets and liabilities at period end exchange rates are reflected as a component of net unrealized appreciation and depreciation of investments and foreign currency denominated assets and liabilities.
3. Taxes
It is the Fund’s policy to meet the requirements of the Internal Revenue Code applicable to regulated investment companies and to distribute all of its investment company taxable income and net realized gains, if any, to shareholders. Therefore, no provisions for federal income or excise taxes are required. The Fund may be subject to taxes imposed by countries in which it invests. Such taxes are generally based on income and/or capital gains earned or repatriated. Taxes are accrued and applied to net investment income, net realized gains and net unrealized appreciation/depreciation as such income and/or gains are earned.
4. Investment Income and Investment Transactions
Dividend income is recorded on the ex-dividend date or as soon as the Fund is informed of the dividend. Interest income is accrued daily. Investment transactions are accounted for on the date securities are purchased or sold. Investment gains and losses are determined on the identified cost basis. The Fund amortizes premiums and accretes discounts as adjustments to interest income.
5. Class Allocations
All income earned and expenses incurred by the Fund are borne on a pro-rata basis by each outstanding class of shares, based on the proportionate interest in the Fund represented by the net assets of such class, except for class specific expenses which are allocated to the respective class. Realized and unrealized gains and losses are allocated among the various share classes based on their respective net assets.
6. Dividends and Distributions
Dividends and distributions to shareholders, if any, are recorded on the ex-dividend date. Income and capital gains distributions are determined in accordance with federal tax regulations and may differ from those determined in accordance with U.S. generally accepted accounting principles. To the extent these differences are permanent, such amounts are reclassified within the capital accounts based on their federal tax basis treatment; temporary differences do not require such reclassification.
| 18 | • ALLIANCEBERNSTEIN GREATER CHINA ’97 FUND |
Notes to Financial Statements
NOTE B
Advisory Fee and Other Transactions with Affiliates
Under the terms of the investment advisory agreement, the Fund pays the Adviser an advisory fee at an annual rate of .75% of the first $2.5 billion, .65% of the next $2.5 billion and .60% in excess of $5 billion, of the Fund’s average daily net assets. The fee is accrued daily and paid monthly. The Adviser has agreed for the current fiscal year to waive its fee and bear certain expenses to the extent necessary to limit total operating expenses on an annual basis to 2.50%, 3.20%, 3.20%, and 2.20% of average daily net assets, respectively, for the Class A, Class B, Class C and Advisor Class shares. For the year ended July 31, 2007, there were no fees waived by the Adviser.
Pursuant to the advisory agreement, the Fund may reimburse the Adviser for certain legal and accounting services provided to the Fund by the Adviser. For the year ended July 31, 2007, the Adviser voluntarily agreed to waive its fees for such services. Such waiver amounted to $83,000.
The Fund compensates AllianceBernstein Investor Services, Inc. (“ABIS”), a wholly-owned subsidiary of the Adviser, under a Transfer Agency Agreement for providing personnel and facilities to perform transfer agency services for the Fund. ABIS may make payments to intermediaries that provide omnibus account services, sub-accounting services and/or networking services. The compensation retained by ABIS amounted to $85,371 for the year ended July 31, 2007.
For the year ended July 31, 2007, the Fund’s expenses were reduced by $6,494 under an expense offset arrangement with ABIS.
AllianceBernstein Investments, Inc. (the “Distributor”), a wholly-owned subsidiary of the Adviser, serves as the distributor of the Fund’s shares. The Distributor has advised the Fund that it has retained front-end sales charges of $31,522 from the sale of Class A shares and received $303, $32,625 and $14,312 in contingent deferred sales charges imposed upon redemptions by shareholders of Class A, Class B and Class C shares, respectively, for the year ended July 31, 2007.
Brokerage commissions paid on investment transactions for the year ended July 31, 2007, amounted to $204,939, none of which was paid to Sanford C. Bernstein & Co. LLC and Sanford C. Bernstein Limited, affiliates of the Adviser.
NOTE C
Distribution Services Agreement
The Fund has adopted a Distribution Services Agreement (the “Agreement”) pursuant to Rule 12b-1 under the Investment Company Act of 1940. Under the Agreement the Fund pays distribution and servicing fees to the Distributor at an annual rate of up to .30% of the Fund’s average daily net assets attributable to Class A shares, 1% of the Fund’s average daily net assets attributable to the
| ALLIANCEBERNSTEIN GREATER CHINA ’97 FUND • | 19 |
Notes to Financial Statements
Class B and Class C shares. There are no distribution and servicing fees on the Advisor Class shares. The fees are accrued daily and paid monthly. The Agreement provides that the Distributor will use such payments in their entirety for distribution assistance and promotional activities. The Distributor has incurred expenses in excess of the distribution costs reimbursed by the Fund in the amounts of $2,340,531 and $1,237,736 for Class B and Class C shares, respectively. Such costs may be recovered from the Fund in future periods so long as the Agreement is in effect. In accordance with the Agreement, there is no provision for recovery of unreimbursed distribution costs, incurred by the Distributor beyond the current fiscal year for Class A shares. The Agreement also provides that the Adviser may use its own resources to finance the distribution of the Fund’s shares.
NOTE D
Investment Transactions
Purchases and sales of investment securities (excluding short-term investments) for the year ended July 31, 2007, were as follows:
| Purchases | Sales | |||||
Investment securities (excluding U.S. government securities) | $ | 57,306,927 | $ | 40,211,466 | ||
U.S. government securities | – 0 – | – 0 – | ||||
The cost of investments for federal income tax purposes, gross unrealized appreciation and unrealized depreciation (excluding foreign currency transactions) are as follows:
Cost | $ | 72,202,904 | ||
Gross unrealized appreciation | $ | 58,330,814 | ||
Gross unrealized depreciation | (984,239 | ) | ||
Net unrealized appreciation | $ | 57,346,575 | ||
Forward Currency Exchange Contracts
The Fund may enter into forward currency exchange contracts in order to hedge its exposure to changes in foreign currency exchange rates on its foreign portfolio holdings, to hedge certain firm purchase and sales commitments denominated in foreign currencies and for investment purposes. A forward currency exchange contract is a commitment to purchase or sell a foreign currency on a future date at a negotiated forward rate. The gain or loss arising from the difference between the original contract and the closing of such contract would be included in net realized gain or loss on foreign currency transactions.
Fluctuations in the value of open forward currency exchange contracts are recorded for financial reporting purposes as unrealized appreciation and depreciation by the Fund.
| 20 | • ALLIANCEBERNSTEIN GREATER CHINA ’97 FUND |
Notes to Financial Statements
The Fund’s custodian will place and maintain cash not available for investment or other liquid assets in a separate account of the Fund having a value at least equal to the aggregate amount of the Fund’s commitments under forward currency exchange contracts entered into with respect to position hedges.
Risks may arise from the potential inability of a counterparty to meet the terms of a contract and from unanticipated movements in the value of foreign currency relative to the U.S. dollar. The face or contract amount, in U.S. dollars reflects the total exposure the Fund has in that particular currency contract.
NOTE E
Capital Stock
Each class consists of 3,000,000,000 authorized shares. Transactions in capital shares for each class were as follows:
| Shares | Amount | |||||||||||||||||
| Year Ended July 31, 2007 | Year Ended July 31, 2006 | Year Ended July 31, 2007 | Year Ended July 31, 2006 | |||||||||||||||
| Class A | ||||||||||||||||||
Shares sold | 1,783,156 | 1,405,406 | $ | 36,025,741 | $ | 21,132,323 | ||||||||||||
Shares issued in reinvestment of dividends and distributions | 98,944 | 7,426 | 1,793,853 | 92,824 | ||||||||||||||
Shares converted from Class B | 80,177 | 85,978 | 1,677,938 | 1,200,130 | ||||||||||||||
Shares redeemed | (1,142,350 | ) | (1,421,685 | ) | (23,520,402 | ) | (21,119,603 | ) | ||||||||||
Net increase | 819,927 | 77,125 | $ | 15,977,130 | $ | 1,305,674 | ||||||||||||
| Class B | ||||||||||||||||||
Shares sold | 413,799 | 300,734 | $ | 8,070,629 | $ | 4,383,027 | ||||||||||||
Shares issued in reinvestment of dividends and distributions | 57,803 | 1,074 | 997,678 | 12,829 | ||||||||||||||
Shares converted to Class A | (84,409 | ) | (90,126 | ) | (1,677,938 | ) | (1,200,130 | ) | ||||||||||
Shares redeemed | (377,451 | ) | (297,120 | ) | (7,439,317 | ) | (4,129,346 | ) | ||||||||||
Net increase (decrease) | 9,742 | (85,438 | ) | $ | (48,948 | ) | $ | (933,620 | ) | |||||||||
| ALLIANCEBERNSTEIN GREATER CHINA ’97 FUND • | 21 |
Notes to Financial Statements
| Shares | Amount | |||||||||||||||||
| Year Ended July 31, 2007 | Year Ended July 31, 2006 | Year Ended July 31, 2007 | Year Ended July 31, 2006 | |||||||||||||||
Class C | ||||||||||||||||||
Shares sold | 652,865 | 317,295 | $ | 12,806,737 | $ | 4,538,016 | ||||||||||||
Shares issued in reinvestment of dividends and distributions | 46,938 | 848 | 808,277 | 10,120 | ||||||||||||||
Shares redeemed | (405,355 | ) | (350,349 | ) | (8,101,592 | ) | (4,864,689 | ) | ||||||||||
Net increase (decrease) | 294,448 | (32,206 | ) | $ | 5,513,422 | $ | (316,553 | ) | ||||||||||
Advisor Class | ||||||||||||||||||
Shares sold | 548,633 | 200,813 | $ | 11,671,868 | $ | 3,252,514 | ||||||||||||
Shares issued in reinvestment of dividends and distributions | 15,381 | 408 | 284,541 | 5,191 | ||||||||||||||
Shares redeemed | (434,389 | ) | (161,490 | ) | (8,914,672 | ) | (2,216,754 | ) | ||||||||||
Net increase | 129,625 | 39,731 | $ | 3,041,737 | $ | 1,040,951 | ||||||||||||
NOTE F
Risks Involved in Investing in the Fund
Foreign Securities Risk — Investing in securities of foreign companies or foreign governments involves special risk which include changes in foreign currency exchange rates and the possibility of future political and economic developments which could adversely affect the value of such securities. Moreover, securities of many foreign companies or foreign governments and their markets may be less liquid and their prices more volatile than those of comparable U.S. companies or of the U.S. government.
The Fund has invested approximately 60% of its net assets in China equity securities. Political, social or economic changes in this market may have a greater impact on the value of the Fund’s portfolio due to this concentration.
Indemnification Risk — In the ordinary course of business, the Fund enters into contracts that contain a variety of indemnifications. The Fund’s maximum exposure under these arrangements is unknown. However, the Fund has not had prior claims or losses pursuant to these indemnification provisions and expects the risk of loss thereunder to be remote.
NOTE G
Joint Credit Facility
A number of open-end mutual funds managed by the Adviser, including the Fund, participate in a $250 million revolving credit facility (the “Facility”)
| 22 | • ALLIANCEBERNSTEIN GREATER CHINA ’97 FUND |
Notes to Financial Statements
intended to provide short-term financing if necessary, subject to certain restrictions in connection with abnormal redemption activity. Commitment fees related to the Facility are paid by the participating funds and are included in miscellaneous expenses in the statement of operations. The Fund did not utilize the Facility during the year ended July 31, 2007.
NOTE H
Distributions to Shareholders
The tax character of distributions paid during the fiscal years ended July 31, 2007 and July 31, 2006 were as follows:
| 2007 | 2006 | |||||
Distributions paid from: | ||||||
Ordinary income | $ | 224,958 | $ | 105,372 | ||
Net long-term capital gains | 4,604,571 | 51,539 | ||||
Total taxable distributions | 4,829,529 | 156,911 | ||||
Total distributions paid | $ | 4,829,529 | $ | 156,911 | ||
As of July 31, 2007, the components of accumulated earnings/(deficit) on a tax basis were as follows:
Undistributed net investment income | $ | 2,960,428 | ||
Undistributed long-term capital gain | 5,540,156 | |||
Unrealized appreciation/(depreciation) | 57,349,594 | (a) | ||
Total accumulated earnings/(deficit) | $ | 65,850,178 | ||
(a) | The differences between book-basis and tax-basis unrealized appreciation/(depreciation) are attributable primarily to the tax deferral of losses on wash sales and to the tax treatment of Passive Foreign Investment Companies (“PFIC’s”). |
During the current fiscal year, permanent differences, primarily due to foreign currency transactions and the tax treatment of PFIC’s, resulted in a net decrease in accumulated net investment loss and a net decrease in accumulated net realized gain on investment and foreign currency transactions. This reclassification had no effect on net assets.
NOTE I
Legal Proceedings
On October 2, 2003, a purported class action complaint entitled Hindo, et al. v. AllianceBernstein Growth & Income Fund, et al. (“Hindo Complaint”) was filed against the Adviser, Alliance Capital Management Holding L.P. (“Alliance Holding”), Alliance Capital Management Corporation, AXA Financial, Inc., the AllianceBernstein Funds, certain officers of the Adviser (“AllianceBernstein defendants”), and certain other unaffiliated defendants, as well as unnamed Doe defendants. The Hindo Complaint was filed in the United States District Court for the Southern District of New York by alleged shareholders of two of the AllianceBernstein Funds. The Hindo Complaint alleges that certain of the
| ALLIANCEBERNSTEIN GREATER CHINA ’97 FUND • | 23 |
Notes to Financial Statements
AllianceBernstein defendants failed to disclose that they improperly allowed certain hedge funds and other unidentified parties to engage in “late trading” and “market timing” of AllianceBernstein Fund securities, violating Sections 11 and 15 of the Securities Act, Sections 10(b) and 20(a) of the Exchange Act and Sections 206 and 215 of the Advisers Act. Plaintiffs seek an unspecified amount of compensatory damages and rescission of their contracts with the Adviser, including recovery of all fees paid to the Adviser pursuant to such contracts.
Following October 2, 2003, 43 additional lawsuits making factual allegations generally similar to those in the Hindo Complaint were filed in various federal and state courts against the Adviser and certain other defendants. All state court actions against the Adviser either were voluntarily dismissed or removed to federal court. On February 20, 2004, the Judicial Panel on Multidistrict Litigation transferred all federal actions to the United States District Court for the District of Maryland (the “Mutual Fund MDL”). On September 29, 2004, plaintiffs filed consolidated amended complaints with respect to four claim types: mutual fund shareholder claims; mutual fund derivative claims; derivative claims brought on behalf of Alliance Holding; and claims brought under ERISA by participants in the Profit Sharing Plan for Employees of the Adviser. All four complaints include substantially identical factual allegations, which appear to be based in large part on the Order of the SEC dated December 18, 2003 as amended and restated January 15, 2004 (“SEC Order”) and the New York State Attorney General Assurance of Discontinuance dated September 1, 2004 (“NYAG Order”)
On April 21, 2006, the Adviser and attorneys for the plaintiffs in the mutual fund shareholder claims, mutual fund derivative claims, and ERISA claims entered into a confidential memorandum of understanding (“MOU”) containing their agreement to settle these claims. The agreement will be documented by a stipulation of settlement and will be submitted for court approval at a later date. The settlement amount ($30 million), which the Adviser previously accrued and disclosed, has been disbursed. The derivative claims brought on behalf of Alliance Holding, in which plaintiffs seek an unspecified amount of damages, remain pending.
On April 11, 2005, a complaint entitled The Attorney General of the State of West Virginia v. AIM Advisors, Inc., et al. (“WVAG Complaint”) was filed against the Adviser, Alliance Holding, and various unaffiliated defendants. The WVAG Complaint was filed in the Circuit Court of Marshall County, West Virginia by the Attorney General of the State of West Virginia. The WVAG Complaint makes factual allegations generally similar to those in the Hindo Complaint. On October 19, 2005, the WVAG Complaint was transferred to the Mutual Fund MDL. On August 30, 2005, the West Virginia Securities Commissioner signed a Summary Order to Cease and Desist, and Notice of Right to Hearing addressed to the Adviser and Alliance Holding. The Summary Order claims that the Adviser and Alliance Holding violated the West Virginia Uniform Securities Act, and makes factual allegations generally similar to those in the Commission Order and the NYAG Order. On January 25, 2006, the Adviser and Alliance Holding
| 24 | • ALLIANCEBERNSTEIN GREATER CHINA ’97 FUND |
Notes to Financial Statements
moved to vacate the Summary Order. In early September 2006, the court denied this motion, and the Supreme Court of Appeals in West Virginia denied the defendants’ petition for appeal. On September 22, 2006, the Adviser and Alliance Holding filed an answer and motion to dismiss the Summary Order with the West Virginia Securities Commissioner.
It is possible that these matters and/or other developments resulting from these matters could result in increased redemptions of the AllianceBernstein Mutual Funds’ shares or other adverse consequences to the AllianceBernstein Mutual Funds. This may require the AllianceBernstein Mutual Funds to sell investments held by those funds to provide for sufficient liquidity and could also have an adverse effect on the investment performance of the AllianceBernstein Mutual Funds. However, the Adviser believes that these matters are not likely to have a material adverse effect on its ability to perform advisory services relating to the AllianceBernstein Mutual Funds.
NOTE J
Recent Accounting Pronouncements
On July 13, 2006, the Financial Accounting Standards Board (“FASB”) released FASB Interpretation No. 48 “Accounting for Uncertainty in Income Taxes” (“FIN 48”). FIN 48 provides guidance for how uncertain tax positions should be recognized, measured, presented and disclosed in the financial statements. FIN 48 requires the evaluation of tax positions taken or expected to be taken in the course of preparing a fund’s tax returns to determine whether the tax positions are “more-likely-than-not” of being sustained by the applicable tax authority. Tax positions not deemed to meet the more-likely-than-not threshold would be recorded in the current period. Adoption of FIN 48 is required for fiscal years beginning after December 15, 2006 and is to be applied to all open tax years as of the effective date. On December 22, 2006, the Securities and Exchange Commission notified the industry that the implementation of FIN 48 by registered investment companies could be delayed until the last business day of the first required financial statement reporting period for fiscal years beginning after December 15, 2006. At this time, management is evaluating the implications of FIN 48 and its impact on the financial statements has not yet been determined.
On September 20, 2006, the FASB released Statement of Financial Accounting Standards No. 157 “Fair Value Measurements” (“FAS 157”). FAS 157 establishes an authoritative definition of fair value, sets out a framework for measuring fair value, and requires additional disclosures about fair-value measurements. The fair value, and requires additional disclosures about fair-value measurements. The application of FAS 157 is required for fiscal years beginning after November 15, 2007 and interim periods within those fiscal years. At this time, management is evaluating the implications of FAS 157 and its impact on the financial statements has not yet been determined.
| ALLIANCEBERNSTEIN GREATER CHINA ’97 FUND • | 25 |
Notes to Financial Statements
FINANCIAL HIGHLIGHTS
Selected Data For A Share Of Capital Stock Outstanding Throughout Each Period
| Class A | |||||||||||||||
| Year Ended July 31, | |||||||||||||||
| 2007 | 2006 | 2005 | 2004 | 2003 | |||||||||||
Net asset value, beginning of period | $16.19 | $ 13.16 | $ 10.75 | $ 8.82 | $ 7.55 | ||||||||||
| Income From Investment Operations | |||||||||||||||
Net investment income (loss)(a)(b) | .04 | .12 | .07 | (.04 | )(c) | .04 | |||||||||
Net realized and unrealized gain on investment and foreign currency transactions | 10.72 | 2.98 | 2.34 | 2.01 | 1.32 | ||||||||||
Net increase in net asset value from operations | 10.76 | 3.10 | 2.41 | 1.97 | 1.36 | ||||||||||
Less: Dividends and Distributions | |||||||||||||||
Dividends from net investment income | (.10 | ) | (.06 | ) | – 0 | – | (.04 | ) | (.09 | ) | |||||
Distributions from net realized gains on investment and foreign currency transactions | (1.07 | ) | (.01 | ) | – 0 | – | – 0 | – | – 0 | – | |||||
Total dividends and | (1.17 | ) | (.07 | ) | – 0 | – | (.04 | ) | (.09 | ) | |||||
Net asset value, end of period | $ 25.78 | $ 16.19 | $ 13.16 | $ 10.75 | $ 8.82 | ||||||||||
| Total Return | |||||||||||||||
Total investment return based on net asset value(d) | 69.53 | % | 23.79 | % | 22.42 | % | 22.30 | % | 18.35 | % | |||||
| Ratios/Supplemental Data | |||||||||||||||
Net assets, end of period | $62,614 | $26,050 | $20,163 | $17,719 | $3,958 | ||||||||||
Ratio to average net assets of: | |||||||||||||||
Expenses, net of waivers/reimbursements | 1.63 | % | 2.02 | %(e) | 2.32 | %(f) | 2.38 | % | 2.50 | % | |||||
Expenses, before waivers/reimbursements | 1.71 | % | 2.17 | %(e) | 2.52 | % | 2.94 | % | 9.24 | % | |||||
Net investment income (loss)(b) | .19 | % | .85 | %(e) | .60 | % | (.37 | )%(c) | .58 | % | |||||
Portfolio turnover rate | 43 | % | 48 | % | 42 | % | 89 | % | 102 | % | |||||
See footnote summary on page 30.
| 26 | • ALLIANCEBERNSTEIN GREATER CHINA ’97 FUND |
Financial Highlights
Selected Data For A Share Of Capital Stock Outstanding Throughout Each Period
| Class B | |||||||||||||||
| Year Ended July 31, | |||||||||||||||
| 2007 | 2006 | 2005 | 2004 | 2003 | |||||||||||
Net asset value, beginning of period | $ 15.41 | $ 12.56 | $ 10.33 | $ 8.52 | $ 7.30 | ||||||||||
| Income From Investment Operations | |||||||||||||||
Net investment loss(a)(b) | (.11 | ) | – 0 | – | (.02 | ) | (.12 | )(c) | (.01 | ) | |||||
Net realized and unrealized gain on investment and foreign currency transactions | 10.20 | 2.86 | 2.25 | 1.95 | 1.27 | ||||||||||
Net increase in net asset value from operations | 10.09 | 2.86 | 2.23 | 1.83 | 1.26 | ||||||||||
Less: Dividends and Distributions | |||||||||||||||
Dividends from net investment income | – 0 | – | – 0 | – | – 0 | – | (.02 | ) | (.04 | ) | |||||
Distributions from net realized gains on investment and foreign currency transactions | (1.07 | ) | (.01 | ) | – 0 | – | – 0 | – | – 0 | – | |||||
Total dividends and | (1.07 | ) | (.01 | ) | – 0 | – | (.02 | ) | (.04 | ) | |||||
Net asset value, end of period | $ 24.43 | $ 15.41 | $ 12.56 | $ 10.33 | $ 8.52 | ||||||||||
| Total Return | |||||||||||||||
Total investment return based on net asset value(d) | 68.40 | % | 22.84 | % | 21.59 | % | 21.41 | % | 17.32 | % | |||||
| Ratios/Supplemental Data | |||||||||||||||
Net assets, end of period (000’s omitted) | $26,697 | $16,697 | $14,676 | $12,872 | $4,632 | ||||||||||
Ratio to average net assets of: | |||||||||||||||
Expenses, net of waivers/reimbursements | 2.36 | % | 2.79 | %(e) | 3.04 | %(f) | 3.18 | % | 3.20 | % | |||||
Expenses, before waivers/reimbursements | 2.45 | % | 2.94 | %(e) | 3.24 | % | 3.79 | % | 9.98 | % | |||||
Net investment loss(b) | (.54 | )% | (.02 | )%(e) | (.13 | )% | (1.11 | )%(c) | (.11 | )% | |||||
Portfolio turnover rate | 43 | % | 48 | % | 42 | % | 89 | % | 102 | % | |||||
See footnote summary on page 30.
| ALLIANCEBERNSTEIN GREATER CHINA ’97 FUND • | 27 |
Financial Highlights
Selected Data For A Share Of Capital Stock Outstanding Throughout Each Period
| Class C | |||||||||||||||
| Year Ended July 31, | |||||||||||||||
| 2007 | 2006 | 2005 | 2004 | 2003 | |||||||||||
Net asset value, beginning of period | $15.38 | $ 12.53 | $ 10.30 | $ 8.50 | $ 7.30 | ||||||||||
| Income From Investment Operations | |||||||||||||||
Net investment income (loss)(a)(b) | (.10 | ) | – 0 | – | (.01 | ) | (.12 | )(c) | (.01 | ) | |||||
Net realized and unrealized gain on investment and foreign currency transactions | 10.16 | 2.86 | 2.24 | 1.94 | 1.25 | ||||||||||
Net increase in net asset value | 10.06 | 2.86 | 2.23 | 1.82 | 1.24 | ||||||||||
Less: Dividends and Distributions | |||||||||||||||
Dividends from net investment income | – 0 | – | – 0 | – | – 0 | – | (.02 | ) | (.04 | ) | |||||
Distributions from net realized gains on investment and foreign currency transactions | (1.07 | ) | (.01 | ) | – 0 | – | – 0 | – | – 0 | – | |||||
Total dividends and | (1.07 | ) | (.01 | ) | – 0 | – | (.02 | ) | (.04 | ) | |||||
Net asset value, end of period | $ 24.37 | $ 15.38 | $ 12.53 | $ 10.30 | $ 8.50 | ||||||||||
| Total Return | |||||||||||||||
Total investment return based on net asset value(d) | 68.34 | % | 22.89 | % | 21.65 | % | 21.34 | % | 17.05 | % | |||||
| Ratios/Supplemental Data | |||||||||||||||
Net assets, end of period | $31,363 | $15,266 | $12,838 | $10,978 | $4,856 | ||||||||||
Ratio to average net assets of: | |||||||||||||||
Expenses, net of waivers/reimbursements | 2.34 | % | 2.75 | %(e) | 3.02 | %(f) | 3.15 | % | 3.20 | % | |||||
Expenses, before waivers/reimbursements | 2.42 | % | 2.91 | %(e) | 3.22 | % | 3.75 | % | 10.19 | % | |||||
Net investment income (loss)(b) | (.50 | )% | .02 | %(e) | (.10 | )% | (1.07 | )%(c) | (.15 | )% | |||||
Portfolio turnover rate | 43 | % | 48 | % | 42 | % | 89 | % | 102 | % | |||||
See footnote summary on page 30.
| 28 | • ALLIANCEBERNSTEIN GREATER CHINA ’97 FUND |
Financial Highlights
Selected Data For A Share Of Capital Stock Outstanding Throughout Each Period
| Advisor Class | |||||||||||||||
| Year Ended July 31, | |||||||||||||||
| 2007 | 2006 | 2005 | 2004 | 2003 | |||||||||||
Net asset value, beginning of period | $ 16.52 | $ 13.43 | $ 10.93 | $ 8.94 | $ 7.66 | ||||||||||
| Income From Investment Operations | |||||||||||||||
Net investment income (loss)(a)(b) | .07 | .22 | .07 | (.02 | )(c) | .08 | |||||||||
Net realized and unrealized gain on investment and foreign currency transactions | 10.98 | 2.98 | 2.43 | 2.05 | 1.31 | ||||||||||
Net increase in net asset value from operations | 11.05 | 3.20 | 2.50 | 2.03 | 1.39 | ||||||||||
Less: Dividends and | |||||||||||||||
Dividends from net investment income | (.14 | ) | (.10 | ) | – 0 | – | (.04 | ) | (.11 | ) | |||||
Distributions from net realized gains on investment and foreign currency transactions | (1.07 | ) | (.01 | ) | – 0 | – | – 0 | – | – 0 | – | |||||
Total dividends and | (1.21 | ) | (.11 | ) | – 0 | – | (.04 | ) | (.11 | ) | |||||
Net asset value, end of period | $ 26.36 | $ 16.52 | $ 13.43 | $ 10.93 | $ 8.94 | ||||||||||
| Total Return | |||||||||||||||
Total investment return based on net asset value(d) | 70.01 | % | 24.11 | % | 22.87 | % | 22.72 | % | 18.55 | % | |||||
| Ratios/Supplemental Data | |||||||||||||||
Net assets, end of period (000’s omitted) | $10,013 | $4,134 | $2,827 | $1,379 | $309 | ||||||||||
Ratio to average net assets of: | |||||||||||||||
Expenses, net of waivers/reimbursements | 1.32 | % | 1.74 | %(e) | 2.00 | %(f) | 2.14 | % | 2.20 | % | |||||
Expenses, before waivers/reimbursements | 1.40 | % | 1.90 | %(e) | 2.20 | % | 2.71 | % | 8.69 | % | |||||
Net investment income (loss)(b) | .35 | % | 1.54 | %(e) | .55 | % | (.13 | )%(c) | 1.14 | % | |||||
Portfolio turnover rate | 43 | % | 48 | % | 42 | % | 89 | % | 102 | % | |||||
See footnote summary on page 30.
| ALLIANCEBERNSTEIN GREATER CHINA ’97 FUND • | 29 |
Financial Highlights
| (a) | Based on average shares outstanding. |
| (b) | Net of expenses waived/reimbursed by the Adviser. |
| (c) | Net of expenses waived by the Transfer Agent. |
| (d) | Total investment return is calculated assuming an initial investment made at the net asset value at the beginning of the period, reinvestment of all dividends and distributions at net asset value during the period, and redemption on the last day of the period. Initial sales charges or contingent deferred sales charges are not reflected in the calculation of total investment return. Total return does not reflect the deduction of taxes that a shareholder would pay on fund distributions or the redemption of fund shares. Total investment return calculated for a period of less than one year is not annualized. |
| (e) | The ratio includes expenses attributable to costs of proxy solicitation. |
| (f) | Ratios reflect expenses grossed up for expense offset arrangement with the Transfer Agent. |
| For the period shown below, the net expense ratios were as follows: |
| Year Ended July 31, 2005 | |||
Class A | 2.31 | % | |
Class B | 3.04 | % | |
Class C | 3.02 | % | |
Advisor Class | 2.00 | % |
| 30 | • ALLIANCEBERNSTEIN GREATER CHINA ’97 FUND |
Financial Highlights
REPORT OF INDEPENDENT REGISTERED
PUBLIC ACCOUNTING FIRM
To the Shareholders and Board of Directors of AllianceBernstein Greater China ‘97 Fund, Inc.
We have audited the accompanying statement of assets and liabilities of AllianceBernstein Greater China ‘97 Fund, Inc., including the portfolio of investments, as of July 31, 2007, and the related statement of operations for the year then ended, the statements of changes in net assets for each of the two years in the period then ended, and the financial highlights for each of the five years in the period then ended. These financial statements and financial highlights are the responsibility of the Fund’s management. Our responsibility is to express an opinion on these financial statements and financial highlights based on our audits.
We conducted our audits in accordance with the standards of the Public Company Accounting Oversight Board (United States). Those standards require that we plan and perform the audit to obtain reasonable assurance about whether the financial statements and financial highlights are free of material misstatement. We were not engaged to perform an audit of the Fund’s internal control over financial reporting. Our audit included consideration of internal control over financial reporting as a basis for designing audit procedures that are appropriate in the circumstances, but not for the purpose of expressing an opinion on the effectiveness of the Fund’s internal control over financial reporting. Accordingly, we express no such opinion. An audit includes examining, on a test basis, evidence supporting the amounts and disclosures in the financial statements and financial highlights. Our procedures included confirmation of securities owned as of July 31, 2007, by correspondence with the custodian and others. An audit also includes assessing the accounting principles used and significant estimates made by management, as well as evaluating the overall financial statement presentation. We believe that our audits provide a reasonable basis for our opinion.
In our opinion, the financial statements and financial highlights referred to above present fairly, in all material respects, the financial position of AllianceBernstein Greater China ‘97 Fund, Inc. at July 31, 2007, the results of its operations for the year then ended, the changes in its net assets for each of the two years in the period then ended, and the financial highlights for each of the five years in the period then ended, in conformity with U.S. generally accepted accounting principles.

New York, New York
September 19, 2007
| ALLIANCEBERNSTEIN GREATER CHINA ’97 FUND • | 31 |
Report of Independent Registered Public Accounting Firm
TAX INFORMATION (unaudited)
For the fiscal year ended July 31, 2007, certain dividends paid by the Fund may be subject to a maximum tax rate of 15%, as provided for by the Jobs and Growth Tax Relief Reconciliation Act of 2003. The Fund designates $224,958 of its ordinary dividends paid during its fiscal year as qualified dividend income, which is taxed at a maximum rate of 15%. The Fund also designates $4,604,571 as long-term capital gain dividends. The Fund also designates $72,479 as foreign tax credit with the associated foreign gross income of $1,675,749.
The information and distributions reported herein may differ from the information and distributions taxable to the shareholders for the calendar year ended December 31, 2007. Complete information will be computed and reported in conjunction with your 2007 Form 1099-DIV.
| 32 | • ALLIANCEBERNSTEIN GREATER CHINA ’97 FUND |
Tax Information
BOARD OF DIRECTORS
William H. Foulk, Jr.(1), Chairman
David H. Dievler(1)
OFFICERS
Marc O. Mayer, President and Chief Executive Officer
Philip L. Kirstein, Senior Vice President and Independent Compliance Officer
Manish Singhai(2), Vice President
Vernon Yu(2), Vice President
Emilie D. Wrapp, Secretary
Joseph J. Mantineo, Treasurer and Chief Financial Officer
Vincent S. Noto, Controller
| Principal Underwriter | Transfer Agent | |
| AllianceBernstein Investments, Inc. | AllianceBernstein Investor Services, Inc. | |
| 1345 Avenue of the Americas | P.O. Box 786003 | |
| New York, NY 10105 | San Antonio, TX 78278-6003 | |
Toll-Free (800) 221-5672
| ||
| Custodian | Independent Registered Public | |
| Brown Brothers Harriman & Co. | Accounting Firm | |
| 40 Water Street | Ernst & Young LLP | |
| Boston, MA 02109 | 5 Times Square | |
| New York, NY 10036 | ||
| Legal Counsel | ||
| Seward & Kissel LLP | ||
| One Battery Park Plaza | ||
| New York, NY 10004 |
| (1) | Member of the Audit Committee, the Governance and Nominating Committee and the Independent Directors Committee. |
| (2) | The management of and investment decisions for the Fund’s portfolio are made by the Global Emerging Market Growth Research Team. Mr. Manish Singhai and Mr. Vernon Yu are the investment professionals with the most significant responsibility for the day-to-day management of the Fund’s portfolio. |
| ALLIANCEBERNSTEIN GREATER CHINA ’97 FUND • | 33 |
Board of Directors
MANAGEMENT OF THE FUND
Board of Directors Information
The business and affairs of the Fund are managed under the direction of the Board of Directors. Certain information concerning the Fund’s Directors is set forth below.
NAME, ADDRESS*, AGE AND (FIRST YEAR ELECTED**) | PRINCIPAL OCCUPATION(S) DURING PAST 5 YEARS | PORTFOLIOS IN FUND COMPLEX OVERSEEN BY DIRECTOR | OTHER DIRECTORSHIPS HELD BY DIRECTOR | |||
| INTERESTED DIRECTOR | ||||||
Chairman of the Board William H. Foulk, Jr., #, + 75 | Investment Adviser and an Independent Consultant. He was formerly Senior Manager of Barrett Associates, Inc., a registered investment adviser, with which he had been associated since prior to 2002. He was formerly Deputy Comptroller and Chief Investment Officer of the State of New York and, prior thereto, Chief Investment Officer of the New York Bank for Savings. | 110 | None | |||
David H. Dievler, # 77 | Independent Consultant. Until December 1994, he was Senior Vice President of AllianceBernstein Corporation (“AB Corp.”, formerly Alliance Capital Management Corporation) responsible for mutual fund administration. Prior to joining AB Corp. in 1984, he was Chief Financial Officer of Eberstadt Asset Management since 1968. Prior to that, he was a Senior Manager at Price Waterhouse & Co. Member of the American Institute of Certified Public Accountants since 1953. | 109 | None | |||
| * | The address for each of the Fund’s disinterested Directors is AllianceBernstein L.P., c/o Philip L. Kirstein, 1345 Avenue of the Americas, New York, NY 10105. |
| ** | There is no stated term of office for the Fund’s Directors. |
| # | Member of the Audit Committee, the Governance and Nominating Committee and the Independent Directors Committee. |
| + | Member of the Fair Value Pricing Committee. |
| 34 | • ALLIANCEBERNSTEIN GREATER CHINA ’97 FUND |
Management of the Fund
Officer Information
Certain information concerning the Fund’s Officers is listed below.
| NAME, ADDRESS* AND AGE | POSITION(S) HELD WITH FUND | PRINCIPAL OCCUPATION DURING PAST 5 YEARS** | ||
Marc O. Mayer,** 49 | President and Chief Executive Officer | Executive Vice President of the Adviser since 2001 and Executive Managing Director of AllianceBernstein Investments, Inc. (“ABI”) since 2003; prior thereto, he was head of AllianceBernstein Institutional Investments, a unit of the Adviser from 2001-2003. Prior thereto, Chief Executive Officer of Sanford C. Bernstein & Co., LLC (institutional research and brokerage arm of Bernstein & Co. LLC) (“SCB & Co.”) and its predecessor since prior to 2002. | ||
Philip L. Kirstein, 62 | Senior Vice President and Independent Compliance Officer | Senior Vice President and Independent Compliance Officer of the AllianceBernstein Funds, with which he has been associated since October 2004. Prior thereto, he was Of Counsel to Kirkpatrick & Lockhart, LLP from October 2003 to October 2004, and General Counsel of Merrill Lynch Investment Managers, L.P. since prior to 2002 until March 2003. | ||
Manish Singhai, 36 | Vice President | Vice President of the Adviser,** and an Emerging Markets Telecoms and Utility Analyst and Portfolio Manager since prior to 2002. | ||
Vernon Yu, 38 | Vice President | Vice President and Research Analyst of AllianceBernstein/Singapore** since January 2005. Prior thereto, he was a Senior Investment Manager with HSBC Asset Management since prior to 2002. | ||
Emilie D. Wrapp, 51 | Secretary | Senior Vice President, Assistant General Counsel and Assistant Secretary of ABI,** with which she has been associated since prior to 2002. | ||
Joseph J. Mantineo, 48 | Treasurer and Chief Financial Officer | Senior Vice President of ABIS,** with which he has been associated since prior to 2002. |
| ALLIANCEBERNSTEIN GREATER CHINA ’97 FUND • | 35 |
Management of the Fund
| NAME, ADDRESS* AND AGE | POSITION(S) HELD WITH FUND | PRINCIPAL OCCUPATION DURING PAST 5 YEARS** | ||
Vincent S. Noto, 42 | Controller | Vice President of ABIS**, with which he has been associated since prior to 2002. |
| * | The address for each of the Fund’s Officers is 1345 Avenue of the Americas, New York, NY 10105. |
| ** | The Adviser, ABI, ABIS, AllianceBernstein/Singapore, and SCB & Co. are affiliates of the Fund. |
| The Fund’s Statement of Additional Information (“SAI”) has additional information about the Fund’s Directors and Officers and is available without charge upon request. Contact your financial representative or AllianceBernstein at 1-800-227-4618 for a free prospectus or SAI. |
| 36 | • ALLIANCEBERNSTEIN GREATER CHINA ’97 FUND |
Management of the Fund
Information Regarding the Review and Approval of the Fund’s Advisory Agreement
The disinterested directors (the “directors”) of AllianceBernstein Greater China ‘97 Fund, Inc. (the “Fund”) unanimously approved the continuance of the Fund’s Advisory Agreement with the Adviser at a meeting held on May 1-3, 2007.
Prior to approval of the continuance of the Advisory Agreement, the directors had requested from the Adviser, and received and evaluated, extensive materials. They reviewed the proposed continuance of the Advisory Agreement with the Adviser and with experienced counsel who are independent of the Adviser who advised on the relevant legal standards. The directors also reviewed an independent evaluation prepared by the Fund’s Senior Officer (who is also the Fund’s Independent Compliance Officer) of the reasonableness of the advisory fees in the Advisory Agreement wherein the Senior Officer concluded that the contractual fees for the Fund were reasonable. The directors also discussed the proposed continuance in private sessions with counsel and the Fund’s Senior Officer.
The directors considered their knowledge of the nature and quality of the services provided by the Adviser to the Fund gained from their experience as directors or trustees of most of the registered investment companies advised by the Adviser, their overall confidence in the Adviser’s integrity and competence they have gained from that experience, the Adviser’s initiative in identifying and raising potential issues with the directors and its responsiveness, frankness and attention to concerns raised by the directors in the past, including the Adviser’s willingness to consider and implement organizational and operational changes designed to improve investment results and the services provided to the AllianceBernstein Funds. The directors noted that they have four regular meetings each year, at each of which they receive presentations from the Adviser on the investment results of the Fund and review extensive materials and information presented by the Adviser.
The directors also considered all other factors they believed relevant, including the specific matters discussed below. In their deliberations, the directors did not identify any particular information that was all-important or controlling, and different directors may have attributed different weights to the various factors. The directors determined that the selection of the Adviser to manage the Fund and the overall arrangements between the Fund and the Adviser, as provided in the Advisory Agreement, including the advisory fee, were fair and reasonable in light of the services performed, expenses incurred and such other matters as the directors considered relevant in the exercise of their business judgment. The material factors and conclusions that formed the basis for the directors’ determinations included the following:
Nature, Extent and Quality of Services Provided
The directors considered the scope and quality of services provided by the Adviser under the Advisory Agreement, including the quality of the investment
| ALLIANCEBERNSTEIN GREATER CHINA ’97 FUND • | 37 |
research capabilities of the Adviser and the other resources it has dedicated to performing services for the Fund. They also noted the professional experience and qualifications of the Fund’s portfolio management team and other senior personnel of the Adviser. The directors also considered that the Advisory Agreement provides that the Fund will reimburse the Adviser for the cost to it of providing certain clerical, accounting, administrative and other services provided at the Fund’s request by employees of the Adviser or its affiliates. Requests for these reimbursements are approved by the directors on a quarterly basis and (to the extent requested and paid) result in a higher rate of total compensation from the Fund to the Adviser than the fee rates stated in the Fund’s Advisory Agreement. The directors noted that the Adviser had waived reimbursement payments from the Fund in the Fund’s last fiscal year. The directors noted that the methodology used to determine the reimbursement amounts had been reviewed by an independent consultant retained by the Fund’s Senior Officer. The quality of administrative and other services, including the Adviser’s role in coordinating the activities of the Fund’s other service providers, also were considered. The directors concluded that, overall, they were satisfied with the nature, extent and quality of services provided to the Fund under the Advisory Agreement.
Costs of Services Provided and Profitability
The directors reviewed a schedule of the revenues, expenses and related notes indicating the profitability of the Fund to the Adviser for calendar years 2005 and 2006 that had been prepared with an updated expense allocation methodology arrived at in consultation with an independent consultant retained by the Fund’s Senior Officer. The directors reviewed the assumptions and methods of allocation used by the Adviser in preparing fund-specific profitability data and noted that there are a number of potentially acceptable allocation methodologies for information of this type. The directors noted that the profitability information reflected all revenues and expenses of the Adviser’s relationship with the Fund, including those relating to its subsidiaries which provide transfer agency, distribution and brokerage services to the Fund. The directors recognized that it is difficult to make comparisons of profitability from fund advisory contracts because comparative information is not generally publicly available and is affected by numerous factors. The directors focused on the profitability of the Adviser’s relationship with the Fund before taxes and distribution expenses. The directors concluded that they were satisfied that the Adviser’s level of profitability from its relationship with the Fund was not unreasonable.
Fall-Out Benefits
The directors considered the benefits to the Adviser and its affiliates from their relationships with the Fund other than the fees and expense reimbursements payable under the Advisory Agreement, including but not limited to benefits relating to soft dollar arrangements (whereby the Adviser receives brokerage and research services from many of the brokers and dealers that execute purchases and sales of securities on behalf of its clients on an agency basis), 12b-1 fees and sales charges received by the Fund’s principal underwriter (which is a wholly owned
| 38 | • ALLIANCEBERNSTEIN GREATER CHINA ’97 FUND |
subsidiary of the Adviser) in respect of certain classes of the Fund’s shares, transfer agency fees paid by the Fund to a wholly owned subsidiary of the Adviser, and brokerage commissions paid by the Fund to brokers affiliated with the Adviser. The directors recognized that the Adviser’s profitability would be somewhat lower without these benefits. The directors understood that the Adviser also might derive reputational and other benefits from its association with the Fund.
Investment Results
In addition to the information reviewed by the directors in connection with the meeting, the directors receive detailed comparative performance information for the Fund at each regular Board meeting during the year. At the meeting, the directors reviewed information prepared by Lipper showing the comparative performance of the Class A Shares of the Fund as compared to a group of funds selected by Lipper (the “Performance Group”) and as compared to a broader array of funds selected by Lipper (the “Performance Universe”), and information prepared by the Adviser showing performance of the Class A Shares as compared to the Morgan Stanley Capital International Golden Dragon Index (Net) (the “Index”), in each case for periods ended December 31, 2006 over the 1-, 3- and 5-year periods. The directors noted that in the Performance Group comparison the Fund was in the 4th quintile in the 1-year period, 4 out of 4 in the 3-year period and 3 out of 3 in the 5-year period, and in the Performance Universe comparison the Fund was in the 4th quintile in the 1- and 5-year periods and 5th quintile in the 3-year period. The comparative information showed that the Fund outperformed the Index in all periods reviewed. The directors noted the small number of funds in the Performance Group, the Fund’s outperformance of the Index and its attractive absolute returns. Based on their review, the directors concluded that the Fund’s relative performance over time had been satisfactory.
Advisory Fees and Other Expenses
The directors considered the advisory fee rate paid by the Fund to the Adviser and information prepared by Lipper concerning fee rates paid by other funds in the same Lipper category as the Fund at a common asset level. The directors recognized that it is difficult to make comparisons of advisory fees because there are variations in the services that are included in the fees paid by other funds.
The Adviser informed the directors that there are no institutional products managed by it which have a substantially similar investment style as the Fund. The directors reviewed information in the Adviser’s Form ADV and noted that it charged institutional clients lower fees for advising comparably sized accounts using strategies that differ from those of the Fund but which involve investments in securities of the same type that the Fund invests in (i.e., equity securities).
The Adviser reviewed with the directors the significantly greater scope of the services it provides to the Fund relative to institutional clients. The Adviser also noted that since mutual funds are constantly issuing and redeeming shares, they are more difficult to manage than an institutional account, where the assets are
| ALLIANCEBERNSTEIN GREATER CHINA ’97 FUND • | 39 |
relatively stable. In light of these facts, the directors did not place significant weight on these fee comparisons.
The directors also considered the total expense ratio of the Class A shares of the Fund in comparison to the fees and expenses of funds within two comparison groups created by Lipper: an Expense Group and an Expense Universe. Lipper described an Expense Group as a representative sample of funds comparable to the Fund and an Expense Universe as a broader group, consisting of all funds in the Fund’s investment classification/objective with a similar load type as the Fund. The Class A expense ratio of the Fund was based on the Fund’s latest fiscal year expense ratio. The directors recognized that the expense ratio information for the Fund potentially reflected on the Adviser’s provision of services, as the Adviser is responsible for coordinating services provided to the Fund by others. The directors noted that it was likely that the expense ratios of some funds in the Fund’s Lipper category were lowered by waivers or reimbursements by those funds’ investment advisers, which in some cases were voluntary and perhaps temporary.
The directors noted that the Fund’s at approximate current size contractual advisory effective fee rate of 75 basis points was lower than the Expense Group median. The directors noted that in the Fund’s latest fiscal year, the administrative expense reimbursement of 15 basis points had been waived by the Adviser. The directors also noted that the Fund’s total expense ratio, which had been capped by the Adviser (although the expense ratio was currently lower than the cap) was slightly higher than the Expense Group median and the same as the Expense Universe median. The directors concluded that the Fund’s expense ratio was satisfactory.
Economies of Scale
The directors noted that the advisory fee schedule for the Fund contains breakpoints that reduce the fee rates on assets above specified levels. The directors also considered presentations by an independent consultant discussing economies of scale in the mutual fund industry and for the AllianceBernstein Funds. The directors believe that economies of scale may be realized (if at all) by the Adviser across a variety of products and services, and not only in respect of a single fund. The directors noted that there is no established methodology for establishing breakpoints that give effect to the fund-specific services provided by a fund’s adviser and to the economies of scale that an adviser may realize in its overall mutual fund business or those components of it which directly or indirectly affect a fund’s operations. The directors observed that in the mutual fund industry as a whole, as well as among funds similar to the Fund, there is no uniformity or pattern in the fees and asset levels at which breakpoints (if any) apply. The directors also noted that the advisory agreements for many funds do not have breakpoints at all. Having taken these factors into account, the directors concluded that the Fund’s breakpoint arrangements would result in a sharing of economies of scale in the event of a very significant increase in the Fund’s net assets.
| 40 | • ALLIANCEBERNSTEIN GREATER CHINA ’97 FUND |
THE FOLLOWING IS NOT PART OF THE SHAREHOLDER REPORT OR THE FINANCIAL STATEMENTS
SUMMARY OF SENIOR OFFICER’S EVALUATION OF INVESTMENT ADVISORY AGREEMENT1
The following is a summary of the evaluation of the Investment Advisory Agreement between AllianceBernstein L.P. (the “Adviser”) and AllianceBernstein Greater China ‘97 Fund, Inc. (the “Fund”).2 The evaluation of the Investment Advisory Agreement was prepared by Philip L. Kirstein, the Senior Officer of the Fund, for the Trustees of the Fund, as required by an August 2004 agreement between the Adviser and the New York State Attorney General (the “NYAG”). The Senior Officer’s evaluation of the Investment Advisory Agreement is not meant to diminish the responsibility or authority of the Board of Directors of the Fund to perform its duties pursuant to Section 15 of the Investment Company Act of 1940 (the “40 Act”) and applicable state law. The purpose of the summary is to provide shareholders with a synopsis of the independent evaluation of the reasonableness of the advisory fees proposed to be paid by the Fund which was provided to the Directors in connection with their review of the proposed approval of the continuance of the Investment Advisory Agreement. The Senior Officer’s evaluation considered the following factors:
| 1. | Advisory fees charged to institutional and other clients of the Adviser for like services; |
| 2. | Advisory fees charged by other mutual fund companies for like services; |
| 3. | Costs to the Adviser and its affiliates of supplying services pursuant to the advisory agreement, excluding any intra-corporate profit; |
| 4. | Profit margins of the Adviser and its affiliates from supplying such services; |
| 5. | Possible economies of scale as the Fund grows larger; and |
| 6. | Nature and quality of the Adviser’s services including the performance of the Fund. |
| 1 | It should be noted that the information in the fee summary was completed on April 23, 2007 and presented to the Board of Directors on May 1-3, 2007. |
| 2 | Future references to the Fund do not include “AllianceBernstein.”. References in the fee summary pertaining to performance and expense ratios refer to the Class A shares of the Fund. |
| ALLIANCEBERNSTEIN GREATER CHINA ’97 FUND • | 41 |
FUND ADVISORY FEES, EXPENSE CAPS, REIMBURSEMENTS & RATIOS
The Adviser proposed that the Fund pay the advisory fee set forth in the table below for receiving the services to be provided pursuant to the Investment Advisory Agreement. The fee schedule below, implemented in January 2004 in consideration of the Adviser’s settlement with the NYAG in December 2003, is based on a master schedule that contemplates eight categories of funds with almost all funds in each category having the same advisory fee schedule.3
| Category | Advisory Fee Based on % of Average Daily Net Assets | Net Assets 02/28/07 ($MIL) | Fund | ||||
| Specialty | 75 bp on 1st $2.5 billion 65 bp on next $2.5 billion 60 bp on the balance | $ | 113.0 | Greater China ‘97 Fund, Inc. | |||
The Adviser is reimbursed as specified in the Investment Advisory Agreement for certain clerical, legal, accounting, administrative and other services provided to the Fund. During the Fund’s most recently completed fiscal year, the Adviser was due to receive $84,000 (0.15% of the Fund’s average daily net assets) for such services but waived the amount in its entirety.
The Adviser has agreed to waive that portion of its management fees and/or reimburse the Fund for that portion of its total operating expenses to the degree necessary to limit the Fund’s expense ratio to the amount set forth below for the Fund’s fiscal year. The waiver is terminable by the Adviser at the end of the Fund’s fiscal year upon at least 60 days written notice prior to the termination date of the undertaking. It should be noted that the Fund was operating below its expense cap as of its most recent fiscal year end; accordingly, the expense limitation undertaking of the Fund was of no effect. Set forth below are the gross expense ratios of the Fund for the most recent semi-annual period:
| Fund | Expense Cap Pursuant to Expense Limitation Undertaking | Gross Expense Ratio (01/31/07)4 | Fiscal Year End | |||||||
| Greater China ‘97 Fund, Inc. | Class A Class B Class C Adv. Class | 2.50 3.20 3.20 2.20 | % % % % | 1.88 2.62 2.60 1.57 | % % % % | July 31 | ||||
I. ADVISORY FEES CHARGED TO INSTITUTIONAL AND OTHER CLIENTS
The advisory fees charged to investment companies which the Adviser manages and sponsors are normally higher than those charged to similar sized institutional accounts, including pension plans and sub-advised investment companies. The fee differential reflects, among other things, different services provided to
| 3 | Most of the AllianceBernstein Mutual Funds, which the Adviser manages, were affected by the Adviser’s settlement with the NYAG. |
| 4 | Annualized. |
| 42 | • ALLIANCEBERNSTEIN GREATER CHINA ’97 FUND |
such clients, and different liabilities assumed. Services provided by the Adviser to the Fund that are not provided to non-investment company clients and sub-advised investment companies include providing office space and personnel to serve as Fund Officers, who among other responsibilities make the certifications required under the Sarbanes–Oxley Act of 2002, and coordinating with and monitoring the Fund’s third party service providers such as Fund counsel, auditors, custodians, transfer agents and pricing services. The accounting, administrative, legal and compliance requirements for the Fund are more costly than those for institutional assets due to the greater complexities and time required for investment companies, although as previously noted, a portion of these expenses are reimbursed by the Fund to the Adviser. Also, retail mutual funds managed by the Adviser are widely held. Servicing the Fund’s investors is more time consuming and labor intensive compared to institutional clients since the Adviser needs to communicate with a more extensive network of financial intermediaries and shareholders. In addition, managing the cash flow of an investment company may be more difficult than managing that of a stable pool of assets, such as an institutional account with little cash movement in either direction, particularly, if a fund is in net redemption and the Adviser is frequently forced to sell securities to raise cash for redemptions. However, managing a fund with positive cash flow may be easier at times than managing a stable pool of assets. Finally, in recent years, investment advisers have been sued by institutional clients and have suffered reputational damage both by the attendant publicity and outcomes other than complete victories. Accordingly, the legal and reputational risks associated with institutional accounts are greater than previously thought, although still not equal to those related to the mutual fund industry.
Notwithstanding the Adviser’s view that managing an investment company is not comparable to managing other institutional accounts because the services provided are different and legal and reputational risks are greater, it is worth considering information regarding the advisory fees charged to institutional accounts with a substantially similar investment style as the Fund. However, with respect to the Fund, the Adviser represented that there is no institutional product that has a substantially similar investment style as the Fund.
The Adviser also manages and sponsors retail mutual funds, which are organized in jurisdictions outside the United States, generally Luxembourg and Japan, and sold to non-United States resident investors. The Adviser charges the following fees for Greater China Portfolio, which is a Luxembourg fund that has a somewhat similar investment style as the Fund:
| Fund | Fee | ||
Greater China Portfolio | |||
Class A5 | 2.00 | % | |
Class I (Institutional) | 1.20 | % |
| 5 | Class A shares of the funds are charged an “all-in” fee, which covers investment advisory services and distribution related services. |
| ALLIANCEBERNSTEIN GREATER CHINA ’97 FUND • | 43 |
The Adviser represented that it does not sub-advise any registered investment company with a substantially similar investment style as the Fund.
| II. | MANAGEMENT FEES CHARGED BY OTHER MUTUAL FUND COMPANIES FOR LIKE SERVICES. |
Lipper, Inc. (“Lipper”), an analytical service that is not affiliated with the Adviser, compared the fees charged to the Fund with fees charged to other investment companies for similar services offered by other investment advisers. Lipper’s analysis included the Fund’s ranking with respect to the proposed management fee relative to the median of the Fund’s Lipper Expense Group (“EG”)6 at the approximate current asset level of the Fund.7
Lipper describes an EG as a representative sample of comparable funds. Lipper’s standard methodology for screening funds to be included in an EG entails the consideration of several fund criteria, including fund type, investment classification/objective, load type and similar 12b-1/non-12b-1 service fees, asset (size) comparability, expense components and attributes. An EG will typically consist of seven to twenty funds.
| Fund | Contractual Management Fee8 | Lipper Group Median | Rank | |||
| Greater China ‘97 Fund, Inc. | 0.750 | 1.250 | 1/5 |
Lipper also analyzed the Fund’s most recently completed fiscal year total expense ratio in comparison to the Fund’s EG and Lipper Expense Universe (“EU”). The EU9 is a broader group compared to the EG, consisting of all funds that have the same investment classification/objective and load type as the subject Fund.
| 6 | It should be noted that Lipper does not consider average account size when constructing EGs. Funds with relatively small average account sizes tend to have higher transfer agent expense ratio than comparable sized funds that have relatively large average account sizes. Note that there are limitations on Lipper expense category data because different funds categorize expenses differently. |
| 7 | The contractual management fee is calculated by Lipper using the Fund’s contractual management fee rate at a hypothetical asset level. The hypothetical asset level is based on the combined net assets of all classes of the Fund, rounded up to the next $25 million. Lipper’s total expense ratio information is based on the most recent annual report except as otherwise noted. A ranking of “1” would mean that the Fund had the lowest effective fee rate in the Lipper peer group. |
| 8 | The contractual management fee does not reflect any expense reimbursements made by the Fund to the Adviser for certain clerical, legal, accounting, administrative and other services. In addition, the contractual management fee would not reflect any advisory fee waiver or expense reimbursement made by the Adviser to the Fund for expense caps that would effectively reduce the actual management fee. |
| 9 | Except for asset (size) comparability, Lipper uses the same criteria for selecting an EG when selecting an EU. Unlike the EG, the EU allows for the same adviser to be represented by more than just one fund. |
| 44 | • ALLIANCEBERNSTEIN GREATER CHINA ’97 FUND |
| Fund | Expense Ratio | Lipper Group Median (%) | Lipper Group Rank | Lipper Universe Median (%) | Lipper Rank | |||||
| Greater China ‘97 Fund, Inc. | 2.020 | 2.003 | 4/5 | 2.020 | 4/7 |
Based on this analysis, the Fund has a more favorable ranking on a management fee basis than on a total expense ratio basis.
| III. | COSTS TO THE ADVISER AND ITS AFFILIATES OF SUPPLYING SERVICES PURSUANT TO THE ADVISORY FEE ARRANGEMENT, EXCLUDING ANY INTRA-CORPORATE PROFIT. |
The Adviser utilizes two profitability reporting systems, which operate independently but are aligned with each other, to estimate the Adviser’s profitability in connection with investment advisory services provided to the Fund. The Senior Officer has retained a consultant to provide independent advice regarding the alignment of the two profitability systems as well as the methodologies and allocations utilized by both profitability systems. See Section IV for additional discussion.
| IV. | PROFIT MARGINS OF THE ADVISER AND ITS AFFILIATES FOR SUPPLYING SUCH SERVICES. |
The Fund’s profitability information, prepared by the Adviser for the Board of Directors, was reviewed by the Senior Officer and the consultant. The Adviser’s profitability from providing investment advisory services to the Fund increased during calendar year 2006, relative to 2005.
In addition to the Adviser’s direct profits from managing the Fund, certain of the Adviser’s affiliates have business relationships with the Fund and may earn a profit from providing other services to the Fund. The courts have referred to this type of business opportunity as “fall-out benefits” to the Adviser and indicated that such benefits should be factored into the evaluation of the total relationship between the Fund and the Adviser. Neither case law nor common business practice precludes the Adviser’s affiliates from earning a reasonable profit on this type of relationship provided the affiliates’ charges and services are competitive. These affiliates provide transfer agent, distribution and brokerage related services to the Fund and receive transfer agent fees, Rule 12b-1 payments, front-end sales loads, contingent deferred sales charges (“CDSC”), and brokerage commissions. In addition, the Adviser benefits from soft dollar arrangements which offset expenses the Adviser would otherwise incur.
AllianceBernstein Investments, Inc. (“ABI”), an affiliate of the Adviser, is the Fund’s principal underwriter. ABI and the Adviser have disclosed in the Fund’s prospectus that they may make revenue sharing payments from their own resources, in addition to resources derived from sales loads and Rule 12b-1 fees,
| 10 | Most recently completed fiscal year end Class A total expense ratio. |
| ALLIANCEBERNSTEIN GREATER CHINA ’97 FUND • | 45 |
to firms that sell shares of the Fund. In 2006, ABI paid approximately 0.044% of the average monthly assets of the AllianceBernstein Mutual Funds or approximately $20.4 million for distribution services and educational support (revenue sharing payments). For 2007, it is anticipated, ABI will pay approximately 0.04% of the average monthly assets of the AllianceBernstein Mutual Funds or approximately $20 million.11 During the Fund’s most recently completed fiscal year, ABI received from the Fund $566, $360,066 and $42,252 in front-end sales charges, Rule 12b-1 and CDSC fees, respectively.
Fees and reimbursements for out of pocket expenses charged by AllianceBernstein Investor Services, Inc. (“ABIS”), the affiliated transfer agent for the Fund, are charged on a per account basis, based on the level of service provided and the class of share held by the account. ABIS also receives a fee per shareholder sub-account for each account maintained by an intermediary on an omnibus basis. ABIS’ after-tax profitability decreased in 2006 in comparison to 2005. During the Fund’s most recently completed fiscal year, ABIS received $63,321 in fees from the Fund.12
The Fund may effect brokerage transactions through the Adviser’s affiliate, Sanford C. Bernstein & Co., LLC (“SCB & Co.”) and/or its U.K. affiliate, Sanford C. Bernstein Limited (“SCB Ltd.”), collectively “SCB,” and pay commissions for such transactions. The Adviser represented that SCB’s profitability from any future business conducted with the Fund would be comparable to the profitability of SCB’s dealings with other similar third party clients. In the ordinary course of business, SCB receives and pays liquidity rebates from electronic communications networks (“ECNs”) derived from trading for its clients. These credits and charges are not being passed onto any SCB client. The Adviser also receives certain soft dollar benefits from brokers that execute agency trades for its clients. These soft dollar benefits reduce the Adviser’s cost of doing business and increase its profitability.
| V. | POSSIBLE ECONOMIES OF SCALE |
An independent consultant, retained by the Senior Officer, made a presentation to the Board of Directors regarding economies of scale and/or scope. Based on the independent consultant’s initial survey, there was a consensus that fund management companies benefited from economies of scale. However, due to the lack of cost data, researchers had to infer facts about the costs from the behavior
| 11 | ABI currently inserts the “Advance” in quarterly account statements and pays the incremental costs associated with the mailing. The incremental cost is less than what an “independent mailing” would cost. |
| 12 | The fees disclosed are net of any expense offsets with ABIS. An expense offset is created by the interest earned on the positive cash balance that occurs within the transfer agent account as there is a one day lag with regards to money movement from the shareholder’s account to the transfer agent’s account and then the transfer agent’s account to the Fund’s account. During the Fund’s most recently completed fiscal year, the fees paid by the Fund to ABIS were reduced by $2,743 under the offset agreement between the Fund and ABIS. |
| 46 | • ALLIANCEBERNSTEIN GREATER CHINA ’97 FUND |
of fund expenses; there was a lack of consensus among researchers as to whether economies of scale were being passed on to the shareholders.
The independent consultant conducted further studies of the Adviser’s operations to determine the existence of economies of scale and/or scope within the Adviser. The independent consultant also analyzed patterns related to advisory fees at the industry level. In a recent presentation to the Board of Directors, the independent consultant noted the potential for economies of scale and/or scope through the use of “pooling portfolios” and blend products. The independent consultant also remarked that there may be diseconomies as assets grow in less liquid and active markets. It was also observed that various factors, including fund size, family size, asset class, and investment style, had an impact on advisory fees.
| VI. | NATURE AND QUALITY OF THE ADVISER’S SERVICES, INCLUDING THE PERFORMANCE OF THE FUND |
With assets under management of approximately $742 billion as of March 31, 2007, the Adviser has the investment experience to manage and provide non-investment services (described in Section I) to the Fund.
The information prepared by Lipper shows the 1, 3, and 5 year performance rankings of the Fund13 relative to its Lipper Performance Group (“PG”) and Lipper Performance Universe (“PU”)14 for the periods ended December 31, 2006.15
| Greater China ’97 Fund, Inc. | Fund Return | PG Median | PU Median | PG Rank | PU Rank | |||||
1 year | 65.53 | 67.26 | 67.26 | 4/5 | 7/11 | |||||
3 year | 21.76 | 24.45 | 24.74 | 4/4 | 6/6 | |||||
5 year | 22.62 | 23.44 | 23.44 | 3/3 | 4/5 |
| 13 | The performance rankings are for the Class A shares of the Fund. It should be noted that the performance returns of the Fund shown were provided by the Adviser. Lipper maintains its own database that includes the Fund’s performance returns. Rounding differences may cause the Adviser’s Fund returns to be one or two basis points different from Lipper’s own Fund returns. To maintain consistency, the performance returns of the Fund, as reported by the Adviser, are provided instead of Lipper. |
| 14 | The Fund’s PG is identical to the Fund’s EG. The Fund’s PU is not identical to the Fund’s EU as the criteria for including or excluding a fund in a PU is somewhat different from that of an EU. |
| 15 | Note that the current Lipper investment classification/objective dictates the PG and PU throughout the life of the fund even if a fund had a different investment classification/objective at a different point in time. |
| ALLIANCEBERNSTEIN GREATER CHINA ’97 FUND • | 47 |
Set forth below are the 1, 3, 5 year and since inception performance returns of the Fund (in bold)16 versus its benchmark.17 Fund and benchmark volatility and reward-to-variability ratio (“Sharpe Ratio”) information is also shown.18
Periods Ending December 31, 2006 Annualized Performance | ||||||||||||||
| 1 Year (%) | 3 Year (%) | 5 Year (%) | Since Inception (%) | Annualized | Risk Period (Year) | |||||||||
| Volatility (%) | Sharpe (%) | |||||||||||||
Greater China ’97 Fund, Inc. | 65.53 | 21.76 | 22.62 | 8.97 | 18.44 | 1.07 | 5 | |||||||
MSCI Golden Dragon Index (Net) | 39.06 | 20.31 | 15.69 | N/A | 17.46 | 0.78 | 5 | |||||||
Inception Date: September 3, 1997 | ||||||||||||||
CONCLUSION:
Based on the factors discussed above the Senior Officer’s conclusion is that the proposed advisory fee for the Fund is reasonable and within the range of what would have been negotiated at arm’s-length in light of all the surrounding circumstances. This conclusion in respect of the Fund is based on an evaluation of all of these factors and no single factor was dispositive.
Dated: June 4, 2007
| 16 | The performance returns and risk measures shown in the table are for the Class A shares of the Fund. |
| 17 | The Adviser provided Fund and benchmark performance return information for periods through December 31, 2006. It should be noted that the “since inception” performance returns of the Fund’s benchmark goes back only through the nearest month-end after inception date. In contrast, the Fund’s since inception return goes back to the Fund’s actual inception date. |
| 18 | Fund and benchmark volatility and Sharpe Ratio information was obtained through Lipper LANA, a database maintained by Lipper. Volatility is a statistical measure of the tendency of a market price or yield to vary over time. A Sharpe Ratio is a risk adjusted measure of return that divides a fund’s return in excess of the riskless return by the fund’s standard deviation. A fund with a greater volatility would be seen as more risky than a fund with equivalent performance but lower volatility; for that reason, a greater return would be demanded for the more risky fund. A fund with a higher Sharpe Ratio would be viewed as better performing than a fund with a lower Sharpe Ratio. |
| 48 | • ALLIANCEBERNSTEIN GREATER CHINA ’97 FUND |
THIS PAGE IS NOT PART OF THE SHAREHOLDER REPORT OR THE FINANCIAL STATEMENTS
ALLIANCEBERNSTEIN FAMILY OF FUNDS
Wealth Strategies Funds
Balanced Wealth Strategy
Wealth Appreciation Strategy
Wealth Preservation Strategy
Tax-Managed Balanced Wealth Strategy
Tax-Managed Wealth Appreciation Strategy
Tax-Managed Wealth Preservation Strategy
Blended Style Funds
U.S. Large Cap Portfolio
International Portfolio
Tax-Managed International Portfolio
Growth Funds
Domestic
Growth Fund
Mid-Cap Growth Fund
Large Cap Growth Fund
Small Cap Growth Portfolio
Global & International
Global Health Care Fund
Global Research Growth Fund
Global Technology Fund
Greater China ‘97 Fund
International Growth Fund
International Research Growth Fund
Value Funds
Domestic
Balanced Shares
Focused Growth & Income Fund
Growth & Income Fund
Small/Mid-Cap Value Fund
Utility Income Fund
Value Fund
Global & International
Global Real Estate Investment Fund*
Global Value Fund
International Value Fund
Taxable Bond Funds
Global Government Income Trust
Corporate Bond Portfolio
Emerging Market Debt Fund
Global Strategic Income Trust
High Yield Fund
Intermediate Bond Portfolio
Short Duration Portfolio
U.S. Government Portfolio
Municipal Bond Funds
National | Michigan |
Intermediate Municipal Bond Funds
Intermediate California
Intermediate Diversified
Intermediate New York
Closed-End Funds
All-Market Advantage Fund
AllianceBernstein Global High Income Fund*
AllianceBernstein Income Fund*
AllianceBernstein National Municipal Income Fund*
ACM Managed Dollar Income Fund
California Municipal Income Fund
New York Municipal Income Fund
The Spain Fund
Retirement Strategies Funds
2000 Retirement Strategy | 2020 Retirement Strategy | 2040 Retirement Strategy | ||
2005 Retirement Strategy | 2025 Retirement Strategy | 2045 Retirement Strategy | ||
2010 Retirement Strategy | 2030 Retirement Strategy | 2050 Retirement Strategy | ||
2015 Retirement Strategy | 2035 Retirement Strategy | 2055 Retirement Strategy |
We also offer Exchange Reserves,** which serves as the money market fund exchange vehicle for the AllianceBernstein mutual funds.
You should consider the investment objectives, risks, charges and expenses of any AllianceBernstein fund/portfolio carefully before investing. For free copies of our prospectuses, which contain this and other information, visit us online at www.alliancebernstein.com or contact your financial advisor. Please read the prospectus carefully before investing.
| * | Prior to January 26, 2007, AllianceBernstein Global High Income Fund was named Alliance World Dollar Government Fund II and AllianceBernstein Income Fund was named ACM Income Fund. Prior to March 1, 2007, Global Real Estate Investment Fund was named Real Estate Investment Fund. Prior to May 18, 2007, AllianceBernstein National Municipal Income Fund was named National Municipal Income Fund. |
| ** | An investment in the Fund is not a deposit in a bank and is not insured or guaranteed by the Federal Deposit Insurance Corporation or any other government agency. Although the Fund seeks to preserve the value of your investment at $1.00 per share, it is possible to lose money by investing in the Fund. |
| ALLIANCEBERNSTEIN GREATER CHINA ’97 FUND • | 49 |
AllianceBernstein Family of Funds
NOTES
| 50 | • ALLIANCEBERNSTEIN GREATER CHINA ’97 FUND |
NOTES
| ALLIANCEBERNSTEIN GREATER CHINA ‘97 FUND • | 51 |
NOTES
| 52 | • ALLIANCEBERNSTEIN GREATER CHINA ’97 FUND |
ALLIANCEBERNSTEIN GREATER CHINA ’97 FUND
1345 Avenue of the Americas
New York, NY 10105
800.221.5672
| GC-0151-0707 |  | |
| ITEM 2. | CODE OF ETHICS. |
(a) The registrant has adopted a code of ethics that applies to its principal executive officer, principal financial officer and principal accounting officer. A copy of the registrant’s code of ethics is filed herewith as Exhibit 12(a)(1).
(b) During the period covered by this report, no material amendments were made to the provisions of the code of ethics adopted in 2(a) above.
(c) During the period covered by this report, no implicit or explicit waivers to the provisions of the code of ethics adopted in 2(a) above were granted.
| ITEM 3. | AUDIT COMMITTEE FINANCIAL EXPERT. |
The registrant’s Board of Directors has determined that independent directors David H. Dievler and William H. Foulk, Jr. qualify as audit committee financial experts.
| ITEM 4. | PRINCIPAL ACCOUNTANT FEES AND SERVICES. |
(a) - (c) The following table sets forth the aggregate fees billed by the independent registered public accounting firm Ernst & Young LLP, for the Fund’s last two fiscal years for professional services rendered for: (i) the audit of the Fund’s annual financial statements included in the Fund’s annual report to stockholders; (ii) assurance and related services that are reasonably related to the performance of the audit of the Fund’s financial statements and are not reported under (i), which include advice and education related to accounting and auditing issues and quarterly press release review (for those Funds which issue press releases), and preferred stock maintenance testing (for those Funds that issue preferred stock); and (iii) tax compliance, tax advice and tax return preparation.
| Audit Fees | Audit-Related Fees | Tax Fees | |||||||||
AB Greater China | 2006 | $ | 28,000 | $ | 4,910 | $ | 13,756 | ||||
| 2007 | $ | 31,000 | $ | 4,471 | $ | 14,625 | |||||
(d) Not applicable.
(e) (1) Beginning with audit and non-audit service contracts entered into on or after May 6, 2003, the Fund’s Audit Committee policies and procedures require the pre-approval of all audit and non-audit services provided to the Fund by the Fund’s independent registered public accounting firm. The Fund’s Audit Committee policies and procedures also require pre-approval of all audit and non-audit services provided to the Adviser and Service Affiliates to the extent that these services are directly related to the operations or financial reporting of the Fund.
(e) (2) All of the amounts for Audit Fees, Audit-Related Fees and Tax Fees in the table under Item 4 (a) – (c) are for services pre-approved by the Fund’s Audit Committee.
(f) Not applicable.
(g) The following table sets forth the aggregate non-audit services provided to the Fund, the Fund’s Adviser and entities that control, are controlled by or under common control with the Adviser that provide ongoing services to the Fund, which include preparing an annual internal control report pursuant to Statement on Auditing Standards No. 70 (“Service Affiliates”):
All Fees for Non-Audit Services Provided to the Portfolio, the Adviser and Service Affiliates | Pre-approved by the Audit Related Fees) (Portion Comprised of | |||||||
| AB Greater China | 2006 | $ | 479,879 | $ | 171,536 | |||
| $ | 157,780 | |||||||
| $ | 13,756 | |||||||
| 2007 | $ | 1,196,020 | $ | 172,285 | ||||
| $ | 157,660 | |||||||
| $ | 14,625 | |||||||
(h) The Audit Committee of the Fund has considered whether the provision of any non-audit services not pre-approved by the Audit Committee provided by the Fund’s independent registered public accounting firm to the Adviser and Service Affiliates is compatible with maintaining the auditor’s independence.
| ITEM 5. | AUDIT COMMITTEE OF LISTED REGISTRANTS. |
Not applicable to the registrant.
| ITEM 6. | SCHEDULE OF INVESTMENTS. |
Please see Schedule of Investments contained in the Report to Shareholders included under Item 1 of this Form N-CSR.
| ITEM 7. | DISCLOSURE OF PROXY VOTING POLICIES AND PROCEDURES FOR CLOSED-END MANAGEMENT INVESTMENT COMPANIES. |
Not applicable to the registrant.
| ITEM 8. | PORTFOLIO MANAGERS OF CLOSED-END MANAGEMENT INVESTMENT COMPANIES. |
Not applicable to the registrant.
| ITEM 9. | PURCHASES OF EQUITY SECURITIES BY CLOSED-END MANAGEMENT INVESTMENT COMPANY AND AFFILIATED PURCHASERS. |
Not applicable to the registrant.
| ITEM 10. | SUBMISSION OF MATTERS TO A VOTE OF SECURITY HOLDERS. |
There have been no material changes to the procedures by which shareholders may recommend nominees to the Fund’s Board of Directors since the Fund last provided disclosure in response to this item.
| ITEM 11. | CONTROLS AND PROCEDURES. |
(a) The registrant’s principal executive officer and principal financial officer have concluded that the registrant’s disclosure controls and procedures (as defined in Rule 30a-2(c) under the Investment Company Act of 1940, as amended) are effective at the reasonable assurance level based on their evaluation of these controls and procedures as of a date within 90 days of the filing date of this document.
(b) There were no changes in the registrant’s internal controls over financial reporting that occurred during the second fiscal quarter of the period that has materially affected, or is reasonably likely to materially affect, the registrant’s internal control over financial reporting.
| ITEM 12. | EXHIBITS. |
The following exhibits are attached to this Form N-CSR:
| EXHIBIT NO. | DESCRIPTION OF EXHIBIT | |
| 12 (a) (1) | Code of Ethics that is subject to the disclosure of Item 2 hereof | |
| 12 (b) (1) | Certification of Principal Executive Officer Pursuant to Section 302 of the Sarbanes-Oxley Act of 2002 | |
| 12 (b) (2) | Certification of Principal Financial Officer Pursuant to Section 302 of the Sarbanes-Oxley Act of 2002 | |
| 12 (c) | Certification of Principal Executive Officer and Principal Financial Officer Pursuant to Section 906 of the Sarbanes-Oxley Act of 2002 | |
SIGNATURES
Pursuant to the requirements of the Securities Exchange Act of 1934 and the Investment Company Act of 1940, the registrant has duly caused this report to be signed on its behalf by the undersigned, thereunto duly authorized.
| (Registrant): AllianceBernstein Greater China ‘97 Fund, Inc. | ||
| By: | /s/ Marc O. Mayer | |
| Marc O. Mayer | ||
| President | ||
Date: September 26, 2007
Pursuant to the requirements of the Securities Exchange Act of 1934 and the Investment Company Act of 1940, this report has been signed below by the following persons on behalf of the registrant and in the capacities and on the dates indicated.
| By: | /s/ Marc O. Mayer | |
| Marc O. Mayer | ||
| President | ||
Date: September 26, 2007
| By: | /s/ Joseph J. Mantineo | |
| Joseph J. Mantineo | ||
| Treasurer and Chief Financial Officer | ||
Date: September 26, 2007