UNITED STATES
SECURITIES AND EXCHANGE COMMISSION
WASHINGTON, D.C. 20549
FORM N-CSR
CERTIFIED SHAREHOLDER REPORT OF REGISTERED MANAGEMENT INVESTMENT COMPANIES
Investment Company Act file number: 811-08201
ALLIANCEBERNSTEIN GREATER CHINA ‘97 FUND, INC.
(Exact name of registrant as specified in charter)
1345 Avenue of the Americas
New York, New York 10105
(Address of principal executive offices) (Zip code)
Joseph J. Mantineo
AllianceBernstein L.P.
1345 Avenue of the Americas
New York, New York 10105
(Name and address of agent for service)
Registrant’s telephone number, including area code: (800) 221-5672
Date of fiscal year end: July 31, 2012
Date of reporting period: January 31, 2012
ITEM 1. REPORTS TO STOCKHOLDERS.
SEMI-ANNUAL REPORT
AllianceBernstein
Greater China ’97 Fund

Semi-Annual Report
Investment Products Offered
|
•Are Not FDIC Insured •May Lose Value •Are Not Bank Guaranteed |
Investors should consider the investment objectives, risks, charges and expenses of the Fund carefully before investing. For copies of our prospectus or summary prospectus, which contain this and other information, visit us online at www.alliancebernstein.com or contact your AllianceBernstein Investments representative. Please read the prospectus and/or summary prospectus carefully before investing.
This shareholder report must be preceded or accompanied by the Fund’s prospectus for individuals who are not current shareholders of the Fund.
You may obtain a description of the Fund’s proxy voting policies and procedures, and information regarding how the Fund voted proxies relating to portfolio securities during the most recent 12-month period ended June 30, without charge. Simply visit AllianceBernstein’s website at www.alliancebernstein.com, or go to the Securities and Exchange Commission’s (the “Commission”) website at www.sec.gov, or call AllianceBernstein at (800) 227-4618.
The Fund files its complete schedule of portfolio holdings with the Commission for the first and third quarters of each fiscal year on Form N-Q. The Fund’s Forms N-Q are available on the Commission’s website at www.sec.gov. The Fund’s Forms N-Q may also be reviewed and copied at the Commission’s Public Reference Room in Washington, DC; information on the operation of the Public Reference Room may be obtained by calling (800) SEC-0330. AllianceBernstein publishes full portfolio holdings for the Fund monthly at www.alliancebernstein.com.
AllianceBernstein Investments, Inc. (ABI) is the distributor of the AllianceBernstein family of mutual funds. ABI is a member of FINRA and is an affiliate of AllianceBernstein L.P., the manager of the funds.
AllianceBernstein® and the AB Logo are registered trademarks and service marks used by permission of the owner, AllianceBernstein L.P.
March 12, 2012
Semi-Annual Report
This report provides management’s discussion of fund performance for AllianceBernstein Greater China ’97 Fund (the “Fund”) for the semi-annual reporting period ended January 31, 2012.
Investment Objective and Policies
The Fund’s investment objective is long-term capital appreciation through investment of at least 80% of its total assets in equity securities of Greater China companies. Under normal circumstances, the Fund will invest at least 80%, and normally substantially all, of its net assets in equity securities of Greater China companies, which are companies in China, Hong Kong and Taiwan. Of these countries, the Fund expects to invest a significant portion of its assets, which may be greater than 50%, in Hong Kong companies and may invest all of its assets in Hong Kong companies or companies of either of the other Greater China countries. The Fund also may invest in convertible securities and equity-linked debt securities issued or guaranteed by Greater China companies or Greater China Governments, their agencies, or instrumentalities. In addition to investing in equity securities of Greater China companies, the Fund may invest up to 20% of its total assets in (i) debt securities issued or guaranteed by Greater China companies or by Greater China Governments, their agencies or instrumentalities and (ii) equity or debt securities issued by issuers other than Greater China companies. The Fund will invest only in investment-grade securities.
Currencies can have a dramatic impact on equity returns, significantly adding to returns in some years and greatly diminishing them in others. Currency and equity positions are evaluated separately. AllianceBernstein L.P. (the “Adviser”) may seek to hedge the currency exposure resulting from securities positions when it finds the currency exposure unattractive. To hedge a portion of its currency risk, the Fund may from time to time invest in currency-related derivatives, including forward currency exchange contracts, futures, options on futures, swaps and options. The Adviser may also seek investment opportunities by taking long or short positions in currencies through the use of currency-related derivatives.
Investment Results
The table on page 4 shows the Fund’s performance compared to its benchmark, the Morgan Stanley Capital International (“MSCI”) Golden Dragon Index (net and gross) and to the Lipper China Region Funds Average (the “Lipper Average”). The MSCI Golden Dragon Index is a composite index consisting of equity securities of companies based in China, Hong Kong and Taiwan. These are the countries in which the great majority of the Fund’s securities are located. Funds in the Lipper Average have generally similar investment objectives to the Fund, although some may have different investment policies and sales and management fees.
The Fund declined and underperformed its benchmark for both the
| | | | |
| ALLIANCEBERNSTEIN GREATER CHINA ’97 FUND • | | | 1 | |
six- and 12-month periods ended January 31, 2012, before sales charges. For both periods, stock selection, particularly in the technology sector, was the main detractor from returns. The technology sector declined, as uncertain global economic outlook hurt sentiment of component stocks. Additionally, renewed euro area debt fears dimmed the outlook for the solar industry, as the industry receives government subsidies, negatively impacting one of the Fund’s largest holdings which is a solar manufacturer. Stock selection in the consumer discretionary, industrials and consumer staples sectors also detracted for both periods.
Sector selection was also negative for both periods. For the six-month period, underweights to the telecommunications and utilities sectors detracted, while an overweight to the consumer staples sector contributed. For the 12-month period, underweights to the telecommunications and energy sectors detracted, while an overweight to the technology sector contributed. During this period of uncertain economic growth outlook, investors sold risky assets in favor of companies with less economic volatility.
The Fund did not utilize derivatives or leverage during the six- or 12-month periods ended January 31, 2012.
Market Review and Investment Strategy
The Hong Kong/China Portfolio Oversight Group (the “Group”)
believes the Fund is well positioned to benefit as fears of an economic collapse ease and investors gain confidence in China’s growth prospects. The Group expects the threat of high, long-term inflation for China to dissipate and inflation for the rest of Asia ex-Japan to trend down starting in the second quarter of 2012. The Group feels this should provide some leeway for a reversal in China’s Central Bank’s restrictive monetary policy.
The Group’s research indicates monetary policy loosening incrementally in China; slower growth but lower inflation for the rest of Asia, and continued market uncertainty in 2012. The Group sees the first two points as the driving force for a market recovery in 2012.
At that pace, the Group believes that China’s economy is resilient enough to support solid gains for the Fund’s holdings. The Group continues to focus on stocks that have exceptional long-term growth prospects across the market, and the Group believes maintaining sector overweights in industrials, consumer discretionary and technology stocks, which the Group believes offer promising long-term return potential. The Group has also moved to an overweight position in financials based on the Group’s conviction of a less restrictive monetary policy environment in China.
| | |
| 2 | | • ALLIANCEBERNSTEIN GREATER CHINA ’97 FUND |
HISTORICAL PERFORMANCE
An Important Note About Historical Performance
The investment return and principal value of the Fund will fluctuate so that shares, when redeemed, may be worth more or less than their original cost. The performance shown on the following pages represents past performance and does not guarantee future results. Current performance may be lower or higher than the performance information shown. You may obtain performance information current to the most recent month-end by visiting www.alliancebernstein.com.
All fees and expenses related to the operation of the Fund have been deducted. NAV returns do not reflect sales charges; if sales charges were reflected, the Fund’s quoted performance would be lower. SEC returns reflect the applicable sales charges for each share class: a 4.25% maximum front-end sales charge for Class A shares; the applicable contingent deferred sales charge for Class B shares (4% year 1, 3% year 2, 2% year 3, 1% year 4); a 1% 1-year contingent deferred sales charge for Class C shares. Returns for the different share classes will vary due to different expenses associated with each class. Performance assumes reinvestment of distributions and does not account for taxes.
Benchmark Disclosure
The unmanaged MSCI Golden Dragon Index (net and gross) do not reflect fees and expenses associated with the active management of a mutual fund portfolio. The MSCI Golden Dragon Net Index (free float-adjusted, market capitalization) represents the equity market performance in the China region. Gross returns include the reinvestment of dividends prior to deduction of non-U.S. withholding tax. Net returns include the reinvestment of dividends after deduction of non-U.S. withholding tax. MSCI makes no express or implied warranties or representations, and shall have no liability whatsoever with respect to any MSCI data contained herein. The MSCI data may not be further redistributed or used as a basis for other indices, any securities or financial products. This report is not approved, reviewed or produced by MSCI. An investor cannot invest directly in an index or average, and its results are not indicative of the performance for any specific investment, including the Fund.
A Word About Risk
Market Risk: The market values of the portfolio’s holdings rise and fall from day to day, so investments may lose value.
Foreign (Non-U.S.) Risk: Non-U.S. securities may be more volatile because of political, regulatory, market and economic uncertainties associated with such securities. Fluctuations in currency exchange rates may negatively affect the value of the investment or reduce returns. These risks are magnified in emerging or developing markets.
Country/Geograhic Risk: Investments in issuers located in a particular country or geographic region may have more risk because of particular market factors affecting that country or region, including political instability or unpredictable economic conditions.
Diversification/Focused Portfolio Risk: Portfolios that hold a smaller number of securities may be more volatile than more diversified portfolios, since gains or losses from each security will have a greater impact on the portfolio’s overall value.
Derivatives Risk: Investing in derivative instruments such as options, futures, forwards or swaps can be riskier than traditional investments, and may be more volatile, especially in a down market.
These risks are fully discussed in the Fund’s prospectus.
(Historical Performance continued on next page)
| | | | |
| ALLIANCEBERNSTEIN GREATER CHINA ’97 FUND • | | | 3 | |
Historical Performance
HISTORICAL PERFORMANCE
(continued from previous page)
| | | | | | | | | | |
| | | | | | | | | | |
THE FUND VS. ITS BENCHMARK
PERIODS ENDED JANUARY 31, 2012 | | NAV Returns | | | |
| | 6 Months | | | 12 Months | | | |
AllianceBernstein Greater China ’97 Fund | | | | | | | | | | |
Class A | | | -19.31% | | | | -22.61% | | | |
|
Class B* | | | -19.54% | | | | -23.16% | | | |
|
Class C | | | -19.58% | | | | -23.15% | | | |
|
Advisor Class** | | | -19.21% | | | | -22.42% | | | |
|
MSCI Golden Dragon Index (net) | | | -10.09% | | | | -11.54% | | | |
|
MSCI Golden Dragon Index (gross) | | | -10.00% | | | | -11.20% | | | |
|
Lipper China Region Funds Average | | | -14.99% | | | | -17.10% | | | |
|
* Effective January 31, 2009, Class B shares are no longer available for purchase to new investors. Please see Note A for more information. ** Please note that this share class is for investors purchasing shares through accounts established under certain fee-based programs sponsored and maintained by certain broker-dealers and financial intermediaries, institutional pension plans and/or advisory clients of, and certain other persons associated with, the Adviser and its affiliates or the Funds. |
| | | | | | | | | | |
See Historical Performance and Benchmark disclosures on previous page.
(Historical Performance continued on next page)
| | |
| 4 | | • ALLIANCEBERNSTEIN GREATER CHINA ’97 FUND |
Historical Performance
HISTORICAL PERFORMANCE
(continued from previous page)
| | | | | | | | |
| AVERAGE ANNUAL RETURNS AS OF JANUARY 31, 2012 | |
| | | NAV Returns | | | SEC Returns | |
| | | | | | | | |
| Class A Shares | | | | | | | | |
1 Year | | | -22.61 | % | | | -25.91 | % |
5 Years | | | -2.21 | % | | | -3.06 | % |
10 Years | | | 9.82 | % | | | 9.35 | % |
| | | | | | | | |
| Class B Shares | | | | | | | | |
1 Year | | | -23.16 | % | | | -25.58 | % |
5 Years | | | -2.91 | % | | | -2.91 | % |
10 Years(a) | | | 9.19 | % | | | 9.19 | % |
| | | | | | | | |
| Class C Shares | | | | | | | | |
1 Year | | | -23.15 | % | | | -23.75 | % |
5 Years | | | -2.90 | % | | | -2.90 | % |
10 Years | | | 9.01 | % | | | 9.01 | % |
| | | | | | | | |
| Advisor Class Shares† | | | | | | | | |
1 Year | | | -22.42 | % | | | -22.42 | % |
5 Years | | | -1.93 | % | | | -1.93 | % |
10 Years | | | 10.14 | % | | | 10.14 | % |
The Fund’s current prospectus fee table shows the Fund’s total annual operating expense ratios as 2.02%, 2.76%, 2.74% and 1.74% for Class A, Class B, Class C and Advisor Class shares, respectively, gross of any fee waivers or expense reimbursements. These waivers/reimbursements extend through the Fund’s current fiscal year and may be extended by the Adviser for additional one-year terms. Absent reimbursements or waivers, performance would have been lower. The Financial Highlights section of this report sets forth expense ratio data for the current reporting period; the expense ratios shown above may differ from the expense ratios in the Financial Highlights section since they are based on different time periods.
| (a) | | Assumes conversion of Class B shares into Class A shares after eight years. |
| † | | This share class is offered at net asset value (NAV) to eligible investors and its SEC returns are the same as its NAV returns. Please note that this share class is for investors purchasing shares through accounts established under certain fee-based programs sponsored and maintained by certain broker-dealers and financial intermediaries, institutional pension plans and/or advisory clients of, and certain other persons associated with, the Adviser and its affiliates or the Funds. |
See Historical Performance disclosures on page 3.
(Historical Performance continued on next page)
| | | | |
| ALLIANCEBERNSTEIN GREATER CHINA ’97 FUND • | | | 5 | |
Historical Performance
HISTORICAL PERFORMANCE
(continued from previous page)
| | | | |
SEC AVERAGE ANNUAL RETURNS (WITH ANY APPLICABLE SALES CHARGES) AS OF THE MOST RECENT CALENDAR QUARTER-END (DECEMBER 31, 2011) | |
| | | SEC Returns | |
| | | | |
| Class A Shares | | | | |
1 Year | | | -32.22 | % |
5 Years | | | -4.39 | % |
10 Years | | | 8.28 | % |
| | | | |
| Class B Shares | | | | |
1 Year | | | -31.88 | % |
5 Years | | | -4.23 | % |
10 Years(a) | | | 8.14 | % |
| | | | |
| Class C Shares | | | | |
1 Year | | | -30.23 | % |
5 Years | | | -4.21 | % |
10 Years | | | 7.98 | % |
| | | | |
| Advisor Class Shares† | | | | |
1 Year | | | -29.02 | % |
5 Years | | | -3.27 | % |
10 Years | | | 9.08 | % |
| (a) | | Assumes conversion of Class B shares into Class A shares after eight years. |
| † | | Please note that this share class is for investors purchasing shares through accounts established under certain fee-based programs sponsored and maintained by certain broker-dealers and financial intermediaries, institutional pension plans and/or advisory clients of, and certain other persons associated with, the Adviser and its affiliates or the Funds. |
See Historical Performance disclosures on page 3.
(Historical Performance continued on next page)
| | |
| 6 | | • ALLIANCEBERNSTEIN GREATER CHINA ’97 FUND |
Historical Performance
FUND EXPENSES
(unaudited)
As a shareholder of the Fund, you incur two types of costs: (1) transaction costs, including sales charges (loads) on purchase payments, contingent deferred sales charges on redemptions and (2) ongoing costs, including management fees; distribution (12b-1) fees; and other Fund expenses. This example is intended to help you understand your ongoing costs (in dollars) of investing in the Fund and to compare these costs with the ongoing costs of investing in other mutual funds.
The Example is based on an investment of $1,000 invested at the beginning of the period and held for the entire period as indicated below.
Actual Expenses
The table below provides information about actual account values and actual expenses. You may use the information, together with the amount you invested, to estimate the expenses that you paid over the period. Simply divide your account value by $1,000 (for example, an $8,600 account value divided by $1,000 = 8.6), then multiply the result by the number under the heading entitled “Expenses Paid During Period” to estimate the expenses you paid on your account during this period.
Hypothetical Example for Comparison Purposes
The table below also provides information about hypothetical account values and hypothetical expenses based on the Fund’s actual expense ratio and an assumed annual rate of return of 5% before expenses, which is not the Fund’s actual return. The hypothetical account values and expenses may not be used to estimate the actual ending account balance or expenses you paid for the period. You may use this information to compare the ongoing costs of investing in the Fund and other funds by comparing this 5% hypothetical example with the 5% hypothetical examples that appear in the shareholder reports of other funds.
Please note that the expenses shown in the table are meant to highlight your ongoing costs only and do not reflect any transactional costs, such as sales charges (loads), or contingent deferred sales charges on redemptions. Therefore, the hypothetical example is useful in comparing ongoing costs only, and will not help you determine the relative total costs of owning different funds. In addition, if these transactional costs were included, your costs would have been higher.
| | | | | | | | | | | | | | | | |
| | | Beginning
Account Value
August 1, 2011 | | | Ending
Account Value
January 31, 2012 | | | Expenses Paid
During Period* | | | Annualized
Expense Ratio* | |
| Class A | | | | | | | | | | | | | | | | |
Actual | | $ | 1,000 | | | $ | 806.90 | | | $ | 11.35 | | | | 2.50 | % |
Hypothetical** | | $ | 1,000 | | | $ | 1,012.57 | | | $ | 12.65 | | | | 2.50 | % |
| Class B | | | | | | | | | | | | | | | | |
Actual | | $ | 1,000 | | | $ | 804.60 | | | $ | 14.52 | | | | 3.20 | % |
Hypothetical** | | $ | 1,000 | | | $ | 1,009.05 | | | $ | 16.16 | | | | 3.20 | % |
| Class C | | | | | | | | | | | | | | | | |
Actual | | $ | 1,000 | | | $ | 804.20 | | | $ | 14.51 | | | | 3.20 | % |
Hypothetical** | | $ | 1,000 | | | $ | 1,009.05 | | | $ | 16.16 | | | | 3.20 | % |
| Advisor Class | | | | | | | | | | | | | | | | |
Actual | | $ | 1,000 | | | $ | 807.90 | | | $ | 10.00 | | | | 2.20 | % |
Hypothetical** | | $ | 1,000 | | | $ | 1,014.08 | | | $ | 11.14 | | | | 2.20 | % |
| * | | Expenses are equal to the classes’ annualized expense ratios respectively, multiplied by the average account value over the period, multiplied by 184/366 (to reflect the one-half year period). |
| ** | | Assumes 5% return before expenses. |
| | | | |
| ALLIANCEBERNSTEIN GREATER CHINA ’97 FUND • | | | 7 | |
Fund Expenses
PORTFOLIO SUMMARY
January 31, 2012 (unaudited)
PORTFOLIO STATISTICS
Net Assets ($mil): $35.5
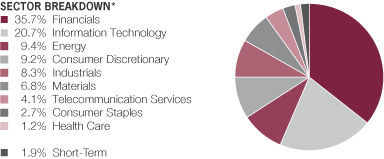
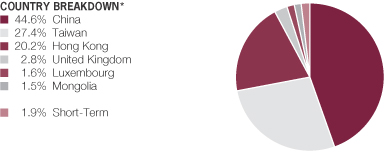
| * | | All data are as of January 31, 2012. The Fund’s sector and country breakdowns are expressed as a percentage of total investments (excluding security lending collateral) and may vary over time. |
Please Note: The sector classifications presented herein are based on the Global Industry Classification Standard (GICS) which was developed by Morgan Stanley Capital International and Standard & Poor’s. The components are divided into sector, industry group, and industry sub-indices as classified by the GICS for each of the market capitalization indices in the broad market. These sector classifications are broadly defined. The “Portfolio of Investments” section of the report reflects more specific industry information and is consistent with the investment restrictions discussed in the Fund’s prospectus.
| | |
| 8 | | • ALLIANCEBERNSTEIN GREATER CHINA ’97 FUND |
Portfolio Summary
TEN LARGEST HOLDINGS*
January 31, 2012 (unaudited)
| | | | | | | | |
| Company | | U.S. $ Value | | | Percent of
Net Assets | |
Taiwan Semiconductor Manufacturing Co., Ltd. | | $ | 2,614,969 | | | | 7.4 | % |
Industrial & Commercial Bank of China – Class H | | | 2,381,044 | | | | 6.7 | |
CNOOC Ltd. | | | 1,710,896 | | | | 4.8 | |
AIA Group Ltd. | | | 1,575,023 | | | | 4.4 | |
China Construction Bank Corp. – Class H | | | 1,171,888 | | | | 3.3 | |
China Unicom Hong Kong Ltd. | | | 1,111,676 | | | | 3.1 | |
Sun Hung Kai Properties Ltd. | | | 985,078 | | | | 2.8 | |
MediaTek, Inc. | | | 955,369 | | | | 2.7 | |
Chinatrust Financial Holding Co., Ltd. | | | 925,860 | | | | 2.6 | |
Cheung Kong Holdings Ltd. | | | 778,564 | | | | 2.2 | |
| | $ | 14,210,367 | | | | 40.0 | % |
| | | | |
| ALLIANCEBERNSTEIN GREATER CHINA ’97 FUND • | | | 9 | |
Ten Largest Holdings
PORTFOLIO OF INVESTMENTS
January 31, 2012 (unaudited)
| | | | | | | | |
| Company | | Shares | | | U.S. $ Value | |
| |
| | | | | | | | |
COMMON STOCKS – 97.9% | | | | | | | | |
Financials – 35.6% | | | | | | | | |
Commercial Banks – 17.7% | | | | | | | | |
BOC Hong Kong Holdings Ltd. | | | 158,500 | | | $ | 417,948 | |
China Construction Bank Corp. – Class H | | | 1,470,600 | | | | 1,171,888 | |
Chinatrust Financial Holding Co., Ltd. | | | 1,434,220 | | | | 925,860 | |
Hang Seng Bank Ltd. | | | 30,700 | | | | 397,688 | |
HSBC Holdings PLC | | | 48,800 | | | | 408,113 | |
Industrial & Commercial Bank of China – Class H | | | 3,403,020 | | | | 2,381,044 | |
Standard Chartered PLC | | | 24,581 | | | | 597,989 | |
| | | | | | | | |
| | | | | | | 6,300,530 | |
| | | | | | | | |
Diversified Financial Services – 3.2% | | | | | | | | |
Fubon Financial Holding Co., Ltd. | | | 389,279 | | | | 433,629 | |
Hong Kong Exchanges and Clearing Ltd. | | | 40,300 | | | | 698,909 | |
| | | | | | | | |
| | | | | | | 1,132,538 | |
| | | | | | | | |
Insurance – 6.6% | | | | | | | | |
AIA Group Ltd. | | | 471,400 | | | | 1,575,023 | |
Cathay Financial Holding Co., Ltd. | | | 153,063 | | | | 174,744 | |
Ping An Insurance Group Co. – Class H | | | 75,000 | | | | 592,162 | |
| | | | | | | | |
| | | | | | | 2,341,929 | |
| | | | | | | | |
Real Estate Management & Development – 8.1% | | | | | | | | |
Cheung Kong Holdings Ltd. | | | 58,000 | | | | 778,564 | |
China Overseas Land & Investment Ltd. | | | 248,000 | | | | 458,851 | |
Hang Lung Properties Ltd. | | | 51,000 | | | | 174,783 | |
Sun Hung Kai Properties Ltd. | | | 71,000 | | | | 985,078 | |
Wharf Holdings Ltd. | | | 82,000 | | | | 467,701 | |
| | | | | | | | |
| | | | | | | 2,864,977 | |
| | | | | | | | |
| | | | | | | 12,639,974 | |
| | | | | | | | |
Information Technology – 20.7% | | | | | | | | |
Communications Equipment – 3.0% | | | | | | | | |
HTC Corp. | | | 35,400 | | | | 582,125 | |
Wistron NeWeb Corp. | | | 91,645 | | | | 188,986 | |
ZTE Corp. – Class H | | | 105,600 | | | | 286,143 | |
| | | | | | | | |
| | | | | | | 1,057,254 | |
| | | | | | | | |
Electronic Equipment, Instruments & Components – 3.8% | | | | | | | | |
Chroma ATE, Inc. | | | 233,074 | | | | 533,730 | |
Hon Hai Precision Industry Co., Ltd. | | | 215,000 | | | | 693,368 | |
Unimicron Technology Corp. | | | 93,000 | | | | 122,638 | |
| | | | | | | | |
| | | | | | | 1,349,736 | |
| | | | | | | | |
Internet Software & Services – 2.7% | | | | | | | | |
Baidu, Inc./China (Sponsored ADR)(a) | | | 2,630 | | | | 335,378 | |
Tencent Holdings Ltd. | | | 25,800 | | | | 629,989 | |
| | | | | | | | |
| | | | | | | 965,367 | |
| | | | | | | | |
| | |
| 10 | | • ALLIANCEBERNSTEIN GREATER CHINA ’97 FUND |
Portfolio of Investments
| | | | | | | | |
Company | | Shares | | | U.S. $ Value | |
| |
| | | | | | | | |
Semiconductors & Semiconductor Equipment – 10.6% | | | | | | | | |
Kinsus Interconnect Technology Corp. | | | 63,000 | | | $ | 204,474 | |
MediaTek, Inc. | | | 100,000 | | | | 955,369 | |
Taiwan Semiconductor Manufacturing Co., Ltd. | | | 985,714 | | | | 2,614,969 | |
| | | | | | | | |
| | | | | | | 3,774,812 | |
| | | | | | | | |
Software – 0.6% | | | | | | | | |
International Games System Co., Ltd. | | | 27,000 | | | | 194,487 | |
| | | | | | | | |
| | | | | | | 7,341,656 | |
| | | | | | | | |
Energy – 9.4% | | | | | | | | |
Oil, Gas & Consumable Fuels – 9.4% | | | | | | | | |
China Shenhua Energy Co., Ltd. – Class H | | | 59,500 | | | | 261,311 | |
CNOOC Ltd. | | | 843,000 | | | | 1,710,896 | |
PetroChina Co., Ltd. – Class H | | | 414,000 | | | | 601,884 | |
Yanzhou Coal Mining Co., Ltd. – Class H | | | 314,000 | | | | 750,855 | |
| | | | | | | | |
| | | | | | | 3,324,946 | |
| | | | | | | | |
Consumer Discretionary – 9.2% | | | | | | | | |
Hotels, Restaurants & Leisure – 2.5% | | | | | | | | |
Ajisen China Holdings Ltd. | | | 57,000 | | | | 65,720 | |
Ctrip.com International Ltd. (ADR)(a)(b) | | | 10,470 | | | | 262,274 | |
Sands China Ltd.(a) | | | 165,200 | | | | 554,457 | |
| | | | | | | | |
| | | | | | | 882,451 | |
| | | | | | | | |
Media – 2.0% | | | | | | | | |
Focus Media Holding Ltd. (ADR)(a)(b) | | | 36,140 | | | | 722,800 | |
| | | | | | | | |
| | |
Specialty Retail – 4.7% | | | | | | | | |
Belle International Holdings Ltd. | | | 352,000 | | | | 570,796 | |
L’Occitane International SA | | | 248,750 | | | | 548,741 | |
Zhongsheng Group Holdings Ltd.(b) | | | 274,500 | | | | 549,572 | |
| | | | | | | | |
| | | | | | | 1,669,109 | |
| | | | | | | | |
| | | | | | | 3,274,360 | |
| | | | | | | | |
Industrials – 8.3% | | | | | | | | |
Airlines – 1.6% | | | | | | | | |
Air China Ltd. | | | 202,000 | | | | 159,801 | |
Eva Airways Corp. | | | 590,700 | | | | 396,705 | |
| | | | | | | | |
| | | | | | | 556,506 | |
| | | | | | | | |
Construction & Engineering – 0.5% | | | | | | | | |
China Communications Construction Co., Ltd. | | | 179,000 | | | | 166,356 | |
| | | | | | | | |
| | |
Industrial Conglomerates – 1.8% | | | | | | | | |
Hutchison Whampoa Ltd. | | | 69,000 | | | | 655,402 | |
| | | | | | | | |
| | |
Machinery – 2.8% | | | | | | | | |
Hiwin Technologies Corp. | | | 56,000 | | | | 517,417 | |
Zoomlion Heavy Industry Science and Technology Co., Ltd.(b) | | | 350,600 | | | | 470,344 | |
| | | | | | | | |
| | | | | | | 987,761 | |
| | | | | | | | |
| | | | |
| ALLIANCEBERNSTEIN GREATER CHINA ’97 FUND • | | | 11 | |
Portfolio of Investments
| | | | | | | | |
Company | | Shares | | | U.S. $ Value | |
| |
| | | | | | | | |
Marine – 1.6% | | | | | | | | |
China Shipping Development Co., Ltd. – Class H | | | 426,000 | | | $ | 294,659 | |
SITC International Holdings Co., Ltd. | | | 1,125,000 | | | | 289,673 | |
| | | | | | | | |
| | | | | | | 584,332 | |
| | | | | | | | |
| | | | | | | 2,950,357 | |
| | | | | | | | |
Materials – 6.8% | | | | | | | | |
Chemicals – 1.2% | | | | | | | | |
Formosa Plastics Corp. | | | 151,000 | | | | 439,967 | |
| | | | | | | | |
| | |
Construction Materials – 1.8% | | | | | | | | |
BBMG Corp. | | | 321,500 | | | | 242,298 | |
China Resources Cement Holdings Ltd. | | | 540,000 | | | | 388,786 | |
| | | | | | | | |
| | | | | | | 631,084 | |
| | | | | | | | |
Metals & Mining – 3.8% | | | | | | | | |
China Metal Recycling Holdings Ltd. | | | 193,200 | | | | 229,018 | |
China Steel Corp. | | | 399,800 | | | | 395,785 | |
Jiangxi Copper Co., Ltd. – Class H | | | 81,000 | | | | 205,485 | |
Mongolian Mining Corp.(a) | | | 637,500 | | | | 512,242 | |
| | | | | | | | |
| | | | | | | 1,342,530 | |
| | | | | | | | |
| | | | | | | 2,413,581 | |
| | | | | | | | |
Telecommunication Services – 4.1% | | | | | | | | |
Diversified Telecommunication Services – 4.1% | | | | | | | | |
China Unicom Hong Kong Ltd. | | | 604,000 | | | | 1,111,676 | |
Chunghwa Telecom Co., Ltd. | | | 105,000 | | | | 341,071 | |
| | | | | | | | |
| | | | | | | 1,452,747 | |
| | | | | | | | |
Consumer Staples – 2.7% | | | | | | | | |
Food Products – 2.7% | | | | | | | | |
China Mengniu Dairy Co., Ltd. | | | 159,000 | | | | 422,349 | |
China Yurun Food Group Ltd.(b) | | | 315,000 | | | | 520,084 | |
| | | | | | | | |
| | | | | | | 942,433 | |
| | | | | | | | |
Health Care – 1.1% | | | | | | | | |
Pharmaceuticals – 1.1% | | | | | | | | |
China Shineway Pharmaceutical Group Ltd. | | | 159,000 | | | | 229,512 | |
Sihuan Pharmaceutical Holdings Group Ltd. | | | 492,000 | | | | 178,002 | |
| | | | | | | | |
| | | | | | | 407,514 | |
| | | | | | | | |
Total Common Stocks
(cost $30,951,082) | | | | | | | 34,747,568 | |
| | | | | | | | |
| | | | | | | | |
SHORT-TERM INVESTMENTS – 1.9% | | | | | | | | |
Investment Companies – 1.9% | | | | | | | | |
AllianceBernstein Fixed-Income Shares,
Inc. – Government STIF Portfolio, 0.10%(c)
(cost $680,572) | | | 680,572 | | | | 680,572 | |
| | | | | | | | |
| | |
Total Investments Before Security Lending Collateral for Securities Loaned – 99.8%
(cost $31,631,654) | | | | | | | 35,428,140 | |
| | | | | | | | |
| | |
| 12 | | • ALLIANCEBERNSTEIN GREATER CHINA ’97 FUND |
Portfolio of Investments
| | | | | | | | |
Company | | Shares | | | U.S. $ Value | |
| |
| | | | | | | | |
INVESTMENTS OF CASH COLLATERAL FOR SECURITIES LOANED – 4.1% | | | | | | | | |
Investment Companies – 4.1% | | | | | | | | |
AllianceBernstein Exchange Reserves – Class I, 0.19%(c)
(cost $1,465,309) | | | 1,465,309 | | | $ | 1,465,309 | |
| | | | | | | | |
| | |
Total Investments – 103.9%
(cost $33,096,963) | | | | | | | 36,893,449 | |
Other assets less liabilities – (3.9)% | | | | | | | (1,383,156 | ) |
| | | | | | | | |
| | |
Net Assets – 100.0% | | | | | | $ | 35,510,293 | |
| | | | | | | | |
| (a) | | Non-income producing security. |
| (b) | | Represents entire or partial securities out on loan. See Note E for securities lending information. |
| (c) | | Investment in affiliated money market mutual fund. The rate shown represents the 7-day yield as of period end. |
Glossary:
ADR – American Depositary Receipt
See notes to financial statements.
| | | | |
| ALLIANCEBERNSTEIN GREATER CHINA ’97 FUND • | | | 13 | |
Portfolio of Investments
STATEMENT OF ASSETS & LIABILITIES
January 31, 2012 (unaudited)
| | | | |
| Assets | | | | |
Investments in securities, at value | | | | |
Unaffiliated issuers (cost $30,951,082) | | $ | 34,747,568 | (a) |
Affiliated issuers (cost $2,145,881—including investment
of cash collateral for securities loaned of $1,465,309) | | | 2,145,881 | |
Foreign currencies, at value (cost $457,286) | | | 458,830 | |
Receivable for capital stock sold | | | 202,656 | |
Receivable for investment securities sold | | | 195,055 | |
Dividends and interest receivable | | | 5,114 | |
| | | | |
Total assets | | | 37,755,104 | |
| | | | |
| Liabilities | | | | |
Payable for collateral received on securities loaned | | | 1,465,309 | |
Payable for capital stock redeemed | | | 323,548 | |
Payable for investment securities purchased | | | 232,622 | |
Administrative fee payable | | | 37,922 | |
Transfer Agent fee payable | | | 16,767 | |
Distribution fee payable | | | 15,048 | |
Advisory fee payable | | | 13,717 | |
Accrued expenses and other liabilities | | | 139,878 | |
| | | | |
Total liabilities | | | 2,244,811 | |
| | | | |
Net Assets | | $ | 35,510,293 | |
| | | | |
| Composition of Net Assets | | | | |
Capital stock, at par | | $ | 4,121 | |
Additional paid-in capital | | | 33,427,713 | |
Accumulated net investment loss | | | (250,164 | ) |
Accumulated net realized loss on investment
and foreign currency transactions | | | (1,469,403 | ) |
Net unrealized appreciation of investments
and foreign currency denominated assets and liabilities | | | 3,798,026 | |
| | | | |
| | $ | 35,510,293 | |
| | | | |
Net Asset Value Per Share—12 billion shares of capital stock authorized, $.001 par value
| | | | | | | | | | |
| Class | | Net Assets | | | Shares
Outstanding | | | Net Asset
Value |
| A | | $ | 20,457,223 | | | | 2,275,536 | | | $ 8.99* |
|
| B | | $ | 4,428,205 | | | | 558,445 | | | $7.93 |
|
| C | | $ | 7,706,114 | | | | 975,501 | | | $7.90 |
|
| Advisor | | $ | 2,918,751 | | | | 311,703 | | | $9.36 |
|
| (a) | | Includes securities on loan with a value of $1,395,054 (See Note E). |
| * | | The maximum offering price per share for Class A shares was $9.39, which reflects a sales charge 4.25%. |
See notes to financial statements.
| | |
| 14 | | • ALLIANCEBERNSTEIN GREATER CHINA ’97 FUND |
Statement of Assets & Liabilities
STATEMENT OF OPERATIONS
Six Months Ended January 31, 2012 (unaudited)
| | | | | | | | |
| Investment Income | | | | | | | | |
Dividends | | | | | | | | |
Unaffiliated issuers (net of foreign taxes withheld of $32,756) | | $ | 265,037 | | | | | |
Affiliated issuers | | | 327 | | | | | |
Securities lending income | | | 6,835 | | | | | |
Interest | | | 13 | | | $ | 272,212 | |
| | | | | | | | |
| Expenses | | | | | | | | |
Advisory fee (see Note B) | | | 143,730 | | | | | |
Distribution fee—Class A | | | 31,927 | | | | | |
Distribution fee—Class B | | | 26,300 | | | | | |
Distribution fee—Class C | | | 42,542 | | | | | |
Transfer agency—Class A | | | 36,748 | | | | | |
Transfer agency—Class B | | | 11,051 | | | | | |
Transfer agency—Class C | | | 15,947 | | | | | |
Transfer agency—Advisor Class | | | 5,584 | | | | | |
Custodian | | | 54,306 | | | | | |
Administrative | | | 41,242 | | | | | |
Registration fees | | | 36,228 | | | | | |
Legal | | | 23,652 | | | | | |
Directors' fees | | | 22,282 | | | | | |
Audit | | | 21,626 | | | | | |
Printing | | | 13,176 | | | | | |
Miscellaneous | | | 9,594 | | | | | |
| | | | | | | | |
Total expenses | | | 535,935 | | | | | |
Less: expenses waived and reimbursed by the Adviser (see Note B) | | | (13,559 | ) | | | | |
| | | | | | | | |
Net expenses | | | | | | | 522,376 | |
| | | | | | | | |
Net investment loss | | | | | | | (250,164 | ) |
| | | | | | | | |
| Realized and Unrealized Gain (Loss) on Investment and Foreign Currency Transactions | | | | | | | | |
Net realized loss on: | | | | | | | | |
Investment transactions | | | | | | | (1,822,456 | ) |
Foreign currency transactions | | | | | | | (2,799 | ) |
Net change in unrealized appreciation/depreciation of: | | | | | | | | |
Investments | | | | | | | (8,083,096 | ) |
Foreign currency denominated assets and liabilities | | | | | | | 1,252 | |
| | | | | | | | |
Net loss on investment and foreign currency transactions | | | | | | | (9,907,099 | ) |
| | | | | | | | |
Net Decrease in Net Assets from Operations | | | | | | $ | (10,157,263 | ) |
| | | | | | | | |
See notes to financial statements.
| | | | |
| ALLIANCEBERNSTEIN GREATER CHINA ’97 FUND • | | | 15 | |
Statement of Operations
STATEMENT OF CHANGES IN NET ASSETS
| | | | | | | | |
| | | Six Months Ended
January 31, 2012
(unaudited) | | | Year Ended
July 31,
2011 | |
| Increase (Decrease) in Net Assets from Operations | | | | | | | | |
Net investment loss | | $ | (250,164 | ) | | $ | (61,464 | ) |
Net realized gain (loss) on investment and foreign currency transactions | | | (1,825,255 | ) | | | 9,870,938 | |
Net change in unrealized appreciation/depreciation of investments and foreign currency denominated assets and liabilities | | | (8,081,844 | ) | | | (4,484,400 | ) |
| | | | | | | | |
Net increase (decrease) in net assets from operations | | | (10,157,263 | ) | | | 5,325,074 | |
| Distributions to Shareholders from | | | | | | | | |
Net realized gain on investment and foreign currency transactions | | | | | | | | |
Class A | | | (3,518,369 | ) | | | (1,637,463 | ) |
Class B | | | (924,419 | ) | | | (496,629 | ) |
Class C | | | (1,536,697 | ) | | | (666,687 | ) |
Advisor Class | | | (518,362 | ) | | | (202,492 | ) |
| Capital Stock Transactions | | | | | | | | |
Net increase (decrease) | | | 482,084 | | | | (10,388,644 | ) |
| | | | | | | | |
Total decrease | | | (16,173,026 | ) | | | (8,066,841 | ) |
| Net Assets | | | | | | | | |
Beginning of period | | | 51,683,319 | | | | 59,750,160 | |
| | | | | | | | |
End of period (including accumulated net investment loss of $(250,164) and $0, respectively) | | $ | 35,510,293 | | | $ | 51,683,319 | |
| | | | | | | | |
See notes to financial statements.
| | |
| 16 | | • ALLIANCEBERNSTEIN GREATER CHINA ’97 FUND |
Statement of Changes in Net Assets
NOTES TO FINANCIAL STATEMENTS
January 31, 2012 (unaudited)
NOTE A
Significant Accounting Policies
AllianceBernstein Greater China ’97 Fund, Inc. (the “Fund”) was organized as a Maryland corporation on April 30, 1997 and is registered under the Investment Company Act of 1940 as a diversified, open-end management investment company. The Fund offers Class A, Class B, Class C and Advisor Class shares. Class A shares are sold with a front-end sales charge of up to 4.25% for purchases not exceeding $1,000,000. With respect to purchases of $1,000,000 or more, Class A shares redeemed within one year of purchase may be subject to a contingent deferred sales charge of 1%. Class B shares are sold with a contingent deferred sales charge which declines from 4% to zero depending on the period of time the shares are held. Effective January 31, 2009, sales of Class B shares of the Fund to new investors were suspended. Class B shares will only be issued (i) upon the exchange of Class B shares from another AllianceBernstein Mutual Fund, (ii) for purposes of dividend reinvestment, (iii) through the Fund’s Automatic Investment Program (the “Program”) for accounts that established the Program prior to January 31, 2009, and (iv) for purchases of additional shares by Class B shareholders as of January 31, 2009. The ability to establish a new Program for accounts containing Class B shares was suspended as of January 31, 2009. Class B shares will automatically convert to Class A shares eight years after the end of the calendar month of purchase. Class C shares are subject to a contingent deferred sales charge of 1% on redemptions made within the first year after purchase. Advisor Class shares are sold without an initial or contingent deferred sales charge and are not subject to ongoing distribution expenses. Advisor Class shares are offered to investors participating in fee-based programs and to certain retirement plan accounts. All four classes of shares have identical voting, dividend, liquidation and other rights, except that the classes bear different distribution and transfer agency expenses. Each class has exclusive voting rights with respect to its distribution plan. The financial statements have been prepared in conformity with U.S. generally accepted accounting principles (“U.S. GAAP”), which require management to make certain estimates and assumptions that affect the reported amounts of assets and liabilities in the financial statements and amounts of income and expenses during the reporting period. Actual results could differ from those estimates. The following is a summary of significant accounting policies followed by the Fund.
1. Security Valuation
Portfolio securities are valued at their current market value determined on the basis of market quotations or, if market quotations are not readily available or are deemed unreliable, at “fair value” as determined in accordance with procedures established by and under the general supervision of the Fund’s Board of Directors.
In general, the market value of securities which are readily available and deemed reliable are determined as follows: securities listed on a national securities exchange (other than securities listed on the NASDAQ Stock Market, Inc.
| | | | |
| ALLIANCEBERNSTEIN GREATER CHINA ’97 FUND • | | | 17 | |
Notes to Financial Statements
(“NASDAQ”)) or on a foreign securities exchange are valued at the last sale price at the close of the exchange or foreign securities exchange. If there has been no sale on such day, the securities are valued at last traded price from the previous day. Securities listed on more than one exchange are valued by reference to the principal exchange on which the securities are traded; securities listed only on NASDAQ are valued in accordance with the NASDAQ Official Closing Price; listed or over the counter market (“OTC”) put or call options are valued at the mid level between the current bid and ask prices. If either a current bid or current ask price is unavailable, AllianceBernstein L.P. (the “Adviser”) will have discretion to determine the best valuation (e.g. last trade price); open futures contracts are valued using the closing settlement price or, in the absence of such a price, the most recent quoted bid price. If there are no quotations available for the day of valuation, the last available closing settlement price is used; U.S. government securities and other debt instruments having 60 days or less remaining until maturity are valued at amortized cost if their original maturity was 60 days or less; or by amortizing their fair value as of the 61st day prior to maturity if their original term to maturity exceeded 60 days; fixed-income securities, including mortgage backed and asset backed securities, may be valued on the basis of prices provided by a pricing service or at a price obtained from one or more of the major broker/dealers. In cases where broker/dealer quotes are obtained, the Adviser may establish procedures whereby changes in market yields or spreads are used to adjust, on a daily basis, a recently obtained quoted price on a security; and swaps and other derivatives are valued daily, primarily using independent pricing services, independent pricing models using market inputs, as well as third party broker-dealers or counterparties, which are approved by the Board of Directors. Investments in money market funds are valued at their net asset value each day.
Securities for which market quotations are not readily available (including restricted securities) or are deemed unreliable are valued at fair value. Factors considered in making this determination may include, but are not limited to, information obtained by contacting the issuer, analysts, analysis of the issuer’s financial statements or other available documents. In addition, the Fund may use fair value pricing for securities primarily traded in non-U.S. markets because most foreign markets close well before the Fund values its securities at 4:00 p.m., Eastern Time. The earlier close of foreign markets gives rise to the possibility that significant events, including broad market moves, may have occurred between the close of the foreign markets and the time at which the Fund values its securities which may materially affect the value of securities trading in such markets. To account for this, the Fund may frequently value many of its foreign equity securities using fair value prices based on third party vendor modeling tools to the extent available.
2. Fair Value Measurements
In accordance with U.S. GAAP regarding fair value measurements, fair value is defined as the price that the Fund would receive to sell an asset or pay to transfer
| | |
| 18 | | • ALLIANCEBERNSTEIN GREATER CHINA ’97 FUND |
Notes to Financial Statements
a liability in an orderly transaction between market participants at the measurement date. The U.S. GAAP disclosure requirements establish a framework for measuring fair value, and a three-level hierarchy for fair value measurements based upon the transparency of inputs to the valuation of an asset or liability. Inputs may be observable or unobservable and refer broadly to the assumptions that market participants would use in pricing the asset or liability. Observable inputs reflect the assumptions market participants would use in pricing the asset or liability based on market data obtained from sources independent of the Fund. Unobservable inputs reflect the Fund’s own assumptions that market participants would use in pricing the asset or liability based on the best information available in the circumstances. Each investment is assigned a level based upon the observability of the inputs which are significant to the overall valuation. The three-tier hierarchy of inputs is summarized below.
| | • | | Level 1—quoted prices in active markets for identical investments |
| | • | | Level 2—other significant observable inputs (including quoted prices for similar investments, interest rates, prepayment speeds, credit risk, etc.) |
| | • | | Level 3—significant unobservable inputs (including the Fund’s own assumptions in determining the fair value of investments) |
The following table summarizes the valuation of the Fund’s investments by the above fair value hierarchy levels as of January 31, 2012:
| | | | | | | | | | | | | | | | |
Investments in
Securities | | Level 1 | | | Level 2 | | | Level 3 | | | Total | |
Common Stocks: | | | | | | | | | | | | | | | | |
Financials | | $ | – 0 | – | | $ | 12,639,974 | | | $ | – 0 | – | | $ | 12,639,974 | |
Information Technology | | | 335,378 | | | | 7,006,278 | | | | – 0 | – | | | 7,341,656 | |
Energy | | | – 0 | – | | | 3,324,946 | | | | – 0 | – | | | 3,324,946 | |
Consumer Discretionary | | | 985,074 | | | | 2,289,286 | | | | – 0 | – | | | 3,274,360 | |
Industrials | | | – 0 | – | | | 2,950,357 | | | | – 0 | – | | | 2,950,357 | |
Materials | | | – 0 | – | | | 2,413,581 | | | | – 0 | – | | | 2,413,581 | |
Telecommunication Services | | | – 0 | – | | | 1,452,747 | | | | – 0 | – | | | 1,452,747 | |
Consumer Staples | | | – 0 | – | | | 942,433 | | | | – 0 | – | | | 942,433 | |
Health Care | | | – 0 | – | | | 407,514 | | | | – 0 | – | | | 407,514 | |
Short-Term Investments | | | 680,572 | | | | – 0 | – | | | – 0 | – | | | 680,572 | |
Investments of Cash Collateral for Securities Loaned in Affiliated Money Market Fund | | | 1,465,309 | | | | – 0 | – | | | – 0 | – | | | 1,465,309 | |
| | | | | | | | | | | | | | | | |
Total Investments in Securities | | | 3,466,333 | | | | 33,427,116 | † | | | – 0 | – | | | 36,893,449 | |
Other Financial Instruments*: | | | – 0 | – | | | – 0 | – | | | – 0 | – | | | – 0 | – |
| | | | | | | | | | | | | | | | |
Total | | $ | 3,466,333 | | | $ | 33,427,116 | | | $ | – 0 | – | | $ | 36,893,449 | |
| | | | | | | | | | | | | | | | |
| * | | Other financial instruments are derivative instruments, such as futures, forwards and swap contracts, which are valued at the unrealized appreciation/depreciation on the instrument. Other financial instruments may also include options written which are valued at market value. |
| † | | A significant portion of the Fund’s foreign equity investments are categorized as Level 2 investments since they are valued using fair value prices based on third party vendor modeling tools to the extent available, see Note A.1. |
| | | | |
| ALLIANCEBERNSTEIN GREATER CHINA ’97 FUND • | | | 19 | |
Notes to Financial Statements
3. Currency Translation
Assets and liabilities denominated in foreign currencies and commitments under forward currency exchange contracts are translated into U.S. dollars at the mean of the quoted bid and asked prices of such currencies against the U.S. dollar. Purchases and sales of portfolio securities are translated into U.S. dollars at the rates of exchange prevailing when such securities were acquired or sold. Income and expenses are translated into U.S. dollars at the rates of exchange prevailing when accrued.
Net realized gain or loss on foreign currency transactions represents foreign exchange gains and losses from sales and maturities of foreign fixed income investments, foreign currency exchange contracts, holding of foreign currencies, currency gains or losses realized between the trade and settlement dates on foreign investment transactions, and the difference between the amounts of dividends, interest and foreign withholding taxes recorded on the Fund’s books and the U.S. dollar equivalent amounts actually received or paid. Net unrealized currency gains and losses from valuing foreign currency denominated assets and liabilities at period end exchange rates are reflected as a component of net unrealized appreciation and depreciation of investments and foreign currency denominated assets and liabilities.
4. Taxes
It is the Fund’s policy to meet the requirements of the Internal Revenue Code applicable to regulated investment companies and to distribute all of its investment company taxable income and net realized gains, if any, to shareholders. Therefore, no provisions for federal income or excise taxes are required. The Fund may be subject to taxes imposed by countries in which it invests. Such taxes are generally based on income and/or capital gains earned or repatriated. Taxes are accrued and applied to net investment income, net realized gains and net unrealized appreciation/depreciation as such income and/or gains are earned.
In accordance with U.S. GAAP requirements regarding accounting for uncertainties in income taxes, management has analyzed the Fund’s tax positions taken or expected to be taken on federal and state income tax returns for all open tax years (the current and the prior three tax years) and has concluded that no provision for income tax is required in the Fund’s financial statements.
5. Investment Income and Investment Transactions
Dividend income is recorded on the ex-dividend date or as soon as the Fund is informed of the dividend. Interest income is accrued daily. Investment transactions are accounted for on the date securities are purchased or sold. Investment gains or losses are determined on the identified cost basis. The Fund amortizes premiums and accretes discounts as adjustments to interest income.
6. Class Allocations
All income earned and expenses incurred by the Fund are borne on a pro-rata basis by each settled class of shares, based on the proportionate interest in the
| | |
| 20 | | • ALLIANCEBERNSTEIN GREATER CHINA ’97 FUND |
Notes to Financial Statements
Fund represented by the net assets of such class, except for class specific expenses which are allocated to the respective class. Realized and unrealized gains and losses are allocated among the various share classes based on their respective net assets.
7. Dividends and Distributions
Dividends and distributions to shareholders, if any, are recorded on the ex-dividend date. Income dividends and capital gains distributions are determined in accordance with federal tax regulations and may differ from those determined in accordance with U.S. GAAP. To the extent these differences are permanent, such amounts are reclassified within the capital accounts based on their federal tax basis treatment; temporary differences do not require such reclassification.
NOTE B
Advisory Fee and Other Transactions with Affiliates
Under the terms of the investment advisory agreement, the Fund pays the Adviser an advisory fee at an annual rate of .75% of the first $2.5 billion, .65% of the next $2.5 billion and .60% in excess of $5 billion, of the Fund’s average daily net assets. The fee is accrued daily and paid monthly.
The Adviser had agreed to waive its fee and bear certain expenses to the extent necessary to limit total operating expenses on an annual basis to 2.50%, 3.20%, 3.20% and 2.20% of the daily average net assets for Class A, Class B, Class C and Advisor Class shares, respectively (the “Expense Caps”). The Expense Caps will expire on November 1, 2012 and then may be extended by the Adviser for additional one year terms. For the six months ended January 31, 2012, such reimbursement amounted to $13,559.
Pursuant to the investment advisory agreement, the Fund may reimburse the Adviser for certain legal and accounting services provided to the Fund by the Adviser. For the six months ended January 31, 2012, such fee amounted to $41,242.
The Fund compensates AllianceBernstein Investor Services, Inc. (“ABIS”), a wholly-owned subsidiary of the Adviser, under a Transfer Agency Agreement for providing personnel and facilities to perform transfer agency services for the Fund. ABIS may make payments to intermediaries that provide omnibus account services, sub-accounting services and/or networking services. Such compensation retained by ABIS amounted to $29,647 for the six months ended January 31, 2012.
For the six months ended January 31, 2012, there was no reduction to the expenses of Class A, Class B, Class C and Advisor Class shares under an expense offset arrangement with ABIS.
| | | | |
| ALLIANCEBERNSTEIN GREATER CHINA ’97 FUND • | | | 21 | |
Notes to Financial Statements
AllianceBernstein Investments, Inc. (the “Distributor”), a wholly-owned subsidiary of the Adviser, serves as the distributor of the Fund’s shares. The Distributor has advised the Fund that it has retained front-end sales charges of $319 from the sale of Class A shares and received $80, $1,948 and $639 in contingent deferred sales charges imposed upon redemptions by shareholders of Class A, Class B and Class C shares, respectively, for the six months ended January 31, 2012.
The Fund may invest in the AllianceBernstein Fixed-Income Shares, Inc.—Government STIF Portfolio, an open-end management investment company managed by the Adviser. The Government STIF Portfolio is offered as a cash management option to mutual funds and other institutional accounts of the Adviser, and is not available for direct purchase by members of the public. The Government STIF Portfolio pays no investment management fees but does bear its own expenses. A summary of the Fund’s transactions in shares of the Government STIF Portfolio for the six months ended January 31, 2012 is as follows:
| | | | | | | | | | | | | | | | | | |
Market Value
July 31, 2011
(000) | | | Purchases
at Cost
(000) | | | Sales
Proceeds
(000) | | | Market Value
January 31, 2012
(000) | | | Dividend
Income
(000) | |
| $ | – 0 | – | | $ | 4,716 | | | $ | 4,035 | | | $ | 681 | | | $ | 0 | * |
| * | | Amount is less than $500. |
Brokerage commissions paid on investment transactions for the six months ended January 31, 2012 amounted to $23,551, of which $0 and $162 was paid to Sanford C. Bernstein & Co. LLC and Sanford C. Bernstein Limited, respectively, affiliates of the Adviser.
NOTE C
Distribution Services Agreement
The Fund has adopted a Distribution Services Agreement (the “Agreement”) pursuant to Rule 12b-1 under the Investment Company Act of 1940. Under the Agreement the Fund pays distribution and servicing fees to the Distributor at an annual rate of up to .30% of the Fund’s average daily net assets attributable to Class A shares and 1% of the Fund’s average daily net assets attributable to both Class B and Class C shares. There are no distribution and servicing fees on Advisor Class shares. The fees are accrued daily and paid monthly. The Agreement provides that the Distributor will use such payments in their entirety for distribution assistance and promotional activities. Since the commencement of the Fund’s operations, the Distributor has incurred expenses in excess of the distribution costs reimbursed by the Fund in the amounts of $2,081,483 and $1,523,365 for Class B and Class C shares, respectively. While such costs may be recovered from the Fund in future periods so long as the Agreement is in effect, the rate of the distribution and servicing fees payable under the Agreement may not be increased without a shareholder vote. In accordance with the Agreement,
| | |
| 22 | | • ALLIANCEBERNSTEIN GREATER CHINA ’97 FUND |
Notes to Financial Statements
there is no provision for recovery of unreimbursed distribution costs incurred by the Distributor beyond the current fiscal year for Class A shares. The Agreement also provides that the Adviser may use its own resources to finance the distribution of the Fund’s shares.
NOTE D
Investment Transactions
Purchases and sales of investment securities (excluding short-term investments) for the six months ended January 31, 2012, were as follows:
| | | | | | | | |
| | | Purchases | | | Sales | |
Investment securities (excluding
U.S. government securities) | | $ | 9,649,768 | | | $ | 16,558,120 | |
U.S. government securities | | | – 0 | – | | | – 0 | – |
The cost of investments for federal income tax purposes was substantially the same as cost for financial reporting purposes. Accordingly, gross unrealized appreciation and unrealized depreciation (excluding foreign currency contracts) are as follows:
| | | | |
Gross unrealized appreciation | | $ | 7,362,279 | |
Gross unrealized depreciation | | | (3,565,793 | ) |
| | | | |
Net unrealized appreciation | | $ | 3,796,486 | |
| | | | |
1. Derivative Financial Instruments
The Fund may use derivatives to earn income and enhance returns, to hedge or adjust the risk profile of its portfolio, to replace more traditional direct investments, or to obtain exposure to otherwise inaccessible markets.
The Fund did not engage in derivative transactions for the six months ended January 31, 2012.
2. Currency Transactions
The Fund may invest in non-U.S. Dollar securities on a currency hedged or unhedged basis. The Fund may seek investment opportunities by taking long or short positions in currencies through the use of currency-related derivatives, including forward currency exchange contracts, futures and options on futures, swaps, and other options. The Fund may enter into transactions for investment opportunities when it anticipates that a foreign currency will appreciate or depreciate in value but securities denominated in that currency are not held by the Fund and do not present attractive investment opportunities. Such transactions may also be used when the Adviser believes that it may be more efficient than a direct investment in a foreign currency-denominated security. The Fund may also conduct currency exchange contracts on a spot basis (i.e., for cash at the spot rate prevailing in the currency exchange market for buying or selling currencies).
| | | | |
| ALLIANCEBERNSTEIN GREATER CHINA ’97 FUND • | | | 23 | |
Notes to Financial Statements
NOTE E
Securities Lending
The Fund may enter into securities lending transactions. Under the Fund’s securities lending program, all securities loans will be collateralized continually by cash. The Fund will be compensated for the loan from a portion of the net return from the income earned on cash collateral after a rebate is paid to the borrower (in some cases, this rebate may be a “negative rebate” or fee paid by the borrower to the Fund in connection with the loan), and payments for fees of the securities lending agent and for certain other administrative expenses. It is the policy of the Fund to receive collateral consisting of cash in an amount exceeding the value of the securities loaned. A Fund will have the right to call a loan and obtain the securities loaned at any time on notice to the borrower within the normal and customary settlement time for the securities. While the securities are on loan, the borrower is obligated to pay the Fund amounts equal to any income or other distributions from the securities. The Fund will not have the right to vote any securities during the existence of a loan, but will have the right to regain ownership of loaned securities in order to exercise voting or other ownership rights. The lending agent has agreed to indemnify the Fund in the case of default of any securities borrower. Collateral received and securities loaned are marked to market daily to ensure that the securities loaned are secured by collateral. The lending agent will invest the cash collateral received in AllianceBernstein Exchange Reserves, an eligible money market vehicle, in accordance with the investment restrictions of the Fund, and as approved by the Fund’s Board of Directors. The collateral received on securities loaned is recorded as an asset as well as a corresponding liability in the statement of assets and liabilities. When the Fund lends securities, its investment performance will continue to reflect changes in the value of the securities loaned. At January 31, 2012, the Fund had securities on loan with a value of $1,395,054 and had received cash collateral which has been invested into AllianceBernstein Exchange Reserves of $1,465,309. The cash collateral will be adjusted on the next business day after period end to maintain the required collateral amount. The Fund earned securities lending income of $6,835 and $237 from the borrowers and AllianceBernstein Exchange Reserves, respectively, for the six months ended January 31, 2012; these amounts are reflected in the statement of operations. A principal risk of lending portfolio securities is that the borrower will fail to return the loaned securities upon termination of the loan and that the collateral will not be sufficient to replace the loaned securities. A summary of the Fund’s transactions in shares of AllianceBernstein Exchange Reserves for the six months ended January 31, 2012 is as follows:
| | | | | | | | | | | | | | | | | | |
Market Value
July 31, 2011
(000) | | | Purchases
at Cost
(000) | | | Sales
Proceeds
(000) | | | Market Value
January 31, 2012
(000) | | | Dividend
Income
(000) | |
| $ | – 0 | – | | $ | 2,993 | | | $ | 1,528 | | | $ | 1,465 | | | $ | 0 | * |
| * | | Amount is less than $500. |
| | |
| 24 | | • ALLIANCEBERNSTEIN GREATER CHINA ’97 FUND |
Notes to Financial Statements
NOTE F
Capital Stock
Each class consists of 3,000,000,000 authorized shares. Transactions in capital shares for each class were as follows:
| | | | | | | | | | | | | | | | | | | | |
| | | | | | | | | | | | | | | | | | | | |
| | | Shares | | | | | Amount | | | |
| | | Six Months Ended
January 31, 2012
(unaudited) | | | Year Ended
July 31, 2011 | | | | | Six Months Ended
January 31, 2012
(unaudited) | | | Year Ended
July 31, 2011 | | | |
| | | | | | |
| Class A | | | | | | | | | | | | | | | | | |
Shares sold | | | 110,635 | | | | 258,306 | | | | | $ | 1,092,158 | | | $ | 3,687,769 | | | |
| | | |
Shares issued in reinvestment of dividends and distributions | | | 413,347 | | | | 105,256 | | | | | | 3,281,977 | | | | 1,518,839 | | | |
| | | |
Shares converted from Class B | | | 86,794 | | | | 57,964 | | | | | | 882,302 | | | | 833,022 | | | |
| | | |
Shares redeemed | | | (370,722 | ) | | | (880,142 | ) | | | | | (3,944,919 | ) | | | (12,548,609 | ) | | |
| | | |
Net increase (decrease) | | | 240,054 | | | | (458,616 | ) | | | | $ | 1,311,518 | | | $ | (6,508,979 | ) | | |
| | | |
| | | | | | | | | | | | | | | | | | | | |
| Class B | | | | | | | | | | | | | | | | | | | | |
Shares sold | | | 13,804 | | | | 26,748 | | | | | $ | 121,076 | | | $ | 355,386 | | | |
| | | |
Shares issued in reinvestment of dividends and distributions | | | 120,366 | | | | 34,896 | | | | | | 843,770 | | | | 459,575 | | | |
| | | |
Shares converted to Class A | | | (96,744 | ) | | | (63,625 | ) | | | | | (882,302 | ) | | | (833,022 | ) | | |
| | | |
Shares redeemed | | | (73,809 | ) | | | (187,906 | ) | | | | | (714,857 | ) | | | (2,444,519 | ) | | |
| | | |
Net decrease | | | (36,383 | ) | | | (189,887 | ) | | | | $ | (632,313 | ) | | $ | (2,462,580 | ) | | |
| | | |
| | | | | | | | | | | | | | | | | | | | |
| Class C | | | | | | | | | | | | | | | | | | | | |
Shares sold | | | 28,664 | | | | 65,982 | | | | | $ | 271,845 | | | $ | 853,919 | | | |
| | | |
Shares issued in reinvestment of dividends and distributions | | | 207,880 | | | | 47,698 | | | | | | 1,451,003 | | | | 626,272 | | | |
| | | |
Shares redeemed | | | (160,898 | ) | | | (280,065 | ) | | | | | (1,449,110 | ) | | | (3,633,634 | ) | | |
| | | |
Net increase (decrease) | | | 75,646 | | | | (166,385 | ) | | | | $ | 273,738 | | | $ | (2,153,443 | ) | | |
| | | |
| | | | | | | | | | | | | | | | | | | | |
| Advisor Class | | | | | | | | | | | | | | | | | | | | |
Shares sold | | | 74,214 | | | | 155,870 | | | | | $ | 687,795 | | | $ | 2,310,957 | | | |
| | | |
Shares issued in reinvestment of dividends and distributions | | | 42,943 | | | | 12,184 | | | | | | 355,143 | | | | 181,044 | | | |
| | | |
Shares redeemed | | | (149,805 | ) | | | (120,415 | ) | | | | | (1,513,797 | ) | | | (1,755,643 | ) | | |
| | | |
Net increase (decrease) | | | (32,648 | ) | | | 47,639 | | | | | $ | (470,859 | ) | | $ | 736,358 | | | |
| | | |
| | | | |
| ALLIANCEBERNSTEIN GREATER CHINA ’97 FUND • | | | 25 | |
Notes to Financial Statements
NOTE G
Risks Involved in Investing in the Fund
Foreign Securities Risk—Investing in securities of foreign companies or foreign governments involves special risks which include changes in foreign currency exchange rates and the possibility of future political and economic developments which could adversely affect the value of such securities. Moreover, securities of many foreign companies or foreign governments and their markets may be less liquid and their prices more volatile than those of comparable U.S. companies and the U.S. government.
The Fund has invested approximately 45% of its net assets in China equity securities. Political, social or economic changes in this market may have a greater impact on the value of the Fund’s portfolio due to this concentration.
Currency Risk—This is the risk that changes in foreign currency exchange rates may negatively affect the value of the Fund’s investments or reduce the returns of the Fund. For example, the value of the Fund’s investments in foreign currency-denominated securities or currencies may decrease if the U.S. Dollar is strong (i.e., gaining value relative to other currencies) and other currencies are weak (i.e., losing value relative to the U.S. Dollar). Currency markets are generally not as regulated as securities markets. Independent of the Fund’s investments denominated in foreign currencies, the Fund’s positions in various foreign currencies may cause the Fund to experience investment losses due to the changes in exchange rates and interest rates.
Emerging Market Risk—Investments in emerging market countries may have more risk because the markets are less developed and less liquid as well as being subject to increased economic, political, regulatory or other uncertainties.
Focused Portfolio Risk—Investments in a limited number of companies may have more risk because changes in the value of a single security may have a more significant effect, either negative or positive, on the Fund’s NAV.
Derivatives Risk—The Fund may enter into derivative transactions such as forwards, options, futures and swaps. Derivatives may be illiquid, difficult to price, and leveraged so that small changes may produce disproportionate losses for the Fund, and subject to counterparty risk to a greater degree than more traditional investments. Derivatives may result in significant losses, including losses that are far greater than the value of the derivatives reflected in the statement of assets and liabilities.
Indemnification Risk—In the ordinary course of business, the Fund enters into contracts that contain a variety of indemnifications. The Fund’s maximum exposure under these arrangements is unknown. However, the Fund has not had prior claims or losses pursuant to these indemnification provisions and expects the risk of loss thereunder to be remote. Therefore, the Fund has not accrued any liability in connection with these indemnification provisions.
| | |
| 26 | | • ALLIANCEBERNSTEIN GREATER CHINA ’97 FUND |
Notes to Financial Statements
NOTE H
Joint Credit Facility
A number of open-end mutual funds managed by the Adviser, including the Fund, participate in a $140 million revolving credit facility (the “Facility”) intended to provide short-term financing if necessary, subject to certain restrictions in connection with abnormal redemption activity. Commitment fees related to the Facility are paid by the participating funds and are included in miscellaneous expenses in the statement of operations. The Fund did not utilize the Facility during the six months ended January 31, 2012.
NOTE I
Distributions to Shareholders
The tax character of distributions paid for the year ending July 31, 2012 will be determined at the end of the current fiscal year. The tax character of distributions paid during the fiscal years ended July 31, 2011 and July 31, 2010 were as follows:
| | | | | | | | |
| | | 2011 | | | 2010 | |
Distributions paid from: | | | | | | | | |
Ordinary income | | $ | – 0 | – | | $ | 417,417 | |
Long-term capital gains | | | 3,003,271 | | | | 17,305 | |
| | | | | | | | |
Total taxable distributions | | $ | 3,003,271 | | | $ | 434,722 | |
| | | | | | | | |
As of July 31, 2011, the components of accumulated earnings/(deficit) on a tax basis were as follows:
| | | | |
Undistributed ordinary income | | $ | 160,091 | |
Undistributed capital gain | | | 7,265,780 | |
Unrealized appreciation/(depreciation) | | | 11,307,698 | (a) |
| | | | |
Total accumulated earnings/(deficit) | | $ | 18,733,569 | |
| | | | |
| (a) | | The difference between book-basis and tax-basis unrealized appreciation/depreciation is attributable primarily to the tax deferral of losses on wash sales. |
For tax purposes, net capital losses may be carried over to offset future capital gains, if any. Under the Regulated Investment Company Modernization Act of 2010, funds are permitted to carry forward capital losses incurred in taxable years beginning after December 22, 2010 for an indefinite period. These post-enactment capital losses must be utilized prior to the pre-enactment capital losses, which are subject to expiration. Post-enactment capital loss carryforwards will retain their character as either short-term or long-term capital losses rather than being considered short-term as under previous regulation.
NOTE J
Recent Accounting Pronouncement
In May 2011, the Financial Accounting Standards Board (“FASB”) issued an Accounting Standards Update (“ASU”) to develop common requirements for
| | | | |
| ALLIANCEBERNSTEIN GREATER CHINA ’97 FUND • | | | 27 | |
Notes to Financial Statements
measuring fair value and for disclosing information about fair value measurements in U.S. GAAP and International Financial Reporting Standards (“IFRS”). The amendments are intended to improve the comparability of fair value measurements presented and disclosed in the financial statements prepared in accordance with U.S. GAAP and IFRS. The ASU is effective during interim or annual periods beginning after December 15, 2011. At this time, management is evaluating the implication of this ASU and its impact on the financial statements has not been determined.
In December 2011, the FASB issued an ASU related to disclosures about offsetting assets and liabilities in financial statements. The amendments in this update require an entity to disclose both gross and net information for derivatives and other financial instruments that are either offset in the statement of assets and liabilities or subject to an enforceable master netting arrangement or similar agreement. The ASU is effective during interim or annual reporting periods beginning on or after January 1, 2013. At this time, management is evaluating the implication of this ASU and its impact on the financial statements has not been determined.
NOTE K
Subsequent Events
Management has evaluated subsequent events for possible recognition or disclosure in the financial statements through the date the financial statements are issued. Management has determined that there are no material events that would require disclosure in the Fund’s financial statements through this date.
| | |
| 28 | | • ALLIANCEBERNSTEIN GREATER CHINA ’97 FUND |
Notes to Financial Statements
FINANCIAL HIGHLIGHTS
Selected Data For A Share Of Capital Stock Outstanding Throughout Each Period
| | | | | | | | | | | | | | | | | | | | | | | | |
| | | Class A | |
| | | Six Months
Ended
January 31,
2012
(unaudited) | | | Year Ended July 31, | |
| | | | 2011 | | | 2010 | | | 2009 | | | 2008 | | | 2007 | |
| | | | |
| | | | | | | | | | | | | | | | | | | | | | | | |
Net asset value, beginning of period | | | $ 13.80 | | | | $ 13.29 | | | | $ 12.54 | | | | $ 21.04 | | | | $ 25.78 | | | | $ 16.19 | |
| | | | |
Income From Investment Operations | | | | | | | | | | | | | | | | | | | | | | | | |
Net investment income (loss)(a) | | | (.06 | )(b) | | | .02 | | | | .02 | | | | .10 | | | | .15 | (b) | | | .04 | (b) |
Net realized and unrealized gain (loss) on investment and foreign currency transactions | | | (2.85 | ) | | | 1.16 | | | | .84 | | | | (4.60 | ) | | | (3.00 | ) | | | 10.72 | |
| | | | |
Net increase (decrease) in net asset value from operations | | | (2.91 | ) | | | 1.18 | | | | .86 | | | | (4.50 | ) | | | (2.85 | ) | | | 10.76 | |
| | | | |
Less: Dividends and Distributions | | | | | | | | | | | | | | | | | | | | | | | | |
Dividends from net investment income | | | – 0 | – | | | – 0 | – | | | (.11 | ) | | | (.14 | ) | | | (.09 | ) | | | (.10 | ) |
Distributions from net realized gain on investment and foreign currency transactions | | | (1.90 | ) | | | (.67 | ) | | | – 0 | – | | | (3.86 | ) | | | (1.80 | ) | | | (1.07 | ) |
| | | | |
Total dividends and distributions | | | (1.90 | ) | | | (.67 | ) | | | (.11 | ) | | | (4.00 | ) | | | (1.89 | ) | | | (1.17 | ) |
| | | | |
Net asset value, end of period | | | $ 8.99 | | | | $ 13.80 | | | | $ 13.29 | | | | $ 12.54 | | | | $ 21.04 | | | | $ 25.78 | |
| | | | |
Total Return | | | | | | | | | | | | | | | | | | | | | | | | |
Total investment return based on net asset value(c) | | | (19.31 | )% | | | 8.62 | % | | | 6.82 | % | | | (11.92 | )% | | | (13.00 | )% | | | 69.53 | % |
Ratios/Supplemental Data | | | | | | | | | | | | | | | | | | | | | | | | |
Net assets, end of period (000’s omitted) | | | $20,457 | | | | $28,089 | | | | $33,146 | | | | $80,444 | | | | $46,250 | | | | $62,614 | |
Ratio to average net assets of: | | | | | | | | | | | | | | | | | | | | | | | | |
Expenses, net of waivers/reimbursements | | | 2.50 | %(d) | | | 2.02 | %(e) | | | 1.88 | %(e) | | | 2.02 | % | | | 1.61 | % | | | 1.63 | % |
Expenses, before waivers/reimbursements | | | 2.56 | %(d) | | | 2.02 | %(e) | | | 1.88 | %(e) | | | 2.02 | % | | | 1.64 | % | | | 1.71 | % |
Net investment income (loss) | | | (1.11 | )%(b)(d) | | | .13 | %(e) | | | .13 | %(e) | | | .95 | % | | | .57 | %(b) | | | .19 | %(b) |
Portfolio turnover rate | | | 25 | % | | | 78 | % | | | 86 | % | | | 105 | % | | | 46 | % | | | 43 | % |
See footnote summary on page 33.
| | | | |
| ALLIANCEBERNSTEIN GREATER CHINA ’97 FUND • | | | 29 | |
Financial Highlights
Selected Data For A Share Of Capital Stock Outstanding Throughout Each Period
| | | | | | | | | | | | | | | | | | | | | | | | |
| | | Class B | |
| | | Six Months
Ended
January 31,
2012
(unaudited) | | | Year Ended July 31, | |
| | | | 2011 | | | 2010 | | | 2009 | | | 2008 | | | 2007 | |
| | | | |
| | | | | | | | | | | | | | | | | | | | | | | | |
Net asset value, beginning of period | | | $ 12.52 | | | | $ 12.20 | | | | $ 11.54 | | | | $ 19.78 | | | | $ 24.43 | | | | $ 15.41 | |
| | | | |
Income From Investment Operations | | | | | | | | | | | | | | | | | | | | | | | | |
Net investment loss(a) | | | (.08 | )(b) | | | (.08 | ) | | | (.10 | ) | | | (.06 | ) | | | (.04 | )(b) | | | (.11 | )(b) |
Net realized and unrealized gain (loss) on investment and foreign currency transactions | | | (2.61 | ) | | | 1.07 | | | | .80 | | | | (4.32 | ) | | | (2.81 | ) | | | 10.20 | |
| | | | |
Net increase (decrease) in net asset value from operations | | | (2.69 | ) | | | .99 | | | | .70 | | | | (4.38 | ) | | | (2.85 | ) | | | 10.09 | |
| | | | |
Less: Dividends and Distributions | | | | | | | | | | | | | | | | | | | | | | | | |
Dividends from net investment income | | | – 0 | – | | | – 0 | – | | | (.04 | ) | | | – 0 | – | | | – 0 | – | | | – 0 | – |
Distributions from net realized gain on investment and foreign currency transactions | | | (1.90 | ) | | | (.67 | ) | | | – 0 | – | | | (3.86 | ) | | | (1.80 | ) | | | (1.07 | ) |
| | | | |
Total dividends and distributions | | | (1.90 | ) | | | (.67 | ) | | | (.04 | ) | | | (3.86 | ) | | | (1.80 | ) | | | (1.07 | ) |
| | | | |
Net asset value, end of period | | | $ 7.93 | | | | $ 12.52 | | | | $ 12.20 | | | | $ 11.54 | | | | $ 19.78 | | | | $ 24.43 | |
| | | | |
Total Return | | | | | | | | | | | | | | | | | | | | | | | | |
Total investment return based on net asset value(c) | | | (19.54 | )% | | | 7.80 | % | | | 6.04 | % | | | (12.59 | )% | | | (13.66 | )% | | | 68.40 | % |
Ratios/Supplemental Data | | | | | | | | | | | | | | | | | | | | | | | | |
Net assets, end of period (000’s omitted) | | | $4,428 | | | | $7,450 | | | | $9,577 | | | | $12,000 | | | | $18,382 | | | | $26,697 | |
Ratio to average net assets of: | | | | | | | | | | | | | | | | | | | | | | | | |
Expenses, net of waivers/reimbursements | | | 3.20 | %(d) | | | 2.76 | %(e) | | | 2.67 | %(e) | | | 2.92 | % | | | 2.32 | % | | | 2.36 | % |
Expenses, before waivers/reimbursements | | | 3.32 | %(d) | | | 2.76 | %(e) | | | 2.67 | %(e) | | | 2.92 | % | | | 2.36 | % | | | 2.45 | % |
Net investment loss | | | (1.74 | )%(b)(d) | | | (.64 | )%(e) | | | (.82 | )%(e) | | | (.55 | )% | | | (.16 | )%(b) | | | (.54 | )%(b) |
Portfolio turnover rate | | | 25 | % | | | 78 | % | | | 86 | % | | | 105 | % | | | 46 | % | | | 43 | % |
See footnote summary on page 33.
| | |
| 30 | | • ALLIANCEBERNSTEIN GREATER CHINA ’97 FUND |
Financial Highlights
Selected Data For A Share Of Capital Stock Outstanding Throughout Each Period
| | | | | | | | | | | | | | | | | | | | | | | | |
| | | Class C | |
| | | Six Months
Ended
January 31,
2012
(unaudited) | | | Year Ended July 31, | |
| | | | 2011 | | | 2010 | | | 2009 | | | 2008 | | | 2007 | |
| | | | |
| | | | | | | | | | | | | | | | | | | | | | | | |
Net asset value, beginning of period | | | $ 12.49 | | | | $ 12.17 | | | | $ 11.50 | | | | $ 19.73 | | | | $ 24.37 | | | | $ 15.38 | |
| | | | |
Income From Investment Operations | | | | | | | | | | | | | | | | | | | | | | | | |
Net investment loss(a) | | | (.08 | )(b) | | | (.07 | ) | | | (.09 | ) | | | (.05 | ) | | | (.03 | )(b) | | | (.10 | )(b) |
Net realized and unrealized gain (loss) on investment and foreign currency transactions | | | (2.61 | ) | | | 1.06 | | | | .80 | | | | (4.32 | ) | | | (2.81 | ) | | | 10.16 | |
| | | | |
Net increase (decrease) in net asset value from operations | | | (2.69 | ) | | | .99 | | | | .71 | | | | (4.37 | ) | | | (2.84 | ) | | | 10.06 | |
| | | | |
Less: Dividends and Distributions | | | | | | | | | | | | | | | | | | | | | | | | |
Dividends from net investment income | | | – 0 | – | | | – 0 | – | | | (.04 | ) | | | – 0 | – | | | – 0 | – | | | – 0 | – |
Distributions from net realized gain on investment and foreign currency transactions | | | (1.90 | ) | | | (.67 | ) | | | – 0 | – | | | (3.86 | ) | | | (1.80 | ) | | | (1.07 | ) |
| | | | |
Total dividends and distributions | | | (1.90 | ) | | | (.67 | ) | | | (.04 | ) | | | (3.86 | ) | | | (1.80 | ) | | | (1.07 | ) |
| | | | |
Net asset value, end of period | | | $ 7.90 | | | | $ 12.49 | | | | $ 12.17 | | | | $ 11.50 | | | | $ 19.73 | | | | $ 24.37 | |
| | | | |
Total Return | | | | | | | | | | | | | | | | | | | | | | | | |
Total investment return based on net asset value(c) | | | (19.58 | )% | | | 7.83 | % | | | 6.15 | % | | | (12.56 | )% | | | (13.66 | )% | | | 68.34 | % |
Ratios/Supplemental Data | | | | | | | | | | | | | | | | | | | | | | | | |
Net assets, end of period (000’s omitted) | | | $7,706 | | | | $11,239 | | | | $12,975 | | | | $16,211 | | | | $25,388 | | | | $31,363 | |
Ratio to average net assets of: | | | | | | | | | | | | | | | | | | | | | | | | |
Expenses, net of waivers/reimbursements | | | 3.20 | %(d) | | | 2.74 | %(e) | | | 2.64 | %(e) | | | 2.88 | % | | | 2.32 | % | | | 2.34 | % |
Expenses, before waivers/reimbursements | | | 3.28 | %(d) | | | 2.74 | %(e) | | | 2.64 | %(e) | | | 2.88 | % | | | 2.35 | % | | | 2.42 | % |
Net investment loss | | | (1.79 | )%(b)(d) | | | (.56 | )%(e) | | | (.76 | )%(e) | | | (.51 | )% | | | (.14 | )%(b) | | | (.50 | )%(b) |
Portfolio turnover rate | | | 25 | % | | | 78 | % | | | 86 | % | | | 105 | % | | | 46 | % | | | 43 | % |
See footnote summary on page 33.
| | | | |
| ALLIANCEBERNSTEIN GREATER CHINA ’97 FUND • | | | 31 | |
Financial Highlights
Selected Data For A Share Of Capital Stock Outstanding Throughout Each Period
| | | | | | | | | | | | | | | | | | | | | | | | |
| | | Advisor Class | |
| | | Six Months
Ended
January 31,
2012
(unaudited) | | | Year Ended July 31, | |
| | | | 2011 | | | 2010 | | | 2009 | | | 2008 | | | 2007 | |
| | | | |
| | | | | | | | | | | | | | | | | | | | | | | | |
Net asset value, beginning of period | | | $ 14.24 | | | | $ 13.66 | | | | $ 12.88 | | | | $ 21.54 | | | | $ 26.36 | | | | $ 16.52 | |
| | | | |
Income From Investment Operations | | | | | | | | | | | | | | | | | | | | | | | | |
Net investment income (loss)(a) | | | (.04 | )(b) | | | .08 | | | | .05 | | | | .04 | | | | .23 | (b) | | | .07 | (b) |
Net realized and unrealized gain (loss) on investment and foreign currency transactions | | | (2.94 | ) | | | 1.17 | | | | .88 | | | | (4.60 | ) | | | (3.09 | ) | | | 10.98 | |
| | | | |
Net increase (decrease) in net asset value from operations | | | (2.98 | ) | | | 1.25 | | | | .93 | | | | (4.56 | ) | | | (2.86 | ) | | | 11.05 | |
| | | | |
Less: Dividends and Distributions | | | | | | | | | | | | | | | | | | | | | | | | |
Dividends from net investment income | | | – 0 | – | | | – 0 | – | | | (.15 | ) | | | (.24 | ) | | | (.16 | ) | | | (.14 | ) |
Distributions from net realized gain on investment and foreign currency transactions | | | (1.90 | ) | | | (.67 | ) | | | – 0 | – | | | (3.86 | ) | | | (1.80 | ) | | | (1.07 | ) |
| | | | |
Total dividends and distributions | | | (1.90 | ) | | | (.67 | ) | | | (.15 | ) | | | (4.10 | ) | | | (1.96 | ) | | | (1.21 | ) |
| | | | |
Net asset value, end of period | | | $ 9.36 | | | | $ 14.24 | | | | $ 13.66 | | | | $ 12.88 | | | | $ 21.54 | | | | $ 26.36 | |
| | | | |
Total Return | | | | | | | | | | | | | | | | | | | | | | | | |
Total investment return based on net asset value(c) | | | (19.21 | )% | | | 8.91 | % | | | 7.18 | % | | | (11.65 | )% | | | (12.82 | )% | | | 70.01 | % |
Ratios/Supplemental Data | | | | | | | | | | | | | | | | | | | | | | | | |
Net assets, end of period (000’s omitted) | | | $2,919 | | | | $4,904 | | | | $4,052 | | | | $3,987 | | | | $7,100 | | | | $10,013 | |
Ratio to average net assets of: | | | | | | | | | | | | | | | | | | | | | | | | |
Expenses, net of waivers/reimbursements | | | 2.20 | %(d) | | | 1.74 | %(e) | | | 1.63 | %(e) | | | 1.87 | % | | | 1.31 | % | | | 1.32 | % |
Expenses, before waivers/reimbursements | | | 2.24 | %(d) | | | 1.74 | %(e) | | | 1.63 | %(e) | | | 1.87 | % | | | 1.34 | % | | | 1.40 | % |
Net investment income (loss) | | | (.65 | )%(b)(d) | | | .55 | %(e) | | | .37 | %(e) | | | .39 | % | | | .85 | %(b) | | | .35 | %(b) |
Portfolio turnover rate | | | 25 | % | | | 78 | % | | | 86 | % | | | 105 | % | | | 46 | % | | | 43 | % |
See footnote summary on page 33.
| | |
| 32 | | • ALLIANCEBERNSTEIN GREATER CHINA ’97 FUND |
Financial Highlights
| (a) | | Based on average shares outstanding. |
| (b) | | Net of expenses waived/reimbursed by the Adviser. |
| (c) | | Total investment return is calculated assuming an initial investment made at the net asset value at the beginning of the period, reinvestment of all dividends and distributions at net asset value during the period, and redemption on the last day of the period. Initial sales charges or contingent deferred sales charges are not reflected in the calculation of total investment return. Total return does not reflect the deduction of taxes that a shareholder would pay on fund distributions or the redemption of fund shares. Total investment return calculated for a period of less than one year is not annualized. |
| (e) | | The ratio includes expenses attributable to costs of proxy solicitation. |
See notes to financial statements.
| | | | |
| ALLIANCEBERNSTEIN GREATER CHINA ’97 FUND • | | | 33 | |
Financial Highlights
BOARD OF DIRECTORS
William H. Foulk, Jr.(1) , Chairman
John H. Dobkin(1)
Michael J. Downey(1)
D. James Guzy(1)
Nancy P. Jacklin(1)
Robert M. Keith, President and Chief Executive Officer
Garry L. Moody(1)
Marshall C. Turner, Jr.(1)
Earl D. Weiner(1)
OFFICERS
Philip L. Kirstein, Senior Vice President and Independent Compliance Officer
Jean-Francois Van de Walle(2), Vice President
Emilie D. Wrapp, Secretary
Joseph J. Mantineo, Treasurer and Chief Financial Officer
Stephen M. Woetzel, Controller
| | |
Principal Underwriter AllianceBernstein Investments, Inc. 1345 Avenue of the Americas New York, NY 10105 Custodian and Accounting Agent Brown Brothers Harriman & Co. 40 Water Street Boston, MA 02109 Legal Counsel Seward & Kissel LLP One Battery Park Plaza New York, NY 10004 | | Transfer Agent AllianceBernstein Investor Services, Inc.
P.O. Box 786003
San Antonio, TX 78278-6003
Toll-Free (800) 221-5672 Independent Registered Public Accounting Firm Ernst & Young LLP 5 Times Square New York, NY 10036 |
| (1) | | Member of the Audit Committee, the Governance and Nominating Committee and the Independent Directors Committee. Mr. Foulk is the sole member of the Fair Value Pricing Committee. |
| (2) | | The day-to-day management of, and investment decisions for, the Fund’s portfolio are made by the Adviser’s Hong Kong/China Investment Team. Mr. Jean-Francois Van de Walle is the investment professional with the most significant responsibility for the day-to-day management of the Fund’s portfolio. |
| | |
| 34 | | • ALLIANCEBERNSTEIN GREATER CHINA ’97 FUND |
Board of Directors
THE FOLLOWING IS NOT PART OF THE SHAREHOLDER REPORT OR THE FINANCIAL STATEMENTS
SUMMARY OF SENIOR OFFICER’S EVALUATION OF INVESTMENT ADVISORY AGREEMENT1
The following is a summary of the evaluation of the Investment Advisory Agreement between AllianceBernstein L.P. (the “Adviser”) and AllianceBernstein Greater China ’97 Fund, Inc. (the “Fund”).2 The evaluation of the Investment Advisory Agreement was prepared by Philip L. Kirstein, the Senior Officer of the Fund, for the Trustees of the Fund, as required by a September 2004 agreement between the Adviser and the New York State Attorney General (the “NYAG”). The Senior Officer’s evaluation of the Investment Advisory Agreement is not meant to diminish the responsibility or authority of the Board of Directors of the Fund to perform its duties pursuant to Section 15 of the Investment Company Act of 1940 (the “40 Act”) and applicable state law. The purpose of the summary is to provide shareholders with a synopsis of the independent evaluation of the reasonableness of the advisory fees proposed to be paid by the Fund which was provided to the Directors in connection with their review of the proposed approval of the continuance of the Investment Advisory Agreement. The Senior Officer’s evaluation considered the following factors:
| | 1. | Advisory fees charged to institutional and other clients of the Adviser for like services; |
| | 2. | Advisory fees charged by other mutual fund companies for like services; |
| | 3. | Costs to the Adviser and its affiliates of supplying services pursuant to the advisory agreement, excluding any intra-corporate profit; |
| | 4. | Profit margins of the Adviser and its affiliates from supplying such services; |
| | 5. | Possible economies of scale as the Fund grows larger; and |
| | 6. | Nature and quality of the Adviser’s services including the performance of the Fund. |
These factors, with the exception of the first factor, are generally referred to as the “Gartenberg factors,” which were articulated by the United States Court of Appeals for the Second Circuit in 1982. Gartenberg v. Merrill Lynch Asset Management, Inc., 694 F. 2d 923 (2d Cir. 1982). On March 30, 2010, the Supreme Court held the Gartenberg decision was correct in its basic formulation of what §36(b) requires: to face liability under §36(b), “an investment adviser must charge a fee that is so disproportionately large that it bears no reasonable relationship to the services rendered and could not have been the product of
| 1 | | It should be noted that the information in the fee summary was completed on April 21, 2011 and discussed with the Board of Directors on May 3-5, 2011. |
| 2 | | Future references to the Fund do not include “AllianceBernstein.” References in the fee summary pertaining to performance and expense ratio rankings refer to the Class A shares of the Fund. |
| | | | |
| ALLIANCEBERNSTEIN GREATER CHINA ’97 FUND • | | | 35 | |
arms length bargaining.” Jones v. Harris Associates L.P., (No. 08-586), 130 U.S. 1418 (2010). In the Jones decision, the Court stated the Gartenberg approach fully incorporates the correct understanding of fiduciary duty within the context of section 36(b) and noted with approval that “Gartenberg insists that all relevant circumstances be taken into account” and “uses the range of fees that might result from arms-length bargaining as the benchmark for reviewing challenged fees.”
FUND ADVISORY FEES, NET ASSETS, EXPENSE CAPS & RATIOS
The Adviser proposed that the Fund pay the advisory fee set forth in the table below for receiving the services to be provided pursuant to the Investment Advisory Agreement. The fee schedule below, implemented in January 2004 in consideration of the Adviser’s settlement with the NYAG in December 2003, is based on a master schedule that contemplates eight categories of funds with almost all funds in each category having the same advisory fee schedule.3
| | | | | | | | |
| Category | | Advisory Fee Based on % of
Average Daily Net Assets | | Net Assets 03/31/11 ($MIL) | | | Fund |
| Specialty | | 75 bp on 1st $2.5 billion 65 bp on next $2.5 billion 60 bp on the balance | | $ | 60.4 | | | Greater China ’97 Fund, Inc. |
The Adviser is reimbursed as specified in the Investment Advisory Agreement for certain clerical, legal, accounting, administrative and other services provided to the Fund. During the Fund’s most recently completed fiscal year, the Adviser received $92,921 (0.13% of the Fund’s average daily net assets) for such services.
The Adviser has agreed to waive that portion of its management fees and/or reimburse the Fund for that portion of its total operating expenses to the degree necessary to limit the Fund’s expense ratio to the amount set forth below for the Fund’s fiscal year. The waiver is terminable by the Adviser at the end of the Fund’s fiscal year upon at least 60 days written notice prior to the termination date of the undertaking. It should be noted that the Fund was operating below its expense cap as of its most recently completed semi-annual period; accordingly, the expense limitation undertaking of the Fund was of no effect. Also shown are the Fund’s gross expense ratios for the most recent semi-annual period:4
| | | | | | | | | | | | |
| Fund | | Expense Cap Pursuant to
Expense Limitation
Undertaking | | | Gross Expense Ratio (as of 01/31/11)5 | | | Fiscal
Year End |
| Greater China ’97 Fund, Inc. | | Advisor Class A Class B Class C | |
| 2.20%
2.50% 3.20% 3.20% |
| |
| 1.67%
1.96% 2.71% 2.68% |
| | July 31 |
| 3 | | Most of the AllianceBernstein Mutual Funds, which the Adviser manages, were affected by the Adviser’s settlement with the NYAG. |
| 4 | | Semi-annual total expense ratios are unaudited. |
| | |
| 36 | | • ALLIANCEBERNSTEIN GREATER CHINA ’97 FUND |
| I. | ADVISORY FEES CHARGED TO INSTITUTIONAL AND OTHER CLIENTS |
The advisory fees charged to investment companies which the Adviser manages and sponsors are normally higher than those charged to similar sized institutional accounts, including pension plans and sub-advised investment companies. The fee differential reflects, among other things, different services provided to such clients, and different liabilities assumed. Services provided by the Adviser to the Fund that are not provided to non-investment company clients and sub-advised investment companies include providing office space and personnel to serve as Fund Officers, who among other responsibilities make the certifications required under the Sarbanes–Oxley Act of 2002, and coordinating with and monitoring the Fund’s third party service providers such as Fund counsel, auditors, custodians, transfer agents and pricing services. The accounting, administrative, legal and compliance requirements for the Fund are more costly than those for institutional assets due to the greater complexities and time required for investment companies, although as previously noted, the Adviser is reimbursed for providing such services. Also, retail mutual funds managed by the Adviser are widely held. Servicing the Fund’s investors is more time consuming and labor intensive compared to institutional clients since the Adviser needs to communicate with a more extensive network of financial intermediaries and shareholders. The Adviser also believes that it incurs substantial entrepreneurial risk when offering a new mutual fund since establishing a new mutual fund requires a large upfront investment and it may take a long time for the fund to achieve profitability since the fund must be priced to scale from inception in order to be competitive and assets are acquired one account at a time. In addition, managing the cash flow of an investment company may be more difficult than managing that of a stable pool of assets, such as an institutional account with little cash movement in either direction, particularly, if a fund is in net redemption and the Adviser is frequently forced to sell securities to raise cash for redemptions. However, managing a fund with positive cash flow may be easier at times than managing a stable pool of assets. Finally, in recent years, investment advisers have been sued by institutional clients and have suffered reputational damage both by the attendant publicity and outcomes other than complete victories. Accordingly, the legal and reputational risks associated with institutional accounts are greater than previously thought, although still not equal to those related to the mutual fund industry.
Notwithstanding the Adviser’s view that managing an investment company is not comparable to managing other institutional accounts because the services provided are different, the Supreme Court has indicated consideration should be given to the advisory fees charged to institutional accounts with a similar investment style as the Fund.6 In addition to the AllianceBernstein Institutional
| 6 | | It should be noted that the Supreme Court stated that “courts may give such comparisons the weight that they merit in light of the similarities and differences between the services that the clients in question require, but the courts must be wary of inapt comparisons.” Among the significant differences the Supreme Court noted that may exist between services provided to mutual funds and institutional accounts are “higher marketing costs.” Jones v. Harris at 1428. |
| | | | |
| ALLIANCEBERNSTEIN GREATER CHINA ’97 FUND • | | | 37 | |
fee schedule, set forth below is what would have been the effective advisory fee of the Fund had the AllianceBernstein Institutional fee schedule been applicable to the Fund versus the Fund’s advisory fee based on March 31, 2011 net assets:7
| | | | | | | | | | | | | | |
| Fund | | Net Assets 03/31/11 ($MIL) | | | AllianceBernstein (“AB”)
Institutional (“Inst.”) Fee Schedule | | Effective
AB Inst.
Adv. Fee | | | Fund Advisory
Fee | |
| Greater China ’97 Fund, Inc. | | | $60.4 | | | Greater China Growth 100 bp on 1st $25 million 90 bp on next $25 million 75 bp on the balance Minimum account size: $25m | | | 0.916% | | | | 0.750% | |
The Adviser also manages and sponsors retail mutual funds, which are organized in jurisdictions outside the United States, generally Luxembourg and Japan, and sold to non-United States resident investors. The Adviser charges the fees set forth below for Greater China Portfolio, which is a Luxembourg fund that has a somewhat similar investment style as the Fund:
| | |
| Fund | | Fee8 |
| Greater China Portfolio | | |
Class A | | 2.00% on the first $300 million
1.75% on the balance |
Class I (Institutional) | | 1.20% on the first $300 million 0.95% on the balance |
The Adviser represented that it does not sub-advise any registered investment company with a substantially similar investment style as the Fund.
| II. | MANAGEMENT FEES CHARGED BY OTHER MUTUAL FUND COMPANIES FOR LIKE SERVICES. |
Lipper, Inc. (“Lipper”), an analytical service that is not affiliated with the Adviser, compared the fees charged to the Fund with fees charged to other investment companies for similar services offered by other investment advisers.9 Lipper’s analysis included the Fund’s ranking with respect to the contractual
| 7 | | The Adviser has indicated that with respect to institutional accounts with assets greater than $300 million, it will negotiate a fee schedule. Discounts that are negotiated vary based upon each client relationship. |
| 8 | | It should be noted that Class A shares of the funds are charged an “all-in” fee, which covers investment advisory services and distribution related services, unlike Class I shares, whose fee is for investment advisory services only. |
| 9 | | It should be noted that the Supreme Court cautioned against accepting mutual fund fee comparisons without careful scrutiny since “these comparisons are problematic because these fees, like those challenged, may not be the product of the negotiations conducted at arms length.” Jones v. Harris at 1429. |
| | |
| 38 | | • ALLIANCEBERNSTEIN GREATER CHINA ’97 FUND |
management fee relative to the median of the Fund’s Lipper Expense Group (“EG”)10 at the approximate current asset level of the Fund.11
Lipper describes an EG as a representative sample of comparable funds. Lipper’s standard methodology for screening funds to be included in an EG entails the consideration of several fund criteria, including fund type, investment classification/objective, load type and similar 12b-1/non-12b-1 service fees, asset (size) comparability, expense components and attributes. An EG will typically consist of seven to twenty funds.
| | | | | | | | | | | | |
| Fund | | Contractual
Management
Fee12 | | | Lipper Exp. Group Median (%) | | | Rank | |
| Greater China ’97 Fund, Inc. | | | 0.750 | | | | 1.250 | | | | 1/9 | |
Lipper also analyzed the Fund’s most recently completed fiscal year total expense ratio in comparison to the Fund’s EG and Lipper Expense Universe (“EU”). The EU13 is a broader group compared to the EG, consisting of all funds that have the same investment classification/objective and load type as the subject Fund.
| | | | | | | | | | | | | | | | | | | | |
| Fund | | Expense Ratio
(%)14 | | | Lipper Exp. Group Median (%) | | | Lipper Group Rank | | | Lipper Exp. Universe Median (%) | | | Lipper
Universe Rank | |
| Greater China ’97 Fund, Inc. | | | 1.878 | | | | 1.870 | | | | 6/9 | | | | 1.874 | | | | 8/14 | |
Based on this analysis, the Fund has a more favorable ranking on a management fee basis than on a total expense ratio basis.
| 10 | | It should be noted that Lipper does not consider average account size when constructing EGs. Funds with relatively small average account sizes tend to have higher transfer agent expense ratio than comparable sized funds that have relatively large average account sizes. Note that there are limitations on Lipper expense category data because different funds categorize expenses differently. |
| 11 | | The contractual management fee is calculated by Lipper using the Fund’s contractual management fee rate at a hypothetical asset level. The hypothetical asset level is based on the combined net assets of all classes of the Fund, rounded up to the next $25 million. Lipper’s total expense ratio information is based on the most recent annual report except as otherwise noted. A ranking of “1” would mean that the Fund had the lowest effective fee rate in the Lipper peer group. |
| 12 | | The contractual management fee would not reflect any expense reimbursements made by the Fund to the Adviser for certain clerical, legal, accounting, administrative and other services. In addition, the contractual management fee does not reflect any advisory fee waivers for expanse caps that would effectively reduce the actual effective management fee. |
| 13 | | Except for asset (size) comparability, Lipper uses the same criteria for selecting an EG when selecting an EU. Unlike the EG, the EU allows for the same adviser to be represented by more than just one fund. |
| 14 | | Most recently completed fiscal year end Class A total expense ratio. |
| | | | |
| ALLIANCEBERNSTEIN GREATER CHINA ’97 FUND • | | | 39 | |
| III. | COSTS TO THE ADVISER AND ITS AFFILIATES OF SUPPLYING SERVICES PURSUANT TO THE ADVISORY FEE ARRANGEMENT, EXCLUDING ANY INTRA-CORPORATE PROFIT. |
The Adviser utilizes two profitability reporting systems, which operate independently but are aligned with each other, to estimate the Adviser’s profitability in connection with investment advisory services provided to the Fund. The Senior Officer has retained a consultant to provide independent advice regarding the alignment of the two profitability systems as well as the methodologies and allocations utilized by both profitability systems. See Section IV for additional discussion.
| IV. | PROFIT MARGINS OF THE ADVISER AND ITS AFFILIATES FOR SUPPLYING SUCH SERVICES. |
The Fund’s profitability information, prepared by the Adviser for the Board of Directors, was reviewed by the Senior Officer and the consultant. The Adviser’s profitability from providing investment advisory services to the Fund decreased during calendar year 2010, relative to 2009.15
In addition to the Adviser’s direct profits from managing the Fund, certain of the Adviser’s affiliates have business relationships with the Fund and may earn a profit from providing other services to the Fund. The courts have referred to this type of business opportunity as “fall-out benefits” to the Adviser and indicated that such benefits should be factored into the evaluation of the total relationship between the Fund and the Adviser. Neither case law nor common business practice precludes the Adviser’s affiliates from earning a reasonable profit on this type of relationship provided the affiliates’ charges and services are competitive and the relationship otherwise complies with the 40 Act restrictions. These affiliates provide transfer agent, distribution and brokerage related services to the Fund and receive transfer agent fees, Rule 12b-1 payments, front-end sales loads, contingent deferred sales charges (“CDSC”) and brokerage commissions. In addition, the Adviser benefits from soft dollar arrangements which offset expenses the Adviser would otherwise incur.
AllianceBernstein Investments, Inc. (“ABI”), an affiliate of the Adviser, is the Fund’s principal underwriter. ABI and the Adviser have disclosed in the Fund’s prospectus that they may make revenue sharing payments from their own resources, in addition to resources derived from sales loads and Rule 12b-1 fees, to firms that sell shares of the Fund. In 2010, ABI paid approximately 0.04% of the average monthly assets of the AllianceBernstein Mutual Funds or approximately $13.8 million for distribution services and educational support (revenue sharing payments).
| 15 | | It should be noted that at the August 2, 2011 meeting, the Adviser presented to the Board revised profitability figures with the respect to the Fund. |
| | |
| 40 | | • ALLIANCEBERNSTEIN GREATER CHINA ’97 FUND |
During the Fund’s most recently completed fiscal year, ABI received from the Fund $3,687, $386,498 and $25,813 in front-end sales charges, Rule 12b-1 and CDSC fees, respectively.
Fees and reimbursements for out of pocket expenses charged by AllianceBernstein Investor Services, Inc. (“ABIS”), the affiliated transfer agent for the Fund, are charged on a per account basis, based on the level of service provided and the class of share held by the account. ABIS also receives a fee per shareholder sub-account for each account maintained by an intermediary on an omnibus basis. During the Fund’s most recently completed fiscal year, ABIS received $91,863 in fees from the Fund.16
The Fund effected brokerage transactions through the Adviser’s affiliate, Sanford C. Bernstein & Co., LLC (“SCB & Co.”) and/or its U.K. affiliate, Sanford C. Bernstein Limited (“SCB Ltd.”), collectively “SCB,” and paid commissions for such transactions during the Fund’s most recently completed fiscal year. The Adviser represented that SCB’s profitability from any business conducted in the future with the Fund would be comparable to the profitability of SCB’s dealings with other similar third party clients. In the ordinary course of business, SCB receives and pays liquidity rebates from electronic communications networks (“ECNs”) derived from trading for its clients. These credits and charges are not being passed onto any SCB client. The Adviser also receives certain soft dollar benefits from brokers that execute agency trades for its clients. These soft dollar benefits reduce the Adviser’s cost of doing business and increase its profitability.
| V. | POSSIBLE ECONOMIES OF SCALE |
The Adviser has indicated that economies of scale are being shared with shareholders through fee structures,17 subsidies and enhancement to services. Based on some of the professional literature that has considered economies of scale in the mutual fund industry, it is thought that to the extent economies of scale exist, they may more often exist across a fund family as opposed to a specific fund. This is because the costs incurred by the Adviser, such as investment research or technology for trading or compliance systems can be spread across a greater asset base as the fund family increases in size. It is also possible that as the level of services required to operate a successful investment company has increased over time, and advisory firms make such investments in their business to provide services, there may be a sharing of economies of scale without a reduction in advisory fees.
| 16 | | The fees disclosed are net of any expense offsets with ABIS. An expense offset is created by the interest earned on the positive cash balance that occurs within the transfer agent account as there is a one day lag with regards to money movement from the shareholder’s account to the transfer agent’s account and then the transfer agent’s account to the Fund’s account. During the Fund’s most recently completed fiscal year, there were no fees paid by the Fund to ABIS under the offset agreement between the Fund and ABIS. |
| 17 | | Fee structures include fee reductions, pricing at scale and breakpoints in advisory fee schedules. |
| | | | |
| ALLIANCEBERNSTEIN GREATER CHINA ’97 FUND • | | | 41 | |
In February 2008, an independent consultant, retained by the Senior Officer, provided the Board of Directors an update of the Deli18 study on advisory fees and various fund characteristics.19 The independent consultant first reiterated the results of his previous two dimensional comparison analysis (fund size and family size) with the Board of Directors.20 The independent consultant then discussed the results of the regression model that was utilized to study the effects of various factors on advisory fees. The regression model output indicated that the bulk of the variation in fees predicted were explained by various factors, but substantially by fund AUM, family AUM, index fund indicator and investment style. The independent consultant also compared the advisory fees of the AllianceBernstein Mutual Funds to similar funds managed by 19 other large asset managers, regardless of the fund size and each Adviser’s proportion of mutual fund assets to non-mutual fund assets.
| VI. | NATURE AND QUALITY OF THE ADVISER’S SERVICES, INCLUDING THE PERFORMANCE OF THE FUND |
With assets under management of approximately $477 billion as of March 31, 2011, the Adviser has the investment experience to manage and provide non-investment services (described in Section I) to the Fund.
The information prepared by Lipper shows the 1, 3, 5 and 10 year performance rankings of the Fund21 relative to its Lipper Performance Group (“PG”) and Lipper Performance Universe (“PU”)22 for the periods ended February 28, 2011.23
| | | | | | | | | | | | | | | | |
| | | Fund Return (%) | | | PG Median (%) | | | PU Median (%) | | | PG Rank | | PU Rank |
1 year | | | 15.97 | | | | 16.54 | | | | 18.74 | | | 6/9 | | 12/16 |
3 year | | | -3.54 | | | | 1.22 | | | | 1.22 | | | 8/8 | | 11/12 |
5 year | | | 10.64 | | | | 13.25 | | | | 13.78 | | | 7/7 | | 9/10 |
10 year | | | 10.53 | | | | 10.53 | | | | 11.90 | | | 2/3 | | 3/4 |
| 18 | | The Deli study was originally published in 2002 based on 1997 data. |
| 19 | | As mentioned previously, the Supreme Court cautioned against accepting mutual fund fee comparisons without careful scrutiny since the fees may not be the product of negotiations conducted at arms length. See Jones V. Harris at 1429. |
| 20 | | The two dimensional analysis showed patterns of lower advisory fees for funds with larger asset sizes and funds from larger family sizes compared to funds with smaller asset sizes and funds from smaller family sizes, which according to the independent consultant is indicative of a sharing of economies of scale and scope. However, in less liquid and active markets, such is not the case, as the empirical analysis showed potential for diseconomies of scale in those markets. The empirical analysis also showed diminishing economies of scale and scope as funds surpassed a certain high level of assets. |
| 21 | | The performance rankings are for the Class A shares of the Fund. It should be noted that the performance returns of the Fund shown were provided by Lipper. |
| 22 | | The Fund’s PG is identical to the Fund’s EG. The Fund’s PU is not identical to the Fund’s EU as the criteria for including/excluding a fund in a PU is somewhat different from that of an EU. |
| 23 | | Note that the current Lipper investment classification/objective dictates the PG and PU throughout the life of the fund even if a fund had a different investment classification/objective at a different point in time. |
| | |
| 42 | | • ALLIANCEBERNSTEIN GREATER CHINA ’97 FUND |
Set forth below are the 1, 3, 5 and 10 year and since inception performance returns of the Fund (in bold)24 versus its benchmark.25 Fund and benchmark volatility and reward-to-variability ratio (“Sharpe Ratio”) information is also shown.26
| | | | | | | | | | | | | | | | | | | | | | | | | | | | | | | | |
| | | Periods Ending February 28, 2011 Annualized Performance | |
| | | | | | | | | | | | | | | Since
Inception (%) | | | Annualized | | | Risk
Period
(Year) | |
Portfolio/
Benchmark | | 1 Year (%) | | | 3 Year (%) | | | 5 Year (%) | | | 10 Year (%) | | | | Volatility
(%) | | | Sharpe
(%) | | |
Greater China ’97 Fund, Inc. | | | 15.97 | | | | -3.54 | | | | 10.64 | | | | 10.53 | | | | 7.19 | | | | 24.14 | | | | 0.44 | | | | 10 | |
| MSCI Golden Dragon Index (Net) | | | 17.66 | | | | 2.96 | | | | 10.49 | | | | 8.13 | | | | N/A | | | | 23.73 | | | | 0.35 | | | | 10 | |
| Inception Date: September 3, 1997 | |
CONCLUSION:
Based on the factors discussed above the Senior Officer’s conclusion is that the proposed advisory fee for the Fund is reasonable and within the range of what would have been negotiated at arm’s-length in light of all the surrounding circumstances. This conclusion in respect of the Fund is based on an evaluation of all of these factors and no single factor was dispositive.
Dated: May 24, 2011
| 24 | | The performance returns and risk measures shown in the table are for the Class A shares of the Fund. |
| 25 | | The Adviser provided Fund and benchmark performance return information for periods through February 28, 2011. |
| 26 | | Fund and benchmark volatility and Sharpe Ratio information was obtained through Lipper LANA, a database maintained by Lipper. Volatility is a statistical measure of the tendency of a market price or yield to vary over time. A Sharpe Ratio is a risk adjusted measure of return that divides a fund’s return in excess of the riskless return by the fund’s standard deviation. A fund with a greater volatility would be regarded as more risky than a fund with equivalent performance but lower volatility; for that reason, a greater return would be demanded for the more risky fund. A fund with a higher Sharpe Ratio would be regarded as better performing than a fund with a lower Sharpe Ratio. |
| | | | |
| ALLIANCEBERNSTEIN GREATER CHINA ’97 FUND • | | | 43 | |
THIS PAGE IS NOT PART OF THE SHAREHOLDER REPORT OR THE FINANCIAL STATEMENTS
ALLIANCEBERNSTEIN FAMILY OF FUNDS
Wealth Strategies Funds
Balanced Wealth Strategy
Conservative Wealth Strategy
Wealth Appreciation Strategy
Tax-Managed Balanced Wealth Strategy
Tax-Managed Conservative Wealth Strategy
Tax-Managed Wealth Appreciation Strategy
Asset Allocation/Multi-Asset
Dynamic All Market Fund
Emerging Markets Multi-Asset
International Portfolio
Real Asset Strategy
Tax-Managed International Portfolio
Growth Funds
Domestic
Growth Fund
Large Cap Growth Fund
Select U.S. Equity Portfolio
Small Cap Growth Portfolio
Small/Mid Cap Growth Fund
U.S. Strategic Research Portfolio
Global & International
Global Thematic Growth Fund
Greater China ’97 Fund
International Discovery Equity Portfolio
International Focus 40 Portfolio
International Growth Fund
Value Funds
Domestic
Core Opportunities Fund
Equity Income Fund
Growth & Income Fund
Small/Mid Cap Value Fund
Value Fund
Global & International
Global Real Estate Investment Fund
Global Value Fund
International Value Fund
Taxable Bond Funds
Bond Inflation Strategy
Global Bond Fund
High Income Fund
Intermediate Bond Portfolio
Limited Duration High Income Portfolio
Short Duration Portfolio
Unconstrained Bond Fund
Municipal Bond Funds
| | |
Arizona California High Income Massachusetts Michigan Minnesota Municipal Bond Inflation Strategy | | National New Jersey New York Ohio Pennsylvania Virginia |
Intermediate Municipal Bond Funds
Intermediate California
Intermediate Diversified
Intermediate New York
Closed-End Funds
Alliance California Municipal Income Fund
Alliance New York Municipal Income Fund
AllianceBernstein Global High Income Fund
AllianceBernstein Income Fund
AllianceBernstein National Municipal Income Fund
Alternatives
Market Neutral Strategy-Global
Market Neutral Strategy-U.S.
Balanced
Balanced Shares
Retirement Strategies Funds
| | | | |
2000 Retirement Strategy | | 2020 Retirement Strategy | | 2040 Retirement Strategy |
2005 Retirement Strategy | | 2025 Retirement Strategy | | 2045 Retirement Strategy |
2010 Retirement Strategy | | 2030 Retirement Strategy | | 2050 Retirement Strategy |
2015 Retirement Strategy | | 2035 Retirement Strategy | | 2055 Retirement Strategy |
We also offer Exchange Reserves,** which serves as the money market fund exchange vehicle for the AllianceBernstein mutual funds.
Investors should consider the investment objectives, risks, charges and expenses of the Fund carefully before investing. For copies of our prospectus or summary prospectus, which contain this and other information, visit us online at www.alliancebernstein.com or contact your AllianceBernstein investments representative. Please read the prospectus and/or summary prospectus carefully before investing.
| ** | An investment in the Fund is not a deposit in a bank and is not insured or guaranteed by the Federal Deposit Insurance Corporation or any other government agency. Although the Fund seeks to preserve the value of your investment at $1.00 per share, it is possible to lose money by investing in the Fund. |
| | |
| 44 | | • ALLIANCEBERNSTEIN GREATER CHINA ’97 FUND |
AllianceBernstein Family of Funds
ALLIANCEBERNSTEIN GREATER CHINA ’97 FUND
1345 Avenue of the Americas
New York, NY 10105
800.221.5672
| | |
| |
| GC-0152-0112 | |  |
Not applicable when filing a semi-annual report to shareholders.
| ITEM 3. | AUDIT COMMITTEE FINANCIAL EXPERT. |
Not applicable when filing a semi-annual report to shareholders.
| ITEM 4. | PRINCIPAL ACCOUNTANT FEES AND SERVICES. |
Not applicable when filing a semi-annual report to shareholders.
| ITEM 5. | AUDIT COMMITTEE OF LISTED REGISTRANTS. |
Not applicable to the registrant.
| ITEM 6. | SCHEDULE OF INVESTMENTS. |
Please see Schedule of Investments contained in the Report to Shareholders included under Item 1 of this Form N-CSR.
| ITEM 7. | DISCLOSURE OF PROXY VOTING POLICIES AND PROCEDURES FOR CLOSED-END MANAGEMENT INVESTMENT COMPANIES. |
Not applicable to the registrant.
| ITEM 8. | PORTFOLIO MANAGERS OF CLOSED-END MANAGEMENT INVESTMENT COMPANIES. |
Not applicable to the registrant.
| ITEM 9. | PURCHASES OF EQUITY SECURITIES BY CLOSED-END MANAGEMENT INVESTMENT COMPANY AND AFFILIATED PURCHASERS. |
Not applicable to the Registrant.
| ITEM 10. | SUBMISSION OF MATTERS TO A VOTE OF SECURITY HOLDERS. |
There have been no material changes to the procedures by which shareholders may recommend nominees to the Fund’s Board of Directors since the Fund last provided disclosure in response to this item.
| ITEM 11. | CONTROLS AND PROCEDURES. |
(a) The registrant’s principal executive officer and principal financial officer have concluded that the registrant’s disclosure controls and procedures (as defined in Rule 30a-3(c) under the Investment Company Act of 1940, as amended) are effective at the reasonable assurance level based on their evaluation of these controls and procedures as of a date within 90 days of the filing date of this document.
(b) There were no changes in the registrant’s internal controls over financial reporting that occurred during the second fiscal quarter of the period that has materially affected, or is reasonably likely to materially affect, the registrant’s internal control over financial reporting.
The following exhibits are attached to this Form N-CSR:
| | |
EXHIBIT NO. | | DESCRIPTION OF EXHIBIT |
| |
12 (b) (1) | | Certification of Principal Executive Officer Pursuant to Section 302 of the Sarbanes-Oxley Act of 2002 |
| |
12 (b) (2) | | Certification of Principal Financial Officer Pursuant to Section 302 of the Sarbanes-Oxley Act of 2002 |
| |
12 (c) | | Certification of Principal Executive Officer and Principal Financial Officer Pursuant to Section 906 of the Sarbanes-Oxley Act of 2002 |
SIGNATURES
Pursuant to the requirements of the Securities Exchange Act of 1934 and the Investment Company Act of 1940, the registrant has duly caused this report to be signed on its behalf by the undersigned, thereunto duly authorized.
(Registrant): AllianceBernstein Greater China ’97 Fund, Inc.
| | |
| BY: | | /s/ Robert M. Keith |
| | Robert M. Keith |
| | President |
| |
Date: | | March 22, 2012 |
Pursuant to the requirements of the Securities Exchange Act of 1934 and the Investment Company Act of 1940, this report has been signed below by the following persons on behalf of the registrant and in the capacities and on the dates indicated.
| | |
| BY: | | /s/ Robert M. Keith |
| | Robert M. Keith |
| | President |
| |
Date: | | March 22, 2012 |
| |
| BY: | | /s/ Joseph J. Mantineo |
| | Joseph J. Mantineo |
| | Treasurer and Chief Financial Officer |
| |
Date: | | March 22, 2012 |