UNITED STATES
SECURITIES AND EXCHANGE COMMISSION
Washington, D.C. 20549
FORM N-CSR
CERTIFIED SHAREHOLDER REPORT OF REGISTERED
MANAGEMENT INVESTMENT COMPANIES
Investment Company Act File Number: 811-08203
| T. Rowe Price Quantitative Management Funds, Inc. |
| (Exact name of registrant as specified in charter) |
| 100 East Pratt Street, Baltimore, MD 21202 |
| (Address of principal executive offices) |
| David Oestreicher |
| 100 East Pratt Street, Baltimore, MD 21202 |
| (Name and address of agent for service) |
Registrant’s telephone number, including area code: (410) 345-2000
Date of fiscal year end: December 31
Date of reporting period: June 30, 2018
 |
| QM U.S. Small & Mid-Cap Core Equity Fund | June 30, 2018 |
| T. ROWE PRICE QM U.S. SMALL & MID-CAP CORE EQUITY FUND |
HIGHLIGHTS
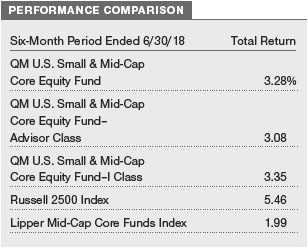
| ■ | Small- and mid-cap stocks produced reasonable gains in the first half of 2018. Your fund returned 3.28% but lagged its benchmark, the Russell 2500 Index. However, the fund outperformed its Lipper peer group index. |
| ■ | Stock selection in most sectors—especially information technology—hurt our relative results, as our holdings generally underperformed their peers in the benchmark. We tend to underweight the investments that did well, such as companies with low returns on equity, companies with negative earnings, and stocks that tend to be very volatile. |
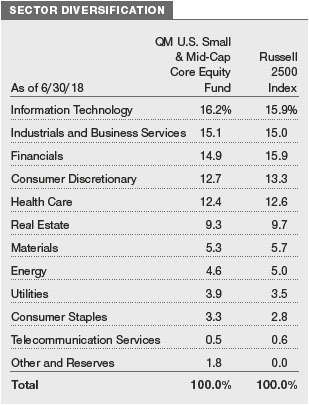
| ■ | The fund’s allocations as of June 30, 2018, were very similar to those of the Russell index. We may occasionally have small overweights or underweights, but we aim to outperform through stock selection, rather than through sector allocation decisions. |
| ■ | Smaller companies would not be immune to a trade war, as many do business with large-cap companies that have higher foreign sales exposure. Unless there is a large increase in earnings above consensus expectations, many small- and mid-cap stocks are fully valued, in our view. |
Log in to your account at troweprice.com for more information.
*Certain mutual fund accounts that are assessed an annual account service fee can also save money by switching to e-delivery.
CIO Market Commentary
Dear Shareholder
U.S. stocks recorded decent gains in the first half of 2018, but unlike last year, investors had to absorb some bumps along the way. In February, volatility spiked and the S&P 500 Index briefly tumbled over 10% from its highs, putting it in correction territory. The major U.S. benchmarks recovered their losses in the spring, eventually bringing the technology-focused Nasdaq Composite Index and the smaller-cap indexes to new highs. Volatility stayed somewhat elevated, however, and many investors clearly remained anxious as the first half of your fund’s fiscal year ended.
Solid corporate and economic fundamentals initially seemed to promise that 2017’s strong stock market momentum might carry forward into 2018. Continued global synchronized growth led to strong profits for many multinationals. In the U.S., earnings for the S&P 500 rose by nearly 25% in the first quarter versus a year before, according to FactSet—the best performance since the recovery from the financial crisis. Profit growth also picked up in Europe, Japan, and emerging markets, even as growth in many international economies cooled a bit.
Inflation fears presented the first obstacle to the markets in February, however. Stocks tumbled on news that hourly wages had jumped in January, sparking fears that the Federal Reserve would pick up its pace of interest rate increases in order to head off inflation. Wage growth moderated in the following months, but a series of strong economic reports raised growth expectations and sent long-term interest rates to multiyear peaks by May. Investors also worried that the massive U.S. fiscal stimulus from December’s tax cuts and March’s spending bill might overheat the economy, though interest rates fell back in late May and June as Fed officials stressed their intention to move slowly in tightening monetary policy.
Trade tensions soon emerged as a second impediment for the markets. The Trump administration began implementing a more populist trade stance in March, announcing tariffs on steel and aluminum imports, threatening to withdraw from the North American Free Trade Agreement (NAFTA), and later raising the possibility of taxing auto imports. The administration also announced a steady escalation in possible tariffs on Chinese goods, eventually targeting a list of $200 billion in Chinese imports. China and other U.S. trading partners vowed to retaliate proportionately.
Investors initially seemed willing to dismiss the tit-for-tat threats as negotiating tactics, but evidence eventually emerged that even the prospect of tariffs was impacting corporate strategies and profit outlooks. Stocks slumped on June 21, after German automaker Daimler lowered its earnings guidance due to possible tariff increases on SUVs it manufactures in the U.S. and sells in China. A few days later, Harley-Davidson revealed that it was planning to move some of its motorcycle production to Europe to avoid retaliatory tariffs recently announced by the European Union.
Boeing, Caterpillar, and other leading exporters suffered declines as trade tensions worsened, but small-caps, which typically have far less international exposure, fared much better than large-caps in the first half of the year. Growth shares continued to outperform value shares despite the strong performance of energy stocks, which benefited from a rise in oil prices to multiyear highs. Stocks in overseas markets reacted particularly poorly to growing trade fears and fell for the period. A decline in many currencies relative to the dollar also weighed on international bond and stock returns for U.S. investors.
Meanwhile, technology shares continued to dominate, with much of the market’s overall gain to date in 2018 concentrated in a handful of mega-cap companies able to leverage dominant Internet platforms. Data breaches and concerns about the growing power of these firms resulted in calls for government intervention in early 2018. For now, however, the threat of increased regulation seems a longer-term one that appears minor in comparison to the powerful fundamental strength of these companies.
T. Rowe Price’s global team of industry experts is monitoring the possible impact of tariffs and other challenges on a wide range of companies—from the global tech titans to small, domestic firms that get little analyst coverage on Wall Street. While the rest of 2018 may bring further surprises, you can rest assured that your portfolio manager is drawing on a wide range of insights in seeking to provide shareholders with superior returns while minimizing the impact of unforeseen political events or other pitfalls.
Thank you for your continued confidence in T. Rowe Price.
Sincerely,

Robert Sharps
Group Chief Investment Officer
Management’s Discussion of Fund Performance
INVESTMENT OBJECTIVE
The fund seeks long-term growth of capital.
FUND COMMENTARY
How did the fund perform in the past six months?
Small- and mid-cap stocks produced reasonable gains in the first half of 2018—a period in which growth stocks outperformed value stocks, smaller companies significantly outpaced large-caps, and market volatility picked up. Your fund returned 3.28%, but, as shown in the Performance Comparison table, it lagged its benchmark, the Russell 2500 Index. However, the fund outperformed its Lipper peer group index. (Performance for the fund’s Advisor and I Class shares will vary due to their different fee structures. Past performance cannot guarantee future results.)
What factors influenced the fund’s performance?
In terms of attribution, stock selection in most sectors—especially information technology—hurt our relative results, as our holdings generally underperformed their peers in the benchmark. We have particularly struggled to find attractive Internet software investments in the tech sector, as companies with expensive valuations and negative earnings are overrepresented in that industry. Sector allocations in aggregate had a marginal positive impact on our performance versus the benchmark.
Looking at the small- and mid-cap universe’s year-to-date performance based on the effectiveness of the components of our stock selection process, we see that companies with low returns on equity (ROE), companies with negative earnings, and stocks that tend to be very volatile (i.e., those with high standard deviation of returns) were among the best performers. The most expensive stocks and companies with low free cash flow yields were also among the top performers. Because we tend to underweight securities with these attributes, the fund lagged its Russell benchmark. We prefer companies with more reasonable valuations, high ROEs, and good free cash flows, as well as firms with good sales growth—as long as they are selling at a reasonable valuation. We believe quality companies will help us outperform over time.
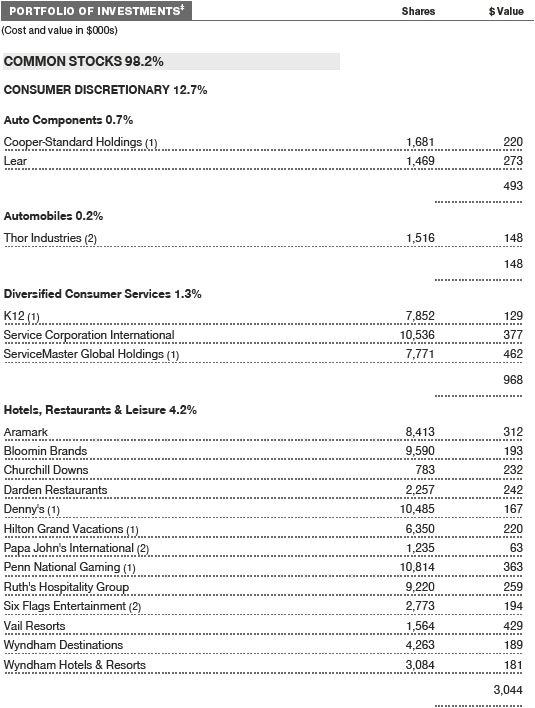
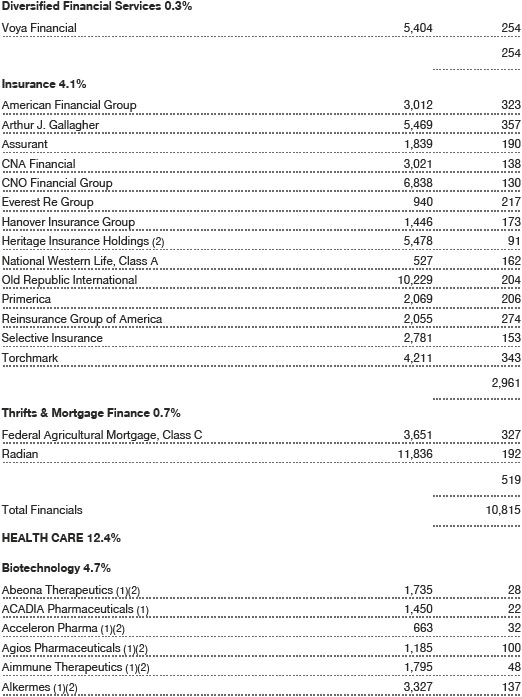
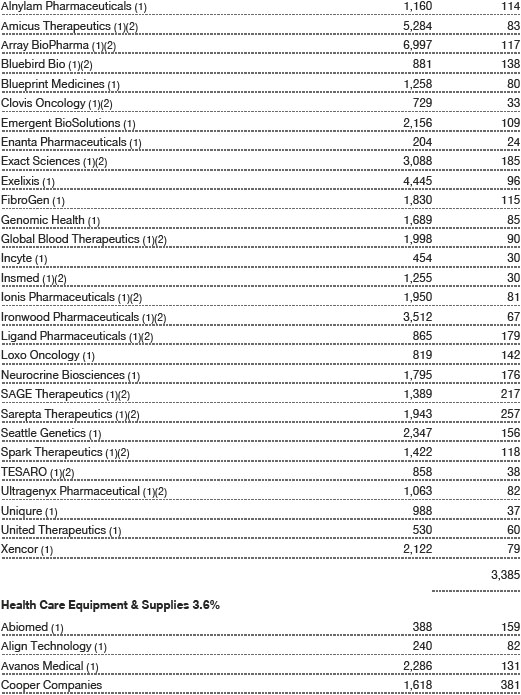
In absolute terms, health care stocks contributed the most to our results. Equipment and supply companies were very strong, such as Align Technology, which serves the dentistry and orthodontic professions with products such as Invisalign clear aligners. The company has good free cash flow and strong long-term growth prospects. Biotechnology firms also did well, led by Bioverativ, which surged after French biopharmaceutical company Sanofi acquired it. We added a number of biotech companies to the portfolio in order to bring the fund’s biotech exposure closer to that of the benchmark. (Please refer to the fund’s portfolio of investments for a complete list of holdings and the amount each represents in the portfolio.)
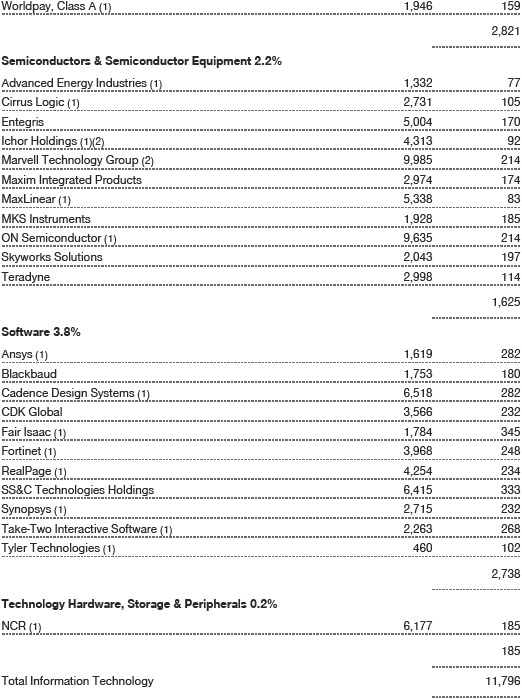
Information technology stocks in aggregate were also significant contributors to our absolute performance. Internet software and services companies performed best, whereas the semiconductor industry was dragged lower by weakness in certain holdings. One of our largest disappointments was MaxLinear, which makes radio-frequency products for broadband communication applications. Shares plunged in May after the company reported weaker-than-expected revenues and reduced near-term revenue expectations. However, we are maintaining our stake: The company seems reasonably valued now, and we believe it has the potential to recover.
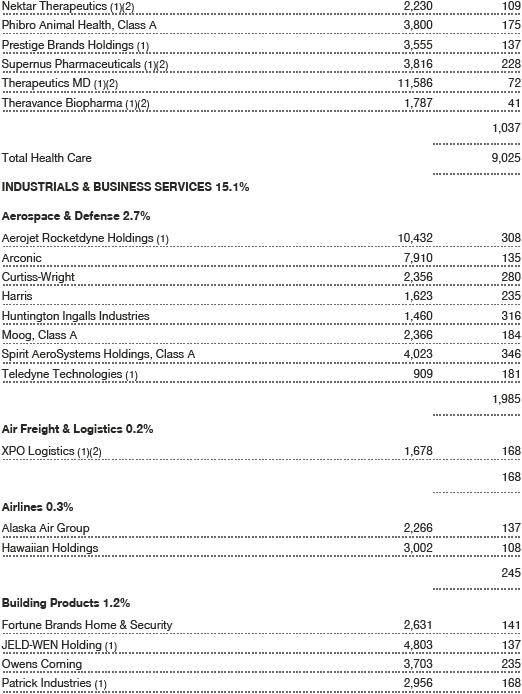
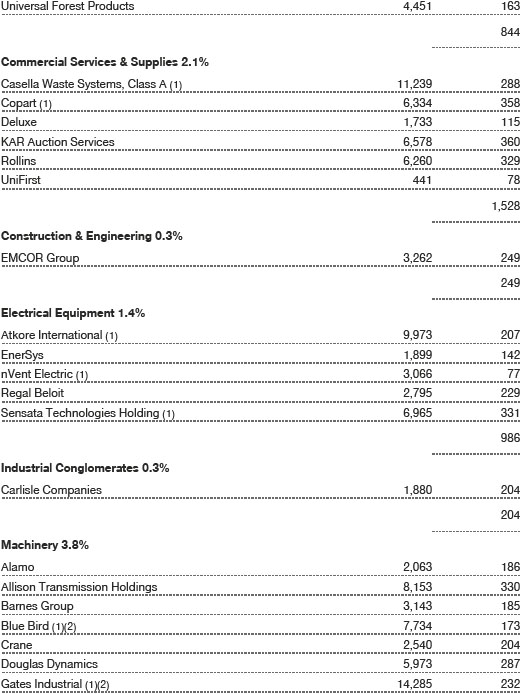
Industrials and business services stocks detracted from our performance. The sector was hurt by fears of a trade war and the stronger U.S. dollar, both of which could hurt firms with significant exports. Most of our aerospace and defense stocks were weak, and several machinery companies were major detractors. Providers of commercial services and supplies held up well.
How is the fund positioned?
Some of the fund’s fundamental characteristics compared favorably with those of the Russell index. At the end of June, the projected earnings growth rate of our holdings matched that of the index (12.0%), while the fund’s forward price/earnings ratio (18.6) was lower than that of the index (19.8). The five-year historical earnings growth rate of our holdings (11.0%) was notably higher than those in the benchmark (8.1%). Also, the fund’s ROE, which measures how effectively and efficiently a company and its management are using stockholder equity, was materially higher (15.4%) than that of the benchmark (11.6%). ROE is one of several important metrics that we consider. (Statistics are based on the companies in the fund’s portfolio and are not a projection of future fund performance.)
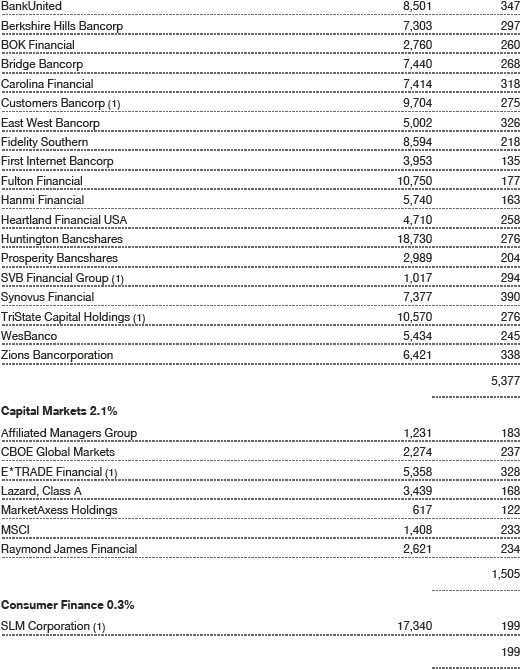
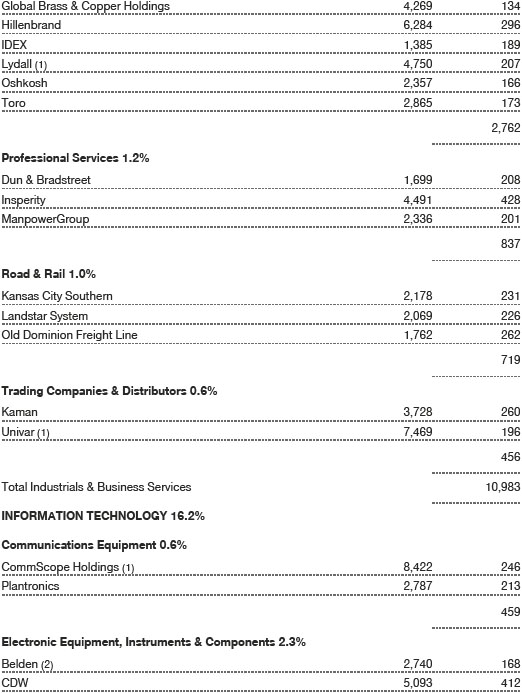
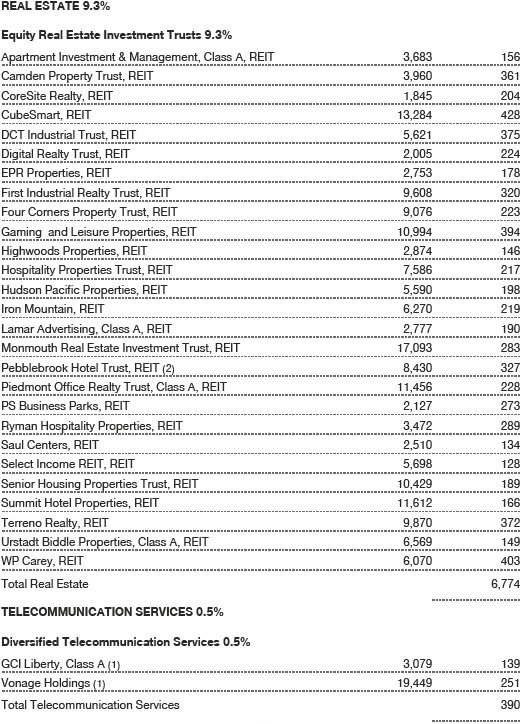
As shown in the Sector Diversification table, the fund’s allocations as of June 30, 2018, were very similar to those of the index. Information technology, industrials and business services, and financials were our largest allocations, though we were underweighting financials versus the index—primarily by underweighting mortgage real estate investment trusts. These bond market proxies are sensitive to interest rate movements, and we believe there are better opportunities in other industries. We may occasionally have small overweights or underweights in various sectors, but we aim to outperform through stock selection, rather than through sector allocation decisions. In addition, we believe sector neutrality versus the benchmark helps us avoid risks due to large moves in any individual sector.
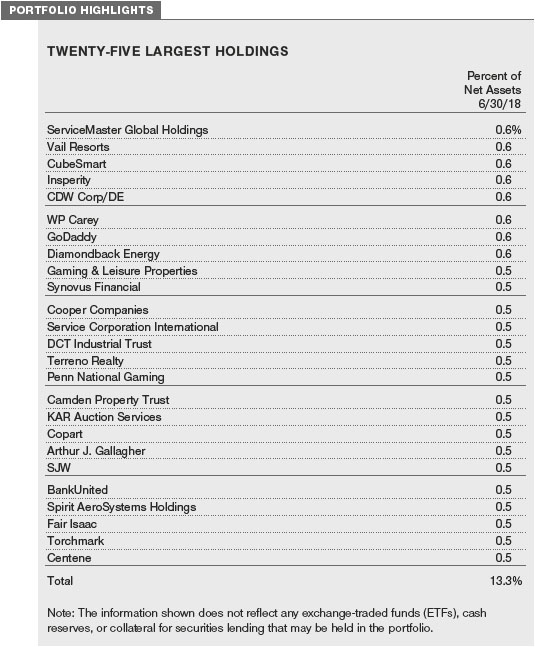
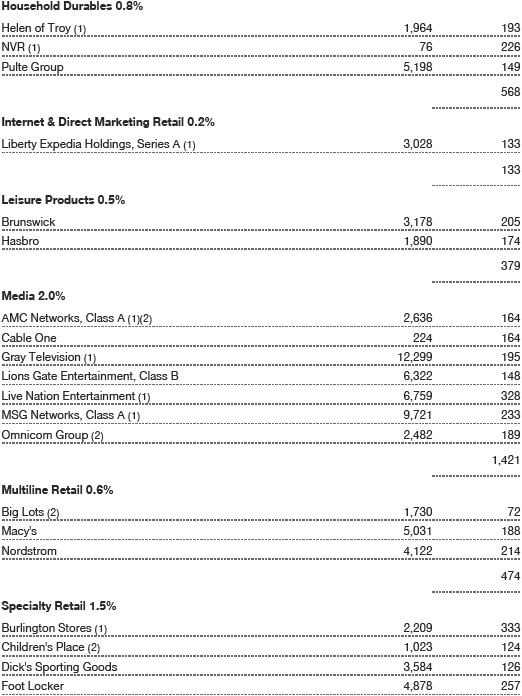
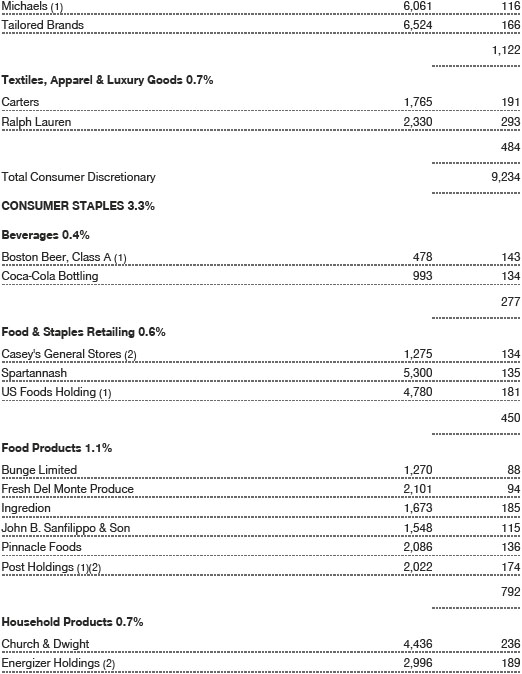
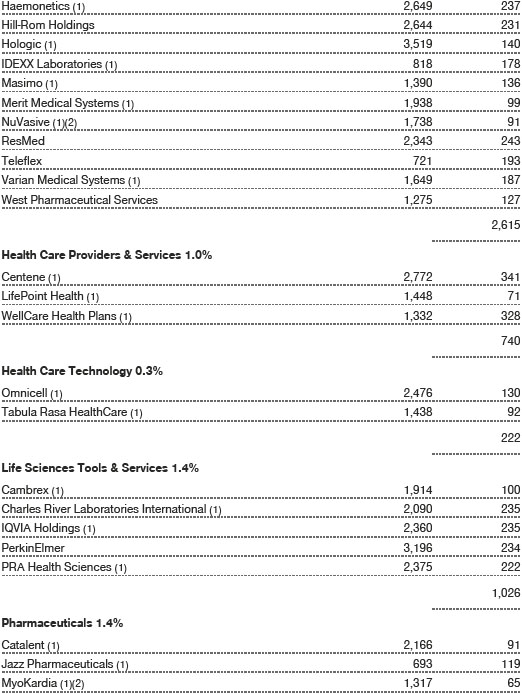
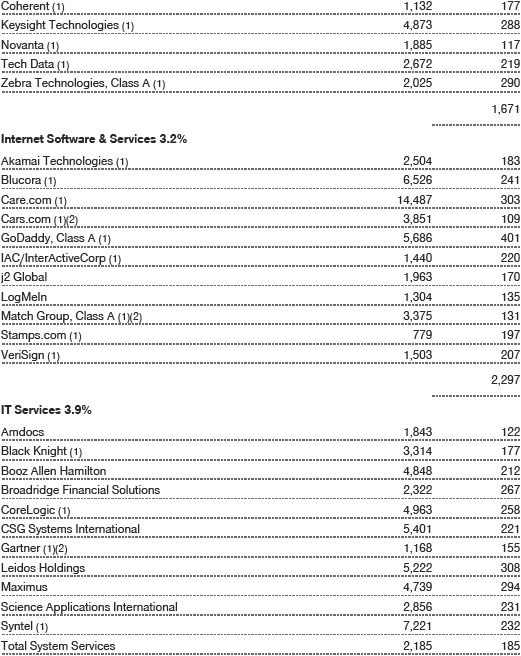
Another means of controlling risk is broad diversification: We had approximately 350 holdings at the end of June, and our largest positions, as shown in the Twenty-Five Largest Holdings table on page 8, each represented only 0.6% of assets. A third means of controlling risk is managing position sizes: We tend to have larger positions in companies that are proven or stable. In contrast, we tend to have smaller positions in higher-risk companies.
What is portfolio management’s outlook?
U.S. macro indicators have been strong, and the 3.8% national unemployment rate in May was near historically low levels. Recent macro data suggest that inflation has moved just above the Federal Reserve’s 2% target. The Fed did indicate that it expects to continue raising short-term interest rates, and the market expects two more rate hikes this year. The Treasury yield curve has been flattening, which means the difference between shorter-term interest rates and longer-term rates has been narrowing. While this is often a precursor of an economic slowdown, based on current data, we do not see one on the horizon.
The major news in recent months was the initiation of tariffs and tariff threats by the U.S. government. We think these actions are hurting markets and certain sectors of the economy, including smaller businesses. Many believe that small-caps have outperformed due to low exposure to exports and that they would be less affected by retaliatory trade sanctions against the U.S. While it is true that large-cap companies have higher foreign sales exposure, most small-cap companies have large-cap companies as their clients. To that extent, we do not believe smaller companies would be immune to a trade war. As we’ve pointed out in the recent past, we feel that many stocks in the small- and mid-cap universe are fully valued—unless there is a large increase in earnings above consensus expectations.
An event that seems to have become more important is the increased focus on personal data and privacy issues. If there is greater regulatory scrutiny of companies that benefit from monetizing users’ personal information, it could lead to new rules and regulations and has the potential to eventually affect the valuations of many technology companies. Another area of concern is the strengthening of the U.S. dollar and the consequent drop in emerging markets, which is partially due to local currency weakness. A strengthening dollar could result in reduced U.S. exports, which would be a negative for the U.S. economy.
Through our disciplined stock selection process, we continue to seek and invest in small- and mid-cap growth and value stocks with favorable attributes. We especially like high-quality stocks of companies that generate good cash flows and are judicious in deploying capital. We believe that such companies will distinguish themselves over time with superior performance relative to lower-quality businesses.
The views expressed reflect the opinions of T. Rowe Price as of the date of this report and are subject to change based on changes in market, economic, or other conditions. These views are not intended to be a forecast of future events and are no guarantee of future results.
RISKS OF INVESTING IN THE FUND
Stocks generally fluctuate in value more than bonds and may decline significantly over short time periods. There is a chance that stock prices overall will decline because stock markets tend to move in cycles, with periods of rising and falling prices. The value of a stock in which the fund invests may decline due to general weakness in the U.S. stock market, such as when the U.S. financial markets decline, or because of factors that affect a particular company or industry.
Because the fund invests primarily in small and medium-sized companies, its share price could be more volatile than a fund that is exposed to only large companies. Small and medium-sized companies often have less experienced management, narrower product lines, more limited financial resources, and less publicly available information than larger companies. Smaller companies may have limited trading markets and tend to be more sensitive to changes in overall economic conditions.
The fund’s strategy relies heavily on quantitative models and the analysis of specific metrics to construct the portfolio. The impact of these metrics on a stock’s performance can be difficult to predict, and stocks that previously possessed certain desirable quantitative characteristics may not continue to demonstrate those same characteristics in the future. In addition, relying on quantitative models entails the risk that the models themselves may be limited or incorrect, that the data on which the models rely may be incorrect or incomplete, and that the adviser may not be successful in selecting companies for investment or determining the weighting of particular stocks in the fund’s portfolio. Any of these factors could cause the fund to underperform funds with similar strategies that do not select stocks based on quantitative analysis.
These are some of the principal risks of investing in this fund. For a more thorough discussion of risks, please see the fund’s prospectus.
BENCHMARK INFORMATION
Note: Frank Russell Company (Russell) is the source and owner of the Russell index data contained or reflected in these materials and all trademarks and copyrights related thereto. Russell® is a registered trademark of Russell. Russell is not responsible for the formatting or configuration of these materials or for any inaccuracy in T. Rowe Price Associates’ presentation thereof.
GROWTH OF $10,000
This chart shows the value of a hypothetical $10,000 investment in the fund over the past 10 fiscal year periods or since inception (for funds lacking 10-year records). The result is compared with benchmarks, which include a broad-based market index and may also include a peer group average or index. Market indexes do not include expenses, which are deducted from fund returns as well as mutual fund averages and indexes.
AVERAGE ANNUAL COMPOUND TOTAL RETURN
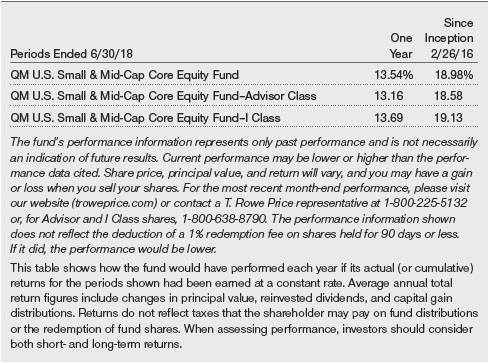
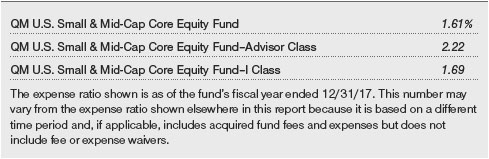
EXPENSE RATIO
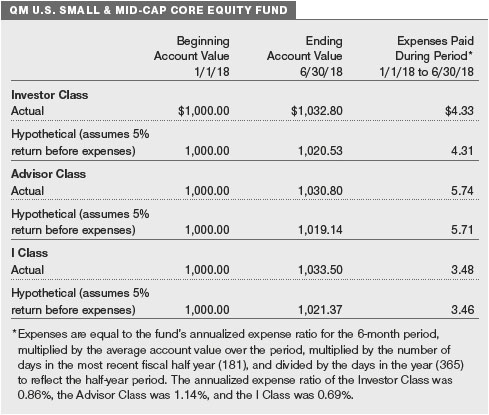
FUND EXPENSE EXAMPLE
As a mutual fund shareholder, you may incur two types of costs: (1) transaction costs, such as redemption fees or sales loads, and (2) ongoing costs, including management fees, distribution and service (12b-1) fees, and other fund expenses. The following example is intended to help you understand your ongoing costs (in dollars) of investing in the fund and to compare these costs with the ongoing costs of investing in other mutual funds. The example is based on an investment of $1,000 invested at the beginning of the most recent six-month period and held for the entire period.
Please note that the fund has three share classes: The original share class (Investor Class) charges no distribution and service (12b-1) fee, the Advisor Class shares are offered only through unaffiliated brokers and other financial intermediaries and charge a 0.25% 12b-1 fee, and I Class shares are available to institutionally oriented clients and impose no 12b-1 or administrative fee payment. Each share class is presented separately in the table.
Actual Expenses
The first line of the following table (Actual) provides information about actual account values and expenses based on the fund’s actual returns. You may use the information on this line, together with your account balance, to estimate the expenses that you paid over the period. Simply divide your account value by $1,000 (for example, an $8,600 account value divided by $1,000 = 8.6), then multiply the result by the number on the first line under the heading “Expenses Paid During Period” to estimate the expenses you paid on your account during this period.
Hypothetical Example for Comparison Purposes
The information on the second line of the table (Hypothetical) is based on hypothetical account values and expenses derived from the fund’s actual expense ratio and an assumed 5% per year rate of return before expenses (not the fund’s actual return). You may compare the ongoing costs of investing in the fund with other funds by contrasting this 5% hypothetical example and the 5% hypothetical examples that appear in the shareholder reports of the other funds. The hypothetical account values and expenses may not be used to estimate the actual ending account balance or expenses you paid for the period.
Note: T. Rowe Price charges an annual account service fee of $20, generally for accounts with less than $10,000. The fee is waived for any investor whose T. Rowe Price mutual fund accounts total $50,000 or more; accounts electing to receive electronic delivery of account statements, transaction confirmations, prospectuses, and shareholder reports; or accounts of an investor who is a T. Rowe Price Personal Services or Enhanced Personal Services client (enrollment in these programs generally requires T. Rowe Price assets of at least $250,000). This fee is not included in the accompanying table. If you are subject to the fee, keep it in mind when you are estimating the ongoing expenses of investing in the fund and when comparing the expenses of this fund with other funds.
You should also be aware that the expenses shown in the table highlight only your ongoing costs and do not reflect any transaction costs, such as redemption fees or sales loads. Therefore, the second line of the table is useful in comparing ongoing costs only and will not help you determine the relative total costs of owning different funds. To the extent a fund charges transaction costs, however, the total cost of owning that fund is higher.
Unaudited
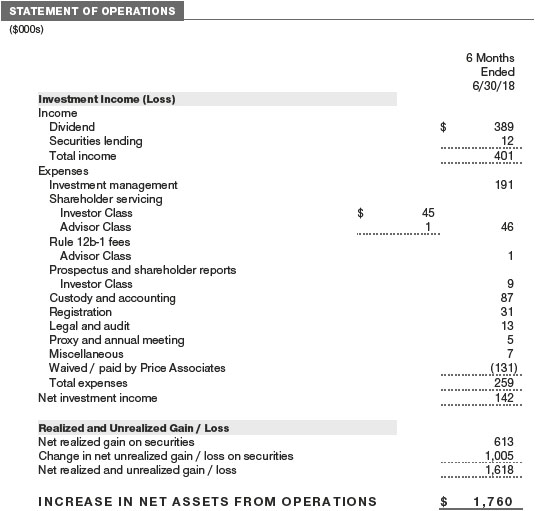
The accompanying notes are an integral part of these financial statements.
Unaudited
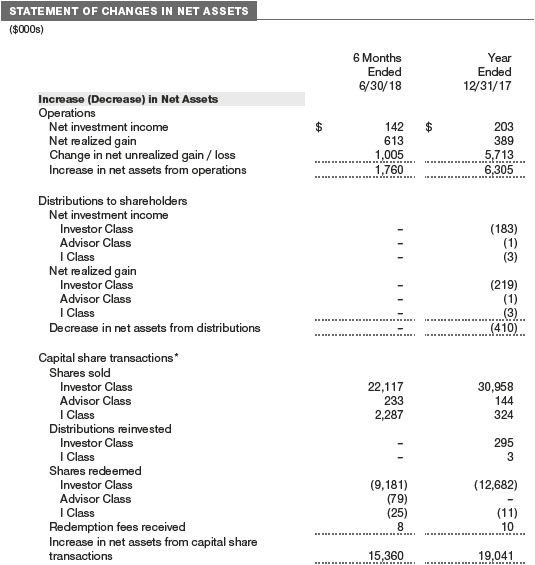
The accompanying notes are an integral part of these financial statements.
Unaudited
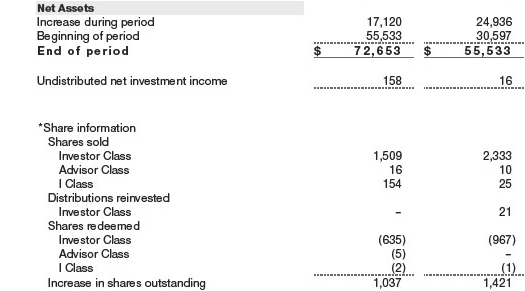
The accompanying notes are an integral part of these financial statements.
Unaudited
The accompanying notes are an integral part of these financial statements.
Unaudited
The accompanying notes are an integral part of these financial statements.
Unaudited
The accompanying notes are an integral part of these financial statements.
Unaudited
The accompanying notes are an integral part of these financial statements.
Unaudited
| NOTES TO FINANCIAL STATEMENTS |
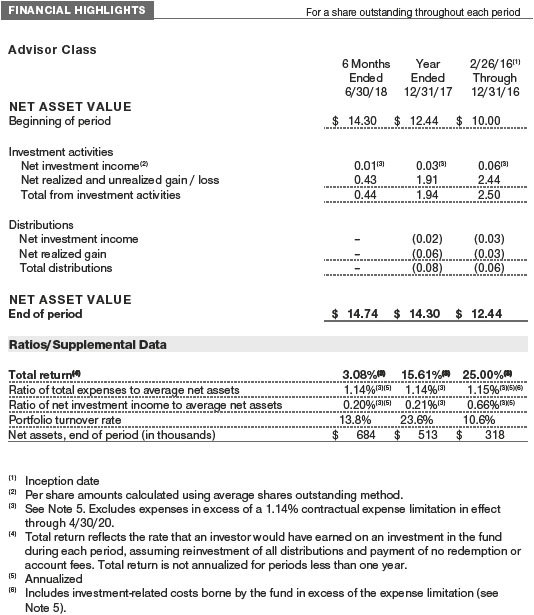
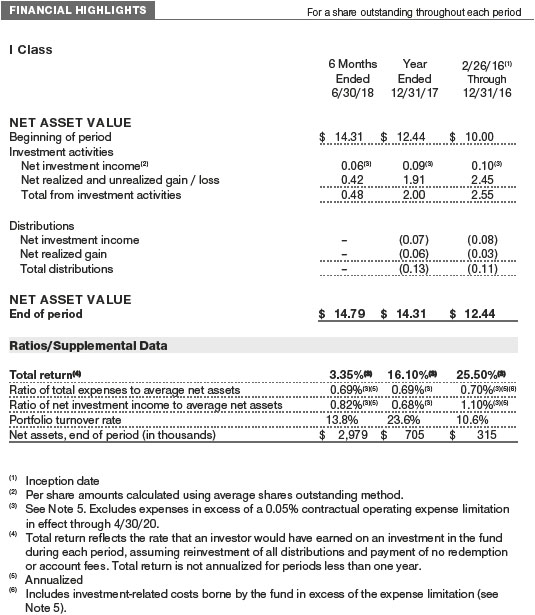
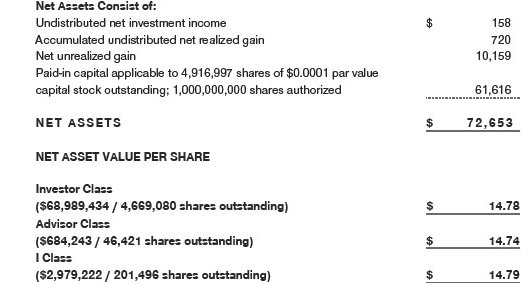
T. Rowe Price Quantitative Management Funds, Inc. (the corporation) is registered under the Investment Company Act of 1940 (the 1940 Act). The QM U.S. Small & Mid-Cap Core Equity Fund (the fund) is a diversified, open-end management investment company established by the corporation. The fund seeks long-term growth of capital. The fund has three classes of shares: the QM U.S. Small & Mid-Cap Core Equity Fund (Investor Class), the QM U.S. Small & Mid-Cap Core Equity Fund–Advisor Class (Advisor Class), and the QM U.S. Small & Mid-Cap Core Equity Fund–I Class (I Class). Advisor Class shares are sold only through unaffiliated brokers and other unaffiliated financial intermediaries. I Class shares generally are available only to investors meeting a $1,000,000 minimum investment or certain other criteria. The Advisor Class operates under a Board-approved Rule 12b-1 plan pursuant to which the class compensates financial intermediaries for distribution, shareholder servicing, and/or certain administrative services; the Investor and I Classes do not pay Rule 12b-1 fees. Each class has exclusive voting rights on matters related solely to that class; separate voting rights on matters that relate to all classes; and, in all other respects, the same rights and obligations as the other classes.
NOTE 1 - SIGNIFICANT ACCOUNTING POLICIES
Basis of Preparation The fund is an investment company and follows accounting and reporting guidance in the Financial Accounting Standards Board (FASB) Accounting Standards Codification Topic 946 (ASC 946). The accompanying financial statements were prepared in accordance with accounting principles generally accepted in the United States of America (GAAP), including, but not limited to, ASC 946. GAAP requires the use of estimates made by management. Management believes that estimates and valuations are appropriate; however, actual results may differ from those estimates, and the valuations reflected in the accompanying financial statements may differ from the value ultimately realized upon sale or maturity.
Investment Transactions, Investment Income, and Distributions Investment transactions are accounted for on the trade date basis. Income and expenses are recorded on the accrual basis. Realized gains and losses are reported on the identified cost basis. Dividends received from mutual fund investments are reflected as dividend income; capital gain distributions are reflected as realized gain/loss. Dividend income and capital gain distributions are recorded on the ex-dividend date. Income tax-related interest and penalties, if incurred, are recorded as income tax expense. Distributions from REITs are initially recorded as dividend income and, to the extent such represent a return of capital or capital gain for tax purposes, are reclassified when such information becomes available. Income distributions, if any, are declared and paid by each class annually. Distributions to shareholders are recorded on the ex-dividend date. A capital gain distribution may also be declared and paid by the fund annually.
Class Accounting Shareholder servicing, prospectus, and shareholder report expenses incurred by each class are charged directly to the class to which they relate. Expenses common to all classes, investment income, and realized and unrealized gains and losses are allocated to the classes based upon the relative daily net assets of each class. To the extent any expenses are waived or reimbursed in accordance with an expense limitation (see Note 5), the waiver or reimbursement is charged to the applicable class or allocated across the classes in the same manner as the related expense. The Advisor Class pays Rule 12b-1 fees, in an amount not exceeding 0.25% of the class’s average daily net assets.
Redemption Fees A 1% fee is assessed on redemptions of fund shares held for 90 days or less to deter short-term trading and to protect the interests of long-term shareholders. Redemption fees are withheld from proceeds that shareholders receive from the sale or exchange of fund shares. The fees are paid to the fund and are recorded as an increase to paid-in capital. The fees may cause the redemption price per share to differ from the net asset value per share.
New Accounting Guidance In March 2017, the FASB issued amended guidance to shorten the amortization period for certain callable debt securities held at a premium. The guidance is effective for fiscal years and interim periods beginning after December 15, 2018. Adoption will have no effect on the fund’s net assets or results of operations.
Indemnification In the normal course of business, the fund may provide indemnification in connection with its officers and directors, service providers, and/or private company investments. The fund’s maximum exposure under these arrangements is unknown; however, the risk of material loss is currently considered to be remote.
NOTE 2 - VALUATION
The fund’s financial instruments are valued and each class’s net asset value (NAV) per share is computed at the close of the New York Stock Exchange (NYSE), normally 4 p.m. ET, each day the NYSE is open for business. However, the NAV per share may be calculated at a time other than the normal close of the NYSE if trading on the NYSE is restricted, if the NYSE closes earlier, or as may be permitted by the SEC.
Fair Value The fund’s financial instruments are reported at fair value, which GAAP defines as the price that would be received to sell an asset or paid to transfer a liability in an orderly transaction between market participants at the measurement date. The T. Rowe Price Valuation Committee (the Valuation Committee) is an internal committee that has been delegated certain responsibilities by the fund’s Board of Directors (the Board) to ensure that financial instruments are appropriately priced at fair value in accordance with GAAP and the 1940 Act. Subject to oversight by the Board, the Valuation Committee develops and oversees pricing-related policies and procedures and approves all fair value determinations. Specifically, the Valuation Committee establishes procedures to value securities; determines pricing techniques, sources, and persons eligible to effect fair value pricing actions; oversees the selection, services, and performance of pricing vendors; oversees valuation-related business continuity practices; and provides guidance on internal controls and valuation-related matters. The Valuation Committee reports to the Board and has representation from legal, portfolio management and trading, operations, risk management, and the fund’s treasurer.
Various valuation techniques and inputs are used to determine the fair value of financial instruments. GAAP establishes the following fair value hierarchy that categorizes the inputs used to measure fair value:
Level 1 – quoted prices (unadjusted) in active markets for identical financial instruments that the fund can access at the reporting date
Level 2 – inputs other than Level 1 quoted prices that are observable, either directly or indirectly (including, but not limited to, quoted prices for similar financial instruments in active markets, quoted prices for identical or similar financial instruments in inactive markets, interest rates and yield curves, implied volatilities, and credit spreads)
Level 3 – unobservable inputs
Observable inputs are developed using market data, such as publicly available information about actual events or transactions, and reflect the assumptions that market participants would use to price the financial instrument. Unobservable inputs are those for which market data are not available and are developed using the best information available about the assumptions that market participants would use to price the financial instrument. GAAP requires valuation techniques to maximize the use of relevant observable inputs and minimize the use of unobservable inputs. When multiple inputs are used to derive fair value, the financial instrument is assigned to the level within the fair value hierarchy based on the lowest-level input that is significant to the fair value of the financial instrument. Input levels are not necessarily an indication of the risk or liquidity associated with financial instruments at that level but rather the degree of judgment used in determining those values.
Valuation Techniques Equity securities listed or regularly traded on a securities exchange or in the over-the-counter (OTC) market are valued at the last quoted sale price or, for certain markets, the official closing price at the time the valuations are made. OTC Bulletin Board securities are valued at the mean of the closing bid and asked prices. A security that is listed or traded on more than one exchange is valued at the quotation on the exchange determined to be the primary market for such security. Listed securities not traded on a particular day are valued at the mean of the closing bid and asked prices. Actively traded equity securities listed on a domestic exchange generally are categorized in Level 1 of the fair value hierarchy. OTC Bulletin Board securities, certain preferred securities, and equity securities traded in inactive markets generally are categorized in Level 2 of the fair value hierarchy.
Investments in mutual funds are valued at the mutual fund’s closing NAV per share on the day of valuation and are categorized in Level 1 of the fair value hierarchy. Assets and liabilities other than financial instruments, including short-term receivables and payables, are carried at cost, or estimated realizable value, if less, which approximates fair value.
Thinly traded financial instruments and those for which the above valuation procedures are inappropriate or are deemed not to reflect fair value are stated at fair value as determined in good faith by the Valuation Committee. The objective of any fair value pricing determination is to arrive at a price that could reasonably be expected from a current sale. Financial instruments fair valued by the Valuation Committee are primarily private placements, restricted securities, warrants, rights, and other securities that are not publicly traded.
Subject to oversight by the Board, the Valuation Committee regularly makes good faith judgments to establish and adjust the fair valuations of certain securities as events occur and circumstances warrant. For instance, in determining the fair value of an equity investment with limited market activity, such as a private placement or a thinly traded public company stock, the Valuation Committee considers a variety of factors, which may include, but are not limited to, the issuer’s business prospects, its financial standing and performance, recent investment transactions in the issuer, new rounds of financing, negotiated transactions of significant size between other investors in the company, relevant market valuations of peer companies, strategic events affecting the company, market liquidity for the issuer, and general economic conditions and events. In consultation with the investment and pricing teams, the Valuation Committee will determine an appropriate valuation technique based on available information, which may include both observable and unobservable inputs. The Valuation Committee typically will afford greatest weight to actual prices in arm’s length transactions, to the extent they represent orderly transactions between market participants, transaction information can be reliably obtained, and prices are deemed representative of fair value. However, the Valuation Committee may also consider other valuation methods such as market-based valuation multiples; a discount or premium from market value of a similar, freely traded security of the same issuer; or some combination. Fair value determinations are reviewed on a regular basis and updated as information becomes available, including actual purchase and sale transactions of the issue. Because any fair value determination involves a significant amount of judgment, there is a degree of subjectivity inherent in such pricing decisions, and fair value prices determined by the Valuation Committee could differ from those of other market participants. Depending on the relative significance of unobservable inputs, including the valuation technique(s) used, fair valued securities may be categorized in Level 2 or 3 of the fair value hierarchy.
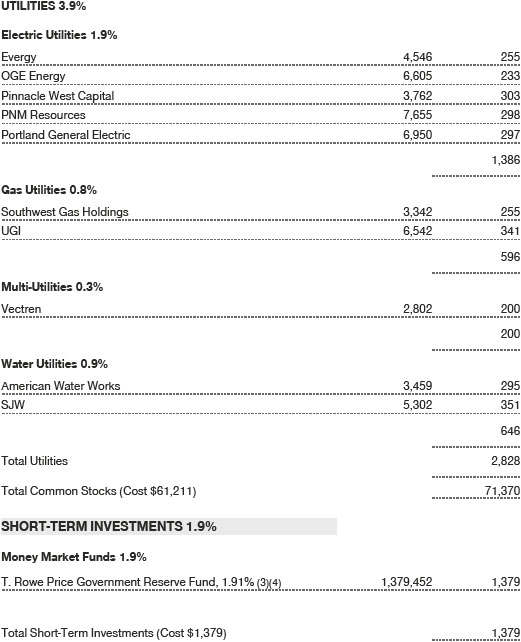
Valuation Inputs On June 30, 2018, all of the fund’s financial instruments were classified as Level 1, based on the inputs used to determine their fair values. There were no material transfers between Levels 1 and 2 during the six months ended June 30, 2018.
NOTE 3 - OTHER INVESTMENT TRANSACTIONS
Consistent with its investment objective, the fund engages in the following practices to manage exposure to certain risks and/or to enhance performance. The investment objective, policies, program, and risk factors of the fund are described more fully in the fund’s prospectus and Statement of Additional Information.
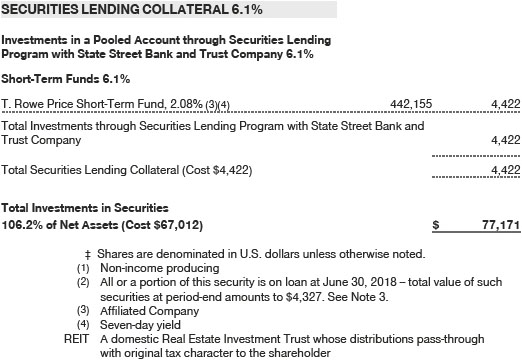
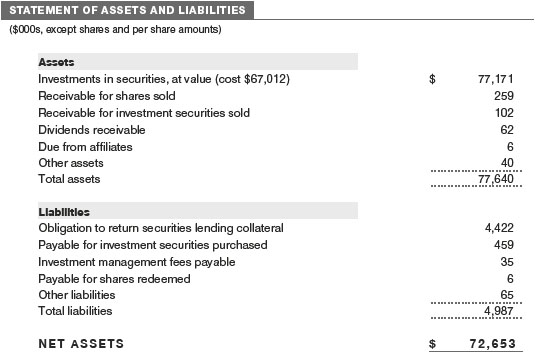
Securities Lending The fund may lend its securities to approved borrowers to earn additional income. Its securities lending activities are administered by a lending agent in accordance with a securities lending agreement. Security loans generally do not have stated maturity dates, and the fund may recall a security at any time. The fund receives collateral in the form of cash or U.S. government securities, valued at 102% to 105% of the value of the securities on loan. Collateral is maintained over the life of the loan in an amount not less than the value of loaned securities; any additional collateral required due to changes in security values is delivered to the fund the next business day. Cash collateral is invested in accordance with investment guidelines approved by fund management. Additionally, the lending agent indemnifies the fund against losses resulting from borrower default. Although risk is mitigated by the collateral and indemnification, the fund could experience a delay in recovering its securities and a possible loss of income or value if the borrower fails to return the securities, collateral investments decline in value, and the lending agent fails to perform. Securities lending revenue consists of earnings on invested collateral and borrowing fees, net of any rebates to the borrower, compensation to the lending agent, and other administrative costs. In accordance with GAAP, investments made with cash collateral are reflected in the accompanying financial statements, but collateral received in the form of securities is not. At June 30, 2018, the value of loaned securities was $4,327,000 the value of cash collateral and related investments was $4,422,000.
Other Purchases and sales of portfolio securities other than short-term securities aggregated $24,645,000 and $8,296,000, respectively, for the six months ended June 30, 2018.
NOTE 4 - FEDERAL INCOME TAXES
No provision for federal income taxes is required since the fund intends to continue to qualify as a regulated investment company under Subchapter M of the Internal Revenue Code and distribute to shareholders all of its taxable income and gains. Distributions determined in accordance with federal income tax regulations may differ in amount or character from net investment income and realized gains for financial reporting purposes. Financial reporting records are adjusted for permanent book/tax differences to reflect tax character but are not adjusted for temporary differences. The amount and character of tax-basis distributions and composition of net assets are finalized at fiscal year-end; accordingly, tax-basis balances have not been determined as of the date of this report.
At June 30, 2018, the cost of investments for federal income tax purposes was $67,045,000. Net unrealized gain aggregated $10,126,000 at period-end, of which $11,755,000 related to appreciated investments and $1,629,000 related to depreciated investments.
NOTE 5 - RELATED PARTY TRANSACTIONS
The fund is managed by T. Rowe Price Associates, Inc. (Price Associates), a wholly owned subsidiary of T. Rowe Price Group, Inc. (Price Group). The investment management agreement between the fund and Price Associates provides for an annual investment management fee, which is computed daily and paid monthly. The fee consists of an individual fund fee, equal to 0.35% of the fund’s average daily net assets, and a group fee. The group fee rate is calculated based on the combined net assets of certain mutual funds sponsored by Price Associates (the group) applied to a graduated fee schedule, with rates ranging from 0.48% for the first $1 billion of assets to 0.265% for assets in excess of $650 billion. The fund’s group fee is determined by applying the group fee rate to the fund’s average daily net assets. At June 30, 2018, the effective annual group fee rate was 0.29%.
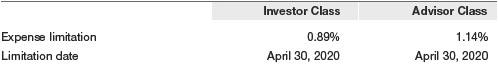
The Investor Class and Advisor Class are each subject to a contractual expense limitation through the limitation dates indicated in the table below. During the limitation period, Price Associates is required to waive its management fee or pay any expenses (excluding interest, expenses related to borrowings, taxes, brokerage, and other non-recurring expenses permitted by the investment management agreement) that would otherwise cause the class’s ratio of annualized total expenses to average net assets (expense ratio) to exceed its expense limitation. Each class is required to repay Price Associates for expenses previously waived/paid to the extent the class’s net assets grow or expenses decline sufficiently to allow repayment without causing the class’s expense ratio (after the repayment is taken into account) to exceed both: (1) the expense limitation in place at the time such amounts were waived; and (2) the class’s current expense limitation. However, no repayment will be made more than three years after the date of a payment or waiver.
The I Class is also subject to an operating expense limitation (I Class limit) pursuant to which Price Associates is contractually required to pay all operating expenses of the I Class, excluding management fees, interest, expenses related to borrowings, taxes, brokerage, and other non-recurring expenses permitted by the investment management agreement, to the extent such operating expenses, on an annualized basis, exceed 0.05% of average net assets. This agreement will continue until April 30, 2020, and may be renewed, revised, or revoked only with approval of the fund’s Board. The I Class is required to repay Price Associates for expenses previously paid to the extent the class’s net assets grow or expenses decline sufficiently to allow repayment without causing the class’s operating expenses (after the repayment is taken into account) to exceed both: (1) the expense limitation in place at the time such amounts were paid; and (2) the class’s current expense limitation. However, no repayment will be made more than three years after the date of a payment or waiver.
Pursuant to these agreements $131,000 of expenses were waived/paid by Price Associates during the six months ended June 30, 2018. Including this amount, expenses previously waived/paid by Price Associates in the amount of $705,000 remain subject to repayment by the fund at June 30, 2018.
In addition, the fund has entered into service agreements with Price Associates and two wholly owned subsidiaries of Price Associates, each an affiliate of the fund (collectively, Price). Price Associates provides certain accounting and administrative services to the fund. T. Rowe Price Services, Inc. provides shareholder and administrative services in its capacity as the fund’s transfer and dividend-disbursing agent. T. Rowe Price Retirement Plan Services, Inc. provides subaccounting and recordkeeping services for certain retirement accounts invested in the Investor Class. For the six months ended June 30, 2018, expenses incurred pursuant to these service agreements were $46,000 for Price Associates; $30,000 for T. Rowe Price Services, Inc.; and less than $1,000 for T. Rowe Price Retirement Plan Services, Inc. All amounts due to and due from Price, exclusive of investment management fees payable, are presented net on the accompanying Statement of Assets and Liabilities.
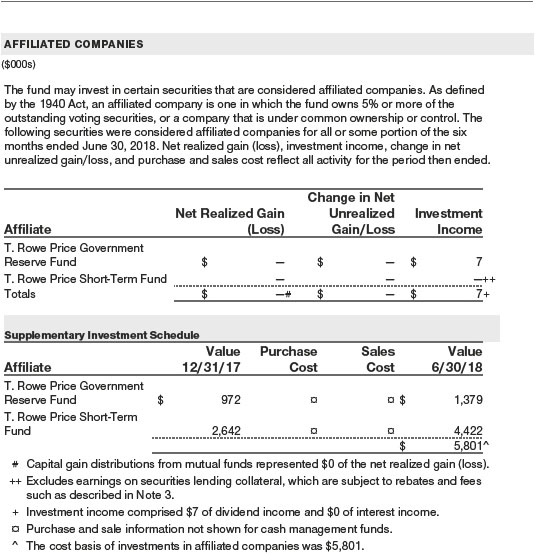
The fund may invest its cash reserves in certain open-end management investment companies managed by Price Associates and considered affiliates of the fund: the T. Rowe Price Government Reserve Fund or the T. Rowe Price Treasury Reserve Fund, organized as money market funds, or the T. Rowe Price Short-Term Fund, a short-term bond fund (collectively, the Price Reserve Funds). The Price Reserve Funds are offered as short-term investment options to mutual funds, trusts, and other accounts managed by Price Associates or its affiliates and are not available for direct purchase by members of the public. Cash collateral from securities lending is invested in the T. Rowe Price Short-Term Fund. The Price Reserve Funds pay no investment management fees.
As of June 30, 2018, T. Rowe Price Group, Inc., or its wholly owned subsidiaries owned 950,000 shares of the Investor Class, representing 20% of the Investor Class’s net assets and 25,000 shares of the Advisor Class, representing 54% of the Advisor Class’s net assets and 25,000 shares of the I Class, representing 12% of the I Class’s net assets.
The fund may participate in securities purchase and sale transactions with other funds or accounts advised by Price Associates (cross trades), in accordance with procedures adopted by the fund’s Board and Securities and Exchange Commission rules, which require, among other things, that such purchase and sale cross trades be effected at the independent current market price of the security. During the six months ended June 30, 2018, the fund had no purchases or sales cross trades with other funds or accounts advised by Price Associates.
INFORMATION ON PROXY VOTING POLICIES, PROCEDURES, AND RECORDS
A description of the policies and procedures used by T. Rowe Price funds and portfolios to determine how to vote proxies relating to portfolio securities is available in each fund’s Statement of Additional Information. You may request this document by calling 1-800-225-5132 or by accessing the SEC’s website, sec.gov.
The description of our proxy voting policies and procedures is also available on our corporate website. To access it, please visit the following Web page:
https://www3.troweprice.com/usis/corporate/en/utility/policies.html
Scroll down to the section near the bottom of the page that says, “Proxy Voting Policies.” Click on the Proxy Voting Policies link in the shaded box.
Each fund’s most recent annual proxy voting record is available on our website and through the SEC’s website. To access it through T. Rowe Price, visit the website location shown above, and scroll down to the section near the bottom of the page that says, “Proxy Voting Records.” Click on the Proxy Voting Records link in the shaded box.
HOW TO OBTAIN QUARTERLY PORTFOLIO HOLDINGS
The fund files a complete schedule of portfolio holdings with the Securities and Exchange Commission for the first and third quarters of each fiscal year on Form N-Q. The fund’s Form N-Q is available electronically on the SEC’s website (sec.gov); hard copies may be reviewed and copied at the SEC’s Public Reference Room, 100 F St. N.E., Washington, DC 20549. For more information on the Public Reference Room, call 1-800-SEC-0330.
APPROVAL OF INVESTMENT MANAGEMENT AGREEMENT
Each year, the fund’s Board of Directors (Board) considers the continuation of the investment management agreement (Advisory Contract) between the fund and its investment advisor, T. Rowe Price Associates, Inc. (Advisor), on behalf of the fund. In that regard, at an in-person meeting held on March 5–6, 2018 (Meeting), the Board, including a majority of the fund’s independent directors, approved the continuation of the fund’s Advisory Contract. At the Meeting, the Board considered the factors and reached the conclusions described below relating to the selection of the Advisor and the approval of the Advisory Contract. The independent directors were assisted in their evaluation of the Advisory Contract by independent legal counsel from whom they received separate legal advice and with whom they met separately.
In providing information to the Board, the Advisor was guided by a detailed set of requests for information submitted by independent legal counsel on behalf of the independent directors. In considering and approving the Advisory Contract, the Board considered the information it believed was relevant, including, but not limited to, the information discussed below. The Board considered not only the specific information presented in connection with the Meeting but also the knowledge gained over time through interaction with the Advisor about various topics. The Board meets regularly and, at each of its meetings, covers an extensive agenda of topics and materials and considers factors that are relevant to its annual consideration of the renewal of the T. Rowe Price funds’ advisory contracts, including performance and the services and support provided to the funds and their shareholders.
Services Provided by the Advisor
The Board considered the nature, quality, and extent of the services provided to the fund by the Advisor. These services included, but were not limited to, directing the fund’s investments in accordance with its investment program and the overall management of the fund’s portfolio, as well as a variety of related activities such as financial, investment operations, and administrative services; compliance; maintaining the fund’s records and registrations; and shareholder communications. The Board also reviewed the background and experience of the Advisor’s senior management team and investment personnel involved in the management of the fund, as well as the Advisor’s compliance record. The Board concluded that it was satisfied with the nature, quality, and extent of the services provided by the Advisor.
Investment Performance of the Fund
The Board took into account discussions with the Advisor and reports that it receives throughout the year relating to fund performance. In connection with the Meeting, the Board reviewed the fund’s net annualized total return for the one-year period as of September 30, 2017, and compared this return with the performance of a peer group of funds with similar investment programs and a wide variety of other previously agreed-upon comparable performance measures and market data, including those supplied by Broadridge, which is an independent provider of mutual fund data.
On the basis of this evaluation and the Board’s ongoing review of investment results, and factoring in the relative market conditions during certain of the performance periods and the fund’s limited operating history, the Board concluded that the fund’s performance was satisfactory.
Costs, Benefits, Profits, and Economies of Scale
The Board reviewed detailed information regarding the revenues received by the Advisor under the Advisory Contract and other benefits that the Advisor (and its affiliates) may have realized from its relationship with the fund, including any research received under “soft dollar” agreements and commission-sharing arrangements with broker-dealers. The Board considered that the Advisor may receive some benefit from soft-dollar arrangements pursuant to which research is received from broker-dealers that execute the fund’s portfolio transactions. The Board received information on the estimated costs incurred and profits realized by the Advisor from managing the T. Rowe Price funds. While the Board did not review information regarding profits realized from managing the fund in particular because the fund had either not achieved sufficient portfolio asset size or not recognized sufficient revenues to produce meaningful profit margin percentages, the Board concluded that the Advisor’s profits were reasonable in light of the services provided to the T. Rowe Price funds.
The Board also considered whether the fund benefits under the fee levels set forth in the Advisory Contract from any economies of scale realized by the Advisor. Under the Advisory Contract, the fund pays a fee to the Advisor for investment management services composed of two components—a group fee rate based on the combined average net assets of most of the T. Rowe Price funds (including the fund) that declines at certain asset levels and an individual fund fee rate based on the fund’s average daily net assets—and the fund pays its own expenses of operations (subject to contractual expense limitations agreed to by the Advisor with respect to the Investor Class, Advisor Class, and I Class). The Board concluded that the advisory fee structure for the fund continued to provide for a reasonable sharing of benefits from any economies of scale with the fund’s investors.
Fees and Expenses
The Board was provided with information regarding industry trends in management fees and expenses. Among other things, the Board reviewed data for peer groups that were compiled by Broadridge, which compared: (i) contractual management fees, total expenses, actual management fees, and nonmanagement expenses of the Investor Class of the fund with a group of competitor funds selected by Broadridge (Investor Class Expense Group); (ii) total expenses and actual management fees of the Advisor Class of the fund with a group of competitor funds selected by Broadridge (Advisor Class Expense Group); and (iii) total expenses, actual management fees, and nonmanagement expenses of the Investor Class of the fund with a broader set of funds within the Lipper investment classification (Expense Universe). The Board considered the fund’s contractual management fee rate, actual management fee rate (which reflects the management fees actually received from the fund by the Advisor after any applicable waivers, reductions, or reimbursements), operating expenses, and total expenses (which reflect the net total expense ratio of the fund after any waivers, reductions, or reimbursements) in comparison with the information for the Broadridge peer groups. Broadridge generally constructed the peer groups by seeking the most comparable funds based on similar investment classifications and objectives, expense structure, asset size, and operating components and attributes and ranked funds into quintiles, with the first quintile representing the funds with the lowest relative expenses and the fifth quintile representing the funds with the highest relative expenses. The information provided to the Board indicated that the fund’s contractual management fee ranked in the first quintile (Investor Class Expense Group), the fund’s actual management fee rate ranked in the first quintile (Investor Class Expense Group, Advisor Class Expense Group, and Expense Universe), and the fund’s total expenses ranked in the first quintile (Investor Class Expense Group, Advisor Class Expense Group, and Expense Universe).
The Board also reviewed the fee schedules for institutional accounts and private accounts with similar mandates that are advised or subadvised by the Advisor and its affiliates. Management provided the Board with information about the Advisor’s responsibilities and services provided to subadvisory and other institutional account clients, including information about how the requirements and economics of the institutional business are fundamentally different from those of the mutual fund business. The Board considered information showing that the Advisor’s mutual fund business is generally more complex from a business and compliance perspective than its institutional account business and considered various relevant factors, such as the broader scope of operations and oversight, more extensive shareholder communication infrastructure, greater asset flows, heightened business risks, and differences in applicable laws and regulations associated with the Advisor’s proprietary mutual fund business. In assessing the reasonableness of the fund’s management fee rate, the Board considered the differences in the nature of the services required for the Advisor to manage its mutual fund business versus managing a discrete pool of assets as a subadvisor to another institution’s mutual fund or for an institutional account and that the Advisor generally performs significant additional services and assumes greater risk in managing the fund and other T. Rowe Price funds than it does for institutional account clients.
On the basis of the information provided and the factors considered, the Board concluded that the fees paid by the fund under the Advisory Contract are reasonable.
Approval of the Advisory Contract
As noted, the Board approved the continuation of the Advisory Contract. No single factor was considered in isolation or to be determinative to the decision. Rather, the Board concluded, in light of a weighting and balancing of all factors considered, that it was in the best interests of the fund and its shareholders for the Board to approve the continuation of the Advisory Contract (including the fees to be charged for services thereunder).
Item 2. Code of Ethics.
A code of ethics, as defined in Item 2 of Form N-CSR, applicable to its principal executive officer, principal financial officer, principal accounting officer or controller, or persons performing similar functions is filed as an exhibit to the registrant’s annual Form N-CSR. No substantive amendments were approved or waivers were granted to this code of ethics during the registrant’s most recent fiscal half-year.
Item 3. Audit Committee Financial Expert.
Disclosure required in registrant’s annual Form N-CSR.
Item 4. Principal Accountant Fees and Services.
Disclosure required in registrant’s annual Form N-CSR.
Item 5. Audit Committee of Listed Registrants.
Not applicable.
Item 6. Investments.
(a) Not applicable. The complete schedule of investments is included in Item 1 of this Form N-CSR.
(b) Not applicable.
Item 7. Disclosure of Proxy Voting Policies and Procedures for Closed-End Management Investment Companies.
Not applicable.
Item 8. Portfolio Managers of Closed-End Management Investment Companies.
Not applicable.
Item 9. Purchases of Equity Securities by Closed-End Management Investment Company and Affiliated Purchasers.
Not applicable.
Item 10. Submission of Matters to a Vote of Security Holders.
Not applicable.
Item 11. Controls and Procedures.
(a) The registrant’s principal executive officer and principal financial officer have evaluated the registrant’s disclosure controls and procedures within 90 days of this filing and have concluded that the registrant’s disclosure controls and procedures were effective, as of that date, in ensuring that information required to be disclosed by the registrant in this Form N-CSR was recorded, processed, summarized, and reported timely.
(b) During the period, the Price Funds’ accounting agent, The Bank of New York Mellon (BNYM), converted the fund’s books and records from a legacy fund accounting system / operating model to a BNYM fund accounting system / operating model.
Item 12. Exhibits.
(a)(1) The registrant’s code of ethics pursuant to Item 2 of Form N-CSR is filed with the registrant’s annual Form N-CSR.
(2) Separate certifications by the registrant’s principal executive officer and principal financial officer, pursuant to Section 302 of the Sarbanes-Oxley Act of 2002 and required by Rule 30a-2(a) under the Investment Company Act of 1940, are attached.
(3) Written solicitation to repurchase securities issued by closed-end companies: not applicable.
(b) A certification by the registrant's principal executive officer and principal financial officer, pursuant to Section 906 of the Sarbanes-Oxley Act of 2002 and required by Rule 30a-2(b) under the Investment Company Act of 1940, is attached.
SIGNATURES
Pursuant to the requirements of the Securities Exchange Act of 1934 and the Investment Company Act of 1940, the registrant has duly caused this report to be signed on its behalf by the undersigned, thereunto duly authorized.
T. Rowe Price Quantitative Management Funds, Inc.
| By | /s/ David Oestreicher | |||||
| David Oestreicher | ||||||
| Principal Executive Officer | ||||||
| Date | August 16, 2018 | |||||
Pursuant to the requirements of the Securities Exchange Act of 1934 and the Investment Company Act of 1940, this report has been signed below by the following persons on behalf of the registrant and in the capacities and on the dates indicated.
| By | /s/ David Oestreicher | |||||
| David Oestreicher | ||||||
| Principal Executive Officer | ||||||
| Date | August 16, 2018 | |||||
| By | /s/ Catherine D. Mathews | |||||
| Catherine D. Mathews | ||||||
| Principal Financial Officer | ||||||
| Date | August 16, 2018 | |||||