UNITED STATES
SECURITIES AND EXCHANGE COMMISSION
Washington, D.C. 20549
FORM N-CSR
CERTIFIED SHAREHOLDER REPORT OF REGISTERED
MANAGEMENT INVESTMENT COMPANIES
Investment Company Act File Number: 811-08207
| T. Rowe Price Tax-Efficient Funds, Inc. |
| (Exact name of registrant as specified in charter) |
| 100 East Pratt Street, Baltimore, MD 21202 |
| (Address of principal executive offices) |
| David Oestreicher |
| 100 East Pratt Street, Baltimore, MD 21202 |
| (Name and address of agent for service) |
Registrant’s telephone number, including area code: (410) 345-2000
Date of fiscal year end: February 28
Date of reporting period: August 31, 2016
Item 1. Report to Shareholders
 |
| Tax-Efficient Equity Fund | August 31, 2016 |
The views and opinions in this report were current as of August 31, 2016. They are not guarantees of performance or investment results and should not be taken as investment advice. Investment decisions reflect a variety of factors, and the managers reserve the right to change their views about individual stocks, sectors, and the markets at any time. As a result, the views expressed should not be relied upon as a forecast of the fund’s future investment intent. The report is certified under the Sarbanes-Oxley Act, which requires mutual funds and other public companies to affirm that, to the best of their knowledge, the information in their financial reports is fairly and accurately stated in all material respects.
REPORTS ON THE WEB
Sign up for our Email Program, and you can begin to receive updated fund reports and prospectuses online rather than through the mail. Log in to your account at troweprice.com for more information.
Manager’s Letter
Fellow Shareholders
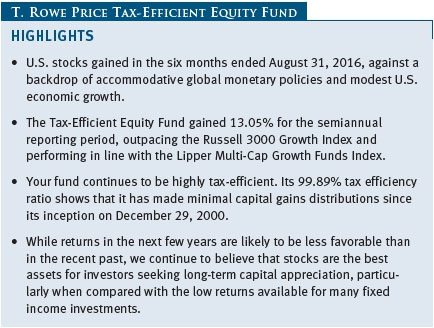
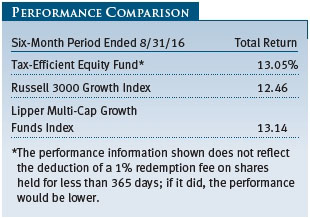
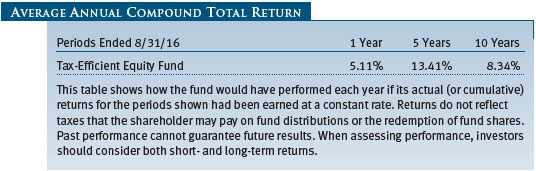
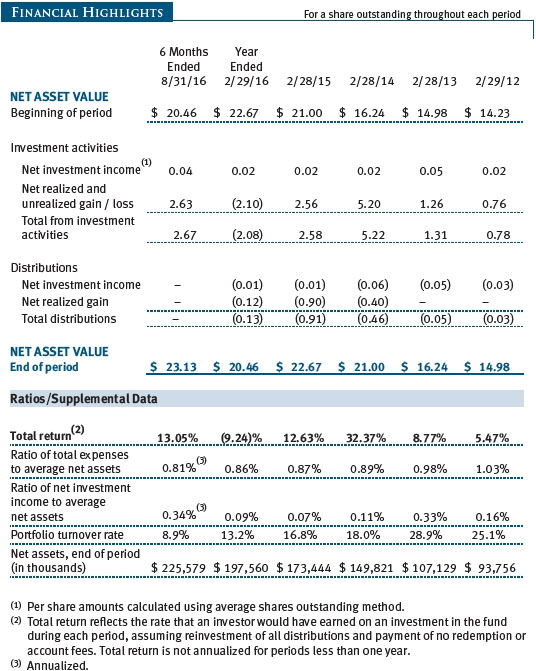
U.S. equities rose in the six months ended August 31, 2016. A cautious approach on interest rate hikes by the Federal Reserve, modest economic growth in the U.S., accommodative global monetary policies, and stabilizing prices for oil and other commodities supported stocks during the period. As shown in the Performance Comparison table, the Tax-Efficient Equity Fund gained 13.05% for the semiannual reporting period. The fund outpaced the Russell 3000 Growth Index for the period and performed roughly in line with the Lipper Multi-Cap Growth Funds Index.
Every sector in the fund’s portfolio turned in positive absolute returns for the six-month period. A small position in the energy sector rose more than 20% as global oil prices stabilized while another modest position in telecommunication services performed nearly as well. Positions in financials, information technology, materials, industrials and business services, and consumer staples each registered solid double-digit gains. Our health care, utilities, and consumer discretionary stocks were close behind with strong single-digit gains. Stock selection and sector weightings benefited results versus the fund’s Russell benchmark.
MARKET ENVIRONMENT
The U.S. economy expanded by a relatively modest 1.1% annualized rate in the second quarter of 2016, marking the third consecutive quarter of below 2% growth. Strength in consumer spending was offset by weakness in business spending, inventories, and the housing sector. Core inflation, which excludes the volatile food and energy sectors, is trending above the Federal Reserve’s 2% target, driven in part by higher wages and a gradually improving labor market. With a wary eye on sluggish growth overseas, the Fed has not raised interest rates so far in 2016. However, there are growing expectations for the Fed to raise rates later in the year as central bank officials signal resolve to advance interest rate policy normalization as they balance a strong job market with still modest economic growth.
Corporate leverage has increased, but balance sheets outside of energy-related sectors remain broadly healthy and provide the corporate sector some flexibility to increase capital spending, engage in mergers and acquisitions, and return capital to shareholders through dividends and share repurchases. The pace of corporate buybacks has slowed considerably since last year, however, along with corporate profits. U.S. companies reported a low single-digit decline in second-quarter profits—the fifth consecutive quarter of year-over-year declines and the worst streak since the 2008–2009 global financial crisis.
Stocks across all market capitalization ranges, sectors, and styles performed well for the six-month period. The UK’s late-June decision to leave the European Union shocked the markets, but they soon recovered due to support from stabilizing energy and materials prices, low interest rates, and slow-but-resilient economic growth in the U.S. and key overseas markets. A lack of compelling investment alternatives in other asset classes, particularly fixed income, offered a further boost to stocks.
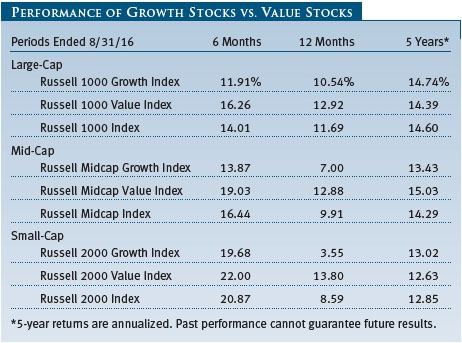
As measured by various Russell indexes, value stocks outperformed growth shares across all market capitalizations as investors generally favored the more defensive, higher-yielding areas of the equity market. Small-cap stocks turned in the strongest gains, followed by mid-caps and large-caps. From a sector perspective, energy, materials, and financials were the top performers in our benchmark, the Russell 3000 Growth Index. Utilities, telecommunication services, and consumer staples—three traditionally defensive areas of the market—trailed with smaller gains as many investors shied away from their relatively rich valuations.
PORTFOLIO CHARACTERISTICS
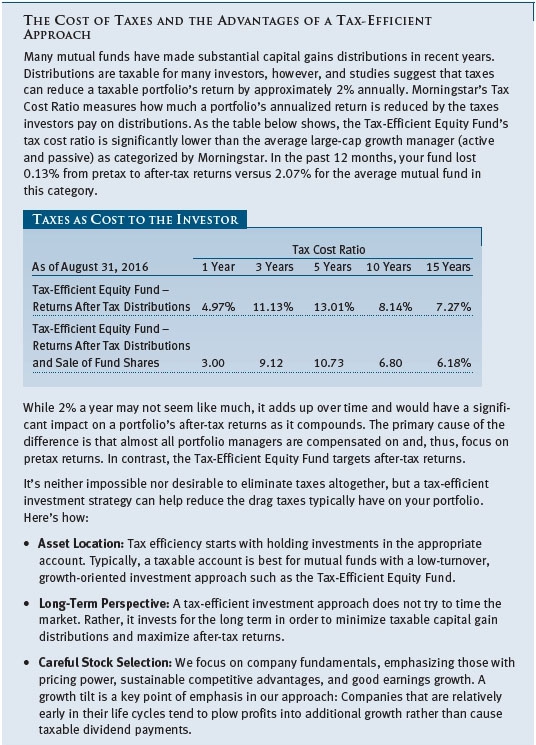
The Tax-Efficient Equity Fund seeks to buy and hold attractively valued, high-quality growth companies with good business models, strong management, and favorable long-term prospects. Our goal is to build a portfolio that provides strong after-tax returns.
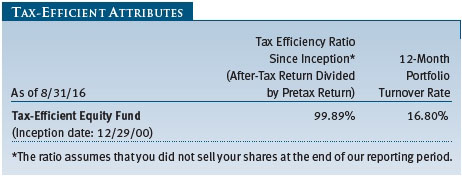
| ● | Tax-Efficiency Ratio: Our 99.89% tax efficiency ratio shows that the fund has made only minimal capital gain distributions since its inception on December 29, 2000, in our pursuit of strong after-tax returns. (The fund’s tax efficiency ratio is calculated by dividing the fund’s after-tax return by its pretax return.) It’s worth noting that we currently do not expect to make a capital gains distribution this year. |
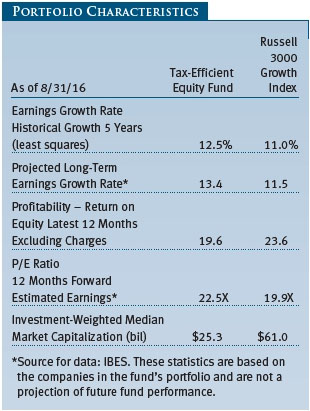
| ● | Earnings Growth: We expect the earnings of our holdings to grow faster than companies in the Russell 3000 Growth Index. The fund’s projected long-term earnings growth rate of 13.4% exceeds the 11.5% index rate, while our historical earnings growth rate over the last five years was 12.5% versus 11.0% for the index. |
| ● | Return on Equity: The fund’s 12-month return on equity (ROE) at the end of our reporting period was 19.6%. A high, sustainable ROE indicates that a company is using its investment dollars to generate earnings growth. It is one of the most important characteristics we consider when researching potential investments and reviewing current holdings. |
| ● | Market Capitalization: The fund’s investment-weighted median market capitalization was $25.3 billion versus $61.0 billion for the index, reflecting the fund’s broad diversification and greater exposure to mid-cap companies. (Although diversification cannot guarantee a profit or protect against loss in a declining market, it may help to lower a portfolio’s volatility versus a more concentrated strategy.) |
PORTFOLIO AND PERFORMANCE REVIEW
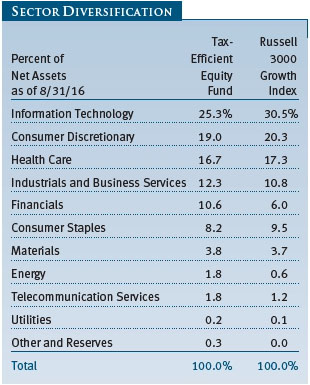
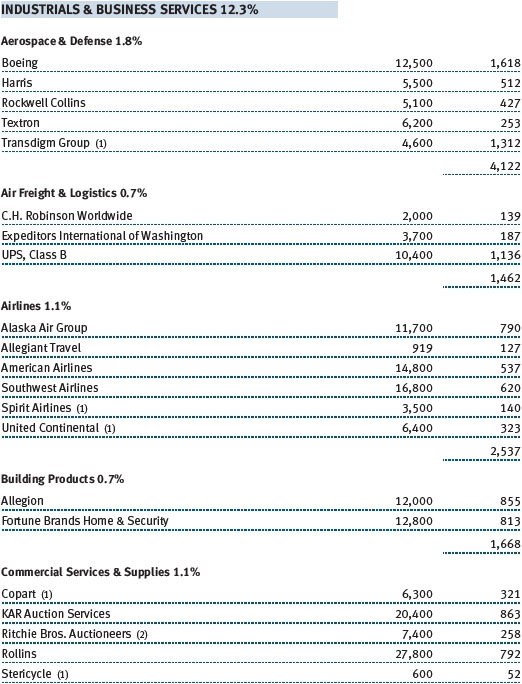
At the end of our six-month reporting period, the fund’s largest sector allocations were information technology, consumer discretionary, health care, and industrials and business services. We had relatively small allocations to materials, energy, telecommunication services, and utilities—sectors that traditionally do not have many of the growth-oriented characteristics that are the focus of our investment approach. Financials, industrials and business services, and energy were our largest overweight allocations relative to the benchmark Russell 3000 Growth Index. Consumer staples, consumer discretionary, and information technology were our largest underweights.
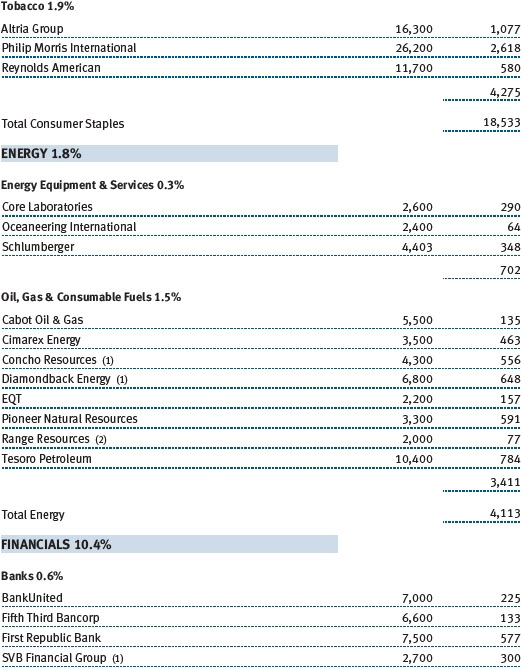
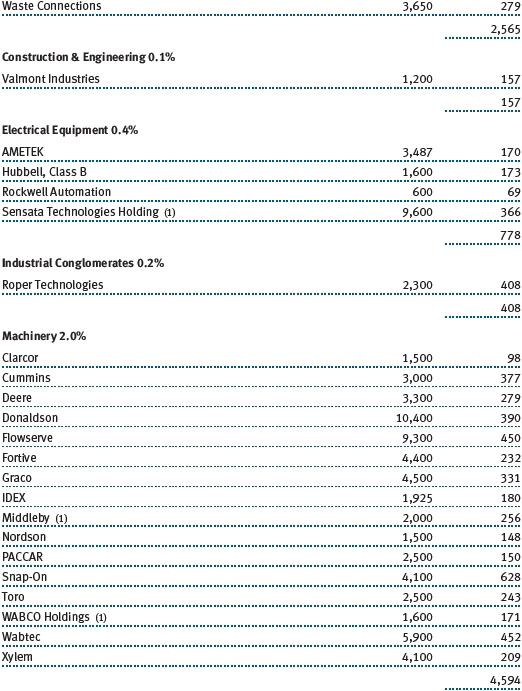
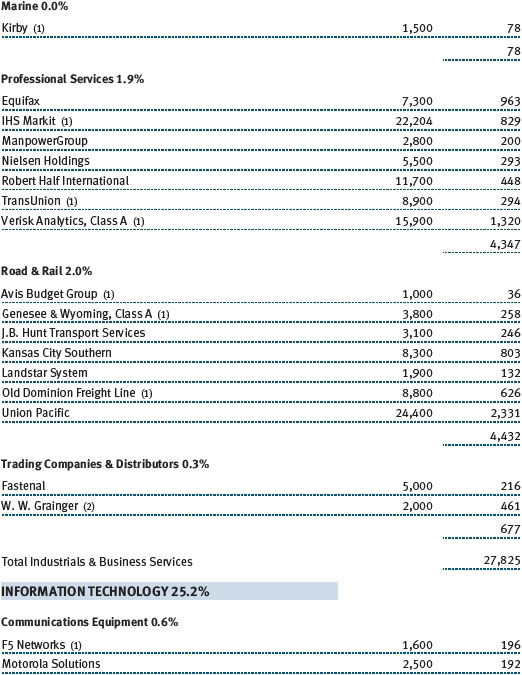
A small allocation to the energy sector generated strong absolute gains for the six-month reporting period. Concho Resources, Pioneer Natural Resources, and Diamondback Energy were our top performers in the sector. These are high-quality U.S. oil exploration and production companies with attractive assets in the Permian Basin, and they should continue to benefit as the ongoing North American shale oil revolution highlights the importance of their lower-cost oil extraction processes and technologies. (Please refer to the fund’s portfolio of investments for a complete list of holdings and the amount each represents in the portfolio.)
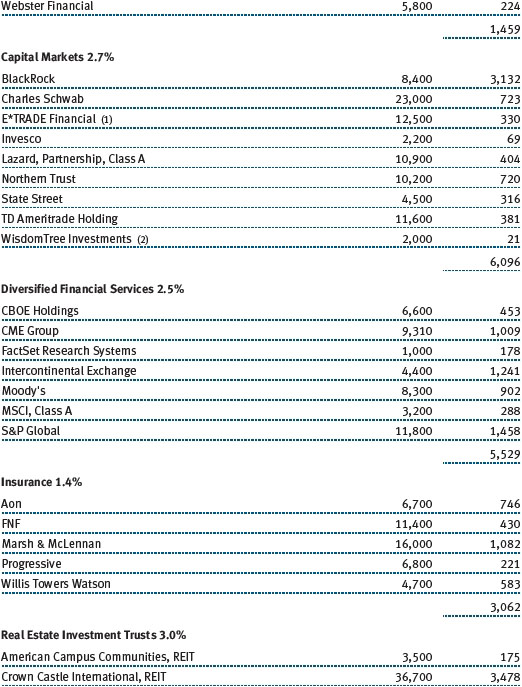
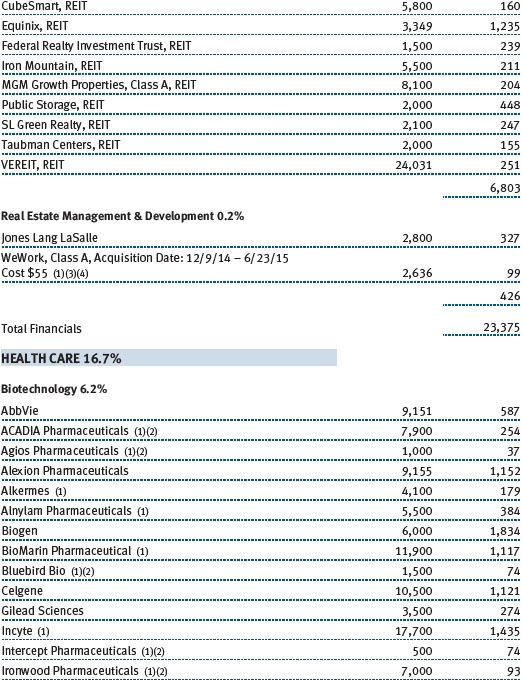
Our financials stocks rose more than 18% for the period. Real estate investment trusts (REITs) were among the fund’s top contributors, led by Crown Castle International, a cellphone tower operator that converted to a REIT a couple of years ago. Crown Castle is one of our larger and older positions and serves as a good example of the fund’s emphasis on buying and holding high-quality companies. The fund’s average cost per share for Crown Castle was $61.26 at the end of our reporting period versus $94.77 market value, resulting in a cost-to-market value of 0.65. (Cost-to-market measures the relationship between the average cost of a stock held in our portfolio versus the market value of that stock at a given time. In simple terms, a cost-to-market value of less than one means that the stock is worth more than our average purchase cost, while a value of more than one shows that the stock is worth less.) Crown Castle’s favorable cost-to-market value at the end of our reporting period indicates that the fund has enjoyed solid gains in the stock over time. Elsewhere in the sector, index and market data provider S&P Global was a good contributor. However, our capital markets holdings declined, with WisdomTree Investments and Lazard among our weaker performers for the period.
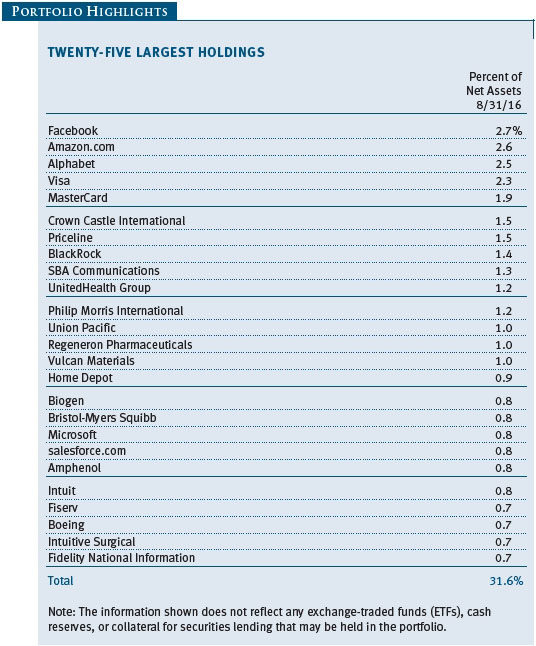
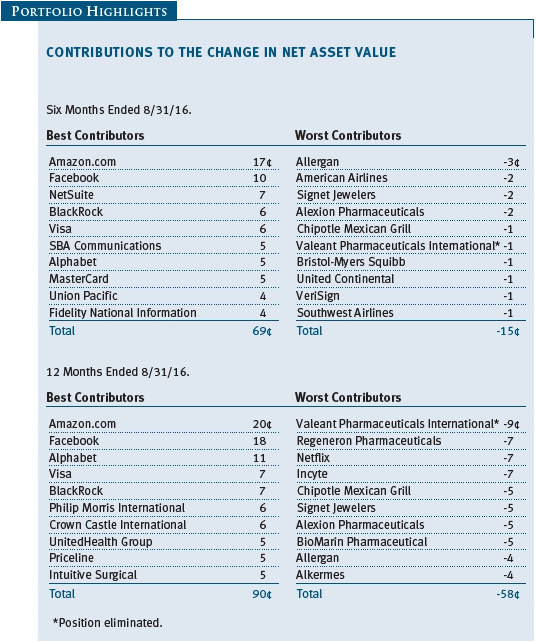
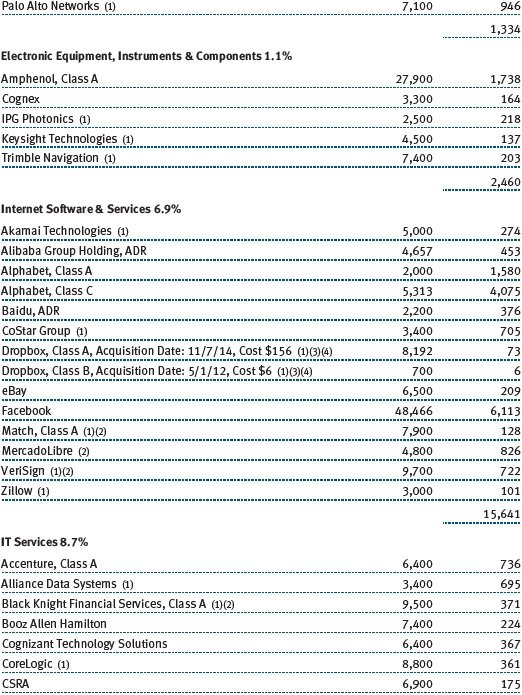
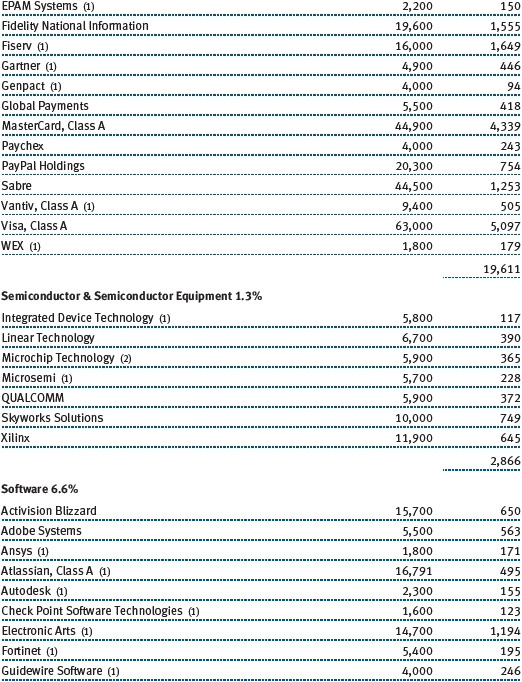
Our information technology stocks gained more than 17% for the reporting period. This is usually a “winner-take-all” space, where an industry leader emerges and eclipses its competitors. As a result, we generally favor companies with strong business models in industries with high barriers to entry and lower risk of commoditization, and we try to avoid companies whose business models are impaired by competing products or services. Facebook and Alphabet (Google’s parent company) were among the fund’s top contributors. Investors appreciated how well Facebook’s advertising products, video strategy, and Instagram photo sharing are being received, while Alphabet’s new holding company structure has improved its financial disclosure and transparency, and its search and advertising businesses are thriving. Facebook and Alphabet are both large, long-term holdings for the fund and have seen attractive gains over time. Our average cost per Facebook share, for example, was $55.14 as of August 31, 2016, versus a market value of $126.12, resulting in a cost-to-market value of 0.44. Software service provider salesforce.com, financial services provider Fidelity National Information, and ARM Holdings, a leading licensor of intellectual property to the semiconductor industry, were also among our top contributors. Chinese e-commerce site Alibaba Group Holding and Chinese search engine Baidu weighed on results. Much of the negative sentiment for these companies was due to higher business expenditures—spending that we believe will provide benefits over the long term as China’s economy and society adopt an increasingly digital focus.
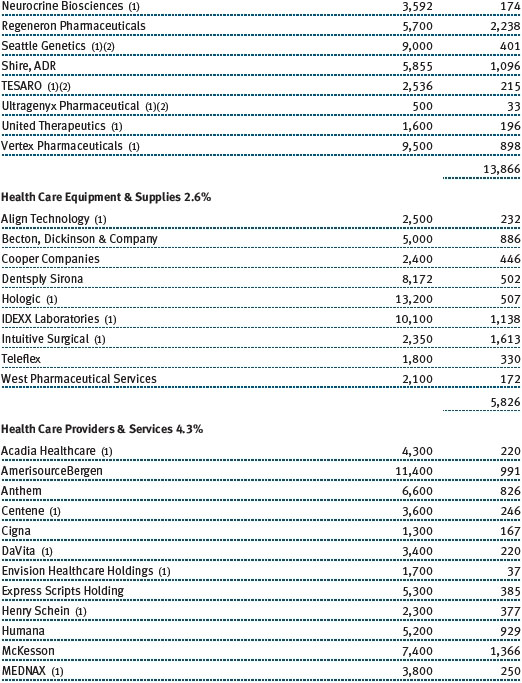
Our health care stocks rose nearly 10% for the period. For several years, we have focused on the promising growth potential of biotechnology companies addressing unmet medical needs rather than large-cap pharmaceutical firms. However, this can be a volatile space in which to invest, and the performance of our holdings was mixed. Incyte was among our top 10 contributors. Incyte has impressive drug-discovery capabilities, and Jakafi, the company’s first commercial oncology product designed to treat myelofibrosis, enjoyed strong sales in late 2015 and early 2016. Baxalta and Seattle Genetics were modest gainers, but a number of other biotech names, including Alkermes, Alnylam Pharmaceuticals, and Alexion Pharmaceuticals, weighed on the fund’s overall performance. Elsewhere in the sector, robotic surgery equipment maker Intuitive Surgical and health insurance and services provider UnitedHealth Group were strong positive contributors.
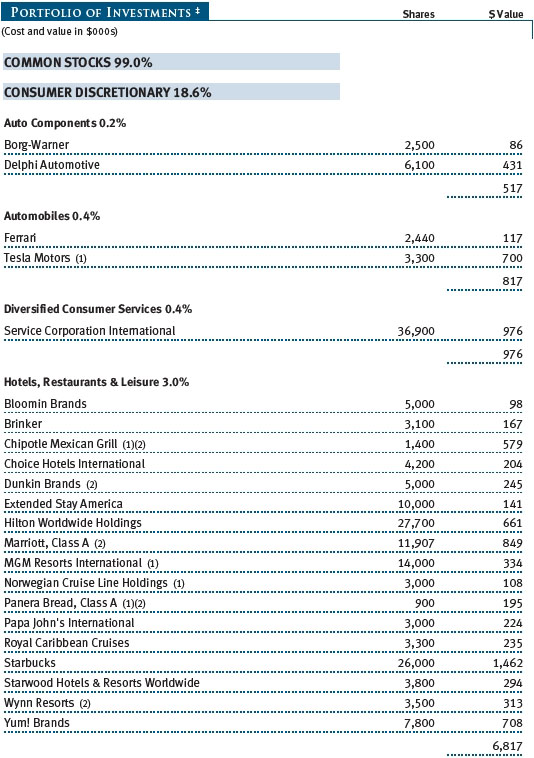
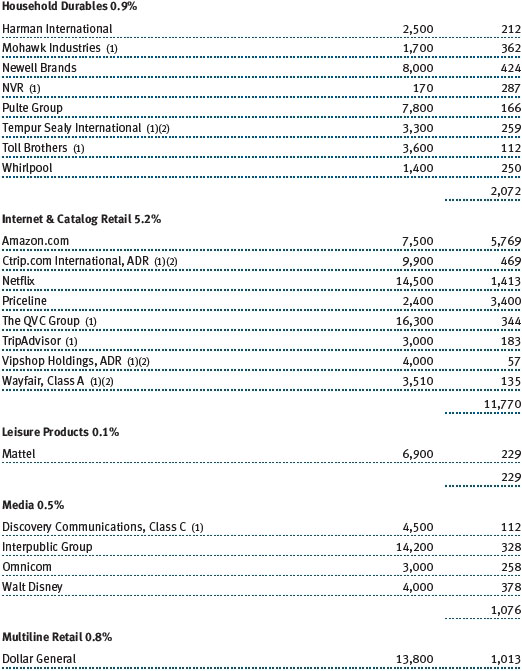
The fund’s consumer discretionary stocks gained more than 9%. Many companies in the sector feature good business models, excellent cash flow, and other favorable attributes. Consumer discretionary is our second-largest allocation, with a focus on leading companies within their respective niches. Internet catalog and retail names were our strongest contributors, led by Amazon.com—our top overall contributor—and Priceline. These are two good examples of the companies that we like to own: high-quality, market-leading franchises operating in businesses with high barriers to entry and good long-term growth trajectories. Amazon and Priceline are also two of our larger positions and have been good long-term holdings, as shown by cost-to-market values of 0.24 and 0.38, respectively. Our hotel, restaurant, and leisure holdings hurt results for the period. Fast food chain Chipotle Mexican Grill had a negative impact on results as the company struggled with concerns about improper food handling that sickened some customers. We believe the company has taken a number of positive steps to address food handling and employee training, and the stock should resume growth once these issues are sufficiently in the rearview mirror. Gaming company Wynn Resorts and coffee purveyor Starbucks were also among our weaker performers.
OUTLOOK
Global equity markets have performed well over the past six months, due in part to optimism about modest but resilient economic growth and stabilization in global energy and commodities prices. The Fed’s cautious approach to interest rate hikes and indications that policymakers are ready and willing to intervene with further monetary and fiscal stimulus have also been supportive. With benchmark interest rates near or below 0% in many developed countries, however, it appears that central banks’ ability to stimulate economic growth is very limited. As a result, we believe that the slow-growth, low-return environment is likely to persist and that investors should expect periodic bouts of volatility.
While absolute returns in the next few years are not likely to be as favorable as they have been in the last few years, we believe that the market will be more discerning of corporate earnings and fundamentals. This should be good for our strategy and our relative performance, given our focus on high-quality companies that generate steady earnings growth over time. Many investors look for the same attributes that we value, such as a demonstrated ability to increase revenues, earnings, and cash flow; capable management; attractive business niches; and a sustainable competitive advantage. To help us mitigate risks, we maintain broad diversification across more than 350 stocks, manage position sizes, and remain conscious of both absolute and relative valuations.
We continue to believe that stocks are the best assets for investors seeking long-term capital appreciation, particularly when compared with the low nominal and negative real (inflation-adjusted) returns available for many fixed income investments. While the precise timing and pace of future rate hikes remains uncertain, it appears that rates will move higher gradually over time. Higher interest rates could undercut bond returns as there is little yield in most core bond strategies to offset expected price declines.
Regardless of whether the market rises, falls, or moves sideways in the coming months, we remain committed to finding and owning high-quality, attractively valued companies that are able to grow earnings consistently. We believe such companies will stand out in a growth-starved world and help us produce solid absolute and relative performance over time.
Thank you for your confidence in T. Rowe Price.
Respectfully submitted,

Donald J. Peters
Portfolio manager and chairman of the fund’s Investment Advisory Committee.
September 15, 2016
The committee chairman has day-to-day responsibility for managing the portfolio and works with committee members in developing and executing the fund’s investment program.
RISKS OF STOCK INVESTING
The stock market as a whole can decline for many reasons, including adverse political or economic developments here or abroad, changes in investor psychology, or heavy institutional selling. The prospects for an industry or company may deteriorate because of a variety of factors, including disappointing earnings or changes in the competitive environment. In addition, our assessment of companies held in the funds may prove incorrect, resulting in losses or poor performance even in a rising market.
Growth stocks can be volatile for several reasons. Since growth companies usually reinvest a high proportion of their earnings in their own businesses, they may lack the dividends often associated with value stocks that could cushion their decline in a falling market. Also, since investors buy growth stocks because of their expected superior earnings growth, earnings disappointments often result in sharp price declines.
The stocks of mid-cap companies entail greater risk and are usually more volatile than the shares of large companies. Investing in small companies also involves greater risk than is customarily associated with larger companies. Stocks of small companies are subject to more abrupt or erratic price movements than larger-company stocks. Small companies often have limited product lines, markets, or financial resources, and their managements may lack depth and experience. Such companies seldom pay significant dividends that could cushion returns in a falling market.
Technology stocks are particularly volatile and subject to greater price swings than the broad market. It is possible that companies whose products and services first appear promising may not succeed over the long term; they may succumb to intense competition or quickly become obsolete in a rapidly developing marketplace. Unmet earnings projections for developing companies can result in sharp price declines. This is true even in a generally rising stock market environment.
GLOSSARY
Cost-to-market ratio: A measure of the relationship between the average cost of a stock held in a portfolio versus the market value of that stock at a given time. A cost-to-market value less than one means that the stock is worth more than the average purchase cost, while a value greater than one shows that the stock is worth less.
Earnings growth rate: Measures the annualized percent change in earnings per share for a given time period.
Historical growth five years (least squares): Least squares growth calculation attempts to find the “normal” growth rate given a stream of historical growth rates. It searches for the growth rate that best fits the line produced by a stream of growth numbers.
Investment-weighted median market capitalization: The investment-weighted midpoint market capitalization (shares outstanding multiplied by current price) representing a typical security in a portfolio. An investment-weighted median represents the breakpoint where 50% of the values are above and 50% of the values are below based on portfolio weight.
Lipper indexes: Fund benchmarks that consist of a small number (10 to 30) of the largest mutual funds in a particular category as tracked by Lipper Inc.
Market capitalization: The total value of a company’s publicly traded shares.
Price-to-book ratio: A valuation measure that compares a stock’s market price with its book value, i.e., the company’s net worth divided by the number of outstanding shares.
Price-to-earnings (P/E) ratio – 12 months forward: A valuation measure calculated by dividing the price of a stock by the analysts’ forecast of the next 12 months’ expected earnings. The ratio is a measure of how much investors are willing to pay for the company’s future earnings. The higher the P/E, the more investors are paying for a company’s earnings growth in the next 12 months.
Projected earnings growth rate (IBES): A company’s expected earnings per share growth rate for a given time period based on the forecast from the Institutional Brokers’ Estimate System, which is commonly referred to as IBES.
Return on equity (ROE) – current fiscal year: A valuation measure calculated by dividing the company’s current fiscal year net income by shareholders’ equity (i.e., the company’s book value). ROE measures how much a company earns on each dollar that common stock investors have put into the company. It indicates how effectively and efficiently a company and its management are using stockholder investments.
Russell 1000 Growth Index: An index that tracks the performance of large-cap stocks with higher price-to-book ratios and higher forecast growth values.
Russell 1000 Index: An index that tracks the performance of the 1,000 largest companies in the Russell 3000 Index.
Russell 1000 Value Index: An index that tracks the performance of large-cap stocks with lower price-to-book ratios and lower forecast growth values.
Russell 2000 Growth Index: An index that tracks the performance of small-cap stocks with higher price-to-book ratios and higher forecast growth values.
Russell 2000 Index: An unmanaged index that tracks the stocks of 2,000 small U.S. companies.
Russell 2000 Value Index: An index that tracks the performance of small-cap stocks with lower price-to-book ratios and lower forecast growth values.
Russell 3000 Growth Index: An index that measures the performance of those Russell 3000 companies with higher price-to-book ratios and higher forecast growth values.
Russell 3000 Index: An index that tracks the performance of the 3,000 largest U.S. companies, representing approximately 98% of the investable U.S. equity market.
Russell Midcap Index: An unmanaged index that tracks the performance of the 800 smallest companies in the Russell 1000 Index.
Russell Midcap Growth Index: An index that tracks the performance of mid-cap stocks with higher price-to-book ratios and higher forecast growth values.
Russell Midcap Value Index: An index that tracks the performance of mid-cap stocks with lower price-to-book ratios and lower forecast growth values.
Note: Russell Investment Group is the source and owner of the trademarks, service marks, and copyrights related to the Russell indexes. Russell® is a trademark of Russell Investment Group.
Performance and Expenses
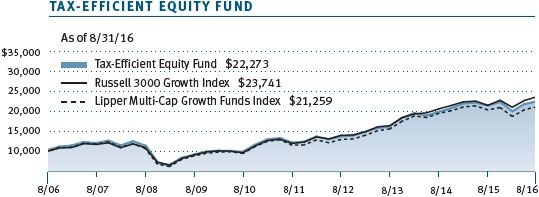
| Growth of $10,000 |
This chart shows the value of a hypothetical $10,000 investment in the fund over the past 10 fiscal year periods or since inception (for funds lacking 10-year records). The result is compared with benchmarks, which may include a broad-based market index and a peer group average or index. Market indexes do not include expenses, which are deducted from fund returns as well as mutual fund averages and indexes.
| Fund Expense Example |
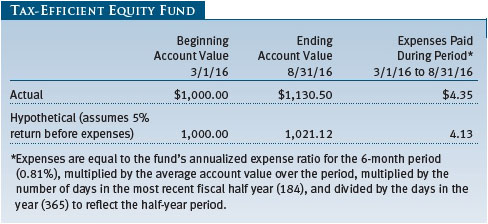
As a mutual fund shareholder, you may incur two types of costs: (1) transaction costs, such as redemption fees or sales loads, and (2) ongoing costs, including management fees, distribution and service (12b-1) fees, and other fund expenses. The following example is intended to help you understand your ongoing costs (in dollars) of investing in the fund and to compare these costs with the ongoing costs of investing in other mutual funds. The example is based on an investment of $1,000 invested at the beginning of the most recent six-month period and held for the entire period.
Actual Expenses
The first line of the following table (Actual) provides information about actual account values and expenses based on the fund’s actual returns. You may use the information on this line, together with your account balance, to estimate the expenses that you paid over the period. Simply divide your account value by $1,000 (for example, an $8,600 account value divided by $1,000 = 8.6), then multiply the result by the number on the first line under the heading “Expenses Paid During Period” to estimate the expenses you paid on your account during this period.
Hypothetical Example for Comparison Purposes
The information on the second line of the table (Hypothetical) is based on hypothetical account values and expenses derived from the fund’s actual expense ratio and an assumed 5% per year rate of return before expenses (not the fund’s actual return). You may compare the ongoing costs of investing in the fund with other funds by contrasting this 5% hypothetical example and the 5% hypothetical examples that appear in the shareholder reports of the other funds. The hypothetical account values and expenses may not be used to estimate the actual ending account balance or expenses you paid for the period.
Note: T. Rowe Price charges an annual account service fee of $20, generally for accounts with less than $10,000. The fee is waived for any investor whose T. Rowe Price mutual fund accounts total $50,000 or more; accounts electing to receive electronic delivery of account statements, transaction confirmations, prospectuses, and shareholder reports; or accounts of an investor who is a T. Rowe Price Preferred Services, Personal Services, or Enhanced Personal Services client (enrollment in these programs generally requires T. Rowe Price assets of at least $100,000). This fee is not included in the accompanying table. If you are subject to the fee, keep it in mind when you are estimating the ongoing expenses of investing in the fund and when comparing the expenses of this fund with other funds.
You should also be aware that the expenses shown in the table highlight only your ongoing costs and do not reflect any transaction costs, such as redemption fees or sales loads. Therefore, the second line of the table is useful in comparing ongoing costs only and will not help you determine the relative total costs of owning different funds. To the extent a fund charges transaction costs, however, the total cost of owning that fund is higher.
Unaudited
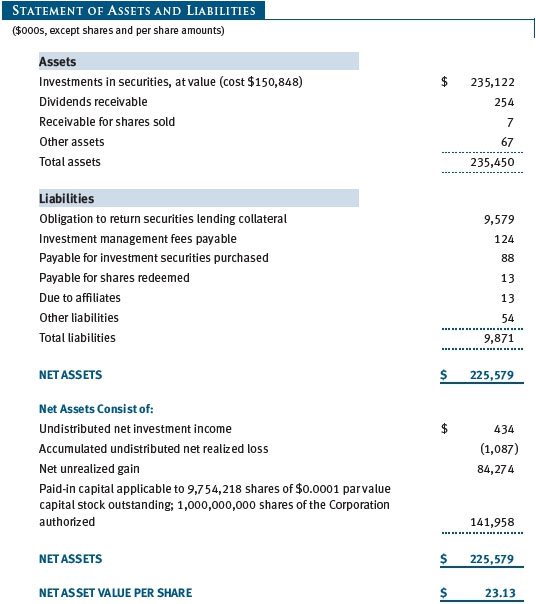
The accompanying notes are an integral part of these financial statements.
Unaudited
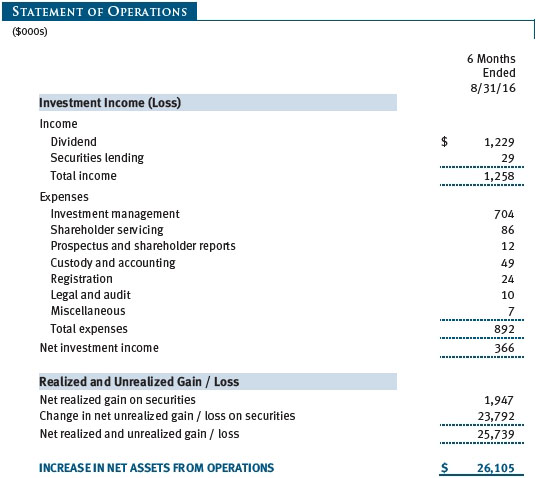
The accompanying notes are an integral part of these financial statements.
Unaudited
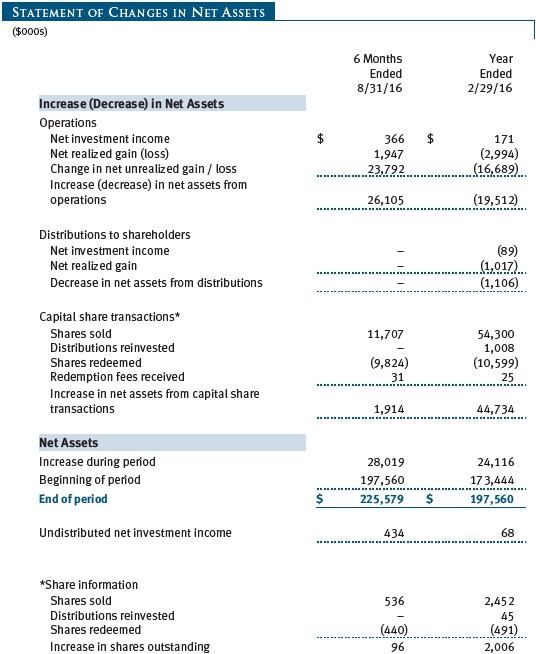
The accompanying notes are an integral part of these financial statements.
Unaudited
The accompanying notes are an integral part of these financial statements.
Unaudited
The accompanying notes are an integral part of these financial statements.
Unaudited
| Notes to Financial Statements |
T. Rowe Price Tax-Efficient Funds, Inc. (the corporation), is registered under the Investment Company Act of 1940 (the 1940 Act). The Tax-Efficient Equity Fund (the fund) is a diversified, open-end management investment company established by the corporation. The fund incepted on December 29, 2000. The fund seeks to maximize after-tax growth of capital through investments primarily in common stocks.
NOTE 1 - SIGNIFICANT ACCOUNTING POLICIES
Basis of Preparation The fund is an investment company and follows accounting and reporting guidance in the Financial Accounting Standards Board (FASB) Accounting Standards Codification Topic 946 (ASC 946). The accompanying financial statements were prepared in accordance with accounting principles generally accepted in the United States of America (GAAP), including, but not limited to, ASC 946. GAAP requires the use of estimates made by management. Management believes that estimates and valuations are appropriate; however, actual results may differ from those estimates, and the valuations reflected in the accompanying financial statements may differ from the value ultimately realized upon sale or maturity.
Investment Transactions, Investment Income, and Distributions Income and expenses are recorded on the accrual basis. Dividends received from mutual fund investments are reflected as dividend income; capital gain distributions, if any, are reflected as realized gain/loss. Earnings on investments recognized as partnerships for federal income tax purposes reflect the tax character of such earnings. Dividend income and capital gain distributions are recorded on the ex-dividend date. Income tax-related interest and penalties, if incurred, would be recorded as income tax expense. Investment transactions are accounted for on the trade date. Realized gains and losses are reported on the identified cost basis. Distributions from REITs are initially recorded as dividend income and, to the extent such represent a return of capital or capital gain for tax purposes, are reclassified when such information becomes available. Income distributions are declared and paid annually. Distributions to shareholders are recorded on the ex-dividend date. Capital gain distributions, if any, are generally declared and paid by the fund annually.
Redemption Fees A 1% fee is assessed on redemptions of fund shares held for less than 365 days to deter short-term trading and to protect the interests of long-term shareholders. Redemption fees are withheld from proceeds that shareholders receive from the sale or exchange of fund shares. The fees are paid to the fund and are recorded as an increase to paid-in capital. The fees may cause the redemption price per share to differ from the net asset value per share.
NOTE 2 - VALUATION
The fund’s financial instruments are valued and its net asset value (NAV) per share is computed at the close of the New York Stock Exchange (NYSE), normally 4 p.m. ET, each day the NYSE is open for business.
Fair Value The fund’s financial instruments are reported at fair value, which GAAP defines as the price that would be received to sell an asset or paid to transfer a liability in an orderly transaction between market participants at the measurement date. The T. Rowe Price Valuation Committee (the Valuation Committee) has been established by the fund’s Board of Directors (the Board) to ensure that financial instruments are appropriately priced at fair value in accordance with GAAP and the 1940 Act. Subject to oversight by the Board, the Valuation Committee develops and oversees pricing-related policies and procedures and approves all fair value determinations. Specifically, the Valuation Committee establishes procedures to value securities; determines pricing techniques, sources, and persons eligible to effect fair value pricing actions; oversees the selection, services, and performance of pricing vendors; oversees valuation-related business continuity practices; and provides guidance on internal controls and valuation-related matters. The Valuation Committee reports to the Board and has representation from legal, portfolio management and trading, operations, risk management, and the fund’s treasurer.
Various valuation techniques and inputs are used to determine the fair value of financial instruments. GAAP establishes the following fair value hierarchy that categorizes the inputs used to measure fair value:
Level 1 – quoted prices (unadjusted) in active markets for identical financial instruments that the fund can access at the reporting date
Level 2 – inputs other than Level 1 quoted prices that are observable, either directly or indirectly (including, but not limited to, quoted prices for similar financial instruments in active markets, quoted prices for identical or similar financial instruments in inactive markets, interest rates and yield curves, implied volatilities, and credit spreads)
Level 3 – unobservable inputs
Observable inputs are developed using market data, such as publicly available information about actual events or transactions, and reflect the assumptions that market participants would use to price the financial instrument. Unobservable inputs are those for which market data are not available and are developed using the best information available about the assumptions that market participants would use to price the financial instrument. GAAP requires valuation techniques to maximize the use of relevant observable inputs and minimize the use of unobservable inputs. When multiple inputs are used to derive fair value, the financial instrument is assigned to the level within the fair value hierarchy based on the lowest-level input that is significant to the fair value of the financial instrument. Input levels are not necessarily an indication of the risk or liquidity associated with financial instruments at that level but rather the degree of judgment used in determining those values.
Valuation Techniques Equity securities listed or regularly traded on a securities exchange or in the over-the-counter (OTC) market are valued at the last quoted sale price or, for certain markets, the official closing price at the time the valuations are made. OTC Bulletin Board securities are valued at the mean of the closing bid and asked prices. A security that is listed or traded on more than one exchange is valued at the quotation on the exchange determined to be the primary market for such security. Listed securities not traded on a particular day are valued at the mean of the closing bid and asked prices. Actively traded equity securities listed on a domestic exchange generally are categorized in Level 1 of the fair value hierarchy. OTC Bulletin Board securities, certain preferred securities, and equity securities traded in inactive markets generally are categorized in Level 2 of the fair value hierarchy.
Investments in mutual funds are valued at the mutual fund’s closing NAV per share on the day of valuation and are categorized in Level 1 of the fair value hierarchy. Assets and liabilities other than financial instruments, including short-term receivables and payables, are carried at cost, or estimated realizable value, if less, which approximates fair value.
Thinly traded financial instruments and those for which the above valuation procedures are inappropriate or are deemed not to reflect fair value are stated at fair value as determined in good faith by the Valuation Committee. The objective of any fair value pricing determination is to arrive at a price that could reasonably be expected from a current sale. Financial instruments fair valued by the Valuation Committee are primarily private placements, restricted securities, warrants, rights, and other securities that are not publicly traded.
Subject to oversight by the Board, the Valuation Committee regularly makes good faith judgments to establish and adjust the fair valuations of certain securities as events occur and circumstances warrant. For instance, in determining the fair value of an equity investment with limited market activity, such as a private placement or a thinly traded public company stock, the Valuation Committee considers a variety of factors, which may include, but are not limited to, the issuer’s business prospects, its financial standing and performance, recent investment transactions in the issuer, new rounds of financing, negotiated transactions of significant size between other investors in the company, relevant market valuations of peer companies, strategic events affecting the company, market liquidity for the issuer, and general economic conditions and events. In consultation with the investment and pricing teams, the Valuation Committee will determine an appropriate valuation technique based on available information, which may include both observable and unobservable inputs. The Valuation Committee typically will afford greatest weight to actual prices in arm’s length transactions, to the extent they represent orderly transactions between market participants, transaction information can be reliably obtained, and prices are deemed representative of fair value. However, the Valuation Committee may also consider other valuation methods such as market-based valuation multiples; a discount or premium from market value of a similar, freely traded security of the same issuer; or some combination. Fair value determinations are reviewed on a regular basis and updated as information becomes available, including actual purchase and sale transactions of the issue. Because any fair value determination involves a significant amount of judgment, there is a degree of subjectivity inherent in such pricing decisions, and fair value prices determined by the Valuation Committee could differ from those of other market participants. Depending on the relative significance of unobservable inputs, including the valuation technique(s) used, fair valued securities may be categorized in Level 2 or 3 of the fair value hierarchy.
Valuation Inputs The following table summarizes the fund’s financial instruments, based on the inputs used to determine their fair values on August 31, 2016:
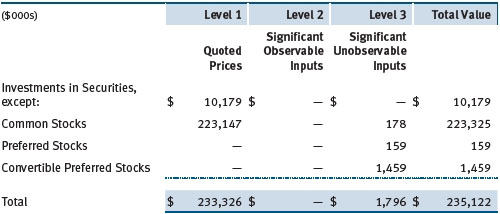
There were no material transfers between Levels 1 and 2 during the six months ended August 31, 2016.
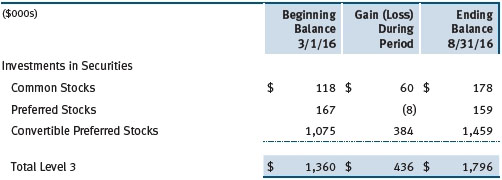
Following is a reconciliation of the fund’s Level 3 holdings for the six months ended August 31, 2016. Gain (loss) reflects both realized and change in unrealized gain/loss on Level 3 holdings during the period, if any, and is included on the accompanying Statement of Operations. The change in unrealized gain/loss on Level 3 instruments held at August 31, 2016, totaled $436,000 for the six months ended August 31, 2016.
NOTE 3 - OTHER INVESTMENT TRANSACTIONS
Consistent with its investment objective, the fund engages in the following practices to manage exposure to certain risks and/or to enhance performance. The investment objective, policies, program, and risk factors of the fund are described more fully in the fund’s prospectus and Statement of Additional Information.
Restricted Securities The fund may invest in securities that are subject to legal or contractual restrictions on resale. Prompt sale of such securities at an acceptable price may be difficult and may involve substantial delays and additional costs.
Securities Lending The fund may lend its securities to approved brokers to earn additional income. Its securities lending activities are administered by a lending agent in accordance with a securities lending agreement. Security loans generally do not have stated maturity dates, and the fund may recall a security at any time. The fund receives collateral in the form of cash or U.S. government securities, valued at 102% to 105% of the value of the securities on loan. Collateral is maintained over the life of the loan in an amount not less than the value of loaned securities; any additional collateral required due to changes in security values is delivered to the fund the next business day. Cash collateral is invested by the lending agent(s) in accordance with investment guidelines approved by fund management. Additionally, the lending agent indemnifies the fund against losses resulting from borrower default. Although risk is mitigated by the collateral and indemnification, the fund could experience a delay in recovering its securities and a possible loss of income or value if the borrower fails to return the securities, collateral investments decline in value, and the lending agent fails to perform. Securities lending revenue consists of earnings on invested collateral and borrowing fees, net of any rebates to the borrower, compensation to the lending agent, and other administrative costs. In accordance with GAAP, investments made with cash collateral are reflected in the accompanying financial statements, but collateral received in the form of securities is not. At August 31, 2016, the value of loaned securities was $9,330,000; the value of cash collateral and related investments was $9,579,000.
Other Purchases and sales of portfolio securities other than short-term securities aggregated $21,270,000 and $19,279,000, respectively, for the six months ended August 31, 2016.
NOTE 4 - FEDERAL INCOME TAXES
No provision for federal income taxes is required since the fund intends to continue to qualify as a regulated investment company under Subchapter M of the Internal Revenue Code and distribute to shareholders all of its taxable income and gains. Distributions determined in accordance with federal income tax regulations may differ in amount or character from net investment income and realized gains for financial reporting purposes. Financial reporting records are adjusted for permanent book/tax differences to reflect tax character but are not adjusted for temporary differences. The amount and character of tax-basis distributions and composition of net assets are finalized at fiscal year-end; accordingly, tax-basis balances have not been determined as of the date of this report.
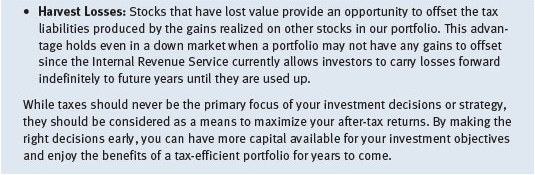
The fund intends to retain realized gains to the extent of available capital loss carryforwards. Net realized capital losses may be carried forward indefinitely to offset future realized capital gains. As of February 29, 2016, the fund had $2,992,000 of available capital loss carryforwards.
At August 31, 2016, the cost of investments for federal income tax purposes was $150,904,000. Net unrealized gain aggregated $84,218,000 at period-end, of which $85,623,000 related to appreciated investments and $1,405,000 related to depreciated investments.
NOTE 5 - RELATED PARTY TRANSACTIONS
The fund is managed by T. Rowe Price Associates, Inc. (Price Associates), a wholly owned subsidiary of T. Rowe Price Group, Inc. (Price Group). The investment management agreement between the fund and Price Associates provides for an annual investment management fee, which is computed daily and paid monthly. The fee consists of an individual fund fee, equal to 0.35% of the fund’s average daily net assets, and a group fee. The group fee rate is calculated based on the combined net assets of certain mutual funds sponsored by Price Associates (the group) applied to a graduated fee schedule, with rates ranging from 0.48% for the first $1 billion of assets to 0.270% for assets in excess of $500 billion. The fund’s group fee is determined by applying the group fee rate to the fund’s average daily net assets. At August 31, 2016, the effective annual group fee rate was 0.29%.
In addition, the fund has entered into service agreements with Price Associates and two wholly owned subsidiaries of Price Associates (collectively, Price). Price Associates provides certain accounting and administrative services to the fund. T. Rowe Price Services, Inc., provides shareholder and administrative services in its capacity as the fund’s transfer and dividend-disbursing agent. T. Rowe Price Retirement Plan Services, Inc., provides subaccounting and recordkeeping services for certain retirement accounts invested in the fund. For the six months ended August 31, 2016, expenses incurred pursuant to these service agreements were $23,000 for Price Associates; $51,000 for T. Rowe Price Services, Inc.; and less than $1,000 for T. Rowe Price Retirement Plan Services, Inc. The total amount payable at period-end pursuant to these service agreements is reflected as Due to Affiliates in the accompanying financial statements.
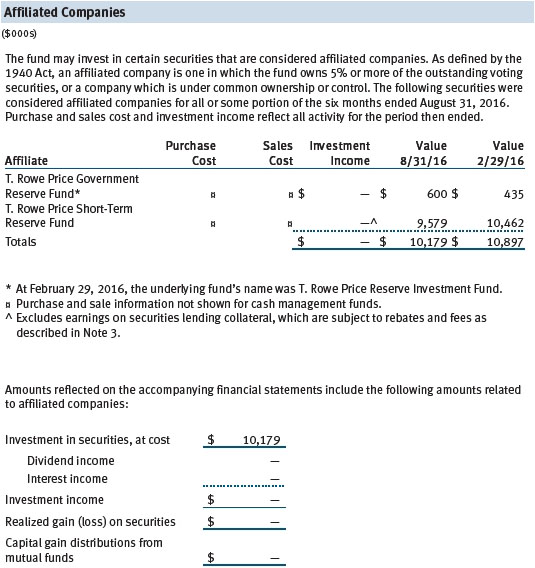
The fund may invest in the T. Rowe Price Government Reserve Fund, the T. Rowe Price Treasury Reserve Fund, or the T. Rowe Price Short-Term Reserve Fund (collectively, the Price Reserve Investment Funds), open-end management investment companies managed by Price Associates and considered affiliates of the fund. The Price Reserve Investment Funds are offered as short-term investment options to mutual funds, trusts, and other accounts managed by Price Associates or its affiliates and are not available for direct purchase by members of the public. The Price Reserve Investment Funds pay no investment management fees.
The fund may participate in securities purchase and sale transactions with other funds or accounts advised by Price Associates (cross trades), in accordance with procedures adopted by the fund’s Board and Securities and Exchange Commission rules, which require, among other things, that such purchase and sale cross trades be effected at the independent current market price of the security. During the six months ended August 31, 2016, the fund had no purchases or sales cross trades with other funds or accounts advised by Price Associates.
| Information on Proxy Voting Policies, Procedures, and Records |
A description of the policies and procedures used by T. Rowe Price funds and portfolios to determine how to vote proxies relating to portfolio securities is available in each fund’s Statement of Additional Information. You may request this document by calling 1-800-225-5132 or by accessing the SEC’s website, sec.gov.
The description of our proxy voting policies and procedures is also available on our corporate website. To access it, please visit the following Web page:
https://www3.troweprice.com/usis/corporate/en/utility/policies.html
Scroll down to the section near the bottom of the page that says, “Proxy Voting Policies.” Click on the Proxy Voting Policies link in the shaded box.
Each fund’s most recent annual proxy voting record is available on our website and through the SEC’s website. To access it through T. Rowe Price, visit the website location shown above, and scroll down to the section near the bottom of the page that says, “Proxy Voting Records.” Click on the Proxy Voting Records link in the shaded box.
| How to Obtain Quarterly Portfolio Holdings |
The fund files a complete schedule of portfolio holdings with the Securities and Exchange Commission for the first and third quarters of each fiscal year on Form N-Q. The fund’s Form N-Q is available electronically on the SEC’s website (sec.gov); hard copies may be reviewed and copied at the SEC’s Public Reference Room, 100 F St. N.E., Washington, DC 20549. For more information on the Public Reference Room, call 1-800-SEC-0330.
| Approval of Investment Management Agreement |
On March 11, 2016, the fund’s Board of Directors (Board), including a majority of the fund’s independent directors, approved the continuation of the investment management agreement (Advisory Contract) between the fund and its investment advisor, T. Rowe Price Associates, Inc. (Advisor). In connection with its deliberations, the Board requested, and the Advisor provided, such information as the Board (with advice from independent legal counsel) deemed reasonably necessary. The Board considered a variety of factors in connection with its review of the Advisory Contract, also taking into account information provided by the Advisor during the course of the year, as discussed below:
Services Provided by the Advisor
The Board considered the nature, quality, and extent of the services provided to the fund by the Advisor. These services included, but were not limited to, directing the fund’s investments in accordance with its investment program and the overall management of the fund’s portfolio, as well as a variety of related activities such as financial, investment operations, and administrative services; compliance; maintaining the fund’s records and registrations; and shareholder communications. The Board also reviewed the background and experience of the Advisor’s senior management team and investment personnel involved in the management of the fund, as well as the Advisor’s compliance record. The Board concluded that it was satisfied with the nature, quality, and extent of the services provided by the Advisor.
Investment Performance of the Fund
The Board reviewed the fund’s three-month, one-year, and year-by-year returns, as well as the fund’s average annualized total returns over the 3-, 5-, and 10-year periods, and compared these returns with a wide variety of comparable performance measures and market data, including those supplied by Lipper and Morningstar, which are independent providers of mutual fund data.
On the basis of this evaluation and the Board’s ongoing review of investment results and factoring in the relative market conditions during certain of the performance periods, the Board concluded that the fund’s performance was satisfactory.
Costs, Benefits, Profits, and Economies of Scale
The Board reviewed detailed information regarding the revenues received by the Advisor under the Advisory Contract and other benefits that the Advisor (and its affiliates) may have realized from its relationship with the fund, including any research received under “soft dollar” agreements and commission-sharing arrangements with broker-dealers. The Board considered that the Advisor may receive some benefit from soft-dollar arrangements pursuant to which research is received from broker-dealers that execute the applicable fund’s portfolio transactions. The Board received information on the estimated costs incurred and profits realized by the Advisor from managing T. Rowe Price mutual funds. The Board also reviewed estimates of the profits realized from managing the fund in particular, and the Board concluded that the Advisor’s profits were reasonable in light of the services provided to the fund.
The Board also considered whether the fund benefits under the fee levels set forth in the Advisory Contract from any economies of scale realized by the Advisor. Under the Advisory Contract, the fund pays a fee to the Advisor for investment management services composed of two components—a group fee rate based on the combined average net assets of most of the T. Rowe Price mutual funds (including the fund) that declines at certain asset levels and an individual fund fee rate based on the fund’s average daily net assets—and the fund pays its own expenses of operations. The Board concluded that the advisory fee structure for the fund continued to provide for a reasonable sharing of benefits from any economies of scale with the fund’s investors.
Fees
The Board was provided with information regarding industry trends in management fees and expenses, and the Board reviewed the fund’s management fee rate, operating expenses, and total expense ratio in comparison with fees and expenses of other comparable funds based on information and data supplied by Lipper. The information provided to the Board indicated that the fund’s management fee rate and total expense ratio were above the median for certain groups of comparable funds and at or below the median for other groups of comparable funds.
The Board also reviewed the fee schedules for institutional accounts (including subadvised mutual funds) and private accounts with similar mandates that are advised or subadvised by the Advisor and its affiliates. Management provided the Board with information about the Advisor’s responsibilities and services provided to subadvisory and other institutional account clients, including information about how the requirements and economics of the institutional business differ from those of the Advisor’s proprietary mutual fund business. The Board considered information showing that the Advisor’s proprietary mutual fund business is generally more complex from a business and compliance perspective than its institutional account business and considered various other relevant factors, including the broader scope of operations and oversight, more extensive shareholder communication infrastructure, greater asset flows, heightened business risks, and differences in applicable laws and regulations associated with the Advisor’s proprietary mutual fund business. In assessing the reasonableness of the fund’s management fee rate, the Board considered the differences in the nature of the services required for the Advisor to manage its proprietary mutual fund business versus managing a discrete pool of assets as a subadvisor to another institution’s mutual fund or for another institutional account and the degree to which the Advisor performs significant additional services and assumes greater risk in managing the fund and other T. Rowe Price mutual funds than it does for institutional account clients.
On the basis of the information provided and the factors considered, the Board concluded that the fees paid by the fund under the Advisory Contract are reasonable.
Approval of the Advisory Contract
As noted, the Board approved the continuation of the Advisory Contract. No single factor was considered in isolation or to be determinative to the decision. Rather, the Board concluded, in light of a weighting and balancing of all factors considered, that it was in the best interests of the fund and its shareholders for the Board to approve the continuation of the Advisory Contract (including the fees to be charged for services thereunder). The independent directors were advised throughout the process by independent legal counsel.
Item 2. Code of Ethics.
A code of ethics, as defined in Item 2 of Form N-CSR, applicable to its principal executive officer, principal financial officer, principal accounting officer or controller, or persons performing similar functions is filed as an exhibit to the registrant’s annual Form N-CSR. No substantive amendments were approved or waivers were granted to this code of ethics during the registrant’s most recent fiscal half-year.
Item 3. Audit Committee Financial Expert.
Disclosure required in registrant’s annual Form N-CSR.
Item 4. Principal Accountant Fees and Services.
Disclosure required in registrant’s annual Form N-CSR.
Item 5. Audit Committee of Listed Registrants.
Not applicable.
Item 6. Investments.
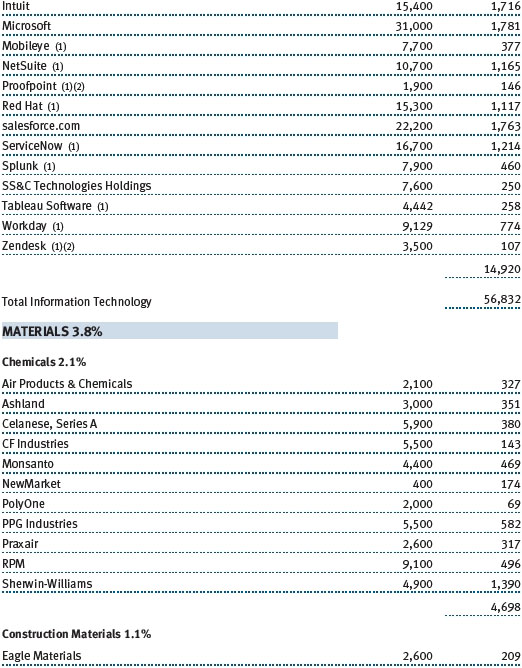
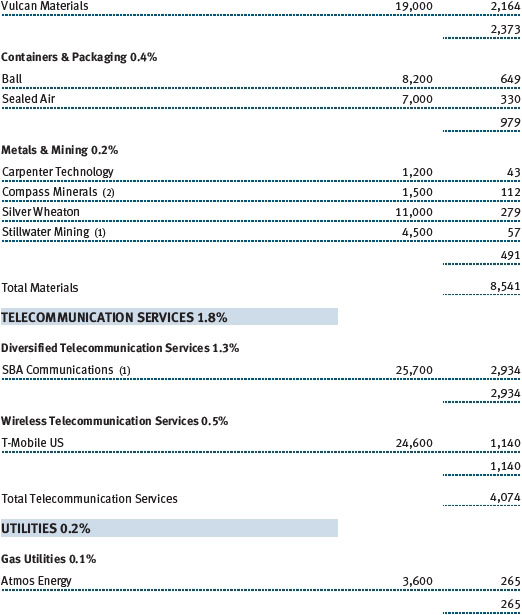
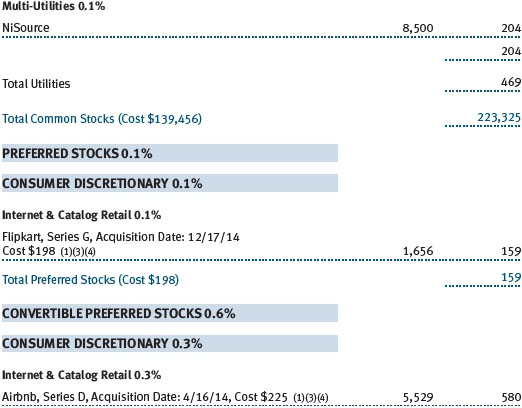
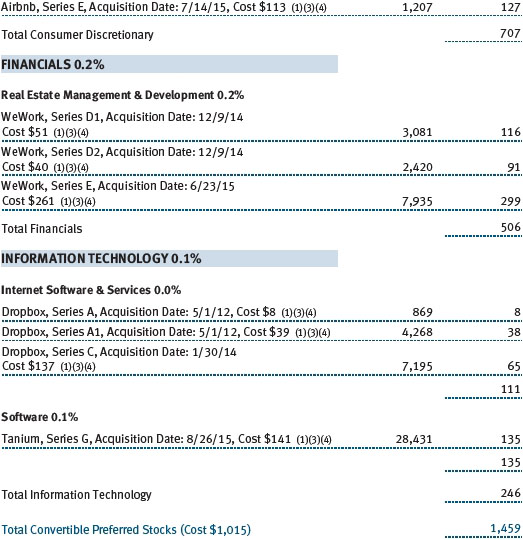
(a) Not applicable. The complete schedule of investments is included in Item 1 of this Form N-CSR.
(b) Not applicable.
Item 7. Disclosure of Proxy Voting Policies and Procedures for Closed-End Management Investment Companies.
Not applicable.
Item 8. Portfolio Managers of Closed-End Management Investment Companies.
Not applicable.
Item 9. Purchases of Equity Securities by Closed-End Management Investment Company and Affiliated Purchasers.
Not applicable.
Item 10. Submission of Matters to a Vote of Security Holders.
Not applicable.
Item 11. Controls and Procedures.
(a) The registrant’s principal executive officer and principal financial officer have evaluated the registrant’s disclosure controls and procedures within 90 days of this filing and have concluded that the registrant’s disclosure controls and procedures were effective, as of that date, in ensuring that information required to be disclosed by the registrant in this Form N-CSR was recorded, processed, summarized, and reported timely.
(b) The registrant’s principal executive officer and principal financial officer are aware of no change in the registrant’s internal control over financial reporting that occurred during the registrant’s second fiscal quarter covered by this report that has materially affected, or is reasonably likely to materially affect, the registrant’s internal control over financial reporting.
Item 12. Exhibits.
(a)(1) The registrant’s code of ethics pursuant to Item 2 of Form N-CSR is filed with the registrant’s annual Form N-CSR.
(2) Separate certifications by the registrant's principal executive officer and principal financial officer, pursuant to Section 302 of the Sarbanes-Oxley Act of 2002 and required by Rule 30a-2(a) under the Investment Company Act of 1940, are attached.
(3) Written solicitation to repurchase securities issued by closed-end companies: not applicable.
(b) A certification by the registrant's principal executive officer and principal financial officer, pursuant to Section 906 of the Sarbanes-Oxley Act of 2002 and required by Rule 30a-2(b) under the Investment Company Act of 1940, is attached.
SIGNATURES
Pursuant to the requirements of the Securities Exchange Act of 1934 and the Investment Company Act of 1940, the registrant has duly caused this report to be signed on its behalf by the undersigned, thereunto duly authorized.
T. Rowe Price Tax-Efficient Funds, Inc.
| By | /s/ Edward C. Bernard | |
| Edward C. Bernard | ||
| Principal Executive Officer | ||
| Date October 17, 2016 | ||
Pursuant to the requirements of the Securities Exchange Act of 1934 and the Investment Company Act of 1940, this report has been signed below by the following persons on behalf of the registrant and in the capacities and on the dates indicated.
| By | /s/ Edward C. Bernard | |
| Edward C. Bernard | ||
| Principal Executive Officer | ||
| Date October 17, 2016 | ||
| By | /s/ Catherine D. Mathews | |
| Catherine D. Mathews | ||
| Principal Financial Officer | ||
| Date October 17, 2016 | ||