UNITED STATES
SECURITIES AND EXCHANGE COMMISSION
Washington, D.C. 20549
FORM N-CSR
CERTIFIED SHAREHOLDER REPORT OF REGISTERED
MANAGEMENT INVESTMENT COMPANIES
Investment Company Act File Number: 811-08207
| T. Rowe Price Tax-Efficient Funds, Inc. |
|
| (Exact name of registrant as specified in charter) |
|
| 100 East Pratt Street, Baltimore, MD 21202 |
|
| (Address of principal executive offices) |
|
| David Oestreicher |
| 100 East Pratt Street, Baltimore, MD 21202 |
|
| (Name and address of agent for service) |
Registrant’s telephone number, including area code: (410) 345-2000
Date of fiscal year end: February 28
Date of reporting period: August 31, 2021
Item 1. Reports to Shareholders
(a) Report pursuant to Rule 30e-1.
| Tax-Efficient Equity Fund | August 31, 2021 |
| PREFX | Investor Class |
| TEEFX | I Class |
| T. ROWE PRICE TAX- EFFICIENT EQUITY FUND |
|
HIGHLIGHTS
| ■ | The Tax-Efficient Equity Fund surpassed the Lipper Multi-Cap Growth Funds Index but trailed the Russell 3000 Growth Index in the first half of our fiscal year. |
| |
| ■ | The fund has made only minimal taxable distributions since its inception, reflecting our attempts to generate strong, long-term after-tax returns. Its tax efficiency since December 29, 2000, through August 31, 2021, was 99.84%, which means that the portfolio’s after-tax returns are close to its pretax returns. Focusing only on pretax returns like other funds could result in a large annual distribution of taxable capital gains. |
| |
| ■ | While most equity portfolio managers pursue only pretax returns, our focus on after-tax returns makes this fund nearly unique among its peers. To help us minimize taxable events, we aim to keep the portfolio’s turnover rate low. The 9.80% portfolio turnover rate over the last year reflects our efforts to keep the realization of capital gains low. |
| |
| ■ | Equities have produced exceptional returns since March 2020, and we believe that it would be prudent for equity investors to temper their near-term performance expectations. Nevertheless, equities are preferable to bonds for those who seek capital growth. With nominal interest rates below the rate of inflation, bond investors earning negative “real” yields and returns will lose real purchasing power over time. |
| |
| ■ | We believe that the basic tenets of our strategy—staying fully invested, focusing on longer-term investment horizons, favoring quality companies, and factoring valuations and risks into our portfolio decisions—have made our strategy successful over the long term. We also believe that our disciplined approach will continue to produce favorable pretax and after-tax returns over time. |

Log in to your account at troweprice.com for more information.
*Certain mutual fund accounts that are assessed an annual account service fee can also save money by switching to e-delivery.
CIO Market Commentary
Dear Shareholder
Most stock and bond indexes produced positive results during the first half of your fund’s fiscal year, the six-month period ended August 31, 2021. Despite concerns about elevated inflation and the spread of coronavirus variants, markets were supported by strong corporate earnings, additional fiscal stimulus, and the continuation of accommodative monetary policy.
Equity markets faced relatively few speed bumps during the period, and most major benchmarks continued the strong recovery they recorded in the second half of 2020. The large-cap S&P 500 Index returned nearly 20% (including dividends) and reached multiple record highs over the six months, with double-digit gains in all sectors except for energy, which was hampered by falling oil prices late in the period. Strong quarterly earnings reports appeared to factor prominently in the market’s advance. According to FactSet, overall profits for the S&P 500 rose nearly 90% in the second quarter versus the year before, the best showing in over a decade, with roughly 87% of firms topping analyst expectations.
Meanwhile, fixed income investors faced a more volatile landscape. A sell-off in Treasuries that had begun in January continued through March, sending longer-term yields to their highest levels since January 2020. However, investors began rotating back into Treasuries in April, and the yield of the benchmark 10-year Treasury note finished the period at 1.30%, down from 1.44% at the end of February.
In the falling yield environment, most bond sectors produced positive returns over the six-month period. Corporate debt performed well, supported by strong corporate earnings and demand for higher-yielding securities. Municipal bonds also delivered solid results during the period, as demand for tax-free income remained strong and state and local governments benefited from an influx of federal cash and stronger-than-expected tax revenues.
Besides strong corporate earnings, investor sentiment was also buoyed by plans for increased fiscal spending. President Joe Biden signed the $1.9 trillion American Rescue Plan Act into law in March, and in August the Senate passed a roughly $1 trillion bipartisan infrastructure package. Monetary policy remained very accommodative, but investors were increasingly focused on when the Federal Reserve would begin tapering the bond-buying program put in place at the outset of the pandemic.
Inflation readings were elevated, with the consumer price index increasing 5.4% for the 12 months through July. While the surge in prices pressured fixed income markets earlier in the year, most investors seemed to agree with Fed officials that higher inflation was a transitory issue that would ease as supply chains recovered from pandemic-related disruptions.
Other economic news was more ambiguous during the period, as some strong reports came in below expectations or showed declines from the beginning of the recovery. But these misses rarely dented investor sentiment. Coronavirus developments were also mixed. The rollout of vaccines and declining case numbers led many to believe that the pandemic was largely finished as the summer began. Unfortunately, the spread of the highly contagious delta variant soon led to an increase in hospitalizations and deaths, and some businesses were feeling the impact as office reopenings and an expected rebound in business travel were again pushed back.
As we look ahead, valuations are elevated in nearly all asset classes, and the path of the pandemic, questions about monetary policy, and the pace of the economic recovery create the possibility for volatility in financial markets. It is not an easy environment to invest in, but our investment teams remain rooted in company and bond issuer fundamentals and focused on the long term, and they will continue to apply strong fundamental analysis as they seek out the best investments for your portfolio.
Thank you for your continued confidence in T. Rowe Price.
Sincerely,
Robert Sharps
Group Chief Investment Officer
Management’s Discussion of Fund Performance
INVESTMENT OBJECTIVE
The fund seeks to maximize after-tax growth of capital through investments primarily in common stocks.
FUND COMMENTARY
How did the fund perform in the past six months?
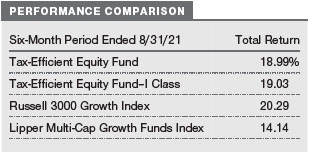
Growth stocks continued to produce excellent returns in the first half of our fiscal year. The Tax-Efficient Equity Fund returned 18.99% in the last six months. It surpassed the Lipper Multi-Cap Growth Funds Index, which returned 14.14%, but trailed its benchmark, the Russell 3000 Growth Index, which returned 20.29%. (Performance for the fund’s I Class shares will vary due to a different fee structure. The fund’s I Class shares are designed to be sold to various institutional investors and generally require a minimum initial investment of $1 million. Past performance cannot guarantee future results.)
What factors influenced the fund’s performance?
The fund trailed the Russell 3000 Growth Index due to stock selection among information technology and communication services companies. The portfolio is more conservatively structured, and the market’s high level of speculation—due to high levels of government stimulus and negative real interest rates—were contributing factors. On the plus side, our stock selection in the health care and industrials and business services sectors helped relative performance. Sector allocations had a negligible impact on relative results.
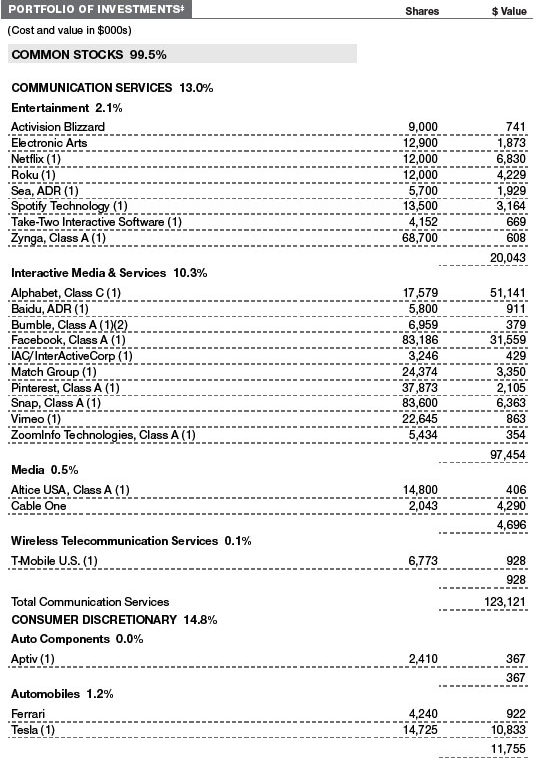
Our preference for mid-cap stocks rather than large-caps was an important factor behind our underperformance of the Russell benchmark. This was particularly true in the information technology sector. While we owned sizable stakes in tech giants Microsoft and Apple, and while these two stocks produced very strong returns in the last six months, underweighting these highly valued, mature companies hindered our relative results. Our position in global network security provider Fortinet produced excellent returns amid vigorous growth in billings and revenues. In the communication services space, where we emphasize entertainment and interactive media businesses over traditional media, we like smaller and rapidly growing companies, such as streaming music provider Spotify Technology, streaming TV platform operator Roku, and social media company Pinterest. However, all of these declined following significant gains in earlier periods. (Please refer to the portfolio of investments for a complete list of holdings and the amount each represents in the portfolio.)
In the health care sector, fund performance benefited significantly from our stake in BioNTech, which is Pfizer’s partner in making a coronavirus vaccine, and from Agilent Technologies, a scaled analytical instrument manufacturer enjoying broad strength across the markets and regions in which the company operates. In the industrials and business services segment, where we favor high-quality companies that provide more stable earnings under varying economic conditions, our stakes in credit agencies TransUnion and Equifax were strong contributors to performance. Not owning hydrogen fuel cell maker Plug Power and ride-sharing provider Uber Technologies—two overvalued stocks that declined significantly following previous extraordinary returns—was also advantageous.
The fund has made only minimal taxable distributions since its inception two decades ago, reflecting our attempts to generate strong, long-term after-tax returns. Its tax efficiency since its inception on December 29, 2000, through August 31, 2021, was 99.84%, which means that the portfolio’s after-tax returns are close to its pretax returns. Focusing only on pretax returns like other funds could result in a large annual distribution of taxable capital gains. (The fund’s tax-efficiency ratio is calculated by dividing its after-tax return by its pretax return.) While most equity portfolio managers pursue only pretax returns, our focus on after-tax returns makes this fund nearly unique among its peers. To help us minimize taxable events, we aim to keep the portfolio’s turnover rate low. The 9.80% portfolio turnover rate over the last 12 months reflects our efforts to keep the realization of capital gains low.
How is the fund positioned?
Several of the portfolio’s fundamental characteristics were similar to those of the Russell 3000 Growth Index. For example, its historical earnings growth rate over the last five years (23.7%) was a little higher than that of the index (21.7%), while its projected long-term earnings growth rate (19.6%) matched that of the benchmark. Also, the portfolio’s 12-month forward price/earnings ratio (35.1) was marginally higher than that of the index (34.4), while the return on equity (ROE) of its holdings was 30.7%, slightly lower than 32.6% for the benchmark. We consider a high ROE—which measures how effectively and efficiently a company and its management are using stockholder investments—to be desirable, though we do not necessarily seek companies with the highest ROEs. We prefer businesses with steady and sustainable growth and profitability, rather than companies whose growth and profitability are unsustainably high.
The portfolio’s investment-weighted median market capitalization at the end of August was about $92.8 billion versus $247.1 billion for the benchmark. As indicated earlier, we prefer mid-cap stocks over large-caps because we believe the former offer better long-term growth potential, especially considering the strong outperformance of large-cap growth stocks over other investment styles in recent years. For example, the Russell 1000 Growth Index produced an average annual total return of 24.35% in the five-year period ended August 31, 2021, versus 20.44% for the Russell MidCap Growth Index and 16.58% for the Russell 2000 Growth Index.
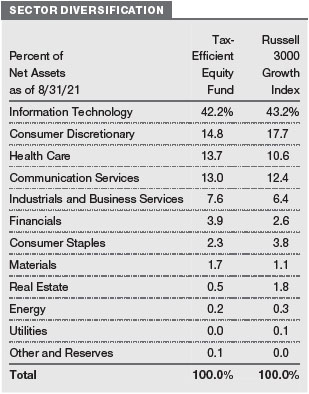
The fund focuses on stock selection and does not make major sector bets. In addition, our cash position tends to be very low, as successful market timing is virtually impossible. As shown in the Sector Diversification table, the fund’s information technology allocation, at 42.2% of assets, was our largest in absolute terms but was slightly lower than that of the benchmark. As our longer-term investors know, we are broadly diversified in the tech sector and favor companies with strong business models in industries with high barriers to entry and low risk of commoditization. We consider this to be a “winner take all” space, and we try to avoid value traps whose business models are challenged by competing products or services.
Our consumer discretionary sector allocation was the next largest, though we underweighted it versus the Russell index. In this sector, which includes an eclectic assortment of businesses, including retailers, restaurants, and casinos, we seek companies with good business models, excellent cash flow, and other favorable attributes that leave them in a position of relative strength. We focus our investments in leading companies within their respective niches and avoid retailers that Amazon.com can easily attack. In health care, which we are overweighting, we are reasonably diversified but favor managed care companies reflective of demographic factors and desires for increased access to health care services, as well as health care device companies. To a lesser extent, we also look for innovative biotechnology companies with promising products that address large, unmet needs.
Elsewhere in the portfolio, we have overweights in the communication services, industrials and business services, and financials sectors, whereas we are underweighting consumer staples companies, as most are mature and fairly valued. We owned no utilities stocks and had very little exposure to energy, real estate, or materials. Most mid-cap companies in those sectors do not meet our growth criteria.
What is portfolio management’s outlook?
The current environment is extraordinary. The U.S. economy has recovered rapidly and vigorously from a deep downturn during the first half of 2020, supported by massive monetary and fiscal stimulus. Commodity prices have been climbing, inflation worries have been increasing, and yet the 10-year U.S. Treasury note yield at the end of August was about 1.3%. This is lower than the dividend yields offered by many companies.
Equities have produced strong returns so far this year—and exceptional returns since March 2020—but there are abundant signs of speculation. For example, private-equity investors have been aggressively raising capital, and IPO activity, which was already robust in the first quarter, was even higher in the second quarter. In fact, that was the busiest quarter for technology companies since the days of the tech bubble about 20 years ago. Also, lower-quality companies, the lowest-priced stocks, and the most volatile stocks have been top performers. Stocks of companies with high debt levels have also outperformed, helped by aggressive stimulus and low rates that have diminished the risk of financial distress.
We believe that it would be prudent for equity investors to temper their near-term performance expectations, though we also believe that equities are preferable to bonds for those who seek capital growth. Rising interest rates or a widening of currently tight credit spreads would lead to losses in fixed income securities in nominal terms, and with nominal rates below the rate of inflation, bond investors earning negative “real” yields and returns will lose real purchasing power over time.
While the current risk-seeking environment has been a headwind for our investment approach, and while some investors are willing to seek growth at any price, we believe it is in the best interests of our long-term investors for us to maintain discipline and adhere to our well-established process of researching and selecting reasonably priced growth companies with favorable attributes while remaining mindful of risks. We believe that the basic tenets of our strategy—staying fully invested, focusing on longer-term investment horizons, favoring quality companies, and factoring valuations and risks into our portfolio decisions—has made our strategy successful over the long term. We also believe that our disciplined approach will continue to produce favorable pretax and after-tax returns over time.
The views expressed reflect the opinions of T. Rowe Price as of the date of this report and are subject to change based on changes in market, economic, or other conditions. These views are not intended to be a forecast of future events and are no guarantee of future results.
RISKS OF INVESTING IN THE TAX-EFFICIENT EQUITY FUND
Common stocks generally fluctuate in value more than bonds and may decline significantly over short time periods. There is a chance that stock prices overall will decline because stock markets tend to move in cycles, with periods of rising and falling prices. The value of a stock in which the fund invests may decline due to general weakness in the stock market or because of factors that affect a particular company or industry.
The fund’s focus on large and medium-sized companies subjects the fund to the risks that larger companies may not be able to attain the high growth rates of successful smaller companies, especially during strong economic periods, and that they may be less capable of responding quickly to competitive challenges and industry changes. Because the fund focuses on large and medium-sized companies, its share price could be more volatile than a fund that invests only in large companies. Medium-sized companies typically have less experienced management, narrower product lines, more limited financial resources, and less publicly available information than larger companies.
Different investment styles tend to shift into and out of favor depending on market conditions and investor sentiment. The fund’s growth approach to investing could cause it to underperform when compared with other stock funds that employ a different investment style. Growth stocks tend to be more volatile than certain other types of stocks, and their prices may fluctuate more dramatically than the overall stock market. A stock with growth characteristics can have sharp price declines due to decreases in current or expected earnings and may lack dividends that can help cushion its share price in a declining market. In addition, the fund’s attempts at investing in a tax-efficient manner could cause it to underperform similar funds that do not make tax efficiency a primary focus.
BENCHMARK INFORMATION
Note: Frank Russell Company (Russell) is the source and owner of the Russell index data contained or reflected in these materials and all trademarks and copyrights related thereto. Russell® is a registered trademark of Russell. Russell is not responsible for the formatting or configuration of these materials or for any inaccuracy in T. Rowe Price Associates’ presentation thereof.
Note: Lipper, a Thomson Reuters Company, is the source for all Lipper content reflected in these materials. Copyright 2021 © Refinitiv. All rights reserved. Any copying, republication or redistribution of Lipper content is expressly prohibited without the prior written consent of Lipper. Lipper shall not be liable for any errors or delays in the content, or for any actions taken in reliance thereon.
GROWTH OF $10,000
This chart shows the value of a hypothetical $10,000 investment in the fund over the past 10 fiscal year periods or since inception (for funds lacking 10-year records). The result is compared with benchmarks, which include a broad-based market index and may also include a peer group average or index. Market indexes do not include expenses, which are deducted from fund returns as well as mutual fund averages and indexes.
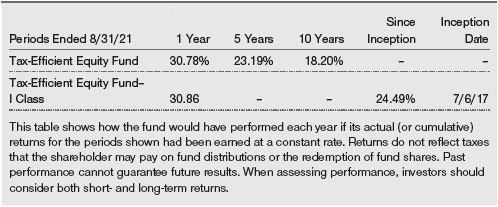
AVERAGE ANNUAL COMPOUND TOTAL RETURN
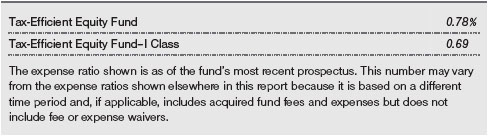
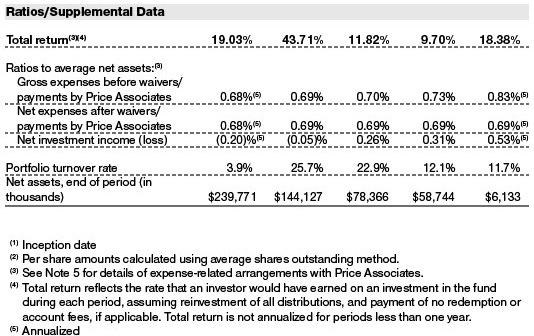
EXPENSE RATIO
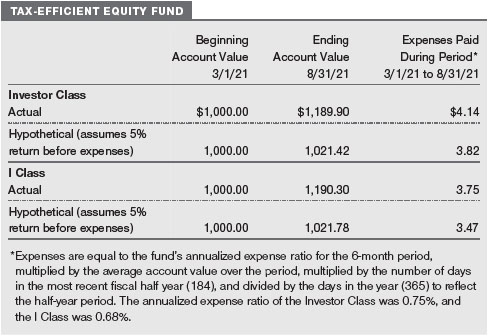
FUND EXPENSE EXAMPLE
As a mutual fund shareholder, you may incur two types of costs: (1) transaction costs, such as redemption fees or sales loads, and (2) ongoing costs, including management fees, distribution and service (12b-1) fees, and other fund expenses. The following example is intended to help you understand your ongoing costs (in dollars) of investing in the fund and to compare these costs with the ongoing costs of investing in other mutual funds. The example is based on an investment of $1,000 invested at the beginning of the most recent six-month period and held for the entire period.
Please note that the fund has two share classes: The original share class (Investor Class) charges no distribution and service (12b-1) fee, and the I Class shares are also available to institutionally oriented clients and impose no 12b-1 or administrative fee payment. Each share class is presented separately in the table.
Actual Expenses
The first line of the following table (Actual) provides information about actual account values and expenses based on the fund’s actual returns. You may use the information on this line, together with your account balance, to estimate the expenses that you paid over the period. Simply divide your account value by $1,000 (for example, an $8,600 account value divided by $1,000 = 8.6), then multiply the result by the number on the first line under the heading “Expenses Paid During Period” to estimate the expenses you paid on your account during this period.
Hypothetical Example for Comparison Purposes
The information on the second line of the table (Hypothetical) is based on hypothetical account values and expenses derived from the fund’s actual expense ratio and an assumed 5% per year rate of return before expenses (not the fund’s actual return). You may compare the ongoing costs of investing in the fund with other funds by contrasting this 5% hypothetical example and the 5% hypothetical examples that appear in the shareholder reports of the other funds. The hypothetical account values and expenses may not be used to estimate the actual ending account balance or expenses you paid for the period.
Note: T. Rowe Price charges an annual account service fee of $20, generally for accounts with less than $10,000. The fee is waived for any investor whose T. Rowe Price mutual fund accounts total $50,000 or more; accounts electing to receive electronic delivery of account statements, transaction confirmations, prospectuses, and shareholder reports; or accounts of an investor who is a T. Rowe Price Personal Services or Enhanced Personal Services client (enrollment in these programs generally requires T. Rowe Price assets of at least $250,000). This fee is not included in the accompanying table. If you are subject to the fee, keep it in mind when you are estimating the ongoing expenses of investing in the fund and when comparing the expenses of this fund with other funds.
You should also be aware that the expenses shown in the table highlight only your ongoing costs and do not reflect any transaction costs, such as redemption fees or sales loads. Therefore, the second line of the table is useful in comparing ongoing costs only and will not help you determine the relative total costs of owning different funds. To the extent a fund charges transaction costs, however, the total cost of owning that fund is higher.
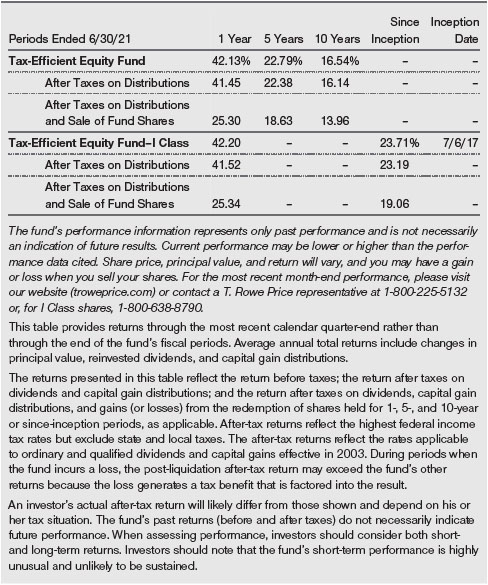
QUARTER-END RETURNS
Unaudited
The accompanying notes are an integral part of these financial statements.
Unaudited
The accompanying notes are an integral part of these financial statements.
August 31, 2021 (Unaudited)
The accompanying notes are an integral part of these financial statements.
August 31, 2021 (Unaudited)
The accompanying notes are an integral part of these financial statements.
Unaudited
The accompanying notes are an integral part of these financial statements.
Unaudited
The accompanying notes are an integral part of these financial statements.
Unaudited
| NOTES TO FINANCIAL STATEMENTS |
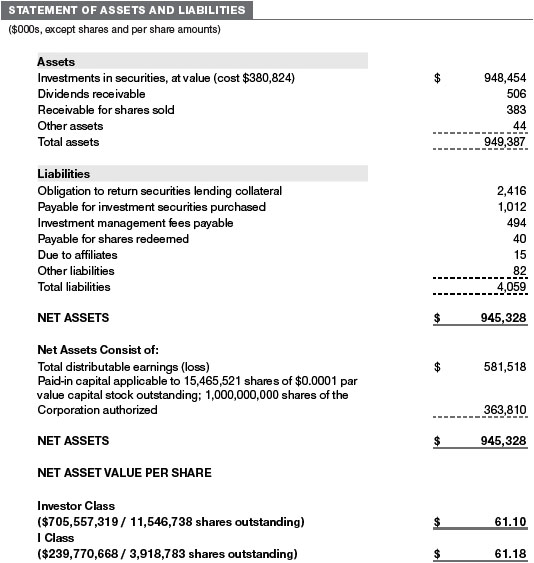
T. Rowe Price Tax-Efficient Funds, Inc. (the corporation) is registered under the Investment Company Act of 1940 (the 1940 Act). The Tax-Efficient Equity Fund (the fund) is a diversified, open-end management investment company established by the corporation. The fund seeks to maximize after-tax growth of capital through investments primarily in common stocks. The fund has two classes of shares: the Tax-Efficient Equity Fund (Investor Class) and the Tax-Efficient Equity Fund–I Class (I Class). I Class shares require a $1 million initial investment minimum, although the minimum generally is waived for retirement plans, financial intermediaries, and certain other accounts. Each class has exclusive voting rights on matters related solely to that class; separate voting rights on matters that relate to both classes; and, in all other respects, the same rights and obligations as the other class.
NOTE 1 - SIGNIFICANT ACCOUNTING POLICIES
Basis of Preparation The fund is an investment company and follows accounting and reporting guidance in the Financial Accounting Standards Board (FASB) Accounting Standards Codification Topic 946 (ASC 946). The accompanying financial statements were prepared in accordance with accounting principles generally accepted in the United States of America (GAAP), including, but not limited to, ASC 946. GAAP requires the use of estimates made by management. Management believes that estimates and valuations are appropriate; however, actual results may differ from those estimates, and the valuations reflected in the accompanying financial statements may differ from the value ultimately realized upon sale or maturity.
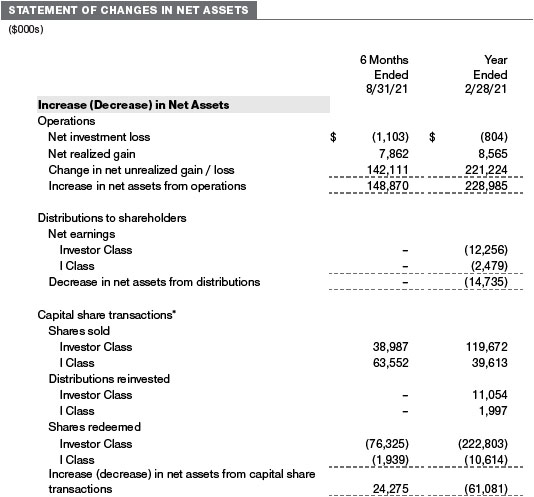
Investment Transactions, Investment Income, and Distributions Investment transactions are accounted for on the trade date basis. Income and expenses are recorded on the accrual basis. Realized gains and losses are reported on the identified cost basis. Income tax-related interest and penalties, if incurred, are recorded as income tax expense. Dividends received from mutual fund investments are reflected as dividend income; capital gain distributions are reflected as realized gain/loss. Dividend income and capital gain distributions are recorded on the ex-dividend date. Distributions from REITs are initially recorded as dividend income and, to the extent such represent a return of capital or capital gain for tax purposes, are reclassified when such information becomes available. Non-cash dividends, if any, are recorded at the fair market value of the asset received. Distributions to shareholders are recorded on the ex-dividend date. Income distributions, if any, are declared and paid by each class annually. A capital gain distribution may also be declared and paid by the fund annually.
Class Accounting Shareholder servicing, prospectus, and shareholder report expenses incurred by each class are charged directly to the class to which they relate. Expenses common to both classes, investment income, and realized and unrealized gains and losses are allocated to the classes based upon the relative daily net assets of each class.
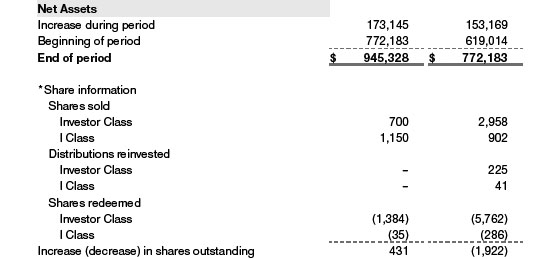
Capital Transactions Each investor’s interest in the net assets of the fund is represented by fund shares. The fund’s net asset value (NAV) per share is computed at the close of the New York Stock Exchange (NYSE), normally 4 p.m. ET, each day the NYSE is open for business. However, the NAV per share may be calculated at a time other than the normal close of the NYSE if trading on the NYSE is restricted, if the NYSE closes earlier, or as may be permitted by the SEC. Purchases and redemptions of fund shares are transacted at the next-computed NAV per share, after receipt of the transaction order by T. Rowe Price Associates, Inc., or its agents.
Indemnification In the normal course of business, the fund may provide indemnification in connection with its officers and directors, service providers, and/or private company investments. The fund’s maximum exposure under these arrangements is unknown; however, the risk of material loss is currently considered to be remote.
NOTE 2 - VALUATION
Fair Value The fund’s financial instruments are valued at the close of the NYSE and are reported at fair value, which GAAP defines as the price that would be received to sell an asset or paid to transfer a liability in an orderly transaction between market participants at the measurement date. The T. Rowe Price Valuation Committee (the Valuation Committee) is an internal committee that has been delegated certain responsibilities by the fund’s Board of Directors (the Board) to ensure that financial instruments are appropriately priced at fair value in accordance with GAAP and the 1940 Act. Subject to oversight by the Board, the Valuation Committee develops and oversees pricing-related policies and procedures and approves all fair value determinations. Specifically, the Valuation Committee establishes policies and procedures used in valuing financial instruments, including those which cannot be valued in accordance with normal procedures or using pricing vendors; determines pricing techniques, sources, and persons eligible to effect fair value pricing actions; evaluates the services and performance of the pricing vendors; oversees the pricing process to ensure policies and procedures are being followed; and provides guidance on internal controls and valuation-related matters. The Valuation Committee provides periodic reporting to the Board on valuation matters.
Various valuation techniques and inputs are used to determine the fair value of financial instruments. GAAP establishes the following fair value hierarchy that categorizes the inputs used to measure fair value:
Level 1 – quoted prices (unadjusted) in active markets for identical financial instruments that the fund can access at the reporting date
Level 2 – inputs other than Level 1 quoted prices that are observable, either directly or indirectly (including, but not limited to, quoted prices for similar financial instruments in active markets, quoted prices for identical or similar financial instruments in inactive markets, interest rates and yield curves, implied volatilities, and credit spreads)
Level 3 – unobservable inputs (including the fund’s own assumptions in determining fair value)
Observable inputs are developed using market data, such as publicly available information about actual events or transactions, and reflect the assumptions that market participants would use to price the financial instrument. Unobservable inputs are those for which market data are not available and are developed using the best information available about the assumptions that market participants would use to price the financial instrument. GAAP requires valuation techniques to maximize the use of relevant observable inputs and minimize the use of unobservable inputs. When multiple inputs are used to derive fair value, the financial instrument is assigned to the level within the fair value hierarchy based on the lowest-level input that is significant to the fair value of the financial instrument. Input levels are not necessarily an indication of the risk or liquidity associated with financial instruments at that level but rather the degree of judgment used in determining those values.
Valuation Techniques Equity securities, including exchange-traded funds, listed or regularly traded on a securities exchange or in the over-the-counter (OTC) market are valued at the last quoted sale price or, for certain markets, the official closing price at the time the valuations are made. OTC Bulletin Board securities are valued at the mean of the closing bid and asked prices. A security that is listed or traded on more than one exchange is valued at the quotation on the exchange determined to be the primary market for such security. Listed securities not traded on a particular day are valued at the mean of the closing bid and asked prices for domestic securities.
Investments in mutual funds are valued at the mutual fund’s closing NAV per share on the day of valuation. Assets and liabilities other than financial instruments, including short-term receivables and payables, are carried at cost, or estimated realizable value, if less, which approximates fair value.
Investments for which market quotations or market-based valuations are not readily available or deemed unreliable are valued at fair value as determined in good faith by the Valuation Committee, in accordance with fair valuation policies and procedures. The objective of any fair value pricing determination is to arrive at a price that could reasonably be expected from a current sale. Financial instruments fair valued by the Valuation Committee are primarily private placements, restricted securities, warrants, rights, and other securities that are not publicly traded. Factors used in determining fair value vary by type of investment and may include market or investment specific considerations. The Valuation Committee typically will afford greatest weight to actual prices in arm’s length transactions, to the extent they represent orderly transactions between market participants, transaction information can be reliably obtained, and prices are deemed representative of fair value. However, the Valuation Committee may also consider other valuation methods such as market-based valuation multiples; a discount or premium from market value of a similar, freely traded security of the same issuer; discounted cash flows; yield to maturity; or some combination. Fair value determinations are reviewed on a regular basis and updated as information becomes available, including actual purchase and sale transactions of the investment. Because any fair value determination involves a significant amount of judgment, there is a degree of subjectivity inherent in such pricing decisions, and fair value prices determined by the Valuation Committee could differ from those of other market participants.
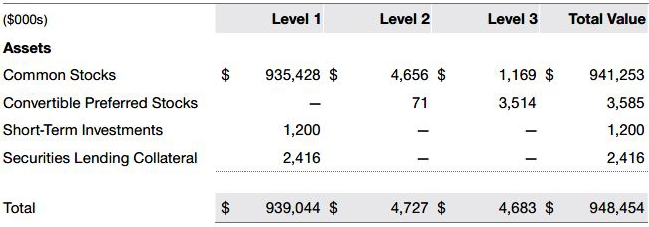
Valuation Inputs The following table summarizes the fund’s financial instruments, based on the inputs used to determine their fair values on August 31, 2021 (for further detail by category, please refer to the accompanying Portfolio of Investments):
NOTE 3 - OTHER INVESTMENT TRANSACTIONS
Consistent with its investment objective, the fund engages in the following practices to manage exposure to certain risks and/or to enhance performance. The investment objective, policies, program, and risk factors of the fund are described more fully in the fund’s prospectus and Statement of Additional Information.
Restricted Securities The fund invests in securities that are subject to legal or contractual restrictions on resale. Prompt sale of such securities at an acceptable price may be difficult and may involve substantial delays and additional costs.
Private Investments Issued by Special Purpose Acquisition Companies Special purpose acquisition companies (SPACs) are shell companies that have no operations but are formed to raise capital with the intention of merging with or acquiring a company with the proceeds of the SPAC’s initial public offering (“IPO”). The fund may enter into a contingent commitment with a SPAC to purchase private investments in public equity (PIPE) if and when the SPAC completes its merger or acquisition. The fund maintains liquid assets sufficient to settle its commitment to purchase the PIPE. However, if the commitment expires, then no shares are purchased. Purchased PIPE shares will be restricted from trading until the registration statement for the shares is declared effective. Upon registration, the shares can be freely sold; however, in certain circumstances, the issuer may have the right to temporarily suspend trading of the shares in the first year after the merger or acquisition. The securities issued by a SPAC may be considered illiquid, more difficult to value, and/or be subject to restrictions on resale.
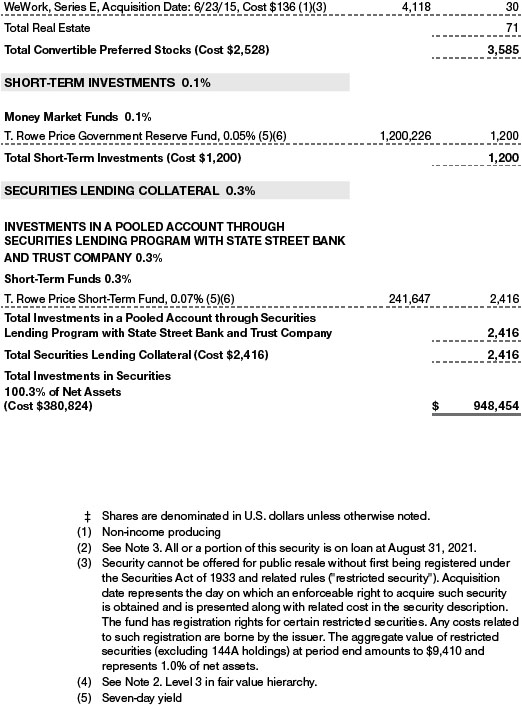
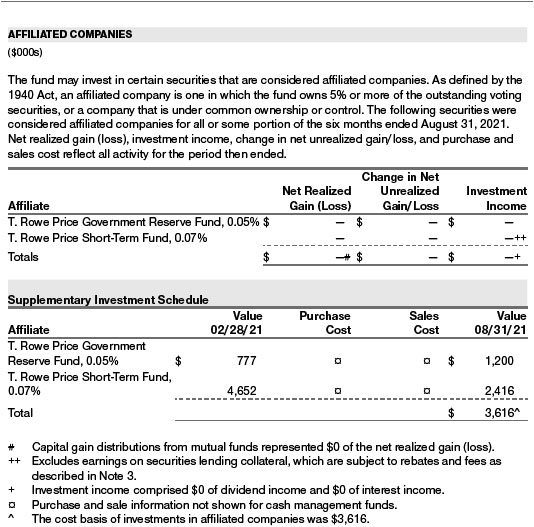
Securities Lending The fund may lend its securities to approved borrowers to earn additional income. Its securities lending activities are administered by a lending agent in accordance with a securities lending agreement. Security loans generally do not have stated maturity dates, and the fund may recall a security at any time. The fund receives collateral in the form of cash or U.S. government securities. Collateral is maintained over the life of the loan in an amount not less than the value of loaned securities; any additional collateral required due to changes in security values is delivered to the fund the next business day. Cash collateral is invested in accordance with investment guidelines approved by fund management. Additionally, the lending agent indemnifies the fund against losses resulting from borrower default. Although risk is mitigated by the collateral and indemnification, the fund could experience a delay in recovering its securities and a possible loss of income or value if the borrower fails to return the securities, collateral investments decline in value, and the lending agent fails to perform. Securities lending revenue consists of earnings on invested collateral and borrowing fees, net of any rebates to the borrower, compensation to the lending agent, and other administrative costs. In accordance with GAAP, investments made with cash collateral are reflected in the accompanying financial statements, but collateral received in the form of securities is not. At August 31, 2021, the value of loaned securities was $2,307,000; the value of cash collateral and related investments was $2,416,000.
Other Purchases and sales of portfolio securities other than short-term securities aggregated $56,709,000 and $33,223,000, respectively, for the six months ended August 31, 2021.
NOTE 4 - FEDERAL INCOME TAXES
No provision for federal income taxes is required since the fund intends to continue to qualify as a regulated investment company under Subchapter M of the Internal Revenue Code and distribute to shareholders all of its taxable income and gains. Distributions determined in accordance with federal income tax regulations may differ in amount or character from net investment income and realized gains for financial reporting purposes. Financial reporting records are adjusted for permanent book/tax differences to reflect tax character but are not adjusted for temporary differences. The amount and character of tax-basis distributions and composition of net assets are finalized at fiscal year-end; accordingly, tax-basis balances have not been determined as of the date of this report.
At August 31, 2021, the cost of investments for federal income tax purposes was $381,612,000. Net unrealized gain aggregated $566,842,000 at period-end, of which $569,224,000 related to appreciated investments and $2,382,000 related to depreciated investments.
NOTE 5 - RELATED PARTY TRANSACTIONS
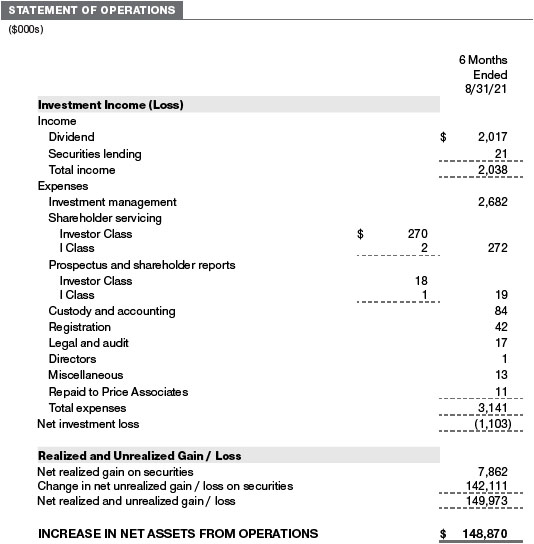
The fund is managed by T. Rowe Price Associates, Inc. (Price Associates), a wholly owned subsidiary of T. Rowe Price Group, Inc. (Price Group). The investment management agreement between the fund and Price Associates provides for an annual investment management fee, which is computed daily and paid monthly. The fee consists of an individual fund fee, equal to 0.35% of the fund’s average daily net assets, and a group fee. The group fee rate is calculated based on the combined net assets of certain mutual funds sponsored by Price Associates (the group) applied to a graduated fee schedule, with rates ranging from 0.48% for the first $1 billion of assets to 0.260% for assets in excess of $845 billion. The fund’s group fee is determined by applying the group fee rate to the fund’s average daily net assets. The fee is computed daily and paid monthly. At August 31, 2021, the effective annual group fee rate was 0.28%.
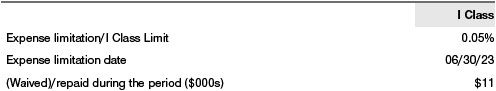
The I Class is subject to an operating expense limitation (I Class Limit) pursuant to which Price Associates is contractually required to pay all operating expenses of the I Class, excluding management fees; interest; expenses related to borrowings, taxes, and brokerage; and other non-recurring expenses permitted by the investment management agreement, to the extent such operating expenses, on an annualized basis, exceed the I Class Limit. This agreement will continue through the expense limitation date indicated in the table below, and may be renewed, revised, or revoked only with approval of the fund’s Board. The I Class is required to repay Price Associates for expenses previously paid to the extent the class’s net assets grow or expenses decline sufficiently to allow repayment without causing the class’s operating expenses (after the repayment is taken into account) to exceed the lesser of: (1) the I Class Limit in place at the time such amounts were paid; or (2) the current I Class Limit. However, no repayment will be made more than three years after the date of a payment or waiver.
Pursuant to this agreement, expenses were waived/paid by and/or repaid to Price Associates during the six months ended August 31, 2021 as indicated in the table below. At August 31, 2021, there were no amounts subject to repayment by the fund. Any repayment of expenses previously waived/paid by Price Associates during the period would be included in the net investment income and expense ratios presented on the accompanying Financial Highlights.
In addition, the fund has entered into service agreements with Price Associates and a wholly owned subsidiary of Price Associates, each an affiliate of the fund (collectively, Price). Price Associates provides certain accounting and administrative services to the fund. T. Rowe Price Services, Inc. provides shareholder and administrative services in its capacity as the fund’s transfer and dividend-disbursing agent. For the six months ended August 31, 2021, expenses incurred pursuant to these service agreements were $35,000 for Price Associates and $85,000 for T. Rowe Price Services, Inc. All amounts due to and due from Price, exclusive of investment management fees payable, are presented net on the accompanying Statement of Assets and Liabilities.
The fund may invest its cash reserves in certain open-end management investment companies managed by Price Associates and considered affiliates of the fund: the T. Rowe Price Government Reserve Fund or the T. Rowe Price Treasury Reserve Fund, organized as money market funds, or the T. Rowe Price Short-Term Fund, a short-term bond fund (collectively, the Price Reserve Funds). The Price Reserve Funds are offered as short-term investment options to mutual funds, trusts, and other accounts managed by Price Associates or its affiliates and are not available for direct purchase by members of the public. Cash collateral from securities lending is invested in the T. Rowe Price Short-Term Fund. The Price Reserve Funds pay no investment management fees.
The fund may participate in securities purchase and sale transactions with other funds or accounts advised by Price Associates (cross trades), in accordance with procedures adopted by the fund’s Board and Securities and Exchange Commission rules, which require, among other things, that such purchase and sale cross trades be effected at the independent current market price of the security. During the six months ended August 31, 2021, the fund had no purchases or sales cross trades with other funds or accounts advised by Price Associates.
Effective January 1, 2020, Price Associates has voluntarily agreed to reimburse the fund from its own resources on a monthly basis for the cost of investment research embedded in the cost of the fund’s securities trades. This agreement may be rescinded at any time. For the six months ended August 31, 2021, this reimbursement amounted to $2,000, which is included in Net realized gain (loss) on Securities in the Statement of Operations.
NOTE 6 - OTHER MATTERS
Unpredictable events such as environmental or natural disasters, war, terrorism, pandemics, outbreaks of infectious diseases, and similar public health threats may significantly affect the economy and the markets and issuers in which a fund invests. Certain events may cause instability across global markets, including reduced liquidity and disruptions in trading markets, while some events may affect certain geographic regions, countries, sectors, and industries more significantly than others, and exacerbate other pre-existing political, social, and economic risks. During 2020, a novel strain of coronavirus (COVID-19) resulted in disruptions to global business activity and caused significant volatility and declines in global financial markets.
These types of events, such as the global pandemic caused by COVID-19, may also cause widespread fear and uncertainty, and result in, among other things: enhanced health screenings, quarantines, cancellations, and travel restrictions, including border closings; disruptions to business operations and supply chains and customer activity; exchange trading suspensions and closures, and overall reduced liquidity of securities, derivatives, and commodities trading markets; reductions in consumer demand and economic output; and significant challenges in healthcare service preparation and delivery. The fund could be negatively impacted if the value of a portfolio holding were harmed by such political or economic conditions or events. In addition, the operations of the fund, its investment advisers, and the fund’s service providers may be significantly impacted, or even temporarily halted, as a result of any impairment to their information technology and other operation systems, extensive employee illnesses or unavailability, government quarantine measures, and restrictions on travel or meetings and other factors related to public emergencies.
Governmental and quasi-governmental authorities and regulators have in the past responded to major economic disruptions with a variety of significant fiscal and monetary policy changes, including but not limited to, direct capital infusions into companies, new monetary programs, and dramatically lower interest rates. An unexpected or quick reversal of these policies, or the ineffectiveness of these policies, could negatively impact overall investor sentiment and further increase volatility in securities markets.
INFORMATION ON PROXY VOTING POLICIES, PROCEDURES, AND RECORDS
A description of the policies and procedures used by T. Rowe Price funds to determine how to vote proxies relating to portfolio securities is available in each fund’s Statement of Additional Information. You may request this document by calling 1-800-225-5132 or by accessing the SEC’s website, sec.gov.
The description of our proxy voting policies and procedures is also available on our corporate website. To access it, please visit the following Web page:
https://www.troweprice.com/corporate/en/utility/policies.html
Scroll down to the section near the bottom of the page that says, “Proxy Voting Policies.” Click on the Proxy Voting Policies link in the shaded box.
Each fund’s most recent annual proxy voting record is available on our website and through the SEC’s website. To access it through T. Rowe Price, visit the website location shown above, and scroll down to the section near the bottom of the page that says, “Proxy Voting Records.” Click on the Proxy Voting Records link in the shaded box.
HOW TO OBTAIN QUARTERLY PORTFOLIO HOLDINGS
The fund files a complete schedule of portfolio holdings with the Securities and Exchange Commission (SEC) for the first and third quarters of each fiscal year as an exhibit to its reports on Form N-PORT. The fund’s reports on Form N-PORT are available electronically on the SEC’s website (sec.gov). In addition, most T. Rowe Price funds disclose their first and third fiscal quarter-end holdings on troweprice.com.
APPROVAL OF INVESTMENT MANAGEMENT AGREEMENT
Each year, the fund’s Board of Directors (Board) considers the continuation of the investment management agreement (Advisory Contract) between the fund and its investment advisor, T. Rowe Price Associates, Inc. (Advisor). In that regard, at a meeting held on March 8–9, 2021 (Meeting), the Board, including all of the fund’s independent directors, approved the continuation of the fund’s Advisory Contract. At the Meeting, the Board considered the factors and reached the conclusions described below relating to the selection of the Advisor and the approval of the Advisory Contract. The independent directors were assisted in their evaluation of the Advisory Contract by independent legal counsel from whom they received separate legal advice and with whom they met separately.
In providing information to the Board, the Advisor was guided by a detailed set of requests for information submitted by independent legal counsel on behalf of the independent directors. In considering and approving the Advisory Contract, the Board considered the information it believed was relevant, including, but not limited to, the information discussed below. The Board considered not only the specific information presented in connection with the Meeting but also the knowledge gained over time through interaction with the Advisor about various topics. The Board meets regularly and, at each of its meetings, covers an extensive agenda of topics and materials and considers factors that are relevant to its annual consideration of the renewal of the T. Rowe Price funds’ advisory contracts, including performance and the services and support provided to the funds and their shareholders.
Services Provided by the Advisor
The Board considered the nature, quality, and extent of the services provided to the fund by the Advisor. These services included, but were not limited to, directing the fund’s investments in accordance with its investment program and the overall management of the fund’s portfolio, as well as a variety of related activities such as financial, investment operations, and administrative services; compliance; maintaining the fund’s records and registrations; and shareholder communications. The Board also reviewed the background and experience of the Advisor’s senior management team and investment personnel involved in the management of the fund, as well as the Advisor’s compliance record. The Board concluded that it was satisfied with the nature, quality, and extent of the services provided by the Advisor.
Investment Performance of the Fund
The Board took into account discussions with the Advisor and reports that it receives throughout the year relating to fund performance. In connection with the Meeting, the Board reviewed the fund’s net annualized total returns for the 1-, 2-, 3-, 4-, 5-, and 10-year periods as of September 30, 2020, and compared these returns with the performance of a peer group of funds with similar investment programs and a wide variety of other previously agreed-upon comparable performance measures and market data, including those supplied by Broadridge, which is an independent provider of mutual fund data.
On the basis of this evaluation and the Board’s ongoing review of investment results, and factoring in the relative market conditions during certain of the performance periods, the Board concluded that the fund’s performance was satisfactory.
Costs, Benefits, Profits, and Economies of Scale
The Board reviewed detailed information regarding the revenues received by the Advisor under the Advisory Contract and other direct and indirect benefits that the Advisor (and its affiliates) may have realized from its relationship with the fund. In considering soft-dollar arrangements pursuant to which research may be received from broker-dealers that execute the fund’s portfolio transactions, the Board noted that the Advisor bears the cost of research services for all client accounts that it advises, including the T. Rowe Price funds. The Board received information on the estimated costs incurred and profits realized by the Advisor from managing the T. Rowe Price funds. The Board also reviewed estimates of the profits realized from managing the fund in particular, and the Board concluded that the Advisor’s profits were reasonable in light of the services provided to the fund.
The Board also considered whether the fund benefits under the fee levels set forth in the Advisory Contract from any economies of scale realized by the Advisor. Under the Advisory Contract, the fund pays a fee to the Advisor for investment management services composed of two components—a group fee rate based on the combined average net assets of most of the T. Rowe Price funds (including the fund) that declines at certain asset levels and an individual fund fee rate based on the fund’s average daily net assets—and the fund pays its own expenses of operations. The Board concluded that the advisory fee structure for the fund continued to provide for a reasonable sharing of benefits from any economies of scale with the fund’s investors.
Fees and Expenses
The Board was provided with information regarding industry trends in management fees and expenses. Among other things, the Board reviewed data for peer groups that were compiled by Broadridge, which compared: (i) contractual management fees, total expenses, actual management fees, and nonmanagement expenses of the Investor Class of the fund with a group of competitor funds selected by Broadridge (Expense Group) and (ii) total expenses, actual management fees, and nonmanagement expenses of the Investor Class of the fund with a broader set of funds within the Lipper investment classification (Expense Universe). The Board considered the fund’s contractual management fee rate, actual management fee rate (which reflects the management fees actually received from the fund by the Advisor after any applicable waivers, reductions, or reimbursements), operating expenses, and total expenses (which reflect the net total expense ratio of the fund after any waivers, reductions, or reimbursements) in comparison with the information for the Broadridge peer groups. Broadridge generally constructed the peer groups by seeking the most comparable funds based on similar investment classifications and objectives, expense structure, asset size, and operating components and attributes and ranked funds into quintiles, with the first quintile representing the funds with the lowest relative expenses and the fifth quintile representing the funds with the highest relative expenses. The information provided to the Board indicated that the fund’s contractual management fee ranked in the first quintile (Expense Group), the fund’s actual management fee rate ranked in the first quintile (Expense Group) and second quintile (Expense Universe), and the fund’s total expenses ranked in the first quintile (Expense Group) and first and second quintiles (Expense Universe).
The Board also reviewed the fee schedules for other investment portfolios with similar mandates that are advised or subadvised by the Advisor and its affiliates, including separately managed accounts for institutional and individual investors; subadvised funds; and other sponsored investment portfolios, including collective investment trusts and pooled vehicles organized and offered to investors outside the United States. Management provided the Board with information about the Advisor’s responsibilities and services provided to subadvisory and other institutional account clients, including information about how the requirements and economics of the institutional business are fundamentally different from those of the proprietary mutual fund business. The Board considered information showing that the Advisor’s mutual fund business is generally more complex from a business and compliance perspective than its institutional account business and considered various relevant factors, such as the broader scope of operations and oversight, more extensive shareholder communication infrastructure, greater asset flows, heightened business risks, and differences in applicable laws and regulations associated with the Advisor’s proprietary mutual fund business. In assessing the reasonableness of the fund’s management fee rate, the Board considered the differences in the nature of the services required for the Advisor to manage its mutual fund business versus managing a discrete pool of assets as a subadvisor to another institution’s mutual fund or for an institutional account and that the Advisor generally performs significant additional services and assumes greater risk in managing the fund and other T. Rowe Price funds than it does for institutional account clients, including subadvised funds.
On the basis of the information provided and the factors considered, the Board concluded that the fees paid by the fund under the Advisory Contract are reasonable.
Approval of the Advisory Contract
As noted, the Board approved the continuation of the Advisory Contract. No single factor was considered in isolation or to be determinative to the decision. Rather, the Board concluded, in light of a weighting and balancing of all factors considered, that it was in the best interests of the fund and its shareholders for the Board to approve the continuation of the Advisory Contract (including the fees to be charged for services thereunder).
LIQUIDITY RISK MANAGEMENT PROGRAM
In accordance with Rule 22e-4 (Liquidity Rule) under the Investment Company Act of 1940, as amended, the fund has established a liquidity risk management program (Liquidity Program) reasonably designed to assess and manage the fund’s liquidity risk, which generally represents the risk that the fund would not be able to meet redemption requests without significant dilution of remaining investors’ interests in the fund. The fund’s Board of Directors (Board) has appointed the fund’s investment advisor, T. Rowe Price Associates, Inc. (Price Associates), as the administrator of the Liquidity Program. As administrator, Price Associates is responsible for overseeing the day-to-day operations of the Liquidity Program and, among other things, is responsible for assessing, managing, and reviewing with the Board at least annually the liquidity risk of each T. Rowe Price fund. Price Associates has delegated oversight of the Liquidity Program to a Liquidity Risk Committee (LRC), which is a cross-functional committee composed of personnel from multiple departments within Price Associates.
The Liquidity Program’s principal objectives include supporting the T. Rowe Price funds’ compliance with limits on investments in illiquid assets and mitigating the risk that the fund will be unable to timely meet its redemption obligations. The Liquidity Program also includes a number of elements that support the management and assessment of liquidity risk, including an annual assessment of factors that influence the fund’s liquidity and the periodic classification and reclassification of a fund’s investments into categories that reflect the LRC’s assessment of their relative liquidity under current market conditions. Under the Liquidity Program, every investment held by the fund is classified at least monthly into one of four liquidity categories based on estimations of the investment’s ability to be sold during designated time frames in current market conditions without significantly changing the investment’s market value.
As required by the Liquidity Rule, at a meeting held on July 27, 2021, the Board was presented with an annual assessment prepared by the LRC, on behalf of Price Associates, that addressed the operation of the Liquidity Program and assessed its adequacy and effectiveness of implementation, including any material changes to the Liquidity Program and the determination of each fund’s Highly Liquid Investment Minimum (HLIM). The annual assessment included consideration of the following factors, as applicable: the fund’s investment strategy and liquidity of portfolio investments during normal and reasonably foreseeable stressed conditions, including whether the investment strategy is appropriate for an open-end fund, the extent to which the strategy involves a relatively concentrated portfolio or large positions in particular issuers, and the use of borrowings for investment purposes and derivatives; short-term and long-term cash flow projections covering both normal and reasonably foreseeable stressed conditions; and holdings of cash and cash equivalents, as well as available borrowing arrangements.
For the fund and other T. Rowe Price funds, the annual assessment incorporated a report related to a fund’s holdings, shareholder and portfolio concentration, any borrowings during the period, cash flow projections, and other relevant data for the period of April 1, 2020, through March 31, 2021. The report described the methodology for classifying a fund’s investments (including derivative transactions) into one of four liquidity categories, as well as the percentage of a fund’s investments assigned to each category. It also explained the methodology for establishing a fund’s HLIM and noted that the LRC reviews the HLIM assigned to each fund no less frequently than annually.
During the period covered by the annual assessment, the LRC has concluded, and reported to the Board, that the Liquidity Program continues to operate adequately and effectively and is reasonably designed to assess and manage the fund’s liquidity risk.
Item 1. (b) Notice pursuant to Rule 30e-3.
Not applicable.
Item 2. Code of Ethics.
A code of ethics, as defined in Item 2 of Form N-CSR, applicable to its principal executive officer, principal financial officer, principal accounting officer or controller, or persons performing similar functions is filed as an exhibit to the registrant’s annual Form N-CSR. No substantive amendments were approved or waivers were granted to this code of ethics during the registrant’s most recent fiscal half-year.
Item 3. Audit Committee Financial Expert.
Disclosure required in registrant’s annual Form N-CSR.
Item 4. Principal Accountant Fees and Services.
Disclosure required in registrant’s annual Form N-CSR.
Item 5. Audit Committee of Listed Registrants.
Not applicable.
Item 6. Investments.
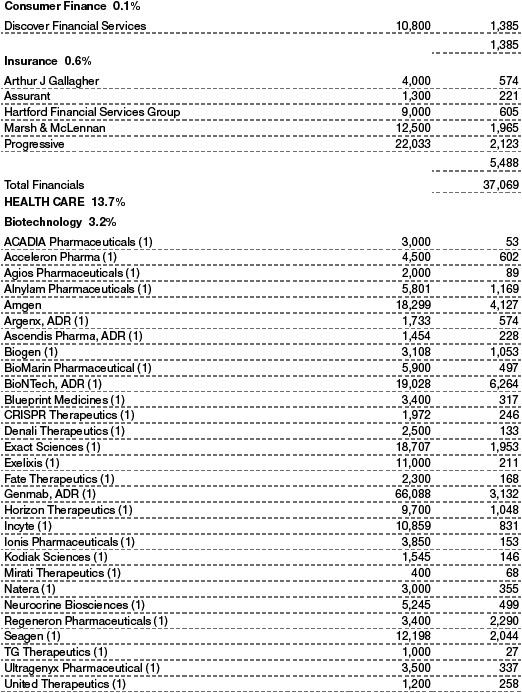
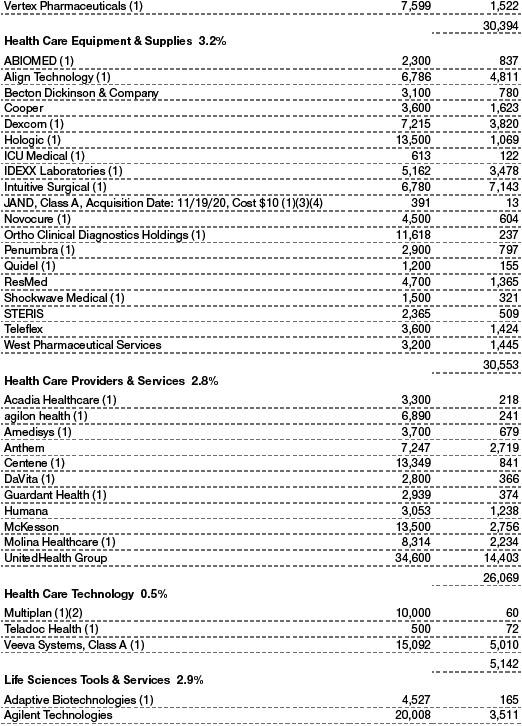
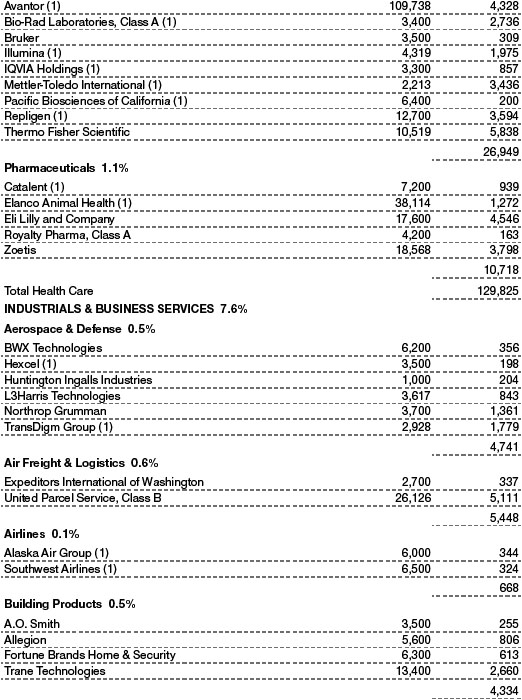
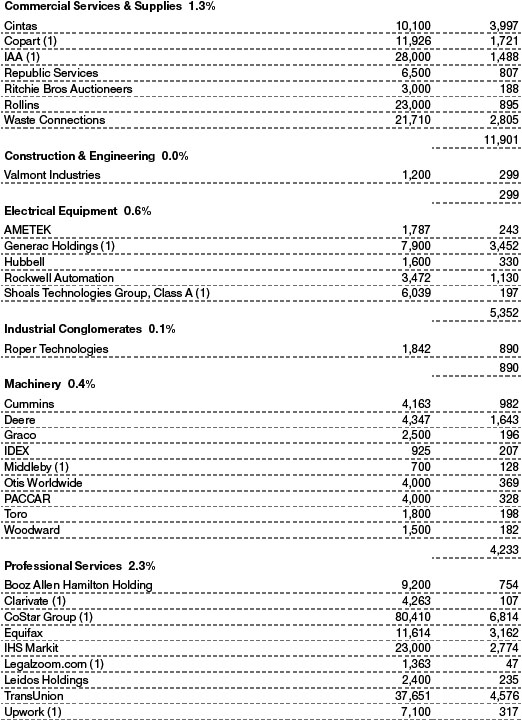
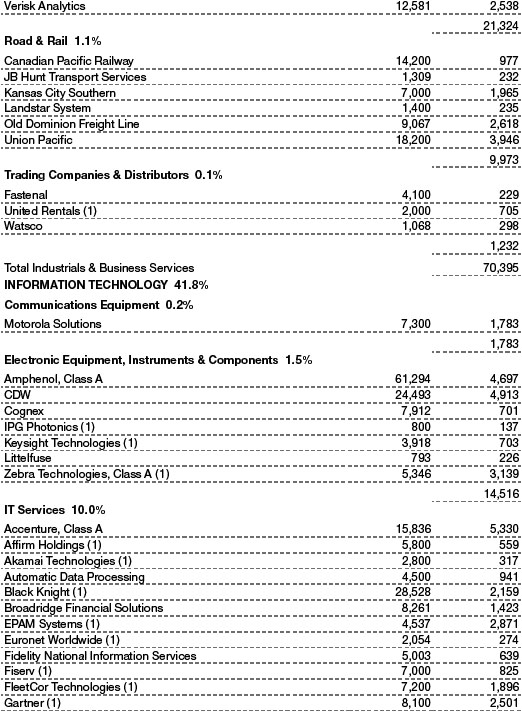
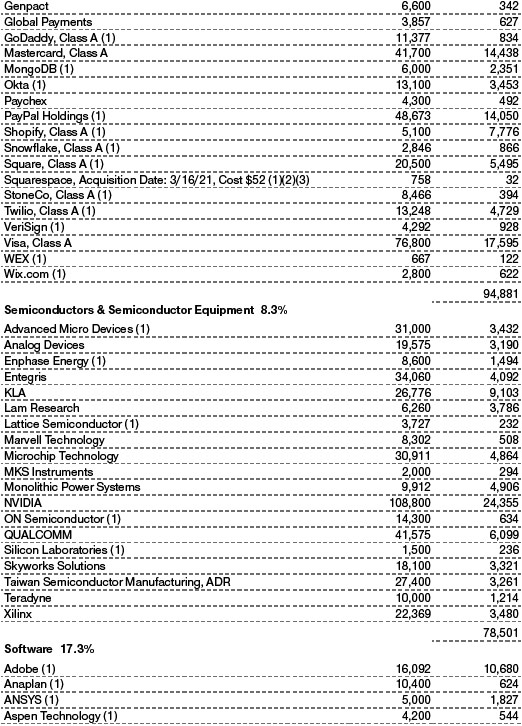
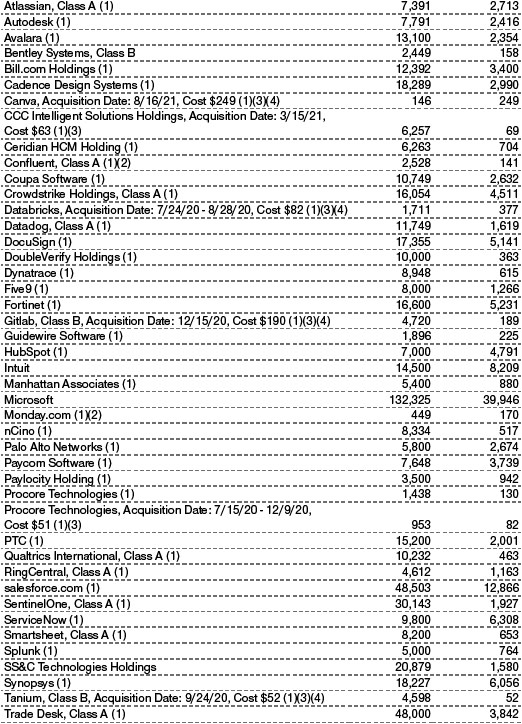
(a) Not applicable. The complete schedule of investments is included in Item 1 of this Form N-CSR.
(b) Not applicable.
Item 7. Disclosure of Proxy Voting Policies and Procedures for Closed-End Management Investment Companies.
Not applicable.
Item 8. Portfolio Managers of Closed-End Management Investment Companies.
Not applicable.
Item 9. Purchases of Equity Securities by Closed-End Management Investment Company and Affiliated Purchasers.
Not applicable.
Item 10. Submission of Matters to a Vote of Security Holders.
There has been no change to the procedures by which shareholders may recommend nominees to the registrant’s board of directors.
Item 11. Controls and Procedures.
(a) The registrant’s principal executive officer and principal financial officer have evaluated the registrant’s disclosure controls and procedures within 90 days of this filing and have concluded that the registrant’s disclosure controls and procedures were effective, as of that date, in ensuring that information required to be disclosed by the registrant in this Form N-CSR was recorded, processed, summarized, and reported timely.
(b) The registrant’s principal executive officer and principal financial officer are aware of no change in the registrant’s internal control over financial reporting that occurred during the period covered by this report that has materially affected, or is reasonably likely to materially affect, the registrant’s internal control over financial reporting.
Item 12. Disclosure of Securities Lending Activities for Closed-End Management Investment Companies.
Not applicable.
Item 13. Exhibits.
(a)(1) The registrant’s code of ethics pursuant to Item 2 of Form N-CSR is filed with the registrant’s annual Form N-CSR.
(2) Separate certifications by the registrant's principal executive officer and principal financial officer, pursuant to Section 302 of the Sarbanes-Oxley Act of 2002 and required by Rule 30a-2(a) under the Investment Company Act of 1940, are attached.
(3) Written solicitation to repurchase securities issued by closed-end companies: not applicable.
(b) A certification by the registrant's principal executive officer and principal financial officer, pursuant to Section 906 of the Sarbanes-Oxley Act of 2002 and required by Rule 30a-2(b) under the Investment Company Act of 1940, is attached.
SIGNATURES
Pursuant to the requirements of the Securities Exchange Act of 1934 and the Investment Company Act of 1940, the registrant has duly caused this report to be signed on its behalf by the undersigned, thereunto duly authorized.
T. Rowe Price Tax-Efficient Funds, Inc.
| By | | /s/ David Oestreicher |
| | | David Oestreicher |
| | | Principal Executive Officer |
| |
| Date | | October 18, 2021 | | | | |
Pursuant to the requirements of the Securities Exchange Act of 1934 and the Investment Company Act of 1940, this report has been signed below by the following persons on behalf of the registrant and in the capacities and on the dates indicated.
| By | | /s/ David Oestreicher |
| | | David Oestreicher |
| | | Principal Executive Officer |
| |
| Date | | October 18, 2021 | | | | |
| |
| |
| By | | /s/ Alan S. Dupski |
| | | Alan S. Dupski |
| | | Principal Financial Officer |
| |
| Date | | October 18, 2021 | | | | |