UNITED STATES
SECURITIES AND EXCHANGE COMMISSION
Washington, D.C. 20549
FORM N-CSR
CERTIFIED SHAREHOLDER REPORT OF REGISTERED MANAGEMENT
INVESTMENT COMPANIES
Investment Company Act file number | 811- 8211 |
| |
| Dreyfus Institutional Preferred Money Market Funds | |
| (Exact name of Registrant as specified in charter) | |
| | |
| c/o The Dreyfus Corporation 200 Park Avenue New York, New York 10166 | |
| (Address of principal executive offices) (Zip code) | |
| | |
| John Pak, Esq. 200 Park Avenue New York, New York 10166 | |
| (Name and address of agent for service) | |
|
Registrant's telephone number, including area code: | (212) 922-6000 |
| |
Date of fiscal year end: | 3/31 | |
Date of reporting period: | 3/31/2013 | |
| | | | | | | |
FORM N-CSR
Item 1. Reports to Stockholders.
Dreyfus Institutional Preferred Money Market Fund
ANNUAL REPORT March 31, 2013

The views expressed in this report reflect those of the portfolio manager only through the end of the period covered and do not necessarily represent the views of Dreyfus or any other person in the Dreyfus organization. Any such views are subject to change at any time based upon market or other conditions and Dreyfus disclaims any responsibility to update such views.These views may not be relied on as investment advice and, because investment decisions for a Dreyfus fund are based on numerous factors, may not be relied on as an indication of trading intent on behalf of any Dreyfus fund.
Not FDIC-Insured • Not Bank-Guaranteed • May Lose Value
| |
| Contents |
| |
| | THE FUND |
| 2 | Letter to Shareholders |
| 5 | Understanding Your Fund’s Expenses |
| 5 | Comparing Your Fund’s Expenses |
| With Those of Other Funds |
| 6 | Statement of Investments |
| 10 | Statement of Assets and Liabilities |
| 11 | Statement of Operations |
| 12 | Statement of Changes in Net Assets |
| 13 | Financial Highlights |
| 15 | Notes to Financial Statements |
| 21 | Report of Independent Registered |
| | Public Accounting Firm |
| 22 | Important Tax Information |
| 23 | Board Members Information |
| 25 | Officers of the Fund |
| |
| FOR MORE INFORMATION |
|
| | Back Cover |
Dreyfus Institutional
Preferred Money Market Fund
The Fund
LETTER TO SHAREHOLDERS
Dear Shareholder:
This annual report for Dreyfus Institutional Preferred Money Market Fund covers the 12-month period ended March 31, 2013. During the reporting period, the fund’s Prime shares produced a yield of 0.15%, and its Reserve shares produced a yield of 0.09%.Taking into account the effects of compounding, the fund’s Prime and Reserve shares also produced effective yields of 0.15% and 0.09%, respectively, for the same period.1
Yields of money market instruments remained near zero percent throughout the reporting period as the Federal Reserve Board (the “Fed”) left short-term interest rates unchanged despite evidence of more robust economic growth.
U.S. Economic Recovery Gained Momentum
The reporting period began near the start of a downturn in investor sentiment stemming from fears of a worsening financial crisis in Europe, a severe economic slowdown in China and a potential double-dip recession in the United States. More specifically, the U.S. economic recovery appeared to falter in April 2012, when only 77,000 new jobs were created. May brought another month of subpar job creation and an uptick in the unemployment rate to 8.2%.The manufacturing sector contracted in June for the first time in three years, but U.S. housing prices climbed for the first time in seven months. For the second quarter of 2012, U.S. economic growth slowed to a 1.3% annualized rate.
The economy added 181,000 jobs in July, but the unemployment rate rose to 8.3% as more people entered the workforce. In addition, investors were encouraged by a stated commitment by the head of the European Central Bank in support of the euro. August saw higher sales and prices in U.S. housing markets, an 8.1% unemployment rate, and higher personal income and expenditures. Corporate earnings proved healthier than many analysts expected.
The U.S. economic recovery seemed to gain more traction in September with the addition of 148,000 new jobs and a sharp drop in the unemployment rate to 7.8%,
2
its lowest level since January 2009.The manufacturing sector rebounded after three months of modest declines, and housing sales prices reached five-year highs. The U.S. economy grew at a respectable 3.1% annualized rate during the third quarter. Nonetheless, the Fed announced a third round of quantitative easing involving the purchase of $40 billion of mortgage-backed securities per month over an indefinite period of time. In addition, the Fed extended its commitment to maintaining historically low short-term interest rates through mid-2015.
The unemployment rate ticked higher in October to 7.9% as more workers joined the labor force. Manufacturing activity increased at a faster rate in October than in September, and home prices posted modest gains. In November, the unemployment rate remained steady while 146,000 new jobs were added. Home prices rose for the sixth straight month, and pending home sales reached their highest level in more than five years. On the other hand, manufacturing activity contracted slightly.
December saw the addition of 164,000 jobs to the labor force, a 7.8% unemployment rate and a mild rebound in manufacturing activity. However, consumer confidence declined somewhat, and retailers reported relatively sluggish sales during the 2012 holiday season.The U.S. Department of Commerce estimated that U.S. GDP grew at only a 0.4% annualized rate during the fourth quarter, which was attributed mainly to reductions in federal spending, particularly on defense. Other indicators proved somewhat more encouraging, including gains in personal consumption, durable goods purchases and housing market activity.
Data from January 2013 also portrayed a sluggish economic recovery, as the economy added 157,000 jobs, but the unemployment rate inched upwards to 7.9%. However, the uptick was reversed in February, when the unemployment rate slid to 7.7%, its lowest level since December 2008, as 236,000 new jobs were created. Employment trends were particularly strong in the professional and business services, construction, and health care industries. Moreover, manufacturing activity increased in February for the third consecutive month, and retail sales posted significant gains. Just 88,000 new jobs were added in March, but the unemployment rate edged lower to 7.6%. Both the manufacturing and services sectors of the U.S. economy posted gains in March.
The Fund 3
LETTER TO SHAREHOLDERS (continued)
Focusing on Quality and Liquidity
Money market yields remained near zero percent throughout the reporting period, and yield differences along the market’s maturity spectrum stayed relatively narrow. Therefore, we maintained the fund’s weighted average maturity in a position that was roughly in line with market averages, and we continued to focus on well-established issuers that historically have demonstrated good liquidity characteristics, including banks in Australia, Canada and Japan, but relatively few in Europe.
The Fed has continued to maintain an aggressively accommodative monetary policy amid low inflation and moderate economic growth.Therefore, as we have for some time, we intend to keep the fund’s focus on quality and liquidity.
April 15, 2013
New York, NY
An investment in Dreyfus Institutional Preferred Money Market Fund (the “fund”) is not insured or guaranteed by the Federal Deposit Insurance Corporation or any other government agency. Although the fund seeks to preserve the value of your investment at $1.00 per share, it is possible to lose money by investing in the fund. Short-term corporate and asset-backed securities holdings, while rated in the highest rating category by one or more NRSROs (or unrated, if deemed of comparable quality by Dreyfus), involve credit and liquidity risks and risk of principal loss.
| |
| 1 | Effective yield is based upon dividends declared daily and reinvested monthly. Past performance is no guarantee of |
| | future results.Yields fluctuate. |
4
UNDERSTANDING YOUR FUND’S EXPENSES (Unaudited)
As a mutual fund investor, you pay ongoing expenses, such as management fees and other expenses. Using the information below, you can estimate how these expenses affect your investment and compare them with the expenses of other funds.You also may pay one-time transaction expenses, including sales charges (loads) and redemption fees, which are not shown in this section and would have resulted in higher total expenses. For more information, see your fund’s prospectus or talk to your financial adviser.
Review your fund’s expenses
The table below shows the expenses you would have paid on a $1,000 investment in Dreyfus Institutional Preferred Money Market Fund from October 1, 2012 to March 31, 2013. It also shows how much a $1,000 investment would be worth at the close of the period, assuming actual returns and expenses.
| | | | |
| Expenses and Value of a $1,000 Investment | | | |
| assuming actual returns for the six months ended March 31, 2013 | | |
| | | Prime Shares | | Reserve Shares |
| Expenses paid per $1,000† | $ | .50 | $ | .80 |
| Ending value (after expenses) | $ | 1,000.60 | $ | 1,000.40 |
COMPARING YOUR FUND’S EXPENSES
WITH THOSE OF OTHER FUNDS (Unaudited)
Using the SEC’s method to compare expenses
The Securities and Exchange Commission (SEC) has established guidelines to help investors assess fund expenses. Per these guidelines, the table below shows your fund’s expenses based on a $1,000 investment, assuming a hypothetical 5% annualized return. You can use this information to compare the ongoing expenses (but not transaction expenses or total cost) of investing in the fund with those of other funds.All mutual fund shareholder reports will provide this information to help you make this comparison. Please note that you cannot use this information to estimate your actual ending account balance and expenses paid during the period.
| | | | | | |
| Expenses and Value of a $1,000 Investment | | | | |
| assuming a hypothetical 5% annualized return for the six months ended March 31, 2013 |
| | | Prime Shares | | Reserve Shares |
| Expenses paid per $1,000† | $ | | .50 | $ | | .81 |
| Ending value (after expenses) | $ | 1,024.43 | $ | 1,024.13 |
| |
| † Expenses are equal to the fund’s annualized expense ratio of .10% for Prime Shares and .16% for Reserve Shares, |
| multiplied by the average account value over the period, multiplied by 182/365 (to reflect the one-half year period). |
The Fund 5
STATEMENT OF INVESTMENTS
March 31, 2013
| | | |
| | Principal | | |
| Negotiable Bank Certificates of Deposit—33.1% | Amount ($) | | Value ($) |
| Bank of Montreal (Yankee) | | | |
| 0.34%, 5/15/13 | 150,000,000 | a | 150,000,000 |
| Bank of Nova Scotia (Yankee) | | | |
| 0.28%, 4/1/13 | 200,000,000 | a | 200,000,000 |
| Bank of Tokyo-Mitsubishi Ltd. (Yankee) | | | |
| 0.27%, 8/30/13 | 200,000,000 | | 200,000,000 |
| Canadian Imperial Bank of Commerce (Yankee) | | | |
| 0.32%, 4/1/13 | 150,000,000 | a | 150,000,000 |
| Deutsche Bank AG (Yankee) | | | |
| 0.41%, 8/12/13—8/26/13 | 200,000,000 | | 200,000,000 |
| JPMorgan Chase Bank, N.A. | | | |
| 0.20%, 7/1/13 | 100,000,000 | | 100,000,000 |
| Mitsubishi UFJ Trust and Banking Corp. (Yankee) | | | |
| 0.27%, 9/9/13 | 100,000,000 | | 100,000,000 |
| Mizuho Corporate Bank (Yankee) | | | |
| 0.23%, 7/1/13 | 300,000,000 | | 300,000,000 |
| Norinchukin Bank (Yankee) | | | |
| 0.26%—0.28%, 4/4/13—6/27/13 | 300,000,000 | | 299,997,585 |
| Rabobank Nederland (Yankee) | | | |
| 0.27%, 7/16/13 | 150,000,000 | | 150,000,000 |
| Royal Bank of Canada (Yankee) | | | |
| 0.34%, 4/1/13 | 100,000,000 | a | 100,000,000 |
| Sumitomo Mitsui Banking Corp. (Yankee) | | | |
| 0.24%, 4/15/13 | 150,000,000 | b | 150,000,000 |
| Svenska Handelsbanken (Yankee) | | | |
| 0.25%—0.29%, 4/4/13—9/27/13 | 340,000,000 | b | 340,004,966 |
| Toronto Dominion Bank (Yankee) | | | |
| 0.19%—0.28%, 4/15/13—6/20/13 | 301,350,000 | | 301,350,453 |
| Westpac Banking Corp. (Yankee) | | | |
| 0.52%, 4/1/13 | 300,000,000 | a,b | 300,000,000 |
| Total Negotiable Bank Certificates of Deposit | | | |
| (cost $3,041,353,004) | | | 3,041,353,004 |
| |
| Commercial Paper—11.7% | | | |
| Australia and New Zealand Banking Group Ltd. | | | |
| 0.23%, 4/25/13 | 225,000,000 | a | 225,000,000 |
| Bank of Nova Scotia | | | |
| 0.08%, 4/1/13 | 250,000,000 | | 250,000,000 |
| NRW Bank | | | |
| 0.20%, 6/28/13 | 300,000,000 | b | 299,857,000 |
6
| | | | |
| | | Principal | | |
| | Commercial Paper (continued) | Amount ($) | | Value ($) |
| | Sumitomo Mitsui Banking Corp. | | | |
| | 0.23%, 6/11/13 | 200,000,000 | b | 199,909,278 |
| | Toyota Motor Credit Corp. | | | |
| | 0.25%, 9/23/13 | 100,000,000 | | 99,878,472 |
| | Total Commercial Paper | | | |
| | (cost $1,074,644,750) | | | 1,074,644,750 |
| |
| Asset-Backed Commercial Paper—3.6% | | | |
| | Collateralized Commercial Paper Program Co., LLC | | | |
| | 0.35%—0.37%, 8/6/13—8/20/13 | 325,000,000 | | 324,567,590 |
| | Market Street Funding LLC | | | |
| | 0.11%, 4/1/13 | 10,053,000 | b | 10,053,000 |
| | Total Asset-Backed Commercial Paper | | | |
| | (cost $334,620,590) | | | 334,620,590 |
| |
| | Time Deposits—27.0% | | | |
| | Bank of America N.A. (Grand Cayman) | | | |
| | 0.01%, 4/1/13 | 50,000,000 | | 50,000,000 |
| | DnB Bank (Grand Cayman) | | | |
| | 0.10%—0.12%, 4/1/13 | 430,000,000 | | 430,000,000 |
| | Lloyds TSB Bank (London) | | | |
| | 0.12%, 4/2/13 | 350,000,000 | | 350,000,000 |
| | Nordea Bank Finland (Grand Cayman) | | | |
| | 0.10%, 4/1/13 | 400,000,000 | | 400,000,000 |
| | Northern Trust Co. (Grand Cayman) | | | |
| | 0.04%, 4/1/13 | 250,000,000 | | 250,000,000 |
| | Royal Bank of Canada (Toronto) | | | |
| | 0.08%, 4/1/13 | 200,000,000 | | 200,000,000 |
| | Skandinaviska Enskilda | | | |
| | Banken (Grand Cayman) | | | |
| | 0.13%, 4/1/13 | 400,000,000 | | 400,000,000 |
| | Swedbank (Grand Cayman) | | | |
| | 0.11%, 4/1/13 | 400,000,000 | | 400,000,000 |
| | Total Time Deposits | | | |
| | (cost $2,480,000,000) | | | 2,480,000,000 |
| |
| | U.S. Treasury Bills—7.1% | | | |
| | 0.03%—0.09%, 4/4/13—5/23/13 | | | |
| | (cost $649,985,208) | 650,000,000 | | 649,985,208 |
The Fund 7
STATEMENT OF INVESTMENTS (continued)
| | | | |
| | | | Principal | |
| | U.S. Treasury Notes—3.3% | | Amount ($) | Value ($) |
| | 0.07%—0.19%, 4/1/13—2/18/14 | | | |
| | (cost $301,415,628) | | 300,000,000 | 301,415,628 |
| |
| |
| | Repurchase Agreements—17.4% | | | |
| | ABN AMRO Bank N.V. | | | |
| | 0.18%, dated 3/28/13, due 4/1/13 in the | | | |
| | amount of $300,006,000 (fully collateralized | | | |
| by $1,280,200 U.S. Treasury Bonds, 4.38%, | | | |
| | due 11/15/39, value $1,631,031 and | | | |
| $291,406,915 U.S. Treasury Notes, 0.50%-4.75%, | | | |
| | due 7/31/16-8/15/21, value $304,369,025) | | 300,000,000 | 300,000,000 |
| | Bank of Nova Scotia | | | |
| | 0.16%, dated 3/28/13, due 4/1/13 in the | | | |
| | amount of $300,005,333 (fully collateralized by | | | |
| | $100,785,000 Federal Home Loan Bank, | | | |
| | 0.18%-3.75%, due 6/14/13-4/2/14, value | | | |
| | $102,444,240 and $202,705,000 Federal | | | |
| | National Mortgage Association, 0.50%-1.55%, | | | |
| | due 11/19/13-10/29/19, value $203,559,018) | | 300,000,000 | 300,000,000 |
| | Citigroup Global Markets Holdings Inc. | | | |
| | 0.12%, dated 3/28/13, due 4/1/13 in the | | | |
| | amount of $200,002,667 (fully collateralized by | | | |
| | $57,969,278 U.S. Treasury Inflation Protected | | | |
| | Securities, 0.13%, due 7/15/22, value $63,275,793 | | | |
| and $140,643,200 U.S. Treasury Notes, 0.25%-1.13%, | | | |
| | due 9/15/15-5/31/19, value $140,724,217) | | 200,000,000 | 200,000,000 |
| | Deutsche Bank Securities Inc. | | | |
| | 0.20%, dated 3/28/13, due 4/1/13 in the amount of | | | |
| $550,012,222 (fully collateralized by $50,950,000 | | | |
| | Federal Farm Credit Bank, 0.50%-3.91%, due | | | |
| | 6/23/15-11/2/35, value $52,430,124, $144,755,000 | | | |
| | Federal Home Loan Bank, 0.28%-5.25%, due | | | |
| | 5/3/13-3/28/23, value $153,791,287, $210,735,000 | | | |
| | Federal Home Loan Mortgage Corp., 0%-6.25%, | | | |
| | due 11/15/13-7/15/32, value $198,588,407 and | | | |
| | $188,695,000 Federal National Mortgage Association, | | | |
| | 0%-6%, due 4/4/13-4/18/36, value $156,191,061) | | 550,000,000 | 550,000,000 |
8
| | | | |
| | Principal | | | |
| Repurchase Agreements (continued) | Amount ($) | | Value ($) | |
| RBS Securities, Inc. | | | | |
| 0.17%, dated 3/28/13, due 4/1/13 in the | | | | |
| amount of $100,001,889 (fully collateralized by | | | | |
| $101,670,000 U.S. Treasury Notes, 0.75%, | | | | |
| due 8/15/13, value $102,002,403) | 100,000,000 | | 100,000,000 | |
| TD Securities (USA) LLC | | | | |
| 0.14%, dated 3/28/13, due 4/1/13 in the | | | | |
| amount of $150,002,333 (fully collateralized by | | | | |
| $22,223,900 U.S. Treasury Bills, due 4/25/13, | | | | |
| value $22,222,789, $15,783,700 U.S. Treasury | | | | |
| Bonds, 6.25%, due 8/15/23, value $22,475,337 | | | | |
| and $101,342,500 U.S. Treasury Notes, | | | | |
| 0.25%-4.75%, due 5/15/14-10/31/19, | | | | |
| value $108,301,937) | 150,000,000 | | 150,000,000 | |
| Total Repurchase Agreements | | | | |
| (cost $1,600,000,000) | | | 1,600,000,000 | |
| |
| Total Investments (cost $9,482,019,180) | 103.2 | % | 9,482,019,180 | |
| |
| Liabilities, Less Cash and Receivables | (3.2 | %) | (295,333,622 | ) |
| |
| Net Assets | 100.0 | % | 9,186,685,558 | |
| a | Variable rate security—interest rate subject to periodic change. |
| b | Securities exempt from registration pursuant to Rule 144A under the Securities Act of 1933.These securities may be resold in transactions exempt from registration, normally to qualified institutional buyers.At March 31, 2013, these securities amounted to $1,299,824,244 or 14.1% of net assets. |
| | | |
| Portfolio Summary (Unaudited)† | | |
| |
| | Value (%) | | Value (%) |
| Banking | 70.7 | Finance | 1.1 |
| Repurchase Agreements | 17.4 | Asset-Backed/Multi-Seller Programs | .1 |
| U.S. Government | 10.4 | | |
| Asset-Backed/Banking | 3.5 | | 103.2 |
| |
| † Based on net assets. | | | |
| See notes to financial statements. | | | |
The Fund 9
STATEMENT OF ASSETS AND LIABILITIES
March 31, 2013
| | |
| | Cost | Value |
| Assets ($): | | |
| Investments in securities—See Statement of | | |
| Investments (including Repurchase Agreements | | |
| of $1,600,000,000)—Note 1(b) | 9,482,019,180 | 9,482,019,180 |
| Cash | | 2,949,053 |
| Interest receivable | | 2,463,667 |
| | | 9,487,431,900 |
| Liabilities ($): | | |
| Due to The Dreyfus Corporation and affiliates—Note 2(b) | | 746,342 |
| Payable for investment securities purchased | | 300,000,000 |
| | | 300,746,342 |
| Net Assets ($) | | 9,186,685,558 |
| Composition of Net Assets ($): | | |
| Paid-in capital | | 9,186,563,673 |
| Accumulated net realized gain (loss) on investments | | 121,885 |
| Net Assets ($) | | 9,186,685,558 |
| |
| |
| Net Asset Value Per Share | | |
| | Prime Shares | Reserve Shares |
| Net Assets ($) | 8,607,593,148 | 579,092,410 |
| Shares Outstanding | 8,607,497,555 | 579,066,118 |
| Net Asset Value Per Share ($) | 1.00 | 1.00 |
| |
| See notes to financial statements. | | |
10
STATEMENT OF OPERATIONS
Year Ended March 31, 2013
| | |
| Investment Income ($): | | |
| Interest Income | 21,129,159 | |
| Expenses: | | |
| Management fee—Note 2(a) | 8,476,789 | |
| Service plan fees (Reserve Shares)—Note 2(b) | 371,323 | |
| Trustees’ fees—Note 2(a,c) | 252,925 | |
| Legal fees—Note 2(a) | 33,160 | |
| Total Expenses | 9,134,197 | |
| Less—Trustees’ fees reimbursed by the Manager—Note 2(a) | (252,925 | ) |
| Less—Legal fees reimbursed by the Manager—Note 2(a) | (33,160 | ) |
| Net Expenses | 8,848,112 | |
| Investment Income—Net | 12,281,047 | |
| Net Realized Gain (Loss) on Investments—Note 1(b) ($) | 121,885 | |
| Net Increase in Net Assets Resulting from Operations | 12,402,932 | |
| |
| See notes to financial statements. | | |
The Fund 11
STATEMENT OF CHANGES IN NET ASSETS
| | | | |
| | | | Year Ended March 31, | |
| | 2013 | | 2012 | |
| Operations ($): | | | | |
| Investment income—net | 12,281,047 | | 14,680,255 | |
| Net realized gain (loss) on investments | 121,885 | | 327,871 | |
| Net Increase (Decrease) in Net Assets | | | | |
| Resulting from Operations | 12,402,932 | | 15,008,126 | |
| Dividends to Shareholders from ($): | | | | |
| Investment income—net: | | | | |
| Prime Shares | (11,788,457 | ) | (13,870,903 | ) |
| Reserve Shares | (554,141 | ) | (809,352 | ) |
| Total Dividends | (12,342,598 | ) | (14,680,255 | ) |
| Beneficial Interest Transactions ($1.00 per share): | | | |
| Net proceeds from shares sold: | | | | |
| Prime Shares | 40,401,471,369 | | 45,247,603,385 | |
| Reserve Shares | 3,066,943,098 | | 6,251,829,692 | |
| Dividends reinvested: | | | | |
| Prime Shares | 6,292,495 | | 5,783,717 | |
| Reserve Shares | 553,214 | | 798,525 | |
| Cost of shares redeemed: | | | | |
| Prime Shares | (41,197,077,395 | ) | (47,427,919,855 | ) |
| Reserve Shares | (4,068,223,794 | ) | (5,916,727,281 | ) |
| Increase (Decrease) in Net Assets from | | | | |
| Beneficial Interest Transactions | (1,790,041,013 | ) | (1,838,631,817 | ) |
| Total Increase (Decrease) in Net Assets | (1,789,980,679 | ) | (1,838,303,946 | ) |
| Net Assets ($): | | | | |
| Beginning of Period | 10,976,666,237 | | 12,814,970,183 | |
| End of Period | 9,186,685,558 | | 10,976,666,237 | |
| |
| See notes to financial statements. | | | | |
12
FINANCIAL HIGHLIGHTS
The following tables describe the performance for each share class for the fiscal periods indicated. All information reflects financial results for a single fund share. Total return shows how much your investment in the fund would have increased (or decreased) during each period, assuming you had reinvested all dividends and distributions.These figures have been derived from the fund’s financial statements.
| | | | | | | | | | |
| | | | | | Year Ended March 31, | | | |
| Prime Shares | 2013 | | 2012 | | 2011 | | 2010 | | 2009 | |
| Per Share Data ($): | | | | | | | | | | |
| Net asset value, | | | | | | | | | | |
| beginning of period | 1.00 | | 1.00 | | 1.00 | | 1.00 | | 1.00 | |
| Investment Operations: | | | | | | | | | | |
| Investment income—net | .001 | | .001 | | .003 | | .003 | | .022 | |
| Distributions: | | | | | | | | | | |
| Dividends from | | | | | | | | | | |
| investment income—net | (.001 | ) | (.001 | ) | (.003 | ) | (.003 | ) | (.022 | ) |
| Net asset value, end of period | 1.00 | | 1.00 | | 1.00 | | 1.00 | | 1.00 | |
| Total Return (%) | .15 | | .15 | | .26 | | .33 | | 2.19 | |
| Ratios/Supplemental Data (%): | | | | | | | | | | |
| Ratio of total expenses | | | | | | | | | | |
| to average net assets | .10 | | .10 | | .10 | | .12 | | .12 | |
| Ratio of net expenses | | | | | | | | | | |
| to average net assets | .10 | | .10 | | .10 | | .12 | | .12 | |
| Ratio of net investment income | | | | | | | | | | |
| to average net assets | .15 | | .15 | | .26 | | .32 | | 2.38 | |
| Net Assets, end of period | | | | | | | | | | |
| ($ x 1,000) | 8,607,593 | | 9,396,853 | | 11,571,089 | | 8,878,284 | | 8,426,342 | |
| |
| See notes to financial statements. | | | | | | | | | | |
The Fund 13
FINANCIAL HIGHLIGHTS (continued)
| | | | | | | | | | |
| | | | | | Year Ended March 31, | | | |
| Reserve Shares | 2013 | | 2012 | | 2011 | | 2010 | | 2009 | |
| Per Share Data ($): | | | | | | | | | | |
| Net asset value, | | | | | | | | | | |
| beginning of period | 1.00 | | 1.00 | | 1.00 | | 1.00 | | 1.00 | |
| Investment Operations: | | | | | | | | | | |
| Investment income—net | .001 | | .001 | | .002 | | .003 | | .021 | |
| Distributions: | | | | | | | | | | |
| Dividends from | | | | | | | | | | |
| investment income—net | (.001 | ) | (.001 | ) | (.002 | ) | (.003 | ) | (.021 | ) |
| Net asset value, end of period | 1.00 | | 1.00 | | 1.00 | | 1.00 | | 1.00 | |
| Total Return (%) | .09 | | .09 | | .20 | | .28 | | 2.13 | |
| Ratios/Supplemental Data (%): | | | | | | | | | | |
| Ratio of total expenses | | | | | | | | | | |
| to average net assets | .16 | | .16 | | .16 | | .18 | | .18 | |
| Ratio of net expenses | | | | | | | | | | |
| to average net assets | .16 | | .16 | | .16 | | .18 | | .18 | |
| Ratio of net investment income | | | | | | | | | | |
| to average net assets | .09 | | .09 | | .20 | | .29 | | 2.09 | |
| Net Assets, end of period | | | | | | | | | | |
| ($ x 1,000) | 579,092 | | 1,579,813 | | 1,243,881 | | 1,263,221 | | 392,929 | |
| |
| See notes to financial statements. | | | | | | | | | | |
14
NOTES TO FINANCIAL STATEMENTS
NOTE 1—Significant Accounting Policies:
Dreyfus Institutional Preferred Money Market Fund (the “fund”) is a separate diversified series of Dreyfus Institutional Preferred Money Market Funds (the “Company”), which is registered under the Investment Company Act of 1940, as amended (the “Act”), as an open-end management investment company currently offering two series, including the fund.The fund’s investment objective is to seek as high a level of current income as is consistent with the preservation of capital and the maintenance of liquidity.The Dreyfus Corporation (the “Manager” or “Dreyfus”), a wholly-owned subsidiary of The Bank of New York Mellon Corporation (“BNY Mellon”), serves as the fund’s investment adviser.
MBSC Securities Corporation (the “Distributor”), a wholly-owned subsidiary of the Manager, is the distributor of the fund’s shares, which are sold to the public without a sales charge.The fund is authorized to issue an unlimited number of $.001 par value shares of Beneficial Interest in each of the following classes of shares: Prime shares and Reserve shares. Prime shares and Reserve shares are identical except for the services offered to and the expenses borne by each class. Income, expenses (other than expenses attributable to a specific class), and realized and unrealized gains or losses on investments are allocated to each class of shares based on its relative net assets.
It is the fund’s policy to maintain a continuous net asset value per share of $1.00; the fund has adopted certain investment, portfolio valuation and dividend and distribution policies to enable it to do so.There is no assurance, however, that the fund will be able to maintain a stable net asset value per share of $1.00.
The Company accounts separately for the assets, liabilities and operations of each series. Expenses directly attributable to each series are charged to that series’ operations; expenses which are applicable to all series are allocated among them on a pro rata basis.
The Fund 15
NOTES TO FINANCIAL STATEMENTS (continued)
The Financial Accounting Standards Board (“FASB”) Accounting Standards Codification is the exclusive reference of authoritative U.S. generally accepted accounting principles (“GAAP”) recognized by the FASB to be applied by nongovernmental entities. Rules and interpretive releases of the Securities and Exchange Commission (“SEC”) under authority of federal laws are also sources of authoritative GAAP for SEC registrants. The fund’s financial statements are prepared in accordance with GAAP, which may require the use of management estimates and assumptions.Actual results could differ from those estimates.
The Company enters into contracts that contain a variety of indemnifications.The fund’s maximum exposure under these arrangements is unknown.The fund does not anticipate recognizing any loss related to these arrangements.
(a) Portfolio valuation: Investments in securities are valued at amortized cost in accordance with Rule 2a-7 under the Act. If amortized cost is determined not to approximate market value, the fair value of the portfolio securities will be determined by procedures established by and under the general supervision of the Company’s Board of Trustees (the “Board”).
The fair value of a financial instrument is the amount that would be received to sell an asset or paid to transfer a liability in an orderly transaction between market participants at the measurement date (i.e., the exit price). GAAP establishes a fair value hierarchy that prioritizes the inputs of valuation techniques used to measure fair value.This hierarchy gives the highest priority to unadjusted quoted prices in active markets for identical assets or liabilities (Level 1 measurements) and the lowest priority to unobservable inputs (Level 3 measurements).
Additionally, GAAP provides guidance on determining whether the volume and activity in a market has decreased significantly and whether such a decrease in activity results in transactions that are not orderly. GAAP requires enhanced disclosures around valuation inputs and techniques used during annual and interim periods.
16
Various inputs are used in determining the value of the fund’s investments relating to fair value measurements.These inputs are summarized in the three broad levels listed below:
Level 1—unadjusted quoted prices in active markets for identical investments.
Level 2—other significant observable inputs (including quoted prices for similar investments, interest rates, prepayment speeds, credit risk, etc.).
Level 3—significant unobservable inputs (including the fund’s own assumptions in determining the fair value of investments).
The inputs or methodology used for valuing securities are not necessarily an indication of the risk associated with investing in those securities. For example, money market securities are valued using amortized cost, in accordance with rules under the Act. Generally, amortized cost approximates the current fair value of a security, but since the value is not obtained from a quoted price in an active market, such securities are reflected within Level 2 of the fair value hierarchy.
The following is a summary of the inputs used as of March 31, 2013 in valuing the fund’s investments:
| |
| | Short-Term |
| Valuation Inputs | Investments ($)† |
| Level 1—Unadjusted Quoted Prices | — |
| Level 2—Other Significant Observable Inputs | 9,482,019,180 |
| Level 3—Significant Unobservable Inputs | — |
| Total | 9,482,019,180 |
| † See Statement of Investments for additional detailed categorizations. | |
At March 31, 2013, there were no transfers between Level 1 and Level 2 of the fair value hierarchy.
(b) Securities transactions and investment income: Securities transactions are recorded on a trade date basis. Interest income, adjusted for accretion of discount and amortization of premium on investments, is
The Fund 17
NOTES TO FINANCIAL STATEMENTS (continued)
earned from settlement date and is recognized on the accrual basis. Realized gains and losses from securities transactions are recorded on the identified cost basis. Cost of investments represents amortized cost.
The fund may enter into repurchase agreements with financial institutions, deemed to be creditworthy by the Manager, subject to the seller’s agreement to repurchase and the fund’s agreement to resell such securities at a mutually agreed upon price. Pursuant to the terms of the repurchase agreement, such securities must have an aggregate market value greater than or equal to the terms of the repurchase price plus accrued interest at all times. If the value of the underlying securities falls below the value of the repurchase price plus accrued interest, the fund will require the seller to deposit additional collateral by the next business day. If the request for additional collateral is not met, or the seller defaults on its repurchase obligation, the fund maintains its right to sell the underlying securities at market value and may claim any resulting loss against the seller.
(c) Dividends to shareholders: It is policy of the fund to declare dividends daily from investment income-net. Such dividends are paid monthly. Dividends from net realized capital gains, if any, are normally declared and paid annually, but the fund may make distributions on a more frequent basis to comply with the distribution requirements of the Internal Revenue Code of 1986, as amended (the “Code”).To the extent that net realized capital gains can be offset by capital loss carryovers, it is the policy of the fund not to distribute such gains.
(d) Federal income taxes: It is the policy of the fund to continue to qualify as a regulated investment company, if such qualification is in the best interests of its shareholders, by complying with the applicable provisions of the Code, and to make distributions of taxable income sufficient to relieve it from substantially all federal income and excise taxes.
As of and during the period ended March 31, 2013, the fund did not have any liabilities for any uncertain tax positions.The fund recognizes interest and penalties, if any, related to uncertain tax positions as income tax expense in the Statement of Operations. During the period, the fund did not incur any interest or penalties.
18
Each tax year in the four-year period ended March 31, 2013 remains subject to examination by the Internal Revenue Service and state taxing authorities.
At March 31, 2013, the components of accumulated earnings on a tax basis were substantially the same as for financial reporting purposes.
The tax character of distributions paid to shareholders during the fiscal periods ended March 31, 2013 and March 31, 2012 were all ordinary income.
During the period ended March 31, 2013, as a result of permanent book to tax differences, primarily due to the tax treatment for dividend reclassification, the fund increased accumulated undistributed investment income-net by $61,551 and decreased accumulated net realized gain (loss) on investments by the same amount. Net assets and net asset value per share were not affected by this reclassification.
At March 31, 2013, the cost of investments for federal income tax purposes was substantially the same as the cost for financial reporting purposes (see the Statement of Investments).
NOTE 2—Management Fee and Other Transactions With Affiliates:
(a) Pursuant to a management agreement with the Manager, the management fee is computed at the annual rate of .10% of the value of the fund’s average daily net assets and is payable monthly. Pursuant to the management agreement, the Manager has agreed to pay all of the fund’s expenses except for the management fee, Service Plan fees, brokerage commissions, taxes, Trustees’ fees, fees and expenses of independent counsel of the fund and extraordinary expenses. In addition, the Manager has agreed to reduce its management fee in an amount equal to the Trustees’ fees and expenses of independent counsel of the fund. During the period ended March 31, 2013, fees reimbursed by the Manager amounted to $286,085.
The Fund 19
NOTES TO FINANCIAL STATEMENTS (continued)
(b) Under the Service Plan adopted pursuant to Rule 12b-1 under the Act, Reserve shares pay the Distributor at the annual rate of .06% of the value of Reserve shares average daily net assets for distributing Reserve shares, for advertising and marketing relating to Reserve shares and for providing certain services to shareholders of Reserve shares. The services provided include answering shareholder inquires regarding the fund and providing reports and other information, and services related to the maintenance of shareholder accounts.The Distributor may make payments to Service Agents (securities dealers, financial institutions or other industry professionals) with respect to these services. The Distributor determines the amounts to be paid to Service Agents. During the period ended March 31, 2013, Reserve shares were charged $371,323 pursuant to the Service Plan.
The components of “Due to The Dreyfus Corporation and affiliates” in the Statement of Assets and Liabilities consist of: management fees $735,791 and Service Plan fees $29,605, which are offset against an expense reimbursement currently in effect in the amount of $19,054.
(c) Each Board member also serves as a Board member of other funds within the Dreyfus complex. Annual retainer fees and attendance fees are allocated to each fund based on net assets.
20
REPORT OF INDEPENDENT REGISTERED
PUBLIC ACCOUNTING FIRM
Shareholders and Board of Trustees
Dreyfus Institutional Preferred Money Market Fund
We have audited the accompanying statement of assets and liabilities, including the statement of investments, of Dreyfus Institutional Preferred Money Market Fund (one of the series comprising Dreyfus Institutional Preferred Money Market Funds) as of March 31, 2013, and the related statement of operations for the year then ended, the statement of changes in net assets for each of the two years in the period then ended, and the financial highlights for each of the five years in the period then ended. These financial statements and financial highlights are the responsibility of the Fund’s management. Our responsibility is to express an opinion on these financial statements and financial highlights based on our audits.
We conducted our audits in accordance with the standards of the Public Company Accounting Oversight Board (United States).Those standards require that we plan and perform the audit to obtain reasonable assurance about whether the financial statements and financial highlights are free of material misstatement. We were not engaged to perform an audit of the Fund’s internal control over financial reporting. Our audits included consideration of internal control over financial reporting as a basis for designing audit procedures that are appropriate in the circumstances, but not for the purpose of expressing an opinion on the effectiveness of the Fund’s internal control over financial reporting. Accordingly, we express no such opinion. An audit also includes examining, on a test basis, evidence supporting the amounts and disclosures in the financial statements and financial highlights, assessing the accounting principles used and significant estimates made by management, and evaluating the overall financial statement presentation. Our procedures included confirmation of securities owned as of March 31, 2013 by correspondence with the custodian and others.We believe that our audits provide a reasonable basis for our opinion.
In our opinion, the financial statements and financial highlights referred to above present fairly, in all material respects, the financial position of Dreyfus Institutional Preferred Money Market Fund at March 31, 2013, the results of its operations for the year then ended, the changes in its net assets for each of the two years in the period then ended, and the financial highlights for each of the five years in the period then ended, in conformity with U.S. generally accepted accounting principles.

New York, New York May 23, 2013
The Fund 21
IMPORTANT TAX INFORMATION (Unaudited)
For federal tax purposes the fund hereby reports 91.32% of ordinary income dividends paid during the fiscal year ended March 31, 2013 as qualifying “interest related dividends.”
22
BOARD MEMBERS INFORMATION (Unaudited)
|
| Joseph S. DiMartino (69) |
| Chairman of the Board (1997) |
| Principal Occupation During Past 5Years: |
| • Corporate Director and Trustee |
| Other Public Company Board Memberships During Past 5Years: |
| • CBIZ (formerly, Century Business Services, Inc.), a provider of outsourcing functions for small |
| and medium size companies, Director (1997-present) |
| • Sunair Services Corporation, a provider of certain outdoor-related services to homes and |
| businesses, Director (2005-2009) |
| • The Newark Group, a provider of a national market of paper recovery facilities, paperboard |
| mills and paperboard converting plants, Director (2000-2010) |
| No. of Portfolios for which Board Member Serves: 142 |
| ——————— |
| Clifford L. Alexander, Jr. (79) |
| Board Member (1997) |
| Principal Occupation During Past 5Years: |
| • President of Alexander & Associates, Inc., a management consulting firm (January 1981-present) |
| No. of Portfolios for which Board Member Serves: 41 |
| ——————— |
| Gordon J. Davis (71) |
| Board Member (2012) |
| Principal Occupation During Past 5Years: |
| • Partner in the law firm of Venable LLP (2012-present) |
| • Partner in the law firm of Dewey & LeBoeuf LLP (1994-2012) |
| Other Public Company Board Memberships During Past 5Years: |
| • Consolidated Edison, Inc., a utility company, Director (1997-present) |
| • The Phoenix Companies, Inc., a life insurance company, Director (2000-present) |
| No. of Portfolios for which Board Member Serves: 46 |
| ——————— |
| Whitney I. Gerard (78) |
| Board Member (2003) |
| Principal Occupation During Past 5Years: |
| • Partner of Chadbourne & Parke LLP |
| No. of Portfolios for which Board Member Serves: 22 |
The Fund 23
BOARD MEMBERS INFORMATION (Unaudited) (continued)
|
| Nathan Leventhal (70) |
| Board Member (2012) |
| Principal Occupation During Past 5Years: |
| • Chairman of the Avery-Fisher Artist Program (November 1997-present) |
| • Commissioner, NYC Planning Commission (March 2007-November 2011) |
| Other Public Company Board Memberships During Past 5Years: |
| • Movado Group, Inc., Director (2003-present) |
| No. of Portfolios for which Board Member Serves: 39 |
| ——————— |
| George L. Perry (79) |
| Board Member (2003) |
| Principal Occupation During Past 5Years: |
| • Economist and Senior Fellow at Brookings Institution |
| No. of Portfolios for which Board Member Serves: 22 |
| ——————— |
| Benaree Pratt Wiley (66) |
| Board Member (2012) |
| Principal Occupation During Past 5Years: |
| • Principal,TheWiley Group, a firm specializing in strategy and business development (2005-present) |
| Other Public Company Board Memberships During Past 5Years: |
| • CBIZ (formerly, Century Business Services, Inc.), a provider of outsourcing functions for small |
| and medium size companies, Director (2008-present) |
| No. of Portfolios for which Board Member Serves: 56 |
| ——————— |
Once elected all Board Members serve for an indefinite term, but achieve Emeritus status upon reaching age 80.The
address of the Board Members and Officers is c/o The Dreyfus Corporation, 200 Park Avenue, NewYork, NewYork
10166.Additional information about the Board Members is available in the fund’s Statement of Additional Information
which can be obtained from Dreyfus free of charge by calling this toll free number: 1-800-DREYFUS.
David W. Burke, Emeritus Board Member
Arthur A. Hartman, Emeritus Board Member
24
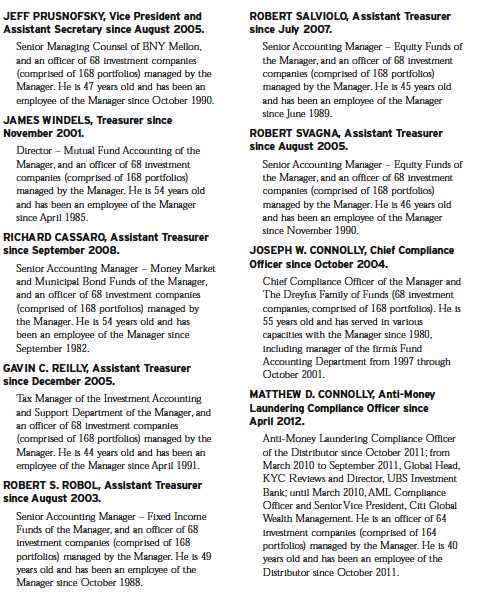
OFFICERS OF THE FUND (Unaudited)
The Fund 25
OFFICERS OF THE FUND (Unaudited) (continued)
26
Dreyfus Institutional Preferred Plus Money Market Fund
ANNUAL REPORT March 31, 2013

The views expressed in this report reflect those of the portfolio manager only through the end of the period covered and do not necessarily represent the views of Dreyfus or any other person in the Dreyfus organization. Any such views are subject to change at any time based upon market or other conditions and Dreyfus disclaims any responsibility to update such views.These views may not be relied on as investment advice and, because investment decisions for a Dreyfus fund are based on numerous factors, may not be relied on as an indication of trading intent on behalf of any Dreyfus fund.
Not FDIC-Insured • Not Bank-Guaranteed • May Lose Value
| |
| Contents |
| |
| | THE FUND |
| 2 | Letter to Shareholders |
| 5 | Understanding Your Fund’s Expenses |
| 5 | Comparing Your Fund’s Expenses |
| With Those of Other Funds |
| 6 | Statement of Investments |
| 8 | Statement of Assets and Liabilities |
| 9 | Statement of Operations |
| 10 | Statement of Changes in Net Assets |
| 11 | Financial Highlights |
| 12 | Notes to Financial Statements |
| 17 | Report of Independent Registered |
| | Public Accounting Firm |
| 18 | Important Tax Information |
| 19 | Board Members Information |
| 21 | Officers of the Fund |
| |
| FOR MORE INFORMATION |
|
| | Back Cover |
Dreyfus Institutional
Preferred Plus Money Market Fund
The Fund
LETTER TO SHAREHOLDERS
Dear Shareholder:
This annual report for Dreyfus Institutional Preferred Plus Money Market Fund covers the 12-month period ended March 31, 2013. During the reporting period, the fund produced a yield of 0.11%.Taking into account the effects of compounding, the fund also produced an effective yield of 0.11% for the same period.1
Yields of money market instruments remained near zero percent throughout the reporting period as the Federal Reserve Board (the “Fed”) left short-term interest rates unchanged despite evidence of more robust economic growth.
U.S. Economic Recovery Gained Momentum
The reporting period began near the start of a downturn in investor sentiment stemming from fears of a worsening financial crisis in Europe, a severe economic slowdown in China and a potential double-dip recession in the United States. More specifically, the U.S. economic recovery appeared to falter in April 2012, when only 77,000 new jobs were created. May brought another month of subpar job creation and an uptick in the unemployment rate to 8.2%.The manufacturing sector contracted in June for the first time in three years, but U.S. housing prices climbed for the first time in seven months. For the second quarter of 2012, U.S. economic growth slowed to a 1.3% annualized rate.
The economy added 181,000 jobs in July, but the unemployment rate rose to 8.3% as more people entered the workforce. In addition, investors were encouraged by a stated commitment by the head of the European Central Bank in support of the euro. August saw higher sales and prices in U.S. housing markets, an 8.1% unemployment rate, and higher personal income and expenditures. Corporate earnings proved healthier than many analysts expected.
The U.S. economic recovery seemed to gain more traction in September with the addition of 148,000 new jobs and a sharp drop in the unemployment rate to 7.8%, its lowest level since January 2009.The manufacturing sector rebounded after three
2
months of modest declines, and housing sales prices reached five-year highs. The U.S. economy grew at a respectable 3.1% annualized rate during the third quarter. Nonetheless, the Fed announced a third round of quantitative easing involving the purchase of $40 billion of mortgage-backed securities per month over an indefinite period of time. In addition, the Fed extended its commitment to maintaining historically low short-term interest rates through mid-2015.
The unemployment rate ticked higher in October to 7.9% as more workers joined the labor force. Manufacturing activity increased at a faster rate in October than in September, and home prices posted modest gains. In November, the unemployment rate remained steady while 146,000 new jobs were added. Home prices rose for the sixth straight month, and pending home sales reached their highest level in more than five years. On the other hand, manufacturing activity contracted slightly.
December saw the addition of 164,000 jobs to the labor force, a 7.8% unemployment rate and a mild rebound in manufacturing activity. However, consumer confidence declined somewhat, and retailers reported relatively sluggish sales during the 2012 holiday season.The U.S. Department of Commerce estimated that U.S. GDP grew at only a 0.4% annualized rate during the fourth quarter, which was attributed mainly to reductions in federal spending, particularly on defense. Other indicators proved somewhat more encouraging, including gains in personal consumption, durable goods purchases and housing market activity.
Data from January 2013 also portrayed a sluggish economic recovery, as the economy added 157,000 jobs, but the unemployment rate inched upwards to 7.9%. However, the uptick was reversed in February, when the unemployment rate slid to 7.7%, its lowest level since December 2008, as 236,000 new jobs were created. Employment trends were particularly strong in the professional and business services, construction, and health care industries. Moreover, manufacturing activity increased in February for the third consecutive month, and retail sales posted significant gains. Just 88,000 new jobs were added in March, but the unemployment rate edged lower to 7.6%. Both the manufacturing and services sectors of the U.S. economy posted gains in March.
The Fund 3
LETTER TO SHAREHOLDERS (continued)
Focusing on Quality and Liquidity
Money market yields remained near zero percent throughout the reporting period, and yield differences along the market’s maturity spectrum stayed relatively narrow. Therefore, we maintained the fund’s weighted average maturity in a position that was shorter than market averages, and we continued to focus on well-established issuers that historically have demonstrated good liquidity characteristics, including banks in Australia, Canada and Japan, but relatively few in Europe.
The Fed has continued to maintain an aggressively accommodative monetary policy amid low inflation and moderate economic growth.Therefore, as we have for some time, we intend to keep the fund’s focus on quality and liquidity.

April 15, 2013
New York, NY
An investment in Dreyfus Institutional Preferred Plus Money Market Fund (the “fund”) is not insured or guaranteed by the Federal Deposit Insurance Corporation or any other government agency. Although the fund seeks to preserve the value of your investment at $1.00 per share, it is possible to lose money by investing in the fund. Short-term corporate and asset-backed securities holdings, while rated in the highest rating category by one or more NRSROs (or unrated, if deemed of comparable quality by Dreyfus), involve credit and liquidity risks and risk of principal loss.
| 1 | Effective yield is based upon dividends declared daily and reinvested monthly. Past performance is no guarantee of future results.Yields fluctuate.Yield provided reflects the absorption of certain fund expenses by The Dreyfus Corporation pursuant to an undertaking in effect that may be extended, terminated or modified at any time. Had these expenses not been absorbed, fund yields would have been lower, and in some cases, 7-day yields during the reporting period would have been negative absent the expense absorption. |
4
UNDERSTANDING YOUR FUND’S EXPENSES (Unaudited)
As a mutual fund investor, you pay ongoing expenses, such as management fees and other expenses. Using the information below, you can estimate how these expenses affect your investment and compare them with the expenses of other funds.You also may pay one-time transaction expenses, including sales charges (loads) and redemption fees, which are not shown in this section and would have resulted in higher total expenses. For more information, see your fund’s prospectus or talk to your financial adviser.
Review your fund’s expenses
The table below shows the expenses you would have paid on a $1,000 investment in Dreyfus Institutional Preferred Plus Money Market Fund from October 1, 2012 to March 31, 2013. It also shows how much a $1,000 investment would be worth at the close of the period, assuming actual returns and expenses.
| | | |
| Expenses and Value of a $1,000 Investment | |
| assuming actual returns for the six months ended March 31, 2013 |
| |
| Expenses paid per $1,000† | $ | | .00 |
| Ending value (after expenses) | $ | 1,000.50 |
COMPARING YOUR FUND’S EXPENSES WITH THOSE OF OTHER FUNDS (Unaudited)
Using the SEC’s method to compare expenses
The Securities and Exchange Commission (SEC) has established guidelines to help investors assess fund expenses. Per these guidelines, the table below shows your fund’s expenses based on a $1,000 investment, assuming a hypothetical 5% annualized return. You can use this information to compare the ongoing expenses (but not transaction expenses or total cost) of investing in the fund with those of other funds.All mutual fund shareholder reports will provide this information to help you make this comparison. Please note that you cannot use this information to estimate your actual ending account balance and expenses paid during the period.
| | | |
| Expenses and Value of a $1,000 Investment | |
| assuming a hypothetical 5% annualized return for the six months ended March 31, 2013 |
| |
| Expenses paid per $1,000† | $ | | .00 |
| Ending value (after expenses) | $ | 1,024.93 |
| |
| † Expenses are equal to the fund’s annualized expense ratio of .00%, multiplied by the average account value over the |
| period, multiplied by 182/365 (to reflect the one-half year period). |
The Fund 5
STATEMENT OF INVESTMENTS
March 31, 2013
| | | | |
| | | Principal | | |
| | Negotiable Bank Certificates of Deposit—19.2% | Amount ($) | | Value ($) |
| | Bank of Montreal (Yankee) | | | |
| | 0.18%, 4/1/13 | 50,000,000 | | 50,000,000 |
| | Mizuho Corporate Bank (Yankee) | | | |
| | 0.16%, 4/8/13 | 40,000,000 | | 40,000,000 |
| | Norinchukin Bank (Yankee) | | | |
| | 0.17%, 4/9/13 | 50,000,000 | | 50,001,221 |
| | Sumitomo Mitsui Banking Corp. (Yankee) | | | |
| | 0.17%, 4/5/13 | 40,000,000 | a | 40,000,000 |
| | Toronto Dominion Bank (Yankee) | | | |
| | 0.18%, 4/26/13 | 50,000,000 | | 50,000,000 |
| | Total Negotiable Bank Certificates of Deposit | | | |
| | (cost $230,001,221) | | | 230,001,221 |
| |
| | Commercial Paper—4.2% | | | |
| | Bank of Nova Scotia | | | |
| | 0.08%, 4/1/13 | | | |
| | (cost $50,000,000) | 50,000,000 | | 50,000,000 |
| |
| Asset-Backed Commercial Paper—4.2% | | | |
| | Gotham Funding Corp. | | | |
| | 0.18%, 4/18/13 | | | |
| | (cost $49,995,750) | 50,000,000 | a | 49,995,750 |
| |
| | Time Deposits—16.7% | | | |
| | Canadian Imperial Bank of Commerce (Grand Cayman) | | | |
| | 0.11%, 4/1/13 | 50,000,000 | | 50,000,000 |
| | Royal Bank of Canada (Toronto) | | | |
| | 0.08%, 4/1/13 | 50,000,000 | | 50,000,000 |
| | Skandinaviska Enskilda Banken (Grand Cayman) | | | |
| | 0.13%, 4/1/13 | 50,000,000 | | 50,000,000 |
| | Swedbank (Grand Cayman) | | | |
| | 0.11%, 4/1/13 | 50,000,000 | | 50,000,000 |
| | Total Time Deposits | | | |
| | (cost $200,000,000) | | | 200,000,000 |
| |
| | U.S. Government Agency—2.1% | | | |
| | Straight-A Funding LLC | | | |
| | 0.19%, 4/15/13 | | | |
| | (cost $24,998,153) | 25,000,000 | a | 24,998,153 |
6
| | | | | | |
| | | | Principal | | | |
| | U.S. Treasury Bills—41.7% | | Amount ($) | | Value ($) | |
| | 0.08%, 4/25/13 | | | | | |
| | (cost $499,975,000) | | 500,000,000 | | 499,975,000 | |
| |
| | U.S. Treasury Notes—8.6% | | | | | |
| | 0.08%, 4/30/13—5/31/13 | | | | | |
| | (cost $102,523,562) | | 102,000,000 | | 102,523,562 | |
| |
| | Repurchase Agreement—3.3% | | | | | |
| | HSBC USA Inc. | | | | | |
| | 0.16%, dated 3/28/13, due 4/1/13 in the amount of | | | | | |
| $40,000,711 (fully collateralized by $40,865,000 | | | | | |
| | U.S. Treasury Notes, 0.25%, due 12/15/15, | | | | | |
| | value $40,804,413) (cost $40,000,000) | | 40,000,000 | | 40,000,000 | |
| | Total Investments (cost $1,197,493,686) | | 100.0 | % | 1,197,493,686 | |
| | Liabilities, Less Cash and Receivables | | (.0 | %) | (565,162 | ) |
| | Net Assets | | 100.0 | % | 1,196,928,524 | |
| a | Securities exempt from registration pursuant to Rule 144A under the Securities Act of 1933.These securities may be resold in transactions exempt from registration, normally to qualified institutional buyers.At March 31, 2013, these securities amounted to $114,993,903 or 9.6% of net assets. |
| | | |
| Portfolio Summary (Unaudited)† | | |
| |
| | Value (%) | | Value (%) |
| U.S. Government/Agency | 52.4 | Repurchase Agreement | 3.3 |
| Banking | 40.1 | | |
| Asset-Backed/Banking | 4.2 | | 100.0 |
| |
| † Based on net assets. | | | |
| See notes to financial statements. | | | |
The Fund 7
STATEMENT OF ASSETS AND LIABILITIES
March 31, 2013
| | |
| | Cost | Value |
| Assets ($): | | |
| Investments in securities—See Statement | | |
| of Investments (including Repurchase Agreement of | | |
| $40,000,000)—Note 1(b) | 1,197,493,686 | 1,197,493,686 |
| Interest receivable | | 1,275,196 |
| Due from The Dreyfus Corporation and affiliates—Note 2(b) | | 6,120 |
| | | 1,198,775,002 |
| Liabilities ($): | | |
| Cash overdraft due to Custodian | | 1,846,478 |
| Net Assets ($) | | 1,196,928,524 |
| Composition of Net Assets ($): | | |
| Paid-in capital | | 1,196,928,334 |
| Accumulated net realized gain (loss) on investments | | 190 |
| Net Assets ($) | | 1,196,928,524 |
| Shares Outstanding | | |
| (unlimited number of $.001 par value shares of | | |
| Beneficial Interest authorized) | | 1,196,928,334 |
| Net Asset Value, offering and redemption price per share ($) | | 1.00 |
| See notes to financial statements. | | |
8
STATEMENT OF OPERATIONS
Year Ended March 31, 2013
| | |
| Investment Income ($): | | |
| Interest Income | 1,431,480 | |
| Expenses: | | |
| Management fee—Note 2(a) | 1,285,708 | |
| Trustees’ fees—Note 2(a,c) | 39,987 | |
| Legal fees—Note 2(a) | 4,240 | |
| Total Expenses | 1,329,935 | |
| Less—reduction in expenses due to undertaking—Note 2(a) | (1,285,708 | ) |
| Less—Trustees’ fees reimbursed by the Manager—Note 2(a) | (39,987 | ) |
| Less—Legal fees reimbursed by the Manager—Note 2(a) | (4,240 | ) |
| Net Expenses | — | |
| Investment Income—Net | 1,431,480 | |
| Net Realized Gain (Loss) on Investments—Note 1(b) ($) | 3,535 | |
| Net Increase in Net Assets Resulting from Operations | 1,435,015 | |
| |
| See notes to financial statements. | | |
The Fund 9
STATEMENT OF CHANGES IN NET ASSETS
| | | | |
| | | | Year Ended March 31, | |
| | 2013 | | 2012 | |
| Operations ($): | | | | |
| Investment income—net | 1,431,480 | | 902,140 | |
| Net realized gain (loss) on investments | 3,535 | | (3,345 | ) |
| Net Increase (Decrease) in Net Assets | | | | |
| Resulting from Operations | 1,435,015 | | 898,795 | |
| Dividends to Shareholders from ($): | | | | |
| Investment income—net | (1,431,480 | ) | (902,140 | ) |
| Beneficial Interest Transactions ($1.00 per share): | | | | |
| Net proceeds from shares sold | 6,840,617,596 | | 8,789,676,683 | |
| Cost of shares redeemed | (6,955,131,330 | ) | (8,430,254,519 | ) |
| Increase (Decrease) in Net Assets from | | | | |
| Beneficial Interest Transactions | (114,513,734 | ) | 359,422,164 | |
| Total Increase (Decrease) in Net Assets | (114,510,199 | ) | 359,418,819 | |
| Net Assets ($): | | | | |
| Beginning of Period | 1,311,438,723 | | 952,019,904 | |
| End of Period | 1,196,928,524 | | 1,311,438,723 | |
| |
| See notes to financial statements. | | | | |
10
FINANCIAL HIGHLIGHTS
The following table describes the performance for the fiscal periods indicated. Total return shows how much your investment in the fund would have increased (or decreased) during each period, assuming you had reinvested all dividends and distributions.These figures have been derived from the fund’s financial statements.
| | | | | | | | | | |
| | | | | | Year Ended March 31, | | | |
| | 2013 | | 2012 | | 2011 | | 2010 | | 2009 | |
| Per Share Data ($): | | | | | | | | | | |
| Net asset value, beginning of period | 1.00 | | 1.00 | | 1.00 | | 1.00 | | 1.00 | |
| Investment Operations: | | | | | | | | | | |
| Investment income—net | .001 | | .001 | | .002 | | .001 | | .015 | |
| Distributions: | | | | | | | | | | |
| Dividends from | | | | | | | | | | |
| investment income—net | (.001 | ) | (.001 | ) | (.002 | ) | (.001 | ) | (.015 | ) |
| Net asset value, end of period | 1.00 | | 1.00 | | 1.00 | | 1.00 | | 1.00 | |
| Total Return (%) | .11 | | .08 | | .21 | | .14 | | 1.50 | |
| Ratios/Supplemental Data (%): | | | | | | | | | | |
| Ratio of total expenses | | | | | | | | | | |
| to average net assets | .10 | | .10 | | .10 | | .12 | | .12 | |
| Ratio of net expenses | | | | | | | | | | |
| to average net assets | .00 | | .00 | | .00 | | .02 | | .02 | |
| Ratio of net investment income | | | | | | | | | | |
| to average net assets | .11 | | .08 | | .20 | | .14 | | 1.59 | |
| Net Assets, end of period | | | | | | | | | | |
| ($ x 1,000) | 1,196,929 | | 1,311,439 | | 952,020 | | 739,015 | | 725,259 | |
| |
| See notes to financial statements. | | | | | | | | | | |
The Fund 11
NOTES TO FINANCIAL STATEMENTS
NOTE 1—Significant Accounting Policies:
Dreyfus Institutional Preferred Plus Money Market Fund (the “fund”) is a separate diversified series of Dreyfus Institutional Preferred Money Market Funds (the “Company”), which is registered under the Investment Company Act of 1940, as amended (the “Act”), as an open-end management investment company currently offering two series, including the fund.The fund’s investment objective is to seek as high a level of current income as is consistent with the preservation of capital and the maintenance of liquidity.The fund serves as an investment vehicle for certain other Dreyfus funds as well as for other institutional investors. At March 31, 2013, all of the fund’s outstanding shares were held by other Dreyfus funds.The Dreyfus Corporation (the “Manager” or “Dreyfus”), a wholly-owned subsidiary of The Bank of New York Mellon Corporation (“BNY Mellon”), serves as the fund’s investment adviser. MBSC Securities Corporation (the “Distributor”), a wholly-owned subsidiary of the Manager, is the distributor of the fund’s shares, which are sold to the public without a sales charge.
It is the fund’s policy to maintain a continuous net asset value per share of $1.00; the fund has adopted certain investment, portfolio valuation and dividend and distribution policies to enable it to do so.There is no assurance, however, that the fund will be able to maintain a stable net asset value per share of $1.00.
The Company accounts separately for the assets, liabilities and operations of each series. Expenses directly attributable to each series are charged to that series’ operations; expenses which are applicable to all series are allocated among them on a pro rata basis.
The Financial Accounting Standards Board (“FASB”) Accounting Standards Codification is the exclusive reference of authoritative U.S. generally accepted accounting principles (“GAAP”) recognized by the FASB to be applied by nongovernmental entities. Rules and interpretive releases of the Securities and Exchange Commission (“SEC”) under authority of federal laws are also sources of authoritative GAAP for SEC registrants. The fund’s financial statements are prepared in accordance with GAAP, which may require the use of management estimates and assumptions.Actual results could differ from those estimates.
12
The Company enters into contracts that contain a variety of indemnifications.The fund’s maximum exposure under these arrangements is unknown.The fund does not anticipate recognizing any loss related to these arrangements.
(a) Portfolio valuation: Investments in securities are valued at amortized cost in accordance with Rule 2a-7 under the Act. If amortized cost is determined not to approximate market value, the fair value of the portfolio securities will be determined by procedures established by and under the general supervision of the Company’s Board of Trustees (the “Board”).
The fair value of a financial instrument is the amount that would be received to sell an asset or paid to transfer a liability in an orderly transaction between market participants at the measurement date (i.e., the exit price). GAAP establishes a fair value hierarchy that prioritizes the inputs of valuation techniques used to measure fair value.This hierarchy gives the highest priority to unadjusted quoted prices in active markets for identical assets or liabilities (Level 1 measurements) and the lowest priority to unobservable inputs (Level 3 measurements).
Additionally, GAAP provides guidance on determining whether the volume and activity in a market has decreased significantly and whether such a decrease in activity results in transactions that are not orderly. GAAP requires enhanced disclosures around valuation inputs and techniques used during annual and interim periods.
Various inputs are used in determining the value of the fund’s investments relating to fair value measurements.These inputs are summarized in the three broad levels listed below:
Level 1—unadjusted quoted prices in active markets for identical investments.
Level 2—other significant observable inputs (including quoted prices for similar investments, interest rates, prepayment speeds, credit risk, etc.).
Level 3—significant unobservable inputs (including the fund’s own assumptions in determining the fair value of investments).
The Fund 13
NOTES TO FINANCIAL STATEMENTS (continued)
The inputs or methodology used for valuing securities are not necessarily an indication of the risk associated with investing in those securities. For example, money market securities are valued using amortized cost, in accordance with rules under the Act. Generally, amortized cost approximates the current fair value of a security, but since the value is not obtained from a quoted price in an active market, such securities are reflected within Level 2 of the fair value hierarchy.
The following is a summary of the inputs used as of March 31, 2013 in valuing the fund’s investments:
| |
| | Short-Term |
| Valuation Inputs | Investments ($)† |
| Level 1—Unadjusted Quoted Prices | — |
| Level 2—Other Significant Observable Inputs | 1,197,493,686 |
| Level 3—Significant Unobservable Inputs | — |
| Total | 1,197,493,686 |
| † See Statement of Investments for additional detailed categorizations. | |
At March 31, 2013, there were no transfers between Level 1 and Level 2 of the fair value hierarchy.
(b) Securities transactions and investment income: Securities transactions are recorded on a trade date basis. Interest income, adjusted for accretion of discount and amortization of premium on investments, is earned from settlement date and is recognized on the accrual basis. Realized gains and losses from securities transactions are recorded on the identified cost basis. Cost of investments represents amortized cost.
The fund may enter into repurchase agreements with financial institutions, deemed to be creditworthy by the Manager, subject to the seller’s agreement to repurchase and the fund’s agreement to resell such securities at a mutually agreed upon price. Pursuant to the terms of the repurchase agreement, such securities must have an aggregate market value greater than or equal to the terms of the repurchase price plus accrued interest at all times. If the value of the underlying securities falls below the value of the repurchase price plus accrued interest, the fund will require the seller to deposit additional collateral by the next business day. If the request for additional collateral is not met, or
14
the seller defaults on its repurchase obligation, the fund maintains its right to sell the underlying securities at market value and may claim any resulting loss against the seller.
(c) Dividends to shareholders: It is policy of the fund to declare dividends daily from investment income-net. Such dividends are paid monthly. Dividends from net realized capital gains, if any, are normally declared and paid annually, but the fund may make distributions on a more frequent basis to comply with the distribution requirements of the Internal Revenue Code of 1986, as amended (the “Code”).To the extent that net realized capital gains can be offset by capital loss carryovers, it is the policy of the fund not to distribute such gains.
(d) Federal income taxes: It is the policy of the fund to continue to qualify as a regulated investment company, if such qualification is in the best interests of its shareholders, by complying with the applicable provisions of the Code, and to make distributions of taxable income sufficient to relieve it from substantially all federal income and excise taxes.
As of and during the period ended March 31, 2013, the fund did not have any liabilities for any uncertain tax positions.The fund recognizes interest and penalties, if any, related to uncertain tax positions as income tax expense in the Statement of Operations. During the period, the fund did not incur any interest or penalties.
Each tax year in the four-year period ended March 31, 2013 remains subject to examination by the Internal Revenue Service and state taxing authorities.
At March 31, 2013, the components of accumulated earnings on a tax basis were substantially the same as for financial reporting purposes.
The tax character of distributions paid to shareholders during the fiscal periods ended March 31, 2013 and March 31, 2012 were all ordinary income.
At March 31, 2013, the cost of investments for federal income tax purposes was substantially the same as the cost for financial reporting purposes (see the Statement of Investments).
The Fund 15
NOTES TO FINANCIAL STATEMENTS (continued)
NOTE 2—Management Fee and Other Transactions With Affiliates:
(a) Pursuant to a management agreement with the Manager, the management fee is computed at the annual rate of .10% of the value of the fund’s average daily net assets and is payable monthly. Pursuant to the management agreement, the Manager has agreed to pay all of the fund’s expenses except the management fee, taxes, brokerage commissions, Trustees’ fees, fees and expenses of independent counsel of the fund and extraordinary expenses. In addition, the Manager has agreed to reduce its management fee in an amount equal to the Trustees’ fees and expenses of independent counsel of the fund. During the period ended March 31, 2013, fees reimbursed by the Manager amounted to $44,227.
The Manager had undertaken from April 1, 2012 through March 31, 2013 to waive its management fee.The reduction in expenses, pursuant to the undertaking, amounted to $1,285,708 during the period ended March 31, 2013. The waiver is voluntary, not contractual and can be terminated at any time.
(b)The components of “Due fromThe Dreyfus Corporation and affiliates” in the Statement of Assets and Liabilities consist of: management fees $105,038, which are offset against an expense reimbursement currently in effect in the amount $111,158.
(c) Each Board member also serves as a Board member of other funds within the Dreyfus complex. Annual retainer fees and attendance fees are allocated to each fund based on net assets.
16
REPORT OF INDEPENDENT REGISTERED
PUBLIC ACCOUNTING FIRM
Shareholders and Board of Trustees
Dreyfus Institutional Preferred Plus Money Market Fund
We have audited the accompanying statement of assets and liabilities, including the statement of investments, of Dreyfus Institutional Preferred Plus Money Market Fund (one of the series comprising Dreyfus Institutional Preferred Money Market Funds) as of March 31, 2013, and the related statement of operations for the year then ended, the statement of changes in net assets for each of the two years in the period then ended, and the financial highlights for each of the five years in the period then ended.These financial statements and financial highlights are the responsibility of the Fund’s management. Our responsibility is to express an opinion on these financial statements and financial highlights based on our audits.
We conducted our audits in accordance with the standards of the Public Company Accounting Oversight Board (United States).Those standards require that we plan and perform the audit to obtain reasonable assurance about whether the financial statements and financial highlights are free of material misstatement.We were not engaged to perform an audit of the Fund’s internal control over financial reporting. Our audits included consideration of internal control over financial reporting as a basis for designing audit procedures that are appropriate in the circumstances, but not for the purpose of expressing an opinion on the effectiveness of the Fund’s internal control over financial reporting. Accordingly, we express no such opinion.An audit also includes examining, on a test basis, evidence supporting the amounts and disclosures in the financial statements and financial highlights, assessing the accounting principles used and significant estimates made by management, and evaluating the overall financial statement presentation. Our procedures included confirmation of securities owned as of March 31, 2013 by correspondence with the custodian and others. We believe that our audits provide a reasonable basis for our opinion.
In our opinion, the financial statements and financial highlights referred to above present fairly, in all material respects, the financial position of Dreyfus Institutional Preferred Plus Money Market Fund at March 31, 2013, the results of its operations for the year then ended, the changes in its net assets for each of the two years in the period then ended, and the financial highlights for each of the five years in the period then ended, in conformity with U.S. generally accepted accounting principles.

New York, New York
May 23, 2013
The Fund 17
IMPORTANT TAX INFORMATION (Unaudited)
For federal tax purposes the fund hereby reports 85.23% of ordinary income dividends paid during the fiscal year ended March 31, 2013 as qualifying “interest related dividends.”
18
BOARD MEMBERS INFORMATION (Unaudited)
|
| Joseph S. DiMartino (69) |
| Chairman of the Board (1997) |
| Principal Occupation During Past 5Years: |
| • Corporate Director and Trustee |
| Other Public Company Board Memberships During Past 5Years: |
| • CBIZ (formerly, Century Business Services, Inc.), a provider of outsourcing functions for small |
| and medium size companies, Director (1997-present) |
| • Sunair Services Corporation, a provider of certain outdoor-related services to homes and |
| businesses, Director (2005-2009) |
| • The Newark Group, a provider of a national market of paper recovery facilities, paperboard |
| mills and paperboard converting plants, Director (2000-2010) |
| No. of Portfolios for which Board Member Serves: 142 |
| ——————— |
| Clifford L. Alexander, Jr. (79) |
| Board Member (1997) |
| Principal Occupation During Past 5Years: |
| • President of Alexander & Associates, Inc., a management consulting firm ( January 1981-present) |
| No. of Portfolios for which Board Member Serves: 41 |
| ——————— |
| Gordon J. Davis (71) |
| Board Member (2012) |
| Principal Occupation During Past 5Years: |
| • Partner in the law firm of Venable LLP (2012-present) |
| • Partner in the law firm of Dewey & LeBoeuf LLP (1994-2012) |
| Other Public Company Board Memberships During Past 5Years: |
| • Consolidated Edison, Inc., a utility company, Director (1997-present) |
| • The Phoenix Companies, Inc., a life insurance company, Director (2000-present) |
| No. of Portfolios for which Board Member Serves: 46 |
| ——————— |
| Whitney I. Gerard (78) |
| Board Member (2003) |
| Principal Occupation During Past 5Years: |
| • Partner of Chadbourne & Parke LLP |
| No. of Portfolios for which Board Member Serves: 22 |
The Fund 19
BOARD MEMBERS INFORMATION (Unaudited) (continued)
|
| Nathan Leventhal (70) |
| Board Member (2012) |
| Principal Occupation During Past 5Years: |
| • Chairman of the Avery-Fisher Artist Program (November 1997-present) |
| • Commissioner, NYC Planning Commission (March 2007-November 2011) |
| Other Public Company Board Memberships During Past 5Years: |
| • Movado Group, Inc., Director (2003-present) |
| No. of Portfolios for which Board Member Serves: 39 |
| ——————— |
| George L. Perry (79) |
| Board Member (2003) |
| Principal Occupation During Past 5Years: |
| • Economist and Senior Fellow at Brookings Institution |
| No. of Portfolios for which Board Member Serves: 22 |
| ——————— |
| |
| Benaree Pratt Wiley (66) |
| Board Member (2012) |
| Principal Occupation During Past 5Years: |
| • Principal,TheWiley Group, a firm specializing in strategy and business development (2005-present) |
| Other Public Company Board Memberships During Past 5Years: |
| • CBIZ (formerly, Century Business Services, Inc.), a provider of outsourcing functions for small |
| and medium size companies, Director (2008-present) |
| No. of Portfolios for which Board Member Serves: 56 |
| ——————— |
Once elected all Board Members serve for an indefinite term, but achieve Emeritus status upon reaching age 80.The address of the Board Members and Officers is c/o The Dreyfus Corporation, 200 Park Avenue, NewYork, NewYork 10166.Additional information about the Board Members is available in the fund’s Statement of Additional Information which can be obtained from Dreyfus free of charge by calling this toll free number: 1-800-DREYFUS.
David W. Burke, Emeritus Board Member
Arthur A. Hartman, Emeritus Board Member
20
OFFICERS OF THE FUND (Unaudited)

The Fund 21
OFFICERS OF THE FUND (Unaudited) (continued)
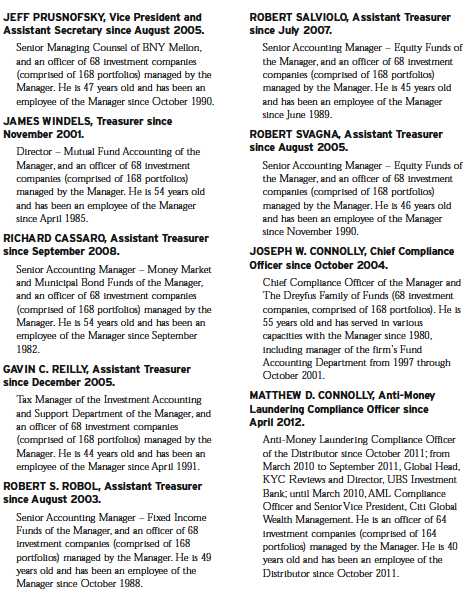
22
Item 2. Code of Ethics.
The Registrant has adopted a code of ethics that applies to the Registrant's principal executive officer, principal financial officer, principal accounting officer or controller, or persons performing similar functions. There have been no amendments to, or waivers in connection with, the Code of Ethics during the period covered by this Report.
Item 3. Audit Committee Financial Expert.
The Registrant's Board has determined that Joseph S. Dimartino, a member of the Audit Committee of the Board, is an audit committee financial expert as defined by the Securities and Exchange Commission (the "SEC"). Joseph S. DiMartino is "independent" as defined by the SEC for purposes of audit committee financial expert determinations.
Item 4. Principal Accountant Fees and Services.
(a) Audit Fees. The aggregate fees billed for each of the last two fiscal years (the "Reporting Periods") for professional services rendered by the Registrant's principal accountant (the "Auditor") for the audit of the Registrant's annual financial statements or services that are normally provided by the Auditor in connection with the statutory and regulatory filings or engagements for the Reporting Periods, were $61,714 in 2012 and $63,188 in 2013.
(b) Audit-Related Fees. The aggregate fees billed in the Reporting Periods for assurance and related services by the Auditor that are reasonably related to the performance of the audit of the Registrant's financial statements and are not reported under paragraph (a) of this Item 4 were $12,000 in 2012 and $12,000 in 2013. These services consisted of one or more of the following: (i) agreed upon procedures related to compliance with Internal Revenue Code section 817(h), (ii) security counts required by Rule 17f-2 under the Investment Company Act of 1940, as amended, (iii) advisory services as to the accounting or disclosure treatment of Registrant transactions or events and (iv) advisory services to the accounting or disclosure treatment of the actual or potential impact to the Registrant of final or proposed rules, standards or interpretations by the Securities and Exchange Commission, the Financial Accounting Standards Boards or other regulatory or standard-setting bodies.
The aggregate fees billed in the Reporting Periods for non-audit assurance and related services by the Auditor to the Registrant's investment adviser (not including any sub-investment adviser whose role is primarily portfolio management and is subcontracted with or overseen by another investment adviser), and any entity controlling, controlled by or under common control with the investment adviser that provides ongoing services to the Registrant ("Service Affiliates"), that were reasonably related to the performance of the annual audit of the Service Affiliate, which required pre-approval by the Audit Committee were $0 in 2012 and $0 in 2013.
(c) Tax Fees. The aggregate fees billed in the Reporting Periods for professional services rendered by the Auditor for tax compliance, tax advice, and tax planning ("Tax Services") were $5,850 in 2012 and 7,127 in 2013. These services consisted of: (i) review or preparation of U.S. federal, state, local and excise tax returns; (ii) U.S. federal, state and local tax planning, advice and assistance regarding statutory, regulatory or administrative developments; (iii) tax advice regarding tax qualification matters and/or treatment of various financial instruments held or proposed to be acquired or held. The aggregate fees billed in the Reporting Periods for Tax Services by the Auditor to Service Affiliates, which required pre-approval by the Audit Committee were $0 in 2012 and $0 in 2013.
(d) All Other Fees. The aggregate fees billed in the Reporting Periods for products and services provided by the Auditor, other than the services reported in paragraphs (a) through (c) of this Item, were $4,304 in 2012 and $12 in 2013. [These services consisted of a review of the Registrant's anti-money laundering program].
The aggregate fees billed in the Reporting Periods for Non-Audit Services by the Auditor to Service Affiliates, other than the services reported in paragraphs (b) through (c) of this Item, which required pre-approval by the Audit Committee, were $0 in 2012 and $200,000 in 2013.
(e)(1) Audit Committee Pre-Approval Policies and Procedures. The Registrant's Audit Committee has established policies and procedures (the "Policy") for pre-approval (within specified fee limits) of the Auditor's engagements for non-audit services to the Registrant and Service Affiliates without specific case-by-case consideration. The pre-approved services in the Policy can include pre-approved audit services, pre-approved audit-related services, pre-approved tax services and pre-approved all other services. Pre-approval considerations include whether the proposed services are compatible with maintaining the Auditor's independence. Pre-approvals pursuant to the Policy are considered annually.
(e)(2) Note: None of the services described in paragraphs (b) through (d) of this Item 4 were approved by the Audit Committee pursuant to paragraph (c)(7)(i)(C) of Rule 2-01 of Regulation S-X.
(f) None of the hours expended on the principal accountant's engagement to audit the registrant's financial statements for the most recent fiscal year were attributed to work performed by persons other than the principal account's full-time, permanent employees.
Non-Audit Fees. The aggregate non-audit fees billed by the Auditor for services rendered to the Registrant, and rendered to Service Affiliates, for the Reporting Periods were $30,258,894 in 2012 and $43,308,358 in 2013.
Auditor Independence. The Registrant's Audit Committee has considered whether the provision of non-audit services that were rendered to Service Affiliates, which were not pre-approved (not requiring pre-approval), is compatible with maintaining the Auditor's independence.
Item 5. Audit Committee of Listed Registrants.
Not applicable. [CLOSED-END FUNDS ONLY]
Item 6. Investments.
(a) Not applicable.
Item 7. Disclosure of Proxy Voting Policies and Procedures for Closed-End Management Investment Companies.
Not applicable. [CLOSED-END FUNDS ONLY]
Item 8. Portfolio Managers of Closed-End Management Investment Companies.
Not applicable. [CLOSED-END FUNDS ONLY, beginning with reports for periods ended on and after December 31, 2005]
Item 9. Purchases of Equity Securities by Closed-End Management Investment Companies and Affiliated Purchasers.
Not applicable. [CLOSED-END FUNDS ONLY]
Item 10. Submission of Matters to a Vote of Security Holders.
There have been no material changes to the procedures applicable to Item 10.
Item 11. Controls and Procedures.
(a) The Registrant's principal executive and principal financial officers have concluded, based on their evaluation of the Registrant's disclosure controls and procedures as of a date within 90 days of the filing date of this report, that the Registrant's disclosure controls and procedures are reasonably designed to ensure that information required to be disclosed by the Registrant on Form N-CSR is recorded, processed, summarized and reported within the required time periods and that information required to be disclosed by the Registrant in the reports that it files or submits on Form N-CSR is accumulated and communicated to the Registrant's management, including its principal executive and principal financial officers, as appropriate to allow timely decisions regarding required disclosure.
(b) There were no changes to the Registrant's internal control over financial reporting that occurred during the second fiscal quarter of the period covered by this report that have materially affected, or are reasonably likely to materially affect, the Registrant's internal control over financial reporting.
Item 12. Exhibits.
(a)(1) Code of ethics referred to in Item 2.
(a)(2) Certifications of principal executive and principal financial officers as required by Rule 30a-2(a) under the Investment Company Act of 1940.
(a)(3) Not applicable.
(b) Certification of principal executive and principal financial officers as required by Rule 30a-2(b) under the Investment Company Act of 1940.
SIGNATURES
Pursuant to the requirements of the Securities Exchange Act of 1934 and the Investment Company Act of 1940, the Registrant has duly caused this Report to be signed on its behalf by the undersigned, thereunto duly authorized.
Dreyfus Institutional Preferred Money Market Funds
By: /s/ Bradley J. Skapyak |
Bradley J. Skapyak, President |
Date: | May 17, 2013 |
|
Pursuant to the requirements of the Securities Exchange Act of 1934 and the Investment Company Act of 1940, this Report has been signed below by the following persons on behalf of the Registrant and in the capacities and on the dates indicated. |
|
By: /s/ Bradley J. Skapyak |
Bradley J. Skapyak, President |
Date: | May 17, 2013 |
|
By: /s/ James Windels |
James Windels, Treasurer |
Date: | May 17, 2013 |
|
EXHIBIT INDEX
(a)(1) Code of ethics referred to in Item 2.
(a)(2) Certifications of principal executive and principal financial officers as required by Rule 30a-2(a) under the Investment Company Act of 1940. (EX-99.CERT)
(b) Certification of principal executive and principal financial officers as required by Rule 30a-2(b) under the Investment Company Act of 1940. (EX-99.906CERT)