FORM 6-K/A
SECURITIES AND EXCHANGE COMMISSION
Washington, D.C. 20549
Report of Foreign Private Issuer
Pursuant to Rule 13a-16 or 15d-16 of
the Securities Exchange Act of 1934
For the month ofMay, 2017
Brazilian Distribution Company
(Translation of Registrant’s Name Into English)
Av. Brigadeiro Luiz Antonio,
3142 São Paulo, SP 01402-901
Brazil
(Address of Principal Executive Offices)
(Indicate by check mark whether the registrant files or will file annual reports under cover of Form 20-F or Form 40-F)
Form 20-F X Form 40-F
(Indicate by check mark if the registrant is submitting the Form 6-K in paper as permitted by Regulation S-T Rule
101 (b) (1)):
Yes ___ No X
(Indicate by check mark if the registrant is submitting the Form 6-K in paper as permitted by Regulation S-T Rule
101 (b) (7)):
Yes ___ No X
(Indicate by check mark whether the registrant by furnishing the information contained in this Form is also thereby furnishing the information to the Commission pursuant to Rule 12g3-2(b) under the Securities Exchange Act of 1934.)
Yes ___ No X
| (FreeTranslation into English from the Original Individual and Consolidated Ernst & Young auditores independentes |
![]()
A free translation from Portuguese into English of Independent Auditor’s Report on Review of Quarterly Financial Information
Independent auditor’s report on review of quarterly financial information
To the Shareholders, Directors and Officers
Companhia Brasileira de Distribuição
São Paulo – SP – Brazil
Introduction
We have reviewed the accompanying individual and consolidated interim financial information of Companhia Brasileira de Distribuição (“Company”), contained in the Quarterly Information Form (ITR) for the quarter ended March 31, 2017, which comprise the balance sheet as of March 31, 2017 and the related statements of income, comprehensive income, changes in equity and cash flows for the three-month period then ended, including other explanatory information.
Management is responsible for the preparation of individual and consolidated interim financial information in accordance with Accounting Pronouncement CPC 21 (R1) -–Demonstração Intermediária (“CPC 21 (R1)”)and International Accounting Standard IAS 34 - Interim Financial Reporting (“IAS 34”), issued by the International Accounting Standards Board (IASB), as well as for the presentation of this information in a manner consistent with the standards issued by the Brazilian Securities and Exchange Commission (CVM) applicable to the preparation of the Quarterly Information Form (ITR). Our responsibility is to express a conclusion on this interim financial information based on our review.
Scope of the review
We conducted our review in accordance with Brazilian and International Standards on Review Engagements (NBC TR 2410Revisão de Informações Intermediárias Executada pelo Auditor da Entidade) and ISRE 2410 - Review of Interim Financial Information Performed by the Independent Auditor of the Entity). A review of interim financial information consists of making inquiries, primarily of persons responsible for financial and accounting matters, and applying analytical and other review procedures. A review is substantially less in scope than an audit conducted in accordance with Brazilian and International Standards on Auditing and consequently does not enable us to obtain assurance that we would become aware of all significant matters that might be identified in an audit. Accordingly, we do not express an audit opinion.
Conclusion on the individual and consolidated interim financial information
Based on our review, nothing has come to our attention that causes us to believe that the accompanying individual and consolidated interim financial information included in the quarterly information referred to above is not prepared, in all material respects, in accordance with CPC 21 (R1) and IAS 34, applicable to the preparation of quarterly financial information (ITR), consistently with the rules issued by the CVM.
Other matters
Statements of value added
We have also reviewed the individual and consolidated statements of value added for the three-month period ended March 31, 2017, prepared under the responsibility of the Company’s management, the presentation of which in the interim financial information is required by the rules issued by the CVM applicable to preparation of Quarterly Financial Information (ITR), and considered as supplementary information under IFRS – International Financial Reporting Standards, which does not require the presentation of the statement of value added. These statements have been subject to the same review procedures previously described and, based on our review, nothing has come to our attention that causes us to believe that they are not prepared, in all material respects, in a manner consistent with the overall individual and consolidated interim financial information.
Audit of prior year financial statements and review of prior year interim financial information by other independent auditors
The audit of the individual and consolidated balance sheet as of December 31, 2016 and the review of individual and consolidated financial information for thethree-month period ended March 31, 2016,presented for comparison purposes, were conducted by other independent auditors, who issued an unqualified opinion and review thereon dated February 23, 2017, andJuly 27, 2016, respectively. As part of our review of individual and consolidated interim financial information for theperiod endedMarch31, 2017,we have reviewed the adjustments to the corresponding prior year figures in the individual and consolidated statements of income and cash flows for thethree-month period endedMarch 31, 2016 made for presentation of discontinued operations, as disclosed in Note 31, and nothing has come to our attention that would lead us to believe that such adjustments have not been made fairly, in all material respects. We have not been engaged to audit, review or apply any other procedures to the information referring to theindividual and consolidatedbalance sheet as of December 31, 2016 and to any otherindividual and consolidatedinterim financial information for theperiod endedMarch 31, 2016.Accordingly, we do not express an opinion or any other form of assurance on the referred to balance sheet or quarterly financial information taken as a whole.
São Paulo,April 27, 2017.
ERNST & YOUNG
Auditores Independentes S.S.
CRC-2SP015199/O-6
Antonio Humberto Barros dos Santos
Accountant CRC-1SP161745/O-3
(FREE TRANSLATION INTO ENGLISH FROM THE ORIGINAL PREVIOUSLY ISSUED IN PORTUGUESE)
ITR – Interim Financial Information – March 31, 2017 – COMPANHIA BRASILEIRA DE DISTRIBUIÇÃO |
Company Information | |
Capital Composition | 2 |
Individual Interim Financial Information |
|
Balance Sheet – Assets | 3 |
Balance Sheet – Liabilities | 4 |
Statement of Operations | 5 |
Statement of Comprehensive Income | 6 |
Statement of Cash Flows | 7 |
Statement of Changes in Shareholders’ Equity |
|
1/1/2017 to 3/31/2017 | 8 |
1/1/2016 to 3/31/2016 | 9 |
Statement of Value Added | 10 |
Consolidated Interim Financial Information |
|
Balance Sheet – Assets | 11 |
Balance Sheet – Liabilities | 12 |
Statement of Operations | 13 |
Statement of Comprehensive Income | 14 |
Statement of Cash Flows | 15 |
Statement of Changes in Shareholders’ Equity |
|
1/1/2017 to 3/31/2017 | 16 |
1/1/2016 to 3/31/2016 | 17 |
Statement of Value Added | 18 |
Comments on the Company`s Performance | 19 |
Notes to the Interim Financial Information | 39 |
(FREE TRANSLATION INTO ENGLISH FROM THE ORIGINAL PREVIOUSLY ISSUED IN PORTUGUESE)
ITR – Interim Financial Information – March 31, 2017 – COMPANHIA BRASILEIRA DE DISTRIBUIÇÃO |
Number of Shares (thousand) | Current Quarter 3/31/2017 |
Share Capital |
|
Common | 99,680 |
Preferred | 166,506 |
Total | 266,186 |
Treasury Shares |
|
Common | - |
Preferred | 233 |
Total | 233 |
(FREE TRANSLATION INTO ENGLISH FROM THE ORIGINAL PREVIOUSLY ISSUED IN PORTUGUESE)
ITR – Interim Financial Information – March 31,2017 – COMPANHIA BRASILEIRA DE DISTRIBUIÇÃO |
Companhia Brasileira de Distribuição
Individual Interim Financial Information / Balance Sheet - Assets | |||
R$ (in thousands) | |||
Code | Description | Current Year | Previous Year |
1 | Total Assets | 20,717,000 | 23,660,000 |
1.01 | Current Assets | 7,728,000 | 10,702,000 |
1.01.01 | Cash and Cash Equivalents | 1,200,000 | 4,496,000 |
1.01.03 | Accounts Receivable | 778,000 | 507,000 |
1.01.03.01 | Trade Receivables | 603,000 | 396,000 |
1.01.03.02 | Other Receivables | 175,000 | 111,000 |
1.01.04 | Inventories | 3,025,000 | 3,106,000 |
1.01.06 | Recoverable Taxes | 495,000 | 557,000 |
1.01.07 | Prepaid Expenses | 206,000 | 81,000 |
1.01.08 | Other Current Assets | 2,024,000 | 1,955,000 |
1.01.08.01 | Noncurrent Assets Held for Sale and Discontinued Operations | 1,970,000 | 1,901,000 |
1.01.08.03 | Other | 54,000 | 54,000 |
1.02 | Noncurrent Assets | 12,989,000 | 12,958,000 |
1.02.01 | Long-term Assets | 1,780,000 | 1,663,000 |
1.02.01.03 | Accounts Receivable | 82,000 | 81,000 |
1.02.01.03.02 | Other Receivables | 82,000 | 81,000 |
1.02.01.06 | Deferred Taxes | 160,000 | 155,000 |
1.02.01.07 | Prepaid Expenses | 12,000 | 13,000 |
1.02.01.08 | Receivables from Related Parties | 445,000 | 359,000 |
1.02.01.09 | Other Noncurrent Assets | 1,081,000 | 1,055,000 |
1.02.01.09.04 | Recoverable Taxes | 533,000 | 521,000 |
1.02.01.09.05 | Judicial Deposits | 548,000 | 534,000 |
1.02.02 | Investments | 3,204,000 | 3,059,000 |
1.02.02.01 | Investments in Associates and Subsidiaries | 3,181,000 | 3,036,000 |
1.02.02.01.02 | Investments in Subsidiaries | 3,181,000 | 3,036,000 |
1.02.02.02 | Investment properties | 23,000 | 23,000 |
1.02.03 | Property and Equipment, Net | 6,827,000 | 7,043,000 |
1.02.04 | Intangible Assets | 1,178,000 | 1,193,000 |
(FREE TRANSLATION INTO ENGLISH FROM THE ORIGINAL PREVIOUSLY ISSUED IN PORTUGUESE)
ITR – Interim Financial Information – March 31,2017 – COMPANHIA BRASILEIRA DE DISTRIBUIÇÃO |
Companhia Brasileira de Distribuição
Individual Interim Financial Information / Balance Sheet - Liabilities | |||
R$ (in thousands) | |||
Code | Description | Current Quarter | Previous Year |
2 | Total Liabilities | 20,717,000 | 23,660,000 |
2.01 | Current Liabilities | 6,787,000 | 9,510,000 |
2.01.01 | Payroll and Related Taxes | 425,000 | 446,000 |
2.01.02 | Trade Payables | 3,509,000 | 5,091,000 |
2.01.03 | Taxes and Contributions Payable | 145,000 | 189,000 |
2.01.04 | Borrowings and Financing | 1,884,000 | 2,763,000 |
2.01.05 | Other Liabilities | 822,000 | 1,018,000 |
2.01.05.01 | Payables to Related Parties | 465,000 | 510,000 |
2.01.05.02 | Other | 357,000 | 508,000 |
2.01.05.02.04 | Utilities | 16,000 | 11,000 |
2.01.05.02.05 | Rent Payable | 67,000 | 100,000 |
2.01.05.02.06 | Advertisement Payable | 35,000 | 40,000 |
2.01.05.02.07 | Pass-through to Third Parties | 15,000 | 15,000 |
2.01.05.02.08 | Financing Related to Acquisition of Assets | 26,000 | 32,000 |
2.01.05.02.09 | Deferred Revenue | 26,000 | 127,000 |
2.01.05.02.12 | Loalty Programs | 143,000 | 155,000 |
2.01.05.02.13 | Suppliers - structured program | 29,000 | 28,000 |
2.01.06 | Provisions | 2,000 | 3,000 |
2.02 | Noncurrent Liabilities | 3,936,000 | 4,290,000 |
2.02.01 | Borrowings and Financing | 2,437,000 | 2,775,000 |
2.02.02 | Other Liabilities | 611,000 | 600,000 |
2.02.02.02 | Other | 611,000 | 600,000 |
2.02.02.02.03 | Taxes Payable in Installments | 528,000 | 540,000 |
2.02.02.02.04 | Negative Equity from Investments | 47,000 | 22,000 |
2.02.02.02.05 | Financing Related to Acquisition of Assets | - | 4,000 |
2.02.02.02.07 | Other Accounts Payable | 36,000 | 34,000 |
2.02.04 | Provisions | 866,000 | 891,000 |
2.02.06 | Deferred Revenue | 22,000 | 24,000 |
2.03 | Shareholders’ Equity | 9,994,000 | 9,860,000 |
2.03.01 | Share Capital | 6,815,000 | 6,811,000 |
2.03.02 | Capital Reserves | 336,000 | 331,000 |
2.03.02.04 | Options Granted | 329,000 | 324,000 |
2.03.02.07 | Capital Reserve | 7,000 | 7,000 |
2.03.04 | Earnings Reserve | 2,718,000 | 2,718,000 |
2.03.04.01 | Legal Reserve | 426,000 | 426,000 |
2.03.04.05 | Earnings Retention Reserve | 234,000 | 234,000 |
2.03.04.10 | Expansion Reserve | 2,299,000 | 2,299,000 |
2.03.04.12 | Transactions with non-controlling interests | (91,000) | (91,000) |
2.03.04.14 | Settlement of Equity Instrument | (150,000) | (150,000) |
2.03.05 | Retained Earnings/ Accumulated Losses | 125,000 | - |
(FREE TRANSLATION INTO ENGLISH FROM THE ORIGINAL PREVIOUSLY ISSUED IN PORTUGUESE)
ITR – Interim Financial Information – March 31,2017 – COMPANHIA BRASILEIRA DE DISTRIBUIÇÃO |
Companhia Brasileira de Distribuição
Individual Interim Financial Information / Statement of Operations | |||
R$ (in thousands) | |||
Code | Description | Year To Date | Year To Date |
3.01 | Net Sales of Goods and/or Services | 6,458,000 | 5,752,000 |
3.02 | Cost of Goods Sold and/or Services Sold | (4,691,000) | (4,289,000) |
3.03 | Gross Profit | 1,767,000 | 1,463,000 |
3.04 | Operating Income/Expenses | (1,450,000) | (1,366,000) |
3.04.01 | Selling Expenses | (1,283,000) | (1,094,000) |
3.04.02 | General and Administrative Expenses | (174,000) | (134,000) |
3.04.05 | Other Operating Expenses | (128,000) | (168,000) |
3.04.05.01 | Depreciation/Amortization | (149,000) | (125,000) |
3.04.05.03 | Other Operating Expenses | 21,000 | (43,000) |
3.04.06 | Share of Profit of Subsidiaries and Associates | 135,000 | 30,000 |
3.05 | Profit before Financial Income (Expenses) and Taxes | 317,000 | 97,000 |
3.06 | Financial Income (Expenses) | (166,000) | (164,000) |
3.07 | Profit (loss) Before Income Tax and Social Contribution | 151,000 | (67,000) |
3.08 | Income Tax and Social Contribution | (8,000) | 26,000 |
3.08.01 | Current | (14,000) | 3,000 |
3.08.02 | Deferred | 6,000 | 23,000 |
3.09 | Net Income (loss) from Continued Operations | 143,000 | (41,000) |
3.10 | Net Income from Descontinued Operations | (18,000) | (10,000) |
3.10.01 | Net Income (loss) from Descontinued Operations | (18,000) | (10,000) |
3.11 | Net Income (loss) for the Period | 125,000 | (51,000) |
3.99 | Earnings per Share - (Reais/Share) | - | - |
3.99.01 | Basic Earnings per Share | 0.00000 | 0.00000 |
3.99.01.01 | Common | 0.44407 | (0.19454) |
3.99.01.02 | Preferred | 0.48848 | (0.19137) |
3.99.02.01 | Common | 0.44407 | (0.19454) |
3.99.02.02 | Preferred | 0.48701 | (0.19137) |
(FREE TRANSLATION INTO ENGLISH FROM THE ORIGINAL PREVIOUSLY ISSUED IN PORTUGUESE)
ITR – Interim Financial Information – March 31,2017 – COMPANHIA BRASILEIRA DE DISTRIBUIÇÃO |
Companhia Brasileira de Distribuição
Individual Interim Financial Information / Statement of Comprehensive Income | |||
R$ (in thousands) | |||
Code | Description | Year To Date | Year To Date |
4.01 | Net income (loss) for the Period | 125,000 | (51,000) |
4.02 | Other Comprehensive Income | - | 16,000 |
4.02.02 | Accumulative Translation Adjustment for the Period | - | 16,000 |
4.03 | Total Comprehensive Income for the Period | 125,000 | (35,000) |
(FREE TRANSLATION INTO ENGLISH FROM THE ORIGINAL PREVIOUSLY ISSUED IN PORTUGUESE)
ITR – Interim Financial Information – March 31,2017 – COMPANHIA BRASILEIRA DE DISTRIBUIÇÃO |
Companhia Brasileira de Distribuição
Individual Interim Financial Information / Statement of Cash Flows - Indirect Method | |||
R$ (in thousands) | |||
Code | Description | Year To Date | Year To Date |
6.01 | Net Cash Provided by Operating Activities | (1,723,000) | (1,075,000) |
6.01.01 | Cash Provided by the Operations | 304,000 | 249,000 |
6.01.01.01 | Net Income for the Period | 125,000 | (51,000) |
6.01.01.02 | Deferred Income and Social Contribution Taxes | (6,000) | (23,000) |
6.01.01.03 | Gain (Losses) on Disposal of Fixed Assets and Intangibles | (12,000) | 20,000 |
6.01.01.04 | Depreciation/Amortization | 160,000 | 135,000 |
6.01.01.05 | Interest and Inflation Adjustments | 196,000 | 146,000 |
6.01.01.06 | Adjustment to Present Value | - | 2,000 |
6.01.01.07 | Share of Profit (Loss) of Subsidiaries and Associates | (135,000) | (37,000) |
6.01.01.08 | Provision for Risks | (15,000) | 18,000 |
6.01.01.10 | Share-based Payment | 5,000 | 6,000 |
6.01.01.11 | Allowance for Doubtful Accounts | (2,000) | 2,000 |
6.01.01.13 | Provision for Obsolescence/Breakage | (7,000) | 26,000 |
6.01.01.14 | Other Operating Expenses | (2,000) | 8,000 |
6.01.01.15 | Deferred Revenue | (3,000) | (3,000) |
6.01.02 | Changes in Assets and Liabilities | (2,027,000) | (1,324,000) |
6.01.02.01 | Accounts Receivable | (205,000) | 185,000 |
6.01.02.02 | Inventories | 88,000 | 92,000 |
6.01.02.03 | Recoverable Taxes | 50,000 | 57,000 |
6.01.02.04 | Other Assets | (111,000) | (49,000) |
6.01.02.05 | Related Parties | (81,000) | (83,000) |
6.01.02.06 | Restricted Deposits for Legal Proceeding | (6,000) | (2,000) |
6.01.02.07 | Trade Payables | (1,583,000) | (1,445,000) |
6.01.02.08 | Payroll and Related Taxes | (20,000) | (4,000) |
6.01.02.09 | Taxes and Social Contributions Payable | (105,000) | (25,000) |
6.01.02.10 | Legal claims | (10,000) | (13,000) |
6.01.02.12 | Other Payables | (44,000) | (47,000) |
6.01.02.15 | Received Dividends and Interest on shareholders' equity | - | 10,000 |
6.02 | Net Cash Provided by (Used in) Investing Activities | (207,000) | (175,000) |
6.02.01 | Capital Increase/Decrease on Subsidiaries | (53,000) | - |
6.02.02 | Acquisition of Property and Equipment | (134,000) | (153,000) |
6.02.03 | Increase in Intangible Assets | (20,000) | (24,000) |
6.02.04 | Sales of Property and Equipment | - | 2,000 |
6.03 | Net Cash Provided by (Used in) Financing Activities | (1,366,000) | 513,000 |
6.03.01 | Capital Increase | 4,000 | - |
6.03.02 | Proceeds From Debt Issuance | 800,000 | 900,000 |
6.03.03 | Repayment of Debt | (2,170,000) | (386,000) |
6.03.05 | Payment of Dividends | - | (1,000) |
6.05 | Net in Cash and Cash Equivalents | (3,296,000) | (737,000) |
6.05.01 | Cash and Cash Equivalents at the Beginning of the Period | 4,496,000 | 2,247,000 |
6.05.02 | Cash and Cash Equivalents at the End of the Period | 1,200,000 | 1,510,000 |
(FREE TRANSLATION INTO ENGLISH FROM THE ORIGINAL PREVIOUSLY ISSUED IN PORTUGUESE)
ITR – Interim Financial Information – March 31,2017 – COMPANHIA BRASILEIRA DE DISTRIBUIÇÃO |
Companhia Brasileira de Distribuição
Individual Interim Financial Information / Statement of Changes in Shareholders' Equity 01/01/2017 to 3/31/2017 | |||||||
R$ (in thousands) | |||||||
Code | Description | Share | Capital Reserves, | Earnings | Retained Earnings /Accumulated Losses | Other comprehensive income | Shareholders' |
5.01 | Opening Balance | 6,811,000 | 331,000 | 2,718,000 | - | - | 9,860,000 |
5.03 | Adjusted Opening Balance | 6,811,000 | 331,000 | 2,718,000 | - | - | 9,860,000 |
5.04 | Capital Transactions with Shareholders | 4,000 | 5,000 | - | - | - | 9,000 |
5.04.01 | Capital Increases | 4,000 | - | - | - | - | 4,000 |
5.04.03 | Options Granted | - | 3,000 | - | - | - | 3,000 |
5.04.09 | Options Granted recognized in subsidiaries | - | 2,000 | - | - | - | 2,000 |
5.05 | Total Comprehensive Income | - | - | - | 125,000 | - | 125,000 |
5.05.01 | Net Income for the Period | - | - | - | 125,000 | - | 125,000 |
5.07 | Closing Balance | 6,815,000 | 336,000 | 2,718,000 | 125,000 | - | 9,994,000 |
(FREE TRANSLATION INTO ENGLISH FROM THE ORIGINAL PREVIOUSLY ISSUED IN PORTUGUESE)
ITR – Interim Financial Information – March 31,2017 – COMPANHIA BRASILEIRA DE DISTRIBUIÇÃO |
Companhia Brasileira de Distribuição
Individual Interim Financial Information / Statement of Changes in Shareholders' Equity 01/01/2016 to 3/31/2016 | |||||||
R$ (in thousands) | |||||||
Code | Description | Share | Capital Reserves, | Earnings | Retained Earnings /Accumulated Losses | Other comprehensive Income | Shareholders' |
5.01 | Opening Balance | 6,806,000 | 302,000 | 3,333,000 | - | (87,000) | 10,354,000 |
5.03 | Adjusted Opening Balance | 6,806,000 | 302,000 | 3,333,000 | - | (87,000) | 10,354,000 |
5.04 | Capital Transactions with Shareholders | - | 6,000 | - | - | - | 6,000 |
5.04.03 | Options Granted | - | 4,000 | - | - | - | 4,000 |
5.04.09 | Options Granted recognized in subsidiaries | - | 2,000 | - | - | - | 2,000 |
5.05 | Total Comprehensive Income | - | - | - | (51,000) | 16,000 | (35,000) |
5.05.01 | Net Income (loss) for the Period | - | - | - | (51,000) | - | (51,000) |
5.05.02 | Other Comprehensive Income | - | - | - | - | 16,000 | 16,000 |
5.05.02.01 | Adjusts to Financial Instruments | - | - | - | - | 16,000 | 16,000 |
5.07 | Closing Balance | 6,806,000 | 308,000 | 3,333,000 | (51,000) | (71,000) | 10,325,000 |
(FREE TRANSLATION INTO ENGLISH FROM THE ORIGINAL PREVIOUSLY ISSUED IN PORTUGUESE)
ITR – Interim Financial Information – March 31, 2017 – COMPANHIA BRASILEIRA DE DISTRIBUIÇÃO |
Companhia Brasileira de Distribuição
Individual Interim Financial Information / Statement of Value Added | |||
R$ (in thousands) | |||
Code | Description | Year To Date | Year To Date |
7.01 | Revenues | 7,151,000 | 6,246,000 |
7.01.01 | Sales of Goods, Products and Services | 6,974,000 | 6,245,000 |
7.01.02 | Other Revenues | - | 3,000 |
7.01.03 | Revenues from building of own assets | 179,000 | - |
7.01.04 | Allowance for/Reversal of Doubtful Accounts | (2,000) | (2,000) |
7.02 | Products Acquired from Third Parties | (5,372,000) | (4,874,000) |
7.02.01 | Costs of Products, Goods and Services Sold | (4,529,000) | (4,246,000) |
7.02.02 | Materials, Energy, Outsourced Services and Other | (843,000) | (628,000) |
7.03 | Gross Value Added | 1,779,000 | 1,372,000 |
7.04 | Retention | (160,000) | (135,000) |
7.04.01 | Depreciation and Amortization | (160,000) | (135,000) |
7.05 | Net Value Added Produced | 1,619,000 | 1,237,000 |
7.06 | Value Added Received in Transfer | 170,000 | 60,000 |
7.06.01 | Share of Profit of Subsidiaries and Associates | 135,000 | 30,000 |
7.06.02 | Financial Revenue | 53,000 | 41,000 |
7.06.03 | Other | (18,000) | (11,000) |
7.06.03.01 | Net Income from Descontinued Operations | (18,000) | (11,000) |
7.07 | Total Value Added to Distribute | 1,789,000 | 1,297,000 |
7.08 | Distribution of Value Added | 1,789,000 | 1,297,000 |
7.08.01 | Personnel | 760,000 | 662,000 |
7.08.01.01 | Direct Compensation | 493,000 | 427,000 |
7.08.01.02 | Benefits | 160,000 | 139,000 |
7.08.01.03 | Government Severance Indemnity Fund for Employees (FGTS) | 44,000 | 39,000 |
7.08.01.04 | Other | 63,000 | 57,000 |
7.08.02 | Taxes, Fees and Contributions | 504,000 | 339,000 |
7.08.02.01 | Federal | 287,000 | 198,000 |
7.08.02.02 | State | 150,000 | 106,000 |
7.08.02.03 | Municipal | 67,000 | 35,000 |
7.08.03 | Value Distributed to Providers of Capital | 400,000 | 347,000 |
7.08.03.01 | Interest | 216,000 | 206,000 |
7.08.03.02 | Rentals | 184,000 | 141,000 |
7.08.04 | Value Distributed to Shareholders | 125,000 | (51,000) |
7.08.04.03 | Retained Earnings/ Accumulated Losses for the Period | 125,000 | (51,000) |
(FREE TRANSLATION INTO ENGLISH FROM THE ORIGINAL PREVIOUSLY ISSUED IN PORTUGUESE)
ITR – Interim Financial Information – March 31, 2017 – COMPANHIA BRASILEIRA DE DISTRIBUIÇÃO |
Companhia Brasileira de Distribuição
Consolidated Interim Financial Information /Balance Sheet - Assets | |||
R$ (in thousands) | |||
Code | Description | Current Quarter | Previous Year |
1 | Total Assets | 41,392,000 | 45,217,000 |
1.01 | Current Assets | 27,970,000 | 31,651,000 |
1.01.01 | Cash and Cash Equivalents | 1,683,000 | 5,112,000 |
1.01.03 | Accounts Receivable | 869,000 | 669,000 |
1.01.03.01 | Trade Receivables | 682,000 | 543,000 |
1.01.03.02 | Other Receivables | 187,000 | 126,000 |
1.01.04 | Inventories | 4,578,000 | 4,641,000 |
1.01.06 | Recoverable Taxes | 617,000 | 674,000 |
1.01.07 | Prepaid Expenses | 247,000 | 97,000 |
1.01.08 | Other Current Assets | 19,976,000 | 20,458,000 |
1.01.08.01 | Noncurrent Assets Held for Sale and Discontinued Operations | 19,848,000 | 20,303,000 |
1.01.08.03 | Other | 128,000 | 155,000 |
1.02 | Noncurrent Assets | 13,422,000 | 13,566,000 |
1.02.01 | Long-term Assets | 2,197,000 | 2,137,000 |
1.02.01.03 | Accounts Receivable | 613,000 | 612,000 |
1.02.01.03.02 | Other Receivables | 613,000 | 612,000 |
1.02.01.06 | Deferred Taxes | 181,000 | 170,000 |
1.02.01.07 | Prepaid Expenses | 42,000 | 45,000 |
1.02.01.08 | Receivables from Related Parties | 28,000 | 17,000 |
1.02.01.09 | Other Noncurrent Assets | 1,333,000 | 1,293,000 |
1.02.01.09.04 | Recoverable Taxes | 653,000 | 632,000 |
1.02.01.09.05 | Judicial Deposits | 680,000 | 661,000 |
1.02.02 | Investments | 356,000 | 339,000 |
1.02.02.01 | Investments in Associates | 333,000 | 316,000 |
1.02.02.02 | Investments Property | 23,000 | 23,000 |
1.02.03 | Property and Equipment, Net | 8,972,000 | 9,182,000 |
1.02.04 | Intangible Assets | 1,897,000 | 1,908,000 |
(FREE TRANSLATION INTO ENGLISH FROM THE ORIGINAL PREVIOUSLY ISSUED IN PORTUGUESE)
ITR – Interim Financial Information – March 31, 2017 – COMPANHIA BRASILEIRA DE DISTRIBUIÇÃO |
Companhia Brasileira de Distribuição
Consolidated Interim Financial Information / Balance Sheet - Liabilities | |||
R$ (in thousands) | |||
Code | Description | Current Quarter | Previous Year |
2 | Total Liabilities | 41,392,000 | 45,217,000 |
2.01 | Current Liabilities | 23,912,000 | 27,582,000 |
2.01.01 | Payroll and Related Taxes | 609,000 | 614,000 |
2.01.02 | Trade Payables | 5,241,000 | 7,232,000 |
2.01.03 | Taxes and Contributions Payable | 203,000 | 254,000 |
2.01.04 | Borrowings and Financing | 2,231,000 | 2,957,000 |
2.01.05 | Other Liabilities | 664,000 | 889,000 |
2.01.05.01 | Payables to Related Parties | 145,000 | 147,000 |
2.01.05.02 | Other | 519,000 | 742,000 |
2.01.05.02.04 | Utilities | 21,000 | 17,000 |
2.01.05.02.05 | Rent Payable | 76,000 | 110,000 |
2.01.05.02.06 | Advertisement Payable | 35,000 | 43,000 |
2.01.05.02.07 | Pass-through to Third Parties | 15,000 | 15,000 |
2.01.05.02.08 | Financing Related to Acquisition of Assets | 49,000 | 116,000 |
2.01.05.02.09 | Deferred revenue | 103,000 | 224,000 |
2.01.05.02.11 | Accounts Payable Related to Acquisition of Companies | 8,000 | 7,000 |
2.01.05.02.12 | Other Payables | 183,000 | 182,000 |
2.01.05.02.13 | Loalty Programs | 29,000 | 28,000 |
2.01.06 | Provisions | 3,000 | 4,000 |
2.01.07 | Noncurrent Liabilities Held for Sale | 14,961,000 | 15,632,000 |
2.02 | Noncurrent Liabilities | 4,659,000 | 5,038,000 |
2.02.01 | Borrowings and Financing | 2,569,000 | 2,912,000 |
2.02.02 | Other Liabilities | 621,000 | 608,000 |
2.02.02.02 | Other | 621,000 | 608,000 |
2.02.02.02.03 | Taxes Payable in Installments | 528,000 | 540,000 |
2.02.02.02.04 | Payables Related to Acquisition of Companies | 47,000 | 22,000 |
2.02.02.02.05 | Financing Related to Acquisition of Assets | - | 4,000 |
2.02.02.02.07 | Other Payables | 46,000 | 42,000 |
2.02.03 | Deferred Taxes | 331,000 | 317,000 |
2.02.04 | Provisions | 1,116,000 | 1,177,000 |
2.02.06 | Deferred revenue | 22,000 | 24,000 |
2.03 | Consolidated Shareholders’ Equity | 12,821,000 | 12,597,000 |
2.03.01 | Share Capital | 6,815,000 | 6,811,000 |
2.03.02 | Capital Reserves | 336,000 | 331,000 |
2.03.02.04 | Options Granted | 329,000 | 324,000 |
2.03.02.07 | Capital Reserve | 7,000 | 7,000 |
2.03.04 | Earnings Reserve | 2,718,000 | 2,718,000 |
2.03.04.01 | Legal Reserve | 426,000 | 426,000 |
2.03.04.05 | Earnings Retention Reserve | 234,000 | 234,000 |
2.03.04.10 | Expansion Reserve | 2,299,000 | 2,299,000 |
2.03.04.12 | Transactions with Non-Controlling interests | (91,000) | (91,000) |
2.03.04.14 | Settlement of Equity Instrument | (150,000) | (150,000) |
2.03.05 | Retained Earnings/ Accumulated Losses | 125,000 | - |
2.03.09 | Non-controlling Interests | 2,827,000 | 2,737,000 |
(FREE TRANSLATION INTO ENGLISH FROM THE ORIGINAL PREVIOUSLY ISSUED IN PORTUGUESE)
ITR – Interim Financial Information – March 31, 2017 – COMPANHIA BRASILEIRA DE DISTRIBUIÇÃO |
Companhia Brasileira de Distribuição
Consolidated Interim Financial Information / Statement of Operations | |||
R$ (in thousands) | |||
Code | Description | Year To Date | Year To Date |
3.01 | Net Sales from Goods and/or Services | 10,552,000 | 9,888,000 |
3.02 | Cost of Goods Sold and/or Services Sold | (8,191,000) | (7,697,000) |
3.03 | Gross Profit | 2,361,000 | 2,191,000 |
3.04 | Operating Income/Expenses | (2,048,000) | (2,004,000) |
3.04.01 | Selling Expenses | (1,657,000) | (1,602,000) |
3.04.02 | General and Administrative Expenses | (227,000) | (210,000) |
3.04.05 | Other Operating Expenses | (156,000) | (215,000) |
3.04.05.01 | Depreciation/Amortization | (190,000) | (170,000) |
3.04.05.03 | Other Operating Expenses | 34,000 | (45,000) |
3.04.06 | Share of Profit of Subsidiaries and Associates | (8,000) | 23,000 |
3.05 | Profit before Financial Income (Expenses) and Taxes | 313,000 | 187,000 |
3.06 | Financial Income (Expenses), Net | (182,000) | (179,000) |
3.07 | Profit (loss) Before Income Tax and Social Contribution | 131,000 | 8,000 |
3.08 | Income tax and Social Contribution | (50,000) | 1,000 |
3.08.01 | Current | (47,000) | (13,000) |
3.08.02 | Deferred | (3,000) | 14,000 |
3.09 | Net Income (loss) from Continuing Operations | 81,000 | 9,000 |
3.10 | Net Income from Descontinued Operations | 133,000 | (166,000) |
3.10.01 | Net Income (loss) from Descontinued Operations | 133,000 | (166,000) |
3.11 | Consolidated Net Income (loss)for the Period | 214,000 | (157,000) |
3.11.01 | Attributable to Owners of the Company | 125,000 | (51,000) |
3.11.02 | Attributable to Non-controlling Interests | 89,000 | (106,000) |
3.99 | Earnings per Share - (Reais/Share) | - | - |
3.99.01 | Basic Earnings per Share | - | - |
3.99.01.01 | Common | 0.44407 | (0.19454) |
3.99.01.02 | Preferred | 0.48848 | (0.19137) |
3.99.02 | Diluted Earnings per Share | - | - |
3.99.02.01 | Common | 0.44407 | (0.19454) |
3.99.02.02 | Preferred | 0.48701 | (0.19137) |
(FREE TRANSLATION INTO ENGLISH FROM THE ORIGINAL PREVIOUSLY ISSUED IN PORTUGUESE)
ITR – Interim Financial Information – March 31, 2017 – COMPANHIA BRASILEIRA DE DISTRIBUIÇÃO |
Companhia Brasileira de Distribuição
Consolidated Interim Financial Information / Statement of Comprehensive Income | |||
R$ (in thousands) | |||
Code | Description | Year To Date | Year To Date |
4.01 | Net Income (loss) for the Period | 214,000 | (157,000) |
4.02 | Other Comprehensive Income | - | 73,000 |
4.02.01 | Defined Benefit Plan | - | 73,000 |
4.03 | Total Comprehensive Income for the Period | 214,000 | (84,000) |
4.03.01 | Attributable to Controlling Interests | 125,000 | (35,000) |
4.03.02 | Attributable to Non-Controlling Interests | 89,000 | (49,000) |
(FREE TRANSLATION INTO ENGLISH FROM THE ORIGINAL PREVIOUSLY ISSUED IN PORTUGUESE)
ITR – Interim Financial Information – March 31, 2017 – COMPANHIA BRASILEIRA DE DISTRIBUIÇÃO |
Companhia Brasileira de Distribuição
Consolidated Interim Financial Information / Statement of Cash Flows - Indirect Method | |||
R$ (in thousands) | |||
Code | Description | Year To Date | Year To Date |
6.01 | Net Cash Provided by Operating Activities | (5,106,000) | (7,975,000) |
6.01.01 | Cash from Operations | 773,000 | 447,000 |
6.01.01.01 | Net Income (loss) for the Period | 214,000 | (157,000) |
6.01.01.02 | Deferred Income Tax and Social Contribution | (30,000) | (7,000) |
6.01.01.03 | Gain (Losses) on Disposal of Fixed Assets and Intangibles | (11,000) | 46,000 |
6.01.01.04 | Depreciation/Amortization | 202,000 | 280,000 |
6.01.01.05 | Interest and Inflation Adjustments | 223,000 | 272,000 |
6.01.01.06 | Adjustment to Present Value | - | 3,000 |
6.01.01.07 | Share of Profit (Loss) of Subsidiaries and Associates | 1,000 | (32,000) |
6.01.01.08 | Provision for Risks | 111,000 | 69,000 |
6.01.01.10 | Share-based Payment | 6,000 | 8,000 |
6.01.01.11 | Allowance for Doubtful Accounts | 159,000 | 109,000 |
6.01.01.13 | Provision for Obsolescence/breakage | (20,000) | 5,000 |
6.01.01.15 | Deferred revenue | (82,000) | (55,000) |
6.01.01.18 | Gain in disposal of subsidiaries | - | (94,000) |
6.01.02 | Changes in Assets and Liabilities | (5,879,000) | (8,422,000) |
6.01.02.01 | Accounts Receivable | (2,557,000) | (2,276,000) |
6.01.02.02 | Inventories | (481,000) | (260,000) |
6.01.02.03 | Recoverable Taxes | (66,000) | (76,000) |
6.01.02.04 | Other Assets | (130,000) | (194,000) |
6.01.02.05 | Related Parties | 14,000 | 33,000 |
6.01.02.06 | Restricted Deposits for Legal Proceeding | (33,000) | (55,000) |
6.01.02.07 | Trade Payables | (2,411,000) | (4,567,000) |
6.01.02.08 | Payroll and Related Taxes | (10,000) | (22,000) |
6.01.02.09 | Taxes and Social Contributions Payable | (58,000) | 77,000 |
6.01.02.10 | Legal Claims | (116,000) | (71,000) |
6.01.02.11 | Other Payables | (25,000) | (316,000) |
6.01.02.12 | Deferred revenue | (3,000) | 10,000 |
6.01.02.13 | Income and Social contribution, paid | (3,000) | - |
6.01.02.14 | Suppliers - structured program | - | (705,000) |
6.02 | Net Cash Provided by (Used in) Investing Activities | (354,000) | (263,000) |
6.02.02 | Acquisition of Property and Equipment | (266,000) | (284,000) |
6.02.03 | Increase in Intangible Assets | (91,000) | (83,000) |
6.02.04 | Sales of Property and Equipment | 3,000 | 13,000 |
6.02.08 | Net Cash From Sale of Subsidiary | - | 91,000 |
6.03 | Net Cash Provided by Financing Activities | (1,473,000) | 1,667,000 |
6.03.01 | Capital Increase/Decrease | 4,000 | - |
6.03.02 | Borrowings | 2,222,000 | 2,409,000 |
6.03.03 | Repayment of Debt | (3,699,000) | (1,592,000) |
6.03.05 | Payments of Dividends | - | (1,000) |
6.03.09 | Borrowings with Related Parties | - | 851,000 |
6.04 | Effects of Exchange Rate Changes on Cash and Cash Equivalents | - | 4,000 |
6.05 | Increase (Decrease) in Cash and Cash Equivalents | (6,933,000) | (6,567,000) |
6.05.01 | Cash and Cash Equivalents at the Beginning of the Period | 9,142,000 | 11,015,000 |
6.05.02 | Cash and Cash Equivalents at the End of the Period | 2,209,000 | 4,448,000 |
(FREE TRANSLATION INTO ENGLISH FROM THE ORIGINAL PREVIOUSLY ISSUED IN PORTUGUESE)
ITR – Interim Financial Information – March 31, 2017 – COMPANHIA BRASILEIRA DE DISTRIBUIÇÃO |
Companhia Brasileira de Distribuição
Consolidated Interim Financial Information / Statement of Changes in Shareholders' Equity 1/1/2017 to 12/31/2017 | |||||||||
R$ (in thousands) | |||||||||
Code | Description | Share | Capital Reserves, | Earnings | Retained Earnings/ Accumulated Losses | Other comprehensive Income | Shareholders' | Non-Controlling | Consolidated |
5.01 | Opening Balance | 6,811,000 | 331,000 | 2,718,000 | - | - | 9,860,000 | 2,737,000 | 12,597,000 |
5.03 | Adjusted Opening Balance | 6,811,000 | 331,000 | 2,718,000 | - | - | 9,860,000 | 2,737,000 | 12,597,000 |
5.04 | Capital Transactions with Shareholders | 4,000 | 5,000 | - | - | - | 9,000 | 1,000 | 10,000 |
5.04.01 | Capital Increases | 4,000 | - | - | - | - | 4,000 | - | 4,000 |
5.04.03 | Options Granted | - | 3,000 | - | - | - | 3,000 | - | 3,000 |
5.04.09 | Options Granted - subsidiaries | - | 2,000 | - | - | - | 2,000 | 1,000 | 3,000 |
5.05 | Total Comprehensive Income | - | - | - | 125,000 | - | 125,000 | 89,000 | 214,000 |
5.05.01 | Net Income for the Period | - | - | - | 125,000 | - | 125,000 | 89,000 | 214,000 |
5.07 | Closing Balance | 6,815,000 | 336,000 | 2,718,000 | 125,000 | - | 9,994,000 | 2,827,000 | 12,821,000 |
(FREE TRANSLATION INTO ENGLISH FROM THE ORIGINAL PREVIOUSLY ISSUED IN PORTUGUESE)
ITR – Interim Financial Information – March 31, 2017 – COMPANHIA BRASILEIRA DE DISTRIBUIÇÃO |
Companhia Brasileira de Distribuição
Consolidated Interim Financial Information / Statement of Changes in Shareholders' Equity 1/1/2016 to 31/31/2016 | |||||||||
R$ (in thousands) | |||||||||
Code | Description | Share | Capital Reserves, | Earnings | Retained Earnings/ Accumulated Losses | Other comprehensive Income | Shareholders' | Non-Controlling | Consolidated |
5.01 | Opening Balance | 6,806,000 | 302,000 | 3,333,000 | - | (87,000) | 10,354,000 | 2,998,000 | 13,352,000 |
5.03 | Adjusted Opening Balance | 6,806,000 | 302,000 | 3,333,000 | - | (87,000) | 10,354,000 | 2,998,000 | 13,352,000 |
5.04 | Capital Transactions with Shareholders | - | 6,000 | - | - | - | 6,000 | 2,000 | 8,000 |
5.04.03 | Options Granted | - | 4,000 | - | - | - | 4,000 | - | 4,000 |
5.04.09 | Options Granted - subsidiaries | - | 2,000 | - | - | - | 2,000 | 2,000 | 4,000 |
5.05 | Total Comprehensive Income | - | - | - | (51,000) | 16,000 | (35,000) | (49,000) | (84,000) |
5.05.01 | Net Income (loss) for the Period | - | - | - | (51,000) | - | (51,000) | (106,000) | (157,000) |
5.05.02 | Other Comprehensive Income | - | - | - | - | 16,000 | 16,000 | 57,000 | 73,000 |
5.05.02.04 | Cumulative Translation Adjustment | - | - | - | - | 16,000 | 16,000 | 57,000 | 73,000 |
5.07 | Closing Balance | 6,806,000 | 308,000 | 3,333,000 | (51,000) | (71,000) | 10,325,000 | 2,951,000 | 13,276,000 |
(FREE TRANSLATION INTO ENGLISH FROM THE ORIGINAL PREVIOUSLY ISSUED IN PORTUGUESE)
ITR – Interim Financial Information – March 31, 2017 – COMPANHIA BRASILEIRA DE DISTRIBUIÇÃO |
Companhia Brasileira de Distribuição
Consolidated Interim Financial Information / Statement of Value Added | |||
R$ (in thousands) | |||
Code | Description | Year To Date | Year To Date |
7.01 | Revenues | 11,609,000 | 10,632,000 |
7.01.01 | Sales of Goods, Products and Services | 11,430,000 | 10,726,000 |
7.01.02 | Other Revenues | 181,000 | 15,000 |
7.01.04 | Allowance for/Reversal of Doubtful Accounts | (2,000) | (109,000) |
7.02 | Products Acquired from Third Parties | (9,282,000) | (8,741,000) |
7.02.01 | Costs of Products, Goods and Services Sold | (8,262,000) | (7,805,000) |
7.02.02 | Materials, Energy, Outsourced Services and Other | (1,020,000) | (936,000) |
7.03 | Gross Value Added | 2,327,000 | 1,891,000 |
7.04 | Retention | (202,000) | (185,000) |
7.04.01 | Depreciation and Amortization | (202,000) | (185,000) |
7.05 | Net Value Added Produced | 2,125,000 | 1,706,000 |
7.06 | Value Added Received in Transfer | 186,000 | 170,000 |
7.06.01 | Share of Profit of Subsidiaries and Associates | (8,000) | 41,000 |
7.06.02 | Financial Income | 61,000 | 65,000 |
7.06.03 | Others | 133,000 | 64,000 |
7.06.03.01 | Net Income from Descontinued Operations | 133,000 | 64,000 |
7.07 | Total Value Added to Distribute | 2,311,000 | 1,876,000 |
7.08 | Distribution of Value Added | 2,311,000 | 1,876,000 |
7.08.01 | Personnel | 975,000 | 912,000 |
7.08.01.01 | Direct Compensation | 632,000 | 587,000 |
7.08.01.02 | Benefits | 221,000 | 202,000 |
7.08.01.03 | Government Severance Indemnity Fund for Employees (FGTS) | 52,000 | 53,000 |
7.08.01.04 | Other | 70,000 | 70,000 |
7.08.01.04.01 | Interest | 70,000 | 70,000 |
7.08.02 | Taxes, Fees and Contributions | 650,000 | 505,000 |
7.08.02.01 | Federal | 364,000 | 292,000 |
7.08.02.02 | State | 213,000 | 163,000 |
7.08.02.03 | Municipal | 73,000 | 50,000 |
7.08.03 | Value Distributed to Providers of Capital | 472,000 | 450,000 |
7.08.03.01 | Interest | 240,000 | 241,000 |
7.08.03.02 | Rentals | 232,000 | 209,000 |
7.08.04 | Value Distributed to Shareholders | 214,000 | 9,000 |
7.08.04.03 | Retained Earnings/ Accumulated Losses for the Period | 125,000 | 9,000 |
7.08.04.04 | Noncontrolling Interest in Retained Earnings | 89,000 | - |

São Paulo, Brazil, April 27, 2017 - GPA [BM&FBovespa: PCAR4 (PN); NYSE: CBD] announces its results for the first quarter of 2017. The comments refer to the consolidated results of the Group or of its business units. All comparisons are with the same period in 2016, except where stated otherwise.
1Q17 Results In the quarterly financial statements of GPA on March 31, 2017, due to the ongoing divestment of the interest held by GPA in Via Varejo S.A. as announced in the material fact notice of November 23, 2016, the operations of Via Varejo are treated as discontinued operations, with a retrospective adjustment to net sales and other profit or loss lines as from January 1, 2015, as determined by IFRS 5/CPC 31, and approved by CVM Resolution 598/09 - Sale of non-current assets and discontinued operations. Accordingly, the following comments do not include the performance of Via Varejo, which is shown on page 13. Food segment net sales reach R$10.5 billion, driven by consistent growth at Assaí and recovery at Extra Hiper
Multivarejo o Sequential volume recovery and improved customer traffic trend translated into market share gains in the period -Notable growth in same-store sales at Extra Hiper of 5.4%, with recovery in market share. This performance reflects the successful commercial strategies without additional pressure on gross margin Assaí o Revenue reached R$4.4 billion, increasing 28.9% in the year, due to: -Strong performance of same-store sales, of 12.9%, and double-digit growth in customer traffic, though impacted by lower food inflation Adjusted EBITDA margin grew 60 bps, and net income(*) grew 97% in the quarter: Multivarejo o Maintenance of price competitiveness initiatives, with higher accuracy and assertiveness on promotional investments. o Decrease of 1.3% in selling, general and administrative expenses as a result of efficiency and productivity projects o Increase of 60 bps in adjusted EBITDA margin, which reached 5.3%. Adjusted EBITDA grew 9.2% to R$345 million, despite the negative impact of the calendar effect. o Net income(*) growth of 72.2% in the quarter Assaí o Gross margin grew 80 bps to 14.4%, due to maturation of stores, optimization of commercial dynamics and higher share of individual customers in sales o Operating expenses fell 10 bps as a percentage of sales, despite the strong store expansion in the last 12 months o Adjusted EBITDA margin reached 4.0%, increasing 80 bps, mainly due to store maturation o Net Income(*) reached R$68 million in 1Q17, up 103.3%, accompanied by margin expansion of 60 bps
Financial result stood at 1.7% of net sales, reducing 10 bps from 1Q16
Net debt(**) improved R$286 million and net debt(**) / EBITDA ratio remained stable at 1.5 times
(*) Adjusted net income attributable to controlling shareholders – continued operations |
| Food Business | Multivarejo(1) | Assaí | |||||||||
| (R$ million)(2) | 1Q17 | 1Q16 | Δ | 1Q17 | 1Q16 | Δ | 1Q17 | 1Q16 | Δ | ||
| Gross Revenue | 11,430 | 10,721 | 6.6% | 7,030 | 7,307 | -3.8% | 4,400 | 3,414 | 28.9% | ||
| Net Revenue | 10,552 | 9,888 | 6.7% | 6,513 | 6,740 | -3.4% | 4,039 | 3,148 | 28.3% | ||
| Gross Profit | 2,361 | 2,191 | 7.8% | 1,780 | 1,762 | 1.0% | 581 | 429 | 35.5% | ||
| Gross Margin | 22.4% | 22.2% | 20 bps | 27.3% | 26.1% | 120 bps | 14.4% | 13.6% | 80 bps | ||
| Selling, General and Adm. Expenses | (1,884) | (1,812) | 4.0% | (1,464) | (1,482) | -1.3% | (421) | (330) | 27.6% | ||
| % of Net Revenue | 17.9% | 18.3% | -40 bps | 22.5% | 22.0% | 50 bps | 10.4% | 10.5% | -10 bps | ||
| EBITDA(3) | 540 | 371 | 45.4% | 365 | 272 | 34.5% | 175 | 100 | 75.0% | ||
| EBITDA Margin | 5.1% | 3.8% | 130 bps | 5.6% | 4.0% | 160 bps | 4.3% | 3.2% | 110 bps | ||
| Adjusted EBITDA(3)(4) | 506 | 416 | 21.7% | 345 | 315 | 9.2% | 162 | 101 | 61.0% | ||
| Adjusted EBITDA Margin | 4.8% | 4.2% | 60 bps | 5.3% | 4.7% | 60 bps | 4.0% | 3.2% | 80 bps | ||
| Net Financial Revenue (Expenses) | (182) | (179) | 1.8% | (164) | (160) | 2.4% | (18) | (18) | -3.7% | ||
| % of Net Revenue | 1.7% | 1.8% | -10 bps | 2.5% | 2.4% | 10 bps | 0.4% | 0.6% | -20 bps | ||
| Net Income (Loss) - Controlling Shareholders - continuing operations | 107 | 9 | 1116.9% | 31 | (24) | n.a. | 76 | 33 | 132.0% | ||
| Net Margin | 1.0% | 0.1% | 90 bps | 0.5% | -0.4% | 90 bps | 1.9% | 1.0% | 90 bps | ||
| Adjusted Net Income (Loss) - Controlling Shareholders - continuing operations(5) | 83 | 42 | 96.8% | 15 | 9 | 72.2% | 68 | 33 | 103.3% | ||
| Adjusted Net Margin | 0.8% | 0.4% | 40 bps | 0.2% | 0.1% | 10 bps | 1.7% | 1.1% | 60 bps | ||
(1) Includes the results of Malls and Corporate. (2) Totals and percentages may not add up due to rounding. All margins were calculated as a percentage of net sales; (3) Earnings before interest, tax, depreciation and amortization; (4) Adjusted by the total of “Other Operating Income and Expenses”, thus eliminating nonrecurring income and expenses; (5) Net Income adjusted for the total of “Other Operating Income and Expenses”, thus eliminating nonrecurring income and expenses, as well as the respective effects of associated income tax.
Sales Performance
| Net Total Store Sales | |||||
| 1Q17 x | |||||
| 1Q16 | Net 'Same-Store' Sales | ||||
| (R$ million) | 1Q17 | (1) | 1Q17(1) | ||
| Food Business | 10,552 | 9.5% | Food Business(3) | 5.6% | |
| Multivarejo(2) | 6,513 | 0.4% | Multivarejo(2) | 2.0% | |
| Assaí | 4,039 | 28.8% | Assaí(3) | 12.9% | |
(1) Adjusted for calendar effects related to: February (1 day less) and March (Easter effect). The adjustment was 280 bps for GPA Food, and approximately 380 bps in Multivarejo and 50 bps in Assaí.
(2) Extra and Pão de Açúcar: Supermarket stores, hypermarket, proximity, gas stations, drugstores and food e-commerce, in addition to revenue from leasing of commercial centers.
(3) Includes sales of two stores already converted from Extra Hiper to Assaí, which contributed by 190 bps to Assaí and 60 bps to Food.
Multivarejo:
Net sales totaled R$6.5 billion in 1Q17, with same-store sales growing 2.0%(1), resulting in market share gains in the first two months of the year.
Other effects had a negative impact on sales performance in the period:
i) optimization of the store portfolio, resulting in the closure of 60 stores in the last 12 months and 20 in the quarter, of which 5 hypermarkets are in process to be converted into Assaí; and
ii) lower food inflation in the period (around 5.2% in 1Q17 vs. 13.1% in the same period last year).
The highlights at each banner were:
o Extra:
Extra Hipercontinued to register improvement in same-store sales performance, with market share recovery and increases in volume and customer traffic as a result of the successful strategies adopted for this format.The highlights were:
– Same-store sales presented a performance above 4Q16, with growth of 5.4%(1). This performance is even more significant considering that inflation in the food category was 520 bps lower in relation to 4Q16.
– The non-food category continued to register positive growth, driven by store-in-store mobile initiatives (already implemented in 60 stores) and the Technology Festival campaign, as well as FGTS (severance guarantee fund for workers) withdrawals in March;
– Market share gains in volume at Extra Hiper in the last 12 measurements. Current market share is already higher than the historical levels of 2015, and the banner outperforms market growth in the initial months of 2017.
Extra Superregisteredsame-store sales performance of 1.0%(1), despite being impacted by the decline in inflation in the food category. The highlight was the strong recovery in volume, growing 1.9% in the quarter, besides improved customer traffic compared to 1Q16 and 4Q16.
o Pão de Açúcar:
Same-store sales performance was significantly affected by lower inflation in the period. The banner continued to retain its market share in January and February within its segment of operation.
o Proximity:
Sales performance impacted by the closure of 41 stores in the last 12 months. Same-store sales growth was affected by a strong comparison basis due to store conversions from Minimercado Extra to Minuto Pão de Açúcar in 1Q16.
Assaí:
o Net sales reached R$4.0 billion in 1Q17, with strong growth of 28.8%(1). Expansion in the last 12 months (12 stores including two Extra Hiper conversions) contributed approximately R$600 million to net sales in the period;
o Assaí already accounts for 38.3% of net sales in 1Q17, an increase of 640 bps from the same period last year;
o Same-stores sales increased 12.9%(1)(3), driven by the continued double-digit growth in customer traffic, but strongly impacted by inflation in the food category, which was 790 bps lower;
o The first two Extra Hiper stores converted into Assaí continue to deliver strong performance in 1Q17, registering an increase of over 2.5 times in sales;
o The Company has already started working on the conversion of five more stores, which should be delivered over the course of 2Q17 and in early 3Q17. A minimum of 15 conversions are expected by the year-end;
o As in 2016, Assaí continues to gain market share due to the maturation of new stores and the strong pace of expansion in recent years.
Expansion:
o In 1Q17, the Company focused on continuing the store portfolio optimization plan:
i) 5 Extra Hiper stores were closed and are in process to be converted to Assaí;
ii) 16 stores were closed: 10 Minimercado Extra, 1 Pão de Açúcar, 1 Assaí, 1 fuel station and 3 drugstores;
o Opening of 1 Pão de Açúcar and 2 gas stations in the quarter, as well as 48 new adhesions to the Aliados project, which already has 150 partners.
o 8 stores are under construction; 7 Assaí (including 5 Extra Hiper conversions), 2 new stores and 1 Minuto Pão de Açúcar. These stores should be delivered in 2Q17 or early 3Q17.
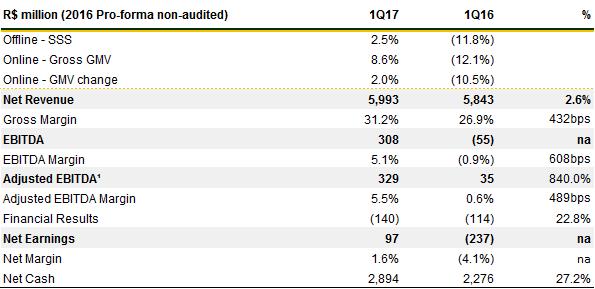
Via Varejo - Discontinued Operations
| Via Varejo - "same store sales" | 1Q17 | 1Q16 | R$ million | 1Q17 | 1Q17 X 1Q16 | |
| Offline | 2.5% | (11.8%) | Offline | 4,891 | 4.2% | |
| Online (GMV change) | 2.0% | (10.5%) | Online | 1,102 | (4.0%) | |
| Total | 5,993 | 2.6% |
Net revenue in 1Q17 was R$6 billion, up 2.6% from 1Q16, showing a significant recovery in performance compared to the previous year (-11.8%) and the previous quarter (-1.0%). This sales level reflects greater balance between growth and profitability. The end of the quarter was marked by a significant recovery in the sales pace at both the online and offline channels. Sales growth returned to above double-digit levels, similar to during the pre-crisis period.
Brick-and-Mortar Stores
o In 1Q17, same-store sales growth recovered by 2.5%. Net sales grew 4.2% in 1Q17 compared to 1Q16. On a pro forma basis, adding R$110 million of revenue from credits related to the Lei do Bem tax incentive law in 1Q16, growth would be 1.8%.
o This performance was the result of the following factors: (1) successful commercial strategy adopted during the Consumer Week; (2) kiosks to provide customers with guidance on withdrawing the balance available in their
inactive FGTS (workers’ severance pay) accounts; (3) activation of multichannel sales; and (4) favorable commercial conditions resulting from close relations with suppliers.
o Mobile Telephones remained the top performing category, with double-digit growth and a greater share of the sales mix. TV sales also increased their share of the total sales mix, possibly reflecting the switch from analog to digital signals in the São Paulo metropolitan region.
Online Business
o Important recovery in GMV, which reached R$1,576, up 2.0%, compared to -10.5% in 1Q16. Marketplace accounted for 20% of total GMV in 1Q17, an increase of 500 bps compared to 1Q16. Today, there are approximately 4,000 sellers who offer around 2 million items that complement the portfolio of products offered by Via Varejo.
o Net sales fell 4.0% in 1Q17 compared to 1Q16. On a pro forma basis, adding R$32 million of revenue from credits related to the Lei do Bem in 1Q16, the decline would be 6.7%.
o Additionally, the click & collect segment expanded its presence to 974 Via Varejo stores, reflecting the successful integration of the Online and Offline stores. Sales volume increased 66%, while eligible products increased from 18% of sales to around 30%.
| Consolidated Operating Performance | |||
| (R$ million) | 1Q17 | 1Q16 | Δ |
| Gross Revenue | 11,430 | 10,721 | 6.6% |
| Net Revenue | 10,552 | 9,888 | 6.7% |
| Gross Profit | 2,361 | 2,191 | 7.8% |
| Gross Margin | 22.4% | 22.2% | 20 bps |
| Selling Expenses | (1,657) | (1,602) | 3.5% |
| General and Administrative Expenses | (227) | (210) | 8.1% |
| Selling, General and Adm. Expenses | (1,884) | (1,812) | 4.0% |
| % of Net Revenue | 17.9% | 18.3% | -40 bps |
| Equity Income(1) | (8) | 23 | n.a. |
| Other Operating Revenue (Expenses) | 34 | (45) | n.a. |
| Depreciation (Logistic) | 12 | 14 | -9.1% |
| EBITDA | 515 | 371 | 38.7% |
| EBITDA Margin | 4.9% | 3.8% | 110 bps |
| Adjusted EBITDA(2) | 481 | 416 | 15.7% |
| Adjusted EBITDA Margin | 4.6% | 4.2% | 40 bps |
(1) Equity Income reflects the Company’s share in FIC and Cdiscount. Note that equity income from Cdiscount is reflected in the Consolidated results and not in the Retail and Cash-and-Carry segments.
(2) EBITDA adjusted for “Other Operating Income and Expenses”, thus eliminating nonrecurring income and expenses.
In thequarterlyfinancial statements of GPA on March 31, 2017, due to the ongoing divestment of the interest held by GPA in Via Varejo S.A. as announced in the material fact notice of November 23, 2016, the operations of Via Varejo are treated as discontinued operations, with a retrospective adjustment to net sales and other profit or loss lines as from January 1, 2015, as determined by IFRS 5/CPC 31, and approved by CVM Resolution 598/09 – Sale of non-current assets and discontinued operations. Accordingly, the following comments do not include the performance of Via Varejo.
The quarter was marked by important operational improvements at Multivarejo and Assaí, which led to higher profitability. This performance mainly reflects a lower shrinkage level and the discipline and control over operating expenses as a result of the initiatives adopted last year.
Adjusted EBITDA grew 15.7% to R$481 million. Margin grew 40 bps to 4.6%. The key factors behind this performance were:
§ Gross Profit totaled R$2,361 million, with margin of 22.4%. DespiteAssaí’s higher share of the sales mix (increase of 640 bps from the previous year), margin growth posted byMultivarejo and Assaí contributed to a higher level compared to 1Q16 gross margin (22.2%).
§ Selling, general and administrative expensesof R$1,884 million, corresponding to 17.9% of net sales, down 40 bps compared to 1Q16, mainly due to the significant reduction in expenses at Multivarejo as a result of efficiency and productivity projects, notably the reduction in electricity consumption and the optimization of staff, with no impact on service levels.
Other Operating Income and Expenses totaled R$34 million in the quarter, mainly due to: (i) the gain from asset divestment; (ii) the write-off of stores undergoing conversion; and (iii) the reversal of provisions related to PIS/COFINS on ICMS due to favorable decision of the STF (Brazilian Supreme Court).
| Multivarejo(1) | |||
| (R$ million) | 1Q17 | 1Q16 | Δ |
| Gross Revenue | 7,030 | 7,307 | -3.8% |
| Net Revenue | 6,513 | 6,740 | -3.4% |
| Gross Profit | 1,780 | 1,762 | 1.0% |
| Gross Margin | 27.3% | 26.1% | 120 bps |
| Selling Expenses | (1,286) | (1,312) | -2.0% |
| General and Administrative Expenses | (177) | (170) | 4.5% |
| Selling, General and Adm. Expenses | (1,464) | (1,482) | -1.3% |
| % of Net Revenue | 22.5% | 22.0% | 50 bps |
| Equity Income | 17 | 23 | -25.4% |
| Other Operating Revenue (Expenses) | 21 | (44) | n.a. |
| Depreciation (Logistic) | 11 | 13 | -11.3% |
| EBITDA | 365 | 272 | 34.5% |
| EBITDA Margin | 5.6% | 4.0% | 160 bps |
| Adjusted EBITDA(2) | 345 | 315 | 9.2% |
| Adjusted EBITDA Margin | 5.3% | 4.7% | 60 bps |
(1) Includes the results of Malls and Corporate
(2) EBITDA adjusted for “Other Operating Income and Expenses”, thus eliminating nonrecurring income and expenses
In 1Q17, Multivarejo posted sequential volume recovery and improved customer traffic compared to 1Q16, which translated into market share gains in the period.
Performance in the quarter was mainly affected by the calendar effect (1 day less in February and Easter effect in March).Despite this negative impact, adjusted EBITDA totaled R$345 million, increasing 9.2% from 1Q16. Adjusted EBITDA margin expanded by 60 bps as a result of higher gross profit and cost-cutting initiatives.The main variations impacting this performance were:
§ Gross Profitof R$1,780 million, with gross margin of 27.3%. This margin level is similar to previous quarters, reflecting the new commercial strategies implemented since late 1Q16. The higher margin compared to the previous year was due to:
– Betterlevel ofshrinkage;
–Maintenance of price competitiveness initiatives, but with higher accuracy and successful investments in promotions;
– Weaker comparison base due to Easter, which this year fell in 2Q.
§ Selling, general and administrative expenses reached R$1,464 million, down 1.3%due to the efficiency and productivity projects, the highlights being:
– Electricity: reduction in consumption through efficiency projects;
–Personnel: optimization of personnel, with the reduction of approximately 7,000 jobs as a result of increased productivity of operational teams at the stores and DCs, such as new restocking practices;
–Service level: increase in customer satisfaction levels through a balance between cost optimization and improved service level, with the highlights being higher investments in store personnel training, new tools to manage customer lines and increase in multifunctional employees to improve efficiency and customer service, among others.
Other Operating Income and Expenses totaled R$21 million, mainly due to the following: (i) gain from asset divestment; (ii) write-off of stores undergoing conversion; and (iii) reversal of provision related to PIS/COFINS on ICMS due to favorable decision of the STF (Brazilian Supreme Court).
| Assaí | |||
| (R$ million) | 1Q17 | 1Q16 | Δ |
| Gross Revenue | 4,400 | 3,414 | 28.9% |
| Net Revenue | 4,039 | 3,148 | 28.3% |
| Gross Profit | 581 | 429 | 35.5% |
| Gross Margin | 14.4% | 13.6% | 80 bps |
| Selling Expenses | (371) | (289) | 28.2% |
| General and Administrative Expenses | (50) | (40) | 23.2% |
| Selling, General and Adm. Expenses | (421) | (330) | 27.6% |
| % of Net Revenue | 10.4% | 10.5% | -10 bps |
| Other Operating Revenue (Expenses) | 13 | (1) | n.a. |
| Depreciation (Logistic) | 1 | 1 | 18.2% |
| EBITDA | 175 | 100 | 75.0% |
| EBITDA Margin | 4.3% | 3.2% | 110 bps |
| Adjusted EBITDA(1) | 162 | 101 | 61.0% |
| Adjusted EBITDA Margin | 4.0% | 3.2% | 80 bps |
(1) EBITDA adjusted for “Other Operating Income and Expenses”, thus eliminating nonrecurring income and expenses
Assaí continues to register strong sales performance, growing 28.3% in the quarter (28.8% adjusted for calendar effects), even when compared to a strong basis of 36.2% in 1Q16. The banner continues a strong organic expansion process and consistent growth in same-store sales, which stood at 12.9% adjusted for calendar effects and conversions.
Same-store growth was strongly impacted by lower food inflation in the period (from 13.1% in 1Q16 to 5.2% in 1Q17), though maintaining the double-digit growth in customer traffic. During 1Q17, Assaí continued to gain market share, with growth of 300 bps from the previous year.
Assaí closed 1Q17 with 106 stores across 16 states. Assaí already accounts for 38.3% of net sales, an increase of 640 bps from 1Q16.
It is worth to mention the success of the first two conversions, which registered an increase of more than 2.5 times in sales and of around 50% growth in customer traffic. Five more stores are in the process of being converted, with the goal being at least 15 conversions by the end of the year.
Gross margin in the quarter reached 14.4%, growing 80 bps from 1Q16. This performance was mainly driven by faster maturation of stores opened in 2016 compared to stores opened in late 2015. This growth was also driven by improvements in the commercial dynamics and an increased share of individual customers in total sales.
Operating expenses as a percentage of net sales reached 10.4%, a dilution of 10 bps in comparison with last year despite the strong expansion in the last 12 months.
Adjusted EBITDA grew 61.0%, which was double the sales growth in the period. Adjusted EBITDA margin reached 4.0%, increasing 80 bps due to operating leverage.
Financial Result – Consolidated
| (R$ million) | 1Q17 | 1Q16 | Δ |
| Financial Revenue | 58 | 64 | -9.8% |
| Financial Expenses | (240) | (243) | -1.2% |
| Cost of Debt | (174) | (151) | 15.1% |
| Cost of Sale of Receivables of Credit Card | (40) | (30) | 32.0% |
| Restatement of Contingent Liabilities and Other financial expenses | (26) | (62) | -57.5% |
| Net Financial Revenue (Expenses) | (182) | (179) | 1.8% |
| % of Net Revenue | 1.7% | 1.8% | -10 bps |
In the financial statements of GPA of December 31, 2016, consequent to the ongoing divestment of the interest held by GPA in Via Varejo S.A. as announced in the material fact notice of November 23, 2016,the operations of Via Varejo are treated as discontinued operations. Accordingly, net sales and other income/expense lines were adjusted retrospectively from January 1, 2015, as defined in IFRS 5 / CPC31, approved by CVM Resolution 598/09 - Sale of non-current assets and discontinued operations. Consequently, the following comments do not include the performance of Via Varejo.
In 1Q17, net financial result of the Company reached R$ 182 million, remaining stable compared to the same period last year. Financial result as a ratio of net sales stood at 1.7%, improving 10 bps from 1Q16.
This ratio of 1.7% represents the trend expected until the end of the year due to the declining curve of the Selic interest rate.
Cost of debt increased 15.1%, mainly due to the non-recurring impact of mark-to-market adjustments last year. Excluding this impact, cost of debt decreased 7%, in line with the decline in the interest rate during the period (as measured by average CDI).
Cost of receivables remained stable at 0.3% of revenue.
Restatements of contingencies and other financial expenses decreased 58%, or R$36 million, mainly due to the effect of the decline in the balance of contingencies, which led to lower monetary restatements, and the improvement in costs of guarantees, benefiting from the process of replacing bails by surety bonds.
Net Income
| Consolidated | Food Business | ||||||
| (R$ million) | 1Q17 | 1Q16 | Δ | 1Q17 | 1Q16 | Δ% | |
| EBITDA | 515 | 371 | 38.7% | 540 | 371 | 45.4% | |
| Depreciation (Logistic) | (12) | (14) | -9.1% | (12) | (14) | -9.1% | |
| Depreciation and Amortization | (190) | (170) | 11.5% | (190) | (170) | 11.5% | |
| Net Financial Revenue (Expenses) | (182) | (179) | 1.8% | (182) | (179) | 1.8% | |
| Income (Loss) before Income Tax | 131 | 9 | 1433.1% | 156 | 9 | 1726.4% | |
| Income Tax | (49) | 0 | n.a. | (49) | 0 | n.a. | |
| Net Income (Loss) Company - continuing operations | 81 | 9 | 826.2% | 106 | 9 | 1110.7% | |
| Net income from discontinued operations | 134 | (165) | n.a. | (25) | (10) | 142.3% | |
| Net Income (Loss) Consolidated Company | 215 | (157) | n.a. | 81 | (2) | n.a. | |
| Net Income (Loss) - Controlling Shareholders - continuing operations | 82 | 9 | 832.5% | 107 | 9 | 1116.9% | |
| Net Income (Loss) - Controlling Shareholders - descontinuing operations | 43 | (57) | n.a. | (25) | (10) | 142.3% | |
| Net Income (Loss) - Controlling Shareholders - Consolidated | 125 | (49) | n.a. | 82 | (2) | n.a. | |
| Other Operating Revenue (Expenses) | 34 | (45) | n.a. | 34 | (45) | n.a. | |
| Income Tax from Other Operating Revenues (Expenses) and Income Tax from Nonrecurring | (9) | 11 | n.a. | (9) | 11 | n.a. | |
| Adjusted Net Income (Loss) - Controlling Shareholders - continuing operations(1) | 58 | 42 | 37.5% | 83 | 42 | 96.8% | |
| Adjusted Net Margin - Controlling Shareholders | 0.5% | 0.4% | 10 bps | 0.8% | 0.4% | 40 bps | |
| (1) Net Income adjusted for “Other Operating Income and Expenses”, thus eliminating nonrecurring income and expenses, excluding the effects of Income and social contribution taxes. | |||||||
In the financial statements of GPA on December 31, 2016, due to the ongoing divestment of the interest held by GPA in Via Varejo S.A. as announced in the material fact notice of November 23, 2016,the operations of Via Varejo are treated as discontinued operations. Hence, net sales and other profit or loss lines were adjusted retroactively as from January 1, 2015, as determined by IFRS 5/CPC 31, and approved by CVM Resolution 598/09 - Sale of non-current assets and discontinued operations.
Adjusted net income of controlling shareholders from continuing operations totaled R$58million in the quarter, with the Food segment growing by a notable96.8% to reach R$83million, driven by greater profitability at bothMultivarejo(+72.2%) andAssaí (+103.3%).
Net income attributable to controlling shareholders, considering continuing and discontinued operations, totaled R$125 million, reflecting a significant improvement in the operating result across all businesses.
Debt – Consolidated
| Debt – Consolidated | |||
| (R$ million) | |||
03.31.2017 Food | 03.31.2016 Food | 03.31.2016 Consolidated including Via | |
| Business | Business | Varejo | |
Short Term Debt | (2,231) | (2,874) | (3,712) |
| Loans and Financing | (1,379) | (2,351) | (3,190) |
| Debentures and Promissory Notes | (852) | (522) | (522) |
Long Term Debt | (2,569) | (2,548) | (2,949) |
| Loans and Financing | (663) | (1,650) | (2,052) |
| Debentures | (1,906) | (898) | (898) |
| Total Gross Debt | (4,800) | (5,421) | (6,661) |
| Cash and Financial investments | 1,683 | 2,386 | 4,448 |
| Net Debt | (3,117) | (3,035) | (2,213) |
| EBITDA(1) | 1,764 | 2,150 | 2,148 |
| Net Debt / EBITDA(1) | -1.8x | -1.4x | -1.03x |
| Payment Book (CDCI) | - | - | (2,464) |
| On balance Credit Card Receivables not discounted | 404 | 37 | 2,880 |
| Net Debt with Payment Book and Credit Card Receivables not discounted | (2,712) | (2,998) | (1,797) |
| Net Debt with Payment Book and Credit Card Receivables not discounted / EBITDA(1) | -1.5x | -1.4x | -0.84x |
In the financial statements of GPA of December 31, 2016, consequent to the ongoing divestment of the interest held by GPA in Via Varejo S.A. as announced in the material fact notice of November 23, 2016, the operations of Via Varejo are treated as discontinued operations. Accordingly, net sales and other income/expense lines were adjusted retrospectively from January 1, 2015, as defined in IFRS 5 / CPC31, approved by CVM Resolution 598/09 - Sale of non-current assets and discontinued operations. Consequently, the following comments do not include the performance of Via Varejo.However, this technical standard does not require restatement of the balance sheet in such situations. For better comparison between the periods, a column presenting comparable results for March 2016 was added to the above table on debt.
(1) EBITDA in the last 12 months.
Net debt, including unsold receivables, totaled R$2,712 million in the quarter, improving by R$286 million from the same period in 2016.
In 1Q17, the Company reached a ratio of net debt to EBITDA of 1.5 times, virtually stable compared to the same period last year.
Gross debt decreased R$621 million from 1Q16 to reach R$4.8 billion in the period.
Successful issuance of a second CRA in the amount of R$1.08 billion, at 96.0% of the CDI rate and with a three-year term.
Cash position was R$1.7 billion and the balance of receivables not discounted was R$404 million, for total available resources of R$2.1 billion.
The Company also has approximately R$1.3 billion in pre-approved/confirmed credit lines.
| Simplified cash flow – Consolidated (including Via Varejo) | ||
| (R$ million) | 1Q17 | 1Q16 |
| Cash Balance at Beginning of Period | 9,142 | 11,015 |
| Cash Flow from Operating Activities | (5,106) | (7,975) |
| EBITDA | 793 | 458 |
| Cost of Sale of Receivables | (174) | (169) |
| Working Capital | (5,449) | (7,808) |
| Assets and Liabilities Variation | (276) | (456) |
| Cash Flow from Investment Activities | (354) | (263) |
| Net Investment | (354) | (354) |
| Acquisition / Sale of Interest and Others | - | 91 |
| Change on net cash after investments | (5,460) | (8,238) |
| Cash Flow from Financing Activities | (1,473) | 1,667 |
| Dividends Payments and Others | - | (1) |
| Net Payments | (1,473) | 1,668 |
| Change on Net Cash | (6,933) | (6,571) |
| Exchange Rate | - | 4 |
| Cash Balance at End of Period | 2,209 | 4,448 |
| (-) Cash includes "Assets held for sale and op. Discontinued" | 526 | - |
| Cash as balance sheet (excluding Via Varejo) | 1,683 | 4,448 |
In the financial statements of GPA of December 31, 2016, consequent to the ongoing divestment of the interest held by GPA in Via Varejo S.A. as announced in the material fact notice of November 23, 2016, the operations of Via Varejo are treated as discontinued operations. Accordingly, net sales and other income/expense lines were adjusted retrospectively from January 1, 2015, as defined in IFRS 5 / CPC31, approved by CVM Resolution 598/09 - Sale of non-current assets and discontinued operations.Held-for-sale assets and the corresponding liabilities were reclassified only on the reporting date, i.e. December 31, 2016, and therefore all of the above changes in balance sheet accounts include Via Varejo, although the closing cash position has been reconciled to reflect only continuing operations.
Cash position including discontinued operations came to R$2.2 billion in 1Q17, an R$2.2 billion change from last year. The main changes were:
§ Lower initial cash in the period of R$1.9 billion, partially explained by the deconsolidation of Cdiscount;
§ Higher debt amortization volume compared to funding in the period;
§ Partially offset by the improvement in working capital in the Non-Food Segment, due to better ratio of suppliers to inventories resulting from the recovery in operational activity.
Capital Expenditure (Capex)
| Food Business | |||
| (R$ million) | 1Q17 | 1Q16 | Δ |
| New stores and land acquisition | 28 | 103 | -73.2% |
| Store renovations and conversions | 74 | 134 | -44.7% |
| Infrastructure and Others | 43 | 142 | -69.9% |
| Non-cash Effect | |||
| Financing Assets | 124 | (60) | n.a. |
| Total | 268 | 319 | -15.8% |
Investments in property and equipment totaled R$268 million in the quarter. Three stores were opened in the quarter: 1 Pão de Açúcar and 2 Extra stations.
At the end of the quarter, another 8 stores were under construction:
o 7 Assaí: 5 conversions from Extra Hiper and 2 new stores
o 1 Minuto Pão de Açúcar
These stores should be delivered in 2Q17 or early 3Q17.
The decrease in Capex compared to the previous year was mainly due to the following factors:
(i) in 1Q17, there was a stronger focus on store conversions, while in 1Q16 the Company invested in land to open Assaí stores;
(ii) a different store expansion calendar. For the year, total Capex will be similar to 2016.
The Company continues to focus on formats with higher return. It will also continue to perform conversions between banners, especially Extra Hiper into Assaí, and implement the store modernization plan, mainly Pão de Açúcar and Extra.
Via Varejo - Discontinued Operations
Net revenue in 1Q17 reached R$6 billion, up 2.6% from 1Q16, a significant recovery in performance compared to the previous year (-11.8%) and the previous quarter (-1.0%). This sales volume reflects greater balance between growth and profitability.The end of the quarter was marked by a significant recovery in the pace of sales at both Online and Brick-and-Mortar channels.Sales growth returned to above double-digit levels in March, similar to during the pre-crisis period, mainly due to(i) withdrawals from inactive FGTS accounts and (ii) an integrated commercial strategy for both businesses.
Gross margin ended 1Q17 at 31.2%, up 432 bps.Considering the effects ofLei do Bem in 1Q16, consolidated gross margin would be 259 bps higher.This improvement is the result of the successful multichannel commercial strategy and the higher share of financial services and products in brick-and-mortar stores.The commercial strategy was focused on balancing sales growth in both businesses with improved profitability.The Online Business saw a significant improvement of approximately 1,000 bps in gross margin, thanks to the successful implementation of the multichannel commercial strategy to establish the correct positioning of prices and assortment.
Adjusted EBITDA margin was 5.5% in 1Q17, higher than adjusted EBITDA of 0.6% in 1Q16.Considering the effects ofLei do Bem in 1Q17, consolidated gross margin was 248 bps higher than in 2016.The successful multichannel commercial strategy, with significant improvement in consolidated gross margin, combined with the optimization of SG&A expenses, contributed to the improvement in adjusted EBITDA margin.It is worth highlighting the profitability achieved by the Online business, which was slightly positive and recovered earlier than expected.
Net Income stood at R$97 million, as against a loss of R$237 million in 1Q16.This result reflects the efforts to implement a multichannel commercial strategy to achieve operating efficiency, and the start of capture of synergies between Brick-and-Mortar and Online operations.
Appendix II – Definitions used in this document
Company’s Business Units:The Company’s business is divided into two segments – Retail and Cash & Carry – grouped as follows:
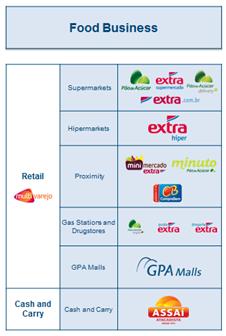
Food segment:Represents the combined results of Multivarejo and Assaí, excluding equity income (loss) from Cdiscount, which is not included in the operating segments reported by the Company.
Growth and changes:The growth and changes presented in this document refer to variations from the same period last year, except where stated otherwise.
EBITDA:EBITDA is calculated in accordance with Instruction 527 issued by the Securities and Exchange Commission of Brazil (CVM) on October 4, 2012.
Adjusted EBITDA:Measure of profitability calculated by excluding Other Operating Income and Expenses from EBITDA. Management uses this measure in its analyses as it believes it eliminates nonrecurring expenses and revenues and other nonrecurring items that could compromise the comparability and analysis of results.
Adjusted net income:Measure of profitability calculated as Net Income from continuing operations excluding Other Operating Income and Expenses and excluding the effects of Income and Social Contribution Taxes. Also excluded are the effects of nonrecurring direct income tax. Management uses this metric in its analyses given its belief that it eliminates any nonrecurring expenses and revenues and other nonrecurring items that could compromise the comparability and analysis of results.
| BALANCE SHEET | |||||||
| ASSETS | |||||||
| Consolidated | Food Businesses | ||||||
| (R$ million) | 03.31.2017 | 12.31.2016 | 03.31.2016 | 03.31.2017 | 12.31.2016 | 03.31.2016 | |
| Current Assets | 27,970 | 31,651 | 21,076 | 8,126 | 11,354 | 8,010 | |
| Cash and Marketable Securities | 1,683 | 5,112 | 4,448 | 1,683 | 5,112 | 2,386 | |
| Accounts Receivable | 682 | 543 | 5,321 | 687 | 549 | 171 | |
| Credit Cards | 404 | 241 | 2,851 | 404 | 241 | 37 | |
| Payment book | - | - | 1,815 | - | - | - | |
| Sales Vouchers and Others | 167 | 209 | 804 | 171 | 215 | 136 | |
| Allowance for Doubtful Accounts | (3) | (2) | (360) | (3) | (2) | (2) | |
| Resulting from Commercial Agreements | 114 | 95 | 211 | 114 | 95 | 76 | |
| Inventories | 4,578 | 4,641 | 9,161 | 4,578 | 4,641 | 4,487 | |
| Recoverable Taxes | 617 | 674 | 1,228 | 617 | 674 | 429 | |
| Noncurrent Assets for Sale | 19,848 | 20,303 | 13 | - | - | 8 | |
| Expenses in Advance and Other Accounts Receivables | 562 | 378 | 905 | 561 | 378 | 452 | |
| Noncurrent Assets | 13,422 | 13,566 | 22,407 | 13,444 | 13,575 | 15,928 | |
| Long-Term Assets | 2,197 | 2,137 | 4,982 | 2,215 | 2,141 | 1,906 | |
| Accounts Receivables | - | - | 123 | - | - | - | |
| Credit Cards | - | - | 29 | - | - | - | |
| Payment Book | - | - | 106 | - | - | - | |
| Allowance for Doubtful Accounts | - | - | (12) | - | - | - | |
| Recoverable Taxes | 653 | 632 | 2,419 | 653 | 632 | 550 | |
| Deferred Income Tax and Social Contribution | 181 | 170 | 364 | 181 | 170 | 44 | |
| Amounts Receivable from Related Parties | 28 | 17 | 312 | 47 | 21 | 63 | |
| Judicial Deposits | 680 | 661 | 1,067 | 680 | 661 | 583 | |
| Expenses in Advance and Others | 655 | 657 | 697 | 655 | 657 | 666 | |
| Investments | 356 | 339 | 439 | 355 | 339 | 282 | |
| Property and Equipment | 8,972 | 9,182 | 10,419 | 8,972 | 9,182 | 8,911 | |
| Intangible Assets | 1,897 | 1,908 | 6,567 | 1,902 | 1,913 | 4,829 | |
| TOTAL ASSETS | 41,392 | 45,217 | 43,483 | 21,571 | 24,929 | 23,939 | |
| LIABILITIES | |||||||
| Consolidated | Food Businesses | ||||||
| 03.31.2017 | 12.31.2016 | 03.31.2016 | 03.31.2017 | 12.31.2016 | 03.31.2016 | ||
| Current Liabilities | 23,912 | 27,582 | 22,691 | 9,147 | 12,191 | 8,946 | |
| Suppliers | 5,241 | 7,232 | 10,849 | 5,243 | 7,235 | 4,312 | |
| Suppliers ('Forfait') | - | - | 350 | - | - | - | |
| Loans and Financing | 1,379 | 2,389 | 3,190 | 1,379 | 2,389 | 2,351 | |
| Payment Book (CDCI) | - | - | 2,293 | - | - | - | |
| Debentures | 852 | 568 | 522 | 852 | 568 | 522 | |
| Payroll and Related Charges | 609 | 614 | 1,001 | 609 | 614 | 543 | |
| Taxes and Social Contribution Payable | 203 | 254 | 932 | 203 | 254 | 180 | |
| Dividends Proposed | - | - | 2 | - | - | 0 | |
| Financing for Purchase of Fixed Assets | 49 | 116 | 70 | 49 | 116 | 48 | |
| Rents | 76 | 110 | 133 | 76 | 110 | 90 | |
| Acquisition of minority interest | 8 | 7 | 80 | 8 | 7 | 80 | |
| Debt with Related Parties | 145 | 147 | 1,446 | 334 | 379 | 173 | |
| Advertisement | 35 | 43 | 83 | 35 | 43 | 62 | |
| Provision for Restructuring | 3 | 4 | 10 | 3 | 4 | 6 | |
| Advanced Revenue | 103 | 224 | 426 | 103 | 224 | 132 | |
| Non-current Assets Held for Sale | 14,961 | 15,632 | - | - | - | - | |
| Others | 248 | 242 | 1,304 | 253 | 248 | 449 | |
| Long-Term Liabilities | 4,659 | 5,038 | 7,517 | 4,659 | 5,038 | 5,097 | |
| Loans and Financing | 663 | 1,008 | 2,052 | 663 | 1,008 | 1,650 | |
| Payment Book (CDCI) | - | - | 171 | - | - | - | |
| Debentures | 1,906 | 1,904 | 898 | 1,906 | 1,904 | 898 | |
| Financing for Purchase of Assets | - | 4 | 4 | - | 4 | 4 | |
| Acquisition of minority interest | - | - | 27 | - | - | - | |
| Deferred Income Tax and Social Contribution | 331 | 317 | 1,148 | 331 | 317 | 1,119 | |
| Tax Installments | 528 | 540 | 563 | 528 | 540 | 563 | |
| Provision for Contingencies | 1,116 | 1,177 | 1,437 | 1,116 | 1,177 | 802 | |
| Advanced Revenue | 22 | 24 | 1,171 | 22 | 24 | 30 | |
| Others | 93 | 64 | 47 | 93 | 64 | 31 | |
| Shareholders' Equity | 12,821 | 12,597 | 13,276 | 7,765 | 7,700 | 9,895 | |
| Capital | 6,815 | 6,811 | 6,806 | 5,519 | 5,584 | 5,135 | |
| Capital Reserves | 336 | 331 | 308 | 336 | 331 | 308 | |
| Profit Reserves | 2,843 | 2,718 | 3,282 | 1,910 | 1,785 | 3,381 | |
| Adjustment of Equity Valuation | - | - | (71) | - | - | (68) | |
| Minority Interest | 2,827 | 2,737 | 2,951 | - | - | 1,140 | |
| TOTAL LIABILITIES | 41,392 | 45,217 | 43,483 | 21,571 | 24,929 | 23,939 | |
INCOME STATEMENT | |||||||||||||||
| Consolidated | Food Businesses | Multivarejo(1) | Assaí | ||||||||||||
| R$ - Million | 1Q17 | 1Q16 | Δ | 1Q17 | 1Q16 | Δ | 1Q17 | 1Q16 | Δ | 1Q17 | 1Q16 | Δ | |||
| Gross Revenue | 11,430 | 10,721 | 6.6% | 11,430 | 10,721 | 6.6% | 7,030 | 7,307 | -3.8% | 4,400 | 3,414 | 28.9% | |||
| Net Revenue | 10,552 | 9,888 | 6.7% | 10,552 | 9,888 | 6.7% | 6,513 | 6,740 | -3.4% | 4,039 | 3,148 | 28.3% | |||
| Cost of Goods Sold | (8,179) | (7,683) | 6.5% | (8,179) | (7,683) | 6.5% | (4,722) | (4,965) | -4.9% | (3,456) | (2,718) | 27.2% | |||
| Depreciation (Logistic) | (12) | (14) | -9.1% | (12) | (14) | -9.1% | (11) | (13) | -11.3% | (1) | (1) | 18.2% | |||
| Gross Profit | 2,361 | 2,191 | 7.8% | 2,361 | 2,191 | 7.8% | 1,780 | 1,762 | 1.0% | 581 | 429 | 35.5% | |||
| Selling Expenses | (1,657) | (1,602) | 3.5% | (1,657) | (1,602) | 3.5% | (1,286) | (1,312) | -2.0% | (371) | (289) | 28.2% | |||
| General and Administrative Expenses | (227) | (210) | 8.1% | (227) | (210) | 8.1% | (177) | (170) | 4.5% | (50) | (40) | 23.2% | |||
| Selling, General and Adm. Expenses | (1,884) | (1,812) | 4.0% | (1,884) | (1,812) | 4.0% | (1,464) | (1,482) | -1.3% | (421) | (330) | 27.6% | |||
| Equity Income(2) | (8) | 23 | n.a. | 17 | 23 | -25.4% | 17 | 23 | -25.4% | - | - | n.a. | |||
| Other Operating Revenue (Expenses) | 34 | (45) | n.a. | 34 | (45) | n.a. | 21 | (44) | n.a. | 13 | (1) | n.a. | |||
| Depreciation and Amortization | (190) | (170) | 11.5% | (190) | (170) | 11.5% | (149) | (140) | 6.7% | (41) | (30) | 33.3% | |||
| Earnings before interest and Taxes - EBIT | 313 | 187 | 66.9% | 338 | 187 | 80.2% | 205 | 119 | 72.1% | 133 | 68 | 94.5% | |||
| Financial Revenue | 58 | 64 | -9.8% | 58 | 64 | -9.8% | 50 | 54 | -7.3% | 7 | 10 | -23.6% | |||
| Financial Expenses | (240) | (243) | -1.2% | (240) | (243) | -1.2% | (215) | (215) | 0.0% | (25) | (28) | -10.5% | |||
| Net Financial Result | (182) | (179) | 1.8% | (182) | (179) | 1.8% | (164) | (160) | 2.4% | (18) | (18) | -3.7% | |||
| Income (Loss) Before Income Tax | 131 | 9 | 1433.1% | 156 | 9 | 1726.4% | 41 | (41) | n.a. | 115 | 50 | 130.9% | |||
| Income Tax | (49) | 0 | n.a. | (49) | 0 | n.a. | (10) | 17 | n.a. | (39) | (17) | 128.9% | |||
| Net Income (Loss) Company - continuing operations | 81 | 9 | 826.2% | 106 | 9 | 1110.7% | 30 | (24) | n.a. | 76 | 33 | 132.0% | |||
| Net Result from discontinued operations | 134 | (165) | n.a. | (25) | (10) | 142.3% | (25) | (10) | 142.3% | - | - | n.a. | |||
| Net Income (Loss) - Consolidated Company | 215 | (157) | n.a. | 81 | (2) | n.a. | 5 | (35) | n.a. | 76 | 33 | 132.0% | |||
| Net Income (Loss) - Controlling Shareholders - continuing operations(3) | 82 | 9 | 832.5% | 107 | 9 | 1116.9% | 31 | (24) | n.a. | 76 | 33 | 132.0% | |||
| Net Income (Loss) - Controlling Shareholders - discontinued operations(3) | 43 | (57) | n.a. | (25) | (10) | 142.3% | (25) | (10) | 142.3% | - | - | n.a. | |||
| Net Income (Loss) - Consolidated Controlling Shareholders | 125 | (49) | n.a. | 82 | (2) | n.a. | 5 | (35) | n.a. | 76 | 33 | 132.0% | |||
| Minority Interest - Noncontrolling - continuing operations | (1) | - | n.a. | (1) | - | n.a. | (1) | - | n.a. | - | - | n.a. | |||
| Minority Interest - Noncontrolling - discontinued operations | 90 | (108) | n.a. | - | - | n.a. | - | - | n.a. | - | - | n.a. | |||
| Minority Interest - Noncontrolling - Consolidated | 89 | (108) | n.a. | (1) | - | n.a. | (1) | - | n.a. | - | - | n.a. | |||
| Earnings before Interest, Taxes, Depreciation, Amortization - EBITDA | 515 | 371 | 38.7% | 540 | 371 | 45.4% | 365 | 272 | 34.5% | 175 | 100 | 75.0% | |||
| Adjusted EBITDA(4) | 481 | 416 | 15.7% | 506 | 416 | 21.7% | 345 | 315 | 9.2% | 162 | 101 | 61.0% | |||
| STATEMENT OF CASH FLOW | ||
| (R$ million) | Consolidated | |
| 03.31.2017 | 03.31.2016 | |
| Net Income (Loss) for the period | 214 | (157) |
| Adjustment for reconciliation of net income | ||
| Deferred income tax | (30) | (7) |
| Loss (gain) on disposal of fixed and intangible assets | (11) | 46 |
| Depreciation and amortization | 202 | 280 |
| Interests and exchange variation | 223 | 272 |
| Adjustment to present value | - | 3 |
| Equity Income | 1 | (32) |
| Provision for contingencies | 111 | 69 |
| Share-Based Compensation | 6 | 8 |
| Allowance for doubtful accounts | 159 | 109 |
| Provision for obsolescence/breakage | (20) | 5 |
| Gains resulting from sale of subisidiaries | - | (94) |
| Deferred revenue | (82) | (55) |
| 773 | 447 | |
| Asset (Increase) decreases | ||
| Accounts receivable | (2,557) | (2,276) |
| Inventories | (481) | (260) |
| Taxes recoverable | (66) | (76) |
| Other Assets | (130) | (194) |
| Related parties | 14 | 33 |
| Restricted deposits for legal proceeding | (33) | (55) |
| (3,253) | (2,828) | |
| Liability (Increase) decrease | ||
| Suppliers | (2,411) | (4,567) |
| Suppliers ('Forfait') | - | (705) |
| Payroll and charges | (10) | (22) |
| Taxes and Social contributions payable | (58) | 77 |
| Other Accounts Payable | (25) | (316) |
| Contingencies | (116) | (71) |
| Deferred revenue | (3) | 10 |
| Taxes and Social contributions paid | (3) | - |
| (2,626) | (5,594) | |
| Net cash generated from (used) in operating activities | (5,106) | (7,975) |
| Acquisition of property and equipment | (266) | (284) |
| Increase Intangible assets | (91) | (83) |
| Sales of property and equipment | 3 | 13 |
| Cash provided on sale of subisidiary | - | 91 |
| Net cash flow investment activities | (354) | (263) |
| Cash flow from financing activities | ||
| Increase of capital | 4 | - |
| Funding and refinancing | 2,222 | 2,409 |
| Payments of loans and financing | (3,699) | (1,592) |
| Dividend Payment | - | (1) |
| Intercompany loans | - | 851 |
| Net cash generated from (used) in financing activities | (1,473) | 1,667 |
| Monetary variation over cash and cash equivalents | - | 4 |
| Increase (decrease) in cash and cash equivalents | (6,933) | (6,567) |
| Cash and cash equivalents at the beginning of the year | 9,142 | 11,015 |
| Cash and cash equivalents at the end of the year | 2,209 | 4,448 |
| Change in cash and cash equivalents | (6,933) | (6,567) |
| BREAKDOWN OF GROSS SALES BY BUSINESS | |||||
| (R$ million) | 1Q17 | % | 1Q16 | % | Δ |
| Pão de Açúcar | 1,718 | 15.0% | 1,804 | 16.8% | -4.8% |
| Extra(1) | 4,416 | 38.6% | 4,580 | 42.7% | -3.6% |
| Convenience Stores(2) | 296 | 2.6% | 304 | 2.8% | -2.4% |
| Assaí | 4,400 | 38.5% | 3,414 | 31.8% | 28.9% |
| Other Businesses(3) | 600 | 5.2% | 620 | 5.8% | -3.2% |
| Food Business | 11,430 | 100.0% | 10,721 | 100.0% | 6.6% |
| (1) Includes Extra Supermercado and Extra Hiper. Same-store gross sales of 4.1%in 1Q17. | |||||
| (2) Includes M inimercado Extra and M inuto Pão de Açúcar sales. | |||||
| (3) Includes Gas Station, Drugstores, Delivery sales and revenues from the leasing of commercial galleries. | |||||
| BREAKDOWN OF NET SALES BY BUSINESS | |||||
| (R$ million) | 1Q17 | % | 1Q16 | % | Δ |
| Pão de Açúcar | 1,585 | 15.0% | 1,660 | 16.8% | -4.5% |
| Extra(1) | 4,065 | 38.5% | 4,191 | 42.4% | -3.0% |
| Convenience Stores(2) | 277 | 2.6% | 283 | 2.9% | -2.2% |
| Assaí | 4,039 | 38.3% | 3,148 | 31.8% | 28.3% |
| Other Businesses(3) | 586 | 5.6% | 606 | 6.1% | -3.3% |
| Food Business | 10,552 | 100.0% | 9,888 | 100.0% | 6.7% |
| (1) Includes Extra Supermercado and Extra Hiper. Same-store gross sales of 3.5%in 1Q17. | |||||
| (2) Includes M inimercado Extra and M inuto Pão de Açúcar sales. | |||||
| (3) Includes Gas Station, Drugstores, Delivery sales and revenues from the leasing of commercial galleries. | |||||
| SALES BREAKDOWN (% of Net Sales) | ||
| Food Business | ||
| 1Q17 | 1Q16 | |
| Cash | 51.5% | 52.4% |
| Credit Card | 38.2% | 37.8% |
| Food Voucher | 10.3% | 9.8% |
| STORE OPENINGS/CLOSINGS BY BANNER | |||||||||
| 12/31/2016 | Opened | Closed | Converted | 03/31/2017 | |||||
| Pão de Açúcar | 185 | 1 | (1) | - | 185 | ||||
| Extra Hiper | 134 | - | (5) | - | 129 | ||||
| Extra Supermercado | 194 | - | - | - | 194 | ||||
| Minimercado Extra | 207 | - | (10) | - | 197 | ||||
| Minuto Pão de Açucar | 77 | - | - | - | 77 | ||||
| Assaí | 107 | - | (1) | - | 106 | ||||
| Other Business | 231 | 2 | (4) | - | 229 | ||||
| Gas Station | 76 | 2 | (1) | - | 77 | ||||
| Drugstores | 155 | - | (3) | - | 152 | ||||
| Food Business | 1,135 | 3 | (21) | - | 1,117 | ||||
| Sales Area ('000 m2) | |||||||||
| Food Business | 1,814 | 1,789 | |||||||
| # of employees ('000)(1) | 91 | 89 | |||||||
| (1)Excludes employees of discontinued operations. | |||||||||
(1) Excludes employees of discontinued operations.
1Q17 Results Conference Call and Webcast Conference call in Portuguese (original language) Conference call in English (simultaneous translation) Webcast: http://www.gpari.com.br Replay http://www.gpari.com.br |
Investor Relations Contacts
GPA Tel.: 55 (11) 3886-0421 Fax: 55 (11) 3884-2677 gpa.ri@gpabr.com www.gpari.com.br |
Via Varejo Tel.: 55 (11) 4225-8668 Fax: 55 (11) 4225-9596 ri@viavarejo.com.br www.viavarejo.com.br/ri |
Cnova Tel.: 33 (1) 5370-5590 investor@cnova.com www.cnova.com/investor-relations | |
Any and all non-accounting information or derived from non-accounting figures has not been reviewed by independent auditors. To calculate EBITDA, we use earnings before interest, taxes, depreciation and amortization. GPA adopts the IPCA consumer price index as its benchmark inflation index, which is also used by the Brazilian Supermarkets Association (ABRAS), since it more accurately reflects the mix of products and brands sold by the Company.IPCA inflation in the 12 months ended March 2017 was 4.57%. | About GPA:GPA is Brazil’s largest retailer, with a distribution network comprising over 2,000 points of sale as well as electronic channels. Established in 1948 in São Paulo, it has its head office in the city and operations in 20 Brazilian states and the Federal District. With a strategy of focusing its decisions on customers and better serving them based on their consumer profile in the wide variety of shopping experiences it offers, GPA adopts a multi-business and multi-channel platform with brick-and-mortar stores and e-commerce operations divided into three business units: Multivarejo, which operates the supermarket, hypermarket and Minimercado store formats, as well as fuel stations and drugstores under the Pão de Açúcar and Extra banners; Assaí, which operates in the cash-and-carry wholesale segment; GPA Malls, which is responsible for managing the Group's real estate assets, expansion projects and new store openings;and Via Varejo’s discontinued operations, with its bricks and mortar electronics and home appliances stores under the Casas Bahia and Pontofrio banners, and the e-commerce segment. | ||
Disclaimer:Statements contained in this release relating to the business outlook of the Company, projections of operating/financial results, the growth potential of the Company and the market and macroeconomic estimates are mere forecasts and were based on the expectations of Management in relation to the Company’s future. These expectations are highly dependent on changes in the market, Brazil’s general economic performance, the industry and international markets, and are thus subject to change. | |||
(FREE TRANSLATION INTO ENGLISH FROM THE ORIGINAL PREVIOUSLY ISSUED IN PORTUGUESE)
Companhia Brasileira de Distribuição
Notes to the interim financial information
March 31, 2017
(In millions of Brazilian reais, unless otherwise stated)
1. Corporate information
Companhia Brasileira de Distribuição ("Company" or “CBD”), directly or through its subsidiaries (“Group” or “GPA”) is engaged in the retail of food, clothing, home appliances, electronics and other products through its chain of hypermarkets, supermarkets, specialized stores and department stores principally under the trade names "Pão de Açúcar, “Minuto Pão de Açúcar”, "Extra Hiper", “Extra Super”, “Minimercado Extra”, “Assai”, and the neighborhood shopping mall brand “Conviva”. The activities related to the segments of electronics and e-commerce are presented with discontinued activities (note 31) and represent the stores under the brands “Ponto Frio” and “Casas Bahia", as well as the e-commerce platforms “CasasBahia.com,” “Extra.com”, “Pontofrio.com”, “Barateiro.com”, “Partiuviagens.com” and “Cdiscount.com”. Its headquarters are located in the city of São Paulo, State of São Paulo, Brazil.
The Company’s shares are listed on the São Paulo Stock Exchange (“BM&FBovespa”) Level 1 of Corporate Governance under the ticker symbol “PCAR4” and on the New York Stock Exchange (ADR level III), under the ticker symbol “CBD”.
The Company is indirectly controlled by Almacenes Exito S.A., through Wilkes Participações S.A. (“Wilkes”), and its ultimate controlling company is Casino Guichard Perrachon (“Casino”), French company listed on Paris Stock Exchange.
1.1. Morzan arbitration request
On August 14, 2015, CBD and its controlling shareholder Wilkes were jointly convicted by International Court of Arbitration - ICA, to indemnify Morzan Empreendimentos e Participações Ltda. (“Morzan”). Such decision was amended on January 27, 2016 with no significant changes.The account payable in the amount of R$233, including legal fees, was fully settled in April 1, 2016.
On October 25, 2016 the Company received a notice from Securities Registration Office (“SRE”) of Brazilian Securities Exchange Commission (“CVM”) stating that the Company pay the equivalent additional amount 80% of effectively paid to Morzan as indemnification to other shareholders of Globex Utilidades S.A. that applied to Share Purchase Agreement resulting in the sale of control of the Company, in accordance to your OPA, the mix payment option, that defined in public notice of public offer for shares acquisition realized for the Company on January 4, 2010. The Company presented on appeal to CVM’s arbitral award and the Company received a suspensive effect of the decision, with the estimated amount in R$150 and likelihood of loss classified as possible.
1.2. Notices from CVM to GPA and subsidiary Via Varejo
On February 18, 2016, the subsidiary Via Varejo received a notice from CVM, the notice 18/2016-CVM/SEP/GEA-5 containing the understanding of the Superintendence of Business Relations – SEP in relation to certain accounting entries related to corporate transactions at Via Varejo level in 2013. Due to the effects in its consolidated financial statements the Company received the notice 19/2016-CVM /SEP/GEA-5.
CVM’s technical area notified its understanding on accounting treatment which is different from those applied by Company in its financial statements of that year, in relation to (i) remeasurement of remaining investment held in Nova Pontocom Comércio Eletrônico S.A. (“NPC”) due to partial sale of interest to Companhia Brasileira de Distribuição; and (ii) accounting treatment applied on acquisition of additional 75% interest of Indústria de Móveis Bartira (“Bartira”) equity.
(FREE TRANSLATION INTO ENGLISH FROM THE ORIGINAL PREVIOUSLY ISSUED IN PORTUGUESE)
Companhia Brasileira de Distribuição
Notes to the interim financial information
March 31, 2017
(In millions of Brazilian reais, unless otherwise stated)
1. Corporate information - Continued
1.2. Notices from CVM to GPA and subsidiary Via Varejo - Continued
Via Varejo and the Company presented an appeal to CVM’s board of commissioners. At July 26, 2016, Via Varejo published relevant fact announcing the end of Cnova’s investigations, and informed that attended partially the requirements on notice 18/2016CVM/SEP/GEA5, specifically to the accounting entries of sale participation on NPC, occurred in 2013. At January 26, 2017 the CVM reported the Company that (i) the appeal was accepted related to Bartira; and (ii) The CVM’s Superintendence of Business Relations – SEP will ask reconsideration of the board of commissioner’s decision. On April 20, 2017 Via Varejo and the Company received the final determination of the board of commissioner informing that kept the decision after reconsideration asked by SEP. Therefore there is not effect to be considered related with this assumption.
2. Basis of preparation
The individual and consolidated interim financial information has been prepared in accordance with IAS 34 - Interim Financial Reporting issued by the International Accounting Standard Board (“IASB”) and CPC 21 (R1) - Interim Financial Reporting and presented consistently with the standards approved and issued by the Brazilian Securities and Exchange Commission (“CVM”) applicable to the preparation of interim financial information – ITR.
The individual and consolidated interim financial information is being presented in millions of Brazilian Reais.The reporting currency of the Company is Real and for subsidiaries located abroad is the local currency of each jurisdiction.
The individual and consolidated interim financial information for the quarter ended March 31, 2017 was approved by the Board of Directors on April 27, 2017.
As a result of the process in progress for the sale of the subsidiarie Via Varejo S.A. (note 35 on the financial statements for year ended December 31, 2016, presented in February 23, 2017) and in accordance to the CPC 31 / IFRS 5 – Non current assets held to sale and discontinued operation, the individual and consolidated interim financial information of the statement of the operations and the statement of the added value for the periods ended March 31, 2017 and March 31, 2016 was presented with the effects of the transaction.
(FREE TRANSLATION INTO ENGLISH FROM THE ORIGINAL PREVIOUSLY ISSUED IN PORTUGUESE)
Companhia Brasileira de Distribuição
Notes to the interim financial information
March 31, 2017
(In millions of Brazilian reais, unless otherwise stated)
3. Basis of consolidation
The information on the basis of consolidation did not have significant modification and was presented in the annual financial statements for 2016, in note 3.
4. Significant accounting policies
The significant accounting policies adopted by the Company in the preparation of the individual and consolidated interim financial information are consistent with those adopted and disclosed on Note 4 of the financial statements for the year ended December 31, 2016 and therefore should be read in conjunction with those annual financial statements.
5. Adoption of new standards, amendments to and interpretations of existing standards issued by the IASB and CPC and standards issued but not yet effective
The adoption of new standards, amendments to and interpretations of existing standards issued by the IASB and CPC and standards issued but not yet effective are consistent with those adopted and disclosed in note 5 to the financial statements for the year ended December 31, 2016 and had no significant effects to the Company.
Except for standards “IFRS 15 – Revenue from contracts with customers” and “IFRS 16 – Leases” which impacts are under analisys by Company. There are expected relevant impacts in the financial statements in relation to IFRS 16.
6. Significant accounting judgments, estimates and assumptions
Judgments, estimates and assumptions
The preparation of the Company’s individual and consolidated interim financial information requires Management to make judgments, estimates and assumptions that affect the reported amounts of revenues, expenses, assets and liabilities, and the disclosure of contingent liabilities at the end of the reporting period; however, uncertainties about these assumptions and estimates may result in outcomes that require adjustments to the carrying amount of the affected asset or liability in future periods.
The significant assumptions and estimates for interim financial information for the three-month period ended March 31, 2017 were the same as those adopted in the individual and consolidated financial statements for the year ended December 31, 2016.
(FREE TRANSLATION INTO ENGLISH FROM THE ORIGINAL PREVIOUSLY ISSUED IN PORTUGUESE)
Companhia Brasileira de Distribuição
Notes to the interim financial information
March 31, 2017
(In millions of Brazilian reais, unless otherwise stated)
7. Cash and cash equivalents
The detailed information on cash and cash equivalents was presented in the annual financial statements for 2016, in note 7.
|
| Parent Company |
| Consolidated | ||
| Rate | 3.31.2017 | 12.31.2016 |
| 3.31.2017 | 12.31.2016 |
|
|
|
|
|
|
|
Cash and banks - Brazil |
| 60 | 255 |
| 96 | 349 |
Cash and banks - Abroad | (*) | 64 | 66 |
| 64 | 66 |
Temporary investments - Brazil | (**) | 1,076 | 4,175 |
| 1,523 | 4,697 |
1,200 | 4,496 |
| 1,683 | 5,112 | ||
(*) Refers to cash and banks denominated in US Dollars.
(**) Temporary investments as at March 31, 2017 refer substantially to repurchase agreements, wich are remunerated by a weighted average rate equivalent to 98.59% of the Interbank Deposit Certificate (“CDI”) and redeemable less than 90 days as of investment date.
8. Trade receivables
The detailed information on trade receivables was presented in the annual financial statements for 2016, in note 8.
Parent Company | Consolidated | ||||
3.31.2017 | 12.31.2016 | 3.31.2017 | 12.31.2016 | ||
|
| ||||
Credit card companies | 355 | 178 |
| 404 | 241 |
Sales vouchers | 76 | 94 |
| 112 | 142 |
Private label credit card | 49 | 62 |
| 50 | 62 |
Receivables from related parties (note 12.2) |
10 |
15 |
|
5 |
5 |
Receivables from suppliers | 114 | 48 |
| 114 | 95 |
Allowance for doubtful accounts (note 8.1) | (1) | (1) |
| (3) | (2) |
Total | 603 | 396 |
| 682 | 543 |
8.1. Allowance for doubtful accounts
Parent Company |
| Consolidated | |||
3.31.2017 | 3.31.2016 | 3.31.2017 | 3.31.2016 | ||
|
|
|
| ||
At the beginning of the period | (1) | - |
| (2) | (298) |
Loss/reversal in the period | (2) | (2) |
| (159) | (106) |
Write-off of receivables | 2 | - |
| 137 | 125 |
Reclassification to assets held for sale and discontinued operations (note 31) |
- |
- |
|
21 |
277 |
At the end of the period | (1) | (2) |
| (3) | (2) |
(FREE TRANSLATION INTO ENGLISH FROM THE ORIGINAL PREVIOUSLY ISSUED IN PORTUGUESE)
Companhia Brasileira de Distribuição
Notes to the interim financial information
March 31, 2017
(In millions of Brazilian reais, unless otherwise stated)
8. Trade receivables – Continued
8.1. Allowance for doubtful accounts - Continued
Below is the aging list of consolidated gross receivables:
Past-due receivables - Consolidated | ||||||
Total | Due | <30 days | 30-60 days | 61-90 days | >90 days | |
03.31.2017 | 685 | 640 | 7 | 7 | 18 | 13 |
12.31.2016 | 545 | 524 | 13 | 6 | 1 | 1 |
|
|
|
|
|
|
|
9. Other receivables
The detailed information on other receivables was presented in the annual financial statements for 2016, in note 9.
Parent Company | Consolidated | ||||
3.31.2017 | 12.31.2016 | 3.31.2017 | 12.31.2016 | ||
Receivables from sale of fixed assets |
80 |
6 |
|
80 |
6 |
Rental advances | 2 | 3 |
| 2 | 3 |
Amounts to be reimbursed | 26 | 29 |
| 26 | 29 |
Accounts receivable from insurance companion | 11 | 10 |
| 11 | 10 |
Rental receivable | 52 | 60 |
| 53 | 61 |
Receivable from Paes Mendonça | - | - |
| 532 | 532 |
Receivable from sale of subsidiaries | 72 | 69 |
| 72 | 69 |
Other | 14 | 15 |
| 24 | 28 |
|
|
|
|
| |
Total | 257 | 192 |
| 800 | 738 |
|
|
|
|
| |
Current | 175 | 111 |
| 187 | 126 |
Noncurrent | 82 | 81 |
| 613 | 612 |
10. Inventories
The detailed information on inventories was presented in the annual financial statements for 2016, in note 10.
| Parent Company |
| Consolidated | ||
| 3.31.2017 | 12.31.2016 |
| 3.31.2017 | 12.31.2016 |
| |||||
Stores | 2,023 | 2,032 |
| 3,330 | 3,400 |
Distribution centers | 1,035 | 1,115 |
| 1,240 | 1,255 |
Real estate inventories under construction | - | - |
| 60 | 61 |
Estimated losses on obsolescence and breakage (note 10.1) | (33) | (41) |
| (52) | (75) |
Total | 3,025 | 3,106 |
| 4,578 | 4,641 |
|
|
|
|
|
|
(FREE TRANSLATION INTO ENGLISH FROM THE ORIGINAL PREVIOUSLY ISSUED IN PORTUGUESE)
Companhia Brasileira de Distribuição
Notes to the interim financial information
March 31, 2017
(In millions of Brazilian reais, unless otherwise stated)
10. Inventories - Continued
10.1.Estimated losses on obsolescence and breakage
Parent Company | Consolidated | ||||
3.31.2017 | 3.31.2016 | 3.31.2017 | 3.31.2016 | ||
At the beginning of the period | (40) | (14) |
| (76) | (150) |
Additions | (5) | (28) |
| (37) | (208) |
Write-offs / reversal | 12 | 2 |
| 57 | 164 |
Exchange rate changes | - | - |
| - | 1 |
Assets held for sale and discontinued operations (note 31) |
- |
- |
| 4 | 118 |
At the end of the period | (33) | (40) |
| (52) | (75) |
|
|
|
|
|
|
11. Recoverable taxes
The detailed information on recoverable taxes was presented in the annual financial statements for 2016, in note 11.
| Parent Company |
| Consolidated | ||
| 3.31.2017 | 12.31.2016 |
| 3.31.2017 | 12.31.2016 |
|
| ||||
State value-added tax on sales and services – ICMS | 435 | 436 |
| 563 | 545 |
Social Integration Program/Contribution for Social Security Financing-PIS/COFINS | 276 | 338 |
| 348 | 418 |
Income tax on Financial investments | 53 | 38 |
| 60 | 45 |
Income tax and Social Contribution | 58 | 71 |
| 67 | 80 |
Social Security Contribution - INSS | 206 | 194 |
| 225 | 211 |
Other | - | 1 |
| 7 | 7 |
Total | 1,028 | 1,078 |
| 1,270 | 1,306 |
|
|
|
|
| |
Current | 495 | 557 |
| 617 | 674 |
Noncurrent | 533 | 521 |
| 653 | 632 |
|
|
|
|
|
|
11.1. ICMS is expected to be realized as follows:
In | Parent Company | Consolidated |
Up to 1 year | 131 | 191 |
1 to 2 years | 111 | 138 |
2 to 3 years | 44 | 64 |
3 to 4 years | 52 | 72 |
4 to 5 years | 40 | 40 |
After 5 years | 57 | 58 |
435 | 563 |
For the ICMS tax credits, management, based on technical feasibility studies, based on growth projections and related tax payments in the normal course of the operations, understand be viable the future compensation. The studies mentioned are prepared periodically based on information extracted from Strategic Planning report, previously approved by the Board of Directors of the Company. For the accounting information as of March 31, 2017, management has monitoring controls over the progress of the plan annually established, revaluating and including eventual new elements that contribute to the realization of the balance.
(FREE TRANSLATION INTO ENGLISH FROM THE ORIGINAL PREVIOUSLY ISSUED IN PORTUGUESE)
Companhia Brasileira de Distribuição
Notes to the interim financial information
March 31, 2017
(In millions of Brazilian reais, unless otherwise stated)
12. Related parties
12.1.Management and Board of Directors compensation
The expenses related to management compensation (officers appointed pursuant to the Bylaws including members of the Board of Directors and the related support committees) and Fiscal Council recorded in the Company’s Statement of Operations for the period ended March 31, 2017, were as follows:
Base salary | Variable compensation | Stock option plan | Total | ||||||||
2017 | 2016 | 2017 | 2016 | 2017 | 2016 | 2017 | 2016 | ||||
Board of directors (*) | 1 | 1 |
| - | - |
| - | - |
| 1 | 1 |
Executive officers | 6 | 5 |
| 6 | 8 |
| 2 | 2 |
| 14 | 15 |
7 | 6 |
| 6 | 8 |
| 2 | 2 |
| 15 | 16 | |
(*) The compensation of the Board of Directors advisory committees (Human Resources and Compensation, Audit, Finance, Sustainable Development and Corporate Governance) is included in this line.
(FREE TRANSLATION INTO ENGLISH FROM THE ORIGINAL PREVIOUSLY ISSUED IN PORTUGUESE)
Companhia Brasileira de Distribuição
Notes to the interim financial information
March 31, 2017
(In millions of Brazilian reais, unless otherwise stated)
12. Related parties – Continued
12.2. Balances and transactions with related parties.
The detailed information on related parties was presented in the annual financial statements for 2016, in note 12.
Parent Company | ||||||||||||||||||||
Balances | Transactions | |||||||||||||||||||
Trade receivables | Other assets | Trade payables | Other liabilities | Sales | Purchases | Revenues (Expenses) | ||||||||||||||
2017 | 2016 | 2017 | 2016 | 2017 | 2016 | 2017 | 2016 | 2017 | 2016 | 2017 | 2016 | 2017 | 2016 | |||||||
|
|
|
|
|
|
|
|
|
|
|
|
|
|
|
|
|
|
|
|
|
Controlling: |
|
|
|
|
|
|
| |||||||||||||
Casino | 5 | 5 | 3 | 1 |
| 3 | - | - | - | - | - | - | - | (13) | (30) | |||||
Euris | - | - | - | - | - | - | 2 | 1 | - | - | - | - | (1) | (2) | ||||||
Helicco Participações Ltda. | - | - | - | - | - | - | 1 | - | - | - | - | - | - | - | ||||||
Subsidiaries: |
|
|
|
|
|
|
| |||||||||||||
Novasoc Comercial | - | - | 223 | 197 | - | 1 | - | - | - | - | - | - | 1 | 1 | ||||||
Barcelona | - | - | - | - | - | - | - | - | - | 77 | - | 67 | - | 29 | ||||||
Sendas Distribuidora | - | 3 | 156 | 123 | 6 | 4 | - | - | - | - | - | - | 38 | - | ||||||
Via Varejo (i) | 5 | 7 | - | - | 2 | 4 | 186 | 230 | - | - | - | - | (33) | (33) | ||||||
VVLOG Logística Ltda. | - | - | - | - | - | - | 2 | 2 | - | - | - | - | - | - | ||||||
Cnova Brasil | - | - | 19 | 4 | - | - | - | - | - | - | - | - | 28 | 16 | ||||||
GPA M&P | - | - | - | - | - | - | 3 | 2 | - | - | - | - | - | - | ||||||
GPA Logística | - | - | 19 | 19 | 17 | 17 | 1 | - | - | - | - | - | - | - | ||||||
Bellamar | - | - | - | - | - | - | 128 | 128 | - | - | - | - | - | - | ||||||
Others | - | - | - | - | - | - | - | 1 | - | - | - | - | - | - | ||||||
Associates: |
|
|
|
|
|
|
|
|
|
|
|
|
|
|
|
|
|
|
|
|
FIC | - | - | 24 | 14 | 7 | 14 | - | - | - | - | - | - | 22 | 7 | ||||||
Other related parties: |
|
|
|
|
|
|
|
|
|
|
|
|
|
|
|
|
|
|
|
|
Greenyellow do Brasil Energia e Serviços Ltda.(Greenyellow) (*) | - | - | - | - | - | - | 141 | 146 | - | - | - | - | (8) | (5) | ||||||
Others | - | - | 1 | 1 | - | - | 1 | - | - | - | - | - | - | - | ||||||
Total | 10 | 15 | 445 | 359 | 35 | 40 | 465 | 510 | - | 77 | - | 67 | 34 | (17) | ||||||
(*)The amount refers to products and services acquisition aiming the energy efficiency of the Company.
(i) Via Varejo: The subsidiarie have a amount to pay reffering to “Primeiro Aditivo ao Acordo de Associação” between Via Varejo e Casas Bahia, that ensure the right to indemnify of some judicial claims and reimbursement of expenses recognized as of June 30, 2010, such as the commercial commission agreement.
(FREE TRANSLATION INTO ENGLISH FROM THE ORIGINAL PREVIOUSLY ISSUED IN PORTUGUESE)
Companhia Brasileira de Distribuição
Notes to the interim financial information
March 31, 2017
(In millions of Brazilian reais, unless otherwise stated)
12. Related parties –Continued
12.2. Balances and transactions with related parties – Continued
Consolidado | ||||||||||||||
Trade receivables | Others assets | Trade payables | Other liabilities | Revenues (Expenses) | ||||||||||
2017 | 2016 | 2017 | 2016 | 2017 | 2016 | 2017 | 2016 | 2017 | 2016 | |||||
|
|
|
|
|
|
|
|
|
|
|
|
|
|
|
Controlling: |
|
|
|
| ||||||||||
Casino | 5 | 5 | 3 | 1 | 3 | - | - | - | (13) | (35) | ||||
Euris | - | - | - | - | - | - | 2 | 1 | (1) | (2) | ||||
Helicco Participações | - | - | - | - | - | - | 1 | - | - | - | ||||
Exito | - | - | - | - | - | - | - | - | - | (4) | ||||
Subsidiaries: |
|
|
|
|
|
| ||||||||
Others | - | - | - | 1 | - | - | - | - | - | - | ||||
Associates: |
|
|
|
|
|
| ||||||||
FIC | - | - | 24 | 14 | 7 | 14 | - | - | 22 | 7 | ||||
Other related parties: |
|
|
|
|
|
|
|
|
|
|
|
|
|
|
Greenyellow | - | - | - | - | - | - | 141 | 146 | (8) | (6) | ||||
Others | - | - | 1 | 1 | - | - | 1 | - | - | - | ||||
Total | 5 | 5 | 28 | 17 | 10 | 14 | 145 | 147 | - | (40) | ||||
(*) Amounts of Via Varejo’s related parties are classified on “held for sale and discontinued operations”, see note 31.
(FREE TRANSLATION INTO ENGLISH FROM THE ORIGINAL PREVIOUSLY ISSUED IN PORTUGUESE)
Companhia Brasileira de Distribuição
Notes to the interim financial information
March 31, 2017
(In millions of Brazilian reais, unless otherwise stated)
13. Investments
The detailed information on investments was presented in the annual financial statements for 2015, in note 13.
13.1. Breakdown of investments
Parent Company | ||||||
Sendas | Novasoc | Via Varejo | Bellamar | GPA M&P and others | Total (*) | |
Balances at 12.31.2016 | 2,330 | 168 | - | 443 | (73) | 3,014 |
Share of profit (loss) of subsidiaries and associates | 77 | (3) | 69 | 17 | (25) | 135 |
Stock option | 1 | - | 1 | - | - | 2 |
Capital increase | 53 | - | - | - | - | 53 |
Reclassification to Held for Sale (note 31) | - | - | (70) | - | - | (70) |
Balances at 3.31.2017 | 2,461 | 165 | - | 460 | 48 | 3,134 |
(*) Includes the effects of the exchange rate changes on translation of the Luxco’s financial information, amount of R$47.
| Parent Company | |||||||
Sendas | Novasoc | Via Varejo | NCB (*) | Barcelona | Bellamar | GPA M&P and others | Total (***) | |
Balances at 12.31.2015 | 1,349 | 174 | 1,844 | 501 | 770 | 367 | (132) | 4,873 |
Share of profit(loss) of subsidiaries and associates | 23 | (1) | 5 | (2) | 24 | 23 | (42) | 30 |
Dividends | - | - | - | - | - | - | (10) | (10) |
Stock option | - | - | 1 | - | 1 | - | - | 2 |
Write-off | - | - | - | - | - | - | 5 | 5 |
Rate exchange | - | - | 4 | - | - | - | 12 | 16 |
Other transactions (**) | - | - | 1 | - | - | - | - | 1 |
Balances at 3.31.2016 | 1,372 | 173 | 1,855 | 499 | 795 | 390 | (167) | 4,917 |
(*) In NCB case, the investment amount refers to the effects of the fair value measurements of the business combination. For Via Varejo, the fair value effects were considered together with the accounting investment held in this subsidiary.
(**) Includes the effects of other comprehensive income in the case of subsidiarie Nova Pontocom and Luxco.
(***)Includes the effects of the exchange rate changes on translation of the Luxco’s financial information, amount of R$311.
(FREE TRANSLATION INTO ENGLISH FROM THE ORIGINAL PREVIOUSLY ISSUED IN PORTUGUESE)
Companhia Brasileira de Distribuição
Notes to the interim financial information
March 31, 2017
(In millions of Brazilian reais, unless otherwise stated)
13. Investments – Continued
13.1. Breakdown of investments – Continued
Consolidated | |||
3.31.2017 |
| 3.31.2016 | |
At the beginning of the period | 294 |
| 382 |
Share of profit (loss) – Continued operations | (8) |
| 23 |
Share of profit (loss) – Disontinued operations | 7 |
| 9 |
Assets held for sale and discontinued operations (note 31) | (7) |
| (9) |
At the end fo the period | 286 |
| 405 |
14. Property and equipment
Parent Company | ||||||
Balance at 12.31.2016 | Additions | Depreciation | Write-offs | Transfers | Balance at 3.31.2017 | |
Land | 1,261 | - | - | (18) | - | 1,243 |
Buildings | 1,611 | 1 | (13) | (97) | - | 1,502 |
Leasehold improvements | 2,226 | 5 | (44) | (29) | 37 | 2,195 |
Machinery and equipment | 1,047 | 7 | (45) | (12) | 28 | 1,025 |
Facilities | 319 | 20 | (8) | (3) | 3 | 331 |
Furniture and fixtures | 396 | - | (15) | (3) | 8 | 386 |
Vehicles | 3 | - | - | - | - | 3 |
Construction in progress | 113 | 42 | - | (2) | (74) | 79 |
Other | 45 | 2 | (4) | (1) | (2) | 40 |
Total | 7,021 | 77 | (129) | (165) | - | 6,804 |
|
|
|
|
|
| |
Finance lease |
|
|
|
|
|
|
IT equipment | 5 | 1 | - | - | - | 6 |
Buildings | 17 | - | - | - | - | 17 |
22 | 1 | - | - | - | 23 | |
Total | 7,043 | 78 | (129) | (165) | - | 6,827 |
(FREE TRANSLATION INTO ENGLISH FROM THE ORIGINAL PREVIOUSLY ISSUED IN PORTUGUESE)
Companhia Brasileira de Distribuição
Notes to the interim financial information
March 31, 2017
(In millions of Brazilian reais, unless otherwise stated)
14. Property and equipment – Continued
| ||||||
| Parent Company | |||||
Balance at 12.31.2015 | Additions | Depreciation | Write-offs | Transfers | Balance at 3.31.2016 | |
Land | 1,272 | - | - | - | 2 | 1,274 |
Buildings | 1,799 | 1 | (15) | - | (39) | 1,746 |
Leasehold improvements | 1,858 | 3 | (38) | (1) | 63 | 1,885 |
Machinery and equipment | 892 | 37 | (35) | (15) | - | 879 |
Facilities | 179 | 3 | (5) | (1) | - | 176 |
Furniture and fixtures | 375 | 10 | (13) | (2) | - | 370 |
Vehicles | 3 | - | - | (1) | 1 | 3 |
Construction in progress | 73 | 85 | - | - | (24) | 134 |
Other | 50 | - | (3) | (2) | (1) | 44 |
Total | 6,501 | 139 | (109) | (22) | 2 | 6,511 |
|
|
|
|
|
| |
Finance lease |
|
|
|
|
|
|
IT equipment | 7 | - | (1) | - | (1) | 5 |
Buildings | 17 | - | - | - | - | 17 |
24 | - | (1) | - | (1) | 22 | |
Total | 6,525 | 139 | (110) | (22) | 1 | 6,533 |
Parent Company | |||||||
Balance at 3.31.2017 | Balance at 12.31.2016 | ||||||
Cost | Accumulated depreciation | Net | Cost | Accumulated depreciation | Net | ||
Land | 1,243 | - | 1,243 |
| 1,261 | - | 1,261 |
Buildings | 2,370 | (868) | 1,502 |
| 2,555 | (944) | 1,611 |
Leasehold improvements | 3,689 | (1,494) | 2,195 |
| 3,685 | (1,459) | 2,226 |
Machinery and equipment | 2,354 | (1,329) | 1,025 |
| 2,345 | (1,298) | 1,047 |
Facilities | 606 | (275) | 331 |
| 589 | (270) | 319 |
Furniture and fixtures | 961 | (575) | 386 |
| 959 | (563) | 396 |
Vehicles | 9 | (6) | 3 |
| 9 | (6) | 3 |
Construction in progress | 79 | - | 79 |
| 113 | - | 113 |
Other | 121 | (81) | 40 |
| 126 | (81) | 45 |
11,432 | (4,628) | 6,804 |
| 11,642 | (4,621) | 7,021 | |
|
|
|
|
|
|
| |
Finance lease |
|
|
|
|
|
|
|
IT equipment | 39 | (33) | 6 |
| 38 | (33) | 5 |
Buildings | 39 | (22) | 17 |
| 41 | (24) | 17 |
78 | (55) | 23 |
| 79 | (57) | 22 | |
Total | 11,510 | (4,683) | 6,827 |
| 11,721 | (4,678) | 7,043 |
(FREE TRANSLATION INTO ENGLISH FROM THE ORIGINAL PREVIOUSLY ISSUED IN PORTUGUESE)
Companhia Brasileira de Distribuição
Notes to the interim financial information
March 31, 2017
(In millions of Brazilian reais, unless otherwise stated)
14. Property and equipment - Continued
Consolidated | |||||||
Balance at 12.31.2016 | Additions | Depreciation | Write-offs | Transfers | Reclassification to Held For Sale (*) | Balance at 3.31.2017 | |
Land | 1,414 | - | - | (18) | - | - | 1,396 |
Buildings | 1,856 | 4 | (15) | (97) | 29 | - | 1,777 |
Leasehold improvements | 3,284 | 16 | (59) | (27) | 55 | (7) | 3,262 |
Machinery and equipment | 1,340 | 19 | (58) | (14) | 34 | (7) | 1,314 |
Facilities | 433 | 23 | (11) | (5) | 7 | - | 447 |
Furniture and fixtures | 543 | 5 | (20) | (3) | 9 | (2) | 532 |
Vehicles | 2 | - | - | (4) | - | 4 | 2 |
Construction in progress | 204 | 78 | - | (2) | (140) | 2 | 142 |
Other | 63 | 3 | (5) | (1) | (1) | (1) | 58 |
Total | 9,139 | 148 | (168) | (171) | (7) | (11) | 8,930 |
|
|
|
|
|
|
| |
Finance lease |
|
|
|
|
|
|
|
Equipment | 9 | - | (1) | - | - | - | 8 |
IT equipment | 8 | - | (1) | - | 1 | - | 8 |
Furniture and fixtures | 6 | - | - | - | - | - | 6 |
Buildings | 20 | - | - | - | - | - | 20 |
43 | - | (2) | - | 1 | - | 42 | |
Total | 9,182 | 148 | (170) | (171) | (6) | (11) | 8,972 |
(*) See note 31
| Consolidated | |||||||
Balance at 12.31.2015 | Additions | Depreciation | Desconso-lidation | Write-offs | Transfers | Exchange rate changes | Balance at 3.31.2016 | |
Land | 1,464 | - | - | - | - | 14 | - | 1,478 |
Buildings | 2,023 | 5 | (16) | - | - | (33) | - | 1,979 |
Leasehold improvements | 3,675 | 30 | (68) | (2) | (11) | 87 | - | 3,711 |
Machinery and equipment | 1,676 | 61 | (71) | (1) | (17) | 3 | - | 1,651 |
Facilities | 422 | 13 | (13) | (4) | (3) | 4 | (1) | 418 |
Furniture and fixtures | 701 | 24 | (23) | - | (2) | 1 | (1) | 700 |
Vehicles | 75 | 1 | (1) | - | (4) | - | - | 71 |
Construction in progress | 172 | 153 | - | - | (1) | (75) | - | 249 |
Other | 97 | 5 | (6) | - | (2) | 1 | - | 95 |
Total | 10,305 | 292 | (198) | (7) | (40) | 2 | (2) | 10,352 |
|
|
|
|
|
|
|
| |
Finance lease |
|
|
|
|
|
|
|
|
Equipment | 13 | - | (1) | - | - | - | - | 12 |
IT equipment | 31 | 1 | (5) | - | - | - | - | 27 |
Facilities | 1 | - | - | - | - | - | - | 1 |
Furniture and fixtures | 6 | - | - | - | - | - | - | 6 |
Buildings | 21 | - | - | - | - | - | - | 21 |
72 | 1 | (6) | - | - | - | - | 67 | |
Total | 10,377 | 293 | (204) | (7) | (40) | 2 | (2) | 10,419 |
(FREE TRANSLATION INTO ENGLISH FROM THE ORIGINAL PREVIOUSLY ISSUED IN PORTUGUESE)
Companhia Brasileira de Distribuição
Notes to the interim financial information
March 31, 2017
(In millions of Brazilian reais, unless otherwise stated)
14. Property and equipment – Continued
| Consolidated | ||||||
Balance at 3.31.2017 | Balance at 12.31.2016 | ||||||
Cost | Accumulated depreciation | Net | Cost | Accumulated depreciation | Net | ||
Land | 1,396 | - | 1,396 |
| 1,414 | - | 1,414 |
Buildings | 2,669 | (892) | 1,777 |
| 2,823 | (967) | 1,856 |
Leasehold improvements |
4,952 |
(1,690) |
3,262 |
|
4,926 |
(1,642) |
3,284 |
Machinery and equipment | 2,797 | (1,483) | 1,314 |
| 2,779 | (1,439) | 1,340 |
Facilities | 745 | (298) | 447 |
| 723 | (290) | 433 |
Furniture and fixtures | 1,164 | (632) | 532 |
| 1,159 | (616) | 543 |
Vehicles | 8 | (6) | 2 |
| 8 | (6) | 2 |
Construction in progress |
142 |
- |
142 |
|
204 |
- |
204 |
Other | 167 | (109) | 58 |
| 168 | (105) | 63 |
14,040 | (5,110) | 8,930 |
| 14,204 | (5,065) | 9,139 | |
|
|
|
|
|
|
| |
Finance lease |
|
|
|
|
|
|
|
Equipment | 28 | (20) | 8 |
| 30 | (21) | 9 |
IT equipment | 47 | (39) | 8 |
| 46 | (38) | 8 |
Facilities | 1 | (1) | - |
| 1 | (1) | - |
Furniture and fixtures | 15 | (9) | 6 |
| 14 | (8) | 6 |
Buildings | 43 | (23) | 20 |
| 43 | (23) | 20 |
134 | (92) | 42 |
| 134 | (91) | 43 | |
Total | 14,174 | (5,202) | 8,972 |
| 14,338 | (5,156) | 9,182 |
14.1. Capitalized borrowing costs
The consolidated borrowing costs for the three-month period ended March 31, 2017 were R$2 (R$3 for the three-month period ended March 31, 2016). The rate used to determine the borrowing costs eligible for capitalization was 102.53% of the CDI (104.06% of the CDI for the period ended March 31, 2016), corresponding to the effective interest rate on the Company’s borrowings.
14.2. Additions to property and equipment
Parent Company | Consolidated | |||
3.31.2017 | 3.31.2016 | 3.31.2017 | 3.31.2016 | |
Additions | 78 | 139 | 148 | 293 |
Finance lease | (1) | - | - | (1) |
Capitalized interest | (1) | (2) | (2) | (3) |
Property and equipment financing - Additions | (22) | (129) | (22) | (199) |
Property and equipment financing - Payments | 80 | 145 | 142 | 194 |
Total | 134 | 153 | 266 | 284 |
(FREE TRANSLATION INTO ENGLISH FROM THE ORIGINAL PREVIOUSLY ISSUED IN PORTUGUESE)
Companhia Brasileira de Distribuição
Notes to the interim financial information
March 31, 2017
(In millions of Brazilian reais, unless otherwise stated)
14. Property and equipment – Continued
14.3. Other information
As at March 31, 2017, the Company and its subsidiaries recorded in cost of goods sold and services sold, the amount of R$11 (R$11 as at March 31, 2016) in parent company and R$12 (R$14 as at March 31, 2016) in consolidated related to the depreciation of its fleet of trucks, machinery, buildings and facilities of its distribution centers.
The Company monitored the plan for impairment test performed on December 31, 2016and do not observed significatives gaps that been denote indicatives of loose or need for a new avaliation at March 31, 2017.
15. Intangible assets
The detailed information on intangible assets was presented in the annual financial statements for 2015, in note 15.
Parent company | ||||
Balance at 12.31.2016 | Additions | Amortization | Balance at 3.31.2017 | |
Goodwill | 501 | - | - | 501 |
Commercial rigths | 46 | - | - | 46 |
Software and implementation | 488 | 16 | (21) | 483 |
Software - capital leasing | 158 | - | (10) | 148 |
Total | 1,193 | 16 | (31) | 1,178 |
Consolidated | ||||||
Balance at 12.31.2016 | Additions | Amortization | Transfers | Assets held for sale and discontinued operations (*) | Balance at 3.31.2017 | |
Goodwill | 1,107 | - | - | - | - | 1,107 |
Brands | 39 | - | - | - | - | 39 |
Commercial rigths | 80 | - | - | 1 | - | 81 |
Software and implementation | 523 | 22 | (22) | 5 | (7) | 521 |
Software - capital leasing | 159 | - | (10) | - | - | 149 |
Total | 1,908 | 22 | (32) | 6 | (7) | 1,897 |
(*) See note 31.
In the Parent Company, the balance of accumulated cost at March 31, 2017 is R$2,647 (R$2,631 at December 31, 2016) and of accumulated amotization R$1,469 (R$1,438 at December 31, 2016). In the Consolidated the balance of accumulated cost at March 31, 2017 is R$3,634 (R$3,614 at December 31, 2016) and of accumulated amotization R$1,737 (R$1,706 at December 31, 2016).
.
(FREE TRANSLATION INTO ENGLISH FROM THE ORIGINAL PREVIOUSLY ISSUED IN PORTUGUESE)
Companhia Brasileira de Distribuição
Notes to the interim financial information
March 31, 2017
(In millions of Brazilian reais, unless otherwise stated)
15. Intangible assets – Continued
15.1. Impairment testing of goodwill and intangible assets
Goodwill and intangible assets were tested for impairment as at December 31, 2016 according to the method described in note 4 - Significant accounting policies, in the financial statements for the year ended December 31, 2016.
The Company has not observed any significant changes that would indicate an impairment test for a new performed at March 31, 2017.
15.2. Additions to intangible assets
Parent Company | Consolidated | |||
3.31.2017 | 3.31.2016 | 3.31.2017 | 3.31.2016 | |
|
|
| ||
Additions | 16 | 101 | 22 | 160 |
Finance lease | - | (79) | - | (79) |
Intangible assets financing - Payments | 4 | 2 | 69 | 2 |
Total | 20 | 24 | 91 | 83 |
16. Borrowings and financing
The detailed information on borrowings and financing was presented in the annual financial statements for 2016, in note 17.
16.1. Debt breakdown
|
| Parent Company | Consolidated | ||
Weighted average rate | 3.31.2017 | 12.31.2016 | 3.31.2017 | 12.31.2016 | |
Debentures and promissory note |
|
|
|
| |
Debentures, net (note 16.4) | 107% of CDI | 907 | 939 | 907 | 939 |
Certificate of Agribusiness Receivables (note 16.4) | 97.5% of CDI | 1,046 | 1,017 | 1,046 | 1,017 |
Promissory note, net | 103.95% of CDI | 817 | 530 | 817 | 530 |
Borrowing cost |
| (12) | (14) | (12) | (14) |
2,758 | 2,472 | 2,758 | 2,472 | ||
|
|
|
|
|
|
Borrowings and financing |
|
|
|
| |
Local currency |
|
|
|
|
|
BNDES | 3.76% per year | 8 | 8 | 50 | 51 |
Working capital | 104.88% of CDI | 274 | 1,129 | 274 | 1,302 |
Working capital | TR + 9.80% per year | 22 | 21 | 133 | 135 |
Finance lease (note 21) |
| 189 | 203 | 200 | 215 |
Swap contracts (note 16.7) | 101.40% of CDI | (2) | (2) | (11) | (10) |
Borrowing cost |
| (2) | (3) | (5) | (6) |
|
| 489 | 1,356 | 641 | 1,687 |
|
|
|
|
|
|
Foreign currency |
|
|
|
|
|
Working capital | USD + 2.66% per year | 768 | 1,360 | 1,087 | 1,361 |
Working capital | EURO + 2.28% per year | 175 | 173 | 175 | 172 |
Swap contracts (note 16.7) | 101.92% of CDI | 131 | 177 | 139 | 177 |
|
| 1,074 | 1,710 | 1,401 | 1,710 |
Totalof borrowing and financing |
| 4,321 | 5,538 | 4,800 | 5,869 |
|
|
|
|
|
|
Total current | 1,884 | 2,763 | 2,231 | 2,957 | |
Total non current | 2,437 | 2,775 | 2,569 | 2,912 | |
(FREE TRANSLATION INTO ENGLISH FROM THE ORIGINAL PREVIOUSLY ISSUED IN PORTUGUESE)
Companhia Brasileira de Distribuição
Notes to the interim financial information
March 31, 2017
(In millions of Brazilian reais, unless otherwise stated)
16. Borrowings and financing
16.2. Changes in borrowings
| Parent Company |
| Consolidated |
At December 31, 2016 | 5,538 |
| 5,869 |
Additions - working capital | 800 |
| 2,222 |
Accrued interest | 107 |
| 219 |
Accrued swap | 70 |
| 49 |
Mark-to-market | 9 |
| 6 |
Monetary and exchange rate changes | (35) |
| (63) |
Borrowing cost | 2 |
| 2 |
Interest paid | (408) |
| (568) |
Payments | (1,656) |
| (3,018) |
Swap paid | (106) |
| (113) |
Liabilities related to assets held for sale and discontinued operations (note 31) | - |
| 195 |
At March 31, 2017 | 4,321 |
| 4,800 |
Parent Company | Consolidated | ||
At December 31, 2015 | 4,105 |
| 7,978 |
Additions – working capital | 900 |
| 2,409 |
Additions – finance lease | 79 |
| 80 |
Accrued interest | 99 |
| 208 |
Accrued swap | 282 |
| 455 |
Mark-to-market | (27) |
| (35) |
Monetary and exchange rate changes | (237) |
| (379) |
Borrowing cost | 1 |
| 1 |
Interest paid | (110) |
| (197) |
Payments | (305) |
| (1,409) |
Swap paid | 29 |
| 14 |
At March 31, 2016 | 4,816 |
| 9,125 |
16.3. Maturity schedule of borrowings and financing recorded in noncurrent liabilities.
Year | Parent Company |
| Consolidated |
Up to 2 years | 838 |
| 858 |
2 to 3 years | 1,517 |
| 1,537 |
3 to 4 years | 47 |
| 65 |
4 to 5 years | 6 |
| 24 |
After 5 years | 37 |
| 96 |
Subtotal | 2,445 |
| 2,580 |
|
|
| |
Borrowing costs | (8) |
| (11) |
Total | 2,437 |
| 2,569 |
Companhia Brasileira de Distribuição
Notes to the interim financial information
March 31, 2017
(In millions of Brazilian reais, unless otherwise stated)
16. Borrowings and financing – Continued
16.4. Debentures, Promissory Note and Certificate of Agribusiness Receivables
Date | Parent Company | Consolidated | |||||||||
Type | Issue Amount (in thousands) | Outstanding debentures | Issue | Maturity | Annual financial charges | Unit price (in thousands) | 03.31.2017 | 12.31.2016 | 03.31.2017 | 12.31.2016 | |
Parent Company | |||||||||||
12th Issue of Debentures – CBD | No preference | 900,000 | 900,000 | 9/17/14 | 9/12/19 | 107.00% of CDI | 1,007 | 906 | 939 | 906 | 939 |
13th Issue of Debentures – CBD and CRA | No preference | 1,012,500 | 1,012,500 | 12/20/16 | 12/20/19 | 97.50% of CDI | 1,034 | 1,047 | 1,017 | 1,047 | 1,017 |
2nd Issue of Promissory Note – CBD | No preference | 500,000 | 200,000 | 08/01/16 | 01/30/17 | 103.95% of CDI | - | - | 530 | - | 530 |
3nd Issue of Promissory Note – CBD | No preference | 800,000 | 320 | 01/30/17 | 07/29/17 | 108.00% of CDI | 2,554,284 | 817 | - | 817 | - |
Borrowing cost | (12) | (14) | (12) | (14) | |||||||
Parent Company/Consolidated - current and noncurrent | 2,758 | 2,472 | 2,758 | 2,472 | |||||||
Current liabilities | 852 | 568 | 852 | 568 | |||||||
Noncurrent liabilities | 1,906 | 1,904 | 1,906 | 1,904 | |||||||
Companhia Brasileira de Distribuição
Notes to the interim financial information
March 31, 2017
(In millions of Brazilian reais, unless otherwise stated)
16. Borrowings and financing – Continued
16.5. Borrowings in foreign currencies
On March 31, 2017 GPA had loans in foreign currencies (dollar and euro) to strengthen its working capital, maintain its cash strategy, lengthen its debt profile and make investments, being the last due date in October, 2018
16.6. Guarantees
The Company signed promissory notes for some borrowings agreements.
16.7. Swap contracts
The Company uses swap transactions for 100% of its borrowings denominated in US dollars and fixed interest rates, exchanging these obligations for Real linked to CDI (floating) interest rates. These contracts have a total debt term and protect the interest and the principal and are signed, with the same due dates and with same counterparty. The weighted average annual rate of CDI as of March 2017 was 13.75% (13.73% at March 2016).
16.8. Financial covenants
In connection with the debentures and promissory note and part of the transactions in borrowings in foreign currencies, GPA is required to maintain certain debt financial covenants. These ratios are calculated based on consolidated financial statements of the Company prepared in accordance with accounting practices adopted in Brazil, in the respective issuing Company as follows: (i) net debt (debt minus cash and cash equivalents and trade accounts receivable) not greater than equity and (ii) consolidated net debt/EBITDA ratio lower than or equal to 3.25. At March 31, 2017, GPA complied with these ratios.
Companhia Brasileira de Distribuição
Notes to the interim financial information
March 31, 2017
(In millions of Brazilian reais, unless otherwise stated)
17. Financial instruments
The detailed information on financial instruments was presented in the annual financial statements for 2016, in note 18.
The main financial instruments and their carrying amounts in the interim financial information, by category, are as follows:
Parent Company | Consolidated | |||
Carrying amount | Carrying amount | |||
3.31.2017 | 12.31.2016 | 3.31.2017 | 12.31.2016 | |
Financial assets: | ||||
Loans and receivables (including cash) | ||||
Cash and cash equivalents | 1,200 | 4,496 | 1,683 | 5,112 |
Trade receivables and other receivables | 860 | 588 | 1,482 | 1,281 |
Related parties - assets | 445 | 359 | 28 | 17 |
Financial liabilities: |
|
|
|
|
Other financial liabilities - amortized cost |
|
|
|
|
Related parties -liabilities | (465) | (510) | (145) | (147) |
Trade payables | (3,509) | (5,091) | (5,241) | (7,232) |
Financing for purchase of assets | (26) | (36) | (49) | (120) |
Acquisition of non-controlling interest | - | - | (8) | (7) |
Debentures | (2,758) | (2,472) | (2,758) | (2,472) |
Borrowings and financing | (468) | (1,336) | (518) | (1,562) |
Fair value through profit or loss |
|
|
|
|
Loans and financing, including derivatives | (1,095) | (1,730) | (1,524) | (1,835) |
The fair value of other financial instruments detailed in table above approximates the carrying amount based on the existing terms and conditions. The financial instruments measured at amortized cost, the related fair values of which differ from the carrying amounts, are disclosed in note 17.3.
17.1. Considerations on risk factors that may affect the business of the Company and its subsidiaries
(i) Capital risk management
The main objective of the Company’s capital management is to ensure that the Company sustains its credit rating and a well-defined equity ratio, in order to support businesses and maximize shareholder value. The Company manages the capital structure and makes adjustments taking into account changes in the economic conditions.
There were no changes as to objectives, policies or processes during the period ended March 31, 2017.
Parent Company | Consolidated | ||||
3.31.2017 | 12.31.2016 | 3.31.2017 | 12.31.2016 | ||
Cash and cash equivalents | 1,200 | 4,496 |
| 1,683 | 5,112 |
Borrowings and financing | (4,321) | (5,538) |
| (4,800) | (5,869) |
Borrowings and financing | (181) | (149) |
| (181) | (149) |
Other liabilities with related parties (note 12.2 and 17.2) (*) |
|
|
|
|
|
(*) Represents the trade payables’ balance of Greenyellow.
Companhia Brasileira de Distribuição
Notes to the interim financial information
March 31, 2017
(In millions of Brazilian reais, unless otherwise stated)
17. Financial instruments - Continued
17.1. Considerations on risk factors that may affect the business of the Company and its subsidiaries - Continued
(ii) Liquidity risk management
The Company manages liquidity risk through the daily follow-up of cash flows, control of maturities of financial assets and liabilities, and a close relationship with the main financial institutions.
The table below summarizes the aging profile of the Company’s financial liabilities as at March 31, 2017.
17.1.1 Parent Company
Up to 1 Year | 1 – 5 years | More than 5 years | Total | |
Borrowings and financing | 926 | 361 | 15 | 1,302 |
Debentures and promissory note | 1,024 | 2,190 | - | 3,214 |
Derivatives | 153 | 62 | - | 215 |
Finance lease | 58 | 160 | 158 | 376 |
Trade payables | 3,509 | - | - | 3,509 |
Total | 5,670 | 2,773 | 173 | 8,616 |
17.1.2Consolidated | Up to 1 Year | 1 – 5 years | More than 5 years | Total |
Borrowings and financing | 1,276 | 467 | 98 | 1,841 |
Debentures and promissory note | 1,024 | 2,190 | - | 3,214 |
Derivatives | 184 | 44 | 42 | 270 |
Finance lease | 62 | 171 | 165 | 398 |
Trade payables | 5,241 | - | - | 5,241 |
Acquisition of noncontrolling interest |
8 |
- |
- |
8 |
Total | 7,795 | 2,872 | 305 | 10,972 |
(iii) Derivative financial instruments
| Consolidated | |||||
| Notional value |
| Fair value | |||
| 3.31.2017 | 12.31.2016 |
| 3.31.2017 | 12.31.2016 | |
Fair value hedge |
|
|
|
|
| |
Purpose of hedge (debt) | 1,515 | 1,768 |
| 1,394 | 1,666 | |
|
|
|
|
|
| |
Long position (buy) |
|
|
|
|
|
|
Prefixed rate | TR+9.80% per year | 124 | 127 |
| 133 | 134 |
US$ + fixed | 2.66% per year | 1,171 | 1,421 |
| 1,087 | 1,362 |
EUR + fixed | 2.28% per year | 220 | 220 |
| 175 | 176 |
| 1,515 | 1,768 |
| 1,395 | 1,672 | |
Short position (sell) |
|
|
|
|
| |
| 101.87% per year | (1,515) | (1,768) |
| (1,523) | (1,839) |
Net hedge position | - | - |
| (128) | (167) | |
Companhia Brasileira de Distribuição
Notes to the interim financial information
March 31, 2017
(In millions of Brazilian reais, unless otherwise stated)
17. Financial instruments – Continued
17.1. Considerations on risk factors that may affect the business of the Company and its subsidiaries - Continued
(iii) Derivative financial instruments - continued
Realized and unrealized gains and losses on these contracts during the three-month period ended March 31, 2017 are recorded in financial income (expenses), net and the balance payable at fair value is R$128 (balance payable of R$167 as at December 31, 2017), recorded in line item “Borrowings and financing”.
The effects of the fair value hedge recorded in the Statement of Operations for the Three-month period ended March 31, 2017 were a gain of R$141 (gain of R$32 as at March 31, 2016).
17.2. Sensitivity analysis of financial instruments
The Company disclosed the net exposure of the derivatives financial instruments, corresponding financial instruments and certain financial instruments in the sensitivity analysis chart below, for each of the scenarios mentioned:
For the probable scenario, exchange weighted average rate was R$3.33 on the due date, and the interest rate weighted was 10.07% per year. The sources used were the same as those of the annual financial statements for 2016.
(i) Other financial instruments
Market projection | ||||||||
Operations | Risk (CDI increase) | Balance at 3.31.2017 | Scenario I | Scenario II | Scenario III | |||
|
|
|
|
|
|
| ||
Fair value hedge (fixed rate) | 101.40% do CDI | (122) |
| (184) |
| (188) |
| (193) |
Fair value hedge (exchange rate) | 101.92% do CDI | (1,401) |
| (852) |
| (862) |
| (871) |
Debentures | 107% do CDI | (906) |
| (1,000) |
| (1,023) |
| (1,047) |
Certificate of Agribusiness Receivables | 97.50% do CDI | (1,047) |
| (1,155) |
| (1,182) |
| (1,209) |
Promissory note | 103.95% do CDI | (817) |
| (911) |
| (935) |
| (958) |
Bank loans - CBD | 104.88% do CDI | (274) |
| (302) |
| (309) |
| (317) |
Leases | 100.19% do CDI | (70) |
| (77) |
| (79) |
| (81) |
Leases | 95.31% do CDI | (78) |
| (87) |
| (89) |
| (91) |
Leases | 100.00% do CDI | (7) |
| (8) |
| (8) |
| (9) |
|
|
(4,722) |
|
(4,576) |
|
(4,675) |
|
(4,776) |
|
|
|
|
|
|
|
|
|
Cash and cash equivalents (*) |
98.59% do CDI | 1,523 |
| 1,681 |
| 1,720 |
| 1,759 |
Net exposure | (3,199) |
| (2,895) |
| (2,955) |
| (3,017) | |
Net effect - loss |
|
| 304 |
| 244 |
| 182 | |
(*) weighted average | ||||||||
Companhia Brasileira de Distribuição
Notes to the interim financial information
March 31, 2017
(In millions of Brazilian reais, unless otherwise stated)
17. Financial instruments – Continued
17.2.Sensitivity analysis of financial instruments - Continued
In addition the Company has the following transaction that don’t represent significant risks for sensitive test:
§ The Company has a net exposure of US$15 million American dollars (between foreign suppliers and cash applied abroad) and EUR€11 million euros, besides the negative investment balance at foreigner subsidiaries at EUR€ 15 million euros. The Company management do not prepared the sensitivity analyses related to cambial exposition because understand that the involving amounts there are no representative.
§ The Company has accounts payable to Greenyellow of R$181, referring to the acquisition of property aiming the energy efficiency of the Company. The payment will occur in 96 instalments with pre-fixed interest of 9% per year.
17.3. Fair value measurements
The Company discloses the fair value of financial instruments measured at fair value and of financial instruments measured at amortized cost, the fair value of which differ from the carrying amount, in accordance with CPC 46 (“IFRS13”), which refer to the concepts of measurement and disclosure requirements.
The fair values of cash and cash equivalents, trade receivables, short and long-term debt and trade payables are equivalent to their carrying amounts.
The table below presents the fair value hierarchy of financial assets and liabilities measured at fair value and of financial instruments measured at amortized cost, the fair value of which is disclosed in the financial statements:
Carrying amount at 3.31.2017 | Fair value at 3.31.2017 | (*) Level | |
Financial instruments at fair value through profit (loss) | |||
Cross-currency interest rate swaps | (140) | (140) | Level 2 |
Interest rate swaps | 11 | 11 | Level 2 |
Borrowings and financing (fair value) | (1,395) | (1,395) | Level 2 |
Borrowings and financing (amortized cost) | (3,276) | (3,237) | Level 2 |
Total | (4,800) | (4,761) |
|
(*)Level 2: Fair value measurement at the end of the reporting period using other significant observable assumptions.
There were no changes between the fair value measurements levels in the three-month period ended March 31, 2017.
Cross-currency and interest rate swaps and borrowings and financing are classified in level 2 since the fair value of such financial instruments was determined based on readily observable market inputs, such as expected interest rate and current and future foreign exchange rate.
Companhia Brasileira de Distribuição
Notes to the interim financial information
March 31, 2017
(In millions of Brazilian reais, unless otherwise stated)
17. Financial instruments – Continued
17.4. Consolidated position of derivative transactions
The consolidated position of outstanding derivative transactions is presented in the table below:
Outstanding | Amount payable or receivable | Fair value | ||||||
Description | Counterparties | Notional value | Contracting date | Maturity | 3.31.2017 | 12.31.2016 | 3.31.2017 | 12.31.2016 |
Exchange swaps registered with CETIP (US$ x CDI) | ||||||||
| Banco Tokyo | US$ 75 | 1/14/2014 | 1/10/2017 | - | 61 | - | 59 |
Banco JP Morgan | US$ 50 | 3/19/2014 | 3/21/2016 | - | - | - | - | |
Mizuho | US$ 50 | 10/31/2014 | 10/31/2017 | 34 | 38 | 35 | 37 | |
Bank of America | US$ 40 | 9/14/2015 | 9/14/2017 | (30) | (26) | (28) | (25) | |
Banco Tokyo | US$ 50 | 7/31/2015 | 7/31/2017 | (10) | (6) | (9) | (6) | |
Scotiabank | US$ 50 | 9/30/2015 | 9/29/2017 | (44) | (39) | (41) | (37) | |
Agricole | EUR 50 | 10/7/2015 | 10/8/2018 | (56) | (54) | (44) | (42) | |
Itaú BBA | US$ 50 | 10/27/2015 | 1/17/2017 | - | (60) | - | (61) | |
Bradesco | US$ 50 | 3/3/2016 | 3/6/2017 | - | (53) | - | (54) | |
Scotiabank | US$ 50 | 1/15/2016 | 1/16/2018 | (48) | (50) | (44) | (47) | |
Tokyo | US$ 100 | 1/20/2017 | 1/19/2018 | (11) | - | (8) | - | |
Interest rate swap registered with CETIP (pre-fixed rate x CDI) | ||||||||
ITAÚ BBA | R$ 21 | 11/11/2014 | 11/5/2026 | 1 | 1 | 2 | 2 | |
ITAÚ BBA | R$ 54 | 1/14/2015 | 1/5/2027 | 2 | 1 | 5 | 3 | |
ITAÚ BBA | R$ 52 | 5/26/2015 | 5/5/2027 | 1 | 2 | 4 | 4 | |
(161) | (185) | (128) | (167) | |||||
Companhia Brasileira de Distribuição
Notes to the interim financial information
March 31, 2017
(In millions of Brazilian reais, unless otherwise stated)
18. Taxes and contributions payable and taxes payable in installments
The detailed information on taxes and contributions payable and taxes payable in installments was presented in the annual financial statements for 2016, in note 19.
18.1. Taxes and contributions payable and taxes payable in installments
Parent Company | Consolidated | ||||
3.31.2017 | 12.31.2016 | 3.31.2017 | 12.31.2016 | ||
PIS and COFINS | 7 | 46 |
| 9 | 49 |
Provision for income tax and social contribution | 9 | - |
| 42 | 10 |
ICMS | 34 | 48 |
| 48 | 75 |
Withholding Income Tax | - | - |
| - | 22 |
INSS | 8 | 8 |
| 8 | 9 |
Taxes payable in installments - Law 11.941/09 | 611 | 621 |
| 611 | 624 |
Others | 4 | 6 |
| 13 | 5 |
673 | 729 |
| 731 | 794 | |
|
|
|
|
| |
Current | 145 | 189 |
| 203 | 254 |
Noncurrent | 528 | 540 |
| 528 | 540 |
18.2. Maturity schedule of taxes payable in installments is as follows:
In | Parent Company and Consolidated |
Up to 1 year | 71 |
1 to 2 years | 83 |
2 to 3 years | 83 |
3 to 4 years | 83 |
4 to 5 years | 83 |
After 5 years | 208 |
| 611 |
Companhia Brasileira de Distribuição
Notes to the interim financial information
March 31, 2017
(In millions of Brazilian reais, unless otherwise stated)
19. Income tax and social contribution
The detailed information on income tax and social contribution was presented in the annual financial statements for 2016, in note 20.
19.1. Income and social contribution tax expense reconciliation
Parent Company | Consolidated | ||||
3.31.2017 | 3.31.2016 | 3.31.2017 | 3.31.2016 | ||
Profit before income tax and social contribution | 151 | (67) |
| 131 | 8 |
Income tax and social contribution at the nominal rate of 25% for the Company and 34% for subsidiaries |
(38) |
17 |
|
(44) |
(11) |
Tax penalties | (1) | - |
| (1) | - |
Share of profit of subsidiaries and associates | 34 | 7 |
| - | 8 |
Other permanent differences (nondeductible) | (3) | 2 |
| (5) | 4 |
Effective income tax and social contribution | (8) | 26 |
| (50) | 1 |
|
|
|
|
| |
Income tax and social contribution for the period: |
|
|
|
|
|
Current | (14) | 3 |
| (47) | (13) |
Deferred | 6 | 23 |
| (3) | 14 |
Deferred income tax and social contribution expense | (8) | 26 |
| (50) | 1 |
Effective rate | 5.30% | 38.81% |
| 38.17% | (12.50%) |
CBD does not pay social contribution based on a final and unappealable court decision in the past; therefore its nominal rate is 25%.
The Company (ou the Group) calculates the period income tax expense using the tax rate that would be applicable to the expected total annual earnings. Such policy is in accordance with IAS 34 / CPC 21 (R1).
19.2. Breakdown of deferred income tax and social contribution
| Parent Company | Consolidated | |||
| 3.31.2017 | 12.31.2016 | 3.31.2017 | 12.31.2016 | |
|
|
|
|
|
|
Tax losses | 27 | 32 |
| 108 | 112 |
Provision for risks | 251 | 251 |
| 350 | 347 |
Provision for derivative transactions taxed on a cash basis | 3 | (18) |
| 14 | (5) |
Estimated loss on doubtful accounts | 2 | 2 |
| 2 | 2 |
Provision for current expenses | 9 | 11 |
| 15 | 23 |
Goodwill tax amortization | (42) | (37) |
| (543) | (531) |
Present value adjustment | 1 | 1 |
| 1 | 1 |
Lease adjustment | 5 | 7 |
| - | 2 |
Mark-to-market adjustment | (5) | (6) |
| (6) | (8) |
Technological innovation – future realization | (15) | (16) |
| (15) | (16) |
Depreciation of fixed assets as per tax rates | (84) | (80) |
| (84) | (81) |
Other | 8 | 8 |
| 8 | 7 |
Deferred income tax and social contribution | 160 | 155 |
| (150) | (147) |
|
|
|
|
|
|
Noncurrent assets | 160 | 155 |
| 181 | 170 |
Noncurrent liabilities | - | - |
| (331) | (317) |
Deferred Income tax and social contribution | 160 | 155 |
| (150) | (147) |
Companhia Brasileira de Distribuição
Notes to the interim financial information
March 31, 2017
(In millions of Brazilian reais, unless otherwise stated)
19. Income tax and social contribution - continued
19.2. Breakdown of deferred income tax and social contribution – Continued
The Company estimates to recover these deferred tax assets as follows:
Year | Parent Company | Consolidated |
Up to 1 year | 128 | 145 |
1 to 2 years | 32 | 36 |
| 160 | 181 |
19.3. Changes in deferred income tax and social contribution balances
Parent Company | Consolidated | ||||
3.31.2017 | 3.31.2016 | 3.31.2017 | 3.31.2016 | ||
At the beginning of the period | 155 | 50 |
| (147) | (778) |
Expense for the period – Continued activities | 6 | 23 |
| (3) | 14 |
Expense for the period – Discontinued activities | - | - |
| 33 | (7) |
Exchange rate variation | - | - |
| - | (6) |
Assets held for sale and discontinued operations (note 31) |
- |
- |
|
(33) |
- |
Other | (1) | - |
| - | (7) |
At the end of the period | 160 | 73 |
| (150) | (784) |
20.Provision for risks
The provision for risks is estimated by the Company’s management, supported by its legal counsel. The provision was recognized in an amount considered sufficient to cover probable losses.
20.1.Parent Company
| PIS/COFINS | Taxes and other | Social security and labor | Civil | Regulatory | Total |
Balances at December 31, 2016 | 109 | 428 | 254 | 80 | 20 | 891 |
Additions | 18 | 4 | 26 | 9 | 8 | 65 |
Payments | - | - | (8) | (1) | (1) | (10) |
Reversals | (56) | (5) | (11) | (7) | (1) | (80) |
Inflation adjustment | (19) | 6 | 9 | 3 | 1 | - |
Transfers | 6 | (6) | - | - | - | - |
Balances at March 31, 2017 | 58 | 427 | 270 | 84 | 27 | 866 |
| PIS/COFINS | Taxes and other | Social security and labor | Civil | Regulatory | Total |
Balances at December 31, 2015 | 63 | 187 | 152 | 71 | 17 | 490 |
Additions | 5 | 2 | 12 | 8 | 6 | 33 |
Payments | - | - | (8) | (2) | (3) | (13) |
Reversals | - | (3) | (1) | (8) | (3) | (15) |
Inflation adjustment | 3 | 8 | 4 | 4 | 1 | 20 |
Balances at March 31, 2016 | 71 | 194 | 159 | 73 | 18 | 515 |
Companhia Brasileira de Distribuição
Notes to the interim financial information
March 31, 2017
(In millions of Brazilian reais, unless otherwise stated)
20. Provision for risks - Continued
20.2.Consolidated
PIS/COFINS | Taxes and other | Social security and labor | Civil | Regulatory | Total | |
Balance at December 31, 2016 | 148 | 586 | 302 | 109 | 32 | 1,177 |
Additions | 19 | 8 | 172 | 34 | 16 | 249 |
Payments | - | (19) | (81) | (13) | (3) | (116) |
Reversals | (82) | (6) | (22) | (21) | (7) | (138) |
Inflation adjustment | (32) | 11 | 29 | 5 | 2 | 15 |
Transfers | 6 | (6) | - | - | - | - |
Liabilities related to assets held for sale and discontinued operations (note 31) |
(1) |
13 |
(79) |
(2) |
(2) |
(71) |
Balance at March 31, 2017 | 58 | 587 | 321 | 112 | 38 | 1,116 |
| PIS/COFINS | Taxes and other | Social security and labor | Civil | Regulatory | Total |
Balance at December 31, 2015 | 103 | 414 | 597 | 248 | 34 | 1,396 |
Additions | 4 | 4 | 88 | 61 | 13 | 170 |
Payments | - | - | (35) | (29) | (6) | (70) |
Reversals | (4) | (12) | (34) | (44) | (7) | (101) |
Inflation adjustment | 4 | 11 | 15 | 11 | 2 | 43 |
Exchange rate changes | - | - | - | (1) | - | (1) |
Balance at March 31, 2016 | 107 | 417 | 631 | 246 | 36 | 1,437 |
20.3.Tax
As per prevailing legislation, tax claims are subject to monetary indexation, which refers to an adjustment to the provision for tax risks according to the indexation rates used by each tax jurisdiction. Both the interest charges and fines, when applicable, were computed and provisioned with respect to unpaid amounts.
The main provisioned tax claims are as follows:
20.3.1. COFINS and PIS
Since the noncumulative regime to calculate PIS and COFINS has been used, the Company and its subsidiaries have challenged the right to deduct ICMS from the base of these two contributions. With the judgement of the thesis by the STF (Federal Supreme court), the assessor of the Company reviwed the loose estimation resulting in the reversion of the provision amounted in R$117. The Company keep in process of credits avaliation related of the period on own judicial claims.
The amount accrued, including less relevant amounts, as at March 31, 2017 is R$59, being R$58 of continued operation and R$1 of discontinued operations (R$204 as at December 31, 2016, being R$148 of continued operation and R$56 of discontinued operations).
Companhia Brasileira de Distribuição
Notes to the interim financial information
March 31, 2017
(In millions of Brazilian reais, unless otherwise stated)
20. Provision for risks - Continued
20.3. Tax - Continued
20.3.2. Tax
The Company and its subsidiaries have other tax claims, which after analysis by its legal counsel, were considered as probable losses and accrued by the Company. These refer to: (i) tax assessment notices related to purchase, industrialization and sale of soybean and byproducts exports (PIS, COFINS and IRPJ); (ii) challenge on the non-application of the Accident Prevention Factor - FAP for 2011; (iii) challenge on the Poverty Fighting Fund established by the Rio de Janeiro State Government; (iv) challenges on purchases from suppliers considered not qualified in the State Finance Department registry, error in application of rate and accessory obligations by State tax authorities; (v) no approval on tax compensations; and (vi) other less relevant issues.
The amount accrued for these matters as at March 31, 2017 is R$385, being R$355 of continued operation and R$30 of discontinued operations (R$408 as at December 31, 2016, being R$356 of continued operation and R$52 of discontinued operations).
ICMS
The Federal Supreme Court ("STF") on October 16, 2014 decided that ICMS taxpayers that trade products included in the “basked of food staples” have no right to fully utilize the ICMS credits. The Company, with the assistance of its legal counsel, decided that it would be an appropriate procedure to record a provision for this matter amounting to R$151 as at March 31, 2017 (R$153 as at December 31, 2016) since this claim is considered a “probable” loss. The amounts accrued represent Management’s best estimate of the probable cash disbursement to settle this claim.
Additionally, among the contingent liabilities not accrued there are cases assessed by São Paulo State tax authorities related to the refund of ICMS over tax substitution without proper compliance with accessory tax obligations introduced by CAT Administrative Rule 17. Considering the last court judgments the Company accrued R$139 in 2016 related to Management estimative of probable loss, related to proof aspect of the process.
20.3.3. Supplementary Law 110/2001
The Company claims in court the eligibility to not pay the contributions provided for by Supplementary Law 110/01, referring to the FGTS (Government Severance Indemnity Fund for Employees) costs. The accrued amount as at March 31, 2017 is R$81 (R$77 as at December 31, 2016).
20.3.4. Others contingent tax liabilities - Via Varejo
Provisions for contingent tax liabilities were recorded as a result of the business combination with Via Varejo, as required by CPC 15(R1) (IFRS 3). As at March 31, 2017, the recorded amount related to contingent tax liabilities is R$91 (R$89 as at December 31, 2016). These accrued claims refer to administrative proceedings related to the offset of tax debts against credits from the contribution levied on coffee exports.
Companhia Brasileira de Distribuição
Notes to the interim financial information
March 31, 2017
(In millions of Brazilian reais, unless otherwise stated)
20. Provision for risks - Continued
20.3.Tax - Continued
20.3.5. Others contingent tax liabilities - Bartira
On the third quarter 2016, the Company reversed most of its contingencies arising from business combination of Bartira, in 2013. The amount reversed is composed for R$6 of tax contingence and R$11 of labor contingence, totalizing R$17. The remaining balance at March 31, 2017 is R$1 (R$1 at December 31, 2016).
20.4.Labor
The Company and its subsidiaries are parties to various labor lawsuits mainly due to termination of employees in the ordinary course of business. At March 31, 2017, the Company recorded a provision amount of R$400, being R$321 for continued operation and R$79 for discontinued operations (R$950 as at December 31, 2016, being R$302 for continued operation and R$648 for discontinued operations) related to the potential risk of loss on these lawsuits. Management, with the assistance of its legal counsel, assesses these claims recording a provision for losses when reasonably estimable, based on past experiences in relation to the amounts claimed. Labor claims are indexed to rate according to a table available by TST (“the Brazilian Supreme Labor Court”), plus monthly interest of 1%.
20.5.Civil and others
The Company and its subsidiaries are parties to civil lawsuits at several court levels (indemnities and collections, among others) and at different courts. The Company’s management records provisions in amounts considered sufficient to cover unfavorable court decisions, when its legal counsel considers the loss as probable.
Among these lawsuits, we point out the following:
·The Company and its subsidiaries are parties to various lawsuits requesting the renewal of rental agreements and the review of the current rent paid. The Company recognizes a provision for the difference between the amount originally paid by the stores and the amounts pleaded by the adverse party (owner of the property) in the lawsuit, when internal and external legal counsel consider that it is probable that the rent amount will be changed by the entity. As at March 31, 2017, the amount accrued for these lawsuits is R$136, being R$61 for continued operation and R$75 for discontinued operations (R$121 as at December 31, 2016, being R$49 of continued operation and R$72 for discontinued operations), for which there are no escrow deposits.
· Company and its subsidiaries answer to legal claims related to penalties applied by regulatory agencies, from the federal, state and municipal administrations, among which Consumer Protection Agencies (Procon) , National Institute of Metrology, Standardization and Industrial Quality (INMETRO) and Municipalities. Company supported by its legal counsel, revises that claims, recording a provision according to probable cash expending and estimative of loss. As at March 31, 2017 the amount of this provision is R$40, being R$38 for continued activities and R$2 for discontinued activities (R$39 at December 31, 2016, being R$32 for continued operations and R$7 for discontinued operations).
Companhia Brasileira de Distribuição
Notes to the interim financial information
March 31, 2017
(In millions of Brazilian reais, unless otherwise stated)
20. Provision for risks – Continued
20.5.Civil and others - continued
·The subsidiary Via Varejo is a party to lawsuits involving consumer relationship rights (civil actions and assessments from PROCON) and lawsuits involving contracts terminated with suppliers and the amount claimed in these lawsuits was R$58 as at March 31, 2017 (R$58 as at December 31, 2016).
Total civil lawsuits and others as at March 31, 2017 amount to R$154, being R$150 for continued activities and R$4 for discontinued activities (R$343 as at December 31, 2016, being R$141 for continued operation and R$202 for discontinued operations).
20.6.Non-accrued contingent liabilities
The Company has other litigations which have been analyzed by the legal counsel and considered as possible, therefore, have not been accrued. In this process, there are litigations related to charges of differences in IRPJ payment, for which the Company, based on management and legal assessment, has the right of compensation from its former and actual shareholders, supposedly due related to years from 2007 to 2013, under allegation that had improper deduction of goodwill amortizations paid. The involved amount is R$1,164 in March 31, 2017 (R$1,141 in December 31, 2016), classified at possible loss and exist other part classified at remote loss. Additionally, the possible litigations balance without compensation is an updated amount of R$12,228, being R$10,710 for continued activities and R$1,518 for discontinued activities at March 31, 2017 (R$12,221 in December 31, 2016, being R$10,736 for continued operation and R$1,485 for discontinued operations), and are principally related to:
· INSS (Social Security Contribution) – GPA was assessed for non-levy of payroll charges on benefits granted to its employees, among other matters, for which possible loss amounts to R$427, being R$395 for continued operation and R$32 for as at March 31, 2017 (R$421 at December 31, 2016, being R$389 for continued operation and R$32 for discontinued operations). The lawsuits are under administrative and court discussions.
· IRPJ, withholding income tax - IRRF, CSLL, tax on financial transactions - IOF, withholding income tax on net income, ILL – GPA has several assessment notices regarding offsetting proceedings, rules on the deductibility of provisions, payment divergences and overpayments; fine for failure to comply with accessory obligations, among other less significant taxes. Among those claims, there are one tax assessment related to the tax deduction of goodwill in the years of 2012 and 2013, originated by the acquisition of Ponto Frio (goodwill Mandala) accrued in the year of 2009. The restated amount of the assessment notice correspond to R$181 of income tax and social contribution (R$79 at December 31, 2016). The lawsuits await administrative and court ruling. The amount involved is R$1,229, being R$1,090 for continued operation and R$139 for discontinued activities as March 31, 2017 (R$1,192 at December 31, 2016, being 1,052 for continued operation and R$140 for discontinued operations).
· COFINS, PIS, provisional contribution on financial transactions – CPMF and IPI – the Company has been challenged about offsets of COFINS and PIS against IPI credits – inputs subject to zero rate or exempt – acquired from third parties with a final and un-appeal decision, other requests for offset, collection of taxes on soybean export operations, tax payment divergences and overpayments; fine for failure to comply with accessory obligations, disallowance of COFINS and PIS credits on one-phase products, among other less significant taxes. These lawsuits await decision at the administrative and court levels. The amount involved in these assessments is R$2,614, being R$2,205 for continued activities and R$409 for discontinued activities at March 31, 2017 (R$2,532 at December 31, 2016, being R$2,140 for continued operation and R$392 for discontinued operations).
Companhia Brasileira de Distribuição
Notes to the interim financial information
March 31, 2017
(In millions of Brazilian reais, unless otherwise stated)
20. Provision for risks – Continued
20.6.Non-accrued contingent liabilities - continued
· ICMS – GPA received tax assessment notices by the State tax authorities regarding: (i) utilization of electric energy credits; (ii) purchases from suppliers considered not qualified in the State Finance Department registry; (iii) levied on its own operation of merchandise purchase (own ICMS)) – article 271 of ICMS by-law; (iv) resulting from sale of extended warranty, (v) resulting from financed sales; and (vi) among other matters. The total amount of these assessments is R$6,991, being R$6,340 for continued activities and R$651 for discontinued activities as March 31, 2017 (R$6,832 as at December 31, 2016, being 6,269 for continued operation and R$563 for discontinued operations), which await a final decision at the administrative and court levels.
· Municipal service tax - ISS, Municipal Real Estate Tax (“IPTU”), Fees, and others – these refer to assessments on withholdings of third parties, IPTU payment divergences, fines for failure to comply with accessory obligations, ISS – reimbursement of advertising expenses and sundry taxes, in the amount of R$299, being R$170 for continued activities and R$129 for discontinued activities as March 31, 2017 (R$292 at December 31, 2016, being R$165 for continued operation and R$127 for discontinued operations), which await decision at the administrative and court levels.
· Other litigations – these refer to administrative proceedings and lawsuits in which the Company pleads the renewal of rental agreements and setting of rents according to market values and actions in the civil court, special civil court, Consumer Protection Agency - PROCON (in many States), Institute of Weights and Measure - IPEM, National Institute of Metrology, Standardization and Industrial Quality - INMETRO and National Health Surveillance Agency - ANVISA, among others, amounting to R$668, being R$510 for continued activities and R$158 for discontinued activities at March 31, 2017 (R$953 at December 31, 2016, being R$722 for continued operation and R$231 for discontinued operations).
The Company engages external attorneys to represent it in the tax assessments received, whose fees are contingent upon a percentage to be applied to the amount of success in the final outcome of these lawsuits. This percentage may vary according to qualitative and quantitative factors of each claim, and as at March 31, 2017 the estimated amount, in case of success in all lawsuits, is approximately R$192, being R$171 for continued activities and R$21 for discontinued activities (R$168, being R$155 of continued operation and R$13 of discontinued operations at December 31, 2016).
Companhia Brasileira de Distribuição
Notes to the interim financial information
March 31, 2017
(In millions of Brazilian reais, unless otherwise stated)
20. Provision for risks – Continued
20.7.Restricted deposits for legal proceedings
The Company is challenging the payment of certain taxes, contributions and labor-related obligations and has made court restricted deposits in the corresponding amounts, as well as escrow deposits related to the provision for legal proceedings.
The Company has recorded judicial deposits in the assets.
| Parent Company | Consolidated | |||
| 3.31.2017 | 12.31.2016 | 3.31.2017 | 12.31.2016 | |
| |||||
Tax | 123 | 120 |
| 185 | 181 |
Labor | 390 | 383 |
| 423 | 414 |
Civil and other | 20 | 17 |
| 30 | 26 |
Regulatory | 15 | 14 |
| 42 | 40 |
Total | 548 | 534 |
| 680 | 661 |
20.8.Guarantees
Judicial deposits | Real estate | Guarantee | Total |
Tax | 851 | 6,827 | 7,678 |
Labor | 3 | 33 | 36 |
Civil and other | - | 65 | 65 |
Regulatory | 9 | 119 | 128 |
Total | 863 | 7,044 | 7,907 |
The cost of guarantees is approximately 0.92% of the amount of the lawsuits and is recorded as expense by the passage of time.
20.9.Share of Cnova N.V. minorities
The associate Cnova N.V., some of its former and actual directors, and the subscribers of the initial public offer of Cnova N.V. – IPO, were mentioned in a lawsuit at South District Court of New York – United States, related to the internal revision, concluded in July 22, 2016, conducted by Cnova N.V., Cnova Brasil and consultants, mentioned at note 1.5. As result of this lawsuit, Cnova N.V., could incur in expenses (including, no limitted, legal fees and others fees of consultants and obligation to indemnify some old and actual directors, and the subscribers of the share public offer that are, or can be part, or involving this subject). The Company and its subsidiary Cnova are unable, at this moment, to predict the extension of potential responsibility in these subjects, including, if any, parallel lawsuit that can be taking by Securities and Exchange Commission as result of the facts of this subject or of internal review conduced by Cnova N.V., Cnova Brasil and its assessors
Companhia Brasileira de Distribuição
Notes to the interim financial information
March 31, 2017
(In millions of Brazilian reais, unless otherwise stated)
21. Leasing transactions
21.1. Operating lease
(i) Minumum rental payments on the agreement termination date
The Company analyzed and concluded that the rental agreements are cancelable over their duration. In case of termination, minimum payments will be due as a termination fee, which can vary from 1 to 12 months of rental or a fixed percentage of the contractual balance.
| Parent Company |
| Consolidated |
| 3.31.2017 |
| 3.31.2017 |
Minimum rental payments |
| ||
Minimum payments on the termination date | 344 |
| 375 |
Total | 344 |
| 375 |
(ii) Contingent payments
Management considers the payment of additional rents as contingent payments, which vary between 0.1% and 4.5% of sales.
Parent Company | Consolidated | ||||
Expenses(Income) for the period | 3.31.2017 | 3.31.2016 | 3.31.2017 | 3.31.2016 | |
Contingent payments | 123 | 89 |
| 128 | 139 |
Non contingent payments | 61 | 43 |
| 104 | 70 |
Sublease rentals (*) | (39) | (28) |
| (41) | (40) |
(*) Refers to lease agreements receivable from commercial shopping malls.
21.2. Finance lease
Finance lease agreements amounted to R$199 as at March 31, 2017 (R$215 as at December 31, 2016), as shown in the table below:
3.31.2017 | 12.31.2016 | 3.31.2017 | 12.31.2016 | ||
Financial lease liability –minimum rental payments: | |||||
Up to 1 year | 42 | 38 | 45 | 41 | |
1 - 5 years | 119 | 138 | 125 | 144 | |
Over 5 years | 27 | 27 | 29 | 30 | |
Present value of finance lease agreements | 188 | 203 | 199 | 215 | |
Future financing charges | 187 | 195 | 198 | 207 | |
Gross amount of finance lease agreements | 375 | 398 | 397 | 422 |
Companhia Brasileira de Distribuição
Notes to the interim financial information
March 31, 2017
(In millions of Brazilian reais, unless otherwise stated)
22. Deferred revenue
The Company and its subsidiary Via Varejo received in advance amounts from business partners on exclusivity in the intermediation of additional or extended warranties services, and the subsidiary Barcelona received in advance amounts for the rental of back lights for exhibition of products from its suppliers.
The amounts related Via Varejo are presented in the line “assets held to sale and discontinued activities”.
Parent Company | Consolidated | ||||
3.31.2017 | 12.31.2016 | 3.31.2017 | 12.31.2016 | ||
Additional or extended warranties | 34 | 35 |
| 34 | 35 |
Barter agreement | - | - |
| 12 | 12 |
Services agreement - Allpark | 14 | 15 |
| 14 | 15 |
Back lights | - | - |
| 65 | 85 |
Future revenue term | - | 100 |
| - | 100 |
Others | - | 1 |
| - | 1 |
48 | 151 |
| 125 | 248 | |
|
|
|
|
| |
Current | 26 | 127 |
| 103 | 224 |
Noncurrent | 22 | 24 |
| 22 | 24 |
23. Shareholders’ equity
The detailed information on shareholders’ equity was presented in the annual financial statements for 2016, in note 25.
23.1. Capital stock
The subscribed and paid-up capital as at March 31, 2017 is represented by 266,186 (266,076 as at December 31, 2016) in thousands of registered shares with no par value, of which 99,680 in thousands of common shares as at March 31, 2017 (99,680 as at December 31, 2016) and 166,506 in thousands of preferred shares as at March 31, 2017 (166,396 as at December 31, 2016).
The Company is authorized to increase its capital stock up to the limit of 400,000 (in thousands of shares), regardless of any amendment to the Company’s Bylaws, upon resolution of the Board of Directors, which will establish the issue conditions.
· At the Board of Directors’ Meetings held on February 23, 2017, and March 23, 2017, were approved capital increases in the amount R$4 (R$5 on December 31, 2016) through the issue of 110 thousands preferred shares (374 thousands of preferred shares on December 31,2016).
Companhia Brasileira de Distribuição
Notes to the interim financial information
March 31, 2017
(In millions of Brazilian reais, unless otherwise stated)
23. Shareholders’ equity
23.2. Stock option plan for preferred shares
The movimentation of the quantit of exercised options, the weighted average of the exercise price, and the weighted average of the remaining term are presented at the chart bellow:
| Shares | Weighted average of exercise price | Weighted average of remaining contractual term |
|
|
| |
Total to be exercised at December 31, 2016 | 2,394 | 29.21 | 1.84 |
|
|
| |
Cancelled during the year | (3) | 53.18 |
|
Expired during the year | (63) | 38.57 |
|
Exercised during the year | (110) | 41.72 |
|
Total to be exercised at March 31, 2017 | 2,218 | 28.36 | 1.80 |
Were not exercised new options at the period. The weighted average of the provided options’ fair value at March 31, 2017 were R$40.54 (R$43.06 at the December 31, 2016).
The recorded amounts at the Parant Company and Consolidated’s statement of operations at the March 31, 2017 were R$3 (R$4 at March 31, 2016).
23.3. Cumulative other comprehensive income
Cumulative other comprehensive income refers to : (i) Cumulative Translation Reserve, corresponding to cumulative effect of exchange gains and losses on the translation of assets, liabilities and operations in Brazilian Real, corresponding to the investment of CBD in subsidiary Cdiscount. At March 31, 2017 there was not effect on Parent Company and for non-controlling (R$88 in Parent Company and R$146 for non-controlling on December 31, 2016).
24. Net sales of goods and/or services
Parent Company | Consolidated | ||||
3.31.2017 | 3.31.2016 | 3.31.2017 | 3.31.2016 | ||
Gross sales: | |||||
Goods | 7,026 | 6,317 |
| 11,489 | 10,814 |
Services rendered | 85 | 65 |
| 87 | 76 |
Sales returns and cancellations | (137) | (137) |
| (146) | (169) |
|
|
|
|
|
|
6,974 | 6,245 |
| 11,430 | 10,721 | |
|
|
|
|
| |
Taxes | (516) | (493) |
| (878) | (833) |
|
|
|
|
|
|
Net sales | 6,458 | 5,752 |
| 10,552 | 9,888 |
Companhia Brasileira de Distribuição
Notes to the interim financial information
March 31, 2017
(In millions of Brazilian reais, unless otherwise stated)
25. Expenses by nature
| Parent Company |
| Consolidated | ||
| 3.31.2017 | 3.31.2016 |
| 3.31.2017 | 3.31.2016 |
|
|
|
|
| |
Cost of inventories | (4,373) | (4,097) |
| (7,830) | (7,346) |
Personnel expenses | (847) | (693) |
| (1,096) | (1,043) |
Outsourced services | (128) | (69) |
| (153) | (134) |
Functional expenses | (490) | (398) |
| (608) | (600) |
Selling expenses | (187) | (171) |
| (244) | (247) |
Other expenses | (123) | (89) |
| (144) | (139) |
| (6,148) | (5,517) |
| (10,075) | (9,509) |
|
|
|
|
|
|
Cost of sales | (4,691) | (4,289) |
| (8,191) | (7,697) |
Selling expenses | (1,283) | (1,094) |
| (1,657) | (1,602) |
General and administrative expenses | (174) | (134) |
| (227) | (210) |
| (6,148) | (5,517) |
| (10,075) | (9,509) |
26. Other operating income (expenses), net
Parent Company |
| Consolidated | |||
3.31.2017 | 3.31.2016 |
| 3.31.2017 | 3.31.2016 | |
|
|
|
|
|
|
Morzan fees | - | (10) |
| - | (10) |
Reestructuring expenses | (14) | (11) |
| (14) | (13) |
Gain (loss) on the disposal of property and equipment | 12 | (20) |
| 11 | (22) |
Tax risks | 25 | - |
| 38 | - |
Others | (2) | (2) |
| (1) | - |
Total | 21 | (43) |
| 34 | (45) |
27. Financial income (expenses), net
| Parent Company |
| Consolidated | ||
| 3.31.2017 | 3.31.2016 |
| 3.31.2017 | 3.31.2016 |
Finance expenses: |
|
|
|
| |
Cost of debt | (163) | (135) |
| (174) | (151) |
Cost of sales of receivables | (27) | (20) |
| (40) | (30) |
Monetary loss | (8) | (30) |
| (6) | (38) |
Other finance expenses | (18) | (19) |
| (20) | (24) |
Total financial expenses | (216) | (204) |
| (240) | (243) |
|
|
|
|
|
|
Financial income: |
|
|
|
|
|
Income from cash and cash equivalents | 15 | 10 |
| 16 | 18 |
Monetary gain | 33 | 30 |
| 39 | 46 |
Other financial income | 2 | - |
| 3 | - |
Total financial income | 50 | 40 |
| 58 | 64 |
|
|
|
|
|
|
Total | (166) | (164) |
| (182) | (179) |
The hedge effects in the period ended March 31, 2017 and March 31, 2016 are disclosed in note 17.
Companhia Brasileira de Distribuição
Notes to the interim financial information
March 31, 2017
(In millions of Brazilian reais, unless otherwise stated)
28. Earnings per share
The information on earnings per share was presented in the annual financial statements for 2015, in note 30.
The table below presents the determination of net income (loss) available to holders of common and preferred shares and the weighted average number of common and preferred shares outstanding used to calculate basic and diluted earnings (loss) per share in each reporting period:
3.31.2017 | 12.31.2016 | ||||||
Preferred | Common | Total | Preferred | Common | Total | ||
Basic numerator | |||||||
Net income (loss) allocated to common and preferred shareholders - continued operations | 53 | 29 | 82 | 6 | 3 | 9 | |
Net income (loss) allocated to common and preferred shareholders - discontinued operations | 28 | 15 | 43 | (39) | (21) | (60) | |
Net income (loss) allocated to common and preferred shareholders | 81 | 44 | 125 | (33) | (18) | (51) | |
Basic denominator (millions of shares) | |||||||
Weighted average of shares | 166 | 100 | 266 | 166 | 100 | 266 | |
Basic earnings per millions of shares (R$) - continued operations | 0,32690 | 0,29718 | 0,03494 | 0,03176 | |||
Basic earnings per millions of shares (R$) - discontinued operations | 0,16158 | 0,14689 | (0,22631) | (0,22631) | |||
Basic earnings per millions of shares (R$) - total | 0,48848 | 0,44407 | (0,19137) | (0,19454) | |||
Diluted numerator | |||||||
Net income (loss) allocated to common and preferred shareholders - continued operations | 53 | 29 | 82 | 6 | 3 | 9 | |
Net income (loss) allocated to common and preferred shareholders - discontinued operations | 28 | 15 | 43 | (39) | (21) | (60) | |
Net income (loss) allocated to common and preferred shareholders | 81 | 44 | 125 | (33) | (18) | (51) | |
Diluted denominator | |||||||
Weighted average of shares (in millions) | 166 | 100 | 266 | 166 | 100 | 266 | |
Diluted weighted average of shares (millions) | 166 | 100 | 266 | 166 | 100 | 266 | |
Diluted earnings per millions of shares (R$) – continued operations | 0,32592 | 0,29718 | 0,03494 | 0,03176 | |||
Diluted earnings per millions of shares (R$) – discontinued operations | 0,16110 | 0,14689 | (0,22631) | (0,22631) | |||
Diluted earnings per millions of shares (R$) – total | 0,48701 | 0,44407 | (0,19137) | (0,19454) | |||
Companhia Brasileira de Distribuição
Notes to the interim financial information
March 31, 2017
(In millions of Brazilian reais, unless otherwise stated)
29. Segment information
The information about segments was presented in the annual financial statements of 2016, in note 33.
Management considers the following segments:
· Retail – includes the banners “Pão de Açúcar”, “Extra Hiper”, “Extra Supermercado”, “Minimercado Extra”, “Minuto Pão de Açúcar”, “Posto Extra”, “Drogaria Extra” and “GPA Malls & Properties”.
· Cash & Carry – includes the brand “ASSAÍ”.
Home appliances and e-commerce segments were reclassified to discontinued operations at March 31, 2017 and 2016 (see note 31).
Information about the Company’s segments is included in the table below:
Companhia Brasileira de Distribuição
Notes to the interim financial information
March 31, 2017
(In millions of Brazilian reais, unless otherwise stated)
29. Segment information – Continued
Description | Retail (a) | Cash & Carry | Assets held for sale and discontinued activities (*) | Subtotal | Eliminations/ Others(**) | Total | |||||||||||
2017 | 2016 | 2017 | 2016 | 2017 | 2016 | 2017 | 2016 | 2017 | 2016 | 2017 | 2016 | ||||||
Net sales | 6,514 | 6,740 |
| 4,038 | 3,148 |
| - | - |
| 10,552 | 9,888 |
| - | - |
| 10,552 | 9,888 |
Gross profit | 1,781 | 1,762 |
| 580 | 429 |
| - | - |
| 2,361 | 2,191 |
| - | - |
| 2,361 | 2,191 |
Depreciation and amortization | (149) | (140) |
| (41) | (30) |
| - | - |
| (190) | (170) |
| - | - |
| (190) | (170) |
Share of profit of subsidiaries and associates | 17 | 23 |
| - | - |
| - | - |
| 17 | 23 |
| (25) | - |
| (8) | 23 |
Operating income | 206 | 119 |
| 132 | 68 |
| - | - |
| 338 | 187 |
| (25) | - |
| 313 | 187 |
Net financial expenses | (164) | (161) |
| (18) | (18) |
| - | - |
| (182) | (179) |
| - | - |
| (182) | (179) |
Profit(loss) before income tax and social contribution | 42 | (42) |
| 114 | 50 |
| - | - |
| 156 | 8 |
| (25) | - |
| 131 | 8 |
Income tax and social contribution | (12) | 18 |
| (38) | (17) |
| - | - |
| (50) | 1 |
| - | - |
| (50) | 1 |
Profit (loss) for continued activities | 30 | (24) |
| 76 | 33 |
| - | - |
| 106 | 9 |
| (25) | - |
| 81 | 9 |
Profit (loss) for discontinued activities | (25) | (10) |
| - | - |
| 158 | (156) |
| 133 | (166) |
| - | - |
| 133 | (166) |
Profit (loss) of year end | 5 | (34) |
| 76 | 33 |
| 158 | (156) |
| 239 | (157) |
| (25) | - |
| 214 | (157) |
|
|
|
|
|
|
|
|
|
|
|
|
|
|
|
|
| |
Current assets | 5,910 | 8,938 |
| 2,217 | 2,417 |
| 20,049 | 20,538 |
| 28,179 | 31,893 |
| (206) | (242) |
| 27,973 | 31,651 |
Noncurrent assets | 10,819 | 10,955 |
| 2,627 | 2,620 |
| - | - |
| 13,446 | 13,575 |
| (24) | (9) |
| 13,422 | 13,566 |
Current liabilities | 6,429 | 9,171 |
| 2,719 | 3,020 |
| 14,994 | 15,642 |
| 24,145 | 27,833 |
| (230) | (251) |
| 23,915 | 27,582 |
Noncurrent liabilities | 4,390 | 4,747 |
| 269 | 291 |
| - | - |
| 4,659 | 5,038 |
| - | - |
| 4,659 | 5,038 |
Shareholders' equity | 5,910 | 5,975 |
| 1,856 | 1,726 |
| 5,055 | 4,896 |
| 12,821 | 12,597 |
| - | - |
| 12,821 | 12,597 |
(*) See note 31.
(**) The eliminations consist of intercompany balances. In the management’s view, the net earnings eliminations are made inside of own segment, besides, the equity pickup of the Company in Cnova.N.V.
a) Retail includes GPA Malls & Properties.
Companhia Brasileira de Distribuição
Notes to the interim financial information
March 31, 2017
(In millions of Brazilian reais, unless otherwise stated)
29. Segment information – Continued
Company’s general information
The Company and its subsidiaries operate primarily as a retailer of food, clothing, home appliances and other products. Total revenues are composed of the following brands:
3.31.2017 | 3.31.2016 | ||
Extra | 4,065 | 4,192 | |
Assaí | 4,039 | 3,148 | |
Pão de Açúcar | 1,585 | 1,660 | |
Proximidade | 277 | 283 | |
Other business | 586 | 605 | |
Total net sales | 10,552 | 9,888 |
30. Non cash transactions
During the three-month period ended at March 31, 2017 and March 31, 2016 the Company had transactions that was not presented at the statement of cash flow, as presented below:
· Merger of subsidiaries and company reorganizations as per note 1.2 of the financial statements of 2016;
· Purchase of fixed assets not paid yet as note 14.2;
· Purchase of intangible assets not paid yet as per note 15.2;
· Deferred income tax as per note 19;
· Additions/reversals to provisions for risk as per note 20;
· Transactions with non-controlling interest as per note 25.4 of the financial statements of 2016;
· Capital increase at Sendas with property and equipment as per note 13 of the financial statements of 2016.
Companhia Brasileira de Distribuição
Notes to the interim financial information
March 31, 2017
(In millions of Brazilian reais, unless otherwise stated)
31. Non current assets held for sale and discontinued activities
The detailed information about assets held for sale and discontinued operations was presented in the annual financial statements of 2016, in note 35.
31.1. Ongoing transaction to dispose of Via Varejo subsidiary
The Board of Directors held on November 23, 2016 approved a process to disposed of the Company’s interest in Via Varejo’s capital stock, in line with its long-term strategy of focusing on the development of the food activity.
As per CPC 31 – Non-current assets held for sale and discontinued activities (IFRS 5), Company consider highly probable the sale of Via Varejo due to the efforts made. As a consequence, Via Varejo (and it subsidiary Cnova Brasil) net results, after tax, is disclosed in statement of operations as a single line, and assets and liabilities balances are disclosed as held for sale and discontinued activities. Statement of operations and statement of value added on December 31, 2016 also discloses the discontinued operations in single line, but for cash flows there were no effects as per IFRS5 being disclosed at this note the effect of discontinued operations. Noncurrent assets and liabilities held for sale on March 31, 2017 were R$19,853 and R$14,965, respectively. The net effects on discontinued operations were a profit of R$41 at March 31, 2017 (loss of R$60 at March 31, 2016).
Via Varejo shares are listed on B3 under ticker symbol “VVAR11” and “VVAR3”.
See below the summary of the consolidated statement of operations, balance sheet and cash flow statement of Via Varejo before the eliminations, including effects of the purchase price allocation of Globex and Casa Bahia acquisition.
Balance sheet (*):
3.31.2017 |
| 12.31.2016 | |
Assets |
|
| |
Current |
|
| |
Cash and cash equivalents | 526 |
| 4,030 |
Trade accounts receivable, net | 5,067 |
| 2,782 |
Inventories | 3,618 |
| 3,054 |
Other receivables | 768 |
| 704 |
Total current assets | 9,979 |
| 10,570 |
|
| ||
Noncurrent |
|
| |
Trade accounts receivable, net | 179 |
| 204 |
Other accounts receivable, net | 3,030 |
| 2,932 |
Deferred income and social contribution taxes | 323 |
| 289 |
Related parties | 649 |
| 681 |
Investment Properties | 151 |
| 144 |
Property and equipment, net | 1,561 |
| 1,550 |
Intangible assets | 4,177 |
| 4,170 |
Total noncurrent assets | 10,070 |
| 9,970 |
Total assets | 20,049 |
| 20,540 |
Companhia Brasileira de Distribuição
Notes to the interim financial information
March 31, 2017
(In millions of Brazilian reais, unless otherwise stated)
31. Non current assets held for sale and discontinued activities – Continued
31.1 Ongoing transaction to dispose of Via Varejo subsidiary – continued
Balance sheet (*):
Liabilities | 3.31.2017 |
| 12.31.2016 |
Current |
|
| |
Trade accounts payable | 5,687 |
| 5,618 |
Suppliers - structured program | - |
| 489 |
Loans and financing | 3,378 |
| 3,532 |
Related parties | 124 |
| 189 |
Other accounts payable | 2,255 |
| 2,231 |
Total current liabilities | 11,444 |
| 12,059 |
|
| ||
Noncurrent |
|
| |
Loans and financing | 366 |
| 407 |
Deferred income and social contribution taxes | 848 |
| 849 |
Other accounts payable | 2,334 |
| 2,329 |
Total noncurrent liabilities | 3,548 |
| 3,585 |
Equity | 5,057 |
| 4,896 |
Total liabilities and shareholders’ equity | 20,049 |
| 20,540 |
(*) Before related parties eliminations with GPA in the amount R$201 of assets and R$33 of liabilities.
Companhia Brasileira de Distribuição
Notes to the interim financial information
March 31, 2017
(In millions of Brazilian reais, unless otherwise stated)
31.1 Ongoing transaction to dispose of Via Varejo subsidiary – continued
Combined statement of operations (*) | 3.31.2017 | 3.31.2016 | |
Net sales from goods and services | 6,118 |
| 5,871 |
Cost of goods sold and services sold | (4,280) |
| (4,339) |
Gross profit | 1,838 |
| 1,532 |
Operating income (expenses) |
|
|
|
General and administrative | (1,516) |
| (1,440) |
Depreciation and amortization | - |
| (58) |
Equity pickup | 7 |
| 9 |
Other operating income (expenses), net | (21) |
| (89) |
(1,530) |
| (1,578) | |
Profit (loss) before Net finance income result | 308 |
| (46) |
|
|
| |
Net financial result | (138) |
| (116) |
Profit (loss) before income and social contribution taxes | 170 |
| (162) |
|
|
| |
Income and social contribution taxes | (10) |
| (17) |
|
|
| |
Net income (loss) for the year | 160 |
| (179) |
Attributed to: |
|
|
|
Controlling shareholders | 69 |
| (62) |
Non-controlling shareholders | 91 |
| (117) |
(*) Before eliminations of amounts of related parties with GPA.
Description | 3.31.2017 | 3.31.2016 |
Sales net income | (8) | (6) |
Cost of goods sold | (2) | (2) |
Selling costs | (3) | - |
Financial result | 1 | 1 |
Income and social contribution taxes | 3 | 1 |
Total | (9) | (6) |
Additionally a reclassification was made of incurred costs on Parent Company basically related to indemnity costs of contingences form prior periods to acquisition, paid to Via Varejo. According to IFRS 5, these costs were reclassified to discontinued operations in the amount of R$18 at March 31, 2017 and (R$10 at March 31, 2016).
Statement of cash flows | 31.3.2017 | 3.31.2016 |
Cash flow used in operating activities | (3,172) | (5,533) |
Cash flow provided by (used in) investing activities | (85) | (37) |
Cash flow from financing activities | (247) | 323 |
Net increase (decrease) in cash and cash equivalents | (3,504) | (5,247) |
Companhia Brasileira de Distribuição
Notes to the interim financial information
March 31, 2017
(In millions of Brazilian reais, unless otherwise stated)
31.2 Effects in 2016
Below the consolidated statement of operations of the Company on March 31, 2016, before and after considering subsidiaries that represent e-commerce and home appliance segments, disclosed as discontinued operations.
Statement of income | 3.31.2016 |
Discontinued activities Cdiscount (*) |
Discontinued activities Via Varejo and Cnova (*) | Discontinued activities Multivarejo (**) | 3.31.2016 |
| |||||
Net sales from goods and services | 17,774 | 2,021 | 5,865 | - | 9,888 |
Cost of goods sold and services sold | (13,860) | (1,822) | (4,341) | - | (7,697) |
Gross profit | 3,914 | 199 | 1,524 | - | 2,191 |
Operating income (expenses) |
|
|
|
|
|
Selling costs | (2,964) | (133) | (1,229) | - | (1,602) |
General and administrative | (488) | (68) | (210) | - | (210) |
Depreciation and amortization | (250) | (22) | (58) | - | (170) |
Equity pickup | 32 | - | 9 | - | 23 |
Other operating income (expenses), net | (68) | 76 | (89) | (10) | (45) |
(3,738) | (147) | (1,577) | (10) | (2,004) | |
Profit before Net finance result |
176 |
52 |
(53) |
(10) |
187 |
|
|
|
|
| |
Net financial results | (317) | (19) | (115) | (4) | (179) |
Profit (loss) before income and social contribution taxes |
(141) |
33 |
(168) |
(14) |
8 |
|
|
|
|
| |
Income and social contribution taxes | (17) | (5) | (16) | 3 | 1 |
|
|
|
|
| |
Net income (loss) for the year related to continued operations |
(158) |
28 |
(184) |
(11) |
9 |
|
|
|
|
| |
Attributed to: |
|
|
|
|
|
Controlling shareholders | (52) | 17 | (67) | (11) | 9 |
Non-controlling shareholders | (106) | 11 | (117) | - | - |
(*)After related parties elimination.
(**)Expenses related directly to discontinued operations.
Companhia Brasileira de Distribuição
Notes to the interim financial information
March 31, 2017
(In millions of Brazilian reais, unless otherwise stated)
On February 23, 2017 the board of directors approved an offer Certificate of Agribusiness Receivables (CRA) by Ápice Securitizadora, represented by debentures issued by the Company, no convertible in shares, unsecured, in a single series, with face value of R$1,000.00 of 14° issue of the Company. The offer was coordinated by Banco Bradesco BBI S.A., Banco Safra S.A. and Banco BNP Paribas Brasil S.A., the total amount was R$1,080 and final remuneration of 96% of CDI after Bookbuilding procedures. The amount was available for the Company at April 17, 2017.
Companhia Brasileira de Distribuição
Notes to the interim financial information
March 31, 2017
(In millions of Brazilian reais, unless otherwise stated)
Other information deemed as relevant by the Company
Shareholding at 3/31/2017 | |||||||
SHAREHOLDING OF CONTROLLING PARTIES OF THE COMPANY’S SHARES. UP TO THE INDIVIDUAL LEVEL | |||||||
COMPANHIA BRASILEIRA DE DISTRIBUIÇÃO (Publicly-held company) | Shareholding at 3/31/2017 | ||||||
Shareholder | Common Shares | Preferred Shares | Total | ||||
Number | % | Number | % | Number | % | ||
Wilkes Participações S/A | 94.019.178 | 94,32% | - | 0,00% | 94.019.178 | 35,32% | |
Jean-Charles Naouri | - | 0,00% | 1 | 0,00% | 1 | 0,00% | |
Geant International BV* | - | 0,00% | 9.423.742 | 5,66% | 9.423.742 | 3,54% | |
Segisor* | 5.600.050 | 5,62% | - | 0,00% | 5.600.050 | 2,10% | |
Casino Guichard Perrachon* | 1 | 0,00% | - | 0,00% | 1 | 0,00% | |
Almacenes Éxito S.A.* | 1 | 0,00% | - | 0,00% | 1 | 0,00% | |
King LLC* | - | 0,00% | 852.000 | 0,51% | 852.000 | 0,32% | |
Helicco Participações Ltda. | - | 0,00% | 581.600 | 0,35% | 581.600 | 0,22% | |
Carmignac Gestion* | - | 0,00% | 13.576.698 | 8,15% | 13.576.698 | 5,10% | |
Harding Loevner, LP* | - | 0,00% | 6.708.049 | 4,03% | 6.708.049 | 2,52% | |
Brandes Investment Partners, LP* | - | 0,00% | 8.510.442 | 5,11% | 8.510.442 | 3,20% | |
Board of Executive Officers | - | 0,00% | 217.762 | 0,13% | 217.762 | 0,08% | |
Board of Directors | - | 0,00% | 244.462 | 0,15% | 244.462 | 0,09% | |
Treasury Shares | - | 0,00% | 232.586 | 0,14% | 232.586 | 0,09% | |
Others | 60.621 | 0,06% | 126.158.447 | 75,77% | 126.219.068 | 47,42% | |
TOTAL | 99.679.851 | 100,00% | 166.505.789 | 100,00% | 266.185.640 | 100% | |
(*) Foreign Company | |||||||
CORPORATE’S CAPITAL STOCK DISTRIBUTION (COMPANY’S SHAREHOLDER). UP TO THE INDIVIDUAL LEVEL | ||||||
WILKES PARTICIPAÇÕES S.A | Shareholding at 3/31/2017 (In units) | |||||
Shareholder/Quotaholder | Common Shares | Preferred Shares | Total | |||
Number | % | Number | % | Number | % | |
Casino Guichard Perrachon* | 1 | 0,00% | - | 0,00% | 1 | 0,00% |
Segisor* | 217.402.606 | 97,23% | - | 0,00% | 217.402.606 | 97,23% |
Bengal LLc* | 2.119.162 | 0,95% | - | 0,00% | 2.119.162 | 0,95% |
Oregon LLc* | 2.119.162 | 0,95% | - | 0,00% | 2.119.162 | 0,95% |
Pincher LLc* | 1.961.612 | 0,88% | - | 0,00% | 1.961.612 | 0,88% |
Almanacenes Éxito S.A.* | 1 | 0,00% | - | 0,00% | 1 | 0,00% |
Treasury Shares | - | 0,00% | - | 0,00% | - | 0,00% |
TOTAL | 223.602.544 | 100,00% | - | 0,00% | 223.602.544 | 100% |
Companhia Brasileira de Distribuição
Notes to the interim financial information
March 31, 2017
(In millions of Brazilian reais, unless otherwise stated)
Other information deemed as relevant by the Company
SHAREHOLDING OF CONTROLLING PARTIES OF THE COMPANY’S SHARES. UP TO THE INDIVIDUAL LEVEL | ||||||
SEGISOR | Shareholding at 3/31/2017 (In units) | |||||
Quotaholder | Quotas | % | Preferred Shares | % | Number | % |
Onper Investimentos 2015 S.L.* | 887.239.543 | 50,00% | - | 0,00% | 887.239.543 | 50,00% |
Casino Guichard Perrachon* | 887.239.543 | 50,00% | - | 0,00% | 887.239.543 | 50,00% |
TOTAL | 1.774.479.086 | 100% | - | 0% | 1.774.479.086 | 100% |
(*) Foreign Company | ||||||
SHAREHOLDING OF CONTROLLING PARTIES OF THE COMPANY’S SHARES. UP TO THE INDIVIDUAL LEVEL | ||||||
ONPER INVESTIMENTOS 2015 S.L. | Shareholding at 3/31/2017 (In units) | |||||
Shareholder | Common Shares | % | Preferred Shares | % | Number | % |
Almanacenes Éxito S.A.* | 3.000 | 100,00% | - | 0,00% | 3.000 | 100,00% |
TOTAL | 3.000 | 100% | - | 0% | 3.000 | 100,00% |
SHAREHOLDING OF CONTROLLING PARTIES OF THE COMPANY’S SHARES. UP TO THE INDIVIDUAL LEVEL | ||||||
ALMANACENES ÉXITO S.A. | Shareholding at 9/30/2016 (In units) | |||||
ShareholderS* | Common Shares | % | Preferref Shares | % | Number | % |
Geant International B.V. | 187.689.792 | 42,03% | - | 0,00% | 187.689.792 | 42,03% |
Geant Fonciere B.V. | 47.725.428 | 10,69% | - | 0,00% | 47.725.428 | 10,69% |
Fondo de Pensiones Obligatorias Porvenir Moderado | 21.039.559 | 4,71% | - | 0,00% | 21.039.559 | 4,71% |
Fondo de Pensiones Obligatorias Protección | 19.079.642 | 4,27% | - | 0,00% | 19.079.642 | 4,27% |
Bergsaar B.V. | 12.130.440 | 2,72% | - | 0,00% | 12.130.440 | 2,72% |
Jara Albarracín Manuel | 9.712.599 | 2,17% | - | 0,00% | 9.712.599 | 2,17% |
EXITO ADR Program | 9.114.922 | 2,04% | - | 0,00% | 9.114.922 | 2,04% |
Alianza Fiduciaria S.A. Fideicomiso ADM Sonnenblume | 7.558.552 | 1,69% | - | 0,00% | 7.558.552 | 1,69% |
Moreno Barbosa Jaime | 6.702.864 | 1,50% | - | 0,00% | 6.702.864 | 1,50% |
Fondo de Pensiones Obligatorias Colfondos Moderado | 6.425.423 | 1,44% | - | 0,00% | 6.425.423 | 1,44% |
Fondo Bursatil Ishares COLCAP | 5.287.908 | 1,18% | - | 0,00% | 5.287.908 | 1,18% |
Fondo de Pensiones Obligatorias Skandia S.A. | 3.762.704 | 0,84% | - | 0,00% | 3.762.704 | 0,84% |
Inversiones Pinamar S.A. | 3.508.779 | 0,79% | - | 0,00% | 3.508.779 | 0,79% |
Vanguard Emerging Markets Stock Index Fund | 3.517.411 | 0,79% | - | 0,00% | 3.517.411 | 0,79% |
Platinu7m International Brands Fund | 3.323.481 | 0,74% | - | 0,00% | 3.323.481 | 0,74% |
Fondo Bursatil Horizons Colombia Select de S&P | 3.279.957 | 0,73% | - | 0,00% | 3.279.957 | 0,73% |
NAT. Westminter Bank PLC Depo for 1st Ste Glob | 2.910.637 | 0,65% | - | 0,00% | 2.910.637 | 0,65% |
TIAA-CREF Funds - Emerging Markets Equit | 2.729.200 | 0,61% | - | 0,00% | 2.729.200 | 0,61% |
Corbeta S.A. Y/O Alkosto S.A. | 2.457.312 | 0,55% | - | 0,00% | 2.457.312 | 0,55% |
Vanguard Total International Stock Index Fund | 1.790.482 | 0,40% | - | 0,00% | 1.790.482 | 0,40% |
Outros acionistas | 86.810.867 | 19,44% | - | 0,00% | 86.810.867 | 19,44% |
TOTAL | 446.557.959 | 100,00% | - | 0,00% | 446.557.959 | 100,00% |
Companhia Brasileira de Distribuição
Notes to the interim financial information
March 31, 2017
(In millions of Brazilian reais, unless otherwise stated)
Other information deemed as relevant by the Company
CONSOLIDATED SHAREHOLDING OF CONTROLLING PARTIES AND MANAGEMENT AND OUTSTANDING SHARES | Shareholding at 3/31/2017 | |||||
Shareholder | Common Shares | Preferred Shares | ||||
Number | % | Number | % | Number | % | |
Controlling parties | 99.619.230 | 99,94% | 10.857.343 | 6,52% | 110.476.573 | 41,50% |
|
|
|
|
|
|
|
Management |
|
|
|
|
|
|
Board of Directors | - | 0,00% | 217.762 | 0,13% | 217.762 | 0,08% |
Board of Executive Officers | - | 0,00% | 244.462 | 0,15% | 244.462 | 0,09% |
|
|
|
|
|
|
|
Treasury Shares | - | 0,00% | 232.586 | 0,14% | 232.586 | 0,09% |
|
|
|
|
|
|
|
Other Shareholders | 60.621 | 0,06% | 154.953.636 | 93,06% | 155.014.257 | 58,24% |
|
|
|
|
|
|
|
Total | 99.679.851 | 100,00% | 166.505.789 | 100,00% | 266.185.640 | 100,00% |
|
|
|
|
|
|
|
Outstanding Shares | 60.621 | 0,06% | 154.953.636 | 93,06% | 155.014.257 | 58,24% |
Shareholding at 3/31/2016 | ||||||
CONSOLIDATED SHAREHOLDING OF CONTROLLING PARTIES AND MANAGEMENT AND OUTSTANDING SHARES | ||||||
Shareholder | Common Shares | Preferred Shares | ||||
Number | % | Number | % | Number | % | |
Controlling parties | 99.619.230 | 99,94% | 9.887.819 | 5,96% | 109.507.049 | 41,21% |
|
|
|
|
|
|
|
Management |
|
|
|
|
|
|
Board of Directors | - | 0,00% | 3 | 0,00% | 3 | 0,00% |
Board of Executive Officers | - | 0,00% | 27.011 | 0,02% | 27.011 | 0,01% |
|
|
|
|
|
|
|
Treasury Shares | - | 0,00% | 232.586 | 0,14% | 232.586 | 0,09% |
|
|
|
|
|
|
|
Other Shareholders | 60.621 | 0,06% | 155.884.700 | 93,89% | 155.945.321 | 58,69% |
|
|
|
|
|
|
|
Total | 99.679.851 | 100,00% | 166.032.119 | 100,00% | 265.711.970 | 100,00% |
|
|
|
|
|
|
|
Outstanding Shares | 60.621 | 0,06% | 155.884.700 | 93,89% | 155.945.321 | 58,69% |
SIGNATURES
Pursuant to the requirement of the Securities Exchange Act of 1934, the registrant has duly caused this report to be signed on its behalf by the undersigned, thereunto duly authorized.
| COMPANHIA BRASILEIRA DE DISTRIBUIÇÃO | ||
| Date: May 5, 2017 | By: /s/ Ronaldo Iabrudi Name: Ronaldo Iabrudi Title: Chief Executive Officer | |
| By: /s/ Daniela Sabbag Name: Daniela Sabbag Title: Investor Relations Officer | ||
FORWARD-LOOKING STATEMENTS
This press release may contain forward-looking statements. These statements are statements that are not historical facts, and are based on management's current view and estimates offuture economic circumstances, industry conditions, company performance and financial results. The words "anticipates", "believes", "estimates", "expects", "plans" and similar expressions, as they relate to the company, are intended to identify forward-looking statements. Statements regarding the declaration or payment of dividends, the implementation of principal operating and financing strategies and capital expenditure plans, the direction of future operations and the factors or trends affecting financial condition, liquidity or results of operations are examples of forward-looking statements. Such statements reflect the current views of management and are subject to a number of risks and uncertainties. There is no guarantee that the expected events, trends or results will actually occur. The statements are based on many assumptions and factors, including general economic and market conditions, industry conditions, and operating factors. Any changes in such assumptions or factors could cause actual results to differ materially from current expectations.