FORM 6-K
SECURITIES AND EXCHANGE COMMISSION
Washington, D.C. 20549
Report of Foreign Private Issuer
Pursuant to Rule 13a-16 or 15d-16 of
the Securities Exchange Act of 1934
For the month of July, 2019
Brazilian Distribution Company
(Translation of Registrant’s Name Into English)
Av. Brigadeiro Luiz Antonio,
3142 São Paulo, SP 01402-901
Brazil
(Address of Principal Executive Offices)
(Indicate by check mark whether the registrant files or will file annual reports under cover of Form 20-F or Form 40-F)
Form 20-F X Form 40-F
(Indicate by check mark if the registrant is submitting the Form 6-K in paper as permitted by Regulation S-T Rule
101 (b) (1)):
Yes ___ No X
(Indicate by check mark if the registrant is submitting the Form 6-K in paper as permitted by Regulation S-T Rule
101 (b) (7)):
Yes ___ No X
(Indicate by check mark whether the registrant by furnishing the information contained in this Form is also thereby furnishing the information to the Commission pursuant to Rule 12g3-2(b) under the Securities Exchange Act of 1934.)
Yes ___ No X
(FreeTranslation into English from the Original Previously Issued in Portuguese.)
Companhia Brasileira Individual and Consolidated Ernst &Young auditores Independentes
|
A free translation from Portuguese into English of Independent Auditor’s Report on Review of Quarterly Financial Information
Independent auditor’s review report on quarterly information
To the Shareholders, Directors and Officers
Companhia Brasileira de Distribuição
São Paulo – SP – Brazil
Introduction
We have reviewed the accompanying individual and consolidated interim financial information, contained in the Quarterly Information Form (ITR) of Companhia Brasileira de Distribuição for the quarter ended June 30, 2019, comprising the statement of financial position as of June 30, 2019 and the related statements of profit or loss and comprehensive income for the three and six-month period then ended, and of changes in equity and cash flows for the six-month period then ended, including other explanatory information.
Management is responsible for the preparation of the individual and consolidated interim financial information in accordance with Accounting Pronouncement CPC 21 (R1) - Interim Financial Reportingand IAS 34 - Interim Financial Reporting, issued by the International Accounting Standards Board (IASB), as well as for the fair presentation of this information in conformity with the rules issued by the Brazilian Securities and Exchange Commission (CVM) applicable to the preparation of the Quarterly Information Form (ITR). Our responsibility is to express a conclusion on this interim financial information based on our review.
Scope of the review
We conducted our review in accordance with Brazilian and International Standards on Review Engagements (NBC TR 2410 and ISRE 2410 - Review of Interim Financial Information Performed by the Independent Auditor of the Entity, respectively). A review of interim financial information consists of making inquiries, primarily of persons responsible for financial and accounting matters, and applying analytical and other review procedures. A review is substantially less in scope than an audit conducted in accordance with auditing standards and consequently does not enable us to obtain assurance that we would become aware of all significant matters that might be identified in an audit. Accordingly, we do not express an audit opinion.
Conclusion on the individual and consolidated interim financial information
Based on our review, nothing has come to our attention that causes us to believe that the accompanying individual and consolidated interim financial information included in the quarterly information referred to above are not prepared, in all material respects, in accordance with CPC 21 (R1) and IAS 34 applicable to the preparation of Quarterly Information Form (ITR), and presented consistently with the rules issued by the Brazilian Securities and Exchange Commission (CVM).
Emphasis of matter
Restatement of corresponding figures
As mentioned in Note 5, due the adoption of the new accounting pronouncement CPC06(R2) and IFRS 16 – Leases, the corresponding individual and consolidated figures related to the balance sheet for the year ended December 31, 2018 and the corresponding individual and consolidated interim financial information comprising the statements of profit or loss and comprehensive income for the three and six-month period ended June 30, 2018, and of changes in equity and cash flows for the six-month period ended June 30, 2018, presented for comparison purposes, were adjusted and restated as required by CPC 23 (Accounting Policies, Changes in Accounting Estimates and Error Correction) and CPC 26(R1) - Presentation of Financial Statements. Our conclusion is not modified in respect of this matter.
Other matters
Statements of value added
We have also reviewed the individual and consolidated statements of value added (SVA) for the six-month period ended June 30, 2019, prepared under Company’s management responsibility, whose presentation in the interim financial information is required by the rules issued by the Brazilian Securities and Exchange Commission (CVM) applicable to preparation of Quarterly Information Form (ITR), and as supplementary information by the International Financial Reporting Standards (IFRS), which does not require SVA presentation. These statements have been subject to the same review procedures previously described and, based on our review, nothing has come to our attention that causes us to believe that they were not prepared, in all material respects, consistently with the overall individual and consolidated interim financial information.
São Paulo,July 24, 2019.
ERNST & YOUNG
Auditores Independentes S.S.
CRC-2SP034519/O-6
Antonio Humberto Barros dos Santos
Accountant CRC-1SP161745/O-3
Company Information | |
Capital Composition | 5 |
Individual Interim Financial Information |
|
Balance Sheet – Assets | 6 |
Balance Sheet – Liabilities | 7 |
Statement of Operations | 8 |
Statement of Comprehensive Income | 9 |
Statement of Cash Flows | 10 |
Statement of Changes in Shareholders’ Equity |
|
1/1/2019 to 6/30/2019 | 11 |
1/1/2018 to 6/30/2018 | 12 |
Statement of Value Added | 13 |
Consolidated Interim Financial Information |
|
Balance Sheet – Assets | 14 |
Balance Sheet – Liabilities | 15 |
Statement of Operations | 16 |
Statement of Comprehensive Income | 17 |
Statement of Cash Flows | 18 |
Statement of Changes in Shareholders’ Equity |
|
1/1/2019 to 6/30/2019 | 19 |
1/1/2018 to 6/30/2018 | 20 |
Statement of Value Added | 21 |
Comments on the Company`s Performance | 22 |
Notes to the Interim Financial Information | 45 |
FREE TRANSLATION INTO ENGLISH FROM THE ORIGINAL PREVIOUSLY ISSUED IN PORTUGUESE) |
ITR – Interim Financial Information – June 30,2019 – COMPANHIA BRASILEIRA DE DISTRIBUIÇÃO |
Number of Shares (thousand) | Current Quarter 6/30/2019 |
|
Share Capital |
|
|
Common | 99,680 |
|
Preferred | 167,399 |
|
Total | 267,079 |
|
Treasury Shares |
|
|
Common | 0 |
|
Preferred | 233 |
|
Total | 233 |
|
5
FREE TRANSLATION INTO ENGLISH FROM THE ORIGINAL PREVIOUSLY ISSUED IN PORTUGUESE) |
ITR – Interim Financial Information – June 30,2019 – COMPANHIA BRASILEIRA DE DISTRIBUIÇÃO |
Individual Interim Financial Information / Balance Sheet - Assets | |||
R$ (in thousands) | |||
Code | Description | Current Quarter | Previous Year |
1 | Total Assets | 26,857,000 | 27,454,000 |
1.01 | Current Assets | 8,498,000 | 9,594,000 |
1.01.01 | Cash and Cash Equivalents | 4,030,000 | 2,935,000 |
1.01.03 | Accounts Receivable | 534,000 | 565,000 |
1.01.03.01 | Trade Receivables | 202,000 | 274,000 |
1.01.03.02 | Other Receivables | 332,000 | 291,000 |
1.01.04 | Inventories | 3,369,000 | 3,606,000 |
1.01.06 | Recoverable Taxes | 341,000 | 316,000 |
1.01.08 | Other Current Assets | 224,000 | 2,172,000 |
1.01.08.01 | Assets Held for Sale | 24,000 | 2,054,000 |
1.01.08.03 | Other | 200,000 | 118,000 |
1.01.08.03.01 | Financial Instruments - Fair Value Hegde | 2,000 | 0 |
1.01.08.03.02 | Others assets | 198,000 | 118,000 |
1.02 | Noncurrent Assets | 18,359,000 | 17,860,000 |
1.02.01 | Long-term Assets | 3,251,000 | 3,208,000 |
1.02.01.04 | Accounts Receivable | 204,000 | 132,000 |
1.02.01.04.01 | Trade receivables, net | 71,000 | 4,000 |
1.02.01.04.02 | Other accounts receivable | 133,000 | 128,000 |
1.02.01.07 | Deferred Taxes | 250,000 | 246,000 |
1.02.01.08 | Prepaid Expenses | 11,000 | 17,000 |
1.02.01.09 | Receivables from related parties | 236,000 | 341,000 |
1.02.01.10 | Other Noncurrent Assets | 2,550,000 | 2,472,000 |
1.02.01.10.04 | Recoverable Taxes | 1,854,000 | 1,813,000 |
1.02.01.10.05 | Restricted deposits for legal proceedings | 658,000 | 624,000 |
1.02.01.10.06 | Financial Instruments - Fair Value Hegde | 38,000 | 35,000 |
1.02.02 | Investments | 4,969,000 | 4,444,000 |
1.02.02.01 | Investments in Associates | 4,969,000 | 4,424,000 |
1.02.02.01.02 | Investments in Subsidiaries | 4,969,000 | 4,424,000 |
1.02.02.02 | Investment properties | 0 | 20,000 |
1.02.03 | Property and Equipment, Net | 8,287,000 | 8,402,000 |
1.02.03.01 | Property and Equipment in Use | 5,850,000 | 5,843,000 |
1.02.03.02 | Leased Properties | 2,437,000 | 2,559,000 |
1.02.04 | Intangible Assets, net | 1,852,000 | 1,806,000 |
1.02.04.01 | Intangible Assets | 1,852,000 | 1,806,000 |
1.02.04.01.02 | Intangible Assets | 1,225,000 | 1,152,000 |
1.02.04.01.03 | Intangible Right-of-use | 627,000 | 654,000 |
6
FREE TRANSLATION INTO ENGLISH FROM THE ORIGINAL PREVIOUSLY ISSUED IN PORTUGUESE) |
ITR – Interim Financial Information – June 30,2019 – COMPANHIA BRASILEIRA DE DISTRIBUIÇÃO |
Individual Interim Financial Information / Balance Sheet - Liabilities | |||
R$ (in thousands) | |||
Code | Description | Current Quarter | Previous Year |
2 | Total Liabilities | 26,857,000 | 27,454,000 |
2.01 | Current Liabilities | 8,210,000 | 8,875,000 |
2.01.01 | Payroll and Related Taxes | 397,000 | 433,000 |
2.01.02 | Trade payables, net | 3,729,000 | 5,604,000 |
2.01.03 | Taxes and Contributions Payable | 290,000 | 236,000 |
2.01.04 | Borrowings and Financing | 2,473,000 | 1,306,000 |
2.01.05 | Other Liabilities | 1,321,000 | 1,296,000 |
2.01.05.01 | Payables to Related Parties | 211,000 | 316,000 |
2.01.05.02 | Other | 1,110,000 | 980,000 |
2.01.05.02.01 | Dividends and interest on own capital | 32,000 | 57,000 |
2.01.05.02.08 | Financing Related to Acquisition of Assets | 41,000 | 68,000 |
2.01.05.02.09 | Deferred Revenue | 71,000 | 89,000 |
2.01.05.02.12 | Other Accounts Payable | 452,000 | 264,000 |
2.01.05.02.17 | Lease Liability | 514,000 | 502,000 |
2.02 | Noncurrent Liabilities | 7,919,000 | 8,292,000 |
2.02.01 | Borrowings and Financing | 3,032,000 | 3,290,000 |
2.02.02 | Other Liabilities | 3,888,000 | 4,005,000 |
2.02.02.02 | Others | 3,888,000 | 4,005,000 |
2.02.02.02.03 | Taxes payable in installments | 423,000 | 471,000 |
2.02.02.02.07 | Other Accounts Payable | 67,000 | 38,000 |
2.02.02.02.08 | Provision for Losses on Investments in Associates | 347,000 | 279,000 |
2.02.02.02.09 | Lease Liability | 3,051,000 | 3,217,000 |
2.02.04 | Provisions | 972,000 | 987,000 |
2.02.06 | Deferred Revenue | 27,000 | 10,000 |
2.03 | Shareholders’ Equity | 10,728,000 | 10,287,000 |
2.03.01 | Share Capital | 6,836,000 | 6,825,000 |
2.03.02 | Capital Reserves | 438,000 | 413,000 |
2.03.02.04 | Stock Option | 431,000 | 406,000 |
2.03.02.07 | Capital Reserve | 7,000 | 7,000 |
2.03.04 | Earnings Reserve | 3,769,000 | 3,115,000 |
2.03.04.01 | Legal Reserve | 517,000 | 517,000 |
2.03.04.05 | Earnings Retention Reserve | 230,000 | 230,000 |
2.03.04.07 | Tax Incentive Reserve | 58,000 | 58,000 |
2.03.04.10 | Expansion Reserve | 3,216,000 | 2,557,000 |
2.03.04.12 | Transactions with non-controlling interests | -102,000 | -97,000 |
2.03.04.14 | Settlement of Equity Instrument | -150,000 | -150,000 |
2.03.05 | Retained Earnings/ Accumulated Losses | -271,000 | 0 |
2.03.08 | Other comprehensive income | -44,000 | -66,000 |
7
FREE TRANSLATION INTO ENGLISH FROM THE ORIGINAL PREVIOUSLY ISSUED IN PORTUGUESE) |
ITR – Interim Financial Information – June 30,2019 – COMPANHIA BRASILEIRA DE DISTRIBUIÇÃO |
Individual Interim Financial Information / Statement of Operations |
R$ (in thousands) | |||||
Code | Description | Current Quarter | Year to date current period | PreviousQuarter | Year to date previous period |
3.01 | Net operating revenue | 6,389,000 | 12,625,000 | 6,443,000 | 12,681,000 |
3.02 | Cost of sales | -4,699,000 | -9,130,000 | -4,584,000 | -9,051,000 |
3.03 | Gross Profit | 1,690,000 | 3,495,000 | 1,859,000 | 3,630,000 |
3.04 | Operating Income/Expenses | -1,451,000 | -2,903,000 | -1,186,000 | -2,602,000 |
3.04.01 | Selling Expenses | -1,153,000 | -2,291,000 | -1,171,000 | -2,301,000 |
3.04.02 | General and administrative expenses | -180,000 | -365,000 | -179,000 | -355,000 |
3.04.05 | Other Operating Expenses | -296,000 | -581,000 | -285,000 | -554,000 |
3.04.05.01 | Depreciation and Amortization | -240,000 | -474,000 | -227,000 | -456,000 |
3.04.05.03 | Other operating expenses, net | -56,000 | -107,000 | -58,000 | -98,000 |
3.04.06 | Share of Profit of associates | 178,000 | 334,000 | 449,000 | 608,000 |
3.05 | Profit from operations before net financial expenses | 239,000 | 592,000 | 673,000 | 1,028,000 |
3.06 | Net Financial expenses | -244,000 | -476,000 | -237,000 | -460,000 |
3.07 | Income (loss) before income tax and social contribution | -5,000 | 116,000 | 436,000 | 568,000 |
3.08 | Income tax and social contribution | 52,000 | 105,000 | 36,000 | 62,000 |
3.08.01 | Current | 166,000 | 158,000 | 5,000 | 1,000 |
3.08.02 | Deferred | -114,000 | -53,000 | 31,000 | 61,000 |
3.09 | Net Income (loss) from continued operations | 47,000 | 221,000 | 472,000 | 630,000 |
3.10 | Net Income (loss) from discontinued operations | 384,000 | 345,000 | -2,000 | -27,000 |
3.10.01 | Net Income (loss) from Discontinued Operations | 384,000 | 345,000 | -2,000 | -27,000 |
3.11 | Net Income (loss) for the period | 431,000 | 566,000 | 470,000 | 603,000 |
3.99.01.01 | ON | 1,52118 | 1,99765 | 1,65978 | 2,13022 |
3.99.01.02 | PN | 1,67330 | 2,19741 | 1,82575 | 2,34325 |
3.99.02.01 | ON | 1,52407 | 2,00054 | 1,65397 | 2,12442 |
3.99.02.02 | PN | 1,66740 | 2,18967 | 1,81552 | 2,33011 |
|
|
|
|
|
|
|
|
|
|
|
|
|
|
|
|
|
|
8
FREE TRANSLATION INTO ENGLISH FROM THE ORIGINAL PREVIOUSLY ISSUED IN PORTUGUESE) |
ITR – Interim Financial Information – June 30,2019 – COMPANHIA BRASILEIRA DE DISTRIBUIÇÃO |
Individual Interim Financial Information / Statement of Comprehensive Income | |||||
R$ (in thousands) | |||||
Code | Description | Current Quarter | Year to date current period | PreviousQuarter | Year to date previous period |
4.01 | Net income for the Period | 431,000 | 566,000 | 470,000 | 603,000 |
4.02 | Other Comprehensive Income | 11,000 | 4,000 | -12,000 | -22,000 |
4.02.02 | Foreign Currency Translation | 4,000 | 5,000 | -24,000 | -31,000 |
4.02.04 | Fair Value of Trade Receivables | 10,000 | -7,000 | 17,000 | 13,000 |
4.02.05 | Income Tax Related to Other Comprehensive Income | -3,000 | 6,000 | -5,000 | -4,000 |
4.03 | Total Comprehensive Income for the Period | 442,000 | 570,000 | 458,000 | 581,000 |
9
FREE TRANSLATION INTO ENGLISH FROM THE ORIGINAL PREVIOUSLY ISSUED IN PORTUGUESE) |
ITR – Interim Financial Information – June 30,2019 – COMPANHIA BRASILEIRA DE DISTRIBUIÇÃO |
Individual Interim Financial Information / Statement of Cash Flows - Indirect Method | ||||
1.000,00 | ||||
R$ (in thousands) | Year to date current period | Year to date previous period | ||
Code | Description | 01/01/2019 to 06/30/2019 | 01/01/2018 to 06/30/2018 | |
6.01 | Net Cash Operating Activities | -1,263,000 | -761,000 | |
6.01.01 | Cash Provided by the Operations | 640,000 | 957,000 | |
6.01.01.01 | Net Income for the Period | 566,000 | 603,000 | |
6.01.01.02 | Deferred Income Tax and Social Contribution | -4,000 | -30,000 | |
6.01.01.03 | Gain (Losses) on Disposal of Property and equipments | 66,000 | 13,000 | |
6.01.01.04 | Depreciation/Amortization | 534,000 | 505,000 | |
6.01.01.05 | Interest and Inflation Adjustments | 447,000 | 416,000 | |
6.01.01.07 | Share of Profit (Loss) of Subsidiaries and Associates | -334,000 | -608,000 | |
6.01.01.08 | Provision for Risks | -9,000 | 63,000 | |
6.01.01.10 | Share-based Payment | 25,000 | 28,000 | |
6.01.01.11 | Allowance for Doubtful Accounts | 11,000 | 0 | |
6.01.01.13 | Allowance for obsolescence and damages | -3,000 | 1,000 | |
6.01.01.14 | Other Operating Expenses | 39,000 | -13,000 | |
6.01.01.15 | Deferred Revenue | -11,000 | -6,000 | |
6.01.01.16 | Loss or gain on lease liabilities | -68,000 | -15,000 | |
6.01.01.18 | Gain in disposal of subsidiaries | -619,000 | 0 | |
6.01.02 | Changes in Assets and Liabilities | -1,903,000 | -1,718,000 | |
6.01.02.01 | Accounts Receivable | -8,000 | 307,000 | |
6.01.02.02 | Inventories | 240,000 | -141,000 | |
6.01.02.03 | Recoverable Taxes | -77,000 | -51,000 | |
6.01.02.04 | Other Assets | -123,000 | -80,000 | |
6.01.02.05 | Related Parties | -166,000 | -17,000 | |
6.01.02.06 | Restricted Deposits for Legal Proceeding | -42,000 | -13,000 | |
6.01.02.07 | Trade Payables | -1,875,000 | -1,606,000 | |
6.01.02.08 | Payroll and Related Taxes | -36,000 | -41,000 | |
6.01.02.09 | Taxes and Social Contributions Payable | 1,000 | -102,000 | |
6.01.02.10 | Payments of provision for risk | -39,000 | -46,000 | |
6.01.02.11 | Deferred Revenue | 10,000 | 11,000 | |
6.01.02.12 | Other Payables | 157,000 | 54,000 | |
6.01.02.13 | Income Tax and Social contribution,paid | -4,000 | 0 | |
6.01.02.15 | Received Dividends and Interest on own capital | 59,000 | 7,000 | |
6.02 | Net Cash of Investing Activities | 2,043,000 | -244,000 | |
6.02.02 | Acquisition of Property and Equipment (Note 14.2) | -421,000 | -243,000 | |
6.02.03 | Increase in Intangible Assets (Note 15.2) | -60,000 | -61,000 | |
6.02.04 | Sales of Property and Equipment | 13,000 | 60,000 | |
6.02.08 | Cash received from subsidiary sale | 2,511,000 | 0 | |
6.03 | Net Cash of Financing Activities | 315,000 | 339,000 | |
6.03.01 | Capital Increase | 11,000 | 1,000 | |
6.03.02 | Proceeds from Borrowings and Financing (Note 16.2) | 1,099,000 | 1,488,000 | |
6.03.03 | Payments of Borrowings and Financing (Note 16.2) | -147,000 | -583,000 | |
6.03.05 | Payment of Dividends | -192,000 | -166,000 | |
6.03.07 | Acquisition of companies | -19,000 | 0 | |
6.03.09 | Payment of lease liability | -437,000 | -401,000 | |
6.05 | Increase (Decrease) in Cash and Cash Equivalents | 1,095,000 | -666,000 | |
6.05.01 | Cash and Cash Equivalents at the Beginning of the Period | 2,935,000 | 2,868,000 | |
6.05.02 | Cash and Cash Equivalents at the End of the Period | 4,030,000 | 2,202,000 | |
|
|
|
| |
|
|
|
| |
10
FREE TRANSLATION INTO ENGLISH FROM THE ORIGINAL PREVIOUSLY ISSUED IN PORTUGUESE) |
ITR – Interim Financial Information – June 30,2019 – COMPANHIA BRASILEIRA DE DISTRIBUIÇÃO |
Individual Interim Financial Information / Statement of Changes in Shareholders' Equity 01/01/2019 to 06/30/2019 | |||||||
R$ (in thousands) |
|
|
|
|
|
| |
Code | Description | Share | Capital Reserves, | Earnings | Retained Earnings /Accumulated Losses | Other comprehensive income | Shareholders' |
5.01 | Opening balance | 6,825,000 | 413,000 | 3,911,000 | 0 | -66,000 | 11,083,000 |
5.02 | Net income for the year | 0 | 0 | 0 | -796,000 | 0 | -796,000 |
5.03 | Adjusted opening balance | 6,825,000 | 413,000 | 3,911,000 | -796,000 | -66,000 | 10,287,000 |
5.04 | Capital Transactions with Shareholders | 11,000 | 25,000 | -137,000 | -41,000 | 18,000 | -124,000 |
5.04.01 | Capital Increases | 11,000 | 0 | 0 | 0 | 0 | 11,000 |
5.04.03 | Share based expenses | 0 | 19,000 | 0 | 0 | 0 | 19,000 |
5.04.07 | Interest on own Capital | 0 | 0 | -137,000 | -37,000 | 0 | -174,000 |
5.04.08 | Share based expenses of Subsidiaries | 0 | 6,000 | 0 | 0 | 0 | 6,000 |
5.04.09 | Desconsolidation Via Varejo | 0 | 0 | 0 | -4,000 | 18,000 | 14,000 |
5.05 | Total Comprehensive Income | 0 | 0 | 0 | 566,000 | 4,000 | 570,000 |
5.05.01 | Net Income for the Period | 0 | 0 | 0 | 566,000 | 0 | 566,000 |
5.05.02 | Other Comprehensive Income | 0 | 0 | 0 | 0 | 4,000 | 4,000 |
5.05.02.04 | Foreign currency translation | 0 | 0 | 0 | 0 | 5,000 | 5,000 |
5.05.02.07 | Fair value of trade receivables | 0 | 0 | 0 | 0 | -7,000 | -7,000 |
5.05.02.08 | Income taxes related to other comprehensive income | 0 | 0 | 0 | 0 | 6,000 | 6,000 |
5.06 | Internal Changes of Shareholders’ Equity | 0 | 0 | -5,000 | 0 | 0 | -5,000 |
5.06.05 | Transactions with Non-controlling Interests | 0 | 0 | -5,000 | 0 | 0 | -5,000 |
5.07 | Closing Balance | 6,836,000 | 438,000 | 3,769,000 | -271,000 | -44,000 | 10,728,000 |
11
FREE TRANSLATION INTO ENGLISH FROM THE ORIGINAL PREVIOUSLY ISSUED IN PORTUGUESE) |
ITR – Interim Financial Information – June 30,2019 – COMPANHIA BRASILEIRA DE DISTRIBUIÇÃO |
Individual Interim Financial Information / Statement of Changes in Shareholders' Equity 01/01/2018 to 06/30/2018 | |||||||
R$ (in thousands) |
|
|
|
|
|
| |
Code | Description | Share | Capital Reserves, | Earnings | Retained Earnings /Accumulated Losses | Other comprehensive Income | Shareholders' |
5.01 | Opening balance | 6,822,000 | 355,000 | 3,174,000 | -114,000 | -49,000 | 10,188,000 |
5.02 | Net income for the year | 0 | 0 | 0 | -768,000 | 0 | -768,000 |
5.03 | Adjusted opening balance | 6,822,000 | 355,000 | 3,174,000 | -882,000 | -49,000 | 9,420,000 |
5.04 | Capital Transactions with Shareholders | 1,000 | 45,000 | -13,000 | -76,000 | 0 | -43,000 |
5.04.01 | Capital Increases | 1,000 | 0 | 0 | 0 | 0 | 1,000 |
5.04.03 | Share based expenses | 0 | 34,000 | 0 | 0 | 0 | 34,000 |
5.04.07 | Interest on own Capital | 0 | 0 | -13,000 | -76,000 | 0 | -89,000 |
5.04.08 | Share based expenses of Subsidiaries | 0 | 11,000 | 0 | 0 | 0 | 11,000 |
5.05 | Total Comprehensive Income | 0 | 0 | 0 | 603,000 | -22,000 | 581,000 |
5.05.01 | Net Income for the Period | 0 | 0 | 0 | 603,000 | 0 | 603,000 |
5.05.02 | Other Comprehensive Income | 0 | 0 | 0 | 0 | -22,000 | -22,000 |
5.05.02.04 | Foreign currency translation | 0 | 0 | 0 | 0 | -31,000 | -31,000 |
5.05.02.07 | Fair value of trade receivables | 0 | 0 | 0 | 0 | 13,000 | 13,000 |
5.05.02.08 | Income taxes related to other comprehensive income | 0 | 0 | 0 | 0 | -4,000 | -4,000 |
5.07 | Closing Balance | 6,823,000 | 400,000 | 3,161,000 | -355,000 | -71,000 | 9,958,000 |
12
FREE TRANSLATION INTO ENGLISH FROM THE ORIGINAL PREVIOUSLY ISSUED IN PORTUGUESE) |
ITR – Interim Financial Information – June 30,2019 – COMPANHIA BRASILEIRA DE DISTRIBUIÇÃO |
Individual Interim Financial Information / Statement of Value Added | |||
R$ (in thousands) | Year to date current period | Year to date previous period | |
Code | Description | 01/01/2019 to 06/30/2019 | 01/01/2018 to 03/31/2018 |
7.01 | Revenues | 14,264,000 | 13,743,000 |
7.01.01 | Sales of Goods, Products and Services | 13,690,000 | 13,728,000 |
7.01.02 | Other Revenues | 572,000 | 12,000 |
7.01.04 | Allowance for/Reversal of Doubtful Accounts | 2,000 | 3,000 |
7.02 | Products Acquired from Third Parties | -10,974,000 | -10,813,000 |
7.02.01 | Costs of Products, Goods and Services Sold | -9,463,000 | -9,273,000 |
7.02.02 | Materials, Energy, Outsourced Services and Other | -1,511,000 | -1,540,000 |
7.03 | Gross Value Added | 3,290,000 | 2,930,000 |
7.04 | Retention | -534,000 | -505,000 |
7.04.01 | Depreciation and Amortization | -534,000 | -505,000 |
7.05 | Net Value Added Produced | 2,756,000 | 2,425,000 |
7.06 | Value Added Received in Transfer | 745,000 | 623,000 |
7.06.01 | Share of Profit of Subsidiaries and Associates | 334,000 | 608,000 |
7.06.02 | Financial Revenue | 66,000 | 42,000 |
7.06.03 | Other | 345,000 | -27,000 |
7.07 | Total Value Added to Distribute | 3,501,000 | 3,048,000 |
7.08 | Distribution of Value Added | 3,501,000 | 3,048,000 |
7.08.01 | Personnel | 1,501,000 | 1,549,000 |
7.08.01.01 | Direct Compensation | 966,000 | 960,000 |
7.08.01.02 | Benefits | 290,000 | 297,000 |
7.08.01.03 | Government Severance Indemnity Fund for Employees (FGTS) | 97,000 | 93,000 |
7.08.01.04 | Other | 148,000 | 199,000 |
7.08.02 | Taxes, Fees and Contributions | 875,000 | 364,000 |
7.08.02.01 | Federal | 522,000 | 177,000 |
7.08.02.02 | State | 205,000 | 94,000 |
7.08.02.03 | Municipal | 148,000 | 93,000 |
7.08.03 | Value Distributed to Providers of Capital | 559,000 | 532,000 |
7.08.03.01 | Interest | 554,000 | 526,000 |
7.08.03.02 | Rentals | 5,000 | 6,000 |
7.08.04 | Value Distributed to Shareholders | 566,000 | 603,000 |
7.08.04.01 | Interest on shareholders' equity | 174,000 | 76,000 |
7.08.04.03 | Retained Earnings/ Accumulated Losses for the Period | 392,000 | 527,000 |
|
|
|
|
13
FREE TRANSLATION INTO ENGLISH FROM THE ORIGINAL PREVIOUSLY ISSUED IN PORTUGUESE) |
ITR – Interim Financial Information – June 30,2019 – COMPANHIA BRASILEIRA DE DISTRIBUIÇÃO |
Consolidated Interim Financial Information /Balance Sheet - Assets | |||
R$ (in thousands) | |||
Code | Description | Current Quarter | Previous Year |
1 | Total Assets | 32,866,000 | 60,374,000 |
1.01 | Current Assets | 12,002,000 | 40,140,000 |
1.01.01 | Cash and Cash Equivalents | 4,705,000 | 4,369,000 |
1.01.03 | Accounts Receivable | 665,000 | 686,000 |
1.01.03.01 | Trade Receivables | 317,000 | 384,000 |
1.01.03.02 | Other Receivables | 348,000 | 302,000 |
1.01.04 | Inventories | 5,692,000 | 5,909,000 |
1.01.06 | Recoverable Taxes | 615,000 | 679,000 |
1.01.08 | Other Current Assets | 325,000 | 28,497,000 |
1.01.08.01 | Assets Held for Sale | 24,000 | 28,305,000 |
1.01.08.03 | Other | 301,000 | 192,000 |
1.01.08.03.01 | Financial Instruments - Fair Value Hegde | 48,000 | 43,000 |
1.01.08.03.02 | Others assets | 253,000 | 149,000 |
1.02 | Noncurrent Assets | 20,864,000 | 20,234,000 |
1.02.01 | Long-term Assets | 4,330,000 | 4,083,000 |
1.02.01.04 | Accounts Receivable | 204,000 | 132,000 |
1.02.01.04.01 | Trade receivables, net | 71,000 | 4,000 |
1.02.01.04.02 | Other accounts receivable | 133,000 | 128,000 |
1.02.01.07 | Deferred Taxes | 294,000 | 335,000 |
1.02.01.08 | Prepaid Expenses | 18,000 | 17,000 |
1.02.01.09 | Receivables from related parties | 37,000 | 34,000 |
1.02.01.10 | Other Noncurrent Assets | 3,777,000 | 3,565,000 |
1.02.01.10.04 | Recoverable Taxes | 2,919,000 | 2,745,000 |
1.02.01.10.05 | Restricted deposits for legal proceedings | 811,000 | 776,000 |
1.02.01.10.06 | Financial Instruments - Fair Value Hegde | 47,000 | 44,000 |
1.02.02 | Investments | 232,000 | 223,000 |
1.02.02.01 | Investments in Associates | 232,000 | 203,000 |
1.02.02.02 | Investment properties | 0 | 20,000 |
1.02.03 | Property and Equipment, Net | 13,425,000 | 13,123,000 |
1.02.03.01 | Property and Equipment in Use | 9,961,000 | 9,621,000 |
1.02.03.02 | Leased Properties | 3,464,000 | 3,502,000 |
1.02.04 | Intangible Assets, net | 2,877,000 | 2,805,000 |
1.02.04.01 | Intangible Assets | 2,877,000 | 2,805,000 |
1.02.04.01.02 | Intangible Assets | 2,022,000 | 1,918,000 |
1.02.04.01.03 | Intangible Right-of-use | 855,000 | 887,000 |
14
FREE TRANSLATION INTO ENGLISH FROM THE ORIGINAL PREVIOUSLY ISSUED IN PORTUGUESE) |
ITR – Interim Financial Information – June 30,2019 – COMPANHIA BRASILEIRA DE DISTRIBUIÇÃO |
Consolidated Interim Financial Information / Balance Sheet - Liabilities | |||
R$ (in thousands) | |||
Code | Description | Current Quarter | Previous Year |
2 | Total Liabilities | 32,866,000 | 60,374,000 |
2.01 | Current Liabilities | 12,553,000 | 36,971,000 |
2.01.01 | Payroll and Related Taxes | 652,000 | 686,000 |
2.01.02 | Trade payables, net | 6,827,000 | 9,246,000 |
2.01.03 | Taxes and Contributions Payable | 470,000 | 370,000 |
2.01.04 | Borrowings and Financing | 3,073,000 | 1,981,000 |
2.01.05 | Other Liabilities | 1,531,000 | 1,499,000 |
2.01.05.01 | Payables to Related Parties | 142,000 | 145,000 |
2.01.05.02 | Other | 1,389,000 | 1,354,000 |
2.01.05.02.01 | Dividends and interest on own capital | 32,000 | 57,000 |
2.01.05.02.08 | Financing Related to Acquisition of Assets | 64,000 | 149,000 |
2.01.05.02.09 | Deferred Revenue | 171,000 | 250,000 |
2.01.05.02.12 | Other Accounts Payable | 518,000 | 323,000 |
2.01.05.02.17 | Lease liability | 604,000 | 575,000 |
2.01.07 | Liabilities related to assets held for sale | 0 | 23,189,000 |
2.02 | Noncurrent Liabilities | 9,585,000 | 10,207,000 |
2.02.01 | Borrowings and Financing | 3,125,000 | 3,392,000 |
2.02.02 | Other Liabilities | 4,967,000 | 4,986,000 |
2.02.02.02 | Others | 4,967,000 | 4,986,000 |
2.02.02.02.03 | Taxes payable in installments | 423,000 | 471,000 |
2.02.02.02.07 | Other Accounts Payable | 80,000 | 49,000 |
2.02.02.02.08 | Provision for Losses on Investments in Associates | 339,000 | 279,000 |
2.02.02.02.09 | Lease Liability | 4,125,000 | 4,187,000 |
2.02.03 | Deferred taxes | 227,000 | 581,000 |
2.02.04 | Provisions | 1,235,000 | 1,235,000 |
2.02.06 | Deferred Revenue | 31,000 | 13,000 |
2.03 | Shareholders’ Equity | 10,728,000 | 13,196,000 |
2.03.01 | Share Capital | 6,836,000 | 6,825,000 |
2.03.02 | Capital Reserves | 438,000 | 413,000 |
2.03.02.04 | Stock Option | 431,000 | 406,000 |
2.03.02.07 | Capital Reserve | 7,000 | 7,000 |
2.03.04 | Earnings Reserve | 3,769,000 | 3,115,000 |
2.03.04.01 | Legal Reserve | 517,000 | 517,000 |
2.03.04.05 | Earnings Retention Reserve | 230,000 | 230,000 |
2.03.04.07 | Tax Incentive Reserve | 58,000 | 58,000 |
2.03.04.10 | Expansion Reserve | 3,216,000 | 2,557,000 |
2.03.04.12 | Transactions with non-controlling interests | -102,000 | -97,000 |
2.03.04.14 | Settlement of Equity Instrument | -150,000 | -150,000 |
2.03.05 | Retained Earnings/ Accumulated Losses | -271,000 | 0 |
2.03.08 | Other comprehensive income | -44,000 | -66,000 |
2.03.09 | Non-Controlling interests | 0 | 2,909,000 |
15
FREE TRANSLATION INTO ENGLISH FROM THE ORIGINAL PREVIOUSLY ISSUED IN PORTUGUESE) |
ITR – Interim Financial Information – June 30,2019 – COMPANHIA BRASILEIRA DE DISTRIBUIÇÃO |
Consolidated Interim Financial Information / Statement of Operations
|
| |||||
R$ (in thousands) | ||||||
Code | Description | Current Quarter | Year to date current period | Previous Quarter | Year to date previous period | |
3.01 | Net operating revenue | 13,081,000 | 25,790,000 | 11,775,000 | 23,118,000 | |
3.02 | Cost of sales | -10,263,000 | -20,174,000 | -8,669,000 | -17,454,000 | |
3.03 | Gross Profit | 2,818,000 | 5,616,000 | 3,106,000 | 5,664,000 | |
3.04 | Operating Income/Expenses | -2,407,000 | -4,759,000 | -2,262,000 | -4,453,000 | |
3.04.01 | Selling Expenses | -1,735,000 | -3,422,000 | -1,618,000 | -3,190,000 | |
3.04.02 | General and administrative expenses | -255,000 | -524,000 | -248,000 | -488,000 | |
3.04.05 | Other Operating Expenses | -407,000 | -786,000 | -388,000 | -731,000 | |
3.04.05.01 | Depreciation and Amortization | -335,000 | -663,000 | -301,000 | -602,000 | |
3.04.05.03 | Other operating expenses, net | -72,000 | -123,000 | -87,000 | -129,000 | |
3.04.06 | Share of Profit of associates | -10,000 | -27,000 | -8,000 | -44,000 | |
3.05 | Profit from operations before net financial expenses | 411,000 | 857,000 | 844,000 | 1,211,000 | |
3.06 | Net Financial expenses | -279,000 | -562,000 | -278,000 | -540,000 | |
3.07 | Income (loss) before income tax and social contribution | 132,000 | 295,000 | 566,000 | 671,000 | |
3.08 | Income tax and social contribution | -61,000 | -78,000 | -161,000 | -191,000 | |
3.08.01 | Current | 33,000 | -75,000 | -80,000 | -112,000 | |
3.08.02 | Deferred | -94,000 | -3,000 | -81,000 | -79,000 | |
3.09 | Net Income (loss) from continued operations | 71,000 | 217,000 | 405,000 | 480,000 | |
3.10 | Net Income (loss) from discontinued operations | 328,000 | 381,000 | 157,000 | 330,000 | |
3.10.01 | Net Income (loss) from Discontinued Operations | 328,000 | 381,000 | 157,000 | 330,000 | |
3.11 | Net Income (loss) for the period | 399,000 | 598,000 | 562,000 | 810,000 | |
3.11.01 | Attributable to Controlling Shareholders | 431,000 | 566,000 | 470,000 | 603,000 | |
3.11.02 | Attributable to Non-controlling Shareholders | -32,000 | 32,000 | 92,000 | 207,000 | |
3.99.01 | Basic Earnings per Share | |||||
3.99.01.01 | ON | 1,52118 | 1,99765 | 1,00396 | 2,13022 | |
3.99.01.02 | PN | 1,68527 | 2,19741 | 1,10436 | 2,34325 | |
3.99.02 | Diluted Earnings per Share | |||||
3.99.02.01 | ON | 1,52118 | 2,00054 | 1,00188 | 2,12442 | |
3.99.02.02 | PN | 1,67330 | 2,18967 | 1,09676 | 2,33011 | |
|
|
|
|
|
| |
16
FREE TRANSLATION INTO ENGLISH FROM THE ORIGINAL PREVIOUSLY ISSUED IN PORTUGUESE) |
ITR – Interim Financial Information – June 30,2019 – COMPANHIA BRASILEIRA DE DISTRIBUIÇÃO |
Consolidated Interim Financial Information / Statement of Comprehensive Income |
| ||||
|
|
|
|
| |
R$ (in thousands) | |||||
Code | Description | Current Quarter | Year to date current period | Previous Quarter | Year to date previous period |
4.01 | Net income for the Period | 399,000 | 598,000 | 562,000 | 810,000 |
4.02 | Other Comprehensive Income | 11,000 | 4,000 | -4,000 | -17,000 |
4.02.02 | Foreign Currency Translation | 4,000 | 5,000 | -24,000 | -31,000 |
4.02.04 | Fair Value of Trade Receivables | 10,000 | -17,000 | 29,000 | 20,000 |
4.02.05 | Income Tax Related to Other Comprehensive Income | -3,000 | 16,000 | -9,000 | -6,000 |
4.03 | Total Comprehensive Income for the Period | 410,000 | 602,000 | 558,000 | 793,000 |
4.03.01 | Attributable to Controlling Shareholders | 442,000 | 570,000 | 458,000 | 581,000 |
4.03.02 | Attributable to Non-Controlling Shareholders | -32,000 | 32,000 | 100,000 | 212,000 |
|
|
| |||
17
FREE TRANSLATION INTO ENGLISH FROM THE ORIGINAL PREVIOUSLY ISSUED IN PORTUGUESE) |
ITR – Interim Financial Information – June 30,2019 – COMPANHIA BRASILEIRA DE DISTRIBUIÇÃO |
Consolidated Interim Financial Information / Statement of Cash Flows - Indirect Method | |||
R$ (in thousands) | 1000 | ||
Year to date current period | Year to date previous period | ||
Code | Description | 01/01/2019 to 06/30/2019 | 01/01/2018 to 06/30/2018 |
6.01 | Net Cash Operating Activities | -3,975,000 | -2,024,000 |
6.01.01 | Cash Provided by the Operations | 1,871,000 | 3,372,000 |
6.01.01.01 | Net Income for the Period | 598,000 | 810,000 |
6.01.01.02 | Deferred Income Tax and Social Contribution | 66,000 | 282,000 |
6.01.01.03 | Gain (Losses) on Disposal of Property and equipments | 110,000 | 115,000 |
6.01.01.04 | Depreciation/Amortization | 732,000 | 666,000 |
6.01.01.05 | Interest and Inflation Adjustments | 837,000 | 851,000 |
6.01.01.07 | Share of Profit (Loss) of Subsidiaries and Associates | 11,000 | 32,000 |
6.01.01.08 | Provision for Risks | 147,000 | 143,000 |
6.01.01.10 | Share-based Payment | 29,000 | 28,000 |
6.01.01.11 | Allowance for Doubtful Accounts | 259,000 | 322,000 |
6.01.01.13 | Allowance for obsolescence and damages | -11,000 | -15,000 |
6.01.01.14 | Other Operating Expenses | 18,000 | 369,000 |
6.01.01.15 | Deferred Revenue | -215,000 | -215,000 |
6.01.01.16 | Loss or gain on lease liabilities | -91,000 | -16,000 |
6.01.01.18 | Gain in disposal of subsidiaries | -619,000 | 0 |
6.01.02 | Changes in Assets and Liabilities | -5,846,000 | -5,396,000 |
6.01.02.01 | Accounts Receivable | -63,000 | 324,000 |
6.01.02.02 | Inventories | -24,000 | -1,321,000 |
6.01.02.03 | Recoverable Taxes | -21,000 | -1,317,000 |
6.01.02.04 | Other Assets | -301,000 | -54,000 |
6.01.02.05 | Related Parties | -97,000 | 56,000 |
6.01.02.06 | Restricted Deposits for Legal Proceeding | -20,000 | -12,000 |
6.01.02.07 | Trade Payables | -4,775,000 | -2,359,000 |
6.01.02.08 | Payroll and Related Taxes | -169,000 | -128,000 |
6.01.02.09 | Taxes and Social Contributions Payable | 101,000 | 6,000 |
6.01.02.10 | Payments of provision for risk | -364,000 | -440,000 |
6.01.02.11 | Deferred Revenue | 12,000 | 117,000 |
6.01.02.12 | Other Payables | -44,000 | -19,000 |
6.01.02.13 | Income Tax and Social contribution,paid | -93,000 | -249,000 |
6.01.02.15 | Received Dividends and Interest on own capital | 12,000 | 0 |
6.02 | Net Cash of Investing Activities | 1,144,000 | -842,000 |
6.02.02 | Acquisition of Property and Equipment (Note 14.2) | -1,000,000 | -711,000 |
6.02.03 | Increase in Intangible Assets (Note 15.2) | -197,000 | -212,000 |
6.02.04 | Sales of Property and Equipment | 15,000 | 81,000 |
6.02.08 | Cash received from subsidiary sale | 2,326,000 | 0 |
6.03 | Net Cash of Financing Activities | -544,000 | -486,000 |
6.03.01 | Capital Increase | 11,000 | 1,000 |
6.03.02 | Proceeds from Borrowings and Financing (Note 16.2) | 3,246,000 | 4,362,000 |
6.03.03 | Payments of Borrowings and Financing (Note 16.2) | -2,672,000 | -3,755,000 |
6.03.05 | Payment of Dividends | -192,000 | -176,000 |
6.03.07 | Acquisition of companies | -19,000 | 0 |
6.03.09 | Payment of lease liability | -918,000 | -918,000 |
6.05 | Increase (Decrease) in Cash and Cash Equivalents | -3,375,000 | -3,352,000 |
6.05.01 | Cash and Cash Equivalents at the Beginning of the Period | 8,080,000 | 7,351,000 |
6.05.02 | Cash and Cash Equivalents at the End of the Period | 4,705,000 | 3,999,000 |
|
|
|
|
18
FREE TRANSLATION INTO ENGLISH FROM THE ORIGINAL PREVIOUSLY ISSUED IN PORTUGUESE) |
ITR – Interim Financial Information – June 30,2019 – COMPANHIA BRASILEIRA DE DISTRIBUIÇÃO |
Consolidated Interim Financial Information / Statement of Changes in Shareholders' Equity 01/01/2019 to 06/30/2019 | ||||||||||
R$ (in thousands) |
| |||||||||
Code | Description | Share | Capital Reserves, | Earnings | Retained Earnings/ Accumulated Losses | Other comprehen-sive Income | Shareholders' | Non-Controlling | Consolidated | |
5.01 | Opening balance | 6,825,000 | 413,000 | 3,911,000 | 0 | -66,000 | 11,083,000 | 2,856,000 | 13,939,000 | |
5.02 | Net income for the year | 0 | 0 | 0 | -796,000 | 0 | -796,000 | 53,000 | -743,000 | |
5.03 | Adjusted opening balance | 6,825,000 | 413,000 | 3,911,000 | -796,000 | -66,000 | 10,287,000 | 2,909,000 | 13,196,000 | |
5.04 | Capital Transactions with Shareholders | 11,000 | 25,000 | -137,000 | -41,000 | 18,000 | -124,000 | -3,269,000 | -3,393,000 | |
5.04.01 | Capital Increases | 11,000 | 0 | 0 | 0 | 0 | 11,000 | 0 | 11,000 | |
5.04.03 | Share based expenses | 0 | 19,000 | 0 | 0 | 0 | 19,000 | 0 | 19,000 | |
5.04.07 | Interest on own Capital | 0 | 0 | -137,000 | -37,000 | 0 | -174,000 | 0 | -174,000 | |
5.04.08 | Share based expenses of Subsidiaries | 0 | 6,000 | 0 | 0 | 0 | 6,000 | 4,000 | 10,000 | |
5.04.09 | Desconsolidation Via Varejo | 0 | 0 | 0 | -4,000 | 18,000 | 14,000 | -3,273,000 | -3,259,000 | |
5.05 | Total Comprehensive Income | 0 | 0 | 0 | 566,000 | 4,000 | 570,000 | 32,000 | 602,000 | |
5.05.01 | Net Income for the Period | 0 | 0 | 0 | 566,000 | 0 | 566,000 | 32,000 | 598,000 | |
5.05.02 | Other Comprehensive Income | 0 | 0 | 0 | 0 | 4,000 | 4,000 | 0 | 4,000 | |
5.05.02.04 | Foreign currency translation | 0 | 0 | 0 | 0 | 5,000 | 5,000 | 0 | 5,000 | |
5.05.02.07 | Fair value of trade receivables | 0 | 0 | 0 | 0 | -7,000 | -7,000 | -10,000 | -17,000 | |
5.05.02.08 | Income taxes related to other comprehensive income | 0 | 0 | 0 | 0 | 6,000 | 6,000 | 10,000 | 16,000 | |
5.06 | Internal Changes of Shareholders’ Equity | 0 | 0 | -5,000 | 0 | 0 | -5,000 | 328,000 | 323,000 | |
5.06.05 | Transactions with Non-controlling Interests | 0 | 0 | -5,000 | 0 | 0 | -5,000 | 328,000 | 323,000 | |
5.07 | Closing Balance | 6,836,000 | 438,000 | 3,769,000 | -271,000 | -44,000 | 10,728,000 | 0 | 10,728,000 | |
19
FREE TRANSLATION INTO ENGLISH FROM THE ORIGINAL PREVIOUSLY ISSUED IN PORTUGUESE) |
ITR – Interim Financial Information – June 30,2019 – COMPANHIA BRASILEIRA DE DISTRIBUIÇÃO |
Consolidated Interim Financial Information / Statement of Changes in Shareholders' Equity 01/01/2018 to 06/30/2018 | ||||||||||
R$ (in thousands) | ||||||||||
Code | Description | Share | Capital Reserves, | Earnings | Retained Earnings/ Accumulated Losses | Other comprehen-sive Income | Shareholders' | Non-Controlling | Consolidated | |
5.01 | Opening balance | 6,822,000 | 355,000 | 3,174,000 | -114,000 | -49,000 | 10,188,000 | 2,853,000 | 13,041,000 | |
5.02 | Net income for the year | 0 | 0 | 0 | -768,000 | 0 | -768,000 | -82,000 | -850,000 | |
5.03 | Adjusted opening balance | 6,822,000 | 355,000 | 3,174,000 | -882,000 | -49,000 | 9,420,000 | 2,771,000 | 12,191,000 | |
5.04 | Capital Transactions with Shareholders | 1,000 | 45,000 | -13,000 | -76,000 | 0 | -43,000 | 8,000 | -35,000 | |
5.04.01 | Capital Increases | 1,000 | 0 | 0 | 0 | 0 | 1,000 | 0 | 1,000 | |
5.04.03 | Share based expenses | 0 | 34,000 | 0 | 0 | 0 | 34,000 | 0 | 34,000 | |
5.04.07 | Interest on own Capital | 0 | 0 | -13,000 | -76,000 | 0 | -89,000 | 0 | -89,000 | |
5.04.08 | Share based expenses of Subsidiaries | 0 | 11,000 | 0 | 0 | 0 | 11,000 | 8,000 | 19,000 | |
5.05 | Total Comprehensive Income | 0 | 0 | 0 | 603,000 | -22,000 | 581,000 | 212,000 | 793,000 | |
5.05.01 | Net Income for the Period | 0 | 0 | 0 | 603,000 | 0 | 603,000 | 207,000 | 810,000 | |
5.05.02 | Other Comprehensive Income | 0 | 0 | 0 | 0 | -22,000 | -22,000 | 5,000 | -17,000 | |
5.05.02.04 | Foreign currency translation | 0 | 0 | 0 | 0 | -31,000 | -31,000 | 0 | -31,000 | |
5.05.02.07 | Fair value of trade receivables | 0 | 0 | 0 | 0 | 13,000 | 13,000 | 7,000 | 20,000 | |
5.05.02.08 | Income taxes related to other comprehensive income | 0 | 0 | 0 | 0 | -4,000 | -4,000 | -2,000 | -6,000 | |
5.07 | Closing Balance | 6,823,000 | 400,000 | 3,161,000 | -355,000 | -71,000 | 9,958,000 | 2,991,000 | 12,949,000 | |
20
FREE TRANSLATION INTO ENGLISH FROM THE ORIGINAL PREVIOUSLY ISSUED IN PORTUGUESE) |
ITR – Interim Financial Information – June 30,2019 – COMPANHIA BRASILEIRA DE DISTRIBUIÇÃO |
Consolidated Interim Financial Information / Statement of Value Added | |||
R$ (in thousands) | 1000 | ||
Year to date current period | Year to date previous period | ||
Code | Description | 1/01/2019 to | 01/01/2018 to 03/31/2018 |
7.01 | Revenues | 28,626,000 | 25,091,000 |
7.01.01 | Sales of Goods, Products and Services | 28,046,000 | 25,071,000 |
7.01.02 | Other Revenues | 578,000 | 17,000 |
7.01.04 | Allowance for/Reversal of Doubtful Accounts | 2,000 | 3,000 |
7.02 | Products Acquired from Third Parties | -23,129,000 | -20,336,000 |
7.02.01 | Costs of Products, Goods and Services Sold | -20,386,000 | -18,289,000 |
7.02.02 | Materials, Energy, Outsourced Services and Other | -2,743,000 | -2,047,000 |
7.03 | Gross Value Added | 5,497,000 | 4,755,000 |
7.04 | Retention | -732,000 | -666,000 |
7.04.01 | Depreciation and Amortization | -732,000 | -666,000 |
7.05 | Net Value Added Produced | 4,765,000 | 4,089,000 |
7.06 | Value Added Received in Transfer | 458,000 | 347,000 |
7.06.01 | Share of Profit of Subsidiaries and Associates | -27,000 | -44,000 |
7.06.02 | Financial Revenue | 104,000 | 61,000 |
7.06.03 | Other | 381,000 | 330,000 |
7.07 | Total Value Added to Distribute | 5,223,000 | 4,436,000 |
7.08 | Distribution of Value Added | 5,223,000 | 4,436,000 |
7.08.01 | Personnel | 2,199,000 | 2,112,000 |
7.08.01.01 | Direct Compensation | 1,437,000 | 1,333,000 |
7.08.01.02 | Benefits | 464,000 | 441,000 |
7.08.01.03 | Government Severance Indemnity Fund for Employees (FGTS) | 139,000 | 126,000 |
7.08.01.04 | Other | 159,000 | 212,000 |
7.08.01.04.01 | Profit (cost) sharing | 159,000 | 212,000 |
7.08.02 | Taxes, Fees and Contributions | 1,730,000 | 872,000 |
7.08.02.01 | Federal | 873,000 | 493,000 |
7.08.02.02 | State | 685,000 | 264,000 |
7.08.02.03 | Municipal | 172,000 | 115,000 |
7.08.03 | Value Distributed to Providers of Capital | 696,000 | 642,000 |
7.08.03.01 | Interest | 683,000 | 630,000 |
7.08.03.02 | Rentals | 13,000 | 12,000 |
7.08.04 | Value Distributed to Shareholders | 598,000 | 810,000 |
7.08.04.01 | Interest on shareholders' equity | 174,000 | 76,000 |
7.08.04.03 | Retained Earnings/ Accumulated Losses for the Period | 392,000 | 527,000 |
7.08.04.04 | Noncontrolling Interest in Retained Earnings | 32,000 | 207,000 |
|
|
|
|
21

São Paulo, July 24, 2019 - GPA [B3: PCAR4; NYSE: CBD] announces its results for the second quarter of 2019. Comparisons are with the same period in 2018, except where stated otherwise. All comments related to adjusted EBITDA and gross margin exclude the non-recurring effects from the periods. In addition, starting from 2019, results include the effects of IFRS 16/CPC 06 (R2) – Leases, which eliminates the distinction between operating and financial leases and requires the recognition of a financial asset and liability related to future leases discounted at present value for virtually all lease agreements of our stores.Comments below refer to numbers before the application of IFRS 16, except stated otherwise.
2Q19 RESULTS
GPA Food
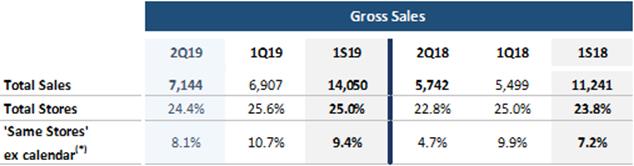
▪ Total sales reached R$14.2 billion, up 11.3%, continuing the excellent trend of recent quarters, despite the challenging consumption scenario and the decrease in inflation during 2Q19
▪ Adjusted EBITDA totaled R$888 million, with margin of 6.8%, with continued consistent results at Assaí and higher investments in competitiveness at Multivarejo;
▪ Net income attributable to controlling shareholders(*) totaled R$490 million, with margin of 3.7%;
▪ Maintenance of strong cash position and solid capital structure, with reduction in leverage mainly due to the conclusion of the sale of Via Varejo’s interest on the stock exchange, which totaled R$2.3 billion;
▪ Continued progress in digital transformation: (i) leadership in food e-commerce with 37% growth; (ii) expansion of James Delivery to Santos and Fortaleza, in addition Curitiba and São Paulo, with sales 4.7 times higher from previous quarter; (iii) 58% increase in downloads of the “Meu Desconto” app, to over 9.3 million, confirming its success and attractiveness; and (iv) Forty-fold increase in Cheftime kit sales since the start of the partnership, surpassing 41,000 kits.
Food Business | Consolidated | |||||||
(R$ million) | 2Q19 | 2Q18 | Δ | 2Q19 | 2Q18 | Δ | ||
Gross Revenue | 14,218 | 12,772 | 11.3% | 14,219 | 12,772 | 11.3% | ||
Gross Margin | 21.6% | 23.0% | -140 bps | 21.6% | 23.0% | -140 bps | ||
Selling, General and Adm. Expenses | (1,985) | (1,866) | 6.3% | (1,991) | (1,866) | 6.7% | ||
% of Net Revenue | 15.2% | 15.9% | -70 bps | 15.2% | 15.9% | -70 bps | ||
Adjusted EBITDA(1)(2) | 888 | 880 | 0.9% | 855 | 851 | 0.4% | ||
Adjusted EBITDA Margin | 6.8% | 7.5% | -70 bps | 6.5% | 7.3% | -80 bps | ||
Net Financial Revenue (Expenses) | (280) | (277) | 0.9% | (280) | (277) | 0.9% | ||
% of Net Revenue | 2.1% | 2.4% | -30 bps | 2.1% | 2.4% | -30 bps | ||
Net Income Controlling Shareholders - Consolidated(*) | 490 | 155 | 217.4% | 432 | 193 | 124.1% | ||
Net margin - Controlling Shareholders Consolidated(*) | 3.7% | 1.3% | 240 bps | 3.3% | 1.6% | 170 bps | ||
(1) Earnings before interest, tax, depreciation and amortization. (2) Adjusted for Other Operating Income and Expenses .
(* ) Excludes nonrecurring effects in 2Q18, corresponding to R$45 million at Multivarejo related to the sale to third parties of a portion of the tax credits related to the exclusion of ICMS from the PIS/COFINS calculation base and R$369 million at Assaí related to the reversal of the provision for ICMS ST credits for periods prior to 2018. Net Income is net of income tax.
“In the quarter, Assaí once again confirmed the sustainability of the format. The performance was mainly marked by the successful organic expansion, resulting in accelerated sales growth and increased profitability. Multivarejo’s performance reflected the challenges in the consumption and economic environments, which were marked by more cautious consumer behavior. Consequently, higher promotional investments were required, which pressured business margins. However, we believe that this is something non-recurrent in the current economic scenario. The result of store renovations and conversions contributed to the consistent improvement in sales, which posted double-digit growth in line with the portfolio adjustment goals. We also made significant progress in private-label brands and in digital transformation projects, notably the expansion of the James Delivery service and Cheftime, which underlined the successful investments we made recently. ”
Peter Estermann - Chief Executive Officer of GPA
22
IFRS 16
As of January 1, 2019, GPA’s results include the effects of IFRS 16/CPC 06 (R2) – Leases, which eliminates the distinction between operating and financial leases and requires the recognition of a financial asset and liability related to future leases, discounted at present value for virtually all lease agreements of our stores.
The Company opted for full retrospective adoption as if the pronouncement had been adopted since the start of the contracts, in order to show the comparative effects for each past period. As such, operational lease expenses are replaced by depreciation expenses related to the right of use and interest expenses related to the lease liability.
The table below shows the adjustments to reconcile the effects of IFRS 16 for GPA Consolidated and GPA Food:
Consolidated | 2Q19 | 2Q18 | Δ | ||||||||
|
|
|
|
|
|
|
|
| |||
(R$ million) | Pre- | Change | Post- | Pre- | Change | Post- | Pre- | Post- | |||
Gross Revenue | 14,219 | (0) | 14,219 | 12,772 | - | 12,772 | 11.3% | 11.3% | |||
Net Revenue(*) | 13,081 | - | 13,081 | 11,730 | - | 11,730 | 11.5% | 11.5% | |||
Gross Profit(*) | 2,811 | 8 | 2,820 | 2,684 | 9 | 2,693 | 4.8% | 4.7% | |||
Gross Margin(*) | 21.5% | 10 bps | 21.6% | 22.9% | 10 bps | 23.0% | -140 bps | -140 bps | |||
Selling, General and Adm. Expenses | (2,177) | 186 | (1,991) | (2,037) | 171 | (1,866) | 6.9% | 6.7% | |||
% of Net Revenue | 16.6% | -140 bps | 15.2% | 17.4% | -150 bps | 15.9% | -80 bps | -70 bps | |||
Adjusted EBITDA(1)(2)(*) | 639 | 216 | 855 | 648 | 203 | 851 | -1.4% | 0.4% | |||
Adjusted EBITDA Margin(1)(2)(*) | 4.9% | 160 bps | 6.5% | 5.5% | 180 bps | 7.3% | -60 bps | -80 bps | |||
Net Financial Revenue (Expenses) | (144) | (136) | (280) | (148) | (130) | (277) | -2.5% | 0.9% | |||
% of Net Revenue | 1.1% | 100 bps | 2.1% | 1.3% | 110 bps | 2.4% | -20 bps | -30 bps | |||
Net IncomeControlling Shareholders - Consolidated(*) | 432 | 0 | 432 | 201 | (8) | 193 | 115.1% | 124.1% | |||
Net margin - Controlling Shareholders Consolidated(*) | 3.3% | 0 bps | 3.3% | 1.7% | -10 bps | 1.6% | 160 bps | 170 bps | |||
Food Business | 2Q19 | 2Q18 | Δ | ||||||||
|
|
|
|
|
|
|
|
| |||
(R$ million) | Pre- | Change | Post- | Pre- | Change | Post- | Pre- | Post- | |||
Gross Revenue | 14,218 | - | 14,218 | 12,772 | - | 12,772 | 11.3% | 11.3% | |||
Net Revenue(*) | 13,081 | - | 13,081 | 11,730 | - | 11,730 | 11.5% | 11.5% | |||
Gross Profit(*) | 2,811 | 8 | 2,820 | 2,684 | 9 | 2,693 | 4.8% | 4.7% | |||
Gross Margin(*) | 21.5% | 10 bps | 21.6% | 22.9% | 10 bps | 23.0% | -140 bps | -140 bps | |||
Selling, General and Adm. Expenses | (2,170) | 186 | (1,985) | (2,037) | 171 | (1,866) | 6.5% | 6.3% | |||
% of Net Revenue | 16.6% | -140 bps | 15.2% | 17.4% | -150 bps | 15.9% | -80 bps | -70 bps | |||
Adjusted EBITDA(1)(2)(*) | 671 | 217 | 888 | 679 | 201 | 880 | -1.2% | 0.9% | |||
Adjusted EBITDA Margin(1)(2)(*) | 5.1% | 170 bps | 6.8% | 5.8% | 170 bps | 7.5% | -70 bps | -70 bps | |||
Net Financial Revenue (Expenses) | (144) | (136) | (280) | (148) | (130) | (277) | -2.5% | 0.9% | |||
% of Net Revenue | 1.1% | 100 bps | 2.1% | 1.3% | 110 bps | 2.4% | -20 bps | -30 bps | |||
Net Income Controlling Shareholders - Consolidated(*) | 508 | (17) | 490 | 199 | (44) | 155 | 155.2% | 217.4% | |||
Net margin - Controlling Shareholders Consolidated(*) | 3.9% | -20 bps | 3.7% | 1.7% | -40 bps | 1.3% | 220 bps | 240 bps | |||
(1) Earnings before interest, tax, depreciation and amortization. (2) Adjusted for Other Operating Income and Expenses.
(* ) Excludes nonrecurring effects in 2Q18, corresponding to R$45 million at Multivarejo related to the sale to third parties of a portion of the tax credits related to the exclusion of ICMS from the PIS/COFINS calculation base and R$369 million at Assaí related to the reversal of the provision for ICMS ST credits for periods prior to 2018. Net Income is net of income tax.
23
OPERATING PERFORMANCE BY BUSINESS
Assaí
(*) To reflect the calendar effect, in 2Q19 60 bps was deducted from same-store sales.
Gross sales revenue totaled R$7.1 billion in 2Q19, up 24.4%, driven by the strong same-store sales growth of 8.1%, successful rollout of the commercial policy and expansion of stores, resulting in significant market share gain (Nielsen data). Assaí opened 18 new stores in the last 12 months and continues its plan to open approximately 20 stores in 2019. In the quarter, 3 stores were opened: in the city of Aricanduva in São Paulo, one of the banner’s largest stores, with sales area of over 7,000 square meters; in the city of Palmas in Tocantins, representing the banner’s entry in the state; and in the city of Serra Talhada in Pernambuco. Another highlight was the Passaí Card, which maintained its strong pace of adhesion, totaling 823,000 cards issued, representing over 5% penetration, compared to 3% in 2Q18.
Gross profit reached R$1.1 billion, with margin of 16.7%, up 30 bps from 2Q18, mainly due to the accelerated maturation of stores opened in the last 2 years, in addition to higher share of individuals and better sales mix, without any change in the format’s level of competitiveness.
Selling, general and administrative expensescontinue to increase but below gross profit growth, remaining practically stable at 9.8% of sales, despite the strong expansion.
Adjusted EBITDAmaintained the consistent growth of recent quarters, increasing 24.4% to R$453 million, and margin of 6.9%.
2Q19 | 2Q18 | Δ | |||||||||
|
|
|
|
|
|
|
|
| |||
(R$ million) | Pre- | Change | Post- | Pre- | Change | Post- | Pre- | Post- | |||
Gross Revenue | 7,144 | - | 7,144 | 5,742 | - | 5,742 | 24.4% | 24.4% | |||
Net Revenue | 6,532 | - | 6,532 | 5,278 | - | 5,278 | 23.8% | 23.8% | |||
Gross Profit(*) | 1,088 | 2 | 1,090 | 868 | 0 | 868 | 25.4% | 25.6% | |||
Gross Margin(*) | 16.7% | 0 bps | 16.7% | 16.4% | 0 bps | 16.4% | 30 bps | 30 bps | |||
Selling, General and Adm. Expenses | (680) | 39 | (642) | (549) | 37 | (512) | 24.0% | 25.4% | |||
% of Net Revenue | 10.4% | -60 bps | 9.8% | 10.4% | -70 bps | 9.7% | 0 bps | 10 bps | |||
Adjusted EBITDA(1)(2)(*) | 410 | 43 | 453 | 321 | 43 | 364 | 27.8% | 24.4% | |||
Adjusted EBITDA Margin(1)(2)(*) | 6.3% | 60 bps | 6.9% | 6.1% | 80 bps | 6.9% | 20 bps | 0 bps | |||
(1) Earnings before interest, tax, depreciation and amortization. (2) Adjusted for Other Operating Income and Expenses.
(*) Excluding in 2Q18 the sum of R$369 million being the reversal of the provision for ICMS-ST tax credits related to periods prior to 2018.
In a challenging economic environment, Assaí continues to demonstrate consistency and adherence of its business model. It expanded its share in the Group, surpassing 50% of GPA Food sales in 2Q19. The success of the format is due to a strategy based on a successful sales policy combined with the excellent performance of store expansion.
24
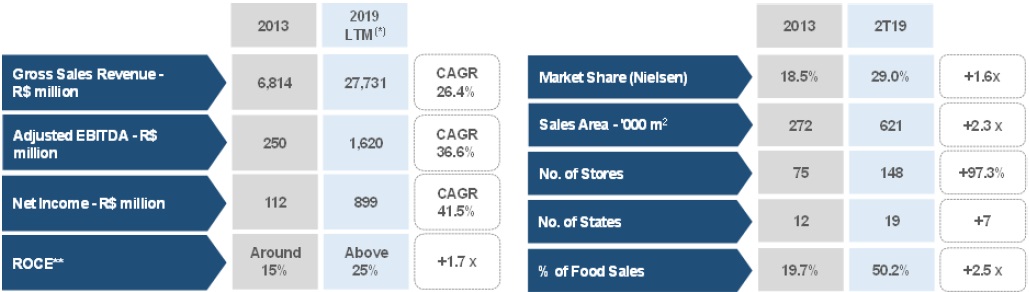
Between 2013 and 2019(*), Assaí’s gross revenue increased four times, expanding its sales area by 129%, and the expectation is to close the year with more than 160 stores across Brazil. As a result, Assaí’s market share expanded by around 60%: from 18.5% at the end of 2013 to 29.0% in June 2019, significantly contributing to the growth of the cash and carry format in Brazil.
This expansion came together with a strong increase in profitability: EBITDA margin (before IFRS) was 4.0% in 2013 and is estimated at 6.3%-6.4% in 2019, representing CAGR of more than 36%(*) in EBITDA per year. Net income in the last 12 months was eight times higher than in 2013, increasing the return to above 25%, reinforcing the format’s solid fundamentals.
(*) Considering the last 12 months in relation to June 2019
(**) Adjusted EBIT / Capital employed
Outlook:
The guidance announced for the banner for the year remains unchanged:
▪ Net sales:continued strong expansion, with same-store sales growth of about 200 bps above inflation and total sales of over 20%;
▪ EBITDA: EBITDA margin should increase by around 30 bps to 40 bps (before IFRS 16), driven mainly by the quality of the stores opened in recent years, which have matured sooner than expected.
25
Multivarejo
(1) To reflect the calendar effect, in 2Q19, 90 bps was excluded from same-store sales’
(*) Includes Extra Super, Mercado Extra and Compre Bem.
Multivarejo’s sales performancechiefly reflected the current consumption scenario, with economic recovery falling behind expectations. Also, other factors affected performance in the quarter, such as the strong comparison base due to the World Cup, the truck drivers’ strike – which had a positive impact on some formats – and adjustments to the commercial policy made at the end of 1Q18.
Despite this challenging scenario, food sales registered significant growth of 2.5%, enabling the continued gain in market share (Nielsen data). In the quarter, there was an increase in the penetration of private-label brands in the food categories to 12.1%, up 60 bps from 2Q18, mainly due to the repositioning of the portfolio and the launch of new products (500 new products expected in the year).
The non-food category was adversely affected by the strong comparison base of 2Q18 (up 20.8%), mainly due to the World Cup.
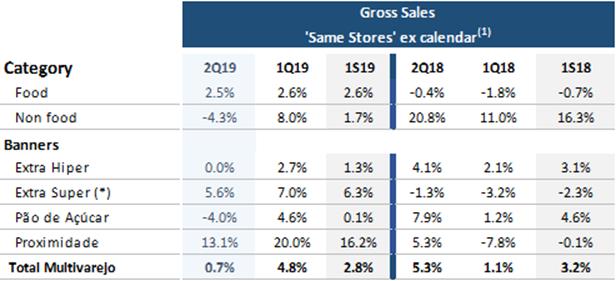
Following are the main factors that influenced ‘same-store’ sales of each banner:
▪ Extra Hiper:captured significant market sharein the last 12 months. Sales performance was influenced by better results in the food category compared to 1Q19, offset by the strong comparison base of the non-food category mainly due to the World Cup.
▪ Extra Super, Mercado Extra and Compre Bem:successful project for the renovation and conversion of Extra Super stores to Mercado Extra (43 stores) and Compre Bem stores (13 stores), which continue to register double-digit growth in sales and number of clients, with consistent market share gains.
▪ Pão de Açúcar:performance affected on a one-off basis by the strong comparison base of 2Q18 (+8%), due to strong commercial activations during the World Cup, the change in the final period of the ‘Juntou e Trocou’ campaign (Jun/2018 vs. Jul/2019) and the effect of the truck drivers’ strike, which benefited the format. In the year, the banner's market share remained stable. Moreover, the 26 renovated stores according to the concepts of last generations (G7 and G6) already account for approximately 25% of the banner’s sales, growing 900 bps above other stores. By the year-end, a total of 20 stores will be renovated.
26
▪ Proximity:maintenance of significant growth above inflation and with significant market share gains, despite the strong comparison base. The format’s performance is mainly due to the increase in customer traffic and average ticket, due to the alignment of commercial activations with the Extra and Pão de Açúcar banners, in addition to the higher penetration of the Private-Label Brands strategy.
Gross profit reached R$1.7 billion, with gross margin of 26.4%, mainly due to two key effects:
(i) one-off impacts:
▪ strong comparison base on account of the truck drivers’ strike in 2Q18, when promotional campaigns were scaled down (20 bps);
▪ negative impact of promotional investments in low turnover products to improve the quality of inventory (20 bps);
▪ effect of the end of the “MP do Bem” in 2018 (30 bps), which affect non-food sales;
▪ lower share of the Pão de Açúcar banner in the sales mix due to the comparison base of 2Q18, as mentioned in the sales performance section (20 bps).
▪ seasonal effect of Easter (20 bps).
(ii) impacts of the economic scenario:
▪ investments in competitiveness at Multivarejo (70 bps), which translated into continued gains in market share. These investments were mainly concentrated in the Hiper format, which is the worst affected by the more cautious consumption environment.
The Company expects to capture the effects of more dynamic economic activity in the second half and will continue to implement initiatives to optimize gross margin:
▪ increased use of digital means for disseminating and activating offers across all channels, enabling greater success and customization of offers, increasing the share of consumers with the full basket purchase profile;
▪ greater integration and planning with key strategic suppliers, drawing up detailed plans and annual targets shared between the industry and retail teams, mainly for grocery categories;
▪ increase in the share of categories with higher margins, such as fruits, vegetables and greens, through strategic projects (renovations of Pão de Açúcar stores with the implementation of G7 concept and the conversion of Extra Super into Mercado Extra and Compre Bem);
▪ additional investments in tools, people and processes related to pricing and analysis of promotional return in order to optimize allocation across diverse formats and regions.
Selling, general and administrative expenses diluted more than in 2Q18, decreasing 0.9%, due to initiatives designed to compensate the investments made to drive competitiveness, without impacting the level of service to customers. The main fronts were personnel expenses, which remained stable despite higher inflation in the period;the 10% decline in marketing expenses, due to the migration from paper to digital leaflets, without reducing the intensity of communication;and the renegotiation of IT services and general services agreements at stores, which enabled a 24% decline in these expenses.
AdjustedEBITDA reached R$435 million, with margin of 6.6%, mainly reflecting the effects on gross margin, as mentioned above.
27
2Q19 | 2Q18 | Δ | |||||||||
|
|
|
|
|
|
|
|
| |||
(R$ million) | Pre- | Change | Post- | Pre- | Change | Post- | Pre- | Post- | |||
Gross Revenue | 7,074 | - | 7,074 | 7,030 | - | 7,030 | 0.6% | 0.6% | |||
Net Revenue(*) | 6,549 | - | 6,549 | 6,452 | - | 6,452 | 1.5% | 1.5% | |||
Gross Profit(*) | 1,723 | 7 | 1,730 | 1,816 | 9 | 1,825 | -5.1% | -5.2% | |||
Gross Margin(*) | 26.3% | 10 bps | 26.4% | 28.1% | 20 bps | 28.3% | -180 bps | -190 bps | |||
Selling, General and Adm. Expenses | (1,490) | 147 | (1,343) | (1,489) | 134 | (1,354) | 0.1% | -0.9% | |||
% of Net Revenue | 22.8% | -230 bps | 20.5% | 23.1% | -210 bps | 21.0% | -30 bps | -50 bps | |||
Adjusted EBITDA(1)(2)(*) | 261 | 174 | 435 | 358 | 157 | 516 | -27.3% | -15.7% | |||
Adjusted EBITDA Margin(1)(2)(*) | 4.0% | 260 bps | 6.6% | 5.6% | 240 bps | 8.0% | -160 bps | -140 bps | |||
(1) Earnings before interest, tax, depreciation and amortization. (2) Adjusted for Other Operating Income and Expenses.
(*) Excluding R$45 million in 2Q18 related to the sale to third parties, a portion of tax credits related to the exclusion of ICMS from the PIS / Cofins calculation bases.
Digital Transformation and E-commerce:
Food E-commerce (sector leader)
▪ Sales growth of 37%: resulting from the higher share of omnichannel consumer and the expansion of delivery models.Approximately 30% of online sales originate from our loyalty apps;
▪ Expansion of “Express” and “Click and Collect” models:already available at 94 Pão de Açúcar and Extra stores, with 89 stores offering both delivery models. By the end of 2019, 120 stores will offer the models;
▪ James Delivery:start of operations in Santos and Fortaleza – as well as Curitiba and São Paulo –, bringing the total stores to 20, and to be expanded to at least 25 cities by 2020. Sales growth was 4.7 times higher than in the previous quarter. During 2Q19, the number of orders on the platform more than doubled and already accounts for more than 64% of all online orders at the stores where it operates. Between April and June, the number of orders from James Delivery is already 75% higher than in the previous operating model (outsourced partner).
Loyalty Programs:
▪ Significant growth, totaling 19.3 million loyal customers and sales penetration of over 85% at Pão de Açúcar and around 60% at Extra;
▪ Underlining the attractiveness and the success of the "My Discount" app, which already totals more than 9.3 million downloads, an increase of 58% from 2Q18. Another significant highlight is the frequency of omnichannel customers, which doubled in relation to other customers.
Innovation:
▪ Aliado Mini Mercado Online Platform:launch of B2B e-commerce platform dedicated to small and midsized merchants, expanding the coverage area and ensuring a more practical and quick ordering process. The project was conducted with a startup under the Liga Retail acceleration program;
▪ Pão de Açúcar Adega:solid 70% growth in the quarter. Since its launch in December 2018, online sales of wine increased by over 2 times;
▪ Cheftime: the operation has already sold over 41,000 kits, 40 times higher growth than before the partnership (1,500 kits). At Pão de Açúcar banner, the complete assortment of kits was expanded to all the stores in São Paulo and Paraná. Extra launched test sales of kits through ‘Meus Prêmios’ and already has an assortment of more than 20 recipes;
28
▪ Startups:Implementation of fast-track process (greater speed in product launches). More than 150 startups have been mapped and 20 were approved. With the focus on experience, the Company is already working with GetNinjas through its app and is in tests with Rentbrella and PetParker, among other partners.
▪ Partnership with Microsoft:new store model with sensors capable of interacting with the Company's digital platforms - apps and e-commerce - and technologies such as lockers, facial recognition and self-checkout.
Outlook:
The quarter was marked by a slower recovery of the economy, which resulted in a more cautious consumption environment. However, the Company maintains a positive outlook about the economic fundamentals of Brazil, which should be materialized through the social security reform, possible tax reform and the injection of liquidity in the economy with the release of FGTS funds. As a result, a more promising environment is expected in the second half of 2019, especially in the fourth quarter.
In this scenario, Multivarejo will continue its efforts to improve operating efficiency, mainly by optimizing investments in competitiveness, logistic costs and SG&A expenses. Considering a more dynamic economic scenario combined with internal efforts, Multivarejo maintains its expectations of increased profitability.
OTHER INCOME AND EXPENSES
In the quarter, Other Income and Expenses amounted to an expense of R$70 million, mainly related to prior-period tax contingencies (from 2001 to 2016), restructuring expenses and results from property, plant and equipment.
29
FINANCIAL RESULT
Consolidated | |||
(R$ million) | 2Q19 | 2Q18 | Δ |
Financial Revenue | 68 | 39 | 74.1% |
Financial Expenses | (207) | (183) | 13.1% |
Cost of Debt | (92) | (82) | 12.2% |
Cost of Receivables Discount | (48) | (51) | -5.9% |
Contingencies adjustments and Other financial expenses | (67) | (50) | 34.0% |
Net Financial Revenue (Expenses) - Pre IFRS 16 | (139) | (144) | -3.4% |
% of Net Revenue | 1.1% | 1.2% | -10 bps |
| |||
Interest on lease liabilities | (141) | (133) | 6.0% |
Net Financial Revenue (Expenses) - Post IFRS 16 | (280) | (277) | 1.1% |
% of Net Revenue | 2.1% | 2.4% | -30 bps |
The Company’s financial result amounted to R$280 million, or 2.1% of net sales, down 30 bps from 2Q18. Excluding IFRS 16, financial result was R$139 million, or 1.1% of net sales, down 10 bps from 2Q18.
The main variations were:
▪ Debt cost: totaled R$92 million, or 0.7% of net sales, remaining stable in relation to 2Q18;
▪ Sales of receivables: the decline was due to the shorter term of the receivables portfolio due to the growth of Assaí’s share;
▪ Variations in contingencies and other expenses: amount remained practically stable in relation to 2Q18, at 0.5% of net sales;
▪ Interest on lease liability:recognition of R$141 million, remaining at 1.1% of net sales when compared with 2Q18.
30
NET INCOME - FOOD
2Q19 | 2Q18 |
| ? | |||||||
(R$ million) | Pre- | Change | Post- | Pre- | Change | Post- |
| Pre- | Post- | |
EBITDA | 586 | 232 | 818 | 1,003 | 203 | 1,206 |
| -41.6% | -32.2% | |
Depreciation (Logistic) | (13) | (23) | (36) | (12) | (21) | (33) |
| 3.0% | 8.4% | |
Depreciation and Amortization | (230) | (107) | (336) | (209) | (92) | (301) |
| 9.9% | 11.9% | |
Net Financial Revenue (Expenses) | (144) | (136) | (280) | (148) | (130) | (277) |
| -2.5% | 0.9% | |
Income (Loss) before Income Tax | 200 | (34) | 166 | 634 | (39) | 595 |
| -68.5% | -72.1% | |
Income Tax | (69) | 10 | (59) | (172) | 11 | (161) |
| -59.9% | -63.5% | |
Net Income - Controlling Shareholders - continuing operations | 131 | (25) | 106 | 462 | (29) | 433 |
| -71.7% | -75.6% | |
Net Income - Controlling Shareholders - descontinuing operations | 377 | 8 | 385 | 14 | (16) | (2) |
| 2543.2% | n.a. | |
Net Income - Controlling Shareholders - Consolidated | 508 | (17) | 490 | 476 | (44) | 432 |
| 6.6% | 13.6% | |
|
|
|
|
|
|
|
|
| ||
Other Operating Revenue (Expenses) | - | - | - | 414 | - | 414 |
| n.a. | n.a. | |
Income Tax from Other Operating Revenues (Expenses) | - | - | - | 137 | - | 137 |
| n.a. | n.a. | |
Net Income - Controlling Shareholders - Consolidated(*) | 508 | (17) | 490 |
| 199 | (45) | 155 |
| 155.1% | 217.4% |
Net Margin - Controlling Shareholders - Consolidated(*) | 3.9% | -20 bps | 3.7% |
| 1.7% | -40 bps | 1.3% |
| 220 bps | 240 bps |
(*) Excluding non-recurring effects in 2Q18 corresponding to R$45 million in Multivarejo and R$369 million in Assaí. Net Income is net of income tax.
In the Food segment, the consolidated net income attributable to controlling shareholderstotaled R$490 million in the quarter, with margin of 3.7%.
Earnings per share stood at R$1.52118 for common shares and R$1.67330 for preferred shares.
31
NET DEBT
To calculate the indicators in the table below, the Company does not consider lease liabilities related to IFRS 16.
(R$ million) | 06.30.2019 | 06.30.2018 |
Short Term Debt | (3,025) | (1,733) |
Loans and Financing | (875) | (1,233) |
Debentures and Promissory Notes | (2,150) | (500) |
Long Term Debt | (3,079) | (3,953) |
Loans and Financing | (256) | (615) |
Debentures | (2,823) | (3,338) |
Total Gross Debt | (6,104) | (5,686) |
Cash and Financial investments | 4,705 | 3,054 |
Net Debt | (1,398) | (2,631) |
EBITDA(1) | 2,738 | 2,642 |
Net Debt / EBITDA(1) | -0.51x | -1.00x |
On balance Credit Card Receivables not discounted | 110 | 253 |
Net Debt incl. Credit Card Receivables not discounted | (1,288) | (2,378) |
Net Debt incl. Credit Card Receivables not discounted / EBITDA(1) | -0.47x | -0.90x |
(1) EBITDA before IFRS 16 in the last 12 months.
The Company kept its debt level low, with the Net debt/EBITDA ratio standing at 0.47 in the quarter. Net debt adjusted by the balance of unsold receivables totaled R$1.3 billion, down 45.8% from the same period last year, mainly due to the conclusion of the sale of interest in Via Varejo.
In the quarter, cash balance reached R$4.7 billion, while the balance of unsold receivables was R$110 million, totaling R$4.8 billion in cash and equivalents for the Company. GPA also has approximately R$1.8 billion in pre-approved/confirmed credit lines.
INVESTMENTS
| Food Business | ||||||
(R$ million) | 2Q19 | 2Q18 | Δ | 1H19 | 1H18 | Δ | |
New stores and land acquisition | 207 | 157 | 31.7% | 371 | 245 | 51.7% | |
Store renovations, conversions and maintenance | 148 | 101 | 47.4% | 250 | 179 | 39.7% | |
Infrastructure and others | 180 | 84 | 114.3% | 274 | 152 | 79.9% | |
Non-cash Effect |
|
|
|
|
|
| |
Financing Assets | (26) | (12) | 106.1% | 78 | 84 | -7.0% | |
Total | 510 | 330 | 54.8% | 973 | 659 | 47.5% | |
Investments in the Food segment totaled R$510 million, increasing 54.8% from 2Q18, due to more dispersed store openings during the year. In the quarter, three Assaí stores were opened, bringing the total stores in the banner to 148. Twelve other stores are under construction. In addition, 13 conversions of Extra Super to Mercado Extra were concluded, bringing the banner total to 43 stores.
32
LATIN AMERICA ASSET REORGANIZATION
In the Board of Directors meeting held on June 26, 2019, the controlling shareholder of the Company, Casino Guichard-Perrachon, presented a recommendation for a transaction to simplify its asset structure in Latin America, improve its corporate governance and support a potential expansion in its investor base. The transaction comprises the following phases:
(i) a public offering to be launched by the Company for the acquisition, in cash, up to 100% of the shares in Almacenes Éxito S.A., a publicly traded corporation located in Colombia (“Éxito”);
(ii) the acquisition by Casino of 100% of the shares representing the controlling interest issued by the Company that currently are held indirectly by Éxito at fair price; and
(iii) the migration of the Company to the Novo Mercado, the listing segment of the B3 with the highest corporate governance standards, with the conversion of all preferred shares issued by the Company into common shares at a ratio of 1 to 1.
Continuing the transaction, on July 24, 2019, a material fact was disclosed informing that the Board of Directors of GPA, based on the favorable recommendation from the Special Independent Committee and within the originally recommended price range, approved that its operational subsidiary Sendas Distribuidora authorize the issue of a public offering for the acquisition, in cash, of up to 100% of the shares in Éxito, at the price of 18,000 Colombian pesos per share (which, on the date hereof, represents R$21.20).
The recommendation of the Special Committee and the approval by the Board of Directors of GPA take into consideration the announcement, on the date hereof, of the intention of Casino Guichard-Perrachon to acquire Éxito’s indirect equity interest in GPA based on a price of R$109.00 for each GPA share
The request for authorization from the Colombian Financial Superintendence must be made if and after obtaining the applicable corporate approvals from Éxito for the sale of its indirect interest in GPA. The Board of Directors also approved the start of work to prepare for the migration of GPA to the Novo Mercado, considering the conversion of all the preferred shares into common shares at a 1:1 ratio. A new Board of Director’s meeting shall be called in due time to approve the migration proposal.
33
CONSOLIDATED FINANCIAL STATEMENTS
1. Balance Sheet
BALANCE SHEET | |||||||
ASSETS | |||||||
Consolidated | Food Businesses | ||||||
(R$ million) | 06.30.2019 | 03.31.2019 | 06.30.2018 | 06.30.2019 | 03.31.2019 | 06.30.2018 | |
Current Assets | 12,003 | 36,198 | 34,791 |
| 12,002 | 10,208 | 9,787 |
Cash and Marketable Securities | 4,705 | 2,359 | 3,054 |
| 4,705 | 2,359 | 3,054 |
Accounts Receivable | 317 | 765 | 296 |
| 317 | 770 | 300 |
Credit Cards | 39 | 487 | 251 |
| 39 | 487 | 255 |
Sales Vouchers and Trade Account Receivable | 217 | 217 | 45 |
| 217 | 222 | 45 |
Allowance for Doubtful Accounts | (5) | (5) | - |
| (5) | (5) | - |
Resulting from Commercial Agreements | 66 | 66 | - |
| 66 | 66 | - |
Inventories | 5,692 | 5,732 | 5,136 |
| 5,692 | 5,732 | 5,136 |
Recoverable Taxes | 615 | 648 | 532 |
| 615 | 648 | 532 |
Noncurrent Assets for Sale | 24 | 26,025 | 25,263 |
| 24 | 31 | 254 |
Prepaid Expenses and Other Accounts Receivables | 648 | 669 | 510 |
| 648 | 669 | 510 |
Noncurrent Assets | 20,864 | 20,561 | 18,618 |
| 20,864 | 20,580 | 18,658 |
Long-Term Assets | 4,330 | 4,298 | 4,253 |
| 4,330 | 4,317 | 4,288 |
Accounts Receivables | 71 | 60 | 3 |
| 71 | 60 | 3 |
Credit Cards | 71 | 60 | 3 |
| 71 | 60 | 3 |
Recoverable Taxes | 2,919 | 2,876 | 2,335 |
| 2,919 | 2,876 | 2,335 |
Deferred Income Tax and Social Contribution | 294 | 350 | 325 |
| 294 | 350 | 325 |
Amounts Receivable from Related Parties | 37 | 39 | 31 |
| 37 | 58 | 66 |
Judicial Deposits | 811 | 785 | 784 |
| 811 | 785 | 784 |
Prepaid Expenses and Others | 198 | 190 | 775 |
| 198 | 190 | 775 |
Investments | 232 | 236 | 209 |
| 232 | 236 | 209 |
Property and Equipment | 13,425 | 13,194 | 12,268 |
| 13,425 | 13,194 | 12,268 |
Intangible Assets | 2,877 | 2,833 | 1,888 |
| 2,877 | 2,833 | 1,894 |
TOTAL ASSETS | 32,866 | 56,759 | 53,409 |
| 32,866 | 30,788 | 28,445 |
LIABILITIES | |||||||
Consolidated | Food Businesses | ||||||
| �� | |||||||
06.30.2019 | 03.31.2019 | 06.30.2018 | 06.30.2019 | 03.31.2019 | 06.30.2018 | ||
Current Liabilities | 12,553 | 32,093 | 29,948 |
| 12,553 | 11,406 | 10,317 |
Suppliers | 6,827 | 6,481 | 6,370 |
| 6,827 | 6,487 | 6,375 |
Loans and Financing | 923 | 1,275 | 1,271 |
| 923 | 1,275 | 1,271 |
Debentures | 2,150 | 1,067 | 500 |
| 2,150 | 1,067 | 500 |
Lease Liability | 604 | 536 | 481 |
| 604 | 536 | 481 |
Payroll and Related Charges | 652 | 694 | 615 |
| 652 | 694 | 615 |
Taxes and Social Contribution Payable | 470 | 363 | 264 |
| 470 | 363 | 264 |
Dividends Proposed | 32 | 164 | 0 |
| 32 | 164 | 0 |
Financing for Purchase of Fixed Assets | 64 | 47 | 39 |
| 64 | 47 | 39 |
Rents | 12 | 12 | 12 |
| 12 | 12 | 12 |
Debt with Related Parties | 142 | 159 | 145 |
| 142 | 278 | 338 |
Advertisement | 33 | 31 | 43 |
| 33 | 31 | 43 |
Provision for Restructuring | 4 | 7 | 13 |
| 4 | 7 | 13 |
Advanced Revenue | 171 | 213 | 151 |
| 171 | 213 | 151 |
Non-current Assets Held for Sale | - | 20,812 | 19,837 |
| - | - | - |
Others | 469 | 232 | 208 |
| 469 | 232 | 215 |
Long-Term Liabilities | 9,585 | 11,054 | 10,512 |
| 9,585 | 11,054 | 10,512 |
Loans and Financing | 302 | 307 | 716 |
| 302 | 307 | 716 |
Debentures | 2,823 | 3,890 | 3,338 |
| 2,823 | 3,890 | 3,338 |
Lease Liability | 4,125 | 4,188 | 3,884 |
| 4,125 | 4,188 | 3,884 |
Deferred Income Tax and Social Contribution | 227 | 561 | 548 |
| 227 | 561 | 548 |
Tax Installments | 423 | 447 | 517 |
| 423 | 447 | 517 |
Provision for Contingencies | 1,235 | 1,276 | 1,127 |
| 1,235 | 1,276 | 1,127 |
Advanced Revenue | 31 | 18 | 15 |
| 31 | 18 | 15 |
Provision for loss on investment in Associates | 339 | 316 | 311 |
| 339 | 316 | 311 |
Others | 79 | 53 | 56 |
| 79 | 53 | 56 |
Shareholders' Equity | 10,729 | 13,611 | 12,949 |
| 10,729 | 8,328 | 7,616 |
Capital | 6,836 | 6,825 | 6,823 |
| 6,836 | 5,692 | 5,407 |
Capital Reserves | 438 | 426 | 400 |
| 439 | 426 | 400 |
Profit Reserves | 3,499 | 3,169 | 2,806 |
| 3,498 | 2,283 | 1,880 |
Other Comprehensive Results | (44) | (73) | (71) |
| (44) | (73) | (71) |
Minority Interest | (0) | 3,264 | 2,991 |
| - | - | - |
TOTAL LIABILITIES | 32,866 | 56,759 | 53,409 |
| 32,866 | 30,788 | 28,445 |
34
2.1 Income Statement for 2Q19 – After IFRS 16
Consolidated | Food Business | Multivarejo(1) | Assaí | ||||||||||||
2Q19 | 2Q18 | Δ | 2Q19 | 2Q18 | Δ | 2Q19 | 2Q18 | Δ | 2Q19 | 2Q18 | Δ | ||||
R$ - Million |
|
|
|
|
|
|
|
|
|
|
|
| |||
Gross Revenue | 14,219 | 12,772 | 11.3% | 14,218 | 12,772 | 11.3% | 7,074 | 7,030 | 0.6% | 7,144 | 5,742 | 24.4% | |||
Net Revenue | 13,081 | 11,775 | 11.1% | 13,081 | 11,775 | 11.1% | 6,549 | 6,497 | 0.8% | 6,532 | 5,278 | 23.8% | |||
Cost of Goods Sold | (10,226) | (8,635) | 18.4% | (10,225) | (8,635) | 18.4% | (4,789) | (4,603) | 4.0% | (5,437) | (4,033) | 34.8% | |||
Depreciation (Logistic) | (36) | (33) | 8.4% | (36) | (33) | 8.4% | (30) | (25) | 23.6% | (5) | (8) | -35.9% | |||
Gross Profit | 2,820 | 3,107 | -9.2% | 2,820 | 3,107 | -9.2% | 1,730 | 1,870 | -7.5% | 1,090 | 1,237 | -11.9% | |||
Selling Expenses | (1,736) | (1,618) | 7.3% | (1,729) | (1,618) | 6.9% | (1,178) | (1,174) | 0.4% | (551) | (444) | 24.2% | |||
General and Administrative Expenses | (255) | (249) | 2.6% | (255) | (249) | 2.6% | (165) | (181) | -8.8% | (90) | (68) | 33.0% | |||
Selling, General and Adm. Expenses | (1,991) | (1,866) | 6.7% | (1,985) | (1,866) | 6.3% | (1,343) | (1,354) | -0.9% | (642) | (512) | 25.4% | |||
Equity Income(2) | (9) | (8) | 13.6% | 17 | 20 | -15.7% | 17 | 20 | -15.7% | - | - | n.a. | |||
Other Operating Revenue (Expenses) | (70) | (88) | -20.0% | (70) | (88) | -20.0% | (58) | (77) | -25.4% | (13) | (11) | 19.0% | |||
Depreciation and Amortization | (336) | (301) | 11.9% | (336) | (301) | 11.9% | (245) | (226) | 8.3% | (91) | (74) | 22.8% | |||
Earnings before interest and Taxes - EBIT | 412 | 844 | -51.1% | 445 | 872 | -48.9% | 102 | 232 | -56.3% | 344 | 640 | -46.3% | |||
Financial Revenue | 68 | 39 | 76.2% | 68 | 39 | 76.1% | 59 | 31 | 90.8% | 10 | 8 | 20.1% | |||
Financial Expenses | (348) | (316) | 10.1% | (348) | (316) | 10.1% | (291) | (274) | 6.3% | (56) | (42) | 34.5% | |||
Net Financial Result | (280) | (277) | 0.9% | (280) | (277) | 0.9% | (233) | (243) | -4.3% | (47) | (34) | 37.9% | |||
Income (Loss) Before Income Tax | 133 | 566 | -76.6% | 166 | 595 | -72.1% | (131) | (11) | n.a. | 297 | 606 | -51.0% | |||
Income Tax | (59) | (161) | -63.5% | (59) | (161) | -63.5% | 38 | 39 | -1.6% | (97) | (201) | -51.4% | |||
Net Income (Loss) Company - continuing operations | 74 | 405 | -81.8% | 107 | 433 | -75.4% | (93) | 28 | n.a. | 200 | 405 | -50.8% | |||
Net Result from discontinued operations | 328 | 157 | 109.4% | 385 | (2) | n.a. | 385 | (2) | n.a. | - | - | n.a. | |||
Net Income (Loss) - Consolidated Company | 401 | 561 | -28.5% | 491 | 432 | 13.8% | 292 | 27 | 995.2% | 200 | 405 | -50.8% | |||
Net Income (Loss) - Controlling Shareholders - continuing operations(3) | 72 | 405 | -82.1% | 106 | 433 | -75.6% | (93) | 28 | n.a. | 199 | 405 | -51.0% | |||
Net Income (Loss) - Controlling Shareholders - discontinued operations(3) | 359 | 65 | 451.5% | 385 | (2) | n.a. | 385 | (2) | n.a. | - | - | n.a. | |||
Net Income (Loss) - Consolidated Controlling Shareholders(3) | 432 | 470 | -8.1% | 490 | 432 | 13.6% | 292 | 27 | 998.9% | 199 | 405 | -51.0% | |||
Minority Interest - Non-controlling - continuing operations | (0) | 0 | n.a. | (0) | 0 | n.a. | (0) | 0 | n.a. | - | - | n.a. | |||
Minority Interest - Non-controlling - discontinued operations | (31) | 91 | n.a. | - | - | n.a. | - | - | n.a. | - | - | n.a. | |||
Minority Interest - Non-controlling - Consolidated | (31) | 92 | n.a. | (0) | 0 | n.a. | (0) | 0 | n.a. | - | - | n.a. | |||
Earnings before Interest, Taxes, Depreciation, Amortization - EBITDA | 785 | 1,177 | -33.4% | 818 | 1,206 | -32.2% | 377 | 484 | -22.0% | 440 | 722 | -39.0% | |||
Adjusted EBITDA(4) | 855 | 1,265 | -32.4% | 888 | 1,294 | -31.4% | 435 | 561 | -22.4% | 453 | 733 | -38.2% | |||
Consolidated | Food Business | Multivarejo(1) | Assaí | ||||||||
% of Net Revenue | 2Q19 | 2Q18 | 2Q19 | 2Q18 | 2Q19 | 2Q18 | 2Q19 | 2Q18 | |||
Gross Profit | 21.6% | 26.4% |
| 21.6% | 26.4% |
| 26.4% | 28.8% |
| 16.7% | 23.4% |
Selling Expenses | 13.3% | 13.7% |
| 13.2% | 13.7% |
| 18.0% | 18.1% |
| 8.4% | 8.4% |
General and Administrative Expenses | 2.0% | 2.1% |
| 2.0% | 2.1% |
| 2.5% | 2.8% |
| 1.4% | 1.3% |
Selling, General and Adm. Expenses | 15.2% | 15.8% |
| 15.2% | 15.8% |
| 20.5% | 20.8% |
| 9.8% | 9.7% |
Equity Income(2) | -0.1% | 0.1% |
| 0.1% | 0.2% |
| 0.3% | 0.3% |
| 0.0% | 0.0% |
Other Operating Revenue (Expenses) | 0.5% | 0.7% |
| 0.5% | 0.7% |
| 0.9% | 1.2% |
| 0.2% | 0.2% |
Depreciation and Amortization | 2.6% | 2.6% |
| 2.6% | 2.6% |
| 3.7% | 3.5% |
| 1.4% | 1.4% |
EBIT | 3.2% | 7.2% |
| 3.4% | 7.4% |
| 1.6% | 3.6% |
| 5.3% | 12.1% |
Net Financial Revenue (Expenses) | 2.1% | 2.4% |
| 2.1% | 2.4% |
| 3.6% | 3.7% |
| 0.7% | 0.6% |
Income Before Income Tax | 1.0% | 4.8% |
| 1.3% | 5.1% |
| 2.0% | -0.2% |
| 4.5% | 11.5% |
Income Tax | 0.5% | 1.4% |
| 0.5% | 1.4% |
| 0.6% | 0.6% |
| 1.5% | 3.8% |
Net Income (Loss) Company - continuing operations | 0.6% | 3.4% |
| 0.8% | 3.7% |
| 1.4% | 0.4% |
| 3.1% | 7.7% |
Net Income (Loss) - Consolidated Company | 3.1% | 4.8% |
| 3.8% | 3.7% |
| 4.5% | 0.4% |
| 3.1% | 7.7% |
Net Income (Loss) - Controlling Shareholders - continuing operations(3) | 0.6% | 3.4% |
| 0.8% | 3.7% |
| 1.4% | 0.4% |
| 3.0% | 7.7% |
Net Income (Loss) - Consolidated Controlling Shareholders(3) | 3.3% | 4.0% |
| 3.7% | 3.7% |
| 4.5% | 0.4% |
| 3.0% | 7.7% |
Minority Interest - Non-controlling - continuing operations | 0.0% | 0.0% |
| 0.0% | 0.0% |
| 0.0% | 0.0% |
| 0.0% | 0.0% |
Minority Interest - Non-controlling - Consolidated | 0.2% | 0.8% |
| 0.0% | 0.0% |
| 0.0% | 0.0% |
| 0.0% | 0.0% |
EBITDA | 6.0% | 10.0% |
| 6.3% | 10.2% |
| 5.8% | 7.4% |
| 6.7% | 13.7% |
Adjusted EBITDA(4) | 6.5% | 10.7% |
| 6.8% | 11.0% |
| 6.6% | 8.6% |
| 6.9% | 13.9% |
(1) Multivarejo includes the results of Malls and Corporate. (2) Equity income from Cdiscount is included in the Consolidated results and not in the Retail and Cash-and-Carry segments. (3) Net income after non-controlling interest. (4) Adjusted for Other Operating Income and Expenses.
35
2.2 Income Statement for 2Q19 – Before IFRS 16
Consolidated | Food Business | Multivarejo(1) | Assaí | ||||||||||||
2Q19 | 2Q18 | Δ | 2Q19 | 2Q18 | Δ | 2Q19 | 2Q18 | Δ | 2Q19 | 2Q18 | Δ | ||||
R$ - Million |
|
|
|
|
|
|
|
|
|
|
|
| |||
Gross Revenue | 14,219 | 12,772 | 11.3% | 14,218 | 12,772 | 11.3% | 7,074 | 7,030 | 0.6% | 7,144 | 5,742 | 24.4% | |||
Net Revenue | 13,081 | 11,775 | 11.1% | 13,081 | 11,775 | 11.1% | 6,549 | 6,497 | 0.8% | 6,532 | 5,278 | 23.8% | |||
Cost of Goods Sold | (10,257) | (8,665) | 18.4% | (10,257) | (8,665) | 18.4% | (4,816) | (4,626) | 4.1% | (5,441) | (4,039) | 34.7% | |||
Depreciation (Logistic) | (13) | (12) | 3.0% | (13) | (12) | 3.0% | (10) | (10) | -0.6% | (3) | (2) | 19.5% | |||
Gross Profit | 2,811 | 3,098 | -9.2% | 2,811 | 3,098 | -9.2% | 1,723 | 1,861 | -7.4% | 1,088 | 1,237 | -12.0% | |||
Selling Expenses | (1,919) | (1,787) | 7.4% | (1,913) | (1,787) | 7.0% | (1,324) | (1,307) | 1.3% | (589) | (480) | 22.7% | |||
General and Administrative Expenses | (257) | (250) | 3.0% | (257) | (250) | 3.0% | (166) | (181) | -8.3% | (91) | (69) | 32.8% | |||
Selling, General and Adm. Expenses | (2,177) | (2,037) | 6.9% | (2,170) | (2,037) | 6.5% | (1,490) | (1,489) | 0.1% | (680) | (549) | 24.0% | |||
Equity Income(2) | (8) | (11) | -24.9% | 17 | 20 | -16.0% | 17 | 20 | -16.0% | - | - | n.a. | |||
Other Operating Revenue (Expenses) | (85) | (90) | -6.1% | (85) | (90) | -6.1% | (72) | (80) | -9.4% | (13) | (11) | 18.1% | |||
Depreciation and Amortization | (230) | (209) | 10.0% | (230) | (209) | 9.9% | (161) | (153) | 5.2% | (69) | (56) | 22.7% | |||
Earnings before interest and Taxes - EBIT | 312 | 750 | -58.5% | 344 | 782 | -56.0% | 18 | 161 | -88.9% | 326 | 621 | -47.5% | |||
Financial Revenue | 68 | 39 | 76.2% | 68 | 39 | 76.1% | 59 | 31 | 90.8% | 10 | 8 | 20.1% | |||
Financial Expenses | (212) | (186) | 13.8% | (212) | (186) | 13.8% | (187) | (174) | 7.4% | (26) | (13) | 102.6% | |||
Net Financial Result | (144) | (148) | -2.5% | (144) | (148) | -2.5% | (128) | (143) | -10.5% | (16) | (5) | 247.5% | |||
Income (Loss) Before Income Tax | 168 | 603 | -72.2% | 200 | 634 | -68.5% | (110) | 18 | n.a. | 310 | 616 | -49.7% | |||
Income Tax | (69) | (172) | -59.9% | (69) | (172) | -59.9% | 33 | 32 | 4.0% | (102) | (204) | -49.9% | |||
Net Income (Loss) Company - continuing operations | 99 | 431 | -77.1% | 131 | 462 | -71.7% | (77) | 50 | n.a. | 208 | 412 | -49.6% | |||
Net Result from discontinued operations | 267 | 95 | 180.5% | 377 | 14 | 2543.2% | 377 | 14 | 2543.2% | - | - | n.a. | |||
Net Income (Loss) - Consolidated Company | 365 | 526 | -30.5% | 508 | 476 | 6.6% | 300 | 64 | 366.9% | 208 | 412 | -49.6% | |||
Net Income (Loss) - Controlling Shareholders - continuing operations(3) | 99 | 431 | -77.1% | 131 | 462 | -71.7% | (77) | 50 | n.a. | 208 | 412 | -49.6% | |||
Net Income (Loss) - Controlling Shareholders - discontinued operations(3) | 333 | 47 | 603.8% | 377 | 14 | 2543.2% | 377 | 14 | 2543.2% | - | - | n.a. | |||
Net Income (Loss) - Consolidated Controlling Shareholders(3) | 432 | 478 | -9.7% | 508 | 476 | 6.6% | 300 | 64 | 366.9% | 208 | 412 | -49.6% | |||
Minority Interest - Non-controlling - continuing operations | - | - | n.a. | - | - | n.a. | - | - | n.a. | - | - | n.a. | |||
Minority Interest - Non-controlling - discontinued operations | (66) | 48 | n.a. | - | - | n.a. | - | - | n.a. | - | - | n.a. | |||
Minority Interest - Non-controlling - Consolidated | (66) | 48 | n.a. | - | - | n.a. | - | - | n.a. | - | - | n.a. | |||
Earnings before Interest, Taxes, Depreciation, Amortization - EBITDA | 554 | 972 | -43.0% | 586 | 1,003 | -41.6% | 188 | 324 | -41.8% | 398 | 679 | -41.5% | |||
Adjusted EBITDA(4) | 639 | 1,062 | -39.8% | 671 | 1,093 | -38.6% | 261 | 403 | -35.4% | 410 | 690 | -40.5% | |||
Consolidated | Food Business | Multivarejo(1) | Assaí | ||||||||
% of Net Revenue | 2Q19 | 2Q18 | 2Q19 | 2Q18 | 2Q19 | 2Q18 | 2Q19 | 2Q18 | |||
Gross Profit | 21.5% | 26.3% |
| 21.5% | 26.3% |
| 26.3% | 28.6% |
| 16.7% | 23.4% |
Selling Expenses | 14.7% | 15.2% |
| 14.6% | 15.2% |
| 20.2% | 20.1% |
| 9.0% | 9.1% |
General and Administrative Expenses | 2.0% | 2.1% |
| 2.0% | 2.1% |
| 2.5% | 2.8% |
| 1.4% | 1.3% |
Selling, General and Adm. Expenses | 16.6% | 17.3% |
| 16.6% | 17.3% |
| 22.8% | 22.9% |
| 10.4% | 10.4% |
Equity Income(2) | -0.1% | 0.1% |
| 0.1% | 0.2% |
| 0.3% | 0.3% |
| 0.0% | 0.0% |
Other Operating Revenue (Expenses) | 0.6% | 0.8% |
| 0.6% | 0.8% |
| 1.1% | 1.2% |
| 0.2% | 0.2% |
Depreciation and Amortization | 1.8% | 1.8% |
| 1.8% | 1.8% |
| 2.5% | 2.3% |
| 1.1% | 1.1% |
EBIT | 2.4% | 6.4% |
| 2.6% | 6.6% |
| 0.3% | 2.5% |
| 5.0% | 11.8% |
Net Financial Revenue (Expenses) | 1.1% | 1.3% |
| 1.1% | 1.3% |
| 2.0% | 2.2% |
| 0.2% | 0.1% |
Income Before Income Tax | 1.3% | 5.1% |
| 1.5% | 5.4% |
| 1.7% | 0.3% |
| 4.7% | 11.7% |
Income Tax | 0.5% | 1.5% |
| 0.5% | 1.5% |
| 0.5% | 0.5% |
| 1.6% | 3.9% |
Net Income (Loss) Company - continuing operations | 0.8% | 3.7% |
| 1.0% | 3.9% |
| 1.2% | 0.8% |
| 3.2% | 7.8% |
Net Income (Loss) - Consolidated Company | 2.8% | 4.5% |
| 3.9% | 4.0% |
| 4.6% | 1.0% |
| 3.2% | 7.8% |
Net Income (Loss) - Controlling Shareholders - continuing operations(3) | 0.8% | 3.7% |
| 1.0% | 3.9% |
| 1.2% | 0.8% |
| 3.2% | 7.8% |
Net Income (Loss) - Consolidated Controlling Shareholders(3) | 3.3% | 4.1% |
| 3.9% | 4.0% |
| 4.6% | 1.0% |
| 3.2% | 7.8% |
Minority Interest - Non-controlling - Consolidated | 0.5% | 0.4% |
| 0.0% | 0.0% |
| 0.0% | 0.0% |
| 0.0% | 0.0% |
EBITDA | 4.2% | 8.3% |
| 4.5% | 8.5% |
| 2.9% | 5.0% |
| 6.1% | 12.9% |
Adjusted EBITDA(4) | 4.9% | 9.0% |
| 5.1% | 9.3% |
| 4.0% | 6.2% |
| 6.3% | 13.1% |
(1) Multivarejo includes the results of Malls and Corporate. (2) Equity income from Cdiscount is included in the Consolidated results and not in the Retail and Cash-and-Carry segments. (3) Net income after non-controlling interest. (4) Adjusted for Other Operating Income and Expenses.
36
2.3 Income Statement for 1H19 – After IFRS 16
Consolidated | Food Business | Multivarejo(1) | Assaí | ||||||||||||
1H19 | 1H18 | Δ | 1H19 | 1H18 | Δ | 1H19 | 1H18 | Δ | 1H19 | 1H18 | Δ | ||||
R$ - Million |
|
|
|
|
|
|
|
|
|
|
|
| |||
Gross Revenue | 28,046 | 25,072 | 11.9% | 28,046 | 25,072 | 11.9% | 13,995 | 13,831 | 1.2% | 14,050 | 11,241 | 25.0% | |||
Net Revenue | 25,790 | 23,118 | 11.6% | 25,789 | 23,118 | 11.6% | 12,931 | 12,783 | 1.2% | 12,859 | 10,336 | 24.4% | |||
Cost of Goods Sold | (20,103) | (17,390) | 15.6% | (20,102) | (17,390) | 15.6% | (9,314) | (9,085) | 2.5% | (10,788) | (8,305) | 29.9% | |||
Depreciation (Logistic) | (71) | (64) | 10.1% | (71) | (64) | 10.1% | (60) | (49) | 22.6% | (11) | (15) | -30.2% | |||
Gross Profit | 5,616 | 5,664 | -0.9% | 5,616 | 5,664 | -0.9% | 3,556 | 3,649 | -2.5% | 2,060 | 2,016 | 2.2% | |||
Selling Expenses | (3,422) | (3,190) | 7.3% | (3,414) | (3,190) | 7.0% | (2,342) | (2,308) | 1.5% | (1,072) | (882) | 21.5% | |||
General and Administrative Expenses | (525) | (488) | 7.5% | (525) | (488) | 7.4% | (354) | (358) | -1.3% | (171) | (130) | 31.6% | |||
Selling, General and Adm. Expenses | (3,947) | (3,678) | 7.3% | (3,939) | (3,678) | 7.1% | (2,696) | (2,666) | 1.1% | (1,243) | (1,012) | 22.8% | |||
Equity Income(2) | (27) | (44) | -39.3% | 38 | 32 | 20.1% | 38 | 32 | 20.1% | - | - | n.a. | |||
Other Operating Revenue (Expenses) | (122) | (130) | -6.5% | (122) | (130) | -6.5% | (108) | (117) | -7.6% | (14) | (13) | 2.8% | |||
Depreciation and Amortization | (663) | (601) | 10.3% | (663) | (601) | 10.3% | (483) | (455) | 6.2% | (180) | (146) | 22.9% | |||
Earnings before interest and Taxes - EBIT | 858 | 1,211 | -29.2% | 931 | 1,287 | -27.6% | 308 | 443 | -30.5% | 624 | 844 | -26.1% | |||
Financial Revenue | 104 | 79 | 31.5% | 104 | 79 | 31.5% | 83 | 63 | 32.0% | 21 | 16 | 29.2% | |||
Financial Expenses | (666) | (618) | 7.8% | (666) | (618) | 7.8% | (554) | (530) | 4.5% | (113) | (88) | 27.6% | |||
Net Financial Result | (562) | (539) | 4.3% | (562) | (539) | 4.3% | (471) | (467) | 0.8% | (92) | (72) | 27.2% | |||
Income (Loss) Before Income Tax | 295 | 672 | -56.0% | 369 | 747 | -50.7% | (163) | (25) | 565.1% | 532 | 772 | -31.1% | |||
Income Tax | (76) | (191) | -60.1% | (76) | (191) | -60.1% | 98 | 65 | 50.0% | (174) | (257) | -32.1% | |||
Net Income (Loss) Company - continuing operations | 219 | 480 | -54.4% | 292 | 556 | -47.4% | (65) | 41 | n.a. | 358 | 515 | -30.6% | |||
Net Result from discontinued operations | 381 | 330 | 15.6% | 346 | (28) | n.a. | 346 | (28) | n.a. | - | - | n.a. | |||
Net Income (Loss) - Consolidated Company | 600 | 810 | -25.9% | 638 | 528 | 20.8% | 280 | 13 | 2041.7% | 358 | 515 | -30.6% | |||
Net Income (Loss) - Controlling Shareholders - continuing operations(3) | 218 | 480 | -54.6% | 291 | 556 | -47.6% | (65) | 41 | n.a. | 357 | 515 | -30.8% | |||
Net Income (Loss) - Controlling Shareholders - discontinued operations(3) | 349 | 122 | 185.1% | 346 | (28) | n.a. | 346 | (28) | n.a. | - | - | n.a. | |||
Net Income (Loss) - Consolidated Controlling Shareholders(3) | 567 | 602 | -5.9% | 637 | 528 | 20.6% | 280 | 13 | 2057.5% | 357 | 515 | -30.8% | |||
Minority Interest - Non-controlling - continuing operations | (0) | 0 | n.a. | (0) | 0 | n.a. | (0) | 0 | n.a. | - | - | n.a. | |||
Minority Interest - Non-controlling - discontinued operations | 33 | 208 | -84.3% | - | - | n.a. | - | - | n.a. | - | - | n.a. | |||
Minority Interest - Non-controlling - Consolidated | 33 | 208 | -84.3% | (0) | 0 | n.a. | (0) | 0 | n.a. | - | - | n.a. | |||
Earnings before Interest, Taxes, Depreciation, Amortization - EBITDA | 1,592 | 1,876 | -15.2% | 1,665 | 1,952 | -14.7% | 851 | 947 | -10.1% | 814 | 1,006 | -19.1% | |||
Adjusted EBITDA(4) | 1,713 | 2,006 | -14.6% | 1,787 | 2,082 | -14.2% | 959 | 1,063 | -9.8% | 828 | 1,019 | -18.8% | |||
Consolidated | Food Business | Multivarejo(1) | Assaí | ||||||||
% of Net Revenue | 1H19 | 1H18 | 1H19 | 1H18 | 1H19 | 1H18 | 1H19 | 1H18 | |||
Gross Profit | 21.8% | 24.5% |
| 21.8% | 24.5% |
| 27.5% | 28.5% | 16.0% | 19.5% | |
Selling Expenses | 13.3% | 13.8% |
| 13.2% | 13.8% |
| 18.1% | 18.1% | 8.3% | 8.5% | |
General and Administrative Expenses | 2.0% | 2.1% |
| 2.0% | 2.1% |
| 2.7% | 2.8% | 1.3% | 1.3% | |
Selling, General and Adm. Expenses | 15.3% | 15.9% |
| 15.3% | 15.9% |
| 20.8% | 20.9% | 9.7% | 9.8% | |
Equity Income(2) | 0.1% | 0.2% |
| 0.1% | 0.1% |
| 0.3% | 0.2% | 0.0% | 0.0% | |
Other Operating Revenue (Expenses) | 0.5% | 0.6% |
| 0.5% | 0.6% |
| 0.8% | 0.9% | 0.1% | 0.1% | |
Depreciation and Amortization | 2.6% | 2.6% |
| 2.6% | 2.6% |
| 3.7% | 3.6% | 1.4% | 1.4% | |
EBIT | 3.3% | 5.2% |
| 3.6% | 5.6% |
| 2.4% | 3.5% | 4.8% | 8.2% | |
Net Financial Revenue (Expenses) | 2.2% | 2.3% |
| 2.2% | 2.3% |
| 3.6% | 3.7% | 0.7% | 0.7% | |
Income Before Income Tax | 1.1% | 2.9% |
| 1.4% | 3.2% |
| 1.3% | -0.2% | 4.1% | 7.5% | |
Income Tax | 0.3% | 0.8% |
| 0.3% | 0.8% |
| 0.8% | 0.5% | 1.4% | 2.5% | |
Net Income (Loss) Company - continuing operations | 0.8% | 2.1% |
| 1.1% | 2.4% |
| 0.5% | 0.3% | 2.8% | 5.0% | |
Net Income (Loss) - Consolidated Company | 2.3% | 3.5% |
| 2.5% | 2.3% |
| 2.2% | 0.1% | 2.8% | 5.0% | |
Net Income (Loss) - Controlling Shareholders - continuing operations(3) | 0.8% | 2.1% |
| 1.1% | 2.4% |
| 0.5% | 0.3% | 2.8% | 5.0% | |
Net Income (Loss) - Consolidated Controlling Shareholders(3) | 2.2% | 2.6% |
| 2.5% | 2.3% |
| 2.2% | 0.1% | 2.8% | 5.0% | |
Minority Interest - Non-controlling - continuing operations | 0.0% | 0.0% |
| 0.0% | 0.0% |
| 0.0% | 0.0% | 0.0% | 0.0% | |
Minority Interest - Non-controlling - Consolidated | -0.1% | 0.9% |
| 0.0% | 0.0% |
| 0.0% | 0.0% | 0.0% | 0.0% | |
EBITDA | 6.2% | 8.1% |
| 6.5% | 8.4% |
| 6.6% | 7.4% | 6.3% | 9.7% | |
Adjusted EBITDA(4) | 6.6% | 8.7% |
| 6.9% | 9.0% |
| 7.4% | 8.3% | 6.4% | 9.9% | |
(1) Multivarejo includes the results of Malls and Corporate. (2) Equity income from Cdiscount is included in the Consolidated results and not in the Retail and Cash-and-Carry segments. (3) Net income after non-controlling interest. (4) Adjusted for Other Operating Income and Expenses.
37
2.4 Income Statement for 1H19 – Before IFRS 16
Consolidated | Food Business | Multivarejo(1) | Assaí | ||||||||||||
1H19 | 1H18 | Δ | 1H19 | 1H18 | Δ | 1H19 | 1H18 | Δ | 1H19 | 1H18 | Δ | ||||
R$ - Million |
|
|
|
|
|
|
|
|
|
|
|
| |||
Gross Revenue | 28,046 | 25,072 | 11.9% | 28,046 | 25,072 | 11.9% | 13,995 | 13,831 | 1.2% | 14,050 | 11,241 | 25.0% | |||
Net Revenue | 25,790 | 23,118 | 11.6% | 25,789 | 23,118 | 11.6% | 12,931 | 12,783 | 1.2% | 12,859 | 10,336 | 24.4% | |||
Cost of Goods Sold | (20,166) | (17,449) | 15.6% | (20,165) | (17,449) | 15.6% | (9,368) | (9,131) | 2.6% | (10,797) | (8,318) | 29.8% | |||
Depreciation (Logistic) | (25) | (25) | 0.6% | (25) | (25) | 0.6% | (20) | (20) | -3.5% | (5) | (4) | 19.4% | |||
Gross Profit | 5,599 | 5,645 | -0.8% | 5,599 | 5,645 | -0.8% | 3,543 | 3,631 | -2.4% | 2,057 | 2,014 | 2.1% | |||
Selling Expenses | (3,790) | (3,526) | 7.5% | (3,782) | (3,526) | 7.3% | (2,632) | (2,574) | 2.3% | (1,150) | (953) | 20.7% | |||
General and Administrative Expenses | (529) | (491) | 7.7% | (529) | (491) | 7.7% | (356) | (360) | -1.1% | (173) | (131) | 31.5% | |||
Selling, General and Adm. Expenses | (4,319) | (4,018) | 7.5% | (4,311) | (4,018) | 7.3% | (2,988) | (2,934) | 1.9% | (1,323) | (1,084) | 22.0% | |||
Equity Income(2) | (26) | (44) | -41.8% | 38 | 32 | 19.9% | 38 | 32 | 19.9% | - | - | n.a. | |||
Other Operating Revenue (Expenses) | (141) | (133) | 5.8% | (141) | (133) | 5.8% | (127) | (120) | 6.2% | (14) | (13) | 2.2% | |||
Depreciation and Amortization | (454) | (419) | 8.3% | (453) | (419) | 8.3% | (317) | (308) | 3.0% | (137) | (111) | 23.0% | |||
Earnings before interest and Taxes - EBIT | 660 | 1,031 | -36.0% | 732 | 1,107 | -33.9% | 148 | 302 | -50.8% | 584 | 805 | -27.5% | |||
Financial Revenue | 104 | 79 | 31.5% | 104 | 79 | 31.5% | 83 | 63 | 32.0% | 21 | 16 | 29.2% | |||
Financial Expenses | (391) | (358) | 9.2% | (391) | (358) | 9.2% | (341) | (327) | 4.2% | (50) | (31) | 60.5% | |||
Net Financial Result | (287) | (279) | 2.8% | (287) | (279) | 2.8% | (258) | (264) | -2.4% | (29) | (15) | 94.7% | |||
Income (Loss) Before Income Tax | 373 | 752 | -50.4% | 445 | 828 | -46.3% | (110) | 38 | n.a. | 554 | 790 | -29.8% | |||
Income Tax | (98) | (213) | -54.1% | (98) | (213) | -54.1% | 84 | 50 | 69.9% | (182) | (263) | -30.7% | |||
Net Income (Loss) Company - continuing operations | 275 | 539 | -49.0% | 347 | 615 | -43.5% | (25) | 87 | n.a. | 372 | 527 | -29.4% | |||
Net Result from discontinued operations | 252 | 212 | 18.6% | 354 | 4 | 9600.8% | 354 | 4 | 9600.8% | - | - | n.a. | |||
Net Income (Loss) - Consolidated Company | 527 | 751 | -29.9% | 701 | 618 | 13.4% | 329 | 91 | 261.8% | 372 | 527 | -29.4% | |||
Net Income (Loss) - Controlling Shareholders - continuing operations(3) | 275 | 539 | -49.0% | 347 | 615 | -43.5% | (25) | 87 | n.a. | 372 | 527 | -29.4% | |||
Net Income (Loss) - Controlling Shareholders - discontinued operations(3) | 307 | 89 | 244.6% | 354 | 4 | 9600.8% | 354 | 4 | 9600.8% | - | - | n.a. | |||
Net Income (Loss) - Consolidated Controlling Shareholders(3) | 582 | 628 | -7.3% | 701 | 618 | 13.4% | 329 | 91 | 261.8% | 372 | 527 | -29.4% | |||
Minority Interest - Non-controlling - continuing operations | - | - | n.a. | - | - | n.a. | - | - | n.a. | - | - | n.a. | |||
Minority Interest - Non-controlling - discontinued operations | (55) | 123 | n.a. | - | - | n.a. | - | - | n.a. | - | - | n.a. | |||
Minority Interest - Non-controlling - Consolidated | (55) | 123 | n.a. | - | - | n.a. | - | - | n.a. | - | - | n.a. | |||
Earnings before Interest, Taxes, Depreciation, Amortization - EBITDA | 1,138 | 1,475 | -22.8% | 1,210 | 1,526 | -20.7% | 485 | 609 | -20.4% | 725 | 916 | -20.8% | |||
Adjusted EBITDA(4) | 1,279 | 1,608 | -20.4% | 1,352 | 1,659 | -18.5% | 612 | 729 | -16.0% | 739 | 930 | -20.5% | |||
Consolidated | Food Business | Multivarejo(1) | Assaí | ||||||||
% of Net Revenue | 1H19 | 1H18 | 1H19 | 1H18 | 1H19 | 1H18 | 1H19 | 1H18 | |||
Gross Profit | 21.7% | 24.4% |
| 21.7% | 24.4% |
| 27.4% | 28.4% |
| 16.0% | 19.5% |
Selling Expenses | 14.7% | 15.3% |
| 14.7% | 15.3% |
| 20.4% | 20.1% |
| 8.9% | 9.2% |
General and Administrative Expenses | 2.1% | 2.1% |
| 2.1% | 2.1% |
| 2.8% | 2.8% |
| 1.3% | 1.3% |
Selling, General and Adm. Expenses | 16.7% | 17.4% |
| 16.7% | 17.4% |
| 23.1% | 22.9% |
| 10.3% | 10.5% |
Equity Income(2) | 0.1% | 0.2% |
| 0.1% | 0.1% |
| 0.3% | 0.2% |
| 0.0% | 0.0% |
Other Operating Revenue (Expenses) | 0.5% | 0.6% |
| 0.5% | 0.6% |
| 1.0% | 0.9% |
| 0.1% | 0.1% |
Depreciation and Amortization | 1.8% | 1.8% |
| 1.8% | 1.8% |
| 2.5% | 2.4% |
| 1.1% | 1.1% |
EBIT | 2.6% | 4.5% |
| 2.8% | 4.8% |
| 1.1% | 2.4% |
| 4.5% | 7.8% |
Net Financial Revenue (Expenses) | 1.1% | 1.2% |
| 1.1% | 1.2% |
| 2.0% | 2.1% |
| 0.2% | 0.1% |
Income Before Income Tax | 1.4% | 3.3% |
| 1.7% | 3.6% |
| 0.8% | 0.3% |
| 4.3% | 7.6% |
Income Tax | 0.4% | 0.9% |
| 0.4% | 0.9% |
| 0.7% | 0.4% |
| 1.4% | 2.5% |
Net Income (Loss) Company - continuing operations | 1.1% | 2.3% |
| 1.3% | 2.7% |
| 0.2% | 0.7% |
| 2.9% | 5.1% |
Net Income (Loss) - Consolidated Company | 2.0% | 3.2% |
| 2.7% | 2.7% |
| 2.5% | 0.7% |
| 2.9% | 5.1% |
Net Income (Loss) - Controlling Shareholders - continuing operations(3) | 1.1% | 2.3% |
| 1.3% | 2.7% |
| 0.2% | 0.7% |
| 2.9% | 5.1% |
Net Income (Loss) - Consolidated Controlling Shareholders(3) | 2.3% | 2.7% |
| 2.7% | 2.7% |
| 2.5% | 0.7% |
| 2.9% | 5.1% |
Minority Interest - Non-controlling - continuing operations | 0.0% | 0.0% |
| 0.0% | 0.0% |
| 0.0% | 0.0% |
| 0.0% | 0.0% |
Minority Interest - Non-controlling - Consolidated | 0.2% | 0.5% |
| 0.0% | 0.0% |
| 0.0% | 0.0% |
| 0.0% | 0.0% |
EBITDA | 4.4% | 6.4% |
| 4.7% | 6.6% |
| 3.8% | 4.8% |
| 5.6% | 8.9% |
Adjusted EBITDA(4) | 5.0% | 7.0% |
| 5.2% | 7.2% |
| 4.7% | 5.7% |
| 5.7% | 9.0% |
(1) Multivarejo includes the results of Malls and Corporate. (2) Equity income from Cdiscount is included in the Consolidated results and not in the Retail and Cash-and-Carry segments. (3) Net income after non-controlling interest. (4) Adjusted for Other Operating Income and Expenses.
38
3. Cash Flow – Consolidated (including Via Varejo)(*)
STATEMENT OF CASH FLOW | |||
Consolidated | |||
(R$ million) | 06.30.2019 | 06.30.2018 | |
Net Income (Loss) for the period | 468 | 841 | |
Deferred income tax | 189 | 251 | |
Loss (gain) on disposal of fixed and intangible assets | 110 | 115 | |
Depreciation and amortization | 732 | 666 | |
Interests and exchange variation | 837 | 851 | |
Equity Income | 11 | 32 | |
Provision for contingencies | 147 | 143 | |
Share-Based Compensation | 29 | 28 | |
Allowance for doubtful accounts | 259 | 322 | |
Provision for obsolescence/breakage | (11) | (15) | |
Other operational expenses | 18 | 369 | |
Deferred revenue | (215) | (215) | |
Eventual expenses | (91) | (16) | |
Gain of sale of subsidiary | (609) | - | |
|
|
| |
Asset (Increase) decreases | - | - | |
Accounts receivable | (63) | 324 | |
Inventories | (24) | (1,321) | |
Taxes recoverable | (21) | (1,317) | |
Dividends received | 12 | - | |
Other Assets | (301) | (54) | |
Related parties | (97) | 56 | |
Restricted deposits for legal proceeding | (20) | (12) | |
|
|
| |
Liability (Increase) decrease |
|
| |
Suppliers | (4,775) | (2,359) | |
Payroll and charges | (169) | (128) | |
Taxes and Social contributions payable | 98 | 6 | |
Other Accounts Payable | (44) | (19) | |
Contingencies | (364) | (440) | |
Deferred revenue | 12 | 117 | |
Taxes and Social contributions paid | (93) | (249) | |
|
| ||
Net cash generated from (used) in operating activities | (3,975) | (2,024) | |
|
| ||
Acquisition of property and equipment | (1,000) | (711) | |
Increase Intangible assets | (197) | (212) | |
Sales of property and equipment | 15 | 81 | |
Cash provided on sale of subisidiary | 2,326 | - | |
Net cash flow investment activities | 1,144 | (842) | |
|
| ||
Cash flow from financing activities |
|
| |
Increase of capital | 11 | 1 | |
Funding and refinancing | 3,246 | 4,362 | |
Payments of loans and financing | (2,672) | (3,755) | |
Dividend Payment | (192) | (176) | |
Acquisition of society | (19) | - | |
Intercompany loans | (918) | (918) | |
Net cash generated from (used) in financing activities | (544) | (486) | |
|
| ||
Increase (decrease) in cash and cash equivalents | (3,375) | (3,352) | |
|
| ||
Cash and cash equivalents at the beginning of the year | 8,080 | 7,351 | |
Cash and cash equivalents at the end of the year | 4,705 | 3,999 | |
Change in cash and cash equivalents | (3,375) | (3,352) | |
(*)Includes 5 months of Via Varejo in 2019 and 6 months in 2018
39
4. Breakdown of Sales by Business
Breakdown of Gross Sales by Business | ||||||||||||
(R$ million) | 2Q19 | % | 2Q18 | % | Δ | 1H19 | % | 1H18 | % | Δ | ||
Multivarejo |
| 7,074 | 49.8% | 7,030 | 55.0% | 0.6% |
| 13,996 | 49.9% | 13,831 | 55.2% | 1.2% |
Pão de Açúcar |
| 1,830 | 12.9% | 1,886 | 14.8% | -3.0% |
| 3,608 | 12.9% | 3,639 | 14.5% | -0.9% |
Extra(1) |
| 4,215 | 29.6% | 4,144 | 32.4% | 1.7% |
| 8,370 | 29.8% | 8,295 | 33.1% | 0.9% |
Convenience Stores(2) |
| 334 | 2.4% | 298 | 2.3% | 12.4% |
| 592 | 2.1% | 562 | 2.2% | 5.4% |
Other Businesses(3) |
| 695 | 4.9% | 703 | 5.5% | -1.2% |
| 1,426 | 5.1% | 1,334 | 5.3% | 6.9% |
Cash & Carry |
| 7,144 | 50.2% | 5,742 | 45.0% | 24.4% |
| 14,050 | 50.1% | 11,241 | 44.8% | 25.0% |
Assaí |
| 7,144 | 50.2% | 5,742 | 45.0% | 24.4% |
| 14,050 | 50.1% | 11,241 | 44.8% | 25.0% |
Food Business |
| 14,218 | 100.0% | 12,772 | 100.0% | 11.3% |
| 28,047 | 100.0% | 25,072 | 100.0% | 11.9% |
Breakdown of Net Sales by Business | ||||||||||||
(R$ million) | 2Q19 | % | 2Q18 | % | Δ | 1H19 | % | 1H18 | % | Δ | ||
Multivarejo |
| 6,549 | 50.1% | 6,497 | 55.2% | 0.8% |
| 12,930 | 50.1% | 12,783 | 55.3% | 1.2% |
Pão de Açúcar |
| 1,681 | 12.9% | 1,732 | 14.7% | -2.9% |
| 3,317 | 12.9% | 3,345 | 14.5% | -0.8% |
Extra(1) |
| 3,840 | 29.4% | 3,802 | 32.3% | 1.0% |
| 7,627 | 29.6% | 7,606 | 32.9% | 0.3% |
Convenience Stores(2) |
| 314 | 2.4% | 278 | 2.4% | 13.0% |
| 555 | 2.2% | 524 | 2.3% | 5.8% |
Other Businesses(3) |
| 713 | 5.5% | 686 | 5.8% | 4.0% |
| 1,431 | 5.5% | 1,307 | 5.7% | 9.5% |
Cash & Carry |
| 6,532 | 49.9% | 5,278 | 44.8% | 23.8% |
| 12,859 | 49.9% | 10,336 | 44.7% | 24.4% |
Assaí |
| 6,532 | 49.9% | 5,278 | 44.8% | 23.8% |
| 12,859 | 49.9% | 10,336 | 44.7% | 24.4% |
Food Business |
| 13,081 | 100.0% | 11,775 | 100.0% | 11.1% |
| 25,789 | 100.0% | 23,118 | 100.0% | 11.6% |
(1) Includes sales by Extra Supermercado, Mercado Extra, Extra Hiper and Compre Bem. (2) Includes sales by Mini Extra, Minuto Pão de Açúcar and Aliados.
(3) Includes sales by Gas stations, Drugstores, Delivery and rental revenue from commercial centers.
5. Breakdown of Sales (% of Net Sales)
SALES BREAKDOWN (% of Net Sales) | ||
Food Business | ||
2Q19 | 2Q18 | |
Cash | 48.2% | 48.2% |
Credit Card | 41.1% | 41.2% |
Food Voucher | 10.7% | 10.6% |
6. Net Sales Performance

(1) To reflect the calendar effect, 80 bps was reduced in GPA Food: 90 bps in Multivarejo and 60 bps in Assaí.
40
7. Store Portfolio Changes by Banner
In the quarter, three new Assaí stores were opened. In addition, 13 conversions of Extra Super to Mercado Extra were concluded.
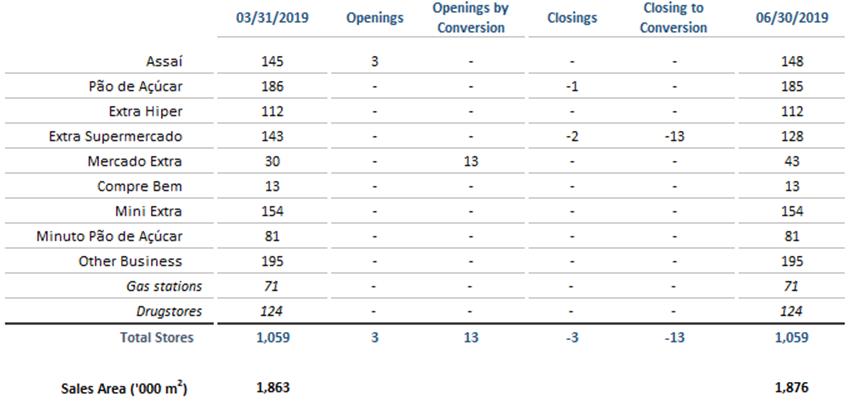
41
2Q19 Results Conference Call and Webcast
Thursday, July 25, 2019
11:00 a.m. (Brasília) | 10:00 a.m. (New York) | 3:00 p.m. (London)
Conference call in Portuguese (original language)
+55 11 3181-8565
Conference call in English (simultaneous translation)
+1 412 717-9627
Webcast:http://www.gpari.com.br
Replay
+55 (11) 3193-1012 or +55 (11) 2820-4012
Access code for audio in Portuguese: 1932275#
Access code for audio in English: 1779586#
http://www.gpari.com.br
Investor Relations Contacts
GPA Telephone: 55 (11) 3886-0421 gpa.ri@gpabr.com www.gpari.com.br
|
About GPA:GPA is Brazil’s largest retailer, with a distribution network comprising over 2,000 points of sale as well as electronic channels. Established in 1948 in São Paulo, it has its head office in the city and operations in 18 Brazilian states and the Federal District. With a strategy of focusing its decisions on customers and better serving them based on their consumer profile in the wide variety of shopping experiences it offers, GPA adopts a multi-business and multi-channel platform consisting of brick-and-mortar stores and e-commerce operations, divided into the following business units: Multivarejo, which operates the supermarket, hypermarket and Minimercado store formats, as well as fuel stations and drugstores under the Pão de Açúcar, Extra and Compre Bem banners; Assaí, which operates in the cash-and-carry wholesale segment; and GPA Malls, which is responsible for managing the Group's real estate assets, expansion projects and new store openings.
Disclaimer: Statements contained in this release relating to the business outlook of the Company, projections of operating/financial results, growth prospects of the Company and market and macroeconomic estimates are merely forecasts and are based on the beliefs, plans and expectations of Management in relation to the Company’s future. These expectations are highly dependent on changes in the market, Brazil’s general economic performance, the industry and international markets, and hence are subject to change.
42
Glossary
Food Segment:Represents the combined results of Multivarejo and Assaí, excluding equity income (loss) from Cdiscount, which is not included in the operating segments reported by the Company.

EBITDA: EBITDA is calculated in accordance with Instruction 527 issued by the Securities and Exchange Commission of Brazil (CVM) on October 4, 2012.
Adjusted EBITDA:Measure of profitability calculated by excluding Other Operating Income and Expenses from EBITDA. Management uses this measure in its analyses as it believes it eliminates nonrecurring expenses and revenues and other nonrecurring items that could compromise the comparability and analysis of results.
Earnings per share:Diluted earnings per share are calculated as follows:
● Numerator: profit for the year adjusted by dilutive effects from stock options granted by subsidiaries.
● Denominator: number of shares of each category adjusted to include potential shares corresponding to dilutive instruments (stock options), less the number of shares that could be bought back at the market, as applicable.
Equity instruments that will or may be settled with the Company and its subsidiaries’ shares are only included in the calculation when their settlement has a dilutive impact on earnings per share.
Compre Bem:Project involving the conversion of stores in order to enter a market niche currently occupied by regional supermarkets. The store model is better adapted to the needs of the consumers in the regions where the stores are located. The service and assortment of the perishables category will be reinforced, while other categories will have a leaner assortment. Compre Bem is managed independently from the Extra Super banner with the focus on streamlining operating costs, especially logistics and IT.
Mercado Extra: Project aims to renovate Extra Super by reinforcing the quality of perishables and customer service, with the focus on the B and C income groups. There will be no change in the operating model of the stores, which will continue to be managed under the Extra banner.
43
James Delivery (last miler):Multiservice platform for ordering and delivering in minutes of diverse products selected by our customers, including restaurants and integration with our supermarkets and drugstores.
Cheftime:pioneering startup in the Foodtech segment, offering online subscription services and sales of gastronomic kits.
Same-store growth:Same-store growth, as mentioned in this document, is adjusted by the calendar effect in each period.
Growth and Changes:The growth and changes presented in this document refer to variations from the same period last year, except where stated otherwise.
44
Companhia Brasileira de Distribuição
Notes to the interim financial information
June 30, 2019
(In millions of Brazilian reais, unless otherwise stated)
1. Corporate information
Companhia Brasileira de Distribuição ("Company" or “CBD”), directly or through its subsidiaries (“Group” or “GPA”) is engaged in the retail of food, clothing, home appliances, electronics and other products through its chain of hypermarkets, supermarkets, specialized stores and department stores especially under the trade names "Pão de Açúcar, “Minuto Pão de Açúcar”, "Extra Hiper", “Extra Super”, “Mercado Extra“, “Minimercado Extra”, “Assai”, and the neighborhood shopping mall brand “Conviva”. The Group’s headquarters are located in the city of São Paulo, State of São Paulo, Brazil.
The Company’s investments in retail activities in the segments of electronics and e-commerce were related to Via Varejo S.A.as discontinued operations and were sold in June 30,2019 (note 13.2) and represented the stores under the brands “Ponto Frio” and “Casas Bahia", as well as the e-commerce platforms “CasasBahia.com,” “Pontofrio.com” and “Barateiro.com”.
The Company’s shares are listed on the São Paulo Stock Exchange (“B3”) Level 1 of Corporate Governance under the ticker symbol “PCAR4” and on the New York Stock Exchange (ADR level III), under the ticker symbol “CBD”.
The Company is indirectly controlled by Almacenes Éxito S.A., through Wilkes Participações S.A. (“Wilkes”), and its ultimate parent company is Casino Guichard Perrachon (“Casino”), French company listed on Paris Stock Exchange.
1.1 Reorganization proposal Latin America
On June 26, 2019, a recommendation of the Company's final controlling shareholder, Casino Guichard-Perrachon ("Casino"), was presented at a meeting of the GPA Board of Directors. With the aimed at simplifying the structure of the Casino in Latin America, a significant improvement in governance and an increase in the base of potential investors.
The proposed reorganization, which has the support of the executive board of the GPA, involves: (i) a public offering to be launched by the GPA for the acquisition, in cash, of all the shares of Almacenes Éxito SA, capital stock located in Colombia ("Success"); (ii) the acquisition by the Casino of all GPA's share control shares currently held indirectly by Éxito at a fair price; and (iii) the migration from the GPA to the Novo Mercado, B3's highest governance segment, with the conversion of all GPA preferred shares into common shares at the ratio of 1 to 1.
The price to be offered by GPA for the shares of Éxito should be examined by an independent special committee ("Special Committee"), whose installation was approved by the Board of Directors, which will deliberate in accordance with CVM Guideline 35, as provided for in GPA Related Party Transactions Policy. Notwithstanding the duty of the Special Committee to examine the price of the proposed potential transaction, it is indicated to the executive board that each share of Éxito to be considered could be in the range of 16,000 to 18,000 Colombian pesos (representing, on this date, between R$19.31 and R$21.72).
On July 24, 2019, the Board of Director of GPA, based on the favorable recommendation from the special independent committee formed to analyze the transaction described in the material fact mentioned above, directed its operational subsidiary Sendas Distribuidora S.A. (“Sendas”) to approve the launch of an all-cash tender offer to acquire up to all of the shares of Almacenes Éxito S.A. (“Éxito”) for the price of 18,000 Colombian pesos for each Éxito share (which, on this date, is equivalent to approximately R$21.20).
The recommendation of the Special Committee and the approval of the Board of Directors take in consideration the proposal of Casino Guichard-Perrachon’s (“Casino”) to acquire Éxito’s indirect equity interest in GPA based on a price of R$109.00 for each GPA share.
45
Companhia Brasileira de Distribuição
Notes to the interim financial information
June 30, 2019
(In millions of Brazilian reais, unless otherwise stated)
1. Corporate information - Continued
The authorization request for the Tender Offer before the Colombian Financial Superintendence shall be made if and after Éxito has granted the proper corporate approvals regarding the sale of its indirectequity interest in GPA. The Board of Directors authorized the commencement of preparatory work with the objective of the migration of GPA to Novo Mercado, considering the conversion of all the preferred shares into common shares at a 1:1 ratio. A new Board of Director’s meeting shall be called in due time to approve the migration proposal.
2. Basis of preparation
The individual and consolidated interim financial information has been prepared in accordance with IAS 34 - Interim Financial Reporting issued by the International Accounting Standard Board (“IASB”) and CPC 21 (R1) - Interim Financial Reporting and presented consistently with the standards approved and issued by the Brazilian Securities and Exchange Commission (“CVM”) applicable to the preparation of interim financial information – ITR.
The individual and consolidated interim financial information is being presented in millions of Brazilian Reais. The reporting currency of the Company is Real and for subsidiaries located abroad is the local currency of each jurisdiction.
The individual and consolidated interim financial information for the period ended June 30, 2019 were approved by the Board of Directors on July 24, 2019.
The Company concluded of the process of sale of the subsidiary Via Varejo S.A. (note 13.2), and recorded until June 14, 2019), the individual and consolidated interim financial information of the statement of the operations and the statement of the added value for the periods ended June 30, 2019 and June 30, 2018 presented with the effects of the transaction.
The cash flow statements presented include the continuing and discontinued operations in line with technical pronouncement CPC31 / IFRS 5.
The balance sheet, the income statement and the comprehensive income, the statement of value added, the statement of changes in shareholders equity and the statement of cash flow were restated with the adoption of IFRS 16 (see note 5).
3. Basis of consolidation
The information on the basis of consolidation did not have significant modification and was disclosed in the annual financial statements for 2018, in note 3.
4. Significant accounting policies
The significant accounting policies adopted by the Company in the preparation of the individual and consolidated interim financial information are consistent with those adopted and disclosed on Note 4 of the financial statements for the year ended December 31, 2018 and therefore should be read in conjunction and except for the adoption of CPC06 (R2) leases pronouncement, presented in note nº 5.1.
46
Companhia Brasileira de Distribuição
Notes to the interim financial information
June 30, 2019
(In millions of Brazilian reais, unless otherwise stated)
5. Adoption of new accounting pronouncements, amendments and interpretations issued by IASB and CPC as from January 1, 2019
5.1. CPC 06(R2)/ IFRS 16 - Leases
CPC 06 (R2) / IFRS 16 sets forth the principles for the recognition, measurement, presentation and disclosure of leasing operations and requires tenants to account for all leases in a single model balance sheet similar to accounting for molds of CPC 06 (R1) / IAS 17.
The Company opted for the adoption of the full retrospective approach as a transition method on January 1, 2019, with effect from the beginning of the first practicable period and consequently, the comparative periods are being restated.
In the signing of an agreement, the Company must consider if the contract is a lease, or contains a lease component. The contract is, or contains, a lease if it transfers the rights to control the use of an asset for a period of time in exchange of a consideration.
The Group leases equipment and commercial spaces, including stores and distribution centers, through cancelable and non-cancelable lease agreements. The agreements length vary substantially from 5 to 25 years.
The Group as a lessee
Company evaluates its agreements in order to identify the lease relationships of a right of use, considering the exceptions described in the standard as short-term agreements lower than twelve months and individual assets with amount lower than US$5 thousands.
Lease agreements are then recorded, at its beginning, as a Lease liability (note 21) against a Right of use (note 14 and 15), both by the present value of the minimum lease payments, using the implied interest rate in the agreement, or the incremental borrowing rate of the lessee.
The amounts of Pis and Cofins were disregarded from the contractual flow of payments, for purposes of measuring the lease liability and the right of use, as the lessor acts as agent in the payment of these taxes.
The lease term utilized in the measurement relates to the term that the lessee is reasonably certain that will extend, or that will not extend, the lease relationship.
Subsequently, the payments made are allocated between financial interest and reduction of the liability, applying the interest rate in the balance of the liability. The financial interest is recognized as financial expenses.
The Right of Use of the lease agreements is amortized as expense, as incurred, by the lease term used lease. The leasehold improvements made in our stores are amortized over their useful life, or the expected time for utilization of the asset limited in the cases where there is evidence that the lease will not be extended.
The contingent rentals are recognized as expenses as incurred.
Group as lessors
Lease agreements in which the Group does not transfer substantially all the risks and rewards of ownership of the asset are classified as operating lease. Rental income arising is accounted for on a straight-line basis over the lease terms and is included in revenue in the statement of profit or loss due to its operating nature. Initial direct costs incurred in negotiating an operating lease are accounted for as part of the carrying amount of the leased asset and amortized over the agreement term on the same basis as rental income.
47
Companhia Brasileira de Distribuição
Notes to the interim financial information
June 30, 2019
(In millions of Brazilian reais, unless otherwise stated)
5. Adoption of new accounting pronouncements, amendments and interpretations issued by IASB and CPC as from January 1, 2019 - Continued
5.2 Presentation of the retrospective effects of the application of pronouncements
Contingent rentals are recognized as revenue in the periods in which they are earned.
As result of the full retrospective approach of CPC 06 (R2) (IFRS16) the comparative periods are being restated. Below are the effects of the effects of the application of CPC06 (R2) / IFRS16 considering the current understanding of the Company and exclusion of the taxes levied, however, discussions the application continue with market and regulatory agencies.
Balance Sheet
Parent Company | |||
12.31.2018 | |||
As originally presented | IFRS16 effects | Restated | |
| |||
Assets held for sale | 2,014 | 40 | 2,054 |
Total current assets | 9,554 | 40 | 9,594 |
| |||
Deferred income tax and social contribution taxes | 172 | 74 | 246 |
Investments in subsidiaries and associates | 4,536 | (112) | 4,424 |
Property and equipment | 5,864 | 2,538 | 8,402 |
Intangible assets | 1,674 | 132 | 1,806 |
Total non-current assets | 15,228 | 2,632 | 17,860 |
Total Assets | 24,782 | 2,672 | 27,454 |
Borrowings and financing | 1,336 | (30) | 1,306 |
Lease liability | - | 502 | 502 |
Other current liabilities | 384 | (120) | 264 |
Total current liabilities | 8,523 | 352 | 8,875 |
| |||
Borrowings and financing | 3,403 | (113) | 3,290 |
Lease liability | - | 3,217 | 3,217 |
Provision for losses on investments in associates | 267 | 12 | 279 |
Total non-current liabilities | 5,176 | 3,116 | 8,292 |
|
|
|
|
Total liabilities | 13,699 | 3,468 | 17,167 |
| |||
Total Shareholders' Equity | 11,083 | (796) | 10,287 |
Total liabilities and shareholders' equity | 24,782 | 2,672 | 27,454 |
48
Companhia Brasileira de Distribuição
Notes to the interim financial information
June 30, 2019
(In millions of Brazilian reais, unless otherwise stated)
5. Adoption of new accounting pronouncements, amendments and interpretations issued by IASB and CPC as from January 1, 2019 - Continued
5.2. Presentation of the retrospective effects of the application of pronouncements - Continued
Consolidated | |||
12.31.2018 | |||
As originally presented | IFRS16 effects | Restated | |
| |||
Other current assets | 175 | (26) | 149 |
Assets held for sale | 24,443 | �� 3,862 | 28,305 |
Total current assets | 36,304 | 3,836 | 40,140 |
|
|
|
|
Deferred income tax and social contribution taxes | |||
Investments in subsidiaries and associates | 207 | 128 | 335 |
Property and equipment | 59 | (42) | 17 |
Intangible assets | 9,650 | 3,473 | 13,123 |
Total non-current assets | 2,675 | 130 | 2,805 |
Total Assets | 16,545 | 3,689 | 20,234 |
| 52,849 | 7,525 | 60,374 |
| |||
Borrowings and financing | 2,016 | (35) | 1,981 |
Lease liability | - | 575 | 575 |
Other current liabilities | 454 | (131) | 323 |
Liabilities related to assets held for sale | 19,412 | 3,777 | 23,189 |
Total current liabilities | 32,785 | 4,186 | 36,971 |
| |||
Borrowings and financing | 3,509 | (117) | 3,392 |
Lease liability | - | 4,187 | 4,187 |
Provision for losses on investments in associates | 267 | 12 | 279 |
Total non-current liabilities | 6,125 | 4,082 | 10,207 |
|
|
|
|
Total liabilities | 38,910 | 8,268 | 47,178 |
| |||
Total Shareholders' Equity | 13,939 | (743) | 13,196 |
Total liabilities and shareholders' equity | 52,849 | 7,525 | 60,374 |
49
Companhia Brasileira de Distribuição
Notes to the interim financial information
June 30, 2019
(In millions of Brazilian reais, unless otherwise stated)
5. Adoption of new accounting pronouncements, amendments and interpretations issued by IASB and CPC as from January 1, 2019 - Continued
5.2. Presentation of the retrospective effects of the application of pronouncements - Continued
Statement of Operations
Parent Company | |||
06.30.2018 | |||
As originally presented | IFRS16 effects | Restated | |
| |||
Cost of sales | (9,073) | 22 | (9,051) |
Gross profit | 3,608 | 22 | 3,630 |
Operating income (expenses) |
|
|
|
Selling expenses | (2,566) | 265 | (2,301) |
General and administrative expenses | (357) | 2 | (355) |
Depreciation and amortization | (307) | (149) | (456) |
Share of profit of associates | 556 | 52 | 608 |
Other operation expenses, net | (101) | 3 | (98) |
Profit from operations before net financial expenses | 833 | 195 | 1,028 |
Net financial expenses | (255) | (205) | (460) |
Income before income tax and social | 578 | (10) | 568 |
Income tax and social contribution | 46 | 16 | 62 |
Net income from continuing operations | 624 | 6 | 630 |
Net income (loss) from discontinued operations | 4 | (31) | (27) |
Net income for the period | 628 | (25) | 603 |
Attributable: |
|
|
|
Controlling shareholders – continuing operations | 624 | 6 | 630 |
Controlling shareholders – discontinued operations | 4 | (31) | (27) |
Total of controlling shareholders | 628 | (25) | 603 |
50
Companhia Brasileira de Distribuição
Notes to the interim financial information
June 30, 2019
(In millions of Brazilian reais, unless otherwise stated)
5. Adoption of new accounting pronouncements, amendments and interpretations issued by IASB and CPC as from January 1, 2019 -Continued
5.2. Presentation of the retrospective effects of the application of pronouncements - Continued
| Consolidated | ||
06.30.2018 | |||
As originally presented | IFRS16 effects | Restated | |
| |||
Cost of sales | (17,473) | 19 | (17,454) |
Gross profit | 5,645 | 19 | 5,664 |
Operating income (expenses) |
|
|
|
Selling expenses |
|
|
|
General and administrative expenses | (3.526) | 336 | (3,190) |
Depreciation and amortization | (492) | 4 | (488) |
Share of profit of associates | (419) | (183) | (602) |
Other operation expenses, net | (133) | 4 | (129) |
Profit from operations before net financial expenses | 1,031 | 180 | 1,211 |
Net financial expenses | (279) | (261) | (540) |
Income before income tax and social | 752 | (81) | 671 |
Income tax and social contribution | (213) | 22 | (191) |
Net income from continuing operations | 539 | (59) | 480 |
Net income (loss) from discontinued operations | 212 | 118 | 330 |
Net income for the period | 751 | 59 | 810 |
Attributable: |
|
|
|
Controlling shareholders – continuing operations | 539 | (59) | 480 |
Controlling shareholders – discontinued operations | 89 | 34 | 123 |
Total of Controlling shareholders | 628 | (25) | 603 |
|
|
| |
Non-controlling shareholders – discontinued operations | 123 | 84 | 207 |
Total of non-controlling shareholders | 123 | 84 | 207 |
51
Companhia Brasileira de Distribuição
Notes to the interim financial information
June 30, 2019
(In millions of Brazilian reais, unless otherwise stated)
5. Adoption of new accounting pronouncements, amendments and interpretations issued by IASB and CPC as from January 1, 2019 -Continued
5.2. Presentation of the retrospective effects of the application of pronouncements - Continued
Statement of Cash Flows
Parent Company | |||
06.30.2018 | |||
As originally presented | IFRS16 effects | Restated | |
| |||
Net income for the period | 628 | (25) | 603 |
Deferred income tax | (45) | 15 | (30) |
Losses (gain) of disposals of property and equipment | 1 | 12 | 13 |
Depreciation/ Amortization | 327 | 178 | 505 |
Interest and inflation adjustments | 210 | 206 | 416 |
Share of profit (loss) of subsidiaries and associates | (556) | (52) | (608) |
Losses (gain) on lease liability write off | - | (15) | (15) |
Other liabilities | 6 | 48 | 54 |
Payments of borrowings and financing | (617) | 34 | (583) |
Payments of lease liability | - | (401) | (401) |
Consolidated | |||
06.30.2018 | |||
As originally presented | IFRS16 effects | Restated | |
| |||
Net income for the period | 751 | 59 | 810 |
Deferred income tax | 196 | 86 | 282 |
Losses (gain) of disposals of property and equipment | 103 | 12 | 115 |
Depreciation/ Amortization | 444 | 222 | 666 |
Interest and inflation adjustments | 396 | 455 | 851 |
Share of profit (loss) of subsidiaries and associates | 32 | - | 32 |
Losses (gain) on lease liability write off | - | (16) | (16) |
Other liabilities | (68) | 49 | (19) |
Payments of borrowings and financing | (3,806) | 51 | (3,755) |
Payments of lease liability | - | (918) | (918) |
5.3 ICPC 22
The interpretation of ICPC22 clarifies how to apply the recognition and measurement requirements of CPC 32 when there is uncertainty about tax treatments on profit. The interpretation was approved on December 21, 2018 and entered into force on January 1, 2019. Management concludes that there are no significant impacts as a result of the adoption of such interpretation.
52
Companhia Brasileira de Distribuição
Notes to the interim financial information
June 30, 2019
(In millions of Brazilian reais, unless otherwise stated)
6. Significant accounting judgments, estimates and assumptions
Judgments, estimates and assumptions
The preparation of the Company’s individual and consolidated interim financial information requires Management to make judgments, estimates and assumptions that affect the reported amounts of revenues, expenses, assets and liabilities, and the disclosure of contingent liabilities at the end of the reporting period; however, uncertainties about these assumptions and estimates may result in outcomes that require adjustments to the carrying amount of the affected asset or liability in future periods.
The significant assumptions and estimates used in the preparation of the individual and consolidated interim financial information for the half period ended June 30, 2019 were the same as those adopted in the individual and consolidated financial statements for the year ended December 31, 2018, except for the adoption of CPC 06 – R2 (IFRS 16) described in Note 5.1.
7. Cash and cash equivalents
The detailed information on cash and cash equivalents was presented in the annual financial statements for 2018, in note 7.
| Parent Company | Consolidated | |||||
Rate |
| 06.30.2019 | 12.31.2018 | 06.30.2019 | 12.31.2018 | ||
| |||||||
Cash and banks - Brazil |
| 162 | 345 | 286 | 406 | ||
Cash and banks - Abroad | (*) |
| 80 | 80 |
| 80 | 80 |
Short-term investments - Brazil | (**) |
| 3,788 | 2,510 |
| 4,339 | 3,883 |
| 4,030 | 2,935 | 4,705 | 4,369 | |||
(*) Refers to amounts deposited in the United States of America in US Dollars.
(**) Short-term investments as June 30, 2019, substantially constitute CDB and repurchase agreements, bearing interest on to a weighted average rate of 94,26% (85.78% on December 31, 2018) of the Interbank deposit Certificate ("CDI") and redeemable in terms of less than 90 days as of investment date.
8. Trade receivables
The detailed information on trade receivables was presented in the annual financial statements for 2018, in note 8.
Parent Company | Consolidated | ||||
06.30.2019 | 12.31.2018 | 06.30.2019 | 12.31.2018 | ||
Credit card companies | 37 | 19 | 60 | 38 | |
Credit card companies - related parties (note 12.2) | 41 | 37 |
| 60 | 58 |
Sales vouchers | 60 | 68 | 121 | 128 | |
Private label credit card | 36 | 52 | 36 | 53 | |
Receivables from related parties (note 12.2) | 21 | 39 | 13 | 15 | |
Receivables from suppliers | 79 | 64 | 102 | 101 | |
Allowance for doubtful accounts (note 8.1) | (1) | (1) | (4) | (5) | |
273 | 278 | 388 | 388 | ||
|
| ||||
Current | 202 | 274 |
| 317 | 384 |
Noncurrent | 71 | 4 |
| 71 | 4 |
|
|
|
|
|
|
|
|
|
|
|
|
53
Companhia Brasileira de Distribuição
Notes to the interim financial information
June 30, 2019
(In millions of Brazilian reais, unless otherwise stated)
8. Trade receivables- Continued
8.1. Allowance for doubtful accounts
Parent Company | Consolidated | ||||
06.30.2019 | 06.30.2018 | 06.30.2019 | 06.30.2018 | ||
At the beginning of the period | (1) | (3) | (5) | (6) | |
Allowance booked for the period | (11) | - | (259) | (322) | |
Write-off of receivables | 11 | 2 | 278 | 322 | |
Deconsolidation Via Varejo | - | - |
| (18) | - |
Assets held for sale and discontinuedoperations | - | - | - | 2 | |
At the end of the period | (1) | (1) | (4) | (4) | |
Below is the aging list of consolidated gross receivables, by maturity period:
Overdue receivables - Consolidated | ||||||
Total | Not overdue | <30 days | 30-60 days | 61-90 days | >90 days | |
06.30.2019 | 392 | 353 | 30 | 1 | 2 | 6 |
12.31.2018 | 393 | 362 | 10 | 5 | 5 | 11 |
9. Other receivables
The detailed information on cash and cash equivalents was presented in the annual financial statements for 2018, in note 9.
Parent Company | Consolidated | ||||
06.30.2019 | 12.31.2018 | 06.30.2019 | 12.31.2018 | ||
|
|
|
| ||
Accounts receivable from insurers | 242 | 213 |
| 247 | 213 |
Receivable from the sale of subsidiaries | 83 | 82 | 83 | 82 | |
Lease receivable | 38 | 40 |
| 41 | 44 |
Receivables – Via Varejo (*) | 40 | - |
| 40 | - |
Receivable from sale of real estate properties | 31 | 40 | 31 | 40 | |
Other | 43 | 58 | 53 | 67 | |
Allowance for doubtful accounts | (12) | (14) |
| (14) | (16) |
465 | 419 | 481 | 430 | ||
|
| ||||
Current | 332 | 291 | 348 | 302 | |
Noncurrent | 133 | 128 | 133 | 128 | |
(*) With the sale of Via Varejo, the balance that was in related parties was reclassified to other accounts receivable.
54
Companhia Brasileira de Distribuição
Notes to the interim financial information
June 30, 2019
(In millions of Brazilian reais, unless otherwise stated)
9. Other receivables- Continued
9.1. Allowance for doubtful accounts
| Parent Company | Consolidated | |||
| 06.30.2019 | 06.30.2018 | 06.30.2019 | 06.30.2018 | |
|
|
|
|
| |
At the beginning of the period | (14) | (10) | (16) | (12) | |
Write-off of receivables | 2 | - | 6 | 13 | |
Deconsolidation Via Varejo | - | - |
| (4) | - |
Assets held for sale and discontinued operations | - | - |
| - | (12) |
At the end of the period | (12) | (10) |
| (14) | (11) |
10. Inventories
The detailed information on inventories was presented in the annual financial statements for 2018, in note 10.
Parent Company | Consolidated | ||||
06.30.2019 | 12.31.2018 | 06.30.2019 | 12.31.2018 | ||
Stores | 2,191 | 2,206 | 4,164 | 4,162 | |
Distribution centers | 1,206 | 1,431 | 1,573 | 1,807 | |
Real estate inventories | - | - | 2 | 5 | |
Allowance for losses on inventory obsolescence and damages (note 10.1) | (28) | (31) | (47) | (65) | |
3,369 | 3,606 |
| 5,692 | 5,909 | |
10.1.Allowance for losses on inventory obsolescence and damages
Parent Company | Consolidated | ||||
06.30.2019 | 06.30.2018 | 06.30.2019 | 06.30.2018 | ||
At the beginning of the period | (31) | (36) | (65) | (73) | |
Additions | (2) | (3) |
| (47) | (47) |
Write-offs | 5 | 2 |
| 58 | 62 |
Deconsolidation Via Varejo | - | - |
| 7 | - |
Assets held for sale and discontinuedoperations | - | - |
| - | (2) |
At the end of the period | (28) | (37) |
| (47) | (60) |
55
Companhia Brasileira de Distribuição
Notes to the interim financial information
June 30, 2019
(In millions of Brazilian reais, unless otherwise stated)
11. Recoverable taxes
The detailed information on recoverable taxes was presented in the annual financial statements for 2018, in note 11.
Parent Company | Consolidated | ||||
03.31.2019 | 12.31.2018 | 03.31.2019 | 12.31.2018 | ||
State VAT tax credits – ICMS | 1,430 | 1,326 | 2,507 | 2,335 | |
Provision for non-realization to ICMS (VAT) tax credits | - | - |
| - | (28) |
Social Integration Program/Contribution for Social Security Financing-PIS/COFINS | 453 | 461 | 674 | 717 | |
Social Security Contribution - INSS | 283 | 295 |
| 312 | 328 |
Income tax and social contribution prepayments | 17 | 38 |
| 20 | 52 |
Other | 12 | 9 | 21 | 20 | |
Total | 2,195 | 2,129 | 3,534 | 3,424 | |
|
|
|
|
|
|
Current | 341 | 316 |
| 615 | 679 |
Noncurrent | 1,854 | 1,813 | 2,919 | 2,745 | |
|
|
|
|
|
|
11.1.State VAT (ICMS) is expected to be realized as follows (net of provision):
In | Parent Company | Consolidated |
Up to one year | 144 | 275 |
From 1 to 2 years | 156 | 284 |
From 2 to 3 years | 152 | 321 |
From 3 to 4 years | 160 | 322 |
From 4 to 5 years | 151 | 306 |
More than 5 years | 667 | 999 |
| 1,430 | 2,507 |
The Group understands that future realization of ICMS tax credits is probable based on a feasibility study, on the expectation of future growth and the expected offset against tax debts from its operations. The projections on the realization of ICMS balances are revised at least annually by the occasion of the annual strategic planning approved by the Company’s Board of Directors. For the quarter ended June 30, 2019, management has implemented monitoring controls over the progress of the plan annually established, assessing and including new elements that contribute to the recoverability of ICMS tax credits, as shown in the table above:
56
Companhia Brasileira de Distribuição
Notes to the interim financial information
June 30, 2019
(In millions of Brazilian reais, unless otherwise stated)
12. Related parties
12.1.Management and Advisory Committees compensation
The expenses related to management compensation (officers appointed pursuant to the Bylaws including members of the Board of Directors and advisory committees) for the half period ended June 30, 2019 and 2018, were as follows:
In thousands of Brazilian reais
Base salary | Variable compensation | Stock option plan | Total | ||||||||
2019 | 2018 | 2019 | 2018 | 2019 | 2018 | 2019 | 2018 | ||||
Board of directors (*) | 7,924 | 4,083 |
| - | - |
| 338 | - |
| 8,262 | 4,083 |
Executive officers | 17,206 | 12,046 |
| 6,688 | 22,676 |
| 9,491 | 6,393 |
| 33,385 | 41,115 |
Fiscal Council | - | 228 |
| - | - |
| - | - |
| - | 228 |
25,130 | 16,357 |
| 6,688 | 22,676 |
| 9,829 | 6,393 |
| 41,647 | 45,426 | |
(*) Includes the compensation of the Board of Directors’ advisory committees (Human Resources and Compensation, Audit, Finance, Sustainable Development and Corporate Governance).
57
Companhia Brasileira de Distribuição
Notes to the interim financial information
June 30, 2019
(In millions of Brazilian reais, unless otherwise stated)
12. Related parties– Continued
12.2. Balances and transactions with related parties.
The detailed information on related parties was presented in the annual financial statements for 2018, in note 12.
Parent company | ||||||||||||||
Balances | Transactions | |||||||||||||
Trade receivables | Other assets | Trade payables | Other liabilities | Revenues (expenses) | ||||||||||
2019 | 2018 | 2019 | 2018 | 2019 | 2018 | 2019 | 2018 | 2019 | 2018 | |||||
|
|
|
|
|
|
|
|
|
|
|
|
|
|
|
Controlling shareholders: |
|
|
|
|
| |||||||||
Casino | 9 | 10 | 2 | - |
| - | 2 | - | 1 | (30) | (26) | |||
Euris | - | - | - | - | - | - | 1 | - | (1) | (1) | ||||
Exito | - |
|
| - |
|
| - |
|
| - |
|
| - | 1 |
Helicco | - | - |
| - | - |
| - | - |
| - | 3 |
| (1) | (1) |
Subsidiaries: |
|
|
|
|
| |||||||||
Novasoc Comercial | - | - |
| 48 | 45 |
| - | - |
| 1 | 2 |
| 1 | - |
Sendas Distribuidora | 10 | 23 | 76 | 94 | 9 | 11 | - | - | 38 | 42 | ||||
SCB Distribuição e Comércio | 2 | - |
| 5 | 96 |
| - | - |
| - | - |
| - | - |
Via Varejo | - | 6 | - | 16 | - | 11 | - | 105 | (31) | (7) | ||||
James Delivery | - | - | 13 | - | - | - | - | - | - | - | ||||
Cnova Brasil | - | - | - | - | - | - | - | - | (1) | 2 | ||||
GPA M&P | - | - | 1 | 3 | - | - | 13 | 13 | - | - | ||||
GPA LogÃstica | - | - | 63 | 59 | 2 | 4 | 55 | 50 | 1 | - | ||||
Bellamar | - | - |
| 1 | 1 |
| - | - |
| - | - |
| - | - |
Associates |
|
|
|
|
| |||||||||
FIC | 41 | 37 | 26 | 26 | 17 | 21 | - | - | 41 | 61 | ||||
Other related parties |
|
|
|
|
|
|
|
|
|
|
|
|
|
|
Greenyellow do Brasil Energia e Serviços Ltda(“Greenyellowâ€) (i) | - | - |
| - | - |
| - | - |
| 140 | 142 |
| (22) | (22) |
Others | - | - |
| 1 | 1 |
| - | - |
| 1 | - |
|
| - |
Total | 62 | 76 |
| 236 | 341 |
| 28 | 49 |
| 211 | 316 |
| (5) | 49 |
|
|
|
|
|
|
|
|
|
|
|
|
|
|
|
|
|
|
|
|
|
|
|
|
|
|
|
|
|
|
(i) Amount refers to acquisition of products and services with purpose the Company’s energy efficience.
58
Companhia Brasileira de Distribuição
Notes to the interim financial information
June 30, 2019
(In millions of Brazilian reais, unless otherwise stated)
12. Related parties– Continued
12.2.Balances and transactions with related parties – Continued
Consolidated | |||||||||||||||
| Balances |
| Transactions | ||||||||||||
Trade receivables | Other assets | Trade payables | Other liabilities | Revenues (expenses) | |||||||||||
2019 | 2018 | 2019 | 2018 | 2019 | 2018 | 2019 | 2018 | 2019 | 2018 | ||||||
Controlling shareholders |
|
|
|
| |||||||||||
Casino | 13 | 15 | 2 | - | - | 2 | - | 1 | (30) | (26) | |||||
Euris | - | - | - | - | - | - | 1 | - | (1) | (1) | |||||
Exito | - | - |
| - | - |
| - | - |
| - | - |
| - | 1 | |
Helicco | - | - |
| - | - |
| - | - |
| - | 3 |
| (1) | (1) | |
Associates |
|
|
|
|
|
| |||||||||
FIC | 60 | 58 | 34 | 33 | 28 | 31 | - | - | 74 | 83 | |||||
Other related parties |
|
|
|
|
|
|
|
|
|
|
|
|
|
| |
Greenyellow do Brasil Energia e Serviços Ltda (Greenyellow) | - | - | - | - | - | - | 140 | 141 | (22) | (22) | |||||
Others | - | - | 1 | 1 | - | - | 1 | - | - | - | |||||
Total | 73 | 73 | 37 | 34 | 28 | 33 | 142 | 145 | 20 | 34 | |||||
59
Companhia Brasileira de Distribuição
Notes to the interim financial information
June 30, 2019
(In millions of Brazilian reais, unless otherwise stated)
13. Investments in subsidiaries and associates
The detailed information on investments was presented in the annual financial statements for 2018, in note 13.
13.1. Breakdown of investments
Parent Company | |||||||
Sendas | Novasoc | Via Varejo | Bellamar | SCB | Others | Total (*) | |
| |||||||
Balances at 12.31.2018 | 4,210 | 1 | - | 207 | 75 | (224) | 4,269 |
Adjustment related to IFRS 16 | (112) | - | - | - | - | (12) | (124) |
Balances at 12.31.2018 - restated | 4,098 | 1 | - | 207 | 75 | (236) | 4,145 |
Share of profit of subsidiaries and associates | 365 | 16 | 16 | 32 | (14) | (81) | 334 |
Sale investment held in Via Varejo | - | - | (1,361) | - | - | (492) | (1,853) |
Dividends and interest on own capital | (50) | - | - | (9) | - | - | (59) |
Stock options | 3 | - | 3 | - | - | - | 6 |
Capital increase | - | - | - | - | 143 | - | 143 |
Capital increase with property and equipment | 67 | - | - | - | - | - | 67 |
Share of other comprehensive income | - | - | - | - | - | 5 | 5 |
Assets held for sale and discontinued operations | - | - | 1,342 | - | - | 492 | 1,834 |
Balances at 06.30.2019 | 4,483 | 17 | - | 230 | 204 | (312) | 4,622 |
Parent Company | ||||||
| Sendas | Novasoc | Via Varejo | Bellamar | Others | Total (*) |
| ||||||
Balances at 12.31.2017 | 3,119 | 5 | - | 155 | (129) | 3,150 |
Adjustment related to IFRS 16 | (89) | - | - | - | (6) | (95) |
Balances at 12.31.2017 - restated | 3,030 | 5 | - | 155 | (135) | 3,055 |
Share of profit of subsidiaries and associates | 515 | (2) | 159 | 32 | (96) | 608 |
Stock options | 5 | - | 5 | - | 1 | 11 |
Share of other comprehensive income | - | - | 8 | - | (32) | (24) |
Others movements | - | - | - | - | (1) | (1) |
Assets held for sale and discontinued operations | - | - | (172) | - | - | (172) |
Balances at 06.30.2018 - restated | 3,550 | 3 | - | 187 | (263) | 3,477 |
(*) Includes the effects of on the provision for losses on investments in associates in Luxco of R$339 on June, 30 2019 (R$311 on June 30, 2018). The parent company includes the effects of a shortfall on the investment in James Delivery in the amount of R$8 as of June 30, 2019.
| Consolidated | |
| 06.30.2019 | 06.30.2018 |
|
| Restated |
Balances in the beginning of the period | (64) | 12 |
Adjustment related to IFRS 16 | (12) | (6) |
Balances in the beginning of the period – restated | (76) | 6 |
Share of profit of associates – Continuing operations | (27) | (44) |
Share of profit of associates – Discontinued operations | 16 | 12 |
Share of other comprehensive income | 5 | (33) |
Dividends and interest on own capital – continuing operations | (9) | - |
Dividends and interest on own capital - discontinued operations | (3) | - |
Assets held for sale and discontinued operations | (13) | (12) |
Balances at the end of the period | (107) | (71) |
|
|
|
60
Companhia Brasileira de Distribuição
Notes to the interim financial information
June 30, 2019
(In millions of Brazilian reais, unless otherwise stated)
13. Investments in subsidiaries and associates - Continued
13.2. Sale of the investment in Via Varejo
The Company concluded the sale process started on November 23, 2016, through an auction held on June 14, 2019 held at B3 SA - Brasil, Bolsa, Balcão, for a price of R$4.90 per share, totaling R$2,300 , in line with its long-term strategy to focus on food sector development. The gain related to the sale of R$414, net of income tax of R$204 (Note 19) was presented in Discontinued Activity.
The company has ceased to exercise control over Via Varejo during the month of June 2019 and is in the process of implementing the formal steps foreseen for such events on the guarantees granted, equity interests in other companies, use of trademarks, etc. The Company will continue to guarantee legal proceedings prior to the acquisition of Globex in 2010, and are disclosed in note 20.
14. Property and equipment
The detailed information on property and equipment was presented in the annual financial statements for 2018, in note 14.
|
| Parent company | ||||||
Balance at 12.31.2018 | Additions | Remeasurement | Depreciation | Write-offs | Transfers | Balance at 06.30.2019 | ||
| Restated |
|
|
|
|
|
| |
Land | 991 | - | - | - | (6) | (16) | 969 | |
Buildings | 1,179 | 3 | - | (21) | - | (7) | 1,154 | |
Leasehold improvements | 2,033 | 14 | - | (100) | (17) | 139 | 2,069 | |
Machinery and equipment | 861 | 56 | - | (82) | 1 | 66 | 902 | |
Facilities | 275 | 11 | - | (19) | (1) | 2 | 268 | |
Furniture and fixtures | 357 | 21 | - | (29) | (7) | 19 | 361 | |
Construction in progress | 115 | 277 | - | - | - | (298) | 94 | |
Other | 32 | 13 | - | (7) | - | (5) | 33 | |
Total | 5,843 | 395 | - | (258) | (30) | (100) | 5,850 | |
|
|
|
|
|
|
| ||
Lease - right of use: |
|
|
|
|
|
|
| |
Buildings | 2,558 | 4 | 127 | (204) | (49) | 1 | 2,437 | |
IT equipment | 1 | - | - | (1) | - | - | - | |
2,559 | 4 | 127 | (205) | (49) | 1 | 2,437 | ||
Total | 8,402 | 399 | 127 | (463) | (79) | (99) | 8,287 | |
61
Companhia Brasileira de Distribuição
Notes to the interim financial information
June 30, 2019
(In millions of Brazilian reais, unless otherwise stated)
14. Property and equipment– Continued
|
| Parent company | |||||||||||||
Balance at 12.31.2017 | Additions | Remeasurement | Depreciation | Write-offs | Transfers | Balance at 06.30.2018 | |||||||||
| Restated |
|
|
|
|
| Restated | ||||||||
Land | 1,094 | - | - | - | - | (49) | 1,045 | ||||||||
Buildings | 1,333 | 2 | - | (23) | 25 | (105) | 1,232 | ||||||||
Leasehold improvements | 2,142 | 6 | - | (100) | (4) | 45 | 2,089 | ||||||||
Machinery and equipment | 904 | 4 | - | (85) | (12) | 32 | 843 | ||||||||
Facilities | 306 | 3 | - | (19) | (1) | 3 | 292 | ||||||||
Furniture and fixtures | 365 | 4 | - | (29) | (11) | 14 | 343 | ||||||||
Construction in progress | 79 | 145 | - | - | - | (163) | 61 | ||||||||
Other | 41 | 8 | - | (7) | - | (9) | 33 | ||||||||
Total | 6,264 | 172 | - | (263) | (3) | (232) | 5,938 | ||||||||
|
|
|
|
|
| ||||||||||
Lease - right of use: |
|
|
|
|
|
| |||||||||
Buildings | 2,536 | 8 | 72 | (186) | (12) | - | 2,418 | ||||||||
IT equipment | 5 | - | - | (1) | - | - | 4 | ||||||||
2,541 | 8 | 72 | (187) | (12) | - | 2,422 | |||||||||
Total | 8,805 | 180 | 72 | (450) | (15) | (232) | 8,360 | ||||||||
| Parent Company |
| |||||||||||||
Balance at 06.30.2019 |
| Balance at 12.31.2018 |
| ||||||||||||
Cost | Accumulated depreciation | Net |
| Cost | Accumulated depreciation | Net |
| ||||||||
|
|
|
|
|
| Restated |
|
| |||||||
Land | 969 | - | 969 |
| 991 | - | 991 |
| |||||||
Buildings | 1,900 | (746) | 1,154 |
| 1,898 | (719) | 1,179 |
| |||||||
Leasehold improvements | 3,784 | (1,715) | 2,069 |
| 3,666 | (1,633) | 2,033 |
| |||||||
Machinery and equipment | 2,341 | (1,439) | 902 |
| 2,247 | (1,386) | 861 |
| |||||||
Facilities | 594 | (326) | 268 |
| 583 | (308) | 275 |
| |||||||
Furniture and fixtures | 967 | (606) | 361 |
| 945 | (588) | 357 |
| |||||||
Construction in progress | 94 | - | 94 |
| 115 | - | 115 |
| |||||||
Other | 141 | (108) | 33 |
| 136 | (104) | 32 |
| |||||||
10,790 | (4,940) | 5,850 |
| 10,581 | (4,738) | 5,843 |
| ||||||||
|
|
|
|
| |||||||||||
Lease - right of use: |
|
|
|
|
| ||||||||||
Buildings | 5,151 | (2,714) | 2,437 |
| 5,111 | (2,553) | 2,558 |
| |||||||
IT equipment | 36 | (36) | - |
| 37 | (36) | 1 |
| |||||||
5,187 | (2,750) | 2,437 |
| 5,148 | (2,589) | 2,559 |
| ||||||||
Total | 15,977 | (7,690) | 8,287 |
| 15,729 | (7,327) | 8,402 |
| |||||||
62
Companhia Brasileira de Distribuição
Notes to the interim financial information
June 30, 2019
(In millions of Brazilian reais, unless otherwise stated)
14. Property and equipment– Continued
|
| Consolidated | |||||||
Balance at 12.31.2018 | Additions | Remensura-tion | Depreciation | Write-offs | Transfers | Deconsolida-tion Via Varejo | Balance at 06.30.2019 | ||
| Restated |
|
|
|
|
|
|
| |
Land | 1,366 | 57 | - | - | (6) | 9 | - | 1,426 | |
Buildings | 1,773 | 72 | - | (30) | 1 | 37 | (1) | 1,852 | |
Leasehold improvements | 3,843 | 176 | - | (158) | (24) | 215 | (63) | 3,989 | |
Machinery and equipment | 1,308 | 121 | - | (122) | (6) | 112 | (34) | 1,379 | |
Facilities | 501 | 31 | - | (29) | (3) | 27 | (24) | 503 | |
Furniture and fixtures | 595 | 45 | - | (46) | (8) | 48 | (16) | 618 | |
Construction in progress | 176 | 385 | - | - | (1) | (492) | 63 | 131 | |
Other | 59 | 15 | - | (12) | (1) | 6 | (4) | 63 | |
Total | 9,621 | 902 | - | (397) | (48) | (38) | (79) | 9,961 | |
|
|
|
|
|
|
| |||
Lease - right of use: |
|
|
|
|
|
|
| ||
Buildings | 3,493 | 63 | 328 | (253) | (69) | 49 | (154) | 3,457 | |
IT equipment | 9 | - | - | (2) | - | - | - | 7 | |
3,502 | 63 | 328 | (255) | (69) | 49 | (154) | 3,464 | ||
Total | 13,123 | 965 | 328 | (652) | (117) | 11 | (233) | 13,425 | |
|
| Consolidated | |||||||
Balance at 12.31.2017 | Additi-ons | Remea-surement | Depre-ciation | Write-offs | Transfers | Assets held for sale and discontinued operations (*) | Balance at 06.30.2018 | ||
| Restated |
|
|
|
|
|
| Restated | |
Land | 1,362 | 10 | - | - | - | (47) | - | 1,325 | |
Buildings | 1,770 | 60 | - | (29) | 26 | (131) | - | 1,696 | |
Leasehold improvements |
3,492 | 165 | - | (145) | (61) | 85 | 1 | 3,537 | |
Machinery and equipment | 1,262 | 54 | - | (120) | (30) | 87 | (53) | 1,200 | |
Facilities | 487 | 26 | - | (27) | (12) | 12 | (3) | 483 | |
Furniture and fixtures | 540 | 34 | - | (43) | (13) | 32 | (14) | 536 | |
Construction in progress | 126 | 269 | - | - | (2) | (285) | (6) | 102 | |
Other | 64 | 16 | - | (11) | (24) | (3) | 22 | 64 | |
Total | 9,103 | 634 | - | (375) | (116) | (250) | (53) | 8,493 | |
|
|
|
|
|
|
| |||
Lease - right of use: |
|
|
|
|
|
|
| ||
Buildings | 3,330 | 115 | 44 | (230) | (12) | - | 66 | 3,313 | |
IT equipment | 15 | - | - | (2) | (1) | - | - | 12 | |
3,345 | 115 | 44 | (232) | (13) | - | 66 | 3,325 | ||
Total | 12,448 | 749 | 44 | (607) | (129) | (250) | 13 | 12,268 | |
63
Companhia Brasileira de Distribuição
Notes to the interim financial information
June 30, 2019
(In millions of Brazilian reais, unless otherwise stated)
14. Property and equipment– Continued
| Consolidated | ||||||
Balance at 06.30.2019 | Balance at 12.31.2018 | ||||||
Cost | Accumulated depreciation | Net | Cost | Accumulated depreciation | Net | ||
|
|
|
|
|
| Restated |
|
Land | 1,426 | - | 1,426 | 1,366 | - | 1,366 | |
Buildings | 2,700 | (848) | 1,852 | 2,585 | (812) | 1,773 | |
Leasehold improvements | 6,154 | (2,165) | 3,989 | 5,868 | (2,025) | 3,843 | |
Machinery and equipment | 3,119 | (1,740) | 1,379 | 2,957 | (1,649) | 1,308 | |
Facilities | 894 | (391) | 503 | 865 | (364) | 501 | |
Furniture and fixtures | 1,345 | (727) | 618 | 1,287 | (692) | 595 | |
Construction in progress | 131 | - | 131 | 176 | - | 176 | |
Other | 219 | (156) | 63 | 206 | (147) | 59 | |
15,988 | (6,027) | 9,961 | 15,310 | (5,689) | 9,621 | ||
|
|
| |||||
Lease - right of use: |
|
|
|
| |||
Buildings | 6,678 | (3,221) | 3,457 | 6,487 | (2,994) | 3,493 | |
IT equipment | 82 | (75) | 7 | 82 | (73) | 9 | |
6,760 | (3,296) | 3,464 | 6,569 | (3,067) | 3,502 | ||
Total | 22,748 | (9,323) | 13,425 | 21,879 | (8,756) | 13,123 | |
14.1. Capitalized borrowing costs
The consolidated capitalized borrowing costs for the half period ended June 30, 2019 were R$8 (R$6 for the half period ended June 30, 2018). The rate used to determine the borrowing costs eligible for capitalization was 102.16% of the CDI (101.50% of the CDI for the period ended June 30, 2018), corresponding to the effective interest rate on the Company’s borrowings.
14.2. Additions to property and equipment for cash flow presentation purposes:
Parent Company |
| Consolidated | |||
06.30.2019 | 06.30.2018 |
| 06.30.2019 | 06.30.2018 | |
|
| Restated |
|
| Restated |
Additions | 399 | 180 |
| 965 | 749 |
Lease | (4) | (8) |
| (64) | (115) |
Capitalized borrowing costs | (3) | (2) |
| (16) | (6) |
Property and equipment financing - Additions | (304) | (157) |
| (679) | (412) |
Property and equipment financing - Payments | 333 | 230 |
| 794 | 495 |
Total | 421 | 243 |
| 1,000 | 711 |
14.3.Other information
On June 30, 2019, the Company and its subsidiaries recorded in the cost of sales the amount of R$60 in the parent company (R$49 on June 30, 2018) and R$71 in consolidated (R$64 on June 30, 2018) related to the depreciation machinery, buildings and facilities related to the distribution centers.
The Company monitored the plan for impairment test performed on December 31, 2018 and there were no significant discrepancies indicating loss or need to perform a new impairment test on June 30,2019.
64
Companhia Brasileira de Distribuição
Notes to the interim financial information
June 30, 2019
(In millions of Brazilian reais, unless otherwise stated)
15. Intangible assets
The detailed information on intangible assets was presented in the annual financial statements for 2018, in note 15.
| Parent Company | ||||
Balance at 12.31.2018 | Additions | Amortization | Transfers | Balance at 06.30.2019 | |
| Restated |
|
|
|
|
|
|
|
|
|
|
Goodwill - retail | 542 | - | - | - | 542 |
Commercial rights - retail | 47 | - | - | - | 47 |
Software and implementation | 563 | 60 | (44) | 57 | 636 |
Total | 1,152 | 60 | (44) | 57 | 1,225 |
|
|
|
|
|
|
Lease - right of use: |
|
|
|
|
|
Right of use Paes Mendonça (**) | 577 | - | (17) | - | 560 |
Software | 77 | - | (10) | - | 67 |
654 | - | (27) | - | 627 | |
Total | 1,806 | 60 | (71) | 57 | 1,852 |
|
| Consolidated | ||||||
Balance at 12.31.2018 | Addi-tions | Amorti-zation | Write-offs
| Transfer | Deconsolida-tion Via Varejo | Balance at 03.31.2019 | ||
Restated |
|
|
|
|
|
| ||
Goodwill - retail | 1,148 | - | - | - | - | - | 1,148 | |
Brands | 39 | - | - | - | - | - | 39 | |
Commercial rights | 111 | 24 | - | - | - | - | 135 | |
Software | 620 | 149 | (49) | (7) | 61 | (75) | 699 | |
Total | 1,918 | 173 | (49) | (7) | 61
| (75) | 2,021 | |
|
|
|
|
|
|
| ||
Lease - right of use: |
|
|
|
|
|
|
| |
Right of use Paes Mendonça (**) | 807 | - | (21) | - | - | - | 786 | |
Software | 80 | - | (10) | (1) | - | 1 | 70 | |
| 887 | - | (31) | (1) | - | 1 | 856 | |
Total | 2,805 | 173 | (80) | (8) | 61 | (74) | 2,877 | |
(*) Related to leases and operations agreements of some stores. The Company has the contractual right to operate these stores for 30 years.
In the Parent Company, the balance of accumulated cost on June 30, 2019 is R$3,485 (R$3,367 on December 31, 2018) and of accumulated amortization R$1,633 (R$1,561 on December 31, 2018). In the Consolidated the balance of accumulated cost on June 30, 2019 is R$4,806 (R$4,653 on December 31, 2018) and of accumulated amortization R$1,929 (R$1,848 on December 31, 2018).
15.1. Impairment testing of goodwill, brands and intangible assets with indefinite useful life
Goodwill and intangible assets were tested for impairment as of December 31, 2018 according to the method described in note 4 - Significant accounting policies, in the financial statements for the year ended December 31, 2018.
The Company monitored the plan used to assess the impairment as of December 31, 2018 and has not observed any significant changes that would indicate the need to perform a new impairment test as of June 30, 2019.
65
Companhia Brasileira de Distribuição
Notes to the interim financial information
June 30, 2019
(In millions of Brazilian reais, unless otherwise stated)
15. Intangible assets - Continued
15.2. Additions to intangible assets for cash flow presentation purposes:
Parent Company |
| Consolidated | |||
06.30.2019 | 06.30.2018 |
| 06.30.2019 | 06.30.2018 | |
|
|
|
|
|
|
Additions | 60 | 61 |
| 173 | 212 |
Intangible assets financing - Additions | - | - |
| (23) | - |
Intangible assets financing - Payments | - | - |
| 47 | - |
Total | 60 | 61 |
| 197 | 212 |
16. Borrowings and financing
The detailed information on borrowings and financing was presented in the annual financial statements for 2018, in note 17.
16.1. Debt breakdown
Parent Company |
| Consolidated | ||||
Weighted average rate | 06.30.2019 | 12.31.2018 |
| 06.30.2019 | 12.31.2018 | |
Debentures and promissory note |
|
|
|
|
|
|
Debentures and Certificate of Agribusiness Receivables (note 16.4) | 105.82% of CDI (i) | 4,973 | 4,146 |
| 4,973 | 4,146 |
|
| 4,973 | 4,146 |
| 4,973 | 4,146 |
|
|
|
|
|
|
|
Borrowings and financing |
|
|
|
|
|
|
Local currency |
|
|
|
|
|
|
BNDES | 3.92% per year | 5 | 6 |
| 32 | 37 |
Working capital | 94.08% of CDI | 12 | 238 |
| 12 | 238 |
Working capital | TR (ii) + 9.80% per year | 17 | 17 |
| 105 | 112 |
Swap contracts (note 16.7) | 101.44% of CDI | (2) | (2) |
| (11) | (11) |
Borrowing costs | - | - |
| (2) | (3) | |
32 | 259 |
| 136 | 373 | ||
Foreign currency (note 16.5) |
|
|
| |||
Working capital | USD + 2.97% per year | 191 | 189 |
| 765 | 843 |
Working capital | EURO + 0.85% per year | 307 | - |
| 307 | - |
Swap contracts (note 16.7) | 106.66% of CDI | (38) | (33) |
| (78) | (76) |
460 | 156 |
| 994 | 767 | ||
Total | 5,465 | 4,561 |
| 6,103 | 5,286 | |
|
|
|
|
|
|
|
Current assets |
| 2 | - |
| 48 | 43 |
Noncurrent assets |
| 38 | 35 |
| 47 | 44 |
Current liabilities |
| 2,473 | 1,306 |
| 3,073 | 1,981 |
Noncurrent liabilities |
| 3,032 | 3,290 |
| 3,125 | 3,392 |
(i) CDI – Certificate of interbank deposit
(ii)TR – Referential rate
66
Companhia Brasileira de Distribuição
Notes to the interim financial information
June 30, 2019
(In millions of Brazilian reais, unless otherwise stated)
16. Borrowings and financing– Continued
16.2. Changes in borrowings
| Parent Company |
| Consolidated |
At December 31, 2018 | 4,704 |
| 5,438 |
Adjustment IFRS 16 | (143) |
| (152) |
Restated beginning balance | 4,561 |
| 5,286 |
Additions - working capital | 1,099 |
| 3,246 |
Accrued interest | 160 |
| 297 |
Accrued swap | 4 |
| 20 |
Mark-to-market | (1) |
| (2) |
Monetary and exchange rate changes | 3 |
| - |
Borrowing costs | 4 |
| 5 |
Interest paid | (138) |
| (277) |
Payments | (7) |
| (2,384) |
Swap paid | (2) |
| (11) |
Deconsolidation Via Varejo | (218) |
| (77) |
At June 30, 2019 | 5,465 |
| 6,103 |
|
|
|
|
|
|
|
|
| Parent Company |
| Consolidated |
At December 31, 2017 | 4,087 |
| 4,560 |
Adjustment IFRS 16 | (181) |
| (195) |
Restated beginning balance | 3,906 |
| 4,365 |
Additions - working capital | 1,488 |
| 4,362 |
Accrued interest | 138 |
| 307 |
Accrued swap | (62) |
| (157) |
Mark-to-market | 2 |
| 3 |
Monetary and exchange rate changes | 72 |
| 173 |
Borrowing costs | 6 |
| 6 |
Interest paid | (110) |
| (303) |
Payments | (417) |
| (3,390) |
Swap paid | (56) |
| (62) |
Liabilities related to assets held for sale and discontinued operations (note 31) | - |
| 381 |
At June 30, 2018 - Restated | 4,967 |
| 5,685 |
16.3. Maturity schedule of noncurrent borrowings and financing
Year | Parent Company | Consolidated | |
|
|
|
|
From 1 to 2 years | 958 |
| 975 |
From 2 to 3 years | 1,528 |
| 1,546 |
From 3 to 4 years | 503 |
| 519 |
From 4 to 5 years | 2 |
| 14 |
After 5 years | 4 |
| 27 |
Subtotal | 2,995 |
| 3,081 |
|
|
| |
Borrowing costs | (1) |
| (3) |
Total | 2,994 |
| 3,078 |
67
Companhia Brasileira de Distribuição
Notes to the interim financial information
June 30, 2019
(In millions of Brazilian reais, unless otherwise stated)
16. Borrowings and financing– Continued
16.4. Debentures, Promissory Note and Certificate of Agribusiness Receivables
Date | Parent Company and Consolidated | ||||||||
Type | Issue Amount | Outstanding debentures (units) | Issue | Maturity | Annual financial charges | Unit price (in reais) | 06.30.2019 | 12.31.2018 | |
13th Issue of Debentures – CBD and CRA | No preference | 1,012 | 1,012,500 | 12/20/16 | 12/20/19 | 97.50% of CDI | 1,000 | 1,013 | 1,014 |
14th Issue of Debentures – CBD and CRA | No preference | 1,080 | 1,080,000 | 04/17/17 | 04/13/20 | 96.00% of CDI | 1,012 | 1,093 | 1,094 |
15th Issue of Debentures – CBD | No preference | 800 | 800,000 | 01/17/18 | 01/15/21 | 104.75% of CDI | 1,030 | 824 | 824 |
16th Issue of Debentures – CBD – 1st serie | No preference | 700 | 700,000 | 09/11/18 | 09/10/21 | 106.00% of CDI | 1,020 | 714 | 714 |
16th Issue of Debentures – CBD – 2nd serie | No preference | 500 | 500,000 | 09/11/18 | 09/12/22 | 107.40% of CDI | 1,020 | 510 | 510 |
4th Issue of Promissory note - CBD | No preference | 800 | 800 | 01/10/19 | 01/09/22 | 105.75% of CDI | 1,030,658 | 825 | - |
Borrowing cost |
| (6) | (10) | ||||||
Parent Company/Consolidated |
| 4,973 | 4,146 | ||||||
|
|
|
|
|
|
|
|
|
|
Current liabilities |
| 2,150 | 1,068 | ||||||
Noncurrent liabilities |
| 2,823 | 3,078 | ||||||
|
68
Companhia Brasileira de Distribuição
Notes to the interim financial information
June 30, 2019
(In millions of Brazilian reais, unless otherwise stated)
16. Borrowings and financing– Continued
16.5.Borrowings in foreign currencies
On June 30, 2019 GPA had loans in foreign currencies (dollar and euro) to strengthen its working capital, maintain its cash strategy, lengthening its debt profile and make investments, being the last due date in September, 2020.
16.6.Guarantees
The Company has signed promissory notes for some loan contracts.
16.7.Swap contracts
The Company use swap transactions for 100% of its borrowings denominated in US dollars, euros and fixed interest rates, exchanging these obligations for Real linked to CDI (floating) interest rates. These contracts have the same debt due date and protect the interest and principal and are signed, with the same economic group. The weighted average annual rate of CDI in June 2019 was 6.32% (7.35% in June 30, 2018).
16.8.Financial covenants
In connection with the debentures and promissory notes and for a portion of borrowings denominated in foreign currencies, GPA is required to maintain certain debt financial covenants. These ratios are quarterly calculated based on consolidated financial statements of the Company prepared in accordance with accounting practices adopted in Brazil, as follows: (i) net debt (debt minus cash and cash equivalents and trade accounts receivable) should not exceed the amount of equity and (ii) consolidated net debt/EBITDA ratio should be lower than or equal to 3.25. At June 30, 2019, GPA was in compliance with these covenants.
16.9.Total Return Swap ("TRS")
The Company sold 50,000,000 shares representing a 3.8% stake in Via Varejo through an auction at B3 on December 27, 2018 for the amount of R$ 218. On December 21, 2018 a contract was signed with a bank foreseeing the sale described and defining a Total Return Swap ("TRS") on the same number of shares. The contract was fully settled during the month of February.
On February 20, 2019, the Board of Directors approved a new TRS agreement authorizing the sale of 40,000,000 (forty million) of shares of Via Varejo held by the Company, corresponding to 3.09%, for the amount of R$200. This auction was made at B3 on February 25, 2019. Although the ownership of the shares was transferred to the Bank, the Group bears the risk on changes to the market value of the shares in future sales made by the bank, which, based on IFRS 9, determines that the shares should not be derecognized. In April 2019 the balance was settled.
.
69
Companhia Brasileira de Distribuição
Notes to the interim financial information
June 30, 2019
(In millions of Brazilian reais, unless otherwise stated)
17. Financial instruments
The detailed information on financial instruments was presented in the annual financial statements for 2018, in note 18.
The main financial instruments and their carrying amounts in the interim financial information, by category, are as follows:
Parent Company |
| Consolidated | |||
Carrying amount |
| Carrying amount | |||
06.30.2019 | 12.31.2018 |
| 06.30.2019 | 12.31.2018 | |
|
| Restated |
|
| Restated |
Financial assets: |
|
|
|
|
|
Amortized cost |
|
|
|
|
|
Related parties - assets | 236 | 341 |
| 37 | 34 |
Trade receivables and other receivables | 642 | 627 |
| 707 | 695 |
Fair value through profit or loss |
|
|
|
|
|
Cash and cash equivalents | 4,030 | 2,935 |
| 4,705 | 4,369 |
Financial instruments – Fair value hedge | 40 | 35 |
| 95 | 87 |
Fair value through other comprehensive income |
|
|
|
|
|
Trade receivables with credit card companies and sales vouchers | 96 | 70 |
| 162 | 123 |
Financial liabilities: |
|
|
|
|
|
Other financial liabilities - amortized cost |
|
|
|
|
|
Related parties -liabilities | (211) | (316) |
| (142) | (145) |
Trade payables | (3,729) | (5,604) |
| (6,827) | (9,246) |
Financing for purchase of assets | (41) | (68) |
| (64) | (149) |
Debentures | (4,973) | (4,146) |
| (4,973) | (4,146) |
Borrowings and financing | (17) | (244) |
| (41) | (271) |
Lease liability | (3,565) | (3,719) |
| (4,729) | (4,762) |
Fair value through profit or loss |
|
|
|
|
|
Loans and financing (Hedge accounting) | (515) | (206) |
| (1,178) | (956) |
Financial instruments – Fair Value Hedge | - | - |
| (6) | - |
The fair value of other financial liabilities detailed in table above approximates the carrying amount based on the existing terms and conditions. The borrowings and financing measured at amortized cost, the related fair values of which differ from the carrying amounts, are disclosed in note 17.3.
17.1. Considerations on risk factors that may affect the business of the Company and its subsidiaries
(i) Capital risk management
The main objective of the Company’s capital management is to ensure that the Company sustains its credit rating and a well-defined equity ratio, in order to support businesses and maximize shareholder value. The Company manages the capital structure and makes adjustments taking into account changes in the economic conditions.
70
Companhia Brasileira de Distribuição
Notes to the interim financial information
June 30, 2019
(In millions of Brazilian reais, unless otherwise stated)
17. Financial instruments- Continued
17.1. Considerations on risk factors that may affect the business of the Company and its subsidiaries - Continued
There were no changes as to objectives, policies or processes during the quarter ended on June 30, 2019. The capital structure is presented as follows:
Parent Company | Consolidated | ||||
06.30.2019 | 12.31.2018 |
| 06.30.2019 | 12.31.2018 | |
|
| Restated |
|
| Restated |
Cash and cash equivalents | 4,030 | 2,935 |
| 4,705 | 4,369 |
Financial instruments – Fair value hedge | 40 | 35 |
| 95 | 87 |
Borrowings and financing | (5,505) | (4,596) |
| (6,198) | (5,373) |
Other liabilities with related parties (*) | (135) | (138) |
| (135) | (138) |
Net debt | (1,570) | (1,764) |
| (1,533) | (1,055) |
|
|
|
|
|
|
Shareholders’ equity | (10,728) | (10,287) |
| (10,728) | (13,196) |
|
|
|
|
|
|
Net debt to equity ratio | 15% | 17% |
| 14% | 8% |
(*) Represents the trade payable to Greenyellow related purchase of equipment.
(ii) Liquidity risk management
The Company manages liquidity risk through the daily analysis of cash flows, control of maturities of financial assets and liabilities.
The table below summarizes the aging profile of the Company’s financial liabilities as of June 30, 2019.
a) Parent Company
Less than 1 Year | 1 – 5 years | More than 5 years | Total | |
Borrowings and financing | 328 | 211 | 7 | 546 |
Debentures and promissory note | 2,316 | 3,173 | - | 5,489 |
Derivative financial instruments | 5 | (35) | - | (30) |
Lease liability | 920 | 3,074 | 1,323 | 5,317 |
Trade payables | 3,729 | - | - | 3,729 |
Total | 7,298 | 6,423 | 1,330 | 15,051 |
b) Consolidated
| Less than 1 Year | 1 – 5 years | More than 5 years | Total |
Borrowings and financing | 938 | 298 | 44 | 1,280 |
Debentures and promissory note | 2,316 | 3,173 | - | 5,489 |
Derivative financial instruments | (35) | (44) | (3) | (82) |
Lease liability | 1,141 | 3,847 | 2,571 | 7,559 |
Trade payables | 6,827 | - | - | 6,827 |
Total | 11,187 | 7,274 | 2,612 | 21,073 |
71
Companhia Brasileira de Distribuição
Notes to the interim financial information
June 30, 2019
(In millions of Brazilian reais, unless otherwise stated)
17. Financial instruments– Continued
17.1. Considerations on risk factors that may affect the business of the Company and its subsidiaries - Continued
(iii) Derivative financial instruments
| Consolidated | |||||
| Notional value |
| Fair value | |||
| 06.30.2019 | 12.31.2018 |
| 06.30.2019 | 12.31.2018 | |
Swap with hedge |
|
|
|
|
| |
Hedge object (debt) | 1,114 | 883 |
| 1,177 | 955 | |
|
|
|
|
|
| |
Long position (buy) |
|
|
|
|
|
|
Prefixed rate | TR+9.80% per year | 127 | 127 |
| 105 | 112 |
US$ + fixed | USD+2.97% per year | 687 | 756 |
| 765 | 843 |
EUR + fixed | EUR+0.85%peryear | 300 | - |
| 307 | - |
| 1,114 | 883 |
| 1,177 | 955 | |
Short position (sell) |
|
|
|
|
| |
| 106.09% of CDI | (1,114) | (883) |
| (1,088) | (868) |
|
|
|
|
|
|
|
Hedge position - asset |
| - | - |
| 95 | 87 |
Hedge position - liability |
| - | - |
| (6) | - |
Net hedge position | - | - |
| 89 | 87 | |
Realized and unrealized gains and losses on these contracts during the quarter ended on June30, 2019 are recorded as financial income (expenses), net and the balance receivable at fair value is R$89 (balance receivable of R$87 as of December 31, 2018), recorded in line item “Financial Instruments – Fair Value Hedge” in the assets and “Borrowings and financing” in the liabilities.
The effects of the fair value hedge recorded in the Statement of Operations for the period ended June 30, 2019 were a loss of R$6 (gain of R$105 as of June 30, 2018).
17.2. Sensitivity analysis of financial instruments
According to the Management’s assessment, the most probable scenario is what the market has been estimating through market curves (currency and interest rates) of B3, on the maturity dates of each transaction. Therefore, in the probable scenario (I), there is no impact on the fair value of financial instruments. For scenarios (II) and (III), for the sensitivity analysis effect, according to CVM rules, a deterioration of 25% and 50%, respectively, on risk variables, up to one year of the financial instruments.
For the probable scenario, weighted exchange rate was R$4.08 on the due date, and the weighted interest rate weighted was 6.32% per year.
In case of derivative financial instruments (aiming at hedging the financial debt), changes in scenarios are accompanied by respective hedges, indicating effects are not significant according to the table below:
72
Companhia Brasileira de Distribuição
Notes to the interim financial information
June 30, 2019
(In millions of Brazilian reais, unless otherwise stated)
17. Financial instruments– Continued
17.2. Sensitivity analysis of financial instruments – Continued
The Company disclosed the net exposure of the derivatives financial instruments, corresponding to financial instruments and certain financial instruments in the sensitivity analysis table below, to each of the scenarios mentioned.
|
|
| Market projection | |||||||
Operations |
| Risk (CDI variation) |
| Balance at 06.30.2019 |
| Scenario I | Scenario II | Scenario III | ||
|
|
| ||||||||
Fair value hedge of fixed rate |
| 101.44% of CDI |
| (94) |
| (209) |
| (213) |
| (217) |
Fair value hedge of exchange rate |
| 106.66% of CDI |
| (994) |
| (1,097) |
| (1,098) |
| (1,127) |
Debentures |
| 105.82% of CDI |
| (2,872) |
| (3,051) |
| (3,095) |
| (3,140) |
Debentures (1st issue CRA) |
| 97.50% of CDI |
| (1,014) |
| (1,079) |
| (1,095) |
| (1,111) |
Debentures (2nd issue CRA) |
| 96.00% of CDI |
| (1,094) |
| (1,162) |
| (1,179) |
| (1,196) |
Bank loans |
| 94.08% of CDI |
| (12) |
| (13) |
| (13) |
| (14) |
Total borrowings and financing exposure |
|
| (6,080) |
| (6,611) |
| (6,693) |
| (6,805) | |
|
|
|
|
|
|
|
|
| ||
|
|
|
|
|
|
|
|
|
|
|
Cash and cash equivalents (*) |
| 94.26% of CDI |
| 4,339 |
| 4,602 |
| 4,667 |
| 4,733 |
Net exposure |
|
| (1,741) |
| (2,009) |
| (2,026) |
| (2,072) | |
Net effect - loss |
|
|
|
| (268) |
| (285) |
| (331) | |
(*) Weighted average
17.3. Fair value measurements
The Company discloses the fair value of financial instruments measured at fair value and of financial instruments measured at amortized cost, the fair value of which differ from the carrying amount, in accordance with CPC 46 (“IFRS13”), which refer to the requirements of measurement and disclosure.
The fair values of cash and cash equivalents, trade receivables and trade payables are equivalent to their carrying amounts.
73
Companhia Brasileira de Distribuição
Notes to the interim financial information
June 30, 2019
(In millions of Brazilian reais, unless otherwise stated)
17. Financial instruments– Continued
17.3. Fair value measurements - Continued
The table below presents the fair value hierarchy of financial assets and liabilities measured at fair value and of financial instruments measured at amortized cost, the fair value of which is disclosed in the financial statements:
Carrying amount | Fair value |
| |
| 06.30.2019 | 06.30.2019 | Level |
Financial assets and liabilities |
|
| |
Trade receivables with credit card companies and sales vouchers (FVOCI) | 162 | 162 | 2 |
Cross-currency interest rate swaps | 78 | 78 | 2 |
Interest rate swaps | 11 | 11 | 2 |
Borrowings and financing (FVPL) | (1,178) | (1,178) | 2 |
Borrowings and financing (amortized cost) | (5,014) | (4,974) | 2 |
Total | (5,941) | (5,901) |
|
There were no changes between the fair value measurements levels in the half ended on June 30, 2019.
Cross-currency and interest rate swaps and borrowings and financing are classified in level 2 since the fair value of such financial instruments was determined based on readily observable market inputs, such as expected interest rate and current and future foreign exchange rate.
74
Companhia Brasileira de Distribuição
Notes to the interim financial information
June 30, 2019
(In millions of Brazilian reais, unless otherwise stated)
17. Financial instruments– Continued
17.4. Consolidated position of derivative transactions
The consolidated position of outstanding derivative financial instruments are presented in the table below:
Outstanding | Amount payable or receivable |
| Fair value | ||||||
Description | Counterparties | Notional value | Contractual date | Maturity | 06.30.2019 | 12.31.2018 |
| 06.30.2019 | 12.31.2018 |
|
|
|
|
|
|
|
|
| |
Exchange swaps registered with CETIP |
| ||||||||
(US$ x CDI) |
| ||||||||
|
|
|
|
|
|
|
|
| |
Scotiabank | US$ 50 | 09/29/2017 | 09/29/2020 | 35 | 37 |
| 36 | 33 | |
| Banco Tokyo | US$ 100 | 12/12/2017 | 12/12/2019 | 48 | 52 |
| 46 | 42 |
| Bradesco | US$ 70 | 06/18/2018 | 06/13/2019 | - | 3 |
| - | 1 |
| Scotiabank | US$ 50 | 01/03/2019 | 12/27/2019 | (5) | - |
| (6) | - |
| Itaú BBA | EUR $ 26 | 03/22/2019 | 12/02/2019 | - | - |
| 1 | - |
| Itaú BBA | EUR $ 44 | 03/22/2019 | 12/02/2019 | - | - |
| 1 | - |
|
|
|
|
| |||||
Interest rate swap registered with CETIP |
|
|
|
|
| ||||
(pre-fixed rate x CDI) |
|
|
|
|
| ||||
Itaú BBA | R$ 21 | 11/11/2014 | 11/5/2026 | 1 | 1 |
| 2 | 2 | |
Itaú BBA | R$ 54 | 1/14/2015 | 1/5/2027 | 3 | 3 |
| 5 | 5 | |
Itaú BBA | R$ 52 | 5/26/2015 | 5/5/2027 | 1 | 2 |
| 4 | 4 | |
|
| ||||||||
83 | 98 |
| 89 | 87 | |||||
75
Companhia Brasileira de Distribuição
Notes to the interim financial information
June 30, 2019
(In millions of Brazilian reais, unless otherwise stated)
18. Taxes and contributions payable and taxes payable in installments
The detailed information on taxes and contributions payable and taxes payable in installments was presented in the annual financial statements for 2018, in note 19.
18.1. Taxes and contributions payable and taxes payable in installments
Parent Company | Consolidated | ||||
06.30.2019 | 12.31.2018 | 06.30.2019 | 12.31.2018 | ||
Taxes payable in installments - Law 11,941/09 | 394 | 432 |
| 394 | 432 |
Taxes payable in installments – PERT | 165 | 169 |
| 165 | 169 |
ICMS | 36 | 62 |
| 72 | 88 |
PIS and COFINS | 4 | 4 |
| 6 | 8 |
Provision for income tax and social contribution | 104 | 26 |
| 230 | 115 |
Withholding income tax | - | 1 |
| 1 | 2 |
INSS | 1 | 1 |
| 4 | 4 |
Other | 9 | 12 |
| 21 | 23 |
713 | 707 |
| 893 | 841 | |
|
|
|
|
| |
Current | 290 | 236 |
| 470 | 370 |
Noncurrent | 423 | 471 |
| 423 | 471 |
18.2. Maturity schedule of taxes payable in installments in noncurrent liabilities:
Parent Company and Consolidated | |
From 1 to 2 years | 103 |
From 2 to 3 years | 103 |
From 3 to 4 years | 103 |
From 4 to 5 years | 45 |
After 5 years | 69 |
| 423 |
76
Companhia Brasileira de Distribuição
Notes to the interim financial information
June 30, 2019
(In millions of Brazilian reais, unless otherwise stated)
19. Income tax and social contribution
19.1.Income tax and social contribution expense reconciliation
The detailed information on income tax and social contribution was presented in the annual financial statements for 2018, in note 20.
Parent Company | Consolidated | ||||
06.30.2019 | 06.30.2018 | 06.30.2019 | 06.30.2018 | ||
Restated | Restated | ||||
Income before income tax and social contribution | 116 | 568 |
| 295 | 671 |
Expense of income tax and social contribution at the nominal rate of 25% for the Company and 34% for subsidiaries | (29) | (141) |
| (124) | (237) |
Tax penalties | (5) | (7) |
| (6) | (9) |
Share of profit of associates | 84 | 152 |
| (3) | (8) |
Interest on own capital (*) | 57 | 42 |
| 57 | 42 |
Exceptional Credits | - | 12 |
| - | 12 |
Tax benefits | 7 | - |
| 15 | - |
Other permanent differences | (9) | 4 |
| (17) | 9 |
Effective income tax and social contribution | 105 | 62 |
| (78) | (191) |
|
|
|
|
| |
Income tax and social contribution for the period: |
|
|
|
|
|
Current | 158 | 1 |
| (75) | (112) |
Deferred | (53) | 61 |
| (3) | (79) |
Income tax and social contribution from continuing operations | 105 | 62 |
| (78) | (191) |
Effective rate | -90,52% | -10,92% |
| 26,44% | 28,46% |
Income tax expense on the sale of Via Varejo totaled R$204 (Note 13.2) in the parent company, presented in the result of discontinued operations.
CBD does not pay social contribution based on a final favorable court decision in the past, therefore its nominal rate is 25%.
(*) Effect of income tax on interest on own capital paid.
77
Companhia Brasileira de Distribuição
Notes to the interim financial information
June 30, 2019
(In millions of Brazilian reais, unless otherwise stated)
19. Income tax and social contribution- Continued
19.2. Breakdown of deferred income tax and social contribution
Parent Company | |||||||
06.30.2019 |
| 12.31.2018 | |||||
Asset | Liability | Net |
| Asset | Liability | Net | |
|
|
|
|
| Restated | ||
Tax losses and negative basis of social contribution | 135 | - | 135 |
| 167 | - | 167 |
Provision for risks | 228 | - | 228 |
| 230 | - | 230 |
Goodwill tax amortization | - | (123) | (123) |
| - | (56) | (56) |
Mark-to-market adjustment | - | (2) | (2) |
| 2 | - | 2 |
Technological innovation – future realization | - | (9) | (9) |
| - | (10) | (10) |
Depreciation of fixed assets as per tax rates | - | (134) | (134) |
| - | (125) | (125) |
Unrealized gains with tax credits | - | (93) | (93) |
| - | (88) | (88) |
Timing difference on adoption of IFRS 16 | 212 | - | 212 |
| 197 | - | 197 |
Other | 47 | (11) | 36 |
| 60 | (131) | 71 |
Deferred income tax and social contribution assets (liabilities) | 622 | (372) | 250 |
| 656 | (410) | 246 |
|
|
|
|
|
|
|
|
Compensation | (372) | 372 | - |
| (410) | 410 | - |
Deferred income tax and social contribution assets (liabilities), net | 250 | - | 250 |
| 246 | - | 246 |
|
|
|
|
|
|
|
|
Consolidated | |||||||
06.30.2019 |
| 12.31.2018 | |||||
Asset | Liability | Net |
| Asset | Liability | Net | |
|
|
|
|
| Restated | ||
Tax losses and negative basis of social contribution | 176 | - | 176 |
| 198 | - | 198 |
Provision for risks | 307 | - | 307 |
| 292 | - | 292 |
Goodwill tax amortization | - | (417) | (417) |
| - | (601) | (601) |
Mark-to-market adjustment | - | (3) | (3) |
| - | (1) | (1) |
Technological innovation – future realization | - | (9) | (9) |
| - | (10) | (10) |
Depreciation of fixed assets as per tax rates | - | (136) | (136) |
| - | (128) | (128) |
Unrealized gains with tax credits | - | (203) | (203) |
| - | (222) | (222) |
Timing difference on adoption of IFRS 16 | 276 | - | 276 |
| 249 | - | 249 |
Other | 96 | (20) | 76 |
| 113 | (136) | (23) |
Deferred income tax and social contribution assets (liabilities) | 855 | (788) | 67 |
| 852 | (1,098) | (246) |
|
|
|
|
|
|
|
|
Compensation | (561) | 561 | - |
| (517) | 517 | - |
Deferred income tax and social contribution assets (liabilities), net | 294 | (227) | 67 |
| 335 | (581) | (246) |
78
Companhia Brasileira de Distribuição
Notes to the interim financial information
June 30, 2019
(In millions of Brazilian reais, unless otherwise stated)
19. Income tax and social contribution– Continued
19.2. Breakdown ofdeferred income tax and social contribution – Continued
The Company estimates to recover these deferred tax assets as follows:
Parent Company | Consolidated | |
Year | ||
Up to one year | 254 | 341 |
From 1 to 2 years | 131 | 184 |
From 2 to 3 years | 159 | 206 |
From 3 to 4 years | 74 | 120 |
From 4 to 5 years | 4 | 4 |
622 | 855 |
19.3. Changes in deferred income tax and social contribution
Parent Company | Consolidated | ||||
06.30.2019 | 06.30.2018 | 06.30.2019 | 06.30.2018 | ||
|
| Restated |
|
| Restated |
At the beginning of the period | 172 | 108 |
| (374) | (273) |
Adjustment related to IFRS 16 | 74 | 119 |
| 128 | 160 |
Restated opening balance | 246 | 227 |
| (246) | (113) |
Expense for the period – continuing operations | (53) | 61 |
| (3) | (79) |
Expense for the period – discontinued operations | - | - |
| (122) | (172) |
Income tax related to good will - discontinued operations | 55 | (31) |
| 315 | (31) |
Income tax related to OCI - continuing operations | 2 | (2) |
| 3 | (2) |
Income tax related to OCI - discontinued operations | - | - |
| - | (4) |
Special Tax Regularization Program - PERT | - | (1) |
| - | 2 |
Assets held for sale and discontinued operations (see note 31) | - | - |
| 122 | 176 |
Other | - | - |
| (2) | 1 |
At the end of the period | 250 | 254 |
| 67 | 222 |
79
Companhia Brasileira de Distribuição
Notes to the interim financial information
June 30, 2019
(In millions of Brazilian reais, unless otherwise stated)
20. Provision for contingencies
The provision for contingencies is estimated by the Company’s management, supported by its legal counsel and the provision was recognized in an amount considered sufficient to cover probable losses.
20.
20.1. Parent Company
PIS/COFINS | Taxes and other | Social security and labor | Civil | Regulatory | Total | |
Balance at December 31, 2018 | 84 | 595 | 231 | 62 | 15 | 987 |
|
|
|
|
|
|
|
Additions | 29 | 62 | 57 | 15 | 7 | 170 |
Payments | (1) | (1) | (25) | (7) | (5) | (39) |
Reversals | (108) | (12) | (45) | (7) | (7) | (179) |
Monetary adjustment | (1) | 11 | 14 | 7 | 2 | 33 |
|
|
|
|
|
|
|
Balance at June 30, 2019 | 3 | 655 | 232 | 70 | 12 | 972 |
| PIS/COFINS | Taxes and other | Social security and labor | Civil | Regulatory | Total |
Balance at December 31, 2017 | 73 | 363 | 274 | 81 | 21 | 812 |
|
|
|
|
|
|
|
Additions | - | 71 | 50 | 33 | 15 | 169 |
Payments | - | (2) | (27) | (6) | (11) | (46) |
Reversals | - | (14) | (38) | (42) | (12) | (106) |
Monetary adjustment | 2 | 4 | 17 | 6 | 2 | 31 |
|
|
|
|
|
| |
Balance at June 30, 2018 | 75 | 422 | 276 | 72 | 15 | 860 |
20.2. Consolidated
PIS/COFINS | Taxes and other | Social security and labor | Civil | Regulatory | Total | |
Balance at December 31, 2018 | 86 | 742 | 291 | 89 | 27 | 1,235 |
|
|
|
|
|
|
|
Additions | 29 | 78 | 369 | 104 | 10 | 590 |
Payments | (1) | (1) | (296) | (60) | (6) | (364) |
Reversals | (218) | (19) | (144) | (53) | (9) | (443) |
Monetary adjustment | (5) | 14 | 48 | 13 | 2 | 72 |
Deconsolidation Via Varejo | 113 | (2) | 28 | 5 | 1 | 145 |
|
|
|
|
|
|
|
Balance at June 30, 2019 | 4 | 812 | 296 | 98 | 25 | 1,235 |
|
|
|
|
|
| |
| PIS/COFINS | Taxes and other | Social security and labor | Civil | Regulatory | Total |
Balance at December 31, 2017 | 74 | 563 | 331 | 105 | 34 | 1,107 |
|
|
|
|
|
|
|
Additions | 35 | 79 | 432 | 183 | 24 | 753 |
Payments | - | (2) | (336) | (89) | (13) | (440) |
Reversals | - | (43) | (413) | (139) | (15) | (610) |
Monetary adjustment | 3 | (3) | 57 | 18 | 3 | 78 |
Liabilities related to assets held for sale and discontinued operations | (37) | (7) | 266 | 21 | (5) | 238 |
|
|
|
|
|
|
|
Balance at June 30, 2018 | 75 | 587 | 337 | 99 | 28 | 1,126 |
80
Companhia Brasileira de Distribuição
Notes to the interim financial information
June 30, 2019
(In millions of Brazilian reais, unless otherwise stated)
20. Provision for contingencies- Continued
20.3. Tax
As per prevailing legislation, tax claims are subject to monetary indexation, which refers to an adjustment to the provision based on tax to the indexation rates used by each tax jurisdiction. In all cases, both the interest charges and fines, when applicable, were computed and fully provisioned with respect to unpaid amounts.
The main provisioned tax claims are as follows:
20.3.1. PIS and COFINS
Correspond to matters related to non-approval of compensation, including amounts of lesser expression, which at June 30, 2019 total R$4 (R$86 as of December 31, 2018).
20.3.2. Tax
After entering in the Special program for installment, remained other tax claims, which according to the analysis of external legal counsel, were accrued by the Company. These refer to: (i) challenge on the non-application of the Accident Prevention Factor - FAP; (ii) challenge on the State Finance Department on the ICMS tax rate calculated on electric energy bills; (iii) undue credit; (iv)non-payment of social security contributions on benefits granted to its employees, as a result of an unfavorable decision before the Court; (v) other minor issues. The amount accrued for these matters as of June 30, 2019 is R$373 (R$340 as of December 31, 2018).
ICMS
The Federal Supreme Court ("STF") on October 16, 2014 decided that ICMS taxpayers that trade products included in the “basic food basket” have no right to fully utilize the ICMS credits. The Company, with the assistance of its legal counsel, decided to record a provision for this matter amounting to R$91 as of June 30, 2019 (R$92 as of December 31, 2018) since this claim was considered a “probable” loss. The amounts accrued represent Management’s best estimate of the probable cash disbursement to settle this claim. On May 9, 2019, the STF upheld the previous understanding and did not comply with the request for modulation of the effects of the decision. However, such a decision did not have a major impact on the Company's financial statements, since the amount was already provisioned in its entirety.
Additionally, there are cases assessed by São Paulo State tax authorities related to the refund of ICMS over tax substitution without proper compliance with accessory tax obligations introduced by CAT Administrative Rule 17. Considering recent court decisions the Company accrued R$251 (R$221 in December 31, 2018) representing the best estimation of probable loss evaluated by management based on documentation evidence aspect of the claims.
20.3.3. Supplementary Law 110/2001
The Company claims in court the eligibility to not pay the contributions related to the Government Severance Indemnity Fund for Employees (“FGTS”) costs. The accrued amount as of June 30, 2019 is R$97 (R$88 of December 31, 2018).
20.4.Labor
The Company and its subsidiaries are parties to various labor lawsuits mainly due to termination of employees in the ordinary course of business. At June 30, 2019, the Company recorded a provision of R$296 (R$291 as of December 31, 2018). Management, with the assistance of its legal counsel, assessed these claims and recorded a provision for losses when reasonably estimable, based on past experiences in relation to the amounts claimed.
81
Companhia Brasileira de Distribuição
Notes to the interim financial information
June 30, 2019
(In millions of Brazilian reais, unless otherwise stated)
20. Provision for contingencies – Continued
20.5.Civil and others
The Company and its subsidiaries are parties to civil lawsuits at several court levels (indemnities and collections, among others) and at different courts. The Company’s management records provisions in amounts considered sufficient to cover unfavorable court decisions, when its legal counsel considers the loss as probable.
Among these lawsuits, we point out the following:
· The Company and its subsidiaries are parties to various lawsuits requesting the renewal of rental agreements and the review of the current rent paid. The Company recognizes a provision for the difference between the amount originally paid and the amounts claimed by the adverse party in the lawsuit, when internal and external legal counsel consider that it is probable that the rent amount will be changed by the Company. As of June 30, 2019, the amount accrued for these lawsuits is R$58 (R$49 as of December 31, 2018), for which there are no escrow deposits.
· The Company and its subsidiaries are parties to legal claims related to penalties applied by regulatory agencies, from the Federal, State and Municipal Administrations, among which includes Consumer Protection Agencies (Procon), National Institute of Metrology, Standardization and Industrial Quality (INMETRO) and Municipalities and some lawsuits involving contract terminations with suppliers. Company supported by its legal counsel, assessed these claims, and recorded a provision according to probable cash expending and estimative of loss .On June 30, 2019 the amount of this provision is R$25 (R$27 on December 31, 2018).
· As of June 30, 2019, the amount accrued related to other civil matters is R$40 (R$40 as of December 31, 2018).
Total civil lawsuits and others as of June 30, 2019 amount to R$123 (R$116 as of December 31, 2018).
20.6 Possible contingent liabilities
The Company has other litigations which have been analyzed by the legal counsel and considered as possible loss and, therefore, have not been accrued. The possible litigations updated balance is of R$10,733 as of June 30, 2019 (R$10,671 as of December 31, 2018), and are mainly related to:
· INSS (Social Security Contribution) – GPA was assessed for non-levy of payroll charges on benefits granted to its employees, among other matters, for which possible loss amounts to R$447 as of June 30, 2019 (R$420 as of December 31, 2018). The lawsuits are under administrative and court discussions.
· IRPJ, withholding income tax - IRRF, CSLL, tax on financial transactions - IOF, withholding income tax on net income – GPA has several assessment notices regarding offsetting proceedings, rules on the deductibility of provisions, payment divergences and overpayments; fine for failure to comply with accessory obligations, among other less significant taxes. The amount involved is R$1,040 as of June 30, 2019 (R$1,021 as of December 31, 2018).
82
Companhia Brasileira de Distribuição
Notes to the interim financial information
June 30, 2019
(In millions of Brazilian reais, unless otherwise stated)
20. Provision for contingencies – Continued
20.6.Possible contingent liabilities - Continued
· COFINS, PIS and IPI – the Company has been challenged about offsets of IPI credits acquired from third parties with a final and an-appeal over the decision, fine for failure to comply with accessory obligations, disallowance of COFINS and PIS credits on one-phase products (“produtos monofásicos”), among others less significant taxes. These lawsuits await decision at the administrative and court levels. The amount involved in these assessments is R$1,991 as June 30, 2019 (R$1,985 as of December 31, 2018).
· ICMS – GPA received tax assessment notices by the State tax authorities regarding: (i) utilization of electric energy credits; (ii) purchases from suppliers considered not qualified in the State Finance Department registry; (iii) levied on its own operation of merchandise purchase (own ICMS)) – article 271 of ICMS by-law; (iv) resulting from sale of extended warranty, (v) resulting from financed sales; and (vi) among other matters. The total amount of these assessments is R$6,691, as of June 30, 2019 (R$6,582 as of December 31, 2018), which await a final decision at the administrative and court levels.
· Municipal service tax - ISS, Municipal Real Estate Tax (“IPTU”), rates, and others – these refer to assessments on withholdings of third parties, IPTU payment divergences, fines for failure to comply with accessory obligations, ISS – reimbursement of advertising expenses and sundry taxes, in the amount of R$148 as June 30, 2019 (R$150 as of December 31, 2018), which await decision at the administrative and court levels.
· Other litigations – these refer to administrative proceedings and lawsuits in which the Company claims the renewal of rental agreements and setting of rents according to market values and actions in the civil court, special civil court, Consumer Protection Agency - PROCON (in many States), Institute of Weights and Measure - IPEM, National Institute of Metrology, Standardization and Industrial Quality - INMETRO and National Health Surveillance Agency - ANVISA, among others, amounting to R$416 as June 30, 2019 (R$513 as of December 31, 2018).
The Company has litigations related to challenges by tax authorities on the income tax payment, for which, based on management and legal assessment, the Company has the right of indenization from its former and current shareholders, related to years from 2007 to 2013, under allegation that had improper deduction of goodwill amortizations. These assessments amount R$1,386 on June 30, 2019 (R$1,317 on December 31, 2018).
The Company is responsible for the legal processes of GLOBEX prior to the association with Casas Bahia (Via Varejo). As of June 30, 2019, the amount involved in tax proceedings is R$483 (R$399 as of December 31, 2018).
The Company engages external legal counsel to represent it in the tax assessments, whose fees are contingent upon a percentage to be applied to the amount of success in the final outcome of these lawsuits. This percentage may vary according to qualitative and quantitative factors of each claim, and as of June 30, 2019 the estimated amount, in case of success in all lawsuits, is approximately R$199 (R$186 as of December 31, 2018).
83
Companhia Brasileira de Distribuição
Notes to the interim financial information
June 30, 2019
(In millions of Brazilian reais, unless otherwise stated)
20. Provision for contingencies– Continued
20.7. Restricted deposits for legal proceedings
The Company is challenging the payment of certain taxes, contributions and labor-related obligations and has made judicial deposits in the corresponding amounts, as well as escrow deposits related to the provision for legal proceedings.
Parent Company | Consolidated | ||||
06.30.2019 | 12.31.2018 | 06.30.2019 | 12.31.2018 | ||
Tax | 176 | 168 |
| 245 | 237 |
Labor | 440 | 417 |
| 487 | 463 |
Civil and other | 27 | 24 |
| 37 | 34 |
Regulatory | 15 | 15 |
| 42 | 42 |
Total | 658 | 624 |
| 811 | 776 |
20.8. Guarantees
Lawsuits | Property and equipment |
| Letter of Guarantee |
| Total | |||
| 06.30.2019 | 12.31.2018 |
| 06.30.2019 | 12.31.2018 |
| 06.30.2019 | 12.31.2018 |
|
|
|
|
| ||||
Tax | 840 | 838 |
| 9,344 | 9,033 |
| 10,184 | 9,871 |
Labor | 2 | 3 |
| 359 | 190 |
| 361 | 193 |
Civil and other | 9 | 9 |
| 257 | 252 |
| 266 | 261 |
Regulatory | 3 | 3 |
| 191 | 181 |
| 194 | 184 |
Total | 854 | 853 |
| 10,151 | 9,656 |
| 11,005 | 10,509 |
The cost of letter of guarantees is approximately 0.65% per year of the amount of the lawsuits and is recorded as expense.
20.9. Deduction of ICMS from the calculation basis for PIS and COFINS
Since the adoption of the non cumulative regime to calculate PIS and COFINS, the Group has challenged the right to deduct ICMS taxes from the calculation basis for PIS and COFINS. On March 15, 2017, the Supreme Court ruled that ICMS should be excluded from the calculation basis of PIS and COFINS..
Since the decision of the Federal Supreme Court (“FSC”) on March 15, 2017, the procedural steps were within the anticipated by the Group’s legal advisors without any change in management's judgment regarding periods prior to March 15, 2017, although a final decision is expected in relation to the appeal filed by the prosecution. The Group and its external legal counsel believe that the decision related to the definitive application of the sentence will not limit the right on a legal claim as proposed by the Group, nevertheless, the elements of the process still pending of decision do not allow the recognition of the asset related to the credits to be measured since the Group started the claim in 2003. The Group estimates that it will be able to use tax credits for an amount of R$1,400.
84
Companhia Brasileira de Distribuição
Notes to the interim financial information
June 30, 2019
(In millions of Brazilian reais, unless otherwise stated)
20. Provision for contingencies– Continued
20.10. ArbitrationPenínsula
On September 12, 2017, the Company received a notice from the Brazil-Canada Chamber of Commerce regarding a request for arbitration (“Proceeding”) filed by Banco Ourinvest S.A., a financial institution, in its capacity as fund manager and acting in the exclusively interest of the quotaholders of Fundo de Investimento Imobiliário Península ("Península").
The Proceeding aims to discuss the calculation of the rental fees and other operational matters related to the stores owned by Peninsula, which are under several lease agreements and contracts entered into between the Company and Peninsula during 2005 (the "Agreements"). The Agreements assure to CBD the rent of the stores for a period of twenty (20) years, which may be extended for an additional 20-year term, at CBD’s discretion, and rules the calculation of the rental fees.
The Proceeding refers to certain terms and conditions of the Agreements and does not affect the continuity of the leasing of the stores, which are contractually assured. The amounts on which the Company is exposed can not be determined with reasonable certainty based on the current stage of the arbitral process. Management assessed the arbitration as possible loss, based on the opinion provided by the external legal counsel.
21. Lease liability
21.1. Leasing obligations
Lease liability amounted to R$4,729 as of June 30, 2019 (R$4,762 as of December 31, 2018), as shown in the table below:
Parent Company | Consolidated | ||||
06.30.2019 | 12.31.2018 | 06.30.2019 | 12.31.2018 | ||
|
| Restated |
|
| Restated |
Lease liability –minimum rental payments: |
|
|
|
| |
Up to 1 year | 514 | 502 |
| 604 | 575 |
1 - 5 years | 2,064 | 2,049 |
| 2,414 | 2,334 |
Over 5 years | 987 | 1,168 |
| 1,711 | 1,853 |
Present value of lease agreements | 3,565 | 3,719 |
| 4,729 | 4,762 |
Future financing charges | 1,752 | 1,947 |
| 2,830 | 2,976 |
Future value of lease agreements | 5,317 | 5,666 |
| 7,559 | 7,738 |
The interest expense on lease liability is presented in note 27. The incremental interest rate of the Company and its subsidiaries at the date of signing of the agreements was 13.01% in the quarter ended June 30, 2019 (13.34% as of June 30, 2018).
85
Companhia Brasileira de Distribuição
Notes to the interim financial information
June 30, 2019
(In millions of Brazilian reais, unless otherwise stated)
21. Leasing transactions - Continued
21.2. Movement of leasing liability
| Parent Company |
| Consolidated |
At December 31, 2018 | 3,719 |
| 4,762 |
Additions | 4 |
| 64 |
Remeasurement | 127 |
| 328 |
Accrued interest | 220 |
| 450 |
Exchange and monetary variation | - |
| 1 |
Payments | (437) |
| (918) |
Anticipated lease contract closure | (68) |
| (91) |
Deconsolidation Via Varejo | - |
| 133 |
At June 30, 2019 | 3,565 |
| 4,729 |
|
|
|
|
Current | 514 |
| 604 |
Noncurrent | 3,051 |
| 4,125 |
|
|
|
|
| Parent Company |
| Consolidated |
At December 31, 2017 | 3,488 |
| 4,372 |
Additions | 8 |
| 115 |
Remeasurement | 72 |
| 328 |
Accrued interest | 214 |
| 464 |
Payments | (401) |
| (918) |
Anticipated lease contract closure | (15) |
| (16) |
Liabilities related to assets held for sale and discontinued operations | - |
| 20 |
At June 30, 2018 | 3,366 |
| 4,365 |
|
|
|
|
Current | 418 |
| 481 |
Noncurrent | 2,948 |
| 3,884 |
21.3. Lease expense on variable rents, low value assets and short-term agreements
Parent Company | Consolidated | ||||
06.30.2019 | 06.30.2018 | 06.30.2019 | 06.30.2018 | ||
Expenses (income) for the period: |
| Restated |
|
| Restated |
Variable (0.1% to 4.5% of sales) | 5 | 6 |
| 13 | 12 |
Sublease rentals (*) | (95) | (86) |
| (104) | (103) |
(*) Refers to lease agreements receivable from commercial shopping malls.
86
Companhia Brasileira de Distribuição
Notes to the interim financial information
June 30, 2019
(In millions of Brazilian reais, unless otherwise stated)
22. Deferred revenue
The Company receives amounts from business partners on exclusivity in the intermediation of additional or extended warranty services, and the subsidiary Sendas receives amounts for the rental of back lights for exhibition of products from its suppliers.
The detailed information on deferred revenue was presented in the annual financial statements for 2018, in note 23.
Parent Company | Consolidated | ||||
06.30.2019 | 12.31.2018 | 06.30.2019 | 12.31.2018 | ||
Deferred revenue in relation to sale of real estate property | 28 | 16 |
| 28 | 16 |
Back lights | - | - |
| 68 | 134 |
Additional or extended warranties | 17 | 19 |
| 17 | 19 |
Services rendering agreement - Allpark | 11 | 11 |
| 11 | 11 |
Revenue from credit card companies | 42 | 44 |
| 42 | 44 |
Others | - | 9 |
| 36 | 39 |
98 | 99 |
| 202 | 263 | |
Current |
|
|
|
|
|
Noncurrent | 71 | 89 |
| 171 | 250 |
| 27 | 10 |
| 31 | 13 |
23. Shareholders’ equity
The detailed information on shareholders’ equity was presented in the annual financial statements for 2018, in note 24.
23.1. Capital stock
The subscribed and paid-up capital as of June 30, 2019 is represented by 267,079 (266,845 as of December 31, 2018) thousands of registered shares with no par value, of which 99,680 thousands of common shares (99,680 as of December 31, 2018) and 167,399 thousands of preferred shares (166,165 as of December 31, 2018).
The Company is authorized to increase its capital stock up to the limit of 400,000 thousands of shares, regardless of any amendment to the Company’s Bylaws, upon resolution of the Board of Directors, which will establish the terms and conditions.
At the Board of Directors’ Meetings held on February 20, 2019, May 7, 2019 and June 24, 2019, were approved a capital increase of R$12 (R$3 on December 31, 2018) through the issuance of 225 thousands preferred shares (265 thousands of preferred shares on December 31,2018). On June 30, 2019, the capital stock is R$ 6,836 (R$ 6,825 on December 31, 2018).
87
Companhia Brasileira de Distribuição
Notes to the interim financial information
June 30, 2019
(In millions of Brazilian reais, unless otherwise stated)
23. Shareholders’ equity– Continued
23.2. Stock option plan for preferred shares
The fair value of each option granted is estimated at the grant date using the Black & Scholes option pricing model, considering the following assumptions for the B6 and C6 series: (a) dividend expectation of 0.67%, (b) volatility expectation of approximately 32.74% and (c) risk-free weighted average interest rate of 7.32%.
|
|
|
|
| 06.30.2019 | |||
|
| Number of options (in thousands) | ||||||
Series granted | Grant date | 1st date of exercise | Expiration date | Exercise price at the grant date |
Granted | Exercised | Cancelled | Total in effect |
Series B3 | 05/30/2016 | 05/30/2019 | 11/30/2019 | 0.01 | 823 | (284) | (75) | 464 |
Series C3 | 05/30/2016 | 05/30/2019 | 11/30/2019 | 37.21 | 823 | (276) | (109) | 438 |
Series B4 | 05/31/2017 | 05/31/2020 | 11/30/2020 | 0.01 | 537 | (161) | (44) | 332 |
Series C4 | 05/31/2017 | 05/31/2020 | 11/30/2020 | 56.78 | 537 | (160) | (45) | 332 |
Series B3 -Tranche2 | 04/27/2018 | 05/30/2019 | 11/30/2019 | 0.01 | 95 | - | - | 95 |
Series C3 -Tranche2 | 04/27/2018 | 05/30/2019 | 11/30/2019 | 56.83 | 95 | - | - | 95 |
Series B5 | 05/31/2018 | 05/31/2021 | 11/30/2021 | 0.01 | 594 | (98) | (12) | 484 |
Series C5 | 05/31/2018 | 05/31/2021 | 11/30/2021 | 62.61 | 594 | (98) | (12) | 484 |
Series B6 | 05/31/2019 | 05/31/2022 | 11/30/2022 | 0.01 | 434 | - | - | 434 |
Series C6 | 05/31/2019 | 05/31/2022 | 11/30/2022 | 70.62 | 331 | - | - | 331 |
|
|
|
|
| 4,863 | (1,077) | (297) | 3,489 |
The changes of the quantity of exercised options, the weighted average of the exercise price, and the weighted average of the remaining term are presented at the chart below:
Options | Weighted average of exercise price | Weighted average of remaining contractual term | |
in thousands | R$ | ||
At December 31, 2018 | 2,755 | 26.03 | 1.37 |
Granted during the period | 765 | 30.55 |
|
Cancelled during the period | (18) | 31.10 |
|
Exercised during the period | (13) | 23.64 |
|
Outstanding at the end of the period | 3,489 | 27.01 | 1.35 |
At June 30, 2018 | 3,489 | 27.01 | 1.35 |
The weighted average of the provided options fair value at June 30, 2019 were R$48.97 (R$45.24 at the December 31, 2018).
The recorded amounts at the Parent Company and Consolidated’s statement of operations at the June 30, 2019 were R$14 (R$10 at the June 30, 2018).
23.3. Foreign exchange variation of investment abroad
Cumulative effect of exchange gains and losses on the translation of assets, liabilities and profit (loss) of Euros to Brazilian reais, corresponding to the investment in subsidiary Cnova N.V.. The effect in the Parent Company was R$5 (R$31 at the June 30, 2018).
88
Companhia Brasileira de Distribuição
Notes to the interim financial information
June 30, 2019
(In millions of Brazilian reais, unless otherwise stated)
24. Net operating revenue
Parent Company | Consolidated | ||||
06.30.2019 | 06.30.2018 | 06.30.2019 | 06.30.2018 | ||
Gross sales |
|
| |||
Goods | 13,597 | 13,733 |
| 27,959 | 25,075 |
Services rendered | 188 | 229 |
| 210 | 251 |
Sales returns and cancellations | (95) | (234) |
| (123) | (255) |
13,690 | 13,728 |
| 28,046 | 25,071 | |
|
|
|
|
| |
Taxes on sales | (1,065) | (1,047) |
| (2,256) | (1,953) |
Net operating revenues | 12,625 | 12,681 |
| 25,790 | 23,118 |
25. Expenses by nature
Parent Company | Consolidated | ||||
06.30.2019 | 06.30.2018 | 06.30.2019 | 06.30.2018 | ||
Restated | Restated | ||||
|
|
|
|
|
|
Cost of inventories | (8,505) | (8,427) |
| (19,379) | (16,703) |
Personnel expenses | (1,648) | (1,669) |
| (2,457) | (2,322) |
Outsourced services | (236) | (248) |
| (332) | (320) |
Functional expenses | (690) | (578) |
| (970) | (785) |
Selling expenses | (476) | (486) |
| (662) | (634) |
Other expenses | (233) | (299) |
| (320) | (368) |
(11,786) | (11,707) |
| (24,120) | (21,132) | |
|
|
|
|
| |
Cost of sales | (9,130) | (9,051) |
| (20,174) | (17,454) |
Selling expenses | (2,291) | (2,301) |
| (3,422) | (3,190) |
General and administrative expenses | (365) | (355) |
| (524) | (488) |
(11,786) | (11,707) |
| (24,120) | (21,132) | |
26. Other operating expenses, net
Parent Company | Consolidated | ||||
06.30.2019 | 06.30.2018 | 06.30.2019 | 06.30.2018 | ||
|
| Restated |
|
| Restated |
|
|
|
| ||
Tax installments and other tax risks | (61) | (40) |
| (71) | (19) |
Restructuring expenses | (48) | (60) |
| (50) | (62) |
Losses on disposals of fixed assets | 2 | 2 |
| (2) | (48) |
Total | (107) | (98) |
| (123) | (129) |
89
Companhia Brasileira de Distribuição
Notes to the interim financial information
June 30, 2019
(In millions of Brazilian reais, unless otherwise stated)
27. Financial income (expenses), net
Parent Company | Consolidated | ||||
06.30.2019 | 06.30.2018 | 06.30.2019 | 06.30.2018 | ||
|
| Restated |
|
| Restated |
Finance expenses: |
|
|
|
| |
Cost of debt | (162) | (155) |
| (185) | (172) |
Cost of discounting receivables | (53) | (66) |
| (77) | (86) |
Monetary restatement loss | (64) | (65) |
| (67) | (52) |
Interest on lease liability | (222) | (216) |
| (284) | (272) |
Other finance expenses | (41) | (22) |
| (53) | (37) |
Total financial expenses | (542) | (524) |
| (666) | (619) |
8% | 4% |
| 8% | 6% | |
Financial income: |
|
|
|
|
|
Income from short term investments | 8 | 14 |
| 10 | 15 |
Monetary restatement gain | 54 | 44 |
| 89 | 58 |
Other financial income | 4 | 6 |
| 5 | 6 |
Total financial income | 66 | 64 |
| 104 | 79 |
|
|
|
|
|
|
Total | (476) | (460) |
| (562) | (540) |
The gains or losses on derivative financial instruments are recorded as cost of debt and disclosed in Note 17.
90
Companhia Brasileira de Distribuição
Notes to the interim financial information
June 30, 2019
(In millions of Brazilian reais, unless otherwise stated)
28. Earnings per share
The information on earnings per share was presented in the annual financial statements for 2018, in note 29.
The table below presents the determination of net income available to holders of common and preferred shares and the weighted average number of common and preferred shares outstanding used to calculate basic and diluted earnings per share in each reporting period:
06.30.2019 | 06.30.2018 | ||||||
Preferred | Common | Total | Preferred | Common | Total | ||
|
|
|
|
| Restated | ||
Basic numerator | |||||||
Net income allocated to common and preferred shares - continuing operations | 141 | 76 | 217 |
| 311 | 169 | 480 |
Net income allocated to common and preferred shares - discontinued operations | 226 | 123 | 349 |
| 80 | 43 | 123 |
Net income allocated to common and preferred shares | 367 | 199 | 566 |
| 391 | 212 | 603 |
|
|
|
|
|
|
| |
Basic denominator (millions of shares) |
|
|
|
|
|
|
|
Weighted average of shares | 167 | 100 | 267 |
| 167 | 100 | 267 |
|
|
|
|
|
|
| |
Basic earnings per millions of shares (R$) - continuing operations | 0.84247 | 0.76588 |
|
| 1.86527 | 1.69570 |
|
Basic earnings per millions of shares (R$) - discontinued operations | 1.35494 | 1.23177 |
|
| 0.47798 | 0.43452 |
|
Basic earnings per millions of shares (R$) - total | 2.19741 | 1.99765 |
|
| 2.34325 | 2.13022 |
|
|
|
|
|
|
|
| |
Diluted numerator |
|
|
|
|
|
|
|
Net income allocated to common and preferred shares - continuing operations | 141 | 77 | 217 |
| 311 | 169 | 480 |
Net income allocated to common and preferred shares - discontinued operations | 226 | 123 | 349 |
| 80 | 43 | 123 |
Net income allocated to common and preferred shares | 367 | 199 | 566 |
| 391 | 212 | 603 |
|
|
|
|
|
|
| |
Diluted denominator |
|
|
|
|
|
|
|
Weighted average of shares (in millions) | 167 | 100 | 267 |
| 167 | 100 | 267 |
Stock options | 1 | - | 1 |
| 1 | - | 1 |
Diluted weighted average of shares (millions) | 168 | 100 | 268 |
| 168 | 100 | 268 |
|
|
|
|
|
|
| |
Diluted earnings per millions of shares (R$) – continuing operations | 0.83950 | 0.76733 |
|
| 1.85481 | 1.69280 |
|
Diluted earnings per millions of shares (R$) – discontinued operations | 1.35017 | 1.23321 |
|
| 0.47530 | 0.43162 |
|
Diluted earnings per millions of shares (R$) – total | 2.18967 | 2.00054 |
|
| 2.33011 | 2.12442 |
|
91
Companhia Brasileira de Distribuição
Notes to the interim financial information
June 30, 2019
(In millions of Brazilian reais, unless otherwise stated)
29. Segment information
The information about segments was presented in the annual financial statements of 2018, in note 30 Management considers the following segments:
· Food retail – includes the banners “Pão de Açúcar”, “Minuto Pão de Açúcar”, “Extra Hiper”, “Extra Supermercado” / “Mercado Extra”, “Minimercado Extra”, “Posto Extra”, “Drogaria Extra” and “GPA Malls & Properties”.
· Cash & Carry – includes the brand “ASSAÍ”.
Home appliances and e-commerce segments were sold are presented as discontinued operations at the June 30, 2019 and 2018 and kept in this note for the purposes of reconciliation with consolidated interim financial information.
Information on the Company’s segments as of June 30, 2019 is included in the table below:
92
Companhia Brasileira de Distribuição
Notes to the interim financial information
June 30, 2019
(In millions of Brazilian reais, unless otherwise stated)
29. Segment information– Continued
Description | Food Retail (*) | Cash & Carry | Assets held for sale and discontinued operations (**) | Subtotal | Eliminations/ Others(***) | Total | |||||||||||
2019 | 2018 | 2019 | 2018 | 2019 | 2018 | 2019 | 2018 | 2019 | 2018 | 2019 | 2018 | ||||||
|
| Restated |
|
| Restated |
|
| Restated |
|
| Restated |
|
| Restated |
|
| Restated |
|
|
|
|
|
|
|
|
|
|
|
|
|
|
|
|
|
|
Net operating revenues | 12,931 | 12,782 |
| 12,859 | 10,336 |
| - | - |
| 25,790 | 23,118 |
| - | - |
| 25,790 | 23,118 |
Gross profit | 3,557 | 3,648 |
| 2,059 | 2,016 |
| - | - |
| 5,616 | 5,664 |
| - | - |
| 5,616 | 5,664 |
Depreciation and amortization | (483) | (456) |
| (180) | (146) |
| - | - |
| (663) | (602) |
| - | - |
| (663) | (602) |
Share of profit of subsidiaries and associates | 38 | 32 |
| - | - |
| - | - |
| 38 | 32 |
| (65) | (76) |
| (27) | (44) |
Operating income | 307 | 444 |
| 623 | 843 |
| - | - |
| 930 | 1,287 |
| (73) | (76) |
| 857 | 1,211 |
Net financial expenses | (470) | (468) |
| (92) | (72) |
| - | - |
| (562) | (540) |
| - | - |
| (562) | (540) |
Profit(loss) before income tax and social contribution | (163) | (24) |
| 531 | 771 |
| - | - |
| 368 | 747 |
| (73) | (76) |
| 295 | 671 |
Income tax and social contribution | 97 | 66 |
| (175) | (257) |
| - | - |
| (78) | (191) |
| - | - |
| (78) | (191) |
Net income (loss) for continuing operations | (66) | 42 |
| 356 | 514 |
| - | - |
| 290 | 556 |
| (73) | (76) |
| 217 | 480 |
Net income (loss) for discontinued operations | 345 | (27) |
| - | - |
| 36 | 357 |
| 381 | 330 |
| - | - |
| 381 | 330 |
Profit (loss) of year end | 279 | 15 |
| 356 | 514 |
| 36 | 357 |
| 671 | 886 |
| (73) | (76) |
| 598 | 810 |
|
|
|
|
|
|
|
|
|
|
|
|
|
|
|
|
| |
Current assets | 8,605 | 7,671 |
| 3,397 | 4,193 |
| - | 28,427 |
| 12,002 | 40,291 |
| - | (151) |
| 12,002 | 40,140 |
Noncurrent assets | 14,377 | 14,253 |
| 6,487 | 5,997 |
| - | - |
| 20,864 | 20,250 |
| - | (16) |
| 20,864 | 20,234 |
Current liabilities | 8,152 | 8,587 |
| 4,401 | 5,306 |
| - | 23,245 |
| 12,553 | 37,138 |
| - | (167) |
| 12,553 | 36,971 |
Noncurrent liabilities | 8,203 | 8,803 |
| 1,382 | 1,404 |
| - | - |
| 9,585 | 10,207 |
| - | - |
| 9,585 | 10,207 |
Shareholders' equity | 6,627 | 4,534 |
| 4,101 | 3,480 |
| - | 5,182 |
| 10,728 | 13,196 |
| - | - |
| 10,728 | 13,196 |
(*)Food retail includes GPA Malls & Properties and Comprebem.
(**) The eliminations consist of intercompany balances. In the management’s view, the net earnings eliminations are made inside of own segment, besides, the equity pickup of the Company in Luxco.
93
Companhia Brasileira de Distribuição
Notes to the interim financial information
June 30, 2019
(In millions of Brazilian reais, unless otherwise stated)
29. Segment information– Continued
The Company and its subsidiaries operate primarily as a retailer of food, clothing, home appliances and other products. Total revenues are composed of the following brands:
06.30.2019 | 06.30.2018 | ||
Assaí | 12,859 |
| 10,336 |
Extra | 7,628 |
| 7,606 |
Pão de Açúcar | 3,392 |
| 3,345 |
Proximidade | 555 |
| 561 |
Other business | 1,356 |
| 1,270 |
Total net operating revenue | 25,790 |
| 23,118 |
30. Non cash transactions
During the half ended at June 30, 2019 and 2018 the Company had the following non-cash transactions:
· Purchase of fixed assets not paid yet as note 14.2;
· Purchase of intangible assets not paid yet as per note 15.2;
· Deferred income tax as per note 19;
· Additions of provisions for contingencies as per note 20;
31. Non current assets held for sale and discontinued operations
The detailed information about assets held for sale and discontinued operations were presented in the annual financial statements of 2018, in note 32.
Parent Company |
| 06.30.2019 | 12.31.2018 |
Restated | |||
|
|
|
|
Reclassification of investment to assets held for sale |
| - | 1,845 |
Goodwill reclassification to assets held for sale |
| - | 179 |
Property/lands held for sale |
| 24 | 30 |
Assets held for sale and discontinued operations | 24 | 2,054 |
Consolidated |
|
| ||
|
| 06.30.2019 |
| 3 12.31.2018 |
|
|
|
| Restated |
Discontinued operations assets | - |
| 28,275 | |
Property/lands held for sale |
| 24 |
| 30 |
Total | 24 |
| 28,305 | |
|
|
|
|
|
Discontinued operations liabilities |
| - |
| 23,189 |
Total |
| - |
| 23,189 |
On September 29, 2018, the Company entered into a land purchase and sale agreement for the amount of R$115, which sale was not recognized under IFRS 15, due to the contractual characteristics of long-term payment and transfer of title in future date to be defined by the buyer.
94
Companhia Brasileira de Distribuição
Notes to the interim financial information
June 30, 2019
(In millions of Brazilian reais, unless otherwise stated)
31. Non current assets held for sale and discontinued operations - Continued
As disclosed in notes 2 and 13.2, on June 14, 2019, the sale of Via Varejo S.A. (“VV”) was concluded, the date on which control of the subsidiary was exercised by its new controlling shareholders. As this process occurred at the end of the second quarter of 2019 and considering that VV's financial information will be released only after the Company's results were presented, specifically for this quarterly financial information, the disclosures about the discontinued operations are being made in a condensed manner.
Following are the balance sheet and consolidated statements of Via Varejo's cash flows before eliminations, including effects of purchase price allocation on the acquisitions of Globex and Casa Bahia:
Balance sheet (*):
05.31.2019 | 12.31.2018 | ||
Assets | Restated | ||
Current | |||
Total current assets | 9,871 | 13,412 | |
Noncurrent |
| ||
Total noncurrent assets | 15,551 | 15,017 | |
Total assets | 25,422 | 28,429 | |
|
|
| |
Liabilities |
|
|
|
Current |
|
| |
Total current liabilities | 13,484 | 15,733 | |
|
| ||
Noncurrent |
|
| |
Total noncurrent liabilities | 6,689 | 7,514 | |
Shareholders’ equity | 5,249 | 5,182 | |
Total liabilities and shareholders’ equity | 25,422 | 28,429 |
Cash flow: | 05.31.2019 | 06.30.2018 | |
Restated | |||
|
|
|
|
Cash flow provided by (used in) operating activities | (2,640) |
| (1,385) |
Net cash provided by (used in) investing activities | (234) |
| (242) |
Net cash provided by (used in) financing activities | (651) |
| (987) |
Cash variation in the period | (3,525) |
| (2,614) |
95
Companhia Brasileira de Distribuição
Notes to the interim financial information
June 30, 2019
(In millions of Brazilian reais, unless otherwise stated)
31. Non current assets held for sale and discontinued operations - Continued
Income Statement:
The breakdown of income from discontinued operations presented in the Company's consolidated statements of income is as follows:
06.30.2019 |
| 06.30.2018 | |
|
|
| Restated |
|
|
| |
Result of discontinued operations | (33) |
| 330 |
Gain on sale of discontinued operations (Note 13.2) | 414 |
| - |
Profit from discontinued operations presented in the Company's consolidated statements of income | 381 |
| 330 |
|
|
|
|
|
|
|
|
Company's controlling shareholders | 349 |
| 123 |
Participation of non-controlling shareholders | 32 |
| 207 |
|
|
|
|
Additionally, the Company incurred costs reclassified related to contingency indemnity costs arising from periods prior to the acquisition, paid to Via Varejo. Under IFRS 5, such costs were reclassified to discontinued activities in the amount of R$33 as of June 30, 2019 (R$4 of income as of June 30, 2018).
32. Subsequent events
32.1 Issuance of promissory notes
On June 24, 2019, the first issue of commercial promissory notes of Sendas Distribuidora was to be held in 6 series, with a nominal value of R$50 and a total value of R $ 800. The issue of the first series occurred on July 4, 2019.
96
Other information deemed as relevant by the Company
Shareholding at 03.31.2019 | |||||||
|
|
|
|
|
|
| |
SHAREHOLDING OF CONTROLLING PARTIES OF THE COMPANY’S SHARES | |||||||
COMPANHIA BRASILEIRA DE DISTRIBUIÇÃO (Publicly-held company) | Shareholding at 06/30/2019 | ||||||
Shareholder | Common Shares | Preferred Shares | Total | ||||
Number | % | Number | % | Number | % | ||
Wilkes Participações S/A | 94.019.178 | 94,32% | 0 | 0,00% | 94.019.178 | 35,20% | |
Jean-Charles Naouri* | 0 | 0,00% | 1 | 0,00% | 1 | 0,00% | |
Geant International BV* | 0 | 0,00% | 9.423.742 | 5,63% | 9.423.742 | 3,53% | |
Segisor* | 5.600.050 | 5,62% | 0 | 0,00% | 5.600.050 | 2,10% | |
Casino Guichard Perrachon* | 1 | 0,00% | 0 | 0,00% | 1 | 0,00% | |
Almacenes Éxito S.A.* | 1 | 0,00% | 0 | 0,00% | 1 | 0,00% | |
King LLC* | 0 | 0,00% | 852.000 | 0,51% | 852.000 | 0,32% | |
Helicco Participações Ltda. | 0 | 0,00% | 581.600 | 0,35% | 581.600 | 0,22% | |
BlackRock, Inc.* | 0 | 0,00% | 15.810.780 | 9,44% | 15.810.780 | 5,92% | |
Conselho de Administração | 0 | 0,00% | 563.804 | 0,34% | 563.804 | 0,21% | |
Diretoria | 0 | 0,00% | 35.815 | 0,02% | 35.815 | 0,01% | |
Em Tesouraria | 0 | 0,00% | 232.586 | 0,14% | 232.586 | 0,09% | |
Outros | 60.621 | 0,06% | 139.898.883 | 83,57% | 139.959.504 | 52,40% | |
Total | 99.679.851 | 100,00% | 167.399.211 | 100,00% | 267.079.062 | 100,00% | |
(*) Foreign Company | |||||||
CORPORATE’S CAPITAL STOCK DISTRIBUTION (COMPANY’S SHAREHOLDER) | ||||||
WILKES PARTICIPAÇÕES S.A | Shareholding | |||||
Shareholder/Quotaholder | Common Shares | Preferred Shares | Total | |||
Number | % | Number | % | Number | % | |
CASINO GUICHARD PERRACHON * | 1 | 0,00% | 0 | 0,00% | 1 | 0,00% |
SEGISOR* | 223.698.566 | 100,00% | 0 | 0,00% | 223.698.566 | 100,00% |
ALMACENES ÉXITO S.A.* | 1 | 0,00% | 0 | 0,00% | 1 | 0,00% |
AÇÕES EM TESOURARIA | 0 | 0,00% | 0 | 0,00% | 0 | 0,00% |
TOTAL | 223.698.568 | 100,00% | 0 | 0,00% | 223.698.568 | 100% |
(*) Foreign Company | ||||||
97
Other information deemed as relevant by the Company
SHAREHOLDING OF CONTROLLING PARTIES OF THE COMPANY’S SHARES | ||||||
SEGISOR |
|
| Shareholding | |||
Quotaholder | Quotas | % | Preferred Shares | % | Number | % |
Onper Investimentos 2015 S.L.* | 887.239.642 | 50,00% | 0 | 0,00% | 887.239.642 | 50,00% |
Casino Guichard Perrachon* | 887.239.642 | 50,00% | 0 | 0,00% | 887.239.642 | 50,00% |
Equitis Gestion* | 2 | 0,00% | 0 | 0,00% | 2 | 0,00% |
TOTAL | 1.774.479.286 | 100% | 0 | 0% | 1.774.479.286 | 100% |
SHAREHOLDING OF CONTROLLING PARTIES OF THE COMPANY’S SHARES | ||||||
ONPER INVESTIMENTOS 2015 S.L. | Shareholding | |||||
Shareholder | Common Shares | % | Preferred Shares | % | Number | % |
ALMANACENES ÉXITO S.A.* | 3,000 | 100.00% | 0 | 0.00% | 3,000 | 100.00% |
TOTAL | 3,000 | 100.00% | 0 | 0.00% | 3,000 | 100.00% |
SHAREHOLDING OF CONTROLLING PARTIES OF THE COMPANY’S SHARES | ||||||
ALMANACENES ÉXITO S.A. | Shareholding | |||||
Shareholders* | Common | % | Preferred | % | Number | % |
Geant International B.V. | 187.689.792 | 41,93% | 0 | 0,00% | 187.689.792 | 41,93% |
Geant Fonciere B.V. | 47.725.428 | 10,66% | 0 | 0,00% | 47.725.428 | 10,66% |
Fondo de Pensiones Obligatorias Porvenir Moderado | 22.493.709 | 5,02% | 0 | 0,00% | 22.493.709 | 5,02% |
Fondo de Pensiones Obligatorias Proteccion | 26.395.301 | 5,90% | 0 | 0,00% | 26.395.301 | 5,90% |
Other Shareholders | 163.336.754 | 36,49% | 0 | 0,00% | 163.336.754 | 36,49% |
TOTAL | 447.640.984 | 100,00% | 0 | 0,00% | 447.640.984 | 100,00% |
98
Other information deemed as relevant by the Company
CONSOLIDATED SHAREHOLDING OF CONTROLLING PARTIES AND MANAGEMENT AND OUTSTANDING SHARES | Shareholding at 06/30/2019 (In units) Total | ||||||
Shareholder | Common Shares | Preferred Shares | |||||
Number | % | Number | % | Number | % | ||
Controlling parties | 99,619,230 | 99,94% | 10.857.343 | 6,49% | 110.476.573 | 41,36% | |
|
| ||||||
Management |
| ||||||
Board of Directors | - | 0,00% | 563.804 | 0,34% | 563.804 | 0,21% | |
Board of Executive Officers | - | 0,00% | 35.815 | 0,02% | 35.815 | 0,01% | |
|
|
|
|
| |||
Treasury Shares | - | 0,00% | 232.586 | 0,14% | 232.586 | 0,09% | |
|
|
|
|
|
| ||
Other Shareholdersas | 60,621 | 0,06% | 155.709.663 | 93,02% | 155.770.284 | 58,32% | |
|
|
|
|
|
| ||
Total | 99,679,851 | 100,00% | 167.399.211 | 100,00% | 267.079.062 | 100,00% | |
|
|
|
|
|
| ||
Outstanding Shares | 60,621 | 0,06% | 156.309.282 | 93,38% | 156.369.903 | 58,55% | |
CONSOLIDATED SHAREHOLDING OF CONTROLLING PARTIES AND MANAGEMENT AND OUTSTANDING | Shareholding at 06/30/2018 (In units) Total | ||||||
Shareholder | Common Shares | Preferred Shares | |||||
Number | % | Number | % | Number | % | ||
Controlling parties | 99.619.230 | 99,94% | 10.857.343 | 6,50% | 110.476.573 | 41,43% | |
|
|
|
|
|
| ||
Management |
|
|
|
|
| ||
Board of Directors | - | 0,00% | 432.236 | 0,26% | 432.236 | 0,16% | |
Board of Executive Officers | - | 0,00% | 37.896 | 0,02% | 37.896 | 0,01% | |
|
|
|
|
|
| ||
Treasury Shares | - | 0,00% | 232.586 | 0,14% | 232.586 | 0,09% | |
|
|
|
|
|
| ||
Other Shareholdersas | 60.621 | 0,06% | 155.389.827 | 93,08% | 155.450.448 | 58,30% | |
|
|
|
|
|
| ||
Total | 99.679.851 | 100,00% | 166.949.888 | 100,00% | 266.629.739 | 100,00% | |
|
|
|
|
|
| ||
Outstanding Shares | 60.621 | 0,06% | 155.859.959 | 93,36% | 155.920.580 | 58,48% | |
99
SIGNATURES
Pursuant to the requirement of the Securities Exchange Act of 1934, the registrant has duly caused this report to be signed on its behalf by the undersigned, thereunto duly authorized.
| COMPANHIA BRASILEIRA DE DISTRIBUIÇÃO | ||
| Date: July 25, 2019 | By: /s/ Peter Estermann Name: Peter Estermann Title: Chief Executive Officer | |
| By: /s/ Daniela Sabbag Name: Daniela Sabbag Title: Investor Relations Officer | ||
FORWARD-LOOKING STATEMENTS
This press release may contain forward-looking statements. These statements are statements that are not historical facts, and are based on management's current view and estimates offuture economic circumstances, industry conditions, company performance and financial results. The words "anticipates", "believes", "estimates", "expects", "plans" and similar expressions, as they relate to the company, are intended to identify forward-looking statements. Statements regarding the declaration or payment of dividends, the implementation of principal operating and financing strategies and capital expenditure plans, the direction of future operations and the factors or trends affecting financial condition, liquidity or results of operations are examples of forward-looking statements. Such statements reflect the current views of management and are subject to a number of risks and uncertainties. There is no guarantee that the expected events, trends or results will actually occur. The statements are based on many assumptions and factors, including general economic and market conditions, industry conditions, and operating factors. Any changes in such assumptions or factors could cause actual results to differ materially from current expectations.