FORM 6-K
SECURITIES AND EXCHANGE COMMISSION
Washington, D.C. 20549
Report of Foreign Private Issuer
Pursuant to Rule 13a-16 or 15d-16 of
the Securities Exchange Act of 1934
For the month ofOctober, 2019
Brazilian Distribution Company
(Translation of Registrant’s Name Into English)
Av. Brigadeiro Luiz Antonio,
3142 São Paulo, SP 01402-901
Brazil
(Address of Principal Executive Offices)
(Indicate by check mark whether the registrant files or will file annual reports under cover of Form 20-F or Form 40-F)
Form 20-F X Form 40-F
(Indicate by check mark if the registrant is submitting the Form 6-K in paper as permitted by Regulation S-T Rule
101 (b) (1)):
Yes ___ No X
(Indicate by check mark if the registrant is submitting the Form 6-K in paper as permitted by Regulation S-T Rule
101 (b) (7)):
Yes ___ No X
(Indicate by check mark whether the registrant by furnishing the information contained in this Form is also thereby furnishing the information to the Commission pursuant to Rule 12g3-2(b) under the Securities Exchange Act of 1934.)
Yes ___ No X

São Paulo, October 30, 2019 – GPA[B3: PCAR4; NYSE: CBD] announces its results for the 3rd quarter of 2019. All comparisons are with the same period of 2018, except where stated otherwise. All comments related to adjusted EBITDA and gross margin exclude the non-recurring effects from the periods. In addition, starting from 2019, results include the effects of IFRS 16/CPC 06 (R2) – Leases, which eliminates the distinction between operating and financial leases and requires the recognition of a financial asset and liability related to future leases discounted at present value for virtually all lease agreements of our stores. Comments below refer to numbers before the application of IFRS 16, except unless otherwise indicated.
3Q19 RESULTS
GPA Food
▪ Strong growth in gross sales revenue, which reached R$14.6 billion (+9.5%), despite the 240 bps decrease in food inflation in 3Q19 vs. 1H19;
▪ Adjusted EBITDA registered significant increase of 10.0%, with margin remaining stable, reflecting the strong and consistent growth of Assaí and higher profitability at Multivarejo compared to 2Q19;
▪ Significant expansion of 42.8% in net income attributable to controlling shareholders, which reached R$216 million, with margin of 1.6% (+40 bps);
▪ Leverage remained low at -0.82 times EBITDA, compared to -1.10 times EBITDA in the same period the previous year, underlining the Company’s solid financial structure;
▪ Omnichannel approach: increase of over 30% in e-commerce food sales, the leader in the segment(*), and continuous development of the digital transformation strategy, with the following highlights:
(i) Amplification of “Express” (107 stores) and “Click & Collect” (113 stores) delivery model, expanding the delivery solutions;
(ii) Expansion of James Delivery to Sorocaba, Teresina, Recife, Salvador, Niterói, Rio de Janeiro, Palmas and Campo Grande, totaling 12 cities, in line with the planned expansion until end-2020;
(iii) Over 20 million loyal customers, 17% up from the year prior, and over 10 million active downloads of “Pão de Açúcar Mais” and “Clube Extra” apps, confirming broad customer acceptance of “My Discount” functionality.
Food Business | Consolidated | |||||||
(R$ million) | 3Q19 | 3Q18 | Δ | 3Q19 | 3Q18 | Δ | ||
Gross Revenue | 14,570 | 13,307 | 9.5% | 14,571 | 13,307 | 9.5% | ||
Gross Margin | 21.3% | 22.2% | -90 bps | 21.3% | 22.2% | -90 bps | ||
Selling, General and Adm. Expenses | (1,962) | (1,872) | 4.8% | (1,975) | (1,872) | 5.5% | ||
% of Net Revenue | 14.5% | 15.3% | -80 bps | 14.6% | 15.3% | -70 bps | ||
EBITDA(1) | 880 | 851 | 3.3% | 839 | 813 | 3.2% | ||
EBITDA Margin(1) | 6.5% | 6.9% | -40 bps | 6.2% | 6.6% | -40 bps | ||
Adjusted EBITDA(1)(2) | 995 | 905 | 10.0% | 960 | 866 | 10.9% | ||
Adjusted EBITDA Margin(1)(2) | 7.4% | 7.4% | 0 bps | 7.1% | 7.1% | 0 bps | ||
Net Financial Revenue (Expenses) | (131) | (265) | -50.6% | (147) | (265) | -44.6% | ||
% of Net Revenue | 1.0% | 2.2% | -120 bps | 1.1% | 2.2% | -110 bps | ||
Net Income Controlling Shareholders - Consolidated | 216 | 151 | 42.8% | 166 | 128 | 29.9% | ||
Net margin - Controlling Shareholders Consolidated | 1.6% | 1.2% | 40 bps | 1.2% | 1.0% | 20 bps | ||
(1) Earnings before interest, tax, depreciation and amortization. (2) Adjusted for Other Operating Income and Expenses.
(*) Source: Nielsen.
1
IFRS 16
As of January 1, 2019, GPA’s results include the effects of IFRS 16/CPC 06 (R2) – Leases, which eliminates the distinction between operating and financial leases and requires the recognition of a financial asset and liability related to future leases, discounted at present value for virtually all lease agreements of our stores.
The Company opted for full retrospective adoption as if the pronouncement had been adopted since the start of the contracts, in order to show the comparative effects for each past period. As such, operational lease expenses are replaced by depreciation expenses related to the right of use and interest expenses related to the lease liability.
The table below shows the adjustments to reconcile the effects of IFRS 16 for GPA Consolidated and GPA Food:
Consolidated | 3Q19 | 3Q18 | Δ | ||||||||
|
|
|
|
|
|
|
| ||||
(R$ million) | Pre- | Change | Post- | Pre- | Change | Post- | Pre- | Post- | |||
Gross Revenue | 14,571 | - | 14,571 | 13,307 | - | 13,307 | 9.5% | 9.5% | |||
Net Revenue | 13,524 | - | 13,524 | 12,258 | - | 12,258 | 10.3% | 10.3% | |||
Gross Profit | 2,872 | 10 | 2,882 | 2,714 | 11 | 2,724 | 5.9% | 5.8% | |||
Gross Margin | 21.2% | 10 bps | 21.3% | 22.1% | 10 bps | 22.2% | -90 bps | -90 bps | |||
Selling, General and Adm. Expenses | (2,172) | 197 | (1,975) | (2,048) | 176 | (1,872) | 6.1% | 5.5% | |||
% of Net Revenue | 16.1% | -150 bps | 14.6% | 16.7% | -140 bps | 15.3% | -60 bps | -70 bps | |||
Adjusted EBITDA(1)(2) | 730 | 231 | 960 | 670 | 196 | 866 | 8.9% | 10.9% | |||
Adjusted EBITDA Margin(1)(2) | 5.4% | 170 bps | 7.1% | 5.5% | 160 bps | 7.1% | -10 bps | 0 bps | |||
Net Financial Revenue (Expenses) | (6) | (141) | (147) | (135) | (130) | (265) | -95.8% | -44.6% | |||
% of Net Revenue | 0.0% | 110 bps | 1.1% | 1.1% | 110 bps | 2.2% | -110 bps | -110 bps | |||
Net Income Controlling Shareholders - Consolidated | 192 | (26) | 166 | 151 | (23) | 128 | 27.2% | 29.9% | |||
Net margin - Controlling Shareholders Consolidated | 1.4% | -20 bps | 1.2% | 1.2% | -20 bps | 1.0% | 20 bps | 20 bps | |||
Food Business | 3Q19 | 3Q18 | Δ | ||||||||
|
|
|
|
|
|
|
| ||||
(R$ million) | Pre- | Change | Post- | Pre- | Change | Post- | Pre- | Post- | |||
Gross Revenue | 14,570 | - | 14,570 | 13,307 | - | 13,307 | 9.5% | 9.5% | |||
Net Revenue | 13,523 | - | 13,523 | 12,258 | - | 12,258 | 10.3% | 10.3% | |||
Gross Profit | 2,873 | 10 | 2,883 | 2,714 | 11 | 2,724 | 5.9% | 5.8% | |||
Gross Margin | 21.2% | 10 bps | 21.3% | 22.1% | 10 bps | 22.2% | -90 bps | -90 bps | |||
Selling, General and Adm. Expenses | (2,159) | 197 | (1,962) | (2,048) | 176 | (1,872) | 5.4% | 4.8% | |||
% of Net Revenue | 16.0% | -150 bps | 14.5% | 16.7% | -140 bps | 15.3% | -70 bps | -80 bps | |||
Adjusted EBITDA(1)(2) | 765 | 230 | 995 | 697 | 207 | 905 | 9.7% | 10.0% | |||
Adjusted EBITDA Margin(1)(2) | 5.7% | 170 bps | 7.4% | 5.7% | 170 bps | 7.4% | 0 bps | 0 bps | |||
Net Financial Revenue (Expenses) | 10 | (141) | (131) | (135) | (130) | (265) | n.d. | -50.6% | |||
% of Net Revenue | -0.1% | 110 bps | 1.0% | 1.1% | 110 bps | 2.2% | -120 bps | -120 bps | |||
Net Income Controlling Shareholders - Consolidated | 242 | (26) | 216 | 193 | (42) | 151 | 25.6% | 42.8% | |||
Net margin - Controlling Shareholders Consolidated | 1.8% | -20 bps | 1.6% | 1.6% | -40 bps | 1.2% | 20 bps | 40 bps | |||
(1) Earnings before interest, tax, depreciation and amortization. (2) Adjusted for Other Operating Income and Expenses.
2
“We reached the end of 3Q19 with significant increase in sales and profitability at Assaí, which confirms the consistency of the expansion strategy of the cash-and-carry business and the rapid maturation of the new stores inaugurated. At Multivarejo, we took another important step in our portfolio optimization and adjustment plan with store renovations and conversions, strengthening the value proposition of our banners. The 47 renovated and opened units in this quarter recorded significant gains in sales, volume and customer traffic. We are confident that our strategic decisions will increasingly enable us to consolidate a sustainable growth in the Company’s results and offer our customers the best choice.
Peter Estermann, Chief Executive Officer of GPA
OPERATING PERFORMANCE BY BUSINESS
Assaí
3Q19 | 3Q18 | Δ | |||||||||
|
|
|
|
|
|
|
| ||||
(R$ million) | Pre- | Change | Post- | Pre- | Change | Post- | Pre- | Post- | |||
Gross Revenue | 7,587 | - | 7,587 | 6,382 | - | 6,382 | 18.9% | 18.9% | |||
Net Revenue | 6,945 | - | 6,945 | 5,865 | - | 5,865 | 18.4% | 18.4% | |||
Gross Profit | 1,149 | 2 | 1,152 | 930 | (2) | 928 | 23.5% | 24.1% | |||
Gross Margin | 16.6% | 0 bps | 16.6% | 15.9% | -10 bps | 15.8% | 70 bps | 80 bps | |||
Selling, General and Adm. Expenses | (714) | 50 | (663) | (597) | 39 | (559) | 19.5% | 18.8% | |||
% of Net Revenue | 10.3% | -70 bps | 9.6% | 10.2% | -70 bps | 9.5% | 10 bps | 10 bps | |||
Adjusted EBITDA(1)(2) | 438 | 56 | 494 | 336 | 41 | 376 | 30.6% | 31.3% | |||
Adjusted EBITDA Margin(1)(2) | 6.3% | 80 bps | 7.1% | 5.7% | 70 bps | 6.4% | 60 bps | 70 bps | |||
(1) Earnings before interest, tax, depreciation and amortization. (2) Adjusted for Other Operating Income and Expenses.
Assaí maintained a strong pace of growth ingross sales revenue of 18.9%, adding 2 million new customers per month, driven by the robust expansion of 19 stores in the last 12 months and the continued healthy performance of ‘same-stores’. In the quarter, 5 new stores were inaugurated in the states of São Paulo, Rio de Janeiro, Bahia, Piauí and Pará, continuing the plan to expand the nationwide footprint by opening around 20 stores in the year.
Gross profittotaled R$1.2 billion, with margin of 16.6%. Gross margin growth reflects:
(i) opening of stores in regions where Assaí already operates, contributing positively to gross margin;
(ii) accelerated maturation of stores opened in the last 2 years, as already noticed in prior quarters.
Despite the strong expansion process, with more than 10 stores under construction,selling, general and administrative expenses remained under control, corresponding to 9.6% of net sales revenue, +10 bps from 3Q18.
Adjusted EBITDA registered significant growth of 31.3%, following the strong growth trend in recent quarters, totaling R$494 million. EBITDA margin increased 70 bps, from 6.4% to 7.1%. Prior to IFRS 16, EBITDA margin increased 60 bps to 6.3%.
3
Multivarejo
3Q19 | 3Q18 | Δ | |||||||||
|
|
|
|
|
|
|
| ||||
(R$ million) | Pre- | Change | Post- | Pre- | Change | Post- | Pre- | Post- | |||
Gross Revenue | 6,982 | - | 6,982 | 6,925 | - | 6,925 | 0.8% | 0.8% | |||
Net Revenue | 6,578 | - | 6,578 | 6,393 | - | 6,393 | 2.9% | 2.9% | |||
Gross Profit | 1,724 | 7 | 1,731 | 1,783 | 13 | 1,796 | -3.3% | -3.6% | |||
Gross Margin | 26.2% | 10 bps | 26.3% | 27.9% | 20 bps | 28.1% | -170 bps | -180 bps | |||
Selling, General and Adm. Expenses | (1,445) | 146 | (1,299) | (1,451) | 137 | (1,313) | -0.4% | -1.1% | |||
% of Net Revenue | 22.0% | -230 bps | 19.7% | 22.7% | -220 bps | 20.5% | -70 bps | -80 bps | |||
Adjusted EBITDA(1)(2) | 327 | 174 | 501 | 362 | 167 | 528 | -9.7% | -5.2% | |||
Adjusted EBITDA Margin(1)(2) | 5.0% | 260 bps | 7.6% | 5.7% | 260 bps | 8.3% | -70 bps | -70 bps | |||
(1) Earnings before interest, tax, depreciation and amortization. (2) Adjusted for Other Operating Income and Expenses.
At Multivarejo,gross sales revenue totaled R$7.0 billion, up 0.8% in the quarter, affected by the closure of stores for conversion and the continued fragility of the economic scenario. The quarter’s main highlights were the notable performance by renovated Pão de Açúcar stores and those converted into Mercado Extra and Compre Bem, as well as the improved performance by the Proximity formats. Food e-commerce posted growth above 30%, confirming its leadership position in the segment.
Adjusted EBITDAtotaled R$501 million, with margin of 7.6%. Prior to IFRS 16, EBITDA margin was 5.0% in the quarter, lower than in 3Q18 but significantly higher compared to 2Q19, resulting from:
● Continued promotional investments in a still cautious consumption environment, which resulted ingross profit of R$1.7 billion and gross margin of 26.3%;
● Dilution of 80 bps inselling, general and administrative expenses, which totaled R$1.3 billion, down 1.1% from the year prior.The main initiatives to reduce expenses without impacting service level at the stores were:(i) migration from printed leaflets to digital media, resulting in lower marketing expenses; and (ii) renegotiation of IT and general services agreements, among others.
Due to the delayed economic recovery and the need for greater efforts in competitiveness, Multivarejo’s gross margin levels have been lower than expected. Considering the capture of the initiatives implemented combined with a possible recovery of the consumption environment, the Company remains confident of a more promising fourth quarter, which will be decisive to increasing the year’s EBITDA margin compared to the 9M19 figure already presented.
Digital Transformation and e-commerce:consistent growth of the omnichannel approach, reflected by strong increase in online sales and continued leadership of the sector.
Significant growth above 30% in e-commerce sales:
■ Express andClick & Collect:already available in 107 and 113 stores, respectively, including the Pão de Açúcar and Extra banners, registered sales growth twice higher than in the same period last year.By the year-end, more than 120 stores will be offering the formats;
4
■ James Delivery:the “last miler” delivery model started operating in Sorocaba, Teresina, Recife, Salvador, Niterói, Rio de Janeiro, Palmas and Campo Grande, totaling 12 cities, in line with the planned expansion until end-2020;
■ My Discount:the “Pão de Açúcar Mais” and “Clube Extra” apps have reached more than 10 million active downloads by the end of the quarter, a 50% growth from the same period in 2018, reflecting the attractiveness of customized offerings and the migration of massive activations to the app;
■ Cheftime: the startup that offers ready and semi-ready meal kits reached the mark of more than 80,000 meals sold in the year. The ready-to-eat solution was expanded to the stores, which in the third quarter alone sold approximately five times more than in the first half of the year;
■ Startups: as a result of these partnerships, more than 65 products of food startups are available; new concepts were implemented, such as the urban vegetable garden; and there was an expansion in the offer of services at store or via app such as Lime, Rentbrella, Pet Parker and Get Ninjas.
■ Initiatives to optimize customers’ time at stores:
○ Self-checkout: rolled out in 2 stores, it is used by more than 25% customers, promoting an experience more agile and with less friction;
○ Pre-scan:this initiative, in which the employee scans the products while the customer is in line in order to speed up checkout. It already benefits more than 10% of customers at stores, thus reducing the waiting time in lines;
○ Scan&Go:accounts for more than 15% of sales and over 10% of the tickets at stores where it is in operation.
■ Technological infrastructure:partnerships with major technology players in the industry to evolve and improve digital products, enabling the integration of new services in the apps, as well as improving the existing systems to better meet the omnichannel consumer journey and enable greater speed and flexibility in business decisions.
5
OTHER INCOME AND EXPENSES
In the quarter, the line of “Other Income and Expenses” totaled an expense of R$121 million, mainly corresponding to: restructuring expenses; tax contingencies, which most of the periods prior to 2009; and results from property and equipment.
FINANCIAL RESULT
Consolidated | |||
(R$ million) | 3Q19 | 3Q18 | Δ |
Financial Revenue | 241 | 48 | 402.1% |
Financial Expenses | (246) | (177) | 39.3% |
Cost of Debt | (152) | (98) | 55.1% |
Cost of Receivables Discount | (31) | (16) | 93.8% |
Contingencies adjustments and Other financial expenses | (63) | (63) | 0.6% |
Net Financial Revenue (Expenses) | (5) | (129) | -96.1% |
Interest on lease liabilities | (142) | (136) | 4.4% |
Net Financial Revenue (Expenses) - Post IFRS 16 | (147) | (265) | -44.4% |
% of Net Revenue | 1.1% | 2.2% | -110 bps |
The Company’s financial result amounted to R$147 million, or 1.1% of net sales revenue. The main variations were:
▪ Financial Income:growth due to higher cash position, mainly explained by: (i) sale of interest in Via Varejo in June, (ii) entry of funds raised, which will be allocated to the Public Tender Offer for theacquisition of Éxito; and (iii) revenue from monetary restatements mainly related to ICMS balance referring to its exclusion from PIS and COFINS tax base;
▪ Cost of debt:increase due to the funding, which will be allocated to the public tender offer of Éxito;
▪ Sales of receivables:higher volume of receivables discounted vs. 3Q18;
▪ Variations in contingencies and other expenses:remained virtually stable in relation to 3Q18.
Due to the adoption of IFRS 16, the financial result now includes theInterest on lease liabilityline. In the quarter, there was a recognition of R$142 million related to this line, corresponding to 1.0% of revenue (vs. 1.1% in 3Q18).
6
Net Income - Food
3Q19 | 3Q18 |
| Δ | |||||||
(R$ million) | Pre- | Change | Post- | Pre- | Change | Post- |
| Pre- | Post- | |
EBITDA | 765 | 230 | 995 | 697 | 207 | 905 |
| 9.7% | 10.0% | |
Depreciation (Logistic) | (12) | (23) | (36) | (12) | (21) | (33) |
| 1.7% | 9.4% | |
Depreciation and Amortization | (232) | (114) | (347) | (206) | (97) | (303) |
| 12.7% | 14.2% | |
Net Financial Revenue (Expenses) | 10 | (141) | (131) | (135) | (130) | (265) |
| n.d. | -50.6% | |
Income before Income Tax | 415 | (48) | 366 | 285 | (34) | 251 |
| 45.5% | 46.2% | |
Income Tax | (148) | 13 | (135) | (70) | 9 | (61) |
| 110.4% | 121.5% | |
Net Income Company - continuing operations | 267 | (36) | 231 | 215 | (25) | 190 |
| 24.3% | 22.0% | |
Net income from discontinued operations | (25) | 8 | (17) | (22) | (17) | (39) |
| 12.8% | -56.8% | |
Net Income Consolidated Company | 242 | (28) | 215 | 193 | (42) | 151 |
| 25.6% | 42.1% | |
Net Income - Controlling Shareholders - continuing operations | 267 | (35) | 233 | 215 | (25) | 190 |
| 24.3% | 22.5% | |
Net Income - Controlling Shareholders - descontinuing operations | (25) | 8 | (17) | (22) | (17) | (39) |
| 12.8% | -56.8% | |
Net Income - Controlling Shareholders - Consolidated | 242 | (26) | 216 | 193 | (42) | 151 |
| 25.6% | 42.8% | |
In the Food segment,net income attributable to controlling shareholders of continuing operations amounted to R$233 million, up 22.5% from 3Q18, with margin of 1.7%, particularly due to the strong net income growth at Assaí.
Earnings per Share
Consolidated net income attributable to the controlling shareholders of GPA Food, considering the continuing and discontinued operations,came to R$216 million, with margin of 1.6%.
In 3Q19, earnings per share stood at R$0.58321 for common shares and R$0.64158 for preferred shares.
7
Net Debt
To calculate the indicators in the table below, the Company does not consider the lease liabilities related to IFRS 16.
(R$ million) | 09.30.2019 | 09.30.2018 |
Short Term Debt | (5,355) | (1,750) |
Loans and Financing | (1,146) | (1,243) |
Debentures and Promissory Notes | (4,209) | (507) |
Long Term Debt | (9,643) | (4,696) |
Loans and Financing | (95) | (607) |
Debentures | (9,548) | (4,089) |
Total Gross Debt | (14,997) | (6,446) |
Cash and Financial investments | 12,656 | 2,625 |
Net Debt | (2,342) | (3,822) |
EBITDA(1) | 2,728 | 2,836 |
Net Debt / EBITDA(1) | -0.86x | -1.35x |
On balance Credit Card Receivables not discounted | 102 | 711 |
Net Debt incl. Credit Card Receivables not discounted | (2,240) | (3,110) |
Net Debt incl. Credit Card Receivables not discounted / EBITDA(1) | -0.82x | -1.10x |
(1) EBITDA before IFRS 16 in the last 12 months.
Net debt adjusted for the balance of unsold receivables stood at R$2.2 billion, down 28.0% from the previous year. The Company maintained a low level of debt, with a Net debt/EBITDA ratio of -0.82 times in the quarter.
Cash balance in the quarter was R$12.7 billion, mainly due to the funds that will be allocated to the public tender offer up to 100% Éxito’s shares, as already announced to the market.
8
Investments
| Food Business | ||||||
(R$ million) | 3Q19 | 3Q18 | Δ | 9M19 | 9M18 | Δ | |
New stores and land acquisition | 378 | 136 | 176.9% | 748 | 381 | 96.5% | |
Store renovations, conversions and maintenance | 175 | 258 | -32.2% | 425 | 437 | -2.8% | |
Infrastructure and others | 182 | 107 | 70.4% | 456 | 259 | 76.0% | |
Non-cash Effect |
|
|
|
|
|
| |
Financing Assets | (12) | (14) | -13.7% | 66 | 70 | -5.6% | |
Total | 723 | 488 | 48.2% | 1,695 | 1,147 | 47.8% | |
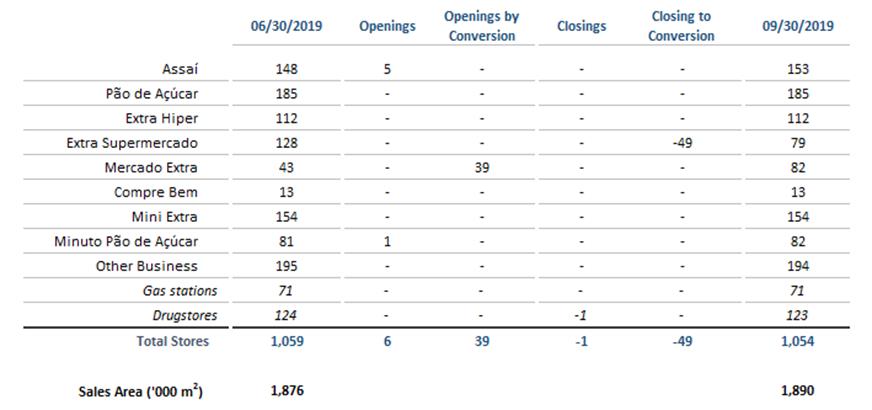
Investments totaled R$723 million in the quarter, up 48.2% from 3Q18, due to the higher number of stores opened (5 Assaí and 1 Minuto Pão de Açúcar), as well as approximately 20 stores under construction in the period. In addition, 39 conversions of Extra Super into Mercado Extra and 2 renovations of Pão de Açúcar were concluded.
9
CONSOLIDATED FINANCIAL STATEMENTS
1. Balance Sheet
BALANCE SHEET | |||||||
ASSETS | |||||||
Consolidated | Food Businesses | ||||||
(R$ million) | 09.30.2019 | 06.30.2019 | 09.30.2018 | 09.30.2019 | 06.30.2019 | 09.30.2018 | |
Current Assets | 20,899 | 12,003 | 35,429 |
| 20,898 | 12,002 | 10,135 |
Cash and Marketable Securities | 12,656 | 4,705 | 2,625 |
| 12,656 | 4,705 | 2,625 |
Accounts Receivable | 364 | 317 | 953 |
| 364 | 317 | 957 |
Credit Cards | 101 | 39 | 659 |
| 86 | 39 | 663 |
Sales Vouchers and Trade Account Receivable | 186 | 217 | 234 |
| 217 | 217 | 234 |
Allowance for Doubtful Accounts | (5) | (5) | (4) |
| (5) | (5) | (4) |
Resulting from Commercial Agreements | 82 | 66 | 64 |
| 66 | 66 | 64 |
Inventories | 6,046 | 5,692 | 5,540 |
| 6,046 | 5,692 | 5,540 |
Recoverable Taxes | 909 | 615 | 363 |
| 909 | 615 | 363 |
Noncurrent Assets for Sale | 94 | 24 | 25,434 |
| 94 | 24 | 136 |
Prepaid Expenses and Other Accounts Receivables | 829 | 648 | 515 |
| 829 | 648 | 515 |
Noncurrent Assets | 21,350 | 20,864 | 19,479 |
| 21,350 | 20,864 | 19,522 |
Long-Term Assets | 4,235 | 4,330 | 4,696 |
| 4,235 | 4,330 | 4,735 |
Accounts Receivables | 1 | 71 | 53 |
| 1 | 71 | 53 |
Credit Cards | 1 | 71 | 53 |
| 1 | 71 | 53 |
Recoverable Taxes | 2,903 | 2,919 | 2,662 |
| 2,903 | 2,919 | 2,662 |
Deferred Income Tax and Social Contribution | 307 | 294 | 353 |
| 307 | 294 | 353 |
Amounts Receivable from Related Parties | 38 | 37 | 33 |
| 38 | 37 | 72 |
Judicial Deposits | 827 | 811 | 799 |
| 827 | 811 | 799 |
Prepaid Expenses and Others | 159 | 198 | 798 |
| 159 | 198 | 798 |
Investments | 271 | 232 | 228 |
| 271 | 232 | 228 |
Property and Equipment | 13,938 | 13,425 | 12,485 |
| 13,938 | 13,425 | 12,485 |
Intangible Assets | 2,906 | 2,877 | 2,069 |
| 2,906 | 2,877 | 2,075 |
TOTAL ASSETS | 42,249 | 32,866 | 54,908 |
| 42,249 | 32,866 | 29,657 |
LIABILITIES | |||||||
Consolidated | Food Businesses | ||||||
09.30.2019 | 06.30.2019 | 09.30.2018 | 09.30.2019 | 06.30.2019 | 09.30.2018 | ||
Current Liabilities | 15,068 | 12,553 | 30,554 |
| 15,068 | 12,553 | 10,691 |
Suppliers | 6,831 | 6,827 | 6,439 |
| 6,831 | 6,827 | 6,444 |
Loans and Financing | 1,408 | 923 | 1,310 |
| 1,408 | 923 | 1,310 |
Debentures | 4,209 | 2,150 | 507 |
| 4,209 | 2,150 | 507 |
Lease Liability | 675 | 604 | 554 |
| 675 | 604 | 554 |
Payroll and Related Charges | 769 | 652 | 696 |
| 769 | 652 | 696 |
Taxes and Social Contribution Payable | 358 | 470 | 285 |
| 358 | 470 | 285 |
Dividends Proposed | 1 | 32 | 98 |
| 1 | 32 | 98 |
Financing for Purchase of Fixed Assets | 82 | 64 | 50 |
| 82 | 64 | 50 |
Rents | 13 | 12 | 9 |
| 13 | 12 | 9 |
Debt with Related Parties | 146 | 142 | 160 |
| 146 | 142 | 376 |
Advertisement | 20 | 33 | 35 |
| 20 | 33 | 35 |
Provision for Restructuring | 5 | 4 | 9 |
| �� 5 | 4 | 9 |
Advanced Revenue | 127 | 171 | 76 |
| 127 | 171 | 76 |
Non-current Assets Held for Sale | - | - | 20,088 |
| - | - | - |
Others | 425 | 469 | 238 |
| 425 | 469 | 241 |
Long-Term Liabilities | 16,319 | 9,585 | 11,365 |
| 16,319 | 9,585 | 11,365 |
Loans and Financing | 106 | 302 | 728 |
| 106 | 302 | 728 |
Debentures | 9,548 | 2,823 | 4,089 |
| 9,548 | 2,823 | 4,089 |
Lease Liability | 4,218 | 4,125 | 3,952 |
| 4,218 | 4,125 | 3,952 |
Deferred Income Tax and Social Contribution | 315 | 227 | 537 |
| 315 | 227 | 537 |
Tax Installments | 399 | 423 | 495 |
| 399 | 423 | 495 |
Provision for Contingencies | 1,263 | 1,235 | 1,166 |
| 1,263 | 1,235 | 1,166 |
Advanced Revenue | 28 | 31 | 12 |
| 28 | 31 | 12 |
Provision for loss on investment in Associates | 373 | 339 | 361 |
| 373 | 339 | 361 |
Others | 68 | 79 | 25 |
| 68 | 79 | 25 |
Shareholders' Equity | 10,862 | 10,729 | 12,988 |
| 10,862 | 10,729 | 7,601 |
Capital | 6,850 | 6,836 | 6,824 |
| 6,850 | 6,836 | 5,416 |
Capital Reserves | 439 | 438 | 406 |
| 439 | 439 | 406 |
Profit Reserves | 3,664 | 3,499 | 2,818 |
| 3,663 | 3,498 | 1,862 |
Other Comprehensive Results | (91) | (44) | (83) |
| (91) | (44) | (83) |
Minority Interest | (0) | (0) | 3,024 |
| - | - | - |
TOTAL LIABILITIES | 42,249 | 32,866 | 54,908 |
| 42,249 | 32,866 | 29,657 |
10
2.1 Income Statement for 3Q19 – After IFRS 16
Consolidated | Food Business | Multivarejo(1) | Assaí | ||||||||||||
3Q19 | 3Q18 | Δ | 3Q19 | 3Q18 | Δ | 3Q19 | 3Q18 | Δ | 3Q19 | 3Q18 | Δ | ||||
R$ - Million |
|
|
|
|
|
|
|
|
|
|
|
| |||
Gross Revenue | 14,571 | 13,307 | 9.5% | 14,570 | 13,307 | 9.5% | 6,982 | 6,925 | 0.8% | 7,587 | 6,382 | 18.9% | |||
Net Revenue | 13,524 | 12,258 | 10.3% | 13,523 | 12,258 | 10.3% | 6,578 | 6,393 | 2.9% | 6,945 | 5,865 | 18.4% | |||
Cost of Goods Sold | (10,607) | (9,501) | 11.6% | (10,605) | (9,501) | 11.6% | (4,817) | (4,571) | 5.4% | (5,788) | (4,930) | 17.4% | |||
Depreciation (Logistic) | (36) | (33) | 9.4% | (36) | (33) | 9.4% | (30) | (26) | 15.8% | (5) | (6) | -16.2% | |||
Gross Profit | 2,882 | 2,724 | 5.8% | 2,883 | 2,724 | 5.8% | 1,731 | 1,796 | -3.6% | 1,152 | 928 | 24.1% | |||
Selling Expenses | (1,697) | (1,624) | 4.4% | (1,683) | (1,624) | 3.6% | (1,115) | (1,135) | -1.7% | (568) | (490) | 16.0% | |||
General and Administrative Expenses | (279) | (248) | 12.5% | (279) | (248) | 12.5% | (184) | (179) | 2.6% | (95) | (69) | 38.1% | |||
Selling, General and Adm. Expenses | (1,975) | (1,872) | 5.5% | (1,962) | (1,872) | 4.8% | (1,299) | (1,313) | -1.1% | (663) | (559) | 18.8% | |||
Equity Income(2) | 18 | (19) | n.d. | 38 | 20 | 94.3% | 38 | 20 | 94.3% | - | - | n.d. | |||
Other Operating Revenue (Expenses) | (121) | (53) | 129.0% | (115) | (53) | 117.1% | (108) | (65) | 66.3% | (7) | 12 | n.d. | |||
Depreciation and Amortization | (347) | (303) | 14.5% | (347) | (303) | 14.2% | (249) | (226) | 9.9% | (98) | (77) | 26.7% | |||
Earnings before interest and Taxes - EBIT | 456 | 477 | -4.4% | 497 | 515 | -3.5% | 114 | 211 | -46.1% | 384 | 305 | 26.0% | |||
Financial Revenue | 241 | 48 | 403.4% | 212 | 48 | 342.4% | 200 | 38 | 427.8% | 12 | 10 | 16.6% | |||
Financial Expenses | (388) | (313) | 24.0% | (343) | (313) | 9.6% | (276) | (260) | 6.5% | (66) | (53) | 24.9% | |||
Net Financial Result | (147) | (265) | -44.6% | (131) | (265) | -50.6% | (76) | (222) | -65.6% | (55) | (43) | 26.8% | |||
Income (Loss) Before Income Tax | 309 | 212 | 45.7% | 366 | 251 | 46.2% | 37 | (11) | n.d. | 329 | 261 | 25.9% | |||
Income Tax | (128) | (61) | 109.9% | (135) | (61) | 121.5% | (32) | 28 | n.d. | (103) | (89) | 15.4% | |||
Net Income (Loss) Company - continuing operations | 181 | 151 | 19.9% | 231 | 190 | 22.0% | 5 | 17 | -69.5% | 226 | 172 | 31.3% | |||
Net Result from discontinued operations | (17) | 3 | n.d. | (17) | (39) | -56.8% | (17) | (39) | -56.8% | - | - | n.d. | |||
Net Income (Loss) - Consolidated Company | 165 | 154 | 7.1% | 215 | 151 | 42.1% | (11) | (21) | -46.2% | 226 | 172 | 31.3% | |||
Net Income (Loss) - Controlling Shareholders - continuing operations(3) | 183 | 151 | 20.5% | 233 | 190 | 22.5% | 5 | 18 | -69.2% | 227 | 172 | 31.9% | |||
Net Income (Loss) - Controlling Shareholders - discontinued operations(3) | (17) | (24) | -29.8% | (17) | (39) | -56.8% | (17) | (39) | -56.8% | - | - | n.d. | |||
Net Income (Loss) - Consolidated Controlling Shareholders(3) | 166 | 128 | 29.9% | 216 | 151 | 42.8% | (11) | (21) | -46.4% | 227 | 172 | 31.9% | |||
Minority Interest - Non-controlling - continuing operations | - | (0) | n.d. | - | (0) | n.d. | - | (0) | n.d. | - | - | n.d. | |||
Minority Interest - Non-controlling - discontinued operations | - �� | 26 | n.d. | - | - | n.d. | - | - | n.d. | - | - | n.d. | |||
Minority Interest - Non-controlling - Consolidated | - | 26 | n.d. | - | (0) | n.d. | - | (0) | n.d. | - | - | n.d. | |||
Earnings before Interest, Taxes, Depreciation, Amortization - EBITDA | 839 | 813 | 3.2% | 880 | 851 | 3.3% | 393 | 463 | -15.3% | 487 | 388 | 25.4% | |||
Adjusted EBITDA(4) | 960 | 866 | 10.9% | 995 | 905 | 10.0% | 501 | 528 | -5.2% | 494 | 376 | 31.3% | |||
Consolidated | Food Business | Multivarejo(1) | Assaí | ||||||||
% of Net Revenue | 3Q19 | 3Q18 | 3Q19 | 3Q18 | 3Q19 | 3Q18 | 3Q19 | 3Q18 | |||
Gross Profit | 21.3% | 22.2% |
| 21.3% | 22.2% |
| 26.3% | 28.1% |
| 16.6% | 15.8% |
Selling Expenses | 12.5% | 13.3% |
| 12.4% | 13.3% |
| 17.0% | 17.7% |
| 8.2% | 8.4% |
General and Administrative Expenses | 2.1% | 2.0% |
| 2.1% | 2.0% |
| 2.8% | 2.8% |
| 1.4% | 1.2% |
Selling, General and Adm. Expenses | 14.6% | 15.3% |
| 14.5% | 15.3% |
| 19.7% | 20.5% |
| 9.6% | 9.5% |
Equity Income(2) | 0.1% | 0.2% |
| 0.3% | 0.2% |
| 0.6% | 0.3% |
| 0.0% | 0.0% |
Other Operating Revenue (Expenses) | 0.9% | 0.4% |
| 0.9% | 0.4% |
| 1.6% | 1.0% |
| 0.1% | -0.2% |
Depreciation and Amortization | 2.6% | 2.5% |
| 2.6% | 2.5% |
| 3.8% | 3.5% |
| 1.4% | 1.3% |
EBIT | 3.4% | 3.9% |
| 3.7% | 4.2% |
| 1.7% | 3.3% |
| 5.5% | 5.2% |
Net Financial Revenue (Expenses) | 1.1% | 2.2% |
| 1.0% | 2.2% |
| 1.2% | 3.5% |
| 0.8% | 0.7% |
Income Before Income Tax | 2.3% | 1.7% |
| 2.7% | 2.0% |
| -0.6% | -0.2% |
| 4.7% | 4.5% |
Income Tax | 0.9% | 0.5% |
| 1.0% | 0.5% |
| -0.5% | 0.4% |
| 1.5% | 1.5% |
Net Income (Loss) Company - continuing operations | 1.3% | 1.2% |
| 1.7% | 1.5% |
| -0.1% | 0.3% |
| 3.3% | 2.9% |
Net Income (Loss) - Consolidated Company | 1.2% | 1.3% |
| 1.6% | 1.2% |
| -0.2% | -0.3% |
| 3.3% | 2.9% |
Net Income (Loss) - Controlling Shareholders - continuing operations(3) | 1.3% | 1.2% |
| 1.7% | 1.5% |
| -0.1% | 0.3% |
| 3.3% | 2.9% |
Net Income (Loss) - Consolidated Controlling Shareholders(3) | 1.2% | 1.0% |
| 1.6% | 1.2% |
| -0.2% | -0.3% |
| 3.3% | 2.9% |
Minority Interest - Non-controlling - continuing operations | 0.0% | 0.0% |
| 0.0% | 0.0% |
| 0.0% | 0.0% |
| 0.0% | 0.0% |
Minority Interest - Non-controlling - Consolidated | 0.0% | 0.2% |
| 0.0% | 0.0% |
| 0.0% | 0.0% |
| 0.0% | 0.0% |
EBITDA | 6.2% | 6.6% |
| 6.5% | 6.9% |
| 6.0% | 7.2% |
| 7.0% | 6.6% |
Adjusted EBITDA(4) | 7.1% | 7.1% |
| 7.4% | 7.4% |
| 7.6% | 8.3% |
| 7.1% | 6.4% |
(1) Multivarejo includes the results of Malls and Corporate. (2) Equity income from Cdiscount is included in the Consolidated results and not in the Retail and Cash-and-Carry segments. (3) Net income after non-controlling interest. (4) Adjusted for Other Operating Income and Expenses.
11
2.2 Income Statement for 3Q19 – Before IFRS 16
Consolidated | Food Business | Multivarejo(1) | Assaí | ||||||||||||
3Q19 | 3Q18 | Δ | 3Q19 | 3Q18 | Δ | 3Q19 | 3Q18 | Δ | 3Q19 | 3Q18 | Δ | ||||
R$ - Million |
|
|
|
|
|
|
|
|
|
|
|
| |||
Gross Revenue | 14,571 | 13,307 | 9.5% | 14,570 | 13,307 | 9.5% | 6,982 | 6,925 | 0.8% | 7,587 | 6,382 | 18.9% | |||
Net Revenue | 13,524 | 12,258 | 10.3% | 13,523 | 12,258 | 10.3% | 6,578 | 6,393 | 2.9% | 6,945 | 5,865 | 18.4% | |||
Cost of Goods Sold | (10,640) | (9,533) | 11.6% | (10,638) | (9,533) | 11.6% | (4,845) | (4,601) | 5.3% | (5,793) | (4,932) | 17.5% | |||
Depreciation (Logistic) | (12) | (12) | 1.7% | (12) | (12) | 1.7% | (10) | (9) | 2.3% | (3) | (3) | -0.3% | |||
Gross Profit | 2,872 | 2,714 | 5.9% | 2,873 | 2,714 | 5.9% | 1,724 | 1,783 | -3.3% | 1,149 | 930 | 23.5% | |||
Selling Expenses | (1,891) | (1,798) | 5.2% | (1,878) | (1,798) | 4.5% | (1,260) | (1,270) | -0.8% | (618) | (528) | 17.1% | |||
General and Administrative Expenses | (281) | (250) | 12.2% | (281) | (250) | 12.1% | (185) | (181) | 2.3% | (96) | (70) | 37.7% | |||
Selling, General and Adm. Expenses | (2,172) | (2,048) | 6.1% | (2,159) | (2,048) | 5.4% | (1,445) | (1,451) | -0.4% | (714) | (597) | 19.5% | |||
Equity Income(2) | 17 | (8) | n.d. | 38 | 20 | 94.9% | 38 | 20 | 94.9% | - | - | n.d. | |||
Other Operating Revenue (Expenses) | (122) | (59) | 105.8% | (116) | (59) | 95.2% | (109) | (67) | 62.7% | (7) | 8 | n.d. | |||
Depreciation and Amortization | (233) | (206) | 13.1% | (232) | (206) | 12.7% | (160) | (147) | 8.5% | (72) | (59) | 23.3% | |||
Earnings before interest and Taxes - EBIT | 362 | 392 | -7.7% | 405 | 420 | -3.6% | 48 | 138 | -65.0% | 356 | 282 | 26.4% | |||
Financial Revenue | 241 | 48 | 403.4% | 212 | 48 | 342.4% | 200 | 38 | 427.8% | 12 | 10 | 16.6% | |||
Financial Expenses | (247) | (183) | 35.1% | (202) | (183) | 10.4% | (173) | (158) | 9.0% | (29) | (24) | 20.0% | |||
Net Financial Result | (6) | (135) | -95.8% | 10 | (135) | n.d. | 27 | (121) | n.d. | (17) | (14) | 22.4% | |||
Income (Loss) Before Income Tax | 357 | 258 | 38.4% | 415 | 285 | 45.5% | 76 | 17 | 334.1% | 339 | 268 | 26.6% | |||
Income Tax | (140) | (70) | 100.3% | (148) | (70) | 110.4% | (42) | 21 | n.d. | (106) | (91) | 16.1% | |||
Net Income (Loss) Company - continuing operations | 216 | 188 | 15.2% | 267 | 215 | 24.3% | 34 | 39 | -11.4% | 233 | 176 | 32.1% | |||
Net Result from discontinued operations | (25) | (50) | -49.9% | (25) | (22) | 12.8% | (25) | (22) | 12.8% | - | - | n.d. | |||
Net Income (Loss) - Consolidated Company | 191 | 138 | 38.9% | 242 | 193 | 25.6% | 9 | 16 | -43.7% | 233 | 176 | 32.1% | |||
Net Income (Loss) - Controlling Shareholders - continuing operations(3) | 216 | 188 | 15.2% | 267 | 215 | 24.3% | 34 | 39 | -11.4% | 233 | 176 | 32.1% | |||
Net Income (Loss) - Controlling Shareholders - discontinued operations(3) | (25) | (37) | -33.5% | (25) | (22) | 12.8% | (25) | (22) | 12.8% | - | - | n.d. | |||
Net Income (Loss) - Consolidated Controlling Shareholders(3) | 192 | 151 | 27.2% | 242 | 193 | 25.6% | 9 | 16 | -43.7% | 233 | 176 | 32.1% | |||
Minority Interest - Non-controlling - continuing operations | - | - | n.d. | - | - | n.d. | - | - | n.d. | - | - | n.d. | |||
Minority Interest - Non-controlling - discontinued operations | (0) | (13) | -96.7% | - | - | n.d. | - | - | n.d. | - | - | n.d. | |||
Minority Interest - Non-controlling - Consolidated | (0) | (13) | -96.7% | - | - | n.d. | - | - | n.d. | - | - | n.d. | |||
Earnings before Interest, Taxes, Depreciation, Amortization - EBITDA | 608 | 611 | -0.5% | 649 | 638 | 1.8% | 218 | 295 | -26.1% | 431 | 343 | 25.7% | |||
Adjusted EBITDA(4) | 730 | 670 | 8.9% | 765 | 697 | 9.7% | 327 | 362 | -9.7% | 438 | 336 | 30.6% | |||
Consolidated | Food Business | Multivarejo(1) | Assaí | ||||||||
% of Net Revenue | 3Q19 | 3Q18 | 3Q19 | 3Q18 | 3Q19 | 3Q18 | 3Q19 | 3Q18 | |||
Gross Profit | 21.2% | 22.1% |
| 21.2% | 22.1% |
| 26.2% | 27.9% |
| 16.6% | 15.9% |
Selling Expenses | 14.0% | 14.7% |
| 13.9% | 14.7% |
| 19.2% | 19.9% |
| 8.9% | 9.0% |
General and Administrative Expenses | 2.1% | 2.0% |
| 2.1% | 2.0% |
| 2.8% | 2.8% |
| 1.4% | 1.2% |
Selling, General and Adm. Expenses | 16.1% | 16.7% |
| 16.0% | 16.7% |
| 22.0% | 22.7% |
| 10.3% | 10.2% |
Equity Income(2) | 0.1% | 0.1% |
| 0.3% | 0.2% |
| 0.6% | 0.3% |
| 0.0% | 0.0% |
Other Operating Revenue (Expenses) | 0.9% | 0.5% |
| 0.9% | 0.5% |
| 1.7% | 1.0% |
| 0.1% | -0.1% |
Depreciation and Amortization | 1.7% | 1.7% |
| 1.7% | 1.7% |
| 2.4% | 2.3% |
| 1.0% | 1.0% |
EBIT | 2.7% | 3.2% |
| 3.0% | 3.4% |
| 0.7% | 2.2% |
| 5.1% | 4.8% |
Net Financial Revenue (Expenses) | 0.0% | 1.1% |
| -0.1% | 1.1% |
| -0.4% | 1.9% |
| 0.3% | 0.2% |
Income Before Income Tax | 2.6% | 2.1% |
| 3.1% | 2.3% |
| -1.2% | 0.3% |
| 4.9% | 4.6% |
Income Tax | 1.0% | 0.6% |
| 1.1% | 0.6% |
| -0.6% | 0.3% |
| 1.5% | 1.6% |
Net Income (Loss) Company - continuing operations | 1.6% | 1.5% |
| 2.0% | 1.8% |
| -0.5% | 0.6% |
| 3.4% | 3.0% |
Net Income (Loss) - Consolidated Company | 1.4% | 1.1% |
| 1.8% | 1.6% |
| 0.1% | 0.3% |
| 3.4% | 3.0% |
Net Income (Loss) - Controlling Shareholders - continuing operations(3) | 1.6% | 1.5% |
| 2.0% | 1.8% |
| -0.5% | 0.6% |
| 3.4% | 3.0% |
Net Income (Loss) - Consolidated Controlling Shareholders(3) | 1.4% | 1.2% |
| 1.8% | 1.6% |
| 0.1% | 0.3% |
| 3.4% | 3.0% |
Minority Interest - Non-controlling - Consolidated | 0.0% | -0.1% |
| 0.0% | 0.0% |
| 0.0% | 0.0% |
| 0.0% | 0.0% |
EBITDA | 4.5% | 5.0% |
| 4.8% | 5.2% |
| 3.3% | 4.6% |
| 6.2% | 5.9% |
Adjusted EBITDA(4) | 5.4% | 5.5% |
| 5.7% | 5.7% |
| 5.0% | 5.7% |
| 6.3% | 5.7% |
(1) Multivarejo includes the results of Malls and Corporate. (2) Equity income from Cdiscount is included in the Consolidated results and not in the Retail and Cash-and-Carry segments. (3) Net income after non-controlling interest. (4) Adjusted for Other Operating Income and Expenses.
12
2.3 Income Statement for 9M19 – After IFRS 16
Consolidated | Food Business | Multivarejo(1) | Assaí | ||||||||||||
9M19 | 9M18 | Δ | 9M19 | 9M18 | Δ | 9M19 | 9M18 | Δ | 9M19 | 9M18 | Δ | ||||
R$ - Million |
|
|
|
|
|
|
|
|
|
|
|
| |||
Gross Revenue | 42,617 | 38,379 | 11.0% | 42,615 | 38,379 | 11.0% | 20,977 | 20,756 | 1.1% | 21,638 | 17,623 | 22.8% | |||
Net Revenue | 39,314 | 35,377 | 11.1% | 39,313 | 35,377 | 11.1% | 19,509 | 19,176 | 1.7% | 19,804 | 16,201 | 22.2% | |||
Cost of Goods Sold | (30,710) | (26,891) | 14.2% | (30,707) | (26,891) | 14.2% | (14,131) | (13,656) | 3.5% | (16,576) | (13,235) | 25.2% | |||
Depreciation (Logistic) | (106) | (97) | 9.9% | (106) | (97) | 9.9% | (90) | (75) | 20.3% | (16) | (22) | -26.0% | |||
Gross Profit | 8,498 | 8,389 | 1.3% | 8,499 | 8,389 | 1.3% | 5,287 | 5,445 | -2.9% | 3,212 | 2,944 | 9.1% | |||
Selling Expenses | (5,119) | (4,814) | 6.3% | (5,097) | (4,814) | 5.9% | (3,457) | (3,443) | 0.4% | (1,640) | (1,372) | 19.6% | |||
General and Administrative Expenses | (803) | (736) | 9.2% | (803) | (736) | 9.1% | (537) | (537) | 0.0% | (266) | (199) | 33.9% | |||
Selling, General and Adm. Expenses | (5,922) | (5,550) | 6.7% | (5,901) | (5,550) | 6.3% | (3,994) | (3,980) | 0.4% | (1,906) | (1,571) | 21.4% | |||
Equity Income(2) | (9) | (63) | -85.9% | 77 | 52 | 48.5% | 77 | 52 | 48.5% | - | - | n.d. | |||
Other Operating Revenue (Expenses) | (243) | (183) | 32.7% | (237) | (183) | 29.3% | (216) | (182) | 18.8% | (21) | (1) | 1547.4% | |||
Depreciation and Amortization | (1,011) | (905) | 11.7% | (1,010) | (905) | 11.6% | (732) | (681) | 7.5% | (278) | (224) | 24.2% | |||
Earnings before interest and Taxes - EBIT | 1,314 | 1,688 | -22.2% | 1,429 | 1,802 | -20.7% | 421 | 654 | -35.5% | 1,007 | 1,149 | -12.3% | |||
Financial Revenue | 345 | 127 | 171.7% | 316 | 127 | 148.7% | 283 | 101 | 181.1% | 33 | 26 | 24.4% | |||
Financial Expenses | (1,054) | (931) | 13.2% | (1,009) | (931) | 8.4% | (830) | (790) | 5.1% | (179) | (142) | 26.5% | |||
Net Financial Result | (709) | (804) | -11.8% | (693) | (804) | -13.8% | (547) | (689) | -20.6% | (146) | (115) | 27.0% | |||
Income (Loss) Before Income Tax | 605 | 884 | -31.6% | 735 | 998 | -26.3% | (126) | (35) | 256.9% | 861 | 1,033 | -16.7% | |||
Income Tax | (204) | (252) | -19.1% | (211) | (252) | -16.3% | 66 | 93 | -29.7% | (277) | (346) | -19.9% | |||
Net Income (Loss) Company - continuing operations | 400 | 631 | -36.6% | 524 | 746 | -29.7% | (60) | 58 | n.d. | 584 | 687 | -15.1% | |||
Net Result from discontinued operations | 365 | 333 | 9.7% | 329 | (66) | n.d. | 329 | (66) | n.d. | - | - | n.d. | |||
Net Income (Loss) - Consolidated Company | 765 | 964 | -20.6% | 853 | 679 | 25.5% | 269 | (8) | n.d. | 584 | 687 | -15.1% | |||
Net Income (Loss) - Controlling Shareholders - continuing operations(3) | 401 | 631 | -36.6% | 524 | 746 | -29.7% | (60) | 58 | n.d. | 584 | 687 | -15.1% | |||
Net Income (Loss) - Controlling Shareholders - discontinued operations(3) | 332 | 99 | 237.0% | 329 | (66) | n.d. | 329 | (66) | n.d. | - | - | n.d. | |||
Net Income (Loss) - Consolidated Controlling Shareholders(3) | 733 | 730 | 0.4% | 853 | 679 | 25.5% | 269 | (8) | n.d. | 584 | 687 | -15.1% | |||
Minority Interest - Non-controlling - continuing operations | (0) | - | n.d. | (0) | - | n.d. | (0) | - | n.d. | - | - | n.d. | |||
Minority Interest - Non-controlling - discontinued operations | 33 | 234 | -86.0% | - | - | n.d. | - | - | n.d. | - | - | n.d. | |||
Minority Interest - Non-controlling - Consolidated | 33 | 234 | -86.1% | (0) | - | n.d. | (0) | - | n.d. | - | - | n.d. | |||
Earnings before Interest, Taxes, Depreciation, Amortization - EBITDA | 2,431 | 2,690 | -9.6% | 2,545 | 2,804 | -9.2% | 1,244 | 1,410 | -11.8% | 1,301 | 1,394 | -6.7% | |||
Adjusted EBITDA(4) | 2,674 | 2,459 | 8.8% | 2,781 | 2,573 | 8.1% | 1,460 | 1,547 | -5.6% | 1,322 | 1,026 | 28.8% | |||
Consolidated | Food Business | Multivarejo(1) | Assaí | ||||||||
% of Net Revenue | 9M19 | 9M18 | 9M19 | 9M18 | 9M19 | 9M18 | 9M19 | 9M18 | |||
Gross Profit | 21.6% | 23.7% |
| 21.6% | 23.7% |
| 27.1% | 28.4% | 16.2% | 18.2% | |
Selling Expenses | 13.0% | 13.6% |
| 13.0% | 13.6% |
| 17.7% | 18.0% | 8.3% | 8.5% | |
General and Administrative Expenses | 2.0% | 2.1% |
| 2.0% | 2.1% |
| 2.8% | 2.8% | 1.3% | 1.2% | |
Selling, General and Adm. Expenses | 15.1% | 15.7% |
| 15.0% | 15.7% |
| 20.5% | 20.8% | 9.6% | 9.7% | |
Equity Income(2) | 0.0% | 0.2% |
| 0.2% | 0.1% |
| 0.4% | 0.3% | 0.0% | 0.0% | |
Other Operating Revenue (Expenses) | 0.6% | 0.5% |
| 0.6% | 0.5% |
| 1.1% | 0.9% | 0.1% | 0.0% | |
Depreciation and Amortization | 2.6% | 2.6% |
| 2.6% | 2.6% |
| 3.8% | 3.6% | 1.4% | 1.4% | |
EBIT | 3.3% | 4.8% |
| 3.6% | 5.1% |
| 2.2% | 3.4% | 5.1% | 7.1% | |
Net Financial Revenue (Expenses) | 1.8% | 2.3% |
| 1.8% | 2.3% |
| 2.8% | 3.6% | 0.7% | 0.7% | |
Income Before Income Tax | 1.5% | 2.5% |
| 1.9% | 2.8% |
| 0.6% | -0.2% | 4.3% | 6.4% | |
Income Tax | 0.5% | 0.7% |
| 0.5% | 0.7% |
| 0.3% | 0.5% | 1.4% | 2.1% | |
Net Income (Loss) Company - continuing operations | 1.0% | 1.8% |
| 1.3% | 2.1% |
| 0.3% | 0.3% | 2.9% | 4.2% | |
Net Income (Loss) - Consolidated Company | 1.9% | 2.7% |
| 2.2% | 1.9% |
| 1.4% | 0.0% | 2.9% | 4.2% | |
Net Income (Loss) - Controlling Shareholders - continuing operations(3) | 1.0% | 1.8% |
| 1.3% | 2.1% |
| 0.3% | 0.3% | 2.9% | 4.2% | |
Net Income (Loss) - Consolidated Controlling Shareholders(3) | 1.9% | 2.1% |
| 2.2% | 1.9% |
| 1.4% | 0.0% | 2.9% | 4.2% | |
Minority Interest - Non-controlling - continuing operations | 0.0% | 0.0% |
| 0.0% | 0.0% |
| 0.0% | 0.0% | 0.0% | 0.0% | |
Minority Interest - Non-controlling - Consolidated | -0.1% | 0.7% |
| 0.0% | 0.0% |
| 0.0% | 0.0% | 0.0% | 0.0% | |
EBITDA | 6.2% | 7.6% |
| 6.5% | 7.9% |
| 6.4% | 7.4% | 6.6% | 8.6% | |
Adjusted EBITDA(4) | 6.8% | 6.9% |
| 7.1% | 7.3% |
| 7.5% | 8.1% | 6.7% | 6.3% | |
(1) Multivarejo includes the results of Malls and Corporate. (2) Equity income from Cdiscount is included in the Consolidated results and not in the Retail and Cash-and-Carry segments. (3) Net income after non-controlling interest. (4) Adjusted for Other Operating Income and Expenses and excluding non-recurring effects from the period.
13
2.4 Income Statement for 9M19 – Before IFRS 16
Consolidated | Food Business | Multivarejo(1) | Assaí | ||||||||||||
9M19 | 9M18 | Δ | 9M19 | 9M18 | Δ | 9M19 | 9M18 | Δ | 9M19 | 9M18 | Δ | ||||
R$ - Million |
|
|
|
|
|
|
|
|
|
|
|
| |||
Gross Revenue | 42,617 | 38,379 | 11.0% | 42,615 | 38,379 | 11.0% | 20,977 | 20,756 | 1.1% | 21,638 | 17,623 | 22.8% | |||
Net Revenue | 39,314 | 35,377 | 11.1% | 39,313 | 35,377 | 11.1% | 19,509 | 19,176 | 1.7% | 19,804 | 16,201 | 22.2% | |||
Cost of Goods Sold | (30,806) | (26,981) | 14.2% | (30,803) | (26,981) | 14.2% | (14,214) | (13,732) | 3.5% | (16,589) | (13,250) | 25.2% | |||
Depreciation (Logistic) | (37) | (37) | 0.9% | (37) | (37) | 0.9% | (29) | (30) | -1.7% | (8) | (7) | 12.0% | |||
Gross Profit | 8,472 | 8,359 | 1.4% | 8,473 | 8,359 | 1.4% | 5,266 | 5,414 | -2.7% | 3,206 | 2,944 | 8.9% | |||
Selling Expenses | (5,681) | (5,324) | 6.7% | (5,660) | (5,324) | 6.3% | (3,892) | (3,843) | 1.3% | (1,768) | (1,480) | 19.4% | |||
General and Administrative Expenses | (810) | (742) | 9.2% | (810) | (742) | 9.2% | (541) | (541) | 0.1% | (269) | (201) | 33.7% | |||
Selling, General and Adm. Expenses | (6,491) | (6,066) | 7.0% | (6,470) | (6,066) | 6.7% | (4,433) | (4,384) | 1.1% | (2,037) | (1,681) | 21.1% | |||
Equity Income(2) | (9) | (52) | -82.9% | 77 | 52 | 48.5% | 77 | 52 | 48.5% | - | - | n.d. | |||
Other Operating Revenue (Expenses) | (263) | (193) | 36.5% | (257) | (193) | 33.3% | (236) | (187) | 26.4% | (21) | (6) | 254.4% | |||
Depreciation and Amortization | (687) | (625) | 9.9% | (686) | (625) | 9.8% | (477) | (455) | 4.8% | (209) | (170) | 23.1% | |||
Earnings before interest and Taxes - EBIT | 1,022 | 1,424 | -28.2% | 1,137 | 1,527 | -25.6% | 197 | 440 | -55.2% | 940 | 1,087 | -13.5% | |||
Financial Revenue | 345 | 127 | 171.7% | 316 | 127 | 148.7% | 283 | 101 | 181.1% | 33 | 26 | 24.4% | |||
Financial Expenses | (638) | (541) | 17.9% | (593) | (541) | 9.6% | (514) | (485) | 5.8% | (79) | (55) | 42.8% | |||
Net Financial Result | (293) | (414) | -29.3% | (277) | (414) | -33.1% | (230) | (385) | -40.1% | (46) | (29) | 59.4% | |||
Income (Loss) Before Income Tax | 729 | 1,010 | -27.8% | 860 | 1,113 | -22.8% | (34) | 55 | n.d. | 893 | 1,058 | -15.6% | |||
Income Tax | (238) | (283) | -15.9% | (245) | (283) | -13.4% | 43 | 71 | -39.7% | (288) | (354) | -18.7% | |||
Net Income (Loss) Company - continuing operations | 491 | 726 | -32.4% | 614 | 830 | -25.9% | 9 | 126 | -92.8% | 605 | 704 | -14.0% | |||
Net Result from discontinued operations | 227 | 163 | 39.7% | 329 | (18) | n.d. | 329 | (18) | n.d. | - | - | n.d. | |||
Net Income (Loss) - Consolidated Company | 718 | 889 | -19.2% | 943 | 811 | 16.3% | 338 | 107 | 214.9% | 605 | 704 | -14.0% | |||
Net Income (Loss) - Controlling Shareholders - continuing operations(3) | 491 | 726 | -32.4% | 614 | 830 | -25.9% | 9 | 126 | -92.8% | 614 | 704 | -12.8% | |||
Net Income (Loss) - Controlling Shareholders - discontinued operations(3) | 282 | 52 | 441.7% | 329 | (18) | n.d. | 329 | (18) | n.d. | - | - | n.d. | |||
Net Income (Loss) - Consolidated Controlling Shareholders(3) | 774 | 778 | -0.6% | 943 | 811 | 16.3% | 338 | 107 | 214.9% | 614 | 704 | -12.8% | |||
Minority Interest - Non-controlling - continuing operations | - | - | n.d. | - | - | n.d. | - | - | n.d. | - | - | n.d. | |||
Minority Interest - Non-controlling - discontinued operations | (55) | 110 | n.d. | - | - | n.d. | - | - | n.d. | - | - | n.d. | |||
Minority Interest - Non-controlling - Consolidated | (55) | 110 | n.d. | - | - | n.d. | - | - | n.d. | - | - | n.d. | |||
Earnings before Interest, Taxes, Depreciation, Amortization - EBITDA | 1,746 | 2,085 | -16.3% | 1,860 | 2,164 | -14.1% | 703 | 904 | -22.3% | 1,157 | 1,260 | -8.2% | |||
Adjusted EBITDA(4) | 2,009 | 1,864 | 7.8% | 2,116 | 1,942 | 9.0% | 939 | 1,046 | -10.2% | 1,177 | 896 | 31.3% | |||
Consolidated | Food Business | Multivarejo(1) | Assaí | ||||||||
% of Net Revenue | 9M19 | 9M18 | 9M19 | 9M18 | 9M19 | 9M18 | 9M19 | 9M18 | |||
Gross Profit | 21.5% | 23.6% |
| 21.6% | 23.6% |
| 27.0% | 28.2% |
| 16.2% | 18.2% |
Selling Expenses | 14.5% | 15.0% |
| 14.4% | 15.0% |
| 19.9% | 20.0% |
| 8.9% | 9.1% |
General and Administrative Expenses | 2.1% | 2.1% |
| 2.1% | 2.1% |
| 2.8% | 2.8% |
| 1.4% | 1.2% |
Selling, General and Adm. Expenses | 16.5% | 17.1% |
| 16.5% | 17.1% |
| 22.7% | 22.9% |
| 10.3% | 10.4% |
Equity Income(2) | 0.0% | 0.1% |
| 0.2% | 0.1% |
| 0.4% | 0.3% |
| 0.0% | 0.0% |
Other Operating Revenue (Expenses) | 0.7% | 0.5% |
| 0.7% | 0.5% |
| 1.2% | 1.0% |
| 0.1% | 0.0% |
Depreciation and Amortization | 1.7% | 1.8% |
| 1.7% | 1.8% |
| 2.4% | 2.4% |
| 1.1% | 1.0% |
EBIT | 2.6% | 4.0% |
| 2.9% | 4.3% |
| 1.0% | 2.3% |
| 4.7% | 6.7% |
Net Financial Revenue (Expenses) | 0.7% | 1.2% |
| 0.7% | 1.2% |
| 1.2% | 2.0% |
| 0.2% | 0.2% |
Income Before Income Tax | 1.9% | 2.9% |
| 2.2% | 3.1% |
| 0.2% | 0.3% |
| 4.5% | 6.5% |
Income Tax | 0.6% | 0.8% |
| 0.6% | 0.8% |
| 0.2% | 0.4% |
| 1.5% | 2.2% |
Net Income (Loss) Company - continuing operations | 1.2% | 2.1% |
| 1.6% | 2.3% |
| 0.0% | 0.7% |
| 3.1% | 4.3% |
Net Income (Loss) - Consolidated Company | 1.8% | 2.5% |
| 2.4% | 2.3% |
| 1.7% | 0.6% |
| 3.1% | 4.3% |
Net Income (Loss) - Controlling Shareholders - continuing operations(3) | 1.2% | 2.1% |
| 1.6% | 2.3% |
| 0.0% | 0.7% |
| 3.1% | 4.3% |
Net Income (Loss) - Consolidated Controlling Shareholders(3) | 2.0% | 2.2% |
| 2.4% | 2.3% |
| 1.7% | 0.6% |
| 3.1% | 4.3% |
Minority Interest - Non-controlling - continuing operations | 0.0% | 0.0% |
| 0.0% | 0.0% |
| 0.0% | 0.0% |
| 0.0% | 0.0% |
Minority Interest - Non-controlling - Consolidated | 0.1% | 0.3% |
| 0.0% | 0.0% |
| 0.0% | 0.0% |
| 0.0% | 0.0% |
EBITDA | 4.4% | 5.9% |
| 4.7% | 6.1% |
| 3.6% | 4.7% |
| 5.8% | 7.8% |
Adjusted EBITDA(4) | 5.1% | 5.3% |
| 5.4% | 5.5% |
| 4.8% | 5.5% |
| 5.9% | 5.5% |
(1) Multivarejo includes the results of Malls and Corporate. (2) Equity income from Cdiscount is included in the Consolidated results and not in the Retail and Cash-and-Carry segments. (3) Net income after non-controlling interest. (4) Adjusted for Other Operating Income and Expenses and excluding non-recurring effects from the period.
14
3. Cash Flow - Consolidated(including Via Varejo)(*)
STATEMENT OF CASH FLOW | |||
Consolidated | |||
(R$ million) | 09.30.2019 | 09.30.2018 | |
Net Income (Loss) for the period | 764 | 965 | |
Deferred income tax | 157 | 250 | |
Loss (gain) on disposal of fixed and intangible assets | 99 | 134 | |
Depreciation and amortization | 1,115 | 998 | |
Interests and exchange variation | 1,158 | 1,270 | |
Adjustment to present value | 1 | 1 | |
Equity Income | (7) | 42 | |
Provision for contingencies | 187 | 404 | |
Provision for disposals and impairment of property and equipment | - | (2) | |
Share-Based Compensation | 29 | 33 | |
Allowance for doubtful accounts | 261 | 464 | |
Provision for obsolescence/breakage | (11) | (19) | |
Other operational expenses | 18 | (369) | |
Deferred revenue | (265) | (324) | |
Eventual expenses | (97) | (37) | |
Gain of sale of subsidiary | (608) | - | |
|
|
| |
Asset (Increase) decreases | - | - | |
Accounts receivable | (39) | (765) | |
Inventories | (377) | (1,877) | |
Taxes recoverable | (299) | (935) | |
Dividends received | 12 | - | |
Other Assets | (268) | (35) | |
Related parties | (93) | 188 | |
Restricted deposits for legal proceeding | (38) | (11) | |
|
|
| |
Liability (Increase) decrease |
|
| |
Suppliers | (4,768) | (1,995) | |
Payroll and charges | (52) | (14) | |
Taxes and Social contributions payable | 52 | 81 | |
Other Accounts Payable | (117) | (69) | |
Contingencies | (396) | (756) | |
Deferred revenue | 15 | 137 | |
Taxes and Social contributions paid | (179) | (354) | |
|
| ||
Net cash generated from (used) in operating activities | (3,746) | (2,595) | |
|
| ||
Acquisition of property and equipment | (1,681) | (1,213) | |
Increase Intangible assets | (241) | (339) | |
Sales of property and equipment | 59 | 148 | |
Cash provided on sale of subisidiary | 2,326 | - | |
Net cash flow investment activities | 463 | (1,404) | |
|
| ||
Cash flow from financing activities |
|
| |
Increase of capital | 25 | 1 | |
Funding and refinancing | 11,957 | 7,096 | |
Payments of loans and financing | (2,701) | (5,913) | |
Dividend Payment | (229) | (174) | |
Acquisition of society | (19) | - | |
Lease liability payments | (1,174) | (1,308) | |
Net cash generated from (used) in financing activities | 7,859 | (298) | |
|
| ||
Increase (decrease) in cash and cash equivalents | 4,576 | (4,297) | |
|
| ||
Cash and cash equivalents at the beginning of the year | 8,080 | 7,351 | |
Cash and cash equivalents at the end of the year | 12,656 | 3,054 | |
Change in cash and cash equivalents | 4,576 | (4,297) | |
(*) Considers 5 months of Via Varejo in 2019 and 9 months in 2018.
15
4.Breakdown of Sales by Business
Breakdown of Gross Sales by Business | ||||||||||||
(R$ million) | 3Q19 | % | 3Q18 | % | Δ | 9M19 | % | 9M18 | % | Δ | ||
Multivarejo |
| 6,982 | 47.9% | 6,925 | 52.0% | 0.8% |
| 20,978 | 49.2% | 20,756 | 54.1% | 1.1% |
Pão de Açúcar |
| 1,817 | 12.5% | 1,838 | 13.8% | -1.1% |
| 5,425 | 12.7% | 5,477 | 14.3% | -1.0% |
Extra(1) |
| 4,098 | 28.1% | 4,084 | 30.7% | 0.3% |
| 12,469 | 29.3% | 12,379 | 32.3% | 0.7% |
Convenience Stores(2) |
| 351 | 2.4% | 321 | 2.4% | 9.3% |
| 996 | 2.3% | 921 | 2.4% | 8.2% |
Other Businesses(3) |
| 716 | 4.9% | 682 | 5.1% | 5.0% |
| 2,090 | 4.9% | 1,979 | 5.2% | 5.6% |
Cash & Carry |
| 7,587 | 52.1% | 6,382 | 48.0% | 18.9% |
| 21,638 | 50.8% | 17,623 | 45.9% | 22.8% |
Assaí |
| 7,587 | 52.1% | 6,382 | 48.0% | 18.9% |
| 21,638 | 50.8% | 17,623 | 45.9% | 22.8% |
Food Business |
| 14,570 | 100.0% | 13,307 | 100.0% | 9.5% |
| 42,616 | 100.0% | 38,379 | 100.0% | 11.0% |
Breakdown of Net Sales by Business | ||||||||||||
(R$ million) | 3Q19 | % | 3Q18 | % | Δ | 9M19 | % | 9M18 | % | Δ | ||
Multivarejo |
| 6,578 | 48.6% | 6,393 | 52.2% | 2.9% |
| 19,509 | 49.6% | 19,176 | 54.2% | 1.7% |
Pão de Açúcar |
| 1,672 | 12.4% | 1,687 | 13.8% | -0.9% |
| 4,989 | 12.7% | 5,032 | 14.2% | -0.9% |
Extra(1) |
| 3,727 | 27.6% | 3,735 | 30.5% | -0.2% |
| 11,355 | 28.9% | 11,341 | 32.1% | 0.1% |
Convenience Stores(2) |
| 331 | 2.4% | 300 | 2.4% | 10.2% |
| 937 | 2.4% | 861 | 2.4% | 8.8% |
Other Businesses(3) |
| 848 | 6.3% | 671 | 5.5% | 26.4% |
| 2,228 | 5.7% | 1,942 | 5.5% | 14.8% |
Cash & Carry |
| 6,945 | 51.4% | 5,865 | 47.8% | 18.4% |
| 19,804 | 50.4% | 16,201 | 45.8% | 22.2% |
Assaí |
| 6,945 | 51.4% | 5,865 | 47.8% | 18.4% |
| 19,804 | 50.4% | 16,201 | 45.8% | 22.2% |
Food Business |
| 13,523 | 100.0% | 12,258 | 100.0% | 10.3% |
| 39,312 | 100.0% | 35,376 | 100.0% | 11.1% |
(1) Includes sales by Extra Supermercado, Mercado Extra, Extra Hiper and Compre Bem. (2) Includes sales by Mini Extra and Minuto Pão de Açúcar.
(3) Includes sales by Gas stations, Drugstores, Delivery and rental revenue from commercial centers.
5. Breakdown of Sales (% of Net Sales)
SALES BREAKDOWN | Food Business | ||
3Q19 | 3Q18 | ||
Cash | 49.1% | 48.5% | |
Credit Card | 40.2% | 40.4% | |
Food Voucher | 10.7% | 11.1% | |
16
6. Store Portfolio Changes by Banner
3Q19 Results Conference Call and Webcast
Thursday, October 31,2019
10:30 a.m. (Brasília) | 9:30 a.m. (New York) | 1:30 p.m. (London)
Conference call in Portuguese (original language)
+55 (11) 3181-8565
Conference call in English (simultaneous translation)
+1 (412)717-9627or +1 (844)204-8942
Webcast:http://www.gpari.com.br
Replay
+55 11 3193-1012
Access code for audio in Portuguese: 1932275#
Access code for audio in English: 1779586#
http://www.gpari.com.br
Investor Relations Contacts
GPA Telephone: 55 (11) 3886-0421 gpa.ri@gpabr.com www.gpari.com.br
|
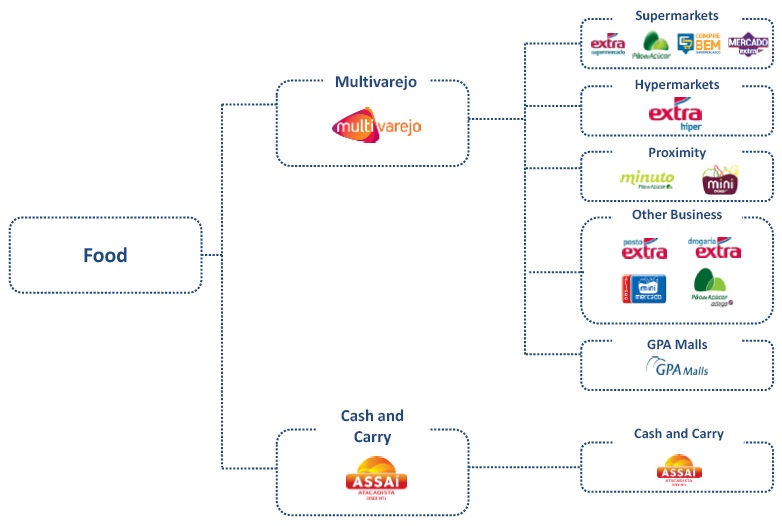
About GPA:GPA is Brazil’s largest retailer, with a distribution network comprising over 2,000 points of sale as well as electronic channels. Established in 1948 in São Paulo, it has its head office in the city and operations in 18 Brazilian states and the Federal District. With a strategy of focusing its decisions on customers and better serving them based on their consumer profile in the wide variety of shopping experiences it offers, GPA adopts a multi-business and multi-channel platform consisting of brick-and-mortar stores and e-commerce operations, divided into the following business units: Multivarejo, which operates the supermarket, hypermarket and Minimercado store formats, as well as fuel stations and drugstores under the Pão de Açúcar, Extra and Compre Bem banners; Assaí, which operates in the cash-and-carry wholesale segment; and GPA Malls, which is responsible for managing the Group's real estate assets, expansion projects and new store openings.
Disclaimer:Statements contained in this release relating to the business outlook of the Company, projections of operating/financial results, growth prospects of the Company and market and macroeconomic estimates are merely forecasts and are based on the beliefs, plans and expectations of Management in relation to the Company’s future. These expectations are highly dependent on changes in the market, Brazil’s general economic performance, the industry and international markets, and hence are subject to change.
17
Glossary
Food Segment:Represents the combined results of Multivarejo and Assaí, as below:
Discontinued activities: Referring to Via Varejo's activities until May 2019 and other after effects related to the investments’ write-off.
EBITDA:EBITDA is calculated in accordance with Instruction 527 issued by the Securities and Exchange Commission of Brazil (CVM) on October 4, 2012.
Adjusted EBITDA:Measure of profitability calculated by excluding Other Operating Income and Expenses from EBITDA. Management uses this measure in its analyses as it believes it eliminates nonrecurring expenses and revenues and other nonrecurring items that could compromise the comparability and analysis of results.
Earnings per Share:Diluted earnings per share are calculated as follows:
● Numerator: profit for the year adjusted by dilutive effects from stock options granted by subsidiaries.
● Denominator: number of shares of each category adjusted to include potential shares corresponding to dilutive instruments (stock options), less the number of shares that could be bought back at the market, as applicable.
Equity instruments that will or may be settled with the Company and its subsidiaries’ shares are only included in the calculation when its settlement has a dilutive impact on earnings per share.
Compre Bem:Project involving the conversion of stores in order to enter a market niche currently occupied by regional supermarkets. The store model is better adapted to the needs of consumers in the regions where the stores are located. The service and assortment of the perishables category will be reinforced, while other categories will have a leaner assortment. Compre Bem is managed independently from the Extra Super banner with the focus on simplifying operating costs, especially logistics and IT.
Mercado Extra:Project aims to renovate Extra Super by reinforcing the quality of perishables and customer service, with the focus on the B and C income groups. There will be no change in the operating model of the stores, which will continue to be managed under the Extra banner.
James Delivery (last miler):Multiservice platform for ordering and delivering in minutes diverse products selected by our customers, including restaurants, and integration with our supermarkets and drugstores.
18
Cheftime:pioneering foodtech startup that offers cook-at-home meal kits and ready-to-eat meals, expanding the offering of ready-to-eat solutions at stores in order to offer and lead new concepts in food products and services.
‘Same-store’ growth: ‘Same-store’ growth, as mentioned in this document, is adjusted by the calendar effect in each period.
Growth and Changes:The growth and changes presented in this document refer to variations from the same period last year, except where stated otherwise.
19
SIGNATURES
Pursuant to the requirement of the Securities Exchange Act of 1934, the registrant has duly caused this report to be signed on its behalf by the undersigned, thereunto duly authorized.
| COMPANHIA BRASILEIRA DE DISTRIBUIÇÃO | ||
| Date: October 30, 2019 | By: /s/ Peter Estermann Name: Peter Estermann Title: Chief Executive Officer | |
| By: /s/ Isabela Cadenassi Name: Isabela Cadenassi Title: Investor Relations Officer | ||
FORWARD-LOOKING STATEMENTS
This press release may contain forward-looking statements. These statements are statements that are not historical facts, and are based on management's current view and estimates offuture economic circumstances, industry conditions, company performance and financial results. The words "anticipates", "believes", "estimates", "expects", "plans" and similar expressions, as they relate to the company, are intended to identify forward-looking statements. Statements regarding the declaration or payment of dividends, the implementation of principal operating and financing strategies and capital expenditure plans, the direction of future operations and the factors or trends affecting financial condition, liquidity or results of operations are examples of forward-looking statements. Such statements reflect the current views of management and are subject to a number of risks and uncertainties. There is no guarantee that the expected events, trends or results will actually occur. The statements are based on many assumptions and factors, including general economic and market conditions, industry conditions, and operating factors. Any changes in such assumptions or factors could cause actual results to differ materially from current expectations.