FORM 6-K
SECURITIES AND EXCHANGE COMMISSION
Washington, D.C. 20549
Report of Foreign Private Issuer
Pursuant to Rule 13a-16 or 15d-16 of
the Securities Exchange Act of 1934
For the month of November, 2021
Brazilian Distribution Company
(Translation of Registrant’s Name Into English)
Av. Brigadeiro Luiz Antonio,
3142 São Paulo, SP 01402-901
Brazil
(Address of Principal Executive Offices)
(Indicate by check mark whether the registrant files or will file annual reports under cover of Form 20-F or Form 40-F)
Form 20-F X Form 40-F
(Indicate by check mark if the registrant is submitting the Form 6-K in paper as permitted by Regulation S-T Rule
101 (b) (1)):
Yes ___ No X
(Indicate by check mark if the registrant is submitting the Form 6-K in paper as permitted by Regulation S-T Rule
101 (b) (7)):
Yes ___ No X
(Indicate by check mark whether the registrant by furnishing the information contained in this Form is also thereby furnishing the information to the Commission pursuant to Rule 12g3-2(b) under the Securities Exchange Act of 1934.)
Yes ___ No X


GPA GROUP - Operational & Financial Highlights
Extra Hiper Transaction:
| § | On October 14, 2021, we announced a transaction involving 71 commercial establishments under the Extra Hiper brand to be assigned to Assaí. A binding memorandum of understanding (“MoU”) was executed by the parties and establishes a total Transaction price to be received by GPA of R$5.2 billion, of which R$4.0 billion will be paid by Assaí to GPA. The remainder will be paid to GPA through a real estate fund, guaranteed by Assaí. |
| § | The Transaction intensifies the focus and accelerates the expansion of the Company's most profitable businesses and our digital platform, through the premium and proximity segments. Of the 32 remaining Extra Hiper stores, 28 will be converted into Pão de Açúcar and Mercado Extra and 4 under evaluation. |
Digital Ecosystem:
| § | GPA Brazil recorded all-time high online food sales of R$475 million, up 46% over 3Q20 and 393% over 3Q19. In 12 months basis, GMV would reach R$1.9 billion. Online sales accounted for 9.3% of total sales in 3Q21, up from 6.3% in 3Q20. At Pão de Açúcar, online sales accounted for an average of 15% of total sales, reaching peaks of 20% in the quarter. |
| § | At Grupo Éxito, Gross Merchandise Volume (GMV) reached R$572 million in 3Q21, while penetration stood at 9.3%. |
Sales:
| § | The group’s consolidated net revenue from sales totaled R$12.1 billion in 3Q21, in line with 3Q20 and up 11.1% over 3Q19. In 9M21, net revenue was R$36.4 billion, in line with the same period in 2020 and 11.5% higher than in 9M19. |
| § | Grupo Éxito recorded strong double-digit growth in same-store sales: 16.4% vs. 3Q19 and 15.7% vs. 3Q20, thanks to increased traffic to stores from lower restrictions. |
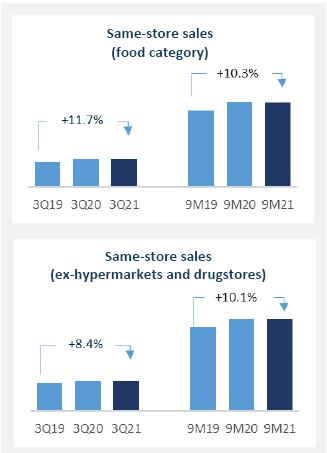
| § | Same-store sales of GPA Brazil (excluding hypermarkets and drugstores) rose 8.4% over 3Q19 and remained in line with 3Q20, reflecting the consistent operation of other formats. |
Consolidated Adjusted EBITDA Margin:
| § | Consolidated Adjusted EBITDA margin dropped 120 bps from 3Q20, concentrated in gross profit due to higher price investment in the Brazilian operation due to the deterioration of the macroeconomic environment with high inflation and unemployment rates. Strict expense control, which reduced the SG&A ratio by 60 bps, partially offset this investment. |
| § | In 9M21, Consolidated Adjusted EBITDA margin remained flat year on year at 7.2%, with a decline at GPA Brazil (-30 bps) and an increase at Grupo Éxito (+70 bps). |
 | 2 |
 |
ESG Commitments:
| § | The GPA Group is included in the main global sustainability indexes and has been constantly improving its ESG initiatives. In 3Q21, it is worth highlighting: |
| § | Brazil: we made important advances in the sustainability agenda this quarter, contributing to the fulfillment of our commitment to being a mobilizing agent for a more inclusive and sustainable society. At the end of September, 53% of our staff were women and 52% self-declared Black, promoting diversity and inclusion for our people. |
| § | Éxito: we promote sustainability through value creation initiatives in order to contribute to economic growth, social development and environment protection. We collected 520 tons of waste in 3Q21, 900% more than in 3Q20, thanks to the excellent participation of our customers. |
Disclaimer: Statements contained in this release relating to the business outlook of the Company, projections of operating/financial results, growth prospects of the Company and market and macroeconomic estimates are merely forecasts and are based on the beliefs, plans and expectations of Management in relation to the Company’s future. These expectations are highly dependent on changes in the market, Brazil’s general economic performance, the industry and international markets, and hence are subject to change.
| | 3 |
| |
GPA Consolidated
Challenging scenario in Brazil and strong recovery in Colombia
| R$ million, except when indicated | GPA Consolidated (1) | |||||||||
| 3Q21 | 3Q20 | 3Q19(5) | Δ 21 vs 20 | Δ 21 vs 19 | 9M21 | 9M20 | 9M19(5) | Δ 21 vs 20 | Δ 21 vs 19 | |
| Gross Revenue | 13,285 | 13,335 | 11,794 | -0.4% | 12.6% | 39,993 | 40,314 | 35,788 | -0.8% | 11.7% |
| Net Revenue | 12,084 | 12,064 | 10,881 | 0.2% | 11.1% | 36,415 | 36,483 | 32,672 | -0.2% | 11.5% |
| Gross Profit | 2,968 | 3,080 | 2,820 | -3.6% | 5.2% | 9,224 | 9,189 | 8,613 | 0.4% | 7.1% |
| Gross Margin | 24.6% | 25.5% | 25.9% | -90 bps | -130 bps | 25.3% | 25.2% | 26.4% | 10 bps | -110 bps |
| Selling, General and Adm. Expenses | (2,233) | (2,299) | (2,092) | -2.9% | 6.8% | (6,764) | (6,828) | (6,419) | -0.9% | 5.4% |
| % of Net Revenue | 18.5% | 19.1% | 19.2% | -60 bps | -70 bps | 18.6% | 18.7% | 19.6% | -10 bps | -100 bps |
| Other Operating Revenue (Expenses) | (161) | (21) | (120) | 673.3% | 34.1% | (281) | (210) | (267) | 33.9% | 5.2% |
| Adjusted EBITDA (2)(3) | 794 | 944 | 796 | -15.9% | -0.2% | 2,628 | 2,606 | 2,317 | 0.9% | 13.4% |
| Adjusted EBITDA Margin (2)(3) | 6.6% | 7.8% | 7.3% | -120 bps | -70 bps | 7.2% | 7.1% | 7.1% | 10 bps | 10 bps |
| Net Income - Controlling Shareholders (4) | (88) | (63) | (22) | 39.6% | 302.1% | 28 | (223) | (169) | -112.6% | -116.6% |
| Net Margin - Controlling Shareholders (4) | -0.7% | -0.5% | -0.2% | -20 bps | -50 bps | 0.1% | -0.6% | -0.5% | 70 bps | 60 bps |
(1) Consolidated figures include the results of GPA Brazil, Grupo Éxito (Colombia, Uruguay and Argentina), other businesses (Stix Fidelidade, Cheftime and James Delivery) and CDiscount (in the equity income line).
(2) Operating income before interest, taxes, depreciation and amortization.
(3) Adjusted for Other Operating Revenue (Expenses).
(4) Continuing Operations.
(5) Grupo Éxito’s 2019 results refer to unaudited pro-forma figures, with adjustments related to the deconsolidation of GPA itself, which until November 2019 was
directly controlled by Grupo Éxito. Thus, GPA’s consolidated results reflect these same adjustments.
Message from the CEO
Despite the challenges imposed by the macro environment, including a decline in the population’s income and inflationary pressure, which have required major adjustments and caution from the entire sector, food sales remained resilient, enabling SSS growth of 8.4% over 3Q19 (excluding hypermarkets and drugstores), reflecting the consistent operation of other formats. In Colombia, this trend is even clearer, with same-store sales growth of 16.8% over 3Q20.
As our digital ecosystem remains strong, with a dynamic that is increasingly well-adapted to the lives of omnichannel consumers, we reached record sales, 393% higher than in 3Q19 and 46% higher than the extremely strong 3Q20, with ever-growing penetration both in Brazil and in Grupo Éxito. This evolution reflects the robustness of our strategic planning and operational efficiency, with an open platform model and extensive experience in food distribution via e-commerce.
We continue to advance our environmental, social and governance initiatives, as pillars of our business, and I would like to highlight the advances of programs aimed at promoting diversity, inclusion and gender equity in the group, as well as the valuable recognition we received in rankings about the job market and ESG published last quarter.
Finally, we have reached the fourth quarter, the most important period for food retail, with a renewed company: last month we announced the most transformative operational transaction in GPA’s recent history, as part of a strategy that looks ahead to the future. It was an important step in creating value for our business, with multiple growth drivers, low leverage and important resources to place us in an advantageous position in the market.
Jorge Faiçal
GPA’s CEO
| | 4 |
| |
Digital Strategy
We will be wherever the customer is, continuing our strategy of providing an open and collaborative platform
The pillars of GPA Brazil’s digital ecosystem are robust strategic planning and efficient execution. In the third quarter, we launched the fulfillment service for marketplace sellers, ensuring fast delivery, competitive freight rates and order traceability. We continued to enhance partnerships with last-mile carriers in order to serve customers wherever they are.
 | 1P & 3P E-commerce Food e-commerce (1P+3P) grew a hefty 46% over 3Q20, despite the strong comparison base in the previous year. These sales accounted for 9.3% of GPA Brazil’s total food sales, with peaks of 20% at Pão de Açúcar. The GMV of GPA Brazil’s online operations continued to grow, reaching R$475 million in the quarter and surpassing the GMV recorded in 4Q20 (which was affected by seasonality due to Christmas and Black Friday). On 12 months basis GMV would reach R$1.9 billion.
It is worth noting the strong growth in the number of orders placed in 3Q21. The number of orders increased 109% over 3Q20 and surpassed the total number of orders placed in the whole of 2019. |
In 3Q21, the Click & Collect service, available in 286 stores, accounted for 11% of total GMV (1P). In the quarter, partnerships with last-miler carriers, available in 563 stores, recorded a strong performance, representing 42% of the GMV, an increases of 37% compared to 2Q21.
The strong growth is supported by other initiatives designed to improve UX usability. In 3Q21, we launched the following initiatives: social login, Sunday delivery, Click & Collect in one hour, cashback, WhatsApp, pix, 30-minute delivery (ultra convenience), delivery using electric cars and the new search tool, which will boost e-commerce growth over the coming quarters.
Marketplace
At GPA’s Marketplace (3P), we continue to advance our strategy to expand our assortment, focusing on verticals that complement our food core business (wine, spirits, craft beer, baby care, beauty, pet care, household items and kitchen utensils). Our onboarding process continues at full speed in order to further maximize the number of SKUs available, with stable service level indicators. In 3Q21, we launched our fulfillment platform.
Fulfillment: As part of the strengthening of our digital ecosystem’s value proposition, we launched a fulfillment platform with GPA Log, the Group’s logistics company. We began to offer services to marketplace sellers, ensuring fast delivery, competitive freight rates and order traceability. Initially, we offer two services: Delivery: the partner company relies on GPA’s expertise in logistics to deliver its sales, ensuring a reduction in delivery time and freight rates for clients; and Mailing: GPA will provide the partner with a sticker that will enable it to send the parcel via the Brazilian postal service at a more competitive rate, thanks to GPA’s business volume with the Brazilian postal service. Currently, 15% of our marketplace is on the fulfillment platform, and our goal is to reach 30% by year-end.
Partnerships
In line with our strategy of being wherever the customer is on an open platform, we entered into a partnership with HomeRefill in October, launching our Retail as a Service (RaaS) business. The project will be executed based on a combination of two services in a full service dynamic, making inventory available for the channel, carrying out handling operations, separating orders and making deliveries.
| | 5 |
| |
Our partnership with Mercado Livre (Meli), announced in 2Q21, has been growing every month. Our revenue increased fourfold after only three months on the platform, and we have also begun selling under the Extra brand. In addition, we expanded the available assortment, adding perishables to the list of over 3,000 supermarket items on the platform, and we plan to reach 4,000 by year-end, with approximately 80% of the assortment focused on Food and Beverages.
Delivery Models
In 3Q21, the Express, Click & Collect (same day) and last mile (next hour) delivery categories accounted for 79% of total online sales, mainly as a result of our efforts to improve the logistics chain, with greater network coverage and expansion of delivery models.
Last Mile (next hour): in 3Q21, all the partnerships of our fast delivery network were in operation, accounting for 42% of total online sales in the period. We currently have partnerships with iFood, B2W/Americanas, Rappi and Cornershop, in addition to our integrated last-mile service, James Delivery. The strong performance of last-mile carriers corroborates the Company’s decision to operate with a more open and collaborative platform, focusing on being where the customer is.
Express and Click & Collect (same day): At the end of 3Q21, 286 GPA Brazil stores had Express and Click & Collect services: our ship-from-store model currently represents approximately 37% of total online sales. We are investing in and encouraging this model, since around 40%-50% of Click & Collect customers make additional purchases when they pick up their orders from the stores, increasing the average ticket by 12%. We implemented 30-minute delivery (ultra convenience) in 3Q21.
Traditional Delivery (next day): The Company continues to benefit from investments made in the expansion of distribution centers in 2020. Traditional delivery services accounted for 21% of total online sales at the end of 3Q21.
Loyalty Program and Digital Ecosystem
The Loyalty programs (Cliente Mais and Clube Extra) create a virtuous cycle for customers and the Company by granting customers exclusive and personalized discounts and enabling them to accumulate Stix points and redeem rewards. In 3Q21, we observed that the most loyal customers spend, on average, six times more than other customers, as a result of our initiatives: the proprietary algorithms are constantly evolving, enabling increasing offer customization and generating a conversion rate ten times higher than that of the massive offer allocation. Since the beginning of the year, the number of customers who benefit from the “Meus Prêmios” (My Rewards) program and engage with Stix rose 150%, with an increase of over 50% in the total points granted and an upturn of more than 30% in catalog reward redemptions.
 | Stix operates as a product and service platform for accumulating and redeeming points that offers discounts and advantages to loyal customers. In 3Q21, Stix celebrated its first anniversary, with a positive EBITDA, creating value for retailers, with additional sales. In 3Q21, we enabled customers to redeem Stix points at the checkout counter of 360 stores, further boosting the platform.
We also began to reap the fruits of the coalition effect on customer synergy among the partners. The number of Raia Drogasil customers who made purchases grew by an average of 40% a month in 9M21, meeting the goals and accumulating points at GPA. |
| | 6 |
| |
Sales Performance
Strong growth in the online channel and supermarket and proximity formats
| Gross Revenue | 3Q21/3Q19 | 3Q21/3Q20 | ||
| (R$ million) | Same stores (3) | Selling | % Stores total | Same stores (3) |
| GPA Brazil(1) | 1.6% | 6,895 | -6.4% | -5.6% |
| Extra Hiper | -6.2% | 2,668 | -14.2% | -12.8% |
| Drugstores | -18.0% | 53 | -10.3% | -4.7% |
| GPA Brazil ex hiper and drugstores | 8.4% | 4,174 | -0.6% | -0.3% |
| Pão de Açúcar | 2.3% | 1,886 | -3.9% | -3.6% |
| Mercado Extra / Compre Bem | 13.6% | 1,253 | -0.3% | -0.2% |
| Proximity | 59.2% | 545 | 12.2% | 12.1% |
| Gas stations | -18.9% | 412 | -3.9% | 1.1% |
| Other businesses(2) | n.d. | 79 | 16.2% | n.d. |
(1) GPA Brazil’s figures do not include the results of Stix Fidelidade, Cheftime and James Delivery.
(2) Revenue from lease of commercial centers.
(3) To reflect the calendar effect, we made a 30 bps reduction in 3Q21.
 | GPA Brazil’s total sales reached R$6.9 billion in 3Q21. Same store sales were down 5.6% from 3Q20 and up 1.6% over 3Q19. Excluding hypermarkets and drugstores, sales were in line with 3Q20 and grew 8.4% over 3Q19, with the largest contribution coming from: | ||
| · | the online channel, which grew 46% year on year, directly related to omnichannel growth and expansion of partnerships with last-mile carriers; and | ||
| · | Proximity formats, Mercado Extra and Compre Bem, in particular Minuto Pão de Açúcar. | ||
In 3Q21, sales were negatively impacted by challenges mainly related to the macroeconomic environment, such as: | |||
| · | the strong comparison base in 3Q20. Non-food sales fell year on year in our hypermarkets, driven by the strong comparison base in 2020, the end of emergency aid payments and high inflation and unemployment rates; | ||
| · | migration of non-food product sales to the online channel (segment in which we currently do not operate); and | ||
| · | decline in consumption by Brazilian families. | ||
In 3Q21, food same-store sales were in line with 3Q20 and 11.7% higher than in 3Q19. In 9M21, the food category grew 10.3% over 9M19. | |||
| | 7 |
| |
Hypermarket/Supermarket/Proximity
On October 14, 2021, we announced a transaction involving 71 commercial establishments that was formalized through the execution of a binding memorandum of understanding (“MoU”) for the assignment to Assaí of the stores operated by GPA under the Extra Hiper banner in properties owned by GPA and leased from third parties, as well as the respective lease agreements, and which may also involve the purchase of certain equipment contained in stores by Assaí.
The MoU establishes that the total price of the Transaction to be received by GPA will be R$5.2 billion, of which R$4.0 billion must be paid by Assaí to GPA and R$1.2 billion will be paid to GPA by a real estate fund, guaranteed by Assaí. This guarantee consists of the obligation to pay for the properties in case the Fund does not meet the agreed deadline.
It is important to note that the funds will provide greater agility and accelerate growth in physical and digital food retail, reinforcing GPA’s leadership position in food retail and e-commerce in the country. Of the 32 remaining Extra Hiper stores, 28 will be converted into Pão de Açúcar and Mercado Extra and 4 under evaluation.
The transaction was designed based on a clear rationale from a business and financial standpoint, for both companies, with significant potential to create value for their respective shareholders.
Extra Hiper
As announced in the previous quarter, Extra Hiper recorded sales growth in the food category in June 2021, and this trend continued in July, August and September, resulting in an increase in food sales in the banner. This growth was the result of the new commercial dynamic of offering wholesale prices every day, already implemented in all the stores, and the evolution of the model, which, in addition to discounts for bulk purchases, offers customers a selection of essential items at wholesale prices regardless of the number of items purchased. As a result of these initiatives, Extra Hiper’s food sales increased 2.9% over 3Q20 and 8.9% over 3Q19.
The strong comparison base of non-food sales was the main driver of Extra Hiper’s unfavorable result in the year-on-year comparison, combined with an unfavorable macroeconomic environment for the purchase of non-food items, which led to a 29% decline in non-food sales.
Pão de Açúcar The stores operating under the G7 concept continued to perform better than the others, strengthening the Group's confidence in the expansion of this format. Of the 181 Pão de Açúcar stores, distributed in 13 Brazilian states, 47 have already been renovated under the G7 concept to provide a better shopping experience for consumers, and another 31 have implemented G7 concepts, 6 of which in 3Q21. After the transaction announced on October 14, we will further accelerate these renovations.
In 2Q21, we announced a series of initiatives to contribute to the resumption of growth at P��o de Açúcar, and we already saw an improvement in performance in 3Q21, despite the challenging scenario. | 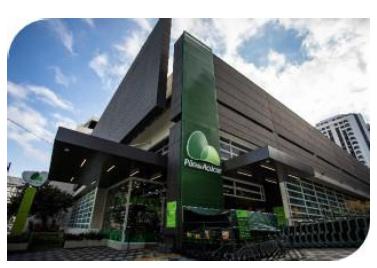 |
Highlights include:
| i. | a significant improvement in operational performance; |
| ii. | improved customer flow, with a better shopping experience and expansion of self-checkout projects, reaching 57 stores at the end of 3Q21; |
| iii. | increase in 1P and 3P supply of products, which contributed to accelerating Pão de Açúcar’s online sales; |
| iv. | resumption of the store expansion plan scheduled for 2H21, with 100 new stores expected by 2024; and |
| v. | reversal of the market share trend with gains in several weeks over self-service players in Brazil and also over premium competitors. |
| | 8 |
| |
Pão de Açúcar’s online sales continued to grow, driven by partnerships with last-mile carriers announced in 1H21, with average penetration of 15%, reaching peaks of 20% in 3Q21.
Mercado Extra and Compre Bem
In 3Q21, the performance of Compre Bem and Mercado Extra was in line with 3Q20 and 13.6% higher than in 3Q19.
Compre Bem continued to reflect the success of the format’s value proposition with its target audience, consolidating its model in all the cities where the banner is present.
Mercado Extra continued to accelerate the integration of its units into the food e-commerce operation, with more than 60 stores operating under the Express model at the end of 3Q21. In addition, last mile sales also accelerated significantly, increasing more than 630% over the same period last year and accounting for over 3% of total sales. |  |
Proximity
In 3Q21, GPA’s Proximity formats continued the strong growth trend observed in recent quarters, with same-store sales up 12.1% over 3Q20 and 59.2% over 3Q19, thus reaching the mark of 13 consecutive quarters of double-digit growth.
As announced in 2Q21, GPA resumed the expansion of Minuto Pão de Açúcar. In 3Q21, three new Minuto Pão de Açúcar units were opened, and we plan to open 100 new stores over the coming three years. The banner maintains an efficient operation in perishables, enabling a complete replenishment basket.
On October 29, we launched a new format: Pão de Açúcar Fresh. This new model is focused on replenishment purchases of fresh products and is designed to occupy the format space between Minuto Pão de Açúcar and Traditional Pão de Açúcar. We have a complete assortment of fruit and vegetables, bakery goods, cold cuts, meat products, sushi, basic and additional grocery items, beverages and breakfast items. It is worth noting that this format has been supported by GPA’s strength in food e-commerce since its inception, with Click & Collect and last mile services. | 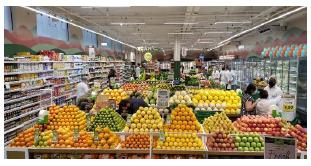 |
Private Label Brands
With ever-growing demand in Brazil and daily acquisition of new consumers, the private label brands represent one of the main strategic aspects for building customer loyalty in our stores. In 3Q21, the share of private label brands reached 21.5%. Qualitá, our main brand in terms of sales, volume and number of products, received an important recognition: it was spontaneously mentioned by consumers in a survey conducted by Datafolha (The new reality of consumption habits) as one of the brands discovered in the pandemic, together with other major market brands.
We have a food assortment of approximately 5,800 SKUs. Our portfolio is composed of the following brands: Qualitá (day-to-day items, focused on food and cleaning products), Taeq (healthy food), Casino (imported and differentiated products), Cheftime (solutions ready to consume, take or prepare, in addition to cooking kits), Club des Sommeliers (wine from several countries), Fábrica 1959 (craft beef), Finlandek (homeware) and, more recently, Nous (personal care and beauty products).
| | 9 |
| |
GRUPO ÉXITO
Digital Strategy
Grupo Éxito’s digital strategy continues to present positive results, reaching R$572 million and accounting for 9.3% of sales. We describe below the main details of the omnichannel and digital transformation strategies adopted by Grupo Éxito. The variations below consider local currency unless otherwise indicated.
1P & 3P E-commerce - Colombia
Omnichannel sales accounted for 12.2% of total sales in Colombia in 9M21. The last-mile and home-delivery services reached 5.8 million orders, driven by the group’s own capacity and the exclusive partnership with Rappi. In 3Q21, Grupo Éxito enhanced its partnership with Rappi to implement “Turbo Fresh”, a ten-minute delivery service in Colombia, with the shipment of products from Carulla stores. Click & Collect sales, available at 476 stores and 12 VIVA malls, grew 1.4x, reaching a 28% share of omnichannel GMV. At Surtimayorista, the channel accounted for 8% of the banner’s total sales in 9M21. In Colombia we also offer sales via WhatsApp, a service that grew 2.3x year to date, accounting for 20% of omnichannel sales.
The Éxito and Carulla apps complement other initiatives integrated into the Company’s business ecosystem, such as the Puntos Colombia loyalty program, Tuya Pay and the sale of insurance policies. Both apps reached over 1.4 million downloads in 9M21.
Grupo Éxito continues to implement solutions using contactless technology, customer service, data analytics, logistics, supply chain and HR management in line with the strategy designed for 2021-2023. The Company continued to promote Puntos Colombia, a coalition loyalty program used by one-third of Colombians, which has over 112 partners and enabled around 5.2 million customers to redeem more than 20.0 billion points in 9M21, of which Éxito accounted for 75%.
Marketplace
The Company focused its efforts on continuing to consolidate its marketplace, integrated into Grupo Éxito’s ecosystem (apps, real estate business tenants, travel, insurance, mobile, etc.). The marketplace accounted for 27% of total non-food omnichannel GMV in 9M21. More than 37,000 units were sold in 9M21, up 19% over 9M20, through over 1,100 sellers. The Company continued to enhance the features and capabilities of its international marketplace platform with 31 sellers.
| | 10 |
| |
Sales Performance
Strong economic recovery in Colombia and gradual improvement in the real estate business in all the countries.
| Gross Revenue | 3Q21/3Q19 | 3Q21/3Q20 | |||
| (R$ million) | Same stores (3) | Selling | % Stores total | % Stores total Constant currency | Same stores (2) |
| Grupo Éxito | 16.4% | 6,369 | 7.0% | 14.6% | 15.7% |
| Colombia | 15.0% | 4,838 | 8.1% | 14.8% | 16.8% |
| Éxito | 16.0% | 3,333 | 9.7% | 16.2% | 17.0% |
| Carulla | 15.7% | 685 | 1.8% | 8.0% | 7.7% |
| Low Cost Segment and Others (1) | 9.3% | 819 | 7.3% | 15.1% | 26.6% |
| Uruguay | 10.8% | 1,049 | -2.6% | 1.8% | -0.8% |
| Argentina | 79.5% | 481 | 21.1% | 55.5% | 59.3% |
(1) Includes Surtimax, Super Inter, Surtimayorista, the Real Estate Business, Aliados and other businesses.
(2) Same-store sales performance (i) considers growth at constant exchange rates; and (ii) in order to reflect the calendar effect, we added -40 bps at Grupo Éxito in 3Q21 (-60 bps in Colombia, +50 bps in Uruguay and -80 bps in Argentina).
 | Grupo Éxito's gross revenue amounted to R$6.4 billion in the quarter, a year-on-year increase of 7.0%. The positive result in Colombia was due to increased traffic, higher contributions from complementary businesses (such as royalties from the Tuya credit card) and improvement in the real estate business.
In Uruguay, we grew less than inflation, while in Argentina, we grew more than inflation as movement restrictions eased and customer traffic increased in stores and malls. Grupo Éxito’s total sales in constant currency grew 14.6%.
This result includes the opening/conversion and renovation of 36 Group stores, 34 of which in Colombia and 2 in Uruguay in the last 12 months. |
Same-store sales grew 15.7% in the quarter. It is worth noting that same-store sales in constant currency grew 16.4% in 3Q21 compared to 3Q19.
Colombia
Performance in Colombia was fueled by the country’s economic recovery in 3Q21, as the market opened and consumer confidence increased.
Éxito The Éxito banner is composed of hypermarkets, supermarkets and express stores mostly located in major urban areas in Colombia. The stores offer a wide range of products, including food and non-food categories. | 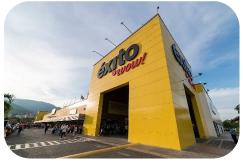 |
| | 11 |
| |
Éxito Wow is an innovative model that allows digitally connected hypermarkets to integrate digital channels and bricks-and-mortar services provided by Éxito with other services, including banking services, co-working areas, gourmet food courts and omnichannel areas, among others. |  |
This segment accounted for approximately 70% of the sales mix in Colombia in 3Q21. Éxito recorded strong same-store sales growth of 17.0%, driven by the performance of apparel and perishables, up 53.5% and 33.7%, respectively. The segment also benefited from the renovation of four WOW stores and two organic openings in the last 12 months, which already represents 27.8% of the banner’s sales.
Carulla
Carulla is a premium banner that comprises supermarkets and express stores mostly located in the major cities of Colombia. This is the segment with the largest share of omnichannel in total sales (16.3%). In 3Q21, one new Carulla store was opened and 1 FreshMarket was added to the store base.
Carulla FreshMarket is an innovative model designed to strengthen the fresh products category, focusing on quality, as well as renovating the store layout. The model includes digital activities, such as apps, improvement in the customer service experience and strengthening of the supply of key items, such as wine, pasta, cheese and coffee, mainly. In 3Q21, it accounted for 36.2% of the banner’s sales. |  |
Low Cost and other segment
The low cost segment is composed of Surtimax and Super Inter, low-cost supermarket brands that offer low prices for a complete basket of basic products, high-quality meats, fresh fruit and vegetables and a wide range of bulk grains with a regional focus, and Surtimayorista, a banner that operates in the cash and carry segment focusing on the sale of products to retailers and institutional consumers, including food retailers, conventional retailers and end customers.
The 26.6% increase in same-store sales was due to (i) the contribution of Super Inter’s sales driven by “Vecino”, an innovative concept implemented in seven stores in the quarter. “Vecino” totaled 21 stores, which already accounted for 34% of the banner’s total sales and outperformed non-converted stores by 1,330 bps; (ii) the recovery of the Surtimayorista banner, whose sales increased 18.1% in 9M21; (iii) the new pilot of renovated stores under the “Barrio” and “Max” models, with expanded offering of products and sessions, discounts, omnichannel strategy with last mile delivery services and digital sales events; and (iv) the use of the “Mi Surti” under the Aliados model, whose sales grew 28.5% in the quarter.
Uruguay
The macroeconomic environment in Uruguay improved in 3Q21, benefiting from fewer restrictions, the return of tourism and improved consumer confidence in the country. As a result, Uruguay contributed 16% of Éxito’s consolidated sales, benefiting from (i) the 23.8% increase in omnichannel sales, which accounted for 3.5% of total sales, and (ii) the strong performance of Fresh Market stores, which accounted for 43.2% of total sales.
Argentina
The economic and consumption environment in the country is showing signs of improvement, with a reduction in the number of cases, the easing of restrictions and the opening of schools and entertainment venues, which seemed to benefit traffic in retail and the real estate business units. Sales outpaced inflation thanks to an improvement in the performance of food retail and the evolution of last mile and e-commerce sales.
| | 12 |
| |
Financial Performance
GPA BRAZIL
| R$ million, except when indicated | GPA Brazil (1) | |||||||||
| 3Q21 | 3Q20 | 3Q19 | Δ 21 vs 20 | Δ 21 vs 19 | 9M21 | 9M20 | 9M19 | Δ 21 vs 20 | Δ 21 vs 19 | |
| Gross Revenue | 6,895 | 7,368 | 6,982 | -6.4% | -1.3% | 21,092 | 22,748 | 20,977 | -7.3% | 0.5% |
| Net Revenue | 6,390 | 6,729 | 6,578 | -5.0% | -2.9% | 19,553 | 20,792 | 19,509 | -6.0% | 0.2% |
| Gross Profit | 1,516 | 1,764 | 1,731 | -14.0% | -12.4% | 4,898 | 5,339 | 5,290 | -8.3% | -7.4% |
| Gross Margin | 23.7% | 26.2% | 26.3% | -250 bps | -260 bps | 25.1% | 25.7% | 27.1% | -60 bps | -200 bps |
| SG&A Expenses | (1,215) | (1,287) | (1,297) | -5.6% | -6.3% | (3,604) | (3,930) | (3,991) | -8.3% | -9.7% |
| % of Net Revenue | 19.0% | 19.1% | 19.7% | -10 bps | -70 bps | 18.4% | 18.9% | 20.5% | -50 bps | -210 bps |
| Equity Income | 12 | 37 | 38 | -67.7% | -68.6% | 41 | 88 | 77 | -53.6% | -46.5% |
| Adjusted EBITDA (2) | 369 | 546 | 502 | -32.5% | -26.4% | 1,455 | 1,594 | 1,460 | -8.8% | -0.4% |
| Adjusted EBITDA Margin (2) | 5.8% | 8.1% | 7.6% | -230 bps | -180 bps | 7.4% | 7.7% | 7.5% | -30 bps | -10 bps |
(1) GPA Brazil’s figures do not include the results of other businesses (Stix Fidelidade, Cheftime and James Delivery).
(2) Income before interest, taxes, depreciation and amortization. Adjusted for Other Operating Revenue (Expenses).
GPA Brazil’s Gross Profit totaled R$1.5 billion in 3Q21, and gross margin was 23.7%, down 250 bps from 3Q20, due to the repositioning of regular prices and the resumption of promotions, especially in the Extra Hiper format, in order to mitigate the effects of strong food inflation, high unemployment rates and increased competition from Cash and Carry players. Year-to-date Gross Profit reached R$4.9 billion with a margin of 25.1%, a 60 bps decline from the same period in 2020.
In this context, we continued to adjust our Selling, General and Administrative Expenses, which totaled R$1.2 billion, dropping 5.6%, despite higher inflation in the period. We also recorded a 10 bps expense dilution to 19.0% of net revenue, thanks to the initiatives implemented in the last twelve months, which led to productivity gains at stores and distribution centers, a strong reduction in store operating expenses and lower administrative expenses. In 9M21, selling, general and administrative expenses totaled R$3.6 billion, representing 18.4% of net revenue, equivalent to a dilution of 50 bps.
Equity Income totaled R$12 million in 3Q21 and R$41 million in 9M21, reflecting the results of the Company’s 18% interest in FIC (vs. 36% in 3Q20).
 | Thanks to the decline in SG&A, we were able to mitigate the effects of the decrease in sales and margin in the period, bringing GPA Brazil’s Adjusted EBITDA to R$369 million, with an Adjusted EBITDA margin of 5.8%, down 230 bps from 3Q20.
In 9M21, Adjusted EBITDA reached R$1.5 billion, a decline of 8.8% over 9M20 and in line with 9M19. EBITDA margin decreased 30 bps to 7.4% in 9M21. |
| | 13 |
| |
GRUPO ÉXITO
| R$ million, except when indicated | Grupo Éxito | |||||||||
| 3Q21 | 3Q20 | 3Q19(2) | Δ 21 vs 20 | Δ 21 vs 19 | 9M21 | 9M20 | 9M19(2) | Δ 21 vs 20 | Δ 21 vs 19 | |
| Gross Revenue | 6,369 | 5,950 | 4,811 | 7.0% | 32.4% | 18,845 | 17,521 | 14,809 | 7.6% | 27.3% |
| Net Revenue | 5,675 | 5,322 | 4,302 | 6.6% | 31.9% | 16,816 | 15,653 | 13,161 | 7.4% | 27.8% |
| Gross Profit | 1,436 | 1,307 | 1,089 | 9.8% | 31.9% | 4,290 | 3,835 | 3,324 | 11.9% | 29.1% |
| Gross Margin | 25.3% | 24.6% | 25.3% | 70 bps | 0 bps | 25.5% | 24.5% | 25.3% | 100 bps | 20 bps |
| SG&A Expenses | (986) | (971) | (781) | 1.6% | 26.2% | (3,047) | (2,802) | (2,407) | 8.7% | 26.6% |
| % of Net Revenue | 17.4% | 18.2% | 18.2% | -80 bps | -80 bps | 18.1% | 17.9% | 18.3% | 20 bps | -20 bps |
| Equity Income | 17 | 58 | 2 | -71.1% | 1002% | 22 | 18 | (7) | 27.2% | -407.1% |
| Adjusted EBITDA (1) | 494 | 436 | 328 | 13.3% | 50.4% | 1,351 | 1,143 | 964 | 18.3% | 40.2% |
| Adjusted EBITDA Margin (1) | 8.7% | 8.2% | 7.6% | 50 bps | 110 bps | 8.0% | 7.3% | 7.3% | 70 bps | 70 bps |
| (1) | Income before interest, taxes, depreciation and amortization. Adjusted for Other Operating Revenue (Expenses). |
| (2) | Grupo Éxito’s 2019 results refer to unaudited pro-forma figures, with adjustments related to the deconsolidation of GPA itself, which until November 2019 was directly controlled by Grupo Éxito. |
Grupo Éxito’s Gross Profit totaled R$1.4 billion in 3Q21 (+9.8 YoY), and gross margin was 25.3%, benefitting from economic recovery that resulted in greater customer traffic, improved consumer confidence in Colombia, a continuous increase in online sales and gradual recovery of the real estate sector. In 9M21, Gross Profit reached R$4.3 billion, up 11.9% over 9M20 and 29.1% over 9M19.
Selling, General, and Administrative Expenses grew less than inflation in each country, due to efficiency gains in the store operational level, totaling R$1.0 billion in 3Q21 (up 1.6%) with a significant decrease in the expense ratio (-80 bps) to 17.4% of net revenue, down from 18.2% in 3Q20. In 9M21, expenses grew 8.7%, reaching R$3.0 billion in the period.
Equity Income totaled a loss of R$17 million in 3Q21 and R$22 million in 9M21, reflecting the results of the Company’s 50% interest in Puntos Colombia and the finance company Tuya (both of them joint ventures with Bancolombia).
As a result of the above-mentioned effects, Adjusted EBITDA totaled R$494 million in 3Q21, up 13.3% over 3Q20. Adjusted EBITDA margin grew 50 bps over 3Q20 and 110 bps over 3Q19, reaching 8.7%. In 9M21, Adjusted EBITDA rose 18.3% over 9M20, reaching R$1.4 billion, while Adjusted EBITDA margin increased 70 bps to 8.0%. Compared to 9M19, Adjusted EBITDA rose 40.2%, with a 70 bps increase in the margin. | 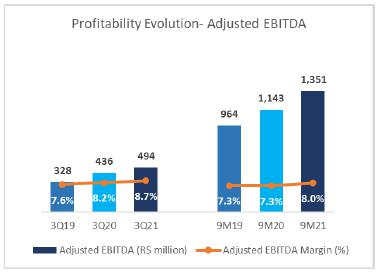 |
| | 14 |
| |
OTHER OPERATING REVENUE (EXPENSES)
Other operating revenue (expenses) reached R$161 million in 3Q21. The result was mainly due to (i) store restructuring; (ii) non-recurring effects of old litigation with landlords.
FINANCIAL RESULT
| FINANCIAL RESULT | Consolidated | |||||
| (R$ million) | 3Q21 | 3Q20 | Δ | 9M21 | 9M20 | Δ |
| Financial Revenue | 43 | 35 | 22.0% | 224 | 147 | 52.2% |
| Financial Expenses | (239) | (207) | 15.5% | (585) | (569) | 2.8% |
| Cost of Debt | (157) | (101) | 56.1% | (327) | (291) | 12.5% |
| Cost of Receivables Discount | (21) | (9) | 135.1% | (54) | (45) | 19.3% |
| Other financial expenses | (62) | (82) | -24.3% | (205) | (215) | -4.4% |
| Net exchange variation | 1 | (15) | -106.1% | 1 | (18) | -104.9% |
| Net Financial Revenue (Expenses) | (196) | (172) | 14.0% | (361) | (422) | -14.4% |
| % of Net Revenue | -1.6% | -1.4% | -20 bps | -1.0% | -1.2% | 20 bps |
| Interest on lease liabilities | (176) | (184) | -4.6% | (539) | (546) | -1.2% |
| Net Financial Revenue (Expenses) - Post IFRS 16 | (372) | (356) | 4.4% | (900) | (968) | -7.0% |
| % of Net Revenue - Post IFRS 16 | -3.1% | -3.0% | -10 bps | -2.5% | -2.7% | 20 bps |
GPA’s consolidated net financial result was an expense of R$196 million in 3Q21, equivalent to -1.6% of net revenue (vs. -1.4% in 3Q20). Including interest on lease liabilities, the amount reached R$372 million, or 3.1% of net revenue.
The main changes in the financial result were as follows:
| ● | Financial revenue totaled R$43 million in 3Q21 (vs. R$35 million in 3Q20), composed of: |
| ○ | an increase in cash returns due to higher interest rates in the period and higher cash volume. |
| ● | Financial expenses (including cost of receivables discount) reached R$239 million in 3Q21 (vs. R$207 million in 3Q20), composed of: |
| ○ | a higher cost of debt due to increased interest rates in Brazil, offset by a lower cost of debt at Grupo Éxito; and |
| ○ | a higher cost of receivables discount as a result of the increase in the CDI rate in the period. |
| · | Interest on lease liabilities was in line with 2Q21. |
| | 15 |
| |
NET DEBT
| INDEBTEDNESS | Consolidated | |
| (R$ million) | 09.30.2021 | 09.30.2020² |
| Short Term Debt | (2,287) | (6,177) |
| Loans and Financing | (717) | (2,861) |
| Debentures | (1,570) | (3,316) |
| Long Term Debt | (7,538) | (11,217) |
| Loans and Financing | (4,039) | (3,137) |
| Debentures | (3,499) | (8,080) |
| Total Gross Debt | (9,825) | (17,394) |
| Cash and Financial investments | 4,526 | 7,283 |
| Net Debt | (5,299) | (10,111) |
| Adjusted EBITDA(1) | 2,447 | 4,547 |
| On balance Credit Card Receivables not discounted | 95 | 194 |
| Net Debt incl. Credit Card Receivables not discounted | (5,204) | (9,917) |
| Net Debt incl. Credit Card Receivables not discounted / | -2.1x | -2.2x |
| Adjusted EBITDA(1) | ||
(1) LTM Adjusted EBITDA (pre-IFRS 16)
(2) Debt and EBITDA figures for September 30, 2020, include Assaí’s results.
GPA’s consolidated net debt including not discounted receivables reached R$5.2 billion at the end of 3Q21, down R$4.7 billion. Thus, the Company reduced its leverage by 0.1x, resulting in a -2.1x net debt/Adjusted EBITDA ratio, and a strong R$4.5 billion cash position, equivalent to 2.0x the short-term debt.
INVESTMENTS
| (R$ million) | Consolidated | |||||
| 3Q21 | 3Q20 | Δ | 9M21 | 9M20 | Δ | |
| New stores and land acquisition | 19 | 8 | 148.1% | 45 | 46 | -1.4% |
| Store renovations, conversions and maintenance | 69 | 67 | 2.2% | 239 | 249 | -4.0% |
| IT, Digital and Logistics | 108 | 104 | 4.3% | 291 | 355 | -18.0% |
| Total Investments GPA Brazil | 196 | 179 | 9.5% | 576 | 650 | -11.5% |
| Total Investments Grupo Éxito | 124 | 89 | 40.0% | 336 | 242 | 39.2% |
| Total Investments Consolidated | 320 | 267 | 19.7% | 912 | 892 | 2.3% |
Capex totaled R$320 million in 3Q21, of which R$196 million in Brazil and R$124 million in Grupo Éxito. Year-to-date capex stood at R$912 million. In Brazil, investments are concentrated in store renovations/conversions; innovation and acceleration of digital transformation projects, including systems, marketplace and last-mile carriers; logistics and IT infrastructure; and other efficiency improvement projects. At Grupo Éxito, around 73% of capex was allocated to innovation, omnichannel and digital transformation initiatives during the period, and the remainder to maintenance and support of operational structures, IT system updates and logistics.
| | 16 |
| |
ESG AT GPA
Agenda with and for society and the environment
GPA Brazil
In 3Q21, we made important advances in the ESG agenda, focusing on the five axes of the Company’s sustainability strategy.
In July, we launched a Development Program for Black People in partnership with Universidade Zumbi dos Palmares, a reference in Racial Equity. The program aims to support the development of Black employees, who represent 52% of our staff, by promoting training in relevant issues for this group and enabling empowerment and interaction with professionals who stand out in the market. |  |
We also completed the training of 261 women in the Female Leadership Development Program registered another 264 women for the new class that will begin this year, addressing issues such as inclusive leadership, self-knowledge, personal strengths and values, gender stereotypes, leadership and strategic influence. Women accounted for 37% of leadership positions (management and above) in 3Q21.
This quarter, we proceeded with our solidarity agenda, collecting, in partnership with our customers and employees, more than 3,600 metric tons of food that were donated to several social institutions that partner with the GPA Institute. We also ran a clothes donation campaign in partnership with NGO Gerando Falcões, giving 96,000 items to the institution’s sale, and Petday, an initiative that collected pet food and items for four partner institutions.
It is important to highlight two initiatives launched in the quarter focused on emissions of polluting gases and inclusive customer service. We began using electric vehicles in Pão de Açúcar’s e-commerce deliveries, initially in São Paulo and Rio de Janeiro, and inclusive customer service for people with disabilities in order to offer a positive shopping experience throughout the customer journey in our stores, with the possibility to schedule services.
In addition, we came second in the ESG ranking of Vigeo Eiris, a Moody’s affiliate, in the category “supermarkets located in emerging markets”. This recognition emphasizes that we are on the right track to fulfill our commitments.
Grupo Éxito
Grupo Éxito promotes sustainability through value creation initiatives in order to contribute to economic growth, social development and environment protection. We collected 520 tons of waste in 3Q21, 900% more than in 3Q20, thanks to the excellent participation of our customers.
As for appreciation of our people, Grupo Éxito achieved 30% of women in the Board of Executive Officers, showing that our efforts towards gender equity have been producing positive results.
Seeking to raise awareness of and train our employees in diversity and inclusion issues and fulfilling our commitment to obtain the Equipares Gold Seal, we trained around 29,000 employees in diversity and inclusion topics (the Equipares Seal is a certification program that recognizes companies and organizations that appropriately implement the Gender Equality Management System. Grupo Éxito currently has the Silver Seal).
| | 17 |
| |
Finally, in 3Q21, Grupo Éxito joined Colombia’s LGBTI Chamber of Commerce, a nonprofit organization that monitors, guides and helps companies become safe spaces free of discrimination, with the purpose of promoting diversity and inclusion through policies put in place to produce employee well-being.
| | 18 |
| |
BREADOWN OF STORE CHANGES BY BANNER
In 3Q21, we closed one Mercado Extra store and opened three new Minuto Pão de Açúcar stores. Grupo Éxito opened two stores in Colombia (one Carulla store and one conversion into Éxito) and one new store in Uruguay.
| 3Q20 | 2Q21 | 3Q21 | ||||||
| Stores | Stores | Openings | Openings by conversion | Closing | Closing to Conversion | Stores | Sales Area ('000 sq. m.) | |
| GPA Brazil | 878 | 871 | 3 | 0 | -1 | 0 | 873 | 1,185 |
| Pão de Açúcar | 182 | 181 | 0 | 0 | 0 | 0 | 181 | 233 |
| Extra Hiper | 104 | 103 | 0 | 0 | 0 | 0 | 103 | 633 |
| Extra Supermercado | 39 | 0 | 0 | 0 | 0 | 0 | 0 | 0 |
| Mercado Extra | 108 | 147 | 0 | 0 | -1 | 0 | 146 | 163 |
| Compre Bem | 28 | 28 | 0 | 0 | 0 | 0 | 28 | 33 |
| Mini Extra | 153 | 149 | 0 | 0 | 0 | 0 | 149 | 37 |
| Minuto Pão de Açúcar | 86 | 87 | 3 | 0 | 0 | 0 | 90 | 21 |
| Specialized businesses | 178 | 176 | 0 | 0 | 0 | 0 | 176 | 65 |
| Gas Stations | 74 | 74 | 0 | 0 | 0 | 0 | 74 | 58 |
| Drugstores | 104 | 102 | 0 | 0 | 0 | 0 | 102 | 7 |
| Grupo Éxito | 630 | 616 | 2 | 1 | -2 | -2 | 615 | 1,024 |
| Colombia | 515 | 501 | 1 | 1 | -2 | -2 | 499 | 828 |
| Uruguay | 90 | 90 | 1 | 0 | 0 | 0 | 91 | 92 |
| Argentina | 25 | 25 | 0 | 0 | 0 | 0 | 25 | 104 |
| Total Group | 1,508 | 1,487 | 5 | 1 | -3 | -2 | 1,488 | 2,209 |
| | 19 |
| |
Brand Portfolio:
With a multiformat and multichannel business channel, we have some of the most well-known and most valuable retail chains and brands, including Compre Bem, Extra and Pão de Açúcar, as well as private label brands Qualitá, Taeq, Club des Sommeliers and Finlandek, among others.
We work to provide the best shopping experience for our customers every day, whenever they want and wherever they are. We are present in all Brazilian regions with 800 physical stores, and we are the leader in food e-commerce in Brazil, in addition to concentrating operations in Colombia, Uruguay and Argentina in Grupo Éxito.

| | 20 |
| |
CONSOLIDATED FINANCIAL STATEMENTS
Balance Sheet
| BALANCE SHEET | |||||||
| (R$ million) | ASSETS | ||||||
| Consolidated(1) | GPA Brazil(1) | Grupo Éxito | |||||
| 09.30.2021 | 09.30.2020 | 09.30.2021 | 09.30.2020 | 09.30.2021 | 09.30.2020 | ||
| Current Assets | 14,256 | 20,818 | 8,408 | 14,714 | 5,735 | 6,027 | |
| Cash and Marketable Securities | 4,526 | 7,283 | 3,068 | 5,620 | 1,375 | 1,608 | |
| Accounts Receivable | 604 | 717 | 274 | 433 | 325 | 282 | |
| Credit Card | 33 | 146 | 35 | 151 | - | - | |
| Sales Vouchers and Trade Account Receivable | 533 | 541 | 163 | 210 | 363 | 324 | |
| Allowance for Doubtful Accounts | (38) | (49) | (0) | (6) | (38) | (44) | |
| Resulting from Commercial Agreements | 77 | 79 | 76 | 78 | 1 | 1 | |
| Inventories | 6,585 | 9,870 | 3,482 | 6,797 | 3,103 | 3,071 | |
| Recoverable Taxes | 1,676 | 1,791 | 1,094 | 1,218 | 581 | 573 | |
| Noncurrent Assets for Sale | 206 | 110 | 172 | 78 | 33 | 31 | |
| Prepaid Expenses and Other Accounts Receivables | 659 | 1,047 | 317 | 567 | 319 | 463 | |
| Noncurrent Assets | 34,440 | 42,420 | 16,193 | 23,786 | 18,165 | 18,583 | |
| Long-Term Assets | 4,608 | 4,563 | 4,351 | 4,369 | 278 | 210 | |
| Accounts Receivables | 62 | 48 | 59 | 43 | 3 | 4 | |
| Credit Cards | 62 | 48 | 59 | 43 | 3 | 4 | |
| Recoverable Taxes | 2,588 | 2,442 | 2,588 | 2,442 | - | - | |
| Deferred Income Tax and Social Contribution | 305 | 339 | 288 | 337 | - | (0) | |
| Amounts Receivable from Related Parties | 239 | 109 | 185 | 58 | 92 | 69 | |
| Judicial Deposits | 647 | 760 | 646 | 758 | 1 | 2 | |
| Prepaid Expenses and Others | 767 | 865 | 585 | 731 | 181 | 134 | |
| Investments | 1,304 | 816 | 811 | 363 | 493 | 452 | |
| Investment Properties | 3,403 | 3,624 | - | - | 3,403 | 3,624 | |
| Property and Equipment | 19,112 | 26,438 | 8,976 | 16,053 | 10,128 | 10,379 | |
| Intangible Assets | 6,013 | 6,979 | 2,055 | 3,002 | 3,863 | 3,917 | |
| TOTAL ASSETS | 48,696 | 63,238 | 24,601 | 38,500 | 23,900 | 24,610 | |
(1) Considers Assaí in 2020
| | 21 |
| |
CONSOLIDATED FINANCIAL STATEMENTS
Balance Sheet
| BALANCE SHEET | |||||||
| (R$ million) | LIABILITIES | ||||||
| Consolidated(1) | GPA Brazil(1) | Grupo Éxito | |||||
| 09.30.2021 | 09.30.2020 | 09.30.2021 | 09.30.2020 | 09.30.2021 | 09.30.2020 | ||
| Current Liabilities | 14,291 | 22,950 | 7,267 | 13,172 | 6,838 | 9,666 | |
| Suppliers | 7,586 | 11,971 | 3,405 | 7,754 | 4,154 | 4,194 | |
| Loans and Financing | 717 | 2,861 | 106 | 980 | 611 | 1,882 | |
| Debentures | 1,570 | 3,316 | 1,570 | 1,562 | - | 1,755 | |
| Lease Liability | 1,011 | 1,029 | 657 | 692 | 353 | 337 | |
| Payroll and Related Charges | 853 | 1,291 | 458 | 902 | 382 | 375 | |
| Taxes and Social Contribution Payable | 457 | 797 | 262 | 610 | 194 | 186 | |
| Financing for Purchase of Fixed Assets | 142 | 128 | 64 | 94 | 78 | 34 | |
| Debt with Related Parties | 248 | 194 | 143 | 81 | 80 | 76 | |
| Advertisement | 40 | 48 | 39 | 47 | - | - | |
| Provision for Restructuring | 21 | 14 | 7 | 7 | 13 | 7 | |
| Unearned Revenue | 311 | 268 | 78 | 143 | 120 | 91 | |
| Others | 1,335 | 1,033 | 479 | 300 | 851 | 729 | |
| Long-Term Liabilities | 18,244 | 24,046 | 14,086 | 15,580 | 4,154 | 8,463 | |
| Loans and Financing | 4,048 | 3,137 | 2,929 | 1,826 | 1,118 | 1,311 | |
| Debentures | 3,499 | 8,080 | 3,499 | 4,114 | - | 3,967 | |
| Lease Liability | 6,936 | 9,221 | 5,084 | 7,156 | 1,851 | 2,065 | |
| Financing by purchasing assets | 100 | - | - | - | 100 | - | |
| Related Parties | 120 | - | 120 | - | - | - | |
| Deferred Income Tax and Social Contribution | 951 | 1,037 | 6 | 70 | 943 | 964 | |
| Tax Installments | 175 | 314 | 169 | 313 | 6 | 1 | |
| Provision for Contingencies | 1,456 | 1,330 | 1,351 | 1,208 | 104 | 123 | |
| Unearned Revenue | 21 | 22 | 21 | 22 | - | - | |
| Provision for loss on investment in Associates | 679 | 618 | 679 | 618 | - | - | |
| Others | 259 | 287 | 227 | 255 | 32 | 32 | |
| Shareholders' Equity | 16,162 | 16,242 | 3,247 | 9,748 | 12,908 | 6,481 | |
| Attributed to controlling shareholders | 13,257 | 13,091 | 3,247 | 9,748 | 10,002 | 3,332 | |
| Capital | 5,858 | 6,865 | 5,858 | 6,865 | - | - | |
| Capital Reserves | 285 | 468 | 285 | 469 | - | - | |
| Profit Reserves | 6,115 | 4,270 | (3,894) | 926 | 10,646 | 1,692 | |
| Other Comprehensive Results | 998 | 1488 | 998 | 1,488 | (644) | 1,639 | |
| Minority Interest | 2,905 | 3,151 | - | - | 2,906 | 3,150 | |
| TOTAL LIABILITIES | 48,696 | 63,238 | 24,601 | 38,500 | 23,900 | 24,610 | |
(1) Considers Assaí in 2020
| | 22 |
| |
INCOME STATEMENT – 3RD QUARTER OF 2021
| R$ Million | Consolidated (1) | GPA Brazil | Grupo Éxito | |||||||||||||
| 3Q21 | 3Q20 | Δ | 3Q21 | 3Q20 | Δ | 3Q21 | 3Q20 | Δ | ||||||||
| Gross Revenue | 13,285 | 13,335 | -0.4% | 6,895 | 7,368 | -6.4% | 6,369 | 5,950 | 7.0% | |||||||
| Net Revenue | 12,084 | 12,064 | 0.2% | 6,390 | 6,729 | -5.0% | 5,675 | 5,322 | 6.6% | |||||||
| Cost of Goods Sold | (9,033) | (8,911) | 1.4% | (4,818) | (4,933) | -2.3% | (4,212) | (3,974) | 6.0% | |||||||
| Depreciation (Logistic) | (83) | (73) | 13.7% | (56) | (32) | 74.0% | (27) | (41) | -34.1% | |||||||
| Gross Profit | 2,968 | 3,080 | -3.6% | 1,516 | 1,764 | -14.0% | 1,436 | 1,307 | 9.8% | |||||||
| Selling Expenses | (1,838) | (1,889) | -2.7% | (1,057) | (1,094) | -3.3% | (763) | (767) | -0.4% | |||||||
| General and Administrative Expenses | (395) | (411) | -3.9% | (158) | (193) | -18.3% | (223) | (204) | 9.1% | |||||||
| Selling, General and Adm. Expenses | (2,233) | (2,299) | -2.9% | (1,215) | (1,287) | -5.6% | (986) | (971) | 1.6% | |||||||
| Equity Income(2) | (24) | 91 | -125.9% | 12 | 37 | -67.7% | 17 | 58 | -71.1% | |||||||
| Other Operating Revenue (Expenses) | (161) | (21) | 673.3% | (139) | 19 | -829.9% | (22) | (39) | -44.6% | |||||||
| Depreciation and Amortization | (452) | (447) | 1.0% | (266) | (270) | -1.5% | (182) | (175) | 3.7% | |||||||
| Earnings before interest and Taxes - EBIT | 98 | 403 | -75.6% | (93) | 263 | -135.4% | 264 | 181 | 45.8% | |||||||
| Financial Revenue | 59 | 30 | 93.7% | 39 | 4 | 948.9% | 19 | 26 | -26.7% | |||||||
| Financial Expenses | (431) | (387) | 11.4% | (353) | (262) | 34.7% | (76) | (124) | -38.9% | |||||||
| Net Financial Result | (372) | (356) | 4.4% | (314) | (258) | 21.7% | (57) | (98) | -42.2% | |||||||
| Income (Loss) Before Income Tax | (274) | 46 | -689.6% | (407) | 5 | -9104.4% | 207 | 83 | 149.4% | |||||||
| Income Tax | 237 | (68) | -449.4% | 299 | (67) | -545.9% | (62) | (2) | 3012.3% | |||||||
| Net Income (Loss) Company - continuing operations | (37) | (21) | 72.4% | (108) | (63) | 72.9% | 145 | 81 | 79.1% | |||||||
| Net Result from discontinued operations | (1) | 450 | -100.2% | (1) | 450 | -100.2% | - | - | -89.9% | |||||||
| Net Income (Loss) - Consolidated Company | (38) | 428 | -108.9% | (109) | 387 | -128.2% | 145 | 81 | 79.8% | |||||||
| Net Income (Loss) - Controlling Shareholders - continuing operations(3) | (88) | (63) | 39.6% | (108) | (63) | 72.9% | 94 | 36 | 160.1% | |||||||
| Net Income (Loss) - Controlling Shareholders - discontinued operations(3) | (1) | 450 | -100.2% | (1) | 450 | -100.2% | - | - | -89.9% | |||||||
| Net Income (Loss) - Consolidated Controlling Shareholders(3) | (89) | 386 | -123.1% | (109) | 387 | -128.2% | 94 | 36 | 162.1% | |||||||
| Minority Interest - Non-controlling - continuing operations | 51 | 42 | 22.9% | - | - | n.d | 52 | 45 | 14.6% | |||||||
| Minority Interest - Non-controlling - discontinued operations | - | - | -89.9% | - | - | n.d | - | - | -89.9% | |||||||
| Minority Interest - Non-controlling – Consolidated | 51 | 42 | 22.9% | - | - | n.d | 52 | 45 | 14.6% | |||||||
| Earnings before Interest, Taxes, Depreciation, Amortization - EBITDA | 633 | 923 | -31.4% | 230 | 565 | -59.4% | 472 | 397 | 19.0% | |||||||
| Adjusted EBITDA (4) | 794 | 944 | -15.9% | 369 | 546 | -32.5% | 494 | 436 | 13.3% | |||||||
| % of Net Revenue | Consolidated (1) | GPA Brazil | Grupo Éxito | |||||||||||||
| 3Q21 | 3Q20 | 3Q21 | 3Q20 | 3Q21 | 3Q20 | |||||||||||
| Gross Profit | 24.6% | 25.5% | 23.7% | 26.2% | 25.3% | 24.6% | ||||||||||
| Selling Expenses | -15.2% | -15.7% | -16.5% | -16.3% | -13.5% | -14.4% | ||||||||||
| General and Administrative Expenses | -3.3% | -3.4% | -2.5% | -2.9% | -3.9% | -3.8% | ||||||||||
| Selling, General and Adm. Expenses | -18.5% | -19.1% | -19.0% | -19.1% | -17.4% | -18.2% | ||||||||||
| Equity Income(2) | -0.2% | 0.8% | 0.2% | 0.6% | 0.3% | 1.1% | ||||||||||
| Other Operating Revenue (Expenses) | -1.3% | -0.2% | -2.2% | 0.3% | -0.4% | -0.7% | ||||||||||
| Depreciation and Amortization | -3.7% | -3.7% | -4.2% | -4.0% | -3.2% | -3.3% | ||||||||||
| Earnings before interest and Taxes - EBIT | 0.8% | 3.3% | -1.5% | 3.9% | 4.6% | 3.4% | ||||||||||
| Net Financial Result | -3.1% | -3.0% | -4.9% | -3.8% | -1.0% | -1.8% | ||||||||||
| Income (Loss) Before Income Tax | -2.3% | 0.4% | -6.4% | 0.1% | 3.7% | 1.6% | ||||||||||
| Income Tax | 2.0% | -0.6% | 4.7% | -1.0% | -1.1% | 0.0% | ||||||||||
| Net Income (Loss) Company - continuing operations | -0.3% | -0.2% | -1.7% | -0.9% | 2.6% | 1.5% | ||||||||||
| Net Income (Loss) - Consolidated Company | -0.3% | 3.5% | -1.7% | 5.8% | 2.6% | 1.5% | ||||||||||
| Net Income (Loss) - Controlling Shareholders - continuing operations(3) | -0.7% | -0.5% | -1.7% | -0.9% | 1.6% | 0.7% | ||||||||||
| Net Income (Loss) - Consolidated Controlling Shareholders(3) | -0.7% | 3.2% | -1.7% | 5.8% | 1.6% | 0.7% | ||||||||||
| Minority Interest - Non-controlling - continuing operations | 0.4% | 0.3% | 0.0% | 0.0% | 0.9% | 0.8% | ||||||||||
| Minority Interest - Non-controlling - Consolidated | 0.4% | 0.3% | 0.0% | 0.0% | 0.9% | 0.8% | ||||||||||
| Earnings before Interest, Taxes, Depreciation, Amortization - EBITDA | 5.2% | 7.7% | 3.6% | 8.4% | 8.3% | 7.5% | ||||||||||
| Adjusted EBITDA (4) | 6.6% | 7.8% | 5.8% | 8.1% | 8.7% | 8.2% | ||||||||||
(1) Consolidated figures include the results of other complementary businesses; (2) Equity income includes CDiscount’s results in the Consolidated figures; (3) Net income after non-controlling interest; (4) Adjusted for Other Operating Revenue (Expenses).
| | 23 |
| |
CASH FLOW – CONSOLIDATED(*)
| STATEMENT OF CASH FLOW | ||
| (R$ million) | Consolidated | |
| 09.30.2021 | 09.30.2020 | |
| Net Income (Loss) for the period | 119 | 693 |
| Deferred income tax | (383) | (331) |
| Loss (gain) on disposal of fixed and intangible assets | 116 | (8) |
| Depreciation and amortization | 1,621 | 1,892 |
| Interests and exchange variation | 928 | 1,312 |
| Adjustment to present value | - | (1) |
| Equity Income | 37 | (55) |
| Provision for contingencies | 125 | 74 |
| Provision for write-offs and losses | 4 | - |
| Share-Based Compensation | 20 | 21 |
| Allowance for doubtful accounts | 45 | 71 |
| Net gains (losses) due to dilution of shareholding interest | (1) | - |
| Provision for obsolescence/breakage | (18) | 1 |
| Other operating expenses | - | (232) |
| Appropriable revenue | (91) | (284) |
| Loss (gain) on write-off of lease liabilities | (147) | (316) |
| Asset (Increase) decreases | ||
| Accounts receivable | 29 | (119) |
| Inventories | (189) | (747) |
| Taxes recoverable | (173) | 263 |
| Dividends received | - | 15 |
| Other Assets | (95) | (62) |
| Related parties | (79) | (15) |
| Restricted deposits for legal proceeding | (90) | 32 |
| Liability (Increase) decrease | ||
| Suppliers | (3,494) | (3,725) |
| Payroll and charges | (31) | 249 |
| Taxes and Social contributions payable | 79 | 151 |
| Other Accounts Payable | 184 | (172) |
| Contingencies | (112) | (116) |
| Deferred revenue | 68 | 160 |
| Taxes and Social contributions paid | (260) | (1) |
| Net cash generated from (used) in operating activities | (1,788) | (1,250) |
| Capital increase in subsidiaries | - | (31) |
| Acquisition of property and equipment | (734) | (1,709) |
| Increase Intangible assets | (176) | (142) |
| Sales of property and equipment | 203 | 1,406 |
| Acquisition of property for investment | (93) | (12) |
| Net cash of discontinued operations – Cdiscount | (1) | - |
| Net cash flow investment activities | (801) | (488) |
| Cash flow from financing activities | ||
| Increase of capital | 8 | 8 |
| Funding and refinancing | 4,160 | 5,912 |
| Payments of loans and financing | (3,696) | (3,732) |
| Dividend Payment | (737) | (294) |
| Company acquisition | (3) | - |
| Resources obtained from the offering of shares and non-controlling shareholders | 14 | 3 |
| Transactions with minorities | (5) | 2 |
| Lease liability payments | (1,148) | (1,260) |
| Net cash generated from (used) in financing activities | (1,407) | 639 |
| Monetary variation over cash and cash equivalents | (189) | 428 |
| Increase (decrease) in cash and cash equivalents | (4,185) | (671) |
| Cash and cash equivalents at the beginning of the year | 8,711 | 7,954 |
| Cash and cash equivalents at the end of the year | 4,526 | 7,283 |
| Change in cash and cash equivalents | (4,185) | (671) |
(*) Considers Assaí in 2020.
| | 24 |
| |
BREAKDOWN OF SALES BY BUSINESS – BRAZIL
| (R$ million) | Breakdown of Gross Sales by Business | ||||||||
| 3Q21 | % | 3Q20 | % | Δ | 9M21 | % | 9M20 | % | |
| GPA Brazil | 6,895 | 99.7% | 7,368 | 99.8% | -6.4% | 21,092 | 99.7% | 22,748 | 99.8% |
| Extra Hiper | 2,668 | 38.6% | 3,109 | 42.1% | -14.2% | 8,298 | 39.2% | 9,852 | 43.2% |
| Drugstores | 53 | 0.8% | 59 | 0.8% | -10.3% | 155 | 0,7% | 195 | 0.9% |
| GPA Brazil ex hiper | 4,174 | 60.3% | 4,200 | 56.9% | -0.6% | 12,640 | 59.8% | 12,702 | 55.7% |
| Pão de Açúcar | 1,886 | 27.3% | 1,961 | 26.6% | -3.9% | 5,668 | 26.8% | 6,117 | 26.8% |
| Mercado Extra / Compre Bem | 1,253 | 18.1% | 1,039 | 14.1% | 20.6% | 3,807 | 18.0% | 3,115 | 13.7% |
| Proximity(1) | 545 | 7.9% | 486 | 6.6% | 12.2% | 1,606 | 7.6% | 1,297 | 5.7% |
| Gas Stations | 412 | 6.0% | 487 | 6.6% | -15.4% | 1,451 | 6.9% | 1,471 | 6.5% |
| Other businesses(2) | 79 | 1.1% | 68 | 0.9% | 16.2% | 252 | 1.2% | 183 | 0.8% |
| GPA (3) | 6,917 | 100.0% | 7,384 | 100.0% | -6.3% | 21,147 | 100.0% | 22,793 | 100.0% |
| (R$ million) | Breakdown of Net Sales by Business | ||||||||
| 3Q21 | % | 3Q20 | % | Δ | 9M21 | % | 9M20 | % | |
| GPA Brazil | 6,390 | 99.7% | 6,729 | 99.8% | -5.0% | 19,553 | 99.8% | 20,792 | 99.8% |
| Extra Hiper | 2,412 | 37.6% | 2,786 | 41.3% | -13.4% | 7,491 | 38.2% | 8,834 | 42.4% |
| Drugstores | 51 | 0.8% | 56 | 0.8% | -9.8% | 149 | 0.8% | 188 | 0.9% |
| GPA Brazil ex hiper | 3,926 | 61.3% | 3,887 | 57.7% | 1.0% | 11,912 | 60.8% | 11,770 | 56.5% |
| Pão de Açúcar | 1,706 | 26.6% | 1,773 | 26.3% | -3.7% | 5,144 | 26.2% | 5,545 | 26.6% |
| Mercado Extra / Compre Bem | 1,164 | 18.2% | 968 | 14.4% | 20.3% | 3,556 | 18.1% | 2,906 | 13.9% |
| Proximity(1) | 516 | 8.0% | 457 | 6.8% | 12.8% | 1,521 | 7.8% | 1,219 | 5.9% |
| Gas Stations | 411 | 6.4% | 484 | 7.2% | -15.0% | 1,392 | 7.1% | 1,461 | 7.0% |
| Other businesses(2) | 129 | 2.0% | 61 | 0.9% | 111.4% | 397 | 2.0% | 164 | 0.8% |
| GPA (3) | 6,409 | 100.0% | 6,742 | 100.0% | -4.9% | 19,599 | 100.0% | 20,830 | 100.0% |
(1) Includes sales of Mini Extra, Minuto Pão de Açúcar and Aliados.
(2) Revenue from lease of commercial centers.
(3) GPA figures include the results of James Delivery, Stix Fidelidade and Cheftime.
BREAKDOWN OF SALES (% of Net Sales) - GPA BRAZIL
| SALES BREAKDOWN | GPA Brazil | |||
| (% of Net Sales) | 3Q21 | 3Q20 | 9M21 | 9M20 |
| Cash | 43.0% | 43.5% | 44.1% | 42.7% |
| Credit Card | 44.9% | 46.4% | 44.5% | 48.0% |
| Food Voucher | 12.1% | 10.0% | 11.3% | 9.4% |
| | 25 |
SIGNATURES
Pursuant to the requirement of the Securities Exchange Act of 1934, the registrant has duly caused this report to be signed on its behalf by the undersigned, thereunto duly authorized.
| COMPANHIA BRASILEIRA DE DISTRIBUIÇÃO | |||
| Date: November 3, 2021 | By: /s/ Jorge Faiçal | ||
| Name: | Jorge Faiçal | ||
| Title: | Chief Executive Officer | ||
| By: /s/ Guillaume Marie Didier Gras | |||
| Name: | Guillaume Marie Didier Gras | ||
| Title: | Investor Relations Officer | ||
FORWARD-LOOKING STATEMENTS
This press release may contain forward-looking statements. These statements are statements that are not historical facts, and are based on management's current view and estimates offuture economic circumstances, industry conditions, company performance and financial results. The words "anticipates", "believes", "estimates", "expects", "plans" and similar expressions, as they relate to the company, are intended to identify forward-looking statements. Statements regarding the declaration or payment of dividends, the implementation of principal operating and financing strategies and capital expenditure plans, the direction of future operations and the factors or trends affecting financial condition, liquidity or results of operations are examples of forward-looking statements. Such statements reflect the current views of management and are subject to a number of risks and uncertainties. There is no guarantee that the expected events, trends or results will actually occur. The statements are based on many assumptions and factors, including general economic and market conditions, industry conditions, and operating factors. Any changes in such assumptions or factors could cause actual results to differ materially from current expectations.