FORM 6-K
SECURITIES AND EXCHANGE COMMISSION
Washington, D.C. 20549
Report of Foreign Private Issuer
Pursuant to Rule 13a-16 or 15d-16 of
the Securities Exchange Act of 1934
For the month of February, 2022
Brazilian Distribution Company
(Translation of Registrant’s Name Into English)
Av. Brigadeiro Luiz Antonio,
3142 São Paulo, SP 01402-901
Brazil
(Address of Principal Executive Offices)
(Indicate by check mark whether the registrant files or will file annual reports under cover of Form 20-F or Form 40-F)
Form 20-F X Form 40-F
(Indicate by check mark if the registrant is submitting the Form 6-K in paper as permitted by Regulation S-T Rule
101 (b) (1)):
Yes ___ No X
(Indicate by check mark if the registrant is submitting the Form 6-K in paper as permitted by Regulation S-T Rule
101 (b) (7)):
Yes ___ No X
(Indicate by check mark whether the registrant by furnishing the information contained in this Form is also thereby furnishing the information to the Commission pursuant to Rule 12g3-2(b) under the Securities Exchange Act of 1934.)
Yes ___ No X
EARNINGS RELEASE
4Q21
São Paulo, February 23, 2022
The GPA [B3: PCAR3; NYSE: CBD] announces the results of the |
| 
|
GPA GROUP - Operating & Financial Highlights
The year 2021 was one of the most important in the recent history of GPA, even in a challenging economic scenario, we went through major changes and took important decisions for the future of New GPA. We started the year with the spin-off of the cash and carry business and ended a cycle with the discontinuation of the hypermarket format in Brazil.
Extra Hiper Transaction:
| § | Extremely successful demobilization execution in record time since its announcement, on October 14, 2021. All efforts were made so that the process was implemented as efficiently as possible and in approximately 3 months we carried out the demobilization of 70 hypermarket stores. |
Sales:
| § | The group's consolidated net sales revenue totaled R$14.9 billion in 4Q21, an increase of 6.7% vs. 4Q20 (excluding tax credits from 4Q20). The accrued net revenue in 2021 was R$51.3 billion; |
| § | The New GPA Brazil (excluding hypermarkets and drugstores) had a positive result despite the challenging macroeconomic scenario, with same-store sales growth of 2.3% vs. 4Q20, representing the growth of banner Pão de Açúcar and Proximity formats, with an important gain of market share. In 4Q21, online sales penetration was 8.4% and e-commerce sales totaled R$480 million, a 46.2% growth vs 4Q20; |
| § | Grupo Éxito once again recorded double-digit growth in same-store sales of 15.3% vs 4Q20, with growth in the 3 countries in which it operates and performance in the quarter above inflation. Omnichannel sales represented 9.9% of total sales in 2021. |
Consolidated Adjusted EBITDA Margin:
| § | The Consolidated Adjusted EBITDA margin was 8.0% in the quarter, a 140 bps decrease vs 4Q20, excluding the tax credits of this period. In 2021, the Consolidated Adjusted EBITDA margin was 7.4%, a 40 bps decrease; |
| § | At GPA Brazil, the Adjusted EBITDA margin was 5.4% in 4Q21. The decrease vs 4Q20, which is concentrated in gross profit, is mainly explained by the process of demobilization of hypermarket stores and drugstores due to the termination of these operations. In the New GPA Brazil perimeter, the Adjusted EBITDA margin was 8.4% in 4Q21, a 20 bps increase vs. 4Q20. In 2021, the increase in the adjusted EBITDA margin was 80 bps, reaching 8.8%; |
| § | Grupo Éxito reached a high level of the Adjusted EBITDA Margin of 10.6% in 4Q21, stable regarding 4Q20. In the total for the year, Grupo Éxito recorded a gain of 50 bps in the margin. |
Consolidated Net Income:
| § | In 4Q21, Consolidated Net Income was R$777 million. In 2021, Consolidated Net Income reached R$805 million, even in a year with a retraction in consumption in Brazil and recovery of the economy in Colombia only in the second half of the year. |
 |
2
 |
Net Debt:
| § | Net Debt of R$-697 million in December 2021, maintaining a low net debt/EBITDA ratio of -0.3x and a solid cash position of R$8.3 billion. |
ESG Commitments:
| § | The GPA Group is part of the main sustainability indexes around the world and has been constantly evolving its ESG initiatives, emphasizing, in 2021: |
| o | Brazil: We became one of 418 companies in 45 countries and regions to participate in the Bloomberg Gender-Equality Index (GEI) 2022, a modified market capitalization index that aims to track the performance of publicly-held companies committed to transparency in gender data reporting. We also highlight that, in line with our commitment to reduce greenhouse gas (GHG) emissions, we have reduced 6.9% in scope 1 and 2 emissions compared to 2020; |
| o | Éxito: we support local trade in Colombia, where 90% of all fruit and vegetables have been purchased from local suppliers. We also emphasize the donation of 934 tons of food and 111 tons of non-food items to food banks and foundations. |
| |
3
| |
GPA Consolidated Recovery scenario in Brazil and maintenance of good performance in Colombia |
| R$ million, except when indicated | GPA Consolidated(1) | |||||||
| 4Q21 | 4Q20(2) Excluding Tax Credits | 4Q20 | Δ 21 vs 20(2) | 2021 | 2020(2) Excluding Tax Credits | 2020 | Δ 21 vs 20(2) | |
| Gross Revenue | 16,381 | 15,417 | 15,417 | 6.2% | 56,374 | 55,732 | 55,732 | 1.2% |
| Net Revenue | 14,875 | 13,936 | 14,770 | 6.7% | 51,291 | 50,419 | 51,253 | 1.7% |
| Gross Profit | 3,726 | 3,725 | 4,559 | 0.0% | 12,950 | 12,915 | 13,749 | 0.3% |
| Gross Margin | 25.0% | 26.7% | 30.9% | -170 bps | 25.2% | 25.6% | 26.8% | -40 bps |
| Selling, General, and Adm. Expenses | (2,589) | (2,498) | (2,515) | 3.6% | (9,353) | (9,326) | (9,343) | 0.3% |
| % of Net Revenue | 17.4% | 17.9% | 17.0% | -50 bps | 18.2% | 18.5% | 18.2% | -30 bps |
| Other Operating Revenues (Expenses) | 273 | 138 | 138 | 97.4% | (7) | (71) | (71) | -89.6% |
| Adjusted EBITDA(3) | 1,186 | 1,314 | 2,132 | -9.8% | 3,814 | 3,920 | 4,738 | -2.7% |
| Adjusted EBITDA Margin(3) | 8.0% | 9.4% | 14.4% | -140 bps | 7.4% | 7.8% | 9.2% | -40 bps |
| Net Income Controlling Shareholders(4) | 777 | 374 | 1,316 | 107.7% | 805 | 151 | 1,092 | 433.0% |
| Net Margin Controlling Shareholders(4) | 5.2% | 2.7% | 8.9% | 250 bps | 1.6% | 0.3% | 2.1% | 130 bps |
(1) Consolidated considers profit and loss of the operations of GPA Brazil, the operations of Grupo Éxito (Colombia, Uruguay, and Argentina), other businesses (Stix Fidelidade, Cheftime, and James Delivery), the profit and loss of CDiscount (in the equity income item), and discontinued operations (stores on assignment to Assaí and drugstores)
(2) Excluding exceptional elements as shown in the 4Q20 release (R$941 million in net income being: R$834 million in net revenue and gross profit, R$-17 million in selling expenses, R$536 million in financial results and R$+412 million in income tax, mainly referring to tax credits)
(3) Operating profit before interest, taxes, depreciation, and amortization. Adjusted by Other Operating Revenues and Expenses
(4) Net Income do not consider the result of Sendas S.A. (Assaí)
Notice / Disclaimer: Statements contained in this release regarding the Company's business outlook, projections of operating/financial profit and loss, the Company's growth potential, and related to market and macroeconomic estimates constitute mere forecasts and were based on the beliefs, intentions, and expectations of the Management regarding the future of the Company. Those estimates are highly dependent on changes in the market, the general economic performance of Brazil, the industry, and international markets and, therefore, are subject to change.
| |
4
| |
Message from the CEO
The year 2021 was intense, challenging, and one of the most important in GPA's recent history. We went through deep changes and made complex and courageous decisions. And, in another year of a pandemic, we continue to play our role of essentiality, supplying the homes of millions of people, always protecting and taking care of our employees and customers, and seeking to advance positive impacts in social, environmental aspects, and governance.
As a result of strategic decisions, a new GPA began to be built: We started the year with the spin-off of the Assaí whosale business and ended a cycle with the discontinuation of the Group's hypermarket format in Brazil, supported by a medium and long-term analysis of retail trends and the characteristics of the Brazilian market.
Our energy is now channeled into accelerating the expansion plan, strengthening core competencies in the most profitable, and performing segments of our portfolio – premium and proximity –, neighborhood supermarkets and the food e-commerce business. It is a new GPA and a new cycle that reinforces our strengths and provides the best shopping experience for our customers.
This period was also a period of consolidation of our digital strategy. We improve applications, tools, and processes, attracting new consumers to e-commerce and strengthening an omnichannel shopping profile, which combines face-to-face and digital – including a marketplace, WhatsApp, our apps, and open collaboration platforms. At Grupo Éxito, we continue to implement solutions that use contactless technologies, customer service, data analysis, logistics, and supply chain, and HR management in accordance with the strategy established for the period 2021-2024.
Therefore, we are increasingly multi-format, multi-channel, and multi-region, in Brazil, Colombia, Argentina, and Uruguay.
Despite the still very challenging macroeconomic scenario, we ended 2021 with a revenue of R$56.4 billion, cash generation (EBITDA) of R$3.8 billion, and net income of R$805 million.
Our operation involves thousands of employees and millions of customers and we are committed to adopting social and environmental practices that contribute to building a more inclusive and responsible company. Our role as an agent of transformation in society, combined with our practices, has been recognized by the market in different rankings, which fills us with pride and signals that we are on the right path.
We have 2022 ahead of us, which should also be a period of great volatility, and we are prepared for another year of adaptation, with flexibility, agility, and resilience, supported by the execution capacity of our incredible team that makes it happen every day.
Everything we do is to constantly act to promote our purpose, which is to feed dreams and lives, legitimately and to continue as protagonists in food retail, increasingly promoting healthy and sustainable consumption and our commitment to the company of which we are part.
Jorge Faiçal
GPA’s CEO
| |
5
| |
GPA BRAZIL
Sales Performance
Sales Performance
Emphasizing supermarket and proximity formats
| GROSS REVENUE | 2021 | 4Q21/4Q20 | ||
| (R$ million) | Selling | Selling | % Total stores | Same Store Sales(3) |
| Pão de Açúcar | 7,801 | 2,133 | 0.2% | 0.9% |
| Mercado Extra / Compre Bem | 5,247 | 1,429 | -1.4% | -1.7% |
| Proximity | 2,196 | 590 | 20.7% | 20.2% |
| Gas Stations | 1,765 | 468 | -2.7% | 2.3% |
| Other businesses(1) | 338 | 86 | -4.5% | n.d. |
| GPA Brazil ex hiper and drugstores | 17,347 | 4,707 | 1.5% | 2.3% |
| Extra Hiper | 11,486 | 3,188 | -10.4% | -7.0% |
| Drugstores | 196 | 41 | -29.4% | -24.1% |
| GPA Brazil(2) | 29,028 | 7,936 | -3.9% | -1.8% |
(1) Revenue from the rental of commercial centers
(2) GPA Brazil does not include the results of Stix Fidelidade, Cheftime, and James Delivery
(3) To reflect the calendar effect, it was reduced by 4 bps in 4Q21 and 30 bps in 2021
Same-store sales vs 2020
| New GPA Brazil's total sales reached R$4.7 billion in 4Q21. Regarding the same stores, even with a strong comparable base and challenging macroeconomic scenario, there was an increase of 2.3% compared to 4Q20. The online channel grew by 46.2% YoY, directly linked to the growth of omnichannel and expansion of partnerships with last milers, besides the resumption of Pão de Açúcar stores with growth in market share and an increase in the customer flow, added to the strong growth in the Proximity and Gas Station formats.
The LfL of 2.3% shows an important recovery versus the second and third quarters of 2021, as shown in the chart aside.
Including the operations of hypermarkets and drugstores, same-store sales decreased 1.8% vs 4Q20, reflecting the efficient demobilization of stores carried out in 3 months and that substantially impacted sales in 4Q21.
In 4Q21, same-store sales under the Pão de Açúcar banner grew 0.9% vs 4Q20, bringing the result of the company's strategy of increased service in the areas of perishables and cash line, operational performance gains, communication of promotions, and store renovations. |
| |
6
| |
With the discontinuation of the operation of hypermarkets and drugstores, the % of sales share of Pão de Açúcar became 43.3% in 2021 vs 26.3% considering the sales of hypermarkets and drugstores, which reinforces the company's positioning of invest in the brand through a cohesive and strategic expansion plan, strengthening the Group's most profitable format.

Supermarket/Proximity
| Pão de Açúcar The fourth quarter of 2021 was marked by the resumption of growth in the Pão de Açúcar banner and by the gain in market share in AS Brasil (Autosserviço Brasil) and also in the premium segment, according to Nielsen survey. This market share gain is the result of a strategy focused on converting stores to our G7 concept, reviewing of the banner’s promotional dynamics, focusing on providing better service in the perishables and cash line, with a great evolution on operational performance gains. In the quarter, we had same-store sales growth, even in a challenging macroeconomic scenario. |  |
During 4Q21, of the 181 stores of the banner, distributed in 13 states of the country, we made layout adjustments in 50 stores, besides the renovation of 4 stores to the G7 concept. Moreover, we opened a new Pão de Açúcar store in Limeira, in the countryside of the state of São Paulo – the first store to be part of our expansion plan of 100 new stores over the next 3 years. The store has a sales area of 1,230m² and has already been opened under the G7 concept for a better consumer shopping experience, focusing on a more fluid shopping flow, with an emphasis on fresh products. Moreover, the store has 5 self-checkouts and the Click & Collect space, where customers may pick up their purchases made through the website or app. In 2021, we reaffirm our commitments to invest and strengthen the brand, a retail icon in Brazil.
| |
7
| |
Another highlight was online sales, which continue to grow driven by last mile partnerships announced throughout 2021, with an average sales penetration of 15%, reaching peaks of 20% throughout 4Q21. Furthermore, we had an important increase in customer loyalty through a new strategy developed in 4Q21: the possibility of redeeming Stix points directly at the cashier in stores. After the availability of this tool, we recorded a 4X growth in the number of redemptions vs 3Q21.
| Mercado Extra and Compre Bem Mercado Extra and Compre Bem performed in 4Q21 in line with 4Q20 results. It is important to emphasize that the consumer profile of the two banners differs greatly from the target audience of wholesalers. Mercado Extra and Compre Bem stores are neighborhood stores, where customers tend to go more than once a week to do their restocking purchases. The consolidation of this model in all the markets where the banners are installed reinforces the Group's confidence in this format.
Mercado Extra continued to accelerate the integration of its units into the food e-commerce operation, with 73 stores operating in the Express modality at the end of 2021. Moreover, last miles sales also accelerated significantly, with a growth of more than 50% vs 3Q21. |  | |
| Proximity Throughout 2021 we opened 12 new Minuto Pão de Açúcar stores as part of our expansion plan, which provides for 100 new stores of this format over the next 3 years.
The proximity model showed double-digit growth in 4Q21, maintaining the strong trend already seen in recent quarters, with same-store sales growth of 20.2% compared to 4Q20. In 2021, the growth was 26.6% vs. the year 2020. |  |
In October 2021, we launched the first store of the new Pão de Açúcar Fresh format in the City of São Caetano do Sul, in the State of São Paulo. This new model is focused on the replenishment purchase of fresh products and allows occupying the format space between Minuto Pão de Açúcar and the traditional Pão de Açúcar. It is important to highlight that this format was born with the strength of GPA in food e-commerce, with Click & Collect and the last mile partnerships.
Private-Label Brands
Throughout 2021, the private-label brands (Qualitá, Taeq, Casino, Cheftime, Club des Sommeliers and Finlandek) had great results and initiatives:
| § | The sales share reached 21.1% with 4.5 billion sales; |
| § | 82% customer penetration (8 out of 10 buy a private label item); |
| § | Launch of more than 100 products resulting in a food assortment of approximately 5,600 SKUs; |
| § | Qualitá brand was recognized by ABMAPRO - Brazilian Association of Exclusive Brands (Associação Brasileira de Marcas Próprias) as the brand with the highest market share, in addition to having received the RA 100 index from Reclame Aqui (excellence in the quality of customer service); |
| § | Club des Sommeliers won 3 gold medals in the international competition Catad’or; |
| § | For the eggs category, 40.2% of Private-Label Brand units sold were cage-free hens (2021 target: 36%, target to reach 100% in 2025). |
| |
8
| |
Digital Strategy
We will be wherever the customer is, continuing our strategy of providing an open and collaborative platform
Growth of food e-commerce (1P+3P)
| E-commerce continues to be an important path of growth for the GPA Group Brazil, representing 8.4% of total food sales in the quarter. In 4Q21, we had a significant gain of 46.2% GMV vs 4Q20, despite the impact of the hypermarket transaction on sales and the challenging consumer market. Year-to-date sales reached R$1.7 billion, 53% growth vs 2020. Those sales already represent 7.9% of the total sales of the food segment of GPA Brazil, with peaks of 20% in representation at Pão de Açúcar.
We also emphasize the strong growth in the number of orders placed in 4Q21, we had an increase of 132.5% in the number of orders compared to 4Q20 and 99% in the year-over-year comparison. |
SALES ON OWN DIGITAL PLATFORM (1P)
As announced in 3Q21, we launched several initiatives that intensify the growth of e-commerce and improve the usability of our platforms: social login, Sunday delivery, Click & Collect in 1 hour, the launch of cashback, WhatsApp, pix, 30-minute delivery (ultra-convenience), electric car delivery and the new search tool. Reinforcing the Group's strategy of being where the customer is, on an open and collaborative platform.
In 2021 we expanded our services with: scheduled delivery, our integrated James Delivery last mile activity, Express delivery and Click & Collect, present in more than 300 stores.
PARTNERSHIPS
In line with our strategy of being where the customer is, we made several partnerships throughout 2021 that have already brought important results in the year:
| § | Last Mile (next hour): partnerships with iFood, B2W/Americanas, Rappi and Cornershop. In the year, sales through those partnerships represented 23.5% of total online sales in the period; |
| § | Mercado Livre (Meli): announced in 2Q21, it has been growing every month. In 4Q21, we increased our revenue by 75.5% compared to the performance of 3Q21, with approximately 4 thousand supermarket items from the chains on the platform with the Pão de Açúcar and Extra brands; |
| § | HomeRefil: where we started our Retail as a service (RAAS). The project shall be executed from the combination of two services in a full-service dynamic: availability of stock for the channel and carrying out operations for handling and picking orders and deliveries. |
MARKET PLACE (3P)
We continue to evolve in our strategy of expanding our assortment focused on verticals supplementary to our core food business (wines, beers, fresh, and healthy, barbecue, baby care, personal care, and pet care). We continue to accelerate our onboarding process to further enhance the number of available SKUs, we continue to maintain our service level indicators. In 2021, we launched our fulfillment platform for marketplace sellers, ensuring fast deliveries, competitive shipping, and order traceability.
| |
9
| |
GRUPO ÉXITO
Sales Performance
Strong economic recovery in Colombia and gradual improvement in real estate business in all countries
| GROSS REVENUE | 2021 | 4Q21/4Q20 | |||
| (R$ million) | Selling | Selling | % Total stores | % Total stores Constant currency | Same Store Sales(1) Constant currency |
| Grupo Éxito | 27,264 | 8,419 | 17.8% | 16,2% | 15.3% |
| Colombia | 20,669 | 6,400 | 13.1% | 15.1% | 14.1% |
| Uruguay | 4,552 | 1,286 | 5.9% | 6.2% | 5.9% |
| Argentina | 2,044 | 733 | 167.4% | 54.9% | 53.4% |
(1) Same-store concept performance considering growth at constant exchange rates. To reflect the calendar effect, in the 4Q21 we added -10 bps no Grupo Éxito (0 bps in Colombia, -50 bps in Uruguay, and 0 bps in Argentina) and, for 2021,-30 bps were added to Grupo Éxito (-40 bps in Colombia, -50 bps in Uruguay, and -40 bps in Argertina)
Grupo Éxito had an excellent sales performance in 4Q21, with strong growth in both BRL and COP. Gross revenue totaled R$8.4 billion in the quarter, representing a growth of 17.8% YoY. In the ‘same store’ concept, sales grew by 15.3% in the quarter. Year-to-date, revenue grew 10.5%, reaching R$27.3 billion. These growths were driven by:
| § | Focus on innovation, in Colombia, innovative formats represented 33.3% of sales; |
| § | Strong omnichannel performance, with sales penetration of 9.9% in 2021 (11.9% in Colombia, 3.6% in Uruguay, and 2.6% in Argentina); |
| § | Greater contribution from supplementary businesses, benefiting from the reduction of restrictions during the year. |
COLOMBIA
Solid quarterly and annual growth in sales in Colombia, as a result of i) recovery in consumer confidence, which boosted consumption levels in the country; ii) renovation of more than 50 stores, to formats more adhering to the style of modern consumers; iii) growth in supplementary businesses such as Real Estate (occupancy rate at 93%), Puntos Colombia, and Tuya, and iv) important growth in omnichannel sales (11.9% in 2021).
URUGUAY
The macroeconomic and consumption context in Uruguay gradually improved throughout 2021, mainly with the resumption of tourism at the end of the year. As a result, same-store sales grew 5.9% in 4Q21, contributing 17% of Éxito's consolidated sales.
ARGENTINA
Sales growth above inflation is a reflection of lower restrictions throughout 2021, better performance of food retail, a positive effect of transit in stores and commercial centers, and the evolution of e-commerce and last mile sales.
For further information on the results of Grupo Éxito, find below the link to the released results: https://www.grupoexito.com.co/en/financial-information
| |
10
| |
Financial Performance
GPA BRAZIL
| R$ million, except when indicated | GPA Brazil(1) | |||||||
| 4Q21 | 4Q20(2) Excluding Tax Credits | 4Q20 | Δ 21 vs 20(2) | 2021 | 2020(2) Excluding Tax Credits | 2020 | Δ 21 vs 20(2) | |
| Gross Revenue | 7,936 | 8,255 | 8,255 | -3.9% | 29,028 | 31,004 | 31,004 | -6.4% |
| Net Revenue | 7,311 | 7,544 | 8,378 | -3.1% | 26,864 | 28,336 | 29,170 | -5.2% |
| Gross Profit | 1,701 | 2,046 | 2,880 | -16.8% | 6,599 | 7,385 | 8,219 | -10.6% |
| Gross Margin | 23.3% | 27.1% | 34.4% | -380 bps | 24.6% | 26.1% | 28.2% | -150 bps |
| Selling, General and Adm. Expenses | (1,345) | (1,428) | (1,445) | -5.8% | (4,948) | (5,358) | (5,374) | -7.6% |
| % of Net Revenue | 18.4% | 18.9% | 17.2% | +50 bps | 18.4% | 18.9% | 18.4% | +50 bps |
| Equity Income | 6 | 29 | 29 | -77.8% | 47 | 118 | 118 | -59.8% |
| % of Net Revenue | 0,1% | 0.4% | 0.3% | -30 bps | 0.2% | 0.4% | 0.4% | -20 bps |
| Adjusted EBITDA(3) | 393 | 676 | 1,494 | -41.8% | 1,848 | 2,271 | 3,088 | -18.6% |
| Adjusted EBITDA Margin(3) | 5.4% | 9.0% | 17.8% | -360 bps | 6.9% | 8.0% | 10.6% | -110 bps |
(1) GPA Brazil does not include results from other businesses (Stix Fidelidade, Cheftime, and James Delivery)
(2) Excluding exceptional elements as shown in the 4Q20 release (R$941 million in net income being: R$834 million in net revenue and gross profit, R$-17 million in selling expenses, R$536 million in financial results and R$+412 million in income tax, mainly referring to tax credits)
(3) Profit before interest, taxes, depreciation, and amortization Adjusted by Other Operating Revenues and Expenses
On October 14, 2021, we announced the end of the hypermarket format operation in Brazil, with the assignment of up to 70 commercial points to Assaí, conversion of stores to other formats, and closure of some points. We maintained our commitment to the customer, mainly in the supply of essential products, we set up a schedule for the demobilization of stores that began in October with the stop of purchases of several non-essential food and non-food categories and continued with store size reductions until its closures between December 2021 and January 2022. The store reduction allowed us to gain productivity, having a simpler store (supply and pricing) and a smaller assortment. In the first half of December, 21 stores were closed and another 10 stores were closed on Christmas Day, totaling 31 stores closed in December 2021.
GPA Brazil's Gross Profit totaled R$1.7 billion in the quarter and a margin of 23.3%, a decrease of 380 bps compared to 4Q20 – this variation is mainly explained by the demobilization process of hypermarket and drugstores: (i) impact of the mix effect, with the demobilization of hypermarket stores; (ii) higher breakage level; (iii) lower investment by the industry given the de-stocking process; and (iv) strong reduction in purchases. In the total for the year, the Gross Profit was R$6.6 billion and a margin of 24.6%, a decrease of 150 bps compared to 2020.
Selling, General, and Administrative Expenses totaled R$1.3 billion, a decrease of 5.8% vs 4Q20, impacted by the reduction in marketing, higher productivity of hypermarkets stores and reduction in personnel expenses. In 4Q21, total expenses reached a percentage of 18.4% of the Net Revenue. In the total for 2021, the percentage decreased 50 bps versus 2020. Selling, General and Administrative Expenses totaled R$4.9 billion in the period.
Equity Income totaled R$6 million in 4Q21 and R$47 million in 2021, reflecting the result of the 18% interest held in FIC (vs 36% in 4Q20).
| |
11
| |
HYPERMARKET TRANSACTION
The fourth quarter of 2021 saw a withdrawal from the hypermarket activity and GPA's repositioning as a premium, digital and proximity food retailer. Hypermarkets and drugstores activities represented R$11.7 billion in annual gross revenue in 2021, of which R$8.1 billion has been transferred to Assaí, R$ 2.7 billion to store conversions and R$860 million to closing/selling. The New GPA, considering the sale of stores that will be converted, will have an annual gross revenue of R$20.0 billion in 2021.
In the result for the quarter, there was a net impact in line with other revenues and expenses of R$0.4 billion, of which:
| · | R$1.2 billion being capital gain of the transfer of 20 stores and 6 owned properties in December, representing 23% of the total estimated capital gain for the transaction: |
| · | R$481 million of asset write-offs. |
| · | a positive effect of R$522 million due to reassessment of IFRS 16; |
| · | R$817 million of expenses, of which: |
| o | R$147 million related to the dismissal of employees; |
| o | R$283 million to the cancelation of agreements; |
| o | R$279 million to inventory demarcation; |
| o | R$108 million to other expenses related to the transaction; |
| · | Generating a net result, before taxes, for the transaction of R$426 million entered as Other Operating Expenses (representing 15% to 18% of the transaction). |
The company expects the transaction to generate an additional impact of R$1.8 billion in the net profit of the activities discontinued in the first quarter of 2022.
As to cash flow, the company received R$1.0 billion in 2021 and will receive R$4.2 billion more by 2024:
| · | Between R$1.2 billion and R$1.5 billion will be used for costs and taxes concerning the Project; |
| · | Up to R$0.5 billion will be set aside for the minimum dividend calculated based on the total net profit estimated for the Project; |
| · | Between R$1.2 billion to R$1.5 billion will be used to speed up store expansion, refurbishment and conversion capex in the next 3 years, in addition to the operation’s recurring capex; |
| · | The remaining balance from R$1.7 billion to R$2.3 billion will be used to deleverage the company. |
| |
12
| |
PRO FORMA COMPARISON
Below, we provide a pro forma comparison of the 4Q21 vs 4Q20 results and the year 2021 vs 2020. This result refers to what we call New GPA Brazil, excluding the 103 Extra hypermarket stores and the 102 drugstores (does not includes converted stores), considering the approximate readjustment of the logistics network, our headquarters, and other costs for the new perimeter.
| R$ million, except when indicated | New GPA Brazil – Pro Forma(1) | |||||
| 4Q21 | 4Q20 | Δ 21 vs 20 | 2021 | 2020 | Δ 21 vs 20 | |
| Net Revenue | 4,401 | 4,282 | 2.8% | 16,228 | 16,278 | -0.3% |
| Gross Profit | 1,178 | 1,175 | 0.3% | 4,291 | 4,358 | -1.5% |
| Gross Margin | 26.8% | 27.4% | -60 bps | 26.4% | 26.8% | -40 bps |
| Selling, General and Adm. Expenses | (845) | (881) | -4.1% | (3,049) | (3,290) | -7.3% |
| % of Net Revenue | 19.2% | 20.6% | +140 bps | 18.8% | 20.2% | +140 bps |
| Equity Income | 6 | 29 | -77.8% | 47 | 118 | -59.8% |
| % of Net Revenue | 0.1% | 0.7% | -60 bps | 0.3% | 0.7% | -40 bps |
| Adjusted EBITDA(2) | 368 | 349 | 5.4% | 1,427 | 1,298 | 9.9% |
| Adjusted EBITDA Margin(2) | 8.4% | 8.2% | 20 bps | 8.8% | 8.0% | 80 bps |
(1) GPA Brazil does not include results from other businesses (Stix Fidelidade, Cheftime, and James Delivery) and excludes the 103 hypermarkets and 102 drugstores
(2) Profit before interest, taxes, depreciation, and amortization. Adjusted by Other Operating Revenues and Expenses
 | In the New GPA Brazil perimeter (ex-hypermarkets and drugstores), we had an Adjusted EBITDA of R$368 million (+5.4% YoY) and a margin of 8.4%, with a gain of 20 bps vs 4Q20.
In 2021, the Adjusted EBITDA reached R$1.4 billion, an increase of 9.9% compared to the performance of 2020. The adjusted EBITDA margin indicated a gain of 80 bps, reaching 8.8% in the year. |
PRO FORMA RECORD
| R$ million, except when indicated | New GPA Brazil – Pro Forma(1) | ||||
| 1Q21 | 2Q21 | 3Q21 | 4Q21 | 2021 | |
| Net Revenue | 3,965 | 3,962 | 3,900 | 4,401 | 16,228 |
| Gross Profit | 1,062 | 1,093 | 958 | 1,178 | 4,291 |
| Gross Margin | 26.8% | 27.6% | 24.6% | 26.8% | 26.4% |
| Selling, General and Adm. Expenses | (735) | (720) | (749) | (845) | (3,049) |
| % of Net Revenue | -18.5% | -18.2% | -19.2% | -19.2% | -18.8% |
| Adjusted EBITDA(2) | 368 | 417 | 274 | 368 | 1,427 |
| Adjusted EBITDA Margin(2) | 9.3% | 10.5% | 7.0% | 8.4% | 8.8% |
(1) GPA Brazil does not include results from other businesses (Stix Fidelidade, Cheftime, and James Delivery) and excludes hypermarkets and drugstores
(2) Profit before interest, taxes, depreciation, and amortization. Adjusted by Other Operating Revenues and Expenses
| |
13
| |
GRUPO ÉXITO
| R$ million, except when indicated | Grupo Éxito | |||||
| 4Q21 | 4Q20 | Δ 21 vs 20 | 2021 | 2020 | Δ 21 vs 20 | |
| Gross Revenue | 8,419 | 7,148 | 17.8% | 27,264 | 24,669 | 10.5% |
| Net Revenue | 7,541 | 6,381 | 18.2% | 24,357 | 22,034 | 10.5% |
| Gross Profit | 2,001 | 1,673 | 19.6% | 6,291 | 5,508 | 14.2% |
| Gross Margin | 26.5% | 26.2% | 30 bps | 25.8% | 25.0% | 80 bps |
| Selling, General and Adm. Expenses | (1,216) | (1,019) | 19.4% | (4,263) | (3,821) | 11.6% |
| % of Net Revenue | 16.1% | 16.0% | 10 bps | 17.5% | 17.3% | 20 bps |
| Equity Income | (12) | 10 | -222.8% | 10 | 27 | -62.0% |
| Adjusted EBITDA(1) | 802 | 679 | 18.1% | 2,153 | 1,822 | 18.2% |
| Adjusted EBITDA Margin(1) | 10.6% | 10.6% | 0 bps | 8.8% | 8.3% | 50 bps |
(1) Profit before interest, taxes, depreciation, and amortization. Adjusted by Other Operating Revenues and Expenses
Grupo Éxito's Gross Profit in 4Q21 totaled R$2.0 billion (+19.6% YoY) with a margin of 26.5%. In 2021, the Gross Profit reached R$6.3 billion, driven by innovation, strong omnichannel performance in all countries, and greater contribution from supplementary businesses benefited by the reduction of restrictions during the year, and the return of tourism in Uruguay at the end of 2021.
Selling, General and Administrative Expenses totaled R$1.2 billion in 4Q21 (growth of 19.4%), reaching 16.1% of net revenue, remaining stable compared to the same period of the previous year. In the total of the year, expenses grew 11.6%, reaching R$4.3 billion, following the growth in revenues.
Equity Income totaled a loss of R$12 million in 4Q21 and a gain of R$10 million in 2021, which reflects the result of the 50% interest held in Puntos Colombia and in Tuya (both joint ventures with Bancolombia).
| The Adjusted EBITDA in 4Q21 totaled R$802 million, an increase of 18.1% compared to 4Q20. The Adjusted EBITDA margin remained in line with 4Q20, reaching 10.6%. When compared to 2020, the year 2021 indicated a growth of 18.2% in Adjusted EBITDA, reaching R$2.2 billion, with an increase of 50 bps in the margin to 8.8%. | 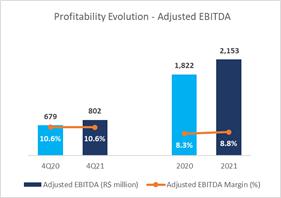 |
| |
14
| |
OTHER OPERATING REVENUES AND EXPENSES
In the quarter, Other Income and Expenses reached R$273 million. The result is mainly related to:
| i) | Transaction of Extra Hiper stores: gain of ~R$426 million, as explained in the hypermarket transaction’s effects; |
| ii) | Tax and real estate contingencies: ~R$70 million; |
| iii) | Grupo Éxito: ~R$70 million in impairment of property, plant, and equipment and tax expenses. |
FINANCIAL RESULT
| FINANCIAL RESULT | Consolidated | |||||||
| (R$ million) | 4Q21 | 4Q20(1) Excluding Tax Credits | 4Q20 | Δ | 2021 | 2020(1) Excluding Tax Credits | 2020 | Δ |
| Financial Revenue | 149 | 22 | 602 | 576.4% | 373 | 169 | 749 | 120.7% |
| Financial Expenses | (390) | (135) | (179) | 188.7% | (975) | (704) | (748) | 38.5% |
| Cost of Debt | (189) | (91) | (135) | 107.2% | (516) | (344) | (388) | 49.9% |
| Cost of Receivables Discount | (64) | (13) | (13) | 389.4% | (117) | (58) | (58) | 102.5% |
| Other financial expenses | (135) | (21) | (21) | 544.9% | (341) | (236) | (236) | 44.3% |
| Net exchange variation | (2) | (10) | (10) | -78.3% | (1) | (66) | (66) | -98.3% |
| Net Financial Revenue (Expenses) | (241) | (113) | 423 | 113.2% | (602) | (535) | 1 | 12.5% |
| % of Net Revenue | 1.6% | 0.8% | 2.9% | 240 bps | 1.2% | 1.1% | 0.0% | 230 bps |
| Interest on lease liabilities | (180) | (183) | (183) | -1.5% | (719) | (728) | (728) | -1.2% |
| Net Financial Revenue (Expenses) - Post IFRS 16 | (421) | (296) | 240 | 42.3% | (1,322) | (1,263) | (727) | 4.6% |
| % of Net Revenue - Post IFRS 16 | -2.8% | 2.1% | 1.6% | -490 bps | -2.6% | 2.5% | -1.4% | -510 bps |
(1) Excluding exceptional elements as shown in the 4Q20 release (R$536 million in the financial result, mainly referring to tax credits)
GPA Consolidated's net financial result totaled an expense of R$241 million in the quarter, representing 1.6% of net revenues. Including interest on lease liabilities, the amount reached R$421 million in the quarter, equivalent to 2.8% of net revenues.
The main changes in the financial results in the quarter were:
- Financial revenues: R$149 million in 4Q21 (vs. R$22 million in 4Q20), comprising of:
| ○ | Higher cash return due to the increase in interest in the period, with a greater volume of cash; |
- Financial expenses (including the cost of prepayment of receivables): R$390 million in 4Q21 (vs. R$135 million in 4Q20), comprising of:
| ○ | A higher cost of debt due to a higher interest rate in Brazil, offset by a lower cost of debt in Grupo Éxito; |
| ○ | Increase in the cost of discounting receivables due to the increase in CDI in the period; |
- Interest on lease liabilities in line with 4Q20.
In the year, the financial results totaled an expense of R$1.3 billion, representing 2.6% of net revenues vs R$1.3 million, in line with 2020 performance.
NET INCOME
Total Consolidated Net Income reached R$805 million, in 2021, even in a year with a retraction in consumption in Brazil and recovery of the economy in Colombia only in the second half of the year. Besides the net impact of the Extra Hiper transaction of approximately R$170 million, we had a non-recurring impact on the income tax line (tax credits, investment subsidies and others), pursuant to note 20.1 of the financial statements.
| |
15
| |
NET DEBT
| INDEBTEDNESS | Consolidated | |
| (R$ million) | 12/31/2021 | 12/31/2020(2) |
| Short-Term Debt | (1,470) | (2,309) |
| Loans and Financing | (381) | (1,089) |
| Debentures | (1,089) | (1,220) |
| Long-Term Debt | (7,582) | (6,831) |
| Loans and Financing | (4,058) | (3,453) |
| Debentures | (3,524) | (3,378) |
| Total Gross Debt | (9,051) | (9,140) |
| Cash and Financial investments | 8,274 | 8,711 |
| Net Debt | (777) | (429) |
| Adjusted EBITDA(1) | 2,349 | 2,625 |
| On balance Credit Card Receivables not discounted | 80 | 91 |
| Net Debt incl. Credit Card Receivables not discounted | (697) | (338) |
| Net Debt incl. Credit Card Receivables not discounted / | -0.3x | -0.1x |
| Adjusted EBITDA(1) | ||
(1) Adjusted EBITDA pre-IFRS 16, accumulated in the last 12 months
(2) For 12/31/2020, the debt and EBITDA values consider the results of Assaí
Net debt including the balance of unearned receivables reached R$697 million in GPA consolidated, on December 31, 2021, while adjusted EBITDA totaled R$2.3 billion. As a result, the Company maintained its low leverage level, with a net debt/adjusted EBITDA ratio of -0.3x and a solid cash position of R$8.3 billion.
In 2021, the group generated an operating cash flow of R$1.8 billion in the scope of continued activities. In the discontinued perimeter, Extra Hiper and drugstores, we had a neutral variation using the funds received from the first installment of R$1.0 billion to resize working capital to the size of the new operation and to finance project costs.
Evolution of the net debt (R$ million)

| |
16
| |
INVESTMENTS
| (R$ million) | Consolidated | |||||
| 4Q21 | 4Q20 | Δ | 2021 | 2020 | Δ | |
| New Stores and Land Acquisition | 34 | 8 | 302.7% | 79 | 54 | 45.4% |
| Store Renovations, Conversions and Maintenance | 99 | 96 | 3.3% | 338 | 344 | -2.0% |
| IT, Digital and Logistics | 22 | 92 | -76.0% | 314 | 447 | -29.9% |
| GPA Brazil Total Investments | 154 | 196 | -21.2% | 730 | 846 | -13.7% |
| Grupo Éxito Total Investments | 203 | 96 | 111.6% | 539 | 337 | 59.7% |
| Total Consolidated Investments | 357 | 291 | 22.4% | 1,269 | 1,183 | 7.2% |
Capex totaled R$357 million in 4Q21, of which R$154 million in Brazil and R$203 million in Grupo Éxito. In the year, the value was R$1.3 billion. In Brazil, investments are focused on store renovations/conversions, innovation, and acceleration of digital transformation projects, including systems, marketplace, and last miles, IT infrastructure, and logistics in and other efficiency improvement projects, and in 4Q21 we accelerated capex of new stores, continuing the expansion plan announced in October 2021: +100 new proximity stores and +100 new Pão de Açúcar stores in the next 3 years, including conversions. At Grupo Éxito, around 66.7% of Capex is related to innovation, omnichannel, and digital transformation initiatives.
| |
17
| |
ESG IN GPA
Agenda with and for society and the environment
GPA BRAZIL
GPA is committed to being a mobilizing agent for a more inclusive and sustainable company. The year 2021 is part of this journey, in which we highlight:
| 1) | Promotion of diversity and inclusion: |
Regarding gender equity, we became one of 418 companies in 45 countries and regions to participate in the Bloomberg Gender-Equality Index (GEI) 2022, a modified market capitalization index that aims to track the performance of publicly-held companies committed to transparency in gender data reporting. We ended 2021 with 36.9% of women in leadership positions (managers and above) and we benefited 608 employees in the Female Leadership Development Program.
In the matter of race equality, we were awarded 1st place in the Census pillar of the Corporate Race Equality index promoted by the Business Initiative for Racial Equality. We launched a Program dedicated to Development of Black workers in partnership with Universidade Zumbi dos Palmares, contributing to the development of 131 employees.
| 2) | Fight against climate change: |
In line with our commitment to reducing greenhouse gas (GHG) emissions by 30% by 2025 and 38% by 2030 (base 2015), we had a result of a 6.9% reduction in 1 and 2 scope emissions, in 2021, compared to 2020. 88% of energy consumption in stores migrated to the Free Energy Market.
| 3) | Integrated management and transparency: |
| o | For the second year running, we became part of the ISE B3 Portfolio (B3’s Corporate Sustainability Index); |
| o | It achieved grade A- in the CDP Climate (Carbon Disclosure Project), making us the food retailer with the highest score in South America; |
| o | We are also present in B3's Carbon Efficient Index (ICO2). |
| 4) | Transformation in the value chain: |
GPA is committed to acting responsibly in its complex value chain. We map and monitor our critical chains and their associated social and environmental risks. This close work and in collaboration with our supply chain resulted in the following highlights:
| · | Fighting deforestation: In the meat chain, 100% of Brazilian beef vendors adhere to our Social and environmental Meat Purchase Policy, which requires the use of their own social and environmental analysis systems for their purchases, sending information on the origin of cattle farms and analyzing double-checked by GPA. |
| o | We participated in the development of the Guide for the Elaboration of the Retail Meat Purchasing Policy, (led by the organizations Imaflora and Proforest), an instrument for the evolution of the traceability of the beef chain and for fighting deforestation; |
| o | We contributed to the Report prepared by of the Protocol for the Voluntary Monitoring of Cattle Vendors in the Cerrado, led by Imaflora and Proforest, with the objective of facilitating the implementation of best practices for the monitoring of cattle vendors in the Cerrado biome; |
| · | Promotion of Human Rights: GPA published the “GPA’s Human Rights Across the Value Chain Policy”, which presents general and specific guidelines in relation to working conditions applied to vendors. |
| 5) | Social impact and promotion of opportunities: |
| o | We ended 2021 with more than 5 thousand tons of food collected, in partnership with our customers and employees, for the more than 350 partner social institutions of the GPA Institute, including Amigos do Bem and Campanha Tem Gente com Fome, benefiting more than 500 thousand families throughout Brazil; |
| o | More than 3,800 tons of fresh fruits and vegetables were donated to food banks and partner institutions, complementing thousands of meals. |
| |
18
| |
GRUPO ÉXITO
Initiatives promoted during the year, with the objective of contributing to sustainable development, brought several positive results. Among the strategic pillars established for 2021, we emphasize:
| 1) | Zero malnutrition: |
| o | Through Fundação Éxito, in 2021, we reached more than 70 thousand children benefited; |
| o | 934 tons of food and 111 tons of non-food items donated to food banks and foundations. |
| 2) | Sustainable trade: |
| o | Supporting local commerce, we highlight that 90% of all fruit and vegetables were purchased from Colombian suppliers, with 84% of the volume purchased directly; |
| o | 100% of our eligible suppliers have valid working conditions approved audits. |
| 3) | My planet: |
| o | Retrofit of refrigeration equipment with gases with lower environmental impact in 23 stores; |
| o | Carulla Fresh Market banner will have the carbon-neutral seal – 21 stores were re-certified in 2021; |
| o | 788 tons of post-consumer waste collected from our customers, an increase of 500% compared to 2020 – which represents the participation of more than 187 thousand customers; |
| o | More than 20 thousand tons of store-back waste were recycled during 2021. |
| 4) | Our people: |
Moving forward in promoting diversity, we ended 2021 with 36.6% of women in leadership positions (managers and above), an increase of 5 bps compared to 2020. Moreover, to obtain the Equipares Gold Seal in 2022, in 2021 we trained around 29 thousand employees in diversity and inclusion.
| 5) | Integrity: |
Grupo Éxito was informed by Standard & Poor's that, after its participation in the Dow Jones Sustainability Index disclosure campaign, it was included in the 2022 Yearbook. This edition is the world’s most comprehensive publication based on information collected through the Corporate Sustainability Assessment (CSA), emphasizing the top 15% of companies in each industry.
| |
19
| |
BREAKDOWN OF STORE CHANGES BY BANNER
In 4Q21, we started the process of closing Extras hypermarkets and drugstores, concluding the operation of 31 hypermarkets and 34 drugstores. In the same period, we accelerated the expansion project with the opening of 10 Minuto Pão de Açúcar stores and 1 new Pão de Açúcar store. At Grupo Éxito, 8 new stores were opened in Colombia and 1 new store in Uruguay.
| 4Q20 | 3Q21 | 4Q21 | ||||||
| Stores | Stores | Openings | Openings by conversion | Closing | Closing to conversion | Stores | Sales area ('000 sq. m.) | |
| GPA Brazil | 873 | 873 | 10 | 2 | -74 | -2 | 809 | 1,005 |
| Pão de Açúcar | 182 | 181 | 1 | 0 | -1 | 0 | 181 | 233 |
| Extra Hiper | 103 | 103 | 0 | 0 | -31 | 0 | 72 | 454 |
| Extra Supermercado | 6 | 0 | 0 | 0 | 0 | 0 | 0 | 0 |
| Mercado Extra | 141 | 146 | 0 | 0 | 0 | 0 | 146 | 163 |
| Compre Bem | 28 | 28 | 0 | 0 | 0 | 0 | 28 | 33 |
| Mini Extra | 150 | 149 | 1 | 0 | -7 | -2 | 141 | 35 |
| Minuto Pão de Açúcar | 86 | 90 | 8 | 2 | -1 | 0 | 99 | 24 |
| Specialized businesses | 177 | 176 | 0 | 0 | -34 | 0 | 142 | 63 |
| Gas Stations | 74 | 74 | 0 | 0 | 0 | 0 | 74 | 58 |
| Drugstores | 103 | 102 | 0 | 0 | -34 | 0 | 68 | 5 |
| Grupo Éxito | 629 | 615 | 4 | 5 | 0 | -4 | 620 | 1,028 |
| Colombia | 513 | 499 | 3 | 5 | 0 | -4 | 503 | 832 |
| Uruguay | 91 | 91 | 1 | 0 | 0 | 0 | 92 | 92 |
| Argentina | 25 | 25 | 0 | 0 | 0 | 0 | 25 | 104 |
| Total Group | 1,502 | 1,488 | 14 | 7 | -74 | -6 | 1,429 | 2,033 |
| |
20
| |
CONSOLIDATED FINANCIAL STATEMENTS
Balance Sheet
| BALANCE SHEET | |||||||
| (R$ million) | ASSETS | ||||||
| Consolidated | GPA Brazil | Grupo Éxito | |||||
| 12/31/2021 | 12/31/2020 | 12/31/2021 | 12/31/2020 | 12/31/2021 | 12/31/2020 | ||
| Current Assets | 17,873 | 17,641 | 9,899 | 9,531 | 7,871 | 8,015 | |
| Cash and Marketable Securities | 8,274 | 8,711 | 4,706 | 4,962 | 3,492 | 3,687 | |
| Accounts Receivable | 831 | 686 | 340 | 297 | 484 | 384 | |
| Credit Card | 79 | 86 | 79 | 90 | - | - | |
| Sales Vouchers and Trade Account Receivable | 722 | 572 | 198 | 138 | 517 | 425 | |
| Allowance for Doubtful Accounts | (35) | (43) | (0) | (1) | (35) | (42) | |
| Resulting from Commercial Agreements | 65 | 71 | 63 | 70 | 2 | 1 | |
| Inventories | 5,257 | 6,536 | 2,340 | 3,542 | 2,916 | 2,993 | |
| Recoverable Taxes | 1,743 | 983 | 1,108 | 412 | 634 | 570 | |
| Noncurrent Assets for Sale | 1,187 | 109 | 1,153 | 78 | 34 | 30 | |
| Prepaid Expenses and Other Accounts Receivables | 581 | 616 | 252 | 240 | 311 | 350 | |
| Noncurrent Assets | 31,570 | 35,654 | 13,794 | 16,672 | 17,694 | 18,930 | |
| Long-Term Assets | 4,966 | 4,713 | 4,731 | 4,480 | 261 | 256 | |
| Accounts Receivable | 1 | 5 | 1 | 1 | - | 4 | |
| Credit Cards | 1 | 5 | 1 | 1 | - | 4 | |
| Recoverable Taxes | 2,410 | 3,100 | 2,410 | 3,100 | - | - | |
| Deferred Income Tax and Social Contribution | 581 | - | 567 | - | - | (0) | |
| Amounts Receivable from Related Parties | 517 | 154 | 447 | 97 | 111 | 82 | |
| Judicial Deposits | 731 | 563 | 730 | 560 | - | 3 | |
| Prepaid Expenses and Others | 725 | 891 | 575 | 723 | 150 | 168 | |
| Investments | 1,253 | 1,250 | 791 | 770 | 463 | 480 | |
| Investment Properties | 3,254 | 3,639 | - | - | 3,254 | 3,639 | |
| Property and Equipment | 16,344 | 19,888 | 6,332 | 9,376 | 10,004 | 10,504 | |
| Intangible Assets | 5,753 | 6,164 | 1,941 | 2,045 | 3,711 | 4,051 | |
| TOTAL ASSETS | 49,443 | 53,295 | 23,693 | 26,203 | 25,565 | 26,944 | |
| |
21
| |
CONSOLIDATED FINANCIAL STATEMENTS
Balance Sheet
| BALANCE SHEET | ||||||||||
| (R$ million) | LIABILITIES | |||||||||
| Consolidated | GPA Brazil | Grupo Éxito | ||||||||
| 12/31/2021 | 12/31/2020 | 12/31/2021 | 12/31/2020 | 12/31/2021 | 12/31/2020 | |||||
| Current Liabilities | 16,550 | 18,483 | 7,528 | 8,573 | 8,852 | 9,729 | ||||
| Suppliers | 10,078 | 11,424 | 3,715 | 4,956 | 6,330 | 6,449 | ||||
| Loans and Financing | 381 | 1,089 | 154 | 37 | 227 | 1,052 | ||||
| Debentures | 1,089 | 1,220 | 1,089 | 1,220 | - | - | ||||
| Lease Liability | 895 | 947 | 547 | 570 | 347 | 377 | ||||
| Payroll and Related Charges | 809 | 897 | 413 | 510 | 382 | 375 | ||||
| Taxes and Social Contribution Payable | 581 | 585 | 303 | 295 | 276 | 288 | ||||
| Financing for Purchase of Fixed Assets | 182 | 100 | 84 | 55 | 98 | 45 | ||||
| Debt with Related Parties | 370 | 194 | 258 | 55 | 90 | 77 | ||||
| Advertisement | 27 | 35 | 26 | 34 | - | - | ||||
| Provision for Restructuring | 122 | 17 | 118 | 11 | 4 | 7 | ||||
| Unearned Revenue | 383 | 297 | 46 | 18 | 243 | 200 | ||||
| Others | 1,571 | 1,678 | 711 | 812 | 855 | 860 | ||||
| Liabilities on Non-Current Assets for Sale | 62 | - | 62 | - | - | - | ||||
| Long-Term Liabilities | 16,511 | 18,005 | 12,469 | 14,390 | 4,040 | 3,619 | ||||
| Loans and Financing | 4,059 | 3,464 | 3,039 | 2,943 | 1,020 | 520 | ||||
| Debentures | 3,524 | 3,378 | 3,524 | 3,379 | - | - | ||||
| Lease Liability | 5,223 | 7,427 | 3,339 | 5,388 | 1,883 | 2,039 | ||||
| Financing by purchasing assets | 68 | - | - | - | 68 | - | ||||
| Related Parties | 96 | 168 | 96 | 168 | - | - | ||||
| Deferred Income Tax and Social Contribution | 935 | 1,034 | 6 | 156 | 927 | 883 | ||||
| Tax Installments | 153 | 248 | 148 | 241 | 5 | 7 | ||||
| Provision for Contingencies | 1,442 | 1,386 | 1,333 | 1,247 | 109 | 139 | ||||
| Unearned Revenue | 65 | 19 | 65 | 19 | - | - | ||||
| Provision for loss on investment in Associates | 689 | 591 | 689 | 591 | - | - | ||||
| Others | 258 | 291 | 231 | 257 | 28 | 31 | ||||
| Shareholders' Equity | 16,381 | 16,807 | 3,696 | 3,240 | 12,673 | 13,595 | ||||
| Attributed to controlling shareholders | 13,650 | 13,695 | 3,696 | 3,240 | 9,943 | 10,480 | ||||
| Capital | 5,859 | 5,434 | 5,859 | 4,672 | - | (0) | ||||
| Capital Reserves | 291 | 479 | 291 | 476 | - | (0) | ||||
| Profit Reserves | 6,925 | 6,091 | (3,029) | (3,664) | 10,973 | 8,455 | ||||
| Other Comprehensive Results | 574 | 1,691 | 574 | 1,755 | (1,031) | 2,025 | ||||
| Minority Interest | 2,731 | 3,112 | - | - | 2,730 | 3,116 | ||||
| TOTAL LIABILITIES AND SHAREHOLDER’S EQUITY | 49,443 | 53,295 | 23,693 | 26,203 | 25,565 | 26,944 | ||||
| |
22
| |
INCOME STATEMENT - 4TH QUARTER OF 2021
| R$ million | Consolidated(1) | GPA Brazil | Grupo Éxito | ||||||
| 4Q21 | 4Q20 | Δ | 4Q21 | 4Q20 | Δ | 4Q21 | 4Q20 | Δ | |
| Gross Revenue | 16,381 | 15,417 | 6.2% | 7,936 | 8,255 | -3.9% | 8,419 | 7,148 | 17.8% |
| Net Revenue | 14,875 | 14,770 | 0.7% | 7,311 | 8,378 | -12.7% | 7,541 | 6,381 | 18.2% |
| Cost of Goods Sold | (11,090) | (10,166) | 9.1% | (5,580) | (5,469) | 2.0% | (5,511) | (4,693) | 17.4% |
| Depreciation (Logistic) | (59) | (44) | 33.2% | (30) | (29) | 2.6% | (29) | (15) | 91.8% |
| Gross Profit | 3,726 | 4,559 | -18.3% | 1,701 | 2,880 | -40.9% | 2,001 | 1,673 | 19.6% |
| Selling Expenses | (2,131) | (2,143) | -0.6% | (1,190) | (1,289) | -7.7% | (930) | (816) | 13.9% |
| General and Administrative Expenses | (458) | (372) | 23.0% | (155) | (156) | -0.7% | (286) | (202) | 41.5% |
| Selling, General and Adm. Expenses | (2,589) | (2,515) | 2.9% | (1,345) | (1,445) | -6.9% | (1,216) | (1,019) | 19.4% |
| Equity Income(2) | (11) | 43 | -125.2% | 6 | 29 | -77.8% | (12) | 10 | -222.8% |
| Other Operating Revenue (Expenses) | 273 | 138 | 97.4% | 352 | 221 | 59.5% | (78) | (81) | -3.7% |
| Depreciation and Amortization | (437) | (484) | -9.6% | (233) | (274) | -15.1% | (200) | (207) | -3.5% |
| Earnings before interest and Taxes - EBIT | 962 | 1,742 | -44.8% | 482 | 1,411 | -65.8% | 494 | 375 | 31.7% |
| Financial Revenue | 168 | 644 | -73.9% | 95 | 599 | -84.1% | 72 | 45 | 60.4% |
| Financial Expenses | (589) | (404) | 46.0% | (428) | (273) | 57.0% | (158) | (130) | 22.0% |
| Net Financial Result | (421) | 240 | -275.1% | (333) | 326 | -202.3% | (86) | (85) | 1.8% |
| Income (Loss) Before Income Tax | 542 | 1,982 | -72.7% | 148.58 | 1,737 | -91.4% | 408 | 290 | 40.4% |
| Income Tax | 300 | (632) | -147.5% | 494 | (494) | -200.0% | (191) | (143) | 33.2% |
| Net Income (Loss) Company - continuing operations | 842 | 1,350 | -37.6% | 642 | 1,243 | -48.3% | 217 | 147 | 47.5% |
| Net Result from discontinued operations | (0) | 282 | -100.1% | (0) | (17) | -100.1% | - | (0) | -100.1% |
| Net Income (Loss) - Consolidated Company | 842 | 1,632 | -48.4% | 642 | 1,226 | -57.9% | 217 | 147 | 47.8% |
| Net Income (Loss) - Controlling Shareholders - continuing operations(3) | 777 | 1,316 | -41.0% | 642 | 1,243 | -48.3% | 153 | 108 | 42.3% |
| Net Income (Loss) - Controlling Shareholders - discontinued operations(3) | (0) | 282 | -100.1% | (0) | (17) | -100.1% | - | - | -100.1% |
| Net Income (Loss) - Consolidated Controlling Shareholders(3) | 777 | 1,598 | -51.4% | 642 | 1,226 | -57.9% | 153 | 108 | 42.7% |
| Minority Interest - Non-controlling - continuing operations | 65 | 35 | 89.1% | - | - | - | 64 | 39 | 61.7% |
| Minority Interest - Non-controlling - discontinued operations | - | - | -100.1% | - | - | - | - | - | -100.1% |
| Minority Interest - Non-controlling - Consolidated | 65 | 35 | 89.1% | - | - | - | 64 | 39 | 61.7% |
| Earnings before Interest, Taxes, Depreciation, Amortization - EBITDA | 1,459 | 2,270 | -35.7% | 745 | 1,714 | -56.5% | 724 | 598 | 21.0% |
| Adjusted EBITDA(4) | 1,186 | 2,132 | -44.4% | 393 | 1,494 | -73.7% | 802 | 679 | 18.1% |
| % of Net Revenue | Consolidated(1) | GPA Brazil | Grupo Éxito | |||
| 4Q21 | 4Q20 | 4Q21 | 4Q20 | 4Q21 | 4Q20 | |
| Gross Profit | 25.0% | 30.9% | 23.3% | 34.4% | 26.5% | 26.2% |
| Selling Expenses | -14.3% | -14.5% | -16.3% | -15.4% | -12.3% | -12.8% |
| General and Administrative Expenses | -3.1% | -2.5% | -2.1% | -1.9% | -3.8% | -3.2% |
| Selling, General and Adm. Expenses | -17.4% | -17.0% | -18.4% | -17.2% | -16.1% | -16.0% |
| Equity Income(2) | -0.1% | 0.3% | 0.1% | 0.3% | -0.2% | 0.2% |
| Other Operating Revenue (Expenses) | 1.8% | 0.9% | 4.8% | 2.6% | -1.0% | -1.3% |
| Depreciation and Amortization | -2.9% | -3.3% | -3.2% | -3.3% | -2.7% | -3.3% |
| Earnings before interest and Taxes - EBIT | 6.5% | 11.8% | 6.6% | 16.8% | 6.6% | 5.9% |
| Net Financial Result | -2.8% | 1.6% | -4.6% | 3.9% | -1.1% | -1.3% |
| Income (Loss) Before Income Tax | 3.6% | 13.4% | 2.0% | 20.7% | 5.4% | 4.6% |
| Income Tax | 2.0% | -4.3% | 6.8% | -5.9% | -2.5% | -2.2% |
| Net Income (Loss) Company - continuing operations | 5.7% | 9.1% | 8.8% | 14.8% | 2.9% | 2.3% |
| Net Income (Loss) - Consolidated Company | 5.7% | 11.1% | 8.8% | 14.6% | 2.9% | 2.3% |
| Net Income (Loss) - Controlling Shareholders - continuing operations(3) | 5.2% | 8.9% | 8.8% | 14.8% | 2.0% | 1.7% |
| Net Income (Loss) - Consolidated Controlling Shareholders(3) | 5.2% | 10.8% | 8.8% | 14.6% | 2.0% | 1.7% |
| Minority Interest - Non-controlling - continuing operations | 0.4% | 0.2% | 0.0% | 0.0% | 0.8% | 0.6% |
| Minority Interest - Non-controlling - Consolidated | 0.4% | 0.2% | 0.0% | 0.0% | 0.8% | 0.6% |
| Earnings before Interest, Taxes, Depreciation, Amortization - EBITDA | 9.8% | 15.4% | 10.2% | 20.5% | 9.6% | 9.4% |
| Adjusted EBITDA(4) | 8.0% | 14.4% | 5.4% | 17.8% | 10.6% | 10.6% |
(1) Consolidated considers the result of other supplementary businesses
(2) Equity income includes the result of CDiscount in the Consolidated
(3) Net income after non-controlling shareholders’ interest
(4) Adjusted by Other Operating Revenues and Expenses
| |
23
| |
INCOME STATEMENT - 2021
| R$ million | Consolidated(1) | GPA Brazil | Grupo Éxito | ||||||
| 2021 | 2020 | Δ | 2021 | 2020 | Δ | 2021 | 2020 | Δ | |
| Gross Revenue | 56,374 | 55,732 | 1.2% | 29,028 | 31,004 | -6.4% | 27,264 | 24,669 | 10.5% |
| Net Revenue | 51,291 | 51,253 | 0.1% | 26,864 | 29,170 | -7.9% | 24,357 | 22,034 | 10.5% |
| Cost of Goods Sold | (38,077) | (37,271) | 2.2% | (20,115) | (20,825) | -3.4% | (17,951) | (16,419) | 9.3% |
| Depreciation (Logistic) | (264) | (233) | 13.3% | (149) | (126) | 18.3% | (115) | (107) | 7.5% |
| Gross Profit | 12,950 | 13,749 | -5.8% | 6,599 | 8,219 | -19.7% | 6,291 | 5,508 | 14.2% |
| Selling Expenses | (7,645) | (7,755) | -1.4% | (4,308) | (4,679) | -7.9% | (3,259) | (2,973) | 9.6% |
| General and Administrative Expenses | (1,708) | (1,587) | 7.6% | (640) | (695) | -7.8% | (1,005) | (848) | 18.5% |
| Selling, General and Adm. Expenses | (9,353) | (9,343) | 0.1% | (4,948) | (5,374) | -7.9% | (4,263) | (3,821) | 11.6% |
| Equity Income(2) | (47) | 98 | -148.2% | 47 | 118 | -59.7% | 10 | 27 | -62.0% |
| Other Operating Revenue (Expenses) | (7) | (71) | -89.7% | 129 | 240 | -46.2% | (136) | (307) | -55.8% |
| Depreciation and Amortization | (1,853) | (1,804) | 2.7% | (1,069) | (1,069) | 0.1% | (771) | (729) | 5.7% |
| Earnings before interest and Taxes - EBIT | 1,689 | 2,630 | -35.8% | 759 | 2,134 | -64.4% | 1,132 | 679 | 66.7% |
| Financial Revenue | 488 | 909 | -46.3% | 317 | 738 | -57.0% | 168 | 170 | -1.4% |
| Financial Expenses | (1,809) | (1,637) | 10.5% | (1,357) | (1,124) | 20.7% | (446) | (510) | -12.5% |
| Net Financial Result | (1,321) | (728) | 81.5% | (1,039) | (386) | 169.5% | (279) | (340) | -18.1% |
| Income (Loss) Before Income Tax | 368 | 1,902 | -80.6% | (280) | 1,748 | -116.0% | 853 | 339 | 152.0% |
| Income Tax | 595 | (663) | -189.7% | 909 | (559) | -262.4% | (321) | (110) | 192.1% |
| Net Income (Loss) Company - continuing operations | 963 | 1,239 | -22.3% | 628 | 1,189 | -47.1% | 532 | 229 | 132.7% |
| Net Result from discontinued operations | (3) | 1,086 | -100.2% | (2) | 84 | -100.2% | (0) | (2) | -76.0% |
| Net Income (Loss) - Consolidated Company | 960 | 2,325 | -58.7% | 626 | 1,273 | -72.5% | 532 | 227 | 134.2% |
| Net Income (Loss) - Controlling Shareholders - continuing operations(3) | 805 | 1,092 | -26.3% | 628 | 1,189 | -47.1% | 371 | 70 | 427.2% |
| Net Income (Loss) - Controlling Shareholders - discontinued operations(3) | (3) | 1,086 | -100.2% | (2) | 84 | -100.2% | - | (2) | -76.0% |
| Net Income (Loss) - Consolidated Controlling Shareholders(3) | 802 | 2,178 | -63.2% | 626 | 1,273 | -72.5% | 370 | 69 | 439.0% |
| Minority Interest - Non-controlling - continuing operations | 158 | 147 | 7.5% | - | - | - | 161 | 158 | 1.9% |
| Minority Interest - Non-controlling - discontinued operations | - | - | -76.0% | - | - | - | - | - | -76.0% |
| Minority Interest - Non-controlling - Consolidated | 158 | 147 | 7.5% | - | - | - | 161 | 158 | 1.9% |
| Earnings before Interest, Taxes, Depreciation, Amortization - EBITDA | 3,806 | 4,666 | -18.4% | 1,977 | 3,329 | -40.6% | 2,018 | 1,515 | 33.2% |
| Adjusted EBITDA(4) | 3,814 | 4,738 | -19.5% | 1,848 | 3,088 | -40.2% | 2,153 | 1,822 | 18.2% |
| % of Net Revenue | Consolidated(1) | GPA Brazil | Grupo Éxito | |||
| 2021 | 2020 | 2021 | 2020 | 2021 | 2020 | |
| Gross Profit | 25.2% | 26.8% | 24.6% | 28.2% | 25.8% | 25.0% |
| Selling Expenses | -14.9% | -15.1% | -16.0% | -16.0% | -13.4% | -13.5% |
| General and Administrative Expenses | -3.3% | -3.1% | -2.4% | -2.4% | -4.1% | -3.8% |
| Selling, General, and Administrative Expenses | -18.2% | -18.2% | -18.4% | -18.4% | -17.5% | -17.3% |
| Result of the Equiv. Equity(2) | -0.1% | 0.2% | 0.2% | 0.4% | 0.0% | 0.1% |
| Other Operating Revenues and Expenses | 0.0% | -0.1% | 0.5% | 0.8% | -0.6% | -1.4% |
| Depreciation and Amortization | -3.6% | -3.5% | -4.0% | -3.7% | -3.2% | -3.3% |
| EBIT - Earnings before interest and taxes | 3.3% | 5.1% | 2.8% | 7.3% | 4.6% | 3.1% |
| Net Financial Result | -2.6% | -1.4% | -3.9% | -1.3% | -1.1% | -1.5% |
| Operating Profit (Loss) Before Income Tax | 0.7% | 3.7% | -1.0% | 6.0% | 3.5% | 1.5% |
| Income Tax | 1.2% | -1.3% | 3.4% | -1.9% | -1.3% | -0.5% |
| Company Net Profit (Loss) - continued operations | 1.9% | 2.4% | 2.3% | 4.1% | 2.2% | 1.0% |
| Consolidated Company's Net Profit | 1.9% | 4.5% | 2.3% | 4.4% | 2.2% | 1.0% |
| Controlling shareholders’ Net Profit (Loss) - continued op.(3) | 1.6% | 2.1% | 2.3% | 4.1% | 1.5% | 0.3% |
| Profit (Loss) of Controlling Shareholders Consolidated(3) | 1.6% | 4.3% | 2.3% | 4.4% | 1.5% | 0.3% |
| Non-controlling Shareholders’ Interests - continued op. | 0.3% | 0.3% | 0.0% | 0.0% | 0.7% | 0.7% |
| Consolidated Non-controlling Shareholders’ Interests | 0.3% | 0.3% | 0.0% | 0.0% | 0.7% | 0.7% |
| EBITDA - Earnings before interest, taxes, depreciation, and amortization. | 7.4% | 9.1% | 7.4% | 11.4% | 8.3% | 6.9% |
| Adjusted EBITDA(4) | 7.4% | 9.2% | 6.9% | 10.6% | 8.8% | 8.3% |
(1) Consolidated considers the result of other supplementary businesses
(2) Equity income includes the result of CDiscount in the Consolidated
(3) Net income after non-controlling shareholders’ interest
(4) Adjusted by Other Operating Revenues and Expenses
| |
24
| |
CASH FLOW - CONSOLIDATED(*)
| STATEMENT OF CASH FLOW | ||
| (R$ million) | Consolidated | |
| 12/31/2021 | 12/31/2020 | |
| Net Income (Loss) for the period | 960 | 2,326 |
| Deferred income tax | (676) | 69 |
| Loss (gain) on disposal of fixed and intangible assets | (247) | 317 |
| Depreciation and amortization | 2,117 | 2,564 |
| Interests and exchange variation | 1,316 | 1,796 |
| Adjustment to present value | 1 | (1) |
| Equity Income | 47 | (99) |
| Provision for contingencies | 137 | 443 |
| Provision for write-offs and losses | 44 | 45 |
| Share-Based Compensation | 26 | 32 |
| Allowance for doubtful accounts | 61 | 86 |
| Provision for obsolescence/breakage | 26 | 24 |
| Other operating expenses | (280) | (1,815) |
| Appropriable revenue | 26 | (349) |
| Loss (gain) on write-off of lease liabilities | (1,022) | (698) |
| Investment revaluation - Bellamar | - | (573) |
| Asset (Increase) decreases | ||
| Accounts receivable | (140) | (257) |
| Inventories | 989 | (1,142) |
| Taxes recoverable | 210 | 392 |
| Dividends received | 11 | 15 |
| Other Assets | (5) | (27) |
| Related parties | (101) | (22) |
| Restricted deposits for legal proceeding | (176) | 87 |
| Liability (Increase) decrease | ||
| Suppliers | (738) | 726 |
| Payroll and charges | (60) | 234 |
| Taxes and Social contributions payable | 355 | 549 |
| Other Accounts Payable | 378 | (1) |
| Contingencies | (161) | (161) |
| Deferred revenue | 55 | 252 |
| Taxes and Social contributions paid | (425) | (70) |
| Net cash generated from (used) in operating activities | 2,728 | 4,742 |
| Capital increase in subsidiaries | - | (31) |
| Acquisition of property and equipment | (1,035) | (2,289) |
| Increase Intangible assets | (232) | (201) |
| Sales of property and equipment | 1,315 | 1,773 |
| Cash in the deconsolidation of Sendas | - | 3,529 |
| Acquisition of property for investment | (124) | (14) |
| Net cash of discontinued operations – Cdiscount | (1) | - |
| Net cash flow investment activities | (77) | (4,291) |
| Cash flow from financing activities | ||
| Increase of capital | 9 | 9 |
| Funding and refinancing | 4,860 | 7,262 |
| Payments of loans and financing | (5,315) | (5,538) |
| Dividend Payment | (780) | (339) |
| Company acquisition | (3) | - |
| Resources obtained from the offering of shares and non-controlling shareholders | 14 | 3 |
| Transactions with minorities | (5) | 2 |
| Lease liability payments | (1,523) | (1,680) |
| Net cash generated from (used) in financing activities | (2,743) | (281) |
| Monetary variation over cash and cash equivalents | (345) | 587 |
| Increase (decrease) in cash and cash equivalents | (437) | 757 |
| Cash and cash equivalents at the beginning of the year | 8,711 | 7,954 |
| Cash and cash equivalents at the end of the year | 8,274 | 8,711 |
| Change in cash and cash equivalents | (437) | 757 |
| |
25
| |
BREAKDOWN OF SALES BY BUSINESS – BRAZIL
| (R$ million) | Breakdown of Net Sales by Business | |||||
| 4Q21 | 4Q20 | Δ | 2021 | 2020 | Δ | |
| Pão de Açúcar | 1,934 | 1,928 | 0.4% | 7,079 | 7,473 | -5.3% |
| Mercado Extra / Compre Bem | 1,330 | 1,255 | 5.9% | 4,876 | 4,161 | 17.2% |
| Proximity(1) | 561 | 459 | 22.3% | 2,082 | 1,678 | 24.1% |
| Gas Stations | 467 | 480 | -2.7% | 1,761 | 1,754 | 0.4% |
| Other businesses(2) | 140 | 80 | 73.7% | 537 | 242 | 121.6% |
| GPA Brazil ex hiper and drugstores | 4,432 | 4,202 | 5.5% | 16,345 | 15,308 | 6.8% |
| Extra Hiper | 2,839 | 3,286 | -13.6% | 10,331 | 12,785 | -19.2% |
| Drugstores | 40 | 56 | -29.7% | 189 | 244 | -22.7% |
| GPA Brazil | 7,311 | 7,544 | -3.1% | 26,864 | 28,336 | -5.2% |
(1) Includes sales of Mini Extra, Minuto Pão de Açúcar, and Aliados
(2) Revenue from the rental of commercial centers, excluding exceptional elements in 4Q20 and 2020
| |
26
| |
BRAND PORTFOLIO
With a multiformat and multichannel business model, we bring together some of the best-known and most valuable retail chains and brands, such as Compre Bem, Extra, Pão de Açúcar, in addition to the private-label brands Qualitá, Taeq, Club des Sommeliers, Finlandek, among others.
We work to offer our customers the best shopping experience every day, whenever they want and wherever they are. We are present in all regions of Brazil, with 800 brick and mortar stores and leaders in food e-commerce in Brazil, in addition to concentrating operations in Colombia, Uruguay, and Argentina with Grupo Éxito.
| |
27
SIGNATURES
Pursuant to the requirement of the Securities Exchange Act of 1934, the registrant has duly caused this report to be signed on its behalf by the undersigned, thereunto duly authorized.
| COMPANHIA BRASILEIRA DE DISTRIBUIÇÃO | |||
| Date: February 23, 2022 | By: /s/ Jorge Faiçal | ||
| Name: | Jorge Faiçal | ||
| Title: | Chief Executive Officer | ||
| By: /s/ Guillaume Marie Didier Gras | |||
| Name: | Guillaume Marie Didier Gras | ||
| Title: | Investor Relations Officer | ||
FORWARD-LOOKING STATEMENTS
This press release may contain forward-looking statements. These statements are statements that are not historical facts, and are based on management's current view and estimates offuture economic circumstances, industry conditions, company performance and financial results. The words "anticipates", "believes", "estimates", "expects", "plans" and similar expressions, as they relate to the company, are intended to identify forward-looking statements. Statements regarding the declaration or payment of dividends, the implementation of principal operating and financing strategies and capital expenditure plans, the direction of future operations and the factors or trends affecting financial condition, liquidity or results of operations are examples of forward-looking statements. Such statements reflect the current views of management and are subject to a number of risks and uncertainties. There is no guarantee that the expected events, trends or results will actually occur. The statements are based on many assumptions and factors, including general economic and market conditions, industry conditions, and operating factors. Any changes in such assumptions or factors could cause actual results to differ materially from current expectations.