FORM 6-K
SECURITIES AND EXCHANGE COMMISSION
Washington, D.C. 20549
Report of Foreign Private Issuer
Pursuant to Rule 13a-16 or 15d-16 of
the Securities Exchange Act of 1934
For the month of November, 2022
Brazilian Distribution Company
(Translation of Registrant’s Name Into English)
Av. Brigadeiro Luiz Antonio,
3142 São Paulo, SP 01402-901
Brazil
(Address of Principal Executive Offices)
(Indicate by check mark whether the registrant files or will file annual reports under cover of Form 20-F or Form 40-F)
Form 20-F X Form 40-F
(Indicate by check mark if the registrant is submitting the Form 6-K in paper as permitted by Regulation S-T Rule
101 (b) (1)):
Yes ___ No X
(Indicate by check mark if the registrant is submitting the Form 6-K in paper as permitted by Regulation S-T Rule
101 (b) (7)):
Yes ___ No X
(Indicate by check mark whether the registrant by furnishing the information contained in this Form is also thereby furnishing the information to the Commission pursuant to Rule 12g3-2(b) under the Securities Exchange Act of 1934.)
Yes ___ No X

Consolidated result with robust growth in total sales in the quarter
| · | Consolidated total gross revenue from continuing operations reached R$11.6 billion in 3Q22, up 9.5% versus 3Q21, as a result of sales growth with acceleration of expansion at New GPA Brazil and continued double-digit growth at Grupo Éxito. In 9M22, total gross sales were R$33.7 billion; |
| · | Consolidated Adjusted EBITDA totaled R$660 million in 3Q22 with an Adjusted EBITDA margin of 6.3%. Year-to-date, Consolidated Adjusted EBITDA reached R$2.0 billion; |
| · | Solid financial situation, with leverage of 1.7x at the end of the quarter, 0.4x lower compared to 3Q21. The cash position at the end of the quarter was R$3.9 billion, 1.7x the Company's short-term debt. |
Improved sales growth in same-store sales, beyond the acceleration of expansion in the New GPA Brazil
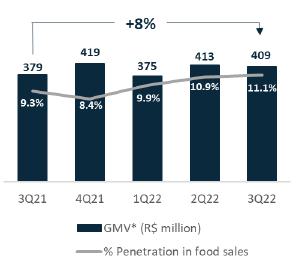
| · | Gross revenue from sales in the continued perimeter, excluding gas stations, totaled R$ 4.3 billion in 3Q22, a 14.2% growth in total sales and 6.6% in same-store concept versus the same period in 2021, as a result of the continuous work in six strategic pillars focused on "do the basics well" and on store openings in the period. In 3Q22, e-commerce sales totaled R$409 million, an increase of 8.0% versus 3Q21, excluding sales from discontinued hypermarkets. Therefore, the total online sales penetration was 11.1%; |
| · | The pro forma Adjusted EBITDA margin was 6.0%, explained by the impact of higher inflation on gross profit, despite a good control of SG&A with a reduction of 70 bps in % of net revenue. Year-to-date, the pro forma Adjusted EBITDA margin was 7.3%; |
| · | GPA Brazil continues its process of repositioning and redefining its internal processes, focusing on operations and on resuming profitability for the Company's turnaround in 2023. |
Continuous double-digit growth in the international perimeter
| · | Grupo Éxito recorded strong double-digit growth in same-store sales at 20.3% versus 3Q21 (in constant currency), growing in the 3 countries in which it operates, which is due to an increase in-store traffic and the satisfactory performance of innovative formats. Omnichannel sales represented 9.5% of total sales for 3Q22; |
| · | Grupo Éxito reached an Adjusted EBITDA Margin of 7.6% in 3Q22, a decrease of 110 bps compared to 3Q21, impacted by the higher level of inflation in the 3 countries in which it operates and by the higher level of provision at Tuya. |
 | 2 |
 |
GPA Consolidated
Resumption of sales growth in Brazil with profitability still evolving and continuity of the good performance of Grupo Éxito
| R$ million, except when indicated | GPA Consolidated(1) | |||||
| 3Q22 | 3Q21 | Δ | 9M22 | 9M21 | Δ | |
| Gross Revenue | 11,561 | 10,560 | 9.5% | 33,727 | 31,518 | 7.0% |
| Net Revenue | 10,453 | 9,595 | 8.9% | 30,637 | 28,689 | 6.8% |
| Gross Profit | 2,596 | 2,412 | 7.6% | 7,812 | 7,445 | 4.9% |
| Gross Margin | 24.8% | 25.1% | -30 bps | 25.5% | 25.9% | -40 bps |
| Selling, General, and Administrative Expenses | (1,936) | (1,789) | 8.2% | (5,748) | (5,400) | 6.4% |
| % of Net Revenue | 18.5% | 18.6% | -10 bps | 18.8% | 18.8% | 0 bps |
| Other Operating Revenue (Expenses) | (56) | (94) | -40.2% | (121) | (198) | -39.0% |
| Adjusted EBITDA(2) | 660 | 677 | -2.5% | 2,021 | 2,198 | -8.1% |
| Adjusted EBITDA Margin(2) | 6.3% | 7.1% | -80 bps | 6.6% | 7.7% | -110 bps |
| Net Income Controlling Shareholders - Continued Operations | (196) | (65) | 203.1% | (457) | 94 | -588.2% |
| Net Margin Controlling Shareholders - Continued Operations | -1.9% | -0.7% | -120 bps | -1.5% | 0.3% | -180 bps |
| Net Income Controlling Shareholders - Discontinued Operations(3) | (92) | (25) | 270.1% | 1,387 | (68) | n.d. |
| Net Income Controlling Shareholders Consolidated | (288) | (89) | 221.7% | 930 | 26 | n.d. |
(1) The consolidated considers profit and loss of the operations of GPA Brazil, the operations of Grupo Éxito (Colombia, Uruguay, and Argentina), other businesses (Stix Fidelidade, Cheftime, and James Delivery), and the result of the equity income of Cdiscount
(2) Operating income before interest, taxes, depreciation and amortization. Adjusted for Other Operating Revenue (Expenses)
(3) Includes the result of hypermarket operations
Message from the CEO
We have ended the third quarter with growth in sales and accelerated expansion of the perimeter of New GPA Brazil and have maintained double-digit growth for Grupo Éxito. The advances in New GPA's results begin to reflect the work we started six months ago, focusing on the Group's pillars and strategic projects, returning to "doing the basics well."
We have made progress in important actions for consolidating our sustainable growth: completing the work of aligning the ideal assortment, in particular for the Pão banner, which will reflect in an improved perception of product price and availability on the shelves; the increased share of perishables in total sales and the reduced level of total stockouts.
Internationally, Éxito continues to show strong, double-digit growth in same-store sales, and a significant part of the sales are online, maintaining growth in the three countries in which we operate, reflecting the strategy of consistently focusing on innovation and omnichannel.
We have hit the ground running in this fourth quarter, positioned to continue evolving in terms of our strategic plan, our deliveries and improving the experience for our customers.
Marcelo Pimentel
GPA’s CEO
Notice/Disclaimer: Statements contained in this release regarding the Company's business outlook, projections of operating/financial profit and loss, the Company's growth potential, and related to market and macroeconomic estimates constitute mere forecasts and were based on the beliefs, intentions, and expectations of the Management regarding the future of the Company. Those estimates are highly dependent on changes in the market, the general economic performance of Brazil, the industry, and international markets and; therefore, are subject to change.
| 3 |
| |
Sales Performance
GPA BRAZIL
Acceleration of total sales with the conclusion of hypermarket conversions
| GROSS REVENUE | 3Q22/3Q21 | ||
| (R$ million) | Total Sales | % Total Stores | Same-Store Sales(3) |
| Pão de Açúcar | 2,109 | 11.9% | 5.5% |
| Mercado Extra / Compre Bem | 1,449 | 12.5% | 2.0% |
| Proximity | 682 | 25.3% | 21.7% |
| Other businesses(1) | 52 | 31.7% | n.d. |
| New GPA Brazil, excluding Gas Stations | 4,293 | 14.2% | 6.6% |
| Gas Stations | 320 | -22.4% | -21.9% |
| New GPA Brazil | 4,612 | 10.6% | 3.8% |
| Extra Hiper - Discontinued Operation / Stores under Conversion | 44 | -98.3% | n.d. |
| GPA Brazil(2) | 4,657 | -32.5% | 3.8% |
(1) Revenue from the lease of commercial centers
(2) GPA Brazil does not include the results of Stix Fidelidade, Cheftime, and James Delivery
(3) To reflect the calendar effect, 80 bps were reduced in 3Q22
Total sales of New GPA Brazil reached R$4.6 billion in 3Q22 and, excluding gas stations, reached R$4.3 billion, resulting in a growth of 14.2%, driven by the converted hypermarket stores. In same-store sales, growth was 6.6% versus 3Q21. In the Pão de Açúcar banner, our same-store sales reached 5.5% in 3Q22. In the Proximity model, we continued with double-digit growth of 21.7%, explained by the increase in sales in the beverage, bakery, and rotisserie sectors, in addition to the continuous increase in the flow of transit stores and a greater number of stores serving last miles partners. In the mainstream banners, Mercado Extra and Compre Bem, same-store sales grew by 2.0%, impacted by an accurate effect from the incorporation of Compre Bem, which brought logistics and systems challenges. In 3Q22, we still had a negative impact on same-store sales of gas stations due to the conversion of stores to wholesale+retail.
Sales from premium formats corresponded to 50.0% of the total gross sales:
*Does not consider the sale of hypermarkets and includes sales of Compre Bem, which started to be considered as of 1Q22. As a result, the numbers for 1Q22 and 2Q22 were retracted. | 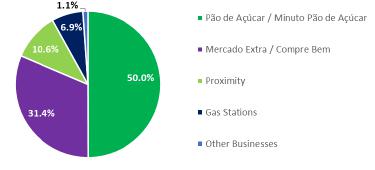
In e-commerce, our GMV was R$409 million in 3Q22, an increase of 8.0% versus 3Q21, excluding sales from hypermarkets in 3Q21. This growth is explained by a series of improvements, including increased same-day delivery times, a new partnership with iFood for fast delivery in 30 stores, in addition to operational improvements for greater efficiency in order picking. |
| 4 |
| |
The six strategic pillars of the New GPA Brazil
| Based on the company's six strategic pillars, below are the highlights for 3Q22.
Top-line: focus on incremental sales To always meet our customers' needs, in the quarter, we concluded the study to define the ideal assortment, especially in the Pão de Açúcar banner. This assortment adjustment will bring about a better structuring of the assortment pyramid, which, consequently, brings better price perception to customers in different formats. In addition to identifying the ideal assortment, we are adjusting our customers' KVI (key value items) to improve our OSA (on-shelf availability) level every day. We have two indicators that already show improvements this quarter: i) the reduction of total stockouts of approximately 20%, and ii) an increase of 160 bps in the share of perishables in total sales. | 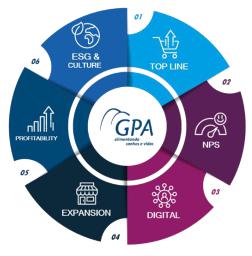 |
Also, in this quarter, we developed the refresh project, which aims to improve the value proposition of perishables, reinterpreting the flow of merchandise and displaying products in the store, bringing higher quality of products on display to the customer and improving profitability by reducing breakage.
NPS: search for continuous evolution in the indicator
In surveys with our customers, we noticed that the main points of attention about NPS are: queues in stores, stockouts, assortments and price mistakes on product labels. We started a complete action plan to improve our NPS, including a stockout reduction plan, multi-skilled training, and implementation of self-checkouts (at the end of 3Q22, we had self-check-outs in 80% of supermarket stores, and in 3Q, we also started the implementation in the proximity format). With these initiatives, we have already seen an evolution of approximately 35% in NPS in 3Q22 versus 4Q21.
Digital: greater availability of delivery times to meet the growing demand of our customers
To sustain our digital growth, we are focused on: i) increasing our assortment, especially in perishables; ii) greater availability of delivery times; and iii) fast delivery. In 3Q22, we implemented fast delivery in our 1P, incorporating James' logistics engine, and today we already have 150 stores serving this model, which took our same-day delivery percentage from 40% to 65% in these stores. Another crucial initiative in our 1P and 3P was the extension of the delivery time to 10 p.m. and the opening of a greater number of stores on Sundays. In our partnerships, we implemented express sales with iFood in 30 proximity stores, with the potential to be implemented in all proximity stores by the end of the year. In October, we started testing operations with BEES and Magazine Luiza to expand our area of operation.
Also, in digital format, we launched the "Stix buy and swap" program, and from September onwards, all customers earn Stix points; just buy and exchange them at the checkout, accelerating the redemption of points and customer loyalty.
Expansion: finalization of the conversions of Extra Hiper stores
In the third quarter, we conducted the conversion of 14 hypermarket stores (10 Pão de Açúcar and 4 Mercado Extra), concluding the conversion plan of 23 stores, 13 of which for the Pão de Açúcar format, 8 for the Mercado Extra, and 2 for the Compre Bem banner.
Pão de Açúcar stores are created with the G7 concept, with a completely revitalized consumer experience and customer flow based on four pillars: Experimental, Exclusive, Social, and Fluid. G7 stores value digital integration into the purchase process, upon the commitment to be increasingly multichannel, offering the customer the choice to buy wherever and however they prefer, whether in stores, on the website, or on the Pão de Açúcar Mais app, which offers exclusive and personalized discounts, which can be used at the time of purchase.
| 5 |
| |
The new Minuto Pão de Açúcar stores were created to be an extension of our customers' pantry and are notable for the premium shopping experience, which adapts the assortment of the neighborhoods where the units are located.
The Mercado Extra stores, a neighborhood supermarket format, have a concept formed by a differentiated exhibition called Rua do Comércio, in addition to the Mercadão and Feira Estendida, which are open from Tuesday to Thursday, always with fresh products. The stores also have Meat products and Cold Cuts section with reinforced service teams, where the most varied types of meat and cuts are offered to the customer's preferences, in addition to the Bakery, which offers bread and recipes made in-house and ready-to-eat products.
In 3Q22, we opened six new stores under the Minuto Pão de Açúcar banner and one under the Pão de Açúcar banner, totaling 10 new stores in the year. For the fourth quarter, we expect to open approximately 40 stores under the Minuto Pão de Açúcar and the Pão de Açúcar banner.
Regarding the Pão de Açúcar refurbishment, we renovated 24 stores. Of the current store network, we have approximately 45% under the G7 model; given the greater share of perishables in this model, these stores have higher sales and margins than the non-renovated stores (an average of +5 points in sales and approximately +1 point in margin). Until the end of 2022, we will have over 55% of our total stores renovated.
| 6 |
| |
GRUPO ÉXITO
A fifth consecutive quarter of double-digit growth with strong sales performance in all three countries of operation
| GROSS REVENUE | 3Q22/3Q21 | |||
| (R$ million) | Total Sales | % Total Stores | % Total Stores Constant Currency | Same-Store Sales(1) Constant Currency |
| Grupo Éxito | 6,930 | 8.8% | 21.8% | 20.3% |
| Colombia | 4,940 | 2.1% | 16.3% | 14.8% |
| Uruguay | 1,252 | 19.3% | 11.7% | 11.1% |
| Argentina | 737 | 53.1% | 133.7% | 126.8% |
(1) Same-store sales concept performance considering growth at constant exchange rates. To reflect the calendar effect, 20 bps was added in the 3Q22 in Grupo Éxito (10 bps in Colombia, 60 bps in Uruguay, and -50 bps in Argentina)
Grupo Éxito showed a solid sales performance in 3Q22, reaching the fifth consecutive quarter with double-digit growth in same-store sales at constant exchange rates. Gross revenue totaled R$6.9 billion in the quarter, with same-store growth of 20.3% versus 3Q21, and due to the appreciation of the Brazilian real versus the Colombian peso, total store growth was 8.8% YoY.
COLOMBIA
Strong growth above inflation in the quarter, mainly driven by the positive trend in the food category. In same-store sales, growth was 14.8% versus the same period of the previous year. Highlight for the solid performance of the cash & carry business in the quarter. The share of omnichannel sales in the country grew by 70 bps versus 3Q21, reaching 11.9%.
URUGUAY
Significant growth in Fresh Market stores (+17.1% YoY), with a high share of sales (51.5%). Same-store sales grew 11.1% in the quarter.
ARGENTINA
Sales growth above inflation (which was approximately 76% in the quarter) reflects the satisfactory performance of commercial centers, increased in-store traffic, and consolidation of the real estate business in the country.
For further information on the results of Grupo Éxito, please find below the link to the earnings released: https://www.grupoexito.com.co/en/financial-information
| 7 |
| |
Financial Performance
GPA BRASIL
We have two views for GPA Brazil’s result, for a better analysis of our businesses: the accounting view and the pro forma view. In applying IFRS5/CPC 31 “Noncurrent Assets Held for Sale and Discontinued Operations”, certain expenses recorded in the Gross Profit, Selling, General and Administrative Expenses cannot be reclassified to net profit of the discontinued operations in accounting since they are only partially related to discontinued operations. Hence, this proration was made for “pro-forma” purposes only and must cease as the expenses reach their new recurring level.
| R$ million, except when indicated | GPA Brazil(1) | |||||
| 3Q22 | 3Q21 | Δ | 9M22 | 9M21 | Δ | |
| Gross Revenue | 4,612 | 4,170 | 10.6% | 13,175 | 12,617 | 4.4% |
| Net Revenue | 4,305 | 3,900 | 10.4% | 12,366 | 11,827 | 4.6% |
| Gross Profit | 1,009 | 960 | 5.1% | 3,138 | 3,119 | 0.6% |
| Gross Margin | 23.4% | 24.6% | -120 bps | 25.4% | 26.4% | -100 bps |
| Selling, General, and Administrative Expenses | (797) | (771) | 3.3% | (2,378) | (2,239) | 6.2% |
| % of Net Revenue | 18.5% | 19.8% | -130 bps | 19.2% | 18.9% | 30 bps |
| Equity Income | 16 | 12 | 36.6% | 34 | 41 | -16.5% |
| Adjusted EBITDA(2) | 255 | 252 | 1.4% | 864 | 1,024 | -15.7% |
| Adjusted EBITDA Margin(2) | 5.9% | 6.5% | -60 bps | 7.0% | 8.7% | -170 bps |
(1) GPA Brazil does not include results from other businesses (Stix Fidelidade, Cheftime, and James Delivery)
(2) Earnings before interest, taxes, depreciation, and amortization. Adjusted for Other Operating Revenue (Expenses)
GPA BRAZIL – PRO-FORMA
| R$ million, except when indicated | GPA Brazil(1) | |||||
| 3Q22 | 3Q21 | Δ | 9M22 | 9M21 | Δ | |
| Gross Revenue | 4,612 | 4,170 | 10.6% | 13,175 | 12,617 | 4.4% |
| Net Revenue | 4,305 | 3,900 | 10.4% | 12,366 | 11,827 | 4.6% |
| Gross Profit | 1,011 | 958 | 5.5% | 3,157 | 3,113 | 1.4% |
| Gross Margin | 23.5% | 24.6% | -110 bps | 25.5% | 26.3% | -80 bps |
| Selling, General, and Administrative Expenses | (797) | (749) | 6.4% | (2,360) | (2,204) | 7.1% |
| % of Net Revenue | 18.5% | 19.2% | -70 bps | 19.1% | 18.6% | 50 bps |
| Equity Income | 16 | 12 | 36.6% | 34 | 41 | -16.5% |
| Adjusted EBITDA(2) | 257 | 274 | -6.4% | 903 | 1,041 | -13.3% |
| Adjusted EBITDA Margin(2) | 6.0% | 7.0% | -100 bps | 7.3% | 8.8% | -150 bps |
(1) GPA Brazil does not include results from other businesses (Stix Fidelidade, Cheftime, and James Delivery)
(2) Earnings before interest, taxes, depreciation, and amortization. Adjusted for Other Operating Revenue (Expenses)
GPA Brazil's Gross Profit totaled R$1.0 billion in the quarter, with a margin of 23.5%, a decline of 110 bps compared to 3Q21, mainly explained by:
| i) | the increase in inflation: resulting in the need to increase promoshare and continuous increase in the costs of in-store transformation of goods, packaging and logistics; and |
| ii) | fees from last mile partners: increased share of last mile partners in our sales, with the negative impact of the fee offset by the positive impact on the dilution of SG&A. |
| 8 |
| |
Selling, General and Administrative Expenses totaled R$797 million in the quarter, an increase of 6.4% compared to the same period in 2021, below inflation in the period, which resulted in a dilution of 70 bps reaching 18.5% of net revenue. This reduction is concentrated in the line of general and administrative expenses with the restructuring carried out at the headquarters after the hypermarkets transaction, with this we reduced the percentage of general and administrative expenses/net revenue from 4.0% in 3Q21 to 3.2% in 3Q22 and we continue to focus on further diluting this share. In 9M22, selling and administrative expenses totaled R$2.4 billion, reaching 19.1% of net revenue.
Equity Income totaled R$16 million in 3Q22, an increase of 36.6% versus 3Q21, reflecting the increase in revenue from FIC's operations in the period. Year-to-date, equity income was R$34 million.
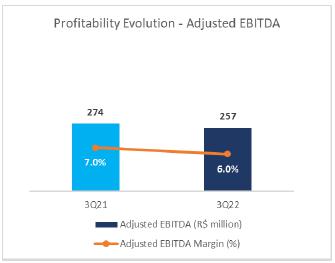 | As a result of the effects mentioned, GPA Brazil's Adjusted EBITDA was R$257 million and Adjusted EBITDA Margin was 6.0%, with a reduction of 100 bps versus 3Q21. GPA Brazil continues its process of repositioning and redefining its internal processes, focusing on operations and on resuming profitability for the Company's turnaround in 2023. |
| 9 |
| |
GRUPO ÉXITO
| R$ million, except when indicated | Grupo Éxito | |||||
| 3Q22 | 3Q21 | Δ | 9M22 | 9M21 | Δ | |
| Gross Revenue | 6,930 | 6,369 | 8.8% | 20,491 | 18,845 | 8.7% |
| Net Revenue | 6,130 | 5,675 | 8.0% | 18,216 | 16,816 | 8.3% |
| Gross Profit | 1,569 | 1,436 | 9.2% | 4,617 | 4,290 | 7.6% |
| Gross Margin | 25.6% | 25.3% | 30 bps | 25.3% | 25.5% | -20 bps |
| Selling, General, and Administrative Expenses | (1,117) | (986) | 13.3% | (3,305) | (3,047) | 8.5% |
| % of Net Revenue | 18.2% | 17.4% | 80 bps | 18.1% | 18.1% | 0 bps |
| Equity Income | (14) | 17 | -181.1% | (35) | 22 | -257.5% |
| Adjusted EBITDA(1) | 464 | 494 | -6.2% | 1,360 | 1,351 | 0.6% |
| Adjusted EBITDA Margin(1) | 7.6% | 8.7% | -110 bps | 7.5% | 8.0% | -50 bps |
(1) Earnings before interest, taxes, depreciation, and amortization. Adjusted for Other Operating Revenue (Expenses)
Grupo Éxito's Gross Profit in 3Q22 totaled R$1.6 billion (+9.2% YoY) with a margin of 25.6%, growth of 30 bps versus 3Q21, driven by the dilution of net revenue, recovery in the performance of Uruguay and the operation in Argentina, in addition to the greater contribution from the real estate business.
Selling, General and Administrative Expenses totaled R$1.1 billion in 3Q22, representing 18.2% of net revenue, an increase of 80 bps versus the same period in 2021, mainly due to higher inflation levels in the 3 countries in which it operates.
Equity Income totaled a loss of R$14 million in 3Q22, which reflects the result of the 50% interest held in Puntos Colombia and in Tuya finance, with higher level of provision in the quarter (both joint ventures with Bancolombia).
| The Adjusted EBITDA in 3Q22 totaled R$464 million, a decrease of 6.2% compared to 3Q21, due to the strong comparison base of 3Q21. The Adjusted EBITDA Margin reduced 110 bps compared to the same period of the previous year, reaching 7.6%, due to the impacts mentioned above. | 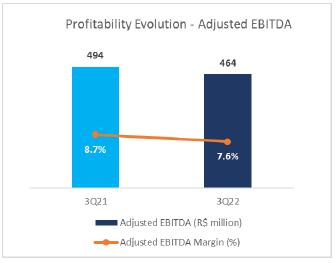 |
| 10 |
| |
OTHER OPERATING REVENUE (EXPENSES)
In the quarter, Other Income and Expenses reached R$56 million, a decrease of -40.2% versus 3Q21. This result is mainly due to stores restructuring and legal contingencies.
FINANCIAL INCOME
| FINANCIAL INCOME | Consolidated | |||||
| (R$ Million) | 3Q22 | 3Q21 | Δ | 9M22 | 9M21 | Δ |
| Financial Revenue | 235 | 43 | 449.2% | 509 | 224 | 127.1% |
| Financial Expenses | (415) | (209) | 98.3% | (1,124) | (506) | 122.1% |
| Cost of Debt | (289) | (157) | 84.1% | (748) | (327) | 128.6% |
| Cost of Receivables Discount | (11) | (1) | n.d. | (35) | (1) | n.d. |
| Other financial expenses | (94) | (52) | 80.5% | (290) | (179) | 62.2% |
| Net exchange variation | (19) | 1 | n.d. | (51) | 1 | n.d. |
| Net Financial Revenue (Expenses) | (180) | (166) | 8.0% | (615) | (282) | 118.1% |
| % of Net Revenue | -1.7% | -1.7% | 0 bps | -2.0% | -1.0% | -100 bps |
| Interest on lease liabilities | (133) | (108) | 22.7% | (372) | (338) | 10.0% |
| Net Financial Revenue (Expenses) - Post IFRS 16 | (313) | (275) | 13.8% | (987) | (620) | 59.2% |
| % of Net Revenue - Post IFRS 16 | -3.0% | -2.9% | -10 bps | -3.2% | -2.2% | -100 bps |
In 3Q22, the Company's net financial result pre-IFRS16 totaled R$180 million, an increase of 8.0% versus the same period of the previous year. This result is mainly explained by:
| · | Financial revenue: a non-recurring effect of some credits in the third quarter of 2022 and monetary restatement related to the assignment of Extra Hiper. |
| · | Financial expenses: the cost of debt due to a higher interest rate scenario, the cost of anticipations of receivables related to the assignment of Extra Hiper, and exchange rate variation in the period. |
| 11 |
| |
NET DEBT
| INDEBTEDNESS | Consolidated | |
| (R$ Million) | 09.30.2022 | 09.30.2021 |
| Short-Term Debt | (2,224) | (2,287) |
| Loans and Financing | (2,139) | (717) |
| Debentures | (85) | (1,570) |
| Long-Term Debt | (5,616) | (7,538) |
| Loans and Financing | (2,984) | (4,039) |
| Debentures | (2,632) | (3,499) |
| Total Gross Debt | (7,840) | (9,825) |
| Cash and Financial investments | 3,860 | 4,526 |
| Net Debt | (3,980) | (5,299) |
| Adjusted EBITDA(1) | 2,259 | 2,447 |
| On balance Credit Card Receivables not discounted | 56 | 95 |
| Net Debt incl. Credit Card Receivables not discounted | (3,924) | (5,204) |
| Net Debt incl. Credit Card Receivables not discounted / | -1.7x | -2.1x |
| Adjusted EBITDA(1) | ||
(1) Adjusted EBITDA pre-IFRS 16, accrued in the last 12 months
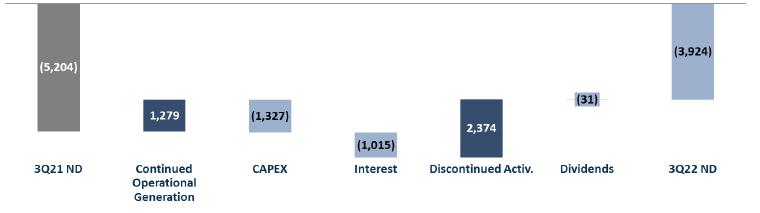
Net debt including the balance of unearned receivables in GPA consolidated reached R$ -3.9 billion, a decrease of R$ -1.2 billion as compared to 3Q21. GPA has a net debt/Adjusted EBITDA ratio of -1.7x, reducing the leverage level by -0.4x.
In the last 12 months, the group generated an operating cash flow of R$1.3 billion in the scope of continuing activities, financing our investment plan. As to the discontinued scope, Extra Hiper stores and Drugstores, presented a positive variation of R$2.4 billion, mainly due to the R$1.7 billion of discount of receivables from the hypermarket transaction, which was partially used by the increase in interest rates. The changes below are in line with the Company's financial deleveraging strategy.
Evolution of the Pro-Forma net debt (R$ million)
| 12 |
| |
INVESTMENTS
| (R$ Million) | Consolidated | |||||
| 3Q22 | 3Q21 | Δ | 9M22 | 9M21 | Δ | |
| New Stores and Land Acquisition | 54 | 19 | 188.0% | 93 | 45 | 105.0% |
| Store Renovations, Conversions and Maintenance | 175 | 72 | 144.8% | 513 | 260 | 97.4% |
| IT, Digital and Logistics | 102 | 106 | -2.9% | 194 | 270 | -28.3% |
| Total Investments GPA Brazil | 331 | 196 | 69.3% | 799 | 576 | 38.9% |
| Total Investments Grupo Éxito | 157 | 124 | 26.3% | 316 | 336 | -6.0% |
| Total Investments Consolidated | 488 | 320 | 52.6% | 1,116 | 912 | 22.3% |
Capex totaled R$488 million in 3Q22, of which R$331 million in Brazil and R$157 million in Grupo Éxito. In Brazil, the focus continues to be on adjusting the portfolio of the Pão de Açúcar banner to our latest G7 model, in addition to converting the remaining hypermarket stores to the group's other banners. In Grupo Éxito, approximately 74% in local currency was allocated to expansion, innovation, omnichannel and digital transformation activities in the period, and the remaining portion to maintenance and support of operational structures, updating of IT and logistics systems.
| 13 |
| |
ESG AT GPA
Agenda with and for society and the environment
With our sustainability strategy and GPA's activity pillars, the following are the highlights for 3Q22:
GPA BRAZIL
1) Promotion of diversity and inclusion: compared to 2021, we increased the percentage of black people on our number of employees by 30 bps, reaching 55% who self-report as black and mixed race and, in leadership positions (management and above), this number reached 40.4%. We are committed to maintaining a level of at least 50% black people on our total number of employees. In 3Q22, we became signatories of the Forum of Generations and the Future of Work, organized by the Mais Diversidade consultancy, which will discuss and provide solutions regarding generational issues in the world of work. In addition, we promoted several discussions in our 6th GPA Diversity Week, which featured several lectures and virtual events – in addition to training – with external guests and which had more than 2,700 participations and NPS of 93;
2) Fight against climate change: we continue to advance our practices and processes to reduce our greenhouse gas emissions (scope 1 and 2), in line with our commitment to reduce 38% by 2030 (base year 2015). We ended 3Q22 with an accumulated reduction of 40% compared to the same period in 2021 due to initiatives to replace refrigerant gases and maintenance of engine rooms, in line with the target established for the year of a reduction of 29.8% (versus 2021);
3) Commitment to Ethics and Transparency: we are part of different market indexes and in 3Q22 we completed our annual climate survey (Fale Na Boa), with the purpose of capturing the perception of our employees about the corporate environment. Using the NPS methodology with quantitative and qualitative questions, we had an overall rating average of 7.9 (an increase of 30 bps versus 2021) and the theme of Diversity and Sustainability was the highlight of the edition with the highest result among the other categories, reaching the score of 8.6 (versus 8.3 in 2021);
4) Transformation in the value chain: in line with our public commitment to reach 100% of sales of our Exclusive Brand eggs from cage-free hens by 2025, we reached, in September, 50% of egg sales that involve animal well-being, advancing the goal established for the year 2022;
5) Social impact and promotion of opportunities: we ended 3Q22 with more than 3.2 million supplemented meals from donations to food banks and partner social organizations, consisting of fruit, vegetables and legumes from our stores not suitable for sale, an increase of 5.5% compared to the same period of 2021. Moreover, in 3Q22, in partnership with the NGO Gerando Falcões, we launched our first social product, the Biscoito de Polvilho Qualitá 200g, with 100% of the proceeds going to the Falcons University project, which invests in the social development of the favelas in which the organization operates. In the first month alone, more than 60,000 units were sold.
GRUPO ÉXITO
| · | Zero malnutrition: 45,794 children benefited (result up to September 2022) in Éxito Fundation programs related to the fight against chronic child malnutrition in children under 5 years old. The number of beneficiaries increased by approximately 27% compared to 2Q22 and is in line with the year's goal of reaching 60,000 children benefited by the end of 2022; |
| · | Sustainable trade: we achieved 90.7% of suppliers of fruit and vegetables from production in Colombia, in line with our target of 91% by the end of the year. As to textile products, 90% of the clothes are produced in Colombia and with 80% of domestic fabric generating more than 9,600 jobs of which 70% are occupied by women in different regions of the country; |
| · | My planet: store-back recycling volume reached the expected target in the period of 15,543 tons of recyclable materials. And in relation to the volume of recycling stations (consumer), the volume exceeded the target for the period with around 671.8 tons of post-consumer recycled waste by 3Q22, around 27% more than the same period in 2021. |
| 14 |
| |
BREAKDOWN OF STORE CHANGES BY BANNERS
In 3Q22, we completed the process of converting the Extra Hiper stores, totaling 23 converted stores: 13 stores for the Pão de Açúcar format, 8 for Mercado Extra, and 2 for the Compre Bem banner. In the quarter, we opened 6 new stores in the Minuto Pão de Açúcar format and 1 in the Pão de Açúcar format, continuing our expansion plan. At Grupo Éxito, we closed 4 stores for conversion in Colombia and opened another 3 stores converted to the Carulla Fresh Market model, in addition to 4 new stores in the Éxito WOW format (3 stores) and Surtimayorista (1 store). In Argentina, five new Mayorista banner stores were opened.
| 2Q22 | 3Q22 | ||||||
| No. of Stores | Openings | Openings by conversion | Closing | Closing to conversion | No of. Stores | Sales area ('000 sq. m.) | |
| GPA Brazil | 694 | 7 | 14 | -2 | -14 | 699 | 641 |
| Pão de Açúcar | 179 | 1 | 10 | 0 | 0 | 190 | 266 |
| Mercado Extra | 149 | 0 | 4 | 0 | 0 | 153 | 187 |
| Compre Bem | 30 | 0 | 0 | 0 | 0 | 30 | 39 |
| Mini Extra | 141 | 0 | 0 | 0 | 0 | 141 | 35 |
| Minuto Pão de Açúcar | 100 | 6 | 0 | 0 | 0 | 106 | 26 |
| Gas stations | 74 | 0 | 0 | 0 | 0 | 74 | 58 |
| Stores under Conversion / Analysis | 21 | 0 | 0 | -2 | -14 | 5 | 29 |
| Grupo Éxito | 601 | 9 | 3 | -7 | -4 | 602 | 1,033 |
| Colombia | 485 | 4 | 3 | -5 | -4 | 483 | 836 |
| Uruguay | 91 | 0 | 0 | -1 | 0 | 90 | 92 |
| Argentina | 25 | 5 | 0 | -1 | 0 | 29 | 105 |
| Total Group | 1,295 | 16 | 17 | -9 | -18 | 1,301 | 1,673 |
| 15 |
| |
CONSOLIDATED FINANCIAL STATEMENTS
Balance Sheet
| BALANCE SHEET | |||||||
| (R$ Million) | ASSETS | ||||||
| Consolidated | GPA Brazil | Grupo Éxito | |||||
| 09.30.2022 | 09.30.2021 | 09.30.2022 | 09.30.2021 | 09.30.2022 | 09.30.2021 | ||
| Current Assets | 13,844 | 14,256 | 7,504 | 8,408 | 6,270 | 5,735 | |
| Cash and Marketable Securities | 3,860 | 4,526 | 2,446 | 3,068 | 1,381 | 1,375 | |
| Accounts Receivable | 696 | 604 | 312 | 274 | 362 | 325 | |
| Credit Card | 56 | 33 | 56 | 35 | - | - | |
| Sales Vouchers and Trade Account Receivable | 613 | 533 | 202 | 163 | 390 | 363 | |
| Allowance for Doubtful Accounts | (30) | (38) | (1) | - | (30) | (38) | |
| Resulting from Commercial Agreements | 57 | 77 | 55 | 76 | 2 | 1 | |
| Inventories | 5,539 | 6,585 | 1,982 | 3,482 | 3,556 | 3,103 | |
| Recoverable Taxes | 1,817 | 1,676 | 1,129 | 1,094 | 687 | 581 | |
| Noncurrent Assets for Sale | 41 | 206 | 34 | 172 | 6 | 33 | |
| Credits with Related Parties - CP | 1,181 | - | 1,181 | - | - | - | |
| Prepaid Expenses and Other Accounts Receivables | 710 | 659 | 420 | 317 | 277 | 319 | |
| Noncurrent Assets | 29,547 | 34,440 | 13,921 | 16,193 | 15,503 | 18,165 | |
| Long-Term Assets | 4,824 | 4,608 | 4,625 | 4,351 | 185 | 278 | |
| Accounts Receivable | - | 62 | - | 59 | - | 3 | |
| Credit Cards | - | 62 | - | 59 | - | 3 | |
| Recoverable Taxes | 2,064 | 2,588 | 2,064 | 2,588 | - | - | |
| Deferred Income Tax and Social Contribution | 647 | 305 | 633 | 288 | - | - | |
| Amounts Receivable from Related Parties | 344 | 239 | 284 | 185 | 60 | 92 | |
| Judicial Deposits | 738 | 647 | 736 | 646 | 2 | 1 | |
| Prepaid Expenses and Others | 1,031 | 767 | 908 | 585 | 122 | 181 | |
| Investments | 1,239 | 1,304 | 824 | 811 | 415 | 493 | |
| Investment Properties | 2,861 | 3,403 | - | - | 2,861 | 3,403 | |
| Property and Equipment | 15,373 | 19,112 | 6,533 | 8,976 | 8,833 | 10,128 | |
| Intangible Assets | 5,250 | 6,013 | 1,939 | 2,055 | 3,209 | 3,863 | |
| TOTAL ASSETS | 43,391 | 48,696 | 21,425 | 24,601 | 21,773 | 23,900 | |
| 16 |
| |
CONSOLIDATED FINANCIAL STATEMENTS
Balance Sheet
| BALANCE SHEET | |||||||
| (R$ Million) | LIABILITIES | ||||||
| Consolidated | GPA Brazil | Grupo Éxito | |||||
| 09.30.2022 | 09.30.2021 | 09.30.2022 | 09.30.2021 | 09.30.2022 | 09.30.2021 | ||
| Current Liabilities | 12,965 | 14,291 | 5,080 | 7,267 | 7,744 | 6,838 | |
| Suppliers | 6,677 | 7,586 | 2,130 | 3,405 | 4,521 | 4,154 | |
| Loans and Financing | 2,154 | 717 | 1,018 | 106 | 1,137 | 611 | |
| Debentures | 85 | 1,570 | 85 | 1,570 | - | - | |
| Lease Liability | 815 | 1,011 | 499 | 657 | 316 | 353 | |
| Payroll and Related Charges | 737 | 853 | 345 | 458 | 378 | 382 | |
| Taxes and Social Contribution Payable | 514 | 457 | 311 | 262 | 201 | 194 | |
| Financing for Purchase of Fixed Assets | 184 | 142 | 82 | 64 | 102 | 78 | |
| Debt with Related Parties | 365 | 248 | 276 | 143 | 57 | 80 | |
| Advertisement | 17 | 40 | 17 | 39 | - | - | |
| Provision for Restructuring | 19 | 21 | 12 | 7 | 6 | 13 | |
| Unearned Revenue | 205 | 311 | 30 | 78 | 121 | 120 | |
| Others | 1,193 | 1,335 | 276 | 479 | 905 | 851 | |
| Long-Term Liabilities | 14,516 | 18,244 | 11,123 | 14,086 | 3,391 | 4,154 | |
| Loans and Financing | 2,987 | 4,048 | 2,276 | 2,929 | 710 | 1,118 | |
| Debentures | 2,632 | 3,499 | 2,632 | 3,499 | - | - | |
| Lease Liability | 5,052 | 6,936 | 3,412 | 5,084 | 1,640 | 1,851 | |
| Financing by purchasing assets | 79 | 100 | - | - | 79 | 100 | |
| Related Parties | 24 | 120 | 24 | 120 | - | - | |
| Deferred Income Tax and Social Contribution | 845 | 951 | 1 | 6 | 841 | 943 | |
| Tax Installments | 82 | 175 | 79 | 169 | 4 | 6 | |
| Provision for Contingencies | 1,664 | 1,456 | 1,570 | 1,351 | 94 | 104 | |
| Unearned Revenue | 102 | 21 | 102 | 21 | - | - | |
| Provision for loss on investment in Associates | 758 | 679 | 758 | 679 | - | - | |
| Others | 291 | 259 | 268 | 227 | 24 | 32 | |
| Shareholders' Equity | 15,910 | 16,162 | 5,221 | 3,247 | 10,638 | 12,908 | |
| Attributed to controlling shareholders | 13,539 | 13,257 | 5,221 | 3,247 | 8,270 | 10,002 | |
| Capital | 5,860 | 5,858 | 5,860 | 5,858 | - | - | |
| Capital Reserves | 308 | 285 | 308 | 285 | - | - | |
| Profit Reserves | 8,388 | 6,115 | 70 | (3,894) | 9,682 | 10,646 | |
| Other Comprehensive Results | (1,016) | 998 | (1,016) | 998 | (1,413) | (644) | |
| Minority Interest | 2,371 | 2,905 | - | - | 2,368 | 2,906 | |
| TOTAL LIABILITIES AND SHAREHOLDER'S EQUITY | 43,391 | 48,696 | 21,425 | 24,601 | 21,773 | 23,900 | |
| 17 |
| |
INCOME STATEMENT – 3rd QUARTER OF 2022
| R$ Million | Consolidated(1) | GPA Brazil | Grupo Éxito | ||||||
| 3Q22 | 3Q21 | Δ | 3Q22 | 3Q21 | Δ | 3Q22 | 3Q21 | Δ | |
| Gross Revenue | 11,561 | 10,560 | 9.5% | 4,612 | 4,170 | 10.6% | 6,930 | 6,369 | 8.8% |
| Net Revenue | 10,453 | 9,595 | 8.9% | 4,305 | 3,900 | 10.4% | 6,130 | 5,675 | 8.0% |
| Cost of Goods Sold | (7,804) | (7,105) | 9.8% | (3,270) | (2,889) | 13.2% | (4,536) | (4,212) | 7.7% |
| Depreciation (Logistics) | (52) | (78) | -33.4% | (26) | (51) | -48.6% | (26) | (27) | -4.5% |
| Gross Profit | 2,596 | 2,412 | 7.6% | 1,009 | 960 | 5.1% | 1,569 | 1,436 | 9.2% |
| Selling Expenses | (1,519) | (1,397) | 8.8% | (660) | (616) | 7.2% | (851) | (763) | 11.5% |
| General and Administrative Expenses | (416) | (393) | 6.0% | (136) | (156) | -12.3% | (266) | (223) | 19.4% |
| Selling, General and Adm. Expenses | (1,936) | (1,789) | 8.2% | (797) | (771) | 3.3% | (1,117) | (986) | 13.3% |
| Equity Income(2) | (53) | (24) | 123.2% | 16 | 12 | 36.6% | (14) | 17 | -181.1% |
| Other Operating Revenue (Expenses) | (56) | (94) | -40.2% | (48) | (72) | -33.5% | (7) | (22) | -66.0% |
| Depreciation and Amortization | (419) | (368) | 13.7% | (239) | (183) | 30.9% | (174) | (182) | -4.1% |
| Earnings before interest and Taxes - EBIT | 133 | 137 | -2.7% | (58) | (55) | 7.2% | 256 | 264 | -2.8% |
| Financial Revenue | 260 | 59 | 343.5% | 222 | 38 | 476.3% | 37 | 19 | 93.1% |
| Financial Expenses | (573) | (333) | 71.8% | (408) | (255) | 59.8% | (163) | (76) | 115.0% |
| Net Financial Result | (313) | (275) | 13.8% | (186) | (217) | -14.0% | (126) | (57) | 122.5% |
| Income (Loss) Before Income Tax | (180) | (138) | 30.1% | (245) | (271) | -9.8% | 130 | 207 | -37.0% |
| Income Tax | 36 | 125 | -71.2% | 82 | 187 | -56.4% | (45) | (62) | -27.3% |
| Net Income (Loss) Company - continuing operations | (144) | (13) | 998.9% | (163) | (84) | 93.7% | 85 | 145 | -41.2% |
| Net Result from discontinued operations | (92) | (25) | 270.1% | (92) | (25) | 270.5% | - | - | - |
| Net Income (Loss) - Consolidated Company | (236) | (38) | 521.2% | (255) | (109) | 133.9% | 85 | 145 | -41.2% |
| Net Income (Loss) - Controlling Shareholders - continuing operations(3) | (196) | (65) | 203.1% | (163) | (84) | 93.7% | 34 | 94 | -63.9% |
| Net Income (Loss) - Controlling Shareholders - discontinued operations(3) | (92) | (25) | 270.1% | (92) | (25) | 270.5% | - | - | - |
| Net Income (Loss) - Consolidated Controlling Shareholders(3) | (288) | (89) | 221.7% | (255) | (109) | 133.9% | 34 | 94 | -63.9% |
| Minority Interest - Non-controlling - continuing operations | 52 | 51 | 1.0% | - | - | - | 52 | 52 | -0.2% |
| Minority Interest - Non-controlling - discontinued operations | - | - | - | - | - | - | - | - | - |
| Minority Interest - Non-controlling - Consolidated | 52 | 51 | 1.0% | - | - | - | 52 | 52 | -0.2% |
| Earnings before Interest, Taxes, Depreciation, Amortization - EBITDA | 604 | 583 | 3.6% | 207 | 180 | 15.4% | 456 | 472 | -3.4% |
| Adjusted EBITDA(4) | 660 | 677 | -2.5% | 255 | 252 | 1.4% | 464 | 494 | -6.2% |
| % of Net Revenue | Consolidated(1) | GPA Brazil | Grupo Éxito | |||
| 3Q22 | 3Q21 | 3Q22 | 3Q21 | 3Q22 | 3Q21 | |
| Gross Profit | 24.8% | 25.1% | 23.4% | 24.6% | 25.6% | 25.3% |
| Selling Expenses | -14.5% | -14.6% | -15.3% | -15.8% | -13.9% | -13.5% |
| General and Administrative Expenses | -4.0% | -4.1% | -3.2% | -4.0% | -4.3% | -3.9% |
| Selling, General and Adm. Expenses | -18.5% | -18.6% | -18.5% | -19.8% | -18.2% | -17.4% |
| Equity Income(2) | -0.5% | -0.2% | 0.4% | 0.3% | -0.2% | 0.3% |
| Other Operating Revenue (Expenses) | -0.5% | -1.0% | -1.1% | -1.9% | -0.1% | -0.4% |
| Depreciation and Amortization | -4.0% | -3.8% | -5.6% | -4.7% | -2.8% | -3.2% |
| Earnings before interest and Taxes - EBIT | 1.3% | 1.4% | -1.4% | -1.4% | 4.2% | 4.6% |
| Net Financial Result | -3.0% | -2.9% | -4.3% | -5.6% | -2.1% | -1.0% |
| Income (Loss) Before Income Tax | -1.7% | -1.4% | -5.7% | -7.0% | 2.1% | 3.7% |
| Income Tax | 0.3% | 1.3% | 1.9% | 4.8% | -0.7% | -1.1% |
| Net Income (Loss) Company - continuing operations | -1.4% | -0.1% | -3.8% | -2.2% | 1.4% | 2.6% |
| Net Income (Loss) - Consolidated Company | -2.3% | -0.4% | -5.9% | -2.8% | 1.4% | 2.6% |
| Net Income (Loss) - Controlling Shareholders - continuing operations(3) | -1.9% | -0.7% | -3.8% | -2.2% | 0.6% | 1.6% |
| Net Income (Loss) - Consolidated Controlling Shareholders(3) | -2.8% | -0.9% | -5.9% | -2.8% | 0.6% | 1.6% |
| Minority Interest - Non-controlling - continuing operations | 0.5% | 0.5% | 0.0% | 0.0% | 0.8% | 0.9% |
| Minority Interest - Non-controlling - Consolidated | 0.5% | 0.5% | 0.0% | 0.0% | 0.8% | 0.9% |
| Earnings before Interest, Taxes, Depreciation, Amortization - EBITDA | 5.8% | 6.1% | 4.8% | 4.6% | 7.4% | 8.3% |
| Adjusted EBITDA(4) | 6.3% | 7.1% | 5.9% | 6.5% | 7.6% | 8.7% |
(1) Consolidated considering the result of other supplementary businesses
(2) Equity income includes the result of CDiscount in the Consolidated
(3) Net income after non-controlling shareholders’ interest
(4) Adjusted by Other Operating Revenue (Expenses)
| 18 |
| |
CASH FLOW – CONSOLIDATED
| STATEMENT OF CASH FLOW | ||
| (R$ million) | Consolidated | |
| 09/30/2022 | 09/30/2021 | |
| Net Income (loss) for the period | 1,057 | 119 |
| Deferred income tax | (37) | (383) |
| Loss (gain) on disposal of fixed and intangible assets | (2,637) | 116 |
| Depreciation and amortization | 1,436 | 1,621 |
| Interests and exchange variation | 1,281 | 928 |
| Equity Income | 195 | 37 |
| Provision for contingencies | 342 | 125 |
| Provision for write-offs and losses | - | 4 |
| Share-Based Compensation | 17 | 20 |
| Allowance for doubtful accounts | 31 | 45 |
| Net profit (loss) per dilution of shareholding interests | - | (1) |
| Provision for obsolescence/breakage | (44) | (18) |
| Appropriable revenue | (103) | (91) |
| Gain on sale of subsidiary | 1 | - |
| Loss (gain) on write-off of lease liabilities | (186) | (147) |
| Asset (Increase) decreases | ||
| Accounts receivable | 64 | 29 |
| Inventories | (661) | (189) |
| Taxes recoverable | 216 | (173) |
| Dividends received | 16 | - |
| Other Assets | (423) | (95) |
| Related parties | (370) | (79) |
| Restricted deposits for legal proceeding | (19) | (90) |
| Liability (Increase) decrease | ||
| Suppliers | (2,618) | (3,494) |
| Payroll and charges | (26) | (31) |
| Taxes and Social contributions payable | 132 | 79 |
| Other Accounts Payable | (378) | 184 |
| Contingencies | (213) | (112) |
| Deferred revenue | (7) | 68 |
| Taxes and Social contributions paid | (286) | (260) |
| Net cash generated from (used) in operating activities | (3,220) | (1,788) |
| Acquisition of property and equipment | (953) | (734) |
| Increase Intangible assets | (163) | (176) |
| Sales of property and equipment | 3,300 | 203 |
| Acquisition of property for investment | (63) | (93) |
| Net cash from incorporations | - | (1) |
| Net cash flow investment activities | 2,121 | (801) |
| Cash flow from financing activities | ||
| Capital increase | 1 | 8 |
| Funding and refinancing | 1,064 | 4,160 |
| Payments of loans and financing | (2,772) | (3,696) |
| Dividend Payment | (187) | (737) |
| Company acquisition | (3) | (3) |
| Resources obtained from the offering of shares and non-controlling shareholders | - | 14 |
| Transactions with minorities | (8) | (5) |
| Lease liability payments | (1,082) | (1,148) |
| Net cash generated from (used) in financing activities | (2,987) | (1,407) |
| Monetary variation over cash and cash equivalents | (328) | (189) |
| Increase (decrease) in cash and cash equivalents | (4,414) | (4,185) |
| Cash and cash equivalents at the beginning of the year | 8,274 | 8,711 |
| Cash and cash equivalents at the end of the year | 3,860 | 4,526 |
| Change in cash and cash equivalents | (4,414) | (4,185) |
| 19 |
| |
BREAKDOWN OF SALES BY BUSINESS – BRAZIL
| (R$ Million) | Breakdown of Net Sales by Business | |||||
| 3Q22 | 3Q21 | Δ | 9M22 | 9M21 | Δ | |
| Pão de Açúcar | 1,913 | 1,706 | 12.1% | 5,408 | 5,146 | 5.1% |
| Mercado Extra/Compre Bem | 1,345 | 1,197 | 12.4% | 3,851 | 3,652 | 5.4% |
| Proximity(1) | 647 | 516 | 25.4% | 1,784 | 1,521 | 17.3% |
| Gas Stations | 319 | 411 | -22.4% | 1,079 | 1,294 | -16.6% |
| Other Business(2) | 81 | 70 | 14.6% | 243 | 213 | 14.1% |
| New GPA Brazil | 4,305 | 3,900 | 10.4% | 12,365 | 11,826 | 4.6% |
| Extra Hiper | 37 | 2,380 | -98.4% | 864 | 7,395 | -88.3% |
| Drugstores | 0 | 51 | -100.0% | 2 | 149 | -98.6% |
| Other Discontinued Business(3) | 3 | 59 | -94.1% | 98 | 182 | -45.9% |
| GPA Brazil | 4,346 | 6,389 | -32.0% | 13,329 | 19,551 | -31.8% |
(1) Includes sales of Mini Extra, Minuto Pão de Açúcar, and Aliados
(2) Revenue from lease of commercial centers
(3) Revenue from lease of commercial centers of discontinued operations
| 20 |
SIGNATURES
Pursuant to the requirement of the Securities Exchange Act of 1934, the registrant has duly caused this report to be signed on its behalf by the undersigned, thereunto duly authorized.
| COMPANHIA BRASILEIRA DE DISTRIBUIÇÃO | |||
| Date: November 3, 2022 | By: /s/ Marcelo Pimentel | ||
| Name: | Marcelo Pimentel | ||
| Title: | Chief Executive Officer | ||
| By: /s/ Guillaume Marie Didier Gras | |||
| Name: | Guillaume Marie Didier Gras | ||
| Title: | Investor Relations Officer | ||
FORWARD-LOOKING STATEMENTS
This press release may contain forward-looking statements. These statements are statements that are not historical facts, and are based on management's current view and estimates offuture economic circumstances, industry conditions, company performance and financial results. The words "anticipates", "believes", "estimates", "expects", "plans" and similar expressions, as they relate to the company, are intended to identify forward-looking statements. Statements regarding the declaration or payment of dividends, the implementation of principal operating and financing strategies and capital expenditure plans, the direction of future operations and the factors or trends affecting financial condition, liquidity or results of operations are examples of forward-looking statements. Such statements reflect the current views of management and are subject to a number of risks and uncertainties. There is no guarantee that the expected events, trends or results will actually occur. The statements are based on many assumptions and factors, including general economic and market conditions, industry conditions, and operating factors. Any changes in such assumptions or factors could cause actual results to differ materially from current expectations.