
Fourth Quarter 2017 Earnings Call February 1, 2018
Important Information Forward Looking Statements This presentation contains forward-looking statements. SmartFinancial cautions you that a number of important factors could cause actual results to differ materially from those currently anticipated in any forward-looking statement. Such factors include, but are not limited to: the expected revenue synergies and cost savings from the proposed merger with Tennessee Bancshares, Inc. (the “Tennessee Bancshares merger”) or the recently completed merger with Capstone Bancshares, Inc. (the “Capstone merger”) may not be fully realized or may take longer than anticipated to be realized; the disruption from either the Tennessee Bancshares merger or the Capstone merger with customers, suppliers or employees or other business partners’ relationships; the risk of successful integration of our business with that of Tennessee Bancshares or Capstone; the amount of costs, fees, expenses, and charges related to Tennessee Bancshares merger; the risk that the shareholders of Tennessee Bancshares may not approve the Tennessee Bancshares merger; risks of expansion into new geographic or product markets, like the proposed expansion into the Nashville, TN MSA associated with the proposed Tennessee Bancshares merger; changes in management’s plans for the future, prevailing economic and political conditions, particularly in our market area; credit risk associated with our lending activities; changes in interest rates, loan demand, real estate values and competition; changes in accounting principles, policies, and guidelines; changes in any applicable law, rule, regulation or practice with respect to tax or legal issues; and other economic, competitive, governmental, regulatory and technological factors affecting our operations, pricing, products and services and other factors that may be described in our annual report on Form 10-K and quarterly reports on Form 10-Q as filed with the Securities and Exchange Commission from time to time. The forward-looking statements are made as of the date of this presentation, and, except as may be required by applicable law or regulation, SmartFinancial assumes no obligation to update the forward-looking statements or to update the reasons why actual results could differ from those projected in the forward-looking statements. Non-GAAP Measures Statements included in this presentation include non-GAAP financial measures and should be read along with the accompanying tables, which provide a reconciliation of non-GAAP financial measures to GAAP financial measures. SmartFinancial management uses non-GAAP financial measures, including: (i) net operating earnings available to common shareholders; (ii) operating efficiency ratio; (iii) tangible common equity, and (iv) net interest income –ex purchase accounting. adjustments in its analysis of the company's performance. Net operating earnings available to common shareholders excludes the following from net income available to common shareholders: securities gains and losses, merger and conversion costs, OREO gain and losses, the effect of the December, 2017 tax law change, and the income tax effect of adjustments. The operating efficiency ratio excludes securities gains and losses, merger and conversion costs, and adjustment for OREO gains and losses from the efficiency ratio. Adjusted allowance for loan losses adds net acquisition accounting fair value discounts to the allowance for loan losses. Tangible common equity excludes total preferred stock, preferred stock paid in capital, goodwill, and other intangible assets. Net interest income –ex purchase accounting adjustments adds the taxable equivalent adjustment for tax free yielding assets and removes loan purchase accounting adjustments that are above the contractual loan interest amount. Management believes that non-GAAP financial measures provide additional useful information that allows readers to evaluate the ongoing performance of the company and provide meaningful comparisons to its peers. Non-GAAP financial measures should not be considered as an alternative to any measure of performance or financial condition as promulgated under GAAP, and investors should consider SmartFinancial's performance and financial condition as reported under GAAP and all other relevant information when assessing the performance or financial condition of the company. Non-GAAP financial measures have limitations as analytical tools, and investors should not consider them in isolation or as a substitute for analysis of the results or financial condition as reported under GAAP. 2
Important Information Important Information for Investors and Shareholders In connection with the Tennessee Bancshares merger, SmartFinancial intends to file a registration statement on Form S-4 with the Securities and Exchange Commission (the “SEC”) to register the shares of SmartFinancial common stock that will be issued to Tennessee Bancshares’ shareholders in connection with the transaction. The registration statement will include a proxy statement/prospectus (that will be delivered to Tennessee Bancshares’ shareholders in connection with their required approval of the proposed merger) and other relevant materials in connection with the proposed Tennessee Bancshares merger. INVESTORS AND SHAREHOLDERS ARE ENCOURAGED TO READ THE PROXY STATEMENT/PROSPECTUS WHEN IT BECOMES AVAILABLE AND ANY OTHER RELEVANT DOCUMENTS TO BE FILED WITH THE SEC IN CONNECTION WITH THE PROPOSED TRANSACTION BECAUSE THEY WILL CONTAIN IMPORTANT INFORMATION ABOUT SMARTFINANCIAL, SMARTBANK, TENNESSEE BANCSHARES, SOUTHERN COMMUNITY BANK, AND THE PROPOSED TENNESSEE BANCSHARES MERGER. Investors and shareholders may obtain free copies of these documents once they are available through the website maintained by the SEC at http://www.sec.gov. Free copies of the proxy statement/prospectus also may be obtained by contacting SmartFinancial’s Investor Relations Department at (423) 385-3009. This communication shall not constitute an offer to sell or the solicitation of an offer to buy securities, nor shall there be any sale of securities in any jurisdiction in which such offer, solicitation or sale would be unlawful prior to registration or qualification under the securities laws of such jurisdiction. SmartFinancial, Tennessee Bancshares, their directors and executive officers, and other members of management and employees may be considered participants in the solicitation of proxies in connection with the proposed transaction. Information about the directors and executive officers of SmartFinancial is set forth in SmartFinancial’s proxy statement for its 2017 annual shareholders meeting. Other information regarding the participants in the proxy solicitations and a description of their direct and indirect interests, by security holdings or otherwise, are contained in the proxy statement/prospectus and other relevant materials filed with the SEC. . 3
SMBK at-a-glance • Core franchise in East Tennessee – SmartBank founded in 2007 • Corporate Headquarters – Knoxville, Tennessee • 22 Branch Offices located in Knoxville, Pigeon Forge/Gatlinburg and Chattanooga/Cleveland regions in TN; in Tuscaloosa and southern AL; and in Pensacola, Destin and Panama City, FL. • SmartBank is currently a $1.7B+ and expected to be approximately $2B by 3Q18, after closing the Southern Community acquisition. • Business Strategy • Create a valuable Southeastern banking franchise through organic growth in strong markets coupled with an acquisition model positioning our company as a partner of choice for banks our region. • Continually improve earnings and efficiency metrics as we build out our model. • Disciplined growth strategy with a focus on strong credit metrics. • Build a solid franchise in all of our markets focusing on strong core deposit growth. • Create a strong, consistent culture with an environment where top performers want to work. 4
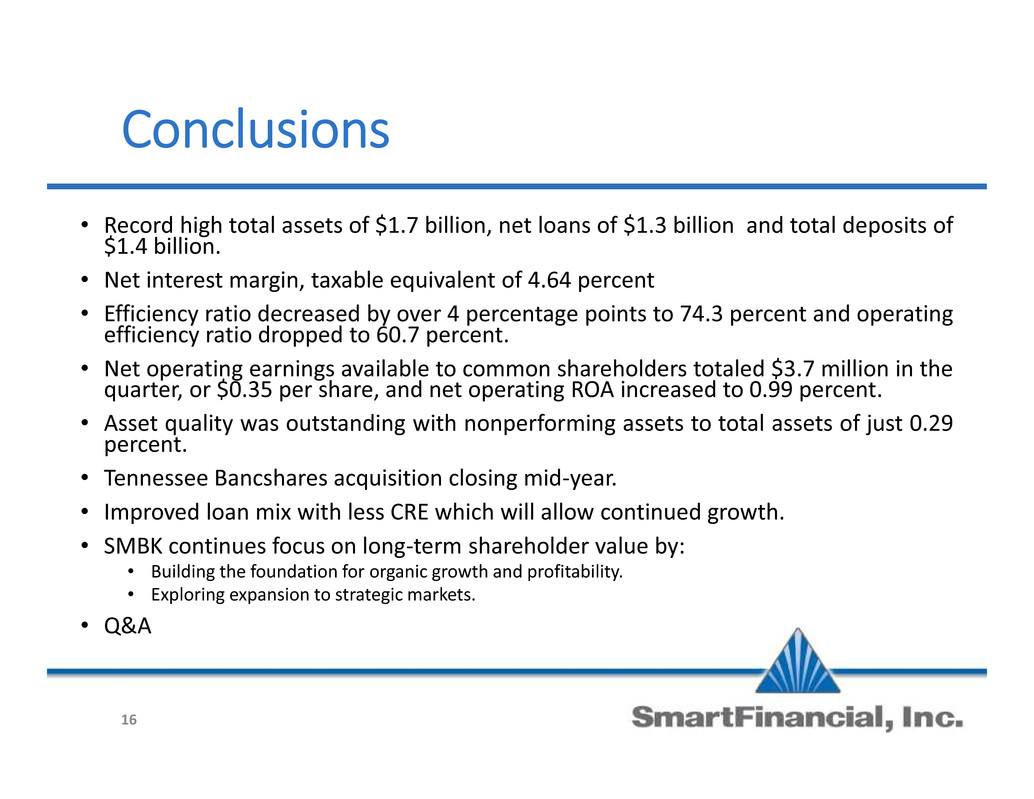
Fourth Quarter 2018 Highlights • Record high total assets of $1.7 billion, net loans of $1.3 billion, and deposits of $1.4 billion. • Net interest margin, taxable equivalent, increased to 4.64 percent in the quarter driven by higher earning asset yields. • Efficiency ratio decreased by over 4 percentage points to 74.3 percent, even after including $1.7 million merger related expenses, while operating efficiency ratio dropped to 60.7 percent. • Net operating earnings available to common shareholders totaled $3.7 million in the quarter, or $0.35 a share, and net operating ROA increased to 0.99 percent. • Asset quality was outstanding with nonperforming assets to total assets of just 0.29 percent. 5
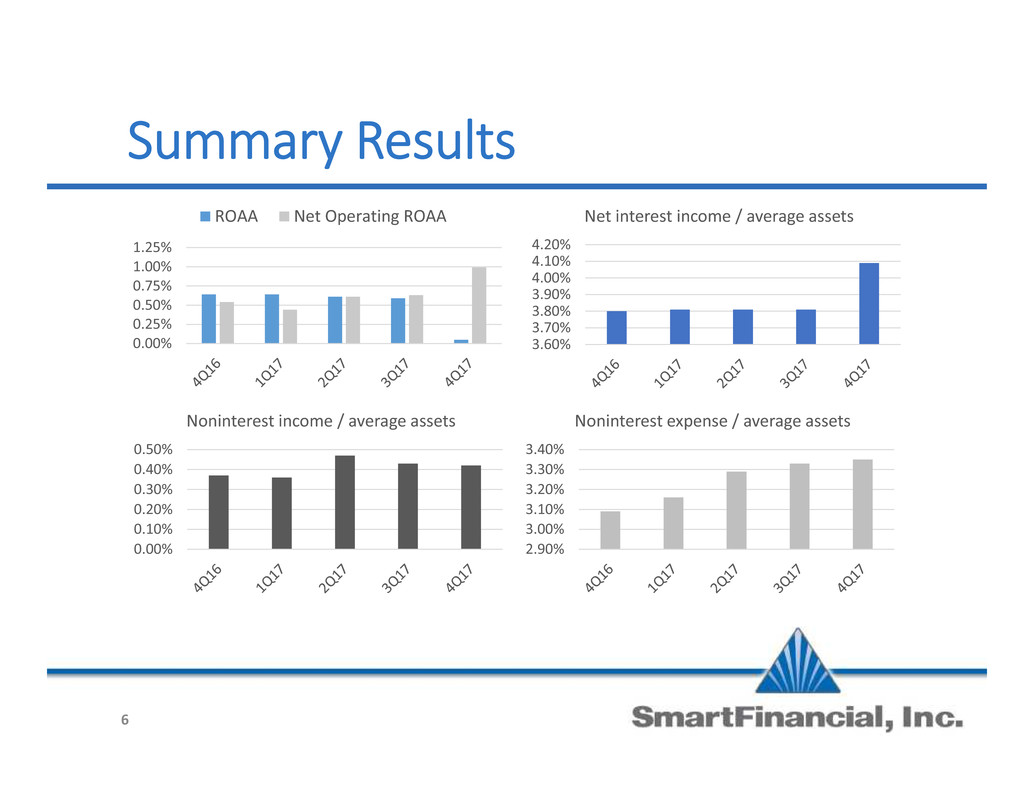
Summary Results 0.00% 0.25% 0.50% 0.75% 1.00% 1.25% ROAA Net Operating ROAA 3.60% 3.70% 3.80% 3.90% 4.00% 4.10% 4.20% Net interest income / average assets 0.00% 0.10% 0.20% 0.30% 0.40% 0.50% Noninterest income / average assets 2.90% 3.00% 3.10% 3.20% 3.30% 3.40% Noninterest expense / average assets 6
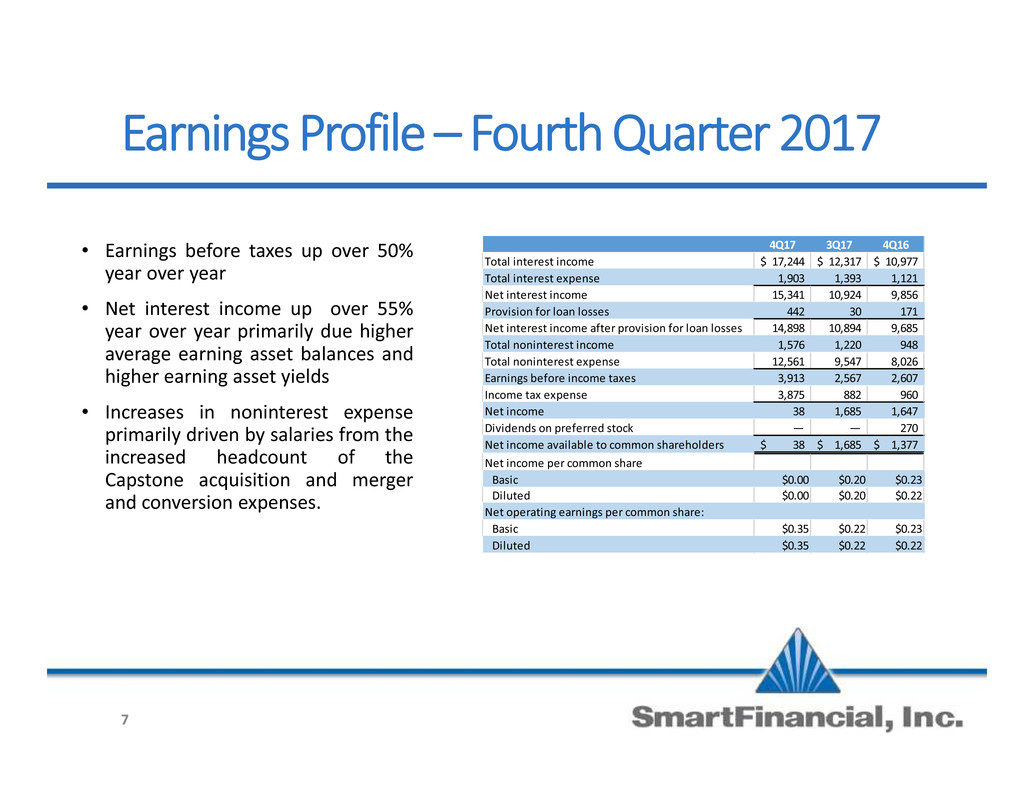
Earnings Profile – Fourth Quarter 2017 • Earnings before taxes up over 50% year over year • Net interest income up over 55% year over year primarily due higher average earning asset balances and higher earning asset yields • Increases in noninterest expense primarily driven by salaries from the increased headcount of the Capstone acquisition and merger and conversion expenses. 4Q17 3Q17 4Q16 Total interest income 17,244$ 12,317$ 10,977$ Total interest expense 1,903 1,393 1,121 Net interest income 15,341 10,924 9,856 Provision for loan losses 442 30 171 Net interest income after provision for loan losses 14,898 10,894 9,685 Total noninterest income 1,576 1,220 948 Total noninterest expense 12,561 9,547 8,026 Earnings before income taxes 3,913 2,567 2,607 Income tax expense 3,875 882 960 Net income 38 1,685 1,647 Dividends on preferred stock — — 270 Net income available to common shareholders 38$ 1,685$ 1,377$ Net income per common share Basic $0.00 $0.20 $0.23 Diluted $0.00 $0.20 $0.22 Net operating earnings per common share: Basic $0.35 $0.22 $0.23 Diluted $0.35 $0.22 $0.22 7
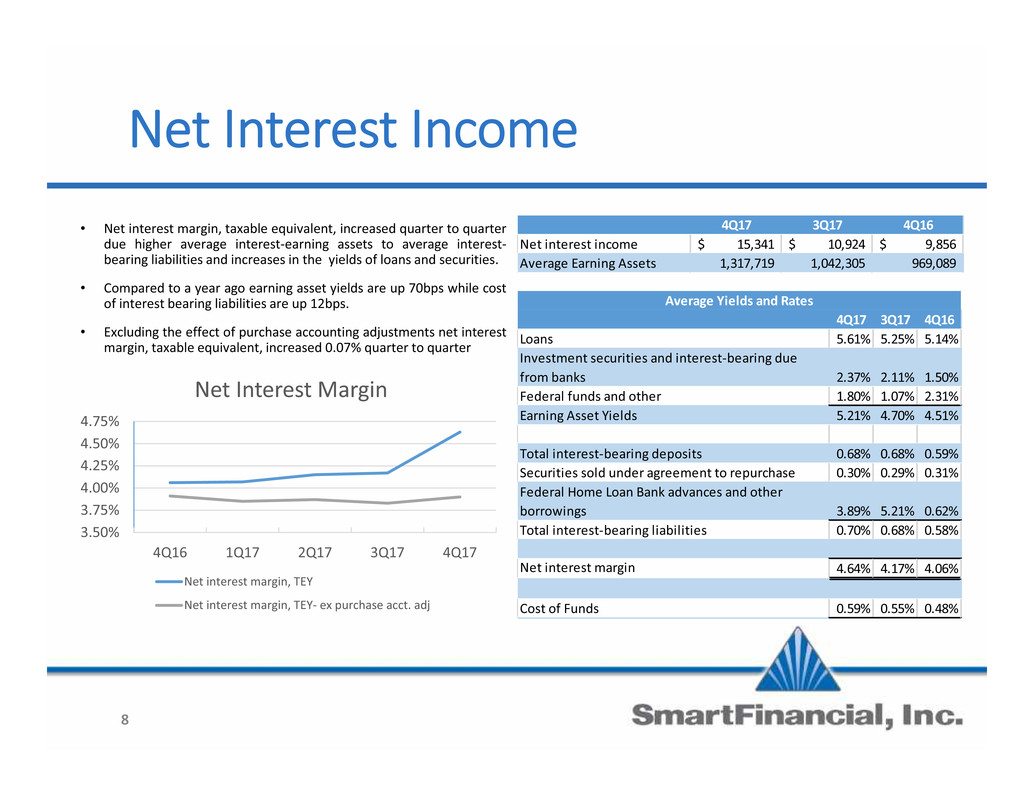
Net Interest Income • Net interest margin, taxable equivalent, increased quarter to quarter due higher average interest-earning assets to average interest- bearing liabilities and increases in the yields of loans and securities. • Compared to a year ago earning asset yields are up 70bps while cost of interest bearing liabilities are up 12bps. • Excluding the effect of purchase accounting adjustments net interest margin, taxable equivalent, increased 0.07% quarter to quarter 4Q17 3Q17 4Q16 Loans 5.61% 5.25% 5.14% Investment securities and interest-bearing due from banks 2.37% 2.11% 1.50% Federal funds and other 1.80% 1.07% 2.31% Earning Asset Yields 5.21% 4.70% 4.51% Total interest-bearing deposits 0.68% 0.68% 0.59% Securities sold under agreement to repurchase 0.30% 0.29% 0.31% Federal Home Loan Bank advances and other borrowings 3.89% 5.21% 0.62% Total interest-bearing liabilities 0.70% 0.68% 0.58% Net interest margin 4.64% 4.17% 4.06% Cost of Funds 0.59% 0.55% 0.48% Average Yields and Rates 3.50% 3.75% 4.00% 4.25% 4.50% 4.75% 4Q16 1Q17 2Q17 3Q17 4Q17 Net Interest Margin Net interest margin, TEY Net interest margin, TEY- ex purchase acct. adj 4Q17 3Q17 4Q16 Net interest income 15,341$ 10,924$ 9,856$ Average Earning Assets 1,317,719 1,042,305 969,089 8
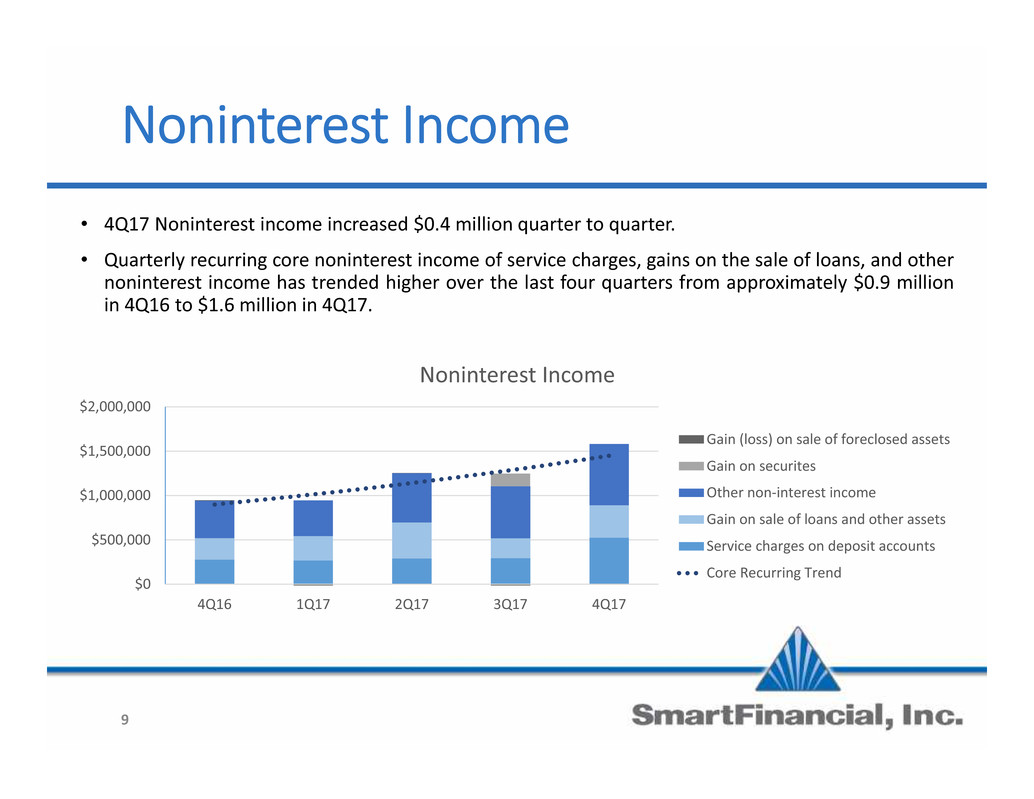
Noninterest Income • 4Q17 Noninterest income increased $0.4 million quarter to quarter. • Quarterly recurring core noninterest income of service charges, gains on the sale of loans, and other noninterest income has trended higher over the last four quarters from approximately $0.9 million in 4Q16 to $1.6 million in 4Q17. $0 $500,000 $1,000,000 $1,500,000 $2,000,000 4Q16 1Q17 2Q17 3Q17 4Q17 Noninterest Income Gain (loss) on sale of foreclosed assets Gain on securites Other non-interest income Gain on sale of loans and other assets Service charges on deposit accounts Core Recurring Trend 9
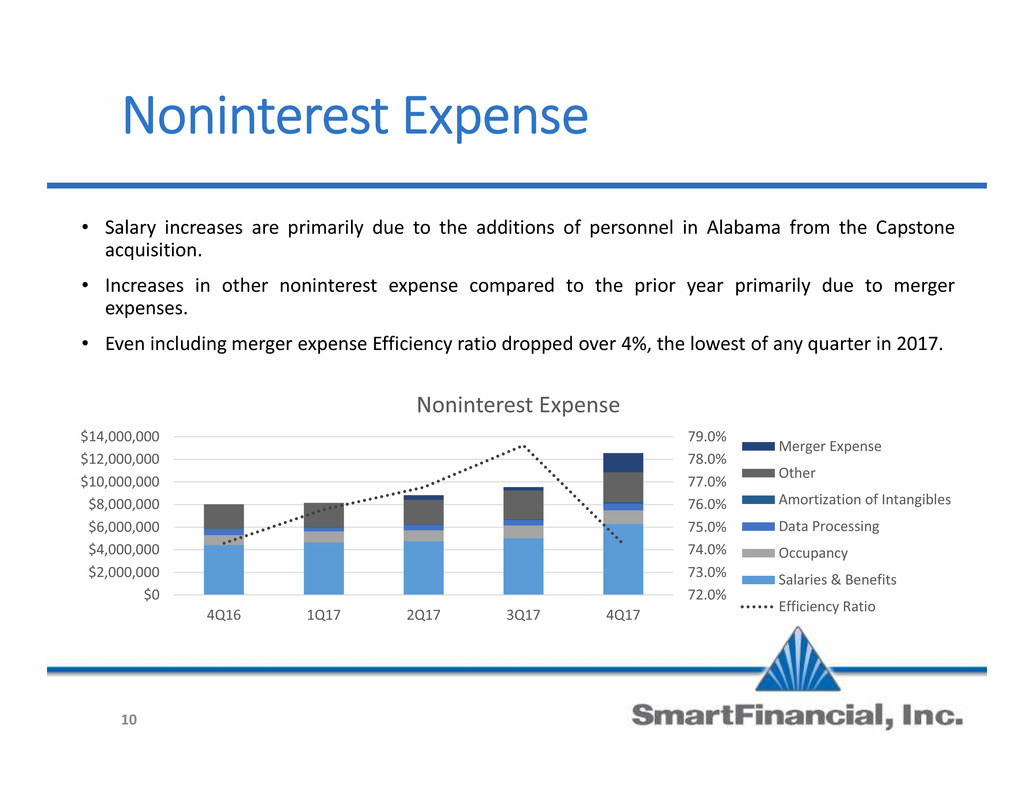
Noninterest Expense • Salary increases are primarily due to the additions of personnel in Alabama from the Capstone acquisition. • Increases in other noninterest expense compared to the prior year primarily due to merger expenses. • Even including merger expense Efficiency ratio dropped over 4%, the lowest of any quarter in 2017. 72.0% 73.0% 74.0% 75.0% 76.0% 77.0% 78.0% 79.0% $0 $2,000,000 $4,000,000 $6,000,000 $8,000,000 $10,000,000 $12,000,000 $14,000,000 4Q16 1Q17 2Q17 3Q17 4Q17 Noninterest Expense Merger Expense Other Amortization of Intangibles Data Processing Occupancy Salaries & Benefits Efficiency Ratio 10
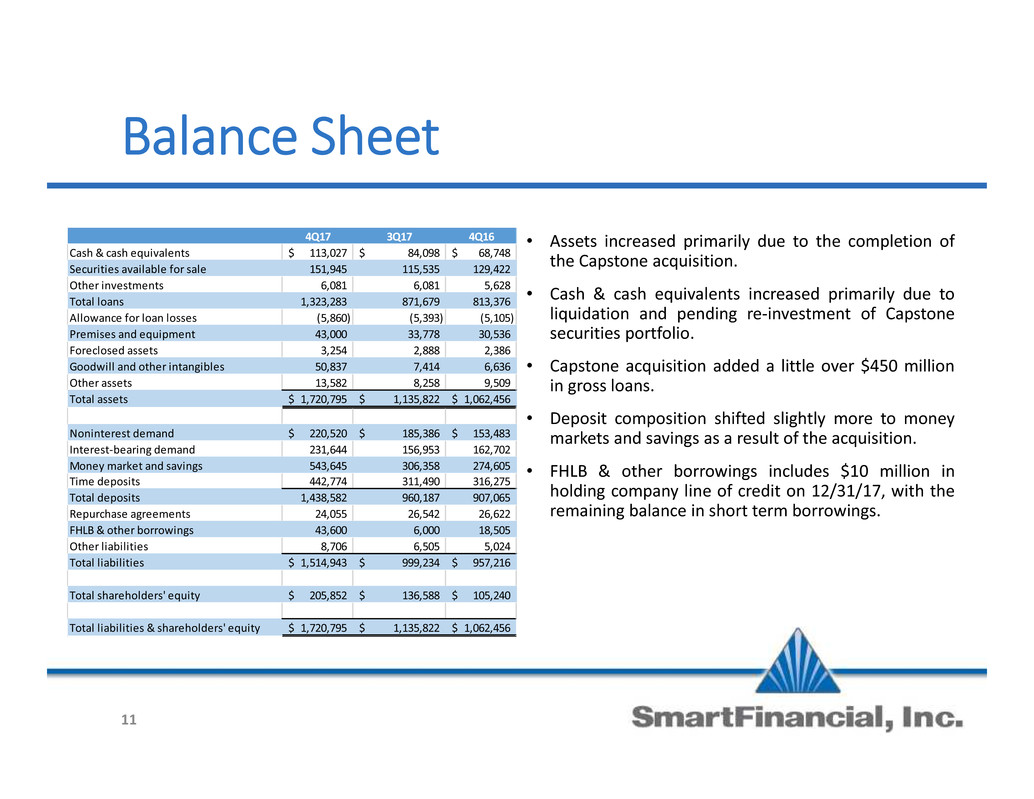
Balance Sheet • Assets increased primarily due to the completion of the Capstone acquisition. • Cash & cash equivalents increased primarily due to liquidation and pending re-investment of Capstone securities portfolio. • Capstone acquisition added a little over $450 million in gross loans. • Deposit composition shifted slightly more to money markets and savings as a result of the acquisition. • FHLB & other borrowings includes $10 million in holding company line of credit on 12/31/17, with the remaining balance in short term borrowings. 4Q17 3Q17 4Q16 Cash & cash equivalents 113,027$ 84,098$ 68,748$ Securities available for sale 151,945 115,535 129,422 Other investments 6,081 6,081 5,628 Total loans 1,323,283 871,679 813,376 Allowance for loan losses (5,860) (5,393) (5,105) Premises and equipment 43,000 33,778 30,536 Foreclosed assets 3,254 2,888 2,386 Goodwill and other intangibles 50,837 7,414 6,636 Other assets 13,582 8,258 9,509 Total assets 1,720,795$ 1,135,822$ 1,062,456$ Noninterest demand 220,520$ 185,386$ 153,483$ Interest-bearing demand 231,644 156,953 162,702 Money market and savings 543,645 306,358 274,605 Time deposits 442,774 311,490 316,275 Total deposits 1,438,582 960,187 907,065 Repurchase agreements 24,055 26,542 26,622 FHLB & other borrowings 43,600 6,000 18,505 Other liabilities 8,706 6,505 5,024 Total liabilities 1,514,943$ 999,234$ 957,216$ Total shareholders' equity 205,852$ 136,588$ 105,240$ Total liabilities & shareholders' equity 1,720,795$ 1,135,822$ 1,062,456$ 11
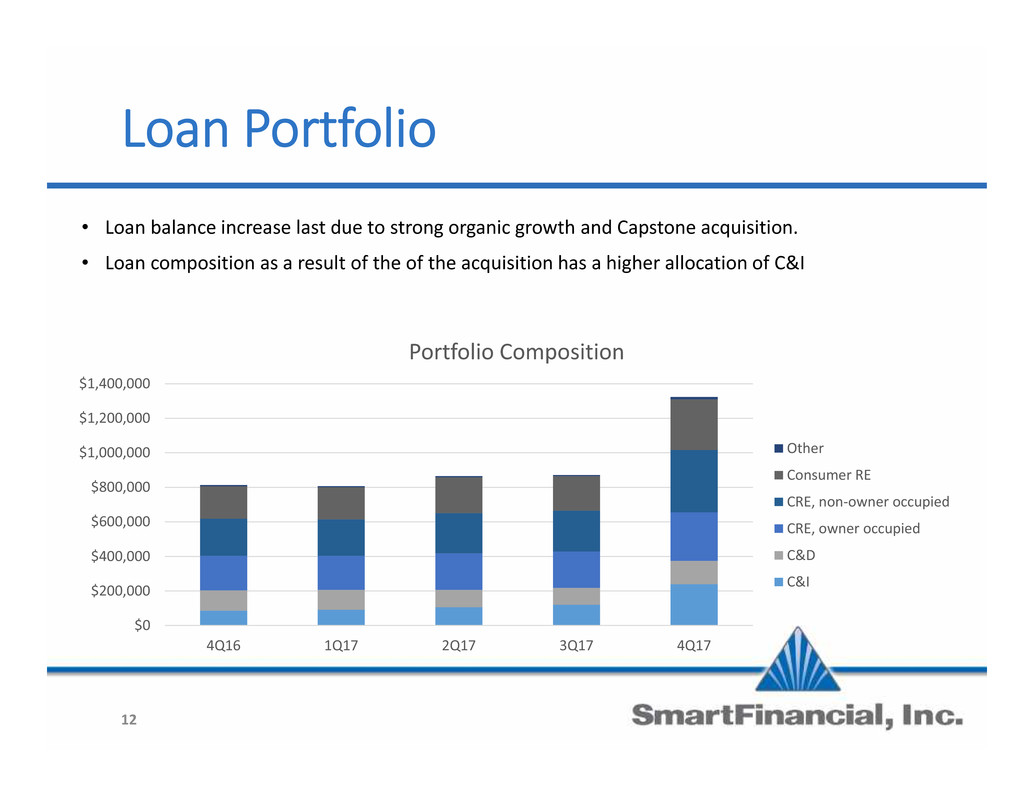
Loan Portfolio • Loan balance increase last due to strong organic growth and Capstone acquisition. • Loan composition as a result of the of the acquisition has a higher allocation of C&I $0 $200,000 $400,000 $600,000 $800,000 $1,000,000 $1,200,000 $1,400,000 4Q16 1Q17 2Q17 3Q17 4Q17 Portfolio Composition Other Consumer RE CRE, non-owner occupied CRE, owner occupied C&D C&I 12
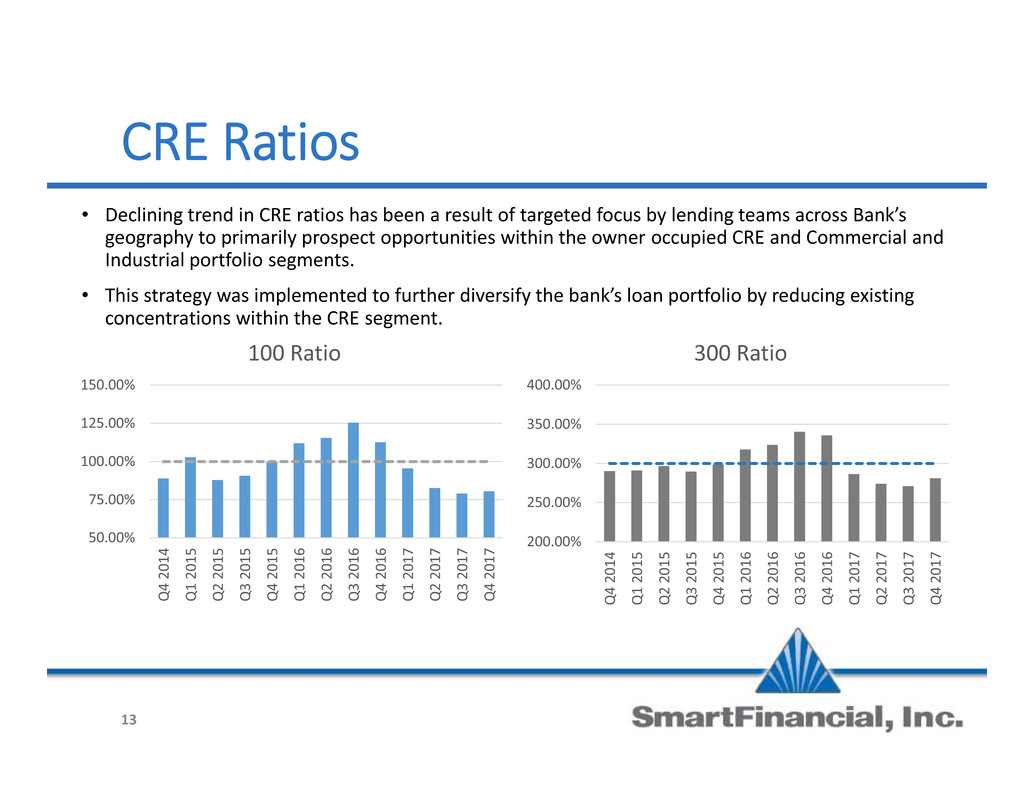
CRE Ratios • Declining trend in CRE ratios has been a result of targeted focus by lending teams across Bank’s geography to primarily prospect opportunities within the owner occupied CRE and Commercial and Industrial portfolio segments. • This strategy was implemented to further diversify the bank’s loan portfolio by reducing existing concentrations within the CRE segment. 50.00% 75.00% 100.00% 125.00% 150.00% Q4 20 14 Q1 20 15 Q2 20 15 Q3 20 15 Q4 20 15 Q1 20 16 Q2 20 16 Q3 20 16 Q4 20 16 Q1 20 17 Q2 20 17 Q3 20 17 Q4 20 17 100 Ratio 13 200.00% 250.00% 300.00% 350.00% 400.00% Q4 20 14 Q1 20 15 Q2 20 15 Q3 20 15 Q4 20 15 Q1 20 16 Q2 20 16 Q3 20 16 Q4 20 16 Q1 20 17 Q2 20 17 Q3 20 17 Q4 20 17 300 Ratio
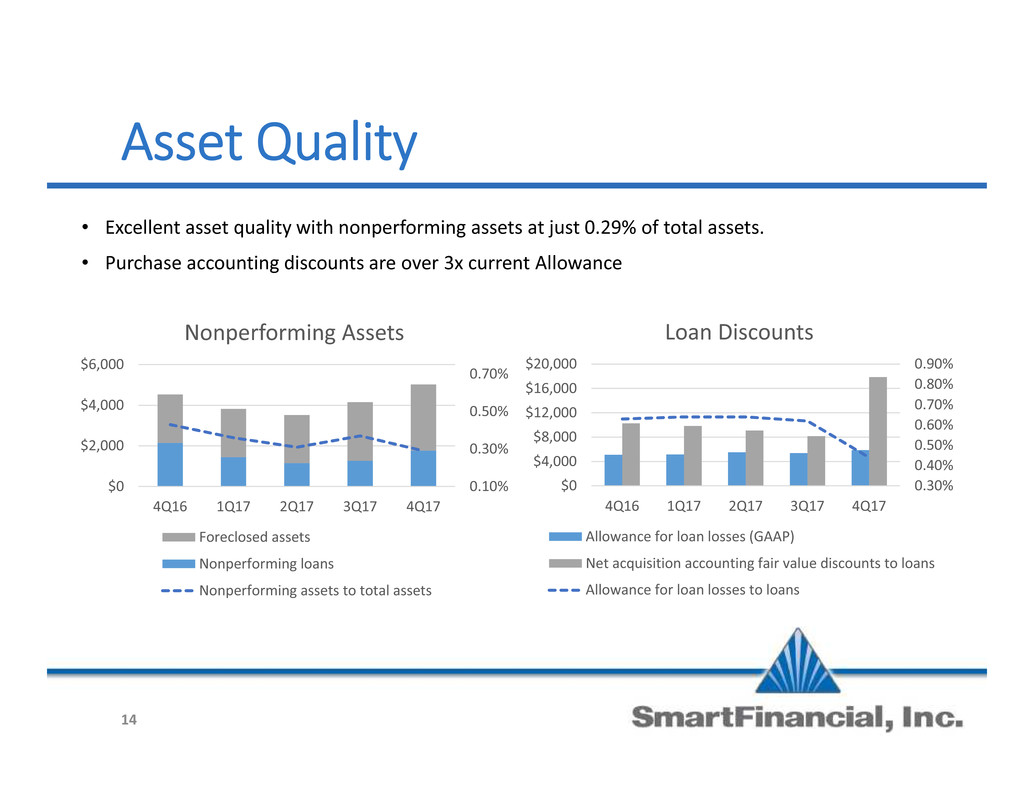
Asset Quality • Excellent asset quality with nonperforming assets at just 0.29% of total assets. • Purchase accounting discounts are over 3x current Allowance 0.10% 0.30% 0.50% 0.70% $0 $2,000 $4,000 $6,000 4Q16 1Q17 2Q17 3Q17 4Q17 Nonperforming Assets Foreclosed assets Nonperforming loans Nonperforming assets to total assets 14 0.30% 0.40% 0.50% 0.60% 0.70% 0.80% 0.90% $0 $4,000 $8,000 $12,000 $16,000 $20,000 4Q16 1Q17 2Q17 3Q17 4Q17 Loan Discounts Allowance for loan losses (GAAP) Net acquisition accounting fair value discounts to loans Allowance for loan losses to loans
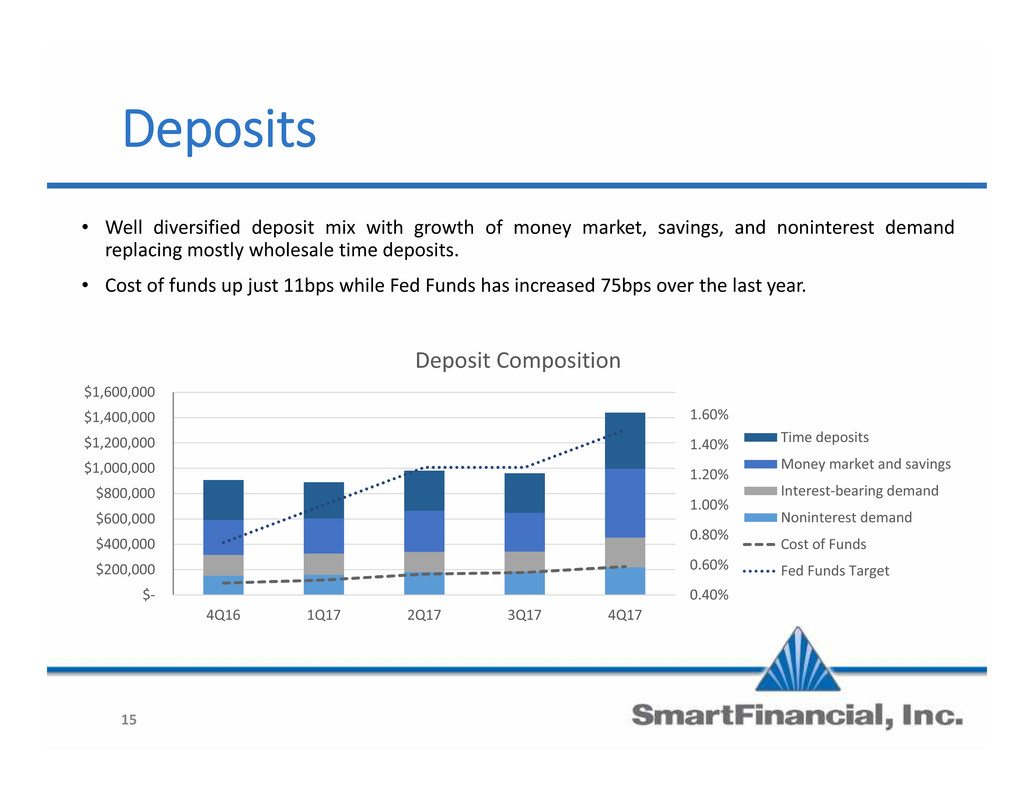
Deposits • Well diversified deposit mix with growth of money market, savings, and noninterest demand replacing mostly wholesale time deposits. • Cost of funds up just 11bps while Fed Funds has increased 75bps over the last year. 0.40% 0.60% 0.80% 1.00% 1.20% 1.40% 1.60% $- $200,000 $400,000 $600,000 $800,000 $1,000,000 $1,200,000 $1,400,000 $1,600,000 4Q16 1Q17 2Q17 3Q17 4Q17 Deposit Composition Time deposits Money market and savings Interest-bearing demand Noninterest demand Cost of Funds Fed Funds Target 15
Conclusions • Record high total assets of $1.7 billion, net loans of $1.3 billion and total deposits of$1.4 billion. • Net interest margin, taxable equivalent of 4.64 percent • Efficiency ratio decreased by over 4 percentage points to 74.3 percent and operatingefficiency ratio dropped to 60.7 percent. • Net operating earnings available to common shareholders totaled $3.7 million in thequarter, or $0.35 per share, and net operating ROA increased to 0.99 percent. • Asset quality was outstanding with nonperforming assets to total assets of just 0.29percent. • Tennessee Bancshares acquisition closing mid-year. • Improved loan mix with less CRE which will allow continued growth. • SMBK continues focus on long-term shareholder value by: • Building the foundation for organic growth and profitability. • Exploring expansion to strategic markets. • Q&A 16
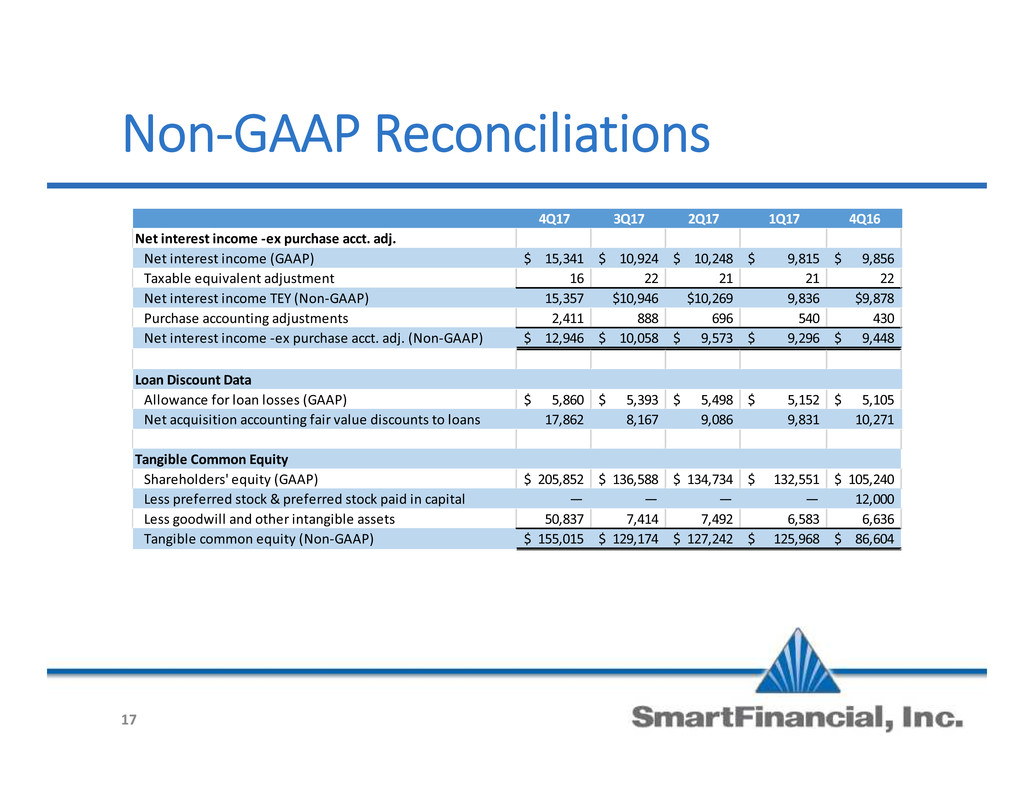
Non-GAAP Reconciliations 4Q17 3Q17 2Q17 1Q17 4Q16 Net interest income -ex purchase acct. adj. Net interest income (GAAP) 15,341$ 10,924$ 10,248$ 9,815$ 9,856$ Taxable equivalent adjustment 16 22 21 21 22 Net interest income TEY (Non-GAAP) 15,357 $10,946 $10,269 9,836 $9,878 Purchase accounting adjustments 2,411 888 696 540 430 Net interest income -ex purchase acct. adj. (Non-GAAP) 12,946$ 10,058$ 9,573$ 9,296$ 9,448$ Loan Discount Data Allowance for loan losses (GAAP) 5,860$ 5,393$ 5,498$ 5,152$ 5,105$ Net acquisition accounting fair value discounts to loans 17,862 8,167 9,086 9,831 10,271 Tangible Common Equity Shareholders' equity (GAAP) 205,852$ 136,588$ 134,734$ 132,551$ 105,240$ Less preferred stock & preferred stock paid in capital — — — — 12,000 Less goodwill and other intangible assets 50,837 7,414 7,492 6,583 6,636 Tangible common equity (Non-GAAP) 155,015$ 129,174$ 127,242$ 125,968$ 86,604$ 17
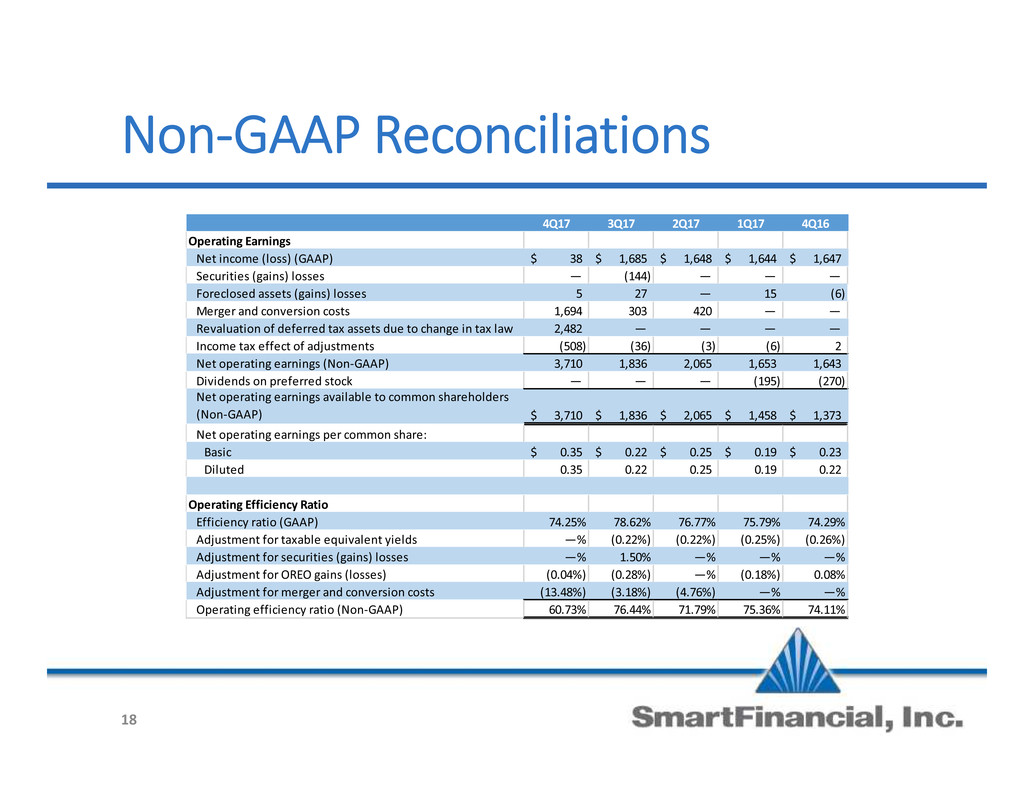
Non-GAAP Reconciliations 4Q17 3Q17 2Q17 1Q17 4Q16 Operating Earnings Net income (loss) (GAAP) 38$ 1,685$ 1,648$ 1,644$ 1,647$ Securities (gains) losses — (144) — — — Foreclosed assets (gains) losses 5 27 — 15 (6) Merger and conversion costs 1,694 303 420 — — Revaluation of deferred tax assets due to change in tax law 2,482 — — — — Income tax effect of adjustments (508) (36) (3) (6) 2 Net operating earnings (Non-GAAP) 3,710 1,836 2,065 1,653 1,643 Dividends on preferred stock — — — (195) (270) Net operating earnings available to common shareholders (Non-GAAP) 3,710$ 1,836$ 2,065$ 1,458$ 1,373$ Net operating earnings per common share: Basic 0.35$ 0.22$ 0.25$ 0.19$ 0.23$ Diluted 0.35 0.22 0.25 0.19 0.22 Operating Efficiency Ratio Efficiency ratio (GAAP) 74.25% 78.62% 76.77% 75.79% 74.29% Adjustment for taxable equivalent yields —% (0.22%) (0.22%) (0.25%) (0.26%) Adjustment for securities (gains) losses —% 1.50% —% —% —% Adjustment for OREO gains (losses) (0.04%) (0.28%) —% (0.18%) 0.08% Adjustment for merger and conversion costs (13.48%) (3.18%) (4.76%) —% —% Operating efficiency ratio (Non-GAAP) 60.73% 76.44% 71.79% 75.36% 74.11% 18
Fourth Quarter 2017 19 Supplemental Information
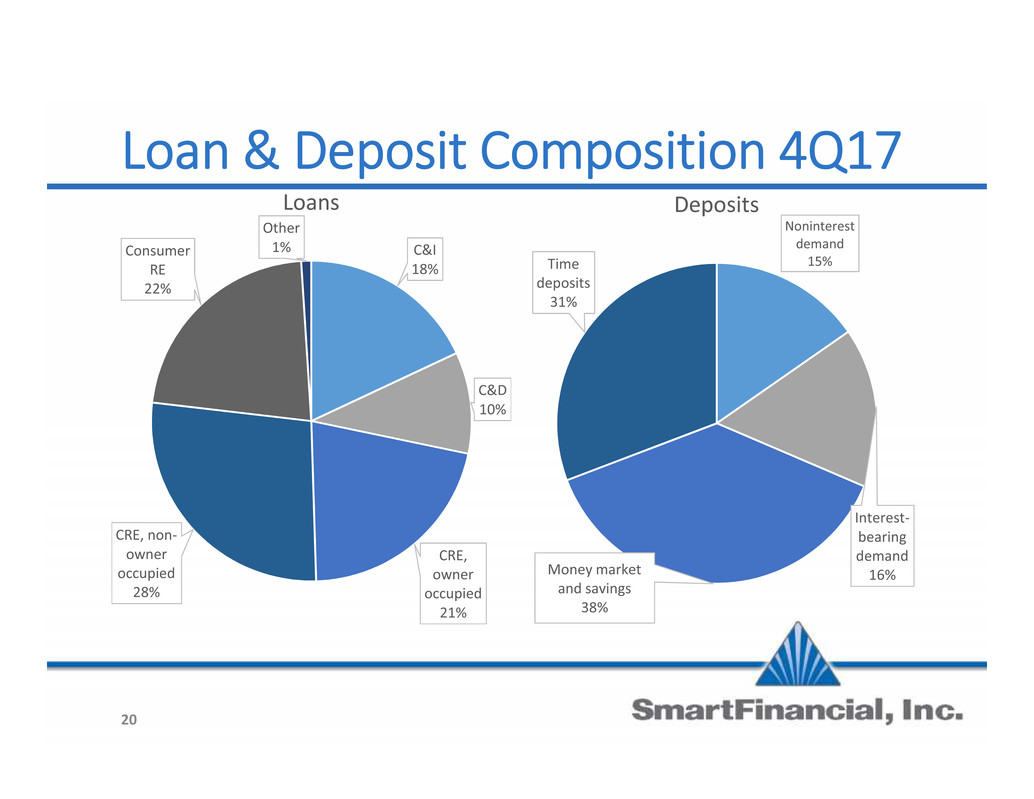
Loan & Deposit Composition 4Q17 C&I 18% C&D 10% CRE, owner occupied 21% CRE, non- owner occupied 28% Consumer RE 22% Other 1% Loans Noninterest demand 15% Interest- bearing demand 16%Money marketand savings 38% Time deposits 31% Deposits 20
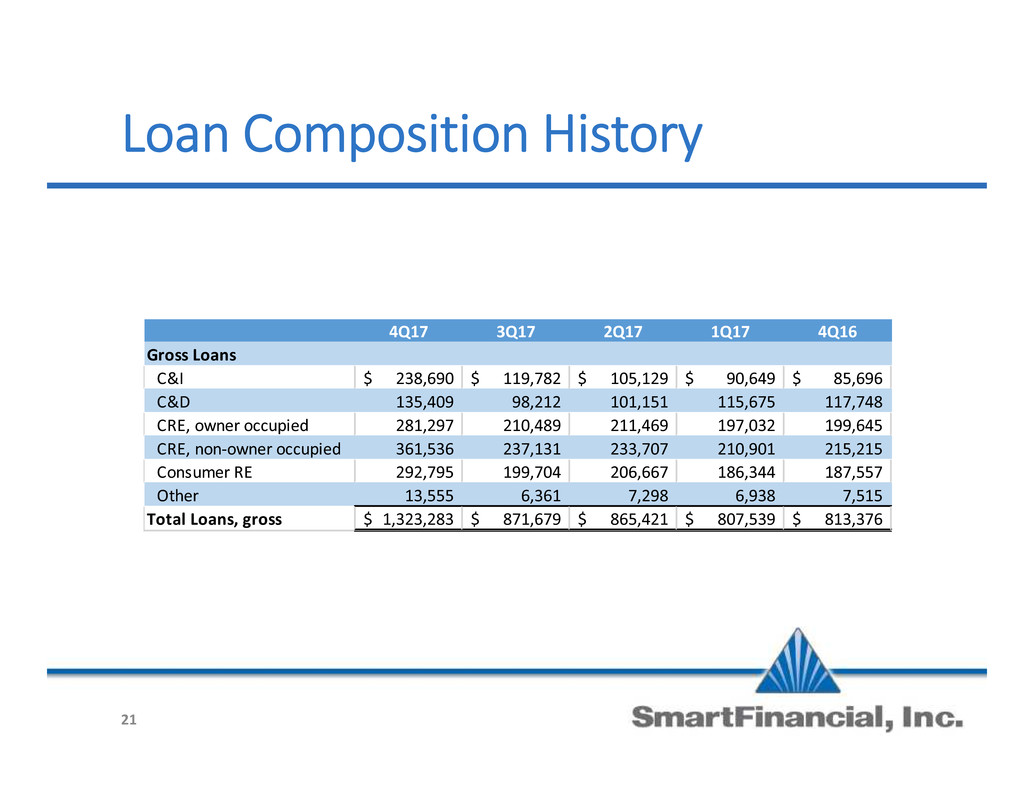
Loan Composition History 4Q17 3Q17 2Q17 1Q17 4Q16 Gross Loans C&I 238,690$ 119,782$ 105,129$ 90,649$ 85,696$ C&D 135,409 98,212 101,151 115,675 117,748 CRE, owner occupied 281,297 210,489 211,469 197,032 199,645 CRE, non-owner occupied 361,536 237,131 233,707 210,901 215,215 Consumer RE 292,795 199,704 206,667 186,344 187,557 Other 13,555 6,361 7,298 6,938 7,515 Total Loans, gross 1,323,283$ 871,679$ 865,421$ 807,539$ 813,376$ 21
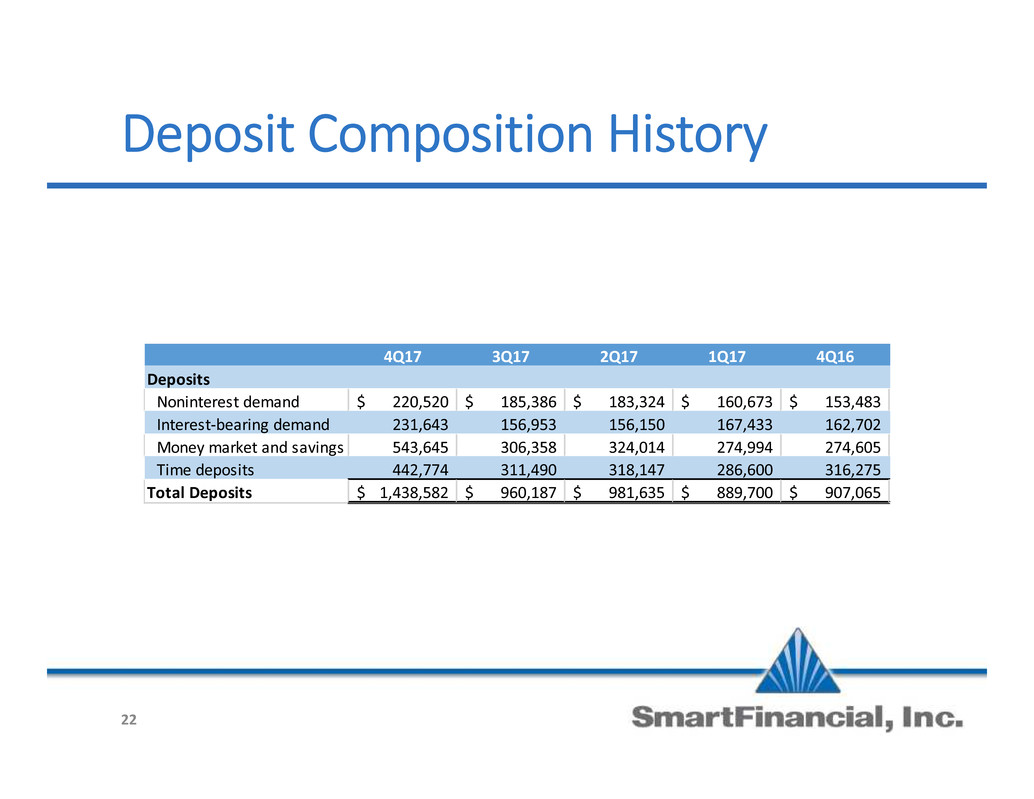
Deposit Composition History 4Q17 3Q17 2Q17 1Q17 4Q16 Deposits Noninterest demand 220,520$ 185,386$ 183,324$ 160,673$ 153,483$ Interest-bearing demand 231,643 156,953 156,150 167,433 162,702 Money market and savings 543,645 306,358 324,014 274,994 274,605 Time deposits 442,774 311,490 318,147 286,600 316,275 Total Deposits 1,438,582$ 960,187$ 981,635$ 889,700$ 907,065$ 22

Management Team 23 Billy Carroll President & CEO Miller Welborn Chairman of the Board C. Bryan Johnson Chief Financial Officer Rhett Jordan Chief Credit Officer Gary Petty Chief Risk Officer Greg Davis Chief Lending Officer


