Acquisition of Progressive Financial Group Inc. October 29, 2019
Legal Disclaimer Forward-Looking Statements Statements in this presentation may not be based on historical facts and may be “forward-looking statements” within the meaning of the Private Securities Litigation Reform Act of 1995. These forward-looking statements may be identified by reference to future period(s) or by the use of forward- looking terminology, such as “anticipate,” “estimate,” “expect,” “foresee,” “may,” “might,” “will,” “would,” “could” or “intend,” future or conditional verb tenses, and variations or negatives of such terms. These forward-looking statements include, without limitation, statements relating to the expected impact of the Proposed Transaction between SmartFinancial, Inc. (“SmartFinancial” or the “Company”) and Progressive Financial Group Inc. (“PFG”) (the “Proposed Transaction”) on the combined entities’ operations, financial condition, and financial results, (ii) expectations regarding the ability of the Company and PFG to successfully integrate the combined businesses, and (iii) the amount of cost savings and other benefits that are expected to be realized as a result of the Proposed Transaction. Readers are cautioned not to place undue reliance on the forward-looking statements contained in this presentation because actual results could differ materially from those indicated in such forward-looking statements due to a variety of factors. These factors, include, but are not limited to, the ability to obtain regulatory approvals and meet other closing conditions required to complete the Proposed Transaction, including necessary approvals by PFG’s shareholders on the expected terms and schedule, delay in closing the Proposed Transaction, difficulties and delays in integrating the PFG businesses or fully realizing cost savings from and other anticipated benefits of the Proposed Transaction, business disruption during and following the Proposed Transaction, changes in interest rates and capital markets, inflation, customer acceptance of the combined business’s products and services, and other risk factors. Other relevant risk factors may be detailed from time to time in the Company’s press releases and filings with the Securities and Exchange Commission (the “SEC”). All forward-looking statements, expressed or implied, included in this presentation are expressly qualified in their entirety by the cautionary statements contained or referred to herein. Any forward-looking statement speaks only as of the date of this presentation, and neither the Company nor PFG undertake any obligation, and each specifically declines any obligation, to revise or update these forward-looking statements, whether as a result of new information, future developments or otherwise. Non-GAAP Financial Measures Statements included in this presentation include non-GAAP financial measures and should be read along with the accompanying tables, which provide a reconciliation of non-GAAP financial measures to GAAP financial measures. The non-GAAP financial measures used in this presentation include: (i) tangible common equity, (ii) tangible book value per share, (iii) core net interest margin, (iv) operating efficiency ratio, (v) operating return on average assets, (vi) operating earnings per share, and (vii) operating return on tangible common equity. Tangible common equity excludes total preferred stock, preferred stock paid in capital, goodwill, and other intangible assets, and tangible book value per share reflects the per share value of tangible common equity. Core net interest margin adjusts net interest margin to exclude the impact of purchase accounting. The operating efficiency ratio excludes securities gains and losses and merger related expenses from the efficiency ratio. Net operating income excludes securities gains and losses and merger related expenses, and the effect of the December, 2017 tax law change on deferred tax assets, and the income tax effect of adjustments, and operating return on average assets is net operating income divided by GAAP total average assets. Operating earnings per share is net operating income divided by GAAP total average assets. Operating return on tangible common equity is net operating income divided by tangible common equity. Management believes that non-GAAP financial measures provide additional useful information that allows readers to evaluate the ongoing performance of the company and provide meaningful comparisons to its peers. Non-GAAP financial measures should not be considered as an alternative to any measure of performance or financial condition as promulgated under GAAP, and investors should consider SmartFinancial's performance and financial condition as reported under GAAP and all other relevant information when assessing the performance or financial condition of the company. Non-GAAP financial measures have limitations as analytical tools, and investors should not consider them in isolation or as a substitute for analysis of the results or financial condition as reported under GAAP. 2
Compliance Disclosures Additional Information and Where to Find It This presentation does not constitute an offer to sell or the solicitation of an offer to buy any securities or a solicitation of any vote or approval with respect to the Proposed Transaction. No offer of securities shall be made except by means of a prospectus meeting the requirements of the Securities Act of 1933, as amended, and no offer to sell or solicitation of an offer to buy shall be made in any jurisdiction in which such offer or solicitation would be unlawful. In connection with the Proposed Transaction, the Company will file with the SEC a registration statement on Form S-4 (the “Registration Statement”) that will include a proxy statement of PFG and a prospectus of the Company (the “Proxy Statement-Prospectus”), and the Company may file with the SEC other relevant documents concerning the Proposed Transaction. The definitive Proxy Statement-Prospectus will be mailed to the shareholders of PFG. SHAREHOLDERS ARE URGED TO READ THE REGISTRATION STATEMENT AND THE PROXY STATEMENT-PROSPECTUS REGARDING THE PROPOSED TRANSACTION CAREFULLY AND IN THEIR ENTIRETY WHEN THEY BECOME AVAILABLE AND ANY OTHER RELEVANT DOCUMENTS FILED WITH THE SEC BY THE COMPANY, AS WELL AS ANY AMENDMENTS OR SUPPLEMENTS TO THOSE DOCUMENTS, BECAUSE THEY WILL CONTAIN IMPORTANT INFORMATION ABOUT THE PROPOSED TRANSACTION. Free copies of the Proxy Statement-Prospectus, as well as other filings containing information about the Company, may be obtained at the SEC’s Internet site (http://www.sec.gov), when they are filed by the Company. You will also be able to obtain these documents, when they are filed, free of charge, from the Company at www.smartfinancialinc.com. Copies of the Proxy Statement-Prospectus can also be obtained, when it becomes available, free of charge, by directing a request to SmartFinancial, Inc., 5401 Kingston Pike, Suite 600, Knoxville, TN 37919, Attention: Ron Gorczynski, the Chief Financial Officer, Telephone: (865) 437-5724 or to Progressive, 500 North Main Street, Jamestown, Tennessee 38556 Attention: Ottis Phillips, Telephone: (615) 563-8011. Participants in the Solicitation The Company, PFG and certain of their directors, executive officers and employees may be deemed to be participants in the solicitation of proxies from the shareholders of PFG in connection with the Proposed Transaction. Information about the Company’s directors and executive officers is available in its proxy statement for its 2019 annual meeting of stockholders, which was filed with the SEC on March 19, 2019. Information regarding all of the persons who may, under the rules of the SEC, be deemed participants in the proxy solicitation and a description of their direct and indirect interests, by security holdings or otherwise, will be contained in the Proxy Statement-Prospectus pertaining to the Proposed Transaction and other relevant materials to be filed with the SEC when they become available. Free copies of these documents may be obtained as described in the preceding paragraph. 3
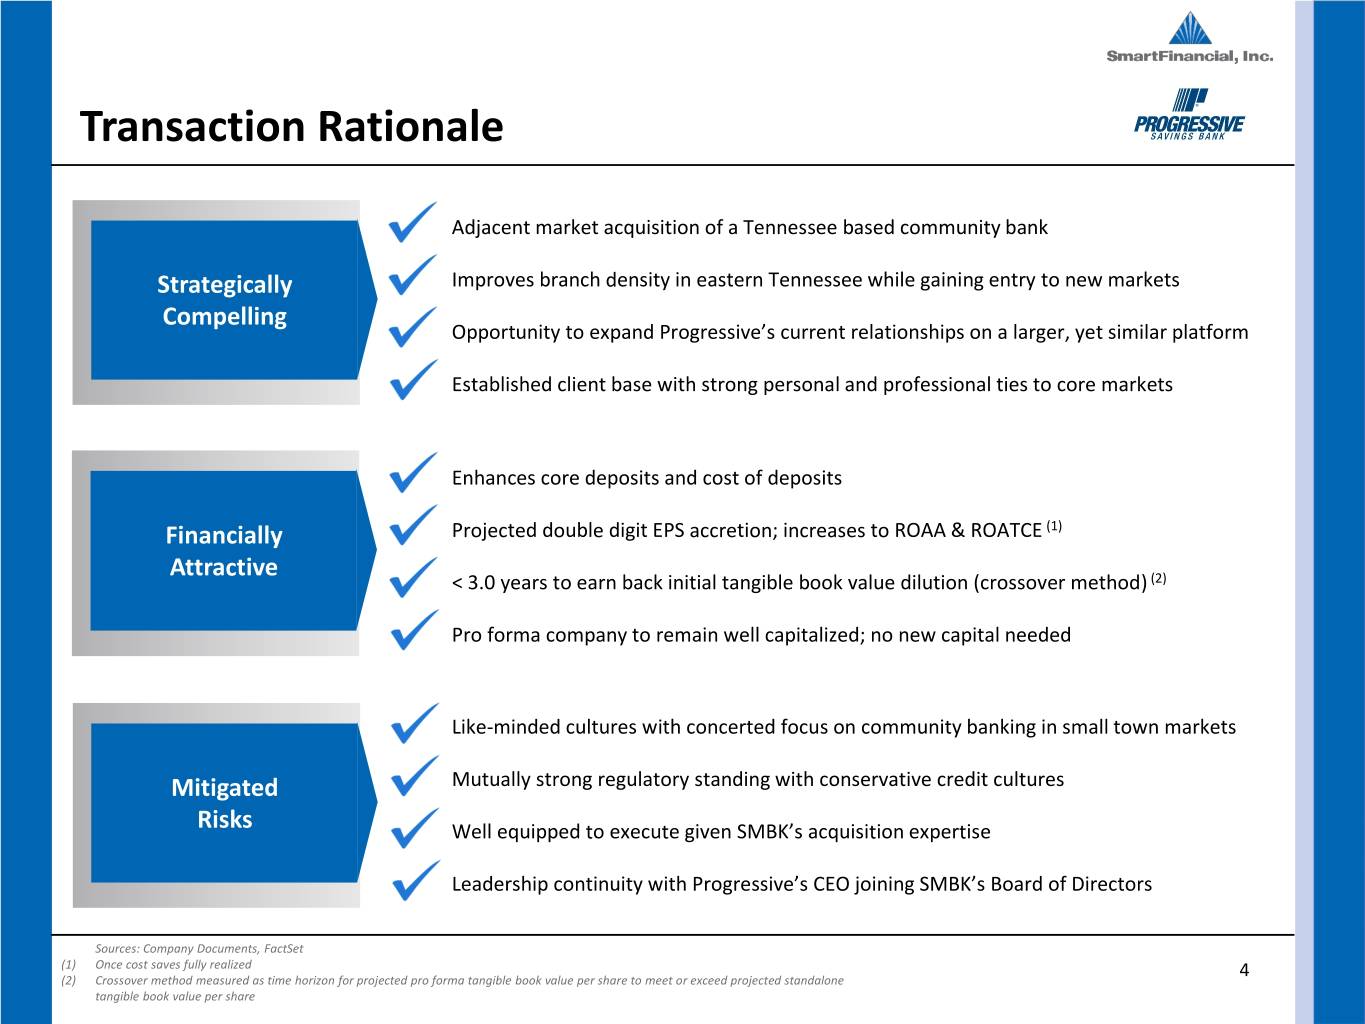
Transaction Rationale Adjacent market acquisition of a Tennessee based community bank Strategically Improves branch density in eastern Tennessee while gaining entry to new markets Compelling Opportunity to expand Progressive’s current relationships on a larger, yet similar platform Established client base with strong personal and professional ties to core markets Enhances core deposits and cost of deposits Financially Projected double digit EPS accretion; increases to ROAA & ROATCE (1) Attractive < 3.0 years to earn back initial tangible book value dilution (crossover method) (2) Pro forma company to remain well capitalized; no new capital needed Like-minded cultures with concerted focus on community banking in small town markets Mitigated Mutually strong regulatory standing with conservative credit cultures Risks Well equipped to execute given SMBK’s acquisition expertise Leadership continuity with Progressive’s CEO joining SMBK’s Board of Directors Sources: Company Documents, FactSet (1) Once cost saves fully realized 4 (2) Crossover method measured as time horizon for projected pro forma tangible book value per share to meet or exceed projected standalone tangible book value per share

Transaction Terms Announced Transaction Value (1) Calculated deal price per share of $1,997 Aggregate transaction value of $41.4 million Consideration 65% Stock; 35% cash Fixed Shares Issued 1,292,592.556 shares of SMBK common stock to be issued to Progressive shareholders Two part structure: aggregate cash payment of $14.6 million (2) 1) Tax free dividend paid by Progressive to its existing shareholders immediately prior to close equal to the accumulated adjustments account; estimated at Cash Consideration Composition ~35% of aggregate cash payment 2) Difference between aggregate cash payment and the tax-free dividend paid at closing, paid by SMBK with existing cash at the holding company Tax Treatment Tax-free reorganization at corporate level SMBK: 92% Pro Forma Ownership Progressive: 8% Board Representation Pro forma Board of Directors to consist of 12 SMBK / 1 Progressive Shareholder approvals for Progressive Required Approvals Customary regulatory approvals Expected Closing First half of 2020 Price / LTM Earnings (3): 27.0x Estimated Transaction Multiples Price / Tangible Book Value Per Share (4): 124% Note: For a reconciliation of Non-GAAP financial measures to their most directly comparable GAAP measures, see the Appendix (1) Based on SMBK’s closing price of $20.72 as of 10/28/19 (2) Subject to receipt of required approvals and satisfaction of other closing conditions 5 (3) Assumes Progressive’s LTM core earnings of $1.5 million as of 09/30/19, excluding income from Upper Cumberland Bancshares; pre-tax earnings tax effected for S-Corp status at 21% (4) Assumes Progressive’s tangible book value per share of $1,610 as of 09/30/19
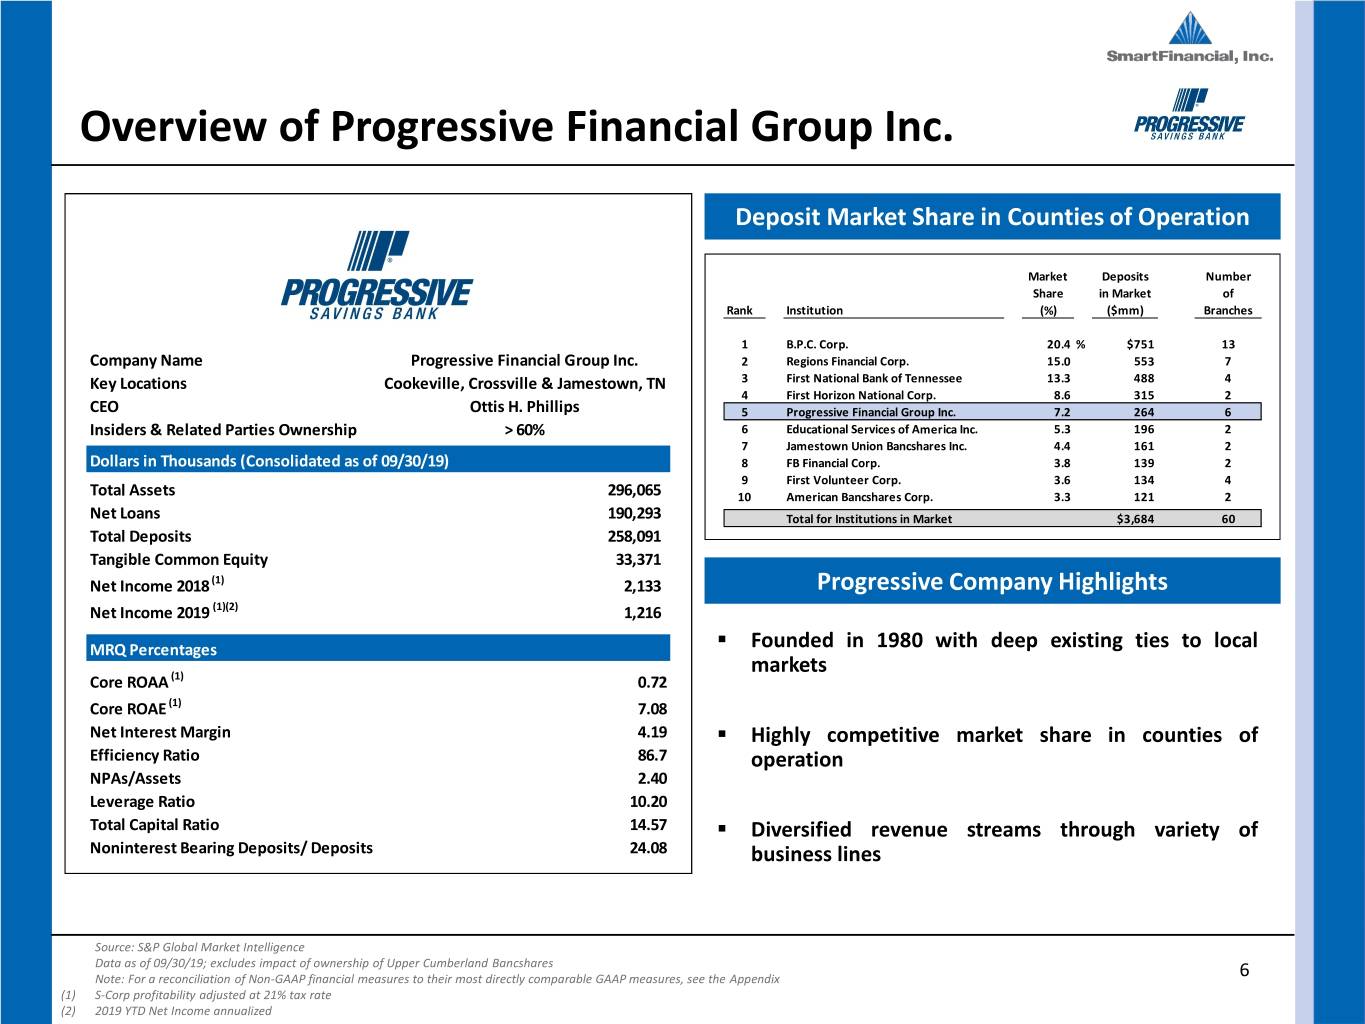
Overview of Progressive Financial Group Inc. Deposit Market Share in Counties of Operation Market Deposits Number Share in Market of Rank Institution (%) ($mm) Branches 1 B.P.C. Corp. 20.4 % $751 13 Company Name Progressive Financial Group Inc. 2 Regions Financial Corp. 15.0 553 7 Key Locations Cookeville, Crossville & Jamestown, TN 3 First National Bank of Tennessee 13.3 488 4 4 First Horizon National Corp. 8.6 315 2 CEO Ottis H. Phillips 5 Progressive Financial Group Inc. 7.2 264 6 Insiders & Related Parties Ownership > 60% 6 Educational Services of America Inc. 5.3 196 2 7 Jamestown Union Bancshares Inc. 4.4 161 2 Dollars in Thousands (Consolidated as of 09/30/19) 8 FB Financial Corp. 3.8 139 2 9 First Volunteer Corp. 3.6 134 4 Total Assets 296,065 10 American Bancshares Corp. 3.3 121 2 Net Loans 190,293 Total for Institutions in Market $3,684 60 Total Deposits 258,091 Tangible Common Equity 33,371 Net Income 2018 (1) 2,133 Progressive Company Highlights Net Income 2019 (1)(2) 1,216 MRQ Percentages . Founded in 1980 with deep existing ties to local markets Core ROAA (1) 0.72 Core ROAE (1) 7.08 Net Interest Margin 4.19 . Highly competitive market share in counties of Efficiency Ratio 86.7 operation NPAs/Assets 2.40 Leverage Ratio 10.20 Total Capital Ratio 14.57 . Diversified revenue streams through variety of Noninterest Bearing Deposits/ Deposits 24.08 business lines Source: S&P Global Market Intelligence Data as of 09/30/19; excludes impact of ownership of Upper Cumberland Bancshares Note: For a reconciliation of Non-GAAP financial measures to their most directly comparable GAAP measures, see the Appendix 6 (1) S-Corp profitability adjusted at 21% tax rate (2) 2019 YTD Net Income annualized
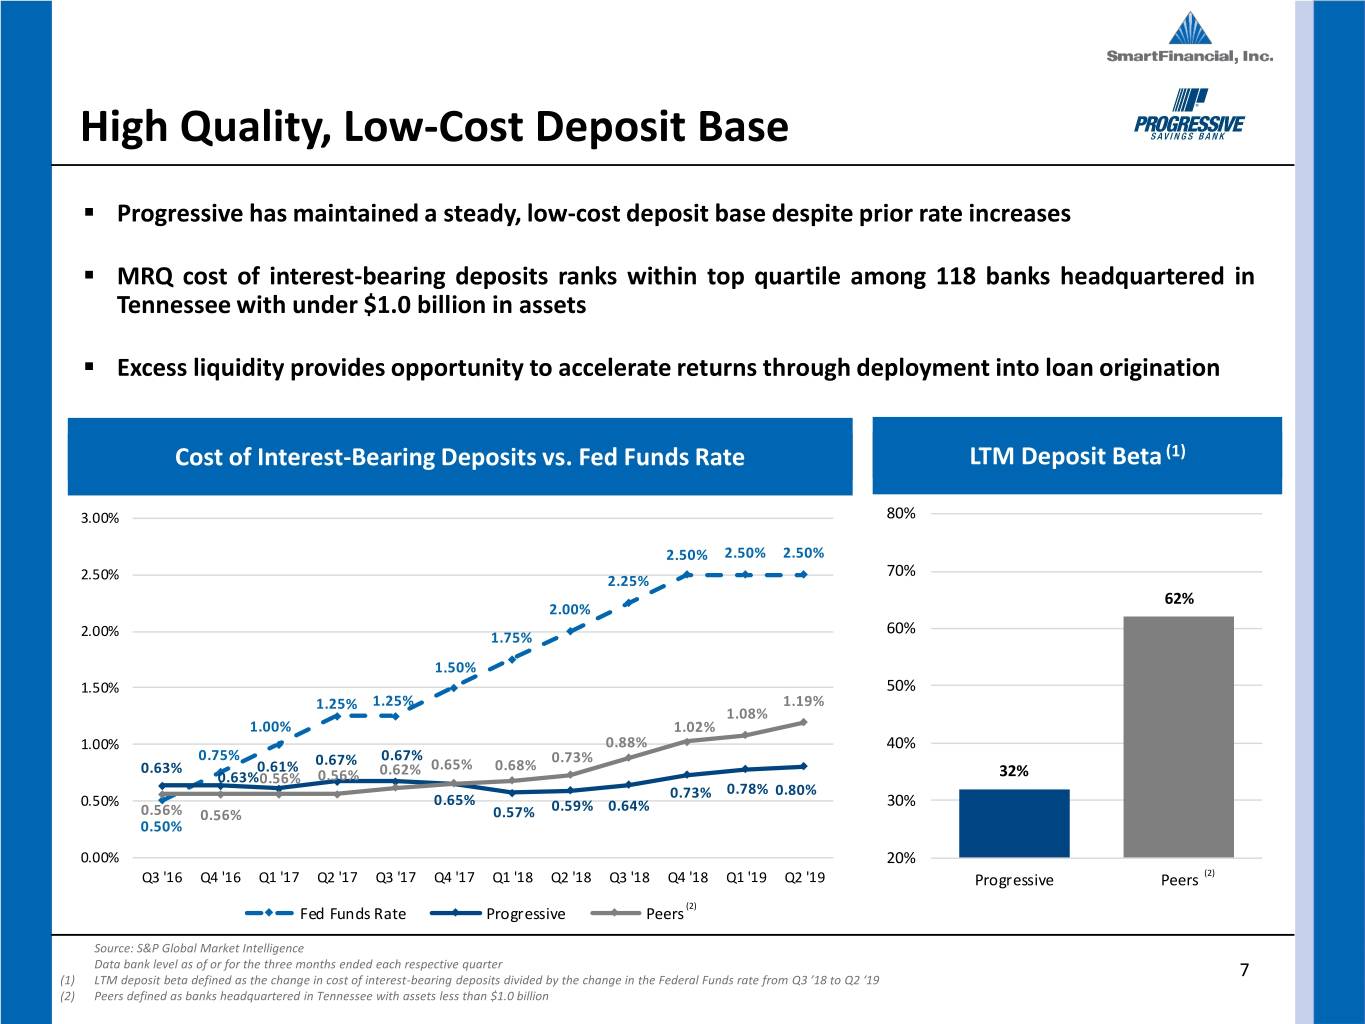
High Quality, Low-Cost Deposit Base . Progressive has maintained a steady, low-cost deposit base despite prior rate increases . MRQ cost of interest-bearing deposits ranks within top quartile among 118 banks headquartered in Tennessee with under $1.0 billion in assets . Excess liquidity provides opportunity to accelerate returns through deployment into loan origination Cost of Interest-Bearing Deposits vs. Fed Funds Rate LTM Deposit Beta (1) 3.00% 80% 2.50% 2.50% 2.50% 70% 2.50% 2.25% 62% 2.00% 60% 2.00% 1.75% 1.50% 1.50% 50% 1.25% 1.25% 1.19% 1.08% 1.00% 1.02% 1.00% 0.88% 40% 0.75% 0.67% 0.67% 0.73% 0.63% 0.61% 0.62% 0.65% 0.68% 0.63%0.56% 0.56% 32% 0.73% 0.78% 0.80% 0.50% 0.65% 0.59% 0.64% 30% 0.56% 0.56% 0.57% 0.50% 0.00% 20% Q3 '16 Q4 '16 Q1 '17 Q2 '17 Q3 '17 Q4 '17 Q1 '18 Q2 '18 Q3 '18 Q4 '18 Q1 '19 Q2 '19 Progressive Peers (2) Fed Funds Rate Progressive Peers (2) Source: S&P Global Market Intelligence Data bank level as of or for the three months ended each respective quarter (1) LTM deposit beta defined as the change in cost of interest-bearing deposits divided by the change in the Federal Funds rate from Q3 ’18 to Q2 ‘19 7 (2) Peers defined as banks headquartered in Tennessee with assets less than $1.0 billion
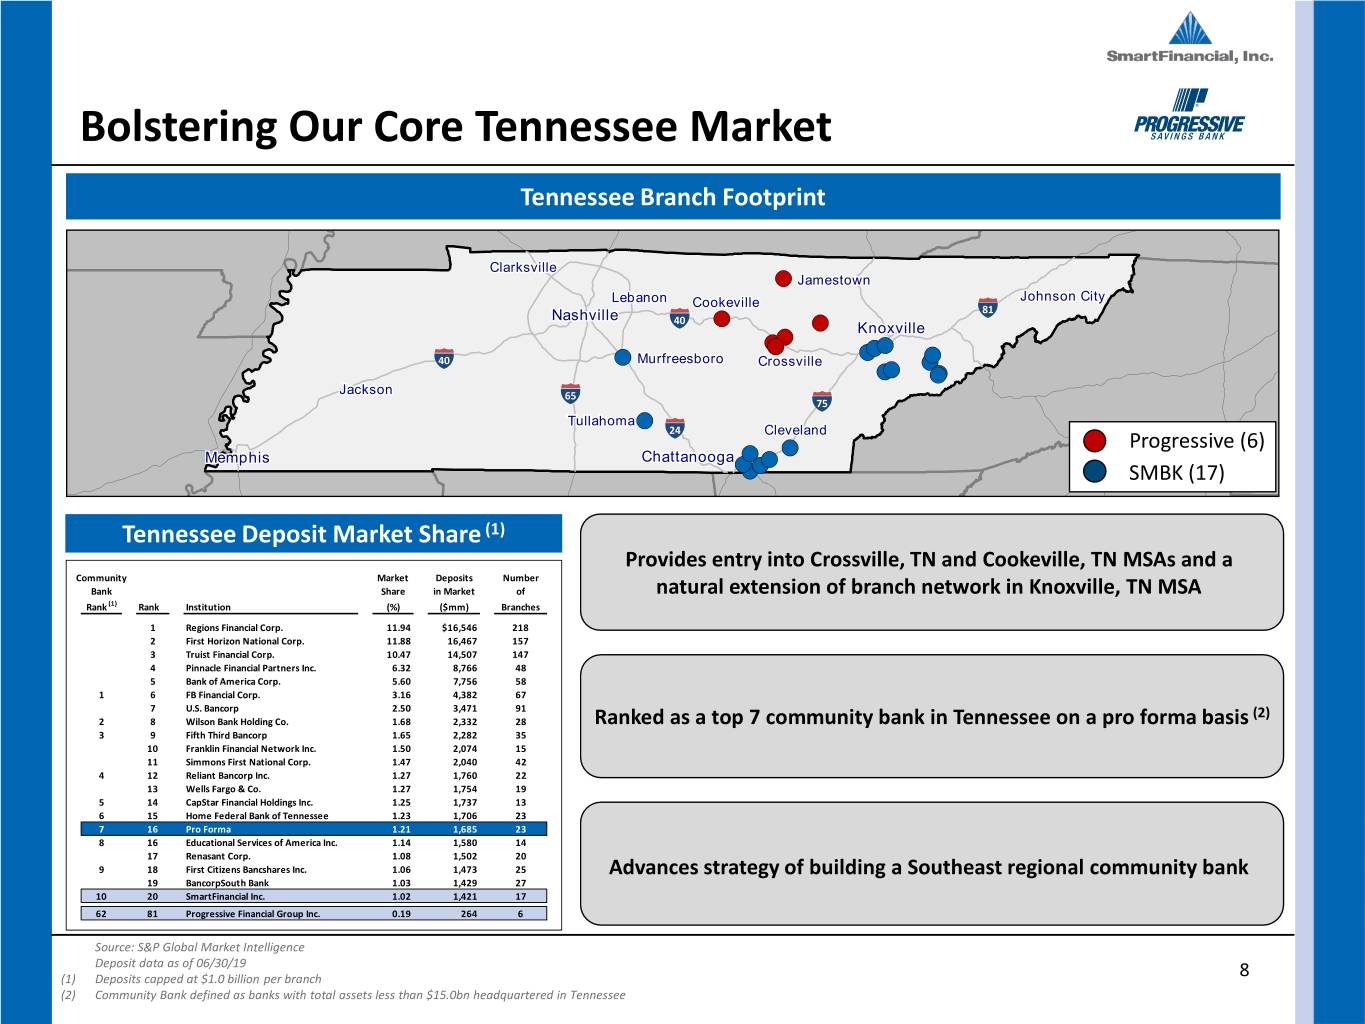
Bolstering Our Core Tennessee Market Tennessee Branch Footprint ClarksvilleClarksville JamestownJamestown JohnsonJohnson CityCity LebanonLebanon CookevilleCookeville JohnsonJohnson CityCity CookevilleCookeville 81 NashvilleNashville 40 KnoxvilleKnoxville 40 MurfreesboroMurfreesboro CrossvilleCrossville JacksonJackson JacksonJackson 65 75 TullahomaTullahoma 24 ClevelandCleveland ClevelandCleveland Progressive (6) MemphisMemphis ChattanoogaChattanooga SMBK (17) Tennessee Deposit Market Share (1) Provides entry into Crossville, TN and Cookeville, TN MSAs and a Community Market Deposits Number Bank Share in Market of natural extension of branch network in Knoxville, TN MSA Rank (1) Rank Institution (%) ($mm) Branches 1 Regions Financial Corp. 11.94 $16,546 218 2 First Horizon National Corp. 11.88 16,467 157 3 Truist Financial Corp. 10.47 14,507 147 4 Pinnacle Financial Partners Inc. 6.32 8,766 48 5 Bank of America Corp. 5.60 7,756 58 1 6 FB Financial Corp. 3.16 4,382 67 7 U.S. Bancorp 2.50 3,471 91 (2) 2 8 Wilson Bank Holding Co. 1.68 2,332 28 Ranked as a top 7 community bank in Tennessee on a pro forma basis 3 9 Fifth Third Bancorp 1.65 2,282 35 10 Franklin Financial Network Inc. 1.50 2,074 15 11 Simmons First National Corp. 1.47 2,040 42 4 12 Reliant Bancorp Inc. 1.27 1,760 22 13 Wells Fargo & Co. 1.27 1,754 19 5 14 CapStar Financial Holdings Inc. 1.25 1,737 13 6 15 Home Federal Bank of Tennessee 1.23 1,706 23 7 16 Pro Forma 1.21 1,685 23 8 16 Educational Services of America Inc. 1.14 1,580 14 17 Renasant Corp. 1.08 1,502 20 9 18 First Citizens Bancshares Inc. 1.06 1,473 25 Advances strategy of building a Southeast regional community bank 19 BancorpSouth Bank 1.03 1,429 27 10 20 SmartFinancial Inc. 1.02 1,421 17 62 81 Progressive Financial Group Inc. 0.19 264 6 Source: S&P Global Market Intelligence Deposit data as of 06/30/19 (1) Deposits capped at $1.0 billion per branch 8 (2) Community Bank defined as banks with total assets less than $15.0bn headquartered in Tennessee
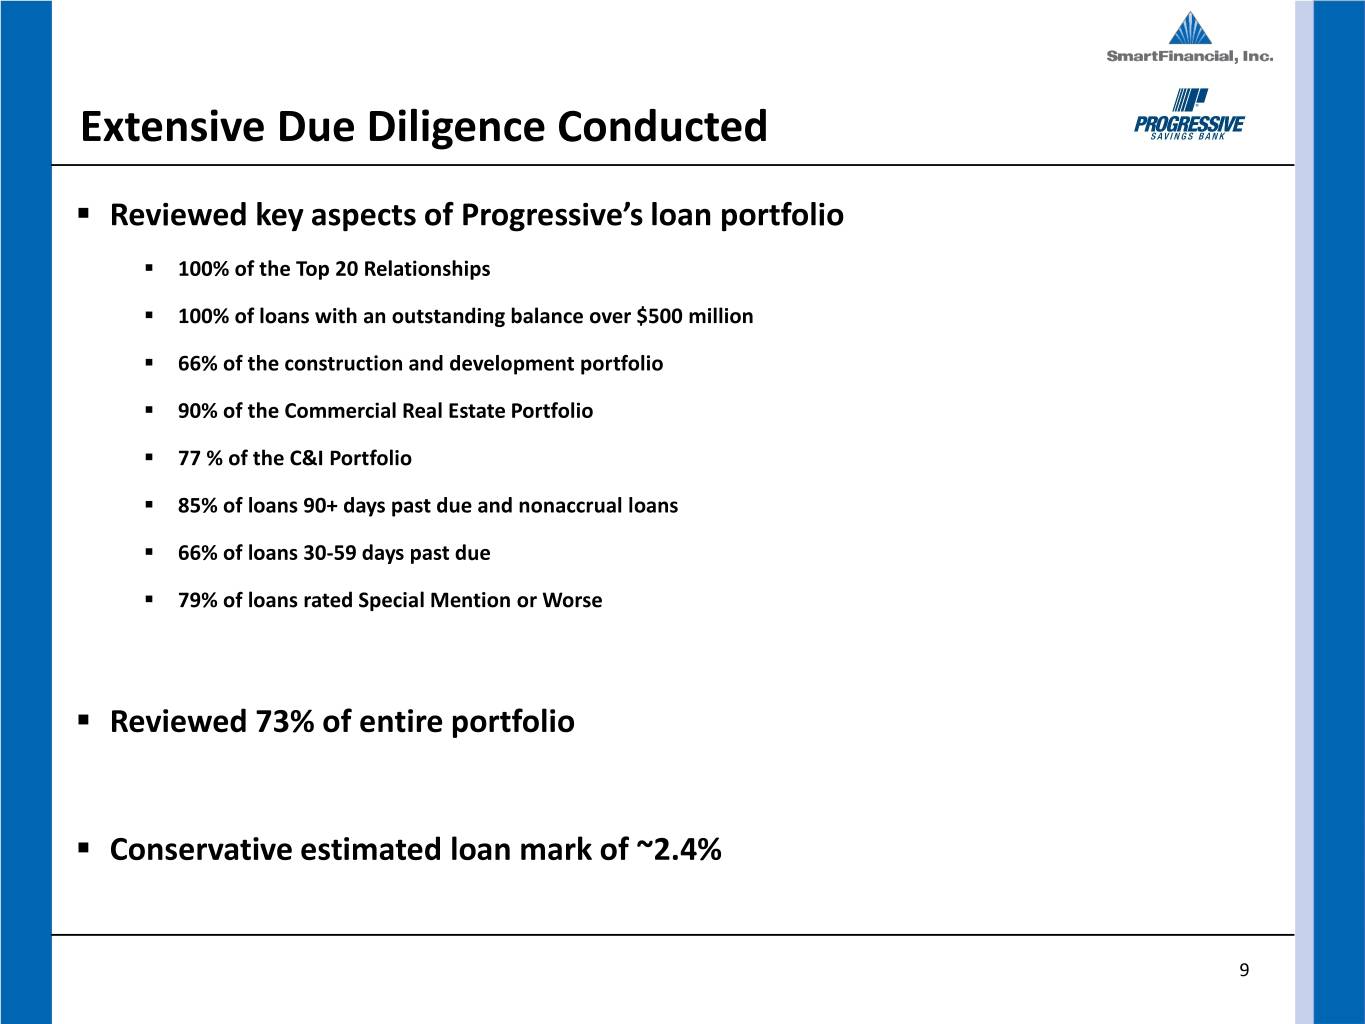
Extensive Due Diligence Conducted . Reviewed key aspects of Progressive’s loan portfolio . 100% of the Top 20 Relationships . 100% of loans with an outstanding balance over $500 million . 66% of the construction and development portfolio . 90% of the Commercial Real Estate Portfolio . 77 % of the C&I Portfolio . 85% of loans 90+ days past due and nonaccrual loans . 66% of loans 30-59 days past due . 79% of loans rated Special Mention or Worse . Reviewed 73% of entire portfolio . Conservative estimated loan mark of ~2.4% 9
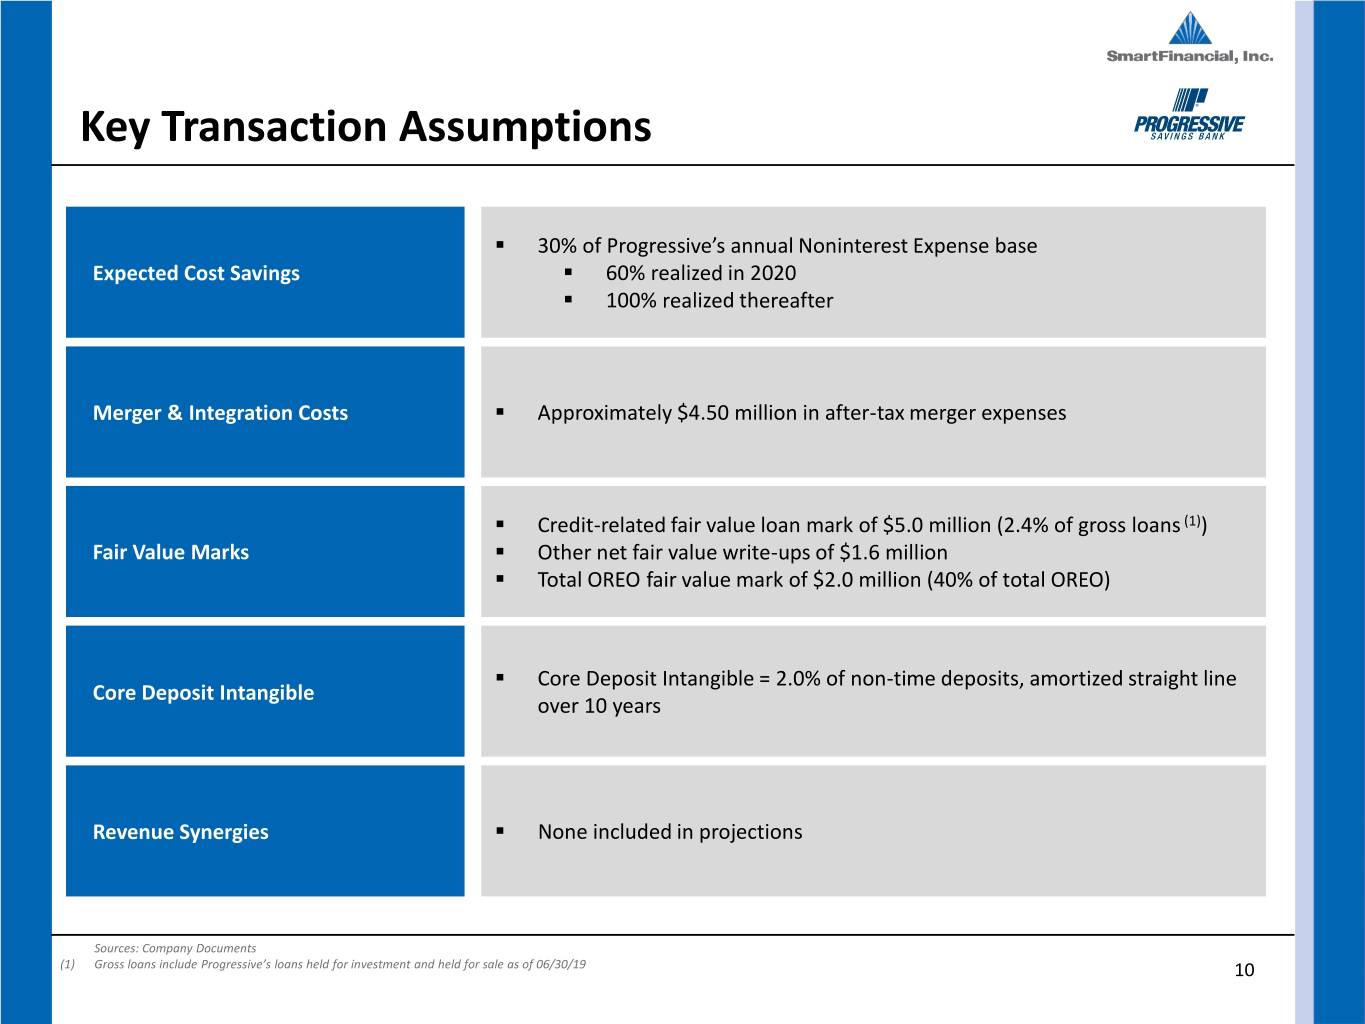
Key Transaction Assumptions . 30% of Progressive’s annual Noninterest Expense base Expected Cost Savings . 60% realized in 2020 . 100% realized thereafter Merger & Integration Costs . Approximately $4.50 million in after-tax merger expenses . Credit-related fair value loan mark of $5.0 million (2.4% of gross loans (1)) Fair Value Marks . Other net fair value write-ups of $1.6 million . Total OREO fair value mark of $2.0 million (40% of total OREO) . Core Deposit Intangible = 2.0% of non-time deposits, amortized straight line Core Deposit Intangible over 10 years Revenue Synergies . None included in projections Sources: Company Documents (1) Gross loans include Progressive’s loans held for investment and held for sale as of 06/30/19 10
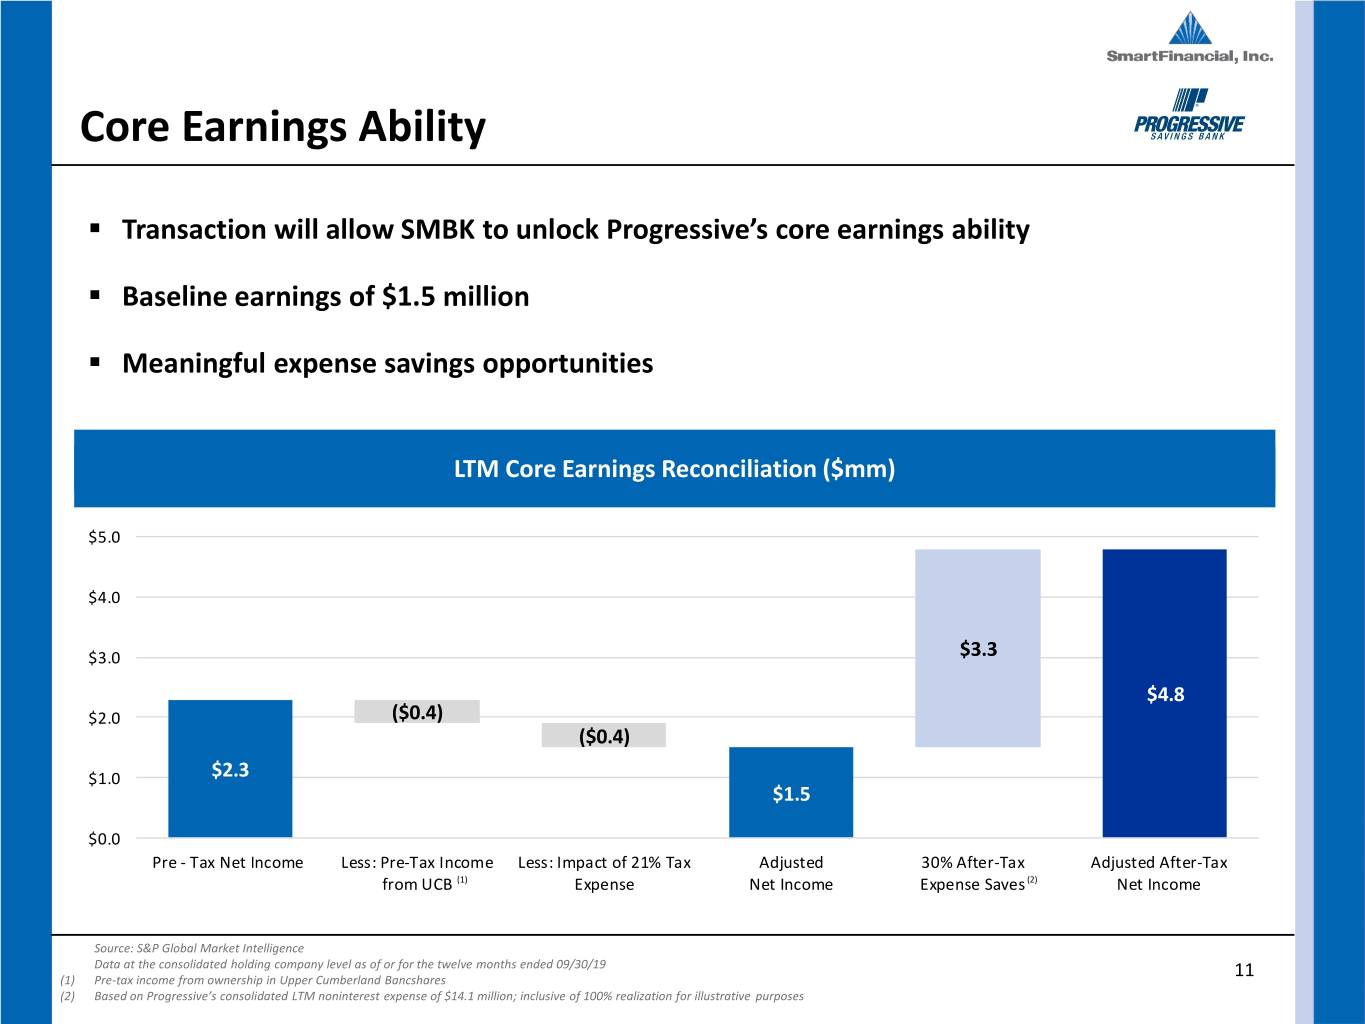
Core Earnings Ability . Transaction will allow SMBK to unlock Progressive’s core earnings ability . Baseline earnings of $1.5 million . Meaningful expense savings opportunities LTM Core Earnings Reconciliation ($mm) $5.0 $4.0 $3.0 $3.3 $4.8 $2.0 ($0.4) ($0.4) $1.0 $2.3 $1.5 $0.0 Pre - Tax Net Income Less: Pre-Tax Income Less: Impact of 21% Tax Adjusted 30% After-Tax Adjusted After-Tax from UCB (1) Expense Net Income Expense Saves (2) Net Income Source: S&P Global Market Intelligence Data at the consolidated holding company level as of or for the twelve months ended 09/30/19 (1) Pre-tax income from ownership in Upper Cumberland Bancshares 11 (2) Based on Progressive’s consolidated LTM noninterest expense of $14.1 million; inclusive of 100% realization for illustrative purposes
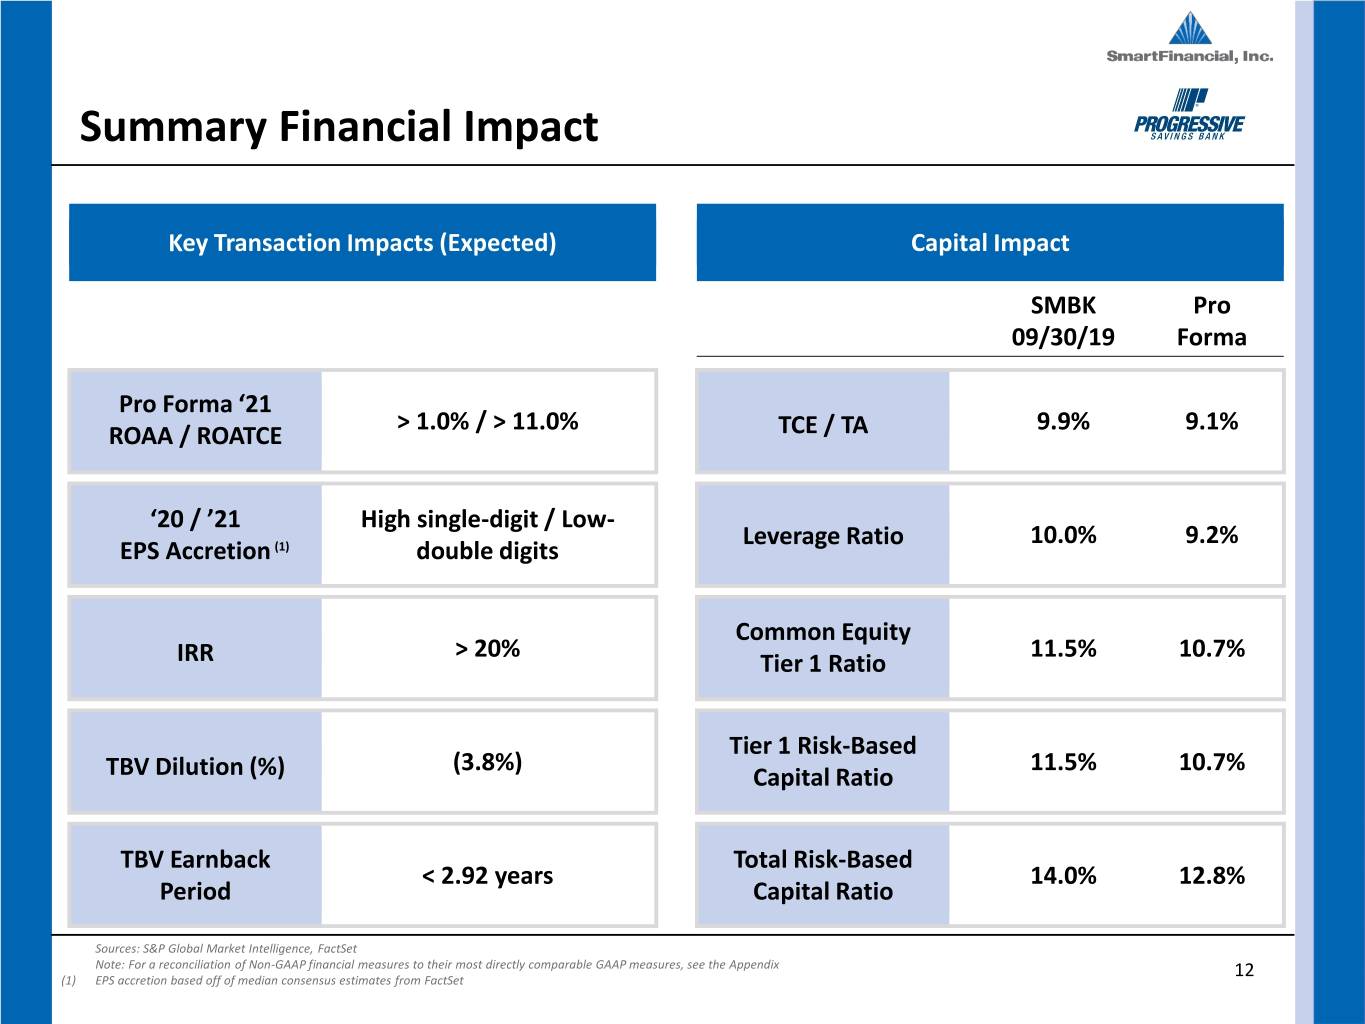
Summary Financial Impact Key Transaction Impacts (Expected) Capital Impact SMBK Pro 09/30/19 Forma Pro Forma ‘21 > 1.0% / > 11.0% 9.9% 9.1% ROAA / ROATCE TCE / TA ‘20 / ’21 High single-digit / Low- Leverage Ratio 10.0% 9.2% EPS Accretion (1) double digits Common Equity > 20% 11.5% 10.7% IRR Tier 1 Ratio Tier 1 Risk-Based (3.8%) 11.5% 10.7% TBV Dilution (%) Capital Ratio TBV Earnback Total Risk-Based < 2.92 years 14.0% 12.8% Period Capital Ratio Sources: S&P Global Market Intelligence, FactSet Note: For a reconciliation of Non-GAAP financial measures to their most directly comparable GAAP measures, see the Appendix 12 (1) EPS accretion based off of median consensus estimates from FactSet
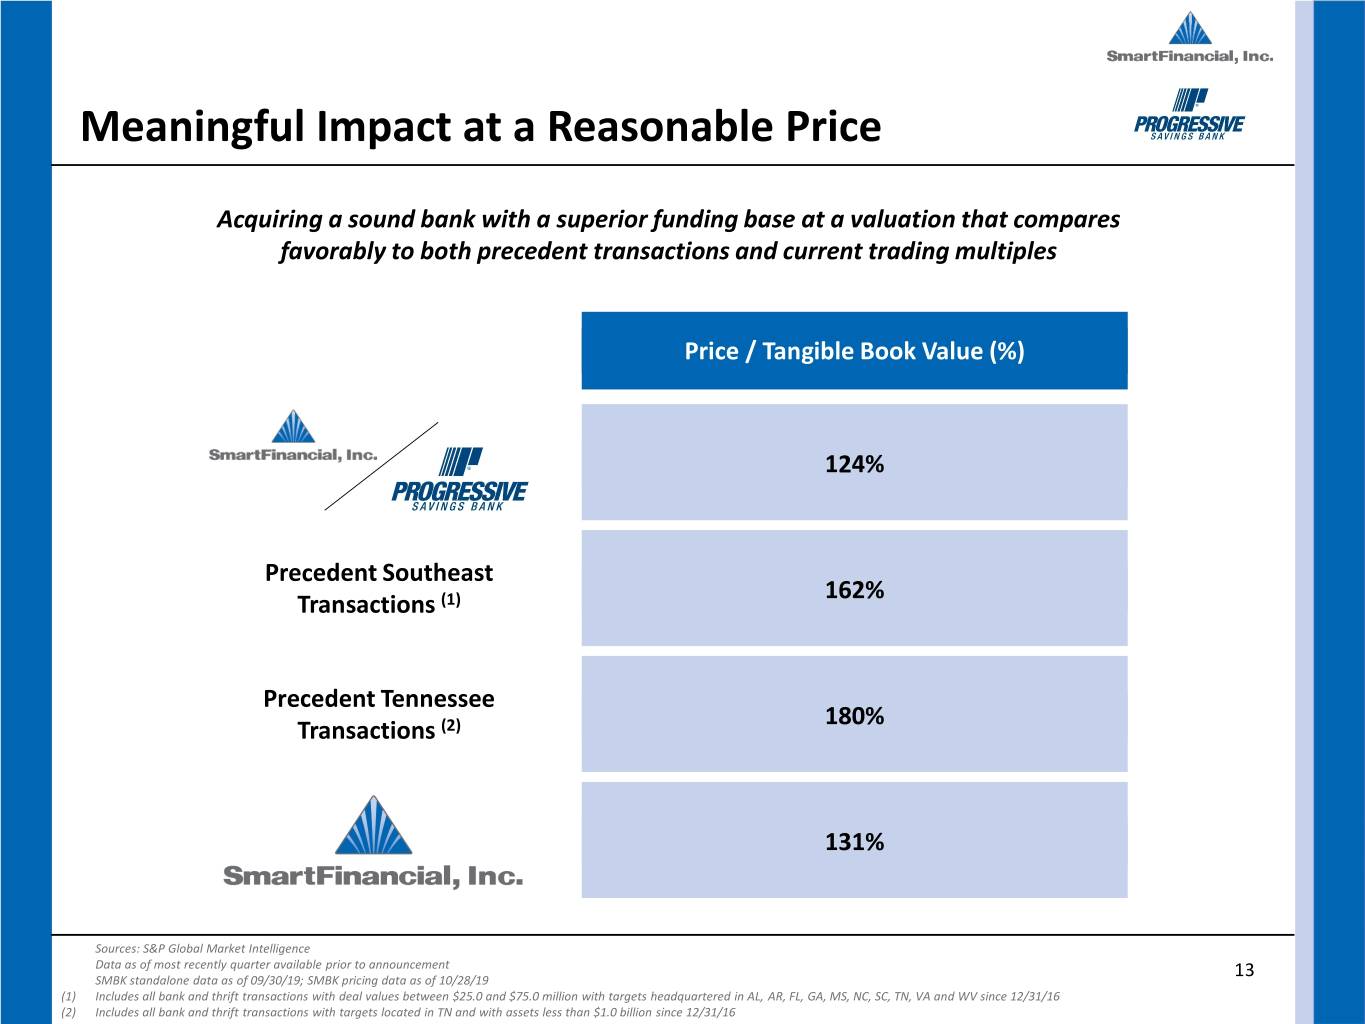
Meaningful Impact at a Reasonable Price Acquiring a sound bank with a superior funding base at a valuation that compares favorably to both precedent transactions and current trading multiples Price / Tangible Book Value (%) 124% Precedent Southeast 162% Transactions (1) Precedent Tennessee 180% Transactions (2) 131% Sources: S&P Global Market Intelligence Data as of most recently quarter available prior to announcement 13 SMBK standalone data as of 09/30/19; SMBK pricing data as of 10/28/19 (1) Includes all bank and thrift transactions with deal values between $25.0 and $75.0 million with targets headquartered in AL, AR, FL, GA, MS, NC, SC, TN, VA and WV since 12/31/16 (2) Includes all bank and thrift transactions with targets located in TN and with assets less than $1.0 billion since 12/31/16
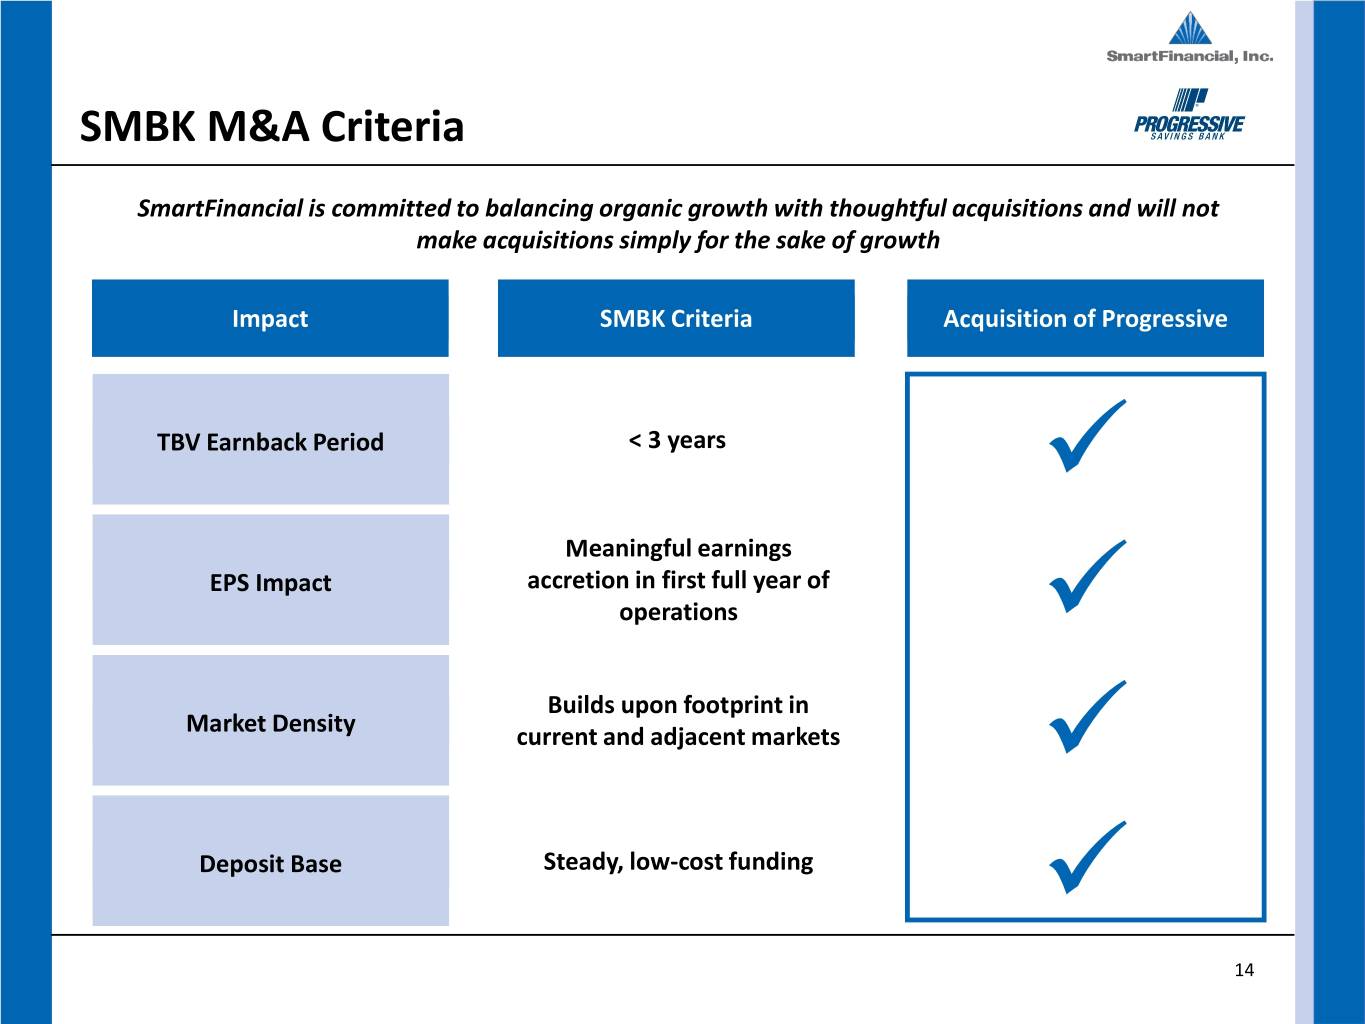
SMBK M&A Criteria SmartFinancial is committed to balancing organic growth with thoughtful acquisitions and will not make acquisitions simply for the sake of growth Impact SMBK Criteria Acquisition of Progressive TBV Earnback Period < 3 years Meaningful earnings EPS Impact accretion in first full year of operations Builds upon footprint in Market Density current and adjacent markets Deposit Base Steady, low-cost funding 14
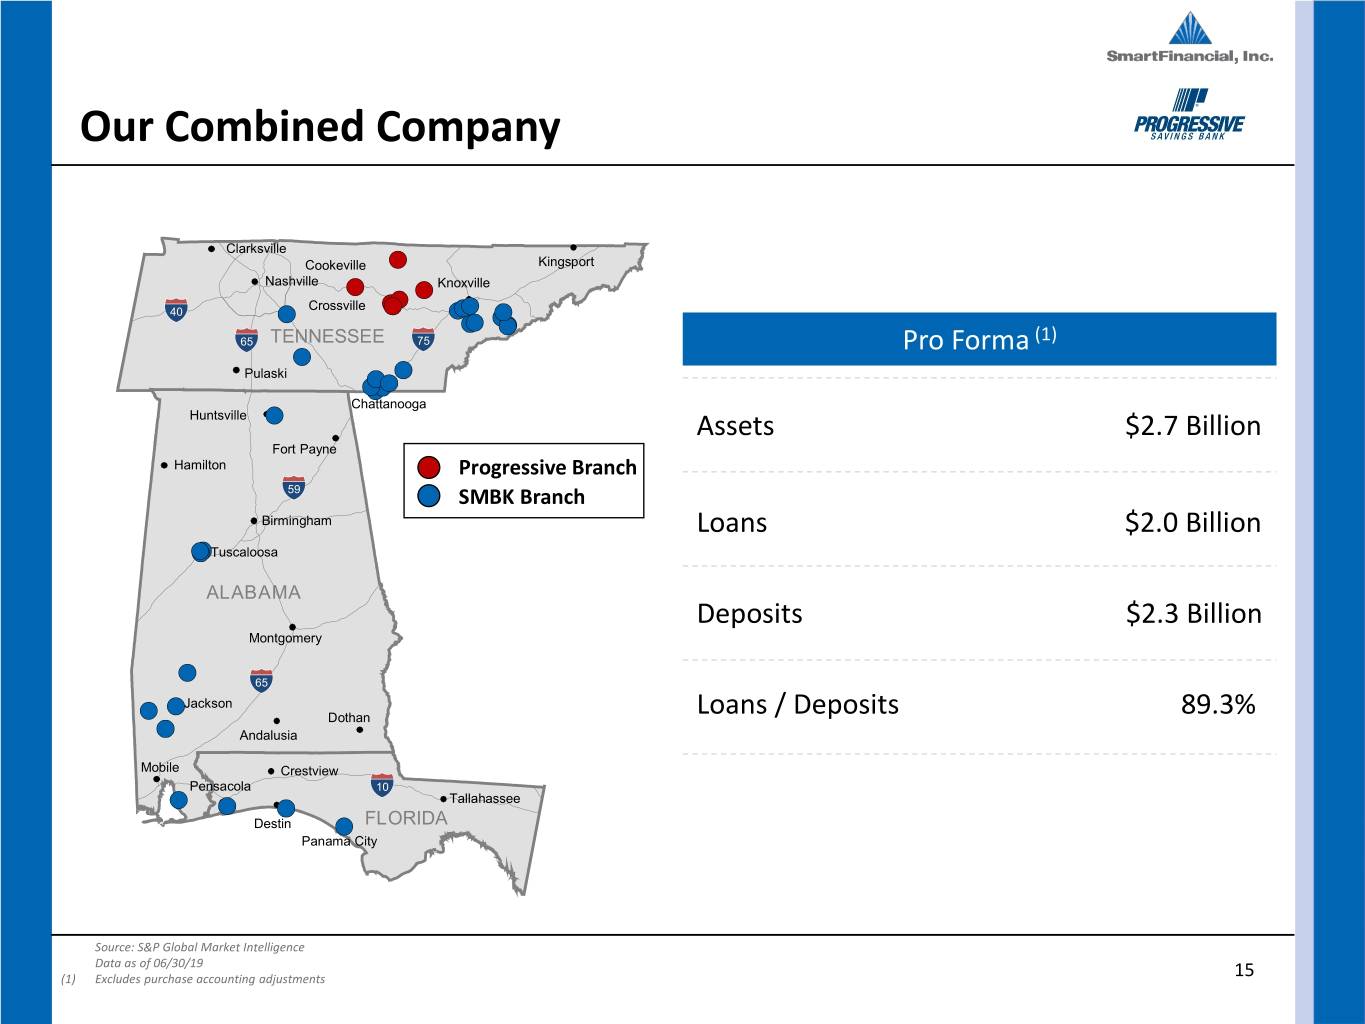
Our Combined Company Clarksville Cookeville Kingsport Nashville Knoxville 40 Crossville (1) 65 TENNESSEE 75 Pro Forma Pulaski Chattanooga Huntsville Assets $2.7 Billion Fort Payne Hamilton Progressive Branch 59 SMBK Branch Birmingham Loans $2.0 Billion Tuscaloosa ALABAMA Deposits $2.3 Billion Montgomery 65 Jackson Dothan Loans / Deposits 89.3% Andalusia Mobile Crestview Pensacola 10 Tallahassee Destin FLORIDA Panama City Source: S&P Global Market Intelligence Data as of 06/30/19 (1) Excludes purchase accounting adjustments 15
Appendix
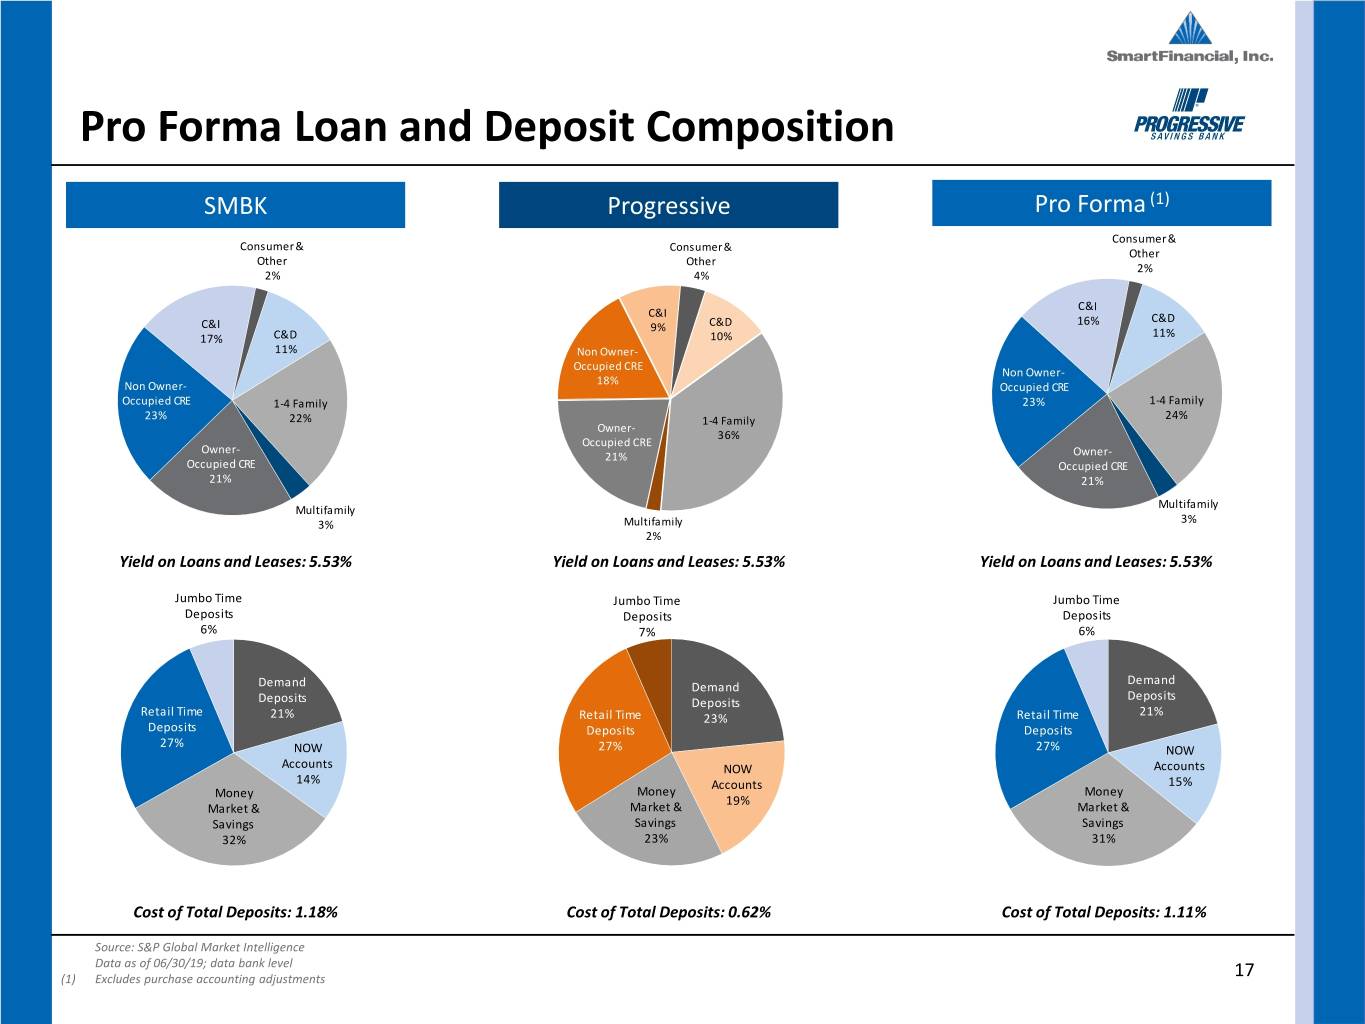
Pro Forma Loan and Deposit Composition SMBK Progressive Pro Forma (1) Consumer & Consumer & Consumer & Other Other Other 2% 2% 4% C&I C&I 16% C&D C&I 9% C&D 17% C&D 10% 11% 11% Non Owner- Occupied CRE Non Owner- 18% Non Owner- Occupied CRE Occupied CRE 1-4 Family 23% 1-4 Family 23% 22% 1-4 Family 24% Owner- 36% Occupied CRE Owner- 21% Owner- Occupied CRE Occupied CRE 21% 21% Multifamily Multifamily 3% Multifamily 3% 2% Yield on Loans and Leases: 5.53% Yield on Loans and Leases: 5.53% Yield on Loans and Leases: 5.53% Jumbo Time Jumbo Time Jumbo Time Deposits Deposits Deposits 6% 7% 6% Demand Demand Demand Deposits Deposits Deposits Retail Time 21% 21% Retail Time 23% Retail Time Deposits Deposits Deposits 27% NOW 27% 27% NOW Accounts NOW Accounts 14% Accounts 15% Money Money Money 19% Market & Market & Market & Savings Savings Savings 32% 23% 31% Cost of Total Deposits: 1.18% Cost of Total Deposits: 0.62% Cost of Total Deposits: 1.11% Source: S&P Global Market Intelligence Data as of 06/30/19; data bank level (1) Excludes purchase accounting adjustments 17
The Rains Agency . Independent insurance agency focused primarily on the Upper Cumberland region . Offers full line of personal, commercial, property and casualty, and life and health insurance . Operated for over 90 years, growing from one-person operation to over 21 employees . Revenues of over $1.2 million YTD as of 06/30/19 18
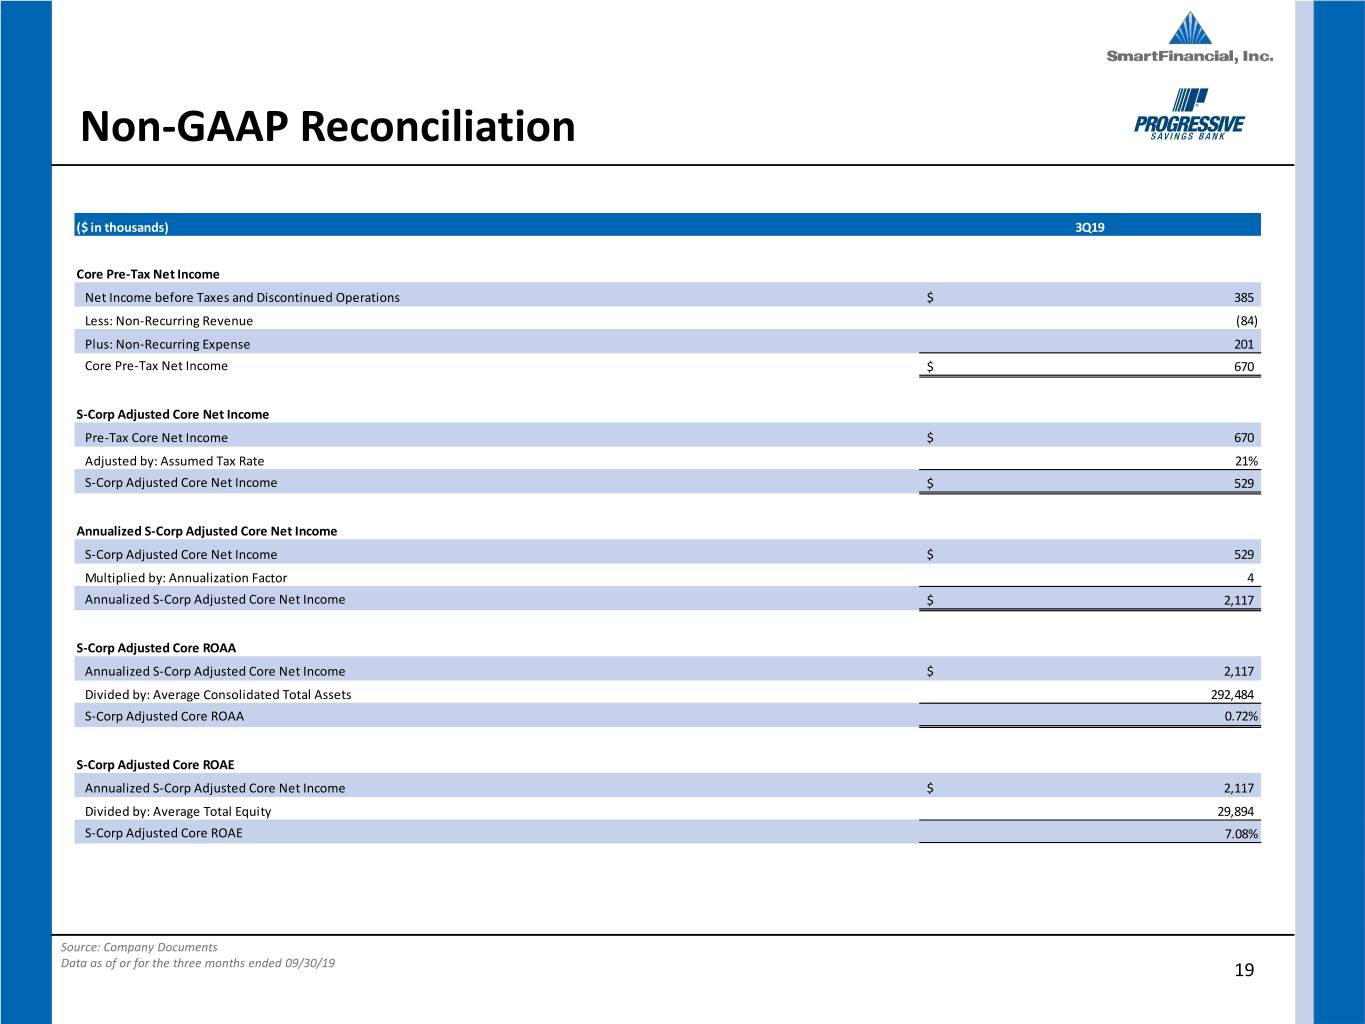
Non-GAAP Reconciliation ($ in thousands) 3Q19 Core Pre-Tax Net Income Net Income before Taxes and Discontinued Operations $ 385 Less: Non-Recurring Revenue (84) Plus: Non-Recurring Expense 201 Core Pre-Tax Net Income $ 670 S-Corp Adjusted Core Net Income Pre-Tax Core Net Income $ 670 Adjusted by: Assumed Tax Rate 21% S-Corp Adjusted Core Net Income $ 529 Annualized S-Corp Adjusted Core Net Income S-Corp Adjusted Core Net Income $ 529 Multiplied by: Annualization Factor 4 Annualized S-Corp Adjusted Core Net Income $ 2,117 S-Corp Adjusted Core ROAA Annualized S-Corp Adjusted Core Net Income $ 2,117 Divided by: Average Consolidated Total Assets 292,484 S-Corp Adjusted Core ROAA 0.72% S-Corp Adjusted Core ROAE Annualized S-Corp Adjusted Core Net Income $ 2,117 Divided by: Average Total Equity 29,894 S-Corp Adjusted Core ROAE 7.08% Source: Company Documents Data as of or for the three months ended 09/30/19 19
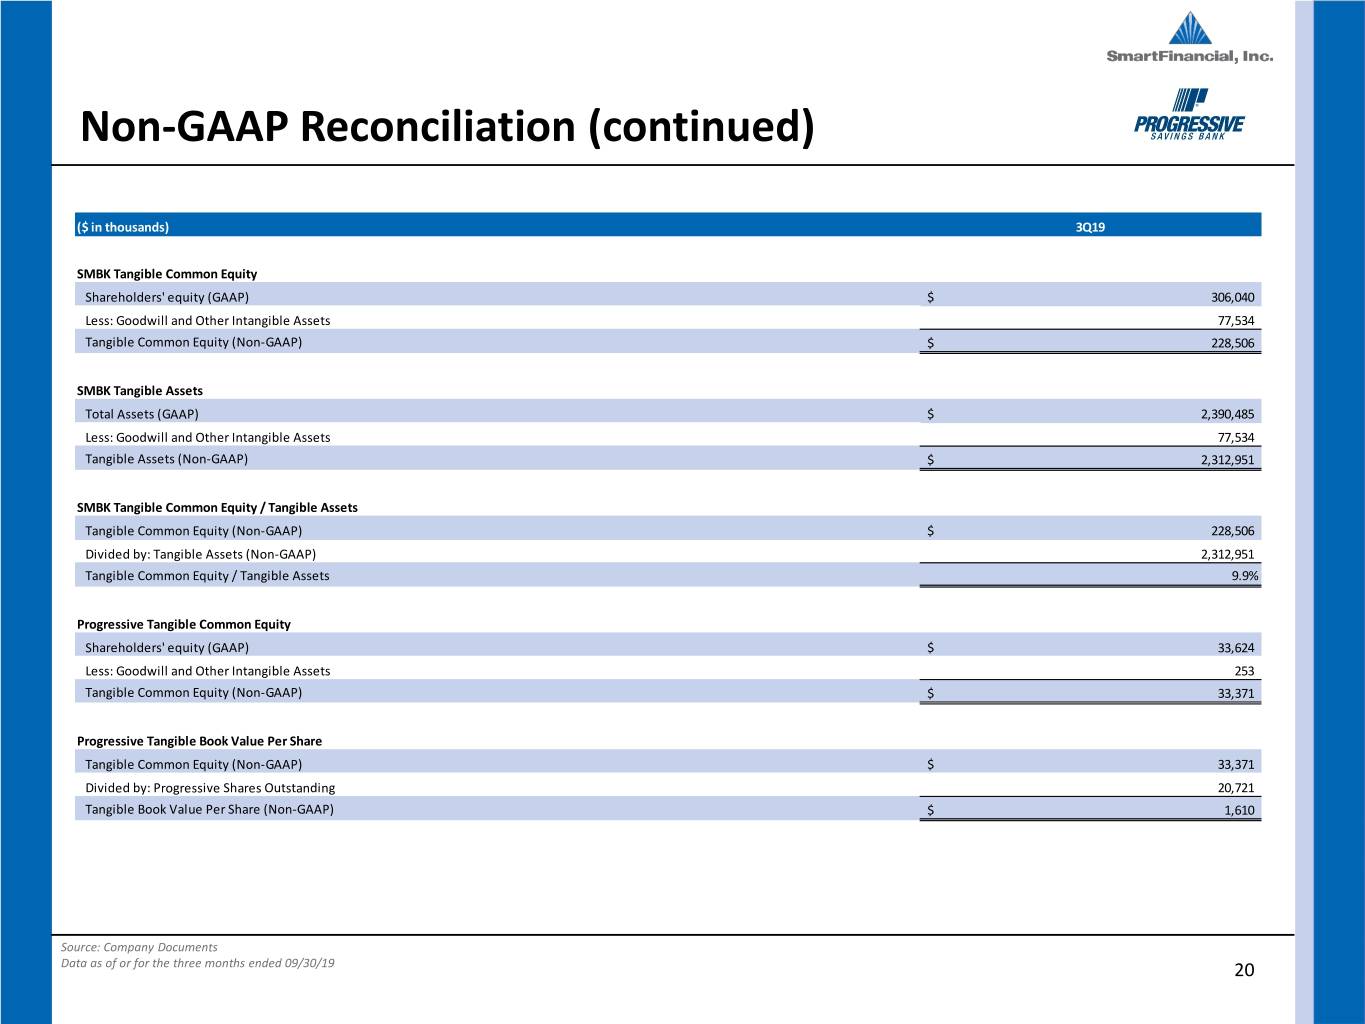
Non-GAAP Reconciliation (continued) ($ in thousands) 3Q19 SMBK Tangible Common Equity Shareholders' equity (GAAP) $ 306,040 Less: Goodwill and Other Intangible Assets 77,534 Tangible Common Equity (Non-GAAP) $ 228,506 SMBK Tangible Assets Total Assets (GAAP) $ 2,390,485 Less: Goodwill and Other Intangible Assets 77,534 Tangible Assets (Non-GAAP) $ 2,312,951 SMBK Tangible Common Equity / Tangible Assets Tangible Common Equity (Non-GAAP) $ 228,506 Divided by: Tangible Assets (Non-GAAP) 2,312,951 Tangible Common Equity / Tangible Assets 9.9% Progressive Tangible Common Equity Shareholders' equity (GAAP) $ 33,624 Less: Goodwill and Other Intangible Assets 253 Tangible Common Equity (Non-GAAP) $ 33,371 Progressive Tangible Book Value Per Share Tangible Common Equity (Non-GAAP) $ 33,371 Divided by: Progressive Shares Outstanding 20,721 Tangible Book Value Per Share (Non-GAAP) $ 1,610 Source: Company Documents Data as of or for the three months ended 09/30/19 20


