
SMARTFINANCIAL, INC.
SMARTFINANCIAL, INC. ANNUAL SHAREHOLDER PRESENTATION MAY 18, 2017 TICKER: SMBK
DISCLAIMER Forward-Looking Statements This presentation may include forward?looking statements within the meaning of the safe? harbor provisions of the Private Securities Litigation Reform Act of 1995, which management believes are a benefit to shareholders. The words “expect,” “anticipate,” “intend,” “consider,” “plan,” “believe,” “seek,” “should,” “estimate,” and similar expressions are intended to identify such forward?looking statements, but other statements may constitute forward?looking statements. These statements should be considered subject to various risks and uncertainties. Such forward?looking statements are made based upon management’s belief as well as assumptions made by, and information currently available to, management. SmartFinancial’s actual results may differ materially from the results anticipated in forward?looking statements due to a variety of factors. Such factors include, without limitation, those specifically described in our annual report on Form 10?K, as well as the following: (i) the possibility that our asset quality would decline or that we experience greater loan losses than anticipated; (ii) the impact of liquidity needs on our results of operations and financial condition; (iii) competition from financial institutions and other financial service providers; (iv) economic conditions in the local markets where we operate; (v) the impact of negative developments in the financial industry and U.S. and global capital and credit markets; (vi) the impact of recently enacted and future legislation and regulation on our business; (vii) the relatively greater credit risk of commercial real estate loans and construction and land development loans in our loan portfolio; (viii) adverse impact on operations and financial condition of changes in interest rates; (ix) our ability to retain the services of key personnel; (x) the impact of Tennessee’s anti-takeover statutes and certain of our charter provisions on potential acquisitions of us; (xi) our ability to use the net proceeds of this offering as currently contemplated; and (xii) other risks the Company discloses in public filings made with the Securities and Exchange Commission which can be accessed at www.sec.gov. Many of such factors are beyond SmartFinancial’s ability to control or predict, and readers are cautioned not to put undue reliance on such forward?looking statements. SmartFinancial does not intend to update or reissue any forward?looking statements contained in this presentation as a result of new information or other circumstances that may become known to SmartFinancial. Use of Non-GAAP Financial Information This presentation includes measures not derived in accordance with generally accepted accounting principles (“GAAP”) including tangible common equity (page 11), return on average tangible common equity (“ROATCE”) (pages 5, 11 and 17), and nonperforming assets (including performing restructured loans) to total assets (page 11). These non-GAAP measures should not be considered in isolation or as a substitute for any measure derived in accordance with GAAP, and may also be inconsistent with similar measures presented by other companies. Reconciliations of these non-GAAP measures to the nearest GAAP equivalents are located on page 20 of this presentation.
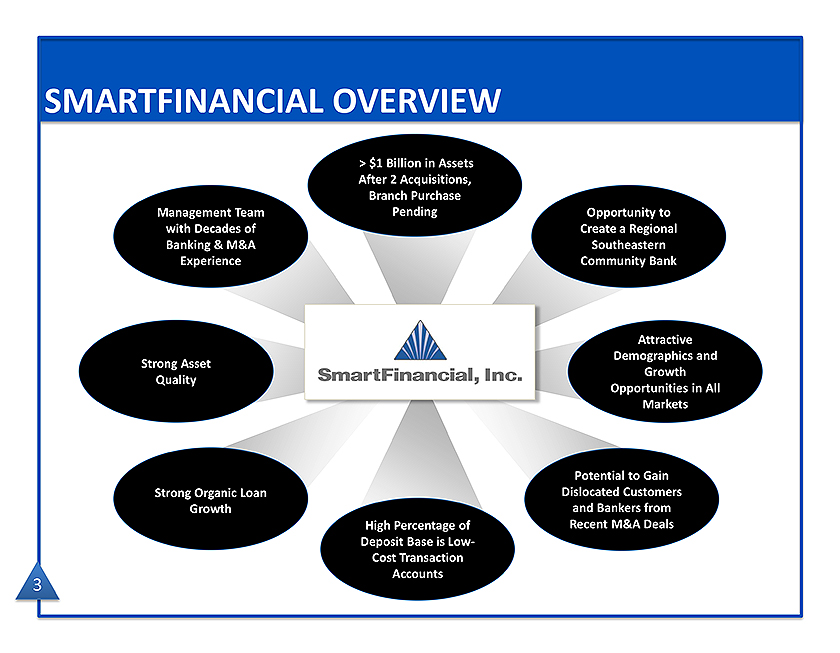
SMARTFINANCIAL OVERVIEW> $1 Billion in Assets After 2 Acquisitions, Branch Purchase Management Team Pending Opportunity to with Decades of Create a Regional Banking & M&A Southeastern Experience Community Bank Attractive Demographics and Strong Asset Growth Quality Opportunities in All Markets Potential to Gain Strong Organic Loan Dislocated Customers Growth and Bankers from High Percentage of Recent M&A Deals Deposit Base is Low-Cost Transaction Accounts
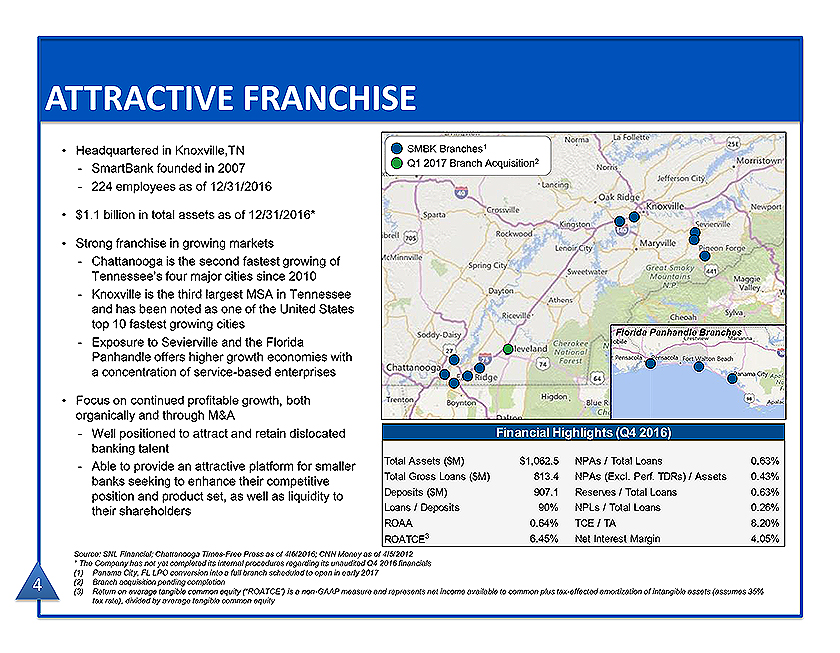
ATTRACTIVE FRANCHISE Headquartered in Knoxville,TN SmartBank founded in 2007 224 employees as of 12/31/2016 $1.1 billion in total assets as of 12/31/2016* Strong franchise in growing markets Chattanooga is the second fastest growing of Tennessee’s four major cities since 2010 Knoxville is the third largest MSA in Tennessee and has been noted as one of the United States top 10 fastest growing cities Exposure to Sevierville and the Florida Panhandle offers higher growth economies with a concentration of service-based enterprises Focus on continued profitable growth, both organically and through M&A Well positioned to attract and retain dislocated banking talent Able to provide an attractive platform for smaller banks seeking to enhance their competitive position and product set, as well as liquidity to their shareholders Source: SNL Financial; Chattanooga Times-Free Press as of 4/6/2016; CNN Money as of 4/5/2012 * The Company has not yet completed its internal procedures regarding its unaudited Q4 2016 financials (1) Panama City, FL LPO conversion into a full branch scheduled to open in early 2017 (2) Branch acquisition pending completion (3) Return on average tangible common equity (“ROATCE”) is a non-GAAP measure and represents net income available to common plus tax-effected amortization of intangible assets (assumes 35% tax rate), divided by average tangible common equity
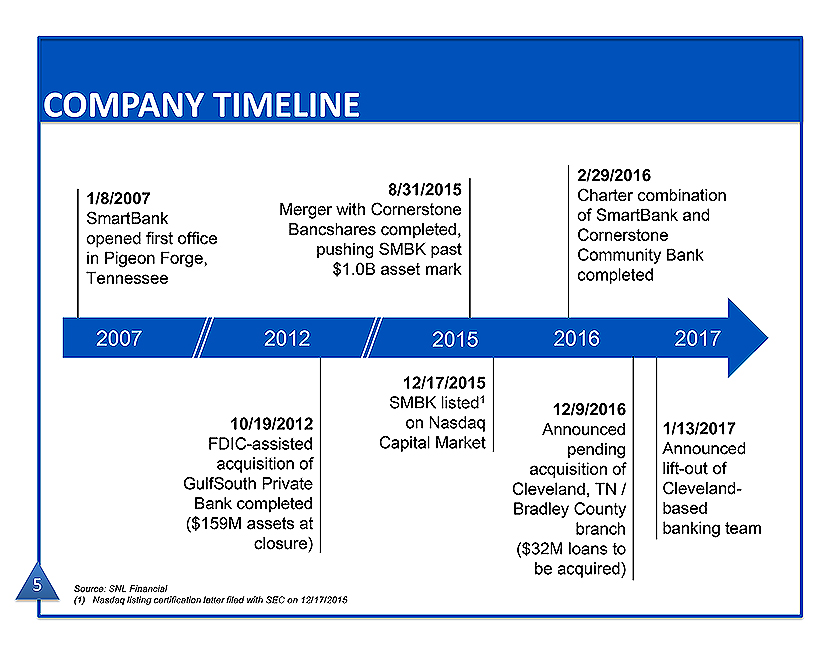
COMPANY TIMELINE 8/31/2015 2/29/2016 1/8/2007 Merger with Cornerstone Charter combination SmartBank Bancshares completed, of SmartBank and opened first office pushing SMBK past Cornerstone in Pigeon Forge, $1.0B asset mark Community Bank Tennessee completed 2007 2012 2015 2016 2017 12/17/2015 SMBK listed1 12/9/2016 10/19/2012 on Nasdaq Announced 1/13/2017 FDIC-assisted Capital Market pending Announced acquisition of acquisition of lift-out of GulfSouth Private Cleveland, TN / Cleveland-Bank completed Bradley County based ($159M assets at branch banking team closure) ($32M loans to be acquired) Source: SNL Financial (1) Nasdaq listing certification letter filed with SEC on 12/17/2015
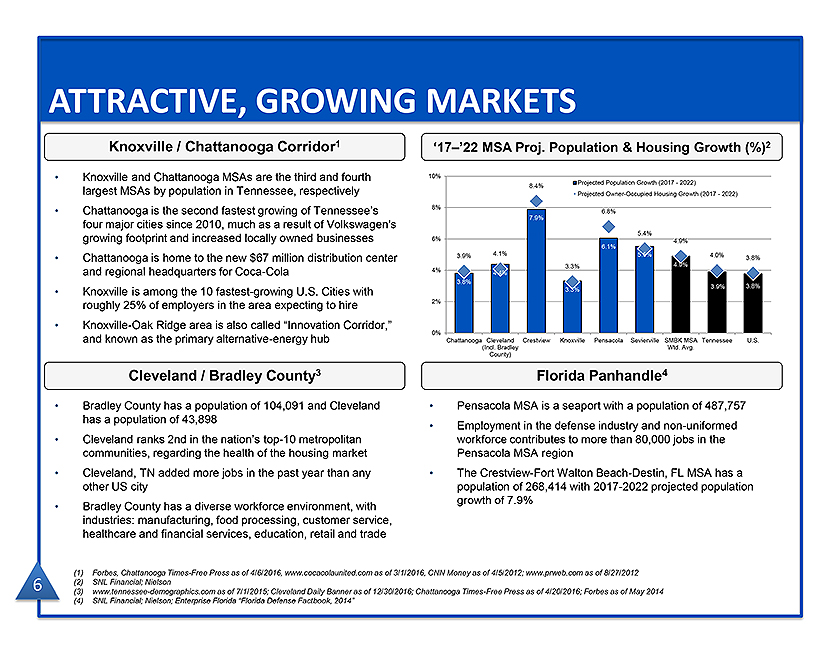
ATTRACTIVE, GROWING MARKETS Knoxville / Chattanooga Corridor1 ‘17–’22 MSA Proj. Population & Housing Growth (%)2 • Knoxville and Chattanooga MSAs are the third and fourth largest MSAs by population in Tennessee, respectively • Chattanooga is the second fastest growing of Tennessee’s four major cities since 2010, much as a result of Volkswagen’s growing footprint and increased locally owned businesses • Chattanooga is home to the new $67 million distribution center and regional headquarters for Coca-Cola • Knoxville is among the 10 fastest-growing U.S. Cities with roughly 25% of employers in the area expecting to hire • Knoxville-Oak Ridge area is also called “Innovation Corridor,” and known as the primary alternative-energy hub Cleveland / Bradley County3 Florida Panhandle4 • Bradley County has a population of 104,091 and Cleveland • Pensacola MSA is a seaport with a population of 487,757 has a population of 43,898 • Employment in the defense industry and non-uniformed • Cleveland ranks 2nd in the nation’s top-10 metropolitan workforce contributes to more than 80,000 jobs in the communities, regarding the health of the housing market Pensacola MSA region • Cleveland, TN added more jobs in the past year than any • The Crestview-Fort Walton Beach-Destin, FL MSA has a other US city population of 268,414 with 2017-2022 projected population growth of 7.9% • Bradley County has a diverse workforce environment, with industries: manufacturing, food processing, customer service, healthcare and financial services, education, retail and trade (1) Forbes, Chattanooga Times-Free Press as of 4/6/2016, www.cocacolaunited.com as of 3/1/2016, CNN Money as of 4/5/2012; www.prweb.com as of 8/27/2012 6 (2) SNL Financial; Nielson (3) www.tennessee-demographics.com as of 7/1/2015; Cleveland Daily Banner as of 12/30/2016; Chattanooga Times-Free Press as of 4/20/2016; Forbes as of May 2014 (4) SNL Financial; Nielson; Enterprise Florida “Florida Defense Factbook, 2014”
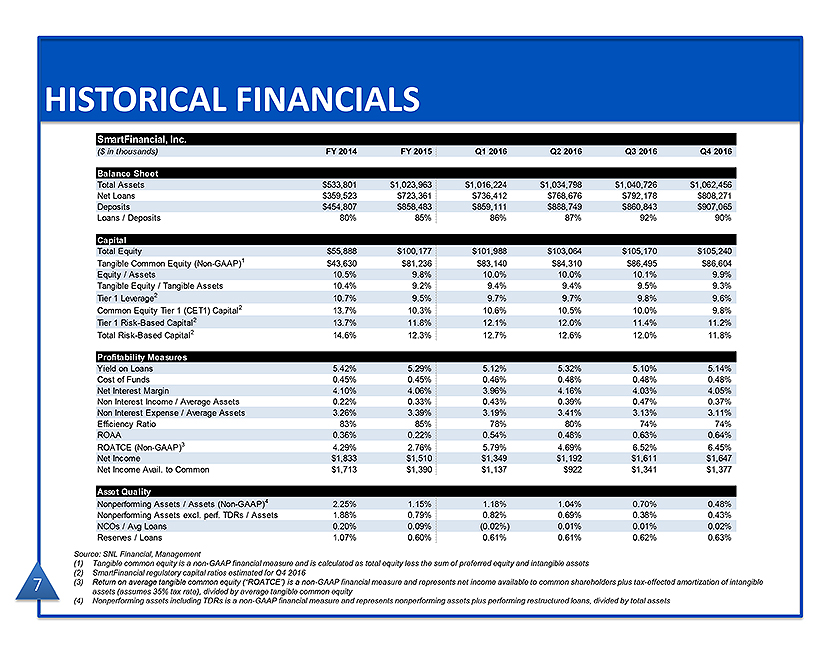
HISTORICAL FINANCIALS SmartFinancial, Inc. ($ in thousands) FY 2014 FY 2015 Q1 2016 Q2 2016 Q3 2016 Q4 2016 Balance Sheet Total Assets $533,801 $1,023,963 $1,016,224 $1,034,798 $1,040,726 $1,062,456 Net Loans $359,523 $723,361 $736,412 $768,676 $792,178 $808,271 Deposits $454,807 $858,483 $859,111 $888,749 $860,843 $907,065 Loans / Deposits 80% 85% 86% 87% 92% 90% Capital Total Equity $55,888 $100,177 $101,988 $103,064 $105,170 $105,240 Tangible Common Equity (Non-GAAP)1 $43,630 $81,236 $83,140 $84,310 $86,495 $86,604 Equity / Assets 10.5% 9.8% 10.0% 10.0% 10.1% 9.9% Tangible Equity / Tangible Assets 10.4% 9.2% 9.4% 9.4% 9.5% 9.3% Tier 1 Leverage2 10.7% 9.5% 9.7% 9.7% 9.8% 9.6% Common Equity Tier 1 (CET1) Capital2 13.7% 10.3% 10.6% 10.5% 10.0% 9.8% Tier 1 Risk-Based Capital2 13.7% 11.8% 12.1% 12.0% 11.4% 11.2% Total Risk-Based Capital2 14.6% 12.3% 12.7% 12.6% 12.0% 11.8% Profitability Measures Yield on Loans 5.42% 5.29% 5.12% 5.32% 5.10% 5.14% Cost of Funds 0.45% 0.45% 0.46% 0.48% 0.48% 0.48% Net Interest Margin 4.10% 4.06% 3.96% 4.16% 4.03% 4.05% Non Interest Income / Average Assets 0.22% 0.33% 0.43% 0.39% 0.47% 0.37% Non Interest Expense / Average Assets 3.26% 3.39% 3.19% 3.41% 3.13% 3.11% Efficiency Ratio 83% 85% 78% 80% 74% 74% ROAA 0.36% 0.22% 0.54% 0.48% 0.63% 0.64% ROATCE (Non-GAAP)3 4.29% 2.76% 5.79% 4.69% 6.52% 6.45% Net Income $1,833 $1,510 $1,349 $1,192 $1,611 $1,647 Net Income Avail. to Common $1,713 $1,390 $1,137 $922 $1,341 $1,377 Asset Quality Nonperforming Assets / Assets (Non-GAAP)4 2.25% 1.15% 1.18% 1.04% 0.70% 0.48% Nonperforming Assets excl. perf. TDRs / Assets 1.88% 0.79% 0.82% 0.69% 0.38% 0.43% NCOs / Avg Loans 0.20% 0.09% (0.02%) 0.01% 0.01% 0.02% Reserves / Loans 1.07% 0.60% 0.61% 0.61% 0.62% 0.63% Source: SNL Financial, Management (1) Tangible common equity is a non-GAAP financial measure and is calculated as total equity less the sum of preferred equity and intangible assets (2) SmartFinancial regulatory capital ratios estimated for Q4 2016 (3) Return on average tangible common equity (“ROATCE”) is a non-GAAP financial measure and represents net income available to common shareholders plus tax-effected amortization of intangible assets (assumes 35% tax rate), divided by average tangible common equity (4) Nonperforming assets including TDRs is a non-GAAP financial measure and represents nonperforming assets plus performing restructured loans, divided by total assets
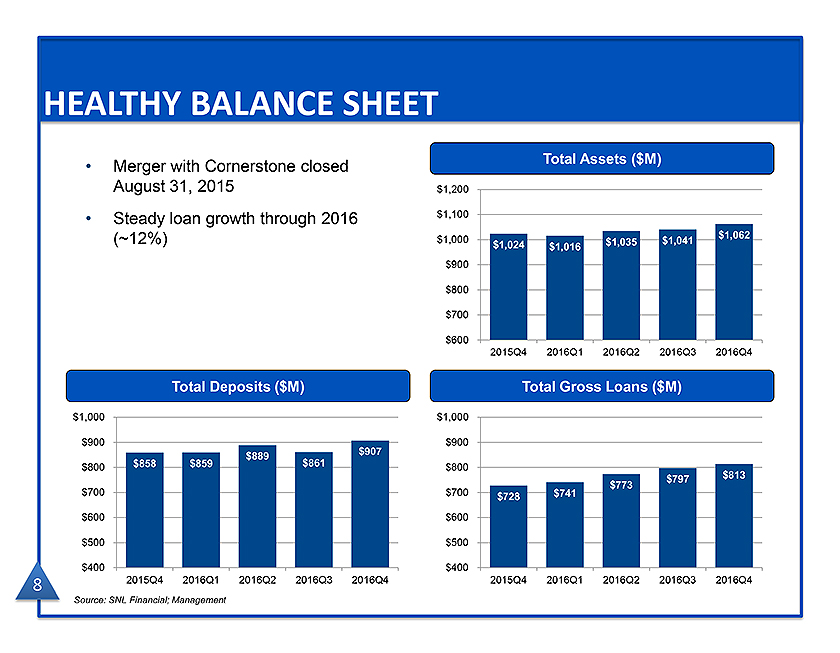
• | | HISTORICAL BALANCE SHEET MERGER with Cornerstone closed Total Assets ($M) August 31, 2015 $1,200 Steady loan growth through 2016 $1,100 $1,062 (~12%) $1,000 $1,035 $1,041 $1,024 $1,016 $900 $800 $700 $600 2015Q4 2016Q1 2016Q2 2016Q3 2016Q4 Total Deposits ($M) Total Gross Loans ($M) $1,000 $1,000 $900 $907 $900 $889 $800 $858 $859 $861 $800 $797 $813 $773 $700 $700 $728 $741 $600 $600 $500 $500 $400 $400 8 2015Q4 2016Q1 2016Q2 2016Q3 2016Q4 2015Q4 2016Q1 2016Q2 2016Q3 2016Q4 Source: SNL Financial; Management |
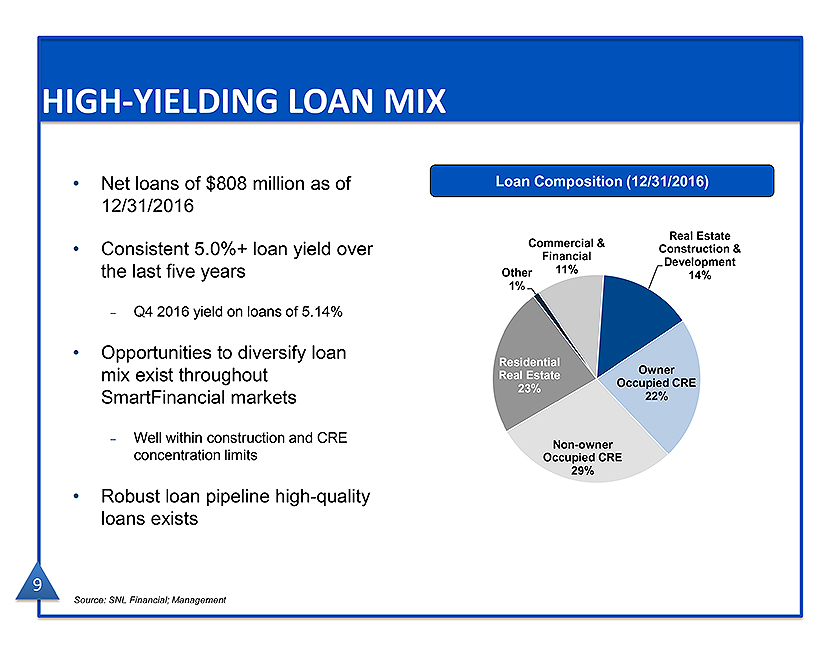
• | | HIGH-YIELDING LOAN MIX Net loans of $808 million as of Loan Composition (12/31/2016) 12/31/2016 Real Estate Commercial & Consistent 5.0%+ loan yield over Construction & Financial Development the last five years Other 11% 14% 1% – Q4 2016 yield on loans of 5.14% Opportunities to diversify loan Residential Owner mix exist throughout Real Estate Occupied CRE 23% SmartFinancial markets 22% – Well within construction and CRE Non-owner concentration limits Occupied CRE 29% Robust loan pipeline high-quality loans exists 9 Source: SNL Financial; Management |
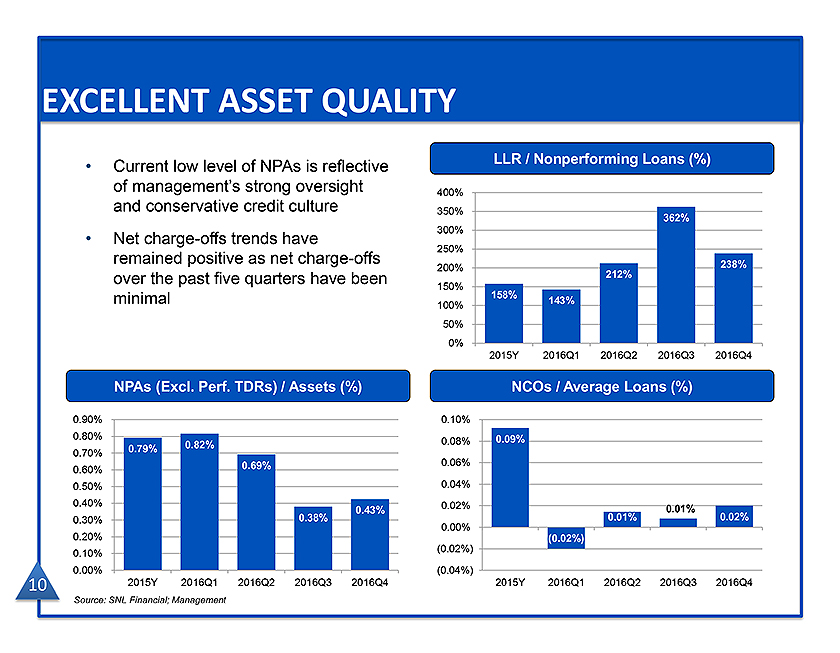
• | | EXCELLENT ASSET QUALITY Current low level of NPAs is reflective LLR / Nonperforming Loans (%) of management’s strong oversight 400% and conservative credit culture 350% 362% 300% Net charge-offs trends have 250% remained positive as net charge-offs 238% 200% over the past five quarters have been 212% 150% minimal 158% 143% 100% 50% 0% 2015Y 2016Q1 2016Q2 2016Q3 2016Q4 NPAs (Excl. Perf. TDRs) / Assets (%) NCOs / Average Loans (%) 0.90% 0.10% 0.80% 0.09% 0.82% 0.08% 0.70% 0.79% 0.69% 0.06% 0.60% 0.50% 0.04% 0.40% 0.02% 0.43% 0.01% 0.30% 0.38% 0.01% 0.02% 0.00% 0.20% (0.02%) (0.02%) 0.10% 0.00% (0.04%) 10 2015Y 2016Q1 2016Q2 2016Q3 2016Q4 2015Y 2016Q1 2016Q2 2016Q3 2016Q4 Source: SNL Financial; Management |
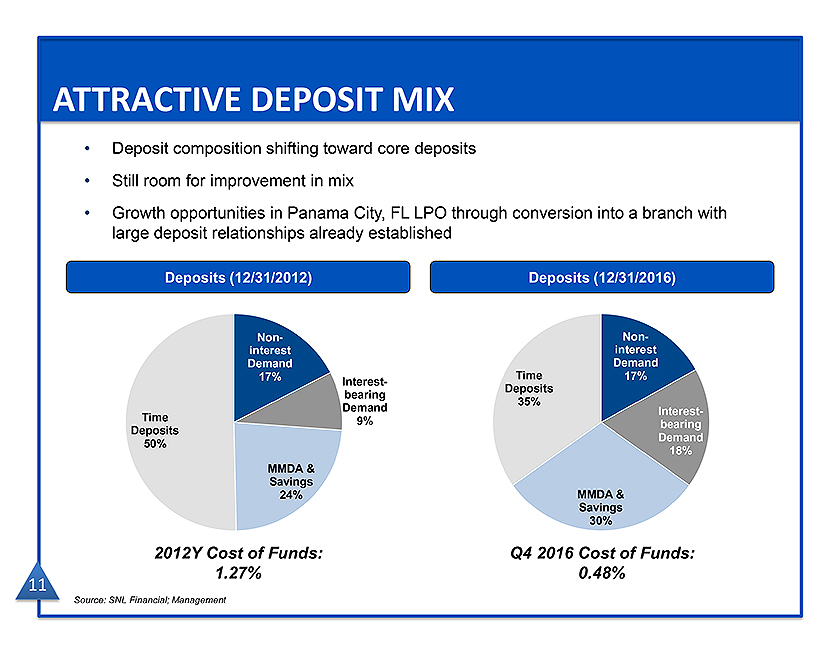
• | | ATTRACTIVE DEPOSIT MIX Deposit composition shifting toward core deposits Still room for improvement in mix Growth opportunities in Panama City, FL LPO through conversion into a branch with large deposit relationships already established Deposits (12/31/2012) Deposits (12/31/2016) 2012Y Cost of Funds: Q4 2016 Cost of Funds: 1.27% 0.48% 11 Source: SNL Financial; Management |
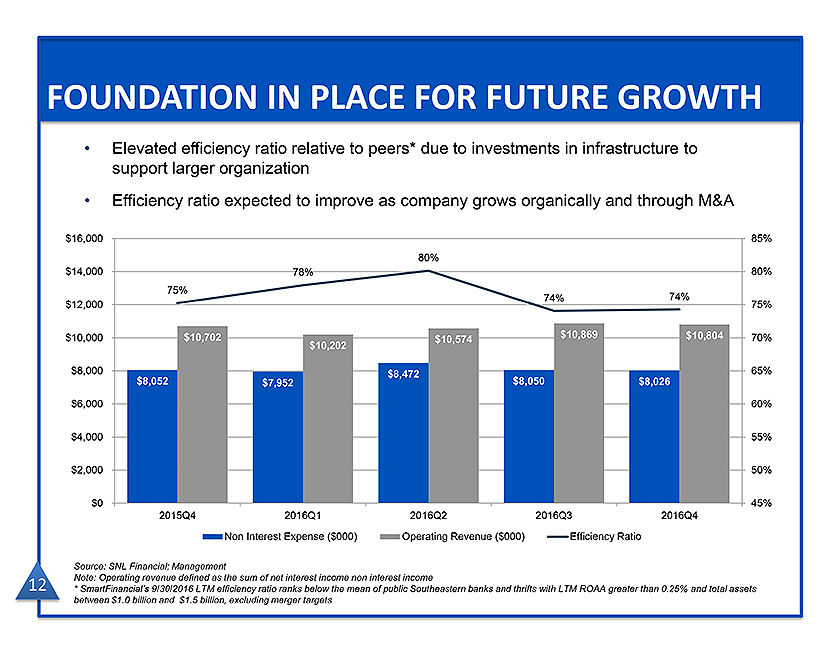
• | | FOUNDATION IN PLACE FOR FUTURE GROWTH Elevated efficiency ratio relative to peers* due to investments in infrastructure to support larger organization Efficiency ratio expected to improve as company grows organically and through M&A $16,000 85% 80% $14,000 78% 80% 75% 74% 74% $12,000 75% $10,000 $10,702 $10,869 $10,804 70% $10,574 $10,202 $8,000 $8,472 65% $8,052 $7,952 $8,050 $8,026 $6,000 60% $4,000 55% $2,000 50% $0 45% 2015Q4 2016Q1 2016Q2 2016Q3 2016Q4 Non Interest Expense ($000) Operating Revenue ($000) Efficiency Ratio Source: SNL Financial; Management 12 Note: Operating revenue defined as the sum of net interest income non interest income * SmartFinancial’s 9/30/2016 LTM efficiency ratio ranks below the mean of public Southeastern banks and thrifts with LTM ROAA greater than 0.25% and total assets between $1.0 billion and $1.5 billion, excluding merger targets |
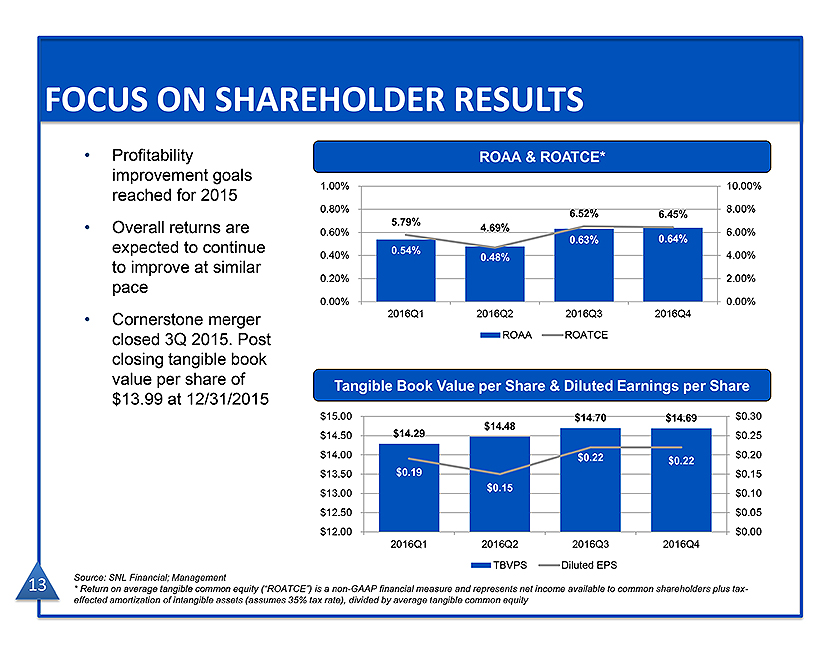
• | | FOCUS ON SHAREHOLDER RESULTS Profitability ROAA & ROATCE* improvement goals 1.00% 10.00% reached for 2015 0.80% 6.52% 8.00% 6.45% 5.79% Overall returns are 4.69% 0.60% 6.00% 0.63% 0.64% expected to continue 0.54% to improve at similar 0.40% 0.48% 4.00% 0.20% 2.00% pace 0.00% 0.00% Cornerstone merger 2016Q1 2016Q2 2016Q3 2016Q4 closed 3Q 2015. Post ROAA ROATCE closing tangible book value per share of Tangible Book Value per Share & Diluted Earnings per Share $13.99 at 12/31/2015 $15.00 $14.70 $14.69 $0.30 $14.48 $14.50 $14.29 $0.25 $14.00 $0.22 $0.20 $0.22 $13.50 $0.19 $0.15 $0.15 $13.00 $0.10 $12.50 $0.05 $12.00 $0.00 2016Q1 2016Q2 2016Q3 2016Q4 TBVPS Diluted EPS 13 Source: SNL Financial; Management * Return on average tangible common equity (“ROATCE”) is a non-GAAP financial measure and represents net income available to common shareholders plus tax-effected amortization of intangible assets (assumes 35% tax rate), divided by average tangible common equity |
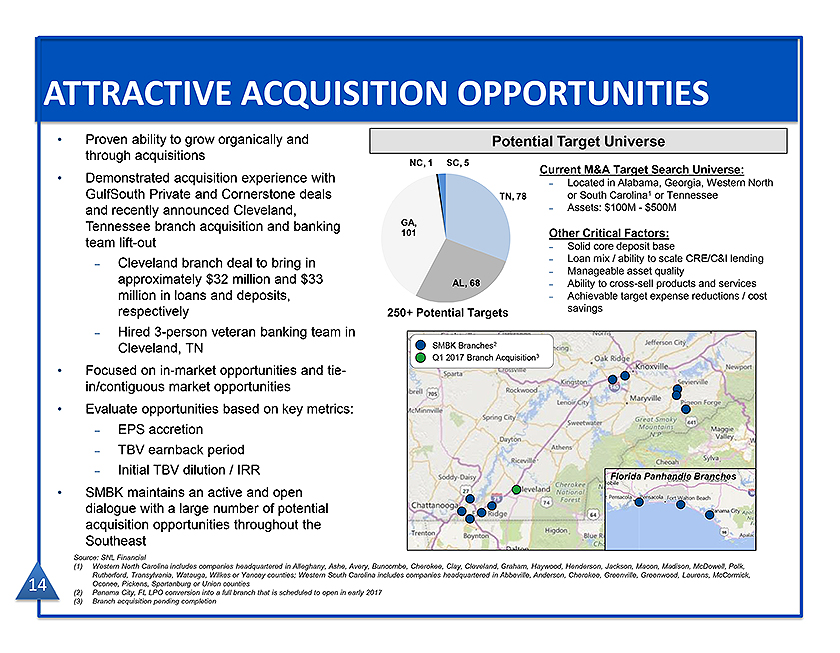
• | | ATTRACTIVE ACQUISITION OPPORTUNITIES Proven ability to grow organically and Potential Target Universe through acquisitions NC, 1 SC, 5 Current M&A Target Search Universe: Demonstrated acquisition experience with Western North – Located in Alabama, Georgia, GulfSouth Private and Cornerstone deals TN, 78 or South Carolina1 or Tennessee and recently announced Cleveland, – Assets: $100M—$500M Tennessee branch acquisition and banking GA, 101 Other Critical Factors: team lift-out – Solid core deposit base – Loan mix / ability to scale CRE/C&I lending – Cleveland branch deal to bring in – Manageable asset quality approximately $32 million and $33 AL, 68 Ability to cross-sell – products and services million in loans and deposits, – Achievable target expense reductions / cost respectively 250+ Potential Targets savings – Hired 3-person veteran banking team in Cleveland, TN SMBK Branches2 Q1 2017 Branch Acquisition3 Focused on in-market opportunities and tie-in/contiguous market opportunities Evaluate opportunities based on key metrics: – EPS accretion – TBV earnback period – Initial TBV dilution / IRR Florida Panhandle Branches SMBK maintains an active and open dialogue with a large number of potential acquisition opportunities throughout the Southeast Source: SNL Financial (1) Western North Carolina includes companies headquartered in Alleghany, Ashe, Avery, Buncombe, Cherokee, Clay, Cleveland, Graham, Haywood, Henderson, Jackson, Macon, Madison, McDowell, Polk, Rutherford, Transylvania, Watauga, Wilkes or Yancey counties; Western South Carolina includes companies headquartered in Abbeville, Anderson, Cherokee, Greenville, Greenwood, Laurens, McCormick, 14 Oconee, Pickens, Spartanburg or Union counties (2) Panama City, FL LPO conversion into a full branch that is scheduled to open in early 2017 (3) Branch acquisition pending completion |
CORE VALUES ACT WITH INTEGRITY BE ENTHUSIASTIC CREATE POSITIVITY DEMONSTRATE ACCOUNTABILTY EMBRACE CHANGE
SMARTFINANCIAL, INC.