1 INVESTOR CALL 3Q 2022 October 25, 2022, 10:00am ET Webcast: www.smartbank.com (Investor Relations) Audio Only: 1 - 833 - 927 - 1758 Access Code: 380946 Miller Welborn Chairman of the Board Billy Carroll President & CEO Ron Gorczynski CFO |
D ISCLOSURES 2 Forward - Looking Statements This presentation may contain statements that are based on management’s current estimates or expectations of future events or future results, and that may be deemed to constitute forward - looking statements as defined under the Private Securities Litigation Reform Act of 1995 .. These statements, including statements regarding the effects of the COVID - 19 pandemic on SmartFinancial Inc .. ’s (“SmartFinancial”) business and financial results and conditions, are not historical in nature and can generally be identified by such words as “expect,” “anticipate,” “intend,” “plan,” “believe,” “seek,” “may,” “estimate,” and similar expressions .. All forward - looking statements are subject to risks, uncertainties, and other factors that may cause the actual results of SmartFinancial to differ materially from future results expressed or implied by such forward - looking statements .. Such risks, uncertainties, and other factors include, among others, ( 1 ) the risk of litigation and reputational risk associated with historic acquisition activity ; ( 2 ) the risk that cost savings and revenue synergies from recently completed acquisitions may not be realized or may take longer than anticipated to realize ; ( 3 ) disruption from recently completed acquisitions with customer, supplier, employee, or other business relationships ; ( 4 ) our ability to successfully integrate the businesses acquired as part of previous acquisitions with the business of SmartBank ; ( 5 ) risks related to the acquisition of Sevier County Bancshares, Inc .. (“SCB”) ; ( 6 ) the risk that the anticipated benefits from the acquisition of SCB may not be realized in the time frame anticipated ; ( 7 ) changes in management’s plans for the future ; ( 8 ) prevailing, or changes in, economic or political conditions, particularly in our market areas ; ( 9 ) credit risk associated with our lending activities ; ( 10 ) changes in interest rates, loan demand, real estate values, or competition ; ( 11 ) developments in our mortgage banking business, including loan modifications, general demand, and the effects of judicial or regulatory requirements or guidance ; ( 12 ) changes in the prices, values and sales volumes of residential and commercial real estate ; ( 13 ) changes in accounting principles, policies, or guidelines ; ( 14 ) changes in applicable laws, rules, or regulations ; ( 15 ) adverse results from current or future litigation, regulatory examinations or other legal and/or regulatory actions, including as a result of the Company’s participation in and execution of government programs related to the COVID - 19 pandemic and related variants ; ( 16 ) the continued impact of the COVID - 19 pandemic and related variants on the Company’s assets, business, cash flows, financial condition, liquidity, prospects and results of operations ; ( 17 ) significant turbulence or a disruption in the capital or financial markets and the effect of a fall in stock market prices on our investment securities ; ( 18 ) higher inflation and its impacts ; ( 19 ) the effects of war or other conflicts including the impacts related to or resulting from Russia’s military action in Ukraine ; and ( 20 ) other general competitive, economic, political, and market factors, including those affecting our business, operations, pricing, products, or services .. These and other factors that could cause results to differ materially from those described in the forward - looking statements can be found in SmartFinancial’s most recent annual report on Form 10 - K, quarterly reports on Form 10 - Q, and current reports on Form 8 - K, in each case filed with or furnished to the Securities and Exchange Commission (the “SEC”) and available on the SEC’s website (www .. sec .. gov) .. Undue reliance should not be placed on forward - looking statements .. SmartFinancial disclaims any obligation to update or revise any forward - looking statements contained in this release, which speak only as of the date hereof, whether as a result of new information, future events, or otherwise .. Non - GAAP Financial Measures Statements included in this presentation include Non - GAAP financial measures and should be read along with the accompanying tables, which provide a reconciliation of Non - GAAP financial measures to GAAP financial measures .. SmartFinancial management uses several Non - GAAP financial measures, including : (i) operating earnings, (ii) operating return on average assets, (iii) operating return on average shareholder equity, (iv) return on average tangible common equity, (v) operating return on average tangible common equity, (vi) operating efficiency ratio ; (vii) tangible common equity ; (viii) average tangible common equity ; (ix) tangible book value ; (x) operating pre - tax pre - provision earnings ; (xi) operating noninterest income ; (xii) operating noninterest expense ; (xiii) tangible assets ; and ratios derived therefrom, in its analysis of the company's performance ; (xiv) accumulated other comprehensive income .. Operating earnings excludes the following from net income : securities gains and losses, merger related and restructuring expenses, and the income tax effect of adjustments .. Operating return on average assets is the annualized operating earnings (Non - GAAP) divided by average assets .. Operating return on average shareholder equity is the annualized operating earnings (Non - GAAP) divided by average equity .. Return on average tangible common equity is the annualized net income divided by average tangible common equity (Non - GAAP) .. Operating return on average tangible common equity is the annualized operating earnings (Non - GAAP) divided by average tangible common equity (Non - GAAP) .. The operating efficiency ratio includes an adjustment for taxable equivalent yields and excludes securities gains and losses and merger related and restructuring expenses from the efficiency ratio .. Tangible common equity and average tangible common equity exclude goodwill and other intangible assets from shareholders’ equity and average shareholders’ equity .. Tangible book value excludes goodwill and other intangible assets less shareholders’ equity divided by common shares outstanding .. Operating pre - tax pre - provision earnings is net interest income plus operating noninterest income (Non - GAAP) less operating noninterest expense (Non - GAAP) .. Operating noninterest income excludes the following from noninterest income : securities gains and losses .. Operating noninterest expense excludes the following from noninterest expense : prior year adjustments to salaries, merger related and restructuring expenses and certain franchise tax true - up expenses .. Tangible assets excludes goodwill and other intangibles from total assets .. Management believes that Non - GAAP financial measures provide additional useful information that allows investors to evaluate the ongoing performance of the company and provide meaningful comparisons to its peers .. Management believes these non - GAAP financial measures also enhance investors' ability to compare period - to - period financial results and allow investors and company management to view our operating results excluding the impact of items that are not reflective of the underlying operating performance .. Non - GAAP financial measures should not be considered as an alternative to any measure of performance or financial condition as promulgated under GAAP, and investors should consider SmartFinancial's performance and financial condition as reported under GAAP and all other relevant information when assessing the performance or financial condition of the company .. Non - GAAP financial measures have limitations as analytical tools, and investors should not consider them in isolation or as a substitute for analysis of the results or financial condition as reported under GAAP .. |
$0.61 $0.61 $0.68 $0.63 $0.61 $0.69 3Q21 2Q22 3Q22 GAAP EPS O PERATING EPS $25.28 $24.88 $24.56 $19.03 $18.69 $18.02 3Q21 2Q22 3Q22 BV P ER S HARE TBV P ER S HARE 0.97% 0.87% 0.95% 1.00% 0.88% 0.96% 3Q21 2Q22 3Q22 GAAP ROAA O PERATING ROAA 12.8% 13.0% 14.4% 13.3% 13.1% 14.4% 3Q21 2Q22 3Q22 GAAP ROATCE O PERATING ROATCE AOCI I MPACT 3 Financial data as of or for the three months ended 9 /30 /22 1) Non - GAAP financial measure - f or a reconciliation of Non - GAAP financial measures to their most directly comparable GAAP measures, see the Appendix 2) QoQ : Quarter - over - Quarter 3) “Loans” for purposes of this presentation includes all SmartFinancial loans and leases 4) Organic loan growth excludes PPP loans 5) AOCI: Accumulated Other Comprehensive Income Q UARTERLY H IGHLIGHTS : T HIRD Q UARTER 2022 5.6% Q O Q 2 A NNUALIZED T ANG .. B OOK V ALUE P ER S HARE G ROWTH (E XCLUDING AOCI) 1 $0.69 D ILUTED O PERATING EPS 1 0.96% O PERATING R ETURN ON A VERAGE A SSETS 1 14.4% O PERATING R ETURN A VERAGE T ANG .. C OMMON E QUITY 1 63% O PERATING E FFICIENCY R ATIO 1 F LAT Q O Q O RGANIC D EPOSIT G ROWTH 15% Q O Q A NNUALIZED O RGANIC L OAN 3 G ROWTH 4 72% L OAN / D EPOSIT R ATIO 0.10% N ON - P ERFORMING A SSETS / A SSETS $4.8 B ILLION IN T OTAL A SSETS E ARNINGS P ER S HARE B OOK V ALUE P ER S HARE R ETURN ON A VERAGE A SSETS R ETURN ON A VERAGE T ANGIBLE C OMMON E QUITY 1 1 1 1 $20.43 $18.02 $20.15 $18.69 1,5 |
4 S MART F INANCIAL : E XPANDING S OUTHEAST F RANCHISE $4.8 B ILLION IN T OTAL A SSETS $3.1 B ILLION IN T OTAL L OANS We are building a culture where Associates thrive and are empowered to be leaders .. The core values that we have established as a company help us operate in unison and have become a critical part of our culture .. Our Associates are key to SmartBank’s success .. $4.3 B ILLION IN T OTAL D EPOSITS 40 T OTAL B RANCHES K NOXVILLE N ASHVILLE H UNTSVILLE T USCALOOSA M OBILE P ENSACOLA B IRMINGHAM A UBURN T ALLAHASSEE D OTHAN M ONTGOMERY S MART B ANK B RANCH O FFICES L OAN P RODUCTION O FFICE P LANNED F UTURE E XPANSION C HATTANOOGA Balance sheet and branch count represent 9/30/22 balances P ANAMA C ITY |
$2.0 $2.1 $2.3 $2 $2 $2 $2 $2 $2 $2 12/31/20 12/31/21 9/30/22 SMBK L OANS $2.5 $3.5 $3.6 $ - $1 $1 $2 $2 $3 $3 $4 $4 $5 12/31/20 12/31/21 9/30/22 SMBK D EPOSITS $0.4 $0.6 $0.8 $ - $0 $0 $0 $0 $1 $1 $1 $1 $1 12/31/20 12/31/21 9/30/22 SMBK L OANS $0.3 $0.5 $0.7 $(0) $0 $0 $0 $0 $0 $1 $1 $1 $1 12/31/20 12/31/21 9/30/22 SMBK D EPOSITS \ M ARKET A REA : T ARGETING I NDUSTRY R ICH G ROWTH M ARKETS 5 ► T OTAL P OPULATION : 2.8 M ILLION ► T OTAL D EPOSITS : $69 B ILLION ► M EDIAN I NCOME : $63 T HOUSAND L EGACY M ARKETS 1) Legacy Markets include Chattanooga, TN, Clarke, AL, Cleveland, TN, Crossville, TN, Cookeville, TN, Fentress, TN, Huntsville, AL, Knoxville, TN, Sevierville, TN, Tullahoma, TN and Tuscaloosa, AL MSAs 2) Expanding Markets include Auburn, AL, Birmingham, AL, Dothan, AL, Fairhope, AL, Fort Walton/Destin, FL, Montgomery, AL, Mobil e, AL, Nashville, TN, Panama City, FL, Pensacola, FL and Tallahassee, FL Source: S&P Market Intelligence; https://www.forbes.com/best - places - for - business Note: Expanding and Legacy market statistics based on the weighted average of the MSAs included in each area based on populat ion ; Legacy market area includes settlement and corporate balances E XPANDING M ARKETS ► T OTAL P OPULATION : 5.9 M ILLION ► T OTAL D EPOSITS : $213 B ILLION ► M EDIAN I NCOME : $68 T HOUSAND L EGACY M ARKETS 1 : S TRONG R ELATIONSHIPS / D EEP M ARKET P ENETRATION E XPANDING M ARKETS 2 : B UILDING T ALENT / G ROWING B RAND A WARENESS Forbes Top 200 Best Places for Business and Careers Knoxville: #86 Huntsville: #93 Chattanooga: #116 Mobile: #184 Forbes Top 200 Best Places for Business and Careers Nashville: #15 Tallahassee: #103 Pensacola: #105 Birmingham: #165 Montgomery: #191 CAGR: 8% $ in Billions CAGR: 23% CAGR: 50% CAGR: 62% S MART B ANK B RANCH O FFICES L OAN P RODUCTION O FFICE P LANNED F UTURE E XPANSION E XPANDING M ARKET A REA L EGACY M ARKET A REA U RBAN AREA D ENSITY |
$1,319 $1,775 $1,897 $2,382 $2,693 $2,806 $2,994 $3,099 5.31% 5.72% 5.49% 4.89% 4.67% 4.40% 4.40% 4.59% 3.00% 4.00% 5.00% 6.00% 7.00% 8.00% 9.00% 10.00% $ - $500 $1,000 $1,500 $2,000 $2,500 $3,000 $3,500 2017Y 2018Y 2019Y 2020Y 2021Y 1Q22 2Q22 3Q22 $1,439 $1,922 $2,047 $2,805 $4,022 $4,191 $4,282 $4,280 0.55% 0.86% 1.12% 0.55% 0.27% 0.20% 0.24% 0.45% 0.00% 0.50% 1.00% 1.50% 2.00% 2.50% 3.00% $ - $500 $1,000 $1,500 $2,000 $2,500 $3,000 $3,500 $4,000 $4,500 2017Y 2018Y 2019Y 2020Y 2021Y 1Q22 2Q22 3Q22 6 1) CA GR: Compound Annualized Growth Rate B ALANCE S HEET : C ONTINUED B ALANCE S HEET E XPANSION T OTAL L OANS CAGR 1 OF 20% S INCE 2017 T OTAL D EPOSITS L OANS TO D EPOSITS R ATIO OF 72% $ in Millions A VERAGE L OAN Y IELD A VERAGE T OTAL D EPOSIT C OST |
26% 26% 26% 27% 28% 22% 22% 23% 23% 22% 37% 37% 38% 38% 39% 15% 14% 13% 12% 11% $3,799 $4,022 $4,191 $4,282 $4,280 3Q21 4Q21 1Q22 2Q22 3Q22 N ONINTEREST D EMAND I NTEREST - B EARING D EMAND M ONEY M ARKET AND S AVINGS T IME D EPOSITS 21% 22% 22% 23% 23% 28% 29% 31% 28% 27% 3% 2% 1% 0% 0% 14% 16% 15% 16% 16% 12% 10% 11% 12% 13% 18% 18% 17% 18% 18% 3% $2,653 $2,693 $2,806 $2,994 $3,099 3Q21 4Q21 1Q22 2Q22 3Q22 CRE, OO CRE, NOO SBA PPP L OANS C&I C&D C ONSUMER RE L EASES & O THER 7 L OAN AND D EPOSIT P ORTFOLIO : S TRONG O RGANIC G ROWTH $ in Millions L OAN C OMPOSITION P OSITIVE M ARKET M OMENTUM D RIVING O RGANIC G ROWTH D EPOSIT C OMPOSITION C ORE D EPOSIT G ROWTH O UTPACING T IME D EPOSIT C ONTRACTION |
$6,059 $5,058 $4,981 $5,042 $4,605 0.14% 0.11% 0.11% 0.11% 0.10% -0.10% 0.10% 0.30% 0.50% 0.70% 0.90% 1.10% 1.30% 1.50% $- $2,000 $4,000 $6,000 $8,000 $10,000 3Q21 4Q21 1Q22 2Q22 3Q22 N ONPERFORMING L OANS OREO & O THER R EPOS N ONPERFORMING A SSETS / T OTAL A SSETS $7,768 $8,991 $5,738 $6,588 $6,398 0.29% 0.33% 0.20% 0.22% 0.21% -0.10% 0.10% 0.30% 0.50% 0.70% 0.90% 1.10% 1.30% 1.50% 1.70% $- $2,000 $4,000 $6,000 $8,000 $10,000 $12,000 $14,000 3Q21 4Q21 1Q22 2Q22 3Q22 T OTAL D ELINQUENT & N ONACCRUAL L OANS & L EASES T OTAL D ELINQUENT & N ONACCRUAL L OANS & L EASES / T OTAL L OANS & L EASES 0.36% 0.35% 0.31% 0.29% 0.22% 0.03% 0.05% 0.04% - 0.09% 0.02% -0.10% -0.05% 0.00% 0.05% 0.10% 0.15% 0.20% 0.25% 0.30% 0.35% 0.40% 3Q21 4Q21 1Q22 2Q22 3Q22 C LASSIFIED L OANS AND L EASES / T OTAL L OANS & L EASES N ET C HARGEOFFS 293% 286% 304% 303% 303% 88% 74% 81% 90% 100% 0% 50% 100% 150% 200% 250% 150% 170% 190% 210% 230% 250% 270% 290% 310% 330% 350% 3Q21 4Q21 1Q22 2Q22 3Q22 CRE L OANS / C APITAL C&D L OANS / C APITAL 8 C REDIT Q UALITY D ELINQUENT AND N ONACCRUALS / T OTAL L OANS N ONPERFORMING A SSETS C OMMERCIAL R EAL E STATE C ONCENTRATION A SSET Q UALITY : S TRONG U NDERWRITING P AYS D IVIDENDS $ in Thousands |
9 R ESERVE R ECONCILIATION : $ in Thousands 3Q21 4Q21 1Q22 2Q22 3Q22 Allowance / Total Loans & Leases ("L&L") 0.73% 0.72% 0.72% 0.73% 0.73% Allowance / Total L&L, less PPP 0.75% 0.73% 0.72% 0.73% 0.74% Allowance - Originated / Orig. L&L, less PPP 0.76% 0.74% 0.74% 0.74% 0.75% Allowance - Acquired / Acquired L&L 0.74% 0.65% 0.63% 0.67% 0.65% Acquired FV Discount / Acquired L&L 2.48% 3.42% 3.64% 4.17% 4.29% Total Reserves / Total L&L 1.22% 1.29% 1.25% 1.22% 1.20% Total Reserves / Total L&L, less PPP 1.26% 1.31% 1.26% 1.23% 1.20% $19,295 $19,352 $20,078 $21,938 $22,769 $13,001 $15,483 $14,913 $14,737 $14,465 0.76% 0.74% 0.74% 0.74% 0.75% 0.00% 0.50% 1.00% 1.50% 2.00% $- $2,000 $4,000 $6,000 $8,000 $10,000 $12,000 $14,000 $16,000 $18,000 $20,000 $22,000 $24,000 3Q21 4Q21 1Q22 2Q22 3Q22 A LLOWANCE FOR L OAN L OSSES A CQUIRE L OAN F AIR V ALUE D ISCOUNTS A LLOWANCE - O RIGINATED / O RIG .. L&L, L ESS PPP |
$1,091 $1,045 $764 $655 $543 $339 $559 $830 $813 $807 7.7% 12.1% 17.6% 17.0% 16.8% 0.0% 5.0% 10.0% 15.0% 20.0% 25.0% 30.0% 35.0% 40.0% 45.0% 50.0% $- $200 $400 $600 $800 $1,000 $1,200 3Q21 4Q21 1Q22 2Q22 3Q22 C ASH AND C ASH E QUIV .. S ECURITIES (AFS/HTM) S ECURITIES (AFS/HTM) / T OTAL A SSETS $30,382 $29,855 $30,118 $33,062 $36,708 $6,264 $6,806 $7,111 $7,229 $6,250 $36,646 $36,661 $37,229 $40,291 $42,958 3.35% 2.92% 2.91% 3.08% 3.29% $15,000 $20,000 $25,000 $30,000 $35,000 $40,000 $45,000 2.00% 2.50% 3.00% 3.50% 4.00% 4.50% 5.00% 5.50% 6.00% 3Q21 4Q21 1Q22 2Q22 3Q22 N ET I NTEREST I NCOME O PERATING N ONINTEREST I NCOME N ET I NTEREST M ARGIN (FTE) 10 L IQUIDITY U TILIZATION : M ARGIN M ANAGEMENT WHILE D RIVING R EVENUE $ in Millions C ASH AND S ECURITIES D EPLOYING E XCESS F UNDING M ARGIN / O PERATING R EVENUE 2 M AINTAINING R EVENUE D ESPITE C HALLENGING M ARGIN E NVIRONMENT $ in Thousands 1) Based on the weighted average of the AFS/HTM securities portfolio. Yields related to investment securities exempt from income ta xes are stated on a taxable - equivalent basis assuming a federal income tax rate of 21.0% 2) Non - GAAP financial measure - f or a reconciliation of Non - GAAP financial measures to their most directly comparable GAAP measures, see the Appendix 2 3Q21 4Q21 1Q22 2Q22 3Q22 Cash Yield 0.23% 0.22% 0.25% 0.91% 2.34% Sec. Yield (AFS/HTM) 1 1.89% 1.64% 1.67% 1.73% 1.87% Loans (less Accr./PPP Fees) 4.21% 4.20% 4.18% 4.27% 4.55% Accretion 0.28% 0.07% 0.06% 0.03% 0.02% PPP Fees 0.46% 0.26% 0.16% 0.10% 0.02% Loan Yield (incl. Fees) 4.95% 4.53% 4.40% 4.40% 4.59% IE Asset Yield 3.67% 3.20% 3.18% 3.39% 3.79% NIM (FTE) 3.35% 2.92% 2.91% 3.08% 3.29% |
$1,862 60% $570 18% $668 22% F IXED R ATE LT V ARIABLE ST V ARIABLE $1,717 , 1.1% $3,368 , 2.2% $4,844 , 3.1% I NTERST I NCOME % C HANGE S HOCK +100 BPS S HOCK +200 BPS S HOCK +300 BPS $1,024 , 0.7% $2,097 , 1.3% $3,177 , 2.0% I NTEREST I NCOME % C HANGE R AMP +100 BPS R AMP +200 BPS R AMP +300 BPS 11 I NTEREST R ATE S ENSITIVITY F IXED VS .. V ARIABLE R ATE L OANS S TATIC S HOCK / R ATE R AMP A NALYSIS 1 1) Based on 12 - month static rate shock and ramp analysis as of 9/30/22. These estimates of changes in the Company’s net interest in come require us to make certain assumption including loan and mortgage - related investment prepayment speeds, reinvestment rate, deposit maturities and decay rates. These assumptions are inherently uncertain and, as a result, we cannot pr ecisely predict the impact of changes in interest rates on net interest income. Although our analysis provides and indication of our interest rate risk exposure at a particular point in time, such estimates are not intended to, and do not, provide a prec ise forecast of the effect of changes in market interest rates and will differ from actual results. ▲ $1.9 B ILLION F IXED R ATE L OANS ▲ $1.2 B ILLION V ARIABLE R ATE L OANS ▲ $668 M ILLION S HORT T ERM V ARIABLE R ATE (1 - 3 M ONTH R ESET ) ▲ $570 M ILLION L ONG T ERM V ARIABLE R ATE (> 3 M ONTH R ESET ) $ in Thousands $ in Millions |
12 N ONINTEREST R EVENUE D ETAILS : G ROWING F EE I NCOME O PERATING N ONINTEREST I NCOME 1 F OCUSED ON R ECURRING F EE I NCOME $ in Thousands 1) Non - GAAP financial measure - f or a reconciliation of Non - GAAP financial measures to their most directly comparable GAAP measures, see the Appendix D IFFERENTIATED R EVENUE S TREAMS B UILDING A F AMILY OF D IVERSIFIED R EVENUE G ENERATORS $6,264 $6,806 $7,111 $7,229 $6,250 3Q21 4Q21 1Q22 2Q22 3Q22 S ERVICE C HARGES ON D EPOSIT A CCOUNTS M ORTGAGE B ANKING I NCOME I NVESTMENT S ERVICES I NCOME I NSURANCE C OMMISSIONS I NTERCHANGE F EES O THER N ONINTEREST I NCOME |
62% 68% 68% 64% 63% 3Q21 4Q21 1Q22 2Q22 3Q22 O PERATING E FFICIENCY R ATIO $22,845 $25,061 $25,279 $25,845 $27,143 3Q21 4Q21 1Q22 2Q22 3Q22 S ALARIES & B ENEFITS O CCUPANCY & E QUIPMENT D ATA P ROCESSING & T ECHNOLOGY P ROFESSIONAL S ERVICES A MORTIZATION OF I NTANGIBLES O THER N ONINTEREST E XPENSE 13 1) Non - GAAP financial measure - f or a reconciliation of Non - GAAP financial measures to their most directly comparable GAAP measures, see the Appendix O PERATING E XPENSE : I NVESTING IN G ROWTH O PERATING E FFICIENCY R ATIO 1 E XECUTING ON E XPANSION O PPORTUNITIES O PERATING N ONINTEREST E XPENSE 1 D ISCIPLINED F OCUS ON E XPENSE C ONTAINMENT $ in Thousands |
7.5% 7.2% 6.8% 6.7% 6.5% 3Q21 4Q21 1Q22 2Q22 3Q22 10.9% 10.2% 10.3% 10.0% 9.6% 3Q21 4Q21 1Q22 2Q22 3Q22 8.4% 7.5% 7.4% 7.5% 7.4% 3Q21 4Q21 1Q22 2Q22 3Q22 12.9% 12.2% 12.2% 11.8% 11.4% 3Q21 4Q21 1Q22 2Q22 3Q22 $13.90 $14.64 $16.82 $17.92 $19.26 $18.02 $14.01 $14.84 $16.80 $17.77 $19.17 $20.43 $8.00 $10.00 $12.00 $14.00 $16.00 $18.00 $20.00 $22.00 $24.00 2017Y 2018Y 2019Y 2020Y 2021Y 3Q22 TBV Per Share Adj. TBV Per Share (Ex. AOCI) C APITAL : W ELL C APITALIZED – B UILDING B OOK V ALUE 14 1) Non - GAAP financial measure - f or a reconciliation of Non - GAAP financial measures to their most directly comparable GAAP measures, see the Appendix Note: Capital ratio data as of the most recent period ended 9/30/22 TCE / TA 1 CET1 R ATIO T OTAL C APITAL R ATIO L EVERAGE R ATIO B ASEL III R EGULATORY C APITAL M INIMUM T O B E C ONSIDERED “W ELL C APITALIZED ” B UILDING S HAREHOLDER V ALUE T ANGIBLE B OOK V ALUE P ER S HARE (TBVPS) 1 $6.43 TBVPS 1 C REATED 2017 – 2022 (E XCLUDING A CCUMULATED O THER C OMPREHENSIVE I NCOME ) $0.07 P ER S HARE Q UARTERLY D IVIDEND 5% W ELL C APITALIZED 10% W ELL C APITALIZED 6.5% W ELL C APITALIZED 1 1 |
W HY S MART B ANK : I NVESTMENT H IGHLIGHTS 15 F RANCHISE S CARCITY V ALUE – B UILDING S OUTHEAST D ENSITY E NGAGED M ANAGEMENT T EAM S TABLE M ARKETS E XPERIENCING P OPULATION E XPANSION L OW - C OST D EPOSIT B ASE G ROWING B USINESS L INES WITH R EVENUE D IVERSIFICATION S OLID C REDIT Q UALITY AND U NDERWRITING H ISTORY OF D EFENDING B OOK V ALUE AND D ELIVERING S HAREHOLDER V ALUE $ |
A PPENDIX 16 |
17 Note: For a reconciliation of Non - GAAP financial measures to their most directly comparable GAAP measures, see the Appendix I NCOME S TATEMENT : D ETAILED T HIRD Q UARTER R ESULTS 2Q22 3Q21 ($ in thousands, except per share data) 3Q22 2Q22 3Q21 % Chg. % Chg. Net Interest Income 36,708 $ 33,062 $ 30,382 $ 11% 21% Provision for Loan & Lease losses 974 1,250 1,149 Noninterest Income 6,250 7,229 6,309 (14%) (1%) Noninterest Expense 27,230 25,926 23,309 5% 17% Income Tax Expense 3,211 2,900 2,633 Net Income (GAAP) 11,543 $ 10,215 $ 9,600 $ 13% 20% Non-GAAP Reconciliations Noninterest Income - - (45) Noninterest Expense 87 81 464 Income Tax Effect Of Adjustments (22) (21) (108) Operating Earnings (Non-GAAP) 11,608 $ 10,275 $ 9,911 $ 13% 17% Operating PTPP Earnings (Non-GAAP) 15,815 $ 14,446 $ 13,801 $ 9% 15% 2Q22 3Q21 Non-GAAP Performance Metrics 3Q22 2Q22 3Q21 % Chg. % Chg. Diluted Operating Earnings Per Share 0.69 $ 0.61 $ 0.63 $ 13% 9% Tangible Book Value Per Common Share 18.02 $ 18.69 $ 19.03 $ (4%) (5%) Operating Return on Average Assets 0.96% 0.88% 1.00% 0.08% (0.04%) Operating PTPP Return on Average Assets 1.30% 1.23% 1.39% 0.07% (0.09%) Operating Return on Average Tang. Common Equity 14.4% 13.1% 13.3% 1.3% 1.2% Operating Efficiency Ratio 62.9% 63.9% 62.1% (0.9%) 0.8% 3Q22 vs. 3Q22 vs. |
Branch Network Modernization Q2 2021 18 Digital Consumer Deposit Origination Upgrade Q2 2021 Treasury Management Platform Upgrade Q1 2022 Q2 2021 Cloud - Based Contact Center Enhanced Cyber Security Technology Q2 2021 O PERATING E XPENSE : T ECHNOLOGY I NITIATIVES I NVESTING IN OUR P LATFORM TO M AKE S MART B ANK AN E ASIER O RGANIZATION WITH W HICH TO DO B USINESS Q2 2021 Telecommunications Management Upgrade Q3 2021 Redesigned SmartBank.com Core OS Platform Upgrade Q2 2022 New Consumer Personal Finance Tools Q3 2022 Teller Modernization Bank - Wide Q2 2022 Q4 2022 nCino © Customer Pricing and Profitability Q3 2022 Upgraded Mobile/Digital Services Q2 2022 nCino © Commercial Loan Origination Q2 2022 Centralized Bank Application Support Team $ PAY E MBRACING T ECHNOLOGY TO I NCREASE E FFICIENCY AND C REATE S TREAMLINED P ROCESSES ATM Fleet Replacement with ITM Upgrade Q3 2022 Q3 2022 Digital Consumer Credit/Finance Tools Enhanced Risk & Anti - Fraud Solutions Q4 2022 Digital Customer Experience Enhancements Q2 2023 Loan Payment Technology Expansion Q1 2023 Q2 2023 Treasury Management System Improvement Q1 2023 Consumer Lending Workflow Enhancement |
N ON - GAAP R ECONCILIATION 19 $ in Thousands, except per share data 1. Operating return on average assets (Non - GAAP) is the annualized operating earnings (Non - GAAP) divided by average assets .. 2. Operating PTPP return on average assets (Non - GAAP) is the annualized operating PTPP earnings (Non - GAAP) divided by average assets .. 3. Return on average tangible common equity (Non - GAAP) is the annualized net income divided by average tangible common equity (Non - GAAP) .. 4. Operating return on average shareholders’ equity (Non - GAAP) is the annualized operating earnings (Non - GAAP) divided by average shareholder equity .. 5. Operating return on average tangible common equity (Non - GAAP) is the annualized operating earnings (Non - GAAP) divided by average tangible common equity (Non - GAAP) .. 3Q22 2Q22 1Q22 4Q21 3Q21 Operating Earnings Net Income (GAAP) 11,543 $ 10,215 $ 8,259 $ 6,655 $ 9,600 $ Noninterest Income: Securities (Gains) Losses - - - - (45) Noninterest Expenses: Merger Related And Restructuring Expenses 87 81 439 2,762 464 Income Taxes: Income Tax Effect Of Adjustments (22) (21) (113) (713) (108) Operating Earnings (Non-GAAP) 11,608 $ 10,275 $ 8,585 $ 8,704 $ 9,911 $ Operating Earnings Per Common Share: Basic 0.69 $ 0.61 $ 0.51 $ 0.52 $ 0.64 $ Diluted 0.69 0.61 0.51 0.52 0.63 Operating Noninterest Income Noninterest Income (GAAP) 6,250 $ 7,229 $ 7,111 $ 6,806 $ 6,309 $ Securities (Gain) Losses - - - - (45) Operating Noninterest Income (Non-GAAP) 6,250 $ 7,229 $ 7,111 $ 6,806 $ 6,264 $ Operating Noninterest Expense Noninterest Expense (GAAP) 27,230 $ 25,926 $ 25,718 $ 27,823 $ 23,309 $ Merger Related And Restructuring Expenses (87) (81) (439) (2,762) (464) Operating Noninterest Expense (Non-GAAP) 27,143 $ 25,845 $ 25,279 $ 25,061 $ 22,845 $ Operating Pre-Tax Pre-Provison ("PTPP") Earnings Net Interest Income (GAAP) 36,708 $ 33,062 $ 30,118 $ 29,855 $ 30,382 $ Operating Noninterest Income (Non-GAAP) 6,250 7,229 7,111 6,806 6,264 Operating Noninterest Expense (Non-GAAP) (27,143) (25,845) (25,279) (25,061) (22,845) Operating PTPP Earnings (Non-GAAP) 15,815 $ 14,446 $ 11,950 $ 11,600 $ 13,801 $ Non-GAAP Return Ratios Operating Return On Average Assets (Non-GAAP) (1) 0.96% 0.88% 0.76% 0.77% 1.00% Operating PTPP Return On Average Assets (Non-GAAP) (2) 1.30% 1.23% 1.05% 1.03% 1.39% Return On Average Tangible Common Equity (Non-GAAP) (3) 14.36% 13.02% 10.39% 8.18% 12.84% Operating Return On Average Shareholders' Equity (Non-GAAP) (4) 10.83% 9.82% 8.14% 8.09% 10.01% Operating Return On Average Tangible Common Equity (Non-GAAP) (5) 14.44% 13.09% 10.80% 10.70% 13.26% Operating Efficiency Ratio Efficiency Ratio (GAAP) 63.39% 64.35% 69.08% 75.89% 63.53% Adjustment For Taxable Equivalent Yields (0.25%) (0.27%) (0.31%) (0.32%) (0.25%) Adjustment For Securities Gains (Losses) - - - - (0.08%) Adjustment For Merger Expenses (0.21%) (0.20%) (1.17%) (7.50%) (1.10%) Operating Efficiency Ratio (Non-GAAP) 62.93% 63.88% 67.60% 68.07% 62.09% |
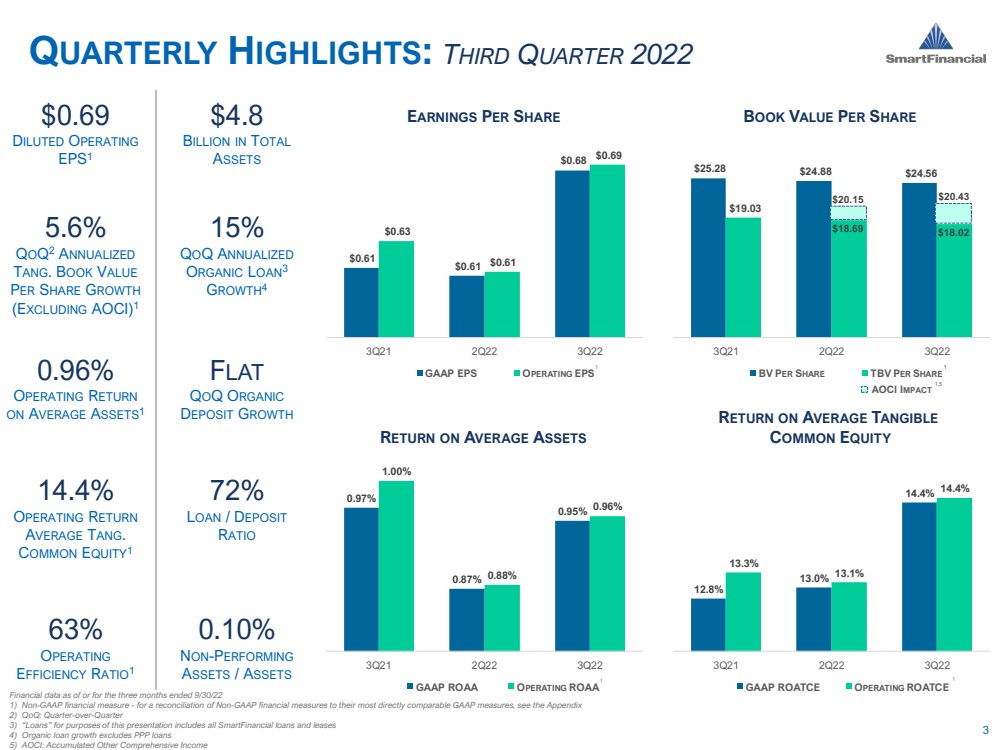
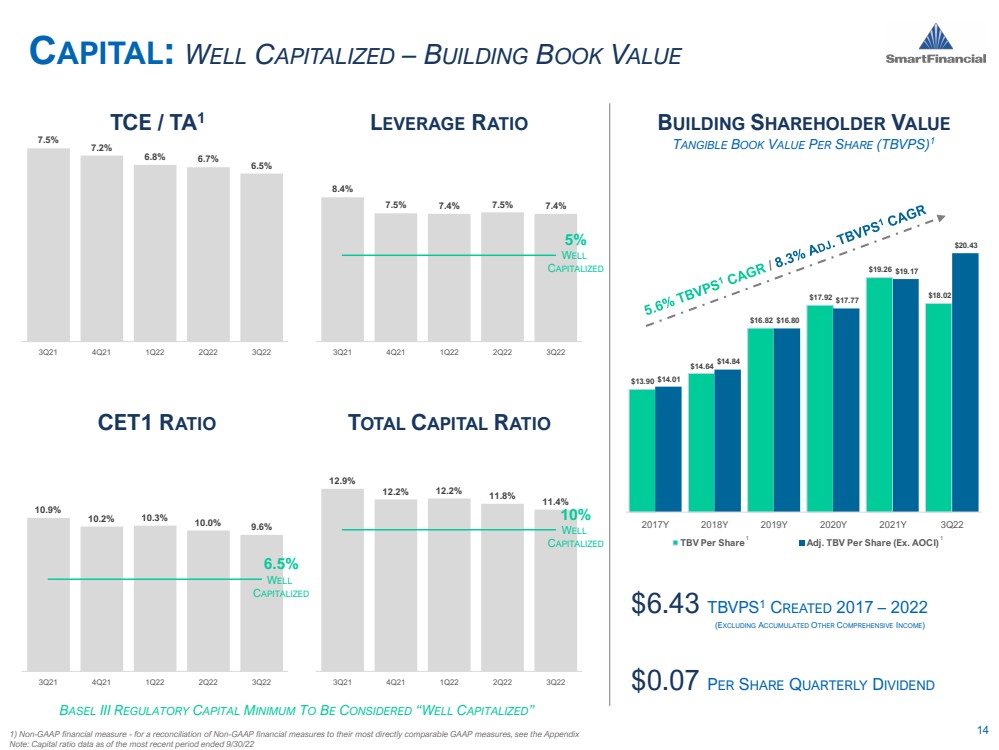
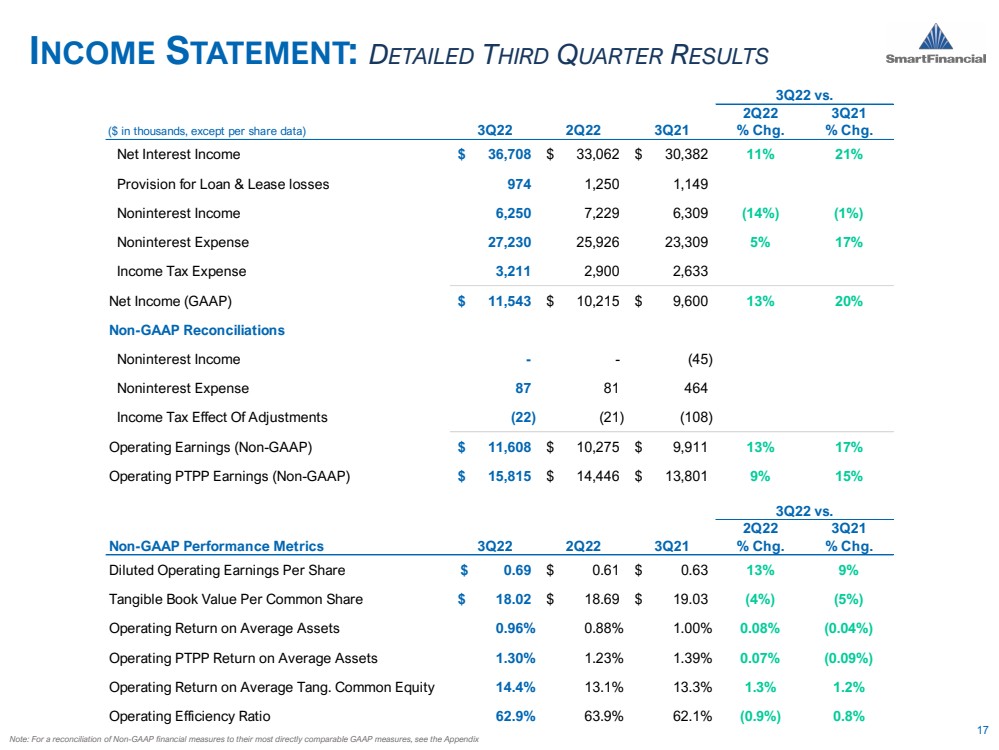
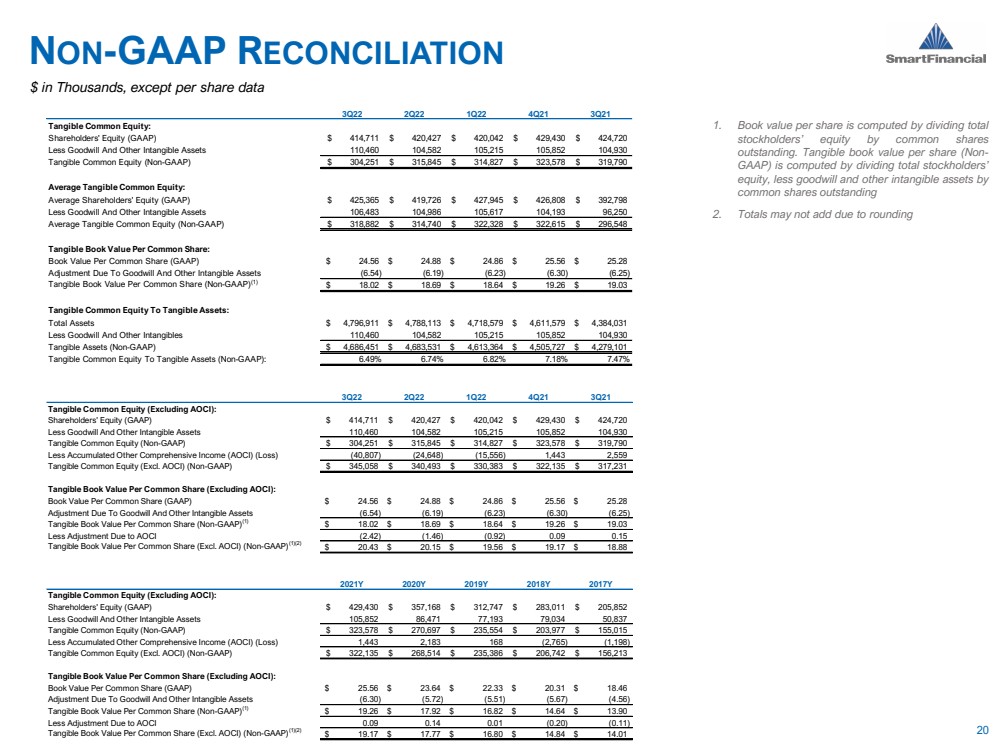
N ON - GAAP R ECONCILIATION 20 $ in Thousands, except per share data 1. Book value per share is computed by dividing total stockholders’ equity by common shares outstanding .. Tangible book value per share (Non - GAAP) is computed by dividing total stockholders’ equity, less goodwill and other intangible assets by common shares outstanding 2. Totals may not add due to rounding 3Q22 2Q22 1Q22 4Q21 3Q21 Tangible Common Equity: Shareholders' Equity (GAAP) 414,711 $ 420,427 $ 420,042 $ 429,430 $ 424,720 $ Less Goodwill And Other Intangible Assets 110,460 104,582 105,215 105,852 104,930 Tangible Common Equity (Non-GAAP) 304,251 $ 315,845 $ 314,827 $ 323,578 $ 319,790 $ Average Tangible Common Equity: Average Shareholders' Equity (GAAP) 425,365 $ 419,726 $ 427,945 $ 426,808 $ 392,798 $ Less Goodwill And Other Intangible Assets 106,483 104,986 105,617 104,193 96,250 Average Tangible Common Equity (Non-GAAP) 318,882 $ 314,740 $ 322,328 $ 322,615 $ 296,548 $ Tangible Book Value Per Common Share: Book Value Per Common Share (GAAP) 24.56 $ 24.88 $ 24.86 $ 25.56 $ 25.28 $ Adjustment Due To Goodwill And Other Intangible Assets (6.54) (6.19) (6.23) (6.30) (6.25) Tangible Book Value Per Common Share (Non-GAAP) (1) 18.02 $ 18.69 $ 18.64 $ 19.26 $ 19.03 $ Tangible Common Equity To Tangible Assets: Total Assets 4,796,911 $ 4,788,113 $ 4,718,579 $ 4,611,579 $ 4,384,031 $ Less Goodwill And Other Intangibles 110,460 104,582 105,215 105,852 104,930 Tangible Assets (Non-GAAP) 4,686,451 $ 4,683,531 $ 4,613,364 $ 4,505,727 $ 4,279,101 $ Tangible Common Equity To Tangible Assets (Non-GAAP): 6.49% 6.74% 6.82% 7.18% 7.47% 3Q22 2Q22 1Q22 4Q21 3Q21 Tangible Common Equity (Excluding AOCI): Shareholders' Equity (GAAP) 414,711 $ 420,427 $ 420,042 $ 429,430 $ 424,720 $ Less Goodwill And Other Intangible Assets 110,460 104,582 105,215 105,852 104,930 Tangible Common Equity (Non-GAAP) 304,251 $ 315,845 $ 314,827 $ 323,578 $ 319,790 $ Less Accumulated Other Comprehensive Income (AOCI) (Loss) (40,807) (24,648) (15,556) 1,443 2,559 Tangible Common Equity (Excl. AOCI) (Non-GAAP) 345,058 $ 340,493 $ 330,383 $ 322,135 $ 317,231 $ Tangible Book Value Per Common Share (Excluding AOCI): Book Value Per Common Share (GAAP) 24.56 $ 24.88 $ 24.86 $ 25.56 $ 25.28 $ Adjustment Due To Goodwill And Other Intangible Assets (6.54) (6.19) (6.23) (6.30) (6.25) Tangible Book Value Per Common Share (Non-GAAP) (1) 18.02 $ 18.69 $ 18.64 $ 19.26 $ 19.03 $ Less Adjustment Due to AOCI (2.42) (1.46) (0.92) 0.09 0.15 Tangible Book Value Per Common Share (Excl. AOCI) (Non-GAAP) (1)(2) 20.43 $ 20.15 $ 19.56 $ 19.17 $ 18.88 $ 2021Y 2020Y 2019Y 2018Y 2017Y Tangible Common Equity (Excluding AOCI): Shareholders' Equity (GAAP) 429,430 $ 357,168 $ 312,747 $ 283,011 $ 205,852 $ Less Goodwill And Other Intangible Assets 105,852 86,471 77,193 79,034 50,837 Tangible Common Equity (Non-GAAP) 323,578 $ 270,697 $ 235,554 $ 203,977 $ 155,015 $ Less Accumulated Other Comprehensive Income (AOCI) (Loss) 1,443 2,183 168 (2,765) (1,198) Tangible Common Equity (Excl. AOCI) (Non-GAAP) 322,135 $ 268,514 $ 235,386 $ 206,742 $ 156,213 $ Tangible Book Value Per Common Share (Excluding AOCI): Book Value Per Common Share (GAAP) 25.56 $ 23.64 $ 22.33 $ 20.31 $ 18.46 $ Adjustment Due To Goodwill And Other Intangible Assets (6.30) (5.72) (5.51) (5.67) (4.56) Tangible Book Value Per Common Share (Non-GAAP) (1) 19.26 $ 17.92 $ 16.82 $ 14.64 $ 13.90 $ Less Adjustment Due to AOCI 0.09 0.14 0.01 (0.20) (0.11) Tangible Book Value Per Common Share (Excl. AOCI) (Non-GAAP) (1)(2) 19.17 $ 17.77 $ 16.80 $ 14.84 $ 14.01 $ |
C ONTACT 21 B ILLY C ARROLL P RESIDENT & CEO 865.868.0613 B ILLY ..C ARROLL @ SMARTBANK .. COM M ILLER W ELBORN C HAIRMAN 423.385.3067 M ILLER ..W ELBORN @ SMARTBANK .. COM 5401 K INGSTON P IKE , S UITE 600 K NOXVILLE , TN 37919 R ON G ORCZYNSKI C HIEF F INANCIAL O FFICER 865.437.5724 R ON ..G ORCZYNSKI @ SMARTBANK .. COM |
22 |