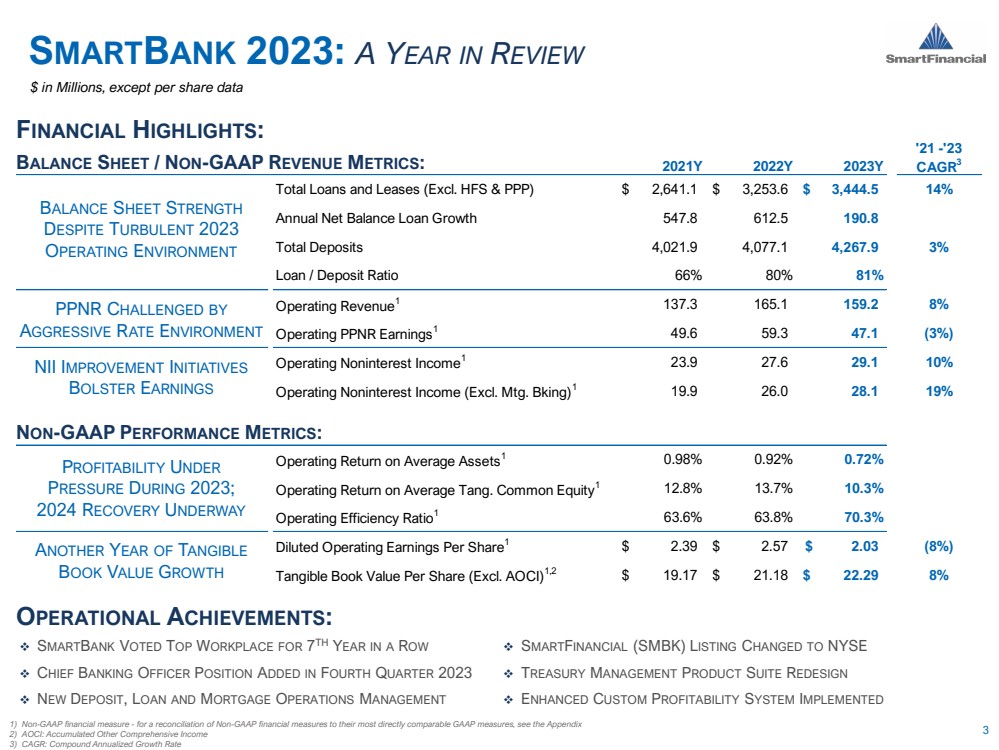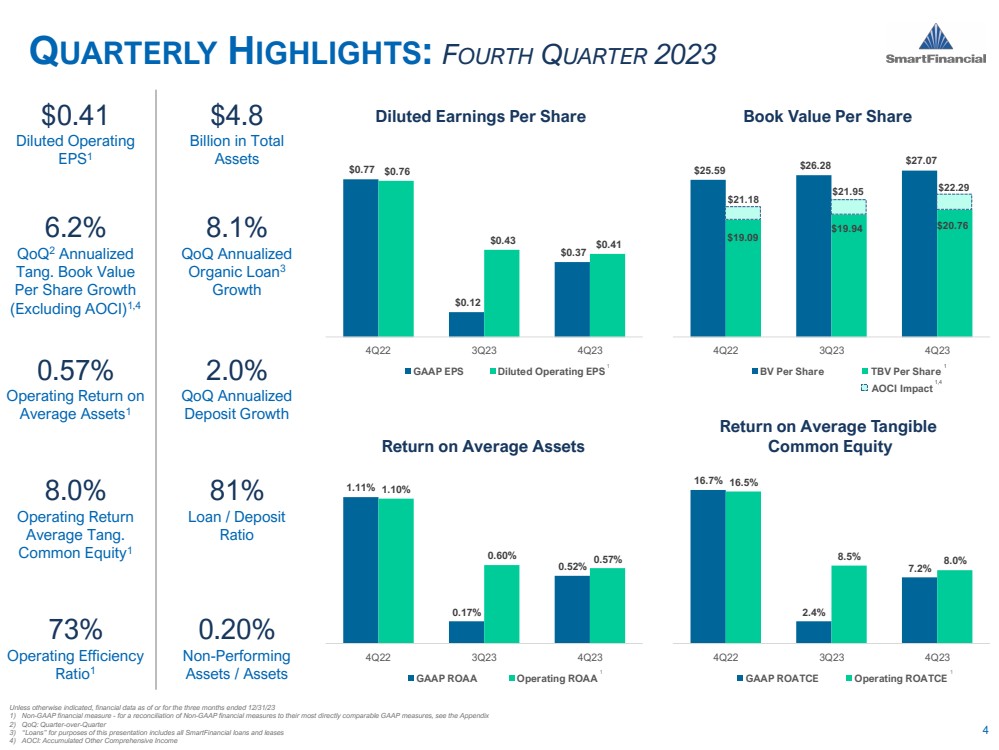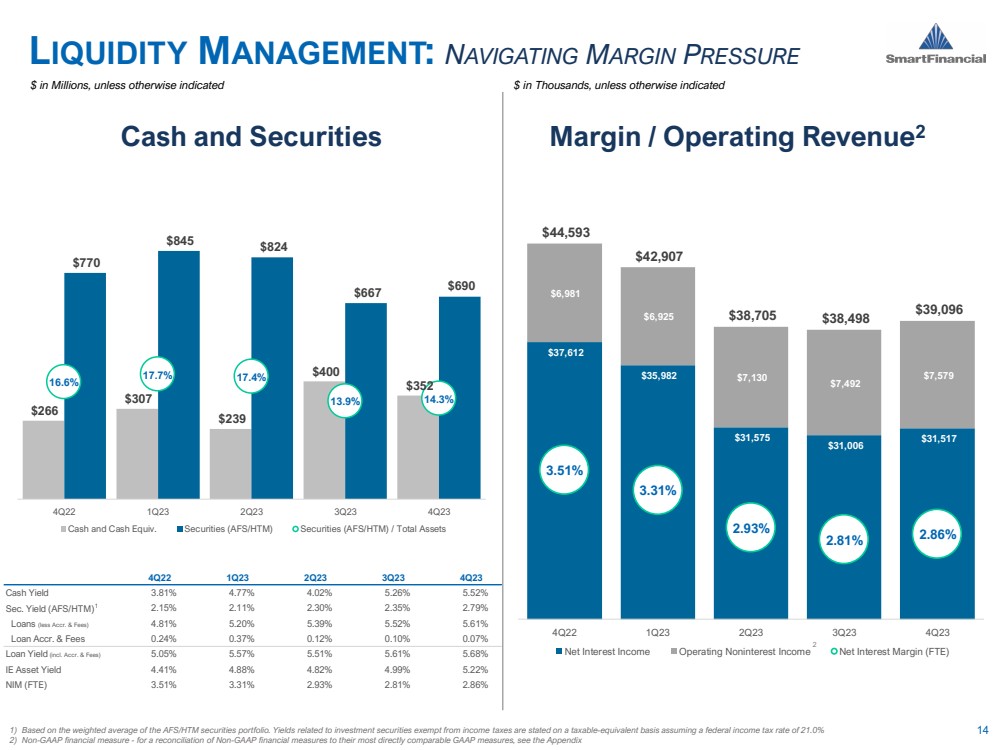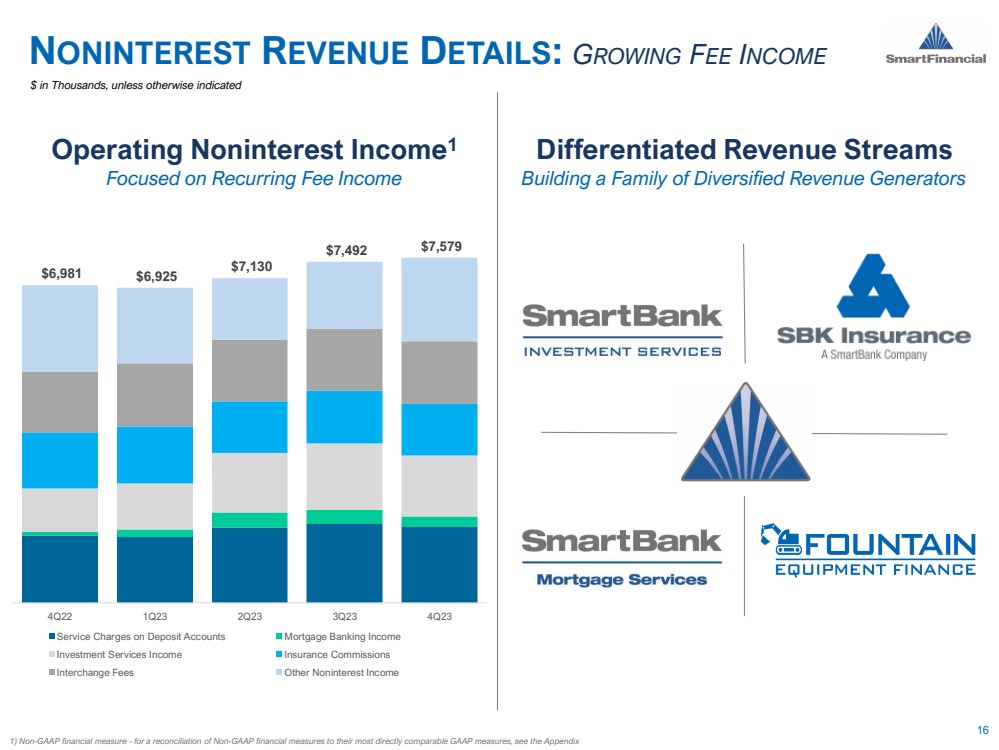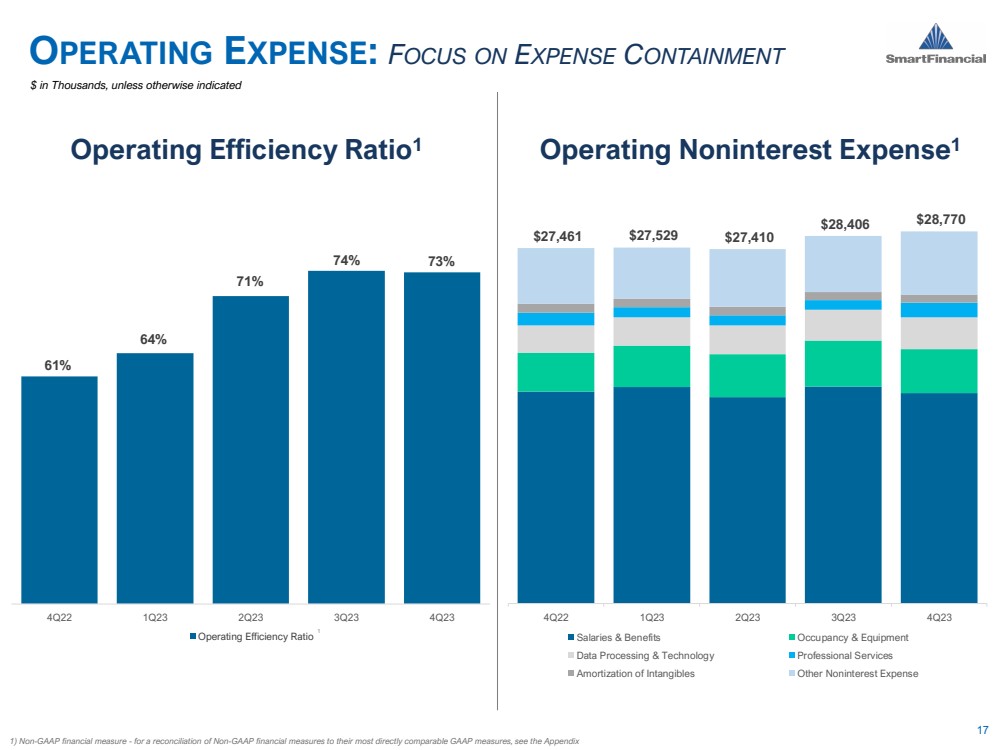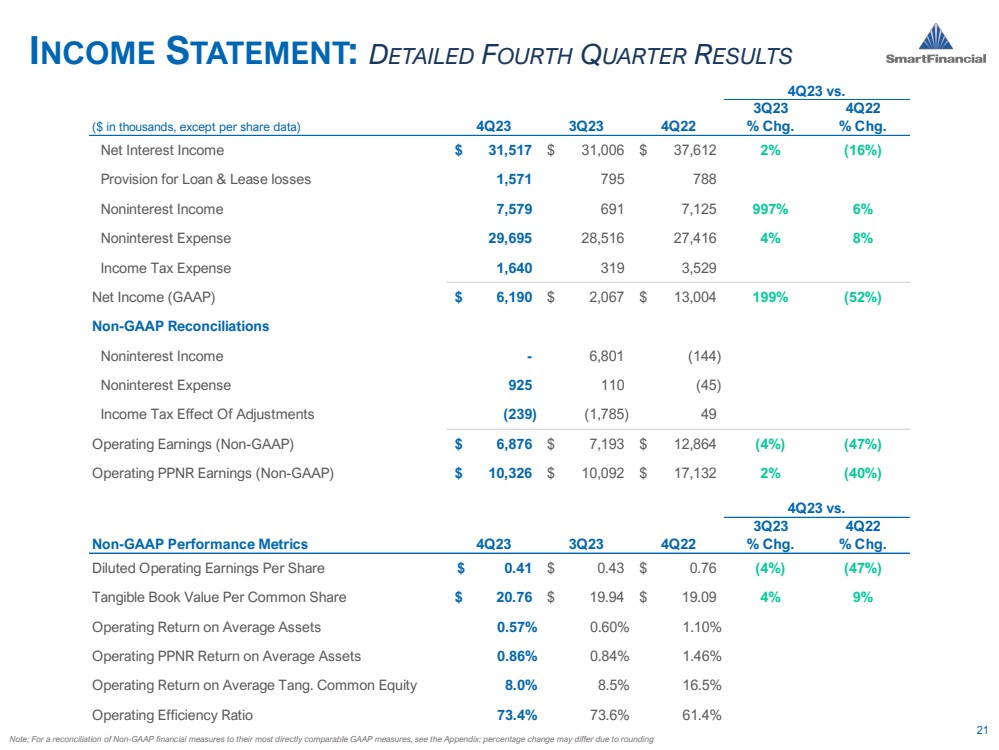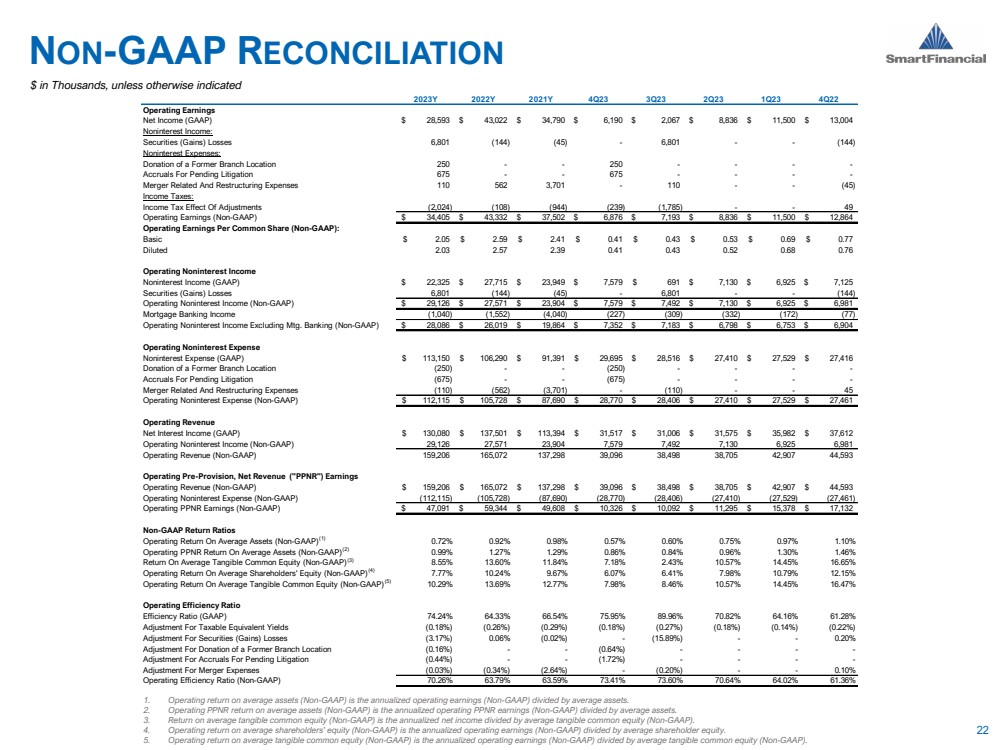
| NON-GAAP RECONCILIATION 22 1. Operating return on average assets (Non-GAAP) is the annualized operating earnings (Non-GAAP) divided by average assets. 2. Operating PPNR return on average assets (Non-GAAP) is the annualized operating PPNR earnings (Non-GAAP) divided by average assets. 3. Return on average tangible common equity (Non-GAAP) is the annualized net income divided by average tangible common equity (Non-GAAP). 4. Operating return on average shareholders’ equity (Non-GAAP) is the annualized operating earnings (Non-GAAP) divided by average shareholder equity. 5. Operating return on average tangible common equity (Non-GAAP) is the annualized operating earnings (Non-GAAP) divided by average tangible common equity (Non-GAAP). $ in Thousands, unless otherwise indicated 2023Y 2022Y 2021Y 4Q23 3Q23 2Q23 1Q23 4Q22 Operating Earnings Net Income (GAAP) $ 28,593 $ 43,022 $ 34,790 $ 6,190 $ 2,067 $ 8,836 $ 11,500 $ 13,004 Noninterest Income: Securities (Gains) Losses 6,801 (144) (45) - 6,801 - - (144) Noninterest Expenses: Donation of a Former Branch Location 250 - - 250 - - - - Accruals For Pending Litigation 675 - - 675 - - - - Merger Related And Restructuring Expenses 110 562 3,701 - 110 - - (45) Income Taxes: Income Tax Effect Of Adjustments (2,024) (108) (944) (239) (1,785) - - 49 Operating Earnings (Non-GAAP) $ 34,405 $ 43,332 $ 37,502 $ 6,876 $ 7,193 $ 8,836 $ 11,500 $ 12,864 Operating Earnings Per Common Share (Non-GAAP): Basic $ 2.05 $ 2.59 $ 2.41 $ 0.41 $ 0.43 $ 0.53 $ 0.69 $ 0.77 Diluted 2.03 2.57 2.39 0.41 0.43 0.52 0.68 0.76 Operating Noninterest Income Noninterest Income (GAAP) $ 22,325 $ 27,715 $ 23,949 $ 7,579 $ 691 $ 7,130 $ 6,925 $ 7,125 Securities (Gains) Losses 6,801 (144) (45) - 6,801 - - (144) Operating Noninterest Income (Non-GAAP) $ 29,126 $ 27,571 $ 23,904 $ 7,579 $ 7,492 $ 7,130 $ 6,925 $ 6,981 Mortgage Banking Income (1,040) (1,552) (4,040) (227) (309) (332) (172) (77) Operating Noninterest Income Excluding Mtg. Banking (Non-GAAP) $ 28,086 $ 26,019 $ 19,864 $ 7,352 $ 7,183 $ 6,798 $ 6,753 $ 6,904 Operating Noninterest Expense Noninterest Expense (GAAP) $ 113,150 $ 106,290 $ 91,391 $ 29,695 $ 28,516 $ 27,410 $ 27,529 $ 27,416 Donation of a Former Branch Location (250) - - (250) - - - - Accruals For Pending Litigation (675) - - (675) - - - - Merger Related And Restructuring Expenses (110) (562) (3,701) - (110) - - 45 Operating Noninterest Expense (Non-GAAP) $ 112,115 $ 105,728 $ 87,690 $ 28,770 $ 28,406 $ 27,410 $ 27,529 $ 27,461 Operating Revenue Net Interest Income (GAAP) $ 130,080 $ 137,501 $ 113,394 $ 31,517 $ 31,006 $ 31,575 $ 35,982 $ 37,612 Operating Noninterest Income (Non-GAAP) 29,126 27,571 23,904 7,579 7,492 7,130 6,925 6,981 Operating Revenue (Non-GAAP) 159,206 165,072 137,298 39,096 38,498 38,705 42,907 44,593 Operating Pre-Provision, Net Revenue ("PPNR") Earnings Operating Revenue (Non-GAAP) $ 159,206 $ 165,072 $ 137,298 $ 39,096 $ 38,498 $ 38,705 $ 42,907 $ 44,593 Operating Noninterest Expense (Non-GAAP) (112,115) (105,728) (87,690) (28,770) (28,406) (27,410) (27,529) (27,461) Operating PPNR Earnings (Non-GAAP) $ 47,091 $ 59,344 $ 49,608 $ 10,326 $ 10,092 $ 11,295 $ 15,378 $ 17,132 Non-GAAP Return Ratios Operating Return On Average Assets (Non-GAAP)(1) 0.72% 0.92% 0.98% 0.57% 0.60% 0.75% 0.97% 1.10% Operating PPNR Return On Average Assets (Non-GAAP)(2) 0.99% 1.27% 1.29% 0.86% 0.84% 0.96% 1.30% 1.46% Return On Average Tangible Common Equity (Non-GAAP)(3) 8.55% 13.60% 11.84% 7.18% 2.43% 10.57% 14.45% 16.65% Operating Return On Average Shareholders' Equity (Non-GAAP)(4) 7.77% 10.24% 9.67% 6.07% 6.41% 7.98% 10.79% 12.15% Operating Return On Average Tangible Common Equity (Non-GAAP)(5) 10.29% 13.69% 12.77% 7.98% 8.46% 10.57% 14.45% 16.47% Operating Efficiency Ratio Efficiency Ratio (GAAP) 74.24% 64.33% 66.54% 75.95% 89.96% 70.82% 64.16% 61.28% Adjustment For Taxable Equivalent Yields (0.18%) (0.26%) (0.29%) (0.18%) (0.27%) (0.18%) (0.14%) (0.22%) Adjustment For Securities (Gains) Losses (3.17%) 0.06% (0.02%) - (15.89%) - - 0.20% Adjustment For Donation of a Former Branch Location (0.16%) - - (0.64%) - - - - Adjustment For Accruals For Pending Litigation (0.44%) - - (1.72%) - - - - Adjustment For Merger Expenses (0.03%) (0.34%) (2.64%) - (0.20%) - - 0.10% Operating Efficiency Ratio (Non-GAAP) 70.26% 63.79% 63.59% 73.41% 73.60% 70.64% 64.02% 61.36% |