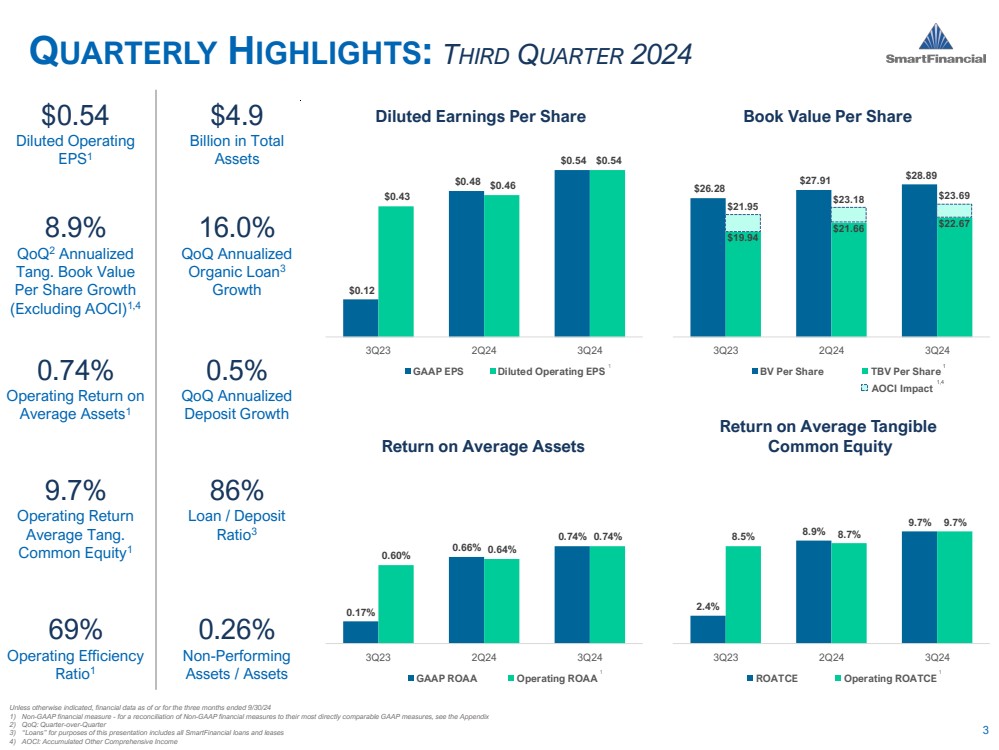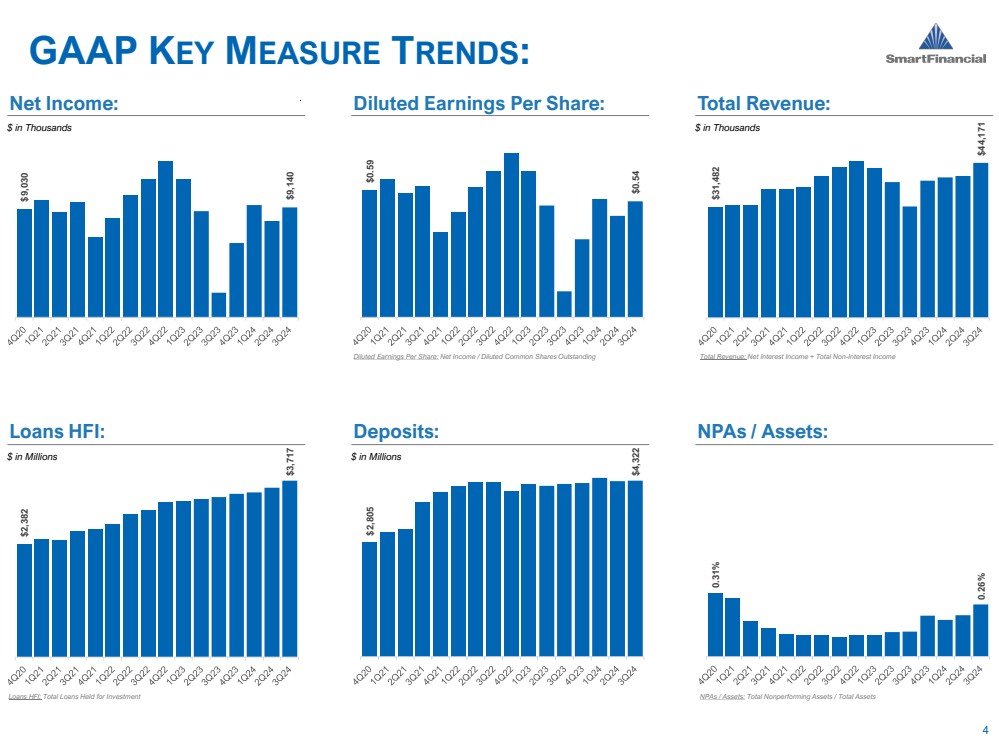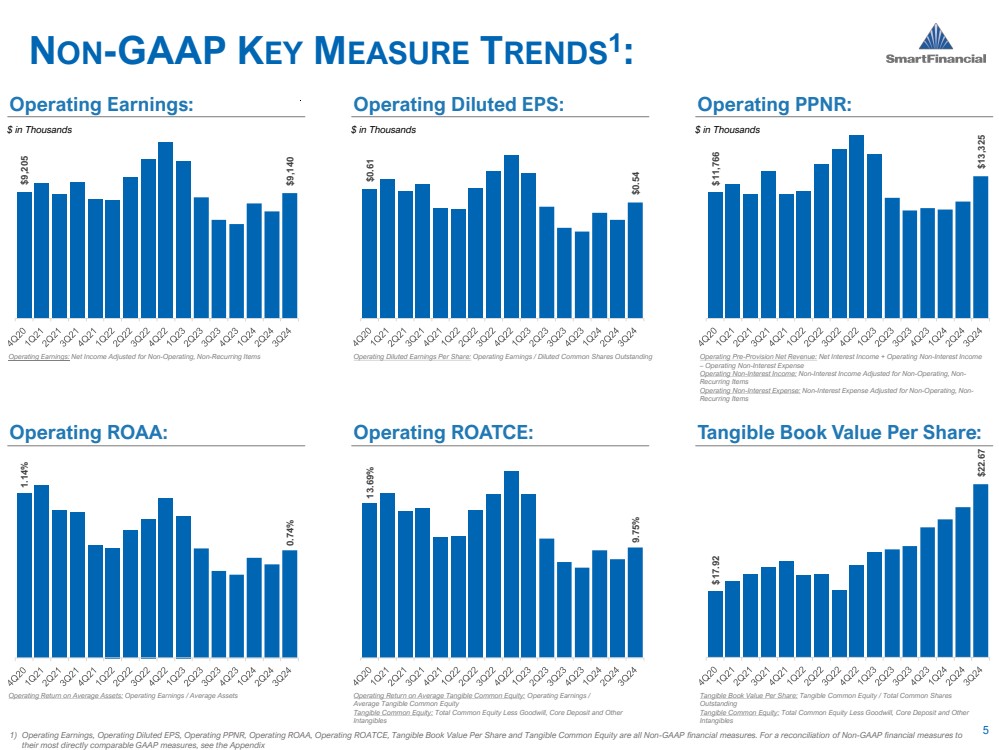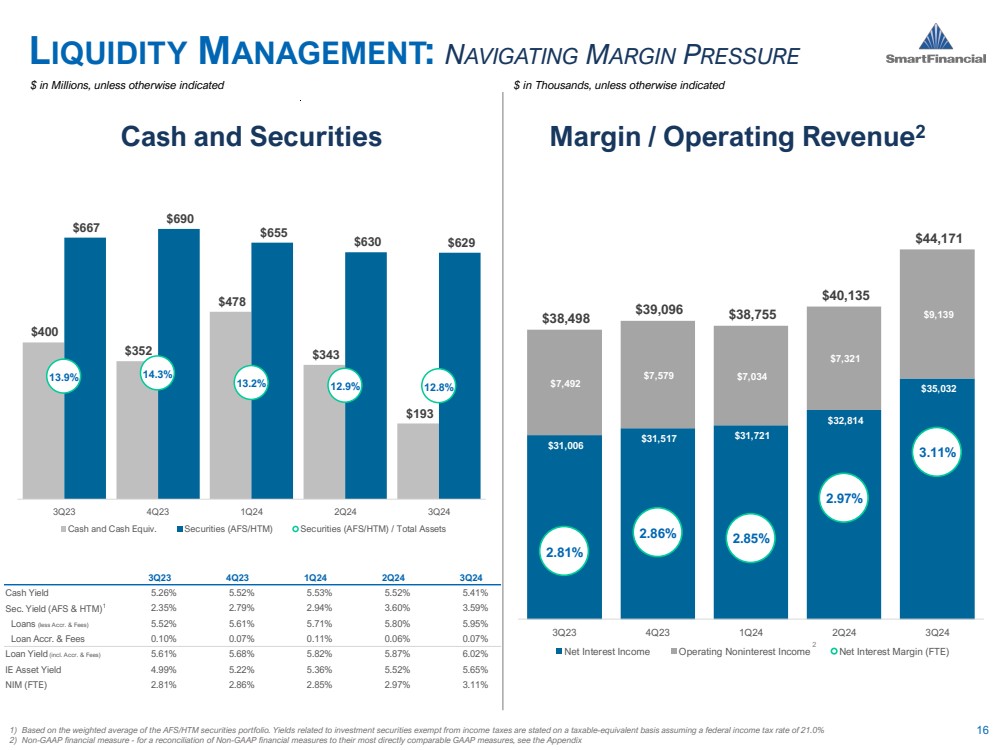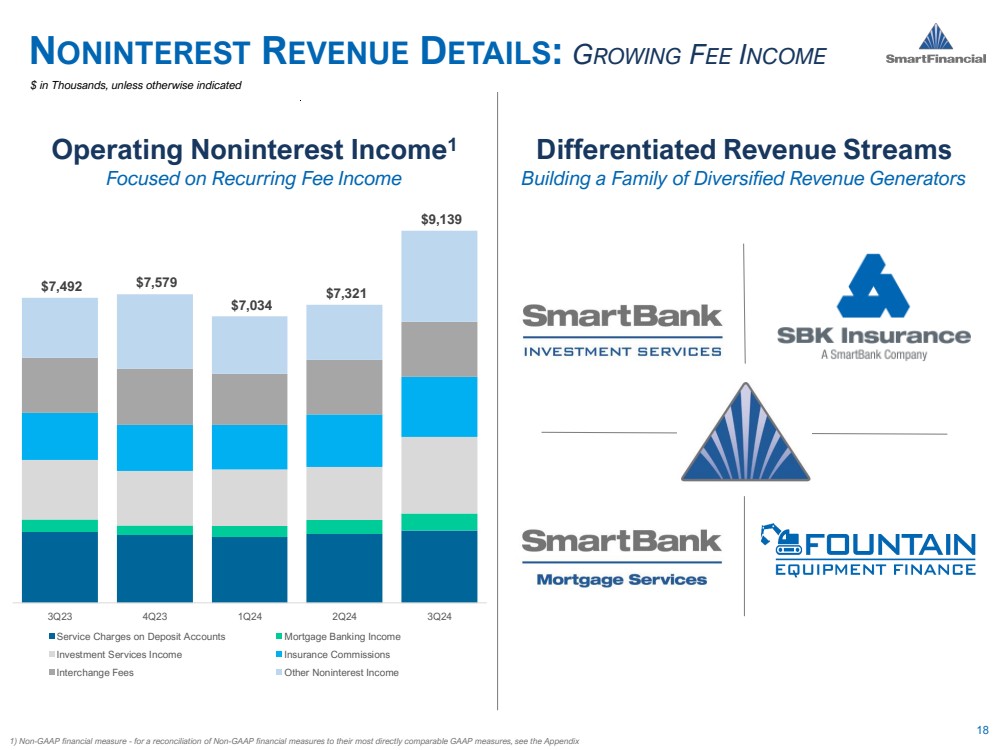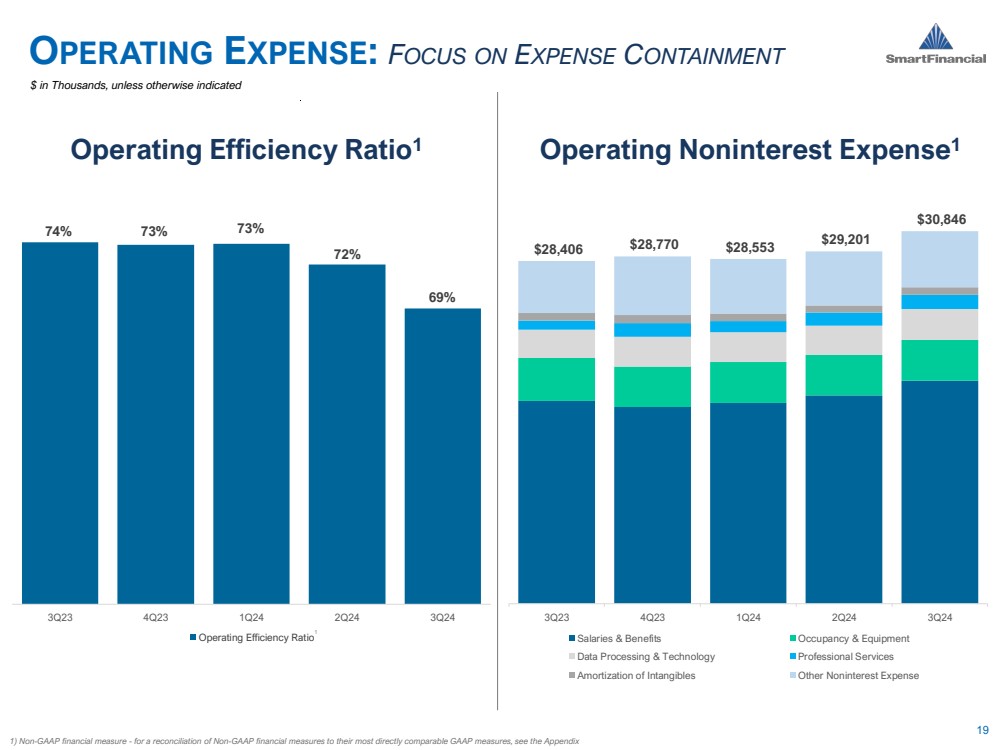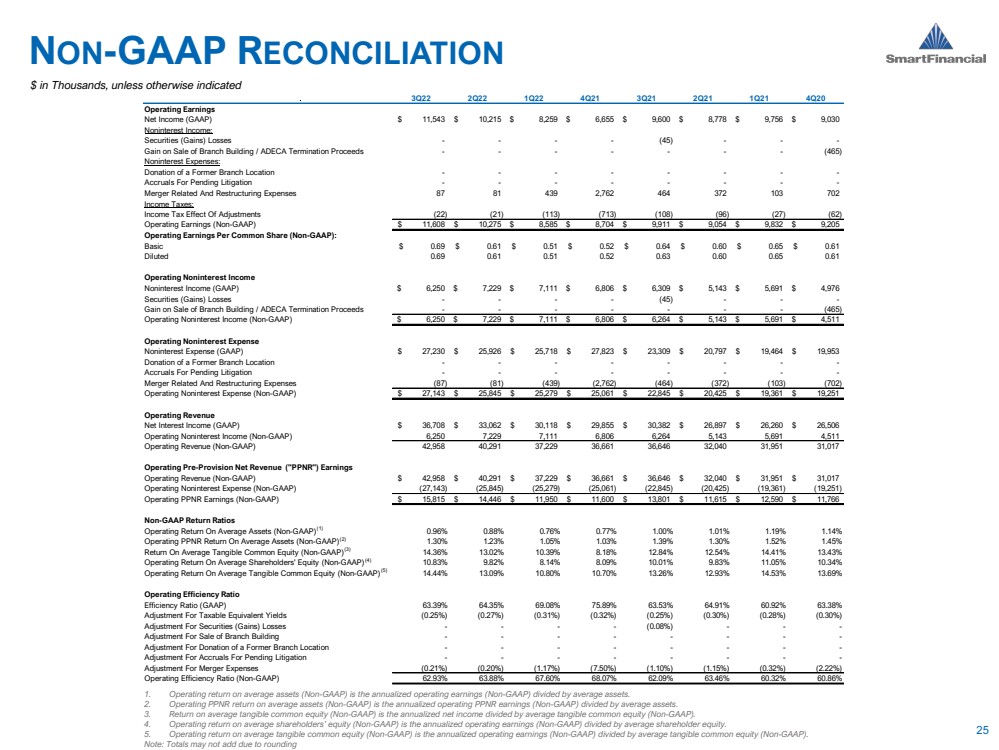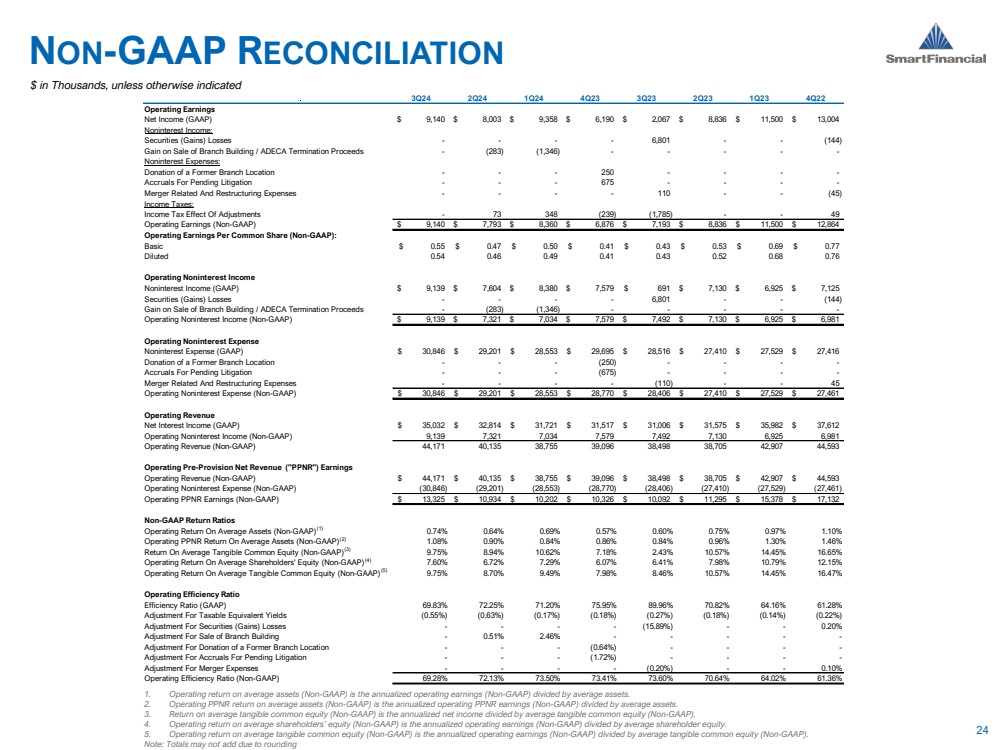
| 3Q24 2Q24 1Q24 4Q23 3Q23 2Q23 1Q23 4Q22 Operating Earnings Net Income (GAAP) $ 9,140 $ 8,003 $ 9,358 $ 6,190 $ 2,067 $ 8,836 $ 11,500 $ 13,004 Noninterest Income: Securities (Gains) Losses - - - - 6,801 - - (144) Gain on Sale of Branch Building / ADECA Termination Proceeds - (283) (1,346) - - - - - Noninterest Expenses: Donation of a Former Branch Location - - - 250 - - - - Accruals For Pending Litigation - - - 675 - - - - Merger Related And Restructuring Expenses - - - - 110 - - (45) Income Taxes: Income Tax Effect Of Adjustments - 73 348 (239) (1,785) - - 49 Operating Earnings (Non-GAAP) $ 9,140 $ 7,793 $ 8,360 $ 6,876 $ 7,193 $ 8,836 $ 11,500 $ 12,864 Operating Earnings Per Common Share (Non-GAAP): Basic $ 0.55 $ 0.47 $ 0.50 $ 0.41 $ 0.43 $ 0.53 $ 0.69 $ 0.77 Diluted 0.54 0.46 0.49 0.41 0.43 0.52 0.68 0.76 Operating Noninterest Income Noninterest Income (GAAP) $ 9,139 $ 7,604 $ 8,380 $ 7,579 $ 691 $ 7,130 $ 6,925 $ 7,125 Securities (Gains) Losses - - - - 6,801 - - (144) Gain on Sale of Branch Building / ADECA Termination Proceeds - (283) (1,346) - - - - - Operating Noninterest Income (Non-GAAP) $ 9,139 $ 7,321 $ 7,034 $ 7,579 $ 7,492 $ 7,130 $ 6,925 $ 6,981 Operating Noninterest Expense Noninterest Expense (GAAP) $ 30,846 $ 29,201 $ 28,553 $ 29,695 $ 28,516 $ 27,410 $ 27,529 $ 27,416 Donation of a Former Branch Location - - - (250) - - - - Accruals For Pending Litigation - - - (675) - - - - Merger Related And Restructuring Expenses - - - - (110) - - 45 Operating Noninterest Expense (Non-GAAP) $ 30,846 $ 29,201 $ 28,553 $ 28,770 $ 28,406 $ 27,410 $ 27,529 $ 27,461 Operating Revenue Net Interest Income (GAAP) $ 35,032 $ 32,814 $ 31,721 $ 31,517 $ 31,006 $ 31,575 $ 35,982 $ 37,612 Operating Noninterest Income (Non-GAAP) 9,139 7,321 7,034 7,579 7,492 7,130 6,925 6,981 Operating Revenue (Non-GAAP) 44,171 40,135 38,755 39,096 38,498 38,705 42,907 44,593 Operating Pre-Provision Net Revenue ("PPNR") Earnings Operating Revenue (Non-GAAP) $ 44,171 $ 40,135 $ 38,755 $ 39,096 $ 38,498 $ 38,705 $ 42,907 $ 44,593 Operating Noninterest Expense (Non-GAAP) (30,846) (29,201) (28,553) (28,770) (28,406) (27,410) (27,529) (27,461) Operating PPNR Earnings (Non-GAAP) $ 13,325 $ 10,934 $ 10,202 $ 10,326 $ 10,092 $ 11,295 $ 15,378 $ 17,132 Non-GAAP Return Ratios Operating Return On Average Assets (Non-GAAP)(1) 0.74% 0.64% 0.69% 0.57% 0.60% 0.75% 0.97% 1.10% Operating PPNR Return On Average Assets (Non-GAAP)(2) 1.08% 0.90% 0.84% 0.86% 0.84% 0.96% 1.30% 1.46% Return On Average Tangible Common Equity (Non-GAAP)(3) 9.75% 8.94% 10.62% 7.18% 2.43% 10.57% 14.45% 16.65% Operating Return On Average Shareholders' Equity (Non-GAAP)(4) 7.60% 6.72% 7.29% 6.07% 6.41% 7.98% 10.79% 12.15% Operating Return On Average Tangible Common Equity (Non-GAAP)(5) 9.75% 8.70% 9.49% 7.98% 8.46% 10.57% 14.45% 16.47% Operating Efficiency Ratio Efficiency Ratio (GAAP) 69.83% 72.25% 71.20% 75.95% 89.96% 70.82% 64.16% 61.28% Adjustment For Taxable Equivalent Yields (0.55%) (0.63%) (0.17%) (0.18%) (0.27%) (0.18%) (0.14%) (0.22%) Adjustment For Securities (Gains) Losses - - - - (15.89%) - - 0.20% Adjustment For Sale of Branch Building - 0.51% 2.46% - - - - - Adjustment For Donation of a Former Branch Location - - - (0.64%) - - - - Adjustment For Accruals For Pending Litigation - - - (1.72%) - - - - Adjustment For Merger Expenses - - - - (0.20%) - - 0.10% Operating Efficiency Ratio (Non-GAAP) 69.28% 72.13% 73.50% 73.41% 73.60% 70.64% 64.02% 61.36% NON-GAAP RECONCILIATION 24 1. Operating return on average assets (Non-GAAP) is the annualized operating earnings (Non-GAAP) divided by average assets. 2. Operating PPNR return on average assets (Non-GAAP) is the annualized operating PPNR earnings (Non-GAAP) divided by average assets. 3. Return on average tangible common equity (Non-GAAP) is the annualized net income divided by average tangible common equity (Non-GAAP). 4. Operating return on average shareholders’ equity (Non-GAAP) is the annualized operating earnings (Non-GAAP) divided by average shareholder equity. 5. Operating return on average tangible common equity (Non-GAAP) is the annualized operating earnings (Non-GAAP) divided by average tangible common equity (Non-GAAP). Note: Totals may not add due to rounding $ in Thousands, unless otherwise indicated |