Second Quarter 2018 Earnings Call June 25, 2018
Legal Disclaimer Forward-Looking Statements Certain of the statements made in this presentation may constitute forward-looking statements within the meaning of Section 27A of the Securities Act of 1933, as amended, and Section 21E of the Securities Exchange Act of 1934, as amended. Such forward-looking statements, including statements regarding the intent, belief, or current expectations of SmartFinancial’s management regarding the company’s strategic direction, prospects, or future results or the benefits of the proposed merger with Foothills Bancorp (the “Foothills merger”), are subject to numerous risks and uncertainties. Such risks and uncertainties include, among others, (1) the risk that the cost savings and revenue synergies anticipated in connection with the Foothills merger may not be realized or may take longer than anticipated to be realized, (2) disruption from the Foothills merger with customers, suppliers, or employee or other business relationships, (3) the occurrence of any event, change, or other circumstances that could give rise to the termination of the merger agreement with Foothills Bancorp, (4) the risk of successful integration of our business with that of Foothills Bancorp, (5) the failure of Foothills Bancorp’s shareholders to approve the merger agreement, (6) the amount of costs, fees, expenses, and charges related to the Foothills merger, (7) our ability to successfully integrate the businesses acquired as part of previous mergers with that of SmartBank, (8) reputational risk and the reaction of our customers and Foothills Bancorp’s customers to the Foothills merger, (9) the failure of the conditions to closing of the Foothills merger to be satisfied, (10) the risk that the integration of our merger partners’ businesses into our operations will be materially delayed or will be more costly or difficult than expected, (11) the possibility that the Foothills merger may be more expensive to complete than anticipated, including as a result of unexpected factors or events, (12) the dilution caused by SmartFinancial’s issuance of additional shares of its common stock in the Foothills merger, (13) changes in management’s plans for the future, (14) prevailing economic and political conditions, particularly in our market areas, (15) credit risk associated with our lending activities, (16) changes in interest rates, loan demand, real estate values, and competition, (17) changes in accounting principles, policies, or guidelines, (18) changes in applicable laws, rules, or regulations, and (19) other competitive, economic, political, and market factors affecting our business, operations, pricing, products, and services. Certain additional factors which could affect the forward-looking statements can be found in SmartFinancial’s annual report on Form 10-K, quarterly reports on Form 10-Q, and current reports on Form 8-K, in each case filed with or furnished to the SEC and available on the SEC’s website (www.sec.gov). SmartFinancial disclaims any obligation to update or revise any forward- Nonlooking-GAAPstatementsFinancialcontainedMeasuresin this presentation, which speak only as of the date hereof, whether as a result of new information, future events, or otherwise. Statements included in this presentation include non-GAAP financial measures and should be read along with the accompanying tables, which provide a reconciliation of non-GAAP financial measures to GAAP financial measures. SmartFinancial management uses several non-GAAP financial measures, including: (i) net operating earnings available to common shareholders; (ii) operating efficiency ratio; (iii) tangible common equity, and (iv) net interest income ex- purchase accounting adjustments in its analysis of the company's performance. Net operating earnings available to common shareholders excludes the following from net income available to common shareholders: securities gains and losses, merger conversion expenses, and the effect of the December, 2017 tax law change on deferred tax assets, and the income tax effect of adjustments. The operating efficiency ratio excludes securities gains and losses and merger expenses from the efficiency ratio. Tangible common equity excludes total preferred stock, preferred stock paid in capital, goodwill, and other intangible assets. Net interest income ex- purchase accounting adjustments excludes the additional accretion income from acquired loans which are a result of purchase accounting treatment. Management believes that non-GAAP financial measures provide additional useful information that allows readers to evaluate the ongoing performance of the company and provide meaningful comparisons to its peers. Non- GAAP financial measures should not be considered as an alternative to any measure of performance or financial condition as promulgated under GAAP, and investors should consider SmartFinancial's performance and financial condition as reported under GAAP and all other relevant information when assessing the performance or financial condition of the company. Non-GAAP financial measures have limitations as analytical tools, and investors should not consider them in isolation or as a substitute for analysis of the results or financial condition as reported under GAAP. 2
Important Information Important Information for Shareholders This presentation shall not constitute an offer to sell, the solicitation of an offer to sell, or the solicitation of an offer to buy any securities or the solicitation of any vote or approval, nor shall there be any sale of securities in any jurisdiction in which such offer, solicitation, or sale would be unlawful prior to registration or qualification under the securities laws of any such jurisdiction. In connection with the proposed merger with Foothills Bancorp, Inc. (“Foothills Bancorp”), SmartFinancial will file a registration statement on Form S-4 with the Securities and Exchange Commission (the “SEC”), which will contain the proxy statement of Foothills Bancorp and a prospectus of SmartFinancial. Shareholders of Foothills Bancorp are encouraged to read the registration statement, including the proxy statement/prospectus that will be part of the registration statement, because it will contain important information about the proposed merger, Foothills Bancorp, and SmartFinancial. After the registration statement is filed with the SEC, the proxy statement/prospectus and other relevant documents will be mailed to Foothills Bancorp shareholders and will be available for free on the SEC’s website (www.sec.gov). The proxy statement/prospectus will also be made available for free by contacting Ron Gorczynski, SmartFinancial’s Chief Administrative Officer, at 865.437.5724 or Mark Loudermilk, the President and Chief Executive Officer of Foothills Bancorp, at 865.738.2230. No offer of securities shall be made except by means of a prospectus meeting the requirements of Section 10 of the Securities Act of 1933, as amended. 3
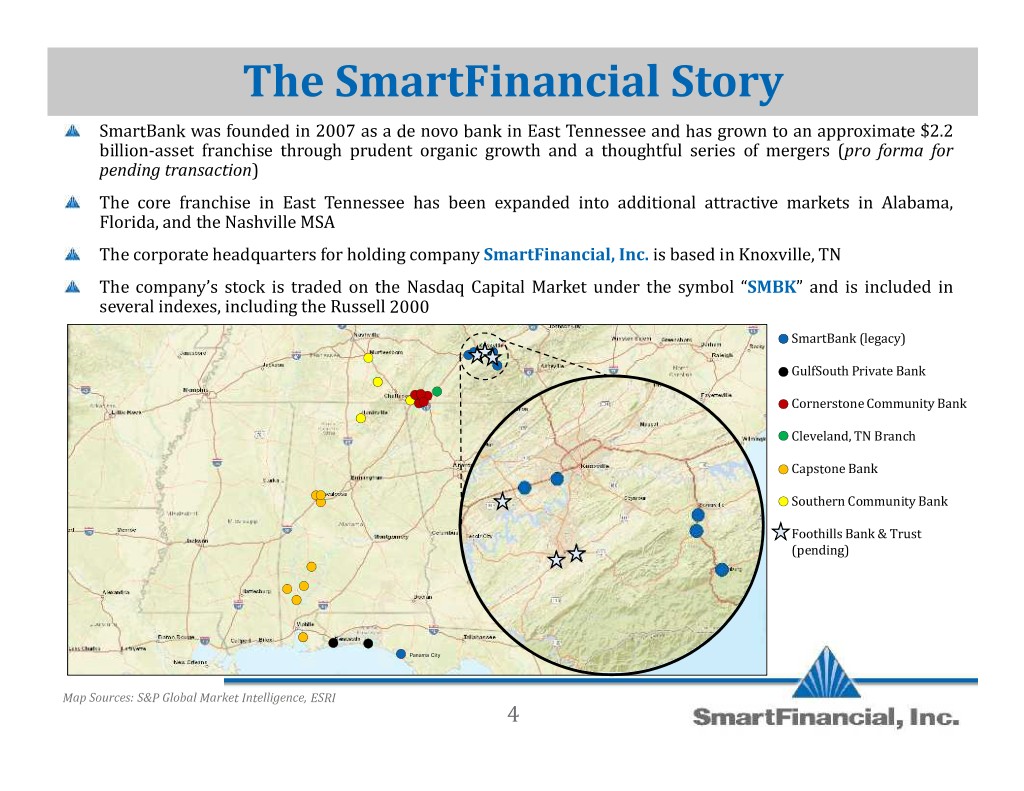
The SmartFinancial Story pro forma for SmartBankpending transactionwas founded in 2007 as a de novo bank in East Tennessee and has grown to an approximate $2.2 billion-asset franchise through prudent organic growth and a thoughtful series of mergers ( ) The core franchise in East Tennessee has been expanded into additional attractive markets in Alabama, Florida, and the Nashville MSA SmartFinancial, Inc. The corporate headquarters for holding company is based in Knoxville,SMBK TN The company’s stock is traded on the Nasdaq Capital Market under the symbol “ ” and is included in several indexes, including the Russell 2000 SmartBank (legacy) GulfSouth Private Bank Cornerstone Community Bank Cleveland, TN Branch Capstone Bank Southern Community Bank Foothills Bank & Trust (pending) Panama City Map Sources: S&P Global Market Intelligence, ESRI 4
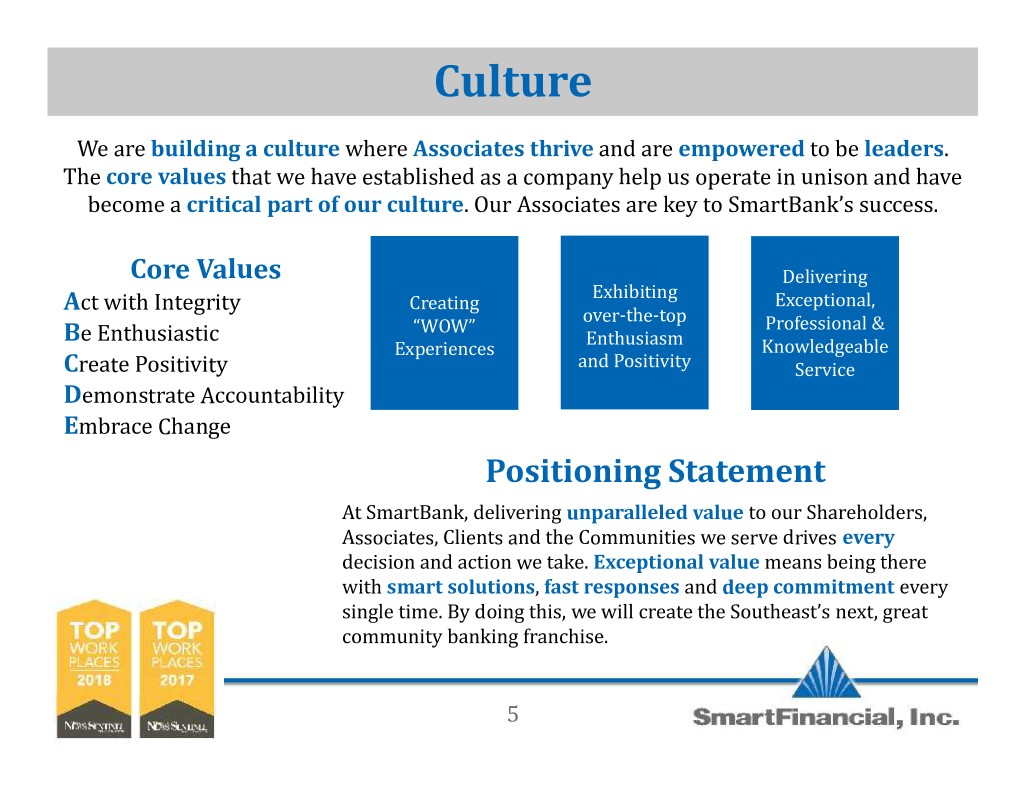
Culture building a culture Associates thrive empowered leaders core values We are critical part of ourwhere culture and are to be . The that we have established as a company help us operate in unison and have become a . Our Associates are key to SmartBank’s success. Core Values A Delivering Exhibiting B Creating Exceptional, ct with Integrity over-the-top C “WOW” Professional & Enthusiasm De Enthusiastic Experiences Knowledgeable and Positivity Service Ereate Positivity emonstrate Accountability mbrace Change Positioning Statement unparalleled value every At SmartBank, delivering Exceptional valueto our Shareholders, Associates,smart Clientssolutions and fastthe Communities responses wedeep serve commitment drives decision and action we take. means being there with , and every single time. By doing this, we will create the Southeast’s next, great community banking franchise. 5
Our Business Strategy Create a valuable southeastern banking franchise through organic growth in strong markets, coupled with an acquisition model positioning our company as a partner of choice for banks in our region Continually improve earnings and efficiency metrics as we build out our model with scale Execute a disciplined growth strategy that never loses focus on a strong asset quality culture Create the premier banking franchise in our markets by driving quality core deposit growth Insist on a consistent culture and environment where top performers want to work 6
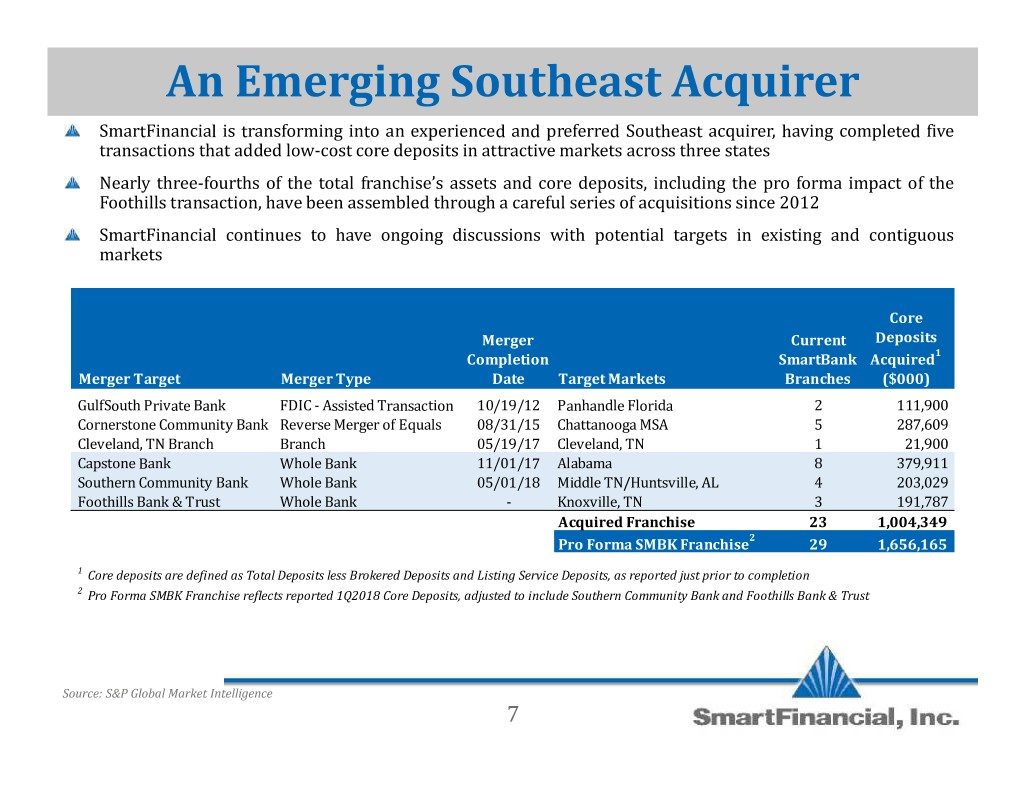
An Emerging Southeast Acquirer SmartFinancial is transforming into an experienced and preferred Southeast acquirer, having completed five transactions that added low-cost core deposits in attractive markets across three states Nearly three-fourths of the total franchise’s assets and core deposits, including the pro forma impact of the Foothills transaction, have been assembled through a careful series of acquisitions since 2012 SmartFinancial continues to have ongoing discussions with potential targets in existing and contiguous markets Core Merger Current Deposits Completion SmartBank Acquired1 Merger Target Merger Type Date Target Markets Branches ($000) GulfSouth Private Bank FDIC - Assisted Transaction 10/19/12 Panhandle Florida 2 111,900 Cornerstone Community Bank Reverse Merger of Equals 08/31/15 Chattanooga MSA 5 287,609 Cleveland, TN Branch Branch 05/19/17 Cleveland, TN 1 21,900 Capstone Bank Whole Bank 11/01/17 Alabama 8 379,911 Southern Community Bank Whole Bank 05/01/18 MiddleAcquired TN/Huntsville, Franchise AL 234 1,004,349203,029 Foothills Bank & Trust Whole Bank - Knoxville, TN 2 3 191,787 Pro Forma SMBK Franchise 29 1,656,165 1 Core deposits are defined as Total Deposits less Brokered Deposits and Listing Service Deposits, as reported just prior to completion 2 Pro Forma SMBK Franchise reflects reported 1Q2018 Core Deposits, adjusted to include Southern Community Bank and Foothills Bank & Trust Source: S&P Global Market Intelligence 7

Disciplined Acquisition Strategy SmartFinancial has adhered to a disciplined set of merger criteria including: No more than 3 years of initial TBV-per-share dilution Meaningful EPS accretion in the first full year of operations Conservative loan marks Franchise additive SmartFinancial is committed to balancing organic growth with thoughtful acquisitions and will not make acquisitions simply for the sake of growth The table below shows the initial projected impacts of the three whole bank acquisitions announced within the last 5 quarters First Full Year Credit TBV EPS Accretion P/TBV Mark Target Announcement Earnback1 (Projected) (Announce) Approach Capstone Bank May 2017 ~ 3.0 years 25% 159% >ALLL Southern Community Bank December 2017 < 2.5 years 10% 149% >ALLL 2 1 FoothillsEarnback periods Bank and & EPSTrust accretion for mergers announcedJune 2018 before federal tax reform~ 2.7 years 8% 168% >ALLL should be more favorable to shareholders under the lower corporate tax rate 2 Pricing based on 20-day closing average in SMBK stock prior to announcement 8

Second Quarter 2018 Earnings Call FINANCIAL HIGHLIGHTS
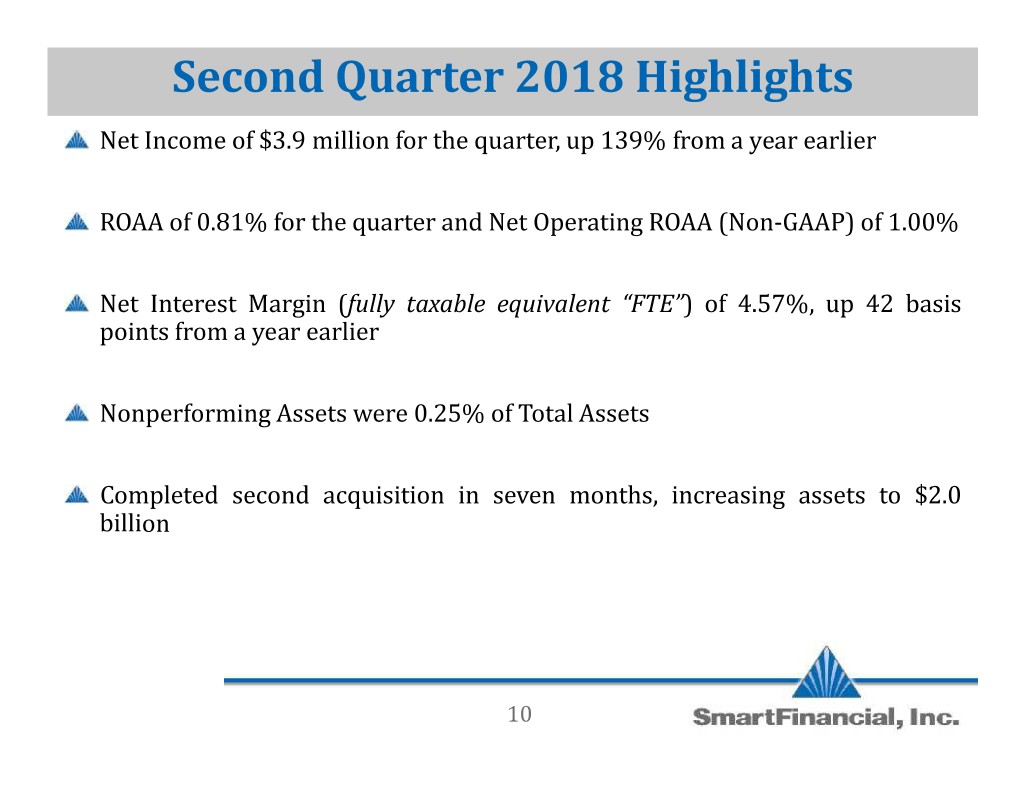
Second Quarter 2018 Highlights Net Income of $3.9 million for the quarter, up 139% from a year earlier ROAA of 0.81% for the quarter and Net Operating ROAA (Non-GAAP) of 1.00% fully taxable equivalent “FTE” Net Interest Margin ( ) of 4.57%, up 42 basis points from a year earlier Nonperforming Assets were 0.25% of Total Assets Completed second acquisition in seven months, increasing assets to $2.0 billion 10
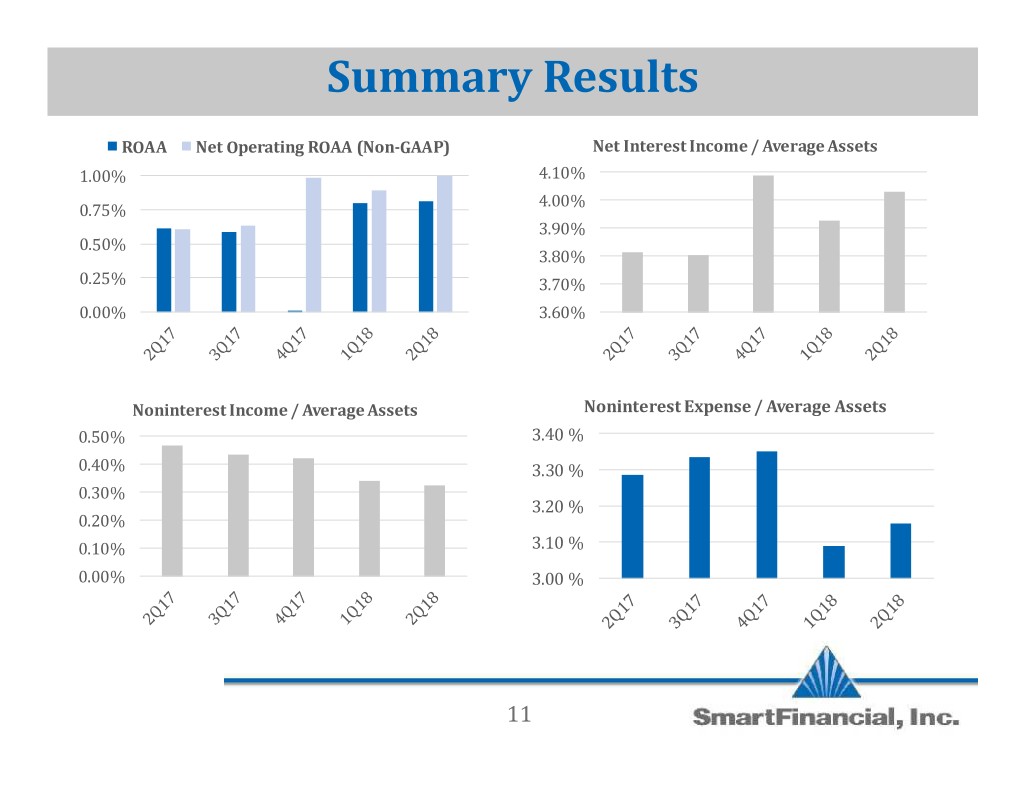
Summary Results ROAA Net Operating ROAA (Non-GAAP) Net Interest Income / Average Assets 1.00% 4.10% 4.00% 0.75% 3.90% 0.50% 3.80% 0.25% 3.70% 0.00% 3.60% Noninterest Income / Average Assets Noninterest Expense / Average Assets 0.50% 3.40 % 0.40% 3.30 % 0.30% 3.20 % 0.20% 0.10% 3.10 % 0.00% 3.00 % 11
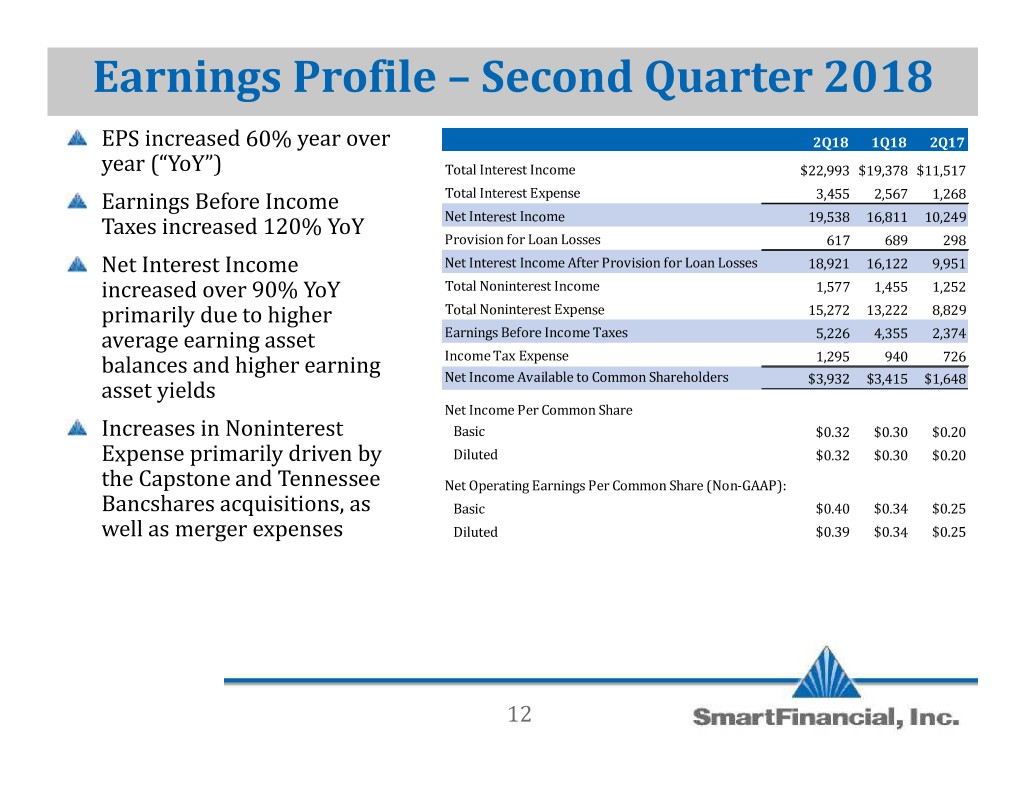
Earnings Profile – Second Quarter 2018 2Q18 1Q18 2Q17 EPS increased 60% year over Total Interest Income $22,993 $19,378 $11,517 year (“YoY”) Total Interest Expense 3,455 2,567 1,268 Earnings Before Income Net Interest Income 19,538 16,811 10,249 Taxes increased 120% YoY Provision for Loan Losses 617 689 298 Net Interest Income After Provision for Loan Losses 18,921 16,122 9,951 Net Interest Income Total Noninterest Income 1,577 1,455 1,252 increased over 90% YoY Total Noninterest Expense 15,272 13,222 8,829 primarily due to higher Earnings Before Income Taxes 5,226 4,355 2,374 average earning asset Income Tax Expense 1,295 940 726 balances and higher earning Net Income Available to Common Shareholders $3,932 $3,415 $1,648 asset yields Net Income Per Common Share Basic $0.32 $0.30 $0.20 Increases in Noninterest Diluted $0.32 $0.30 $0.20 Expense primarily driven by Net Operating Earnings Per Common Share (Non-GAAP): the Capstone and Tennessee Basic $0.40 $0.34 $0.25 Bancshares acquisitions, as Diluted $0.39 $0.34 $0.25 well as merger expenses 12
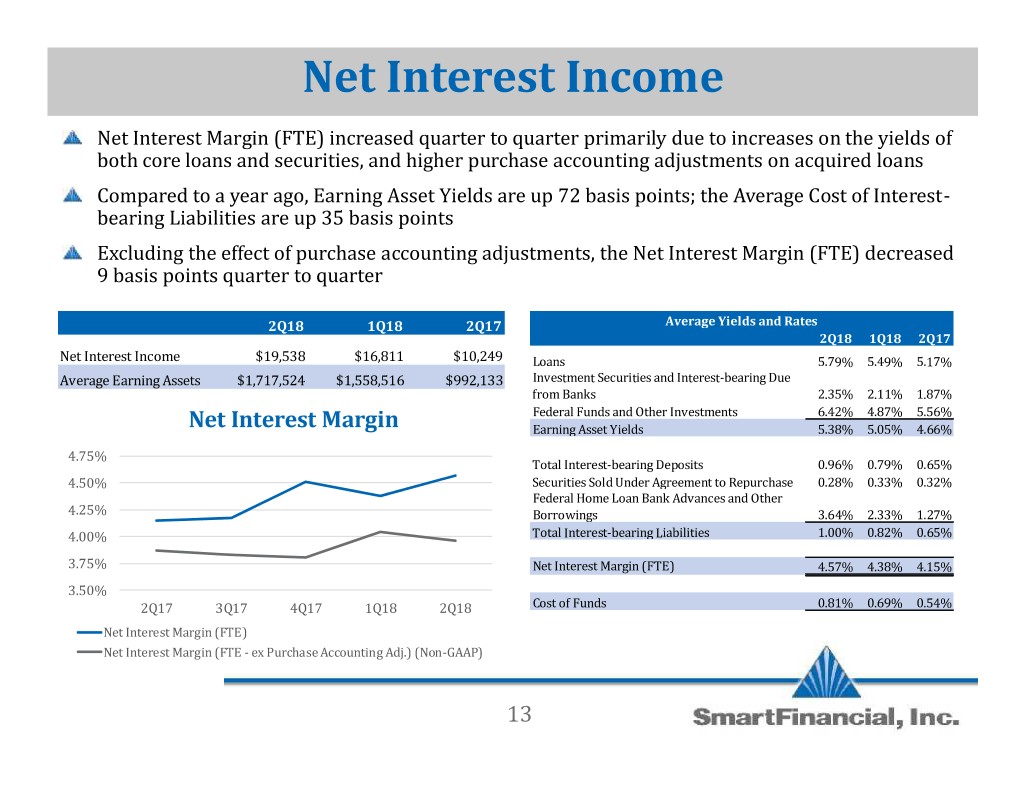
Net Interest Income Net Interest Margin (FTE) increased quarter to quarter primarily due to increases on the yields of both core loans and securities, and higher purchase accounting adjustments on acquired loans Compared to a year ago, Earning Asset Yields are up 72 basis points; the Average Cost of Interest- bearing Liabilities are up 35 basis points Excluding the effect of purchase accounting adjustments, the Net Interest Margin (FTE) decreased 9 basis points quarter2Q18 to quarter1Q18 2Q17 Average Yields and Rates 2Q18 1Q18 2Q17 Net Interest Income $19,538 $16,811 $10,249 Loans 5.79% 5.49% 5.17% Average Earning Assets $1,717,524 $1,558,516 $992,133 Investment Securities and Interest-bearing Due Net Interest Margin from Banks 2.35% 2.11% 1.87% Federal Funds and Other Investments 6.42% 4.87% 5.56% Earning Asset Yields 5.38% 5.05% 4.66% 4.75% Total Interest-bearing Deposits 0.96% 0.79% 0.65% 4.50% Securities Sold Under Agreement to Repurchase 0.28% 0.33% 0.32% Federal Home Loan Bank Advances and Other 4.25% Borrowings 3.64% 2.33% 1.27% 4.00% Total Interest-bearing Liabilities 1.00% 0.82% 0.65% 3.75% Net Interest Margin (FTE) 4.57% 4.38% 4.15% 3.50% Cost of Funds 0.81% 0.69% 0.54% 2Q17 3Q17 4Q17 1Q18 2Q18 Net Interest Margin (FTE) Net Interest Margin (FTE - ex Purchase Accounting Adj.) (Non-GAAP) 13

Noninterest Income 2Q18 Noninterest Income increased primarily due to higher other noninterest income Quarterly Noninterest Income has trended higher over the last five quarters from approximately $1.2 million in 2Q17 to $1.6 million in 2Q18 Noninterest Income $2,000,000 $1,500,000 (Loss) Gain on Securities $1,000,000 Other Noninterest Income Gain on Sale of Loans and Other Assets $500,000 Service Charges on Deposit Accounts $0 2Q17 3Q17 4Q17 1Q18 2Q18 14
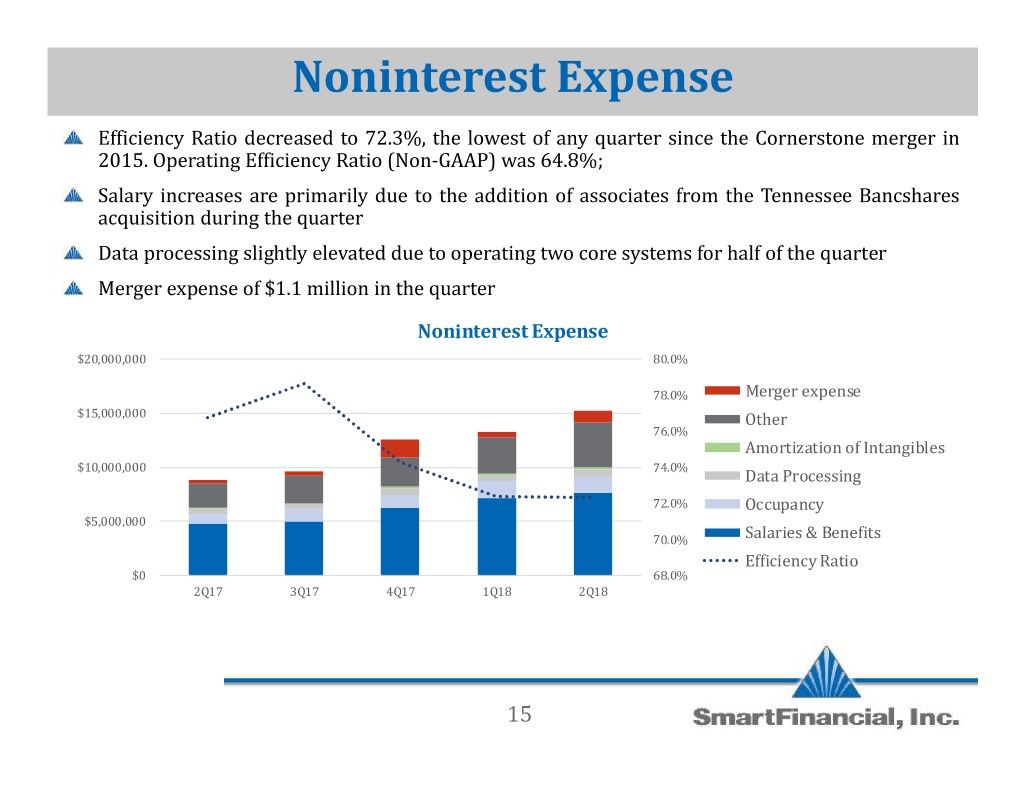
Noninterest Expense Efficiency Ratio decreased to 72.3%, the lowest of any quarter since the Cornerstone merger in 2015. Operating Efficiency Ratio (Non-GAAP) was 64.8%; Salary increases are primarily due to the addition of associates from the Tennessee Bancshares acquisition during the quarter Data processing slightly elevated due to operating two core systems for half of the quarter Merger expense of $1.1 million in theNoninterestquarter Expense $20,000,000 80.0% 78.0% Merger expense $15,000,000 76.0% Other Amortization of Intangibles $10,000,000 74.0% Data Processing 72.0% $5,000,000 Occupancy 70.0% Salaries & Benefits $0 68.0% Efficiency Ratio 2Q17 3Q17 4Q17 1Q18 2Q18 15
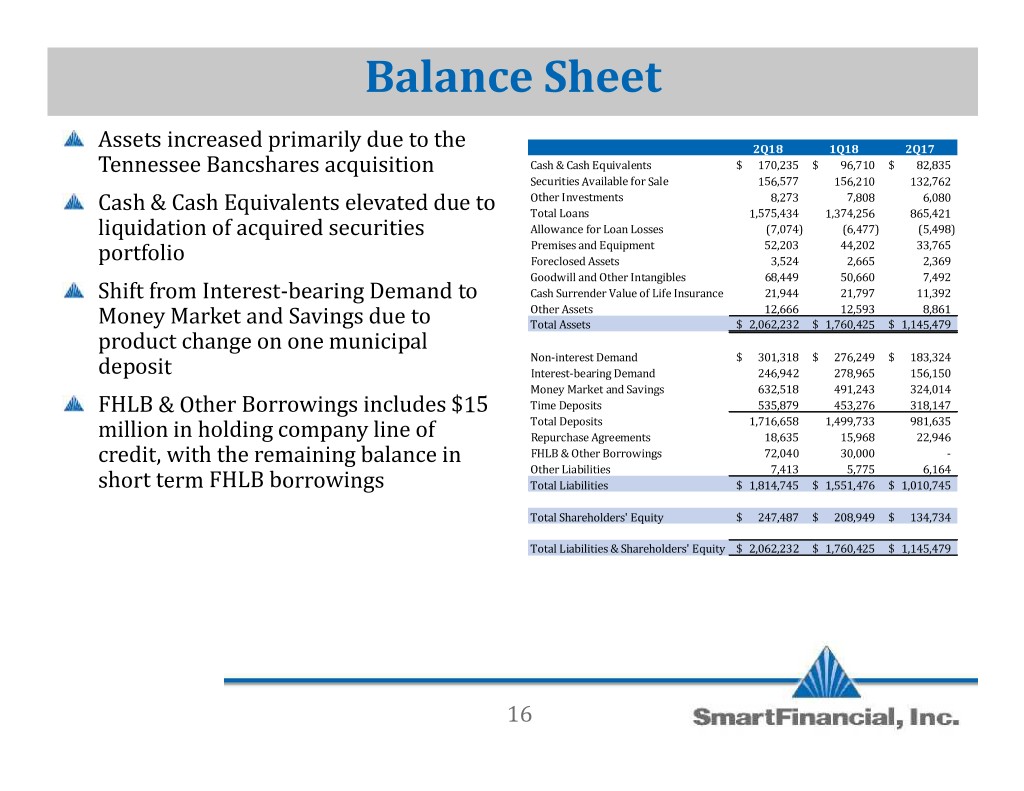
Balance Sheet 2Q18 1Q18 2Q17 Assets increased primarily due to the Cash & Cash Equivalents $ 170,235 $ 96,710 $ 82,835 Securities Available for Sale 156,577 156,210 132,762 Tennessee Bancshares acquisition Other Investments 8,273 7,808 6,080 Total Loans 1,575,434 1,374,256 865,421 Cash & Cash Equivalents elevated due to Allowance for Loan Losses (7,074) (6,477) (5,498) Premises and Equipment 52,203 44,202 33,765 liquidation of acquired securities Foreclosed Assets 3,524 2,665 2,369 portfolio Goodwill and Other Intangibles 68,449 50,660 7,492 Cash Surrender Value of Life Insurance 21,944 21,797 11,392 Other Assets 12,666 12,593 8,861 Shift from Interest-bearing Demand to Total Assets $ 2,062,232 $ 1,760,425 $ 1,145,479 Money Market and Savings due to Non-interest Demand $ 301,318 $ 276,249 $ 183,324 product change on one municipal Interest-bearing Demand 246,942 278,965 156,150 deposit Money Market and Savings 632,518 491,243 324,014 Time Deposits 535,879 453,276 318,147 Total Deposits 1,716,658 1,499,733 981,635 FHLB & Other Borrowings includes $15 Repurchase Agreements 18,635 15,968 22,946 million in holding company line of FHLB & Other Borrowings 72,040 30,000 - Other Liabilities 7,413 5,775 6,164 credit, with the remaining balance in Total Liabilities $ 1,814,745 $ 1,551,476 $ 1,010,745 short term FHLB borrowings Total Shareholders' Equity $ 247,487 $ 208,949 $ 134,734 Total Liabilities & Shareholders' Equity $ 2,062,232 $ 1,760,425 $ 1,145,479 16
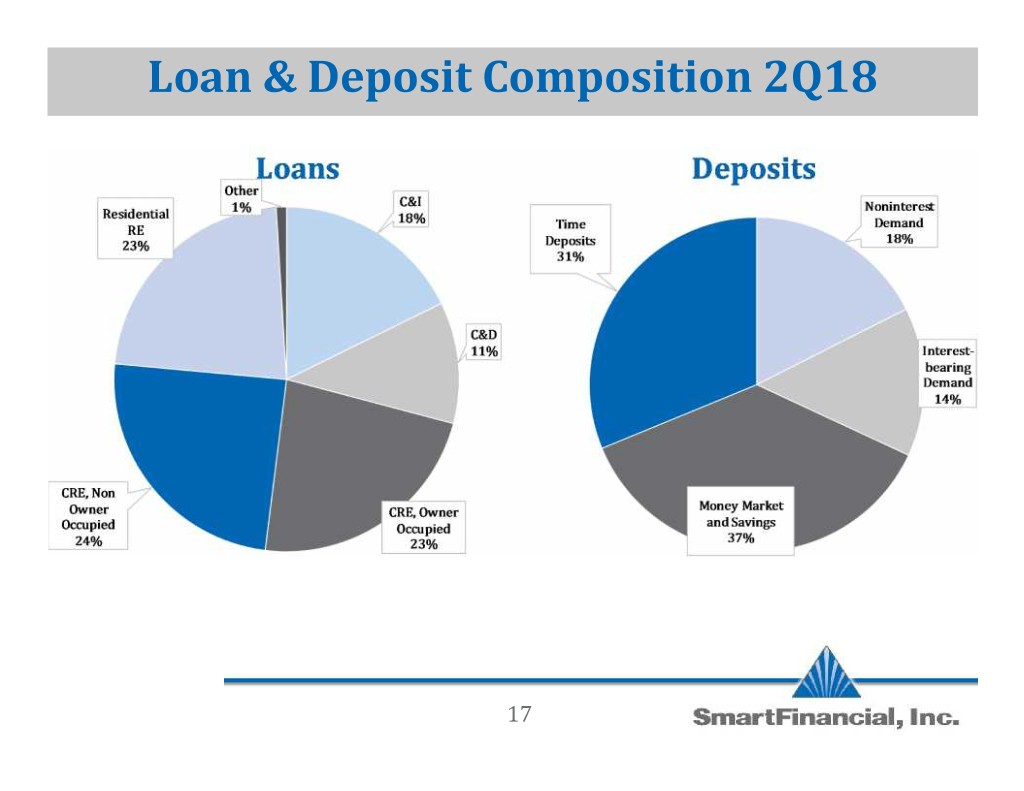
Loan & Deposit Composition 2Q18 17
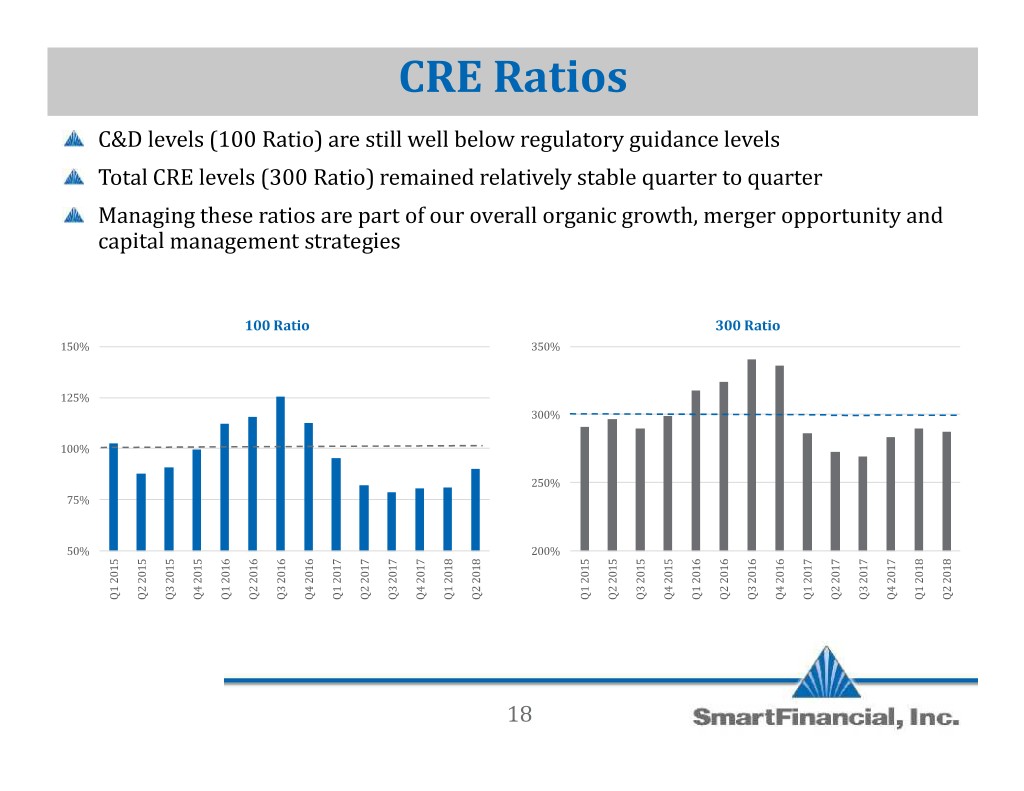
CRE Ratios C&D levels (100 Ratio) are still well below regulatory guidance levels Total CRE levels (300 Ratio) remained relatively stable quarter to quarter Managing these ratios are part of our overall organic growth, merger opportunity and capital management strategies 100 Ratio 300 Ratio 150% 350% 125% 300% 100% 250% 75% 50% 200% Q1 2015 Q1 2015 Q2 2015 Q3 2015 Q4 2016 Q1 2016 Q2 2016 Q3 2016 Q4 2017 Q1 2017 Q2 2017 Q3 2017 Q4 2018 Q1 2018 Q2 Q1 2015 Q1 2015 Q2 2015 Q3 2015 Q4 2016 Q1 2016 Q2 2016 Q3 2016 Q4 2017 Q1 2017 Q2 2017 Q3 2017 Q4 2018 Q1 2018 Q2 18
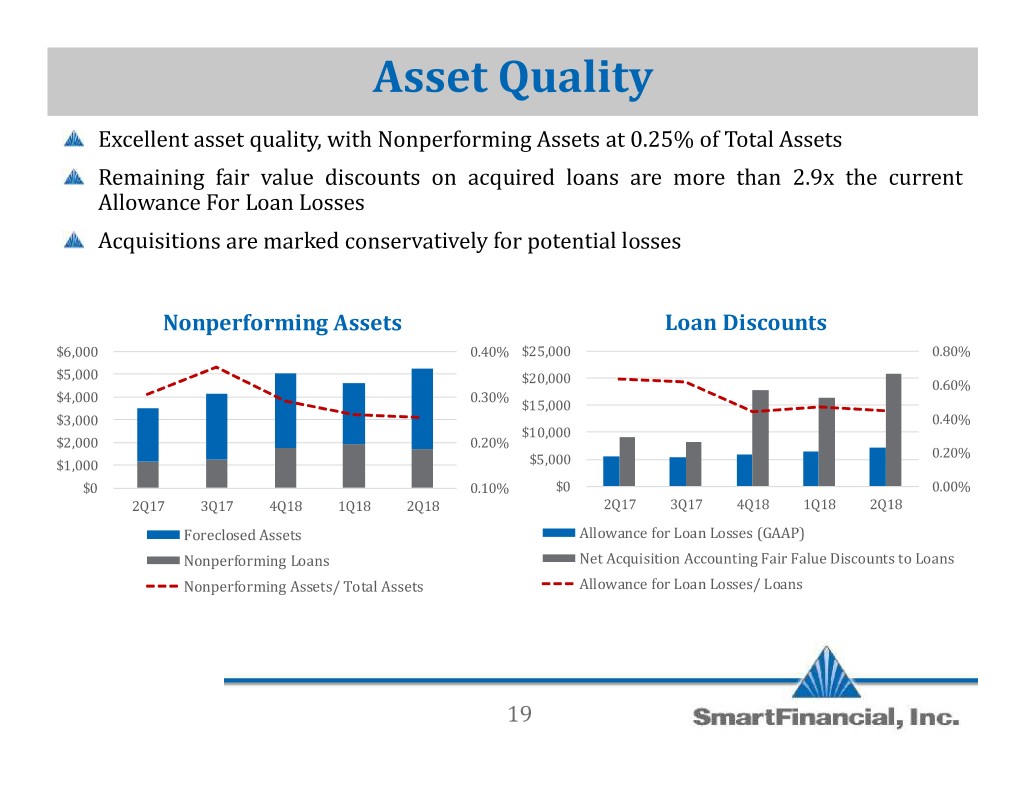
Asset Quality Excellent asset quality, with Nonperforming Assets at 0.25% of Total Assets Remaining fair value discounts on acquired loans are more than 2.9x the current Allowance For Loan Losses Acquisitions are marked conservatively for potential losses Nonperforming Assets Loan Discounts $6,000 0.40% $25,000 0.80% $5,000 $20,000 0.60% $4,000 0.30% $15,000 $3,000 0.40% $10,000 $2,000 0.20% 0.20% $1,000 $5,000 $0 0.10% $0 0.00% 2Q17 3Q17 4Q18 1Q18 2Q18 2Q17 3Q17 4Q18 1Q18 2Q18 Foreclosed Assets Allowance for Loan Losses (GAAP) Nonperforming Loans Net Acquisition Accounting Fair Falue Discounts to Loans Nonperforming Assets/ Total Assets Allowance for Loan Losses/ Loans 19
Supplemental Information
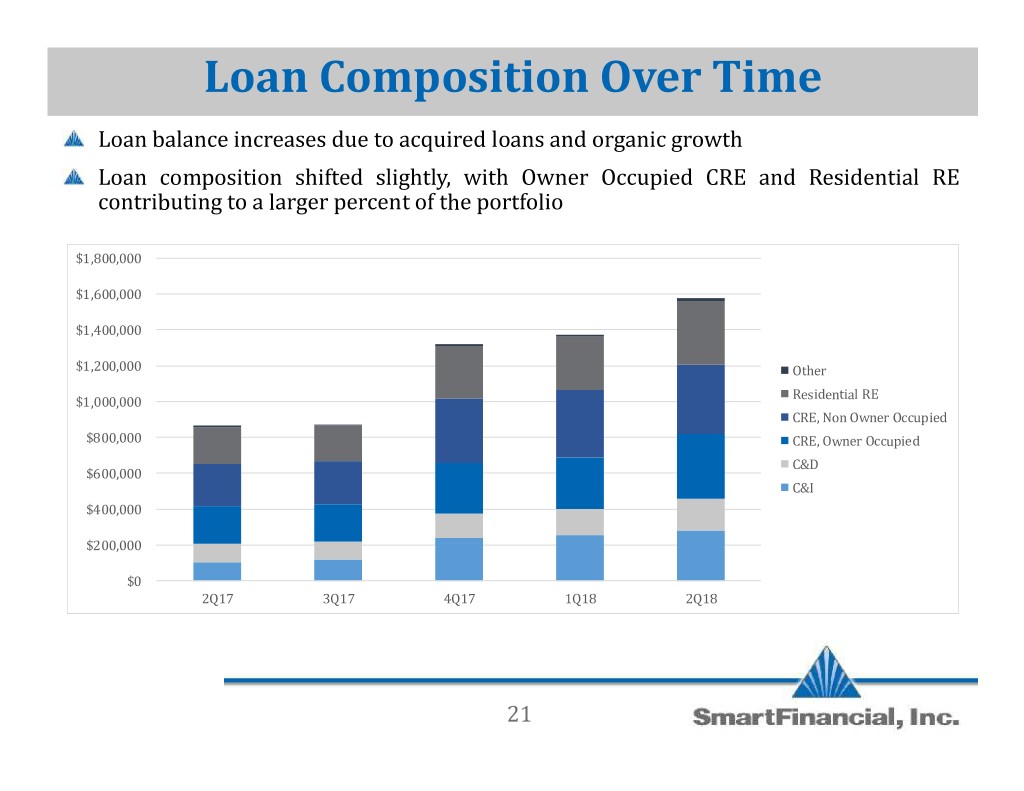
Loan Composition Over Time Loan balance increases due to acquired loans and organic growth Loan composition shifted slightly, with Owner Occupied CRE and Residential RE contributing to a larger percent of the portfolio $1,800,000 $1,600,000 $1,400,000 $1,200,000 Other Residential RE $1,000,000 CRE, Non Owner Occupied $800,000 CRE, Owner Occupied C&D $600,000 C&I $400,000 $200,000 $0 2Q17 3Q17 4Q17 1Q18 2Q18 21
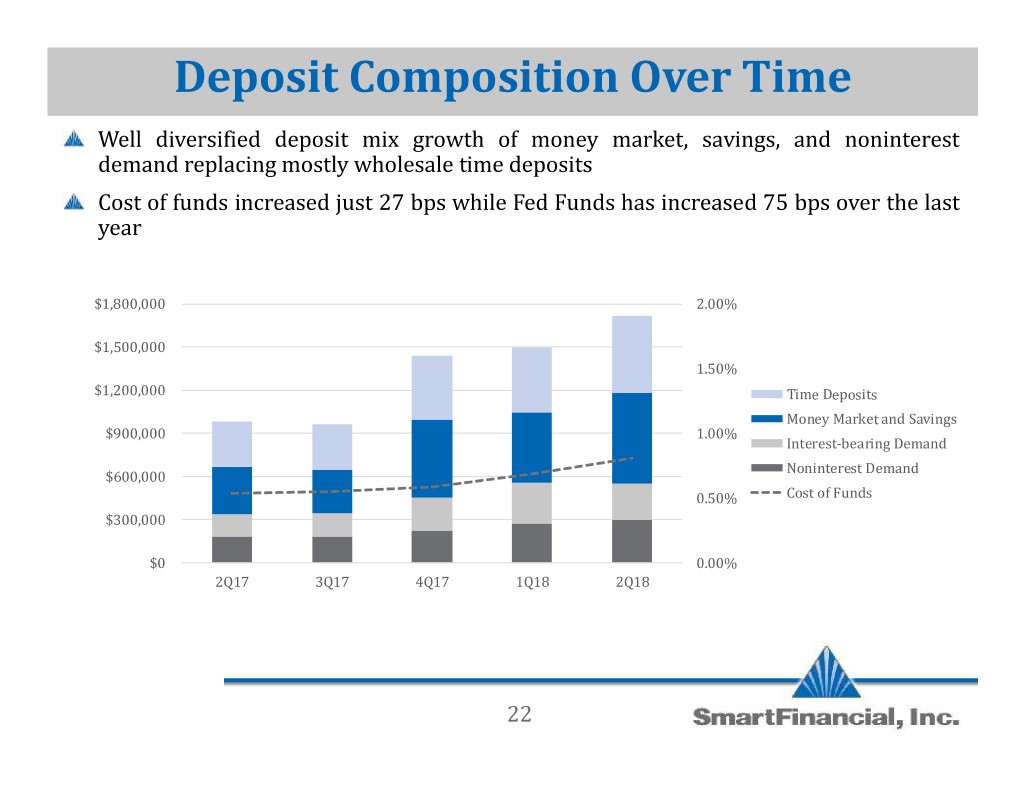
Deposit Composition Over Time Well diversified deposit mix growth of money market, savings, and noninterest demand replacing mostly wholesale time deposits Cost of funds increased just 27 bps while Fed Funds has increased 75 bps over the last year $1,800,000 2.00% $1,500,000 1.50% $1,200,000 Time Deposits Money Market and Savings $900,000 1.00% Interest-bearing Demand Noninterest Demand $600,000 0.50% Cost of Funds $300,000 $0 0.00% 2Q17 3Q17 4Q17 1Q18 2Q18 22

Non-GAAP Reconciliations 2Q18 1Q18 4Q17 3Q17 2Q17 Net interest income - ex purchase acct. adj. Net interest income (GAAP) $ 19,538 $ 16,811 $ 15,342 $ 10,924 $ 10,249 Taxable equivalent adjustment 23 16 22 21 21 Net interest income TEY 19,561 16,827 15,364 10,945 10,270 Purchase accounting adjustments 2,583 1,273 2,411 888 696 Net interest income -ex purchase acct. adj. (Non-GAAP) $ 16,978 $ 15,554 $ 12,953 $ 10,057 $ 9,574 Loan Discount Data Allowance for loan losses (GAAP) $ 7,074 $ 6,477 $ 5,860 $ 5,393 $ 5,498 Net acquisition accounting fair value discounts to loans 20,748 16,323 17,862 8,167 9,086 Tangible Common Equity Shareholders' equity (GAAP) $ 247,487 $ 208,949 $ 205,852 $ 136,588 $ 134,734 Less goodwill and other intangible assets 68,449 50,660 50,837 7,414 7,492 Tangible Common Equity (Non-GAAP) $ 179,037 $ 158,289 $ 155,015 $ 129,174 $ 127,242 23
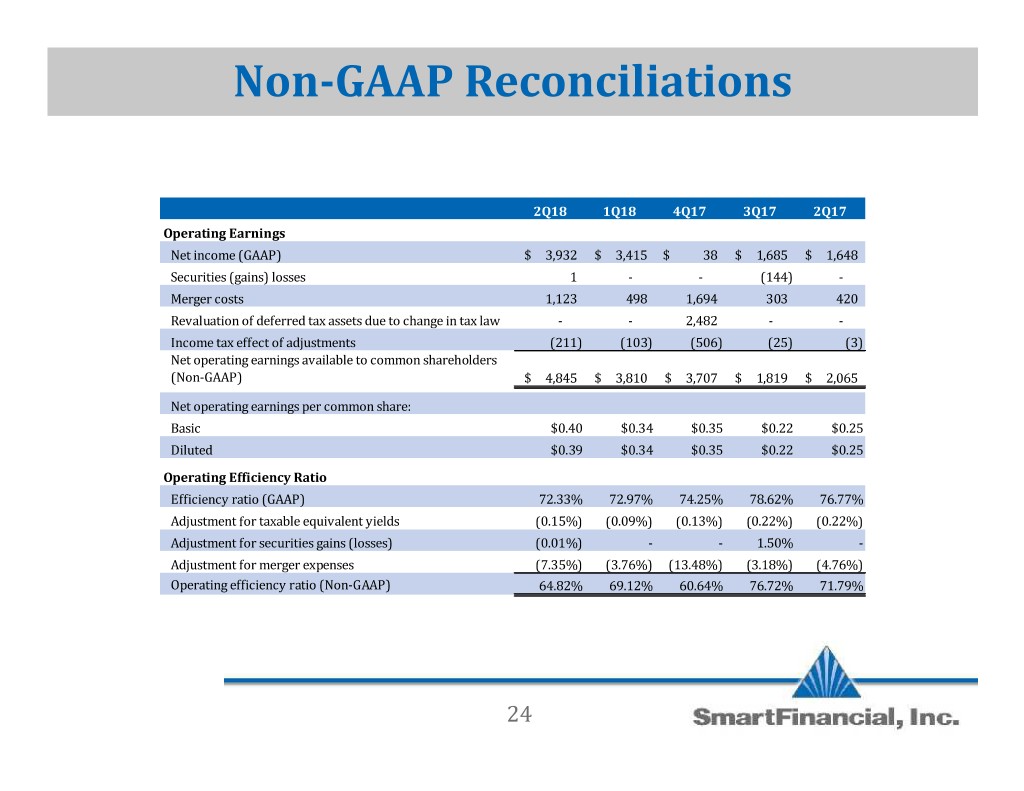
Non-GAAP Reconciliations 2Q18 1Q18 4Q17 3Q17 2Q17 Operating Earnings Net income (GAAP) $ 3,932 $ 3,415 $ 38 $ 1,685 $ 1,648 Securities (gains) losses 1 - - (144) - Merger costs 1,123 498 1,694 303 420 Revaluation of deferred tax assets due to change in tax law - - 2,482 - - Income tax effect of adjustments (211) (103) (506) (25) (3) Net operating earnings available to common shareholders (Non-GAAP) $ 4,845 $ 3,810 $ 3,707 $ 1,819 $ 2,065 Net operating earnings per common share: Basic $0.40 $0.34 $0.35 $0.22 $0.25 OperatingDiluted Efficiency Ratio $0.39 $0.34 $0.35 $0.22 $0.25 Efficiency ratio (GAAP) 72.33% 72.97% 74.25% 78.62% 76.77% Adjustment for taxable equivalent yields (0.15%) (0.09%) (0.13%) (0.22%) (0.22%) Adjustment for securities gains (losses) (0.01%) - - 1.50% - Adjustment for merger expenses (7.35%) (3.76%) (13.48%) (3.18%) (4.76%) Operating efficiency ratio (Non-GAAP) 64.82% 69.12% 60.64% 76.72% 71.79% 24
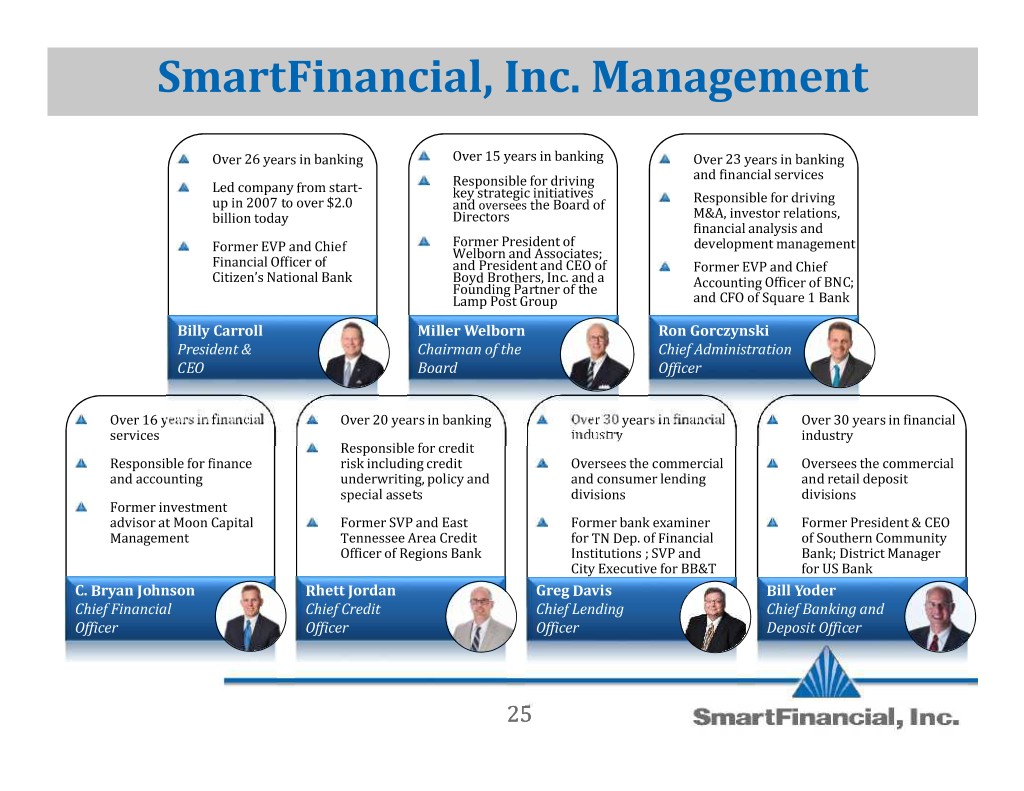
SmartFinancial, Inc. Management Over 26 years in banking Over 15 years in banking Over 23 years in banking and financial services Led company from start- Responsible for driving key strategic initiatives Responsible for driving up in 2007 to over $2.0 and oversees the Board of billion today Directors M&A, investor relations, financial analysis and Former President of development management Former EVP and Chief Welborn and Associates; Financial Officer of and President and CEO of Former EVP and Chief Citizen’s National Bank Boyd Brothers, Inc. and a Accounting Officer of BNC; Founding Partner of the Billy Carroll MillerLamp Welborn Post Group Ron Gorczynskiand CFO of Square 1 Bank President & Chairman of the Chief Administration CEO Board Officer Over 16 years in financial Over 20 years in banking Over 30 years in financial Over 30 years in financial services industry industry Responsible for credit Responsible for finance risk including credit Oversees the commercial Oversees the commercial and accounting underwriting, policy and and consumer lending and retail deposit special assets divisions divisions Former investment advisor at Moon Capital Former SVP and East Former bank examiner Former President & CEO Management Tennessee Area Credit for TN Dep. of Financial of Southern Community C. Bryan Johnson RhettOfficer Jordan of Regions Bank Greg InstitutionsDavis ; SVP and Bill YoderBank; District Manager City Executive for BB&T for US Bank Chief Financial Chief Credit Chief Lending Chief Banking and Officer Officer Officer Deposit Officer 25
Investor Contacts Billy Carroll Miller Welborn President & CEO Chairman (865) 868-0613 (423) 385-3067 Billy.Carroll@SmartBank.com Miller.Welborn@SmartBank.com SmartFinancial, Inc. 5401 Kingston Pike, Suite 600 Knoxville, TN 37919


