June 28, 2016
Client Talking Points
Filed by Voya Partners, Inc. (SEC File Nos.: 333-32575; 811-08319) pursuant to Rule 425 under the Securities Act of 1933, as amended, and deemed filed pursuant to Rule 14a-12 under the Securities Exchange Act of 1934, as amended.
June 28, 2016
Voya Investment Management
ClientTalking Points
VY® Fidelity® VIP Mid Cap Portfolio
Voya Investment Management has announced the following changes:
| Planned Change(s) | Effective Date (on or about) | Merging Portfolio Name | Surviving Portfolio Name |
| Reorganization | August 26, 2016 | VY® Fidelity® VIP Mid Cap Portfolio | VY® T. Rowe Price Diversified Mid Cap Growth Portfolio |
The Board of Directors (the “Board”) of VY® Fidelity® VIP Mid Cap Portfolio (the “Mid Cap Portfolio”) and VY® T. Rowe Price Diversified Mid Cap Growth Portfolio(“Diversified Mid Cap Growth Portfolio”) approved an Agreement and Plan of Reorganization (“Merger” or “Reorganization”). The approval of shareholders of the VY® Fidelity® VIP Mid Cap Portfolio is required before the Merger may take place.
| § | What is happening? |
| o | On March 18, 2016, the Board approved a proposal to merge Mid Cap Portfolio into Diversified Mid Cap Growth Portfolio. |
| o | Shareholders of Mid Cap Portfolio will be sent a combined proxy statement and prospectus on or about June 22, 2016. |
| o | A shareholder meeting will be held on or about August 9, 2016. |
| o | Pending shareholder approval, the Merger will occur as of the close of business on or about August 26, 2016. |
| o | Mid Cap Portfolio operates as a “feeder fund” which means it invests all of its assets in a separate mutual fund: the Service Class 2 shares of Fidelity® VIP Mid Cap Portfolio (“Master Fund”). Fidelity Mid Cap Portfolio has the same investment objective and limitations as the Master Fund in which it invests. T. Rowe Price Associates, Inc. (“T. Rowe Price”) serves as sub-adviser to Diversified Mid Cap Growth Portfolio. If the Merger is approved, shareholders of Mid Cap Portfolio will become shareholders of Diversified Mid Cap Growth Portfolio as of the close of business on or about August 26, 2016. |
| o | A prospectus supplement was filed on or about March 28, 2016 to notify shareholders of the changes. |
| 1 |
June 28, 2016
Client Talking Points
| § | Why is the Merger proposed? |
| o | As part of the Board’s annual review of contractual arrangements in November of 2015, the Board directed Directed Services LLC (“DSL” or “Adviser”) to explore the future viability of Mid Cap Portfolio due to underperformance, asset size, and asset outflows. At the March 2016 Board meeting the Adviser presented the Board with the Reorganization proposal. In support of its proposal, the Adviser noted that in its view, the Reorganization would provide the shareholders of Mid Cap Portfolio with the potential for improved performance and an immediate benefit through lower gross and net expenses. |
| § | How do the Investment Objectives compare? |
| Mid Cap Portfolio | Diversified Mid Cap Growth Portfolio | |
| Investment Objective | The Portfolio seeks long-term growth of capital. | The Portfolio seeks long-term capital appreciation. |
| § | What is the experience of the T. Rowe Price Associates, Inc. Team? |
TRP Diversified Mid Cap Growth Portfolio is managed by the T. Rowe Price Associates, Inc. team of Donald J. Easley, and Donald J. Peters.
Donald J. Easley, CFA
Portfolio Manager
Mr. Easley, CFA, Vice President and Portfolio Manager in the U.S. equity division for the tax-efficient and structured active mid-cap growth strategies, joined T. Rowe Price in 2000. Prior to that, he worked as a credit analyst with the Bank of New York.
Donald J. Peters
Portfolio Manager
Mr. Peters is a Vice President of T. Rowe Price and has been managing investments since joining T. Rowe Price in 1993. Mr. Peters is a portfolio manager for major institutional relationships at T. Rowe Price with structured active tax-efficient strategies.
| 2 |
June 28, 2016
Client Talking Points
| § | How do the Annual Portfolio Operating Expenses compare? |
The table below describes the fees and expenses that you may pay if you buy and hold shares of the Portfolios.Pro formafees and expenses, which are the estimated fees and expenses of Diversified Mid Cap Growth Portfolio after giving effect to the Reorganization, assume the Reorganization occurred on December 31, 2015. The table does not reflect fees or expenses that are, or may be, imposed under your Variable Contract or Qualified Plan. For more information on these charges, please refer to the documents governing your Variable Contract or consult your plan administrator.
Annual Portfolio Operating Expenses1 Expenses you pay each year as a % of the value of your investment | ||||
| Mid Cap Portfolio | Diversified Mid Cap Growth Portfolio | Diversified Cap Growth Pro Forma | ||
| Class ADV | ||||
| Management Fees | % | 0.652 | 0.74 | 0.74 |
| Distribution and/or Shareholder Services (12b-1) Fees | % | 0.50 | 0.50 | 0.50 |
| Shareholder Services Fee | % | 0.253 | N/A | N/A |
| Other Expenses | % | 0.19 | 0.03 | 0.03 |
| Total Annual Portfolio Operating Expenses | % | 1.59 | 1.27 | 1.27 |
| Waivers and Reimbursements | % | (0.16)4 | None5 | None5 |
| Total Annual Portfolio Operating Expenses after Waivers and Reimbursements | % | 1.43 | 1.27 | 1.27 |
| Class S | ||||
| Management Fees | % | 0.652 | 0.74 | 0.74 |
| Distribution and/or Shareholder Services (12b-1) Fees | % | 0.25 | 0.25 | 0.25 |
| Shareholder Services Fee | % | 0.253 | N/A | N/A |
| Other Expenses | % | 0.19 | 0.03 | 0.03 |
| Total Annual Portfolio Operating Expenses | % | 1.34 | 1.02 | 1.02 |
| Waivers and Reimbursements | % | (0.16)4 | None5 | None5 |
| Total Annual Portfolio Operating Expenses after Waivers and Reimbursements | % | 1.18 | 1.02 | 1.02 |
1. Expense ratios have been adjusted to reflect current contractual rates.
2. The management fees include the management fee of Fidelity® VIP Mid Cap Portfolio (“Master Fund”) of 0.55%.
3. Service Class 2 shareholders of the Master Fund, including Equity-Income Portfolio, pay a shareholder servicing fee of 0.25%.
4. The adviser is contractually obligated to limit expenses to 0.55% and 0.30% for Class ADV and Class S shares, respectively, through May 1, 2018. The limitation does not extend to interest, taxes, investment-related costs, leverage expenses, Master Fund Fees and Expenses, and extraordinary expenses. This limitation is subject to possible recoupment by the adviser. Amounts may be recouped only within three years from the date when an amount is waived or reimbursed, and are limited to the lesser of (i) the expense cap in effect at the time of waiver, and (ii) the expense cap in effect at the time of recapture. Termination or modification of this obligation requires approval by the Portfolio’s board.
5. The adviser is contractually obligated to limit expenses to 1.30% and 1.05% for Class ADV and Class S shares, respectively, through May 1, 2018. The limitation does not extend to interest, taxes, investment-related costs, leverage expenses, extraordinary expenses, and Acquired Fund Fees and Expenses. This limitation is subject to possible recoupment by the adviser. Amounts may be recouped only within three years from the date when an amount is waived or reimbursed, and are limited to the lesser of (i) the expense cap in effect at the time of waiver, and (ii) the expense cap in effect at the time of recapture. Termination or modification of this obligation requires approval by the Portfolio’s board.
| 3 |
June 28, 2016
Client Talking Points
| § | How does Mid Cap Portfolio’s performance compare to Diversified Mid Cap Growth Portfolio? |
The following information is intended to help you understand the risks of investing in the Portfolios. The following bar charts show the changes in the Portfolios’ performance from year to year, and the tables compare the Portfolios’ performance to the performance of a broad-based securities market index/indices for the same period. The Portfolios’ performance information reflects applicable fee waivers and/or expense limitations in effect during the period presented. Absent such fee waivers/expense limitations, if any, performance would have been lower. The bar chart shows the performance of the Portfolios’ Class ADV shares. Other class shares’ performance would be higher than Class ADV shares’ performance because of the higher expenses paid by Class ADV shares. Performance in the Average Annual Total Returns table does not include insurance-related charges imposed under a Variable Contract or expenses related to a Qualified Plan. If these charges or expenses were included, performance would be lower. Thus, you should not compare the Portfolio’s performance directly with the performance information of other investment products without taking into account all insurance-related charges and expenses payable under your Variable Contract or Qualified Plan. The Portfolio’s past performance is no guarantee of future results.
Mid Cap Portfolio – Calendar Year Total Returns
(as of December 31 of each year)
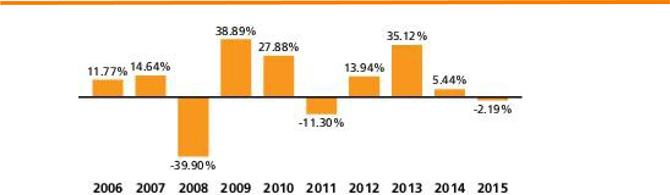
Best quarter: 2nd 2009, 19.08% and Worst quarter: 4th 2008, -23.79
The Portfolio’s Class ADV shares’ year-to-date total return as of March 31, 2016: -0.53
| 4 |
June 28, 2016
Client Talking Points
Diversified Mid Cap Portfolio – Calendar Year Total Returns
(as of December 31 of each year)

Best quarter: 2nd 2009, 19.35% and Worst quarter: 4th 2008, -27.57%
The Portfolio’s Class ADV shares’ year-to-date total return as of March 31, 2016: -0.31
| § | Average Annual Total Returns % |
(for the periods ended December 31, 2015)
The performance is set out below.
| Average Annual Total Returns % (for the periods ended December 31, 2015) | ||||||
| 1 Year | 5 Years | 10 Years | Since Inception | Inception Date | ||
| Mid Cap Portfolio | ||||||
| Class ADV | % | -2.19 | 7.09 | 6.78 | N/A | 11/15/04 |
| S&P MidCap 400 Index1 | % | -2.18 | 10.68 | 8.18 | N/A | |
| Class S | % | -1.88 | 7.35 | 7.05 | N/A | 11/15/04 |
| S&P MidCap 400 Index1 | % | -2.18 | 10.68 | 8.18 | N/A | |
| Diversified Mid Cap Growth Portfolio | ||||||
| Class ADV | % | 1.51 | 10.98 | 8.07 | N/A | 12/10/01 |
| S&P MidCap 400 Index1 | % | -2.18 | 10.68 | 8.18 | N/A | |
| Russell Midcap® Growth Index1 | % | -0.20 | 11.54 | 8.16 | N/A | |
| Class S | % | 1.72 | 11.25 | 8.34 | N/A | 12/10/01 |
| S&P MidCap 400 Index1 | % | -2.18 | 10.68 | 8.18 | N/A | |
| Russell Midcap® Growth Index1 | % | -0.20 | 11.54 | 8.16 | N/A | |
1. The index returns do not reflect the deductions for fees, expenses, or taxes.
The performance quoted represents past performance and does not guarantee future results. Current performance may be lower or higher than the performance information shown. The investment return and principal value of an investment in the Portfolio will fluctuate, so that your shares, when redeemed, may be worth more or less than their original cost. You may obtain performance information current to the most recent month end by visiting www.voyainvestments.com.
| 5 |
June 28, 2016
Client Talking Points
After-tax returns are calculated using the historical highest individual federal marginal income tax rates and do not reflect the impact of state and local taxes. Actual after-tax returns depend on an investor’s tax situation and may differ from those shown, and the after-tax returns shown are not relevant to investors who hold their Fund shares through tax-deferred arrangements such as 401(k) plans or individual retirement accounts. In some cases the after-tax returns may exceed the return before taxes due to an assumed tax benefit from any losses on the sale of Fund shares at the end of the measurement period.
TheS&P MidCap 400 Indexis a broad-based unmanaged capitalization weighted index of mid-capitalization companies.
TheRussell Midcap® Growth Indexis an unmanaged index that measures the performance of those companies included in the Russell Midcap® Index with relatively higher price-to-book ratios and higher forecasted growth values.
| § | Tax Considerations |
The Reorganization is intended to qualify for federal income tax purposes as a tax-free reorganization under Section 368 of the Code. Accordingly, pursuant to this treatment, neither Mid Cap Portfolio nor the Separate Accounts and Qualified Plans as its shareholders, nor Diversified Mid Cap Growth Portfolio nor the Separate Accounts and Qualified Plans as its shareholders, are expected to recognize any gain or loss for federal income tax purposes from the transactions contemplated by the Reorganization Agreement. As a condition to the closing of the Reorganization, the Portfolios will receive an opinion from tax counsel to the effect that, on the basis of existing provisions of the Code, U.S. Treasury Regulations promulgated thereunder, current administrative rules, pronouncements and court decisions, and subject to certain qualifications, the Reorganization will qualify as a tax-free reorganization for federal income tax purposes.
On or prior to the Closing Date, Mid Cap Portfolio will pay to the Separate Accounts of Participating Insurance Companies and Qualified Plans that own its
shares, a distribution consisting of any undistributed investment company taxable income, any net tax-exempt income, and/or any undistributed realized net capital gains, including any net gains realized from any sales of assets prior to the Closing Date, including portfolio transitions in connection with the Reorganization and the redemption of Master Fund shares. Variable Contract owners and Plan Participants are not expected to recognize any income or gains for federal income tax purposes from this cash distribution.
For financial professional use only. Not for inspection by or distribution to the general public.
The foregoing is not an offer to sell, nor a solicitation of an offer to buy, shares of any portfolio, nor is it a solicitation of any proxy. For information regarding the VY® T. Rowe Price Diversified Mid Cap Growth Portfolio, please call Voya Investment Management toll free at 1-800-992-0180.
For information regarding any of the Portfolios discussed in this Client Talking Points, please call Voya Investment Management toll free at 1-800-992-0180. To receive a free copy of a Proxy Statement/Prospectus relating to the proposed merger of VY® Fidelity® VIP Mid CapPortfolio with and into VY® T. Rowe Price Diversified Mid Cap Growth Portfolio, please call Voya Investment Management toll free at 1-800-992-0180. This “Client Talking Points” is qualified in its entirety by reference to the Proxy Statement/ Prospectus, and supersedes any prior Client Talking Points. The Proxy Statement/Prospectus contains important information about fund objectives, strategies, fees, expenses and risk considerations, and therefore you are advised to
| 6 |
June 28, 2016
Client Talking Points
read it. The Proxy Statement/Prospectus and shareholder reports and other information are or will also be available for free on the SEC’s website (www.sec.gov). Please read any Proxy Statement/Prospectus carefully before making any decision to invest or to approve the merger.
This information is proprietary and cannot be reproduced or distributed. Certain information may be received from sources Voya Investment Management considers reliable; Voya Investment Management does not represent that such information is accurate or complete. Certain statements contained herein may constitute "projections," "forecasts" and other "forward-looking statements" which do not reflect actual results and are based primarily upon applying retroactively a hypothetical set of assumptions to certain historical financial data. Actual results, performance or events may differ materially from those in such statements. Any opinions, projections, forecasts and forward looking statements presented herein are valid only as of the date of this document and are subject to change. Nothing contained herein should be construed as: (i) an offer to buy any security; or (ii) a recommendation as to the advisability of investing in, purchasing or selling any security. Voya Investment Management assumes no obligation to update any forward-looking information. Past performance is no guarantee of future results.
Your clients should consider the investment objectives, risks, charges and expenses of VY®T. Rowe Price Diversified Mid Cap Growth Portfolio carefully before investing. For a free copy of the VY®T. Rowe Price Diversified Mid Cap Growth Portfolio’s prospectus, which contains this and other information, visit us atwww.voyainvestments.com or call Voya Investment Management at 1-800-992-0180. Please instruct your clients to read the prospectus carefully before investing.
| 7 |