UNITED STATES SECURITIES AND EXCHANGE COMMISSION
WASHINGTON, D.C. 20549
FORM 10-K/A
(Amendment No. 1)
| ☒ | ANNUAL REPORT PURSUANT TO SECTION 13 OR 15(d) OF THE SECURITIES EXCHANGE ACT OF 1934 |
For the fiscal year ended December 31, 2018
| ☐ | TRANSITION REPORT PURSUANT TO SECTION 13 OR 15(d) OF THE SECURITIES EXCHANGE ACT OF 1934 |
For the transition period from to
Commission file number 001-37975
L3 TECHNOLOGIES, INC.
(Exact name of registrant as specified in its charter)
Delaware | 13-3937436 | |
(State or other jurisdiction of incorporation or organization) | (I.R.S. Employer Identification No.) |
600 Third Avenue, New York, NY | 10016 | |
(Address of principal executive offices) | (Zip Code) |
(212) 697-1111
(Registrant’s telephone number, including area code)
Securities registered pursuant to Section 12(b) of the Act:
| Title of each class | Name of each exchange on which registered: | |
Common stock, par value $0.01 per share | New York Stock Exchange |
Securities registered pursuant to Section 12(g) of the Act: None
Indicate by check mark if the registrant is a well-known seasoned issuer, as defined in Rule 405 of the Securities Act. ☒ Yes ☐ No
Indicate by check mark if the registrant is not required to file reports pursuant to Section 13 or Section 15(d) of the Act. ☐ Yes ☒ No
Indicate by check mark whether the registrant (1) has filed all reports required to be filed by Section 13 or 15(d) of the Securities Exchange Act of 1934 during the preceding 12 months (or for such shorter period that the registrant was required to file such reports), and (2) has been subject to such filing requirements for the past 90 days. ☒ Yes ☐ No
Indicate by check mark whether the registrant has submitted electronically every Interactive Data File required to be submitted pursuant to Rule 405 of Regulation S-T (§ 232.405 of this chapter) during the preceding 12 months (or for such shorter period that the registrant was required to submit such files). ☒ Yes ☐ No
Indicate by check mark if disclosure of the delinquent filer pursuant to Item 405 of Regulation S-K (§ 229.405 of this chapter) is not contained herein, and will not be contained, to the best of registrant’s knowledge, in definitive proxy or information statements incorporated by reference in Part III of this Form 10-K or any amendment to this Form 10-K. ☐
Indicate by check mark whether the registrant is a large accelerated filer, an accelerated filer, a non-accelerated filer, a smaller reporting company, or an emerging growth company. See the definitions of “large accelerated filer,” “accelerated filer,” “smaller reporting company,” and “emerging growth company” in Rule 12b-2 of the Exchange Act. (Check one):
| Large accelerated filer ☒ | Accelerated filer ☐ | Non-accelerated filer ☐ | Smaller reporting company ☐ | Emerging growth company ☐ |
If an emerging growth company, indicate by check mark if the registrant has elected not to use the extended transition period for complying with any new or revised financial accounting standards provided pursuant to Section 13(a) of the Exchange Act. ☐
Indicate by check mark whether the registrant is a shell company (as defined in Rule 12b-2 of the Act). ☐ Yes ☒ No
The aggregate market value of the registrant’s voting stock held by non-affiliates as of June 29, 2018, based upon the closing price of the stock on the New York Stock Exchange, was approximately $15.0 billion. For purposes of this calculation, the registrant has assumed that the directors and executive officers are affiliates.
There were 79,421,056 shares of the registrant’s common stock with a par value of $0.01 outstanding as of the close of business on April 15, 2019.
DOCUMENTS INCORPORATED BY REFERENCE
None.
EXPLANATORY NOTE
This Amendment No. 1 on Form 10-K/A (this “Form 10-K/A”) amends the Annual Report on Form 10-K (the “Initial Form 10-K,” and as amended by this Form 10-K/A, the “Form 10-K”) of L3 Technologies, Inc. for the fiscal year ended December 31, 2018, originally filed with the U.S. Securities and Exchange Commission (the “SEC”) on February 21, 2019. This Form 10‑K/A is being filed to amend Part III to include information required by Items 10 through 14. This information was previously omitted from the Initial Form 10-K in reliance on General Instruction G(3) to Form 10-K. In accordance with Rule 12b-15 under the Securities Exchange Act of 1934, as amended (the “Exchange Act”), Part III, including Items 10 through 14 of the Initial Form 10-K, is hereby amended and restated in its entirety.
This Amendment consists solely of the preceding cover page, this explanatory note, the information required by Part III, Items 10, 11, 12, 13, and 14 of Form 10-K, a signature page and certifications required to be filed as exhibits. We are amending Part IV solely to add those certifications.
Except as described above, no other changes have been made to the Initial Form 10-K. Except as otherwise indicated herein, this Amendment continues to speak as of the date of the Initial Form 10-K, and we have not updated the disclosures contained therein to reflect any events that occurred subsequent to the date of the Initial Form 10-K.
Unless otherwise indicated herein, all page references contained in this Form 10-K/A are to the pages of this Form 10-K/A, and not to the Initial Form 10-K.
i
L3 TECHNOLOGIES, INC.
ANNUAL REPORT ON FORM 10-K/A
For the Year Ended December 31, 2018
PART III | ||
| Item 10: | 1 | |
Item 11: | 12 | |
| Item 12: | 60 | |
Item 13: | 63 | |
| Item 14: | 64 | |
PART IV | ||
| Item 15: | 65 | |
| 67 | ||
PART III
DIRECTORS
Our Board of Directors (the “Board”) currently consists of ten directors. The following information describes the offices held and other business directorships of each director. The particular experiences, qualifications, attributes or skills of each director that the Nominating and Governance Committee believes advance the Company’s goals are included in the individual biographies below. The Nominating and Governance Committee and the Board believe that each of the directors possesses a strong and unique set of attributes and that, as a group, these directors provide the Board with an optimal balance of experience, leadership, competencies, qualifications and skills.
 Director Since: 2003 Board Committees: • Audit and Ethics Age: 73 | CLAUDE R. CANIZARES Position, Principal Occupation and Professional Experience: Bruno Rossi Professor of Physics, Massachusetts Institute of Technology. Since 1971, Professor Canizares has been at MIT, where until recently he served as Vice President. Prior positions include Vice President for Research, Associate Provost, and Director of the Center for Space Research. In addition, he is a principal investigator on NASA’s Chandra X-ray Observatory and Associate Director of its science center. Other Directorships, Trusteeships and Memberships: Member of the National Academy of Sciences and the International Academy of Astronautics; Fellow of the American Academy of Arts and Sciences, the American Physical Society and the American Association for the Advancement of Science. Professor Canizares served on the Department of Commerce’s Emerging Technology and Research Advisory Committee and currently serves on the National Research Council’s (NRC) Advisory Committee for the Division of Engineering and Physical Sciences. He chairs the Auditing Committee of the National Academy of Sciences. Professor Canizares has served on the Air Force Scientific Advisory Board, the NASA Advisory Council, and the Council of the National Academy of Sciences. Director Qualifications: The Board considered Professor Canizares’ distinguished career as a tenured professor at MIT including his past responsibility for over 20 research laboratories, including Lincoln Laboratory, with an aggregate annual research budget of $1.5 billion, as well as his extensive knowledge of the aerospace industry. |
 Director Since: 1997 Board Committees: • Audit and Ethics • Compensation Age: 74 | THOMAS A. CORCORAN Position, Principal Occupation and Professional Experience: President, Corcoran Enterprises, LLC. Mr. Corcoran has been the President of Corcoran Enterprises, LLC, a private management consulting firm, since 2001. From March 2001 to April 2004, Mr. Corcoran was the President and Chief Executive Officer of Gemini Air Cargo, a Carlyle Group Company, and served as Senior Advisor of The Carlyle Group, a private investment firm, from 2001 to 2017. Previously, Mr. Corcoran was the President and Chief Executive Officer of Allegheny Teledyne Incorporated. From April 1993 to September 1999, he was the President and Chief Operating Officer of the Electronic Systems Sector and Space & Strategic Missiles Sector of Lockheed Martin Corporation. Prior to that he worked for General Electric for 26 years and held various management positions with GE Aerospace. Other Current Public Directorships: Aerojet Rocketdyne Holdings, Inc. (Director, Member of the Organization & Compensation and Corporate Governance & Nominating Committees) Director Qualifications: The Board considered Mr. Corcoran’s business operations background, including his service as the chief executive officer of a number of businesses, and his expertise in the aerospace and defense industries. | ||
 Director Since: 2013 Board Committees: • Nominating and Governance Age: 66 | ANN E. DUNWOODY Position, Principal Occupation and Professional Experience: General (U.S. Army – Ret) and Chief Executive Officer, First 2 Four LLC.General (Ret.) Dunwoody was the first woman in U.S. military history to achieve the rank of four-star general. From 2008 until her retirement in 2012, she led and ran the largest global logistics command in the Army comprising 69,000 military and civilian individuals, located in all 50 states and over 140 countries with a budget of $60 billion dollars. General (Ret.) Dunwoody also served as a strategic planner for the Chief of Staff of the Army. During her 38-year military career, she was decorated for distinguished service and has received many major military and honorary awards. Other Current Public Directorships: Kforce Inc. (Director and Member of the Corporate Governance Committee) Prior Public Company Directorships (within the last five years): Republic Services, Inc. (until May 2017) Other Directorships, Trusteeships and Memberships: The Association of the United States Army (Council of Trustees), ThanksUSA (Director), Florida Institute of Technology (Director), Army Historical Foundation (Director), Logistics Management LLC (Director), National Association of Corporate Directors (Fellow), Fidelity Fixed Income and Asset Allocation Funds (FIAA) (Director and Member of Board of Trustees), Automattic (Director) Director Qualifications: The Board considered General (Ret.) Dunwoody’s distinguished career in the United States Army and her extensive knowledge of the defense industry. | ||
 Director Since: 2009 Board Committees: • Audit and Ethics (Chair) • Compensation Age: 71 | LEWIS KRAMER Position, Principal Occupation and Professional Experience: Retired Partner, Ernst & Young LLP. Mr. Kramer was a partner at Ernst & Young from 1981 until he retired in June 2009 after a nearly 40-year career at Ernst & Young. At the time of his retirement, Mr. Kramer served as the Global Client Service Partner for worldwide external audit and all other services for major clients and served on the firm’s United States Executive Board. He previously served as Ernst & Young’s National Director of Audit Services. Other Current Public Directorships: Las Vegas Sands Corp. (Director and Member of the Audit and Nominating and Governance Committees) Director Qualifications: The Board considered Mr. Kramer’s significant experience, expertise and background with regard to accounting and internal control matters as well as the breadth of his business knowledge gained while serving as an independent auditor for numerous organizations across many industries. | ||
 Director Since: 2018 • Chairman, CEO and President Age: 58 | CHRISTOPHER E. KUBASIK Position, Principal Occupation and Professional Experience: Chairman, Chief Executive Officer and President, L3 Technologies, Inc. Mr. Kubasik became our Chief Executive Officer and President and a member of our Board in January 2018; he assumed the role of Chairman in May 2018. From October 2015 to December 2017, Mr. Kubasik served as the Company’s President and Chief Operating Officer. From March 2014 to October 2015, Mr. Kubasik served as President and Chief Executive Officer of the Seabury Advisory Group. Prior to that, Mr. Kubasik held various executive positions with Lockheed Martin Corporation including Vice Chairman, President and Chief Operating Officer from 2010 to 2012. Mr. Kubasik graduated magna cum laude from the University of Maryland School of Business. Prior Public Company Directorships (within the last five years): Spirit AeroSystems Holdings, Inc. (until April 2016) Director Qualifications: The Board considered Mr. Kubasik’s position as Chairman, Chief Executive Officer and President and his expertise and experience in the aerospace and defense industries. | ||
 Director Since: 2018 Board Committees: • Audit and Ethics • Nominating and Governance Age: 56 | RITA S. LANE Position, Principal Occupation and Professional Experience: Principal, Hajime, LLC. Ms. Lane has been the Principal at Hajime, LLC a supply chain advisor for start-up companies, since August 2014. From July 2008 through January 2014, Ms. Lane served as Vice President, Operations, for Apple Inc. From June 2006 through July 2008, Ms. Lane was Senior Vice President, Integrated Supply Chain/Chief Procurement Officer for Motorola Solutions, Inc. and prior to that time held senior supply chain positions at International Business Machines Corporation for more than ten years. Ms. Lane also served for five years in the United States Air Force as a Captain. Prior Public Company Directorships (within the last five years): Ms. Lane serves on the Board of Directors of Sanmina Corporation, a global manufacturing solutions provider, and is a Supervisory Board member of Signify N.V., a publicly-traded global lighting systems manufacturer. Director Qualifications: The Board considered Ms. Lane’s extensive engineering and operational background, as well as her expertise in innovation across global businesses. |
 Director Since: 1997 • Lead Independent Director Board Committees: • Compensation (Chair) Age: 68 | ROBERT B. MILLARD Position, Principal Occupation and Professional Experience: Chairman, Massachusetts Institute of Technology Corporation. Mr. Millard has been the Chairman of the Massachusetts Institute of Technology Corporation since 2014. Prior to becoming Chairman of MIT, Mr. Millard held various positions in business, including Managing Director at Lehman Brothers and its predecessors from 1976 to 2008 and Chairman of Realm Partners L.L.C. from 2009 to 2014. Other Current Public Directorships: Evercore Inc. Prior Public Company Directorships (within the last five years): Gulfmark Offshore, Inc. (until June 2013) Other Directorships, Trusteeships and Memberships: Member, Council on Foreign Relations and Fellow of the American Academy of Arts and Sciences Director Qualifications: The Board considered Mr. Millard’s extensive financial background. |
 Director Since: 2012 Board Committees: • Compensation Age: 76 | LLOYD W. NEWTON Position, Principal Occupation and Professional Experience: General (U.S. Air Force – Ret). General (Ret.) Newton was a four-star General and Commander of the Air Force, Air Education and Training Command, where he was responsible for the recruiting, training and education of all Air Force personnel from 1997 until his retirement in 2000. Following his retirement from the Air Force, General (Ret.) Newton was Executive Vice President of Pratt & Whitney Military Engines until 2006. During his 34 year military career, General (Ret.) Newton also served as an Air Force congressional liaison officer with the U.S. House of Representatives and was a member of the Air Force’s Air Demonstration Squadron, the Thunderbirds. Prior Public Company Directorships (within the last five years): Torchmark Corporation (until April 2018); Sonoco Products Co. (until December 2014) and Goodrich Corporation (until August 2012) Director Qualifications: The Board considered General (Ret.) Newton’s distinguished career in the Air Force, his experience as an Executive Vice President of Pratt & Whitney Military Engines and his knowledge as a director of public companies. |
 Director Since: 2013 Board Committees: • Audit and Ethics • Nominating and Governance (Chair) Age: 68 | VINCENT PAGANO, JR. Position, Principal Occupation and Professional Experience: Retired Partner, Simpson Thacher & Bartlett LLP. Mr. Pagano was a partner at Simpson Thacher & Bartlett LLP until his retirement at the end of 2012. He was the head of the firm’s capital markets practice from 1999 to 2012 and, before that, administrative partner of the firm from 1996 to 1999. He was a member of the firm’s executive committee during substantially all of the 1996-2012 period. Other Current Public Directorships: Cheniere Energy Partners GP, LLC, the general partner of Cheniere Energy Partners, L.P. (Director and Member of the Audit and Conflicts Committees) and Hovnanian Enterprises, Inc. (Director and Member of the Audit and Corporate Governance and Nominating Committees) Director Qualifications: The Board considered Mr. Pagano’s significant experience, expertise and background with regard to legal, capital markets and corporate governance matters, including his broad perspective brought by his experience advising clients in many diverse industries. |
 Director Since: 2011 Board Committees: • Nominating and Governance Age: 77 | H. HUGH SHELTON Position, Principal Occupation and Professional Experience: General (U.S. Army - Ret). General (Ret.) Shelton was the senior officer of the United States military and principal military advisor to the President of the United States, the Secretary of Defense and the National Security Council when he served as the fourteenth Chairman of the Joint Chiefs of Staff from 1997 until his retirement in 2001. He had previously served as Commander-in-Chief of U.S. Special Operations Command (SOCOM). From January 2002 until April 2006, General (Ret.) Shelton served as the President, International Sales of M.I.C. Industries, an international manufacturing company. General (Ret.) Shelton was knighted by Queen Elizabeth II in 2001 and awarded the Congressional Gold Medal in 2002. Prior Public Company Directorships (within the last five years): Red Hat, Inc. (until August 2017) Other Directorships, Trusteeships and Memberships: Executive Director of the General H. Hugh Shelton Leadership Center at North Carolina State University, National Association of Corporate Directors (NACD) Fellow Director Qualifications: The Board considered General (Ret.) Shelton’s distinguished career as the Chairman of the Joint Chiefs of Staff, Department of Defense and as the Commander in Chief of U.S. Special Operations Command (SOCOM) and his extensive knowledge of the defense industry. |
THE BOARD OF DIRECTORS AND CERTAIN GOVERNANCE MATTERS
Our Board oversees the management of our business and affairs, as provided by Delaware law, and, during 2018, conducted its business through meetings of the Board and three standing committees: Audit, Compensation, Nominating and Governance Committees. From time to time, other special committees may be established under the direction of the Board when necessary to address specific issues.
Directors are expected to attend board meetings and meetings of the committees on which they serve, to spend the time needed and to meet as frequently as necessary in order to properly discharge their responsibilities. In addition, to the extent reasonably practicable, directors are expected to attend shareholder meetings. In accordance with applicable listing requirements of the New York Stock Exchange (the “NYSE”), our independent directors hold regular executive sessions at which management, including the Chief Executive Officer, is not present. Mr. Millard, our Lead Independent Director of the Board, presides at the regularly held executive sessions of the independent directors
COMMITTEES OF THE BOARD OF DIRECTORS
The Board has established various committees to assist it with the performance of its responsibilities. The Board has three standing committees: the Audit and Ethics Committee, Compensation Committee and Nominating and Governance Committee. The Board designates the members of these committees and the committee chairs based on the recommendations of the Nominating and Governance Committee. The chair of each committee develops the agenda for its committee, and each committee regularly provides a full report to the Board.
The Board has adopted written charters for each of the Audit and Ethics, Compensation and Nominating and Governance Committees. These charters are available on the Company’s website at http://www.L3T.com/investor-relations/corporate-governance.
The following table summarizes the primary responsibilities of the committees:
Committee | Primary Responsibilities | |||
Audit and Ethics | The Audit and Ethics Committee is generally responsible for, among other things: | |||
• | selecting, appointing, compensating, retaining and terminating our independent registered public accounting firm; | |||
• | overseeing the auditing work of any independent registered public accounting firm employed by us, including the resolution of any disagreements, if any, between management and the independent registered public accounting firm regarding financial reporting, for the purpose of preparing or issuing an audit report or performing other audit, review or attest services; | |||
• | pre-approving audit, other audit, audit-related and permitted non-audit services to be performed by the independent registered public accounting firm and related fees; | |||
• | meeting with our independent registered public accounting firm to review the proposed scope of the annual audit of our financial statements and to discuss such other matters that it deems appropriate; | |||
• | reviewing the findings of the independent registered public accounting firm with respect to the annual audit; | |||
• | meeting to review and discuss with management and the independent registered public accounting firm our periodic financial reports prior to our filing them with the SEC and reporting annually to the Board with respect to such matters; | |||
• | reviewing with our financial and accounting management, the independent registered public accounting firm and internal auditor the adequacy and effectiveness of our internal control over financial reporting, financial reporting procedures and disclosure controls and procedures; | |||
• | reviewing the internal audit function; | |||
• | oversee the Company’s compliance with relevant legal and regulatory requirements and the adequacy of control systems in place to assure such compliance; | |||
• | review and approve, or ratify, related person transactions; | |||
• | oversight of the Company’s ethics program and all investigations; and | |||
• | reporting to the Board regarding matters covered at each committee meeting on a timely basis. | |||
Compensation | The Compensation Committee is generally responsible for, among other things: | |||
• | reviewing and approving corporate goals and objectives relevant to the Chief Executive Officer’s compensation; | |||
• | evaluating the performance of the Chief Executive Officer in light of these corporate goals and objectives and, either as a committee or together with other independent directors (as directed by the Board), determining and approving the annual salary, bonus, equity and equity-based incentives and other benefits, direct and indirect, of the Chief Executive Officer based on such evaluation; | |||
• | reviewing and approving the annual salary, bonus, equity and equity-based incentives and other benefits, direct and indirect, of the other executive officers; | |||
• | discussing the results of the shareholder advisory vote on the compensation paid to our named executive officers; | |||
• | reviewing and recommending to the Board, or approving, all equity-based awards, including pursuant to the Company’s equity-based plans; | |||
• | reviewing and approving, or making recommendations to the Board with respect to, the Company’s equity-based plans and executive officer incentive compensation plans, and overseeing the activities of the individuals responsible for administering those plans; | |||
• | reviewing and discussing with management, on at least an annual basis, management’s assessment of whether risks arising from the Company’s compensation policies and practices for all employees, including non-executive officers, are reasonably likely to have a material adverse effect on the Company; | |||
| Committee | Primary Responsibilities | ||
• | reviewing and discussing the “Compensation Discussion and Analysis” section contained in this Form 10-K/A; | ||
• | overseeing and approving the management continuity planning process; | ||
• | periodically reviewing and evaluating the succession plans relating to the Chief Executive Officer and other executive officer positions, including plans related to unanticipated vacancies; | ||
• | retaining or terminating, as necessary or appropriate, and approving the fees and any other retention terms for, compensation and benefits consultants and other outside consultants, legal counsels or advisors hired to provide independent advice to the committee; | ||
• | evaluating on at least an annual basis whether any work provided by a compensation consultant retained by the committee raised any conflict of interest; and | ||
• | reporting to the Board regarding matters covered at each committee meeting on a timely basis. | ||
Nominating and Governance | The Nominating and Governance Committee is generally responsible for, among other things: | ||
• | developing, recommending and monitoring corporate governance policies and procedures for the Company and the Board; | ||
• | overseeing the Company’s political contributions, lobbying activities, and the Company’s Federal political action committee; | ||
• | recommending to the Board criteria for the selection of new directors; | ||
• | identifying and recommending to the Board individuals to be nominated as directors; | ||
• | evaluating candidates recommended by shareholders in a timely manner; | ||
• | conducting all necessary and appropriate inquiries into the backgrounds and qualifications of possible candidates; | ||
• | overseeing the evaluation of the Board and its committees and management; | ||
• | reviewing and making recommendations to the Board with respect to the form and amounts of compensation for directors; and | ||
• | reporting to Board regarding matters covered at each committee meeting on a timely basis. | ||
The following table sets forth the members of each of the Committees during 2018:
Name | Audit and Ethics(1) | Compensation(2) | Nominating and Governance(3) |
Claude R. Canizares* | |||
Thomas A. Corcoran* | |||
Ann E. Dunwoody* | |||
Lewis Kramer* | |||
| Christopher E. Kubasik | |||
Rita S. Lane* | |||
Robert B. Millard*(4) | |||
Lloyd W. Newton* | |||
Vincent Pagano, Jr.* | |||
H. Hugh Shelton* |
| * | Independent Director. |
| (1) | The Audit and Ethics Committee consists entirely of non-management directors, all of whom have been determined by the Board to be independent within the meaning of the listing standards of the NYSE and Rule 10A-3 of the Exchange Act. The Board has also determined that all members of the Audit and Ethics Committee are financially literate and that Mr. Kramer is an “audit committee financial expert” within the meaning set forth in the regulations of the SEC. |
| (2) | The Compensation Committee consists entirely of non-management directors, all of whom the Board has determined are independent within the meaning of the listing standards of the NYSE; are non-employee directors for purposes of Rule 16b-3 of the Exchange Act; and satisfy the requirements of Section 162(m) of the Internal Revenue Code of 1986, as amended (the “Internal Revenue Code”) for outside directors. |
| (3) | The Nominating and Governance Committee consists entirely of non-management directors, all of whom have been determined by the Board to be independent within the meaning of the listing standards of the NYSE and our standards of independence. |
| (4) | Lead Independent Director. |
COMMUNICATIONS WITH THE BOARD OF DIRECTORS
Anyone who would like to communicate with, or otherwise make his or her concerns known directly to, the full Board, the Chair of any of the Audit and Ethics, Compensation and Nominating and Governance Committees, to the non-employee directors as a group or to our Lead Independent Director, may do so either by email that can be accessed through our website at http://www.L3T.com or by addressing such communications or concerns to the Corporate Secretary of L3 Technologies, Inc., 600 Third Avenue, New York, New York 10016, who will forward such communications to the appropriate party. The addressed communications may be done confidentially or anonymously. The Corporate Secretary will forward all correspondence to the Board or the specifically designated party, except for spam, junk mail, mass mailings, product complaints or inquiries, job inquiries, surveys, business solicitations or advertisements or patently offensive or otherwise inappropriate material.
All communications involving accounting, internal controls over financial reporting or auditing matters, possible violations of, or non-compliance with, applicable legal or regulatory requirements or the Company’s Code of Ethics and Business Conduct, or retaliatory acts against anyone who makes such a complaint or assists in the investigation of such a complaint, may be made via email to Ethics@L3T.com, or through the L3 Helpline at (877) 532-6339 within the United States or using the AT&T International Toll-Free Dial codes available online at http://www.usa.att.com/traveler/index.jsp outside of the United States. You may also contact the Audit and Ethics Committee, particularly regarding concerns about violations of our standards in the areas of accounting, internal controls or auditing, in the manner described above.
CODE OF ETHICS AND BUSINESS CONDUCT
The Board has adopted a code of ethics and business conduct that applies to all of our directors, officers and employees. You can find a link to the code on our website at http://www.L3T.com. In accordance with, and to the extent required by, the rules and regulations of the SEC, we intend to post on our website waivers or implicit waivers (as such terms are defined in Item 5.05 of Form 8-K of the Exchange Act) and amendments to the code of ethics and business conduct that apply to any of our directors and executive officers, including our Chairman, Chief Executive Officer and President, Senior Vice President and Chief Financial Officer, and Vice President, Controller and Principal Accounting Officer or other persons performing similar functions.
EXECUTIVES AND CERTAIN OTHER OFFICERS OF THE COMPANY
Set forth below is certain information regarding each of our current executives other than Mr. Kubasik, who is presented under “Directors” beginning on page 1.
RALPH G. D’AMBROSIO | |||
Senior Vice President and Chief Financial Officer Age 51 | Principal Occupation and Other Information Mr. D’Ambrosio became our Chief Financial Officer in January 2007 and a Senior Vice President in April 2010. From March 2005 to January 2007, he was Vice President – Finance and Principal Accounting Officer, and he continued to be our Principal Accounting Officer until April 2008. He became Controller in August 2000 and a Vice President in July 2001 and was Vice President and Controller until March 2005. He joined L3 in August 1997 and was Assistant Controller until July 2000. Prior to joining L3, he was a senior manager at Coopers & Lybrand LLP, where he held a number of positions since 1989. Mr. D’Ambrosio holds a Bachelor’s degree, summa cum laude, in Business Administration from Iona College and a Master’s degree, with honors, in Business Administration from the Stern School of Business at New York University. | ||
ANN D. DAVIDSON | |||
Senior Vice President and Chief Legal Officer Age 67 | Principal Occupation and Other Information Ms. Davidson became our Senior Vice President and General Counsel in August 2016 and was named our Chief Legal Officer in May 2018. Prior to joining L3, Ms. Davidson was the Senior Vice President, Chief Legal Officer and Corporate Secretary of Exelis Inc. from September 2011 to May 2015. Her legal career includes two decades of working in the aerospace and defense industry with ITT Corporation, Alliant Techsystems Inc., Thales North America Inc., Parker Hannifin Corporation and Honeywell International Inc. Earlier in her career she was an attorney advisor and trial attorney for the Office of the General Counsel of the U.S. Department of the Navy. Ms. Davidson received her Bachelor of Arts degree from Ohio University and her Juris Doctor degree from the University of Dayton School of Law. She is a member of the bar in Virginia and New York. |
TODD W. GAUTIER | |||
Senior Vice President and President of Electronic Systems Segment Age 55 | Principal Occupation and Other Information Mr. Gautier became our Senior Vice President and President of Electronic Systems Segment in March 2017. Prior to that, he was President of the Precision Engagement and Training Sector from January 2014 to March 2017, President of the Precision Engagement Sector from January 2010 to January 2014, and Vice President of Business Development and Strategy for the Sensors and Simulation Group from January 2005 to January 2010. With 30 years of defense, aerospace and leadership experience, Mr. Gautier joined L3 in 2001. Prior to joining L3, Mr. Gautier served in the U.S. Navy for 15 years as a Strike/Fighter Pilot, where he held a variety of leadership, operational, and instructional positions across combat and peacetime operations. After leaving the Navy in 2000, he served as the Vice President of Navy Operations for BGI, LLC, and as a flight crew member for United Airlines. Mr. Gautier received his Bachelor’s degree in Business Administration, Finance, from Southern Methodist University in 1986. |
JEFFREY A. MILLER | |||
Senior Vice President and President of ISR Systems Segment Age 55 | Principal Occupation and Other Information Mr. Miller became our Senior Vice President and President of ISR Systems Segment in August 2018. Previously, he was Senior Vice President and President of the Sensor Systems Segment from March 2017 to August 2018. Mr. Miller joined L3 in April 2014 as Sector President of Integrated Sensor Systems. Prior to joining L3, Mr. Miller held executive positions with Raytheon. Earlier in his career, he was an F-16 product line manager for identification and electronic warfare programs at Teledyne Electronics. Mr. Miller has over 30 years of industry experience in U.S. and international sensors and fire control systems, battlefield information systems, networked communication, command and control, electronic warfare, missiles, and force protection systems. Mr. Miller studied electronic engineering at California Polytechnic State University. In addition, he has studied electronic engineering at various university programs and participated in executive management development and business leadership programs. | ||
SEAN J. STACKLEY | |||
Senior Vice President and President of Communications & Networked Systems Segment Age 61 | Principal Occupation and Other Information (Hon.) Mr. Stackley was promoted to Senior Vice President and President of Communications & Networked Systems Segment in September 2018. He joined L3 as Corporate Vice President, Strategic Advance Programs and Technologies in January 2018. Before joining L3, he spent four decades in public service, including a 27-year career in the U.S. Navy. Most recently, from January 2017 to July 2017, Mr. Stackley served as Acting Secretary of the Navy. From 2008 to 2017, he served as Assistant Secretary of the Navy (Research, Development and Acquisition). Mr. Stackley graduated with distinction from the U.S. Naval Academy with a Bachelor of Science in Mechanical Engineering. He holds the degrees of Ocean Engineer and Master of Science in Mechanical Engineering from the Massachusetts Institute of Technology and is a Certified Professional Engineer in the Commonwealth of Virginia. |
SECTION 16(a) BENEFICIAL OWNERSHIP REPORTING COMPLIANCE
Section 16(a) of the Exchange Act requires our officers and directors, and persons who own more than 10% of a registered class of our equity securities, to file reports of ownership and changes in ownership with the SEC and the NYSE. Officers, directors and greater than 10% shareholders are required by SEC regulations to furnish us with copies of all Section 16(a) forms they file. Based on our records and other information, we believe that all Section 16(a) forms required to be filed for 2018 were filed on a timely basis and in compliance with the requirements of Section 16(a), except that one Form 3 was not timely filed due to an administrative error.
COMPENSATION DISCUSSION AND ANALYSIS
This Compensation Discussion and Analysis describes L3’s executive compensation program related to the year ended December 31, 2018 (our 2018 fiscal year). This section details the compensation framework applied by the Compensation Committee of our Board of Directors (the “Committee”) in determining the pay levels and programs available to our named executive officers for whom compensation is disclosed in the compensation tables included in the Tabular Executive Compensation Disclosure section beginning on page 36. Our named executive officers for the 2018 fiscal year were:
| • | Christopher E. Kubasik, Chairman, Chief Executive Officer and President |
| • | Ralph G. D’Ambrosio, Senior Vice President and Chief Financial Officer |
| • | Ann D. Davidson, Senior Vice President and Chief Legal Officer |
| • | Todd W. Gautier, Senior Vice President and President of Electronic Systems Segment |
| • | Jeffrey A. Miller, Senior Vice President and President of ISR Systems Segment |
COMPANY BACKGROUND AND 2018 PERFORMANCE ACHIEVEMENTS
Company Background. L3 is a prime contractor in Intelligence, Surveillance and Reconnaissance (“ISR”) systems, aircraft sustainment (including modifications and fleet management of special mission aircraft), simulation and training, night vision and image intensification equipment, and security and detection systems. L3 is also a leading provider of a broad range of communication, electronic and sensor systems used on military, homeland security and commercial platforms. Approximately 70% of our consolidated net sales for 2018 were made to the U.S. Government (the “USG”), including 66% to the Department of Defense (the “DoD”). The remaining 30% of our sales were made to international and commercial customers.
On June 29, 2018, we completed the sale of our Vertex Aerospace business for a sales price of $540 million, subject to customary closing net working capital adjustments. The divestiture of the Vertex Aerospace business represents a strategic shift by us to exit the logistics solution and maintenance services business for military aircraft where we do not provide complex ISR systems integration and modification. The Vertex Aerospace business generated sales of $0.6 billion in 2018 and $1.4 billion in 2017. The assets and liabilities and results of operations of the Vertex Aerospace business are reported as discontinued operations in our 2018 financial statements and are excluded from the specific financial results set forth in “2018 Performance Achievements” below.
On October 14, 2018, L3 and Harris Corporation (“Harris”) announced an agreement to combine in an all stock merger of equals (the “L3 Harris Merger”). Under the terms of the Agreement and Plan of Merger governing the proposed transaction (the “L3 Harris Merger Agreement”), which was unanimously approved by the boards of directors of both companies, L3 shareholders will receive a fixed exchange ratio of 1.30 shares of Harris common stock for each share of L3 common stock they hold. Upon completion of the L3 Harris Merger, Harris shareholders will own approximately 54% and L3 shareholders will own approximately 46% of the combined company, which will be renamed L3 Harris Technologies, Inc. The L3 Harris Merger was approved by the respective stockholders of L3 and Harris on April 4, 2019, and is expected to close in the middle of 2019 subject to customary closing conditions, including the receipt of regulatory approvals.
2018 Performance Achievements. L3 delivered strong financial performance for 2018, highlighted by the items described below.
| • | Our diluted earnings per share (“EPS”) and free cash flow (“FCF”) achievements significantly exceeded the corporate goals in our annual incentive plan. Our 2018 EPS from continuing operations increased by 6% to $10.05, compared with $9.46 for 2017, and our net cash from operating activities from continuing operations increased by 6% to $1,042 million for 2018, as compared to $985 million from 2017. Our 2018 EPS from continuing operations included certain debt retirement charges, merger and acquisition-related expenses and divestiture gains that are described more fully in “– Reconciliation of Non-GAAP Measures to GAAP Measures” on page 34. Excluding these items, our EPS from continuing operations grew by 14% to $10.75 for 2018, as compared to $9.46 for 2017. Our 2017 EPS from continuing operations also included an estimated tax benefit of $0.99 per diluted share related to the enactment of the U.S. Tax Cuts and Jobs Act in December 2017 (the “2017 Tax Reform Law”). Our FCF from continuing operations increased 8% to $935 million in 2018, as compared to $862 million for 2017. The FCF results discussed in this paragraph are subject to the adjustments set forth in “– Reconciliation of Non-GAAP Measures to GAAP Measures” on page 34. |
| • | Our consolidated organic sales growth (that is, the growth in our net sales excluding the sales impact of business acquisitions and divestitures) (“OSG”) also significantly exceeded our annual incentive plan goal. Our consolidated net sales grew by 7% to $10,244 million for 2018, as compared to $9,573 million for 2017. Our consolidated OSG was 7% for 2018 (with organic sales increasing by $635 million, to $10,138 million for 2018), led by organic growth of 6% for our USG business (including the DoD). Consolidated organic sales exclude $106 million of sales increases related to business acquisitions and $70 million of sales declines related to business divestitures. |
| • | Our segment operating margin was 10.8% for 2018 and was unchanged from 2017. |
| • | Our segment operating income increased by $75 million, or 7%, to $1,106 million for 2018, as compared to $1,031 million for 2017. Favorable contract performance at Electronic Systems was offset by lower manufacturing yields, inventory provisions and unfavorable contract performance for the Traveling Wave Tube business in our Communications & Networked Systems segment and higher research and development costs, primarily at our Intelligence Surveillance and Reconnaissance Systems segment, as described below. |
| • | We undertook significant strategic actions to reshape and strengthen our business portfolio for continued future success. As discussed above, on June 29, 2018, we completed the sale of our Vertex Aerospace business, representing a strategic shift in the scope of our business. We also invested $386 million to acquire five businesses in 2018. Our acquisitions build and strengthen select L3 business areas, including with respect to information security; unmanned surface vessel (USV) and autonomous vessel control systems; aerospace engineering, software development and space situational awareness; robotic solutions for automotive manufacturing; and unmanned aerial systems. We also increased our research and development (R&D) investment by 14%, or $39 million, to $326 million for 2018, as compared to $287 million for 2017. |
| • | As discussed above, on October 14, 2018, we entered into an agreement to combine L3 and Harris in an all stock merger of equals in which L3 shareholders will receive a fixed exchange ratio of 1.30 shares of Harris common stock for each share of L3 common stock they hold and will collectively own approximately 46% of the combined company. |
| • | We returned $576 million of cash to our shareholders in 2018, by repurchasing $322 million of our Common Stock and paying dividends of $254 million following our 14th consecutive annual dividend increase. |
| • | Credit rating agencies S&P, Moody’s and Fitch reaffirmed their stable outlooks and investment-grade credit ratings for L3. We also maintained an efficient capital structure with ample liquidity. We ended 2018 with $3.3 billion of debt, unchanged from 2017 and representing approximately 35% of invested capital, $1,066 million of cash on hand (an increase of approximately 60% as compared to the end of 2017) and an available revolver of $1 billion. |
COMPENSATION PHILOSOPHY, 2018 TARGET PAY AND 2018 INCENTIVE PLAN PAYOUTS
Compensation Philosophy. Our compensation philosophy supports a pay-for-performance culture. We target base salaries and annual and long-term incentive opportunities to approximate market median compensation levels, subject to adjustments based on experience, performance, other individual factors as described in “– Use of Market Data and Competitive Compensation Positioning” beginning on page 18 and as otherwise appropriate. On average, the majority of each executive’s target pay for 2018 was in the form of incentive compensation, which was subject to future performance to have any realized value. See the information in “– Mix of Pay” beginning on page 17.
2018 Target Pay. The table below details each named executive officer’s 2018 base salary, target annual incentive opportunity (“target bonus”) and grant date target value of long-term incentive awards (collectively, “target pay”).
Salary(1) | Target Bonus as % of Salary | Target Value of Long-Term Incentives(2) | Target Pay(1) | |||||||||||||
| Christopher E. Kubasik | $ | 1,200,000 | 130% | $ | 9,600,000 | $ | 12,360,000 | |||||||||
| Ralph G. D’Ambrosio | 730,500 | 100% | 2,700,000 | 4,161,000 | ||||||||||||
| Ann D. Davidson | 618,000 | 90% | 1,000,000 | 2,174,200 | ||||||||||||
| Todd W. Gautier | 546,300 | 100% | 1,300,000 | 2,392,600 | ||||||||||||
| Jeffrey A. Miller | 520,550 | 100% | 1,000,000 | 2,041,100 | ||||||||||||
| (1) | Other than with respect to Messrs. Kubasik and Miller, amounts disclosed in the Salary column represent the annualized base salary established for each named executive officer by the Committee effective February 24, 2018. Mr. Kubasik’s annualized base salary became effective on January 1, 2018 in connection with his promotion to Chief Executive Officer. Mr. Miller’s annualized base salary was initially set at $488,800 effective February 24, 2018 in connection with his then existing role as president of our Sensor Systems segment, and was increased to $565,000 in connection with his promotion to president of our ISR Systems segment effective August 2, 2018. The amounts disclosed in the Salary and Target Pay columns for Mr. Miller reflect his prorated annualized based salary for his service during 2018 in these roles. |
| (2) | The amounts disclosed in this column exclude the value of long-term incentives granted to Messrs. Kubasik and Miller in December 2018, in lieu of being granted in February 2019 as part of their respective 2019 target pay, to mitigate potential excise taxes that may be applicable under Section 280G of the Internal Revenue Code in connection with the L3 Harris Merger. For a further discussion, see “– Summary of 2019 Target Pay” beginning on page 29. |
For 2018, our Chief Executive Officer’s target pay was set by the Committee to approximate market median. The Committee approved target pay increases for Mr. D’Ambrosio and Ms. Davidson that reflected their strong, long-term individual performance. The Committee also approved market-based increases to the target pay of Messrs. Gautier and Miller to bring their pay closer to market median (including, in the case of Mr. Miller, in connection with his promotion to president of our ISR Systems segment in August 2018). Following these pay adjustments, the 2018 target pay of our named executive officers other than our Chief Executive Officer fell, on average, within a competitive range of 85% to 115% of market median. For a further discussion, see “– Use of Market Data and Competitive Compensation Positioning” beginning on page 18.
2018 Incentive Plan Payouts. Payouts under our annual incentive plan and our long-term incentive plan performance awards are subject to the achievement of pre-established targets.
With respect to our annual incentive plan, our overall financial performance was above plan targets, and the applicable functional and personal performance of each of our named executive officers was also assessed as above target. Accordingly, calculated payouts under our annual incentive plan were above target for all of our named executive officers. Notwithstanding the formula-based calculation of these payouts under our annual incentive plan, after considering all aspects of our financial performance for 2018, including the fact that our 2018 segment operating margin fell below management’s internal objectives, Mr. Kubasik recommended and the Committee agreed that calculated payouts for Messrs. Kubasik and D’Ambrosio should be reduced by approximately 10% and for our other named executive officers by approximately 5%. For a further discussion, see “– Elements of 2018 Target Pay – Annual Incentives” beginning on page 20.
For our long-term performance awards that vested on December 31, 2018, our three-year performance achievements exceeded the maximum performance target for EPS and were at the 75th percentile of our peer group for relative total shareholder return. Based on these results, our named executive officers received performance award payouts at 200% of their target awards for each of these performance measures. For a further discussion, see “– Payment of Performance Awards for the 2016-2018 Award Cycle” on page 29.
2018 SHAREHOLDER ADVISORY VOTE ON EXECUTIVE COMPENSATION (“Say-on-Pay”)
At our 2018 annual shareholders meeting, approximately 96% of the votes cast on our Say-on-Pay proposal were voted in favor of the compensation paid to our named executive officers for 2017. We believe that this strong level of shareholder support demonstrates, among other things, the effectiveness of the significant changes made to our compensation program over the past several years in response to shareholder feedback. The Committee considers the outcome of Say-on-Pay votes and other shareholder input in making decisions regarding the executive compensation program.
SOUND PAY PRACTICES
The Committee believes L3’s executive compensation program reinforces its pay-for-performance culture and includes corporate governance practices that are considered by investors to reflect market “best practices.” The table below highlights key features of our executive compensation program.
| Executive Compensation Program Features | |
Executive Compensation Program Includes | • Emphasis on long-term, performance-based compensation and meaningful stock ownership guidelines to align executive and shareholder interests • Transparent, formulaic incentive plans designed to promote short- and long-term business success • Performance conditions on the Chief Executive Officer’s stock options • Clawback policy that applies to all incentive compensation, including equity-based awards • Modest perquisites consistent with competitive practices • Double trigger provisions for severance payable in the event of a change in control • Annual compensation risk assessment to ensure program does not encourage excessive risk-taking • Tally sheet analysis to better understand current and accumulated compensation and benefits |
Executive Compensation Program Does Not Include or Prohibits | • Excise tax gross-ups on severance/change in control payments • Repricing of stock options or other equity-based awards without shareholder approval • Pension plan/SERP credit for years not worked with L3 or its predecessor companies • Excessive severance or change in control provisions • Payment of dividends on stock options, or on other equity-based awards prior to vesting • Hedging or pledging of L3 stock by executives, employees and non-employee directors |
PROGRAM OVERVIEW
The table below outlines the principal elements of our executive compensation program. Detailed descriptions of each element of compensation and discussion of how the Committee determined compensation levels for 2018 can be found in the section “– Elements of 2018 Target Pay” beginning on page 19.


Legend: Fixed compensation At-risk compensation Purpose/Objectives lAttract and retain top executives BASE Fixed Cash lSteady income stream SALARY Compensation 2018 Highlights lAnnual "merit" increases eliminated lFuture increases will be based on market benchmarking / positioning CEO, CFO60% Consolidated EPS Purpose/Objectives 80% Financial lLink pay with short-term performance Performance 20% Consolidated FCF lAlign with individual, segment and company performance 20% Individual lFormulaic plan based on pre-established goals Performance 20% Consolidated Organic lPayouts range from 0% to 200% of target Sales Growth lEmphasis on metrics that drive company performance 2018 Highlights Other Corp. Reports60% Consolidated EPS lConsolidated organic sales growth added as a performance measure 60% Financial lIncreased emphasis on financial performance Performance 20% Consolidated FCF lDepartmental performance added as a measure for Corporate ANNUAL20% Departmental Reports (other than CFO) INCENTIVE Performance 20% Consolidated Organic lSegment operating income growth eliminated as a separate 20% Individual Sales Growth performance measure for Segment Presidents Performance 15% Consolidated EPS Segment Presidents 80% Financial 5% Consolidated FCF Performance 20% Individual 20% Consolidated Organic Performance Sales Growth 45% Segment Operating Income 15% Segment FCF 50% Performance Units Purpose/Objectives 40% Performance (Cumulative EPS) lLink pay with long-term performance Awards 50% Performance Cash lPromote stock price appreciation (absolute & relative to peers) (Relative TSR) lAlign executive and shareholder interests lMotivate achievement of long-term business objectives LONG-TERM30% Stock 100% Absolute Stock Price lFacilitate ownership of L3 Common Stock INCENTIVES Options Appreciation lRetention of key employees lPerformance award payouts range from 0% to 200% of target lPerformance vesting conditions imposed on CEO's stock options 30% Restricted CEO Performance Conditions Stock Units 50% Consolidated EPS 2018 Highlights lTSR peer group expanded from 14 to 20 public companies 50% Consolidated FCF
DETERMINING EXECUTIVE COMPENSATION
Role of the Compensation Committee. L3’s executive compensation program is administered by the Committee. The Committee is ultimately responsible for the review and approval of compensation for L3’s Chief Executive Officer and all other executive officers, including the other named executive officers. Key areas of responsibility for the Committee are described in “Committees of the Board of Directors” beginning on page 6.
Role of Management and the Chief Executive Officer. The Company’s human resources, finance and legal departments assist the Committee in the design and development of competitive compensation programs by providing data and analyses to the Committee and Frederic W. Cook (“FW Cook”), the Committee’s independent compensation consultant, in order to ensure that L3’s programs and incentives align with and support the Company’s business strategy. Management also recommends incentive plan metrics, performance targets and other plan objectives to be achieved, based on expected Company performance and subject to Committee approval.
On an annual basis, the Chief Executive Officer reviews the performance of the other executive officers relative to Company performance and their respective functional and/or individual goals, and submits recommendations to the Committee for proposed base salary adjustments, target bonuses and personal ratings under the annual incentive plan, and grant date target values for long-term incentive awards. The Chief Executive Officer further provides the Committee with an annual assessment of his own performance, but otherwise has no role in determining his own compensation. Except as described above, no other executive officer participated in the setting of his or her own compensation or the compensation of any other executive officer.
Role of Compensation Consultants. The Committee has the sole authority to select, retain, terminate and approve the fees payable to outside consultants to provide it with advice on various aspects of executive compensation design and delivery. The Committee has retained FW Cook to advise the Committee as its independent consultant on executive compensation matters generally. During 2018, FW Cook and its affiliates did not provide any services to the Company or any of the Company’s affiliates other than providing (1) advice on executive officer compensation to the Committee and (2) advice on director compensation to both the Committee and the Nominating and Governance Committee of our Board of Directors.
In the course of conducting its activities for the Committee during 2018, FW Cook attended meetings of the Committee and presented its findings and recommendations to the Committee for discussion. FW Cook also met with management to obtain and validate data and review materials. In March of 2019, the Committee evaluated whether any work performed by FW Cook raised any conflict of interest and determined that it did not.
MIX OF PAY
The Committee believes that L3’s pay mix strongly supports the Company’s pay-for-performance culture. In 2018, 67% of the Chief Executive Officer’s 2018 target pay was “at risk” and subject to performance to have any realized value.
Base salary and restricted stock units (“RSUs”) are the only elements of 2018 target pay that are not contingent on future performance to have value (“fixed” pay). However, they both serve to attract and retain top executive talent, and the use of these pay elements is consistent with competitive market practices. As illustrated below, the mix of incentive compensation for our named executive officers is balanced to avoid the risk of emphasizing short-term gains at the expense of long-term performance. The emphasis on long-term incentives demonstrates our strong commitment to the alignment of management and shareholder interests over time.
| 2018 Target Pay Mix |
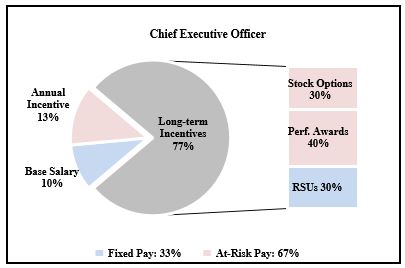 | 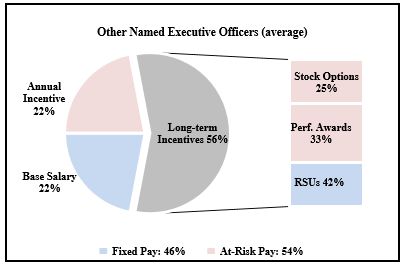 |
Chief Executive OfficerAnnual Incentive 13%Base Salary 10%Long-termIncentives 77%Stock Options 30%Perf. Awards 40%RSUs 30%Fixed Pay: 33%At-Risk Pay: 67%Other Named Executive Officers (average)Annual Incentive 23%Base Salary 24%Long-termIncentives 53%Stock Options 25%Perf. Awards 33%RSUs 42%Fixed Pay: 48%At-Risk Pay: 52% | |
USE OF MARKET DATA AND COMPETITIVE COMPENSATION POSITIONING
Compensation Peer Group. The Committee believes that the success of our Company is dependent upon its ability to continue to attract and retain high-performing executives. To ensure the comparability of our executive compensation practices and pay levels, the Committee has historically monitored executive pay at leading defense, aerospace and other industrial companies (the “compensation peer group”) with whom L3 competes for business, executive talent or investor capital. The Committee evaluates each peer company on an annual basis to determine its continued suitability from a pay benchmarking perspective. The selection criteria examined include:
| ▪ | Operational Fit: companies in the same or similar industries with a comparable business mix and client base, and diversified global operations. Due to the limited number of “pure defense” companies of comparable size, the Committee believes that it is appropriate to include other companies in L3’s compensation peer group that are similar in size and compete with L3 for executive talent or investor capital. |
| ▪ | Financial Scope: companies of similar size as measured by annual corporate revenues. At the time this peer group was approved, most of the peers fell within a range of one-third to three times the size of L3. In limited circumstances, the Committee has found it appropriate to include companies with revenues that fall both above and below this range when they are proven competitors for business, executive talent or investor capital. |
The table below shows the composition of our peer group used to benchmark target pay in 2018 and indicates those companies that were added or removed for 2018 as compared to the peer group used to benchmark target pay in 2017.
| 2018 Compensation Peer Group | ||
| Leidos Holdings, Inc. | Rockwell Collins, Inc. | |
| General Dynamics Corporation | Lockheed Martin Corporation. | Spirit AeroSystems Holdings, Inc. |
| Harris Corporation | Northrop Grumman Corporation | Textron, Inc. |
| Honeywell International, Inc. | Orbital ATK, Inc.** | TransDigm Group Incorporated |
| Huntington Ingalls Industries, Inc. | Parker Hannifin Corporation | |
| Ingersoll-Rand plc | Raytheon Company | |
| * | Removed from the compensation peer group for 2018 |
| ** | Added to the compensation peer group for 2018 |
The peer group used to benchmark target pay in 2018 was established in connection with the Committee’s review of the suitability of the peer group companies conducted in June 2017. At that time, the Committee determined to replace Eaton with Orbital ATK, as Eaton’s aerospace segment was the smallest among its five segments and had declined over time to only 9% of Eaton’s total revenue, while Orbital ATK is an aerospace and defense company that falls within appropriate size parameters and competes with L3 in similar markets.
In June 2018, the Committee conducted its review of the suitability of the peer group companies to be used to benchmark target pay in 2019 and determined not to make any further changes to the peer group at that time.
Use of Market Data. In reviewing competitive compensation levels for 2018, the Committee considered compensation peer group data for all named executive officers other than Ms. Davidson. The Committee did not utilize compensation peer group data for Ms. Davidson (who serves as our Chief Legal Officer) due to the limited number of publicly available benchmarking matches for her position within the compensation peer group. Instead, the Committee used survey data from the Willis Towers Watson Executive Compensation Database General Industry survey (the “General Industry Survey Data”) for this purpose. For Messrs. Gautier and Miller, who serve as segment presidents, the Committee considered competitive compensation levels based on the average of the compensation peer group data and the General Industry Survey Data because it believed that including a broader industry group more accurately reflects the labor market for segment presidents and ensures a meaningful sample size given the revenue of the segments they lead.
Competitive Market Positioning. The Committee’s general practice is to make pay decisions regarding the elements of compensation that compose each named executive officer’s target pay (base salary, target bonus and grant date target value of long-term incentives) in February of each fiscal year. As part of its decision-making process, the Committee compares each named executive officer’s target pay for the fiscal year against the market median; however, the Committee does not use market data in isolation in determining pay. Instead, competitive market data serves as one of many considerations used by the Committee in determining base salary adjustments and target pay opportunities for both annual and long-term incentives. The primary factors considered by the Committee in making its annual pay determinations are shown below.
| Target Pay Determinants | ||
| • Positioning to competitive market median | • Long-term financial and individual performance | • Role and responsibilities relative to benchmark |
| • Competitive mix of fixed and at-risk pay | • Tenure and experience in role | • Internal pay equity |
| • Competitive mix of cash and equity | • Expected future contributions and market conditions | • Prior year’s compensation levels |
As discussed in “– Compensation Philosophy, 2018 Target Pay and 2018 Incentive Plan Payouts – 2018 Target Pay” beginning on page 13, our Chief Executive Officer’s target pay was set by the Committee at the beginning of 2018 to approximate market median, while the target pay of our other named executive officers for 2018 fell, on average, within a competitive range of 85% to 115% of market median.
ELEMENTS OF 2018 TARGET PAY
Base Salary
Base salary serves as the foundation of an executive’s compensation and is an important component in L3’s ability to attract and retain executive talent. The Committee considers each executive’s role and responsibilities, experience, tenure, business results and individual performance, competitive market pay levels, and internal pay equity in making base salary adjustments. In the first quarter of 2018, the Committee increased Mr. Kubasik’s base salary in connection with his promotion to Chief Executive Officer and increased the base salaries of Messrs. Gautier and Miller to bring their pay closer to market median. The Committee further increased Mr. Miller’s pay in August 2018 in connection with his promotion to president of our ISR Systems segment. No base salary changes were made during 2018 for Mr. D’Ambrosio or Ms. Davidson.
2018 Salary(1) (in thousands) | ||||
| Christopher E. Kubasik | $ | 1,200 | ||
| Ralph G. D’Ambrosio | 731 | |||
| Ann D. Davidson | 618 | |||
| Todd W. Gautier | 546 | |||
| Jeffrey A. Miller | 521 | |||
| (1) | Other than with respect to Messrs. Kubasik and Miller, amounts disclosed in the 2018 Salary column represent the 2018 annualized base salary established for each named executive officer by the Committee effective February 24, 2018. Mr. Kubasik’s annualized base salary became effective on January 1, 2018. Mr. Miller’s annualized base salary was initially set at $488,800 effective February 24, 2018 in connection with his then existing role as president of our Sensor Systems segment, and was increased to $565,000 in connection with his promotion to president of our ISR Systems segment effective August 2, 2018. The amounts disclosed in the 2018 Salary column for Mr. Miller reflect his prorated annualized based salary for his service during 2018 in these roles. |
Annual Incentives
The annual incentive plan provides senior executives with the opportunity to earn annual cash incentive awards based on corporate, segment, functional and individual performance relative to pre-established internal targets.
| Award Determination under Annual Incentive Plan |
| • Performance criteria defined at the beginning of the performance period |
| • Performance compared to pre-established goals |
| • For corporate named executive officers, financial performance is based on consolidated EPS, FCF and OSG results |
| • For segment presidents, financial performance is primarily based on the operating income (“OI”) and FCF results for their respective segments, with additional consideration given to consolidated EPS, FCF and OSG results |
| • Functional and individual performance measured based on pre-established goals and assigned specific weightings |
| • Payouts can range from 0% to 200% of target bonus based on performance |
The Committee established the overall design of the annual incentive plan for 2018 in February 2018. The 2018 plan design is similar to the 2017 design, except for the following changes:
| Changes to Annual Incentive Plan Design for 2018 |
| • Consolidated OSG was added as a performance measure for all participants |
| • For all corporate participants other than the CEO and CFO, functional performance was added as a performance measure |
| • The weighting of financial performance in determining overall plan payouts was increased |
| • The maximum payout for segment presidents was reduced to 200%, by eliminating a separate opportunity for an additional 25% payout based solely on segment organic income growth |
The Committee established the 2018 consolidated and segment financial targets under the annual incentive plan in February 2018. The consolidated financial targets were based on management’s most recent consolidated internal financial plan presented to L3’s Board of Directors (the “2018 Plan”), which formed the basis for L3’s financial guidance disclosed to investors in January 2018. The segment financial targets for OI and FCF were based on internal segment financial plans that were consistent with the 2018 Plan.
Based on L3’s actual 2018 financial performance relative to plan and the Committee’s assessment of the named executive officers’ functional and individual performance for 2018, the Committee approved 2018 annual incentive payouts for the named executive officers as detailed in the steps below.
STEP 1. Determine target bonus at beginning of fiscal year
Annual incentive plan (“AIP”) target bonuses are set as a percentage of base salary in connection with the determination of target pay for each named executive officer. For 2018, the Committee increased Mr. Kubasik’s target bonus percentage in connection with his promotion to Chief Executive Officer effective January 1, 2018. The Committee also approved increases in the target bonus percentages for Mr. D’Ambrosio and Ms. Davidson that reflected their strong, long-term individual performance. The 2018 target bonus percentage for each of Messrs. Gautier and Miller was held constant at 2017 levels.
2018 Salary(1) (in thousands) | 2018 AIP Target Bonus (%) | 2018 AIP Target Bonus (in thousands) | ||||||||||
| Christopher E. Kubasik | $ | 1,200 | 130% | $ | 1,560 | |||||||
| Ralph G. D’Ambrosio | 731 | 100% | 731 | |||||||||
| Ann D. Davidson | 618 | 90% | 556 | |||||||||
| Todd W. Gautier | 546 | 100% | 546 | |||||||||
| Jeffrey A. Miller | 521 | 100% | 521 | |||||||||
| (1) | Represents each named executive officer’s annualized base salary that was established as part of their 2018 target pay. For a further discussion, see “– Base Salary” beginning on page 19. |
STEP 2. Determine the financial rating based on performance for the fiscal year
Financial ratings are based on a weighted-average calculation of L3’s consolidated performance (or, for segment presidents, both L3’s and their respective segment’s performance) relative to pre-established targets for key financial measures.
For corporate named executive officers, our annual incentive plan is focused on L3’s consolidated EPS, FCF and OSG performance because we believe that these metrics constitute three of the most important financial measures that create shareholder value.
For segment presidents, our plan emphasizes the respective segment’s OI and FCF performance because we consider those to be important financial measures that segment presidents can directly influence in order to increase L3’s consolidated EPS, FCF and OSG. Our plan also takes into account L3’s consolidated EPS, FCF and OSG results in evaluating segment presidents’ financial ratings in order to align segment presidents’ plan payouts with L3’s overall performance.
The table below provides the relative weightings of these performance measures as utilized in evaluating each named executive officer’s financial rating. We believe that the weightings appropriately reflect the importance of these measures to our overall financial success.
| Corporate Executives | Segment Presidents | ||||||||
| Financial Measure | Weight | Financial Measure | Weight | ||||||
| Consolidated EPS | 60% | Consolidated EPS | 15% | ||||||
| Consolidated FCF | 20% | Consolidated FCF | 5% | ||||||
| Consolidated OSG | 20% | Consolidated OSG | 20% | ||||||
| Segment OI | 45% | ||||||||
| Segment FCF | 15% | ||||||||
| Total | 100% | Total | 100% | ||||||
Pay-for-Performance: A financial rating of 100% indicates weighted-average performance at target levels (that is, at plan). For each of EPS, FCF and OI, performance that exceeds plan by 15% (or by 25% for segment-level measures) results in a maximum financial rating of 200% for that measure, while performance that is below plan by 15% (or by 25% for segment-level measures) results in a threshold financial rating of 50% for that measure. For OSG, performance that exceeds plan by 50% results in a maximum financial rating of 200% for that measure, while performance that is below plan by 50% results in a threshold financial rating of 50% for that measure. If performance on any measure is below threshold, this results in a financial rating of zero for that measure. The financial rating for each measure is interpolated between these points. The combined financial rating is calculated by adding up each measure’s financial rating multiplied by each measure’s respective weight.
| Performance Level | Consolidated EPS & FCF (% of Plan Performance) | Consolidated OSG (% of Plan Performance) | Segment OI & FCF (% of Plan Performance) | Financial Rating | ||||||||||||||||
| Maximum | ≥ 115% | ≥ 150% | ≥ 125% | 200% | ||||||||||||||||
| Target | 100% | 100% | 100% | 100% | ||||||||||||||||
| Threshold | 85% | 50% | 75% | 50% | ||||||||||||||||
| Below Threshold | < 85% | < 50% | < 75% | 0% | ||||||||||||||||
In February 2018, the Committee determined that for purposes of calculating actual financial results under the annual incentive plan, the effects of the following pre-established categories of items are not reflective of operating performance, and should be excluded:
| L3 Consolidated EPS Adjustments | L3 Consolidated FCF Adjustments | L3 Consolidated OSG Adjustments | ||
• Impairment losses on goodwill and other intangible assets, or on debt or equity investments • Gains or losses on retirement of debt, or on asset dispositions that are not contemplated under L3’s 2018 plan • Extraordinary gains and losses under U.S. generally accepted accounting principles (“GAAP”) • Non-cash gains or losses on discontinued operations • New accounting standards required to be adopted under GAAP or SEC rules • Gains or losses on litigation matters at or exceeding $5 million individually or $25 million in the aggregate • Gains or losses related to the resolution of income tax contingencies for business acquisitions that existed at the date of acquisition | • Discretionary contributions to pension plans that exceed the amount forecasted in L3’s plan established in February of the fiscal year • Premiums and other payments in excess of principal and interest associated with the retirement of debt, including income taxes incurred in connection with the debt retirement • Tax payments or benefits associated with gains or losses on business divestitures in determining net cash from operating activities | • New accounting standards required to be adopted under GAAP or SEC rules |
The Committee subsequently determined to also exclude merger and integration expenses incurred in contemplation of the L3 Harris Merger for purposes of calculating consolidated EPS and FCF under the annual incentive plan for 2018.
The segment OI and FCF performance targets are subject to adjustment based on acquisitions or dispositions that occur during the fiscal year, or to account for internal realignments that result in business units being transferred from one segment to another segment during the fiscal year. In addition, the segment OI and FCF results reflect adjustments to account for the impact of non-operational items that were not anticipated at the time the segment performance targets were established; however, we do not make adjustments for program or operational shortfalls.
2018 Financial Performance Achieved Relative to Plan
Our 2018 performance targets under the annual incentive plan for consolidated EPS, FCF and OSG were $9.40, $900 million and 3.5%, respectively. Based on the methodology set forth above, our weighted-average performance for 2018 resulted in a financial rating of 181% for our corporate named executive officers.
As described above, the 2018 financial performance of our segment named executive officers, Messrs. Gautier and Miller, was measured primarily based on the financial results of their respective segments. During the third quarter of 2018, we realigned the scope of the business units that fell within their respective segments (and, in the case of Mr. Miller, renamed his segment as the ISR Systems segment). To account for these changes, the Committee approved new full-year financial performance targets for the realigned segments, which were calculated consistent with our 2018 Plan as if the realignments had occurred at the beginning of 2018, and measured the full-year financial performance of the original and realigned segments as compared to their original and realigned performance targets, respectively. The financial ratings for Messrs. Gautier and Miller were calculated based on the original and realigned performance achievements of the respective segments they led, which were weighted to account for the portions of 2018 during which they were in effect.
Through September 2018, Mr. Gautier was president of the Electronic Systems segment, which had original, full-year performance targets of $436 million for OI and $432 million for FCF. For the remaining part of the year, Mr. Gautier was president of the realigned Electronic Systems segment, which had realigned, full-year performance targets of $354 million for OI and $359 million for FCF. Based on the methodology set forth above, the overall 2018 financial rating for Mr. Gautier, taking into account both the segment financial results and the corporate financial results above, was 133%.
Through July 2018, Mr. Miller was president of the Sensor Systems segment, which had original, full-year performance targets of $211 million for OI and $218 million for FCF. For the remaining part of the year, Mr. Miller was president of the newly created ISR Systems segment, which had realigned, full-year performance targets of $440 million for OI and $354 million for FCF. Based on the methodology set forth above, the overall 2018 financial rating for Mr. Miller, taking into account both the segment financial results and the corporate financial results above, was 162%.
STEP 3. Determine personal and functional ratings
Personal ratings are based on the assessment of an executive’s performance relative to pre-determined individual goals. The personal rating can range from 0% to 200% of target. For 2018, the Chief Executive Officer provided individual performance assessments and recommended personal ratings for the Committee’s consideration for the other named executive officers based on the factors in the table below. The Chief Executive Officer also submitted a self-assessment addressing his factors listed below, but made no recommendation to the Committee as to his own personal rating. For 2018, each of our named executive officers received a personal rating that was above target (that is, above 100%).
Christopher E. Kubasik (Chairman, Chief Executive Officer and President) | Ralph G. D’Ambrosio (Senior Vice President and Chief Financial Officer) | Ann D. Davidson (Senior Vice President and Chief Legal Officer) | Todd W. Gautier (Senior Vice President and President of Electronic Systems Segment) | Jeffrey A. Miller (Senior Vice President and President of ISR Systems Segment) |
• Leadership • Strategic planning • External relations • Communication / branding • Optimize operations • Internal collaboration • Talent management • Financial performance • Risk management • Board relations / corporate governance | • Financial reporting and forecasting • Management of capital structure and liquidity • Internal controls over financial reporting • Enterprise risk management • Company-wide cost savings • Tax planning and strategies • Expand scope of company-wide shared services • Talent management | • Strategic advice on legal, regulatory and transactional matters • Legal risk management • Corporate and organizational governance • Contract management and regulatory compliance • Oversight of ethics and business conduct program • Legal and compliance-related cost savings | • Winning re- competitions and new business • Program performance • Optimize operations / cost savings • Developing adjacent markets / international expansion • Internal collaboration • Talent management • Identify acquisition targets and integrate acquired businesses • Continuous process improvements | • Winning re- competitions and new business • Program performance • Optimize operations / cost savings • Developing adjacent markets / international expansion • Internal collaboration • Talent management • Identify acquisition targets and integrate acquired businesses • Continuous process improvements |
Ms. Davidson also received a functional rating based on the performance of the Company’s legal function relative to pre-determined functional goals, including with respect to talent management, internal reporting, collaboration initiatives, cost savings and efficiency initiatives, strategic advice, leadership, corporate governance, executive compensation, ethics and compliance, contracts and program management and law department operations. The functional rating can range from 0% to 200% of target. For 2018, the Chief Executive Officer assessed the performance of the Company’s legal function and recommended a functional rating for the Committee’s consideration based on this assessment. Following this assessment, Ms. Davidson received a functional rating that was above target (that is, above 100%).
STEP 4. Determine total rating
Each executive’s total rating determines the potential payout under the annual incentive plan and is equal to the weight- adjusted sum of the financial and individual ratings.
| Corporate Executives | Segment Presidents | |||||||||||
CEO and CFO (weight) | Chief Legal Officer (weight) | (weight) | ||||||||||
| Financial Rating | 80% | 60% | 80% | |||||||||
| Functional Rating | — | 20% | — | |||||||||
| Personal Rating | 20% | 20% | 20% | |||||||||
| Total Rating | 100% | 100% | 100% | |||||||||
Annual Incentive Plan Payout Formula | Total Rating = [Financial Rating x Weight] + [Functional Rating x Weight] + [Personal Rating x Weight] Potential Annual Incentive Plan Payout ($) = Target Bonus ($) x Total Rating |
STEP 5. Discretionary adjustment
Notwithstanding the performance criteria described above, the Committee has the authority to apply negative discretion to reduce awards that would otherwise be considered “earned” based on the formulaic plan design. For 2018, management and the Committee believed that the calculated payouts under the annual incentive plan did not sufficiently reflect all aspects of the Company’s financial performance for 2018, including the fact that our 2018 segment operating margin fell below management’s internal objectives. Therefore, prior to the Committee’s determination of the awards to be approved under the annual incentive plan for the named executive officers, Mr. Kubasik recommended and the Committee agreed that calculated payouts for Messrs. Kubasik and D’Ambrosio should be reduced by approximately 10% and for our other named executive officers by approximately 5%.
2018 Annual Incentive Plan Payouts. The table below lists the final 2018 annual incentive plan payments to the named executive officers that were approved by the Committee.
| 2018 Annual Incentive Plan Payouts | ||||||||||||||||||||
2018 AIP Target | Total Rating | Formulaic Payout | Discretionary Adjustment | 2018 AIP Payout | ||||||||||||||||
| Named Executive Officer | [Step 1] | [Steps 2-4] | [Subtotal] | [Step 5] | [Total] | |||||||||||||||
| Christopher E. Kubasik | $ | 1,560,000 | 185% | $ | 2,882,880 | $ | (287,880 | ) | $ | 2,595,000 | ||||||||||
| Ralph G. D’Ambrosio | 730,500 | 182% | 1,328,049 | (133,049 | ) | 1,195,000 | ||||||||||||||
| Ann D. Davidson | 556,200 | 183% | 1,015,621 | (50,621 | ) | 965,000 | ||||||||||||||
| Todd W. Gautier | 546,300 | 135% | 739,690 | (36,690 | ) | 703,000 | ||||||||||||||
| Jeffrey A. Miller | 520,550 | 165% | 857,787 | (42,787 | ) | 815,000 | ||||||||||||||
Long-Term Incentives
Long-term incentives are intended to align the interests of the named executive officers with shareholders by linking a meaningful portion of executive pay to shareholder value creation over a multi-year period. Long-term incentives are also provided to drive the performance of our long-term business strategy, engage and retain our key executives and facilitate ownership of our Common Stock. The table below details the long-term incentive vehicles granted to our named executive officers in February 2018 as part of their 2018 target pay, and the respective weights of these vehicles as a percentage of the total grant date target value of the long-term incentives awarded. Except for Ms. Davidson, who received 100% of her long-term incentive award in RSUs, the forms and weightings of the long-term incentives awarded to the named executive officers as part of their 2018 target pay are substantially identical to those awarded in 2017.
| Long-term Incentive | Weight(1) | Rationale | Performance Criteria & Other Features | |||
| Stock Options | 30% | • Stock price appreciation | • Ultimate value dependent on stock price appreciation | |||
| • Stock ownership and capital accumulation | • Vest in equal annual increments over three years with a 10-year term | |||||
| • Exercise price equal to the closing price of our Common Stock on the date of grant | ||||||
| • Grants to the Chief Executive Officer include additional performance vesting conditions as described below under “Stock Options” | ||||||
| RSUs | 30% | • Retention | • Ultimate value dependent on stock price | |||
| • Stock ownership and capital accumulation | • Vest at the end of three years | |||||
| Performance Awards | 40% | • Stock price appreciation | • 50% Performance Cash Awards: vest at the end of a three-year period based on TSR relative to performance peer group and are paid in cash | |||
| • Stock ownership and capital accumulation for performance units | • 50% Performance Units: vest at the end of a three-year period based on EPS performance and are paid in shares of Common Stock (together with accrued cash dividends on shares of Common Stock earned) | |||||
| • Motivates achievement of long- term business strategy | • The actual percentages of the awards that vest range from 0 to 200% of target, based on performance | |||||
| (1) | Ms. Davidson received 100% of her 2018 long-term incentive awards in the form of RSUs. |
For purposes of allocating the total grant date target value of long-term incentives approved by the Committee in accordance with the weightings listed above, stock options are valued based on their grant date fair value for financial reporting purposes, RSUs are valued based on the total number of units awarded multiplied by the closing price of our Common Stock on the grant date, performance cash awards are valued based on the target dollar value at the time the award is made, and performance units are valued based on the target number of units awarded multiplied by the closing price of our Common Stock on the grant date.
2018 Grant Date Target Values for Long-Term Incentive Awards. In connection with determining the total grant date target value of the long-term incentives awarded to each named executive officer as part of their 2018 target pay, the Committee primarily considered the following factors:
| • | Competitive market median pay levels in the context of target pay as described in the section “Use of Market Data and Competitive Compensation Positioning” beginning on page 18; |
| • | The scope of responsibility of the named executive officer relative to the other participants in the long-term incentive program and the relative importance of the named executive officer to the Company’s long term success; |
| • | In the case of the named executive officers other than Mr. Kubasik, the long-term incentive award recommendation of Mr. Kubasik; and |
| • | The grant date target value of the prior year’s long-term incentive awards and the long-term performance of the named executive officer. |
2018 Grant Date Target Value(1) (in thousands) | ||||
| Christopher E. Kubasik | $ | 9,600 | ||
| Ralph G. D’Ambrosio | 2,700 | |||
| Ann D. Davidson | 1,000 | |||
| Todd W. Gautier | 1,300 | |||
| Jeffrey A. Miller | 1,000 | |||
| (1) | The amounts disclosed exclude the value of long-term incentives granted to Messrs. Kubasik and Miller in December 2018, in lieu of being granted in February 2019 as part of their 2019 target pay, to mitigate potential excise taxes that may be applicable under Section 280G of the Internal Revenue Code in connection with the L3 Harris Merger. For a further discussion, see “– Summary of 2019 Target Pay” beginning on page 29. |
Stock Options. Stock options are a regular component of our long-term incentive program. Stock options directly align the long-term interests of our executives with those of shareholders because they provide value only if the price of our Common Stock increases after the options are granted. Stock options are granted with an exercise price equal to the closing price of our Common Stock on the date of grant, generally vest in equal annual increments over a three-year period and expire ten years from the grant date.
Consistent with prior years, the Committee continued to include performance-based vesting conditions on the stock options granted to our Chief Executive Officer in 2018 in order to strengthen the performance-based orientation of our executive compensation programs. As a result,
| • | 50% of these stock options would vest only if L3’s consolidated EPS for the fiscal year ended December 31, 2018 is at least $7.99; and |
| • | 50% of these stock options would vest only if L3’s consolidated FCF for the fiscal year ended December 31, 2018 is at least $765 million. |
In the event that one or both of the performance conditions were not satisfied, the stock options that failed to vest would be forfeited.
Consistent with the terms of last year’s CEO stock option grant, the performance-based vesting requirements for EPS and FCF under the CEO stock options granted in 2018 represent a 15% reduction from the 2018 consolidated financial targets for these measures established by the Committee in February 2018 under the annual incentive plan.
For purposes of evaluating whether the performance conditions have been satisfied, L3’s consolidated EPS and FCF results for 2018 are required to be calculated on the same basis as the methodology established by the Committee in February 2018 used to determine performance for these measures under L3’s annual incentive plan. In February 2019, the Committee determined that both the EPS and FCF performance conditions of the stock options granted to Mr. Kubasik in 2018 were satisfied.
Performance Awards. The performance awards granted by the Committee in 2018 were equally weighted between performance cash awards earned on the basis of relative TSR and performance units earned on the basis of cumulative EPS results, in each case for the three-year period ending December 31, 2020. The payout ultimately earned can range from zero to 200% of the target amount of cash or stock, in each case based on actual performance relative to the pre-determined goals. The Committee chose relative TSR and cumulative EPS because it believes that they are aligned with shareholder value creation, both directly (relative TSR) and indirectly (EPS).
Performance Cash Awards: Relative TSR (50% weighting; denominated and paid in cash) | Performance Units: EPS (50% weighting; denominated and paid in stock) | ||||||
| Level | Relative TSR | Payout* | Level | EPS | Payout* | ||
| Maximum | ≥ 75th Percentile | 200% | Maximum | ≥ $33.28 | 200% | ||
| Target | 50th Percentile | 100% | $31.76 | 150% | |||
| Threshold | 25th Percentile | 25% | Target | $30.25 | 100% | ||
| Below Threshold | < 25th Percentile | 0% | $28.74 | 75% | |||
| Threshold | $27.23 | 50% | |||||
| Below Threshold | < $27.23 | 0% | |||||
*Interim points are interpolated. | *Interim points are interpolated. | ||||||
While the Committee has elected to use EPS as a performance measure for both the annual incentive plan and the long-term performance awards, the performance requirements under these plans are designed so that the resulting payouts under the plans reflect different and important aspects of Company performance that are not duplicative. Payouts under the annual incentive plan take into account EPS performance for a single fiscal year, while payouts under the long-term performance awards require EPS performance to be sustained and measured over a three-year period. The Committee believes it is appropriate to separately reward annual and long-term EPS performance achievements because of the importance of EPS in creating shareholder value.
The target performance goal set by the Committee for the 2018 EPS-based performance unit awards reflects a three-year forecast presented by management to the Committee in February 2018. The Committee set the threshold and maximum EPS performance goals under the 2018 performance unit awards based on a range of ±10% of the target three-year goal, which was consistent with the performance range used for the 2017 EPS-based performance awards.
For purposes of calculating actual financial results for the performance unit awards, EPS is required to be calculated on the same basis as the methodology established by the Committee in February 2018 used to determine EPS performance under L3’s annual incentive plan.
Relative Benchmark for the TSR-Based Performance Awards. The Company’s relative TSR performance for its long-term performance awards is assessed over a three-year period using a custom peer group (the “performance peer group”) of companies with a sales mix that is heavily weighted towards sales to the DoD and the defense industry, and which include the primary U.S. public company competitors for each of L3’s reporting segments. For the 2018 awards, the Committee elected to add six companies to the performance peer group that were not included in the performance peer group utilized for the 2017 awards in order to ensure that an appropriate sample size of peer companies remained following pending consolidations among them. The companies included in the 2018 performance peer group at the time of grant are listed below.
| Performance Peer Group | ||
| Aerojet Rocketdyne Holdings, Inc.* | FLIR Systems, Inc. | Northrop Grumman Corporation |
| BAE Systems | General Dynamics Corporation | Orbital ATK, Inc. |
| BWX Technologies, Inc.* | Harris Corporation | Raytheon Company |
| CAE Inc.* | Huntington Ingalls Industries, Inc. | Rockwell Collins, Inc. |
| Cubic Corporation | Leidos Holdings, Inc.* | Teledyne Technologies Inc. |
| Curtiss-Wright Corporation* | Lockheed Martin Corporation | Textron Inc. |
| Esterline Technologies Corporation | Moog Inc.* |
| * | Added to the performance peer group for 2018 |
RSUs. RSUs are a regular component of our long-term incentive program. The Committee believes that RSUs enhance retention of L3’s senior executives. The Committee may also make these awards to recognize increased responsibilities or special contributions, attract new executives, retain executives or recognize other special circumstances. RSU grants generally have the following characteristics:
| • | automatically convert into shares of our Common Stock on the vesting date; |
| • | vest three years from the grant date; and |
| • | accumulate cash dividend equivalents payable in a lump sum contingent upon vesting. |
PAYMENT OF PERFORMANCE AWARDS FOR THE 2016-2018 AWARD CYCLE
In February 2019, the Committee reviewed and certified the results for the performance awards granted to named executive officers in 2016. Payouts under the 2016 performance awards were contingent upon L3’s cumulative EPS and relative TSR achievements over the three-year performance period ending December 31, 2018. The Company’s cumulative EPS achievement exceeded the maximum EPS performance target, and, as a result, the named executive officers earned 200% of the target number of EPS-based performance units originally awarded in 2016 (which were settled in shares of our Common Stock). With respect to the performance cash awards based on relative TSR performance, L3’s TSR was at the 75th percentile of the peer group used to measure our performance under these awards, and, as a result, 200% of the target dollar value originally awarded in 2016 was earned with respect to these awards.
SATISFACTION OF PERFORMANCE-BASED VESTING CONDITIONS FOR 2017 RSU AWARDS
On December 20, 2017, the Committee awarded special, one-time grants of RSUs to Mr. Kubasik and Ms. Davidson which were subject to partial or complete forfeiture if the respective grant date fair values of the RSUs awarded to them on that date exceeded 1.0% (in the case of Mr. Kubasik) or 0.5% (in the case of Ms. Davidson) of our 2018 FCF, calculated on the same basis as the methodology established by the Committee in February 2018 to determine FCF performance under L3’s annual incentive plan. In February 2019, in the Committee reviewed and certified that our 2018 FCF performance was sufficient to avoid any forfeiture of these awards.
SUMMARY OF 2019 TARGET PAY
For 2019, the Committee made the following changes to the target pay levels of our named executive officers:
| • | base salary increases of 3% for each named executive officer other than Mr. Miller (who received a base salary increase effective August 2, 2018 in connection with his prior promotion to president of our ISR Systems segment); |
| • | a market-based increase in the target value of long-term incentives for Mr. Kubasik; |
| • | an increase in the target value of long-term incentives for Mr. Miller in connection with his prior promotion to president of our ISR Systems segment. |
Following these pay adjustments, the 2019 target pay of our named executive officers as detailed below fell, on average, within a competitive range of 85% to 115% of market median.
Salary(1) | Target Bonus as % of Salary | Target Value of Long-Term Incentives(2) | Target Pay | ||||||||||||
| Christopher E. Kubasik | $ | 1,236,000 | 130% | $ | 10,000,000 | $ | 12,842,800 | ||||||||
| Ralph G. D’Ambrosio | 752,415 | 100% | 2,700,000 | 4,204,830 | |||||||||||
| Ann D. Davidson | 636,540 | 90% | 1,000,000 | 2,209,426 | |||||||||||
| Todd W. Gautier | 562,689 | 100% | 1,300,000 | 2,425,378 | |||||||||||
| Jeffrey A. Miller | 565,000 | 100% | 1,300,000 | 2,430,000 | |||||||||||
| (1) | Amounts disclosed in this column represent the annualized base salary established for each named executive officer by the Committee effective February 23, 2019. |
| (2) | The amounts disclosed in this column include the value of long-term incentives granted to Messrs. Kubasik and Miller in December 2018 as further described below. |
The long-term incentives awarded to Messrs. D’Ambrosio and Gautier and Ms. Davidson as part of their 2019 target pay were granted in February 2019 and were entirely in the form of RSUs. The long-term incentives awarded to Messrs. Kubasik and Miller as part of their 2019 target pay were granted in December 2018, instead of February 2019, in order to mitigate potential excise taxes that may be applicable under Section 280G of the Internal Revenue Code in connection with the L3 Harris Merger. As a result, these awards are reflected in the “Summary Compensation Table” beginning on page 36 as part of the stock awards granted to Messrs. Kubasik and Miller in 2018. The December 2018 grants were made entirely in the form of restricted stock awards (“RSAs”) under which Messrs. Kubasik and Miller were required to make elections under Section 83(b) of the Internal Revenue Code to be taxed on the value of such awards in 2018. The taxes payable by Messrs. Kubasik and Miller in connection with their Section 83(b) elections were satisfied through withholding from the shares subject to their awards.
The long-term incentive awards granted to the named executive officers in December 2018 and February 2019 have terms and conditions that are similar to the terms and conditions of the RSUs previously granted to them as part of their 2018 target pay, except that they are subject to “double trigger” vesting in the event of a change in control of the Company. Accordingly, a change in control of the Company as a result of the L3 Harris Merger or otherwise would not result in accelerated vesting for these awards unless a qualified termination of the named executive officer’s employment occurs within two years following the change in control.
EXECUTIVE BENEFITS AND PERQUISITES
Retirement Plans. L3 provides retirement benefits as part of a competitive compensation package to retain key employees. Messrs. D’Ambrosio and Gautier participate in the L3 Technologies, Inc. Pension Plan (the “Corporate Pension Plan”) and the L3 Link Simulation and Training Retirement Plan (the “Link Pension Plan”), respectively, each of which is a tax-qualified defined benefit plan. Messrs. D’Ambrosio and Gautier also participate in a nonqualified supplemental executive retirement plan (the “SERP”) that restores benefits that are not accrued under the defined benefit plans in which they participate due to limits imposed by the Internal Revenue Code. Messrs. Kubasik and Miller and Ms. Davidson do not participate in any of our defined benefit plans, which were generally closed to new participants hired on or after January 1, 2007. See “2018 Pension Benefits” beginning on page 45 for additional details.
The amounts relating to our defined benefit plans that are reported in the Summary Compensation Table on page 36 under the heading “Change in Pension Value and Nonqualified Deferred Compensation Earnings” are substantially affected by changes in actuarial assumptions made since 2015 that are required under GAAP, and are not the result of any arrangements entered into between the Company and any named executive officer that modify any of our pension plans or enhance any benefits accrued or to be accrued thereunder. For a further discussion of the actuarial assumptions upon which the values reported for 2018 are based, see Note 20 to our audited consolidated financial statements included in the Initial Form 10-K.
It is the Committee’s practice to periodically review the plan design and benefit levels of our retirement plans to ensure that they are consistent with the pay practices of our compensation peer group. The Committee most recently performed this review in 2017. Subsequent to this review, the Company determined to reduce future benefit accruals under substantially all of its salaried defined benefit plans, including the Corporate Pension Plan, the Link Pension Plan and the related portions of the SERP, effective January 1, 2019.
Deferred Compensation Plans. L3 sponsors two nonqualified deferred compensation plans, the L3 Technologies, Inc. Deferred Compensation Plan II (the “DCP II”) and the L3 Technologies, Inc. Supplemental Savings Plan II (the “SSP II”), for a select group of highly compensated executives, including our named executive officers, as a competitive practice.
The DCP II allows for voluntary deferrals by executives, including the named executive officers, of up to 50% of base salary and 100% of annual incentive payouts into an unfunded, nonqualified account. There are no company contributions under this plan, and deferred amounts earn interest at the prime rate.
The SSP II allows for voluntary deferrals by executives, including the named executive officers, of up to 10% of the portion of the executive’s eligible compensation (generally, base salary and annual incentive payouts) that exceeds certain Internal Revenue Code limits into an unfunded, nonqualified account. The Company matches up to the first 4% of eligible compensation that was contributed by a participant during the prior calendar year and makes supplemental contributions of 1% of eligible compensation for participants who do not participate in any defined benefit plan maintained by the Company. Earnings on amounts credited to a participant’s SSP II account are based on participant elections among investment choices, which generally mirror those available to participants in the L3 Technologies Master Savings Plan, which is our tax-qualified, 401(k) defined contribution plan.
Employment, Severance and Change in Control Arrangements. Except as described in “2017 Offer Letter with Christopher E. Kubasik” below and “2018 Letter Agreement with Christopher E. Kubasik” on page 32, L3 does not have any employment agreements with its named executive officers. L3’s named executive officers are covered under both the L3 Technologies, Inc. Executive Severance Plan (the “Executive Severance Plan”), which provides for specified severance benefits in the event of termination by the Company without cause outside of a change of control, and the L3 Technologies, Inc. Change in Control Severance Plan (the “Change in Control Severance Plan”), which provides for specified severance benefits in the event of termination by the Company without cause or by the employee for good reason following a change of control. The purpose of these arrangements is to preserve morale and productivity and encourage retention. Severance benefits under the Executive Severance Plan and the Change in Control Severance Plan are designed to be market competitive and do not provide tax gross-ups. See “Potential Payments Upon Change in Control or Termination of Employment” beginning on page 49 for additional details.
Perquisites. L3 provides the named executive officers with modest perquisites consistent with competitive practices. In 2018, the named executive officers were eligible for an annual executive physical, financial planning services, supplemental life insurance and participation in our executive medical plan. We also provide our Chief Executive Officer with a car and security driver and access to L3’s fractionally-owned aircraft for occasional personal use. Our corporate aircraft policy requires that our Chief Executive Officer reimburse the Company for the incremental costs incurred in connection with his personal use of the aircraft. We also maintain a key employee relocation policy applicable to management employees generally. While Mr. Kubasik completed the relocation of his personal residence to New York in 2017, the final reimbursement to Mr. Kubasik under this policy was made in 2018. For a further discussion, see Note 6 to the “Summary Compensation Table” beginning on page 36.
2017 OFFER LETTER WITH CHRISTOPHER E. KUBASIK
On October 31, 2017, the Company entered into an offer letter with Mr. Kubasik in respect of his pending promotion to Chief Executive Officer effective January 1, 2018. The offer letter provides that Mr. Kubasik’s 2018 target pay would be $12.36 million effective January 1, 2018, composed of an annual base salary of $1.2 million, a target bonus opportunity of 130% of base salary and long-term incentive compensation having a grant date value of $9.6 million.
2018 LETTER AGREEMENT WITH CHRISTOPHER E. KUBASIK
In connection with the execution of the L3 Harris Merger Agreement, the Company entered into a letter agreement with Mr. Kubasik (the “Letter Agreement”) to confirm the terms of the changes to his roles and compensation arrangements in anticipation of, in connection with, and following the contemplated L3 Harris Merger. The Letter Agreement provides that from the closing of the L3 Harris Merger, Mr. Kubasik will serve as the Vice-Chairman, President and Chief Operating Officer of the combined company through the second anniversary of the closing of the L3 Harris Merger or, if earlier, until William M. Brown ceases to serve as the Chief Executive Officer of the combined company, at which point Mr. Kubasik will become the Chief Executive Officer of the combined company. On the third anniversary of the closing of the L3 Harris Merger, Mr. Kubasik will become Chairman of the combined company. Beginning at the closing of the L3 Harris Merger, Mr. Kubasik’s annual target pay would be $14.2 million, composed of an annual base salary of $1.45 million, a target bonus opportunity of $2.5 million and long-term incentive compensation having a grant date value of $10.25 million. Prior to the closing of the L3 Harris Merger, the elements of Mr. Kubasik’s annual target pay may not exceed the levels set forth in the preceding sentence. In all cases, the compensation elements provided to Mr. Kubasik following the closing of the L3 Harris Merger will be no less than the corresponding amounts provided to Mr. Brown. After the closing of the L3 Harris Merger, Mr. Kubasik will also receive a one-time integration award of performance stock units and performance-based stock options with grant date fair values of $2.5 million and $5 million, respectively. Mr. Kubasik will also receive up to $1.25 million for relocation-related expenses, with a tax gross-up of any amounts taxed as ordinary income. The protection period under which Mr. Kubasik will be covered by L3’s Change in Control Severance Plan will be extended until the fourth anniversary after the closing of the L3 Harris Merger, and the definitions of “cause” and “good reason” applicable to Mr. Kubasik thereunder will be modified in certain respects. In the event Mr. Kubasik is terminated following the L3 Harris Merger without “cause” or he terminates his employment for “good reason” (under the modified definitions referred to in the prior sentence), his then outstanding long-term incentive awards (including the one-time integration awards referred to above) will be subject to accelerated vesting and/or remain outstanding and eligible for further vesting in whole or in part. The description of the material terms of Mr. Kubasik’s Letter Agreement set forth above is qualified in its entirety by the description of such terms included in our Form 8-K filed with the SEC on October 15, 2018, which is hereby incorporated by reference.
STOCK OWNERSHIP GUIDELINES AND RETENTION REQUIREMENTS
L3’s stock ownership guidelines reflect the Committee’s belief that executives should accumulate a meaningful level of ownership in Company stock to align their interests with those of our shareholders. The Chief Executive Officer’s ownership guideline is equivalent in value to six times his base salary. Ownership guidelines for senior executives, other than the Chief Executive Officer, range from one and a half to three times base salary depending on roles and organizational levels. The Committee reviews progress toward guideline achievement annually. Each executive subject to stock ownership guidelines is required to retain 50% of net shares (after payment of fees, taxes and exercise prices, if applicable) acquired upon the vesting of stock awards or the exercise of stock options until the guideline multiple of base salary is met.
The stock ownership of our named executive officers as of December 31, 2018, as compared to our guideline and retention requirements is as follows:
Stock Guideline (multiple of salary) | Stock Ownership (in dollars) | Stock Ownership (multiple of salary) | Subject to Retention Ratio | ||||||||||
| Christopher E. Kubasik | 6.0 | $ | 10,311,983 | 8.6 | No | ||||||||
| Ralph G. D’Ambrosio | 3.0 | 9,791,089 | 13.4 | No | |||||||||
Ann D. Davidson(1) | 3.0 | 1,558,217 | 2.5 | Yes | |||||||||
Todd W. Gautier(1) | 3.0 | 1,401,439 | 2.6 | Yes | |||||||||
| Jeffrey A. Miller | 3.0 | 2,014,110 | 3.6 | No | |||||||||
| (1) | Ms. Davidson and Mr. Gautier achieved stock ownership in excess of their respective guidelines in February 2019. |
“Stock ownership” is defined to include shares of Common Stock held outright, shares and share equivalents held in benefit plans, and unvested RSUs and RSAs. Unvested performance units and unexercised stock options are not included in this calculation.
COMPENSATION CLAWBACK POLICY
Under L3’s clawback policy, the Company may recoup and/or cancel any incentive-based compensation, including equity- based compensation, awarded to executives who are subject to the policy, under the following circumstances:
| • | The award was predicated upon the achievement of financial results that were subsequently the subject of a material restatement of L3’s financial statements; |
| • | The executive’s fraud or willful misconduct was a significant contributing cause to the need for the restatement; and |
| • | A smaller award would have been earned under the restated financial results. |
Subject to the discretion and approval of the Board of Directors, the Company will, to the extent permitted by law, seek to recover the amount of incentive compensation paid or payable to the executive in excess of the amount that would have been paid based on the financial restatement.
ANTI-HEDGING AND ANTI-PLEDGING POLICIES
Our policies prohibit the hedging or pledging of our Common Stock by all executives, employees and non-employee directors.
COMPENSATION RISK ASSESSMENT
The Committee reviews and discusses with management, on at least an annual basis, management’s assessment of whether risks arising from the Company’s compensation policies and practices for all employees, including executive officers, are reasonably likely to have a material adverse effect on the Company. As part of the 2018 assessment performed by L3, the following were determined on a collective basis for L3 and its subsidiaries:
| • | no business unit carries a significant portion of the Company’s risk profile; |
| • | the Company’s compensation policies and practices are not structured differently from one business unit to another in any material respect; |
| • | incentive compensation expense is not a significant percentage of the Company’s sales; |
| • | the Company’s compensation programs do not vary significantly from the overall risk and reward structure of the Company; |
| • | the Company’s long-term incentive awards are intended to align the interests of the Company’s executives and key employees with those of shareholders by linking a meaningful portion of their compensation to value creation over a multi-year period (and, with respect to senior executives, by utilizing overlapping performance periods and multiple performance measures such as relative TSR and cumulative EPS) to promote sustainable, long-term performance; |
| • | the Company’s annual incentive awards, capped at 200% of target for executive officers, are based upon a variety of financial and nonfinancial performance measures, which, in the Company’s view, reward performance without incentivizing inappropriate risk-taking; and |
| • | the Company has policies and procedures that require material compensation programs adopted at the subsidiary and business unit level to be reviewed and approved by senior corporate management to, among other things, ensure that none of the Company’s or its subsidiaries’ compensation programs encourage inappropriate risk-taking. |
The Committee has also adopted stock ownership guidelines for our senior executives, including our named executive officers, which are intended to align their long-term interests with those of our shareholders and to encourage a long-term focus in managing the Company. For a further discussion, see “Stock Ownership Guidelines and Retention Requirements” on page 32.
TAX CONSIDERATIONS
Section 162(m) of the Internal Revenue Code generally limits tax deductibility of compensation paid by a public company to its chief executive officer and certain other highly compensated executive officers to $1 million in the year compensation becomes taxable to the executive, subject historically to an exception for performance-based compensation that meets specified requirements. The Committee considers the impact of this rule when developing and implementing its executive compensation programs; however, the Committee expects to provide compensation that is not tax deductible when it believes the value in doing so outweighs the value of the lost tax deduction. The 2017 Tax Reform Law generally eliminated the performance-based compensation exception under Section 162(m) for tax years beginning after December 31, 2017, other than with respect to payments made pursuant to certain “grandfathered” arrangements that were in effect on or before November 2, 2017. The Tax Act also expanded the definition of “covered employee” to include a company’s chief financial officer and certain individuals who were covered employees in years other than the then-current taxable year. In light of these changes from the Tax Act, the Committee anticipates that a larger portion of future compensation paid to our named executive officers will be subject to a tax deduction disallowance under Section 162(m).
EQUITY GRANT TIMING
We do not time the grant of equity awards, including stock options, to precede the release of non-public information. The Committee makes grants on an annual basis at a scheduled meeting in February, and may also approve the grant of long-term incentive awards in connection with or following new hires, promotions or under certain other limited circumstances, including those described in “Summary of 2019 Target Pay” beginning on page 29. Under the terms of the Company’s long-term equity incentive plan, the exercise price of each stock option granted is equal to the fair market value of the underlying Common Stock on the date of grant. The Committee does not grant discounted stock options, and the Company’s long-term equity incentive plan does not permit stock option repricing without shareholder approval.
RECONCILIATION OF NON-GAAP MEASURES TO GAAP MEASURES
Our EPS from continuing operations for the year ended December 31, 2018 included the following items (the “2018 Items”): (1) debt retirement charges of $69 million ($52 million after income taxes, or $0.66 per diluted share), (2) merger and acquisition-related expenses of $28 million ($23 million after income taxes, or $0.28 per diluted share) and (3) a gain on business divestitures of $42 million ($19 million after income taxes, or $0.24 per diluted share) relating to the 2018 divestitures of the Crestview and TCS businesses. The Company believes that excluding the 2018 Items from EPS from continuing operations will allow shareholders to more easily compare the Company’s results from period to period.
The following table provides a reconciliation of EPS from continuing operations to EPS from continuing operations, excluding the 2018 Items, for the year ended December 31, 2018:
For the year ended December 31, (per share amounts) | 2018 | 2017 | ||||||
| Diluted earnings per share | $ | 10.05 | $ | 9.46 | ||||
| 2018 Items | 0.70 | — | ||||||
| Diluted earnings per share excluding 2018 Items | $ | 10.75 | $ | 9.46 | ||||
Free cash flow is defined as net cash from operating activities from continuing operations, less net capital expenditures (capital expenditures less cash proceeds from dispositions of property, plant and equipment), plus tax and transaction payments related to divestitures (Vertex, Crestview & TCS businesses) and merger and acquisition-related payments. The company believes free cash flow is a useful measure for investors because it portrays the company's ability to generate cash from operations for purposes such as repaying debt, returning cash to shareholders and funding acquisitions. The company also uses free cash flow as a performance measure in evaluating management.
The following table provides a reconciliation of net cash from operating activities from continuing operations to free cash flow for the year ended December 31, 2018:
For the year ended December 31, ($ in millions) | 2018 | 2017 | ||||||
| Net cash from operating activities from continuing operations | $ | 1,042 | $ | 985 | ||||
| Less: Capital expenditures | (232 | ) | (224 | ) | ||||
| Plus: Disposition of property, plant and equipment | 3 | 74 | ||||||
| Plus: Tax and transaction payments related to divestitures | 96 | 27 | ||||||
| Plus: Merger and acquisition-related payments | 26 | — | ||||||
| Free cash flow | $ | 935 | $ | 834 | ||||
REPORT OF THE COMPENSATION COMMITTEE
The Compensation Committee has reviewed and discussed the Compensation Discussion and Analysis with management. Based on its review and discussion with management, the Compensation Committee recommended to L3’s Board of Directors that the Compensation Discussion and Analysis be included in L3’s Annual Report on Form 10-K for the fiscal year ended December 31, 2018.
During 2018, Robert B. Millard (Chairman), Thomas A. Corcoran, Lewis Kramer and Lloyd W. Newton served as members of the Compensation Committee.
| Robert B. Millard (Chairman) | ||
| Thomas A. Corcoran | ||
| Lewis Kramer | ||
| Lloyd W. Newton |
TABULAR EXECUTIVE COMPENSATION DISCLOSURE
Summary Compensation Table
The following table provides summary information concerning compensation paid or accrued by us to or on behalf of our Chairman, Chief Executive Officer and President, our Senior Vice President and Chief Financial Officer, and each of our three other most highly compensated executive officers serving at our 2018 fiscal year-end. These officers are collectively referred to as the named executive officers.
Name and Principal Position | Year | Salary ($) | Stock Awards(1)(2) ($) | Option Awards(3) ($) | Non-Equity Incentive Plan Compensation(4) ($) | Change in Pension Value and Nonqualified Deferred Compensation Earnings(5) ($) | All Other Compensation(6) ($) | Total(2) ($) | ||||||||||||||||||||||
Christopher E. Kubasik (Chairman, Chief Executive Officer and President) | 2018 | 1,189,808 | 14,800,073 | 2,880,002 | 6,435,000 | — | 206,550 | 25,511,433 | ||||||||||||||||||||||
| 2017 | 927,068 | 3,199,868 | 3,999,995 | 1,589,500 | — | 1,228,184 | 10,944,615 | |||||||||||||||||||||||
| 2016 | 905,365 | 1,600,074 | 959,999 | 1,400,000 | — | 232,509 | 5,097,947 | |||||||||||||||||||||||
Ralph G. D’Ambrosio (Senior Vice President and Chief Financial Officer) | 2018 | 730,500 | 1,349,850 | 810,016 | 2,275,000 | 30,901 | 37,607 | 5,233,874 | ||||||||||||||||||||||
| 2017 | 724,297 | 1,350,062 | 809,998 | 1,411,700 | 1,206,509 | 40,572 | 5,543,138 | |||||||||||||||||||||||
| 2016 | 705,015 | 1,312,479 | 787,501 | 960,000 | 458,378 | 34,372 | 4,257,745 | |||||||||||||||||||||||
Ann D. Davidson (Senior Vice President and Chief Legal Officer) (7) | 2018 | 618,000 | 1,000,045 | — | 965,000 | — | 42,676 | 2,625,721 | ||||||||||||||||||||||
| 2017 | 612,807 | 650,057 | 239,988 | 850,400 | — | 187,697 | 2,540,949 | |||||||||||||||||||||||
Todd W. Gautier (Senior Vice President and President of Electronic Systems Segment) (8) | 2018 | 532,587 | 650,029 | 390,001 | 1,223,000 | 313,510 | 61,657 | 3,170,784 | ||||||||||||||||||||||
Jeffrey A. Miller (Senior Vice President and President of ISR Systems Segment) (8) | 2018 | 504,850 | 1,800,030 | 299,995 | 1,215,000 | — | 51,292 | 3,871,167 | ||||||||||||||||||||||
| (1) | Represents the grant date fair values of RSUs, RSAs and performance units, which are calculated in accordance with the accounting standards for share-based compensation using the price of our Common Stock on the date of grant. For a discussion of the general terms of RSUs and performance units, see “Compensation Discussion and Analysis – Elements of 2018 Target Pay – Long-Term Incentives” beginning on page 19. For a discussion of the general terms of RSAs, see “Compensation Discussion and Analysis – Summary of 2019 Target Pay” beginning on page 29. |
The grant date fair value of the performance units assumes that the Target level of performance is achieved, which represents the probable outcome of the performance conditions of the awards on the date of grant. The following table provides the value of the performance units granted in 2018 as of their grant date assuming the Target and Maximum levels of performance are achieved:
Name | Target ($) | Maximum ($) | ||||||
| Christopher E. Kubasik | 1,919,918 | 3,839,836 | ||||||
| Ralph G. D’Ambrosio | 539,898 | 1,079,796 | ||||||
| Ann D. Davidson | — | — | ||||||
| Todd W. Gautier | 259,927 | 519,855 | ||||||
| Jeffrey A. Miller | 200,009 | 400,019 | ||||||
| (2) | For Messrs. Kubasik and Miller, the amounts reported in the Stock Awards column for 2018 include the grant date fair values of RSAs granted to them in December 2018, in the amounts of $10,000,067 and $1,300,007, respectively, as part of their target pay for 2019. These RSAs were granted in December 2018 (in lieu of being granted in February 2019), and Messrs. Kubasik and Miller were required to make elections under Section 83(b) of the Internal Revenue Code to be taxed on the value of such grants in 2018 to mitigate potential excise taxes that may be applicable under Section 280G of the Internal Revenue Code in connection with the L3 Harris Merger. For a further discussion, see “Compensation Discussion and Analysis – Summary of 2019 Target Pay” beginning on page 29. If these RSAs had been granted in February 2019, the amounts reported for Messrs. Kubasik and Miller in the Stock Awards column for 2018 would have been $4,800,006 and $500,023, respectively, and the amounts that would have been reported for them in the Total column for 2018 would have been $15,511,366 and $2,571,160, respectively. |
| (3) | Represents the grant date fair value of stock options, calculated in accordance with the accounting standards for share-based compensation. See Note 18 to the audited consolidated financial statements included in the Initial Form 10-K for a discussion of the assumptions used in calculating equity compensation expense in connection with stock options granted in 2018. For a discussion of the general terms of our stock options, see “Compensation Discussion and Analysis – Elements of 2018 Target Pay – Long-Term Incentives – Stock Options” on page 27. |
| (4) | Amounts reported in this column for 2018 represent: (a) amounts earned under the annual incentive plan for 2018 and (b) amounts earned under performance cash awards whose performance period ended during 2018. The following table provides additional information regarding these amounts. |
Name | Annual Incentive Plan ($) | Performance Cash Awards ($) | ||||||
| Christopher E. Kubasik | 2,595,000 | 3,840,000 | ||||||
| Ralph G. D’Ambrosio | 1,195,000 | 1,080,000 | ||||||
| Ann D. Davidson | 965,000 | — | ||||||
| Todd W. Gautier | 703,000 | 520,000 | ||||||
| Jeffrey A. Miller | 815,000 | 400,000 | ||||||
For a further discussion of these awards, see “Compensation Discussion and Analysis – Elements of 2018 Target Pay – Annual Incentives” beginning on page 20 and “Compensation Discussion and Analysis – Payment of Performance Awards for the 2016-2018 Award Cycle” on page 29.
| (5) | Amounts reported in this column represent the increase in the actuarial value of defined benefit plans and are substantially affected by changes in actuarial assumptions made since 2015 as required under GAAP. Actuarial value computations for 2018 are based on assumptions discussed in Note 20 to the audited consolidated financial statements included in the Initial Form 10-K. Messrs. Kubasik and Miller and Ms. Davidson do not participate in any of L3’s defined benefit plans because such plans were generally closed to new participants hired on or after January 1, 2007. None of the named executive officers earned above-market interest on deferred compensation balances for any of the years indicated. |
| (6) | The following table describes each component of the All Other Compensation column for 2018. |
Name | Employer Contribution to Employee Savings Plan(a) ($) | Life Insurance(b) ($) | Medical Insurance Benefits(c) ($) | Other ($) | Total ($) | |||||||||||||||
Christopher E. Kubasik(d) | 17,000 | 10,812 | 15,513 | 163,225(e) | 206,550 | |||||||||||||||
| Ralph G. D’Ambrosio | 17,000 | 8,978 | 11,628 | — | 37,607 | |||||||||||||||
| Ann D. Davidson | 17,000 | 15,986 | 9,690 | — | 42,676 | |||||||||||||||
| Todd W. Gautier | 17,000 | 13,185 | 14,861 | 16,611(f) | 61,657 | |||||||||||||||
| Jeffrey A. Miller | 17,000 | 6,066 | 11,628 | 16,598(g) | 51,292 | |||||||||||||||
| (a) | Reflects Company contributions credited to accounts of our named executive officers under the L3 Technologies Master Savings Plan, which is a tax-qualified, 401(k) defined contribution plan. |
| (b) | Represents payments of premiums for executive and group term life insurance. |
| (c) | Represents payments of premiums for a Company-provided executive medical reimbursement plan. |
| (d) | During fiscal 2018, Mr. Kubasik had access to L3’s fractionally-owned aircraft for occasional personal use. Mr. Kubasik was required to and did reimburse L3 for all incremental costs incurred by L3 in connection with his personal use of the aircraft. |
| (e) | Represents (i) incremental costs of $138,859 associated with a Company car and security driver, including the monthly lease payments, maintenance, gas, tolls, parking and all other costs associated with the car, (ii) payments of $19,703 for financial planning services and (iii) payments of $4,663 for relocation expenses. Consistent with our key employee relocation policy applicable to management employees generally, the amount for relocation expenses includes a gross-up payment of $1,603 related to the portion of relocation expenses treated as taxable compensation, in order to the make the relocation tax neutral to the employee. |
| (f) | Represents payments of $16,611 for financial planning services. |
| (g) | Represents payments of $16,598 for financial planning services. |
| (7) | Ms. Davidson was not considered a named executive officer prior to our 2017 fiscal year. |
| (8) | Messrs. Gautier and Miller were not considered named executive officers prior to our 2018 fiscal year. |
2018 Grants of Plan-Based Awards
The following table provides information regarding: (1) annual incentive plan awards and long-term performance cash awards under the L3 Technologies, Inc. Amended and Restated 2012 Cash Incentive Plan and (2) performance unit, RSU, RSA and stock option awards under the L3 Technologies, Inc. Amended and Restated 2008 Long Term Performance Plan.
Estimated Future Payouts Under Non-Equity IncentivePlan Awards | Estimated Future Payouts Under Equity Incentive Plan Awards | All Other Stock Awards: Number of Shares of | All Other Option Awards: Number of Securities | Exercise or Base Price of | Grant Date Fair Value of Stock and | ||||||||||||||||||||||||||||||||||||||
Grant Type | Grant Date | Threshold ($) | Target ($) | Maximum ($) | Threshold (#) | Target (#) | Maximum (#) | Stock or Units (#) | Underlying Options (#) | Option Awards ($/Sh) | Option Awards ($) | ||||||||||||||||||||||||||||||||
Christopher E. Kubasik | AIP(1) | — | 1,560,000 | 3,120,000 | |||||||||||||||||||||||||||||||||||||||
| PCA (2) | 2/20/18 | 480,000 | 1,920,000 | 3,840,000 | |||||||||||||||||||||||||||||||||||||||
PU(3) | 2/20/18 | 4,550 | 9,100 | 18,200 | 1,919,918 | ||||||||||||||||||||||||||||||||||||||
RSU(4) | 2/20/18 | 13,651 | 2,880,088 | ||||||||||||||||||||||||||||||||||||||||
Option(5) | 2/20/18 | 37,374 | 74,747 | 74,747 | 210.98 | 2,880,002 | |||||||||||||||||||||||||||||||||||||
RSA(6) | 12/14/18 | 52,277 | 10,000,067 | ||||||||||||||||||||||||||||||||||||||||
| Ralph G. D’Ambrosio | AIP(1) | — | 730,500 | 1,461,000 | |||||||||||||||||||||||||||||||||||||||
PCA(2) | 2/20/18 | 135,000 | 540,000 | 1,080,000 | |||||||||||||||||||||||||||||||||||||||
PU(3) | 2/20/18 | 1,279 | 2,559 | 5,118 | 539,898 | ||||||||||||||||||||||||||||||||||||||
RSU(4) | 2/20/18 | 3,839 | 809,952 | ||||||||||||||||||||||||||||||||||||||||
Option(5) | 2/20/18 | 21,023 | 210.98 | 810,016 | |||||||||||||||||||||||||||||||||||||||
| Ann D. Davidson | AIP(1) | — | 556,200 | 1,112,400 | |||||||||||||||||||||||||||||||||||||||
RSU(4) | 2/20/18 | 4,740 | 1,000,045 | ||||||||||||||||||||||||||||||||||||||||
| Todd W. Gautier | AIP(1) | — | 546,300 | 1,092,600 | |||||||||||||||||||||||||||||||||||||||
PCA(2) | 2/20/18 | 65,000 | 260,000 | 520,000 | |||||||||||||||||||||||||||||||||||||||
PU(3) | 2/20/18 | 616 | 1,232 | 2,464 | 259,927 | ||||||||||||||||||||||||||||||||||||||
RSU(4) | 2/20/18 | 1,849 | 390,102 | ||||||||||||||||||||||||||||||||||||||||
Option(5) | 2/20/18 | 10,122 | 210.98 | 390,001 | |||||||||||||||||||||||||||||||||||||||
| Jeffrey A. Miller | AIP(1) | — | 520,804 | 1,041,608 | |||||||||||||||||||||||||||||||||||||||
PCA(2) | 2/20/18 | 50,000 | 200,000 | 400,000 | |||||||||||||||||||||||||||||||||||||||
PU(3) | 2/20/18 | 474 | 948 | 1,896 | 200,009 | ||||||||||||||||||||||||||||||||||||||
RSU(4) | 2/20/18 | 1,422 | 300,014 | ||||||||||||||||||||||||||||||||||||||||
Option(5) | 2/20/18 | 7,786 | 210.98 | 299,995 | |||||||||||||||||||||||||||||||||||||||
RSA(6) | 12/14/18 | 6,796 | 1,300,007 | ||||||||||||||||||||||||||||||||||||||||
| (1) | Represents the Threshold, Target and Maximum cash payout opportunities for fiscal 2018 under the annual incentive plan. For a further discussion of the payout opportunities, see “Compensation Discussion and Analysis – Elements of 2018 Target Pay – Annual Incentives” beginning on page 20. |
| (2) | Represents long-term performance cash awards granted to the named executive officers. The final value of each award will vary based upon L3’s relative TSR achieved over the three-year performance period beginning January 1, 2018 and ending December 31, 2020 in relation to TSR performance requirements established by the Compensation Committee of our Board (the “Committee”) in February 2018. The amounts disclosed in the Estimated Future Payouts Under Non-Equity Incentive Plan Awards columns represent the amounts of cash to be paid assuming achievement of the specific Threshold, Target or Maximum levels of performance established by the Committee for these awards over the performance period. See “Compensation Discussion and Analysis – Elements of 2018 Target Pay – Long-Term Incentives – Performance Awards” beginning on page 27 for a further discussion of the performance cash awards. See “– Potential Payments Upon Change in Control or Termination of Employment – Effect of Change in Control or Termination of Employment Upon Long-Term Incentive Awards” beginning on page 51 for a discussion concerning the effect of a change in control or termination of employment on outstanding performance cash awards. |
| (3) | Represents performance units granted to the named executive officers, which are payable in shares of our Common Stock at the end of the performance period. The final number of shares of our Common Stock issuable for each unit will vary based upon L3’s EPS achieved over the three-year performance period beginning January 1, 2018 and ending December 31, 2020 in relation to EPS performance requirements established by the Committee in February 2018. The amounts disclosed in the Estimated Future Payouts Under Equity Incentive Plan Awards columns represent the number of shares of our Common Stock issuable assuming achievement of the specific Threshold, Target or Maximum levels of performance established by the Committee for these units over the performance period. The amounts disclosed in the Grant Date Fair Value of Stock and Option Awards column represent the grant date fair values of the performance unit awards assuming that the Target level of performance for the awards is achieved, as calculated in accordance with the accounting standards for share-based compensation. See “Compensation Discussion and Analysis – Elements of 2018 Target Pay – Long-Term Incentives – Performance Awards” beginning on page 27 for a further discussion of the performance units. See “– Potential Payments Upon Change in Control or Termination of Employment – Effect of Change in Control or Termination of Employment Upon Long-Term Incentive Awards” beginning on page 51 for a discussion concerning the effect of a change in control or termination of employment on outstanding performance units. |
| (4) | Represents RSUs granted to the named executive officers, which vest three years after the grant date. The amounts disclosed in the Grant Date Fair Value of Stock and Option Awards column represent the grant date fair values of the RSU awards, as calculated in accordance with the accounting standards for share-based compensation. For a further discussion of our RSUs, see “Compensation Discussion and Analysis – Elements of 2018 Target Pay – Long-Term Incentives – RSUs” on page 29. For a discussion concerning the effect of a change in control or termination of employment on outstanding RSUs, see “– Potential Payments Upon Change in Control or Termination of Employment – Effect of Change in Control or Termination of Employment Upon Long-Term Incentive Awards” beginning on page 51. |
| (5) | Represents stock options granted to the named executive officers. The awards have an exercise price equal to the closing price of our Common Stock on the grant date and provide value to the recipient only if the price of our Common Stock increases after the grant date. Stock options have a term of ten years and vest in equal, annual increments over a three-year period starting with the first anniversary of the grant date and, in the case of the options granted to Mr. Kubasik, are also subject to two separate vesting conditions based on L3’s 2018 financial performance, which include L3 achieving consolidated EPS of at least $7.99 and consolidated FCF of at least $765 million, calculated on the same basis as the pre-established methodology used to calculate these measures under the annual incentive plan for fiscal 2018 performance. With regard to the options granted to Mr. Kubasik, the Threshold level of performance reported in the table above assumes the satisfaction of only one of the financial performance conditions, while the Target and Maximum levels of performance reported in the table above assume the satisfaction of both financial performance conditions. The amounts disclosed in the Grant Date Fair Value of Stock and Option Awards column represent the grant date fair values of the option awards, as calculated in accordance with the accounting standards for share-based compensation. With regard to the options granted to Mr. Kubasik, the amount disclosed in the Grant Date Fair Value of Stock and Option Awards column assumes that both of the financial performance conditions of his award are satisfied. For a further discussion of the stock options, see “Compensation Discussion and Analysis – Elements of 2018 Target Pay – Long-Term Incentives – Stock Options” on page 27. For a discussion concerning the effect of a change in control or termination of employment on outstanding stock option awards, see “‑ Potential Payments Upon Change in Control or Termination of Employment – Effect of Change in Control or Termination of Employment Upon Long-Term Incentive Awards” beginning on page 51. |
| (6) | Represents RSAs granted to Messrs. Kubasik and Miller in December 2018 as part of their target pay for 2019. These RSAs were granted in December 2018 (in lieu of being granted in February 2019), and Messrs. Kubasik and Miller were required to make elections under Section 83(b) of the Internal Revenue Code to be taxed on the value of such grants in 2018, to mitigate potential excise taxes that may be applicable under Section 280G of the Internal Revenue Code in connection with the L3 Harris Merger. The taxes payable by Messrs. Kubasik and Miller in connection with their Section 83(b) elections were satisfied through withholding from the shares subject to their RSAs. For a further discussion, see Note 1 to the “2018 Option Exercises and Stock Vested” table on page 43. The RSAs otherwise vest three years after the grant date. The amounts disclosed in the Grant Date Fair Value of Stock and Option Awards column represent the grant date fair values of the RSAs, as calculated in accordance with the accounting standards for share-based compensation. For a further discussion of the RSAs, see “Compensation Discussion and Analysis – Summary of 2019 Target Pay” beginning on page 29. For a discussion concerning the effect of a change in control or termination of employment on outstanding RSAs, see “– Potential Payments Upon Change in Control or Termination of Employment – Effect of Change in Control or Termination of Employment Upon Long-Term Incentive Awards” beginning on page 51. |
Outstanding Equity Awards at Fiscal Year End 2018
The following table provides information with respect to holdings of exercisable and unexercisable stock options, and unvested RSUs, RSAs and performance units held by the named executive officers at December 31, 2018.
Option Awards | Stock Awards | ||||||||||||||||||||||||||||||||
Name | Grant Date | Number of Securities Underlying Unexercised Options (#) Exercisable(1)(2) | Number of Securities Underlying Unexercised Options (#) Unexercisable(2) | Option Exercise Price(1) ($) | Option Expiration Date | Number of Shares or Units of Stock That Have Not Vested(3)(4) (#) | Market Value of Shares or Units of Stock That Have Not Vested(5) ($) | Equity Incentive Plan Awards: Number of Unearned Shares, Units or Other Rights That Have Not Vested(6) (#) | Equity Incentive Plan Awards: Market or Payout Value of Unearned Shares, Units or Other Rights That Have Not Vested(5) ($) | ||||||||||||||||||||||||
| Christopher E. Kubasik | 12/14/18 | — | — | — | — | 24,455 | 4,246,855 | ||||||||||||||||||||||||||
| 2/20/18 | — | 74,747 | 210.98 | 2/20/28 | 13,651 | 2,370,633 | 18,200 | 3,160,612 | |||||||||||||||||||||||||
| 12/20/17 | — | 86,260 | 194.10 | 12/20/27 | 6,182 | 1,073,566 | |||||||||||||||||||||||||||
| 2/21/17 | 14,519 | 29,038 | 168.80 | 2/21/27 | 7,109 | 1,234,549 | 9,478 | 1,645,949 | |||||||||||||||||||||||||
| 2/16/16 | 39,072 | 19,536 | 116.20 | 2/16/26 | 8,262 | 1,434,779 | |||||||||||||||||||||||||||
| 10/30/15 | 50,968 | — | 126.40 | 10/30/25 | |||||||||||||||||||||||||||||
| Ralph G. D’Ambrosio | 2/20/18 | — | 21,023 | 210.98 | 2/20/28 | 3,839 | 666,681 | 5,118 | 888,792 | ||||||||||||||||||||||||
| 2/21/17 | 9,800 | 19,601 | 168.80 | 2/21/27 | 4,799 | 833,394 | 6,398 | 1,111,077 | |||||||||||||||||||||||||
| 2/16/16 | 32,051 | 16,026 | 116.20 | 2/16/26 | 6,777 | 1,176,894 | |||||||||||||||||||||||||||
| 2/17/15 | 36,729 | — | 129.31 | 2/17/25 | |||||||||||||||||||||||||||||
| 2/19/14 | 37,850 | — | 113.67 | 2/19/24 | |||||||||||||||||||||||||||||
| 2/20/13 | 62,086 | — | 77.00 | 2/20/23 | |||||||||||||||||||||||||||||
| 2/22/12 | 16,978 | — | 67.49 | 2/22/22 | |||||||||||||||||||||||||||||
| 2/24/11 | 39,262 | — | 76.82 | 2/24/21 | |||||||||||||||||||||||||||||
| 2/23/10 | 36,144 | — | 86.41 | 2/23/20 | |||||||||||||||||||||||||||||
| Ann D. Davidson | 2/20/18 | — | — | — | — | 4,740 | 823,148 | ||||||||||||||||||||||||||
| 2/21/17 | 2,903 | 5,808 | 168.80 | 2/21/27 | — | — | 1,896 | 329,259 | |||||||||||||||||||||||||
| 8/15/16 | 5,810 | 2,905 | 150.37 | 8/15/26 | 1,330 | 230,968 | |||||||||||||||||||||||||||
| Todd W. Gautier | 2/20/18 | — | 10,122 | 210.98 | 2/20/28 | 1,849 | 321,097 | 2,464 | 427,898 | ||||||||||||||||||||||||
| 2/21/17 | 3,992 | 7,986 | 168.80 | 2/21/27 | 1,955 | 339,505 | 2,606 | 452,558 | |||||||||||||||||||||||||
| 2/16/16 | 6,526 | 3,264 | 116.20 | 2/16/26 | 1,162 | 201,793 | |||||||||||||||||||||||||||
| 2/17/15 | 7,438 | — | 129.31 | 2/17/25 | |||||||||||||||||||||||||||||
| Jeffrey A. Miller | 12/14/18 | — | — | — | — | 4,121 | 715,653 | ||||||||||||||||||||||||||
| 2/20/18 | — | 7,786 | 210.98 | 2/20/28 | 1,422 | 246,945 | 1,896 | 329,259 | |||||||||||||||||||||||||
| 2/21/17 | 3,266 | 6,534 | 168.80 | 2/21/27 | 1,600 | 277,856 | 2,132 | 370,243 | |||||||||||||||||||||||||
| 2/16/16 | 5,801 | 2,901 | 116.20 | 2/16/26 | 1,033 | 179,391 | |||||||||||||||||||||||||||
| 2/17/15 | 6,612 | — | 129.31 | 2/17/25 | |||||||||||||||||||||||||||||
| (1) | In connection with our spin-off of Engility Holdings, Inc. on July 17, 2012, the number of shares subject to then outstanding option awards, and the exercise price for the option awards, were adjusted to maintain the intrinsic value of each award as required pursuant to the terms of the stock-based compensation plans under which they were issued. The awards otherwise retained the original terms and conditions after adjustment, except in the case of financial performance conditions, which were also adjusted to reflect the spin-off. |
| (2) | Stock options generally vest in equal, annual increments over a three-year period starting with the first anniversary of the grant date, except that the options granted to Mr. Kubasik on December 20, 2017 vest three years after the grant date. The options granted to Mr. Kubasik in 2018 are also subject to performance-based vesting conditions that have been fully satisfied. For a further discussion, see “Compensation Discussion and Analysis – Elements of 2018 Target Pay – Long-Term Incentives – Stock Options” on page 27. For a discussion concerning the effect of a change in control or termination of employment on outstanding stock option awards, see “– Potential Payments Upon Change in Control or Termination of Employment – Effect of Change in Control or Termination of Employment Upon Long–Term Incentive Awards” beginning on page 51. |
| (3) | In the case of awards granted prior to December 2018, represents RSUs, which generally vest three years after the grant date. The RSUs granted during or prior to 2017 are also subject to performance-based forfeiture conditions that have been fully satisfied. For a further discussion, see “Compensation Discussion and Analysis – Satisfaction of Performance-Based Vesting Conditions for 2017 RSU Awards” beginning on page 29. On the vesting date, each RSU generally converts into the right to receive one share of our Common Stock. For a discussion concerning the effect of a change in control or termination of employment on outstanding RSU awards, see “– Potential Payments Upon Change in Control or Termination of Employment – Effect of Change in Control or Termination of Employment Upon Long-Term Incentive Awards” beginning on page 51. For a further discussion concerning the effect of retirement eligibility on outstanding RSU awards, see Note 1 to the “2018 Option Exercises and Stock Vested” table on page 43. |
| (4) | In the case of awards granted on December 14, 2018, represents RSAs granted to Messrs. Kubasik and Miller as part of their target pay for 2019. For a further discussion of these awards, see Note 6 to the “2018 Grants of Plan-Based Awards” table beginning on page 39. For a discussion concerning the effect of a change in control or termination of employment on outstanding RSAs, see “– Potential Payments Upon Change in Control or Termination of Employment – Effect of Change in Control or Termination of Employment Upon Long-Term Incentive Awards” beginning on page 51. |
| (5) | The market value is based on the closing price of our Common Stock on December 31, 2018 of $173.66, multiplied by the number of shares or units, and does not include accumulated cash dividend equivalents payable upon the vesting of RSUs, RSAs or performance units, as applicable. |
| (6) | Reflects the number of shares of our Common Stock issuable under performance units granted in 2018 and 2017 assuming achievement of the Maximum level of performance for these units. The Maximum level of performance is reported for the performance units because the Company’s performance from the beginning of the applicable performance period (January 1, 2018 for the units granted in 2018 and January 1, 2017 for the units granted in 2017) through December 31, 2018, measured against the applicable performance goals, exceeded the Target level of performance. For a further discussion of our performance units, see “Compensation Discussion and Analysis – Elements of 2018 Target Pay – Long-Term Incentives – Performance Awards” beginning on page 27. For a discussion concerning the effect of a change in control or termination of employment on performance unit awards, see “– Potential Payments Upon Change in Control or Termination of Employment – Effect of Change in Control or Termination of Employment Upon Long-Term Incentive Awards” beginning on page 51. |
2018 Option Exercises and Stock Vested
The following table provides information regarding the exercise of stock options and vesting of RSUs, RSAs and performance units held by our named executive officers during the year ended December 31, 2018. Except as set forth in Note 1 to the table below, the performance units vested on December 31, 2018 and the underlying shares were delivered in February 2019. For a further discussion, see “Compensation Discussion and Analysis – Payment of Performance Awards for the 2016‑2018 Award Cycle” beginning on page 29.
Option Awards | Stock Awards | |||||||||||||||
Name | Number of Shares Acquired on Exercise (#) | Value Realized on Exercise ($) | Number of Shares Acquired on Vesting(1) (#) | Value Realized on Vesting(2) ($) | ||||||||||||
| Christopher E. Kubasik | — | — | 38,838 | 7,419,610 | ||||||||||||
| Ralph G. D’Ambrosio | — | — | 14,836 | 2,803,954 | ||||||||||||
| Ann D. Davidson | — | — | 2,710 | 515,610 | ||||||||||||
| Todd W. Gautier | — | — | 2,594 | 491,430 | ||||||||||||
| Jeffrey A. Miller | — | — | 4,979 | 971,265 | ||||||||||||
| (1) | The following table provides additional information regarding the Number of Shares Acquired on Vesting. |
Name | Award Type | Vesting Date | Number of Shares Acquired on Vesting (#) | |||||
| Christopher E. Kubasik | Restricted Stock Awards(a) | 12/14/18 | 27,822 | |||||
Performance Units(b) | 12/14/18 | 10,465 | ||||||
Performance Units(b) | 12/31/18 | 551 | ||||||
| Ralph G. D’Ambrosio | Restricted Stock Units | 2/17/18 | 5,800 | |||||
| Performance Units | 12/31/18 | 9,036 | ||||||
| Ann D. Davidson | Restricted Stock Units(c) | 2/22/18 | 1,422 | |||||
Restricted Stock Units(c) | 12/21/18 | 1,288 | ||||||
| Todd W. Gautier | Restricted Stock Units | 2/17/18 | 1,044 | |||||
| Performance Units | 12/31/18 | 1,550 | ||||||
| Jeffrey A. Miller | Restricted Stock Units | 2/17/18 | 928 | |||||
Restricted Stock Awards(a) | 12/14/18 | 2,675 | ||||||
Performance Units(b) | 12/14/18 | 1,307 | ||||||
Performance Units(b) | 12/31/18 | 69 | ||||||
| (a) | Represents shares withheld to satisfy taxes payable by Messrs. Kubasik and Miller under Section 83(b) of the Internal Revenue Code in accordance with their elections to be taxed on the value of their RSA grants in 2018. For a further discussion, see “Compensation Discussion and Analysis – Summary of 2019 Target Pay” beginning on page 29. |
| (b) | To mitigate potential excise taxes that may be applicable under Section 280G of the Internal Revenue Code in connection with the L3 Harris Merger, on December 14, 2018, the Committee approved the immediate vesting and settlement of 10,465 and 1,307 shares of our Common Stock for Messrs. Kubasik and Miller, respectively, representing 95% of the shares that they were expected to earn based on anticipated results for their performance units for the three-year performance period ended December 31, 2018. This accelerated distribution was subject to clawback in the event that the final number of shares determined to have been earned as of December 31, 2018 (based on actual performance for the three-year period ended December 31, 2018) was less than the number of shares previously distributed. In February 2019, the Committee determined that the final number of shares earned as of December 31, 2018 exceeded the number of shares previously distributed, and distributed these remaining shares in February 2019. |
| (c) | On February 22, 2018 and December 21, 2018, Ms. Davidson became eligible for qualified retirement under the terms of RSUs granted to her on February 21, 2017 and December 20, 2017, respectively. The shares underlying these RSU awards are deemed to have vested on the dates on which Ms. Davidson became eligible for qualified retirement thereunder. However, in accordance with the terms of the RSUs, the underlying shares will not be delivered until the three-year anniversary of the respective dates on which the RSUs were granted, unless accelerated due to death, disability or a change in control. For a further discussion, see the “2018 Nonqualified Deferred Compensation” table beginning on page 47, including Note 10 to such table, and “ – Potential Payments Upon Change in Control or Termination of Employment–Effect of Change of Control or Termination of Employment Upon Long–Term Incentive Awards” beginning on page 51. |
| (2) | Value realized on vesting is based on the fair market value of the shares at the time of vesting and includes the value of payments in lieu of fractional shares. The amounts in this column do not include accrued cash dividends realized on vesting. |
2018 Pension Benefits
The following table provides information regarding the pension benefits for our named executive officers under L3’s tax-qualified and supplemental plans. The named executive officers participate in multiple tax-qualified or supplemental pension plans. The purpose of each plan is to provide the named executive officers with retirement benefits as part of their overall compensation package. The material terms of the plans are described following the table.
Name | Plan Name | Number of Years Credited Service (#) | Present Value of Accumulated Benefit(1) ($) | Payments During Last Fiscal Year ($) | |||||||||||
Christopher E. Kubasik(2) | — | — | — | — | |||||||||||
Ralph G. D’Ambrosio(3) | L3 Technologies, Inc. Pension Plan(4) | 21.42 | 698,091 | — | |||||||||||
L3 Technologies, Inc. Supplemental Executive Retirement Plan(5) | 21.42 | 3,683,121 | — | ||||||||||||
Ann D.Davidson(2) | — | — | — | — | |||||||||||
Todd W. Gautier(6) | L3 Link Simulation and Training Retirement Plan(7) | 17.17 | 503,529 | — | |||||||||||
L3 Technologies, Inc. Supplemental Executive Retirement Plan(5) | 17.17 | 1,244,566 | — | ||||||||||||
Jeffrey A. Miller(2) | — | — | — | — | |||||||||||
| (1) | The present values of the accumulated benefits in the table were determined using the same assumptions that were used by L3 as of December 31, 2018 for financial reporting purposes, including an effective discount rate of 4.48% and post-retirement mortality in accordance with the RP-2014 table (adjusted back to 2006), with mortality rates generally reduced by 10%, projected generationally with the 2017 Social Security Administration Intermediate-Cost Projections Scale. We used age 65, the normal retirement age under the pension plans and the supplemental executive retirement plan (or current age, if greater), to determine the present value of the accumulated benefits in the table. For the other assumptions used in calculating the present value of the accumulated benefits, see Note 20 to the audited consolidated financial statements included in the Initial Form 10-K. |
| (2) | None of Messrs. Kubasik and Miller nor Ms. Davidson participates in any of our defined benefit plans because these plans were generally closed to new participants hired on or after January 1, 2007. |
| (3) | Mr. D’Ambrosio has not yet met the eligibility requirements for early retirement under the retirement plans in which he participates. |
| (4) | Employees are eligible to participate in the L3 Technologies, Inc. Pension Plan (the “Corporate Pension Plan”) after one year of service and upon attaining 21 years of age; however, employees hired on or after January 1, 2007 are not eligible to participate in the Corporate Pension Plan. Participants are fully vested after five years of service, and there is no partial vesting. Participants are eligible for early retirement benefits after age 55, if they have ten years of eligibility service. The annual pension benefit is equal to 1.5% of Final Average Earnings (up to Covered Compensation), plus 1.75% of Final Average Earnings in excess of Covered Compensation, for each plan year (partial and completed months) of accrual service; provided, that no accrual service is credited after December 31, 2018. For those participants who are eligible to retire early, the early retirement reduction factor is 1/180 for each of the first 60 months prior to age 65 and 1/360 for each of the next 60 months. The Corporate Pension Plan provides for a number of payment options including a single life annuity (normal form for single participants), a qualified 50% joint and survivor annuity (normal form for married participants), other joint and survivor options, period-certain and continuous options, and a level income option. For purposes of the above description: (1) “Covered Compensation” is equal to the average of the Social Security Wage Bases for 35 calendar years ending with the year the participant attains Social Security retirement age; however, upon separation for service, Covered Compensation is determined as of the date of separation; (2) “Earnings” are defined as base pay, overtime, commissions and performance-based cash bonuses (excluding long-term incentive awards payable in cash) and are limited to the IRS earnings limit of $275,000 in 2018 and $280,000 in 2019; (3) “Final Average Earnings” is equal to the average of the participant’s earnings for the five calendar years during the ten calendar years prior to date of termination that result in the highest average earnings amount, but not less than the Final Average Earnings as of December 31, 2018; and (4) “Social Security Wage Base” means the wage level at which social security tax is applied for a given year. |
| (5) | The provisions of the L3 Technologies, Inc. Supplemental Executive Retirement Plan (the “SERP”) generally mirror the provisions of the tax-qualified pension plans (the “Qualified Pension Plans”) under which each participant accrues a benefit. However, the SERP takes into consideration earnings above the annual IRS earnings limit and provides a non-qualified benefit to those participants based on those earnings in excess of the IRS limit or the benefit limits under Section 415 of the Internal Revenue Code. |
| (6) | Mr. Gautier is eligible for early retirement under the retirement plans in which he participates. |
| (7) | Employees are eligible to participate in the L3 Link Simulation and Training Retirement Plan (the “Link Pension Plan”) if (a) they participated in a specific component of the Raytheon Pension Plan on February 10, 2000 and became employees of L3 Link Training and Simulation on February 11, 2000, (b) they were an employee of Raytheon on February 10, 2000 and became a full-time employee of L3 Link Training and Simulation after February 11, 2000 but on or before August 31, 2000 or (c) they were hired before January 1, 2007 in a pension eligible organization and have met the one year of service requirement to participate in the Link Pension Plan. Employees hired on or after January 1, 2007 are not eligible to participate in the Link Pension Plan. Participants are fully vested after five years of service, and there is no partial vesting. Participants are eligible for early retirement benefits after age 55, if they have five years of eligibility service. The annual pension benefit is equal to 1.5% of Final Average Earnings, less 0.6% of Final Average Earnings up to Covered Compensation, for each plan year (partial and completed months) of benefit service up to 35 years, plus 0.5% of Final Average Earnings for each plan year (partial and completed months) of benefit service in excess of 35 years; provided, that no benefit service is credited after December 31, 2018. For those participants that are eligible to retire early, the early retirement reduction factor is the smaller of (a) the actuarial equivalent or (b) 6% for each year prior to the participant’s normal retirement date for Social Security purposes. Unreduced early retirement is available if retirement is within three years prior to Social Security normal retirement age and following 10 years of continuous service. The Link Pension Plan provides for a number of payment options including a single life annuity (normal form for single participants), a qualified 50% joint and survivor annuity (normal form for married participants), other joint and survivor options, a period-certain and continuous option, a period-certain option, and a level income option. For purposes of the above description, (1) “Covered Compensation” is equal to the average of the Social Security Wage Bases for 35 calendar years ending with the year the participant attains Social Security retirement age; however, upon separation for service, Covered Compensation is determined as of the date of separation; (2) “Earnings” are defined as base pay, overtime, and performance-based cash bonuses (excluding long-term incentive awards payable in cash), and are limited to the IRS earnings limit of $275,000 in 2017 and $280,000 in 2018; (3) “Final Average Earnings” is equal to the average of the participant’s earnings for the five calendar years during the ten calendar years prior to date of termination that result in the highest average earnings amount, but not less than the Final Average Earnings as of December 31, 2018; and (4) “Social Security Wage Base” means the wage level at which social security tax is applied for a given year. |
The present value of the accumulated benefits for each of the named executives shown in the table above reflects the present value of the benefits earned under each of the pension plans as of December 31, 2018. The pension benefits that are the basis for the present values of the accumulated benefits shown are calculated based on all years of creditable service under each of the plans as of December 31, 2018.
2018 Nonqualified Deferred Compensation
The following table provides information regarding: (1) contributions, earnings and balances for our named executive officers under the nonqualified deferred compensation plans set forth below and (2) shares and cash dividend equivalents underlying RSU awards deemed to have vested based on the retirement eligibility of our named executive officers (“Retirement Eligible RSU Awards”).
Name | Plan or Award | Executive Contributions in Last Fiscal Year(1)(2) ($) | Registrant Contributions in Last Fiscal Year(3)(4) ($) | Aggregate Earnings in Last Fiscal Year(5)(6)(7) ($) | Aggregate Withdrawals/ Distributions ($) | Aggregate Balance at Last Fiscal Year End(8)(9) ($) | ||||||||||||||||
| Christopher E. Kubasik | Supplemental Savings Plan II | 200,738 | — | (6,469 | ) | — | 194,269 | |||||||||||||||
| Ralph G. D’Ambrosio | Supplemental Savings Plan II | 61,812 | — | (3,210 | ) | — | 58,602 | |||||||||||||||
| Ann D. Davidson | Supplemental Savings Plan II | 141,792 | — | (5,334 | ) | — | 136,458 | |||||||||||||||
Retirement Eligible RSU Awards(10) | — | 523,997 | (40,440 | ) | — | 483,557 | ||||||||||||||||
| Todd W. Gautier | Supplemental Savings Plan II | 45,951 | — | (3,733 | ) | — | 42,218 | |||||||||||||||
| Jeffrey A. Miller | Supplemental Savings Plan II | 66,084 | — | (2,449 | ) | — | 63,635 | |||||||||||||||
| Deferred Compensation Plan II | 425,767 | — | 45,875 | — | 1,158,896 | |||||||||||||||||
| (1) | Represents, in the case of the Supplemental Savings Plan II, contributions of base salary and annual incentive plan payouts that were deferred and credited during fiscal 2018. The amounts representing deferrals of base salary are included in the Salary column for 2018 in the “Summary Compensation Table” on page 36. The amounts representing deferrals of annual incentive plan payouts relate to payouts made in fiscal 2018 based on fiscal 2018 performance and are included in the Non-Equity Incentive Plan Compensation column for 2018 in the “Summary Compensation Table” on page 36. Deferrals relating to annual incentive plan payouts made in fiscal 2019 based on fiscal 2018 performance will be reported as executive contributions in 2019. |
| (2) | Represents, in the case of the Deferred Compensation Plan II, contributions by Mr. Miller of base salary and annual incentive plan payouts that were deferred and credited during fiscal 2018. The amounts representing deferrals of base salary are included for Mr. Miller in the Salary column for 2018 in the “Summary Compensation Table” on page 36. The amounts representing deferrals of annual incentive plan payouts relate to payouts made in fiscal 2018 based on fiscal performance in 2017 and 2018. The amount deferred in fiscal 2018 in respect of the annual incentive plan payout made in fiscal 2018 based on fiscal 2018 performance was $101,400, and is included for Mr. Miller in the Non-Equity Incentive Plan Compensation column for 2018 in the “Summary Compensation Table” on page 36. Deferrals relating to annual incentive plan payouts made in fiscal 2019 based on fiscal 2018 performance will be reported as executive contributions in 2019. |
| (3) | Participants in the Supplemental Savings Plan II are entitled to receive Company contributions based on executive contributions that were deferred and credited during the prior fiscal year. The Supplemental Savings Plan II was not in effect prior to fiscal 2018; accordingly, no Company contributions were made in 2018. Company contributions based on executive contributions deferred and credited during fiscal 2018 will be reported as Company contributions in 2019. |
| (4) | Represents, in the case of Retirement Eligible RSU Awards, the value of such awards that is deemed to have vested in 2018. The value reported is based on the sum of (a) the number of shares underlying the awards multiplied by the closing price of our Common Stock on the vesting date and (b) accrued cash dividend equivalents in respect of these awards as of the vesting date. The grant date fair value of these awards is included for Ms. Davidson in the Stock Awards column for 2017 in the “Summary Compensation Table” on page 36. For further information concerning the Retirement Eligible RSU awards that vested in 2018 and their respective grant date fair values, see Note 10 below. |
| (5) | Represents, in the case of the Supplemental Savings Plan II, aggregate earnings on plan balances in fiscal 2018, which are based on participant selections among investment options that generally mirror those available to participants in the L3 Technologies Master Savings Plan, which is our tax-qualified, 401(k) defined contribution plan. The amounts reported are not considered above-market or preferential earnings and, accordingly, are not included in the “Summary Compensation Table” on page 36. |
| (6) | Represents, in the case of each Retirement Eligible RSU Award, the sum of (a) the change in market value of the shares underlying such award during the period in 2018 for which the award was deemed to have been vested but the underlying shares remained undelivered and (b) the aggregate cash dividend equivalents that accrued in respect of such award during this period. These amounts are not considered above-market or preferential earnings and, accordingly, are not included in the “Summary Compensation Table” on page 36. For further information concerning the Retirement Eligible RSU Awards included in this column, see Note 10 below. |
| (7) | Represents, in the case of the Deferred Compensation Plan II, aggregate earnings on plan balances in fiscal 2018, which are based on the prime interest rate. The average interest rate for the year was 4.88%. The amounts reported are not considered above-market or preferential earnings and, accordingly, are not included in the “Summary Compensation Table” on page 36. |
| (8) | No portions of the amounts reported in this column for the Supplemental Savings Plan II and the Deferred Compensation Plan II were reported as compensation in the “Summary Compensation Table” on page 36 for prior fiscal years. |
| (9) | Represents, in the case of Retirement Eligible RSU Awards, the value of the underlying shares and cash dividend equivalents that were deemed to have vested but remained undelivered and unpaid, respectively, as of December 31, 2018. The value reported represents the sum of (a) the number of shares underlying the awards multiplied by $173.66, the closing price of our Common Stock on December 31, 2018, and (b) accrued cash dividend equivalents in respect of these awards as of December 31, 2018. The grant date fair value of each Retirement Eligible RSU Award included in this column is included in the Stock Awards column for 2017 in the “Summary Compensation Table” on page 36. For further information concerning the Retirement Eligible RSU Awards included in this column and their respective grant date fair values, see Note 10 below. |
| (10) | The following table provides additional information regarding the Retirement Eligible RSU Awards held by Ms. Davidson during 2018. |
Name | Grant Date | Number of Shares Underlying RSU Award (#) | Grant Date Fair Value ($) | Vesting Date(a) | Delivery Date(b) | ||||||||
| Ann D. Davidson | 2/21/17 | 1,422 | 240,034 | 2/22/18 | 2/21/20 | ||||||||
| 12/20/17 | 1,288 | 250,001 | 12/21/18 | 12/20/20 | |||||||||
| (a) | Reflects the date on which the RSU award is deemed to have vested based on the retirement eligibility of the named executive officer. |
| (b) | Reflects the date on which the shares and accrued cash dividend equivalents underlying the RSU award are to be delivered and paid, respectively, to the named executive officer. The delivery date is subject to acceleration in the event of death, disability or a change in control. For a further discussion, see “– Potential Payments Upon Change in Control or Termination of Employment – Effect of Change in Control or Termination of Employment Upon Long-Term Incentive Awards” beginning on page 51. |
For a further discussion of our nonqualified deferred compensation plans, see “Compensation Discussion and Analysis – Executive Benefits and Perquisites – Deferred Compensation Plans” on page 31.
Potential Payments Upon Change in Control
or Termination of Employment
Change in Control Severance Plan
Under our Change in Control Severance Plan, executive officers and other corporate employees are entitled to severance benefits if, under specified conditions, their employment is terminated in connection with or following a change in control of L3. The material terms of the program with respect to our named executive officers are as follows:
| Protection Period | Two years following the occurrence of a change in control. In addition, the program covers terminations that become effective prior to the occurrence of a change in control if such termination occurs (1) upon the request of the acquirer or (2) otherwise in anticipation of the change in control. |
| Payout Requirements | Severance payments are required following termination by us without cause, or termination by the executive for good reason, during the Protection Period. |
| Severance Benefits | Lump sum payment equal to a multiple of current annual salary and average annual incentive plan payouts for the prior three years: • Chief Executive Officer, Chief Financial Officer and Chief Legal Officer – 3x • Segment Presidents – 2.5x |
Annual Incentive Plan Payout for Year of Termination | Pro rata payout based on (a) the number of months worked in the year of termination and (b) the average annual incentive plan payouts for the prior three years (or the actual annual incentive plan award payable for the full year of termination, if performance is determinable at the time of termination). |
| Qualified Promotion | In the event the executive receives a qualified promotion during the prior three years, then for purposes of the above calculations, “average annual incentive plan payouts for the prior three years” shall not be less than the executive’s annual incentive plan target bonus. |
| Benefits/Perquisites Continuation | Continuation of medical and life insurance benefits at the same cost to the executive, or cash equal to any increased premiums, for the number of years as the severance multiple discussed above under “Severance Benefits.” |
| Restrictive Covenants | Non-competition and non-solicitation covenants for one year following termination of employment. |
Amendment or Termination of the Plan | Prior to the occurrence of a change in control, the Compensation Committee may amend or terminate the program at any time upon 90 days written notice. |
Executive Severance Plan
Under our Executive Severance Plan, executive officers and other corporate employees are entitled to severance benefits if, under specified conditions, their employment is terminated other than in connection with or following a change in control of L3. The material terms of the program with respect to our named executive officers are as follows:
| Payout Requirements | Severance payments are required following termination by us without cause. |
| Severance Benefits | Lump sum payment equal to a multiple of current annual salary and target bonus under the annual incentive plan: • Chief Executive Officer – 2x • Other Named Executive Officers – 1x |
Annual Incentive Plan Payout for Year of Termination | If termination occurs after the end of the second quarter of our fiscal year, pro rata payout based on actual performance for the year of termination. |
Benefits/Perquisites Continuation | Continuation of medical benefits at the same cost charged to similarly-situated active employees, or cash equal to any increased premiums, for 18 months following termination. |
| Restrictive Covenants | Non-competition and non-solicitation covenants for one or two years following termination of employment. |
Amendment or Termination of the Plan | The Compensation Committee may amend or terminate the plan at any time upon 30 days written notice. |
Effect of Change in Control or Termination of Employment Upon Long-Term Incentive Awards
The following table summarizes the effect of the following events upon outstanding long-term incentive awards granted to our named executive officers on or prior to December 31, 2018.
Long-Term Incentive Award Type | Change in Control | Death/ Disability | Qualified Retirement(1) | Termination by Company for Cause | Termination by Company without Cause | Resignation | |||||||
| Stock Options | | Immediate vesting of remaining unvested award. | Immediate vesting of remaining unvested award. | Unvested options are forfeited. | Forfeiture of remaining unexercised award. | Generally, unvested options are forfeited.(2) | Generally, unvested options are forfeited.(2) | ||||||
| RSUs/RSAs | Immediate vesting and delivery of full award.(3) | Immediate vesting and delivery of full award. | Full award is deemed to have vested, but underlying shares and dividend equivalents remain undelivered and unpaid until expiration of original three-year vesting period. | Forfeiture of full award. | Generally, forfeiture of full award.(2) | Generally, forfeiture of full award.(2) | |||||||
| Performance Awards | | Immediate vesting based on Target level of performance, prorated to reflect reduced service period.(4) Following the change in control, portion of award attributable to remaining service period (based on Target level of performance, or higher as applicable) is subject to (1) immediate vesting of full award in the case of a termination without cause or for good reason, (2) immediate vesting of prorated portion of award (reflecting the reduced service period) in the case of death, disability or a Qualified Retirement or (3) normal vesting of full award upon continued employment through the original three-year vesting period. | Forfeiture of prorated portion of award to reflect reduced service period. Payment level for the remaining award is based on actual performance for the full performance period. | Forfeiture of prorated portion of award to reflect reduced service period. Payment level for the remaining award is based on actual performance for the full performance period. | Forfeiture of full award. | Forfeiture of prorated portion of award to reflect reduced service period. Payment level for the remaining award is based on actual performance for the full performance period. | Forfeiture of full award. |
| (1) | For long-term incentive awards granted prior to 2017, Qualified Retirement is defined as a termination of employment that satisfies all of the following: (a) the executive terminates employment more than one year after the grant date of the applicable award (or in the case of performance awards, one year after the first day of the applicable performance period), (b) the executive terminates employment on or after attaining age 65 and completing at least five years of service (which must be continuous through the date of termination except for a single break in service that does not exceed one year in length), (c) the executive is not subject to termination for cause by the Company at the time of the employee’s termination and (d) the executive is available for consultation following the termination of employment at the reasonable request of the Company. Long-term incentive awards granted in or after 2017 use the same definition for Qualified Retirement as set forth above, except that with respect to clause (b), the age referenced therein has been reduced from 65 to 60, and the requirement to have completed five years of service at the time of termination does not apply in the case of an executive who terminates employment on or after attaining age 65. |
| (2) | The vesting of RSUs and stock options granted to Mr. Kubasik on December 20, 2017 is subject to automatic acceleration in the event Mr. Kubasik’s employment is terminated by L3 without cause or he terminates his employment for good reason. All other unvested stock options and RSUs held by Mr. Kubasik and the other NEOs are forfeited upon a termination by the Company without cause. |
| (3) | In the case of RSUs or RSAs granted after October 12, 2018, a change in control has no immediate effect, but vesting and delivery of the full award is accelerated in the event a termination without cause, a termination for good reason or a Qualified Retirement occurs within two years following the change in control. |
| (4) | In connection with a change in control, the Compensation Committee has the discretion to increase this payment (but not above the benefit payable for the Maximum level of performance achievement) to the extent (if any) that the Compensation Committee is able to assess that the Company’s progress towards achievement of the applicable performance measures, at or prior to the change in control, exceeds the Target performance level requirement as adjusted to reflect the reduced service period. |
Payments Upon Change in Control or Termination of Employment
The following table quantifies the payments under our severance arrangements and long-term incentive awards that would be made assuming that a change in control, death, disability or termination of employment by us without cause (or certain other terminations of employment as described below with respect to financial planning services, or the acceleration of stock options and RSUs granted to Mr. Kubasik in December 2017) occurred on December 31, 2018. Payments under other plans that do not change as a result of a change in control or termination of employment are found under “2018 Pension Benefits” beginning on page 45 and “2018 Nonqualified Deferred Compensation” on page 47 and are not included in this table. In addition, payments that are available generally to salaried employees that do not discriminate in scope, terms or operation in favor of executive officers are also not included in this table.
Named Executive Officer | Change in Control ($) | Death/Disability ($) | Termination without Cause ($) | |||||||||
| Christopher E. Kubasik | ||||||||||||
Severance(1)(2)(3)(4) | 9,184,500 | — | 5,520,000 | |||||||||
Medical Benefits(1)(3)(5) | 90,621 | — | 45,311 | |||||||||
Life Insurance Premiums(1)(5) | 32,436 | — | — | |||||||||
Outplacement Benefits(1)(3)(6) | 6,400 | — | 6,400 | |||||||||
Financial Planning Services(7) | 19,703 | 19,703 | 19,703 | |||||||||
Acceleration of Stock Options(8)(9) | 1,263,663 | 1,263,663 | — | |||||||||
Acceleration of RSUs and RSAs(10)(11)(12) | 10,542,281 | 10,542,281 | 1,073,566 | |||||||||
Acceleration of Performance Awards(13)(14)(15) | 2,277,984 | — | — | |||||||||
| TOTAL | 23,417,588 | 11,825,647 | 6,664,980 | |||||||||
| Ralph G. D’Ambrosio | ||||||||||||
Severance(1)(2)(3)(4) | 5,431,300 | — | 1,461,000 | |||||||||
Medical Benefits(1)(3)(5) | 78,965 | — | 39,483 | |||||||||
Life Insurance Premiums(1)(5) | 26,934 | — | — | |||||||||
Outplacement Benefits(1)(3)(6) | 6,400 | — | 6,400 | |||||||||
Acceleration of Stock Options(8)(9) | 1,016,057 | 1,016,057 | — | |||||||||
Acceleration of RSUs and RSAs(10)(11)(12) | 2,780,001 | 2,780,001 | — | |||||||||
Acceleration of Performance Awards(13)(14)(15) | 1,074,447 | — | — | |||||||||
| TOTAL | 10,414,104 | 3,796,058 | 1,506,883 | |||||||||
| Ann D. Davidson | ||||||||||||
Severance(1)(2)(3)(4) | 4,442,733 | — | 1,174,200 | |||||||||
Medical Benefits(1)(3)(5) | 56,377 | — | 28,188 | |||||||||
Life Insurance Premiums(1)(5) | 47,958 | — | — | |||||||||
Outplacement Benefits(1)(3)(6) | 6,400 | — | 6,400 | |||||||||
Acceleration of Stock Options(8)(9) | 95,884 | 95,884 | — | |||||||||
Acceleration of RSUs and RSAs(10)(11)(12) | 1,562,949 | 1,562,949 | — | |||||||||
Acceleration of Performance Awards(13)(14)(15) | 220,349 | — | — | |||||||||
| TOTAL | 6,432,650 | 1,658,833 | 1,208,788 | |||||||||
Named Executive Officer | Change in Control ($) | Death/Disability ($) | Termination without Cause ($) | |||||||||
| Todd W. Gautier | ||||||||||||
Severance(1)(2)(3)(4) | 2,892,667 | — | 1,092,600 | |||||||||
Medical Benefits(1)(3)(5) | 85,719 | — | 51,432 | |||||||||
Life Insurance Premiums(1)(5) | 32,963 | — | — | |||||||||
Outplacement Benefits(1)(3)(6) | 6,400 | — | 6,400 | |||||||||
Financial Planning Services(7) | 16,611 | 16,611 | 16,611 | |||||||||
Acceleration of Stock Options(8)(9) | 226,361 | 226,361 | — | |||||||||
Acceleration of RSUs and RSAs(10)(11)(12) | 890,892 | 890,892 | — | |||||||||
Acceleration of Performance Awards(13)(14)(15) | 310,719 | — | — | |||||||||
| TOTAL | 4,462,332 | 1,133,864 | 1,167,043 | |||||||||
| Jeffrey A. Miller | ||||||||||||
Severance(1)(2)(3)(4) | 3,032,333 | — | 1,130,000 | |||||||||
Medical Benefits(1)(3)(5) | 80,672 | — | 48,403 | |||||||||
Life Insurance Premiums(1)(5) | 15,165 | — | — | |||||||||
Outplacement Benefits(1)(3)(6) | 6,400 | — | 6,400 | |||||||||
Financial Planning Services(7) | 16,598 | 16,598 | 16,598 | |||||||||
Acceleration of Stock Options(8)(9) | 198,447 | 198,447 | — | |||||||||
Acceleration of RSUs and RSAs(10)(11)(12) | 1,443,611 | 1,443,611 | — | |||||||||
Acceleration of Performance Awards(13)(14)(15) | 370,375 | — | — | |||||||||
| TOTAL | 5,163,601 | 1,658,656 | 1,201,401 | |||||||||
| (1) | Severance, medical benefits, life insurance premiums and outplacement benefits in connection with a change in control are payable only if the named executive officer (a) is involuntarily terminated (other than for cause, death or disability) at the request of the acquirer or otherwise in anticipation of, or during the two-year period following, the change in control or (b) voluntarily terminates employment for good reason during the two-year period following the change in control. For purposes of calculating the amount of these benefits in connection with a change in control, we assumed that such a termination of employment occurred on December 31, 2018. Receipt of these benefits is conditioned upon the named executive officer’s execution of an agreement with the Company containing protective covenants and a customary release of all claims against the Company. For a further discussion, see “– Change in Control Severance Plan” on page 49. |
| (2) | As discussed in “– Change in Control Severance Plan” on page 49, the change in control severance amount for each named executive officer is a multiple of base salary and average annual incentive plan payouts for the three years prior to the year of termination (or target bonus, as applicable). While the Change in Control Severance Plan also provides for an additional annual incentive plan payout for the year of termination, such amounts for each named executive officer are not reflected in this table because the amounts earned under the annual incentive plan for 2018 are already included in the “Summary Compensation Table” on page 36 in the Non-Equity Incentive Plan Compensation column for 2018. In the event that these payments, when aggregated with all other change in control payments, would subject the named executive officer to an excise tax under IRS regulations, then these payments will be reduced to the highest amount for which no excise tax would be due, but only if the reduced amount is greater than the unreduced amount net of the excise tax. |
| (3) | Severance, medical benefits and outplacement benefits in connection with a termination of employment without cause that is unrelated to a change in control is conditioned upon the named executive officer’s execution of an agreement with the Company containing protective covenants and a customary release of all claims against the Company. For a further discussion, see “– Executive Severance Plan” on page 50. |
| (4) | As discussed in “– Executive Severance Plan” on page 50, the severance payable to each named executive officer in connection with a termination of employment without cause that is unrelated to a change in control is a multiple of base salary and target bonus. While the Executive Severance Plan also provides for an additional annual incentive plan payout for the year of termination if such termination occurs after the end of the second quarter of our fiscal year, such amounts for each named executive officer are not reflected in this table because the amounts earned under the annual incentive plan for 2018 are already included in the “Summary Compensation Table” on page 36 in the Non-Equity Incentive Plan Compensation column for 2018. |
| (5) | Medical benefits and life insurance premiums are based on the applicable multiple of the premiums paid by the Company in 2018 to provide the named executive officer (and the named executive officer’s spouse and dependents, as applicable) with medical benefits and life insurance. |
| (6) | Under both our Change in Control Severance Plan and our Executive Severance Plan, a named executive officer is entitled to reasonable outplacement services. The amount disclosed represents the Company’s reasonable estimate of the cost to provide this benefit. |
| (7) | In the event of a change in control, death, disability, termination of employment by the Company without cause or a Qualified Retirement, named executive officers who were receiving Company-paid financial planning services immediately prior to such event are entitled to continue receiving such services for one year following the event at the Company’s expense. The amount disclosed for each named executive officer is based on the amount paid by the Company in 2018 for such officer’s financial planning services, and would be payable by the Company not only in connection with a change in control, death, disability or termination of employment by the Company without cause (as disclosed in the table), but also upon a Qualified Retirement. Neither Mr. D’Ambrosio nor Ms. Davidson elected to receive financial planning services in 2018. |
| (8) | As disclosed above and except with respect to stock options granted to Mr. Kubasik in December 2017, in the event of any termination of employment other than death or disability, unvested stock options (or all stock options, in the case of a termination for cause) are forfeited. Accordingly, stock options are not quantified in the table above with respect to any termination of employment event other than in connection with a change in control, or upon death or disability. With respect to the stock options granted to Mr. Kubasik in December 2017, the vesting of such options accelerates not only in the event of a change in control, death or disability, but also in the event of a termination of employment without cause or for good reason. However, no value for such acceleration is included in the table for Mr. Kubasik because the per share exercise price of such options ($194.10) exceeded the closing price of our Common Stock ($173.66) on December 31, 2018. |
| (9) | The value attributable to the acceleration of unvested stock options is based upon the number of unvested stock options multiplied by the amount by which the closing price of our Common Stock ($173.66) on December 31, 2018 exceeded the per share exercise price of the option. |
| (10) | As disclosed above, in the event of the named executive officer’s Qualified Retirement, RSUs are deemed to have vested, but the underlying Common Stock and accrued cash dividend equivalents remain undelivered and unpaid until the end of the original vesting period. Except with respect to RSUs granted to Mr. Kubasik in December 2017 as described in Note 12 below, in the event of any termination of employment other than death or disability, the RSUs are forfeited. Accordingly, the RSUs are not quantified in the table above with respect to any termination of employment event other than in connection with a change in control, or upon death or disability. In addition, the amounts disclosed in the table above exclude the value attributable to the accelerated delivery and payment upon a change in control, death, disability or termination without cause of shares and dividend equivalents underlying Retirement Eligible RSU Awards because these amounts are already included in the “2018 Nonqualified Deferred Compensation” table on page 47 in the Aggregate Balance at Last Fiscal Year End column. |
| (11) | As disclosed above, a change in control has no immediate effect on vesting or delivery of shares underlying RSAs, but vesting and delivery of the full award is accelerated in the event a termination without cause, a termination for good reason or a Qualified Retirement occurs within two years following the change in control. For purposes of calculating the value attributable to the acceleration of unvested RSAs in connection with a change in control, we assumed that such a termination of employment occurred on December 31, 2018. |
| (12) | The value attributable to the acceleration of unvested RSUs and RSAs is based upon the sum of (a) number of shares underlying the awards multiplied by the closing price of our Common Stock ($173.66) on December 31, 2018 and (b) the accrued cash dividend equivalents underlying the awards as of December 31, 2018. The value disclosed for Mr. Kubasik includes $1,073,566 attributable to the acceleration of RSUs granted to him on December 20, 2017. This acceleration would occur not only in the event of a change in control, death or disability or termination of employment without cause (as disclosed in the table), but also in the event Mr. Kubasik terminates his employment for good reason. |
| (13) | As disclosed above, in the event of the named executive officer’s death, disability, Qualified Retirement or termination by the Company without cause, a prorated portion of the performance awards is forfeited, and the remaining portion is not delivered or paid until the end of the original performance period based on actual performance for the full performance period. In the event of any other termination of employment, the performance awards are forfeited. Accordingly, the performance awards are not quantified in the table above with respect to any termination of employment event other than in connection with a change in control. |
| (14) | As disclosed above, in the event of a change in control, a prorated portion of the unvested performance awards (reflecting the reduced service period) is subject to immediate vesting and delivery. Following the change in control, the remaining portion of the awards is subject to (1) immediate vesting of the full award in the case of a termination without cause or for good reason, (2) immediate vesting of a prorated portion of the award in the case of death, disability or a Qualified Retirement or (3) normal vesting of the full award upon continued employment through the original three-year vesting period. For purposes of calculating the value attributable to the acceleration of performance awards in connection with a change in control, we assumed that the executive was terminated without cause on December 31, 2018. |
| (15) | The value attributable to the acceleration of performance units is based upon the sum of (a) the number of shares issuable assuming a Target level of performance achievement multiplied by the closing price of our Common Stock ($173.66) on December 31, 2018 and (b) the accrued cash dividend equivalents underlying such number of shares as of December 31, 2018. The value attributable to the acceleration of performance cash awards is based upon the amount of cash payable assuming a Target level of performance achievement. As disclosed above, the Compensation Committee has the discretion to increase the number of shares issuable or the amount of cash payable up to the number of shares issuable or amount of cash payable assuming the Maximum level of performance achievement based on the Compensation Committee’s assessment of the Company’s progress towards achievement of the applicable performance measures at or prior to the change in control, but only if such assessment is that the Target performance level would be exceeded. |
CEO Pay Ratio
We are providing the following information about the ratio of our CEO’s total compensation for 2018 to the total compensation of our median compensated employee for 2018 (our “CEO pay ratio”) pursuant to the SEC’s guidance under Item 402(u) of Regulation S-K. The CEO pay ratio disclosed below represents a reasonable good faith estimate, calculated in a manner consistent with SEC rules, based on our payroll and employment records and the methodology described below.
| - | Our CEO’s total annual compensation for 2018, as reflected in the Summary Compensation Table on page 36, was $25,511,433. |
| - | Our median employee’s total annual compensation for 2018, calculated using the same methodology we used in the Summary Compensation Table with respect to our named executive officers, was $80,692. |
| - | The resulting CEO pay ratio for 2018 is approximately 316:1. |
| - | As described under “Compensation Discussion and Analysis – Summary of 2019 Target Pay” beginning on page 29, to mitigate the potential impact of Section 280G in connection with the L3 Harris Merger, the Committee approved, for certain executive officers including our CEO, the acceleration of annual LTI awards that would otherwise have been granted in February 2019 to December 2018. Had the granting of these awards not been accelerated, our CEO’s total annual compensation for 2018 would have been $15,511,366, resulting in a CEO pay ratio of approximately 192:1. |
We identified our median employee using our employee population as of October 1, 2018.
During our initial review of our employee population, we excluded, in accordance with SEC regulations, approximately 314 persons that became our employees as the result of recent acquisitions that were completed in 2018. After giving effect to this exclusion, as of October 1, 2018, our total number of full- and part-time employees was 30,669, of which 25,721 were U.S. employees and 4,948 were non-U.S. employees.
We next excluded from the employee population identified above all employees from the non-U.S. jurisdictions listed below, each of which had less than 100 employees, other than for Australia (252), Italy (217), Portugal (168), Germany (120) and New Zealand (113). This exclusion is permitted by SEC regulations because the total number of employees from these non-U.S. jurisdictions (1,287) is less than 5% of our total employee population identified above (30,669).
| Australia | Ireland | Poland |
| Bahrain | Italy | Portugal |
| Brazil | Japan | Saudi Arabia |
| China | Jordan | Singapore |
| Costa Rica | Malaysia | South Korea |
| Dominican Republic | Mexico | Spain |
| Egypt | Morocco | Thailand |
| France | Netherlands | Turks & Caicos Islands |
| Germany | New Zealand | United Arab Emirates |
| Hong Kong | Panama | |
| India | Philippines |
Our remaining employee population was composed of 29,382 employees, of which 25,721 were U.S. employees and 3,661 were non-U.S. employees.
To determine our median compensated employee from this remaining employee population, we chose base pay as our consistently applied compensation measure, which we believe encompasses the principal method of cash compensation we use for our employees and provides a reasonable estimate of annual compensation for our employees. We then calculated an annual base salary for each employee, annualizing pay for those employees who commenced work during 2018 and any employees who were on leave for a portion of 2018. For hourly employees, we used a reasonable estimate of hours worked to determine annual base pay. Within this employee population, we used a clustered sampling methodology to identify the median employee based on base salary. After we identified the median employee, we calculated annual total compensation for that employee using the same methodology we used for our named executive officers as set forth in the Summary Compensation Table.
The SEC rules for identifying the median compensated employee and calculating the CEO pay ratio based on that employee’s annual total compensation allow companies to adopt a variety of methodologies, to apply certain exclusions and to make reasonable estimates and assumptions that reflect their compensation practices. As such, the CEO pay ratio reported by other companies, including in our own industry, may not be comparable to the CEO pay ratio reported above, as other companies may have different employment and compensation practices and may utilize different methodologies, exclusions, estimates and assumptions in calculating their own CEO pay ratios.
COMPENSATION OF DIRECTORS
L3’s compensation program for non-employee directors (the “Director Compensation Program”) is determined by our Board. The objectives of the program are to attract and retain highly qualified directors and to compensate them in a manner that closely aligns their interests with those of our shareholders. Directors who are also employees of L3 do not receive additional compensation for their services as directors.
Prior to July 2018, the Compensation Committee was responsible for periodically reviewing and making recommendations to our Board with respect to director compensation. The Compensation Committee’s practice was to review the appropriateness of the components, amounts and forms of compensation provided to directors on an annual basis. In July 2018, this responsibility was assumed by our Nominating and Governance Committee.
In May 2018, the Compensation Committee completed its annual review of the Director Compensation Program and recommended the following changes: (1) an increase in the annual board member retainer from $110,000 to $115,000, (2) an increase in the annual board member equity award from $135,000 to $145,000, (3) an increase in the annual lead independent director retainer from $25,000 to $30,000 and (4) an increase in the stock ownership guideline for each non-employee director from five times to six times the annual board member retainer amount. The Compensation Committee’s recommendation was based, in part, upon a market assessment of L3’s director pay levels and the practices of L3’s compensation peer group conducted by FW Cook. The Board approved these recommendations in May 2018.
The following table provides information concerning the Director Compensation Program for 2018, as amended.
Compensation Type | Compensation Rates | |||
Annual Board Member Retainer(1) | $ | 115,000 | ||
Annual Board Member Equity Award(2) | 145,000 | |||
Annual Audit and Ethics Committee Chairperson Retainer(1) | 30,000 | |||
Annual Compensation Committee Chairperson Retainer(1) | 15,000 | |||
Annual Nominating and Governance Committee Chairperson Retainer(1) | 15,000 | |||
Annual Audit and Ethics Committee Member Retainer(1) | 20,000 | |||
Annual Lead Independent Director Retainer(1) | 30,000 | |||
| (1) | Annual retainers are payable in quarterly installments in arrears on the final day of each quarterly, in-person, regular meeting of the Board. In 2018, these dates were February 13, May 8, July 10 and November 27. |
| (2) | Each non-employee director received on May 8, 2018, the day after the 2018 annual meeting of shareholders, an award of RSUs having a grant date fair value of $145,000, calculated in accordance with the accounting standards for share-based compensation. The RSUs vest one year after the grant date (or on the date of the 2019 annual meeting of shareholders, if earlier), subject to acceleration in the event of death, permanent disability or a change in control. Regardless of vesting, the RSUs will not be converted into shares until the earlier of (a) the date on which the recipient ceases to be a director or (b) a change in control that satisfies specified requirements set forth in Section 409A of the Internal Revenue Code. Dividend equivalents are accrued in the form of additional RSUs with the same vesting and delivery terms as the underlying RSUs. |
With respect to the retainers described above (other than the annual equity award), each non-employee director may elect to receive all such compensation in cash and/or RSUs. RSUs received pursuant to such elections (“Elected RSUs”) have identical terms and conditions as the RSUs issued in respect of the annual board member equity award, except that Elected RSUs are fully vested at the time of issuance.
2018 Director Compensation
The following table provides summary information concerning compensation paid or accrued by us to or on behalf of our non-employee directors for services rendered to us during the fiscal year ended December 31, 2018.
Name | Fees Earned or Paid in Cash(1) ($) | Stock Awards(2) ($) | All Other Compensation ($) | Total ($) | ||||||||||||
| Claude R. Canizares | 132,500 | 145,000 | — | 277,500 | ||||||||||||
| Thomas A. Corcoran | 132,500 | 145,000 | — | 277,500 | ||||||||||||
| Ann E. Dunwoody | 112,500 | 145,000 | 5,000(3) | 262,500 | ||||||||||||
| Lewis Kramer | 142,500 | 145,000 | 500(3) | 288,000 | ||||||||||||
Rita S. Lane(4) | 67,500 | 145,000 | 5,000(3) | 217,500 | ||||||||||||
| Robert B. Millard | 155,000 | 145,000 | — | 300,000 | ||||||||||||
| Lloyd W. Newton | 112,500 | 145,000 | — | 257,500 | ||||||||||||
| Vincent Pagano, Jr. | 147,500 | 145,000 | — | 292,500 | ||||||||||||
| H. Hugh Shelton | 112,500 | 145,000 | — | 257,500 | ||||||||||||
Arthur L. Simon(5) | 65,000 | — | 10,000(6) | 75,000 | ||||||||||||
| (1) | Includes fees with respect to which directors elected to receive payment in Elected RSUs, each valued at the closing price on the date the director would have otherwise received a disbursement for such payment. For 2018, General (Ret.) Dunwoody and Mr. Millard elected to receive payments in Elected RSUs with respect to all or a portion of their fees. |
| (2) | Represents the grant date fair value of RSUs based on L3’s closing stock price on May 8, 2018, the date of grant. |
| (3) | Represents charitable contributions made by the Company that match director contributions to L3’s Political Action Committee. |
| (4) | Ms. Lane was appointed to our Board on May 8, 2018. |
| (5) | Mr. Simon retired from our Board on May 7, 2018. |
| (6) | Represents charitable contribution made by the Company in connection with Mr. Simon’s retirement. |
The following table provides a summary of the aggregate number of unvested RSUs outstanding for each of our non-employee directors as of December 31, 2018. Stock options have not been granted to non-employee directors since April 1, 2008, and no such options were outstanding as of December 31, 2018.
Name | Unvested RSUs Outstanding | |||
| Claude R. Canizares | 763 | |||
| Thomas A. Corcoran | 763 | |||
| Ann E. Dunwoody | 763 | |||
| Lewis Kramer | 763 | |||
| Rita S. Lane | 763 | |||
| Robert B. Millard | 763 | |||
| Lloyd W. Newton | 763 | |||
| Vincent Pagano, Jr. | 763 | |||
| H. Hugh Shelton | 763 | |||
The Board has maintained Company stock ownership guidelines for non-employee directors since 2006. Each non-employee director is required to own shares with a value that is equal to six times the annual board member retainer amount. Each non-employee director is required to retain 100% of net shares (after payment of fees, taxes and exercise prices, if applicable) acquired under equity-based awards until the ownership guideline is met.
“Stock ownership” is defined to include shares of Common Stock held outright, unvested RSUs and vested but undelivered RSUs. Unexercised stock options are not taken into account for purposes of the ownership guidelines.
COMPENSATION COMMITTEE INTERLOCKS AND INSIDER PARTICIPATION
None of the individuals who served on our Compensation Committee during the 2018 fiscal year has served us or any of our subsidiaries as an officer or employee or had any relationships requiring disclosure under Item 404 of Regulation S-K during the 2018 fiscal year. None of our executive officers has served on the board of directors or compensation committee of any other entity that has or has had one or more executive officers who served as a member of our Board or our Compensation Committee during the 2018 fiscal year.
| ITEM 12. |
EQUITY COMPENSATION PLAN INFORMATION
The table below sets forth information about shares of our common stock, par value of $0.01 (“Common Stock”) that may be issued under our equity compensation plans as of December 31, 2018. For a description of our equity compensation plans, see Note 18 to the audited consolidated financial statements included in our Initial Form 10-K.
| Equity Compensation Plan Information | ||||||||||||
Plan category | Number of securities to be issued upon exercise of outstanding options, warrants and rights (a) | Weighted-average exercise price of outstanding options, warrants and rights (b) | Number of securities remaining available for future issuance under equity compensation plans (excluding securities reflected in column (a)) (c) | |||||||||
(In millions) | (In millions) | |||||||||||
Equity compensation plans approved by security holders | 2.2 | (1) | $ | 146.70 | (2) | 10.3 | (3) | |||||
| (1) | Represents awards, including stock options, RSUs, RSAs and performance units issuable under the L3 Technologies, Inc. Amended and Restated 2008 Long Term Performance Plan (the “2008 LTPP”) and the L3 Technologies, Inc. Amended and Restated 2008 Directors Stock Incentive Plan (the “2008 DSIP”). The number of shares of Common Stock to be issued in respect of performance units has been calculated based on the assumption that the maximum levels of performance applicable to the performance units will be achieved. |
| (2) | The calculation of the weighted average exercise price excludes the effect of the RSU, RSA and performance unit awards, which have been granted to employees at no cost. |
| (3) | Includes 3.3 million and 7.0 million shares available for future issuance under the L3 Technologies, Inc. 2009 Employee Stock Purchase Plan (the “2009 ESPP”) and the 2008 LTPP, respectively. For purposes of calculating the number of shares available for future issuance under the 2008 LTPP, each share of our Common Stock issued under a “full value” award (that is, awards other than stock options or stock appreciation rights) is counted as 4.26 shares, in the case of awards granted on or after February 23, 2016. |
SECURITY OWNERSHIP OF CERTAIN BENEFICIAL OWNERS
Based on information available to us as of April 15, 2019, we know of no person who beneficially owned more than five percent of the Common Stock, except as set forth below.
Name and Address of Beneficial Owner | Amount and Nature of Beneficial Ownership | Percent of Class | ||||||
The Vanguard Group, Inc. 100 Vanguard Blvd. Malvern, PA 19355(1) | 8,986,137 | 11.4% | ||||||
BlackRock, Inc. 55 East 52nd Street New York, NY 10055(2) | 6,073,343 | 7.7% | ||||||
ClearBridge Investments, LLC 620 8th Avenue New York, NY 10018(3) | 5,147,432 | 6.5% | ||||||
| (1) | Information shown is based on information reported by the filer on a Schedule 13G/A filed with the SEC on February 11, 2019 in which The Vanguard Group, Inc. reported that it has sole dispositive power over 8,880,611 shares of Common Stock, shared dispositive power over 105,526 shares of Common Stock, sole voting power over 90,405 shares of Common Stock and shared voting power over 14,996 shares of Common Stock. The Vanguard Group, Inc. reported that Vanguard Fiduciary Trust Company and Vanguard Investments Australia, Ltd., wholly-owned subsidiaries of The Vanguard Group, Inc., are the beneficial owners of 66,848 shares and 61,212 shares, respectively, of Common Stock as a result of serving as investment manager of collective trust accounts and as investment manager of Australian investment offerings, respectively. |
| (2) | Information shown is based on information reported by the filer on a Schedule 13G/A filed with the SEC on February 6, 2019 in which BlackRock, Inc. reported that it has sole dispositive power over 6,073,343 shares of Common Stock and sole voting power over 5,468,366 shares of Common Stock. |
| (3) | Information shown is based on information reported by the filer on a Schedule 13G/A filed with the SEC on February 14, 2019 in which ClearBridge Investments, LLC reported that it has sole dispositive power over 5,147,432 shares of Common Stock and sole voting power over 4,953,116 shares of Common Stock. |
SECURITY OWNERSHIP OF MANAGEMENT
As of April 15, 2019, there were 79,421,056 shares of our Common Stock outstanding. The following table shows the amount of Common Stock beneficially owned (unless otherwise indicated) by our named executive officers, our directors, and by all of our current executive officers and directors as a group.
Except as otherwise indicated, all information listed below is as of April 15, 2019.
Name of Beneficial Owner | Common Stock Beneficially Owned Directly or Indirectly(1) | Common Stock Acquirable Within 60 Days(2) | Total Common Stock Beneficially Owned | Percentage of Shares of Common Stock Outstanding(3) | ||||||||||||
Directors and Named Executive Officers: | ||||||||||||||||
| Christopher E. Kubasik | 34,486 | 163,529 | 198,015 | * | ||||||||||||
Ralph G. D’Ambrosio | 49,818 | 303,733 | 353,551 | * | ||||||||||||
| Ann D. Davidson | 364 | 11,617 | 11,981 | * | ||||||||||||
Todd W. Gautier | 304 | 21,149 | 21,453 | * | ||||||||||||
Jeffrey A. Miller | 7,818 | 24,442 | 32,260 | * | ||||||||||||
Claude R. Canizares | 4,717 | 13,249 | 17,966 | * | ||||||||||||
Thomas A. Corcoran | 4,971 | 13,249 | 18,220 | * | ||||||||||||
Ann E. Dunwoody | — | 9,755 | 9,755 | * | ||||||||||||
Lewis Kramer | 1,300 | 12,858 | 14,158 | * | ||||||||||||
Rita S. Lane | — | 766 | 766 | * | ||||||||||||
Robert B. Millard(4) | 253,862 | 18,663 | 272,525 | * | ||||||||||||
Lloyd W. Newton | — | 7,817 | 7,817 | * | ||||||||||||
Vincent Pagano, Jr. | — | 7,164 | 7,164 | * | ||||||||||||
H. Hugh Shelton | — | 10,209 | 10,209 | * | ||||||||||||
Directors and Executive Officers as a Group (15 persons) | 357,758 | 618,766 | 976,524 | 1.2% | ||||||||||||
| (1) | The number of shares shown includes shares that are individually or jointly owned and over which the individual has either sole or shared investment or voting authority. The shares of our Common Stock directly owned include the number of shares allocated to the accounts of executive officers under the L3 Technologies Master Savings Plan as follows: Mr. Kubasik, 453 shares; Mr. D’Ambrosio, 2,988 shares; Ms. Davidson, 364 shares; Mr. Gautier, 255 shares; Mr. Miller, 258 shares; and 4,436 shares held by the executive officers as a group. |
| (2) | Shares that are deemed to be beneficially owned by the individual either by virtue of the individual’s right to acquire the shares upon the exercise of outstanding stock options within 60 days from April 15, 2019 and, in the case of non-employee directors, by virtue of the fact that shares issuable upon termination of Board service under outstanding restricted stock unit awards have vested or will vest within 60 days of April 15, 2019. |
| (3) | In computing the percentage ownership of any person, the amount of shares outstanding is deemed to include the amount of shares beneficially owned by such person (and only such person) by reason of the acquisition rights described above. As a result, the percentage of outstanding shares of any person as shown in this table does not necessarily reflect the person’s actual ownership or voting power with respect to the number of shares of Common Stock actually outstanding at April 15, 2019. |
| (4) | Includes 63,545 shares owned by a charitable foundation of which Mr. Millard and his wife are the sole trustees, and as to which Mr. Millard disclaims beneficial ownership. |
| * | Share ownership does not exceed one percent, including stock options exercisable within 60 days of April 15, 2019 and, in the case of non-employee directors, shares issuable upon termination of board service under outstanding restricted stock units that have vested or will vest within 60 days of April 15, 2019. |
CHANGES IN CONTROL
On October 14, 2018, L3 and Harris announced an agreement to combine in an all stock merger of equals. For a further discussion of the Merger, see “Compensation Discussion and Analysis—Company Background and 2018 Performance Achievements—Company Background” on page 12.
CERTAIN RELATIONSHIPS AND RELATED TRANSACTIONS
The Board has adopted a written policy and written procedures for the review, approval and monitoring of transactions involving L3 and “related persons.” For the purposes of the policy, “related persons” include executive officers, directors and director nominees or their immediate family members, or shareholders owning five percent or greater of our outstanding Common Stock.
The related person transaction policy requires:
| • | that any transaction in which a related person has a material direct or indirect interest and which exceeds $120,000 (a “related person” transaction), and any material amendment or modification to a related person transaction, be reviewed and approved or ratified by a committee of the Board composed solely of independent directors who are disinterested, or by the disinterested members of the Board; and |
| • | that any employment relationship or transaction involving an executive officer and any related compensation must be approved by the Compensation Committee or recommended by the Compensation Committee to the Board for its approval. |
In connection with the review and approval or ratification of a related person transaction:
| • | management must disclose to the Compensation Committee or disinterested directors, as applicable, the material terms of the related person transaction, including the approximate dollar value of the amount involved in the transaction, and all material facts as to the related person’s direct or indirect interest in, or relationship to, the related person transaction; |
| • | management must advise the Compensation Committee or disinterested directors, as applicable, as to whether the related person transaction complies with the terms of our agreements governing our material outstanding indebtedness that limit or restrict our ability to enter into related person transactions; |
| • | management must advise the Compensation Committee or disinterested directors, as applicable, as to whether the related person transaction will be required to be disclosed in our SEC filings. To the extent required to be disclosed, management must ensure that the related person transaction is disclosed in accordance with SEC rules; and |
| • | management must advise the Compensation Committee or disinterested directors, as applicable, as to whether the related person transaction constitutes a “personal loan” for purposes of Section 402 of the Sarbanes-Oxley Act of 2002. |
In addition, the related person transaction policy provides that the Compensation Committee, in connection with any approval or ratification of a related person transaction involving a non-employee director or director nominee, should consider whether such transaction would compromise the director or director nominee’s status as an “independent,” “outside,” or “non-employee” director, as applicable, under the rules and regulations of the SEC, NYSE and the Internal Revenue Code.
During 2018, we did not enter into any transactions with related persons that required review, approval or ratification under the Board’s related person transaction policy.
DIRECTOR INDEPENDENCE
Pursuant to the rules of the NYSE, a director is not independent unless the Board affirmatively determines that he or she does not have a direct or indirect material relationship with the Company. Furthermore, as part of our Corporate Governance Guidelines, the Board has adopted categorical standards to assist it in evaluating the independence of each of its directors. The categorical standards are intended to assist the Board in determining whether or not certain relationships between our directors and us, either directly or as a partner, shareholder or officer of an organization that has a relationship with us, are “material relationships” for purposes of the NYSE independence standards. The categorical standards establish thresholds at which such relationships are deemed not to be material. Our Corporate Governance Guidelines, which include our categorical standards of independence, can be obtained through our website at http://www.L3T.com.
The Board has affirmatively determined that no director other than Mr. Kubasik, including those who serve on the Audit and Ethics, Compensation and Nominating and Governance Committees of the Board, has a material relationship with us, either directly or as a partner, shareholder or officer of an organization that has a relationship with us. Accordingly, the Board has concluded that all of our directors, other than Mr. Kubasik, are “independent” under the rules of the NYSE and our Corporate Governance Guidelines.
In connection with its independence determination, the Board considered that:
| • | The Company conducts business with the Massachusetts Institute of Technology, where Mr. Millard is chair of the Massachusetts Institute of Technology Corporation and Professor Canizares is employed as a full time professor. In no instances did the amount received by the Company or such other organization in fiscal 2018 exceed the greater of $1 million or 1% of either the Company’s or such other organization’s consolidated gross revenues. Mr. Millard and Professor Canizares did not have any interest in these transactions and were not involved in decisions regarding L3 with respect to these transactions. |
| • | General (Ret.) Dunwoody serves as a director (but not as an executive officer or employee) for non-profit organizations to which we have made charitable contributions. Contributions to each of these organizations did not exceed the greater of $120,000 or 1% of the organization’s annual consolidated gross revenues during its last completed fiscal year and were below the thresholds set forth under our categorical standards of director independence. |
In addition, the Board has determined that Professor Canizares and Messrs. Corcoran, Kramer and Pagano and Ms. Lane, the current members of the Audit and Ethics Committee, and Messrs. Corcoran, Millard and Kramer and General (Ret.) Newton, the current members of the Compensation Committee, are “independent” in accordance with the NYSE standards applicable to members of the Audit and Ethics Committee and Compensation Committee, respectively.
For services rendered in 2018 and 2017 by PricewaterhouseCoopers LLP, our independent registered public accounting firm, we incurred the following fees:
Year | ||||||||
2018 | 2017 | |||||||
Audit Fees(1) | $ | 16,563,782 | $ | 17,306,922 | ||||
Audit-Related Fees(2) | 1,195,716 | 7,087,252 | ||||||
Tax Fees(3) | 9,200,233 | 8,815,184 | ||||||
All Other Fees(4) | 1,101,369 | 62,780 | ||||||
| (1) | Represents fees incurred for the annual audits of the consolidated financial statements and internal control over financial reporting, quarterly reviews of interim financial statements and statutory audits of foreign subsidiaries. Audit fees for 2018 include additional fees for procedures related to the new revenue recognition standard and fees incurred as part of the Form S-4 filing relating to the L3 Harris merger. |
| (2) | Represents fees incurred primarily for the sell-side due diligence for the Vertex Aerospace divestiture. Audit-related fees for 2017 include fees incurred for: (a) employee-benefit plan audits, which include fees paid by both the Company and the employee benefit plans and (b) Vertex Aerospace stand-alone financial statements. |
| (3) | Represents fees incurred for: (a) U.S. and foreign income tax compliance, (b) expatriate tax services, (c) state tax planning services and (d) acquisition, divestiture and restructuring-related tax services. Tax fees related to tax compliance in 2018 and 2017 were $2,302,571 and $1,987,934, respectively. |
| (4) | Primarily represents advisory fees for benchmarking services. |
The Audit and Ethics Committee has considered and determined that the provision of the services covered under the captions “Audit-Related Fees,” “Tax Fees” and “All Other Fees” is compatible with maintaining the registered public accounting firm’s independence.
In accordance with its charter, the Audit and Ethics Committee has established pre-approval policies with respect to annual audit, other audit and audit-related services and permitted non-audit services to be provided by our independent registered public accounting firm and related fees. The Audit and Ethics Committee has pre-approved detailed, specific services. Fees related to the annual audits of our consolidated financial statements, including the Section 404 attestation, are specifically approved by the Audit and Ethics Committee on an annual basis. All fees for pre-approved other audit and audit-related services are pre-approved annually or more frequently, if required, up to a maximum amount equal to 50% of the annual audit fee. All fees for pre-approved permitted non-audit services are pre-approved annually or more frequently, if required, up to a maximum amount equal to 50% of the fees for audit and audit related services as reported in our most recently filed proxy statement with the SEC. Fees for permitted non-audit services that exceed 50% of the fees for audit and audit related services as reported in our most recently filed proxy statement with the SEC are approved by the Audit and Ethics Committee as required. The Audit and Ethics Committee also pre-approves any proposed engagement to provide services not included in the approved list of audit and permitted non-audit services and for fees in excess of amounts previously pre-approved. One or more designated members of the Audit and Ethics Committee may approve these services and related fees and expenses on behalf of the Audit and Ethics Committee, provided that such approval is reported to the Audit and Ethics Committee at the next regularly scheduled meeting.
All of the services covered under the captions “Audit Fees,” “Audit-Related Fees,” “Tax Fees” and “All Other Fees” were pre-approved by the Audit and Ethics Committee.
PART IV
The agreements and other documents filed as exhibits to this report are not intended to provide factual information or other disclosure other than with respect to the terms of the agreements or other documents themselves, and you should not rely on them for that purpose. In particular, any representations and warranties made by us in these agreements or other documents were made solely within the specific context of the relevant agreement or document and may not describe the actual state of affairs as of the date they were made or at any other time.
| (a)(1) | Financial statements filed as part of this report: |
The consolidated financial statements of the Company were previously filed with the Initial Form 10-K.
| (a)(2) | Financial Statement Schedules |
Financial statement schedules are omitted since the required information is either not applicable or is included in our audited consolidated financial statements.
| (a)(3) | Exhibits |
Exhibit No. | Description of Exhibits | |
| Certification of Chairman, Chief Executive Officer and President pursuant to Rule 13a-14(a) and Rule 15d-14(a) of the Securities Exchange Act of 1934, as amended. | ||
| Certification of Senior Vice President and Chief Financial Officer pursuant to Rule 13a-14(a) and Rule 15d-14(a) of the Securities Exchange Act of 1934, as amended. |
| * | Filed herewith. |
Pursuant to the requirements of Section 13 or 15(d) of the Securities Exchange Act of 1934, the Registrant has duly caused this report to be signed on its behalf by the undersigned, thereunto duly authorized.
| L3 TECHNOLOGIES, INC. | ||
| By: | /s/ Ralph G. D’Ambrosio | |
| Title: | Senior Vice President and Chief Financial Officer | |
| Date: April 30, 2019 | ||
67