UNITED STATES
SECURITIES AND EXCHANGE COMMISSION
Washington, D.C. 20549
FORM 10-K
| | | |
| þ | | Annual Report Pursuant to Section 13 or 15(d) of the Securities Exchange Act of 1934 |
For the Fiscal Year Ended December 31, 2007
OR
| | | |
| o | | Transition report pursuant to Section 13 or 15(d) of the Securities Exchange Act of 1934 |
Commission File Number 000-23019
KENDLE INTERNATIONAL INC.
| | | |
| Ohio | | IRS Employer ID |
| (State or other jurisdiction | | No. 31-1274091 |
| of incorporation or organization) | | |
441 Vine Street, 1200 Carew Tower
Cincinnati, Ohio 45202
513-381-5550
Securities Registered Pursuant to Section 12(b) of the Act:
| | | |
| Title of each class | | Name of each exchange on which registered |
| | | |
| Common Stock, no par value | | The NASDAQ Stock Market LLC |
| | | (NASDAQ Global Select Market) |
Securities Registered Pursuant to Section 12(g) of the Act:
None
Indicate by check mark if the registrant is a well-known seasoned issuer, as defined in Rule 405 of the Securities Act. Yeso. Noþ
Indicate by check mark if the registrant is not required to file reports pursuant to Section 13 or Section 15(d) of the Act. Yeso. Noþ
Indicate by check mark whether the Registrant (1) has filed all reports required to be filed by Section 13 or 15(d) of the Securities Exchange Act of 1934 during the preceding 12 months (or for such shorter period that the registrant was required to file such reports), and (2) has been subject to such filing requirements for the past 90 days. Yesþ. Noo
Indicate by check mark if disclosure of delinquent filers pursuant to Item 405 of Regulation S-K is not contained herein, and will not be contained, to the best of registrant’s knowledge, in definitive proxy or information statements incorporated by reference in Part III of this Form 10-K or any amendment to this Form 10-K.þ
Indicate by check mark whether the Registrant is a large accelerated filer, an accelerated filer, or a non-accelerated filer. See definition of “accelerated filer and large accelerated filer” in Rule 12b-2 of the Exchange Act.
Large accelerated filero Accelerated filerþ Non-accelerated filero Smaller reporting companyo
Indicate by check mark whether the registrant is a shell company (as defined in Rule 12b-2 of the Exchange Act). Yeso. Noþ
The aggregate market value of the Registrant’s Common Stock at June 29, 2007, held by non-affiliates was $469,273,080 (based on the $36.77 closing price of the Company’s Common Stock on The NASDAQ Global Select Market LLC on June 29, 2007). Shares of Common Stock held by each Executive Officer and Director and by any person who owns 10% or more of the outstanding Common Stock have been excluded in that such person might be deemed to be an affiliate.
As of March 3, 2008, 14,715,068 shares of no par value Common Stock were issued and 14,692,016 shares of no par value Common Stock were outstanding.
Documents Incorporated by Reference
Portions of the Registrant’s Proxy Statement to be filed with the Commission for its 2008 Annual Meeting of Shareholders to be held May 15, 2008, are incorporated by reference into Part III.
See Exhibit Index on page 33.
Kendle International Inc.
Form 10-K Annual Report
For the Fiscal Year Ended December 31, 2007
Table of Contents
| | | | | |
| | | Page |
| | | | |
| | | | | |
| | | 3 | |
| | | 5 | |
| | | 9 | |
| | | 9 | |
| | | 10 | |
| | | 10 | |
| | | | | |
| | | | |
| | | | | |
| | | 10 | |
| | | 12 | |
| | | 13 | |
| | | 26 | |
| | | 28 | |
| | | 28 | |
| | | 28 | |
| | | 30 | |
| | | | | |
| | | | |
| | | | | |
| | | 30 | |
| | | 31 | |
| | | 31 | |
| | | 32 | |
| | | 33 | |
| | | | | |
| | | | |
| |
| | | 33 | |
| | | | | |
| | | | |
2
This Annual Report on Form 10-K contains certain statements that are “forward-looking statements” within the meaning of the Private Securities Litigation Reform Act of 1995. These statements are subject to a number of assumptions, risks and uncertainties, many of which are beyond the control of Kendle International Inc. (the Company or Kendle). See “Item1A - Risk Factors” for further information.
The forward-looking statements speak as of the date made and are not guarantees of future performance. Actual results or developments may differ materially from the expectations expressed or implied in the forward-looking statements, and the Company undertakes no obligation to update any such statements.
PART I
ITEM 1.
BUSINESS
General
Kendle International Inc., an Ohio corporation established in 1989, is a global clinical research organization (CRO) that provides a broad range of Phase I-IV global clinical development services to the biopharmaceutical industry. The Company augments the research and development activities of biopharmaceutical companies by offering high-quality, value-added clinical research services and proprietary information technology designed to reduce drug development time and expense. The Company is managed in two reportable segments, Early Stage and Late Stage. The Early Stage business currently focuses on the Company’s Phase I operations, while Late Stage is comprised of clinical development services related to Phases II through IV.
The Company believes that the outsourcing of drug development activities by biopharmaceutical companies has been increasing and will continue to increase as these companies strive to grow revenues through an accelerated drug development cycle while responding to cost containment pressures. The CRO industry, by specializing in clinical trial management, often performs the needed services with a higher level of expertise or specialization at a faster pace and at a lower cost than a biopharmaceutical company could perform such services internally.
Acquisition Activity
In April 2006, the Company completed its acquisition of a Latin America CRO, International Clinical Research Limited (“IC-Research”) and related companies. IC-Research is a leading CRO in Latin America with operations in Argentina, Brazil, Chile and Colombia. This acquisition supports the Company’s goal of strategic business expansion and diversification in high-growth regions to deliver global clinical trials for its customers. The acquisition closed in April 2006.
In August 2006, the Company acquired the Phase II-IV Clinical Services business of Charles River Laboratories International, Inc. (“CRL Clinical Services”). The acquisition strengthened the Company’s position as one of the leading global players in the clinical development industry, adding therapeutic expertise, diversifying its customer base and expanding its capacity to deliver large global trials.
Business Strategy
The Company’s strategy is to continue to enhance its reputation as a high-quality, global provider of a full range of CRO services. The Company’s strategy consists of the following strategic initiatives:
| | • | | Driving growth in the Company’s core competency in Phases I through IV clinical trials. |
| |
| | • | | Meeting the specific development pipeline needs for the Company’s targeted customers. |
| |
| | • | | Gaining share in the CRO market through further penetration in the large (greater than $10 million in contract value) trial sector as well as continued expansion in mid-sized trials. |
| |
| | • | | Expanding the Company’s geographic footprint with a focus on high-growth regions such as Africa and Asia/Pacific. |
| |
| | • | | Setting the stage for business mix expansion, such as expansion in support of Early Stage. |
| |
| | • | | Building infrastructure to support the continued expansion and growth of the Company. |
| EX-10.24 |
| EX-12.1 |
| EX-21 |
| EX-23.1 |
| EX-24 |
| EX-31.1 |
| EX-31.2 |
| EX-32.1 |
| EX-32.2 |
3
Customers and Marketing
Net service revenues from the top five customers accounted for approximately 25% of the Company’s total net service revenues for the year ended December 31, 2007 compared to 28% for the year ended December 31, 2006. No customer accounted for more than 10% of the Company’s net service revenues for 2007. In 2006, net service revenues from Pfizer, Inc. accounted for approximately 12% of the Company’s net service revenues. No other customer accounted for more than 10% of 2006 net service revenues.
Segment and geographic information for the Company is contained in Note 14 to the Consolidated Financial Statements.
Backlog
Backlog consists of anticipated net service revenue from contracts, letters of intent and other forms of commitments (collectively defined as backlog) that either have not started but are anticipated to begin in the near future, or are in process and have not been completed. Amounts included in backlog represent anticipated future net service revenue and exclude net service revenue that has been recognized previously in the Consolidated Statements of Operations. Once contracted work begins, net service revenue is recognized in the Consolidated Statements of Operations. Backlog at December 31, 2007, was approximately $869 million compared to approximately $659 million at December 31, 2006. The average duration of the contracts in backlog fluctuates from quarter to quarter based on the contracts constituting backlog at any given time. The Company generally experiences a longer period of time between contract award and revenue recognition with respect to large contracts covering global services. As the Company increasingly competes for and enters into large contracts that are global in nature, the Company expects the average duration of the contracts in backlog to increase.
No assurance can be given that the Company will be able to realize the net service revenues that are included in the backlog. Backlog is not necessarily a meaningful indicator of future results for a variety of reasons, including, but not limited to, the following: (i) contracts vary in size and duration, with revenue from some studies realized over a number of years; (ii) the scope of contracts may change, either increasing or decreasing the value of the contract; and (iii) studies may be terminated or delayed by the study’s sponsor or by regulatory authorities.
Competition
The Company competes primarily against in-house research and development departments of biopharmaceutical companies, universities, teaching hospitals and other full-service CROs, some of which possess substantially greater capital, technical expertise and other resources than the Company. CROs generally compete on the basis of past performance for a customer, medical and scientific expertise in specific therapeutic areas, the quality of services provided, the ability to manage large-scale trials on a global basis, medical database management capabilities, the ability to provide statistical and regulatory services, the ability to recruit investigators, the ability to recruit patients into studies, the ability to integrate information technology with systems to improve the efficiency of clinical research, an international presence with strategically located facilities and financial viability and price.
The CRO industry is highly fragmented with hundreds of CROs ranging from small, limited-service providers to full-service, global drug development corporations. Some of the full-service CROs competing with the Company include Covance, Inc., PAREXEL International Corporation, Pharmaceutical Product Development, Inc., ICON plc, PRA International and Quintiles Transnational Corporation.
Government Regulation
The Company’s clinical services are subject to industry standards for the conduct of clinical research and development studies that are contained in regulations for Good Clinical Practice (GCP). The Food and Drug Administration (FDA) in the United States and the European Agency for the Evaluation of Medicinal Products in Europe (EMEA), along with other regulatory bodies, require that clinical trial test results submitted to the regulatory bodies be based on studies conducted in accordance with GCP.
In addition, the International Conference on Harmonization — Good Clinical Practice Guidelines provides guidance on GCP. The Company implements and revises its standard operating procedures to facilitate GCP compliance.
Employees
As of December 31, 2007, the Company employed approximately 3,325 associates, about 55% of whom were employed outside the United States. None of the Company’s employees are covered by a collective bargaining agreement and the Company believes its relations with its associates are good. Employees in certain of the Company’s non-U.S. locations are represented by workers’ councils as required by local laws.
4
Available Information
The Company maintains a Web site at the addresswww.kendle.com. The Company is not including the information contained on its Web site as a part of, or incorporating it by reference into, this Annual Report on Form 10-K. The Company makes available free of charge through its Web site its Annual Reports on Form 10-K, Quarterly Reports on Form 10-Q and Current Reports on Form 8-K, and amendments to these reports, as soon as reasonably practicable after it electronically files such material with, or furnishes such material to, the Securities and Exchange Commission (SEC).
Required filings by the Company’s officers and directors with respect to the Company furnished in electronic form are also made available on its Web site as are the Company’s proxy statement for its annual meeting of shareholders. These filings also may be read or copied at the SEC’s Public Reference Room located in Washington, D.C. The SEC also maintains an Internet site (http://www.SEC.gov) that contains reports, proxy statements and other information regarding issuers that file electronically with the SEC.
ITEM 1A.
RISK FACTORS
Certain statements contained in this Annual Report on Form 10-K that are not historical facts constitute forward-looking statements, within the meaning of the Private Securities Litigation Reform Act of 1995, and are intended to be covered by the safe harbors created by that Act. Reliance should not be placed on forward-looking statements because they involve known and unknown risks, uncertainties and other factors that may cause actual results, performance or achievements to differ materially from those expressed or implied. Forward-looking statements generally contain the words “believe”, “expect,” “may,” “anticipate,” “intend,” “estimate,” “project,” “plan,” “assume,” “seek to” or other similar expressions, although not all forward-looking statements contain these identifying words. Any forward-looking statement speaks only as of the date made. The Company undertakes no obligation to update any forward-looking statements to reflect events or circumstances arising after the date on which they are made.
Statements concerning expected financial performance, on-going business strategies and possible future action which the Company intends to pursue to achieve strategic objectives constitute forward-looking information. Implementation of these strategies and the achievement of such financial performance are each subject to numerous conditions, uncertainties and risk factors.
Factors that could cause actual performance to differ materially from these forward-looking statements include, without limitation, the following:
The Company depends on the biopharmaceutical industry for most of its revenue.
The Company’s revenues depend on the outsourcing trends, size of the drug-development pipeline and research and development expenditures of the biopharmaceutical industry. Economic factors and industry trends that affect companies in those industries affect its business. A slowdown in research and development spending in the biopharmaceutical industry could negatively affect its net service revenues and results of operations. Mergers and acquisitions in the biopharmaceutical industry and the related rationalization of the drug-development pipelines could result in delay or cancellation of certain projects.
The Company’s contracts may be delayed, terminated or reduced in scope with little or no notice.
Many of the Company’s contracts provide for services on a fixed-price basis and may be terminated or reduced in scope with little or no notice. Cancellations may occur for a variety of reasons, including the failure of the product to satisfy safety requirements, the Customer’s inability to manufacture sufficient quantities of the drug, unexpected results of the product or the client’s decision to terminate the development of a product.
The loss, reduction in scope or delay of a large contract or the delay of multiple contracts could have a material adverse effect on the Company’s results of operations, although its contracts entitle it to receive payments for work performed in the event of a cancellation. Cancellation or delay of a large contract or multiple contracts could leave the Company with under-utilized resources and thereby negatively affect its net service revenues and results of operations. The Company believes its aggregate backlog and is not necessarily a meaningful indicator of future net service revenues and financial results.
The fixed price nature of many of the Company’s contracts could result in financial losses.
Because many of the Company’s contracts are structured as fixed price, it is at financial risk if it initially underbids the contract or overruns the initial cost estimates. Such under-bidding or significant cost overruns could have a material adverse effect on the Company’s business, results of operations, financial condition and cash flows.
If the Company fails to hire, retain and integrate qualified personnel, it will be difficult for it to achieve its goals.
The Company’s success depends to a significant extent upon the skills, experience and efforts of its senior management team and its ability to hire qualified personnel in the regions in which it operates. The loss of any of the Company’s executive officers or other key
5
employees, without a properly executed transition plan, could have an adverse effect on it. In addition, there is substantial competition among both CROs and biopharmaceutical companies for qualified personnel. Difficulty recruiting or retaining qualified personnel and/or unexpected recruiting costs will affect the Company’s ability to meet financial and operational goals.
If the Company is required to write off goodwill or other intangible assets acquired in its business combinations, its financial position and results of operations would be adversely affected.
For the year ended December 31, 2006, the Company incurred a non-cash goodwill impairment charge of $8.2 million relating to a customer relationship intangible asset acquired in 2002 (see Note 5 to the Consolidated Financial Statements). The Company had goodwill and other acquisition-related intangible assets of approximately $250 million and $254 million (after deducting the impairment charge) as of December 31, 2007 and December 31, 2006, respectively, which constituted approximately 50% and 56%, respectively, of its total assets at these periods. The Company periodically evaluates goodwill and other acquired intangible assets for impairment. Any future determination requiring the write off of a significant portion of the Company’s goodwill or other acquired intangible assets could adversely affect its results of operations and financial condition.
The CRO industry is highly competitive.
The CRO industry is comprised of a wide range of competitors, including small, niche providers as well as full-service global clinical research organizations. These companies compete based on a variety of factors, including reputation for quality performance, price, scope of service offerings and geographic presence. Some of the Company’s competitors have greater financial resources and a wider range of service offerings over a greater geographic area. Additionally, the Company’s customers have in-house capabilities to perform services that are provided by CROs. These factors potentially could have a negative impact on the Company’s ability to win business awards.
The Company has grown rapidly and its growth has placed, and is expected to continue to place, significant demands on it.
The Company has grown rapidly. Some of this growth has come as a result of acquisitions, and the Company continues to evaluate new acquisition opportunities. Businesses that grow rapidly often have difficulty managing their growth. The Company’s rapid growth has placed, and is expected to continue to place, significant demands on its management, its business and on its financial, accounting, information and other systems. The Company needs to continue recruiting and employing experienced executives and key employees capable of providing the necessary support. In addition, the Company will need to continue to improve its financial, accounting, information and other systems in order to effectively manage the Company’s growth. The Company’s ability to grow successfully through acquisitions could be affected by expenses incurred in integrating an acquired company, losses of key employees from an acquired company and unforeseen risks in acquiring companies in certain geographies. The Company cannot assure you that its management will be able to manage the Company’s growth and integrate acquired businesses effectively or successfully, or that its financial, accounting, information or other systems will be able to successfully accommodate the Company’s external and internal growth. A failure to meet these challenges could materially impair our business. Additionally, depending upon the nature of the consideration in an acquisition, an acquisition could result in dilution to existing shareholders.
The Company’s backlog is composed of contracts varying in terms of amounts, global nature and type. To the extent this mix of contracts continues to shift toward larger (in excess of $10 million) contracts with a more global component, this may cause the rate at which this backlog converts into revenue to lengthen when compared with historical trends.
As the Company increasingly competes for and enters into large contracts that are more global in nature, the Company expects the rate at which this backlog converts into revenue, referred to as the “conversion rate”, to increase (or lengthen). An increase in this conversion rate means that the rate of revenue recognized on these large contract awards may be slower than what the Company has experienced in the past, which could impact the Company’s net service revenues and results of operations on a quarterly and annual basis. The revenue recognition on larger, more global in nature projects could be slower than on smaller, less global in nature projects for a variety of reasons, including but not limited to an extended period of negotiation between the time the project is awarded to the Company and the actual signature of the contract as well as an increased timeframe for obtaining the regulatory approvals necessary.
The Company’s indebtedness could adversely affect its business and financial condition.
As of December 31, 2007, the Company had $200.0 million in convertible debt outstanding and an additional $53.5 million of borrowing capacity under a revolving line of credit as well as approximately $0.5 million of obligations outstanding under capital leases. The Company maintains a $5.0 million multicurrency facility that is renewable annually and used in connection with its European operations. For a description of the Company’s indebtedness and that of its subsidiaries, see Liquidity and Capital Resources section of Management’s Discussion and Analysis of Financial Condition and Results of Operations.
The Company’s level of indebtedness will have several important effects on its future operations. For example, the Company will be required to use a portion of its cash flow from operations for the payment of principal and interest due on its outstanding indebtedness. In addition, the Company’s outstanding indebtedness and leverage could increase the impact of negative changes in general economic and industry conditions, as well as competitive pressures. Finally, the level of the Company’s outstanding indebtedness may affect its ability to obtain additional financing for working capital, capital expenditures or general corporate purposes.
6
General economic conditions as well as conditions affecting the Company’s operations specifically, including, but not limited to, financial and business conditions, many of which are beyond its control, may affect its future performance. As a result, these and other factors may affect the Company’s ability to make principal and interest payments on its indebtedness. The Company’s business might not continue to generate cash flow at or above current levels. Moreover, if the Company is required to repatriate foreign earnings in order to pay its debt service, it may incur additional income taxes. If the Company cannot generate sufficient cash flow from operations in the future to service its indebtedness, it may, among other things:
| | • | | Seek additional financing in the debt or equity markets; |
| |
| | • | | Seek to refinance or restructure all or a portion of its indebtedness; |
| |
| | • | | Sell selected assets; |
| |
| | • | | Reduce or delay planned capital expenditures |
These measures might not be sufficient to enable the Company to service its indebtedness. In addition, any financing, refinancing or sale of assets might not be available on economically favorable terms, if at all.
Furthermore, the Company’s credit facility contains certain restrictive covenants which will affect, and in many respects significantly limit, management’s choices in responding to business, economic, regulatory and other competitive conditions.
The current accounting treatment applicable to the Company’s Convertible Notes may be rescinded.
The Financial Accounting Standards Board (FASB) recently proposed FASB Staff Position (FSP) APB 14-a,Accounting for Convertible Debt Instruments That May Be Settled in Cash Upon Conversion (Including Partial Cash Settlement) (FSP 14-a). The proposed FSP specifies that issuers of convertible debt instruments should separately account for the liability and equity components of the instrument in a manner that will reflect the entity’s nonconvertible debt borrowing rate on the instrument’s issuance date when interest cost is recognized in subsequent periods. The Company has issued convertible notes that are within the scope of FSP APB 14-a; therefore, the Company would be required to record the debt portions of our convertible notes at their fair value on the date of issuance and amortize the resulting discount into interest expense over the life of the debt. However, there would be no effect on cash interest payments. The FASB is scheduled to re-deliberate the guidance in the current proposed, FSP APB 14-a in 2008 and it remains unclear as to the final form and effective date of this proposal. The Company will continue to monitor the status of this staff position and will evaluate the impact on its consolidated financial statements when more definitive information becomes available. If adopted in its current form, the proposed change would result in a significant increase in reported interest expense with respect to the Convertible Notes (defined in Recent Developments and CRO Marketplace in Management’s Discussion and Analysis).
The Company’s convertible note hedge and warrant transactions may affect the trading price of its common stock.
In connection with the issuance of the Company’s Convertible Notes (see Note 7, Debt), the Company entered into convertible note hedge transactions with the participating Underwriter and JP Morgan Chase (collectively, the counterparties). The convertible note hedge transactions are comprised of purchased call options and sold warrants. The purchased call options are expected to reduce our exposure to potential dilution upon the conversion of the Convertible Notes. The Company also entered into warrant transactions with such counterparties. The sold warrants have an exercise price that is approximately 70% higher than the closing price of our common stock on the date the Convertible Notes were priced. The warrants are expected to provide us with some protection against increases in our stock price over the conversion price per share. In connection with these transactions, the counterparties, or their affiliates:
| | • | | may enter into various over-the-counter derivative transactions or purchase or sell the Company’s common stock in secondary market transactions; and |
| |
| | • | | may enter into, or may unwind, various over-the-counter derivatives or purchase or sell the Company’s common stock in secondary market transactions, including during any conversion reference period with respect to a conversion the Convertible Notes. |
These activities may have the effect of increasing, or preventing a decline in, the market price of the Company’s common stock. In addition, any hedging transactions by the counterparties, or their affiliates, including during any conversion reference period, may have an adverse impact on the trading price of the Company’s common stock. The counterparties, or their affiliates, are likely to modify their hedge positions from time to time prior to conversion or maturity of the Convertible Notes by purchasing and selling shares of the Company’s common stock or other instruments, including over-the-counter derivative instruments, that they may wish to use in connection with such hedging. In addition, the Company intends to exercise its purchased call options whenever the Convertible Notes are converted, although not required to do so. In order to unwind any hedge positions with respect to our exercise of the purchased call options, the counterparties or their affiliates would expect to sell shares of common stock in secondary market transactions or unwind various over-the-counter derivative transactions with respect to the Company’s common stock during the conversion reference period for any Convertible Notes that may be converted.
7
The effect, if any, of any of these transactions and activities in connection with the Convertible Notes on the market price of the Company’s common stock will depend in part on market conditions and cannot be ascertained at this time, but any of these activities could adversely affect the trading price of the Company’s common stock and, as a result, the number of shares and value of the common stock received upon conversion of the Convertible Notes.
Change in government regulation could adversely affect the Company.
Government agencies regulate the drug development process utilized by the Company in its work with biopharmaceutical companies. Changes in regulations that simplify the drug approval process or increases in regulatory requirements that lessen the research and development efforts of the Company’s customers could negatively affect it. In addition, any failure on the Company’s part to comply with existing regulations or in the adoption of new regulations could impair the value of its services and result in the termination of or additional costs under its contracts with customers.
The Company’s international operations are subject to numerous risks.
The Company has international operations in many foreign countries, including South Africa, India and countries in Eastern Europe and Latin America. These operations are subject to risks and uncertainties inherent in operating in these countries, including government regulations, currency restrictions and other restraints, burdensome taxes and political instability. These risks and uncertainties could impact negatively the Company’s ability to perform large, global projects for its customers. Furthermore, the Company’s ability to deal with these issues could be affected by applicable U.S. laws and the need to protect its assets in those locations.
The Company’s quarterly operating results may vary.
The Company’s operating results may vary significantly from quarter to quarter and are influenced by a variety of factors, such as:
| | • | | Exchange rate fluctuations; |
| |
| | • | | Timing of contract amendments for changes in scope that could affect the value of a contract and potentially impact the amount of net service revenues from quarter to quarter. |
| |
| | • | | Commencement, completion or cancellation of large contracts; |
| |
| | • | | Progress of ongoing contracts; |
| |
| | • | | Timing of and charges associated with completed acquisitions or other events; and |
| |
| | • | | Changes in the mix of our services. |
The Company believes that operating results for any particular quarter are not necessarily a meaningful indication of future results. Although fluctuations in quarterly operating results could negatively or positively affect the market price of the Company’s common stock, these fluctuations may not be related to future overall operating performance.
The Company’s financial results are exposed to exchange rate fluctuations.
For the year ended December 31, 2007, approximately 50% of the Company’s net service revenues were derived from operations outside the United States compared to 45% in the same period of 2006. The Company’s consolidated financial statements are denominated in U.S. dollars. As a result, changes in foreign currency exchange rates could significantly affect the Company’s results of operations, financial position and cash flows as well as its ability to finance large acquisitions outside the United States.
The Company’s business could expose it to potential liability for personal injury claims that could affect its financial condition.
The Company’s business involves clinical trial management which includes the testing of new drugs on human volunteers. This business exposes the Company to the risk of liability for personal injury or death to patients resulting from, among other things, possible unforeseen adverse side effects or improper administration of a drug or device. Many of these volunteers and patients are already seriously ill and are at risk of further illness or death. Any claim or liability could have a material adverse effect on the Company’s financial position and its reputation if, as a result, it were required to pay damages or incur defense costs in connection with a claim and if: (i) such claim is outside the scope of indemnification agreements the Company has with clients and collaborative partners, (ii) an indemnification agreement is not performed in accordance with its terms or (iii) its liability exceeds the amount of any applicable indemnification limits or available insurance coverage. The Company might also not be able to purchase adequate insurance for these risks at reasonable rates in the future.
The Company’s operations might be affected by the occurrence of a natural disaster or other catastrophic event.
The Company depends on its clients, investigators, collaboration partners and other facilities for the continued operation of its business. Natural disasters or other catastrophic events, including terrorist attacks, pandemic flu, hurricanes and ice storms, could disrupt the Company’s operations or those of its clients, investigators and collaboration partners, which could also affect the Company. Even though the Company carries business interruption insurance policies and typically has provisions in its contracts that protect it in certain events, the Company might suffer losses as a result of business interruptions that exceed the coverage available under its insurance policies or for which the policies do not provide coverage. Any natural disaster or catastrophic event affecting the
8
Company or its clients, investigators or collaboration partners could have a significant negative impact on its operations and financial performance.
The Company’s business depends on the continued effectiveness and availability of its information technology infrastructure, and failures of this infrastructure could harm its operations.
To remain competitive in the Company’s industry, it must employ information technologies that capture, manage, and analyze the large streams of data generated during the clinical trials we manage in compliance with applicable regulatory requirements. In addition, because the Company provides services on a global basis, it relies extensively on its technology to allow the concurrent conduct of studies and work sharing around the world. As with all information technology, the Company’s system could become vulnerable to potential damage or interruptions from fires, blackouts, telecommunications failures and other unexpected events, as well as to break-ins, sabotage or intentional acts of vandalism. Given the extensive reliance of the Company’s business on this technology, any substantial disruption or resulting loss of data that is not avoided or corrected by its backup measures could harm its business and operations.
The nature of the Company’s business exposes it to litigation and regulatory risk.
The nature of the Company’s business exposes it to litigation risk, and it is a party to lawsuits in the ordinary course of its business. While the Company does not believe that the resolution of any currently pending lawsuits against it will, individually or in the aggregate, have a material adverse effect on its business, financial condition or results of operations, it is possible that one or more lawsuits to which it’s currently a party to or to which it subsequently becomes a party to, could adversely affect it in the future. In addition, failure to comply with applicable regulatory requirements can result in actions that could adversely affect the Company’s business and financial performance.
Anti-takeover provisions in the Company’s charter documents and under Ohio law may make an acquisition of it, which may be beneficial to its stockholders, more difficult, which could depress its stock price.
Certain provisions of the Company’s Articles of Incorporation and Code of Regulations and of Ohio law make it difficult for a third party to acquire control of it without the consent of its Board of Directors (Board). These anti-takeover defenses may discourage, delay or prevent a transaction involving a change in control of the Company, and, accordingly, could limit the price that investors may be willing to pay for its common stock, including transactions in which holders of common stock might receive a premium for their shares over the market price. In cases where Board approval is not obtained, these provisions could also discourage proxy contests and make it more difficult for existing shareholders to elect directors of their choosing and cause the Company to take other corporate actions they desire. These provisions include:
| | • | | the authorization of undesignated preferred stock, the terms, rights, privileges and restrictions of which may be established and shares of which may be issued without shareholder approval; |
| |
| | • | | limitations on persons authorized to call a special meeting of shareholders; and |
| |
| | • | | advance notice procedures required for shareholders to nominate candidates for election as directors or to bring matters before an annual meeting of shareholders. |
In addition, the Company has adopted a shareholder rights plan that may have anti-takeover effects which will make an acquisition of it by another company more difficult. The Company’s shareholder rights plan provides that, in the event any person or entity acquires 15% or more of its outstanding common stock, its shareholders will be entitled to purchase shares of common stock, or in certain instances, shares of the acquirer, at a discounted price. The rights are intended to discourage a significant share acquisition, merger or tender offer involving the Company’s common stock by increasing the cost of effecting any such transaction and, accordingly, could have an adverse impact on a takeover attempt that a shareholder might consider to be in the Company’s best interests.
ITEM 1B.
UNRESOLVED STAFF COMMENTS
None.
ITEM 2.
PROPERTIES
The Company leases all of its facilities with the exception of the Company-owned facility in Ely, United Kingdom. The Company’s principal executive offices are located in Cincinnati, Ohio. Early in 2008, the Company entered into a lease extension which extended the term of the lease from 2009 to 2019 and increased the amount of space leased from approximately 122,000 square feet to
9
approximately 130,000 square feet. The lease extension also provides the Company with an opportunity to lease additional space in the future.
In addition, the Company leases substantial facilities in Durham, North Carolina; Munich, Germany; Crowthorne, United Kingdom; Edinburgh, United Kingdom; Utrecht, The Netherlands; and Mexico City, Mexico. The Company’s Early Stage operations are located in Morgantown, West Virginia and Utrecht, The Netherlands. The Company also maintains offices in various other North American, European and Australian locations, as well as in Latin America and South Africa.
Management believes that such offices are sufficient to meet its current needs and does not anticipate any difficulty in securing additional space, as needed, on terms acceptable to the Company.
ITEM 3.
LEGAL PROCEEDINGS
The Company is party to lawsuits and administrative proceedings incidental to the normal course of business. The Company currently is not a party to any pending material litigation, nor, to the Company’s knowledge, is any material litigation currently threatened against the Company.
ITEM 4.
SUBMISSION OF MATTERS TO A VOTE OF SECURITY HOLDERS
No matters were submitted to a vote of security holders during the fourth quarter of 2007.
PART II
ITEM 5.
MARKET FOR REGISTRANT’S COMMON EQUITY,
RELATED SHAREHOLDER MATTERS AND ISSUER PURCHASES OF EQUITY SECURITIES
Shares of the Company’s Common Stock are listed on The NASDAQ Global Select Market LLC® and are traded under the symbol “KNDL.” The following table sets forth the high and low prices for shares of the Company’s Common Stock for the periods indicated.
| | | | | | | | | | | | | | | | | |
| 2007 Quarterly | | First | | Second | | Third | | Fourth |
| Ranges of stock price | | | | | | | | | | | | | | | | |
| High | | $ | 39.61 | | | $ | 37.57 | | | $ | 44.51 | | | $ | 51.34 | |
| Low | | | 30.02 | | | | 31.22 | | | | 34.70 | | | | 39.02 | |
| | | | | | | | | | | | | | | | | |
| 2006 Quarterly | | First | | Second | | Third | | Fourth |
| Ranges of stock price | | | | | | | | | | | | | | | | |
| High | | $ | 34.94 | | | $ | 41.11 | | | $ | 37.34 | | | $ | 36.44 | |
| Low | | | 21.40 | | | | 29.11 | | | | 21.34 | | | | 29.25 | |
The number of holders of record of Kendle International Inc. common stock was 159 as of March 4, 2008. This total excludes shares held under beneficial ownership in nominee name or within clearinghouse positions of brokerage firms or banks. The Company has not paid dividends on its Common Stock since its initial public offering in August 1997. The Company does not currently intend to pay dividends in the foreseeable future and, in any event, is restricted from paying dividends under the terms and conditions of its credit facility.
10
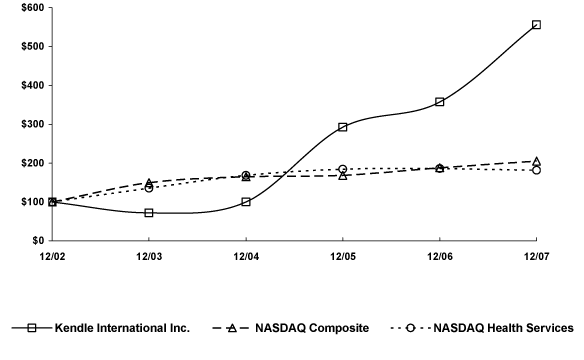
Performance Graph
The following graph compares the five-year cumulative total shareholder returns of the Company’s Common Stock with the NASDAQ Composite Index and the NASDAQ Health Services Index.
COMPARISON OF 5 YEAR CUMULATIVE TOTAL RETURN*
Among Kendle International Inc., The NASDAQ Composite Index
And The NASDAQ Health Services Index
* $100 invested on 12/31/02 in stock or index-including reinvestment of dividends.
Fiscal year ending December 31.
| | | | | | | | | | | | | | | | | | | | | | | | | | | | | | | | | |
| |
| | | | | Dollar Value of $100 Investment at December 31 | |
| | | | | 12/02 | | | 12/03 | | | 12/04 | | | 12/05 | | | 12/06 | | | 12/07 | |
| | Kendle International Inc. | | | | 100.00 | | | | | 72.04 | | | | | 99.99 | | | | | 292.47 | | | | | 357.35 | | | | | 555.85 | | |
| | NASDAQ Composite | | | | 100.00 | | | | | 149.75 | | | | | 164.64 | | | | | 168.60 | | | | | 187.83 | | | | | 205.22 | | |
| | NASDAQ Health Services | | | | 100.00 | | | | | 135.61 | | | | | 168.24 | | | | | 184.41 | | | | | 186.06 | | | | | 181.42 | | |
| |
Securities Authorized Under Equity Compensation Plans:
The information required for Securities Authorized Under Equity Compensation Plans can be found in Part III, Item 12, Security Ownership of Certain Beneficial Owners and Management of this Annual Report on Form 10-K.
11
ITEM 6.
CONSOLIDATED STATEMENTS OF OPERATIONS (3)
| | | | | | | | | | | | | | | | | | | | | |
| | | For the years ended December 31, | |
| | | (in thousands except per share data) | |
| | | 2007 (1) | | | 2006 (2) | | | 2005 | | | 2004 | | | 2003 | |
| |
| Net service revenues | | $ | 397,584 | | | $ | 283,471 | | | $ | 202,032 | | | $ | 172,888 | | | $ | 156,221 | |
| Reimbursable out-of-pocket revenues | | | 171,234 | | | | 90,465 | | | | 48,607 | | | | 42,980 | | | | 53,436 | |
| | | | | | | | | | | | | | | | |
| Total revenues | | | 568,818 | | | | 373,936 | | | | 250,639 | | | | 215,868 | | | | 209,657 | |
| | | | | | | | | | | | | | | | | | | | | |
| Cost and expenses: | | | | | | | | | | | | | | | | | | | | |
| Direct costs | | | 204,161 | | | | 152,826 | | | | 108,582 | | | | 96,909 | | | | 91,133 | |
| Reimbursable out-of-pocket costs | | | 171,234 | | | | 90,465 | | | | 48,607 | | | | 42,980 | | | | 53,436 | |
| Selling, general and administrative | | | 125,744 | | | | 91,796 | | | | 68,216 | | | | 59,797 | | | | 52,402 | |
| Depreciation and amortization | | | 14,865 | | | | 10,403 | | | | 7,991 | | | | 9,175 | | | | 9,057 | |
| Employee severance and office consolidation costs | | | — | | | | 236 | | | | — | | | | 302 | | | | 1,468 | |
| Intangible impairment charge | | | — | | | | 8,200 | | | | — | | | | — | | | | — | |
| | | | | | | | | | | | | | | | |
| Total costs and expenses | | | 516,004 | | | | 353,926 | | | | 233,396 | | | | 209,163 | | | | 207,496 | |
| | | | | | | | | | | | | | | | | | | | | |
| Income from operations | | | 52,814 | | | | 20,010 | | | | 17,243 | | | | 6,705 | | | | 2,161 | |
| | | | | | | | | | | | | | | | | | | | | |
| Other income (expense): | | | | | | | | | | | | | | | | | | | | |
| Interest income | | | 1,466 | | | | 1,939 | | | | 1,019 | | | | 400 | | | | 334 | |
| Interest expense | | | (14,870 | ) | | | (6,781 | ) | | | (460 | ) | | | (776 | ) | | | (1,039 | ) |
| Write-off deferred financing costs | | | (4,152 | ) | | | — | | | | — | | | | — | | | | — | |
| Other | | | (4,816 | ) | | | (1,795 | ) | | | (287 | ) | | | (873 | ) | | | (725 | ) |
| Investment impairment | | | — | | | | — | | | | — | | | | — | | | | (405 | ) |
| Gain on debt extinguishment | | | — | | | | — | | | | 300 | | | | 597 | | | | 558 | |
| | | | | | | | | | | | | | | | |
| Total other income (expenses) | | | (22,372 | ) | | | (6,637 | ) | | | 572 | | | | (652 | ) | | | (1,277 | ) |
| Income before income taxes | | | 30,442 | | | | 13,373 | | | | 17,815 | | | | 6,053 | | | | 884 | |
| Income taxes | | | 11,755 | | | | 4,843 | | | | 7,141 | | | | 2,481 | | | | 2,574 | |
| | | | | | | | | | | | | | | | |
| Net income (loss) | | $ | 18,687 | | | $ | 8,530 | | | $ | 10,674 | | | $ | 3,572 | | | $ | (1,690 | ) |
| | | | | | | | | | | | | | | | |
| | | | | | | | | | | | | | | | | | | | | |
INCOME (LOSS) PER SHARE DATA | | | | | | | | | | | | | | | | | | | | |
| Basic: | | | | | | | | | | | | | | | | | | | | |
| Net income (loss) per share | | $ | 1.29 | | | $ | 0.60 | | | $ | 0.79 | | | $ | 0.27 | | | $ | (0.13 | ) |
| Weighted average shares | | | 14,520 | | | | 14,323 | | | | 13,572 | | | | 13,166 | | | | 12,973 | |
| Diluted: | | | | | | | | | | | | | | | | | | | | |
| Net income (loss) per share | | $ | 1.26 | | | $ | 0.58 | | | $ | 0.76 | | | $ | 0.27 | | | $ | (0.13 | ) |
| Weighted average shares | | | 14,889 | | | | 14,762 | | | | 14,120 | | | | 13,391 | | | | 12,973 | |
CONSOLIDATED BALANCE SHEET DATA (3)
| | | | | | | | | | | | | | | | | | | | | |
| | | as of December 31, |
| | | 2007 | | 2006 | | 2005 | | 2004 | | 2003 |
| Working capital | | $ | 60,084 | | | $ | 56,404 | | | $ | 63,992 | | | $ | 40,714 | | | $ | 38,523 | |
| Total assets | | | 499,723 | | | | 455,072 | | | | 184,759 | | | | 162,680 | | | | 154,415 | |
| Total short and long-term debt, including capital leases | | | 200,455 | | | | 200,099 | | | | 4,572 | | | | 9,853 | | | | 15,503 | |
| Total shareholders’ equity | | | 141,523 | | | | 140,112 | | | | 122,504 | | | | 102,775 | | | | 96,369 | |
| | |
| (1) | | Includes the effects of the January 1, 2007 adoption of FASB Interpretation No. 48, Accounting for Uncertainty in Income Taxes. |
| |
| (2) | | Includes the effects of the January 1, 2006 adoption of SFAS 123R, Share-Based Payment. |
| |
| (3) | | From 2003 to 2007, the Company made three acquisitions. See Note 11 to the Consolidated Financial Statements. |
12
ITEM 7.
MANAGEMENT’S DISCUSSION AND ANALYSIS OF FINANCIAL
CONDITION AND RESULTS OF OPERATIONS
Management’s Discussion and Analysis of Financial Condition and Results of Operations
The information set forth and discussed below in Management’s Discussion and Analysis of Financial Condition and Results of Operations (MD&A) is derived from the Company’s Consolidated Financial Statements and the related notes thereto, which are included herein, and should be read in conjunction therewith.
Company Overview
Kendle International Inc. (the Company or Kendle) is a global clinical research organization (CRO) that delivers integrated clinical development services, including clinical trial management, clinical data management, statistical analysis, medical writing, regulatory consulting and organizational meeting management and publications services, among other things, on a contract basis to the biopharmaceutical industry. The Company operates in North America, Europe, Asia/Pacific, Latin America and Africa. The Company operates its business in two reportable operating segments, Early Stage and Late Stage. The Early Stage business currently focuses on the Company’s Phase I operations while Late Stage is comprised of clinical development services related to Phase II through IV clinical trials, regulatory affairs and biometrics offerings. The Company aggregates its clinical development operating unit, regulatory affairs operating unit, and biometrics operating unit into the Late Stage segment under the aggregation criteria in Statement of Financial Accounting Standards (SFAS) No. 131. The aggregation criteria met includes a similar nature of services provided, a similar type of customer, similar methods used to distribute services, similar economic characteristics and a similar regulatory environment. In addition, the Company reports support functions primarily composed of Human Resources, Information Technology, Sales and Marketing and Finance under the Support and Other category for purposes of segment reporting. A portion of the costs incurred from the support units are allocated to the Early and Late Stage reportable operating segments.
The Company primarily earns net service revenues through performance under Late Stage segment “full-service” contracts. The Company also recognizes revenues through limited service contracts, consulting contracts and Early Stage segment contracts. The Company’s revenue recognition process is described later in this MD&A under “Critical Accounting Policies and Estimates.”
Late Stage Segment Contracts
The Company provides services to its customers primarily under “full-service” contracts that include a broad range of services in support of a customer’s clinical trial. These services typically include biometrics, clinical development services and regulatory affairs. The Company from time to time provides a select number of these services under “limited-service” contracts. The Company usually competes for business awards in a competitive bidding process. In the bidding process, the Company submits a bid that includes a price based upon hourly billing rates for billable employees multiplied by task hours the Company estimates will be necessary to achieve the service assumptions. Upon receiving a business award, the Company and its customer negotiate a contract to memorialize these assumptions and the related price.
Service contracts usually are long-term arrangements that require Company performance over several years. A contract usually requires a portion of the contract fee to be paid at the time of contract execution, and the balance is received in specified installments or milestones over the contract’s duration. Other methods for receiving payment include units achieved and time and materials. During performance of the services, any of the following events may occur and impact the contract price:
| | • | | The customer may request a change in the assumptions; |
| |
| | • | | The customer may increase or decrease the scope of services, which requires a change to the service assumptions; and |
| |
| | • | | The Company may discover that, for a particular contract, the assumptions are incorrect or insufficient to permit completion of the contract. |
In each of the foregoing situations, the Company enters into negotiations for a contract amendment to reflect the change in scope or assumptions and the related price. Depending on the complexity of the amendment, the amendment process can take from a few weeks for a simple adjustment, such as a timeline extension, to several months for a complex amendment, such as a change in patient
13
enrollment strategy. Under the Company’s policy, project teams are not authorized to engage in tasks outside the scope of the contract without prior management approval. In some situations, management may authorize the project team to commence work on activities outside the contract scope while the Company and its customer negotiate and finalize the contract amendment.
Contract amendments are commonplace within the industry and occur on the majority of the Company’s contracts. At any point in time, the Company will be in the process of discussing numerous proposed amendments, the scope and value of which can change significantly between time of proposal and final agreement. The total value of these amendments primarily represents future work and revenues.
In addition to full-service and limited-service arrangements described above, the Company provides consulting services to its customers under contracts that generally are shorter-term in nature than full-service contracts. Net service revenues from these contracts represent less than 5% of the Company’s consolidated net service revenues.
In connection with providing services, the Company incurs pass-through costs, which include travel-related expenses for Company employees performing services and fees payable to third-party investigators or labs participating in, or supporting, the customer’s clinical trial. The customer agrees to reimburse the Company on a dollar-for-dollar basis for the costs incurred by the Company in accordance with contractually specified parameters. The revenues and costs from these pass-through and third-party costs are reflected in the Company’s Consolidated Statements of Operations under the line items titled “Reimbursable out-of-pocket revenues” and “Reimbursable out-of-pocket costs”, respectively.
The customer may terminate the contract at any time with little or no advance notice to the Company. Customers, in particular, may terminate a contract immediately for concerns related to the efficacy or safety of a particular drug. Upon termination, the customer is required to pay the Company for the value of work completed up to termination as well as reimburse the Company for its out-of-pocket costs incurred in accordance with the contract.
Early Stage Segment Contracts
Early Stage segment business awards are subject to a competitive bidding process and, upon award, are memorialized in a contract that includes terms and conditions that are substantially similar to the Company’s contracts with its Late Stage segment customers. The Early Stage segment contract duration is usually substantially less than the Late Stage segment. Because these business awards require the Company to commit beds at its Early Stage facilities, the Company attempts to require the customer to pay a cancellation fee if the customer cancels a project award. Net service revenues from these contracts generally represent less than 10% of the Company’s consolidated net service revenues.
Acquisitions
In April 2006, the Company completed its acquisition of IC-Research. At the time of acquisition, IC-Research was a CRO in Latin America with operations in Argentina, Brazil, Chile and Colombia. This acquisition supports the Company’s goal of strategic business expansion and diversification in high-growth regions to deliver global clinical trials for its customers. IC-Research was integrated as part of the Company’s Late Stage segment.
In August 2006, the Company acquired CRL Clinical Services. The acquisition was expected to strengthen the Company’s position as one of the leading global players in the clinical development industry, adding therapeutic expertise, diversifying its customer base and expanding its capacity to deliver large global trials. The total purchase price, including acquisition costs and the working capital adjustment, in which the Company paid for any working capital in excess of $2.0 million, was approximately $236 million. The Company financed the purchase with $200 million in term debt as well as its existing cash and proceeds from the sale of available-for-sale securities.
The results of operations for these acquisitions are included in the Company’s Consolidated Statements of Operations from the dates of acquisition.
Recent Developments and CRO Marketplace
On July 10, 2007, the Company entered into a Purchase Agreement with UBS Securities LLC (the Underwriter) for the issuance and sale by the Company of $175 million in aggregate principal amount of the Company’s 3.375% Senior Convertible Notes due July 15, 2012 (the Convertible Notes), pursuant to the Company’s effective Registration Statement on Form S-3. On July 11, 2007, the Underwriter exercised an over-allotment option and purchased an additional $25 million in aggregate principal amount of Convertible Notes. On July 16, 2007, $200 million in aggregate principal amount of the 5-year Convertible Notes with a maturity date of July 15, 2012 were sold to the Underwriters at a price of $1,000 per Convertible Note, less an underwriting discount of 3% per Convertible Note. Proceeds from the issuance of Convertible Notes were primarily used to pay down term debt incurred in connection with the acquisition of CRL Clinical Services. See discussion of debt in Liquidity and Capital Resources section of this MD&A.
14
The CRO industry in general continues to be dependent on the research and development efforts of the principal pharmaceutical and biotechnology companies as major customers, and the Company believes this dependence will continue. The loss of business from any of its major customers could have a material adverse effect on the Company.
Results of Operations
Year Ended December 31, 2007 (2007) Compared with Year Ended December 31, 2006 (2006)
Net Service Revenues
Net service revenues increased 40% to $397.6 million for 2007 from $283.5 million in 2006. The 40% increase includes a 6% increase due to the impact of foreign currency exchange rate fluctuations. As Kendle and CRL Clinical Services have integrated project teams and revenue is recognized on integrated labor hours and costs, it is difficult to precisely determine the amount of 2007 and third and fourth quarter 2006 revenue that is attributable to the acquisition of CRL Clinical Services. The Company estimates that a significant portion of the growth in net service revenues is due to this acquisition.
Net service revenues in the Early Stage segment declined approximately $1.9 million to approximately $21.4 million in 2007 compared to $23.3 million in 2006. Net service revenues at the Company’s Phase I unit in Morgantown, West Virginia increased by approximately $1.1 million in 2007 compared to 2006 while net service revenues at the Phase I unit in the Netherlands declined by approximately $3.0 million in 2007 compared to 2006. The decline in net service revenue at the Company’s Early Stage unit in the Netherlands was due partially to a third quarter of 2007 contract cancellation of approximately $1.9 million. The majority of the work on this contract would have been completed in the third and fourth quarters of 2007.
Net service revenues in the Late Stage segment increased approximately 44% to $366.4 million in 2007 compared to $255.0 million in 2006. A significant portion of the increase is due to including a full-year of net service revenue in 2007 from the acquisition of CRL Clinical Services compared to 4.5 months of net service revenue in 2006.
Net service revenues in North America and Europe increased by approximately 28% and 50%, respectively, in 2007 compared to 2006 primarily due to the impact of the CRL Clinical Services acquisition, strong demand for Phase II-IV services and larger projects awarded to the Company. Net service revenues in Latin America increased by over 100% to $20.8 million, due to increased customer demand for clinical trials in the region. Net service revenues in Asia-Pacific increased by approximately 68% in 2007 compared to 2006 due to increased customer demand for clinical trials in the Asia-Pacific region.
Approximately 50% of the Company’s net service revenues in 2007 were derived from its operations outside of North America compared to 45% in 2006. Revenues from the Company’s top five customers accounted for approximately 25% and 28% of net service revenues in 2007 and 2006, respectively. No customer accounted for more than 10% of total net service revenues for 2007. Net service revenues from Pfizer Inc. accounted for approximately 12% of the total 2006 net service revenues. No other customer accounted for more than 10% of 2006 net service revenues. A primary reason for the shifts in the above referenced revenue metrics was the CRL Clinical Services acquisition, which strengthened the Company’s role in global clinical trials and assisted in diversifying the customer base.
Reimbursable Out-of-Pocket Revenues/Expenses
Reimbursable out-of-pocket revenues and expenses fluctuate from period to period due primarily to the level of investigator activity in a particular period. Reimbursable out-of-pocket revenues and expenses increased 89% to $171.2 million in 2007 from $90.5 million in 2006. A significant portion of the increase in reimbursable out-of-pocket revenues and costs is due to the CRL Clinical Services acquisition. The remainder of the change is due primarily to an increase in the number of studies in which the Company is procuring investigator services as well as to an increase in size of those studies.
Operating Expenses
Direct costs increased by 34% from $152.8 million in 2006 to $204.2 million in 2007. A significant portion of the increase in costs is related to the acquisition of CRL Clinical Services. The remaining portion of the increase in direct costs is attributable to the increased hiring of billable employees to support the growth in the overall business. Direct costs expressed as a percentage of net service revenues were 51.4% in 2007 compared to 53.9% in 2006. The decrease in direct costs as a percentage of net service revenues in 2007 is due to the Company’s work on larger, global trials in 2007 which result in greater opportunities for efficiencies in individual projects as well as opportunities to increase work in lower cost geographic regions.
Selling, general and administrative expenses increased $33.9 million, or 36.9%, from $91.8 million in 2006 to $125.7 million in 2007. The increase is primarily due to increases in employee-related costs from the Company’s increase in headcount. Significant
15
headcount growth occurred with the August 2006 acquisition of CRL Clinical Services. Headcount increased to build the Company’s infrastructure to support the growth in revenue. The increase in employee-related costs is comprised of general salary increases and corresponding payroll tax and benefit increases including increased health care costs. Selling, general and administrative expenses expressed as a percentage of net service revenues were 31.6% in 2007 compared to 32.4% in 2006.
Depreciation and amortization expense increased by $4.5 million, from $10.4 million in 2006 to $14.9 million in 2007. A portion of the increase is related to the increased amortization expense of finite-lived intangible assets acquired in the CRL Clinical Services acquisition. For 2007 this amount was $4.2 million compared to $2.4 million in 2006. The remaining portion of the change is the result of an increase in depreciation expense attributable to an increase in depreciable assets originating from the CRL Clinical Services acquisition and 2007 purchases.
In 2006, the Company recorded an $8.2 million impairment charge on a $15.0 million customer relationship intangible asset that was acquired in the Company’s 2002 acquisition of Clinical and Pharmacologic Research, Inc. (CPR) in Morgantown, West Virginia. The intangible asset represents one customer relationship which due to its characteristics was considered to have an indefinite life and was subject to annual impairment testing. The fair value of the intangible at December 31, 2006, was calculated by using a discounted cash flow model. Due to declining net service revenue in 2006 from this customer at the Morgantown facility as well as budgeted net service revenue for 2007 and future projected net service revenues that are at lesser levels than historically experienced from this customer, the Company determined that the customer relationship was impaired. As a result of this impairment charge, the Company has assigned a 23-year useful life to the customer relationship and began amortizing this asset in 2007. The 2007 amortization expense on this asset was approximately $300,000.
Income from operations in 2007 increased to $52.8 million, or 13.3% of net service revenues, compared to $20.0 million, or 7.1% of net service revenues in 2006. Income from operations from Kendle’s Early Stage segment in 2007 was $3.6 million, or 16.8% of net service revenues compared to Early Stage loss from operations of $2.5 million in 2006. The Early Stage loss from operations in 2006 was due to the $8.2 million impairment charge discussed above.
Income from operations from Kendle’s Late Stage segment in 2007 was $84.6 million or 23.1% of net service revenues compared to Late Stage income from operations of $65.8 million, or 25.8% of net service revenues in 2006. The decrease in income from operations as a percentage of net services revenues for the year ended December 31, 2007 compared to the same period of 2006 is primarily due to two factors. First, during 2007, the Company increased its support infrastructure to support the increase in Late Stage net service revenue. This growth in infrastructure resulted in an increase in support type costs allocated to the Late Stage segment. In addition, amortization expense related to finite-lived intangible assets acquired in the CRL Clinical Services acquisition increased from $2.4 million in 2006 to $4.2 million in 2007.
Other Income/(Expense)
Total other income (expense) was expense of $22.4 million in 2007 compared to expense of $6.6 million in 2006.
Interest income decreased by approximately $473,000 in 2007 due to smaller cash and investment balances in 2007 compared to 2006. In addition to term debt used to finance the acquisition of CRL Clinical Services, the Company used available cash and proceeds from the sale of investments to finance the acquisition.
In 2007 the Company incurred interest expense of approximately $14.9 million compared to interest expense of approximately $6.8 million in 2006. The increase in interest expense is primarily due to acquisition-related debt outstanding for the entire year of 2007 compared to approximately 4.5 months of 2006, as discussed below.
In June 2006, the Company paid the remaining outstanding balance of approximately $3.0 million under a prior term loan and terminated the agreements related to the loan. In August 2006, the Company borrowed $200 million under a term loan agreement in connection with the closing and purchase of CRL Clinical Services. Therefore, this new term loan had outstanding principal for approximately 4.5 months in 2006 and for approximately 10 months of 2007 until the Company paid off this term loan with proceeds from the sale of Convertible Notes discussed below.
In the third quarter of 2007, the Company issued $200.0 million in 3.375% Convertible Notes. In conjunction with issuance and sale of the Convertible Notes, the Company made a mandatory prepayment on its term debt and subsequently paid off the balance of the term note in the third quarter of 2007. Consequently, in the third quarter of 2007 the Company wrote-off approximately $4.2 million in deferred financing costs related to the term note.
In the first quarter of 2007, the Company entered into interest rate swap and collar arrangements to fix the rate on a portion of its then outstanding term debt. The derivative arrangements were not designed for hedge accounting treatment and mark to market adjustments on these arrangements are recorded in the Company’s Consolidated Statements of Operations. In the fourth quarter of 2007, the Company terminated the interest rate swap and paid $881,000 to reflect the amounts due upon termination of the swap.
16
Total 2007 losses related to the interest rate swap/collar arrangements, including the $881,000 paid upon termination of the swap arrangement, were approximately $1.3 million.
In the first quarter of 2007, the Company entered into foreign currency hedge arrangements to hedge foreign currency exposure related to intercompany notes outstanding. These derivative arrangements were not designed for hedge accounting treatment and mark to market adjustments on these arrangements are recorded in the Company’s Consolidated Statements of Operations. In 2007, the Company recorded gains of approximately $1.4 million related to exchange rate fluctuations on these intercompany notes and the related derivative instruments.
In addition to the gains on the foreign currency hedge arrangements, discussed above, the Company recorded foreign exchange rate losses of approximately $5.9 million in 2007 compared to losses of approximately $1.6 million in 2006. The increased foreign exchange rate loss is due to the continued weakening of the US dollar against the British pound and the Euro as well as an increase in the number of global contracts the Company has entered into in 2007, leading to increased exchange rate exposure. The exchange rate transaction losses typically occur when the Company holds assets in a currency other than the functional currency of the reporting location. With the exception of the hedge arrangements on intercompany notes referred to above, the Company does not currently have hedges in place to mitigate exposure due to foreign exchange rate fluctuations. Due to uncertainties regarding the timing of and currencies involved in the majority of the Company’s foreign exchange rate transactions it is impracticable to implement hedging instruments to match the Company’s foreign currency inflows and outflows. The Company will continue to evaluate ways to mitigate the risk of this impact in the future.
Income Taxes
The Company recorded tax expense at an effective rate of approximately 38.6% in 2007 compared to approximately 36.2% in 2006. The increase in the effective income tax rate in 2007 is primarily due to the distribution of income among the Company’s non-U.S. subsidiaries. In addition, in 2007 the Company recorded additional expense of approximately $416,000 related to FASB Interpretation No. 48 “Accounting for Uncertainty in Income Taxes — an interpretation of FASB Statement 109.” In the fourth quarter of 2006, the Company recorded a tax charge of approximately $921,000 related to the tax effect of a dividend declared in the course of setting up an intercompany note between the Company’s German and U.S. entities. In 2006, the Company also recorded a valuation allowance of approximately $230,000 related to state and local net operating loss carryforwards. Because Kendle operates on a global basis, the effective tax rate may vary from year to year based on the locations that generate the pre-tax earnings.
Net Income
The net income for 2007, including the effects of amortization of 2006 acquired intangibles and the write-off of deferred financing costs (items totaling approximately $5.3 million or $0.35 per diluted share) was approximately $18.7 million or $1.26 per diluted share and $1.29 per basic share.
The net income for 2006, including the effects of amortization of 2006 acquired intangibles, acquisition-related expenses and the intangible impairment charge (items totaling approximately $7.4 million or $0.50 per diluted share) was approximately $8.5 million, or $0.58 per diluted share and $0.60 per basic share.
Year Ended December 31, 2006, Compared With Year Ended December 31, 2005 (2005)
Net service revenues increased 40% to $283.5 million for 2006 from $202.0 million in 2005. The 40% increase includes a 1% increase due to the impact of foreign currency exchange rate fluctuations. Of the 40% increase in net service revenues, approximately 23% resulted from organic growth with the remainder of the growth due to the Company’s acquisitions, primarily the August acquisition of CRL Clinical Services.
Net service revenues in the Early Stage segment were approximately $23.3 million in 2006 and $24.0 million in 2005, Net service revenues at the Company’s Phase I unit in Morgantown, West Virginia declined by approximately $475,000 with the remainder of the decline at the Company’s Phase I unit in The Netherlands. Net service revenues in the Late Stage segment grew by approximately 46% to $255.0 million in 2006 from $174.6 million in 2005. This growth was driven by an expanded customer base as well as the Company’s ability to secure additional large, global studies in 2006.
Net service revenues in North America and Europe increased by 41% and 38%, respectively, in 2006 compared to 2005 due to strong demand in Phase II-IV services, an increased customer base and the impact of the CRL Clinical Services acquisition. Net services revenues in Latin America increased by approximately 95% to $10.2 million due to the April 2006 IC-Research acquisition and the increased demand for work out of the Company’s Mexico office as the Company continues to grow its data management services in Mexico.
17
Approximately 45% of the Company’s net service revenues in both 2006 and 2005 were derived from its operations outside of North America. Revenues from the Company’s top five customers accounted for approximately 28% and 34% of net service revenues in 2006 and 2005, respectively. Net service revenues from Pfizer Inc. accounted for approximately 12% of the total 2006 net service revenues as compared to 15% for 2005. The Company’s net service revenues from Pfizer Inc. are derived from numerous projects that vary in size, duration and therapeutic indication. No other customer accounted for more than 10% of the Company’s net service revenues in either 2006 or 2005.
Reimbursable Out-of-Pocket Revenues/Expenses
Reimbursable out-of-pocket revenues and expenses fluctuate from period to period due primarily to the level of investigator activity in a particular period. Reimbursable out-of-pocket revenues and expenses increased 86% to $90.5 million in 2006 from $48.6 million in 2005. Approximately 26% of the increase in reimbursable-out-of-pocket revenues and expenses was due to growth from the CRL Clinical Services acquisition. The remainder of the increase is due primarily to an increase in the number of studies in which the Company is procuring investigator payments as well as to an increase in size of those studies.
Operating Expenses
Direct costs increased by 41% from $108.6 million in 2005 to $152.8 million in 2006, including a 22% increase in direct costs due to the acquisition of CRL Clinical Services. The increase in direct costs corresponds to the increase in net service revenues. The Company increased the use of outside contractors in 2006 to support the increase in project work. Direct costs as a percentage of net service revenues were 53.9% and 53.7% in 2006 and 2005, respectively. Direct costs as a percentage of net service revenues in the Early Stage segment increased from 56.1% in 2005 to 58.8% in 2006. The increase in direct costs as a percentage of Early Stage segment revenues is due to increasing fixed costs at the Early Stage facilities, primarily increased personnel costs, without a corresponding increase in revenue. Billable headcount at the Early Stage facilities increased by approximately 10% from 2005 to 2006. Direct costs as a percentage of net services revenues in the Late Stage segment were 53.5% in 2006 compared to 53.4% in 2005.
Selling, general and administrative (SG&A) expenses increased by 35%, including a 14% increase due to the acquisition of CRL Clinical Services, to $91.8 million in 2006 from $68.2 million in 2005. Primary reasons for the increase in SG&A costs included increases in employee-related costs such as increased salaries, profit-sharing accrual and sales commissions. In addition, recruiting and retention costs increased, including recruiting costs of approximately $1.3 million in 2006 to recruit certain executive positions, project leaders and clinical research associates. Also, the Company recorded approximately $1.2 million in expenses related to the integration of the CRL Clinical Services acquisition and an additional $794,000 in severance costs related primarily to the acquisition. Finally, the Company recorded stock-based compensation of approximately $1.5 million in 2006 due to the adoption of SFAS 123(R). In fourth quarter 2005, the Company recorded a bad debt reserve of approximately $1.7 million associated with one study being managed out of the Company’s offices in the United Kingdom. Selling, general and administrative costs as a percentage of net services revenues were 32.5% in 2006 compared to 33.8% in 2005.
In 2006, as discussed earlier, the Company recorded an $8.2 million impairment charge on a $15 million customer relationship intangible asset that was acquired in the Company’s 2002 acquisition of CPR in Morgantown, West Virginia.
Depreciation and amortization increased by $2.4 million, or 30%, in 2006, from $8.0 million in 2005 to $10.4 million in 2006. This increase was due to increased amortization of acquired-intangibles as well as increased depreciation on fixed asset purchases.
Income from operations for 2006 increased to $20.0 million or 7.1% of net service revenues up from $17.2 million or 8.5% of net services revenues for 2005. Income from operations from Kendle’s Early Stage segment was a loss of $2.5 million in 2006 due to an $8.2 million impairment charge on a customer relationship intangible asset acquired in the Company’s 2002 acquisition of a Phase I unit in Morgantown, West Virginia. Including the $8.2 million impairment charge (which was 35.2% of Early Stage net service revenues) income from Early Stage operations was negative 10.6% of Early Stage net service revenues for 2006 compared to income from Early Stage operations of 31.9% of Early Stage net service revenues for 2005. The decrease in operating margin as a percentage of net service revenue was also driven by study delays at the Company’s Phase I unit in Morgantown, West Virginia, resulting in a lower revenue base to absorb fixed costs.
Income from operations from the Company’s Late Stage segment increased $28.8 million, or 78%, to $65.8 million or 25.8% of Late Stage net service revenues for 2006 up from approximately $37.0 million or 21.2% of net service revenues for the corresponding period in 2005. Growth in the Late Stage segment was driven by strong performance in both Europe and the Americas as well as the acquisition of CRL Clinical Services. In the second quarter of 2006, the Company recorded a charge to provide additional study services to resolve non-medical customer concerns over one study. The charge reduced revenue by approximately $800,000 and increased direct costs by approximately $700,000.
18
Other Income/(Expense)
Total other income (expense) was expense of $6.6 million in 2006 compared to income of approximately $0.6 million in 2005. In 2006, the Company incurred interest expense of approximately $6.8 million compared to expense of approximately $460,000 in 2005. The increased interest expense is a result of the interest on the $200 million in term debt used to finance the August acquisition of CRL Clinical Services. In 2006 the Company recorded foreign currency transaction losses of approximately $1.6 million as a result of fluctuations between the British Pound and the Euro and between the U.S. dollar and either the Euro or the British Pound. These transaction losses are due to the Company holding assets in a currency other than the functional currency of the reporting location and are increased partially due to the acquisition of CRL Clinical Services as the acquired European subsidiaries maintain significant dollar denominated assets. In 2005, these foreign currency transaction losses were approximately $79,000. In 2005, the Company made a final partial early repayment on its convertible note and recorded a gain of approximately $300,000. Interest income in 2006 was approximately $1.9 million compared to approximately $1.0 million in 2005. The increased interest income is due to larger cash and investment balances in the first seven months of 2006 as well as increased interest rates.
Income Taxes
The Company recorded tax expense at an effective rate of approximately 36.2% in 2006 compared to approximately 40.1% in 2005. The drop in the effective income tax rate in 2006 is due to the distribution of income among the Company’s non-U.S. subsidiaries as well as a drop in state and local taxes in 2006. In the second quarter of 2005, the Company recorded a one-time, non-cash charge of approximately $1.2 million, net of federal income tax effect, to reflect the write-off of deferred state income tax assets due to a change in Ohio state tax law enacted on June 30, 2005. The one-time charge results from adoption of a comprehensive change in Ohio corporate tax laws that provides for the phase-in of a Commercial Activities Tax (CAT) on gross receipts. Concurrent with the phase-in of the CAT, the Ohio income tax, net worth tax and personal property tax will be phased out. In the fourth quarter of 2006, the Company recorded a tax charge of approximately $921,000 related to the tax effect of a dividend declared in the course of setting up an intercompany note between the Company’s German and U.S. entities. In 2006, the Company also recorded a valuation allowance of approximately $230,000 related to state and local net operating loss carryforwards. In the fourth quarter of 2005, the Company reversed a previously established valuation allowance of $820,000 associated with future tax benefits in The Netherlands. Because Kendle operates on a global basis, the effective tax rate may vary from year to year based on the locations that generate the pre-tax earnings.
Net Income
The net income for 2006, including the effects of the stock-based compensation, amortization of 2006 acquired intangibles, severance costs, acquisition-related expenses, the intangible impairment charge and state tax valuation allowances (items totaling approximately $9.2 million, or $0.62 per diluted share) was approximately $8.5 million, or $0.58 per diluted share and $0.60 per basic share. The net income for 2005, including the effects of the bad debt reserve, the reversal of the tax valuation allowance, the gain on debt extinguishment and the write-off of the deferred state income taxes (items totaling approximately $1.8 million, or $0.12 per diluted share) was approximately $10.7 million or $0.76 per diluted share and $0.79 per basic share.
Liquidity and Capital Resources
The Company had cash and cash equivalents of approximately $45.5 million at December 31, 2007 compared to approximately $19.9 million at December 31, 2006. In 2007, cash and cash equivalents increased by $25.6 million as a result of cash provided by operating activities of $61.0 million offset by cash used in investing activities of $13.8 million and cash used in financing activities of $22.0 million. The positive effect of foreign exchange rates on cash and cash equivalents was approximately $428,000. In addition, the Company has restricted cash of approximately $844,000, which represents cash received from customers that is segregated in a separate Company bank account and available for use only for specific project-related expenses, primarily investigator fees, upon authorization from the customer.
Net cash provided by operating activities consisted primarily of net income increased by non-cash adjustments (primarily depreciation and amortization). The change in net operating assets provided $22.6 million in cash in 2007 primarily due to an increase in advance billings, and an increase in accrued liabilities partially offset by an increase in accounts receivable. The change in net operating assets used $7.1 million in cash in 2006, primarily due to an increase in accounts receivable and unbilled services, partially offset by an increase in advanced billings and accrued liabilities. Fluctuations in accounts receivable and advance billings occur on a regular basis as services are performed, milestones or other billing criteria are achieved, invoices are sent to customers and payments for outstanding accounts receivable are collected from customers. Accounts receivable, net of advance billings, decreased from $60.3 million at December 31, 2006, to $57.1 million at December 31, 2007.
Cash flows from investing activities for the year ended December 31, 2007 consisted primarily of capital expenditures of $15.3 million and additional acquisition expenses of approximately $1.0 million offset by cash of $3.1 million received by the Company related to the settlement of the final working capital amount in the purchase of CRL Clinical Services. Cash flows from investing
19
activities for the year ended December 31, 2006, consisted primarily of $231.9 million used for the acquisitions of CRL Clinical Services and IC-Research and capital expenditures of $8.8 million partially offset by net proceeds from the sale and maturity of available-for-sale securities of $10.8 million.
Cash flows from financing activities for the year ended December 31, 2007 consisted primarily of proceeds from the sale and issuance of the Convertible Notes of $200.0 million offset by payments of $199.5 million on the Company’s term note, debt issuance costs of $6.9 million, of which $6.6 million was associated with the issuance of the Convertible Notes, and net payments of $18.1 million related to the purchase of bond hedges and proceeds from the issuance of warrants, also related to the sale and issuance of the Convertible Notes. Cash flows from financing activities for the year ended December 31, 2006, consisted primarily of gross proceeds from note payable of $200.0 million and proceeds from stock option activity of $3.5 million partially offset by payments on debt of $4.3 million and debt issuance costs of $5.6 million.
Cash used for capital expenditures was $15.3 million, $8.8 million and $5.0 million in 2007, 2006 and 2005, respectively.
In August 2006, in conjunction with its acquisition of CRL Clinical Services, the Company entered into a new credit agreement (including all amendments, the “Facility”). The Facility is comprised of a $200 million term loan that matures in August 2012 and a revolving loan commitment that expires in August 2011. The balance of the $200 million term loan was paid off in the third quarter of 2007 with proceeds from the Convertible Notes discussed below. The original revolving loan commitment was $25 million and was increased to $53.5 million under an amendment to the Facility and an Increase Joinder Agreement, which was entered into on June 27, 2007 and shortly thereafter permitted the Company to increase the revolving loan commitment. The Facility contains various affirmative and negative covenants including financial covenants regarding maximum leverage ratio, minimum interest coverage ratio and limitations on capital expenditures.
The Company also maintains an existing $5.0 million Multicurrency Facility that is renewable annually and is used in connection with the Company’s European operations.
On July 10, 2007, the Company entered into a Purchase Agreement with the Underwriter for the issuance and sale by the Company of $175 million in aggregate principal amount of the Company’s Convertible Notes pursuant to the Company’s effective Registration Statement on Form S-3. On July 11, 2007, the Underwriter exercised an over-allotment option and purchased an additional $25 million in aggregate principal amount of Convertible Notes. On July 16, 2007, $200 million in aggregate principal amount of the 5-year Convertible Notes with a maturity date of July 15, 2012 were sold to the Underwriters at a price of $1,000 per Convertible Note, less an underwriting discount of 3% per Convertible Note.
The Convertible Notes bear interest at an annual rate of 3.375%, payable semi-annually in arrears on January 15 and July 15 of each year, with the first interest payment being made on January 15, 2008. The Convertible Notes are convertible at the option of the holder into cash and, if applicable, shares of the Company’s common stock at an initial conversion price of $47.71 per share (approximating 20.9585 shares per $1,000 principal amount of the Convertible Notes), upon the occurrence of certain events, including (1) any calendar quarter ending after September 30, 2007 in which the closing price of the Company’s common stock is greater than 130% of the conversion price for at least 20 trading days during the period of 30 consecutive trading days ending on the last trading day of the preceding calendar quarter (establishing a contingent conversion price of $47.71 per share); (2) any five business day period after any five consecutive trading day period in which the trading price per $1,000 principal amount of Convertible Notes for each day of that period is equal to or less than 97% of the product of the closing sale price of the Company’s common stock and the applicable conversion rate; (3) upon specified corporate transactions including consolidation or merger; and (4) any time during the period beginning on January 1, 2012 until the close of business on the second business day immediately preceding July 15, 2012. In addition, upon events defined as a “fundamental change” under the Convertible Note Indenture, holders of the Convertible Notes may require the Company to repurchase the Convertible Notes. If upon the occurrence of such events in which the holders of the Convertible Notes exercise the conversion provisions of the Convertible Notes, the Company will need to remit the principal balance of the Convertible Notes to the holders in cash. As such, the Company would be required to classify the entire amount outstanding of the Convertible Notes as a current liability in the following quarter. The evaluation of the classification of amounts outstanding associated with the Convertible Notes will occur every quarter. As of December 31, 2007 the Convertible Notes are classified as long-term in the accompanying Consolidated Balance Sheets.
Upon conversion, holders will receive cash up to the principal amount of the Convertible Notes to be converted, and any excess conversion value will be delivered in shares of the Company’s common stock. If conversion occurs in connection with a “fundamental change” as defined in the Convertible Notes Indenture, the Company may be required to repurchase the Convertible Notes for cash at a price equal to the principal amount plus accrued but unpaid interest. In addition, if conversion occurs in connection with a change in control, the Company may be required to deliver additional shares of the Company’s common stock (a “make whole” premium) by increasing the conversion rate with respect to such notes. The maximum aggregate number of shares that the Company would be obligated to issue upon conversion of the Convertible Notes is 5.6 million shares, but under most conditions, the Company would be obligated to issue 4.2 million shares upon conversion of the Convertible Notes.
20
Pursuant to Emerging Issues Task Force (EITF) 90-19,Convertible Bonds with Issuer Option to Settle for Cash upon Conversion, EITF 00-19,Accounting for Derivative Financial Instruments Indexed to, and Potentially Settled in, a Company’s Own Stock(“EITF 00-19”), and EITF 01-6,The Meaning of Indexed to a Company’s Own Stock(EITF 01-6), the Convertible Notes are accounted for as convertible debt in the accompanying Consolidated Balance Sheets and the embedded conversion option in the Convertible Notes has not been accounted for as a separate derivative. For a discussion of the effects of the Convertible Notes and the bond hedges and warrants discussed below on earnings per share, see Note 1 to the Consolidated Financial Statements.
Concurrent with the sale of the Convertible Notes, the Company purchased convertible bond hedges from the Underwriter and JP Morgan Chase (collectively, the counterparties), which are designed to mitigate potential dilution from the conversion of the Convertible Notes in the event that the market value per share of the Company’s common stock at the time of exercise is greater than approximately $47.71. Under the bond hedges that cover approximately 4.2 million shares of the Company’s common stock, the counterparties are required to deliver either shares of the Company’s common stock or cash in the amount that the Company is obligated to deliver to the holders of the Convertible Notes with respect to the conversion, calculated exclusive of shares deliverable by the Company by reason of any additional premium relating to the Convertible Notes or by reason of any election by the Company to unilaterally increase the conversion rate pursuant to the indenture governing the Convertible Notes. The bond hedges expire at the close of trading on July 15, 2012, which is also the maturity date of the Convertible Notes although the counterparties will have ongoing obligations with respect to Convertible Notes properly converted on or prior to that date of which the counterparties have been timely notified.
In addition, the Company issued warrants to the counterparties that could require the Company to issue up to approximately 4.2 million shares of the Company’s common stock on expiration dates consisting of the 100 consecutive business days beginning on and including January 15, 2013 (European style). The strike price is $61.22 per share, which represented a 70 % premium over the closing price of the Company’s shares of common stock on July 10, 2007.
The Convertible Note hedge and warrant transactions generally have the effect of increasing the conversion price of the Convertible Notes to approximately $61.22 per share of Kendle common stock, representing approximately a 70% premium based on the closing sale price as reported on The Nasdaq Global Market on July 10, 2007, of $36.01 per share.
The bond hedges and warrants are separate and legally distinct instruments that bind the Company and the counterparties and have no binding effect on the holders of the Convertible Notes. In addition, pursuant to EITF 00-19 and EITF 01-6, the bond hedges and warrants are accounted for as equity transactions. Therefore, the payment associated with the issuance of the bond hedges and the proceeds received from the issuance of the warrants were recorded as a charge and an increase, respectively, in Additional Paid-in Capital in Stockholders’ Equity as separate equity transactions.
For income tax reporting purposes, the Company has elected to integrate the Convertible Notes and the bond hedges. Integration of the bond hedges with the Convertible Notes creates an original issue discount (OID) debt instrument for income tax reporting purposes. Therefore, the cost of the bond hedges will be accounted for as interest expense over the term of the Convertible Notes for income tax reporting purposes. The associated income tax benefits that are recognized for financial reporting purposes will be recognized as a reduction in the income tax provision in the periods that the deductions are taken for income tax reporting purposes.
The Company received net proceeds from the sale of the Convertible Notes of approximately $194.0 million after deducting the underwriter’s discounts and commissions. In addition, the Company used approximately $18.1 million of the net proceeds of the offering to pay the net cost of the Convertible Note hedge transactions and the warrant transactions. The Company made a mandatory prepayment of $146.0 million (75% of the net proceeds of the offering) toward repayment of amounts owed under the term loan under its credit agreement and made additional voluntary prepayments during the third quarter of 2007 to pay off the remaining balance of the term loan.
As of December 31, 2007, $200.0 million was outstanding under the Convertible Notes, no amounts were outstanding under the revolving credit loan and no amounts were outstanding under the Multicurrency Facility.
The weighted-average interest rate in effect on the term loan for the first nine months of 2007 was approximately 7.82%.
The Company’s primary cash needs on both a short-term and long-term basis are for the payment of salaries and fringe benefits, hiring and recruiting expenses, business development costs, capital expenditures, acquisitions and facility-related expenses. The Company believes that its existing capital resources, together with cash flows from operations and borrowing capacity under the Facility and the Multicurrency Facility, will be sufficient to meet its foreseeable cash needs. In the future, the Company will continue to consider the acquisition of businesses to enhance its service offerings, therapeutic base and global presence. Any such acquisitions may require additional external financings and the Company may from time to time seek to obtain funds from public or private issuances of equity or debt securities. There can be no assurance that such financings will be available on terms acceptable to the Company.
21
Contractual Obligations
Future minimum payments for all contractual obligations for years subsequent to December 31, 2007, are as follows:
| | | | | | | | | | | | | | | | | | | | | |
| | | Year | | | Years | | | Years | | | Years | | | | |
| (in thousands) | | 2008 | | | 2009-2010 | | | 2011-2012 | | | After 2012 | | | Total | |
| Capital lease obligations (including interest) | | $ | 215 | | | $ | 232 | | | $ | 35 | | | $ | — | | | $ | 482 | |
| Operating Leases | | | 15,162 | | | | 21,610 | | | | 13,350 | | | | 13,002 | | | | 63,124 | |
| Debt payments (1) | | | — | | | | — | | | | 200,000 | | | | — | | | | 200,000 | |
| Interest on debt (1) | | | 6,750 | | | | 13,500 | | | | 10,406 | | | | — | | | | 30,656 | |
| Interest rate collar arrangement (2) | | | — | | | | 382 | | | | — | | | | — | | | | 382 | |
| Foreign currency hedge arrangements (3) | | | — | | | | 203 | | | | 1,414 | | | | — | | | | 1,617 | |
| FIN 48 obligation, including interest and penalties(4) | | | — | | | | — | | | | — | | | | — | | | | — | |
| | | | | | | | | | | | | | | | |
| Total | | $ | 22,127 | | | $ | 35,927 | | | $ | 225,205 | | | $ | 13,002 | | | $ | 296,261 | |
| | | | | | | | | | | | | | | | |
Short-term obligations arising in the ordinary course of business are excluded from the above table.
| | |
| (1) | | Under the terms of the Convertible Notes, the Convertible Notes are convertible into shares of the Common Stock upon the occurrence of various factors described in the Liquidity and Capital Resources section of Management’s Discussion and Analysis. The above table assumes no conversion with the principal amount of the Convertible Notes paid at the maturity date of July 15, 2012. |
| |
| | | The interest rate used in the calculation of interest was 3.375% as outlined in the Convertible Notes. |
| |
| (2) | | Based on December 31, 2007 fair value of interest rate collar arrangement maturing March of 2010. |
| |
| (3) | | Based on December 31, 2007 fair value of foreign currency hedge arrangements maturing in 2009 and 2012. |
| |
| (4) | | FIN 48 obligations of $5.4 million have not been reflected in the above table due to the inherent uncertainty as to the amount and timing of settlement, which is contingent upon the occurrence of possible future events, such as examinations and determinations by various tax authorities. |
Critical Accounting Policies and Estimates
The preparation of financial statements in conformity with accounting principles generally accepted in the United States of America requires management to make significant estimates and assumptions that affect the reported Consolidated Financial Statements for a particular period. Actual results could differ from those estimates.
Revenue Recognition
The majority of the Company’s net service revenues are based on fixed-price contracts calculated on a proportional performance basis (also referred to herein as “percentage-of-completion”) based upon assumptions regarding the estimated total costs for each contract. Additionally, work is performed under time-and-materials contracts, recognizing revenue as hours are worked based on the hourly billing rate for each contract. The Company also recognizes revenue under units-based contracts by multiplying units completed by the applicable contract per-unit price. Finally, at one of the Company’s Early Stage operations, the contracts are of a short-term nature and revenue is recognized under the completed contract method of accounting.
With respect to fixed price contracts, a percentage of completion is multiplied by the contract value to determine the amount of revenue recognized. Costs are incurred for performance of each contract and compared to the estimated budgeted costs for that contract to determine a percentage of completion on the contract. The contract value equals the value of the services to be performed under the contract as determined by aggregating the labor hours estimated to be incurred to perform the tasks in the contract at the agreed rates. Contract value excludes the value of third-party and other pass-through costs. As the work progresses, original estimates might be changed as a result of management’s regular contract review process.
22
Management regularly reviews the budget on each contract to determine if the budgeted costs accurately reflect the costs that the Company will incur for contract performance. The Company reviews each contract’s performance to date, current cost trends and circumstances specific to each contract. The Company estimates its remaining costs to complete the contract based on a variety of factors, including:
| | • | | Actual costs incurred to date and the work completed in incurring the actual costs; |
| |
| | • | | The remaining work to be completed based on the timeline of the contract as well as the number of units remaining for certain tasks in the contract; and |
| |
| | • | | Factors that could change the rate of progress of future contract performance. |
Examples of factors included in the review process include patient enrollment rate, changes in the composition of staff on the project or other customer requirements, among other things.
Based on these contract reviews, the Company adjusts its cost estimates. Adjustments to net service revenue resulting from changes in cost estimates are recorded on a cumulative basis in the period in which the revisions are made. When estimates indicate a loss, such loss is provided in the current period in its entirety. While the Company routinely adjusts cost estimates on individual contracts, the Company’s estimates and assumptions historically have been accurate in all material respects in the aggregate. The Company expects the estimates and assumptions to remain accurate in all material respects in the aggregate in future periods.
A contract amendment, which results in revisions to net service revenues and cost estimates, is recognized in the percentage-of-completion calculations beginning in the period in which the parties agree to the amendment. (See also Company Overview section of MD&A for a description of the contract amendment process.) Historically the aggregate value of contract amendments signed in any year represents 15% to 20% of annual sales, and, like sales, represents future net service revenues. Although the majority of the Company’s contract amendments relate to future services, the Company and its customers may execute contract amendments for services that the Company already has performed. In these circumstances, net service revenue from these services is recognized in the current period. Historically, the impact of such amendments on results of operations has not been material.
Under the Company’s policy, project teams are not authorized to engage in tasks outside the scope of the contract without prior management approval. In some situations, management may authorize the project team to commence work on activities outside the contract scope while the Company and its customer negotiate and finalize the contract amendment. When work progresses on unsigned, unprocessed contract amendments, the Company reviews the direct costs incurred, and, where material defers such costs on the balance sheet. In addition, the impact of such costs on the estimates to complete is considered and, where material, the estimates are adjusted. Historically, neither the deferred costs nor the impact on estimates have been material.
The Company believes that total costs constitute the most appropriate indicator of the performance of fixed price contracts because the costs relate primarily to the amount of labor hours incurred to perform the contract. The customer receives the benefit of the work performed throughout the contract term and is obligated to pay for services once performed. Accordingly, the Company believes that an input measure of cost is a reasonable surrogate for an output measure under the proportional performance model and is consistent with the revenue recognition concepts of Staff Accounting Bulletin (SAB) 104.
As the Company provides services on projects, it also incurs third-party and other pass-through costs, which are reimbursable by its customers pursuant to the contract. The revenues and costs from these third-party and other pass-through costs are reflected in the Company’s Consolidated Statements of Operations under the line items titled “Reimbursable out-of-pocket revenues” and “Reimbursable out-of-pocket costs”, respectively.
Direct Costs
Direct costs consist of compensation and related fringe benefits for project-related associates, unreimbursed project-related costs and an allocated portion of indirect costs, which primarily includes facilities-related costs and information systems costs. Labor costs represent over 80% of total direct costs with the allocated portion of indirect costs representing less than 10% of total. To determine the allocated portion of indirect costs, the Company calculates an allocation percentage based on the relationship between billable associate salaries and total salaries. The remaining indirect costs are allocated to SG&A.
Because the Company’s business is labor intensive, direct costs historically have increased with an increase in net service revenues. The Company, however, has not experienced any material variations in the relationship between direct costs and net service revenues for the fiscal years ended 2005, 2006 and 2007. The following factors will cause direct costs to decrease as a percentage of net service revenues:
| | • | | Higher utilization rates for billable employees; and |
| |
| | • | | The ability to complete contracted work more efficiently than estimated by the Company. |
23
The following factors will cause direct costs to increase as a percentage of net service revenues:
| | • | | The occurrence of cost overruns from increased time to complete contract performance; |
| |
| | • | | Increased costs due to higher-paid employees or contractors performing contract services; and |
| |
| | • | | Pricing pressure from increased competition. |
The Company does not expect that the foregoing factors will have a material impact on the historical relationship between direct costs and net service revenues.
Other Costs
Selling, general and administrative expenses consist of compensation and related fringe benefits for sales and administrative employees and professional services, as well as unallocated costs related to facilities, information systems and other costs.
Depreciation and amortization expenses consist of depreciation and amortization costs recorded on a straight-line method over the estimated useful life of the property or equipment and internally developed software. Finite-lived intangible assets are generally amortized on an accelerated basis based on the discounted cash flow calculations used in the valuation of the asset.
Accounts Receivable/Allowance for Doubtful Accounts
Billed accounts receivable represent amounts for which invoices have been issued to customers. Unbilled accounts receivable are amounts recognized as revenue for which invoices have not yet been issued to customers. Advance billings represent amounts billed or payment received for which revenues have not yet been earned. The Company maintains an allowance for doubtful accounts receivable based on historical evidence of accounts receivable collections and specific identification of accounts receivable that might pose collection problems. The bad debt provision is monitored on a regular basis and adjusted as circumstances warrant. With the exception of a $1.7 million write-off in 2005 of receivables due from one customer, the Company’s allowance for doubtful accounts has been sufficient to cover any bad debt write-offs. If the Company is unable to collect all or part of its outstanding receivables, there could be a material impact to the Company’s Consolidated Statements of Operations or financial position.
Long-Lived Assets
The Company analyzes goodwill and other finite-lived intangible assets to determine any potential impairment loss on an annual basis, unless conditions exist that require an updated analysis on an interim basis. Certain factors that may occur and indicate an impairment include the following: significant underperformance relative to historical or projected operating results; significant changes in the manner of the Company’s use of the underlying assets; and significant adverse industry or market economic trends.
A fair value approach is used to test goodwill for impairment. The fair value approach compares estimates related to the fair value of the reporting unit with the unit’s carrying amount, including goodwill. If the carrying amount of the reporting unit exceeds the fair value, the amount of the impairment loss must be measured. At December 31, 2007 and 2006, the fair value of the reporting units exceeded the carrying value, resulting in no goodwill impairment charge.
In addition, the Company has an intangible asset representing one customer relationship acquired in the Company’s acquisition of CPR. The fair value of this customer relationship had been $15 million prior to the fourth quarter of 2006 and the useful life had been designated as indefinite. Due to declining net service revenue from this customer in 2006 and declining net service revenue projected for 2007 and future years, the Company determined that the asset was impaired and recorded an $8.2 million impairment charge in 2006. Effective January 1, 2007, the Company assigned a 23-year useful life to the customer relationship and in the first quarter of 2007 the Company began amortizing the customer relationship basis over the 23 years on a straight-line basis.
The estimate of fair value of long-lived assets is inherently subjective and requires the Company to make a number of assumptions and projections. These assumptions and projections relate to future net service revenue, earnings and the probability of certain outcomes and scenarios. If factors change and the Company employs different assumptions in estimating fair value of its long-lived assets, the estimated fair value of these assets could change and result in impairment charges.
Internally Developed Software
Pursuant to the guidance included in Statement of Position 98-1, “Accounting for the Costs of Computer Software Developed or Obtained for Internal Use”, the Company capitalizes costs incurred to internally develop software used primarily in the Company’s proprietary clinical trial and data management systems, and amortizes these costs over the useful life of the product, not to exceed five years. Internally developed software represents software in the application development stage, and there is no assurance that the software development process will produce a final product for which the fair value exceeds its carrying value. Internally developed software is an intangible asset subject to impairment write-downs whenever events indicate that the carrying value of the software
24
may not be recoverable. As with other long-lived assets, this asset is reviewed at least annually to determine the appropriateness of the carrying value of the asset. Assessing the fair value of the internally developed software requires estimates and judgment on the part of management.
Tax Valuation Allowance and Tax Liabilities
The Company adopted FIN 48 as of January 1, 2007. FIN 48 requires significant judgment in determining what constitutes an individual tax position as well as assessing the outcome of each tax position. Changes in judgments as to recognition or measurement of tax positions can materially affect the estimate of the effective tax rate, and, consequently, the Company’s operating results. The Company considers many factors when evaluating and estimating tax positions and tax benefits, which may require periodic adjustments and which may not accurately anticipate actual outcomes. In addition, the calculation of tax liabilities involves dealing with uncertainties in the application of complex tax regulations in a multitude of jurisdictions. The Company determines its liability for uncertain tax positions globally under the provisions in FIN 48. At December 31, 2007, the Company has recorded a gross FIN 48 liability of $5.4 million. If events occur and the payment of these amounts ultimately proves to be unnecessary, the reversal of liabilities would result in tax benefits being recognized in the period when it is determined the liabilities are no longer necessary. If the calculation of liability related to uncertain tax positions proves to be more or less than the ultimate assessment, a tax expense or benefit to expense, respectively, would result.
The Company provides for income taxes on all transactions that have been recognized in the Consolidated Financial Statements in accordance with SFAS No. 109, “Accounting for Income Taxes.” Specifically, the Company estimates its tax liability based on current tax laws in the statutory jurisdictions in which it operates. Because the Company conducts business on a global basis, its effective tax rate has and will continue to depend upon the geographic distribution of its pre-tax earnings (losses) among jurisdictions with varying tax rates. These estimates include judgments about deferred tax assets and liabilities resulting from temporary differences between assets and liabilities recognized for financial reporting purposes and such amounts recognized for tax purposes. The Company has assessed the realization of deferred tax assets and a valuation allowance has been established based on an assessment that it is more likely than not that realization cannot be assured. The ultimate realization of this tax benefit is dependent upon the generation of sufficient operating income in the respective tax jurisdictions. If estimates prove inaccurate or if the tax laws change unfavorably, significant revisions in the valuation allowance may be required in the future.
Stock-based Compensation
Effective January 1, 2006, the Company began accounting for stock-based incentive programs under SFAS 123(R), “Share-Based Payment.” SFAS 123(R) superseded Accounting Principles Board Opinion No. 25, “Accounting for Stock Issued to Employees.” SFAS 123(R) requires all share-based payments to employees, including grants of employee stock options, be recognized as compensation expense in the income statement at fair value. The Company adopted the provisions of SFAS 123(R) for all share-based payments granted after January 1, 2006, and for all awards granted to employees prior to January 1, 2006, that remain unvested on January 1, 2006. The Company adopted SFAS 123(R) using a modified prospective application. The Company uses the straight-line method of recording compensation expense relative to share-based payment.
The weighted average fair value of the options granted was estimated on the date of grant using the Black-Scholes option-pricing model. The use of a Black-Scholes model requires the use of extensive historical employee exercise data and the use of a number of complex assumptions including assumptions regarding expected volatility of the stock, the risk free interest rate, expected dividends and expected term of the grant. The Company calculated expected volatility of its stock based on the volatility of its stock over a period approximating the expected term of the grants. The risk-free interest rate assumption is based upon observed interest rates appropriate for the term of the Company’s employee stock options. The Company assumed a dividend yield of zero because the Company has not paid dividends in the past and does not expect to do so in the future. Because stock-based compensation expense is based on awards ultimately expected to vest, it has been reduced for estimated forfeitures. SFAS 123(R) requires forfeitures to be estimated at the time of grant and revised, if necessary, in subsequent periods if actual forfeitures differ from those estimates. Forfeitures were estimated based on historical experience. The expected term of the option is based upon the contractual term and expected employee exercise and expected post-vesting employment termination behavior.
The adoption of SFAS 123(R) resulted in additional stock-based compensation expense of approximately $860,000 and $1.5 million in 2007 and 2006, respectively. The incremental stock-based compensation expense caused net income to decrease by approximately $690,000 and basic and diluted earnings per share to decrease by $0.05 per share in 2007. The incremental stock-based compensation expense caused net income to decrease by approximately $1.1 million and basic and diluted earnings per share to decrease by $0.08 per share in 2006. Stock-based compensation expense is recorded primarily in general and administrative expenses in the Company’s Consolidated Statements of Operations as the majority of the stock option expense related to options granted to executives.
If factors change and the Company employs different assumptions in the application of SFAS 123(R) in future periods, the compensation expense that the Company records may differ significantly from the expense recorded in the current period.
25
New Accounting Pronouncements
For a discussion of New Accounting Pronouncements, see Note 1 to the Company’s Consolidated Financial Statements.
Cautionary Statement for Forward-Looking Information
Certain statements contained in this Annual Report on Form 10-K that are not historical facts constitute forward-looking statements within the meaning of the Private Securities Litigation Reform Act of 1995 and are intended to be covered by the safe harbors created by that Act. Reliance should not be placed on forward-looking statements because they involve known and unknown risks, uncertainties and other factors that may cause actual results, performance or achievements to differ materially from those expressed or implied. Any forward-looking statement speaks only as of the date made. The Company undertakes no obligation to update any forward-looking statements to reflect events or circumstances arising after the date on which they are made.
Statements concerning expected financial performance, on-going business strategies and possible future action which the Company intends to pursue to achieve strategic objectives constitute forward-looking information. Implementation of these strategies and the achievement of such financial performance are each subject to numerous conditions, uncertainties and risk factors.
Factors that could cause actual performance to differ materially from these forward-looking statements include those Risk Factors set forth in Item 1A of this Annual Report on Form 10-K.
ITEM 7A.
QUANTITATIVE AND QUALITATIVE DISCLOSURES ABOUT MARKET RISK
Interest Rates
The Company is exposed to changes in interest rates on its amounts outstanding under the Facility and Multicurrency Facility. At December 31, 2007, no amounts were outstanding under either the Facility or the Multicurrency Facility.
In February 2007, the Company entered into an interest rate swap arrangement and an interest rate collar arrangement to fix the interest rate on a portion of its debt. The Company fixed the interest rate on the total outstanding balance of the term loan through April 30, 2007 at a fixed rate of 5.079% plus the 2.50% margin. Beginning May 1, 2007, the Company fixed the interest rate on $40.0 million of the outstanding term loan at the rate of 5.079% plus the 2.5% margin with an additional $51.0 million covered under the interest rate collar. The collar provides for interest rate protection at a cap of 6.25% and a floor of 3.21%. These agreements were not designated for hedge accounting treatment under SFAS No. 133 and all changes in the fair market value of the hedge will be recorded in the Company’s Consolidated Statements of Operations. In December 2007, the Company terminated the swap transaction and paid $881,000 to reflect the amounts due upon termination of the swap. Total 2007 losses related to changes in the fair market value of the interest rate swap and collar arrangements, including the $881,000 paid out upon termination of the swap arrangement were approximately $1.3 million. A 1% change in interest rates would change the amount recorded related to the fair market value of the interest rate collar arrangement by approximately $1.4 million in 2007.
Foreign Currency
The Company operates on a global basis and is therefore exposed to various types of currency risks. Two specific transaction risks arise from the nature of the contracts the Company executes with its customers. From time to time contracts are denominated in a currency different than the particular local currency. This contract currency denomination issue is applicable only to a portion of the contracts executed by the Company. The first risk occurs as revenue recognized for services rendered is denominated in a currency different from the currency in which the subsidiary’s expenses are incurred. As a result, the subsidiary’s net service revenues and resultant net income or loss can be affected by fluctuations in exchange rates.
The second risk results from the passage of time between the invoicing of customers under these contracts and the ultimate collection of customer payments against such invoices. Because the contract is denominated in a currency other than the subsidiary’s local currency, the Company recognizes a receivable at the time of invoicing at the local currency equivalent of the foreign currency invoice amount. Changes in exchange rates from the time the invoice is prepared until the payment from the customer is received will result in the Company receiving either more or less in local currency than the local currency equivalent of the invoice amount at the time the invoice was prepared and the receivable established. This difference is recognized by the Company as a foreign currency transaction gain or loss, as applicable, and is reported in Other Income (Expense) in the Consolidated Statements of Operations.
26
A third type of transaction risk arises from transactions denominated in multiple currencies between any two of the Company’s various subsidiary locations. For each subsidiary, the Company maintains an intercompany receivable and payable, which is denominated in multiple currencies. Changes in exchange rates from the time the intercompany receivable/payable balance arises until the balance is settled or measured for reporting purposes, results in exchange rate gains and losses. This intercompany receivable/payable arises when work is performed by a Kendle location in one country on behalf of a Kendle location in a different country under contract with the customer. Additionally, there are occasions when funds are transferred between subsidiaries for working capital purposes. The foreign currency transaction gain or loss is reported in Other Income (Expense) in the Consolidated Statements of Operations.
In 2007, the Company recorded total foreign exchange losses of approximately $5.9 million compared to $1.6 million in 2006 related to the risks described above. As described below, in the first quarter of 2007 the Company entered into foreign currency hedge transactions to hedge exposure related to intercompany notes between the Company’s U.S. subsidiary, as lender, and the Company’s subsidiaries in each of the United Kingdom and Germany.
The Company’s Consolidated Financial Statements are denominated in U.S. dollars. Accordingly, changes in exchange rates between the applicable foreign currency and the U.S. dollar will affect the translation of each foreign subsidiary’s financial results into U.S. dollars for purposes of reporting the Consolidated Financial Statements. The Company’s foreign subsidiaries translate their financial results from local currency into U.S. dollars as follows: income statement accounts are translated at average exchange rates for the period; balance sheet asset and liability accounts are translated at end of period exchange rates; and equity accounts are translated at historical exchange rates. Translation of the balance sheet in this manner affects the shareholders’ equity account referred to as the foreign currency translation adjustment account. This account exists only in the foreign subsidiaries’ U.S. dollar balance sheet and is necessary to keep the foreign subsidiaries’ balance sheet stated in U.S. dollars in balance. Foreign currency translation adjustments, which are reported as a separate component of Shareholders’ Equity, were approximately $3.8 million at December 31, 2007 and $2.3 million at December 31, 2006.
Foreign Currency Hedges
In the first quarter of 2007, the Company entered into foreign currency hedging transactions to mitigate exposure in movements between the U.S dollar and British Pounds Sterling and U.S dollar and Euro. The hedging transactions are designed to mitigate the Company’s exposure related to two intercompany notes between the Company’s U.S. subsidiary, as lender, and the Company’s subsidiaries in each of the United Kingdom and Germany. The note between the Company’s U.S. subsidiary and United Kingdom subsidiary is denominated in Pounds Sterling and had an outstanding principal amount of approximately $58.8 million at December 31, 2007. The note between the Company’s U.S. subsidiary and German subsidiary is denominated in Euro and had an outstanding principal amount of approximately $25.7 million at December 31, 2007. The hedge agreements were not designated for hedge accounting treatment under SFAS No. 133 and all changes in the fair market value of the hedge are recorded in the Company’s Consolidated Statements of Operations. In 2007, the Company recorded losses of approximately $1.9 million on the Euro hedge transaction and gains of approximately $300,000 on the Pound Sterling transaction related to the changes in the fair market value of the hedge. The losses on the fair market value of the hedge were offset by foreign exchange gains of approximately $2.6 million on the change in value of the Euro intercompany note and approximately $366,000 on the change in value of the Pound Sterling intercompany note. As it relates specifically to the foreign currency hedges discussed above, a 10% change in the U.S. dollar to Euro and U.S. dollar to Pound Sterling exchange rates would impact pre-tax income by approximately $950,000 in 2007.
Fair Value of Derivative Transactions
The notional amounts and fair values of the Company’s interest rate collar and foreign currency hedges at December 31, 2007 are shown below (in thousands).
| | | | | | | | | |
| | | Notional | | | Fair | |
| | | Amount | | | Value | |
| Interest rate collar | | $ | 52,000 | | | $ | (382 | ) |
| Foreign currency hedges | | | 81,098 | | | | (1,617 | ) |
| | | | | | | | |
| | | | | | | $ | (1,999 | ) |
| | | | | | | | |
27
ITEM 8.
FINANCIAL STATEMENTS AND SUPPLEMENTARY DATA
The Financial Statements and Supplementary Data called for by this Item are set forth in pages F-1 to F-27, which are incorporated herein by reference.
ITEM 9.
CHANGES IN AND DISAGREEMENTS WITH ACCOUNTANTS
ON ACCOUNTING AND FINANCIAL DISCLOSURE
None to report.
ITEM 9A.CONTROLS AND PROCEDURES
Management’s Evaluation of Disclosure Controls and Procedures
Based on the Company’s most recent evaluation, which was completed as of the end of the period covered by this Annual Report on Form 10-K, our CEO/Chairman (principal executive officer) and Chief Financial Officer (principal financial and accounting officer) believe the Company’s disclosure controls and procedures (as defined in Rules 13a-15(e) and 15d-15(e) of the Securities Exchange Act of 1934, as amended) are effective.
(a) Management’s Report on Internal Control over Financial Reporting
The Company’s management is responsible for establishing and maintaining adequate internal controls designed to provide reasonable assurance regarding the reliability of financial reporting and the preparation of financial statements for external purposes in accordance with accounting principles generally accepted in the United States of America (“GAAP”). The Company’s internal control over financial reporting includes those policies and procedures that:
| | 1. | | pertain to the maintenance of records that, in reasonable detail, accurately and fairly reflect the transactions and dispositions of assets of the Company; |
| |
| | 2. | | provide reasonable assurance that transactions are recorded as necessary to permit preparation of consolidated financial statements in accordance with GAAP and that receipts and expenditures of the Company are being made only in accordance with the authorizations of management and the Directors of the Company; and |
| |
| | 3. | | provide reasonable assurance regarding prevention or timely detection of unauthorized acquisition, use or disposition of the Company’s assets that could have a material effect on the Consolidated Financial Statements. |
All internal control systems, no matter how well designed, have inherent limitations, including the possibility of human error, collusion and the improper overriding of controls by management. Accordingly, even those systems determined to be effective can provide only reasonable, but not absolute assurance with respect to financial statement preparation and presentation. Further, because of changes in conditions, the effectiveness of internal control may vary over time.
As required by Section 404 of the Sarbanes Oxley Act of 2002, management assessed the effectiveness of the Company’s internal control over financial reporting as of December 31, 2007. Management’s assessment is based on the criteria established in the Internal Control — Integrated Framework issued by the Committee of Sponsoring Organizations of the Treadway Commission. Based upon our assessment, management believes that the Company maintained effective internal control over financial reporting as of December 31, 2007.
Deloitte and Touche LLP, the Company’s independent registered public accounting firm, has issued an attestation report on the Company’s internal control over financial reporting and as of December 31, 2007. This report appears below.
(b) Changes in Internal Control Over Financial Reporting
In the fourth quarter of 2007, the Company implemented its existing accounting system at one of the Company’s European subsidiaries that was acquired as part of the acquisition of CRL Clinical Services. Previously, this subsidiary had been using the accounting system that was used prior to acquisition.
28
| | | | | |
| /s/ Candace Kendle | | Chairman of the Board of Directors, Chief Executive Officer and Principal Executive Officer | | March 17, 2008 |
| | | | |
| Candace Kendle, PharmD | | | |
| | | | | |
| /s/ Karl Brenkert III | | Senior Vice President, Chief Financial Officer and Principal Financial Accounting Officer | | March 17, 2008 |
| | | | |
| Karl Brenkert III | | | |
REPORT OF INDEPENDENT REGISTERED PUBLIC ACCOUNTING FIRM
To the Board of Directors and Shareholders of
Kendle International Inc.
Cincinnati, Ohio
We have audited the internal control over financial reporting of Kendle International Inc. and subsidiaries (the “Company”) as of December 31, 2007, based on criteria established inInternal Control — Integrated Frameworkissued by the Committee of Sponsoring Organizations of the Treadway Commission. The Company’s management is responsible for maintaining effective internal control over financial reporting and for its assessment of the effectiveness of internal control over financial reporting, included in the accompanying Management’s Report on Internal Control over Financial Reporting. Our responsibility is to express an opinion on the Company’s internal control over financial reporting based on our audit.
We conducted our audit in accordance with the standards of the Public Company Accounting Oversight Board (United States). Those standards require that we plan and perform the audit to obtain reasonable assurance about whether effective internal control over financial reporting was maintained in all material respects. Our audit included obtaining an understanding of internal control over financial reporting, assessing the risk that a material weakness exists, testing and evaluating the design and operating effectiveness of internal control based on the assessed risk, and performing such other procedures as we considered necessary in the circumstances. We believe that our audit provides a reasonable basis for our opinion.
A company’s internal control over financial reporting is a process designed by, or under the supervision of, the company’s principal executive and principal financial officers, or persons performing similar functions, and effected by the company’s board of directors, management, and other personnel to provide reasonable assurance regarding the reliability of financial reporting and the preparation of financial statements for external purposes in accordance with generally accepted accounting principles. A company’s internal control over financial reporting includes those policies and procedures that (1) pertain to the maintenance of records that, in reasonable detail, accurately and fairly reflect the transactions and dispositions of the assets of the company; (2) provide reasonable assurance that transactions are recorded as necessary to permit preparation of financial statements in accordance with generally accepted accounting principles, and that receipts and expenditures of the company are being made only in accordance with authorizations of management and directors of the company; and (3) provide reasonable assurance regarding prevention or timely detection of unauthorized acquisition, use, or disposition of the company’s assets that could have a material effect on the financial statements.
Because of the inherent limitations of internal control over financial reporting, including the possibility of collusion or improper management override of controls, material misstatements due to error or fraud may not be prevented or detected on a timely basis. Also, projections of any evaluation of the effectiveness of the internal control over financial reporting to future periods are subject to the risk that the controls may become inadequate because of changes in conditions, or that the degree of compliance with the policies or procedures may deteriorate.
In our opinion, the Company maintained, in all material respects, effective internal control over financial reporting as of December 31, 2007, based on the criteria established inInternal Control — Integrated Frameworkissued by the Committee of Sponsoring Organizations of the Treadway Commission.
We have also audited, in accordance with the standards of the Public Company Accounting Oversight Board (United States), the consolidated financial statements as of and for the year ended December 31, 2007 of the Company and our report dated March 17, 2008 expressed an unqualified opinion on those financial statements and included an explanatory paragraph regarding the adoption of Financial Accounting Standards Board Interpretation No. 48, “Accounting for Uncertainty in Income Taxes — an Interpretation of Financial Accounting Standards Board Statement No. 109” on January 1, 2007 and Statement of Financial Accounting Standards No. 123 (Revised 2004), “Share-Based Payment,” on January 1, 2006.
DELOITTE & TOUCHE LLP
Cincinnati, Ohio
March 17, 2008
29
ITEM 9BOTHER INFORMATION
Nothing to report.
PART III
ITEM 10.
DIRECTORS, EXECUTIVE OFFICERS AND CORPORATE GOVERNANCE
DIRECTORS OF THE COMPANY
The name, age and background information for each of the Company’s Directors is set forth in the section entitled “Election of Directors” contained in the Company’s definitive Proxy Statement to be filed with the SEC and is incorporated herein by reference.
AUDIT COMMITTEE
Information regarding the members of the audit committee and the audit committee financial expert is set forth in the sections entitled “Board of Directors” and “Audit Committee” under the heading “Governance of the Company” in the Company’s definitive Proxy Statement to be filed with the SEC. The information in these sections is incorporated herein by reference.
EXECUTIVE OFFICERS OF THE COMPANY
The Executive Officers of the Company at March 1, 2008, were as follows:
| | | | | | | |
| | | | | | | EXECUTIVE |
| NAME | | AGE | | POSITION | | OFFICER SINCE |
| Candace Kendle, PharmD | | 61 | | Chief Executive Officer and Chairman | | 1989 |
| | | | | of the Board of Directors | | |
| | | | | | | |
| Christopher C. Bergen | | 57 | | President, Chief Operating | | 1989 |
| | | | | Officer and Director | | |
| | | | | | | |
| Karl Brenkert III | | 60 | | Senior Vice President, Chief Financial | | 2002 |
| | | | | Officer | | |
| | | | | | | |
| Martha R. Feller | | 59 | | Senior Vice President, Global Clinical | | 2007 |
| | | | | Development | | |
| | | | | | | |
| Simon S. Higginbotham | | 47 | | Vice President and Chief | | 2004 |
| | | | | Marketing Officer | | |
Background information regarding Dr. Kendle and Mr. Bergen is set forth in the section entitled “Election of Directors” in the Company’s definitive Proxy Statement to be filed with the SEC. Background information regarding Mr. Brenkert, Dr. Feller and Mr. Higginbotham is set forth in footnote numbers 3, 4 and 5, respectively, to the table within the section entitled “Securities Ownership
30
of Management” contained in the Company’s definitive Proxy Statement to be filed with the SEC. This information is incorporated herein by reference.
SECTION 16(A) BENEFICIAL OWNERSHIP REPORTING COMPLIANCE
Information on compliance with Section 16(a) of the Exchange Act is set forth in the section entitled “Section 16(a) Beneficial Ownership Reporting Compliance” under the heading entitled “Securities Ownership” in the Company’s definitive Proxy Statement to be filed with the SEC and is incorporated herein by reference.
CODE OF ETHICS
The Company has adopted a Code of Ethics and Conduct, which applies to the Company’s employees, including its Chief Executive Officer and its principal financial and accounting officer. The Code of Ethics and Conduct is available on the Company’s Web site atwww.kendle.com. Amendments to the Code of Ethics and Conduct will be posted to the Company’s Web site. In addition, the Company will make available, free of charge, to any person, a copy of its Code of Ethics and Conduct upon written request submitted to the Company. This written request should be addressed to the Company’s Secretary at the Company’s principal executive offices.
ITEM 11.
EXECUTIVE COMPENSATION
Information required by this report is set forth in the following sections under the heading entitled “Governance of the Company” in the Company’s definitive Proxy Statement to be filed with the SEC, which information is incorporated herein by reference:
| | • | | “Compensation Committee Interlocks and Insider Participation”; and |
| |
| | • | | “Compensation of Directors”. |
Information required by this report is set forth in the “Executive Compensation” section in the Company’s definitive Proxy Statement to be filed with the SEC. The “Executive Compensation” section includes information under the following headings, which information is incorporated herein by reference.
| | • | | “Compensation Discussion and Analysis:; |
| |
| | • | | “Compensation Committee Report”; |
| |
| | • | | “Summary Compensation Table”; |
| |
| | • | | “Grants of Plan-Based Awards”; |
| |
| | • | | “Outstanding Equity Awards at Fiscal Year End:; |
| |
| | • | | “Option Exercises and Stock Vested”; and |
| |
| | • | | “Potential Payments Upon Termination or Change-in-Control”. |
ITEM 12.
SECURITY OWNERSHIP OF CERTAIN BENEFICIAL OWNERS AND MANAGEMENT AND RELATED STOCKHOLDER MATTERS
Information on the number of shares beneficially owned by each Director and by all Directors and Executive Officers as a group is set forth in the section entitled “Securities Ownership of Management” under the heading entitled “Securities Ownership” in the Company’s definitive Proxy Statement to be filed with the SEC. The information set forth in such section is incorporated herein by reference.
Information on the number of shares beneficially owned by any person who is known to the Company to be the beneficial owner of more than five percent of the Company’s Common Stock is set forth in the section entitled “Principal Shareholders” under the heading entitled “Securities Ownership” in the Company’s definitive Proxy Statement to be filed with the Securities and Exchange Commission. The information set forth in such section is incorporated herein by reference.
31
The following table presents summary information at December 31, 2007, with respect to all of the Company’s equity compensation plans.
Equity Compensation Plan Information
| | | | | | | | | | | | | |
| | | (a) | | (b) | | (c) |
| | | | | | | | | | | Number of securities |
| | | | | | | | | | | remaining |
| | | Number of Securities to be | | | | | | available for future issuance |
| | | issued upon exercise of | | Weighted-average exercise | | under equity compensation |
| | | outstanding options, warrants | | price of outstanding options, | | plans (excluding securities |
| Plan Category | | and rights (1) | | warrants and rights (1) | | reflected in column (a)) (2) |
| Equity compensation plans approved by security holders | | | 543,007 | | | $ | 13.33 | | | | 1,000,000 | |
| Equity compensation plans not approved by security holders | | | — | | | | — | | | | — | |
| Total | | | 543,007 | | | $ | 13.33 | | | | 1,000,000 | |
| | |
| (1) | | Excludes the 2003 Directors’ Compensation Plan under which no options, warrants or rights are granted. This plan has been approved by shareholders for up to 75,000 shares. |
| |
| (2) | | Represents shares available for issuance under the 2007 Stock Plan. |
ITEM 13.
CERTAIN RELATIONSHIPS AND RELATED TRANSACTIONS, AND DIRECTOR INDEPENDENCE
TRANSACTIONS WITH RELATED PERSONS
Information with respect to transactions with related persons, if any, is contained under the caption “Review and Approval of Transactions with Related Persons” under the heading entitled “Governance of the Company” in the Company’s definitive Proxy Statement to be filed with the SEC. The information set forth in such section is incorporated herein by reference.
REVIEW, APPROVAL OR RATIFICATION OF TRANSACTIONS WITH RELATED PERSONS
Information with respect to the review, approval or ratification of transactions with related persons is contained under the caption “Review and Approval of Transactions with Related Persons” under the heading entitled “Governance of the Company” in the Company’s definitive Proxy Statement to be filed with the SEC. The information set forth in such section is incorporated herein by reference.
PROMOTERS AND CERTAIN CONTROL PERSONS
Not applicable.
DIRECTOR INDEPENDENCE
The name of each Director that is independent is contained in the section entitled “Board of Directors” under the heading entitled “Governance of the Company” in the Company’s definitive Proxy Statement to be filed with the SEC. The information set forth in such section is incorporated herein by reference.
32
ITEM 14.
PRINCIPAL ACCOUNTANT FEES AND SERVICES
Information required by this Item is contained in the sections entitled “Audit Committee’s Pre-Approval Policies and Procedures” and “Fees Paid to Registered Public Accounting Firm” under the heading entitled “Ratification of Appointment of Registered Public Accounting Firm” in the Company’s definitive Proxy Statement to be filed with the SEC and is incorporated herein by reference.
PART IV
ITEM 15.
EXHIBITS AND FINANCIAL STATEMENT SCHEDULES
| | (a) | | (1) and (2) - All financial statements and schedules required to be filed by Item 8 of this Annual Report on Form 10-K and included in this report are listed beginning on page F-1. No additional financial statements or schedules are being filed as the required information is not applicable or because the information is required and is included in the respective financial statements or notes thereto. |
| |
| | (3) | | Exhibits – Exhibits set forth below that are on file with the SEC are incorporated by reference as exhibits hereto. |
| | | | | |
| Exhibit | | | | |
| Number | | Description of Exhibit | | Filing Status |
| | | | | |
| 2.1 | | Stock Purchase Agreement dated July 1, 1997 by and among the Company and Shareholders of U-Gene Research B.V. | | A |
| | | | | |
| 2.2 | | Escrow Agreement dated June 27, 1997 among the Company, Keating, Muething & Klekamp, P.L.L., Bio-Medical Research Holdings, B.V., Utrechtse Particatiemaatschappij B.V., P.J. Morrison, T.S. Schwarz, I.M. Hoepelman , Ph.K. Peterson, J. Remington, M. Rozenberg-Arska and L.G.W. Sterkman | | A |
| | | | | |
| 2.3 | | Share Purchase Agreement dated July 2, 1997 by and among the Company and the Shareholders of GMI Gescellschaft für Angewandte Mathematick und Informatik mbH | | A |
| | | | | |
| 2.4 | | Stock Purchase Agreement dated February 11, 1998 by and among the Company and the Shareholders of ACER/EXCEL Inc. | | B |
| | | | | |
| 2.5 | | Escrow Agreement dated February 11, 1998 among the Company, Tzuo-Yan Lee, Jean C. Lee, Michael Minor, Conway Lee, Steven Lee, Jean C. Lee, as Trustee under a Trust dated March 8, 1991 fbo Jennifer Lee, Citicorp Trust-South Dakota and The Fifth Third Bank | | C |
| | | | | |
| 2.6 | | Registration Rights Agreement dated February 11, 1998 among the Company and Tzuo-Yan Lee, Jean C. Lee, Michael Minor, Conway Lee, Steven Lee, Jean C. Lee, as Trustee under a Trust dated March 8, 1991 fbo Jennifer Lee, Citicorp Trust-South Dakota | | C |
| | | | | |
| 2.7 | | Share Purchase Agreement dated December 23, 1998 by and among the Company and the Shareholders of Research Consultants (International) Holdings Limited | | D |
| | | | | |
| 2.8 | | Escrow Agreement dated January 5, 1999 among the Company, John Glasby, Gillian Gregory, Michael Roy Broomby and Peter Nightingale | | D |
| | | | | |
| 2.9 | | Option Agreement dated September 9, 1998 by and between the Company and Component Software International, Inc. | | D |
| | | | | |
| 2.10 | | Notice of Option Exercise dated January 11, 1999 of the Option Agreement dated September 9, 1998 | | D |
| | | | | |
| 2.11 | | Multi-Year Strategic Services Agreement dated January 20, 1999 by and between the Company and Component Software International, Inc. | | D |
| | | | | |
| 2.12 | | Asset Purchase Agreement dated June 27, 1999 by and among the Company and the Shareholders of Health Care Communications, Inc. | | F |
| | | | | |
| 2.13 | | Stock Purchase Agreement dated June 4, 1999 by and among the Company and the Shareholders of ESCLI S.A. | | G |
| | | | | |
| 2.14 | | Asset Purchase Agreement dated July 13, 1999 by and among the Company and the Shareholders of HCC Health Care Communications (1991), Ltd. | | G |
| | | | | |
| 2.15 | | Share Purchase Agreement dated August 31, 1999 by and among the Company and the Shareholder of Specialist Monitoring Services Limited | | G |
| | | | | |
| 2.16 | | Escrow Agreement dated July 13, 1999 by and among the Company, Geoffrey H. Kalish, M.D., Bradley D. Kalish, Jill Kalish, and The Fifth Third Bank, as Escrow Agent | | I |
| | | | | |
| 2.17 | | Escrow Agreement dated August 31, 1999 by and among the Company, Paul Martin, and The Fifth Third Bank, as Escrow Agent | | I |
33
| | | | | |
| Exhibit | | | | |
| Number | | Description of Exhibit | | Filing Status |
| | | | | |
| 2.18 | | Units Purchase Agreement dated April 7, 2000 by and among the Company and the Shareholders of SYNERmedicaPTY Limited and SYNERmedicaUnit Trust | | J |
| | | | | |
| 2.19 | | Stock Purchase Agreement dated February 27, 2001 by and among the Company and the Shareholders of AAC Consulting Group, Inc. | | L |
| | | | | |
| 2.20 | | Form of Note Prepayment Agreement | | O |
| | | | | |
| 2(a) | | Asset Purchase Agreement dated January 29, 2002 among Kendle International Inc., Clinical and Pharmacologic Research, Inc., Thomas S. Clark, M.D., Charles T. Clark, and E. Stuart Clark | | M |
| | | | | |
| 2(b) | | Convertible Subordinated Note, dated January 29, 2002 issued by Kendle International Inc. to Clinical and Pharmacologic Research, Inc. | | M |
| | | | | |
| 2.21 | | Stock Purchase Agreement between the Company and Charles River Laboratories International, Inc. dated as of May 9, 2006 | | U |
| | | | | |
| 3.1 | | Restated and Amended Articles of Incorporation | | A |
| | | | | |
| 3.2 | | Amended and Restated Code of Regulations | | A |
| | | | | |
| 3.3 | | Amendment of the Restated and Amended Articles of Incorporation to Increase the Authorized Shares | | E |
| | | | | |
| 4 | | Specimen Common Stock Certificate | | A |
| | | | | |
| 4.1 | | Shareholder Rights Agreement dated August 13, 1999 between the Company and The Fifth Third Bank, as Rights Agent | | H |
| | | | | |
| 4.2 | | Indenture dated March 31, 2007 between the Company and LaSalle Bank National Association | | X |
| | | | | |
| 4.3 | | Supplemental Indenture No. 1 dated July 16, 2007 between the Company and LaSalle Bank National Association | | BB |
| | | | | |
| 10.1 | | Amended and Restated Shareholders’ Agreement dated June 26, 1997 | | A |
| | | | | |
| 10.2 | | Master Lease Agreement dated November 27, 1996 by and between the Company and Bank One Leasing Corporation, as amended on April 18, 1997 | | A |
| | | | | |
| 10.6 | | Master Equipment Lease dated August 16, 1996 by and between the Company and The Fifth Third Leasing Company | | A |
| | | | | |
| 10.7 | | Lease Agreement dated December 9, 1991 by and between the Company and Carew Realty, Inc., as amended on December 30, 1991, March 18, 1996, October 8, 1996, January 29, 1997, and February 16, 1999 | | D |
| | | | | |
| 10.8 | | Indemnity Agreement dated June 21, 1996 by and between the Company and Candace Kendle Bryan | | A |
| | | | | |
| 10.9 | | Indemnity Agreement dated June 21, 1996 by and between the Company and Christopher C. Bergen | | A |
| | | | | |
| 10.10 | | Indemnity Agreement dated June 21, 1996 by and between the Company and Timothy M. Mooney | | A |
| | | | | |
| 10.11 | | Indemnity Agreement dated May 14, 1997 by and between the Company and Charles A. Sanders | | C |
| | | | | |
| 10.12 | | Indemnity Agreement dated May 14, 1997 by and between the Company and Philip E. Beekman | | C |
| | | | | |
| 10.13 | | Indemnity Agreement dated December 10, 1998 by and between the Company and Robert Buck | | D |
| | | | | |
| 10.14 | | Indemnity Agreement dated December 10, 1998 by and between the Company and Mary Beth Price | | D |
| | | | | |
| 10.15 | | Form of Indemnity Agreement by and between the Company and each member of the Company’s Board of Directors, except for those Indemnity Agreements noted above and filed previously. | | P |
| | | | | |
| 10.16 | | Credit Agreement dated as of August 16, 2006 by and among the Company, certain subsidiary Guarantors, various Lenders, UBS Securities LLC, as Sole Lead Arranger and Sole Bookrunner, UBS AG, Stamford Branch, as Issuing Bank, Administrative Agent and Collateral Agent, UBS Loan Finance LLC, as Swingline Lender, JPMorgan Chase Bank, N.A., as Syndication Agent, and KeyBank National Association, LaSalle Bank N.A. and National City Bank, as Co-Documentation Agents. | | V |
| | (a) | | First Amended and Restated Credit Agreement dated as of December 11, 2006 among Kendle International Inc., the several lenders from time to time party thereto and UBS AG, Stamford Branch, as administrative agent | Z |
| | | | | |
| | | | | |
| 10.17 | | First Amendment to the Stock Purchase Agreement dated as of August 16, 2006 between the Company and Charles River Laboratories, Inc. | | V |
| | | | | |
| 10.18 | | Second Amended and Restated Credit Agreement dated as of April 13, 2007 among Kendle International Inc., the several lenders from time to time party thereto and UBS AG, Stamford Branch, as administrative agent. | | W |
| | | | | |
| 10.19 | | Increase Joinder Agreement dated June 27, 2007 among the Company, certain of its subsidiaries, various Lenders, and UBS AG, Stamford Branch as administrative agent for the lenders | | Y |
| | | | | |
| 10.20 | | Confirmation of Convertible Bond Hedge Transaction, dated July 10, 2007, by and between the Company and UBS AG, London Branch | | CC |
| | | | | |
| 10.21 | | Confirmation of Convertible Bond Hedge Transaction, dated July 10, 2007, by and between the Company and JPMorgan Chase Bank, National Association, London Branch | | CC |
| | | | | |
| 10.22 | | Confirmation of Issuer Warrant Transaction, dated July 10, 2007, by and between the Company and UBS AG, London Branch | | CC |
| | | | | |
| 10.23 | | Confirmation of Issuer Warrant Transaction, dated July 10, 2007, by and between the Company and JPMorgan Chase Bank, National Association, London Branch | | CC |
34
| | | | | |
| Exhibit | | | | |
| Number | | Description of Exhibit | | Filing Status |
| | | | | |
| 10.24 | | Third Amended and Restated Credit Agreement dated as of December 18, 2007 among Kendle International Inc., the several lenders from time to time party thereto and UBS AG, Stamford Branch, as administrative agent | | DD |
| | | | | |
| 10.30 | | MANAGEMENT CONTRACTS AND COMPENSATION PLANS | | |
| | | | | | | |
| | | (a) | | 1995 Stock Option and Stock Incentive Plan | | A |
| | | | | | | |
| | | (b) | | 1995 Stock Option and Stock Incentive Plan —Individual Stock Option Agreement for Incentive Stock Option (contained in Exhibit 10.20(a)) | | A |
| | | | | | | |
| | | (c) | | 1997 Stock Option and Stock Incentive Plan | | A |
| | | | | | | |
| | | (c)(1) | | Amendment No. 1 to 1997 Stock Option and Stock Incentive Plan | | N |
| | | | | | | |
| | | (c)(2) | | Amendment No. 2 to 1997 Stock Option and Stock Incentive Plan | | K |
| | | | | | | |
| | | (c)(3) | | Amendment No. 3 to 1997 Stock Option and Stock Incentive Plan | | N |
| | | | | | | |
| | | (c)(4) | | Form of Restricted Stock Award Agreement | | S |
| | | | | | | |
| | | (d) | | Form of Protective Compensation and Benefit Agreement | | A |
| | | | | | | |
| | | (e) | | 1998 Employee Stock Purchase Plan | | D |
| | | | | | | |
| | | (e)(1) | | Amendment No. 1 to 1998 Employee Stock Purchase Plan | | N |
| | | | | | | |
| | | (e)(2) | | Amendment No. 2 to 1998 Employee Stock Purchase Plan | | N |
| | | | | | | |
| | | (e)(3) | | Amendment No. 3 to 1998 Employee Stock Purchase Plan | | N |
| | | | | | | |
| | | (e)(4) | | Amendment No. 4 to 1998 Employee Stock Purchase Plan | | Q |
| | | | | | | |
| | | (e)(5) | | Amendment No. 5 to 1998 Employee Stock Purchase Plan | | R |
| | | | | | | |
| | | (f) | | 2007 Stock Incentive Plan | | AA |
| | | | | | | |
| | | (n) | | 2003 Directors Compensation Plan | | O |
| | | | | |
| | | | | |
| 12.1 | | Computation of Ratio of Earnings to Fixed Charges | | DD |
| | | | | |
| 14 | | Code of Ethics | | EE |
| | | | | |
| 21 | | List of Subsidiaries | | DD |
| | | | | |
| 23.1 | | Consent of Deloitte & Touche LLP | | DD |
| | | | | |
| 24 | | Powers of Attorney | | DD |
| | | | | |
| 31.1 | | Certification of the Chief Executive Officer pursuant to Rule 13a-14(a) | | DD |
| | | | | |
| 31.2 | | Certification of the Chief Financial Officer pursuant to Rule 13a-14(a) | | DD |
| | | | | |
| 32.1 | | Certification Pursuant to 18 U.S.C Section 1350 as Adopted Pursuant to Section 906 of the Sarbanes- Oxley Act of 2002- Chief Executive Officer | | DD |
| | | | | |
| 32.2 | | Certification Pursuant to 18 U.S.C Section 1350 as Adopted Pursuant to Section 906 of the Sarbanes- Oxley Act of 2002 – Chief Financial Officer | | DD |
| | | |
| Filing | | |
| Status | | Description of Filing Status |
| | | |
| A | | Incorporated by reference to the Company’s Registration Statement No. 333-30581 filed under the Securities Act of 1933 |
| | | |
| B | | Filed as an exhibit to the Company’s Current Report on Form 8-K dated November 13, 1997 |
| | | |
| C | | Incorporated by reference to the Company’s Annual Report on Form 10-K for the year ended December 31, 1997 |
| | | |
| D | | Incorporated by reference to the Company’s Annual Report on Form 10-K for the year ended December 31, 1998 |
| | | |
| E | | Incorporated by reference to the Company’s Proxy Statement for its 1999 Annual Shareholders’ Meeting |
| | | |
| F | | Incorporated by reference to the Company’s Quarterly Report on Form 10-Q for the quarterly period ended June 30, 1999 |
| | | |
| G | | Incorporated by reference to the Company’s Quarterly Report on Form 10-Q for the quarterly period ended September 30, 1999 |
35
| | | |
| Filing | | |
| Status | | Description of Filing Status |
| | | |
| H | | Incorporated by reference to the Company’s filing on Form 8-A dated September 7, 1999 |
| | | |
| I | | Incorporated by reference to the Company’s Annual Report on Form 10-K for the year ended December 31, 1999 |
| | | |
| J | | Incorporated by reference to the Company’s Quarterly Report on Form 10-Q for the quarterly period ended March 31, 2000 |
| | | |
| K | | Incorporated by reference to the Company’s Proxy Statement for its 2000 Annual Shareholders’ Meeting |
| | | |
| L | | Incorporated by reference to the Company’s Annual Report on Form 10-K for the year ended December 31, 2000 |
| | | |
| M | | Filed as an exhibit to the Company’s Current Report on Form 8-K dated January 29, 2002 |
| | | |
| N | | Incorporated by reference to the Company’s Annual Report on Form 10-K for the year ended December 31, 2002 |
| | | |
| O | | Filed as an exhibit to the Company’s Quarterly Report on Form 10-Q for the quarterly period ended June 30, 2003 |
| | | |
| P | | Filed as an exhibit to the Company’s Annual Report on Form 10-K for the year ended December 31, 2003 |
| | | |
| Q | | Incorporated by reference to the Company’s Quarterly Report on Form 10-Q for the quarterly period ended March 31, 2005 |
| | | |
| R | | Incorporated by reference to the Company’s Current Report on Form 8-K dated June 3, 2005. |
| | | |
| S | | Filed as an exhibit to the Company’s Annual Report on Form 10-K for the year ended December 31, 2004 |
| | | |
| T | | Incorporated by reference to the Company’s Quarterly Report on Form 10-Q for the quarterly period ended March 31, 2003 |
| | | |
| U | | Incorporated herein by reference to Exhibit 2.1 to the Form 8-K filed with the Commission on May 12, 2006 |
| | | |
| V | | Incorporated by reference to the Company’s Current Report on Form 8-K dated August 18, 2006 |
| | | |
| W | | Incorporated by reference to the Company’s Quarterly Report on Form 10-Q for the quarterly period ended March 31, 2007 |
| | | |
| X | | Incorporated by reference to Exhibit 4.1 to the Company’s Form S-3 filed with the Commission on April 9, 2007 |
| | | |
| Y | | Incorporated by reference to the Company’s Quarterly Report on Form 10-Q for the quarterly period |
| | | ended June 30, 2007 |
| | | |
| Z | | Incorporated by reference to the Company’s Quarterly Report on Form 10-Q for the quarterly period ended September 30, 2007 |
| | | |
| AA | | Incorporated by reference to the Company’s definitive Proxy Statement on Schedule 14A filed with the Commission on April 9, 2007 |
| | | |
| BB | | Incorporated by reference to Exhibit 4.2 to the Company’s Current Report on Form 8-K filed with the Commission on July 16, 2007 |
| | | |
| CC | | Incorporated by reference to Exhibits 10.1, 10.2, 10.3 and 10.4 to the Company’s Current Report on Form 8-k filed with the Commission on July 10, 2007 |
| | | |
| DD | | Filed herewith |
| | | |
| EE | | Available on the Company’s Web site atwww.kendle.com |
The Company will furnish, without charge, to a security holder upon request a copy of the documents, portions of which are incorporated by reference (Annual Report to Shareholders and Proxy Statement), and will furnish any other Exhibit upon payment of reproduction charges.
(b) Exhibits required by this Form 10-K:
See (a)(3) above.
(c) Financial Statements and Schedules
See (a)(2) above.
36
Kendle International Inc.
Index to Consolidated Financial Statements
| | | | | |
| | | Page |
| | | | | |
| | | F-2 | |
| | | F-3 | |
| | | F-4 | |
| | | F-5 | |
| | | F-6 | |
| | | F-7 | |
F-1
REPORT OF INDEPENDENT REGISTERED PUBLIC ACCOUNTING FIRM
To the Board of Directors and Shareholders of
Kendle International Inc.
Cincinnati, Ohio
We have audited the accompanying consolidated balance sheets of Kendle International Inc. and subsidiaries (the “Company”) as of December 31, 2007 and 2006, and the related consolidated statements of operations, shareholders’ equity, and cash flows for each of the three years in the period ended December 31, 2007. These consolidated financial statements are the responsibility of the Company’s management. Our responsibility is to express an opinion on these financial statements based on our audits.
We conducted our audits in accordance with the standards of the Public Company Accounting Oversight Board (United States). Those standards require that we plan and perform the audit to obtain reasonable assurance about whether the financial statements are free of material misstatement. An audit includes examining, on a test basis, evidence supporting the amounts and disclosures in the financial statements. An audit also includes assessing the accounting principles used and significant estimates made by management, as well as evaluating the overall financial statement presentation. We believe that our audits provide a reasonable basis for our opinion.
In our opinion, such consolidated financial statements present fairly, in all material respects, the financial position of Kendle International Inc. and subsidiaries as of December 31, 2007 and 2006, and the results of their operations and their cash flows for each of the three years in the period ended December 31, 2007, in conformity with accounting principles generally accepted in the United States of America.
As discussed in Note 1, effective January 1, 2007, the Company adopted Financial Accounting Standards Board Interpretation No. 48, “Accounting for Uncertainty in Income Taxes — an Interpretation of Financial Accounting Standards Board Statement No. 109.” Also, the Company adopted Statement of Financial Accounting Standards No. 123 (Revised 2004), “Share-Based Payment,” on January 1, 2006.
We have also audited, in accordance with the standards of the Public Company Accounting Oversight Board (United States), the Company’s internal control over financial reporting as of December 31, 2007, based on the criteria established in Internal Control—Integrated Framework issued by the Committee of Sponsoring Organizations of the Treadway Commission and our report dated March 17, 2008 expressed an unqualified opinion on the Company’s internal control over financial reporting.
DELOITTE & TOUCHE LLP
Cincinnati, Ohio
March 17, 2008
F-2
CONSOLIDATED STATEMENTS OF OPERATIONS
(in thousands except per share data)
For the Years Ended December 31,
| | | | | | | | | | | | | |
| | | 2007 | | | 2006 | | | 2005 | |
| |
| Net service revenues | | $ | 397,584 | | | $ | 283,471 | | | $ | 202,032 | |
| Reimbursable out-of-pocket revenues | | | 171,234 | | | | 90,465 | | | | 48,607 | |
| | | | | | | | | | |
| Total revenues | | | 568,818 | | | | 373,936 | | | | 250,639 | |
| | | | | | | | | | | | | |
| Costs and expenses: | | | | | | | | | | | | |
| Direct costs | | | 204,161 | | | | 152,826 | | | | 108,582 | |
| Reimbursable out-of-pocket costs | | | 171,234 | | | | 90,465 | | | | 48,607 | |
| Selling, general and administrative | | | 125,744 | | | | 91,796 | | | | 68,216 | |
| Depreciation and amortization | | | 14,865 | | | | 10,403 | | | | 7,991 | |
| Employee severance and office consolidation costs | | | — | | | | 236 | | | | — | |
| Intangible impairment charge | | | — | | | | 8,200 | | | | — | |
| | | | | | | | | | |
| Total costs and expenses | | | 516,004 | | | | 353,926 | | | | 233,396 | |
| | | | | | | | | | | | | |
| Income from operations | | | 52,814 | | | | 20,010 | | | | 17,243 | |
| | | | | | | | | | | | | |
| Other income (expense): | | | | | | | | | | | | |
| Interest income | | | 1,466 | | | | 1,939 | | | | 1,019 | |
| Interest expense | | | (14,870 | ) | | | (6,781 | ) | | | (460 | ) |
| Write-off of deferred financing costs | | | (4,152 | ) | | | — | | | | — | |
| Other | | | (4,816 | ) | | | (1,795 | ) | | | (287 | ) |
| Gain on debt extinguishment | | | — | | | | — | | | | 300 | |
| | | | | | | | | | |
| Total other income (expenses) | | | (22,372 | ) | | | (6,637 | ) | | | 572 | |
| Income before income taxes | | | 30,442 | | | | 13,373 | | | | 17,815 | |
| Income taxes | | | 11,755 | | | | 4,843 | | | | 7,141 | |
| | | | | | | | | | |
| Net income | | $ | 18,687 | | | $ | 8,530 | | | $ | 10,674 | |
| | | | | | | | | | |
| | | | | | | | | | | | | |
| Income per share data: | | | | | | | | | | | | |
| Basic: | | | | | | | | | | | | |
| Net income per share | | $ | 1.29 | | | $ | 0.60 | | | $ | 0.79 | |
| Weighted average shares | | | 14,520 | | | | 14,323 | | | | 13,572 | |
| Diluted: | | | | | | | | | | | | |
| Net income per share | | $ | 1.26 | | | $ | 0.58 | | | $ | 0.76 | |
| Weighted average shares | | | 14,889 | | | | 14,762 | | | | 14,120 | |
The accompanying notes are an integral part of these Consolidated Financial Statements.
F-3
CONSOLIDATED BALANCE SHEETS
(in thousands except share data)
As of December 31,
| | | | | | | | | |
| | | 2007 | | | 2006 | |
| |
Assets | | | | | | | | |
| Current assets: | | | | | | | | |
| Cash and cash equivalents | | $ | 45,512 | | | $ | 19,917 | |
| Restricted cash | | | 844 | | | | 2,395 | |
| Accounts receivable, net | | | 135,550 | | | | 122,680 | |
| Deferred tax asset — current | | | 11,403 | | | | 5,249 | |
| Other current assets | | | 13,476 | | | | 16,435 | |
| | | | | | | |
| Total current assets | | | 206,785 | | | | 166,676 | |
| | | | | | | | | |
| Property and equipment, net | | | 32,021 | | | | 23,024 | |
| Goodwill | | | 230,168 | | | | 229,598 | |
| Other finite-lived intangible assets, net | | | 19,464 | | | | 24,227 | |
| Long-term deferred tax asset | | | 1,171 | | | | 3,181 | |
| Other assets | | | 10,114 | | | | 8,366 | |
| | | | | | | |
| Total assets | | $ | 499,723 | | | $ | 455,072 | |
| | | | | | | |
| | | | | | | | | |
Liabilities and Shareholders’ Equity | | | | | | | | |
| Current liabilities: | | | | | | | | |
| Current portion of obligations under capital leases | | $ | 199 | | | $ | 195 | |
| Current portion of amounts outstanding under credit facilities | | | — | | | | 2,000 | |
| Trade payables | | | 20,993 | | | | 15,150 | |
| Advance billings | | | 78,402 | | | | 62,427 | |
| Other accrued liabilities | | | 47,107 | | | | 30,500 | |
| | | | | | | |
| Total current liabilities | | | 146,701 | | | | 110,272 | |
| Obligations under capital leases, less current portion | | | 256 | | | | 404 | |
| Long-term debt | | | — | | | | 197,500 | |
| Convertible notes | | | 200,000 | | | | — | |
| Deferred income taxes payable | | | 2,322 | | | | 760 | |
| Non-current income taxes payable | | | 3,582 | | | | — | |
| Other liabilities | | | 5,339 | | | | 6,024 | |
| | | | | | | |
| Total liabilities | | | 358,200 | | | | 314,960 | |
| | | | | | | | | |
| Commitments and contingencies | | | | | | | | |
| Shareholders’ equity: | | | | | | | | |
| Preferred stock—no par value; 100,000 shares authorized; none issued and outstanding | | | | | | | | |
| Common stock—no par value; 45,000,000 shares authorized; 14,681,029 and 14,445,393 shares issued and 14,657,977 and 14,422,341 outstanding at December 31, 2007 and 2006, respectively | | | 75 | | | | 75 | |
| Additional paid-in capital | | | 140,109 | | | | 154,641 | |
| Accumulated deficit | | | (1,967 | ) | | | (16,392 | ) |
| Accumulated other comprehensive income: | | | | | | | | |
| Foreign currency translation adjustment | | | 3,798 | | | | 2,280 | |
| Less: Cost of Common Stock held in treasury, 23,052 shares at December 31, 2007 and 2006, respectively | | | (492 | ) | | | (492 | ) |
| | | | | | | |
| Total shareholders’ equity | | | 141,523 | | | | 140,112 | |
| | | | | | | |
| Total liabilities and shareholders’ equity | | $ | 499,723 | | | $ | 455,072 | |
| | | | | | | |
The accompanying notes are an integral part of these Consolidated Financial Statements.
F-4
CONSOLIDATED STATEMENTS OF SHAREHOLDERS’ EQUITY
| | | | | | | | | | | | | | | | | | | | | | | | | | | | | | | | | |
| | | | | | | Common | | | | | | | | | | (Accumulated | | Accumulated Other | | | | |
| | | Common Stock | | Stock | | Additional | | Treasury | | Deficit) Retained | | Comprehensive | | Total Shareholders’ | | Comprehensive |
| (in thousands except share data) | | Number of Shares | | Amount | | Paid-in Capital | | Stock | | Earning | | Income(Loss) | | Equity | | Income (Loss) |
| | | |
Balance at January 1, 2005 | | | 13,242,929 | | | $ | 75 | | | $ | 136,111 | | | $ | (393 | ) | | $ | (35,596 | ) | | $ | 2,578 | | | $ | 102,775 | | | | | |
| Net income | | | | | | | | | | | | | | | | | | | 10,674 | | | | | | | | 10,674 | | | | 10,674 | |
| Other comprehensive income: | | | | | | | | | | | | | | | | | | | | | | | | | | | | | | | | |
| Foreign currency translation adjustment | | | | | | | | | | | | | | | | | | | | | | | (2,655 | ) | | | (2,655 | ) | | | (2,655 | ) |
| Net unrealized holding gains on available-for-sale securities, net of tax | | | | | | | | | | | | | | | | | | | | | | | 10 | | | | 10 | | | | 10 | |
| Net unrealized holding gains on interest rate swap agreement | | | | | | | | | | | | | | | | | | | | | | | 99 | | | | 99 | | | | 99 | |
| | | |
| Comprehensive income | | | | | | | | | | | | | | | | | | | | | | | | | | | | | | | 8,128 | |
| | | |
| Shares issued under stock plans | | | 842,827 | | | | | | | | 9,633 | | | | | | | | | | | | | | | | 9,633 | | | | | |
| Deferred compensation - restricted stock | | | | | | | | | | | (66 | ) | | | | | | | | | | | | | | | (66 | ) | | | | |
| Income tax benefit from exercise of stock options | | | | | | | | | | | 2,034 | | | | | | | | | | | | | | | | 2,034 | | | | | |
| | | |
Balance at December 31, 2005 | | | 14,085,756 | | | $ | 75 | | | $ | 147,712 | | | $ | (393 | ) | | $ | (24,922 | ) | | $ | 32 | | | $ | 122,504 | | | | | |
| Net income | | | | | | | | | | | | | | | | | | | 8,530 | | | | | | | | 8,530 | | | | 8,530 | |
| Other comprehensive income: | | | | | | | | | | | | | | | | | | | | | | | | | | | | | | | | |
| Foreign currency translation adjustment | | | | | | | | | | | | | | | | | | | | | | | 2,217 | | | | 2,217 | | | | 2,217 | |
| Portion of prior year unrealized loss recognized in current year, net of tax | | | | | | | | | | | | | | | | | | | | | | | 34 | | | | 34 | | | | 34 | |
| Realized holding loss on available-for-sale securities, net of tax | | | | | | | | | | | | | | | | | | | | | | | 5 | | | | 5 | | | | 5 | |
| Net unrealized holding gains on interest rate swap agreement | | | | | | | | | | | | | | | | | | | | | | | (8 | ) | | | (8 | ) | | | (8 | ) |
| | | |
| Comprehensive income | | | | | | | | | | | | | | | | | | | | | | | | | | | | | | | 10,778 | |
| | | |
| Shares issued under stock plans | | | 336,585 | | | | | | | | 4,271 | | | | | | | | | | | | | | | | 4,271 | | | | | |
| Stock option expense | | | | | | | | | | | 1,490 | | | | | | | | | | | | | | | | 1,490 | | | | | |
| Deferred compensation - restricted stock | | | | | | | | | | | (19 | ) | | | | | | | | | | | | | | | (19 | ) | | | | |
| Income tax benefit from exercise of stock options | | | | | | | | | | | 1,187 | | | | | | | | | | | | | | | | 1,187 | | | | | |
| Treasury stock transaction | | | | | | | | | | | | | | | (99 | ) | | | | | | | | | | | (99 | ) | | | | |
| | | |
Balance at December 31, 2006 | | | 14,422,341 | | | $ | 75 | | | $ | 154,641 | | | $ | (492 | ) | | $ | (16,392 | ) | | $ | 2,280 | | | $ | 140,112 | | | | | |
| Net income | | | | | | | | | | | | | | | | | | | 18,687 | | | | | | | | 18,687 | | | | 18,687 | |
| Other comprehensive income: | | | | | | | | | | | | | | | | | | | | | | | | | | | | | | | | |
| Foreign currency translation adjustment | | | | | | | | | | | | | | | | | | | | | | | 1,518 | | | | 1,518 | | | | 1,518 | |
| | | |
| Comprehensive income | | | | | | | | | | | | | | | | | | | | | | | | | | | | | | | 20,205 | |
| | | |
| Shares issued under stock plans | | | 235,636 | | | | | | | | 2,560 | | | | | | | | | | | | | | | | 2,560 | | | | | |
| Stock option expense | | | | | | | | | | | 860 | | | | | | | | | | | | | | | | 860 | | | | | |
| Income tax benefit from exercise of stock options | | | | | | | | | | | 188 | | | | | | | | | | | | | | | | 188 | | | | | |
| Note hedge transaction | | | | | | | | | | | (42,880 | ) | | | | | | | | | | | | | | | (42,880 | ) | | | | |
| Issuance of warrants | | | | | | | | | | | 24,740 | | | | | | | | | | | | | | | | 24,740 | | | | | |
| FIN 48 adoption | | | | | | | | | | | | | | | | | | | (4,262 | ) | | | | | | | (4,262 | ) | | | | |
| | | |
Balance at December 31, 2007 | | | 14,657,977 | | | $ | 75 | | | $ | 140,109 | | | $ | (492 | ) | | $ | (1,967 | ) | | $ | 3,798 | | | $ | 141,523 | | | | | |
| | | | | | | | | | | |
The accompanying notes are an integral part of these Consolidated Financial Statements.
F-5
CONSOLIDATED STATEMENTS OF CASH FLOWS
| | | | | | | | | | | | | |
| (in thousands) | | | | | | | | | |
| For the Years Ended December 31, | | 2007 | | | 2006 | | | 2005 | |
| Cash flows from operating activities | | | | | | | | | | | | |
| Net income | | $ | 18,687 | | | $ | 8,530 | | | $ | 10,674 | |
| Adjustments to reconcile net income to cash provided by operating activities: | | | | | | | | | | | | |
| Depreciation and amortization | | | 14,865 | | | | 10,403 | | | | 7,991 | |
| Goodwill and investment impairment | | | — | | | | 8,200 | | | | — | |
| Deferred income taxes | | | (5,234 | ) | | | (3,967 | ) | | | 1,416 | |
| Income tax benefit from stock option exercises | | | (188 | ) | | | (898 | ) | | | — | |
| Compensation expense on stock grants | | | 879 | | | | 1,879 | | | | 78 | |
| Debt issue cost amortization | | | 5,404 | | | | — | | | | — | |
| Foreign currency exchange (gain) / loss | | | 3,770 | | | | 184 | | | | (215 | ) |
| Other | | | 172 | | | | 338 | | | | 306 | |
| Gain on convertible note repayment | | | — | | | | — | | | | (300 | ) |
| Changes in operating assets and liabilities, net of effects from acquisitions: | | | | | | | | | | | | |
| Restricted cash | | | 1,587 | | | | (441 | ) | | | 293 | |
| Accounts receivable | | | (16,138 | ) | | | (27,559 | ) | | | (10,328 | ) |
| Other current assets | | | 1,507 | | | | (1,262 | ) | | | (385 | ) |
| Other assets | | | (486 | ) | | | (207 | ) | | | 256 | |
| Trade payables | | | 2,632 | | | | 2,806 | | | | 355 | |
| Advance billings | | | 18,814 | | | | 15,895 | | | | 7,471 | |
| Accrued liabilities and other | | | 14,712 | | | | 3,650 | | | | 5,707 | |
| | | | | | | | | | |
| Net cash provided by operating activities | | | 60,983 | | | | 17,551 | | | | 23,319 | |
| | | | | | | | | | | | | |
| Cash flows from investing activities | | | | | | | | | | | | |
| Purchase of available-for-sale securities | | | — | | | | (7,027 | ) | | | (9,552 | ) |
| Proceeds from sale and maturity of available-for-sale securities | | | — | | | | 17,868 | | | | 9,050 | |
| Acquisitions of property and equipment | | | (14,724 | ) | | | (8,725 | ) | | | (4,732 | ) |
| Additions to internally developed software | | | (531 | ) | | | (91 | ) | | | (233 | ) |
| Acquisitions of businesses, less cash acquired | | | 2,154 | | | | (231,879 | ) | | | — | |
| Other | | | (722 | ) | | | (153 | ) | | | 20 | |
| | | | | | | | | | |
| Net cash used in investing activities | | | (13,823 | ) | | | (230,007 | ) | | | (5,447 | ) |
| | | | | | | | | | | | | |
| Cash flows from financing activities | | | | | | | | | | | | |
| Proceeds from issuance of long-term debt | | | 200,000 | | | | 200,000 | | | | — | |
| Payments of long-term debt | | | (199,500 | ) | | | (4,250 | ) | | | (2,937 | ) |
| Payment of convertible note | | | — | | | | — | | | | (1,200 | ) |
| Purchase of note hedges | | | (42,880 | ) | | | — | | | | — | |
| Proceeds from the issuance of warrants | | | 24,740 | | | | — | | | | — | |
| Proceeds from issuance of Common Stock | | | 2,623 | | | | 3,505 | | | | 7,422 | |
| Income tax benefit from stock option exercises | | | 188 | | | | 898 | | | | — | |
| Amounts payable – book overdraft | | | (22 | ) | | | (65 | ) | | | (353 | ) |
| Payments on capital lease obligations | | | (196 | ) | | | (382 | ) | | | (691 | ) |
| Purchase of treasury stock | | | — | | | | (99 | ) | | | — | |
| Debt issue costs | | | (6,946 | ) | | | (5,568 | ) | | | (30 | ) |
| | | | | | | | | | |
| Net cash provided by (used in) financing activities | | | (21,993 | ) | | | 194,039 | | | | 2,211 | |
| Effects of exchange rates on cash and cash equivalents | | | 428 | | | | 897 | | | | (311 | ) |
| Net increase (decrease) in cash and cash equivalents | | | 25,595 | | | | (17,520 | ) | | | 19,772 | |
| | | | | | | | | | | | | |
| Cash and cash equivalents | | | | | | | | | | | | |
| Beginning of year | | | 19,917 | | | | 37,437 | | | | 17,665 | |
| | | | | | | | | | |
| End of year | | $ | 45,512 | | | $ | 19,917 | | | $ | 37,437 | |
| | | | | | | | | | | | | |
| Supplemental disclosure of cash flow information | | | | | | | | | | | | |
| Cash paid during the year for interest | | $ | 10,107 | | | $ | 6,198 | | | $ | 489 | |
| Cash paid during the year for income taxes | | $ | 4,870 | | | $ | 7,698 | | | $ | 3,154 | |
| | | | | | | | | | | | | |
| Supplemental schedule of noncash investing and financing activities | | | | | | | | | | | | |
| Acquisition of equipment under capital leases | | $ | 173 | | | $ | 184 | | | $ | — | |
| Accrued equipment purchases | | $ | (3,574) | | | $ | — | | | $ | — | |
| | | | | | | | | | | | | |
| Acquisitions of businesses: | | | | | | | | | | | | |
| Fair value of assets acquired via cash | | $ | (2,154 | ) | | $ | 266,850 | | | $ | — | |
| Fair value of liabilities assumed or incurred | | $ | — | | | $ | (34,971 | ) | | $ | — | |
| Stock issued | | $ | — | | | $ | — | | | $ | — | |
| | | | | | | | | | |
Net cash payments | | $ | (2,154 | ) | | $ | 231,879 | | | $ | — | |
| | | | | | | | | | |
The accompanying notes are an integral part of these Consolidated Financial Statements.
F-6
NOTES TO CONSOLIDATED FINANCIAL STATEMENTS
1. NATURE OF BUSINESS AND SIGNIFICANT ACCOUNTING POLICIES:
Nature of Business
Kendle International Inc. (the Company or Kendle), an Ohio corporation established in 1989, is a global clinical research organization (CRO) that provides a broad range of Phase I-IV global clinical development services to the biopharmaceutical industry. The Company has operations in North America, Europe, Asia/Pacific, Latin America and Africa.
Principles of Consolidation and Organization
The Consolidated Financial Statements include the financial information of Kendle International Inc. and its wholly-owned subsidiaries. Investments in unconsolidated companies that are at least 20% owned and in which the Company can exercise significant influence, but not control, are carried at cost plus equity in undistributed earnings since acquisition. Investments in unconsolidated companies that are less than 20% owned and in which the Company cannot exercise significant influence are carried at cost. There are no significant amounts on the Consolidated Balance Sheets related to investments in unconsolidated companies.
All intercompany accounts and transactions have been eliminated. The results of operations of the Company’s wholly-owned subsidiaries have been included in the Consolidated Financial Statements of the Company from the respective dates of acquisition.
Business Combinations
Statement of Financial Accounting Standards (SFAS) No. 141, Business Combinations, requires assets acquired and liabilities assumed in a business combination to be recorded at fair value. Fair values are generally determined by using comparisons to market value transactions and present value techniques. The use of a discounted cash flow technique requires significant judgments with respect to expected cash flows to be derived from the assets, the estimated period of time the assets will produce those cash flows and the selections of an appropriate discount rate. Changes in such estimates could change the amounts allocated to individual identifiable assets, the lives over which the assigned values are amortized and the amounts allocated to goodwill. While the Company believes its assumptions are reasonable, if different assumptions were made, the purchase price allocation and the estimated useful lives of amortizable assets could differ substantially from the reported amounts.
Results of operations for acquired entities are included in the Company’s results of operations from the date of acquisition.
Foreign Currency Translation
Assets and liabilities of the Company’s wholly-owned subsidiaries are translated into U.S. dollars at year-end exchange rates. Income statement accounts are translated at average exchange rates for the quarter. These translation adjustments are recorded as a separate component of Shareholders’ Equity. Foreign currency transaction gains and losses are included in the Consolidated Statements of Operations.
Cash and Cash Equivalents, Including Restricted Cash
Cash and cash equivalents consist of demand deposits and money market funds held with a financial institution, with an initial maturity of three months or less.
The Company maintains its demand deposits with certain financial institutions. The balance of one account from time-to-time exceeds the maximum U.S. federally insured amount. Additionally, there is no state insurance coverage on bank balances held in The Netherlands.
At December 31, 2007, the Company held cash of approximately $844,000 that is restricted as to its use as compared to approximately $2.4 million at December 31, 2006. The restricted cash represents cash received from customers that is segregated in a separate Company bank account and available for use only for specific project-related expenses, primarily investigator fees, upon authorization from the customer.
F-7
Revenue Recognition
The majority of the Company’s net service revenues are based on fixed-price contracts calculated on a proportional performance basis (also referred to herein as “percentage-of-completion”) based upon assumptions regarding the estimated total costs for each contract. Additionally, work is performed under time-and-materials contracts, recognizing revenue as hours are worked based on the hourly billing rate for each contract. The Company also recognizes revenue under units-based contracts by multiplying units completed by the applicable contract per-unit price. Finally, at one of the Company’s Early Stage operations, the contracts are of a short-term nature and revenue is recognized under the completed contract method of accounting.
With respect to fixed price contracts, a percentage of completion is multiplied by the contract value to determine the amount of revenue recognized. Costs are incurred for performance of each contract and compared to the estimated budgeted costs for that contract to determine a percentage of completion on the contract. The contract value equals the value of the services to be performed under the contract as determined by aggregating the labor hours estimated to be incurred to perform the tasks in the contract at the agreed rates. Contract value excludes the value of third-party and other pass-through costs. As the work progresses, original estimates might be changed as a result of management’s regular contract review process.
Management regularly reviews the budget on each contract to determine if the budgeted costs accurately reflect the costs that the Company will incur for contract performance. The Company reviews each contract’s performance to date, current cost trends and circumstances specific to each contract. The Company estimates its remaining costs to complete the contract based on a variety of factors, including:
| | • | | Actual costs incurred to date and the work completed in incurring the actual costs; |
| |
| | • | | The remaining work to be completed based on the timeline of the contract as well as the number of units remaining for certain tasks in the contract; and |
| |
| | • | | Factors that could change the rate of progress of future contract performance. |
Examples of factors included in the review process include patient enrollment rate, changes in the composition of staff on the project or other customer requirements, among other things.
Based on these contract reviews, the Company adjusts its cost estimates. Adjustments to net service revenue resulting from changes in cost estimates are recorded on a cumulative basis in the period in which the revisions are made. When estimates indicate a loss, such loss is provided in the current period in its entirety. While the Company routinely adjusts cost estimates on individual contracts, the Company’s estimates and assumptions historically have been accurate in all material respects in the aggregate. The Company expects the estimates and assumptions to remain accurate in all material respects in the aggregate in future periods.
A contract amendment, which results in revisions to net service revenues and cost estimates, is recognized in the percentage-of-completion calculations beginning in the period in which the parties agree to the amendment. Historically the aggregate value of contract amendments signed in any year represents 15% to 20% of annual sales, and, like sales, represents future net service revenues. Although the majority of the Company’s contract amendments relate to future services, the Company and its customers may execute contract amendments for services that the Company already has performed. In these circumstances, net service revenue from these services is recognized in the current period. Historically, the impact of such amendments on results of operations has not been material.
Under the Company’s policy, project teams are not authorized to engage in tasks outside the scope of the contract without prior management approval. In some situations, management may authorize the project team to commence work on activities outside the contract scope while the Company and its customer negotiate and finalize the contract amendment. When work progresses on unsigned, unprocessed contract amendments, the Company reviews the direct costs incurred, and, where material defers such costs on the balance sheet. In addition, the impact of such costs on the estimates to complete is considered and, where material, the estimates are adjusted. Historically, neither the deferred costs nor the impact on estimates have been material.
The Company believes that total costs constitute the most appropriate indicator of the performance of fixed price contracts because the costs relate primarily to the amount of labor hours incurred to perform the contract. The customer receives the benefit of the work performed throughout the contract term and is obligated to pay for services once performed. Accordingly, the Company believes that an input measure of cost is a reasonable surrogate for an output measure under the proportional performance model and is consistent with the revenue recognition concepts of Staff Accounting Bulletin (SAB) 104.
As the Company provides services on projects, it also incurs third-party and other pass-through costs, which are reimbursable by its customers pursuant to the contract. The revenues and costs from these third-party and other pass-through costs are reflected in the Company’s Consolidated Statements of Operations under the line items titled “Reimbursable out-of-pocket revenues” and “Reimbursable out-of-pocket costs”, respectively.
F-8
Concentration of Credit Risk
Accounts receivable represent amounts due from customers that are concentrated mainly in the biopharmaceutical industry. The concentration of credit risk is subject to the financial and industry conditions of the Company’s customers. The Company does not require collateral or other securities to support customer receivables. The Company monitors the creditworthiness of its customers. Refer to Note 14 for additional information regarding revenue concentration.
Long-Lived Assets
Property and equipment are stated at cost, net of accumulated depreciation. Depreciation is computed over the estimated useful lives, ranging from five to fifty years using the straight-line method. Leasehold improvements are amortized over the lesser of the estimated useful life of the improvement or the remaining term of the underlying lease. Repairs and maintenance are charged to expense as incurred. Upon disposition, the asset and the related accumulated depreciation are relieved and any gains or losses are reflected in the Consolidated Statements of Operations.
Useful lives by asset category can vary based on the nature of the asset purchased. The following represents the maximum estimated useful lives for the below categories of assets:
| | | | | |
| | | Furniture and Fixtures | | 10 years |
| | | Computer and Software | | 5 years |
| | | Leasehold Improvements | | Lesser of estimated life of asset or lease term |
| | | Buildings | | 50 years |
| | | Capital Lease Assets | | Lesser of estimated life of asset or lease term |
Equipment under capital leases is recorded at the present value of future minimum lease payments and is amortized over the estimated useful lives of the assets, not to exceed the terms of the related leases. Accumulated amortization on equipment under capital leases was approximately $1.7 million at both December 31, 2007, and 2006.
The Company capitalizes costs incurred internally to develop software used primarily in the Company’s proprietary clinical trial and data management systems, and amortizes these costs on a straight-line basis over the estimated useful life of the product, not to exceed five years. Internally developed software costs included in the Consolidated Balance Sheets at December 31, 2007, and 2006 were $16.3 million and $15.8 million, respectively. The related accumulated amortization at December 31, 2007, and 2006 was $14.9 million and $14.0 million, respectively.
In accordance with SFAS No. 144, “Accounting for Impairment or Disposal of Long-Lived Assets,” long-lived assets such as property, plant and equipment, software and investments are reviewed for impairment whenever facts and circumstances indicate that the carrying value may not be recoverable. When required, impairment losses on assets to be held and used are recognized based on the fair value of the asset. The fair value is determined based on estimates of future cash flows, market value of similar assets, if available, or independent appraisals, if required. If the carrying amount of the long-lived asset is not recoverable from its undiscounted cash flows, an impairment loss is recognized for the difference between the carrying amount and fair value of the asset.
Goodwill
In accordance with SFAS No.142, “Goodwill and Other Intangible Assets,” effective January 1, 2002, the Company discontinued the amortization of goodwill and other identifiable intangible assets that have indefinite useful lives. Intangible assets that have finite useful lives will continue to be amortized over their estimated useful lives.
In accordance with SFAS No. 142, goodwill is evaluated on an annual basis for impairment at the reporting unit level. Such evaluation is based on a two-step test starting with a comparison of the carrying amount of the reporting unit to the fair value of the reporting unit. If the carrying amount of the reporting unit exceeds the fair value, the second phase of the test measures the impairment.
In 2007 and 2006, consistent with the above-referenced guidance, the Company analyzed goodwill for impairment by comparing the carrying amounts of the reporting units to the fair values of the reporting units. The fair values of the reporting units were calculated based on the Income Approach which uses discounted cash flows as well as public information regarding the market capitalization of the Company.
The Company completed the testing in the fourth quarter of 2007. The fair value of the reporting units exceeded the carrying value, resulting in no goodwill impairment for 2007. Similarly, the analysis in the fourth quarter of 2006 resulted in no goodwill impairment for 2006.
F-9
Derivatives
From time to time, the Company may use derivative instruments to manage exposure to interest rates and foreign currency. Derivatives meeting the hedge criteria established by SFAS No. 133, “Accounting for Derivative Instruments and Hedging Activities,” as amended by SFAS No. 138, are recorded in the Consolidated Balance Sheets at fair value at each balance sheet date. When the derivative is entered into, the Company designates whether or not the derivative instrument is an effective hedge of an asset, liability or firm commitment and classifies the hedge as a cash flow hedge or a fair value hedge. If the hedge is determined to be an effective cash flow hedge, changes in the fair value of the derivative instrument are recorded as a component of other comprehensive income (loss). Changes in the value of fair value hedges are recorded in results of operations.
In July 2002, the Company entered into an interest rate swap agreement to fix the interest rate on its $15 million term loan. The swap was designated as a cash flow hedge. The Company terminated the swap in the second quarter of 2006 in conjunction with paying off the term loan. In February 2007, the Company entered into a hedge agreement to fix the interest rate on a portion of its then existing term debt (see Note 7, Debt) via interest rate swap and collar arrangements. The hedge agreement was not designated for hedge accounting treatment under SFAS No. 133 and all changes in the fair market value of the hedge are recorded in the Company’s Consolidated Statements of Operations in the line item interest expense.
In the first quarter of 2007, the Company entered into foreign currency hedging transactions to mitigate exposure in movements between the U.S dollar and British Pounds Sterling and U.S dollar and Euro. The hedging transactions are designed to mitigate the Company’s exposure related to two intercompany notes between the Company’s U.S. subsidiary, as lender, and the Company’s subsidiaries in each of the United Kingdom and Germany. The note between the Company’s U.S. subsidiary and United Kingdom subsidiary is denominated in Pounds Sterling and had an outstanding principal amount of approximately $58.8 million at December 31, 2007. The note between the Company’s U.S. subsidiary and German subsidiary is denominated in Euro and had an outstanding principal amount of approximately $25.7 million at December 31, 2007. The hedge agreements were not designated for hedge accounting treatment under SFAS No. 133 and all changes in the fair market value of the hedge are recorded in the Company’s Consolidated Statements of Operations in the line item Other. In 2007, the Company recorded losses of approximately $1.9 million on the Euro hedge transaction and gains of approximately $300,000 on the Pound Sterling transaction related to the changes in the fair market value of the hedge. The losses on the fair market value of the hedge were offset by foreign exchange gains of approximately $2.6 million on the change in value of the Euro intercompany note and approximately $366,000 on the change in value of the Pound Sterling intercompany note.
Marketing and Advertising Costs
Marketing and advertising costs include costs incurred to promote the Company’s business. Marketing and advertising costs are expensed as incurred. Advertising expense incurred by the Company in the years ended December 31, 2007, 2006 and 2005 was $2.4 million, $2.0 million and $1.9 million, respectively.
Investigator and Project Costs
In addition to various contract costs previously described, the Company incurs costs, in excess of contract amounts, which are reimbursable by its customers. Emerging Issues Task Force (EITF) 01-14, “Income Statement Characterization of Reimbursements Received for Out-of-Pocket Expenses Incurred,” requires the Company to include amounts paid to investigators and other out-of-pocket costs as reimbursable out-of-pocket revenues and reimbursable out-of-pocket expenses in the Consolidated Statements of Operations. In certain contracts, these costs are fixed by the contract terms, so the Company recognizes these costs as part of net service revenues and direct costs.
F-10
Net Income Per Share Data
Net income per basic share is computed using the weighted average common shares outstanding. Net income per diluted share is computed using the weighted average common shares and potential common shares outstanding.
The weighted average shares used in computing net income per diluted share have been calculated as follows:
Net Income Per Share Data
| | | | | | | | | | | | | |
| (in thousands) | | 2007 | | 2006 | | 2005 |
| Weighted average common shares outstanding | | | 14,520 | | | | 14,323 | | | | 13,572 | |
| Stock options and non-vested restricted shares | | | 369 | | | | 439 | | | | 548 | |
| | | | | | | | | | | | | |
| Weighted average shares | | | 14,889 | | | | 14,762 | | | | 14,120 | |
| | | | | | | | | | | | | |
Options to purchase approximately 30,000 and 240,000 shares of common stock were outstanding during 2006 and 2005, respectively, but were not included in the computation of earnings per diluted share because the effect would be antidilutive. No options were antidilutive in 2007.
Under EITF 04-8, The Effect of Contingently Convertible Instruments on Diluted Earnings Per Share, and EITF 90-19, and because of the Company’s obligation to settle the par value of its Convertible Notes (defined in Note 7) in cash, the Company is not required to include any shares underlying the Convertible Notes in its weighted average shares outstanding used in calculating diluted earnings per share until the average stock price per share for the quarter exceeds the $47.71 conversion price and only to the extent of the additional shares that the Company may be required to issue in the event that the Company’s conversion obligation exceeds the principal amount of the Convertible Notes converted (see Note 7 for full description of Convertible Notes). These conditions have not been met as of December 31, 2007. At any such time in the future that these conditions are met, only the number of shares that would be issuable (under the “treasury” method of accounting for the share dilution) will be included, which is based upon the amount by which the average stock price exceeds the conversion price. The following table provides examples of how changes in the Company’s stock price will require the inclusion of additional shares in the denominator of the weighted average shares outstanding – assuming dilution calculation. The table also reflects the impact on the number of shares that the Company would expect to issue upon concurrent settlement of the Convertible Notes and the bond hedges and warrants mentioned below:
| | | | | | | | | | | | | | | | | | | | | |
| | | | | | | | | | | | | | | Shares Due to the | | Incremental Shares Issued |
| | | Convertible Notes | | Warrant | | Total Treasury Method | | Company under Note | | by the Company Upon |
| Share Price | | Shares | | Shares | | Incremental Share (1) | | Hedges | | Conversion (2) |
| |
| $40.00 | | | — | | | | — | | | | — | | | | — | | | | — | |
| $45.00 | | | — | | | | — | | | | — | | | | — | | | | — | |
| $50.00 | | | 191,993 | | | | — | | | | 191,993 | | | | (191,993 | ) | | | — | |
| $55.00 | | | 555,630 | | | | — | | | | 555,630 | | | | (555,630 | ) | | | — | |
| $60.00 | | | 858,660 | | | | — | | | | 858,660 | | | | (858,660 | ) | | | — | |
| $65.00 | | | 1,115,070 | | | | 245,070 | | | | 1,360,140 | | | | (1,115,070 | ) | | | 245,070 | |
| $70.00 | | | 1,334,850 | | | | 526,993 | | | | 1,861,843 | | | | (1,334,850 | ) | | | 526,993 | |
| |
| | |
| (1) | | Represents the number of incremental shares that must be included in the calculation of fully diluted shares under U.S. Generally Accepted Accounting Principles. |
| |
| (2) | | Represents the number of incremental shares to be issued by the Company upon conversion of the Convertible Notes, assuming concurrent settlement of the bond hedges and warrants. |
Income Taxes
The Company and its U.S. subsidiaries file a consolidated U.S. federal income tax return. Other subsidiaries of the Company file tax returns in their local jurisdictions.
The Company provides for income taxes on all transactions that have been recognized in the Consolidated Financial Statements in accordance with SFAS No. 109. Accordingly, the impact of changes in income tax laws on deferred tax assets and deferred tax liabilities are recognized in net earnings in the period during which such changes are enacted.
The Company records deferred tax assets and liabilities based on temporary differences between the financial statement and tax bases of assets and liabilities and for tax benefit carryforwards using enacted tax rates in effect in the year in which the differences are expected to reverse. Management provides valuation allowances against deferred tax assets for amounts that are not considered more likely than not to be realized. The valuation of the deferred tax asset is dependent on, among other things, the ability of the Company to generate a sufficient level of future taxable income. In estimating future taxable income, the Company has considered both positive and negative evidence, such as historical and forecasted results of operations, and has considered the implementation of prudent and feasible tax planning strategies.
F-11
At December 31, 2007, the Company has recorded a net deferred tax asset of $10.2 million. Further detail on the Company’s deferred tax assets and valuation allowances is contained in Note 10, Income Taxes.
The Company adopted FASB Interpretation No. 48, “Accounting for Uncertainty in Income Taxes” (“FIN 48”) as of January 1, 2007. FIN 48 requires significant judgment in determining what constitutes an individual tax position as well as assessing the outcome of each tax position. Changes in judgments as to recognition or measurement of tax positions can materially affect the estimate of the effective tax rate, and, consequently, the Company’s operating results. The Company considers many factors when evaluating and estimating tax positions and tax benefits, which may require periodic adjustments and which many not accurately anticipate actual outcomes. In addition, the calculation of tax liabilities involves dealing with uncertainties in the application of complex tax regulations in a multitude of jurisdictions. The Company determines its liability for uncertain tax positions globally under the provisions in FIN 48. At December 31, 2007, the Company has recorded a gross FIN 48 liability of $5.4 million. If events occur and the payment of these amounts ultimately proves to be unnecessary, the reversal of liabilities would result in tax benefits being recognized in the period when it is determined the liabilities are no longer necessary. If the calculation of liability related to uncertain tax positions proves to be more or less than the ultimate assessment, a tax expense or benefit to expense, respectively, would result.
In December 2007, the FASB issued SFAS No. 141R, Business Combinations, or SFAS 141R. SFAS 141R establishes principles and requirements for how the acquirer of a business recognizes and measures in its financial statements the identifiable assets acquired, the liabilities assumed and any noncontrolling interests in the acquiree. The statement also provides guidance for recognizing and measuring goodwill acquired in the business combination and determines what information to disclose to enable users of the financial statements to evaluate the nature and financial effects of the business combination. SFAS 141R is effective for financial statements for fiscal years beginning after December 15, 2008. Accordingly, any business combinations the Company engages in will be recorded and disclosed under existing GAAP until January 1, 2009. The Company expects SFAS 141R will have an impact on its consolidated financial statements when effective, but will depend on the nature, terms and size of the acquisitions consummated after the effective date. An immaterial portion of the $5.4 million liability for unrecognized tax benefits as of December 31, 2007 relates to tax positions of acquired entities taken prior to their acquisition by the Company. If such liabilities are settled for lesser amounts prior to the adoption of SFAS 141R, the reversal of any remaining liability will affect goodwill. If such liabilities reverse subsequent to the adoption of SFAS 141R, such reversals will affect the income tax provision in the period of reversal. The Company is still assessing the future impact of this standard on future Consolidated Financial Statements.
Stock Options
Effective January 1, 2006, the Company began accounting for stock-based incentive programs under SFAS 123(R), “Share-Based Payment.” Prior to 2006, the Company had accounted for stock options issued in accordance with Accounting Principles Board Option (APB) No. 25, “Accounting for Stock Issued to Employees.” SFAS 123(R) requires all share-based payments to employees, including grants of employee stock options, be recognized as compensation expense in the income statement at fair value. The Company adopted the provisions of SFAS 123(R) for all share-based payments granted after January 1, 2006, and for all awards granted to employees prior to January 1, 2006, that remain unvested on January 1, 2006. The Company adopted SFAS 123(R) using a modified prospective application. Accordingly, prior period amounts have not been restated. The Company uses the straight-line method of recording compensation expense relative to share-based payment.
Restricted/Unrestricted Stock
Restricted stock also may be granted pursuant to the 1997 Plan (defined in Note 8). Restricted shares typically vest ratably over a three-year period, with shares restricted from transfer until vesting. In 2006 the Company granted 250 shares of restricted stock. No such shares were granted during either 2007 or 2005. If a participant ceases to be an eligible employee prior to the lapsing of transfer restrictions, such shares return to the Company without consideration. Unrestricted stock also may be granted to key employees under the 1997 Plan. Unrestricted shares vest immediately. The Company granted 10,700 shares of unrestricted Common Stock in 2006. No shares of unrestricted stock were granted in 2007 or 2005.
Use of Estimates
The preparation of Consolidated Financial Statements in conformity with accounting principles generally accepted in the United States requires management to make estimates and assumptions that affect the reported amounts of assets and liabilities and disclosure of contingent assets and liabilities at the date of the Consolidated Financial Statements and the reported amounts of revenues and expenses during the reporting period. Actual results could differ from those estimates.
F-12
New Accounting Pronouncements
In September 2006, the Financial Accounting Standards Board (FASB) issued SFAS No. 157, “Fair Value Measurements”. SFAS No. 157 provides a new, single authoritative definition of fair value and provides enhanced guidance for measuring the fair value of assets and liabilities. It requires additional disclosures related to the extent to which companies measure assets and liabilities at fair value, the information used to measure fair value and the effect of fair value measurements on earnings. SFAS No. 157 is effective for the Company as of January 1, 2008. Two FASB Staff Positions on SFAS No. 157 were subsequently issued. On February 12, 2007, FSP No. 157-2 delayed the effective date of this SFAS No. 157 for non-financial assets and non-financial liabilities that are recognized or disclosed at fair value in the financial statements on a nonrecurring basis. The FSP is effective for fiscal years beginning after November 15, 2008. On February 14, 2007, FSP No. 157-1 excluded SFAS No. 13 Accounting for Leases and other accounting pronouncements that address fair value measurements for purposes of lease classification or measurement under SFAS No. 13. However, this scope exception does not apply to assets acquired and liabilities assumed in a business combination that are required to be measured at fair value under SFAS No. 141, Business Combinations, or SFAS No. 141(R), Business Combinations. This FSP is effective upon initial adoption of SFAS No. 157. At this time, the Company is currently evaluating the impact of SFAS No. 157 on its Consolidated Financial Statements.
In February 2007, the FASB issued SFAS No. 159, “Fair Value Option for Financial Assets and Financial Liabilities”. Under SFAS No. 159, entities may choose to measure at fair value many financial instruments and certain other items that are not currently required to be measured at fair value. SFAS No. 159 also establishes recognition, presentation, and disclosure requirements designed to facilitate comparisons between entities that choose different measurement attributes for similar types of assets and liabilities. SFAS No. 159 does not affect any existing accounting literature that requires certain assets and liabilities to be carried at fair value. SFAS No. 159 is effective for the Company as of January 1, 2008. At this time, the Company is currently evaluating the impact of SFAS No. 159 on its Consolidated Financial Statements.
In May 2007, FASB Staff Position (FSP) FIN 48-1, Definition of Settlement in FASB Interpretation No. 48, was issued. FSP FIN 48-1 provides guidance on how to determine whether a tax position is effectively settled for the purpose of recognizing previously unrecognized tax benefits. FSP FIN 48-1 is effective retroactively to January 1, 2007. The implementation of this standard did not have a material impact on the Company’s consolidated financial statements.
In December 2007, the FASB issued SFAS No. 141(R) (revised 2007), Business Combinations, and Statement No. 160, Noncontrolling Interests in Consolidated Financial Statements. SFAS No. 141(R) (revised 2007) requires an acquirer to measure the identifiable assets acquired, the liabilities assumed and any noncontrolling interest in the acquiree at their fair values on the acquisition date, with goodwill being the excess value over the net identifiable assets acquired. This standard also requires the fair value measurement of certain other assets and liabilities related to the acquisition such as contingencies and research and development. Statement No. 160 clarifies that a noncontrolling interest in a subsidiary should be reported at fair value as equity in the consolidated financial statements. Consolidated net income should include the net income for both the parent and the noncontrolling interest with disclosure of both amounts on the consolidated statement of income. The calculation of earnings per share will continue to be based on income amounts attributable to the parent. The Statements are effective for fiscal years beginning after December 15, 2008. At this time, with the exception of the impact of SFAS No. 141(R) on the Company’s FIN48 tax liability, which is discussed above, the Company is currently evaluating the impact of SFAS No. 160 and 141(R) on its Consolidated Financial Statements.
2. FAIR VALUE OF FINANCIAL INSTRUMENTS:
The carrying amounts of the Company’s financial instruments, including cash and cash equivalents, derivative liabilities, accounts receivable, accounts payable and the Convertible Notes approximate their fair value.
3. ACCOUNTS RECEIVABLE:
Accounts receivable are billed when certain milestones defined in customer contracts are achieved. All unbilled accounts receivable are expected to be collected within one year.
| | | | | | | | | |
| (in thousands) | | | | |
| December 31, | | 2007 | | | 2006 | |
| Billed | | $ | 62,993 | | | $ | 64,125 | |
| Unbilled | | | 72,557 | | | | 58,555 | |
| | | | | | | |
| | | $ | 135,550 | | | $ | 122,680 | |
| | | | | | | |
F-13
The Company maintains an allowance for doubtful accounts receivable based on historical evidence of accounts receivable collections and specific identification of accounts receivable that might cause collection problems. The balance in allowance for doubtful accounts receivable was as follows:
| | | | | |
| (in thousands) | | | | |
| Balance at 12/31/04 | | $ | 246 | |
| Invoice write-offs | | | (90 | ) |
| Additional expense | | | 1,901 | |
| | | | |
| Balance at 12/31/05 | | $ | 2,057 | |
| Invoice write-offs | | | (1,754 | ) |
| Allowance acquired via acquisition | | | 199 | |
| Additional expense | | | 250 | |
| | | | |
| Balance at 12/31/06 | | $ | 752 | |
| Invoice write-offs | | | (34 | ) |
| Additional expense | | | 236 | |
| | | | |
| Balance at 12/31/07 | | $ | 954 | |
| | | | |
In the fourth quarter of 2005, the Company recorded a bad debt reserve of approximately $1.7 million associated with one study being conducted in the United Kingdom. In the third quarter of 2006, the receivable was deemed uncollectible and was written-off.
4. PROPERTY AND EQUIPMENT:
Property and equipment is summarized as follows:
| | | | | | | | | |
| (in thousands) | | | | | | |
| December 31, | | 2007 | | | 2006 | |
| Furnishings, equipment and other | | $ | 80,368 | | | $ | 63,290 | |
| Equipment under capital leases | | | 2,068 | | | | 2,168 | |
| Less: accumulated depreciation and amortization | | | (50,415 | ) | | | (42,434 | ) |
| | | | | | | |
| Property and equipment, net | | $ | 32,021 | | | $ | 23,024 | |
| | | | | | | |
Depreciation expense for the years ended December 31, 2007, 2006 and 2005 was $8.9 million, $6.0 million and $5.1 million, respectively.
5. GOODWILL AND OTHER INTANGIBLE ASSETS:
Non-amortizable intangible assets at December 31, 2007, and December 31, 2006, are comprised of:
| | | | | |
| (in thousands) | | Goodwill | |
| Balance at 12/31/05 | | $ | 24,075 | |
| Additional amount acquired | | | 204,735 | |
| Foreign currency fluctuations | | | 1,140 | |
| Tax benefit to reduce goodwill | | | (352 | ) |
| | | | |
| Balance at 12/31/06 | | $ | 229,598 | |
| Additional adjustments | | | (383 | ) |
| Foreign currency fluctuations | | | 1,291 | |
| Tax benefit to reduce goodwill | | | (338 | ) |
| | | | |
| Balance at 12/31/07 | | $ | 230,168 | |
| | | | |
F-14
The Company has an intangible asset representing one customer relationship acquired in the Company’s acquisition of CPR. The value of this customer relationship had been $15 million prior to the fourth quarter of 2006 and the useful life had been designated as indefinite. Due to declining revenue from this customer in 2006 and the declining revenue projected for 2007 and future years, the Company determined that the asset was impaired and recorded an $8.2 million impairment charge in 2006. Effective January 1, 2007, the Company assigned a 23-year useful life to the customer relationship due to changes in a number of the conditions around the relationship, including the Company’s decision to market its services to additional customers in the future.
In April 2006, the Company acquired approximately $300,000 of goodwill as a result of its acquisition of International Clinical Research Limited (“IC-Research”) and related companies. Approximately $100,000 of the goodwill and the full amount of the intangible asset acquired in the acquisition are deductible for income tax purposes over a 15-year period.
The Company acquired approximately $204.4 million of goodwill in August 2006 resulting from the acquisition of the Phase II-IV Clinical Services business of Charles River Laboratories International, Inc (“CRL Clinical Services”). The goodwill and the intangible asset acquired in the acquisition are not deductible for income tax purposes.
Goodwill and other intangible assets consisted of the following:
| | | | | | | | | |
| | | | | | | (a) | |
| | | As of December 31, | |
| (in thousands) | | 2007 | | | 2006 | |
| Goodwill | | $ | 230,168 | | | $ | 229,598 | |
| | | | | | | |
| Amortizable intangible assets: | | | | | | | | |
| Carrying amount: | | | | | | | | |
| Customer relationships | | | 18,000 | | | | 18,000 | |
| Non-compete agreements | | | 460 | | | | 460 | |
| Completed technology | | | 2,600 | | | | 2,600 | |
| Backlog | | | 6,200 | | | | 6,200 | |
| Internally developed software (b) | | | 16,256 | | | | 15,783 | |
| | | | | | | |
| Total carrying amount | | $ | 43,516 | | | $ | 43,043 | |
| Accumulated Amortization: | | | | | | | | |
| Customer relationships | | | (1,975 | ) | | | (682 | ) |
| Non-compete agreements | | | (460 | ) | | | (374 | ) |
| Completed technology | | | (736 | ) | | | (205 | ) |
| Backlog | | | (4,625 | ) | | | (1,772 | ) |
| Internally developed software | | | (14,896 | ) | | | (13,972 | ) |
| | | | | | | |
| Total accumulated amortization | | $ | (22,692 | ) | | $ | (17,005 | ) |
| | | | | | | |
| Net amortizable assets | | | 20,824 | | | | 26,038 | |
| | | | | | | |
| Total goodwill and intangible assets | | $ | 250,992 | | | $ | 255,636 | |
| | | | | | | |
| | |
| (a) | | As disclosed in the paragraphs preceding this table, a $15 million customer relationship intangible was determined to be impaired in 2006. The Company recorded an $8.2 million impairment charge and changed the asset’s designation from indefinite to finite-lived. |
| |
| (b) | | Internally developed software is contained in Other Assets in the Company’s Consolidated Balance Sheets. |
F-15
Amortizable intangible assets at December 31, 2007, and December 31, 2006, are composed of:
| | | | | | | | | | | | | | | | | | | | | |
| | | | | | | | | | | | | | | | | | | (b) | |
| | | (a) | | | | | | | | | | | | | | | Internally | |
| | | Customer | | | Non-Compete | | | Completed | | | | | | | Developed | |
| (in thousands) | | Relationships | | | Agreements | | | Technology | | | Backlog | | | Software | |
| Balance at 12/31/05 | | $ | 15,309 | | | $ | 202 | | | $ | — | | | $ | — | | | $ | 3,139 | |
| Additional amounts acquired | | | 10,800 | | | | — | | | | 2,600 | | | | 6,200 | | | | 90 | |
| Intangible impairment charge | | | (8,200 | ) | | | — | | | | — | | | | — | | | | — | |
| Dispositions | | | — | | | | — | | | | — | | | | — | | | | (50 | ) |
| 2006 amortization | | | (592 | ) | | | (115 | ) | | | (205 | ) | | | (1,772 | ) | | | (1,368 | ) |
| | | | | | | | | | | | | | | | |
| Balance at 12/31/06 | | $ | 17,317 | | | $ | 87 | | | $ | 2,395 | | | $ | 4,428 | | | $ | 1,811 | |
| Additional amounts acquired | | | — | | | | — | | | | — | | | | — | | | | 531 | |
| Dispositions | | | — | | | | — | | | | — | | | | — | | | | | |
| 2007 amortization | | | (1,292 | ) | | | (87 | ) | | | (531 | ) | | | (2,853 | ) | | | (982 | ) |
| | | | | | | | | | | | | | | | |
| Balance at 12/31/07 | | $ | 16,025 | | | $ | — | | | $ | 1,864 | | | $ | 1,575 | | | $ | 1,360 | |
| | | | | | | | | | | | | | | | |
| | |
| (a) | | As disclosed in the paragraphs preceding this table, a $15 million customer relationship intangible was determined to be impaired in 2006. The Company recorded an $8.2 million impairment charge and changed the asset’s designation from indefinite to finite-lived. |
| |
| (b) | | Internally developed software is contained in Other Assets in the Company’s Consolidated Balance Sheets. |
Amortization expense on amortizable intangible assets was approximately $2.3 million in the year 2005.
The weighted-average useful life of the Company’s Customer Relationship intangible assets is approximately 15 years. The customer relationship intangible assets are amortized in a manner consistent with the underlying expected future cash flows from the customers.
The weighted-average useful life of the Company’s Non-Compete Agreements intangible asset is approximately 4 years.
Completed technology represents proprietary technology acquired in the Company’s August 2006 acquisition of CRL Clinical Services. Value was assigned to the completed technology based on the technology directly related to revenue generation or profit enhancement. The value was calculated using an income approach, which assumes that the value of the technology is equivalent to the present value of the future stream of economic benefits that can be derived from its ownership. A useful life of five years for the intangible asset was determined by estimating the remaining useful life of the technology acquired.
Backlog represents backlog acquired in the Company’s August 2006 acquisition of CRL Clinical Services. Value was assigned to backlog by evaluating the expected future economic operating income generated by the backlog. The useful life of the backlog of approximately 7 years was determined by evaluating the remaining life of the contracts that compose the backlog acquired.
Internally-developed software is included in Other Assets within the Consolidated Financial Statements. The Company typically amortizes internally-developed software over a 5 year useful life.
Amortization expense for the next five years relating to these amortizable intangible assets is estimated to be as follows:
| | | | | |
| (in thousands) | | | | |
| 2008 | | $ | 4,104 | |
| 2009 | | $ | 3,239 | |
| 2010 | | $ | 2,544 | |
| 2011 | | $ | 2,374 | �� |
| 2012 | | $ | 1,554 | |
| Thereafter | | $ | 7,009 | |
For further detail regarding the amortizable assets acquired in 2006, see Note 11, Acquisitions.
F-16
6. OTHER ACCRUED LIABILITIES:
Other accrued liabilities at December 31, 2007 and 2006 consisted of the following:
| | | | | | | | | |
| (in thousands) | | 2007 | | | 2006 | |
December 31, | | | | | | | | |
| Accrued compensation and related payroll withholdings and taxes | | $ | 16,354 | | | $ | 14,521 | |
| Income tax payable | | | 9,078 | | | | 2,790 | |
| Interest payable | | | 3,102 | | | | 90 | |
| Other | | | 18,573 | | | | 13,099 | |
| | | | | | | |
| | | $ | 47,107 | | | $ | 30,500 | |
| | | | | | | |
7. DEBT:
In August 2006, in conjunction with its acquisition of CRL Clinical Services, the Company entered into a new credit agreement (including all amendments, the Facility). The Facility is comprised of a $200 million term loan that matures in August 2012 and a revolving loan commitment that expires in August 2011. The balance of the $200 million term loan was paid off in the third quarter of 2007 with proceeds from the Convertible Notes discussed below. The original revolving loan commitment was $25 million and was increased to $53.5 million under an amendment to the Facility and an Increase Joinder Agreement, which was entered into on June 27, 2007 and shortly thereafter permitted the Company to increase the revolving loan commitment. The Facility contains various affirmative and negative covenants including financial covenants regarding maximum leverage ratio, minimum interest coverage ratio and limitations on capital expenditures.
The Company also maintains an existing $5.0 million Multicurrency Facility that is renewable annually and is used in connection with the Company’s European operations.
On July 10, 2007, the Company entered into a Purchase Agreement with UBS Securities LLC (the Underwriter) for the issuance and sale by the Company of $175 million in aggregate principal amount of the Company’s 3.375% Senior Convertible Notes due July 15, 2012 (the Convertible Notes), pursuant to the Company’s effective Registration Statement on Form S-3. On July 11, 2007, the Underwriter exercised an over-allotment option and purchased an additional $25 million in aggregate principal amount of Convertible Notes. On July 16, 2007, $200 million in aggregate principal amount of the 5-year Convertible Notes with a maturity date of July 15, 2012 were sold to the Underwriters at a price of $1,000 per Convertible Note, less an underwriting discount of 3% per Convertible Note.
The Convertible Notes bear interest at an annual rate of 3.375%, payable semi-annually in arrears on January 15 and July 15 of each year, with the first interest payment being made on January 15, 2008. The Convertible Notes are convertible at the option of the holder into cash and, if applicable, shares of the Company’s common stock at an initial conversion price of $47.71 per share (approximating 20.9585 shares per $1,000 principal amount of the Convertible Notes), upon the occurrence of certain events, including (1) any calendar quarter ending after September 30, 2007 in which the closing price of the Company’s common stock is greater than 130% of the conversion price for at least 20 trading days during the period of 30 consecutive trading days ending on the last trading day of the preceding calendar quarter (establishing a contingent conversion price of $47.71per share); (2) any five business day period after any five consecutive trading day period in which the trading price per $1,000 principal amount of Convertible Notes for each day of that period is equal to or less than 97% of the product of the closing sale price of the Company’s common stock and the applicable conversion rate; (3) upon specified corporate transactions including consolidation or merger; and (4) any time during the period beginning on January 1, 2012 until the close of business on the second business day immediately preceding July 15, 2012. In addition, upon events defined as a “fundamental change” under the Convertible Note Indenture, holders of the Convertible Notes may require the Company to repurchase the Convertible Notes. If upon the occurrence of such events in which the holders of the Convertible Notes exercise the conversion provisions of the Convertible Notes, the Company will need to remit the principal balance of the Convertible Notes to the holders in cash. As such, the Company would be required to classify the entire amount outstanding of the Convertible Notes as a current liability in the following quarter. The evaluation of the classification of amounts outstanding associated with the Convertible Notes will occur every quarter. As of December 31, 2007 the Convertible Notes are classified as long-term in the accompanying Consolidated Balance Sheet.
Upon conversion, holders will receive cash up to the principal amount of the notes to be converted, and any excess conversion value will be delivered in shares of the Company’s common stock. If conversion occurs in connection with a “fundamental change” as defined in the Convertible Notes Indenture, the Company may be required to repurchase the Convertible Notes for cash at a price equal to the principal amount plus accrued but unpaid interest. In addition, if conversion occurs in connection with a change in control, the Company may be required to deliver additional shares of the Company’s common stock (a “make whole” premium) by increasing the conversion rate with respect to such notes. The maximum aggregate number of shares that the Company would be
F-17
obligated to issue upon conversion of the Convertible Notes is 5.6 million shares, but under most conditions, the Company would be obligated to issue 4.2 million shares upon conversion of the Convertible Notes.
Pursuant to EITF 90-19,Convertible Bonds with Issuer Option to Settle for Cash upon Conversion, EITF 00-19,Accounting for Derivative Financial Instruments Indexed to, and Potentially Settled in, a Company’s Own Stock(EITF 00-19), and EITF 01-6,The Meaning of Indexed to a Company’s Own Stock(EITF 01-6), the Convertible Notes are accounted for as convertible debt in the accompanying Consolidated Balance Sheets and the embedded conversion option in the Convertible Notes has not been accounted for as a separate derivative. For a discussion of the effects of the Convertible Notes and the bond hedges and warrants discussed below on earnings per share, see Note 1 to the Consolidated Financial Statements.
Concurrent with the sale of the Convertible Notes, the Company purchased Convertible Note hedges from the Underwriter and JP Morgan Chase (collectively, the counterparties), which are designed to mitigate potential dilution from the conversion of the Convertible Notes in the event that the market value per share of the Company’s common stock at the time of exercise is greater than approximately $47.71. Under the bond hedges that cover approximately 4.2 million shares of the Company’s common stock, the counterparties are required to deliver either shares of the Company’s common stock or cash in the amount that the Company is obligated to deliver to the holders of the Convertible Notes with respect to the conversion, calculated exclusive of shares deliverable by the Company by reason of any additional premium relating to the Convertible Notes or by reason of any election by the Company to unilaterally increase the conversion rate pursuant to the indenture governing the Convertible Notes. The bond hedges expire at the close of trading on July 15, 2012, which is also the maturity date of the Convertible Notes although the counterparties will have ongoing obligations with respect to Convertible Notes properly converted on or prior to that date of which the counterparties have been timely notified.
In addition, the Company issued warrants to the counterparties that could require the Company to issue up to approximately 4.2 million shares of the Company’s common stock on expiration dates consisting of the 100 consecutive business days beginning on and including January 15, 2013 (European style). The strike price is $61.22 per share, which represented a 70 % premium over the closing price of the Company’s shares of common stock as reported on The NASDAQ Global Market on July 10, 2007.
The Convertible Note hedge and warrant transactions generally have the effect of increasing the conversion price of the Convertible Notes to approximately $61.22 per share of Kendle common stock, representing approximately a 70% premium based on the closing sale price of the Company’s common sock of $36.01 per share as reported on The NASDAQ Global Market on July 10, 2007.
The bond hedges and warrants are separate and legally distinct instruments that bind the Company and the counterparties and have no binding effect on the holders of the Convertible Notes. In addition, pursuant to EITF 00-19 and EITF 01-6, the bond hedges and warrants are accounted for as equity transactions. Therefore, the payment associated with the issuance of the bond hedges and the proceeds received from the issuance of the warrants were recorded as a charge and an increase, respectively, in Additional Paid-in Capital in Stockholders’ Equity as separate equity transactions.
For income tax reporting purposes, the Company has elected to integrate the Convertible Notes and the bond hedges. Integration of the bond hedges with the Convertible Notes creates an original issue discount (OID) debt instrument for income tax reporting purposes. Therefore, the cost of the bond hedges will be accounted for as interest expense over the term of the Convertible Notes for income tax reporting purposes. The associated income tax benefits that are recognized for financial reporting purposes will be recognized as a reduction in the income tax provision in the periods that the deductions are taken for income tax reporting purposes.
The Company received net proceeds from the sale of the Convertible Notes of approximately $194.0 million after deducting the Underwriter’s discounts and commissions. In addition, the Company used approximately $18.1 million of the net proceeds of the offering to pay the net cost of the Convertible Note hedge transactions and the warrant transactions. The Company made a mandatory prepayment of $146.0 million (75% of the net proceeds of the offering) toward repayment of amounts owed under the term loan under its credit agreement and made additional voluntary prepayments during the third quarter of 2007 to pay off the remaining balance of the term loan.
As of December 31, 2007, $200.0 million was outstanding under the Convertible Notes, no amounts were outstanding under the revolving credit loan and no amounts were outstanding under the Multicurrency Facility.
8. EMPLOYEE BENEFIT PLANS:
401(k) Plan
The Company maintains a 401(k) retirement plan covering substantially all U.S. associates that meet minimum age requirements. The Company makes a matching contribution of 50% of each participant’s contribution of up to 6% of salary. The Company’s matching contributions to this plan totaled approximately $1,873,000, $1,375,000 and $1,005,000 for the years ended December 31, 2007, 2006 and 2005, respectively.
F-18
Stock Option and Stock Incentive Plan
In 1997, the Company established the 1997 Stock Option and Stock Incentive Plan (including amendments, the “1997 Plan”) that, as amended, provided for the issuance of up to 3,000,000 shares of the Company’s Common Stock, including both incentive and non-qualified stock options, restricted and unrestricted shares, and stock appreciation rights. The 1997 Plan expired by its terms on August 14, 2007. See below for a discussion of the successor plan. Participation in the 1997 Plan was at the discretion of the Board of Directors’ Management Development and Compensation Committee. Prior to August 2002, the 1997 Plan was administered by the Board of Director’s Compensation Subcommittee. The exercise price of incentive stock options granted under the 1997 Plan must be no less than the fair market value of the Common Stock, as determined under the 1997 Plan provisions, at the date the option is granted (110% of fair market value for shareholders owning more than 10% of the Company’s Common Stock). The exercise price of non-qualified stock options must be no less than 95% of the fair market value of the Common Stock at the date the option is granted. The vesting provisions of the options granted under the 1997 Plan are determined at the discretion of the Management Development and Compensation Committee. The options generally expire either 90 days after termination of employment or, if earlier, ten years after date of grant. No options under this 1997 plan could be granted after its termination date in August 2007.
Restricted stock may also be granted pursuant to the 1997 Plan. Restricted shares typically vest ratably over a three year period, with shares restricted from transfer until vesting. If a participant ceases to be an eligible employee prior to the lapsing of transfer restrictions, such shares return to the Company without consideration. Unrestricted stock may also be granted to key employees under the 1997 Plan. Unrestricted shares vest immediately. The Company granted 10,700 shares of Common Stock in the first quarter of 2006. No additional shares of Common Stock were granted in remainder of 2006 or in 2007.
At the Annual Meeting of Shareholders on May 10, 2007, shareholders of the Company approved the 2007 Stock Incentive Plan (the “2007 Plan”). The 2007 Plan was unanimously approved by the Board of Directors on March 9, 2007, subject to shareholder approval. Under the 2007 Plan, all employees of the Company and its subsidiaries will be eligible to receive awards. The 2007 Plan is an “omnibus” stock plan that provides a variety of equity award vehicles to maintain flexibility. The 2007 Plan will permit the grant of stock options, stock appreciation rights, restricted stock awards, restricted stock units and stock awards. A maximum of 1,000,000 shares will be available for grants of all equity awards under the 2007 Plan.
The Company had reserved 3,000,000 shares of Common Stock for the 1997 Plan, of which approximately 1,232,435 were available for grant at August 14, 2007, the termination date of the 1997 Plan. None of these remaining shares of Common Stock under the 1997 Plan were made available to the 2007 Plan. As a result of the adoption of the 2007 Plan, the Company has reserved 1,000,000 shares of Common Stock for the 2007 Plan. No shares of Common Stock were granted under the 2007 Plan in 2007.
On May 12, 2005, the Compensation Committee amended the vesting schedule for a total of approximately 140,000 options outstanding that met the following criteria:
| | 1) | | Outstanding/unvested as of May 12, 2005 |
| |
| | 2) | | Have an option price greater than $11.73 (fair market value on May 12, 2005) |
| |
| | 3) | | Were granted between May 1, 2001, and May 1, 2002 |
All unvested shares that met the above criteria, with the exception of options held by any executive officer of the Company, were immediately vested as of May 12, 2005. The Compensation Committee decided to accelerate the vesting schedule of these options primarily to enhance employee appreciation of the importance of focusing on increasing shareholder value and to avoid expensing the options upon adoption of SFAS 123(R).
The adoption of SFAS 123(R) resulted in stock-based compensation expense related to stock options of approximately $860,000 and $1.5 million in 2007 and 2006, respectively. The stock-based compensation expense caused net income in 2007 to decrease by approximately $690,000. The stock-based compensation expense caused net income in 2006 to decrease by approximately $1.1 million. Stock-based compensation expense is recorded primarily in general and administrative expenses in the Company’s Consolidated Statements of Operations as the majority of the stock option expense related to options granted to executives.
F-19
Had the Company adopted SFAS No. 123, “Accounting for Stock-Based Compensation,” for expense recognition purposes, the amount of compensation expense that would have been recognized in 2005 would have been $4.8 million. Approximately $2.2 million of the $4.8 million in compensation expense that would have been recognized for the year ended December 31, 2005, resulted from the amendment made to the vesting schedule. The Company’s pro forma net income and pro forma net income per basic and diluted share for the year ended December 31, 2005 would have been reduced to the amounts below:
| | | | | |
| (in thousands, except per share data) | | 2005 | |
| Pro forma net income | | | | |
| As reported | | $ | 10,674 | |
| Less: pro forma adjustment for stock-based compensation, net of tax | | | (3,739 | ) |
| | | | |
| Pro forma net income | | | 6,935 | |
| | | | |
| | | | | |
| Pro forma net income per diluted share | | | | |
| As reported | | | 0.76 | |
| Pro forma | | | 0.49 | |
| | | | |
| Effect of pro forma expense | | | (0.27 | ) |
| | | | |
| | | | | |
| Pro forma net income per basic share | | | | |
| As reported | | | 0.79 | |
| Pro forma | | | 0.51 | |
| | | | |
| Effect of pro forma expense | | | (0.28 | ) |
| | | | |
The weighted average fair value of the options granted in 2007, 2006 and 2005 was estimated as $12.79, $18.79 and $9.21, respectively, on the date of grant using the Black-Scholes option-pricing model with the following assumptions:
| | | | | | | | | | | | | |
| | | 2007 | | 2006 | | 2005 |
| Expected dividend yield | | | 0 | % | | | 0 | % | | | 0 | % |
| Risk-free interest rate | | | 4.7 | % | | | 4.9 | % | | | 3.7 | % |
| Expected volatility | | | 41.9 | % | | | 56.2 | % | | | 55.6 | % |
| Expected holding period | | 4.5 years | | 5.9 years | | 4.7 years |
The expected volatility is based on the Company’s stock price over a historical period which approximates the expected term of the option as well a comparison to volatility for other companies in the Company’s industry and expectations of future volatility. The risk free interest rate is based on the implied yield in U.S Treasury issues with a remaining term approximating the expected term of the option. The expected option term is calculated as the historic weighted average life of similar awards.
As of December 31, 2007, there was $619,000 of total unrecognized compensation cost, all relating to options. The cost is expected to be recognized over a weighted average period of 2.0 years.
In addition, SFAS 123(R) also requires the benefits of tax deductions in excess of recognized compensation expense to be reported as a financing cash flow, rather than as an operating cash flow. This requirement reduced net operating cash flows and increased net financing cash flows by approximately $188,000 in 2007 and $898,000 during 2006.
F-20
Aggregate stock option activity during 2007, 2006 and 2005 was as follows:
| | | | | | | | | | | | | | | | | |
| | | | | | | | | | | Weighted | | | Aggregate | |
| | | | | | | Weighted | | | Average | | | Intrinsic | |
| | | | | | | Average | | | Remaining | | | Value | |
| | | Shares | | | Exercise Price | | | Contractual Life | | | ($ in thousands) | |
| Options outstanding at 12/31/04 | | | 1,977,040 | | | $ | 10.54 | | | | | | | | | |
| Granted | | | 51,500 | | | | 11.80 | | | | | | | | | |
| Canceled | | | (197,583 | ) | | | 10.57 | | | | | | | | | |
| Exercised | | | (715,628 | ) | | | 10.52 | | | | | | | | | |
| | | | | | | | | | | | | | | | |
| Options outstanding at 12/31/05 | | | 1,115,329 | | | | 10.60 | | | | | | | | | |
| Granted | | | 46,000 | | | | 32.66 | | | | | | | | | |
| Canceled | | | (77,649 | ) | | | 8.89 | | | | | | | | | |
| Exercised | | | (286,083 | ) | | | 12.32 | | | | | | | | | |
| | | | | | | | | | | | | | | |
| Options outstanding at 12/31/06 | | | 797,597 | | | | 11.55 | | | | | | | | | |
| Granted | | | 40,000 | | | | 32.50 | | | | | | | | | |
| Canceled | | | (55,056 | ) | | | 10.23 | | | | | | | | | |
| Exercised | | | (239,534 | ) | | | 10.98 | | | | | | | | | |
| | | | | | | | | | | | | |
| Options outstanding at 12/31/07 | | | 543,007 | | | $ | 13.33 | | | | 5.5 | | | $ | 19,466 | |
| Exercisable at 12/31/07 | | | 421,687 | | | $ | 13.62 | | | | 5.2 | | | $ | 14,991 | |
The intrinsic value of options exercised was approximately $6.7 million in 2007, $5.7 million in 2006 and $8.1 million in 2005.
At December 31, 2006, the aggregate intrinsic value of options outstanding was $9.2 million and the aggregate intrinsic value of options exercisable was $6.9 million. Intrinsic value for stock options is calculated based on the difference between the exercise price of the underlying awards and the quoted price of the Company’s Common Stock as of the reporting date. Substantially all of the outstanding options are expected to vest.
Options Outstanding
| | | | | | | | | | | | | | | | | |
| | | | | | | | | | | Weighted Average | | | Weighted | |
| Range of | | | | | Outstanding at | | | Remaining | | | Average | |
| Exercise Price | | | | | December 31, 2007 | | | Contractual Life | | | Exercise Price | |
| $ | 3.46-$6.92 | | | | | | 104,890 | | | | 5.55 | | | $ | 5.41 | |
| $ | 6.93-$10.38 | | | | | | 228,700 | | | | 5.24 | | | | 8.26 | |
| $ | 10.38-$13.83 | | | | | | 45,175 | | | | 5.39 | | | | 11.39 | |
| $ | 13.84-$17.29 | | | | | | 7,400 | | | | 2.62 | | | | 16.42 | |
| $ | 17.30-$20.75 | | | | | | 67,792 | | | | 3.55 | | | | 19.78 | |
| $ | 20.76-$24.21 | | | | | | 9,500 | | | | 0.66 | | | | 23.56 | |
| $ | 24.22-$27.67 | | | | | | 550 | | | | 0.42 | | | | 25.94 | |
| $ | 27.68-$31.13 | | | | | | 14,000 | | | | 8.98 | | | | 30.06 | |
| $ | 31.14-$34.59 | | | | | | 65,000 | | | | 8.99 | | | | 33.03 | |
| | | | | | | | | | | | | | |
| | | | | | | | 543,007 | | | | 5.53 | | | $ | 13.33 | |
| | | | | | | | | | | | | | | | |
F-21
Options Exercisable
| | | | | | | | | | | | | |
| | | | | | | | | | | Weighted | |
| Range of | | | | | Exercisable at | | | Average | |
| Exercise Price | | | | | December 31, 2007 | | | Exercise Price | |
| $ | 3.46-$6.92 | | | | | | 63,670 | | | $ | 5.29 | |
| $ | 6.93-$10.38 | | | | | | 178,400 | | | | 8.44 | |
| $ | 10.38-$13.83 | | | | | | 41,575 | | | | 11.42 | |
| $ | 13.84-$17.29 | | | | | | 7,400 | | | | 16.42 | |
| $ | 17.30-$20.75 | | | | | | 67,792 | | | | 19.78 | |
| $ | 20.76-$24.21 | | | | | | 9,500 | | | | 23.56 | |
| $ | 24.22-$27.67 | | | | | | 550 | | | | 25.94 | |
| $ | 27.68-$31.13 | | | | | | 2,800 | | | | 30.06 | |
| $ | 31.14-$34.59 | | | | | | 50,000 | | | | 32.81 | |
| | | | | | | | | | | |
| | | | | | | | 421,687 | | | $ | 13.62 | |
| | | | | | | | | | | | |
At December 31, 2006, 533,177 options were exercisable with a weighted-average exercise price of $12.99. At December 31, 2005, 652,570 options were exercisable with a weighted-average exercise price of $12.95.
Restricted/Unrestricted Stock
The Company has granted awards of restricted shares to certain executives pursuant to the 1997 Plan. Such shares generally vest ratably over a three-year period, with shares restricted from transfer until vesting. If a participant ceases to be an eligible employee prior to the lapsing of transfer restrictions, such shares return to the Company without consideration.
Compensation expense related to restricted and unrestricted stock awards was as follows:
| | | | | | | | | | | | | |
| Compensation Expense (in thousands) | | 2007 | | | 2006 | | | 2005 | |
| | | |
| Year Ended December 31, | | | | | | | | | | | | |
| Restricted stock | | $ | 19 | | | $ | 57 | | | $ | 78 | |
| Unrestricted stock | | | — | | | | 336 | | | | — | |
| | | |
| Total stock based compensation | | $ | 19 | | | $ | 393 | | | $ | 78 | |
| | | |
F-22
A summary of restricted stock activity is as follows:
Restricted Stock
| | | | | |
| | | Shares |
| Outstanding at 12/31/04 | | | 23,333 | |
| Granted | | | — | |
| Vested | | | (11,333 | ) |
| Canceled | | | — | |
| | | | | |
| Outstanding at 12/31/05 | | | 12,000 | |
| Granted | | | 250 | |
| Vested | | | (6,000 | ) |
| Canceled | | | — | |
| | | | | |
| Outstanding at 12/31/06 | | | 6,250 | |
| Granted | | | — | |
| Vested | | | (6,125 | ) |
| Canceled | | | — | |
| | | | | |
| Outstanding at 12/31/07 | | | 125 | |
| | | | | |
The weighted-average per share fair value of restricted shares vested was $8.63 in 2007, $8.30 in 2006 and 7.69 in 2005. The weighted-average per share fair value of restricted shares granted was $8.30 in 2004 and $24.47 in 2006.
9. COMMITMENTS AND CONTINGENCIES:
Leases:
The Company leases facilities, office equipment and computers under agreements that are classified as either capital or operating leases. The leases have initial terms that range from two to seven years, with eight facility leases that have provisions to extend the leases for an additional three to five years. Future minimum payments, by year and in the aggregate, under non-cancelable capital and operating leases with initial or remaining terms of one year or more, are as follows at December 31, 2007:
| | | | | | | | | |
| | | Capital | | | Operating | |
| (in thousands) | | Leases | | | Leases | |
| 2008 | | $ | 215 | | | $ | 15,162 | |
| 2009 | | | 177 | | | | 12,208 | |
| 2010 | | | 55 | | | | 9,402 | |
| 2011 | | | 35 | | | | 7,390 | |
| 2012 | | | — | | | | 5,960 | |
| thereafter | | | — | | | | 13,002 | |
| | | | | | | |
| Total minimum lease payments | | | 482 | | | $ | 63,124 | |
| | | | | | | | |
| Amounts representing interest | | | (27 | ) | | | | |
| | | | | | | | |
| Present value of net minimum lease payments | | | 455 | | | | | |
| Current portion | | | 199 | | | | | |
| | | | | | | | |
| Obligations under capital leases, less current portion | | $ | 256 | | | | | |
| | | | | | | | |
Rental expense under operating leases for 2007, 2006 and 2005 was $14.7 million, $10.1 million and $7.6, million, respectively.
Early in 2008, the Company entered into a lease extension related to office space at the Company’s principal executive offices in Cincinnati, Ohio. The lease extension extended the term of the lease from 2009 to 2019 and increased the amount of space leased from approximately 122,000 square feet to approximately 130,000 square feet.
F-23
Protective Compensation and Benefit Agreements:
The Company has entered into Protective Compensation and Benefit Agreements with certain associates, including all Executive Officers of the Company. These Agreements, subject to annual review by the Company’s Board of Directors, expire on the last day of the fiscal year, and are automatically extended in one-year increments unless canceled by the Company. These Agreements provide for specified benefits in the event of a change in control, as defined in the Agreements. At December 31, 2007, the maximum amount which could be required to be paid under these Agreements, if such events occur, is approximately $9.8 million.
Other:
In 2007, the Company identified an issue relating to the timing of certain expenses imposed by the benefit plan administrator on investments contained in the benefit plan at one of the Company’s non-U.S. subsidiaries. The Company, in working with the benefit plan administrator, identified a range of its potential liability. Consistent with the provisions of SFAS No. 5, Accounting for Contingencies, the Company has recorded a liability of approximately $300,000, which is at the low end of the range as no amount in the range is more likely. The Company is currently working with the benefit plan administrator to recover amounts that might be potentially due to former employees of the non-U.S. subsidiary, which would serve to partially offset this charge. However, under the provisions of SFAS No. 5, any such recovery would be considered a gain contingency and is not yet reflected in the Consolidated Financial Statements of the Company.
Legal Proceedings:
In the normal course of business, the Company is a party to various claims and legal proceedings. The Company records a reserve for these matters when an adverse outcome is probable and the amount of the potential liability is reasonably estimable. Although the ultimate outcome of these matters is currently not determinable, management of the Company, after consultation with legal counsel, does not believe that the resolution of these matters will have a material effect upon the Company’s financial condition, results of operations or cash flows for an interim or annual period.
Anti-takeover Provisions:
The Company has adopted a shareholder rights plan that may have anti-takeover effects which will make an acquisition of the Company by another company more difficult. The Company’s shareholder rights plan provides that, in the event any person or entity acquires 15% or more of the Company’s outstanding Common Stock, shareholders of the Company will be entitled to purchase shares of Common Stock, or in certain instances shares of the acquirer, at a discounted price. The rights are intended to discourage a significant share acquisition, merger or tender offer involving the Company’s Common Stock by increasing the cost of effecting any such transaction and, accordingly, could have an adverse impact on a takeover attempt that a shareholder might consider to be in its best interests.
10. INCOME TAXES:
The provision for income taxes for the years ended December 31, 2007, 2006 and 2005, is as follows:
| | | | | | | | | | | | | |
| expense/(benefit) | | | | | | | | | |
| (in thousands) | | 2007 | | | 2006 | | | 2005 | |
| Current: | | | | | | | | | | | | |
| Federal | | $ | 1,946 | | | $ | 2,131 | | | $ | 1,149 | |
| State and local | | | 510 | | | | 314 | | | | (20 | ) |
| Foreign | | | 14,195 | | | | 6,012 | | | | 4,207 | |
| | | | | | | | | | |
| Subtotal | | | 16,651 | | | | 8,457 | | | | 5,336 | |
| Deferred: | | | | | | | | | | | | |
| Federal | | | (3,091 | ) | | | (4,252 | ) | | | (95 | ) |
| State and local | | | (755 | ) | | | (336 | ) | | | 2,081 | |
| Foreign | | | (1,388 | ) | | | 621 | | | | (570 | ) |
| | | | | | | | | | |
| Subtotal | | | (5,234 | ) | | | (3,967 | ) | | | 1,416 | |
| Benefit applied to reduce goodwill | | | 338 | | | | 353 | | | | 389 | |
| | | | | | | | | | |
| Total provision | | $ | 11,755 | | | $ | 4,843 | | | $ | 7,141 | |
| | | | | | | | | | |
F-24
The sources of income (loss) before income taxes are presented as follows:
| | | | | | | | | | | | | |
| (in thousands) | | 2007 | | | 2006 | | | 2005 | |
| United States | | $ | 520 | | | $ | (7,062 | ) | | $ | 6,055 | |
| Foreign | | | 29,922 | | | | 20,435 | | | | 11,760 | |
| | | | | | | | | | |
| Income before income taxes | | $ | 30,442 | | | $ | 13,373 | | | $ | 17,815 | |
| | | | | | | | | | |
The Company’s consolidated effective income tax rate differed from the U.S. Federal statutory income tax rate of 34% in 2007 and 35% in 2006 and 2005 as set forth below:
| | | | | | | | | | | | | |
| | | 2007 | | 2006 | | 2005 |
| Income tax expense at the U.S. Federal statutory rate | | | 34.0 | % | | | 35.0 | % | | | 35.0 | % |
| Effects of foreign taxes, net of foreign tax credits and deductions | | | 3.3 | | | | (6.5 | ) | | | 2.2 | |
| State and local income taxes, net of Federal benefit | | | (0.7 | ) | | | 0.1 | | | | 7.8 | |
| Dutch operating loss carryforward- reversal of valuation allowance | | | — | | | | — | | | | (4.6 | ) |
| Original issue discount-Convertible Notes | | | (3.6 | ) | | | — | | | | — | |
| Effects of repatriated foreign dividend | | | — | | | | 6.9 | | | | — | |
| Effects of deemed foreign dividend | | | 2.6 | | | | — | | | | — | |
| Other | | | 3.0 | | | | 0.7 | | | | (0.3 | ) |
| | | | | | | | | | | | | |
| Total | | | 38.6 | % | | | 36.2 | % | | | 40.1 | % |
| | | | | | | | | | | | | |
A provision has not been made for U.S. or additional foreign taxes on the undistributed portion of earnings of foreign subsidiaries as those earnings have been permanently reinvested. The undistributed earnings of foreign subsidiaries approximate $38.9 million. It is not practicable to determine the additional taxes that would result if these earnings were repatriated.
Components of the Company’s net deferred tax asset and liability included in the Consolidated Balance Sheets at December 31, 2007, and 2006 are as follows:
| | | | | | | | | |
| (in thousands) | | 2007 | | | 2006 | |
| Deferred tax assets: | | | | | | | | |
| Compensation and employee benefits | | $ | 1,884 | | | $ | 1,634 | |
| Accrued expenses and other future deductible items | | | 4,633 | | | | 4,667 | |
| Foreign operating loss carryforward | | | 14,903 | | | | 14,050 | |
| State and local operating loss carryforward | | | 1,592 | | | | 1,055 | |
| Federal operating loss carryforward | | | 871 | | | | — | |
| Deferred state income taxes | | | 13 | | | | — | |
| Contributions carryforward | | | 31 | | | | — | |
| Capital loss carryforward | | | 726 | | | | 716 | |
| Foreign tax credit carryforward | | | 2,081 | | | | 2,402 | |
| Unrealized foreign exchange losses | | | 501 | | | | 650 | |
| Depreciation and software costs | | | 2,216 | | | | 1,233 | |
| Stock option expense | | | 458 | | | | 357 | |
| Accounting method differences | | | 816 | | | | 925 | |
| | | | | | | |
| Total deferred tax assets | | | 30,725 | | | | 27,689 | |
| | | | | | | | | |
| Deferred tax liabilities: | | | | | | | | |
| Intangible assets | | | 1,216 | | | | 1,800 | |
| Deferred state income taxes | | | — | | | | 101 | |
| | | | | | | |
| Total deferred tax liability | | | 1,216 | | | | 1,901 | |
| | | | | | | |
| Valuation allowance | | | 19,341 | | | | 18,118 | |
| | | | | | | |
| Total net deferred tax (asset)/liability | | $ | (10,168 | ) | | $ | (7,670 | ) |
| | | | | | | |
As a result of certain realization requirements of SFAS 123 (R), the table of deferred tax assets and liabilities shown above does not include certain deferred tax assets at December 31, 2007 and 2006 that arose directly from tax deductions related to equity
F-25
compensation in excess of compensation recognized for financial reporting. Equity will be increased by $1.9 million if and when such deferred tax assets are ultimately realized. The Company uses tax law ordering for purposes of determining when excess tax benefits have been realized.
The Company has a Federal operating loss carryforward of $2.6 million with a recognized tax benefit of $871,000 that will expire in 2028.
The deferred tax asset for state and local operating loss carryforward of $1,592,000 relates to amounts that expire at various times from 2008 to 2028. The amount that will expire in 2008 is $52,000. A valuation allowance has been established for $316,000 of this tax asset based upon an assessment that it is more likely than not that realization cannot be assured in certain tax jurisdictions.
The Company has foreign operating loss carryforwards of $2.2 million with a recognized tax benefit of $563,000 that can be carried forward indefinitely.
The Company has foreign operating loss carryforwards of $51.4 million with a tax benefit of $14.3 million for which a valuation allowance has been established based upon an assessment that it is more likely than not that realization cannot be assured. The ultimate realization of this tax benefit is dependent upon the generation of sufficient operating income in the respective tax jurisdictions. Of this benefit, $600,000 will expire at various times from 2008 to 2018 and $13.7 million can be carried forward indefinitely.
The Company has capital loss carryforwards of $2.0 million with a tax benefit of $726,000 for which a valuation allowance has been established based upon an assessment that it is more likely than not that realization cannot be assured. Of this tax benefit, $708,000 will expire in 2008, $5,000 will expire in 2010 and $13,000 will expire in 2012. The ultimate realization of this tax benefit is dependent upon the generation of sufficient capital gains within the carryforward periods.
The Company has a Federal foreign tax credit carryforward of $2.0 million that will expire in 2017.
The Company has foreign tax credit carryforwards with a tax benefit of $67,000 for which a valuation allowance has been established based upon an assessment that it is more likely than not that realization cannot be assured. This benefit can be carried forward indefinitely.
A valuation allowance has been established for other deferred tax assets of $3.9 million related to operations in foreign tax jurisdictions based upon an assessment that it is more likely than not that realization cannot be assured.
Yearly activity related to the Company’s valuation allowance is as follows:
| | | | | | | | | | | | | |
| (in thousands) | | 2007 | | | 2006 | | | 2005 | |
| Beginning balance | | $ | 18,118 | | | $ | 4,548 | | | $ | 7,014 | |
| Additions charged to expense | | | 3,050 | | | | 1,357 | | | | 399 | |
| Additions attributable to acquisitions | | | — | | | | 12,739 | | | | — | |
| Reductions from utilization, reassessments and expirations | | | (1,827 | ) | | | (526 | ) | | | (2,865 | ) |
| | | | | | | | | | |
| Ending balance | | $ | 19,341 | | | $ | 18,118 | | | $ | 4,548 | |
| | | | | | | | | | |
Under current accounting requirements, at December 31, 2007, $12.4 million of the valuation allowance would be allocated to reduce goodwill if the deferred tax asset is subsequently recognized.
Income tax benefits related to stock option exercises and the employee stock purchase plan were $188,000, $1.2 million and $2.0 million for 2007, 2006 and 2005, respectively, and have been shown as increases to Additional Paid-In Capital.
The income tax costs (benefits) related to unrealized gains and losses in Other Comprehensive Income components of Shareholders’ Equity were $0 in both 2007 and 2006 and $(23,000) in 2005.
On July 13, 2006, the FASB issued FIN No. 48 “Accounting for Uncertainty in Income Taxes—an interpretation of FASB Statement 109.” FIN No. 48 establishes a single model to address accounting for uncertainty in tax positions. FIN No. 48 clarifies the accounting for income taxes by prescribing a minimum recognition threshold a tax position is required to meet before being recognized in the
F-26
financial statements. FIN 48 also provides guidance on de-recognition, measurement, classification, interest and penalties, accounting in interim periods, disclosure and transition. FIN No. 48 is effective for fiscal years beginning after December 15, 2006.
On January 1, 2007, the Company adopted the provisions of FIN No. 48. The cumulative effect of adoption was a $4.3 million increase of Accumulated Deficit. The following is a tabular reconciliation of the amounts of unrecognized tax benefits for the year:
| | | | | |
| | | (in thousands) | |
| Unrecognized tax benefit - adoption | | $ | 6,828 | |
| Gross increases - tax positions in prior period | | | 167 | |
| Gross decreases - tax positions in prior period | | | (352 | ) |
| Gross increases - tax positions in current period | | | 1,663 | |
| Gross decreases - tax positions in current period | | | (71 | ) |
| Settlements | | | - | |
| Lapse of statute of limitations | | | (2,788 | ) |
| | | | |
| Unrecognized tax benefit - ending balance | | $ | 5,447 | |
| | | | |
Included in the balance of unrecognized tax benefits at December 31, 2007 are $5.0 million of tax benefits that, if recognized, would affect the effective tax rate.
Interest and penalties associated with uncertain tax positions are recognized as components of the income tax expense on the Consolidated Statements of Operations. The Company recognized tax-related interest and penalties of approximately ($88,000) in its Consolidated Statements of Operations during 2007 and at December 31, 2007 has a recorded liability of $375,000 for interest and penalties.
The Company has approximately $1.5 million in unrecognized tax benefits for which the statute of limitations is expected to expire within the next 12 months. It is reasonably possible that the expiration of the statute of limitations on some or all of these unrecognized tax benefits may cause a material impact on the Company’s effective tax rate in a particular period. These unrecognized tax benefits primarily include potential transfer pricing exposures from allocation of income between tax jurisdictions and potential deemed foreign dividends.
The tax years that remain subject to examination for the Company’s major tax jurisdictions are shown below:
| | | |
| Jurisdiction | | Open Years |
| United States | | 2002, 2004 - 2007 |
| Germany | | 2003 - 2007 |
| United Kingdom | | 2005 - 2007 |
| Netherlands | | 2004 - 2007 |
The Company operates in various state and local jurisdictions. Open tax years for state and local jurisdictions approximate the open years reflected above for the United States.
11. ACQUISITIONS:
Details pertaining to Company’s acquisitions in 2006 are listed below. The Company had no acquisitions in either 2007 or 2005. The acquisitions have been accounted for using the purchase method of accounting.
2006:
Acquisition of International Clinical Research Limited and related companies:
In April 2006, the Company completed its acquisition of IC-Research and its related companies. IC-Research is a leading CRO in Latin America with operations in Argentina, Brazil, Chile and Colombia. The acquisition supports the Company’s goal of strategic business expansion and diversification in high-growth regions to deliver global clinical trials for its customers. IC-Research was integrated as part of the Company’s Late Stage segment.
F-27
The acquisition closed in April 2006. The aggregate purchase price was approximately $971,000 in cash, including acquisition costs. In addition, there is an earnout provision, with a maximum additional amount to be paid of $260,000 as well as an additional contingent payment of $100,000. To date, the Company has paid out approximately $70,000 of the earnout and contingency provisions. In 2007, the Company accrued approximately $74,000 to record the additional contingency provision amount earned. The additional goodwill amounts were recorded in the Consolidated Financial Statements in 2007.
The following table summarizes the fair values of the assets acquired and liabilities assumed at the date of acquisition. Contingent payments discussed above are not included in the purchase price allocation table below. A third party was used to assist the Company in valuing the intangible assets.
Purchase Price Allocation:
| | | | | |
| (in thousands at the prevailing exchange rate at April 25, 2006): | |
| Current assets | | $ | 94 | |
| Property, plant and equipment | | | 9 | |
| Intangible assets | | | 500 | |
| Goodwill | | | 418 | |
| | | | |
| Total assets acquired | | | 1,021 | |
| Current liabilities | | | (50 | ) |
| | | | |
| Net assets acquired | | $ | 971 | |
| | | | |
Acquisition of Phase II-IV Clinical Services Business of Charles River Laboratories International, Inc.:
In August 2006, the Company acquired CRL Clinical Services. The acquisition strengthened the Company’s position as one of the leading global players in the clinical development industry, adding therapeutic expertise, diversifying its customer base and expanding its capacity to deliver large global trials. The total purchase price, including acquisition costs and the working capital adjustment, in which the Company paid for any working capital in excess of $2.0 million, was approximately $236 million. The Company financed the purchase with $200 million in term debt as well as its existing cash and proceeds from the sale of available-for-sale securities.
The following table summarizes the estimated fair values of the assets acquired and liabilities assumed at the date of acquisition. A third party was used to assist the Company in valuing the intangible asset.
Purchase Price Allocation:
| | | | | |
| (in thousands at the prevailing exchange rate at August 16, 2006): | |
| Accounts receivable | | $ | 23,221 | |
| Other current assets | | | 17,002 | |
| Property, plant and equipment | | | 4,427 | |
| Other long-term assets | | | 2,851 | |
| Intangible assets | | | 19,100 | |
| Goodwill | | | 203,857 | |
| | | | |
| Total assets acquired | | | 270,458 | |
| Advance billings | | | (10,264 | ) |
| Other current liabilities | | | (11,008 | ) |
| Other long-term liabilities | | | (12,920 | ) |
| | | | |
| Total liabilities assumed | | | (34,192 | ) |
| | | | |
| Net assets acquired | | $ | 236,266 | |
| | | | |
F-28
For the acquisitions discussed above, results of operations are included in the Company’s Consolidated Statements of Operations from the date of acquisition.
The following unaudited pro forma results of operations assume the acquisitions of IC-Research and CRL Clinical Services occurred at the beginning of 2006:
| | | | | |
| | | Twelve Months Ended |
| (in thousands, except per share data) | | December 31, 2006 |
| Net service revenues | | $ | 350,781 | |
| Net income | | | 1,229 | |
| Net income per diluted share | | $ | 0.08 | |
| Weighted average shares | | | 14,762 | |
The pro forma adjustments represent management’s best estimates based on information available at the time the pro forma information was prepared and may differ from the adjustments that may actually have been required. Accordingly, the pro forma financial information should not be relied upon as being indicative of the historical results that would have been realized had the acquisition occurred as of the dates indicated or that may be achieved in the future.
12. INVESTMENTS:
The Company has a 50%-owned joint venture investment in Beijing KendleWits Medical Consulting Co., Ltd. (KendleWits), a company located in China. This investment is accounted for under the equity method. To date, the Company has contributed approximately $750,000 for the capitalization of KendleWits. In the second quarter of 2003, the Company determined that its investment in KendleWits was permanently impaired and as a result recorded a $405,000 non-cash charge to reduce the carrying value of its investment to zero. Future capital investment needs will be dependent upon the on-going capitalization needs of KendleWits and the Company’s willingness to provide additional capital. The Company is not obligated to make any additional investment in KendleWits and currently has no plans to do so.
13. RELATED PARTY TRANSACTIONS:
The Company made payments in 2006 totaling approximately $25,000 to a construction company owned by a relative of the Company’s primary shareholder, for construction and renovations at various Company locations. No such payments were made in either 2007 or 2005.
The Company made payments in 2006 totaling approximately $4,000 to a law firm owned by the son of the Company’s primary shareholder, for professional services. No such payments were made in either 2007 or 2005.
F-29
14. SEGMENT INFORMATION:
In the first quarter of 2006, the Company reorganized its business into two reportable segments, Early Stage and Late Stage. The reorganization was made to move the Company’s two Early stage units under a single leadership team and the segment reporting reflects the way in which management and the Company’s chief operating decision maker reviews the results of the business. The Early Stage business currently focuses on the Company’s Phase I operations, while Late Stage is comprised of clinical development services related to Phase II through IV clinical trials, regulatory affairs and biometrics offerings. Support and Other consists of unallocated corporate expenses, primarily information technology, marketing and communications, human resources, finance and legal.
| | | | | | | | | | | | | | | | | |
| | | Early | | | Late | | | Support | | | | |
| (in thousands) | | Stage | | | Stage | | | & Other | | | Total | |
| |
Twelve months ended December 31, 2007 | | | | | | | | | | | | | | | | |
| Net service revenues | | $ | 21,373 | | | $ | 366,379 | | | $ | 9,832 | | | $ | 397,584 | |
| Reimbursable out-of-pocket revenues | | $ | — | | | $ | 171,234 | | | $ | — | | | $ | 171,234 | |
| | | | | | | | | | | | | |
Total revenues | | $ | 21,373 | | | $ | 537,613 | | | $ | 9,832 | | | $ | 568,818 | |
| Operating Income (loss) | | $ | 3,599 | | | $ | 84,609 | | | $ | (35,394 | ) | | $ | 52,814 | |
| Total assets | | $ | 33,258 | | | $ | 388,680 | | | $ | 77,785 | (a) | | $ | 499,723 | |
| | | | | | | | | | | | | | | | | |
Twelve months ended December 31, 2006 | | | | | | | | | | | | | | | | |
| Net service revenues | | $ | 23,328 | | | $ | 254,954 | | | $ | 5,189 | | | $ | 283,471 | |
| Reimbursable out-of-pocket revenues | | $ | — | | | $ | 90,465 | | | $ | — | | | $ | 90,465 | |
| | | | | | | | | | | | | |
Total revenues | | $ | 23,328 | | | $ | 345,419 | | | $ | 5,189 | | | $ | 373,936 | |
| Operating Income (loss) | | $ | (2,476 | ) | | $ | 65,846 | | | $ | (43,360 | ) | | $ | 20,010 | |
| Total assets | | $ | 31,992 | | | $ | 370,527 | | | $ | 52,553 | (a) | | $ | 455,072 | |
| | | | | | | | | | | | | | | | | |
Twelve months ended December 31, 2005 | | | | | | | | | | | | | | | | |
| Net service revenues | | $ | 23,999 | | | $ | 174,622 | | | $ | 3,411 | | | $ | 202,032 | |
| Reimbursable out-of-pocket revenues | | $ | — | | | $ | 48,607 | | | $ | — | | | $ | 48,607 | |
| | | | | | | | | | | | | |
Total revenues | | $ | 23,999 | | | $ | 223,229 | | | $ | 3,411 | | | $ | 250,639 | |
| Operating Income (loss) | | $ | 7,648 | | | $ | 37,021 | | | $ | (27,426 | ) | | $ | 17,243 | |
| Total assets | | $ | 30,825 | | | $ | 94,156 | | | $ | 59,778 | (a) | | $ | 184,759 | |
| | |
| (a) | | Primarily comprised of cash, marketable securities and tax-related assets. |
Financial information by geographic area is as follows:
| | | | | | | | | | | | | |
| (in thousands) | | 2007 | | | 2006 | | | 2005 | |
| Net service revenues | | | | | | | | | | | | |
| United States | | $ | 198,242 | | | $ | 155,469 | | | $ | 110,456 | |
| Non-United States | | | 199,342 | | | | 128,002 | | | | 91,576 | |
| | | | | | | | | | |
| | | $ | 397,584 | | | $ | 283,471 | | | $ | 202,032 | |
| | | | | | | | | | |
| | | | | | | | | | | | | |
| Identifiable assets | | | | | | | | | | | | |
| United States | | $ | 309,678 | | | $ | 261,585 | | | $ | 134,759 | |
| Non-United States | | | 190,045 | | | | 193,487 | | | | 50,000 | |
| | | | | | | | | | |
| | | $ | 499,723 | | | $ | 455,072 | | | $ | 184,759 | |
| | | | | | | | | | |
F-30
In 2007, there were no sponsors who individually accounted for more than 10% of the Company’s consolidated net service revenues. Net revenues from sponsors that accounted for more than 10% of the Company’s consolidated net service revenues for 2006 and 2005 are as follows:
| | | | | | | | | |
| | | 2006 | | 2005 |
| Sponsor A | | | 12 | % | | | 15 | % |
Sponsor A accounted for approximately 7% and 5% of the Company’s consolidated accounts receivable at December 31, 2006; and December 31, 2005, respectively.
15. QUARTERLY FINANCIAL DATA (unaudited):
(in thousands, except per share data)
Earnings per basic share as presented on the 2007 and 2006 income statements do not equal the sum of earnings per share for each quarter presented below to rounding differences in each quarter.
| | | | | | | | | | | | | | | | | |
| | | First | | Second | | Third | | Fourth |
| Quarter | | | | | | | | | | | | | | | | |
2007 | | | | | | | | | | | | | | | | |
| Net service revenues | | $ | 95,439 | | | $ | 97,802 | | | $ | 100,070 | | | $ | 104,273 | |
| Gross profit | | | 46,040 | | | | 46,258 | | | | 50,951 | | | | 50,174 | |
| Income from operations | | | 12,489 | | | | 10,879 | | | | 14,245 | | | | 15,201 | |
| Net income | | | 4,203 | | | | 4,332 | | | | 3,786 | | | | 6,366 | |
| Net income per diluted share | | | 0.28 | | | | 0.29 | | | | 0.25 | | | | 0.43 | |
| Net income per basic share | | | 0.29 | | | | 0.30 | | | | 0.26 | | | | 0.44 | |
| | | | | | | | | | | | | | | | | |
| | | First | | Second | | Third | | Fourth |
| Quarter | | | | | | | | | | | | | | | | |
2006 | | | | | | | | | | | | | | | | |
| Net service revenues | | $ | 59,753 | | | $ | 62,086 | | | $ | 75,236 | | | $ | 86,396 | |
| Gross profit | | | 28,929 | | | | 28,131 | | | | 34,295 | | | | 39,290 | |
| * Income (loss) from operations | | | 7,278 | | | | 6,396 | | | | 8,093 | | | | (1,757 | ) |
| * Net income (loss) | | | 4,899 | | | | 4,289 | | | | 3,997 | | | | (4,655 | ) |
| * Net income (loss) per diluted share | | | 0.33 | | | | 0.29 | | | | 0.27 | | | | (0.32 | ) |
| * Net income (loss) per basic share | | | 0.35 | | | | 0.30 | | | | 0.28 | | | | (0.32 | ) |
| | |
| (*) | | The net loss from operations in the fourth quarter of 2006 includes an $8.2 million impairment charge on a customer relationship intangible asset acquired in the Company’s acquisition of CPR in 2002. |
F-31
SIGNATURES
Pursuant to the requirements of Section 13 of the Securities Exchange Act of 1934, the Registrant has duly caused this report to be signed on its behalf by the undersigned, thereunto duly authorized.
| | | | | |
| | KENDLE INTERNATIONAL INC.
| |
| DATE SIGNED: March 17, 2008 | /s/ Candace Kendle | |
| | Candace Kendle, PharmD | |
| | Chairman, CEO and Principal Executive Officer | |
| |
Pursuant to the requirements of the Securities Exchange Act of 1934, this report has been signed by the following persons on behalf of the Registrant and in the capacities and on the dates indicated.
| | | | | |
| Signature | | Capacity | | Date |
| | | | | |
| /s/ Candace Kendle | | Chairman of the Board of Directors, Chief Executive | | March 17, 2008 |
| | | | | |
| Candace Kendle, PharmD | | Officer and Principal Executive Officer | | |
| | | | | |
| /s/ Christopher C. Bergen | | President, Chief Operating Officer and Director | | March 17, 2008 |
| | | | | |
| Christopher C. Bergen | | | | |
| | | | | |
| /s/ Karl Brenkert III | | Senior Vice President, Chief Financial Officer and | | March 17, 2008 |
| | | | | |
| Karl Brenkert III | | Principal Financial Accounting Officer | | |
| | | | | |
| * | | Director | | March 17, 2008 |
| | | | | |
| G. Steven Geis, Ph.D., M.D. | | | | |
| | | | | |
| * | | Director | | March 17, 2008 |
| | | | | |
| Donald C. Harrison, M.D. | | | | |
| | | | | |
| * | | Director | | March 17, 2008 |
| | | | | |
| Timothy E. Johnson, Ph.D. | | | | |
| | | | | |
| | Director | | March 17, 2008 |
| | | | | |
| Frederick A. Russ, Ph.D. | | | | |
| | | | | |
| * | | Director | | March 17, 2008 |
| | | | | |
| Robert R. Buck | | | | |
| | | | | |
| * /s/ Stacey Heiser | | as Attorney In-Fact | | March 17, 2008 |
| | | | | |
| Stacey Heiser | | | | |
EXHIBIT INDEX
| | | | | |
| Exhibit | | | | |
| Number | | Description of Exhibit | | Filing Status |
| | | | | |
| 2.1 | | Stock Purchase Agreement dated July 1, 1997 by and among the Company and Shareholders of U-Gene Research B.V. | | * |
| | | | | |
| 2.2 | | Escrow Agreement dated June 27, 1997 among the Company, Keating, Muething & Klekamp, P.L.L., Bio-Medical Research Holdings, B.V., Utrechtse Particatiemaatschappij B.V., P.J. Morrison, T.S. Schwarz, I.M. Hoepelman , Ph.K. Peterson, J. Remington, M. Rozenberg-Arska and L.G.W. Sterkman | | * |
| | | | | |
| 2.3 | | Share Purchase Agreement dated July 2, 1997 by and among the Company and the Shareholders of GMI Gescellschaft für Angewandte Mathematick und Informatik mbH | | * |
| | | | | |
| 2.4 | | Stock Purchase Agreement dated February 11, 1998 by and among the Company and the Shareholders of ACER/EXCEL Inc. | | * |
| | | | | |
| 2.5 | | Escrow Agreement dated February 11, 1998 among the Company, Tzuo-Yan Lee, Jean C. Lee Michael Minor, Conway Lee, Steven Lee, Jean C. Lee, as Trustee under a Trust dated March 8, 1991 fbo Jennifer Lee, Citicorp Trust-South Dakota and The Fifth Third Bank | | * |
| | | | | |
| 2.6 | | Registration Rights Agreement dated February 11, 1998 among the Company and Tzuo-Yan Lee, Jean C. Lee, Michael Minor, Conway Lee, Steven Lee, Jean C. Lee, as Trustee under a Trust dated March 8, 1991 fbo Jennifer Lee, Citicorp Trust-South Dakota | | * |
| | | | | |
| 2.7 | | Share Purchase Agreement dated December 23, 1998 by and among the Company and the Shareholders of Research Consultants (International) Holdings Limited | | * |
| | | | | |
| 2.8 | | Escrow Agreement dated January 5, 1999 among the Company, John Glasby, Gillian Gregory Michael Roy Broomby and Peter Nightingale | | * |
| | | | | |
| 2.9 | | Option Agreement dated September 9, 1998 by and between the Company and Component Software International, Inc. | | * |
| | | | | |
| 2.10 | | Notice of Option Exercise dated January 11, 1999 of the Option Agreement dated September 9, 1998 | | * |
| | | | | |
| 2.11 | | Multi-Year Strategic Services Agreement dated January 20, 1999 by and between the Company and Component Software International, Inc. | | * |
| | | | | |
| 2.12 | | Asset Purchase Agreement dated June 27, 1999 by and among the Company and the Shareholders of Health Care Communications, Inc. | | * |
| | | | | |
| 2.13 | | Stock Purchase Agreement dated June 4, 1999 by and among the Company and the Shareholders of ESCLI S.A. | | * |
| | | | | |
| 2.14 | | Asset Purchase Agreement dated July 13, 1999 by and among the Company and the Shareholders of HCC Health Care Communications (1991), Ltd. | | * |
| | | | | |
| 2.15 | | Share Purchase Agreement dated August 31, 1999 by and among the Company and the Shareholder of Specialist Monitoring Services Limited | | * |
| | | | | |
| 2.16 | | Escrow Agreement dated July 13, 1999 by and among the Company, Geoffrey H. Kalish, M.D., Bradley D. Kalish, Jill Kalish, and The Fifth Third Bank, as Escrow Agent | | * |
| | | | | |
| 2.17 | | Escrow Agreement dated August 31, 1999 by and among the Company, Paul Martin, and The Fifth Third Bank, as Escrow Agent | | * |
| | | | | |
| 2.18 | | Units Purchase Agreement dated April 7, 2000 by and among the Company and the Shareholders of SYNERmedica PTY Limited and SYNERmedica Unit Trust | | * |
| | | | | |
| 2.19 | | Stock Purchase Agreement dated February 27, 2001 by and among the Company and the Shareholders of AAC Consulting Group, Inc. | | * |
| | | | | |
| 2.20 | | Form of Note Prepayment Agreement | | * |
| | | | | |
| 2(a) | | Asset Purchase Agreement dated January 29, 2002 among Kendle International Inc., Clinical and Pharmacologic Research, Inc., Thomas S. Clark, M.D., Charles T. Clark, and E. Stuart Clark | | * |
| | | | | |
| 2(b) | | Convertible Subordinated Note, dated January 29, 2002 issued by Kendle International Inc. to Clinical and Pharmacologic Research, Inc. | | * |
| | | | | |
| 2.21 | | Stock Purchase Agreement between the Company and Charles River Laboratories International, Inc. dated as of May 9, 2006 | | * |
| | | | | |
| 3.1 | | Restated and Amended Articles of Incorporation | | * |
| | | | | |
| 3.2 | | Amended and Restated Code of Regulations | | * |
| | | | | |
| 3.3 | | Amendment of the Restated and Amended Articles of Incorporation to Increase the Authorized Shares | | * |
| | | | | |
| 4 | | Specimen Common Stock Certificate | | * |
| | | | | |
| 4.1 | | Shareholder Rights Agreement dated August 13, 1999 between the Company and The Fifth Third Bank, as Rights Agent | | * |
| | | | | |
| 4.2 | | Indenture dated March 31, 2007 between the Company and LaSalle Bank National Association | | * |
| | | | | |
| Exhibit | | | | |
| Number | | Description of Exhibit | | Filing Status |
| 4.3 | | Supplemental Indenture No. 1 dated July 16, 2007 between the Company and LaSalle Bank National Association | | * |
| | | | | |
| 10.1 | | Amended and Restated Shareholders’ Agreement dated June 26, 1997 | | * |
| | | | | |
| 10.2 | | Master Lease Agreement dated November 27, 1996 by and between the Company and Bank One Leasing Corporation, as amended on April 18, 1997 | | * |
| | | | | |
| 10.6 | | Master Equipment Lease dated August 16, 1996 by and between the Company and The Fifth Third Leasing Company | | * |
| | | | | |
| 10.7 | | Lease Agreement dated December 9, 1991 by and between the Company and Carew Realty, Inc., as amended on December 30, 1991, March 18, 1996, October 8, 1996, January 29, 1997, and February 16, 1999 | | * |
| | | | | |
| 10.8 | | Indemnity Agreement dated June 21, 1996 by and between the Company and Candace Kendle Bryan | | * |
| | | | | |
| 10.9 | | Indemnity Agreement dated June 21, 1996 by and between the Company and Christopher C. Bergen | | * |
| | | | | |
| 10.10 | | Indemnity Agreement dated June 21, 1996 by and between the Company and Timothy M. Mooney | | * |
| | | | | |
| 10.11 | | Indemnity Agreement dated May 14, 1997 by and between the Company and Charles A. Sanders | | * |
| | | | | |
| 10.12 | | Indemnity Agreement dated May 14, 1997 by and between the Company and Philip E. Beekman | | * |
| | | | | |
| 10.13 | | Indemnity Agreement dated December 10, 1998 by and between the Company and Robert Buck | | * |
| | | | | |
| 10.14 | | Indemnity Agreement dated December 10, 1998 by and between the Company and Mary Beth Price | | * |
| | | | | |
| 10.15 | | Form of Indemnity Agreement by and between the Company and each member of the Company’s Board of Directors, except for those Indemnity Agreements noted above and filed previously. | | * |
| | | | | |
| 10.16 | | Credit Agreement dated as of August 16, 2006 by and among the Company, certain subsidiary Guarantors, various Lenders, UBS Securities LLC, as Sole Lead Arranger and Sole Bookrunner, UBS AG, Stamford Branch, as Issuing Bank, Administrative Agent and Collateral Agent, UBS Loan Finance LLC, as Swingline Lender, JPMorgan Chase Bank, N.A., as Syndication Agent, and KeyBank National Association, LaSalle Bank N.A. and National City Bank, as Co-Documentation Agents. | | * |
| | | | | |
| | | (a) First Amended and Restated Credit Agreement dated as of December 11, 2006 among Kendle International Inc., the several lenders from time to time party thereto and UBS AG, Stamford Branch, as administrative agent | | * |
| | | | | |
| 10.17 | | First Amendment to the Stock Purchase Agreement dated as of August 16, 2006 between the Company and Charles River Laboratories, Inc. | | * |
| | | | | |
| 10.18 | | Second Amended and Restated Credit Agreement dated as of April 13, 2007 among Kendle International Inc., the several lenders from time to time party thereto and UBS AG, Stamford Branch, as administrative agent | | * |
| | | | | |
| 10.19 | | Increase Joinder Agreement dated June 27, 2007 among the Company,certain of its subsidiaries, various lenders, and UBS AG, Stamford Branch, as administrative agent for the lenders | | * |
| | | | | |
| 10.20 | | Confirmation of Convertible Bond Hedge Transaction, dated July 10, 2007, by and between the Company and UBS AG, London Branch | | * |
| | | | | |
| 10.21 | | Confirmation of Convertible Bond Hedge Transaction, dated July 10, 2007, by and between the Company and JPMorgan Chase Bank, National Association, London Branch | | * |
| | | | | |
| 10.22 | | Confirmation of Issuer Warrant Transaction, dated July 10, 2007, by and between the Company and UBS AG, London Branch | | * |
| | | | | |
| 10.23 | | Confirmation of Issuer Warrant Transaction, dated July 10, 2007, by and between the Company and JPMorgan Chase Bank, National Association, London Branch | | * |
| | | | | |
| 10.24 | | Third Amended and Restated Credit Agreement dated as of December 18, 2007 among Kendle International Inc., the several lenders from time to time party thereto and UBS AG, Stamford Branch, as administrative Agent | | DD |
| | | | | | | |
| Exhibit | | | | | | |
| Number | | | | Description of Exhibit | | Filing Status |
| | | | | | | |
| 10.30 | | | | MANAGEMENT CONTRACTS AND COMPENSATION PLANS | | |
| | | | | | | |
| | | (a) | | 1995 Stock Option and Stock Incentive Plan | | * |
| | | | | | | |
| | | (b) | | 1995 Stock Option and Stock Incentive Plan —Individual Stock Option Agreement for Incentive Stock Option (contained in Exhibit 10.20(a)) | | * |
| | | | | | | |
| | | (c) | | 1997 Stock Option and Stock Incentive Plan | | * |
| | | | | | | |
| | | (c)(1) | | Amendment No. 1 to 1997 Stock Option and Stock Incentive Plan | | * |
| | | | | | | |
| | | (c)(2) | | Amendment No. 2 to 1997 Stock Option and Stock Incentive Plan | | * |
| | | | | | | |
| | | (c)(3) | | Amendment No. 3 to 1997 Stock Option and Stock Incentive Plan | | * |
| | | | | | | |
| | | (c)(4) | | Form of Restricted Stock Award Agreement | | * |
| | | | | | | |
| | | (d) | | Form of Protective Compensation and Benefit Agreement | | * |
| | | | | | | |
| | | (e) | | 1998 Employee Stock Purchase Plan | | * |
| | | | | | | |
| | | (e)(1) | | Amendment No. 1 to 1998 Employee Stock Purchase Plan | | * |
| | | | | | | |
| | | (e)(2) | | Amendment No. 2 to 1998 Employee Stock Purchase Plan | | * |
| | | | | | | |
| | | (e)(3) | | Amendment No. 3 to 1998 Employee Stock Purchase Plan | | * |
| | | | | | | |
| | | (e)(4) | | Amendment No. 4 to 1998 Employee Stock Purchase Plan | | * |
| | | | | | | |
| | | (e)(5) | | Amendment No. 5 to 1998 Employee Stock Purchase Plan | | * |
| | | | | | | |
| | | (f) | | 2007 Stock Incentive Plan | | * |
| | | | | | | |
| | | (n) | | 2003 Directors Compensation Plan | | * |
| | | | | | | |
| 12.1 | | Computation of Ratio of Earnings to Fixed Charges | | DD |
| | | | | | | |
| 14 | | Code of Ethics | | * |
| | | | | | | |
| 21 | | List of Subsidiaries | | DD |
| | | | | | | |
| 23.1 | | Consent of Deloitte & Touche LLP | | DD |
| | | | | | | |
| 24 | | Powers of Attorney | | DD |
| | | | | | | |
| 31.1 | | Certification of the Chief Executive Officer pursuant to Rule 13a-14(a) | | DD |
| | | | | | | |
| 31.2 | | Certification of the Chief Financial Officer pursuant to Rule 13a-14(a) | | DD |
| | | | | | | |
| 32.1 | | Certification Pursuant to 18 U.S.C Section 1350 as Adopted Pursuant to Section 906 of the Sarbanes-Oxley Act of 2002- Chief Executive Officer | | DD |
| | | | | | | |
| 32.2 | | Certification Pursuant to 18 U.S.C Section 1350 as Adopted Pursuant to Section 906 of the Sarbanes-Oxley Act of 2002 – Chief Financial Officer | | DD |
| | | |
| Filing | | |
| Status | | Description of Exhibit |
| | | |
| * | | Incorporated by reference – See Item 15 |
| | | |
| DD | | Filed herewith |