UNITED STATES
SECURITIES AND EXCHANGE COMMISSION
Washington, D.C. 20549
FORM N-CSR
CERTIFIED SHAREHOLDER REPORT OF REGISTERED
MANAGEMENT INVESTMENT COMPANIES
| Investment Company Act file number | 811-08239 |
| |
| ProFunds |
| (Exact name of registrant as specified in charter) |
| | 7272 Wisconsin Avenue, 21st Floor Bethesda, MD | 20814 |
| | (Address of principal executive offices) | (Zip code) |
| Citi Fund Services Ohio, Inc., 4400 Easton Commons, Suite 200, Columbus, OH 43219 |
| (Name and address of agent for service) |
Registrant’s telephone number, including area code: (240) 497-6400
Date of fiscal year end: December 31
Date of reporting period: December 31, 2021
EXPLANATORY NOTE
The Registrant is filing this amendment to its Form N-CSR for the period ended December 31, 2021, originally filed with the Securities and Exchange Commission on March 9, 2022 (Accession Number 0001104659-22-032055). The purpose of this amendment is to update Items 11(b) and Item 4(d) of the registrant’s certifications required by Item 13(a)(2).
Items 11(b) and 4(d) are amended to reflect the correct full period covered by the report.
Item 1. Reports to Stockholders.
Annual Report
DECEMBER 31, 2021
Government Money Market ProFund
Beginning on January 1, 2021, as permitted by regulations adopted by the Securities and Exchange Commission, paper copies of the Fund's annual and semi-annual shareholder reports will no longer be sent by mail, unless you specifically request paper copies of the reports. Instead, the reports will be made available on the Fund's website (www.profunds.com), and you will be notified by mail each time a report is posted and provided with a website link to access the report.
If you already elected to receive shareholder reports electronically, you will not be affected by this change and you need not take any action. You may elect to receive shareholder reports and other communications from the Fund electronically anytime by contacting your financial intermediary (such as a broker-dealer or bank) or, if you are a direct investor, by calling 888-PRO-FNDS (888-776-3637) or by sending an e-mail request to info@profunds.com.
Beginning on January 1, 2019, you may elect to receive all future reports in paper free of charge. If you invest through a financial intermediary, you can contact your financial intermediary to request that you continue to receive paper copies of your shareholder reports. If you invest directly with the Fund, you can call 888-PRO-FNDS (888-776-3637) or send an email request to info@profunds.com to let the Fund know you wish to continue receiving paper copies of your shareholder reports.Your election to receive reports in paper will apply to all funds held in your account if you invest through your financial intermediary or all funds held with the fund complex if you invest directly with the Fund.
Table of Contents
| 1 | | Message from the Chairman | |
| 3 | | Fund Performance, Allocation of Portfolio Holdings and Expense Examples | |
| 7 | | Financial Statements and Financial Highlights | |
| 11 | | Notes to Financial Statements | |
| 16 | | Report of Independent Registered Public Accounting Firm | |
| 17 | | Board Approval of Investment Advisory Agreement | |
| 18 | | Trustees and Officers | |
| 19 | | Government Cash Management Portfolio | |
Receive investor materials electronically:
Shareholders may sign up for electronic delivery of investor materials. By doing so, you will receive the information faster and help us reduce the impact on the environment of providing these materials. To enroll in electronic delivery,
| 1. | Go to www.icsdelivery.com |
| 2. | Select the first letter of your brokerage firm's name. |
| 3. | From the list that follows, select your brokerage firm. If your brokerage firm is not listed, electronic delivery may not be available. Please contact your brokerage firm. |
| 4. | Complete the information requested, including the e-mail address where you would like to receive notifications for electronic documents. |
Your information will be kept confidential and will not be used for any purpose other than electronic delivery. If you change your mind, you can cancel electronic delivery at any time and revert to physical delivery of your materials. Just go to www.icsdelivery.com, perform the first three steps above, and follow the instructions for cancelling electronic delivery. If you have any questions, please contact your brokerage firm.
This Page Intentionally Left Blank

Message from the Chairman
Dear Shareholder:
As communities and economies around the world address the continuously evolving impacts of the pandemic, I would like to reaffirm ProFunds' commitment to providing you, our investors, with products and services to help you meet your investment objectives. ProFunds remains focused on ensuring the effective management of our funds for investors, so I am pleased to provide you with this Government Money Market ProFund annual report to shareholders for the 12 months ending December 31, 2021.
The Government Money Market ProFund invests substantially all of its assets in the Government Cash Management Portfolio, a separate investment company managed by DWS Investment Management Americas, Inc.
Money market rates moved in a range of 0.0% to 0.1% during the period, closely tracking the effective Federal Funds rate, which ended the period at 0.1%.
A Surge in Inflation and Robust Labor Markets Dominated Headlines
The U.S. economy grew at a robust pace during the first half of the reporting period as a result of strong corporate earnings, Congress's $1.9 trillion coronavirus stimulus package, the lifting of restrictions on most businesses as cases of COVID-19 declined, and significant progress on administering vaccines. The third quarter saw real GDP grow by 2.3%, annualized, and fourth quarter advance estimates show 6.9% growth. During the fourth quarter, uncertainty increased due to inflation concerns, higher interest rates, ongoing supply chain challenges, and the emergence of Omicron – a new COVID-19 variant – in late November.
Nevertheless, unemployment continued to decline in 2021, according to the U.S. Bureau of Labor Statistics, closing December at 3.9% – the lowest since February 2020 – with the economy adding 199,000 new jobs.
Inflation was worrisome, especially later in the year, as it rose to the highest rate in nearly 40 years. Prices for many consumer goods, such as housing, food, gasoline, and new and used vehicles, rose significantly as the economy emerged from the pandemic. In fact, from December 2020 to December 2021, consumer prices for all items rose 7.0%, the largest percent change since 1981, according to the Bureau of Labor Statistics. In an effort to reduce gas prices, President Biden announced in November that he would authorize releasing 50 million barrels of petroleum from the U.S. oil reserves (an action similar to those taken by other countries) to increase supply and hopefully reduce prices. The U.S. Federal Reserve Bank slashed interest rates to near zero after the coronavirus pandemic began and pledged not to raise rates until the labor market had recovered. In its last meeting in December, the Fed decided not to raise interest rates and the federal funds rate was kept in a range of 0 to 0.25%. However, the Fed announced that it would increase the speed of tapering its stimulus of monthly bond purchases. The Fed now plans to eliminate the emergency quantitative easing program a few months earlier than previously expected in response to the significant spike in inflation and the robust labor market.
Government Money Market ProFund
During this period characterized by low interest rates, the Government Money Market ProFund continued to achieve its objective of maintaining a stable net asset value of
$1.00 per share for investors. The fund potentially benefits investors by seeking a higher level of current income consistent with liquidity and capital preservation. It also serves investors as a vehicle for moving money between ProFunds products or for holding assets until they are ready to invest.
We thank you for the trust and confidence you have placed in us by using the Government Money Market ProFund, and we appreciate the opportunity to continue serving your investing needs.
Sincerely,

Michael L. Sapir
Chairman of the Board of Trustees
Fund Performance, Allocation of Portfolio Holdings and Expense Examples
4 :: Government Money Market ProFund :: Fund Performance
The Government Money Market ProFund seeks, as its investment objective, a high level of current income consistent with liquidity and preservation of capital. The seven-day yield, as of December 31, 2021, was 0.02% for the Investor Class and 0.02% for the Service Class.
The assets of the Fund are part of a $33.6 billion portfolio managed by DWS Investment Management Americas, Inc. Its managers seek to maintain a stable net asset value of $1.00, however there is no assurance that they will be able to do so.
An investment in this Fund is neither guaranteed nor insured by the Federal Deposit Insurance Corporation or any other government agency. Although the ProFund strives to maintain the value of your investment at $1.00 per share, it is possible to lose money by investing in this Fund.
Past performance is not predictive of future results. The performance data quoted represents past performance and current returns may be lower or higher. Yield will vary and principal value may fluctuate so that the investor's shares, when redeemed, may be worth more or less than the original cost. The performance above reflects any fee reductions during the applicable periods. If such fee reductions had not occurred, the quoted performance would be lower. To obtain performance information current to the most recent month end, please visit ProFunds.com.
The above information is not covered by the Report of the Independent Registered Public Accounting Firm.
Allocation of Portfolio Holdings and Expense Examples :: Government Money Market ProFund :: 5
Investment Objective: The Government Money Market ProFund seeks a high level of current income consistent with liquidity and preservation of capital.
An investment in this ProFund is neither guaranteed nor insured by the Federal Deposit Insurance Corporation or any other government agency. Although the ProFund strives to maintain the value of your investment at $1.00 per share, it is possible to lose money by investing in the ProFund.
Allocation of Portfolio Holdings
Government Money Market ProFund Market Exposure
| Investment Type | | % of
Net Assets | |
| Investment in Government Cash Management Portfolio(a) | | | 95 | % |
| Total Exposure | | | 95 | % |
| (a) | The Government Cash Management Portfolio holdings are included in the accompanying financial statements of the Portfolio. |
Government Cash Management Portfolio Asset Allocation(a)
| Investment Type | | % of
Net Assets | |
| Government & Agency Obligations | | | | |
| U.S. Government Sponsored Agencies | | | 22 | % |
| U.S. Treasury Obligations | | | 38 | % |
| Repurchase Agreements | | | 40 | % |
Expense Examples
As a ProFund shareholder, you may incur two types of costs: (1) transaction costs, including wire redemption fees; and (2) ongoing costs, including management fees; distribution and service (12b-1) fees; and other ProFund expenses (including expenses allocated from the Government Cash Management Portfolio). These examples are intended to help you understand your ongoing costs (in dollars) of investing in the ProFund and to compare these costs with the ongoing cost of investing in other mutual funds. Please note that the expenses shown in the table below are meant to highlight your ongoing costs only and do not reflect any transactional costs. If these transactional costs were included, your costs would have been higher. Therefore, these examples are useful in comparing ongoing costs only and will not help you determine the relative total cost of owning different funds.
Actual Expenses
The actual expense examples are based on an investment of $1,000 invested at the beginning of a six-month period and held throughout the period ended December 31, 2021.
The columns below under the heading entitled "Actual" provide information about actual account values and actual expenses. You may use this information, together with the amount you invested, to estimate the expenses that you paid over the period. Simply divide your account value by $1,000 (for example, an $8,600 account value divided by $1,000 = 8.6), then multiply the result by the number in the table under the heading entitled "Actual Expenses Paid During Period" to estimate the expenses you paid on your account during this period.
Hypothetical Expenses for Comparison Purposes
The hypothetical expense examples are based on an investment of $1,000 invested at the beginning of a six-month period and held throughout the period ended December 31, 2021.
The columns below under the heading entitled "Hypothetical" provide information about hypothetical account values and hypothetical expenses based on the ProFund's actual expense ratio and an assumed rate of return of 5% per year before expenses, which is not the ProFund's actual return. The hypothetical account values and expenses may not be used to estimate the actual ending account balance or expenses you paid for the period. You may use this information to compare the ongoing costs of investing in the ProFund and other funds. To do so, compare this 5% hypothetical example with the 5% hypothetical examples that appear in the shareholder reports of the other funds.
| | | | | Actual | | Hypothetical
(5% return before expense) | |
| | | Annualized
Expense Ratio
During Period | | Beginning
Account Value
7/1/21 | | Ending
Account Value
12/31/21 | | Expenses
Paid During
Period* | | Ending
Account Value
12/31/21 | | Expenses
Paid During
Period* | |
| Government Money Market ProFund – Investor Class | | 0.04 | % | $ | 1,000.00 | | $ | 1,000.10 | | $ | 0.20 | | $ | 1,025.00 | | $ | 0.20 | |
| Government Money Market ProFund – Service Class | | 0.04 | % | | 1,000.00 | | | 1,000.10 | | | 0.20 | | | 1,025.00 | | | 0.20 | |
| * | Expenses are equal to the average account value over the period multiplied by the ProFund's annualized expense ratio multiplied by 184/365 (the number of days in the most recent fiscal half-year divided by the number of days in the fiscal year). |
The above information is not covered by the Report of the Independent Registered Public Accounting Firm.
This Page Intentionally Left Blank
Financial Statements and Financial Highlights
8 :: Government Money Market ProFund :: Financial Statements
Statement of Assets and Liabilities
December 31, 2021
| ASSETS: |
| Investment in Government Cash Management Portfolio, at value | | $ | 193,891,588 | |
| Receivable for capital shares issued | | | 34,086,706 | |
| Receivable from Advisor under a yield support agreement | | | 16,948 | |
| Prepaid expenses | | | 27,235 | |
| TOTAL ASSETS | | | 228,022,477 | |
| LIABILITIES: | | | | |
| Distributions payable | | | 177 | |
| Payable for capital shares redeemed | | | 24,636,677 | |
| Administration fees payable | | | 4,807 | |
| Transfer agency fees payable | | | 35,821 | |
| Compliance services fees payable | | | 912 | |
| Service fees payable | | | 766 | |
| Other accrued expenses | | | 113,598 | |
| TOTAL LIABILITIES | | | 24,792,758 | |
| NET ASSETS | | $ | 203,229,719 | |
| NET ASSETS CONSIST OF: | | | | |
| Capital | | $ | 203,229,814 | |
| Total distributable earnings (loss) | | | (95 | ) |
| NET ASSETS | | $ | 203,229,719 | |
| INVESTOR CLASS: | | | | |
| Net Assets | | $ | 194,081,714 | |
| Shares of Beneficial Interest Outstanding (unlimited number of shares authorized, no par value) | | | 194,080,208 | |
| Net Asset Value (offering and redemption price per share) | | $ | 1.00 | |
| SERVICE CLASS: | | | | |
| Net Assets | | $ | 9,148,005 | |
| Shares of Beneficial Interest Outstanding (unlimited number of shares authorized, no par value) | | | 9,147,930 | |
| Net Asset Value (offering and redemption price per share) | | $ | 1.00 | |
Statement of Operations
For the Year Ended December 31, 2021
| INVESTMENT INCOME: | | | |
| Interest | | $ | 130,237 | (a) |
| Expenses | | | (58,098 | )(a)(b) |
| TOTAL INVESTMENT INCOME | | | 72,139 | |
| EXPENSES: | | | | |
| Management services fees | | | 756,762 | |
| Administration fees | | | 56,084 | |
| Transfer agency fees | | | 222,287 | |
| Administrative services fees | | | 177,124 | |
| Registration and filing fees | | | 57,729 | |
| Fund accounting fees | | | 10,000 | |
| Trustee fees | | | 3,563 | |
| Compliance services fees | | | 1,590 | |
| Service fees | | | 9,413 | |
| Audit fees | | | 103,900 | |
| Other fees | | | 66,283 | |
| Total Gross Expenses before reductions | | | 1,464,735 | |
| Less Expenses reduced by the Advisor | | | (1,440,469 | ) |
| TOTAL NET EXPENSES | | | 24,266 | |
| NET INVESTMENT INCOME | | | 47,873 | |
| REALIZED GAINS (LOSSES) ON INVESTMENTS: | | | | |
| Net realized gains (losses) on investment securities | | | 3,219 | (a) |
| CHANGE IN NET ASSETS RESULTING FROM OPERATIONS | | $ | 51,092 | |
| (a) | Allocated from Government Cash Management Portfolio. |
| (b) | For the year ended December 31, 2021, the Advisor to the Government Cash Management Portfolio waived fees, of which $234,281 was allocated to the Government Money Market ProFund on a pro-rated basis. |
See accompanying notes to the financial statements.
Financial Statements :: Government Money Market ProFund :: 9
Statements of Changes in Net Assets
| | | Year Ended
December 31, 2021 | | | Year Ended
December 31, 2020 | |
| FROM INVESTMENT ACTIVITIES: | | | | | | | | |
| OPERATIONS: | | | | | | | | |
| Net investment income | | $ | 47,873 | | | $ | 352,353 | |
| Net realized gains (losses) on investments | | | 3,219 | | | | 2,327 | |
| Change in net assets resulting from operations | | | 51,092 | | | | 354,680 | |
| DISTRIBUTIONS TO SHAREHOLDERS: | | | | | | | | |
| Total Distributions | | | | | | | | |
| Investor Class | | | (44,300 | ) | | | (350,025 | ) |
| Service Class | | | (2,023 | ) | | | (2,320 | ) |
| Change in net assets resulting from distributions | | | (46,323 | ) | | | (352,345 | ) |
| CAPITAL TRANSACTIONS: | | | | | | | | |
| Proceeds from shares issued | | | | | | | | |
| Investor Class | | | 3,633,566,774 | | | | 4,492,277,770 | |
| Service Class | | | 61,280,585 | | | | 94,151,558 | |
| Distributions reinvested | | | | | | | | |
| Investor Class | | | 39,632 | | | | 336,839 | |
| Service Class | | | 1,876 | | | | 2,320 | |
| Value of shares redeemed | | | | | | | | |
| Investor Class | | | (3,663,943,541 | ) | | | (4,545,935,226 | ) |
| Service Class | | | (61,771,682 | ) | | | (92,953,045 | ) |
| Change in net assets resulting from capital transactions | | | (30,826,356 | ) | | | (52,119,784 | ) |
| Change in net assets | | | (30,821,587 | ) | | | (52,117,449 | ) |
| NET ASSETS: | | | | | | | | |
| Beginning of period | | | 234,051,306 | | | | 286,168,755 | |
| End of period | | $ | 203,229,719 | | | $ | 234,051,306 | |
| SHARE TRANSACTIONS: | | | | | | | | |
| Issued | | | | | | | | |
| Investor Class | | | 3,633,566,774 | | | | 4,492,275,851 | |
| Service Class | | | 61,280,585 | | | | 94,151,558 | |
| Reinvested | | | | | | | | |
| Investor Class | | | 39,632 | | | | 336,839 | |
| Service Class | | | 1,876 | | | | 2,320 | |
| Redeemed | | | | | | | | |
| Investor Class | | | (3,663,943,541 | ) | | | (4,545,935,226 | ) |
| Service Class | | | (61,771,682 | ) | | | (92,953,045 | ) |
| Change in shares | | | (30,826,356 | ) | | | (52,121,703 | ) |
See accompanying notes to the financial statements.
10 :: Government Money Market ProFund :: Financial Highlights
ProFunds Financial Highlights FOR THE PERIODS INDICATED
Selected data for a share of beneficial interest outstanding throughout the periods indicated.
| | | | | | Investment Activities | | | Distributions to Shareholders From | |
| | | Net Asset
Value,
Beginning
of Period | | | Net
Investment
Income(a)(b) | | | Net Realized
Gains
(Losses) on
Investments(b) | | | Total from
Investment
Activities | | | Net
Investment
Income | | | Net
Realized
Gains on
Investments | | | Total
Distributions | |
| Government Money Market ProFund | | | | | | | | | | | | | | | | | | | | | | | | | | | | |
| Investor Class | | | | | | | | | | | | | | | | | | | | | | | | | | | | |
| Year Ended December 31, 2021 | | $ | 1.000 | | | | — | (d) | | | — | (d) | | | — | (d) | | | — | (d) | | | — | | | | — | (d) |
| Year Ended December 31, 2020 | | $ | 1.000 | | | | 0.001 | | | | — | (d) | | | 0.001 | | | | (0.001 | ) | | | — | | | | (0.001 | ) |
| Year Ended December 31, 2019 | | $ | 1.000 | | | | 0.013 | | | | — | (d) | | | 0.013 | | | | (0.013 | ) | | | — | | | | (0.013 | ) |
| Year Ended December 31, 2018 | | $ | 1.000 | | | | 0.009 | | | | — | (d) | | | 0.009 | | | | (0.009 | ) | | | — | (d) | | | (0.009 | ) |
| Year Ended December 31, 2017 | | $ | 1.000 | | | | — | (d) | | | — | (d) | | | — | (d) | | | — | (d) | | | — | | | | — | (d) |
| Service Class | | | | | | | | | | | | | | | | | | | | | | | | | | | | |
| Year Ended December 31, 2021 | | $ | 1.000 | | | | — | (d) | | | — | (d) | | | — | (d) | | | — | (d) | | | — | | | | — | (d) |
| Year Ended December 31, 2020 | | $ | 1.000 | | | | — | (d) | | | — | (d) | | | — | (d) | | | — | (d) | | | — | | | | — | (d) |
| Year Ended December 31, 2019 | | $ | 1.000 | | | | 0.003 | | | | — | (d) | | | 0.003 | | | | (0.003 | ) | | | — | | | | (0.003 | ) |
| Year Ended December 31, 2018 | | $ | 1.000 | | | | 0.002 | | | | — | (d) | | | 0.002 | | | | (0.002 | ) | | | — | (d) | | | (0.002 | ) |
| Year Ended December 31, 2017 | | $ | 1.000 | | | | — | (d) | | | — | (d) | | | — | (d) | | | — | (d) | | | — | | | | — | (d) |
| | | | | | | Ratios to Average Net Assets | | | Supplemental Data | |
Net Asset
Value,
End of
Period | | | Total
Return | | | Gross
Expenses(b)(c) | | | Net
Expenses(b) | | | Net
Investment
Income(b) | | | Net Assets,
End of Period
(000's) | |
| | | | | | | | | | | | | | | | | |
| | | | | | | | | | | | | | | | | |
| $ | 1.000 | | | | 0.02 | % | | | 0.70 | % | | | 0.04 | %(e) | | | 0.02 | % | | $ | 194,082 | |
| $ | 1.000 | | | | 0.14 | % | | | 0.84 | % | | | 0.34 | %(e) | | | 0.14 | % | | $ | 224,414 | |
| $ | 1.000 | | | | 1.25 | % | | | 0.98 | % | | | 0.98 | % | | | 1.26 | % | | $ | 277,733 | |
| $ | 1.000 | | | | 0.86 | % | | | 1.01 | % | | | 1.01 | % | | | 0.87 | % | | $ | 460,210 | |
| $ | 1.000 | | | | 0.02 | % | | | 0.96 | % | | | 0.90 | % | | | 0.02 | % | | $ | 386,955 | |
| | | | | | | | | | | | | | | | | | | | | | | |
| $ | 1.000 | | | | 0.02 | % | | | 0.70 | % | | | 0.04 | %(e) | | | 0.02 | % | | $ | 9,148 | |
| $ | 1.000 | | | | 0.02 | % | | | 1.24 | % | | | 0.41 | %(e) | | | 0.02 | % | | $ | 9,637 | |
| $ | 1.000 | | | | 0.31 | % | | | 1.98 | % | | | 1.98 | % | | | 0.32 | % | | $ | 8,436 | |
| $ | 1.000 | | | | 0.20 | % | | | 1.64 | % | | | 1.64 | % | | | 0.20 | % | | $ | 14,517 | |
| $ | 1.000 | | | | 0.02 | % | | | 0.96 | % | | | 0.90 | % | | | 0.02 | % | | $ | 13,037 | |
| (a) | Per share net investment income has been calculated using the average daily shares method. |
| (b) | Per share amounts and percentages include the applicable allocation from the Government Cash Management Portfolio. |
| (c) | For the periods ended December 31, 2021, December 31, 2020, December 31, 2019, December 31, 2018, and December 31, 2017, the Advisor to the Government Cash Management Portfolio waived fees which were allocated to the Government Money Market ProFund on a pro-rata basis. If included, the corresponding impact to the gross expense ratio would be an increase of 0.11%, 0.06%, 0.07%, 0.04%, and 0.03%, respectively. |
| (d) | Amount is less than $0.0005. |
| (e) | The expense ratio for the period reflects the deduction of certain expenses to maintain a certain minimum net yield. |
See accompanying notes to the financial statements.
Notes to Financial Statements
12 :: Government Money Market ProFund :: Notes to Financial Statements :: December 31, 2021
1. Organization
ProFunds (the "Trust") consists of 116 separate investment portfolios and is registered as an open-end management investment company under the Investment Company Act of 1940 (the "1940 Act") and thus follows accounting and reporting guidance for investment companies. On December 10, 2020, the Trust's Board of Trustees approved an agreement and plan of reorganization and termination pursuant to which Access One Trust would reorganize into a corresponding newly created series within ProFunds (an affiliated trust). That transaction occurred on April 26, 2021. The Trust is organized as a Delaware statutory trust and is authorized to issue an unlimited number of shares of beneficial interest of no par value which may be issued in more than one class or series. The accompanying financial statements relate to the Government Money Market ProFund, (the "ProFund"). The ProFund has two classes of shares: the Investor Class and Service Class. The ProFund is a feeder fund in a master-feeder fund structure and seeks to achieve its objective by investing all of its investable assets in the Government Cash Management Portfolio (the "Portfolio"), an open-end management investment company that is advised by DWS Investment Management Americas, Inc. ("DIMA") and has the same investment objective as the ProFund. As of December 31, 2021, the percentage of the Portfolio's interests owned by the ProFund was 0.6%. The financial statements of the Portfolio, including its schedule of portfolio investments, are included in this report and should be read in conjunction with the ProFund's financial statements.
Each class of shares has identical rights and privileges except with respect to fees paid under the Distribution and Shareholder Services Plan and voting rights on matters affecting a single class of shares.
Under the Trust's organizational documents, its Officers and Trustees are indemnified against certain liabilities arising out of the performance of their duties to the Trust. In addition, in the normal course of business, the Trust enters into contracts with its vendors and others that provide for general indemnifications. The Trust and ProFund's maximum exposure under these arrangements is unknown as this would involve future claims that may be made against the ProFund.
2. Significant Accounting Policies
The following is a summary of significant accounting policies followed by the ProFund in preparation of its financial statements. These policies are in conformity with U.S. generally accepted accounting principles ("GAAP"). The preparation of financial statements in accordance with GAAP requires management to make estimates and assumptions that affect the reported amounts of assets and liabilities and disclosure of contingent assets and liabilities at the date of the financial statements and the reported amounts of income and expenses during the reporting period. The actual results could differ from those estimates.
Investment Valuation
The ProFund records its investments in the Portfolio at fair value, which represents its proportionate ownership of the value of the Portfolio's net assets. The valuation techniques used to determine fair value are further described in Note 3. The Portfolio's Notes to Financial Statements included elsewhere in this report provide information about the Portfolio's valuation policy and its period-end security valuations.
Investment Transactions and Related Income
The ProFund records daily its proportionate share of the Portfolio's income, expenses, and realized gains and losses. In addition, the ProFund accrues its own expenses.
Allocations
Expenses directly attributable to the ProFund are charged to the ProFund, while expenses which are attributable to more than one fund in the Trust, or jointly with an affiliate, are allocated among the respective funds in the Trust and/or affiliate based upon relative net assets or another reasonable basis.
The investment income, expenses (other than class specific expenses charged to a class) and realized gains and losses on investments of the ProFund are allocated to each class of shares based upon relative net assets on the date income is earned or expenses and realized gains and losses are incurred.
Distributions to Shareholders
The ProFund declares distributions from net investment income daily and pays the dividends on a monthly basis. Net realized capital gains, if any, will be distributed annually.
The amount of distributions from net investment income and net realized gains are determined in accordance with federal income tax regulations which may differ from GAAP. These "book/tax" differences are either considered temporary or permanent in nature. To the extent these differences are permanent in nature (e.g., return of capital, distribution reclassification), such amounts are reclassified within the composition of net assets based on their federal tax-basis treatment; temporary differences do not require reclassification.
Federal Income Taxes
The ProFund intends to continue to qualify each year as a regulated investment company (a "RIC") under Subchapter M of the Internal Revenue Code of 1986, as amended. A RIC generally is not subject to federal income tax on income and gains distributed in a timely manner to its shareholders. The ProFund intends to make timely distributions in order to avoid tax liability. Accordingly, no provision for federal income taxes is required in the financial statements. The ProFund has a calendar tax year end.
Management of the ProFund has reviewed tax positions taken in tax years that remain subject to examination by all major tax jurisdictions, including federal (i.e., the last four tax year ends and the interim tax period since then, as applicable). Management believes that there is no tax liability resulting from unrecognized tax benefits related to uncertain tax positions taken and the ProFund is not aware of any tax positions for which it is reasonably possible that the total amounts of unrecognized tax benefits will significantly change in the next twelve months.
3. Investment Valuation Summary
The valuation techniques employed by the ProFund, described below, maximize the use of observable inputs and minimize the
December 31, 2021 :: Notes to Financial Statements :: Government Money Market ProFund :: 13
use of unobservable inputs in determining fair value. The inputs used for valuing the ProFund's investments are summarized in the three broad levels listed below:
• Level 1 – quoted prices in active markets for identical assets
• Level 2 – other significant observable inputs (including quoted prices for similar securities, interest rates, prepayments speeds, credit risk, etc.)
• Level 3 – significant unobservable inputs (including the ProFund's own assumptions in determining the fair value of investments)
The inputs or methodology used for valuing investments are not necessarily an indication of the risk associated with investing in those investments. Changes in valuation techniques may result in transfers in or out of an assigned level within the disclosure hierarchy.
As of December 31, 2021, the ProFund's $193,891,588 investment in the Portfolio, which is a registered investment company, is based on Level 2 inputs due to the ProFund's master-feeder structure. There were no Level 1 or Level 3 investments held by the ProFund during the year ended December 31, 2021.
4. Fees and Transactions with Affiliates and Other Parties
ProFund Advisors LLC (the "Advisor") serves as the investment advisor of the ProFund for an annual fee equal to 0.35% of the average daily net assets of the ProFund, although no fee is payable under the agreement unless the master-feeder relationship with the Portfolio is terminated and the Advisor directly invests the assets of the ProFund. DIMA is the investment advisor to the Portfolio in which the ProFund invests its assets.
Citi Fund Services Ohio, Inc. ("Citi") acts as the Trust's administrator (the "Administrator"). For its services as Administrator, the Trust pays Citi an annual fee based on the Trust's aggregate average net assets at an annualized tier rate ranging from 0.00375% to 0.05%, and a base fee for certain filings. Administration fees include additional fees paid to Citi by the Trust for additional services provided, including support of the Trust's compliance program.
FIS Investor Services LLC ("FIS") acts as the Trust's transfer agent. For these services, the Trust pays FIS a base fee, account and service charges, and reimbursement of certain expenses.
ProFunds Distributors, Inc. (the "Distributor"), a wholly owned subsidiary of the Advisor, serves as the Trust's distributor. Under a Distribution and Shareholder Services Plan, adopted by the Trust's Board of Trustees pursuant to Rule 12b-1 under the 1940 Act, the ProFund may pay financial intermediaries such as broker-dealers, investment advisors and the Distributor up to 1.00%, on an annualized basis, of the average daily net assets attributable to Service Class shares as compensation for service and distribution-related activities and/or shareholder services with respect to Service Class shares.
The Distribution and Service Fees were suspended effective January 1, 2021 throughout the remainder of the year ended December 31, 2021. If the ProFund had paid an amount equal to 1.00% of the average daily net assets attributable to Service Class shares for the entire period, the Distribution and Service Fees would have been $93,885 for the year ended December 31, 2021. All or a portion of the Distribution and Services Fees may be reinstated at any time.
The Advisor, pursuant to a separate Management Services Agreement, performs certain client support services and other administrative services on behalf of the ProFund. For these services, the ProFund pays the Advisor a fee at the annual rate of 0.35% of its average daily net assets for providing feeder fund management and administrative services to the ProFund.
The Advisor, pursuant to a separate Services Agreement, performs certain services related to the operation and maintenance of a shareholder trading platform. For these services, the Trust pays the Advisor a monthly base fee as reflected on the Statement of Operations as "Service fees".
The ProFund pays fees to certain intermediaries or financial institutions for record keeping, sub-accounting services, transfer agency and other administrative services as reflected on the Statement of Operations as "Administrative services fees".
Certain Officers and a Trustee of the Trust are affiliated with the Advisor or the Administrator. Except as noted below with respect to the Trust's Chief Compliance Officer, such Officers and Trustee receive no compensation from the ProFund for serving in their respective roles. The Trust, together with affiliated Trusts, pays each Independent Trustee compensation for his services at the annual rate of $185,000. Independent Trustees also receive $10,000 for attending each regular quarterly in-person meeting, $3,000 for attending each special in-person meeting and $3,000 for attending each telephonic meeting. Effective July 1, 2021, Independent Trustee compensation increased to an annual rate of $325,000 per Trustee, inclusive of all meetings. During the year ended December 31, 2021, actual Trustee compensation was $834,000 in aggregate from the Trust and affiliated trusts. There are certain employees of the Advisor, such as the Trust's Chief Compliance Officer and staff who administer the Trust's compliance program, in which the ProFund reimburses the Advisor for their related compensation and certain other expenses incurred as reflected on the Statement of Operations as "Compliance services fees".
The Advisor has contractually agreed to waive management services fees, and if necessary, reimburse certain other expenses of the ProFund for the periods below in order to limit the annual operating expenses (exclusive of brokerage costs, interest, taxes, litigation, indemnification, and extraordinary expenses) as follows:
| | | For the Period May 1, 2021
through April 30, 2022 | | | For the Period May 1, 2020
through April 30, 2021 | |
| | | Investor Class | | | Service Class | | | Investor Class | | | Service Class | |
| Government Money Market ProFund | | | 0.98 | % | | | 1.98 | % | | | 0.98 | % | | | 1.98 | % |
14 :: Government Money Market ProFund :: Notes to Financial Statements :: December 31, 2021
The Advisor has also contractually agreed to waive management services fees, and if necessary, reimburse certain other expenses of the ProFund through April 30, 2022 to the extent necessary to maintain a certain minimum net yield as determined by the Advisor. The Advisor has contractually undertaken to waive its fees and/or reimburse certain expenses to maintain the minimum yield floor limit at 0.02% through April 30, 2022.
The Advisor may recoup the management services fees contractually waived or limited and other expenses reimbursed by it within three years from the expense limit period and minimum yield limit period in which they were taken. Such recoupment shall be made monthly, but only to the extent that such recoupment would not cause the net yield of each Class of the ProFund to fall below the highest previously determined minimum yield and such recoupment would not cause annualized operating expenses to exceed the expense limit in effect at the time of the waiver, and the expense limit in effect at the time of the recoupment. Any amounts recouped by the Advisor during the period are reflected on the Statement of Operations as "Recoupment of prior expenses reduced by the Advisor". As of December 31, 2021, the recoupments that may potentially be made by the ProFund are as follows:
| | | Expires
4/30/23 | | | Expires
4/30/24 | | | Expires
4/30/25 | | | Total | |
| Government Money Market ProFund | | $ | 204,782 | | | $ | 1,712,162 | | | $ | 837,631 | | | $ | 2,754,575 | |
5. Investment Risks
The Fund may be subject to other risks in addition to these identified risks. This section discusses certain common principal risks encountered by the Fund. The risks are presented in an order intended to facilitate readability, and their order does not imply that the realization of one risk is likely to occur more frequently than another risk, nor does it imply that the realization of one risk is likely to have a greater adverse impact than another risk.
Natural Disaster/Epidemic Risk
Natural or environmental disasters, such as earthquakes, fires, floods, hurricanes, tsunamis and other severe weather-related phenomena generally, and widespread disease, including pandemics and epidemics (for example, the novel coronavirus (COVID-19)), have been and can be highly disruptive to economies and markets and have recently led, and may continue to lead, to increased market volatility and significant market losses. Such as natural disaster and health crises could exacerbate political, social, and economic risks previously mentioned, and result in significant breakdowns, delays, shutdowns, social isolation, and other disruptions to important global, local and regional supply chains affected, with potential corresponding results on the operating performance of the Fund and its investments. A climate of uncertainty and panic, including the contagion of infectious viruses or diseases, may adversely affect global, regional, and local economies and reduce the availability of potential investment opportunities, and increases the difficulty of performing due diligence and modeling market conditions, potentially reducing the accuracy of financial projections. Under these circumstances, the Fund may have difficulty achieving its investment objective which may adversely impact performance. Further, such events can be highly disruptive to economies and markets, significantly disrupt the operations of individual companies (including, but not limited to, the Fund's investment advisor and third party service providers), sectors, industries, markets, securities and commodity exchanges, currencies, interest and inflation rates, credit ratings, investor sentiment, and other factors affecting the value of the Fund's investments. These factors can cause substantial market volatility, exchange trading suspensions and closures and can impact the ability of the Fund to complete redemptions and otherwise affect Fund performance and Fund trading in the secondary market. A widespread crisis may also affect the global economy in ways that cannot necessarily be foreseen at the current time. How long such events will last and whether they will continue or recur cannot be predicted. Impacts from these events could have significant impact on the Fund's performance, resulting in losses to your investment.
Risk that Current Assumptions and Expectations Could Become Outdated As a Result of Global Economic Shocks
The onset of the novel coronavirus (COVID-19) has caused significant shocks to global financial markets and economies, with many governments taking extreme actions to slow and contain the spread of COVID-19. These actions have had, and likely will continue to have, a severe economic impact on global economies as economic activity in some instances has essentially ceased. Financial markets across the globe are experiencing severe distress at least equal to what was experienced during the global financial crisis in 2008. In March 2020, U.S. equity markets entered a bear market in the fastest such move in the history of U.S. financial markets. During much of 2020, the unemployment rate in the U.S. was extremely high by historical standards. It is not possible to predict when unemployment and market conditions will return to more normal levels. The global economic shocks being experienced as of the date hereof may cause the underlying assumptions and expectations of the Fund to quickly become outdated or inaccurate, resulting in significant losses.
December 31, 2021 :: Notes to Financial Statements :: Government Money Market ProFund :: 15
6. Federal Income Tax Information
The tax character of dividends paid to shareholders during the applicable tax years ended, as noted below, were as follows:
| | | Ordinary
Income | | | Total
Distributions
Paid | |
| December 31, 2021 | | | | | | | | |
| Government Money Market ProFund | | $ | 47,673 | | | $ | 47,673 | |
| December 31, 2020 | | | | | | | | |
| Government Money Market ProFund | | $ | 352,353 | | | $ | 352,353 | |
As of the most recent tax year ended December 31, 2021, the components of accumulated earnings (deficit) on a tax basis were as follows:
| | | Undistributed
Ordinary
Income | | | Undistributed
Long-Term
Capital Gains | | | Distributions
Payable | | | Accumulated
Capital and
Other Losses | | | Total
Unrealized
Appreciation
(Depreciation) | | | Accumulated
Earnings
(Deficit) | |
| Government Money Market ProFund | | $ | 200 | | | $ | — | | | $ | — | | | $ | (295 | ) | | $ | — | | | $ | (95 | ) |
As of the tax year ended December 31, 2021, the ProFund had net capital loss carryforwards ("CLCFs") as summarized in the table below:
| | | No Expiration Date | |
| Government Money Market ProFund | | $ | 295 | |
Unused limitations accumulate and increase limited CLCFs available for use in offsetting net capital gains. The Board does not intend to authorize a distribution of any realized gain for the ProFund until any applicable CLCF has been offset or utilized.
7. Subsequent Events
The ProFund has evaluated the need for additional disclosures or adjustments resulting from subsequent events through the date these financial statements were issued. Based on this evaluation, there were no subsequent events to report that have a material impact on the ProFund's financial statements.
16 :: Government Money Market ProFund :: Report of Independent Registered Public Accounting Firm
To the Board of Trustees of ProFunds and Shareholders of Government Money Market ProFund
Opinion on the Financial Statements
We have audited the accompanying statement of assets and liabilities of Government Money Market ProFund (one of the funds constituting ProFunds, referred to hereafter as the "Fund") as of December 31, 2021, the related statement of operations for the year ended December 31, 2021, the statement of changes in net assets for each of the two years in the period ended December 31, 2021, including the related notes, and the financial highlights for each of the five years in the period ended December 31, 2021 (collectively referred to as the "financial statements"). In our opinion, the financial statements present fairly, in all material respects, the financial position of the Fund as of December 31, 2021, the results of its operations for the year then ended, the changes in its net assets for each of the two years in the period ended December 31, 2021 and the financial highlights for each of the five years in the period ended December 31, 2021 in conformity with accounting principles generally accepted in the United States of America.
Basis for Opinion
These financial statements are the responsibility of the Fund's management. Our responsibility is to express an opinion on the Fund's financial statements based on our audits. We are a public accounting firm registered with the Public Company Accounting Oversight Board (United States) (PCAOB) and are required to be independent with respect to the Fund in accordance with the U.S. federal securities laws and the applicable rules and regulations of the Securities and Exchange Commission and the PCAOB.
We conducted our audits of these financial statements in accordance with the standards of the PCAOB. Those standards require that we plan and perform the audit to obtain reasonable assurance about whether the financial statements are free of material misstatement, whether due to error or fraud.
Our audits included performing procedures to assess the risks of material misstatement of the financial statements, whether due to error or fraud, and performing procedures that respond to those risks. Such procedures included examining, on a test basis, evidence regarding the amounts and disclosures in the financial statements. Our audits also included evaluating the accounting principles used and significant estimates made by management, as well as evaluating the overall presentation of the financial statements. Our procedures included confirmation of securities owned as of December 31, 2021 by correspondence with the Accounting Agent for the Master Fund. We believe that our audits provide a reasonable basis for our opinion.
/s/ PricewaterhouseCoopers LLP
Baltimore, Maryland
March 1, 2022
We have served as the auditor of one or more investment companies in ProFunds and ProShares Trust group since 1997.
December 31, 2021 :: Board Approval of Investment Advisory Agreement (unaudited) :: Government Money Market ProFund :: 17
At a meeting held on September 13-14, 2021, the Board of Trustees (the "Board") of ProFunds (the "Trust") considered the annual renewal of the Investment Advisory Agreement (the "Advisory Agreement") between ProFund Advisors LLC (the "Advisor") and the Trust on behalf of the Government Money Market ProFund (the "Fund").
The Board did not identify any particular information that was most relevant to its consideration to approve the continuation of the Advisory Agreement and each Trustee may have afforded different weight to the various factors. The Board received a memorandum from independent legal counsel to the Independent Trustees regarding the Board's fiduciary responsibilities under state and federal law with respect to the Board's considerations of the renewal or approval of investment advisory agreements. The Independent Trustees were advised by their independent legal counsel throughout the process, including about the legal standards applicable to their review.
The Independent Trustees met in executive session to discuss and evaluate the information provided by the Advisor and the independent consultant, as well as that of a separate independent consultant retained to review profitability.
The Board noted that the Fund is a feeder fund that invests all its shares in a master fund that is advised by a third party investment adviser. The Trustees noted that the contractual amount of the fee is 0.35% of the Fund's average annual daily net assets, but that the Advisor does not collect this fee for so long as the Fund is a feeder fund that invests in shares of a master fund. The Board also noted that the Fund pays the Advisor a Management Services fee of 0.35% of the Fund's average annual daily net assets, all of which the Advisor has waived. The Board noted that the Advisor has contractually agreed to reduce Fund expenses to retain a certain minimum floor yield limit as well as to reimburse advisory and management services fees that exceed 0.98% for Investor Class and 1.98% for Service Class through April 30, 2022. In response to a request from the Independent Trustees, the Advisor provided information for the Board to consider relating to the continuation of the Advisory Agreement in light of the structure of the Fund.
The Board considered that the Advisor has the requisite portfolio management skills to manage the Fund if necessary and considered the reasonableness of the fee should the Advisor begin to provide services under the Advisory Agreement. In assessing the reasonableness of the fee, the Board considered the nature of the services described in the Advisory Agreement, and fees charged by comparable money market funds.
In its deliberations, the Board also considered the Advisor's non-advisory services, including those performed under a separate Management Services Agreement. The Board considered any indirect, or "fall-out," benefits that the Advisor or its affiliates derived from their relationship to the Fund but concluded that such benefits were relatively insignificant. The Board considered that ProFund Distributors, Inc. ("PDI"), a wholly-owned subsidiary of the Advisor, earns fees from the Fund for providing services under a Distribution and Shareholder Services Plan.
In addition to the information provided and discussions that occurred at the meeting, the Board regularly considers matters bearing on the Fund and its investment advisory, administration and distribution arrangements including the Fund's investment results and performance data, at their regular meetings throughout the year. The Board's conclusions may take into account their consideration for the relevant arrangements during the course of the year and in prior years.
Based on, but not limited to, the above considerations and determinations, the Board, including all of the Independent Trustees, determined that the Advisory Agreement for the Fund is fair and reasonable in light of the nature, extent and quality of the services to be performed, the fee rates to be paid, the Advisor's expenses, the feeder fund structure of the Fund, and such other matters as the Board considered relevant in the exercise of its business judgement. Accordingly, the Board concluded that the continuation of the Advisory Agreement and the continued investment by the Fund into the master portfolio was in the best interests of the shareholders of the Fund. On this basis, the Board unanimously voted in favor of the renewal of the Advisory Agreement.
18 :: Government Money Market ProFund :: Trustees and Executive Officers (unaudited)
Name, Address,
and Birth Date | | Position(s)
Held with the
Trust | | Term of Office
and Length of
Time Served | | Principal Occupation(s) During Past 5 Years | | Number of
Operational
Portfolios in Fund
Complex Overseen
by Trustee* | | Other
Directorships
Held by
Trustee
During
Past 5 Years |
| | | | | | | | | | | |
| Independent Trustees |
| |
William D. Fertig
c/o ProFunds Trust
7272 Wisconsin Avenue,
21st Floor
Bethesda, MD 20814
Birth Date: 9/56 | | Trustee | | Indefinite; June 2011 to present | | Context Capital Management (Alternative Asset Management): Chief Investment Officer (September 2002 to present). | | ProFunds (116);
ProShares Trust (123) | | Context Capital |
| | | | | | | | | | | |
Russell S. Reynolds, III
c/o ProFunds Trust
7272 Wisconsin Avenue,
21st Floor
Bethesda, MD 20814
Birth Date: 7/57 | | Trustee | | Indefinite; October 1997 to present | | RSR Partners, Inc. (Executive Recruitment and Corporate Governance Consulting): Managing Director (February 1993 to present). | | ProFunds (116);
ProShares Trust (123) | | RSR Partners, Inc. |
| | | | | | | | | | | |
Michael C. Wachs
c/o ProFunds Trust
7272 Wisconsin Avenue,
21st Floor
Bethesda, MD 20814
Birth Date: 10/61 | | Trustee | | Indefinite; October 1997 to present | | Linden Lane Capital Partners LLC (Real Estate Investment and Development): Managing Principal (2010 to present). | | ProFunds (116);
ProShares Trust (123) | | NAIOP (the Commercial Real Estate Development Association) |
| | | | | | | | | | | |
| Interested Trustee |
| |
Michael L. Sapir**
7272 Wisconsin Avenue,
21st Floor
Bethesda, MD 20814
Birth Date: 5/58 | | Trustee and Chairman of the Board | | Indefinite; April 1997 to present | | Chairman and Chief Executive Officer of the Advisor (April 1997 to present); ProShare Advisors LLC (November 2005 to present); ProShare Capital Management LLC (June 2008 to present). | | ProFunds (116);
ProShares Trust (123) | | |
| * | The "Fund Complex" consists of all operational registered investment companies under the 1940 Act that are advised by ProFund Advisors LLC and any operational registered investment companies that have an investment adviser that is an affiliated person of ProFund Advisors LLC. Investment companies that are non-operational (and therefore, not publicly offered) as of the date of this report are excluded from these figures. |
| ** | Mr. Sapir is an "interested person," as defined by the 1940 Act, because of his ownership interest in the Advisor. |
Name, Address,
and Birth Date | | Position(s) Held
with the Trust | | Term of Office and
Length of Time Served | | Principal Occupation(s) During the Past 5 Years |
| | | | | | | |
| Executive Officers |
| |
Todd B. Johnson
7272 Wisconsin Avenue,
21st Floor
Bethesda, MD 20814
Birth Date: 1/64 | | President | | Indefinite; January 2014
to present | | Chief Investment Officer of the Advisor and ProShare Advisors LLC (December 2008 to present); and ProShare Capital Management LLC (February 2009 to present). |
| | | | | | | |
Victor M. Frye, Esq.
7272 Wisconsin Avenue,
21st Floor
Bethesda, MD 20814
Birth Date: 10/58 | | Chief Compliance Officer and Anti-Money
Laundering Officer | | Indefinite; September 2004
to present | | Counsel and Chief Compliance Officer of the Advisor (October 2002 to present) and ProShare Advisors LLC (December 2004 to present); Secretary of ProFunds Distributors, Inc. (April 2008 to present); Chief Compliance Officer of ProFunds Distributors, Inc. (July 2015 to present). |
| | | | | | | |
Richard F. Morris
7272 Wisconsin Avenue,
21st Floor
Bethesda, MD 20814
Birth Date: 8/67 | | Chief Legal Officer and Secretary | | Indefinite; December 2015 to present | | General Counsel of the Advisor, ProShare Advisors, and ProShare Capital Management LLC (December 2015 to present); Chief Legal Officer of ProFunds Distributors, Inc. (December 2015 to present); Partner at Morgan Lewis & Bockius, LLP (October 2012 to November 2015). |
| | | | | | | |
Christopher E. Sabato
4400 Easton Commons,
Suite 200
Columbus, OH 43219
Birth Date: 12/68 | | Treasurer | | Indefinite;
September 2009 to present | | Senior Vice President, Fund Administration, Citi Fund Services Ohio, Inc. (2007 to present) |
The Funds' Statement of Additional Information includes additional information about the Funds' Trustees and Officers. To receive your free copy of the Statement of Additional Information, call toll-free 888-776-3637.
Government Cash Management Portfolio
20 :: Government Cash Management Portfolio :: Investment Portfolio :: as of December 31, 2021
Investment Portfolio
Government & Agency Obligations 60.1%
U.S. Government Sponsored Agencies 22.1%
| | | Principal
Amount | | | Value | |
| Federal Farm Credit Bank: | | | | | | | | |
| SOFR + 0.07%, 0.12%(a), 8/11/2022 | | $ | 152,975,000 | | | $ | 152,979,718 | |
| SOFR + 0.08%, 0.13%(a), 3/10/2022 | | | 70,000,000 | | | | 70,000,000 | |
| Federal Home Loan Bank: | | | | | | | | |
| 0.044%(b), 1/5/2022 | | | 1,335,000,000 | | | | 1,334,993,614 | |
| 0.046%(b), 1/14/2022 | | | 190,000,000 | | | | 189,996,912 | |
| 0.051%(b), 2/2/2022 | | | 25,000,000 | | | | 24,998,939 | |
| SOFR + 0.005%, 0.055%(a), 3/11/2022 | | | 500,000,000 | | | | 500,000,000 | |
| SOFR + 0.005%, 0.055%(a), 3/14/2022 | | | 538,500,000 | | | | 538,500,000 | |
| SOFR + 0.01%, 0.06%(a), 1/13/2022 | | | 235,000,000 | | | | 235,000,000 | |
| SOFR + 0.01%, 0.06%(a), 3/25/2022 | | | 45,000,000 | | | | 45,000,000 | |
| SOFR + 0.01%, 0.06%(a), 8/1/2022 | | | 440,000,000 | | | | 440,000,000 | |
| SOFR + 0.01%, 0.06%(a), 8/15/2022 | | | 175,000,000 | | | | 175,000,000 | |
| SOFR + 0.01%, 0.06%(a), 9/8/2022 | | | 585,000,000 | | | | 585,000,000 | |
| SOFR + 0.01%, 0.06%(a), 9/30/2022 | | | 310,000,000 | | | | 310,000,000 | |
| SOFR + 0.01%, 0.06%(a), 10/7/2022 | | | 578,000,000 | | | | 578,000,000 | |
| SOFR + 0.01%, 0.06%(a), 11/4/2022 | | | 221,500,000 | | | | 221,500,000 | |
| SOFR + 0.015%, 0.065%(a), 4/11/2022 | | | 100,000,000 | | | | 100,000,000 | |
| SOFR + 0.015%, 0.065%(a), 6/23/2022 | | | 350,000,000 | | | | 350,000,000 | |
| 0.071%(b), 5/25/2022 | | | 75,000,000 | | | | 74,979,000 | |
| SOFR + 0.03%, 0.08%(a), 1/13/2023 | | | 360,000,000 | | | | 360,000,000 | |
| 0.13%(b), 6/8/2022 | | | 210,000,000 | | | | 209,882,025 | |
| SOFR + 0.12%, 0.17%(a), 2/28/2022 | | | 150,000,000 | | | | 150,000,000 | |
| Federal Home Loan Mortgage Corp.: | | | | | | | | |
| SOFR + 0.07%, 0.12%(a), 2/25/2022 | | | 450,000,000 | | | | 450,000,000 | |
| SOFR + 0.095%, 0.145%(a), 8/19/2022 | | | 207,000,000 | | | | 207,000,000 | |
| SOFR + 0.19%, 0.24%(a), 6/2/2022 | | | 40,000,000 | | | | 40,000,000 | |
| Federal National Mortgage Association, | | | | | | | | |
| SOFR + 0.30%, 0.35%(a), 1/7/2022 | | | 80,000,000 | | | | 80,000,000 | |
| | | | | | | | 7,422,830,208 | |
| U.S. Treasury Obligations 38.0% | | | | | | | | |
| U.S. Treasury Bills: | | | | | | | | |
| 0.03%(b), 2/10/2022 | | | 15,000,000 | | | | 14,999,500 | |
| 0.041%(b), 1/6/2022 | | | 930,350,000 | | | | 930,344,810 | |
| 0.051%(b), 1/13/2022 | | | 2,340,850,000 | | | | 2,340,810,983 | |
| 0.051%(b), 2/17/2022 | | | 1,000,000,000 | | | | 999,934,720 | |
| 0.051%(b), 3/17/2022 | | | 95,280,000 | | | | 95,270,075 | |
| 0.051%(b), 3/31/2022 | | | 789,000,000 | | | | 788,902,469 | |
| 0.052%(b), 1/6/2022 | | | 22,500,000 | | | | 22,499,854 | |
| 0.056%(b), 1/4/2022 | | | 948,000,000 | | | | 947,995,651 | |
| 0.056%(b), 1/20/2022 | | | 950,000,000 | | | | 949,972,421 | |
| 0.056%(b), 3/3/2022 | | | 565,000,000 | | | | 564,947,343 | |
| 0.056%(b), 3/10/2022 | | | 415,000,000 | | | | 414,956,885 | |
| 0.081%(b), 8/11/2022 | | | 881,250,000 | | | | 880,815,249 | |
| 0.088%(b), 6/2/2022 | | | 10,000,000 | | | | 9,996,327 | |
| 0.107%(b), 6/9/2022 | | | 940,000,000 | | | | 939,564,072 | |
| 0.243%(b), 12/1/2022 | | | 1,180,000,000 | | | | 1,177,372,529 | |
| U.S. Treasury Floating Rate Notes: | | | | | | | | |
| 3-month U.S. Treasury Bill Money Market Yield + 0.055%, 0.14%(a), 7/31/2022 | | | 400,000,000 | | | | 400,121,450 | |
| 3-month U.S. Treasury Bill Money Market Yield + 0.114%, 0.199%(a), 4/30/2022 | | | 1,133,500,000 | | | | 1,133,824,502 | |
| 3-month U.S. Treasury Bill Money Market Yield + 0.154%, 0.239%(a), 1/31/2022 | | | 176,000,000 | | | | 176,021,407 | |
| | | | | | | | 12,788,350,247 | |
Total Government & Agency Obligations
(Cost $20,211,180,455) | | | | | | | 20,211,180,455 | |
| | | | | | | | | |
| Repurchase Agreements 39.9% | | | | | | | | |
| BNP Paribas, 0.05%, dated 12/31/2021, to be repurchased at $60,000,250 on 1/3/2022(c) | | | 60,000,000 | | | | 60,000,000 | |
| Citigroup Global Markets, Inc., 0.05%, dated 12/31/2021, to be repurchased at $20,800,087 on 1/3/2022(d) | | | 20,800,000 | | | | 20,800,000 | |
| Federal Reserve Bank of New York, 0.05%, dated 12/31/2021, to be repurchased at $12,800,053,333 on 1/3/2022(e) | | | 12,800,000,000 | | | | 12,800,000,000 | |
| Fixed Income Clearing Corp., 0.01%, dated 12/31/2021, to be repurchased at $116,600,097 on 1/3/2022(f) | | | 116,600,000 | | | | 116,600,000 | |
| HSBC Securities, Inc., 0.05%, dated 12/31/2021, to be repurchased at $90,100,375 on 1/3/2022(g) | | | 90,100,000 | | | | 90,100,000 | |
| JPMorgan Securities, Inc, 0.05%, dated 12/31/2021, to be repurchased at $200,000,833 on 1/3/2022(h) | | | 200,000,000 | | | | 200,000,000 | |
| Merrill Lynch & Co., Inc., 0.05%, dated 12/31/2021, to be repurchased at $150,000,625 on 1/3/2022(i) | | | 150,000,000 | | | | 150,000,000 | |
Total Repurchase Agreements
(Cost $13,437,500,000) | | | | | | | 13,437,500,000 | |
| | | % of Net
Assets | | | Value | |
Total Investment Portfolio
(Cost $33,648,680,455) | | | 100.0 | | | | 33,648,680,455 | |
| Other Assets and Liabilities, Net | | | 0.0 | | | | 184,852 | |
| Net Assets | | | 100.0 | | | $ | 33,648,865,307 | |
| (a) | Floating rate security. These securities are shown at their current rate as of December 31, 2021. |
| (b) | Annualized yield at time of purchase; not a coupon rate. |
The accompanying notes are an integral part of the financial statements.
as of December 31, 2021 :: Investment Portfolio :: Government Cash Management Portfolio :: 21
(c) Collateralized by:
Principal
Amount ($) | | | Security | | Rate (%) | | Maturity
Date | | Collateral
Value ($) | |
| 1,000 | | | U.S. Treasury Bills | | Zero Coupon | | 1/11/2022–12/1/2022 | | | 1,000 | |
| 60,165,900 | | | U.S. Treasury Notes | | 1.5–2.125 | | 7/31/2022–12/31/2022 | | | 61,197,438 | |
| 1,200 | | | U.S. Treasury Inflation-Indexed Bonds | | 0.125 | | 7/15/2022 | | | 1,480 | |
| 100 | | | U.S. Cash Management Bills | | Zero Coupon | | 3/22/2022 | | | 100 | |
| Total Collateral Value | | | | | | | | | | 61,200,018 | |
(d) Collateralized by:
Principal
Amount ($) | | | Security | | Rate (%) | | Maturity
Date | | Collateral
Value ($) | |
| | 8,380,500 | | | U.S. Treasury Bills | | Zero Coupon | | 2/15/2022–3/1/2022 | | | 8,379,996 | |
| | 12,542,400 | | | U.S. Treasury Bonds | | 1.875–2.375 | | 2/15/2051–8/15/2051 | | | 12,836,101 | |
| Total Collateral Value | | | | | | | | | | 21,216,097 | |
(e) Collateralized by:
Principal
Amount ($) | | | Security | | Rate (%) | | Maturity
Date | | Collateral
Value ($) | |
| | 12,528,065,700 | | | U.S. Treasury Notes | | 0.125–2.0 | | 3/31/2023–11/15/2026 | | | 12,800,053,403 | |
(f) Collateralized by:
Principal
Amount ($) | | | Security | | Rate (%) | | Maturity
Date | | Collateral
Value ($) | |
| | 102,991,100 | | | U.S. Treasury Inflation-Indexed Bonds | | 0.125 | | 4/15/2022 | | | 118,932,047 | |
(g) Collateralized by:
Principal
Amount ($) | | | Security | | Rate (%) | | Maturity
Date | | Collateral
Value ($) | |
| | 95,913,547 | | | U.S. Treasury STRIPS | | Zero Coupon | | 11/15/2023–11/15/2028 | | | 91,902,000 | |
(h) Collateralized by:
Principal
Amount ($) | | | Security | | Rate (%) | | Maturity
Date | | Collateral
Value ($) | |
| | 206,950,600 | | | U.S. Treasury Notes | | 0.25–2.0 | | 6/15/2024–6/30/2024 | | | 203,996,845 | |
| | 2,600 | | | U.S. Treasury Bonds | | 3.125–5.5 | | 8/15/2028–2/15/2042 | | | 3,162 | |
| Total Collateral Value | | | | | | | | | | 204,000,007 | |
(i) Collateralized by:
Principal
Amount ($) | | | Security | | Rate (%) | | Maturity
Date | | Collateral
Value ($) | |
| | 145,752,834 | | | Government National Mortgage Association | | 1.0–6.0 | | 3/20/2027–12/20/2051 | | | 153,000,000 | |
SOFR: Secured Overnight Financing Rate
STRIPS: Separate Trading of Registered Interest and Principal Securities
Fair Value Measurements
Various inputs are used in determining the value of the Portfolio's investments. These inputs are summarized in three broad levels. Level 1 includes quoted prices in active markets for identical securities. Level 2 includes other significant observable inputs (including quoted prices for similar securities, interest rates, prepayment speeds and credit risk). Level 3 includes significant unobservable inputs (including the Portfolio's own assumptions in determining the fair value of investments). The level assigned to the securities valuations may not be an indication of the risk or liquidity associated with investing in those securities. Securities held by the Portfolio are reflected as Level 2 because the securities are valued at amortized cost (which approximates fair value) and, accordingly, the inputs used to determine value are not quoted prices in an active market.
The accompanying notes are an integral part of the financial statements.
22 :: Government Cash Management Portfolio :: Investment Portfolio :: as of December 31, 2021
The following is a summary of the inputs used as of December 31, 2021 in valuing the Portfolio's investments. For information on the Portfolio's policy regarding the valuation of investments, please refer to the Security Valuation section of Note A in the accompanying Notes to Financial Statements.
| Assets | | Level 1 | | | Level 2 | | | Level 3 | | | Total | |
| Investments in Securities(a) | | $ | — | | | $ | 20,211,180,455 | | | $ | — | | | $ | 20,211,180,455 | |
| Repurchase Agreements | | $ | — | | | $ | 13,437,500,000 | | | $ | — | | | $ | 13,437,500,000 | |
| Total | | $ | — | | | $ | 33,648,680,455 | | | $ | — | | | $ | 33,648,680,455 | |
| (a) | See Investment Portfolio for additional detailed categorizations. |
The accompanying notes are an integral part of the financial statements.
Financial Statements :: Government Cash Management Portfolio :: 23
Statement of Assets and Liabilities
as of December 31, 2021 | | | | |
| | | | | |
| ASSETS: | | | | |
| Investments in non-affiliated securities, valued at amortized cost | | $ | 20,211,180,455 | |
| Repurchase agreements, valued at amortized cost | | | 13,437,500,000 | |
| Cash | | | 78,726 | |
| Interest receivable | | | 975,099 | |
| Other assets | | | 621,316 | |
| TOTAL ASSETS | | | 33,650,355,596 | |
| LIABILITIES: | | | | |
| Accrued investment advisory fee | | | 100,908 | |
| Accrued Trustees' fees | | | 279,495 | |
| Other accrued expenses and payables | | | 1,109,886 | |
| TOTAL LIABILITIES | | | 1,490,289 | |
| NET ASSETS, AT VALUE | | $ | 33,648,865,307 | |
Statement of Operations
For the Year Ended December 31, 2021 | | | | |
| | | | | |
| INVESTMENT INCOME: | | | | |
| Income: | | | | |
| Interest | | $ | 15,544,526 | |
| EXPENSES: | | | | |
| Management fee | | | 25,253,382 | |
| Administration fee | | | 7,930,294 | |
| Custodian fee | | | 242,721 | |
| Professional fees | | | 374,589 | |
| Reports to shareholders | | | 34,153 | |
| Trustees' fees and expenses | | | 833,902 | |
| Other | | | 916,884 | |
| Total expenses before expense reductions | | | 35,585,925 | |
| Expense reductions | | | (28,939,728 | ) |
| TOTAL EXPENSES AFTER EXPENSE REDUCTIONS | | | 6,646,197 | |
| NET INVESTMENT INCOME | | | 8,898,329 | |
| Net realized gain (loss) from investments | | | 217,749 | |
| NET INCREASE (DECREASE) IN NET ASSETS RESULTING FROM OPERATIONS | | $ | 9,116,078 | |
The accompanying notes are an integral part of the financial statements.
24 :: Government Cash Management Portfolio :: Financial Statements
Statements of Changes in Net Assets
| | | Years Ended
December 31, 2021 | | | Years Ended
December 31, 2020 | |
| INCREASE (DECREASE) IN NET ASSETS | | | | | | | | |
| OPERATIONS: | | | | | | | | |
| Net investment income | | $ | 8,898,329 | | | $ | 86,147,167 | |
| Net realized gain (loss) | | | 217,749 | | | | 202,122 | |
| Net increase (decrease) in net assets resulting from operations | | | 9,116,078 | | | | 86,349,289 | |
| CAPITAL TRANSACTIONS IN SHARES OF BENEFICIAL INTEREST: | | | | | | | | |
| Proceeds from capital invested | | | 93,706,698,612 | | | | 82,358,268,912 | |
| Value of capital withdrawn | | | (86,189,439,789 | ) | | | (75,212,997,203 | ) |
| Net increase (decrease) in net assets from capital transactions in shares of beneficial interest | | | 7,517,258,823 | | | | 7,145,271,709 | |
| INCREASE (DECREASE) IN NET ASSETS | | | 7,526,374,901 | | | | 7,231,620,998 | |
| Net assets at beginning of period | | | 26,122,490,406 | | | | 18,890,869,408 | |
| Net assets at end of period | | $ | 33,648,865,307 | | | $ | 26,122,490,406 | |
The accompanying notes are an integral part of the financial statements.
Financial Highlights :: Government Cash Management Portfolio :: 25
| | | For the
year ended
Dec. 31, 2021 | | | For the
year ended
Dec. 31, 2020 | | | For the
year ended
Dec. 31, 2019 | | | For the
year ended
Dec. 31, 2018 | | | For the
year ended
Dec. 31, 2017 | |
| RATIOS TO AVERAGE NET ASSETS AND SUPPLEMENTAL DATA | | | | | | | | | | | | | | | | | | | | |
| Net assets, end of period ($ millions) | | | 33,649 | | | | 26,122 | | | | 18,891 | | | | 15,720 | | | | 17,172 | |
| Ratio of expenses before expense reductions (%) | | | .13 | | | | .13 | | | | .14 | | | | .14 | | | | .14 | |
| Ratio of expenses after expense reductions (%) | | | .03 | | | | .07 | | | | .07 | | | | .10 | | | | .11 | |
| Ratio of net investment income (%) | | | .03 | | | | .36 | | | | 2.13 | | | | 1.76 | | | | .83 | |
| Total Return (%)(a) | | | .03 | (b) | | | .41 | (c) | | | 2.17 | (c) | | | 1.78 | (c) | | | .81 | (c) |
| (a) | Total return would have been lower had certain expenses not been reduced. |
| (b) | Total return for the Portfolio was derived from the performance of DWS Government Money Market Series. |
| (c) | Total return for the Portfolio was derived from the performance of DWS Government Cash Reserves Fund Institutional. |
The accompanying notes are an integral part of the financial statements.
26 :: Government Cash Management Portfolio :: Notes to Financial Statements :: December 31, 2021
A. Organization and Significant Accounting Policies
Government Cash Management Portfolio (the "Portfolio") is registered under the Investment Company Act of 1940, as amended (the "1940 Act"), as an open-end management investment company organized as a New York trust.
The Portfolio is a master fund; A master/feeder fund structure is one in which a fund (a "feeder fund"), instead of investing directly in a portfolio of securities, invests most or all of its investment assets in a separate registered investment company (the "master fund") with substantially the same investment objective and policies as the feeder fund. Such a structure permits the pooling of assets of two or more feeder funds, preserving separate identities or distribution channels at the feeder fund level. The Portfolio may have several feeder funds, including affiliated DWS feeder funds and unaffiliated feeder funds, with a significant ownership percentage of the Portfolio's net assets. Investment activities of these feeder funds could have a material impact on the Portfolio. As of December 31, 2021, DWS Government Cash Management Fund and DWS Government Money Market Series owned approximately 1% and 98%, respectively, of the Portfolio.
The Portfolio's financial statements are prepared in accordance with accounting principles generally accepted in the United States of America ("U.S. GAAP") which require the use of management estimates. Actual results could differ from those estimates. The Portfolio qualifies as an investment company under Topic 946 of Accounting Standards Codification of U.S. GAAP. The policies described below are followed consistently by the Portfolio in the preparation of its financial statements.
Security Valuation
Various inputs are used in determining the value of the Portfolio's investments. These inputs are summarized in three broad levels. Level 1 includes quoted prices in active markets for identical securities. Level 2 includes other significant observable inputs (including quoted prices for similar securities, interest rates, prepayment speeds and credit risk). Level 3 includes significant unobservable inputs (including the Portfolio's own assumptions in determining the fair value of investments). The level assigned to the securities valuations may not be an indication of the risk or liquidity associated with investing in those securities.
The Portfolio values all securities utilizing the amortized cost method permitted in accordance with Rule 2a-7 under the 1940 Act and certain conditions therein. Under this method, which does not take into account unrealized capital gains or losses on securities, an instrument is initially valued at its cost and thereafter assumes a constant accretion/amortization rate to maturity of any discount or premium. Securities held by the Portfolio are reflected as Level 2 because the securities are valued at amortized cost (which approximates fair value) and, accordingly, the inputs used to determine value are not quoted prices in an active market.
Repurchase Agreements
The Portfolio may enter into repurchase agreements, under the terms of a Master Repurchase Agreement, with certain banks and broker/dealers whereby the Portfolio, through its custodian or a sub-custodian bank, receives delivery of the underlying securities, the amount of which at the time of purchase and each subsequent business day is required to be maintained at such a level that the value is equal to at least the principal amount of the repurchase price plus accrued interest. The custodian bank or another designated sub-custodian bank holds the collateral in a separate account until the agreement matures. If the value of the securities falls below the principal amount of the repurchase agreement plus accrued interest, the financial institution deposits additional collateral by the following business day. If the financial institution either fails to deposit the required additional collateral or fails to repurchase the securities as agreed, the Portfolio has the right to sell the securities and recover any resulting loss from the financial institution. If the financial institution enters into bankruptcy, the Portfolio's claims on the collateral may be subject to legal proceedings.
As of December 31, 2021, the Portfolio held repurchase agreements with a gross value of $13,437,500,000. The value of the related collateral exceeded the value of the repurchase agreements at period end. The detail of the related collateral is included in the footnotes following the Portfolio's Investment Portfolio.
Federal Income Taxes
The Portfolio is considered a Partnership under the Internal Revenue Code, as amended. Therefore, no federal income tax provision is necessary.
It is intended that the Portfolio's assets, income and distributions will be managed in such a way that an investor in the Portfolio will be able to satisfy the requirements of Subchapter M of the Code, assuming that the investor invested all of its assets in the Portfolio.
At December 31, 2021, Government Cash Management Portfolio had an aggregate cost of investments for federal income tax purposes of $33,648,680,455.
The Portfolio has reviewed the tax positions for the open tax years as of December 31, 2021 and has determined that no provision for income tax and/or uncertain tax positions is required in the Portfolio's financial statements. The Portfolio's federal tax returns for the prior three fiscal years remain open subject to examination by the Internal Revenue Service.
Contingencies
In the normal course of business, the Portfolio may enter into contracts with service providers that contain general indemnification clauses. The Portfolio's maximum exposure under these arrangements is unknown, as this would involve future claims that may be made against the Portfolio that have not yet
December 31, 2021 :: Notes to Financial Statements :: Government Cash Management Portfolio :: 27
been made. However, based on experience, the Portfolio expects the risk of loss to be remote.
Other
Investment transactions are accounted for on trade date. Interest income is recorded on the accrual basis. Realized gains and losses from investment transactions are recorded on an identified cost basis. All premiums and discounts are amortized/accreted for both tax and financial reporting purposes.
The Portfolio makes an allocation of its net investment income and realized gains and losses from securities transactions to its investors in proportion to their investment in the Portfolio.
B. Fees and Transactions with Affiliates
Management Agreement
Under the Investment Management Agreement with DWS Investment Management Americas, Inc. ("DIMA" or the "Advisor"), an indirect, wholly owned subsidiary of DWS Group GmbH & Co. KGaA ("DWS Group"), the Advisor determines the securities, instruments and other contracts relating to investments to be purchased, sold or entered into by the Portfolio.
Under the Investment Management Agreement with the Advisor, the Portfolio pays a monthly management fee based on its average daily net assets, computed and accrued daily and payable monthly, at the following annual rates:
| First $3.0 billion of the Portfolio's average daily net assets | | | .1200 | % |
| Next $4.5 billion of such net assets | | | .1025 | % |
| Over $7.5 billion of such net assets | | | .0900 | % |
Accordingly, for the year ended December 31, 2021, the fee pursuant to the Investment Management Agreement was equivalent to an annual rate (exclusive of any applicable waivers/reimbursements) of 0.096% of the Portfolio's average daily net assets.
For the period from January 1, 2021 through December 8, 2021, the Advisor had voluntarily agreed to waive its fees and/or reimburse certain operating expenses to the extent necessary to maintain the total annual operating expenses (excluding certain expenses such as extraordinary expenses, taxes, brokerage and interest expense) at 0.08% of the Portfolio's average daily net assets.
Effective December 9, 2021 through December 31, 2021, the Advisor has voluntarily agreed to waive its fees and/or reimburse certain operating expenses to the extent necessary to maintain the total annual operating expenses (excluding certain expenses such as extraordinary expenses, taxes, brokerage and interest expense) at 0.10% of the Portfolio's average daily net assets. This voluntary waiver or reimbursement may be terminated at any time at the option of the Advisor.
In addition, the Advisor has agreed to voluntarily waive additional expenses. This voluntary waiver may be changed or terminated at any time without notice. Under these arrangements, the Advisor waived certain expenses of the Portfolio.
For the year ended December 31, 2021, fees waived and/or expenses reimbursed are $28,939,728.
Administration Fee
Pursuant to an Administrative Services Agreement, DIMA provides most administrative services to the Portfolio. For all services provided under the Administrative Services Agreement, the Portfolio paid the Advisor an annual fee ("Administration Fee") of 0.03% of the Portfolio's average daily net assets, computed and accrued daily and payable monthly. For the year ended December 31, 2021, the Administration Fee was $7,930,294, of which $849,354 is unpaid.
Other Service Fees
Under an agreement with the Portfolio, DIMA is compensated for providing regulatory filing services to the Portfolio. For the year ended December 31, 2021, the amount charged to the Portfolio by DIMA included in the Statement of Operations under "Reports to shareholders" aggregated $800, of which $251 is unpaid.
Trustees' Fees and Expenses
The Portfolio paid retainer fees to each Trustee not affiliated with the Advisor, plus specified amounts to the Board Chairperson and to each committee Chairperson.
C. Line of Credit
The Portfolio and other affiliated funds (the "Participants") share in a $350 million revolving credit facility provided by a syndication of banks. The Portfolio may borrow for temporary or emergency purposes, including the meeting of redemption requests that otherwise might require the untimely disposition of securities. The Participants are charged an annual commitment fee, which is allocated based on net assets, among each of the Participants. Interest is calculated at a daily fluctuating rate per annum equal to the sum of 0.10% plus the higher of the Federal Funds Effective Rate and the Overnight Bank Funding Rate, plus 1.25%. The Portfolio may borrow up to a maximum of 33 percent of its net assets under the agreement. The Portfolio had no outstanding loans at December 31, 2021.
D. Money Market Fund Investments and Yield
Rising interest rates could cause the value of the Portfolio's investments — and therefore its share price as well — to decline. Conversely, any decline in interest rates is likely to cause the Portfolio's yield to decline, and during periods of unusually low interest rates, the Portfolio's yield may approach zero. A low interest rate environment may prevent the Portfolio from
28 :: Government Cash Management Portfolio :: Notes to Financial Statements :: December 31, 2021
providing a positive yield or paying Portfolio expenses out of current income and, at times, could impair the Portfolio's ability to maintain a stable $1.00 share price. Over time, the total return of a money market fund may not keep pace with inflation, which could result in a net loss of purchasing power for long-term investors. Recent and potential future changes in monetary policy made by central banks or governments are likely to affect the level of interest rates. Money market funds try to minimize this risk by purchasing short-term securities.
If there is an insufficient supply of U.S. government securities to meet investor demand, it could result in lower yields on such securities and increase interest rate risk for the fund.
E. Other – COVID-19 Pandemic
A novel coronavirus known as COVID-19, declared a pandemic by the World Health Organization, has caused significant uncertainty, market volatility, decreased economic and other activity, increased government activity, including economic stimulus measures, and supply chain interruptions. The full effects, duration and costs of the COVID-19 pandemic are impossible to predict, and the circumstances surrounding the COVID-19 pandemic will continue to evolve, including the risk of future increased rates of infection due to low vaccination rates and/or the lack of effectiveness of current vaccines against new variants. The pandemic has affected and may continue to affect certain countries, industries, economic sectors, companies and investment products more than others, may exacerbate existing economic, political, or social tensions and may increase the probability of an economic recession or depression. The Portfolio and its investments may be adversely affected by the effects of the COVID-19 pandemic, and the pandemic may result in the Portfolio and its service providers experiencing operational difficulties in coordinating a remote workforce and implementing their business continuity plans, among others. Management will continue to monitor the impact COVID-19 has on the Portfolio and reflect the consequences as appropriate in the Portfolio's accounting and financial reporting.
Report of Independent Registered Public Accounting Firm :: Government Cash Management Portfolio :: 29
To the Board of Trustees and Holders of Beneficial Interest in Government Cash Management Portfolio:
Opinion on the Financial Statements
We have audited the accompanying statement of assets and liabilities of Government Cash Management Portfolio (the "Portfolio"), including the investment portfolio, as of December 31, 2021, and the related statement of operations for the year then ended, the statements of changes in net assets for each of the two years in the period then ended, the financial highlights for each of the three years in the period then ended and the related notes (collectively referred to as the "financial statements"). In our opinion, the financial statements present fairly, in all material respects, the financial position of the Portfolio at December 31, 2021, the results of its operations for the year then ended, the changes in its net assets for each of the two years in the period then ended and its financial highlights for each of the three years in the period then ended, in conformity with U.S. generally accepted accounting principles.
The financial highlights for the years ended December 31, 2017 and December 31, 2018, were audited by another independent registered public accounting firm whose report, dated February 21, 2019, expressed an unqualified opinion on those financial highlights.
Basis for Opinion
These financial statements are the responsibility of the Portfolio's management. Our responsibility is to express an opinion on the Portfolio's financial statements based on our audits. We are a public accounting firm registered with the Public Company Accounting Oversight Board (United States) ("PCAOB") and are required to be independent with respect to the Portfolio in accordance with the U.S. federal securities laws and the applicable rules and regulations of the Securities and Exchange Commission and the PCAOB.
We conducted our audits in accordance with the standards of the PCAOB. Those standards require that we plan and perform the audit to obtain reasonable assurance about whether the financial statements are free of material misstatement, whether due to error or fraud. The Portfolio is not required to have, nor were we engaged to perform, an audit of the Portfolio's internal control over financial reporting. As part of our audits, we are required to obtain an understanding of internal control over financial reporting, but not for the purpose of expressing an opinion on the effectiveness of the Portfolio's internal control over financial reporting. Accordingly, we express no such opinion.
Our audits included performing procedures to assess the risks of material misstatement of the financial statements, whether due to error or fraud, and performing procedures that respond to those risks. Such procedures included examining, on a test basis, evidence regarding the amounts and disclosures in the financial statements. Our procedures included confirmation of securities owned as of December 31, 2021, by correspondence with the custodian and brokers. Our audits also included evaluating the accounting principles used and significant estimates made by management, as well as evaluating the overall presentation of the financial statements. We believe that our audits provide a reasonable basis for our opinion.

We have served as the auditor of one or more investment companies in the DWS family of funds since at least 1979, but we are unable to determine the specific year.
Boston, Massachusetts
February 24, 2022
 | |
| | |
| P.O. Box 182800 | |
| Columbus, OH 43218-2800 | |
ProFunds®
Post Office Mailing Address for Investments
P.O. Box 182800
Columbus, OH 43218-2800
Phone Numbers
For Individual Investors Only: 888-776-3637 or 614-470-8122
Institutions and Financial Professionals Only: 888-776-5717 Or: 240-497-6552
Fax Number: (800) 782-4797
Website Address: ProFunds.com
This report is submitted for the general information of the shareholders of the ProFunds. It is not authorized for distribution to prospective investors unless preceded or accompanied by an effective prospectus. To receive the most recent month end performance information for each Fund, please call toll-free 888-776-5717.
A description of the policies and procedures that the ProFunds uses to determine how to vote proxies relating to portfolio securities is available without charge, upon request, by calling toll-free 888-776-3637; and on the Securities and Exchange Commission's website at sec.gov. Information regarding how the ProFund voted proxies relating to portfolio securities during the most recent 12-month period ended June 30 is available. (i) without change by calling toll-free 888-776-3637; (ii) on the ProFunds' website at ProFunds.com; and (iii) on the Commission's website at sec.gov.
The ProFund discloses on the Adviser's website that it invests substantially all of its assets in the Portfolio and includes a link to the latest available listing of holdings in the Portfolio. In addition, the ProFund will file with the SEC on Form N-MFP, within five business days after the end of each month, more detailed portfolio holdings information. The ProFund's Form N-MFP filings will be available on the SEC's website, and the Adviser's website will contain a link to such filings.
PRO1221

Annual Report
DECEMBER 31, 2021
ProFunds VP
Access VP High Yield
Asia 30
Banks
Basic Materials
Bear
Biotechnology
Bull
Consumer Goods
Consumer Services
Dow 30
Emerging Markets
Europe 30
Falling U.S. Dollar
Financials
Government Money Market
Health Care
Industrials
International
Internet
Japan
Large-Cap Growth
Large-Cap Value
Mid-Cap
Mid-Cap Growth
Mid-Cap Value
Nasdaq-100
Oil & Gas
Pharmaceuticals
Precious Metals
Real Estate
Rising Rates Opportunity
Semiconductor
Short Dow 30
Short Emerging Markets
Short International
Short Mid-Cap
Short Nasdaq-100
Short Small-Cap
Small-Cap
Small-Cap Growth
Small-Cap Value
Technology
Telecommunications
UltraBull
UltraMid-Cap
UltraNasdaq-100
UltraShort Dow 30
UltraShort Nasdaq-100
UltraSmall-Cap
U.S. Government Plus
Utilities
Beginning on January 1, 2021, as permitted by regulations adopted by the Securities and Exchange Commission, paper copies of the Fund’s annual and semiannual shareholder reports will no longer be sent by mail, unless you specifically request paper copies of the reports. Instead, the reports will be made available on the ProFunds’ VP website at ProFunds.com, and you will be notified by mail each time a report is posted and provided with a website link to access the report.
If you already elected to receive shareholder reports electronically, you will not be affected by this change and you need not take any action. You may elect to receive shareholder reports and other communications from the Fund electronically anytime by contacting your financial intermediary (such as banks & insurance companies).
Beginning on January 1, 2019, you may elect to receive all future reports in paper free of charge. Please contact your financial intermediary to request that you continue to receive paper copies of your shareholder reports. Your election to receive reports in paper will apply to all funds held in your account that you invest in through your financial intermediary.
Table of Contents
| 1 | | Message from the Chairman |
| 3 | | Management Discussion of Fund Performance |
| 7 | | Financial Statements and Financial Highlights |
| 8 | | ProFund Access VP High Yield |
| 13 | | ProFund VP Asia 30 |
| 18 | | ProFund VP Banks |
| 24 | | ProFund VP Basic Materials |
| 29 | | ProFund VP Bear |
| 34 | | ProFund VP Biotechnology |
| 40 | | ProFund VP Bull |
| 52 | | ProFund VP Consumer Goods |
| 58 | | ProFund VP Consumer Services |
| 65 | | ProFund VP Dow 30 |
| 70 | | ProFund VP Emerging Markets |
| 76 | | ProFund VP Europe 30 |
| 82 | | ProFund VP Falling U.S. Dollar |
| 87 | | ProFund VP Financials |
| 95 | | ProFund VP Government Money Market |
| 100 | | ProFund VP Health Care |
| 107 | | ProFund VP Industrials |
| 115 | | ProFund VP International |
| 120 | | ProFund VP Internet |
| 126 | | ProFund VP Japan |
| 131 | | ProFund VP Large-Cap Growth |
| 139 | | ProFund VP Large-Cap Value |
| 149 | | ProFund VP Mid-Cap |
| 154 | | ProFund VP Mid-Cap Growth |
| 162 | | ProFund VP Mid-Cap Value |
| 171 | | ProFund VP Nasdaq-100 |
| 178 | | ProFund VP Oil & Gas |
| 184 | | ProFund VP Pharmaceuticals |
| 190 | | ProFund VP Precious Metals |
| 195 | | ProFund VP Real Estate |
| 201 | | ProFund VP Rising Rates Opportunity |
| 206 | | ProFund VP Semiconductor |
| 212 | | ProFund VP Short Dow 30 |
| 217 | | ProFund VP Short Emerging Markets |
| 222 | | ProFund VP Short International |
| 227 | | ProFund VP Short Mid-Cap |
| 232 | | ProFund VP Short Nasdaq-100 |
| 237 | | ProFund VP Short Small-Cap |
| 242 | | ProFund VP Small-Cap |
| 270 | | ProFund VP Small-Cap Growth |
| 280 | | ProFund VP Small-Cap Value |
| 292 | | ProFund VP Technology |
| 299 | | ProFund VP Telecommunications |
| 305 | | ProFund VP UltraBull |
| 317 | | ProFund VP UltraMid-Cap |
| 328 | | ProFund VP UltraNasdaq-100 |
| 335 | | ProFund VP UltraShort Dow 30 |
| 340 | | ProFund VP UltraShort Nasdaq-100 |
| 345 | | ProFund VP UltraSmall-Cap |
| 374 | | ProFund VP U.S. Government Plus |
| 379 | | ProFund VP Utilities |
| 385 | | Notes to Financial Statements |
| 417 | | Report of Independent Registered Public Accounting Firm |
| 418 | | Additional Tax Information |
| 420 | | Board Approval of Investment Advisory Agreement |
| 426 | | Expense Examples |
| 429 | | Trustees and Officers |
This Page Intentionally Left Blank

Message from the Chairman
Dear Shareholder:
As communities and economies around the world address the continuously evolving impacts of the pandemic, I would like to reaffirm ProFunds’ commitment to providing you, our investors, with products and services to help you meet your investment objectives. ProFunds remains focused on ensuring the effective management of our funds for investors. I am pleased to provide you with this ProFunds VP annual report to shareholders for the 12 months ending December 31, 2021.
Equity Markets Post Big Gains Despite Headwinds
The U.S. equity market generally offered strong returns for the year, despite brief setbacks, particularly in late November and December. The S&P 500® recorded more than 50 all-time-high closings for the year, second only to 1995. Equity markets generally shrugged off events like new variants of COVID-19 (and the prospect of a resumption of restrictions on travel and social activities), supply chain issues, inflation spikes, and legislative difficulties passing the Build Back Better spending plan, any of which may have had a more significant impact on market performance in previous years.
The stock market’s strong performance over the year can be largely attributed to a resilient economic recovery boosted by widespread vaccination, ongoing stimulus from the Federal Reserve, Congress’s $1.9 trillion coronavirus aid package, and robust corporate earnings. Uncertainty increased later in the year amid surging inflation, higher interest rates, ongoing supply chain challenges (especially before the crucial holiday shopping season), and the emergence of Omicron – a new COVID-19 variant. Inflation recorded a 6.8% annual rate in November, according to the Bureau of Labor Statistics, with prices rising significantly on consumer items such as housing, food, gasoline, and new and used vehicles.
Due to rising inflation, investors kept a close watch on the U.S. Federal Reserve Bank during 2021. By late December, the Fed announced that interest rates would remain in a range of 0 to 0.25%. However, the Fed stated that it would complete the tapering of its monthly stimulus earlier than previously indicated. The moves were in response to rising inflation (Fed Chairman Powell stopped using the word "transitory" in November to describe the current inflation) and the robust labor market of late 2021.
Reflecting the performance of equities during the 12-month period, U.S. large-cap stocks returned 28.7%, as measured by the S&P 500, and 21.0%, according to the Dow Jones Industrial Average® . The Dow’s® top-performing sectors were oil and gas at 54.4%, technology at 37.2%, and financials with 32.3% returns. The worst performer was telecommunications, which fell 8.7%. The S&P MidCap 400® gained 24.8%, and the tech-heavy Nasdaq-100 Index® returned 27.5%.
International Equity Performance Varied Significantly by Region
Developed markets outside North America returned 11.3% for the year, as measured by the MSCI EAFE Index® . The
MSCI Europe Index® rose 16.3%, with financials and technology the best-performing sectors, and the Nikkei Total Return Index declined 4.7%. In the developing world, the S&P/BNY Mellon Emerging Markets 50 ADR Index retreated 16.6%, and the S&P/BNY Mellon Latin America 35 ADR Index fell 1.1%.
ProFunds VP Trust’s U.S. Equity Strategies Post Strong Results
ProFunds’ index-based mutual funds offer many advantages, such as diverse market exposures, a transparent investment process, efficient fund management, and high daily correlation to their indexes. Overall market appreciation and inflows during the period led to a 12% increase in ProFunds VP assets under management. Mid-cap and large-cap stocks experienced the largest percentage increase.
During the period, the Access VP High Yield Fund was reorganized from the former Access One Trust into ProFund. We are confident this change should benefit investors by increasing the efficiency with which we can manage the fund. The name of the fund changed from the Access VP High Yield Fund to the ProFund Access VP High Yield. This change was seamless for investors, requiring no action on their part, and neither the fund’s objective nor its investments changed as a result.
No matter what direction the market takes in these rapidly changing times, ProFunds VP mutual funds offer an extensive lineup of strategies designed to meet investor goals, help manage risk, and potentially enhance returns. We appreciate the trust and confidence you have placed in ProFunds, and we look forward to continuing to serve your investing needs.
Sincerely,

Michael L. Sapir
Chairman of the Board of Trustees
Management Discussion of Fund Performance
4 :: Management Discussion of Fund Performance
Investment Strategies and Techniques:
Each ProFund VP (each, a "Fund" and, collectively, the "Funds") is a series of ProFunds (the "Trust"). Each Fund (except the Classic ProFunds VP1, the Sector ProFunds VP1, ProFund VP Falling U.S. Dollar and ProFund VP Government Money Market) is a "geared" fund (the "Geared Funds") in the sense that each is designed to seek daily investment results, before fees and expenses, that correspond to the inverse (-1x), a multiple (i.e., 1.25x or 2x), or an inverse multiple (i.e., -1.25x or -2x) of the daily performance of a benchmark for a single day, not for any other period.
Each of the Classic ProFunds VP, the Sector ProFunds VP and ProFund VP Falling U.S. Dollar seek investments results, before fees and expenses, that correspond to the performance of a benchmark. ProFund VP Government Money Market seeks a high level of current income consistent with liquidity and preservation of capital.
Each Geared Fund seeks investment results for a single day only, as measured from the time the Geared Fund calculates its net asset value ("NAV") to the time of the Geared Fund's next NAV calculation, and not for longer periods. The return for a period longer than a single day will be the result of each day's returns compounded over the period, which will very likely differ from the stated leveraged, inverse, or inverse leveraged multiple times the return of the benchmark for that period. During periods of higher market volatility, the volatility of a Geared Fund's benchmark may affect the return as much as or more than the return of the benchmark.
ProFund Advisors LLC (the "Advisor"), uses a passive approach in seeking to achieve the investment objective of each Fund. Using this approach, the Advisor determines the type, quantity and mix of investment positions that a Fund should hold to approximate the daily performance of its benchmark.
The Advisor does not invest the assets of the Funds in securities or financial instruments based on its view of the investment merit of a particular security, instrument, or company nor does it conduct conventional research or analysis, forecast market movements, trends or market conditions, or take defensive positions in managing Fund assets.
The Funds, other than certain Classic ProFunds VP and certain Sector ProFunds VP, make significant use of investment techniques that may be considered aggressive, including the use of swap agreements, futures contracts, forward contracts, and similar instruments ("derivatives"). These investment techniques may be considered aggressive and Funds using these techniques are exposed to risks different from, or possibly greater than, the risks associated with investing directly in securities, including one or more of the following: counterparty risk (i.e., the risk that a counterparty is unable or unwilling to make timely payments) on the amount the Fund expects to receive from a derivatives counterparty, liquidity risk (i.e., the ability of a Fund to acquire or dispose of certain holdings quickly or at prices that represent true market value in the judgment of the Advisor) and increased correlation risk (i.e., the Fund's ability to achieve a high degree of correlation with its benchmark). If a counterparty becomes bankrupt, or otherwise fails to perform its obligations, the value of an investment in the Fund may decline. With respect to swaps and forward contracts, the Funds have sought to mitigate these risks by generally requiring derivatives counterparties to post collateral for the benefit of each Fund, marked to market daily, in an amount approximately equal to the amount the counterparty owes the Fund, subject to certain minimum thresholds. The Funds typically only enter into derivatives with counterparties that are major, global financial institutions. Any costs associated with using derivatives may also have the effect of lowering the Fund's return.
Factors that Materially Affected the Performance of Each Fund during the Fiscal Year Ended December 31, 20212:
Primary factors affecting Fund performance, before fees and expenses, include the following: the total return of the securities and derivatives held by the Funds, including the performance of the reference assets to which any derivatives are linked, financing rates paid or earned by the Fund (including those included in the total return of derivatives contracts); the types of derivative contracts used by the Funds and their correlation to the relevant benchmark or asset; fees, expenses, and transaction costs; other miscellaneous factors; and in the case of the Geared Funds, the volatility of the Fund's benchmark (and its impact on compounding).
| ● | Benchmark Performance: The performance of each Fund's benchmark and, in turn, the factors and market conditions affecting that benchmark are generally the principal factors driving Fund performance.3 |
| ● | Compounding of Daily Returns and Volatility: Each Geared Fund seeks to provide a multiple (i.e., 1.25x or 2x), the inverse (i.e.,-1x) or an inverse multiple (i.e., -1.25x or -2x) of its benchmark return for a single day only. For longer periods, performance may be greater than or less than the one-day multiple times the benchmark return. This is due to the effects of compounding, which exists in all investments, but has a more significant impact on Geared Funds. In general, during periods of higher benchmark volatility, compounding will cause Fund Performance for periods longer than a single day to be more or less than the multiple of the return of the benchmark. This effect becomes more pronounced as volatility increases. Conversely, in periods of lower benchmark volatility (particularly when combined with large higher benchmark returns), Fund returns over longer periods can be higher than the multiple of the return of the benchmark. Actual results for a particular period, before fees and expenses, are also dependent on the following factors: a) period of time; b) financing rates associated with the use of derivatives; c) other Fund expenses; d) interest and dividends paid with respect to the securities in the benchmark; e) the benchmark's volatility; and f) the benchmark's performance. Longer holding periods, higher benchmark volatility, inverse exposure and/or greater leverage each exacerbates the impact of compounding on a Fund's performance. During periods of higher benchmark volatility, the volatility of a benchmark may affect a Fund's return as much as or more than the return of its benchmark. |
| 1 | ProFunds VP included as Classic ProFunds VP and Sector ProFunds VP are listed in Note 1 of the Notes to Financial Statements. |
| 2 | Past performance is not a guarantee of future results. |
| 3 | Unlike the Funds, indexes that may serve as benchmarks for the Funds do not actually hold a portfolio of securities and/or financial instruments. Indexes do not incur fees, expenses and transaction costs. Fees, expenses and transaction costs incurred by the Funds negatively impact the performance of the Funds relative to their benchmark. Performance for each Fund will generally differ from the performance of the Fund's benchmark index. |
Management Discussion of Fund Performance :: 5
Daily volatility for the U.S. equity markets increased from a year ago. The annual volatility for the S&P 500 for the year ended December 31, 2021, was 13.10%, which was lower than the prior year's volatility of 34.69%. The volatility of each Geared Fund benchmark is shown below.
| Index | | 1 yr Vol. | |
| ProFunds Asia 30 Index® | | | 34.78 | % |
| Dow Jones U.S. SemiconductorsSM Index | | | 30.89 | % |
| Dow Jones U.S. Oil & GasSM Index | | | 29.38 | % |
| Dow Jones Precious MetalsSM Index | | | 29.27 | % |
| S&P/BNY Mellon Emerging 50 ADR Index (USD) | | | 24.49 | % |
| Dow Jones U.S. BanksSM Index | | | 24.07 | % |
| S&P SmallCap 600® Value Index | | | 23.04 | % |
| Dow Jones Internet CompositeSM Index | | | 22.32 | % |
| Russell 2000® Index | | | 21.98 | % |
| S&P SmallCap 600® Growth Index | | | 20.88 | % |
| Dow Jones U.S. TechnologySM Index | | | 20.55 | % |
| S&P MidCap 400® Value Index | | | 19.41 | % |
| Dow Jones U.S. Basic MaterialsSM Index | | | 19.05 | % |
| Nasdaq-100® Index | | | 18.57 | % |
| Nikkei 225 Stock Average | | | 18.57 | % |
| S&P MidCap 400® Growth Index | | | 17.96 | % |
| S&P MidCap 400® | | | 17.93 | % |
| Ryan Labs Returns Treasury Yield Curve 30 Year Index | | | 16.66 | % |
| S&P 500® Growth Index | | | 16.51 | % |
| Dow Jones U.S. BiotechnologySM Index | | | 16.13 | % |
| Dow Jones U.S. FinancialsSM Index | | | 16.00 | % |
| ProFunds Europe 30 Index® | | | 15.48 | % |
| Dow Jones U.S. Consumer GoodsSM Index | | | 15.24 | % |
| Dow Jones U.S. IndustrialsSM Index | | | 15.15 | % |
| Dow Jones U.S. UtilitiesSM Index | | | 14.83 | % |
| Dow Jones U.S. Real EstateSM Index | | | 14.54 | % |
| Dow Jones U.S. Consumer ServicesSM Index | | | 14.53 | % |
| S&P 500® Value Index | | | 13.12 | % |
| S&P 500® | | | 13.10 | % |
| Dow Jones U.S. Select TelecommunicationsSM Index | | | 12.99 | % |
| Dow Jones U.S. Select PharmaceuticalsSM Index | | | 12.85 | % |
| Dow Jones Industrial Average® | | | 12.42 | % |
| Dow Jones U.S. Health CareSM Index | | | 11.93 | % |
| MSCI EAFE Index® | | | 11.62 | % |
| U.S. Dollar Index | | | 5.05 | % |
| ● | Financing Rates Associated with Swap Agreements and Forward Contracts: The performance of Funds that use swap agreements and forward contacts was impacted by financing costs associated with such derivatives. Financing rates are negotiated between the Funds and their counterparties, and are typically set at the one-week/one-month London Interbank Offered Rate ("LIBOR") plus or minus a negotiated spread. The one-week LIBOR decreased from 0.10% to .08% and the one-month LIBOR decreased from 0.14% to .10% during the fiscal year. Each Fund with long exposure to its benchmark generally was negatively affected by financing rates. Conversely, each Fund with short/inverse exposure generally benefited from financing rates. In certain market environments, LIBOR adjusted by the spread may result in a Fund with short/inverse exposure also being negatively affected by financing rates. |
| ● | Stock Dividends and Bond Yields: The performance of Funds that provide long or leveraged exposure was positively impacted by capturing the dividend or income yield of the underlying assets to which they have exposure. The performance of Funds that provide an inverse or leveraged inverse exposure was negatively impacted by virtue of effectively having to pay out the dividend or income yield (or a multiple thereof, as applicable) associated with the assets to which they have short exposure. |
| ● | Fees, Expenses and Transaction Costs: Fees and expenses are listed in the financial statements of each Fund, and may generally be higher and thus have a more negative impact on performance than the fees and expenses of many traditional index-based funds. For Geared Funds, daily repositioning of each Fund's portfolio to maintain exposure consistent with its investment objective, high levels of shareholder purchase and redemption activity, and use of leverage may lead to commensurate increases in portfolio transactions and transaction costs which negatively impact the daily NAV of each Fund. Transaction costs are not reflected in the Funds' expense ratio. Transaction costs are generally higher for Geared Funds, Funds whose benchmarks are more volatile than other funds' benchmarks, and Funds that hold or have exposure to assets that are comparatively less liquid than those held by other funds. |
| ● | Miscellaneous Factors: Each Fund holds a mix of securities and/or derivatives that is designed to provide returns that |
6 :: Management Discussion of Fund Performance
correspond to the performance of its investment objective. Certain Funds may obtain exposure to only a representative sample of the securities of their benchmark and may not have investment exposure to all securities of the benchmark or may have weightings that are different from that of its benchmark. Certain Funds may also obtain exposure to securities not contained in the relevant benchmark or in financial instruments, with the intent of obtaining exposure with aggregate characteristics similar to those of a multiple of the benchmark.
In addition, certain Funds invested in swap agreements based on exchange-traded funds ("ETFs") that are designed to track the performance of the Fund's benchmark. Because the closing price of an ETF may not perfectly track the performance of its benchmark, there are deviations between the return of a swap whose reference asset is an ETF and the return of a swap based directly on the Fund's benchmark. Thus, the performance of a Fund investing significantly in swap agreements based on an ETF had less correlation with its benchmark than a Fund investing in swap agreements based directly on the Fund's benchmark.
Financial Statements and Financial Highlights
8 :: ProFund Access VP High Yield :: Management Discussion of Fund Performance
The Access VP High Yield Fund (the "Fund") seeks to provide investment results that correspond generally to the total return of the high yield market, consistent with maintaining reasonable liquidity. However, the Fund does not seek to match the daily returns of a specific benchmark. For the year ended December 31, 2021, the Fund had a total return of 0.27%%. For the same period, the Markit iBoxx $ Liquid High Yield Index, a widely used measure of high yield market performance, had a total return of 4.48%%1. The total return for the 5-year U.S. Treasury Note was -2.82%2.
The Fund is designed to maintain exposure to the high yield market, regardless of market conditions. This means the Fund does not adopt defensive positions in anticipation of an adverse market climate. The Fund seeks to achieve its high yield exposure primarily through credit default swaps (CDS) and 5-year treasury exposure but may also invest in high yield debt instruments (commonly referred to as junk bonds), other debt, money market instruments, total return swap agreements and futures contracts.
During the year ended December 31, 2021, the Fund invested in credit default swap agreements and futures contracts as a substitute for investing directly in high yield bonds. These derivatives generally tracked the performance of their underlying benchmark and were negatively impacted by financing costs associated with their use. The Fund entered into credit default swap agreements that were centrally cleared. In a centrally cleared swap agreement, the clearing organization takes on the credit risk of all parties involved in the trade, and in effect, guarantees each party's obligation under the contract. As a result, each party involved in a centrally cleared contract only faces the clearing organization. There can be no assurance, however, that the clearing organization, or its members, will satisfy its obligations to the Fund.
Value of a $10,000 Investment at Net Asset Value*

| * | The line graph represents the historical performance of a hypothetical investment of $10,000 in the ProFund Access VP High Yield from December 31, 2011 to December 31, 2021, assuming the reinvestment of distributions. |
Average Annual Total Return as of 12/31/21
| Fund | | One Year | | | Five Year | | | Ten Year | |
| ProFund Access VP High Yield | | | 0.27 | % | | | 3.25 | % | | | 5.11 | % |
| Markit iBoxx $ Liquid High Yield Index | | | 4.48 | % | | | 5.60 | % | | | 5.91 | % |
Expense Ratios**
| Fund | | Gross | | | Net | | | | |
| ProFund Access VP High Yield | | | 1.87 | % | | | 1.68 | % | | | | |
| ** | Reflects the expense ratio as reported in the Prospectus dated May 1, 2021. Contractual fee waivers are in effect through April 30, 2022. See Financial Highlights for effective expense ratios. |
Allocation of Portfolio Holdings & Index Composition
Market Exposure
| Investment Type | | % of Net Assets | |
| U.S. Treasury Obligation | | | 45 | % |
| Futures Contracts | | | 19 | % |
| Credit Default Swap Agreements | | | 75 | % |
"Market Exposure" includes the value of total investments (including the contract value of any derivatives) and excludes any instruments used for cash management.
Holdings
The Access VP High Yield Fund primarily invests in non-equity securities, which may include: credit default swap agreements, utures contracts, repurchase agreements, U.S. Government and money market securities.
Industry Exposure
| | | % of Market
Exposure (CDS) | |
| Consumer, Cyclical | | | 28 | % |
| Consumer, Non-cyclical | | | 16 | % |
| Communications | | | 12 | % |
| Financial | | | 11 | % |
| Energy | | | 9 | % |
| Industrials | | | 7 | % |
| Basic Materials | | | 6 | % |
| Utilities | | | 6 | % |
| Technology | | | 5 | % |
Past performance does not guarantee future results. Return calculations assume the reinvestment of distributions and do not reflect taxes that a shareholder would pay on Fund distributions or on the redemption of Fund shares. The performance data quoted represents past performance and current returns may be lower or higher. The investment return and net asset value ("NAV") will fluctuate so that an investor's shares, when redeemed, may be worth more or less than the original cost. The performance above reflects any fee reductions during the applicable periods. If such fee reductions had not occurred, the quoted performance would be lower. Performance numbers are net of all Fund fees and expenses but do not include any insurance, sales, or administrative charges of variable annuity or life insurance contracts. If these charges were included, the returns would be lower. To obtain performance current to the most recent month-end, please call toll-free 888-776-3637.
| 1 | The graph and table reflect the theoretical reinvestment of dividends on securities in the Index. The impact of transaction costs and the deduction of fees and expenses associated with a mutual fund, such as investment management and accounting fees, are not reflected in the Index calculations. The Fund's performance reflects the reinvestment of dividends as well as the impact of transaction costs and the deduction of fees and expenses. It is not possible to invest directly in an index. |
| 2 | The 5-year U.S. Treasury Note reflects both price return and yield components. It does not reflect the impact of transaction and financing costs, nor the deduction of expenses associated with a mutual fund, such as investment management and accounting fees. |
Investments in high yield bonds or in investments linked to the high yield market are subject to greater volatility and greater credit risks than investing in U.S. Treasuries. U.S. Treasury instruments are guaranteed by the U.S. government as to the timely payment of principal and interest, if held to maturity. Both the principal and yield of a mutual fund will fluctuate with changes in market conditions.
The above information is not covered by the Report of the Independent Registered Public Accounting Firm.
Financial Statements :: ProFund Access VP High Yield :: 9
Schedule of Portfolio Investments :: December 31, 2021
U.S. Treasury Obligations (44.7%)
| | | Principal
Amount | | | Value | |
| U.S. Treasury Notes, 1.25%, 11/30/26 | | $ | 6,850,000 | | | $ | 6,851,605 | |
TOTAL U.S. TREASURY OBLIGATIONS
(Cost $6,872,386) | | | | | | | 6,851,605 | |
| | | | | | | | | |
| Repurchase Agreements(a) (49.3%) | | | | | | | | |
| Repurchase Agreements with various counterparties, 0.00%, dated 12/31/21, due 1/3/22, total to be received $7,560,000 | | | 7,560,000 | | | | 7,560,000 | |
TOTAL REPURCHASE AGREEMENTS
(Cost $7,560,000) | | | | | | | 7,560,000 | |
TOTAL INVESTMENT SECURITIES
(Cost $14,432,386)—94.0% | | | | | | | 14,411,605 | |
| Net other assets (liabilities)—6.0% | | | | | | | 913,430 | |
| NET ASSETS—100.0% | | | | | | $ | 15,325,035 | |
| (a) | The ProFund VP invests in Repurchase Agreements jointly with other funds in the Trust. See "Repurchase Agreements" under Note 2 in the Notes to Financial Statements to view the details of each individual agreement and counterparty as well as a description of the securities subject to repurchase. |
Futures Contracts Purchased
| | | Number
of
Contracts | | | Expiration
Date | | Notional
Amount | | | Value and
Unrealized
Appreciation/
(Depreciation) | |
| 5-Year US Treasury Note Futures Contracts | | | 24 | | | 4/1/22 | | $ | 2,901,188 | | | $ | (2,978 | ) |
Centrally Cleared Swap Agreements
Credit Default Swap Agreements—Sell Protection(a)
Underlying
Instrument | | Payment
Frequency | | Fixed Deal
Receive
Rate | | | Maturity
Date | | Implied Credit
Spread at
December 31,
2021(b) | | | Notional
Amount(c) | | | Value | | | Premiums
Paid
(Received) | | | Unrealized
Appreciation/
(Depreciation) | | | Variation
Margin | |
| CDX North America High Yield Index Swap Agreement; Series 37 | | Daily | | | 5.00 | % | | 12/20/26 | | | 2.92 | % | | $ | 11,500,000 | | | $ | 1,052,731 | | | $ | 1,097,609 | | | $ | (44,878 | ) | | $ | 6,926 | |
| (a) | When a credit event occurs as defined under the terms of the swap agreement, the Fund as a seller of credit protection will either (i) pay to the buyer of protection an amount equal to the par value of the defaulted reference entity and take delivery of the reference entity or (ii) pay a net amount equal to the par value of the defaulted reference entity less its recovery value. |
| (b) | Implied credit spread, represented in absolute terms, utilized in determining the value of the credit default swap agreements as of period end will serve as an indicator of the current status of the payment/performance risk and represent the likelihood or risk of default or other credit event for the credit derivative. The implied credit spread of a referenced entity reflects the cost of buying/selling protection and may include payments required to be made to enter into the agreement. Generally, wider credit spreads represent a perceived deterioration of the referenced entity's credit soundness and a greater likelihood or risk of default or other credit event occurring as defined under the terms of the swap agreement. |
| (c) | The notional amount represents the maximum potential amount the Fund could be required pay as a seller of credit protection if a credit event occurs, as defined under the terms of the swap agreement, for each security included in the CDX North America High Yield Index. |
See accompanying notes to financial statements.
10 :: ProFund Access VP High Yield :: Financial Statements
Statement of Assets and Liabilities
December 31, 2021
| ASSETS: | | | | |
| Total Investment Securities, at cost | | $ | 14,432,386 | |
| Securities, at value | | | 6,851,605 | |
| Repurchase agreements, at value | | | 7,560,000 | |
| Total Investment Securities, at value | | | 14,411,605 | |
| Cash | | | 3,244 | |
| Segregated cash balances for futures contracts with brokers | | | 24,420 | |
| Segregated cash balances for credit default swap agreements with brokers | | | 932,279 | |
| Interest receivable | | | 7,527 | |
| Receivable for capital shares issued | | | 16,219 | |
| Variation margin on credit default swap agreements | | | 6,926 | |
| Prepaid expenses | | | 87 | |
| TOTAL ASSETS | | | 15,402,307 | |
| | | | | |
| LIABILITIES: | | | | |
| Payable for capital shares redeemed | | | 19,196 | |
| Variation margin on futures contracts | | | 563 | |
| Advisory fees payable | | | 24,568 | |
| Management services fees payable | | | 3,276 | |
| Administration fees payable | | | 800 | |
| Administrative services fees payable | | | 7,419 | |
| Distribution fees payable | | | 7,938 | |
| Transfer agency fees payable | | | 1,357 | |
| Fund accounting fees payable | | | 442 | |
| Compliance services fees payable | | | 72 | |
| Other accrued expenses | | | 11,641 | |
| TOTAL LIABILITIES | | | 77,272 | |
| NET ASSETS | | $ | 15,325,035 | |
| | | | | |
| NET ASSETS CONSIST OF: | | | | |
| Capital | | $ | 17,387,809 | |
| Total distributable earnings (loss) | | | (2,062,774 | ) |
| NET ASSETS | | $ | 15,325,035 | |
| Shares of Beneficial Interest Outstanding (unlimited number of shares authorized, no par value) | | | 578,075 | |
| Net Asset Value (offering and redemption price per share) | | $ | 26.51 | |
Statement of Operations
For the Year Ended December 31, 2021
| INVESTMENT INCOME: | | | | |
| Interest | | $ | 70,020 | |
| | | | | |
| EXPENSES: | | | | |
| Advisory fees | | | 132,435 | |
| Management services fees | | | 17,658 | |
| Administration fees | | | 13,792 | |
| Transfer agency fees | | | 10,943 | |
| Administrative services fees | | | 43,943 | |
| Distribution fees | | | 44,145 | |
| Custody fees | | | 2,720 | |
| Fund accounting fees | | | 7,332 | |
| Trustee fees | | | 298 | |
| Compliance services fees | | | 108 | |
| Other fees | | | 12,856 | |
| Recoupment of prior expenses reduced by the Advisor | | | 18,232 | |
| Total Gross Expenses before reductions | | | 304,462 | |
| Expenses reduced and reimbursed by the Advisor | | | (7,808 | ) |
| TOTAL NET EXPENSES | | | 296,654 | |
| NET INVESTMENT INCOME (LOSS) | | | (226,634 | ) |
| | | | | |
| REALIZED AND UNREALIZED GAINS (LOSSES) ON INVESTMENTS: | | | | |
| Net realized gains (losses) on investment securities | | | (301,775 | ) |
| Net realized gains (losses) on futures contracts | | | (32,309 | ) |
| Net realized gains (losses) on swap agreements | | | 1,316,483 | |
| Change in net unrealized appreciation/depreciation on investment securities | | | (56,709 | ) |
| Change in net unrealized appreciation/depreciation on futures contracts | | | (6,309 | ) |
| Change in net unrealized appreciation/depreciation on swap agreements | | | (735,664 | ) |
| NET REALIZED AND UNREALIZED GAINS (LOSSES) ON INVESTMENTS | | | 183,717 | |
| CHANGE IN NET ASSETS RESULTING FROM OPERATIONS | | $ | (42,917 | ) |
See accompanying notes to financial statements.
Financial Statements :: ProFund Access VP High Yield :: 11
Statements of Changes in Net Assets
| | | Year Ended
December 31, 2021 | | | Year Ended
December 31, 2020 | |
| FROM INVESTMENT ACTIVITIES: | | | | | | | | |
| | | | | | | | | |
| OPERATIONS: | | | | | | | | |
| Net investment income (loss) | | $ | (226,634 | ) | | $ | (231,011 | ) |
| Net realized gains (losses) on investments | | | 982,399 | | | | (191,529 | ) |
| Change in net unrealized appreciation/depreciation on investments | | | (798,682 | ) | | | (46,749 | ) |
| Change in net assets resulting from operations | | | (42,917 | ) | | | (469,289 | ) |
| | | | | | | | | |
| DISTRIBUTIONS TO SHAREHOLDERS: | | | | | | | | |
| Total distributions | | | (490,299 | ) | | | (842,012 | ) |
| Change in net assets resulting from distributions | | | (490,299 | ) | | | (842,012 | ) |
| | | | | | | | | |
| CAPITAL TRANSACTIONS: | | | | | | | | |
| Proceeds from shares issued | | | 30,924,436 | | | | 62,693,306 | |
| Distributions reinvested | | | 490,299 | | | | 842,012 | |
| Value of shares redeemed | | | (35,479,084 | ) | | | (74,339,134 | ) |
| Change in net assets resulting from capital transactions | | | (4,064,349 | ) | | | (10,803,816 | ) |
| Change in net assets | | | (4,597,565 | ) | | | (12,115,117 | ) |
| | | | | | | | | |
| NET ASSETS: | | | | | | | | |
| Beginning of period | | | 19,922,600 | | | | 32,037,717 | |
| End of period | | $ | 15,325,035 | | | $ | 19,922,600 | |
| | | | | | | | | |
| SHARE TRANSACTIONS: | | | | | | | | |
| Issued | | | 1,157,931 | | | | 2,384,127 | |
| Reinvested | | | 18,614 | | | | 33,789 | |
| Redeemed | | | (1,333,589 | ) | | | (2,798,588 | ) |
| Change in shares | | | (157,044 | ) | | | (380,672 | ) |
See accompanying notes to financial statements.
12 :: ProFund Access VP High Yield :: Financial Highlights
ProFunds Financial Highlights FOR THE PERIODS INDICATED
Selected data for a share of beneficial interest outstanding throughout the periods indicated.
| | | Year Ended | | | Year Ended | | | Year Ended | | | Year Ended | | | Year Ended | |
| | | Dec. 31, 2021 | | | Dec. 31, 2020 | | | Dec. 31, 2019 | | | Dec. 31, 2018 | | | Dec. 31, 2017 | |
| Net Asset Value, Beginning of Period | | $ | 27.10 | | | $ | 28.71 | | | $ | 26.74 | | | $ | 28.25 | | | $ | 29.12 | |
| | | | | | | | | | | | | | | | | | | | | |
| Investment Activities: | | | | | | | | | | | | | | | | | | | | |
| Net investment income (loss)(a) | | | (0.34 | ) | | | (0.31 | ) | | | 0.06 | | | | 0.16 | | | | (0.10 | ) |
| Net realized and unrealized gains (losses) on investments | | | 0.41 | | | | 0.16 | (b) | | | 3.21 | | | | (0.33 | ) | | | 1.47 | |
| Total income (loss) from investment activities | | | 0.07 | | | | (0.15 | ) | | | 3.27 | | | | (0.17 | ) | | | 1.37 | |
| | | | | | | | | | | | | | | | | | | | | |
| Distributions to Shareholders From: | | | | | | | | | | | | | | | | | | | | |
| Net investment income | | | — | | | | — | | | | (0.06 | ) | | | (0.16 | ) | | | — | |
| In excess of net investment income | | | (0.66 | ) | | | (1.46 | ) | | | (1.24 | ) | | | (0.37 | ) | | | (1.11 | ) |
| Net realized gains on investments | | | — | | | | — | | | | — | | | | (0.60 | ) | | | (1.13 | ) |
| Return of capital | | | — | | | | — | | | | — | | | | (0.21 | ) | | | — | |
| Total distributions | | | (0.66 | ) | | | (1.46 | ) | | | (1.30 | ) | | | (1.34 | ) | | | (2.24 | ) |
| | | | | | | | | | | | | | | | | | | | | |
| Net Asset Value, End of Period | | $ | 26.51 | | | $ | 27.10 | | | $ | 28.71 | | | $ | 26.74 | | | $ | 28.25 | |
| | | | | | | | | | | | | | | | | | | | | |
| Total Return | | | 0.27 | % | | | 0.06 | % | | | 12.43 | % | | | (0.61 | )%(c) | | | 4.79 | % |
| | | | | | | | | | | | | | | | | | | | | |
| Ratios to Average Net Assets: | | | | | | | | | | | | | | | | | | | | |
| Gross expenses | | | 1.72 | % | | | 1.87 | % | | | 1.73 | % | | | 1.72 | % | | | 1.71 | % |
| Net expenses | | | 1.68 | % | | | 1.68 | % | | | 1.70 | %(d) | | | 1.66 | %(c) | | | 1.68 | % |
| Net investment income (loss) | | | (1.28 | )% | | | (1.16 | )% | | | 0.23 | % | | | 0.58 | %(c) | | | (0.34 | )% |
| | | | | | | | | | | | | | | | | | | | | |
| Supplemental Data: | | | | | | | | | | | | | | | | | | | | |
| Net assets, end of period (000's) | | $ | 15,325 | | | $ | 19,923 | | | $ | 32,038 | | | $ | 16,054 | | | $ | 25,713 | |
| Portfolio turnover rate(e) | | | 1,351 | % | | | 1,447 | % | | | 1,459 | % | | | 1,539 | % | | | 1,407 | % |
| (a) | Per share net investment income (loss) has been calculated using the average daily shares method. |
| (b) | The amount shown for a share outstanding throughout the period does not accord with the change in aggregate gains and losses in the portfolio of securities during the period because of the timing of sales and purchases of fund shares in relation to fluctuating market values during the period. |
| (c) | During 2018, the Fund received a non-recurring reimbursement from a third party relating to expenses that were incurred in a prior year. Had this reimbursement not occurred, the net expense ratio and net investment income (loss) ratio would have been 1.67% and 0.57%, respectively, and the total return would have been (0.62)%. |
| (d) | The expense ratio does not correlate to the applicable expense limits in place during the period given that the annual contractual expense limitation is applied for one year periods ended April 30th of each year, instead of coinciding with the December 31st year end. Details of the current expense limitation in effect can be found in Note 4 of the accompanying Notes to Financial Statements. |
| (e) | Portfolio turnover rate is calculated without regard to instruments having a maturity of less than one year from acquisition or derivative instruments (including swap agreements and futures contracts). The portfolio turnover rate can be high and volatile due to the amount and timing of sales and purchases of fund shares during the period. |
See accompanying notes to financial statements.
Management Discussion of Fund Performance :: ProFund VP Asia 30 :: 13
ProFund VP Asia 30 (the “Fund”) seeks investment results, before fees and expenses, that correspond to the performance of the ProFunds Asia 30 Index® (the “Index”). For the year ended December 31, 2021, the Fund had a price return of -18.52%. For the same period, the Index had a total return of -19.08%1 and a volatility of 34.78%. For the year, the Fund achieved an average daily statistical correlation of over 0.99 to the daily performance of the Index.2
The Fund takes positions in financial instruments that, in combination, should have similar return characteristics as the return of the Index. The Index, created by ProFund Advisors, is composed of 30 companies whose principal offices are located in the Asia/Pacific region, excluding Japan, and whose securities are traded on U.S. exchanges or on Nasdaq as depositary receipts or ordinary shares and meet certain liquidity requirements. The component companies in the Index are the 30 most liquid companies based upon their U.S. dollar-traded volume. Their relative weights are determined using a modified market capitalization method. The Index is reconstituted annually. The Index is expressed in U.S. dollar terms and as such should generally reflect the relative movement of the U.S. dollar against the basket of foreign currencies represented by the constituent companies in the Index.
Value of a $10,000 Investment at Net Asset Value*

| * | The line graph represents the historical performance of a hypothetical investment of $10,000 in the ProFund VP Asia 30 from December 31, 2011 to December 31, 2021, assuming the reinvestment of distributions. |
Average Annual Total Return as of 12/31/21
| Fund | | One Year | | | Five Year | | | Ten Year | |
| ProFund VP Asia 30 | | | -18.52 | % | | | 8.58 | % | | | 6.04 | % |
| ProFunds Asia 30 Index® | | | -19.08 | % | | | 8.23 | % | | | 5.91 | % |
| MSCI AC Asia Pacific Free Excluding Japan Index | | | -2.90 | % | | | 10.81 | % | | | 7.71 | % |
Expense Ratios**
| Fund | | Gross | | | Net | | | | | |
| ProFund VP Asia 30 | | | 1.71 | % | | | 1.68 | % | | | | |
| ** | Reflects the expense ratio as reported in the Prospectus dated May 1, 2021. Contractual fee waivers are in effect through April 30, 2022. See Financial Highlights for effective expense ratios. |
Allocation of Portfolio Holdings & Index Composition
Market Exposure
| Investment Type | | % of Net Assets | |
| Equity Securities | | | 99 | % |
| Total Exposure | | | 99 | % |
“Market Exposure” includes the value of total investments (including the contract value of any derivatives) and excludes any instruments used for cash management or collateral for securities loaned.
Largest Equity Holdings
| Company | | % of Net Assets | |
| Taiwan Semiconductor Manufacturing Co., Ltd. | | | 11.9 | % |
| BHP Billiton, Ltd. | | | 6.3 | % |
| Infosys Technologies, Ltd. | | | 5.3 | % |
| Alibaba Group Holding, Ltd. | | | 5.2 | % |
| HDFC Bank, Ltd. | | | 5.1 | % |
ProFunds Asia 30® Index – Composition
| Industry Breakdown | | % of Index | |
| Information Technology | | | 23 | % |
| Consumer Discretionary | | | 23 | % |
| Communication Services | | | 20 | % |
| Financials | | | 18 | % |
| Materials | | | 6 | % |
| Health Care | | | 4 | % |
| Industrials | | | 3 | % |
| Real Estate | | | 3 | % |
| | | | | |
| Country Composition | | | |
| China | | | 58 | % |
| India | | | 15 | % |
| Taiwan | | | 12 | % |
| Singapore | | | 7 | % |
| Australia | | | 6 | % |
| Hong Kong | | | 2 | % |
Past performance does not guarantee future results. Return calculations assume the reinvestment of distributions and do not reflect taxes that a shareholder would pay on Fund distributions or on the redemption of Fund shares. The performance data quoted represents past performance and current returns may be lower or higher. The investment return and net asset value ("NAV") will fluctuate so that an investor's shares, when redeemed, may be worth more or less than the original cost. The performance above reflects any fee reductions during the applicable periods. If such fee reductions had not occurred, the quoted performance would be lower. Performance numbers are net of all Fund fees and expenses but do not include any insurance, sales, or administrative charges of variable annuity or life insurance contracts. If these charges were included, the returns would be lower. To obtain performance current to the most recent month-end, please call toll-free 888-776-3637.
| 1 | The graph and table DO NOT reflect the theoretical reinvestment of dividends on securities in the Index nor the impact of transaction costs and the deduction of fees and expenses associated with a mutual fund, such as investment management and accounting fees. The Fund's performance reflects the reinvestment of dividends as well as the impact of transaction costs and the deduction of fees and expenses. It is not possible to invest directly in an index. |
| 2 | 1.00 equals perfect correlation. This calculation is based on the daily total return of the Index and the performance of the daily total return of the NAV per share of the Fund. |
| 3 | The MSCI AC Asia Pacific Free Excluding Japan Index is a capitalization weighted index generally representative of the performance of the Asia Pacific region excluding the country of Japan. The graph and table reflect the theoretical reinvestment of dividends in the Index. The impact of transactions costs and the deduction of fees and expenses associated with a mutual fund, such as investment management and accounting fees, are not reflected in the Index calculations. It is not possible to invest directly in an index. |
The above information is not covered by the Report of the Independent Registered Public Accounting Firm.
14 :: ProFund VP Asia 30 :: Financial Statements
Schedule of Portfolio Investments :: December 31, 2021
Common Stocks (99.2%)
| | | Shares | | | Value | |
| 360 DigiTech, Inc.ADR (Consumer Finance) | | | 25,099 | | | $ | 575,520 | |
| Alibaba Group Holding, Ltd.*ADR (Internet & Direct Marketing Retail) | | | 9,638 | | | | 1,144,897 | |
| Baidu, Inc.*ADR (Interactive Media & Services) | | | 4,953 | | | | 736,957 | |
| Beigene, Ltd.*ADR (Biotechnology) | | | 2,008 | | | | 544,028 | |
| BHP Billiton, Ltd.ADR(a) (Metals & Mining) | | | 22,757 | | | | 1,373,385 | |
| Bilibili, Inc.*ADR(a) (Entertainment) | | | 8,902 | | | | 413,053 | |
| Daqo New Energy Corp.*ADR (Semiconductors & Semiconductor Equipment) | | | 8,099 | | | | 326,552 | |
| Futu Holdings, Ltd.*ADR (Capital Markets) | | | 9,170 | | | | 397,061 | |
| GDS Holdings, Ltd.*ADR (IT Services) | | | 9,772 | | | | 460,848 | |
| HDFC Bank, Ltd.ADR (Banks) | | | 17,067 | | | | 1,110,550 | |
| ICICI Bank, Ltd.ADR (Banks) | | | 46,651 | | | | 923,223 | |
| Infosys Technologies, Ltd.ADR (IT Services) | | | 46,048 | | | | 1,165,475 | |
| iQIYI, Inc.*ADR (Entertainment) | | | 61,710 | | | | 281,398 | |
| JD.com, Inc.*ADR (Internet & Direct Marketing Retail) | | | 9,170 | | | | 642,542 | |
| JinkoSolar Holding Co., Ltd.*ADR(a) (Semiconductors & Semiconductor Equipment) | | | 10,508 | | | | 482,947 | |
| JOYY, Inc.ADR (Interactive Media & Services) | | | 10,040 | | | | 456,117 | |
| KE Holdings, Inc.*ADR (Real Estate Management & Development) | | | 30,587 | | | | 615,410 | |
| Li Auto, Inc.*ADR (Automobiles) | | | 20,816 | | | | 668,194 | |
| Lufax Holding, Ltd.*ADR (Consumer Finance) | | | 89,085 | | | | 501,549 | |
| NetEase, Inc.ADR (Entertainment) | | | 9,103 | | | | 926,502 | |
| NIO, Inc.*ADR (Automobiles) | | | 22,957 | | | | 727,278 | |
| Pinduoduo, Inc.*ADR (Internet & Direct Marketing Retail) | | | 7,898 | | | | 460,453 | |
| Sea, Ltd.*ADR (Entertainment) | | | 4,752 | | | | 1,063,070 | |
| Taiwan Semiconductor Manufacturing Co., Ltd.ADR (Semiconductors & Semiconductor Equipment) | | | 21,619 | | | | 2,600,982 | |
| TAL Education Group*ADR (Diversified Consumer Services) | | | 132,389 | | | | 520,289 | |
| Tencent Music Entertainment Group*ADR (Entertainment) | | | 74,695 | | | | 511,661 | |
| Up Fintech Holding, Ltd.*ADR(a) (Capital Markets) | | | 68,738 | | | | 337,504 | |
| XPeng, Inc.*ADR (Automobiles) | | | 15,126 | | | | 761,291 | |
| Zai Lab, Ltd.*ADR (Biotechnology) | | | 6,158 | | | | 387,030 | |
| ZTO Express Cayman, Inc.ADR (Air Freight & Logistics) | | | 22,221 | | | | 627,077 | |
TOTAL COMMON STOCKS
(Cost $15,173,890) | | | | | | | 21,742,843 | |
Repurchase Agreements(b) (1.3%)
| | | Principal
Amount | | | Value | |
| Repurchase Agreements with various counterparties, 0.00%, dated 12/31/21, due 1/3/22, total to be received $278,000 | | $ | 278,000 | | | $ | 278,000 | |
TOTAL REPURCHASE AGREEMENTS
(Cost $278,000) | | | | | | | 278,000 | |
Collateral for Securities Loaned(c) (8.3%)
| | | Shares | | | Value | |
| BlackRock Liquidity Funds FedFund Portfolio—Institutional Shares, 0.03%(d) | | | 1,818,424 | | | $ | 1,818,424 | |
TOTAL COLLATERAL FOR SECURITIES LOANED
(Cost $1,818,424) | | | | | | | 1,818,424 | |
TOTAL INVESTMENT SECURITIES
(Cost $17,270,314)—108.8% | | | | | | | 23,839,267 | |
| Net other assets (liabilities)—(8.8)% | | | | | | | (1,932,231 | ) |
| NET ASSETS—100.0% | | | | | | $ | 21,907,036 | |
| * | Non-income producing security. |
| (a) | All or part of this security was on loan as of December 31, 2021. The total value of securities on loan as of December 31, 2021 was $1,710,239. |
| (b) | The ProFund VP invests in Repurchase Agreements jointly with other funds in the Trust. See "Repurchase Agreements" under Note 2 in the Notes to Financial Statements to view the details of each individual agreement and counterparty as well as a description of the securities subject to repurchase. |
| (c) | Securities were purchased with cash collateral held from securities on loan at December 31, 2021. |
| (d) | Rate periodically changes. Rate disclosed is the daily yield on December 31, 2021. |
| ADR | American Depositary Receipt |
ProFund VP Asia 30 invested in the following industries as of December 31, 2021:
| | | Value | | | % of
Net Assets | |
| Air Freight & Logistics | | $ | 627,077 | | | | 2.9 | % |
| Automobiles | | | 2,156,763 | | | | 9.8 | % |
| Banks | | | 2,033,773 | | | | 9.2 | % |
| Biotechnology | | | 931,058 | | | | 4.3 | % |
| Capital Markets | | | 734,565 | | | | 3.4 | % |
| Consumer Finance | | | 1,077,069 | | | | 4.9 | % |
| Diversified Consumer Services | | | 520,289 | | | | 2.4 | % |
| Entertainment | | | 3,195,684 | | | | 14.6 | % |
| Interactive Media & Services | | | 1,193,074 | | | | 5.4 | % |
| Internet & Direct Marketing Retail | | | 2,247,892 | | | | 10.2 | % |
| IT Services | | | 1,626,323 | | | | 7.4 | % |
| Metals & Mining | | | 1,373,385 | | | | 6.3 | % |
| Real Estate Management & Development | | | 615,410 | | | | 2.8 | % |
| Semiconductors & Semiconductor Equipment | | | 3,410,481 | | | | 15.6 | % |
| Other** | | | 164,193 | | | | 0.8 | % |
| Total | | $ | 21,907,036 | | | | 100.0 | % |
ProFund VP Asia 30 invested in securities with exposure to the following countries as of December 31, 2021:
| | | Value | | | % of
Net Assets | |
| Australia | | $ | 1,373,385 | | | | 6.3 | % |
| China | | | 13,506,158 | | | | 61.6 | % |
| India | | | 3,199,248 | | | | 14.5 | % |
| Singapore | | | 1,063,070 | | | | 4.9 | % |
| Taiwan | | | 2,600,982 | | | | 11.9 | % |
| Other** | | | 164,193 | | | | 0.8 | % |
| Total | | $ | 21,907,036 | | | | 100.0 | % |
| ** | Includes any non-equity securities and net other assets (liabilities), which includes any receivable for capital shares issued and payable for capital shares redeemed. |
See accompanying notes to financial statements.
Financial Statements :: ProFund VP Asia 30 :: 15
Statement of Assets and Liabilities
December 31, 2021
| ASSETS: |
| Total Investment Securities, at cost | | $ | 17,270,314 | |
| Securities, at value(a) | | | 23,561,267 | |
| Repurchase agreements, at value | | | 278,000 | |
| Total Investment Securities, at value | | | 23,839,267 | |
| Cash | | | 3,522 | |
| Dividends receivable | | | 16,128 | |
| Receivable for capital shares issued | | | 204,543 | |
| Prepaid expenses | | | 232 | |
| TOTAL ASSETS | | | 24,063,692 | |
| | | | | |
| LIABILITIES: | | | | |
| Payable for collateral for securities loaned | | | 1,818,424 | |
| Payable for capital shares redeemed | | | 2,540 | |
| Payable for investments purchased | | | 274,434 | |
| Advisory fees payable | | | 15,963 | |
| Management services fees payable | | | 2,128 | |
| Administration fees payable | | | 1,295 | |
| Administrative services fees payable | | | 8,728 | |
| Distribution fees payable | | | 12,469 | |
| Transfer agency fees payable | | | 2,281 | |
| Fund accounting fees payable | | | 723 | |
| Compliance services fees payable | | | 107 | |
| Other accrued expenses | | | 17,564 | |
| TOTAL LIABILITIES | | | 2,156,656 | |
| NET ASSETS | | $ | 21,907,036 | |
| | | | | |
| NET ASSETS CONSIST OF: | | | | |
| Capital | | $ | 14,743,762 | |
| Total distributable earnings (loss) | | | 7,163,274 | |
| NET ASSETS | | $ | 21,907,036 | |
| Shares of Beneficial Interest Outstanding (unlimited number of shares authorized, no par value) | | | 411,294 | |
| Net Asset Value (offering and redemption price per share) | | $ | 53.26 | |
| | | | |
| (a) Includes securities on loan valued at: | | $ | 1,710,239 | |
Statement of Operations
For the Year Ended December 31, 2021
| INVESTMENT INCOME: | | | | |
| Dividends | | $ | 475,188 | |
| Interest | | | 2 | |
| Foreign tax withholding | | | (5,638 | ) |
| Net income from securities lending | | | 164,866 | |
| TOTAL INVESTMENT INCOME | | | 634,418 | |
| | | | | |
| EXPENSES: | | | | |
| Advisory fees | | | 237,097 | |
| Management services fees | | | 31,613 | |
| Administration fees | | | 24,448 | |
| Transfer agency fees | | | 19,609 | |
| Administrative services fees | | | 65,985 | |
| Distribution fees | | | 79,032 | |
| Custody fees | | | 14,430 | |
| Fund accounting fees | | | 13,270 | |
| Trustee fees | | | 497 | |
| Compliance services fees | | | 191 | |
| Other fees | | | 24,022 | |
| Recoupment of prior expenses reduced by the Advisor | | | 19,045 | |
| TOTAL NET EXPENSES | | | 529,239 | |
| NET INVESTMENT INCOME (LOSS) | | | 105,179 | |
| | | | | |
| REALIZED AND UNREALIZED GAINS (LOSSES) ON INVESTMENTS: | | | | |
| Net realized gains (losses) on investment securities | | | 1,586,187 | |
| Change in net unrealized appreciation/depreciation on investment securities | | | (7,229,921 | ) |
| NET REALIZED AND UNREALIZED GAINS (LOSSES) ON INVESTMENTS | | | (5,643,734 | ) |
| CHANGE IN NET ASSETS RESULTING FROM OPERATIONS | | $ | (5,538,555 | ) |
See accompanying notes to financial statements.
16 :: ProFund VP Asia 30 :: Financial Statements
Statements of Changes in Net Assets
| | | Year Ended
December 31, 2021 | | | Year Ended
December 31, 2020 | |
| FROM INVESTMENT ACTIVITIES: | | | | | | | | |
| | | | | | | | | |
| OPERATIONS: | | | | | | | | |
| Net investment income (loss) | | $ | 105,179 | | | $ | (43,383 | ) |
| Net realized gains (losses) on investments | | | 1,586,187 | | | | 4,545,593 | |
| Change in net unrealized appreciation/depreciation on investments | | | (7,229,921 | ) | | | 3,066,891 | |
| Change in net assets resulting from operations | | | (5,538,555 | ) | | | 7,569,101 | |
| | | | | | | | | |
| DISTRIBUTIONS TO SHAREHOLDERS: | | | | | | | | |
| Total distributions | | | (4,388,382 | ) | | | (2,519,835 | ) |
| Change in net assets resulting from distributions | | | (4,388,382 | ) | | | (2,519,835 | ) |
| | | | | | | | | |
| CAPITAL TRANSACTIONS: | | | | | | | | |
| Proceeds from shares issued | | | 45,782,302 | | | | 30,433,386 | |
| Distributions reinvested | | | 4,388,382 | | | | 2,519,835 | |
| Value of shares redeemed | | | (47,830,246 | ) | | | (37,565,743 | ) |
| Change in net assets resulting from capital transactions | | | 2,340,438 | | | | (4,612,522 | ) |
| Change in net assets | | | (7,586,499 | ) | | | 436,744 | |
| | | | | | | | | |
| NET ASSETS: | | | | | | | | |
| Beginning of period | | | 29,493,535 | | | | 29,056,791 | |
| End of period | | $ | 21,907,036 | | | $ | 29,493,535 | |
| | | | | | | | | |
| SHARE TRANSACTIONS: | | | | | | | | |
| Issued | | | 616,849 | | | | 480,489 | |
| Reinvested | | | 65,294 | | | | 38,110 | |
| Redeemed | | | (659,603 | ) | | | (597,380 | ) |
| Change in shares | | | 22,540 | | | | (78,781 | ) |
See accompanying notes to financial statements.
Financial Highlights :: ProFund VP Asia 30 :: 17
ProFunds Financial Highlights FOR THE PERIODS INDICATED
Selected data for a share of beneficial interest outstanding throughout the periods indicated.
| | | Year Ended | | | Year Ended | | | Year Ended | | | Year Ended | | | Year Ended | |
| | | Dec. 31, 2021 | | | Dec. 31, 2020 | | | Dec. 31, 2019 | | | Dec. 31, 2018 | | | Dec. 31, 2017 | |
| Net Asset Value, Beginning of Period | | $ | 75.87 | | | $ | 62.15 | | | $ | 49.34 | | | $ | 60.88 | | | $ | 47.26 | |
| | | | | | | | | | | | | | | | | | | | | |
| Investment Activities: | | | | | | | | | | | | | | | | | | | | |
| Net investment income (loss)(a) | | | 0.24 | | | | (0.11 | ) | | | 0.39 | | | | 0.11 | | | | 0.21 | |
| Net realized and unrealized gains (losses) on investments | | | (12.05 | ) | | | 21.13 | | | | 12.56 | | | | (11.37 | ) | | | 15.27 | |
| Total income (loss) from investment activities | | | (11.81 | ) | | | 21.02 | | | | 12.95 | | | | (11.26 | ) | | | 15.48 | |
| | | | | | | | | | | | | | | | | | | | | |
| Distributions to Shareholders From: | | | | | | | | | | | | | | | | | | | | |
| Net investment income | | | — | | | | (0.72 | ) | | | (0.14 | ) | | | (0.28 | ) | | | — | |
| Net realized gains on investments | | | (10.80 | ) | | | (6.58 | ) | | | — | | | | — | | | | (1.86 | ) |
| Total distributions | | | (10.80 | ) | | | (7.30 | ) | | | (0.14 | ) | | | (0.28 | ) | | | (1.86 | ) |
| | | | | | | | | | | | | | | | | | | | | |
| Net Asset Value, End of Period | | $ | 53.26 | | | $ | 75.87 | | | $ | 62.15 | | | $ | 49.34 | | | $ | 60.88 | |
| | | | | | | | | | | | | | | | | | | | | |
| Total Return | | | (18.52 | )%(b) | | | 35.55 | % | | | 26.31 | % | | | (18.59 | )% | | | 32.87 | % |
| | | | | | | | | | | | | | | | | | | | | |
| Ratios to Average Net Assets: | | | | | | | | | | | | | | | | | | | | |
| Gross expenses | | | 1.68 | % | | | 1.71 | % | | | 1.72 | % | | | 1.74 | % | | | 1.70 | % |
| Net expenses | | | 1.68 | % | | | 1.68 | % | | | 1.68 | % | | | 1.68 | % | | | 1.68 | % |
| Net investment income (loss) | | | 0.33 | % | | | (0.18 | )% | | | 0.68 | % | | | 0.19 | % | | | 0.37 | % |
| | | | | | | | | | | | | | | | | | | | | |
| Supplemental Data: | | | | | | | | | | | | | | | | | | | | |
| Net assets, end of period (000's) | | $ | 21,907 | | | $ | 29,494 | | | $ | 29,057 | | | $ | 19,796 | | | $ | 34,695 | |
| Portfolio turnover rate(c) | | | 125 | % | | | 130 | % | | | 111 | % | | | 87 | % | | | 96 | % |
| (a) | Per share net investment income (loss) has been calculated using the average daily shares method. |
| (b) | During the year ended December 31, 2021, the Fund received monies related to certain nonrecurring litigation settlements. The corresponding impact to the total return was an increase of 0.34%. |
| (c) | Portfolio turnover rate is calculated without regard to instruments having a maturity of less than one year from acquisition or derivative instruments (including swap agreements and futures contracts). The portfolio turnover rate can be high and volatile due to the amount and timing of sales and purchases of fund shares during the period. |
See accompanying notes to financial statements.
18 :: ProFund VP Banks :: Management Discussion of Fund Performance
ProFund VP Banks (the "Fund") seeks investment results, before fees and expenses, that correspond to the performance of the Dow Jones U.S. BanksSM Index (the "Index"). For the year ended December 31, 2021, the Fund had a total return of 34.09%. For the same period, the Index had a total return of 36.28%1 and a volatility of 24.07%. For the year, the Fund achieved an average daily statistical correlation of over 0.99 to the daily performance of the Index.2
The Fund takes positions in financial instruments that, in combination, should have similar return characteristics as the return of the Index. The Index measures the performance of the banking sector of the U.S. equity market. Component companies include, among others, regional and major U.S. domiciled banks engaged in a wide range of financial services, including retail banking, loans, and money transmissions.
During the year ended December 31, 2021, the Fund invested in swap agreements as a substitute for investing directly in stocks in order to gain exposure to the Index. These derivatives generally tracked the performance of their underlying benchmark and were negatively impacted by financing costs associated with their use. The Fund entered into swap agreements with counterparties that the Fund's advisor determined to be major, global financial institutions. If a counterparty becomes insolvent or otherwise fails to perform on its obligations, the value of investments in the Fund may decline. The Fund has sought to mitigate this risk by generally requiring counterparties to post collateral for the benefit of the Fund, marked to market daily, in an amount approximately equal to the amount the counterparty owed to the Fund, subject to certain minimum thresholds.
Value of a $10,000 Investment at Net Asset Value*
| * | The line graph represents the historical performance of a hypothetical investment of $10,000 in the ProFund VP Banks from December 31, 2011 to December 31, 2021, assuming the reinvestment of distributions. |
Average Annual Total Return as of 12/31/21
| Fund | | One Year | | | Five Year | | | Ten Year | |
| ProFund VP Banks | | | 34.09 | % | | | 8.47 | % | | | 13.73 | % |
| Dow Jones U.S. BanksSM Index | | | 36.28 | % | | | 10.42 | % | | | 15.78 | % |
| S&P 500® | | | 28.71 | % | | | 18.47 | % | | | 16.55 | % |
Expense Ratios**
| Fund | | Gross | | | Net | | | | | |
| ProFund VP Banks | | | 1.74 | % | | | 1.68 | % | | | | |
| ** | Reflects the expense ratio as reported in the Prospectus dated May 1, 2021. Contractual fee waivers are in effect through April 30, 2022. See Financial Highlights for effective expense ratios. |
Allocation of Portfolio Holdings & Index Composition
Market Exposure
| Investment Type | | % of Net Assets | |
| Equity Securities | | | 79 | % |
| Swap Agreements | | | 21 | % |
| Total Exposure | | | 100 | % |
"Market Exposure" includes the value of total investments (including the contract value of any derivatives) and excludes any instruments used for cash management.
Largest Equity Holdings
| Company | | % of Net Assets | |
| JPMorgan Chase & Co. | | | 21.2 | % |
| Bank of America Corp. | | | 14.5 | % |
| Wells Fargo & Co. | | | 8.7 | % |
| Citigroup, Inc. | | | 5.4 | % |
| The PNC Financial Services Group, Inc. | | | 3.8 | % |
Dow Jones U.S. BanksSM Index – Composition
| | | % of Index | |
| Diversified Banks | | | 68 | % |
| Regional Banks | | | 32 | % |
Past performance does not guarantee future results. Return calculations assume the reinvestment of distributions and do not reflect taxes that a shareholder would pay on Fund distributions or on the redemption of Fund shares. The performance data quoted represents past performance and current returns may be lower or higher. The investment return and net asset value ("NAV") will fluctuate so that an investor's shares, when redeemed, may be worth more or less than the original cost. The performance above reflects any fee reductions during the applicable periods. If such fee reductions had not occurred, the quoted performance would be lower. Performance numbers are net of all Fund fees and expenses but do not include any insurance, sales, or administrative charges of variable annuity or life insurance contracts. If these charges were included, the returns would be lower. To obtain performance current to the most recent month-end, please call toll-free 888-776-3637.
| 1 | The graph and table reflect the theoretical reinvestment of dividends on securities in the Indexes. The impact of transaction costs and the deduction of fees and expenses associated with a mutual fund, such as investment management and accounting fees, are not reflected in calculations of the Indexes. The Fund's performance reflects the reinvestment of dividends as well as the impact of transaction costs and the deduction of fees and expenses. It is not possible to invest directly in an index. |
| 2 | 1.00 equals perfect correlation. This calculation is based on the daily total return of the Index and the performance of the daily total return of the NAV per share of the Fund. |
| 3 | The S&P 500® is an unmanaged index that consists of the common stocks of 500 major U.S. corporations selected for their size and the frequency and ease with which their stocks trade. |
The above information is not covered by the Report of the Independent Registered Public Accounting Firm.
Financial Statements :: ProFund VP Banks :: 19
Schedule of Portfolio Investments :: December 31, 2021
Common Stocks (79.0%)
| | | Shares | | | Value | |
| Bank of America Corp. (Banks) | | | 24,471 | | | $ | 1,088,714 | |
| Bank OZK (Banks) | | | 410 | | | | 19,077 | |
| BOK Financial Corp. (Banks) | | | 103 | | | | 10,865 | |
| Citigroup, Inc. (Banks) | | | 6,740 | | | | 407,029 | |
| Citizens Financial Group, Inc. (Banks) | | | 1,448 | | | | 68,418 | |
| Comerica, Inc. (Banks) | | | 445 | | | | 38,715 | |
| Commerce Bancshares, Inc. (Banks) | | | 378 | | | | 25,984 | |
| Cullen/Frost Bankers, Inc. (Banks) | | | 193 | | | | 24,332 | |
| East West Bancorp, Inc. (Banks) | | | 482 | | | | 37,924 | |
| F.N.B. Corp. (Banks) | | | 1,085 | | | | 13,161 | |
| Fifth Third Bancorp (Banks) | | | 2,323 | | | | 101,167 | |
| First Citizens BancShares, Inc.— Class A (Banks) | | | 24 | | | | 19,916 | |
| First Financial Bankshares, Inc. (Banks) | | | 435 | | | | 22,115 | |
| First Horizon Corp. (Banks) | | | 1,838 | | | | 30,008 | |
| First Republic Bank (Banks) | | | 608 | | | | 125,558 | |
| Glacier Bancorp, Inc. (Banks) | | | 368 | | | | 20,866 | |
| Home BancShares, Inc. (Banks) | | | 513 | | | | 12,492 | |
| Huntington Bancshares, Inc. (Banks) | | | 4,913 | | | | 75,758 | |
| JPMorgan Chase & Co. (Banks) | | | 10,044 | | | | 1,590,466 | |
| KeyCorp (Banks) | | | 3,162 | | | | 73,137 | |
| M&T Bank Corp. (Banks) | | | 437 | | | | 67,114 | |
| New York Community Bancorp, Inc. (Thrifts & Mortgage Finance) | | | 1,580 | | | | 19,292 | |
| People's United Financial, Inc. (Banks) | | | 1,455 | | | | 25,928 | |
| Pinnacle Financial Partners, Inc. (Banks) | | | 258 | | | | 24,639 | |
| Popular, Inc. (Banks) | | | 271 | | | | 22,233 | |
| Prosperity Bancshares, Inc. (Banks) | | | 313 | | | | 22,630 | |
| Regions Financial Corp. (Banks) | | | 3,240 | | | | 70,632 | |
| Signature Bank (Banks) | | | 206 | | | | 66,635 | |
| SVB Financial Group* (Banks) | | | 200 | | | | 135,648 | |
| Synovus Financial Corp. (Banks) | | | 494 | | | | 23,648 | |
| TFS Financial Corp. (Thrifts & Mortgage Finance) | | | 162 | | | | 2,895 | |
| The PNC Financial Services Group, Inc. (Banks) | | | 1,436 | | | | 287,947 | |
| Truist Financial Corp. (Banks) | | | 4,534 | | | | 265,466 | |
| U.S. Bancorp (Banks) | | | 4,583 | | | | 257,427 | |
| UMB Financial Corp. (Banks) | | | 146 | | | | 15,492 | |
| Umpqua Holdings Corp. (Banks) | | | 736 | | | | 14,161 | |
| United Bankshares, Inc. (Banks) | | | 462 | | | | 16,761 | |
| Valley National Bancorp (Banks) | | | 1,382 | | | | 19,003 | |
| Webster Financial Corp. (Banks) | | | 307 | | | | 17,143 | |
| Wells Fargo & Co. (Banks) | | | 13,543 | | | | 649,793 | |
| Western Alliance Bancorp (Banks) | | | 354 | | | | 38,108 | |
| Wintrust Financial Corp. (Banks) | | | 194 | | | | 17,619 | |
| Zions Bancorp (Banks) | | | 532 | | | | 33,601 | |
TOTAL COMMON STOCKS
(Cost $1,732,973) | | | | | | | 5,919,517 | |
Repurchase Agreements(a) (1.1%)
| | | Principal
Amount | | | Value | |
| Repurchase Agreements with various counterparties, 0.00%, dated 12/31/21, due 1/3/22, total to be received $85,000 | | $ | 85,000 | | | $ | 85,000 | |
TOTAL REPURCHASE AGREEMENTS
(Cost $85,000) | | | | | | | 85,000 | |
TOTAL INVESTMENT SECURITIES
(Cost $1,817,973) — 80.1% | | | | | | | 6,004,517 | |
| Net other assets (liabilities) — 19.9% | | | | | | | 1,495,796 | |
| NET ASSETS — 100.0% | | | | | | $ | 7,500,313 | |
| * | Non-income producing security. |
| (a) | The ProFund VP invests in Repurchase Agreements jointly with other funds in the Trust. See "Repurchase Agreements" under Note 2 in the Notes to Financial Statements to view the details of each individual agreement and counterparty as well as a description of the securities subject to repurchase. |
Total Return Swap Agreements — Long
| Underlying Instrument | | Counterparty | | Termination
Date(1) | | Rate Paid
(Received)(2) | | | Notional
Amount | | | Value and
Unrealized
Appreciation/
(Depreciation) | |
| Dow Jones U.S. Banks Index | | Goldman Sachs International | | 1/24/22 | | | 0.68 | % | | $ | 1,558,398 | | | $ | 610 | |
| (1) | Agreements may be terminated at will by either party without penalty. Payment is due at termination/maturity. |
| (2) | Reflects the floating financing rate, as of December 31, 2021, on the notional amount of the swap agreement paid to the counterparty or received from the counterparty, excluding any commissions. This amount is included as part of the unrealized appreciation/(depreciation). |
See accompanying notes to financial statements.
20 :: ProFund VP Banks :: Financial Statements
ProFund VP Banks invested in the following industries as of December 31, 2021:
| | | Value | | | % of
Net Assets | |
| Banks | | $ | 5,897,330 | | | | 78.7 | % |
| Thrifts & Mortgage Finance | | | 22,187 | | | | 0.3 | % |
| Other** | | | 1,580,796 | | | | 21.0 | % |
| Total | | $ | 7,500,313 | | | | 100.0 | % |
| ** | Includes any non-equity securities and net other assets (liabilities), which includes any receivable for capital shares issued and payable for capital shares redeemed. |
See accompanying notes to financial statements.
Financial Statements :: ProFund VP Banks :: 21
Statement of Assets and Liabilities
December 31, 2021
| ASSETS: | | | | |
| Total Investment Securities, at cost | | $ | 1,817,973 | |
| Securities, at value | | | 5,919,517 | |
| Repurchase agreements, at value | | | 85,000 | |
| Total Investment Securities, at value | | | 6,004,517 | |
| Cash | | | 790 | |
| Segregated cash balances for swap agreements with custodian | | | 30,000 | |
| Dividends receivable | | | 7,060 | |
| Unrealized appreciation on swap agreements | | | 610 | |
| Receivable for investments sold | | | 1,497,278 | |
| Prepaid expenses | | | 130 | |
| TOTAL ASSETS | | | 7,540,385 | |
| | | | | |
| LIABILITIES: | | | | |
| Payable for capital shares redeemed | | | 20,937 | |
| Advisory fees payable | | | 5,743 | |
| Management services fees payable | | | 766 | |
| Administration fees payable | | | 459 | |
| Administrative services fees payable | | | 3,271 | |
| Distribution fees payable | | | 3,381 | |
| Transfer agency fees payable | | | 827 | |
| Fund accounting fees payable | | | 266 | |
| Compliance services fees payable | | | 34 | |
| Other accrued expenses | | | 4,388 | |
| TOTAL LIABILITIES | | | 40,072 | |
| NET ASSETS | | $ | 7,500,313 | |
| | | | | |
| NET ASSETS CONSIST OF: | | | | |
| Capital | | $ | 8,012,656 | |
| Total distributable earnings (loss) | | | (512,343 | ) |
| NET ASSETS | | $ | 7,500,313 | |
| Shares of Beneficial Interest Outstanding (unlimited number of shares authorized, no par value) | | | 237,094 | |
| Net Asset Value (offering and redemption price per share) | | $ | 31.63 | |
Statement of Operations
For the Year Ended December 31, 2021
| INVESTMENT INCOME: | | | | |
| Dividends | | $ | 192,702 | |
| Interest | | | 2 | |
| Net income from securities lending | | | 1 | |
| TOTAL INVESTMENT INCOME | | | 192,705 | |
| | | | | |
| EXPENSES: | | | | |
| Advisory fees | | | 64,146 | |
| Management services fees | | | 8,553 | |
| Administration fees | | | 6,220 | |
| Transfer agency fees | | | 5,198 | |
| Administrative services fees | | | 24,159 | |
| Distribution fees | | | 21,382 | |
| Custody fees | | | 1,257 | |
| Fund accounting fees | | | 3,638 | |
| Trustee fees | | | 121 | |
| Compliance services fees | | | 65 | |
| Other fees | | | 8,280 | |
| Recoupment of prior expenses reduced by the Advisor | | | 1,000 | |
| Total Gross Expenses before reductions | | | 144,019 | |
| Expenses reduced and reimbursed by the Advisor | | | (332 | ) |
| TOTAL NET EXPENSES | | | 143,687 | |
| NET INVESTMENT INCOME (LOSS) | | | 49,018 | |
| | | | | |
| REALIZED AND UNREALIZED GAINS (LOSSES) ON INVESTMENTS: | | | | |
| Net realized gains (losses) on investment securities | | | 188,160 | |
| Net realized gains (losses) on swap agreements | | | 103,616 | |
| Change in net unrealized appreciation/depreciation on investment securities | | | 1,462,980 | |
| Change in net unrealized appreciation/depreciation on swap agreements | | | (255 | ) |
| NET REALIZED AND UNREALIZED GAINS (LOSSES) ON INVESTMENTS | | | 1,754,501 | |
| CHANGE IN NET ASSETS RESULTING FROM OPERATIONS | | $ | 1,803,519 | |
See accompanying notes to financial statements.
22 :: ProFund VP Banks :: Financial Statements
Statements of Changes in Net Assets
| | | Year Ended
December 31, 2021 | | | Year Ended
December 31, 2020 | |
| FROM INVESTMENT ACTIVITIES: | | | | | | | | |
| | | | | | | | | |
| OPERATIONS: | | | | | | | | |
| Net investment income (loss) | | $ | 49,018 | | | $ | 82,428 | |
| Net realized gains (losses) on investments | | | 291,776 | | | | (7,095 | ) |
| Change in net unrealized appreciation/depreciation on investments | | | 1,462,725 | | | | (1,708,378 | ) |
| Change in net assets resulting from operations | | | 1,803,519 | | | | (1,633,045 | ) |
| | | | | | | | | |
| DISTRIBUTIONS TO SHAREHOLDERS: | | | | | | | | |
| Total distributions | | | (82,428 | ) | | | (92,909 | ) |
| Change in net assets resulting from distributions | | | (82,428 | ) | | | (92,909 | ) |
| | | | | | | | | |
| CAPITAL TRANSACTIONS: | | | | | | | | |
| Proceeds from shares issued | | | 42,197,240 | | | | 18,733,923 | |
| Distributions reinvested | | | 82,428 | | | | 92,909 | |
| Value of shares redeemed | | | (41,323,046 | ) | | | (21,610,921 | ) |
| Change in net assets resulting from capital transactions | | | 956,622 | | | | (2,784,089 | ) |
| Change in net assets | | | 2,677,713 | | | | (4,510,043 | ) |
| | | | | | | | | |
| NET ASSETS: | | | | | | | | |
| Beginning of period | | | 4,822,600 | | | | 9,332,643 | |
| End of period | | $ | 7,500,313 | | | $ | 4,822,600 | |
| | | | | | | | | |
| SHARE TRANSACTIONS: | | | | | | | | |
| Issued | | | 1,390,030 | | | | 921,543 | |
| Reinvested | | | 2,662 | | | | 4,862 | |
| Redeemed | | | (1,358,451 | ) | | | (1,048,260 | ) |
| Change in shares | | | 34,241 | | | | (121,855 | ) |
See accompanying notes to financial statements.
Financial Highlights :: ProFund VP Banks :: 23
ProFunds Financial Highlights FOR THE PERIODS INDICATED
Selected data for a share of beneficial interest outstanding throughout the periods indicated.
| | | Year Ended
Dec. 31, 2021 | | | Year Ended
Dec. 31, 2020 | | | Year Ended
Dec. 31, 2019 | | | Year Ended
Dec. 31, 2018 | | | Year Ended
Dec. 31, 2017 | |
| Net Asset Value, Beginning of Period | | $ | 23.77 | | | $ | 28.74 | | | $ | 21.31 | | | $ | 26.03 | | | $ | 22.14 | |
| | | | | | | | | | | | | | | | | | | | | |
| Investment Activities: | | | | | | | | | | | | | | | | | | | | |
| Net investment income (loss)(a) | | | 0.17 | | | | 0.36 | | | | 0.31 | | | | 0.15 | | | | 0.08 | |
| Net realized and unrealized gains (losses) on investments | | | 7.93 | | | | (4.85 | ) | | | 7.39 | | | | (4.79 | ) | | | 3.87 | |
| Total income (loss) from investment activities | | | 8.10 | | | | (4.49 | ) | | | 7.70 | | | | (4.64 | ) | | | 3.95 | |
| | | | | | | | | | | | | | | | | | | | | |
| Distributions to Shareholders From: | | | | | | | | | | | | | | | | | | | | |
| Net investment income | | | (0.24 | ) | | | (0.48 | ) | | | (0.27 | ) | | | (0.08 | ) | | | (0.06 | ) |
| | | | | | | | | | | | | | | | | | | | | |
| Net Asset Value, End of Period | | $ | 31.63 | | | $ | 23.77 | | | $ | 28.74 | | | $ | 21.31 | | | $ | 26.03 | |
| | | | | | | | | | | | | | | | | | | | | |
| Total Return | | | 34.09 | % | | | (15.21 | )% | | | 36.43 | % | | | (17.90 | )% | | | 17.92 | % |
| | | | | | | | | | | | | | | | | | | | | |
| Ratios to Average Net Assets: | | | | | | | | | | | | | | | | | | | | |
| Gross expenses | | | 1.68 | % | | | 1.74 | % | | | 1.70 | % | | | 1.71 | % | | | 1.69 | % |
| Net expenses | | | 1.68 | % | �� | | 1.68 | % | | | 1.68 | % | | | 1.68 | % | | | 1.68 | % |
| Net investment income (loss) | | | 0.57 | % | | | 1.74 | % | | | 1.24 | % | | | 0.57 | % | | | 0.36 | % |
| | | | | | | | | | | | | | | | | | | | | |
| Supplemental Data: | | | | | | | | | | | | | | | | | | | | |
| Net assets, end of period (000's) | | $ | 7,500 | | | $ | 4,823 | | | $ | 9,333 | | | $ | 6,539 | | | $ | 14,608 | |
| Portfolio turnover rate(b) | | | 551 | % | | | 478 | % | | | 293 | % | | | 324 | % | | | 319 | % |
| (a) | Per share net investment income (loss) has been calculated using the average daily shares method. |
| (b) | Portfolio turnover rate is calculated without regard to instruments having a maturity of less than one year from acquisition or derivative instruments (including swap agreements and futures contracts). The portfolio turnover rate can be high and volatile due to the amount and timing of sales and purchases of fund shares during the period. |
See accompanying notes to financial statements.
24 :: ProFund VP Basic Materials :: Management Discussion of Fund Performance
ProFund VP Basic Materials (the "Fund") seeks investment results, before fees and expenses, that correspond to the performance of the Dow Jones U.S. Basic MaterialsSM Index (the "Index"). For the year ended December 31, 2021, the Fund had a total return of 25.63%. For the same period, the Index had a total return of 27.78%1 and a volatility of 19.05%. For the year, the Fund achieved an average daily statistical correlation of over 0.99 to the daily performance of the Index.2
The Fund takes positions in financial instruments that, in combination, should have similar return characteristics as the return of the Index. The Index measures the performance of the basic materials sector of the U.S. equity market. Component companies are involved in the production of aluminum, steel, non-ferrous metals, commodity chemicals, specialty chemicals, forest products, paper products, as well as the mining of precious metals and coal.
During the year ended December 31, 2021, the Fund invested in swap agreements as a substitute for investing directly in stocks in order to gain exposure to the Index. These derivatives generally tracked the performance of their underlying benchmark and were negatively impacted by financing costs associated with their use. The Fund entered into swap agreements with counterparties that the Fund's advisor determined to be major, global financial institutions. If a counterparty becomes insolvent or otherwise fails to perform on its obligations, the value of investments in the Fund may decline. The Fund has sought to mitigate this risk by generally requiring counterparties to post collateral for the benefit of the Fund, marked to market daily, in an amount approximately equal to the amount the counterparty owed to the Fund, subject to certain minimum thresholds.
Value of a $10,000 Investment at Net Asset Value*
| * | The line graph represents the historical performance of a hypothetical investment of $10,000 in the ProFund VP Basic Materials from December 31, 2011 to December 31, 2021, assuming the reinvestment of distributions. |
Average Annual Total Return as of 12/31/21
| Fund | | One Year | | | Five Year | | | Ten Year | |
| ProFund VP Basic Materials | | | 25.63 | % | | | 11.77 | % | | | 8.80 | % |
| Dow Jones U.S. Basic MaterialsSM Index | | | 27.78 | % | | | 13.68 | % | | | 10.65 | % |
| S&P 500® | | | 28.71 | % | | | 18.47 | % | | | 16.55 | % |
Expense Ratios**
| Fund | | Gross | | | Net | | | | | |
| ProFund VP Basic Materials | | | 1.73 | % | | | 1.68 | % | | | | |
| ** | Reflects the expense ratio as reported in the Prospectus dated May 1, 2021. Contractual fee waivers are in effect through April 30, 2022. See Financial Highlights for effective expense ratios. |
Allocation of Portfolio Holdings & Index Composition
Market Exposure
| Investment Type | | % of Net Assets | |
| Equity Securities | | | 100 | % |
| Swap Agreements | | | 1 | % |
| Total Exposure | | | 101 | % |
"Market Exposure" includes the value of total investments (including the contract value of any derivatives) and excludes any instruments used for cash management.
Largest Equity Holdings
| Company | | % of Net Assets | |
| Linde PLC | | | 19.3 | % |
| Air Products & Chemicals, Inc. | | | 7.3 | % |
| Freeport-McMoRan, Inc. | | | 6.7 | % |
| Ecolab, Inc. | | | 6.4 | % |
| Newmont Corp. | | | 5.4 | % |
Dow Jones U.S. Basic MaterialsSM Index – Composition
| | | % of Index | |
| Chemicals | | | 77 | % |
| Metals & Mining | | | 23 | % |
Past performance does not guarantee future results. Return calculations assume the reinvestment of distributions and do not reflect taxes that a shareholder would pay on Fund distributions or on the redemption of Fund shares. The performance data quoted represents past performance and current returns may be lower or higher. The investment return and net asset value ("NAV") will fluctuate so that an investor's shares, when redeemed, may be worth more or less than the original cost. The performance above reflects any fee reductions during the applicable periods. If such fee reductions had not occurred, the quoted performance would be lower. Performance numbers are net of all Fund fees and expenses but do not include any insurance, sales, or administrative charges of variable annuity or life insurance contracts. If these charges were included, the returns would be lower. To obtain performance current to the most recent month-end, please call toll-free 888-776-3637.
| 1 | The graph and table reflect the theoretical reinvestment of dividends on securities in the Indexes. The impact of transaction costs and the deduction of fees and expenses associated with a mutual fund, such as investment management and accounting fees, are not reflected in calculations of the Indexes. The Fund's performance reflects the reinvestment of dividends as well as the impact of transaction costs and the deduction of fees and expenses. It is not possible to invest directly in an index. |
| 2 | 1.00 equals perfect correlation. This calculation is based on the daily total return of the Index and the performance of the daily total return of the NAV per share of the Fund. |
| 3 | The S&P 500® is an unmanaged index that consists of the common stocks of 500 major U.S. corporations selected for their size and the frequency and ease with which their stocks trade. |
The above information is not covered by the Report of the Independent Registered Public Accounting Firm.
Financial Statements :: ProFund VP Basic Materials :: 25
Schedule of Portfolio Investments :: December 31, 2021
Common Stocks (99.5%)
| | | Shares | | | Value | |
| Air Products & Chemicals, Inc. (Chemicals) | | | 4,167 | | | $ | 1,267,851 | |
| Albemarle Corp. (Chemicals) | | | 2,202 | | | | 514,762 | |
| Alcoa Corp. (Metals & Mining) | | | 3,522 | | | | 209,841 | |
| Ashland Global Holdings, Inc. (Chemicals) | | | 1,063 | | | | 114,443 | |
| Axalta Coating Systems, Ltd.* (Chemicals) | | | 4,042 | | | | 133,871 | |
| Celanese Corp. (Chemicals) | | | 2,049 | | | | 344,355 | |
| CF Industries Holdings, Inc. (Chemicals) | | | 4,038 | | | | 285,810 | |
| Cleveland-Cliffs, Inc.* (Metals & Mining) | | | 8,567 | | | | 186,504 | |
| Commercial Metals Co. (Metals & Mining) | | | 2,270 | | | | 82,378 | |
| Corteva, Inc. (Chemicals) | | | 13,722 | | | | 648,776 | |
| Dow, Inc. (Chemicals) | | | 13,923 | | | | 789,713 | |
| DuPont de Nemours, Inc. (Chemicals) | | | 9,753 | | | | 787,847 | |
| Eastman Chemical Co. (Chemicals) | | | 2,531 | | | | 306,023 | |
| Ecolab, Inc. (Chemicals) | | | 4,693 | | | | 1,100,931 | |
| Element Solutions, Inc. (Chemicals) | | | 4,100 | | | | 99,548 | |
| FMC Corp. (Chemicals) | | | 2,386 | | | | 262,198 | |
| Freeport-McMoRan, Inc. (Metals & Mining) | | | 27,644 | | | | 1,153,585 | |
| Huntsman Corp. (Chemicals) | | | 3,900 | | | | 136,032 | |
| Ingevity Corp.* (Chemicals) | | | 740 | | | | 53,058 | |
| International Flavors & Fragrances, Inc. (Chemicals) | | | 4,791 | | | | 721,764 | |
| Linde PLC (Chemicals) | | | 9,649 | | | | 3,342,702 | |
| LyondellBasell Industries N.V. — Class A (Chemicals) | | | 4,949 | | | | 456,446 | |
| MP Materials Corp.* (Metals & Mining) | | | 1,405 | | | | 63,815 | |
| NewMarket Corp. (Chemicals) | | | 130 | | | | 44,554 | |
| Newmont Corp. (Metals & Mining) | | | 15,011 | | | | 930,983 | |
| Nucor Corp. (Metals & Mining) | | | 5,381 | | | | 614,241 | |
| Olin Corp. (Chemicals) | | | 2,700 | | | | 155,304 | |
| PPG Industries, Inc. (Chemicals) | | | 4,469 | | | | 770,634 | |
| Reliance Steel & Aluminum Co. (Metals & Mining) | | | 1,179 | | | | 191,257 | |
| Royal Gold, Inc. (Metals & Mining) | | | 1,235 | | | | 129,934 | |
| RPM International, Inc. (Chemicals) | | | 2,442 | | | | 246,642 | |
| Steel Dynamics, Inc. (Metals & Mining) | | | 3,549 | | | | 220,286 | |
| Sylvamo Corp.* (Paper & Forest Products) | | | 664 | | | | 18,519 | |
| The Chemours Co. (Chemicals) | | | 3,068 | | | | 102,962 | |
| The Mosaic Co. (Chemicals) | | | 6,973 | | | | 273,969 | |
| The Scotts Miracle-Gro Co. — Class A (Chemicals) | | | 766 | | | | 123,326 | |
| United States Steel Corp. (Metals & Mining) | | | 5,088 | | | | 121,145 | |
| Valvoline, Inc. (Chemicals) | | | 3,403 | | | | 126,898 | |
| Westlake Chemical Corp. (Chemicals) | | | 625 | | | | 60,706 | |
TOTAL COMMON STOCKS (Cost $6,604,156) | | | | | | | 17,193,613 | |
Repurchase Agreements(a) (1.0%)
| | | Principal
Amount | | | Value | |
| Repurchase Agreements with various counterparties, 0.00%, dated 12/31/21, due 1/3/22, total to be received $181,000 | | $ | 181,000 | | | $ | 181,000 | |
TOTAL REPURCHASE AGREEMENTS
(Cost $181,000) | | | | | | | 181,000 | |
TOTAL INVESTMENT SECURITIES
(Cost $6,785,156) — 100.5% | | | | | | | 17,374,613 | |
| Net other assets (liabilities) — (0.5)% | | | | | | | (91,074 | ) |
| NET ASSETS — 100.0% | | | | | | $ | 17,283,539 | |
| * | Non-income producing security. |
| (a) | The ProFund VP invests in Repurchase Agreements jointly with other funds in the Trust. See "Repurchase Agreements" under Note 2 in the Notes to Financial Statements to view the details of each individual agreement and counterparty as well as a description of the securities subject to repurchase. |
Total Return Swap Agreements — Long
| Underlying Instrument | | Counterparty | | Termination
Date(1) | | | Rate Paid
(Received)(2) | | | Notional
Amount | | | Value and
Unrealized
Appreciation/
(Depreciation) | |
| Dow Jones U.S. Basic Materials Index | | Goldman Sachs International | | 1/24/22 | | | | 0.68 | % | | $ | 93,674 | | | $ | 7,105 | |
| (1) | Agreements may be terminated at will by either party without penalty. Payment is due at termination/maturity. |
| (2) | Reflects the floating financing rate, as of December 31, 2021, on the notional amount of the swap agreement paid to the counterparty or received from the counterparty, excluding any commissions. This amount is included as part of the unrealized appreciation/(depreciation). |
ProFund VP Basic Materials invested in the following industries as of December 31, 2021:
| | | Value | | | % of
Net Assets | |
| Chemicals | | $ | 13,271,125 | | | | 76.8 | % |
| Metals & Mining | | | 3,903,969 | | | | 22.6 | % |
| Paper & Forest Products | | | 18,519 | | | | 0.1 | % |
| Other** | | | 89,926 | | | | 0.5 | % |
| Total | | $ | 17,283,539 | | | | 100.0 | % |
| ** | Includes any non-equity securities and net other assets (liabilities), which includes any receivable for capital shares issued and payable for capital shares redeemed. |
See accompanying notes to financial statements.
26 :: ProFund VP Basic Materials :: Financial Statements
Statement of Assets and Liabilities
December 31, 2021
| ASSETS: | | | | |
| Total Investment Securities, at cost | | $ | 6,785,156 | |
| Securities, at value | | | 17,193,613 | |
| Repurchase agreements, at value | | | 181,000 | |
| Total Investment Securities, at value | | | 17,374,613 | |
| Cash | | | 243 | |
| Segregated cash balances for swap agreements with custodian | | | 90,000 | |
| Dividends receivable | | | 20,218 | |
| Unrealized appreciation on swap agreements | | | 7,105 | |
| Prepaid expenses | | | 224 | |
| TOTAL ASSETS | | | 17,492,403 | |
| | | | | |
| LIABILITIES: | | | | |
| Payable for capital shares redeemed | | | 164,844 | |
| Advisory fees payable | | | 13,241 | |
| Management services fees payable | | | 1,765 | |
| Administration fees payable | | | 993 | |
| Administrative services fees payable | | | 8,221 | |
| Distribution fees payable | | | 8,236 | |
| Transfer agency fees payable | | | 1,634 | |
| Fund accounting fees payable | | | 559 | |
| Compliance services fees payable | | | 73 | |
| Other accrued expenses | | | 9,298 | |
| TOTAL LIABILITIES | | | 208,864 | |
| NET ASSETS | | $ | 17,283,539 | |
| | | | | |
| NET ASSETS CONSIST OF: | | | | |
| Capital | | $ | 8,552,666 | |
| Total distributable earnings (loss) | | | 8,730,873 | |
| NET ASSETS | | $ | 17,283,539 | |
| Shares of Beneficial Interest Outstanding (unlimited number of shares authorized, no par value) | | | 203,476 | |
| Net Asset Value (offering and redemption price per share) | | $ | 84.94 | |
Statement of Operations
For the Year Ended December 31, 2021
| INVESTMENT INCOME: | | | | |
| Dividends | | $ | 323,774 | |
| Interest | | | 5 | |
| Net income from securities lending | | | 6,244 | |
| TOTAL INVESTMENT INCOME | | | 330,023 | |
| | | | | |
| EXPENSES: | | | | |
| Advisory fees | | | 133,153 | |
| Management services fees | | | 17,754 | |
| Administration fees | | | 13,277 | |
| Transfer agency fees | | | 10,825 | |
| Administrative services fees | | | 46,893 | |
| Distribution fees | | | 44,384 | |
| Custody fees | | | 2,647 | |
| Fund accounting fees | | | 7,385 | |
| Trustee fees | | | 291 | |
| Compliance services fees | | | 133 | |
| Other fees | | | 17,179 | |
| Recoupment of prior expenses reduced by the Advisor | | | 4,343 | |
| TOTAL NET EXPENSES | | | 298,264 | |
| NET INVESTMENT INCOME (LOSS) | | | 31,759 | |
| | | | | |
| REALIZED AND UNREALIZED GAINS (LOSSES) ON INVESTMENTS: | | | | |
| Net realized gains (losses) on investment securities | | | 113,393 | |
| Net realized gains (losses) on swap agreements | | | 92,187 | |
| Change in net unrealized appreciation/depreciation on investment securities | | | 2,934,300 | |
| Change in net unrealized appreciation/depreciation on swap agreements | | | 2,128 | |
| NET REALIZED AND UNREALIZED GAINS (LOSSES) ON INVESTMENTS | | | 3,142,008 | |
| CHANGE IN NET ASSETS RESULTING FROM OPERATIONS | | $ | 3,173,767 | |
See accompanying notes to financial statements.
Financial Statements :: ProFund VP Basic Materials :: 27
Statements of Changes in Net Assets
| | | Year Ended
December 31, 2021 | | | Year Ended
December 31, 2020 | |
| FROM INVESTMENT ACTIVITIES: | | | | | | | | |
| | | | | | | | | |
| OPERATIONS: | | | | | | | | |
| Net investment income (loss) | | $ | 31,759 | | | $ | 60,934 | |
| Net realized gains (losses) on investments | | | 205,580 | | | | 561,553 | |
| Change in net unrealized appreciation/depreciation on investments | | | 2,936,428 | | | | 1,247,587 | |
| Change in net assets resulting from operations | | | 3,173,767 | | | | 1,870,074 | |
| | | | | | | | | |
| DISTRIBUTIONS TO SHAREHOLDERS: | | | | | | | | |
| Total distributions | | | (550,093 | ) | | | (949,400 | ) |
| Change in net assets resulting from distributions | | | (550,093 | ) | | | (949,400 | ) |
| | | | | | | | | |
| CAPITAL TRANSACTIONS: | | | | | | | | |
| Proceeds from shares issued | | | 31,694,090 | | | | 18,333,702 | |
| Distributions reinvested | | | 550,093 | | | | 949,400 | |
| Value of shares redeemed | | | (34,000,418 | ) | | | (15,671,527 | ) |
| Change in net assets resulting from capital transactions | | | (1,756,235 | ) | | | 3,611,575 | |
| Change in net assets | | | 867,439 | | | | 4,532,249 | |
| | | | | | | | | |
| NET ASSETS: | | | | | | | | |
| Beginning of period | | | 16,416,100 | | | | 11,883,851 | |
| End of period | | $ | 17,283,539 | | | $ | 16,416,100 | |
| | | | | | | | | |
| SHARE TRANSACTIONS: | | | | | | | | |
| Issued | | | 402,912 | | | | 299,803 | |
| Reinvested | | | 6,830 | | | | 14,862 | |
| Redeemed | | | (442,935 | ) | | | (261,657 | ) |
| Change in shares | | | (33,193 | ) | | | 53,008 | |
See accompanying notes to financial statements.
28 :: ProFund VP Basic Materials :: Financial Highlights
ProFunds Financial Highlights FOR THE PERIODS INDICATED
Selected data for a share of beneficial interest outstanding throughout the periods indicated.
| | | Year Ended
Dec. 31, 2021 | | | Year Ended
Dec. 31, 2020 | | | Year Ended
Dec. 31, 2019 | | | Year Ended
Dec. 31, 2018 | | | Year Ended
Dec. 31, 2017 | |
| Net Asset Value, Beginning of Period | | $ | 69.36 | | | $ | 64.71 | | | $ | 56.94 | | | $ | 69.41 | | | $ | 56.66 | |
| | | | | | | | | | | | | | | | | | | | | |
| Investment Activities: | | | | | | | | | | | | | | | | | | | | |
| Net investment income (loss)(a) | | | 0.14 | | | | 0.32 | | | | 0.37 | | | | 0.14 | | | | 0.17 | |
| Net realized and unrealized gains (losses) on investments | | | 17.52 | | | | 9.87 | | | | 9.53 | | | | (12.36 | ) | | | 12.84 | |
| Total income (loss) from investment activities | | | 17.66 | | | | 10.19 | | | | 9.90 | | | | (12.22 | ) | | | 13.01 | |
| | | | | | | | | | | | | | | | | | | | | |
| Distributions to Shareholders From: | | | | | | | | | | | | | | | | | | | | |
| Net investment income | | | (0.23 | ) | | | (0.42 | ) | | | (0.22 | ) | | | (0.25 | ) | | | (0.26 | ) |
| Net realized gains on investments | | | (1.85 | ) | | | (5.12 | ) | | | (1.91 | ) | | | — | | | | — | |
| Total distributions | | | (2.08 | ) | | | (5.54 | ) | | | (2.13 | ) | | | (0.25 | ) | | | (0.26 | ) |
| | | | | | | | | | | | | | | | | | | | | |
| Net Asset Value, End of Period | | $ | 84.94 | | | $ | 69.36 | | | $ | 64.71 | | | $ | 56.94 | | | $ | 69.41 | |
| | | | | | | | | | | | | | | | | | | | | |
| Total Return | | | 25.63 | % | | | 16.49 | % | | | 17.72 | % | | | (17.66 | )% | | | 22.96 | % |
| | | | | | | | | | | | | | | | | | | | | |
| Ratios to Average Net Assets: | | | | | | | | | | | | | | | | | | | | |
| Gross expenses | | | 1.68 | % | | | 1.73 | % | | | 1.71 | % | | | 1.74 | % | | | 1.69 | % |
| Net expenses | | | 1.68 | % | | | 1.68 | % | | | 1.68 | % | | | 1.68 | % | | | 1.68 | % |
| Net investment income (loss) | | | 0.18 | % | | | 0.53 | % | | | 0.60 | % | | | 0.21 | % | | | 0.27 | % |
| | | | | | | | | | | | | | | | | | | | | |
| Supplemental Data: | | | | | | | | | | | | | | | | | | | | |
| Net assets, end of period (000's) | | $ | 17,284 | | | $ | 16,416 | | | $ | 11,884 | | | $ | 12,171 | | | $ | 33,707 | |
| Portfolio turnover rate(b) | | | 134 | % | | | 135 | % | | | 58 | % | | | 39 | % | | | 127 | % |
| (a) | Per share net investment income (loss) has been calculated using the average daily shares method. |
| (b) | Portfolio turnover rate is calculated without regard to instruments having a maturity of less than one year from acquisition or derivative instruments (including swap agreements and futures contracts). The portfolio turnover rate can be high and volatile due to the amount and timing of sales and purchases of fund shares during the period. |
See accompanying notes to financial statements.
Management Discussion of Fund Performance :: ProFund VP Bear :: 29
ProFund VP Bear (the "Fund") seeks daily investment results, before fees and expenses, that correspond to the inverse (-1x) of the return of the S&P 500® (the "Index") for a single day, not for any other period. A "single day" is measured from the time the Fund calculates its net asset value ("NAV") to the time of the Fund's next NAV calculation. The Fund does not seek to achieve its stated investment objective over a period of time greater than a single day. The return of the Fund for periods longer than a single day will be the result of its return for each day compounded over the period. The Fund's returns for periods longer than a single day will very likely differ in amount, and possible even direction from the Fund's stated multiple (-1x) times the return of the Fund's Index for the same period. For periods longer than a single day, the Fund will lose money if the Index's performance is flat, and it is possible that the Fund will lose money even if the level of the index falls. For the year ended December 31, 2021, the Fund had a total return of -24.57%. For the same period, the Index had a total return of 28.71%1 and a volatility of 13.10%. For the year, the Fund achieved an average daily statistical correlation of over 0.99 to the inverse of the daily performance of the Index.2
The Fund takes positions in financial instruments that, in combination, should have similar daily return characteristics as the inverse of the daily return of the Index. The Index is a measure of large-cap U.S. stock market performance. It is a float-adjusted, market capitalization-weighted index of 500 U.S. operating companies and real estate investment trusts selected through a process that factors in criteria such as liquidity, price, market capitalization, and financial viability. Reconstitution occurs both on a quarterly and ongoing basis.
During the year ended December 31, 2021, the Fund invested in swap agreements and futures contracts as a substitute for shorting stocks in order to gain inverse exposure to the Index. These derivatives generally tracked the performance of their underlying benchmark and benefited from financing costs associated with their use. The Fund entered into swap agreements with counterparties that the Fund's advisor determined to be major, global financial institutions. If a counterparty becomes insolvent or otherwise fails to perform on its obligations, the value of investments in the Fund may decline. The Fund has sought to mitigate this risk by generally requiring counterparties to post collateral for the benefit of the Fund, marked to market daily, in an amount approximately equal to the amount the counterparty owed to the Fund, subject to certain minimum thresholds.
Value of a $10,000 Investment at Net Asset Value*
| * | The line graph represents the historical performance of a hypothetical investment of $10,000 in the ProFund VP Bear from December 31, 2011 to December 31, 2021, assuming the reinvestment of distributions. |
Average Annual Total Return as of 12/31/21
| Fund | | One Year | | | Five Year | | | Ten Year | |
| ProFund VP Bear | | | -24.57 | % | | | -18.08 | % | | | -16.73 | % |
| S&P 500® | | | 28.71 | % | | | 18.47 | % | | | 16.55 | % |
Expense Ratios**
| Fund | | Gross | | | Net | | | | |
| ProFund VP Bear | | | 1.79 | % | | | 1.68 | % | | | | |
| ** | Reflects the expense ratio as reported in the Prospectus dated May 1, 2021. Contractual fee waivers are in effect through April 30, 2022. See Financial Highlights for effective expense ratios. |
Allocation of Portfolio Holdings & Index Composition
Market Exposure
| Investment Type | | % of Net Assets | |
| Swap Agreements | | | (99 | )% |
| Total Exposure | | | (99 | )% |
"Market Exposure" includes the value of total investments (including the contract value of any derivatives) and excludes any instruments used for cash management.
Holdings
The ProFund VP Bear primarily invests in non-equity securities, which may include: swap agreements, futures contracts, repurchase agreements and U.S. Government securities.
S&P 500® – Composition
| | | % of Index | |
| Information Technology | | | 28 | % |
| Health Care | | | 13 | % |
| Consumer Discretionary | | | 13 | % |
| Financials | | | 11 | % |
| Communication Services | | | 10 | % |
| Industrials | | | 8 | % |
| Consumer Staples | | | 6 | % |
| Real Estate | | | 3 | % |
| Energy | | | 3 | % |
| Materials | | | 3 | % |
| Utilities | | | 2 | % |
Past performance does not guarantee future results. Return calculations assume the reinvestment of distributions and do not reflect taxes that a shareholder would pay on Fund distributions or on the redemption of Fund shares. The performance data quoted represents past performance and current returns may be lower or higher. The investment return and NAV will fluctuate so that an investor's shares, when redeemed, may be worth more or less than the original cost. The performance above reflects any fee reductions during the applicable periods. If such fee reductions had not occurred, the quoted performance would be lower. Performance numbers are net of all Fund fees and expenses but do not include any insurance, sales, or administrative charges of variable annuity or life insurance contracts. If these charges were included, the returns would be lower. To obtain performance current to the most recent month-end, please call toll-free 888-776-3637.
| 1 | The graph and table reflect the theoretical reinvestment of dividends on securities in the Index. The impact of transaction costs and the deduction of fees and expenses associated with a mutual fund, such as investment management and accounting fees, are not reflected in the index calculations. The Fund's performance reflects the reinvestment of dividends as well as the impact of transaction costs and the deduction of fees and expenses. It is not possible to invest directly in an index. |
| 2 | 1.00 equals perfect correlation. This calculation is based on the daily total return of the Index and the performance of the daily total return of the NAV per share of the Fund. |
The above information is not covered by the Report of the Independent Registered Public Accounting Firm.
30 :: ProFund VP Bear :: Financial Statements
Schedule of Portfolio Investments :: December 31, 2021
Repurchase Agreements(a)(b) (99.9%)
| | | Principal
Amount | | | Value | |
| Repurchase Agreements with various counterparties, 0.00%, dated 12/31/21, due 1/3/22, total to be received $1,555,000 | | $ | 1,555,000 | | | $ | 1,555,000 | |
TOTAL REPURCHASE AGREEMENTS
(Cost $1,555,000) | | | | | | | 1,555,000 | |
TOTAL INVESTMENT SECURITIES
(Cost $1,555,000)—99.9% | | | | | | | 1,555,000 | |
| Net other assets (liabilities)—0.1% | | | | | | | 1,821 | |
| NET ASSETS—100.0% | | | | | | $ | 1,556,821 | |
| (a) | A portion of these securities were held in a segregated account for the benefit of swap counterparties in the event of default. At December 31, 2021, the aggregate amount held in a segregated account was $329,000. |
| (b) | The ProFund VP invests in Repurchase Agreements jointly with other funds in the Trust. See "Repurchase Agreements" under Note 2 in the Notes to Financial Statements to view the details of each individual agreement and counterparty as well as a description of the securities subject to repurchase. |
Total Return Swap Agreements—Short
| Underlying Instrument | | Counterparty | | Termination
Date(1) | | | Rate Paid
(Received)(2) | | | Notional
Amount | | | Value and
Unrealized
Appreciation/
(Depreciation) | |
| S&P 500 | | Goldman Sachs International | | 1/27/22 | | | | (0.43 | )% | | $ | (238,309 | ) | | $ | 1,167 | |
| S&P 500 | | UBS AG | | 1/27/22 | | | | (0.23 | )% | | | (1,306,410 | ) | | | 6,701 | |
| | | | | | | | | | | | $ | (1,544,719 | ) | | $ | 7,868 | |
| (1) | Agreements may be terminated at will by either party without penalty. Payment is due at termination/maturity. |
| (2) | Reflects the floating financing rate, as of December 31, 2021, on the notional amount of the swap agreement paid to the counterparty or received from the counterparty, excluding any commissions. This amount is included as part of the unrealized appreciation/(depreciation). |
See accompanying notes to financial statements.
Financial Statements :: ProFund VP Bear :: 31
Statement of Assets and Liabilities
December 31, 2021
| ASSETS: | | | | |
| Total Investment Securities, at cost | | $ | 1,555,000 | |
| Repurchase agreements, at value | | | 1,555,000 | |
| Total Investment Securities, at value | | | 1,555,000 | |
| Cash | | | 430 | |
| Unrealized appreciation on swap agreements | | | 7,868 | |
| Receivable for capital shares issued | | | 648 | |
| Prepaid expenses | | | 400 | |
| TOTAL ASSETS | | | 1,564,346 | |
| | | | | |
| LIABILITIES: | | | | |
| Payable for capital shares redeemed | | | 444 | |
| Advisory fees payable | | | 2,253 | |
| Management services fees payable | | | 300 | |
| Administration fees payable | | | 87 | |
| Administrative services fees payable | | | 1,099 | |
| Distribution fees payable | | | 1,297 | |
| Transfer agency fees payable | | | 163 | |
| Fund accounting fees payable | | | 49 | |
| Compliance services fees payable | | | 18 | |
| Other accrued expenses | | | 1,815 | |
| TOTAL LIABILITIES | | | 7,525 | |
| NET ASSETS | | $ | 1,556,821 | |
| | | | | |
| NET ASSETS CONSIST OF: | | | | |
| Capital | | $ | 24,231,817 | |
| Total distributable earnings (loss) | | | (22,674,996 | ) |
| NET ASSETS | | $ | 1,556,821 | |
| Shares of Beneficial Interest Outstanding (unlimited number of shares authorized, no par value) | | | 106,912 | |
| Net Asset Value (offering and redemption price per share) | | $ | 14.56 | |
Statement of Operations
For the Year Ended December 31, 2021
| INVESTMENT INCOME: | | | | |
| Interest | | $ | 37 | |
| | | | | |
| EXPENSES: | | | | |
| Advisory fees | | | 22,977 | |
| Management services fees | | | 3,064 | |
| Administration fees | | | 2,389 | |
| Transfer agency fees | | | 1,912 | |
| Administrative services fees | | | 7,874 | |
| Distribution fees | | | 7,659 | |
| Custody fees | | | 487 | |
| Fund accounting fees | | | 1,283 | |
| Trustee fees | | | 55 | |
| Compliance services fees | | | 16 | |
| Other fees | | | 2,672 | |
| Recoupment of prior expenses reduced by the Advisor | | | 1,500 | |
| Total Gross Expenses before reductions | | | 51,888 | |
| Expenses reduced and reimbursed by the Advisor | | | (420 | ) |
| TOTAL NET EXPENSES | | | 51,468 | |
| NET INVESTMENT INCOME (LOSS) | | | (51,431 | ) |
| | | | | |
| REALIZED AND UNREALIZED GAINS (LOSSES) ON INVESTMENTS: | | | | |
| Gain received from non-recurring class action settlement | | | 1,180 | |
| Net realized gains (losses) on futures contracts | | | (76,638 | ) |
| Net realized gains (losses) on swap agreements | | | (617,127 | ) |
| Change in net unrealized appreciation/depreciation on futures contracts | | | 12,695 | |
| Change in net unrealized appreciation/depreciation on swap agreements | | | 18,165 | |
| NET REALIZED AND UNREALIZED GAINS (LOSSES) ON INVESTMENTS | | | (661,725 | ) |
| CHANGE IN NET ASSETS RESULTING FROM OPERATIONS | | $ | (713,156 | ) |
See accompanying notes to financial statements.
32 :: ProFund VP Bear :: Financial Statements
Statements of Changes in Net Assets
| | | Year Ended
December 31, 2021 | | | Year Ended
December 31, 2020 | |
| FROM INVESTMENT ACTIVITIES: | | | | | | | | |
| | | | | | | | | |
| OPERATIONS: | | | | | | | | |
| Net investment income (loss) | | $ | (51,431 | ) | | $ | (63,287 | ) |
| Net realized gains (losses) on investments | | | (692,585 | ) | | | (1,644,432 | ) |
| Change in net unrealized appreciation/depreciation on investments | | | 30,860 | | | | (15,309 | ) |
| Change in net assets resulting from operations | | | (713,156 | ) | | | (1,723,028 | ) |
| | | | | | | | | |
| DISTRIBUTIONS TO SHAREHOLDERS: | | | | | | | | |
| Total distributions | | | (21,696 | ) | | | (18,942 | ) |
| Change in net assets resulting from distributions | | | (21,696 | ) | | | (18,942 | ) |
| | | | | | | | | |
| CAPITAL TRANSACTIONS: | | | | | | | | |
| Proceeds from shares issued | | | 24,842,719 | | | | 55,517,005 | |
| Distributions reinvested | | | 21,696 | | | | 18,942 | |
| Value of shares redeemed | | | (24,924,990 | ) | | | (54,648,756 | ) |
| Change in net assets resulting from capital transactions | | | (60,575 | ) | | | 887,191 | |
| Change in net assets | | | (795,427 | ) | | | (854,779 | ) |
| | | | | | | | | |
| NET ASSETS: | | | | | | | | |
| Beginning of period | | | 2,352,248 | | | | 3,207,027 | |
| End of period | | $ | 1,556,821 | | | $ | 2,352,248 | |
| | | | | | | | | |
| SHARE TRANSACTIONS: | | | | | | | | |
| Issued | | | 1,499,798 | | | | 2,071,685 | |
| Reinvested | | | 1,237 | | | | 896 | |
| Redeemed | | | (1,514,177 | ) | | | (2,073,662 | ) |
| Change in shares | | | (13,142 | ) | | | (1,081 | ) |
See accompanying notes to financial statements.
Financial Highlights :: ProFund VP Bear :: 33
ProFunds Financial Highlights FOR THE PERIODS INDICATED
Selected data for a share of beneficial interest outstanding throughout the periods indicated.
| | | Year Ended
Dec. 31, 2021 | | | Year Ended
Dec. 31, 2020 | | | Year Ended
Dec. 31, 2019 | | | Year Ended
Dec. 31, 2018 | | | Year Ended
Dec. 31, 2017 | |
| Net Asset Value, Beginning of Period | | $ | 19.59 | | | $ | 26.47 | | | $ | 34.40 | | | $ | 33.06 | | | $ | 40.30 | |
| | | | | | | | | | | | | | | | | | | | | |
| Investment Activities: | | | | | | | | | | | | | | | | | | | | |
| Net investment income (loss)(a) | | | (0.28 | ) | | | (0.35 | ) | | | 0.13 | | | | 0.03 | | | | (0.32 | ) |
| Net realized and unrealized gains (losses) on investments | | | (4.49 | ) | | | (6.41 | ) | | | (8.03 | ) | | | 1.31 | | | | (6.92 | ) |
| Total income (loss) from investment activities | | | (4.77 | ) | | | (6.76 | ) | | | (7.90 | ) | | | 1.34 | | | | (7.24 | ) |
| | | | | | | | | | | | | | | | | | | | | |
| Distributions to Shareholders From: | | | | | | | | | | | | | | | | | | | | |
| Net investment income | | | — | | | | (0.12 | ) | | | (0.03 | ) | | | — | | | | — | |
| Net realized gains on investments | | | (0.26 | ) | | | — | | | | — | | | | — | | | | — | |
| Total distributions | | | (0.26 | ) | | | (0.12 | ) | | | (0.03 | ) | | | — | | | | — | |
| | | | | | | | | | | | | | | | | | | | | |
| Net Asset Value, End of Period | | $ | 14.56 | | | $ | 19.59 | | | $ | 26.47 | | | $ | 34.40 | | | $ | 33.06 | |
| | | | | | | | | | | | | | | | | | | | | |
| Total Return | | | (24.57 | )% | | | (25.61 | )% | | | (22.95 | )% | | | 4.05 | % | | | (17.97 | )% |
| | | | | | | | | | | | | | | | | | | | | |
| Ratios to Average Net Assets: | | | | | | | | | | | | | | | | | | | | |
| Gross expenses | | | 1.69 | % | | | 1.79 | % | | | 1.74 | % | | | 1.65 | % | | | 1.68 | % |
| Net expenses | | | 1.68 | % | | | 1.68 | % | | | 1.71 | %(b) | | | 1.65 | % | | | 1.68 | % |
| Net investment income (loss) | | | (1.68 | )% | | | (1.40 | )% | | | 0.43 | % | | | 0.08 | % | | | (0.88 | )% |
| | | | | | | | | | | | | | | | | | | | | |
| Supplemental Data: | | | | | | | | | | | | | | | | | | | | |
| Net assets, end of period (000's) | | $ | 1,557 | | | $ | 2,352 | | | $ | 3,207 | | | $ | 4,135 | | | $ | 4,157 | |
| Portfolio turnover rate(c) | | | — | | | | — | | | | — | | | | — | | | | — | |
| (a) | Per share net investment income (loss) has been calculated using the average daily shares method. |
| (b) | The expense ratio does not correlate to the applicable expense limits in place during the period given that the annual contractual expense limitation is applied for one year periods ended April 30th of each year, instead of coinciding with the December 31st year end. Details of the current expense limitation in effect can be found in Note 4 of the accompanying Notes to Financial Statements. |
| (c) | Portfolio turnover rate is calculated without regard to instruments having a maturity of less than one year from acquisition or derivative instruments (including swap agreements and futures contracts). |
See accompanying notes to financial statements.
34 :: ProFund VP Biotechnology :: Management Discussion of Fund Performance
ProFund VP Biotechnology (the “Fund”) seeks investment results, before fees and expenses, that correspond to the performance of the Dow Jones U.S. BiotechnologySM Index (the “Index”). For the year ended December 31, 2021, the Fund had a total return of 15.73%. For the same period, the Index had a total return of 17.65%1 and a volatility of 16.13%. For the year, the Fund achieved an average daily statistical correlation of over 0.99 to one and one-half times the daily performance of the Index.2
The Fund takes positions in financial instruments that, in combination, should have similar return characteristics as the return of the Index. The Index measures the performance of the biotechnology sector of the U.S. equity market. Component companies engage in the research and development of biological substances for drug discovery and diagnostic development. These companies derive most of their revenue from the sale or licensing of drugs and diagnostic tools.
During the year ended December 31, 2021, the Fund invested in swap agreements as a substitute for investing directly in stocks in order to gain exposure to the Index. These derivatives generally tracked the performance of their underlying benchmark and were negatively impacted by financing costs associated with their use. The Fund entered into swap agreements with counterparties that the Fund's advisor determined to be major, global financial institutions. If a counterparty becomes insolvent or otherwise fails to perform on its obligations, the value of investments in the Fund may decline. The Fund has sought to mitigate this risk by generally requiring counterparties to post collateral for the benefit of the Fund, marked to market daily, in an amount approximately equal to the amount the counterparty owed to the Fund, subject to certain minimum thresholds.
Value of a $10,000 Investment at Net Asset Value*
| * | The line graph represents the historical performance of a hypothetical investment of $10,000 in the ProFund VP Biotechnology from December 31, 2011 to December 31, 2021, assuming the reinvestment of distributions. |
Average Annual Total Return as of 12/31/21
| Fund | | One Year | | | Five Year | | | Ten Year | |
| ProFund VP Biotechnology | | | 15.73 | % | | | 12.19 | % | | | 16.91 | % |
| Dow Jones U.S. BiotechnologySM Index | | | 17.65 | % | | | 14.13 | % | | | 18.96 | % |
| S&P 500® | | | 28.71 | % | | | 18.47 | % | | | 16.55 | % |
Expense Ratios**
| Fund | | Gross | | | Net | | | | | |
| ProFund VP Biotechnology | | | 1.67 | % | | | 1.67 | % | | | | |
| ** | Reflects the expense ratio as reported in the Prospectus dated May 1, 2021. Contractual fee waivers are in effect through April 30, 2022. See Financial Highlights for effective expense ratios. |
Allocation of Portfolio Holdings & Index Composition
Market Exposure
| Investment Type | | % of Net Assets | |
| Equity Securities | | | 99 | % |
| Swap Agreements | | | 1 | % |
| Total Exposure | | | 100 | % |
“Market Exposure” includes the value of total investments (including the contract value of any derivatives) and excludes any instruments used for cash management.
Largest Equity Holdings
| Company | | % of Net Assets | |
| AbbVie, Inc. | | | 15.6 | % |
| Danaher Corp. | | | 13.6 | % |
| Amgen, Inc. | | | 8.3 | % |
| Gilead Sciences, Inc. | | | 5.9 | % |
| Moderna, Inc. | | | 5.8 | % |
Dow Jones U.S. BiotechnologySM Index – Composition
| | | % of Index | |
| Biotechnology | | | 63 | % |
| Life Sciences Tools & Services | | | 37 | % |
Past performance does not guarantee future results. Return calculations assume the reinvestment of distributions and do not reflect taxes that a shareholder would pay on Fund distributions or on the redemption of Fund shares. The performance data quoted represents past performance and current returns may be lower or higher. The investment return and net asset value (“NAV”) will fluctuate so that an investor's shares, when redeemed, may be worth more or less than the original cost. The performance above reflects any fee reductions during the applicable periods. If such fee reductions had not occurred, the quoted performance would be lower. Performance numbers are net of all Fund fees and expenses but do not include any insurance, sales, or administrative charges of variable annuity or life insurance contracts. If these charges were included, the returns would be lower. To obtain performance current to the most recent month-end, please call toll-free 888-776-3637.
| 1 | The graph and table reflect the theoretical reinvestment of dividends on securities in the Indexes. The impact of transaction costs and the deduction of fees and expenses associated with a mutual fund, such as investment management and accounting fees, are not reflected in calculations of the Indexes. The Fund's performance reflects the reinvestment of dividends as well as the impact of transaction costs and the deduction of fees and expenses. It is not possible to invest directly in an index. |
| 2 | 1.00 equals perfect correlation. This calculation is based on the daily total return of the Index and the performance of the daily total return of the NAV per share of the Fund. |
| 3 | The S&P 500® is an unmanaged index that consists of the common stocks of 500 major U.S. corporations selected for their size and the frequency and ease with which their stocks trade. |
The above information is not covered by the Report of the Independent Registered Public Accounting Firm.
Financial Statements :: ProFund VP Biotechnology :: 35
Schedule of Portfolio Investments :: December 31, 2021
Common Stocks (99.2%)
| | | Shares | | | Value | |
| 10X Genomics, Inc.*—Class A (Life Sciences Tools & Services) | | | 3,691 | | | $ | 549,811 | |
| AbbVie, Inc. (Biotechnology) | | | 71,253 | | | | 9,647,656 | |
| ACADIA Pharmaceuticals, Inc.* (Biotechnology) | | | 4,731 | | | | 110,422 | |
| Agilent Technologies, Inc. (Life Sciences Tools & Services) | | | 12,201 | | | | 1,947,890 | |
| Agios Pharmaceuticals, Inc.* (Biotechnology) | | | 2,189 | | | | 71,952 | |
| Alkermes PLC* (Biotechnology) | | | 6,517 | | | | 151,585 | |
| Allogene Therapeutics, Inc.* (Biotechnology) | | | 2,987 | | | | 44,566 | |
| Alnylam Pharmaceuticals, Inc.* (Biotechnology) | | | 4,820 | | | | 817,376 | |
| Amgen, Inc. (Biotechnology) | | | 22,702 | | | | 5,107,269 | |
| Arrowhead Pharmaceuticals, Inc.* (Biotechnology) | | | 4,203 | | | | 278,659 | |
| Avantor, Inc.* (Life Sciences Tools & Services) | | | 24,564 | | | | 1,035,127 | |
| Beam Therapeutics, Inc.* (Biotechnology) | | | 1,812 | | | | 144,398 | |
| Berkeley Lights, Inc.* (Life Sciences Tools & Services) | | | 1,686 | | | | 30,651 | |
| Biogen, Inc.* (Biotechnology) | | | 5,920 | | | | 1,420,326 | |
| Biohaven Pharmaceutical Holding Co., Ltd.* (Biotechnology) | | | 2,350 | | | | 323,854 | |
| BioMarin Pharmaceutical, Inc.* (Biotechnology) | | | 7,400 | | | | 653,790 | |
| Bio-Techne Corp. (Life Sciences Tools & Services) | | | 1,584 | | | | 819,467 | |
| Blueprint Medicines Corp.* (Biotechnology) | | | 2,371 | | | | 253,958 | |
| Bridgebio Pharma, Inc.* (Biotechnology) | | | 4,330 | | | | 72,224 | |
| Charles River Laboratories International, Inc.* (Life Sciences Tools & Services) | | | 2,034 | | | | 766,371 | |
| Danaher Corp. (Health Care Equipment & Supplies) | | | 25,632 | | | | 8,433,184 | |
| Denali Therapeutics, Inc.* (Biotechnology) | | | 3,741 | | | | 166,849 | |
| Emergent BioSolutions, Inc.* (Biotechnology) | | | 1,930 | | | | 83,897 | |
| Exact Sciences Corp.* (Biotechnology) | | | 6,945 | | | | 540,529 | |
| Exelixis, Inc.* (Biotechnology) | | | 12,752 | | | | 233,107 | |
| Fate Therapeutics, Inc.* (Biotechnology) | | | 3,273 | | | | 191,503 | |
| Gilead Sciences, Inc. (Biotechnology) | | | 50,557 | | | | 3,670,944 | |
| Halozyme Therapeutics, Inc.* (Biotechnology) | | | 5,674 | | | | 228,152 | |
| Horizon Therapeutics PLC* (Pharmaceuticals) | | | 9,142 | | | | 985,142 | |
| Illumina, Inc.* (Life Sciences Tools & Services) | | | 6,300 | | | | 2,396,772 | |
| Incyte Corp.* (Biotechnology) | | | 7,567 | | | | 555,418 | |
| Intellia Therapeutics, Inc.* (Biotechnology) | | | 2,789 | | | | 329,771 | |
| Invitae Corp.* (Biotechnology) | | | 8,384 | | | | 128,024 | |
| Ionis Pharmaceuticals, Inc.* (Biotechnology) | | | 5,691 | | | | 173,177 | |
| IQVIA Holdings, Inc.* (Life Sciences Tools & Services) | | | 7,700 | | | | 2,172,478 | |
| Maravai LifeSciences Holdings, Inc.*—Class A (Life Sciences Tools & Services) | | | 4,396 | | | | 184,192 | |
| Medpace Holdings, Inc.* (Life Sciences Tools & Services) | | | 1,159 | | | | 252,245 | |
| Mettler-Toledo International, Inc.* (Life Sciences Tools & Services) | | | 926 | | | | 1,571,616 | |
| Mirati Therapeutics, Inc.* (Biotechnology) | | | 1,998 | | | | 293,087 | |
| Moderna, Inc.* (Biotechnology) | | | 14,217 | | | | 3,610,834 | |
| Natera, Inc.* (Biotechnology) | | | 3,546 | | | | 331,161 | |
| Nektar Therapeutics* (Pharmaceuticals) | | | 7,438 | | | | 100,487 | |
| Neurocrine Biosciences, Inc.* (Biotechnology) | | | 3,825 | | | | 325,775 | |
| Novavax, Inc.* (Biotechnology) | | | 3,047 | | | | 435,934 | |
| Pacific Biosciences of California, Inc.* (Life Sciences Tools & Services) | | | 8,889 | | | | 181,869 | |
| Regeneron Pharmaceuticals, Inc.* (Biotechnology) | | | 4,261 | | | | 2,690,907 | |
| Repligen Corp.* (Biotechnology) | | | 2,072 | | | | 548,748 | |
| Sarepta Therapeutics, Inc.* (Biotechnology) | | | 3,510 | | | | 316,076 | |
| Seagen, Inc.* (Biotechnology) | | | 5,380 | | | | 831,748 | |
| Sotera Health Co.* (Life Sciences Tools & Services) | | | 3,991 | | | | 93,988 | |
| Syneos Health, Inc.* (Life Sciences Tools & Services) | | | 4,179 | | | | 429,100 | |
| Twist Bioscience Corp.* (Biotechnology) | | | 1,987 | | | | 153,774 | |
| Ultragenyx Pharmaceutical, Inc.* (Biotechnology) | | | 2,747 | | | | 230,995 | |
| United Therapeutics Corp.* (Biotechnology) | | | 1,815 | | | | 392,185 | |
| Vertex Pharmaceuticals, Inc.* (Biotechnology) | | | 10,247 | | | | 2,250,241 | |
| Vir Biotechnology, Inc.* (Biotechnology) | | | 2,952 | | | | 123,600 | |
| West Pharmaceutical Services, Inc. (Health Care Equipment & Supplies) | | | 2,986 | | | | 1,400,464 | |
TOTAL COMMON STOCKS
(Cost $25,608,537) | | | | | | | 61,285,325 | |
Repurchase Agreements(a) (0.6%)
| | | Principal
Amount | | | Value | |
| Repurchase Agreements with various counterparties, 0.00%, dated 12/31/21, due 1/3/22, total to be received $374,000 | | $ | 374,000 | | | $ | 374,000 | |
TOTAL REPURCHASE AGREEMENTS
(Cost $374,000) | | | | | | | 374,000 | |
TOTAL INVESTMENT SECURITIES
(Cost $25,982,537)—99.8% | | | | | | | 61,659,325 | |
| Net other assets (liabilities)—0.2% | | | | | | | 139,076 | |
| NET ASSETS—100.0% | | | | | | $ | 61,798,401 | |
| * | Non-income producing security. |
| (a) | The ProFund VP invests in Repurchase Agreements jointly with other funds in the Trust. See “Repurchase Agreements” under Note 2 in the Notes to Financial Statements to view the details of each individual agreement and counterparty as well as a description of the securities subject to repurchase. |
See accompanying notes to financial statements.
36 :: ProFund VP Biotechnology :: Financial Statements
Total Return Swap Agreements—Long
| Underlying Instrument | | Counterparty | | Termination
Date(1) | | Rate Paid
(Received)(2) | | | Notional
Amount | | | Value and
Unrealized
Appreciation/
(Depreciation) | |
| Dow Jones U.S. Biotechnology Index | | Goldman Sachs International | | 1/24/22 | | | 0.68 | % | | $ | 440,689 | | | $ | 823 | |
| (1) | Agreements may be terminated at will by either party without penalty. Payment is due at termination/maturity. |
| (2) | Reflects the floating financing rate, as of December 31, 2021, on the notional amount of the swap agreement paid to the counterparty or received from the counterparty, excluding any commissions. This amount is included as part of the unrealized appreciation/(depreciation). |
ProFund VP Biotechnology invested in the following industries as of December 31, 2021:
| | | Value | | | % of
Net Assets | |
| Biotechnology | | $ | 37,934,471 | | | | 61.4 | % |
| Health Care Equipment & Supplies | | | 9,833,648 | | | | 15.9 | % |
| Life Sciences Tools & Services | | | 12,431,577 | | | | 20.1 | % |
| Pharmaceuticals | | | 1,085,629 | | | | 1.8 | % |
| Other** | | | 513,076 | | | | 0.8 | % |
| Total | | $ | 61,798,401 | | | | 100.0 | % |
| ** | Includes any non-equity securities and net other assets (liabilities), which includes any receivable for capital shares issued and payable for capital shares redeemed. |
See accompanying notes to financial statements.
Financial Statements :: ProFund VP Biotechnology :: 37
Statement of Assets and Liabilities
December 31, 2021
| ASSETS: | | | | |
| Total Investment Securities, at cost | | $ | 25,982,537 | |
| Securities, at value | | | 61,285,325 | |
| Repurchase agreements, at value | | | 374,000 | |
| Total Investment Securities, at value | | | 61,659,325 | |
| Cash | | | 492 | |
| Segregated cash balances for swap agreements with custodian | | | 185,000 | |
| Dividends receivable | | | 5,383 | |
| Unrealized appreciation on swap agreements | | | 823 | |
| Receivable for capital shares issued | | | 110,998 | |
| Prepaid expenses | | | 877 | |
| TOTAL ASSETS | | | 61,962,898 | |
| | | | | |
| LIABILITIES: | | | | |
| Payable for capital shares redeemed | | | 10,372 | |
| Advisory fees payable | | | 38,557 | |
| Management services fees payable | | | 5,141 | |
| Administration fees payable | | | 3,641 | |
| Administrative services fees payable | | | 23,459 | |
| Distribution fees payable | | | 35,321 | |
| Transfer agency fees payable | | | 5,917 | |
| Fund accounting fees payable | | | 2,025 | |
| Compliance services fees payable | | | 282 | |
| Other accrued expenses | | | 39,782 | |
| TOTAL LIABILITIES | | | 164,497 | |
| NET ASSETS | | $ | 61,798,401 | |
| | | | | |
| NET ASSETS CONSIST OF: | | | | |
| Capital | | $ | 19,637,186 | |
| Total distributable earnings (loss) | | | 42,161,215 | |
| NET ASSETS | | $ | 61,798,401 | |
| Shares of Beneficial Interest Outstanding (unlimited number of shares authorized, no par value) | | | 654,204 | |
| Net Asset Value (offering and redemption price per share) | | $ | 94.46 | |
Statement of Operations
For the Year Ended December 31, 2021
| INVESTMENT INCOME: | | | | |
| Dividends | | $ | 916,956 | |
| Interest | | | 17 | |
| TOTAL INVESTMENT INCOME | | | 916,973 | |
| | | | | |
| EXPENSES: | | | | |
| Advisory fees | | | 480,796 | |
| Management services fees | | | 64,106 | |
| Administration fees | | | 48,256 | |
| Transfer agency fees | | | 39,170 | |
| Administrative services fees | | | 116,847 | |
| Distribution fees | | | 160,265 | |
| Custody fees | | | 9,965 | |
| Fund accounting fees | | | 26,412 | |
| Trustee fees | | | 1,069 | |
| Compliance services fees | | | 409 | |
| Other fees | | | 67,787 | |
| TOTAL NET EXPENSES | | | 1,015,082 | |
| NET INVESTMENT INCOME (LOSS) | | | (98,109 | ) |
| | | | | |
| REALIZED AND UNREALIZED GAINS (LOSSES) ON INVESTMENTS: | | | | |
| Net realized gains (losses) on investment securities | | | 10,708,852 | |
| Net realized gains (losses) on swap agreements | | | 86,334 | |
| Change in net unrealized appreciation/depreciation on investment securities | | | (1,573,124 | ) |
| Change in net unrealized appreciation/depreciation on swap agreements | | | 9,992 | |
| NET REALIZED AND UNREALIZED GAINS (LOSSES) ON INVESTMENTS | | | 9,232,054 | |
| CHANGE IN NET ASSETS RESULTING FROM OPERATIONS | | $ | 9,133,945 | |
See accompanying notes to financial statements.
38 :: ProFund VP Biotechnology :: Financial Statements
Statements of Changes in Net Assets
| | | Year Ended
December 31, 2021 | | | Year Ended
December 31, 2020 | |
| FROM INVESTMENT ACTIVITIES: | | | | | | | | |
| | | | | | | | | |
| OPERATIONS: | | | | | | | | |
| Net investment income (loss) | | $ | (98,109 | ) | | $ | (35,623 | ) |
| Net realized gains (losses) on investments | | | 10,795,186 | | | | 1,081,311 | |
| Change in net unrealized appreciation/depreciation on investments | | | (1,563,132 | ) | | | 7,110,278 | |
| Change in net assets resulting from operations | | | 9,133,945 | | | | 8,155,966 | |
| | | | | | | | | |
| DISTRIBUTIONS TO SHAREHOLDERS: | | | | | | | | |
| Total distributions | | | (384,376 | ) | | | (4,096,849 | ) |
| Change in net assets resulting from distributions | | | (384,376 | ) | | | (4,096,849 | ) |
| | | | | | | | | |
| CAPITAL TRANSACTIONS: | | | | | | | | |
| Proceeds from shares issued | | | 21,315,729 | | | | 31,935,839 | |
| Distributions reinvested | | | 384,376 | | | | 4,096,849 | |
| Value of shares redeemed | | | (29,619,878 | ) | | | (36,890,561 | ) |
| Change in net assets resulting from capital transactions | | | (7,919,773 | ) | | | (857,873 | ) |
| Change in net assets | | | 829,796 | | | | 3,201,244 | |
| | | | | | | | | |
| NET ASSETS: | | | | | | | | |
| Beginning of period | | | 60,968,605 | | | | 57,767,361 | |
| End of period | | $ | 61,798,401 | | | $ | 60,968,605 | |
| | | | | | | | | |
| SHARE TRANSACTIONS: | | | | | | | | |
| Issued | | | 233,740 | | | | 395,668 | |
| Reinvested | | | 4,479 | | | | 51,572 | |
| Redeemed | | | (326,324 | ) | | | (463,770 | ) |
| Change in shares | | | (88,105 | ) | | | (16,530 | ) |
See accompanying notes to financial statements.
Financial Highlights :: ProFund VP Biotechnology :: 39
ProFunds Financial Highlights FOR THE PERIODS INDICATED
Selected data for a share of beneficial interest outstanding throughout the periods indicated.
| | | Year Ended
Dec. 31, 2021 | | | Year Ended
Dec. 31, 2020 | | | Year Ended
Dec. 31, 2019 | | | Year Ended
Dec. 31, 2018 | | | Year Ended
Dec. 31, 2017 | |
| Net Asset Value, Beginning of Period | | $ | 82.13 | | | $ | 76.13 | | | $ | 65.65 | | | $ | 70.40 | | | $ | 57.44 | |
| | | | | | | | | | | | | | | | | | | | | |
| Investment Activities: | | | | | | | | | | | | | | | | | | | | |
| Net investment income (loss)(a) | | | (0.14 | ) | | | (0.05 | ) | | | 0.01 | | | | (0.07 | ) | | | (0.14 | ) |
| Net realized and unrealized gains (losses) on investments | | | 13.01 | | | | 11.57 | | | | 10.75 | | | | (4.68 | ) | | | 13.10 | |
| Total income (loss) from investment activities | | | 12.87 | | | | 11.52 | | | | 10.76 | | | | (4.75 | ) | | | 12.96 | |
| | | | | | | | | | | | | | | | | | | | | |
| Distributions to Shareholders From: | | | | | | | | | | | | | | | | | | | | |
| Net investment income | | | — | | | | (0.01 | ) | | | — | | | | — | | | | — | |
| Net realized gains on investments | | | (0.54 | ) | | | (5.51 | ) | | | (0.28 | ) | | | — | | | | — | |
| Total distributions | | | (0.54 | ) | | | (5.52 | ) | | | (0.28 | ) | | | — | | | | — | |
| | | | | | | | | | | | | | | | | | | | | |
| Net Asset Value, End of Period | | $ | 94.46 | | | $ | 82.13 | | | $ | 76.13 | | | $ | 65.65 | | | $ | 70.40 | |
| | | | | | | | | | | | | | | | | | | | | |
| Total Return | | | 15.73 | % | | | 15.38 | % | | | 16.46 | % | | | (6.75 | )% | | | 22.54 | % |
| | | | | | | | | | | | | | | | | | | | | |
| Ratios to Average Net Assets: | | | | | | | | | | | | | | | | | | | | |
| Gross expenses | | | 1.58 | % | | | 1.67 | % | | | 1.63 | % | | | 1.58 | % | | | 1.59 | % |
| Net expenses | | | 1.58 | % | | | 1.67 | % | | | 1.63 | % | | | 1.58 | % | | | 1.59 | % |
| Net investment income (loss) | | | (0.15 | )% | | | (0.06 | )% | | | 0.02 | % | | | (0.10 | )% | | | (0.22 | )% |
| | | | | | | | | | | | | | | | | | | | | |
| Supplemental Data: | | | | | | | | | | | | | | | | | | | | |
| Net assets, end of period (000's) | | $ | 61,798 | | | $ | 60,969 | | | $ | 57,767 | | | $ | 55,520 | | | $ | 68,165 | |
| Portfolio turnover rate(b) | | | 43 | % | | | 70 | % | | | 81 | % | | | 114 | % | | | 157 | % |
| (a) | Per share net investment income (loss) has been calculated using the average daily shares method. |
| (b) | Portfolio turnover rate is calculated without regard to instruments having a maturity of less than one year from acquisition or derivative instruments (including swap agreements and futures contracts). The portfolio turnover rate can be high and volatile due to the amount and timing of sales and purchases of fund shares during the period. |
See accompanying notes to financial statements.
40 :: ProFund VP Bull :: Management Discussion of Fund Performance
ProFund VP Bull (the "Fund") seeks investment results, before fees and expenses, that correspond to the performance of the S&P 500® (the "Index"). For the year ended December 31, 2021, the Fund had a total return of 26.33%. For the same period, the Index had a total return of 28.71%1 and a volatility of 13.10%. For the year, the Fund achieved an average daily statistical correlation of over 0.99 to the daily performance of the Index.2
The Fund takes positions in financial instruments that, in combination, should have similar return characteristics as the return of the Index. The Index is a measure of large-cap U.S. stock market performance. It is a float-adjusted, market capitalization-weighted index of 500 U.S. operating companies and real estate investment trusts selected through a process that factors in criteria such as liquidity, price, market capitalization, and financial viability. Reconstitution occurs both on a quarterly and an ongoing basis.
During the year ended December 31, 2021, the Fund invested in swap agreements and futures contracts as a substitute for investing directly in stocks in order to gain exposure to the Index. These derivatives generally tracked the performance of their underlying benchmark and were negatively impacted by financing costs associated with their use. The Fund entered into swap agreements with counterparties that the Fund's advisor determined to be major, global financial institutions. If a counterparty becomes insolvent or otherwise fails to perform on its obligations, the value of investments in the Fund may decline. The Fund has sought to mitigate this risk by generally requiring counterparties to post collateral for the benefit of the Fund, marked to market daily, in an amount approximately equal to the amount the counterparty owed to the Fund, subject to certain minimum thresholds.
Value of a $10,000 Investment at Net Asset Value*

| * | The line graph represents the historical performance of a hypothetical investment of $10,000 in the ProFund VP Bull from December 31, 2011 to December 31, 2021, assuming the reinvestment of distributions. |
Average Annual Total Return as of 12/31/21
| Fund | | One Year | | | Five Year | | | Ten Year | |
| ProFund VP Bull | | | 26.33 | % | | | 16.17 | % | | | 14.30 | % |
| S&P 500® | | | 28.71 | % | | | 18.47 | % | | | 16.55 | % |
Expense Ratios**
| Fund | | Gross | | | Net | | | | | |
| ProFund VP Bull | | | 1.72 | % | | | 1.68 | % | | | | |
| ** | Reflects the expense ratio as reported in the Prospectus dated May 1, 2021. Contractual fee waivers are in effect through April 30, 2022. See Financial Highlights for effective expense ratios. |
Allocation of Portfolio Holdings & Index Composition
Market Exposure
| Investment Type | | % of Net Assets | |
| Equity Securities | | | 83 | % |
| Futures Contracts | | | 5 | % |
| Swap Agreements | | | 12 | % |
| Total Exposure | | | 100 | % |
"Market Exposure" includes the value of total investments (including the contract value of any derivatives) and excludes any instruments used for cash management or collateral for securities loaned.
Largest Equity Holdings
| Company | | % of Net Assets | |
| Apple, Inc. | | | 5.7 | % |
| Microsoft Corp. | | | 5.2 | % |
| Alphabet, Inc. | | | 3.5 | % |
| Amazon.com, Inc. | | | 3.0 | % |
| Tesla, Inc. | | | 1.8 | % |
S&P 500® Index – Composition
| | | % of Index | |
| Information Technology | | | 28 | % |
| Health Care | | | 13 | % |
| Consumer Discretionary | | | 13 | % |
| Financials | | | 11 | % |
| Communication Services | | | 10 | % |
| Industrials | | | 8 | % |
| Consumer Staples | | | 6 | % |
| Real Estate | | | 3 | % |
| Energy | | | 3 | % |
| Materials | | | 3 | % |
| Utilities | | | 2 | % |
Past performance does not guarantee future results. Return calculations assume the reinvestment of distributions and do not reflect taxes that a shareholder would pay on Fund distributions or on the redemption of Fund shares. The performance data quoted represents past performance and current returns may be lower or higher. The investment return and net asset value ("NAV") will fluctuate so that an investor's shares, when redeemed, may be worth more or less than the original cost. The performance above reflects any fee reductions during the applicable periods. If such fee reductions had not occurred, the quoted performance would be lower. Performance numbers are net of all Fund fees and expenses but do not include any insurance, sales, or administrative charges of variable annuity or life insurance contracts. If these charges were included, the returns would be lower. To obtain performance current to the most recent month-end, please call toll-free 888-776-3637.
| 1 | The graph and table reflect the theoretical reinvestment of dividends on securities in the Index. The impact of transaction costs and the deduction of fees and expenses associated with a mutual fund, such as investment management and accounting fees, are not reflected in the index calculations. The Fund's performance reflects the reinvestment of dividends as well as the impact of transaction costs and the deduction of fees and expenses. It is not possible to invest directly in an index. |
| 2 | 1.00 equals perfect correlation. This calculation is based on the daily total return of the Index and the performance of the daily total return of the NAV per share of the Fund. |
The above information is not covered by the Report of the Independent Registered Public Accounting Firm.
Financial Statements :: ProFund VP Bull :: 41
Schedule of Portfolio Investments :: December 31, 2021
Common Stocks (83.2%)
| | | Shares | | | Value | |
| 3M Co. (Industrial Conglomerates) | | | 779 | | | $ | 138,374 | |
| A.O. Smith Corp. (Building Products) | | | 180 | | | | 15,453 | |
| Abbott Laboratories (Health Care Equipment & Supplies) | | | 2,389 | | | | 336,228 | |
| AbbVie, Inc. (Biotechnology) | | | 2,389 | | | | 323,472 | |
| ABIOMED, Inc.* (Health Care Equipment & Supplies) | | | 61 | | | | 21,909 | |
| Accenture PLC — Class A (IT Services) | | | 853 | | | | 353,611 | |
| Activision Blizzard, Inc. (Entertainment) | | | 1,052 | | | | 69,990 | |
| Adobe, Inc.* (Software) | | | 643 | | | | 364,620 | |
| Advance Auto Parts, Inc. (Specialty Retail) | | | 85 | | | | 20,390 | |
| Advanced Micro Devices, Inc.* (Semiconductors & Semiconductor Equipment) | | | 1,631 | | | | 234,701 | |
| Aflac, Inc. (Insurance) | | | 822 | | | | 47,997 | |
| Agilent Technologies, Inc. (Life Sciences Tools & Services) | | | 409 | | | | 65,297 | |
| Air Products & Chemicals, Inc. (Chemicals) | | | 299 | | | | 90,973 | |
| Akamai Technologies, Inc.* (IT Services) | | | 220 | | | | 25,749 | |
| Alaska Air Group, Inc.* (Airlines) | | | 169 | | | | 8,805 | |
| Albemarle Corp. (Chemicals) | | | 158 | | | | 36,936 | |
| Alexandria Real Estate Equities, Inc. (Equity Real Estate Investment Trusts) | | | 191 | | | | 42,585 | |
| Align Technology, Inc.* (Health Care Equipment & Supplies) | | | 99 | | | | 65,061 | |
| Allegion PLC (Building Products) | | | 121 | | | | 16,025 | |
| Alliant Energy Corp. (Electric Utilities) | | | 338 | | | | 20,777 | |
| Alphabet, Inc.* — Class A (Interactive Media & Services) | | | 406 | | | | 1,176,197 | |
| Alphabet, Inc.* — Class C (Interactive Media & Services) | | | 378 | | | | 1,093,777 | |
| Altria Group, Inc. (Tobacco) | | | 2,482 | | | | 117,622 | |
| Amazon.com, Inc.* (Internet & Direct Marketing Retail) | | | 589 | | | | 1,963,926 | |
| Amcor PLC (Containers & Packaging) | | | 2,071 | | | | 24,873 | |
| Ameren Corp. (Multi-Utilities) | | | 348 | | | | 30,975 | |
| American Airlines Group, Inc.* (Airlines) | | | 875 | | | | 15,715 | |
| American Electric Power Co., Inc. (Electric Utilities) | | | 680 | | | | 60,500 | |
| American Express Co. (Consumer Finance) | | | 847 | | | | 138,569 | |
| American International Group, Inc. (Insurance) | | | 1,122 | | | | 63,797 | |
| American Tower Corp. (Equity Real Estate Investment Trusts) | | | 615 | | | | 179,887 | |
| American Water Works Co., Inc. (Water Utilities) | | | 245 | | | | 46,271 | |
| Ameriprise Financial, Inc. (Capital Markets) | | | 151 | | | | 45,551 | |
| AmerisourceBergen Corp. (Health Care Providers & Services) | | | 202 | | | | 26,844 | |
| AMETEK, Inc. (Electrical Equipment) | | | 313 | | | | 46,024 | |
| Amgen, Inc. (Biotechnology) | | | 761 | | | | 171,202 | |
| Amphenol Corp. — Class A (Electronic Equipment, Instruments & Components) | | | 808 | | | | 70,668 | |
| Analog Devices, Inc. (Semiconductors & Semiconductor Equipment) | | | 726 | | | | 127,609 | |
| ANSYS, Inc.* (Software) | | | 118 | | | | 47,332 | |
| Anthem, Inc. (Health Care Providers & Services) | | | 328 | | | | 152,041 | |
| Aon PLC (Insurance) | | | 298 | | | | 89,567 | |
| APA Corp. (Oil, Gas & Consumable Fuels) | | | 491 | | | | 13,203 | |
| Apple, Inc. (Technology Hardware, Storage & Peripherals) | | | 21,056 | | | | 3,738,915 | |
| Applied Materials, Inc. (Semiconductors & Semiconductor Equipment) | | | 1,220 | | | | 191,979 | |
| Aptiv PLC* (Auto Components) | | | 365 | | | | 60,206 | |
| Archer-Daniels-Midland Co. (Food Products) | | | 756 | | | | 51,098 | |
| Arista Networks, Inc.* (Communications Equipment) | | | 303 | | | | 43,556 | |
| Arthur J. Gallagher & Co. (Insurance) | | | 280 | | | | 47,508 | |
| Assurant, Inc. (Insurance) | | | 77 | | | | 12,001 | |
| AT&T, Inc. (Diversified Telecommunication Services) | | | 9,648 | | | | 237,341 | |
| Atmos Energy Corp. (Gas Utilities) | | | 179 | | | | 18,754 | |
| Autodesk, Inc.* (Software) | | | 297 | | | | 83,513 | |
| Automatic Data Processing, Inc. (IT Services) | | | 569 | | | | 140,304 | |
| AutoZone, Inc.* (Specialty Retail) | | | 28 | | | | 58,699 | |
| AvalonBay Communities, Inc. (Equity Real Estate Investment Trusts) | | | 189 | | | | 47,740 | |
| Avery Dennison Corp. (Containers & Packaging) | | | 112 | | | | 24,256 | |
| Baker Hughes Co. — Class A (Energy Equipment & Services) | | | 1,181 | | | | 28,415 | |
| Ball Corp. (Containers & Packaging) | | | 438 | | | | 42,166 | |
| Bank of America Corp. (Banks) | | | 9,730 | | | | 432,887 | |
| Bath & Body Works, Inc. (Specialty Retail) | | | 357 | | | | 24,915 | |
| Baxter International, Inc. (Health Care Equipment & Supplies) | | | 677 | | | | 58,114 | |
| Becton, Dickinson & Co. (Health Care Equipment & Supplies) | | | 388 | | | | 97,574 | |
| Berkshire Hathaway, Inc.* — Class B (Diversified Financial Services) | | | 2,474 | | | | 739,726 | |
| Best Buy Co., Inc. (Specialty Retail) | | | 299 | | | | 30,378 | |
| Biogen, Inc.* (Biotechnology) | | | 198 | | | | 47,504 | |
| Bio-Rad Laboratories, Inc.* — Class A (Life Sciences Tools & Services) | | | 29 | | | | 21,912 | |
| Bio-Techne Corp. (Life Sciences Tools & Services) | | | 53 | | | | 27,419 | |
| BlackRock, Inc. — Class A (Capital Markets) | | | 193 | | | | 176,703 | |
| Booking Holdings, Inc.* (Hotels, Restaurants & Leisure) | | | 55 | | | | 131,958 | |
| BorgWarner, Inc. (Auto Components) | | | 324 | | | | 14,603 | |
| Boston Properties, Inc. (Equity Real Estate Investment Trusts) | | | 192 | | | | 22,115 | |
| Boston Scientific Corp.* (Health Care Equipment & Supplies) | | | 1,925 | | | | 81,774 | |
| Bristol-Myers Squibb Co. (Pharmaceuticals) | | | 2,999 | | | | 186,988 | |
| Broadcom, Inc. (Semiconductors & Semiconductor Equipment) | | | 556 | | | | 369,968 | |
| Broadridge Financial Solutions, Inc. (IT Services) | | | 158 | | | | 28,886 | |
| Brown & Brown, Inc. (Insurance) | | | 317 | | | | 22,279 | |
| Brown-Forman Corp. — Class B (Beverages) | | | 247 | | | | 17,996 | |
| C.H. Robinson Worldwide, Inc. (Air Freight & Logistics) | | | 176 | | | | 18,943 | |
| Cadence Design Systems, Inc.* (Software) | | | 374 | | | | 69,695 | |
| Caesars Entertainment, Inc.* (Hotels, Restaurants & Leisure) | | | 289 | | | | 27,030 | |
| Campbell Soup Co. (Food Products) | | | 273 | | | | 11,865 | |
| Capital One Financial Corp. (Consumer Finance) | | | 575 | | | | 83,427 | |
See accompanying notes to financial statements.
42 :: ProFund VP Bull :: Financial Statements
Common Stocks, continued
| | | Shares | | | Value | |
Cardinal Health, Inc. (Health Care Providers & Services) | | | 381 | | | $ | 19,618 | |
| CarMax, Inc.* (Specialty Retail) | | | 219 | | | | 28,520 | |
| Carnival Corp.* — Class A (Hotels, Restaurants & Leisure) | | | 1,087 | | | | 21,870 | |
| Carrier Global Corp. (Building Products) | | | 1,171 | | | | 63,515 | |
| Catalent, Inc.* (Pharmaceuticals) | | | 231 | | | | 29,575 | |
| Caterpillar, Inc. (Machinery) | | | 731 | | | | 151,128 | |
| Cboe Global Markets, Inc. (Capital Markets) | | | 144 | | | | 18,778 | |
| CBRE Group, Inc.* — Class A (Real Estate Management & Development) | | | 452 | | | | 49,047 | |
| CDW Corp. (Electronic Equipment, Instruments & Components) | | | 183 | | | | 37,475 | |
| Celanese Corp. (Chemicals) | | | 147 | | | | 24,705 | |
| Centene Corp.* (Health Care Providers & Services) | | | 788 | | | | 64,931 | |
| CenterPoint Energy, Inc. (Multi — Utilities) | | | 850 | | | | 23,724 | |
| Ceridian HCM Holding, Inc.* (Software) | | | 184 | | | | 19,221 | |
| Cerner Corp. (Health Care Technology) | | | 398 | | | | 36,962 | |
| CF Industries Holdings, Inc. (Chemicals) | | | 290 | | | | 20,526 | |
| Charles River Laboratories International, Inc.* (Life Sciences Tools & Services) | | | 68 | | | | 25,621 | |
| Charter Communications, Inc.* — Class A (Media) | | | 167 | | | | 108,879 | |
| Chevron Corp. (Oil, Gas & Consumable Fuels) | | | 2,605 | | | | 305,696 | |
| Chipotle Mexican Grill, Inc.* (Hotels, Restaurants & Leisure) | | | 38 | | | | 66,434 | |
| Chubb, Ltd. (Insurance) | | | 582 | | | | 112,505 | |
| Church & Dwight Co., Inc. (Household Products) | | | 330 | | | | 33,825 | |
| Cigna Corp. (Health Care Providers & Services) | | | 448 | | | | 102,874 | |
| Cincinnati Financial Corp. (Insurance) | | | 202 | | | | 23,014 | |
| Cintas Corp. (Commercial Services & Supplies) | | | 119 | | | | 52,737 | |
| Cisco Systems, Inc. (Communications Equipment) | | | 5,698 | | | | 361,081 | |
| Citigroup, Inc. (Banks) | | | 2,681 | | | | 161,906 | |
| Citizens Financial Group, Inc. (Banks) | | | 576 | | | | 27,216 | |
| Citrix Systems, Inc. (Software) | | | 169 | | | | 15,986 | |
| CME Group, Inc. (Capital Markets) | | | 486 | | | | 111,032 | |
| CMS Energy Corp. (Multi — Utilities) | | | 391 | | | | 25,435 | |
| Cognizant Technology Solutions Corp. — Class A (IT Services) | | | 710 | | | | 62,991 | |
| Colgate — Palmolive Co. (Household Products) | | | 1,139 | | | | 97,202 | |
| Comcast Corp. — Class A (Media) | | | 6,160 | | | | 310,032 | |
| Comerica, Inc. (Banks) | | | 177 | | | | 15,399 | |
| Conagra Brands, Inc. (Food Products) | | | 648 | | | | 22,129 | |
| ConocoPhillips (Oil, Gas & Consumable Fuels) | | | 1,782 | | | | 128,624 | |
| Consolidated Edison, Inc. (Multi — Utilities) | | | 478 | | | | 40,783 | |
| Constellation Brands, Inc. — Class A (Beverages) | | | 222 | | | | 55,715 | |
| Copart, Inc.* (Commercial Services & Supplies) | | | 288 | | | | 43,667 | |
| Corning, Inc. (Electronic Equipment, Instruments & Components) | | | 1,038 | | | | 38,645 | |
| Corteva, Inc. (Chemicals) | | | 985 | | | | 46,571 | |
| Costco Wholesale Corp. (Food & Staples Retailing) | | | 597 | | | | 338,917 | |
| Coterra Energy, Inc. (Oil, Gas & Consumable Fuels) | | | 1,099 | | | | 20,881 | |
| Crown Castle International Corp. (Equity Real Estate Investment Trusts) | | | 584 | | | | 121,904 | |
| CSX Corp. (Road & Rail) | | | 2,997 | | | | 112,687 | |
| Cummins, Inc. (Machinery) | | | 193 | | | | 42,101 | |
| CVS Health Corp. (Health Care Providers & Services) | | | 1,783 | | | | 183,934 | |
| Danaher Corp. (Health Care Equipment & Supplies) | | | 859 | | | | 282,620 | |
| Darden Restaurants, Inc. (Hotels, Restaurants & Leisure) | | | 175 | | | | 26,362 | |
| DaVita, Inc.* (Health Care Providers & Services) | | | 88 | | | | 10,011 | |
| Deere & Co. (Machinery) | | | 381 | | | | 130,642 | |
| Delta Air Lines, Inc.* (Airlines) | | | 865 | | | | 33,804 | |
| DENTSPLY SIRONA, Inc. (Health Care Equipment & Supplies) | | | 295 | | | | 16,458 | |
| Devon Energy Corp. (Oil, Gas & Consumable Fuels) | | | 851 | | | | 37,487 | |
| DexCom, Inc.* (Health Care Equipment & Supplies) | | | 131 | | | | 70,340 | |
| Diamondback Energy, Inc. (Oil, Gas & Consumable Fuels) | | | 230 | | | | 24,806 | |
| Digital Realty Trust, Inc. (Equity Real Estate Investment Trusts) | | | 383 | | | | 67,741 | |
| Discover Financial Services (Consumer Finance) | | | 396 | | | | 45,762 | |
| Discovery, Inc.*(a) (Media) | | | 229 | | | | 5,391 | |
| Discovery, Inc.* — Class C (Media) | | | 410 | | | | 9,389 | |
| DISH Network Corp.* — Class A (Media) | | | 337 | | | | 10,932 | |
| Dollar General Corp. (Multiline Retail) | | | 315 | | | | 74,286 | |
| Dollar Tree, Inc.* (Multiline Retail) | | | 304 | | | | 42,718 | |
| Dominion Energy, Inc. (Multi — Utilities) | | | 1,094 | | | | 85,944 | |
| Domino's Pizza, Inc. (Hotels, Restaurants & Leisure) | | | 49 | | | | 27,652 | |
| Dover Corp. (Machinery) | | | 195 | | | | 35,412 | |
| Dow, Inc. (Chemicals) | | | 999 | | | | 56,663 | |
| DR Horton, Inc. (Household Durables) | | | 440 | | | | 47,718 | |
| DTE Energy Co. (Multi — Utilities) | | | 262 | | | | 31,319 | |
| Duke Energy Corp. (Electric Utilities) | | | 1,039 | | | | 108,990 | |
| Duke Realty Corp. (Equity Real Estate Investment Trusts) | | | 515 | | | | 33,805 | |
| DuPont de Nemours, Inc. (Chemicals) | | | 700 | | | | 56,546 | |
| DXC Technology Co.* (IT Services) | | | 341 | | | | 10,977 | |
| Eastman Chemical Co. (Chemicals) | | | 182 | | | | 22,006 | |
| Eaton Corp. PLC (Electrical Equipment) | | | 539 | | | | 93,150 | |
| eBay, Inc. (Internet & Direct Marketing Retail) | | | 846 | | | | 56,259 | |
| Ecolab, Inc. (Chemicals) | | | 337 | | | | 79,057 | |
| Edison International (Electric Utilities) | | | 513 | | | | 35,012 | |
| Edwards Lifesciences Corp.* (Health Care Equipment & Supplies) | | | 844 | | | | 109,340 | |
| Electronic Arts, Inc. (Entertainment) | | | 382 | | | | 50,386 | |
| Eli Lilly & Co. (Pharmaceuticals) | | | 1,073 | | | | 296,384 | |
| Emerson Electric Co. (Electrical Equipment) | | | 808 | | | | 75,120 | |
| Enphase Energy, Inc.* (Semiconductors & Semiconductor Equipment) | | | 182 | | | | 33,295 | |
| Entergy Corp. (Electric Utilities) | | | 272 | | | | 30,641 | |
| EOG Resources, Inc. (Oil, Gas & Consumable Fuels) | | | 790 | | | | 70,176 | |
| EPAM Systems, Inc.* (IT Services) | | | 77 | | | | 51,471 | |
| Equifax, Inc. (Professional Services) | | | 165 | | | | 48,310 | |
| Equinix, Inc. (Equity Real Estate Investment Trusts) | | | 122 | | | | 103,192 | |
| Equity Residential (Equity Real Estate Investment Trusts) | | | 461 | | | | 41,721 | |
| Essex Property Trust, Inc. (Equity Real Estate Investment Trusts) | | | 88 | | | | 30,996 | |
| Etsy, Inc.* (Internet & Direct Marketing Retail) | | | 171 | | | | 37,439 | |
See accompanying notes to financial statements.
Financial Statements :: ProFund VP Bull :: 43
Common Stocks, continued
| | | Shares | | | Value | |
| Everest Re Group, Ltd. (Insurance) | | | 53 | | | $ | 14,518 | |
| Evergy, Inc. (Electric Utilities) | | | 310 | | | | 21,269 | |
| Eversource Energy (Electric Utilities) | | | 465 | | | | 42,306 | |
| Exelon Corp. (Electric Utilities) | | | 1,322 | | | | 76,359 | |
| Expedia Group, Inc.* (Hotels, Restaurants & Leisure) | | | 197 | | | | 35,602 | |
| Expeditors International of Washington, Inc. (Air Freight & Logistics) | | | 229 | | | | 30,752 | |
| Extra Space Storage, Inc. (Equity Real Estate Investment Trusts) | | | 181 | | | | 41,038 | |
| Exxon Mobil Corp. (Oil, Gas & Consumable Fuels) | | | 5,719 | | | | 349,945 | |
| F5, Inc.* (Communications Equipment) | | | 81 | | | | 19,822 | |
| FactSet Research Systems, Inc. (Capital Markets) | | | 51 | | | | 24,787 | |
| Fastenal Co. (Trading Companies & Distributors) | | | 777 | | | | 49,775 | |
| Federal Realty Investment Trust (Equity Real Estate Investment Trusts) | | | 95 | | | | 12,950 | |
| FedEx Corp. (Air Freight & Logistics) | | | 330 | | | | 85,351 | |
| Fidelity National Information Services, Inc. (IT Services) | | | 822 | | | | 89,721 | |
| Fifth Third Bancorp (Banks) | | | 924 | | | | 40,240 | |
| First Horizon Corp. (Banks) | | | 1 | | | | 9 | |
| First Republic Bank (Banks) | | | 242 | | | | 49,975 | |
| FirstEnergy Corp. (Electric Utilities) | | | 736 | | | | 30,610 | |
| Fiserv, Inc.* (IT Services) | | | 803 | | | | 83,343 | |
| FleetCor Technologies, Inc.* (IT Services) | | | 110 | | | | 24,622 | |
| FMC Corp. (Chemicals) | | | 171 | | | | 18,791 | |
| Ford Motor Co. (Automobiles) | | | 5,303 | | | | 110,143 | |
| Fortinet, Inc.* (Software) | | | 183 | | | | 65,770 | |
| Fortive Corp. (Machinery) | | | 484 | | | | 36,924 | |
| Fortune Brands Home & Security, Inc. (Building Products) | | | 183 | | | | 19,563 | |
| Fox Corp. — Class A (Media) | | | 433 | | | | 15,978 | |
| Fox Corp. — Class B (Media) | | | 199 | | | | 6,820 | |
| Franklin Resources, Inc. (Capital Markets) | | | 380 | | | | 12,726 | |
| Freeport — McMoRan, Inc. (Metals & Mining) | | | 1,984 | | | | 82,792 | |
| Garmin, Ltd. (Household Durables) | | | 205 | | | | 27,915 | |
| Gartner, Inc.* (IT Services) | | | 111 | | | | 37,110 | |
| Generac Holdings, Inc.* (Electrical Equipment) | | | 85 | | | | 29,913 | |
| General Dynamics Corp. (Aerospace & Defense) | | | 313 | | | | 65,251 | |
| General Electric Co. (Industrial Conglomerates) | | | 1,484 | | | | 140,193 | |
| General Mills, Inc. (Food Products) | | | 818 | | | | 55,117 | |
| General Motors Co.* (Automobiles) | | | 1,962 | | | | 115,032 | |
| Genuine Parts Co. (Distributors) | | | 192 | | | | 26,918 | |
| Gilead Sciences, Inc. (Biotechnology) | | | 1,695 | | | | 123,074 | |
| Global Payments, Inc. (IT Services) | | | 392 | | | | 52,991 | |
| Globe Life, Inc. (Insurance) | | | 126 | | | | 11,809 | |
| Halliburton Co. (Energy Equipment & Services) | | | 1,209 | | | | 27,650 | |
| Hartford Financial Services Group, Inc. (Insurance) | | | 460 | | | | 31,758 | |
| Hasbro, Inc. (Leisure Products) | | | 175 | | | | 17,812 | |
| HCA Healthcare, Inc. (Health Care Providers & Services) | | | 323 | | | | 82,985 | |
| Healthpeak Properties, Inc. (Equity Real Estate Investment Trusts) | | | 728 | | | | 26,274 | |
| Henry Schein, Inc.* (Health Care Providers & Services) | | | 187 | | | | 14,498 | |
| Hess Corp. (Oil, Gas & Consumable Fuels) | | | 372 | | | | 27,539 | |
| Hewlett Packard Enterprises Co. (Technology Hardware, Storage & Peripherals) | | | 1,767 | | | | 27,866 | |
| Hilton Worldwide Holdings, Inc.* (Hotels, Restaurants & Leisure) | | | 377 | | | | 58,808 | |
| Hologic, Inc.* (Health Care Equipment & Supplies) | | | 342 | | | | 26,184 | |
| Honeywell International, Inc. (Industrial Conglomerates) | | | 930 | | | | 193,915 | |
| Hormel Foods Corp. (Food Products) | | | 381 | | | | 18,597 | |
| Host Hotels & Resorts, Inc.* (Equity Real Estate Investment Trusts) | | | 965 | | | | 16,781 | |
| Howmet Aerospace, Inc. (Aerospace & Defense) | | | 519 | | | | 16,520 | |
| HP, Inc. (Technology Hardware, Storage & Peripherals) | | | 1,557 | | | | 58,652 | |
| Humana, Inc. (Health Care Providers & Services) | | | 174 | | | | 80,712 | |
| Huntington Bancshares, Inc. (Banks) | | | 1,954 | | | | 30,131 | |
| Huntington Ingalls Industries, Inc. (Aerospace & Defense) | | | 54 | | | | 10,084 | |
| IDEX Corp. (Machinery) | | | 103 | | | | 24,341 | |
| IDEXX Laboratories, Inc.* (Health Care Equipment & Supplies) | | | 115 | | | | 75,723 | |
| IHS Markit, Ltd. (Professional Services) | | | 539 | | | | 71,645 | |
| Illinois Tool Works, Inc. (Machinery) | | | 386 | | | | 95,265 | |
| Illumina, Inc.* (Life Sciences Tools & Services) | | | 211 | | | | 80,273 | |
| Incyte Corp.* (Biotechnology) | | | 254 | | | | 18,644 | |
| Ingersoll Rand, Inc. (Machinery) | | | 551 | | | | 34,090 | |
| Intel Corp. (Semiconductors & Semiconductor Equipment) | | | 5,495 | | | | 282,993 | |
| Intercontinental Exchange, Inc. (Capital Markets) | | | 761 | | | | 104,082 | |
| International Business Machines Corp. (IT Services) | | | 1,212 | | | | 161,996 | |
| International Flavors & Fragrances, Inc. (Chemicals) | | | 344 | | | | 51,824 | |
| International Paper Co. (Containers & Packaging) | | | 523 | | | | 24,571 | |
| Intuit, Inc. (Software) | | | 383 | | | | 246,353 | |
| Intuitive Surgical, Inc.* (Health Care Equipment & Supplies) | | | 483 | | | | 173,542 | |
| Invesco, Ltd. (Capital Markets) | | | 461 | | | | 10,612 | |
| IPG Photonics Corp.* (Electronic Equipment, Instruments & Components) | | | 48 | | | | 8,263 | |
| IQVIA Holdings, Inc.* (Life Sciences Tools & Services) | | | 258 | | | | 72,792 | |
| Iron Mountain, Inc. (Equity Real Estate Investment Trusts) | | | 391 | | | | 20,461 | |
| J.B. Hunt Transport Services, Inc. (Road & Rail) | | | 114 | | | | 23,302 | |
| Jack Henry & Associates, Inc. (IT Services) | | | 100 | | | | 16,699 | |
| Jacobs Engineering Group, Inc. (Professional Services) | | | 176 | | | | 24,504 | |
| Johnson & Johnson (Pharmaceuticals) | | | 3,557 | | | | 608,496 | |
| Johnson Controls International PLC (Building Products) | | | 957 | | | | 77,813 | |
| JPMorgan Chase & Co. (Banks) | | | 3,992 | | | | 632,132 | |
| Juniper Networks, Inc. (Communications Equipment) | | | 439 | | | | 15,677 | |
| Kellogg Co. (Food Products) | | | 346 | | | | 22,289 | |
| KeyCorp (Banks) | | | 1,258 | | | | 29,098 | |
| Keysight Technologies, Inc.* (Electronic Equipment, Instruments & Components) | | | 249 | | | | 51,421 | |
| Kimberly — Clark Corp. (Household Products) | | | 455 | | | | 65,029 | |
| Kimco Realty Corp. (Equity Real Estate Investment Trusts) | | | 833 | | | | 20,533 | |
| Kinder Morgan, Inc. (Oil, Gas & Consumable Fuels) | | | 2,635 | | | | 41,791 | |
See accompanying notes to financial statements.
44 :: ProFund VP Bull :: Financial Statements
Common Stocks, continued
| | | Shares | | | Value | |
| KLA Corp. (Semiconductors & Semiconductor Equipment) | | | 205 | | | $ | 88,173 | |
| L3Harris Technologies, Inc. (Aerospace & Defense) | | | 265 | | | | 56,509 | |
| Laboratory Corp. of America Holdings* (Health Care Providers & Services) | | | 129 | | | | 40,533 | |
| Lam Research Corp. (Semiconductors & Semiconductor Equipment) | | | 190 | | | | 136,639 | |
| Lamb Weston Holding, Inc. (Food Products) | | | 197 | | | | 12,486 | |
| Las Vegas Sands Corp.* (Hotels, Restaurants & Leisure) | | | 464 | | | | 17,465 | |
| Leidos Holdings, Inc. (Professional Services) | | | 190 | | | | 16,891 | |
| Lennar Corp. — Class A (Household Durables) | | | 367 | | | | 42,631 | |
| Lincoln National Corp. (Insurance) | | | 229 | | | | 15,632 | |
| Linde PLC (Chemicals) | | | 692 | | | | 239,729 | |
| Live Nation Entertainment, Inc.* (Entertainment) | | | 183 | | | | 21,903 | |
| LKQ Corp. (Distributors) | | | 362 | | | | 21,731 | |
| Lockheed Martin Corp. (Aerospace & Defense) | | | 332 | | | | 117,996 | |
| Loews Corp. (Insurance) | | | 271 | | | | 15,653 | |
| Lowe's Cos., Inc. (Specialty Retail) | | | 936 | | | | 241,937 | |
| Lumen Technologies, Inc. (Diversified Telecommunication Services) | | | 1,245 | | | | 15,625 | |
| LyondellBasell Industries N.V. — Class A (Chemicals) | | | 355 | | | | 32,742 | |
| M&T Bank Corp. (Banks) | | | 174 | | | | 26,723 | |
| Marathon Oil Corp. (Oil, Gas & Consumable Fuels) | | | 1,052 | | | | 17,274 | |
| Marathon Petroleum Corp. (Oil, Gas & Consumable Fuels) | | | 832 | | | | 53,240 | |
| MarketAxess Holdings, Inc. (Capital Markets) | | | 51 | | | | 20,975 | |
| Marriott International, Inc.* — Class A (Hotels, Restaurants & Leisure) | | | 371 | | | | 61,278 | |
| Marsh & McLennan Cos., Inc. (Insurance) | | | 682 | | | | 118,544 | |
| Martin Marietta Materials, Inc. (Construction Materials) | | | 84 | | | | 37,004 | |
| Masco Corp. (Building Products) | | | 330 | | | | 23,173 | |
| Mastercard, Inc. — Class A (IT Services) | | | 1,172 | | | | 421,123 | |
| Match Group, Inc.* (Interactive Media & Services) | | | 382 | | | | 50,520 | |
| McCormick & Co., Inc. (Food Products) | | | 337 | | | | 32,558 | |
| McDonald's Corp. (Hotels, Restaurants & Leisure) | | | 1,009 | | | | 270,482 | |
| McKesson Corp. (Health Care Providers & Services) | | | 206 | | | | 51,205 | |
| Medtronic PLC (Health Care Equipment & Supplies) | | | 1,818 | | | | 188,072 | |
| Merck & Co., Inc. (Pharmaceuticals) | | | 3,413 | | | | 261,572 | |
| Meta Platforms, Inc.* — Class A (Interactive Media & Services) | | | 3,197 | | | | 1,075,311 | |
| MetLife, Inc. (Insurance) | | | 966 | | | | 60,365 | |
| Mettler — Toledo International, Inc.* (Life Sciences Tools & Services) | | | 31 | | | | 52,614 | |
| MGM Resorts International (Hotels, Restaurants & Leisure) | | | 526 | | | | 23,607 | |
| Microchip Technology, Inc. (Semiconductors & Semiconductor Equipment) | | | 750 | | | | 65,295 | |
| Micron Technology, Inc. (Semiconductors & Semiconductor Equipment) | | | 1,511 | | | | 140,750 | |
| Microsoft Corp. (Software) | | | 10,144 | | | | 3,411,631 | |
| Mid — America Apartment Communities, Inc. (Equity Real Estate Investment Trusts) | | | 156 | | | | 35,793 | |
| Moderna, Inc.* (Biotechnology) | | | 477 | | | | 121,148 | |
| Mohawk Industries, Inc.* (Household Durables) | | | 74 | | | | 13,481 | |
| Molson Coors Beverage Co. — Class B (Beverages) | | | 255 | | | | 11,819 | |
| Mondelez International, Inc. — Class A (Food Products) | | | 1,885 | | | | 124,993 | |
| Monolithic Power Systems, Inc. (Semiconductors & Semiconductor Equipment) | | | 59 | | | | 29,106 | |
| Monster Beverage Corp.* (Beverages) | | | 508 | | | | 48,788 | |
| Moody's Corp. (Capital Markets) | | | 219 | | | | 85,537 | |
| Morgan Stanley (Capital Markets) | | | 1,940 | | | | 190,429 | |
| Motorola Solutions, Inc. (Communications Equipment) | | | 228 | | | | 61,948 | |
| MSCI, Inc. — Class A (Capital Markets) | | | 111 | | | | 68,009 | |
| Nasdaq, Inc. (Capital Markets) | | | 158 | | | | 33,182 | |
| NetApp, Inc. (Technology Hardware, Storage & Peripherals) | | | 302 | | | | 27,781 | |
| Netflix, Inc.* (Entertainment) | | | 598 | | | | 360,259 | |
| Newell Brands, Inc. (Household Durables) | | | 512 | | | | 11,182 | |
| Newmont Corp. (Metals & Mining) | | | 1,077 | | | | 66,796 | |
| News Corp. — Class A (Media) | | | 531 | | | | 11,847 | |
| News Corp. — Class B (Media) | | | 165 | | | | 3,713 | |
| NextEra Energy, Inc. (Electric Utilities) | | | 2,651 | | | | 247,496 | |
| Nielsen Holdings PLC (Professional Services) | | | 485 | | | | 9,947 | |
| NIKE, Inc. — Class B (Textiles, Apparel & Luxury Goods) | | | 1,726 | | | | 287,673 | |
| NiSource, Inc. (Multi — Utilities) | | | 531 | | | | 14,661 | |
| Norfolk Southern Corp. (Road & Rail) | | | 329 | | | | 97,947 | |
| Northern Trust Corp. (Capital Markets) | | | 281 | | | | 33,610 | |
| Northrop Grumman Corp. (Aerospace & Defense) | | | 201 | | | | 77,801 | |
| NortonLifelock, Inc. (Software) | | | 786 | | | | 20,420 | |
| Norwegian Cruise Line Holdings, Ltd.* (Hotels, Restaurants & Leisure) | | | 500 | | | | 10,370 | |
| NRG Energy, Inc. (Electric Utilities) | | | 331 | | | | 14,259 | |
| Nucor Corp. (Metals & Mining) | | | 386 | | | | 44,062 | |
| NVIDIA Corp. (Semiconductors & Semiconductor Equipment) | | | 3,378 | | | | 993,503 | |
| NVR, Inc.* (Household Durables) | | | 4 | | | | 23,635 | |
| NXP Semiconductors N.V. (Semiconductors & Semiconductor Equipment) | | | 359 | | | | 81,773 | |
| Occidental Petroleum Corp. (Oil, Gas & Consumable Fuels) | | | 1,199 | | | | 34,759 | |
| Old Dominion Freight Line, Inc. (Road & Rail) | | | 126 | | | | 45,156 | |
| Omnicom Group, Inc. (Media) | | | 287 | | | | 21,028 | |
| ONEOK, Inc. (Oil, Gas & Consumable Fuels) | | | 602 | | | | 35,374 | |
| Oracle Corp. (Software) | | | 2,179 | | | | 190,031 | |
| O'Reilly Automotive, Inc.* (Specialty Retail) | | | 91 | | | | 64,267 | |
| Organon & Co. (Pharmaceuticals) | | | 343 | | | | 10,444 | |
| Otis Worldwide Corp. (Machinery) | | | 574 | | | | 49,978 | |
| PACCAR, Inc. (Machinery) | | | 469 | | | | 41,394 | |
| Packaging Corp. of America (Containers & Packaging) | | | 128 | | | | 17,427 | |
| Parker — Hannifin Corp. (Machinery) | | | 174 | | | | 55,353 | |
| Paychex, Inc. (IT Services) | | | 434 | | | | 59,241 | |
| Paycom Software, Inc.* (Software) | | | 65 | | | | 26,987 | |
| PayPal Holdings, Inc.* (IT Services) | | | 1,587 | | | | 299,276 | |
| Penn National Gaming, Inc.* (Hotels, Restaurants & Leisure) | | | 224 | | | | 11,614 | |
| Pentair PLC (Machinery) | | | 224 | | | | 16,359 | |
| People's United Financial, Inc. (Banks) | | | 578 | | | | 10,300 | |
| PepsiCo, Inc. (Beverages) | | | 1,868 | | | | 324,491 | |
See accompanying notes to financial statements.
Financial Statements :: ProFund VP Bull :: 45
Common Stocks, continued
| | | Shares | | | Value | |
| PerkinElmer, Inc. (Life Sciences Tools & Services) | | | 171 | | | $ | 34,381 | |
| Pfizer, Inc. (Pharmaceuticals) | | | 7,583 | | | | 447,776 | |
| Philip Morris International, Inc. (Tobacco) | | | 2,103 | | | | 199,785 | |
| Phillips 66 (Oil, Gas & Consumable Fuels) | | | 592 | | | | 42,896 | |
| Pinnacle West Capital Corp. (Electric Utilities) | | | 152 | | | | 10,730 | |
| Pioneer Natural Resources Co. (Oil, Gas & Consumable Fuels) | | | 307 | | | | 55,837 | |
| Pool Corp. (Distributors) | | | 54 | | | | 30,564 | |
| PPG Industries, Inc. (Chemicals) | | | 321 | | | | 55,353 | |
| PPL Corp. (Electric Utilities) | | | 1,014 | | | | 30,481 | |
| Principal Financial Group, Inc. (Insurance) | | | 333 | | | | 24,086 | |
| Prologis, Inc. (Equity Real Estate Investment Trusts) | | | 999 | | | | 168,191 | |
| Prudential Financial, Inc. (Insurance) | | | 511 | | | | 55,311 | |
| PTC, Inc.* (Software) | | | 143 | | | | 17,324 | |
| Public Service Enterprise Group, Inc. (Multi — Utilities) | | | 683 | | | | 45,577 | |
| Public Storage (Equity Real Estate Investment Trusts) | | | 206 | | | | 77,159 | |
| PulteGroup, Inc. (Household Durables) | | | 342 | | | | 19,549 | |
| PVH Corp. (Textiles, Apparel & Luxury Goods) | | | 96 | | | | 10,238 | |
| Qorvo, Inc.* (Semiconductors & Semiconductor Equipment) | | | 149 | | | | 23,302 | |
| Qualcomm, Inc. (Semiconductors & Semiconductor Equipment) | | | 1,513 | | | | 276,682 | |
| Quanta Services, Inc. (Construction & Engineering) | | | 193 | | | | 22,129 | |
| Quest Diagnostics, Inc. (Health Care Providers & Services) | | | 166 | | | | 28,720 | |
| Ralph Lauren Corp. (Textiles, Apparel & Luxury Goods) | | | 66 | | | | 7,845 | |
| Raymond James Financial, Inc. (Capital Markets) | | | 250 | | | | 25,100 | |
| Raytheon Technologies Corp. (Aerospace & Defense) | | | 2,022 | | | | 174,012 | |
| Realty Income Corp. (Equity Real Estate Investment Trusts) | | | 764 | | | | 54,695 | |
| Regency Centers Corp. (Equity Real Estate Investment Trusts) | | | 208 | | | | 15,673 | |
| Regeneron Pharmaceuticals, Inc.* (Biotechnology) | | | 143 | | | | 90,307 | |
| Regions Financial Corp. (Banks) | | | 1,288 | | | | 28,078 | |
| Republic Services, Inc. — Class A (Commercial Services & Supplies) | | | 283 | | | | 39,464 | |
| ResMed, Inc. (Health Care Equipment & Supplies) | | | 197 | | | | 51,315 | |
| Robert Half International, Inc. (Professional Services) | | | 150 | | | | 16,728 | |
| Rockwell Automation, Inc. (Electrical Equipment) | | | 157 | | | | 54,769 | |
| Rollins, Inc. (Commercial Services & Supplies) | | | 306 | | | | 10,468 | |
| Roper Technologies, Inc. (Industrial Conglomerates) | | | 143 | | | | 70,336 | |
| Ross Stores, Inc. (Specialty Retail) | | | 480 | | | | 54,854 | |
| Royal Caribbean Cruises, Ltd.* (Hotels, Restaurants & Leisure) | | | 303 | | | | 23,301 | |
| S&P Global, Inc. (Capital Markets) | | | 326 | | | | 153,849 | |
| Salesforce.com, Inc.* (Software) | | | 1,323 | | | | 336,214 | |
| SBA Communications Corp. (Equity Real Estate Investment Trusts) | | | 147 | | | | 57,186 | |
| Schlumberger, Ltd. (Energy Equipment & Services) | | | 1,895 | | | | 56,755 | |
| Seagate Technology Holdings PLC (Technology Hardware, Storage & Peripherals) | | | 277 | | | | 31,295 | |
| Sealed Air Corp. (Containers & Packaging) | | | 200 | | | | 13,494 | |
| Sempra Energy (Multi — Utilities) | | | 431 | | | | 57,013 | |
| ServiceNow, Inc.* (Software) | | | 269 | | | | 174,611 | |
| Signature Bank (Banks) | | | 82 | | | | 26,525 | |
| Simon Property Group, Inc. (Equity Real Estate Investment Trusts) | | | 444 | | | | 70,938 | |
| Skyworks Solutions, Inc. (Semiconductors & Semiconductor Equipment) | | | 223 | | | | 34,596 | |
| Snap — on, Inc. (Machinery) | | | 73 | | | | 15,723 | |
| SolarEdge Technologies, Inc.* (Semiconductors & Semiconductor Equipment) | | | 71 | | | | 19,920 | |
| Southwest Airlines Co.* (Airlines) | | | 800 | | | | 34,272 | |
| Stanley Black & Decker, Inc. (Machinery) | | | 220 | | | | 41,496 | |
| Starbucks Corp. (Hotels, Restaurants & Leisure) | | | 1,594 | | | | 186,450 | |
| State Street Corp. (Capital Markets) | | | 494 | | | | 45,942 | |
| STERIS PLC (Health Care Equipment & Supplies) | | | 135 | | | | 32,860 | |
| Stryker Corp. (Health Care Equipment & Supplies) | | | 454 | | | | 121,409 | |
| SVB Financial Group* (Banks) | | | 79 | | | | 53,581 | |
| Synchrony Financial (Consumer Finance) | | | 739 | | | | 34,282 | |
| Synopsys, Inc.* (Software) | | | 206 | | | | 75,911 | |
| Sysco Corp. (Food & Staples Retailing) | | | 693 | | | | 54,435 | |
| T. Rowe Price Group, Inc. (Capital Markets) | | | 304 | | | | 59,779 | |
| Take — Two Interactive Software, Inc.* (Entertainment) | | | 156 | | | | 27,724 | |
| Tapestry, Inc. (Textiles, Apparel & Luxury Goods) | | | 372 | | | | 15,103 | |
| Target Corp. (Multiline Retail) | | | 659 | | | | 152,519 | |
| TE Connectivity, Ltd. (Electronic Equipment, Instruments & Components) | | | 441 | | | | 71,151 | |
| Teledyne Technologies, Inc.* (Electronic Equipment, Instruments & Components) | | | 63 | | | | 27,524 | |
| Teleflex, Inc. (Health Care Equipment & Supplies) | | | 63 | | | | 20,694 | |
| Teradyne, Inc. (Semiconductors & Semiconductor Equipment) | | | 220 | | | | 35,977 | |
| Tesla, Inc.* (Automobiles) | | | 1,099 | | | | 1,161,402 | |
| Texas Instruments, Inc. (Semiconductors & Semiconductor Equipment) | | | 1,248 | | | | 235,211 | |
| Textron, Inc. (Aerospace & Defense) | | | 298 | | | | 23,006 | |
| The AES Corp. (Independent Power and Renewable Electricity Producers) | | | 901 | | | | 21,894 | |
| The Allstate Corp. (Insurance) | | | 387 | | | | 45,531 | |
| The Bank of New York Mellon Corp. (Capital Markets) | | | 1,026 | | | | 59,590 | |
| The Boeing Co.* (Aerospace & Defense) | | | 746 | | | | 150,185 | |
| The Charles Schwab Corp. (Capital Markets) | | | 2,031 | | | | 170,807 | |
| The Clorox Co. (Household Products) | | | 166 | | | | 28,944 | |
| The Coca — Cola Co. (Beverages) | | | 5,252 | | | | 310,971 | |
| The Cooper Cos., Inc. (Health Care Equipment & Supplies) | | | 67 | | | | 28,069 | |
| The Estee Lauder Co., Inc. (Personal Products) | | | 313 | | | | 115,873 | |
| The Gap, Inc. (Specialty Retail) | | | 290 | | | | 5,119 | |
| The Goldman Sachs Group, Inc. (Capital Markets) | | | 459 | | | | 175,590 | |
| The Hershey Co. (Food Products) | | | 196 | | | | 37,920 | |
| The Home Depot, Inc. (Specialty Retail) | | | 1,425 | | | | 591,390 | |
| The Interpublic Group of Cos., Inc. (Media) | | | 532 | | | | 19,923 | |
| The JM Smucker Co. — Class A (Food Products) | | | 146 | | | | 19,830 | |
| The Kraft Heinz Co. (Food Products) | | | 959 | | | | 34,428 | |
| The Kroger Co. (Food & Staples Retailing) | | | 914 | | | | 41,368 | |
| The Mosaic Co. (Chemicals) | | | 500 | | | | 19,645 | |
| The PNC Financial Services Group, Inc. (Banks) | | | 571 | | | | 114,497 | |
| The Procter & Gamble Co. (Household Products) | | | 3,269 | | | | 534,743 | |
See accompanying notes to financial statements.
46 :: ProFund VP Bull :: Financial Statements
Common Stocks, continued
| | | Shares | | | Value | |
| The Progressive Corp. (Insurance) | | | 790 | | | $ | 81,094 | |
| The Sherwin — Williams Co. (Chemicals) | | | 326 | | | | 114,803 | |
| The Southern Co. (Electric Utilities) | | | 1,432 | | | | 98,207 | |
| The TJX Cos., Inc. (Specialty Retail) | | | 1,625 | | | | 123,370 | |
| The Travelers Cos., Inc. (Insurance) | | | 332 | | | | 51,935 | |
| The Walt Disney Co.* (Entertainment) | | | 2,455 | | | | 380,255 | |
| The Williams Cos., Inc. (Oil, Gas & Consumable Fuels) | | | 1,642 | | | | 42,758 | |
| Thermo Fisher Scientific, Inc. (Life Sciences Tools & Services) | | | 532 | | | | 354,971 | |
| T — Mobile US, Inc.* (Wireless Telecommunication Services) | | | 793 | | | | 91,972 | |
| Tractor Supply Co. (Specialty Retail) | | | 154 | | | | 36,744 | |
| Trane Technologies PLC (Building Products) | | | 321 | | | | 64,852 | |
| TransDigm Group, Inc.* (Aerospace & Defense) | | | 71 | | | | 45,176 | |
| Trimble, Inc.* (Electronic Equipment, Instruments & Components) | | | 339 | | | | 29,557 | |
| Truist Financial Corp. (Banks) | | | 1,803 | | | | 105,566 | |
| Twitter, Inc.* (Interactive Media & Services) | | | 1,080 | | | | 46,678 | |
| Tyler Technologies, Inc.* (Software) | | | 55 | | | | 29,587 | |
| Tyson Foods, Inc. — Class A (Food Products) | | | 398 | | | | 34,690 | |
| U.S. Bancorp (Banks) | | | 1,823 | | | | 102,398 | |
| UDR, Inc. (Equity Real Estate Investment Trusts) | | | 393 | | | | 23,576 | |
| Ulta Beauty, Inc.* (Specialty Retail) | | | 73 | | | | 30,101 | |
| Under Armour, Inc.* — Class A (Textiles, Apparel & Luxury Goods) | | | 255 | | | | 5,403 | |
| Under Armour, Inc.* — Class C (Textiles, Apparel & Luxury Goods) | | | 291 | | | | 5,250 | |
| Union Pacific Corp. (Road & Rail) | | | 869 | | | | 218,926 | |
| United Airlines Holdings , Inc.* (Airlines) | | | 437 | | | | 19,132 | |
| United Parcel Service, Inc. — Class B (Air Freight & Logistics) | | | 985 | | | | 211,125 | |
| United Rentals, Inc.* (Trading Companies & Distributors) | | | 98 | | | | 32,564 | |
| UnitedHealth Group, Inc. (Health Care Providers & Services) | | | 1,272 | | | | 638,723 | |
| Universal Health Services, Inc. — Class B (Health Care Providers & Services) | | | 99 | | | | 12,836 | |
| Valero Energy Corp. (Oil, Gas & Consumable Fuels) | | | 552 | | | | 41,461 | |
| Ventas, Inc. (Equity Real Estate Investment Trusts) | | | 539 | | | | 27,554 | |
| VeriSign, Inc.* (IT Services) | | | 131 | | | | 33,250 | |
| Verisk Analytics, Inc. (Professional Services) | | | 218 | | | | 49,863 | |
| Verizon Communications, Inc. (Diversified Telecommunication Services) | | | 5,593 | | | | 290,612 | |
| Vertex Pharmaceuticals, Inc.* (Biotechnology) | | | 344 | | | | 75,542 | |
| VF Corp. (Textiles, Apparel & Luxury Goods) | | | 440 | | | | 32,217 | |
| ViacomCBS, Inc. — Class B (Media) | | | 820 | | | | 24,748 | |
| Viatris, Inc. (Pharmaceuticals) | | | 1,634 | | | | 22,108 | |
| Visa, Inc. — Class A (IT Services) | | | 2,266 | | | | 491,065 | |
| Vornado Realty Trust (Equity Real Estate Investment Trusts) | | | 215 | | | | 9,000 | |
| Vulcan Materials Co. (Construction Materials) | | | 179 | | | | 37,157 | |
| W.R. Berkley Corp. (Insurance) | | | 189 | | | | 15,572 | |
| W.W. Grainger, Inc. (Trading Companies & Distributors) | | | 58 | | | | 30,058 | |
| Walgreens Boots Alliance, Inc. (Food & Staples Retailing) | | | 970 | | | | 50,595 | |
| Walmart, Inc. (Food & Staples Retailing) | | | 1,921 | | | | 277,949 | |
| Waste Management, Inc. (Commercial Services & Supplies) | | | 520 | | | | 86,788 | |
| Waters Corp.* (Life Sciences Tools & Services) | | | 82 | | | | 30,553 | |
| WEC Energy Group, Inc. (Multi — Utilities) | | | 426 | | | | 41,352 | |
| Wells Fargo & Co. (Banks) | | | 5,386 | | | | 258,420 | |
| Welltower, Inc. (Equity Real Estate Investment Trusts) | | | 588 | | | | 50,433 | |
| West Pharmaceutical Services, Inc. (Health Care Equipment & Supplies) | | | 100 | | | | 46,901 | |
| Western Digital Corp.* (Technology Hardware, Storage & Peripherals) | | | 421 | | | | 27,453 | |
| Westinghouse Air Brake Technologies Corp. (Machinery) | | | 252 | | | | 23,212 | |
| WestRock Co. (Containers & Packaging) | | | 361 | | | | 16,014 | |
| Weyerhaeuser Co. (Equity Real Estate Investment Trusts) | | | 1,012 | | | | 41,674 | |
| Whirlpool Corp. (Household Durables) | | | 82 | | | | 19,242 | |
| Willis Towers Watson PLC (Insurance) | | | 168 | | | | 39,898 | |
| Wynn Resorts, Ltd.* (Hotels, Restaurants & Leisure) | | | 142 | | | | 12,076 | |
| Xcel Energy, Inc. (Electric Utilities) | | | 728 | | | | 49,286 | |
| Xilinx, Inc. (Semiconductors & Semiconductor Equipment) | | | 335 | | | | 71,030 | |
| Xylem, Inc. (Machinery) | | | 244 | | | | 29,260 | |
| Yum! Brands, Inc. (Hotels, Restaurants & Leisure) | | | 396 | | | | 54,989 | |
| Zebra Technologies Corp.* (Electronic Equipment, Instruments & Components) | | | 72 | | | | 42,854 | |
| Zimmer Biomet Holdings, Inc. (Health Care Equipment & Supplies) | | | 282 | | | | 35,825 | |
| Zions Bancorp (Banks) | | | 211 | | | | 13,327 | |
| Zoetis, Inc. (Pharmaceuticals) | | | 639 | | | | 155,935 | |
TOTAL COMMON STOCKS
(Cost $10,806,124) | | | | | | | 54,516,545 | |
Repurchase Agreements(b)(c) (28.1%)
| | | Principal
Amount | | | Value | |
| Repurchase Agreements with various counterparties, 0.00%, dated 12/31/21, due 1/3/22, total to be received $18,415,000 | | $ | 18,415,000 | | | $ | 18,415,000 | |
| TOTAL REPURCHASE AGREEMENTS | | | | | | | | |
| (Cost $18,415,000) | | | | | | | 18,415,000 | |
Collateral for Securities Loaned(d)(NM)
| | | Shares | | | Value | |
| BlackRock Liquidity Funds FedFund Portfolio — Institutional Shares, 0.03%(e) | | | 5,025 | | | $ | 5,025 | |
TOTAL COLLATERAL FOR SECURITIES LOANED
(Cost $5,025) | | | | | | | 5,025 | |
TOTAL INVESTMENT SECURITIES
(Cost $29,226,149) — 111.3% | | | | | | | 72,936,570 | |
| Net other assets (liabilities) — (11.3)% | | | | | | | (7,396,756 | ) |
| NET ASSETS — 100.0% | | | | | | $ | 65,539,814 | |
See accompanying notes to financial statements.
Financial Statements :: ProFund VP Bull :: 47
| * | Non-income producing security. |
| (a) | All or part of this security was on loan as of December 31, 2021. The total value of securities on loan as of December 31, 2021 was $4,732. |
| (b) | A portion of these securities were held in a segregated account for the benefit of swap counterparties in the event of default. At December 31, 2021, the aggregate amount held in a segregated account was $2,043,000. |
| (c) | The ProFund VP invests in Repurchase Agreements jointly with other funds in the Trust. See "Repurchase Agreements" under Note 2 in the Notes to Financial Statements to view the details of each individual agreement and counterparty as well as a description of the securities subject to repurchase. |
| (d) | Securities were purchased with cash collateral held from securities on loan at December 31, 2021. |
| (e) | Rate periodically changes. Rate disclosed is the daily yield on December 31, 2021. |
Futures Contracts Purchased
| | | Number
of
Contracts | | | Expiration
Date | | Notional
Amount | | | Value and
Unrealized
Appreciation/
(Depreciation) | |
| E-Mini S&P 500 Futures Contracts | | 14 | | | 3/21/22 | | $ | 3,330,950 | | | $ | 39,069 | |
Total Return Swap Agreements—Long
| Underlying Instrument | | Counterparty | | Termination
Date(1) | | | Rate Paid
(Received)(2) | | | Notional
Amount | | | Value and
Unrealized
Appreciation/
(Depreciation) | |
| S&P 500 | | Goldman Sachs International | | 1/27/22 | | | | 0.68 | % | | $ | 6,505,836 | | | $ | (33,703 | ) |
| S&P 500 | | UBS AG | | 1/27/22 | | | | 0.58 | % | | | 1,267,804 | | | | (44,187 | ) |
| | | | | | | | | | | | $ | 7,773,640 | | | $ | (77,890 | ) |
| (1) | Agreements may be terminated at will by either party without penalty. Payment is due at termination/maturity. |
| (2) | Reflects the floating financing rate, as of December 31, 2021, on the notional amount of the swap agreement paid to the counterparty or received from the counterparty, excluding any commissions. This amount is included as part of the unrealized appreciation/(depreciation). |
See accompanying notes to financial statements.
48 :: ProFund VP Bull :: Financial Statements
ProFund VP Bull invested in the following industries as of December 31, 2021:
| | | Value | | | % of
Net Assets | |
| Aerospace & Defense | | $ | 736,540 | | | | 1.1 | % |
| Air Freight & Logistics | | | 346,171 | | | | 0.5 | % |
| Airlines | | | 111,728 | | | | 0.2 | % |
| Auto Components | | | 74,809 | | | | 0.1 | % |
| Automobiles | | | 1,386,577 | | | | 2.1 | % |
| Banks | | | 2,158,408 | | | | 3.3 | % |
| Beverages | | | 769,780 | | | | 1.1 | % |
| Biotechnology | | | 970,893 | | | | 1.5 | % |
| Building Products | | | 280,394 | | | | 0.4 | % |
| Capital Markets | | | 1,626,670 | | | | 2.5 | % |
| Chemicals | | | 966,870 | | | | 1.5 | % |
| Commercial Services & Supplies | | | 233,124 | | | | 0.4 | % |
| Communications Equipment | | | 502,084 | | | | 0.8 | % |
| Construction & Engineering | | | 22,129 | | | | NM | |
| Construction Materials | | | 74,161 | | | | 0.1 | % |
| Consumer Finance | | | 302,040 | | | | 0.5 | % |
| Containers & Packaging | | | 162,801 | | | | 0.2 | % |
| Distributors | | | 79,213 | | | | 0.1 | % |
| Diversified Financial Services | | | 739,726 | | | | 1.1 | % |
| Diversified Telecommunication Services | | | 543,578 | | | | 0.8 | % |
| Electric Utilities | | | 876,923 | | | | 1.4 | % |
| Electrical Equipment | | | 298,976 | | | | 0.5 | % |
| Electronic Equipment, Instruments & Components | | | 377,558 | | | | 0.6 | % |
| Energy Equipment & Services | | | 112,820 | | | | 0.2 | % |
| Entertainment | | | 910,517 | | | | 1.4 | % |
| Equity Real Estate Investment Trusts | | | 1,461,595 | | | | 2.2 | % |
| Food & Staples Retailing | | | 763,264 | | | | 1.2 | % |
| Food Products | | | 478,000 | | | | 0.7 | % |
| Gas Utilities | | | 18,754 | | | | NM | |
| Health Care Equipment & Supplies | | | 1,940,012 | | | | 3.0 | % |
| Health Care Providers & Services | | | 1,510,465 | | | | 2.3 | % |
| Health Care Technology | | | 36,962 | | | | 0.1 | % |
| Hotels, Restaurants & Leisure | | | 1,067,348 | | | | 1.6 | % |
| Household Durables | | | 205,353 | | | | 0.3 | % |
| Household Products | | | 759,743 | | | | 1.2 | % |
| Independent Power and Renewable Electricity Producers | | | 21,894 | | | | NM | |
| Industrial Conglomerates | | | 542,818 | | | | 0.8 | % |
| Insurance | | | 1,000,374 | | | | 1.5 | % |
| Interactive Media & Services | | | 3,442,483 | | | | 5.3 | % |
| Internet & Direct Marketing Retail | | | 2,057,624 | | | | 3.2 | % |
| IT Services | | | 2,444,426 | | | | 3.7 | % |
| Leisure Products | | | 17,812 | | | | NM | |
| Life Sciences Tools & Services | | | 765,833 | | | | 1.2 | % |
| Machinery | | | 822,678 | | | | 1.2 | % |
| Media | | | 548,680 | | | | 0.8 | % |
| Metals & Mining | | | 193,650 | | | | 0.3 | % |
| Multiline Retail | | | 269,523 | | | | 0.4 | % |
| Multi-Utilities | | | 396,783 | | | | 0.6 | % |
| Oil, Gas & Consumable Fuels | | | 1,343,747 | | | | 2.0 | % |
| Personal Products | | | 115,873 | | | | 0.2 | % |
| Pharmaceuticals | | | 2,019,278 | | | | 3.0 | % |
| Professional Services | | | 237,888 | | | | 0.4 | % |
| Real Estate Management & Development | | | 49,047 | | | | 0.1 | % |
| Road & Rail | | | 498,018 | | | | 0.8 | % |
| Semiconductors & Semiconductor Equipment | | | 3,472,502 | | | | 5.3 | % |
| Software | | | 5,195,206 | | | | 7.9 | % |
| Specialty Retail | | | 1,310,684 | | | | 2.0 | % |
| Technology Hardware, Storage & Peripherals | | | 3,911,962 | | | | 6.0 | % |
| Textiles, Apparel & Luxury Goods | | | 363,729 | | | | 0.6 | % |
| Tobacco | | | 317,407 | | | | 0.5 | % |
| Trading Companies & Distributors | | | 112,397 | | | | 0.2 | % |
| Water Utilities | | | 46,271 | | | | 0.1 | % |
| Wireless Telecommunication Services | | | 91,972 | | | | 0.1 | % |
| Other** | | | 11,023,269 | | | | 16.8 | % |
| Total | | $ | 65,539,814 | | | | 100.0 | % |
| ** | Includes any non-equity securities and net other assets (liabilities), which includes any receivable for capital shares issued and payable for capital shares redeemed. |
| NM | Not meaningful, amount is less than 0.05%. |
See accompanying notes to financial statements.
Financial Statements :: ProFund VP Bull :: 49
Statement of Assets and Liabilities
December 31, 2021
| ASSETS: | | | | |
| Total Investment Securities, at cost | | $ | 29,226,149 | |
| Securities, at value(a) | | | 54,521,570 | |
| Repurchase agreements, at value | | | 18,415,000 | |
| Total Investment Securities, at value | | | 72,936,570 | |
| Segregated cash balances for futures contracts with brokers | | | 177,100 | |
| Dividends receivable | | | 32,795 | |
| Receivable for capital shares issued | | | 14,018 | |
| Prepaid expenses | | | 5,675 | |
| TOTAL ASSETS | | | 73,166,158 | |
| | | | | |
| LIABILITIES: | | | | |
| Cash overdraft | | | 124 | |
| Payable for collateral for securities loaned | | | 5,025 | |
| Payable for capital shares redeemed | | | 7,363,930 | |
| Unrealized depreciation on swap agreements | | | 77,890 | |
| Variation margin on futures contracts | | | 9,625 | |
| Advisory fees payable | | | 47,621 | |
| Management services fees payable | | | 6,350 | |
| Administration fees payable | | | 4,003 | |
| Administrative services fees payable | | | 32,650 | |
| Distribution fees payable | | | 35,318 | |
| Transfer agency fees payable | | | 6,854 | |
| Fund accounting fees payable | | | 2,360 | |
| Compliance services fees payable | | | 330 | |
| Other accrued expenses | | | 34,264 | |
| TOTAL LIABILITIES | | | 7,626,344 | |
| NET ASSETS | | $ | 65,539,814 | |
| | | | | |
| NET ASSETS CONSIST OF: | | | | |
| Capital | | $ | 20,062,908 | |
| Total distributable earnings (loss) | | | 45,476,906 | |
| NET ASSETS | | $ | 65,539,814 | |
| Shares of Beneficial Interest Outstanding (unlimited number of shares authorized, no par value) | | | 932,407 | |
| Net Asset Value (offering and redemption price per share) | | $ | 70.29 | |
| | | | |
| (a) Includes securities on loan valued at: | | $ | 4,732 | |
Statement of Operations
For the Year Ended December 31, 2021
| INVESTMENT INCOME: | | | | |
| Dividends | | $ | 730,871 | |
| Interest | | | 268 | |
| Foreign tax withholding | | | (71 | ) |
| Net income from securities lending | | | 433 | |
| TOTAL INVESTMENT INCOME | | | 731,501 | |
| | | | | |
| EXPENSES: | | | | |
| Advisory fees | | | 550,790 | |
| Management services fees | | | 73,438 | |
| Administration fees | | | 54,436 | |
| Transfer agency fees | | | 44,480 | |
| Administrative services fees | | | 188,008 | |
| Distribution fees | | | 183,597 | |
| Custody fees | | | 11,082 | |
| Fund accounting fees | | | 31,595 | |
| Trustee fees | | | 1,223 | |
| Compliance services fees | | | 491 | |
| Other fees | | | 59,253 | |
| Recoupment of prior expenses reduced by the Advisor | | | 17,083 | |
| TOTAL NET EXPENSES | | | 1,215,476 | |
| NET INVESTMENT INCOME (LOSS) | | | (483,975 | ) |
| | | | | |
| REALIZED AND UNREALIZED GAINS (LOSSES) ON INVESTMENTS: | | | | |
| Net realized gains (losses) on investment securities | | | 813,944 | |
| Net realized gains (losses) on futures contracts | | | 1,882,126 | |
| Net realized gains (losses) on swap agreements | | | 3,443,200 | |
| Change in net unrealized appreciation/depreciation on investment securities | | | 11,153,348 | |
| Change in net unrealized appreciation/depreciation on futures contracts | | | (185,022 | ) |
| Change in net unrealized appreciation/depreciation on swap agreements | | | (164,378 | ) |
| NET REALIZED AND UNREALIZED GAINS (LOSSES) ON INVESTMENTS | | | 16,943,218 | |
| CHANGE IN NET ASSETS RESULTING FROM OPERATIONS | | $ | 16,459,243 | |
See accompanying notes to financial statements.
50 :: ProFund VP Bull :: Financial Statements
Statements of Changes in Net Assets
| | | Year Ended
December 31, 2021 | | | Year Ended
December 31, 2020 | |
| FROM INVESTMENT ACTIVITIES: | | | | | | | | |
| | | | | | | | | |
| OPERATIONS: | | | | | | | | |
| Net investment income (loss) | | $ | (483,975 | ) | | $ | (254,150 | ) |
| Net realized gains (losses) on investments | | | 6,139,270 | | | | 5,255,967 | |
| Change in net unrealized appreciation/depreciation on investments | | | 10,803,948 | | | | 3,135,954 | |
| Change in net assets resulting from operations | | | 16,459,243 | | | | 8,137,771 | |
| | | | | | | | | |
| DISTRIBUTIONS TO SHAREHOLDERS: | | | | | | | | |
| Total distributions | | | (4,701,790 | ) | | | (3,153,052 | ) |
| Change in net assets resulting from distributions | | | (4,701,790 | ) | | | (3,153,052 | ) |
| | | | | | | | | |
| CAPITAL TRANSACTIONS: | | | | | | | | |
| Proceeds from shares issued | | | 283,899,315 | | | | 133,700,471 | |
| Distributions reinvested | | | 4,701,790 | | | | 3,153,052 | |
| Value of shares redeemed | | | (300,862,764 | ) | | | (141,766,141 | ) |
| Change in net assets resulting from capital transactions | | | (12,261,659 | ) | | | (4,912,618 | ) |
| Change in net assets | | | (504,206 | ) | | | 72,101 | |
| | | | | | | | | |
| NET ASSETS: | | | | | | | | |
| Beginning of period | | | 66,044,020 | | | | 65,971,919 | |
| End of period | | $ | 65,539,814 | | | $ | 66,044,020 | |
| | | | | | | | | |
| SHARE TRANSACTIONS: | | | | | | | | |
| Issued | | | 4,348,636 | | | | 2,571,796 | |
| Reinvested | | | 78,246 | | | | 55,639 | |
| Redeemed | | | (4,606,790 | ) | | | (2,745,422 | ) |
| Change in shares | | | (179,908 | ) | | | (117,987 | ) |
See accompanying notes to financial statements.
Financial Highlights :: ProFund VP Bull :: 51
ProFunds Financial Highlights FOR THE PERIODS INDICATED
Selected data for a share of beneficial interest outstanding throughout the periods indicated.
| | | Year Ended
Dec. 31, 2021 | | | Year Ended
Dec. 31, 2020 | | | Year Ended
Dec. 31, 2019 | | | Year Ended
Dec. 31, 2018 | | | Year Ended
Dec. 31, 2017 | |
| Net Asset Value, Beginning of Period | | $ | 59.38 | | | $ | 53.62 | | | $ | 42.46 | | | $ | 50.65 | | | $ | 43.55 | |
| | | | | | | | | | | | | | | | | | | | | |
| Investment Activities: | | | | | | | | | | | | | | | | | | | | |
| Net investment income (loss)(a) | | | (0.42 | ) | | | (0.23 | ) | | | 0.16 | | | | 0.11 | | | | (0.13 | ) |
| Net realized and unrealized gains (losses) on investments | | | 15.37 | | | | 8.70 | | | | 11.98 | | | | (2.71 | ) | | | 8.48 | |
| Total income (loss) from investment activities | | | 14.95 | | | | 8.47 | | | | 12.14 | | | | (2.60 | ) | | | 8.35 | |
| | | | | | | | | | | | | | | | | | | | | |
| Distributions to Shareholders From: | | | | | | | | | | | | | | | | | | | | |
| Net investment income | | | — | | | | (0.05 | ) | | | (0.13 | ) | | | — | | | | — | |
| Net realized gains on investments | | | (4.04 | ) | | | (2.66 | ) | | | (0.85 | ) | | | (5.59 | ) | | | (1.25 | ) |
| Total distributions | | | (4.04 | ) | | | (2.71 | ) | | | (0.98 | ) | | | (5.59 | ) | | | (1.25 | ) |
| | | | | | | | | | | | | | | | | | | | | |
| Net Asset Value, End of Period | | $ | 70.29 | | | $ | 59.38 | | | $ | 53.62 | | | $ | 42.46 | | | $ | 50.65 | |
| | | | | | | | | | | | | | | | | | | | | |
| Total Return | | | 26.33 | % | | | 16.03 | % | | | 28.88 | % | | | (6.15 | )%(b) | | | 19.34 | % |
| | | | | | | | | | | | | | | | | | | | | |
| Ratios to Average Net Assets: | | | | | | | | | | | | | | | | | | | | |
| Gross expenses | | | 1.65 | % | | | 1.72 | % | | | 1.70 | % | | | 1.69 | % | | | 1.68 | % |
| Net expenses | | | 1.65 | % | | | 1.69 | %(c) | | | 1.70 | %(c) | | | 1.62 | %(b) | | | 1.68 | % |
| Net investment income (loss) | | | (0.66 | )% | | | (0.44 | )% | | | 0.32 | % | | | 0.23 | %(b) | | | (0.28 | )% |
| | | | | | | | | | | | | | | | | | | | | |
| Supplemental Data: | | | | | | | | | | | | | | | | | | | | |
| Net assets, end of period (000's) | | $ | 65,540 | | | $ | 66,044 | | | $ | 65,972 | | | $ | 58,926 | | | $ | 92,541 | |
| Portfolio turnover rate(d) | | | 49 | % | | | 4 | % | | | 56 | % | | | 8 | % | | | 3 | % |
| (a) | Per share net investment income (loss) has been calculated using the average daily shares method. |
| (b) | During 2018, the Fund received a non-recurring reimbursement from a third party relating to expenses that were incurred in a prior year. Had this reimbursement not occurred, the net expense ratio and net investment income (loss) ratio would have been 1.68% and 0.17%, respectively, and the total return would have been (6.22)%. |
| (c) | The expense ratio does not correlated to the applicable expense limits in place during the period given that the annual contractual expense limitation is applied for one year periods ended April 30th of each year, instead of coinciding with the December 31st year end. Details of the current expense limitation in effect can be found in Note 4 of the accompanying Notes to Financial Statements. |
| (d) | Portfolio turnover rate is calculated without regard to instruments having a maturity of less than one year from acquisition or derivative instruments (including swap agreements and futures contracts). The portfolio turnover rate can be high and volatile due to the amount and timing of sales and purchases of fund shares during the period. |
See accompanying notes to financial statements.
52 :: ProFund VP Consumer Goods :: Management Discussion of Fund Performance
ProFund VP Consumer Goods seeks investment results, before fees and expenses, that correspond to the performance of the Dow Jones U.S. Consumer GoodsSM Index (the "Index"). For the year ended December 31, 2021, the Fund had a total return of 19.65%. For the same period, the Index had a return of 21.82%1 and a volatility of 15.24%. For the year, the Fund achieved an average daily statistical correlation of over 0.99 to the daily performance of the Index.2
The Fund takes positions in financial instruments that, in combination, should have similar return characteristics as the return of the Index. The Index measures the performance of consumer goods sector of the U.S. equity market. Component companies include, among others, automobiles and auto parts and tires, brewers and distillers, farming and fishing, durable and non-durable household product manufacturers, cosmetic companies, food and tobacco products, clothing accessories, and footwear.
During the year ended December 31, 2021, the Fund invested in swap agreements as a substitute for investing directly in stocks in order to gain exposure to the Index. These derivatives generally tracked the performance of their underlying benchmark and were negatively impacted by financing costs associated with their use. The Fund entered into swap agreements with counterparties that the Fund's advisor determined to be major, global financial institutions. If a counterparty becomes insolvent or otherwise fails to perform on its obligations, the value of investments in the Fund may decline. The Fund has sought to mitigate this risk by generally requiring counterparties to post collateral for the benefit of the Fund, marked to market daily, in an amount approximately equal to the amount the counterparty owed to the Fund, subject to certain minimum thresholds.
Value of a $10,000 Investment at Net Asset Value*
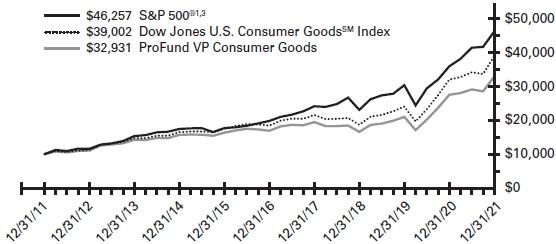
| * | The line graph represents the historical performance of a hypothetical investment of $10,000 in the ProFund VP Consumer Goods from December 31, 2011 to December 31, 2021, assuming the reinvestment of distributions. |
Average Annual Total Return as of 12/31/21
| Fund | | One Year | | | Five Year | | | Ten Year | |
| ProFund VP Consumer Goods | | | 19.65 | % | | | 14.23 | % | | | 12.66 | % |
| Dow Jones U.S. Consumer GoodsSM Index | | | 21.82 | % | | | 16.17 | % | | | 14.58 | % |
| S&P 500® | | | 28.71 | % | | | 18.47 | % | | | 16.55 | % |
Expense Ratios**
| Fund | | Gross | | | Net | | | | | |
| ProFund VP Consumer Goods | | | 1.75 | % | | | 1.68 | % | | | | |
| ** | Reflects the expense ratio as reported in the Prospectus dated May 1, 2021. Contractual fee waivers are in effect through April 30, 2022. See Financial Highlights for effective expense ratios. |
Allocation of Portfolio Holdings & Index Composition
Market Exposure
| Investment Type | | % of Net Assets | |
| Equity Securities | | | 99 | % |
| Swap Agreements | | | 1 | % |
| Total Exposure | | | 100 | % |
“Market Exposure” includes the value of total investments (including the contract value of any derivatives) and excludes any instruments used for cash management or collateral for securities loaned.
Largest Equity Holdings
| Company | | % of Net Assets | |
| Tesla, Inc. | | | 21.9 | % |
| The Procter & Gamble Co. | | | 10.1 | % |
| PepsiCo, Inc. | | | 6.1 | % |
| The Coca-Cola Co. | | | 5.9 | % |
| NIKE, Inc. | | | 5.4 | % |
Dow Jones U.S. Consumer GoodsSM
Index – Composition
| | | % of Index | |
| Food, Beverage & Tobacco | | | 33 | % |
| Automobiles & Components | | | 30 | % |
| Household & Personal Products | | | 17 | % |
| Consumer Durables & Apparel | | | 15 | % |
| Media & Entertainment | | | 3 | % |
| Retailing | | | 1 | % |
| Capital Goods | | | 1 | % |
Past performance does not guarantee future results. Return calculations assume the reinvestment of distributions and do not reflect taxes that a shareholder would pay on Fund distributions or on the redemption of Fund shares. The performance data quoted represents past performance and current returns may be lower or higher. The investment return and net asset value (“NAV”) will fluctuate so that an investor’s shares, when redeemed, may be worth more or less than the original cost. The performance above reflects any fee reductions during the applicable periods. If such fee reductions had not occurred, the quoted performance would be lower. Performance numbers are net of all Fund fees and expenses but do not include any insurance, sales, or administrative charges of variable annuity or life insurance contracts. If these charges were included, the returns would be lower. To obtain performance current to the most recent month-end, please call toll-free 888-776-3637.
| 1 | The graph and table reflect the theoretical reinvestment of dividends on securities in the Indexes. The impact of transaction costs and the deduction of fees and expenses associated with a mutual fund, such as investment management and accounting fees, are not reflected in calculations of the Indexes. The Fund's performance reflects the reinvestment of dividends as well as the impact of transaction costs and the deduction of fees and expenses. It is not possible to invest directly in an index. |
| 2 | 1.00 equals perfect correlation. This calculation is based on the daily total return of the Index and the performance of the daily total return of the NAV per share of the Fund. |
| 3 | The S&P 500® is an unmanaged index that consists of the common stocks of 500 major U.S. corporations selected for their size and the frequency and ease with which their stocks trade. |
The above information is not covered by the Report of the Independent Registered Public Accounting Firm.
Financial Statements :: ProFund VP Consumer Goods :: 53
Schedule of Portfolio Investments :: December 31, 2021
Common Stocks (99.0%)
| | | Shares | | | Value | |
| Activision Blizzard, Inc. (Entertainment) | | | 5,226 | | | $ | 347,687 | |
| Altria Group, Inc. (Tobacco) | | | 12,328 | | | | 584,224 | |
| Aptiv PLC* (Auto Components) | | | 1,815 | | | | 299,385 | |
| Archer-Daniels-Midland Co. (Food Products) | | | 3,755 | | | | 253,800 | |
| Autoliv, Inc. (Auto Components) | | | 528 | | | | 54,600 | |
| Beyond Meat, Inc.*(a) (Food Products) | | | 403 | | | | 26,259 | |
| BorgWarner, Inc. (Auto Components) | | | 1,608 | | | | 72,473 | |
| Brown-Forman Corp.—Class B (Beverages) | | | 1,226 | | | | 89,326 | |
| Brunswick Corp. (Leisure Products) | | | 517 | | | | 52,077 | |
| Bunge, Ltd. (Food Products) | | | 944 | | | | 88,132 | |
| Callaway Golf Co.* (Leisure Products) | | | 785 | | | | 21,540 | |
| Campbell Soup Co. (Food Products) | | | 1,358 | | | | 59,019 | |
| Capri Holdings, Ltd.* (Textiles, Apparel & Luxury Goods) | | | 1,009 | | | | 65,494 | |
| Carter's, Inc. (Textiles, Apparel & Luxury Goods) | | | 284 | | | | 28,746 | |
| Church & Dwight Co., Inc. (Household Products) | | | 1,639 | | | | 167,998 | |
| Colgate-Palmolive Co. (Household Products) | | | 5,656 | | | | 482,683 | |
| Columbia Sportswear Co. (Textiles, Apparel & Luxury Goods) | | | 232 | | | | 22,606 | |
| Conagra Brands, Inc. (Food Products) | | | 3,218 | | | | 109,895 | |
| Constellation Brands, Inc.—Class A (Beverages) | | | 1,103 | | | | 276,820 | |
| Coty, Inc.*—Class A (Personal Products) | | | 2,250 | | | | 23,625 | |
| Cricut, Inc.*—Class A (Household Durables) | | | 242 | | | | 5,346 | |
| Crocs, Inc.* (Textiles, Apparel & Luxury Goods) | | | 396 | | | | 50,775 | |
| Darling Ingredients, Inc.* (Food Products) | | | 1,085 | | | | 75,180 | |
| Deckers Outdoor Corp.* (Textiles, Apparel & Luxury Goods) | | | 184 | | | | 67,401 | |
| DR Horton, Inc. (Household Durables) | | | 2,188 | | | | 237,288 | |
| Electronic Arts, Inc. (Entertainment) | | | 1,898 | | | | 250,346 | |
| Energizer Holdings, Inc. (Household Products) | | | 421 | | | | 16,882 | |
| Flowers Foods, Inc. (Food Products) | | | 1,333 | | | | 36,618 | |
| Ford Motor Co. (Automobiles) | | | 26,343 | | | | 547,144 | |
| Fox Factory Holding Corp.* (Auto Components) | | | 283 | | | | 48,138 | |
| Freshpet, Inc.* (Food Products) | | | 291 | | | | 27,724 | |
| General Mills, Inc. (Food Products) | | | 4,065 | | | | 273,900 | |
| General Motors Co.* (Automobiles) | | | 9,743 | | | | 571,232 | |
| Gentex Corp. (Auto Components) | | | 1,585 | | | | 55,237 | |
| Genuine Parts Co. (Distributors) | | | 955 | | | | 133,891 | |
| Hanesbrands, Inc. (Textiles, Apparel & Luxury Goods) | | | 2,342 | | | | 39,158 | |
| Harley-Davidson, Inc. (Automobiles) | | | 1,032 | | | | 38,896 | |
| Hasbro, Inc. (Leisure Products) | | | 871 | | | | 88,651 | |
| Helen of Troy, Ltd.* (Household Durables) | | | 162 | | | | 39,604 | |
| Herbalife Nutrition, Ltd.* (Personal Products) | | | 662 | | | | 27,096 | |
| Hormel Foods Corp. (Food Products) | | | 1,893 | | | | 92,397 | |
| Ingredion, Inc. (Food Products) | | | 447 | | | | 43,198 | |
| Kellogg Co. (Food Products) | | | 1,716 | | | | 110,545 | |
| Keurig Dr Pepper, Inc. (Beverages) | | | 4,947 | | | | 182,346 | |
| Kimberly-Clark Corp. (Household Products) | | | 2,259 | | | | 322,856 | |
| Lamb Weston Holding, Inc. (Food Products) | | | 980 | | | | 62,112 | |
| Lancaster Colony Corp. (Food Products) | | | 133 | | | | 22,025 | |
| Lear Corp. (Auto Components) | | | 401 | | | | 73,363 | |
| Leggett & Platt, Inc. (Household Durables) | | | 894 | | | | 36,797 | |
| Lennar Corp.—Class A (Household Durables) | | | 1,825 | | | | 211,992 | |
| Lennar Corp.—Class B (Household Durables) | | | 104 | | | | 9,944 | |
| Levi Strauss & Co. (Textiles, Apparel & Luxury Goods) | | | 647 | | | | 16,194 | |
| Lucid Group, Inc.*(a) (Automobiles) | | | 3,692 | | | | 140,481 | |
| Lululemon Athletica, Inc.* (Textiles, Apparel & Luxury Goods) | | | 793 | | | | 310,420 | |
| Luminar Technologies, Inc.* (Auto Components) | | | 1,445 | | | | 24,435 | |
| Mattel, Inc.* (Leisure Products) | | | 2,349 | | | | 50,644 | |
| McCormick & Co., Inc. (Food Products) | | | 1,673 | | | | 161,629 | |
| Mohawk Industries, Inc.* (Household Durables) | | | 368 | | | | 67,042 | |
| Molson Coors Beverage Co.—Class B (Beverages) | | | 1,264 | | | | 58,586 | |
| Mondelez International, Inc.—Class A (Food Products) | | | 9,362 | | | | 620,793 | |
| Monster Beverage Corp.* (Beverages) | | | 2,522 | | | | 242,213 | |
| National Beverage Corp. (Beverages) | | | 156 | | | | 7,071 | |
| Newell Brands, Inc. (Household Durables) | | | 2,540 | | | | 55,474 | |
| NIKE, Inc.—Class B (Textiles, Apparel & Luxury Goods) | | | 8,576 | | | | 1,429,363 | |
| NVR, Inc.* (Household Durables) | | | 22 | | | | 129,995 | |
| Peloton Interactive, Inc.*—Class A (Leisure Products) | | | 1,997 | | | | 71,413 | |
| PepsiCo, Inc. (Beverages) | | | 9,279 | | | | 1,611,856 | |
| Performance Food Group Co.* (Food & Staples Retailing) | | | 1,035 | | | | 47,496 | |
| Philip Morris International, Inc. (Tobacco) | | | 10,449 | | | | 992,655 | |
| Pilgrim's Pride Corp.* (Food Products) | | | 326 | | | | 9,193 | |
| Playtika Holding Corp.* (Entertainment) | | | 686 | | | | 11,861 | |
| Polaris, Inc. (Leisure Products) | | | 383 | | | | 42,096 | |
| Pool Corp. (Distributors) | | | 269 | | | | 152,254 | |
| Post Holdings, Inc.* (Food Products) | | | 393 | | | | 44,303 | |
| PulteGroup, Inc. (Household Durables) | | | 1,698 | | | | 97,058 | |
| PVH Corp. (Textiles, Apparel & Luxury Goods) | | | 477 | | | | 50,872 | |
| QuantumScape Corp.* (Auto Components) | | | 1,660 | | | | 36,835 | |
| Ralph Lauren Corp. (Textiles, Apparel & Luxury Goods) | | | 327 | | | | 38,867 | |
| Reynolds Consumer Products, Inc. (Household Products) | | | 365 | | | | 11,461 | |
| Rivian Automotive, Inc.*—Class A (Automobiles) | | | 1,039 | | | | 107,734 | |
| ROBLOX Corp.*—Class A (Entertainment) | | | 283 | | | | 29,194 | |
| Seaboard Corp. (Food Products) | | | 2 | | | | 7,870 | |
| Skechers U.S.A., Inc.*—Class A (Textiles, Apparel & Luxury Goods) | | | 904 | | | | 39,234 | |
| Stanley Black & Decker, Inc. (Machinery) | | | 1,094 | | | | 206,350 | |
| Take-Two Interactive Software, Inc.* (Entertainment) | | | 774 | | | | 137,555 | |
| Tapestry, Inc. (Textiles, Apparel & Luxury Goods) | | | 1,846 | | | | 74,948 | |
| Tempur Sealy International, Inc. (Household Durables) | | | 1,291 | | | | 60,716 | |
| Tesla, Inc.* (Automobiles) | | | 5,457 | | | | 5,766,849 | |
| The Boston Beer Co., Inc.*—Class A (Beverages) | | | 63 | | | | 31,821 | |
| The Clorox Co. (Household Products) | | | 825 | | | | 143,847 | |
| The Coca-Cola Co. (Beverages) | | | 26,095 | | | | 1,545,085 | |
| The Estee Lauder Co., Inc. (Personal Products) | | | 1,556 | | | | 576,031 | |
| The Hain Celestial Group, Inc.* (Food Products) | | | 622 | | | | 26,503 | |
| The Hershey Co. (Food Products) | | | 975 | | | | 188,633 | |
| The JM Smucker Co.—Class A (Food Products) | | | 727 | | | | 98,741 | |
See accompanying notes to financial statements.
54 :: ProFund VP Consumer Goods :: Financial Statements
Common Stocks, continued
| | | Shares | | | Value | |
| The Kraft Heinz Co. (Food Products) | | | 4,764 | | | $ | 171,028 | |
| The Procter & Gamble Co. (Household Products) | | | 16,241 | | | | 2,656,703 | |
| Thor Industries, Inc. (Automobiles) | | | 373 | | | | 38,706 | |
| Toll Brothers, Inc. (Household Durables) | | | 768 | | | | 55,596 | |
| TopBuild Corp.* (Household Durables) | | | 221 | | | | 60,976 | |
| Tyson Foods, Inc.—Class A (Food Products) | | | 1,979 | | | | 172,490 | |
| Under Armour, Inc.*—Class A (Textiles, Apparel & Luxury Goods) | | | 1,264 | | | | 26,784 | |
| Under Armour, Inc.*—Class C (Textiles, Apparel & Luxury Goods) | | | 1,441 | | | | 25,996 | |
| US Foods Holding Corp.* (Food & Staples Retailing) | | | 1,494 | | | | 52,036 | |
| VF Corp. (Textiles, Apparel & Luxury Goods) | | | 2,188 | | | | 160,205 | |
| Whirlpool Corp. (Household Durables) | | | 408 | | | | 95,741 | |
| YETI Holdings, Inc.* (Leisure Products) | | | 588 | | | | 48,704 | |
| Zynga, Inc.* (Entertainment) | | | 7,063 | | | | 45,203 | |
TOTAL COMMON STOCKS
(Cost $11,234,221) | | | | | | | 26,108,310 | |
Repurchase Agreements(b) (3.4%)
| | | Principal
Amount | | | Value | |
| Repurchase Agreements with various counterparties, 0.00%, dated 12/31/21, due 1/3/22, total to be received $904,000 | | $ | 904,000 | | | $ | 904,000 | |
TOTAL REPURCHASE AGREEMENTS
(Cost $904,000) | | | | | | | 904,000 | |
Collateral for Securities Loaned(c) (0.6%)
| | | Shares | | | Value | |
| BlackRock Liquidity Funds FedFund Portfolio—Institutional Shares, 0.03%(d) | | | 156,395 | | | $ | 156,395 | |
TOTAL COLLATERAL FOR SECURITIES LOANED
(Cost $156,395) | | | | | | | 156,395 | |
TOTAL INVESTMENT SECURITIES
(Cost $12,294,616)—103.0% | | | | | | | 27,168,705 | |
| Net other assets (liabilities)—(3.0)% | | | | | | | (792,314 | ) |
| NET ASSETS—100.0% | | | | | | $ | 26,376,391 | |
| * | Non-income producing security. |
| (a) | All or part of this security was on loan as of December 31, 2021. The total value of securities on loan as of December 31, 2021 was $149,474. |
| (b) | The ProFund VP invests in Repurchase Agreements jointly with other funds in the Trust. See "Repurchase Agreements" under Note 2 in the Notes to Financial Statements to view the details of each individual agreement and counterparty as well as a description of the securities subject to repurchase. |
| (c) | Securities were purchased with cash collateral held from securities on loan at December 31, 2021. |
| (d) | Rate periodically changes. Rate disclosed is the daily yield on December 31, 2021. |
Total Return Swap Agreements—Long
| Underlying Instrument | | Counterparty | | Termination
Date(1) | | Rate Paid
(Received)(2) | | | Notional
Amount | | | Value and
Unrealized
Appreciation/
(Depreciation) | |
| Dow Jones U.S. Consumer Goods Index | | Goldman Sachs International | | 1/24/22 | | | 0.68 | % | | $ | 231,391 | | | $ | 4,204 | |
| (1) | Agreements may be terminated at will by either party without penalty. Payment is due at termination/maturity. |
| (2) | Reflects the floating financing rate, as of December 31, 2021, on the notional amount of the swap agreement paid to the counterparty or received from the counterparty, excluding any commissions. This amount is included as part of the unrealized appreciation/(depreciation). |
ProFund VP Consumer Goods invested in the following industries as of December 31, 2021:
| | | Value | | | % of
Net Assets | |
| Auto Components | | $ | 664,466 | | | | 2.5 | % |
| Automobiles | | | 7,211,042 | | | | 27.4 | % |
| Beverages | | | 4,045,124 | | | | 15.3 | % |
| Distributors | | | 286,145 | | | | 1.1 | % |
| Entertainment | | | 821,846 | | | | 3.1 | % |
| Food & Staples Retailing | | | 99,532 | | | | 0.4 | % |
| Food Products | | | 2,781,987 | | | | 10.5 | % |
| Household Durables | | | 1,163,569 | | | | 4.4 | % |
| Household Products | | | 3,802,430 | | | | 14.4 | % |
| Leisure Products | | | 375,125 | | | | 1.4 | % |
| Machinery | | | 206,350 | | | | 0.8 | % |
| Personal Products | | | 626,752 | | | | 2.4 | % |
| Textiles, Apparel & Luxury Goods | | | 2,447,063 | | | | 9.3 | % |
| Tobacco | | | 1,576,879 | | | | 6.0 | % |
| Other** | | | 268,081 | | | | 1.0 | % |
| Total | | $ | 26,376,391 | | | | 100.0 | % |
| ** | Includes any non-equity securities and net other assets (liabilities), which includes any receivable for capital shares issued and payable for capital shares redeemed. |
See accompanying notes to financial statements.
Financial Statements :: ProFund VP Consumer Goods :: 55
Statement of Assets and Liabilities
December 31, 2021
| ASSETS: | | | | |
| Total Investment Securities, at cost | | $ | 12,294,616 | |
| Securities, at value(a) | | | 26,264,705 | |
| Repurchase agreements, at value | | | 904,000 | |
| Total Investment Securities, at value | | | 27,168,705 | |
| Cash | | | 44 | |
| Dividends receivable | | | 41,486 | |
| Unrealized appreciation on swap agreements | | | 4,204 | |
| Prepaid expenses | | | 286 | |
| TOTAL ASSETS | | | 27,214,725 | |
| | | | | |
| LIABILITIES: | | | | |
| Payable for collateral for securities loaned | | | 156,395 | |
| Payable for capital shares redeemed | | | 627,398 | |
| Advisory fees payable | | | 17,996 | |
| Management services fees payable | | | 2,399 | |
| Administration fees payable | | | 1,491 | |
| Administrative services fees payable | | | 9,622 | |
| Distribution fees payable | | | 9,757 | |
| Transfer agency fees payable | | | 2,381 | |
| Fund accounting fees payable | | | 854 | |
| Compliance services fees payable | | | 100 | |
| Other accrued expenses | | | 9,941 | |
| TOTAL LIABILITIES | | | 838,334 | |
| NET ASSETS | | $ | 26,376,391 | |
| | | | | |
| NET ASSETS CONSIST OF: | | | | |
| Capital | | $ | 12,288,582 | |
| Total distributable earnings (loss) | | | 14,087,809 | |
| NET ASSETS | | $ | 26,376,391 | |
| Shares of Beneficial Interest Outstanding (unlimited number of shares authorized, no par value) | | | 379,794 | |
| Net Asset Value (offering and redemption price per share) | | $ | 69.45 | |
| | | | |
| (a) Includes securities on loan valued at: | | $ | 149,474 | |
Statement of Operations
For the Year Ended December 31, 2021
| INVESTMENT INCOME: | | | | |
| Dividends | | $ | 351,081 | |
| Interest | | | 4 | |
| Net income from securities lending | | | 211 | |
| TOTAL INVESTMENT INCOME | | | 351,296 | |
| | | | | |
| EXPENSES: | | | | |
| Advisory fees | | | 153,826 | |
| Management services fees | | | 20,510 | |
| Administration fees | | | 14,981 | |
| Transfer agency fees | | | 12,345 | |
| Administrative services fees | | | 59,013 | |
| Distribution fees | | | 51,275 | |
| Custody fees | | | 3,096 | |
| Fund accounting fees | | | 8,611 | |
| Trustee fees | | | 331 | |
| Compliance services fees | | | 143 | |
| Other fees | | | 20,043 | |
| Recoupment of prior expenses reduced by the Advisor | | | 2,500 | |
| Total Gross Expenses before reductions | | | 346,674 | |
| Expenses reduced and reimbursed by the Advisor | | | (2,104 | ) |
| TOTAL NET EXPENSES | | | 344,570 | |
| NET INVESTMENT INCOME (LOSS) | | | 6,726 | |
| | | | | |
| REALIZED AND UNREALIZED GAINS (LOSSES) ON INVESTMENTS: | | | | |
| Net realized gains (losses) on investment securities | | | 417,793 | |
| Net realized gains (losses) on swap agreements | | | 60,929 | |
| Change in net unrealized appreciation/depreciation on investment securities | | | 3,453,016 | |
| Change in net unrealized appreciation/depreciation on swap agreements | | | (3,245 | ) |
| NET REALIZED AND UNREALIZED GAINS (LOSSES) ON INVESTMENTS | | | 3,928,493 | |
| CHANGE IN NET ASSETS RESULTING FROM OPERATIONS | | $ | 3,935,219 | |
See accompanying notes to financial statements.
56 :: ProFund VP Consumer Goods :: Financial Statements
Statements of Changes in Net Assets
| | | Year Ended
December 31, 2021 | | | Year Ended
December 31, 2020 | |
| FROM INVESTMENT ACTIVITIES: | | | | | | | | |
| | | | | | | | | |
| OPERATIONS: | | | | | | | | |
| Net investment income (loss) | | $ | 6,726 | | | $ | 69,981 | |
| Net realized gains (losses) on investments | | | 478,722 | | | | 615,340 | |
| Change in net unrealized appreciation/depreciation on investments | | | 3,449,771 | | | | 3,235,118 | |
| Change in net assets resulting from operations | | | 3,935,219 | | | | 3,920,439 | |
| | | | | | | | | |
| DISTRIBUTIONS TO SHAREHOLDERS: | | | | | | | | |
| Total distributions | | | (1,063,035 | ) | | | (257,808 | ) |
| Change in net assets resulting from distributions | | | (1,063,035 | ) | | | (257,808 | ) |
| | | | | | | | | |
| CAPITAL TRANSACTIONS: | | | | | | | | |
| Proceeds from shares issued | | | 28,285,552 | | | | 29,203,257 | |
| Distributions reinvested | | | 1,063,035 | | | | 257,808 | |
| Value of shares redeemed | | | (24,217,241 | ) | | | (26,887,846 | ) |
| Change in net assets resulting from capital transactions | | | 5,131,346 | | | | 2,573,219 | |
| Change in net assets | | | 8,003,530 | | | | 6,235,850 | |
| | | | | | | | | |
| NET ASSETS: | | | | | | | | |
| Beginning of period | | | 18,372,861 | | | | 12,137,011 | |
| End of period | | $ | 26,376,391 | | | $ | 18,372,861 | |
| | | | | | | | | |
| SHARE TRANSACTIONS: | | | | | | | | |
| Issued | | | 443,795 | | | | 598,676 | |
| Reinvested | | | 18,134 | | | | 4,680 | |
| Redeemed | | | (377,573 | ) | | | (559,659 | ) |
| Change in shares | | | 84,356 | | | | 43,697 | |
See accompanying notes to financial statements.
Financial Highlights :: ProFund VP Consumer Goods :: 57
ProFunds Financial Highlights FOR THE PERIODS INDICATED
Selected data for a share of beneficial interest outstanding throughout the periods indicated.
| | | Year Ended
Dec. 31, 2021 | | | Year Ended
Dec. 31, 2020 | | | Year Ended
Dec. 31, 2019 | | | Year Ended
Dec. 31, 2018 | | | Year Ended
Dec. 31, 2017 | |
| Net Asset Value, Beginning of Period | | $ | 62.19 | | | $ | 48.21 | | | $ | 46.16 | | | $ | 66.23 | | | $ | 59.18 | |
| | | | | | | | | | | | | | | | | | | | | |
| Investment Activities: | | | | | | | | | | | | | | | | | | | | |
| Net investment income (loss)(a) | | | 0.02 | | | | 0.25 | | | | 0.49 | | | | 0.70 | | | | 0.49 | |
| Net realized and unrealized gains (losses) on investments | | | 11.42 | | | | 14.61 | | | | 10.83 | | | | (9.43 | ) | | | 8.33 | |
| Total income (loss) from investment activities | | | 11.44 | | | | 14.86 | | | | 11.32 | | | | (8.73 | ) | | | 8.82 | |
| | | | | | | | | | | | | | | | | | | | | |
| Distributions to Shareholders From: | | | | | | | | | | | | | | | | | | | | |
| Net investment income | | | (0.27 | ) | | | (0.38 | ) | | | (0.80 | ) | | | (0.74 | ) | | | (0.82 | ) |
| Net realized gains on investments | | | (3.91 | ) | | | (0.50 | ) | | | (8.47 | ) | | | (10.60 | ) | | | (0.95 | ) |
| Total distributions | | | (4.18 | ) | | | (0.88 | ) | | | (9.27 | ) | | | (11.34 | ) | | | (1.77 | ) |
| | | | | | | | | | | | | | | | | | | | | |
| Net Asset Value, End of Period | | $ | 69.45 | | | $ | 62.19 | | | $ | 48.21 | | | $ | 46.16 | | | $ | 66.23 | |
| | | | | | | | | | | | | | | | | | | | | |
| Total Return | | | 19.65 | % | | | 31.05 | % | | | 26.56 | % | | | (14.80 | )% | | | 15.05 | % |
| | | | | | | | | | | | | | | | | | | | | |
| Ratios to Average Net Assets: | | | | | | | | | | | | | | | | | | | | |
| Gross expenses | | | 1.69 | % | | | 1.75 | % | | | 1.73 | % | | | 1.72 | % | | | 1.68 | % |
| Net expenses | | | 1.68 | % | | | 1.68 | % | | | 1.68 | % | | | 1.68 | % | | | 1.68 | % |
| Net investment income (loss) | | | 0.03 | % | | | 0.50 | % | | | 1.01 | % | | | 1.23 | % | | | 0.76 | % |
| | | | | | | | | | | | | | | | | | | | | |
| Supplemental Data: | | | | | | | | | | | | | | | | | | | | |
| Net assets, end of period (000’s) | | $ | 26,376 | | | $ | 18,373 | | | $ | 12,137 | | | $ | 8,989 | | | $ | 18,827 | |
| Portfolio turnover rate(b) | | | 65 | % | | | 141 | % | | | 71 | % | | | 41 | % | | | 107 | % |
| (a) | Per share net investment income (loss) has been calculated using the average daily shares method. |
| (b) | Portfolio turnover rate is calculated without regard to instruments having a maturity of less than one year from acquisition or derivative instruments (including swap agreements and futures contracts). The portfolio turnover rate can be high and volatile due to the amount and timing of sales and purchases of fund shares during the period. |
See accompanying notes to financial statements.
58 :: ProFund VP Consumer Services :: Management Discussion of Fund Performance
ProFund VP Consumer Services (the "Fund") seeks investment results, before fees and expenses, that correspond to the performance of the Dow Jones U.S. Consumer ServicesSM Index (the "Index"). For the year ended December 31, 2021, the Fund had a total return of 10.23%. For the same period, the Index had a return of 12.01%1 and a volatility of 14.53%. For the year, the Fund achieved an average daily statistical correlation of over 0.99 to one and one-half times the daily performance of the Index.2
The Fund takes positions in financial instruments that, in combination, should have similar return characteristics as the return of the Index. The Index measures the performance of consumer services sector of the U.S. equity market. Component companies include, among others, airlines, broadcasting and entertainment, apparel and broadline retailers, food and drug retailers, media agencies, publishing, gambling, hotels, restaurants and bars, and travel and tourism.
During the year ended December 31, 2021, the Fund invested in swap agreements as a substitute for investing directly in stocks in order to gain exposure to the Index. These derivatives generally tracked the performance of their underlying benchmark and were negatively impacted by financing costs associated with their use. The Fund entered into swap agreements with counterparties that the Fund's advisor determined to be major, global financial institutions. If a counterparty becomes insolvent or otherwise fails to perform on its obligations, the value of investments in the Fund may decline. The Fund has sought to mitigate this risk by generally requiring counterparties to post collateral for the benefit of the Fund, marked to market daily, in an amount approximately equal to the amount the counterparty owed to the Fund, subject to certain minimum thresholds.
Value of a $10,000 Investment at Net Asset Value*

| * | The line graph represents the historical performance of a hypothetical investment of $10,000 in the ProFund VP Consumer Services from December 31, 2011 to December 31, 2021, assuming the reinvestment of distributions. |
Average Annual Total Return as of 12/31/21
| Fund | | One Year | | | Five Year | | | Ten Year | |
| ProFund VP Consumer Services | | | 10.23 | % | | | 16.00 | % | | | 15.97 | % |
| Dow Jones U.S. Consumer ServicesSM Index | | | 12.01 | % | | | 17.78 | % | | | 17.87 | % |
| S&P 500® | | | 28.71 | % | | | 18.47 | % | | | 16.55 | % |
Expense Ratios**
| Fund | | Gross | | | Net | | | | | |
| ProFund VP Consumer Services | | | 1.75 | % | | | 1.68 | % | | | | |
| ** | Reflects the expense ratio as reported in the Prospectus dated May 1, 2021. Contractual fee waivers are in effect through April 30, 2022. See Financial Highlights for effective expense ratios. |
Allocation of Portfolio Holdings & Index Composition
Market Exposure
| Investment Type | | % of Net Assets | |
| Equity Securities | | | 99 | % |
| Swap Agreements | | | 1 | % |
| Total Exposure | | | 100 | % |
“Market Exposure” includes the value of total investments (including the contract value of any derivatives) and excludes any instruments used for cash management or collateral for securities loaned.
Largest Equity Holdings
| Company | | % of Net Assets | |
| Amazon.com, Inc. | | | 24.5 | % |
| The Home Depot, Inc. | | | 7.4 | % |
| The Walt Disney Co. | | | 4.7 | % |
| Netflix, Inc. | | | 4.5 | % |
| Costco Wholesale Corp. | | | 4.2 | % |
Dow Jones U.S. Consumer ServicesSM
Index – Composition
| | | % of Index | |
| Retailing | | | 47 | % |
| Media & Entertainment | | | 20 | % |
| Consumer Services | | | 17 | % |
| Food & Staples Retailing | | | 10 | % |
| Transportation | | | 3 | % |
| Commercial & Professional Services | | | 2 | % |
| Health Care Equipment & Services | | | 1 | % |
Past performance does not guarantee future results. Return calculations assume the reinvestment of distributions and do not reflect taxes that a shareholder would pay on Fund distributions or on the redemption of Fund shares. The performance data quoted represents past performance and current returns may be lower or higher. The investment return and net asset value (“NAV”) will fluctuate so that an investor's shares, when redeemed, may be worth more or less than the original cost. The performance above reflects any fee reductions during the applicable periods. If such fee reductions had not occurred, the quoted performance would be lower. Performance numbers are net of all Fund fees and expenses but do not include any insurance, sales, or administrative charges of variable annuity or life insurance contracts. If these charges were included, the returns would be lower. To obtain performance current to the most recent month-end, please call toll-free 888-776-3637.
| 1 | The graph and table reflect the theoretical reinvestment of dividends on securities in the Indexes. The impact of transaction costs and the deduction of fees and expenses associated with a mutual fund, such as investment management and accounting fees, are not reflected in calculations of the Indexes. The Fund's performance reflects the reinvestment of dividends as well as the impact of transaction costs and the deduction of fees and expenses. It is not possible to invest directly in an index. |
| 2 | 1.00 equals perfect correlation. This calculation is based on the daily total return of the Index and the performance of the daily total return of the NAV per share of the Fund. |
| 3 | The S&P 500® is an unmanaged index that consists of the common stocks of 500 major U.S. corporations selected for their size and the frequency and ease with which their stocks trade. |
The above information is not covered by the Report of the Independent Registered Public Accounting Firm.
Financial Statements :: ProFund VP Consumer Services :: 59
Schedule of Portfolio Investments :: December 31, 2021
Common Stocks (98.7%)
| | | Shares | | | Value | |
| Advance Auto Parts, Inc. (Specialty Retail) | | | 328 | | | $ | 78,681 | |
| Airbnb, Inc.*—Class A (Hotels, Restaurants & Leisure) | | | 1,805 | | | | 300,514 | |
| Alaska Air Group, Inc.* (Airlines) | | | 652 | | | | 33,969 | |
| Albertsons Cos., Inc.—Class A (Food & Staples Retailing) | | | 511 | | | | 15,427 | |
| Altice USA, Inc.* (Media) | | | 1,176 | | | | 19,028 | |
| Amazon.com, Inc.* (Internet & Direct Marketing Retail) | | | 2,269 | | | | 7,565,617 | |
| AMC Entertainment Holdings, Inc.*(a) (Entertainment) | | | 2,674 | | | | 72,733 | |
| AMERCO (Road & Rail) | | | 51 | | | | 37,038 | |
| American Airlines Group, Inc.* (Airlines) | | | 3,371 | | | | 60,543 | |
| American Eagle Outfitters, Inc. (Specialty Retail) | | | 799 | | | | 20,231 | |
| AmerisourceBergen Corp. (Health Care Providers & Services) | | | 778 | | | | 103,389 | |
| Aramark (Hotels, Restaurants & Leisure) | | | 1,328 | | | | 48,937 | |
| AutoNation, Inc.* (Specialty Retail) | | | 208 | | | | 24,305 | |
| AutoZone, Inc.* (Specialty Retail) | | | 109 | | | | 228,507 | |
| Bath & Body Works, Inc. (Specialty Retail) | | | 1,375 | | | | 95,961 | |
| Best Buy Co., Inc. (Specialty Retail) | | | 1,151 | | | | 116,942 | |
| BJ's Wholesale Club Holdings, Inc.* (Food & Staples Retailing) | | | 711 | | | | 47,616 | |
| Booking Holdings, Inc.* (Hotels, Restaurants & Leisure) | | | 213 | | | | 511,036 | |
| Boyd Gaming Corp.* (Hotels, Restaurants & Leisure) | | | 426 | | | | 27,933 | |
| Bright Horizons Family Solutions, Inc.* (Diversified Consumer Services) | | | 314 | | | | 39,526 | |
| Burlington Stores, Inc.* (Specialty Retail) | | | 347 | | | | 101,154 | |
| Cable One, Inc. (Media) | | | 26 | | | | 45,850 | |
| Caesars Entertainment, Inc.* (Hotels, Restaurants & Leisure) | | | 1,112 | | | | 104,005 | |
| Cardinal Health, Inc. (Health Care Providers & Services) | | | 1,466 | | | | 75,484 | |
| CarMax, Inc.* (Specialty Retail) | | | 844 | | | | 109,914 | |
| Carnival Corp.*—Class A (Hotels, Restaurants & Leisure) | | | 4,186 | | | | 84,222 | |
| Carvana Co.* (Specialty Retail) | | | 445 | | | | 103,147 | |
| Casey's General Stores, Inc. (Food & Staples Retailing) | | | 194 | | | | 38,286 | |
| Charter Communications, Inc.*—Class A (Media) | | | 643 | | | | 419,217 | |
| Chegg, Inc.* (Diversified Consumer Services) | | | 754 | | | | 23,148 | |
| Chipotle Mexican Grill, Inc.* (Hotels, Restaurants & Leisure) | | | 146 | | | | 255,245 | |
| Choice Hotels International, Inc. (Hotels, Restaurants & Leisure) | | | 171 | | | | 26,674 | |
| Churchill Downs, Inc. (Hotels, Restaurants & Leisure) | | | 179 | | | | 43,121 | |
| Comcast Corp.—Class A (Media) | | | 23,730 | | | | 1,194,330 | |
| ContextLogic, Inc.*—Class A (Internet & Direct Marketing Retail) | | | 1,743 | | | | 5,421 | |
| Copart, Inc.* (Commercial Services & Supplies) | | | 1,110 | | | | 168,298 | |
| Costco Wholesale Corp. (Food & Staples Retailing) | | | 2,298 | | | | 1,304,574 | |
| Cracker Barrel Old Country Store, Inc. (Hotels, Restaurants & Leisure) | | | 123 | | | | 15,823 | |
| Darden Restaurants, Inc. (Hotels, Restaurants & Leisure) | | | 675 | | | | 101,682 | |
| Delta Air Lines, Inc.* (Airlines) | | | 3,330 | | | | 130,136 | |
| Dick's Sporting Goods, Inc. (Specialty Retail) | | | 338 | | | | 38,867 | |
| Discovery, Inc.*(a) (Media) | | | 881 | | | | 20,739 | |
| Discovery, Inc.*—Class C (Media) | | | 1,581 | | | | 36,205 | |
| DISH Network Corp.*—Class A (Media) | | | 1,300 | | | | 42,172 | |
| Dollar General Corp. (Multiline Retail) | | | 1,214 | | | | 286,298 | |
| Dollar Tree, Inc.* (Multiline Retail) | | | 1,170 | | | | 164,408 | |
| Domino's Pizza, Inc. (Hotels, Restaurants & Leisure) | | | 190 | | | | 107,223 | |
| DraftKings, Inc.*—Class A (Hotels, Restaurants & Leisure) | | | 1,734 | | | | 47,633 | |
| Endeavor Group Holdings, Inc.*—Class A (Entertainment) | | | 109 | | | | 3,803 | |
| Expedia Group, Inc.* (Hotels, Restaurants & Leisure) | | | 759 | | | | 137,166 | |
| Five Below, Inc.* (Specialty Retail) | | | 292 | | | | 60,412 | |
| Floor & Decor Holdings, Inc.* (Specialty Retail) | | | 549 | | | | 71,375 | |
| Foot Locker, Inc. (Specialty Retail) | | | 470 | | | | 20,506 | |
| Fox Corp.—Class A (Media) | | | 1,667 | | | | 61,512 | |
| Fox Corp.—Class B (Media) | | | 766 | | | | 26,251 | |
| frontdoor, Inc.*—Class A (Diversified Consumer Services) | | | 441 | | | | 16,163 | |
| GameStop Corp.*—Class A (Specialty Retail) | | | 322 | | | | 47,782 | |
| Grand Canyon Education, Inc.* (Diversified Consumer Services) | | | 208 | | | | 17,828 | |
| H&R Block, Inc. (Diversified Consumer Services) | | | 914 | | | | 21,534 | |
| Hilton Worldwide Holdings, Inc.* (Hotels, Restaurants & Leisure) | | | 1,450 | | | | 226,186 | |
| Hyatt Hotels Corp.*—Class A (Hotels, Restaurants & Leisure) | | | 262 | | | | 25,126 | |
| IAA, Inc.* (Commercial Services & Supplies) | | | 701 | | | | 35,485 | |
| IHS Markit, Ltd. (Professional Services) | | | 2,074 | | | | 275,676 | |
| JetBlue Airways Corp.* (Airlines) | | | 1,654 | | | | 23,553 | |
| Joby Aviation, Inc.* (Industrial) | | | 1,384 | | | | 10,103 | |
| Kohl's Corp. (Multiline Retail) | | | 783 | | | | 38,672 | |
| Las Vegas Sands Corp.* (Hotels, Restaurants & Leisure) | | | 1,790 | | | | 67,376 | |
| Liberty Broadband Corp.*—Class A (Media) | | | 122 | | | | 19,630 | |
| Liberty Broadband Corp.*—Class C (Media) | | | 736 | | | | 118,570 | |
| Liberty Media Corp-Liberty Formula One*—Class A (Entertainment) | | | 117 | | | | 6,943 | |
| Liberty Media Corp-Liberty Formula One*—Class C (Entertainment) | | | 1,059 | | | | 66,971 | |
| Liberty Media Corp-Liberty SiriusXM*—Class A (Media) | | | 411 | | | | 20,899 | |
| Liberty Media Corp-Liberty SiriusXM*—Class C (Media) | | | 832 | | | | 42,307 | |
| Lithia Motors, Inc.—Class A (Specialty Retail) | | | 157 | | | | 46,621 | |
| Live Nation Entertainment, Inc.* (Entertainment) | | | 702 | | | | 84,022 | |
| LiveRamp Holdings, Inc.* (IT Services) | | | 355 | | | | 17,022 | |
| LKQ Corp. (Distributors) | | | 1,395 | | | | 83,742 | |
| Lowe's Cos., Inc. (Specialty Retail) | | | 3,602 | | | | 931,044 | |
| Lyft, Inc.* (Road & Rail) | | | 1,538 | | | | 65,719 | |
| Marriott International, Inc.*—Class A (Hotels, Restaurants & Leisure) | | | 1,424 | | | | 235,280 | |
| Marriott Vacations Worldwide Corp. (Hotels, Restaurants & Leisure) | | | 222 | | | | 37,514 | |
See accompanying notes to financial statements.
60 :: ProFund VP Consumer Services :: Financial Statements
Common Stocks, continued
| | | Shares | | | Value | |
| McDonald’s Corp. (Hotels, Restaurants & Leisure) | | | 3,888 | | | $ | 1,042,256 | |
| MGM Resorts International (Hotels, Restaurants & Leisure) | | | 2,026 | | | | 90,927 | |
| Murphy USA, Inc. (Specialty Retail) | | | 123 | | | | 24,507 | |
| National Vision Holdings, Inc.* (Specialty Retail) | | | 430 | | | | 20,636 | |
| Netflix, Inc.* (Entertainment) | | | 2,304 | | | | 1,388,022 | |
| News Corp.—Class A (Media) | | | 2,046 | | | | 45,646 | |
| News Corp.—Class B (Media) | | | 634 | | | | 14,265 | |
| Nexstar Media Group, Inc.—Class A (Media) | | | 213 | | | | 32,159 | |
| Norwegian Cruise Line Holdings, Ltd.* (Hotels, Restaurants & Leisure) | | | 1,926 | | | | 39,945 | |
| Ollie's Bargain Outlet Holdings, Inc.* (Multiline Retail) | | | 315 | | | | 16,125 | |
| Omnicom Group, Inc. (Media) | | | 1,106 | | | | 81,037 | |
| O'Reilly Automotive, Inc.* (Specialty Retail) | | | 351 | | | | 247,886 | |
| Penn National Gaming, Inc.* (Hotels, Restaurants & Leisure) | | | 864 | | | | 44,798 | |
| Penske Automotive Group, Inc. (Specialty Retail) | | | 159 | | | | 17,048 | |
| Petco Health & Wellness Co., Inc.* (Specialty Retail) | | | 425 | | | | 8,411 | |
| Pinterest, Inc.*—Class A (Interactive Media & Services) | | | 2,927 | | | | 106,396 | |
| Planet Fitness, Inc.* (Hotels, Restaurants & Leisure) | | | 433 | | | | 39,221 | |
| Qurate Retail, Inc.—Class A (Internet & Direct Marketing Retail) | | | 1,860 | | | | 14,136 | |
| RH* (Specialty Retail) | | | 90 | | | | 48,235 | |
| Roku, Inc.* (Entertainment) | | | 612 | | | | 139,658 | |
| Rollins, Inc. (Commercial Services & Supplies) | | | 1,178 | | | | 40,299 | |
| Ross Stores, Inc. (Specialty Retail) | | | 1,850 | | | | 211,418 | |
| Royal Caribbean Cruises, Ltd.* (Hotels, Restaurants & Leisure) | | | 1,167 | | | | 89,742 | |
| Scientific Games Corp.* (Hotels, Restaurants & Leisure) | | | 502 | | | | 33,549 | |
| Service Corp. International (Diversified Consumer Services) | | | 857 | | | | 60,838 | |
| Sirius XM Holdings, Inc.(a) (Media) | | | 4,786 | | | | 30,391 | |
| Southwest Airlines Co.* (Airlines) | | | 3,080 | | | | 131,947 | |
| Sprouts Farmers Market, Inc.* (Food & Staples Retailing) | | | 585 | | | | 17,363 | |
| Starbucks Corp. (Hotels, Restaurants & Leisure) | | | 6,139 | | | | 718,079 | |
| Stitch Fix, Inc.*—Class A (Internet & Direct Marketing Retail) | | | 433 | | | | 8,192 | |
| Sysco Corp. (Food & Staples Retailing) | | | 2,667 | | | | 209,493 | |
| Target Corp. (Multiline Retail) | | | 2,539 | | | | 587,626 | |
| TEGNA, Inc. (Media) | | | 1,152 | | | | 21,381 | |
| Terminix Global Holdings, Inc.* (Diversified Consumer Services) | | | 631 | | | | 28,540 | |
| Texas Roadhouse, Inc.—Class A (Hotels, Restaurants & Leisure) | | | 362 | | | | 32,319 | |
| The Gap, Inc. (Specialty Retail) | | | 1,116 | | | | 19,697 | |
| The Home Depot, Inc. (Specialty Retail) | | | 5,491 | | | | 2,278,819 | |
| The Interpublic Group of Cos., Inc. (Media) | | | 2,049 | | | | 76,735 | |
| The Kroger Co. (Food & Staples Retailing) | | | 3,520 | | | | 159,315 | |
| The Madison Square Garden Co.*—Class A (Entertainment) | | | 89 | | | | 15,462 | |
| The New York Times Co.—Class A (Media) | | | 869 | | | | 41,973 | |
| The TJX Cos., Inc. (Specialty Retail) | | | 6,256 | | | | 474,955 | |
| The Walt Disney Co.* (Entertainment) | | | 9,453 | | | | 1,464,176 | |
| The Wendy's Co. (Hotels, Restaurants & Leisure) | | | 919 | | | | 21,918 | |
| Tractor Supply Co. (Specialty Retail) | | | 592 | | | | 141,251 | |
| TripAdvisor, Inc.* (Interactive Media & Services) | | | 516 | | | | 14,066 | |
| Uber Technologies, Inc.* (Road & Rail) | | | 8,680 | | | | 363,953 | |
| Ulta Beauty, Inc.* (Specialty Retail) | | | 283 | | | | 116,692 | |
| United Airlines Holdings , Inc.* (Airlines) | | | 1,685 | | | | 73,769 | |
| Vail Resorts, Inc. (Hotels, Restaurants & Leisure) | | | 210 | | | | 68,859 | |
| ViacomCBS, Inc.—Class A (Media) | | | 47 | | | | 1,568 | |
| ViacomCBS, Inc.—Class B (Media) | | | 3,156 | | | | 95,248 | |
| Victoria's Secret & Co.* (Specialty Retail) | | | 377 | | | | 20,939 | |
| Walgreens Boots Alliance, Inc. (Food & Staples Retailing) | | | 3,737 | | | | 194,922 | |
| Walmart, Inc. (Food & Staples Retailing) | | | 7,398 | | | | 1,070,417 | |
| Warner Music Group Corp.—Class A (Entertainment) | | | 529 | | | | 22,842 | |
| Wayfair, Inc.*—Class A (Internet & Direct Marketing Retail) | | | 406 | | | | 77,128 | |
| Williams-Sonoma, Inc. (Specialty Retail) | | | 387 | | | | 65,453 | |
| World Wrestling Entertainment, Inc.—Class A (Entertainment) | | | 233 | | | | 11,496 | |
| Wyndham Hotels & Resorts, Inc. (Hotels, Restaurants & Leisure) | | | 485 | | | | 43,480 | |
| Wynn Resorts, Ltd.* (Hotels, Restaurants & Leisure) | | | 547 | | | | 46,517 | |
| Yum! Brands, Inc. (Hotels, Restaurants & Leisure) | | | 1,525 | | | | 211,762 | |
| ZoomInfo Technologies, Inc.*—Class A (Interactive Media & Services) | | | 1,574 | | | | 101,051 | |
TOTAL COMMON STOCKS
(Cost $14,475,119) | | | | | | | 30,480,956 | |
Repurchase Agreements(b) (0.6%)
| | | Principal
Amount | | | Value | |
| Repurchase Agreements with various counterparties, 0.00%, dated 12/31/21, due 1/3/22, total to be received $182,000 | | $ | 182,000 | | | $ | 182,000 | |
TOTAL REPURCHASE AGREEMENTS
(Cost $182,000) | | | | | | | 182,000 | |
Collateral for Securities Loaned(c) (0.4%)
| | | Shares | | | Value | |
| BlackRock Liquidity Funds FedFund Portfolio—Institutional Shares, 0.03%(d) | | | 118,871 | | | $ | 118,871 | |
TOTAL COLLATERAL FOR SECURITIES LOANED
(Cost $118,871) | | | | | | | 118,871 | |
TOTAL INVESTMENT SECURITIES
(Cost $14,775,990)—99.7% | | | | | | | 30,781,827 | |
| Net other assets (liabilities)—0.3% | | | | | | | 102,622 | |
| NET ASSETS—100.0% | | | | | | $ | 30,884,449 | |
| * | Non-income producing security. |
| (a) | All or part of this security was on loan as of December 31, 2021. The total value of securities on loan as of December 31, 2021 was $109,410. |
| (b) | The ProFund VP invests in Repurchase Agreements jointly with other funds in the Trust. See “Repurchase Agreements” under Note 2 in the Notes to Financial Statements to view the details of each individual agreement and counterparty as well as a description of the securities subject to repurchase. |
| (c) | Securities were purchased with cash collateral held from securities on loan at December 31, 2021. |
| (d) | Rate periodically changes. Rate disclosed is the daily yield on December 31, 2021. |
See accompanying notes to financial statements.
Financial Statements :: ProFund VP Consumer Services :: 61
Total Return Swap Agreements—Long
| Underlying Instrument | | Counterparty | | Termination
Date(1) | | Rate Paid
(Received)(2) | | | Notional
Amount | | | Value and
Unrealized
Appreciation/
(Depreciation) | |
Dow Jones U.S. Consumer
Services Index | | Goldman Sachs International | | 1/24/22 | | | 0.68 | % | | $ | 421,963 | | | $ | 2,031 | |
| (1) | Agreements may be terminated at will by either party without penalty. Payment is due at termination/maturity. |
| (2) | Reflects the floating financing rate, as of December 31, 2021, on the notional amount of the swap agreement paid to the counterparty or received from the counterparty, excluding any commissions. This amount is included as part of the unrealized appreciation/(depreciation). |
ProFund VP Consumer Services invested in the following industries as of December 31, 2021:
| | | Value | | | % of
Net Assets | |
| Airlines | | $ | 453,917 | | | | 1.5 | % |
| Commercial Services & Supplies | | | 244,082 | | | | 0.8 | % |
| Distributors | | | 83,742 | | | | 0.3 | % |
| Diversified Consumer Services | | | 207,577 | | | | 0.7 | % |
| Entertainment | | | 3,276,128 | | | | 10.6 | % |
| Food & Staples Retailing | | | 3,057,413 | | | | 9.9 | % |
| Health Care Providers & Services | | | 178,873 | | | | 0.6 | % |
| Hotels, Restaurants & Leisure | | | 4,926,068 | | | | 15.9 | % |
| Industrial | | | 10,103 | | | | NM | |
| Interactive Media & Services | | | 221,513 | | | | 0.7 | % |
| Internet & Direct Marketing Retail | | | 7,670,494 | | | | 24.8 | % |
| IT Services | | | 17,022 | | | | 0.1 | % |
| Media | | | 2,507,113 | | | | 8.1 | % |
| Multiline Retail | | | 1,093,129 | | | | 3.5 | % |
| Professional Services | | | 275,676 | | | | 0.9 | % |
| Road & Rail | | | 466,710 | | | | 1.5 | % |
| Specialty Retail | | | 5,791,396 | | | | 18.8 | % |
| Other** | | | 403,493 | | | | 1.3 | % |
| Total | | $ | 30,884,449 | | | | 100.0 | % |
| ** | Includes any non-equity securities and net other assets (liabilities), which includes any receivable for capital shares issued and payable for capital shares redeemed. |
| NM | Not meaningful, amount is less than 0.05%. |
See accompanying notes to financial statements.
62 :: ProFund VP Consumer Services :: Financial Statements
Statement of Assets and Liabilities
December 31, 2021
| ASSETS: | | | | |
| Total Investment Securities, at cost | | $ | 14,775,989 | |
| Securities, at value(a) | | | 30,599,827 | |
| Repurchase agreements, at value | | | 182,000 | |
| Total Investment Securities, at value | | | 30,781,827 | |
| Cash | | | 959 | |
| Segregated cash balances for swap agreements with custodian | | | 270,000 | |
| Dividends receivable | | | 8,464 | |
| Unrealized appreciation on swap agreements | | | 2,031 | |
| Receivable for capital shares issued | | | 86,379 | |
| Prepaid expenses | | | 440 | |
| TOTAL ASSETS | | | 31,150,100 | |
| | | | | |
| LIABILITIES: | | | | |
| Payable for collateral for securities loaned | | | 118,871 | |
| Payable for capital shares redeemed | | | 68,083 | |
| Advisory fees payable | | | 23,167 | |
| Management services fees payable | | | 3,089 | |
| Administration fees payable | | | 1,853 | |
| Administrative services fees payable | | | 15,540 | |
| Distribution fees payable | | | 14,998 | |
| Transfer agency fees payable | | | 3,050 | |
| Fund accounting fees payable | | | 1,065 | |
| Compliance services fees payable | | | 135 | |
| Other accrued expenses | | | 15,800 | |
| TOTAL LIABILITIES | | | 265,651 | |
| NET ASSETS | | $ | 30,884,449 | |
| | | | | |
| NET ASSETS CONSIST OF: | | | | |
| Capital | | $ | 15,892,451 | |
| Total distributable earnings (loss) | | | 14,991,998 | |
| NET ASSETS | | $ | 30,884,449 | |
| Shares of Beneficial Interest Outstanding (unlimited number of shares authorized, no par value) | | | 399,205 | |
| Net Asset Value (offering and redemption price per share) | | $ | 77.36 | |
| | | | |
| (a) Includes securities on loan valued at: | | $ | 109,410 | |
Statement of Operations
For the Year Ended December 31, 2021
| INVESTMENT INCOME: | | | | |
| Dividends | | $ | 219,337 | |
| Interest | | | 8 | |
| Net income from securities lending | | | 272 | |
| TOTAL INVESTMENT INCOME | | | 219,617 | |
| | | | | |
| EXPENSES: | | | | |
| Advisory fees | | | 237,530 | |
| Management services fees | | | 31,670 | |
| Administration fees | | | 23,852 | |
| Transfer agency fees | | | 19,310 | |
| Administrative services fees | | | 88,143 | |
| Distribution fees | | | 79,177 | |
| Custody fees | | | 4,704 | |
| Fund accounting fees | | | 13,430 | |
| Trustee fees | | | 531 | |
| Compliance services fees | | | 197 | |
| Other fees | | | 31,096 | |
| Recoupment of prior expenses reduced by the Advisor | | | 4,000 | |
| Total Gross Expenses before reductions | | | 533,640 | |
| Expenses reduced and reimbursed by the Advisor | | | (1,572 | ) |
| TOTAL NET EXPENSES | | | 532,068 | |
| NET INVESTMENT INCOME (LOSS) | | | (312,451 | ) |
| | | | | |
| REALIZED AND UNREALIZED GAINS (LOSSES) ON INVESTMENTS: | | | | |
| Net realized gains (losses) on investment securities | | | 602,369 | |
| Net realized gains (losses) on swap agreements | | | (8,807 | ) |
| Change in net unrealized appreciation/depreciation on investment securities | | | 2,803,048 | |
| Change in net unrealized appreciation/depreciation on swap agreements | | | (6,486 | ) |
| NET REALIZED AND UNREALIZED GAINS (LOSSES) ON INVESTMENTS | | | 3,390,124 | |
| CHANGE IN NET ASSETS RESULTING FROM OPERATIONS | | $ | 3,077,673 | |
See accompanying notes to financial statements.
Financial Statements :: ProFund VP Consumer Services :: 63
| Statements of Changes in Net Assets |
| |
| | | Year Ended
December 31, 2021 | | | Year Ended
December 31, 2020 | |
| FROM INVESTMENT ACTIVITIES: | | | | | | | | |
| | | | | | | | | |
| OPERATIONS: | | | | | | | | |
| Net investment income (loss) | | $ | (312,451 | ) | | $ | (189,170 | ) |
| Net realized gains (losses) on investments | | | 593,562 | | | | 2,045,045 | |
| Change in net unrealized appreciation/depreciation on investments | | | 2,796,562 | | | | 4,377,426 | |
| Change in net assets resulting from operations | | | 3,077,673 | | | | 6,233,301 | |
| | | | | | | | | |
| DISTRIBUTIONS TO SHAREHOLDERS: | | | | | | | | |
| Total distributions | | | (2,445,589 | ) | | | (9,139,256 | ) |
| Change in net assets resulting from distributions | | | (2,445,589 | ) | | | (9,139,256 | ) |
| | | | | | | | | |
| CAPITAL TRANSACTIONS: | | | | | | | | |
| Proceeds from shares issued | | | 16,484,139 | | | | 25,070,116 | |
| Distributions reinvested | | | 2,445,589 | | | | 9,139,256 | |
| Value of shares redeemed | | | (20,612,082 | ) | | | (26,214,874 | ) |
| Change in net assets resulting from capital transactions | | | (1,682,354 | ) | | | 7,994,498 | |
| Change in net assets | | | (1,050,270 | ) | | | 5,088,543 | |
| | | | | | | | | |
| NET ASSETS: | | | | | | | | |
| Beginning of period | | | 31,934,719 | | | | 26,846,176 | |
| End of period | | $ | 30,884,449 | | | $ | 31,934,719 | |
| | | | | | | | | |
| SHARE TRANSACTIONS: | | | | | | | | |
| Issued | | | 211,808 | | | | 317,539 | |
| Reinvested | | | 33,835 | | | | 125,075 | |
| Redeemed | | | (265,804 | ) | | | (346,817 | ) |
| Change in shares | | | (20,161 | ) | | | 95,797 | |
See accompanying notes to financial statements.
64 :: ProFund VP Consumer Services :: Financial Highlights
ProFunds Financial Highlights FOR THE PERIODS INDICATED
Selected data for a share of beneficial interest outstanding throughout the periods indicated.
| | | Year Ended
Dec. 31, 2021 | | | Year Ended
Dec. 31, 2020 | | | Year Ended
Dec. 31, 2019 | | | Year Ended
Dec. 31, 2018 | | | Year Ended
Dec. 31, 2017 | |
| Net Asset Value, Beginning of Period | | $ | 76.15 | | | $ | 82.97 | | | $ | 69.55 | | | $ | 72.88 | | | $ | 61.58 | |
| | | | | | | | | | | | | | | | | | | | | |
| Investment Activities: | | | | | | | | | | | | | | | | | | | | |
| Net investment income (loss)(a) | | | (0.76 | ) | | | (0.56 | ) | | | (0.40 | ) | | | (0.29 | ) | | | (0.12 | ) |
| Net realized and unrealized gains (losses) on investments | | | 8.12 | | | | 22.85 | | | | 17.30 | | | | 1.12 | | | | 11.42 | |
| Total income (loss) from investment activities | | | 7.36 | | | | 22.29 | | | | 16.90 | | | | 0.83 | | | | 11.30 | |
| | | | | | | | | | | | | | | | | | | | | |
| Distributions to Shareholders From: | | | | | | | | | | | | | | | | | | | | |
| Net realized gains on investments | | | (6.15 | ) | | | (29.11 | ) | | | (3.48 | ) | | | (4.16 | ) | | | — | |
| | | | | | | | | | | | | | | | | | | | | |
| Net Asset Value, End of Period | | $ | 77.36 | | | $ | 76.15 | | | $ | 82.97 | | | $ | 69.55 | | | $ | 72.88 | |
| | | | | | | | | | | | | | | | | | | | | |
| Total Return | | | 10.23 | % | | | 28.34 | % | | | 24.64 | % | | | 0.62 | %(b) | | | 18.37 | % |
| | | | | | | | | | | | | | | | | | | | | |
| Ratios to Average Net Assets: | | | | | | | | | | | | | | | | | | | | |
| Gross expenses | | | 1.68 | % | | | 1.75 | % | | | 1.72 | % | | | 1.73 | % | | | 1.72 | % |
| Net expenses | | | 1.68 | % | | | 1.68 | % | | | 1.71 | %(c) | | | 1.65 | %(b) | | | 1.68 | % |
| Net investment income (loss) | | | (0.99 | )% | | | (0.72 | )% | | | (0.50 | )% | | | (0.38 | )%(b) | | | (0.18 | )% |
| | | | | | | | | | | | | | | | | | | | | |
| Supplemental Data: | | | | | | | | | | | | | | | | | | | | |
| Net assets, end of period (000's) | | $ | 30,884 | | | $ | 31,935 | | | $ | 26,846 | | | $ | 25,222 | | | $ | 32,762 | |
| Portfolio turnover rate(d) | | | 39 | % | | | 116 | % | | | 182 | % | | | 82 | % | | | 81 | % |
| (a) | Per share net investment income (loss) has been calculated using the average daily shares method. |
| (b) | During 2018, the Fund received a non-recurring reimbursement from a third party relating to expenses that were incurred in a prior year. Had this reimbursement not occurred, the net expense ratio and net investment income (loss) ratio would have been 1.67% and (0.40)%, respectively, and the total return would have been 0.60%. |
| (c) | The expense ratio does not correlate to the applicable expense limits in place during the period given that the annual contractual expense limitation is applied for one year periods ended April 30th of each year, instead of coinciding with the December 31st year end. Details of the current expense limitation in effect can be found in Note 4 of the accompanying Notes to Financial Statements. |
| (d) | Portfolio turnover rate is calculated without regard to instruments having a maturity of less than one year from acquisition or derivative instruments (including swap agreements and futures contracts). The portfolio turnover rate can be high and volatile due to the amount and timing of sales and purchases of fund shares during the period. |
See accompanying notes to financial statements.
Management Discussion of Fund Performance :: ProFund VP Dow 30 :: 65
ProFund VP Dow 30 (the "Fund") seeks investment results, before fees and expenses, that correspond to the performance of the Dow Jones Industrial Average® (the "Index"). For the year ended December 31, 2021, the Fund had a total return of 17.51%. For the same period, the Index had a total return of 20.95%1 and a volatility of 12.42%. For the year, the Fund achieved an average daily statistical correlation of 0.99 to the daily performance of the Index.2
The Fund takes positions in financial instruments that, in combination, should have similar return characteristics as the return of the Index. The Index is a price-weighted index. The Index includes 30 large-cap, "blue-chip" U.S. stocks, excluding utility and transportation companies. Components are selected through a discretionary process with no pre-determined criteria except that components should be established U.S. companies that are leaders in their industries, have an excellent reputation, demonstrate sustained growth, are of interest to a large number of investors, and accurately represents the sectors covered by the average. The Index is not limited to traditionally defined industrial stocks. Instead, the Index serves as a measure of the entire U.S. market, covering such diverse industries as financial services, technology, retail, entertainment, and consumer goods. Composition changes are rare, and generally occur only after corporate acquisitions or other dramatic shifts in a component's core business. When such an event necessitates that one component be replaced, the entire Index is reviewed.
During the year ended December 31, 2021, the Fund invested in swap agreements as a substitute for investing directly in stocks in order to gain exposure to the Index. These derivatives generally tracked the performance of their underlying benchmark and were negatively impacted by financing costs associated with their use. The Fund entered into swap agreements with counterparties that the Fund's advisor determined to be major, global financial institutions. If a counterparty becomes insolvent or otherwise fails to perform on its obligations, the value of investments in the Fund may decline. The Fund has sought to mitigate this risk by generally requiring counterparties to post collateral for the benefit of the Fund, marked to market daily, in an amount approximately equal to the amount the counterparty owed to the Fund, subject to certain minimum thresholds.
Value of a $10,000 Investment at Net Asset Value*

| * | The line graph represents the historical performance of a hypothetical investment of $10,000 in the ProFund VP Dow 30 from December 31, 2011 to December 31, 2021, assuming the reinvestment of distributions. |
Average Annual Total Return as of 12/31/21
| Fund | | One Year | | | Five Year | | | Ten Year | |
| ProFund VP Dow 30 | | | 17.51 | % | | | 12.36 | % | | | 10.81 | % |
| Dow Jones Industrial Average® | | | 20.95 | % | | | 15.51 | % | | | 14.21 | % |
Expense Ratios**
| Fund | | Gross | | | Net | | | | | |
| ProFund VP Dow 30 | | | 1.58 | % | | | 1.58 | % | | | | |
| ** | Reflects the expense ratio as reported in the Prospectus dated May 1, 2021. Contractual fee waivers are in effect through April 30, 2022. See Financial Highlights for effective expense ratios. |
Allocation of Portfolio Holdings & Index Composition
Market Exposure
| Investment Type | | % of Net Assets | |
| Swap Agreements | | | 100 | % |
| Total Exposure | | | 100 | % |
"Market Exposure" includes the value of total investments (including the contract value of any derivatives) and excludes any instruments used for cash management.
Holdings
The ProFund VP Dow 30 primarily invests in non-equity securities, which may include: swap agreements, futures contracts, repurchase agreements and U.S. Government securities.
Dow Jones Industrial Average® Index – Composition
| | | % of Index | |
| Information Technology | | | 22 | % |
| Health Care | | | 18 | % |
| Financials | | | 16 | % |
| Consumer Discretionary | | | 15 | % |
| Industrials | | | 14 | % |
| Consumer Staples | | | 8 | % |
| Communication Services | | | 4 | % |
| Energy | | | 2 | % |
| Materials | | | 1 | % |
Past performance does not guarantee future results. Return calculations assume the reinvestment of distributions and do not reflect taxes that a shareholder would pay on Fund distributions or on the redemption of Fund shares. The performance data quoted represents past performance and current returns may be lower or higher. The investment return and net asset value ("NAV") will fluctuate so that an investor's shares, when redeemed, may be worth more or less than the original cost. The performance above reflects any fee reductions during the applicable periods. If such fee reductions had not occurred, the quoted performance would be lower. Performance numbers are net of all Fund fees and expenses but do not include any insurance, sales, or administrative charges of variable annuity or life insurance contracts. If these charges were included, the returns would be lower. To obtain performance current to the most recent month-end, please call toll-free 888-776-3637.
| 1 | The graph and table reflect the theoretical reinvestment of dividends on securities in the Index. The impact of transaction costs and the deduction of fees and expenses associated with a mutual fund, such as investment management and accounting fees, are not reflected in the index calculations. The Fund's performance reflects the reinvestment of dividends as well as the impact of transaction costs and the deduction of fees and expenses. It is not possible to invest directly in an index. |
| 2 | 1.00 equals perfect correlation. This calculation is based on the daily total return of the Index and the performance of the daily total return of the NAV per share of the Fund. |
The above information is not covered by the Report of the Independent Registered Public Accounting Firm.
66 :: ProFund VP Dow 30 :: Financial Statements
Schedule of Portfolio Investments :: December 31, 2021
Repurchase Agreements(a)(b) (99.8%)
| | | Principal
Amount | | | Value | |
| Repurchase Agreements with various counterparties, 0.00%, dated 12/31/21, due 1/3/22, total to be received $218,000 | | $ | 218,000 | | | $ | 218,000 | |
TOTAL REPURCHASE AGREEMENTS
(Cost $218,000) | | | | | | | 218,000 | |
TOTAL INVESTMENT SECURITIES
(Cost $218,000)—99.8% | | | | | | | 218,000 | |
| Net other assets (liabilities)—0.2% | | | | | | | 490 | |
| NET ASSETS—100.0% | | | | | | $ | 218,490 | |
| (a) | A portion of these securities were held in a segregated account for the benefit of swap counterparties in the event of default. At December 31, 2021, the aggregate amount held in a segregated account was $192,000. |
| (b) | The ProFund VP invests in Repurchase Agreements jointly with other funds in the Trust. See "Repurchase Agreements" under Note 2 in the Notes to Financial Statements to view the details of each individual agreement and counterparty as well as a description of the securities subject to repurchase. |
Total Return Swap Agreements—Long
| Underlying Instrument | | Counterparty | | Termination
Date(1) | | Rate Paid
(Received)(2) | | | Notional
Amount | | | Value and
Unrealized
Appreciation/
(Depreciation) | |
| Dow Jones Industrial Average | | Goldman Sachs International | | 1/27/22 | | | 0.68 | % | | $ | 154,704 | | | $ | 141 | |
| Dow Jones Industrial Average | | UBS AG | | 1/27/22 | | | 0.58 | % | | | 63,756 | | | | 59 | |
| | | | | | | | | | | $ | 218,460 | | | $ | 200 | |
| (1) | Agreements may be terminated at will by either party without penalty. Payment is due at termination/maturity. |
| (2) | Reflects the floating financing rate, as of December 31, 2021, on the notional amount of the swap agreement paid to the counterparty or received from the counterparty, excluding any commissions. This amount is included as part of the unrealized appreciation/(depreciation). |
See accompanying notes to financial statements.
Financial Statements :: ProFund VP Dow 30 :: 67
Statement of Assets and Liabilities
December 31, 2021
|
| ASSETS: | | | | |
| Total Investment Securities, at cost | | $ | 218,000 | |
| Repurchase agreements, at value | | | 218,000 | |
| Total Investment Securities, at value | | | 218,000 | |
| Cash | | | 925 | |
| Unrealized appreciation on swap agreements | | | 200 | |
| Prepaid expenses | | | 4 | |
| TOTAL ASSETS | | | 219,129 | |
| | | | | |
| LIABILITIES: | | | | |
| Payable for capital shares redeemed | | | 35 | |
| Advisory fees payable | | | 159 | |
| Management services fees payable | | | 21 | |
| Administration fees payable | | | 14 | |
| Administrative services fees payable | | | 51 | |
| Distribution fees payable | | | 107 | |
| Transfer agency fees payable | | | 34 | |
| Fund accounting fees payable | | | 8 | |
| Compliance services fees payable | | | 2 | |
| Other accrued expenses | | | 208 | |
| TOTAL LIABILITIES | | | 639 | |
| NET ASSETS | | $ | 218,490 | |
| | | | | |
| NET ASSETS CONSIST OF: | | | | |
| Capital | | $ | 1,819,368 | |
| Total distributable earnings (loss) | | | (1,600,878 | ) |
| NET ASSETS | | $ | 218,490 | |
| Shares of Beneficial Interest Outstanding (unlimited number of shares authorized, no par value) | | | 9,142 | |
| Net Asset Value (offering and redemption price per share) | | $ | 23.90 | |
Statement of Operations
For the Year Ended December 31, 2021
| INVESTMENT INCOME: | | | | |
| Interest | | $ | 8 | |
| | | | | |
| EXPENSES: | | | | |
| Advisory fees | | | 3,412 | |
| Management services fees | | | 455 | |
| Administration fees | | | 324 | |
| Transfer agency fees | | | 278 | |
| Administrative services fees | | | 233 | |
| Distribution fees | | | 1,137 | |
| Custody fees | | | 89 | |
| Fund accounting fees | | | 185 | |
| Trustee fees | | | 7 | |
| Compliance services fees | | | 5 | |
| Other fees | | | 562 | |
| TOTAL NET EXPENSES | | | 6,687 | |
| NET INVESTMENT INCOME (LOSS) | | | (6,679 | ) |
| | | | | |
| REALIZED AND UNREALIZED GAINS (LOSSES) ON INVESTMENTS: | | | | |
| Net realized gains (losses) on swap agreements | | | 36,870 | |
| Change in net unrealized appreciation/depreciation on swap agreements | | | (6,186 | ) |
| NET REALIZED AND UNREALIZED GAINS (LOSSES) ON INVESTMENTS | | | 30,684 | |
| CHANGE IN NET ASSETS RESULTING FROM OPERATIONS | | $ | 24,005 | |
See accompanying notes to financial statements.
68 :: ProFund VP Dow 30 :: Financial Statements
Statements of Changes in Net Assets
| | | Year Ended
December 31, 2021 | | | Year Ended
December 31, 2020 | |
| FROM INVESTMENT ACTIVITIES: | | | | | | | | |
| | | | | | | | | |
| OPERATIONS: | | | | | | | | |
| Net investment income (loss) | | $ | (6,679 | ) | | $ | (5,802 | ) |
| Net realized gains (losses) on investments | | | 36,870 | | | | 70,081 | |
| Change in net unrealized appreciation/depreciation on investments | | | (6,186 | ) | | | 7,638 | |
| Change in net assets resulting from operations | | | 24,005 | | | | 71,917 | |
| | | | | | | | | |
| DISTRIBUTIONS TO SHAREHOLDERS: | | | | | | | | |
| Total distributions | | | (55,117 | ) | | | (111,280 | ) |
| Change in net assets resulting from distributions | | | (55,117 | ) | | | (111,280 | ) |
| | | | | | | | | |
| CAPITAL TRANSACTIONS: | | | | | | | | |
| Proceeds from shares issued | | | 24,536,278 | | | | 18,480,818 | |
| Distributions reinvested | | | 26,861 | | | | 111,280 | |
| Value of shares redeemed | | | (24,698,466 | ) | | | (18,483,574 | ) |
| Change in net assets resulting from capital transactions | | | (135,327 | ) | | | 108,524 | |
| Change in net assets | | | (166,439 | ) | | | 69,161 | |
| | | | | | | | | |
| NET ASSETS: | | | | | | | | |
| Beginning of period | | | 384,929 | | | | 315,768 | |
| End of period | | $ | 218,490 | | | $ | 384,929 | |
| | | | | | | | | |
| SHARE TRANSACTIONS: | | | | | | | | |
| Issued | | | 1,048,587 | | | | 800,228 | |
| Reinvested | | | 1,208 | | | | 5,026 | |
| Redeemed | | | (1,057,199 | ) | | | (799,920 | ) |
| Change in shares | | | (7,404 | ) | | | 5,334 | |
See accompanying notes to financial statements.
Financial Highlights :: ProFund VP Dow 30 :: 69
ProFunds Financial Highlights FOR THE PERIODS INDICATED
Selected data for a share of beneficial interest outstanding throughout the periods indicated.
| | | Year Ended
Dec. 31, 2021 | | | Year Ended
Dec. 31, 2020 | | | Year Ended
Dec. 31, 2019 | | | Year Ended
Dec. 31, 2018 | | | Year Ended
Dec. 31, 2017 | |
| Net Asset Value, Beginning of Period | | $ | 23.26 | | | $ | 28.16 | | | $ | 23.07 | | | $ | 31.90 | | | $ | 36.39 | |
| | | | | | | | | | | | | | | | | | | | | |
| Investment Activities: | | | | | | | | | | | | | | | | | | | | |
| Net investment income (loss)(a) | | | (0.34 | ) | | | (0.31 | ) | | | 0.15 | | | | 0.05 | | | | (0.24 | ) |
| Net realized and unrealized gains (losses) on investments | | | 4.18 | | | | 2.05 | | | | 4.97 | | | | (1.18 | ) | | | 7.74 | |
| Total income (loss) from investment activities | | | 3.84 | | | | 1.74 | | | | 5.12 | | | | (1.13 | ) | | | 7.50 | |
| | | | | | | | | | | | | | | | | | | | | |
| Distributions to Shareholders From: | | | | | | | | | | | | | | | | | | | | |
| Net investment income | | | — | | | | (0.13 | ) | | | (0.03 | ) | | | — | | | | — | |
| Net realized gains on investments | | | (3.20 | ) | | | (6.51 | ) | | | — | | | | (7.70 | ) | | | (11.99 | ) |
| Total distributions | | | (3.20 | ) | | | (6.64 | ) | | | (0.03 | ) | | | (7.70 | ) | | | (11.99 | ) |
| | | | | | | | | | | | | | | | | | | | | |
| Net Asset Value, End of Period | | $ | 23.90 | | | $ | 23.26 | | | $ | 28.16 | | | $ | 23.07 | | | $ | 31.90 | |
| | | | | | | | | | | | | | | | | | | | | |
| Total Return | | | 17.51 | % | | | 7.41 | % | | | 22.18 | % | | | (6.03 | )% | | | 23.63 | % |
| | | | | | | | | | | | | | | | | | | | | |
| Ratios to Average Net Assets: | | | | | | | | | | | | | | | | | | | | |
| Gross expenses | | | 1.47 | % | | | 1.58 | % | | | 1.47 | % | | | 1.49 | % | | | 1.44 | % |
| Net expenses | | | 1.47 | % | | | 1.58 | % | | | 1.47 | % | | | 1.49 | % | | | 1.44 | % |
| Net investment income (loss) | | | (1.47 | )% | | | (1.31 | )% | | | 0.56 | % | | | 0.16 | % | | | (0.68 | )% |
| | | | | | | | | | | | | | | | | | | | | |
| Supplemental Data: | | | | | | | | | | | | | | | | | | | | |
| Net assets, end of period (000's) | | $ | 218 | | | $ | 385 | | | $ | 316 | | | $ | 307 | | | $ | 349 | |
| Portfolio turnover rate(b) | | | — | | | | — | | | | — | | | | — | | | | — | |
| (a) | Per share net investment income (loss) has been calculated using the average daily shares method. |
| (b) | Portfolio turnover rate is calculated without regard to instruments having a maturity of less than one year from acquisition or derivative instruments (including swap agreements and futures contracts). |
See accompanying notes to financial statements.
70 :: ProFund VP Emerging Markets :: Management Discussion of Fund Performance
ProFund VP Emerging Markets (the "Fund") seeks investment results, before fees and expenses, that correspond to the performance of the S&P/BNY Mellon Emerging 50 ADR Index (USD) (the "Index"). For the year ended December 31, 2021, the Fund had a total return of -18.01%. For the same period, the Index had a total return of -16.59%1 and a volatility of 24.49%. For the year, the Fund achieved an average daily statistical correlation of over 0.99 to that of the daily performance of the Index.2
The Fund takes positions in financial instruments that, in combination, should have similar return characteristics as the return of the Index. The Index is a free-float adjusted, market capitalization-weighted index. The Index is designed to track the performance of a basket of companies who have their primary equity listing on a stock exchange of an emerging market country and who also have depositary receipts that trade on a U.S. exchange or on Nasdaq. As of December 31, 2021, the Index consists of companies from the following emerging market countries: Brazil, Chile, China, Colombia, India, Indonesia, Mexico, South Africa, South Korea and Taiwan. The Index is expressed in U.S. dollar terms and as such should generally reflect the relative movement of the U.S. dollar against the basket of foreign currencies represented by the constituent companies in the Index.
During the year ended December 31, 2021, the Fund invested in swap agreements as a substitute for investing directly in stocks in order to gain exposure to the Index. These derivatives generally tracked the performance of their underlying benchmark and were negatively impacted by financing costs associated with their use. The Fund entered into swap agreements with counterparties that the Fund's advisor determined to be major, global financial institutions. If a counterparty becomes insolvent or otherwise fails to perform on its obligations, the value of investments in the Fund may decline. The Fund has sought to mitigate this risk by generally requiring counterparties to post collateral for the benefit of the Fund, marked to market daily, in an amount approximately equal to the amount the counterparty owed to the Fund, subject to certain minimum thresholds.
Value of a $10,000 Investment at Net Asset Value*
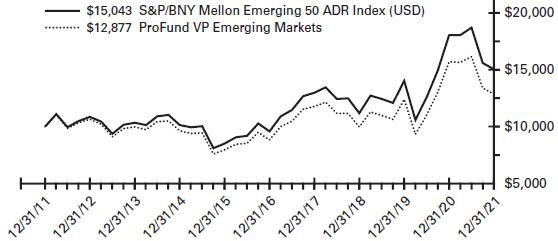
| * | The line graph represents the historical performance of a hypothetical investment of $10,000 in the ProFund VP Emerging Markets from December 31, 2011 to December 31, 2021, assuming the reinvestment of distributions. |
Average Annual Total Return as of 12/31/21
| Fund | | One Year | | | Five Year | | | Ten Year | |
| ProFund VP Emerging Markets | | | -18.01 | % | | | 7.82 | % | | | 2.56 | % |
| S&P/BNY Mellon Emerging 50 ADR Index (USD) | | | -16.59 | % | | | 9.44 | % | | | 4.17 | % |
Expense Ratios**
| Fund | | Gross | | | Net | | | | | |
| ProFund VP Emerging Markets | | | 1.74 | % | | | 1.68 | % | | | | |
| ** | Reflects the expense ratio as reported in the Prospectus dated May 1, 2021. Contractual fee waivers are in effect through April 30, 2022. See Financial Highlights for effective expense ratios. |
Allocation of Portfolio Holdings & Index Composition
Market Exposure
| Investment Type | | % of Net Assets | |
| Equity Securities | | | 96 | % |
| Swap Agreements | | | 4 | % |
| Total Exposure | | | 100 | % |
"Market Exposure" includes the value of total investments (including the contract value of any derivatives) and excludes any instruments used for cash management or collateral for securities loaned.
Largest Equity Holdings
| Company | | % of Net Assets | |
| Taiwan Semiconductor Manufacturing Co., Ltd. | | | 19.5 | % |
| Alibaba Group Holding, Ltd. | | | 13.2 | % |
| Infosys Technologies, Ltd. | | | 5.6 | % |
| HDFC Bank, Ltd. | | | 5.4 | % |
| JD.com, Inc. | | | 4.0 | % |
S&P/BNY Mellon Emerging 50 ADR Index (USD) – Composition
| Industry Breakdown | | % of Index | |
| Information Technology | | | 29 | % |
| Consumer Discretionary | | | 25 | % |
| Financials | | | 15 | % |
| Communication Services | | | 11 | % |
| Materials | | | 10 | % |
| Energy | | | 4 | % |
| Consumer Staples | | | 2 | % |
| Health Care | | | 2 | % |
| Industrials | | | 1 | % |
| Real Estate | | | 1 | % |
| Country Composition | | | | |
| China | | | 36 | % |
| Taiwan | | | 24 | % |
| India | | | 17 | % |
| Brazil | | | 11 | % |
| Other | | | 12 | % |
Past performance does not guarantee future results. Return calculations assume the reinvestment of distributions and do not reflect taxes that a shareholder would pay on Fund distributions or on the redemption of Fund shares. The performance data quoted represents past performance and current returns may be lower or higher. The investment return and net asset value ("NAV") will fluctuate so that an investor's shares, when redeemed, may be worth more or less than the original cost. The performance above reflects any fee reductions during the applicable periods. If such fee reductions had not occurred, the quoted performance would be lower. Performance numbers are net of all Fund fees and expenses but do not include any insurance, sales, or administrative charges of variable annuity or life insurance contracts. If these charges were included, the returns would be lower. To obtain performance current to the most recent month-end, please call toll-free 888-776-3637.
| 1 | The graph and table reflect the theoretical reinvestment of dividends on securities in the Index. The impact of transaction costs and the deduction of fees and expenses associated with a mutual fund, such as investment management and accounting fees, are not reflected in the index calculations. The Fund's performance reflects the reinvestment of dividends as well as the impact of transaction costs and the deduction of fees and expenses. It is not possible to invest directly in an index. |
| 2 | 1.00 equals perfect correlation. This calculation is based on the daily total return of the Index and the performance of the daily total return of the NAV per share of the Fund. |
The above information is not covered by the Report of the Independent Registered Public Accounting Firm.
Financial Statements :: ProFund VP Emerging Markets :: 71
Schedule of Portfolio Investments :: December 31, 2021
Common Stocks (94.3%)
| | | Shares | | | Value | |
| Alibaba Group Holding, Ltd.*ADR (Internet & Direct Marketing Retail) | | | 21,893 | | | $ | 2,600,670 | |
| Ambev S.A.ADR (Beverages) | | | 57,223 | | | | 160,224 | |
| America Movil S.A.B. de C.V.ADR (Wireless Telecommunication Services) | | | 15,078 | | | | 318,297 | |
| AngloGold Ashanti, Ltd.ADR (Metals & Mining) | | | 5,419 | | | | 113,691 | |
| ASE Technology Holding Co., Ltd.ADR (Semiconductors & Semiconductor Equipment) | | | 22,192 | | | | 173,320 | |
| Baidu, Inc.*ADR (Interactive Media & Services) | | | 3,682 | | | | 547,845 | |
| Banco Bradesco S.A.ADR (Banks) | | | 62,947 | | | | 215,279 | |
| Beigene, Ltd.*ADR (Biotechnology) | | | 679 | | | | 183,961 | |
| Bilibili, Inc.*ADR (Entertainment) | | | 2,821 | | | | 130,894 | |
| Cemex SAB de CV*ADR (Construction Materials) | | | 19,653 | | | | 133,247 | |
| China Life Insurance Co., Ltd.ADR(a) (Insurance) | | | 19,322 | | | | 159,020 | |
| China Petroleum & Chemical Corp.ADR (Oil, Gas & Consumable Fuels) | | | 3,312 | | | | 154,041 | |
| Chunghwa Telecom Co., Ltd.ADR (Diversified Telecommunication Services) | | | 4,935 | | | | 208,306 | |
| Dr. Reddy's Laboratories, Ltd.ADR (Pharmaceuticals) | | | 1,577 | | | | 103,152 | |
| Fomento Economico Mexicano S.A.B. de C.V.ADR (Beverages) | | | 2,385 | | | | 185,338 | |
| GDS Holdings, Ltd.*ADR (IT Services) | | | 1,483 | | | | 69,938 | |
| Gerdau S.A.ADR (Metals & Mining) | | | 14,879 | | | | 73,205 | |
| Gold Fields, Ltd.ADR (Metals & Mining) | | | 11,525 | | | | 126,659 | |
| Grupo Televisa SABADR (Media) | | | 6,570 | | | | 61,561 | |
| HDFC Bank, Ltd.ADR (Banks) | | | 16,231 | | | | 1,056,151 | |
| Huazhu Group, Ltd.*ADR (Hotels, Restaurants & Leisure) | | | 1,909 | | | | 71,282 | |
| ICICI Bank, Ltd.ADR (Banks) | | | 33,332 | | | | 659,640 | |
| Infosys Technologies, Ltd.ADR (IT Services) | | | 43,453 | | | | 1,099,796 | |
| Itau Unibanco Holding S.A.ADR (Banks) | | | 62,913 | | | | 235,923 | |
| JD.com, Inc.*ADR (Internet & Direct Marketing Retail) | | | 11,156 | | | | 781,701 | |
| KB Financial Group, Inc.ADR (Banks) | | | 5,074 | | | | 234,217 | |
| KE Holdings, Inc.*ADR (Real Estate Management & Development) | | | 6,513 | | | | 131,042 | |
| Natura & Co. Holding SA* ADR (Personal Products) | | | 5,461 | | | | 50,623 | |
| NetEase, Inc.ADR (Entertainment) | | | 4,845 | | | | 493,125 | |
| NIO, Inc.*ADR (Automobiles) | | | 17,679 | | | | 560,071 | |
| PetroChina Co., Ltd.ADR (Oil, Gas & Consumable Fuels) | | | 2,739 | | | | 121,091 | |
| Petroleo Brasileiro S.A.ADR (Oil, Gas & Consumable Fuels) | | | 24,156 | | | | 265,233 | |
| Pinduoduo, Inc.*ADR (Internet & Direct Marketing Retail) | | | 5,695 | | | | 332,019 | |
| POSCOADR (Metals & Mining) | | | 3,939 | | | | 229,604 | |
| PT Telekomunikasi Indonesia TbkADR (Diversified Telecommunication Services) | | | 6,173 | | | | 178,955 | |
| Sasol, Ltd.*ADR (Chemicals) | | | 7,514 | | | | 123,230 | |
| Shinhan Financial Group Co., Ltd.ADR (Banks) | | | 6,707 | | | | 207,313 | |
| Sibanye Stillwater, Ltd.ADR (Metals & Mining) | | | 8,660 | | | | 108,596 | |
| SK Telecom Co., Ltd.ADR (Wireless Telecommunication Services) | | | 2,505 | | | | 66,808 | |
| Sociedad Quimica y Minera de Chile SAADR (Chemicals) | | | 1,854 | | | | 93,497 | |
| Suzano Papel e Celulose S.A.*ADR (Paper & Forest Products) | | | 10,250 | | | | 110,700 | |
| Taiwan Semiconductor Manufacturing Co., Ltd.ADR (Semiconductors & Semiconductor Equipment) | | | 31,869 | | | | 3,834,159 | |
| Tata Motors, Ltd.*ADR (Automobiles) | | | 4,569 | | | | 146,619 | |
| Trip.com Group, Ltd.*ADR (Internet & Direct Marketing Retail) | | | 5,994 | | | | 147,572 | |
| United Microelectronics Corp.ADR (Semiconductors & Semiconductor Equipment) | | | 30,000 | | | | 351,000 | |
| Vale S.A.ADR (Metals & Mining) | | | 53,514 | | | | 750,267 | |
| Wipro, Ltd.ADR (IT Services) | | | 19,212 | | | | 187,509 | |
| Zai Lab, Ltd.*ADR (Biotechnology) | | | 989 | | | | 62,159 | |
| ZTO Express Cayman, Inc.ADR (Air Freight & Logistics) | | | 5,731 | | | | 161,729 | |
TOTAL COMMON STOCKS
(Cost $10,775,461) | | | | | | | 18,570,279 | |
| | | | | | | | | |
| Preferred Stock (1.5%) | | | | | | | | |
| Petroleo Brasileiro S.A.ADR (Oil, Gas & Consumable Fuels) | | | 29,820 | | | | 301,480 | |
TOTAL PREFERRED STOCK
(Cost $32,646) | | | | | | | 301,480 | |
Repurchase Agreements(b)(c) (3.6%)
| | | Principal
Amount | | | Value | |
| Repurchase Agreements with various counterparties, 0.00%, dated 12/31/21, due 1/3/22, total to be received $711,000 | | $ | 711,000 | | | $ | 711,000 | |
TOTAL REPURCHASE AGREEMENTS
(Cost $711,000) | | | | | | | 711,000 | |
Collateral for Securities Loaned(d)(NM)
| | | Shares | | | Value | |
| BlackRock Liquidity Funds FedFund Portfolio – Institutional Shares, 0.03%(e) | | | 1,800 | | | $ | 1,800 | |
TOTAL COLLATERAL FOR SECURITIES LOANED
(Cost $1,800) | | | | | | | 1,800 | |
TOTAL INVESTMENT SECURITIES
(Cost $11,520,907) — 99.4% | | | | | | | 19,584,559 | |
| Net other assets (liabilities) — 0.6% | | | | | | | 117,646 | |
| NET ASSETS — 100.0% | | | | | | $ | 19,702,205 | |
| NM | Not meaningful, amount is less than 0.05%. |
| * | Non-income producing security. |
| (a) | All or part of this security was on loan as of December 31, 2021. The total value of securities on loan as of December 31, 2021 was $1,646. |
| (b) | A portion of these securities were held in a segregated account for the benefit of swap counterparties in the event of default. At December 31, 2021, the aggregate amount held in a segregated account was $267,000. |
| (c) | The ProFund VP invests in Repurchase Agreements jointly with other funds in the Trust. See "Repurchase Agreements" under Note 2 in the Notes to Financial Statements to view the details of each individual agreement and counterparty as well as a description of the securities subject to repurchase. |
| (d) | Securities were purchased with cash collateral held from securities on loan at December 31, 2021. |
| (e) | Rate periodically changes. Rate disclosed is the daily yield on December 31, 2021. |
| ADR | American Depositary Receipt |
See accompanying notes to financial statements.
72 :: ProFund VP Emerging Markets :: Financial Statements
Total Return Swap Agreements—Long
| Underlying Instrument | | Counterparty | | Termination
Date(1) | | | Rate Paid
(Received)(2) | | | Notional
Amount | | | Value and
Unrealized
Appreciation/
(Depreciation) | |
| S&P/BNY Mellon Emerging 50 ADR Index (USD) | | Goldman Sachs International | | | 1/27/22 | | | | 0.68 | % | | $ | 233,497 | | | $ | 728 | |
| S&P/BNY Mellon Emerging 50 ADR Index (USD) | | UBS AG | | | 1/27/22 | | | | 0.58 | % | | | 564,176 | | | | 3,667 | |
| | | | | | | | | | | | | $ | 797,673 | | | $ | 4,395 | |
| (1) | Agreements may be terminated at will by either party without penalty. Payment is due at termination/maturity. |
| (2) | Reflects the floating financing rate, as of December 31, 2021, on the notional amount of the swap agreement paid to the counterparty or received from the counterparty, excluding any commissions. This amount is included as part of the unrealized appreciation/(depreciation). |
ProFund VP Emerging Markets invested in the following industries as of December 31, 2021:
| | | Value | | | % of
Net Assets | |
| Air Freight & Logistics | | $ | 161,729 | | | | 0.8 | % |
| Automobiles | | | 706,690 | | | | 3.5 | % |
| Banks | | | 2,608,523 | | | | 13.3 | % |
| Beverages | | | 345,562 | | | | 1.7 | % |
| Biotechnology | | | 246,120 | | | | 1.2 | % |
| Chemicals | | | 216,727 | | | | 1.1 | % |
| Construction Materials | | | 133,247 | | | | 0.7 | % |
| Diversified Telecommunication Services | | | 387,261 | | | | 2.0 | % |
| Entertainment | | | 624,019 | | | | 3.2 | % |
| Hotels, Restaurants & Leisure | | | 71,282 | | | | 0.4 | % |
| Insurance | | | 159,020 | | | | 0.8 | % |
| Interactive Media & Services | | | 547,845 | | | | 2.8 | % |
| Internet & Direct Marketing Retail | | | 3,861,962 | | | | 19.7 | % |
| IT Services | | | 1,357,243 | | | | 6.9 | % |
| Media | | | 61,561 | | | | 0.3 | % |
| Metals & Mining | | | 1,402,022 | | | | 7.1 | % |
| Oil, Gas & Consumable Fuels | | | 841,845 | | | | 4.2 | % |
| Paper & Forest Products | | | 110,700 | | | | 0.6 | % |
| Personal Products | | | 50,623 | | | | 0.3 | % |
| Pharmaceuticals | | | 103,152 | | | | 0.5 | % |
| Real Estate Management & Development | | | 131,042 | | | | 0.7 | % |
| Semiconductors & Semiconductor Equipment | | | 4,358,479 | | | | 22.1 | % |
| Wireless Telecommunication Services | | | 385,105 | | | | 1.9 | % |
| Other** | | | 830,446 | | | | 4.2 | % |
| Total | | $ | 19,702,205 | | | | 100.0 | % |
ProFund VP Emerging Markets invested in securities with exposure to the following countries as of December 31, 2021:
| | | Value | | | % of
Net Assets | |
| Brazil | | $ | 2,162,934 | | | | 10.9 | % |
| Chile | | | 93,497 | | | | 0.5 | % |
| China | | | 6,774,968 | | | | 34.5 | % |
| India | | | 3,252,867 | | | | 16.5 | % |
| Indonesia | | | 178,955 | | | | 0.9 | % |
| Mexico | | | 698,443 | | | | 3.5 | % |
| South Africa | | | 472,176 | | | | 2.4 | % |
| South Korea | | | 671,134 | | | | 3.4 | % |
| Taiwan | | | 4,566,785 | | | | 23.2 | % |
| Other** | | | 830,446 | | | | 4.2 | % |
| Total | | $ | 19,702,205 | | | | 100.0 | % |
| ** | Includes any non-equity securities and net other assets (liabilities), which includes any receivable for capital shares issued and payable for capital shares redeemed. |
See accompanying notes to financial statements.
Financial Statements :: ProFund VP Emerging Markets :: 73
Statement of Assets and Liabilities
December 31, 2021
| ASSETS: | | | | |
| Total Investment Securities, at cost | | $ | 11,520,907 | |
| Securities, at value(a) | | | 18,873,559 | |
| Repurchase agreements, at value | | | 711,000 | |
| Total Investment Securities, at value | | | 19,584,559 | |
| Dividends receivable | | | 44,163 | |
| Unrealized appreciation on swap agreements | | | 4,395 | |
| Receivable for capital shares issued | | | 192,714 | |
| Prepaid expenses | | | 1,172 | |
| TOTAL ASSETS | | | 19,827,003 | |
| | | | | |
| LIABILITIES: | | | | |
| Cash overdraft | | | 2,013 | |
| Payable for collateral for securities loaned | | | 1,800 | |
| Payable for capital shares redeemed | | | 63,999 | |
| Advisory fees payable | | | 12,292 | |
| Management services fees payable | | | 1,639 | |
| Administration fees payable | | | 1,170 | |
| Administrative services fees payable | | | 12,607 | |
| Distribution fees payable | | | 13,190 | |
| Transfer agency fees payable | | | 1,976 | |
| Fund accounting fees payable | | | 661 | |
| Compliance services fees payable | | | 91 | |
| Other accrued expenses | | | 13,360 | |
| TOTAL LIABILITIES | | | 124,798 | |
| NET ASSETS | | $ | 19,702,205 | |
| | | | | |
| NET ASSETS CONSIST OF: | | | | |
| Capital | | $ | 19,892,863 | |
| Total distributable earnings (loss) | | | (190,658 | ) |
| NET ASSETS | | $ | 19,702,205 | |
| Shares of Beneficial Interest Outstanding (unlimited number of shares authorized, no par value) | | | 655,856 | |
| Net Asset Value (offering and redemption price per share) | | $ | 30.04 | |
| | | | |
| (a) Includes securities on loan valued at: | | $ | 1,646 | |
Statement of Operations
For the Year Ended December 31, 2021
| INVESTMENT INCOME: | | | | |
| Dividends | | $ | 583,497 | |
| Interest | | | 53 | |
| Foreign tax withholding | | | (41,787 | ) |
| Net income from securities lending | | | 1,856 | |
| TOTAL INVESTMENT INCOME | | | 543,619 | |
| | | | | |
| EXPENSES: | | | | |
| Advisory fees | | | 193,205 | |
| Management services fees | | | 25,760 | |
| Administration fees | | | 19,936 | |
| Transfer agency fees | | | 15,983 | |
| Administrative services fees | | | 60,934 | |
| Distribution fees | | | 64,402 | |
| Custody fees | | | 14,007 | |
| Fund accounting fees | | | 10,907 | |
| Trustee fees | | | 422 | |
| Compliance services fees | | | 168 | |
| Other fees | | | 23,089 | |
| Recoupment of prior expenses reduced by the Advisor | | | 6,479 | |
| Total Gross Expenses before reductions | | | 435,292 | |
| Expenses reduced and reimbursed by the Advisor | | | (2,513 | ) |
| TOTAL NET EXPENSES | | | 432,779 | |
| NET INVESTMENT INCOME (LOSS) | | | 110,840 | |
| REALIZED AND UNREALIZED GAINS (LOSSES) ON INVESTMENTS: | | | | |
| Net realized gains (losses) on investment securities | | | (417,916 | ) |
| Net realized gains (losses) on swap agreements | | | (195,067 | ) |
| Change in net unrealized appreciation/depreciation on investment securities | | | (4,821,741 | ) |
| Change in net unrealized appreciation/depreciation on swap agreements | | | (4,709 | ) |
| NET REALIZED AND UNREALIZED GAINS (LOSSES) ON INVESTMENTS | | | (5,439,433 | ) |
| CHANGE IN NET ASSETS RESULTING FROM OPERATIONS | | $ | (5,328,593 | ) |
See accompanying notes to financial statements.
74 :: ProFund VP Emerging Markets :: Financial Statements
Statements of Changes in Net Assets
| | | Year Ended
December 31, 2021 | | | Year Ended
December 31, 2020 | |
| FROM INVESTMENT ACTIVITIES: | | | | | | | | |
| | | | | | | | | |
| OPERATIONS: | | | | | | | | |
| Net investment income (loss) | | $ | 110,840 | | | $ | (57,370 | ) |
| Net realized gains (losses) on investments | | | (612,983 | ) | | | (391,936 | ) |
| Change in net unrealized appreciation/depreciation on investments | | | (4,826,450 | ) | | | 4,645,377 | |
| Change in net assets resulting from operations | | | (5,328,593 | ) | | | 4,196,071 | |
| | | | | | | | | |
| DISTRIBUTIONS TO SHAREHOLDERS: | | | | | | | | |
| Total distributions | | | — | | | | (117,347 | ) |
| Change in net assets resulting from distributions | | | — | | | | (117,347 | ) |
| | | | | | | | | |
| CAPITAL TRANSACTIONS: | | | | | | | | |
| Proceeds from shares issued | | | 31,922,131 | | | | 35,488,770 | |
| Distributions reinvested | | | — | | | | 117,347 | |
| Value of shares redeemed | | | (33,400,828 | ) | | | (39,127,017 | ) |
| Change in net assets resulting from capital transactions | | | (1,478,697 | ) | | | (3,520,900 | ) |
| Change in net assets | | | (6,807,290 | ) | | | 557,824 | |
| | | | | | | | | |
| NET ASSETS: | | | | | | | | |
| Beginning of period | | | 26,509,495 | | | | 25,951,671 | |
| End of period | | $ | 19,702,205 | | | $ | 26,509,495 | |
| | | | | | | | | |
| SHARE TRANSACTIONS: | | | | | | | | |
| Issued | | | 863,608 | | | | 1,201,057 | |
| Reinvested | | | �� | | | | 3,737 | |
| Redeemed | | | (931,355 | ) | | | (1,373,518 | ) |
| Change in shares | | | (67,747 | ) | | | (168,724 | ) |
See accompanying notes to financial statements.
Financial Highlights :: ProFund VP Emerging Markets :: 75
ProFunds Financial Highlights FOR THE PERIODS INDICATED
Selected data for a share of beneficial interest outstanding throughout the periods indicated.
| | | Year Ended
Dec. 31, 2021 | | | Year Ended
Dec. 31, 2020 | | | Year Ended
Dec. 31, 2019 | | | Year Ended
Dec. 31, 2018 | | | Year Ended
Dec. 31, 2017 | |
| Net Asset Value, Beginning of Period | | $ | 36.64 | | | $ | 29.08 | | | $ | 23.54 | | | $ | 27.85 | | | $ | 20.91 | |
| | | | | | | | | | | | | | | | | | | | | |
| Investment Activities: | | | | | | | | | | | | | | | | | | | | |
| Net investment income (loss)(a) | | | 0.15 | | | | (0.08 | ) | | | 0.15 | | | | 0.09 | | | | 0.06 | |
| Net realized and unrealized gains (losses) on investments | | | (6.75 | ) | | | 7.82 | | | | 5.53 | | | | (4.33 | ) | | | 6.89 | |
| Total income (loss) from investment activities | | | (6.60 | ) | | | 7.74 | | | | 5.68 | | | | (4.24 | ) | | | 6.95 | |
| | | | | | | | | | | | | | | | | | | | | |
| Distributions to Shareholders From: | | | | | | | | | | | | | | | | | | | | |
| Net investment income | | | — | | | | (0.18 | ) | | | (0.14 | ) | | | (0.07 | ) | | | (0.01 | ) |
| | | | | | | | | | | | | | | | | | | | | |
| Net Asset Value, End of Period | | $ | 30.04 | | | $ | 36.64 | | | $ | 29.08 | | | $ | 23.54 | | | $ | 27.85 | |
| | | | | | | | | | | | | | | | | | | | | |
| Total Return | | | (18.01 | )% | | | 26.72 | %(b) | | | 24.23 | %(c) | | | (15.27 | )% | | | 33.26 | % |
| | | | | | | | | | | | | | | | | | | | | |
| Ratios to Average Net Assets: | | | | | | | | | | | | | | | | | | | | |
| Gross expenses | | | 1.69 | % | | | 1.74 | % | | | 1.74 | % | | | 1.74 | % | | | 1.70 | % |
| Net expenses | | | 1.68 | % | | | 1.68 | % | | | 1.68 | % | | | 1.68 | % | | | 1.68 | % |
| Net investment income (loss) | | | 0.43 | % | | | (0.29 | )% | | | 0.58 | % | | | 0.34 | % | | | 0.21 | % |
| | | | | | | | | | | | | | | | | | | | | |
| Supplemental Data: | | | | | | | | | | | | | | | | | | | | |
| Net assets, end of period (000's) | | $ | 19,702 | | | $ | 26,509 | | | $ | 25,952 | | | $ | 17,065 | | | $ | 34,450 | |
| Portfolio turnover rate(d) | | | 60 | % | | | 108 | % | | | 83 | % | | | 21 | % | | | 54 | % |
| (a) | Per share net investment income (loss) has been calculated using the average daily shares method. |
| (b) | During the year ended December 31, 2020, the Fund received monies related to certain nonrecurring litigation settlements. The corresponding impact to the total return was an increase of 0.20%. |
| (c) | During the year ended December 31, 2019, the Fund received monies related to certain nonrecurring litigation settlements. The corresponding impact to the total return was an increase of 0.69%. |
| (d) | Portfolio turnover rate is calculated without regard to instruments having a maturity of less than one year from acquisition or derivative instruments (including swap agreements and futures contracts). The portfolio turnover rate can be high and volatile due to the amount and timing of sales and purchases of fund shares during the period. |
See accompanying notes to financial statements.
76 :: ProFund VP Europe 30 :: Management Discussion of Fund Performance
ProFund VP Europe 30 (the "Fund") seeks investment results, before fees and expenses, that correspond to the performance of the ProFunds Europe 30 Index® (the "Index"). For the year ended December 31, 2021, the Fund had a total return of 24.53%. For the same period, the Index had a price return of 23.69%1 and a volatility of 15.48%. For the year, the Fund achieved an average daily statistical correlation of over 0.99 to the daily performance of the Index.2
The Fund takes positions in financial instruments that, in combination, should have similar return characteristics as the return of the Index. The Index, created by ProFund Advisors, is composed of companies whose principal offices are located in Europe and whose securities are traded on U.S. exchanges or on Nasdaq as depositary receipts or ordinary shares and meet certain liquidity requirements. The component companies included in the Index are the 30 most liquid companies based upon their U.S. dollar-traded volume. Their relative weights are determined using a modified market capitalization method. The Index is reconstituted annually. The Index is expressed in U.S. dollar terms and as such should generally reflect the relative movement of the U.S. dollar against the basket of foreign currencies represented by the constituent companies in the Index.
Value of a $10,000 Investment at Net Asset Value*

| * | The line graph represents the historical performance of a hypothetical investment of $10,000 in the ProFund VP Europe 30 from December 31, 2011 to December 31, 2021, assuming the reinvestment of distributions. |
Average Annual Total Return as of 12/31/21
| Fund | | One Year | | | Five Year | | | Ten Year | |
| ProFund VP Europe 30 | | | 24.53 | % | | | 6.48 | % | | | 5.47 | % |
| ProFunds Europe 30 Index® | | | 23.69 | % | | | 5.12 | % | | | 3.76 | % |
| STOXX Europe 50® Index | | | 17.16 | % | | | 9.69 | % | | | 6.87 | % |
Expense Ratios**
| Fund | | Gross | | | Net | | | | |
| ProFund VP Europe 30 | | | 1.77 | % | | | 1.68 | % | | | | |
| ** | Reflects the expense ratio as reported in the Prospectus dated May 1, 2021. Contractual fee waivers are in effect through April 30, 2022. See Financial Highlights for effective expense ratios. |
Allocation of Portfolio Holdings & Index Composition
Market Exposure
| Investment Type | | % of Net Assets | |
| Equity Securities | | | 100 | % |
| Total Exposure | | | 100 | % |
"Market Exposure" includes the value of total investments (including the contract value of any derivatives) and excludes any instruments used for cash management or collateral for securities loaned.
Largest Equity Holdings
| Company | | % of Net Assets | |
| ASML Holding N.V. | | | 6.3 | % |
| SAP SE | | | 5.2 | % |
| Royal Dutch Shell PLC | | | 5.1 | % |
| AstraZeneca PLC | | | 4.5 | % |
| Diageo PLC | | | 4.4 | % |
ProFunds Europe 30® Index – Composition
| Industry Breakdown | | % of Index | |
| Health Care | | | 20 | % |
| Information Technology | | | 19 | % |
| Energy | | | 19 | % |
| Consumer Staples | | | 14 | % |
| Financials | | | 10 | % |
| Materials | | | 9 | % |
| Consumer Discretionary | | | 4 | % |
| Communication Services | | | 3 | % |
| Industrials | | | 2 | % |
| Country Composition | | |
| United Kingdom | | | 36 | % |
| Netherlands | | | 19 | % |
| France | | | 9 | % |
| Germany | | | 7 | % |
| Luxembourg | | | 7 | % |
| Other | | | 22 | % |
Past performance does not guarantee future results. Return calculations assume the reinvestment of distributions and do not reflect taxes that a shareholder would pay on Fund distributions or on the redemption of Fund shares. The performance data quoted represents past performance and current returns may be lower or higher. The investment return and net asset value ("NAV") will fluctuate so that an investor's shares, when redeemed, may be worth more or less than the original cost. The performance above reflects any fee reductions during the applicable periods. If such fee reductions had not occurred, the quoted performance would be lower. Performance numbers are net of all Fund fees and expenses but do not include any insurance, sales, or administrative charges of variable annuity or life insurance contracts. If these charges were included, the returns would be lower. To obtain performance current to the most recent month-end, please call toll-free 888-776-3637.
| 1 | The graph and table DO NOT reflect the theoretical reinvestment of dividends on securities in the Index nor the impact of transaction costs and the deduction of fees and expenses associated with a mutual fund, such as investment management and accounting fees. The Fund's performance reflects the reinvestment of dividends as well as the impact of transaction costs and the deduction of fees and expenses. It is not possible to invest directly in an index. |
| 2 | 1.00 equals perfect correlation. This calculation is based on the daily total return of the Index and the performance of the daily total return of the NAV per share of the Fund. |
| 3 | The STOXX Europe 50® Index is a capitalization-weighted index of 50 European blue-chip stocks. The graph and table reflect the theoretical reinvestment of dividends in the Index. The impact of transaction costs and the deduction of fees and expenses associated with a mutual fund, such as investment management and accounting fees, are not reflected in the Index calculations. It is not possible to invest directly in an index. |
The above information is not covered by the Report of the Independent Registered Public Accounting Firm.
Financial Statements :: ProFund VP Europe 30 :: 77
Schedule of Portfolio Investments :: December 31, 2021
Common Stocks (99.8%)
| | | Shares | | | Value | |
| Anheuser-Busch InBev N.V.ADR (Beverages) | | | 12,318 | | | $ | 745,855 | |
| ArcelorMittal SANYS—Class A (Metals & Mining) | | | 13,301 | | | | 423,370 | |
| Argenx SE*ADR (Biotechnology) | | | 1,105 | | | | 386,960 | |
| ASML Holding N.V.NYS (Semiconductors & Semiconductor Equipment) | | | 1,386 | | | | 1,103,451 | |
| AstraZeneca PLCADR (Pharmaceuticals) | | | 13,441 | | | | 782,937 | |
| Barclays PLCADR (Banks) | | | 47,150 | | | | 488,002 | |
| BP PLCADR (Oil, Gas & Consumable Fuels) | | | 23,566 | | | | 627,563 | |
| British American Tobacco PLCADR (Tobacco) | | | 16,319 | | | | 610,494 | |
| Diageo PLCADR (Beverages) | | | 3,492 | | | | 768,729 | |
| Endava PLC*ADR (IT Services) | | | 2,281 | | | | 383,026 | |
| Equinor ASAADR(a) (Oil, Gas & Consumable Fuels) | | | 23,145 | | | | 609,408 | |
| GlaxoSmithKline PLCADR (Pharmaceuticals) | | | 15,968 | | | | 704,189 | |
| HSBC Holdings PLCADR (Banks) | | | 24,724 | | | | 745,428 | |
| ING Groep N.V.ADR (Banks) | | | 36,972 | | | | 514,650 | |
| Jumia Technologies AG*ADR (Internet & Direct Marketing Retail) | | | 27,111 | | | | 309,065 | |
| Just Eat Takeaway.com NV*ADR(a) (Internet & Direct Marketing Retail) | | | 34,340 | | | | 369,498 | |
| Nokia Corp.*ADR (Communications Equipment) | | | 72,716 | | | | 452,294 | |
| NOVO Nordisk A/SADR (Pharmaceuticals) | | | 6,843 | | | | 766,416 | |
| Oatly Group AB*ADR (Consumer Staple Products) | | | 42,886 | | | | 341,373 | |
| Orphazyme A/S*ADR(a) (Health Care) | | | 109,548 | | | | 264,011 | |
| Rio Tinto PLCADR (Metals & Mining) | | | 10,581 | | | | 708,292 | |
| Royal Dutch Shell PLCADR—Class A (Oil, Gas & Consumable Fuels) | | | 20,688 | | | | 897,859 | |
| Ryanair Holdings PLC*ADR (Airlines) | | | 3,896 | | | | 398,678 | |
| SanofiADR (Pharmaceuticals) | | | 14,477 | | | | 725,298 | |
| SAP SEADR (Software) | | | 6,545 | | | | 917,020 | |
| Telefonaktiebolaget LM EricssonADR(Communications Equipment) | | | 41,500 | | | | 451,105 | |
| Tenaris S.A.ADR (Energy Equipment & Services) | | | 17,688 | | | | 368,972 | |
| Ternium S.A.ADR (Metals & Mining) | | | 8,388 | | | | 365,046 | |
| TOTAL S.A.ADR (Oil, Gas & Consumable Fuels) | | | 15,512 | | | | 767,223 | |
| Vodafone Group PLCADR (Wireless Telecommunication Services) | | | 30,497 | | | | 455,320 | |
TOTAL COMMON STOCKS
(Cost $11,343,547) | | | | | | | 17,451,532 | |
Repurchase Agreements(b) (4.7%)
| | | Principal
Amount | | | Value | |
| Repurchase Agreements with various counterparties, 0.00%, dated 12/31/21, due 1/3/22, total to be received $817,000 | | $ | 817,000 | | | $ | 817,000 | |
TOTAL REPURCHASE AGREEMENTS
(Cost $817,000) | | | | | | | 817,000 | |
| | | | | | | | | |
Collateral for Securities Loaned(c) (5.0%)
| | | Shares | | | Value | |
| BlackRock Liquidity Funds FedFund Portfolio – Institutional Shares, 0.03%(d) | | | 876,916 | | | $ | 876,916 | |
TOTAL COLLATERAL FOR SECURITIES LOANED
(Cost $876,916) | | | | | | | 876,916 | |
TOTAL INVESTMENT SECURITIES
(Cost $13,037,463)—109.5% | | | | | | | 19,145,448 | |
| Net other assets (liabilities)—(9.5)% | | | | | | | (1,656,575 | ) |
| NET ASSETS—100.0% | | | | | | $ | 17,488,873 | |
| * | Non-income producing security. |
| (a) | All or part of this security was on loan as of December 31, 2021. The total value of securities on loan as of December 31, 2021 was $810,059. |
| (b) | The ProFund VP invests in Repurchase Agreements jointly with other funds in the Trust. See "Repurchase Agreements" under Note 2 in the Notes to Financial Statements to view the details of each individual agreement and counterparty as well as a description of the securities subject to repurchase. |
| (c) | Securities were purchased with cash collateral held from securities on loan at December 31, 2021. |
| (d) | Rate periodically changes. Rate disclosed is the daily yield on December 31, 2021. |
| ADR | American Depositary Receipt |
ProFund VP Europe 30 invested in the following industries as of December 31, 2021:
| | | Value | | | % of
Net Assets | |
| Airlines | | $ | 398,678 | | | | 2.3 | % |
| Banks | | | 1,748,080 | | | | 10.0 | % |
| Beverages | | | 1,514,584 | | | | 8.7 | % |
| Biotechnology | | | 386,960 | | | | 2.2 | % |
| Communications Equipment | | | 903,399 | | | | 5.1 | % |
| Consumer Staple Products | | | 341,373 | | | | 2.0 | % |
| Energy Equipment & Services | | | 368,972 | | | | 2.1 | % |
| Health Care | | | 264,011 | | | | 1.5 | % |
| Internet & Direct Marketing Retail | | | 678,563 | | | | 3.9 | % |
| IT Services | | | 383,026 | | | | 2.2 | % |
| Metals & Mining | | | 1,496,708 | | | | 8.5 | % |
| Oil, Gas & Consumable Fuels | | | 2,902,053 | | | | 16.6 | % |
| Pharmaceuticals | | | 2,978,840 | | | | 17.0 | % |
| Semiconductors & Semiconductor Equipment | | | 1,103,451 | | | | 6.4 | % |
| Software | | | 917,020 | | | | 5.2 | % |
| Tobacco | | | 610,494 | | | | 3.5 | % |
| Wireless Telecommunication Services | | | 455,320 | | | | 2.6 | % |
| Other** | | | 37,341 | | | | 0.2 | % |
| Total | | $ | 17,488,873 | | | | 100.0 | % |
See accompanying notes to financial statements.
78 :: ProFund VP Europe 30 :: Financial Statements
ProFund VP Europe 30 invested in securities with exposure to the following countries as of December 31, 2021:
| | | Value | | | % of
Net Assets | |
| Belgium | | $ | 745,855 | | | | 4.3 | % |
| Denmark | | | 1,030,427 | | | | 5.9 | % |
| Finland | | | 452,294 | | | | 2.6 | % |
| France | | | 1,492,521 | | | | 8.5 | % |
| Germany | | | 1,226,085 | | | | 7.0 | % |
| Ireland | | | 398,678 | | | | 2.3 | % |
| Luxembourg | | | 1,157,388 | | | | 6.6 | % |
| Netherlands | | | 3,272,418 | | | | 18.7 | % |
| Norway | | | 609,408 | | | | 3.5 | % |
| Sweden | | | 792,478 | | | | 4.5 | % |
| United Kingdom | | | 6,273,980 | | | | 35.9 | % |
| Other** | | | 37,341 | | | | 0.2 | % |
| Total | | $ | 17,488,873 | | | | 100.0 | % |
| ** | Includes any non-equity securities and net other assets (liabilities), which includes any receivable for capital shares issued and payable for capital shares redeemed. |
See accompanying notes to financial statements.
Financial Statements :: ProFund VP Europe 30 :: 79
Statement of Assets and Liabilities
December 31, 2021
| ASSETS: |
| Total Investment Securities, at cost | | $ | 13,037,463 | |
| Securities, at value(a) | | | 18,328,448 | |
| Repurchase agreements, at value | | | 817,000 | |
| Total Investment Securities, at value | | | 19,145,448 | |
| Cash | | | 2,740 | |
| Dividends receivable | | | 47,421 | |
| Receivable for capital shares issued | | | 205,110 | |
| Receivable for tax reclaims | | | 21,382 | |
| Prepaid expenses | | | 100 | |
| TOTAL ASSETS | | | 19,422,201 | |
| | | | | |
| LIABILITIES: | | | | |
| Payable for collateral for securities loaned | | | 876,916 | |
| Payable for capital shares redeemed | | | 43,956 | |
| Payable for investments purchased | | | 968,321 | |
| Advisory fees payable | | | 13,181 | |
| Management services fees payable | | | 1,757 | |
| Administration fees payable | | | 995 | |
| Administrative services fees payable | | | 6,920 | |
| Distribution fees payable | | | 8,560 | |
| Transfer agency fees payable | | | 1,719 | |
| Fund accounting fees payable | | | 558 | |
| Compliance services fees payable | | | 84 | |
| Other accrued expenses | | | 10,361 | |
| TOTAL LIABILITIES | | | 1,933,328 | |
| NET ASSETS | | $ | 17,488,873 | |
| NET ASSETS CONSIST OF: | | | | |
| Capital | | $ | 14,847,327 | |
| Total distributable earnings (loss) | | | 2,641,546 | |
| NET ASSETS | | $ | 17,488,873 | |
| Shares of Beneficial Interest Outstanding (unlimited number of shares authorized, no par value) | | | 682,569 | |
| Net Asset Value (offering and redemption price per share) | | $ | 25.62 | |
| | | | |
| (a) Includes securities on loan valued at | | $ | 810,059 | |
Statement of Operations
For the Year Ended December 31, 2021
| INVESTMENT INCOME: | | | | |
| Dividends | | $ | 587,232 | |
| Foreign tax withholding | | | (34,013 | ) |
| Net income from securities lending | | | 3,251 | |
| TOTAL INVESTMENT INCOME | | | 556,470 | |
| | | | | |
| EXPENSES: | | | | |
| Advisory fees | | | 140,179 | |
| Management services fees | | | 18,690 | |
| Administration fees | | | 13,939 | |
| Transfer agency fees | | | 11,376 | |
| Administrative services fees | | | 45,223 | |
| Distribution fees | | | 46,726 | |
| Custody fees | | | 13,192 | |
| Fund accounting fees | | | 7,722 | |
| Trustee fees | | | 298 | |
| Compliance services fees | | | 137 | |
| Other fees | | | 15,504 | |
| Recoupment of prior expenses reduced by the Advisor | | | 3,000 | |
| Total Gross Expenses before reductions | | | 315,986 | |
| Expenses reduced and reimbursed by the Advisor | | | (1,985 | ) |
| TOTAL NET EXPENSES | | | 314,001 | |
| NET INVESTMENT INCOME (LOSS) | | | 242,469 | |
| | | | | |
| REALIZED AND UNREALIZED GAINS (LOSSES) ON INVESTMENTS: | | | | |
| Net realized gains (losses) on investment securities | | | 1,582,954 | |
| Change in net unrealized appreciation/depreciation on investment securities | | | 1,803,942 | |
| NET REALIZED AND UNREALIZED GAINS (LOSSES) ON INVESTMENTS | | | 3,386,896 | |
| CHANGE IN NET ASSETS RESULTING FROM OPERATIONS | | $ | 3,629,365 | |
See accompanying notes to financial statements.
80 :: ProFund VP Europe 30 :: Financial Statements
Statements of Changes in Net Assets
| | | Year Ended
December 31, 2021 | | | Year Ended
December 31, 2020 | |
| FROM INVESTMENT ACTIVITIES: |
| |
| OPERATIONS: |
| Net investment income (loss) | | $ | 242,469 | | | $ | 163,002 | |
| Net realized gains (losses) on investments | | | 1,582,954 | | | | 249,041 | |
| Change in net unrealized appreciation/depreciation on investments | | | 1,803,942 | | | | (2,367,248 | ) |
| Change in net assets resulting from operations | | | 3,629,365 | | | | (1,955,205 | ) |
| | | | | | | | | |
| DISTRIBUTIONS TO SHAREHOLDERS: | | | | | | | | |
| Total distributions | | | (163,002 | ) | | | (395,173 | ) |
| Change in net assets resulting from distributions | | | (163,002 | ) | | | (395,173 | ) |
| | | | | | | | | |
| CAPITAL TRANSACTIONS: | | | | | | | | |
| Proceeds from shares issued | | | 30,171,919 | | | | 11,365,686 | |
| Distributions reinvested | | | 163,002 | | | | 395,173 | |
| Value of shares redeemed | | | (31,041,897 | ) | | | (14,207,043 | ) |
| Change in net assets resulting from capital transactions | | | (706,976 | ) | | | (2,446,184 | ) |
| Change in net assets | | | 2,759,387 | | | | (4,796,562 | ) |
| | | | | | | | | |
| NET ASSETS: | | | | | | | | |
| Beginning of period | | | 14,729,486 | | | | 19,526,048 | |
| End of period | | $ | 17,488,873 | | | $ | 14,729,486 | |
| | | | | | | | | |
| SHARE TRANSACTIONS: | | | | | | | | |
| Issued | | | 1,231,380 | | | | 581,469 | |
| Reinvested | | | 6,733 | | | | 20,561 | |
| Redeemed | | | (1,265,056 | ) | | | (723,251 | ) |
| Change in shares | | | (26,943 | ) | | | (121,221 | ) |
See accompanying notes to financial statements.
Financial Highlights :: ProFund VP Europe 30 :: 81
ProFunds Financial Highlights FOR THE PERIODS INDICATED
Selected data for a share of beneficial interest outstanding throughout the periods indicated.
| | | Year Ended
Dec. 31, 2021 | | | Year Ended
Dec. 31, 2020 | | | Year Ended
Dec. 31, 2019 | | | Year Ended
Dec. 31, 2018 | | | Year Ended
Dec. 31, 2017 | |
| Net Asset Value, Beginning of Period | | $ | 20.76 | | | $ | 23.50 | | | $ | 20.55 | | | $ | 24.53 | | | $ | 20.84 | |
| | | | | | | | | | | | | | | | | | | | | |
| Investment Activities: | | | | | | | | | | | | | | | | | | | | |
| Net investment income (loss)(a) | | | 0.32 | | | | 0.22 | | | | 0.45 | | | | 0.48 | | | | 0.50 | |
| Net realized and unrealized gains (losses) on investments | | | 4.76 | | | | (2.43 | ) | | | 3.15 | | | | (3.86 | ) | | | 3.60 | |
| Total income (loss) from investment activities | | | 5.08 | | | | (2.21 | ) | | | 3.60 | | | | (3.38 | ) | | | 4.10 | |
| | | | | | | | | | | | | | | | | | | | | |
| Distributions to Shareholders From: | | | | | | | | | | | | | | | | | | | | |
| Net investment income | | | (0.22 | ) | | | (0.53 | ) | | | (0.65 | ) | | | (0.60 | ) | | | (0.41 | ) |
| | | | | | | | | | | | | | | | | | | | | |
| Net Asset Value, End of Period | | $ | 25.62 | | | $ | 20.76 | | | $ | 23.50 | | | $ | 20.55 | | | $ | 24.53 | |
| | | | | | | | | | | | | | | | | | | | | |
| Total Return | | | 24.53 | % | | | (9.23 | )% | | | 17.79 | % | | | (14.13 | )% | | | 19.71 | % |
| | | | | | | | | | | | | | | | | | | | | |
| Ratios to Average Net Assets: | | | | | | | | | | | | | | | | | | | | |
| Gross expenses | | | 1.69 | % | | | 1.77 | % | | | 1.79 | % | | | 1.75 | % | | | 1.74 | % |
| Net expenses | | | 1.68 | % | | | 1.68 | % | | | 1.68 | % | | | 1.68 | % | | | 1.68 | % |
| Net investment income (loss) | | | 1.30 | % | | | 1.10 | % | | | 1.97 | % | | | 1.99 | % | | | 2.14 | % |
| | | | | | | | | | | | | | | | | | | | | |
| Supplemental Data: | | | | | | | | | | | | | | | | | | | | |
| Net assets, end of period (000's) | | $ | 17,489 | | | $ | 14,729 | | | $ | 19,526 | | | $ | 18,331 | | | $ | 32,199 | |
| Portfolio turnover rate(b) | | | 138 | % | | | 63 | % | | | 85 | % | | | 228 | % | | | 181 | % |
| (a) | Per share net investment income (loss) has been calculated using the average daily shares method. |
| (b) | Portfolio turnover rate is calculated without regard to instruments having a maturity of less than one year from acquisition or derivative instruments (including swap agreements and futures contracts). The portfolio turnover rate can be high and volatile due to the amount and timing of sales and purchases of fund shares during the period. |
See accompanying notes to financial statements.
82 :: ProFund VP Falling U.S. Dollar :: Management Discussion of Fund Performance
ProFund VP Falling U.S. Dollar (the "Fund") seeks daily investment results, before fees and expenses, that correspond to the return of the basket of non-U.S. currencies included in the U.S. Dollar Index (the "Index"). The Index measures the performance of the U.S. dollar against a basket of six major world currencies (the "Benchmark"). For the year ended December 31, 2021, the Fund had a total return of -8.03%. For the same period, the Index had a price return of 6.37%1 and a volatility of 5.05%. For the year, the Fund achieved an average daily statistical correlation of over 0.99 to the inverse of the daily performance of the Index.2
The Fund takes positions in financial instruments that, in combination, should have similar daily return characteristics as the daily return of the Benchmark. The currencies and their weightings are: Euro 57%; Japanese yen 14%; British pound 12%; Canadian dollar 9%; Swedish krona 4% and Swiss franc 4%. The Fund is designed to benefit from a decline in the value of the U.S. dollar against the value of the currencies included in the Benchmark. Accordingly, as the value of the U.S. dollar depreciates (i.e., "falls") versus the Benchmark, the performance of the Fund generally should be expected to increase. As the value of the U.S. dollar appreciates versus the Benchmark, the performance of the Fund generally should be expected to decline. The Fund does not normally provide investment returns that match the inverse of the Index.
During the year ended December 31, 2021, the Fund invested in forward currency contracts to gain exposure to the Benchmark. These derivatives generally tracked the performance of their underlying benchmark. The Fund entered into forward currency contracts with counterparties that the Fund's advisor determined to be major, global financial institutions. If a counterparty becomes insolvent or otherwise fails to perform on its obligations, the value of investments in the Fund may decline. The Fund has sought to mitigate this risk by generally requiring counterparties to post collateral for the benefit of the Fund, marked to market daily, in an amount approximately equal to the amount the counterparty owed to the Fund, subject to certain minimum thresholds.
Value of a $10,000 Investment at Net Asset Value*

| * | The line graph represents the historical performance of a hypothetical investment of $10,000 in the ProFund VP Falling U.S. Dollar from December 31, 2011 to December 31, 2021, assuming the reinvestment of distributions. |
Average Annual Total Return as of 12/31/21
| Fund | | One Year | | | Five Year | | | Ten Year | |
| ProFund VP Falling U.S. Dollar | | | -8.03 | % | | | -0.89 | % | | | -3.66 | % |
| U.S. Dollar Index | | | 6.37 | % | | | -1.31 | % | | | 1.78 | % |
| S&P 500® | | | 28.71 | % | | | 18.47 | % | | | 16.55 | % |
Expense Ratios**
| Fund | | Gross | | | Net | | | | | |
| ProFund VP Falling U.S. Dollar | | | 2.87 | % | | | 1.68 | % | | | | |
| ** | Reflects the expense ratio as reported in the Prospectus dated May 1, 2021. Contractual fee waivers are in effect through April 30, 2022. See Financial Highlights for effective expense ratios. |
Allocation of Portfolio Holdings & Index Composition
Market Exposure
| Investment Type | | % of Net Assets | |
| Forward Currency Contracts | | | (101 | )% |
| Total Exposure | | | (101 | )% |
“Market Exposure” includes the value of total investments (including the contract value of any derivatives) and excludes any instruments used for cash management.
Holdings
The ProFund VP Falling U.S. Dollar primarily invests in non-equity securities, which may include: swap agreements, futures contracts, repurchase agreements and U.S. Government securities.
U.S. Dollar Index – Composition
| | | % of Index | |
| Euro | | | 57 | % |
| Japanese yen | | | 14 | % |
| British pound | | | 12 | % |
| Canadian dollar | | | 9 | % |
| Swedish krona | | | 4 | % |
| Swiss franc | | | 4 | % |
Past performance does not guarantee future results. Return calculations assume the reinvestment of distributions and do not reflect taxes that a shareholder would pay on Fund distributions or on the redemption of Fund shares. The performance data quoted represents past performance and current returns may be lower or higher. The investment return and net asset value ("NAV") will fluctuate so that an investor's shares, when redeemed, may be worth more or less than the original cost. The performance above reflects any fee reductions during the applicable periods. If such fee reductions had not occurred, the quoted performance would be lower. Performance numbers are net of all Fund fees and expenses but do not include any insurance, sales, or administrative charges of variable annuity or life insurance contracts. If these charges were included, the returns would be lower. To obtain performance current to the most recent month-end, please call toll-free 888-776-3637.
| 1 | The graph and table DO NOT reflect the theoretical reinvestment of dividends nor the impact of transaction costs and the deduction of fees and expenses associated with a mutual fund, such as investment management and accounting fees. The Fund's performance reflects the reinvestment of dividends as well as the impact of transaction costs and the deduction of fees and expenses. It is not possible to invest directly in an index. |
| 2 | 1.00 equals perfect correlation. This calculation is based on the daily total return of the Index and the performance of the daily total return of the NAV per share of the Fund. |
| 3 | The S&P 500® is an unmanaged index that consists of the common stocks of 500 major U.S. corporations selected for their size and the frequency and ease with which their stocks trade. The graph and table reflect the theoretical reinvestment of dividends on securities in the Index. The impact of transaction costs and the deduction of fees and expenses associated with a mutual fund, such as investment management and accounting fees, are not reflected in the Index calculations. It is not possible to invest directly into an index. |
The above information is not covered by the Report of the Independent Registered Public Accounting Firm.
Financial Statements :: ProFund VP Falling U.S. Dollar :: 83
Schedule of Portfolio Investments :: December 31, 2021
Repurchase Agreements(a)(b) (100.9%)
| | | Principal
Amount | | | Value | |
| Repurchase Agreements with various counterparties, 0.00%, dated 12/31/21, due 1/3/22, total to be received $485,000 | | $ | 485,000 | | | $ | 485,000 | |
TOTAL REPURCHASE AGREEMENTS
(Cost $485,000) | | | | | | | 485,000 | |
TOTAL INVESTMENT SECURITIES
(Cost $485,000)—100.9% | | | | | | | 485,000 | |
| Net other assets (liabilities)—(0.9)% | | | | | | | (4,216 | ) |
| NET ASSETS—100.0% | | | | | | $ | 480,784 | |
| (a) | A portion of these securities were held in a segregated account for the benefit of forward currency contract counterparties in the event of default. At December 31, 2021, the aggregate amount held in a segregated account was $73,000. |
| (b) | The ProFund VP invests in Repurchase Agreements jointly with other funds in the Trust. See "Repurchase Agreements" under Note 2 in the Notes to Financial Statements to view the details of each individual agreement and counterparty as well as a description of the securities subject to repurchase. |
As of December 31, 2021, the ProFund VP Falling U.S. Dollar's forward currency contracts with Goldman Sachs International, were as follows:
Description and amount of
currency purchased | | Description and amount of
currency sold | | Delivery
Date | | Fair
Value | | | Unrealized
Appreciation/
(Depreciation) | |
| Long: | | | | | | | | | | | | | | | | | | | |
| British pound | | $ | 33,771 | | U.S. dollar | | $ | 45,076 | | | 1/14/22 | | $ | 45,700 | | | $ | 624 | |
| Canadian dollar | | | 45,612 | | U.S. dollar | | | 35,811 | | | 1/14/22 | | | 36,063 | | | | 252 | |
| Euro | | | 183,279 | | U.S. dollar | | | 208,282 | | | 1/14/22 | | | 208,704 | | | | 422 | |
| Japanese yen | | | 5,115,296 | | U.S. dollar | | | 45,334 | | | 1/14/22 | | | 44,482 | | | | (852 | ) |
| Swedish krona | | | 128,952 | | U.S. dollar | | | 14,297 | | | 1/14/22 | | | 14,277 | | | | (20 | ) |
| Swiss franc | | | 10,269 | | U.S. dollar | | | 11,208 | | | 1/14/22 | | | 11,278 | | | | 70 | |
| Total Long Contracts | | | | | | | $ | 360,008 | | | | | $ | 360,504 | | | $ | 496 | |
As of December 31, 2021, the ProFund VP Falling U.S. Dollar's forward currency contracts with UBS AG, were as follows:
Description and amount of
currency purchased | | | Description and amount of
currency sold | | Delivery
Date | | Fair
Value | | | Unrealized
Appreciation/
(Depreciation) | |
| Short: | | | | | | | | | | | | | | | | | | | |
| U.S. dollar | | $ | 2,246 | | | British pound | | $ | 1,693 | | 1/14/22 | | $ | 2,291 | | | $ | (45 | ) |
| U.S. dollar | | | 2,003 | | | Canadian dollar | | | 2,571 | | 1/14/22 | | | 2,033 | | | | (30 | ) |
| U.S. dollar | | | 9,335 | | | Euro | | | 8,259 | | 1/14/22 | | | 9,405 | | | | (70 | ) |
| U.S. dollar | | | 2,079 | | | Japanese yen | | | 236,423 | | 1/14/22 | | | 2,056 | | | | 23 | |
| U.S. dollar | | | 946 | | | Swedish krona | | | 8,575 | | 1/14/22 | | | 949 | | | | (3 | ) |
| U.S. dollar | | | 551 | | | Swiss franc | | | 509 | | 1/14/22 | | | 559 | | | | (8 | ) |
| Total Short Contracts | | | | | | | | $ | 17,160 | | | | $ | 17,293 | | | $ | (133 | ) |
| Long: | | | | | | | | | | | | | | | | | | | |
| British pound | | $ | 11,031 | | | U.S. dollar | | $ | 14,687 | | 1/14/22 | | $ | 14,928 | | | $ | 241 | |
| Canadian dollar | | | 12,593 | | | U.S. dollar | | | 9,876 | | 1/14/22 | | | 9,957 | | | | 81 | |
| Euro | | | 70,280 | | | U.S. dollar | | | 79,774 | | 1/14/22 | | | 80,029 | | | | 255 | |
| Japanese yen | | | 2,575,429 | | | U.S. dollar | | | 22,800 | | 1/14/22 | | | 22,396 | | | | (404 | ) |
| Swedish krona | | | 62,170 | | | U.S. dollar | | | 6,867 | | 1/14/22 | | | 6,884 | | | | 17 | |
| Swiss franc | | | 6,168 | | | U.S. dollar | | | 6,727 | | 1/14/22 | | | 6,774 | | | | 47 | |
| Total Long Contracts | | | | | | | | $ | 140,731 | | | | $ | 140,968 | | | $ | 237 | |
| | | | | | | | | Total unrealized appreciation | | | $ | 2,032 | |
| | | | | | | | | Total unrealized (depreciation) | | | | (1,432 | ) |
| | | | | | | | | Total net unrealized appreciation/(depreciation) | | | $ | 600 | |
See accompanying notes to financial statements.
84 :: ProFund VP Falling U.S. Dollar :: Financial Statements
Statement of Assets and Liabilities
December 31, 2021
| ASSETS: | | | | |
| Total Investment Securities, at cost | | $ | 485,000 | |
| Repurchase agreements, at value | | | 485,000 | |
| Total Investment Securities, at value | | | 485,000 | |
| Cash | | | 123 | |
| Segregated cash balances for swap agreements with custodian | | | 345 | |
| Unrealized appreciation on forward foreign currency contracts | | | 2,032 | |
| Prepaid expenses | | | 7 | |
| TOTAL ASSETS | | | 487,507 | |
| | | | | |
| LIABILITIES: | | | | |
| Payable for capital shares redeemed | | | 22 | |
| Unrealized depreciation on forward foreign currency contracts | | | 1,432 | |
| Advisory fees payable | | | 588 | |
| Management services fees payable | | | 78 | |
| Administration fees payable | | | 29 | |
| Administrative services fees payable | | | 297 | |
| Distribution fees payable | | | 319 | |
| Transfer agency fees payable | | | 47 | |
| Fund accounting fees payable | | | 16 | |
| Compliance services fees payable | | | 3 | |
| Other accrued expenses | | | 3,892 | |
| TOTAL LIABILITIES | | | 6,723 | |
| NET ASSETS | | $ | 480,784 | |
| NET ASSETS CONSIST OF: | | | | |
| Capital | | $ | 823,746 | |
| Total distributable earnings (loss) | | | (342,962 | ) |
| NET ASSETS | | $ | 480,784 | |
| Shares of Beneficial Interest Outstanding (unlimited number of shares authorized, no par value) | | | 29,043 | |
| Net Asset Value (offering and redemption price per share) | | $ | 16.55 | |
Statement of Operations
For the Year Ended December 31, 2021
| INVESTMENT INCOME: | | | | |
| Interest | | $ | 21 | |
| | | | | |
| EXPENSES: | | | | |
| Advisory fees | | | 6,295 | |
| Management services fees | | | 839 | |
| Administration fees | | | 648 | |
| Transfer agency fees | | | 517 | |
| Administrative services fees | | | 1,894 | |
| Distribution fees | | | 2,098 | |
| Custody fees | | | 4,670 | |
| Fund accounting fees | | | 348 | |
| Trustee fees | | | 13 | |
| Compliance services fees | | | 4 | |
| Other fees | | | 1,367 | |
| Total Gross Expenses before reductions | | | 18,693 | |
| Expenses reduced and reimbursed by the Advisor | | | (4,592 | ) |
| TOTAL NET EXPENSES | | | 14,101 | |
| NET INVESTMENT INCOME (LOSS) | | | (14,080 | ) |
| | | | | |
| REALIZED AND UNREALIZED GAINS (LOSSES) ON INVESTMENTS: | | | | |
| Net realized gains (losses) on forward currency contracts | | | (52,276 | ) |
| Change in net unrealized appreciation/depreciation on forward currency contracts | | | (13,169 | ) |
| NET REALIZED AND UNREALIZED GAINS (LOSSES) ON INVESTMENTS | | | (65,445 | ) |
| CHANGE IN NET ASSETS RESULTING FROM OPERATIONS | | $ | (79,525 | ) |
See accompanying notes to financial statements.
Financial Statements :: ProFund VP Falling U.S. Dollar :: 85
Statements of Changes in Net Assets
| | | Year Ended
December 31, 2021 | | | Year Ended
December 31, 2020 | |
| FROM INVESTMENT ACTIVITIES: | | | | | | | | |
| | | | | | | | | |
| OPERATIONS: | | | | | | | | |
| Net investment income (loss) | | $ | (14,080 | ) | | $ | (8,906 | ) |
| Net realized gains (losses) on investments | | | (52,276 | ) | | | 31,832 | |
| Change in net unrealized appreciation/depreciation on investments | | | (13,169 | ) | | | 10,007 | |
| Change in net assets resulting from operations | | | (79,525 | ) | | | 32,933 | |
| | | | | | | | | |
| DISTRIBUTIONS TO SHAREHOLDERS: | | | | | | | | |
| Total distributions | | | (15,895 | ) | | | (1,949 | ) |
| Change in net assets resulting from distributions | | | (15,895 | ) | | | (1,949 | ) |
| | | | | | | | | |
| CAPITAL TRANSACTIONS: | | | | | | | | |
| Proceeds from shares issued | | | 752,331 | | | | 3,690,898 | |
| Distributions reinvested | | | 15,895 | | | | 1,949 | |
| Value of shares redeemed | | | (1,527,575 | ) | | | (3,003,417 | ) |
| Change in net assets resulting from capital transactions | | | (759,349 | ) | | | 689,430 | |
| Change in net assets | | | (854,769 | ) | | | 720,414 | |
| | | | | | | | | |
| NET ASSETS: | | | | | | | | |
| Beginning of period | | | 1,335,553 | | | | 615,139 | |
| End of period | | $ | 480,784 | | | $ | 1,335,553 | |
| | | | | | | | | |
| SHARE TRANSACTIONS: | | | | | | | | |
| Issued | | | 42,420 | | | | 209,103 | |
| Reinvested | | | 899 | | | | 108 | |
| Redeemed | | | (86,998 | ) | | | (171,434 | ) |
| Change in shares | | | (43,679 | ) | | | 37,777 | |
See accompanying notes to financial statements.
86 :: ProFund VP Falling U.S. Dollar :: Financial Highlights
ProFunds Financial Highlights FOR THE PERIODS INDICATED
Selected data for a share of beneficial interest outstanding throughout the periods indicated.
| | | Year Ended
Dec. 31, 2021 | | | Year Ended
Dec. 31, 2020 | | | Year Ended
Dec. 31, 2019 | | | Year Ended
Dec. 31, 2018 | | | Year Ended
Dec. 31, 2017 | |
| Net Asset Value, Beginning of Period | | $ | 18.37 | | | $ | 17.60 | | | $ | 18.03 | | | $ | 22.30 | | | $ | 20.57 | |
| | | | | | | | | | | | | | | | | | | | | |
| Investment Activities: | | | | | | | | | | | | | | | | | | | | |
| Net investment income (loss)(a) | | | (0.30 | ) | | | (0.25 | ) | | | 0.08 | | | | 0.01 | | | | (0.18 | ) |
| Net realized and unrealized gains (losses) on investments | | | (1.15 | ) | | | 1.09 | | | | (0.50 | ) | | | (1.34 | ) | | | 1.91 | |
| Total income (loss) from investment activities | | | (1.45 | ) | | | 0.84 | | | | (0.42 | ) | | | (1.33 | ) | | | 1.73 | |
| | | | | | | | | | | | | | | | | | | | | |
| Distributions to Shareholders From: | | | | | | | | | | | | | | | | | | | | |
| Net investment income | | | — | | | | (0.07 | ) | | | (0.01 | ) | | | — | | | | — | |
| Net realized gains on investments | | | (0.37 | ) | | | — | | | | — | | | | (2.94 | ) | | | — | |
| Total distributions | | | (0.37 | ) | | | (0.07 | ) | | | (0.01 | ) | | | (2.94 | ) | | | — | |
| | | | | | | | | | | | | | | | | | | | | |
| Net Asset Value, End of Period | | $ | 16.55 | | | $ | 18.37 | | | $ | 17.60 | | | $ | 18.03 | | | $ | 22.30 | |
| | | | | | | | | | | | | | | | | | | | | |
| Total Return | | | (8.03 | )% | | | 4.80 | % | | | (2.34 | )% | | | (6.31 | )% | | | 8.46 | % |
| | | | | | | | | | | | | | | | | | | | | |
| Ratios to Average Net Assets: | | | | | | | | | | | | | | | | | | | | |
| Gross expenses | | | 2.23 | % | | | 3.18 | % | | | 5.49 | % | | | 4.51 | % | | | 3.09 | % |
| Net expenses | | | 1.68 | % | | | 1.68 | % | | | 1.68 | % | | | 1.68 | % | | | 1.68 | % |
| Net investment income (loss) | | | (1.68 | )% | | | (1.44 | )% | | | 0.44 | % | | | 0.03 | % | | | (0.84 | )% |
| | | | | | | | | | | | | | | | | | | | | |
| Supplemental Data: | | | | | | | | | | | | | | | | | | | | |
| Net assets, end of period (000's) | | $ | 481 | | | $ | 1,336 | | | $ | 615 | | | $ | 677 | | | $ | 693 | |
| Portfolio turnover rate(b) | | | — | | | | — | | | | — | | | | — | | | | — | |
| (a) | Per share net investment income (loss) has been calculated using the average daily shares method. |
| (b) | Portfolio turnover rate is calculated without regard to instruments having a maturity of less than one year from acquisition or derivative instruments (including swap agreements and futures contracts). |
See accompanying notes to financial statements.
Management Discussion of Fund Performance :: ProFund VP Financials :: 87
ProFund VP Financials (the "Fund") seeks investment results, before fees and expenses, that correspond to the performance of the Dow Jones U.S. FinancialsSM Index (the "Index"). For the year ended December 31, 2021, the Fund had a total return of 30.10%. For the same period, the Index had a return of 32.32%1 and a volatility of 16.00%. For the year, the Fund achieved an average daily statistical correlation of over 0.99 to the daily performance of the Index.2
The Fund takes positions in financial instruments that, in combination, should have similar return characteristics as the return of the Index. The Index measures the performance of the financial services sector of the U.S. equity market. Component companies include, among others, regional banks; major U.S. domiciled international banks; full line, life, and property and casualty insurance companies; companies that invest, directly or indirectly in real estate; diversified financial companies such as Fannie Mae, credit card issuers, check cashing companies, mortgage lenders and investment advisers; securities brokers and dealers including investment banks, merchant banks and online brokers; and publicly traded stock exchanges.
During the year ended December 31, 2021, the Fund invested in swap agreements as a substitute for investing directly in stocks in order to gain exposure to the Index. These derivatives generally tracked the performance of their underlying benchmark and were negatively impacted by financing costs associated with their use. The Fund entered into swap agreements with counterparties that the Fund's advisor determined to be major, global financial institutions. If a counterparty becomes insolvent or otherwise fails to perform on its obligations, the value of investments in the Fund may decline. The Fund has sought to mitigate this risk by generally requiring counterparties to post collateral for the benefit of the Fund, marked to market daily, in an amount approximately equal to the amount the counterparty owed to the Fund, subject to certain minimum thresholds.
Value of a $10,000 Investment at Net Asset Value*
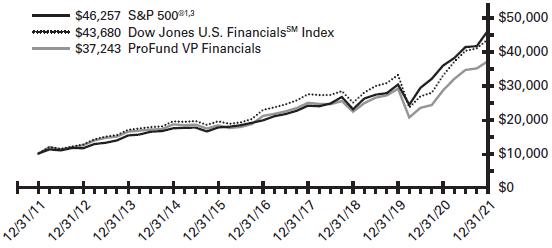
| * | The line graph represents the historical performance of a hypothetical investment of $10,000 in the ProFund VP Financials from December 31, 2011 to December 31, 2021, assuming the reinvestment of distributions. |
Average Annual Total Return as of 12/31/21
| Fund | | One Year | | | Five Year | | | Ten Year | |
| ProFund VP Financials | | | 30.10 | % | | | 12.00 | % | | | 14.05 | % |
| Dow Jones U.S. FinancialsSM Index | | | 32.32 | % | | | 13.77 | % | | | 15.89 | % |
| S&P 500® | | | 28.71 | % | | | 18.47 | % | | | 16.55 | % |
Expense Ratios**
| Fund | | Gross | | | Net | | | | | |
| ProFund VP Financials | | | 1.74 | % | | | 1.68 | % | | | | |
| ** | Reflects the expense ratio as reported in the Prospectus dated May 1, 2021. Contractual fee waivers are in effect through April 30, 2022. See Financial Highlights for effective expense ratios. |
Allocation of Portfolio Holdings & Index Composition
Market Exposure
| Investment Type | | % of Net Assets | |
| Equity Securities | | | 99 | % |
| Swap Agreements | | | 1 | % |
| Total Exposure | | | 100 | % |
"Market Exposure" includes the value of total investments (including the contract value of any derivatives) and excludes any instruments used for cash management.
Largest Equity Holdings
| Company | | % of Net Assets | |
| Berkshire Hathaway, Inc. | | | 7.4 | % |
| JPMorgan Chase & Co. | | | 6.4 | % |
| Visa, Inc. | | | 4.9 | % |
| Bank of America Corp. | | | 4.4 | % |
| Mastercard, Inc. | | | 4.2 | % |
Dow Jones U.S. FinancialsSM Index – Composition
| | | % of Index | |
| Diversified Financials | | | 34 | % |
| Banks | | | 24 | % |
| Real Estate | | | 21 | % |
| Insurance | | | 12 | % |
| Software & Services | | | 9 | % |
Past performance does not guarantee future results. Return calculations assume the reinvestment of distributions and do not reflect taxes that a shareholder would pay on Fund distributions or on the redemption of Fund shares. The performance data quoted represents past performance and current returns may be lower or higher. The investment return and net asset value ("NAV") will fluctuate so that an investor's shares, when redeemed, may be worth more or less than the original cost. The performance above reflects any fee reductions during the applicable periods. If such fee reductions had not occurred, the quoted performance would be lower. Performance numbers are net of all Fund fees and expenses but do not include any insurance, sales, or administrative charges of variable annuity or life insurance contracts. If these charges were included, the returns would be lower. To obtain performance current to the most recent month-end, please call toll-free 888-776-3637.
| 1 | The graph and table reflect the theoretical reinvestment of dividends on securities in the Indexes. The impact of transaction costs and the deduction of fees and expenses associated with a mutual fund, such as investment management and accounting fees, are not reflected in calculations of the Indexes. The Fund's performance reflects the reinvestment of dividends as well as the impact of transaction costs and the deduction of fees and expenses. It is not possible to invest directly in an index. |
| 2 | 1.00 equals perfect correlation. This calculation is based on the daily total return of the Index and the performance of the daily total return of the NAV per share of the Fund. |
| 3 | The S&P 500® is an unmanaged index that consists of the common stocks of 500 major U.S. corporations selected for their size and the frequency and ease with which their stocks trade. |
The above information is not covered by the Report of the Independent Registered Public Accounting Firm.
88 :: ProFund VP Financials :: Financial Statements
Schedule of Portfolio Investments :: December 31, 2021
Common Stocks (98.8%)
| | | Shares | | | Value | |
| Affiliated Managers Group, Inc. (Capital Markets) | | | 231 | | | $ | 38,002 | |
| Aflac, Inc. (Insurance) | | | 3,453 | | | | 201,621 | |
| AGNC Investment Corp. (Mortgage Real Estate Investment Trusts) | | | 2,978 | | | | 44,789 | |
| Alexandria Real Estate Equities, Inc. (Equity Real Estate Investment Trusts) | | | 800 | | | | 178,368 | |
| Alleghany Corp.* (Insurance) | | | 78 | | | | 52,072 | |
| Ally Financial, Inc. (Consumer Finance) | | | 1,966 | | | | 93,601 | |
| American Campus Communities, Inc. (Equity Real Estate Investment Trusts) | | | 790 | | | | 45,259 | |
| American Express Co. (Consumer Finance) | | | 3,560 | | | | 582,417 | |
| American Financial Group, Inc. (Insurance) | | | 375 | | | | 51,495 | |
| American Homes 4 Rent – Class A (Equity Real Estate Investment Trusts) | | | 1,610 | | | | 70,212 | |
| American International Group, Inc. (Insurance) | | | 4,711 | | | | 267,867 | |
| American Tower Corp. (Equity Real Estate Investment Trusts) | | | 2,584 | | | | 755,820 | |
| Americold Realty Trust (Equity Real Estate Investment Trusts) | | | 1,514 | | | | 49,644 | |
| Ameriprise Financial, Inc. (Capital Markets) | | | 635 | | | | 191,554 | |
| Annaly Capital Management, Inc. (Mortgage Real Estate Investment Trusts) | | | 8,232 | | | | 64,375 | |
| Aon PLC (Insurance) | | | 1,251 | | | | 376,001 | |
| Apartment Income REIT Corp. (Equity Real Estate Investment Trusts) | | | 891 | | | | 48,711 | |
| Apollo Global Management, Inc. (Capital Markets) | | | 2,094 | | | | 151,668 | |
| Arch Capital Group, Ltd.* (Insurance) | | | 2,191 | | | | 97,390 | |
| Ares Management Corp. — Class A (Capital Markets) | | | 951 | | | | 77,288 | |
| Arthur J. Gallagher & Co. (Insurance) | | | 1,176 | | | | 199,532 | |
| Assurant, Inc. (Insurance) | | | 323 | | | | 50,343 | |
| AvalonBay Communities, Inc. (Equity Real Estate Investment Trusts) | | | 793 | | | | 200,304 | |
| Axis Capital Holdings, Ltd. (Insurance) | | | 438 | | | | 23,858 | |
| Bank of America Corp. (Banks) | | | 40,878 | | | | 1,818,661 | |
| Bank OZK (Banks) | | | 686 | | | | 31,920 | |
| Berkshire Hathaway, Inc.* — Class B (Diversified Financial Services) | | | 10,391 | | | | 3,106,910 | |
| BlackRock, Inc. — Class A (Capital Markets) | | | 810 | | | | 741,604 | |
| Blackstone Group, Inc. — Class A (Capital Markets) | | | 3,900 | | | | 504,621 | |
| Blackstone Mortgage Trust, Inc. — Class A (Mortgage Real Estate Investment Trusts) | | | 948 | | | | 29,028 | |
| Blue Owl Capital, Inc. (Financial Services) | | | 1,888 | | | | 28,150 | |
| BOK Financial Corp. (Banks) | | | 171 | | | | 18,039 | |
| Boston Properties, Inc. (Equity Real Estate Investment Trusts) | | | 807 | | | | 92,950 | |
| Brighthouse Financial, Inc.* (Insurance) | | | 453 | | | | 23,465 | |
| Brixmor Property Group, Inc. (Equity Real Estate Investment Trusts) | | | 1,685 | | | | 42,816 | |
| Brown & Brown, Inc. (Insurance) | | | 1,331 | | | | 93,543 | |
| Camden Property Trust (Equity Real Estate Investment Trusts) | | | 580 | | | | 103,634 | |
| Capital One Financial Corp. (Consumer Finance) | | | 2,415 | | | | 350,393 | |
| Cboe Global Markets, Inc. (Capital Markets) | | | 605 | | | | 78,892 | |
| CBRE Group, Inc.* — Class A (Real Estate Management & Development) | | | 1,899 | | | | 206,061 | |
| Chubb, Ltd. (Insurance) | | | 2,444 | | | | 472,450 | |
| Cincinnati Financial Corp. (Insurance) | | | 850 | | | | 96,841 | |
| Citigroup, Inc. (Banks) | | | 11,259 | | | | 679,930 | |
| Citizens Financial Group, Inc. (Banks) | | | 2,418 | | | | 114,251 | |
| CME Group, Inc. (Capital Markets) | | | 2,039 | | | | 465,830 | |
| CNA Financial Corp. (Insurance) | | | 154 | | | | 6,788 | |
| Coinbase Global, Inc.* — Class A (Capital Markets) | | | 167 | | | | 42,146 | |
| Comerica, Inc. (Banks) | | | 744 | | | | 64,728 | |
| Commerce Bancshares, Inc. (Banks) | | | 630 | | | | 43,306 | |
| Compass, Inc.* — Class A (Real Estate Management & Development) | | | 161 | | | | 1,463 | |
| Corporate Office Properties Trust (Equity Real Estate Investment Trusts) | | | 637 | | | | 17,817 | |
| CoStar Group, Inc.* (Professional Services) | | | 2,241 | | | | 177,106 | |
| Cousins Properties, Inc. (Equity Real Estate Investment Trusts) | | | 844 | | | | 33,996 | |
| Credit Acceptance Corp.* (Consumer Finance) | | | 47 | | | | 32,321 | |
| Crown Castle International Corp. (Equity Real Estate Investment Trusts) | | | 2,452 | | | | 511,830 | |
| CubeSmart (Equity Real Estate Investment Trusts) | | | 1,230 | | | | 69,999 | |
| Cullen/Frost Bankers, Inc. (Banks) | | | 322 | | | | 40,595 | |
| CyrusOne, Inc. (Equity Real Estate Investment Trusts) | | | 720 | | | | 64,598 | |
| Digital Realty Trust, Inc. (Equity Real Estate Investment Trusts) | | | 1,610 | | | | 284,761 | |
| Discover Financial Services (Consumer Finance) | | | 1,663 | | | | 192,176 | |
| Douglas Emmett, Inc. (Equity Real Estate Investment Trusts) | | | 996 | | | | 33,366 | |
| Duke Realty Corp. (Equity Real Estate Investment Trusts) | | | 2,161 | | | | 141,848 | |
| East West Bancorp, Inc. (Banks) | | | 805 | | | | 63,337 | |
| EastGroup Properties, Inc. (Equity Real Estate Investment Trusts) | | | 231 | | | | 52,633 | |
| Enstar Group, Ltd.* (Insurance) | | | 70 | | | | 17,331 | |
| Equinix, Inc. (Equity Real Estate Investment Trusts) | | | 511 | | | | 432,224 | |
| Equitable Holdings, Inc. (Diversified Financial Services) | | | 2,136 | | | | 70,039 | |
| Equity Commonwealth* (Equity Real Estate Investment Trusts) | | | 686 | | | | 17,767 | |
| Equity LifeStyle Properties, Inc. (Equity Real Estate Investment Trusts) | | | 970 | | | | 85,030 | |
| Equity Residential (Equity Real Estate Investment Trusts) | | | 1,937 | | | | 175,299 | |
| Erie Indemnity Co. — Class A (Insurance) | | | 142 | | | | 27,358 | |
| Essent Group, Ltd. (Thrifts & Mortgage Finance) | | | 627 | | | | 28,547 | |
| Essex Property Trust, Inc. (Equity Real Estate Investment Trusts) | | | 369 | | | | 129,973 | |
| Everest Re Group, Ltd. (Insurance) | | | 223 | | | | 61,084 | |
See accompanying notes to financial statements.
Financial Statements :: ProFund VP Financials :: 89
Common Stocks, continued
| | | Shares | | | Value | |
| Extra Space Storage, Inc. (Equity Real Estate Investment Trusts) | | | 760 | | | $ | 172,315 | |
| F.N.B. Corp. (Banks) | | | 1,810 | | | | 21,955 | |
| FactSet Research Systems, Inc. (Capital Markets) | | | 214 | | | | 104,006 | |
| Federal Realty Investment Trust (Equity Real Estate Investment Trusts) | | | 397 | | | | 54,119 | |
| Federated Hermes, Inc. — Class B (Capital Markets) | | | 549 | | | | 20,631 | |
| Fifth Third Bancorp (Banks) | | | 3,880 | | | | 168,974 | |
| First American Financial Corp. (Insurance) | | | 623 | | | | 48,737 | |
| First Citizens BancShares, Inc. — Class A (Banks) | | | 40 | | | | 33,194 | |
| First Financial Bankshares, Inc. (Banks) | | | 728 | | | | 37,012 | |
| First Horizon Corp. (Banks) | | | 3,068 | | | | 50,107 | |
| First Industrial Realty Trust, Inc. (Equity Real Estate Investment Trusts) | | | 739 | | | | 48,922 | |
| First Republic Bank (Banks) | | | 1,017 | | | | 210,021 | |
| FirstCash Holdings, Inc. (Consumer Finance) | | | 229 | | | | 17,131 | |
| FNF Group (Insurance) | | | 1,614 | | | | 84,219 | |
| Franklin Resources, Inc. (Capital Markets) | | | 1,595 | | | | 53,417 | |
| Gaming & Leisure Properties, Inc. (Equity Real Estate Investment Trusts) | | | 1,286 | | | | 62,577 | |
| Glacier Bancorp, Inc. (Banks) | | | 615 | | | | 34,871 | |
| Globe Life, Inc. (Insurance) | | | 527 | | | | 49,390 | |
| Hartford Financial Services Group, Inc. (Insurance) | | | 1,931 | | | | 133,316 | |
| Healthcare Realty Trust, Inc. (Equity Real Estate Investment Trusts) | | | 837 | | | | 26,483 | |
| Healthcare Trust of America, Inc. — Class A (Equity Real Estate Investment Trusts) | | | 1,253 | | | | 41,838 | |
| Healthpeak Properties, Inc. (Equity Real Estate Investment Trusts) | | | 3,059 | | | | 110,399 | |
| Highwoods Properties, Inc. (Equity Real Estate Investment Trusts) | | | 593 | | | | 26,442 | |
| Home BancShares, Inc. (Banks) | | | 855 | | | | 20,819 | |
| Host Hotels & Resorts, Inc.* (Equity Real Estate Investment Trusts) | | | 4,051 | | | | 70,447 | |
| Houlihan Lokey, Inc. (Capital Markets) | | | 289 | | | | 29,917 | |
| Hudson Pacific Properties, Inc. (Equity Real Estate Investment Trusts) | | | 865 | | | | 21,374 | |
| Huntington Bancshares, Inc. (Banks) | | | 8,207 | | | | 126,552 | |
| Interactive Brokers Group, Inc. (Capital Markets) | | | 496 | | | | 39,392 | |
| Intercontinental Exchange, Inc. (Capital Markets) | | | 3,197 | | | | 437,254 | |
| Invesco, Ltd. (Capital Markets) | | | 1,936 | | | | 44,567 | |
| Invitation Homes, Inc. (Equity Real Estate Investment Trusts) | | | 3,386 | | | | 153,521 | |
| Iron Mountain, Inc. (Equity Real Estate Investment Trusts) | | | 1,643 | | | | 85,978 | |
| Jackson Financial, Inc. — Class A (Diversified Financial Services) | | | 528 | | | | 22,086 | |
| Janus Henderson Group PLC (Capital Markets) | | | 968 | | | | 40,598 | |
| JBG Smith Properties (Equity Real Estate Investment Trusts) | | | 648 | | | | 18,604 | |
| Jefferies Financial Group, Inc. (Diversified Financial Services) | | | 1,115 | | | | 43,262 | |
| Jones Lang LaSalle, Inc.* (Real Estate Management & Development) | | | 286 | | | | 77,032 | |
| JPMorgan Chase & Co. (Banks) | | | 16,778 | | | | 2,656,795 | |
| Kemper Corp. (Insurance) | | | 339 | | | | 19,930 | |
| KeyCorp (Banks) | | | 5,283 | | | | 122,196 | |
| Kilroy Realty Corp. (Equity Real Estate Investment Trusts) | | | 595 | | | | 39,544 | |
| Kimco Realty Corp. (Equity Real Estate Investment Trusts) | | | 3,498 | | | | 86,226 | |
| KKR & Co., Inc. (Capital Markets) | | | 3,319 | | | | 247,266 | |
| Lamar Advertising Co. — Class A (Equity Real Estate Investment Trusts) | | | 493 | | | | 59,801 | |
| Lazard, Ltd. — Class A (Capital Markets) | | | 640 | | | | 27,923 | |
| Lexington Realty Trust (Equity Real Estate Investment Trusts) | | | 1,605 | | | | 25,070 | |
| Life Storage, Inc. (Equity Real Estate Investment Trusts) | | | 465 | | | | 71,229 | |
| Lincoln National Corp. (Insurance) | | | 964 | | | | 65,803 | |
| Loews Corp. (Insurance) | | | 1,137 | | | | 65,673 | |
| LPL Financial Holdings, Inc. (Capital Markets) | | | 455 | | | | 72,841 | |
| M&T Bank Corp. (Banks) | | | 730 | | | | 112,113 | |
| Markel Corp.* (Insurance) | | | 78 | | | | 96,252 | |
| MarketAxess Holdings, Inc. (Capital Markets) | | | 216 | | | | 88,834 | |
| Marsh & McLennan Cos., Inc. (Insurance) | | | 2,865 | | | | 497,993 | |
| Mastercard, Inc. — Class A (IT Services) | | | 4,922 | | | | 1,768,573 | |
| Medical Properties Trust, Inc. (Equity Real Estate Investment Trusts) | | | 3,383 | | | | 79,940 | |
| Mercury General Corp. (Insurance) | | | 151 | | | | 8,012 | |
| MetLife, Inc. (Insurance) | | | 4,057 | | | | 253,522 | |
| MGIC Investment Corp. (Thrifts & Mortgage Finance) | | | 1,847 | | | | 26,634 | |
| Mid-America Apartment Communities, Inc. (Equity Real Estate Investment Trusts) | | | 653 | | | | 149,824 | |
| Moody's Corp. (Capital Markets) | | | 918 | | | | 358,552 | |
| Morgan Stanley (Capital Markets) | | | 8,146 | | | | 799,610 | |
| Morningstar, Inc. (Capital Markets) | | | 134 | | | | 45,827 | |
| MSCI, Inc. — Class A (Capital Markets) | | | 468 | | | | 286,739 | |
| Nasdaq, Inc. (Capital Markets) | | | 664 | | | | 139,447 | |
| National Health Investors, Inc. (Equity Real Estate Investment Trusts) | | | 260 | | | | 14,942 | |
| National Retail Properties, Inc. (Equity Real Estate Investment Trusts) | | | 996 | | | | 47,878 | |
| National Storage Affiliates Trust (Equity Real Estate Investment Trusts) | | | 465 | | | | 32,178 | |
| New Residential Investment Corp. (Mortgage Real Estate Investment Trusts) | | | 2,647 | | | | 28,349 | |
| New York Community Bancorp, Inc. (Thrifts & Mortgage Finance) | | | 2,639 | | | | 32,223 | |
| Northern Trust Corp. (Capital Markets) | | | 1,178 | | | | 140,901 | |
| Old Republic International Corp. (Insurance) | | | 1,620 | | | | 39,820 | |
| Omega Healthcare Investors, Inc. (Equity Real Estate Investment Trusts) | | | 1,356 | | | | 40,124 | |
| Onemain Holdings, Inc. (Consumer Finance) | | | 634 | | | | 31,725 | |
| Opendoor Technologies, Inc.* (Real Estate Management & Development) | | | 2,190 | | | | 31,996 | |
| Orion Office REIT, Inc.* (Equity Real Estate Investment Trusts) | | | 307 | | | | 5,732 | |
| People's United Financial, Inc. (Banks) | | | 2,429 | | | | 43,285 | |
| Physicians Realty Trust (Equity Real Estate Investment Trusts) | | | 1,250 | | | | 23,538 | |
| Pinnacle Financial Partners, Inc. (Banks) | | | 432 | | | | 41,256 | |
| Popular, Inc. (Banks) | | | 453 | | | | 37,164 | |
| PotlatchDeltic Corp. (Equity Real Estate Investment Trusts) | | | 381 | | | | 22,944 | |
See accompanying notes to financial statements.
90 :: ProFund VP Financials :: Financial Statements
Common Stocks, continued
| | | Shares | | | Value | |
| Primerica, Inc. (Insurance) | | | 224 | | | $ | 34,332 | |
| Principal Financial Group, Inc. (Insurance) | | | 1,399 | | | | 101,190 | |
| PROG Holdings, Inc.* (Consumer Finance) | | | 322 | | | | 14,525 | |
| Prologis, Inc. (Equity Real Estate Investment Trusts) | | | 4,195 | | | | 706,270 | |
| Prosperity Bancshares, Inc. (Banks) | | | 523 | | | | 37,813 | |
| Prudential Financial, Inc. (Insurance) | | | 2,146 | | | | 232,283 | |
| PS Business Parks, Inc. (Equity Real Estate Investment Trusts) | | | 114 | | | | 20,995 | |
| Public Storage (Equity Real Estate Investment Trusts) | | | 866 | | | | 324,369 | |
| Radian Group, Inc. (Thrifts & Mortgage Finance) | | | 1,018 | | | | 21,510 | |
| Raymond James Financial, Inc. (Capital Markets) | | | 1,051 | | | | 105,520 | |
| Rayonier, Inc. (Equity Real Estate Investment Trusts) | | | 812 | | | | 32,772 | |
| Realty Income Corp. (Equity Real Estate Investment Trusts) | | | 3,210 | | | | 229,804 | |
| Redfin Corp.* (Real Estate Management & Development) | | | 598 | | | | 22,957 | |
| Regency Centers Corp. (Equity Real Estate Investment Trusts) | | | 875 | | | | 65,931 | |
| Regions Financial Corp. (Banks) | | | 5,411 | | | | 117,960 | |
| Reinsurance Group of America, Inc. (Insurance) | | | 384 | | | | 42,044 | |
| RenaissanceRe Holdings, Ltd. (Insurance) | | | 261 | | | | 44,195 | |
| Rexford Industrial Realty, Inc. (Equity Real Estate Investment Trusts) | | | 860 | | | | 69,755 | |
| RLI Corp. (Insurance) | | | 226 | | | | 25,335 | |
| Robinhood Markets, Inc.* — Class A (Capital Markets) | | | 331 | | | | 5,879 | |
| Rocket Cos., Inc. — Class A (Thrifts & Mortgage Finance) | | | 767 | | | | 10,738 | |
| Ryan Specialty Group Holdings, Inc.* — Class A (Insurance) | | | 331 | | | | 13,356 | |
| S&P Global, Inc. (Capital Markets) | | | 1,367 | | | | 645,128 | |
| Sabra Health Care REIT, Inc. (Equity Real Estate Investment Trusts) | | | 1,298 | | | | 17,575 | |
| SBA Communications Corp. (Equity Real Estate Investment Trusts) | | | 617 | | | | 240,025 | |
| SEI Investments Co. (Capital Markets) | | | 601 | | | | 36,625 | |
| Selective Insurance Group, Inc. (Insurance) | | | 341 | | | | 27,942 | |
| Signature Bank (Banks) | | | 344 | | | | 111,274 | |
| Simon Property Group, Inc. (Equity Real Estate Investment Trusts) | | | 1,865 | | | | 297,971 | |
| SL Green Realty Corp. (Equity Real Estate Investment Trusts) | | | 379 | | | | 27,174 | |
| SLM Corp. (Consumer Finance) | | | 1,663 | | | | 32,711 | |
| SoFi Technologies, Inc.* (Consumer Finance) | | | 3,663 | | | | 57,912 | |
| Spirit Realty Capital, Inc. (Equity Real Estate Investment Trusts) | | | 700 | | | | 33,733 | |
| STAG Industrial, Inc. (Equity Real Estate Investment Trusts) | | | 993 | | | | 47,624 | |
| Starwood Property Trust, Inc. (Mortgage Real Estate Investment Trusts) | | | 1,728 | | | | 41,990 | |
| State Street Corp. (Capital Markets) | | | 2,075 | | | | 192,975 | |
| Stifel Financial Corp. (Capital Markets) | | | 591 | | | | 41,618 | |
| STORE Capital Corp. (Equity Real Estate Investment Trusts) | | | 1,392 | | | | 47,885 | |
| Sun Communities, Inc. (Equity Real Estate Investment Trusts) | | | 658 | | | | 138,160 | |
| SVB Financial Group* (Banks) | | | 333 | | | | 225,854 | |
| Synchrony Financial (Consumer Finance) | | | 3,106 | | | | 144,087 | |
| Synovus Financial Corp. (Banks) | | | 826 | | | | 39,541 | |
| T. Rowe Price Group, Inc. (Capital Markets) | | | 1,275 | | | | 250,716 | |
| TFS Financial Corp. (Thrifts & Mortgage Finance) | | | 271 | | | | 4,843 | |
| The Allstate Corp. (Insurance) | | | 1,627 | | | | 191,417 | |
| The Bank of New York Mellon Corp. (Capital Markets) | | | 4,311 | | | | 250,383 | |
| The Carlyle Group, Inc. (Capital Markets) | | | 789 | | | | 43,316 | |
| The Charles Schwab Corp. (Capital Markets) | | | 8,530 | | | | 717,373 | |
| The Goldman Sachs Group, Inc. (Capital Markets) | | | 1,926 | | | | 736,791 | |
| The Hanover Insurance Group, Inc. (Insurance) | | | 202 | | | | 26,474 | |
| The Howard Hughes Corp.* (Real Estate Management & Development) | | | 235 | | | | 23,918 | |
| The PNC Financial Services Group, Inc. (Banks) | | | 2,398 | | | | 480,847 | |
| The Progressive Corp. (Insurance) | | | 3,320 | | | | 340,798 | |
| The Travelers Cos., Inc. (Insurance) | | | 1,396 | | | | 218,376 | |
| Tradeweb Markets, Inc. — Class A (Capital Markets) | | | 597 | | | | 59,784 | |
| Truist Financial Corp. (Banks) | | | 7,574 | | | | 443,458 | |
| U.S. Bancorp (Banks) | | | 7,656 | | | | 430,038 | |
| UDR, Inc. (Equity Real Estate Investment Trusts) | | | 1,649 | | | | 98,924 | |
| UMB Financial Corp. (Banks) | | | 244 | | | | 25,891 | |
| Umpqua Holdings Corp. (Banks) | | | 1,229 | | | | 23,646 | |
| United Bankshares, Inc. (Banks) | | | 774 | | | | 28,081 | |
| Unum Group (Insurance) | | | 1,160 | | | | 28,501 | |
| Upstart Holdings, Inc.* (Consumer Finance) | | | 279 | | | | 42,213 | |
| UWM Holdings Corp. (Thrifts & Mortgage Finance) | | | 495 | | | | 2,930 | |
| Valley National Bancorp (Banks) | | | 2,309 | | | | 31,749 | |
| Ventas, Inc. (Equity Real Estate Investment Trusts) | | | 2,265 | | | | 115,787 | |
| VICI Properties, Inc. (Equity Real Estate Investment Trusts) | | | 3,569 | | | | 107,463 | |
| Virtu Financial, Inc. — Class A (Capital Markets) | | | 484 | | | | 13,954 | |
| Visa, Inc. — Class A (IT Services) | | | 9,516 | | | | 2,062,212 | |
| Vornado Realty Trust (Equity Real Estate Investment Trusts) | | | 903 | | | | 37,800 | |
| Voya Financial, Inc. (Diversified Financial Services) | | | 630 | | | | 41,775 | |
| W.R. Berkley Corp. (Insurance) | | | 792 | | | | 65,253 | |
| Webster Financial Corp. (Banks) | | | 514 | | | | 28,702 | |
| Wells Fargo & Co. (Banks) | | | 22,623 | | | | 1,085,451 | |
| Welltower, Inc. (Equity Real Estate Investment Trusts) | | | 2,470 | | | | 211,852 | |
| Western Alliance Bancorp (Banks) | | | 591 | | | | 63,621 | |
| Weyerhaeuser Co. (Equity Real Estate Investment Trusts) | | | 4,250 | | | | 175,015 | |
| White Mountains Insurance Group, Ltd. (Insurance) | | | 17 | | | | 17,236 | |
| Willis Towers Watson PLC (Insurance) | | | 707 | | | | 167,905 | |
| Wintrust Financial Corp. (Banks) | | | 323 | | | | 29,335 | |
| WP Carey, Inc. (Equity Real Estate Investment Trusts) | | | 1,057 | | | | 86,727 | |
See accompanying notes to financial statements.
Financial Statements :: ProFund VP Financials :: 91
Common Stocks, continued
| | | Shares | | | Value | |
| Zillow Group, Inc.* — Class A (Interactive Media & Services) | | | 209 | | | $ | 13,004 | |
| Zillow Group, Inc.* — Class C (Interactive Media & Services) | | | 966 | | | | 61,679 | |
| Zions Bancorp (Banks) | | | 888 | | | | 56,086 | |
TOTAL COMMON STOCKS
(Cost $13,790,553) | | | | | | | 41,328,010 | |
Repurchase Agreements(a) (1.1%)
| | | Principal
Amount | | | Value | |
| Repurchase Agreements with various counterparties, 0.00%, dated 12/31/21, due 1/3/22, total to be received $451,000 | | $ | 451,000 | | | $ | 451,000 | |
TOTAL REPURCHASE AGREEMENTS
(Cost $451,000) | | | | | | | 451,000 | |
TOTAL INVESTMENT SECURITIES
(Cost $14,241,553) — 99.9% | | | | | | | 41,779,010 | |
| Net other assets (liabilities) — 0.1% | | | | | | | 21,584 | |
| NET ASSETS — 100.0% | | | | | | $ | 41,800,594 | |
| * | Non-income producing security. |
| (a) | The ProFund VP invests in Repurchase Agreements jointly with other funds in the Trust. See "Repurchase Agreements" under Note 2 in the Notes to Financial Statements to view the details of each individual agreement and counterparty as well as a description of the securities subject to repurchase. |
Total Return Swap Agreements — Long
| Underlying Instrument | | Counterparty | | Termination
Date(1) | | Rate Paid
(Received)(2) | | | Notional
Amount | | | Value and
Unrealized
Appreciation/
(Depreciation) | |
| Dow Jones U.S. Financials Index | | Goldman Sachs International | | 1/24/22 | | | 0.68 | % | | $ | 523,517 | | | $ | 5,305 | |
| (1) | Agreements may be terminated at will by either party without penalty. Payment is due at termination/maturity. |
| (2) | Reflects the floating financing rate, as of December 31, 2021, on the notional amount of the swap agreement paid to the counterparty or received from the counterparty, excluding any commissions. This amount is included as part of the unrealized appreciation/(depreciation). |
ProFund VP Financials invested in the following industries as of December 31, 2021:
| | | Value | | | % of
Net Assets | |
| Banks | | $ | 9,850,428 | | | | 23.5 | % |
| Capital Markets | | | 8,369,389 | | | | 19.9 | % |
| Consumer Finance | | | 1,591,212 | | | | 3.8 | % |
| Diversified Financial Services | | | 3,284,072 | | | | 7.9 | % |
| Equity Real Estate Investment Trusts | | | 8,364,459 | | | | 20.0 | % |
| Financial Services | | | 28,150 | | | | 0.1 | % |
| Insurance | | | 5,058,343 | | | | 12.1 | % |
| Interactive Media & Services | | | 74,683 | | | | 0.2 | % |
| IT Services | | | 3,830,785 | | | | 9.2 | % |
| Mortgage Real Estate Investment Trusts | | | 208,531 | | | | 0.5 | % |
| Professional Services | | | 177,106 | | | | 0.4 | % |
| Real Estate Management & Development | | | 363,427 | | | | 0.9 | % |
| Thrifts & Mortgage Finance | | | 127,425 | | | | 0.3 | % |
| Other** | | | 472,584 | | | | 1.2 | % |
| Total | | $ | 41,800,594 | | | | 100.0 | % |
| ** | Includes any non-equity securities and net other assets (liabilities), which includes any receivable for capital shares issued and payable for capital shares redeemed. |
See accompanying notes to financial statements.
92 :: ProFund VP Financials :: Financial Statements
Statement of Assets and Liabilities
December 31, 2021
| ASSETS: |
| Total Investment Securities, at cost | $ | 14,241,553 | |
| Securities, at value | | 41,328,010 | |
| Repurchase agreements, at value | | 451,000 | |
| Total Investment Securities, at value | | 41,779,010 | |
| Cash | | 2,594 | |
| Dividends receivable | | 52,891 | |
| Unrealized appreciation on swap agreements | | 5,305 | |
| Receivable for capital shares issued | | 198,454 | |
| Receivable for investments sold | | 61,740 | |
| Prepaid expenses | | 557 | |
| TOTAL ASSETS | | 42,100,551 | |
| | | | |
| LIABILITIES: | | | |
| Payable for capital shares redeemed | | 129,204 | |
| Payable for investments purchased | | 61,500 | |
| Advisory fees payable | | 37,785 | |
| Management services fees payable | | 5,038 | |
| Administration fees payable | | 2,486 | |
| Administrative services fees payable | | 18,245 | |
| Distribution fees payable | | 20,446 | |
| Transfer agency fees payable | | 4,095 | |
| Fund accounting fees payable | | 1,442 | |
| Compliance services fees payable | | 180 | |
| Other accrued expenses | | 19,536 | |
| TOTAL LIABILITIES | | 299,957 | |
| NET ASSETS | $ | 41,800,594 | |
| | | | |
| NET ASSETS CONSIST OF: | | | |
| Capital | $ | 20,961,982 | |
| Total distributable earnings (loss) | | 20,838,612 | |
| NET ASSETS | $ | 41,800,594 | |
| Shares of Beneficial Interest Outstanding (unlimited number of shares authorized, no par value) | | 829,047 | |
| Net Asset Value (offering and redemption price per share) | $ | 50.42 | |
Statement of Operations
For the Year Ended December 31, 2021
| INVESTMENT INCOME: | | | |
| Dividends | $ | 675,366 | |
| Interest | | 6 | |
| Net income from securities lending | | 271 | |
| TOTAL INVESTMENT INCOME | | 675,643 | |
| | | | |
| EXPENSES: | | | |
| Advisory fees | | 289,962 | |
| Management services fees | | 38,661 | |
| Administration fees | | 28,100 | |
| Transfer agency fees | | 23,307 | |
| Administrative services fees | | 99,389 | |
| Distribution fees | | 96,654 | |
| Custody fees | | 5,787 | |
| Fund accounting fees | | 16,426 | |
| Trustee fees | | 597 | |
| Compliance services fees | | 288 | |
| Other fees | | 39,248 | |
| Recoupment of prior expenses reduced by the Advisor | | 13,000 | |
| Total Gross Expenses before reductions | | 651,419 | |
| Expenses reduced and reimbursed by the Advisor | | (1,906 | ) |
| TOTAL NET EXPENSES | | 649,513 | |
| NET INVESTMENT INCOME (LOSS) | | 26,130 | |
| | | | |
| REALIZED AND UNREALIZED GAINS (LOSSES) ON INVESTMENTS: | | | |
| Net realized gains (losses) on investment securities | | 137,631 | |
| Net realized gains (losses) on swap agreements | | 144,777 | |
| Change in net unrealized appreciation/depreciation on investment securities | | 8,859,021 | |
| Change in net unrealized appreciation/depreciation on swap agreements | | (6,449 | ) |
| NET REALIZED AND UNREALIZED GAINS (LOSSES) ON INVESTMENTS | | 9,134,980 | |
| CHANGE IN NET ASSETS RESULTING FROM OPERATIONS | $ | 9,161,110 | |
See accompanying notes to financial statements.
Financial Statements :: ProFund VP Financials :: 93
Statements of Changes in Net Assets
| | | Year Ended
December 31, 2021 | | | Year Ended
December 31, 2020 | |
| FROM INVESTMENT ACTIVITIES: |
| |
| OPERATIONS: |
| Net investment income (loss) | | $ | 26,130 | | | $ | 150,451 | |
| Net realized gains (losses) on investments | | | 282,408 | | | | 4,169,153 | |
| Change in net unrealized appreciation/depreciation on investments | | | 8,852,572 | | | | (6,420,744 | ) |
| Change in net assets resulting from operations | | | 9,161,110 | | | | (2,101,140 | ) |
| | | | | | | | | |
| DISTRIBUTIONS TO SHAREHOLDERS: | | | | | | | | |
| Total distributions | | | (2,699,374 | ) | | | (2,129,838 | ) |
| Change in net assets resulting from distributions | | | (2,699,374 | ) | | | (2,129,838 | ) |
| | | | | | | | | |
| CAPITAL TRANSACTIONS: | | | | | | | | |
| Proceeds from shares issued | | | 36,493,693 | | | | 45,167,242 | |
| Distributions reinvested | | | 2,699,374 | | | | 2,129,838 | |
| Value of shares redeemed | | | (31,088,356 | ) | | | (52,579,134 | ) |
| Change in net assets resulting from capital transactions | | | 8,104,711 | | | | (5,282,054 | ) |
| Change in net assets | | | 14,566,447 | | | | (9,513,032 | ) |
| | | | | | | | | |
| NET ASSETS: | | | | | | | | |
| Beginning of period | | | 27,234,147 | | | | 36,747,179 | |
| End of period | | $ | 41,800,594 | | | $ | 27,234,147 | |
| | | | | | | | | |
| SHARE TRANSACTIONS: | | | | | | | | |
| Issued | | | 777,951 | | | | 1,192,582 | |
| Reinvested | | | 58,823 | | | | 56,978 | |
| Redeemed | | | (662,224 | ) | | | (1,392,931 | ) |
| Change in shares | | | 174,550 | | | | (143,371 | ) |
See accompanying notes to financial statements.
94 :: ProFund VP Financials :: Financial Highlights
ProFunds Financial Highlights FOR THE PERIODS INDICATED
Selected data for a share of beneficial interest outstanding throughout the periods indicated.
| | | Year Ended
Dec. 31, 2021 | | | Year Ended
Dec. 31, 2020 | | | Year Ended
Dec. 31, 2019 | | | Year Ended
Dec. 31, 2018 | | | Year Ended
Dec. 31, 2017 | |
| Net Asset Value, Beginning of Period | | $ | 41.61 | | | $ | 46.06 | | | $ | 37.39 | | | $ | 41.89 | | | $ | 35.57 | |
| | | | | | | | | | | | | | | | | | | | | |
| Investment Activities: | | | | | | | | | | | | | | | | | | | | |
| Net investment income (loss)(a) | | | 0.03 | | | | 0.23 | | | | 0.21 | | | | 0.19 | | | | 0.13 | |
| Net realized and unrealized gains (losses) on investments | | | 12.16 | | | | (1.41 | ) | | | 10.83 | | | | (4.53 | ) | | | 6.32 | |
| Total income (loss) from investment activities | | | 12.19 | | | | (1.18 | ) | | | 11.04 | | | | (4.34 | ) | | | 6.45 | |
| | | | | | | | | | | | | | | | | | | | | |
| Distributions to Shareholders From: | | | | | | | | | | | | | | | | | | | | |
| Net investment income | | | (0.17 | ) | | | (0.28 | ) | | | (0.23 | ) | | | (0.16 | ) | | | (0.13 | ) |
| Net realized gains on investments | | | (3.21 | ) | | | (2.99 | ) | | | (2.14 | ) | | | — | | | | — | |
| Total distributions | | | (3.38 | ) | | | (3.27 | ) | | | (2.37 | ) | | | (0.16 | ) | | | (0.13 | ) |
| | | | | | | | | | | | | | | | | | | | | |
| Net Asset Value, End of Period | | $ | 50.42 | | | $ | 41.61 | | | $ | 46.06 | | | $ | 37.39 | | | $ | 41.89 | |
| | | | | | | | | | | | | | | | | | | | | |
| Total Return | | | 30.10 | % | | | (1.77 | )% | | | 30.27 | % | | | (10.43 | )%(b) | | | 18.19 | % |
| | | | | | | | | | | | | | | | | | | | | |
| Ratios to Average Net Assets: | | | | | | | | | | | | | | | | | | | | |
| Gross expenses | | | 1.68 | % | | | 1.74 | % | | | 1.71 | % | | | 1.70 | % | | | 1.68 | % |
| Net expenses | | | 1.68 | % | | | 1.68 | % | | | 1.71 | %(c) | | | 1.63 | %(b) | | | 1.68 | % |
| Net investment income (loss) | | | 0.07 | % | | | 0.58 | % | | | 0.50 | % | | | 0.45 | %(b) | | | 0.35 | % |
| | | | | | | | | | | | | | | | | | | | | |
| Supplemental Data: | | | | | | | | | | | | | | | | | | | | |
| Net assets, end of period (000’s) | | $ | 41,801 | | | $ | 27,234 | | | $ | 36,747 | | | $ | 29,825 | | | $ | 51,452 | |
| Portfolio turnover rate(d) | | | 31 | % | | | 145 | % | | | 52 | % | | | 27 | % | | | 64 | % |
| (a) | Per share net investment income (loss) has been calculated using the average daily shares method. |
| (b) | During 2018, the Fund received a non-recurring reimbursement from a third party relating to expenses that were incurred in a prior year. Had this reimbursement not occurred, the net expense ratio and net investment income (loss) ratio would have been 1.67% and 0.41%, respectively, and the total return would have been (10.48)%. |
| (c) | The expense ratio does not correlate to the applicable expense limits in place during the period given that the annual contractual expense limitation is applied for one year periods ended April 30th of each year, instead of coinciding with the December 31st year end. Details of the current expense limitation in effect can be found in Note 4 of the accompanying Notes to Financial Statements. |
| (d) | Portfolio turnover rate is calculated without regard to instruments having a maturity of less than one year from acquisition or derivative instruments (including swap agreements and futures contracts). The portfolio turnover rate can be high and volatile due to the amount and timing of sales and purchases of fund shares during the period. |
See accompanying notes to financial statements.
Management Discussion of Fund Performance :: ProFund VP Government Money Market :: 95
ProFund VP Government Money Market (the "Fund") seeks, as its investment objective, a high level of current income consistent with liquidity and preservation of capital. For the year ended December 31, 2021, the Fund returned 0.01%. The Fund's seven-day yield, as of December 31, 2021, was 0.01%1.
An investment in this ProFund VP is neither guaranteed nor insured by the Federal Deposit Insurance Corporation or any other government agency. Although the ProFund VP strives to maintain the value of your investment at $1.00 per share, it is possible to lose money by investing in this ProFund VP.
Allocation of Portfolio Holdings
Market Exposure
| Investment Type | | % of Net Assets | |
| U.S. Treasury Obligations | | | 22 | % |
| Repurchase Agreements | | | 83 | % |
| Total Exposure | | | 105 | % |
“Market Exposure” includes the value of total investments (including the contract value of any derivatives) and excludes any instruments used for cash management.
Past performance does not guarantee future results. Return calculations assume the reinvestment of distributions and do not reflect taxes that a shareholder would pay on Fund distributions or on the redemption of Fund shares. The performance data quoted represents past performance and current returns may be lower or higher. The investment return and net asset value will fluctuate so that an investor's shares, when redeemed, may be worth more or less than the original cost. The performance above reflects any fee reductions during the applicable periods. If such fee reductions had not occurred, the quoted performance would be lower. Performance numbers are net of all Fund fees and expenses but do not include any insurance, sales, or administrative charges of variable annuity or life insurance contracts. If these charges were included, the returns would be lower. To obtain performance current to the most recent month-end, please call toll-free 888-776-3637.
| 1 | The seven-day yield quotation more closely reflects the current earnings of the government money market fund than the total return quotation. |
The above information is not covered by the Report of the Independent Registered Public Accounting Firm.
96 :: ProFund VP Government Money Market :: Financial Statements
Schedule of Portfolio Investments :: December 31, 2021
U.S. Treasury Obligations (21.6%)
| | | Principal
Amount | | | Value | |
| U.S. Treasury Bills | | | | | | | | |
| 0.03%+, 1/27/22 | | $ | 5,000,000 | | | $ | 4,999,879 | |
| 0.08%+, 8/11/22 | | | 5,000,000 | | | | 4,997,610 | |
TOTAL U.S. TREASURY OBLIGATIONS
(Cost $9,997,489) | | | | | | | 9,997,489 | |
| | | | | | | | | |
| Repurchase Agreements(a) (82.7%) | | | | | | | | |
| Repurchase Agreements with various counterparties, 0.00%, dated 12/31/21, due 1/3/22, total to be received $38,332,000 | | | 38,332,000 | | | | 38,332,000 | |
TOTAL REPURCHASE AGREEMENTS
(Cost $38,332,000) | | | | | | | 38,332,000 | |
TOTAL INVESTMENT SECURITIES
(Cost $48,329,489)—104.3% | | | | | | | 48,329,489 | |
| Net other assets (liabilities)—(4.3)% | | | | | | | (1,979,739 | ) |
| NET ASSETS—100.0% | | | | | | $ | 46,349,750 | |
| + | Reflects the effective yield or interest rate in effect at December 31, 2021. |
| (a) | The ProFund VP invests in Repurchase Agreements jointly with other funds in the Trust. See "Repurchase Agreements" under Note 2 in the Notes to Financial Statements to view the details of each individual agreement and counterparty as well as a description of the securities subject to repurchase. |
See accompanying notes to financial statements.
Financial Statements :: ProFund VP Government Money Market :: 97
Statement of Assets and Liabilities
December 31, 2021
| ASSETS: |
| Total Investment Securities, at cost | $ | 48,329,489 | |
| Securities, at value | | 9,997,489 | |
| Repurchase agreements, at value | | 38,332,000 | |
| Total Investment Securities, at value | | 48,329,489 | |
| Cash | | 484 | |
| Receivable for capital shares issued | | 396,889 | |
| Prepaid expenses | | 263 | |
| TOTAL ASSETS | | 48,727,125 | |
| | | | |
| LIABILITIES: | | | |
| Payable for capital shares redeemed | | 2,353,926 | |
| Administration fees payable | | 1,374 | |
| Transfer agency fees payable | | 4,348 | |
| Fund accounting fees payable | | 1,574 | |
| Compliance services fees payable | | 206 | |
| Other accrued expenses | | 15,947 | |
| TOTAL LIABILITIES | | 2,377,375 | |
| NET ASSETS | $ | 46,349,750 | |
| | | | |
| NET ASSETS CONSIST OF: | | | |
| Capital | $ | 46,385,987 | |
| Total distributable earnings (loss) | | (36,237 | ) |
| NET ASSETS | $ | 46,349,750 | |
| Shares of Beneficial Interest Outstanding (unlimited number of shares authorized, no par value) | | 46,385,987 | |
| Net Asset Value (offering and redemption price per share) | $ | 1.00 | |
Statement of Operations
For the Year Ended December 31, 2021
| INVESTMENT INCOME: | | | |
| Interest | $ | 6,123 | |
| | | | |
| EXPENSES: | | | |
| Advisory fees | | 331,197 | |
| Management services fees | | 44,159 | |
| Administration fees | | 17,174 | |
| Transfer agency fees | | 27,094 | |
| Custody fees | | 6,708 | |
| Fund accounting fees | | 18,498 | |
| Trustee fees | | 764 | |
| Compliance services fees | | 274 | |
| Other fees | | 28,801 | |
| Total Gross Expenses before reductions | | 474,669 | |
| Expenses reduced and reimbursed by the Advisor | | (474,108 | ) |
| TOTAL NET EXPENSES | | 561 | |
| NET INVESTMENT INCOME | | 5,562 | |
| | | | |
| REALIZED GAINS ON INVESTMENTS: | | | |
| Gain received from non-recurring class action settlement | | 17,958 | |
| NET REALIZED GAINS ON INVESTMENTS | | 17,958 | |
| CHANGE IN NET ASSETS RESULTING FROM OPERATIONS | $ | 23,520 | |
See accompanying notes to financial statements.
98 :: ProFund VP Government Money Market :: Financial Statements
Statements of Changes in Net Assets
| | | Year Ended
December 31, 2021 | | | Year Ended
December 31, 2020 | |
| FROM INVESTMENT ACTIVITIES: |
| |
| OPERATIONS: |
| Net investment income | | $ | 5,562 | | | $ | 55,902 | |
| Net realized gains on investments | | | 17,958 | | | | 5,797 | |
| Change in net assets resulting from operations | | | 23,520 | | | | 61,699 | |
| | | | | | | | | |
| DISTRIBUTIONS TO SHAREHOLDERS: | | | | | | | | |
| Total distributions | | | (5,562 | ) | | | (55,902 | ) |
| Change in net assets resulting from distributions | | | (5,562 | ) | | | (55,902 | ) |
| | | | | | | | | |
| CAPITAL TRANSACTIONS: | | | | | | | | |
| Proceeds from shares issued | | | 177,647,763 | | | | 767,736,315 | |
| Distributions reinvested | | | 5,562 | | | | 55,902 | |
| Value of shares redeemed | | | (179,396,339 | ) | | | (865,437,747 | ) |
| Change in net assets resulting from capital transactions | | | (1,743,014 | ) | | | (97,645,530 | ) |
| Change in net assets | | | (1,725,056 | ) | | | (97,639,733 | ) |
| | | | | | | | | |
| NET ASSETS: | | | | | | | | |
| Beginning of period | | | 48,074,806 | | | | 145,714,539 | |
| End of period | | $ | 46,349,750 | | | $ | 48,074,806 | |
| | | | | | | | | |
| SHARE TRANSACTIONS: | | | | | | | | |
| Issued | | | 177,647,763 | | | | 767,736,315 | |
| Reinvested | | | 5,562 | | | | 55,902 | |
| Redeemed | | | (179,396,339 | ) | | | (865,437,747 | ) |
| Change in shares | | | (1,743,014 | ) | | | (97,645,530 | ) |
See accompanying notes to financial statements.
Financial Highlights :: ProFund VP Government Money Market :: 99
ProFunds Financial Highlights FOR THE PERIODS INDICATED
Selected data for a share of beneficial interest outstanding throughout the periods indicated.
| | | Year Ended
Dec. 31, 2021 | | | Year Ended
Dec. 31, 2020 | | | Year Ended
Dec. 31, 2019 | | | Year Ended
Dec. 31, 2018 | | | Year Ended
Dec. 31, 2017 | |
| Net Asset Value, Beginning of Period | | $ | 1.000 | | | $ | 1.000 | | | $ | 1.000 | | | $ | 1.000 | | | $ | 1.000 | |
| | | | | | | | | | | | | | | | | | | | | |
| Investment Activities: | | | | | | | | | | | | | | | | | | | | |
| Net investment income (loss)(a) | | | — | (b) | | | 0.001 | | | | 0.008 | | | | — | (b) | | | — | (b) |
| Net realized gains (losses) on investments | | | — | (b) | | | — | (b) | | | — | (b) | | | — | (b) | | | — | (b) |
| Total income (loss) from investment activities | | | — | (b) | | | 0.001 | | | | 0.008 | | | | — | (b) | | | — | (b) |
| | | | | | | | | | | | | | | | | | | | | |
| Distributions to Shareholders From: | | | | | | | | | | | | | | | | | | | | |
| Net investment income | | | — | (b) | | | (0.001 | ) | | | (0.008 | ) | | | — | (b) | | | — | (b) |
| | | | | | | | | | | | | | | | | | | | | |
| Net Asset Value, End of Period | | $ | 1.000 | | | $ | 1.000 | | | $ | 1.000 | | | $ | 1.000 | | | $ | 1.000 | |
| | | | | | | | | | | | | | | | | | | | | |
| Total Return | | | 0.01 | % | | | 0.04 | % | | | 0.77 | % | | | 0.42 | % | | | 0.02 | % |
| | | | | | | | | | | | | | | | | | | | | |
| Ratios to Average Net Assets: | | | | | | | | | | | | | | | | | | | | |
| Gross expenses | | | 1.07 | % | | | 1.16 | % | | | 1.35 | % | | | 1.46 | % | | | 1.14 | % |
| Net expenses | | | — | (c)(d) | | | 0.52 | %(d) | | | 1.35 | % | | | 1.37 | %(e) | | | 0.83 | %(d) |
| Net investment income (loss) | | | 0.01 | % | | | 0.05 | % | | | 0.78 | % | | | 0.41 | % | | | 0.01 | % |
| | | | | | | | | | | | | | | | | | | | | |
| Supplemental Data: | | | | | | | | | | | | | | | | | | | | |
| Net assets, end of period (000's) | | $ | 46,350 | | | $ | 48,075 | | | $ | 145,715 | | | $ | 193,519 | | | $ | 188,217 | |
| (a) | Per share net investment income (loss) has been calculated using the average daily shares method. |
| (b) | Amount is less than $0.0005. |
| (c) | Amount is less than 0.005%. |
| (d) | The expense ratio for the period reflects the reduction of certain expenses to maintain a certain minimum net yield. |
| (e) | The expense ratio does not correlate to the applicable expense limits in place during the period given that the annual contractual expense limitation is applied for the one year periods ended April 30th of each year, instead of coinciding with the December 31st year end. Details of the current expense limitation in effect can be found in Note 4 of the accompanying Notes to Financial Statements. |
See accompanying notes to financial statements.
100 :: ProFund VP Health Care :: Management Discussion of Fund Performance
ProFund VP Health Care (the "Fund") seeks investment results, before fees and expenses, that correspond to the performance of the Dow Jones U.S. Health CareSM Index (the "Index"). For the year ended December 31, 2021, the Fund had a total return of 21.54%. For the same period, the Index had a return of 23.62%1 and a volatility of 11.93%. For the year, the Fund achieved an average daily statistical correlation of over 0.99 to the daily performance of the Index.2
The Fund takes positions in financial instruments that, in combination, should have similar return characteristics as the return of the Index. The Index measures the performance of the healthcare sector of the U.S. equity market. Component companies include, among others, health care providers, biotechnology companies, medical supplies, advanced medical devices, and pharmaceuticals.
During the year ended December 31, 2021, the Fund invested in swap agreements as a substitute for investing directly in stocks in order to gain exposure to the Index. These derivatives generally tracked the performance of their underlying benchmark and were negatively impacted by financing costs associated with their use. The Fund entered into swap agreements with counterparties that the Fund's advisor determined to be major, global financial institutions. If a counterparty becomes insolvent or otherwise fails to perform on its obligations, the value of investments in the Fund may decline. The Fund has sought to mitigate this risk by generally requiring counterparties to post collateral for the benefit of the Fund, marked to market daily, in an amount approximately equal to the amount the counterparty owed to the Fund, subject to certain minimum thresholds.
Value of a $10,000 Investment at Net Asset Value*

| * | The line graph represents the historical performance of a hypothetical investment of $10,000 in the ProFund VP Health Care from December 31, 2011 to December 31, 2021, assuming the reinvestment of distributions. |
Average Annual Total Return as of 12/31/21
| Fund | | One Year | | | Five Year | | | Ten Year | |
| ProFund VP Health Care | | | 21.54 | % | | | 15.96 | % | | | 15.67 | % |
| Dow Jones U.S. Health CareSM Index | | | 23.62 | % | | | 17.80 | % | | | 17.52 | % |
| S&P 500® | | | 28.71 | % | | | 18.47 | % | | | 16.55 | % |
Expense Ratios**
| Fund | | Gross | | | Net | | | | | |
| ProFund VP Health Care | | | 1.73 | % | | | 1.68 | % | | | | |
| ** | Reflects the expense ratio as reported in the Prospectus dated May 1, 2021. Contractual fee waivers are in effect through April 30, 2022. See Financial Highlights for effective expense ratios. |
Allocation of Portfolio Holdings & Index Composition
Market Exposure
| Investment Type | | % of Net Assets | |
| Equity Securities | | | 97 | % |
| Swap Agreements | | | 4 | % |
| Total Exposure | | | 101 | % |
"Market Exposure" includes the value of total investments (including the contract value of any derivatives) and excludes any instruments used for cash management.
Largest Equity Holdings
| Company | | % of Net Assets | |
| UnitedHealth Group, Inc. | | | 7.8 | % |
| Johnson & Johnson | | | 7.4 | % |
| Pfizer, Inc. | | | 5.5 | % |
| Thermo Fisher Scientific, Inc. | | | 4.3 | % |
| Abbott Laboratories | | | 4.1 | % |
Dow Jones U.S. Health CareSM Index – Composition
| | | % of Index | |
| Pharmaceuticals | | | 27 | % |
| Health Care Equipment & Supplies | | | 22 | % |
| Health Care Providers & Services | | | 20 | % |
| Biotechnology | | | 16 | % |
| Life Sciences Tools & Services | | | 15 | % |
Past performance does not guarantee future results. Return calculations assume the reinvestment of distributions and do not reflect taxes that a shareholder would pay on Fund distributions or on the redemption of Fund shares. The performance data quoted represents past performance and current returns may be lower or higher. The investment return and net asset value ("NAV") will fluctuate so that an investor's shares, when redeemed, may be worth more or less than the original cost. The performance above reflects any fee reductions during the applicable periods. If such fee reductions had not occurred, the quoted performance would be lower. Performance numbers are net of all Fund fees and expenses but do not include any insurance, sales, or administrative charges of variable annuity or life insurance contracts. If these charges were included, the returns would be lower. To obtain performance current to the most recent month-end, please call toll-free 888-776-3637.
| 1 | The graph and table reflect the theoretical reinvestment of dividends on securities in the Indexes. The impact of transaction costs and the deduction of fees and expenses associated with a mutual fund, such as investment management and accounting fees, are not reflected in calculations of the Indexes. The Fund's performance reflects the reinvestment of dividends as well as the impact of transaction costs and the deduction of fees and expenses. It is not possible to invest directly in an index. |
| 2 | 1.00 equals perfect correlation. This calculation is based on the daily total return of the Index and the performance of the daily total return of the NAV per share of the Fund. |
| 3 | The S&P 500® is an unmanaged index that consists of the common stocks of 500 major U.S. corporations selected for their size and the frequency and ease with which their stocks trade. |
The above information is not covered by the Report of the Independent Registered Public Accounting Firm.
Financial Statements :: ProFund VP Health Care :: 101
Schedule of Portfolio Investments :: December 31, 2021
Common Stocks (96.7%)
| | | Shares | | | Value | |
| 10X Genomics, Inc.* — Class A (Life Sciences Tools & Services) | | | 841 | | | $ | 125,275 | |
| 1Life Healthcare, Inc.* (Health Care Providers & Services) | | | 1,560 | | | | 27,409 | |
| Abbott Laboratories (Health Care Equipment & Supplies) | | | 16,240 | | | | 2,285,619 | |
| AbbVie, Inc. (Biotechnology) | | | 16,236 | | | | 2,198,353 | |
| ABIOMED, Inc.* (Health Care Equipment & Supplies) | | | 418 | | | | 150,133 | |
| Acadia Healthcare Co., Inc.* (Health Care Providers & Services) | | | 826 | | | | 50,138 | |
| ACADIA Pharmaceuticals, Inc.* (Biotechnology) | | | 1,078 | | | | 25,161 | |
| Agilent Technologies, Inc. (Life Sciences Tools & Services) | | | 2,780 | | | | 443,827 | |
| agilon health, Inc.* (Health Care Providers & Services) | | | 434 | | | | 11,718 | |
| Agios Pharmaceuticals, Inc.* (Biotechnology) | | | 499 | | | | 16,402 | |
| Align Technology, Inc.* (Health Care Equipment & Supplies) | | | 674 | | | | 442,939 | |
| Alkermes PLC* (Biotechnology) | | | 1,485 | | | | 34,541 | |
| Allogene Therapeutics, Inc.* (Biotechnology) | | | 681 | | | | 10,161 | |
| Alnylam Pharmaceuticals, Inc.* (Biotechnology) | | | 1,098 | | | | 186,199 | |
| Amedisys, Inc.* (Health Care Providers & Services) | | | 299 | | | | 48,402 | |
| American Well Corp.* — Class A (Health Care Technology) | | | 1,797 | | | | 10,854 | |
| Amgen, Inc. (Biotechnology) | | | 5,173 | | | | 1,163,770 | |
| Anthem, Inc. (Health Care Providers & Services) | | | 2,229 | | | | 1,033,230 | |
| Arrowhead Pharmaceuticals, Inc.* (Biotechnology) | | | 958 | | | | 63,515 | |
| Avantor, Inc.* (Life Sciences Tools & Services) | | | 5,597 | | | | 235,858 | |
| Baxter International, Inc. (Health Care Equipment & Supplies) | | | 4,598 | | | | 394,692 | |
| Beam Therapeutics, Inc.* (Biotechnology) | | | 413 | | | | 32,912 | |
| Becton, Dickinson & Co. (Health Care Equipment & Supplies) | | | 2,638 | | | | 663,404 | |
| Berkeley Lights, Inc.* (Life Sciences Tools & Services) | | | 384 | | | | 6,981 | |
| Biogen, Inc.* (Biotechnology) | | | 1,349 | | | | 323,652 | |
| Biohaven Pharmaceutical Holding Co., Ltd.* (Biotechnology) | | | 535 | | | | 73,728 | |
| BioMarin Pharmaceutical, Inc.* (Biotechnology) | | | 1,686 | | | | 148,958 | |
| Bio-Rad Laboratories, Inc.* — Class A (Life Sciences Tools & Services) | | | 198 | | | | 149,603 | |
| Bio-Techne Corp. (Life Sciences Tools & Services) | | | 361 | | | | 186,760 | |
| Blueprint Medicines Corp.* (Biotechnology) | | | 540 | | | | 57,839 | |
| Boston Scientific Corp.* (Health Care Equipment & Supplies) | | | 13,087 | | | | 555,936 | |
| Bridgebio Pharma, Inc.* (Biotechnology) | | | 987 | | | | 16,463 | |
| Bristol-Myers Squibb Co. (Pharmaceuticals) | | | 20,386 | | | | 1,271,067 | |
| Bruker Corp. (Life Sciences Tools & Services) | | | 933 | | | | 78,288 | |
| Catalent, Inc.* (Pharmaceuticals) | | | 1,572 | | | | 201,263 | |
| Centene Corp.* (Health Care Providers & Services) | | | 5,359 | | | | 441,582 | |
| Charles River Laboratories International, Inc.* (Life Sciences Tools & Services) | | | 463 | | | | 174,449 | |
| Chemed Corp. (Health Care Providers & Services) | | | 141 | | | | 74,595 | |
| Cigna Corp. (Health Care Providers & Services) | | | 3,044 | | | | 698,994 | |
| Covetrus, Inc.* (Health Care Providers & Services) | | | 949 | | | | 18,952 | |
| CVS Health Corp. (Health Care Providers & Services) | | | 12,124 | | | | 1,250,711 | |
| Danaher Corp. (Health Care Equipment & Supplies) | | | 5,841 | | | | 1,921,747 | |
| DaVita, Inc.* (Health Care Providers & Services) | | | 599 | | | | 68,142 | |
| Denali Therapeutics, Inc.* (Biotechnology) | | | 852 | | | | 37,999 | |
| DENTSPLY SIRONA, Inc. (Health Care Equipment & Supplies) | | | 2,008 | | | | 112,026 | |
| DexCom, Inc.* (Health Care Equipment & Supplies) | | | 890 | | | | 477,886 | |
| Doximity, Inc.* — Class A (Health Care Technology) | | | 447 | | | | 22,408 | |
| Edwards Lifesciences Corp.* (Health Care Equipment & Supplies) | | | 5,734 | | | | 742,840 | |
| Elanco Animal Health, Inc.* (Pharmaceuticals) | | | 4,345 | | | | 123,311 | |
| Eli Lilly & Co. (Pharmaceuticals) | | | 7,292 | | | | 2,014,197 | |
| Emergent BioSolutions, Inc.* (Biotechnology) | | | 440 | | | | 19,127 | |
| Encompass Health Corp. (Health Care Providers & Services) | | | 914 | | | | 59,648 | |
| Envista Holdings Corp.* (Health Care Equipment & Supplies) | | | 1,482 | | | | 66,779 | |
| Exact Sciences Corp.* (Biotechnology) | | | 1,583 | | | | 123,205 | |
| Exelixis, Inc.* (Biotechnology) | | | 2,906 | | | | 53,122 | |
| Fate Therapeutics, Inc.* (Biotechnology) | | | 746 | | | | 43,648 | |
| Gilead Sciences, Inc. (Biotechnology) | | | 11,520 | | | | 836,467 | |
| Globus Medical, Inc.* — Class A (Health Care Equipment & Supplies) | | | 726 | | | | 52,417 | |
| GoodRx Holdings, Inc.* — Class A (Health Care Technology) | | | 589 | | | | 19,249 | |
| Guardant Health, Inc.* (Health Care Providers & Services) | | | 934 | | | | 93,419 | |
| Haemonetics Corp.* (Health Care Equipment & Supplies) | | | 469 | | | | 24,876 | |
| Halozyme Therapeutics, Inc.* (Biotechnology) | | | 1,293 | | | | 51,992 | |
| HCA Healthcare, Inc. (Health Care Providers & Services) | | | 2,199 | | | | 564,967 | |
| HealthEquity, Inc.* (Health Care Providers & Services) | | | 767 | | | | 33,932 | |
| Henry Schein, Inc.* (Health Care Providers & Services) | | | 1,274 | | | | 98,773 | |
| Hologic, Inc.* (Health Care Equipment & Supplies) | | | 2,328 | | | | 178,232 | |
| Horizon Therapeutics PLC* (Pharmaceuticals) | | | 2,083 | | | | 224,464 | |
| Humana, Inc. (Health Care Providers & Services) | | | 1,180 | | | | 547,355 | |
| ICU Medical, Inc.* (Health Care Equipment & Supplies) | | | 183 | | | | 43,433 | |
| IDEXX Laboratories, Inc.* (Health Care Equipment & Supplies) | | | 779 | | | | 512,940 | |
| Illumina, Inc.* (Life Sciences Tools & Services) | | | 1,435 | | | | 545,931 | |
| Incyte Corp.* (Biotechnology) | | | 1,724 | | | | 126,542 | |
| Insulet Corp.* (Health Care Equipment & Supplies) | | | 633 | | | | 168,422 | |
See accompanying notes to financial statements.
102 :: ProFund VP Health Care :: Financial Statements
Common Stocks, continued
| | | Shares | | | Value | |
| Integra LifeSciences Holdings Corp.* (Health Care Equipment & Supplies) | | | 669 | | | $ | 44,816 | |
| Intellia Therapeutics, Inc.* (Biotechnology) | | | 636 | | | | 75,201 | |
| Intuitive Surgical, Inc.* (Health Care Equipment & Supplies) | | | 3,278 | | | | 1,177,785 | |
| Invitae Corp.* (Biotechnology) | | | 1,911 | | | | 29,181 | |
| Ionis Pharmaceuticals, Inc.* (Biotechnology) | | | 1,297 | | | | 39,468 | |
| IQVIA Holdings, Inc.* (Life Sciences Tools & Services) | | | 1,755 | | | | 495,156 | |
| Jazz Pharmaceuticals PLC* (Pharmaceuticals) | | | 565 | | | | 71,981 | |
| Johnson & Johnson (Pharmaceuticals) | | | 24,178 | | | | 4,136,131 | |
| Laboratory Corp. of America Holdings* (Health Care Providers & Services) | | | 879 | | | | 276,191 | |
| LHC Group, Inc.* (Health Care Providers & Services) | | | 291 | | | | 39,934 | |
| Maravai LifeSciences Holdings, Inc.* — Class A (Life Sciences Tools & Services) | | | 1,002 | | | | 41,984 | |
| Masimo Corp.* (Health Care Equipment & Supplies) | | | 467 | | | | 136,728 | |
| McKesson Corp. (Health Care Providers & Services) | | | 1,402 | | | | 348,495 | |
| Medpace Holdings, Inc.* (Life Sciences Tools & Services) | | | 264 | | | | 57,457 | |
| Medtronic PLC (Health Care Equipment & Supplies) | | | 12,360 | | | | 1,278,642 | |
| Merck & Co., Inc. (Pharmaceuticals) | | | 23,199 | | | | 1,777,972 | |
| Mettler-Toledo International, Inc.* (Life Sciences Tools & Services) | | | 211 | | | | 358,111 | |
| Mirati Therapeutics, Inc.* (Biotechnology) | | | 455 | | | | 66,744 | |
| Moderna, Inc.* (Biotechnology) | | | 3,240 | | | | 822,895 | |
| Molina Healthcare, Inc.* (Health Care Providers & Services) | | | 536 | | | | 170,491 | |
| Natera, Inc.* (Biotechnology) | | | 808 | | | | 75,459 | |
| Nektar Therapeutics* (Pharmaceuticals) | | | 1,695 | | | | 22,899 | |
| Neogen Corp.* (Health Care Equipment & Supplies) | | | 987 | | | | 44,820 | |
| NeoGenomics, Inc.* (Life Sciences Tools & Services) | | | 1,131 | | | | 38,590 | |
| Neurocrine Biosciences, Inc.* (Biotechnology) | | | 872 | | | | 74,268 | |
| Novavax, Inc.* (Biotechnology) | | | 694 | | | | 99,291 | |
| Novocure, Ltd.* (Health Care Equipment & Supplies) | | | 820 | | | | 61,566 | |
| NuVasive, Inc.* (Health Care Equipment & Supplies) | | | 475 | | | | 24,928 | |
| Oak Street Health, Inc.* (Health Care Providers & Services) | | | 1,283 | | | | 42,519 | |
| Organon & Co. (Pharmaceuticals) | | | 2,329 | | | | 70,918 | |
| Pacific Biosciences of California, Inc.* (Life Sciences Tools & Services) | | | 2,026 | | | | 41,452 | |
| Penumbra, Inc.* (Health Care Equipment & Supplies) | | | 323 | | | | 92,804 | |
| Perrigo Co. PLC (Pharmaceuticals) | | | 1,229 | | | | 47,808 | |
| Pfizer, Inc. (Pharmaceuticals) | | | 51,549 | | | | 3,043,969 | |
| Premier, Inc. (Health Care Providers & Services) | | | 1,119 | | | | 46,069 | |
| Quest Diagnostics, Inc. (Health Care Providers & Services) | | | 1,127 | | | | 194,982 | |
| Quidel Corp.* (Health Care Equipment & Supplies) | | | 348 | | | | 46,977 | |
| R1 RCM, Inc.* (Health Care Providers & Services) | | | 1,224 | | | | 31,200 | |
| Regeneron Pharmaceuticals, Inc.* (Biotechnology) | | | 971 | | | | 613,206 | |
| Repligen Corp.* (Biotechnology) | | | 472 | | | | 125,004 | |
| ResMed, Inc. (Health Care Equipment & Supplies) | | | 1,338 | | | | 348,522 | |
| Royalty Pharma PLC — Class A (Pharmaceuticals) | | | 3,274 | | | | 130,469 | |
| Sarepta Therapeutics, Inc.* (Biotechnology) | | | 800 | | | | 72,040 | |
| Seagen, Inc.* (Biotechnology) | | | 1,226 | | | | 189,540 | |
| Shockwave Medical, Inc.* (Health Care Equipment & Supplies) | | | 324 | | | | 57,779 | |
| Signify Health, Inc.* — Class A (Health Care Providers & Services) | | | 219 | | | | 3,114 | |
| Sotera Health Co.* (Life Sciences Tools & Services) | | | 909 | | | | 21,407 | |
| STAAR Surgical Co.* (Health Care Equipment & Supplies) | | | 437 | | | | 39,898 | |
| STERIS PLC (Health Care Equipment & Supplies) | | | 919 | | | | 223,694 | |
| Stryker Corp. (Health Care Equipment & Supplies) | | | 3,084 | | | | 824,723 | |
| Syneos Health, Inc.* (Life Sciences Tools & Services) | | | 952 | | | | 97,751 | |
| Tandem Diabetes Care, Inc.* (Health Care Equipment & Supplies) | | | 583 | | | | 87,753 | |
| Teladoc Health, Inc.* (Health Care Technology) | | | 1,470 | | | | 134,975 | |
| Teleflex, Inc. (Health Care Equipment & Supplies) | | | 430 | | | | 141,246 | |
| Tenet Healthcare Corp.* (Health Care Providers & Services) | | | 984 | | | | 80,383 | |
| The Cooper Cos., Inc. (Health Care Equipment & Supplies) | | | 453 | | | | 189,780 | |
| Thermo Fisher Scientific, Inc. (Life Sciences Tools & Services) | | | 3,619 | | | | 2,414,741 | |
| Twist Bioscience Corp.* (Biotechnology) | | | 453 | | | | 35,058 | |
| Ultragenyx Pharmaceutical, Inc.* (Biotechnology) | | | 626 | | | | 52,640 | |
| United Therapeutics Corp.* (Biotechnology) | | | 414 | | | | 89,457 | |
| UnitedHealth Group, Inc. (Health Care Providers & Services) | | | 8,650 | | | | 4,343,510 | |
| Universal Health Services, Inc. — Class B (Health Care Providers & Services) | | | 672 | | | | 87,132 | |
| Vertex Pharmaceuticals, Inc.* (Biotechnology) | | | 2,335 | | | | 512,766 | |
| Viatris, Inc. (Pharmaceuticals) | | | 11,108 | | | | 150,291 | |
| Vir Biotechnology, Inc.* (Biotechnology) | | | 673 | | | | 28,179 | |
| Waters Corp.* (Life Sciences Tools & Services) | | | 561 | | | | 209,029 | |
| West Pharmaceutical Services, Inc. (Health Care Equipment & Supplies) | | | 680 | | | | 318,927 | |
| Zimmer Biomet Holdings, Inc. (Health Care Equipment & Supplies) | | | 1,919 | | | | 243,790 | |
| Zoetis, Inc. (Pharmaceuticals) | | | 4,345 | | | | 1,060,310 | |
TOTAL COMMON STOCKS
(Cost $12,527,904) | | | | | | | 53,866,825 | |
See accompanying notes to financial statements.
Financial Statements :: ProFund VP Health Care :: 103
Repurchase Agreements(a) (3.1%)
| | | Principal
Amount | | | Value | |
| Repurchase Agreements with various counterparties, 0.00%, dated 12/31/21, due 1/3/22, total to be received $1,716,000 | | $ | 1,716,000 | | | $ | 1,716,000 | |
TOTAL REPURCHASE AGREEMENTS
(Cost $1,716,000) | | | | | | | 1,716,000 | |
TOTAL INVESTMENT SECURITIES
(Cost $14,243,904) — 99.8% | | | | | | | 55,582,825 | |
| Net other assets (liabilities) — 0.2% | | | | | | | 94,216 | |
| NET ASSETS — 100.0% | | | | | | $ | 55,677,041 | |
| * | Non-income producing security. |
| (a) | The ProFund VP invests in Repurchase Agreements jointly with other funds in the Trust. See "Repurchase Agreements" under Note 2 in the Notes to Financial Statements to view the details of each individual agreement and counterparty as well as a description of the securities subject to repurchase. |
Total Return Swap Agreements — Long
| Underlying Instrument | | Counterparty | | Termination
Date(1) | | | Rate Paid
(Received)(2) | | | Notional
Amount | | | Value and
Unrealized
Appreciation/
(Depreciation) | |
| Dow Jones U.S. Health Care Index | | Goldman Sachs International | | | 1/24/22 | | | | 0.68 | % | | $ | 1,964,554 | | | $ | 10,767 | |
| (1) | Agreements may be terminated at will by either party without penalty. Payment is due at termination/maturity. |
| (2) | Reflects the floating financing rate, as of December 31, 2021, on the notional amount of the swap agreement paid to the counterparty or received from the counterparty, excluding any commissions. This amount is included as part of the unrealized appreciation/(depreciation). |
ProFund VP Health Care invested in the following industries as of December 31, 2021:
| | | Value | | | % of
Net Assets | |
| Biotechnology | | $ | 8,644,153 | | | | 15.5 | % |
| Health Care Equipment & Supplies | | | 14,179,499 | | | | 25.5 | % |
| Health Care Providers & Services | | | 10,785,987 | | | | 19.4 | % |
| Health Care Technology | | | 187,486 | | | | 0.3 | % |
| Life Sciences Tools & Services | | | 5,722,650 | | | | 10.3 | % |
| Pharmaceuticals | | | 14,347,050 | | | | 25.7 | % |
| Other** | | | 1,810,216 | | | | 3.3 | % |
| Total | | $ | 55,677,041 | | | | 100.0 | % |
| ** | Includes any non-equity securities and net other assets (liabilities), which includes any receivable for capital shares issued and payable for capital shares redeemed. |
See accompanying notes to financial statements.
104 :: ProFund VP Health Care :: Financial Statements
Statement of Assets and Liabilities
December 31, 2021
| ASSETS: | | | |
| Total Investment Securities, at cost | | $ | 14,243,904 | |
| Securities, at value | | | 53,866,825 | |
| Repurchase agreements, at value | | | 1,716,000 | |
| Total Investment Securities, at value | | | 55,582,825 | |
| Cash | | | 439 | |
| Segregated cash balances for swap agreements with custodian | | | 190,000 | |
| Dividends receivable | | | 31,863 | |
| Unrealized appreciation on swap agreements | | | 10,767 | |
| Receivable for capital shares issued | | | 10,331 | |
| Prepaid expenses | | | 738 | |
| TOTAL ASSETS | | | 55,826,963 | |
| | | | | |
| LIABILITIES: | | | | |
| Payable for capital shares redeemed | | | 22,086 | |
| Advisory fees payable | | | 44,234 | |
| Management services fees payable | | | 5,898 | |
| Administration fees payable | | | 3,223 | |
| Administrative services fees payable | | | 18,918 | |
| Distribution fees payable | | | 21,241 | |
| Transfer agency fees payable | | | 5,173 | |
| Fund accounting fees payable | | | 1,821 | |
| Compliance services fees payable | | | 239 | |
| Other accrued expenses | | | 27,089 | |
| TOTAL LIABILITIES | | | 149,922 | |
| NET ASSETS | | $ | 55,677,041 | |
| | | | | |
| NET ASSETS CONSIST OF: | | | | |
| Capital | | $ | 14,241,372 | |
| Total distributable earnings (loss) | | | 41,435,669 | |
| NET ASSETS | | $ | 55,677,041 | |
| Shares of Beneficial Interest Outstanding (unlimited number of shares authorized, no par value) | | | 662,280 | |
| Net Asset Value (offering and redemption price per share) | | $ | 84.07 | |
Statement of Operations
For the Year Ended December 31, 2021
| INVESTMENT INCOME: | | | | |
| Dividends | | $ | 728,544 | |
| Interest | | | 17 | |
| Net income from securities lending | | | 15 | |
| TOTAL INVESTMENT INCOME | | | 728,576 | |
| | | | | |
| EXPENSES: | | | | |
| Advisory fees | | | 396,031 | |
| Management services fees | | | 52,804 | |
| Administration fees | | | 39,721 | |
| Transfer agency fees | | | 32,179 | |
| Administrative services fees | | | 143,076 | |
| Distribution fees | | | 132,010 | |
| Custody fees | | | 7,913 | |
| Fund accounting fees | | | 22,025 | |
| Trustee fees | | | 886 | |
| Compliance services fees | | | 337 | |
| Other fees | | | 50,829 | |
| Recoupment of prior expenses reduced by the Advisor | | | 11,500 | |
| Total Gross Expenses before reductions | | | 889,311 | |
| Expenses reduced and reimbursed by the Advisor | | | (2,200 | ) |
| TOTAL NET EXPENSES | | | 887,111 | |
| NET INVESTMENT INCOME (LOSS) | | | (158,535 | ) |
| | | | | |
| REALIZED AND UNREALIZED GAINS (LOSSES) ON INVESTMENTS: | | | | |
| Net realized gains (losses) on investment securities | | | 2,847,297 | |
| Net realized gains (losses) on swap agreements | | | 251,511 | |
| Change in net unrealized appreciation/depreciation on investment securities | | | 7,310,524 | |
| Change in net unrealized appreciation/depreciation on swap agreements | | | (15,044 | ) |
| NET REALIZED AND UNREALIZED GAINS (LOSSES) ON INVESTMENTS | | | 10,394,288 | |
| CHANGE IN NET ASSETS RESULTING FROM OPERATIONS | | $ | 10,235,753 | |
See accompanying notes to financial statements.
Financial Statements :: ProFund VP Health Care :: 105
| Statements of Changes in Net Assets |
| |
| | | Year Ended
December 31, 2021 | | | Year Ended
December 31, 2020 | |
| FROM INVESTMENT ACTIVITIES: |
| |
| OPERATIONS: |
| Net investment income (loss) | | $ | (158,535 | ) | | $ | 19,004 | |
| Net realized gains (losses) on investments | | | 3,098,808 | | | | 4,344,309 | |
| Change in net unrealized appreciation/depreciation on investments | | | 7,295,480 | | | | 1,182,442 | |
| Change in net assets resulting from operations | | | 10,235,753 | | | | 5,545,755 | |
| | | | | | | | | |
| DISTRIBUTIONS TO SHAREHOLDERS: | | | | | | | | |
| Total distributions | | | (4,237,991 | ) | | | (6,154,240 | ) |
| Change in net assets resulting from distributions | | | (4,237,991 | ) | | | (6,154,240 | ) |
| | | | | | | | | |
| CAPITAL TRANSACTIONS: | | | | | | | | |
| Proceeds from shares issued | | | 19,002,003 | | | | 42,078,065 | |
| Distributions reinvested | | | 4,237,991 | | | | 6,154,240 | |
| Value of shares redeemed | | | (25,561,869 | ) | | | (45,032,120 | ) |
| Change in net assets resulting from capital transactions | | | (2,321,875 | ) | | | 3,200,185 | |
| Change in net assets | | | 3,675,887 | | | | 2,591,700 | |
| | | | | | | | | |
| NET ASSETS: | | | | | | | | |
| Beginning of period | | | 52,001,154 | | | | 49,409,454 | |
| End of period | | $ | 55,677,041 | | | $ | 52,001,154 | |
| | | | | | | | | |
| SHARE TRANSACTIONS: | | | | | | | | |
| Issued | | | 240,693 | | | | 578,868 | |
| Reinvested | | | 57,817 | | | | 85,821 | |
| Redeemed | | | (325,367 | ) | | | (635,160 | ) |
| Change in shares | | | (26,857 | ) | | | 29,529 | |
See accompanying notes to financial statements.
106 :: ProFund VP Health Care :: Financial Highlights
ProFunds Financial Highlights FOR THE PERIODS INDICATED
Selected data for a share of beneficial interest outstanding throughout the periods indicated.
| | | Year Ended
Dec. 31, 2021 | | | Year Ended
Dec. 31, 2020 | | | Year Ended
Dec. 31, 2019 | | | Year Ended
Dec. 31, 2018 | | | Year Ended
Dec. 31, 2017 | |
| Net Asset Value, Beginning of Period | | $ | 75.46 | | | $ | 74.91 | | | $ | 71.82 | | | $ | 73.28 | | | $ | 64.38 | |
| | | | | | | | | | | | | | | | | | | | | |
| Investment Activities: | | | | | | | | | | | | | | | | | | | | |
| Net investment income (loss)(a) | | | (0.24 | ) | | | 0.03 | | | | (0.01 | ) | | | (0.06 | ) | | | (0.03 | ) |
| Net realized and unrealized gains (losses) on investments | | | 15.51 | | | | 10.27 | | | | 12.63 | | | | 3.29 | | | | 13.49 | |
| Total income (loss) from investment activities | | | 15.27 | | | | 10.30 | | | | 12.62 | | | | 3.23 | | | | 13.46 | |
| | | | | | | | | | | | | | | | | | | | | |
| Distributions to Shareholders From: | | | | | | | | | | | | | | | | | | | | |
| Net investment income | | | (0.03 | ) | | | — | | | | — | | | | — | | | | — | |
| Net realized gains on investments | | | (6.63 | ) | | | (9.75 | ) | | | (9.53 | ) | | | (4.69 | ) | | | (4.56 | ) |
| Total distributions | | | (6.66 | ) | | | (9.75 | ) | | | (9.53 | ) | | | (4.69 | ) | | | (4.56 | ) |
| | | | | | | | | | | | | | | | | | | | | |
| Net Asset Value, End of Period | | $ | 84.07 | | | $ | 75.46 | | | $ | 74.91 | | | $ | 71.82 | | | $ | 73.28 | |
| | | | | | | | | | | | | | | | | | | | | |
| Total Return | | | 21.54 | % | | | 14.44 | % | | | 19.37 | % | | | 4.44 | % | | | 20.92 | % |
| | | | | | | | | | | | | | | | | | | | | |
| Ratios to Average Net Assets: | | | | | | | | | | | | | | | | | | | | |
| Gross expenses | | | 1.68 | % | | | 1.73 | % | | | 1.72 | % | | | 1.66 | % | | | 1.64 | % |
| Net expenses | | | 1.68 | % | | | 1.68 | % | | | 1.68 | % | | | 1.65 | % | | | 1.64 | % |
| Net investment income (loss) | | | (0.30 | )% | | | 0.04 | % | | | (0.01 | )% | | | (0.08 | )% | | | (0.04 | )% |
| | | | | | | | | | | | | | | | | | | | | |
| Supplemental Data: | | | | | | | | | | | | | | | | | | | | |
| Net assets, end of period (000's) | | $ | 55,677 | | | $ | 52,001 | | | $ | 49,409 | | | $ | 52,173 | | | $ | 53,670 | |
| Portfolio turnover rate(b) | | | 10 | % | | | 58 | % | | | 33 | % | | | 61 | % | | | 43 | % |
| (a) | Per share net investment income (loss) has been calculated using the average daily shares method. |
| (b) | Portfolio turnover rate is calculated without regard to instruments having a maturity of less than one year from acquisition or derivative instruments (including swap agreements and futures contracts). The portfolio turnover rate can be high and volatile due to the amount and timing of sales and purchases of fund shares during the period. |
See accompanying notes to financial statements.
Management Discussion of Fund Performance :: ProFund VP Industrials :: 107
ProFund VP Industrials (the "Fund") seeks investment results, before fees and expenses, that correspond to the performance of the Dow Jones U.S. IndustrialsSM Index (the "Index"). For the year ended December 31, 2021, the Fund had a total return of 16.40%. For the same period, the Index had a total return of 18.37%1 and a volatility of 15.15%. For the year, the Fund achieved an average daily statistical correlation of over 0.99 to the daily performance of the Index.2
The Fund takes positions in financial instruments that, in combination, should have similar return characteristics as the return of the Index. The Index measures the performance of the industrial sector of the U.S. equity market. Component companies include, among others, building materials, heavy construction, factory equipment, heavy machinery, industrial services, pollution control, containers and packaging, industrial diversified, air freight, marine transportation, railroads, trucking, land-transportation equipment, shipbuilding, transportation services, advanced industrial equipment, electric components and equipment, and aerospace.
During the year ended December 31, 2021, the Fund invested in swap agreements as a substitute for investing directly in stocks in order to gain exposure to the Index. These derivatives generally tracked the performance of their underlying benchmark and were negatively impacted by financing costs associated with their use. The Fund entered into swap agreements with counterparties that the Fund's advisor determined to be major, global financial institutions. If a counterparty becomes insolvent or otherwise fails to perform on its obligations, the value of investments in the Fund may decline. The Fund has sought to mitigate this risk by generally requiring counterparties to post collateral for the benefit of the Fund, marked to market daily, in an amount approximately equal to the amount the counterparty owed to the Fund, subject to certain minimum thresholds.
Value of a $10,000 Investment at Net Asset Value*
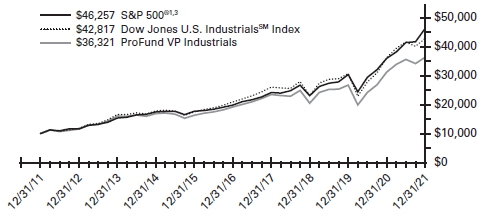
| * | The line graph represents the historical performance of a hypothetical investment of $10,000 in the ProFund VP Industrials from December 31, 2011 to December 31, 2021, assuming the reinvestment of distributions. |
Average Annual Total Return as of 12/31/21
| Fund | | One Year | | | Five Year | | | Ten Year | |
| ProFund VP Industrials | | | 16.40 | % | | | 13.62 | % | | | 13.77 | % |
| Dow Jones U.S. IndustrialsSM Index | | | 18.37 | % | | | 15.43 | % | | | 15.65 | % |
| S&P 500® | | | 28.71 | % | | | 18.47 | % | | | 16.55 | % |
Expense Ratios**
| Fund | | Gross | | | Net | | | | | |
| ProFund VP Industrials | | | 1.75 | % | | | 1.68 | % | | | | |
| ** | Reflects the expense ratio as reported in the Prospectus dated May 1, 2021. Contractual fee waivers are in effect through April 30, 2022. See Financial Highlights for effective expense ratios. |
Allocation of Portfolio Holdings & Index Composition
Market Exposure
| Investment Type | | % of Net Assets | |
| Equity Securities | | | 97 | % |
| Swap Agreements | | | 3 | % |
| Total Exposure | | | 100 | % |
"Market Exposure" includes the value of total investments (including the contract value of any derivatives) and excludes any instruments used for cash management or collateral for securities loaned.
Largest Equity Holdings
| Company | | % of Net Assets | |
| Accenture PLC | | | 4.9 | % |
| PayPal Holdings, Inc. | | | 4.1 | % |
| Union Pacific Corp. | | | 3.0 | % |
| United Parcel Service, Inc. | | | 2.9 | % |
| Honeywell International, Inc. | | | 2.7 | % |
Dow Jones U.S. IndustrialsSM Index – Composition
| | | % of Index | |
| Capital Goods | | | 49 | % |
| Software & Services | | | 19 | % |
| Transportation | | | 13 | % |
| Commercial & Professional Services | | | 7 | % |
| Technology Hardware & Equipment | | | 6 | % |
| Materials | | | 6 | % |
Past performance does not guarantee future results. Return calculations assume the reinvestment of distributions and do not reflect taxes that a shareholder would pay on Fund distributions or on the redemption of Fund shares. The performance data quoted represents past performance and current returns may be lower or higher. The investment return and net asset value ("NAV") will fluctuate so that an investor's shares, when redeemed, may be worth more or less than the original cost. The performance above reflects any fee reductions during the applicable periods. If such fee reductions had not occurred, the quoted performance would be lower. Performance numbers are net of all Fund fees and expenses but do not include any insurance, sales, or administrative charges of variable annuity or life insurance contracts. If these charges were included, the returns would be lower. To obtain performance current to the most recent month-end, please call toll-free 888-776-3637.
| 1 | The graph and table reflect the theoretical reinvestment of dividends on securities in the Indexes. The impact of transaction costs and the deduction of fees and expenses associated with a mutual fund, such as investment management and accounting fees, are not reflected in calculations of the Indexes. The Fund's performance reflects the reinvestment of dividends as well as the impact of transaction costs and the deduction of fees and expenses. It is not possible to invest directly in an index. |
| 2 | 1.00 equals perfect correlation. This calculation is based on the daily total return of the Index and the performance of the daily total return of the NAV per share of the Fund. |
| 3 | The S&P 500® is an unmanaged index that consists of the common stocks of 500 major U.S. corporations selected for their size and the frequency and ease with which their stocks trade. |
The above information is not covered by the Report of the Independent Registered Public Accounting Firm.
108 :: ProFund VP Industrials :: Financial Statements
Schedule of Portfolio Investments :: December 31, 2021
Common Stocks (96.6%)
| | | Shares | | | Value | |
| 3M Co. (Industrial Conglomerates) | | | 2,350 | | | $ | 417,431 | |
| A.O. Smith Corp. (Building Products) | | | 543 | | | | 46,617 | |
| Accenture PLC—Class A (IT Services) | | | 2,575 | | | | 1,067,466 | |
| Acuity Brands, Inc. (Electrical Equipment) | | | 142 | | | | 30,064 | |
| ADT, Inc. (Commercial Services & Supplies) | | | 594 | | | | 4,996 | |
| Advanced Drainage Systems, Inc. (Building Products) | | | 229 | | | | 31,174 | |
| AECOM* (Construction & Engineering) | | | 587 | | | | 45,404 | |
| Affirm Holdings, Inc.* (IT Services) | | | 596 | | | | 59,934 | |
| AGCO Corp. (Machinery) | | | 250 | | | | 29,005 | |
| Air Lease Corp. (Trading Companies & Distributors) | | | 437 | | | | 19,329 | |
| Alight, Inc.*—Class A (Professional Services) | | | 1,002 | | | | 10,832 | |
| Allegion PLC (Building Products) | | | 366 | | | | 48,473 | |
| Allison Transmission Holdings, Inc. (Machinery) | | | 425 | | | | 15,449 | |
| Amcor PLC (Containers & Packaging) | | | 6,251 | | | | 75,075 | |
| AMETEK, Inc. (Electrical Equipment) | | | 943 | | | | 138,659 | |
| Amphenol Corp.—Class A (Electronic Equipment, Instruments & Components) | | | 2,438 | | | | 213,228 | |
| Applied Industrial Technologies, Inc. (Trading Companies & Distributors) | | | 157 | | | | 16,124 | |
| AptarGroup, Inc. (Containers & Packaging) | | | 268 | | | | 32,825 | |
| Armstrong World Industries, Inc. (Building Products) | | | 194 | | | | 22,527 | |
| Arrow Electronics, Inc.* (Electronic Equipment, Instruments & Components) | | | 284 | | | | 38,133 | |
| ASGN, Inc.* (Professional Services) | | | 212 | | | | 26,161 | |
| Automatic Data Processing, Inc. (IT Services) | | | 1,718 | | | | 423,624 | |
| Avery Dennison Corp. (Containers & Packaging) | | | 338 | | | | 73,201 | |
| Avnet, Inc. (Electronic Equipment, Instruments & Components) | | | 405 | | | | 16,698 | |
| Axon Enterprise, Inc.* (Aerospace & Defense) | | | 268 | | | | 42,076 | |
| Ball Corp. (Containers & Packaging) | | | 1,321 | | | | 127,172 | |
| Berry Global Group, Inc.* (Containers & Packaging) | | | 552 | | | | 40,727 | |
| Booz Allen Hamilton Holding Corp. (Professional Services) | | | 546 | | | | 46,295 | |
| Broadridge Financial Solutions, Inc. (IT Services) | | | 475 | | | | 86,840 | |
| Builders FirstSource, Inc.* (Building Products) | | | 781 | | | | 66,940 | |
| BWX Technologies, Inc. (Aerospace & Defense) | | | 376 | | | | 18,003 | |
| C.H. Robinson Worldwide, Inc. (Air Freight & Logistics) | | | 530 | | | | 57,044 | |
| CACI International, Inc.*—Class A (Professional Services) | | | 95 | | | | 25,575 | |
| Carlisle Cos., Inc. (Industrial Conglomerates) | | | 213 | | | | 52,850 | |
| Carrier Global Corp. (Building Products) | | | 3,533 | | | | 191,630 | |
| Caterpillar, Inc. (Machinery) | | | 2,206 | | | | 456,069 | |
| ChargePoint Holdings, Inc.* (Electrical Equipment) | | | 702 | | | | 13,373 | |
| Chart Industries, Inc.* (Machinery) | | | 145 | | | | 23,126 | |
| Cimpress PLC* (Commercial Services & Supplies) | | | 80 | | | | 5,729 | |
| Cintas Corp. (Commercial Services & Supplies) | | | 358 | | | | 158,655 | |
| Clarivate PLC* (Professional Services) | | | 1,513 | | | | 35,586 | |
| Clean Harbors, Inc.* (Commercial Services & Supplies) | | | 204 | | | | 20,353 | |
| Cognex Corp. (Electronic Equipment, Instruments & Components) | | | 721 | | | | 56,065 | |
| Coherent, Inc.* (Electronic Equipment, Instruments & Components) | | | 100 | | | | 26,654 | |
| Colfax Corp.* (Machinery) | | | 549 | | | | 25,238 | |
| Concentrix Corp. (IT Services) | | | 175 | | | | 31,259 | |
| Core & Main, Inc.* (Trading Companies & Distributors) | | | 150 | | | | 4,551 | |
| Corning, Inc. (Electronic Equipment, Instruments & Components) | | | 3,132 | | | | 116,604 | |
| Crane Co. (Machinery) | | | 204 | | | | 20,753 | |
| Crown Holdings, Inc. (Containers & Packaging) | | | 521 | | | | 57,633 | |
| CSX Corp. (Road & Rail) | | | 9,043 | | | | 340,017 | |
| Cummins, Inc. (Machinery) | | | 583 | | | | 127,176 | |
| Curtiss-Wright Corp. (Aerospace & Defense) | | | 160 | | | | 22,187 | |
| Deere & Co. (Machinery) | | | 1,150 | | | �� | 394,324 | |
| Donaldson Co., Inc. (Machinery) | | | 504 | | | | 29,867 | |
| Dover Corp. (Machinery) | | | 587 | | | | 106,599 | |
| Dun & Bradstreet Holdings, Inc.* (Professional Services) | | | 615 | | | | 12,601 | |
| Eagle Materials, Inc. (Construction Materials) | | | 166 | | | | 27,632 | |
| Eaton Corp. PLC (Electrical Equipment) | | | 1,625 | | | | 280,832 | |
| EMCOR Group, Inc. (Construction & Engineering) | | | 218 | | | | 27,771 | |
| Emerson Electric Co. (Electrical Equipment) | | | 2,437 | | | | 226,568 | |
| EnerSys (Electrical Equipment) | | | 171 | | | | 13,519 | |
| Equifax, Inc. (Professional Services) | | | 497 | | | | 145,516 | |
| Euronet Worldwide, Inc.* (IT Services) | | | 216 | | | | 25,741 | |
| Expeditors International of Washington, Inc. (Air Freight & Logistics) | | | 691 | | | | 92,794 | |
| Fastenal Co. (Trading Companies & Distributors) | | | 2,345 | | | | 150,220 | |
| FedEx Corp. (Air Freight & Logistics) | | | 997 | | | | 257,864 | |
| Fidelity National Information Services, Inc. (IT Services) | | | 2,483 | | | | 271,019 | |
| Fiserv, Inc.* (IT Services) | | | 2,423 | | | | 251,483 | |
| FleetCor Technologies, Inc.* (IT Services) | | | 331 | | | | 74,091 | |
| Flowserve Corp. (Machinery) | | | 531 | | | | 16,249 | |
| Fortive Corp. (Machinery) | | | 1,462 | | | | 111,536 | |
| Fortune Brands Home & Security, Inc. (Building Products) | | | 553 | | | | 59,116 | |
| FTI Consulting, Inc.* (Professional Services) | | | 140 | | | | 21,479 | |
| Gates Industrial Corp. PLC* (Machinery) | | | 393 | | | | 6,253 | |
| Generac Holdings, Inc.* (Electrical Equipment) | | | 257 | | | | 90,443 | |
| General Dynamics Corp. (Aerospace & Defense) | | | 945 | | | | 197,004 | |
| General Electric Co. (Industrial Conglomerates) | | | 4,477 | | | | 422,942 | |
| Genpact, Ltd. (IT Services) | | | 705 | | | | 37,421 | |
| Global Payments, Inc. (IT Services) | | | 1,183 | | | | 159,918 | |
| Graco, Inc. (Machinery) | | | 693 | | | | 55,870 | |
| Graphic Packaging Holding Co. (Containers & Packaging) | | | 1,152 | | | | 22,464 | |
| GXO Logistics, Inc.* (Air Freight & Logistics) | | | 402 | | | | 36,514 | |
| HEICO Corp. (Aerospace & Defense) | | | 172 | | | | 24,806 | |
| HEICO Corp.—Class A (Aerospace & Defense) | | | 304 | | | | 39,070 | |
| Hertz Global Holdings, Inc.* (Road & Rail) | | | 232 | | | | 5,798 | |
| Hexcel Corp.* (Aerospace & Defense) | | | 342 | | | | 17,716 | |
| Honeywell International, Inc. (Industrial Conglomerates) | | | 2,807 | | | | 585,287 | |
See accompanying notes to financial statements.
Financial Statements :: ProFund VP Industrials :: 109
Common Stocks, continued
| | | Shares | | | Value | |
| Howmet Aerospace, Inc. (Aerospace & Defense) | | | 1,568 | | | $ | 49,909 | |
| Hubbell, Inc. (Electrical Equipment) | | | 222 | | | | 46,236 | |
| Huntington Ingalls Industries, Inc. (Aerospace & Defense) | | | 163 | | | | 30,439 | |
| IDEX Corp. (Machinery) | | | 310 | | | | 73,259 | |
| II-VI, Inc.* (Electronic Equipment, Instruments & Components) | | | 433 | | | | 29,587 | |
| Illinois Tool Works, Inc. (Machinery) | | | 1,165 | | | | 287,522 | |
| Ingersoll Rand, Inc. (Machinery) | | | 1,662 | | | | 102,828 | |
| Insperity, Inc. (Professional Services) | | | 146 | | | | 17,244 | |
| International Paper Co. (Containers & Packaging) | | | 1,579 | | | | 74,181 | |
| IPG Photonics Corp.* (Electronic Equipment, Instruments & Components) | | | 146 | | | | 25,132 | |
| Itron, Inc.* (Electronic Equipment, Instruments & Components) | | | 185 | | | | 12,676 | |
| ITT, Inc. (Machinery) | | | 349 | | | | 35,664 | |
| J.B. Hunt Transport Services, Inc. (Road & Rail) | | | 343 | | | | 70,109 | |
| Jabil, Inc. (Electronic Equipment, Instruments & Components) | | | 584 | | | | 41,084 | |
| Jack Henry & Associates, Inc. (IT Services) | | | 302 | | | | 50,431 | |
| Jacobs Engineering Group, Inc. (Professional Services) | | | 531 | | | | 73,931 | |
| Johnson Controls International PLC (Building Products) | | | 2,890 | | | | 234,985 | |
| KBR, Inc. (Professional Services) | | | 572 | | | | 27,239 | |
| Keysight Technologies, Inc.* (Electronic Equipment, Instruments & Components) | | | 751 | | | | 155,089 | |
| Kirby Corp.* (Marine) | | | 245 | | | | 14,558 | |
| Knight-Swift Transportation Holdings, Inc.(Road & Rail) | | | 677 | | | | 41,256 | |
| L3Harris Technologies, Inc. (Aerospace & Defense) | | | 800 | | | | 170,592 | |
| Landstar System, Inc. (Road & Rail) | | | 155 | | | | 27,748 | |
| Leidos Holdings, Inc. (Professional Services) | | | 572 | | | | 50,851 | |
| Lennox International, Inc. (Building Products) | | | 137 | | | | 44,437 | |
| Lincoln Electric Holdings, Inc. (Machinery) | | | 241 | | | | 33,612 | |
| Littelfuse, Inc. (Electronic Equipment, Instruments & Components) | | | 100 | | | | 31,468 | |
| Lockheed Martin Corp. (Aerospace & Defense) | | | 1,001 | | | | 355,765 | |
| Louisiana-Pacific Corp. (Paper & Forest Products) | | | 359 | | | | 28,128 | |
| ManpowerGroup, Inc. (Professional Services) | | | 221 | | | | 21,510 | |
| Marqeta, Inc.*—Class A (IT Services) | | | 948 | | | | 16,277 | |
| Martin Marietta Materials, Inc. (Construction Materials) | | | 254 | | | | 111,892 | |
| Masco Corp. (Building Products) | | | 996 | | | | 69,939 | |
| MasTec, Inc.* (Construction & Engineering) | | | 233 | | | | 21,501 | |
| MAXIMUS, Inc. (IT Services) | | | 251 | | | | 19,997 | |
| Mercury Systems, Inc.* (Aerospace & Defense) | | | 231 | | | | 12,719 | |
| MSA Safety, Inc. (Commercial Services & Supplies) | | | 149 | | | | 22,493 | |
| MSC Industrial Direct Co., Inc. (Trading Companies & Distributors) | | | 191 | | | | 16,055 | |
| National Instruments Corp. (Electronic Equipment, Instruments & Components) | | | 538 | | | | 23,494 | |
| Nielsen Holdings PLC (Professional Services) | | | 1,463 | | | | 30,006 | |
| Nikola Corp.*(a) (Machinery) | | | 840 | | | | 8,291 | |
| Nordson Corp. (Machinery) | | | 220 | | | | 56,159 | |
| Norfolk Southern Corp. (Road & Rail) | | | 992 | | | | 295,328 | |
| Northrop Grumman Corp. (Aerospace & Defense) | | | 608 | | | | 235,339 | |
| nVent Electric PLC (Electrical Equipment) | | | 686 | | | | 26,068 | |
| Old Dominion Freight Line, Inc. (Road & Rail) | | | 380 | | | | 136,184 | |
| Oshkosh Corp. (Machinery) | | | 280 | | | | 31,559 | |
| Otis Worldwide Corp. (Machinery) | | | 1,732 | | | | 150,805 | |
| Owens Corning (Building Products) | | | 410 | | | | 37,105 | |
| PACCAR, Inc. (Machinery) | | | 1,416 | | | | 124,976 | |
| Packaging Corp. of America (Containers & Packaging) | | | 387 | | | | 52,690 | |
| Parker-Hannifin Corp. (Machinery) | | | 526 | | | | 167,331 | |
| Paychex, Inc. (IT Services) | | | 1,309 | | | | 178,679 | |
| PayPal Holdings, Inc.* (IT Services) | | | 4,791 | | | | 903,487 | |
| Pentair PLC (Machinery) | | | 675 | | | | 49,295 | |
| PerkinElmer, Inc. (Life Sciences Tools & Services) | | | 515 | | | | 103,546 | |
| Quanta Services, Inc. (Construction & Engineering) | | | 582 | | | | 66,733 | |
| Raytheon Technologies Corp. (Aerospace & Defense) | | | 6,103 | | | | 525,223 | |
| RBC Bearings, Inc.* (Machinery) | | | 118 | | | | 23,832 | |
| Regal Rexnord Corp. (Electrical Equipment) | | | 276 | | | | 46,970 | |
| Republic Services, Inc.—Class A (Commercial Services & Supplies) | | | 853 | | | | 118,951 | |
| Robert Half International, Inc. (Professional Services) | | | 454 | | | | 50,630 | |
| Rockwell Automation, Inc. (Electrical Equipment) | | | 473 | | | | 165,006 | |
| Roper Technologies, Inc. (Industrial Conglomerates) | | | 430 | | | | 211,500 | |
| Saia, Inc.* (Road & Rail) | | | 107 | | | | 36,062 | |
| Science Applications International Corp. (Professional Services) | | | 235 | | | | 19,644 | |
| Sealed Air Corp. (Containers & Packaging) | | | 604 | | | | 40,752 | |
| Sensata Technologies Holding PLC* (Electrical Equipment) | | | 646 | | | | 39,852 | |
| Shift4 Payments, Inc.*—Class A (IT Services) | | | 193 | | | | 11,180 | |
| Shoals Technologies Group, Inc.*—Class A (Electrical Equipment) | | | 425 | | | | 10,328 | |
| Silgan Holdings, Inc. (Containers & Packaging) | | | 342 | | | | 14,651 | |
| Siteone Landscape Supply, Inc.* (Trading Companies & Distributors) | | | 182 | | | | 44,095 | |
| Snap-on, Inc. (Machinery) | | | 219 | | | | 47,168 | |
| Sonoco Products Co. (Containers & Packaging) | | | 401 | | | | 23,214 | |
| Square, Inc.*—Class A (IT Services) | | | 1,628 | | | | 262,938 | |
| Stericycle, Inc.* (Commercial Services & Supplies) | | | 375 | | | | 22,365 | |
| Sunrun, Inc.* (Electrical Equipment) | | | 844 | | | | 28,949 | |
| TaskUS, Inc.*—Class A (IT Services) | | | 111 | | | | 5,990 | |
| TE Connectivity, Ltd. (Electronic Equipment, Instruments & Components) | | | 1,330 | | | | 214,583 | |
| Teledyne Technologies, Inc.* (Electronic Equipment, Instruments & Components) | | | 190 | | | | 83,009 | |
| Tetra Tech, Inc. (Commercial Services & Supplies) | | | 220 | | | | 37,356 | |
| Textron, Inc. (Aerospace & Defense) | | | 899 | | | | 69,403 | |
| The Boeing Co.* (Aerospace & Defense) | | | 2,252 | | | | 453,373 | |
| The Middleby Corp.* (Machinery) | | | 227 | | | | 44,665 | |
| The Sherwin-Williams Co. (Chemicals) | | | 984 | | | | 346,525 | |
| The Timken Co. (Machinery) | | | 281 | | | | 19,470 | |
| The Toro Co. (Machinery) | | | 434 | | | | 43,361 | |
See accompanying notes to financial statements.
110 :: ProFund VP Industrials :: Financial Statements
Common Stocks, continued
| | | Shares | | | Value | |
| The Western Union Co. (IT Services) | | | 1,639 | | | $ | 29,240 | |
| Trane Technologies PLC (Building Products) | | | 969 | | | | 195,767 | |
| TransDigm Group, Inc.* (Aerospace & Defense) | | | 214 | | | | 136,164 | |
| TransUnion (Professional Services) | | | 781 | | | | 92,610 | |
| Trex Co., Inc.* (Building Products) | | | 470 | | | | 63,464 | |
| Trimble, Inc.* (Electronic Equipment, Instruments & Components) | | | 1,023 | | | | 89,195 | |
| TriNet Group, Inc.* (Professional Services) | | | 164 | | | | 15,623 | |
| TuSimple Holdings, Inc.*— Class A (Road & Rail) | | | 139 | | | | 4,983 | |
| Union Pacific Corp. (Road & Rail) | | | 2,621 | | | | 660,310 | |
| United Parcel Service, Inc.—Class B (Air Freight & Logistics) | | | 2,973 | | | | 637,233 | |
| United Rentals, Inc.* (Trading Companies & Distributors) | | | 295 | | | | 98,026 | |
| Univar Solutions, Inc.* (Trading Companies & Distributors) | | | 697 | | | | 19,760 | |
| Upwork, Inc.* (Professional Services) | | | 491 | | | | 16,773 | |
| Valmont Industries, Inc. (Construction & Engineering) | | | 87 | | | | 21,794 | |
| Verisk Analytics, Inc. (Professional Services) | | | 657 | | | | 150,275 | |
| Vertiv Holdings Co. (Electrical Equipment) | | | 1,236 | | | | 30,863 | |
| Virgin Galactic Holdings, Inc.* (Aerospace & Defense) | | | 726 | | | | 9,714 | |
| Vontier Corp. (Electronic Equipment, Instruments & Components) | | | 689 | | | | 21,173 | |
| Vulcan Materials Co. (Construction Materials) | | | 541 | | | | 112,301 | |
| W.W. Grainger, Inc. (Trading Companies & Distributors) | | | 176 | | | | 91,210 | |
| Waste Management, Inc. (Commercial Services & Supplies) | | | 1,569 | | | | 261,865 | |
| Watsco, Inc. (Trading Companies & Distributors) | | | 135 | | | | 42,239 | |
| Westinghouse Air Brake Technologies Corp. (Machinery) | | | 762 | | | | 70,188 | |
| WestRock Co. (Containers & Packaging) | | | 1,089 | | | | 48,308 | |
| WEX, Inc.* (IT Services) | | | 183 | | | | 25,691 | |
| WillScot Mobile Mini Holdings Corp.* (Construction & Engineering) | | | 910 | | | | 37,164 | |
| Woodward, Inc. (Machinery) | | | 257 | | | | 28,131 | |
| XPO Logistics, Inc.* (Air Freight & Logistics) | | | 402 | | | | 31,127 | |
| Xylem, Inc. (Machinery) | | | 735 | | | | 88,141 | |
| Zebra Technologies Corp.* (Electronic Equipment, Instruments & Components) | | | 218 | | | | 129,754 | |
| Zurn Water Solutions Corp. (Building Products) | | | 495 | | | | 18,018 | |
TOTAL COMMON STOCKS
(Cost $7,907,317) | | | | | | | 21,060,503 | |
Repurchase Agreements(b) (3.5%)
| | | Principal
Amount | | | Value | |
| Repurchase Agreements with various counterparties, 0.00%, dated 12/31/21, due 1/3/22, total to be received $753,000 | | $ | 753,000 | | | $ | 753,000 | |
TOTAL REPURCHASE AGREEMENTS
(Cost $753,000) | | | | | | | 753,000 | |
Collateral for Securities Loaned(c)(NM)
| | | Shares | | | Value | |
| BlackRock Liquidity Funds FedFund Portfolio—Institutional Shares, 0.03%(d) | | | 8,129 | | | $ | 8,129 | |
TOTAL COLLATERAL FOR SECURITIES LOANED
(Cost $8,129) | | | | | | | 8,129 | |
TOTAL INVESTMENT SECURITIES
(Cost $8,668,446)—100.1% | | | | | | | 21,821,632 | |
| Net other assets (liabilities)—(0.1)% | | | | | | | (17,796 | ) |
| NET ASSETS—100.0% | | | | | | $ | 21,803,836 | |
| * | Non-income producing security. |
| (a) | All or part of this security was on loan as of December 31, 2021. The total value of securities on loan as of December 31, 2021 was $7,294. |
| (b) | The ProFund VP invests in Repurchase Agreements jointly with other funds in the Trust. See "Repurchase Agreements" under Note 2 in the Notes to Financial Statements to view the details of each individual agreement and counterparty as well as a description of the securities subject to repurchase. |
| (c) | Securities were purchased with cash collateral held from securities on loan at December 31, 2021. |
| (d) | Rate periodically changes. Rate disclosed is the daily yield on December 31, 2021. |
| NM | Not meaningful, amount is less than 0.05%. |
Total Return Swap Agreements—Long
| Underlying Instrument | | Counterparty | | Termination
Date(1) | | Rate Paid
(Received)(2) | | | Notional
Amount | | | Value and
Unrealized
Appreciation/
(Depreciation) | |
| Dow Jones U.S. Industrials Index | | Goldman Sachs International | | | 1/24/22 | | | 0.68 | % | | $ | 652,139 | | | $ | 8,820 | |
| (1) | Agreements may be terminated at will by either party without penalty. Payment is due at termination/maturity. |
| (2) | Reflects the floating financing rate, as of December 31, 2021, on the notional amount of the swap agreement paid to the counterparty or received from the counterparty, excluding any commissions. This amount is included as part of the unrealized appreciation/(depreciation). |
See accompanying notes to financial statements.
Financial Statements :: ProFund VP Industrials :: 111
ProFund VP Industrials invested in the following industries as of December 31, 2021:
| | | Value | | | % of
Net Assets | |
| Aerospace & Defense | | $ | 2,409,502 | | | | 11.1 | % |
| Air Freight & Logistics | | | 1,112,576 | | | | 5.1 | % |
| Building Products | | | 1,130,192 | | | | 5.2 | % |
| Chemicals | | | 346,525 | | | | 1.6 | % |
| Commercial Services & Supplies | | | 652,763 | | | | 3.0 | % |
| Construction & Engineering | | | 220,367 | | | | 1.0 | % |
| Construction Materials | | | 251,825 | | | | 1.2 | % |
| Containers & Packaging | | | 682,893 | | | | 3.1 | % |
| Electrical Equipment | | | 1,187,730 | | | | 5.4 | % |
| Electronic Equipment, Instruments & Components | | | 1,323,626 | | | | 6.1 | % |
| Industrial Conglomerates | | | 1,690,010 | | | | 7.8 | % |
| IT Services | | | 3,992,706 | | | | 18.3 | % |
| Life Sciences Tools & Services | | | 103,546 | | | | 0.5 | % |
| Machinery | | | 2,903,771 | | | | 13.2 | % |
| Marine | | | 14,558 | | | | 0.1 | % |
| Paper & Forest Products | | | 28,128 | | | | 0.1 | % |
| Professional Services | | | 890,381 | | | | 4.1 | % |
| Road & Rail | | | 1,617,795 | | | | 7.4 | % |
| Trading Companies & Distributors | | | 501,609 | | | | 2.3 | % |
| Other** | | | 743,333 | | | | 3.4 | % |
| Total | | $ | 21,803,836 | | | | 100.0 | % |
| ** | Includes any non-equity securities and net other assets (liabilities), which includes any receivable for capital shares issued and payable for capital shares redeemed. |
See accompanying notes to financial statements.
112 :: ProFund VP Industrials :: Financial Statements
Statement of Assets and Liabilities
December 31, 2021
| ASSETS: |
| Total Investment Securities, at cost | | $ | 8,668,446 | |
| Securities, at value(a) | | | 21,068,632 | |
| Repurchase agreements, at value | | | 753,000 | |
| Total Investment Securities, at value | | | 21,821,632 | |
| Cash | | | 344 | |
| Dividends receivable | | | 11,343 | |
| Unrealized appreciation on swap agreements | | | 8,820 | |
| Receivable for capital shares issued | | | 80,318 | |
| Prepaid expenses | | | 299 | |
| TOTAL ASSETS | | | 21,922,756 | |
| | | | | |
| LIABILITIES: | | | | |
| Payable for collateral for securities loaned | | | 8,129 | |
| Payable for capital shares redeemed | | | 58,461 | |
| Advisory fees payable | | | 16,603 | |
| Management services fees payable | | | 2,214 | |
| Administration fees payable | | | 1,277 | |
| Administrative services fees payable | | | 9,323 | |
| Distribution fees payable | | | 9,617 | |
| Transfer agency fees payable | | | 2,150 | |
| Fund accounting fees payable | | | 764 | |
| Compliance services fees payable | | | 93 | |
| Other accrued expenses | | | 10,289 | |
| TOTAL LIABILITIES | | | 118,920 | |
| NET ASSETS | | $ | 21,803,836 | |
| | | | | |
| NET ASSETS CONSIST OF: | | | | |
| Capital | | $ | 9,756,493 | |
| Total distributable earnings (loss) | | | 12,047,343 | |
| NET ASSETS | | $ | 21,803,836 | |
| Shares of Beneficial Interest Outstanding (unlimited number of shares authorized, no par value) | | | 218,149 | |
| Net Asset Value (offering and redemption price per share) | | $ | 99.95 | |
| | | | |
| (a) Includes securities on loan valued at: | | $ | 7,294 | |
Statement of Operations
For the Year Ended December 31, 2021
| INVESTMENT INCOME: | | | | |
| Dividends | | $ | 259,286 | |
| Interest | | | 7 | |
| Net income from securities lending | | | 60 | |
| TOTAL INVESTMENT INCOME | | | 259,353 | |
| | | | | |
| EXPENSES: | | | | |
| Advisory fees | | | 158,354 | |
| Management services fees | | | 21,114 | |
| Administration fees | | | 15,439 | |
| Transfer agency fees | | | 12,765 | |
| Administrative services fees | | | 59,035 | |
| Distribution fees | | | 52,784 | |
| Custody fees | | | 3,174 | |
| Fund accounting fees | | | 9,236 | |
| Trustee fees | | | 337 | |
| Compliance services fees | | | 152 | |
| Other fees | | | 20,448 | |
| Recoupment of prior expenses reduced by the Advisor | | | 3,500 | |
| Total Gross Expenses before reductions | | | 356,338 | |
| Expenses reduced and reimbursed by the Advisor | | | (1,625 | ) |
| TOTAL NET EXPENSES | | | 354,713 | |
| NET INVESTMENT INCOME (LOSS) | | | (95,360 | ) |
| | | | | |
| REALIZED AND UNREALIZED GAINS (LOSSES) ON INVESTMENTS: | | | | |
| Net realized gains (losses) on investment securities | | | 178,201 | |
| Net realized gains (losses) on swap agreements | | | 31,110 | |
| Change in net unrealized appreciation/depreciation on investment securities | | | 2,846,151 | |
| Change in net unrealized appreciation/depreciation on swap agreements | | | 6,968 | |
| NET REALIZED AND UNREALIZED GAINS (LOSSES) ON INVESTMENTS | | | 3,062,430 | |
| CHANGE IN NET ASSETS RESULTING FROM OPERATIONS | | $ | 2,967,070 | |
See accompanying notes to financial statements.
Financial Statements :: ProFund VP Industrials :: 113
Statements of Changes in Net Assets
| | | Year Ended
December 31, 2021 | | | Year Ended
December 31, 2020 | |
| FROM INVESTMENT ACTIVITIES: |
| |
| OPERATIONS: |
| Net investment income (loss) | | $ | (95,360 | ) | | $ | (25,859 | ) |
| Net realized gains (losses) on investments | | | 209,311 | | | | 1,209,058 | |
| Change in net unrealized appreciation/depreciation on investments | | | 2,853,119 | | | | (3,842 | ) |
| Change in net assets resulting from operations | | | 2,967,070 | | | | 1,179,357 | |
| | | | | | | | | |
| DISTRIBUTIONS TO SHAREHOLDERS: | | | | | | | | |
| Total distributions | | | (1,172,179 | ) | | | (268,929 | ) |
| Change in net assets resulting from distributions | | | (1,172,179 | ) | | | (268,929 | ) |
| | | | | | | | | |
| CAPITAL TRANSACTIONS: | | | | | | | | |
| Proceeds from shares issued | | | 26,430,009 | | | | 22,558,963 | |
| Distributions reinvested | | | 1,172,179 | | | | 268,929 | |
| Value of shares redeemed | | | (24,672,981 | ) | | | (24,537,213 | ) |
| Change in net assets resulting from capital transactions | | | 2,929,207 | | | | (1,709,321 | ) |
| Change in net assets | | | 4,724,098 | | | | (798,893 | ) |
| | | | | | | | | |
| NET ASSETS: | | | | | | | | |
| Beginning of period | | | 17,079,738 | | | | 17,878,631 | |
| End of period | | $ | 21,803,836 | | | $ | 17,079,738 | |
| | | | | | | | | |
| SHARE TRANSACTIONS: | | | | | | | | |
| Issued | | | 270,168 | | | | 294,654 | |
| Reinvested | | | 12,291 | | | | 3,320 | |
| Redeemed | | | (252,655 | ) | | | (335,213 | ) |
| Change in shares | | | 29,804 | | | | (37,239 | ) |
See accompanying notes to financial statements.
114 :: ProFund VP Industrials :: Financial Highlights
ProFunds Financial Highlights FOR THE PERIODS INDICATED
Selected data for a share of beneficial interest outstanding throughout the periods indicated.
| | | Year Ended
Dec. 31, 2021 | | | Year Ended
Dec. 31, 2020 | | | Year Ended
Dec. 31, 2019 | | | Year Ended
Dec. 31, 2018 | | | Year Ended
Dec. 31, 2017 | |
| Net Asset Value, Beginning of Period | | $ | 90.68 | | | $ | 79.25 | | | $ | 72.70 | | | $ | 83.42 | | | $ | 68.28 | |
| | | | | | | | | | | | | | | | | | | | | |
| Investment Activities: | | | | | | | | | | | | | | | | | | | | |
| Net investment income (loss)(a) | | | (0.44 | ) | | | (0.15 | ) | | | 0.10 | | | | (0.07 | ) | | | 0.09 | |
| Net realized and unrealized gains (losses) on investments | | | 15.06 | | | | 13.24 | | | | 20.77 | | | | (10.56 | ) | | | 15.19 | |
| Total income (loss) from investment activities | | | 14.62 | | | | 13.09 | | | | 20.87 | | | | (10.63 | ) | | | 15.28 | |
| | | | | | | | | | | | | | | | | | | | | |
| Distributions to Shareholders From: | | | | | | | | | | | | | | | | | | | | |
| Net investment income | | | — | | | | (0.14 | ) | | | — | | | | (0.09 | ) | | | (0.14 | ) |
| Net realized gains on investments | | | (5.35 | ) | | | (1.52 | ) | | | (14.32 | ) | | | — | | | | — | |
| Total distributions | | | (5.35 | ) | | | (1.66 | ) | | | (14.32 | ) | | | (0.09 | ) | | | (0.14 | ) |
| | | | | | | | | | | | | | | | | | | | | |
| Net Asset Value, End of Period | | $ | 99.95 | | | $ | 90.68 | | | $ | 79.25 | | | $ | 72.70 | | | $ | 83.42 | |
| | | | | | | | | | | | | | | | | | | | | |
| Total Return | | | 16.40 | % | | | 16.76 | % | | | 30.49 | % | | | (12.76 | )% | | | 22.40 | % |
| | | | | | | | | | | | | | | | | | | | | |
| Ratios to Average Net Assets: | | | | | | | | | | | | | | | | | | | | |
| Gross expenses | | | 1.69 | % | | | 1.75 | % | | | 1.71 | % | | | 1.68 | % | | | 1.68 | % |
| Net expenses | | | 1.68 | % | | | 1.68 | % | | | 1.68 | % | | | 1.67 | % | | | 1.68 | % |
| Net investment income (loss) | | | (0.45 | )% | | | (0.20 | )% | | | 0.12 | % | | | (0.09 | )% | | | 0.12 | % |
| | | | | | | | | | | | | | | | | | | | | |
| Supplemental Data: | | | | | | | | | | | | | | | | | | | | |
| Net assets, end of period (000's) | | $ | 21,804 | | | $ | 17,080 | | | $ | 17,879 | | | $ | 11,116 | | | $ | 39,291 | |
| Portfolio turnover rate(b) | | | 72 | % | | | 123 | % | | | 71 | % | | | 67 | % | | | 107 | % |
| (a) | Per share net investment income (loss) has been calculated using the average daily shares method. |
| (b) | Portfolio turnover rate is calculated without regard to instruments having a maturity of less than one year from acquisition or derivative instruments (including swap agreements and futures contracts). The portfolio turnover rate can be high and volatile due to the amount and timing of sales and purchases of fund shares during the period. |
See accompanying notes to financial statements.
Management Discussion of Fund Performance :: ProFund VP International :: 115
ProFund VP International (the "Fund") seeks investment results, before fees and expenses, that correspond to the performance of the Morgan Stanley Capital International Europe, Australasia and Far East ("MSCI EAFE") Index® (the "Index"). Since the foreign markets are not open when this Fund values its shares, it determines its success in meeting this investment objective by comparing its daily return on a given day with the daily performance of related futures contracts traded in the United States. For the year ended December 31, 2021, the Fund had a total return of 8.82%. For the same period, the Index had a total return of 11.26%1 and a volatility of 11.62%. For the year, the Fund achieved an average daily statistical correlation of over 0.99 to that of the daily performance of the U.S.-traded MSCI EAFE futures contract.2
The Fund takes positions in financial instruments that, in combination, should have similar return characteristics as the return of the Index. The Index includes 85% of free-float adjusted, market capitalization in each industry group in developed market countries, excluding the U.S. and Canada. As of December 31, 2021, the Index has constituent companies from the following 21 developed market countries: Australia, Austria, Belgium, Denmark, Finland, France, Germany, Hong Kong, Ireland, Israel, Italy, Japan, the Netherlands, New Zealand, Norway, Portugal, Singapore, Spain, Sweden, Switzerland, and the United Kingdom. The Index levels and the price of the related futures contracts are expressed in U.S. dollar terms and as such they should generally reflect the relative movement of the U.S. dollar against the basket of foreign currencies represented by the constituent companies in the Index.
During the year ended December 31, 2021, the Fund invested in swap agreements as a substitute for investing directly in stocks in order to gain exposure to the Index. These derivatives generally tracked the performance of their underlying benchmark and were negatively impacted by financing costs associated with their use. The Fund entered into swap agreements with counterparties that the Fund's advisor determined to be major, global financial institutions. If a counterparty becomes insolvent or otherwise fails to perform on its obligations, the value of investments in the Fund may decline. The Fund has sought to mitigate this risk by generally requiring counterparties to post collateral for the benefit of the Fund, marked to market daily, in an amount approximately equal to the amount the counterparty owed to the Fund, subject to certain minimum thresholds.
Value of a $10,000 Investment at Net Asset Value*
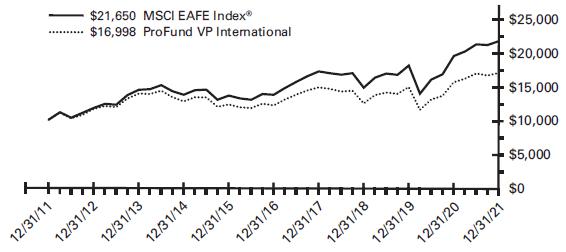
| * | The line graph represents the historical performance of a hypothetical investment of $10,000 in the ProFund VP International from December 31, 2011 to December 31, 2021, assuming the reinvestment of distributions. |
Average Annual Total Return as of 12/31/21
| Fund | | One Year | | | Five Year | | | Ten Year | |
| ProFund VP International | | | 8.82 | % | | | 6.91 | % | | | 5.45 | % |
| MSCI EAFE Index® | | | 11.26 | % | | | 9.55 | % | | | 8.03 | % |
Expense Ratios**
| Fund | | Gross | | | Net | | | | | |
| ProFund VP International | | | 1.68 | % | | | 1.68 | % | | | | |
| ** | Reflects the expense ratio as reported in the Prospectus dated May 1, 2021. Contractual fee waivers are in effect through April 30, 2022. See Financial Highlights for effective expense ratios. |
Allocation of Portfolio Holdings & Index Composition
Market Exposure
| Investment Type | | % of Net Assets | |
| Swap Agreements | | | 100 | % |
| Total Exposure | | | 100 | % |
"Market Exposure" includes the value of total investments (including the contract value of any derivatives) and excludes any instruments used for cash management.
Holdings
The ProFund VP International primarily invests in non-equity securities, which may include: swap agreements, futures contracts, repurchase agreements and U.S. Government securities.
MSCI EAFE Index – Composition
| Industry Breakdown | | % of Index | |
| Financials | | | 16 | % |
| Industrials | | | 16 | % |
| Health Care | | | 13 | % |
| Consumer Discretionary | | | 13 | % |
| Consumer Staples | | | 10 | % |
| Information Technology | | | 10 | % |
| Materials | | | 8 | % |
| Communication Services | | | 5 | % |
| Utilities | | | 3 | % |
| Energy | | | 3 | % |
| Real Estate | | | 3 | % |
| | | | | |
| Country Composition | | | | |
| Japan | | | 23 | % |
| United Kingdom | | | 15 | % |
| France | | | 12 | % |
| Switzerland | | | 10 | % |
| Germany | | | 9 | % |
| Other | | | 31 | % |
Past performance does not guarantee future results. Return calculations assume the reinvestment of distributions and do not reflect taxes that a shareholder would pay on Fund distributions or on the redemption of Fund shares. The performance data quoted represents past performance and current returns may be lower or higher. The investment return and net asset value ("NAV") will fluctuate so that an investor's shares, when redeemed, may be worth more or less than the original cost. The performance above reflects any fee reductions during the applicable periods. If such fee reductions had not occurred, the quoted performance would be lower. Performance numbers are net of all Fund fees and expenses but do not include any insurance, sales, or administrative charges of variable annuity or life insurance contracts. If these charges were included, the returns would be lower. To obtain performance current to the most recent month-end, please call toll-free 888-776-3637.
| 1 | The graph and table reflect the theoretical reinvestment of dividends on securities in the Index. The impact of transaction costs and the deduction of fees and expenses associated with a mutual fund, such as investment management and accounting fees, are not reflected in the index calculations. The Fund's performance reflects the reinvestment of dividends as well as the impact of transaction costs and the deduction of fees and expenses. It is not possible to invest directly in an index. |
| 2 | 1.00 equals perfect correlation. This calculation is based on the daily total return of the U.S.-traded MSCI EAFE futures contract and the performance of the daily total return of the NAV per share of the Fund. |
The above information is not covered by the Report of the Independent Registered Public Accounting Firm.
116 :: ProFund VP International :: Financial Statements
Schedule of Portfolio Investments :: December 31, 2021
Repurchase Agreements(a)(b) (100.7%)
| | | Principal
Amount | | | Value | |
| Repurchase Agreements with various counterparties, 0.00%, dated 12/31/21, due 1/3/22, total to be received $12,234,000 | | $ | 12,234,000 | | | $ | 12,234,000 | |
TOTAL REPURCHASE AGREEMENTS
(Cost $12,234,000) | | | | | | | 12,234,000 | |
TOTAL INVESTMENT SECURITIES
(Cost $12,234,000)—100.7% | | | | | | | 12,234,000 | |
| Net other assets (liabilities)—(0.7)% | | | | | | | (82,760 | ) |
| NET ASSETS—100.0% | | | | | | $ | 12,151,240 | |
| (a) | A portion of these securities were held in a segregated account for the benefit of swap counterparties in the event of default. At December 31, 2021, the aggregate amount held in a segregated account was $1,679,000. |
| (b) | The ProFund VP invests in Repurchase Agreements jointly with other funds in the Trust. See "Repurchase Agreements" under Note 2 in the Notes to Financial Statements to view the details of each individual agreement and counterparty as well as a description of the securities subject to repurchase. |
Total Return Swap Agreements—Long
| Underlying Instrument | | Counterparty | | Termination
Date(1) | | Rate Paid
(Received)(2) | | | Notional
Amount | | | Value and
Unrealized
Appreciation/
(Depreciation) | |
| MSCI EAFE Index | | Goldman Sachs International | | 1/27/22 | | | 0.58 | % | | $ | 6,030,915 | | | $ | (26,917 | ) |
| MSCI EAFE Index | | UBS AG | | 1/27/22 | | | 0.88 | % | | | 6,110,277 | | | | (27,747 | ) |
| | | | | | | | | | | $ | 12,141,192 | | | $ | (54,664 | ) |
| (1) | Agreements may be terminated at will by either party without penalty. Payment is due at termination/maturity. |
| (2) | Reflects the floating financing rate, as of December 31, 2021, on the notional amount of the swap agreement paid to the counterparty or received from the counterparty, excluding any commissions. This amount is included as part of the unrealized appreciation/(depreciation). |
See accompanying notes to financial statements.
Financial Statements :: ProFund VP International :: 117
Statement of Assets and Liabilities
December 31, 2021
| ASSETS: |
| Total Investment Securities, at cost | | $ | 12,234,000 | |
| Repurchase agreements, at value | | | 12,234,000 | |
| Total Investment Securities, at value | | | 12,234,000 | |
| Cash | | | 203 | |
| Segregated cash balances for swap agreements with custodian | | | 50 | |
| Receivable for capital shares issued | | | 4,401 | |
| Prepaid expenses | | | 74 | |
| TOTAL ASSETS | | | 12,238,728 | |
| | | | | |
| LIABILITIES: | | | | |
| Payable for capital shares redeemed | | | 566 | |
| Unrealized depreciation on swap agreements | | | 54,664 | |
| Advisory fees payable | | | 7,641 | |
| Management services fees payable | | | 1,019 | |
| Administration fees payable | | | 665 | |
| Administrative services fees payable | | | 7,683 | |
| Distribution fees payable | | | 7,927 | |
| Transfer agency fees payable | | | 1,210 | |
| Fund accounting fees payable | | | 398 | |
| Compliance services fees payable | | | 55 | |
| Other accrued expenses | | | 5,660 | |
| TOTAL LIABILITIES | | | 87,488 | |
| NET ASSETS | | $ | 12,151,240 | |
| | | | | |
| NET ASSETS CONSIST OF: | | | | |
| Capital | | $ | 12,814,199 | |
| Total distributable earnings (loss) | | | (662,959 | ) |
| NET ASSETS | | $ | 12,151,240 | |
| Shares of Beneficial Interest Outstanding (unlimited number of shares authorized, no par value) | | | 544,101 | |
| Net Asset Value (offering and redemption price per share) | | $ | 22.33 | |
Statement of Operations
For the Year Ended December 31, 2021
| INVESTMENT INCOME: | | | | |
| Interest | | $ | 98 | |
| | | | | |
| EXPENSES: | | | | |
| Advisory fees | | | 91,130 | |
| Management services fees | | | 12,151 | |
| Administration fees | | | 8,100 | |
| Transfer agency fees | | | 7,344 | |
| Administrative services fees | | | 29,528 | |
| Distribution fees | | | 30,377 | |
| Custody fees | | | 1,832 | |
| Fund accounting fees | | | 4,914 | |
| Trustee fees | | | 172 | |
| Compliance services fees | | | 96 | |
| Other fees | | | 9,035 | |
| TOTAL NET EXPENSES | | | 194,679 | |
| NET INVESTMENT INCOME (LOSS) | | | (194,581 | ) |
| | | | | |
| REALIZED AND UNREALIZED GAINS (LOSSES) ON INVESTMENTS: | | | | |
| Net realized gains (losses) on swap agreements | | | 1,116,774 | |
| Change in net unrealized appreciation/depreciation on swap agreements | | | (47,845 | ) |
| NET REALIZED AND UNREALIZED GAINS (LOSSES) ON INVESTMENTS | | | 1,068,929 | |
| CHANGE IN NET ASSETS RESULTING FROM OPERATIONS | | $ | 874,348 | |
See accompanying notes to financial statements.
118 :: ProFund VP International :: Financial Statements
| Statements of Changes in Net Assets |
| |
| | | Year Ended
December 31, 2021 | | | Year Ended
December 31, 2020 | |
| FROM INVESTMENT ACTIVITIES: |
| |
| OPERATIONS: |
| Net investment income (loss) | | $ | (194,581 | ) | | $ | (71,607 | ) |
| Net realized gains (losses) on investments | | | 1,116,774 | | | | 295,215 | |
| Change in net unrealized appreciation/depreciation on investments | | | (47,845 | ) | | | 13,230 | |
| Change in net assets resulting from operations | | | 874,348 | | | | 236,838 | |
| | | | | | | | | |
| DISTRIBUTIONS TO SHAREHOLDERS: | | | | | | | | |
| Total distributions | | | — | | | | (26,163 | ) |
| Change in net assets resulting from distributions | | | — | | | | (26,163 | ) |
| | | | | | | | | |
| CAPITAL TRANSACTIONS: | | | | | | | | |
| Proceeds from shares issued | | | 47,750,286 | | | | 9,567,191 | |
| Distributions reinvested | | | — | | | | 26,163 | |
| Value of shares redeemed | | | (42,005,838 | ) | | | (9,950,961 | ) |
| Change in net assets resulting from capital transactions | | | 5,744,448 | | | | (357,607 | ) |
| Change in net assets | | | 6,618,796 | | | | (146,932 | ) |
| | | | | | | | | |
| NET ASSETS: | | | | | | | | |
| Beginning of period | | | 5,532,444 | | | | 5,679,376 | |
| End of period | | $ | 12,151,240 | | | $ | 5,532,444 | |
| | | | | | | | | |
| SHARE TRANSACTIONS: | | | | | | | | |
| Issued | | | 2,190,643 | | | | 537,342 | |
| Reinvested | | | — | | | | 1,410 | |
| Redeemed | | | (1,916,162 | ) | | | (557,950 | ) |
| Change in shares | | | 274,481 | | | | (19,198 | ) |
See accompanying notes to financial statements.
Financial Highlights :: ProFund VP International :: 119
ProFunds Financial Highlights FOR THE PERIODS INDICATED
Selected data for a share of beneficial interest outstanding throughout the periods indicated.
| | | Year Ended
Dec. 31, 2021 | | | Year Ended
Dec. 31, 2020 | | | Year Ended
Dec. 31, 2019 | | | Year Ended
Dec. 31, 2018 | | | Year Ended
Dec. 31, 2017 | |
| Net Asset Value, Beginning of Period | | $ | 20.52 | | | $ | 19.66 | | | $ | 16.53 | | | $ | 23.47 | | | $ | 19.27 | |
| | | | | | | | | | | | | | | | | | | | | |
| Investment Activities: | | | | | | | | | | | | | | | | | | | | |
| Net investment income (loss)(a) | | | (0.35 | ) | | | (0.24 | ) | | | 0.08 | | | | 0.04 | | | | (0.18 | ) |
| Net realized and unrealized gains (losses) on investments | | | 2.16 | | | | 1.19 | | | | 3.10 | | | | (3.26 | ) | | | 4.38 | |
| Total income (loss) from investment activities | | | 1.81 | | | | 0.95 | | | | 3.18 | | | | (3.22 | ) | | | 4.20 | |
| | | | | | | | | | | | | | | | | | | | | |
| Distributions to Shareholders From: | | | | | | | | | | | | | | | | | | | | |
| Net investment income | | | — | | | | (0.09 | ) | | | (0.05 | ) | | | — | | | | — | |
| Net realized gains on investments | | | — | | | | — | | | | — | | | | (3.72 | ) | | | — | |
| Total distributions | | | — | | | | (0.09 | ) | | | (0.05 | ) | | | (3.72 | ) | | | — | |
| | | | | | | | | | | | | | | | | | | | | |
| Net Asset Value, End of Period | | $ | 22.33 | | | $ | 20.52 | | | $ | 19.66 | | | $ | 16.53 | | | $ | 23.47 | |
| | | | | | | | | | | | | | | | | | | | | |
| Total Return | | | 8.82 | % | | | 4.90 | % | | | 19.27 | % | | | (15.76 | )%(b) | | | 21.80 | % |
| | | | | | | | | | | | | | | | | | | | | |
| Ratios to Average Net Assets: | | | | | | | | | | | | | | | | | | | | |
| Gross expenses | | | 1.60 | % | | | 1.68 | % | | | 1.65 | % | | | 1.57 | % | | | 1.68 | % |
| Net expenses | | | 1.60 | % | | | 1.68 | % | | | 1.65 | % | | | 1.50 | %(b) | | | 1.68 | % |
| Net investment income (loss) | | | (1.60 | )% | | | (1.36 | )% | | | 0.43 | % | | | 0.20 | %(b) | | | (0.81 | )% |
| | | | | | | | | | | | | | | | | | | | | |
| Supplemental Data: | | | | | | | | | | | | | | | | | | | | |
| Net assets, end of period (000's) | | $ | 12,151 | | | $ | 5,532 | | | $ | 5,679 | | | $ | 6,140 | | | $ | 15,131 | |
| Portfolio turnover rate(c) | | | — | | | | — | | | | — | | | | — | | | | — | |
| (a) | Per share net investment income (loss) has been calculated using the average daily shares method. |
| (b) | During 2018, the Fund received a non-recurring reimbursement from a third party relating to expenses that were incurred in a prior year. Had this reimbursement not occurred, the net expense ratio and net investment income (loss) ratio would have been 1.57% and 0.13%, respectively, and the total return would have been (15.84)%. |
| (c) | Portfolio turnover rate is calculated without regard to instruments having a maturity of less than one year from acquisition or derivative instruments (including swap agreements and futures contracts). |
See accompanying notes to financial statements.
120 :: ProFund VP Internet :: Management Discussion of Fund Performance
ProFund VP Internet (the “Fund”) seeks investment results, before fees and expenses, that correspond to the performance of the Dow Jones Internet CompositeSM Index (the “Index”). For the year ended December 31, 2021, the Fund had a total return of 5.30%. For the same period, the Index had a total return of 6.97%1 and a volatility of 22.32%. For the year, the Fund achieved an average daily statistical correlation of over 0.99 to the daily performance of the Index.2
The Fund takes positions in financial instruments that, in combination, should have similar return characteristics as the return of the Index. The Index measures the performance of stocks in the U.S. equity markets that generate the majority of their revenues from the Internet. The Index is composed of two sub-groups: Internet Commerce, which includes companies that derive the majority of their revenues from providing goods and/or services through an open network, such as a web site, and Internet Services, which includes companies that derive the majority of their revenues from providing access to the Internet or providing services to people using the Internet.
During the year ended December 31, 2021, the Fund invested in swap agreements as a substitute for investing directly in stocks in order to gain exposure to the Index. These derivatives generally tracked the performance of their underlying benchmark and were negatively impacted by financing costs associated with their use. The Fund entered into swap agreements with counterparties that the Fund's advisor determined to be major, global financial institutions. If a counterparty becomes insolvent or otherwise fails to perform on its obligations, the value of investments in the Fund may decline. The Fund has sought to mitigate this risk by generally requiring counterparties to post collateral for the benefit of the Fund, marked to market daily, in an amount approximately equal to the amount the counterparty owed to the Fund, subject to certain minimum thresholds.
Value of a $10,000 Investment at Net Asset Value*

| * | The line graph represents the historical performance of a hypothetical investment of $10,000 in the ProFund VP Internet from December 31, 2011 to December 31, 2021, assuming the reinvestment of distributions. |
Average Annual Total Return as of 12/31/21
| Fund | | One Year | | | Five Year | | | Ten Year | |
| ProFund VP Internet | | | 5.30 | % | | | 21.76 | % | | | 20.10 | % |
| Dow Jones Internet CompositeSM Index | | | 6.97 | % | | | 23.84 | % | | | 22.15 | % |
| S&P 500® | | | 28.71 | % | | | 18.47 | % | | | 16.55 | % |
Expense Ratios**
| Fund | | Gross | | | Net | | | | | |
| ProFund VP Internet | | | 1.71 | % | | | 1.68 | % | | | | |
| ** | Reflects the expense ratio as reported in the Prospectus dated May 1, 2021. Contractual fee waivers are in effect through April 30, 2022. See Financial Highlights for effective expense ratios. |
Allocation of Portfolio Holdings & Index Composition
Market Exposure
| Investment Type | | % of Net Assets | |
| Equity Securities | | | 99 | % |
| Swap Agreements | | | 2 | % |
| Total Exposure | | | 101 | % |
“Market Exposure” includes the value of total investments (including the contract value of any derivatives) and excludes any instruments used for cash management.
Largest Equity Holdings
| Company | | % of Net Assets | |
| Alphabet, Inc. | | | 9.9 | % |
| Amazon.com, Inc. | | | 9.1 | % |
| Meta Platforms, Inc. | | | 7.4 | % |
| Cisco Systems, Inc. | | | 5.1 | % |
| Netflix, Inc. | | | 4.8 | % |
Dow Jones Internet CompositeSM Index – Composition
| | | % of Index | |
| Interactive Media & Services | | | 28 | % |
| Software | | | 19 | % |
| IT Services | | | 15 | % |
| Internet & Direct Marketing Retail | | | 14 | % |
| Communications Equipment | | | 11 | % |
| Entertainment | | | 5 | % |
| Hotels, Restaurants & Leisure | | | 4 | % |
| Health Care Technology | | | 3 | % |
| Real Estate Management & Development | | | 1 | % |
Past performance does not guarantee future results. Return calculations assume the reinvestment of distributions and do not reflect taxes that a shareholder would pay on Fund distributions or on the redemption of Fund shares. The performance data quoted represents past performance and current returns may be lower or higher. The investment return and net asset value (“NAV”) will fluctuate so that an investor’s shares, when redeemed, may be worth more or less than the original cost. The performance above reflects any fee reductions during the applicable periods. If such fee reductions had not occurred, the quoted performance would be lower. Performance numbers are net of all Fund fees and expenses but do not include any insurance, sales, or administrative charges of variable annuity or life insurance contracts. If these charges were included, the returns would be lower. To obtain performance current to the most recent month-end, please call toll-free 888-776-3637.
| 1 | The graph and table reflect the theoretical reinvestment of dividends on securities in the Indexes. The impact of transaction costs and the deduction of fees and expenses associated with a mutual fund, such as investment management and accounting fees, are not reflected in calculations of the Indexes. The Fund’s performance reflects the reinvestment of dividends as well as the impact of transaction costs and the deduction of fees and expenses. It is not possible to invest directly in an index. |
| 2 | 1.00 equals perfect correlation. This calculation is based on the daily total return of the Index and the performance of the daily total return of the NAV per share of the Fund. |
| 3 | The S&P 500® is an unmanaged index that consists of the common stocks of 500 major U.S. corporations selected for their size and the frequency and ease with which their stocks trade. |
The above information is not covered by the Report of the Independent Registered Public Accounting Firm.
Financial Statements :: ProFund VP Internet :: 121
Schedule of Portfolio Investments :: December 31, 2021
Common Stocks (98.9%)
| | | Shares | | | Value | |
| Airbnb, Inc.*—Class A (Hotels, Restaurants & Leisure) | | | 2,889 | | | $ | 480,990 | |
| Akamai Technologies, Inc.* (IT Services) | | | 2,614 | | | | 305,943 | |
| Alphabet, Inc.*—Class A (Interactive Media & Services) | | | 346 | | | | 1,002,376 | |
| Alphabet, Inc.*—Class C (Interactive Media & Services) | | | 322 | | | | 931,736 | |
| Amazon.com, Inc.* (Internet & Direct Marketing Retail) | | | 532 | | | | 1,773,868 | |
| Arista Networks, Inc.* (Communications Equipment) | | | 2,876 | | | | 413,425 | |
| Box, Inc.*—Class A (Software) | | | 5,460 | | | | 142,997 | |
| Ciena Corp.* (Communications Equipment) | | | 3,475 | | | | 267,471 | |
| Cisco Systems, Inc. (Communications Equipment) | | | 15,866 | | | | 1,005,428 | |
| Citrix Systems, Inc. (Software) | | | 2,701 | | | | 255,488 | |
| Cloudflare, Inc.*—Class A (Software) | | | 2,789 | | | | 366,754 | |
| CommScope Holding Co., Inc.* (Communications Equipment) | | | 10,189 | | | | 112,487 | |
| Coupa Software, Inc.* (Software) | | | 1,433 | | | | 226,486 | |
| Datadog, Inc.*—Class A (Software) | | | 2,527 | | | | 450,084 | |
| DocuSign, Inc.* (Software) | | | 2,431 | | | | 370,266 | |
| Dropbox, Inc.* (Software) | | | 7,546 | | | | 185,179 | |
| eBay, Inc. (Internet & Direct Marketing Retail) | | | 6,521 | | | | 433,647 | |
| Etsy, Inc.* (Internet & Direct Marketing Retail) | | | 1,542 | | | | 337,605 | |
| Expedia Group, Inc.* (Hotels, Restaurants & Leisure) | | | 1,985 | | | | 358,729 | |
| Fastly, Inc.*—Class A (IT Services) | | | 3,561 | | | | 126,237 | |
| GoDaddy, Inc.*—Class A (IT Services) | | | 3,318 | | | | 281,565 | |
| Juniper Networks, Inc. (Communications Equipment) | | | 6,964 | | | | 248,684 | |
| Match Group, Inc.* (Interactive Media & Services) | | | 3,092 | | | | 408,917 | |
| Meta Platforms, Inc.*—Class A (Interactive Media & Services) | | | 4,302 | | | | 1,446,977 | |
| Netflix, Inc.* (Entertainment) | | | 1,545 | | | | 930,770 | |
| Nutanix, Inc.*—Class A (Software) | | | 5,538 | | | | 176,441 | |
| Okta, Inc.* (IT Services) | | | 1,679 | | | | 376,381 | |
| PayPal Holdings, Inc.* (IT Services) | | | 4,503 | | | | 849,177 | |
| Pinterest, Inc.*—Class A (Interactive Media & Services) | | | 8,052 | | | | 292,690 | |
| Salesforce.com, Inc.* (Software) | | | 3,532 | | | | 897,586 | |
| Snap, Inc.* (Interactive Media & Services) | | | 9,508 | | | | 447,161 | |
| Snowflake, Inc.*—Class A (IT Services) | | | 1,655 | | | | 560,631 | |
| Teladoc Health, Inc.* (Health Care Technology) | | | 2,725 | | | | 250,210 | |
| Twitter, Inc.* (Interactive Media & Services) | | | 8,953 | | | | 386,949 | |
| Veeva Systems, Inc.*—Class A (Health Care Technology) | | | 1,526 | | | | 389,862 | |
| Vonage Holdings Corp.* (Software) | | | 7,862 | | | | 163,451 | |
| Wayfair, Inc.*—Class A (Internet & Direct Marketing Retail) | | | 1,242 | | | | 235,943 | |
| Workday, Inc.*—Class A (Software) | | | 1,748 | | | | 477,519 | |
| Zillow Group, Inc.*—Class A (Interactive Media & Services) | | | 694 | | | | 43,181 | |
| Zillow Group, Inc.*—Class C (Interactive Media & Services) | | | 3,209 | | | | 204,895 | |
| Zoom Video Communications, Inc.*—Class A (Software) | | | 2,252 | | | | 414,165 | |
| ZoomInfo Technologies, Inc.*—Class A (Interactive Media & Services) | | | 4,642 | | | | 298,016 | |
TOTAL COMMON STOCKS
(Cost $8,171,863) | | | | | | | 19,328,367 | |
Repurchase Agreements(a) (1.8%)
| | | Principal
Amount | | | Value | |
| Repurchase Agreements with various counterparties, 0.00%, dated 12/31/21, due 1/3/22, total to be received $347,000 | | $ | 347,000 | | | $ | 347,000 | |
TOTAL REPURCHASE AGREEMENTS
(Cost $347,000) | | | | | | | 347,000 | |
TOTAL INVESTMENT SECURITIES
(Cost $8,518,863)—100.7% | | | | | | | 19,675,367 | |
| Net other assets (liabilities)—(0.7)% | | | | | | | (143,302 | ) |
| NET ASSETS—100.0% | | | | | | $ | 19,532,065 | |
| * | Non-income producing security. |
| (a) | The ProFund VP invests in Repurchase Agreements jointly with other funds in the Trust. See “Repurchase Agreements” under Note 2 in the Notes to Financial Statements to view the details of each individual agreement and counterparty as well as a description of the securities subject to repurchase. |
Total Return Swap Agreements—Long
| Underlying Instrument | | Counterparty | | Termination
Date(1) | | | Rate Paid
(Received)(2) | | | Notional
Amount | | | Value and
Unrealized
Appreciation/
(Depreciation) | |
| Dow Jones Internet Composite Index | | Goldman Sachs International | | | 1/24/22 | | | | 0.68 | % | | $ | 327,447 | | | $ | (4,286 | ) |
| (1) | Agreements may be terminated at will by either party without penalty. Payment is due at termination/maturity. |
| (2) | Reflects the floating financing rate, as of December 31, 2021, on the notional amount of the swap agreement paid to the counterparty or received from the counterparty, excluding any commissions. This amount is included as part of the unrealized appreciation/(depreciation). |
See accompanying notes to financial statements.
122 :: ProFund VP Internet :: Financial Statements
ProFund VP Internet invested in the following industries as of December 31, 2021:
| | | Value | | | % of
Net Assets | |
| Communications Equipment | | $ | 2,047,495 | | | | 10.5 | % |
| Entertainment | | | 930,770 | | | | 4.8 | % |
| Health Care Technology | | | 640,072 | | | | 3.3 | % |
| Hotels, Restaurants & Leisure | | | 839,719 | | | | 4.3 | % |
| Interactive Media & Services | | | 5,462,898 | | | | 27.9 | % |
| Internet & Direct Marketing Retail | | | 2,781,063 | | | | 14.2 | % |
| IT Services | | | 2,499,934 | | | | 12.8 | % |
| Software | | | 4,126,416 | | | | 21.1 | % |
| Other** | | | 203,698 | | | | 1.1 | % |
| Total | | $ | 19,532,065 | | | | 100.0 | % |
| ** | Includes any non-equity securities and net other assets (liabilities), which includes any receivable for capital shares issued and payable for capital shares redeemed. |
See accompanying notes to financial statements.
Financial Statements :: ProFund VP Internet :: 123
Statement of Assets and Liabilities
December 31, 2021
| ASSETS: | | | | |
| Total Investment Securities, at cost | | $ | 8,518,863 | |
| Securities, at value | | | 19,328,367 | |
| Repurchase agreements, at value | | | 347,000 | |
| Total Investment Securities, at value | | | 19,675,367 | |
| Cash | | | 765 | |
| Prepaid expenses | | | 311 | |
| TOTAL ASSETS | | | 19,676,443 | |
| | | | | |
| LIABILITIES: | | | | |
| Payable for capital shares redeemed | | | 88,377 | |
| Unrealized depreciation on swap agreements | | | 4,286 | |
| Advisory fees payable | | | 16,371 | |
| Management services fees payable | | | 2,183 | |
| Administration fees payable | | | 1,185 | |
| Administrative services fees payable | | | 8,495 | |
| Distribution fees payable | | | 9,283 | |
| Transfer agency fees payable | | | 1,995 | |
| Fund accounting fees payable | | | 666 | |
| Compliance services fees payable | | | 92 | |
| Other accrued expenses | | | 11,445 | |
| TOTAL LIABILITIES | | | 144,378 | |
| NET ASSETS | | $ | 19,532,065 | |
| | | | | |
| NET ASSETS CONSIST OF: | | | | |
| Capital | | $ | 4,858,496 | |
| Total distributable earnings (loss) | | | 14,673,569 | |
| NET ASSETS | | $ | 19,532,065 | |
| Shares of Beneficial Interest Outstanding (unlimited number of shares authorized, no par value) | | | 380,717 | |
| Net Asset Value (offering and redemption price per share) | | $ | 51.30 | |
Statement of Operations
For the Year Ended December 31, 2021
| INVESTMENT INCOME: | | | | |
| Dividends | | $ | 47,155 | |
| Interest | | | 3 | |
| Net income from securities lending | | | 55 | |
| TOTAL INVESTMENT INCOME | | | 47,213 | |
| | | | | |
| EXPENSES: | | | | |
| Advisory fees | | | 170,801 | |
| Management services fees | | | 22,773 | |
| Administration fees | | | 17,402 | |
| Transfer agency fees | | | 14,004 | |
| Administrative services fees | | | 59,053 | |
| Distribution fees | | | 56,934 | |
| Custody fees | | | 3,467 | |
| Fund accounting fees | | | 9,537 | |
| Trustee fees | | | 394 | |
| Compliance services fees | | | 135 | |
| Other fees | | | 20,723 | |
| Recoupment of prior expenses reduced by the Advisor | | | 6,477 | |
| TOTAL NET EXPENSES | | | 381,700 | |
| NET INVESTMENT INCOME (LOSS) | | | (334,487 | ) |
| | | | | |
| REALIZED AND UNREALIZED GAINS (LOSSES) ON INVESTMENTS: | | | | |
| Net realized gains (losses) on investment securities | | | 4,743,478 | |
| Net realized gains (losses) on swap agreements | | | (31,815 | ) |
| Change in net unrealized appreciation/depreciation on investment securities | | | (3,205,856 | ) |
| Change in net unrealized appreciation/depreciation on swap agreements | | | 1,174 | |
| NET REALIZED AND UNREALIZED GAINS (LOSSES) ON INVESTMENTS | | | 1,506,981 | |
| CHANGE IN NET ASSETS RESULTING FROM OPERATIONS | | $ | 1,172,494 | |
See accompanying notes to financial statements.
124 :: ProFund VP Internet :: Financial Statements
Statements of Changes in Net Assets
| | | Year Ended
December 31, 2021 | | | Year Ended
December 31, 2020 | |
| FROM INVESTMENT ACTIVITIES: | | | | | | | | |
| | | | | | | | | |
| OPERATIONS: | | | | | | | | |
| Net investment income (loss) | | $ | (334,487 | ) | | $ | (279,735 | ) |
| Net realized gains (losses) on investments | | | 4,711,663 | | | | 4,092,000 | |
| Change in net unrealized appreciation/depreciation on investments | | | (3,204,682 | ) | | | 4,475,987 | |
| Change in net assets resulting from operations | | | 1,172,494 | | | | 8,288,252 | |
| | | | | | | | | |
| DISTRIBUTIONS TO SHAREHOLDERS: | | | | | | | | |
| Total distributions | | | (3,581,962 | ) | | | (2,716,437 | ) |
| Change in net assets resulting from distributions | | | (3,581,962 | ) | | | (2,716,437 | ) |
| | | | | | | | | |
| CAPITAL TRANSACTIONS: | | | | | | | | |
| Proceeds from shares issued | | | 16,070,740 | | | | 27,276,562 | |
| Distributions reinvested | | | 3,581,962 | | | | 2,716,437 | |
| Value of shares redeemed | | | (24,109,917 | ) | | | (25,759,486 | ) |
| Change in net assets resulting from capital transactions | | | (4,457,215 | ) | | | 4,233,513 | |
| Change in net assets | | | (6,866,683 | ) | | | 9,805,328 | |
| | | | | | | | | |
| NET ASSETS: | | | | | | | | |
| Beginning of period | | | 26,398,748 | | | | 16,593,420 | |
| End of period | | $ | 19,532,065 | | | $ | 26,398,748 | |
| | | | | | | | | |
| SHARE TRANSACTIONS: | | | | | | | | |
| Issued | | | 279,532 | | | | 541,488 | |
| Reinvested | | | 74,485 | | | | 47,498 | |
| Redeemed | | | (424,181 | ) | | | (523,130 | ) |
| Change in shares | | | (70,164 | ) | | | 65,856 | |
See accompanying notes to financial statements.
Financial Highlights :: ProFund VP Internet :: 125
ProFunds Financial Highlights FOR THE PERIODS INDICATED
Selected data for a share of beneficial interest outstanding throughout the periods indicated.
| | | Year Ended
Dec. 31, 2021 | | | Year Ended
Dec. 31, 2020 | | | Year Ended
Dec. 31, 2019(a) | | | Year Ended
Dec. 31, 2018(a) | | | Year Ended
Dec. 31, 2017(a) | |
| Net Asset Value, Beginning of Period | | $ | 58.55 | | | $ | 43.10 | | | $ | 37.40 | | | $ | 37.12 | | | $ | 27.28 | |
| | | | | | | | | | | | | | | | | | | | | |
| Investment Activities: | | | | | | | | | | | | | | | | | | | | |
| Net investment income (loss)(b) | | | (0.84 | ) | | | (0.69 | ) | | | (0.54 | ) | | | (0.59 | ) | | | (0.47 | ) |
| Net realized and unrealized gains (losses) on investments | | | 3.30 | | | | 22.44 | | | | 7.27 | | | | 2.80 | | | | 10.31 | |
| Total income (loss) from investment activities | | | 2.46 | | | | 21.75 | | | | 6.73 | | | | 2.21 | | | | 9.84 | |
| | | | | | | | | | | | | | | | | | | | | |
| Distributions to Shareholders From: | | | | | | | | | | | | | | | | | | | | |
| Net realized gains on investments | | | (9.71 | ) | | | (6.30 | ) | | | (1.03 | ) | | | (1.93 | ) | | | — | |
| | | | | | | | | | | | | | | | | | | | | |
| Net Asset Value, End of Period | | $ | 51.30 | | | $ | 58.55 | | | $ | 43.10 | | | $ | 37.40 | | | $ | 37.12 | |
| | | | | | | | | | | | | | | | | | | | | |
| Total Return | | | 5.30 | % | | | 50.82 | % | | | 18.03 | % | | | 4.93 | % | | | 36.05 | % |
| Ratios to Average Net Assets: | | | | | | | | | | | | | | | | | | | | |
| Gross expenses | | | 1.68 | % | | | 1.71 | % | | | 1.69 | % | | | 1.64 | % | | | 1.64 | % |
| Net expenses | | | 1.68 | % | | | 1.68 | % | | | 1.69 | %(c) | | | 1.64 | % | | | 1.64 | % |
| Net investment income (loss) | | | (1.47 | )% | | | (1.36 | )% | | | (1.24 | )% | | | (1.39 | )% | | | (1.43 | )% |
| | | | | | | | | | | | | | | | | | | | | |
| Supplemental Data: | | | | | | | | | | | | | | | | | | | | |
| Net assets, end of period (000's) | | $ | 19,532 | | | $ | 26,399 | | | $ | 16,593 | | | $ | 17,917 | | | $ | 16,656 | |
| Portfolio turnover rate(d) | | | 57 | % | | | 116 | % | | | 163 | % | | | 138 | % | | | 116 | % |
| (a) | As described in Note 9, share amounts have been adjusted for 3:1 share split that occurred on November 18, 2019. |
| (b) | Per share net investment income (loss) has been calculated using the average daily shares method. |
| (c) | The expense ratio does not correlate to the applicable expense limits in place during the period given that the annual contractual expense limitation is applied for one year periods ended April 30th of each year, instead of coinciding with the December 31st year end. Details of the current expense limitation in effect can be found in Note 4 of the accompanying Notes to Financial Statements. |
| (d) | Portfolio turnover rate is calculated without regard to instruments having a maturity of less than one year from acquisition or derivative instruments (including swap agreements and futures contracts). The portfolio turnover rate can be high and volatile due to the amount and timing of sales and purchases of fund shares during the period. |
See accompanying notes to financial statements.
126 :: ProFund VP Japan :: Management Discussion of Fund Performance
ProFund VP Japan (the "Fund") seeks investment results, before fees and expenses, that correspond to the performance of the Nikkei 225 Stock Average (the "Index"). Since the Japanese markets are not open when this Fund values its shares, it determines its success in meeting this investment objective by comparing its daily return on a given day with the daily performance of related, dollar-denominated futures contracts traded in the United States. For the year ended December 31, 2021, the Fund had a total return of 3.89%. For the same period, the Index had a total return of -4.37%1, as measured in unhedged U.S. dollar terms, or 6.66%1 in local (Japanese yen) terms and a volatility of 18.57%. The U.S. dollar-denominated Nikkei futures contracts held in the Fund are not directly impacted by the dollar/yen exchange rate, which may cause the Fund to over or underperform versus the performance of the Index measured in unhedged U.S. dollar terms, depending upon whether the U.S. dollar rises or falls in value versus the yen. During the year, the Fund was generally not exposed to fluctuations in the dollar/yen exchange rate. For the year, the Fund achieved an average daily statistical correlation of over 0.99 to the daily performance of the U.S.-traded U.S. dollar-denominated futures contract on the Index.2
The Fund takes positions in financial instruments that, in combination, should have similar return characteristics as the return of the Index. The Index is a modified price-weighted index of the 225 most actively traded and liquid Japanese stocks traded in the First Section of the Tokyo Stock Exchange.
During the year ended December 31, 2021, the Fund invested in swap agreements and futures contracts as a substitute for investing directly in stocks in order to gain exposure to the Index. These derivatives generally tracked the performance of their underlying benchmark and were negatively impacted by financing costs associated with their use. The Fund entered into swap agreements with counterparties that the Fund's advisor determined to be major, global financial institutions. If a counterparty becomes insolvent or otherwise fails to perform on its obligations, the value of investments in the Fund may decline. The Fund has sought to mitigate this risk by generally requiring counterparties to post collateral for the benefit of the Fund, marked to market daily, in an amount approximately equal to the amount the counterparty owed to the Fund, subject to certain minimum thresholds.
Value of a $10,000 Investment at Net Asset Value*
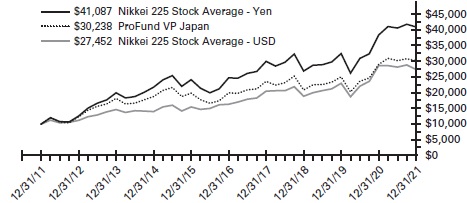
| * | The line graph represents the historical performance of a hypothetical investment of $10,000 in the ProFund VP Japan from December 31, 2011 to December 31, 2021, assuming the reinvestment of distributions. |
Average Annual Total Return as of 12/31/21
| Fund | | One Year | | | Five Year | | | Ten Year | |
| ProFund VP Japan | | | 3.89 | % | | | 8.63 | % | | | 11.70 | % |
| Nikkei 225 Stock Average - USD | | | -4.37 | % | | | 10.92 | % | | | 10.63 | % |
| Nikkei 225 Stock Average - Yen | | | 6.66 | % | | | 10.63 | % | | | 15.18 | % |
Expense Ratios**
| Fund | | Gross | | | Net | | | | | |
| ProFund VP Japan | | | 1.75 | % | | | 1.68 | % | | | | |
| ** | Reflects the expense ratio as reported in the Prospectus dated May 1, 2021. Contractual fee waivers are in effect through April 30, 2022. See Financial Highlights for effective expense ratios. |
Allocation of Portfolio Holdings & Index Composition
Market Exposure
| Investment Type | | % of Net Assets | |
| Futures Contracts | | | 99 | % |
| Swap Agreements | | | — | (a) |
| Total Exposure | | | 99 | % |
"Market Exposure" includes the value of total investments (including the contract value of any derivatives) and excludes any instruments used for cash management.
| (a) | Amount is less than 0.5%. |
Holdings
The ProFund VP Japan primarily invests in non-equity securities, which may include: swap agreements, futures contracts, repurchase agreements and U.S. Government securities.
Nikkei 225 Stock Average – Composition
| | | % of Index | |
| Information Technology | | | 25 | % |
| Industrials | | | 19 | % |
| Consumer Discretionary | | | 19 | % |
| Health Care | | | 12 | % |
| Communication Services | | | 10 | % |
| Consumer Staples | | | 6 | % |
| Materials | | | 6 | % |
| Financials | | | 2 | % |
| Real Estate | | | 1 | % |
Past performance does not guarantee future results. Return calculations assume the reinvestment of distributions and do not reflect taxes that a shareholder would pay on Fund distributions or on the redemption of Fund shares. The performance data quoted represents past performance and current returns may be lower or higher. The investment return and net asset value ("NAV") will fluctuate so that an investor's shares, when redeemed, may be worth more or less than the original cost. The performance above reflects any fee reductions during the applicable periods. If such fee reductions had not occurred, the quoted performance would be lower. Performance numbers are net of all Fund fees and expenses but do not include any insurance, sales, or administrative charges of variable annuity or life insurance contracts. If these charges were included, the returns would be lower. To obtain performance current to the most recent month-end, please call toll-free 888-776-3637.
| 1 | The graph and table reflect the theoretical reinvestment of dividends in the Index. Unhedged U.S. dollar performance is calculated by converting U.S. dollars to yen at the beginning of the period and to U.S. dollars at the end of the period. "Local (yen)" returns are theoretical Index returns experienced by local residents living in Japan. The impact of transaction costs and the deduction of fees and expenses associated with a mutual fund, such as investment management and accounting fees, are not reflected in the Index calculations. The Fund's performance reflects the reinvestment of dividends as well as the impact of transaction costs and the deduction of fees and expenses. It is not possible to invest directly in an index. |
| 2 | 1.00 equals perfect correlation. This calculation is based on the daily total return of the U.S.-traded U.S. dollar-denominated futures contract on the index and the performance of the daily total return of the NAV per share of the Fund. |
The above information is not covered by the Report of the Independent Registered Public Accounting Firm.
Financial Statements :: ProFund VP Japan :: 127
Schedule of Portfolio Investments :: December 31, 2021
Repurchase Agreements(a) (92.8%)
| | | Principal
Amount | | | Value | |
| Repurchase Agreements with various counterparties, 0.00%, dated 12/31/21, due 1/3/22, total to be received $6,738,000 | | $ | 6,738,000 | | | $ | 6,738,000 | |
TOTAL REPURCHASE AGREEMENTS
(Cost $6,738,000) | | | | | | | 6,738,000 | |
TOTAL INVESTMENT SECURITIES
(Cost $6,738,000)—92.8% | | | | | | | 6,738,000 | |
| Net other assets (liabilities)—7.2% | | | | | | | 522,923 | |
| NET ASSETS—100.0% | | | | | | $ | 7,260,923 | |
| (a) | The ProFund VP invests in Repurchase Agreements jointly with other funds in the Trust. See "Repurchase Agreements" under Note 2 in the Notes to Financial Statements to view the details of each individual agreement and counterparty as well as a description of the securities subject to repurchase. |
Futures Contracts Purchased
| | | Number
of
Contracts | | Expiration
Date | | Notional
Amount | | Value and
Unrealized
Appreciation/
(Depreciation) | |
| Nikkei 225 Futures Contracts | | | 50 | | | 3/11/22 | | $ | 7,220,000 | | | $ | 248,706 | | |
Total Return Swap Agreements—Long
| Underlying Instrument | | Counterparty | | Termination
Date(1) | | Rate Paid
(Received)(2) | | | Notional
Amount | | | Value and
Unrealized
Appreciation/
(Depreciation) | |
| Nikkei 225 Stock Average | | Goldman Sachs International | | 1/27/22 | | | 0.53 | % | | $ | 36,104 | | | $ | (45 | ) |
| (1) | Agreements may be terminated at will by either party without penalty. Payment is due at termination/maturity. |
| (2) | Reflects the floating financing rate, as of December 31, 2021, on the notional amount of the swap agreement paid to the counterparty or received from the counterparty, excluding any commissions. This amount is included as part of the unrealized appreciation/(depreciation). |
See accompanying notes to financial statements.
128 :: ProFund VP Japan :: Financial Statements
Statement of Assets and Liabilities
December 31, 2021
| ASSETS: |
| Total Investment Securities, at cost | | $ | 6,738,000 | |
| Repurchase agreements, at value | | | 6,738,000 | |
| Total Investment Securities, at value | | | 6,738,000 | |
| Segregated cash balances for futures contracts with brokers | | | 431,200 | |
| Receivable for capital shares issued | | | 114,178 | |
| Prepaid expenses | | | 54 | |
| TOTAL ASSETS | | | 7,283,432 | |
| | | | | |
| LIABILITIES: | | | | |
| Cash overdraft | | | 29 | |
| Payable for capital shares redeemed | | | 518 | |
| Unrealized depreciation on swap agreements | | | 45 | |
| Variation margin on futures contracts | | | 2,550 | |
| Advisory fees payable | | | 6,274 | |
| Management services fees payable | | | 836 | |
| Administration fees payable | | | 426 | |
| Administrative services fees payable | | | 3,049 | |
| Distribution fees payable | | | 2,884 | |
| Transfer agency fees payable | | | 714 | |
| Fund accounting fees payable | | | 236 | |
| Compliance services fees payable | | | 35 | |
| Other accrued expenses | | | 4,913 | |
| TOTAL LIABILITIES | | | 22,509 | |
| NET ASSETS | | $ | 7,260,923 | |
| | | | | |
| NET ASSETS CONSIST OF: | | | | |
| Capital | | $ | 6,904,122 | |
| Total distributable earnings (loss) | | | 356,801 | |
| NET ASSETS | | $ | 7,260,923 | |
| Shares of Beneficial Interest Outstanding (unlimited number of shares authorized, no par value) | | | 127,901 | |
| Net Asset Value (offering and redemption price per share) | | $ | 56.77 | |
Statement of Operations
For the Year Ended December 31, 2021
| INVESTMENT INCOME: | | | | |
| Interest | | $ | 167 | |
| | | | | |
| EXPENSES: | | | | |
| Advisory fees | | | 63,151 | |
| Management services fees | | | 8,420 | |
| Administration fees | | | 6,645 | |
| Transfer agency fees | | | 5,236 | |
| Administrative services fees | | | 24,441 | |
| Distribution fees | | | 21,050 | |
| Custody fees | | | 1,316 | |
| Fund accounting fees | | | 3,519 | |
| Trustee fees | | | 147 | |
| Compliance services fees | | | 55 | |
| Other fees | | | 5,896 | |
| Recoupment of prior expenses reduced by the Advisor | | | 2,000 | |
| Total Gross Expenses before reductions | | | 141,876 | |
| Expenses reduced and reimbursed by the Advisor | | | (419 | ) |
| TOTAL NET EXPENSES | | | 141,457 | |
| NET INVESTMENT INCOME (LOSS) | | | (141,290 | ) |
| | | | | |
| REALIZED AND UNREALIZED GAINS (LOSSES) ON INVESTMENTS: | | | | |
| Net realized gains (losses) on futures contracts | | | 518,215 | |
| Net realized gains (losses) on swap agreements | | | 4,315 | |
| Change in net unrealized appreciation/depreciation on futures contracts | | | (24,395 | ) |
| Change in net unrealized appreciation/depreciation on swap agreements | | | (2,139 | ) |
| NET REALIZED AND UNREALIZED GAINS (LOSSES) ON INVESTMENTS | | | 495,996 | |
| CHANGE IN NET ASSETS RESULTING FROM OPERATIONS | | $ | 354,706 | |
See accompanying notes to financial statements.
Financial Statements :: ProFund VP Japan :: 129
| Statements of Changes in Net Assets |
| | | Year Ended
December 31, 2021 | | | Year Ended
December 31, 2020 | |
| FROM INVESTMENT ACTIVITIES: |
| |
| OPERATIONS: |
| Net investment income (loss) | | $ | (141,290 | ) | | $ | (105,584 | ) |
| Net realized gains (losses) on investments | | | 522,530 | | | | 1,232,701 | |
| Change in net unrealized appreciation/depreciation on investments | | | (26,534 | ) | | | 261,597 | |
| Change in net assets resulting from operations | | | 354,706 | | | | 1,388,714 | |
| | | | | | | | | |
| DISTRIBUTIONS TO SHAREHOLDERS: | | | | | | | | |
| Total distributions | | | (1,106,527 | ) | | | (18,886 | ) |
| Change in net assets resulting from distributions | | | (1,106,527 | ) | | | (18,886 | ) |
| | | | | | | | | |
| CAPITAL TRANSACTIONS: | | | | | | | | |
| Proceeds from shares issued | | | 11,905,725 | | | | 15,082,367 | |
| Distributions reinvested | | | 1,106,527 | | | | 18,886 | |
| Value of shares redeemed | | | (16,667,638 | ) | | | (14,121,561 | ) |
| Change in net assets resulting from capital transactions | | | (3,655,386 | ) | | | 979,692 | |
| Change in net assets | | | (4,407,207 | ) | | | 2,349,520 | |
| | | | | | | | | |
| NET ASSETS: | | | | | | | | |
| Beginning of period | | | 11,668,130 | | | | 9,318,610 | |
| End of period | | $ | 7,260,923 | | | $ | 11,668,130 | |
| | | | | | | | | |
| SHARE TRANSACTIONS: | | | | | | | | |
| Issued | | | 199,699 | | | | 275,712 | |
| Reinvested | | | 20,122 | | | | 347 | |
| Redeemed | | | (275,248 | ) | | | (261,962 | ) |
| Change in shares | | | (55,427 | ) | | | 14,097 | |
See accompanying notes to financial statements.
130 :: ProFund VP Japan :: Financial Highlights
ProFunds Financial Highlights FOR THE PERIODS INDICATED
Selected data for a share of beneficial interest outstanding throughout the periods indicated.
| | | Year Ended
Dec. 31, 2021 | | | Year Ended
Dec. 31, 2020 | | | Year Ended
Dec. 31, 2019 | | | Year Ended
Dec. 31, 2018 | | | Year Ended
Dec. 31, 2017 | |
| Net Asset Value, Beginning of Period | | $ | 63.65 | | | $ | 55.06 | | | $ | 45.95 | | | $ | 52.00 | | | $ | 43.90 | |
| | | | | | | | | | | | | | | | | | | | | |
| Investment Activities: | | | | | | | | | | | | | | | | | | | | |
| Net investment income (loss)(a) | | | (1.02 | ) | | | (0.73 | ) | | | 0.12 | | | | 0.05 | | | | (0.41 | ) |
| Net realized and unrealized gains (losses) on investments | | | 3.20 | | | | 9.48 | | | | 9.06 | | | | (6.10 | ) | | | 8.51 | |
| Total income (loss) from investment activities | | | 2.18 | | | | 8.75 | | | | 9.18 | | | | (6.05 | ) | | | 8.10 | |
| | | | | | | | | | | | | | | | | | | | | |
| Distributions to Shareholders From: | | | | | | | | | | | | | | | | | | | | |
| Net investment income | | | — | | | | (0.16 | ) | | | (0.07 | ) | | | — | | | | — | |
| Net realized gains on investments | | | (9.06 | ) | | | — | | | | — | | | | — | | | | — | |
| Total distributions | | | (9.06 | ) | | | (0.16 | ) | | | (0.07 | ) | | | — | | | | — | |
| | | | | | | | | | | | | | | | | | | | | |
| Net Asset Value, End of Period | | $ | 56.77 | | | $ | 63.65 | | | $ | 55.06 | | | $ | 45.95 | | | $ | 52.00 | |
| | | | | | | | | | | | | | | | | | | | | |
| Total Return | | | 3.89 | % | | | 15.93 | % | | | 20.00 | % | | | (11.63 | )%(b) | | | 18.45 | % |
| | | | | | | | | | | | | | | | | | | | | |
| Ratios to Average Net Assets: | | | | | | | | | | | | | | | | | | | | |
| Gross expenses | | | 1.69 | % | | | 1.75 | % | | | 1.74 | % | | | 1.63 | % | | | 1.71 | % |
| Net expenses | | | 1.68 | % | | | 1.68 | % | | | 1.74 | %(c) | | | 1.56 | %(b) | | | 1.68 | % |
| Net investment income (loss) | | | (1.68 | )% | | | (1.38 | )% | | | 0.23 | % | | | 0.09 | %(b) | | | (0.89 | )% |
| | | | | | | | | | | | | | | | | | | | | |
| Supplemental Data: | | | | | | | | | | | | | | | | | | | | |
| Net assets, end of period (000's) | | $ | 7,261 | | | $ | 11,668 | | | $ | 9,319 | | | $ | 8,606 | | | $ | 12,840 | |
| Portfolio turnover rate(d) | | | — | | | | — | | | | — | | | | — | | | | — | |
| (a) | Per share net investment income (loss) has been calculated using the average daily shares method. |
| (b) | During 2018, the Fund received a non-recurring reimbursement from a third party relating to expenses that were incurred in a prior year. Had this reimbursement not occurred, the net expense ratio and net investment income (loss) ratio would have been 1.63% and 0.02%, respectively, and the total return would have been (11.71)%. |
| (c) | The expense ratio does not correlate to the applicable expense limits in place during the period given that the annual contractual expense limitation is applied for one year periods ended April 30th of each year, instead of coinciding with the December 31st year end. Details of the current expense limitation in effect can be found in Note 4 of the accompanying Notes to Financial Statements. |
| (d) | Portfolio turnover rate is calculated without regard to instruments having a maturity of less than one year from acquisition or derivative instruments (including swap agreements and futures contracts). |
See accompanying notes to financial statements.
Management Discussion of Fund Performance :: ProFund VP Large-Cap Growth :: 131
ProFund VP Large-Cap Growth (the "Fund") seeks investment results, before fees and expenses, that correspond to the performance of the S&P 500® Growth Index (the "Index"). For the year ended December 31, 2021, the Fund had a total return of 29.86%. For the same period, the Index had a total return of 32.01%1 and a volatility of 16.51%. For the year, the Fund achieved an average daily statistical correlation of over 0.99 to the daily performance of the Index.2
The Fund takes positions in financial instruments that, in combination, should have similar return characteristics as the return of the Index. The Index is designed to provide a comprehensive measure of large-cap U.S. equity "growth" performance. It is an unmanaged, float-adjusted, market capitalization-weighted index comprising stocks representing approximately half the market capitalization of the S&P 500® that have been identified as being on the growth end of the growth-value spectrum.
Value of a $10,000 Investment at Net Asset Value*
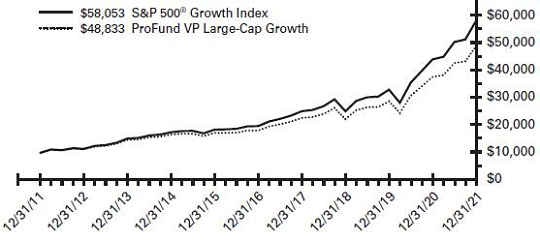
| * | The line graph represents the historical performance of a hypothetical investment of $10,000 in the ProFund VP Large-Cap Growth from December 31, 2011 to December 31, 2021, assuming the reinvestment of distributions. |
Average Annual Total Return as of 12/31/21
| Fund | | One Year | | | Five Year | | | Ten Year | |
| ProFund VP Large-Cap Growth | | | 29.86 | % | | | 21.93 | % | | | 17.18 | % |
| S&P 500® Growth Index | | | 32.01 | % | | | 24.11 | % | | | 19.23 | % |
Expense Ratios**
| Fund | | Gross | | | Net | | | | | |
| ProFund VP Large-Cap Growth | | | 1.75 | % | | | 1.68 | % | | | | |
| ** | Reflects the expense ratio as reported in the Prospectus dated May 1, 2021. Contractual fee waivers are in effect through April 30, 2022. See Financial Highlights for effective expense ratios. |
Allocation of Portfolio Holdings & Index Composition
Market Exposure
| Investment Type | | % of Net Assets | |
| Equity Securities | | | 100 | % |
| Total Exposure | | | 100 | % |
"Market Exposure" includes the value of total investments (including the contract value of any derivatives) and excludes any instruments used for cash management.
Largest Equity Holdings
| Company | | % of Net Assets | |
| Apple, Inc. | | | 13.1 | % |
| Microsoft Corp. | | | 11.9 | % |
| Alphabet, Inc. | | | 8.0 | % |
| Amazon.com, Inc. | | | 6.9 | % |
| Tesla, Inc. | | | 4.1 | % |
S&P 500® Growth Index – Composition
| | | % of Index | |
| Information Technology | | | 44 | % |
| Consumer Discretionary | | | 17 | % |
| Communication Services | | | 13 | % |
| Health Care | | | 11 | % |
| Financials | | | 7 | % |
| Industrials | | | 3 | % |
| Real Estate | | | 2 | % |
| Consumer Staples | | | 1 | % |
| Materials | | | 1 | % |
| Energy | | | 1 | % |
Past performance does not guarantee future results. Return calculations assume the reinvestment of distributions and do not reflect taxes that a shareholder would pay on Fund distributions or on the redemption of Fund shares. The performance data quoted represents past performance and current returns may be lower or higher. The investment return and net asset value ("NAV") will fluctuate so that an investor's shares, when redeemed, may be worth more or less than the original cost. The performance above reflects any fee reductions during the applicable periods. If such fee reductions had not occurred, the quoted performance would be lower. Performance numbers are net of all Fund fees and expenses but do not include any insurance, sales, or administrative charges of variable annuity or life insurance contracts. If these charges were included, the returns would be lower. To obtain performance current to the most recent month-end, please call toll-free 888-776-3637.
| 1 | The graph and table reflect the theoretical reinvestment of dividends on securities in the Index. The impact of transaction costs and the deduction of fees and expenses associated with a mutual fund, such as investment management and accounting fees, are not reflected in the index calculations. The Fund's performance reflects the reinvestment of dividends as well as the impact of transaction costs and the deduction of fees and expenses. It is not possible to invest directly in an index. |
| 2 | 1.00 equals perfect correlation. This calculation is based on the daily total return of the Index and the performance of the daily total return of the NAV per share of the Fund. |
The above information is not covered by the Report of the Independent Registered Public Accounting Firm.
132 :: ProFund VP Large-Cap Growth :: Financial Statements
Schedule of Portfolio Investments :: December 31, 2021
Common Stocks (100.4%)
| | | Shares | | | Value | |
| A.O. Smith Corp. (Building Products) | | | 117 | | | $ | 10,044 | |
| Abbott Laboratories (Health Care Equipment & Supplies) | | | 1,647 | | | | 231,799 | |
| AbbVie, Inc. (Biotechnology) | | | 1,679 | | | | 227,336 | |
| ABIOMED, Inc.* (Health Care Equipment & Supplies) | | | 45 | | | | 16,163 | |
| Accenture PLC—Class A (IT Services) | | | 643 | | | | 266,556 | |
| Adobe, Inc.* (Software) | | | 835 | | | | 473,495 | |
| Advance Auto Parts, Inc. (Specialty Retail) | | | 53 | | | | 12,714 | |
| Advanced Micro Devices, Inc.* (Semiconductors & Semiconductor Equipment) | | | 2,122 | | | | 305,356 | |
| Agilent Technologies, Inc. (Life Sciences Tools & Services) | | | 320 | | | | 51,089 | |
| Akamai Technologies, Inc.* (IT Services) | | | 121 | | | | 14,162 | |
| Albemarle Corp. (Chemicals) | | | 140 | | | | 32,728 | |
| Align Technology, Inc.* (Health Care Equipment & Supplies) | | | 130 | | | | 85,433 | |
| Alphabet, Inc.*—Class A (Interactive Media & Services) | | | 529 | | | | 1,532,534 | |
| Alphabet, Inc.*—Class C (Interactive Media & Services) | | | 492 | | | | 1,423,646 | |
| Amazon.com, Inc.* (Internet & Direct Marketing Retail) | | | 766 | | | | 2,554,105 | |
| American Express Co. (Consumer Finance) | | | 484 | | | | 79,183 | |
| American Tower Corp. (Equity Real Estate Investment Trusts) | | | 408 | | | | 119,340 | |
| Ameriprise Financial, Inc. (Capital Markets) | | | 122 | | | | 36,803 | |
| Amgen, Inc. (Biotechnology) | | | 405 | | | | 91,113 | |
| Amphenol Corp.—Class A (Electronic Equipment, Instruments & Components) | | | 557 | | | | 48,715 | |
| ANSYS, Inc.* (Software) | | | 95 | | | | 38,106 | |
| Aon PLC (Insurance) | | | 231 | | | | 69,429 | |
| APA Corp. (Oil, Gas & Consumable Fuels) | | | 355 | | | | 9,546 | |
| Apple, Inc. (Technology Hardware, Storage & Peripherals) | | | 27,395 | | | | 4,864,530 | |
| Applied Materials, Inc. (Semiconductors & Semiconductor Equipment) | | | 1,587 | | | | 249,730 | |
| Aptiv PLC* (Auto Components) | | | 195 | | | | 32,165 | |
| Arista Networks, Inc.* (Communications Equipment) | | | 394 | | | | 56,638 | |
| Arthur J. Gallagher & Co. (Insurance) | | | 161 | | | | 27,317 | |
| Autodesk, Inc.* (Software) | | | 247 | | | | 69,454 | |
| Automatic Data Processing, Inc. (IT Services) | | | 392 | | | | 96,659 | |
| AutoZone, Inc.* (Specialty Retail) | | | 38 | | | | 79,663 | |
| AvalonBay Communities, Inc. (Equity Real Estate Investment Trusts) | | | 105 | | | | 26,522 | |
| Avery Dennison Corp. (Containers & Packaging) | | | 74 | | | | 16,026 | |
| Bank of America Corp. (Banks) | | | 5,573 | | | | 247,943 | |
| Bath & Body Works, Inc. (Specialty Retail) | | | 303 | | | | 21,146 | |
| Bio-Rad Laboratories, Inc.*—Class A (Life Sciences Tools & Services) | | | 20 | | | | 15,111 | |
| Bio-Techne Corp. (Life Sciences Tools & Services) | | | 69 | | | | 35,696 | |
| BlackRock, Inc.—Class A (Capital Markets) | | | 130 | | | | 119,023 | |
| Broadcom, Inc. (Semiconductors & Semiconductor Equipment) | | | 412 | | | | 274,149 | |
| Broadridge Financial Solutions, Inc. (IT Services) | | | 91 | | | | 16,637 | |
| Brown & Brown, Inc. (Insurance) | | | 284 | | | | 19,960 | |
| Cadence Design Systems, Inc.* (Software) | | | 486 | | | | 90,566 | |
| Caesars Entertainment, Inc.* (Hotels, Restaurants & Leisure) | | | 240 | | | | 22,447 | |
| Capital One Financial Corp. (Consumer Finance) | | | 359 | | | | 52,087 | |
| CarMax, Inc.* (Specialty Retail) | | | 151 | | | | 19,665 | |
| Catalent, Inc.* (Pharmaceuticals) | | | 179 | | | | 22,917 | |
| Cboe Global Markets, Inc. (Capital Markets) | | | 111 | | | | 14,474 | |
| CBRE Group, Inc.*—Class A (Real Estate Management & Development) | | | 292 | | | | 31,685 | |
| CDW Corp. (Electronic Equipment, Instruments & Components) | | | 140 | | | | 28,669 | |
| Celanese Corp. (Chemicals) | | | 82 | | | | 13,781 | |
| Ceridian HCM Holding, Inc.* (Software) | | | 96 | | | | 10,028 | |
| CF Industries Holdings, Inc. (Chemicals) | | | 226 | | | | 15,996 | |
| Charles River Laboratories International, Inc.* (Life Sciences Tools & Services) | | | 90 | | | | 33,910 | |
| Chipotle Mexican Grill, Inc.* (Hotels, Restaurants & Leisure) | | | 33 | | | | 57,692 | |
| Cincinnati Financial Corp. (Insurance) | | | 123 | | | | 14,013 | |
| Cintas Corp. (Commercial Services & Supplies) | | | 70 | | | | 31,022 | |
| Cisco Systems, Inc. (Communications Equipment) | | | 3,337 | | | | 211,465 | |
| Comerica, Inc. (Banks) | | | 104 | | | | 9,048 | |
| Copart, Inc.* (Commercial Services & Supplies) | | | 255 | | | | 38,663 | |
| Costco Wholesale Corp. (Food & Staples Retailing) | | | 396 | | | | 224,810 | |
| Crown Castle International Corp. (Equity Real Estate Investment Trusts) | | | 341 | | | | 71,180 | |
| Danaher Corp. (Health Care Equipment & Supplies) | | | 760 | | | | 250,048 | |
| Deere & Co. (Machinery) | | | 227 | | | | 77,837 | |
| Devon Energy Corp. (Oil, Gas & Consumable Fuels) | | | 1,110 | | | | 48,896 | |
| DexCom, Inc.* (Health Care Equipment & Supplies) | | | 171 | | | | 91,818 | |
| Diamondback Energy, Inc. (Oil, Gas & Consumable Fuels) | | | 299 | | | | 32,247 | |
| Discover Financial Services (Consumer Finance) | | | 515 | | | | 59,513 | |
| Domino's Pizza, Inc. (Hotels, Restaurants & Leisure) | | | 44 | | | | 24,831 | |
| Dover Corp. (Machinery) | | | 117 | | | | 21,247 | |
| DR Horton, Inc. (Household Durables) | | | 302 | | | | 32,751 | |
| Duke Realty Corp. (Equity Real Estate Investment Trusts) | | | 436 | | | | 28,619 | |
| eBay, Inc. (Internet & Direct Marketing Retail) | | | 848 | | | | 56,392 | |
| Edwards Lifesciences Corp.* (Health Care Equipment & Supplies) | | | 690 | | | | 89,390 | |
| Eli Lilly & Co. (Pharmaceuticals) | | | 1,396 | | | | 385,604 | |
| Enphase Energy, Inc.* (Semiconductors & Semiconductor Equipment) | | | 237 | | | | 43,357 | |
| EOG Resources, Inc. (Oil, Gas & Consumable Fuels) | | | 474 | | | | 42,105 | |
| EPAM Systems, Inc.* (IT Services) | | | 100 | | | | 66,845 | |
| Equifax, Inc. (Professional Services) | | | 215 | | | | 62,950 | |
| Equinix, Inc. (Equity Real Estate Investment Trusts) | | | 71 | | | | 60,055 | |
| Essex Property Trust, Inc. (Equity Real Estate Investment Trusts) | | | 50 | | | | 17,612 | |
| Etsy, Inc.* (Internet & Direct Marketing Retail) | | | 223 | | | | 48,824 | |
| Expeditors International of Washington, Inc. (Air Freight & Logistics) | | | 298 | | | | 40,018 | |
| Extra Space Storage, Inc. (Equity Real Estate Investment Trusts) | | | 235 | | | | 53,282 | |
See accompanying notes to financial statements.
Financial Statements :: ProFund VP Large-Cap Growth :: 133
Common Stocks, continued
| | | Shares | | | Value | |
| F5, Inc.* (Communications Equipment) | | | 55 | | | $ | 13,459 | |
| FactSet Research Systems, Inc. (Capital Markets) | | | 39 | | | | 18,954 | |
| Fastenal Co. (Trading Companies & Distributors) | | | 486 | | | | 31,133 | |
| Federal Realty Investment Trust (Equity Real Estate Investment Trusts) | | | 51 | | | | 6,952 | |
| First Horizon Corp. (Banks) | | | — | (a) | | | — | (b) |
| First Republic Bank (Banks) | | | 316 | | | | 65,257 | |
| Fortinet, Inc.* (Software) | | | 238 | | | | 85,537 | |
| Fortune Brands Home & Security, Inc. (Building Products) | | | 107 | | | | 11,438 | |
| Franklin Resources, Inc. (Capital Markets) | | | 225 | | | | 7,535 | |
| Freeport-McMoRan, Inc. (Metals & Mining) | | | 1,139 | | | | 47,530 | |
| Garmin, Ltd. (Household Durables) | | | 134 | | | | 18,247 | |
| Gartner, Inc.* (IT Services) | | | 144 | | | | 48,142 | |
| Generac Holdings, Inc.* (Electrical Equipment) | | | 112 | | | | 39,415 | |
| HCA Healthcare, Inc. (Health Care Providers & Services) | | | 244 | | | | 62,688 | |
| Hess Corp. (Oil, Gas & Consumable Fuels) | | | 344 | | | | 25,466 | |
| Hilton Worldwide Holdings, Inc.* (Hotels, Restaurants & Leisure) | | | 200 | | | | 31,198 | |
| Hologic, Inc.* (Health Care Equipment & Supplies) | | | 329 | | | | 25,188 | |
| HP, Inc. (Technology Hardware, Storage & Peripherals) | | | 1,015 | | | | 38,235 | |
| IDEX Corp. (Machinery) | | | 54 | | | | 12,761 | |
| IDEXX Laboratories, Inc.* (Health Care Equipment & Supplies) | | | 103 | | | | 67,821 | |
| IHS Markit, Ltd. (Professional Services) | | | 337 | | | | 44,794 | |
| Illinois Tool Works, Inc. (Machinery) | | | 207 | | | | 51,088 | |
| Illumina, Inc.* (Life Sciences Tools & Services) | | | 134 | | | | 50,979 | |
| Incyte Corp.* (Biotechnology) | | | 142 | | | | 10,423 | |
| Intercontinental Exchange, Inc. (Capital Markets) | | | 563 | | | | 77,002 | |
| Intuit, Inc. (Software) | | | 497 | | | | 319,680 | |
| Intuitive Surgical, Inc.* (Health Care Equipment & Supplies) | | | 432 | | | | 155,218 | |
| IQVIA Holdings, Inc.* (Life Sciences Tools & Services) | | | 245 | | | | 69,125 | |
| Iron Mountain, Inc. (Equity Real Estate Investment Trusts) | | | 312 | | | | 16,327 | |
| J.B. Hunt Transport Services, Inc. (Road & Rail) | | | 85 | | | | 17,374 | |
| Jacobs Engineering Group, Inc. (Professional Services) | | | 101 | | | | 14,062 | |
| Johnson Controls International PLC (Building Products) | | | 761 | | | | 61,878 | |
| JPMorgan Chase & Co. (Banks) | | | 2,389 | | | | 378,299 | |
| Keysight Technologies, Inc.* (Electronic Equipment, Instruments & Components) | | | 243 | | | | 50,182 | |
| KLA Corp. (Semiconductors & Semiconductor Equipment) | | | 267 | | | | 114,839 | |
| L3Harris Technologies, Inc. (Aerospace & Defense) | | | 144 | | | | 30,706 | |
| Laboratory Corp. of America Holdings* (Health Care Providers & Services) | | | 90 | | | | 28,279 | |
| Lam Research Corp. (Semiconductors & Semiconductor Equipment) | | | 247 | | | | 177,630 | |
| Linde PLC (Chemicals) | | | 461 | | | | 159,705 | |
| Live Nation Entertainment, Inc.* (Entertainment) | | | 102 | | | | 12,208 | |
| LKQ Corp. (Distributors) | | | 202 | | | | 12,126 | |
| Lowe's Cos., Inc. (Specialty Retail) | | | 1,218 | | | | 314,829 | |
| MarketAxess Holdings, Inc. (Capital Markets) | | | 32 | | | | 13,161 | |
| Marriott International, Inc.*—Class A (Hotels, Restaurants & Leisure) | | | — | (a) | | | 53 | |
| Marsh & McLennan Cos., Inc. (Insurance) | | | 542 | | | | 94,211 | |
| Martin Marietta Materials, Inc. (Construction Materials) | | | 63 | | | | 27,752 | |
| Masco Corp. (Building Products) | | | 206 | | | | 14,465 | |
| Mastercard, Inc.—Class A (IT Services) | | | 718 | | | | 257,992 | |
| McDonald's Corp. (Hotels, Restaurants & Leisure) | | | 591 | | | | 158,430 | |
| Meta Platforms, Inc.*—Class A (Interactive Media & Services) | | | 4,160 | | | | 1,399,216 | |
| Mettler-Toledo International, Inc.* (Life Sciences Tools & Services) | | | 26 | | | | 44,127 | |
| Microchip Technology, Inc. (Semiconductors & Semiconductor Equipment) | | | 469 | | | | 40,831 | |
| Microsoft Corp. (Software) | | | 13,196 | | | | 4,438,079 | |
| Mid-America Apartment Communities, Inc. (Equity Real Estate Investment Trusts) | | | 126 | | | | 28,909 | |
| Moderna, Inc.* (Biotechnology) | | | 621 | | | | 157,722 | |
| Monolithic Power Systems, Inc. (Semiconductors & Semiconductor Equipment) | | | 75 | | | | 37,000 | |
| Monster Beverage Corp.* (Beverages) | | | 341 | | | | 32,750 | |
| Moody's Corp. (Capital Markets) | | | 188 | | | | 73,429 | |
| Morgan Stanley (Capital Markets) | | | 1,237 | | | | 121,424 | |
| Motorola Solutions, Inc. (Communications Equipment) | | | 175 | | | | 47,548 | |
| MSCI, Inc.—Class A (Capital Markets) | | | 144 | | | | 88,227 | |
| Nasdaq, Inc. (Capital Markets) | | | 161 | | | | 33,812 | |
| NetApp, Inc. (Technology Hardware, Storage & Peripherals) | | | 279 | | | | 25,665 | |
| Netflix, Inc.* (Entertainment) | | | 779 | | | | 469,301 | |
| Newell Brands, Inc. (Household Durables) | | | 357 | | | | 7,797 | |
| NIKE, Inc.—Class B (Textiles, Apparel & Luxury Goods) | | | 1,214 | | | | 202,337 | |
| NRG Energy, Inc. (Electric Utilities) | | | 433 | | | | 18,654 | |
| Nucor Corp. (Metals & Mining) | | | 271 | | | | 30,935 | |
| NVIDIA Corp. (Semiconductors & Semiconductor Equipment) | | | 4,394 | | | | 1,292,319 | |
| NVR, Inc.* (Household Durables) | | | 2 | | | | 11,818 | |
| NXP Semiconductors N.V. (Semiconductors & Semiconductor Equipment) | | | 295 | | | | 67,195 | |
| Occidental Petroleum Corp. (Oil, Gas & Consumable Fuels) | | | 642 | | | | 18,612 | |
| Old Dominion Freight Line, Inc. (Road & Rail) | | | 163 | | | | 58,416 | |
| ONEOK, Inc. (Oil, Gas & Consumable Fuels) | | | 340 | | | | 19,978 | |
| Oracle Corp. (Software) | | | 2,835 | | | | 247,240 | |
| O'Reilly Automotive, Inc.* (Specialty Retail) | | | 118 | | | | 83,335 | |
| Otis Worldwide Corp. (Machinery) | | | 299 | | | | 26,034 | |
| Paychex, Inc. (IT Services) | | | 300 | | | | 40,950 | |
| Paycom Software, Inc.* (Software) | | | 63 | | | | 26,157 | |
| PayPal Holdings, Inc.* (IT Services) | | | 1,115 | | | | 210,267 | |
| Pentair PLC (Machinery) | | | 170 | | | | 12,415 | |
| PepsiCo, Inc. (Beverages) | | | 1,022 | | | | 177,531 | |
| PerkinElmer, Inc. (Life Sciences Tools & Services) | | | 221 | | | | 44,434 | |
| Pfizer, Inc. (Pharmaceuticals) | | | 5,328 | | | | 314,618 | |
| Pioneer Natural Resources Co. (Oil, Gas & Consumable Fuels) | | | 224 | | | | 40,741 | |
| Pool Corp. (Distributors) | | | 70 | | | | 39,620 | |
| Prologis, Inc. (Equity Real Estate Investment Trusts) | | | 793 | | | | 133,510 | |
| PTC, Inc.* (Software) | | | 92 | | | | 11,146 | |
| Public Storage (Equity Real Estate Investment Trusts) | | �� | 158 | | | | 59,180 | |
| Qorvo, Inc.* (Semiconductors & Semiconductor Equipment) | | | 95 | | | | 14,857 | |
See accompanying notes to financial statements.
134 :: ProFund VP Large-Cap Growth :: Financial Statements
Common Stocks, continued
| | | Shares | | | Value | |
| Qualcomm, Inc. (Semiconductors & Semiconductor Equipment) | | | 1,969 | | | $ | 360,071 | |
| Quanta Services, Inc. (Construction & Engineering) | | | 134 | | | | 15,364 | |
| Quest Diagnostics, Inc. (Health Care Providers & Services) | | | 99 | | | | 17,128 | |
| Raymond James Financial, Inc. (Capital Markets) | | | 193 | | | | 19,377 | |
| Regeneron Pharmaceuticals, Inc.* (Biotechnology) | | | 187 | | | | 118,094 | |
| Regions Financial Corp. (Banks) | | | 754 | | | | 16,437 | |
| Republic Services, Inc.—Class A (Commercial Services & Supplies) | | | 161 | | | | 22,451 | |
| ResMed, Inc. (Health Care Equipment & Supplies) | | | 148 | | | | 38,551 | |
| Robert Half International, Inc. (Professional Services) | | | 133 | | | | 14,832 | |
| Rockwell Automation, Inc. (Electrical Equipment) | | | 107 | | | | 37,327 | |
| Rollins, Inc. (Commercial Services & Supplies) | | | 176 | | | | 6,021 | |
| S&P Global, Inc. (Capital Markets) | | | 258 | | | | 121,758 | |
| Salesforce.com, Inc.* (Software) | | | 1,049 | | | | 266,582 | |
| SBA Communications Corp. (Equity Real Estate Investment Trusts) | | | 109 | | | | 42,403 | |
| Seagate Technology Holdings PLC (Technology Hardware, Storage & Peripherals) | | | 262 | | | | 29,601 | |
| Sealed Air Corp. (Containers & Packaging) | | | 144 | | | | 9,716 | |
| ServiceNow, Inc.* (Software) | | | 350 | | | | 227,189 | |
| Signature Bank (Banks) | | | 109 | | | | 35,258 | |
| Simon Property Group, Inc. (Equity Real Estate Investment Trusts) | | | 347 | | | | 55,440 | |
| Skyworks Solutions, Inc. (Semiconductors & Semiconductor Equipment) | | | 135 | | | | 20,944 | |
| SolarEdge Technologies, Inc.* (Semiconductors & Semiconductor Equipment) | | | 69 | | | | 19,359 | |
| Starbucks Corp. (Hotels, Restaurants & Leisure) | | | 1,058 | | | | 123,754 | |
| STERIS PLC (Health Care Equipment & Supplies) | | | 73 | | | | 17,769 | |
| Stryker Corp. (Health Care Equipment & Supplies) | | | 241 | | | | 64,448 | |
| SVB Financial Group* (Banks) | | | 105 | | | | 71,215 | |
| Synchrony Financial (Consumer Finance) | | | 550 | | | | 25,515 | |
| Synopsys, Inc.* (Software) | | | 179 | | | | 65,962 | |
| T. Rowe Price Group, Inc. (Capital Markets) | | | 277 | | | | 54,469 | |
| Take-Two Interactive Software, Inc.* (Entertainment) | | | 126 | | | | 22,393 | |
| Target Corp. (Multiline Retail) | | | 472 | | | | 109,240 | |
| Teradyne, Inc. (Semiconductors & Semiconductor Equipment) | | | 287 | | | | 46,933 | |
| Tesla, Inc.* (Automobiles) | | | 1,430 | | | | 1,511,195 | |
| Texas Instruments, Inc. (Semiconductors & Semiconductor Equipment) | | | 797 | | | | 150,211 | |
| The Charles Schwab Corp. (Capital Markets) | | | 1,795 | | | | 150,960 | |
| The Estee Lauder Co., Inc. (Personal Products) | | | 240 | | | | 88,848 | |
| The Goldman Sachs Group, Inc. (Capital Markets) | | | 597 | | | | 228,381 | |
| The Hershey Co. (Food Products) | | | 115 | | | | 22,249 | |
| The Home Depot, Inc. (Specialty Retail) | | | 1,411 | | | | 585,578 | |
| The Sherwin-Williams Co. (Chemicals) | | | 225 | | | | 79,236 | |
| Thermo Fisher Scientific, Inc. (Life Sciences Tools & Services) | | | 692 | | | | 461,731 | |
| Tractor Supply Co. (Specialty Retail) | | | 200 | | | | 47,720 | |
| TransDigm Group, Inc.* (Aerospace & Defense) | | | 42 | | | | 26,724 | |
| Trimble, Inc.* (Electronic Equipment, Instruments & Components) | | | 248 | | | | 21,623 | |
| Twitter, Inc.* (Interactive Media & Services) | | | 677 | | | | 29,260 | |
| Tyler Technologies, Inc.* (Software) | | | 45 | | | | 24,208 | |
| UDR, Inc. (Equity Real Estate Investment Trusts) | | | 281 | | | | 16,857 | |
| Ulta Beauty, Inc.* (Specialty Retail) | | | 53 | | | | 21,854 | |
| Under Armour, Inc.*—Class A (Textiles, Apparel & Luxury Goods) | | | 145 | | | | 3,073 | |
| Under Armour, Inc.*—Class C (Textiles, Apparel & Luxury Goods) | | | 165 | | | | 2,977 | |
| Union Pacific Corp. (Road & Rail) | | | 464 | | | | 116,896 | |
| United Parcel Service, Inc.—Class B (Air Freight & Logistics) | | | 550 | | | | 117,887 | |
| United Rentals, Inc.* (Trading Companies & Distributors) | | | 76 | | | | 25,254 | |
| UnitedHealth Group, Inc. (Health Care Providers & Services) | | | 695 | | | | 348,988 | |
| VeriSign, Inc.* (IT Services) | | | 80 | | | | 20,306 | |
| Verisk Analytics, Inc. (Professional Services) | | | 144 | | | | 32,937 | |
| Vertex Pharmaceuticals, Inc.* (Biotechnology) | | | 269 | | | | 59,072 | |
| Visa, Inc.—Class A (IT Services) | | | 1,269 | | | | 275,004 | |
| Vulcan Materials Co. (Construction Materials) | | | 113 | | | | 23,457 | |
| Waste Management, Inc. (Commercial Services & Supplies) | | | 345 | | | | 57,581 | |
| Waters Corp.* (Life Sciences Tools & Services) | | | 79 | | | | 29,435 | |
| West Pharmaceutical Services, Inc. (Health Care Equipment & Supplies) | | | 130 | | | | 60,971 | |
| Weyerhaeuser Co. (Equity Real Estate Investment Trusts) | | | 556 | | | | 22,896 | |
| Xilinx, Inc. (Semiconductors & Semiconductor Equipment) | | | 323 | | | | 68,486 | |
| Xylem, Inc. (Machinery) | | | 128 | | | | 15,350 | |
| Yum! Brands, Inc. (Hotels, Restaurants & Leisure) | | | 243 | | | | 33,743 | |
| Zebra Technologies Corp.* (Electronic Equipment, Instruments & Components) | | | 69 | | | | 41,069 | |
| Zions Bancorp (Banks) | | | 134 | | | | 8,463 | |
| Zoetis, Inc. (Pharmaceuticals) | | | 548 | | | | 133,728 | |
TOTAL COMMON STOCKS
(Cost $17,001,508) | | | | | | | 37,343,841 | |
Repurchase Agreements(c) (0.2%)
| | | Principal Amount | | | Value | |
| Repurchase Agreements with various counterparties, 0.00%, dated 12/31/21, due 1/3/22, total to be received $73,000 | | $ | 73,000 | | | $ | 73,000 | |
TOTAL REPURCHASE AGREEMENTS
(Cost $73,000) | | | | | | | 73,000 | |
TOTAL INVESTMENT SECURITIES
(Cost $17,074,508)—100.6% | | | | | | | 37,416,841 | |
| Net other assets (liabilities)—(0.6)% | | | | | | | (236,688 | ) |
| NET ASSETS—100.0% | | | | | | $ | 37,180,153 | |
| * | Non-income producing security. |
| (a) | Number of shares is less than 0.50. |
| (b) | Amount is less than $0.50. |
| (c) | The ProFund VP invests in Repurchase Agreements jointly with other funds in the Trust. See "Repurchase Agreements" under Note 2 in the Notes to Financial Statements to view the details of each individual agreement and counterparty as well as a description of the securities subject to repurchase. |
See accompanying notes to financial statements.
Financial Statements :: ProFund VP Large-Cap Growth :: 135
ProFund VP Large-Cap Growth invested in the following industries as of December 31, 2021:
| | | Value | | | % of
Net Assets | |
| Aerospace & Defense | | $ | 57,430 | | | | 0.2 | % |
| Air Freight & Logistics | | | 157,905 | | | | 0.4 | % |
| Auto Components | | | 32,165 | | | | 0.1 | % |
| Automobiles | | | 1,511,195 | | | | 4.1 | % |
| Banks | | | 831,920 | | | | 2.2 | % |
| Beverages | | | 210,281 | | | | 0.6 | % |
| Biotechnology | | | 663,760 | | | | 1.8 | % |
| Building Products | | | 97,825 | | | | 0.3 | % |
| Capital Markets | | | 1,178,789 | | | | 3.2 | % |
| Chemicals | | | 301,446 | | | | 0.8 | % |
| Commercial Services & Supplies | | | 155,738 | | | | 0.4 | % |
| Communications Equipment | | | 329,110 | | | | 0.9 | % |
| Construction & Engineering | | | 15,364 | | | | NM | |
| Construction Materials | | | 51,209 | | | | 0.1 | % |
| Consumer Finance | | | 216,298 | | | | 0.6 | % |
| Containers & Packaging | | | 25,742 | | | | 0.1 | % |
| Distributors | | | 51,746 | | | | 0.1 | % |
| Electric Utilities | | | 18,654 | | | | 0.1 | % |
| Electrical Equipment | | | 76,742 | | | | 0.2 | % |
| Electronic Equipment, Instruments & Components | | | 190,258 | | | | 0.5 | % |
| Entertainment | | | 503,902 | | | | 1.4 | % |
| Equity Real Estate Investment Trusts | | | 759,084 | | | | 2.0 | % |
| Food & Staples Retailing | | | 224,810 | | | | 0.6 | % |
| Food Products | | | 22,249 | | | | 0.1 | % |
| Health Care Equipment & Supplies | | | 1,194,617 | | | | 3.3 | % |
| Health Care Providers & Services | | | 457,083 | | | | 1.2 | % |
| Hotels, Restaurants & Leisure | | | 452,148 | | | | 1.2 | % |
| Household Durables | | | 70,613 | | | | 0.2 | % |
| Insurance | | | 224,930 | | | | 0.6 | % |
| Interactive Media & Services | | | 4,384,656 | | | | 11.7 | % |
| Internet & Direct Marketing Retail | | | 2,659,321 | | | | 7.1 | % |
| IT Services | | | 1,313,520 | | | | 3.5 | % |
| Life Sciences Tools & Services | | | 835,637 | | | | 2.2 | % |
| Machinery | | | 216,732 | | | | 0.5 | % |
| Metals & Mining | | | 78,465 | | | | 0.2 | % |
| Multiline Retail | | | 109,240 | | | | 0.3 | % |
| Oil, Gas & Consumable Fuels | | | 237,591 | | | | 0.6 | % |
| Personal Products | | | 88,848 | | | | 0.2 | % |
| Pharmaceuticals | | | 856,867 | | | | 2.3 | % |
| Professional Services | | | 169,575 | | | | 0.5 | % |
| Real Estate Management & Development | | | 31,685 | | | | 0.1 | % |
| Road & Rail | | | 192,686 | | | | 0.5 | % |
| Semiconductors & Semiconductor Equipment | | | 3,283,267 | | | | 8.8 | % |
| Software | | | 6,393,429 | | | | 17.3 | % |
| Specialty Retail | | | 1,186,504 | | | | 3.2 | % |
| Technology Hardware, Storage & Peripherals | | | 4,958,031 | | | | 13.3 | % |
| Textiles, Apparel & Luxury Goods | | | 208,387 | | | | 0.6 | % |
| Trading Companies & Distributors | | | 56,387 | | | | 0.2 | % |
| Other** | | | (163,688 | ) | | | (0.4 | )% |
| Total | | $ | 37,180,153 | | | | 100.0 | % |
| ** | Includes any non-equity securities and net other assets (liabilities), which includes any receivable for capital shares issued and payable for capital shares redeemed. |
| NM | Not meaningful, amount is less than 0.05%. |
See accompanying notes to financial statements.
136 :: ProFund VP Large-Cap Growth :: Financial Statements
Statement of Assets and Liabilities
December 31, 2021
| ASSETS: |
| Total Investment Securities, at cost | | $ | 17,074,508 | |
| Securities, at value | | | 37,343,841 | |
| Repurchase agreements, at value | | | 73,000 | |
| Total Investment Securities, at value | | | 37,416,841 | |
| Cash | | | 1,486 | |
| Dividends receivable | | | 6,060 | |
| Receivable for capital shares issued | | | 107,763 | |
| Prepaid expenses | | | 2,213 | |
| TOTAL ASSETS | | | 37,534,363 | |
| | | | | |
| LIABILITIES: | | | | |
| Payable for capital shares redeemed | | | 282,742 | |
| Payable for investments purchased | | | 874 | |
| Advisory fees payable | | | 22,857 | |
| Management services fees payable | | | 3,048 | |
| Administration fees payable | | | 1,991 | |
| Administrative services fees payable | | | 12,557 | |
| Distribution fees payable | | | 11,908 | |
| Transfer agency fees payable | | | 3,279 | |
| Fund accounting fees payable | | | 1,171 | |
| Compliance services fees payable | | | 145 | |
| Other accrued expenses | | | 13,638 | |
| TOTAL LIABILITIES | | | 354,210 | |
| NET ASSETS | | $ | 37,180,153 | |
| | | | | |
| NET ASSETS CONSIST OF: | | | | |
| Capital | | $ | 13,799,588 | |
| Total distributable earnings (loss) | | | 23,380,565 | |
| NET ASSETS | | $ | 37,180,153 | |
| Shares of Beneficial Interest Outstanding (unlimited number of shares authorized, no par value) | | | 432,600 | |
| Net Asset Value (offering and redemption price per share) | | $ | 85.95 | |
Statement of Operations
For the Year Ended December 31, 2021
| INVESTMENT INCOME: | | | | |
| Dividends | | $ | 220,060 | |
| Interest | | | 1 | |
| Foreign tax withholding | | | (4 | ) |
| TOTAL INVESTMENT INCOME | | | 220,057 | |
| | | | | |
| EXPENSES: | | | | |
| Advisory fees | | | 224,624 | |
| Management services fees | | | 29,950 | |
| Administration fees | | | 22,090 | |
| Transfer agency fees | | | 18,016 | |
| Administrative services fees | | | 90,220 | |
| Distribution fees | | | 74,875 | |
| Custody fees | | | 5,168 | |
| Fund accounting fees | | | 12,898 | |
| Trustee fees | | | 519 | |
| Compliance services fees | | | 192 | |
| Other fees | | | 25,293 | |
| Recoupment of prior expenses reduced by the Advisor | | | 2,000 | |
| Total Gross Expenses before reductions | | | 505,845 | |
| Expenses reduced and reimbursed by the Advisor | | | (2,687 | ) |
| TOTAL NET EXPENSES | | | 503,158 | |
| NET INVESTMENT INCOME (LOSS) | | | (283,101 | ) |
| | | | | |
| REALIZED AND UNREALIZED GAINS (LOSSES) ON INVESTMENTS: | | | | |
| Net realized gains (losses) on investment securities | | | 4,101,255 | |
| Change in net unrealized appreciation/depreciation on investment securities | | | 3,485,807 | |
| NET REALIZED AND UNREALIZED GAINS (LOSSES) ON INVESTMENTS | | | 7,587,062 | |
| CHANGE IN NET ASSETS RESULTING FROM OPERATIONS | | $ | 7,303,961 | |
See accompanying notes to financial statements.
Financial Statements :: ProFund VP Large-Cap Growth :: 137
| Statements of Changes in Net Assets |
| | | Year Ended
December 31, 2021 | | | Year Ended
December 31, 2020 | |
| FROM INVESTMENT ACTIVITIES: |
| |
| OPERATIONS: |
| Net investment income (loss) | | $ | (283,101 | ) | | $ | (140,157 | ) |
| Net realized gains (losses) on investments | | | 4,101,255 | | | | 4,081,236 | |
| Change in net unrealized appreciation/depreciation on investments | | | 3,485,807 | | | | 3,170,326 | |
| Change in net assets resulting from operations | | | 7,303,961 | | | | 7,111,405 | |
| | | | | | | | | |
| DISTRIBUTIONS TO SHAREHOLDERS: | | | | | | | | |
| Total distributions | | | (3,932,438 | ) | | | (2,722,527 | ) |
| Change in net assets resulting from distributions | | | (3,932,438 | ) | | | (2,722,527 | ) |
| | | | | | | | | |
| CAPITAL TRANSACTIONS: | | | | | | | | |
| Proceeds from shares issued | | | 39,677,623 | | | | 43,774,938 | |
| Distributions reinvested | | | 3,932,438 | | | | 2,722,527 | |
| Value of shares redeemed | | | (39,764,236 | ) | | | (49,864,282 | ) |
| Change in net assets resulting from capital transactions | | | 3,845,825 | | | | (3,366,817 | ) |
| Change in net assets | | | 7,217,348 | | | | 1,022,061 | |
| | | | | | | | | |
| NET ASSETS: | | | | | | | | |
| Beginning of period | | | 29,962,805 | | | | 28,940,744 | |
| End of period | | $ | 37,180,153 | | | $ | 29,962,805 | |
| | | | | | | | | |
| SHARE TRANSACTIONS: | | | | | | | | |
| Issued | | | 490,409 | | | | 650,844 | |
| Reinvested | | | 57,737 | | | | 35,998 | |
| Redeemed | | | (503,495 | ) | | | (748,650 | ) |
| Change in shares | | | 44,651 | | | | (61,808 | ) |
See accompanying notes to financial statements.
138 :: ProFund VP Large-Cap Growth :: Financial Highlights
ProFunds Financial Highlights FOR THE PERIODS INDICATED
Selected data for a share of beneficial interest outstanding throughout the periods indicated.
| | | Year Ended
Dec. 31, 2021 | | | Year Ended
Dec. 31, 2020 | | | Year Ended
Dec. 31, 2019 | | | Year Ended
Dec. 31, 2018 | | | Year Ended
Dec. 31, 2017 | |
| Net Asset Value, Beginning of Period | | $ | 77.23 | | | $ | 64.35 | | | $ | 65.02 | | | $ | 69.22 | | | $ | 57.48 | |
| | | | | | | | | | | | | | | | | | | | | |
| Investment Activities: | | | | | | | | | | | | | | | | | | | | |
| Net investment income (loss)(a) | | | (0.75 | ) | | | (0.35 | ) | | | (0.10 | ) | | | (0.22 | ) | | | (0.04 | ) |
| Net realized and unrealized gains (losses) on investments | | | 20.84 | | | | 20.11 | | | | 17.13 | | | | (0.74 | ) | | | 14.41 | |
| Total income (loss) from investment activities | | | 20.09 | | | | 19.76 | | | | 17.03 | | | | (0.96 | ) | | | 14.37 | |
| | | | | | | | | | | | | | | | | | | | | |
| Distributions to Shareholders From: | | | | | | | | | | | | | | | | | | | | |
| Net realized gains on investments | | | (11.37 | ) | | | (6.88 | ) | | | (17.70 | ) | | | (3.24 | ) | | | (2.63 | ) |
| Total distributions | | | (11.37 | ) | | | (6.88 | ) | | | (17.70 | ) | | | (3.24 | ) | | | (2.63 | ) |
| | | | | | | | | | | | | | | | | | | | | |
| Net Asset Value, End of Period | | $ | 85.95 | | | $ | 77.23 | | | $ | 64.35 | | | $ | 65.02 | | | $ | 69.22 | |
| | | | | | | | | | | | | | | | | | | | | |
| Total Return | | | 29.86 | % | | | 30.93 | % | | | 28.89 | % | | | (1.86 | )% | | | 25.29 | % |
| | | | | | | | | | | | | | | | | | | | | |
| Ratios to Average Net Assets: | | | | | | | | | | | | | | | | | | | | |
| Gross expenses | | | 1.69 | % | | | 1.75 | % | | | 1.73 | % | | | 1.69 | % | | | 1.68 | % |
| Net expenses | | | 1.68 | % | | | 1.68 | % | | | 1.68 | % | | | 1.68 | % | | | 1.68 | % |
| Net investment income (loss) | | | (0.94 | )% | | | (0.52 | )% | | | (0.14 | )% | | | (0.30 | )% | | | (0.07 | )% |
| | | | | | | | | | | | | | | | | | | | | |
| Supplemental Data: | | | | | | | | | | | | | | | | | | | | |
| Net assets, end of period (000's) | | $ | 37,180 | | | $ | 29,963 | | | $ | 28,941 | | | $ | 24,821 | | | $ | 34,398 | |
| Portfolio turnover rate(b) | | | 122 | % | | | 150 | % | | | 136 | % | | | 149 | % | | | 154 | % |
| (a) | Per share net investment income (loss) has been calculated using the average daily shares method. |
| (b) | Portfolio turnover rate is calculated without regard to instruments having a maturity of less than one year from acquisition or derivative instruments (including swap agreements and futures contracts). The portfolio turnover rate can be high and volatile due to the amount and timing of sales and purchases of fund shares during the period. |
See accompanying notes to financial statements.
Management Discussion of Fund Performance :: ProFund VP Large-Cap Value :: 139
ProFund VP Large-Cap Value (the "Fund") seeks investment results, before fees and expenses, that correspond to the performance of the S&P 500® Value Index (the "Index"). For the year ended December 31, 2021, the Fund had a total return of 22.93%. For the same period, the Index had a total return of 24.90%1 and a volatility of 13.12%. For the year, the Fund achieved an average daily statistical correlation of over 0.99 to the daily performance of the Index.2
The Fund takes positions in financial instruments that, in combination, should have similar return characteristics as the return of the Index. The Index is designed to provide a comprehensive measure of large-cap U.S. equity "value" performance. It is an unmanaged, float-adjusted, market capitalization-weighted index comprising stocks representing approximately half the market capitalization of the S&P 500® that have been identified as being on the value end of the growth-value spectrum.
Value of a $10,000 Investment at Net Asset Value*
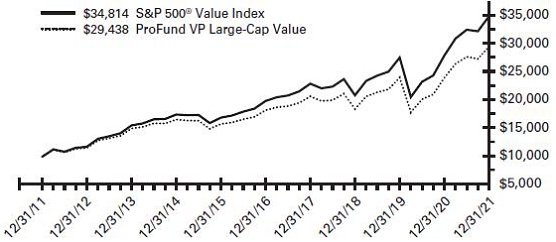
| * | The line graph represents the historical performance of a hypothetical investment of $10,000 in the ProFund VP Large-Cap Value from December 31, 2011 to December 31, 2021, assuming the reinvestment of distributions. |
Average Annual Total Return as of 12/31/21
| Fund | | One Year | | | Five Year | | | Ten Year | |
| ProFund VP Large-Cap Value | | | 22.93 | % | | | 10.08 | % | | | 11.40 | % |
| S&P 500® Value Index | | | 24.90 | % | | | 11.90 | % | | | 13.29 | % |
Expense Ratios**
| Fund | | Gross | | | Net | | | | | |
| ProFund VP Large-Cap Value | | | 1.77 | % | | | 1.68 | % | | | | |
| ** | Reflects the expense ratio as reported in the Prospectus dated May 1, 2021. Contractual fee waivers are in effect through April 30, 2022. See Financial Highlights for effective expense ratios. |
Allocation of Portfolio Holdings & Index Composition
Market Exposure
| Investment Type | | % of Net Assets | |
| Equity Securities | | | 99 | % |
| Total Exposure | | | 99 | % |
"Market Exposure" includes the value of total investments (including the contract value of any derivatives) and excludes any instruments used for cash management or collateral for securities loaned.
Largest Equity Holdings
| Company | | % of Net Assets | |
| Berkshire Hathaway, Inc. | | | 2.8 | % |
| Johnson & Johnson | | | 2.3 | % |
| The Procter & Gamble Co. | | | 2.1 | % |
| The Walt Disney Co. | | | 1.5 | % |
| UnitedHealth Group, Inc. | | | 1.4 | % |
S&P 500® Value Index – Composition
| | | % of Index | |
| Health Care | | | 16 | % |
| Financials | | | 15 | % |
| Industrials | | | 13 | % |
| Information Technology | | | 13 | % |
| Consumer Staples | | | 11 | % |
| Consumer Discretionary | | | 8 | % |
| Communication Services | | | 7 | % |
| Utilities | | | 5 | % |
| Energy | | | 5 | % |
| Materials | | | 4 | % |
| Real Estate | | | 3 | % |
Past performance does not guarantee future results. Return calculations assume the reinvestment of distributions and do not reflect taxes that a shareholder would pay on Fund distributions or on the redemption of Fund shares. The performance data quoted represents past performance and current returns may be lower or higher. The investment return and net asset value ("NAV") will fluctuate so that an investor's shares, when redeemed, may be worth more or less than the original cost. The performance above reflects any fee reductions during the applicable periods. If such fee reductions had not occurred, the quoted performance would be lower. Performance numbers are net of all Fund fees and expenses but do not include any insurance, sales, or administrative charges of variable annuity or life insurance contracts. If these charges were included, the returns would be lower. To obtain performance current to the most recent month-end, please call toll-free 888-776-3637.
| 1 | The graph and table reflect the theoretical reinvestment of dividends on securities in the Index. The impact of transaction costs and the deduction of fees and expenses associated with a mutual fund, such as investment management and accounting fees, are not reflected in the index calculations. The Fund's performance reflects the reinvestment of dividends as well as the impact of transaction costs and the deduction of fees and expenses. It is not possible to invest directly in an index. |
| 2 | 1.00 equals perfect correlation. This calculation is based on the daily total return of the Index and the performance of the daily total return of the NAV per share of the Fund. |
The above information is not covered by the Report of the Independent Registered Public Accounting Firm.
140 :: ProFund VP Large-Cap Value :: Financial Statements
Schedule of Portfolio Investments :: December 31, 2021
Common Stocks (99.3%)
| | | Shares | | | Value | |
| 3M Co. (Industrial Conglomerates) | | | 535 | | | $ | 95,032 | |
| A.O. Smith Corp. (Building Products) | | | 63 | | | | 5,409 | |
| Abbott Laboratories (Health Care Equipment & Supplies) | | | 772 | | | | 108,651 | |
| AbbVie, Inc. (Biotechnology) | | | 756 | | | | 102,362 | |
| ABIOMED, Inc.* (Health Care Equipment & Supplies) | | | 19 | | | | 6,824 | |
| Accenture PLC—Class A (IT Services) | | | 246 | | | | 101,979 | |
| Activision Blizzard, Inc. (Entertainment) | | | 724 | | | | 48,168 | |
| Advance Auto Parts, Inc. (Specialty Retail) | | | 31 | | | | 7,436 | |
| Aflac, Inc. (Insurance) | | | 566 | | | | 33,049 | |
| Agilent Technologies, Inc. (Life Sciences Tools & Services) | | | 113 | | | | 18,040 | |
| Air Products & Chemicals, Inc. (Chemicals) | | | 205 | | | | 62,373 | |
| Akamai Technologies, Inc.* (IT Services) | | | 88 | | | | 10,300 | |
| Alaska Air Group, Inc.* (Airlines) | | | 117 | | | | 6,096 | |
| Albemarle Corp. (Chemicals) | | | 35 | | | | 8,182 | |
| Alexandria Real Estate Equities, Inc. (Equity Real Estate Investment Trusts) | | | 130 | | | | 28,985 | |
| Allegion PLC (Building Products) | | | 84 | | | | 11,125 | |
| Alliant Energy Corp. (Electric Utilities) | | | 234 | | | | 14,384 | |
| Altria Group, Inc. (Tobacco) | | | 1,707 | | | | 80,895 | |
| Amcor PLC (Containers & Packaging) | | | 1,423 | | | | 17,090 | |
| Ameren Corp. (Multi-Utilities) | | | 239 | | | | 21,273 | |
| American Airlines Group, Inc.* (Airlines) | | | 602 | | | | 10,812 | |
| American Electric Power Co., Inc. (Electric Utilities) | | | 469 | | | | 41,727 | |
| American Express Co. (Consumer Finance) | | | 327 | | | | 53,498 | |
| American International Group, Inc. (Insurance) | | | 771 | | | | 43,839 | |
| American Tower Corp. (Equity Real Estate Investment Trusts) | | | 207 | | | | 60,547 | |
| American Water Works Co., Inc. (Water Utilities) | | | 169 | | | | 31,917 | |
| Ameriprise Financial, Inc. (Capital Markets) | | | 40 | | | | 12,066 | |
| AmerisourceBergen Corp. (Health Care Providers & Services) | | | 138 | | | | 18,339 | |
| AMETEK, Inc. (Electrical Equipment) | | | 214 | | | | 31,467 | |
| Amgen, Inc. (Biotechnology) | | | 309 | | | | 69,516 | |
| Amphenol Corp.—Class A (Electronic Equipment, Instruments & Components) | | | 262 | | | | 22,915 | |
| Analog Devices, Inc. (Semiconductors & Semiconductor Equipment) | | | 499 | | | | 87,709 | |
| ANSYS, Inc.* (Software) | | | 31 | | | | 12,435 | |
| Anthem, Inc. (Health Care Providers & Services) | | | 226 | | | | 104,760 | |
| Aon PLC (Insurance) | | | 82 | | | | 24,646 | |
| APA Corp. (Oil, Gas & Consumable Fuels) | | | 152 | | | | 4,087 | |
| Aptiv PLC* (Auto Components) | | | 148 | | | | 24,412 | |
| Archer-Daniels-Midland Co. (Food Products) | | | 520 | | | | 35,147 | |
| Arthur J. Gallagher & Co. (Insurance) | | | 109 | | | | 18,494 | |
| Assurant, Inc. (Insurance) | | | 53 | | | | 8,261 | |
| AT&T, Inc. (Diversified Telecommunication Services) | | | 6,635 | | | | 163,221 | |
| Atmos Energy Corp. (Gas Utilities) | | | 122 | | | | 12,782 | |
| Autodesk, Inc.* (Software) | | | 74 | | | | 20,808 | |
| Automatic Data Processing, Inc. (IT Services) | | | 185 | | | | 45,617 | |
| AvalonBay Communities, Inc. (Equity Real Estate Investment Trusts) | | | 76 | | | | 19,197 | |
| Avery Dennison Corp. (Containers & Packaging) | | | 38 | | | | 8,230 | |
| Baker Hughes Co.—Class A (Energy Equipment & Services) | | | 813 | | | | 19,561 | |
| Ball Corp. (Containers & Packaging) | | | 301 | | | | 28,977 | |
| Bank of America Corp. (Banks) | | | 3,748 | | | | 166,749 | |
| Bath & Body Works, Inc. (Specialty Retail) | | | 86 | | | | 6,002 | |
| Baxter International, Inc. (Health Care Equipment & Supplies) | | | 466 | | | | 40,001 | |
| Becton, Dickinson & Co. (Health Care Equipment & Supplies) | | | 268 | | | | 67,397 | |
| Berkshire Hathaway, Inc.*—Class B (Diversified Financial Services) | | | 1,702 | | | | 508,898 | |
| Best Buy Co., Inc. (Specialty Retail) | | | 205 | | | | 20,828 | |
| Biogen, Inc.* (Biotechnology) | | | 136 | | | | 32,629 | |
| Bio-Rad Laboratories, Inc.*—Class A (Life Sciences Tools & Services) | | | 9 | | | | 6,800 | |
| BlackRock, Inc.—Class A (Capital Markets) | | | 64 | | | | 58,596 | |
| Booking Holdings, Inc.* (Hotels, Restaurants & Leisure) | | | 38 | | | | 91,170 | |
| BorgWarner, Inc. (Auto Components) | | | 222 | | | | 10,006 | |
| Boston Properties, Inc. (Equity Real Estate Investment Trusts) | | | 131 | | | | 15,089 | |
| Boston Scientific Corp.* (Health Care Equipment & Supplies) | | | 1,325 | | | | 56,286 | |
| Bristol-Myers Squibb Co. (Pharmaceuticals) | | | 2,062 | | | | 128,566 | |
| Broadcom, Inc. (Semiconductors & Semiconductor Equipment) | | | 165 | | | | 109,793 | |
| Broadridge Financial Solutions, Inc. (IT Services) | | | 60 | | | | 10,969 | |
| Brown & Brown, Inc. (Insurance) | | | 68 | | | | 4,779 | |
| Brown-Forman Corp.—Class B (Beverages) | | | 170 | | | | 12,386 | |
| C.H. Robinson Worldwide, Inc. (Air Freight & Logistics) | | | 120 | | | | 12,916 | |
| Caesars Entertainment, Inc.* (Hotels, Restaurants & Leisure) | | | 72 | | | | 6,734 | |
| Campbell Soup Co. (Food Products) | | | 189 | | | | 8,214 | |
| Capital One Financial Corp. (Consumer Finance) | | | 205 | | | | 29,743 | |
| Cardinal Health, Inc. (Health Care Providers & Services) | | | 261 | | | | 13,439 | |
| CarMax, Inc.* (Specialty Retail) | | | 71 | | | | 9,246 | |
| Carnival Corp.*—Class A (Hotels, Restaurants & Leisure) | | | 748 | | | | 15,050 | |
| Carrier Global Corp. (Building Products) | | | 805 | | | | 43,663 | |
| Catalent, Inc.* (Pharmaceuticals) | | | 64 | | | | 8,194 | |
| Caterpillar, Inc. (Machinery) | | | 502 | | | | 103,783 | |
| Cboe Global Markets, Inc. (Capital Markets) | | | 41 | | | | 5,346 | |
| CBRE Group, Inc.*—Class A (Real Estate Management & Development) | | | 156 | | | | 16,928 | |
| CDW Corp. (Electronic Equipment, Instruments & Components) | | | 51 | | | | 10,444 | |
| Celanese Corp. (Chemicals) | | | 57 | | | | 9,579 | |
| Centene Corp.* (Health Care Providers & Services) | | | 542 | | | | 44,661 | |
| CenterPoint Energy, Inc. (Multi-Utilities) | | | 585 | | | | 16,327 | |
| Ceridian HCM Holding, Inc.* (Software) | | | 75 | | | | 7,835 | |
| Cerner Corp. (Health Care Technology) | | | 274 | | | | 25,446 | |
| CF Industries Holdings, Inc. (Chemicals) | | | 80 | | | | 5,662 | |
| Charter Communications, Inc.*—Class A (Media) | | | 115 | | | | 74,977 | |
| Chevron Corp. (Oil, Gas & Consumable Fuels) | | | 1,791 | | | | 210,174 | |
| Chipotle Mexican Grill, Inc.* (Hotels, Restaurants & Leisure) | | | 8 | | | | 13,986 | |
| Chubb, Ltd. (Insurance) | | | 401 | | | | 77,518 | |
| Church & Dwight Co., Inc. (Household Products) | | | 227 | | | | 23,268 | |
| Cigna Corp. (Health Care Providers & Services) | | | 308 | | | | 70,726 | |
See accompanying notes to financial statements.
Financial Statements :: ProFund VP Large-Cap Value :: 141
Common Stocks, continued
| | | Shares | | | Value | |
| Cincinnati Financial Corp. (Insurance) | | | 74 | | | $ | 8,431 | |
| Cintas Corp. (Commercial Services & Supplies) | | | 43 | | | | 19,056 | |
| Cisco Systems, Inc. (Communications Equipment) | | | 2,155 | | | | 136,562 | |
| Citigroup, Inc. (Banks) | | | 1,844 | | | | 111,359 | |
| Citizens Financial Group, Inc. (Banks) | | | 397 | | | | 18,758 | |
| Citrix Systems, Inc. (Software) | | | 115 | | | | 10,878 | |
| CME Group, Inc. (Capital Markets) | | | 334 | | | | 76,307 | |
| CMS Energy Corp. (Multi-Utilities) | | | 270 | | | | 17,564 | |
| Cognizant Technology Solutions Corp.—Class A (IT Services) | | | 489 | | | | 43,384 | |
| Colgate-Palmolive Co. (Household Products) | | | 784 | | | | 66,906 | |
| Comcast Corp.—Class A (Media) | | | 4,236 | | | | 213,198 | |
| Comerica, Inc. (Banks) | | | 68 | | | | 5,916 | |
| Conagra Brands, Inc. (Food Products) | | | 445 | | | | 15,197 | |
| ConocoPhillips (Oil, Gas & Consumable Fuels) | | | 1,224 | | | | 88,348 | |
| Consolidated Edison, Inc. (Multi-Utilities) | | | 329 | | | | 28,070 | |
| Constellation Brands, Inc.—Class A (Beverages) | | | 152 | | | | 38,147 | |
| Copart, Inc.* (Commercial Services & Supplies) | | | 64 | | | | 9,704 | |
| Corning, Inc. (Electronic Equipment, Instruments & Components) | | | 715 | | | | 26,619 | |
| Corteva, Inc. (Chemicals) | | | 677 | | | | 32,009 | |
| Costco Wholesale Corp. (Food & Staples Retailing) | | | 201 | | | | 114,108 | |
| Coterra Energy, Inc. (Oil, Gas & Consumable Fuels) | | | 756 | | | | 14,364 | |
| Crown Castle International Corp. (Equity Real Estate Investment Trusts) | | | 220 | | | | 45,923 | |
| CSX Corp. (Road & Rail) | | | 2,062 | | | | 77,531 | |
| Cummins, Inc. (Machinery) | | | 132 | | | | 28,794 | |
| CVS Health Corp. (Health Care Providers & Services) | | | 1,227 | | | | 126,577 | |
| Danaher Corp. (Health Care Equipment & Supplies) | | | 190 | | | | 62,512 | |
| Darden Restaurants, Inc. (Hotels, Restaurants & Leisure) | | | 120 | | | | 18,077 | |
| DaVita, Inc.* (Health Care Providers & Services) | | | 60 | | | | 6,826 | |
| Deere & Co. (Machinery) | | | 142 | | | | 48,690 | |
| Delta Air Lines, Inc.* (Airlines) | | | 595 | | | | 23,253 | |
| DENTSPLY SIRONA, Inc. (Health Care Equipment & Supplies) | | | 204 | | | | 11,381 | |
| Digital Realty Trust, Inc. (Equity Real Estate Investment Trusts) | | | 265 | | | | 46,871 | |
| Discovery, Inc.*(a) (Media) | | | 157 | | | | 3,696 | |
| Discovery, Inc.*—Class C (Media) | | | 283 | | | | 6,481 | |
| DISH Network Corp.*—Class A (Media) | | | 232 | | | | 7,526 | |
| Dollar General Corp. (Multiline Retail) | | | 216 | | | | 50,939 | |
| Dollar Tree, Inc.* (Multiline Retail) | | | 209 | | | | 29,369 | |
| Dominion Energy, Inc. (Multi-Utilities) | | | 753 | | | | 59,156 | |
| Domino's Pizza, Inc. (Hotels, Restaurants & Leisure) | | | 11 | | | | 6,208 | |
| Dover Corp. (Machinery) | | | 73 | | | | 13,257 | |
| Dow, Inc. (Chemicals) | | | 687 | | | | 38,967 | |
| DR Horton, Inc. (Household Durables) | | | 142 | | | | 15,400 | |
| DTE Energy Co. (Multi-Utilities) | | | 180 | | | | 21,517 | |
| Duke Energy Corp. (Electric Utilities) | | | 716 | | | | 75,107 | |
| Duke Realty Corp. (Equity Real Estate Investment Trusts) | | | 124 | | | | 8,139 | |
| DuPont de Nemours, Inc. (Chemicals) | | | 482 | | | | 38,936 | |
| DXC Technology Co.* (IT Services) | | | 234 | | | | 7,532 | |
| Eastman Chemical Co. (Chemicals) | | | 124 | | | | 14,993 | |
| Eaton Corp. PLC (Electrical Equipment) | | | 371 | | | | 64,116 | |
| eBay, Inc. (Internet & Direct Marketing Retail) | | | 134 | | | | 8,911 | |
| Ecolab, Inc. (Chemicals) | | | 232 | | | | 54,425 | |
| Edison International (Electric Utilities) | | | 354 | | | | 24,161 | |
| Edwards Lifesciences Corp.* (Health Care Equipment & Supplies) | | | 214 | | | | 27,724 | |
| Electronic Arts, Inc. (Entertainment) | | | 264 | | | | 34,822 | |
| Emerson Electric Co. (Electrical Equipment) | | | 556 | | | | 51,691 | |
| Entergy Corp. (Electric Utilities) | | | 188 | | | | 21,178 | |
| EOG Resources, Inc. (Oil, Gas & Consumable Fuels) | | | 293 | | | | 26,027 | |
| Equinix, Inc. (Equity Real Estate Investment Trusts) | | | 44 | | | | 37,217 | |
| Equity Residential (Equity Real Estate Investment Trusts) | | | 317 | | | | 28,689 | |
| Essex Property Trust, Inc. (Equity Real Estate Investment Trusts) | | | 34 | | | | 11,976 | |
| Everest Re Group, Ltd. (Insurance) | | | 37 | | | | 10,135 | |
| Evergy, Inc. (Electric Utilities) | | | 213 | | | | 14,614 | |
| Eversource Energy (Electric Utilities) | | | 320 | | | | 29,114 | |
| Exelon Corp. (Electric Utilities) | | | 909 | | | | 52,504 | |
| Expedia Group, Inc.* (Hotels, Restaurants & Leisure) | | | 135 | | | | 24,397 | |
| Exxon Mobil Corp. (Oil, Gas & Consumable Fuels) | | | 3,935 | | | | 240,784 | |
| F5, Inc.* (Communications Equipment) | | | 27 | | | | 6,607 | |
| FactSet Research Systems, Inc. (Capital Markets) | | | 14 | | | | 6,804 | |
| Fastenal Co. (Trading Companies & Distributors) | | | 278 | | | | 17,809 | |
| Federal Realty Investment Trust (Equity Real Estate Investment Trusts) | | | 38 | | | | 5,180 | |
| FedEx Corp. (Air Freight & Logistics) | | | 227 | | | | 58,711 | |
| Fidelity National Information Services, Inc. (IT Services) | | | 566 | | | | 61,779 | |
| Fifth Third Bancorp (Banks) | | | 636 | | | | 27,698 | |
| First Horizon Corp. (Banks) | | | — | (b) | | | 8 | |
| FirstEnergy Corp. (Electric Utilities) | | | 506 | | | | 21,045 | |
| Fiserv, Inc.* (IT Services) | | | 552 | | | | 57,292 | |
| FleetCor Technologies, Inc.* (IT Services) | | | 76 | | | | 17,012 | |
| FMC Corp. (Chemicals) | | | 117 | | | | 12,857 | |
| Ford Motor Co. (Automobiles) | | | 3,648 | | | | 75,769 | |
| Fortive Corp. (Machinery) | | | 333 | | | | 25,405 | |
| Fortune Brands Home & Security, Inc. (Building Products) | | | 70 | | | | 7,483 | |
| Fox Corp.—Class A (Media) | | | 297 | | | | 10,959 | |
| Fox Corp.—Class B (Media) | | | 136 | | | | 4,661 | |
| Franklin Resources, Inc. (Capital Markets) | | | 144 | | | | 4,823 | |
| Freeport-McMoRan, Inc. (Metals & Mining) | | | 764 | | | | 31,882 | |
| Garmin, Ltd. (Household Durables) | | | 70 | | | | 9,532 | |
| General Dynamics Corp. (Aerospace & Defense) | | | 215 | | | | 44,821 | |
| General Electric Co. (Industrial Conglomerates) | | | 1,021 | | | | 96,454 | |
| General Mills, Inc. (Food Products) | | | 564 | | | | 38,002 | |
| General Motors Co.* (Automobiles) | | | 1,348 | | | | 79,033 | |
| Genuine Parts Co. (Distributors) | | | 132 | | | | 18,507 | |
| Gilead Sciences, Inc. (Biotechnology) | | | 1,165 | | | | 84,591 | |
| Global Payments, Inc. (IT Services) | | | 270 | | | | 36,499 | |
| Globe Life, Inc. (Insurance) | | | 87 | | | | 8,154 | |
| Halliburton Co. (Energy Equipment & Services) | | | 831 | | | | 19,005 | |
| Hartford Financial Services Group, Inc. (Insurance) | | | 317 | | | | 21,886 | |
| Hasbro, Inc. (Leisure Products) | | | 120 | | | | 12,214 | |
| HCA Healthcare, Inc. (Health Care Providers & Services) | | | 93 | | | | 23,894 | |
| Healthpeak Properties, Inc. (Equity Real Estate Investment Trusts) | | | 501 | | | | 18,081 | |
See accompanying notes to financial statements.
142 :: ProFund VP Large-Cap Value :: Financial Statements
Common Stocks, continued
| | | Shares | | | Value | |
| Henry Schein, Inc.* (Health Care Providers & Services) | | | 129 | | | $ | 10,001 | |
| Hess Corp. (Oil, Gas & Consumable Fuels) | | | 75 | | | | 5,552 | |
| Hewlett Packard Enterprises Co. (Technology Hardware, Storage & Peripherals) | | | 1,217 | | | | 19,192 | |
| Hilton Worldwide Holdings, Inc.* (Hotels, Restaurants & Leisure) | | | 153 | | | | 23,866 | |
| Hologic, Inc.* (Health Care Equipment & Supplies) | | | 62 | | | | 4,747 | |
| Honeywell International, Inc. (Industrial Conglomerates) | | | 640 | | | | 133,447 | |
| Hormel Foods Corp. (Food Products) | | | 262 | | | | 12,788 | |
| Host Hotels & Resorts, Inc.* (Equity Real Estate Investment Trusts) | | | 664 | | | | 11,547 | |
| Howmet Aerospace, Inc. (Aerospace & Defense) | | | 357 | | | | 11,363 | |
| HP, Inc. (Technology Hardware, Storage & Peripherals) | | | 535 | | | | 20,154 | |
| Humana, Inc. (Health Care Providers & Services) | | | 119 | | | | 55,199 | |
| Huntington Bancshares, Inc. (Banks) | | | 1,345 | | | | 20,740 | |
| Huntington Ingalls Industries, Inc. (Aerospace & Defense) | | | 37 | | | | 6,909 | |
| IDEX Corp. (Machinery) | | | 41 | | | | 9,689 | |
| IDEXX Laboratories, Inc.* (Health Care Equipment & Supplies) | | | 25 | | | | 16,462 | |
| IHS Markit, Ltd. (Professional Services) | | | 193 | | | | 25,653 | |
| Illinois Tool Works, Inc. (Machinery) | | | 156 | | | | 38,501 | |
| Illumina, Inc.* (Life Sciences Tools & Services) | | | 75 | | | | 28,533 | |
| Incyte Corp.* (Biotechnology) | | | 99 | | | | 7,267 | |
| Ingersoll Rand, Inc. (Machinery) | | | 379 | | | | 23,449 | |
| Intel Corp. (Semiconductors & Semiconductor Equipment) | | | 3,779 | | | | 194,619 | |
| Intercontinental Exchange, Inc. (Capital Markets) | | | 225 | | | | 30,773 | |
| International Business Machines Corp. (IT Services) | | | 834 | | | | 111,472 | |
| International Flavors & Fragrances, Inc. (Chemicals) | | | 237 | | | | 35,704 | |
| International Paper Co. (Containers & Packaging) | | | 359 | | | | 16,866 | |
| Intuitive Surgical, Inc.* (Health Care Equipment & Supplies) | | | 104 | | | | 37,367 | |
| Invesco, Ltd. (Capital Markets) | | | 316 | | | | 7,274 | |
| IPG Photonics Corp.* (Electronic Equipment, Instruments & Components) | | | 33 | | | | 5,681 | |
| IQVIA Holdings, Inc.* (Life Sciences Tools & Services) | | | 47 | | | | 13,261 | |
| Iron Mountain, Inc. (Equity Real Estate Investment Trusts) | | | 107 | | | | 5,599 | |
| J.B. Hunt Transport Services, Inc. (Road & Rail) | | | 32 | | | | 6,541 | |
| Jack Henry & Associates, Inc. (IT Services) | | | 69 | | | | 11,522 | |
| Jacobs Engineering Group, Inc. (Professional Services) | | | 68 | | | | 9,468 | |
| Johnson & Johnson (Pharmaceuticals) | | | 2,446 | | | | 418,436 | |
| Johnson Controls International PLC (Building Products) | | | 257 | | | | 20,897 | |
| JPMorgan Chase & Co. (Banks) | | | 1,483 | | | | 234,833 | |
| Juniper Networks, Inc. (Communications Equipment) | | | 302 | | | | 10,784 | |
| Kellogg Co. (Food Products) | | | 239 | | | | 15,396 | |
| KeyCorp (Banks) | | | 865 | | | | 20,007 | |
| Keysight Technologies, Inc.* (Electronic Equipment, Instruments & Components) | | | 42 | | | | 8,673 | |
| Kimberly-Clark Corp. (Household Products) | | | 313 | | | | 44,734 | |
| Kimco Realty Corp. (Equity Real Estate Investment Trusts) | | | 573 | | | | 14,124 | |
| Kinder Morgan, Inc. (Oil, Gas & Consumable Fuels) | | | 1,811 | | | | 28,722 | |
| L3Harris Technologies, Inc. (Aerospace & Defense) | | | 107 | | | | 22,817 | |
| Laboratory Corp. of America Holdings* (Health Care Providers & Services) | | | 41 | | | | 12,883 | |
| Lamb Weston Holding, Inc. (Food Products) | | | 136 | | | | 8,620 | |
| Las Vegas Sands Corp.* (Hotels, Restaurants & Leisure) | | | 320 | | | | 12,045 | |
| Leidos Holdings, Inc. (Professional Services) | | | 130 | | | | 11,557 | |
| Lennar Corp.—Class A (Household Durables) | | | 252 | | | | 29,272 | |
| Lincoln National Corp. (Insurance) | | | 159 | | | | 10,853 | |
| Linde PLC (Chemicals) | | | 233 | | | | 80,718 | |
| Live Nation Entertainment, Inc.* (Entertainment) | | | 72 | | | | 8,618 | |
| LKQ Corp. (Distributors) | | | 143 | | | | 8,584 | |
| Lockheed Martin Corp. (Aerospace & Defense) | | | 228 | | | | 81,033 | |
| Loews Corp. (Insurance) | | | 187 | | | | 10,801 | |
| Lumen Technologies, Inc. (Diversified Telecommunication Services) | | | 855 | | | | 10,730 | |
| LyondellBasell Industries N.V.—Class A (Chemicals) | | | 244 | | | | 22,504 | |
| M&T Bank Corp. (Banks) | | | 119 | | | | 18,276 | |
| Marathon Oil Corp. (Oil, Gas & Consumable Fuels) | | | 723 | | | | 11,872 | |
| Marathon Petroleum Corp. (Oil, Gas & Consumable Fuels) | | | 573 | | | | 36,666 | |
| MarketAxess Holdings, Inc. (Capital Markets) | | | 18 | | | | 7,403 | |
| Marriott International, Inc.*—Class A (Hotels, Restaurants & Leisure) | | | 254 | | | | 42,023 | |
| Marsh & McLennan Cos., Inc. (Insurance) | | | 184 | | | | 31,983 | |
| Martin Marietta Materials, Inc. (Construction Materials) | | | 25 | | | | 11,013 | |
| Masco Corp. (Building Products) | | | 117 | | | | 8,216 | |
| Mastercard, Inc.—Class A (IT Services) | | | 427 | | | | 153,430 | |
| Match Group, Inc.* (Interactive Media & Services) | | | 265 | | | | 35,046 | |
| McCormick & Co., Inc. (Food Products) | | | 232 | | | | 22,414 | |
| McDonald's Corp. (Hotels, Restaurants & Leisure) | | | 382 | | | | 102,402 | |
| McKesson Corp. (Health Care Providers & Services) | | | 142 | | | | 35,297 | |
| Medtronic PLC (Health Care Equipment & Supplies) | | | 1,251 | | | | 129,416 | |
| Merck & Co., Inc. (Pharmaceuticals) | | | 2,347 | | | | 179,874 | |
| MetLife, Inc. (Insurance) | | | 664 | | | | 41,493 | |
| Mettler-Toledo International, Inc.* (Life Sciences Tools & Services) | | | 8 | | | | 13,578 | |
| MGM Resorts International (Hotels, Restaurants & Leisure) | | | 361 | | | | 16,202 | |
| Microchip Technology, Inc. (Semiconductors & Semiconductor Equipment) | | | 269 | | | | 23,419 | |
| Micron Technology, Inc. (Semiconductors & Semiconductor Equipment) | | | 1,039 | | | | 96,783 | |
| Mid-America Apartment Communities, Inc. (Equity Real Estate Investment Trusts) | | | 40 | | | | 9,178 | |
| Mohawk Industries, Inc.* (Household Durables) | | | 50 | | | | 9,109 | |
| Molson Coors Beverage Co.—Class B (Beverages) | | | 175 | | | | 8,111 | |
| Mondelez International, Inc.—Class A (Food Products) | | | 1,296 | | | | 85,937 | |
| Monster Beverage Corp.* (Beverages) | | | 168 | | | | 16,135 | |
| Moody's Corp. (Capital Markets) | | | 50 | | | | 19,529 | |
| Morgan Stanley (Capital Markets) | | | 682 | | | | 66,945 | |
See accompanying notes to financial statements.
Financial Statements :: ProFund VP Large-Cap Value :: 143
Common Stocks, continued
| | | Shares | | | Value | |
| Motorola Solutions, Inc. (Communications Equipment) | | | 65 | | | $ | 17,661 | |
| Nasdaq, Inc. (Capital Markets) | | | 24 | | | | 5,040 | |
| NetApp, Inc. (Technology Hardware, Storage & Peripherals) | | | 60 | | | | 5,519 | |
| Newell Brands, Inc. (Household Durables) | | | 166 | | | | 3,625 | |
| Newmont Corp. (Metals & Mining) | | | 740 | | | | 45,895 | |
| News Corp.—Class A (Media) | | | 366 | | | | 8,165 | |
| News Corp.—Class B (Media) | | | 113 | | | | 2,543 | |
| NextEra Energy, Inc. (Electric Utilities) | | | 1,823 | | | | 170,194 | |
| Nielsen Holdings PLC (Professional Services) | | | 333 | | | | 6,830 | |
| NIKE, Inc.—Class B (Textiles, Apparel & Luxury Goods) | | | 547 | | | | 91,167 | |
| NiSource, Inc. (Multi-Utilities) | | | 364 | | | | 10,050 | |
| Norfolk Southern Corp. (Road & Rail) | | | 226 | | | | 67,282 | |
| Northern Trust Corp. (Capital Markets) | | | 193 | | | | 23,085 | |
| Northrop Grumman Corp. (Aerospace & Defense) | | | 138 | | | | 53,416 | |
| NortonLifelock, Inc. (Software) | | | 540 | | | | 14,029 | |
| Norwegian Cruise Line Holdings, Ltd.* (Hotels, Restaurants & Leisure) | | | 344 | | | | 7,135 | |
| Nucor Corp. (Metals & Mining) | | | 122 | | | | 13,926 | |
| NVR, Inc.* (Household Durables) | | | 2 | | | | 11,818 | |
| NXP Semiconductors N.V. (Semiconductors & Semiconductor Equipment) | | | 92 | | | | 20,956 | |
| Occidental Petroleum Corp. (Oil, Gas & Consumable Fuels) | | | 487 | | | | 14,118 | |
| Omnicom Group, Inc. (Media) | | | 197 | | | | 14,434 | |
| ONEOK, Inc. (Oil, Gas & Consumable Fuels) | | | 237 | | | | 13,926 | |
| Organon & Co. (Pharmaceuticals) | | | 236 | | | | 7,186 | |
| Otis Worldwide Corp. (Machinery) | | | 237 | | | | 20,636 | |
| PACCAR, Inc. (Machinery) | | | 323 | | | | 28,508 | |
| Packaging Corp. of America (Containers & Packaging) | | | 88 | | | | 11,981 | |
| Parker-Hannifin Corp. (Machinery) | | | 119 | | | | 37,856 | |
| Paychex, Inc. (IT Services) | | | 139 | | | | 18,974 | |
| Paycom Software, Inc.* (Software) | | | 11 | | | | 4,567 | |
| PayPal Holdings, Inc.* (IT Services) | | | 502 | | | | 94,667 | |
| Penn National Gaming, Inc.* (Hotels, Restaurants & Leisure) | | | 155 | | | | 8,037 | |
| Pentair PLC (Machinery) | | | 65 | | | | 4,747 | |
| People's United Financial, Inc. (Banks) | | | 397 | | | | 7,075 | |
| PepsiCo, Inc. (Beverages) | | | 744 | | | | 129,240 | |
| Pfizer, Inc. (Pharmaceuticals) | | | 2,400 | | | | 141,720 | |
| Philip Morris International, Inc. (Tobacco) | | | 1,447 | | | | 137,465 | |
| Phillips 66 (Oil, Gas & Consumable Fuels) | | | 407 | | | | 29,491 | |
| Pinnacle West Capital Corp. (Electric Utilities) | | | 106 | | | | 7,483 | |
| Pioneer Natural Resources Co. (Oil, Gas & Consumable Fuels) | | | 93 | | | | 16,915 | |
| PPG Industries, Inc. (Chemicals) | | | 220 | | | | 37,937 | |
| PPL Corp. (Electric Utilities) | | | 698 | | | | 20,982 | |
| Principal Financial Group, Inc. (Insurance) | | | 230 | | | | 16,636 | |
| Prologis, Inc. (Equity Real Estate Investment Trusts) | | | 269 | | | | 45,289 | |
| Prudential Financial, Inc. (Insurance) | | | 351 | | | | 37,992 | |
| PTC, Inc.* (Software) | | | 48 | | | | 5,815 | |
| Public Service Enterprise Group, Inc. (Multi-Utilities) | | | 471 | | | | 31,430 | |
| Public Storage (Equity Real Estate Investment Trusts) | | | 58 | | | | 21,724 | |
| PulteGroup, Inc. (Household Durables) | | | 236 | | | | 13,490 | |
| PVH Corp. (Textiles, Apparel & Luxury Goods) | | | 67 | | | | 7,146 | |
| Qorvo, Inc.* (Semiconductors & Semiconductor Equipment) | | | 51 | | | | 7,976 | |
| Quanta Services, Inc. (Construction & Engineering) | | | 62 | | | | 7,109 | |
| Quest Diagnostics, Inc. (Health Care Providers & Services) | | | 62 | | | | 10,727 | |
| Ralph Lauren Corp. (Textiles, Apparel & Luxury Goods) | | | 44 | | | | 5,230 | |
| Raymond James Financial, Inc. (Capital Markets) | | | 71 | | | | 7,128 | |
| Raytheon Technologies Corp. (Aerospace & Defense) | | | 1,392 | | | | 119,796 | |
| Realty Income Corp. (Equity Real Estate Investment Trusts) | | | 526 | | | | 37,656 | |
| Regency Centers Corp. (Equity Real Estate Investment Trusts) | | | 144 | | | | 10,850 | |
| Regions Financial Corp. (Banks) | | | 488 | | | | 10,638 | |
| Republic Services, Inc.—Class A (Commercial Services & Supplies) | | | 110 | | | | 15,340 | |
| ResMed, Inc. (Health Care Equipment & Supplies) | | | 57 | | | | 14,847 | |
| Robert Half International, Inc. (Professional Services) | | | 33 | | | | 3,680 | |
| Rockwell Automation, Inc. (Electrical Equipment) | | | 51 | | | | 17,791 | |
| Rollins, Inc. (Commercial Services & Supplies) | | | 118 | | | | 4,037 | |
| Roper Technologies, Inc. (Industrial Conglomerates) | | | 98 | | | | 48,202 | |
| Ross Stores, Inc. (Specialty Retail) | | | 330 | | | | 37,712 | |
| Royal Caribbean Cruises, Ltd.* (Hotels, Restaurants & Leisure) | | | 208 | | | | 15,995 | |
| S&P Global, Inc. (Capital Markets) | | | 87 | | | | 41,058 | |
| Salesforce.com, Inc.* (Software) | | | 354 | | | | 89,962 | |
| SBA Communications Corp. (Equity Real Estate Investment Trusts) | | | 44 | | | | 17,117 | |
| Schlumberger, Ltd. (Energy Equipment & Services) | | | 1,303 | | | | 39,025 | |
| Seagate Technology Holdings PLC (Technology Hardware, Storage & Peripherals) | | | 51 | | | | 5,762 | |
| Sealed Air Corp. (Containers & Packaging) | | | 63 | | | | 4,251 | |
| Sempra Energy (Multi-Utilities) | | | 296 | | | | 39,155 | |
| Simon Property Group, Inc. (Equity Real Estate Investment Trusts) | | | 122 | | | | 19,492 | |
| Skyworks Solutions, Inc. (Semiconductors & Semiconductor Equipment) | | | 82 | | | | 12,721 | |
| Snap-on, Inc. (Machinery) | | | 49 | | | | 10,554 | |
| SolarEdge Technologies, Inc.* (Semiconductors & Semiconductor Equipment) | | | 12 | | | | 3,367 | |
| Southwest Airlines Co.* (Airlines) | | | 550 | | | | 23,561 | |
| Stanley Black & Decker, Inc. (Machinery) | | | 151 | | | | 28,482 | |
| Starbucks Corp. (Hotels, Restaurants & Leisure) | | | 537 | | | | 62,812 | |
| State Street Corp. (Capital Markets) | | | 340 | | | | 31,620 | |
| STERIS PLC (Health Care Equipment & Supplies) | | | 54 | | | | 13,144 | |
| Stryker Corp. (Health Care Equipment & Supplies) | | | 185 | | | | 49,473 | |
| Synchrony Financial (Consumer Finance) | | | 218 | | | | 10,113 | |
| Synopsys, Inc.* (Software) | | | 46 | | | | 16,951 | |
| Sysco Corp. (Food & Staples Retailing) | | | 477 | | | | 37,468 | |
| T. Rowe Price Group, Inc. (Capital Markets) | | | 63 | | | | 12,388 | |
| Take-Two Interactive Software, Inc.* (Entertainment) | | | 40 | | | | 7,109 | |
| Tapestry, Inc. (Textiles, Apparel & Luxury Goods) | | | 255 | | | | 10,353 | |
| Target Corp. (Multiline Retail) | | | 204 | | | | 47,214 | |
| TE Connectivity, Ltd. (Electronic Equipment, Instruments & Components) | | | 304 | | | | 49,047 | |
See accompanying notes to financial statements.
144 :: ProFund VP Large-Cap Value :: Financial Statements
Common Stocks, continued
| | | Shares | | | Value | |
| Teledyne Technologies, Inc.* (Electronic Equipment, Instruments & Components) | | | 42 | | | $ | 18,349 | |
| Teleflex, Inc. (Health Care Equipment & Supplies) | | | 43 | | | | 14,125 | |
| Texas Instruments, Inc. (Semiconductors & Semiconductor Equipment) | | | 437 | | | | 82,361 | |
| Textron, Inc. (Aerospace & Defense) | | | 205 | | | | 15,826 | |
| The AES Corp. (Independent Power and Renewable Electricity Producers) | | | 619 | | | | 15,042 | |
| The Allstate Corp. (Insurance) | | | 268 | | | | 31,530 | |
| The Bank of New York Mellon Corp. (Capital Markets) | | | 705 | | | | 40,946 | |
| The Boeing Co.* (Aerospace & Defense) | | | 514 | | | | 103,478 | |
| The Charles Schwab Corp. (Capital Markets) | | | 447 | | | | 37,593 | |
| The Clorox Co. (Household Products) | | | 115 | | | | 20,051 | |
| The Coca-Cola Co. (Beverages) | | | 3,613 | | | | 213,927 | |
| The Cooper Cos., Inc. (Health Care Equipment & Supplies) | | | 45 | | | | 18,852 | |
| The Estee Lauder Co., Inc. (Personal Products) | | | 88 | | | | 32,578 | |
| The Gap, Inc. (Specialty Retail) | | | 199 | | | | 3,512 | |
| The Hershey Co. (Food Products) | | | 75 | | | | 14,510 | |
| The Home Depot, Inc. (Specialty Retail) | | | 235 | | | | 97,528 | |
| The Interpublic Group of Cos., Inc. (Media) | | | 365 | | | | 13,669 | |
| The JM Smucker Co.—Class A (Food Products) | | | 102 | | | | 13,854 | |
| The Kraft Heinz Co. (Food Products) | | | 659 | | | | 23,658 | |
| The Kroger Co. (Food & Staples Retailing) | | | 630 | | | | 28,514 | |
| The Mosaic Co. (Chemicals) | | | 345 | | | | 13,555 | |
| The PNC Financial Services Group, Inc. (Banks) | | | 393 | | | | 78,804 | |
| The Procter & Gamble Co. (Household Products) | | | 2,248 | | | | 367,727 | |
| The Progressive Corp. (Insurance) | | | 543 | | | | 55,739 | |
| The Sherwin-Williams Co. (Chemicals) | | | 106 | | | | 37,329 | |
| The Southern Co. (Electric Utilities) | | | 984 | | | | 67,483 | |
| The TJX Cos., Inc. (Specialty Retail) | | | 1,118 | | | | 84,879 | |
| The Travelers Cos., Inc. (Insurance) | | | 229 | | | | 35,822 | |
| The Walt Disney Co.* (Entertainment) | | | 1,689 | | | | 261,608 | |
| The Williams Cos., Inc. (Oil, Gas & Consumable Fuels) | | | 1,130 | | | | 29,425 | |
| T-Mobile US, Inc.* (Wireless Telecommunication Services) | | | 546 | | | | 63,325 | |
| Trane Technologies PLC (Building Products) | | | 220 | | | | 44,446 | |
| TransDigm Group, Inc.* (Aerospace & Defense) | | | 28 | | | | 17,816 | |
| Trimble, Inc.* (Electronic Equipment, Instruments & Components) | | | 103 | | | | 8,981 | |
| Truist Financial Corp. (Banks) | | | 1,240 | | | | 72,602 | |
| Twitter, Inc.* (Interactive Media & Services) | | | 387 | | | | 16,726 | |
| Tyler Technologies, Inc.* (Software) | | | 14 | | | | 7,531 | |
| Tyson Foods, Inc.—Class A (Food Products) | | | 274 | | | | 23,882 | |
| U.S. Bancorp (Banks) | | | 1,254 | | | | 70,437 | |
| UDR, Inc. (Equity Real Estate Investment Trusts) | | | 122 | | | | 7,319 | |
| Ulta Beauty, Inc.* (Specialty Retail) | | | 23 | | | | 9,484 | |
| Under Armour, Inc.*—Class A (Textiles, Apparel & Luxury Goods) | | | 100 | | | | 2,119 | |
| Under Armour, Inc.*—Class C (Textiles, Apparel & Luxury Goods) | | | 114 | | | | 2,057 | |
| Union Pacific Corp. (Road & Rail) | | | 352 | | | | 88,680 | |
| United Airlines Holdings , Inc.* (Airlines) | | | 301 | | | | 13,178 | |
| United Parcel Service, Inc.—Class B (Air Freight & Logistics) | | | 387 | | | | 82,949 | |
| United Rentals, Inc.* (Trading Companies & Distributors) | | | 27 | | | | 8,972 | |
| UnitedHealth Group, Inc. (Health Care Providers & Services) | | | 508 | | | | 255,086 | |
| Universal Health Services, Inc.—Class B (Health Care Providers & Services) | | | 69 | | | | 8,947 | |
| Valero Energy Corp. (Oil, Gas & Consumable Fuels) | | | 380 | | | | 28,542 | |
| Ventas, Inc. (Equity Real Estate Investment Trusts) | | | 370 | | | | 18,914 | |
| VeriSign, Inc.* (IT Services) | | | 47 | | | | 11,930 | |
| Verisk Analytics, Inc. (Professional Services) | | | 74 | | | | 16,926 | |
| Verizon Communications, Inc. (Diversified Telecommunication Services) | | | 3,846 | | | | 199,838 | |
| Vertex Pharmaceuticals, Inc.* (Biotechnology) | | | 95 | | | | 20,862 | |
| VF Corp. (Textiles, Apparel & Luxury Goods) | | | 304 | | | | 22,259 | |
| ViacomCBS, Inc.—Class B (Media) | | | 564 | | | | 17,022 | |
| Viatris, Inc. (Pharmaceuticals) | | | 1,124 | | | | 15,208 | |
| Visa, Inc.—Class A (IT Services) | | | 888 | | | | 192,438 | |
| Vornado Realty Trust (Equity Real Estate Investment Trusts) | | | 148 | | | | 6,195 | |
| Vulcan Materials Co. (Construction Materials) | | | 65 | | | | 13,493 | |
| W.R. Berkley Corp. (Insurance) | | | 129 | | | | 10,628 | |
| W.W. Grainger, Inc. (Trading Companies & Distributors) | | | 39 | | | | 20,211 | |
| Walgreens Boots Alliance, Inc. (Food & Staples Retailing) | | | 667 | | | | 34,791 | |
| Walmart, Inc. (Food & Staples Retailing) | | | 1,322 | | | | 191,280 | |
| Waste Management, Inc. (Commercial Services & Supplies) | | | 176 | | | | 29,374 | |
| Waters Corp.* (Life Sciences Tools & Services) | | | 14 | | | | 5,216 | |
| WEC Energy Group, Inc. (Multi-Utilities) | | | 293 | | | | 28,442 | |
| Wells Fargo & Co. (Banks) | | | 3,704 | | | | 177,718 | |
| Welltower, Inc. (Equity Real Estate Investment Trusts) | | | 405 | | | | 34,737 | |
| Western Digital Corp.* (Technology Hardware, Storage & Peripherals) | | | 289 | | | | 18,846 | |
| Westinghouse Air Brake Technologies Corp. (Machinery) | | | 174 | | | | 16,027 | |
| WestRock Co. (Containers & Packaging) | | | 248 | | | | 11,001 | |
| Weyerhaeuser Co. (Equity Real Estate Investment Trusts) | | | 404 | | | | 16,637 | |
| Whirlpool Corp. (Household Durables) | | | 56 | | | | 13,141 | |
| Willis Towers Watson PLC (Insurance) | | | 115 | | | | 27,311 | |
| Wynn Resorts, Ltd.* (Hotels, Restaurants & Leisure) | | | 98 | | | | 8,334 | |
| Xcel Energy, Inc. (Electric Utilities) | | | 500 | | | | 33,850 | |
| Xilinx, Inc. (Semiconductors & Semiconductor Equipment) | | | 60 | | | | 12,722 | |
| Xylem, Inc. (Machinery) | | | 99 | | | | 11,872 | |
| Yum! Brands, Inc. (Hotels, Restaurants & Leisure) | | | 144 | | | | 19,996 | |
| Zebra Technologies Corp.* (Electronic Equipment, Instruments & Components) | | | 13 | | | | 7,738 | |
| Zimmer Biomet Holdings, Inc. (Health Care Equipment & Supplies) | | | 194 | | | | 24,646 | |
| Zions Bancorp (Banks) | | | 76 | | | | 4,800 | |
| Zoetis, Inc. (Pharmaceuticals) | | | 149 | | | | 36,360 | |
TOTAL COMMON STOCKS
(Cost $11,444,758) | | | | | | | 17,758,357 | |
See accompanying notes to financial statements.
Financial Statements :: ProFund VP Large-Cap Value :: 145
Repurchase Agreements(c) (0.9%)
| | | Principal
Amount | | | Value | |
| Repurchase Agreements with various counterparties, 0.00%, dated 12/31/21, due 1/3/22, total to be received $157,000 | | $ | 157,000 | | | $ | 157,000 | |
TOTAL REPURCHASE AGREEMENTS
(Cost $157,000) | | | | | | | 157,000 | |
Collateral for Securities Loaned(d)(NM)
| | | Shares | | | Value | |
| BlackRock Liquidity Funds FedFund Portfolio—Institutional Shares, 0.03%(e) | | | 3,400 | | | $ | 3,400 | |
TOTAL COLLATERAL FOR SECURITIES LOANED
(Cost $3,400) | | | | | | | 3,400 | |
TOTAL INVESTMENT SECURITIES
(Cost $11,605,158)—100.2% | | | | | | | 17,918,757 | |
| Net other assets (liabilities)—(0.2)% | | | | | | | (41,714 | ) |
| NET ASSETS—100.0% | | | | | | $ | 17,877,043 | |
| * | Non-income producing security. |
| (a) | All or part of this security was on loan as of December 31, 2021. The total value of securities on loan as of December 31, 2021 was $3,201. |
| (b) | Number of shares is less than 0.50. |
| (c) | The ProFund VP invests in Repurchase Agreements jointly with other funds in the Trust. See "Repurchase Agreements" under Note 2 in the Notes to Financial Statements to view the details of each individual agreement and counterparty as well as a description of the securities subject to repurchase. |
| (d) | Securities were purchased with cash collateral held from securities on loan at December 31, 2021. |
| (e) | Rate periodically changes. Rate disclosed is the daily yield on December 31, 2021. |
ProFund VP Large-Cap Value invested in the following industries as of December 31, 2021:
| | | Value | | | % of
Net Assets | |
| Aerospace & Defense | | $ | 477,275 | | | | 2.8 | % |
| Air Freight & Logistics | | | 154,576 | | | | 0.9 | % |
| Airlines | | | 76,900 | | | | 0.4 | % |
| Auto Components | | | 34,418 | | | | 0.2 | % |
| Automobiles | | | 154,802 | | | | 0.9 | % |
| Banks | | | 1,046,418 | | | | 5.9 | % |
| Beverages | | | 417,946 | | | | 2.3 | % |
| Biotechnology | | | 317,227 | | | | 1.8 | % |
| Building Products | | | 141,239 | | | | 0.8 | % |
| Capital Markets | | | 494,724 | | | | 2.8 | % |
| Chemicals | | | 505,730 | | | | 2.8 | % |
| Commercial Services & Supplies | | | 77,511 | | | | 0.4 | % |
| Communications Equipment | | | 171,614 | | | | 1.0 | % |
| Construction & Engineering | | | 7,109 | | | | NM | |
| Construction Materials | | | 24,506 | | | | 0.1 | % |
| Consumer Finance | | | 93,354 | | | | 0.5 | % |
| Containers & Packaging | | | 98,396 | | | | 0.6 | % |
| Distributors | | | 27,091 | | | | 0.2 | % |
| Diversified Financial Services | | | 508,898 | | | | 2.8 | % |
| Diversified Telecommunication Services | | | 373,789 | | | | 2.1 | % |
| Electric Utilities | | | 593,826 | | | | 3.3 | % |
| Electrical Equipment | | | 165,065 | | | | 0.9 | % |
| Electronic Equipment, Instruments & Components | | | 158,447 | | | | 0.9 | % |
| Energy Equipment & Services | | | 77,591 | | | | 0.4 | % |
| Entertainment | | | 360,325 | | | | 2.0 | % |
| Equity Real Estate Investment Trusts | | | 602,272 | | | | 3.4 | % |
| Food & Staples Retailing | | | 406,161 | | | | 2.3 | % |
| Food Products | | | 317,619 | | | | 1.8 | % |
| Gas Utilities | | | 12,782 | | | | 0.1 | % |
| Health Care Equipment & Supplies | | | 703,855 | | | | 3.9 | % |
| Health Care Providers & Services | | | 797,362 | | | | 4.5 | % |
| Health Care Technology | | | 25,446 | | | | 0.1 | % |
| Hotels, Restaurants & Leisure | | | 494,469 | | | | 2.7 | % |
| Household Durables | | | 105,387 | | | | 0.6 | % |
| Household Products | | | 522,686 | | | | 2.9 | % |
| Independent Power and Renewable Electricity Producers | | | 15,042 | | | | 0.1 | % |
| Industrial Conglomerates | | | 373,135 | | | | 2.1 | % |
| Insurance | | | 569,980 | | | | 3.2 | % |
| Interactive Media & Services | | | 51,772 | | | | 0.3 | % |
| Internet & Direct Marketing Retail | | | 8,911 | | | | NM | |
| IT Services | | | 986,796 | | | | 5.5 | % |
| Leisure Products | | | 12,214 | | | | 0.1 | % |
| Life Sciences Tools & Services | | | 85,428 | | | | 0.5 | % |
| Machinery | | | 450,250 | | | | 2.5 | % |
| Media | | | 377,331 | | | | 2.1 | % |
| Metals & Mining | | | 91,703 | | | | 0.5 | % |
| Multiline Retail | | | 127,522 | | | | 0.7 | % |
| Multi-Utilities | | | 272,984 | | | | 1.5 | % |
| Oil, Gas & Consumable Fuels | | | 799,013 | | | | 4.5 | % |
| Personal Products | | | 32,578 | | | | 0.2 | % |
| Pharmaceuticals | | | 935,544 | | | | 5.1 | % |
| Professional Services | | | 74,114 | | | | 0.4 | % |
| Real Estate Management & Development | | | 16,928 | | | | 0.1 | % |
| Road & Rail | | | 240,034 | | | | 1.3 | % |
| Semiconductors & Semiconductor Equipment | | | 652,426 | | | | 3.6 | % |
| Software | | | 190,811 | | | | 1.1 | % |
| Specialty Retail | | | 276,627 | | | | 1.5 | % |
| Technology Hardware, Storage & Peripherals | | | 69,473 | | | | 0.4 | % |
| Textiles, Apparel & Luxury Goods | | | 140,331 | | | | 0.8 | % |
| Tobacco | | | 218,360 | | | | 1.2 | % |
| Trading Companies & Distributors | | | 46,992 | | | | 0.3 | % |
| Water Utilities | | | 31,917 | | | | 0.2 | % |
| Wireless Telecommunication Services | | | 63,325 | | | | 0.4 | % |
| Other** | | | 118,686 | | | | 0.7 | % |
| Total | | $ | 17,877,043 | | | | 100.0 | % |
| ** | Includes any non-equity securities and net other assets (liabilities), which includes any receivable for capital shares issued and payable for capital shares redeemed. |
| NM | Not meaningful, amount is less than 0.05%. |
See accompanying notes to financial statements.
146 :: ProFund VP Large-Cap Value :: Financial Statements
Statement of Assets and Liabilities
December 31, 2021
| ASSETS: |
| Total Investment Securities, at cost | | $ | 11,605,158 | |
| Securities, at value(a) | | | 17,761,757 | |
| Repurchase agreements, at value | | | 157,000 | |
| Total Investment Securities, at value | | | 17,918,757 | |
| Cash | | | 812 | |
| Dividends receivable | | | 18,925 | |
| Receivable for capital shares issued | | | 214 | |
| Prepaid expenses | | | 1,083 | |
| TOTAL ASSETS | | | 17,939,791 | |
| | | | | |
| LIABILITIES: | | | | |
| Payable for collateral for securities loaned | | | 3,400 | |
| Payable for capital shares redeemed | | | 21,949 | |
| Advisory fees payable | | | 12,469 | |
| Management services fees payable | | | 1,663 | |
| Administration fees payable | | | 1,012 | |
| Administrative services fees payable | | | 6,407 | |
| Distribution fees payable | | | 5,687 | |
| Transfer agency fees payable | | | 1,577 | |
| Fund accounting fees payable | | | 686 | |
| Compliance services fees payable | | | 70 | |
| Other accrued expenses | | | 7,828 | |
| TOTAL LIABILITIES | | | 62,748 | |
| NET ASSETS | | $ | 17,877,043 | |
| | | | | |
| NET ASSETS CONSIST OF: | | | | |
| Capital | | $ | 13,301,586 | |
| Total distributable earnings (loss) | | | 4,575,457 | |
| NET ASSETS | | $ | 17,877,043 | |
| Shares of Beneficial Interest Outstanding (unlimited number of shares authorized, no par value) | | | 362,467 | |
| Net Asset Value (offering and redemption price per share) | | $ | 49.32 | |
| | | | |
| (a) Includes Securities on loan valued at: | | $ | 3,201 | |
Statement of Operations
For the Year Ended December 31, 2021
| INVESTMENT INCOME: | | | | |
| Dividends | | $ | 339,734 | |
| Foreign tax withholding | | | (42 | ) |
| Net income from securities lending | | | 314 | |
| TOTAL INVESTMENT INCOME | | | 340,006 | |
| | | | | |
| EXPENSES: | | | | |
| Advisory fees | | | 118,238 | |
| Management services fees | | | 15,765 | |
| Administration fees | | | 11,796 | |
| Transfer agency fees | | | 9,627 | |
| Administrative services fees | | | 48,761 | |
| Distribution fees | | | 39,413 | |
| Custody fees | | | 3,031 | |
| Fund accounting fees | | | 8,021 | |
| Trustee fees | | | 256 | |
| Compliance services fees | | | 110 | |
| Other fees | | | 13,857 | |
| Total Gross Expenses before reductions | | | 268,875 | |
| Expenses reduced and reimbursed by the Advisor | | | (4,021 | ) |
| TOTAL NET EXPENSES | | | 264,854 | |
| NET INVESTMENT INCOME (LOSS) | | | 75,152 | |
| | | | | |
| REALIZED AND UNREALIZED GAINS (LOSSES) ON INVESTMENTS: | | | | |
| Net realized gains (losses) on investment securities | | | 1,472,035 | |
| Change in net unrealized appreciation/depreciation on investment securities | | | 1,709,206 | |
| NET REALIZED AND UNREALIZED GAINS (LOSSES) ON INVESTMENTS | | | 3,181,241 | |
| CHANGE IN NET ASSETS RESULTING FROM OPERATIONS | | $ | 3,256,393 | |
See accompanying notes to financial statements.
Financial Statements :: ProFund VP Large-Cap Value :: 147
Statements of Changes in Net Assets
| | | Year Ended
December 31, 2021 | | | Year Ended
December 31, 2020 | |
| FROM INVESTMENT ACTIVITIES: |
| |
| OPERATIONS: |
| Net investment income (loss) | | $ | 75,152 | | | $ | 147,146 | |
| Net realized gains (losses) on investments | | | 1,472,035 | | | | (961,353 | ) |
| Change in net unrealized appreciation/depreciation on investments | | | 1,709,206 | | | | (977,130 | ) |
| Change in net assets resulting from operations | | | 3,256,393 | | | | (1,791,337 | ) |
| | | | | | | | | |
| DISTRIBUTIONS TO SHAREHOLDERS: | | | | | | | | |
| Total distributions | | | (149,393 | ) | | | (1,869,000 | ) |
| Change in net assets resulting from distributions | | | (149,393 | ) | | | (1,869,000 | ) |
| | | | | | | | | |
| CAPITAL TRANSACTIONS: | | | | | | | | |
| Proceeds from shares issued | | | 12,214,725 | | | | 13,542,534 | |
| Distributions reinvested | | | 149,393 | | | | 1,869,000 | |
| Value of shares redeemed | | | (12,200,852 | ) | | | (19,346,347 | ) |
| Change in net assets resulting from capital transactions | | | 163,266 | | | | (3,934,813 | ) |
| Change in net assets | | | 3,270,266 | | | | (7,595,150 | ) |
| | | | | | | | | |
| NET ASSETS: | | | | | | | | |
| Beginning of period | | | 14,606,777 | | | | 22,201,927 | |
| End of period | | $ | 17,877,043 | | | $ | 14,606,777 | |
| | | | | | | | | |
| SHARE TRANSACTIONS: | | | | | | | | |
| Issued | | | 264,757 | | | | 345,274 | |
| Reinvested | | | 3,267 | | | | 50,418 | |
| Redeemed | | | (266,202 | ) | | | (501,456 | ) |
| Change in shares | | | 1,822 | | | | (105,764 | ) |
See accompanying notes to financial statements.
148 :: ProFund VP Large-Cap Value :: Financial Highlights
ProFunds Financial Highlights FOR THE PERIODS INDICATED
Selected data for a share of beneficial interest outstanding throughout the periods indicated.
| | | Year Ended
Dec. 31, 2021 | | | Year Ended
Dec. 31, 2020 | | | Year Ended
Dec. 31, 2019 | | | Year Ended
Dec. 31, 2018 | | | Year Ended
Dec. 31, 2017 | |
| Net Asset Value, Beginning of Period | | $ | 40.50 | | | $ | 47.60 | | | $ | 41.32 | | | $ | 46.62 | | | $ | 41.52 | |
| | | | | | | | | | | | | | | | | | | | | |
| Investment Activities: | | | | | | | | | | | | | | | | | | | | |
| Net investment income (loss)(a) | | | 0.22 | | | | 0.43 | | | | 0.37 | | | | 0.38 | | | | 0.35 | |
| Net realized and unrealized gains (losses) on investments | | | 9.03 | | | | (1.06 | ) | | | 11.15 | | | | (5.29 | ) | | | 5.21 | |
| Total income (loss) from investment activities | | | 9.25 | | | | (0.63 | ) | | | 11.52 | | | | (4.91 | ) | | | 5.56 | |
| | | | | | | | | | | | | | | | | | | | | |
| Distributions to Shareholders From: | | | | | | | | | | | | | | | | | | | | |
| Net investment income | | | (0.43 | ) | | | (0.50 | ) | | | (0.46 | ) | | | (0.39 | ) | | | (0.46 | ) |
| Net realized gains on investments | | | — | | | | (5.97 | ) | | | (4.78 | ) | | | — | | | | — | |
| Total distributions | | | (0.43 | ) | | | (6.47 | ) | | | (5.24 | ) | | | (0.39 | ) | | | (0.46 | ) |
| | | | | | | | | | | | | | | | | | | | | |
| Net Asset Value, End of Period | | $ | 49.32 | | | $ | 40.50 | | | $ | 47.60 | | | $ | 41.32 | | | $ | 46.62 | |
| | | | | | | | | | | | | | | | | | | | | |
| Total Return | | | 22.93 | % | | | (0.06 | )% | | | 29.77 | % | | | (10.63 | )% | | | 13.43 | % |
| | | | | | | | | | | | | | | | | | | | | |
| Ratios to Average Net Assets: | | | | | | | | | | | | | | | | | | | | |
| Gross expenses | | | 1.70 | % | | | 1.77 | % | | | 1.74 | % | | | 1.70 | % | | | 1.68 | % |
| Net expenses | | | 1.68 | % | | | 1.68 | % | | | 1.68 | % | | | 1.68 | % | | | 1.68 | % |
| Net investment income (loss) | | | 0.48 | % | | | 1.05 | % | | | 0.81 | % | | | 0.84 | % | | | 0.81 | % |
| | | | | | | | | | | | | | | | | | | | | |
| Supplemental Data: | | | | | | | | | | | | | | | | | | | | |
| Net assets, end of period (000's) | | $ | 17,877 | | | $ | 14,607 | | | $ | 22,202 | | | $ | 15,394 | | | $ | 20,450 | |
| Portfolio turnover rate(b) | | | 79 | % | | | 97 | % | | | 110 | % | | | 116 | % | | | 72 | % |
| (a) | Per share net investment income (loss) has been calculated using the average daily shares method. |
| (b) | Portfolio turnover rate is calculated without regard to instruments having a maturity of less than one year from acquisition or derivative instruments (including swap agreements and futures contracts). The portfolio turnover rate can be high and volatile due to the amount and timing of sales and purchases of fund shares during the period. |
See accompanying notes to financial statements.
Management Discussion of Fund Performance :: ProFund VP Mid-Cap :: 149
ProFund VP Mid-Cap (the "Fund") seeks investment results, before fees and expenses, that correspond to the performance of the S&P MidCap 400® (the "Index"). For the year ended December 31, 2021, the Fund had a total return of 22.21%. For the same period, the Index had a total return of 24.76%1 and a volatility of 17.93%. For the year, the Fund achieved an average daily statistical correlation of over 0.99 to the daily performance of the Index.2
The Fund takes positions in financial instruments that, in combination, should have similar return characteristics as the return of the Index. The Index is a measure of mid-size company U.S. stock market performance. It is a float-adjusted, market capitalization-weighted index of 400 U.S. operating companies and real estate investment trusts selected through a process that factors in criteria such as liquidity, price, market capitalization, and financial viability. Reconstitution occurs both on a quarterly and ongoing basis.
During the year ended December 31, 2021, the Fund invested in swap agreements and futures contracts as a substitute for investing directly in stocks in order to gain exposure to the Index. These derivatives generally tracked the performance of their underlying benchmark and were negatively impacted by financing costs associated with their use. The Fund entered into swap agreements with counterparties that the Fund's advisor determined to be major, global financial institutions. If a counterparty becomes insolvent or otherwise fails to perform on its obligations, the value of investments in the Fund may decline. The Fund has sought to mitigate this risk by generally requiring counterparties to post collateral for the benefit of the Fund, marked to market daily, in an amount approximately equal to the amount the counterparty owed to the Fund, subject to certain minimum thresholds.
Value of a $10,000 Investment at Net Asset Value*

| * | The line graph represents the historical performance of a hypothetical investment of $10,000 in the ProFund VP Mid-Cap from December 31, 2011 to December 31, 2021, assuming the reinvestment of distributions. |
Average Annual Total Return as of 12/31/21
| Fund | | One Year | | | Five Year | | | Ten Year | |
| ProFund VP Mid-Cap | | | 22.21 | % | | | 10.57 | % | | | 11.75 | % |
| S&P MidCap 400® | | | 24.76 | % | | | 13.09 | % | | | 14.20 | % |
Expense Ratios**
| Fund | | Gross | | | Net | | | | | |
| ProFund VP Mid-Cap | | | 1.70 | % | | | 1.68 | % | | | | |
| ** | Reflects the expense ratio as reported in the Prospectus dated May 1, 2021. Contractual fee waivers are in effect through April 30, 2022. See Financial Highlights for effective expense ratios. |
Allocation of Portfolio Holdings & Index Composition
Market Exposure
| Investment Type | | % of Net Assets | |
| Futures Contracts | | | 30 | % |
| Swap Agreements | | | 70 | % |
| Total Exposure | | | 100 | % |
"Market Exposure" includes the value of total investments (including the contract value of any derivatives) and excludes any instruments used for cash management.
Holdings
The ProFund VP Mid-Cap primarily invests in non-equity securities, which may include: swap agreements, futures contracts, repurchase agreements and U.S. Government securities.
S&P MidCap 400® – Composition
| | | % of Index | |
| Industrials | | | 20 | % |
| Consumer Discretionary | | | 15 | % |
| Information Technology | | | 14 | % |
| Financials | | | 14 | % |
| Real Estate | | | 10 | % |
| Health Care | | | 10 | % |
| Materials | | | 7 | % |
| Consumer Staples | | | 3 | % |
| Utilities | | | 3 | % |
| Energy | | | 2 | % |
| Communication Services | | | 2 | % |
Past performance does not guarantee future results. Return calculations assume the reinvestment of distributions and do not reflect taxes that a shareholder would pay on Fund distributions or on the redemption of Fund shares. The performance data quoted represents past performance and current returns may be lower or higher. The investment return and net asset value ("NAV") will fluctuate so that an investor's shares, when redeemed, may be worth more or less than the original cost. The performance above reflects any fee reductions during the applicable periods. If such fee reductions had not occurred, the quoted performance would be lower. Performance numbers are net of all Fund fees and expenses but do not include any insurance, sales, or administrative charges of variable annuity or life insurance contracts. If these charges were included, the returns would be lower. To obtain performance current to the most recent month-end, please call toll-free 888-776-3637.
| 1 | The graph and table reflect the theoretical reinvestment of dividends on securities in the Index. The impact of transaction costs and the deduction of fees and expenses associated with a mutual fund, such as investment management and accounting fees, are not reflected in the index calculations. The Fund's performance reflects the reinvestment of dividends as well as the impact of transaction costs and the deduction of fees and expenses. It is not possible to invest directly in an index. |
| 2 | 1.00 equals perfect correlation. This calculation is based on the daily total return of the Index and the performance of the daily total return of the NAV per share of the Fund. |
The above information is not covered by the Report of the Independent Registered Public Accounting Firm.
150 :: ProFund VP Mid-Cap :: Financial Statements
Schedule of Portfolio Investments :: December 31, 2021
Repurchase Agreements(a)(b) (98.6%)
| | | Principal
Amount | | | Value | |
| Repurchase Agreements with various counterparties, 0.00%, dated 12/31/21, due 1/3/22, total to be received $15,630,000 | | $ | 15,630,000 | | | $ | 15,630,000 | |
TOTAL REPURCHASE AGREEMENTS
(Cost $15,630,000) | | | | | | | 15,630,000 | |
TOTAL INVESTMENT SECURITIES
(Cost $15,630,000)—98.6% | | | | | | | 15,630,000 | |
| Net other assets (liabilities)—1.4% | | | | | | | 220,381 | |
| NET ASSETS—100.0% | | | | | | $ | 15,850,381 | |
| (a) | A portion of these securities were held in a segregated account for the benefit of swap counterparties in the event of default. At December 31, 2021, the aggregate amount held in a segregated account was $1,788,000. |
| (b) | The ProFund VP invests in Repurchase Agreements jointly with other funds in the Trust. See "Repurchase Agreements" under Note 2 in the Notes to Financial Statements to view the details of each individual agreement and counterparty as well as a description of the securities subject to repurchase. |
Futures Contracts Purchased
| | | Number
of
Contracts | | Expiration
Date | | Notional
Amount | | | Value and
Unrealized
Appreciation/
(Depreciation) | |
| E-Mini S&P MidCap 400 Futures Contracts | | 17 | | 3/21/22 | | $ | 4,824,090 | | | $ | 107,578 | |
Total Return Swap Agreements—Long
| Underlying Instrument | | Counterparty | | Termination
Date(1) | | Rate Paid
(Received)(2) | | | Notional
Amount | | | Value and
Unrealized
Appreciation/
(Depreciation) | |
| S&P MidCap 400 | | Goldman Sachs International | | 1/27/22 | | | 0.58 | % | | $ | 3,969,848 | | | $ | 13,524 | |
| S&P MidCap 400 | | UBS AG | | 1/27/22 | | | 0.43 | % | | | 7,048,160 | | | | 24,231 | |
| | | | | | | | | | | $ | 11,018,008 | | | $ | 37,755 | |
| (1) | Agreements may be terminated at will by either party without penalty. Payment is due at termination/maturity. |
| (2) | Reflects the floating financing rate, as of December 31, 2021, on the notional amount of the swap agreement paid to the counterparty or received from the counterparty, excluding any commissions. This amount is included as part of the unrealized appreciation/(depreciation). |
See accompanying notes to financial statements.
Financial Statements :: ProFund VP Mid-Cap :: 151
Statement of Assets and Liabilities
December 31, 2021
| ASSETS: | | | | |
| Total Investment Securities, at cost | | $ | 15,630,000 | |
| Repurchase agreements, at value | | | 15,630,000 | |
| Total Investment Securities, at value | | | 15,630,000 | |
| Cash | | | 216 | |
| Segregated cash balances for futures contracts with brokers | | | 252,450 | |
| Unrealized appreciation on swap agreements | | | 37,755 | |
| Receivable for capital shares issued | | | 24,925 | |
| Variation margin on futures contracts | | | 1,870 | |
| Prepaid expenses | | | 1,114 | |
| TOTAL ASSETS | | | 15,948,330 | |
| | | | | |
| LIABILITIES: | | | | |
| Payable for capital shares redeemed | | | 55,735 | |
| Advisory fees payable | | | 10,016 | |
| Management services fees payable | | | 1,335 | |
| Administration fees payable | | | 946 | |
| Administrative services fees payable | | | 9,855 | |
| Distribution fees payable | | | 10,225 | |
| Transfer agency fees payable | | | 1,632 | |
| Fund accounting fees payable | | | 523 | |
| Compliance services fees payable | | | 69 | |
| Other accrued expenses | | | 7,613 | |
| TOTAL LIABILITIES | | | 97,949 | |
| NET ASSETS | | $ | 15,850,381 | |
| | | | | |
| NET ASSETS CONSIST OF: | | | | |
| Capital | | $ | 13,586,306 | |
| Total distributable earnings (loss) | | | 2,264,075 | |
| NET ASSETS | | $ | 15,850,381 | |
| Shares of Beneficial Interest Outstanding (unlimited number of shares authorized, no par value) | | | 738,358 | |
| Net Asset Value (offering and redemption price per share) | | $ | 21.47 | |
Statement of Operations
For the Year Ended December 31, 2021
| INVESTMENT INCOME: | | | | |
| Interest | | $ | 134 | |
| | | | | |
| EXPENSES: | | | | |
| Advisory fees | | | 123,906 | |
| Management services fees | | | 16,521 | |
| Administration fees | | | 12,095 | |
| Transfer agency fees | | | 10,023 | |
| Administrative services fees | | | 39,616 | |
| Distribution fees | | | 41,302 | |
| Custody fees | | | 2,490 | |
| Fund accounting fees | | | 6,724 | |
| Trustee fees | | | 255 | |
| Compliance services fees | | | 129 | |
| Other fees | | | 13,655 | |
| TOTAL NET EXPENSES | | | 266,716 | |
| NET INVESTMENT INCOME (LOSS) | | | (266,582 | ) |
| | | | | |
| REALIZED AND UNREALIZED GAINS (LOSSES) ON INVESTMENTS: | | | | |
| Net realized gains (losses) on futures contracts | | | 435,097 | |
| Net realized gains (losses) on swap agreements | | | 2,383,706 | |
| Change in net unrealized appreciation/depreciation on futures contracts | | | 90,622 | |
| Change in net unrealized appreciation/depreciation on swap agreements | | | 48,547 | |
| NET REALIZED AND UNREALIZED GAINS (LOSSES) ON INVESTMENTS | | | 2,957,972 | |
| CHANGE IN NET ASSETS RESULTING FROM OPERATIONS | | $ | 2,691,390 | |
See accompanying notes to financial statements.
152 :: ProFund VP Mid-Cap :: Financial Statements
Statements of Changes in Net Assets
| | | Year Ended
December 31, 2021 | | | Year Ended
December 31, 2020 | |
| FROM INVESTMENT ACTIVITIES: | | | | | | | | |
| | | | | | | | | |
| OPERATIONS: | | | | | | | | |
| Net investment income (loss) | | $ | (266,582 | ) | | $ | (114,283 | ) |
| Net realized gains (losses) on investments | | | 2,818,803 | | | | 941,668 | |
| Change in net unrealized appreciation/depreciation on investments | | | 139,169 | | | | (21,961 | ) |
| Change in net assets resulting from operations | | | 2,691,390 | | | | 805,424 | |
| | | | | | | | | |
| DISTRIBUTIONS TO SHAREHOLDERS: | | | | | | | | |
| Total distributions | | | (607,067 | ) | | | (2,255,783 | ) |
| Change in net assets resulting from distributions | | | (607,067 | ) | | | (2,255,783 | ) |
| | | | | | | | | |
| CAPITAL TRANSACTIONS: | | | | | | | | |
| Proceeds from shares issued | | | 29,302,491 | | | | 15,596,622 | |
| Distributions reinvested | | | 607,067 | | | | 2,255,783 | |
| Value of shares redeemed | | | (26,874,287 | ) | | | (17,003,217 | ) |
| Change in net assets resulting from capital transactions | | | 3,035,271 | | | | 849,188 | |
| Change in net assets | | | 5,119,594 | | | | (601,171 | ) |
| | | | | | | | | |
| NET ASSETS: | | | | | | | | |
| Beginning of period | | | 10,730,787 | | | | 11,331,958 | |
| End of period | | $ | 15,850,381 | | | $ | 10,730,787 | |
| | | | | | | | | |
| SHARE TRANSACTIONS: | | | | | | | | |
| Issued | | | 1,429,285 | | | | 855,896 | |
| Reinvested | | | 30,429 | | | | 145,347 | |
| Redeemed | | | (1,312,571 | ) | | | (884,417 | ) |
| Change in shares | | | 147,143 | | | | 116,826 | |
See accompanying notes to financial statements.
Financial Highlights :: ProFund VP Mid-Cap :: 153
ProFunds Financial Highlights FOR THE PERIODS INDICATED
Selected data for a share of beneficial interest outstanding throughout the periods indicated.
| | | Year Ended
Dec. 31, 2021 | | | Year Ended
Dec. 31, 2020 | | | Year Ended
Dec. 31, 2019 | | | Year Ended
Dec. 31, 2018 | | | Year Ended
Dec. 31, 2017 | |
| Net Asset Value, Beginning of Period | | $ | 18.15 | | | $ | 23.89 | | | $ | 19.37 | | | $ | 29.47 | | | $ | 34.24 | |
| | | | | | | | | | | | | | | | | | | | | |
| Investment Activities: | | | | | | | | | | | | | | | | | | | | |
| Net investment income (loss)(a) | | | (0.33 | ) | | | (0.26 | ) | | | 0.11 | | | | 0.02 | | | | (0.33 | ) |
| Net realized and unrealized gains (losses) on investments | | | 4.31 | | | | 1.63 | | | | 4.44 | | | | (2.56 | ) | | | 4.53 | |
| Total income (loss) from investment activities | | | 3.98 | | | | 1.37 | | | | 4.55 | | | | (2.54 | ) | | | 4.20 | |
| | | | | | | | | | | | | | | | | | | | | |
| Distributions to Shareholders From: | | | | | | | | | | | | | | | | | | | | |
| Net investment income | | | — | | | | (0.22 | ) | | | (0.03 | ) | | | — | | | | — | |
| Net realized gains on investments | | | (0.66 | ) | | | (6.89 | ) | | | — | | | | (7.56 | ) | | | (8.97 | ) |
| Total distributions | | | (0.66 | ) | | | (7.11 | ) | | | (0.03 | ) | | | (7.56 | ) | | | (8.97 | ) |
| | | | | | | | | | | | | | | | | | | | | |
| Net Asset Value, End of Period | | $ | 21.47 | | | $ | 18.15 | | | $ | 23.89 | | | $ | 19.37 | | | $ | 29.47 | |
| | | | | | | | | | | | | | | | | | | | | |
| Total Return | | | 22.21 | % | | | 10.76 | % | | | 23.53 | % | | | (12.86 | )%(b) | | | 13.43 | % |
| | | | | | | | | | | | | | | | | | | | | |
| Ratios to Average Net Assets: | | | | | | | | | | | | | | | | | | | | |
| Gross expenses | | | 1.61 | % | | | 1.70 | % | | | 1.64 | % | | | 1.52 | % | | | 1.66 | % |
| Net expenses | | | 1.61 | % | | | 1.70 | %(c) | | | 1.64 | % | | | 1.49 | %(b) | | | 1.66 | % |
| Net investment income (loss) | | | (1.61 | )% | | | (1.34 | )% | | | 0.50 | % | | | 0.08 | %(b) | | | (0.96 | )% |
| | | | | | | | | | | | | | | | | | | | | |
| Supplemental Data: | | | | | | | | | | | | | | | | | | | | |
| Net assets, end of period (000's) | | $ | 15,850 | | | $ | 10,731 | | | $ | 11,332 | | | $ | 21,039 | | | $ | 38,793 | |
| Portfolio turnover rate(d) | | | — | | | | — | | | | — | | | | — | | | | — | |
| (a) | Per share net investment income (loss) has been calculated using the average daily shares method. |
| (b) | During 2018, the Fund received a non-recurring reimbursement from a third party relating to expenses that were incurred in a prior year. Had this reimbursement not occurred, the net expense ratio and net investment income (loss) ratio would have been 1.52% and 0.05%, respectively, and the total return would have been (12.94)%. |
| (c) | The expense ratio does not correlate to the applicable expense limits in place during the period given that the annual contractual expense limitation is applied for one year periods ended April 30th of each year, instead of coinciding with the December 31st year end. Details of the current expense limitation in effect can be found in Note 4 of the accompanying Notes to Financial Statements. |
| (d) | Portfolio turnover rate is calculated without regard to instruments having a maturity of less than one year from acquisition or derivative instruments (including swap agreements and futures contracts). |
See accompanying notes to financial statements.
154 :: ProFund VP Mid-Cap Growth :: Management Discussion of Fund Performance
ProFund VP Mid-Cap Growth (the "Fund") seeks investment results, before fees and expenses, that correspond to the performance of the S&P MidCap 400® Growth Index (the "Index"). For the year ended December 31, 2021, the Fund had a total return of 16.97%. For the same period, the Index had a total return of 18.90%1 and a volatility of 17.96%. For the year, the Fund achieved an average daily statistical correlation of over 0.99 to the daily performance of the Index.2
The Fund takes positions in financial instruments that, in combination, should have similar return characteristics as the return of the Index. The Index is designed to provide a comprehensive measure of mid-cap U.S. equity "growth" performance. It is an unmanaged, float-adjusted, market capitalization-weighted index comprising stocks representing approximately half the market capitalization of the S&P MidCap 400® that have been identified as being on the growth end of the growth-value spectrum.
Value of a $10,000 Investment at Net Asset Value*

| * | The line graph represents the historical performance of a hypothetical investment of $10,000 in the ProFund VP Mid-Cap Growth from December 31, 2011 to December 31, 2021, assuming the reinvestment of distributions. |
Average Annual Total Return as of 12/31/21
| Fund | | One Year | | | Five Year | | | Ten Year | |
| ProFund VP Mid-Cap Growth | | | 16.97 | % | | | 12.84 | % | | | 12.69 | % |
| S&P MidCap 400® Growth Index | | | 18.90 | % | | | 14.66 | % | | | 14.54 | % |
Expense Ratios**
| Fund | | Gross | | | Net | | | | | |
| ProFund VP Mid-Cap Growth | | | 1.78 | % | | | 1.68 | % | | | | |
| ** | Reflects the expense ratio as reported in the Prospectus dated May 1, 2021. Contractual fee waivers are in effect through April 30, 2022. See Financial Highlights for effective expense ratios. |
Allocation of Portfolio Holdings & Index Composition
Market Exposure
| Investment Type | | % of Net Assets | |
| Equity Securities | | | 100 | % |
| Total Exposure | | | 100 | % |
"Market Exposure" includes the value of total investments (including the contract value of any derivatives) and excludes any instruments used for cash management.
Largest Equity Holdings
| Company | | % of Net Assets | |
| Camden Property Trust | | | 1.5 | % |
| Builders FirstSource, Inc. | | | 1.3 | % |
| Trex Co., Inc. | | | 1.2 | % |
| Masimo Corp. | | | 1.2 | % |
| Repligen Corp. | | | 1.1 | % |
S&P MidCap 400® Growth Index – Composition
| | | % of Index | |
| Industrials | | | 19 | % |
| Information Technology | | | 18 | % |
| Consumer Discretionary | | | 17 | % |
| Health Care | | | 13 | % |
| Financials | | | 11 | % |
| Real Estate | | | 9 | % |
| Materials | | | 7 | % |
| Communication Services | | | 2 | % |
| Energy | | | 2 | % |
| Consumer Staples | | | 1 | % |
| Utilities | | | 1 | % |
Past performance does not guarantee future results. Return calculations assume the reinvestment of distributions and do not reflect taxes that a shareholder would pay on Fund distributions or on the redemption of Fund shares. The performance data quoted represents past performance and current returns may be lower or higher. The investment return and net asset value ("NAV") will fluctuate so that an investor's shares, when redeemed, may be worth more or less than the original cost. The performance above reflects any fee reductions during the applicable periods. If such fee reductions had not occurred, the quoted performance would be lower. Performance numbers are net of all Fund fees and expenses but do not include any insurance, sales, or administrative charges of variable annuity or life insurance contracts. If these charges were included, the returns would be lower. To obtain performance current to the most recent month-end, please call toll-free 888-776-3637.
| 1 | The graph and table reflect the theoretical reinvestment of dividends on securities in the Index. The impact of transaction costs and the deduction of fees and expenses associated with a mutual fund, such as investment management and accounting fees, are not reflected in the index calculations. The Fund's performance reflects the reinvestment of dividends as well as the impact of transaction costs and the deduction of fees and expenses. It is not possible to invest directly in an index. |
| 2 | 1.00 equals perfect correlation. This calculation is based on the daily total return of the Index and the performance of the daily total return of the NAV per share of the Fund. |
The above information is not covered by the Report of the Independent Registered Public Accounting Firm.
Financial Statements :: ProFund VP Mid-Cap Growth :: 155
Schedule of Portfolio Investments :: December 31, 2021
Common Stocks (99.6%)
| | | Shares | | | Value | |
| ACI Worldwide, Inc.* (Software) | | | 916 | | | $ | 31,785 | |
| Acuity Brands, Inc. (Electrical Equipment) | | | 579 | | | | 122,585 | |
| Affiliated Managers Group, Inc. (Capital Markets) | | | 674 | | | | 110,880 | |
| Alcoa Corp. (Metals & Mining) | | | 1,241 | | | | 73,939 | |
| American Campus Communities, Inc. (Equity Real Estate Investment Trusts) | | | 1,270 | | | | 72,758 | |
| American Eagle Outfitters, Inc. (Specialty Retail) | | | 1,069 | | | | 27,067 | |
| American Financial Group, Inc. (Insurance) | | | 515 | | | | 70,719 | |
| Amkor Technology, Inc. (Semiconductors & Semiconductor Equipment) | | | 682 | | | | 16,907 | |
| Antero Midstream Corp. (Oil, Gas & Consumable Fuels) | | | 5,382 | | | | 52,098 | |
| Apartment Income REIT Corp. (Equity Real Estate Investment Trusts) | | | 1,223 | | | | 66,861 | |
| AptarGroup, Inc. (Containers & Packaging) | | | 502 | | | | 61,485 | |
| Arrowhead Pharmaceuticals, Inc.* (Biotechnology) | | | 1,728 | | | | 114,566 | |
| ASGN, Inc.* (Professional Services) | | | 864 | | | | 106,618 | |
| Ashland Global Holdings, Inc. (Chemicals) | | | 403 | | | | 43,387 | |
| Aspen Technology, Inc.* (Software) | | | 1,110 | | | | 168,942 | |
| AutoNation, Inc.* (Specialty Retail) | | | 312 | | | | 36,457 | |
| Avient Corp. (Chemicals) | | | 1,517 | | | | 84,876 | |
| Avis Budget Group, Inc.* (Road & Rail) | | | 664 | | | | 137,694 | |
| Axon Enterprise, Inc.* (Aerospace & Defense) | | | 1,089 | | | | 170,973 | |
| Azenta, Inc. (Semiconductors & Semiconductor Equipment) | | | 1,233 | | | | 127,135 | |
| Bank of Hawaii Corp. (Banks) | | | 282 | | | | 23,620 | |
| Bank OZK (Banks) | | | 943 | | | | 43,878 | |
| Blackbaud, Inc.* (Software) | | | 446 | | | | 35,225 | |
| Boyd Gaming Corp.* (Hotels, Restaurants & Leisure) | | | 1,359 | | | | 89,110 | |
| Brixmor Property Group, Inc. (Equity Real Estate Investment Trusts) | | | 2,708 | | | | 68,810 | |
| Bruker Corp. (Life Sciences Tools & Services) | | | 1,684 | | | | 141,304 | |
| Brunswick Corp. (Leisure Products) | | | 1,278 | | | | 128,734 | |
| Builders FirstSource, Inc.* (Building Products) | | | 3,175 | | | | 272,130 | |
| Cable One, Inc. (Media) | | | 48 | | | | 84,646 | |
| Camden Property Trust (Equity Real Estate Investment Trusts) | | | 1,694 | | | | 302,684 | |
| Capri Holdings, Ltd.* (Textiles, Apparel & Luxury Goods) | | | 1,522 | | | | 98,793 | |
| Carlisle Cos., Inc. (Industrial Conglomerates) | | | 867 | | | | 215,120 | |
| Cathay General Bancorp (Banks) | | | 499 | | | | 21,452 | |
| CDK Global, Inc. (Software) | | | 923 | | | | 38,526 | |
| Cerence, Inc.* (Software) | | | 328 | | | | 25,138 | |
| ChampionX Corp.* (Energy Equipment & Services) | | | 1,575 | | | | 31,831 | |
| Chemed Corp. (Health Care Providers & Services) | | | 145 | | | | 76,711 | |
| Choice Hotels International, Inc. (Hotels, Restaurants & Leisure) | | | 370 | | | | 57,716 | |
| Churchill Downs, Inc. (Hotels, Restaurants & Leisure) | | | 571 | | | | 137,555 | |
| Ciena Corp.* (Communications Equipment) | | | 1,618 | | | | 124,537 | |
| Cirrus Logic, Inc.* (Semiconductors & Semiconductor Equipment) | | | 455 | | | | 41,869 | |
| CIT Group, Inc. (Banks) | | | 658 | | | | 33,782 | |
| Clean Harbors, Inc.* (Commercial Services & Supplies) | | | 489 | | | | 48,788 | |
| Cleveland-Cliffs, Inc.* (Metals & Mining) | | | 7,544 | | | | 164,233 | |
| CMC Materials, Inc. (Semiconductors & Semiconductor Equipment) | | | 315 | | | | 60,382 | |
| CNX Resources Corp.* (Oil, Gas & Consumable Fuels) | | | 1,646 | | | | 22,633 | |
| Cognex Corp. (Electronic Equipment, Instruments & Components) | | | 1,846 | | | | 143,544 | |
| Coherent, Inc.* (Electronic Equipment, Instruments & Components) | | | 407 | | | | 108,482 | |
| Colfax Corp.* (Machinery) | | | 915 | | | | 42,063 | |
| Columbia Sportswear Co. (Textiles, Apparel & Luxury Goods) | | | 304 | | | | 29,622 | |
| Commerce Bancshares, Inc. (Banks) | | | 921 | | | | 63,310 | |
| CommVault Systems, Inc.* (Software) | | | 490 | | | | 33,771 | |
| Concentrix Corp. (IT Services) | | | 711 | | | | 126,999 | |
| Crane Co. (Machinery) | | | 406 | | | | 41,302 | |
| Crocs, Inc.* (Textiles, Apparel & Luxury Goods) | | | 975 | | | | 125,015 | |
| Cullen/Frost Bankers, Inc. (Banks) | | | 527 | | | | 66,439 | |
| CyrusOne, Inc. (Equity Real Estate Investment Trusts) | | | 1,367 | | | | 122,647 | |
| Darling Ingredients, Inc.* (Food Products) | | | 2,683 | | | | 185,905 | |
| Deckers Outdoor Corp.* (Textiles, Apparel & Luxury Goods) | | | 455 | | | | 166,670 | |
| Dick's Sporting Goods, Inc. (Specialty Retail) | | | 1,075 | | | | 123,614 | |
| Digital Turbine, Inc.* (Software) | | | 1,458 | | | | 88,923 | |
| Donaldson Co., Inc. (Machinery) | | | 1,045 | | | | 61,927 | |
| Douglas Emmett, Inc. (Equity Real Estate Investment Trusts) | | | 1,338 | | | | 44,823 | |
| DT Midstream, Inc. (Oil, Gas & Consumable Fuels) | | | 674 | | | | 32,339 | |
| Dycom Industries, Inc.* (Construction & Engineering) | | | 195 | | | | 18,283 | |
| Eagle Materials, Inc. (Construction Materials) | | | 675 | | | | 112,361 | |
| East West Bancorp, Inc. (Banks) | | | 2,353 | | | | 185,134 | |
| EastGroup Properties, Inc. (Equity Real Estate Investment Trusts) | | | 675 | | | | 153,799 | |
| Envestnet, Inc.* (Software) | | | 480 | | | | 38,083 | |
| Essential Utilities, Inc. (Water Utilities) | | | 2,401 | | | | 128,910 | |
| Evercore Partners, Inc. — Class A (Capital Markets) | | | 646 | | | | 87,759 | |
| Exelixis, Inc.* (Biotechnology) | | | 2,780 | | | | 50,818 | |
| Fair Isaac Corp.* (Software) | | | 263 | | | | 114,055 | |
| Federated Hermes, Inc. — Class B (Capital Markets) | | | 755 | | | | 28,373 | |
| First American Financial Corp. (Insurance) | | | 837 | | | | 65,479 | |
| First Financial Bankshares, Inc. (Banks) | | | 2,126 | | | | 108,086 | |
| First Industrial Realty Trust, Inc. (Equity Real Estate Investment Trusts) | | | 1,489 | | | | 98,572 | |
| First Solar, Inc.* (Semiconductors & Semiconductor Equipment) | | | 967 | | | | 84,284 | |
| Five Below, Inc.* (Specialty Retail) | | | 928 | | | | 191,994 | |
| Fox Factory Holding Corp.* (Auto Components) | | | 698 | | | | 118,730 | |
| FTI Consulting, Inc.* (Professional Services) | | | 569 | | | | 87,296 | |
| GameStop Corp.* — Class A (Specialty Retail) | | | 1,028 | | | | 152,545 | |
See accompanying notes to financial statements.
156 :: ProFund VP Mid-Cap Growth :: Financial Statements
Common Stocks, continued
| | | Shares | | | Value | |
| Genpact, Ltd. (IT Services) | | | 1,893 | | | $ | 100,480 | |
| Gentex Corp. (Auto Components) | | | 2,078 | | | | 72,418 | |
| Glacier Bancorp, Inc. (Banks) | | | 1,798 | | | | 101,947 | |
| Globus Medical, Inc.* — Class A (Health Care Equipment & Supplies) | | | 786 | | | | 56,749 | |
| Graco, Inc. (Machinery) | | | 1,691 | | | | 136,328 | |
| GXO Logistics, Inc.* (Air Freight & Logistics) | | | 1,635 | | | | 148,507 | |
| H&R Block, Inc. (Diversified Consumer Services) | | | 1,340 | | | | 31,570 | |
| Halozyme Therapeutics, Inc.* (Biotechnology) | | | 2,334 | | | | 93,850 | |
| Hancock Whitney Corp. (Banks) | | | 647 | | | | 32,363 | |
| Healthcare Realty Trust, Inc. (Equity Real Estate Investment Trusts) | | | 1,150 | | | | 36,386 | |
| HealthEquity, Inc.* (Health Care Providers & Services) | | | 927 | | | | 41,010 | |
| Helen of Troy, Ltd.* (Household Durables) | | | 400 | | | | 97,788 | |
| Home BancShares, Inc. (Banks) | | | 924 | | | | 22,499 | |
| Hubbell, Inc. (Electrical Equipment) | | | 488 | | | | 101,636 | |
| IAA, Inc.* (Commercial Services & Supplies) | | | 1,206 | | | | 61,048 | |
| ICU Medical, Inc.* (Health Care Equipment & Supplies) | | | 156 | | | | 37,025 | |
| II-VI, Inc.* (Electronic Equipment, Instruments & Components) | | | 845 | | | | 57,739 | |
| Ingevity Corp.* (Chemicals) | | | 352 | | | | 25,238 | |
| Insperity, Inc. (Professional Services) | | | 594 | | | | 70,157 | |
| Integra LifeSciences Holdings Corp.* (Health Care Equipment & Supplies) | | | 616 | | | | 41,266 | |
| Interactive Brokers Group, Inc. (Capital Markets) | | | 899 | | | | 71,399 | |
| Iridium Communications, Inc.* (Diversified Telecommunication Services) | | | 1,162 | | | | 47,979 | |
| ITT, Inc. (Machinery) | | | 795 | | | | 81,241 | |
| Jabil, Inc. (Electronic Equipment, Instruments & Components) | | | 1,046 | | | | 73,586 | |
| Jack in the Box, Inc. (Hotels, Restaurants & Leisure) | | | 248 | | | | 21,695 | |
| Janus Henderson Group PLC (Capital Markets) | | | 1,301 | | | | 54,564 | |
| Jefferies Financial Group, Inc. (Diversified Financial Services) | | | 3,257 | | | | 126,372 | |
| John Wiley & Sons, Inc. — Class A (Media) | | | 360 | | | | 20,617 | |
| Jones Lang LaSalle, Inc.* (Real Estate Management & Development) | | | 410 | | | | 110,429 | |
| KBR, Inc. (Professional Services) | | | 1,511 | | | | 71,954 | |
| Kinsale Capital Group, Inc. (Insurance) | | | 356 | | | | 84,688 | |
| Lamar Advertising Co. — Class A (Equity Real Estate Investment Trusts) | | | 950 | | | | 115,235 | |
| Lancaster Colony Corp. (Food Products) | | | 158 | | | | 26,165 | |
| Landstar System, Inc. (Road & Rail) | | | 411 | | | | 73,577 | |
| Lattice Semiconductor Corp.* (Semiconductors & Semiconductor Equipment) | | | 2,270 | | | | 174,926 | |
| Lennox International, Inc. (Building Products) | | | 324 | | | | 105,093 | |
| Life Storage, Inc. (Equity Real Estate Investment Trusts) | | | 1,359 | | | | 208,172 | |
| Lincoln Electric Holdings, Inc. (Machinery) | | | 568 | | | | 79,219 | |
| Littelfuse, Inc. (Electronic Equipment, Instruments & Components) | | | 253 | | | | 79,614 | |
| LivaNova PLC* (Health Care Equipment & Supplies) | | | 530 | | | | 46,338 | |
| LiveRamp Holdings, Inc.* (IT Services) | | | 1,129 | | | | 54,136 | |
| Louisiana-Pacific Corp. (Paper & Forest Products) | | | 1,459 | | | | 114,313 | |
| Lumentum Holdings, Inc.* (Communications Equipment) | | | 539 | | | | 57,010 | |
| Manhattan Associates, Inc.* (Software) | | | 1,048 | | | | 162,954 | |
| Marriott Vacations Worldwide Corp. (Hotels, Restaurants & Leisure) | | | 317 | | | | 53,567 | |
| Masimo Corp.* (Health Care Equipment & Supplies) | | | 842 | | | | 246,520 | |
| MasTec, Inc.* (Construction & Engineering) | | | 484 | | | | 44,664 | |
| Mattel, Inc.* (Leisure Products) | | | 5,808 | | | | 125,220 | |
| MAXIMUS, Inc. (IT Services) | | | 1,019 | | | | 81,184 | |
| Medpace Holdings, Inc.* (Life Sciences Tools & Services) | | | 476 | | | | 103,597 | |
| Mimecast, Ltd.* (Software) | | | 1,024 | | | | 81,480 | |
| MKS Instruments, Inc. (Semiconductors & Semiconductor Equipment) | | | 506 | | | | 88,130 | |
| Molina Healthcare, Inc.* (Health Care Providers & Services) | | | 474 | | | | 150,770 | |
| MSA Safety, Inc. (Commercial Services & Supplies) | | | 309 | | | | 46,647 | |
| Murphy Oil Corp. (Oil, Gas & Consumable Fuels) | | | 2,406 | | | | 62,820 | |
| National Fuel Gas Co. (Gas Utilities) | | | 786 | | | | 50,257 | |
| National Instruments Corp. (Electronic Equipment, Instruments & Components) | | | 1,159 | | | | 50,614 | |
| National Retail Properties, Inc. (Equity Real Estate Investment Trusts) | | | 1,311 | | | | 63,020 | |
| National Storage Affiliates Trust (Equity Real Estate Investment Trusts) | | | 1,358 | | | | 93,974 | |
| Navient Corp. (Consumer Finance) | | | 2,672 | | | | 56,700 | |
| Neogen Corp.* (Health Care Equipment & Supplies) | | | 1,033 | | | | 46,909 | |
| Neurocrine Biosciences, Inc.* (Biotechnology) | | | 1,573 | | | | 133,972 | |
| Nordson Corp. (Machinery) | | | 537 | | | | 137,080 | |
| nVent Electric PLC (Electrical Equipment) | | | 1,646 | | | | 62,548 | |
| OGE Energy Corp. (Electric Utilities) | | | 1,227 | | | | 47,092 | |
| Olin Corp. (Chemicals) | | | 2,378 | | | | 136,782 | |
| Option Care Health, Inc.* (Health Care Providers & Services) | | | 2,297 | | | | 65,327 | |
| PacWest Bancorp (Banks) | | | 1,944 | | | | 87,810 | |
| Papa John's International, Inc. (Hotels, Restaurants & Leisure) | | | 536 | | | | 71,540 | |
| Paylocity Holding Corp.* (Software) | | | 657 | | | | 155,157 | |
| Penumbra, Inc.* (Health Care Equipment & Supplies) | | | 582 | | | | 167,219 | |
| Pinnacle Financial Partners, Inc. (Banks) | | | 1,262 | | | | 120,521 | |
| Polaris, Inc. (Leisure Products) | | | 407 | | | | 44,733 | |
| PotlatchDeltic Corp. (Equity Real Estate Investment Trusts) | | | 489 | | | | 29,448 | |
| Power Integrations, Inc. (Semiconductors & Semiconductor Equipment) | | | 1,000 | | | | 92,890 | |
| Primerica, Inc. (Insurance) | | | 406 | | | | 62,228 | |
| Progyny, Inc.* (Health Care Providers & Services) | | | 716 | | | | 36,051 | |
| PS Business Parks, Inc. (Equity Real Estate Investment Trusts) | | | 210 | | | | 38,676 | |
| Qualys, Inc.* (Software) | | | 554 | | | | 76,020 | |
See accompanying notes to financial statements.
Financial Statements :: ProFund VP Mid-Cap Growth :: 157
Common Stocks, continued
| | | Shares | | | Value | |
| Quidel Corp.* (Health Care Equipment & Supplies) | | | 628 | | | $ | 84,774 | |
| R1 RCM, Inc.* (Health Care Providers & Services) | | | 1,281 | | | | 32,653 | |
| Rayonier, Inc. (Equity Real Estate Investment Trusts) | | | 1,423 | | | | 57,432 | |
| Regal Rexnord Corp. (Electrical Equipment) | | | 472 | | | | 80,325 | |
| Repligen Corp.* (Biotechnology) | | | 852 | | | | 225,645 | |
| Rexford Industrial Realty, Inc. (Equity Real Estate Investment Trusts) | | | 2,511 | | | | 203,667 | |
| RH* (Specialty Retail) | | | 288 | | | | 154,351 | |
| RLI Corp. (Insurance) | | | 396 | | | | 44,392 | |
| Royal Gold, Inc. (Metals & Mining) | | | 653 | | | | 68,702 | |
| RPM International, Inc. (Chemicals) | | | 1,097 | | | | 110,797 | |
| Sabre Corp.* (IT Services) | | | 2,575 | | | | 22,119 | |
| Saia, Inc.* (Road & Rail) | | | 437 | | | | 147,282 | |
| Sailpoint Technologies Holding, Inc.* (Software) | | | 1,546 | | | | 74,734 | |
| Sanderson Farms, Inc. (Food Products) | | | 165 | | | | 31,528 | |
| Scientific Games Corp.* (Hotels, Restaurants & Leisure) | | | 1,600 | | | | 106,928 | |
| SEI Investments Co. (Capital Markets) | | | 1,036 | | | | 63,134 | |
| Semtech Corp.* (Semiconductors & Semiconductor Equipment) | | | 705 | | | | 62,696 | |
| Sensient Technologies Corp. (Chemicals) | | | 397 | | | | 39,724 | |
| Service Corp. International (Diversified Consumer Services) | | | 2,733 | | | | 194,016 | |
| Silicon Laboratories, Inc.* (Semiconductors & Semiconductor Equipment) | | | 666 | | | | 137,476 | |
| Simpson Manufacturing Co., Inc. (Building Products) | | | 720 | | | | 100,130 | |
| SiTime Corp.* (Semiconductors & Semiconductor Equipment) | | | 249 | | | | 72,842 | |
| Six Flags Entertainment Corp.* (Hotels, Restaurants & Leisure) | | | 628 | | | | 26,740 | |
| Skechers U.S.A., Inc.* — Class A (Textiles, Apparel & Luxury Goods) | | | 1,052 | | | | 45,657 | |
| SLM Corp. (Consumer Finance) | | | 4,861 | | | | 95,616 | |
| STAAR Surgical Co.* (Health Care Equipment & Supplies) | | | 789 | | | | 72,036 | |
| Steel Dynamics, Inc. (Metals & Mining) | | | 3,125 | | | | 193,968 | |
| Stifel Financial Corp. (Capital Markets) | | | 1,727 | | | | 121,614 | |
| SunPower Corp.* (Semiconductors & Semiconductor Equipment) | | | 1,376 | | | | 28,717 | |
| Synaptics, Inc.* (Semiconductors & Semiconductor Equipment) | | | 651 | | | | 188,471 | |
| Syneos Health, Inc.* (Life Sciences Tools & Services) | | | 1,719 | | | | 176,507 | |
| Synovus Financial Corp. (Banks) | | | 966 | | | | 46,242 | |
| Tandem Diabetes Care, Inc.* (Health Care Equipment & Supplies) | | | 1,054 | | | | 158,648 | |
| Targa Resources Corp. (Oil, Gas & Consumable Fuels) | | | 3,796 | | | | 198,302 | |
| TEGNA, Inc. (Media) | | | 1,614 | | | | 29,956 | |
| Tempur Sealy International, Inc. (Household Durables) | | | 3,192 | | | | 150,120 | |
| Tenet Healthcare Corp.* (Health Care Providers & Services) | | | 1,776 | | | | 145,081 | |
| Teradata Corp.* (IT Services) | | | 1,798 | | | | 76,361 | |
| Tetra Tech, Inc. (Commercial Services & Supplies) | | | 896 | | | | 152,140 | |
| Texas Roadhouse, Inc. — Class A (Hotels, Restaurants & Leisure) | | | 693 | | | | 61,871 | |
| The Boston Beer Co., Inc.* — Class A (Beverages) | | | 94 | | | | 47,479 | |
| The Middleby Corp.* (Machinery) | | | 591 | | | | 116,285 | |
| The New York Times Co. — Class A (Media) | | | 1,607 | | | | 77,618 | |
| The Scotts Miracle-Gro Co. — Class A (Chemicals) | | | 676 | | | | 108,836 | |
| The Toro Co. (Machinery) | | | 1,765 | | | | 176,341 | |
| The Wendy's Co. (Hotels, Restaurants & Leisure) | | | 1,464 | | | | 34,916 | |
| TopBuild Corp.* (Household Durables) | | | 546 | | | | 150,647 | |
| Trex Co., Inc.* (Building Products) | | | 1,908 | | | | 257,637 | |
| Trinity Industries, Inc. (Machinery) | | | 678 | | | | 20,476 | |
| TripAdvisor, Inc.* (Interactive Media & Services) | | | 689 | | | | 18,782 | |
| UMB Financial Corp. (Banks) | | | 714 | | | | 75,763 | |
| Umpqua Holdings Corp. (Banks) | | | 1,328 | | | | 25,551 | |
| United Therapeutics Corp.* (Biotechnology) | | | 358 | | | | 77,357 | |
| Universal Display Corp. (Semiconductors & Semiconductor Equipment) | | | 719 | | | | 118,657 | |
| Urban Edge Properties (Equity Real Estate Investment Trusts) | | | 821 | | | | 15,599 | |
| Valmont Industries, Inc. (Construction & Engineering) | | | 352 | | | | 88,176 | |
| Valvoline, Inc. (Chemicals) | | | 2,996 | | | | 111,721 | |
| Vicor Corp.* (Electrical Equipment) | | | 356 | | | | 45,205 | |
| Victoria's Secret & Co.* (Specialty Retail) | | | 589 | | | | 32,713 | |
| Watsco, Inc. (Trading Companies & Distributors) | | | 360 | | | | 112,637 | |
| Webster Financial Corp. (Banks) | | | 616 | | | | 34,397 | |
| WEX, Inc.* (IT Services) | | | 319 | | | | 44,784 | |
| Williams-Sonoma, Inc. (Specialty Retail) | | | 1,233 | | | | 208,537 | |
| Wingstop, Inc. (Hotels, Restaurants & Leisure) | | | 494 | | | | 85,363 | |
| Wintrust Financial Corp. (Banks) | | | 472 | | | | 42,867 | |
| Wolfspeed, Inc.* (Semiconductors & Semiconductor Equipment) | | | 1,056 | | | | 118,029 | |
| World Wrestling Entertainment, Inc. — Class A (Entertainment) | | | 460 | | | | 22,696 | |
| Wyndham Hotels & Resorts, Inc. (Hotels, Restaurants & Leisure) | | | 1,005 | | | | 90,098 | |
| Yelp, Inc.* (Interactive Media & Services) | | | 557 | | | | 20,186 | |
| YETI Holdings, Inc.* (Leisure Products) | | | 1,453 | | | | 120,352 | |
| Ziff Davis, Inc.* (Software) | | | 799 | | | | 88,577 | |
TOTAL COMMON STOCKS
(Cost $13,924,104) | | | | | | | 20,629,018 | |
Repurchase Agreements(a) (0.2%)
| | | Principal
Amount | | | Value | |
| Repurchase Agreements with various counterparties, 0.00%, dated 12/31/21, due 1/3/22, total to be received $36,000 | | $ | 36,000 | | | $ | 36,000 | |
TOTAL REPURCHASE AGREEMENTS
(Cost $36,000) | | | | | | | 36,000 | |
TOTAL INVESTMENT SECURITIES
(Cost $13,960,104) — 99.8% | | | | | | | 20,665,018 | |
| Net other assets (liabilities) — 0.2% | | | | | | | 37,116 | |
| NET ASSETS — 100.0% | | | | | | $ | 20,702,134 | |
| * | Non-income producing security. |
| (a) | The ProFund VP invests in Repurchase Agreements jointly with other funds in the Trust. See "Repurchase Agreements" under Note 2 in the Notes to Financial Statements to view the details of each individual agreement and counterparty as well as a description of the securities subject to repurchase. |
See accompanying notes to financial statements.
158 :: ProFund VP Mid-Cap Growth :: Financial Statements
ProFund VP Mid-Cap Growth invested in the following industries as of December 31, 2021:
| | | Value | | | % of
Net Assets | |
| Aerospace & Defense | | $ | 170,973 | | | | 0.8 | % |
| Air Freight & Logistics | | | 148,507 | | | | 0.7 | % |
| Auto Components | | | 191,148 | | | | 0.9 | % |
| Banks | | | 1,135,661 | | | | 5.5 | % |
| Beverages | | | 47,479 | | | | 0.2 | % |
| Biotechnology | | | 696,208 | | | | 3.4 | % |
| Building Products | | | 734,990 | | | | 3.6 | % |
| Capital Markets | | | 537,723 | | | | 2.6 | % |
| Chemicals | | | 661,361 | | | | 3.2 | % |
| Commercial Services & Supplies | | | 308,623 | | | | 1.5 | % |
| Communications Equipment | | | 181,547 | | | | 0.9 | % |
| Construction & Engineering | | | 151,123 | | | | 0.7 | % |
| Construction Materials | | | 112,361 | | | | 0.5 | % |
| Consumer Finance | | | 152,316 | | | | 0.7 | % |
| Containers & Packaging | | | 61,485 | | | | 0.3 | % |
| Diversified Consumer Services | | | 225,586 | | | | 1.1 | % |
| Diversified Financial Services | | | 126,372 | | | | 0.6 | % |
| Diversified Telecommunication Services | | | 47,979 | | | | 0.2 | % |
| Electric Utilities | | | 47,092 | | | | 0.2 | % |
| Electrical Equipment | | | 412,299 | | | | 2.0 | % |
| Electronic Equipment, Instruments & Components | | | 513,579 | | | | 2.5 | % |
| Energy Equipment & Services | | | 31,831 | | | | 0.2 | % |
| Entertainment | | | 22,696 | | | | 0.1 | % |
| Equity Real Estate Investment Trusts | | | 1,792,563 | | | | 8.7 | % |
| Food Products | | | 243,598 | | | | 1.2 | % |
| Gas Utilities | | | 50,257 | | | | 0.2 | % |
| Health Care Equipment & Supplies | | | 957,484 | | | | 4.7 | % |
| Health Care Providers & Services | | | 547,603 | | | | 2.6 | % |
| Hotels, Restaurants & Leisure | | | 837,099 | | | | 4.0 | % |
| Household Durables | | | 398,555 | | | | 1.9 | % |
| Industrial Conglomerates | | | 215,120 | | | | 1.0 | % |
| Insurance | | | 327,506 | | | | 1.6 | % |
| Interactive Media & Services | | | 38,968 | | | | 0.2 | % |
| IT Services | | | 506,063 | | | | 2.4 | % |
| Leisure Products | | | 419,039 | | | | 2.0 | % |
| Life Sciences Tools & Services | | | 421,408 | | | | 2.0 | % |
| Machinery | | | 892,262 | | | | 4.4 | % |
| Media | | | 212,837 | | | | 1.1 | % |
| Metals & Mining | | | 500,842 | | | | 2.4 | % |
| Oil, Gas & Consumable Fuels | | | 368,192 | | | | 1.7 | % |
| Paper & Forest Products | | | 114,313 | | | | 0.6 | % |
| Professional Services | | | 336,025 | | | | 1.6 | % |
| Real Estate Management & Development | | | 110,429 | | | | 0.5 | % |
| Road & Rail | | | 358,553 | | | | 1.7 | % |
| Semiconductors & Semiconductor Equipment | | | 1,413,411 | | | | 6.8 | % |
| Software | | | 1,213,370 | | | | 5.9 | % |
| Specialty Retail | | | 927,278 | | | | 4.6 | % |
| Textiles, Apparel & Luxury Goods | | | 465,757 | | | | 2.2 | % |
| Trading Companies & Distributors | | | 112,637 | | | | 0.5 | % |
| Water Utilities | | | 128,910 | | | | 0.7 | % |
| Other** | | | 73,116 | | | | 0.4 | % |
| Total | | $ | 20,702,134 | | | | 100.0 | % |
| ** | Includes any non-equity securities and net other assets (liabilities), which includes any receivable for capital shares issued and payable for capital shares redeemed. |
See accompanying notes to financial statements.
Financial Statements :: ProFund VP Mid-Cap Growth :: 159
Statement of Assets and Liabilities
December 31, 2021
| ASSETS: | | | | |
| Total Investment Securities, at cost | | $ | 13,960,104 | |
| Securities, at value | | | 20,629,018 | |
| Repurchase agreements, at value | | | 36,000 | |
| Total Investment Securities, at value | | | 20,665,018 | |
| Cash | | | 3,507 | |
| Dividends receivable | | | 9,220 | |
| Receivable for capital shares issued | | | 111,150 | |
| Prepaid expenses | | | 1,400 | |
| TOTAL ASSETS | | | 20,790,295 | |
| | | | | |
| LIABILITIES: | | | | |
| Payable for capital shares redeemed | | | 46,336 | |
| Payable for investments purchased | | | 1,242 | |
| Advisory fees payable | | | 13,250 | |
| Management services fees payable | | | 1,767 | |
| Administration fees payable | | | 1,189 | |
| Administrative services fees payable | | | 6,977 | |
| Distribution fees payable | | | 5,353 | |
| Transfer agency fees payable | | | 2,038 | |
| Fund accounting fees payable | | | 725 | |
| Compliance services fees payable | | | 89 | |
| Other accrued expenses | | | 9,195 | |
| TOTAL LIABILITIES | | | 88,161 | |
| NET ASSETS | | $ | 20,702,134 | |
| | | | | |
| NET ASSETS CONSIST OF: | | | | |
| Capital | | $ | 11,894,402 | |
| Total distributable earnings (loss) | | | 8,807,732 | |
| NET ASSETS | | $ | 20,702,134 | |
| Shares of Beneficial Interest Outstanding (unlimited number of shares authorized, no par value) | | | 407,845 | |
| Net Asset Value (offering and redemption price per share) | | $ | 50.76 | |
Statement of Operations
For the Year Ended December 31, 2021
| INVESTMENT INCOME: | | | | |
| Dividends | | $ | 135,127 | |
| Interest | | | 1 | |
| Net income from securities lending | | | 25 | |
| TOTAL INVESTMENT INCOME | | | 135,153 | |
| | | | | |
| EXPENSES: | | | | |
| Advisory fees | | | 152,712 | |
| Management services fees | | | 20,361 | |
| Administration fees | | | 15,224 | |
| Transfer agency fees | | | 12,374 | |
| Administrative services fees | | | 69,470 | |
| Distribution fees | | | 50,904 | |
| Custody fees | | | 3,507 | |
| Fund accounting fees | | | 9,105 | |
| Trustee fees | | | 349 | |
| Compliance services fees | | | 132 | |
| Other fees | | | 17,234 | |
| Total Gross Expenses before reductions | | | 351,372 | |
| Expenses reduced and reimbursed by the Advisor | | | (9,297 | ) |
| TOTAL NET EXPENSES | | | 342,075 | |
| NET INVESTMENT INCOME (LOSS) | | | (206,922 | ) |
| | | | | |
| REALIZED AND UNREALIZED GAINS (LOSSES) ON INVESTMENTS: | | | | |
| Net realized gains (losses) on investment securities | | | 3,588,752 | |
| Change in net unrealized appreciation/depreciation on investment securities | | | (558,524 | ) |
| NET REALIZED AND UNREALIZED GAINS (LOSSES) ON INVESTMENTS | | | 3,030,228 | |
| CHANGE IN NET ASSETS RESULTING FROM OPERATIONS | | $ | 2,823,306 | |
See accompanying notes to financial statements.
160 :: ProFund VP Mid-Cap Growth :: Financial Statements
Statements of Changes in Net Assets
| | | Year Ended
December 31, 2021 | | | Year Ended
December 31, 2020 | |
| FROM INVESTMENT ACTIVITIES: | | | | | | | | |
| | | | | | | | | |
| OPERATIONS: | | | | | | | | |
| Net investment income (loss) | | $ | (206,922 | ) | | $ | (115,451 | ) |
| Net realized gains (losses) on investments | | | 3,588,752 | | | | 1,311,631 | |
| Change in net unrealized appreciation/depreciation on investments | | | (558,524 | ) | | | 2,366,308 | |
| Change in net assets resulting from operations | | | 2,823,306 | | | | 3,562,488 | |
| | | | | | | | | |
| DISTRIBUTIONS TO SHAREHOLDERS: | | | | | | | | |
| Total distributions | | | (1,717,430 | ) | | | (1,823,049 | ) |
| Change in net assets resulting from distributions | | | (1,717,430 | ) | | | (1,823,049 | ) |
| | | | | | | | | |
| CAPITAL TRANSACTIONS: | | | | | | | | |
| Proceeds from shares issued | | | 16,047,007 | | | | 26,201,483 | |
| Distributions reinvested | | | 1,717,430 | | | | 1,823,049 | |
| Value of shares redeemed | | | (19,196,646 | ) | | | (29,527,637 | ) |
| Change in net assets resulting from capital transactions | | | (1,432,209 | ) | | | (1,503,105 | ) |
| Change in net assets | | | (326,333 | ) | | | 236,334 | |
| | | | | | | | | |
| NET ASSETS: | | | | | | | | |
| Beginning of period | | | 21,028,467 | | | | 20,792,133 | |
| End of period | | $ | 20,702,134 | | | $ | 21,028,467 | |
| | | | | | | | | |
| SHARE TRANSACTIONS: | | | | | | | | |
| Issued | | | 318,114 | | | | 651,878 | |
| Reinvested | | | 37,279 | | | | 44,014 | |
| Redeemed | | | (388,586 | ) | | | (736,942 | ) |
| Change in shares | | | (33,193 | ) | | | (41,050 | ) |
See accompanying notes to financial statements.
Financial Highlights :: ProFund VP Mid-Cap Growth :: 161
ProFunds Financial Highlights FOR THE PERIODS INDICATED
Selected data for a share of beneficial interest outstanding throughout the periods indicated.
| | | Year Ended
Dec. 31, 2021 | | | Year Ended
Dec. 31, 2020 | | | Year Ended
Dec. 31, 2019 | | | Year Ended
Dec. 31, 2018 | | | Year Ended
Dec. 31, 2017 | |
| Net Asset Value, Beginning of Period | | $ | 47.68 | | | $ | 43.13 | | | $ | 38.51 | | | $ | 47.64 | | | $ | 44.26 | |
| | | | | | | | | | | | | | | | | | | | | |
| Investment Activities: | | | | | | | | | | | | | | | | | | | | |
| Net investment income (loss)(a) | | | (0.51 | ) | | | (0.28 | ) | | | (0.16 | ) | | | (0.23 | ) | | | (0.23 | ) |
| Net realized and unrealized gains (losses) on investments | | | 8.14 | | | | 8.71 | | | | 9.17 | | | | (4.76 | ) | | | 8.08 | |
| Total income (loss) from investment activities | | | 7.63 | | | | 8.43 | | | | 9.01 | | | | (4.99 | ) | | | 7.85 | |
| | | | | | | | | | | | | | | | | | | | | |
| Distributions to Shareholders From: | | | | | | | | | | | | | | | | | | | | |
| Net realized gains on investments | | | (4.55 | ) | | | (3.88 | ) | | | (4.39 | ) | | | (4.14 | ) | | | (4.47 | ) |
| | | | | | | | | | | | | | | | | | | | | |
| Net Asset Value, End of Period | | $ | 50.76 | | | $ | 47.68 | | | $ | 43.13 | | | $ | 38.51 | | | $ | 47.64 | |
| | | | | | | | | | | | | | | | | | | | | |
| Total Return | | | 16.97 | % | | | 20.90 | % | | | 24.24 | % | | | (11.98 | )% | | | 18.31 | % |
| | | | | | | | | | | | | | | | | | | | | |
| Ratios to Average Net Assets: | | | | | | | | | | | | | | | | | | | | |
| Gross expenses | | | 1.73 | % | | | 1.78 | % | | | 1.75 | % | | | 1.70 | % | | | 1.69 | % |
| Net expenses | | | 1.68 | % | | | 1.68 | % | | | 1.68 | % | | | 1.68 | % | | | 1.68 | % |
| Net investment income (loss) | | | (1.02 | )% | | | (0.68 | )% | | | (0.38 | )% | | | (0.48 | )% | | | (0.49 | )% |
| | | | | | | | | | | | | | | | | | | | | |
| Supplemental Data: | | | | | | | | | | | | | | | | | | | | |
| Net assets, end of period (000's) | | $ | 20,702 | | | $ | 21,028 | | | $ | 20,792 | | | $ | 14,603 | | | $ | 22,590 | |
| Portfolio turnover rate(b) | | | 113 | % | | | 184 | % | | | 191 | % | | | 131 | % | | | 88 | % |
| (a) | Per share net investment income (loss) has been calculated using the average daily shares method. |
| (b) | Portfolio turnover rate is calculated without regard to instruments having a maturity of less than one year from acquisition or derivative instruments (including swap agreements and futures contracts). The portfolio turnover rate can be high and volatile due to the amount and timing of sales and purchases of fund shares during the period. |
See accompanying notes to financial statements.
162 :: ProFund VP Mid-Cap Value :: Management Discussion of Fund Performance
ProFund VP Mid-Cap Value (the "Fund") seeks investment results, before fees and expenses, that correspond to the performance of the S&P MidCap 400® Value Index (the "Index"). For the year ended December 31, 2021, the Fund had a total return of 28.53%. For the same period, the Index had a total return of 30.65%1 and a volatility of 19.41%. For the year, the Fund achieved an average daily statistical correlation of over 0.99 to the daily performance of the Index.2
The Fund takes positions in financial instruments that, in combination, should have similar return characteristics as the return of the Index. The Index is designed to provide a comprehensive measure of mid-cap U.S. equity "value" performance. It is an unmanaged, float-adjusted, market capitalization-weighted index comprising stocks representing approximately half the market capitalization of the S&P MidCap 400® that have been identified as being on the value end of the growth-value spectrum.
Value of a $10,000 Investment at Net Asset Value*
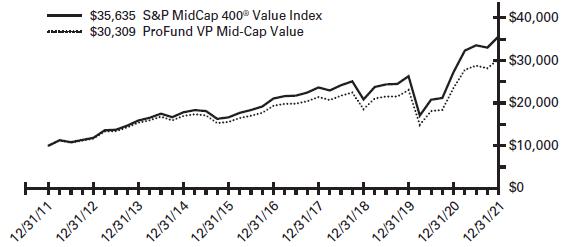
| * | The line graph represents the historical performance of a hypothetical investment of $10,000 in the ProFund VP Mid-Cap Value from December 31, 2011 to December 31, 2021, assuming the reinvestment of distributions. |
Average Annual Total Return as of 12/31/21
| Fund | | One Year | | | Five Year | | | Ten Year | |
| ProFund VP Mid-Cap Value | | | 28.53 | % | | | 9.37 | % | | | 11.73 | % |
| S&P MidCap 400® Value Index | | | 30.65 | % | | | 11.08 | % | | | 13.55 | % |
Expense Ratios**
| Fund | | Gross | | | Net | | | | | |
| ProFund VP Mid-Cap Value | | | 1.80 | % | | | 1.68 | % | | | | |
| ** | Reflects the expense ratio as reported in the Prospectus dated May 1, 2021. Contractual fee waivers are in effect through April 30, 2022. See Financial Highlights for effective expense ratios. |
Allocation of Portfolio Holdings & Index Composition
Market Exposure
| Investment Type | | % of Net Assets | |
| Equity Securities | | | 100 | % |
| Total Exposure | | | 100 | % |
"Market Exposure" includes the value of total investments (including the contract value of any derivatives) and excludes any instruments used for cash management.
Largest Equity Holdings
| Company | | % of Net Assets | |
| Medical Properties Trust, Inc. | | | 1.2 | % |
| AECOM | | | 0.9 | % |
| Lear Corp. | | | 0.9 | % |
| Reliance Steel & Aluminum Co. | | | 0.8 | % |
| Knight-Swift Transportation Holdings, Inc. | | | 0.8 | % |
S&P MidCap 400® Value Index – Composition
| | | % of Index | |
| Industrials | | | 19 | % |
| Financials | | | 16 | % |
| Consumer Discretionary | | | 14 | % |
| Real Estate | | | 12 | % |
| Information Technology | | | 11 | % |
| Health Care | | | 7 | % |
| Materials | | | 6 | % |
| Utilities | | | 6 | % |
| Consumer Staples | | | 6 | % |
| Energy | | | 2 | % |
| Communication Services | | | 1 | % |
Past performance does not guarantee future results. Return calculations assume the reinvestment of distributions and do not reflect taxes that a shareholder would pay on Fund distributions or on the redemption of Fund shares. The performance data quoted represents past performance and current returns may be lower or higher. The investment return and net asset value ("NAV") will fluctuate so that an investor's shares, when redeemed, may be worth more or less than the original cost. The performance above reflects any fee reductions during the applicable periods. If such fee reductions had not occurred, the quoted performance would be lower. Performance numbers are net of all Fund fees and expenses but do not include any insurance, sales, or administrative charges of variable annuity or life insurance contracts. If these charges were included, the returns would be lower. To obtain performance current to the most recent month-end, please call toll-free 888-776-3637.
| 1 | The graph and table reflect the theoretical reinvestment of dividends on securities in the Index. The impact of transaction costs and the deduction of fees and expenses associated with a mutual fund, such as investment management and accounting fees, are not reflected in the index calculations. The Fund's performance reflects the reinvestment of dividends as well as the impact of transaction costs and the deduction of fees and expenses. It is not possible to invest directly in an index. |
| 2 | 1.00 equals perfect correlation. This calculation is based on the daily total return of the Index and the performance of the daily total return of the NAV per share of the Fund. |
The above information is not covered by the Report of the Independent Registered Public Accounting Firm.
Financial Statements :: ProFund VP Mid-Cap Value :: 163
Schedule of Portfolio Investments :: December 31, 2021
Common Stocks (100.3%)
| | | Shares | | | Value | |
| Acadia Healthcare Co., Inc.* (Health Care Providers & Services) | | | 1,380 | | | $ | 83,766 | |
| ACI Worldwide, Inc.* (Software) | | | 957 | | | | 33,208 | |
| Adient PLC* (Auto Components) | | | 1,450 | | | | 69,426 | |
| AECOM* (Construction & Engineering) | | | 2,211 | | | | 171,022 | |
| AGCO Corp. (Machinery) | | | 942 | | | | 109,291 | |
| Alcoa Corp. (Metals & Mining) | | | 1,723 | | | | 102,656 | |
| Alleghany Corp.* (Insurance) | | | 211 | | | | 140,861 | |
| ALLETE, Inc. (Electric Utilities) | | | 806 | | | | 53,478 | |
| Alliance Data Systems Corp. (IT Services) | | | 763 | | | | 50,793 | |
| Amedisys, Inc.* (Health Care Providers & Services) | | | 500 | | | | 80,940 | |
| American Campus Communities, Inc. (Equity Real Estate Investment Trusts) | | | 961 | | | | 55,056 | |
| American Eagle Outfitters, Inc. (Specialty Retail) | | | 1,368 | | | | 34,638 | |
| American Financial Group, Inc. (Insurance) | | | 537 | | | | 73,741 | |
| Amkor Technology, Inc. (Semiconductors & Semiconductor Equipment) | | | 909 | | | | 22,534 | |
| Apartment Income REIT Corp. (Equity Real Estate Investment Trusts) | | | 1,276 | | | | 69,759 | |
| AptarGroup, Inc. (Containers & Packaging) | | | 546 | | | | 66,874 | |
| Arrow Electronics, Inc.* (Electronic Equipment, Instruments & Components) | | | 1,070 | | | | 143,670 | |
| Ashland Global Holdings, Inc. (Chemicals) | | | 493 | | | | 53,076 | |
| Associated Banc-Corp. (Banks) | | | 2,304 | | | | 52,047 | |
| AutoNation, Inc.* (Specialty Retail) | | | 325 | | | | 37,976 | |
| Avnet, Inc. (Electronic Equipment, Instruments & Components) | | | 1,523 | | | | 62,793 | |
| Bank of Hawaii Corp. (Banks) | | | 360 | | | | 30,154 | |
| Bank OZK (Banks) | | | 984 | | | | 45,786 | |
| Belden, Inc. (Electronic Equipment, Instruments & Components) | | | 689 | | | | 45,288 | |
| BJ's Wholesale Club Holdings, Inc.* (Food & Staples Retailing) | | | 2,095 | | | | 140,303 | |
| Black Hills Corp. (Multi-Utilities) | | | 981 | | | | 69,229 | |
| Blackbaud, Inc.* (Software) | | | 222 | | | | 17,534 | |
| Brighthouse Financial, Inc.* (Insurance) | | | 1,226 | | | | 63,507 | |
| Brixmor Property Group, Inc. (Equity Real Estate Investment Trusts) | | | 2,052 | | | | 52,141 | |
| Cable One, Inc. (Media) | | | 32 | | | | 56,431 | |
| Cabot Corp. (Chemicals) | | | 871 | | | | 48,950 | |
| CACI International, Inc.* — Class A (Professional Services) | | | 359 | | | | 96,646 | |
| Cadence Bank (Banks) | | | 3,006 | | | | 89,549 | |
| Callaway Golf Co.* (Leisure Products) | | | 1,799 | | | | 49,365 | |
| Capri Holdings, Ltd.* (Textiles, Apparel & Luxury Goods) | | | 902 | | | | 58,549 | |
| Carter's, Inc. (Textiles, Apparel & Luxury Goods) | | | 648 | | | | 65,591 | |
| Casey's General Stores, Inc. (Food & Staples Retailing) | | | 569 | | | | 112,293 | |
| Cathay General Bancorp (Banks) | | | 724 | | | | 31,125 | |
| CDK Global, Inc. (Software) | | | 962 | | | | 40,154 | |
| Cerence, Inc.* (Software) | | | 281 | | | | 21,536 | |
| ChampionX Corp.* (Energy Equipment & Services) | | | 1,644 | | | | 33,225 | |
| Chemed Corp. (Health Care Providers & Services) | | | 101 | | | | 53,433 | |
| Choice Hotels International, Inc. (Hotels, Restaurants & Leisure) | | | 161 | | | | 25,114 | |
| Ciena Corp.* (Communications Equipment) | | | 881 | | | | 67,810 | |
| Cirrus Logic, Inc.* (Semiconductors & Semiconductor Equipment) | | | 456 | | | | 41,961 | |
| CIT Group, Inc. (Banks) | | | 914 | | | | 46,925 | |
| Clean Harbors, Inc.* (Commercial Services & Supplies) | | | 315 | | | | 31,428 | |
| CMC Materials, Inc. (Semiconductors & Semiconductor Equipment) | | | 144 | | | | 27,603 | |
| CNO Financial Group, Inc. (Insurance) | | | 1,894 | | | | 45,153 | |
| CNX Resources Corp.* (Oil, Gas & Consumable Fuels) | | | 1,721 | | | | 23,664 | |
| Cognex Corp. (Electronic Equipment, Instruments & Components) | | | 1,005 | | | | 78,149 | |
| Colfax Corp.* (Machinery) | | | 1,220 | | | | 56,083 | |
| Columbia Sportswear Co. (Textiles, Apparel & Luxury Goods) | | | 249 | | | | 24,263 | |
| Commerce Bancshares, Inc. (Banks) | | | 852 | | | | 58,566 | |
| Commercial Metals Co. (Metals & Mining) | | | 1,851 | | | | 67,173 | |
| CommVault Systems, Inc.* (Software) | | | 244 | | | | 16,816 | |
| Compass Minerals International, Inc. (Metals & Mining) | | | 523 | | | | 26,715 | |
| Corporate Office Properties Trust (Equity Real Estate Investment Trusts) | | | 1,725 | | | | 48,248 | |
| Coty, Inc.* — Class A (Personal Products) | | | 5,152 | | | | 54,096 | |
| Cousins Properties, Inc. (Equity Real Estate Investment Trusts) | | | 2,282 | | | | 91,919 | |
| Cracker Barrel Old Country Store, Inc. (Hotels, Restaurants & Leisure) | | | 360 | | | | 46,310 | |
| Crane Co. (Machinery) | | | 390 | | | | 39,675 | |
| Cullen/Frost Bankers, Inc. (Banks) | | | 382 | | | | 48,159 | |
| Curtiss-Wright Corp. (Aerospace & Defense) | | | 602 | | | | 83,480 | |
| CyrusOne, Inc. (Equity Real Estate Investment Trusts) | | | 682 | | | | 61,189 | |
| Dana, Inc. (Auto Components) | | | 2,215 | | | | 50,546 | |
| Donaldson Co., Inc. (Machinery) | | | 930 | | | | 55,112 | |
| Douglas Emmett, Inc. (Equity Real Estate Investment Trusts) | | | 1,454 | | | | 48,709 | |
| DT Midstream, Inc. (Oil, Gas & Consumable Fuels) | | | 862 | | | | 41,359 | |
| Dycom Industries, Inc.* (Construction & Engineering) | | | 282 | | | | 26,440 | |
| EMCOR Group, Inc. (Construction & Engineering) | | | 819 | | | | 104,332 | |
| Encompass Health Corp. (Health Care Providers & Services) | | | 1,528 | | | | 99,717 | |
| Energizer Holdings, Inc. (Household Products) | | | 964 | | | | 38,656 | |
| EnerSys (Electrical Equipment) | | | 642 | | | | 50,757 | |
| Envestnet, Inc.* (Software) | | | 394 | | | | 31,260 | |
| Envista Holdings Corp.* (Health Care Equipment & Supplies) | | | 2,478 | | | | 111,659 | |
| EPR Properties (Equity Real Estate Investment Trusts) | | | 1,149 | | | | 54,566 | |
| EQT Corp.* (Oil, Gas & Consumable Fuels) | | | 4,641 | | | | 101,220 | |
| Equitrans Midstream Corp. (Oil, Gas & Consumable Fuels) | | | 6,242 | | | | 64,542 | |
See accompanying notes to financial statements.
164 :: ProFund VP Mid-Cap Value :: Financial Statements
Common Stocks, continued
| | | Shares | | | Value | |
| Essent Group, Ltd. (Thrifts & Mortgage Finance) | | | 1,696 | | | $ | 77,219 | |
| Essential Utilities, Inc. (Water Utilities) | | | 1,307 | | | | 70,173 | |
| Exelixis, Inc.* (Biotechnology) | | | 2,284 | | | | 41,752 | |
| F.N.B. Corp. (Banks) | | | 4,896 | | | | 59,388 | |
| Fair Isaac Corp.* (Software) | | | 176 | | | | 76,326 | |
| Federated Hermes, Inc. — Class B (Capital Markets) | | | 789 | | | | 29,651 | |
| First American Financial Corp. (Insurance) | | | 910 | | | | 71,189 | |
| First Horizon Corp. (Banks) | | | 8,299 | | | | 135,522 | |
| First Industrial Realty Trust, Inc. (Equity Real Estate Investment Trusts) | | | 619 | | | | 40,978 | |
| First Solar, Inc.* (Semiconductors & Semiconductor Equipment) | | | 622 | | | | 54,214 | |
| FirstCash Holdings, Inc. (Consumer Finance) | | | 620 | | | | 46,382 | |
| Flowers Foods, Inc. (Food Products) | | | 3,050 | | | | 83,784 | |
| Flowserve Corp. (Machinery) | | | 2,001 | | | | 61,231 | |
| Fluor Corp.* (Construction & Engineering) | | | 2,170 | | | | 53,751 | |
| Foot Locker, Inc. (Specialty Retail) | | | 1,386 | | | | 60,471 | |
| Fulton Financial Corp. (Banks) | | | 2,476 | | | | 42,092 | |
| GATX Corp. (Trading Companies & Distributors) | | | 545 | | | | 56,784 | |
| Genpact, Ltd. (IT Services) | | | 904 | | | | 47,984 | |
| Gentex Corp. (Auto Components) | | | 1,707 | | | | 59,489 | |
| Globus Medical, Inc.* — Class A (Health Care Equipment & Supplies) | | | 485 | | | | 35,017 | |
| Graco, Inc. (Machinery) | | | 1,043 | | | | 84,087 | |
| Graham Holdings Co. — Class B (Diversified Consumer Services) | | | 61 | | | | 38,420 | |
| Grand Canyon Education, Inc.* (Diversified Consumer Services) | | | 615 | | | | 52,712 | |
| Greif, Inc. — Class A (Containers & Packaging) | | | 407 | | | | 24,571 | |
| Grocery Outlet Holding Corp.* (Food & Staples Retailing) | | | 1,341 | | | | 37,923 | |
| H&R Block, Inc. (Diversified Consumer Services) | | | 1,458 | | | | 34,350 | |
| Haemonetics Corp.* (Health Care Equipment & Supplies) | | | 784 | | | | 41,583 | |
| Hancock Whitney Corp. (Banks) | | | 734 | | | | 36,715 | |
| Hanesbrands, Inc. (Textiles, Apparel & Luxury Goods) | | | 5,360 | | | | 89,618 | |
| Harley-Davidson, Inc. (Automobiles) | | | 2,362 | | | | 89,024 | |
| Hawaiian Electric Industries, Inc. (Electric Utilities) | | | 1,678 | | | | 69,637 | |
| Healthcare Realty Trust, Inc. (Equity Real Estate Investment Trusts) | | | 1,201 | | | | 38,000 | |
| HealthEquity, Inc.* (Health Care Providers & Services) | | | 422 | | | | 18,669 | |
| Hexcel Corp.* (Aerospace & Defense) | | | 1,288 | | | | 66,718 | |
| Highwoods Properties, Inc. (Equity Real Estate Investment Trusts) | | | 1,602 | | | | 71,433 | |
| HollyFrontier Corp. (Oil, Gas & Consumable Fuels) | | | 2,295 | | | | 75,230 | |
| Home BancShares, Inc. (Banks) | | | 1,460 | | | | 35,551 | |
| Hubbell, Inc. (Electrical Equipment) | | | 384 | | | | 79,976 | |
| Hudson Pacific Properties, Inc. (Equity Real Estate Investment Trusts) | | | 2,341 | | | | 57,846 | |
| IAA, Inc.* (Commercial Services & Supplies) | | | 952 | | | | 48,190 | |
| ICU Medical, Inc.* (Health Care Equipment & Supplies) | | | 163 | | | | 38,686 | |
| IDACORP, Inc. (Electric Utilities) | | | 774 | | | | 87,702 | |
| II-VI, Inc.* (Electronic Equipment, Instruments & Components) | | | 847 | | | | 57,876 | |
| Ingevity Corp.* (Chemicals) | | | 278 | | | | 19,933 | |
| Ingredion, Inc. (Food Products) | | | 1,021 | | | | 98,669 | |
| Integra LifeSciences Holdings Corp.* (Health Care Equipment & Supplies) | | | 547 | | | | 36,644 | |
| Interactive Brokers Group, Inc. (Capital Markets) | | | 510 | | | | 40,504 | |
| International Bancshares Corp. (Banks) | | | 818 | | | | 34,675 | |
| Iridium Communications, Inc.* (Diversified Telecommunication Services) | | | 953 | | | | 39,349 | |
| ITT, Inc. (Machinery) | | | 577 | | | | 58,964 | |
| Jabil, Inc. (Electronic Equipment, Instruments & Components) | | | 1,232 | | | | 86,671 | |
| Jack in the Box, Inc. (Hotels, Restaurants & Leisure) | | | 103 | | | | 9,010 | |
| Janus Henderson Group PLC (Capital Markets) | | | 1,415 | | | | 59,345 | |
| Jazz Pharmaceuticals PLC* (Pharmaceuticals) | | | 943 | | | | 120,138 | |
| JBG Smith Properties (Equity Real Estate Investment Trusts) | | | 1,754 | | | | 50,357 | |
| JetBlue Airways Corp.* (Airlines) | | | 4,883 | | | | 69,534 | |
| John Wiley & Sons, Inc. — Class A (Media) | | | 334 | | | | 19,128 | |
| Jones Lang LaSalle, Inc.* (Real Estate Management & Development) | | | 395 | | | | 106,389 | |
| KB Home (Household Durables) | | | 1,316 | | | | 58,865 | |
| KBR, Inc. (Professional Services) | | | 754 | | | | 35,905 | |
| Kemper Corp. (Insurance) | | | 919 | | | | 54,028 | |
| Kennametal, Inc. (Machinery) | | | 1,285 | | | | 46,144 | |
| Kilroy Realty Corp. (Equity Real Estate Investment Trusts) | | | 1,610 | | | | 107,001 | |
| Kirby Corp.* (Marine) | | | 922 | | | | 54,785 | |
| Kite Realty Group Trust (Equity Real Estate Investment Trusts) | | | 3,362 | | | | 73,224 | |
| Knight-Swift Transportation Holdings, Inc. (Road & Rail) | | | 2,548 | | | | 155,276 | |
| Kohl's Corp. (Multiline Retail) | | | 2,311 | | | | 114,140 | |
| Kyndryl Holdings, Inc.* (IT Services) | | | 2,752 | | | | 49,811 | |
| Lamar Advertising Co. — Class A (Equity Real Estate Investment Trusts) | | | 452 | | | | 54,828 | |
| Lancaster Colony Corp. (Food Products) | | | 158 | | | | 26,165 | |
| Landstar System, Inc. (Road & Rail) | | | 204 | | | | 36,520 | |
| Lear Corp. (Auto Components) | | | 916 | | | | 167,582 | |
| Leggett & Platt, Inc. (Household Durables) | | | 2,046 | | | | 84,213 | |
| Lennox International, Inc. (Building Products) | | | 217 | | | | 70,386 | |
| LHC Group, Inc.* (Health Care Providers & Services) | | | 485 | | | | 66,557 | |
| Lincoln Electric Holdings, Inc. (Machinery) | | | 380 | | | | 52,999 | |
| Lithia Motors, Inc. — Class A (Specialty Retail) | | | 465 | | | | 138,082 | |
| Littelfuse, Inc. (Electronic Equipment, Instruments & Components) | | | 143 | | | | 44,999 | |
| LivaNova PLC* (Health Care Equipment & Supplies) | | | 326 | | | | 28,502 | |
| Lumentum Holdings, Inc.* (Communications Equipment) | | | 609 | | | | 64,414 | |
| Macy's, Inc. (Multiline Retail) | | | 4,753 | | | | 124,433 | |
| ManpowerGroup, Inc. (Professional Services) | | | 832 | | | | 80,979 | |
| Marriott Vacations Worldwide Corp. (Hotels, Restaurants & Leisure) | | | 360 | | | | 60,833 | |
| MasTec, Inc.* (Construction & Engineering) | | | 430 | | | | 39,680 | |
| MDU Resources Group, Inc. (Multi-Utilities) | | | 3,121 | | | | 96,252 | |
See accompanying notes to financial statements.
Financial Statements :: ProFund VP Mid-Cap Value :: 165
Common Stocks, continued
| | | Shares | | | Value | |
| Medical Properties Trust, Inc. (Equity Real Estate Investment Trusts) | | | 9,154 | | | $ | 216,309 | |
| Mercury General Corp. (Insurance) | | | 407 | | | | 21,595 | |
| Mercury Systems, Inc.* (Aerospace & Defense) | | | 870 | | | | 47,902 | |
| MGIC Investment Corp. (Thrifts & Mortgage Finance) | | | 4,999 | | | | 72,086 | |
| MillerKnoll, Inc. (Commercial Services & Supplies) | | | 1,163 | | | | 45,578 | |
| Minerals Technologies, Inc. (Chemicals) | | | 511 | | | | 37,380 | |
| MKS Instruments, Inc. (Semiconductors & Semiconductor Equipment) | | | 383 | | | | 66,707 | |
| Molina Healthcare, Inc.* (Health Care Providers & Services) | | | 458 | | | | 145,680 | |
| MSA Safety, Inc. (Commercial Services & Supplies) | | | 275 | | | | 41,514 | |
| MSC Industrial Direct Co., Inc. (Trading Companies & Distributors) | | | 718 | | | | 60,355 | |
| Murphy USA, Inc. (Specialty Retail) | | | 361 | | | | 71,926 | |
| National Fuel Gas Co. (Gas Utilities) | | | 672 | | | | 42,968 | |
| National Instruments Corp. (Electronic Equipment, Instruments & Components) | | | 951 | | | | 41,530 | |
| National Retail Properties, Inc. (Equity Real Estate Investment Trusts) | | | 1,483 | | | | 71,288 | |
| NCR Corp.* (Technology Hardware, Storage & Peripherals) | | | 2,025 | | | | 81,405 | |
| Neogen Corp.* (Health Care Equipment & Supplies) | | | 694 | | | | 31,515 | |
| New Jersey Resources Corp. (Gas Utilities) | | | 1,480 | | | | 60,769 | |
| New York Community Bancorp, Inc. (Thrifts & Mortgage Finance) | | | 7,138 | | | | 87,154 | |
| NewMarket Corp. (Chemicals) | | | 105 | | | | 35,986 | |
| Nordson Corp. (Machinery) | | | 331 | | | | 84,494 | |
| Nordstrom, Inc.* (Multiline Retail) | | | 1,708 | | | | 38,635 | |
| NorthWestern Corp. (Multi-Utilities) | | | 807 | | | | 46,128 | |
| NOV, Inc. (Energy Equipment & Services) | | | 5,996 | | | | 81,246 | |
| Nu Skin Enterprises, Inc. — Class A (Personal Products) | | | 764 | | | | 38,773 | |
| NuVasive, Inc.* (Health Care Equipment & Supplies) | | | 794 | | | | 41,669 | |
| nVent Electric PLC (Electrical Equipment) | | | 1,060 | | | | 40,280 | |
| OGE Energy Corp. (Electric Utilities) | | | 1,936 | | | | 74,304 | |
| Old Republic International Corp. (Insurance) | | | 4,382 | | | | 107,710 | |
| Ollie's Bargain Outlet Holdings, Inc.* (Multiline Retail) | | | 930 | | | | 47,607 | |
| Omega Healthcare Investors, Inc. (Equity Real Estate Investment Trusts) | | | 3,669 | | | | 108,566 | |
| ONE Gas, Inc. (Gas Utilities) | | | 823 | | | | 63,857 | |
| Oshkosh Corp. (Machinery) | | | 1,054 | | | | 118,795 | |
| Owens Corning (Building Products) | | | 1,543 | | | | 139,642 | |
| Park Hotels & Resorts, Inc.* (Equity Real Estate Investment Trusts) | | | 3,631 | | | | 68,553 | |
| Patterson Cos., Inc. (Health Care Providers & Services) | | | 1,330 | | | | 39,036 | |
| Pebblebrook Hotel Trust (Equity Real Estate Investment Trusts) | | | 2,018 | | | | 45,143 | |
| Performance Food Group Co.* (Food & Staples Retailing) | | | 2,369 | | | | 108,713 | |
| Perrigo Co. PLC (Pharmaceuticals) | | | 2,053 | | | | 79,862 | |
| Physicians Realty Trust (Equity Real Estate Investment Trusts) | | | 3,382 | | | | 63,683 | |
| Pilgrim's Pride Corp.* (Food Products) | | | 749 | | | | 21,122 | |
| PNM Resources, Inc. (Electric Utilities) | | | 1,318 | | | | 60,114 | |
| Polaris, Inc. (Leisure Products) | | | 498 | | | | 54,735 | |
| Post Holdings, Inc.* (Food Products) | | | 899 | | | | 101,343 | |
| PotlatchDeltic Corp. (Equity Real Estate Investment Trusts) | | | 576 | | | | 34,687 | |
| Primerica, Inc. (Insurance) | | | 231 | | | | 35,405 | |
| PROG Holdings, Inc.* (Consumer Finance) | | | 871 | | | | 39,291 | |
| Progyny, Inc.* (Health Care Providers & Services) | | | 406 | | | | 20,442 | |
| Prosperity Bancshares, Inc. (Banks) | | | 1,415 | | | | 102,304 | |
| PS Business Parks, Inc. (Equity Real Estate Investment Trusts) | | | 113 | | | | 20,811 | |
| R1 RCM, Inc.* (Health Care Providers & Services) | | | 859 | | | | 21,896 | |
| Rayonier, Inc. (Equity Real Estate Investment Trusts) | | | 880 | | | | 35,517 | |
| Regal Rexnord Corp. (Electrical Equipment) | | | 603 | | | | 102,619 | |
| Reinsurance Group of America, Inc. (Insurance) | | | 1,038 | | | | 113,651 | |
| Reliance Steel & Aluminum Co. (Metals & Mining) | | | 961 | | | | 155,894 | |
| RenaissanceRe Holdings, Ltd. (Insurance) | | | 705 | | | | 119,378 | |
| RLI Corp. (Insurance) | | | 244 | | | | 27,352 | |
| Royal Gold, Inc. (Metals & Mining) | | | 402 | | | | 42,294 | |
| RPM International, Inc. (Chemicals) | | | 976 | | | | 98,575 | |
| Ryder System, Inc. (Road & Rail) | | | 824 | | | | 67,922 | |
| Sabra Health Care REIT, Inc. (Equity Real Estate Investment Trusts) | | | 3,512 | | | | 47,552 | |
| Sabre Corp.* (IT Services) | | | 2,584 | | | | 22,197 | |
| Sanderson Farms, Inc. (Food Products) | | | 172 | | | | 32,866 | |
| Science Applications International Corp. (Professional Services) | | | 883 | | | | 73,810 | |
| SEI Investments Co. (Capital Markets) | | | 667 | | | | 40,647 | |
| Selective Insurance Group, Inc. (Insurance) | | | 924 | | | | 75,713 | |
| Semtech Corp.* (Semiconductors & Semiconductor Equipment) | | | 336 | | | | 29,880 | |
| Sensient Technologies Corp. (Chemicals) | | | 278 | | | | 27,817 | |
| Silgan Holdings, Inc. (Containers & Packaging) | | | 1,288 | | | | 55,178 | |
| Six Flags Entertainment Corp.* (Hotels, Restaurants & Leisure) | | | 607 | | | | 25,846 | |
| Skechers U.S.A., Inc.* — Class A (Textiles, Apparel & Luxury Goods) | | | 1,097 | | | | 47,610 | |
| SL Green Realty Corp. (Equity Real Estate Investment Trusts) | | | 1,024 | | | | 73,421 | |
| Sonoco Products Co. (Containers & Packaging) | | | 1,509 | | | | 87,356 | |
| Southwest Gas Holdings, Inc. (Gas Utilities) | | | 928 | | | | 65,006 | |
| Spire, Inc. (Gas Utilities) | | | 793 | | | | 51,719 | |
| Spirit Realty Capital, Inc. (Equity Real Estate Investment Trusts) | | | 1,892 | | | | 91,175 | |
| Sprouts Farmers Market, Inc.* (Food & Staples Retailing) | | | 1,722 | | | | 51,109 | |
| Stericycle, Inc.* (Commercial Services & Supplies) | | | 1,410 | | | | 84,092 | |
| Sterling Bancorp (Banks) | | | 2,958 | | | | 76,287 | |
| STORE Capital Corp. (Equity Real Estate Investment Trusts) | | | 3,767 | | | | 129,585 | |
| Sunrun, Inc.* (Electrical Equipment) | | | 3,177 | | | | 108,970 | |
| SYNNEX Corp. (Electronic Equipment, Instruments & Components) | | | 634 | | | | 72,504 | |
| Synovus Financial Corp. (Banks) | | | 1,340 | | | | 64,146 | |
See accompanying notes to financial statements.
166 :: ProFund VP Mid-Cap Value :: Financial Statements
Common Stocks, continued
| | | Shares | | | Value | |
| Taylor Morrison Home Corp.* (Household Durables) | | | 1,886 | | | $ | 65,935 | |
| TEGNA, Inc. (Media) | | | 1,903 | | | | 35,320 | |
| Terex Corp. (Machinery) | | | 1,072 | | | | 47,114 | |
| Texas Capital Bancshares, Inc.* (Banks) | | | 776 | | | | 46,754 | |
| Texas Roadhouse, Inc. — Class A (Hotels, Restaurants & Leisure) | | | 427 | | | | 38,123 | |
| The Boston Beer Co., Inc.* — Class A (Beverages) | | | 58 | | | | 29,296 | |
| The Brink's Co. (Commercial Services & Supplies) | | | 753 | | | | 49,374 | |
| The Chemours Co. (Chemicals) | | | 2,502 | | | | 83,967 | |
| The Goodyear Tire & Rubber Co.* (Auto Components) | | | 4,316 | | | | 92,017 | |
| The Hain Celestial Group, Inc.* (Food Products) | | | 1,426 | | | | 60,762 | |
| The Hanover Insurance Group, Inc. (Insurance) | | | 546 | | | | 71,559 | |
| The Macerich Co. (Equity Real Estate Investment Trusts) | | | 3,270 | | | | 56,506 | |
| The Middleby Corp.* (Machinery) | | | 307 | | | | 60,405 | |
| The New York Times Co. — Class A (Media) | | | 1,078 | | | | 52,068 | |
| The Timken Co. (Machinery) | | | 1,060 | | | | 73,447 | |
| The Wendy's Co. (Hotels, Restaurants & Leisure) | | | 1,357 | | | | 32,364 | |
| The Western Union Co. (IT Services) | | | 6,172 | | | | 110,108 | |
| Thor Industries, Inc. (Automobiles) | | | 852 | | | | 88,412 | |
| Toll Brothers, Inc. (Household Durables) | | | 1,757 | | | | 127,189 | |
| Travel + Leisure Co. (Hotels, Restaurants & Leisure) | | | 1,326 | | | | 73,289 | |
| Tri Pointe Homes, Inc.* (Household Durables) | | | 1,707 | | | | 47,608 | |
| Trinity Industries, Inc. (Machinery) | | | 628 | | | | 18,966 | |
| TripAdvisor, Inc.* (Interactive Media & Services) | | | 882 | | | | 24,043 | |
| UGI Corp. (Gas Utilities) | | | 3,211 | | | | 147,416 | |
| Umpqua Holdings Corp. (Banks) | | | 2,095 | | | | 40,308 | |
| United Bankshares, Inc. (Banks) | | | 2,092 | | | | 75,898 | |
| United States Steel Corp. (Metals & Mining) | | | 4,148 | | | | 98,764 | |
| United Therapeutics Corp.* (Biotechnology) | | | 360 | | | | 77,788 | |
| Univar Solutions, Inc.* (Trading Companies & Distributors) | | | 2,625 | | | | 74,419 | |
| Unum Group (Insurance) | | | 3,139 | | | | 77,125 | |
| Urban Edge Properties (Equity Real Estate Investment Trusts) | | | 931 | | | | 17,689 | |
| Urban Outfitters, Inc.* (Specialty Retail) | | | 1,012 | | | | 29,712 | |
| Valley National Bancorp (Banks) | | | 6,247 | | | | 85,896 | |
| ViaSat, Inc.* (Communications Equipment) | | | 1,129 | | | | 50,286 | |
| Victoria's Secret & Co.* (Specialty Retail) | | | 566 | | | | 31,436 | |
| Vishay Intertechnology, Inc. (Electronic Equipment, Instruments & Components) | | | 2,036 | | | | 44,527 | |
| Visteon Corp.* (Auto Components) | | | 429 | | | | 47,679 | |
| Vontier Corp. (Electronic Equipment, Instruments & Components) | | | 2,595 | | | | 79,744 | |
| Voya Financial, Inc. (Diversified Financial Services) | | | 1,697 | | | | 112,528 | |
| Washington Federal, Inc. (Thrifts & Mortgage Finance) | | | 999 | | | | 33,347 | |
| Watsco, Inc. (Trading Companies & Distributors) | | | 172 | | | | 53,815 | |
| Webster Financial Corp. (Banks) | | | 821 | | | | 45,845 | |
| Werner Enterprises, Inc. (Road & Rail) | | | 935 | | | | 44,562 | |
| WEX, Inc.* (IT Services) | | | 392 | | | | 55,033 | |
| Wintrust Financial Corp. (Banks) | | | 437 | | | | 39,688 | |
| Wolfspeed, Inc.* (Semiconductors & Semiconductor Equipment) | | | 800 | | | | 89,417 | |
| Woodward, Inc. (Machinery) | | | 968 | | | | 105,957 | |
| World Wrestling Entertainment, Inc. — Class A (Entertainment) | | | 260 | | | | 12,828 | |
| Worthington Industries, Inc. (Metals & Mining) | | | 496 | | | | 27,111 | |
| Wyndham Hotels & Resorts, Inc. (Hotels, Restaurants & Leisure) | | | 500 | | | | 44,825 | |
| Xerox Holdings Corp. (Technology Hardware, Storage & Peripherals) | | | 2,110 | | | | 47,770 | |
| XPO Logistics, Inc.* (Air Freight & Logistics) | | | 1,513 | | | | 117,152 | |
| Yelp, Inc.* (Interactive Media & Services) | | | 538 | | | | 19,497 | |
TOTAL COMMON STOCKS
(Cost $14,105,293) | | | | | | | 18,730,464 | |
Repurchase Agreements(a) (0.1%)
| | | Principal
Amount | | | Value | |
| Repurchase Agreements with various counterparties, 0.00%, dated 12/31/21, due 1/3/22, total to be received $20,000 | | $ | 20,000 | | | $ | 20,000 | |
TOTAL REPURCHASE AGREEMENTS
(Cost $20,000) | | | | | | | 20,000 | |
TOTAL INVESTMENT SECURITIES
(Cost $14,125,293) — 100.4% | | | | | | | 18,750,464 | |
| Net other assets (liabilities) — (0.4)% | | | | | | | (69,039 | ) |
| NET ASSETS — 100.0% | | | | | | $ | 18,681,425 | |
| * | Non-income producing security. |
| (a) | The ProFund VP invests in Repurchase Agreements jointly with other funds in the Trust. See "Repurchase Agreements" under Note 2 in the Notes to Financial Statements to view the details of each individual agreement and counterparty as well as a description of the securities subject to repurchase. |
See accompanying notes to financial statements.
Financial Statements :: ProFund VP Mid-Cap Value :: 167
ProFund VP Mid-Cap Value invested in the following industries as of December 31, 2021:
| | | Value | | | % of
Net Assets | |
| Aerospace & Defense | | $ | 198,100 | | | | 1.1 | % |
| Air Freight & Logistics | | | 117,152 | | | | 0.6 | % |
| Airlines | | | 69,534 | | | | 0.4 | % |
| Auto Components | | | 486,739 | | | | 2.6 | % |
| Automobiles | | | 177,436 | | | | 0.9 | % |
| Banks | | | 1,323,380 | | | | 7.1 | % |
| Beverages | | | 29,296 | | | | 0.2 | % |
| Biotechnology | | | 119,540 | | | | 0.6 | % |
| Building Products | | | 210,028 | | | | 1.1 | % |
| Capital Markets | | | 170,147 | | | | 0.9 | % |
| Chemicals | | | 405,684 | | | | 2.2 | % |
| Commercial Services & Supplies | | | 300,176 | | | | 1.6 | % |
| Communications Equipment | | | 182,510 | | | | 1.0 | % |
| Construction & Engineering | | | 395,225 | | | | 2.1 | % |
| Consumer Finance | | | 85,673 | | | | 0.5 | % |
| Containers & Packaging | | | 233,979 | | | | 1.3 | % |
| Diversified Consumer Services | | | 125,482 | | | | 0.7 | % |
| Diversified Financial Services | | | 112,528 | | | | 0.6 | % |
| Diversified Telecommunication Services | | | 39,349 | | | | 0.2 | % |
| Electric Utilities | | | 345,235 | | | | 1.8 | % |
| Electrical Equipment | | | 382,602 | | | | 2.0 | % |
| Electronic Equipment, Instruments & Components | | | 757,751 | | | | 4.0 | % |
| Energy Equipment & Services | | | 114,471 | | | | 0.6 | % |
| Entertainment | | | 12,828 | | | | 0.1 | % |
| Equity Real Estate Investment Trusts | | | 2,055,739 | | | | 11.0 | % |
| Food & Staples Retailing | | | 450,341 | | | | 2.3 | % |
| Food Products | | | 424,711 | | | | 2.3 | % |
| Gas Utilities | | | 431,735 | | | | 2.4 | % |
| Health Care Equipment & Supplies | | | 365,275 | | | | 2.0 | % |
| Health Care Providers & Services | | | 630,136 | | | | 3.3 | % |
| Hotels, Restaurants & Leisure | | | 355,714 | | | | 1.9 | % |
| Household Durables | | | 383,810 | | | | 2.1 | % |
| Household Products | | | 38,656 | | | | 0.2 | % |
| Insurance | | | 1,097,967 | | | | 5.9 | % |
| Interactive Media & Services | | | 43,540 | | | | 0.2 | % |
| IT Services | | | 335,926 | | | | 1.8 | % |
| Leisure Products | | | 104,100 | | | | 0.6 | % |
| Machinery | | | 1,072,764 | | | | 5.8 | % |
| Marine | | | 54,785 | | | | 0.3 | % |
| Media | | | 162,947 | | | | 0.9 | % |
| Metals & Mining | | | 520,607 | | | | 2.7 | % |
| Multiline Retail | | | 324,815 | | | | 1.7 | % |
| Multi-Utilities | | | 211,609 | | | | 1.1 | % |
| Oil, Gas & Consumable Fuels | | | 306,015 | | | | 1.7 | % |
| Personal Products | | | 92,869 | | | | 0.5 | % |
| Pharmaceuticals | | | 200,000 | | | | 1.1 | % |
| Professional Services | | | 287,340 | | | | 1.5 | % |
| Real Estate Management & Development | | | 106,389 | | | | 0.6 | % |
| Road & Rail | | | 304,280 | | | | 1.6 | % |
| Semiconductors & Semiconductor Equipment | | | 332,316 | | | | 1.8 | % |
| Software | | | 236,834 | | | | 1.3 | % |
| Specialty Retail | | | 404,241 | | | | 2.2 | % |
| Technology Hardware, Storage & Peripherals | | | 129,175 | | | | 0.7 | % |
| Textiles, Apparel & Luxury Goods | | | 285,631 | | | | 1.5 | % |
| Thrifts & Mortgage Finance | | | 269,806 | | | | 1.4 | % |
| Trading Companies & Distributors | | | 245,373 | | | | 1.3 | % |
| Water Utilities | | | 70,173 | | | | 0.4 | % |
| Other** | | | (49,039 | ) | | | (0.3 | )% |
| Total | | $ | 18,681,425 | | | | 100.0 | % |
| ** | Includes any non-equity securities and net other assets (liabilities), which includes any receivable for capital shares issued and payable for capital shares redeemed. |
See accompanying notes to financial statements.
168 :: ProFund VP Mid-Cap Value :: Financial Statements
Statement of Assets and Liabilities
December 31, 2021
| ASSETS: | | | | |
| Total Investment Securities, at cost | | $ | 14,125,293 | |
| Securities, at value | | | 18,730,464 | |
| Repurchase agreements, at value | | | 20,000 | |
| Total Investment Securities, at value | | | 18,750,464 | |
| Cash | | | 2,917 | |
| Dividends receivable | | | 25,689 | |
| Prepaid expenses | | | 1,349 | |
| TOTAL ASSETS | | | 18,780,419 | |
| | | | | |
| LIABILITIES: | | | | |
| Payable for capital shares redeemed | | | 58,240 | |
| Payable for investments purchased | | | 310 | |
| Advisory fees payable | | | 12,748 | |
| Management services fees payable | | | 1,700 | |
| Administration fees payable | | | 1,100 | |
| Administrative services fees payable | | | 7,004 | |
| Distribution fees payable | | | 6,080 | |
| Transfer agency fees payable | | | 1,825 | |
| Fund accounting fees payable | | | 698 | |
| Compliance services fees payable | | | 80 | |
| Other accrued expenses | | | 9,209 | |
| TOTAL LIABILITIES | | | 98,994 | |
| NET ASSETS | | $ | 18,681,425 | |
| | | | | |
| NET ASSETS CONSIST OF: | | | | |
| Capital | | $ | 13,781,473 | |
| Total distributable earnings (loss) | | | 4,899,952 | |
| NET ASSETS | | $ | 18,681,425 | |
| Shares of Beneficial Interest Outstanding (unlimited number of shares authorized, no par value) | | | 370,188 | |
| Net Asset Value (offering and redemption price per share) | | $ | 50.46 | |
Statement of Operations
For the Year Ended December 31, 2021
| INVESTMENT INCOME: | | | | |
| Dividends | | $ | 338,413 | |
| Interest | | | 1 | |
| Net income from securities lending | | | 200 | |
| TOTAL INVESTMENT INCOME | | | 338,614 | |
| | | | | |
| EXPENSES: | | | | |
| Advisory fees | | | 143,884 | |
| Management services fees | | | 19,184 | |
| Administration fees | | | 14,120 | |
| Transfer agency fees | | | 11,691 | |
| Administrative services fees | | | 60,412 | |
| Distribution fees | | | 47,961 | |
| Custody fees | | | 3,411 | |
| Fund accounting fees | | | 8,944 | |
| Trustee fees | | | 297 | |
| Compliance services fees | | | 146 | |
| Other fees | | | 15,776 | |
| Total Gross Expenses before reductions | | | 325,826 | |
| Expenses reduced and reimbursed by the Advisor | | | (3,526 | ) |
| TOTAL NET EXPENSES | | | 322,300 | |
| NET INVESTMENT INCOME (LOSS) | | | 16,314 | |
| | | | | |
| REALIZED AND UNREALIZED GAINS (LOSSES) ON INVESTMENTS: | | | | |
| Net realized gains (losses) on investment securities | | | 2,612,443 | |
| Change in net unrealized appreciation/depreciation on investment securities | | | 1,298,752 | |
| NET REALIZED AND UNREALIZED GAINS (LOSSES) ON INVESTMENTS | | | 3,911,195 | |
| CHANGE IN NET ASSETS RESULTING FROM OPERATIONS | | $ | 3,927,509 | |
See accompanying notes to financial statements.
Financial Statements :: ProFund VP Mid-Cap Value :: 169
Statements of Changes in Net Assets
| | | Year Ended
December 31, 2021 | | | Year Ended
December 31, 2020 | |
| FROM INVESTMENT ACTIVITIES: | | | | | | | | |
| | | | | | | | | |
| OPERATIONS: | | | | | | | | |
| Net investment income (loss) | | $ | 16,314 | | | $ | 62,966 | |
| Net realized gains (losses) on investments | | | 2,612,443 | | | | (891,489 | ) |
| Change in net unrealized appreciation/depreciation on investments | | | 1,298,752 | | | | 571,872 | |
| Change in net assets resulting from operations | | | 3,927,509 | | | | (256,651 | ) |
| | | | | | | | | |
| DISTRIBUTIONS TO SHAREHOLDERS: | | | | | | | | |
| Total distributions | | | (54,454 | ) | | | (925,031 | ) |
| Change in net assets resulting from distributions | | | (54,454 | ) | | | (925,031 | ) |
| | | | | | | | | |
| CAPITAL TRANSACTIONS: | | | | | | | | |
| Proceeds from shares issued | | | 32,827,757 | | | | 14,126,058 | |
| Distributions reinvested | | | 54,454 | | | | 925,031 | |
| Value of shares redeemed | | | (30,546,186 | ) | | | (19,109,077 | ) |
| Change in net assets resulting from capital transactions | | | 2,336,025 | | | | (4,057,988 | ) |
| Change in net assets | | | 6,209,080 | | | | (5,239,670 | ) |
| | | | | | | | | |
| NET ASSETS: | | | | | | | | |
| Beginning of period | | | 12,472,345 | | | | 17,712,015 | |
| End of period | | $ | 18,681,425 | | | $ | 12,472,345 | |
| | | | | | | | | |
| SHARE TRANSACTIONS: | | | | | | | | |
| Issued | | | 697,548 | | | | 422,692 | |
| Reinvested | | | 1,143 | | | | 28,211 | |
| Redeemed | | | (645,363 | ) | | | (554,235 | ) |
| Change in shares | | | 53,328 | | | | (103,332 | ) |
See accompanying notes to financial statements.
170 :: ProFund VP Mid-Cap Value :: Financial Highlights
ProFunds Financial Highlights FOR THE PERIODS INDICATED
Selected data for a share of beneficial interest outstanding throughout the periods indicated.
| | | Year Ended
Dec. 31, 2021 | | | Year Ended
Dec. 31, 2020 | | | Year Ended
Dec. 31, 2019 | | | Year Ended
Dec. 31, 2018 | | | Year Ended
Dec. 31, 2017 | |
| Net Asset Value, Beginning of Period | | $ | 39.36 | | | $ | 42.15 | | | $ | 35.25 | | | $ | 46.61 | | | $ | 45.02 | |
| | | | | | | | | | | | | | | | | | | | | |
| Investment Activities: | | | | | | | | | | | | | | | | | | | | |
| Net investment income (loss)(a) | | | 0.04 | | | | 0.21 | | | | 0.10 | | | | 0.09 | | | | 0.03 | |
| Net realized and unrealized gains (losses) on investments | | | 11.18 | | | | 0.13 | (b) | | | 8.22 | | | | (5.33 | ) | | | 4.63 | |
| Total income (loss) from investment activities | | | 11.22 | | | | 0.34 | | | | 8.32 | | | | (5.24 | ) | | | 4.66 | |
| | | | | | | | | | | | | | | | | | | | | |
| Distributions to Shareholders From: | | | | | | | | | | | | | | | | | | | | |
| Net investment income | | | (0.12 | ) | | | (0.15 | ) | | | (0.08 | ) | | | (0.05 | ) | | | (0.15 | ) |
| Net realized gains on investments | | | — | | | | (2.98 | ) | | | (1.34 | ) | | | (6.07 | ) | | | (2.92 | ) |
| Total distributions | | | (0.12 | ) | | | (3.13 | ) | | | (1.42 | ) | | | (6.12 | ) | | | (3.07 | ) |
| | | | | | | | | | | | | | | | | | | | | |
| Net Asset Value, End of Period | | $ | 50.46 | | | $ | 39.36 | | | $ | 42.15 | | | $ | 35.25 | | | $ | 46.61 | |
| | | | | | | | | | | | | | | | | | | | | |
| Total Return | | | 28.53 | % | | | 2.30 | % | | | 24.08 | % | | | (13.29 | )% | | | 10.61 | % |
| | | | | | | | | | | | | | | | | | | | | |
| Ratios to Average Net Assets: | | | | | | | | | | | | | | | | | | | | |
| Gross expenses | | | 1.70 | % | | | 1.80 | % | | | 1.75 | % | | | 1.71 | % | | | 1.70 | % |
| Net expenses | | | 1.68 | % | | | 1.68 | % | | | 1.68 | % | | | 1.68 | % | | | 1.68 | % |
| Net investment income (loss) | | | 0.08 | % | | | 0.60 | % | | | 0.26 | % | | | 0.21 | % | | | 0.07 | % |
| | | | | | | | | | | | | | | | | | | | | |
| Supplemental Data: | | | | | | | | | | | | | | | | | | | | |
| Net assets, end of period (000's) | | $ | 18,681 | | | $ | 12,472 | | | $ | 17,712 | | | $ | 10,985 | | | $ | 16,464 | |
| Portfolio turnover rate(c) | | | 172 | % | | | 163 | % | | | 232 | % | | | 127 | % | | | 66 | % |
| (a) | Per share net investment income (loss) has been calculated using the average daily shares method. |
| (b) | The amount shown for a share outstanding throughout the period does not accord with the change in aggregate gains and losses in the portfolio of securities during the period because of the timing of sales and purchase of fund shares in relation to fluctuating market values during the period. |
| (c) | Portfolio turnover rate is calculated without regard to instruments having a maturity of less than one year from acquisition or derivative instruments (including swap agreements and futures contracts). The portfolio turnover rate can be high and volatile due to the amount and timing of sales and purchases of fund shares during the period. |
See accompanying notes to financial statements.
Management Discussion of Fund Performance :: ProFund VP Nasdaq-100 :: 171
ProFund VP Nasdaq-100 (the "Fund") seeks investment results, before fees and expenses, that correspond to the performance of the Nasdaq-100® Index (the "Index"). For the year ended December 31, 2021, the Fund had a total return of 24.80%. For the same period, the Index had a total return of 27.51%1 and a volatility of 18.57%. For the year, the Fund achieved an average daily statistical correlation of over 0.99 to the daily performance of the Index.2
The Fund takes positions in financial instruments that, in combination, should have similar return characteristics as the return of the Index. The Index, a modified market capitalization-weighted index, includes 100 of the largest non-financial domestic and international issues listed on Nasdaq.
During the year ended December 31, 2021, the Fund invested in swap agreements and futures contracts as a substitute for investing directly in stocks in order to gain exposure to the Index. These derivatives generally tracked the performance of their underlying benchmark and were negatively impacted by financing costs associated with their use. The Fund entered into swap agreements with counterparties that the Fund's advisor determined to be major, global financial institutions. If a counterparty becomes insolvent or otherwise fails to perform on its obligations, the value of investments in the Fund may decline. The Fund has sought to mitigate this risk by generally requiring counterparties to post collateral for the benefit of the Fund, marked to market daily, in an amount approximately equal to the amount the counterparty owed to the Fund, subject to certain minimum thresholds.
Value of a $10,000 Investment at Net Asset Value*

| * | The line graph represents the historical performance of a hypothetical investment of $10,000 in the ProFund VP Nasdaq-100 from December 31, 2011 to December 31, 2021, assuming the reinvestment of distributions. |
Average Annual Total Return as of 12/31/21
| Fund | | One Year | | | Five Year | | | Ten Year | |
| ProFund VP Nasdaq-100 | | | 24.80 | % | | | 26.01 | % | | | 20.70 | % |
| Nasdaq-100® Index | | | 27.51 | % | | | 28.63 | % | | | 23.15 | % |
Expense Ratios**
| Fund | | Gross | | | Net | | | | | |
| ProFund VP Nasdaq-100 | | | 1.73 | % | | | 1.68 | % | | | | |
| ** | Reflects the expense ratio as reported in the Prospectus dated May 1, 2021. Contractual fee waivers are in effect through April 30, 2022. See Financial Highlights for effective expense ratios. |
Allocation of Portfolio Holdings & Index Composition
Market Exposure
| Investment Type | | % of Net Assets | |
| Equity Securities | | | 66 | % |
| Futures Contracts | | | 1 | % |
| Swap Agreements | | | 32 | % |
| Total Exposure | | | 99 | % |
"Market Exposure" includes the value of total investments (including the contract value of any derivatives) and excludes any instruments used for cash management or collateral for securities loaned.
Largest Equity Holdings
| Company | | % of Net Assets | |
| Apple, Inc. | | | 7.7 | % |
| Microsoft Corp. | | | 6.7 | % |
| Alphabet, Inc. | | | 4.8 | % |
| Amazon.com, Inc. | | | 4.5 | % |
| Meta Platforms, Inc. | | | 3.2 | % |
Nasdaq-100® Index – Composition
| | | % of Index | |
| Information Technology | | | 51 | % |
| Communication Services | | | 18 | % |
| Consumer Discretionary | | | 16 | % |
| Health Care | | | 6 | % |
| Consumer Staples | | | 5 | % |
| Industrials | | | 3 | % |
| Utilities | | | 1 | % |
Past performance does not guarantee future results. Return calculations assume the reinvestment of distributions and do not reflect taxes that a shareholder would pay on Fund distributions or on the redemption of Fund shares. The performance data quoted represents past performance and current returns may be lower or higher. The investment return and net asset value ("NAV") will fluctuate so that an investor's shares, when redeemed, may be worth more or less than the original cost. The performance above reflects any fee reductions during the applicable periods. If such fee reductions had not occurred, the quoted performance would be lower. Performance numbers are net of all Fund fees and expenses but do not include any insurance, sales, or administrative charges of variable annuity or life insurance contracts. If these charges were included, the returns would be lower. To obtain performance current to the most recent month-end, please call toll-free 888-776-3637.
| 1 | The graph and table reflect the theoretical reinvestment of dividends on securities in the Index. The impact of transaction costs and the deduction of fees and expenses associated with a mutual fund, such as investment management and accounting fees, are not reflected in the index calculations. The Fund's performance reflects the reinvestment of dividends as well as the impact of transaction costs and the deduction of fees and expenses. It is not possible to invest directly in an index. |
| 2 | 1.00 equals perfect correlation. This calculation is based on the daily total return of the Index and the performance of the daily total return of the NAV per share of the Fund. |
The above information is not covered by the Report of the Independent Registered Public Accounting Firm.
172 :: ProFund VP Nasdaq-100 :: Financial Statements
Schedule of Portfolio Investments :: December 31, 2021
Common Stocks (66.3%)
| | | Shares | | | Value | |
| Activision Blizzard, Inc. (Entertainment) | | | 6,086 | | | $ | 404,902 | |
| Adobe, Inc.* (Software) | | | 3,718 | | | | 2,108,330 | |
| Advanced Micro Devices, Inc.* (Semiconductors & Semiconductor Equipment) | | | 9,436 | | | | 1,357,840 | |
| Airbnb, Inc.* — Class A (Hotels, Restaurants & Leisure) | | | 2,710 | | | | 451,188 | |
| Align Technology, Inc.* (Health Care Equipment & Supplies) | | | 616 | | | | 404,823 | |
| Alphabet, Inc.* — Class A (Interactive Media & Services) | | | 1,417 | | | | 4,105,106 | |
| Alphabet, Inc.* — Class C (Interactive Media & Services) | | | 1,497 | | | | 4,331,704 | |
| Amazon.com, Inc.* (Internet & Direct Marketing Retail) | | | 2,389 | | | | 7,965,738 | |
| American Electric Power Co., Inc. (Electric Utilities) | | | 3,935 | | | | 350,097 | |
| Amgen, Inc. (Biotechnology) | | | 4,404 | | | | 990,768 | |
| Analog Devices, Inc. (Semiconductors & Semiconductor Equipment) | | | 4,198 | | | | 737,882 | |
| ANSYS, Inc.* (Software) | | | 682 | | | | 273,564 | |
| Apple, Inc. (Technology Hardware, Storage & Peripherals) | | | 77,268 | | | | 13,720,479 | |
| Applied Materials, Inc. (Semiconductors & Semiconductor Equipment) | | | 7,056 | | | | 1,110,332 | |
| ASML Holding N.V.NYS (Semiconductors & Semiconductor Equipment) | | | 633 | | | | 503,957 | |
| Atlassian Corp. PLC* — Class A (Software) | | | 1,097 | | | | 418,275 | |
| Autodesk, Inc.* (Software) | | | 1,718 | | | | 483,084 | |
| Automatic Data Processing, Inc. (IT Services) | | | 3,293 | | | | 811,988 | |
| Baidu, Inc.*ADR (Interactive Media & Services) | | | 1,897 | | | | 282,255 | |
| Biogen, Inc.* (Biotechnology) | | | 1,148 | | | | 275,428 | |
| Booking Holdings, Inc.* (Hotels, Restaurants & Leisure) | | | 321 | | | | 770,153 | |
| Broadcom, Inc. (Semiconductors & Semiconductor Equipment) | | | 3,216 | | | | 2,139,959 | |
| Cadence Design Systems, Inc.* (Software) | | | 2,166 | | | | 403,634 | |
| Charter Communications, Inc.* — Class A (Media) | | | 1,401 | | | | 913,410 | |
| Cintas Corp. (Commercial Services & Supplies) | | | 808 | | | | 358,081 | |
| Cisco Systems, Inc. (Communications Equipment) | | | 32,957 | | | | 2,088,485 | |
| Cognizant Technology Solutions Corp. — Class A (IT Services) | | | 4,104 | | | | 364,107 | |
| Comcast Corp. — Class A (Media) | | | 35,628 | | | | 1,793,157 | |
| Copart, Inc.* (Commercial Services & Supplies) | | | 1,853 | | | | 280,952 | |
| Costco Wholesale Corp. (Food & Staples Retailing) | | | 3,452 | | | | 1,959,700 | |
| Crowdstrike Holdings, Inc.* — Class A (Software) | | | 1,608 | | | | 329,238 | |
| CSX Corp. (Road & Rail) | | | 17,332 | | | | 651,683 | |
| Datadog, Inc.* — Class A (Software) | | | 2,010 | | | | 358,001 | |
| DexCom, Inc.* (Health Care Equipment & Supplies) | | | 757 | | | | 406,471 | |
| DocuSign, Inc.* (Software) | | | 1,537 | | | | 234,100 | |
| Dollar Tree, Inc.* (Multiline Retail) | | | 1,758 | | | | 247,034 | |
| eBay, Inc. (Internet & Direct Marketing Retail) | | | 4,892 | | | | 325,318 | |
| Electronic Arts, Inc. (Entertainment) | | | 2,210 | | | | 291,499 | |
| Exelon Corp. (Electric Utilities) | | | 7,645 | | | | 441,575 | |
| Fastenal Co. (Trading Companies & Distributors) | | | 4,494 | | | | 287,886 | |
| Fiserv, Inc.* (IT Services) | | | 5,158 | | | | 535,349 | |
| Fortinet, Inc.* (Software) | | | 1,278 | | | | 459,313 | |
| Gilead Sciences, Inc. (Biotechnology) | | | 9,802 | | | | 711,723 | |
| Honeywell International, Inc. (Industrial Conglomerates) | | | 5,379 | | | | 1,121,576 | |
| IDEXX Laboratories, Inc.* (Health Care Equipment & Supplies) | | | 663 | | | | 436,559 | |
| Illumina, Inc.* (Life Sciences Tools & Services) | | | 1,221 | | | | 464,517 | |
| Intel Corp. (Semiconductors & Semiconductor Equipment) | | | 31,780 | | | | 1,636,670 | |
| Intuit, Inc. (Software) | | | 2,213 | | | | 1,423,446 | |
| Intuitive Surgical, Inc.* (Health Care Equipment & Supplies) | | | 2,793 | | | | 1,003,525 | |
| JD.com, Inc.*ADR (Internet & Direct Marketing Retail) | | | 5,795 | | | | 406,056 | |
| Keurig Dr Pepper, Inc. (Beverages) | | | 11,080 | | | | 408,409 | |
| KLA Corp. (Semiconductors & Semiconductor Equipment) | | | 1,185 | | | | 509,680 | |
| Lam Research Corp. (Semiconductors & Semiconductor Equipment) | | | 1,100 | | | | 791,065 | |
| Lucid Group, Inc.*(a) (Automobiles) | | | 12,865 | | | | 489,513 | |
| Lululemon Athletica, Inc.* (Textiles, Apparel & Luxury Goods) | | | 974 | | | | 381,272 | |
| Marriott International, Inc.* — Class A (Hotels, Restaurants & Leisure) | | | 2,545 | | | | 420,536 | |
| Marvell Technology, Inc. (Semiconductors & Semiconductor Equipment) | | | 6,436 | | | | 563,086 | |
| Match Group, Inc.* (Interactive Media & Services) | | | 2,212 | | | | 292,537 | |
| Mercadolibre, Inc.* (Internet & Direct Marketing Retail) | | | 394 | | | | 531,270 | |
| Meta Platforms, Inc.* — Class A (Interactive Media & Services) | | | 16,691 | | | | 5,614,018 | |
| Microchip Technology, Inc. (Semiconductors & Semiconductor Equipment) | | | 4,336 | | | | 377,492 | |
| Micron Technology, Inc. (Semiconductors & Semiconductor Equipment) | | | 8,740 | | | | 814,131 | |
| Microsoft Corp. (Software) | | | 35,362 | | | | 11,892,949 | |
| Moderna, Inc.* (Biotechnology) | | | 3,168 | | | | 804,609 | |
| Mondelez International, Inc. — Class A (Food Products) | | | 10,900 | | | | 722,779 | |
| Monster Beverage Corp.* (Beverages) | | | 4,134 | | | | 397,029 | |
| NetEase, Inc.ADR (Entertainment) | | | 2,214 | | | | 225,341 | |
| Netflix, Inc.* (Entertainment) | | | 3,461 | | | | 2,085,044 | |
| NVIDIA Corp. (Semiconductors & Semiconductor Equipment) | | | 16,573 | | | | 4,874,285 | |
| NXP Semiconductors N.V. (Semiconductors & Semiconductor Equipment) | | | 2,078 | | | | 473,327 | |
| Okta, Inc.* (IT Services) | | | 1,153 | | | | 258,468 | |
| O'Reilly Automotive, Inc.* (Specialty Retail) | | | 527 | | | | 372,183 | |
| PACCAR, Inc. (Machinery) | | | 2,713 | | | | 239,449 | |
| Palo Alto Networks, Inc.* (Software) | | | 771 | | | | 429,262 | |
| Paychex, Inc. (IT Services) | | | 2,818 | | | | 384,657 | |
| PayPal Holdings, Inc.* (IT Services) | | | 9,179 | | | | 1,730,975 | |
See accompanying notes to financial statements.
Financial Statements :: ProFund VP Nasdaq-100 :: 173
Common Stocks, continued
| | | Shares | | | Value | |
| Peloton Interactive, Inc.* — Class A (Leisure Products) | | | 2,353 | | | $ | 84,143 | |
| PepsiCo, Inc. (Beverages) | | | 10,802 | | | | 1,876,416 | |
| Pinduoduo, Inc.*ADR (Internet & Direct Marketing Retail) | | | 3,247 | | | | 189,300 | |
| Qualcomm, Inc. (Semiconductors & Semiconductor Equipment) | | | 8,752 | | | | 1,600,478 | |
| Regeneron Pharmaceuticals, Inc.* (Biotechnology) | | | 826 | | | | 521,636 | |
| Ross Stores, Inc. (Specialty Retail) | | | 2,777 | | | | 317,356 | |
| Seagen, Inc.* (Biotechnology) | | | 1,429 | | | | 220,923 | |
| Sirius XM Holdings, Inc.(a) (Media) | | | 31,252 | | | | 198,450 | |
| Skyworks Solutions, Inc. (Semiconductors & Semiconductor Equipment) | | | 1,292 | | | | 200,441 | |
| Splunk, Inc.* (Software) | | | 1,262 | | | | 146,039 | |
| Starbucks Corp. (Hotels, Restaurants & Leisure) | | | 9,168 | | | | 1,072,380 | |
| Synopsys, Inc.* (Software) | | | 1,192 | | | | 439,252 | |
| Tesla, Inc.* (Automobiles) | | | 4,730 | | | | 4,998,570 | |
| Texas Instruments, Inc. (Semiconductors & Semiconductor Equipment) | | | 7,217 | | | | 1,360,188 | |
| The Kraft Heinz Co. (Food Products) | | | 9,563 | | | | 343,312 | |
| T-Mobile US, Inc.* (Wireless Telecommunication Services) | | | 9,760 | | | | 1,131,965 | |
| VeriSign, Inc.* (IT Services) | | | 868 | | | | 220,316 | |
| Verisk Analytics, Inc. (Professional Services) | | | 1,259 | | | | 287,971 | |
| Vertex Pharmaceuticals, Inc.* (Biotechnology) | | | 1,987 | | | | 436,345 | |
| Walgreens Boots Alliance, Inc. (Food & Staples Retailing) | | | 6,763 | | | | 352,758 | |
| Workday, Inc.* — Class A (Software) | | | 1,508 | | | | 411,955 | |
| Xcel Energy, Inc. (Electric Utilities) | | | 4,209 | | | | 284,949 | |
| Xilinx, Inc. (Semiconductors & Semiconductor Equipment) | | | 1,937 | | | | 410,702 | |
| Zoom Video Communications, Inc.* — Class A (Software) | | | 1,893 | | | | 348,142 | |
| Zscaler, Inc.* (Software) | | | 1,094 | | | | 351,535 | |
TOTAL COMMON STOCKS
(Cost $26,627,568) | | | | | | | 117,819,805 | |
Repurchase Agreements(b)(c) (32.7%)
| | | Principal
Amount | | | Value | |
| Repurchase Agreements with various counterparties, 0.00%, dated 12/31/21, due 1/3/22, total to be received $57,993,000 | | $ | 57,993,000 | | | $ | 57,993,000 | |
TOTAL REPURCHASE AGREEMENTS
(Cost $57,993,000) | | | | | | | 57,993,000 | |
Collateral for Securities Loaned(d) (0.4%)
| | | Shares | | | Value | |
| BlackRock Liquidity Funds FedFund Portfolio — Institutional Shares, 0.03%(e) | | | 656,874 | | | $ | 656,874 | |
TOTAL COLLATERAL FOR SECURITIES LOANED
(Cost $656,874) | | | | | | | 656,874 | |
TOTAL INVESTMENT SECURITIES
(Cost $85,277,442) — 99.4% | | | | | | | 176,469,679 | |
| Net other assets (liabilities) — 0.6% | | | | | | | 1,111,748 | |
| NET ASSETS — 100.0% | | | | | | $ | 177,581,427 | |
| * | Non-income producing security. |
| (a) | All or part of this security was on loan as of December 31, 2021. The total value of securities on loan as of December 31, 2021 was $618,921. |
| (b) | A portion of these securities were held in a segregated account for the benefit of swap counterparties in the event of default. At December 31, 2021, the aggregate amount held in a segregated account was $8,100,000. |
| (c) | The ProFund VP invests in Repurchase Agreements jointly with other funds in the Trust. See "Repurchase Agreements" under Note 2 in the Notes to Financial Statements to view the details of each individual agreement and counterparty as well as a description of the securities subject to repurchase. |
| (d) | Securities were purchased with cash collateral held from securities on loan at December 31, 2021. |
| (e) | Rate periodically changes. Rate disclosed is the daily yield on December 31, 2021. |
| ADR | American Depositary Receipt |
Futures Contracts Purchased
| | | Number of
Contracts | | | Expiration
Date | | | Notional
Amount | | | Value and
Unrealized
Appreciation/
(Depreciation) | |
| E-Mini Nasdaq 100 Futures Contracts | | 8 | | | 3/21/22 | | | $ | 2,611,320 | | | $ | (1,647 | ) |
Total Return Swap Agreements — Long
| Underlying Instrument | | Counterparty | | Termination
Date(1) | | Rate Paid
(Received)(2) | | | Notional
Amount | | | Value and
Unrealized
Appreciation/
(Depreciation) | |
| Nasdaq-100 Index | | Goldman Sachs International | | 1/27/22 | | | 0.68 | % | | $ | 17,674,647 | | | $ | (229,652 | ) |
| Nasdaq-100 Index | | UBS AG | | 1/27/22 | | | 0.88 | % | | | 39,445,633 | | | | (557,157 | ) |
| | | | | | | | | | | $ | 57,120,280 | | | $ | (786,809 | ) |
| (1) | Agreements may be terminated at will by either party without penalty. Payment is due at termination/maturity. |
| (2) | Reflects the floating financing rate, as of December 31, 2021, on the notional amount of the swap agreement paid to the counterparty or received from the counterparty, excluding any commissions. This amount is included as part of the unrealized appreciation/(depreciation). |
See accompanying notes to financial statements.
174 :: ProFund VP Nasdaq-100 :: Financial Statements
ProFund VP Nasdaq-100 invested in the following industries as of December 31, 2021:
| | | Value | | | % of
Net Assets | |
| Automobiles | | $ | 5,488,083 | | | | 3.1 | % |
| Beverages | | | 2,681,854 | | | | 1.5 | % |
| Biotechnology | | | 3,961,432 | | | | 2.2 | % |
| Commercial Services & Supplies | | | 639,033 | | | | 0.4 | % |
| Communications Equipment | | | 2,088,485 | | | | 1.2 | % |
| Electric Utilities | | | 1,076,621 | | | | 0.6 | % |
| Entertainment | | | 3,006,786 | | | | 1.7 | % |
| Food & Staples Retailing | | | 2,312,458 | | | | 1.3 | % |
| Food Products | | | 1,066,091 | | | | 0.6 | % |
| Health Care Equipment & Supplies | | | 2,251,378 | | | | 1.3 | % |
| Hotels, Restaurants & Leisure | | | 2,714,257 | | | | 1.5 | % |
| Industrial Conglomerates | | | 1,121,576 | | | | 0.5 | % |
| Interactive Media & Services | | | 14,625,620 | | | | 8.3 | % |
| Internet & Direct Marketing Retail | | | 9,417,682 | | | | 5.4 | % |
| IT Services | | | 4,305,860 | | | | 2.4 | % |
| Leisure Products | | | 84,143 | | | | NM | |
| Life Sciences Tools & Services | | | 464,517 | | | | 0.3 | % |
| Machinery | | | 239,449 | | | | 0.1 | % |
| Media | | | 2,905,017 | | | | 1.6 | % |
| Multiline Retail | | | 247,034 | | | | 0.1 | % |
| Professional Services | | | 287,971 | | | | 0.2 | % |
| Road & Rail | | | 651,683 | | | | 0.4 | % |
| Semiconductors & Semiconductor Equipment | | | 19,461,515 | | | | 11.0 | % |
| Software | | | 20,510,119 | | | | 11.5 | % |
| Specialty Retail | | | 689,539 | | | | 0.4 | % |
| Technology Hardware, Storage & Peripherals | | | 13,720,479 | | | | 7.7 | % |
| Textiles, Apparel & Luxury Goods | | | 381,272 | | | | 0.2 | % |
| Trading Companies & Distributors | | | 287,886 | | | | 0.2 | % |
| Wireless Telecommunication Services | | | 1,131,965 | | | | 0.6 | % |
| Other** | | | 59,761,622 | | | | 33.7 | % |
| Total | | $ | 177,581,427 | | | | 100.0 | % |
| ** | Includes any non-equity securities and net other assets (liabilities), which includes any receivable for capital shares issued and payable for capital shares redeemed. |
| NM | Not meaningful, amount is less than 0.05%. |
See accompanying notes to financial statements.
Financial Statements :: ProFund VP Nasdaq-100 :: 175
Statement of Assets and Liabilities
December 31, 2021
| ASSETS: | | | | |
| Total Investment Securities, at cost | | $ | 85,277,442 | |
| Securities, at value(a) | | | 118,476,679 | |
| Repurchase agreements, at value | | | 57,993,000 | |
| Total Investment Securities, at value | | | 176,469,679 | |
| Cash | | | 778 | |
| Segregated cash balances for futures contracts with brokers | | | 149,600 | |
| Dividends receivable | | | 28,518 | |
| Receivable for capital shares issued | | | 7,596,042 | |
| Prepaid expenses | | | 774 | |
| TOTAL ASSETS | | | 184,245,391 | |
| | | | | |
| LIABILITIES: | | | | |
| Payable for collateral for securities loaned | | | 656,874 | |
| Payable for capital shares redeemed | | | 4,748,587 | |
| Unrealized depreciation on swap agreements | | | 786,809 | |
| Variation margin on futures contracts | | | 17,520 | |
| Advisory fees payable | | | 139,963 | |
| Management services fees payable | | | 18,662 | |
| Administration fees payable | | | 10,086 | |
| Administrative services fees payable | | | 85,482 | |
| Distribution fees payable | | | 92,313 | |
| Transfer agency fees payable | | | 16,463 | |
| Fund accounting fees payable | | | 5,596 | |
| Compliance services fees payable | | | 740 | |
| Other accrued expenses | | | 84,869 | |
| TOTAL LIABILITIES | | | 6,663,964 | |
| NET ASSETS | | $ | 177,581,427 | |
| | | | | |
| NET ASSETS CONSIST OF: | | | | |
| Capital | | $ | 68,897,757 | |
| Total distributable earnings (loss) | | | 108,683,670 | |
| NET ASSETS | | $ | 177,581,427 | |
| Shares of Beneficial Interest Outstanding (unlimited number of shares authorized, no par value) | | | 2,404,050 | |
| Net Asset Value (offering and redemption price per share) | | $ | 73.87 | |
| | | | |
| (a) Includes securities on loan valued at: | | $ | 618,921 | |
Statement of Operations
For the Year Ended December 31, 2021
| INVESTMENT INCOME: | | | | |
| Dividends | | $ | 807,701 | |
| Interest | | | 799 | |
| Foreign tax withholding | | | (724 | ) |
| Net income from securities lending | | | 603 | |
| TOTAL INVESTMENT INCOME | | | 808,379 | |
| | | | | |
| EXPENSES: | | | | |
| Advisory fees | | | 1,153,034 | |
| Management services fees | | | 153,737 | |
| Administration fees | | | 113,728 | |
| Transfer agency fees | | | 92,883 | |
| Administrative services fees | | | 380,975 | |
| Distribution fees | | | 384,345 | |
| Custody fees | | | 23,698 | |
| Fund accounting fees | | | 62,496 | |
| Trustee fees | | | 2,559 | |
| Compliance services fees | | | 985 | |
| Other fees | | | 181,387 | |
| Recoupment of prior expenses reduced by the Advisor | | | 37,500 | |
| Total Gross Expenses before reductions | | | 2,587,327 | |
| Expenses reduced and reimbursed by the Advisor | | | (4,531 | ) |
| TOTAL NET EXPENSES | | | 2,582,796 | |
| NET INVESTMENT INCOME (LOSS) | | | (1,774,417 | ) |
| | | | | |
| REALIZED AND UNREALIZED GAINS (LOSSES) ON INVESTMENTS: | | | | |
| Net realized gains (losses) on investment securities | | | 11,670,188 | |
| Net realized gains (losses) on futures contracts | | | 1,076,174 | |
| Net realized gains (losses) on swap agreements | | | 9,073,697 | |
| Change in net unrealized appreciation/depreciation on investment securities | | | 16,231,994 | |
| Change in net unrealized appreciation/depreciation on futures contracts | | | (209,496 | ) |
| Change in net unrealized appreciation/depreciation on swap agreements | | | (959,353 | ) |
| NET REALIZED AND UNREALIZED GAINS (LOSSES) ON INVESTMENTS | | | 36,883,204 | |
| CHANGE IN NET ASSETS RESULTING FROM OPERATIONS | | $ | 35,108,787 | |
See accompanying notes to financial statements.
176 :: ProFund VP Nasdaq-100 :: Financial Statements
Statements of Changes in Net Assets
| | | Year Ended
December 31, 2021 | | | Year Ended
December 31, 2020 | |
| FROM INVESTMENT ACTIVITIES: | | | | | | | | |
| | | | | | | | | |
| OPERATIONS: | | | | | | | | |
| Net investment income (loss) | | $ | (1,774,417 | ) | | $ | (1,216,715 | ) |
| Net realized gains (losses) on investments | | | 21,820,059 | | | | 20,397,769 | |
| Change in net unrealized appreciation/depreciation on investments | | | 15,063,145 | | | | 27,656,711 | |
| Change in net assets resulting from operations | | | 35,108,787 | | | | 46,837,765 | |
| | | | | | | | | |
| DISTRIBUTIONS TO SHAREHOLDERS: | | | | | | | | |
| Total distributions | | | (18,959,830 | ) | | | (9,496,625 | ) |
| Change in net assets resulting from distributions | | | (18,959,830 | ) | | | (9,496,625 | ) |
| | | | | | | | | |
| CAPITAL TRANSACTIONS: | | | | | | | | |
| Proceeds from shares issued | | | 711,820,368 | | | | 709,912,384 | |
| Distributions reinvested | | | 18,959,830 | | | | 9,496,625 | |
| Value of shares redeemed | | | (724,556,281 | ) | | | (704,734,911 | ) |
| Change in net assets resulting from capital transactions | | | 6,223,917 | | | | 14,674,098 | |
| Change in net assets | | | 22,372,874 | | | | 52,015,238 | |
| | | | | | | | | |
| NET ASSETS: | | | | | | | | |
| Beginning of period | | | 155,208,553 | | | | 103,193,315 | |
| End of period | | $ | 177,581,427 | | | $ | 155,208,553 | |
| | | | | | | | | |
| SHARE TRANSACTIONS: | | | | | | | | |
| Issued | | | 10,203,150 | | | | 12,097,369 | |
| Reinvested | | | 319,350 | | | | 138,657 | |
| Redeemed | | | (10,312,826 | ) | | | (12,038,447 | ) |
| Change in shares | | | 209,674 | | | | 197,579 | |
See accompanying notes to financial statements.
Financial Highlights :: ProFund VP Nasdaq-100 :: 177
ProFunds Financial Highlights FOR THE PERIODS INDICATED
Selected data for a share of beneficial interest outstanding throughout the periods indicated.
| | | Year Ended
Dec. 31, 2021 | | | Year Ended
Dec. 31, 2020 | | | Year Ended
Dec. 31, 2019 | | | Year Ended
Dec. 31, 2018 | | | Year Ended
Dec. 31, 2017 | |
| Net Asset Value, Beginning of Period | | $ | 70.73 | | | $ | 51.68 | | | $ | 38.09 | | | $ | 42.74 | | | $ | 32.91 | |
| | | | | | | | | | | | | | | | | | | | | |
| Investment Activities: | | | | | | | | | | | | | | | | | | | | |
| Net investment income (loss)(a) | | | (0.81 | ) | | | (0.59 | ) | | | (0.13 | ) | | | (0.15 | ) | | | (0.26 | ) |
| Net realized and unrealized gains (losses) on investments | | | 15.53 | | | | 24.00 | | | | 14.06 | | | | (0.08 | ) | | | 10.24 | |
| Total income (loss) from investment activities | | | 14.72 | | | | 23.41 | | | | 13.93 | | | | (0.23 | ) | | | 9.98 | |
| | | | | | | | | | | | | | | | | | | | | |
| Distributions to Shareholders From: | | | | | | | | | | | | | | | | | | | | |
| Net realized gains on investments | | | (11.58 | ) | | | (4.36 | ) | | | (0.34 | ) | | | (4.42 | ) | | | (0.15 | ) |
| | | | | | | | | | | | | | | | | | | | | |
| Net Asset Value, End of Period | | $ | 73.87 | | | $ | 70.73 | | | $ | 51.68 | | | $ | 38.09 | | | $ | 42.74 | |
| | | | | | | | | | | | | | | | | | | | | |
| Total Return | | | 24.80 | % | | | 45.57 | % | | | 36.70 | % | | | (1.87 | )%(b) | | | 30.37 | % |
| | | | | | | | | | | | | | | | | | | | | |
| Ratios to Average Net Assets: | | | | | | | | | | | | | | | | | | | | |
| Gross expenses | | | 1.68 | % | | | 1.73 | % | | | 1.72 | % | | | 1.74 | % | | | 1.71 | % |
| Net expenses | | | 1.68 | % | | | 1.68 | % | | | 1.69 | %(c) | | | 1.67 | %(b) | | | 1.68 | % |
| Net investment income (loss) | | | (1.15 | )% | | | (0.99 | )% | | | (0.29 | )% | | | (0.34 | )%(b) | | | (0.68 | )% |
| | | | | | | | | | | | | | | | | | | | | |
| Supplemental Data: | | | | | | | | | | | | | | | | | | | | |
| Net assets, end of period (000's) | | $ | 177,581 | | | $ | 155,209 | | | $ | 103,193 | | | $ | 64,653 | | | $ | 73,907 | |
| Portfolio turnover rate(d) | | | 13 | % | | | 10 | % | | | 9 | % | | | 6 | % | | | 4 | % |
| (a) | Per share net investment income (loss) has been calculated using the average daily shares method. |
| (b) | During 2018, the Fund received a non-recurring reimbursement from a third party relating to expenses that were incurred in a prior year. Had this reimbursement not occurred, the net expense ratio and net investment income (loss) ratio would have been 1.68% and (0.35)%, respectively, and the total return would have been (1.88)%. |
| (c) | The expense ratio does not correlate to the applicable expense limits in place during the period given that the annual contractual expense limitation is applied for one year periods ended April 30th of each year, instead of coinciding with the December 31st year end. Details of the current expense limitation in effect can be found in Note 4 of the accompanying Notes to Financial Statements. |
| (d) | Portfolio turnover rate is calculated without regard to instruments having a maturity of less than one year from acquisition or derivative instruments (including swap agreements and futures contracts). The portfolio turnover rate can be high and volatile due to the amount and timing of sales and purchases of fund shares during the period. |
See accompanying notes to financial statements.
178 :: ProFund VP Oil & Gas :: Management Discussion of Fund Performance
ProFund VP Oil & Gas (the "Fund") seeks investment results, before fees and expenses, that correspond to the performance of the Dow Jones U.S. Oil & GasSM Index (the "Index"). For the year ended December 31, 2021, the Fund had a total return of 51.93%. For the same period, the Index had a total return of 54.44%1 and a volatility of 29.38%. For the year, the Fund achieved an average daily statistical correlation of over 0.99 to the daily performance of the Index.2
The Fund takes positions in financial instruments that, in combination, should have similar return characteristics as the return of the Index. The Index measures the performance of the oil and gas sector of the U.S. equity market. Component companies include, among others, exploration and production, integrated oil and gas, oil equipment and services, pipelines, renewable energy equipment companies and alternative fuel producers.
During the year ended December 31, 2021, the Fund invested in swap agreements as a substitute for investing directly in stocks in order to gain exposure to the Index. These derivatives generally tracked the performance of their underlying benchmark and were negatively impacted by financing costs associated with their use. The Fund entered into swap agreements with counterparties that the Fund's advisor determined to be major, global financial institutions. If a counterparty becomes insolvent or otherwise fails to perform on its obligations, the value of investments in the Fund may decline. The Fund has sought to mitigate this risk by generally requiring counterparties to post collateral for the benefit of the Fund, marked to market daily, in an amount approximately equal to the amount the counterparty owed to the Fund, subject to certain minimum thresholds.
Value of a $10,000 Investment at Net Asset Value*
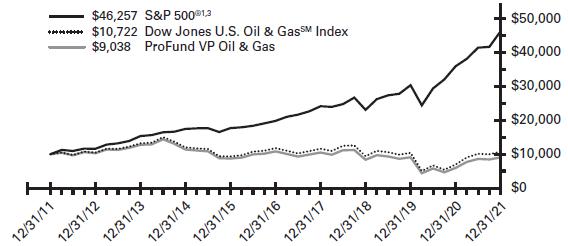
| * | The line graph represents the historical performance of a hypothetical investment of $10,000 in the ProFund VP Oil & Gas from December 31, 2011 to December 31, 2021, assuming the reinvestment of distributions. |
Average Annual Total Return as of 12/31/21
| Fund | | One Year | | | Five Year | | | Ten Year | |
| ProFund VP Oil & Gas | | | 51.93 | % | | | -3.55 | % | | | -1.01 | % |
| Dow Jones U.S. Oil & GasSM Index | | | 54.44 | % | | | -1.89 | % | | | 0.70 | % |
| S&P 500® | | | 28.71 | % | | | 18.47 | % | | | 16.55 | % |
Expense Ratios**
| Fund | | Gross | | | Net | | | | | |
| ProFund VP Oil & Gas | | | 1.76 | % | | | 1.68 | % | | | | |
| ** | Reflects the expense ratio as reported in the Prospectus dated May 1, 2021. Contractual fee waivers are in effect through April 30, 2022. See Financial Highlights for effective expense ratios. |
Allocation of Portfolio Holdings & Index Composition
Market Exposure
| Investment Type | | % of Net Assets | |
| Equity Securities | | | 99 | % |
| Swap Agreements | | | 2 | % |
| Total Exposure | | | 101 | % |
"Market Exposure" includes the value of total investments (including the contract value of any derivatives) and excludes any instruments used for cash management.
Largest Equity Holdings
| Company | | % of Net Assets | |
| Exxon Mobil Corp. | | | 21.4 | % |
| Chevron Corp. | | | 18.7 | % |
| ConocoPhillips | | | 7.9 | % |
| EOG Resources, Inc. | | | 4.3 | % |
| Schlumberger, Ltd. | | | 3.5 | % |
Dow Jones U.S. Oil & GasSM Index – Composition
| | | % of Index | |
| Oil, Gas & Consumable Fuels | | | 89 | % |
| Energy Equipment & Services | | | 8 | % |
| Electrical Equipment | | | 1 | % |
| Semiconductors & Semiconductor Equipment | | | 1 | % |
| Electric Utilities | | | 1 | % |
Past performance does not guarantee future results. Return calculations assume the reinvestment of distributions and do not reflect taxes that a shareholder would pay on Fund distributions or on the redemption of Fund shares. The performance data quoted represents past performance and current returns may be lower or higher. The investment return and net asset value ("NAV") will fluctuate so that an investor's shares, when redeemed, may be worth more or less than the original cost. The performance above reflects any fee reductions during the applicable periods. If such fee reductions had not occurred, the quoted performance would be lower. Performance numbers are net of all Fund fees and expenses but do not include any insurance, sales, or administrative charges of variable annuity or life insurance contracts. If these charges were included, the returns would be lower. To obtain performance current to the most recent month-end, please call toll-free 888-776-3637.
| 1 | The graph and table reflect the theoretical reinvestment of dividends on securities in the Indexes. The impact of transaction costs and the deduction of fees and expenses associated with a mutual fund, such as investment management and accounting fees, are not reflected in calculations of the Indexes. The Fund's performance reflects the reinvestment of dividends as well as the impact of transaction costs and the deduction of fees and expenses. It is not possible to invest directly in an index. |
| 2 | 1.00 equals perfect correlation. This calculation is based on the daily total return of the Index and the performance of the daily total return of the NAV per share of the Fund. |
| 3 | The S&P 500® is an unmanaged index that consists of the common stocks of 500 major U.S. corporations selected for their size and the frequency and ease with which their stocks trade. |
The above information is not covered by the Report of the Independent Registered Public Accounting Firm.
Financial Statements :: ProFund VP Oil & Gas :: 179
Schedule of Portfolio Investments :: December 31, 2021
Common Stocks (98.5%)
| | | Shares | | | Value | |
| APA Corp. (Oil, Gas & Consumable Fuels) | | | 9,216 | | | $ | 247,818 | |
| Baker Hughes Co. — Class A (Energy Equipment & Services) | | | 22,174 | | | | 533,506 | |
| Cheniere Energy, Inc. (Oil, Gas & Consumable Fuels) | | | 5,983 | | | | 606,796 | |
| Chevron Corp. (Oil, Gas & Consumable Fuels) | | | 48,904 | | | | 5,738,884 | |
| ConocoPhillips (Oil, Gas & Consumable Fuels) | | | 33,461 | | | | 2,415,215 | |
| Continental Resources, Inc. (Oil, Gas & Consumable Fuels) | | | 1,484 | | | | 66,424 | |
| Coterra Energy, Inc. (Oil, Gas & Consumable Fuels) | | | 20,640 | | | | 392,160 | |
| Devon Energy Corp. (Oil, Gas & Consumable Fuels) | | | 15,973 | | | | 703,611 | |
| Diamondback Energy, Inc. (Oil, Gas & Consumable Fuels) | | | 4,322 | | | | 466,128 | |
| DT Midstream, Inc. (Oil, Gas & Consumable Fuels) | | | 2,454 | | | | 117,743 | |
| EOG Resources, Inc. (Oil, Gas & Consumable Fuels) | | | 14,843 | | | | 1,318,504 | |
| EQT Corp.* (Oil, Gas & Consumable Fuels) | | | 7,671 | | | | 167,305 | |
| Equitrans Midstream Corp. (Oil, Gas & Consumable Fuels) | | | 10,314 | | | | 106,647 | |
| Exxon Mobil Corp. (Oil, Gas & Consumable Fuels) | | | 107,402 | | | | 6,571,927 | |
| First Solar, Inc.* (Semiconductors & Semiconductor Equipment) | | | 2,509 | | | | 218,684 | |
| Halliburton Co. (Energy Equipment & Services) | | | 22,708 | | | | 519,332 | |
| Hess Corp. (Oil, Gas & Consumable Fuels) | | | 6,993 | | | | 517,692 | |
| HollyFrontier Corp. (Oil, Gas & Consumable Fuels) | | | 3,793 | | | | 124,335 | |
| Kinder Morgan, Inc. (Oil, Gas & Consumable Fuels) | | | 49,470 | | | | 784,594 | |
| Marathon Oil Corp. (Oil, Gas & Consumable Fuels) | | | 19,751 | | | | 324,311 | |
| Marathon Petroleum Corp. (Oil, Gas & Consumable Fuels) | | | 15,617 | | | | 999,332 | |
| New Fortress Energy, Inc. (Oil, Gas & Consumable Fuels) | | | 1,050 | | | | 25,347 | |
| NOV, Inc. (Energy Equipment & Services) | | | 9,912 | | | | 134,308 | |
| Occidental Petroleum Corp. (Oil, Gas & Consumable Fuels) | | | 22,510 | | | | 652,565 | |
| OGE Energy Corp. (Electric Utilities) | | | 5,080 | | | | 194,970 | |
| ONEOK, Inc. (Oil, Gas & Consumable Fuels) | | | 11,313 | | | | 664,752 | |
| Ovintiv, Inc. (Oil, Gas & Consumable Fuels) | | | 6,623 | | | | 223,195 | |
| Phillips 66 (Oil, Gas & Consumable Fuels) | | | 11,116 | | | | 805,465 | |
| Pioneer Natural Resources Co. (Oil, Gas & Consumable Fuels) | | | 5,760 | | | | 1,047,629 | |
| Plug Power, Inc.* (Electrical Equipment) | | | 13,155 | | | | 371,366 | |
| Schlumberger, Ltd. (Energy Equipment & Services) | | | 35,584 | | | | 1,065,741 | |
| Targa Resources Corp. (Oil, Gas & Consumable Fuels) | | | 5,809 | | | | 303,462 | |
| TechnipFMC PLC (Energy Equipment & Services) | | | 10,748 | | | | 63,628 | |
| Texas Pacific Land Corp. (Oil, Gas & Consumable Fuels) | | | 157 | | | | 196,073 | |
| The Williams Cos., Inc. (Oil, Gas & Consumable Fuels) | | | 30,824 | | | | 802,657 | |
| Valero Energy Corp. (Oil, Gas & Consumable Fuels) | | | 10,372 | | | | 779,041 | |
TOTAL COMMON STOCKS
(Cost $13,622,430) | | | | | | | 30,271,147 | |
Repurchase Agreements(a) (1.4%)
| | | Principal
Amount | | | Value | |
| Repurchase Agreements with various counterparties, 0.00%, dated 12/31/21, due 1/3/22, total to be received $431,000 | | $ | 431,000 | | | $ | 431,000 | |
TOTAL REPURCHASE AGREEMENTS
(Cost $431,000) | | | | | | | 431,000 | |
TOTAL INVESTMENT SECURITIES
(Cost $14,053,430) — 99.9% | | | | | | | 30,702,147 | |
| Net other assets (liabilities) — 0.1% | | | | | | | 38,248 | |
| NET ASSETS — 100.0% | | | | | | $ | 30,740,395 | |
| * | Non-income producing security. |
| (a) | The ProFund VP invests in Repurchase Agreements jointly with other funds in the Trust. See "Repurchase Agreements" under Note 2 in the Notes to Financial Statements to view the details of each individual agreement and counterparty as well as a description of the securities subject to repurchase. |
Total Return Swap Agreements — Long
| Underlying Instrument | | Counterparty | | Termination
Date(1) | | Rate Paid
(Received)(2) | | | Notional
Amount | | | Value and
Unrealized
Appreciation/
(Depreciation) | |
| Dow Jones U.S. Oil & Gas Index | | Goldman Sachs International | | 1/24/22 | | | 0.68 | % | | $ | 520,647 | | | $ | (864 | ) |
| (1) | Agreements may be terminated at will by either party without penalty. Payment is due at termination/maturity. |
| (2) | Reflects the floating financing rate, as of December 31, 2021, on the notional amount of the swap agreement paid to the counterparty or received from the counterparty, excluding any commissions. This amount is included as part of the unrealized appreciation/(depreciation). |
See accompanying notes to financial statements.
180 :: ProFund VP Oil & Gas :: Financial Statements
ProFund VP Oil & Gas invested in the following industries as of December 31, 2021:
| | | Value | | | % of
Net Assets | |
| Electric Utilities | | $ | 194,970 | | | | 0.6 | % |
| Electrical Equipment | | | 371,366 | | | | 1.2 | % |
| Energy Equipment & Services | | | 2,316,515 | | | | 7.5 | % |
| Oil, Gas & Consumable Fuels | | | 27,169,612 | | | | 88.5 | % |
| Semiconductors & Semiconductor Equipment | | | 218,684 | | | | 0.7 | % |
| Other** | | | 469,248 | | | | 1.5 | % |
| Total | | $ | 30,740,395 | | | | 100.0 | % |
| ** | Includes any non-equity securities and net other assets (liabilities), which includes any receivable for capital shares issued and payable for capital shares redeemed. |
See accompanying notes to financial statements.
Financial Statements :: ProFund VP Oil & Gas :: 181
Statement of Assets and Liabilities
December 31, 2021
| ASSETS: | | | | |
| Total Investment Securities, at cost | | $ | 14,053,430 | |
| Securities, at value | | | 30,271,147 | |
| Repurchase agreements, at value | | | 431,000 | |
| Total Investment Securities, at value | | | 30,702,147 | |
| Cash | | | 939 | |
| Segregated cash balances for swap agreements with custodian | | | 150,000 | |
| Dividends receivable | | | 16,387 | |
| Receivable for capital shares issued | | | 15,252 | |
| Prepaid expenses | | | 434 | |
| TOTAL ASSETS | | | 30,885,159 | |
| | | | | |
| LIABILITIES: | | | | |
| Payable for capital shares redeemed | | | 59,056 | |
| Unrealized depreciation on swap agreements | | | 864 | |
| Advisory fees payable | | | 27,469 | |
| Management services fees payable | | | 3,663 | |
| Administration fees payable | | | 1,843 | |
| Administrative services fees payable | | | 15,627 | |
| Distribution fees payable | | | 15,183 | |
| Transfer agency fees payable | | | 3,056 | |
| Fund accounting fees payable | | | 1,028 | |
| Compliance services fees payable | | | 124 | |
| Other accrued expenses | | | 16,851 | |
| TOTAL LIABILITIES | | | 144,764 | |
| NET ASSETS | | $ | 30,740,395 | |
| | | | | |
| NET ASSETS CONSIST OF: | | | | |
| Capital | | $ | 20,045,239 | |
| Total distributable earnings (loss) | | | 10,695,156 | |
| NET ASSETS | | $ | 30,740,395 | |
| Shares of Beneficial Interest Outstanding (unlimited number of shares authorized, no par value) | | | 1,096,128 | |
| Net Asset Value (offering and redemption price per share) | | $ | 28.04 | |
Statement of Operations
For the Year Ended December 31, 2021
| INVESTMENT INCOME: | | | | |
| Dividends | | $ | 1,133,809 | |
| Interest | | | 7 | |
| TOTAL INVESTMENT INCOME | | | 1,133,816 | |
| | | | | |
| EXPENSES: | | | | |
| Advisory fees | | | 213,744 | |
| Management services fees | | | 28,499 | |
| Administration fees | | | 20,699 | |
| Transfer agency fees | | | 17,218 | |
| Administrative services fees | | | 75,434 | |
| Distribution fees | | | 71,248 | |
| Custody fees | | | 4,242 | |
| Fund accounting fees | | | 11,652 | |
| Trustee fees | | | 421 | |
| Compliance services fees | | | 221 | |
| Other fees | | | 28,835 | |
| Recoupment of prior expenses reduced by the Advisor | | | 9,000 | |
| Total Gross Expenses before reductions | | | 481,213 | |
| Expenses reduced and reimbursed by the Advisor | | | (2,428 | ) |
| TOTAL NET EXPENSES | | | 478,785 | |
| NET INVESTMENT INCOME (LOSS) | | | 655,031 | |
| | | | | |
| REALIZED AND UNREALIZED GAINS (LOSSES) ON INVESTMENTS: | | | | |
| Net realized gains (losses) on investment securities | | | (18,309 | ) |
| Net realized gains (losses) on swap agreements | | | 228,382 | |
| Change in net unrealized appreciation/depreciation on investment securities | | | 9,104,467 | |
| Change in net unrealized appreciation/depreciation on swap agreements | | | 2,274 | |
| NET REALIZED AND UNREALIZED GAINS (LOSSES) ON INVESTMENTS | | | 9,316,814 | |
| CHANGE IN NET ASSETS RESULTING FROM OPERATIONS | | $ | 9,971,845 | |
See accompanying notes to financial statements.
182 :: ProFund VP Oil & Gas :: Financial Statements
Statements of Changes in Net Assets
| | | Year Ended
December 31, 2021 | | | Year Ended
December 31, 2020 | |
| FROM INVESTMENT ACTIVITIES: | | | | | | | | |
| | | | | | | | | |
| OPERATIONS: | | | | | | | | |
| Net investment income (loss) | | $ | 655,031 | | | $ | 531,800 | |
| Net realized gains (losses) on investments | | | 210,073 | | | | (2,174,156 | ) |
| Change in net unrealized appreciation/depreciation on investments | | | 9,106,741 | | | | (6,098,116 | ) |
| Change in net assets resulting from operations | | | 9,971,845 | | | | (7,740,472 | ) |
| | | | | | | | | |
| DISTRIBUTIONS TO SHAREHOLDERS: | | | | | | | | |
| Total distributions | | | (528,770 | ) | | | (607,652 | ) |
| Change in net assets resulting from distributions | | | (528,770 | ) | | | (607,652 | ) |
| | | | | | | | | |
| CAPITAL TRANSACTIONS: | | | | | | | | |
| Proceeds from shares issued | | | 50,736,870 | | | | 29,132,344 | |
| Distributions reinvested | | | 528,770 | | | | 607,652 | |
| Value of shares redeemed | | | (48,503,718 | ) | | | (29,298,442 | ) |
| Change in net assets resulting from capital transactions | | | 2,761,922 | | | | 441,554 | |
| Change in net assets | | | 12,204,997 | | | | (7,906,570 | ) |
| | | | | | | | | |
| NET ASSETS: | | | | | | | | |
| Beginning of period | | | 18,535,398 | | | | 26,441,968 | |
| End of period | | $ | 30,740,395 | | | $ | 18,535,398 | |
| | | | | | | | | |
| SHARE TRANSACTIONS: | | | | | | | | |
| Issued | | | 2,062,933 | | | | 1,586,151 | |
| Reinvested | | | 20,639 | | | | 35,681 | |
| Redeemed | | | (1,974,291 | ) | | | (1,520,551 | ) |
| Change in shares | | | 109,281 | | | | 101,281 | |
See accompanying notes to financial statements.
Financial Highlights :: ProFund VP Oil & Gas :: 183
ProFunds Financial Highlights FOR THE PERIODS INDICATED
Selected data for a share of beneficial interest outstanding throughout the periods indicated.
| | | Year Ended
Dec. 31, 2021 | | | Year Ended
Dec. 31, 2020 | | | Year Ended
Dec. 31, 2019 | | | Year Ended
Dec. 31, 2018 | | | Year Ended
Dec. 31, 2017 | |
| Net Asset Value, Beginning of Period | | $ | 18.78 | | | $ | 29.86 | | | $ | 28.99 | | | $ | 36.93 | | | $ | 38.63 | |
| | | | | | | | | | | | | | | | | | | | | |
| Investment Activities: | | | | | | | | | | | | | | | | | | | | |
| Net investment income (loss)(a) | | | 0.58 | | | | 0.57 | | | | 0.45 | | | | 0.36 | | | | 0.53 | |
| Net realized and unrealized gains (losses) on investments | | | 9.13 | | | | (10.93 | ) | | | 1.90 | | | | (7.68 | ) | | | (1.78 | ) |
| Total income (loss) from investment activities | | | 9.71 | | | | (10.36 | ) | | | 2.35 | | | | (7.32 | ) | | | (1.25 | ) |
| | | | | | | | | | | | | | | | | | | | | |
| Distributions to Shareholders From: | | | | | | | | | | | | | | | | | | | | |
| Net investment income | | | (0.45 | ) | | | (0.50 | ) | | | (0.44 | ) | | | (0.62 | ) | | | (0.45 | ) |
| Net realized gains on investments | | | — | | | | (0.22 | ) | | | (1.04 | ) | | | — | | | | — | |
| Total distributions | | | (0.45 | ) | | | (0.72 | ) | | | (1.48 | ) | | | (0.62 | ) | | | (0.45 | ) |
| | | | | | | | | | | | | | | | | | | | | |
| Net Asset Value, End of Period | | $ | 28.04 | | | $ | 18.78 | | | $ | 29.86 | | | $ | 28.99 | | | $ | 36.93 | |
| | | | | | | | | | | | | | | | | | | | | |
| Total Return | | | 51.93 | % | | | (34.46 | )% | | | 8.52 | % | | | (20.22 | )%(b) | | | (3.17 | )% |
| | | | | | | | | | | | | | | | | | | | | |
| Ratios to Average Net Assets: | | | | | | | | | | | | | | | �� | | | | | |
| Gross expenses | | | 1.69 | % | | | 1.76 | % | | | 1.72 | % | | | 1.72 | % | | | 1.69 | % |
| Net expenses | | | 1.68 | % | | | 1.68 | % | | | 1.72 | %(c) | | | 1.65 | %(b) | | | 1.68 | % |
| Net investment income (loss) | | | 2.30 | % | | | 3.00 | % | | | 1.46 | % | | | 0.99 | %(b) | | | 1.52 | % |
| | | | | | | | | | | | | | | | | | | | | |
| Supplemental Data: | | | | | | | | | | | | | | | | | | | | |
| Net assets, end of period (000's) | | $ | 30,740 | | | $ | 18,535 | | | $ | 26,442 | | | $ | 25,783 | | | $ | 41,863 | |
| Portfolio turnover rate(d) | | | 80 | % | | | 130 | % | | | 38 | % | | | 76 | % | | | 35 | % |
| (a) | Per share net investment income (loss) has been calculated using the average daily shares method. |
| (b) | During 2018, the Fund received a non-recurring reimbursement from a third party relating to expenses that were incurred in a prior year. Had this reimbursement not occurred, the net expense ratio and net investment income (loss) ratio would have been 1.68% and 0.96%, respectively, and the total return would have been (20.26)%. |
| (c) | The expense ratio does not correlate to the applicable expense limits in place during the period given that the annual contractual expense limitation is applied for one year periods ended April 30th of each year, instead of coinciding with the December 31st year end. Details of the current expense limitation in effect can be found in Note 4 of the accompanying Notes to Financial Statements. |
| (d) | Portfolio turnover rate is calculated without regard to instruments having a maturity of less than one year from acquisition or derivative instruments (including swap agreements and futures contracts). The portfolio turnover rate can be high and volatile due to the amount and timing of sales and purchases of fund shares during the period. |
See accompanying notes to financial statements.
184 :: ProFund VP Pharmaceuticals :: Management Discussion of Fund Performance
ProFund VP Pharmaceuticals (the "Fund") seeks investment results, before fees and expenses, that correspond to the performance of the Dow Jones U.S. Select PharmaceuticalsSM Index (the "Index"). For the year ended December 31, 2021, the Fund had a total return of 11.20%. For the same period, the Index had a total return of 13.11%1 and a volatility of 12.85%. For the year, the Fund achieved an average daily statistical correlation of over 0.99 to the daily performance of the Index.2
The Fund takes positions in financial instruments that, in combination, should have similar return characteristics as the return of the Index. The Index measures the performance of the pharmaceuticals sector of the U.S. equity market. Component companies include, among others, the makers of prescription and over-the-counter drugs. The Index includes vaccine producers, but excludes vitamin producers.
During the year ended December 31, 2021, the Fund invested in swap agreements as a substitute for investing directly in stocks in order to gain exposure to the Index. These derivatives generally tracked the performance of their underlying benchmark and were negatively impacted by financing costs associated with their use. The Fund entered into swap agreements with counterparties that the Fund's advisor determined to be major, global financial institutions. If a counterparty becomes insolvent or otherwise fails to perform on its obligations, the value of investments in the Fund may decline. The Fund has sought to mitigate this risk by generally requiring counterparties to post collateral for the benefit of the Fund, marked to market daily, in an amount approximately equal to the amount the counterparty owed to the Fund, subject to certain minimum thresholds.
Value of a $10,000 Investment at Net Asset Value*

| * | The line graph represents the historical performance of a hypothetical investment of $10,000 in the ProFund VP Pharmaceuticals from December 31, 2011 to December 31, 2021, assuming the reinvestment of distributions. |
Average Annual Total Return as of 12/31/21
| Fund | | One Year | | | Five Year | | | Ten Year | |
| ProFund VP Pharmaceuticals | | | 11.20 | % | | | 8.11 | % | | | 10.07 | % |
| Dow Jones U.S. Select PharmaceuticalsSM Index | | | 13.11 | % | | | 8.96 | % | | | 11.98 | % |
| S&P 500® | | | 28.71 | % | | | 18.47 | % | | | 16.55 | % |
Expense Ratios**
| Fund | | Gross | | | Net | | | | | |
| ProFund VP Pharmaceuticals | | | 1.73 | % | | | 1.68 | % | | | | |
| ** | Reflects the expense ratio as reported in the Prospectus dated May 1, 2021. Contractual fee waivers are in effect through April 30, 2022. See Financial Highlights for effective expense ratios. |
Allocation of Portfolio Holdings & Index Composition
Market Exposure
| Investment Type | | % of Net Assets | |
| Equity Securities | | | 98 | % |
| Swap Agreements | | | 3 | % |
| Total Exposure | | | 101 | % |
"Market Exposure" includes the value of total investments (including the contract value of any derivatives) and excludes any instruments used for cash management or collateral for securities loaned.
Largest Equity Holdings
| Company | | % of Net Assets | |
| Pfizer, Inc. | | | 23.0 | % |
| Johnson & Johnson | | | 21.5 | % |
| Eli Lilly & Co. | | | 4.7 | % |
| Viatris, Inc. | | | 4.5 | % |
| Bristol-Myers Squibb Co. | | | 4.5 | % |
Dow Jones U.S. Select PharmaceuticalsSM Index – Composition
| | | % of Index | |
| Pharmaceuticals | | | 97 | % |
| Biotechnology | | | 3 | % |
Past performance does not guarantee future results. Return calculations assume the reinvestment of distributions and do not reflect taxes that a shareholder would pay on Fund distributions or on the redemption of Fund shares. The performance data quoted represents past performance and current returns may be lower or higher. The investment return and net asset value ("NAV") will fluctuate so that an investor's shares, when redeemed, may be worth more or less than the original cost. The performance above reflects any fee reductions during the applicable periods. If such fee reductions had not occurred, the quoted performance would be lower. Performance numbers are net of all Fund fees and expenses but do not include any insurance, sales, or administrative charges of variable annuity or life insurance contracts. If these charges were included, the returns would be lower. To obtain performance current to the most recent month-end, please call toll-free 888-776-3637.
| 1 | The graph and table reflect the theoretical reinvestment of dividends on securities in the Indexes. The impact of transaction costs and the deduction of fees and expenses associated with a mutual fund, such as investment management and accounting fees, are not reflected in calculations of the Indexes. The Fund's performance reflects the reinvestment of dividends as well as the impact of transaction costs and the deduction of fees and expenses. It is not possible to invest directly in an index. |
| 2 | 1.00 equals perfect correlation. This calculation is based on the daily total return of the Index and the performance of the daily total return of the NAV per share of the Fund. |
| 3 | The S&P 500® is an unmanaged index that consists of the common stocks of 500 major U.S. corporations selected for their size and the frequency and ease with which their stocks trade. |
The above information is not covered by the Report of the Independent Registered Public Accounting Firm.
Financial Statements :: ProFund VP Pharmaceuticals :: 185
Schedule of Portfolio Investments :: December 31, 2021
Common Stocks (97.7%)
| | | Shares | | | Value | |
| Aerie Pharmaceuticals, Inc.* (Pharmaceuticals) | | | 2,432 | | | $ | 17,073 | |
| Amicus Therapeutics, Inc.* (Biotechnology) | | | 12,876 | | | | 148,718 | |
| Amneal Pharmaceuticals, Inc.* (Pharmaceuticals) | | | 5,062 | | | | 24,247 | |
| Amphastar Pharmaceuticals, Inc.* (Pharmaceuticals) | | | 1,892 | | | | 44,065 | |
| Antares Pharma, Inc.* (Health Care Equipment & Supplies) | | | 8,731 | | | | 31,170 | |
| Arvinas, Inc.* (Pharmaceuticals) | | | 2,217 | | | | 182,104 | |
| Atea Pharmaceuticals, Inc.* (Biotechnology) | | | 2,720 | | | | 24,317 | |
| Axsome Therapeutics, Inc.* (Pharmaceuticals) | | | 1,529 | | | | 57,766 | |
| Bristol-Myers Squibb Co. (Pharmaceuticals) | | | 12,069 | | | | 752,502 | |
| Cara Therapeutics, Inc.* (Biotechnology) | | | 2,168 | | | | 26,406 | |
| Cassava Sciences, Inc.*(a) (Pharmaceuticals) | | | 1,931 | | | | 84,385 | |
| Catalent, Inc.* (Pharmaceuticals) | | | 5,454 | | | | 698,276 | |
| Catalyst Pharmaceuticals, Inc.* (Biotechnology) | | | 4,924 | | | | 33,335 | |
| ChemoCentryx, Inc.* (Biotechnology) | | | 2,513 | | | | 91,498 | |
| Collegium Pharmaceutical, Inc.* (Pharmaceuticals) | | | 1,775 | | | | 33,157 | |
| Corcept Therapeutics, Inc.* (Pharmaceuticals) | | | 4,876 | | | | 96,545 | |
| Elanco Animal Health, Inc.* (Pharmaceuticals) | | | 23,533 | | | | 667,867 | |
| Eli Lilly & Co. (Pharmaceuticals) | | | 2,845 | | | | 785,846 | |
| Endo International PLC* (Pharmaceuticals) | | | 11,998 | | | | 45,112 | |
| Harmony Biosciences Holdings, Inc.* (Pharmaceuticals) | | | 1,171 | | | | 49,931 | |
| Innoviva, Inc.* (Pharmaceuticals) | | | 3,211 | | | | 55,390 | |
| Intra-Cellular Therapies, Inc.* (Pharmaceuticals) | | | 3,806 | | | | 199,206 | |
| Ironwood Pharmaceuticals, Inc.* (Biotechnology) | | | 8,403 | | | | 97,979 | |
| Jazz Pharmaceuticals PLC* (Pharmaceuticals) | | | 3,156 | | | | 402,074 | |
| Johnson & Johnson (Pharmaceuticals) | | | 21,151 | | | | 3,618,302 | |
| Madrigal Pharmaceuticals, Inc.* (Biotechnology) | | | 632 | | | | 53,556 | |
| Merck & Co., Inc. (Pharmaceuticals) | | | 9,496 | | | | 727,773 | |
| NGM Biopharmaceuticals, Inc.* (Pharmaceuticals) | | | 1,915 | | | | 33,915 | |
| Nuvation Bio, Inc.* (Pharmaceuticals) | | | 5,926 | | | | 50,371 | |
| Omeros Corp.* (Pharmaceuticals) | | | 3,211 | | | | 20,647 | |
| Organon & Co. (Pharmaceuticals) | | | 13,019 | | | | 396,429 | |
| Pacira BioSciences, Inc.* (Pharmaceuticals) | | | 2,287 | | | | 137,609 | |
| Perrigo Co. PLC (Pharmaceuticals) | | | 6,869 | | | | 267,204 | |
| Pfizer, Inc. (Pharmaceuticals) | | | 65,362 | | | | 3,859,625 | |
| Phathom Pharmaceuticals, Inc.* (Pharmaceuticals) | | | 807 | | | | 15,874 | |
| Phibro Animal Health Corp. — Class A (Pharmaceuticals) | | | 1,044 | | | | 21,318 | |
| Prestige Consumer Healthcare, Inc.* (Pharmaceuticals) | | | 2,573 | | | | 156,052 | |
| Reata Pharmaceuticals, Inc.* — Class A (Pharmaceuticals) | | | 1,406 | | | | 37,076 | |
| Revance Therapeutics, Inc.* (Pharmaceuticals) | | | 3,391 | | | | 55,341 | |
| Royalty Pharma PLC — Class A (Pharmaceuticals) | | | 17,752 | | | | 707,417 | |
| Theravance Biopharma, Inc.* (Pharmaceuticals) | | | 2,687 | | | | 29,691 | |
| Vanda Pharmaceuticals, Inc.* (Biotechnology) | | | 2,861 | | | | 44,889 | |
| Viatris, Inc. (Pharmaceuticals) | | | 55,928 | | | | 756,706 | |
| Zoetis, Inc. (Pharmaceuticals) | | | 3,028 | | | | 738,923 | |
| Zogenix, Inc.* (Pharmaceuticals) | | | 2,587 | | | | 42,039 | |
TOTAL COMMON STOCKS
(Cost $10,208,702) | | | | | | | 16,419,726 | |
Repurchase Agreements(b) (1.2%)
| | | Principal Amount | | | Value | |
| Repurchase Agreements with various counterparties, 0.00%, dated 12/31/21, due 1/3/22, total to be received $197,000 | | $ | 197,000 | | | $ | 197,000 | |
TOTAL REPURCHASE AGREEMENTS
(Cost $197,000) | | | | | | | 197,000 | |
Collateral for Securities Loaned(c) (0.5%)
| | | Shares | | | Value | |
| BlackRock Liquidity Funds FedFund Portfolio — Institutional Shares, 0.03%(d) | | | 77,507 | | | $ | 77,507 | |
TOTAL COLLATERAL FOR SECURITIES LOANED
(Cost $77,507) | | | | | | | 77,507 | |
TOTAL INVESTMENT SECURITIES
(Cost $10,483,209) — 99.4% | | | | | | | 16,694,233 | |
| Net other assets (liabilities) — 0.6% | | | | | | | 96,265 | |
| NET ASSETS — 100.0% | | | | | | $ | 16,790,498 | |
| * | Non-income producing security. |
| (a) | All or part of this security was on loan as of December 31, 2021. The total value of securities on loan as of December 31, 2021 was $75,688. |
| (b) | The ProFund VP invests in Repurchase Agreements jointly with other funds in the Trust. See "Repurchase Agreements" under Note 2 in the Notes to Financial Statements to view the details of each individual agreement and counterparty as well as a description of the securities subject to repurchase. |
| (c) | Securities were purchased with cash collateral held from securities on loan at December 31, 2021. |
| (d) | Rate periodically changes. Rate disclosed is the daily yield on December 31, 2021. |
See accompanying notes to financial statements.
186 :: ProFund VP Pharmaceuticals :: Financial Statements
Total Return Swap Agreements — Long
| Underlying Instrument | | Counterparty | | Termination
Date(1) | | Rate Paid
(Received)(2) | | | Notional
Amount | | | Value and
Unrealized
Appreciation/
(Depreciation) | |
| Dow Jones U.S. Select Pharmaceuticals Index | | Goldman Sachs International | | 1/24/22 | | | 0.68 | % | | $ | 461,144 | | | $ | 124 | |
| (1) | Agreements may be terminated at will by either party without penalty. Payment is due at termination/maturity. |
| (2) | Reflects the floating financing rate, as of December 31, 2021, on the notional amount of the swap agreement paid to the counterparty or received from the counterparty, excluding any commissions. This amount is included as part of the unrealized appreciation/(depreciation). |
ProFund VP Pharmaceuticals invested in the following industries as of December 31, 2021:
| | | Value | | | % of
Net Assets | |
| Biotechnology | | $ | 520,698 | | | | 3.1 | % |
| Health Care Equipment & Supplies | | | 31,170 | | | | 0.2 | % |
| Pharmaceuticals | | | 15,867,858 | | | | 94.4 | % |
| Other** | | | 370,772 | | | | 2.3 | % |
| Total | | $ | 16,790,498 | | | | 100.0 | % |
| ** | Includes any non-equity securities and net other assets (liabilities), which includes any receivable for capital shares issued and payable for capital shares redeemed. |
See accompanying notes to financial statements.
Financial Statements :: ProFund VP Pharmaceuticals :: 187
Statement of Assets and Liabilities
December 31, 2021
| ASSETS: | | | | |
| Total Investment Securities, at cost | | $ | 10,483,209 | |
| Securities, at value(a) | | | 16,497,233 | |
| Repurchase agreements, at value | | | 197,000 | |
| Total Investment Securities, at value | | | 16,694,233 | |
| Cash | | | 237 | |
| Segregated cash balances for swap agreements with custodian | | | 220,000 | |
| Dividends receivable | | | 5,946 | |
| Unrealized appreciation on swap agreements | | | 124 | |
| Receivable for capital shares issued | | | 141 | |
| Prepaid expenses | | | 203 | |
| TOTAL ASSETS | | | 16,920,884 | |
| | | | | |
| LIABILITIES: | | | | |
| Payable for collateral for securities loaned | | | 77,507 | |
| Payable for capital shares redeemed | | | 11,529 | |
| Advisory fees payable | | | 12,312 | |
| Management services fees payable | | | 1,642 | |
| Administration fees payable | | | 926 | |
| Administrative services fees payable | | | 8,166 | |
| Distribution fees payable | | | 8,214 | |
| Transfer agency fees payable | | | 1,478 | |
| Fund accounting fees payable | | | 525 | |
| Compliance services fees payable | | | 66 | |
| Other accrued expenses | | | 8,021 | |
| TOTAL LIABILITIES | | | 130,386 | |
| NET ASSETS | | $ | 16,790,498 | |
| | | | | |
| NET ASSETS CONSIST OF: | | | | |
| Capital | | $ | 11,345,407 | |
| Total distributable earnings (loss) | | | 5,445,091 | |
| NET ASSETS | | $ | 16,790,498 | |
| Shares of Beneficial Interest Outstanding (unlimited number of shares authorized, no par value) | | | 398,258 | |
| Net Asset Value (offering and redemption price per share) | | $ | 42.16 | |
| | | | |
| (a) Includes securities on loan valued at: | | $ | 75,688 | |
Statement of Operations
For the Year Ended December 31, 2021
| INVESTMENT INCOME: | | | | |
| Dividends | | $ | 286,305 | |
| Interest | | | 4 | |
| Net income from securities lending | | | 154 | |
| TOTAL INVESTMENT INCOME | | | 286,463 | |
| | | | | |
| EXPENSES: | | | | |
| Advisory fees | | | 115,381 | |
| Management services fees | | | 15,384 | |
| Administration fees | | | 11,655 | |
| Transfer agency fees | | | 9,449 | |
| Administrative services fees | | | 39,573 | |
| Distribution fees | | | 38,460 | |
| Custody fees | | | 2,286 | |
| Fund accounting fees | | | 6,497 | |
| Trustee fees | | | 259 | |
| Compliance services fees | | | 100 | |
| Other fees | | | 14,978 | |
| Recoupment of prior expenses reduced by the Advisor | | | 4,432 | |
| TOTAL NET EXPENSES | | | 258,454 | |
| NET INVESTMENT INCOME (LOSS) | | | 28,009 | |
| | | | | |
| REALIZED AND UNREALIZED GAINS (LOSSES) ON INVESTMENTS: | | | | |
| Net realized gains (losses) on investment securities | | | 841,130 | |
| Net realized gains (losses) on swap agreements | | | 49,254 | |
| Change in net unrealized appreciation/depreciation on investment securities | | | 662,838 | |
| Change in net unrealized appreciation/depreciation on swap agreements | | | (8,418 | ) |
| NET REALIZED AND UNREALIZED GAINS (LOSSES) ON INVESTMENTS | | | 1,544,804 | |
| CHANGE IN NET ASSETS RESULTING FROM OPERATIONS | | $ | 1,572,813 | |
See accompanying notes to financial statements.
188 :: ProFund VP Pharmaceuticals :: Financial Statements
| Statements of Changes in Net Assets |
| |
| | | Year Ended
December 31, 2021 | | | Year Ended
December 31, 2020 | |
| FROM INVESTMENT ACTIVITIES: | | | | | | | | |
| | | | | | | | | |
| OPERATIONS: | | | | | | | | |
| Net investment income (loss) | | $ | 28,009 | | | $ | 734 | |
| Net realized gains (losses) on investments | | | 890,384 | | | | 460,193 | |
| Change in net unrealized appreciation/depreciation on investments | | | 654,420 | | | | 1,342,133 | |
| Change in net assets resulting from operations | | | 1,572,813 | | | | 1,803,060 | |
| | | | | | | | | |
| DISTRIBUTIONS TO SHAREHOLDERS: | | | | | | | | |
| Total distributions | | | (236,561 | ) | | | (15,201 | ) |
| Change in net assets resulting from distributions | | | (236,561 | ) | | | (15,201 | ) |
| | | | | | | | | |
| CAPITAL TRANSACTIONS: | | | | | | | | |
| Proceeds from shares issued | | | 12,167,906 | | | | 12,366,348 | |
| Distributions reinvested | | | 236,561 | | | | 15,201 | |
| Value of shares redeemed | | | (13,221,422 | ) | | | (11,502,033 | ) |
| Change in net assets resulting from capital transactions | | | (816,955 | ) | | | 879,516 | |
| Change in net assets | | | 519,297 | | | | 2,667,375 | |
| | | | | | | | | |
| NET ASSETS: | | | | | | | | |
| Beginning of period | | | 16,271,201 | | | | 13,603,826 | |
| End of period | | $ | 16,790,498 | | | $ | 16,271,201 | |
| | | | | | | | | |
| SHARE TRANSACTIONS: | | | | | | | | |
| Issued | | | 306,437 | | | | 367,558 | |
| Reinvested | | | 6,201 | | | | 423 | |
| Redeemed | | | (336,517 | ) | | | (342,539 | ) |
| Change in shares | | | (23,879 | ) | | | 25,442 | |
See accompanying notes to financial statements.
Financial Highlights :: ProFund VP Pharmaceuticals :: 189
ProFunds Financial Highlights FOR THE PERIODS INDICATED
Selected data for a share of beneficial interest outstanding throughout the periods indicated.
| | | Year Ended
Dec. 31, 2021 | | | Year Ended
Dec. 31, 2020 | | | Year Ended
Dec. 31, 2019 | | | Year Ended
Dec. 31, 2018 | | | Year Ended
Dec. 31, 2017 | |
| Net Asset Value, Beginning of Period | | $ | 38.54 | | | $ | 34.29 | | | $ | 34.85 | | | $ | 38.53 | | | $ | 35.42 | |
| | | | | | | | | | | | | | | | | | | | | |
| Investment Activities: | | | | | | | | | | | | | | | | | | | | |
| Net investment income (loss)(a) | | | 0.07 | | | | — | (b) | | | 0.04 | | | | 0.25 | | | | 0.33 | |
| Net realized and unrealized gains (losses) on investments | | | 4.18 | | | | 4.29 | | | | 4.22 | | | | (2.58 | ) | | | 3.34 | |
| Total income (loss) from investment activities | | | 4.25 | | | | 4.29 | | | | 4.26 | | | | (2.33 | ) | | | 3.67 | |
| | | | | | | | | | | | | | | | | | | | | |
| Distributions to Shareholders From: | | | | | | | | | | | | | | | | | | | | |
| Net investment income | | | (0.11 | ) | | | (0.04 | ) | | | (0.31 | ) | | | (0.42 | ) | | | (0.39 | ) |
| Net realized gains on investments | | | (0.52 | ) | | | — | | | | (4.51 | ) | | | (0.93 | ) | | | (0.17 | ) |
| Total distributions | | | (0.63 | ) | | | (0.04 | ) | | | (4.82 | ) | | | (1.35 | ) | | | (0.56 | ) |
| | | | | | | | | | | | | | | | | | | | | |
| Net Asset Value, End of Period | | $ | 42.16 | | | $ | 38.54 | | | $ | 34.29 | | | $ | 34.85 | | | $ | 38.53 | |
| | | | | | | | | | | | | | | | | | | | | |
| Total Return | | | 11.20 | % | | | 12.51 | % | | | 14.04 | % | | | (6.20 | )% | | | 10.36 | % |
| | | | | | | | | | | | | | | | | | | | | |
| Ratios to Average Net Assets: | | | | | | | | | | | | | | | | | | | | |
| Gross expenses | | | 1.68 | % | | | 1.73 | % | | | 1.74 | % | | | 1.76 | % | | | 1.70 | % |
| Net expenses | | | 1.68 | % | | | 1.68 | % | | | 1.68 | % | | | 1.68 | % | | | 1.68 | % |
| Net investment income (loss) | | | 0.18 | % | | | 0.01 | % | | | 0.12 | % | | | 0.65 | % | | | 0.88 | % |
| | | | | | | | | | | | | | | | | | | | | |
| Supplemental Data: | | | | | | | | | | | | | | | | | | | | |
| Net assets, end of period (000's) | | $ | 16,790 | | | $ | 16,271 | | | $ | 13,604 | | | $ | 13,833 | | | $ | 17,278 | |
| Portfolio turnover rate(c) | | | 60 | % | | | 91 | % | | | 126 | % | | | 261 | % | | | 219 | % |
| (a) | Per share net investment income (loss) has been calculated using the average daily shares method. |
| (b) | Amount is less than $0.005. |
| (c) | Portfolio turnover rate is calculated without regard to instruments having a maturity of less than one year from acquisition or derivative instruments (including swap agreements and futures contracts). The portfolio turnover rate can be high and volatile due to the amount and timing of sales and purchases of fund shares during the period. |
See accompanying notes to financial statements.
190 :: ProFund VP Precious Metals :: Management Discussion of Fund Performance
ProFund VP Precious Metals (the "Fund") seeks investment results, before fees and expenses, that correspond to the performance of the Dow Jones Precious MetalsSM Index (the "Index"). For the year ended December 31, 2021, the Fund had a total return of -8.94%. For the same period, the Index had a return of -6.76%1 and a volatility of 29.27%. For the year, the Fund achieved an average daily statistical correlation of over 0.99 to the daily performance of the Index.2
The Fund takes positions in financial instruments that, in combination, should have similar return characteristics as the return of the Index. The Index measures the performance of the precious metals mining sector. Component companies include, among others, leading miners and producers of gold, silver and platinum-group metals whose securities are available to U.S. investors during U.S. trading hours.
During the year ended December 31, 2021, the Fund invested in swap agreements as a substitute for investing directly in stocks in order to gain exposure to the Index. These derivatives generally tracked the performance of their underlying benchmark and were negatively impacted by financing costs associated with their use. The Fund entered into swap agreements with counterparties that the Fund's advisor determined to be major, global financial institutions. If a counterparty becomes insolvent or otherwise fails to perform on its obligations, the value of investments in the Fund may decline. The Fund has sought to mitigate this risk by generally requiring counterparties to post collateral for the benefit of the Fund, marked to market daily, in an amount approximately equal to the amount the counterparty owed to the Fund, subject to certain minimum thresholds.
Value of a $10,000 Investment at Net Asset Value*
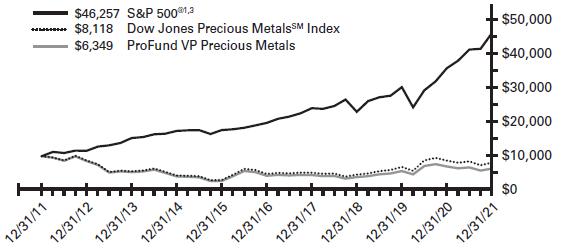
| * | The line graph represents the historical performance of a hypothetical investment of $10,000 in the ProFund VP Precious Metals from December 31, 2011 to December 31, 2021, assuming the reinvestment of distributions. |
Average Annual Total Return as of 12/31/21
| Fund | | One Year | | | Five Year | | | Ten Year | |
| ProFund VP Precious Metals | | | -8.94 | % | | | 8.49 | % | | | -4.44 | % |
| Dow Jones Precious MetalsSM Index | | | -6.76 | % | | | 11.29 | % | | | -2.06 | % |
| S&P 500® | | | 28.71 | % | | | 18.47 | % | | | 16.55 | % |
Expense Ratios**
| Fund | | Gross | | | Net | | | | | |
| ProFund VP Precious Metals | | | 1.74 | % | | | 1.68 | % | | | | |
| ** | Reflects the expense ratio as reported in the Prospectus dated May 1, 2021. Contractual fee waivers are in effect through April 30, 2022. See Financial Highlights for effective expense ratios. |
Allocation of Portfolio Holdings & Index Composition
Market Exposure
| Investment Type | | % of Net Assets | |
| Swap Agreements | | | 100 | % |
| Total Exposure | | | 100 | % |
"Market Exposure" includes the value of total investments (including the contract value of any derivatives) and excludes any instruments used for cash management.
Holdings
The ProFund VP Precious Metals primarily invests in non-equity securities, which may include: swap agreements, futures contracts, repurchase agreements and U.S. Government securities.
Dow Jones Precious MetalsSM Index – Composition
| | | % of Index | |
| Gold | | | 90 | % |
| Silver | | | 6 | % |
| Precious Metals & Minerals | | | 4 | % |
Past performance does not guarantee future results. Return calculations assume the reinvestment of distributions and do not reflect taxes that a shareholder would pay on Fund distributions or on the redemption of Fund shares. The performance data quoted represents past performance and current returns may be lower or higher. The investment return and net asset value ("NAV") will fluctuate so that an investor's shares, when redeemed, may be worth more or less than the original cost. The performance above reflects any fee reductions during the applicable periods. If such fee reductions had not occurred, the quoted performance would be lower. Performance numbers are net of all Fund fees and expenses but do not include any insurance, sales, or administrative charges of variable annuity or life insurance contracts. If these charges were included, the returns would be lower. To obtain performance current to the most recent month-end, please call toll-free 888-776-3637.
| 1 | The graph and table reflect the theoretical reinvestment of dividends on securities in the Indexes. The impact of transaction costs and the deduction of fees and expenses associated with a mutual fund, such as investment management and accounting fees, are not reflected in calculations of the Indexes. The Fund's performance reflects the reinvestment of dividends as well as the impact of transaction costs and the deduction of fees and expenses. It is not possible to invest directly in an index. |
| 2 | 1.00 equals perfect correlation. This calculation is based on the daily total return of the Index and the performance of the daily total return of the NAV per share of the Fund. |
| 3 | The S&P 500® is an unmanaged index that consists of the common stocks of 500 major U.S. corporations selected for their size and the frequency and ease with which their stocks trade. |
The above information is not covered by the Report of the Independent Registered Public Accounting Firm.
Financial Statements :: ProFund VP Precious Metals :: 191
Schedule of Portfolio Investments :: December 31, 2021
Repurchase Agreements(a)(b) (92.2%)
| | | Principal
Amount | | | Value | |
| Repurchase Agreements with various counterparties, 0.00%, dated 12/31/21, due 1/3/22, total to be received $27,834,000 | | $ | 27,834,000 | | | $ | 27,834,000 | |
TOTAL REPURCHASE AGREEMENTS
(Cost $27,834,000) | | | | | | | 27,834,000 | |
TOTAL INVESTMENT SECURITIES
(Cost $27,834,000) — 92.2% | | | | | | | 27,834,000 | |
| Net other assets (liabilities) — 7.8% | | | | | | | 2,370,468 | |
| NET ASSETS — 100.0% | | | | | | $ | 30,204,468 | |
| (a) | A portion of these securities were held in a segregated account for the benefit of swap counterparties in the event of default. At December 31, 2021, the aggregate amount held in a segregated account was $3,750,000. |
| (b) | The ProFund VP invests in Repurchase Agreements jointly with other funds in the Trust. See "Repurchase Agreements" under Note 2 in the Notes to Financial Statements to view the details of each individual agreement and counterparty as well as a description of the securities subject to repurchase. |
Total Return Swap Agreements — Long
| Underlying Instrument | | Counterparty | | Termination
Date(1) | | Rate Paid
(Received)(2) | | | Notional
Amount | | | Value and
Unrealized
Appreciation/
(Depreciation) | |
| Dow Jones Precious Metals Index | | Goldman Sachs International | | 1/24/22 | | | 0.68 | % | | $ | 15,267,879 | | | $ | 285,903 | |
| Dow Jones Precious Metals Index | | UBS AG | | 1/24/22 | | | 0.83 | % | | | 14,891,898 | | | | 316,549 | |
| | | | | | | | | | | $ | 30,159,777 | | | $ | 602,452 | |
| (1) | Agreements may be terminated at will by either party without penalty. Payment is due at termination/maturity. |
| (2) | Reflects the floating financing rate, as of December 31, 2021, on the notional amount of the swap agreement paid to the counterparty or received from the counterparty, excluding any commissions. This amount is included as part of the unrealized appreciation/(depreciation). |
See accompanying notes to financial statements.
192 :: ProFund VP Precious Metals :: Financial Statements
Statement of Assets and Liabilities
December 31, 2021
| ASSETS: | | | | |
| Total Investment Securities, at cost | | $ | 27,834,000 | |
| Repurchase agreements, at value | | | 27,834,000 | |
| Total Investment Securities, at value | | | 27,834,000 | |
| Unrealized appreciation on swap agreements | | | 602,452 | |
| Receivable for capital shares issued | | | 2,050,811 | |
| Prepaid expenses | | | 433 | |
| TOTAL ASSETS | | | 30,487,696 | |
| | | | | |
| LIABILITIES: | | | | |
| Cash overdraft | | | 1,692 | |
| Payable for capital shares redeemed | | | 207,333 | |
| Advisory fees payable | | | 23,369 | |
| Management services fees payable | | | 3,116 | |
| Administration fees payable | | | 1,513 | |
| Administrative services fees payable | | | 13,354 | |
| Distribution fees payable | | | 13,121 | |
| Transfer agency fees payable | | | 2,762 | |
| Fund accounting fees payable | | | 906 | |
| Compliance services fees payable | | | 122 | |
| Other accrued expenses | | | 15,940 | |
| TOTAL LIABILITIES | | | 283,228 | |
| NET ASSETS | | $ | 30,204,468 | |
| | | | | |
| NET ASSETS CONSIST OF: | | | | |
| Capital | | $ | 91,677,610 | |
| Total distributable earnings (loss) | | | (61,473,142 | ) |
| NET ASSETS | | $ | 30,204,468 | |
| Shares of Beneficial Interest Outstanding(unlimited number of shares authorized, no par value) | | | 1,073,678 | |
| Net Asset Value (offering and redemption price per share) | | $ | 28.13 | |
Statement of Operations
For the Year Ended December 31, 2021
| INVESTMENT INCOME: | | | | |
| Interest | | $ | 568 | |
| | | | | |
| EXPENSES: | | | | |
| Advisory fees | | | 239,841 | |
| Management services fees | | | 31,979 | |
| Administration fees | | | 22,497 | |
| Transfer agency fees | | | 19,564 | |
| Administrative services fees | | | 89,134 | |
| Distribution fees | | | 79,947 | |
| Custody fees | | | 4,839 | |
| Fund accounting fees | | | 13,128 | |
| Trustee fees | | | 555 | |
| Compliance services fees | | | 162 | |
| Other fees | | | 30,130 | |
| Recoupment of prior expenses reduced by the Advisor | | | 6,776 | |
| Total Gross Expenses before reductions | | | 538,552 | |
| Expenses reduced and reimbursed by the Advisor | | | (1,309 | ) |
| TOTAL NET EXPENSES | | | 537,243 | |
| NET INVESTMENT INCOME (LOSS) | | | (536,675 | ) |
| | | | | |
| REALIZED AND UNREALIZED GAINS (LOSSES) ON INVESTMENTS: | | | | |
| Net realized gains (losses) on swap agreements | | | (3,151,213 | ) |
| Change in net unrealized appreciation/depreciation on swap agreements | | | 594,004 | |
| NET REALIZED AND UNREALIZED GAINS (LOSSES) ON INVESTMENTS | | | (2,557,209 | ) |
| CHANGE IN NET ASSETS RESULTING FROM OPERATIONS | | $ | (3,093,884 | ) |
See accompanying notes to financial statements.
Financial Statements :: ProFund VP Precious Metals :: 193
Statements of Changes in Net Assets
| | | Year Ended
December 31, 2021 | | | Year Ended
December 31, 2020 | |
| FROM INVESTMENT ACTIVITIES: | | | | | | | | |
| | | | | | | | | |
| OPERATIONS: | | | | | | | | |
| Net investment income (loss) | | $ | (536,675 | ) | | $ | (529,251 | ) |
| Net realized gains (losses) on investments | | | (3,151,213 | ) | | | 3,558,430 | |
| Change in net unrealized appreciation/depreciation on investments | | | 594,004 | | | | (1,457,345 | ) |
| Change in net assets resulting from operations | | | (3,093,884 | ) | | | 1,571,834 | |
| | | | | | | | | |
| DISTRIBUTIONS TO SHAREHOLDERS: | | | | | | | | |
| Total distributions | | | — | | | | (89,778 | ) |
| Change in net assets resulting from distributions | | | — | | | | (89,778 | ) |
| | | | | | | | | |
| CAPITAL TRANSACTIONS: | | | | | | | | |
| Proceeds from shares issued | | | 55,173,894 | | | | 104,066,719 | |
| Distributions reinvested | | | — | | | | 89,778 | |
| Value of shares redeemed | | | (60,246,173 | ) | | | (99,662,435 | ) |
| Change in net assets resulting from capital transactions | | | (5,072,279 | ) | | | 4,494,062 | |
| Change in net assets | | | (8,166,163 | ) | | | 5,976,118 | |
| | | | | | | | | |
| NET ASSETS: | | | | | | | | |
| Beginning of period | | | 38,370,631 | | | | 32,394,513 | |
| End of period | | $ | 30,204,468 | | | $ | 38,370,631 | |
| | | | | | | | | |
| SHARE TRANSACTIONS: | | | | | | | | |
| Issued | | | 1,860,381 | | | | 3,624,215 | |
| Reinvested | | | — | | | | 2,482 | |
| Redeemed | | | (2,028,762 | ) | | | (3,683,477 | ) |
| Change in shares | | | (168,381 | ) | | | (56,780 | ) |
See accompanying notes to financial statements.
194 :: ProFund VP Precious Metals :: Financial Highlights
ProFunds Financial Highlights FOR THE PERIODS INDICATED
Selected data for a share of beneficial interest outstanding throughout the periods indicated.
| | | Year Ended
Dec. 31, 2021 | | | Year Ended
Dec. 31, 2020 | | | Year Ended
Dec. 31, 2019 | | | Year Ended
Dec. 31, 2018 | | | Year Ended
Dec. 31, 2017 | |
| Net Asset Value, Beginning of Period | | $ | 30.89 | | | $ | 24.94 | | | $ | 17.10 | | | $ | 19.75 | | | $ | 18.76 | |
| | | | | | | | | | | | | | | | | | | | | |
| Investment Activities: | | | | | | | | | | | | | | | | | | | | |
| Net investment income (loss)(a) | | | (0.49 | ) | | | (0.42 | ) | | | 0.07 | | | | 0.01 | | | | (0.18 | ) |
| Net realized and unrealized gains (losses) on investments | | | (2.27 | ) | | | 6.44 | | | | 7.78 | | | | (2.66 | ) | | | 1.17 | |
| Total income (loss) from investment activities | | | (2.76 | ) | | | 6.02 | | | | 7.85 | | | | (2.65 | ) | | | 0.99 | |
| | | | | | | | | | | | | | | | | | | | | |
| Distributions to Shareholders From: | | | | | | | | | | | | | | | | | | | | |
| Net investment income | | | — | | | | (0.07 | ) | | | (0.01 | ) | | | — | | | | — | |
| | | | | | | | | | | | | | | | | | | | | |
| Net Asset Value, End of Period | | $ | 28.13 | | | $ | 30.89 | | | $ | 24.94 | | | $ | 17.10 | | | $ | 19.75 | |
| | | | | | | | | | | | | | | | | | | | | |
| Total Return | | | (8.94 | )% | | | 24.10 | % | | | 45.98 | % | | | (13.47 | )% | | | 5.28 | % |
| | | | | | | | | | | | | | | | | | | | | |
| Ratios to Average Net Assets: | | | | | | | | | | | | | | | | | | | | |
| Gross expenses | | | 1.68 | % | | | 1.74 | % | | | 1.72 | % | | | 1.75 | % | | | 1.70 | % |
| Net expenses | | | 1.68 | % | | | 1.68 | % | | | 1.68 | % | | | 1.68 | % | | | 1.68 | % |
| Net investment income (loss) | | | (1.68 | )% | | | (1.43 | )% | | | 0.37 | % | | | 0.04 | % | | | (0.88 | )% |
| | | | | | | | | | | | | | | | | | | | | |
| Supplemental Data: | | | | | | | | | | | | | | | | | | | | |
| Net assets, end of period (000's) | | $ | 30,204 | | | $ | 38,371 | | | $ | 32,395 | | | $ | 19,001 | | | $ | 24,286 | |
| Portfolio turnover rate(b) | | | — | | | | — | | | | — | | | | — | | | | — | |
| (a) | Per share net investment income (loss) has been calculated using the average daily shares method. |
| (b) | Portfolio turnover rate is calculated without regard to instruments having a maturity of less than one year from acquisition or derivative instruments (including swap agreements and futures contracts). |
See accompanying notes to financial statements.
Management Discussion of Fund Performance :: ProFund VP Real Estate :: 195
ProFund VP Real Estate (the "Fund") seeks investment results, before fees and expenses, that correspond to the performance of the Dow Jones U.S. Real EstateSM Index (the "Index"). For the year ended December 31, 2021, the Fund had a total return of 37.07%. For the same period, the Index had a total return of 38.99%1 and a volatility of 14.54%. For the year, the Fund achieved an average daily statistical correlation of over 0.99 to the daily performance of the Index.2
The Fund takes positions in financial instruments that, in combination, should have similar return characteristics as the return of the Index. The Index measures the performance of the real estate sector of the U.S. equity market. Component companies include real estate holding and development and real estate service companies; and real estate investment trusts ("REITs") that invest in industrial, office and retail properties. REITs are passive investment vehicles that invest primarily in income-producing real estate and real estate related loans or interests.
During the year ended December 31, 2021, the Fund invested in swap agreements as a substitute for investing directly in stocks in order to gain exposure to the Index. These derivatives generally tracked the performance of their underlying benchmark and were negatively impacted by financing costs associated with their use. The Fund entered into swap agreements with counterparties that the Fund's advisor determined to be major, global financial institutions. If a counterparty becomes insolvent or otherwise fails to perform on its obligations, the value of investments in the Fund may decline. The Fund has sought to mitigate this risk by generally requiring counterparties to post collateral for the benefit of the Fund, marked to market daily, in an amount approximately equal to the amount the counterparty owed to the Fund, subject to certain minimum thresholds.
Value of a $10,000 Investment at Net Asset Value*

| * | The line graph represents the historical performance of a hypothetical investment of $10,000 in the ProFund VP Real Estate from December 31, 2011 to December 31, 2021, assuming the reinvestment of distributions. |
Average Annual Total Return as of 12/31/21
| Fund | | One Year | | | Five Year | | | Ten Year | |
| ProFund VP Real Estate | | | 37.07 | % | | | 10.66 | % | | | 9.94 | % |
| Dow Jones U.S. Real EstateSM Index | | | 38.99 | % | | | 12.34 | % | | | 11.71 | % |
| S&P 500® | | | 28.71 | % | | | 8.47 | % | | | 16.55 | % |
Expense Ratios**
| Fund | | Gross | | | Net | | | | | |
| ProFund VP Real Estate | | | 1.76 | % | | | 1.68 | % | | | | |
| ** | Reflects the expense ratio as reported in the Prospectus dated May 1, 2021. Contractual fee waivers are in effect through April 30, 2022. See Financial Highlights for effective expense ratios. |
Allocation of Portfolio Holdings & Index Composition
Market Exposure
| Investment Type | | % of Net Assets | |
| Equity Securities | | | 96 | % |
| Swap Agreements | | | 3 | % |
| Total Exposure | | | 99 | % |
"Market Exposure" includes the value of total investments (including the contract value of any derivatives) and excludes any instruments used for cash management.
Largest Equity Holdings
| Company | | % of Net Assets | |
| American Tower Corp. | | | 7.9 | % |
| Prologis, Inc. | | | 7.4 | % |
| Crown Castle International Corp. | | | 5.4 | % |
| Equinix, Inc. | | | 4.5 | % |
| Public Storage | | | 3.4 | % |
Dow Jones U.S. Real EstateSM Index – Composition
| | | % of Index | |
| Equity Real Estate Investment Trusts (REITs) | | | 91 | % |
| Real Estate Management & Development | | | 5 | % |
| Mortgage Real Estate Investment Trusts (REITs) | | | 2 | % |
| Professional Services | | | 2 | % |
Past performance does not guarantee future results. Return calculations assume the reinvestment of distributions and do not reflect taxes that a shareholder would pay on Fund distributions or on the redemption of Fund shares. The performance data quoted represents past performance and current returns may be lower or higher. The investment return and net asset value ("NAV") will fluctuate so that an investor's shares, when redeemed, may be worth more or less than the original cost. The performance above reflects any fee reductions during the applicable periods. If such fee reductions had not occurred, the quoted performance would be lower. Performance numbers are net of all Fund fees and expenses but do not include any insurance, sales, or administrative charges of variable annuity or life insurance contracts. If these charges were included, the returns would be lower. To obtain performance current to the most recent month-end, please call toll-free 888-776-3637.
| 1 | The graph and table reflect the theoretical reinvestment of dividends on securities in the Indexes. The impact of transaction costs and the deduction of fees and expenses associated with a mutual fund, such as investment management and accounting fees, are not reflected in calculations of the Indexes. The Fund's performance reflects the reinvestment of dividends as well as the impact of transaction costs and the deduction of fees and expenses. It is not possible to invest directly in an index. |
| 2 | 1.00 equals perfect correlation. This calculation is based on the daily total return of the Index and the performance of the daily total return of the NAV per share of the Fund. |
| 3 | The S&P 500® is an unmanaged index that consists of the common stocks of 500 major U.S. corporations selected for their size and the frequency and ease with which their stocks trade. |
The above information is not covered by the Report of the Independent Registered Public Accounting Firm.
196 :: ProFund VP Real Estate :: Financial Statements
Schedule of Portfolio Investments :: December 31, 2021
Common Stocks (96.3%)
| | | Shares | | | Value | |
| AGNC Investment Corp. (Mortgage Real Estate Investment Trusts) | | | 4,346 | | | $ | 65,364 | |
| Alexandria Real Estate Equities, Inc. (Equity Real Estate Investment Trusts) | | | 1,168 | | | | 260,417 | |
| American Campus Communities, Inc. (Equity Real Estate Investment Trusts) | | | 1,153 | | | | 66,055 | |
| American Homes 4 Rent—Class A (Equity Real Estate Investment Trusts) | | | 2,349 | | | | 102,440 | |
| American Tower Corp. (Equity Real Estate Investment Trusts) | | | 3,770 | | | | 1,102,725 | |
| Americold Realty Trust (Equity Real Estate Investment Trusts) | | | 2,209 | | | | 72,433 | |
| Annaly Capital Management, Inc. (Mortgage Real Estate Investment Trusts) | | | 12,012 | | | | 93,934 | |
| Apartment Income REIT Corp. (Equity Real Estate Investment Trusts) | | | 1,299 | | | | 71,016 | |
| AvalonBay Communities, Inc. (Equity Real Estate Investment Trusts) | | | 1,156 | | | | 291,994 | |
| Blackstone Mortgage Trust, Inc.—Class A (Mortgage Real Estate Investment Trusts) | | | 1,383 | | | | 42,347 | |
| Boston Properties, Inc. (Equity Real Estate Investment Trusts) | | | 1,177 | | | | 135,567 | |
| Brixmor Property Group, Inc. (Equity Real Estate Investment Trusts) | | | 2,460 | | | | 62,509 | |
| Camden Property Trust (Equity Real Estate Investment Trusts) | | | 846 | | | | 151,163 | |
| CBRE Group, Inc.*—Class A (Real Estate Management & Development) | | | 2,770 | | | | 300,572 | |
| Compass, Inc.*—Class A (Real Estate Management & Development) | | | 236 | | | | 2,145 | |
| Corporate Office Properties Trust (Equity Real Estate Investment Trusts) | | | 930 | | | | 26,012 | |
| CoStar Group, Inc.* (Professional Services) | | | 3,270 | | | | 258,428 | |
| Cousins Properties, Inc. (Equity Real Estate Investment Trusts) | | | 1,232 | | | | 49,625 | |
| Crown Castle International Corp. (Equity Real Estate Investment Trusts) | | | 3,579 | | | | 747,080 | |
| CubeSmart (Equity Real Estate Investment Trusts) | | | 1,795 | | | | 102,153 | |
| CyrusOne, Inc. (Equity Real Estate Investment Trusts) | | | 1,051 | | | | 94,296 | |
| Digital Realty Trust, Inc. (Equity Real Estate Investment Trusts) | | | 2,349 | | | | 415,468 | |
| Douglas Emmett, Inc. (Equity Real Estate Investment Trusts) | | | 1,453 | | | | 48,676 | |
| Duke Realty Corp. (Equity Real Estate Investment Trusts) | | | 3,153 | | | | 206,963 | |
| EastGroup Properties, Inc. (Equity Real Estate Investment Trusts) | | | 336 | | | | 76,558 | |
| Equinix, Inc. (Equity Real Estate Investment Trusts) | | | 746 | | | | 630,997 | |
| Equity Commonwealth* (Equity Real Estate Investment Trusts) | | | 1,003 | | | | 25,971 | |
| Equity LifeStyle Properties, Inc. (Equity Real Estate Investment Trusts) | | | 1,415 | | | | 124,039 | |
| Equity Residential (Equity Real Estate Investment Trusts) | | | 2,826 | | | | 255,753 | |
| Essex Property Trust, Inc. (Equity Real Estate Investment Trusts) | | | 539 | | | | 189,852 | |
| Extra Space Storage, Inc. (Equity Real Estate Investment Trusts) | | | 1,108 | | | | 251,217 | |
| Federal Realty Investment Trust (Equity Real Estate Investment Trusts) | | | 579 | | | | 78,929 | |
| First Industrial Realty Trust, Inc. (Equity Real Estate Investment Trusts) | | | 1,079 | | | | 71,430 | |
| Gaming & Leisure Properties, Inc. (Equity Real Estate Investment Trusts) | | | 1,876 | | | | 91,286 | |
| Healthcare Realty Trust, Inc. (Equity Real Estate Investment Trusts) | | | 1,222 | | | | 38,664 | |
| Healthcare Trust of America, Inc.—Class A (Equity Real Estate Investment Trusts) | | | 1,828 | | | | 61,037 | |
| Healthpeak Properties, Inc. (Equity Real Estate Investment Trusts) | | | 4,463 | | | | 161,070 | |
| Highwoods Properties, Inc. (Equity Real Estate Investment Trusts) | | | 865 | | | | 38,570 | |
| Host Hotels & Resorts, Inc.* (Equity Real Estate Investment Trusts) | | | 5,912 | | | | 102,810 | |
| Hudson Pacific Properties, Inc. (Equity Real Estate Investment Trusts) | | | 1,262 | | | | 31,184 | |
| Invitation Homes, Inc. (Equity Real Estate Investment Trusts) | | | 4,941 | | | | 224,025 | |
| Iron Mountain, Inc. (Equity Real Estate Investment Trusts) | | | 2,397 | | | | 125,435 | |
| JBG Smith Properties (Equity Real Estate Investment Trusts) | | | 945 | | | | 27,131 | |
| Jones Lang LaSalle, Inc.* (Real Estate Management & Development) | | | 418 | | | | 112,584 | |
| Kilroy Realty Corp. (Equity Real Estate Investment Trusts) | | | 867 | | | | 57,621 | |
| Kimco Realty Corp. (Equity Real Estate Investment Trusts) | | | 5,104 | | | | 125,814 | |
| Lamar Advertising Co.—Class A (Equity Real Estate Investment Trusts) | | | 719 | | | | 87,215 | |
| Lexington Realty Trust (Equity Real Estate Investment Trusts) | | | 2,341 | | | | 36,566 | |
| Life Storage, Inc. (Equity Real Estate Investment Trusts) | | | 679 | | | | 104,009 | |
| Medical Properties Trust, Inc. (Equity Real Estate Investment Trusts) | | | 4,937 | | | | 116,661 | |
| Mid-America Apartment Communities, Inc. (Equity Real Estate Investment Trusts) | | | 953 | | | | 218,656 | |
| National Health Investors, Inc. (Equity Real Estate Investment Trusts) | | | 380 | | | | 21,839 | |
| National Retail Properties, Inc. (Equity Real Estate Investment Trusts) | | | 1,453 | | | | 69,846 | |
| National Storage Affiliates Trust (Equity Real Estate Investment Trusts) | | | 678 | | | | 46,918 | |
| New Residential Investment Corp. (Mortgage Real Estate Investment Trusts) | | | 3,863 | | | | 41,373 | |
| Omega Healthcare Investors, Inc. (Equity Real Estate Investment Trusts) | | | 1,978 | | | | 58,529 | |
| Opendoor Technologies, Inc.* (Real Estate Management & Development) | | | 3,196 | | | | 46,694 | |
| Orion Office REIT, Inc.* (Equity Real Estate Investment Trusts) | | | 449 | | | | 8,383 | |
| Physicians Realty Trust (Equity Real Estate Investment Trusts) | | | 1,824 | | | | 34,346 | |
| PotlatchDeltic Corp. (Equity Real Estate Investment Trusts) | | | 555 | | | | 33,422 | |
| Prologis, Inc. (Equity Real Estate Investment Trusts) | | | 6,120 | | | | 1,030,363 | |
| PS Business Parks, Inc. (Equity Real Estate Investment Trusts) | | | 166 | | | | 30,572 | |
| Public Storage (Equity Real Estate Investment Trusts) | | | 1,263 | | | | 473,069 | |
| Rayonier, Inc. (Equity Real Estate Investment Trusts) | | | 1,186 | | | | 47,867 | |
| Realty Income Corp. (Equity Real Estate Investment Trusts) | | | 4,684 | | | | 335,328 | |
See accompanying notes to financial statements.
Financial Statements :: ProFund VP Real Estate :: 197
Common Stocks, continued
| | | Shares | | | Value | |
| Redfin Corp.* (Real Estate Management & Development) | | | 874 | | | $ | 33,553 | |
| Regency Centers Corp. (Equity Real Estate Investment Trusts) | | | 1,277 | | | | 96,222 | |
| Rexford Industrial Realty, Inc. (Equity Real Estate Investment Trusts) | | | 1,254 | | | | 101,712 | |
| Sabra Health Care REIT, Inc. (Equity Real Estate Investment Trusts) | | | 1,893 | | | | 25,631 | |
| SBA Communications Corp. (Equity Real Estate Investment Trusts) | | | 900 | | | | 350,118 | |
| Simon Property Group, Inc. (Equity Real Estate Investment Trusts) | | | 2,721 | | | | 434,734 | |
| SL Green Realty Corp. (Equity Real Estate Investment Trusts) | | | 552 | | | | 39,578 | |
| Spirit Realty Capital, Inc. (Equity Real Estate Investment Trusts) | | | 1,021 | | | | 49,202 | |
| STAG Industrial, Inc. (Equity Real Estate Investment Trusts) | | | 1,449 | | | | 69,494 | |
| Starwood Property Trust, Inc. (Mortgage Real Estate Investment Trusts) | | | 2,521 | | | | 61,260 | |
| STORE Capital Corp. (Equity Real Estate Investment Trusts) | | | 2,032 | | | | 69,901 | |
| Sun Communities, Inc. (Equity Real Estate Investment Trusts) | | | 960 | | | | 201,571 | |
| The Howard Hughes Corp.* (Real Estate Management & Development) | | | 343 | | | | 34,911 | |
| UDR, Inc. (Equity Real Estate Investment Trusts) | | | 2,406 | | | | 144,336 | |
| Ventas, Inc. (Equity Real Estate Investment Trusts) | | | 3,306 | | | | 169,003 | |
| VICI Properties, Inc. (Equity Real Estate Investment Trusts) | | | 5,207 | | | | 156,783 | |
| Vornado Realty Trust (Equity Real Estate Investment Trusts) | | | 1,318 | | | | 55,171 | |
| Welltower, Inc. (Equity Real Estate Investment Trusts) | | | 3,604 | | | | 309,115 | |
| Weyerhaeuser Co. (Equity Real Estate Investment Trusts) | | | 6,201 | | | | 255,357 | |
| WP Carey, Inc. (Equity Real Estate Investment Trusts) | | | 1,543 | | | | 126,603 | |
| Zillow Group, Inc.* — Class A (Interactive Media & Services) | | | 305 | | | | 18,977 | |
| Zillow Group, Inc.* — Class C (Interactive Media & Services) | | | 1,410 | | | | 90,029 | |
TOTAL COMMON STOCKS
(Cost $5,174,543) | | | | | | | 13,406,276 | |
Repurchase Agreements(a) (2.8%)
| | | Principal
Amount | | | Value | |
| Repurchase Agreements with various counterparties, 0.00%, dated 12/31/21, due 1/3/22, total to be received $395,000 | | $ | 395,000 | | | $ | 395,000 | |
TOTAL REPURCHASE AGREEMENTS
(Cost $395,000) | | | | | | | 395,000 | |
TOTAL INVESTMENT SECURITIES
(Cost $5,569,543) — 99.1% | | | | | | | 13,801,276 | |
| Net other assets (liabilities) — 0.9% | | | | | | | 125,965 | |
| NET ASSETS — 100.0% | | | | | | $ | 13,927,241 | |
| * | Non-income producing security. |
| (a) | The ProFund VP invests in Repurchase Agreements jointly with other funds in the Trust. See "Repurchase Agreements" under Note 2 in the Notes to Financial Statements to view the details of each individual agreement and counterparty as well as a description of the securities subject to repurchase. |
Total Return Swap Agreements—Long
| Underlying Instrument | | Counterparty | | Termination
Date(1) | | | Rate Paid
(Received)(2) | | | Notional
Amount | | | Value and
Unrealized
Appreciation/
(Depreciation) | |
| Dow Jones U.S. Real Estate Index | | Goldman Sachs International | | 1/24/22 | | | | 0.68 | % | | $ | 455,284 | | | $ | 10,836 | |
| (1) | Agreements may be terminated at will by either party without penalty. Payment is due at termination/maturity. |
| (2) | Reflects the floating financing rate, as of December 31, 2021, on the notional amount of the swap agreement paid to the counterparty or received from the counterparty, excluding any commissions. This amount is included as part of the unrealized appreciation/(depreciation). |
ProFund VP Real Estate invested in the following industries as of December 31, 2021:
| | | Value | | | % of
Net Assets | |
| Equity Real Estate Investment Trusts | | $ | 12,204,105 | | | | 87.6 | % |
| Interactive Media & Services | | | 109,006 | | | | 0.8 | % |
| Mortgage Real Estate Investment Trusts | | | 304,278 | | | | 2.2 | % |
| Professional Services | | | 258,428 | | | | 1.9 | % |
| Real Estate Management & Development | | | 530,459 | | | | 3.8 | % |
| Other** | | | 520,965 | | | | 3.7 | % |
| Total | | $ | 13,927,241 | | | | 100.0 | % |
| ** | Includes any non-equity securities and net other assets (liabilities), which includes any receivable for capital shares issued and payable for capital shares redeemed. |
See accompanying notes to financial statements.
198 :: ProFund VP Real Estate :: Financial Statements
Statement of Assets and Liabilities
December 31, 2021
| ASSETS: | | | | |
| Total Investment Securities, at cost | | $ | 5,569,543 | |
| Securities, at value | | | 13,406,276 | |
| Repurchase agreements, at value | | | 395,000 | |
| Total Investment Securities, at value | | | 13,801,276 | |
| Cash | | | 2,720 | |
| Dividends receivable | | | 40,640 | |
| Unrealized appreciation on swap agreements | | | 10,836 | |
| Receivable for capital shares issued | | | 104,572 | |
| Prepaid expenses | | | 305 | |
| TOTAL ASSETS | | | 13,960,349 | |
| | | | | |
| LIABILITIES: | | | | |
| Payable for capital shares redeemed | | | 1,143 | |
| Advisory fees payable | | | 10,370 | |
| Management services fees payable | | | 1,383 | |
| Administration fees payable | | | 740 | |
| Administrative services fees payable | | | 5,629 | |
| Distribution fees payable | | | 5,918 | |
| Transfer agency fees payable | | | 1,305 | |
| Fund accounting fees payable | | | 434 | |
| Compliance services fees payable | | | 64 | |
| Other accrued expenses | | | 6,122 | |
| TOTAL LIABILITIES | | | 33,108 | |
| NET ASSETS | | $ | 13,927,241 | |
| | | | | |
| NET ASSETS CONSIST OF: | | | | |
| Capital | | $ | 6,105,305 | |
| Total distributable earnings (loss) | | | 7,821,936 | |
| NET ASSETS | | $ | 13,927,241 | |
| Shares of Beneficial Interest Outstanding (unlimited number of shares authorized, no par value) | | | 174,774 | |
| Net Asset Value (offering and redemption price per share) | | $ | 79.69 | |
Statement of Operations
For the Year Ended December 31, 2021
| INVESTMENT INCOME: | | | | |
| Dividends | | $ | 262,183 | |
| Interest | | | 3 | |
| Net income from securities lending | | | 5 | |
| TOTAL INVESTMENT INCOME | | | 262,191 | |
| | | | | |
| EXPENSES: | | | | |
| Advisory fees | | | 100,751 | |
| Management services fees | | | 13,433 | |
| Administration fees | | | 9,721 | |
| Transfer agency fees | | | 8,029 | |
| Administrative services fees | | | 38,012 | |
| Distribution fees | | | 33,584 | |
| Custody fees | | | 2,002 | |
| Fund accounting fees | | | 5,661 | |
| Trustee fees | | | 209 | |
| Compliance services fees | | | 94 | |
| Other fees | | | 12,337 | |
| Recoupment of prior expenses reduced by the Advisor | | | 2,890 | |
| Total Gross Expenses before reductions | | | 226,723 | |
| Expenses reduced and reimbursed by the Advisor | | | (1,039 | ) |
| TOTAL NET EXPENSES | | | 225,684 | |
| NET INVESTMENT INCOME (LOSS) | | | 36,507 | |
| | | | | |
| REALIZED AND UNREALIZED GAINS (LOSSES) ON INVESTMENTS: | | | | |
| Net realized gains (losses) on investment securities | | | 903,603 | |
| Net realized gains (losses) on swap agreements | | | 67,078 | |
| Change in net unrealized appreciation/depreciation on investment securities | | | 2,809,392 | |
| Change in net unrealized appreciation/depreciation on swap agreements | | | 9,326 | |
| NET REALIZED AND UNREALIZED GAINS (LOSSES) ON INVESTMENTS | | | 3,789,399 | |
| CHANGE IN NET ASSETS RESULTING FROM OPERATIONS | | $ | 3,825,906 | |
See accompanying notes to financial statements.
Financial Statements :: ProFund VP Real Estate :: 199
Statements of Changes in Net Assets
| | | Year Ended
December 31, 2021 | | | Year Ended
December 31, 2020 | |
| FROM INVESTMENT ACTIVITIES: | | | | | | | | |
| | | | | | | | | |
| OPERATIONS: | | | | | | | | |
| Net investment income (loss) | | $ | 36,507 | | | $ | 72,876 | |
| Net realized gains (losses) on investments | | | 970,681 | | | | 175,859 | |
| Change in net unrealized appreciation/depreciation on investments | | | 2,818,718 | | | | (2,299,385 | ) |
| Change in net assets resulting from operations | | | 3,825,906 | | | | (2,050,650 | ) |
| | | | | | | | | |
| DISTRIBUTIONS TO SHAREHOLDERS: | | | | | | | | |
| Total distributions | | | (3,298 | ) | | | (404,416 | ) |
| Return of capital | | | — | | | | (28,104 | ) |
| Change in net assets resulting from distributions | | | (3,298 | ) | | | (432,520 | ) |
| | | | | | | | | |
| CAPITAL TRANSACTIONS: | | | | | | | | |
| Proceeds from shares issued | | | 28,548,171 | | | | 19,545,765 | |
| Distributions reinvested | | | 3,298 | | | | 432,520 | |
| Value of shares redeemed | | | (28,175,883 | ) | | | (23,711,191 | ) |
| Change in net assets resulting from capital transactions | | | 375,586 | | | | (3,732,906 | ) |
| Change in net assets | | | 4,198,194 | | | | (6,216,076 | ) |
| | | | | | | | | |
| NET ASSETS: | | | | | | | | |
| Beginning of period | | | 9,729,047 | | | | 15,945,123 | |
| End of period | | $ | 13,927,241 | | | $ | 9,729,047 | |
| | | | | | | | | |
| SHARE TRANSACTIONS: | | | | | | | | |
| Issued | | | 413,871 | | | | 338,735 | |
| Reinvested | | | 41 | | | | 7,778 | |
| Redeemed | | | (406,457 | ) | | | (424,323 | ) |
| Change in shares | | | 7,455 | | | | (77,810 | ) |
See accompanying notes to financial statements.
200 :: ProFund VP Real Estate :: Financial Highlights
ProFunds Financial Highlights FOR THE PERIODS INDICATED
Selected data for a share of beneficial interest outstanding throughout the periods indicated.
| | | Year Ended
Dec. 31, 2021 | | | Year Ended
Dec. 31, 2020 | | | Year Ended
Dec. 31, 2019 | | | Year Ended
Dec. 31, 2018 | | | Year Ended
Dec. 31, 2017 | |
| Net Asset Value, Beginning of Period | | $ | 58.15 | | | $ | 65.05 | | | $ | 54.51 | | | $ | 66.65 | | | $ | 65.02 | |
| | | | | | | | | | | | | | | | | | | | | |
| Investment Activities: | | | | | | | | | | | | | | | | | | | | |
| Net investment income (loss)(a) | | | 0.19 | | | | 0.42 | | | | 0.75 | | | | 1.09 | | | | 1.02 | |
| Net realized and unrealized gains (losses) on investments | | | 21.37 | | | | (4.66 | ) | | | 13.65 | | | | (4.66 | ) | | | 4.13 | |
| Total income (loss) from investment activities | | | 21.56 | | | | (4.24 | ) | | | 14.40 | | | | (3.57 | ) | | | 5.15 | |
| | | | | | | | | | | | | | | | | | | | | |
| Distributions to Shareholders From: | | | | | | | | | | | | | | | | | | | | |
| Net investment income | | | (0.02 | ) | | | (0.78 | ) | | | (1.06 | ) | | | (1.36 | ) | | | (0.66 | ) |
| Net realized gains on investments | | | — | | | | (1.71 | ) | | | (2.80 | ) | | | (7.21 | ) | | | (2.86 | ) |
| Return of capital | | | — | | | | (0.17 | ) | | | — | | | | — | | | | — | |
| Total distributions | | | (0.02 | ) | | | (2.66 | ) | | | (3.86 | ) | | | (8.57 | ) | | | (3.52 | ) |
| | | | | | | | | | | | | | | | | | | | | |
| Net Asset Value, End of Period | | $ | 79.69 | | | $ | 58.15 | | | $ | 65.05 | | | $ | 54.51 | | | $ | 66.65 | |
| | | | | | | | | | | | | | | | | | | | | |
| Total Return | | | 37.07 | % | | | (6.29 | )%(b) | | | 26.76 | % | | | (5.70 | )% | | | 8.05 | % |
| | | | | | | | | | | | | | | | | | | | | |
| Ratios to Average Net Assets: | | | | | | | | | | | | | | | | | | | | |
| Gross expenses | | | 1.69 | % | | | 1.76 | % | | | 1.71 | % | | | 1.69 | % | | | 1.68 | % |
| Net expenses | | | 1.68 | % | | | 1.68 | % | | | 1.68 | % | | | 1.68 | % | | | 1.68 | % |
| Net investment income (loss) | | | 0.27 | % | | | 0.72 | % | | | 1.18 | % | | | 1.82 | % | | | 1.52 | % |
| | | | | | | | | | | | | | | | | | | | | |
| Supplemental Data: | | | | | | | | | | | | | | | | | | | | |
| Net assets, end of period (000's) | | $ | 13,927 | | | $ | 9,729 | | | $ | 15,945 | | | $ | 10,384 | | | $ | 11,419 | |
| Portfolio turnover rate(c) | | | 147 | % | | | 150 | % | | | 126 | % | | | 82 | % | | | 135 | % |
| (a) | Per share net investment income (loss) has been calculated using the average daily shares method. |
| (b) | During the year ended December 31, 2020, the Fund received monies related to certain nonrecurring litigation settlements. The corresponding impact to the total return was an increase of 0.29%. |
| (c) | Portfolio turnover rate is calculated without regard to instruments having a maturity of less than one year from acquisition or derivative instruments (including swap agreements and futures contracts). The portfolio turnover rate can be high and volatile due to the amount and timing of sales and purchases of fund shares during the period. |
See accompanying notes to financial statements.
Management Discussion of Fund Performance :: ProFund VP Rising Rates Opportunity :: 201
ProFund VP Rising Rates Opportunity (the "Fund") seeks daily investment results, before fees and expenses, that correspond to one and one-quarter times the inverse (-1.25x) of the movement of the most recently issued 30-Year U.S. Treasury Bond (the "Long Bond") for a single day, not for any other period. A "single day" is measured from the time the Fund calculates its net asset value ("NAV") to the time of the Fund's next NAV calculation. The Fund does not seek to achieve its stated investment objective over a period of time greater than a single day. The return of the Fund for periods longer than a single day will be the result of its return for each day compounded over the period. The Fund's returns for periods longer than a single day very likely differ in amount, and possibly even direction, from the Fund's stated multiple (-1.25x) times the return of the Long Bond for the same period. For periods longer than a single day, the Fund will lose money if the Long Bond's performance is flat, and it is possible that the Fund will lose money even if the level of the Long Bond falls. For the year ended December 31, 2021, the Fund had a total return of -0.07%. For the same period, the Long Bond, as measured by the Ryan Labs Returns Treasury Yield Curve 30 Year Index1, had a total return of -4.37%2 and a volatility of 16.66%. For the year, the Fund achieved an average daily statistical correlation of over 0.99 to one and one-quarter times the inverse of the daily price movement of the Long Bond.3
The Fund takes positions in financial instruments that, in combination, should have similar daily return characteristics as one and one-quarter times the inverse of the daily price movement of the Long Bond. The Long Bond is the longest term outstanding 30-year bond issued by the U.S. Treasury. As of December 31, 2021, the most recent Long Bond carried a maturity date of 11/15/51 and a 1.875% coupon.
During the year ended December 31, 2021, the Fund invested in swap agreements and futures contracts as a substitute for shorting bonds in order to gain inverse leveraged exposure to the Long Bond. These derivatives generally tracked the performance of their underlying benchmark and benefited from financing costs associated with their use. The Fund entered into swap agreements with counterparties that the Fund's advisor determined to be major, global financial institutions. If a counterparty becomes insolvent or otherwise fails to perform on its obligations, the value of investments in the Fund may decline. The Fund has sought to mitigate this risk by generally requiring counterparties to post collateral for the benefit of the Fund, marked to market daily, in an amount approximately equal to the amount the counterparty owed to the Fund, subject to certain minimum thresholds.
Value of a $10,000 Investment at Net Asset Value*

| * | The line graph represents the historical performance of a hypothetical investment of $10,000 in the ProFund VP Rising Rates Opportunity from December 31, 2011 to December 31, 2021, assuming the reinvestment of distributions. |
Average Annual Total Return as of 12/31/21
| Fund | | One Year | | | Five Year | | | Ten Year | |
| ProFund VP Rising Rates Opportunity | | | -0.07 | % | | | -11.11 | % | | | -8.95 | % |
| Ryan Labs Returns Treasury Yield Curve 30 Year Index | | | -4.37 | % | | | 7.13 | % | | | 4.49 | % |
Expense Ratios**
| Fund | | Gross | | | Net | | | | | |
| ProFund VP Rising Rates Opportunity | | | 1.73 | % | | | 1.68 | % | | | | |
| ** | Reflects the expense ratio as reported in the Prospectus dated May 1, 2021. Contractual fee waivers are in effect through April 30, 2022. See Financial Highlights for effective expense ratios. |
Allocation of Portfolio Holdings
Market Exposure
| Investment Type | | % of Net Assets | |
| Swap Agreements | | | (123 | )% |
| Total Exposure | | | (123 | )% |
"Market Exposure" includes the value of total investments (including the contract value of any derivatives) and excludes any instruments used for cash management.
Holdings
The ProFund VP Rising Rates Opportunity primarily invests in non-equity securities, which may include: swap agreements, futures contracts, repurchase agreements and U.S. Government securities.
Past performance does not guarantee future results. Return calculations assume the reinvestment of distributions and do not reflect taxes that a shareholder would pay on Fund distributions or on the redemption of Fund shares. The performance data quoted represents past performance and current returns may be lower or higher. The investment return and NAV will fluctuate so that an investor's shares, when redeemed, may be worth more or less than the original cost. The performance above reflects any fee reductions during the applicable periods. If such fee reductions had not occurred, the quoted performance would be lower. Performance numbers are net of all Fund fees and expenses but do not include any insurance, sales, or administrative charges of variable annuity or life insurance contracts. If these charges were included, the returns would be lower. To obtain performance current to the most recent month-end, please call toll-free 888-776-3637.
| 1 | The Ryan Labs Returns Treasury Yield Curve 30 Year Index is an index that consists of public obligations of the U.S. Treasury consisting of a single security, the latest issued on-the-run 30 Year Treasury bond. This Index reflects both price return and yield. It does not reflect the impact of transaction costs nor the deduction of fees and expenses associated with a mutual fund, such as investment management and accounting fees. It is not possible to invest directly in an index. |
| 2 | The Long Bond reflects a yield component. It does not reflect the impact of transaction and financing costs, nor the deduction of fees and expenses associated with a mutual fund, such as investment management and accounting fees. The Fund's performance reflects a yield component, the impact of transaction and financing costs and the deduction of fees and expenses. |
| 3 | 1.00 equals perfect correlation. This calculation is based on the daily total return of the Long Bond and the performance of the daily total return of the NAV per share of the Fund. |
The above information is not covered by the Report of the Independent Registered Public Accounting Firm.
202 :: ProFund VP Rising Rates Opportunity :: Financial Statements
Schedule of Portfolio Investments :: December 31, 2021
Repurchase Agreements(a)(b) (98.3%)
| | | Principal
Amount | | | Value | |
| Repurchase Agreements with various counterparties, 0.00%, dated 12/31/21, due 1/3/22, total to be received $5,787,000 | | $ | 5,787,000 | | | $ | 5,787,000 | |
TOTAL REPURCHASE AGREEMENTS (Cost $5,787,000) | | | | | | | 5,787,000 | |
TOTAL INVESTMENT SECURITIES (Cost $5,787,000)—98.3% | | | | | | | 5,787,000 | |
| Net other assets (liabilities)—1.7% | | | | | | | 102,632 | |
| NET ASSETS—100.0% | | | | | | $ | 5,889,632 | |
| (a) | A portion of these securities were held in a segregated account for the benefit of swap counterparties in the event of default. At December 31, 2021, the aggregate amount held in a segregated account was $88,000. |
| (b) | The ProFund VP invests in Repurchase Agreements jointly with other funds in the Trust. See "Repurchase Agreements" under Note 2 in the Notes to Financial Statements to view the details of each individual agreement and counterparty as well as a description of the securities subject to repurchase. |
Total Return Swap Agreements—Short
| Underlying Instrument | | Counterparty | | Termination
Date(1) | | | Rate Paid
(Received)(2) | | | Notional
Amount | | | Value and
Unrealized
Appreciation/
(Depreciation) | |
| 30-Year U.S. Treasury Bond, 1.875% due on 11/15/51 | | Citibank North America | | | 1/17/22 | | | | 0.20 | % | | $ | (5,922,830 | ) | | $ | 10,658 | |
| 30-Year U.S. Treasury Bond, 1.875% due on 11/15/51 | | Societe' Generale | | | 1/17/22 | | | | 0.22 | % | | | (1,296,242 | ) | | | 3,660 | |
| | | | | | | | | | | | | $ | (7,219,072 | ) | | $ | 14,318 | |
| (1) | Agreements may be terminated at will by either party without penalty. Payment is due at termination/maturity. |
| (2) | Reflects the floating financing rate, as of December 31, 2021, on the notional amount of the swap agreement paid to the counterparty or received from the counterparty, excluding any commissions. This amount is included as part of the unrealized appreciation/(depreciation). |
See accompanying notes to financial statements.
Financial Statements :: ProFund Rising Rates Opportunity :: 203
Statement of Assets and Liabilities
December 31, 2021
| ASSETS: |
| Total Investment Securities, at cost | | $ | 5,787,000 | |
| Repurchase agreements, at value | | | 5,787,000 | |
| Total Investment Securities, at value | | | 5,787,000 | |
| Segregated cash balances for swap agreements with custodian | | | 90 | |
| Unrealized appreciation on swap agreements | | | 14,318 | |
| Receivable for capital shares issued | | | 104,459 | |
| Prepaid expenses | | | 39 | |
| TOTAL ASSETS | | | 5,905,906 | |
| | | | | |
| LIABILITIES: | | | | |
| Cash overdraft | | | 441 | |
| Payable for capital shares redeemed | | | 823 | |
| Advisory fees payable | | | 3,950 | |
| Management services fees payable | | | 527 | |
| Administration fees payable | | | 350 | |
| Administrative services fees payable | | | 2,470 | |
| Distribution fees payable | | | 3,299 | |
| Transfer agency fees payable | | | 600 | |
| Fund accounting fees payable | | | 193 | |
| Compliance services fees payable | | | 24 | |
| Other accrued expenses | | | 3,597 | |
| TOTAL LIABILITIES | | | 16,274 | |
| NET ASSETS | | $ | 5,889,632 | |
| | | | | |
| NET ASSETS CONSIST OF: | | | | |
| Capital | | $ | 34,553,279 | |
| Total distributable earnings (loss) | | | (28,663,647 | ) |
| NET ASSETS | | $ | 5,889,632 | |
| Shares of Beneficial Interest Outstanding (unlimited number of shares authorized, no par value) | | | 212,179 | |
| Net Asset Value (offering and redemption price per share) | | $ | 27.76 | |
Statement of Operations
For the Year Ended December 31, 2021
| INVESTMENT INCOME: | | | | |
| Interest | | $ | 71 | |
| EXPENSES: | | | | |
| Advisory fees | | | 45,168 | |
| Management services fees | | | 6,022 | |
| Administration fees | | | 4,432 | |
| Transfer agency fees | | | 3,649 | |
| Administrative services fees | | | 13,002 | |
| Distribution fees | | | 15,056 | |
| Custody fees | | | 908 | |
| Fund accounting fees | | | 2,447 | |
| Trustee fees | | | 93 | |
| Compliance services fees | | | 38 | |
| Other fees | | | 5,898 | |
| Recoupment of prior expenses reduced by the Advisor | | | 2,065 | |
| TOTAL NET EXPENSES | | | 98,778 | |
| NET INVESTMENT INCOME (LOSS) | | | (98,707 | ) |
| REALIZED AND UNREALIZED GAINS (LOSSES) ON INVESTMENTS: | | | | |
| Net realized gains (losses) on futures contracts | | | (8,224 | ) |
| Net realized gains (losses) on swap agreements | | | (202,026 | ) |
| Change in net unrealized appreciation/depreciation on swap agreements | | | 34,092 | |
| NET REALIZED AND UNREALIZED GAINS (LOSSES) ON INVESTMENTS | | | (176,158 | ) |
| CHANGE IN NET ASSETS RESULTING FROM OPERATIONS | | $ | (274,865 | ) |
See accompanying notes to financial statements.
204 :: ProFund VP Rising Rates Opportunity :: Financial Statements
| Statements of Changes in Net Assets |
| |
| | | Year Ended
December 31, 2021 | | | Year Ended
December 31, 2020 | |
| FROM INVESTMENT ACTIVITIES: | | | | | | | | |
| | | | | | | | | |
| OPERATIONS: | | | | | | | | |
| Net investment income (loss) | | $ | (98,707 | ) | | $ | (58,251 | ) |
| Net realized gains (losses) on investments | | | (210,250 | ) | | | (1,441,415 | ) |
| Change in net unrealized appreciation/depreciation on investments | | | 34,092 | | | | (129,318 | ) |
| Change in net assets resulting from operations | | | (274,865 | ) | | | (1,628,984 | ) |
| | | | | | | | | |
| DISTRIBUTIONS TO SHAREHOLDERS: | | | | | | | | |
| Total distributions | | | — | | | | (37,790 | ) |
| Change in net assets resulting from distributions | | | — | | | | (37,790 | ) |
| | | | | | | | | |
| CAPITAL TRANSACTIONS: | | | | | | | | |
| Proceeds from shares issued | | | 14,045,664 | | | | 12,193,038 | |
| Distributions reinvested | | | — | | | | 37,790 | |
| Value of shares redeemed | | | (12,321,786 | ) | | | (12,085,309 | ) |
| Change in net assets resulting from capital transactions | | | 1,723,878 | | | | 145,519 | |
| Change in net assets | | | 1,449,013 | | | | (1,521,255 | ) |
| | | | | | | | | |
| NET ASSETS: | | | | | | | | |
| Beginning of period | | | 4,440,619 | | | | 5,961,874 | |
| End of period | | $ | 5,889,632 | | | $ | 4,440,619 | |
| | | | | | | | | |
| SHARE TRANSACTIONS: | | | | | | | | |
| Issued | | | 450,241 | | | | 423,425 | |
| Reinvested | | | — | | | | 1,443 | |
| Redeemed | | | (397,906 | ) | | | (421,054 | ) |
| Change in shares | | | 52,335 | | | | 3,814 | |
See accompanying notes to financial statements.
Financial Highlights :: ProFund VP Rising Rates Opportunity :: 205
ProFunds Financial Highlights FOR THE PERIODS INDICATED
Selected data for a share of beneficial interest outstanding throughout the periods indicated.
| | | Year Ended
Dec. 31, 2021 | | | Year Ended
Dec. 31, 2020 | | | Year Ended
Dec. 31, 2019 | | | Year Ended
Dec. 31, 2018 | | | Year Ended
Dec. 31, 2017 | |
| Net Asset Value, Beginning of Period | | $ | 27.78 | | | $ | 38.21 | | | $ | 48.56 | | | $ | 46.61 | | | $ | 52.91 | |
| | | | | | | | | | | | | | | | | | | | | |
| Investment Activities: | | | | | | | | | | | | | | | | | | | | |
| Net investment income (loss)(a) | | | (0.50 | ) | | | (0.37 | ) | | | 0.21 | | | | 0.06 | | | | (0.46 | ) |
| Net realized and unrealized gains (losses) on investments | | | 0.48 | (b) | | | (9.84 | ) | | | (8.70 | ) | | | 1.89 | | | | (5.84 | ) |
| Total income (loss) from investment activities | | | (0.02 | ) | | | (10.21 | ) | | | (8.49 | ) | | | 1.95 | | | | (6.30 | ) |
| | | | | | | | | | | | | | | | | | | | | |
| Distributions to Shareholders From: | | | | | | | | | | | | | | | | | | | | |
| Net investment income | | | — | | | | (0.22 | ) | | | (0.08 | ) | | | — | | | | — | |
| Net realized gains on investments | | | — | | | | — | | | | (1.78 | ) | | | — | | | | — | |
| Total distributions | | | — | | | | (0.22 | ) | | | (1.86 | ) | | | — | | | | — | |
| | | | | | | | | | | | | | | | | | | | | |
| Net Asset Value, End of Period | | $ | 27.76 | | | $ | 27.78 | | | $ | 38.21 | | | $ | 48.56 | | | $ | 46.61 | |
| | | | | | | | | | | | | | | | | | | | | |
| Total Return | | | (0.07 | )% | | | (26.70 | )% | | | (17.41 | )% | | | 4.16 | % | | | (11.90 | )% |
| | | | | | | | | | | | | | | | | | | | | |
| Ratios to Average Net Assets: | | | | | | | | | | | | | | | | | | | | |
| Gross expenses | | | 1.64 | % | | | 1.73 | % | | | 1.70 | % | | | 1.64 | % | | | 1.70 | % |
| Net expenses | | | 1.64 | % | | | 1.68 | % | | | 1.67 | % | | | 1.64 | % | | | 1.68 | % |
| Net investment income (loss) | | | (1.64 | )% | | | (1.30 | )% | | | 0.50 | % | | | 0.12 | % | | | (0.91 | )% |
| | | | | | | | | | | | | | | | | | | | | |
| Supplemental Data: | | | | | | | | | | | | | | | | | | | | |
| Net assets, end of period (000's) | | $ | 5,890 | | | $ | 4,441 | | | $ | 5,962 | | | $ | 9,941 | | | $ | 7,626 | |
| Portfolio turnover rate(c) | | | — | | | | — | | | | — | | | | — | | | | — | |
| (a) | Per share net investment income (loss) has been calculated using the average daily shares method. |
| (b) | The amount shown for a share outstanding throughout the period does not accord with the change in aggregate gains and losses in the portfolio of securities during the period because of the timing of sales and purchases of fund shares in relation to fluctuating market values during the period. |
| (c) | Portfolio turnover rate is calculated without regard to instruments having a maturity of less than one year from acquisition or derivative instruments (including swap agreements and futures contracts). |
See accompanying notes to financial statements.
206 :: ProFund VP Semiconductor :: Management Discussion of Fund Performance
ProFund VP Semiconductor (the "Fund") seeks investment results, before fees and expenses, that correspond to the performance of the Dow Jones U.S. SemiconductorsSM Index (the "Index"). For the year ended December 31, 2021, the Fund had a total return of 48.49%. For the same period, the Index had a return of 50.87%1 and a volatility of 30.89%. For the year, the Fund achieved an average daily statistical correlation of over 0.99 to the daily performance of the Index.2
The Fund takes positions in financial instruments that, in combination, should have similar return characteristics as the return of the Index. The Index measures the performance of the semiconductor sector of the U.S. equity market. Component companies are engaged in the production of semiconductors and other integrated chips, as well as other related products such as semiconductor capital equipment and motherboards.
During the year ended December 31, 2021, the Fund invested in swap agreements as a substitute for investing directly in stocks in order to gain exposure to the Index. These derivatives generally tracked the performance of their underlying benchmark and were negatively impacted by financing costs associated with their use. The Fund entered into swap agreements with counterparties that the Fund's advisor determined to be major, global financial institutions. If a counterparty becomes insolvent or otherwise fails to perform on its obligations, the value of investments in the Fund may decline. The Fund has sought to mitigate this risk by generally requiring counterparties to post collateral for the benefit of the Fund, marked to market daily, in an amount approximately equal to the amount the counterparty owed to the Fund, subject to certain minimum thresholds.
Value of a $10,000 Investment at Net Asset Value*
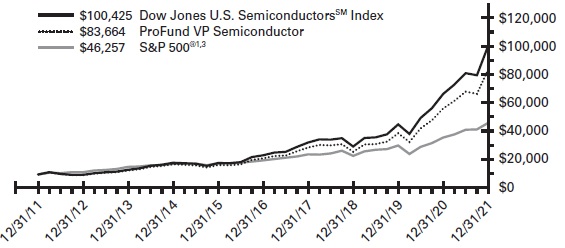
| * | The line graph represents the historical performance of a hypothetical investment of $10,000 in the ProFund VP Semiconductor from December 31, 2011 to December 31, 2021, assuming the reinvestment of distributions. |
Average Annual Total Return as of 12/31/21
| Fund | | One Year | | | Five Year | | | Ten Year | |
| ProFund VP Semiconductor | | | 48.49 | % | | | 31.42 | % | | | 23.67 | % |
| Dow Jones U.S. SemiconductorsSM Index | | | 50.87 | % | | | 33.72 | % | | | 25.95 | % |
| S&P 500® | | | 28.71 | % | | | 18.47 | % | | | 16.55 | % |
Expense Ratios**
| Fund | | Gross | | | Net | | | | | |
| ProFund VP Semiconductor | | | 1.72 | % | | | 1.68 | % | | | | |
| | | | | | | | | | | | | |
| ** | Reflects the expense ratio as reported in the Prospectus dated May 1, 2021. Contractual fee waivers are in effect through April 30, 2022. See Financial Highlights for effective expense ratios. |
Allocation of Portfolio Holdings & Index Composition
Market Exposure
| Investment Type | | % of Net Assets | |
| Equity Securities | | | 82 | % |
| Swap Agreements | | | 18 | % |
| Total Exposure | | | 100 | % |
“Market Exposure” includes the value of total investments (including the contract value of any derivatives) and excludes any instruments used for cash management.
Largest Equity Holdings
| Company | | % of Net Assets | |
| NVIDIA Corp. | | | 21.8 | % |
| Broadcom, Inc. | | | 8.1 | % |
| Intel Corp. | | | 6.2 | % |
| Qualcomm, Inc. | | | 6.1 | % |
| Texas Instruments, Inc. | | | 5.2 | % |
Dow Jones U.S. SemiconductorsSM
Index – Composition
| | | % of Index | |
| Semiconductors & Semiconductor Equipment | | | 100 | % |
Past performance does not guarantee future results. Return calculations assume the reinvestment of distributions and do not reflect taxes that a shareholder would pay on Fund distributions or on the redemption of Fund shares. The performance data quoted represents past performance and current returns may be lower or higher. The investment return and net asset value ("NAV") will fluctuate so that an investor's shares, when redeemed, may be worth more or less than the original cost. The performance above reflects any fee reductions during the applicable periods. If such fee reductions had not occurred, the quoted performance would be lower. Performance numbers are net of all Fund fees and expenses but do not include any insurance, sales, or administrative charges of variable annuity or life insurance contracts. If these charges were included, the returns would be lower. To obtain performance current to the most recent month-end, please call toll-free 888-776-3637.
| 1 | The graph and table reflect the theoretical reinvestment of dividends on securities in the Indexes. The impact of transaction costs and the deduction of fees and expenses associated with a mutual fund, such as investment management and accounting fees, are not reflected in calculations of the Indexes. The Fund's performance reflects the reinvestment of dividends as well as the impact of transaction costs and the deduction of fees and expenses. It is not possible to invest directly in an index. |
| 2 | 1.00 equals perfect correlation. This calculation is based on the daily total return of the Index and the performance of the daily total return of the NAV per share of the Fund. |
| 3 | The S&P 500® is an unmanaged index that consists of the common stocks of 500 major U.S. corporations selected for their size and the frequency and ease with which their stocks trade. |
The above information is not covered by the Report of the Independent Registered Public Accounting Firm.
Financial Statements :: ProFund VP Semiconductor :: 207
Schedule of Portfolio Investments :: December 31, 2021
Common Stocks (82.0%)
| | | Shares | | | Value | |
| Advanced Micro Devices, Inc.* (Semiconductors & Semiconductor Equipment) | | | 7,619 | | | $ | 1,096,374 | |
| Allegro MicroSystems, Inc.* (Semiconductors & Semiconductor Equipment) | | | 346 | | | | 12,518 | |
| Amkor Technology, Inc. (Semiconductors & Semiconductor Equipment) | | | 632 | | | | 15,667 | |
| Analog Devices, Inc. (Semiconductors & Semiconductor Equipment) | | | 3,391 | | | | 596,036 | |
| Applied Materials, Inc. (Semiconductors & Semiconductor Equipment) | | | 5,696 | | | | 896,323 | |
| Azenta, Inc. (Semiconductors & Semiconductor Equipment) | | | 469 | | | | 48,359 | |
| Broadcom, Inc. (Semiconductors & Semiconductor Equipment) | | | 2,597 | | | | 1,728,069 | |
| Cirrus Logic, Inc.* (Semiconductors & Semiconductor Equipment) | | | 360 | | | | 33,127 | |
| Enphase Energy, Inc.* (Semiconductors & Semiconductor Equipment) | | | 851 | | | | 155,682 | |
| Entegris, Inc. (Semiconductors & Semiconductor Equipment) | | | 855 | | | | 118,486 | |
| GLOBALFOUNDRIES, Inc.* (Semiconductors & Semiconductor) | | | 338 | | | | 21,960 | |
| Intel Corp. (Semiconductors & Semiconductor Equipment) | | | 25,658 | | | | 1,321,387 | |
| KLA Corp. (Semiconductors & Semiconductor Equipment) | | | 956 | | | | 411,185 | |
| Lam Research Corp. (Semiconductors & Semiconductor Equipment) | | | 887 | | | | 637,886 | |
| Lattice Semiconductor Corp.* (Semiconductors & Semiconductor Equipment) | | | 863 | | | | 66,503 | |
| Marvell Technology, Inc. (Semiconductors & Semiconductor Equipment) | | | 5,197 | | | | 454,686 | |
| Microchip Technology, Inc. (Semiconductors & Semiconductor Equipment) | | | 3,501 | | | | 304,797 | |
| Micron Technology, Inc. (Semiconductors & Semiconductor Equipment) | | | 7,058 | | | | 657,453 | |
| MKS Instruments, Inc. (Semiconductors & Semiconductor Equipment) | | | 350 | | | | 60,960 | |
| Monolithic Power Systems, Inc. (Semiconductors & Semiconductor Equipment) | | | 273 | | | | 134,679 | |
| NVIDIA Corp. (Semiconductors & Semiconductor Equipment) | | | 15,772 | | | | 4,638,702 | |
| NXP Semiconductors N.V. (Semiconductors & Semiconductor Equipment) | | | 1,677 | | | | 381,987 | |
| ON Semiconductor Corp.* (Semiconductors & Semiconductor Equipment) | | | 2,718 | | | | 184,607 | |
| Power Integrations, Inc. (Semiconductors & Semiconductor Equipment) | | | 381 | | | | 35,391 | |
| Qorvo, Inc.* (Semiconductors & Semiconductor Equipment) | | | 696 | | | | 108,847 | |
| Qualcomm, Inc. (Semiconductors & Semiconductor Equipment) | | | 7,066 | | | | 1,292,159 | |
| Semtech Corp.* (Semiconductors & Semiconductor Equipment) | | | 406 | | | | 36,106 | |
| Silicon Laboratories, Inc.* (Semiconductors & Semiconductor Equipment) | | | 254 | | | | 52,431 | |
| Skyworks Solutions, Inc. (Semiconductors & Semiconductor Equipment) | | | 1,042 | | | | 161,656 | |
| SolarEdge Technologies, Inc.* (Semiconductors & Semiconductor Equipment) | | | 332 | | | | 93,149 | |
| Teradyne, Inc. (Semiconductors & Semiconductor Equipment) | | | 1,028 | | | | 168,109 | |
| Texas Instruments, Inc. (Semiconductors & Semiconductor Equipment) | | | 5,827 | | | | 1,098,215 | |
| Universal Display Corp. (Semiconductors & Semiconductor Equipment) | | | 274 | | | | 45,218 | |
| Wolfspeed, Inc.* (Semiconductors & Semiconductor Equipment) | | | 731 | | | | 81,704 | |
| Xilinx, Inc. (Semiconductors &Semiconductor Equipment) | | | 1,564 | | | | 331,615 | |
TOTAL COMMON STOCKS
(Cost $4,980,512) | | | | | | | 17,482,033 | |
Repurchase Agreements(a) (1.4%)
| | | Principal
Amount | | | Value | |
| Repurchase Agreements with various counterparties, 0.00%, dated 12/31/21, due 1/3/22, total to be received $298,000 | | $ | 298,000 | | | $ | 298,000 | |
TOTAL REPURCHASE AGREEMENTS
(Cost $298,000) | | | | | | | 298,000 | |
TOTAL INVESTMENT SECURITIES
(Cost $5,278,512) — 83.4% | | | | | | | 17,780,033 | |
| Net other assets (liabilities) — 16.6% | | | | | | | 3,529,864 | |
| NET ASSETS — 100.0% | | | | | | $ | 21,309,897 | |
| * | Non-income producing security. |
| (a) | The ProFund VP invests in Repurchase Agreements jointly with other funds in the Trust. See "Repurchase Agreements" under Note 2 in the Notes to Financial Statements to view the details of each individual agreement and counterparty as well as a description of the securities subject to repurchase. |
See accompanying notes to financial statements.
208 :: ProFund VP Semiconductor :: Financial Statements
Total Return Swap Agreements—Long
| Underlying Instrument | | Counterparty | | Termination
Date(1) | | Rate Paid
(Received)(2) | | | Notional
Amount | | | Value and
Unrealized
Appreciation/
(Depreciation) | |
| Dow Jones U.S. Semiconductors Index | | Goldman Sachs International | | 1/24/22 | | | 0.68 | % | | $ | 3,794,266 | | | $ | (7,163 | ) |
| (1) | Agreements may be terminated at will by either party without penalty. Payment is due at termination/maturity. |
| (2) | Reflects the floating financing rate, as of December 31, 2021, on the notional amount of the swap agreement paid to the counterparty or received from the counterparty, excluding any commissions. This amount is included as part of the unrealized appreciation/(depreciation). |
ProFund VP Semiconductor invested in the following industries as of December 31, 2021:
| | | Value | | | % of
Net Assets | |
| Semiconductors & Semiconductor Equipment | | $ | 17,482,033 | | | | 82.0 | % |
| Other** | | | 3,827,864 | | | | 18.0 | % |
| Total | | $ | 21,309,897 | | | | 100.0 | % |
| ** | Includes any non-equity securities and net other assets (liabilities), which includes any receivable for capital shares issued and payable for capital shares redeemed. |
See accompanying notes to financial statements.
Financial Statements :: ProFund VP Semiconductor :: 209
Statement of Assets and Liabilities
December 31, 2021
| ASSETS: |
| Total Investment Securities, at cost | | $ | 5,278,512 | |
| Securities, at value | | | 17,482,033 | |
| Repurchase agreements, at value | | | 298,000 | |
| Total Investment Securities, at value | | | 17,780,033 | |
| Cash | | | 181 | |
| Segregated cash balances for swap agreements with custodian | | | 60,000 | |
| Dividends receivable | | | 3,676 | |
| Receivable for capital shares issued | | | 1,019,696 | |
| Receivable for investments sold | | | 2,497,362 | |
| Prepaid expenses | | | 204 | |
| TOTAL ASSETS | | | 21,361,152 | |
| | | | | |
| LIABILITIES: | | | | |
| Payable for capital shares redeemed | | | 644 | |
| Unrealized depreciation on swap agreements | | | 7,163 | |
| Advisory fees payable | | | 12,829 | |
| Management services fees payable | | | 1,711 | |
| Administration fees payable | | | 1,210 | |
| Administrative services fees payable | | | 8,364 | |
| Distribution fees payable | | | 9,450 | |
| Transfer agency fees payable | | | 1,962 | |
| Fund accounting fees payable | | | 678 | |
| Compliance services fees payable | | | 78 | |
| Other accrued expenses | | | 7,166 | |
| TOTAL LIABILITIES | | | 51,255 | |
| NET ASSETS | | $ | 21,309,897 | |
| | | | | |
| NET ASSETS CONSIST OF: | | | | |
| Capital | | $ | 8,885,996 | |
| Total distributable earnings (loss) | | | 12,423,901 | |
| NET ASSETS | | $ | 21,309,897 | |
| Shares of Beneficial Interest Outstanding (unlimited number of shares authorized, no par value) | | | 191,056 | |
| Net Asset Value (offering and redemption price per share) | | $ | 111.54 | |
Statement of Operations
For the Year Ended December 31, 2021
| INVESTMENT INCOME: | | | | |
| Dividends | | $ | 168,478 | |
| Interest | | | 7 | |
| Foreign tax withholding | | | (565 | ) |
| TOTAL INVESTMENT INCOME | | | 167,920 | |
| | | | | |
| EXPENSES: | | | | |
| Advisory fees | | | 115,702 | |
| Management services fees | | | 15,427 | |
| Administration fees | | | 11,051 | |
| Transfer agency fees | | | 9,198 | |
| Administrative services fees | | | 37,925 | |
| Distribution fees | | | 38,567 | |
| Custody fees | | | 2,272 | |
| Fund accounting fees | | | 6,261 | |
| Trustee fees | | | 251 | |
| Compliance services fees | | | 113 | |
| Other fees | | | 14,950 | |
| Recoupment of prior expenses reduced by the Advisor | | | 1,280 | |
| TOTAL NET EXPENSES | | | 252,997 | |
| NET INVESTMENT INCOME (LOSS) | | | (85,077 | ) |
| | | | | |
| REALIZED AND UNREALIZED GAINS (LOSSES) ON INVESTMENTS: | | | | |
| Net realized gains (losses) on investment securities | | | 186,677 | |
| Net realized gains (losses) on swap agreements | | | 222,552 | |
| Change in net unrealized appreciation/depreciation on investment securities | | | 5,573,183 | |
| Change in net unrealized appreciation/depreciation on swap agreements | | | (15,993 | ) |
| NET REALIZED AND UNREALIZED GAINS (LOSSES) ON INVESTMENTS | | | 5,966,419 | |
| CHANGE IN NET ASSETS RESULTING FROM OPERATIONS | | $ | 5,881,342 | |
See accompanying notes to financial statements.
210 :: ProFund VP Semiconductor :: Financial Statements
| Statements of Changes in Net Assets |
| |
| | | Year Ended
December 31, 2021 | | | Year Ended
December 31, 2020 | |
| FROM INVESTMENT ACTIVITIES: | | | | | | | | |
| | | | | | | | | |
| OPERATIONS: | | | | | | | | |
| Net investment income (loss) | | $ | (85,077 | ) | | $ | (9,012 | ) |
| Net realized gains (losses) on investments | | | 409,229 | | | | 1,160,724 | |
| Change in net unrealized appreciation/depreciation on investments | | | 5,557,190 | | | | 2,168,996 | |
| Change in net assets resulting from operations | | | 5,881,342 | | | | 3,320,708 | |
| | | | | | | | | |
| DISTRIBUTIONS TO SHAREHOLDERS: | | | | | | | | |
| Total distributions | | | (1,055,565 | ) | | | (696,166 | ) |
| Change in net assets resulting from distributions | | | (1,055,565 | ) | | | (696,166 | ) |
| | | | | | | | | |
| CAPITAL TRANSACTIONS: | | | | | | | | |
| Proceeds from shares issued | | | 37,060,548 | | | | 28,294,483 | |
| Distributions reinvested | | | 1,055,565 | | | | 696,166 | |
| Value of shares redeemed | | | (34,738,070 | ) | | | (28,026,511 | ) |
| Change in net assets resulting from capital transactions | | | 3,378,043 | | | | 964,138 | |
| Change in net assets | | | 8,203,820 | | | | 3,588,680 | |
| | | | | | | | | |
| NET ASSETS: | | | | | | | | |
| Beginning of period | | | 13,106,077 | | | | 9,517,397 | |
| End of period | | $ | 21,309,897 | | | $ | 13,106,077 | |
| | | | | | | | | |
| SHARE TRANSACTIONS: | | | | | | | | |
| Issued | | | 395,856 | | | | 444,871 | |
| Reinvested | | | 14,005 | | | | 9,454 | |
| Redeemed | | | (377,619 | ) | | | (452,544 | ) |
| Change in shares | | | 32,242 | | | | 1,781 | |
See accompanying notes to financial statements.
Financial Highlights :: ProFund VP Semiconductor :: 211
ProFunds Financial Highlights FOR THE PERIODS INDICATED
Selected data for a share of beneficial interest outstanding throughout the periods indicated.
| | | Year Ended
Dec. 31, 2021 | | | Year Ended
Dec. 31, 2020 | | | Year Ended
Dec. 31, 2019 | | | Year Ended
Dec. 31, 2018 | | | Year Ended
Dec. 31, 2017 | |
| Net Asset Value, Beginning of Period | | $ | 82.52 | | | $ | 60.61 | | | $ | 44.36 | | | $ | 52.82 | | | $ | 39.06 | |
| | | | | | | | | | | | | | | | | | | | | |
| Investment Activities: | | | | | | | | | | | | | | | | | | | | |
| Net investment income (loss)(a) | | | (0.51 | ) | | | (0.06 | ) | | | 0.22 | | | | 0.17 | | | | (0.06 | ) |
| Net realized and unrealized gains (losses) on investments | | | 36.96 | | | | 26.68 | | | | 20.66 | | | | (4.81 | ) | | | 13.95 | |
| Total income (loss) from investment activities | | | 36.45 | | | | 26.62 | | | | 20.88 | | | | (4.64 | ) | | | 13.89 | |
| | | | | | | | | | | | | | | | | | | | | |
| Distributions to Shareholders From: | | | | | | | | | | | | | | | | | | | | |
| Net investment income | | | — | | | | (0.23 | ) | | | (0.15 | ) | | | — | | | | (0.13 | ) |
| Net realized gains on investments | | | (7.43 | ) | | | (4.48 | ) | | | (4.48 | ) | | | (3.82 | ) | | | — | |
| Total distributions | | | (7.43 | ) | | | (4.71 | ) | | | (4.63 | ) | | | (3.82 | ) | | | (0.13 | ) |
| | | | | | | | | | | | | | | | | | | | | |
| Net Asset Value, End of Period | | $ | 111.54 | | | $ | 82.52 | | | $ | 60.61 | | | $ | 44.36 | | | $ | 52.82 | |
| | | | | | | | | | | | | | | | | | | | | |
| Total Return | | | 48.49 | % | | | 44.85 | % | | | 49.77 | % | | | (10.23 | )% | | | 35.55 | % |
| | | | | | | | | | | | | | | | | | | | | |
| Ratios to Average Net Assets: | | | | | | | | | | | | | | | | | | | | |
| Gross expenses | | | 1.64 | % | | | 1.72 | % | | | 1.67 | % | | | 1.65 | % | | | 1.68 | % |
| Net expenses | | | 1.64 | % | | | 1.70 | %(b) | | | 1.66 | % | | | 1.65 | % | | | 1.68 | % |
| Net investment income (loss) | | | (0.55 | )% | | | (0.09 | )% | | | 0.41 | % | | | 0.31 | % | | | (0.12 | )% |
| | | | | | | | | | | | | | | | | | | | | |
| Supplemental Data: | | | | | | | | | | | | | | | | | | | | |
| Net assets, end of period (000's) | | $ | 21,310 | | | $ | 13,106 | | | $ | 9,517 | | | $ | 5,364 | | | $ | 11,060 | |
| Portfolio turnover rate(c) | | | 230 | % | | | 348 | % | | | 561 | % | | | 249 | % | | | 297 | % |
| (a) | Per share net investment income (loss) has been calculated using the average daily shares method. |
| (b) | The expense ratio does not correlate to the applicable expense limits in place during the period given that the annual contractual expense limitation is applied for one year periods ended April 30th of each year, instead of coinciding with the December 31st year end. Details of the current expense limitation in effect can be found in Note 4 of the accompanying Notes to Financial Statements. |
| (c) | Portfolio turnover rate is calculated without regard to instruments having a maturity of less than one year from acquisition or derivative instruments (including sap agreements and futures contracts). The portfolio turnover rate can be high and volatile due to the amount and timing of sales and purchases of fund shares during the period. |
See accompanying notes to financial statements.
212 :: ProFund VP Short Dow 30 :: Management Discussion of Fund Performance
ProFund VP Short Dow 30 (the "Fund") seeks daily investment results, before fees and expenses, that correspond to the inverse (-1x) of the return of the Dow Jones Industrial Average® (the "Index") for a single day, not for any other period. A "single day" is measured from the time the Fund calculates its net asset value ("NAV") to the time of the Fund's next NAV calculation. The Fund does not seek to achieve its stated investment objective over a period of time greater than a single day. The return of the Fund for periods longer than a single day will be the result of its return for each day compounded over the period. The Fund's returns for periods longer than a single day will very likely differ in amount, and possibly even direction from the Fund's stated multiple (-1x) times the return of the Fund's Index for the same period. For periods longer than a single day, the Fund will lose money if the Index's performance is flat, and it is possible that the Fund will lose money even if the level of the index falls. For the year ended December 31, 2021, the Fund had a total return of -19.12%. For the same period, the Index had a total return of 20.95%1 and a volatility of 12.42%. For the year, the Fund achieved an average daily statistical correlation of over 0.99 to the inverse of the daily performance of the Index.2
The Fund takes positions in financial instruments that, in combination, should have similar daily return characteristics as the inverse of the daily return of the Index. The Index is a price-weighted index. The Index includes 30 large-cap, "blue-chip" U.S. stocks, excluding utility and transportation companies. Components are selected through a discretionary process with no pre-determined criteria except that components should be established U.S. companies that are leaders in their industries, have an excellent reputation, demonstrate sustained growth, are of interest to a large number of investors, and accurately represents the sectors covered by the average. The Index is not limited to traditionally defined industrial stocks. Instead, the Index serves as a measure of the entire U.S. market, covering such diverse industries as financial services, technology, retail, entertainment, and consumer goods. Composition changes are rare, and generally occur only after corporate acquisitions or other dramatic shifts in a component's core business. When such an event necessitates that one component be replaced, the entire Index is reviewed.
During the year ended December 31, 2021, the Fund invested in swap agreements as a substitute for shorting stocks in order to gain inverse exposure to the Index. These derivatives generally tracked the performance of their underlying benchmark and benefited from financing costs associated with their use. The Fund entered into swap agreements with counterparties that the Fund's advisor determined to be major, global financial institutions. If a counterparty becomes insolvent or otherwise fails to perform on its obligations, the value of investments in the Fund may decline. The Fund has sought to mitigate this risk by generally requiring counterparties to post collateral for the benefit of the Fund, marked to market daily, in an amount approximately equal to the amount the counterparty owed to the Fund, subject to certain minimum thresholds.
Value of a $10,000 Investment at Net Asset Value*
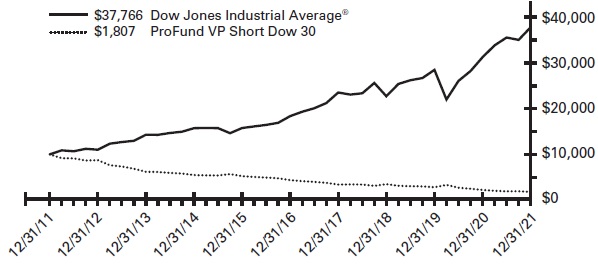
| * | The line graph represents the historical performance of a hypothetical investment of $10,000 in the ProFund VP Short Dow 30 from December 31, 2011 to December 31, 2021, assuming the reinvestment of distributions. |
Average Annual Total Return as of 12/31/21
| Fund | | One Year | | | Five Year | | | Ten Year | |
| ProFund VP Short Dow 30 | | | -19.12 | % | | | -16.23 | % | | | -15.73 | % |
| Dow Jones Industrial Average® | | | 20.95 | % | | | 15.51 | % | | | 14.21 | % |
Expense Ratios**
| Fund | | Gross | | | Net | | | | | |
| ProFund VP Short Dow 30 | | | 1.75 | % | | | 1.68 | % | | | | |
| ** | Reflects the expense ratio as reported in the Prospectus dated May 1, 2021. Contractual fee waivers are in effect through April 30, 2022. See Financial Highlights for effective expense ratios. |
Allocation of Portfolio Holdings & Index Composition
Market Exposure
| Investment Type | | % of Net Assets | |
| Swap Agreements | | | (99 | )% |
| Total Exposure | | | (99 | )% |
"Market Exposure" includes the value of total investments (including the contract value of any derivatives) and excludes any instruments used for cash management.
Holdings
The ProFund VP Short Dow 30 primarily invests in non-equity securities, which may include: swap agreements, futures contracts, repurchase agreements and U.S. Government securities.
Dow Jones Industrial Average® – Composition
| | | % of Index | |
| Information Technology | | | 22 | % |
| Health Care | | | 18 | % |
| Financials | | | 16 | % |
| Consumer Discretionary | | | 15 | % |
| Industrials | | | 14 | % |
| Consumer Staples | | | 8 | % |
| Communication Services | | | 4 | % |
| Energy | | | 2 | % |
| Materials | | | 1 | % |
Past performance does not guarantee future results. Return calculations assume the reinvestment of distributions and do not reflect taxes that a shareholder would pay on Fund distributions or on the redemption of Fund shares. The performance data quoted represents past performance and current returns may be lower or higher. The investment return and NAV will fluctuate so that an investor's shares, when redeemed, may be worth more or less than the original cost. The performance above reflects any fee reductions during the applicable periods. If such fee reductions had not occurred, the quoted performance would be lower. Performance numbers are net of all Fund fees and expenses but do not include any insurance, sales, or administrative charges of variable annuity or life insurance contracts. If these charges were included, the returns would be lower. To obtain performance current to the most recent month-end, please call toll-free 888-776-3637.
| 1 | The graph and table reflect the theoretical reinvestment of dividends on securities in the Index. The impact of transaction costs and the deduction of fees and expenses associated with a mutual fund, such as investment management and accounting fees, are not reflected in the index calculations. The Fund's performance reflects the reinvestment of dividends as well as the impact of transaction costs and the deduction of fees and expenses. It is not possible to invest directly in an index. |
| 2 | 1.00 equals perfect correlation. This calculation is based on the daily total return of the Index and the performance of the daily total return of the NAV per share of the Fund. |
The above information is not covered by the Report of the Independent Registered Public Accounting Firm.
Financial Statements :: ProFund VP Short Dow 30 :: 213
Schedule of Portfolio Investments :: December 31, 2021
Repurchase Agreements(a)(b) (88.9%)
| | | Principal
Amount | | | Value | |
| Repurchase Agreements with various counterparties, 0.00%, dated 12/31/21, due 1/3/22, total to be received $6,000 | | $ | 6,000 | | | $ | 6,000 | |
TOTAL REPURCHASE AGREEMENTS (Cost $6,000) | | | | | | | 6,000 | |
TOTAL INVESTMENT SECURITIES (Cost $6,000) — 88.9% | | | | | | | 6,000 | |
| Net other assets (liabilities)—11.1% | | | | | | | 750 | |
| NET ASSETS — 100.0% | | | | | | $ | 6,750 | |
| (a) | A portion of these securities were held in a segregated account for the benefit of swap counterparties in the event of default. At December 31, 2021, the aggregate amount held in a segregated account was $4,000. |
| (b) | The ProFund VP invests in Repurchase Agreements jointly with other funds in the Trust. See "Repurchase Agreements" under Note 2 in the Notes to Financial Statements to view the details of each individual agreement and counterparty as well as a description of the securities subject to repurchase. |
Total Return Swap Agreements — Short
| Underlying Instrument | | Counterparty | | Termination
Date(1) | | | Rate Paid
(Received)(2) | | | Notional
Amount | | | Value and
Unrealized
Appreciation/
(Depreciation) | |
| Dow Jones Industrial Average | | Goldman Sachs International | | 1/27/22 | | | | (0.43 | )% | | $ | (1,031 | ) | | $ | (1 | ) |
| Dow Jones Industrial Average | | UBS AG | | 1/27/22 | | | | (0.28 | )% | | | (5,664 | ) | | | (6 | ) |
| | | | | | | | | | | | $ | (6,695 | ) | | $ | (7 | ) |
| (1) | Agreements may be terminated at will by either party without penalty. Payment is due at termination/maturity. |
| (2) | Reflects the floating financing rate, as of December 31, 2021, on the notional amount of the swap agreement paid to the counterparty or received from the counterparty, excluding any commissions. This amount is included as part of the unrealized appreciation/(depreciation). |
See accompanying notes to financial statements.
214 :: ProFund VP Short Dow 30 :: Financial Statements
Statement of Assets and Liabilities
December 31, 2021
| ASSETS: | | | | |
| Total Investment Securities, at cost | | $ | 6,000 | |
| Repurchase agreements, at value | | | 6,000 | |
| Total Investment Securities, at value | | | 6,000 | |
| Cash | | | 786 | |
| Prepaid expenses | | | — | (a) |
| TOTAL ASSETS | | | 6,786 | |
| | | | | |
| LIABILITIES: | | | | |
| Unrealized depreciation on swap agreements | | | 7 | |
| Advisory fees payable | | | 18 | |
| Management services fees payable | | | 2 | |
| Administration fees payable | | | — | (a) |
| Administrative services fees payable | | | 1 | |
| Distribution fees payable | | | 2 | |
| Transfer agency fees payable | | | 1 | |
| Fund accounting fees payable | | | — | (a) |
| Compliance services fees payable | | | — | (a) |
| Other accrued expenses | | | 5 | |
| TOTAL LIABILITIES | | | 36 | |
| NET ASSETS | | $ | 6,750 | |
| | | | | |
| NET ASSETS CONSIST OF: | | | | |
| Capital | | $ | 126,117 | |
| Total distributable earnings (loss) | | | (119,367 | ) |
| NET ASSETS | | $ | 6,750 | |
| Shares of Beneficial Interest Outstanding (unlimited number of shares authorized, no par value) | | | 302 | |
| Net Asset Value (offering and redemption price per share) | | $ | 22.35 | |
| (a) | Amount is less than $0.50. |
Statement of Operations
For the Year Ended December 31, 2021
| INVESTMENT INCOME: | | | | |
| Interest | | $ | — | (a) |
| | | | | |
| EXPENSES: | | | | |
| Advisory fees | | | 58 | |
| Management services fees | | | 8 | |
| Administration fees | | | 6 | |
| Transfer agency fees | | | 5 | |
| Administrative services fees | | | 5 | |
| Distribution fees | | | 20 | |
| Custody fees | | | — | (a) |
| Fund accounting fees | | | 3 | |
| Trustee fees | | | — | (a) |
| Compliance services fees | | | — | (a) |
| Other fees | | | 3 | |
| Recoupment of prior expenses reduced by the Advisor | | | 21 | |
| TOTAL NET EXPENSES | | | 129 | |
| NET INVESTMENT INCOME (LOSS) | | | (129 | ) |
| | | | | |
| REALIZED AND UNREALIZED GAINS (LOSSES) ON INVESTMENTS: | | | | |
| Gain received from non-recurring class action settlement | | | 50 | |
| Net realized gains (losses) on swap agreements | | | (1,733 | ) |
| Change in net unrealized appreciation/depreciation on swap agreements | | | 100 | |
| NET REALIZED AND UNREALIZED GAINS (LOSSES) ON INVESTMENTS | | | (1,583 | ) |
| CHANGE IN NET ASSETS RESULTING FROM OPERATIONS | | $ | (1,712 | ) |
See accompanying notes to financial statements.
Financial Statements :: ProFund VP Short Dow 30 :: 215
Statements of Changes in Net Assets
| |
| | | Year Ended
December 31, 2021 | | | Year Ended
December 31, 2020 | |
| FROM INVESTMENT ACTIVITIES: | | | | | | | | |
| | | | | | | | | |
| OPERATIONS: | | | | | | | | |
| Net investment income (loss) | | $ | (129 | ) | | $ | (1,509 | ) |
| Net realized gains (losses) on investments | | | (1,683 | ) | | | (62,897 | ) |
| Change in net unrealized appreciation/depreciation on investments | | | 100 | | | | (152 | ) |
| Change in net assets resulting from operations | | | (1,712 | ) | | | (64,558 | ) |
| | | | | | | | | |
| DISTRIBUTIONS TO SHAREHOLDERS: | | | | | | | | |
| Total distributions | | | — | | | | (43 | ) |
| Change in net assets resulting from distributions | | | — | | | | (43 | ) |
| | | | | | | | | |
| CAPITAL TRANSACTIONS: | | | | | | | | |
| Proceeds from shares issued | | | — | | | | 1,047,279 | |
| Distributions reinvested | | | — | | | | 43 | |
| Value of shares redeemed | | | (7,564 | ) | | | (978,223 | ) |
| Change in net assets resulting from capital transactions | | | (7,564 | ) | | | 69,099 | |
| Change in net assets | | | (9,276 | ) | | | 4,498 | |
| | | | | | | | | |
| NET ASSETS: | | | | | | | | |
| Beginning of period | | | 16,026 | | | | 11,528 | |
| End of period | | $ | 6,750 | | | $ | 16,026 | |
| | | | | | | | | |
| SHARE TRANSACTIONS: | | | | | | | | |
| Issued | | | — | | | | 30,329 | |
| Reinvested | | | — | | | | 1 | |
| Redeemed | | | (278 | ) | | | (30,079 | ) |
| Change in shares | | | (278 | ) | | | 251 | |
See accompanying notes to financial statements.
216 :: ProFund VP Short Dow 30 :: Financial Highlights
ProFunds Financial Highlights FOR THE PERIODS INDICATED
Selected data for a share of beneficial interest outstanding throughout the periods indicated.
| | | Year Ended
Dec. 31, 2021 | | | Year Ended
Dec. 31, 2020 | | | Year Ended
Dec. 31, 2019(a) | | | Year Ended
Dec. 31, 2018(a) | | | Year Ended
Dec. 31, 2017(a) | |
| Net Asset Value, Beginning of Period | | $ | 27.63 | | | $ | 35.04 | | | $ | 43.37 | | | $ | 42.35 | | | $ | 54.31 | |
| | | | | | | | | | | | | | | | | | | | | |
| Investment Activities: | | | | | | | | | | | | | | | | | | | | |
| Net investment income (loss)(b) | | | (0.41 | ) | | | (0.56 | ) | | | 0.13 | | | | — | (c) | | | (0.44 | ) |
| Net realized and unrealized gains (losses) on investments | | | (4.87 | ) | | | (6.78 | ) | | | (8.44 | ) | | | 1.02 | | | | (11.52 | ) |
| Total income (loss) from investment activities | | | (5.28 | ) | | | (7.34 | ) | | | (8.31 | ) | | | 1.02 | | | | (11.96 | ) |
| | | | | | | | | | | | | | | | | | | | | |
| Distributions to Shareholders From: | | | | | | | | | | | | | | | | | | | | |
| Net investment income | | | — | | | | (0.07 | ) | | | (0.02 | ) | | | — | | | | — | |
| | | | | | | | | | | | | | | | | | | | | |
| Net Asset Value, End of Period | | $ | 22.35 | | | $ | 27.63 | | | $ | 35.04 | | | $ | 43.37 | | | $ | 42.35 | |
| | | | | | | | | | | | | | | | | | | | | |
| Total Return | | | (19.12 | )%(d) | | | (20.89 | )% | | | (19.25 | )% | | | 2.36 | % | | | (22.02 | )% |
| | | | | | | | | | | | | | | | | | | | | |
| Ratios to Average Net Assets: | | | | | | | | | | | | | | | | | | | | |
| Gross expenses | | | 1.68 | % | | | 1.75 | % | | | 1.76 | % | | | 1.81 | % | | | 2.87 | % |
| Net expenses | | | 1.68 | % | | | 1.68 | % | | | 1.68 | % | | | 1.68 | % | | | 1.68 | % |
| Net investment income (loss) | | | (1.68 | )% | | | (1.63 | )% | | | 0.34 | % | | | 0.03 | % | | | (0.90 | )% |
| | | | | | | | | | | | | | | | | | | | | |
| Supplemental Data: | | | | | | | | | | | | | | | | | | | | |
| Net assets, end of period (000's) | | $ | 7 | | | $ | 16 | | | $ | 12 | | | $ | 14 | | | $ | 14 | |
| Portfolio turnover rate(e) | | | — | | | | — | | | | — | | | | — | | | | — | |
| (a) | As described in Note 8, share amounts have been adjusted for 1:4 reverse share split that occurred on November 18, 2019. |
| (b) | Per share net investment income (loss) has been calculated using the average daily shares method. |
| (c) | Amount is less than $0.005. |
| (d) | During the year ended December 31, 2021, the Fund received monies related to certain nonrecurring litigation settlements. The corresponding impact to the total return was an increase of 0.60%. |
| (e) | Portfolio turnover rate is calculated without regard to instruments having a maturity of less than one year from acquisition or derivative instruments (including swap agreements and futures contracts). |
See accompanying notes to financial statements.
Management Discussion of Fund Performance :: ProFund VP Short Emerging Markets :: 217
ProFund VP Short Emerging Markets (the "Fund") seeks daily investment results, before fees and expenses, that correspond to the inverse (-1x) of the return of the S&P/BNY Mellon Emerging 50 ADR Index (USD) (the "Index") for a single day, not for any other period. A "single day" is measured from the time the Fund calculates its net asset value ("NAV") to the time of the Fund's next NAV calculation. The Fund does not seek to achieve its stated investment objective over a period of time greater than a single day. The return of the Fund for periods longer than a single day will be the result of its return for each day compounded over the period. The Fund's returns for periods longer than a single day will very likely differ in amount, and possibly even direction from the Fund's stated multiple (-1x) times the return of the Fund's Index for the same period. For periods longer than a single day, the Fund will lose money if the Index's performance is flat, and it is possible that the Fund will lose money even if the level of the index falls. For the year ended December 31, 2021, the Fund had a total return of 9.96%. For the same period, the Index had a total return of -16.59%1 and a volatility of 24.49%. For the year, the Fund achieved an average daily statistical correlation of over 0.99 to the inverse of the daily performance of the Index.2
The Fund takes positions in financial instruments that, in combination, should have similar daily return characteristics as the inverse of the daily return of the Index. The Index is a free-float adjusted, market capitalization-weighted index. The Index is designed to track the performance of a basket of companies who have their primary equity listing on a stock exchange of an emerging market country and who also have depositary receipts that trade on a U.S. exchange or on Nasdaq. As of December 31, 2021, the Index consists of companies from the following emerging market countries: Brazil, Chile, China, Colombia, India, Indonesia, Mexico, South Africa, South Korea and Taiwan. The Index is expressed in U.S. dollar terms and as such should generally reflect the relative movement of the U.S. dollar against the basket of foreign currencies represented by the constituent companies in the Index.
During the year ended December 31, 2021, the Fund invested in swap agreements as a substitute for shorting stocks in order to gain inverse exposure to the Index. These derivatives generally tracked the performance of their underlying benchmark and benefited from financing costs associated with their use. The Fund entered into swap agreements with counterparties that the Fund's advisor determined to be major, global financial institutions. If a counterparty becomes insolvent or otherwise fails to perform on its obligations, the value of investments in the Fund may decline. The Fund has sought to mitigate this risk by generally requiring counterparties to post collateral for the benefit of the Fund, marked to market daily, in an amount approximately equal to the amount the counterparty owed to the Fund, subject to certain minimum thresholds.
Value of a $10,000 Investment at Net Asset Value*
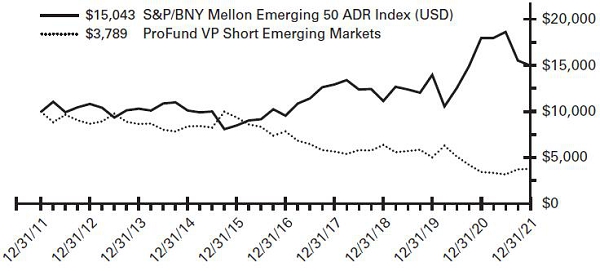
| * | The line graph represents the historical performance of a hypothetical investment of $10,000 in the ProFund VP Short Emerging Markets from December 31, 2011 to December 31, 2021, assuming the reinvestment of distributions. |
Average Annual Total Return as of 12/31/21
| Fund | | One Year | | | Five Year | | | Ten Year | |
| ProFund VP Short Emerging Markets | | | 9.96 | % | | | -13.59 | % | | | -9.25 | % |
| S&P/BNY Mellon Emerging 50 ADR Index (USD) | | | -16.59 | % | | | 9.44 | % | | | 4.17 | % |
Expense Ratios**
| Fund | | Gross | | | Net | | | | | |
| ProFund VP Short Emerging Markets | | | 1.72 | % | | | 1.68 | % | | | | |
| ** | Reflects the expense ratio as reported in the Prospectus dated May 1, 2021. Contractual fee waivers are in effect through April 30, 2022. See Financial Highlights for effective expense ratios. |
Allocation of Portfolio Holdings & Index Composition
Market Exposure
| Investment Type | | % of Net Assets | |
| Swap Agreements | | | (100 | )% |
| Total Exposure | | | (100 | )% |
“Market Exposure” includes the value of total investments (including the contract value of any derivatives) and excludes any instruments used for cash management.
Holdings
The ProFund VP Short Emerging Markets primarily invests in non-equity securities, which may include: swap agreements, futures contracts, repurchase agreements and U.S. Government securities.
S&P/BNY Mellon Emerging 50 ADR Index (USD) – Composition
| Industry Breakdown | | % of Index | |
| Information Technology | | | 29 | % |
| Consumer Discretionary | | | 25 | % |
| Financials | | | 15 | % |
| Communication Services | | | 11 | % |
| Materials | | | 10 | % |
| Energy | | | 4 | % |
| Consumer Staples | | | 2 | % |
| Health Care | | | 2 | % |
| Industrials | | | 1 | % |
| Real Estate | | | 1 | % |
| Country Composition | | | |
| China | | | 36 | % |
| Taiwan | | | 24 | % |
| India | | | 17 | % |
| Brazil | | | 11 | % |
| Other | | | 12 | % |
Past performance does not guarantee future results. Return calculations assume the reinvestment of distributions and do not reflect taxes that a shareholder would pay on Fund distributions or on the redemption of Fund shares. The performance data quoted represents past performance and current returns may be lower or higher. The investment return and NAV will fluctuate so that an investor's shares, when redeemed, may be worth more or less than the original cost. The performance above reflects any fee reductions during the applicable periods. If such fee reductions had not occurred, the quoted performance would be lower. Performance numbers are net of all Fund fees and expenses but do not include any insurance, sales, or administrative charges of variable annuity or life insurance contracts. If these charges were included, the returns would be lower. To obtain performance current to the most recent month-end, please call toll-free 888-776-3637.
| 1 | The graph and table reflect the theoretical reinvestment of dividends on securities in the Index. The impact of transaction costs and the deduction of fees and expenses associated with a mutual fund, such as investment management and accounting fees, are not reflected in the index calculations. The Fund's performance reflects the reinvestment of dividends as well as the impact of transaction costs and the deduction of fees and expenses. It is not possible to invest directly in an index. |
| 2 | 1.00 equals perfect correlation. This calculation is based on the daily total return of the Index and the performance of the daily total return of the NAV per share of the Fund. |
The above information is not covered by the Report of the Independent Registered Public Accounting Firm.
218 :: ProFund VP Short Emerging Markets :: Financial Statements
Schedule of Portfolio Investments :: December 31, 2021
Repurchase Agreements(a)(b) (159.8%)
| | | Principal
Amount | | | Value | |
| Repurchase Agreements with various counterparties, 0.00%, dated 12/31/21, due 1/3/22, total to be received $1,137,000 | | $ | 1,137,000 | | | $ | 1,137,000 | |
TOTAL REPURCHASE AGREEMENTS
(Cost $1,137,000) | | | | | | | 1,137,000 | |
TOTAL INVESTMENT SECURITIES
(Cost $1,137,000) — 159.8% | | | | | | | 1,137,000 | |
| Net other assets (liabilities) — (59.8)% | | | | | | | (425,520 | ) |
| NET ASSETS — 100.0% | | | | | | $ | 711,480 | |
| (a) | A portion of these securities were held in a segregated account for the benefit of swap counterparties in the event of default. At December 31, 2021, the aggregate amount held in a segregated account was $302,000. |
| (b) | The ProFund VP invests in Repurchase Agreements jointly with other funds in the Trust. See "Repurchase Agreements" under Note 2 in the Notes to Financial Statements to view the details of each individual agreement and counterparty as well as a description of the securities subject to repurchase. |
Total Return Swap Agreements — Short
| Underlying Instrument | | Counterparty | | Termination
Date(1) | | Rate Paid
(Received)(2) | | | Notional
Amount | | | Value and
Unrealized
Appreciation/
(Depreciation) | |
| S&P/BNY Mellon Emerging 50 ADR Index (USD) | | Goldman Sachs International | | 1/27/22 | | | 0.27 | % | | $ | (15,794 | ) | | $ | (2,299 | ) |
| S&P/BNY Mellon Emerging 50 ADR Index (USD) | | UBS AG | | 1/27/22 | | | 0.42 | % | | | (692,311 | ) | | | (9,283 | ) |
| | | | | | | | | | | $ | (708,105 | ) | | $ | (11,582 | ) |
| (1) | Agreements may be terminated at will by either party without penalty. Payment is due at termination/maturity. |
| (2) | Reflects the floating financing rate, as of December 31, 2021, on the notional amount of the swap agreement paid to the counterparty or received from the counterparty, excluding any commissions. This amount is included as part of the unrealized appreciation/(depreciation). |
See accompanying notes to financial statements.
Financial Statements :: ProFund VP Short Emerging Markets :: 219
Statement of Assets and Liabilities
December 31, 2021
| ASSETS: | | | |
| Total Investment Securities, at cost | | $ | 1,137,000 | |
| Repurchase agreements, at value | | | 1,137,000 | |
| Total Investment Securities, at value | | | 1,137,000 | |
| Cash | | | 770 | |
| Receivable for capital shares issued | | | 49 | |
| Prepaid expenses | | | 40 | |
| TOTAL ASSETS | | | 1,137,859 | |
| | | | | |
| LIABILITIES: | | | | |
| Payable for capital shares redeemed | | | 412,004 | |
| Unrealized depreciation on swap agreements | | | 11,582 | |
| Advisory fees payable | | | 1,019 | |
| Management services fees payable | | | 136 | |
| Administration fees payable | | | 65 | |
| Administrative services fees payable | | | 550 | |
| Distribution fees payable | | | 582 | |
| Transfer agency fees payable | | | 96 | |
| Fund accounting fees payable | | | 39 | |
| Compliance services fees payable | | | 5 | |
| Other accrued expenses | | | 301 | |
| TOTAL LIABILITIES | | | 426,379 | |
| NET ASSETS | | $ | 711,480 | |
| | | | | |
| NET ASSETS CONSIST OF: | | | | |
| Capital | | $ | 3,336,125 | |
| Total distributable earnings (loss) | | | (2,624,645 | ) |
| NET ASSETS | | $ | 711,480 | |
| Shares of Beneficial Interest Outstanding (unlimited number of shares authorized, no par value) | | | 27,883 | |
| Net Asset Value (offering and redemption price per share) | | $ | 25.52 | |
Statement of Operations For the Year Ended
December 31, 2021
| INVESTMENT INCOME: | | | | |
| Interest | | $ | 10 | |
| | | | | |
| EXPENSES: | | | | |
| Advisory fees | | | 5,026 | |
| Management services fees | | | 670 | |
| Administration fees | | | 449 | |
| Transfer agency fees | | | 396 | |
| Administrative services fees | | | 1,542 | |
| Distribution fees | �� | | 1,675 | |
| Custody fees | | | 113 | |
| Fund accounting fees | | | 265 | |
| Trustee fees | | | 10 | |
| Compliance services fees | | | 5 | |
| Other fees | | | 649 | |
| Recoupment of prior expenses reduced by the Advisor | | | 456 | |
| TOTAL NET EXPENSES | | | 11,256 | |
| NET INVESTMENT INCOME (LOSS) | | | (11,246 | ) |
| | | | | |
| REALIZED AND UNREALIZED GAINS (LOSSES) ON INVESTMENTS: | | | | |
| Net realized gains (losses) on swap agreements | | | 4,707 | |
| Change in net unrealized appreciation/depreciation on swap agreements | | | 2,060 | |
| NET REALIZED AND UNREALIZED GAINS (LOSSES) ON INVESTMENTS | | | 6,767 | |
| CHANGE IN NET ASSETS RESULTING FROM OPERATIONS | | $ | (4,479 | ) |
See accompanying notes to financial statements.
220 :: ProFund VP Short Emerging Markets :: Financial Statements
| Statements of Changes in Net Assets |
| |
| | | Year Ended
December 31, 2021 | | | Year Ended
December 31, 2020 | |
| FROM INVESTMENT ACTIVITIES: | | | | | | | | |
| | | | | | | | | |
| OPERATIONS: | | | | | | | | |
| Net investment income (loss) | | $ | (11,246 | ) | | $ | (18,615 | ) |
| Net realized gains (losses) on investments | | | 4,707 | | | | (573,184 | ) |
| Change in net unrealized appreciation/depreciation on investments | | | 2,060 | | | | (20,260 | ) |
| Change in net assets resulting from operations | | | (4,479 | ) | | | (612,059 | ) |
| | | | | | | | | |
| DISTRIBUTIONS TO SHAREHOLDERS: | | | | | | | | |
| Total distributions | | | — | | | | (5,130 | ) |
| Change in net assets resulting from distributions | | | — | | | | (5,130 | ) |
| | | | | | | | | |
| CAPITAL TRANSACTIONS: | | | | | | | | |
| Proceeds from shares issued | | | 19,451,966 | | | | 15,139,462 | |
| Distributions reinvested | | | — | | | | 5,130 | |
| Value of shares redeemed | | | (19,101,772 | ) | | | (15,006,836 | ) |
| Change in net assets resulting from capital transactions | | | 350,194 | | | | 137,756 | |
| Change in net assets | | | 345,715 | | | | (479,433 | ) |
| | | | | | | | | |
| NET ASSETS: | | | | | | | | |
| Beginning of period | | | 365,765 | | | | 845,198 | |
| End of period | | $ | 711,480 | | | $ | 365,765 | |
| | | | | | | | | |
| SHARE TRANSACTIONS: | | | | | | | | |
| Issued | | | 823,716 | | | | 434,598 | |
| Reinvested | | | — | | | | 185 | |
| Redeemed | | | (811,599 | ) | | | (443,623 | ) |
| Change in shares | | | 12,117 | | | | (8,840 | ) |
See accompanying notes to financial statements.
Financial Highlights :: ProFund VP Short Emerging Markets :: 221
ProFunds Financial Highlights FOR THE PERIODS INDICATED
Selected data for a share of beneficial interest outstanding throughout the periods indicated.
| | | Year Ended
Dec. 31, 2021 | | | Year Ended
Dec. 31, 2020 | | | Year Ended
Dec. 31, 2019 | | | Year Ended
Dec. 31, 2018 | | | Year Ended
Dec. 31, 2017(a) | |
| Net Asset Value, Beginning of Period | | $ | 23.20 | | | $ | 34.35 | | | $ | 47.77 | | | $ | 42.43 | | | $ | 58.80 | |
| | | | | | | | | | | | | | | | | | | | | |
| Investment Activities: | | | | | | | | | | | | | | | | | | | | |
| Net investment income (loss)(b) | | | (0.39 | ) | | | (0.51 | ) | | | 0.20 | | | | 0.15 | | | | (0.44 | ) |
| Net realized and unrealized gains (losses) on investments | | | 2.71 | | | | (10.35 | ) | | | (9.52 | ) | | | 5.19 | | | | (15.93 | ) |
| Total income (loss) from investment activities | | | 2.32 | | | | (10.86 | ) | | | (9.32 | ) | | | 5.34 | | | | (16.37 | ) |
| | | | | | | | | | | | | | | | | | | | | |
| Distributions to Shareholders From: | | | | | | | | | | | | | | | | | | | | |
| Net investment income | | | — | | | | (0.29 | ) | | | (0.23 | ) | | | — | | | | — | |
| Net realized gains on investments | | | — | | | | — | | | | (3.87 | ) | | | — | | | | — | |
| Total distributions | | | — | | | | (0.29 | ) | | | (4.10 | ) | | | — | | | | — | |
| | | | | | | | | | | | | | | | | | | | | |
| Net Asset Value, End of Period | | $ | 25.52 | | | $ | 23.20 | | | $ | 34.35 | | | $ | 47.77 | | | $ | 42.43 | |
| | | | | | | | | | | | | | | | | | | | | |
| Total Return | | | 9.96 | % | | | (31.76 | )% | | | (20.99 | )% | | | 12.59 | %(c) | | | (27.84 | )% |
| | | | | | | | | | | | | | | | | | | | | |
| Ratios to Average Net Assets: | | | | | | | | | | | | | | | | | | | | |
| Gross expenses | | | 1.68 | % | | | 1.72 | % | | | 1.67 | % | | | 1.59 | % | | | 1.69 | % |
| Net expenses | | | 1.68 | % | | | 1.69 | %(d) | | | 1.67 | % | | | 1.52 | %(c) | | | 1.68 | % |
| Net investment income (loss) | | | (1.68 | )% | | | (1.43 | )% | | | 0.48 | % | | | 0.34 | %(c) | | | (0.91 | )% |
| | | | | | | | | | | | | | | | | | | | | |
| Supplemental Data: | | | | | | | | | | | | | | | | | | | | |
| Net assets, end of period (000's) | | $ | 711 | | | $ | 366 | | | $ | 845 | | | $ | 1,988 | | | $ | 959 | |
| Portfolio turnover rate(e) | | | — | | | | — | | | | — | | | | — | | | | — | |
| (a) | As described in Note 8, share amounts have been adjusted for 1:5 reverse share split that occurred on December 11, 2017. |
| (b) | Per share net investment income (loss) has been calculated using the average daily shares method. |
| (c) | During 2018, the Fund received a non-recurring reimbursement from a third party relating to expenses that were incurred in a prior year. Had this reimbursement not occurred, the net expense ratio and net investment income (loss) ratio would have been 1.59% and 0.27%, respectively, and the total return would have been 12.51%. |
| (d) | The expense ratio does not correlate to the applicable expense limits in place during the period given that the annual contractual expense limitation is applied for one year periods ended April 30th of each year, instead of coinciding with the December 31st year end. Details of the current expense limitation effect can be found in Note 4 of the accompanying Notes to Financial Statements. |
| (e) | Portfolio turnover rate is calculated without regard to instruments having a maturity of less than one year from acquisition or derivative instruments (including swap agreements and futures contracts). |
See accompanying notes to financial statements.
222 :: ProFund VP Short International :: Management Discussion of Fund Performance
ProFund VP Short International (the "Fund") seeks daily investment results, before fees and expenses, that correspond to the inverse (-1x) of the return of the Morgan Stanley Capital International Europe, Australasia and Far East ("MSCI EAFE") Index® (the "Index") for a single day, not for any other period. Since the foreign markets are not open when this Fund values its shares, it determines its success in meeting this daily investment objective by comparing its daily return on a given day with the inverse of the daily performance of related futures contracts traded in the United States. A "single day" is measured from the time the Fund calculates its net asset value ("NAV") to the time of the Fund's next NAV calculation. The Fund does not seek to achieve its stated investment objective over a period of time greater than a single day. The return of the Fund for periods longer than a single day will be the result of its return for each day compounded over the period. The Fund's returns for periods longer than a single day will likely differ in amount, and possibly even direction from the Fund's stated multiple (-1x) times the return of the Fund's Index for the same period. For periods longer than a single day, the Fund will lose money if the Index's performance is flat, and it is possible that the Fund will lose money even if the level of the index falls. For the year ended December 31, 2021, the Fund had a total return of -13.40%. For the same period, the Index had a total return of 11.26%1 and a volatility of 11.62%. For the year, the Fund achieved an average daily statistical correlation of over 0.99 to the inverse of the daily performance of the U.S.-traded MSCI EAFE futures contract.2
The Fund takes positions in financial instruments that, in combination, should have similar daily return characteristics as the inverse of the daily return of the Index. The Index includes 85% of free-float adjusted, market capitalization in each industry group in developed market countries equity performance, excluding the U.S. and Canada. As of December 31, 2021, the Index has constituent companies from the following 21 developed market countries: Australia, Austria, Belgium, Denmark, Finland, France, Germany, Hong Kong, Ireland, Israel, Italy, Japan, the Netherlands, New Zealand, Norway, Portugal, Singapore, Spain, Sweden, Switzerland and the United Kingdom. The Index levels and the price of the related futures contracts are expressed in U.S. dollar terms and as such they should generally reflect the relative movement of the U.S. dollar against the basket of foreign currencies represented by the constituent companies in the Index.
During the year ended December 31, 2021, the Fund invested in swap agreements as a substitute for shorting stocks in order to gain inverse exposure to the Index. These derivatives generally tracked the performance of their underlying benchmark and benefited from financing costs associated with their use. The Fund entered into swap agreements with counterparties that the Fund's advisor determined to be major, global financial institutions. If a counterparty becomes insolvent or otherwise fails to perform on its obligations, the value of investments in the Fund may decline. The Fund has sought to mitigate this risk by generally requiring counterparties to post collateral for the benefit of the Fund, marked to market daily, in an amount approximately equal to the amount the counterparty owed to the Fund, subject to certain minimum thresholds.
Value of a $10,000 Investment at Net Asset Value*
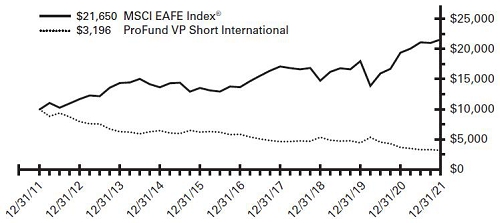
| * | The line graph represents the historical performance of a hypothetical investment of $10,000 in the ProFund VP Short International from December 31, 2011 to December 31, 2021, assuming the reinvestment of distributions. |
Average Annual Total Return as of 12/31/21
| Fund | | One Year | | | Five Year | | | Ten Year | |
| ProFund VP Short International | | | -13.40 | % | | | -11.45 | % | | | -10.78 | % |
| MSCI EAFE Index® | | | 11.26 | % | | | 9.55 | % | | | 8.03 | % |
Expense Ratios**
| Fund | | Gross | | | Net | | | | | |
| ProFund VP Short International | | | 1.70 | % | | | 1.68 | % | | | | |
| | | | | | | | | | | | | |
| ** | Reflects the expense ratio as reported in the Prospectus dated May 1, 2021. Contractual fee waivers are in effect through April 30, 2022. See Financial Highlights for effective expense ratios. |
Allocation of Portfolio Holdings & Index Composition
Market Exposure
| Investment Type | | % of Net Assets | |
| Swap Agreements | | | (100 | )% |
| Total Exposure | | | (100 | )% |
“Market Exposure” includes the value of total investments (including the contract value of any derivatives) and excludes any instruments used for cash management.
Holdings
The ProFund VP Short International primarily invests in non-equity securities, which may include: swap agreements, futures contracts, repurchase agreements and U.S. Government securities.
MSCI EAFE Index – Composition
| Industry Breakdown | | % of Index | |
| Financials | | | 16 | % |
| Industrials | | | 16 | % |
| Health Care | | | 13 | % |
| Consumer Discretionary | | | 13 | % |
| Consumer Staples | | | 10 | % |
| Information Technology | | | 10 | % |
| Materials | | | 8 | % |
| Communication Services | | | 5 | % |
| Utilities | | | 3 | % |
| Energy | | | 3 | % |
| Real Estate | | | 3 | % |
| Country Composition | | | |
| Japan | | | 23 | % |
| United Kingdom | | | 15 | % |
| France | | | 12 | % |
| Switzerland | | | 10 | % |
| Germany | | | 9 | % |
| Other | | | 31 | % |
Past performance does not guarantee future results. Return calculations assume the reinvestment of distributions and do not reflect taxes that a shareholder would pay on Fund distributions or on the redemption of Fund shares. The performance data quoted represents past performance and current returns may be lower or higher. The investment return and NAV will fluctuate so that an investor's shares, when redeemed, may be worth more or less than the original cost. The performance above reflects any fee reductions during the applicable periods. If such fee reductions had not occurred, the quoted performance would be lower. Performance numbers are net of all Fund fees and expenses but do not include any insurance, sales, or administrative charges of variable annuity or life insurance contracts. If these charges were included, the returns would be lower. To obtain performance current to the most recent month-end, please call toll-free 888-776-3637.
| 1 | The graph and table reflect the theoretical reinvestment of dividends on securities in the Index. The impact of transaction costs and the deduction of fees and expenses associated with a mutual fund, such as investment management and accounting fees, are not reflected in the index calculations. The Fund's performance reflects the reinvestment of dividends as well as the impact of transaction costs and the deduction of fees and expenses. It is not possible to invest directly in an index. |
| 2 | 1.00 equals perfect correlation. This calculation is based on the daily total return of the U.S.-traded MSCI EAFE futures contract and the performance of the daily total return of the NAV per share of the Fund. |
The above information is not covered by the Report of the Independent Registered Public Accounting Firm.
Financial Statements :: ProFund VP Short International :: 223
Schedule of Portfolio Investments :: December 31, 2021
Repurchase Agreements(a)(b) (99.9%)
| | | Principal
Amount | | | Value | |
| Repurchase Agreements with various counterparties, 0.00%, dated 12/31/21, due 1/3/22, total to be received $536,000 | | $ | 536,000 | | | $ | 536,000 | |
TOTAL REPURCHASE AGREEMENTS
(Cost $536,000) | | | | | | | 536,000 | |
TOTAL INVESTMENT SECURITIES
(Cost $536,000) — 99.9% | | | | | | | 536,000 | |
| Net other assets (liabilities) — 0.1% | | | | | | | 763 | |
| NET ASSETS — 100.0% | | | | | | $ | 536,763 | |
| (a) | A portion of these securities were held in a segregated account for the benefit of swap counterparties in the event of default. At December 31, 2021, the aggregate amount held in a segregated account was $220,000. |
| (b) | The ProFund VP invests in Repurchase Agreements jointly with other funds in the Trust. See "Repurchase Agreements" under Note 2 in the Notes to Financial Statements to view the details of each individual agreement and counterparty as well as a description of the securities subject to repurchase. |
Total Return Swap Agreements — Short
| Underlying Instrument | | Counterparty | | Termination
Date(1) | | Rate Paid
(Received)(2) | | | Notional
Amount | | | Value and
Unrealized
Appreciation/
(Depreciation) | |
| MSCI EAFE Index | | Goldman Sachs International | | 1/27/22 | | | 0.12 | % | | $ | (123,999 | ) | | $ | 544 | |
| MSCI EAFE Index | | UBS AG | | 1/27/22 | | | 0.22 | % | | | (410,770 | ) | | | 1,764 | |
| | | | | | | | | | | $ | (534,769 | ) | | $ | 2,308 | |
| (1) | Agreements may be terminated at will by either party without penalty. Payment is due at termination/maturity. |
| (2) | Reflects the floating financing rate, as of December 31, 2021, on the notional amount of the swap agreement paid to the counterparty or received from the counterparty, excluding any commissions. This amount is included as part of the unrealized appreciation/(depreciation). |
See accompanying notes to financial statements.
224 :: ProFund VP Short International :: Financial Statements
Statement of Assets and Liabilities
December 31, 2021
| ASSETS: | | | | |
| Total Investment Securities, at cost | | $ | 536,000 | |
| Repurchase agreements, at value | | | 536,000 | |
| Total Investment Securities, at value | | | 536,000 | |
| Cash | | | 258 | |
| Unrealized appreciation on swap agreements | | | 2,308 | |
| Receivable for capital shares issued | | | 28 | |
| Prepaid expenses | | | 3 | |
| TOTAL ASSETS | | | 538,597 | |
| | | | | |
| LIABILITIES: | | | | |
| Payable for capital shares redeemed | | | 136 | |
| Advisory fees payable | | | 472 | |
| Management services fees payable | | | 63 | |
| Administration fees payable | | | 41 | |
| Administrative services fees payable | | | 363 | |
| Distribution fees payable | | | 401 | |
| Transfer agency fees payable | | | 64 | |
| Fund accounting fees payable | | | 25 | |
| Compliance services fees payable | | | 3 | |
| Other accrued expenses | | | 266 | |
| TOTAL LIABILITIES | | | 1,834 | |
| NET ASSETS | | $ | 536,763 | |
| | | | | |
| NET ASSETS CONSIST OF: | | | | |
| Capital | | $ | 2,887,730 | |
| Total distributable earnings (loss) | | | (2,350,967 | ) |
| NET ASSETS | | $ | 536,763 | |
| Shares of Beneficial Interest Outstanding (unlimited number of shares authorized, no par value) | | | 21,349 | |
| Net Asset Value (offering and redemption price per share) | | $ | 25.14 | |
Statement of Operations For the Year Ended
December 31, 2021
| INVESTMENT INCOME: | | | | |
| Interest | | $ | 10 | |
| | | | | |
| EXPENSES: | | | | |
| Advisory fees | | | 4,274 | |
| Management services fees | | | 570 | |
| Administration fees | | | 392 | |
| Transfer agency fees | | | 345 | |
| Administrative services fees | | | 1,302 | |
| Distribution fees | | | 1,425 | |
| Custody fees | | | 85 | |
| Fund accounting fees | | | 231 | |
| Trustee fees | | | 10 | |
| Compliance services fees | | | 3 | |
| Other fees | | | 399 | |
| Recoupment of prior expenses reduced by the Advisor | | | 268 | |
| TOTAL NET EXPENSES | | | 9,304 | |
| NET INVESTMENT INCOME (LOSS) | | | (9,294 | ) |
| | | | | |
| REALIZED AND UNREALIZED GAINS (LOSSES) ON INVESTMENTS: | | | | |
| Net realized gains (losses) on swap agreements | | | (111,588 | ) |
| Change in net unrealized appreciation/depreciation on swap agreements | | | 1,482 | |
| NET REALIZED AND UNREALIZED GAINS (LOSSES) ON INVESTMENTS | | | (110,106 | ) |
| CHANGE IN NET ASSETS RESULTING FROM OPERATIONS | | $ | (119,400 | ) |
See accompanying notes to financial statements.
Financial Statements :: ProFund VP Short International :: 225
| Statements of Changes in Net Assets |
| |
| | | Year Ended
December 31, 2021 | | | Year Ended
December 31, 2020 | |
| FROM INVESTMENT ACTIVITIES: | | | | | | | | |
| | | | | | | | | |
| OPERATIONS: |
| Net investment income (loss) | | $ | (9,294 | ) | | $ | (14,177 | ) |
| Net realized gains (losses) on investments | | | (111,588 | ) | | | (304,709 | ) |
| Change in net unrealized appreciation/depreciation on investments | | | 1,482 | | | | (1,131 | ) |
| Change in net assets resulting from operations | | | (119,400 | ) | | | (320,017 | ) |
| | | | | | | | | |
| DISTRIBUTIONS TO SHAREHOLDERS: | | | | | | | | |
| Total distributions | | | — | | | | (3,789 | ) |
| Change in net assets resulting from distributions | | | — | | | | (3,789 | ) |
| | | | | | | | | |
| CAPITAL TRANSACTIONS: | | | | | | | | |
| Proceeds from shares issued | | | 2,980,066 | | | | 8,938,153 | |
| Distributions reinvested | | | — | | | | 3,789 | |
| Value of shares redeemed | | | (3,008,511 | ) | | | (8,529,787 | ) |
| Change in net assets resulting from capital transactions | | | (28,445 | ) | | | 412,155 | |
| Change in net assets | | | (147,845 | ) | | | 88,349 | |
| | | | | | | | | |
| NET ASSETS: | | | | | | | | |
| Beginning of period | | | 684,608 | | | | 596,259 | |
| End of period | | $ | 536,763 | | | $ | 684,608 | |
| | | | | | | | | |
| SHARE TRANSACTIONS: | | | | | | | | |
| Issued | | | 112,771 | | | | 229,595 | |
| Reinvested | | | — | | | | 115 | |
| Redeemed | | | (115,005 | ) | | | (223,082 | ) |
| Change in shares | | | (2,234 | ) | | | 6,628 | |
See accompanying notes to financial statements.
226 :: ProFund VP Short International :: Financial Highlights
ProFunds Financial Highlights FOR THE PERIODS INDICATED
Selected data for a share of beneficial interest outstanding throughout the periods indicated.
| | | Year Ended
Dec. 31, 2021 | | | Year Ended
Dec. 31, 2020 | | | Year Ended
Dec. 31, 2019(a) | | | Year Ended
Dec. 31, 2018(a) | | | Year Ended
Dec. 31, 2017(a) | |
| Net Asset Value, Beginning of Period | | $ | 29.03 | | | $ | 35.17 | | | $ | 43.87 | | | $ | 37.99 | | | $ | 47.87 | |
| | | | | | | | | | | | | | | | | | | | | |
| Investment Activities: | | | | | | | | | | | | | | | | | | | | |
| Net investment income (loss)(b) | | | (0.43 | ) | | | (0.53 | ) | | | 0.19 | | | | 0.16 | | | | (0.36 | ) |
| Net realized and unrealized gains (losses) on investments | | | (3.46 | ) | | | (5.40 | ) | | | (7.70 | ) | | | 5.72 | | | | (9.52 | ) |
| Total income (loss) from investment activities | | | (3.89 | ) | | | (5.93 | ) | | | (7.51 | ) | | | 5.88 | | | | (9.88 | ) |
| | | | | | | | | | | | | | | | | | | | | |
| Distributions to Shareholders From: | | | | | | | | | | | | | | | | | | | | |
| Net investment income | | | — | | | | (0.21 | ) | | | (0.20 | ) | | | — | | | | — | |
| Net realized gains on investments | | | — | | | | — | | | | (0.99 | ) | | | — | | | | — | |
| Total distributions | | | — | | | | (0.21 | ) | | | (1.19 | ) | | | — | | | | — | |
| | | | | | | | | | | | | | | | | | | | | |
| Net Asset Value, End of Period | | $ | 25.14 | | | $ | 29.03 | | | $ | 35.17 | | | $ | 43.87 | | | $ | 37.99 | |
| | | | | | | | | | | | | | | | | | | | | |
| Total Return | | | (13.40 | )% | | | (16.94 | )% | | | (17.42 | )% | | | 15.47 | %(c) | | | (20.63 | )% |
| | | | | | | | | | | | | | | | | | | | | |
| Ratios to Average Net Assets: | | | | | | | | | | | | | | | | | | | | |
| Gross expenses | | | 1.63 | % | | | 1.70 | % | | | 1.69 | % | | | 1.54 | % | | | 1.69 | % |
| Net expenses | | | 1.63 | % | | | 1.68 | % | | | 1.68 | % | | | 1.46 | %(c) | | | 1.68 | % |
| Net investment income (loss) | | | (1.63 | )% | | | (1.43 | )% | | | 0.48 | % | | | 0.41 | %(c) | | | (0.90 | )% |
| | | | | | | | | | | | | | | | | | | | | |
| Supplemental Data: | | | | | | | | | | | | | | | | | | | | |
| Net assets, end of period (000's) | | $ | 537 | | | $ | 685 | | | $ | 596 | | | $ | 2,183 | | | $ | 611 | |
| Portfolio turnover rate(d) | | | — | | | | — | | | | — | | | | — | | | | — | |
| (a) | As described in Note 8, share amounts have been adjusted for 1:4 reverse share split that occurred on November 18, 2019. |
| (b) | Per share net investment income (loss) has been calculated using the average daily shares method. |
| (c) | During 2018, the Fund received a non-recurring reimbursement from a third party relating to expenses that were incurred in a prior year. Had this reimbursement not occurred, the net expense ratio and net investment income (loss) ratio would have been 1.54% and 0.33%, respectively, and the total return would have been 15.39%. |
| (d) | Portfolio turnover rate is calculated without regard to instruments having a maturity of less than one year from acquisition or derivative instruments (including swap agreements and futures contracts). |
See accompanying notes to financial statements.
Management Discussion of Fund Performance :: ProFund VP Short Mid-Cap :: 227
ProFund VP Short Mid-Cap (the "Fund") seeks daily investment results, before fees and expenses, that correspond to the inverse (-1x) of the return of the S&P MidCap 400® Index (the "Index") for a single day, not for any other period. A "single day" is measured from the time the Fund calculates its net asset value ("NAV") to the time of the Fund's next NAV calculation. The Fund does not seek to achieve its stated investment objective over a period of time greater than a single day. The return of the Fund for periods longer than a single day will be the result of its return for each day compounded over the period. The Fund's returns for periods longer than a single day will very likely differ in amount, and possibly even direction from the Fund's stated multiple (-1x) times the return of the Fund's Index for the same period. For periods longer than a single day, the Fund will lose money if the Index's performance is flat, and it is possible that the Fund will lose money even if the level of the index falls. For the year ended December 31, 2021, the Fund had a total return of -23.87%. For the same period, the Index had a total return of 24.76%1 and a volatility of 17.93%. For the year, the Fund achieved an average daily statistical correlation of 0.99 to the inverse of the daily performance of the Index.2
The Fund takes positions in financial instruments that, in combination, should have similar daily return characteristics as the inverse of the daily return of the Index. The Index is a measure of mid-size company U.S. stock market performance. It is a float-adjusted, market capitalization-weighted index of 400 U.S. operating companies and real estate investment trusts selected through a process that factors in criteria such as liquidity, price, market capitalization, and financial viability. Reconstitution occurs both on a quarterly and ongoing basis.
During the year ended December 31, 2021, the Fund invested in swap agreements as a substitute for shorting stocks in order to gain inverse exposure to the Index. These derivatives generally tracked the performance of their underlying benchmark and benefited from financing costs associated with their use. The Fund entered into swap agreements with counterparties that the Fund's advisor determined to be major, global financial institutions. If a counterparty becomes insolvent or otherwise fails to perform on its obligations, the value of investments in the Fund may decline. The Fund has sought to mitigate this risk by generally requiring counterparties to post collateral for the benefit of the Fund, marked to market daily, in an amount approximately equal to the amount the counterparty owed to the Fund, subject to certain minimum thresholds.
Value of a $10,000 Investment at Net Asset Value*
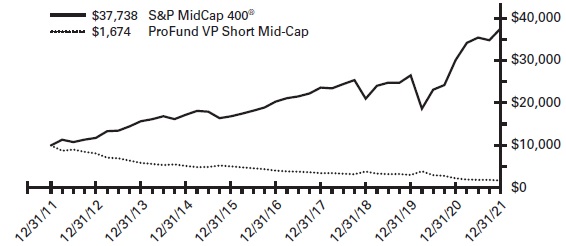
| * | The line graph represents the historical performance of a hypothetical investment of $10,000 in the ProFund VP Short Mid-Cap from December 31, 2011 to December 31, 2021, assuming the reinvestment of distributions. |
Average Annual Total Return as of 12/31/21
| Fund | | One Year | | | Five Year | | | Ten Year | |
| ProFund VP Short Mid-Cap | | | -23.87 | % | | | -16.09 | % | | | -16.37 | % |
| S&P MidCap 400® | | | 24.76 | % | | | 13.09 | % | | | 14.20 | % |
Expense Ratios**
| Fund | | Gross | | | Net | | | | | |
| ProFund VP Short Mid-Cap | | | 1.76 | % | | | 1.68 | % | | | | |
| ** | Reflects the expense ratio as reported in the Prospectus dated May 1, 2021. Contractual fee waivers are in effect through April 30, 2022. See Financial Highlights for effective expense ratios. |
Allocation of Portfolio Holdings & Index Composition
Market Exposure
| Investment Type | | % of Net Assets | |
| Swap Agreements | | | (100 | )% |
| Total Exposure | | | (100 | )% |
“Market Exposure” includes the value of total investments (including the contract value of any derivatives) and excludes any instruments used for cash management.
Holdings
The ProFund VP Short Mid-Cap primarily invests in non-equity securities, which may include: swap agreements, futures contracts, repurchase agreements and U.S. Government securities.
S&P MidCap 400® Index – Composition
| | | % of Index | |
| Industrials | | | 20 | % |
| Consumer Discretionary | | | 15 | % |
| Information Technology | | | 14 | % |
| Financials | | | 14 | % |
| Real Estate | | | 10 | % |
| Health Care | | | 10 | % |
| Materials | | | 7 | % |
| Consumer Staples | | | 3 | % |
| Utilities | | | 3 | % |
| Energy | | | 2 | % |
| Communication Services | | | 2 | % |
Past performance does not guarantee future results. Return calculations assume the reinvestment of distributions and do not reflect taxes that a shareholder would pay on Fund distributions or on the redemption of Fund shares. The performance data quoted represents past performance and current returns may be lower or higher. The investment return and NAV will fluctuate so that an investor's shares, when redeemed, may be worth more or less than the original cost. The performance above reflects any fee reductions during the applicable periods. If such fee reductions had not occurred, the quoted performance would be lower. Performance numbers are net of all Fund fees and expenses but do not include any insurance, sales, or administrative charges of variable annuity or life insurance contracts. If these charges were included, the returns would be lower. To obtain performance current to the most recent month-end, please call toll-free 888-776-3637.
| 1 | The graph and table reflect the theoretical reinvestment of dividends on securities in the Index. The impact of transaction costs and the deduction of fees and expenses associated with a mutual fund, such as investment management and accounting fees, are not reflected in the index calculations. The Fund's performance reflects the reinvestment of dividends as well as the impact of transaction costs and the deduction of fees and expenses. It is not possible to invest directly in an index. |
| 2 | 1.00 equals perfect correlation. This calculation is based on the daily total return of the Index and the performance of the daily total return of the NAV per share of the Fund. |
The above information is not covered by the Report of the Independent Registered Public Accounting Firm.
228 :: ProFund VP Short Mid-Cap :: Financial Statements
Schedule of Portfolio Investments :: December 31, 2021
Repurchase Agreements(a)(b) (123.5%)
| | | Principal
Amount | | | Value | |
| Repurchase Agreements with various counterparties, 0.00%, dated 12/31/21, due 1/3/22, total to be received $55,000 | | $ | 55,000 | | | $ | 55,000 | |
TOTAL REPURCHASE AGREEMENTS (Cost $55,000) | | | | | | | 55,000 | |
TOTAL INVESTMENT SECURITIES (Cost $55,000) — 123.5% | | | | | | | 55,000 | |
| Net other assets (liabilities) — (23.5)% | | | | | | | (10,464 | ) |
| NET ASSETS — 100.0% | | | | | | $ | 44,536 | |
| (a) | A portion of these securities were held in a segregated account for the benefit of swap counterparties in the event of default. At December 31, 2021, the aggregate amount held in a segregated account was $5,000. |
| (b) | The ProFund VP invests in Repurchase Agreements jointly with other funds in the Trust. See "Repurchase Agreements" under Note 2 in the Notes to Financial Statements to view the details of each individual agreement and counterparty as well as a description of the securities subject to repurchase. |
Total Return Swap Agreements—Short
| Underlying Instrument | | Counterparty | | Termination
Date(1) | | | Rate Paid
(Received)(2) | | | Notional
Amount | | | Value and
Unrealized
Appreciation/
(Depreciation) | |
| S&P MidCap 400 | | Goldman Sachs International | | | 1/27/22 | | | | (0.18 | )% | | $ | (30,545 | ) | | $ | (81 | ) |
| S&P MidCap 400 | | UBS AG | | | 1/27/22 | | | | (0.08 | )% | | | (13,878 | ) | | | (86 | ) |
| | | | | | | | | | | | | $ | (44,423 | ) | | $ | (167 | ) |
| (1) | Agreements may be terminated at will by either party without penalty. Payment is due at termination/maturity. |
| (2) | Reflects the floating financing rate, as of December 31, 2021, on the notional amount of the swap agreement paid to the counterparty or received from the counterparty, excluding any commissions. This amount is included as part of the unrealized appreciation/(depreciation). |
See accompanying notes to financial statements.
Financial Statements :: ProFund VP Short Mid-Cap :: 229
Statement of Assets and Liabilities
December 31, 2021
| ASSETS: | | | | |
| Total Investment Securities, at cost | | $ | 55,000 | |
| Repurchase agreements, at value | | | 55,000 | |
| Total Investment Securities, at value | | | 55,000 | |
| Cash | | | 319 | |
| Prepaid expenses | | | 6 | |
| TOTAL ASSETS | | | 55,325 | |
| | | | | |
| LIABILITIES: | | | | |
| Payable for capital shares redeemed | | | 10,467 | |
| Unrealized depreciation on swap agreements | | | 167 | |
| Advisory fees payable | | | 65 | |
| Management services fees payable | | | 9 | |
| Administration fees payable | | | 3 | |
| Administrative services fees payable | | | 14 | |
| Distribution fees payable | | | 15 | |
| Transfer agency fees payable | | | 4 | |
| Fund accounting fees payable | | | 2 | |
| Compliance services fees payable | | | — | (a) |
| Other accrued expenses | | | 43 | |
| TOTAL LIABILITIES | | | 10,789 | |
| NET ASSETS | | $ | 44,536 | |
| | | | | |
| NET ASSETS CONSIST OF: | | | | |
| Capital | | $ | 2,588,796 | |
| Total distributable earnings (loss) | | | (2,544,260 | ) |
| NET ASSETS | | $ | 44,536 | |
| Shares of Beneficial Interest Outstanding (unlimited number of shares authorized, no par value) | | | 5,860 | |
| Net Asset Value (offering and redemption price per share) | | $ | 7.60 | |
| | | | |
| (a) Amount is less than $0.50. | | | | |
Statement of Operations
For the Year Ended December 31, 2021
| INVESTMENT INCOME: | | | | |
| Interest | | $ | 1 | |
| | | | | |
| EXPENSES: | | | | |
| Advisory fees | | | 547 | |
| Management services fees | | | 73 | |
| Administration fees | | | 56 | |
| Transfer agency fees | | | 47 | |
| Administrative services fees | | | 189 | |
| Distribution fees | | | 182 | |
| Custody fees | | | 14 | |
| Fund accounting fees | | | 31 | |
| Trustee fees | | | 2 | |
| Compliance services fees | | | — | (a) |
| Other fees | | | 49 | |
| Recoupment of prior expenses reduced by the Advisor | | | 40 | |
| Total Gross Expenses before reductions | | | 1,230 | |
| Expenses reduced and reimbursed by the Advisor | | | (5 | ) |
| TOTAL NET EXPENSES | | | 1,225 | |
| NET INVESTMENT INCOME (LOSS) | | | (1,224 | ) |
| | | | | |
| REALIZED AND UNREALIZED GAINS (LOSSES) ON INVESTMENTS: | | | | |
| Gain received from non-recurring class action settlement | | | 94 | |
| Net realized gains (losses) on swap agreements | | | (37,779 | ) |
| Change in net unrealized appreciation/depreciation on swap agreements | | | (87 | ) |
| NET REALIZED AND UNREALIZED GAINS (LOSSES) ON INVESTMENTS | | | (37,772 | ) |
| CHANGE IN NET ASSETS RESULTING FROM OPERATIONS | | $ | (38,996 | ) |
See accompanying notes to financial statements.
230 :: ProFund VP Short Mid-Cap :: Financial Statements
| Statements of Changes in Net Assets |
| |
| | | Year Ended
December 31, 2021 | | | Year Ended
December 31, 2020 | |
| FROM INVESTMENT ACTIVITIES: | | | | | | | | |
| | | | | | | | | |
| OPERATIONS: | | | | | | | | |
| Net investment income (loss) | | $ | (1,224 | ) | | $ | (4,648 | ) |
| Net realized gains (losses) on investments | | | (37,685 | ) | | | 123,744 | |
| Change in net unrealized appreciation/depreciation on investments | | | (87 | ) | | | (6 | ) |
| Change in net assets resulting from operations | | | (38,996 | ) | | | 119,090 | |
| | | | | | | | | |
| DISTRIBUTIONS TO SHAREHOLDERS: | | | | | | | | |
| Total distributions | | | (139,495 | ) | | | (1,287 | ) |
| Change in net assets resulting from distributions | | | (139,495 | ) | | | (1,287 | ) |
| | | | | | | | | |
| CAPITAL TRANSACTIONS: | | | | | | | | |
| Proceeds from shares issued | | | 4,378,802 | | | | 19,396,710 | |
| Distributions reinvested | | | 24,595 | | | | 1,287 | |
| Value of shares redeemed | | | (4,248,482 | ) | | | (19,589,287 | ) |
| Change in net assets resulting from capital transactions | | | 154,915 | | | | (191,290 | ) |
| Change in net assets | | | (23,576 | ) | | | (73,487 | ) |
| | | | | | | | | |
| NET ASSETS: | | | | | | | | |
| Beginning of period | | | 68,112 | | | | 141,599 | |
| End of period | | $ | 44,536 | | | $ | 68,112 | |
| | | | | | | | | |
| SHARE TRANSACTIONS: | | | | | | | | |
| Issued | | | 386,203 | | | | 650,184 | |
| Reinvested | | | 3,022 | | | | 53 | |
| Redeemed | | | (386,749 | ) | | | (651,955 | ) |
| Change in shares | | | 2,476 | | | | (1,718 | ) |
See accompanying notes to financial statements.
Financial Highlights :: ProFund VP Short Mid-Cap :: 231
ProFunds Financial Highlights FOR THE PERIODS INDICATED
Selected data for a share of beneficial interest outstanding throughout the periods indicated.
| | | Year Ended
Dec. 31, 2021 | | | Year Ended
Dec. 31, 2020 | | | Year Ended
Dec. 31, 2019 | | | Year Ended
Dec. 31, 2018 | | | Year Ended
Dec. 31, 2017 | |
| Net Asset Value, Beginning of Period | | $ | 20.13 | | | $ | 27.75 | | | $ | 35.30 | | | $ | 33.94 | | | $ | 40.17 | |
| | | | | | | | | | | | | | | | | | | | | |
| Investment Activities: | | | | | | | | | | | | | | | | | | | | |
| Net investment income (loss)(a) | | | (0.18 | ) | | | (0.44 | ) | | | 0.18 | | | | 0.05 | | | | (0.30 | ) |
| Net realized and unrealized gains (losses) on investments | | | (4.08 | ) | | | (6.91 | )(b) | | | (7.64 | ) | | | 3.33 | | | | (5.66 | ) |
| Total income (loss) from investment activities | | | (4.26 | ) | | | (7.35 | ) | | | (7.46 | ) | | | 3.38 | | | | (5.96 | ) |
| | | | | | | | | | | | | | | | | | | | | |
| Distributions to Shareholders From: | | | | | | | | | | | | | | | | | | | | |
| Net investment income | | | — | | | | (0.27 | ) | | | (0.09 | ) | | | — | | | | — | |
| Net realized gains on investments | | | (8.27 | ) | | | — | | | | — | | | | (2.02 | ) | | | (0.27 | ) |
| Total distributions | | | (8.27 | ) | | | (0.27 | ) | | | (0.09 | ) | | | (2.02 | ) | | | (0.27 | ) |
| Net Asset Value, End of Period | | $ | 7.60 | | | $ | 20.13 | | | $ | 27.75 | | | $ | 35.30 | | | $ | 33.94 | |
| | | | | | | | | | | | | | | | | | | | | |
| Total Return | | | (23.87 | )%(c) | | | (26.65 | )% | | | (21.17 | )% | | | 10.97 | % | | | (14.85 | )% |
| | | | | | | | | | | | | | | | | | | | | |
| Ratios to Average Net Assets: | | | | | | | | | | | | | | | | | | | | |
| Gross expenses | | | 1.69 | % | | | 1.76 | % | | | 1.66 | % | | | 1.67 | % | | | 1.68 | % |
| Net expenses | | | 1.68 | % | | | 1.69 | %(d) | | | 1.66 | % | | | 1.67 | % | | | 1.68 | % |
| Net investment income (loss) | | | (1.68 | )% | | | (1.49 | )% | | | 0.59 | % | | | 0.17 | % | | | (0.81 | )% |
| | | | | | | | | | | | | | | | | | | | | |
| Supplemental Data: | | | | | | | | | | | | | | | | | | | | |
| Net assets, end of period (000's) | | $ | 45 | | | $ | 68 | | | $ | 142 | | | $ | 657 | | | $ | 165 | |
| Portfolio turnover rate(e) | | | — | | | | — | | | | — | | | | — | | | | — | |
| (a) | Per share net investment income (loss) has been calculated using the average daily shares method. |
| (b) | The amount shown for a share outstanding throughout the period does not accord with the change in aggregate gains and losses in the portfolio of securities during the period because of the timing of sales and purchases of fund shares in relation to fluctuating market values during the period. |
| (c) | During the year ended December 31, 2021, the Fund received monies related to certain nonrecurring litigation settlements. The corresponding impact to the total return was an increase of 0.16%. |
| (d) | The expense ratio does not correlate to the applicable expense limits in place during the period given that the annual contractual expense limitation is applied for one year periods ended April 30th of each year, instead of coinciding with the December 31st year end. Details of the current expense limitation in effect can be found in Note 4 of the accompanying Notes to Financial Statements. |
| (e) | Portfolio turnover rate is calculated without regard to instruments having a maturity of less than one year from acquisition or derivative instruments (including swap agreements and futures contracts). |
See accompanying notes to financial statements.
232 :: ProFund VP Short Nasdaq-100 :: Management Discussion of Fund Performance
ProFund VP Short Nasdaq-100 (the "Fund") seeks daily investment results, before fees and expenses, that correspond to the inverse (-1x) of the return of the Nasdaq-100® Index (the "Index") for a single day, not for any other period. A "single day" is measured from the time the Fund calculates its net asset value ("NAV") to the time of the Fund's next NAV calculation. The Fund does not seek to achieve its stated investment objective over a period of time greater than a single day. The return of the Fund for periods longer than a single day will be the result of its return for each day compounded over the period. The Fund's returns for periods longer than a single day will very likely differ in amount, and possibly even direction from the Fund's stated multiple (-1x) times the return of the Fund's Index for the same period. For periods longer than a single day, the Fund will lose money if the Index's performance is flat, and it is possible that the Fund will lose money even if the level of the index falls. For the year ended December 31, 2021, the Fund had a total return of -25.13%. For the same period, the Index had a total return of 27.51%1 and a volatility of 18.57%. For the year, the Fund achieved an average daily statistical correlation of over 0.99 to the inverse of the daily performance of the Index.2
The Fund takes positions in financial instruments that, in combination, should have similar daily return characteristics as the inverse of the daily return of the Index. The Index, a modified market capitalization-weighted index, includes 100 of the largest non-financial domestic and international issues listed on Nasdaq.
During the year ended December 31, 2021, the Fund invested in swap agreements and futures contracts as a substitute for shorting stocks in order to gain inverse exposure to the Index. These derivatives generally tracked the performance of their underlying benchmark and benefited from financing costs associated with their use. The Fund entered into swap agreements with counterparties that the Fund's advisor determined to be major, global financial institutions. If a counterparty becomes insolvent or otherwise fails to perform on its obligations, the value of investments in the Fund may decline. The Fund has sought to mitigate this risk by generally requiring counterparties to post collateral for the benefit of the Fund, marked to market daily, in an amount approximately equal to the amount the counterparty owed to the Fund, subject to certain minimum thresholds.
Value of a $10,000 Investment at Net Asset Value*

| * | The line graph represents the historical performance of a hypothetical investment of $10,000 in the ProFund VP Short Nasdaq-100 from December 31, 2011 to December 31, 2021, assuming the reinvestment of distributions. |
Average Annual Total Return as of 12/31/21
| Fund | | One Year | | | Five Year | | | Ten Year | |
| ProFund VP Short Nasdaq-100 | | | -25.13 | % | | | -25.87 | % | | | -22.23 | % |
| Nasdaq-100® Index | | | 27.51 | % | | | 28.63 | % | | | 23.15 | % |
Expense Ratios**
| Fund | | Gross | | | Net | | | | | |
| ProFund VP Short Nasdaq-100 | | | 1.75 | % | | | 1.68 | % | | | | |
| ** | Reflects the expense ratio as reported in the Prospectus dated May 1, 2021. Contractual fee waivers are in effect through April 30, 2022. See Financial Highlights for effective expense ratios. |
Allocation of Portfolio Holdings & Index Composition
Market Exposure
| Investment Type | | % of Net Assets | |
| Swap Agreements | | | (99 | )% |
| Total Exposure | | | (99 | )% |
“Market Exposure” includes the value of total investments (including the contract value of any derivatives) and excludes any instruments used for cash management.
Holdings
The ProFund VP Short Nasdaq-100 primarily invests in non-equity securities, which may include: swap agreements, futures contracts, repurchase agreements and U.S. Government securities.
Nasdaq-100® Index – Composition
| | | % of Index | |
| Information Technology | | | 51 | % |
| Communication Services | | | 18 | % |
| Consumer Discretionary | | | 16 | % |
| Health Care | | | 6 | % |
| Consumer Staples | | | 5 | % |
| Industrials | | | 3 | % |
| Utilities | | | 1 | % |
Past performance does not guarantee future results. Return calculations assume the reinvestment of distributions and do not reflect taxes that a shareholder would pay on Fund distributions or on the redemption of Fund shares. The performance data quoted represents past performance and current returns may be lower or higher. The investment return and NAV will fluctuate so that an investor's shares, when redeemed, may be worth more or less than the original cost. The performance above reflects any fee reductions during the applicable periods. If such fee reductions had not occurred, the quoted performance would be lower. Performance numbers are net of all Fund fees and expenses but do not include any insurance, sales, or administrative charges of variable annuity or life insurance contracts. If these charges were included, the returns would be lower. To obtain performance current to the most recent month-end, please call toll-free 888-776-3637.
| 1 | The graph and table reflect the theoretical reinvestment of dividends on securities in the Index. The impact of transaction costs and the deduction of fees and expenses associated with a mutual fund, such as investment management and accounting fees, are not reflected in the index calculations. The Fund's performance reflects the reinvestment of dividends as well as the impact of transaction costs and the deduction of fees and expenses. It is not possible to invest directly in an index. |
| 2 | 1.00 equals perfect correlation. This calculation is based on the daily total return of the Index and the performance of the daily total return of the NAV per share of the Fund. |
The above information is not covered by the Report of the Independent Registered Public Accounting Firm.
Financial Statements :: ProFund VP Short Nasdaq-100 :: 233
Schedule of Portfolio Investments :: December 31, 2021
Repurchase Agreements(a)(b) (106.7%)
| | | Principal Amount | | | Value | |
| Repurchase Agreements with various counterparties, 0.00%, dated 12/31/21, due 1/3/22, total to be received $1,944,000 | | $ | 1,944,000 | | | $ | 1,944,000 | |
TOTAL REPURCHASE AGREEMENTS (Cost $1,944,000) | | | | | | | 1,944,000 | |
TOTAL INVESTMENT SECURITIES (Cost $1,944,000) — 106.7% | | | | | | | 1,944,000 | |
| Net other assets (liabilities) — (6.7)% | | | | | | | (121,372 | ) |
| NET ASSETS — 100.0% | | | | | | $ | 1,822,628 | |
| (a) | A portion of these securities were held in a segregated account for the benefit of swap counterparties in the event of default. At December 31, 2021, the aggregate amount held in a segregated account was $274,000. |
| (b) | The ProFund VP invests in Repurchase Agreements jointly with other funds in the Trust. See "Repurchase Agreements" under Note 2 in the Notes to Financial Statements to view the details of each individual agreement and counterparty as well as a description of the securities subject to repurchase. |
Total Return Swap Agreements — Short
| Underlying Instrument | | Counterparty | | Termination
Date(1) | | Rate Paid
(Received)(2) | | | Notional
Amount | | | Value and
Unrealized
Appreciation/
(Depreciation) | |
| Nasdaq-100 Index | | Goldman Sachs International | | 1/27/22 | | | (0.43 | )% | | $ | (1,419,847 | ) | | $ | 19,907 | |
| Nasdaq-100 Index | | UBS AG | | 1/27/22 | | | (0.23 | )% | | | (391,682 | ) | | | 7,652 | |
| | | | | | | | | | | $ | (1,811,529 | ) | | $ | 27,559 | |
| (1) | Agreements may be terminated at will by either party without penalty. Payment is due at termination/maturity. |
| (2) | Reflects the floating financing rate, as of December 31, 2021, on the notional amount of the swap agreement paid to the counterparty or received from the counterparty, excluding any commissions. This amount is included as part of the unrealized appreciation/(depreciation). |
See accompanying notes to financial statements.
234 :: ProFund VP Short Nasdaq-100 :: Financial Statements
Statement of Assets and Liabilities
December 31, 2021
| ASSETS: | | | | |
| Total Investment Securities, at cost | | $ | 1,944,000 | |
| Repurchase agreements, at value | | | 1,944,000 | |
| Total Investment Securities, at value | | | 1,944,000 | |
| Segregated cash balances for swap agreements with custodian | | | 625 | |
| Unrealized appreciation on swap agreements | | | 27,559 | |
| Receivable for capital shares issued | | | 6,729 | |
| Prepaid expenses | | | 27 | |
| TOTAL ASSETS | | | 1,978,940 | |
| | | | | |
| LIABILITIES: | | | | |
| Cash overdraft | | | 76 | |
| Payable for capital shares redeemed | | | 145,863 | |
| Advisory fees payable | | | 2,959 | |
| Management services fees payable | | | 395 | |
| Administration fees payable | | | 249 | |
| Administrative services fees payable | | | 2,120 | |
| Distribution fees payable | | | 2,322 | |
| Transfer agency fees payable | | | 453 | |
| Fund accounting fees payable | | | 138 | |
| Compliance services fees payable | | | 13 | |
| Other accrued expenses | | | 1,724 | |
| TOTAL LIABILITIES | | | 156,312 | |
| NET ASSETS | | $ | 1,822,628 | |
| | | | | |
| NET ASSETS CONSIST OF: | | | | |
| Capital | | $ | 15,785,483 | |
| Total distributable earnings (loss) | | | (13,962,855 | ) |
| NET ASSETS | | $ | 1,822,628 | |
| Shares of Beneficial Interest Outstanding (unlimited number of shares authorized, no par value) | | | 135,118 | |
| Net Asset Value (offering and redemption price per share) | | $ | 13.49 | |
Statement of Operations
For the Year Ended December 31, 2021
| INVESTMENT INCOME: | | | | |
| Interest | | $ | 124 | |
| | | | | |
| EXPENSES: | | | | |
| Advisory fees | | | 25,999 | |
| Management services fees | | | 3,467 | |
| Administration fees | | | 2,627 | |
| Transfer agency fees | | | 2,076 | |
| Administrative services fees | | | 8,408 | |
| Distribution fees | | | 8,666 | |
| Custody fees | | | 472 | |
| Fund accounting fees | | | 1,398 | |
| Trustee fees | | | 69 | |
| Compliance services fees | | | 13 | |
| Other fees | | | 2,983 | |
| Recoupment of prior expenses reduced by the Advisor | | | 2,061 | |
| TOTAL NET EXPENSES | | | 58,239 | |
| NET INVESTMENT INCOME (LOSS) | | | (58,115 | ) |
| | | | | |
| REALIZED AND UNREALIZED GAINS (LOSSES) ON INVESTMENTS: | | | | |
| Net realized gains (losses) on futures contracts | | | (173,395 | ) |
| Net realized gains (losses) on swap agreements | | | (155,929 | ) |
| Change in net unrealized appreciation/depreciation on futures contracts | | | 62,482 | |
| Change in net unrealized appreciation/depreciation on swap agreements | | | 41,331 | |
| NET REALIZED AND UNREALIZED GAINS (LOSSES) ON INVESTMENTS | | | (225,511 | ) |
| CHANGE IN NET ASSETS RESULTING FROM OPERATIONS | | $ | (283,626 | ) |
See accompanying notes to financial statements.
Financial Statements :: ProFund VP Short Nasdaq-100 :: 235
| Statements of Changes in Net Assets |
| |
| | | Year Ended
December 31, 2021 | | | Year Ended
December 31, 2020 | |
| FROM INVESTMENT ACTIVITIES: |
| |
| OPERATIONS: |
| Net investment income (loss) | | $ | (58,115 | ) | | $ | (92,549 | ) |
| Net realized gains (losses) on investments | | | (329,324 | ) | | | (706,056 | ) |
| Change in net unrealized appreciation/depreciation on investments | | | 103,813 | | | | (103,227 | ) |
| Change in net assets resulting from operations | | | (283,626 | ) | | | (901,832 | ) |
| | | | | | | | | |
| DISTRIBUTIONS TO SHAREHOLDERS: | | | | | | | | |
| Total distributions | | | (224,885 | ) | | | (11,485 | ) |
| Change in net assets resulting from distributions | | | (224,885 | ) | | | (11,485 | ) |
| | | | | | | | | |
| CAPITAL TRANSACTIONS: | | | | | | | | |
| Proceeds from shares issued | | | 279,257,492 | | | | 321,915,101 | |
| Distributions reinvested | | | 224,885 | | | | 11,485 | |
| Value of shares redeemed | | | (282,271,549 | ) | | | (323,245,706 | ) |
| Change in net assets resulting from capital transactions | | | (2,789,172 | ) | | | (1,319,120 | ) |
| Change in net assets | | | (3,297,683 | ) | | | (2,232,437 | ) |
| | | | | | | | | |
| NET ASSETS: | | | | | | | | |
| Beginning of period | | | 5,120,311 | | | | 7,352,748 | |
| End of period | | $ | 1,822,628 | | | $ | 5,120,311 | |
| | | | | | | | | |
| SHARE TRANSACTIONS: | | | | | | | | |
| Issued | | | 17,721,531 | | | | 13,086,902 | |
| Reinvested | | | 12,939 | | | | 587 | |
| Redeemed | | | (17,880,396 | ) | | | (13,036,912 | ) |
| Change in shares | | | (145,926 | ) | | | 50,577 | |
See accompanying notes to financial statements.
236 :: ProFund VP Short Nasdaq-100 :: Financial Highlights
ProFunds Financial Highlights FOR THE PERIODS INDICATED
Selected data for a share of beneficial interest outstanding throughout the periods indicated.
| | | Year Ended
Dec. 31, 2021 | | | Year Ended
Dec. 31, 2020 | | | Year Ended
Dec. 31, 2019(a) | | | Year Ended
Dec. 31, 2018(a) | | | Year Ended
Dec. 31, 2017(a) | |
| Net Asset Value, Beginning of Period | | $ | 18.22 | | | $ | 31.90 | | | $ | 44.38 | | | $ | 45.72 | | | $ | 61.17 | |
| | | | | | | | | | | | | | | | | | | | | |
| Investment Activities: | | | | | | | | | | | | | | | | | | | | |
| Net investment income (loss)(b) | | | (0.27 | ) | | | (0.32 | ) | | | 0.12 | | | | 0.04 | | | | (0.44 | ) |
| Net realized and unrealized gains (losses) on investments | | | (4.26 | ) | | | (13.32 | ) | | | (12.55 | ) | | | (1.38 | ) | | | (15.01 | ) |
| Total income (loss) from investment activities | | | (4.53 | ) | | | (13.64 | ) | | | (12.43 | ) | | | (1.34 | ) | | | (15.45 | ) |
| | | | | | | | | | | | | | | | | | | | | |
| Distributions to Shareholders From: | | | | | | | | | | | | | | | | | | | | |
| Net investment income | | | — | | | | (0.04 | ) | | | (0.05 | ) | | | — | | | | — | |
| Net realized gains on investments | | | (0.20 | ) | | | — | | | | — | | | | — | | | | — | |
| Total distributions | | | (0.20 | ) | | | (0.04 | ) | | | (0.05 | ) | | | — | | | | — | |
| | | | | | | | | | | | | | | | | | | | | |
| Net Asset Value, End of Period | | $ | 13.49 | | | $ | 18.22 | | | $ | 31.90 | | | $ | 44.38 | | | $ | 45.72 | |
| | | | | | | | | | | | | | | | | | | | | |
| Total Return | | | (25.13 | )% | | | (42.77 | )% | | | (28.05 | )% | | | (2.89 | )%(c) | | | (25.25 | )% |
| | | | | | | | | | | | | | | | | | | | | |
| Ratios to Average Net Assets: | | | | | | | | | | | | | | | | | | | | |
| Gross expenses | | | 1.68 | % | | | 1.75 | % | | | 1.73 | % | | | 1.76 | % | | | 1.72 | % |
| Net expenses | | | 1.68 | % | | | 1.68 | % | | | 1.69 | %(d) | | | 1.66 | %(c) | | | 1.68 | % |
| Net investment income (loss) | | | (1.68 | )% | | | (1.33 | )% | | | 0.32 | % | | | 0.08 | %(c) | | | (0.85 | )% |
| | | | | | | | | | | | | | | | | | | | | |
| Supplemental Data: | | | | | | | | | | | | | | | | | | | | |
| Net assets, end of period (000's) | | $ | 1,823 | | | $ | 5,120 | | | $ | 7,353 | | | $ | 4,667 | | | $ | 3,593 | |
| Portfolio turnover rate(e) | | | — | | | | — | | | | — | | | | — | | | | — | |
| (a) | As described in Note 8, share amounts have been adjusted for 1:4 reverse share split that occurred on November 18, 2019. |
| (b) | Per share net investment income (loss) has been calculated using the average daily shares method. |
| (c) | During 2018, the Fund received a non-recurring reimbursement from a third party relating to expenses that were incurred in a prior year. Had this reimbursement not occurred, the net expense ratio and net investment income (loss) ratio would have been 1.67% and 0.07%, respectively, and the total return would have been (2.90)%. |
| (d) | The expense ratio does not correlate to the applicable expense limits in place during the period given that the annual contractual expense limitation is applied for one year periods ended April 30th of each year, instead of coinciding with the December 31st year end. Details of the current expense limitation in effect can be found in Note 4 of the accompanying Notes to Financial Statements. |
| (e) | Portfolio turnover rate is calculated without regard to instruments having a maturity of less than one year from acquisition or derivative instruments (including swap agreements and futures contracts). |
See accompanying notes to financial statements.
Management Discussion of Fund Performance :: ProFund VP Short Small-Cap :: 237
ProFund VP Short Small-Cap (the "Fund") seeks daily investment results, before fees and expenses, that correspond to the inverse (-1x) of the return of the Russell 2000® Index (the "Index") for a single day, not for any other period. A "single day" is measured from the time the Fund calculates its net asset value ("NAV") to the time of the Fund's next NAV calculation. The Fund does not seek to achieve its stated investment objective over a period of time greater than a single day. The return of the Fund for periods longer than a single day will be the result of its return for each day compounded over the period. The Fund's returns for periods longer than a single day will very likely differ in amount, and possibly even direction from the Fund's stated multiple (-1x) times the return of the Fund's Index for the same period. For periods longer than a single day, the Fund will lose money if the Index's performance is flat, and it is possible that the Fund will lose money even if the level of the index falls. For the year ended December 31, 2021, the Fund had a total return of -19.05%. For the same period, the Index had a total return of 14.82%1 and a volatility of 21.98%. For the year, the Fund achieved an average daily statistical correlation of over 0.99 to the inverse of the daily performance of the Index.2
The Fund takes positions in financial instruments that, in combination, should have similar daily return characteristics as the inverse of the daily return of the Index. The Index is a measure of small-cap U.S. stock market performance. It is a float-adjusted, market capitalization-weighted index containing approximately 2,000 of the smallest companies in the Russell 3000® Index or approximately 8% of the total market capitalization of the Russell 3000® Index, which in turn represents approximately 98% of the investable U.S. equity market.
During the year ended December 31, 2021, the Fund invested in swap agreements and futures contracts as a substitute for shorting stocks in order to gain inverse exposure to the Index. These derivatives generally tracked the performance of their underlying benchmark and benefited from financing costs associated with their use. The Fund entered into swap agreements with counterparties that the Fund's advisor determined to be major, global financial institutions. If a counterparty becomes insolvent or otherwise fails to perform on its obligations, the value of investments in the Fund may decline. The Fund has sought to mitigate this risk by generally requiring counterparties to post collateral for the benefit of the Fund, marked to market daily, in an amount approximately equal to the amount the counterparty owed to the Fund, subject to certain minimum thresholds.
Value of a $10,000 Investment at Net Asset Value*

| * | The line graph represents the historical performance of a hypothetical investment of $10,000 in the ProFund VP Short Small-Cap from December 31, 2011 to December 31, 2021, assuming the reinvestment of distributions. |
Average Annual Total Return as of 12/31/21
| Fund | | One Year | | | Five Year | | | Ten Year | |
| ProFund VP Short Small-Cap | | | -19.05 | % | | | -16.20 | % | | | -16.62 | % |
| Russell 2000® Index | | | 14.82 | % | | | 12.02 | % | | | 13.23 | % |
Expense Ratios**
| Fund | | Gross | | | Net | | | | | |
| ProFund VP Short Small-Cap | | | 1.83 | % | | | 1.68 | % | | | | |
| ** | Reflects the expense ratio as reported in the Prospectus dated May 1, 2021. Contractual fee waivers are in effect through April 30, 2022. See Financial Highlights for effective expense ratios. |
Allocation of Portfolio Holdings & Index Composition
Market Exposure
| Investment Type | | % of Net Assets | |
| Futures Contracts | | | (11 | )% |
| Swap Agreements | | | (88 | )% |
| Total Exposure | | | (99 | )% |
"Market Exposure" includes the value of total investments (including the contract value of any derivatives) and excludes any instruments used for cash management.
Holdings
The ProFund VP Short Small-Cap primarily invests in non-equity securities, which may include: swap agreements, futures contracts, repurchase agreements and U.S. Government securities.
Russell 2000® Index – Composition
| | | % of Index | |
| Health Care | | | 19 | % |
| Financials | | | 16 | % |
| Industrials | | | 15 | % |
| Information Technology | | | 15 | % |
| Consumer Discretionary | | | 11 | % |
| Real Estate | | | 7 | % |
| Energy | | | 4 | % |
| Materials | | | 4 | % |
| Consumer Staples | | | 3 | % |
| Communication Services | | | 3 | % |
| Utilities | | | 3 | % |
Past performance does not guarantee future results. Return calculations assume the reinvestment of distributions and do not reflect taxes that a shareholder would pay on Fund distributions or on the redemption of Fund shares. The performance data quoted represents past performance and current returns may be lower or higher. The investment return and NAV will fluctuate so that an investor's shares, when redeemed, may be worth more or less than the original cost. The performance above reflects any fee reductions during the applicable periods. If such fee reductions had not occurred, the quoted performance would be lower. Performance numbers are net of all Fund fees and expenses but do not include any insurance, sales, or administrative charges of variable annuity or life insurance contracts. If these charges were included, the returns would be lower. To obtain performance current to the most recent month-end, please call toll-free 888-776-3637.
| 1 | The graph and table reflect the theoretical reinvestment of dividends on securities in the Index. The impact of transaction costs and the deduction of fees and expenses associated with a mutual fund, such as investment management and accounting fees, are not reflected in the index calculations. The Fund's performance reflects the reinvestment of dividends as well as the impact of transaction costs and the deduction of fees and expenses. It is not possible to invest directly in an index. |
| 2 | 1.00 equals perfect correlation. This calculation is based on the daily total return of the Index and the performance of the daily total return of the NAV per share of the Fund. |
The above information is not covered by the Report of the Independent Registered Public Accounting Firm.
238 :: ProFund VP Short Small-Cap :: Financial Statements
Schedule of Portfolio Investments :: December 31, 2021
Repurchase Agreements(a)(b) (116.6%)
| | | Principal
Amount | | | Value | |
| Repurchase Agreements with various counterparties, 0.00%, dated 12/31/21, due 1/3/22, total to be received $1,161,000 | | $ | 1,161,000 | | | $ | 1,161,000 | |
TOTAL REPURCHASE AGREEMENTS
(Cost $1,161,000) | | | | | | | 1,161,000 | |
TOTAL INVESTMENT SECURITIES
(Cost $1,161,000)—116.6% | | | | | | | 1,161,000 | |
| Net other assets (liabilities)—(16.6)% | | | | | | | (165,348 | ) |
| NET ASSETS—100.0% | | | | | | $ | 995,652 | |
| (a) | A portion of these securities were held in a segregated account for the benefit of swap counterparties in the event of default. At December 31, 2021, the aggregate amount held in a segregated account was $246,000. |
| (b) | The ProFund VP invests in Repurchase Agreements jointly with other funds in the Trust. See "Repurchase Agreements" under Note 2 in the Notes to Financial Statements to view the details of each individual agreement and counterparty as well as a description of the securities subject to repurchase. |
Futures Contracts Sold
| | | Number
of
Contracts | | | Expiration
Date | | Notional
Amount | | | Value and
Unrealized
Appreciation/
(Depreciation) | |
| E-Mini Russell 2000 Index Futures Contracts | | | 1 | | | 3/21/22 | | $ | (112,140 | ) | | $ | (1,694 | ) |
Total Return Swap Agreements—Short
| Underlying Instrument | | Counterparty | | Termination
Date(1) | | Rate Paid
(Received)(2) | | | Notional
Amount | | | Value and
Unrealized
Appreciation/
(Depreciation) | |
| Russell 2000 Index | | Goldman Sachs International | | 1/27/22 | | | (0.08 | )% | | $ | (370,476 | ) | | $ | 501 | |
| Russell 2000 Index | | UBS AG | | 1/27/22 | | | 0.42 | % | | | (507,440 | ) | | | 4,585 | |
| | | | | | | | | | | $ | (877,916 | ) | | $ | 5,086 | |
| (1) | Agreements may be terminated at will by either party without penalty. Payment is due at termination/maturity. |
| (2) | Reflects the floating financing rate, as of December 31, 2021, on the notional amount of the swap agreement paid to the counterparty or received from the counterparty, excluding any commissions. This amount is included as part of the unrealized appreciation/(depreciation). |
See accompanying notes to financial statements.
Financial Statements :: ProFund VP Short Small-Cap :: 239
Statement of Assets and Liabilities
December 31, 2021
| ASSETS: |
| Total Investment Securities, at cost | | $ | 1,161,000 | |
| Repurchase agreements, at value | | | 1,161,000 | |
| Total Investment Securities, at value | | | 1,161,000 | |
| Cash | | | 181 | |
| Segregated cash balances for futures contracts with brokers | | | 6,600 | |
| Unrealized appreciation on swap agreements | | | 5,086 | |
| Receivable for capital shares issued | | | 181 | |
| Variation margin on futures contracts | | | 205 | |
| Prepaid expenses | | | 5 | |
| TOTAL ASSETS | | | 1,173,258 | |
| | | | | |
| LIABILITIES: | | | | |
| Payable for capital shares redeemed | | | 174,256 | |
| Advisory fees payable | | | 1,019 | |
| Management services fees payable | | | 136 | |
| Administration fees payable | | | 79 | |
| Administrative services fees payable | | | 583 | |
| Distribution fees payable | | | 593 | |
| Transfer agency fees payable | | | 107 | |
| Fund accounting fees payable | | | 45 | |
| Compliance services fees payable | | | 5 | |
| Other accrued expenses | | | 783 | |
| TOTAL LIABILITIES | | | 177,606 | |
| NET ASSETS | | $ | 995,652 | |
| | | | | |
| NET ASSETS CONSIST OF: | | | | |
| Capital | | $ | 6,919,650 | |
| Total distributable earnings (loss) | | | (5,923,998 | ) |
| NET ASSETS | | $ | 995,652 | |
| Shares of Beneficial Interest Outstanding (unlimited number of shares authorized, no par value) | | | 44,557 | |
| Net Asset Value (offering and redemption price per share) | | $ | 22.35 | |
Statement of Operations
For the Year Ended December 31, 2021
| INVESTMENT INCOME: | | | | |
| Interest | | $ | 17 | |
| | | | | |
| EXPENSES: | | | | |
| Advisory fees | | | 8,324 | |
| Management services fees | | | 1,110 | |
| Administration fees | | | 853 | |
| Transfer agency fees | | | 692 | |
| Administrative services fees | | | 2,770 | |
| Distribution fees | | | 2,775 | |
| Custody fees | | | 172 | |
| Fund accounting fees | | | 471 | |
| Trustee fees | | | 19 | |
| Compliance services fees | | | 6 | |
| Other fees | | | 1,314 | |
| Recoupment of prior expenses reduced by the Advisor | | | 200 | |
| Total Gross Expenses before reductions | | | 18,706 | |
| Expenses reduced and reimbursed by the Advisor | | | (59 | ) |
| TOTAL NET EXPENSES | | | 18,647 | |
| NET INVESTMENT INCOME (LOSS) | | | (18,630 | ) |
| | | | | |
| REALIZED AND UNREALIZED GAINS (LOSSES) ON INVESTMENTS: | | | | |
| Net realized gains (losses) on futures contracts | | | (16,123 | ) |
| Net realized gains (losses) on swap agreements | | | (234,252 | ) |
| Change in net unrealized appreciation/depreciation on futures contracts | | | 1,970 | |
| Change in net unrealized appreciation/depreciation on swap agreements | | | (1,010 | ) |
| NET REALIZED AND UNREALIZED GAINS (LOSSES) ON INVESTMENTS | | | (249,415 | ) |
| CHANGE IN NET ASSETS RESULTING FROM OPERATIONS | | $ | (268,045 | ) |
See accompanying notes to financial statements.
240 :: ProFund VP Short Small-Cap :: Financial Statements
| Statements of Changes in Net Assets |
| |
| | | Year Ended
December 31, 2021 | | | Year Ended
December 31, 2020 | |
| FROM INVESTMENT ACTIVITIES: |
| |
| OPERATIONS: |
| Net investment income (loss) | | $ | (18,630 | ) | | $ | (28,165 | ) |
| Net realized gains (losses) on investments | | | (250,375 | ) | | | (252,652 | ) |
| Change in net unrealized appreciation/depreciation on investments | | | 960 | | | | 7,905 | |
| Change in net assets resulting from operations | | | (268,045 | ) | | | (272,912 | ) |
| | | | | | | | | |
| DISTRIBUTIONS TO SHAREHOLDERS: | | | | | | | | |
| Total distributions | | | — | | | | (9,164 | ) |
| Change in net assets resulting from distributions | | | — | | | | (9,164 | ) |
| | | | | | | | | |
| CAPITAL TRANSACTIONS: | | | | | | | | |
| Proceeds from shares issued | | | 25,830,717 | | | | 45,008,330 | |
| Distributions reinvested | | | — | | | | 9,164 | |
| Value of shares redeemed | | | (25,651,108 | ) | | | (45,506,199 | ) |
| Change in net assets resulting from capital transactions | | | 179,609 | | | | (488,705 | ) |
| Change in net assets | | | (88,436 | ) | | | (770,781 | ) |
| | | | | | | | | |
| NET ASSETS: | | | | | | | | |
| Beginning of period | | | 1,084,088 | | | | 1,854,869 | |
| End of period | | $ | 995,652 | | | $ | 1,084,088 | |
| | | | | | | | | |
| SHARE TRANSACTIONS: | | | | | | | | |
| Issued | | | 1,108,415 | | | | 1,018,688 | (a) |
| Reinvested | | | — | | | | 259 | (a) |
| Redeemed | | | (1,103,127 | ) | | | (1,025,160 | )(a) |
| Change in shares | | | 5,288 | | | | (6,213 | ) |
| (a) | As described in Note 8, share amounts have been adjusted for 1:4 reverse share split that occurred on December 14, 2020. |
See accompanying notes to financial statements.
Financial Highlights :: ProFund VP Short Small-Cap :: 241
ProFunds Financial Highlights FOR THE PERIODS INDICATED
Selected data for a share of beneficial interest outstanding throughout the periods indicated.
| | | Year Ended
Dec. 31, 2021 | | | Year Ended
Dec. 31, 2020(a) | | | Year Ended
Dec. 31, 2019(a) | | | Year Ended
Dec. 31, 2018(a) | | | Year Ended
Dec. 31, 2017(a) | |
| Net Asset Value, Beginning of Period | | $ | 27.61 | | | $ | 40.78 | | | $ | 57.35 | | | $ | 51.94 | | | $ | 60.57 | |
| | | | | | | | | | | | | | | | | | | | | |
| Investment Activities: | | | | | | | | | | | | | | | | | | | | |
| Net investment income (loss)(b) | | | (0.39 | ) | | | (0.56 | ) | | | 0.20 | | | | 0.04 | | | | (0.48 | ) |
Net realized and unrealized gains (losses) on
investments | | | (4.87 | ) | | | (12.42 | ) | | | (11.57 | ) | | | 5.37 | | | | (8.15 | ) |
| Total income (loss) from investment activities | | | (5.26 | ) | | | (12.98 | ) | | | (11.37 | ) | | | 5.41 | | | | (8.63 | ) |
| | | | | | | | | | | | | | | | | | | | | |
| Distributions to Shareholders From: | | | | | | | | | | | | | | | | | | | | |
| Net investment income | | | — | | | | (0.19 | ) | | | (0.04 | ) | | | — | | | | — | |
| Net realized gains on investments | | | — | | | | — | | | | (5.16 | ) | | | — | | | | — | |
| Total distributions | | | — | | | | (0.19 | ) | | | (5.20 | ) | | | — | | | | — | |
| | | | | | | | | | | | | | | | | | | | | |
| Net Asset Value, End of Period | | $ | 22.35 | | | $ | 27.61 | | | $ | 40.78 | | | $ | 57.35 | | | $ | 51.94 | |
| | | | | | | | | | | | | | | | | | | | | |
| Total Return | | | (19.05 | )% | | | (31.96 | )% | | | (20.78 | )% | | | 10.39 | %(c) | | | (14.20 | )% |
| | | | | | | | | | | | | | | | | | | | | |
| Ratios to Average Net Assets: | | | | | | | | | | | | | | | | | | | | |
| Gross expenses | | | 1.69 | % | | | 1.83 | % | | | 1.77 | % | | | 1.78 | % | | | 1.70 | % |
| Net expenses | | | 1.68 | % | | | 1.68 | % | | | 1.68 | % | | | 1.68 | %(c) | | | 1.68 | % |
| Net investment income (loss) | | | (1.68 | )% | | | (1.36 | )% | | | 0.42 | % | | | 0.10 | %(c) | | | (0.87 | )% |
| | | | | | | | | | | | | | | | | | | | | |
| Supplemental Data: | | | | | | | | | | | | | | | | | | | | |
| Net assets, end of period (000's) | | $ | 996 | | | $ | 1,084 | | | $ | 1,855 | | | $ | 2,931 | | | $ | 1,882 | |
| Portfolio turnover rate(d) | | | — | | | | — | | | | — | | | | — | | | | — | |
| (a) | As described in Note 8, share amounts have been adjusted for 1:4 reverse share split that occurred on December 14, 2020. |
| (b) | Per share net investment income (loss) has been calculated using the average daily shares method. |
| (c) | During 2018, the Fund received a non-recurring reimbursement from a third party relating to expenses that were incurred in a prior year. The effect to the net expense ratio, net investment income (loss) ratio, and total return were each less than 0.005%. |
| (d) | Portfolio turnover rate is calculated without regard to instruments having a maturity of less than one year from acquisition or derivative instruments (including swap agreements and futures contracts). |
See accompanying notes to financial statements.
242 :: ProFund VP Small-Cap :: Management Discussion of Fund Performance
ProFund VP Small-Cap (the "Fund") seeks investment results, before fees and expenses, that correspond to the performance of the Russell 2000® Index (the "Index"). For the year ended December 31, 2021, the Fund had a total return of 12.88%. For the same period, the Index had a total return of 14.82%1 and a volatility of 21.98%. For the year, the Fund achieved an average daily statistical correlation of over 0.99 to the daily performance of the Index.2
The Fund takes positions in financial instruments that, in combination, should have similar return characteristics as the return of the Index. The Index is a measure of small-cap U.S. stock market performance. It is a float-adjusted market capitalization-weighted index containing approximately 2,000 of the smallest companies in the Russell 3000® Index or approximately 8% of the total market capitalization of the Russell 3000® Index, which in turn represents approximately 98% of the investable U.S. equity market.
During the year ended December 31, 2021, the Fund invested in swap agreements as a substitute for investing directly in stocks in order to gain exposure to the Index. These derivatives generally tracked the performance of their underlying benchmark and were negatively impacted by financing costs associated with their use. The Fund entered into swap agreements with counterparties that the Fund's advisor determined to be major, global financial institutions. If a counterparty becomes insolvent or otherwise fails to perform on its obligations, the value of investments in the Fund may decline. The Fund has sought to mitigate this risk by generally requiring counterparties to post collateral for the benefit of the Fund, marked to market daily, in an amount approximately equal to the amount the counterparty owed to the Fund, subject to certain minimum thresholds.
Value of a $10,000 Investment at Net Asset Value*
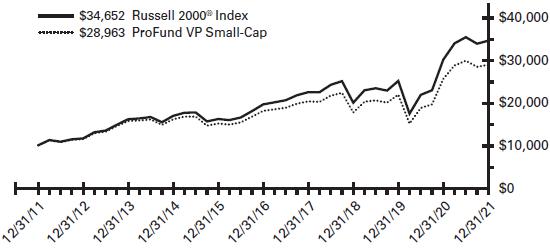
| * | The line graph represents the historical performance of a hypothetical investment of $10,000 in the ProFund VP Small-Cap from December 31, 2011 to December 31, 2021, assuming the reinvestment of distributions. |
Average Annual Total Return as of 12/31/21
| Fund | | One Year | | | Five Year | | | Ten Year | |
| ProFund VP Small-Cap | | | 12.88 | % | | | 9.85 | % | | | 11.22 | % |
| Russell 2000® Index | | | 14.82 | % | | | 12.02 | % | | | 13.23 | % |
Expense Ratios**
| Fund | | Gross | | | Net | | | | |
| ProFund VP Small-Cap | | | 1.82 | % | | | 1.68 | % | | | | |
| ** | Reflects the expense ratio as reported in the Prospectus dated May 1, 2021. Contractual fee waivers are in effect through April 30, 2022. See Financial Highlights for effective expense ratios. |
Allocation of Portfolio Holdings & Index Composition
Market Exposure
| Investment Type | | % of Net Assets | |
| Equity Securities | | | 71 | % |
| Swap Agreements | | | 29 | % |
| Total Exposure | | | 100 | % |
"Market Exposure" includes the value of total investments (including the contract value of any derivatives) and excludes any instruments used for cash management or collateral for securities loaned.
Largest Equity Holdings
| Company | | % of Net Assets | |
| AMC Entertainment Holdings, Inc. | | | 0.3 | % |
| Synaptics, Inc. | | | 0.3 | % |
| Lattice Semiconductor Corp. | | | 0.2 | % |
| EastGroup Properties, Inc. | | | 0.2 | % |
| BJ's Wholesale Club Holdings, Inc. | | | 0.2 | % |
Russell 2000® Index – Composition
| | | % of Index | |
| Health Care | | | 19 | % |
| Financials | | | 16 | % |
| Industrials | | | 15 | % |
| Information Technology | | | 15 | % |
| Consumer Discretionary | | | 11 | % |
| Real Estate | | | 7 | % |
| Energy | | | 4 | % |
| Materials | | | 4 | % |
| Consumer Staples | | | 3 | % |
| Communication Services | | | 3 | % |
| Utilities | | | 3 | % |
Past performance does not guarantee future results. Return calculations assume the reinvestment of distributions and do not reflect taxes that a shareholder would pay on Fund distributions or on the redemption of Fund shares. The performance data quoted represents past performance and current returns may be lower or higher. The investment return and net asset value ("NAV") will fluctuate so that an investor's shares, when redeemed, may be worth more or less than the original cost. The performance above reflects any fee reductions during the applicable periods. If such fee reductions had not occurred, the quoted performance would be lower. Performance numbers are net of all Fund fees and expenses but do not include any insurance, sales, or administrative charges of variable annuity or life insurance contracts. If these charges were included, the returns would be lower. To obtain performance current to the most recent month-end, please call toll-free 888-776-3637.
| 1 | The graph and table reflect the theoretical reinvestment of dividends on securities in the Index. The impact of transaction costs and the deduction of fees and expenses associated with a mutual fund, such as investment management and accounting fees, are not reflected in the index calculations. The Fund's performance reflects the reinvestment of dividends as well as the impact of transaction costs and the deduction of fees and expenses. It is not possible to invest directly in an index. |
| 2 | 1.00 equals perfect correlation. This calculation is based on the daily total return of the Index and the performance of the daily total return of the NAV per share of the Fund. |
The above information is not covered by the Report of the Independent Registered Public Accounting Firm.
Financial Statements :: ProFund VP Small-Cap :: 243
Schedule of Portfolio Investments :: December 31, 2021
Common Stocks (70.8%)
| | | Shares | | | Value | |
| 1-800-Flowers.com, Inc.*—Class A (Internet & Direct Marketing Retail) | | | 93 | | | $ | 2,173 | |
| 1Life Healthcare, Inc.* (Health Care Providers & Services) | | | 405 | | | | 7,116 | |
| 1st Source Corp. (Banks) | | | 59 | | | | 2,926 | |
| 1stdibs.com, Inc.* (Internet & Direct Marketing Retail) | | | 23 | | | | 288 | |
| 22nd Century Group, Inc.* (Tobacco) | | | 559 | | | | 1,727 | |
| 2seventy bio, Inc.* (Biotechnology) | | | 78 | | | | 1,999 | |
| 2U, Inc.* (Diversified Consumer Services) | | | 252 | | | | 5,058 | |
| 3D Systems Corp.* (Technology Hardware, Storage & Peripherals) | | | 431 | | | | 9,283 | |
| 4D Molecular Therapeutics, Inc.* (Biotechnology) | | | 97 | | | | 2,128 | |
| 89bio, Inc.* (Biotechnology) | | | 34 | | | | 444 | |
| 8x8, Inc.* (Software) | | | 392 | | | | 6,570 | |
| 9 Meters Biopharma, Inc.* (Pharmaceuticals) | | | 786 | | | | 769 | |
| 908 Devices, Inc.* (Electronic Equipment, Instruments & Components) | | | 65 | | | | 1,682 | |
| A10 Networks, Inc. (Software) | | | 209 | | | | 3,465 | |
| AAON, Inc. (Building Products) | | | 146 | | | | 11,597 | |
| AAR Corp.* (Aerospace & Defense) | | | 118 | | | | 4,606 | |
| Aaron's Co., Inc. (The) (Specialty Retail) | | | 109 | | | | 2,687 | |
| Abercrombie & Fitch Co.*—Class A (Specialty Retail) | | | 203 | | | | 7,070 | |
| ABM Industries, Inc. (Commercial Services & Supplies) | | | 234 | | | | 9,559 | |
| Absci Corp.* (Life Sciences Tools & Services) | | | 48 | | | | 394 | |
| Acacia Research Corp.* (Professional Services) | | | 170 | | | | 872 | |
| Academy Sports & Outdoors, Inc.* (Leisure Products) | | | 270 | | | | 11,853 | |
| ACADIA Pharmaceuticals, Inc.* (Biotechnology) | | | 416 | | | | 9,709 | |
| Acadia Realty Trust (Equity Real Estate Investment Trusts) | | | 302 | | | | 6,593 | |
| Accel Entertainment, Inc.* (Hotels, Restaurants & Leisure) | | | 196 | | | | 2,552 | |
| Accelerate Diagnostics, Inc.* (Life Sciences Tools & Services) | | | 115 | | | | 600 | |
| ACCO Brands Corp. (Commercial Services & Supplies) | | | 324 | | | | 2,676 | |
| Accolade, Inc.* (Health Care Technology) | | | 175 | | | | 4,613 | |
| Accuray, Inc.* (Health Care Equipment & Supplies) | | | 313 | | | | 1,493 | |
| ACI Worldwide, Inc.* (Software) | | | 410 | | | | 14,227 | |
| Aclaris Therapeutics, Inc.* (Pharmaceuticals) | | | 177 | | | | 2,574 | |
| Acumen Pharmaceuticals, Inc.* (Biotechnology) | | | 35 | | | | 237 | |
| Acushnet Holdings Corp. (Leisure Products) | | | 119 | | | | 6,317 | |
| Acutus Medical, Inc.* (Health Care Equipment & Supplies) | | | 66 | | | | 225 | |
| Adagio Therapeutics, Inc.* (Biotechnology) | | | 73 | | | | 530 | |
| AdaptHealth Corp.* (Health Care Providers & Services) | | | 249 | | | | 6,091 | |
| Addus Homecare Corp.* (Health Care Providers & Services) | | | 53 | | | | 4,956 | |
| Adicet Bio, Inc.* (Pharmaceuticals) | | | 73 | | | | 1,277 | |
| Adient PLC* (Auto Components) | | | 330 | | | | 15,800 | |
| Adtalem Global Education, Inc.* (Diversified Consumer Services) | | | 172 | | | | 5,084 | |
| ADTRAN, Inc. (Communications Equipment) | | | 167 | | | | 3,813 | |
| Advanced Energy Industries, Inc. (Semiconductors & Semiconductor Equipment) | | | 131 | | | | 11,929 | |
| AdvanSix, Inc. (Chemicals) | | | 95 | | | | 4,489 | |
| Advantage Solutions, Inc.* (Media) | | | 265 | | | | 2,125 | |
| Advent Technologies Holdings, Inc.* (Electrical Equipment) | | | 55 | | | | 386 | |
| Adverum Biotechnologies, Inc.* (Biotechnology) | | | 302 | | | | 532 | |
| Aeglea BioTherapeutics, Inc.* (Biotechnology) | | | 141 | | | | 670 | |
| Aemetis, Inc.* (Oil, Gas & Consumable Fuels) | | | 94 | | | | 1,156 | |
| Aerie Pharmaceuticals, Inc.* (Pharmaceuticals) | | | 147 | | | | 1,032 | |
| Aerojet Rocketdyne Holdings, Inc. (Aerospace & Defense) | | | 260 | | | | 12,158 | |
| Aerovate Therapeutics, Inc.* (Biotechnology) | | | 35 | | | | 413 | |
| AeroVironment, Inc.* (Aerospace & Defense) | | | 78 | | | | 4,838 | |
| AerSale Corp.* (Aerospace & Defense) | | | 33 | | | | 585 | |
| Aeva Technologies, Inc.* (Electronic Equipment, Instruments & Components) | | | 367 | | | | 2,775 | |
| AFC Gamma, Inc. (Mortgage Real Estate Investment Trusts) | | | 43 | | | | 979 | |
| Affimed N.V.* (Biotechnology) | | | 403 | | | | 2,225 | |
| AgEagle Aerial Systems, Inc.* (Machinery) | | | 236 | | | | 371 | |
| Agenus, Inc.* (Biotechnology) | | | 761 | | | | 2,450 | |
| Agiliti, Inc.* (Health Care Providers & Services) | | | 82 | | | | 1,899 | |
| Agilysys, Inc.* (Software) | | | 74 | | | | 3,290 | |
| Agios Pharmaceuticals, Inc.* (Biotechnology) | | | 189 | | | | 6,212 | |
| Agree Realty Corp. (Equity Real Estate Investment Trusts) | | | 239 | | | | 17,055 | |
| Air Transport Services Group, Inc.* (Air Freight & Logistics) | | | 205 | | | | 6,023 | |
| AirSculpt Technologies, Inc.* (Health Care Providers & Services) | | | 23 | | | | 395 | |
| aka Brands Holding Corp.* (Internet & Direct Marketing Retail) | | | 33 | | | | 305 | |
| Akebia Therapeutics, Inc.* (Biotechnology) | | | 606 | | | | 1,370 | |
| Akero Therapeutics, Inc.* (Biotechnology) | | | 89 | | | | 1,882 | |
| Akouos, Inc.* (Biotechnology) | | | 83 | | | | 706 | |
| Akoustis Technologies, Inc.* (Electronic Equipment, Instruments & Components) | | | 170 | | | | 1,136 | |
| Akoya Biosciences, Inc.* (Life Sciences Tools & Services) | | | 47 | | | | 720 | |
| Alamo Group, Inc. (Machinery) | | | 35 | | | | 5,151 | |
| Alarm.com Holdings, Inc.* (Software) | | | 164 | | | | 13,909 | |
| Albany International Corp.—Class A (Machinery) | | | 107 | | | | 9,464 | |
| Albireo Pharma, Inc.* (Biotechnology) | | | 59 | | | | 1,374 | |
| Aldeyra Therapeutics, Inc.* (Biotechnology) | | | 169 | | | | 676 | |
| Alector, Inc.* (Biotechnology) | | | 203 | | | | 4,192 | |
| Alerus Financial Corp. (Diversified Financial Services) | | | 52 | | | | 1,523 | |
| Alexander & Baldwin, Inc. (Equity Real Estate Investment Trusts) | | | 252 | | | | 6,323 | |
| Alexander's, Inc. (Equity Real Estate Investment Trusts) | | | 7 | | | | 1,822 | |
| Alignment Healthcare, Inc.* (Health Care Providers & Services) | | | 276 | | | | 3,881 | |
| Aligos Therapeutics, Inc.* (Biotechnology) | | | 73 | | | | 867 | |
| Alkami Technology, Inc.* (Software) | | | 99 | | | | 1,986 | |
| Alkermes PLC* (Biotechnology) | | | 557 | | | | 12,956 | |
| Allakos, Inc.* (Biotechnology) | | | 123 | | | | 1,204 | |
| Allegheny Technologies, Inc.* (Metals & Mining) | | | 442 | | | | 7,041 | |
See accompanying notes to financial statements.
244 :: ProFund VP Small-Cap :: Financial Statements
Common Stocks, continued
| | | Shares | | | Value | |
| Allegiance Bancshares, Inc. (Banks) | | | 66 | | | $ | 2,786 | |
| Allegiant Travel Co.* (Airlines) | | | 53 | | | | 9,913 | |
| ALLETE, Inc. (Electric Utilities) | | | 182 | | | | 12,076 | |
| Allied Motion Technologies, Inc. (Electrical Equipment) | | | 40 | | | | 1,460 | |
| Allogene Therapeutics, Inc.* (Biotechnology) | | | 236 | | | | 3,521 | |
| Allovir, Inc.* (Biotechnology) | | | 102 | | | | 1,320 | |
| Allscripts Healthcare Solutions, Inc.* (Health Care Technology) | | | 422 | | | | 7,786 | |
| Alpha & Omega Semiconductor, Ltd.* (Semiconductors & Semiconductor Equipment) | | | 74 | | | | 4,481 | |
| Alpha Teknova, Inc.* (Biotechnology) | | | 24 | | | | 492 | |
| Alphatec Holdings, Inc.* (Health Care Equipment & Supplies) | | | 246 | | | | 2,812 | |
| Alpine Immune Sciences, Inc.* (Biotechnology) | | | 40 | | | | 554 | |
| Alta Equipment Group, Inc.* (Trading Companies & Distributors) | | | 66 | | | | 966 | |
| Altair Engineering, Inc.*—Class A (Software) | | | 161 | | | | 12,449 | |
| Altimmune, Inc.* (Biotechnology) | | | 138 | | | | 1,264 | |
| Alto Ingredients, Inc.* (Oil, Gas & Consumable Fuels) | | | 248 | | | | 1,193 | |
| Altra Industrial Motion Corp. (Machinery) | | | 225 | | | | 11,603 | |
| Altus Midstream Co.—Class A (Oil, Gas & Consumable Fuels) | | | 11 | | | | 674 | |
| ALX Oncology Holdings, Inc.* (Biotechnology) | | | 62 | | | | 1,332 | |
| Amalgamated Financial Corp. (Banks) | | | 47 | | | | 788 | |
| A-Mark Precious Metals, Inc. (Diversified Financial Services) | | | 31 | | | | 1,894 | |
| Ambac Financial Group, Inc.* (Insurance) | | | 158 | | | | 2,536 | |
| Ambarella, Inc.* (Semiconductors & Semiconductor Equipment) | | | 123 | | | | 24,956 | |
| AMC Entertainment Holdings, Inc.*(a)(Entertainment) | | | 1,794 | | | | 48,797 | |
| AMC Networks, Inc.*—Class A (Media) | | | 101 | | | | 3,478 | |
| Amerant Bancorp, Inc. (Banks) | | | 94 | | | | 3,248 | |
| Ameresco, Inc.*—Class A (Construction & Engineering) | | | 107 | | | | 8,714 | |
| American Assets Trust, Inc. (Equity Real Estate Investment Trusts) | | | 173 | | | | 6,493 | |
| American Axle & Manufacturing Holdings, Inc.* (Auto Components) | | | 392 | | | | 3,657 | |
| American Eagle Outfitters, Inc. (Specialty Retail) | | | 529 | | | | 13,394 | |
| American Equity Investment Life Holding Co. (Insurance) | | | 287 | | | | 11,170 | |
| American Finance Trust, Inc. (Equity Real Estate Investment Trusts) | | | 431 | | | | 3,935 | |
| American National Bankshares, Inc. (Banks) | | | 36 | | | | 1,356 | |
| American National Group, Inc. (Insurance) | | | 26 | | | | 4,910 | |
| American Outdoor Brands, Inc.* (Leisure Products) | | | 49 | | | | 977 | |
| American Public Education, Inc.* (Diversified Consumer Services) | | | 65 | | | | 1,446 | |
| American Software, Inc.—Class A (Software) | | | 109 | | | | 2,853 | |
| American States Water Co. (Water Utilities) | | | 128 | | | | 13,241 | |
| American Superconductor Corp.* (Electrical Equipment) | | | 96 | | | | 1,044 | |
| American Vanguard Corp. (Chemicals) | | | 102 | | | | 1,672 | |
| American Well Corp.*—Class A (Health Care Technology) | | | 635 | | | | 3,835 | |
| American Woodmark Corp.* (Building Products) | | | 57 | | | | 3,716 | |
| America's Car-Mart, Inc.* (Specialty Retail) | | | 21 | | | | 2,150 | |
| Ameris Bancorp (Banks) | | | 231 | | | | 11,476 | |
| AMERISAFE, Inc. (Insurance) | | | 67 | | | | 3,607 | |
| Amicus Therapeutics, Inc.* (Biotechnology) | | | 913 | | | | 10,545 | |
| Amkor Technology, Inc. (Semiconductors & Semiconductor Equipment) | | | 355 | | | | 8,800 | |
| AMMO, Inc.* (Leisure Products) | | | 303 | | | | 1,651 | |
| AMN Healthcare Services, Inc.* (Health Care Providers & Services) | | | 164 | | | | 20,063 | |
| Amneal Pharmaceuticals, Inc.* (Pharmaceuticals) | | | 346 | | | | 1,657 | |
| Amphastar Pharmaceuticals, Inc.* (Pharmaceuticals) | | | 129 | | | | 3,004 | |
| Ampio Pharmaceuticals, Inc.* (Pharmaceuticals) | | | 677 | | | | 386 | |
| Amyris, Inc.* (Oil, Gas & Consumable Fuels) | | | 614 | | | | 3,322 | |
| AnaptysBio, Inc.* (Biotechnology) | | | 67 | | | | 2,328 | |
| Anavex Life Sciences Corp.* (Biotechnology) | | | 233 | | | | 4,040 | |
| Angel Oak Mortgage, Inc. (Mortgage Real Estate Investment Trusts) | | | 25 | | | | 410 | |
| AngioDynamics, Inc.* (Health Care Equipment & Supplies) | | | 130 | | | | 3,585 | |
| Angion Biomedica Corp.* (Pharmaceuticals) | | | 76 | | | | 220 | |
| ANI Pharmaceuticals, Inc.* (Pharmaceuticals) | | | 38 | | | | 1,751 | |
| Anika Therapeutics, Inc.* (Health Care Equipment & Supplies) | | | 50 | | | | 1,792 | |
| Annexon, Inc.* (Biotechnology) | | | 108 | | | | 1,241 | |
| Antares Pharma, Inc.* (Health Care Equipment & Supplies) | | | 580 | | | | 2,071 | |
| Anterix, Inc.* (Diversified Telecommunication Services) | | | 40 | | | | 2,350 | |
| Antero Resources Corp.* (Oil, Gas & Consumable Fuels) | | | 994 | | | | 17,395 | |
| Apartment Investment and Management Co.* (Equity Real Estate Investment Trusts) | | | 525 | | | | 4,053 | |
| Apellis Pharmaceuticals, Inc.* (Biotechnology) | | | 248 | | | | 11,725 | |
| API Group Corp.* (Construction & Engineering) | | | 701 | | | | 18,065 | |
| Apogee Enterprises, Inc. (Building Products) | | | 86 | | | | 4,141 | |
| Apollo Commercial Real Estate Finance, Inc. (Mortgage Real Estate Investment Trusts) | | | 487 | | | | 6,409 | |
| Apollo Medical Holdings, Inc.* (Health Care Providers & Services) | | | 131 | | | | 9,626 | |
| Appfolio, Inc.* (Software) | | | 66 | | | | 7,990 | |
| AppHarvest, Inc.* (Food Products) | | | 242 | | | | 941 | |
| Appian Corp.* (Software) | | | 137 | | | | 8,934 | |
| Apple Hospitality REIT, Inc. (Equity Real Estate Investment Trusts) | | | 745 | | | | 12,032 | |
| Applied Industrial Technologies, Inc. (Trading Companies & Distributors) | | | 133 | | | | 13,659 | |
| Applied Molecular Transport, Inc.* (Biotechnology) | | | 87 | | | | 1,216 | |
| Applied Therapeutics, Inc.* (Biotechnology) | | | 62 | | | | 555 | |
| Apria, Inc.* (Health Care Providers & Services) | | | 68 | | | | 2,217 | |
| Apyx Medical Corp.* (Health Care Equipment & Supplies) | | | 108 | | | | 1,385 | |
| AquaBounty Technologies, Inc.* (Biotechnology) | | | 182 | | | | 382 | |
| Arbor Realty Trust, Inc. (Mortgage Real Estate Investment Trusts) | | | 500 | | | | 9,160 | |
| Arbutus Biopharma Corp.* (Biotechnology) | | | 279 | | | | 1,085 | |
| ArcBest Corp. (Road & Rail) | | | 88 | | | | 10,547 | |
| Arch Resources, Inc. (Oil, Gas & Consumable Fuels) | | | 53 | | | | 4,840 | |
| Archrock, Inc. (Energy Equipment & Services) | | | 468 | | | | 3,501 | |
| Arcimoto, Inc.* (Automobiles) | | | 99 | | | | 770 | |
| Arconic Corp.* (Metals & Mining) | | | 371 | | | | 12,246 | |
| Arcosa, Inc. (Construction & Engineering) | | | 168 | | | | 8,854 | |
| Arcturus Therapeutics Holdings, Inc.* (Biotechnology) | | | 73 | | | | 2,702 | |
See accompanying notes to financial statements.
Financial Statements :: ProFund VP Small-Cap :: 245
Common Stocks, continued
| | | Shares | | | Value | |
| Arcus Biosciences, Inc.* (Biotechnology) | | | 156 | | | $ | 6,313 | |
| Arcutis Biotherapeutics, Inc.* (Biotechnology) | | | 96 | | | | 1,991 | |
| Ardelyx, Inc.* (Biotechnology) | | | 336 | | | | 370 | |
| Arena Pharmaceuticals, Inc.* (Biotechnology) | | | 215 | | | | 19,982 | |
| Ares Commercial Real Estate Corp. (Mortgage Real Estate Investment Trusts) | | | 152 | | | | 2,210 | |
| Argan, Inc. (Construction & Engineering) | | | 52 | | | | 2,012 | |
| Argo Group International Holdings, Ltd. (Insurance) | | | 110 | | | | 6,392 | |
| Aris Water Solution, Inc.*—Class A (Commercial Services & Supplies) | | | 68 | | | | 881 | |
| Arko Corp.* (Specialty Retail) | | | 419 | | | | 3,675 | |
| Arlo Technologies, Inc.* (Electronic Equipment, Instruments & Components) | | | 293 | | | | 3,074 | |
| Armada Hoffler Properties, Inc. (Equity Real Estate Investment Trusts) | | | 210 | | | | 3,196 | |
| ARMOUR Residential REIT, Inc. (Mortgage Real Estate Investment Trusts) | | | 310 | | | | 3,041 | |
| Array Technologies, Inc.* (Electrical Equipment) | | | 444 | | | | 6,966 | |
| Arrow Financial Corp. (Banks) | | | 48 | | | | 1,691 | |
| Arrowhead Pharmaceuticals, Inc.* (Biotechnology) | | | 352 | | | | 23,339 | |
| Arteris, Inc.* (Software) | | | 18 | | | | 380 | |
| Artesian Resources Corp.—Class A (Water Utilities) | | | 28 | | | | 1,297 | |
| Artisan Partners Asset Management, Inc. (Capital Markets) | | | 203 | | | | 9,671 | |
| Arvinas, Inc.* (Pharmaceuticals) | | | 164 | | | | 13,470 | |
| Asana, Inc.*—Class A (Software) | | | 247 | | | | 18,414 | |
| Asbury Automotive Group, Inc.* (Specialty Retail) | | | 80 | | | | 13,818 | |
| Asensus Surgical, Inc.* (Health Care Equipment & Supplies) | | | 813 | | | | 902 | |
| ASGN, Inc.* (Professional Services) | | | 177 | | | | 21,842 | |
| Ashford Hospitality Trust, Inc.* (Equity Real Estate Investment Trusts) | | | 59 | | | | 566 | |
| Aspen Aerogels, Inc.* (Energy Equipment & Services) | | | 77 | | | | 3,834 | |
| Aspira Women's Health, Inc.* (Health Care Equipment & Supplies) | | | 252 | | | | 446 | |
| Assetmark Financial Holdings, Inc.* (Capital Markets) | | | 63 | | | | 1,651 | |
| Associated Banc-Corp. (Banks) | | | 516 | | | | 11,656 | |
| Associated Capital Group, Inc.—Class A (Capital Markets) | | | 6 | | | | 258 | |
| Astec Industries, Inc. (Machinery) | | | 79 | | | | 5,472 | |
| Astronics Corp.* (Aerospace & Defense) | | | 87 | | | | 1,044 | |
| Atara Biotherapeutics, Inc.* (Biotechnology) | | | 302 | | | | 4,760 | |
| Atea Pharmaceuticals, Inc.* (Biotechnology) | | | 224 | | | | 2,003 | |
| Aterian, Inc.* (Household Durables) | | | 90 | | | | 370 | |
| Athenex, Inc.* (Biotechnology) | | | 300 | | | | 408 | |
| Athersys, Inc.* (Biotechnology) | | | 711 | | | | 642 | |
| Athira Pharma, Inc.* (Pharmaceuticals) | | | 112 | | | | 1,459 | |
| Atkore, Inc.* (Electrical Equipment) | | | 160 | | | | 17,789 | |
| Atlantic Capital Bancshares, Inc.* (Banks) | | | 68 | | | | 1,956 | |
| Atlantic Union Bankshares (Banks) | | | 262 | | | | 9,770 | |
| Atlanticus Holdings Corp.* (Consumer Finance) | | | 17 | | | | 1,212 | |
| Atlas Air Worldwide Holdings, Inc.* (Air Freight & Logistics) | | | 100 | | | | 9,412 | |
| Atlas Technical Consultants, Inc.* (Professional Services) | | | 50 | | | | 421 | |
| ATN International, Inc. (Diversified Telecommunication Services) | | | 39 | | | | 1,558 | |
| Atomera, Inc.* (Semiconductors & Semiconductor Equipment) | | | 71 | | | | 1,429 | |
| Atossa Therapeutics, Inc.* (Health Care Equipment & Supplies) | | | 406 | | | | 650 | |
| Atreca, Inc.*—Class A (Biotechnology) | | | 90 | | | | 273 | |
| AtriCure, Inc.* (Health Care Equipment & Supplies) | | | 156 | | | | 10,847 | |
| Atrion Corp. (Health Care Equipment & Supplies) | | | 5 | | | | 3,525 | |
| Aura Biosciences, Inc.* (Biotechnology) | | | 19 | | | | 323 | |
| Avalo Therapeutics, Inc.* (Pharmaceuticals) | | | 216 | | | | 367 | |
| Avanos Medical, Inc.* (Health Care Equipment & Supplies) | | | 167 | | | | 5,790 | |
| Avaya Holdings Corp.*—Class C (Software) | | | 287 | | | | 5,683 | |
| Aveanna Healthcare Holdings, Inc.* (Health Care Providers & Services) | | | 137 | | | | 1,014 | |
| Aviat Networks, Inc.* (Communications Equipment) | | | 38 | | | | 1,219 | |
| Avid Bioservices, Inc.* (Biotechnology) | | | 210 | | | | 6,128 | |
| Avid Technology, Inc.* (Technology Hardware, Storage & Peripherals) | | | 126 | | | | 4,104 | |
| Avidity Biosciences, Inc.* (Biotechnology) | | | 131 | | | | 3,114 | |
| AvidXchange Holdings, Inc.* (Software) | | | 88 | | | | 1,325 | |
| Avient Corp. (Chemicals) | | | 316 | | | | 17,679 | |
| Avis Budget Group, Inc.* (Road & Rail) | | | 144 | | | | 29,861 | |
| Avista Corp. (Multi-Utilities) | | | 246 | | | | 10,453 | |
| Avita Medical, Inc.* (Biotechnology) | | | 84 | | | | 1,006 | |
| Avrobio, Inc.* (Biotechnology) | | | 132 | | | | 508 | |
| Axcelis Technologies, Inc.* (Semiconductors & Semiconductor Equipment) | | | 116 | | | | 8,649 | |
| AxoGen, Inc.* (Health Care Equipment & Supplies) | | | 134 | | | | 1,256 | |
| Axonics, Inc.* (Health Care Equipment & Supplies) | | | 159 | | | | 8,904 | |
| Axos Financial, Inc.*—Class I (Thrifts & Mortgage Finance) | | | 198 | | | | 11,070 | |
| Axsome Therapeutics, Inc.* (Pharmaceuticals) | | | 96 | | | | 3,627 | |
| AXT, Inc.* (Semiconductors & Semiconductor Equipment) | | | 141 | | | | 1,242 | |
| AZZ, Inc. (Electrical Equipment) | | | 86 | | | | 4,755 | |
| B Riley Financial, Inc. (Capital Markets) | | | 70 | | | | 6,220 | |
| B&G Foods, Inc.(a)—Class A (Food Products) | | | 222 | | | | 6,822 | |
| Babcock & Wilcox Enterprises, Inc.* (Electrical Equipment) | | | 193 | | | | 1,741 | |
| Badger Meter, Inc. (Electronic Equipment, Instruments & Components) | | | 101 | | | | 10,763 | |
| Balchem Corp. (Chemicals) | | | 112 | | | | 18,882 | |
| Bally's Corp.* (Hotels, Restaurants & Leisure) | | | 113 | | | | 4,301 | |
| Banc of California, Inc. (Banks) | | | 190 | | | | 3,728 | |
| BancFirst Corp. (Banks) | | | 60 | | | | 4,234 | |
| Banco Latinoamericano de Comercio Exterior S.A.—Class E (Diversified Financial Services) | | | 108 | | | | 1,793 | |
| Bandwidth, Inc.* (Diversified Telecommunication Services) | | | 80 | | | | 5,741 | |
| Bank First Corp. (Banks) | | | 23 | | | | 1,662 | |
| Bank of Marin Bancorp (Banks) | | | 54 | | | | 2,010 | |
| BankUnited, Inc. (Banks) | | | 309 | | | | 13,074 | |
| Banner Corp. (Banks) | | | 119 | | | | 7,220 | |
| Bar Harbor Bankshares (Banks) | | | 51 | | | | 1,475 | |
| Barnes & Noble Education, Inc.* (Specialty Retail) | | | 157 | | | | 1,069 | |
| Barnes Group, Inc. (Machinery) | | | 164 | | | | 7,641 | |
| Barrett Business Services, Inc. (Professional Services) | | | 26 | | | | 1,796 | |
| Bassett Furniture Industries, Inc. (Household Durables) | | | 32 | | | | 537 | |
See accompanying notes to financial statements.
246 :: ProFund VP Small-Cap :: Financial Statements
Common Stocks, continued
| | | Shares | | | Value | |
| Beacon Roofing Supply, Inc.* (Trading Companies & Distributors) | | | 194 | | | $ | 11,126 | |
| Beam Global* (Electrical Equipment) | | | 31 | | | | 577 | |
| Beam Therapeutics, Inc.* (Biotechnology) | | | 178 | | | | 14,185 | |
| Beauty Health Co. (The)* (Personal Products) | | | 299 | | | | 7,224 | |
| Beazer Homes USA, Inc.* (Household Durables) | | | 102 | | | | 2,368 | |
| Bed Bath & Beyond, Inc.* (Specialty Retail) | | | 353 | | | | 5,147 | |
| Belden, Inc. (Electronic Equipment, Instruments & Components) | | | 154 | | | | 10,122 | |
| BellRing Brands, Inc.*—Class A (Personal Products) | | | 138 | | | | 3,937 | |
| Benchmark Electronics, Inc. (Electronic Equipment, Instruments & Components) | | | 122 | | | | 3,306 | |
| Benefitfocus, Inc.* (Software) | | | 87 | | | | 927 | |
| Berkeley Lights, Inc.* (Life Sciences Tools & Services) | | | 169 | | | | 3,072 | |
| Berkshire Hills Bancorp, Inc. (Banks) | | | 170 | | | | 4,833 | |
| Berry Corp. (Oil, Gas & Consumable Fuels) | | | 234 | | | | 1,970 | |
| Beyondspring, Inc.* (Biotechnology) | | | 78 | | | | 353 | |
| BGC Partners, Inc.—Class A (Capital Markets) | | | 1,099 | | | | 5,110 | |
| Big 5 Sporting Goods Corp. (Specialty Retail) | | | 72 | | | | 1,369 | |
| Big Lots, Inc. (Multiline Retail) | | | 112 | | | | 5,046 | |
| BigCommerce Holdings, Inc.*—Class 1 (IT Services) | | | 168 | | | | 5,942 | |
| Biglari Holdings, Inc.*—Class B (Hotels, Restaurants & Leisure) | | | 3 | | | | 428 | |
| BioAtla, Inc.* (Biotechnology) | | | 54 | | | | 1,060 | |
| BioCryst Pharmaceuticals, Inc.* (Biotechnology) | | | 625 | | | | 8,656 | |
| BioDelivery Sciences International, Inc.* (Pharmaceuticals) | | | 323 | | | | 1,001 | |
| Biodesix, Inc.* (Health Care Providers & Services) | | | 43 | | | | 227 | |
| Biohaven Pharmaceutical Holding Co., Ltd.* (Biotechnology) | | | 193 | | | | 26,598 | |
| BioLife Solutions, Inc.* (Health Care Equipment & Supplies) | | | 36 | | | | 1,342 | |
| Biomea Fusion, Inc.* (Biotechnology) | | | 75 | | | | 559 | |
| Bionano Genomics, Inc.* (Life Sciences Tools & Services) | | | 1,013 | | | | 3,029 | |
| Bioventus, Inc.*—Class A (Health Care Equipment & Supplies) | | | 97 | | | | 1,406 | |
| Bioxcel Therapeutics, Inc.* (Biotechnology) | | | 60 | | | | 1,220 | |
| BJ's Restaurants, Inc.* (Hotels, Restaurants & Leisure) | | | 78 | | | | 2,695 | |
| BJ's Wholesale Club Holdings, Inc.* (Food & Staples Retailing) | | | 476 | | | | 31,877 | |
| Black Diamond Therapeutics, Inc.* (Biotechnology) | | | 79 | | | | 421 | |
| Black Hills Corp. (Multi-Utilities) | | | 222 | | | | 15,667 | |
| Blackbaud, Inc.* (Software) | | | 166 | | | | 13,111 | |
| Blackline, Inc.* (Software) | | | 188 | | | | 19,465 | |
| Blackstone Mortgage Trust, Inc.—Class A (Mortgage Real Estate Investment Trusts) | | | 546 | | | | 16,718 | |
| Blink Charging Co.* (Specialty Retail) | | | 127 | | | | 3,367 | |
| Bloom Energy Corp.* (Electrical Equipment) | | | 494 | | | | 10,833 | |
| Bloomin' Brands, Inc.* (Hotels, Restaurants & Leisure) | | | 308 | | | | 6,462 | |
| Blucora, Inc.* (Capital Markets) | | | 169 | | | | 2,927 | |
| Blue Bird Corp.* (Machinery) | | | 55 | | | | 860 | |
| Blue Foundry Bancorp* (Thrifts & Mortgage Finance) | | | 97 | | | | 1,419 | |
| Blue Ridge Bankshares, Inc. (Banks) | | | 60 | | | | 1,074 | |
| Bluebird Bio, Inc.* (Biotechnology) | | | 235 | | | | 2,348 | |
| Bluegreen Vacations Holding Corp.* (Hotels, Restaurants & Leisure) | | | 50 | | | | 1,755 | |
| BlueLinx Holdings, Inc.* (Trading Companies & Distributors) | | | 32 | | | | 3,064 | |
| Blueprint Medicines Corp.* (Biotechnology) | | | 203 | | | | 21,743 | |
| BM Technologies, Inc.* (IT Services) | | | 17 | | | | 157 | |
| Boise Cascade Co. (Trading Companies & Distributors) | | | 137 | | | | 9,754 | |
| Bolt Biotherapeutics, Inc.* (Biotechnology) | | | 79 | | | | 387 | |
| Boot Barn Holdings, Inc.* (Specialty Retail) | | | 102 | | | | 12,551 | |
| Boston Omaha Corp.*—Class A (Media) | | | 71 | | | | 2,040 | |
| Bottomline Technologies, Inc.* (Software) | | | 156 | | | | 8,809 | |
| Box, Inc.*—Class A (Software) | | | 485 | | | | 12,702 | |
| Brady Corp.—Class A (Commercial Services & Supplies) | | | 164 | | | | 8,840 | |
| Braemar Hotels & Resorts, Inc.* (Equity Real Estate Investment Trusts) | | | 198 | | | | 1,010 | |
| Brandywine Realty Trust (Equity Real Estate Investment Trusts) | | | 589 | | | | 7,904 | |
| Bridgebio Pharma, Inc.* (Biotechnology) | | | 368 | | | | 6,138 | |
| Bridgewater Bancshares, Inc.* (Thrifts & Mortgage Finance) | | | 73 | | | | 1,291 | |
| Brigham Minerals, Inc. (Oil, Gas & Consumable Fuels) | | | 152 | | | | 3,206 | |
| Bright Health Group, Inc.* (Insurance) | | | 184 | | | | 633 | |
| Brightcove, Inc.* (IT Services) | | | 141 | | | | 1,441 | |
| Brightsphere Investment Group, Inc. (Capital Markets) | | | 201 | | | | 5,146 | |
| BrightSpire Capital, Inc. (Mortgage Real Estate Investment Trusts) | | | 293 | | | | 3,006 | |
| BrightView Holdings, Inc.* (Commercial Services & Supplies) | | | 142 | | | | 1,999 | |
| Brinker International, Inc.* (Hotels, Restaurants & Leisure) | | | 158 | | | | 5,781 | |
| Bristow Group, Inc.* (Energy Equipment & Services) | | | 82 | | | | 2,597 | |
| Broadmark Realty Capital, Inc. (Mortgage Real Estate Investment Trusts) | | | 446 | | | | 4,206 | |
| Broadstone Net Lease, Inc. (Equity Real Estate Investment Trusts) | | | 547 | | | | 13,577 | |
| Brookdale Senior Living, Inc.* (Health Care Providers & Services) | | | 643 | | | | 3,318 | |
| Brookfield Infrastructure Corp.—Class A (Gas Utilities) | | | 214 | | | | 14,607 | |
| Brookline Bancorp, Inc. (Banks) | | | 267 | | | | 4,323 | |
| Brooklyn ImmunoTherapeutics, Inc.* (Entertainment) | | | 103 | | | | 430 | |
| BRP Group, Inc.*—Class A (Insurance) | | | 165 | | | | 5,958 | |
| BRT Apartments Corp. (Equity Real Estate Investment Trusts) | | | 40 | | | | 960 | |
| BTRS Holdings, Inc.* (Software) | | | 229 | | | | 1,791 | |
| Business First Bancshares, Inc. (Banks) | | | 66 | | | | 1,868 | |
| Butterfly Network, Inc.* (Health Care Equipment & Supplies) | | | 434 | | | | 2,903 | |
| Byline Bancorp, Inc. (Banks) | | | 87 | | | | 2,379 | |
| Byrna Technologies, Inc.* (Aerospace & Defense) | | | 64 | | | | 854 | |
| C4 Therapeutics, Inc.* (Biotechnology) | | | 134 | | | | 4,315 | |
| Cabot Corp. (Chemicals) | | | 195 | | | | 10,958 | |
| Cactus, Inc.—Class A (Energy Equipment & Services) | | | 193 | | | | 7,359 | |
| Cadence Bank (Banks) | | | 653 | | | | 19,454 | |
| Cadiz, Inc.* (Water Utilities) | | | 74 | | | | 286 | |
| Cadre Holdings, Inc. (Aerospace & Defense) | | | 22 | | | | 559 | |
| Caesarstone, Ltd. (Building Products) | | | 79 | | | | 896 | |
| CalAmp Corp.* (Communications Equipment) | | | 123 | | | | 868 | |
| Calavo Growers, Inc. (Food Products) | | | 59 | | | | 2,502 | |
| Caleres, Inc. (Specialty Retail) | | | 128 | | | | 2,903 | |
See accompanying notes to financial statements.
Financial Statements :: ProFund VP Small-Cap :: 247
Common Stocks, continued
| | | Shares | | | Value | |
| California Resources Corp. (Oil, Gas & Consumable Fuels) | | | 282 | | | $ | 12,044 | |
| California Water Service Group (Water Utilities) | | | 183 | | | | 13,150 | |
| Calix, Inc.* (Communications Equipment) | | | 192 | | | | 15,353 | |
| Callaway Golf Co.* (Leisure Products) | | | 402 | | | | 11,031 | |
| Callon Petroleum Co.* (Oil, Gas & Consumable Fuels) | | | 165 | | | | 7,796 | |
| Cal-Maine Foods, Inc. (Food Products) | | | 142 | | | | 5,253 | |
| Cambium Networks Corp.* (Communications Equipment) | | | 37 | | | | 948 | |
| Cambridge Bancorp (Banks) | | | 24 | | | | 2,246 | |
| Camden National Corp. (Banks) | | | 51 | | | | 2,456 | |
| Camping World Holdings, Inc.—Class A (Specialty Retail) | | | 145 | | | | 5,858 | |
| Cannae Holdings, Inc.* (Diversified Financial Services) | | | 294 | | | | 10,333 | |
| Canoo, Inc.* (Automobiles) | | | 370 | | | | 2,856 | |
| Cantaloupe, Inc.* (IT Services) | | | 202 | | | | 1,794 | |
| Capital Bancorp, Inc. (Banks) | | | 27 | | | | 707 | |
| Capital City Bank Group, Inc. (Banks) | | | 47 | | | | 1,241 | |
| Capitol Federal Financial, Inc. (Thrifts & Mortgage Finance) | | | 451 | | | | 5,110 | |
| Capstar Financial Holdings, Inc. (Banks) | | | 71 | | | | 1,493 | |
| Cara Therapeutics, Inc.* (Biotechnology) | | | 154 | | | | 1,876 | |
| Cardiff Oncology, Inc.* (Biotechnology) | | | 132 | | | | 793 | |
| Cardiovascular Systems, Inc.* (Health Care Equipment & Supplies) | | | 138 | | | | 2,592 | |
| Cardlytics, Inc.* (Media) | | | 112 | | | | 7,402 | |
| CareDx, Inc.* (Biotechnology) | | | 176 | | | | 8,004 | |
| CareTrust REIT, Inc. (Equity Real Estate Investment Trusts) | | | 335 | | | | 7,648 | |
| Cargurus, Inc.* (Interactive Media & Services) | | | 332 | | | | 11,168 | |
| Caribou Biosciences, Inc.* (Biotechnology) | | | 70 | | | | 1,056 | |
| CarLotz, Inc.* (Specialty Retail) | | | 249 | | | | 565 | |
| CarParts.com, Inc.* (Internet & Direct Marketing Retail) | | | 170 | | | | 1,904 | |
| Carpenter Technology Corp. (Metals & Mining) | | | 165 | | | | 4,816 | |
| Carriage Services, Inc. (Diversified Consumer Services) | | | 53 | | | | 3,415 | |
| Carrols Restaurant Group, Inc. (Hotels, Restaurants & Leisure) | | | 116 | | | | 343 | |
| Cars.com, Inc.* (Interactive Media & Services) | | | 238 | | | | 3,829 | |
| Carter Bankshares, Inc.* (Banks) | | | 90 | | | | 1,385 | |
| Casa Systems, Inc.* (Communications Equipment) | | | 110 | | | | 624 | |
| Casella Waste Systems, Inc.*—Class A (Commercial Services & Supplies) | | | 171 | | | | 14,607 | |
| Casper Sleep, Inc.* (Household Durables) | | | 101 | | | | 675 | |
| Cass Information Systems, Inc. (IT Services) | | | 48 | | | | 1,887 | |
| Cassava Sciences, Inc.*(a) (Pharmaceuticals) | | | 133 | | | | 5,812 | |
| Castle Biosciences, Inc.* (Biotechnology) | | | 74 | | | | 3,172 | |
| Castlight Health, Inc.*—Class B (Health Care Technology) | | | 428 | | | | 659 | |
| Catalyst Pharmaceuticals, Inc.* (Biotechnology) | | | 337 | | | | 2,281 | |
| CatchMark Timber Trust, Inc.—Class A (Equity Real Estate Investment Trusts) | | | 170 | | | | 1,481 | |
| Cathay General Bancorp (Banks) | | | 258 | | | | 11,091 | |
| Cavco Industries, Inc.* (Household Durables) | | | 32 | | | | 10,165 | |
| CBIZ, Inc.* (Professional Services) | | | 170 | | | | 6,650 | |
| CBTX, Inc. (Banks) | | | 64 | | | | 1,856 | |
| CECO Environmental Corp.* (Commercial Services & Supplies) | | | 108 | | | | 673 | |
| Celcuity, Inc.* (Biotechnology) | | | 34 | | | | 448 | |
| Celldex Therapeutics, Inc.* (Biotechnology) | | | 160 | | | | 6,182 | |
| CEL-SCI Corp.* (Biotechnology) | | | 125 | | | | 888 | |
| Celsius Holdings, Inc.* (Beverages) | | | 187 | | | | 13,944 | |
| Centennial Resource Development, Inc.*—Class A (Oil, Gas & Consumable Fuels) | | | 640 | | | | 3,827 | |
| Centerspace (Equity Real Estate Investment Trusts) | | | 50 | | | | 5,545 | |
| Central Garden & Pet Co.* (Household Products) | | | 34 | | | | 1,789 | |
| Central Garden & Pet Co.*—Class A (Household Products) | | | 141 | | | | 6,747 | |
| Central Pacific Financial Corp. (Banks) | | | 95 | | | | 2,676 | |
| Centrus Energy Corp.*—Class A (Oil, Gas & Consumable Fuels) | | | 34 | | | | 1,697 | |
| Century Aluminum Co.* (Metals & Mining) | | | 178 | | | | 2,948 | |
| Century Casinos, Inc.* (Hotels, Restaurants & Leisure) | | | 95 | | | | 1,157 | |
| Century Communities, Inc. (Household Durables) | | | 104 | | | | 8,506 | |
| Century Therapeutics, Inc.* (Biotechnology) | | | 41 | | | | 650 | |
| Cerence, Inc.* (Software) | | | 131 | | | | 10,040 | |
| Cerevel Therapeutics Holdings, Inc.* (Biotechnology) | | | 141 | | | | 4,571 | |
| Cerus Corp.* (Health Care Equipment & Supplies) | | | 584 | | | | 3,977 | |
| CEVA, Inc.* (Semiconductors & Semiconductor Equipment) | | | 78 | | | | 3,373 | |
| ChampionX Corp.* (Energy Equipment & Services) | | | 704 | | | | 14,227 | |
| ChannelAdvisor Corp.* (Software) | | | 102 | | | | 2,517 | |
| Chart Industries, Inc.* (Machinery) | | | 127 | | | | 20,255 | |
| Chase Corp. (Chemicals) | | | 26 | | | | 2,589 | |
| Chatham Lodging Trust* (Equity Real Estate Investment Trusts) | | | 166 | | | | 2,278 | |
| Chefs' Warehouse, Inc.* (Food & Staples Retailing) | | | 109 | | | | 3,630 | |
| ChemoCentryx, Inc.* (Biotechnology) | | | 188 | | | | 6,845 | |
| Chesapeake Energy Corp. (Oil, Gas & Consumable Fuels) | | | 365 | | | | 23,550 | |
| Chesapeake Utilities Corp. (Gas Utilities) | | | 60 | | | | 8,749 | |
| Chicken Soup For The Soul Entertainment, Inc.* (Entertainment) | | | 25 | | | | 346 | |
| Chico's FAS, Inc.* (Specialty Retail) | | | 418 | | | | 2,249 | |
| Chimera Investment Corp. (Mortgage Real Estate Investment Trusts) | | | 818 | | | | 12,335 | |
| Chimerix, Inc.* (Biotechnology) | | | 254 | | | | 1,633 | |
| Chinook Therapeutics, Inc.* (Biotechnology) | | | 136 | | | | 2,218 | |
| ChromaDex Corp.* (Life Sciences Tools & Services) | | | 163 | | | | 610 | |
| Chuy's Holdings, Inc.* (Hotels, Restaurants & Leisure) | | | 69 | | | | 2,078 | |
| Cimpress PLC* (Commercial Services & Supplies) | | | 61 | | | | 4,368 | |
| Cinemark Holdings, Inc.* (Entertainment) | | | 375 | | | | 6,045 | |
| CIRCOR International, Inc.* (Machinery) | | | 64 | | | | 1,740 | |
| CIT Group, Inc. (Banks) | | | 345 | | | | 17,713 | |
| Citi Trends, Inc.* (Specialty Retail) | | | 30 | | | | 2,843 | |
| Citius Pharmaceuticals, Inc.* (Pharmaceuticals) | | | 394 | | | | 607 | |
| Citizens & Northern Corp. (Banks) | | | 53 | | | | 1,384 | |
| Citizens, Inc.* (Insurance) | | | 173 | | | | 919 | |
| City Holding Co. (Banks) | | | 52 | | | | 4,253 | |
| City Office REIT, Inc. (Equity Real Estate Investment Trusts) | | | 148 | | | | 2,919 | |
| Civista Bancshares, Inc. (Banks) | | | 52 | | | | 1,269 | |
| Civitas Resources, Inc. (Oil, Gas & Consumable Fuels) | | | 151 | | | | 7,394 | |
| Clarus Corp. (Leisure Products) | | | 92 | | | | 2,550 | |
See accompanying notes to financial statements.
248 :: ProFund VP Small-Cap :: Financial Statements
Common Stocks, continued
| | | Shares | | | Value | |
| Clean Energy Fuels Corp.* (Oil, Gas & Consumable Fuels) | | | 539 | | | $ | 3,304 | |
| Cleanspark, Inc.* (Software) | | | 119 | | | | 1,133 | |
| Clear Channel Outdoor Holdings, Inc.* (Media) | | | 1,261 | | | | 4,174 | |
| Clearfield, Inc.* (Communications Equipment) | | | 40 | | | | 3,377 | |
| ClearPoint Neuro, Inc.* (Health Care Equipment & Supplies) | | | 66 | | | | 741 | |
| Clearwater Paper Corp.* (Paper & Forest Products) | | | 57 | | | | 2,090 | |
| Clearway Energy, Inc.—Class A (Independent Power and Renewable Electricity Producers) | | | 121 | | | | 4,051 | |
| Clearway Energy, Inc.—Class C (Independent Power and Renewable Electricity Producers) | | | 285 | | | | 10,269 | |
| Clene, Inc.* (Biotechnology) | | | 71 | | | | 291 | |
| Clipper Realty, Inc. (Equity Real Estate Investment Trusts) | | | 42 | | | | 417 | |
| Clovis Oncology, Inc.* (Biotechnology) | | | 392 | | | | 1,062 | |
| CMC Materials, Inc. (Semiconductors & Semiconductor Equipment) | | | 99 | | | | 18,977 | |
| CNB Financial Corp. (Banks) | | | 56 | | | | 1,484 | |
| CNO Financial Group, Inc. (Insurance) | | | 428 | | | | 10,204 | |
| CNX Resources Corp.* (Oil, Gas & Consumable Fuels) | | | 729 | | | | 10,024 | |
| Coastal Financial Corp.* (Banks) | | | 33 | | | | 1,670 | |
| Coca-Cola Consolidated, Inc. (Beverages) | | | 16 | | | | 9,907 | |
| Codex DNA, Inc.* (Life Sciences Tools & Services) | | | 27 | | | | 292 | |
| Codexis, Inc.* (Life Sciences Tools & Services) | | | 209 | | | | 6,535 | |
| Codiak Biosciences, Inc.* (Biotechnology) | | | 55 | | | | 613 | |
| Coeur Mining, Inc.* (Metals & Mining) | | | 889 | | | | 4,481 | |
| Cogent Biosciences, Inc.* (Biotechnology) | | | 129 | | | | 1,107 | |
| Cogent Communications Holdings, Inc. (Diversified Telecommunication Services) | | | 148 | | | | 10,831 | |
| Cohen & Steers, Inc. (Capital Markets) | | | 86 | | | | 7,956 | |
| Coherus Biosciences, Inc.* (Biotechnology) | | | 226 | | | | 3,607 | |
| Cohu, Inc.* (Semiconductors & Semiconductor Equipment) | | | 166 | | | | 6,323 | |
| Collegium Pharmaceutical, Inc.* (Pharmaceuticals) | | | 120 | | | | 2,242 | |
| Columbia Banking System, Inc. (Banks) | | | 272 | | | | 8,900 | |
| Columbia Financial, Inc.* (Thrifts & Mortgage Finance) | | | 137 | | | | 2,858 | |
| Columbus McKinnon Corp. (Machinery) | | | 97 | | | | 4,487 | |
| Comfort Systems USA, Inc. (Construction & Engineering) | | | 124 | | | | 12,269 | |
| Commercial Metals Co. (Metals & Mining) | | | 417 | | | | 15,132 | |
| Commercial Vehicle Group, Inc.* (Machinery) | | | 111 | | | | 895 | |
| Community Bank System, Inc. (Banks) | | | 186 | | | | 13,853 | |
| Community Health Systems, Inc.* (Health Care Providers & Services) | | | 432 | | | | 5,750 | |
| Community Healthcare Trust, Inc. (Equity Real Estate Investment Trusts) | | | 83 | | | | 3,923 | |
| Community Trust Bancorp, Inc. (Banks) | | | 54 | | | | 2,355 | |
| CommVault Systems, Inc.* (Software) | | | 159 | | | | 10,958 | |
| Compass Minerals International, Inc. (Metals & Mining) | | | 119 | | | | 6,079 | |
| Computer Programs & Systems, Inc.* (Health Care Technology) | | | 49 | | | | 1,436 | |
| CompX International, Inc. (Commercial Services & Supplies) | | | 6 | | | | 135 | |
| comScore, Inc.* (Media) | | | 243 | | | | 812 | |
| Comstock Resources, Inc.* (Oil, Gas & Consumable Fuels) | | | 318 | | | | 2,573 | |
| Comtech Telecommunications Corp. (Communications Equipment) | | | 90 | | | | 2,132 | |
| Concrete Pumping Holdings, Inc.* (Construction & Engineering) | | | 90 | | | | 738 | |
| Conduent, Inc.* (IT Services) | | | 582 | | | | 3,108 | |
| CONMED Corp. (Health Care Equipment & Supplies) | | | 101 | | | | 14,318 | |
| ConnectOne Bancorp, Inc. (Banks) | | | 130 | | | | 4,252 | |
| Conn's, Inc.* (Specialty Retail) | | | 62 | | | | 1,458 | |
| Consensus Cloud Solutions, Inc.* (Software) | | | 56 | | | | 3,241 | |
| CONSOL Energy, Inc.* (Oil, Gas & Consumable Fuels) | | | 119 | | | | 2,702 | |
| Consolidated Communications Holdings, Inc.* (Diversified Telecommunication Services) | | | 253 | | | | 1,892 | |
| Constellium SE* (Metals & Mining) | | | 432 | | | | 7,737 | |
| Construction Partners, Inc.*—Class A (Construction & Engineering) | | | 101 | | | | 2,970 | |
| Convey Health Solutions Holdings, Inc.* (Health Care Technology) | | | 47 | | | | 393 | |
| Cooper-Standard Holding, Inc.* (Auto Components) | | | 58 | | | | 1,300 | |
| Corcept Therapeutics, Inc.* (Pharmaceuticals) | | | 332 | | | | 6,574 | |
| CoreCard Corp.* (Software) | | | 25 | | | | 970 | |
| CoreCivic, Inc.* (Equity Real Estate Investment Trusts) | | | 417 | | | | 4,157 | |
| CorePoint Lodging, Inc.* (Equity Real Estate Investment Trusts) | | | 137 | | | | 2,151 | |
| CorMedix, Inc.* (Pharmaceuticals) | | | 132 | | | | 601 | |
| Cornerstone Building Brands, Inc.* (Building Products) | | | 190 | | | | 3,314 | |
| Corporate Office Properties Trust (Equity Real Estate Investment Trusts) | | | 392 | | | | 10,964 | |
| Corsair Gaming, Inc.*(a) (Technology Hardware, Storage & Peripherals) | | | 95 | | | | 1,996 | |
| Cortexyme, Inc.* (Biotechnology) | | | 69 | | | | 871 | |
| CorVel Corp.* (Health Care Providers & Services) | | | 31 | | | | 6,448 | |
| Costamare, Inc. (Marine) | | | 183 | | | | 2,315 | |
| Couchbase, Inc.* (Software) | | | 34 | | | | 849 | |
| Coursera, Inc.* (Diversified Consumer Services) | | | 254 | | | | 6,208 | |
| Covenant Logistics Group, Inc.*—Class A (Road & Rail) | | | 42 | | | | 1,110 | |
| Covetrus, Inc.* (Health Care Providers & Services) | | | 359 | | | | 7,169 | |
| Cowen, Inc.—Class A (Capital Markets) | | | 92 | | | | 3,321 | |
| CRA International, Inc. (Professional Services) | | | 25 | | | | 2,334 | |
| Cracker Barrel Old Country Store, Inc. (Hotels, Restaurants & Leisure) | | | 82 | | | | 10,548 | |
| Crawford & Co.—Class A (Insurance) | | | 57 | | | | 427 | |
| Crescent Energy, Inc.*—Class A (Oil, Gas & Consumable Fuels) | | | 102 | | | | 1,293 | |
| Crinetics Pharmaceuticals, Inc.* (Biotechnology) | | | 160 | | | | 4,546 | |
| Crocs, Inc.* (Textiles, Apparel & Luxury Goods) | | | 202 | | | | 25,900 | |
| Cross Country Healthcare, Inc.* (Health Care Providers & Services) | | | 125 | | | | 3,470 | |
| CrossFirst Bankshares, Inc.* (Banks) | | | 162 | | | | 2,529 | |
| CryoLife, Inc.* (Health Care Equipment & Supplies) | | | 132 | | | | 2,686 | |
| CryoPort, Inc.* (Health Care Equipment & Supplies) | | | 141 | | | | 8,343 | |
| CS Disco, Inc.* (Software) | | | 27 | | | | 965 | |
| CSG Systems International, Inc. (IT Services) | | | 113 | | | | 6,511 | |
| CSW Industrials, Inc. (Building Products) | | | 52 | | | | 6,285 | |
| CTO Realty Growth, Inc. (Equity Real Estate Investment Trusts) | | | 20 | | | | 1,228 | |
| CTS Corp. (Electronic Equipment, Instruments & Components) | | | 111 | | | | 4,076 | |
See accompanying notes to financial statements.
Financial Statements :: ProFund VP Small-Cap :: 249
Common Stocks, continued
| | | Shares | | | Value | |
| Cue BioPharma, Inc.* (Biotechnology) | | | 107 | | | $ | 1,210 | |
| Cue Health, Inc.* (Health Care Equipment & Supplies) | | | 51 | | | | 684 | |
| Cullinan Oncology, Inc.* (Biotechnology) | | | 90 | | | | 1,389 | |
| CuriosityStream, Inc.* (Entertainment) | | | 90 | | | | 534 | |
| Curis, Inc.* (Biotechnology) | | | 301 | | | | 1,433 | |
| Curo Group Holdings Corp. (Consumer Finance) | | | 71 | | | | 1,137 | |
| Cushman & Wakefield PLC* (Real Estate Management & Development) | | | 482 | | | | 10,720 | |
| Custom Truck One Source, Inc.* (Trading Companies & Distributors) | | | 161 | | | | 1,288 | |
| Customers Bancorp, Inc. (Banks) | | | 104 | | | | 6,798 | |
| Cutera, Inc.* (Health Care Equipment & Supplies) | | | 61 | | | | 2,521 | |
| CVB Financial Corp. (Banks) | | | 449 | | | | 9,613 | |
| CVR Energy, Inc. (Oil, Gas & Consumable Fuels) | | | 103 | | | | 1,731 | |
| CVRx, Inc.* (Health Care Equipment & Supplies) | | | 28 | | | | 342 | |
| Cymabay Therapeutics, Inc.* (Pharmaceuticals) | | | 241 | | | | 815 | |
| Cyteir Therapeutics, Inc.* (Pharmaceuticals) | | | 29 | | | | 330 | |
| Cytek Biosciences, Inc.* (Life Sciences Tools & Services) | | | 56 | | | | 914 | |
| Cytokinetics, Inc.* (Biotechnology) | | | 275 | | | | 12,535 | |
| CytomX Therapeutics, Inc.* (Biotechnology) | | | 225 | | | | 974 | |
| CytoSorbents Corp.* (Health Care Equipment & Supplies) | | | 143 | | | | 599 | |
| Daily Journal Corp.* (Media) | | | 4 | | | | 1,427 | |
| Daktronics, Inc.* (Electronic Equipment, Instruments & Components) | | | 128 | | | | 646 | |
| Dana, Inc. (Auto Components) | | | 505 | | | | 11,524 | |
| Danimer Scientific, Inc.* (Chemicals) | | | 315 | | | | 2,684 | |
| DarioHealth Corp.* (Health Care Equipment & Supplies) | | | 47 | | | | 610 | |
| Daseke, Inc.* (Road & Rail) | | | 139 | | | | 1,396 | |
| Dave & Buster's Entertainment, Inc.* (Hotels, Restaurants & Leisure) | | | 150 | | | | 5,760 | |
| Day One Biopharmaceuticals, Inc.* (Biotechnology) | | | 38 | | | | 640 | |
| Deciphera Pharmaceuticals, Inc.* (Biotechnology) | | | 137 | | | | 1,338 | |
| Del Taco Restaurants, Inc. (Hotels, Restaurants & Leisure) | | | 104 | | | | 1,295 | |
| Delek US Holdings, Inc.* (Oil, Gas & Consumable Fuels) | | | 228 | | | | 3,418 | |
| Deluxe Corp. (Commercial Services & Supplies) | | | 146 | | | | 4,688 | |
| Denali Therapeutics, Inc.* (Biotechnology) | | | 316 | | | | 14,094 | |
| Denbury, Inc.* (Oil, Gas & Consumable Fuels) | | | 175 | | | | 13,403 | |
| Denny's Corp.* (Hotels, Restaurants & Leisure) | | | 215 | | | | 3,440 | |
| DermTech, Inc.* (Biotechnology) | | | 84 | | | | 1,327 | |
| Design Therapeutics, Inc.* (Biotechnology) | | | 92 | | | | 1,970 | |
| Designer Brands, Inc.* (Specialty Retail) | | | 209 | | | | 2,970 | |
| Desktop Metal, Inc.*—Class A (Machinery) | | | 650 | | | | 3,218 | |
| DHT Holdings, Inc. (Oil, Gas & Consumable Fuels) | | | 492 | | | | 2,553 | |
| Diamond Hill Investment Group, Inc. (Capital Markets) | | | 11 | | | | 2,137 | |
| DiamondRock Hospitality Co.* (Equity Real Estate Investment Trusts) | | | 726 | | | | 6,977 | |
| DICE Therapeutics, Inc.* (Pharmaceuticals) | | | 48 | | | | 1,215 | |
| Diebold Nixdorf, Inc.* (Technology Hardware, Storage & Peripherals) | | | 250 | | | | 2,263 | |
| Digi International, Inc.* (Communications Equipment) | | | 117 | | | | 2,875 | |
| Digimarc Corp.* (Software) | | | 44 | | | | 1,737 | |
| Digital Media Solutions, Inc.*—Class A (Media) | | | 11 | | | | 53 | |
| Digital Turbine, Inc.* (Software) | | | 315 | | | | 19,212 | |
| DigitalBridge Group, Inc.* (Equity Real Estate Investment Trusts) | | | 1,685 | | | | 14,036 | |
| DigitalOcean Holdings, Inc.* (IT Services) | | | 176 | | | | 14,138 | |
| Dillard's, Inc.—Class A (Multiline Retail) | | | 20 | | | | 4,900 | |
| Dime Community Bancshares, Inc. (Banks) | | | 120 | | | | 4,219 | |
| Dine Brands Global, Inc. (Hotels, Restaurants & Leisure) | | | 57 | | | | 4,321 | |
| Diodes, Inc.* (Semiconductors & Semiconductor Equipment) | | | 151 | | | | 16,581 | |
| Diversified Healthcare Trust (Equity Real Estate Investment Trusts) | | | 824 | | | | 2,546 | |
| DMC Global, Inc.* (Energy Equipment & Services) | | | 65 | | | | 2,575 | |
| Domo, Inc.* (Software) | | | 97 | | | | 4,811 | |
| Donegal Group, Inc.—Class A (Insurance) | | | 51 | | | | 729 | |
| Donnelley Financial Solutions, Inc.* (Capital Markets) | | | 102 | | | | 4,808 | |
| Dorian LPG, Ltd. (Oil, Gas & Consumable Fuels) | | | 108 | | | | 1,371 | |
| Dorman Products, Inc.* (Auto Components) | | | 92 | | | | 10,397 | |
| Douglas Dynamics, Inc. (Machinery) | | | 78 | | | | 3,047 | |
| Douglas Elliman, Inc.* (Real Estate Management & Development) | | | 250 | | | | 2,869 | |
| Dril-Quip, Inc.* (Energy Equipment & Services) | | | 122 | | | | 2,401 | |
| Drive Shack, Inc.* (Hotels, Restaurants & Leisure) | | | 287 | | | | 410 | |
| Duckhorn Portfolio, Inc. (The)* (Beverages) | | | 125 | | | | 2,918 | |
| Ducommun, Inc.* (Aerospace & Defense) | | | 38 | | | | 1,777 | |
| Duluth Holdings, Inc.*—Class B (Internet & Direct Marketing Retail) | | | 42 | | | | 638 | |
| Durect Corp.* (Pharmaceuticals) | | | 786 | | | | 775 | |
| DXP Enterprises, Inc.* (Trading Companies & Distributors) | | | 60 | | | | 1,540 | |
| Dycom Industries, Inc.* (Construction & Engineering) | | | 102 | | | | 9,564 | |
| Dynavax Technologies Corp.* (Biotechnology) | | | 374 | | | | 5,262 | |
| Dyne Therapeutics, Inc.* (Biotechnology) | | | 104 | | | | 1,237 | |
| Dynex Capital, Inc. (Mortgage Real Estate Investment Trusts) | | | 125 | | | | 2,089 | |
| DZS, Inc.* (Communications Equipment) | | | 59 | | | | 957 | |
| E2open Parent Holdings, Inc.* (Software) | | | 691 | | | | 7,781 | |
| Eagle Bancorp, Inc. (Banks) | | | 110 | | | | 6,417 | |
| Eagle Bulk Shipping, Inc. (Marine) | | | 31 | | | | 1,411 | |
| Eagle Pharmaceuticals, Inc.* (Biotechnology) | | | 40 | | | | 2,037 | |
| Eargo, Inc.* (Health Care Equipment & Supplies) | | | 105 | | | | 536 | |
| Earthstone Energy, Inc.*—Class A (Oil, Gas & Consumable Fuels) | | | 88 | | | | 963 | |
| Easterly Government Properties, Inc. (Equity Real Estate Investment Trusts) | | | 301 | | | | 6,899 | |
| Eastern Bankshares, Inc. (Banks) | | | 597 | | | | 12,041 | |
| EastGroup Properties, Inc. (Equity Real Estate Investment Trusts) | | | 140 | | | | 31,899 | |
| Eastman Kodak Co.* (Technology Hardware, Storage & Peripherals) | | | 156 | | | | 730 | |
| Ebix, Inc. (Software) | | | 92 | | | | 2,797 | |
| EchoStar Corp.*—Class A (Communications Equipment) | | | 130 | | | | 3,426 | |
| Ecovyst, Inc. (Chemicals) | | | 178 | | | | 1,823 | |
| Edgewell Personal Care Co. (Personal Products) | | | 189 | | | | 8,639 | |
| Edgewise Therapeutics, Inc.* (Pharmaceuticals) | | | 134 | | | | 2,048 | |
| Editas Medicine, Inc.* (Biotechnology) | | | 238 | | | | 6,319 | |
| eGain Corp.* (Software) | | | 72 | | | | 719 | |
| eHealth, Inc.* (Insurance) | | | 86 | | | | 2,193 | |
| Eiger Biopharmaceuticals, Inc.* (Biotechnology) | | | 111 | | | | 576 | |
See accompanying notes to financial statements.
250 :: ProFund VP Small-Cap :: Financial Statements
Common Stocks, continued
| | | Shares | | | Value | |
| El Pollo Loco Holdings, Inc.* (Hotels, Restaurants & Leisure) | | | 66 | | | $ | 937 | |
| elf Beauty, Inc.* (Personal Products) | | | 167 | | | | 5,546 | |
| Eliem Therapeutics, Inc.* (Biotechnology) | | | 25 | | | | 262 | |
| Ellington Financial, Inc. (Mortgage Real Estate Investment Trusts) | | | 187 | | | | 3,196 | |
| EMCOR Group, Inc. (Construction & Engineering) | | | 185 | | | | 23,567 | |
| EMCORE Corp.* (Communications Equipment) | | | 127 | | | | 886 | |
| Emerald Holding, Inc.* (Media) | | | 82 | | | | 326 | |
| Emergent BioSolutions, Inc.* (Biotechnology) | | | 170 | | | | 7,390 | |
| Empire State Realty Trust, Inc. (Equity Real Estate Investment Trusts) | | | 497 | | | | 4,423 | |
| Employers Holdings, Inc. (Insurance) | | | 97 | | | | 4,014 | |
| Enact Holdings, Inc. (Thrifts & Mortgage Finance) | | | 51 | | | | 1,054 | |
| Enanta Pharmaceuticals, Inc.* (Biotechnology) | | | 67 | | | | 5,010 | |
| Encore Capital Group, Inc.* (Consumer Finance) | | | 101 | | | | 6,273 | |
| Encore Wire Corp. (Electrical Equipment) | | | 69 | | | | 9,874 | |
| Endo International PLC* (Pharmaceuticals) | | | 796 | | | | 2,993 | |
| Energizer Holdings, Inc. (Household Products) | | | 236 | | | | 9,464 | |
| Energy Fuels, Inc.* (Oil, Gas & Consumable Fuels) | | | 537 | | | | 4,097 | |
| Energy Recovery, Inc.* (Machinery) | | | 144 | | | | 3,095 | |
| Enerpac Tool Group Corp. (Machinery) | | | 210 | | | | 4,259 | |
| EnerSys (Electrical Equipment) | | | 149 | | | | 11,779 | |
| Enfusion, Inc.*—Class A (Software) | | | 76 | | | | 1,591 | |
| EngageSmart, Inc.* (Software) | | | 56 | | | | 1,351 | |
| Ennis, Inc. (Commercial Services & Supplies) | | | 89 | | | | 1,738 | |
| Enova International, Inc.* (Consumer Finance) | | | 126 | | | | 5,161 | |
| EnPro Industries, Inc. (Machinery) | | | 72 | | | | 7,925 | |
| Enstar Group, Ltd.* (Insurance) | | | 43 | | | | 10,646 | |
| Entercom Communications Corp.* (Media) | | | 410 | | | | 1,054 | |
| Enterprise Bancorp, Inc. (Banks) | | | 32 | | | | 1,437 | |
| Enterprise Financial Services Corp. (Banks) | | | 123 | | | | 5,792 | |
| Entrada Therapeutics, Inc.* (Biotechnology) | | | 32 | | | | 548 | |
| Entravision Communications Corp.—Class A (Media) | | | 209 | | | | 1,417 | |
| Envestnet, Inc.* (Software) | | | 189 | | | | 14,995 | |
| Eos Energy Enterprises, Inc.* (Electrical Equipment) | | | 155 | | | | 1,166 | |
| Epizyme, Inc.* (Biotechnology) | | | 318 | | | | 795 | |
| ePlus, Inc.* (Electronic Equipment, Instruments & Components) | | | 92 | | | | 4,957 | |
| Equitrans Midstream Corp. (Oil, Gas & Consumable Fuels) | | | 1,421 | | | | 14,693 | |
| Equity Bancshares, Inc.—Class A (Banks) | | | 47 | | | | 1,595 | |
| Equity Commonwealth* (Equity Real Estate Investment Trusts) | | | 407 | | | | 10,541 | |
| Erasca, Inc.* (Biotechnology) | | | 73 | | | | 1,137 | |
| Eros STX Global Corp.* (Entertainment) | | | 1,103 | | | | 264 | |
| Escalade, Inc. (Leisure Products) | | | 34 | | | | 537 | |
| ESCO Technologies, Inc. (Machinery) | | | 89 | | | | 8,009 | |
| Esperion Therapeutics, Inc.* (Biotechnology) | | | 94 | | | | 470 | |
| Esports Technologies, Inc.* (Hotels, Restaurants & Leisure) | | | 38 | | | | 781 | |
| Essent Group, Ltd. (Thrifts & Mortgage Finance) | | | 376 | | | | 17,120 | |
| Essential Properties Realty Trust, Inc. (Real Estate Management & Development) | | | 421 | | | | 12,137 | |
| Ethan Allen Interiors, Inc. (Household Durables) | | | 78 | | | | 2,051 | |
| European Wax Center, Inc.*—Class A (Diversified Consumer Services) | | | 46 | | | | 1,396 | |
| Evelo Biosciences, Inc.* (Biotechnology) | | | 105 | | | | 637 | |
| Eventbrite, Inc.* (Interactive Media & Services) | | | 266 | | | | 4,639 | |
| EverCommerce, Inc.* (Software) | | | 58 | | | | 914 | |
| Everi Holdings, Inc.* (Hotels, Restaurants & Leisure) | | | 297 | | | | 6,341 | |
| EverQuote, Inc.*—Class A (Interactive Media & Services) | | | 68 | | | | 1,065 | |
| EVERTEC, Inc. (IT Services) | | | 210 | | | | 10,496 | |
| EVI Industries, Inc.* (Trading Companies & Distributors) | | | 20 | | | | 625 | |
| Evo Payments, Inc.* (IT Services) | | | 165 | | | | 4,224 | |
| Evolent Health, Inc.* (Health Care Technology) | | | 277 | | | | 7,665 | |
| Evolus, Inc.* (Pharmaceuticals) | | | 115 | | | | 749 | |
| Evoqua Water Technologies Corp.* (Machinery) | | | 402 | | | | 18,794 | |
| Exagen, Inc.* (Health Care Providers & Services) | | | 36 | | | | 419 | |
| ExlService Holdings, Inc.* (IT Services) | | | 114 | | | | 16,503 | |
| eXp World Holdings, Inc. (Real Estate Management & Development) | | | 218 | | | | 7,344 | |
| Exponent, Inc. (Professional Services) | | | 180 | | | | 21,011 | |
| Expro Group Holdings N.V.* (Energy Equipment & Services) | | | 161 | | | | 2,310 | |
| Extreme Networks, Inc.* (Communications Equipment) | | | 441 | | | | 6,924 | |
| EyePoint Pharmaceuticals, Inc.* (Pharmaceuticals) | | | 73 | | | | 894 | |
| EZCORP, Inc.*—Class A (Consumer Finance) | | | 171 | | | | 1,260 | |
| F45 Training Holdings, Inc.* (Hotels, Restaurants & Leisure) | | | 71 | | | | 773 | |
| Fabrinet* (Electronic Equipment, Instruments & Components) | | | 128 | | | | 15,164 | |
| Falcon Minerals Corp. (Oil, Gas & Consumable Fuels) | | | 137 | | | | 667 | |
| Farmers National Bancorp (Banks) | | | 107 | | | | 1,985 | |
| Farmland Partners, Inc. (Equity Real Estate Investment Trusts) | | | 99 | | | | 1,183 | |
| FARO Technologies, Inc.* (Electronic Equipment, Instruments & Components) | | | 63 | | | | 4,411 | |
| Fate Therapeutics, Inc.* (Biotechnology) | | | 282 | | | | 16,500 | |
| Fathom Holdings, Inc.* (Real Estate Management & Development) | | | 21 | | | | 430 | |
| FB Financial Corp. (Banks) | | | 116 | | | | 5,083 | |
| Federal Agricultural Mortgage Corp. (Thrifts & Mortgage Finance) | | | 32 | | | | 3,966 | |
| Federal Signal Corp. (Machinery) | | | 209 | | | | 9,058 | |
| Federated Hermes, Inc.—Class B (Capital Markets) | | | 323 | | | | 12,138 | |
| Ferro Corp.* (Chemicals) | | | 285 | | | | 6,222 | |
| FibroGen, Inc.* (Biotechnology) | | | 299 | | | | 4,216 | |
| Fidelity D&D Bancorp, Inc. (Banks) | | | 14 | | | | 826 | |
| Fiesta Restaurant Group, Inc.* (Hotels, Restaurants & Leisure) | | | 61 | | | | 672 | |
| Finance Of America Cos., Inc.*—Class A (Thrifts & Mortgage Finance) | | | 64 | | | | 254 | |
| Financial Institutions, Inc. (Banks) | | | 54 | | | | 1,717 | |
| Finch Therapeutics Group, Inc.* (Biotechnology) | | | 26 | | | | 259 | |
| First Advantage Corp.* (Professional Services) | | | 191 | | | | 3,637 | |
| First Bancorp (Banks) | | | 119 | | | | 5,441 | |
| First Bancorp (Banks) | | | 704 | | | | 9,701 | |
| First Bancshares, Inc. (Banks) | | | 70 | | | | 2,703 | |
| First Bank/Hamilton NJ (Banks) | | | 54 | | | | 784 | |
| First Busey Corp. (Banks) | | | 175 | | | | 4,746 | |
| First Commonwealth Financial Corp. (Banks) | | | 327 | | | | 5,261 | |
| First Community Bancshares, Inc. (Banks) | | | 58 | | | | 1,938 | |
| First Financial Bancorp (Banks) | | | 322 | | | | 7,850 | |
| First Financial Bankshares, Inc. (Banks) | | | 451 | | | | 22,930 | |
| First Financial Corp. (Banks) | | | 40 | | | | 1,812 | |
| First Foundation, Inc. (Banks) | | | 138 | | | | 3,431 | |
| First Internet Bancorp (Banks) | | | 32 | | | | 1,505 | |
See accompanying notes to financial statements.
Financial Statements :: ProFund VP Small-Cap :: 251
Common Stocks, continued
| | | Shares | | Value | |
| First Interstate BancSystem—Class A (Banks) | | | 142 | | $ | 5,775 | |
| First Merchants Corp. (Banks) | | | 198 | | | 8,294 | |
| First Mid Bancshares, Inc. (Banks) | | | 58 | | | 2,482 | |
| First Midwest Bancorp, Inc. (Banks) | | | 396 | | | 8,110 | |
| First of Long Island Corp. (Banks) | | | 80 | | | 1,727 | |
| First Watch Restaurant Group, Inc.* (Hotels, Restaurants & Leisure) | | | 38 | | | 637 | |
| FirstCash Holdings, Inc. (Consumer Finance) | | | 138 | | | 10,324 | |
| Fisker, Inc.*(a) (Automobiles) | | | 567 | | | 8,919 | |
| Five Star Bancorp (Banks) | | | 43 | | | 1,290 | |
| Flagstar Bancorp, Inc. (Thrifts & Mortgage Finance) | | | 181 | | | 8,677 | |
| Flexsteel Industries, Inc. (Household Durables) | | | 23 | | | 618 | |
| Fluent, Inc.* (Media) | | | 151 | | | 300 | |
| Fluidigm Corp.* (Life Sciences Tools & Services) | | | 265 | | | 1,039 | |
| Fluor Corp.* (Construction & Engineering) | | | 493 | | | 12,212 | |
| Flushing Financial Corp. (Banks) | | | 102 | | | 2,479 | |
| Flywire Corp.* (IT Services) | | | 219 | | | 8,335 | |
| Focus Financial Partners, Inc.* (Capital Markets) | | | 207 | | | 12,362 | |
| Foghorn Therapeutics, Inc.* (Pharmaceuticals) | | | 68 | | | 1,555 | |
| Forestar Group, Inc.* (Real Estate Management & Development) | | | 59 | | | 1,283 | |
| Forian, Inc.* (Health Care Technology) | | | 65 | | | 586 | |
| Forma Therapeutics Holdings, Inc.* (Biotechnology) | | | 118 | | | 1,678 | |
| FormFactor, Inc.* (Semiconductors & Semiconductor Equipment) | | | 270 | | | 12,344 | |
| Forrester Research, Inc.* (Professional Services) | | | 39 | | | 2,290 | |
| Forte Biosciences, Inc.* (Biotechnology) | | | 39 | | | 83 | |
| Forterra, Inc.* (Construction Materials) | | | 101 | | | 2,402 | |
| Fortress Biotech, Inc.* (Biotechnology) | | | 258 | | | 645 | |
| Forward Air Corp. (Air Freight & Logistics) | | | 93 | | | 11,261 | |
| Fossil Group, Inc.* (Textiles, Apparel & Luxury Goods) | | | 166 | | | 1,708 | |
| Four Corners Property Trust, Inc. (Equity Real Estate Investment Trusts) | | | 268 | | | 7,882 | |
| Fox Factory Holding Corp.* (Auto Components) | | | 147 | | | 25,005 | |
| Franchise Group, Inc. (Diversified Consumer Services) | | | 98 | | | 5,112 | |
| Franklin BSP Realty Trust, Inc. (Mortgage Real Estate Investment Trusts) | | | 125 | | | 1,868 | |
| Franklin Covey Co.* (Professional Services) | | | 44 | | | 2,040 | |
| Franklin Electric Co., Inc. (Machinery) | | | 161 | | | 15,224 | |
| Franklin Street Properties Corp. (Equity Real Estate Investment Trusts) | | | 353 | | | 2,100 | |
| Frequency Therapeutics, Inc.* (Biotechnology) | | | 111 | | | 569 | |
| Fresh Del Monte Produce, Inc. (Food Products) | | | 117 | | | 3,229 | |
| Frontier Group Holdings, Inc.* (Airlines) | | | 121 | | | 1,642 | |
| Frontline, Ltd.* (Oil, Gas & Consumable Fuels) | | | 415 | | | 2,934 | |
| FRP Holdings, Inc.* (Real Estate Management & Development) | | | 23 | | | 1,329 | |
| FS Bancorp, Inc. (Thrifts & Mortgage Finance) | | | 25 | | | 841 | |
| FTC Solar, Inc.* (Electrical Equipment) | | | 66 | | | 499 | |
| FTS International, Inc.*—Class A (Energy Equipment & Services) | | | 31 | | | 814 | |
| fuboTV, Inc.* (Software) | | | 470 | | | 7,294 | |
| FuelCell Energy, Inc.* (Electrical Equipment) | | | 1,284 | | | 6,677 | |
| Fulcrum Therapeutics, Inc.* (Pharmaceuticals) | | | 95 | | | 1,681 | |
| Fulgent Genetics, Inc.* (Health Care Providers & Services) | | | 72 | | | 7,242 | |
| Full House Resorts, Inc.* (Hotels, Restaurants & Leisure) | | | 114 | | | 1,381 | |
| Fulton Financial Corp. (Banks) | | | 552 | | | 9,384 | |
| Funko, Inc.* (Distributors) | | | 93 | | | 1,748 | |
| FutureFuel Corp. (Chemicals) | | | 90 | | | 688 | |
| G1 Therapeutics, Inc.* (Biotechnology) | | | 138 | | | 1,409 | |
| GAMCO Investors, Inc.—Class A (Capital Markets) | | | 18 | | | 450 | |
| GAN, Ltd.* (Hotels, Restaurants & Leisure) | | | 139 | | | 1,277 | |
| Gannett Co., Inc.* (Media) | | | 489 | | | 2,606 | |
| Gatos Silver, Inc.* (Metals & Mining) | | | 161 | | | 1,671 | |
| GATX Corp. (Trading Companies & Distributors) | | | 123 | | | 12,815 | |
| GCM Grosvenor, Inc.—Class A (Capital Markets) | | | 154 | | | 1,617 | |
| GCP Applied Technologies, Inc.* (Chemicals) | | | 171 | | | 5,414 | |
| Gemini Therapeutics, Inc.* (Biotechnology) | | | 76 | | | 221 | |
| Genco Shipping & Trading, Ltd. (Marine) | | | 112 | | | 1,792 | |
| Generation Bio Co.* (Biotechnology) | | | 152 | | | 1,076 | |
| Genesco, Inc.* (Specialty Retail) | | | 51 | | | 3,273 | |
| Genius Brands International, Inc.*(a) (Leisure Products) | | | 980 | | | 1,029 | |
| Gentherm, Inc.* (Auto Components) | | | 116 | | | 10,080 | |
| Genworth Financial, Inc.* (Insurance) | | | 1,761 | | | 7,132 | |
| German American Bancorp, Inc. (Banks) | | | 86 | | | 3,352 | |
| Geron Corp.* (Biotechnology) | | | 1,058 | | | 1,291 | |
| Getty Realty Corp. (Equity Real Estate Investment Trusts) | | | 141 | | | 4,525 | |
| Gevo, Inc.* (Oil, Gas & Consumable Fuels) | | | 691 | | | 2,957 | |
| Gibraltar Industries, Inc.* (Building Products) | | | 114 | | | 7,602 | |
| G-III Apparel Group, Ltd.* (Textiles, Apparel & Luxury Goods) | | | 153 | | | 4,229 | |
| Glacier Bancorp, Inc. (Banks) | | | 383 | | | 21,717 | |
| Gladstone Commercial Corp. (Equity Real Estate Investment Trusts) | | | 128 | | | 3,299 | |
| Gladstone Land Corp. (Equity Real Estate Investment Trusts) | | | 109 | | | 3,680 | |
| Glatfelter Corp. (Paper & Forest Products) | | | 152 | | | 2,614 | |
| Glaukos Corp.* (Health Care Equipment & Supplies) | | | 158 | | | 7,022 | |
| Global Blood Therapeutics, Inc.* (Biotechnology) | | | 215 | | | 6,293 | |
| Global Industrial Co. (Trading Companies & Distributors) | | | 44 | | | 1,800 | |
| Global Medical REIT, Inc. (Equity Real Estate Investment Trusts) | | | 208 | | | 3,692 | |
| Global Net Lease, Inc. (Equity Real Estate Investment Trusts) | | | 362 | | | 5,531 | |
| Global Water Resources, Inc. (Water Utilities) | | | 44 | | | 752 | |
| Globalstar, Inc.* (Diversified Telecommunication Services) | | | 2,109 | | | 2,446 | |
| GMS, Inc.* (Trading Companies & Distributors) | | | 148 | | | 8,896 | |
| Gogo, Inc.* (Wireless Telecommunication Services) | | | 205 | | | 2,774 | |
| Golar LNG, Ltd.* (Oil, Gas & Consumable Fuels) | | | 351 | | | 4,349 | |
| Golden Entertainment, Inc.* (Hotels, Restaurants & Leisure) | | | 60 | | | 3,032 | |
| Golden Nugget Online Gaming, Inc.* (Hotels, Restaurants & Leisure) | | | 139 | | | 1,383 | |
| Goosehead Insurance, Inc. (Insurance) | | | 63 | | | 8,195 | |
| GoPro, Inc.*—Class A (Household Durables) | | | 447 | | | 4,609 | |
| Gorman-Rupp Co. (Machinery) | | | 79 | | | 3,519 | |
| Gossamer Bio, Inc.* (Biotechnology) | | | 216 | | | 2,443 | |
| GrafTech International, Ltd. (Electrical Equipment) | | | 696 | | | 8,234 | |
| Graham Holdings Co.—Class B (Diversified Consumer Services) | | | 13 | | | 8,187 | |
| Granite Construction, Inc. (Construction & Engineering) | | | 159 | | | 6,153 | |
| Granite Point Mortgage Trust, Inc. (Mortgage Real Estate Investment Trusts) | | | 186 | | | 2,178 | |
| Graphite Bio, Inc.* (Biotechnology) | | | 56 | | | 696 | |
See accompanying notes to financial statements.
252 :: ProFund VP Small-Cap :: Financial Statements
Common Stocks, continued
| | | Shares | | Value | |
| Gray Television, Inc. (Media) | | | 297 | | $ | 5,988 | |
| Great Ajax Corp. (Mortgage Real Estate Investment Trusts) | | | 75 | | | 987 | |
| Great Lakes Dredge & Dock Corp.* (Construction & Engineering) | | | 225 | | | 3,537 | |
| Great Southern Bancorp, Inc. (Banks) | | | 36 | | | 2,133 | |
| Great Western Bancorp, Inc. (Banks) | | | 192 | | | 6,520 | |
| Green Brick Partners, Inc.* (Household Durables) | | | 107 | | | 3,245 | |
| Green Dot Corp.*—Class A (Consumer Finance) | | | 186 | | | 6,741 | |
| Green Plains, Inc.* (Oil, Gas & Consumable Fuels) | | | 166 | | | 5,770 | |
| GreenBox POS* (IT Services) | | | 63 | | | 265 | |
| Greenhill & Co., Inc. (Capital Markets) | | | 48 | | | 861 | |
| Greenlane Holdings, Inc.*—Class A (Distributors) | | | 57 | | | 55 | |
| Greenlight Capital Re, Ltd.*—Class A (Insurance) | | | 91 | | | 713 | |
| Greenwich Lifesciences, Inc.* (Biotechnology) | | | 14 | | | 341 | |
| Greif, Inc.—Class A (Containers & Packaging) | | | 90 | | | 5,434 | |
| Greif, Inc.—Class B (Containers & Packaging) | | | 21 | | | 1,255 | |
| Grid Dynamics Holdings, Inc.* (IT Services) | | | 158 | | | 5,999 | |
| Griffon Corp. (Building Products) | | | 161 | | | 4,585 | |
| Gritstone bio, Inc.* (Biotechnology) | | | 148 | | | 1,903 | |
| Group 1 Automotive, Inc. (Specialty Retail) | | | 61 | | | 11,908 | |
| Groupon, Inc.* (Internet & Direct Marketing Retail) | | | 82 | | | 1,899 | |
| GrowGeneration Corp.* (Specialty Retail) | | | 192 | | | 2,506 | |
| GT Biopharma, Inc.* (Biotechnology) | | | 62 | | | 189 | |
| GTY Technology Holdings, Inc.* (Software) | | | 112 | | | 750 | |
| Guaranty Bancshares, Inc. (Banks) | | | 28 | | | 1,052 | |
| Guess?, Inc. (Specialty Retail) | | | 140 | | | 3,315 | |
| H&E Equipment Services, Inc. (Trading Companies & Distributors) | | | 112 | | | 4,958 | |
| H.B. Fuller Co. (Chemicals) | | | 181 | | | 14,660 | |
| Haemonetics Corp.* (Health Care Equipment & Supplies) | | | 175 | | | 9,282 | |
| Hall of Fame Resort & Entertainment Co.* (Hotels, Restaurants & Leisure) | | | 193 | | | 293 | |
| Halozyme Therapeutics, Inc.* (Biotechnology) | | | 481 | | | 19,341 | |
| Hamilton Beach Brands Holding Co.—Class A (Household Durables) | | | 26 | | | 373 | |
| Hamilton Lane, Inc. (Capital Markets) | | | 121 | | | 12,538 | |
| Hancock Whitney Corp. (Banks) | | | 301 | | | 15,056 | |
| Hanger, Inc.* (Health Care Providers & Services) | | | 130 | | | 2,357 | |
| Hanmi Financial Corp. (Banks) | | | 106 | | | 2,510 | |
| Hannon Armstrong Sustainable Infrastructure Capital, Inc.—Class I (Mortgage Real Estate Investment Trusts) | | | 266 | | | 14,129 | |
| HarborOne Bancorp, Inc. (Banks) | | | 166 | | | 2,463 | |
| Harmonic, Inc.* (Communications Equipment) | | | 315 | | | 3,704 | |
| Harmony Biosciences Holdings, Inc.* (Pharmaceuticals) | | | 80 | | | 3,411 | |
| Harpoon Therapeutics, Inc.* (Biotechnology) | | | 65 | | | 491 | |
| Harsco Corp.* (Machinery) | | | 272 | | | 4,545 | |
| Harvard Bioscience, Inc.* (Life Sciences Tools & Services) | | | 136 | | | 959 | |
| Haverty Furniture Cos., Inc. (Specialty Retail) | | | 57 | | | 1,742 | |
| Hawaiian Holdings, Inc.* (Airlines) | | | 176 | | | 3,233 | |
| Hawkins, Inc. (Chemicals) | | | 67 | | | 2,643 | |
| Haynes International, Inc. (Metals & Mining) | | | 43 | | | 1,734 | |
| HBT Financial, Inc. (Banks) | | | 35 | | | 656 | |
| HCI Group, Inc. (Insurance) | | | 20 | | | 1,671 | |
| Health Catalyst, Inc.* (Health Care Technology) | | | 182 | | | 7,211 | |
| Healthcare Realty Trust, Inc. (Equity Real Estate Investment Trusts) | | | 513 | | | 16,231 | |
| Healthcare Services Group, Inc. (Commercial Services & Supplies) | | | 260 | | | 4,625 | |
| HealthEquity, Inc.* (Health Care Providers & Services) | | | 284 | | | 12,564 | |
| HealthStream, Inc.* (Health Care Technology) | | | 88 | | | 2,320 | |
| Heartland Express, Inc. (Road & Rail) | | | 164 | | | 2,758 | |
| Heartland Financial USA, Inc. (Banks) | | | 140 | | | 7,085 | |
| Hecla Mining Co. (Metals & Mining) | | | 1,846 | | | 9,636 | |
| Heidrick & Struggles International, Inc. (Professional Services) | | | 67 | | | 2,930 | |
| Helen of Troy, Ltd.* (Household Durables) | | | 84 | | | 20,536 | |
| Helios Technologies, Inc. (Machinery) | | | 112 | | | 11,779 | |
| Helix Energy Solutions Group, Inc.* (Energy Equipment & Services) | | | 497 | | | 1,551 | |
| Helmerich & Payne, Inc. (Energy Equipment & Services) | | | 366 | | | 8,673 | |
| Hemisphere Media Group, Inc.* (Media) | | | 56 | | | 407 | |
| Herc Holdings, Inc. (Trading Companies & Distributors) | | | 87 | | | 13,620 | |
| Heritage Commerce Corp. (Banks) | | | 203 | | | 2,424 | |
| Heritage Financial Corp. (Banks) | | | 120 | | | 2,933 | |
| Heritage Insurance Holdings, Inc. (Insurance) | | | 90 | | | 529 | |
| Heritage-Crystal Clean, Inc.* (Commercial Services & Supplies) | | | 54 | | | 1,729 | |
| Heron Therapeutics, Inc.* (Biotechnology) | | | 321 | | | 2,931 | |
| Hersha Hospitality Trust* (Equity Real Estate Investment Trusts) | | | 112 | | | 1,027 | |
| Heska Corp.* (Health Care Equipment & Supplies) | | | 34 | | | 6,205 | |
| HF Foods Group, Inc.* (Food & Staples Retailing) | | | 126 | | | 1,066 | |
| Hibbett, Inc. (Specialty Retail) | | | 52 | | | 3,740 | |
| HighPeak Energy, Inc. (Oil, Gas & Consumable Fuels) | | | 18 | | | 264 | |
| Hillenbrand, Inc. (Machinery) | | | 253 | | | 13,153 | |
| Hilltop Holdings, Inc. (Banks) | | | 215 | | | 7,555 | |
| Hilton Grand Vacations, Inc.* (Hotels, Restaurants & Leisure) | | | 297 | | | 15,477 | |
| Hingham Institution For Savings The (Thrifts & Mortgage Finance) | | | 5 | | | 2,099 | |
| HireQuest, Inc. (Professional Services) | | | 18 | | | 363 | |
| HireRight Holdings Corp.* (Professional Services) | | | 78 | | | 1,248 | |
| HNI Corp. (Commercial Services & Supplies) | | | 151 | | | 6,350 | |
| Home Bancorp, Inc. (Thrifts & Mortgage Finance) | | | 26 | | | 1,079 | |
| Home BancShares, Inc. (Banks) | | | 530 | | | 12,906 | |
| Home Point Capital, Inc. (Thrifts & Mortgage Finance) | | | 25 | | | 113 | |
| HomeStreet, Inc. (Thrifts & Mortgage Finance) | | | 69 | | | 3,588 | |
| HomeTrust Bancshares, Inc. (Banks) | | | 52 | | | 1,611 | |
| Homology Medicines, Inc.* (Biotechnology) | | | 146 | | | 531 | |
| Honest Co., Inc. (The)* (Personal Products) | | | 295 | | | 2,387 | |
| Hooker Furnishings Corp. (Household Durables) | | | 41 | | | 954 | |
| Hookipa Pharma, Inc.* (Biotechnology) | | | 67 | | | 156 | |
| Hope Bancorp, Inc. (Banks) | | | 402 | | | 5,913 | |
| Horace Mann Educators Corp. (Insurance) | | | 145 | | | 5,612 | |
| Horizon Bancorp, Inc. (Banks) | | | 149 | | | 3,107 | |
| Hostess Brands, Inc.* (Food Products) | | | 480 | | | 9,802 | |
| Houghton Mifflin Harcourt Co.* (Diversified Consumer Services) | | | 442 | | | 7,116 | |
| Houlihan Lokey, Inc. (Capital Markets) | | | 177 | | | 18,323 | |
See accompanying notes to financial statements.
Financial Statements :: ProFund VP Small-Cap :: 253
Common Stocks, continued
| | | Shares | | Value | |
| Hovnanian Enterprises, Inc.*—Class A (Household Durables) | | | 18 | | $ | 2,291 | |
| Howard Bancorp, Inc.* (Banks) | | | 46 | | | 1,002 | |
| Hub Group, Inc.*—Class A (Air Freight & Logistics) | | | 115 | | | 9,688 | |
| Humanigen, Inc.* (Biotechnology) | | | 169 | | | 629 | |
| Huron Consulting Group, Inc.* (Professional Services) | | | 75 | | | 3,743 | |
| Hydrofarm Holdings Group, Inc.* (Machinery) | | | 135 | | | 3,819 | |
| Hyliion Holdings Corp.* (Machinery) | | | 407 | | | 2,523 | |
| HyreCar, Inc.* (Diversified Consumer Services) | | | 62 | | | 292 | |
| Hyster-Yale Materials Handling, Inc. (Machinery) | | | 35 | | | 1,439 | |
| I3 Verticals, Inc.*—Class A (IT Services) | | | 74 | | | 1,686 | |
| IBEX, Ltd.* (Commercial Services & Supplies) | | | 20 | | | 258 | |
| iBio, Inc.* (Biotechnology) | | | 751 | | | 412 | |
| iCAD, Inc.* (Health Care Technology) | | | 76 | | | 547 | |
| ICF International, Inc. (Professional Services) | | | 64 | | | 6,563 | |
| Ichor Holdings, Ltd.* (Semiconductors & Semiconductor Equipment) | | | 97 | | | 4,465 | |
| Icosavax, Inc.* (Biotechnology) | | | 46 | | | 1,052 | |
| Ideanomics, Inc.* (Software) | | | 1,527 | | | 1,832 | |
| Ideaya Biosciences, Inc.* (Biotechnology) | | | 114 | | | 2,695 | |
| Identiv, Inc.* (Electronic Equipment, Instruments & Components) | | | 75 | | | 2,111 | |
| IDT Corp.*—Class B (Diversified Telecommunication Services) | | | 70 | | | 3,091 | |
| IES Holdings, Inc.* (Construction & Engineering) | | | 30 | | | 1,519 | |
| IGM Biosciences, Inc.* (Biotechnology) | | | 28 | | | 821 | |
| iHeartMedia, Inc.*—Class A (Media) | | | 389 | | | 8,185 | |
| II-VI, Inc.* (Electronic Equipment, Instruments & Components) | | | 368 | | | 25,144 | |
| Ikena Oncology, Inc.* (Biotechnology) | | | 96 | | | 1,204 | |
| Imago Biosciences, Inc.* (Biotechnology) | | | 34 | | | 806 | |
| IMAX Corp.* (Entertainment) | | | 173 | | | 3,086 | |
| Immuneering Corp.*—Class A (Biotechnology) | | | 29 | | | 469 | |
| Immunic, Inc.* (Biotechnology) | | | 65 | | | 622 | |
| ImmunityBio, Inc.* (Biotechnology) | | | 237 | | | 1,441 | |
| ImmunoGen, Inc.* (Biotechnology) | | | 687 | | | 5,098 | |
| Immunovant, Inc.* (Biotechnology) | | | 139 | | | 1,184 | |
| Impel Neuropharma, Inc.* (Biotechnology) | | | 19 | | | 164 | |
| Impinj, Inc.* (Semiconductors & Semiconductor Equipment) | | | 66 | | | 5,854 | |
| Inari Medical, Inc.* (Health Care Equipment & Supplies) | | | 120 | | | 10,952 | |
| Independence Holding Co. (Insurance) | | | 15 | | | 850 | |
| Independence Realty Trust, Inc. (Equity Real Estate Investment Trusts) | | | 366 | | | 9,454 | |
| Independent Bank Corp. (Banks) | | | 71 | | | 1,695 | |
| Independent Bank Corp. (Banks) | | | 159 | | | 12,963 | |
| Independent Bank Group, Inc. (Banks) | | | 131 | | | 9,452 | |
| Indus Realty Trust, Inc. (Real Estate Management & Development) | | | 20 | | | 1,621 | |
| Industrial Logistics Properties Trust (Equity Real Estate Investment Trusts) | | | 226 | | | 5,661 | |
| Infinera Corp.* (Communications Equipment) | | | 635 | | | 6,090 | |
| Infinity Pharmaceuticals, Inc.* (Biotechnology) | | | 304 | | | 684 | |
| Infrastructure and Energy Alternatives, Inc.* (Construction & Engineering) | | | 95 | | | 874 | |
| InfuSystem Holdings, Inc.* (Health Care Providers & Services) | | | 63 | | | 1,073 | |
| Ingevity Corp.* (Chemicals) | | | 138 | | | 9,895 | |
| Ingles Markets, Inc. (Food & Staples Retailing) | | | 49 | | | 4,231 | |
| Inhibrx, Inc.* (Biotechnology) | | | 97 | | | 4,236 | |
| Innospec, Inc. (Chemicals) | | | 85 | | | 7,679 | |
| Innovage Holding Corp.* (Health Care Providers & Services) | | | 64 | | | 320 | |
| INNOVATE Corp.* (Construction & Engineering) | | | 164 | | | 607 | |
| Innovative Industrial Properties, Inc. (Equity Real Estate Investment Trusts) | | | 82 | | | 21,559 | |
| Innoviva, Inc.* (Pharmaceuticals) | | | 151 | | | 2,605 | |
| Inogen, Inc.* (Health Care Equipment & Supplies) | | | 69 | | | 2,346 | |
| Inotiv, Inc.* (Life Sciences Tools & Services) | | | 51 | | | 2,146 | |
| Inovio Pharmaceuticals, Inc.* (Biotechnology) | | | 718 | | | 3,583 | |
| Inozyme Pharma, Inc.* (Biotechnology) | | | 50 | | | 341 | |
| Inseego Corp.* (Communications Equipment) | | | 296 | | | 1,726 | |
| Insight Enterprises, Inc.* (Electronic Equipment, Instruments & Components) | | | 120 | | | 12,792 | |
| Insmed, Inc.* (Biotechnology) | | | 410 | | | 11,168 | |
| Insperity, Inc. (Professional Services) | | | 126 | | | 14,882 | |
| Inspire Medical Systems, Inc.* (Health Care Technology) | | | 93 | | | 21,396 | |
| Installed Building Products, Inc. (Household Durables) | | | 82 | | | 11,457 | |
| Insteel Industries, Inc. (Building Products) | | | 65 | | | 2,588 | |
| Instil Bio, Inc.* (Biotechnology) | | | 188 | | | 3,217 | |
| Instructure Holdings, Inc.* (Software) | | | 42 | | | 1,007 | |
| Intapp, Inc.* (Software) | | | 36 | | | 906 | |
| Integer Holdings Corp.* (Health Care Equipment & Supplies) | | | 114 | | | 9,757 | |
| Integral Ad Science Holding Corp.* (Technology Hardware, Storage & Peripherals) | | | 60 | | | 1,333 | |
| Intellia Therapeutics, Inc.* (Biotechnology) | | | 242 | | | 28,615 | |
| Inter Parfums, Inc. (Personal Products) | | | 62 | | | 6,628 | |
| Intercept Pharmaceuticals, Inc.* (Biotechnology) | | | 87 | | | 1,417 | |
| InterDigital, Inc. (Communications Equipment) | | | 107 | | | 7,664 | |
| Interface, Inc. (Commercial Services & Supplies) | | | 202 | | | 3,222 | |
| International Bancshares Corp. (Banks) | | | 187 | | | 7,927 | |
| International Game Technology PLC (Hotels, Restaurants & Leisure) | | | 347 | | | 10,032 | |
| International Money Express, Inc.* (IT Services) | | | 112 | | | 1,788 | |
| International Seaways, Inc. (Oil, Gas & Consumable Fuels) | | | 160 | | | 2,349 | |
| Intersect ENT, Inc.* (Pharmaceuticals) | | | 116 | | | 3,168 | |
| Intra-Cellular Therapies, Inc.* (Pharmaceuticals) | | | 245 | | | 12,823 | |
| Intrepid Potash, Inc.* (Chemicals) | | | 35 | | | 1,496 | |
| Invacare Corp.* (Health Care Equipment & Supplies) | | | 117 | | | 318 | |
| Invesco Mortgage Capital, Inc. (Mortgage Real Estate Investment Trusts) | | | 1,091 | | | 3,033 | |
| Investors Bancorp, Inc. (Banks) | | | 795 | | | 12,044 | |
| Investors Title Co. (Insurance) | | | 5 | | | 986 | |
| Invitae Corp.* (Biotechnology) | | | 696 | | | 10,628 | |
| iRadimed Corp.* (Health Care Equipment & Supplies) | | | 22 | | | 1,017 | |
| iRhythm Technologies, Inc.* (Health Care Equipment & Supplies) | | | 102 | | | 12,004 | |
| Iridium Communications, Inc.* (Diversified Telecommunication Services) | | | 410 | | | 16,930 | |
| iRobot Corp.* (Household Durables) | | | 93 | | | 6,127 | |
| Ironwood Pharmaceuticals, Inc.* (Biotechnology) | | | 510 | | | 5,947 | |
| IsoPlexis Corp.* (Life Sciences Tools & Services) | | | 29 | | | 267 | |
| iStar, Inc. (Equity Real Estate Investment Trusts) | | | 233 | | | 6,018 | |
| iTeos Therapeutics, Inc.* (Biotechnology) | | | 70 | | | 3,259 | |
| Iteris, Inc.* (Electronic Equipment, Instruments & Components) | | | 147 | | | 588 | |
See accompanying notes to financial statements.
254 :: ProFund VP Small-Cap :: Financial Statements
Common Stocks, continued
| | | Shares | | Value | |
| Itron, Inc.* (Electronic Equipment, Instruments & Components) | | | 157 | | $ | 10,758 | |
| IVERIC bio, Inc.* (Biotechnology) | | | 400 | | | 6,688 | |
| J & J Snack Foods Corp. (Food Products) | | | 51 | | | 8,056 | |
| Jack in the Box, Inc. (Hotels, Restaurants & Leisure) | | | 76 | | | 6,648 | |
| James River Group Holdings, Ltd. (Insurance) | | | 127 | | | 3,659 | |
| Janux Therapeutics, Inc.* (Biotechnology) | | | 46 | | | 908 | |
| JELD-WEN Holding, Inc.* (Building Products) | | | 318 | | | 8,382 | |
| JFrog, Ltd.* (Software) | | | 184 | | | 5,465 | |
| JOANN, Inc. (Specialty Retail) | | | 40 | | | 415 | |
| John B Sanfilippo & Son, Inc. (Food Products) | | | 31 | | | 2,795 | |
| John Bean Technologies Corp. (Machinery) | | | 109 | | | 16,738 | |
| John Wiley & Sons, Inc.—Class A (Media) | | | 150 | | | 8,591 | |
| Johnson Outdoors, Inc.—Class A (Leisure Products) | | | 18 | | | 1,686 | |
| Jounce Therapeutics, Inc.* (Biotechnology) | | | 114 | | | 952 | |
| Kadant, Inc. (Machinery) | | | 40 | | | 9,219 | |
| Kaiser Aluminum Corp. (Metals & Mining) | | | 55 | | | 5,167 | |
| Kala Pharmaceuticals, Inc.* (Pharmaceuticals) | | | 168 | | | 203 | |
| Kaleido Biosciences, Inc.* (Pharmaceuticals) | | | 67 | | | 160 | |
| Kaltura, Inc.* (Software) | | | 60 | | | 202 | |
| KalVista Pharmaceuticals, Inc.* (Biotechnology) | | | 78 | | | 1,032 | |
| Kaman Corp.—Class A (Trading Companies & Distributors) | | | 96 | | | 4,142 | |
| KAR Auction Services, Inc.* (Commercial Services & Supplies) | | | 420 | | | 6,560 | |
| Karat Packaging, Inc.* (Trading Companies & Distributors) | | | 16 | | | 323 | |
| Karuna Therapeutics, Inc.* (Biotechnology) | | | 77 | | | 10,087 | |
| Karyopharm Therapeutics, Inc.* (Biotechnology) | | | 250 | | | 1,608 | |
| KB Home (Household Durables) | | | 276 | | | 12,345 | |
| KBR, Inc. (Professional Services) | | | 491 | | | 23,381 | |
| Kearny Financial Corp. (Thrifts & Mortgage Finance) | | | 236 | | | 3,127 | |
| Kelly Services, Inc.—Class A (Professional Services) | | | 122 | | | 2,046 | |
| KemPharm, Inc.* (Pharmaceuticals) | | | 103 | | | 897 | |
| Kennametal, Inc. (Machinery) | | | 290 | | | 10,414 | |
| Kennedy-Wilson Holdings, Inc. (Real Estate Management & Development) | | | 413 | | | 9,862 | |
| Keros Therapeutics, Inc.* (Biotechnology) | | | 54 | | | 3,160 | |
| Kezar Life Sciences, Inc.* (Biotechnology) | | | 121 | | | 2,023 | |
| Kforce, Inc. (Professional Services) | | | 70 | | | 5,265 | |
| Kimball Electronics, Inc.* (Electronic Equipment, Instruments & Components) | | | 84 | | | 1,828 | |
| Kimball International, Inc.—Class B (Commercial Services & Supplies) | | | 125 | | | 1,279 | |
| Kiniksa Pharmaceuticals, Ltd.*—Class A (Biotechnology) | | | 101 | | | 1,189 | |
| Kinnate Biopharma, Inc.* (Biotechnology) | | | 89 | | | 1,577 | |
| Kinsale Capital Group, Inc. (Insurance) | | | 75 | | | 17,841 | |
| Kirkland's, Inc.* (Specialty Retail) | | | 46 | | | 687 | |
| Kite Realty Group Trust (Equity Real Estate Investment Trusts) | | | 754 | | | 16,422 | |
| KKR Real Estate Finance Trust, Inc. (Mortgage Real Estate Investment Trusts) | | | 123 | | | 2,562 | |
| Knowles Corp.* (Electronic Equipment, Instruments & Components) | | | 309 | | | 7,215 | |
| Kodiak Sciences, Inc.* (Biotechnology) | | | 116 | | | 9,834 | |
| Kontoor Brands, Inc. (Textiles, Apparel & Luxury Goods) | | | 180 | | | 9,225 | |
| Kopin Corp.* (Semiconductors & Semiconductor Equipment) | | | 270 | | | 1,104 | |
| Koppers Holdings, Inc.* (Chemicals) | | | 72 | | | 2,254 | |
| Korn Ferry (Professional Services) | | | 187 | | | 14,162 | |
| Kosmos Energy, Ltd.* (Oil, Gas & Consumable Fuels) | | | 1,556 | | | 5,384 | |
| Kraton Corp.* (Chemicals) | | | 109 | | | 5,049 | |
| Kratos Defense & Security Solutions, Inc.* (Aerospace & Defense) | | | 426 | | | 8,264 | |
| Krispy Kreme, Inc.(a) (Hotels, Restaurants & Leisure) | | | 78 | | | 1,476 | |
| Kronos Bio, Inc.* (Chemicals) | | | 135 | | | 1,835 | |
| Kronos Worldwide, Inc. (Chemicals) | | | 77 | | | 1,156 | |
| Krystal Biotech, Inc.* (Biotechnology) | | | 62 | | | 4,337 | |
| Kulicke & Soffa Industries, Inc. (Semiconductors & Semiconductor Equipment) | | | 213 | | | 12,895 | |
| Kura Oncology, Inc.* (Biotechnology) | | | 221 | | | 3,094 | |
| Kura Sushi USA, Inc.*—Class A (Hotels, Restaurants & Leisure) | | | 14 | | | 1,132 | |
| KVH Industries, Inc.* (Communications Equipment) | | | 53 | | | 487 | |
| Kymera Therapeutics, Inc.* (Biotechnology) | | | 119 | | | 7,555 | |
| Ladder Capital Corp. (Mortgage Real Estate Investment Trusts) | | | 395 | | | 4,736 | |
| Laird Superfood, Inc.* (Food Products) | | | 22 | | | 287 | |
| Lakeland Bancorp, Inc. (Banks) | | | 170 | | | 3,228 | |
| Lakeland Financial Corp. (Banks) | | | 85 | | | 6,812 | |
| Lancaster Colony Corp. (Food Products) | | | 66 | | | 10,930 | |
| Landec Corp.* (Food Products) | | | 91 | | | 1,010 | |
| Landos Biopharma, Inc.* (Pharmaceuticals) | | | 16 | | | 77 | |
| Lands' End, Inc.* (Internet & Direct Marketing Retail) | | | 50 | | | 982 | |
| Landsea Homes Corp.* (Household Durables) | | | 37 | | | 271 | |
| Lantheus Holdings, Inc.* (Health Care Equipment & Supplies) | | | 234 | | | 6,760 | |
| Laredo Petroleum, Inc.* (Oil, Gas & Consumable Fuels) | | | 44 | | | 2,646 | |
| Latham Group, Inc.* (Leisure Products) | | | 111 | | | 2,778 | |
| Lattice Semiconductor Corp.* (Semiconductors & Semiconductor Equipment) | | | 471 | | | 36,296 | |
| Laureate Education, Inc.—Class A (Diversified Consumer Services) | | | 345 | | | 4,223 | |
| Lawson Products, Inc.* (Trading Companies & Distributors) | | | 17 | | | 931 | |
| La-Z-Boy, Inc. (Household Durables) | | | 153 | | | 5,555 | |
| Lazydays Holdings, Inc.* (Specialty Retail) | | | 27 | | | 582 | |
| LCI Industries (Auto Components) | | | 86 | | | 13,405 | |
| Legacy Housing Corp.* (Household Durables) | | | 28 | | | 741 | |
| Lemaitre Vascular, Inc. (Health Care Equipment & Supplies) | | | 66 | | | 3,315 | |
| LendingClub Corp.* (Consumer Finance) | | | 344 | | | 8,318 | |
| LendingTree, Inc.* (Thrifts & Mortgage Finance) | | | 40 | | | 4,904 | |
| Lexicon Pharmaceuticals, Inc.* (Biotechnology) | | | 243 | | | 957 | |
| Lexington Realty Trust (Equity Real Estate Investment Trusts) | | | 971 | | | 15,167 | |
| LGI Homes, Inc.* (Household Durables) | | | 75 | | | 11,586 | |
| LHC Group, Inc.* (Health Care Providers & Services) | | | 106 | | | 14,546 | |
| Liberty Latin America, Ltd.*—Class A (Media) | | | 141 | | | 1,644 | |
| Liberty Latin America, Ltd.*—Class C (Media) | | | 537 | | | 6,122 | |
| Liberty Media Corp-Liberty Braves*—Class A (Entertainment) | | | 35 | | | 1,006 | |
| Liberty Media Corp-Liberty Braves*—Class C (Entertainment) | | | 127 | | | 3,569 | |
| Liberty Oilfield Services, Inc.* (Energy Equipment & Services) | | | 316 | | | 3,065 | |
See accompanying notes to financial statements.
Financial Statements :: ProFund VP Small-Cap :: 255
Common Stocks, continued
| | | Shares | | Value | |
| Liberty TripAdvisor Holdings, Inc.*—Class A (Interactive Media & Services) | | | 253 | | $ | 549 | |
| Life Time Group Holdings, Inc.* (Hotels, Restaurants & Leisure) | | | 135 | | | 2,323 | |
| LifeStance Health Group, Inc.* (Health Care Providers & Services) | | | 159 | | | 1,514 | |
| Lifetime Brands, Inc. (Household Durables) | | | 44 | | | 703 | |
| Ligand Pharmaceuticals, Inc.* (Biotechnology) | | | 52 | | | 8,032 | |
| Limelight Networks, Inc.* (IT Services) | | | 434 | | | 1,489 | |
| Limoneira Co. (Food Products) | | | 54 | | | 810 | |
| Lindblad Expeditions Holdings, Inc.* (Hotels, Restaurants & Leisure) | | | 107 | | | 1,669 | |
| Lindsay Corp. (Machinery) | | | 38 | | | 5,776 | |
| Lineage Cell Therapeutics, Inc.* (Biotechnology) | | | 436 | | | 1,068 | |
| Lions Gate Entertainment Corp.*—Class A (Entertainment) | | | 202 | | | 3,361 | |
| Lions Gate Entertainment Corp.*—Class B (Entertainment) | | | 410 | | | 6,310 | |
| Liquidity Services, Inc.* (Internet & Direct Marketing Retail) | | | 92 | | | 2,031 | |
| LivaNova PLC* (Health Care Equipment & Supplies) | | | 186 | | | 16,261 | |
| Live Oak Bancshares, Inc. (Banks) | | | 111 | | | 9,689 | |
| Livent Corp.* (Chemicals) | | | 563 | | | 13,725 | |
| LiveOne, Inc.* (Entertainment) | | | 205 | | | 262 | |
| LivePerson, Inc.* (Software) | | | 228 | | | 8,144 | |
| LiveRamp Holdings, Inc.* (IT Services) | | | 229 | | | 10,981 | |
| Lordstown Motors Corp.*—Class A (Automobiles) | | | 539 | | | 1,860 | |
| LTC Properties, Inc. (Equity Real Estate Investment Trusts) | | | 135 | | | 4,609 | |
| Lucid Diagnostics, Inc.* (Health Care Equipment & Supplies) | | | 18 | | | 97 | |
| Lulu's Fashion Lounge Holdings, Inc.* (Internet & Direct Marketing Retail) | | | 20 | | | 205 | |
| Lumber Liquidators Holdings, Inc.* (Specialty Retail) | | | 100 | | | 1,707 | |
| Luna Innovations, Inc.* (Electronic Equipment, Instruments & Components) | | | 107 | | | 903 | |
| Luther Burbank Corp. (Thrifts & Mortgage Finance) | | | 54 | | | 758 | |
| Luxfer Holdings PLC (Machinery) | | | 96 | | | 1,854 | |
| Lyell Immunopharma, Inc.* (Biotechnology) | | | 82 | | | 635 | |
| M.D.C Holdings, Inc. (Household Durables) | | | 199 | | | 11,110 | |
| M/I Homes, Inc.* (Household Durables) | | | 99 | | | 6,156 | |
| Macatawa Bank Corp. (Banks) | | | 91 | | | 803 | |
| MACOM Technology Solutions Holdings, Inc.* (Semiconductors & Semiconductor Equipment) | | | 169 | | | 13,233 | |
| MacroGenics, Inc.* (Biotechnology) | | | 209 | | | 3,354 | |
| Macy's, Inc. (Multiline Retail) | | | 1,091 | | | 28,562 | |
| Madison Square Garden Entertainment Corp.* (Entertainment) | | | 91 | | | 6,401 | |
| Madrigal Pharmaceuticals, Inc.* (Biotechnology) | | | 41 | | | 3,474 | |
| Magellan Health, Inc.* (Health Care Providers & Services) | | | 82 | | | 7,789 | |
| Magenta Therapeutics, Inc.* (Biotechnology) | | | 104 | | | 461 | |
| Magnite, Inc.* (Media) | | | 451 | | | 7,893 | |
| Magnolia Oil & Gas Corp. (Oil, Gas & Consumable Fuels) | | | 501 | | | 9,454 | |
| Maiden Holdings, Ltd.* (Insurance) | | | 241 | | | 737 | |
| Malibu Boats, Inc.* (Leisure Products) | | | 72 | | | 4,949 | |
| MannKind Corp.* (Biotechnology) | | | 858 | | | 3,749 | |
| ManTech International Corp.—Class A (Professional Services) | | | 95 | | | 6,928 | |
| Marathon Digital Holdings, Inc.* (IT Services) | | | 332 | | | 10,910 | |
| Marcus & Millichap, Inc.* (Real Estate Management & Development) | | | 82 | | | 4,220 | |
| Marine Products Corp. (Leisure Products) | | | 28 | | | 350 | |
| MarineMax, Inc.* (Specialty Retail) | | | 73 | | | 4,310 | |
| Marinus Pharmaceuticals, Inc.* (Pharmaceuticals) | | | 128 | | | 1,521 | |
| Marlin Business Services Corp. (Diversified Financial Services) | | | 28 | | | 652 | |
| Marrone Bio Innovations, Inc.* (Chemicals) | | | 352 | | | 254 | |
| Marten Transport, Ltd. (Road & Rail) | | | 207 | | | 3,552 | |
| Masonite International Corp.* (Building Products) | | | 83 | | | 9,790 | |
| MasterCraft Boat Holdings, Inc.* (Leisure Products) | | | 65 | | | 1,841 | |
| Matador Resources Co. (Oil, Gas & Consumable Fuels) | | | 385 | | | 14,214 | |
| Materion Corp. (Metals & Mining) | | | 71 | | | 6,528 | |
| Matrix Service Co.* (Construction & Engineering) | | | 90 | | | 677 | |
| Matson, Inc. (Marine) | | | 144 | | | 12,964 | |
| Matthews International Corp.—Class A (Commercial Services & Supplies) | | | 107 | | | 3,924 | |
| MAX Holdings, Inc. (Real Estate Management & Development) | | | 64 | | | 1,951 | |
| Maxar Technologies, Inc. (Aerospace & Defense) | | | 252 | | | 7,442 | |
| MaxCyte, Inc.* (Biotechnology) | | | 333 | | | 3,393 | |
| MAXIMUS, Inc. (IT Services) | | | 213 | | | 16,969 | |
| MaxLinear, Inc.*—Class A (Semiconductors & Semiconductor Equipment) | | | 246 | | | 18,546 | |
| Mayville Engineering Co., Inc.* (Machinery) | | | 31 | | | 462 | |
| MBIA, Inc.* (Insurance) | | | 167 | | | 2,637 | |
| McGrath RentCorp (Commercial Services & Supplies) | | | 84 | | | 6,742 | |
| MedAvail Holdings, Inc.* (Food & Staples Retailing) | | | 42 | | | 59 | |
| MediaAlpha, Inc.*—Class A (Interactive Media & Services) | | | 74 | | | 1,143 | |
| Medifast, Inc. (Personal Products) | | | 40 | | | 8,377 | |
| MEDNAX, Inc.* (Health Care Providers & Services) | | | 264 | | | 7,183 | |
| Medpace Holdings, Inc.* (Life Sciences Tools & Services) | | | 101 | | | 21,981 | |
| MEI Pharma, Inc.* (Biotechnology) | | | 376 | | | 1,004 | |
| MeiraGTx Holdings PLC* (Biotechnology) | | | 103 | | | 2,445 | |
| Mercantile Bank Corp. (Banks) | | | 53 | | | 1,857 | |
| Merchants Bancorp (Thrifts & Mortgage Finance) | | | 34 | | | 1,609 | |
| Meridian Bioscience, Inc.* (Health Care Equipment & Supplies) | | | 148 | | | 3,019 | |
| MeridianLink, Inc.* (Software) | | | 44 | | | 950 | |
| Merit Medical Systems, Inc.* (Health Care Equipment & Supplies) | | | 178 | | | 11,089 | |
| Meritage Homes Corp.* (Household Durables) | | | 128 | | | 15,625 | |
| Meritor, Inc.* (Machinery) | | | 236 | | | 5,848 | |
| Mersana Therapeutics, Inc.* (Biotechnology) | | | 249 | | | 1,549 | |
| Mesa Air Group, Inc.* (Airlines) | | | 119 | | | 666 | |
| Mesa Laboratories, Inc. (Health Care Equipment & Supplies) | | | 17 | | | 5,578 | |
| Meta Financial Group, Inc. (Thrifts & Mortgage Finance) | | | 109 | | | 6,503 | |
See accompanying notes to financial statements.
256 :: ProFund VP Small-Cap :: Financial Statements
Common Stocks, continued
| | | Shares | | | Value | |
| Meta Materials, Inc.* (Oil, Gas & Consumable Fuels) | | | 704 | | | $ | 1,732 | |
| Methode Electronics, Inc. (Electronic Equipment, Instruments & Components) | | | 133 | | | | 6,540 | |
| Metrocity Bankshares, Inc. (Banks) | | | 66 | | | | 1,817 | |
| MetroMile, Inc.* (Insurance) | | | 334 | | | | 731 | |
| Metropolitan Bank Holding Corp.* (Banks) | | | 34 | | | | 3,622 | |
| MFA Financial, Inc. (Mortgage Real Estate Investment Trusts) | | | 1,538 | | | | 7,013 | |
| MGE Energy, Inc. (Electric Utilities) | | | 127 | | | | 10,446 | |
| MGP Ingredients, Inc. (Beverages) | | | 49 | | | | 4,165 | |
| MicroStrategy, Inc.* (Software) | | | 29 | | | | 15,790 | |
| MicroVision, Inc.* (Electronic Equipment, Instruments & Components) | | | 571 | | | | 2,861 | |
| Mid Penn Bancorp, Inc. (Banks) | | | 49 | | | | 1,555 | |
| Middlesex Water Co. (Water Utilities) | | | 60 | | | | 7,218 | |
| Midland States Bancorp, Inc. (Banks) | | | 74 | | | | 1,834 | |
| MidwestOne Financial Group, Inc. (Banks) | | | 49 | | | | 1,586 | |
| Miller Industries, Inc. (Machinery) | | | 39 | | | | 1,303 | |
| MillerKnoll, Inc. (Commercial Services & Supplies) | | | 258 | | | | 10,111 | |
| Mimecast, Ltd.* (Software) | | | 212 | | | | 16,869 | |
| MiMedx Group, Inc.* (Biotechnology) | | | 386 | | | | 2,331 | |
| Mind Medicine MindMed, Inc.* (Pharmaceuticals) | | | 1,208 | | | | 1,667 | |
| Minerals Technologies, Inc. (Chemicals) | | | 115 | | | | 8,412 | |
| MiNK Therapeutics, Inc.* (Biotechnology) | | | 7 | | | | 31 | |
| Mirum Pharmaceuticals, Inc.* (Biotechnology) | | | 13 | | | | 207 | |
| Mission Produce, Inc.* (Food Products) | | | 129 | | | | 2,025 | |
| Mistras Group, Inc.* (Professional Services) | | | 69 | | | | 513 | |
| Mitek System, Inc.* (Software) | | | 149 | | | | 2,645 | |
| Model N, Inc.* (Software) | | | 123 | | | | 3,694 | |
| Modine Manufacturing Co.* (Auto Components) | | | 174 | | | | 1,756 | |
| ModivCare, Inc.* (Health Care Providers & Services) | | | 43 | | | | 6,376 | |
| Moelis & Co. (Capital Markets) | | | 212 | | | | 13,252 | |
| Molecular Templates, Inc.* (Biotechnology) | | | 128 | | | | 502 | |
| Momentive Global, Inc.* (Software) | | | 451 | | | | 9,539 | |
| Monarch Casino & Resort, Inc.* (Hotels, Restaurants & Leisure) | | | 46 | | | | 3,402 | |
| MoneyGram International, Inc.* (IT Services) | | | 311 | | | | 2,454 | |
| Monmouth Real Estate Investment Corp.—Class A (Equity Real Estate Investment Trusts) | | | 331 | | | | 6,954 | |
| Monro, Inc. (Specialty Retail) | | | 115 | | | | 6,701 | |
| Monte Rosa Therapeutics, Inc.* (Biotechnology) | | | 42 | | | | 858 | |
| Montrose Environmental Group, Inc.* (Commercial Services & Supplies) | | | 91 | | | | 6,416 | |
| Moog, Inc.—Class A (Aerospace & Defense) | | | 101 | | | | 8,178 | |
| Morphic Holding, Inc.* (Biotechnology) | | | 73 | | | | 3,459 | |
| Motorcar Parts of America, Inc.* (Auto Components) | | | 65 | | | | 1,110 | |
| Movado Group, Inc. (Textiles, Apparel & Luxury Goods) | | | 54 | | | | 2,259 | |
| MP Materials Corp.* (Metals & Mining) | | | 263 | | | | 11,944 | |
| Mr. Cooper Group, Inc.* (Thrifts & Mortgage Finance) | | | 215 | | | | 8,946 | |
| MRC Global, Inc.* (Trading Companies & Distributors) | | | 280 | | | | 1,926 | |
| Mueller Industries, Inc. (Machinery) | | | 195 | | | | 11,575 | |
| Mueller Water Products, Inc.—Class A (Machinery) | | | 547 | | | | 7,877 | |
| Multiplan Corp.* (Health Care Technology) | | | 1,323 | | | | 5,861 | |
| Murphy Oil Corp. (Oil, Gas & Consumable Fuels) | | | 509 | | | | 13,290 | |
| Murphy USA, Inc. (Specialty Retail) | | | 84 | | | | 16,735 | |
| Mustang Bio, Inc.* (Biotechnology) | | | 253 | | | | 420 | |
| MVB Financial Corp. (Banks) | | | 35 | | | | 1,453 | |
| Myers Industries, Inc. (Containers & Packaging) | | | 125 | | | | 2,501 | |
| MYR Group, Inc.* (Construction & Engineering) | | | 57 | | | | 6,301 | |
| Myriad Genetics, Inc.* (Biotechnology) | | | 276 | | | | 7,618 | |
| Nabors Industries, Ltd.* (Energy Equipment & Services) | | | 25 | | | | 2,027 | |
| NanoString Technologies, Inc.* (Life Sciences Tools & Services) | | | 158 | | | | 6,672 | |
| Nanthealth, Inc.* (Health Care Technology) | | | 93 | | | | 98 | |
| Napco Security Technologies, Inc.* (Electronic Equipment, Instruments & Components) | | | 50 | | | | 2,499 | |
| Nathan's Famous, Inc. (Hotels, Restaurants & Leisure) | | | 10 | | | | 584 | |
| National Bank Holdings Corp. (Banks) | | | 101 | | | | 4,438 | |
| National Beverage Corp. (Beverages) | | | 82 | | | | 3,717 | |
| National CineMedia, Inc. (Media) | | | 209 | | | | 587 | |
| National Energy Services Reunited Corp.* (Energy Equipment & Services) | | | 132 | | | | 1,247 | |
| National Health Investors, Inc. (Equity Real Estate Investment Trusts) | | | 152 | | | | 8,735 | |
| National Healthcare Corp. (Health Care Providers & Services) | | | 44 | | | | 2,989 | |
| National Presto Industries, Inc. (Aerospace & Defense) | | | 18 | | | | 1,477 | |
| National Research Corp. (Health Care Providers & Services) | | | 49 | | | | 2,034 | |
| National Storage Affiliates Trust (Equity Real Estate Investment Trusts) | | | 282 | | | | 19,514 | |
| National Vision Holdings, Inc.* (Specialty Retail) | | | 284 | | | | 13,629 | |
| National Western Life Group, Inc.—Class A (Insurance) | | | 9 | | | | 1,930 | |
| Natural Grocers by Vitamin Cottage, Inc. (Food & Staples Retailing) | | | 32 | | | | 456 | |
| Nature's Sunshine Products, Inc. (Personal Products) | | | 41 | | | | 759 | |
| Natus Medical, Inc.* (Health Care Equipment & Supplies) | | | 117 | | | | 2,776 | |
| Nautilus, Inc.* (Leisure Products) | | | 105 | | | | 644 | |
| Navient Corp. (Consumer Finance) | | | 550 | | | | 11,671 | |
| NBT Bancorp, Inc. (Banks) | | | 147 | | | | 5,662 | |
| Neenah, Inc. (Paper & Forest Products) | | | 59 | | | | 2,731 | |
| Nelnet, Inc.—Class A (Consumer Finance) | | | 59 | | | | 5,763 | |
| NEOGAMES SA* (Hotels, Restaurants & Leisure) | | | 36 | | | | 1,000 | |
| Neogen Corp.* (Health Care Equipment & Supplies) | | | 374 | | | | 16,982 | |
| NeoGenomics, Inc.* (Life Sciences Tools & Services) | | | 394 | | | | 13,442 | |
| Neoleukin Therapeutics, Inc.* (Biotechnology) | | | 122 | | | | 588 | |
| NeoPhotonics Corp.* (Semiconductors & Semiconductor Equipment) | | | 178 | | | | 2,736 | |
| NETGEAR, Inc.* (Communications Equipment) | | | 101 | | | | 2,950 | |
| NetScout Systems, Inc.* (Communications Equipment) | | | 244 | | | | 8,072 | |
| NETSTREIT Corp. (Equity Real Estate Investment Trusts) | | | 138 | | | | 3,160 | |
| Neuronetics, Inc.* (Health Care Equipment & Supplies) | | | 89 | | | | 397 | |
| NeuroPace, Inc.* (Health Care Equipment & Supplies) | | | 25 | | | | 252 | |
See accompanying notes to financial statements.
Financial Statements :: ProFund VP Small-Cap :: 257
Common Stocks, continued
| | | Shares | | | Value | |
| Nevro Corp.* (Health Care Equipment & Supplies) | | | 120 | | | $ | 9,728 | |
| New Jersey Resources Corp. (Gas Utilities) | | | 336 | | | | 13,796 | |
| New York Mortgage Trust, Inc. (Mortgage Real Estate Investment Trusts) | | | 1,319 | | | | 4,907 | |
| NewAge, Inc.* (Beverages) | | | 467 | | | | 481 | |
| Newmark Group, Inc. (Real Estate Management & Development) | | | 518 | | | | 9,687 | |
| Newpark Resources, Inc.* (Energy Equipment & Services) | | | 315 | | | | 926 | |
| NexImmune, Inc.* (Biotechnology) | | | 61 | | | | 281 | |
| Nexpoint Residential Trust, Inc. (Equity Real Estate Investment Trusts) | | | 77 | | | | 6,455 | |
| NextGen Healthcare, Inc.* (Health Care Technology) | | | 199 | | | | 3,540 | |
| NexTier Oilfield Solutions, Inc.* (Energy Equipment & Services) | | | 601 | | | | 2,134 | |
| NGM Biopharmaceuticals, Inc.* (Pharmaceuticals) | | | 109 | | | | 1,930 | |
| NI Holdings, Inc.* (Insurance) | | | 30 | | | | 567 | |
| Nicolet Bankshares, Inc.* (Banks) | | | 43 | | | | 3,687 | |
| Nikola Corp.*(a) (Machinery) | | | 794 | | | | 7,837 | |
| Nkarta, Inc.* (Biotechnology) | | | 49 | | | | 752 | |
| NL Industries, Inc. (Commercial Services & Supplies) | | | 29 | | | | 215 | |
| nLight, Inc.* (Electronic Equipment, Instruments & Components) | | | 152 | | | | 3,640 | |
| NMI Holdings, Inc.*—Class A (Thrifts & Mortgage Finance) | | | 292 | | | | 6,380 | |
| NN, Inc.* (Machinery) | | | 148 | | | | 607 | |
| Noodles & Co.* (Hotels, Restaurants & Leisure) | | | 141 | | | | 1,279 | |
| Nordic American Tankers, Ltd. (Oil, Gas & Consumable Fuels) | | | 584 | | | | 987 | |
| Northern Oil And Gas, Inc. (Oil, Gas & Consumable Fuels) | | | 182 | | | | 3,746 | |
| Northfield Bancorp, Inc. (Thrifts & Mortgage Finance) | | | 153 | | | | 2,472 | |
| Northrim Bancorp, Inc. (Banks) | | | 21 | | | | 913 | |
| Northwest Bancshares, Inc. (Thrifts & Mortgage Finance) | | | 425 | | | | 6,018 | |
| Northwest Natural Holding Co. (Gas Utilities) | | | 106 | | | | 5,171 | |
| Northwest Pipe Co.* (Construction & Engineering) | | | 34 | | | | 1,081 | |
| NorthWestern Corp. (Multi-Utilities) | | | 184 | | | | 10,517 | |
| Novagold Resources, Inc.* (Metals & Mining) | | | 824 | | | | 5,653 | |
| Novanta, Inc.* (Electronic Equipment, Instruments & Components) | | | 123 | | | | 21,688 | |
| NOW, Inc.* (Trading Companies & Distributors) | | | 383 | | | | 3,271 | |
| Nu Skin Enterprises, Inc.—Class A (Personal Products) | | | 173 | | | | 8,779 | |
| Nurix Therapeutics, Inc.* (Biotechnology) | | | 109 | | | | 3,156 | |
| Nuvalent, Inc.*—Class A (Biotechnology) | | | 37 | | | | 704 | |
| NuVasive, Inc.* (Health Care Equipment & Supplies) | | | 180 | | | | 9,446 | |
| Nuvation Bio, Inc.* (Pharmaceuticals) | | | 552 | | | | 4,692 | |
| NV5 Global, Inc.* (Construction & Engineering) | | | 46 | | | | 6,354 | |
| NVE Corp. (Semiconductors & Semiconductor Equipment) | | | 17 | | | | 1,161 | |
| Oasis Petroleum, Inc. (Oil, Gas & Consumable Fuels) | | | 69 | | | | 8,693 | |
| Oceaneering International, Inc.* (Energy Equipment & Services) | | | 346 | | | | 3,913 | |
| Oceanfirst Financial Corp. (Thrifts & Mortgage Finance) | | | 202 | | | | 4,484 | |
| Ocugen, Inc.* (Biotechnology) | | | 641 | | | | 2,917 | |
| Ocular Therapeutix, Inc.* (Pharmaceuticals) | | | 266 | | | | 1,854 | |
| Ocwen Financial Corp.* (Thrifts & Mortgage Finance) | | | 28 | | | | 1,119 | |
| Office Properties Income Trust (Equity Real Estate Investment Trusts) | | | 166 | | | | 4,123 | |
| OFG Bancorp (Banks) | | | 170 | | | | 4,515 | |
| O-I Glass, Inc.* (Containers & Packaging) | | | 549 | | | | 6,605 | |
| Oil States International, Inc.* (Energy Equipment & Services) | | | 210 | | | | 1,044 | |
| Oil-Dri Corp. of America (Household Products) | | | 18 | | | | 589 | |
| Old National Bancorp (Banks) | | | 574 | | | | 10,401 | |
| Old Second Bancorp, Inc. (Banks) | | | 96 | | | | 1,209 | |
| Olema Pharmaceuticals, Inc.* (Biotechnology) | | | 87 | | | | 814 | |
| Olympic Steel, Inc. (Metals & Mining) | | | 33 | | | | 776 | |
| Omega Flex, Inc. (Machinery) | | | 11 | | | | 1,396 | |
| Omega Therapeutics, Inc.* (Biotechnology) | | | 26 | | | | 295 | |
| Omeros Corp.* (Pharmaceuticals) | | | 209 | | | | 1,344 | |
| Omnicell, Inc.* (Health Care Technology) | | | 152 | | | | 27,426 | |
| ON24, Inc.* (Software) | | | 93 | | | | 1,614 | |
| Oncocyte Corp.* (Biotechnology) | | | 209 | | | | 454 | |
| Oncorus, Inc.* (Biotechnology) | | | 71 | | | | 374 | |
| Oncternal Therapeutics, Inc.* (Biotechnology) | | | 154 | | | | 350 | |
| ONE Gas, Inc. (Gas Utilities) | | | 183 | | | | 14,199 | |
| ONE Group Hospitality, Inc. (The)* (Hotels, Restaurants & Leisure) | | | 72 | | | | 908 | |
| One Liberty Properties, Inc. (Equity Real Estate Investment Trusts) | | | 56 | | | | 1,976 | |
| OneSpan, Inc.* (Software) | | | 122 | | | | 2,065 | |
| OneSpaWorld Holdings, Ltd.* (Diversified Consumer Services) | | | 186 | | | | 1,864 | |
| Onewater Marine, Inc. (Specialty Retail) | | | 36 | | | | 2,195 | |
| Onto Innovation, Inc.* (Semiconductors & Semiconductor Equipment) | | | 169 | | | | 17,108 | |
| Ontrak, Inc.* (Health Care Providers & Services) | | | 32 | | | | 201 | |
| Ooma, Inc.* (Diversified Telecommunication Services) | | | 76 | | | | 1,553 | |
| Open Lending Corp.*—Class A (Capital Markets) | | | 362 | | | | 8,138 | |
| OPKO Health, Inc.* (Biotechnology) | | | 1,388 | | | | 6,676 | |
| Oportun Financial Corp.* (Consumer Finance) | | | 73 | | | | 1,478 | |
| Oppenheimer Holdings, Inc.—Class A (Capital Markets) | | | 32 | | | | 1,484 | |
| OptimizeRx Corp.* (Health Care Technology) | | | 60 | | | | 3,727 | |
| Option Care Health, Inc.* (Health Care Providers & Services) | | | 552 | | | | 15,700 | |
| Oramed Pharmaceuticals, Inc.* (Pharmaceuticals) | | | 105 | | | | 1,499 | |
| OraSure Technologies, Inc.* (Health Care Equipment & Supplies) | | | 248 | | | | 2,155 | |
| Orchid Island Capital, Inc. (Mortgage Real Estate Investment Trusts) | | | 472 | | | | 2,124 | |
| Organogenesis Holdings, Inc.* (Biotechnology) | | | 132 | | | | 1,220 | |
| ORIC Pharmaceuticals, Inc.* (Biotechnology) | | | 110 | | | | 1,617 | |
| Origin Bancorp, Inc. (Banks) | | | 77 | | | | 3,305 | |
| Orion Engineered Carbons SA* (Chemicals) | | | 210 | | | | 3,856 | |
| Ormat Technologies, Inc. (Independent Power and Renewable Electricity Producers) | | | 157 | | | | 12,450 | |
| Orrstown Financial Services, Inc. (Banks) | | | 38 | | | | 958 | |
| Ortho Clinical Diagnostics Holdings PLC* (Health Care Equipment & Supplies) | | | 418 | | | | 8,941 | |
| Orthofix Medical, Inc.* (Health Care Equipment & Supplies) | | | 66 | | | | 2,052 | |
| OrthoPediatrics Corp.* (Health Care Equipment & Supplies) | | | 48 | | | | 2,873 | |
| OSI Systems, Inc.* (Electronic Equipment, Instruments & Components) | | | 59 | | | | 5,499 | |
See accompanying notes to financial statements.
258 :: ProFund VP Small-Cap :: Financial Statements
Common Stocks, continued
| | | Shares | | | Value | |
| Otter Tail Corp. (Electric Utilities) | | | 143 | | | $ | 10,213 | |
| Ouster, Inc.* (Electronic Equipment, Instruments & Components) | | | 544 | | | | 2,829 | |
| Outbrain, Inc.* (Interactive Media & Services) | | | 29 | | | | 406 | |
| Outfront Media, Inc. (Equity Real Estate Investment Trusts) | | | 506 | | | | 13,571 | |
| Outlook Therapeutics, Inc.* (Biotechnology) | | | 309 | | | | 420 | |
| Outset Medical, Inc.* (Health Care Equipment & Supplies) | | | 163 | | | | 7,513 | |
| Overstock.com, Inc.* (Internet & Direct Marketing Retail) | | | 149 | | | | 8,792 | |
| Ovintiv, Inc. (Oil, Gas & Consumable Fuels) | | | 910 | | | | 30,666 | |
| Owens & Minor, Inc. (Health Care Providers & Services) | | | 252 | | | | 10,962 | |
| Oxford Industries, Inc. (Textiles, Apparel & Luxury Goods) | | | 56 | | | | 5,685 | |
| Oyster Point Pharma, Inc.* (Biotechnology) | | | 39 | | | | 712 | |
| Pacific Biosciences of California, Inc.* (Life Sciences Tools & Services) | | | 675 | | | | 13,810 | |
| Pacific Premier Bancorp, Inc. (Banks) | | | 326 | | | | 13,050 | |
| Pacira BioSciences, Inc.* (Pharmaceuticals) | | | 153 | | | | 9,206 | |
| Pactiv Evergreen, Inc. (Containers & Packaging) | | | 149 | | | | 1,889 | |
| PAE, Inc.* (Aerospace & Defense) | | | 241 | | | | 2,393 | |
| PagerDuty, Inc.* (Software) | | | 285 | | | | 9,904 | |
| Palomar Holdings, Inc.* (Insurance) | | | 85 | | | | 5,505 | |
| PAM Transportation Services, Inc.* (Road & Rail) | | | 12 | | | | 852 | |
| Papa John's International, Inc. (Hotels, Restaurants & Leisure) | | | 115 | | | | 15,349 | |
| Par Pacific Holdings, Inc.* (Oil, Gas & Consumable Fuels) | | | 155 | | | | 2,556 | |
| PAR Technology Corp.* (Electronic Equipment, Instruments & Components) | | | 88 | | | | 4,644 | |
| Paragon 28, Inc.* (Health Care Equipment & Supplies) | | | 31 | | | | 548 | |
| Paramount Group, Inc. (Equity Real Estate Investment Trusts) | | | 648 | | | | 5,404 | |
| Paratek Pharmaceuticals, Inc.* (Pharmaceuticals) | | | 170 | | | | 763 | |
| Park Aerospace Corp. (Aerospace & Defense) | | | 68 | | | | 898 | |
| Park National Corp. (Banks) | | | 50 | | | | 6,866 | |
| Park-Ohio Holdings Corp. (Machinery) | | | 30 | | | | 635 | |
| Parsons Corp.* (Aerospace & Defense) | | | 91 | | | | 3,062 | |
| Party City Holdco, Inc.* (Specialty Retail) | | | 384 | | | | 2,139 | |
| Passage Bio, Inc.* (Biotechnology) | | | 129 | | | | 819 | |
| Patrick Industries, Inc. (Auto Components) | | | 79 | | | | 6,375 | |
| Patterson Cos., Inc. (Health Care Providers & Services) | | | 298 | | | | 8,746 | |
| Patterson-UTI Energy, Inc. (Energy Equipment & Services) | | | 648 | | | | 5,476 | |
| PAVmed, Inc.* (Health Care Equipment & Supplies) | | | 252 | | | | 620 | |
| Paya Holdings, Inc.* (IT Services) | | | 298 | | | | 1,889 | |
| PBF Energy, Inc.*—Class A (Oil, Gas & Consumable Fuels) | | | 335 | | | | 4,345 | |
| PC Connection, Inc. (Electronic Equipment, Instruments & Components) | | | 39 | | | | 1,682 | |
| PCSB Financial Corp. (Thrifts & Mortgage Finance) | | | 45 | | | | 857 | |
| PDC Energy, Inc. (Oil, Gas & Consumable Fuels) | | | 339 | | | | 16,536 | |
| PDF Solutions, Inc.* (Semiconductors & Semiconductor Equipment) | | | 104 | | | | 3,306 | |
| Peabody Energy Corp.* (Oil, Gas & Consumable Fuels) | | | 309 | | | | 3,112 | |
| Peapack Gladstone Financial Corp. (Banks) | | | 62 | | | | 2,195 | |
| Pebblebrook Hotel Trust (Equity Real Estate Investment Trusts) | | | 452 | | | | 10,111 | |
| Pennymac Financial Services, Inc. (Thrifts & Mortgage Finance) | | | 109 | | | | 7,606 | |
| PennyMac Mortgage Investment Trust (Mortgage Real Estate Investment Trusts) | | | 340 | | | | 5,892 | |
| Peoples Bancorp, Inc. (Banks) | | | 88 | | | | 2,799 | |
| Peoples Financial Services Corp. (Banks) | | | 24 | | | | 1,265 | |
| Perdoceo Education Corp.* (Diversified Consumer Services) | | | 244 | | | | 2,869 | |
| Perficient, Inc.* (IT Services) | | | 113 | | | | 14,609 | |
| Performance Food Group Co.* (Food & Staples Retailing) | | | 527 | | | | 24,184 | |
| Perpetua Resources Corp.* (Metals & Mining) | | | 113 | | | | 537 | |
| Personalis, Inc.* (Life Sciences Tools & Services) | | | 125 | | | | 1,784 | |
| Petiq, Inc.* (Health Care Providers & Services) | | | 94 | | | | 2,135 | |
| PetMed Express, Inc. (Internet & Direct Marketing Retail) | | | 71 | | | | 1,793 | |
| PGT Innovations, Inc.* (Building Products) | | | 200 | | | | 4,498 | |
| Phathom Pharmaceuticals, Inc.* (Pharmaceuticals) | | | 70 | | | | 1,377 | |
| Phibro Animal Health Corp.—Class A (Pharmaceuticals) | | | 71 | | | | 1,450 | |
| Phillips Edison & Co., Inc. (Equity Real Estate Investment Trusts) | | | 65 | | | | 2,148 | |
| Photronics, Inc.* (Semiconductors & Semiconductor Equipment) | | | 207 | | | | 3,902 | |
| Phreesia, Inc.* (Health Care Technology) | | | 173 | | | | 7,207 | |
| Physicians Realty Trust (Equity Real Estate Investment Trusts) | | | 766 | | | | 14,424 | |
| Piedmont Office Realty Trust, Inc.—Class A (Equity Real Estate Investment Trusts) | | | 431 | | | | 7,922 | |
| Ping Identity Holding Corp.* (Software) | | | 211 | | | | 4,828 | |
| Pioneer Bancorp, Inc.* (Thrifts & Mortgage Finance) | | | 40 | | | | 453 | |
| Piper Sandler Cos. (Capital Markets) | | | 61 | | | | 10,889 | |
| Pitney Bowes, Inc. (Commercial Services & Supplies) | | | 611 | | | | 4,051 | |
| PJT Partners, Inc.—Class A (Capital Markets) | | | 82 | | | | 6,075 | |
| Plantronics, Inc.* (Communications Equipment) | | | 147 | | | | 4,313 | |
| PlayAGS, Inc.* (Hotels, Restaurants & Leisure) | | | 95 | | | | 645 | |
| PLBY Group, Inc.* (Textiles, Apparel & Luxury Goods) | | | 100 | | | | 2,664 | |
| Plexus Corp.* (Electronic Equipment, Instruments & Components) | | | 97 | | | | 9,301 | |
| Pliant Therapeutics, Inc.* (Pharmaceuticals) | | | 84 | | | | 1,134 | |
| Plymouth Industrial REIT, Inc. (Equity Real Estate Investment Trusts) | | | 109 | | | | 3,488 | |
| PMV Pharmaceuticals, Inc.* (Pharmaceuticals) | | | 91 | | | | 2,102 | |
| PNM Resources, Inc. (Electric Utilities) | | | 297 | | | | 13,546 | |
| PolyMet Mining Corp.* (Metals & Mining) | | | 100 | | | | 250 | |
| Porch Group, Inc.* (Internet & Direct Marketing Retail) | | | 268 | | | | 4,178 | |
| Portage Biotech, Inc.* (Biotechnology) | | | 17 | | | | 182 | |
| Portillo's, Inc.*—Class A (Hotels, Restaurants & Leisure) | | | 82 | | | | 3,078 | |
| Portland General Electric Co. (Electric Utilities) | | | 313 | | | | 16,564 | |
| Poseida Therapeutics, Inc.* (Biotechnology) | | | 100 | | | | 681 | |
| Postal Realty Trust, Inc.—Class A (Equity Real Estate Investment Trusts) | | | 43 | | | | 851 | |
| PotlatchDeltic Corp. (Equity Real Estate Investment Trusts) | | | 229 | | | | 13,790 | |
| Powell Industries, Inc. (Electrical Equipment) | | | 32 | | | | 944 | |
| Power Integrations, Inc. (Semiconductors & Semiconductor Equipment) | | | 210 | | | | 19,507 | |
| PowerSchool Holdings, Inc.* (Diversified Consumer Services) | | | 187 | | | | 3,080 | |
See accompanying notes to financial statements.
Financial Statements :: ProFund VP Small-Cap :: 259
Common Stocks, continued
| | | Shares | | | Value | |
| PRA Group, Inc.* (Consumer Finance) | | | 150 | | | $ | 7,532 | |
| Praxis Precision Medicines, Inc.* (Biotechnology) | | | 116 | | | | 2,285 | |
| Precigen, Inc.* (Biotechnology) | | | 330 | | | | 1,224 | |
| Precision BioSciences, Inc.* (Biotechnology) | | | 176 | | | | 1,302 | |
| Preferred Apartment Communities, Inc.—Class A (Equity Real Estate Investment Trusts) | | | 181 | | | | 3,269 | |
| Preferred Bank (Banks) | | | 48 | | | | 3,446 | |
| Preformed Line Products Co. (Electrical Equipment) | | | 10 | | | | 647 | |
| Prelude Therapeutics, Inc.* (Biotechnology) | | | 38 | | | | 473 | |
| Premier Financial Corp. (Thrifts & Mortgage Finance) | | | 129 | | | | 3,987 | |
| Prestige Consumer Healthcare, Inc.* (Pharmaceuticals) | | | 174 | | | | 10,553 | |
| PriceSmart, Inc. (Food & Staples Retailing) | | | 81 | | | | 5,927 | |
| Primis Financial Corp. (Banks) | | | 84 | | | | 1,263 | |
| Primo Water Corp. (Beverages) | | | 546 | | | | 9,626 | |
| Primoris Services Corp. (Construction & Engineering) | | | 186 | | | | 4,460 | |
| Priority Technology Holdings, Inc.* (IT Services) | | | 35 | | | | 248 | |
| Privia Health Group, Inc.* (Health Care Providers & Services) | | | 56 | | | | 1,449 | |
| ProAssurance Corp. (Insurance) | | | 187 | | | | 4,731 | |
| PROCEPT BioRobotics Corp.* (Health Care Equipment & Supplies) | | | 25 | | | | 625 | |
| PROG Holdings, Inc.* (Consumer Finance) | | | 226 | | | | 10,195 | |
| Progress Software Corp. (Software) | | | 153 | | | | 7,385 | |
| Progyny, Inc.* (Health Care Providers & Services) | | | 224 | | | | 11,278 | |
| Prometheus Biosciences, Inc.* (Biotechnology) | | | 104 | | | | 4,112 | |
| ProPetro Holding Corp.* (Energy Equipment & Services) | | | 300 | | | | 2,430 | |
| PROS Holdings, Inc.* (Software) | | | 139 | | | | 4,794 | |
| Protagonist Therapeutics, Inc.* (Biotechnology) | | | 156 | | | | 5,335 | |
| Prothena Corp. PLC* (Biotechnology) | | | 126 | | | | 6,224 | |
| Proto Labs, Inc.* (Machinery) | | | 97 | | | | 4,981 | |
| Provention Bio, Inc.* (Pharmaceuticals) | | | 193 | | | | 1,085 | |
| Provident BanCorp, Inc. (Thrifts & Mortgage Finance) | | | 53 | | | | 986 | |
| Provident Financial Services, Inc. (Thrifts & Mortgage Finance) | | | 264 | | | | 6,394 | |
| PS Business Parks, Inc. (Equity Real Estate Investment Trusts) | | | 70 | | | | 12,892 | |
| PTC Therapeutics, Inc.* (Biotechnology) | | | 241 | | | | 9,599 | |
| Pulmonx Corp.* (Health Care Equipment & Supplies) | | | 91 | | | | 2,918 | |
| Pulse Biosciences, Inc.* (Health Care Equipment & Supplies) | | | 48 | | | | 711 | |
| Puma Biotechnology, Inc.* (Biotechnology) | | | 112 | | | | 340 | |
| Pure Cycle Corp.* (Water Utilities) | | | 67 | | | | 978 | |
| PureCycle Technologies, Inc.* (Chemicals) | | | 185 | | | | 1,770 | |
| Purple Innovation, Inc.* (Household Durables) | | | 200 | | | | 2,654 | |
| Pyxis Oncology, Inc.* (Biotechnology) | | | 37 | | | | 406 | |
| Pzena Investment Management, Inc.—Class A (Capital Markets) | | | 58 | | | | 549 | |
| Q2 Holdings, Inc.* (Software) | | | 190 | | | | 15,094 | |
| QCR Holdings, Inc. (Banks) | | | 53 | | | | 2,968 | |
| Quaker Chemical Corp. (Chemicals) | | | 47 | | | | 10,847 | |
| Qualys, Inc.* (Software) | | | 118 | | | | 16,192 | |
| Quanex Building Products Corp. (Building Products) | | | 116 | | | | 2,874 | |
| Quanterix Corp.* (Life Sciences Tools & Services) | | | 107 | | | | 4,537 | |
| Quantum Corp.* (Technology Hardware, Storage & Peripherals) | | | 203 | | | | 1,121 | |
| QuinStreet, Inc.* (Interactive Media & Services) | | | 174 | | | | 3,165 | |
| Quotient Technology, Inc.* (Internet & Direct Marketing Retail) | | | 312 | | | | 2,315 | |
| Quotient, Ltd.* (Health Care Equipment & Supplies) | | | 273 | | | | 707 | |
| R. R. Donnelley & Sons Co.* (Commercial Services & Supplies) | | | 246 | | | | 2,770 | |
| R1 RCM, Inc.* (Health Care Providers & Services) | | | 413 | | | | 10,527 | |
| Rackspace Technology, Inc.* (IT Services) | | | 189 | | | | 2,546 | |
| Radian Group, Inc. (Thrifts & Mortgage Finance) | | | 626 | | | | 13,227 | |
| Radiant Logistics, Inc.* (Air Freight & Logistics) | | | 136 | | | | 991 | |
| Radius Global Infrastructure, Inc.*—Class A (Diversified Telecommunication Services) | | | 205 | | | | 3,301 | |
| Radius Health, Inc.* (Biotechnology) | | | 163 | | | | 1,128 | |
| RadNet, Inc.* (Health Care Providers & Services) | | | 158 | | | | 4,757 | |
| Rafael Holdings, Inc.*—Class B (Real Estate Management & Development) | | | 34 | | | | 173 | |
| Rain Therapeutics, Inc.* (Biotechnology) | | | 55 | | | | 708 | |
| Rallybio Corp.* (Biotechnology) | | | 25 | | | | 239 | |
| Rambus, Inc.* (Semiconductors & Semiconductor Equipment) | | | 377 | | | | 11,080 | |
| Range Resources Corp.* (Oil, Gas & Consumable Fuels) | | | 830 | | | | 14,799 | |
| Ranger Oil Corp.* (Oil, Gas & Consumable Fuels) | | | 74 | | | | 1,992 | |
| Ranpak Holdings Corp.* (Containers & Packaging) | | | 131 | | | | 4,923 | |
| Rapid Micro Biosystems, Inc.*—Class A (Life Sciences Tools & Services) | | | 29 | | | | 309 | |
| Rapid7, Inc.* (Software) | | | 195 | | | | 22,949 | |
| RAPT Therapeutics, Inc.* (Biotechnology) | | | 74 | | | | 2,718 | |
| Rayonier Advanced Materials, Inc.* (Chemicals) | | | 215 | | | | 1,228 | |
| RBB Bancorp (Banks) | | | 49 | | | | 1,284 | |
| RBC Bearings, Inc.* (Machinery) | | | 97 | | | | 19,591 | |
| RCI Hospitality Holdings, Inc. (Hotels, Restaurants & Leisure) | | | 29 | | | | 2,259 | |
| Ready Capital Corp. (Mortgage Real Estate Investment Trusts) | | | 208 | | | | 3,251 | |
| Realogy Holdings Corp.* (Real Estate Management & Development) | | | 400 | | | | 6,724 | |
| Reata Pharmaceuticals, Inc.*—Class A (Pharmaceuticals) | | | 95 | | | | 2,505 | |
| Recursion Pharmaceuticals, Inc.*—Class A (Biotechnology) | | | 400 | | | | 6,852 | |
| Red River Bancshares, Inc. (Banks) | | | 16 | | | | 856 | |
| Red Robin Gourmet Burgers, Inc.* (Hotels, Restaurants & Leisure) | | | 54 | | | | 893 | |
| Red Rock Resorts, Inc.—Class A (Hotels, Restaurants & Leisure) | | | 207 | | | | 11,387 | |
| Redfin Corp.* (Real Estate Management & Development) | | | 358 | | | | 13,745 | |
| Redwood Trust, Inc. (Mortgage Real Estate Investment Trusts) | | | 398 | | | | 5,250 | |
| REGENXBIO, Inc.* (Biotechnology) | | | 137 | | | | 4,480 | |
| Regional Management Corp. (Consumer Finance) | | | 27 | | | | 1,551 | |
| Regis Corp.* (Diversified Consumer Services) | | | 148 | | | | 258 | |
| Rekor Systems, Inc.* (Professional Services) | | | 117 | | | | 766 | |
| Relay Therapeutics, Inc.* (Biotechnology) | | | 243 | | | | 7,463 | |
| Relmada Therapeutics, Inc.* (Pharmaceuticals) | | | 54 | | | | 1,217 | |
See accompanying notes to financial statements.
260 :: ProFund VP Small-Cap :: Financial Statements
Common Stocks, continued
| | | Shares | | | Value | |
| Remitly Global, Inc.* (IT Services) | | | 43 | | | $ | 887 | |
| Renasant Corp. (Banks) | | | 190 | | | | 7,211 | |
| Reneo Pharmaceuticals, Inc.* (Biotechnology) | | | 30 | | | | 257 | |
| Renewable Energy Group, Inc.* (Oil, Gas & Consumable Fuels) | | | 156 | | | | 6,621 | |
| Rent The Runway, Inc.*—Class A (Internet & Direct Marketing Retail) | | | 60 | | | | 489 | |
| Rent-A-Center, Inc. (Specialty Retail) | | | 229 | | | | 11,001 | |
| Repay Holdings Corp.* (IT Services) | | | 301 | | | | 5,499 | |
| Replimune Group, Inc.* (Biotechnology) | | | 103 | | | | 2,791 | |
| Republic Bancorp, Inc.—Class A (Banks) | | | 32 | | | | 1,627 | |
| Republic First Bancorp, Inc.* (Banks) | | | 155 | | | | 577 | |
| Resideo Technologies, Inc.* (Building Products) | | | 502 | | | | 13,067 | |
| Resources Connection, Inc. (Professional Services) | | | 111 | | | | 1,980 | |
| Retail Opportunity Investments Corp. (Equity Real Estate Investment Trusts) | | | 413 | | | | 8,095 | |
| Retail Value, Inc. (Equity Real Estate Investment Trusts) | | | 61 | | | | 392 | |
| Retractable Technologies, Inc.* (Health Care Equipment & Supplies) | | | 60 | | | | 416 | |
| REV Group, Inc. (Machinery) | | | 99 | | | | 1,401 | |
| Revance Therapeutics, Inc.* (Pharmaceuticals) | | | 244 | | | | 3,982 | |
| Revlon, Inc.*—Class A (Personal Products) | | | 25 | | | | 284 | |
| REVOLUTION Medicines, Inc.* (Biotechnology) | | | 206 | | | | 5,185 | |
| Revolve Group, Inc.* (Internet & Direct Marketing Retail) | | | 125 | | | | 7,005 | |
| REX American Resources Corp.* (Oil, Gas & Consumable Fuels) | | | 18 | | | | 1,728 | |
| Rhythm Pharmaceuticals, Inc.* (Biotechnology) | | | 153 | | | | 1,527 | |
| Ribbon Communications, Inc.* (Communications Equipment) | | | 244 | | | | 1,476 | |
| Rigel Pharmaceuticals, Inc.* (Biotechnology) | | | 593 | | | | 1,571 | |
| Riley Exploration Permian, Inc. (Oil, Gas & Consumable Fuels) | | | 9 | | | | 174 | |
| Rimini Street, Inc.* (Software) | | | 155 | | | | 925 | |
| Riot Blockchain, Inc.*(a) (Software) | | | 309 | | | | 6,900 | |
| Rite Aid Corp.* (Food & Staples Retailing) | | | 193 | | | | 2,835 | |
| RLI Corp. (Insurance) | | | 139 | | | | 15,582 | |
| RLJ Lodging Trust (Equity Real Estate Investment Trusts) | | | 575 | | | | 8,010 | |
| Rocket Pharmaceuticals, Inc.* (Biotechnology) | | | 143 | | | | 3,122 | |
| Rocky Brands, Inc. (Textiles, Apparel & Luxury Goods) | | | 24 | | | | 955 | |
| Rogers Corp.* (Electronic Equipment, Instruments & Components) | | | 65 | | | | 17,744 | |
| Romeo Power, Inc.* (Electrical Equipment) | | | 449 | | | | 1,639 | |
| RPC, Inc.* (Energy Equipment & Services) | | | 235 | | | | 1,067 | |
| RPT Realty (Equity Real Estate Investment Trusts) | | | 291 | | | | 3,894 | |
| Rubius Therapeutics, Inc.* (Biotechnology) | | | 160 | | | | 1,549 | |
| Rush Enterprises, Inc.—Class A (Trading Companies & Distributors) | | | 147 | | | | 8,179 | |
| Rush Enterprises, Inc.—Class B (Trading Companies & Distributors) | | | 22 | | | | 1,187 | |
| Rush Street Interactive, Inc.* (Hotels, Restaurants & Leisure) | | | 183 | | | | 3,020 | |
| Ruth's Hospitality Group, Inc.* (Hotels, Restaurants & Leisure) | | | 115 | | | | 2,289 | |
| RxSight, Inc.* (Health Care Equipment & Supplies) | | | 29 | | | | 326 | |
| Ryerson Holding Corp. (Metals & Mining) | | | 57 | | | | 1,485 | |
| Ryman Hospitality Properties, Inc.*—Class I (Equity Real Estate Investment Trusts) | | | 187 | | | | 17,197 | |
| S&T Bancorp, Inc. (Banks) | | | 135 | | | | 4,255 | |
| Sabra Health Care REIT, Inc. (Equity Real Estate Investment Trusts) | | | 793 | | | | 10,737 | |
| Safe Bulkers, Inc.* (Marine) | | | 220 | | | | 829 | |
| Safehold, Inc. (Equity Real Estate Investment Trusts) | | | 72 | | | | 5,749 | |
| Safety Insurance Group, Inc. (Insurance) | | | 50 | | | | 4,252 | |
| Saia, Inc.* (Road & Rail) | | | 92 | | | | 31,008 | |
| Sailpoint Technologies Holding, Inc.* (Software) | | | 318 | | | | 15,372 | |
| Sally Beauty Holdings, Inc.* (Specialty Retail) | | | 391 | | | | 7,218 | |
| Sana Biotechnology, Inc.* (Biotechnology) | | | 300 | | | | 4,644 | |
| Sanderson Farms, Inc. (Food Products) | | | 71 | | | | 13,566 | |
| Sandy Spring Bancorp, Inc. (Banks) | | | 155 | | | | 7,452 | |
| Sangamo Therapeutics, Inc.* (Biotechnology) | | | 412 | | | | 3,090 | |
| Sanmina Corp.* (Electronic Equipment, Instruments & Components) | | | 221 | | | | 9,163 | |
| Sapiens International Corp. N.V. (Software) | | | 107 | | | | 3,686 | |
| Saul Centers, Inc. (Equity Real Estate Investment Trusts) | | | 41 | | | | 2,174 | |
| ScanSource, Inc.* (Electronic Equipment, Instruments & Components) | | | 87 | | | | 3,052 | |
| Schnitzer Steel Industries, Inc.—Class A (Metals & Mining) | | | 90 | | | | 4,673 | |
| Scholar Rock Holding Corp.* (Biotechnology) | | | 98 | | | | 2,434 | |
| Scholastic Corp. (Media) | | | 92 | | | | 3,676 | |
| Schrodinger, Inc.* (Health Care Technology) | | | 157 | | | | 5,468 | |
| Schweitzer-Mauduit International, Inc. (Paper & Forest Products) | | | 109 | | | | 3,259 | |
| Scientific Games Corp.* (Hotels, Restaurants & Leisure) | | | 334 | | | | 22,320 | |
| Scorpio Tankers, Inc. (Oil, Gas & Consumable Fuels) | | | 169 | | | | 2,165 | |
| Sculptor Capital Management, Inc. (Capital Markets) | | | 77 | | | | 1,644 | |
| Seacoast Banking Corporation of Florida (Banks) | | | 181 | | | | 6,406 | |
| SeaSpine Holdings Corp.* (Health Care Equipment & Supplies) | | | 110 | | | | 1,498 | |
| SeaWorld Entertainment, Inc.* (Hotels, Restaurants & Leisure) | | | 179 | | | | 11,610 | |
| SecureWorks Corp.*—Class A (Software) | | | 35 | | | | 559 | |
| Seelos Therapeutics, Inc.* (Pharmaceuticals) | | | 341 | | | | 556 | |
| Seer, Inc.* (Life Sciences Tools & Services) | | | 145 | | | | 3,307 | |
| Select Energy Services, Inc.* (Energy Equipment & Services) | | | 217 | | | | 1,352 | |
| Select Medical Holdings Corp. (Health Care Providers & Services) | | | 384 | | | | 11,290 | |
| Selecta Biosciences, Inc.* (Biotechnology) | | | 320 | | | | 1,043 | |
| Selective Insurance Group, Inc. (Insurance) | | | 206 | | | | 16,880 | |
| Selectquote, Inc.* (Insurance) | | | 465 | | | | 4,213 | |
| Semtech Corp.* (Semiconductors & Semiconductor Equipment) | | | 225 | | | | 20,009 | |
| Seneca Foods Corp.*—Class A (Food Products) | | | 21 | | | | 1,007 | |
| Sensei Biotherapeutics, Inc.* (Biotechnology) | | | 73 | | | | 423 | |
| Senseonics Holdings, Inc.* (Health Care Equipment & Supplies) | | | 1,501 | | | | 4,008 | |
| Sensient Technologies Corp. (Chemicals) | | | 147 | | | | 14,708 | |
| Sera Prognostics, Inc.*—Class A (Biotechnology) | | | 16 | | | | 110 | |
| Seres Therapeutics, Inc.* (Biotechnology) | | | 242 | | | | 2,016 | |
| Seritage Growth Properties*—Class A (Equity Real Estate Investment Trusts) | | | 130 | | | | 1,725 | |
| Service Properties Trust (Equity Real Estate Investment Trusts) | | | 570 | | | | 5,010 | |
See accompanying notes to financial statements.
Financial Statements :: ProFund VP Small-Cap :: 261
Common Stocks, continued
| | | Shares | | | Value | |
| ServisFirst Bancshares, Inc. (Banks) | | | 173 | | | $ | 14,695 | |
| Sesen Bio, Inc.*(a) (Biotechnology) | | | 699 | | | | 570 | |
| SFL Corp., Ltd. (Oil, Gas & Consumable Fuels) | | | 431 | | | | 3,513 | |
| Shake Shack, Inc.*—Class A (Hotels, Restaurants & Leisure) | | | 130 | | | | 9,381 | |
| Sharps Compliance Corp.* (Health Care Providers & Services) | | | 64 | | | | 456 | |
| Shattuck Labs, Inc.* (Biotechnology) | | | 92 | | | | 783 | |
| Shenandoah Telecommunications Co. (Wireless Telecommunication Services) | | | 168 | | | | 4,284 | |
| Shift Technologies, Inc.* (Specialty Retail) | | | 216 | | | | 737 | |
| Shockwave Medical, Inc.* (Health Care Equipment & Supplies) | | | 117 | | | | 20,864 | |
| Shoe Carnival, Inc. (Specialty Retail) | | | 61 | | | | 2,384 | |
| ShotSpotter, Inc.* (Software) | | | 29 | | | | 856 | |
| Shutterstock, Inc. (Internet & Direct Marketing Retail) | | | 81 | | | | 8,982 | |
| SI-BONE, Inc.* (Health Care Equipment & Supplies) | | | 113 | | | | 2,510 | |
| Sientra, Inc.* (Health Care Equipment & Supplies) | | | 202 | | | | 741 | |
| Sierra Bancorp (Banks) | | | 49 | | | | 1,330 | |
| SIGA Technologies, Inc.* (Pharmaceuticals) | | | 168 | | | | 1,263 | |
| Sight Sciences, Inc.* (Health Care Equipment & Supplies) | | | 39 | | | | 685 | |
| Sigilon Therapeutics, Inc.* (Biotechnology) | | | 53 | | | | 146 | |
| Signet Jewelers, Ltd. (Specialty Retail) | | | 184 | | | | 16,014 | |
| Silicon Laboratories, Inc.* (Semiconductors & Semiconductor Equipment) | | | 139 | | | | 28,693 | |
| Silk Road Medical, Inc.* (Health Care Equipment & Supplies) | | | 119 | | | | 5,071 | |
| Silverback Therapeutics, Inc.* (Biotechnology) | | | 71 | | | | 473 | |
| Silvergate Capital Corp.*—Class A (Banks) | | | 96 | | | | 14,227 | |
| Simmons First National Corp.—Class A (Banks) | | | 395 | | | | 11,684 | |
| Simpson Manufacturing Co., Inc. (Building Products) | | | 151 | | | | 20,999 | |
| Simulations Plus, Inc. (Health Care Technology) | | | 53 | | | | 2,507 | |
| Sinclair Broadcast Group, Inc.—Class A (Media) | | | 160 | | | | 4,229 | |
| Singular Genomics Systems, Inc.* (Life Sciences Tools & Services) | | | 42 | | | | 486 | |
| SiriusPoint, Ltd.* (Insurance) | | | 307 | | | | 2,496 | |
| SITE Centers Corp. (Equity Real Estate Investment Trusts) | | | 602 | | | | 9,530 | |
| SiTime Corp.* (Semiconductors & Semiconductor Equipment) | | | 55 | | | | 16,090 | |
| SJW Corp. (Water Utilities) | | | 96 | | | | 7,027 | |
| Skyline Champion Corp.* (Household Durables) | | | 182 | | | | 14,374 | |
| SkyWater Technology, Inc.* (Semiconductors & Semiconductor Equipment) | | | 28 | | | | 454 | |
| SkyWest, Inc.* (Airlines) | | | 173 | | | | 6,799 | |
| Sleep Number Corp.* (Specialty Retail) | | | 77 | | | | 5,898 | |
| SM Energy Co. (Oil, Gas & Consumable Fuels) | | | 417 | | | | 12,293 | |
| SMART Global Holdings, Inc.* (Semiconductors & Semiconductor Equipment) | | | 61 | | | | 4,330 | |
| SmartFinancial, Inc. (Banks) | | | 48 | | | | 1,313 | |
| Smith & Wesson Brands, Inc. (Leisure Products) | | | 166 | | | | 2,955 | |
| Smith Micro Software, Inc.* (Software) | | | 160 | | | | 787 | |
| Snap One Holdings Corp.* (Household Durables) | | | 47 | | | | 991 | |
| SOC Telemed, Inc.* (Health Care Providers & Services) | | | 211 | | | | 270 | |
| Society Pass, Inc.* (Interactive Media & Services) | | | 11 | | | | 115 | |
| Solaris Oilfield Infrastructure, Inc. (Energy Equipment & Services) | | | 109 | | | | 714 | |
| Solid Biosciences, Inc.* (Biotechnology) | | | 207 | | | | 362 | |
| Solo Brands, Inc.*—Class A (Leisure Products) | | | 41 | | | | 641 | |
| Sonic Automotive, Inc.—Class A (Specialty Retail) | | | 75 | | | | 3,709 | |
| Sonos, Inc.* (Household Durables) | | | 418 | | | | 12,456 | |
| Sorrento Therapeutics, Inc.* (Biotechnology) | | | 1,037 | | | | 4,822 | |
| South Jersey Industries, Inc. (Gas Utilities) | | | 358 | | | | 9,351 | |
| South Plains Financial, Inc. (Banks) | | | 36 | | | | 1,001 | |
| Southern First Bancshares, Inc.* (Banks) | | | 26 | | | | 1,625 | |
| Southern Missouri Bancorp, Inc. (Thrifts & Mortgage Finance) | | | 27 | | | | 1,409 | |
| Southside Bancshares, Inc. (Banks) | | | 108 | | | | 4,517 | |
| SouthState Corp. (Banks) | | | 243 | | | | 19,468 | |
| Southwest Gas Holdings, Inc. (Gas Utilities) | | | 210 | | | | 14,710 | |
| Southwestern Energy Co.* (Oil, Gas & Consumable Fuels) | | | 3,530 | | | | 16,450 | |
| Sovos Brands, Inc.* (Food Products) | | | 89 | | | | 1,339 | |
| SP Plus Corp.* (Commercial Services & Supplies) | | | 80 | | | | 2,258 | |
| SpartanNash Co. (Food & Staples Retailing) | | | 124 | | | | 3,194 | |
| Spectrum Pharmaceuticals, Inc.* (Biotechnology) | | | 566 | | | | 719 | |
| Spero Therapeutics, Inc.* (Biotechnology) | | | 84 | | | | 1,345 | |
| Spire, Inc. (Gas Utilities) | | | 176 | | | | 11,479 | |
| Spirit Airlines, Inc.* (Airlines) | | | 342 | | | | 7,473 | |
| Spirit of Texas Bancshares, Inc. (Banks) | | | 44 | | | | 1,266 | |
| Sportsman's Warehouse Holdings, Inc.* (Specialty Retail) | | | 151 | | | | 1,782 | |
| SpringWorks Therapeutics, Inc.* (Biotechnology) | | | 101 | | | | 6,260 | |
| Sprout Social, Inc.*—Class A (Software) | | | 157 | | | | 14,238 | |
| Sprouts Farmers Market, Inc.* (Food & Staples Retailing) | | | 392 | | | | 11,635 | |
| Spruce Biosciences, Inc.* (Biotechnology) | | | 30 | | | | 134 | |
| SPS Commerce, Inc.* (Software) | | | 125 | | | | 17,794 | |
| SPX Corp.* (Machinery) | | | 152 | | | | 9,071 | |
| SPX FLOW, Inc. (Machinery) | | | 144 | | | | 12,453 | |
| SQZ Biotechnologies Co.* (Biotechnology) | | | 79 | | | | 705 | |
| STAAR Surgical Co.* (Health Care Equipment & Supplies) | | | 165 | | | | 15,065 | |
| STAG Industrial, Inc. (Equity Real Estate Investment Trusts) | | | 613 | | | | 29,399 | |
| Stagwell, Inc.* (Media) | | | 214 | | | | 1,855 | |
| Standard Motor Products, Inc. (Auto Components) | | | 73 | | | | 3,824 | |
| Standex International Corp. (Machinery) | | | 42 | | | | 4,648 | |
| Startek, Inc.* (IT Services) | | | 58 | | | | 303 | |
| State Auto Financial Corp. (Insurance) | | | 62 | | | | 3,205 | |
| Steelcase, Inc.—Class A (Commercial Services & Supplies) | | | 302 | | | | 3,539 | |
| Stem, Inc.* (Electrical Equipment) | | | 396 | | | | 7,512 | |
| Stepan Co. (Chemicals) | | | 75 | | | | 9,322 | |
| StepStone Group, Inc.—Class A (Capital Markets) | | | 140 | | | | 5,820 | |
| Stereotaxis, Inc.* (Health Care Equipment & Supplies) | | | 172 | | | | 1,066 | |
| Sterling Check Corp.* (Professional Services) | | | 58 | | | | 1,190 | |
| Sterling Construction Co., Inc.* (Construction & Engineering) | | | 97 | | | | 2,551 | |
| Steven Madden, Ltd. (Textiles, Apparel & Luxury Goods) | | | 280 | | | | 13,012 | |
| Stewart Information Services Corp. (Insurance) | | | 93 | | | | 7,415 | |
| Stitch Fix, Inc.*—Class A (Internet & Direct Marketing Retail) | | | 283 | | | | 5,354 | |
See accompanying notes to financial statements.
262 :: ProFund VP Small-Cap :: Financial Statements
Common Stocks, continued
| | | Shares | | | Value | |
| Stock Yards Bancorp, Inc. (Banks) | | | 84 | | | $ | 5,366 | |
| Stoke Therapeutics, Inc.* (Biotechnology) | | | 66 | | | | 1,583 | |
| StoneMor, Inc.* (Diversified Consumer Services) | | | 112 | | | | 255 | |
| Stoneridge, Inc.* (Auto Components) | | | 91 | | | | 1,796 | |
| StoneX Group, Inc.* (Capital Markets) | | | 58 | | | | 3,553 | |
| Strategic Education, Inc. (Diversified Consumer Services) | | | 85 | | | | 4,916 | |
| Stride, Inc.* (Diversified Consumer Services) | | | 144 | | | | 4,800 | |
| Stronghold Digital Mining, Inc.*—Class A (Software) | | | 26 | | | | 334 | |
| Sturm Ruger & Co., Inc. (Leisure Products) | | | 60 | | | | 4,081 | |
| Summit Financial Group, Inc. (Banks) | | | 39 | | | | 1,071 | |
| Summit Hotel Properties, Inc.* (Equity Real Estate Investment Trusts) | | | 360 | | | | 3,514 | |
| Summit Materials, Inc.*—Class A (Construction Materials) | | | 412 | | | | 16,538 | |
| Summit Therapeutics, Inc.* (Biotechnology) | | | 92 | | | | 247 | |
| Sumo Logic, Inc.* (Software) | | | 305 | | | | 4,136 | |
| Sun Country Airlines Holdings, Inc.* (Airlines) | | | 112 | | | | 3,052 | |
| SunCoke Energy, Inc. (Metals & Mining) | | | 289 | | | | 1,905 | |
| Sunnova Energy International, Inc.* (Independent Power and Renewable Electricity Producers) | | | 299 | | | | 8,348 | |
| SunPower Corp.* (Semiconductors & Semiconductor Equipment) | | | 278 | | | | 5,802 | |
| Sunstone Hotel Investors, Inc.* (Equity Real Estate Investment Trusts) | | | 756 | | | | 8,868 | |
| Super Micro Computer, Inc.* (Technology Hardware, Storage & Peripherals) | | | 152 | | | | 6,679 | |
| Superior Group of Cos., Inc. (Textiles, Apparel & Luxury Goods) | | | 41 | | | | 900 | |
| Supernus Pharmaceuticals, Inc.* (Pharmaceuticals) | | | 171 | | | | 4,986 | |
| Surface Oncology, Inc.* (Biotechnology) | | | 123 | | | | 588 | |
| Surgery Partners, Inc.* (Health Care Providers & Services) | | | 118 | | | | 6,302 | |
| Surmodics, Inc.* (Health Care Equipment & Supplies) | | | 47 | | | | 2,263 | |
| Sutro BioPharma, Inc.* (Biotechnology) | | | 151 | | | | 2,247 | |
| Synaptics, Inc.* (Semiconductors & Semiconductor Equipment) | | | 136 | | | | 39,374 | |
| Syndax Pharmaceuticals, Inc.* (Biotechnology) | | | 156 | | | | 3,415 | |
| Syros Pharmaceuticals, Inc.* (Biotechnology) | | | 200 | | | | 652 | |
| Tabula Rasa HealthCare, Inc.* (Health Care Technology) | | | 78 | | | | 1,170 | |
| Tactile Systems Technology, Inc.* (Health Care Equipment & Supplies) | | | 67 | | | | 1,275 | |
| Talaris Therapeutics, Inc.* (Biotechnology) | | | 74 | | | | 1,131 | |
| Talis Biomedical Corp.* (Health Care Equipment & Supplies) | | | 50 | | | | 201 | |
| Talos Energy, Inc.* (Oil, Gas & Consumable Fuels) | | | 128 | | | | 1,254 | |
| Tanger Factory Outlet Centers, Inc. (Equity Real Estate Investment Trusts) | | | 355 | | | | 6,844 | |
| Target Hospitality Corp.* (Hotels, Restaurants & Leisure) | | | 87 | | | | 310 | |
| Tarsus Pharmaceuticals, Inc.* (Pharmaceuticals) | | | 29 | | | | 653 | |
| Tattooed Chef, Inc.*(a) (Food Products) | | | 164 | | | | 2,549 | |
| Taylor Morrison Home Corp.* (Household Durables) | | | 416 | | | | 14,543 | |
| Taysha Gene Therapies, Inc.* (Biotechnology) | | | 79 | | | | 920 | |
| TCR2 Therapeutics, Inc.* (Biotechnology) | | | 106 | | | | 494 | |
| Team, Inc.* (Commercial Services & Supplies) | | | 92 | | | | 100 | |
| TechTarget, Inc.* (Media) | | | 91 | | | | 8,704 | |
| Teekay Corp.* (Oil, Gas & Consumable Fuels) | | | 241 | | | | 757 | |
| Teekay Tankers, Ltd.*—Class A (Oil, Gas & Consumable Fuels) | | | 83 | | | | 905 | |
| TEGNA, Inc. (Media) | | | 768 | | | | 14,253 | |
| Tejon Ranch Co.* (Real Estate Management & Development) | | | 72 | | | | 1,374 | |
| Telephone and Data Systems, Inc. (Wireless Telecommunication Services) | | | 351 | | | | 7,072 | |
| Telesat Corp.* (Diversified Telecommunication Services) | | | 45 | | | | 1,290 | |
| Tellurian, Inc.* (Oil, Gas & Consumable Fuels) | | | 1,283 | | | | 3,952 | |
| Telos Corp.* (Software) | | | 139 | | | | 2,143 | |
| Tenable Holdings, Inc.* (Software) | | | 321 | | | | 17,677 | |
| Tenaya Therapeutics, Inc.* (Biotechnology) | | | 48 | | | | 910 | |
| Tenet Healthcare Corp.* (Health Care Providers & Services) | | | 369 | | | | 30,145 | |
| Tennant Co. (Machinery) | | | 64 | | | | 5,187 | |
| Tenneco, Inc.* (Auto Components) | | | 236 | | | | 2,667 | |
| Terex Corp. (Machinery) | | | 238 | | | | 10,460 | |
| Terns Pharmaceuticals, Inc.* (Pharmaceuticals) | | | 48 | | | | 339 | |
| Terreno Realty Corp. (Equity Real Estate Investment Trusts) | | | 256 | | | | 21,834 | |
| Tetra Tech, Inc. (Commercial Services & Supplies) | | | 187 | | | | 31,753 | |
| TETRA Technologies, Inc.* (Energy Equipment & Services) | | | 426 | | | | 1,210 | |
| Texas Capital Bancshares, Inc.* (Banks) | | | 176 | | | | 10,604 | |
| Texas Roadhouse, Inc.—Class A (Hotels, Restaurants & Leisure) | | | 243 | | | | 21,695 | |
| Textainer Group Holdings, Ltd. (Trading Companies & Distributors) | | | 164 | | | | 5,856 | |
| TG Therapeutics, Inc.* (Biotechnology) | | | 450 | | | | 8,550 | |
| The Andersons, Inc. (Food & Staples Retailing) | | | 109 | | | | 4,219 | |
| The Bancorp, Inc.* (Banks) | | | 182 | | | | 4,606 | |
| The Bank of Nt Butterfield & Son, Ltd. (Banks) | | | 174 | | | | 6,631 | |
| The Brink's Co. (Commercial Services & Supplies) | | | 167 | | | | 10,950 | |
| The Buckle, Inc. (Specialty Retail) | | | 103 | | | | 4,358 | |
| The Cato Corp.—Class A (Specialty Retail) | | | 69 | | | | 1,184 | |
| The Cheesecake Factory, Inc.* (Hotels, Restaurants & Leisure) | | | 160 | | | | 6,264 | |
| The Children's Place, Inc.* (Specialty Retail) | | | 49 | | | | 3,885 | |
| The Container Store Group, Inc.* (Specialty Retail) | | | 110 | | | | 1,098 | |
| The E.W. Scripps Co.*—Class A (Media) | | | 199 | | | | 3,851 | |
| The Ensign Group, Inc. (Health Care Providers & Services) | | | 183 | | | | 15,365 | |
| The First Bancorp, Inc. (Banks) | | | 36 | | | | 1,130 | |
| The GEO Group, Inc. (Equity Real Estate Investment Trusts) | | | 409 | | | | 3,170 | |
| The Goodyear Tire & Rubber Co.* (Auto Components) | | | 961 | | | | 20,489 | |
| The Greenbrier Cos., Inc. (Machinery) | | | 111 | | | | 5,094 | |
| The Hackett Group, Inc. (IT Services) | | | 85 | | | | 1,745 | |
| The Joint Corp.* (Health Care Providers & Services) | | | 48 | | | | 3,153 | |
| The Lovesac Co.* (Household Durables) | | | 44 | | | | 2,915 | |
| The Macerich Co. (Equity Real Estate Investment Trusts) | | | 743 | | | | 12,839 | |
| The Manitowoc Co., Inc.* (Machinery) | | | 119 | | | | 2,212 | |
| The Marcus Corp.* (Entertainment) | | | 79 | | | | 1,411 | |
| The ODP Corp.* (Specialty Retail) | | | 160 | | | | 6,285 | |
| The Pennant Group, Inc.* (Health Care Providers & Services) | | | 89 | | | | 2,054 | |
See accompanying notes to financial statements.
Financial Statements :: ProFund VP Small-Cap :: 263
Common Stocks, continued
| | | Shares | | | Value | |
| The RealReal, Inc.* (Internet & Direct Marketing Retail) | | | 278 | | | $ | 3,228 | |
| The RMR Group, Inc.—Class A (Real Estate Management & Development) | | | 53 | | | | 1,838 | |
| The Shyft Group, Inc. (Machinery) | | | 120 | | | | 5,896 | |
| The Simply Good Foods Co.* (Food Products) | | | 296 | | | | 12,305 | |
| The St Joe Co. (Real Estate Management & Development) | | | 116 | | | | 6,038 | |
| The Vita Coco Co., Inc.* (Beverages) | | | 38 | | | | 424 | |
| TherapeuticsMD, Inc.* (Pharmaceuticals) | | | 1,354 | | | | 481 | |
| Theravance Biopharma, Inc.* (Pharmaceuticals) | | | 208 | | | | 2,298 | |
| Thermon Group Holdings, Inc.* (Electrical Equipment) | | | 114 | | | | 1,930 | |
| Theseus Pharmaceuticals, Inc.* (Pharmaceuticals) | | | 40 | | | | 507 | |
| Third Coast Bancshares, Inc.* (Banks) | | | 12 | | | | 312 | |
| Thorne HealthTech, Inc.* (Personal Products) | | | 23 | | | | 143 | |
| Thryv Holdings, Inc.* (Media) | | | 27 | | | | 1,111 | |
| Tidewater, Inc.* (Energy Equipment & Services) | | | 143 | | | | 1,532 | |
| Tilly's, Inc.—Class A (Specialty Retail) | | | 79 | | | | 1,273 | |
| TimkenSteel Corp.* (Metals & Mining) | | | 160 | | | | 2,640 | |
| Tiptree, Inc. (Insurance) | | | 82 | | | | 1,134 | |
| Titan International, Inc.* (Machinery) | | | 177 | | | | 1,940 | |
| Titan Machinery, Inc.* (Trading Companies & Distributors) | | | 67 | | | | 2,257 | |
| Tivity Health, Inc.* (Health Care Providers & Services) | | | 153 | | | | 4,045 | |
| Tompkins Financial Corp. (Banks) | | | 49 | | | | 4,095 | |
| Tonix Pharmaceuticals Holding Corp.* (Biotechnology) | | | 1,540 | | | | 551 | |
| Tootsie Roll Industries, Inc. (Food Products) | | | 53 | | | | 1,920 | |
| Torrid Holdings, Inc.* (Specialty Retail) | | | 44 | | | | 435 | |
| TowneBank (Banks) | | | 233 | | | | 7,360 | |
| TPG RE Finance Trust, Inc.—Class T (Mortgage Real Estate Investment Trusts) | | | 209 | | | | 2,575 | |
| TPI Composites, Inc.* (Electrical Equipment) | | | 126 | | | | 1,885 | |
| Traeger, Inc.* (Household Durables) | | | 78 | | | | 948 | |
| Transcat, Inc.* (Trading Companies & Distributors) | | | 25 | | | | 2,311 | |
| TransMedics Group, Inc.* (Health Care Equipment & Supplies) | | | 90 | | | | 1,724 | |
| TravelCenters of America, Inc.* (Specialty Retail) | | | 43 | | | | 2,220 | |
| Travere Therapeutics, Inc.* (Biotechnology) | | | 205 | | | | 6,363 | |
| Treace Medical Concepts, Inc.* (Health Care Equipment & Supplies) | | | 104 | | | | 1,939 | |
| Trean Insurance Group, Inc.* (Insurance) | | | 61 | | | | 544 | |
| Tredegar Corp. (Chemicals) | | | 91 | | | | 1,076 | |
| TreeHouse Foods, Inc.* (Food Products) | | | 181 | | | | 7,336 | |
| Trevena, Inc.* (Biotechnology) | | | 568 | | | | 331 | |
| Tri Pointe Homes, Inc.* (Household Durables) | | | 388 | | | | 10,821 | |
| TriCo Bancshares (Banks) | | | 96 | | | | 4,124 | |
| TriMas Corp. (Machinery) | | | 150 | | | | 5,550 | |
| TriNet Group, Inc.* (Professional Services) | | | 141 | | | | 13,432 | |
| Trinity Industries, Inc. (Machinery) | | | 268 | | | | 8,094 | |
| Trinseo PLC* (Chemicals) | | | 135 | | | | 7,082 | |
| Triple-S Management Corp.* (Health Care Providers & Services) | | | 79 | | | | 2,819 | |
| TriState Capital Holdings, Inc.* (Banks) | | | 101 | | | | 3,056 | |
| Triton International, Ltd. (Trading Companies & Distributors) | | | 232 | | | | 13,974 | |
| Triumph Bancorp, Inc.* (Banks) | | | 82 | | | | 9,765 | |
| Triumph Group, Inc.* (Aerospace & Defense) | | | 221 | | | | 4,095 | |
| Tronox Holdings PLC—Class A (Chemicals) | | | 398 | | | | 9,564 | |
| TrueBlue, Inc.* (Professional Services) | | | 121 | | | | 3,348 | |
| TrueCar, Inc.* (Interactive Media & Services) | | | 331 | | | | 1,125 | |
| Trupanion, Inc.* (Insurance) | | | 133 | | | | 17,559 | |
| TrustCo Bank Corp. (Thrifts & Mortgage Finance) | | | 66 | | | | 2,198 | |
| Trustmark Corp. (Banks) | | | 216 | | | | 7,011 | |
| TTEC Holdings, Inc. (IT Services) | | | 64 | | | | 5,795 | |
| TTM Technologies, Inc.* (Electronic Equipment, Instruments & Components) | | | 362 | | | | 5,394 | |
| Tucows, Inc.* (IT Services) | | | 34 | | | | 2,850 | |
| Tupperware Brands Corp.* (Household Durables) | | | 170 | | | | 2,599 | |
| Turning Point Brands, Inc. (Tobacco) | | | 51 | | | | 1,927 | |
| Turning Point Therapeutics, Inc.* (Biotechnology) | | | 160 | | | | 7,632 | |
| Turtle Beach Corp.* (Technology Hardware, Storage & Peripherals) | | | 53 | | | | 1,180 | |
| Tutor Perini Corp.* (Construction & Engineering) | | | 143 | | | | 1,769 | |
| Twist Bioscience Corp.* (Biotechnology) | | | 164 | | | | 12,692 | |
| Two Harbors Investment Corp. (Mortgage Real Estate Investment Trusts) | | | 1,195 | | | | 6,895 | |
| Tyra Biosciences, Inc.* (Biotechnology) | | | 42 | | | | 591 | |
| U.S. Cellular Corp.* (Wireless Telecommunication Services) | | | 53 | | | | 1,671 | |
| U.S. Ecology, Inc.* (Commercial Services & Supplies) | | | 109 | | | | 3,481 | |
| U.S. Lime & Minerals, Inc. (Construction Materials) | | | 7 | | | | 903 | |
| U.S. Physical Therapy, Inc. (Health Care Providers & Services) | | | 44 | | | | 4,204 | |
| U.S. Silica Holdings, Inc.* (Energy Equipment & Services) | | | 255 | | | | 2,397 | |
| Udemy, Inc.* (Diversified Consumer Services) | | | 48 | | | | 938 | |
| UFP Industries, Inc. (Building Products) | | | 209 | | | | 19,230 | |
| UFP Technologies, Inc.* (Containers & Packaging) | | | 24 | | | | 1,686 | |
| Ultra Clean Holdings, Inc.* (Semiconductors & Semiconductor Equipment) | | | 154 | | | | 8,833 | |
| UMB Financial Corp. (Banks) | | | 152 | | | | 16,129 | |
| UMH Properties, Inc. (Equity Real Estate Investment Trusts) | | | 147 | | | | 4,018 | |
| Unifi, Inc.* (Textiles, Apparel & Luxury Goods) | | | 48 | | | | 1,111 | |
| UniFirst Corp. (Commercial Services & Supplies) | | | 52 | | | | 10,941 | |
| Unisys Corp.* (IT Services) | | | 228 | | | | 4,690 | |
| United Bankshares, Inc. (Banks) | | | 458 | | | | 16,617 | |
| United Community Banks, Inc. (Banks) | | | 364 | | | | 13,082 | |
| United Fire Group, Inc. (Insurance) | | | 73 | | | | 1,693 | |
| United Insurance Holdings Corp. (Insurance) | | | 71 | | | | 308 | |
| United Natural Foods, Inc.* (Food & Staples Retailing) | | | 194 | | | | 9,522 | |
| Uniti Group, Inc. (Equity Real Estate Investment Trusts) | | | 683 | | | | 9,569 | |
| Unitil Corp. (Multi-Utilities) | | | 54 | | | | 2,483 | |
| Universal Corp. (Tobacco) | | | 84 | | | | 4,613 | |
| Universal Electronics, Inc.* (Household Durables) | | | 44 | | | | 1,793 | |
| Universal Health Realty Income Trust (Equity Real Estate Investment Trusts) | | | 45 | | | | 2,676 | |
| Universal Insurance Holdings, Inc. (Insurance) | | | 94 | | | | 1,598 | |
| Universal Logistics Holdings, Inc. (Road & Rail) | | | 27 | | | | 509 | |
| Univest Financial Corp. (Banks) | | | 100 | | | | 2,992 | |
| Upland Software, Inc.* (Software) | | | 100 | | | | 1,794 | |
| Upwork, Inc.* (Professional Services) | | | 410 | | | | 14,006 | |
| Uranium Energy Corp.* (Oil, Gas & Consumable Fuels) | | | 890 | | | | 2,982 | |
See accompanying notes to financial statements.
264 :: ProFund VP Small-Cap :: Financial Statements
Common Stocks, continued
| | | Shares | | | Value | |
| Urban Edge Properties (Equity Real Estate Investment Trusts) | | | 402 | | | $ | 7,638 | |
| Urban Outfitters, Inc.* (Specialty Retail) | | | 238 | | | | 6,988 | |
| Ur-Energy, Inc.* (Oil, Gas & Consumable Fuels) | | | 628 | | | | 766 | |
| UroGen Pharma, Ltd.* (Biotechnology) | | | 68 | | | | 647 | |
| Urstadt Biddle Properties, Inc.—Class A (Equity Real Estate Investment Trusts) | | | 103 | | | | 2,194 | |
| US Xpress Enterprises, Inc.*—Class A (Road & Rail) | | | 93 | | | | 546 | |
| USANA Health Sciences, Inc.* (Personal Products) | | | 42 | | | | 4,250 | |
| Utah Medical Products, Inc. (Health Care Equipment & Supplies) | | | 12 | | | | 1,200 | |
| Utz Brands, Inc. (Food Products) | | | 205 | | | | 3,270 | |
| Valhi, Inc. (Chemicals) | | | 8 | | | | 230 | |
| Valley National Bancorp (Banks) | | | 1,391 | | | | 19,127 | |
| Value Line, Inc. (Capital Markets) | | | 3 | | | | 140 | |
| Vanda Pharmaceuticals, Inc.* (Biotechnology) | | | 190 | | | | 2,981 | |
| Vapotherm, Inc.* (Health Care Equipment & Supplies) | | | 79 | | | | 1,636 | |
| Varex Imaging Corp.* (Health Care Equipment & Supplies) | | | 133 | | | | 4,196 | |
| Varonis Systems, Inc.* (Software) | | | 372 | | | | 18,146 | |
| Vaxart, Inc.* (Biotechnology) | | | 425 | | | | 2,665 | |
| Vaxcyte, Inc.* (Pharmaceuticals) | | | 140 | | | | 3,331 | |
| VBI Vaccines, Inc.* (Biotechnology) | | | 655 | | | | 1,533 | |
| Vector Group, Ltd. (Tobacco) | | | 499 | | | | 5,729 | |
| Vectrus, Inc.* (Aerospace & Defense) | | | 40 | | | | 1,831 | |
| Veeco Instruments, Inc.* (Semiconductors & Semiconductor Equipment) | | | 173 | | | | 4,925 | |
| Velocity Financial, Inc.* (Thrifts & Mortgage Finance) | | | 30 | | | | 411 | |
| Velodyne Lidar, Inc.* (Electronic Equipment, Instruments & Components) | | | 262 | | | | 1,216 | |
| Ventyx Biosciences, Inc.* (Pharmaceuticals) | | | 36 | | | | 715 | |
| Vera Bradley, Inc.* (Textiles, Apparel & Luxury Goods) | | | 90 | | | | 766 | |
| Vera Therapeutics, Inc.* (Biotechnology) | | | 34 | | | | 908 | |
| Veracyte, Inc.* (Biotechnology) | | | 234 | | | | 9,641 | |
| Verastem, Inc.* (Biotechnology) | | | 602 | | | | 1,234 | |
| Vericel Corp.* (Biotechnology) | | | 161 | | | | 6,327 | |
| Verint Systems, Inc.* (Software) | | | 224 | | | | 11,762 | |
| Veris Residential, Inc.* (Equity Real Estate Investment Trusts) | | | 305 | | | | 5,606 | |
| Veritex Holdings, Inc. (Banks) | | | 165 | | | | 6,564 | |
| Veritiv Corp.* (Trading Companies & Distributors) | | | 50 | | | | 6,129 | |
| Veritone, Inc.* (Software) | | | 99 | | | | 2,226 | |
| Verra Mobility Corp.*—Class C (IT Services) | | | 500 | | | | 7,715 | |
| Verrica Pharmaceuticals, Inc.* (Pharmaceuticals) | | | 45 | | | | 412 | |
| Verso Corp.—Class A (Paper & Forest Products) | | | 93 | | | | 2,513 | |
| Veru, Inc.* (Personal Products) | | | 224 | | | | 1,319 | |
| Verve Therapeutics, Inc.* (Biotechnology) | | | 55 | | | | 2,028 | |
| Via Renewables, Inc. (Multi-Utilities) | | | 42 | | | | 480 | |
| Viad Corp.* (Commercial Services & Supplies) | | | 71 | | | | 3,038 | |
| Viant Technology, Inc.*—Class A (Software) | | | 40 | | | | 388 | |
| Viavi Solutions, Inc.* (Communications Equipment) | | | 832 | | | | 14,660 | |
| Vicor Corp.* (Electrical Equipment) | | | 73 | | | | 9,270 | |
| Viemed Healthcare, Inc.* (Health Care Providers & Services) | | | 123 | | | | 642 | |
| View, Inc.*(a) (Building Products) | | | 485 | | | | 1,896 | |
| ViewRay, Inc.* (Health Care Equipment & Supplies) | | | 481 | | | | 2,650 | |
| Viking Therapeutics, Inc.* (Biotechnology) | | | 238 | | | | 1,095 | |
| Village Super Market, Inc.—Class A (Food & Staples Retailing) | | | 29 | | | | 678 | |
| Vincerx Pharma, Inc.* (Biotechnology) | | | 57 | | | | 581 | |
| Vir Biotechnology, Inc.* (Biotechnology) | | | 209 | | | | 8,751 | |
| Viracta Therapeutics, Inc.* (Biotechnology) | | | 126 | | | | 460 | |
| VirnetX Holding Corp.* (Software) | | | 220 | | | | 572 | |
| Virtus Investment Partners, Inc. (Capital Markets) | | | 25 | | | | 7,428 | |
| Vishay Intertechnology, Inc. (Electronic Equipment, Instruments & Components) | | | 463 | | | | 10,126 | |
| Vishay Precision Group, Inc.* (Electronic Equipment, Instruments & Components) | | | 43 | | | | 1,596 | |
| Vista Outdoor, Inc.* (Leisure Products) | | | 200 | | | | 9,214 | |
| VistaGen Therapeutics, Inc.* (Biotechnology) | | | 674 | | | | 1,314 | |
| Visteon Corp.* (Auto Components) | | | 96 | | | | 10,669 | |
| Vital Farms, Inc.* (Food Products) | | | 85 | | | | 1,535 | |
| Vivint Smart Home, Inc.* (Diversified Consumer Services) | | | 318 | | | | 3,110 | |
| Vocera Communications, Inc.* (Health Care Technology) | | | 120 | | | | 7,781 | |
| Vonage Holdings Corp.* (Software) | | | 840 | | | | 17,464 | |
| Vor BioPharma, Inc.* (Biotechnology) | | | 66 | | | | 767 | |
| VOXX International Corp.* (Auto Components) | | | 54 | | | | 549 | |
| VSE Corp. (Commercial Services & Supplies) | | | 37 | | | | 2,255 | |
| Vuzix Corp.*(a) (Household Durables) | | | 204 | | | | 1,769 | |
| W&T Offshore, Inc.* (Oil, Gas & Consumable Fuels) | | | 326 | | | | 1,053 | |
| Wabash National Corp. (Machinery) | | | 172 | | | | 3,357 | |
| Walker & Dunlop, Inc. (Thrifts & Mortgage Finance) | | | 101 | | | | 15,240 | |
| Warrior Met Coal, Inc. (Metals & Mining) | | | 179 | | | | 4,602 | |
| Washington Federal, Inc. (Thrifts & Mortgage Finance) | | | 226 | | | | 7,544 | |
| Washington Real Estate Investment Trust (Equity Real Estate Investment Trusts) | | | 294 | | | | 7,600 | |
| Washington Trust Bancorp, Inc. (Banks) | | | 59 | | | | 3,326 | |
| Waterstone Financial, Inc. (Thrifts & Mortgage Finance) | | | 74 | | | | 1,618 | |
| Watts Water Technologies, Inc.—Class A (Machinery) | | | 96 | | | | 18,640 | |
| WaVe Life Sciences, Ltd.* (Pharmaceuticals) | | | 154 | | | | 484 | |
| WD-40 Co. (Household Products) | | | 47 | | | | 11,498 | |
| Weave Communications, Inc.* (Software) | | | 16 | | | | 243 | |
| Weber, Inc.—Class A (Household Durables) | | | 62 | | | | 802 | |
| Weis Markets, Inc. (Food & Staples Retailing) | | | 57 | | | | 3,755 | |
| Welbilt, Inc.* (Machinery) | | | 454 | | | | 10,792 | |
| Werewolf Therapeutics, Inc.* (Biotechnology) | | | 92 | | | | 1,096 | |
| Werner Enterprises, Inc. (Road & Rail) | | | 214 | | | | 10,199 | |
| WesBanco, Inc. (Banks) | | | 213 | | | | 7,453 | |
| WESCO International, Inc.* (Trading Companies & Distributors) | | | 155 | | | | 20,397 | |
| West Bancorp, Inc. (Banks) | | | 56 | | | | 1,740 | |
| Westamerica Bancorp (Banks) | | | 90 | | | | 5,196 | |
| Whitestone REIT (Equity Real Estate Investment Trusts) | | | 160 | | | | 1,621 | |
| Whiting Petroleum Corp.* (Oil, Gas & Consumable Fuels) | | | 137 | | | | 8,861 | |
| Whole Earth Brands, Inc.* (Food Products) | | | 130 | | | | 1,396 | |
| WideOpenWest, Inc.* (Media) | | | 182 | | | | 3,917 | |
| Willdan Group, Inc.* (Professional Services) | | | 39 | | | | 1,373 | |
| Willis Lease Finance Corp.* (Trading Companies & Distributors) | | | 10 | | | | 377 | |
See accompanying notes to financial statements.
Financial Statements :: ProFund VP Small-Cap :: 265
Common Stocks, continued
| | | Shares | | | Value | |
| WillScot Mobile Mini Holdings Corp.* (Construction & Engineering) | | | 735 | | | $ | 30,016 | |
| Wingstop, Inc. (Hotels, Restaurants & Leisure) | | | 104 | | | | 17,971 | |
| Winmark Corp. (Specialty Retail) | | | 12 | | | | 2,979 | |
| Winnebago Industries, Inc. (Automobiles) | | | 112 | | | | 8,391 | |
| WisdomTree Investments, Inc. (Capital Markets) | | | 468 | | | | 2,864 | |
| Wolverine World Wide, Inc. (Textiles, Apparel & Luxury Goods) | | | 282 | | | | 8,124 | |
| Workhorse Group, Inc.* (Auto Components) | | | 419 | | | | 1,827 | |
| Workiva, Inc.* (Software) | | | 149 | | | | 19,443 | |
| World Acceptance Corp.* (Consumer Finance) | | | 15 | | | | 3,681 | |
| World Fuel Services Corp. (Oil, Gas & Consumable Fuels) | | | 217 | | | | 5,744 | |
| Worthington Industries, Inc. (Metals & Mining) | | | 115 | | | | 6,286 | |
| WSFS Financial Corp. (Thrifts & Mortgage Finance) | | | 225 | | | | 11,277 | |
| WW International, Inc.* (Diversified Consumer Services) | | | 183 | | | | 2,952 | |
| XBiotech, Inc. (Biotechnology) | | | 53 | | | | 590 | |
| Xencor, Inc.* (Biotechnology) | | | 196 | | | | 7,864 | |
| Xenia Hotels & Resorts, Inc.* (Equity Real Estate Investment Trusts) | | | 396 | | | | 7,172 | |
| Xilio Therapeutics, Inc.* (Biotechnology) | | | 26 | | | | 416 | |
| XL Fleet Corp.* (Auto Components) | | | 121 | | | | 401 | |
| XOMA Corp.* (Biotechnology) | | | 21 | | | | 438 | |
| Xometry, Inc.*—Class A (Internet & Direct Marketing Retail) | | | 28 | | | | 1,435 | |
| XPEL, Inc.* (Auto Components) | | | 62 | | | | 4,233 | |
| Xperi Holding Corp. (Software) | | | 365 | | | | 6,902 | |
| Xponential Fitness, Inc.*—Class A (Hotels, Restaurants & Leisure) | | | 32 | | | | 654 | |
| Yellow Corp.* (Road & Rail) | | | 175 | | | | 2,203 | |
| Yelp, Inc.* (Interactive Media & Services) | | | 249 | | | | 9,024 | |
| Yext, Inc.* (Software) | | | 391 | | | | 3,879 | |
| Y-mAbs Therapeutics, Inc.* (Biotechnology) | | | 121 | | | | 1,961 | |
| York Water Co. (Water Utilities) | | | 45 | | | | 2,240 | |
| Zentalis Pharmaceuticals, Inc.* (Biotechnology) | | | 127 | | | | 10,676 | |
| Zevia PBC*—Class A (Beverages) | | | 36 | | | | 254 | |
| Ziff Davis, Inc.* (Software) | | | 151 | | | | 16,740 | |
| ZIOPHARM Oncology, Inc.* (Biotechnology) | | | 728 | | | | 794 | |
| Zogenix, Inc.* (Pharmaceuticals) | | | 195 | | | | 3,169 | |
| Zumiez, Inc.* (Specialty Retail) | | | 74 | | | | 3,551 | |
| Zuora, Inc.*—Class A (Software) | | | 387 | | | | 7,229 | |
| Zurn Water Solutions Corp. (Building Products) | | | 422 | | | | 15,361 | |
| Zymergen, Inc.* (Chemicals) | | | 278 | | | | 1,860 | |
| Zynex, Inc.*(a) (Health Care Equipment & Supplies) | | | 68 | | | | 678 | |
TOTAL COMMON STOCKS
(Cost $7,545,505) | | | | | | | 10,324,107 | |
Trust (0.0%)
| | | Interest
Units | | | Value | |
| Ferroglobe Representation and Warranty Insurance*+ (Metals & Mining) | | | 250 | | | $ | — | |
TOTAL TRUST
(Cost $—) | | | | | | | — | |
Contingent Escrow Shares (0.0%)
| | | Shares | | | Value | |
| Wright Medical Group, Inc.*+(b) (Health Care Equipment & Supplies) | | | 385 | | | $ | — | |
TOTAL CONTINGENT ESCROW SHARES
(Cost $—) | | | | | | | — | |
Repurchase Agreements(c)(d) (30.0%)
| | | Principal
Amount | | | Value | |
| Repurchase Agreements with various counterparties, 0.00%, dated 12/31/21, due 1/3/22, total to be received $4,372,000 | | $ | 4,372,000 | | | $ | 4,372,000 | |
TOTAL REPURCHASE AGREEMENTS
(Cost $4,372,000) | | | | | | | 4,372,000 | |
Collateral for Securities Loaned(e) (0.6%)
| | | Shares | | | Value | |
| BlackRock Liquidity Funds FedFund Portfolio—Institutional Shares, 0.03%(f) | | | 91,428 | | | $ | 91,428 | |
TOTAL COLLATERAL FOR SECURITIES LOANED
(Cost $91,428) | | | | | | | 91,428 | |
TOTAL INVESTMENT SECURITIES
(Cost $12,008,933)—101.4% | | | | | | | 14,787,535 | |
| Net other assets (liabilities)—(1.4)% | | | | | | | (200,276 | ) |
| NET ASSETS—100.0% | | | | | | $ | 14,587,259 | |
| * | Non-income producing security. |
| + | These securities were fair valued based on procedures approved by the Board of Trustees. As of December 31, 2021, these securities represented 0.00% of the net assets of the Fund. |
| (a) | All or part of this security was on loan as of December 31, 2021. The total value of securities on loan as of December 31, 2021 was $83,638. |
| (b) | On November 12, 2020, Stryker Corp. acquired Wright Medical Group. As part of the acquisition, $1.85 per acquired share was allocated 1:1 to Escrow Shares, contingent on whether the $1.85 per share is determined to be payable to the Dutch Government; otherwise, the value of the Escrow Shares will be remitted to pre-acquisition shareholders of Wright Medical Group. In January 2022, all Escrow Shares were sold at a value of $1.85 per share. |
| (c) | A portion of these securities were held in a segregated account for the benefit of swap counterparties in the event of default. At December 31, 2021, the aggregate amount held in a segregated account was $815,000. |
| (d) | The ProFund VP invests in Repurchase Agreements jointly with other funds in the Trust. See "Repurchase Agreements" under Note 2 in the Notes to Financial Statements to view the details of each individual agreement and counterparty as well as a description of the securities subject to repurchase. |
| (e) | Securities were purchased with cash collateral held from securities on loan at December 31, 2021. |
| (f) | Rate periodically changes. Rate disclosed is the daily yield on December 31, 2021. |
See accompanying notes to financial statements.
266 :: ProFund VP Small-Cap :: Financial Statements
Total Return Swap Agreements—Long
| Underlying Instrument | | Counterparty | | Termination
Date(1) | | Rate Paid
(Received)(2) | | | Notional
Amount | | | Value and
Unrealized
Appreciation/
(Depreciation) | |
| Russell 2000 Index | | Goldman Sachs International | | 1/27/22 | | | 0.48 | % | | $ | 260,456 | | | $ | (1,367 | ) |
| Russell 2000 Index | | UBS AG | | 1/27/22 | | | 0.08 | % | | | 4,012,369 | | | | (32,206 | ) |
| | | | | | | | | | | $ | 4,272,825 | | | $ | (33,573 | ) |
| (1) | Agreements may be terminated at will by either party without penalty. Payment is due at termination/maturity. |
| (2) | Reflects the floating financing rate, as of December 31, 2021, on the notional amount of the swap agreement paid to the counterparty or received from the counterparty, excluding any commissions. This amount is included as part of the unrealized appreciation/(depreciation). |
ProFund VP Small-Cap invested in the following industries as of December 31, 2021:
| | | Value | | | % of
Net Assets | |
| Aerospace & Defense | | $ | 64,061 | | | | 0.4 | % |
| Air Freight & Logistics | | | 37,375 | | | | 0.3 | % |
| Airlines | | | 32,778 | | | | 0.2 | % |
| Auto Components | | | 146,864 | | | | 1.0 | % |
| Automobiles | | | 22,796 | | | | 0.2 | % |
| Banks | | | 870,389 | | | | 5.9 | % |
| Beverages | | | 45,436 | | | | 0.3 | % |
| Biotechnology | | | 867,715 | | | | 6.0 | % |
| Building Products | | | 140,821 | | | | 1.0 | % |
| Capital Markets | | | 169,330 | | | | 1.2 | % |
| Chemicals | | | 203,701 | | | | 1.4 | % |
| Commercial Services & Supplies | | | 176,731 | | | | 1.2 | % |
| Communications Equipment | | | 94,544 | | | | 0.6 | % |
| Construction & Engineering | | | 164,864 | | | | 1.1 | % |
| Construction Materials | | | 19,843 | | | | 0.1 | % |
| Consumer Finance | | | 82,297 | | | | 0.6 | % |
| Containers & Packaging | | | 24,293 | | | | 0.2 | % |
| Distributors | | | 1,803 | | | | NM | |
| Diversified Consumer Services | | | 72,579 | | | | 0.5 | % |
| Diversified Financial Services | | | 16,195 | | | | 0.1 | % |
| Diversified Telecommunication Services | | | 50,983 | | | | 0.3 | % |
| Electric Utilities | | | 62,845 | | | | 0.4 | % |
| Electrical Equipment | | | 107,607 | | | | 0.7 | % |
| Electronic Equipment, Instruments & Components | | | 232,925 | | | | 1.6 | % |
| Energy Equipment & Services | | | 80,376 | | | | 0.6 | % |
| Entertainment | | | 81,822 | | | | 0.6 | % |
| Equity Real Estate Investment Trusts | | | 679,453 | | | | 4.7 | % |
| Food & Staples Retailing | | | 107,268 | | | | 0.7 | % |
| Food Products | | | 100,685 | | | | 0.7 | % |
| Gas Utilities | | | 92,062 | | | | 0.7 | % |
| Health Care Equipment & Supplies | | | 333,561 | | | | 2.4 | % |
| Health Care Providers & Services | | | 296,546 | | | | 2.0 | % |
| Health Care Technology | | | 123,232 | | | | 0.8 | % |
| Hotels, Restaurants & Leisure | | | 245,888 | | | | 1.6 | % |
| Household Durables | | | 205,639 | | | | 1.4 | % |
| Household Products | | | 30,087 | | | | 0.2 | % |
| Independent Power and Renewable Electricity Producers | | | 35,118 | | | | 0.2 | % |
| Insurance | | | 205,243 | | | | 1.4 | % |
| Interactive Media & Services | | | 36,228 | | | | 0.2 | % |
| Internet & Direct Marketing Retail | | | 53,996 | | | | 0.4 | % |
| IT Services | | | 175,853 | | | | 1.2 | % |
| Leisure Products | | | 65,084 | | | | 0.4 | % |
| Life Sciences Tools & Services | | | 86,905 | | | | 0.6 | % |
| Machinery | | | 392,253 | | | | 2.8 | % |
| Marine | | | 19,311 | | | | 0.1 | % |
| Media | | | 108,227 | | | | 0.8 | % |
| Metals & Mining | | | 125,967 | | | | 0.9 | % |
| Mortgage Real Estate Investment Trusts | | | 131,159 | | | | 0.9 | % |
| Multiline Retail | | | 38,508 | | | | 0.3 | % |
| Multi-Utilities | | | 39,600 | | | | 0.3 | % |
| Oil, Gas & Consumable Fuels | | | 374,849 | | | | 2.5 | % |
| Paper & Forest Products | | | 13,207 | | | | 0.1 | % |
| Personal Products | | | 58,272 | | | | 0.4 | % |
| Pharmaceuticals | | | 153,904 | | | | 1.1 | % |
| Professional Services | | | 181,012 | | | | 1.2 | % |
| Real Estate Management & Development | | | 93,345 | | | | 0.6 | % |
| Road & Rail | | | 94,541 | | | | 0.6 | % |
| Semiconductors & Semiconductor Equipment | | | 398,787 | | | | 2.7 | % |
| Software | | | 596,968 | | | | 4.2 | % |
| Specialty Retail | | | 243,726 | | | | 1.7 | % |
| Technology Hardware, Storage & Peripherals | | | 28,689 | | | | 0.2 | % |
| Textiles, Apparel & Luxury Goods | | | 76,538 | | | | 0.5 | % |
| Thrifts & Mortgage Finance | | | 180,066 | | | | 1.2 | % |
| Tobacco | | | 13,996 | | | | 0.1 | % |
| Trading Companies & Distributors | | | 155,371 | | | | 1.1 | % |
| Water Utilities | | | 46,189 | | | | 0.3 | % |
| Wireless Telecommunication Services | | | 15,801 | | | | 0.1 | % |
| Other** | | | 4,263,152 | | | | 29.2 | % |
| Total | | $ | 14,587,259 | | | | 100.0 | % |
| ** | Includes any non-equity securities and net other assets (liabilities), which includes any receivable for capital shares issued and payable for capital shares redeemed. |
| NM | Not meaningful, amount is less than 0.05%. |
See accompanying notes to financial statements.
Financial Statements :: ProFund VP Small-Cap :: 267
Statement of Assets and Liabilities
December 31, 2021
| ASSETS: |
| Total Investment Securities, at cost | | $ | 12,008,933 | |
| Securities, at value(a) | | | 10,415,535 | |
| Repurchase agreements, at value | | | 4,372,000 | |
| Total Investment Securities, at value | | | 14,787,535 | |
| Cash | | | 376 | |
| Segregated cash balances for swap agreements with custodian | | | 55 | |
| Dividends receivable | | | 8,229 | |
| Receivable for capital shares issued | | | 26,925 | |
| Receivable for investments sold | | | 4,986 | |
| Prepaid expenses | | | 135 | |
| TOTAL ASSETS | | | 14,828,241 | |
| | | | | |
| LIABILITIES: | | | | |
| Payable for collateral for securities loaned | | | 91,428 | |
| Payable for capital shares redeemed | | | 64,271 | |
| Payable for investments purchased | | | 5,013 | |
| Unrealized depreciation on swap agreements | | | 33,573 | |
| Advisory fees payable | | | 10,659 | |
| Management services fees payable | | | 1,421 | |
| Administration fees payable | | | 923 | |
| Administrative services fees payable | | | 9,468 | |
| Distribution fees payable | | | 10,689 | |
| Transfer agency fees payable | | | 1,661 | |
| Fund accounting fees payable | | | 1,104 | |
| Compliance services fees payable | | | 67 | |
| Other accrued expenses | | | 10,705 | |
| TOTAL LIABILITIES | | | 240,982 | |
| NET ASSETS | | $ | 14,587,259 | |
| | | | | |
| NET ASSETS CONSIST OF: | | | | |
| Capital | | $ | 10,315,908 | |
| Total distributable earnings (loss) | | | 4,271,351 | |
| NET ASSETS | | $ | 14,587,259 | |
| Shares of Beneficial Interest Outstanding (unlimited number of shares authorized, no par value) | | | 337,644 | |
| Net Asset Value (offering and redemption price per share) | | $ | 43.20 | |
| | | | |
| (a) Includes securities on loan valued at: | | $ | 83,638 | |
Statement of Operations
For the Year Ended December 31, 2021
| INVESTMENT INCOME: | | | | |
| Dividends | | $ | 104,352 | |
| Interest | | | 177 | |
| Foreign tax withholding | | | (152 | ) |
| Net income from securities lending | | | 1,335 | |
| TOTAL INVESTMENT INCOME | | | 105,712 | |
| | | | | |
| EXPENSES: | | | | |
| Advisory fees | | | 144,070 | |
| Management services fees | | | 19,209 | |
| Administration fees | | | 14,292 | |
| Transfer agency fees | | | 11,766 | |
| Administrative services fees | | | 42,993 | |
| Distribution fees | | | 48,023 | |
| Custody fees | | | 2,983 | |
| Fund accounting fees | | | 15,141 | |
| Trustee fees | | | 304 | |
| Compliance services fees | | | 136 | |
| Other fees | | | 25,775 | |
| Recoupment of prior expenses reduced by the Advisor | | | 1,000 | |
| Total Gross Expenses before reductions | | | 325,692 | |
| Expenses reduced and reimbursed by the Advisor | | | (2,974 | ) |
| TOTAL NET EXPENSES | | | 322,718 | |
| NET INVESTMENT INCOME (LOSS) | | | (217,006 | ) |
| | | | | |
| REALIZED AND UNREALIZED GAINS (LOSSES) ON INVESTMENTS: | | | | |
| Net realized gains (losses) on investment securities | | | 638,320 | |
| Net realized gains (losses) on swap agreements | | | 1,121,454 | |
| Change in net unrealized appreciation/depreciation on investment securities | | | 313,206 | |
| Change in net unrealized appreciation/depreciation on swap agreements | | | 93,159 | |
| NET REALIZED AND UNREALIZED GAINS (LOSSES) ON INVESTMENTS | | | 2,166,139 | |
| CHANGE IN NET ASSETS RESULTING FROM OPERATIONS | | $ | 1,949,133 | |
See accompanying notes to financial statements.
268 :: ProFund VP Small-Cap :: Financial Statements
| Statements of Changes in Net Assets |
| |
| | | Year Ended
December 31, 2021 | | | Year Ended
December 31, 2020 | |
| FROM INVESTMENT ACTIVITIES: | | | | | | | | |
| | | | | | | | | |
| OPERATIONS: | | | | | | | | |
| Net investment income (loss) | | $ | (217,006 | ) | | $ | (88,561 | ) |
| Net realized gains (losses) on investments | | | 1,759,774 | | | | 857,468 | |
| Change in net unrealized appreciation/depreciation on investments | | | 406,365 | | | | 773,376 | |
| Change in net assets resulting from operations | | | 1,949,133 | | | | 1,542,283 | |
| | | | | | | | | |
| DISTRIBUTIONS TO SHAREHOLDERS: | | | | | | | | |
| Total distributions | | | (767,607 | ) | | | (377,359 | ) |
| Change in net assets resulting from distributions | | | (767,607 | ) | | | (377,359 | ) |
| | | | | | | | | |
| CAPITAL TRANSACTIONS: | | | | | | | | |
| Proceeds from shares issued | | | 34,196,772 | | | | 26,159,780 | |
| Distributions reinvested | | | 767,607 | | | | 377,359 | |
| Value of shares redeemed | | | (39,944,075 | ) | | | (25,391,616 | ) |
| Change in net assets resulting from capital transactions | | | (4,979,696 | ) | | | 1,145,523 | |
| Change in net assets | | | (3,798,170 | ) | | | 2,310,447 | |
| | | | | | | | | |
| NET ASSETS: | | | | | | | | |
| Beginning of period | | | 18,385,429 | | | | 16,074,982 | |
| End of period | | $ | 14,587,259 | | | $ | 18,385,429 | |
| | | | | | | | | |
| SHARE TRANSACTIONS: | | | | | | | | |
| Issued | | | 772,224 | | | | 799,907 | |
| Reinvested | | | 18,600 | | | | 11,716 | |
| Redeemed | | | (914,846 | ) | | | (804,043 | ) |
| Change in shares | | | (124,022 | ) | | | 7,580 | |
See accompanying notes to financial statements.
Financial Highlights :: ProFund VP Small-Cap :: 269
ProFunds Financial Highlights FOR THE PERIODS INDICATED
Selected data for a share of beneficial interest outstanding throughout the periods indicated.
| | | Year Ended
Dec. 31, 2021 | | | Year Ended
Dec. 31, 2020 | | | Year Ended
Dec. 31, 2019 | | | Year Ended
Dec. 31, 2018 | | | Year Ended
Dec. 31, 2017 | |
| Net Asset Value, Beginning of Period | | $ | 39.82 | | | $ | 35.40 | | | $ | 28.64 | | | $ | 35.03 | | | $ | 35.32 | |
| | | | | | | | | | | | | | | | | | | | | |
| Investment Activities: | | | | | | | | | | | | | | | | | | | | |
| Net investment income (loss)(a) | | | (0.50 | ) | | | (0.28 | ) | | | 0.01 | | | | (0.04 | ) | | | (0.29 | ) |
| Net realized and unrealized gains (losses) on investments | | | 5.55 | | | | 6.01 | | | | 6.75 | | | | (3.99 | ) | | | 4.63 | |
| Total income (loss) from investment activities | | | 5.05 | | | | 5.73 | | | | 6.76 | | | | (4.03 | ) | | | 4.34 | |
| | | | | | | | | | | | | | | | | | | | | |
| Distributions to Shareholders From: | | | | | | | | | | | | | | | | | | | | |
| Net investment income | | | — | | | | (0.02 | ) | | | — | | | | — | | | | — | |
| Net realized gains on investments | | | (1.67 | ) | | | (1.29 | ) | | | — | | | | (2.36 | ) | | | (4.63 | ) |
| Total distributions | | | (1.67 | ) | | | (1.31 | ) | | | — | | | | (2.36 | ) | | | (4.63 | ) |
| | | | | | | | | | | | | | | | | | | | | |
| Net Asset Value, End of Period | | $ | 43.20 | | | $ | 39.82 | | | $ | 35.40 | | | $ | 28.64 | | | $ | 35.03 | |
| | | | | | | | | | | | | | | | | | | | | |
| Total Return | | | 12.88 | % | | | 17.06 | % | | | 23.60 | % | | | (12.89 | )% | | | 12.43 | % |
| | | | | | | | | | | | | | | | | | | | | |
| Ratios to Average Net Assets: | | | | | | | | | | | | | | | | | | | | |
| Gross expenses | | | 1.70 | % | | | 1.82 | % | | | 1.74 | % | | | 1.76 | % | | | 1.72 | % |
| Net expenses | | | 1.68 | % | | | 1.68 | % | | | 1.68 | % | | | 1.68 | % | | | 1.68 | % |
| Net investment income (loss) | | | (1.13 | )% | | | (0.85 | )% | | | 0.03 | % | | | (0.10 | )% | | | (0.81 | )% |
| | | | | | | | | | | | | | | | | | | | | |
| Supplemental Data: | | | | | | | | | | | | | | | | | | | | |
| Net assets, end of period (000's) | | $ | 14,587 | | | $ | 18,385 | | | $ | 16,075 | | | $ | 10,303 | | | $ | 14,191 | |
| Portfolio turnover rate(b) | | | 24 | % | | | 26 | % | | | 22 | % | | | 18 | % | | | 12 | % |
| (a) | Per share net investment income (loss) has been calculated using the average daily shares method. |
| (b) | Portfolio turnover rate is calculated without regard to instruments having a maturity of less than one year from acquisition or derivative instruments (including swap agreements and futures contracts). The portfolio turnover rate can be high and volatile due to the amount and timing of sales and purchases of fund shares during the period. |
See accompanying notes to financial statements.
270 :: ProFund VP Small-Cap Growth :: Management Discussion of Fund Performance
ProFund VP Small-Cap Growth (the "Fund") seeks investment results, before fees and expenses, that correspond to the performance of the S&P SmallCap 600® Growth Index (the "Index"). For the year ended December 31, 2021, the Fund had a total return of 20.64%. For the same period, the Index had a total return of 22.62%1 and a volatility of 20.88%. For the year, the Fund achieved an average daily statistical correlation of over 0.99 to the daily performance of the Index.2
The Fund takes positions in financial instruments that, in combination, should have similar return characteristics as the return of the Index. The Index is designed to provide a comprehensive measure of small-cap U.S. equity "growth" performance. It is an unmanaged, float-adjusted, market capitalization-weighted index comprising stocks representing approximately half the market capitalization of the S&P SmallCap 600® that have been identified as being on the growth end of the growth-value spectrum. Securities are selected for inclusion in the Index by an S&P committee through a process that factors in criteria such as liquidity, price, market capitalization, financial viability, and public float.
Value of a $10,000 Investment at Net Asset Value*
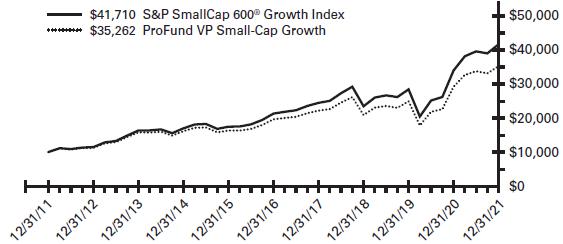
| * | The line graph represents the historical performance of a hypothetical investment of $10,000 in the ProFund VP Small-Cap Growth from December 31, 2011 to December 31, 2021, assuming the reinvestment of distributions. |
Average Annual Total Return as of 12/31/21
| Fund | | One Year | | | Five Year | | | Ten Year | |
| ProFund VP Small-Cap Growth | | | 20.64 | % | | | 12.43 | % | | | 13.43 | % |
| S&P Small Cap 600® Growth Index | | | 22.62 | % | | | 14.37 | % | | | 15.35 | % |
Expense Ratios**
| Fund | | Gross | | | Net | | | | | |
| ProFund VP Small-Cap Growth | | | 1.74 | % | | | 1.68 | % | | | | |
| ** | Reflects the expense ratio as reported in the Prospectus dated May 1, 2021. Contractual fee waivers are in effect through April 30, 2022. See Financial Highlights for effective expense ratios. |
Allocation of Portfolio Holdings & Index Composition
Market Exposure
| Investment Type | | % of Net Assets | |
| Equity Securities | | | 100 | % |
| Total Exposure | | | 100 | % |
"Market Exposure" includes the value of total investments (including the contract value of any derivatives) and excludes any instruments used for cash management or collateral for securities loaned.
Largest Equity Holdings
| Company | | % of Net Assets | |
| Omnicell, Inc. | | | 1.5 | % |
| Innovative Industrial Properties, Inc. | | | 1.2 | % |
| Exponent, Inc. | | | 1.1 | % |
| AMN Healthcare Services, Inc. | | | 1.1 | % |
| UFP Industries, Inc. | | | 1.0 | % |
S&P SmallCap 600® Growth Index – Composition
| | | % of Index | |
| Information Technology | | | 20 | % |
| Financials | | | 16 | % |
| Industrials | | | 15 | % |
| Health Care | | | 15 | % |
| Consumer Discretionary | | | 12 | % |
| Real Estate | | | 7 | % |
| Energy | | | 5 | % |
| Consumer Staples | | | 5 | % |
| Materials | | | 3 | % |
| Utilities | | | 1 | % |
| Communication Services | | | 1 | % |
Past performance does not guarantee future results. Return calculations assume the reinvestment of distributions and do not reflect taxes that a shareholder would pay on Fund distributions or on the redemption of Fund shares. The performance data quoted represents past performance and current returns may be lower or higher. The investment return and net asset value ("NAV") will fluctuate so that an investor's shares, when redeemed, may be worth more or less than the original cost. The performance above reflects any fee reductions during the applicable periods. If such fee reductions had not occurred, the quoted performance would be lower. Performance numbers are net of all Fund fees and expenses but do not include any insurance, sales, or administrative charges of variable annuity or life insurance contracts. If these charges were included, the returns would be lower. To obtain performance current to the most recent month-end, please call toll-free 888-776-3637.
| 1 | The graph and table reflect the theoretical reinvestment of dividends on securities in the Index. The impact of transaction costs and the deduction of fees and expenses associated with a mutual fund, such as investment management and accounting fees, are not reflected in the index calculations. The Fund's performance reflects the reinvestment of dividends as well as the impact of transaction costs and the deduction of fees and expenses. It is not possible to invest directly in an index. |
| 2 | 1.00 equals perfect correlation. This calculation is based on the daily total return of the Index and the performance of the daily total return of the NAV per share of the Fund. |
The above information is not covered by the Report of the Independent Registered Public Accounting Firm.
Financial Statements :: ProFund VP Small-Cap Growth :: 271
Schedule of Portfolio Investments :: December 31, 2021
Common Stocks (99.8%)
| | | Shares | | | Value | |
| 3D Systems Corp.* (Technology Hardware, Storage & Peripherals) | | | 5,891 | | | $ | 126,892 | |
| 8x8, Inc.* (Software) | | | 5,256 | | | | 88,091 | |
| AAON, Inc. (Building Products) | | | 1,279 | | | | 101,591 | |
| Abercrombie & Fitch Co.*—Class A (Specialty Retail) | | | 1,280 | | | | 44,582 | |
| Acadia Realty Trust (Equity Real Estate Investment Trusts) | | | 1,795 | | | | 39,185 | |
| Addus Homecare Corp.* (Health Care Providers & Services) | | | 316 | | | | 29,549 | |
| ADTRAN, Inc. (Communications Equipment) | | | 2,246 | | | | 51,276 | |
| Advanced Energy Industries, Inc. (Semiconductors & Semiconductor Equipment) | | | 1,737 | | | | 158,171 | |
| AdvanSix, Inc. (Chemicals) | | | 700 | | | | 33,075 | |
| Aerojet Rocketdyne Holdings, Inc. (Aerospace & Defense) | | | 1,795 | | | | 83,935 | |
| AeroVironment, Inc.* (Aerospace & Defense) | | | 574 | | | | 35,605 | |
| Agilysys, Inc.* (Software) | | | 565 | | | | 25,120 | |
| Agree Realty Corp. (Equity Real Estate Investment Trusts) | | | 1,448 | | | | 103,329 | |
| Alamo Group, Inc. (Machinery) | | | 191 | | | | 28,111 | |
| Alarm.com Holdings, Inc.* (Software) | | | 2,125 | | | | 180,221 | |
| Albany International Corp.—Class A (Machinery) | | | 747 | | | | 66,072 | |
| Allegheny Technologies, Inc.* (Metals & Mining) | | | 2,642 | | | | 42,087 | |
| Allscripts Healthcare Solutions, Inc.* (Health Care Technology) | | | 2,204 | | | | 40,664 | |
| American Assets Trust, Inc. (Equity Real Estate Investment Trusts) | | | 1,043 | | | | 39,144 | |
| American States Water Co. (Water Utilities) | | | 1,124 | | | | 116,266 | |
| Ameris Bancorp (Banks) | | | 1,739 | | | | 86,394 | |
| AMN Healthcare Services, Inc.* (Health Care Providers & Services) | | | 2,180 | | | | 266,680 | |
| Amphastar Pharmaceuticals, Inc.* (Pharmaceuticals) | | | 1,155 | | | | 26,900 | |
| AngioDynamics, Inc.* (Health Care Equipment & Supplies) | | | 1,783 | | | | 49,175 | |
| ANI Pharmaceuticals, Inc.* (Pharmaceuticals) | | | 294 | | | | 13,548 | |
| Anika Therapeutics, Inc.* (Health Care Equipment & Supplies) | | | 353 | | | | 12,648 | |
| Apollo Medical Holdings, Inc.* (Health Care Providers & Services) | | | 1,742 | | | | 128,002 | |
| Applied Industrial Technologies, Inc. (Trading Companies & Distributors) | | | 763 | | | | 78,360 | |
| ArcBest Corp. (Road & Rail) | | | 1,178 | | | | 141,183 | |
| Arlo Technologies, Inc.* (Electronic Equipment, Instruments & Components) | | | 2,179 | | | | 22,858 | |
| Armada Hoffler Properties, Inc. (Equity Real Estate Investment Trusts) | | | 1,731 | | | | 26,346 | |
| Asbury Automotive Group, Inc.* (Specialty Retail) | | | 479 | | | | 82,738 | |
| Assured Guaranty, Ltd. (Insurance) | | | 1,352 | | | | 67,870 | |
| Avid Bioservices, Inc.* (Biotechnology) | | | 2,829 | | | | 82,550 | |
| Axcelis Technologies, Inc.* (Semiconductors & Semiconductor Equipment) | | | 1,536 | | | | 114,524 | |
| Axos Financial, Inc.*—Class I (Thrifts & Mortgage Finance) | | | 2,469 | | | | 138,041 | |
| B Riley Financial, Inc. (Capital Markets) | | | 737 | | | | 65,490 | |
| Badger Meter, Inc. (Electronic Equipment, Instruments & Components) | | | 877 | | | | 93,453 | |
| Balchem Corp. (Chemicals) | | | 1,493 | | | | 251,720 | |
| Banc of California, Inc. (Banks) | | | 1,124 | | | | 22,053 | |
| BancFirst Corp. (Banks) | | | 462 | | | | 32,599 | |
| Banner Corp. (Banks) | | | 679 | | | | 41,195 | |
| Barnes & Noble Education, Inc.* (Specialty Retail) | | | 1,667 | | | | 11,352 | |
| BioLife Solutions, Inc.* (Health Care Equipment & Supplies) | | | 1,351 | | | | 50,352 | |
| Blucora, Inc.* (Capital Markets) | | | 989 | | | | 17,129 | |
| Boise Cascade Co. (Trading Companies & Distributors) | | | 870 | | | | 61,944 | |
| Boot Barn Holdings, Inc.* (Specialty Retail) | | | 1,366 | | | | 168,087 | |
| Bottomline Technologies, Inc.* (Software) | | | 963 | | | | 54,381 | |
| Brady Corp.—Class A (Commercial Services & Supplies) | | | 1,030 | | | | 55,516 | |
| Brightsphere Investment Group, Inc. (Capital Markets) | | | 1,656 | | | | 42,394 | |
| Brookline Bancorp, Inc. (Banks) | | | 1,576 | | | | 25,515 | |
| California Water Service Group (Water Utilities) | | | 1,431 | | | | 102,832 | |
| Callon Petroleum Co.* (Oil, Gas & Consumable Fuels) | | | 2,189 | | | | 103,430 | |
| Cara Therapeutics, Inc.* (Biotechnology) | | | 1,949 | | | | 23,739 | |
| Cardiovascular Systems, Inc.* (Health Care Equipment & Supplies) | | | 787 | | | | 14,780 | |
| CareTrust REIT, Inc. (Equity Real Estate Investment Trusts) | | | 2,103 | | | | 48,011 | |
| Cars.com, Inc.* (Interactive Media & Services) | | | 1,469 | | | | 23,636 | |
| Cavco Industries, Inc.* (Household Durables) | | | 394 | | | | 125,154 | |
| Celsius Holdings, Inc.* (Beverages) | | | 1,761 | | | | 131,318 | |
| Centerspace (Equity Real Estate Investment Trusts) | | | 422 | | | | 46,800 | |
| Central Pacific Financial Corp. (Banks) | | | 800 | | | | 22,536 | |
| Century Aluminum Co.* (Metals & Mining) | | | 1,048 | | | | 17,355 | |
| Century Communities, Inc. (Household Durables) | | | 1,371 | | | | 112,134 | |
| CEVA, Inc.* (Semiconductors & Semiconductor Equipment) | | | 1,059 | | | | 45,791 | |
| Chart Industries, Inc.* (Machinery) | | | 1,642 | | | | 261,882 | |
| Chesapeake Utilities Corp. (Gas Utilities) | | | 422 | | | | 61,532 | |
| Cinemark Holdings, Inc.* (Entertainment) | | | 2,554 | | | | 41,170 | |
| City Holding Co. (Banks) | | | 335 | | | | 27,400 | |
| Civitas Resources, Inc. (Oil, Gas & Consumable Fuels) | | | 3,324 | | | | 162,776 | |
| Coca-Cola Consolidated, Inc. (Beverages) | | | 214 | | | | 132,507 | |
| Cogent Communications Holdings, Inc. (Diversified Telecommunication Services) | | | 1,311 | | | | 95,939 | |
| Coherus Biosciences, Inc.* (Biotechnology) | | | 2,940 | | | | 46,922 | |
| Cohu, Inc.* (Semiconductors & Semiconductor Equipment) | | | 1,302 | | | | 49,593 | |
| Collegium Pharmaceutical, Inc.* (Pharmaceuticals) | | | 1,595 | | | | 29,795 | |
See accompanying notes to financial statements.
272 :: ProFund VP Small-Cap Growth :: Financial Statements
Common Stocks, continued
| | | Shares | | | Value | |
| Comfort Systems USA, Inc. (Construction & Engineering) | | | 1,663 | | | $ | 164,537 | |
| Community Bank System, Inc. (Banks) | | | 1,144 | | | | 85,205 | |
| Community Health Systems, Inc.* (Health Care Providers & Services) | | | 5,728 | | | | 76,240 | |
| Community Healthcare Trust, Inc. (Equity Real Estate Investment Trusts) | | | 640 | | | | 30,253 | |
| CONMED Corp. (Health Care Equipment & Supplies) | | | 863 | | | | 122,338 | |
| Corcept Therapeutics, Inc.* (Pharmaceuticals) | | | 2,673 | | | | 52,925 | |
| Core Laboratories N.V. (Energy Equipment & Services) | | | 897 | | | | 20,012 | |
| CorVel Corp.* (Health Care Providers & Services) | | | 433 | | | | 90,064 | |
| Cross Country Healthcare, Inc.* (Health Care Providers & Services) | | | 1,630 | | | | 45,249 | |
| CSG Systems International, Inc. (IT Services) | | | 888 | | | | 51,167 | |
| CTS Corp. (Electronic Equipment, Instruments & Components) | | | 758 | | | | 27,834 | |
| Customers Bancorp, Inc. (Banks) | | | 1,375 | | | | 89,884 | |
| Cutera, Inc.* (Health Care Equipment & Supplies) | | | 474 | | | | 19,586 | |
| Cytokinetics, Inc.* (Biotechnology) | | | 3,869 | | | | 176,348 | |
| Dave & Buster's Entertainment, Inc.* (Hotels, Restaurants & Leisure) | | | 801 | | | | 30,758 | |
| Diebold Nixdorf, Inc.* (Technology Hardware, Storage & Peripherals) | | | 3,361 | | | | 30,417 | |
| Digi International, Inc.* (Communications Equipment) | | | 740 | | | | 18,182 | |
| Dime Community Bancshares, Inc. (Banks) | | | 734 | | | | 25,807 | |
| Dine Brands Global, Inc. (Hotels, Restaurants & Leisure) | | | 428 | | | | 32,447 | |
| Diodes, Inc.* (Semiconductors & Semiconductor Equipment) | | | 2,077 | | | | 228,075 | |
| Donnelley Financial Solutions, Inc.* (Capital Markets) | | | 1,346 | | | | 63,450 | |
| Dorian LPG, Ltd. (Oil, Gas & Consumable Fuels) | | | 1,279 | | | | 16,231 | |
| Dorman Products, Inc.* (Auto Components) | | | 880 | | | | 99,449 | |
| Douglas Elliman, Inc.* (Real Estate Management & Development) | | | 3,019 | | | | 34,713 | |
| Eagle Bancorp, Inc. (Banks) | | | 869 | | | | 50,697 | |
| Eagle Pharmaceuticals, Inc.* (Biotechnology) | | | 256 | | | | 13,036 | |
| elf Beauty, Inc.* (Personal Products) | | | 2,208 | | | | 73,328 | |
| Ellington Financial, Inc. (Mortgage Real Estate Investment Trusts) | | | 1,108 | | | | 18,936 | |
| Enanta Pharmaceuticals, Inc.* (Biotechnology) | | | 498 | | | | 37,240 | |
| Encore Capital Group, Inc.* (Consumer Finance) | | | 548 | | | | 34,036 | |
| Encore Wire Corp. (Electrical Equipment) | | | 935 | | | | 133,799 | |
| Endo International PLC* (Pharmaceuticals) | | | 10,778 | | | | 40,525 | |
| Enerpac Tool Group Corp. (Machinery) | | | 1,335 | | | | 27,074 | |
| Enova International, Inc.* (Consumer Finance) | | | 1,680 | | | | 68,814 | |
| Essential Properties Realty Trust, Inc. (Real Estate Management & Development) | | | 2,914 | | | | 84,010 | |
| EVERTEC, Inc. (IT Services) | | | 1,846 | | | | 92,263 | |
| ExlService Holdings, Inc.* (IT Services) | | | 1,536 | | | | 222,366 | |
| Exponent, Inc. (Professional Services) | | | 2,403 | | | | 280,503 | |
| Extreme Networks, Inc.* (Communications Equipment) | | | 5,990 | | | | 94,043 | |
| Fabrinet* (Electronic Equipment, Instruments & Components) | | | 1,708 | | | | 202,347 | |
| FARO Technologies, Inc.* (Electronic Equipment, Instruments & Components) | | | 402 | | | | 28,148 | |
| FB Financial Corp. (Banks) | | | 791 | | | | 34,662 | |
| Federal Signal Corp. (Machinery) | | | 1,718 | | | | 74,458 | |
| Ferro Corp.* (Chemicals) | | | 1,793 | | | | 39,141 | |
| First Bancorp (Banks) | | | 9,485 | | | | 130,703 | |
| First Bancorp (Banks) | | | 796 | | | | 36,393 | |
| First Commonwealth Financial Corp. (Banks) | | | 2,408 | | | | 38,745 | |
| Flagstar Bancorp, Inc. (Thrifts & Mortgage Finance) | | | 2,438 | | | | 116,878 | |
| FormFactor, Inc.* (Semiconductors & Semiconductor Equipment) | | | 2,271 | | | | 103,830 | |
| Forrester Research, Inc.* (Professional Services) | | | 513 | | | | 30,128 | |
| Forward Air Corp. (Air Freight & Logistics) | | | 1,244 | | | | 150,636 | |
| Four Corners Property Trust, Inc. (Equity Real Estate Investment Trusts) | | | 1,748 | | | | 51,409 | |
| Franklin Electric Co., Inc. (Machinery) | | | 1,204 | | | | 113,850 | |
| Fulgent Genetics, Inc.* (Health Care Providers & Services) | | | 894 | | | | 89,927 | |
| Gannett Co., Inc.* (Media) | | | 2,495 | | | | 13,298 | |
| Genesco, Inc.* (Specialty Retail) | | | 314 | | | | 20,149 | |
| Gentherm, Inc.* (Auto Components) | | | 1,532 | | | | 133,131 | |
| Getty Realty Corp. (Equity Real Estate Investment Trusts) | | | 837 | | | | 26,859 | |
| Gibraltar Industries, Inc.* (Building Products) | | | 708 | | | | 47,209 | |
| Glaukos Corp.* (Health Care Equipment & Supplies) | | | 1,124 | | | | 49,951 | |
| GMS, Inc.* (Trading Companies & Distributors) | | | 1,114 | | | | 66,963 | |
| Great Western Bancorp, Inc. (Banks) | | | 2,542 | | | | 86,326 | |
| Greenhill & Co., Inc. (Capital Markets) | | | 640 | | | | 11,475 | |
| H.B. Fuller Co. (Chemicals) | | | 1,115 | | | | 90,315 | |
| Hanmi Financial Corp. (Banks) | | | 785 | | | | 18,589 | |
| Harmonic, Inc.* (Communications Equipment) | | | 4,732 | | | | 55,648 | |
| Harmony Biosciences Holdings, Inc.* (Pharmaceuticals) | | | 589 | | | | 25,115 | |
| Hawkins, Inc. (Chemicals) | | | 468 | | | | 18,463 | |
| Haynes International, Inc. (Metals & Mining) | | | 333 | | | | 13,430 | |
| HCI Group, Inc. (Insurance) | | | 369 | | | | 30,826 | |
| HealthStream, Inc.* (Health Care Technology) | | | 628 | | | | 16,554 | |
| Heidrick & Struggles International, Inc. (Professional Services) | | | 904 | | | | 39,532 | |
| Heska Corp.* (Health Care Equipment & Supplies) | | | 494 | | | | 90,149 | |
| Hibbett, Inc. (Specialty Retail) | | | 694 | | | | 49,919 | |
| Hillenbrand, Inc. (Machinery) | | | 1,819 | | | | 94,570 | |
| Hilltop Holdings, Inc. (Banks) | | | 1,430 | | | | 50,250 | |
| HomeStreet, Inc. (Thrifts & Mortgage Finance) | | | 943 | | | | 49,036 | |
| Ichor Holdings, Ltd.* (Semiconductors & Semiconductor Equipment) | | | 747 | | | | 34,384 | |
| Independence Realty Trust, Inc. (Equity Real Estate Investment Trusts) | | | 4,828 | | | | 124,707 | |
| Independent Bank Corp. (Banks) | | | 920 | | | | 75,008 | |
| Industrial Logistics Properties Trust (Equity Real Estate Investment Trusts) | | | 1,237 | | | | 30,987 | |
| Innovative Industrial Properties, Inc. (Equity Real Estate Investment Trusts) | | | 1,103 | | | | 289,991 | |
| Innoviva, Inc.* (Pharmaceuticals) | | | 2,885 | | | | 49,766 | |
See accompanying notes to financial statements.
Financial Statements :: ProFund VP Small-Cap Growth :: 273
Common Stocks, continued
| | | Shares | | | Value | |
| Installed Building Products, Inc. (Household Durables) | | | 1,082 | | | $ | 151,177 | |
| Insteel Industries, Inc. (Building Products) | | | 894 | | | | 35,590 | |
| Inter Parfums, Inc. (Personal Products) | | | 820 | | | | 87,658 | |
| InterDigital, Inc. (Communications Equipment) | | | 736 | | | | 52,720 | |
| Interface, Inc. (Commercial Services & Supplies) | | | 1,227 | | | | 19,571 | |
| Investors Bancorp, Inc. (Banks) | | | 10,398 | | | | 157,530 | |
| iRobot Corp.* (Household Durables) | | | 684 | | | | 45,062 | |
| iStar, Inc. (Equity Real Estate Investment Trusts) | | | 1,794 | | | | 46,339 | |
| J & J Snack Foods Corp. (Food Products) | | | 303 | | | | 47,862 | |
| John Bean Technologies Corp. (Machinery) | | | 937 | | | | 143,886 | |
| KKR Real Estate Finance Trust, Inc. (Mortgage Real Estate Investment Trusts) | | | 799 | | | | 16,643 | |
| Knowles Corp.* (Electronic Equipment, Instruments & Components) | | | 1,704 | | | | 39,788 | |
| Kontoor Brands, Inc. (Textiles, Apparel & Luxury Goods) | | | 1,119 | | | | 57,349 | |
| Korn Ferry (Professional Services) | | | 2,514 | | | | 190,385 | |
| Kulicke & Soffa Industries, Inc. (Semiconductors & Semiconductor Equipment) | | | 2,857 | | | | 172,963 | |
| Lakeland Financial Corp. (Banks) | | | 1,167 | | | | 93,523 | |
| Lantheus Holdings, Inc.* (Health Care Equipment & Supplies) | | | 1,842 | | | | 53,215 | |
| Laredo Petroleum, Inc.* (Oil, Gas & Consumable Fuels) | | | 443 | | | | 26,638 | |
| LCI Industries (Auto Components) | | | 781 | | | | 121,734 | |
| Lemaitre Vascular, Inc. (Health Care Equipment & Supplies) | | | 886 | | | | 44,504 | |
| Lexington Realty Trust (Equity Real Estate Investment Trusts) | | | 6,523 | | | | 101,889 | |
| LGI Homes, Inc.* (Household Durables) | | | 985 | | | | 152,162 | |
| Ligand Pharmaceuticals, Inc.* (Biotechnology) | | | 771 | | | | 119,089 | |
| Lindsay Corp. (Machinery) | | | 297 | | | | 45,144 | |
| Liquidity Services, Inc.* (Internet & Direct Marketing Retail) | | | 1,227 | | | | 27,092 | |
| Livent Corp.* (Chemicals) | | | 7,451 | | | | 181,655 | |
| LivePerson, Inc.* (Software) | | | 1,882 | | | | 67,225 | |
| Marcus & Millichap, Inc.* (Real Estate Management & Development) | | | 645 | | | | 33,192 | |
| MarineMax, Inc.* (Specialty Retail) | | | 1,003 | | | | 59,217 | |
| Matador Resources Co. (Oil, Gas & Consumable Fuels) | | | 5,088 | | | | 187,849 | |
| Materion Corp. (Metals & Mining) | | | 546 | | | | 50,199 | |
| Matson, Inc. (Marine) | | | 1,939 | | | | 174,568 | |
| MaxLinear, Inc.*—Class A (Semiconductors & Semiconductor Equipment) | | | 3,255 | | | | 245,394 | |
| Medifast, Inc. (Personal Products) | | | 536 | | | | 112,254 | |
| Meridian Bioscience, Inc.* (Health Care Equipment & Supplies) | | | 1,280 | | | | 26,112 | |
| Merit Medical Systems, Inc.* (Health Care Equipment & Supplies) | | | 1,335 | | | | 83,171 | |
| Meritage Homes Corp.* (Household Durables) | | | 809 | | | | 98,747 | |
| Mesa Laboratories, Inc. (Health Care Equipment & Supplies) | | | 142 | | | | 46,589 | |
| Meta Financial Group, Inc. (Thrifts & Mortgage Finance) | | | 1,460 | | | | 87,104 | |
| Methode Electronics, Inc. (Electronic Equipment, Instruments & Components) | | | 775 | | | | 38,107 | |
| MGP Ingredients, Inc. (Beverages) | | | 577 | | | | 49,039 | |
| Middlesex Water Co. (Water Utilities) | | | 556 | | | | 66,887 | |
| ModivCare, Inc.* (Health Care Providers & Services) | | | 324 | | | | 48,046 | |
| Monarch Casino & Resort, Inc.* (Hotels, Restaurants & Leisure) | | | 604 | | | | 44,666 | |
| Monro, Inc. (Specialty Retail) | | | 666 | | | | 38,808 | |
| Movado Group, Inc. (Textiles, Apparel & Luxury Goods) | | | 761 | | | | 31,833 | |
| Mueller Industries, Inc. (Machinery) | | | 2,646 | | | | 157,067 | |
| Myers Industries, Inc. (Containers & Packaging) | | | 719 | | | | 14,387 | |
| MYR Group, Inc.* (Construction & Engineering) | | | 778 | | | | 86,008 | |
| Myriad Genetics, Inc.* (Biotechnology) | | | 1,915 | | | | 52,854 | |
| National Bank Holdings Corp. (Banks) | | | 811 | | | | 35,635 | |
| National Beverage Corp. (Beverages) | | | 614 | | | | 27,833 | |
| Nektar Therapeutics* (Pharmaceuticals) | | | 3,831 | | | | 51,757 | |
| NeoGenomics, Inc.* (Life Sciences Tools & Services) | | | 3,122 | | | | 106,523 | |
| Nexpoint Residential Trust, Inc. (Equity Real Estate Investment Trusts) | | | 1,047 | | | | 87,770 | |
| Northfield Bancorp, Inc. (Thrifts & Mortgage Finance) | | | 1,168 | | | | 18,875 | |
| NV5 Global, Inc.* (Construction & Engineering) | | | 546 | | | | 75,414 | |
| OFG Bancorp (Banks) | | | 1,149 | | | | 30,517 | |
| Omnicell, Inc.* (Health Care Technology) | | | 2,027 | | | | 365,751 | |
| OneSpan, Inc.* (Software) | | | 777 | | | | 13,155 | |
| Onto Innovation, Inc.* (Semiconductors & Semiconductor Equipment) | | | 2,272 | | | | 229,995 | |
| OptimizeRx Corp.* (Health Care Technology) | | | 820 | | | | 50,930 | |
| Organogenesis Holdings, Inc.* (Biotechnology) | | | 2,909 | | | | 26,879 | |
| OSI Systems, Inc.* (Electronic Equipment, Instruments & Components) | | | 331 | | | | 30,849 | |
| Oxford Industries, Inc. (Textiles, Apparel & Luxury Goods) | | | 469 | | | | 47,613 | |
| Pacific Premier Bancorp, Inc. (Banks) | | | 1,915 | | | | 76,657 | |
| Pacira BioSciences, Inc.* (Pharmaceuticals) | | | 1,252 | | | | 75,333 | |
| Palomar Holdings, Inc.* (Insurance) | | | 1,113 | | | | 72,089 | |
| Park Aerospace Corp. (Aerospace & Defense) | | | 395 | | | | 5,214 | |
| Park National Corp. (Banks) | | | 420 | | | | 57,670 | |
| Patrick Industries, Inc. (Auto Components) | | | 487 | | | | 39,296 | |
| PDC Energy, Inc. (Oil, Gas & Consumable Fuels) | | | 4,491 | | | | 219,070 | |
| PDF Solutions, Inc.* (Semiconductors & Semiconductor Equipment) | | | 867 | | | | 27,562 | |
| Perficient, Inc.* (IT Services) | | | 1,517 | | | | 196,133 | |
| PGT Innovations, Inc.* (Building Products) | | | 1,238 | | | | 27,843 | |
| Piper Sandler Cos. (Capital Markets) | | | 651 | | | | 116,210 | |
| Plantronics, Inc.* (Communications Equipment) | | | 945 | | | | 27,726 | |
| Preferred Bank (Banks) | | | 632 | | | | 45,371 | |
| Prestige Consumer Healthcare, Inc.* (Pharmaceuticals) | | | 1,225 | | | | 74,296 | |
| Progress Software Corp. (Software) | | | 2,022 | | | | 97,602 | |
| Provident Financial Services, Inc. (Thrifts & Mortgage Finance) | | | 1,639 | | | | 39,697 | |
| Quaker Chemical Corp. (Chemicals) | | | 359 | | | | 82,850 | |
| RadNet, Inc.* (Health Care Providers & Services) | | | 2,046 | | | | 61,605 | |
| Rambus, Inc.* (Semiconductors & Semiconductor Equipment) | | | 5,043 | | | | 148,214 | |
See accompanying notes to financial statements.
274 :: ProFund VP Small-Cap Growth :: Financial Statements
Common Stocks, continued
| | | Shares | | | Value | |
| Range Resources Corp.* (Oil, Gas & Consumable Fuels) | | | 7,949 | | | $ | 141,731 | |
| Ranger Oil Corp.* (Oil, Gas & Consumable Fuels) | | | 973 | | | | 26,193 | |
| Redwood Trust, Inc. (Mortgage Real Estate Investment Trusts) | | | 5,289 | | | | 69,762 | |
| REGENXBIO, Inc.* (Biotechnology) | | | 781 | | | | 25,539 | |
| Rent-A-Center, Inc. (Specialty Retail) | | | 1,338 | | | | 64,278 | |
| Retail Opportunity Investments Corp. (Equity Real Estate Investment Trusts) | | | 2,744 | | | | 53,782 | |
| Rogers Corp.* (Electronic Equipment, Instruments & Components) | | | 863 | | | | 235,599 | |
| RPT Realty (Equity Real Estate Investment Trusts) | | | 1,984 | | | | 26,546 | |
| Safehold, Inc. (Equity Real Estate Investment Trusts) | | | 652 | | | | 52,062 | |
| Sally Beauty Holdings, Inc.* (Specialty Retail) | | | 2,295 | | | | 42,366 | |
| Saul Centers, Inc. (Equity Real Estate Investment Trusts) | | | 415 | | | | 22,003 | |
| Seacoast Banking Corporation of Florida (Banks) | | | 1,399 | | | | 49,511 | |
| Selectquote, Inc.* (Insurance) | | | 2,817 | | | | 25,522 | |
| ServisFirst Bancshares, Inc. (Banks) | | | 2,250 | | | | 191,115 | |
| Shake Shack, Inc.*—Class A (Hotels, Restaurants & Leisure) | | | 995 | | | | 71,799 | |
| Shoe Carnival, Inc. (Specialty Retail) | | | 808 | | | | 31,577 | |
| Shutterstock, Inc. (Internet & Direct Marketing Retail) | | | 1,080 | | | | 119,751 | |
| Signet Jewelers, Ltd. (Specialty Retail) | | | 2,446 | | | | 212,876 | |
| Simulations Plus, Inc. (Health Care Technology) | | | 435 | | | | 20,576 | |
| SITE Centers Corp. (Equity Real Estate Investment Trusts) | | | 4,555 | | | | 72,106 | |
| Sleep Number Corp.* (Specialty Retail) | | | 1,044 | | | | 79,970 | |
| SM Energy Co. (Oil, Gas & Consumable Fuels) | | | 5,602 | | | | 165,147 | |
| SMART Global Holdings, Inc.* (Semiconductors & Semiconductor Equipment) | | | 651 | | | | 46,214 | |
| Southside Bancshares, Inc. (Banks) | | | 937 | | | | 39,185 | |
| Southwestern Energy Co.* (Oil, Gas & Consumable Fuels) | | | 29,957 | | | | 139,600 | |
| Spectrum Pharmaceuticals, Inc.* (Biotechnology) | | | 4,313 | | | | 5,478 | |
| SPS Commerce, Inc.* (Software) | | | 1,659 | | | | 236,159 | |
| SPX Corp.* (Machinery) | | | 880 | | | | 52,518 | |
| SPX FLOW, Inc. (Machinery) | | | 1,180 | | | | 102,046 | |
| Standex International Corp. (Machinery) | | | 270 | | | | 29,878 | |
| Steven Madden, Ltd. (Textiles, Apparel & Luxury Goods) | | | 2,364 | | | | 109,854 | |
| Stewart Information Services Corp. (Insurance) | | | 607 | | | | 48,396 | |
| Sturm Ruger & Co., Inc. (Leisure Products) | | | 812 | | | | 55,232 | |
| Supernus Pharmaceuticals, Inc.* (Pharmaceuticals) | | | 2,452 | | | | 71,500 | |
| Surmodics, Inc.* (Health Care Equipment & Supplies) | | | 416 | | | | 20,030 | |
| Tabula Rasa HealthCare, Inc.* (Health Care Technology) | | | 547 | | | | 8,205 | |
| Tanger Factory Outlet Centers, Inc. (Equity Real Estate Investment Trusts) | | | 4,796 | | | | 92,467 | |
| TechTarget, Inc.* (Media) | | | 1,196 | | | | 114,410 | |
| Tennant Co. (Machinery) | | | 368 | | | | 29,823 | |
| The Bancorp, Inc.* (Banks) | | | 2,628 | | | | 66,515 | |
| The Buckle, Inc. (Specialty Retail) | | | 1,354 | | | | 57,288 | |
| The Children's Place, Inc.* (Specialty Retail) | | | 645 | | | | 51,142 | |
| The E.W. Scripps Co.*—Class A (Media) | | | 1,213 | | | | 23,472 | |
| The Ensign Group, Inc. (Health Care Providers & Services) | | | 1,307 | | | | 109,736 | |
| The Joint Corp.* (Health Care Providers & Services) | | | 665 | | | | 43,684 | |
| The Pennant Group, Inc.* (Health Care Providers & Services) | | | 637 | | | | 14,702 | |
| The Simply Good Foods Co.* (Food Products) | | | 3,890 | | | | 161,707 | |
| The St Joe Co. (Real Estate Management & Development) | | | 1,520 | | | | 79,116 | |
| Thryv Holdings, Inc.* (Media) | | | 783 | | | | 32,205 | |
| Tivity Health, Inc.* (Health Care Providers & Services) | | | 959 | | | | 25,356 | |
| Tompkins Financial Corp. (Banks) | | | 241 | | | | 20,143 | |
| Tootsie Roll Industries, Inc. (Food Products) | | | 399 | | | | 14,456 | |
| Triumph Bancorp, Inc.* (Banks) | | | 1,089 | | | | 129,678 | |
| Triumph Group, Inc.* (Aerospace & Defense) | | | 2,980 | | | | 55,219 | |
| Trupanion, Inc.* (Insurance) | | | 1,583 | | | | 209,004 | |
| TTEC Holdings, Inc. (IT Services) | | | 844 | | | | 76,424 | |
| U.S. Physical Therapy, Inc. (Health Care Providers & Services) | | | 268 | | | | 25,607 | |
| UFP Industries, Inc. (Building Products) | | | 2,854 | | | | 262,597 | |
| Ultra Clean Holdings, Inc.* (Semiconductors & Semiconductor Equipment) | | | 2,071 | | | | 118,793 | |
| uniQure N.V.* (Biotechnology) | | | 1,662 | | | | 34,470 | |
| Unisys Corp.* (IT Services) | | | 1,487 | | | | 30,588 | |
| United Community Banks, Inc. (Banks) | | | 3,089 | | | | 111,019 | |
| United Natural Foods, Inc.* (Food & Staples Retailing) | | | 2,599 | | | | 127,559 | |
| Uniti Group, Inc. (Equity Real Estate Investment Trusts) | | | 6,315 | | | | 88,473 | |
| Universal Health Realty Income Trust (Equity Real Estate Investment Trusts) | | | 319 | | | | 18,971 | |
| Urstadt Biddle Properties, Inc.—Class A (Equity Real Estate Investment Trusts) | | | 749 | | | | 15,954 | |
| USANA Health Sciences, Inc.* (Personal Products) | | | 361 | | | | 36,533 | |
| Vanda Pharmaceuticals, Inc.* (Biotechnology) | | | 1,645 | | | | 25,810 | |
| Varex Imaging Corp.* (Health Care Equipment & Supplies) | | | 1,163 | | | | 36,693 | |
| Vector Group, Ltd. (Tobacco) | | | 6,036 | | | | 69,293 | |
| Veeco Instruments, Inc.* (Semiconductors & Semiconductor Equipment) | | | 2,329 | | | | 66,307 | |
| Vericel Corp.* (Biotechnology) | | | 2,159 | | | | 84,849 | |
| Veritex Holdings, Inc. (Banks) | | | 2,272 | | | | 90,380 | |
| Viad Corp.* (Commercial Services & Supplies) | | | 501 | | | | 21,438 | |
| Viavi Solutions, Inc.* (Communications Equipment) | | | 6,796 | | | | 119,746 | |
| Virtus Investment Partners, Inc. (Capital Markets) | | | 329 | | | | 97,746 | |
| Vista Outdoor, Inc.* (Leisure Products) | | | 2,642 | | | | 121,717 | |
| Vonage Holdings Corp.* (Software) | | | 11,643 | | | | 242,057 | |
| Walker & Dunlop, Inc. (Thrifts & Mortgage Finance) | | | 1,352 | | | | 203,989 | |
| Washington Real Estate Investment Trust (Equity Real Estate Investment Trusts) | | | 1,717 | | | | 44,384 | |
| Watts Water Technologies, Inc.—Class A (Machinery) | | | 1,271 | | | | 246,790 | |
| WD-40 Co. (Household Products) | | | 367 | | | | 89,783 | |
See accompanying notes to financial statements.
Financial Statements :: ProFund VP Small-Cap Growth :: 275
Common Stocks, continued
| | | Shares | | | Value | |
| Winnebago Industries, Inc. (Automobiles) | | | 787 | | | $ | 58,962 | |
| WisdomTree Investments, Inc. (Capital Markets) | | | 3,115 | | | | 19,064 | |
| Wolverine World Wide, Inc. (Textiles, Apparel & Luxury Goods) | | | 1,747 | | | | 50,331 | |
| World Acceptance Corp.* (Consumer Finance) | | | 194 | | | | 47,613 | |
| WSFS Financial Corp. (Thrifts & Mortgage Finance) | | | 1,329 | | | | 66,609 | |
| Xencor, Inc.* (Biotechnology) | | | 2,697 | | | | 108,204 | |
| Xperi Holding Corp. (Software) | | | 2,507 | | | | 47,407 | |
| Zynex, Inc.*(a) (Health Care Equipment & Supplies) | | | 916 | | | | 9,133 | |
TOTAL COMMON STOCKS
(Cost $15,908,340) | | | | | | | 25,166,638 | |
Repurchase Agreements(b) (0.2%)
| | | Principal
Amount | | | Value | |
| Repurchase Agreements with various counterparties, 0.00%, dated 12/31/21, due 1/3/22, total to be received $42,000 | | $ | 42,000 | | | $ | 42,000 | |
TOTAL REPURCHASE AGREEMENTS
(Cost $42,000) | | | | | | | 42,000 | |
Collateral for Securities Loaned(c)(NM)
| | | Shares | | | Value | |
| BlackRock Liquidity Funds FedFund Portfolio—Institutional Shares, 0.03%(d) | | | 8,264 | | | $ | 8,264 | |
TOTAL COLLATERAL FOR SECURITIES LOANED
(Cost $8,264) | | | | | | | 8,264 | |
TOTAL INVESTMENT SECURITIES
(Cost $15,958,604)—100.0% | | | | | | | 25,216,902 | |
| Net other assets (liabilities)—NM | | | | | | | (2,309 | ) |
| NET ASSETS—100.0% | | | | | | $ | 25,214,593 | |
| * | Non-income producing security. |
| (a) | All or part of this security was on loan as of December 31, 2021. The total value of securities on loan as of December 31, 2021 was $7,846. |
| (b) | The ProFund VP invests in Repurchase Agreements jointly with other funds in the Trust. See "Repurchase Agreements" under Note 2 in the Notes to Financial Statements to view the details of each individual agreement and counterparty as well as a description of the securities subject to repurchase. |
| (c) | Securities were purchased with cash collateral held from securities on loan at December 31, 2021. |
| (d) | Rate periodically changes. Rate disclosed is the daily yield on December 31, 2021. |
| NM | Not meaningful, amount is less than 0.05%. |
See accompanying notes to financial statements.
276 :: ProFund VP Small-Cap Growth :: Financial Statements
ProFund VP Small-Cap Growth invested in the following industries as of December 31, 2021:
| | | Value | | | % of
Net Assets | |
| Aerospace & Defense | | $ | 179,973 | | | | 0.7 | % |
| Air Freight & Logistics | | | 150,636 | | | | 0.6 | % |
| Auto Components | | | 393,610 | | | | 1.6 | % |
| Automobiles | | | 58,962 | | | | 0.2 | % |
| Banks | | | 2,174,410 | | | | 8.6 | % |
| Beverages | | | 340,697 | | | | 1.3 | % |
| Biotechnology | | | 863,007 | | | | 3.4 | % |
| Building Products | | | 474,830 | | | | 1.9 | % |
| Capital Markets | | | 432,958 | | | | 1.7 | % |
| Chemicals | | | 697,219 | | | | 2.7 | % |
| Commercial Services & Supplies | | | 96,525 | | | | 0.4 | % |
| Communications Equipment | | | 419,341 | | | | 1.7 | % |
| Construction & Engineering | | | 325,959 | | | | 1.3 | % |
| Consumer Finance | | | 150,463 | | | | 0.6 | % |
| Containers & Packaging | | | 14,387 | | | | 0.1 | % |
| Diversified Telecommunication Services | | | 95,939 | | | | 0.4 | % |
| Electrical Equipment | | | 133,799 | | | | 0.5 | % |
| Electronic Equipment, Instruments & Components | | | 718,983 | | | | 2.9 | % |
| Energy Equipment & Services | | | 20,012 | | | | 0.1 | % |
| Entertainment | | | 41,170 | | | | 0.2 | % |
| Equity Real Estate Investment Trusts | | | 1,579,767 | | | | 6.3 | % |
| Food & Staples Retailing | | | 127,559 | | | | 0.5 | % |
| Food Products | | | 224,025 | | | | 0.9 | % |
| Gas Utilities | | | 61,532 | | | | 0.2 | % |
| Health Care Equipment & Supplies | | | 728,426 | | | | 2.9 | % |
| Health Care Providers & Services | | | 1,054,447 | | | | 4.2 | % |
| Health Care Technology | | | 502,680 | | | | 2.0 | % |
| Hotels, Restaurants & Leisure | | | 179,670 | | | | 0.7 | % |
| Household Durables | | | 684,436 | | | | 2.7 | % |
| Household Products | | | 89,783 | | | | 0.4 | % |
| Insurance | | | 453,707 | | | | 1.8 | % |
| Interactive Media & Services | | | 23,636 | | | | 0.1 | % |
| Internet & Direct Marketing Retail | | | 146,843 | | | | 0.6 | % |
| IT Services | | | 668,941 | | | | 2.7 | % |
| Leisure Products | | | 176,949 | | | | 0.7 | % |
| Life Sciences Tools & Services | | | 106,523 | | | | 0.4 | % |
| Machinery | | | 1,473,169 | | | | 5.9 | % |
| Marine | | | 174,568 | | | | 0.7 | % |
| Media | | | 183,385 | | | | 0.7 | % |
| Metals & Mining | | | 123,071 | | | | 0.5 | % |
| Mortgage Real Estate Investment Trusts | | | 105,341 | | | | 0.4 | % |
| Oil, Gas & Consumable Fuels | | | 1,188,665 | | | | 4.7 | % |
| Personal Products | | | 309,773 | | | | 1.2 | % |
| Pharmaceuticals | | | 511,460 | | | | 2.0 | % |
| Professional Services | | | 540,548 | | | | 2.1 | % |
| Real Estate Management & Development | | | 231,031 | | | | 0.9 | % |
| Road & Rail | | | 141,183 | | | | 0.6 | % |
| Semiconductors & Semiconductor Equipment | | | 1,789,810 | | | | 7.0 | % |
| Software | | | 1,051,418 | | | | 4.1 | % |
| Specialty Retail | | | 1,014,349 | | | | 4.0 | % |
| Technology Hardware, Storage & Peripherals | | | 157,309 | | | | 0.6 | % |
| Textiles, Apparel & Luxury Goods | | | 296,980 | | | | 1.2 | % |
| Thrifts & Mortgage Finance | | | 720,229 | | | | 2.9 | % |
| Tobacco | | | 69,293 | | | | 0.3 | % |
| Trading Companies & Distributors | | | 207,267 | | | | 0.8 | % |
| Water Utilities | | | 285,985 | | | | 1.2 | % |
| Other** | | | 47,955 | | | | 0.2 | % |
| Total | | $ | 25,214,593 | | | | 100.0 | % |
| ** | Includes any non-equity securities and net other assets (liabilities), which includes any receivable for capital shares issued and payable for capital shares redeemed. |
See accompanying notes to financial statements.
Financial Statements :: ProFund VP Small-Cap Growth :: 277
Statement of Assets and Liabilities
December 31, 2021
| ASSETS: | | | | |
| Total Investment Securities, at cost | | $ | 15,958,604 | |
| Securities, at value(a) | | | 25,174,902 | |
| Repurchase agreements, at value | | | 42,000 | |
| Total Investment Securities, at value | | | 25,216,902 | |
| Cash | | | 1,629 | |
| Dividends receivable | | | 15,535 | |
| Receivable for capital shares issued | | | 110,633 | |
| Prepaid expenses | | | 1,751 | |
| TOTAL ASSETS | | | 25,346,450 | |
| | | | | |
| LIABILITIES: | | | | |
| Payable for collateral for securities loaned | | | 8,264 | |
| Payable for capital shares redeemed | | | 30,905 | |
| Payable for investments purchased | | | 35,984 | |
| Advisory fees payable | | | 19,804 | |
| Management services fees payable | | | 2,640 | |
| Administration fees payable | | | 1,454 | |
| Administrative services fees payable | | | 8,121 | |
| Distribution fees payable | | | 8,647 | |
| Transfer agency fees payable | | | 2,433 | |
| Fund accounting fees payable | | | 902 | |
| Compliance services fees payable | | | 108 | |
| Other accrued expenses | | | 12,595 | |
| TOTAL LIABILITIES | | | 131,857 | |
| NET ASSETS | | $ | 25,214,593 | |
| | | | | |
| NET ASSETS CONSIST OF: | | | | |
| Capital | | $ | 14,439,538 | |
| Total distributable earnings (loss) | | | 10,775,055 | |
| NET ASSETS | | $ | 25,214,593 | |
| Shares of Beneficial Interest Outstanding (unlimited number of shares authorized, no par value) | | | 615,111 | |
| Net Asset Value (offering and redemption price per share) | | $ | 40.99 | |
| | | | |
| (a) Includes securities on loan valued at: | | $ | 7,846 | |
Statement of Operations
For the Year Ended December 31, 2021
| INVESTMENT INCOME: | | | | |
| Dividends | | $ | 219,245 | |
| Interest | | | 1 | |
| Foreign tax withholding | | | (6 | ) |
| Net income from securities lending | | | 2,819 | |
| TOTAL INVESTMENT INCOME | | | 222,059 | |
| | | | | |
| EXPENSES: | | | | |
| Advisory fees | | | 194,150 | |
| Management services fees | | | 25,886 | |
| Administration fees | | | 19,308 | |
| Transfer agency fees | | | 15,810 | |
| Administrative services fees | | | 72,005 | |
| Distribution fees | | | 64,717 | |
| Custody fees | | | 4,431 | |
| Fund accounting fees | | | 11,791 | |
| Trustee fees | | | 410 | |
| Compliance services fees | | | 179 | |
| Other fees | | | 21,936 | |
| Recoupment of prior expenses reduced by the Advisor | | | 5,000 | |
| Total Gross Expenses before reductions | | | 435,623 | |
| Expenses reduced and reimbursed by the Advisor | | | (726 | ) |
| TOTAL NET EXPENSES | | | 434,897 | |
| NET INVESTMENT INCOME (LOSS) | | | (212,838 | ) |
| | | | | |
| REALIZED AND UNREALIZED GAINS (LOSSES) ON INVESTMENTS: | | | | |
| Net realized gains (losses) on investment securities | | | 3,179,664 | |
| Change in net unrealized appreciation/depreciation on investment securities | | | 1,532,721 | |
| NET REALIZED AND UNREALIZED GAINS (LOSSES) ON INVESTMENTS | | | 4,712,385 | |
| CHANGE IN NET ASSETS RESULTING FROM OPERATIONS | | $ | 4,499,547 | |
See accompanying notes to financial statements.
278 :: ProFund VP Small-Cap Growth :: Financial Statements
| Statements of Changes in Net Assets |
| |
| | | Year Ended
December 31, 2021 | | | Year Ended
December 31, 2020 | |
| FROM INVESTMENT ACTIVITIES: | | | | | | | | |
| | | | | | | | | |
| OPERATIONS: | | | | | | | | |
| Net investment income (loss) | | $ | (212,838 | ) | | $ | (117,692 | ) |
| Net realized gains (losses) on investments | | | 3,179,664 | | | | 1,051,766 | |
| Change in net unrealized appreciation/depreciation on investments | | | 1,532,721 | | | | 2,590,035 | |
| Change in net assets resulting from operations | | | 4,499,547 | | | | 3,524,109 | |
| | | | | | | | | |
| DISTRIBUTIONS TO SHAREHOLDERS: | | | | | | | | |
| Total distributions | | | (1,751,943 | ) | | | (2,419,892 | ) |
| Change in net assets resulting from distributions | | | (1,751,943 | ) | | | (2,419,892 | ) |
| | | | | | | | | |
| CAPITAL TRANSACTIONS: | | | | | | | | |
| Proceeds from shares issued | | | 23,826,116 | | | | 20,530,573 | |
| Distributions reinvested | | | 1,751,943 | | | | 2,419,892 | |
| Value of shares redeemed | | | (25,640,769 | ) | | | (19,595,112 | ) |
| Change in net assets resulting from capital transactions | | | (62,710 | ) | | | 3,355,353 | |
| Change in net assets | | | 2,684,894 | | | | 4,459,570 | |
| | | | | | | | | |
| NET ASSETS: | | | | | | | | |
| Beginning of period | | | 22,529,699 | | | | 18,070,129 | |
| End of period | | $ | 25,214,593 | | | $ | 22,529,699 | |
| | | | | | | | | |
| SHARE TRANSACTIONS: | | | | | | | | |
| Issued | | | 594,889 | | | | 669,204 | |
| Reinvested | | | 48,104 | | | | 79,733 | |
| Redeemed | | | (644,056 | ) | | | (636,862 | ) |
| Change in shares | | | (1,063 | ) | | | 112,075 | |
See accompanying notes to financial statements.
Financial Highlights :: ProFund VP Small-Cap Growth :: 279
ProFunds Financial Highlights FOR THE PERIODS INDICATED
Selected data for a share of beneficial interest outstanding throughout the periods indicated.
| | | Year Ended
Dec. 31, 2021 | | | Year Ended
Dec. 31, 2020 | | | Year Ended
Dec. 31, 2019 | | | Year Ended
Dec. 31, 2018 | | | Year Ended
Dec. 31, 2017 | |
| Net Asset Value, Beginning of Period | | $ | 36.56 | | | $ | 35.85 | | | $ | 34.55 | | | $ | 39.34 | | | $ | 37.88 | |
| | | | | | | | | | | | | | | | | | | | | |
| Investment Activities: | | | | | | | | | | | | | | | | | | | | |
| Net investment income (loss)(a) | | | (0.33 | ) | | | (0.22 | ) | | | (0.19 | ) | | | (0.32 | ) | | | (0.22 | ) |
| Net realized and unrealized gains (losses) on investments | | | 7.53 | | | | 5.52 | | | | 6.37 | | | | (1.42 | ) | | | 5.07 | |
| Total income (loss) from investment activities | | | 7.20 | | | | 5.30 | | | | 6.18 | | | | (1.74 | ) | | | 4.85 | |
| | | | | | | | | | | | | | | | | | | | | |
| Distributions to Shareholders From: | | | | | | | | | | | | | | | | | | | | |
| Net realized gains on investments | | | (2.77 | ) | | | (4.59 | ) | | | (4.88 | ) | | | (3.05 | ) | | | (3.39 | ) |
| | | | | | | | | | | | | | | | | | | | | |
| Net Asset Value, End of Period | | $ | 40.99 | | | $ | 36.56 | | | $ | 35.85 | | | $ | 34.55 | | | $ | 39.34 | |
| | | | | | | | | | | | | | | | | | | | | |
| Total Return | | | 20.64 | % | | | 17.39 | % | | | 19.12 | % | | | (5.75 | )% | | | 12.97 | % |
| | | | | | | | | | | | | | | | | | | | | |
| Ratios to Average Net Assets: | | | | | | | | | | | | | | | | | | | | |
| Gross expenses | | | 1.68 | % | | | 1.74 | % | | | 1.73 | % | | | 1.69 | % | | | 1.68 | % |
| Net expenses | | | 1.68 | % | | | 1.68 | % | | | 1.68 | % | | | 1.68 | % | | | 1.68 | % |
| Net investment income (loss) | | | (0.82 | )% | | | (0.69 | )% | | | (0.51 | )% | | | (0.78 | )% | | | (0.56 | )% |
| | | | | | | | | | | | | | | | | | | | | |
| Supplemental Data: | | | | | | | | | | | | | | | | | | | | |
| Net assets, end of period (000's) | | $ | 25,215 | | | $ | 22,530 | | | $ | 18,070 | | | $ | 19,185 | | | $ | 25,788 | |
| Portfolio turnover rate(b) | | | 112 | % | | | 148 | % | | | 108 | % | | | 155 | % | | | 134 | % |
| (a) | Per share net investment income (loss) has been calculated using the average daily shares method. |
| (b) | Portfolio turnover rate is calculated without regard to instruments having a maturity of less than one year from acquisition or derivative instruments (including swap agreements and futures contracts). The portfolio turnover rate can be high and volatile due to the amount and timing of sales and purchases of fund shares during the period. |
See accompanying notes to financial statements.
280 :: ProFund VP Small-Cap Value :: Management Discussion of Fund Performance
ProFund VP Small-Cap Value (the "Fund") seeks investment results, before fees and expenses, that correspond to the performance of the S&P SmallCap 600® Value Index (the "Index"). For the year ended December 31, 2021, the Fund had a total return of 28.56%. For the same period, the Index had a return of 30.95%1 and a volatility of 23.04%. For the year, the Fund achieved an average daily statistical correlation of over 0.99 to the daily performance of the Index.2
The Fund takes positions in financial instruments that, in combination, should have similar return characteristics as the return of the Index. The Index is designed to provide a comprehensive measure of small-cap U.S. equity "value" performance. It is an unmanaged, float-adjusted, market capitalization-weighted index comprising stocks representing approximately half the market capitalization of the S&P SmallCap 600® that have been identified as being on the value end of the growth-value spectrum. Securities are selected for inclusion in the Index by an S&P committee through a process that factors in criteria such as liquidity, price, market capitalization, financial viability, and public float.
Value of a $10,000 Investment at Net Asset Value*
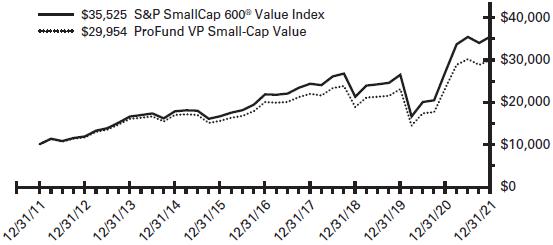
| * | The line graph represents the historical performance of a hypothetical investment of $10,000 in the ProFund VP Small-Cap Value from December 31, 2011 to December 31, 2021, assuming the reinvestment of distributions. |
Average Annual Total Return as of 12/31/21
| Fund | | One Year | | | Five Year | | | Ten Year | |
| ProFund VP Small-Cap Value | | | 28.56 | % | | | 8.43 | % | | | 11.60 | % |
| S&P SmallCap 600® Value Index | | | 30.95 | % | | | 10.25 | % | | | 13.52 | % |
Expense Ratios**
| Fund | | Gross | | | Net | | | | |
| ProFund VP Small-Cap Value | | | 1.78 | % | | | 1.68 | % | | | | |
| ** | Reflects the expense ratio as reported in the Prospectus dated May 1, 2021. Contractual fee waivers are in effect through April 30, 2022. See Financial Highlights for effective expense ratios. |
Allocation of Portfolio Holdings & Index Composition
Market Exposure
| Investment Type | | % of Net Assets | |
| Equity Securities | | | 100 | % |
| Total Exposure | | | 100 | % |
"Market Exposure" includes the value of total investments (including the contract value of any derivatives) and excludes any instruments used for cash management.
Largest Equity Holdings
| Company | | % of Net Assets | |
| BankUnited, Inc. | | | 0.7 | % |
| Resideo Technologies, Inc. | | | 0.7 | % |
| Insight Enterprises, Inc. | | | 0.7 | % |
| Group 1 Automotive, Inc. | | | 0.7 | % |
| First Hawaiian, Inc. | | | 0.7 | % |
S&P SmallCap 600® Value Index – Composition
| | | % of Index | |
| Financials | | | 22 | % |
| Industrials | | | 19 | % |
| Consumer Discretionary | | | 12 | % |
| Health Care | | | 10 | % |
| Real Estate | | | 9 | % |
| Information Technology | | | 8 | % |
| Materials | | | 7 | % |
| Energy | | | 5 | % |
| Consumer Staples | | | 4 | % |
| Utilities | | | 2 | % |
| Communication Services | | | 2 | % |
Past performance does not guarantee future results. Return calculations assume the reinvestment of distributions and do not reflect taxes that a shareholder would pay on Fund distributions or on the redemption of Fund shares. The performance data quoted represents past performance and current returns may be lower or higher. The investment return and net asset value ("NAV") will fluctuate so that an investor's shares, when redeemed, may be worth more or less than the original cost. The performance above reflects any fee reductions during the applicable periods. If such fee reductions had not occurred, the quoted performance would be lower. Performance numbers are net of all Fund fees and expenses but do not include any insurance, sales, or administrative charges of variable annuity or life insurance contracts. If these charges were included, the returns would be lower. To obtain performance current to the most recent month-end, please call toll-free 888-776-3637.
| 1 | The graph and table reflect the theoretical reinvestment of dividends on securities in the Index. The impact of transaction costs and the deduction of fees and expenses associated with a mutual fund, such as investment management and accounting fees, are not reflected in the index calculations. The Fund's performance reflects the reinvestment of dividends as well as the impact of transaction costs and the deduction of fees and expenses. It is not possible to invest directly in an index. |
| 2 | 1.00 equals perfect correlation. This calculation is based on the daily total return of the Index and the performance of the daily total return of the NAV per share of the Fund. |
The above information is not covered by the Report of the Independent Registered Public Accounting Firm.
Financial Statements :: ProFund VP Small-Cap Value :: 281
Schedule of Portfolio Investments :: December 31, 2021
Common Stocks (100.4%)
| | | Shares | | | Value | |
| AAON, Inc. (Building Products) | | | 700 | | | $ | 55,601 | |
| AAR Corp.* (Aerospace & Defense) | | | 1,709 | | | | 66,702 | |
| Aaron's Co., Inc. (The) (Specialty Retail) | | | 1,613 | | | | 39,760 | |
| Abercrombie & Fitch Co.*—Class A (Specialty Retail) | | | 1,605 | | | | 55,902 | |
| ABM Industries, Inc. (Commercial Services & Supplies) | | | 3,446 | | | | 140,769 | |
| Acadia Realty Trust (Equity Real Estate Investment Trusts) | | | 2,539 | | | | 55,426 | |
| Addus Homecare Corp.* (Health Care Providers & Services) | | | 465 | | | | 43,482 | |
| Adtalem Global Education, Inc.* (Diversified Consumer Services) | | | 2,551 | | | | 75,407 | |
| AdvanSix, Inc. (Chemicals) | | | 664 | | | | 31,374 | |
| Aerojet Rocketdyne Holdings, Inc. (Aerospace & Defense) | | | 1,842 | | | | 86,132 | |
| AeroVironment, Inc.* (Aerospace & Defense) | | | 544 | | | | 33,744 | |
| Agilysys, Inc.* (Software) | | | 369 | | | | 16,406 | |
| Agree Realty Corp. (Equity Real Estate Investment Trusts) | | | 1,967 | | | | 140,366 | |
| Alamo Group, Inc. (Machinery) | | | 294 | | | | 43,271 | |
| Albany International Corp.—Class A (Machinery) | | | 830 | | | | 73,414 | |
| Alexander & Baldwin, Inc. (Equity Real Estate Investment Trusts) | | | 3,717 | | | | 93,260 | |
| Allegheny Technologies, Inc.* (Metals & Mining) | | | 3,587 | | | | 57,141 | |
| Allegiance Bancshares, Inc. (Banks) | | | 965 | | | | 40,733 | |
| Allegiant Travel Co.* (Airlines) | | | 778 | | | | 145,517 | |
| Allscripts Healthcare Solutions, Inc.* (Health Care Technology) | | | 3,832 | | | | 70,700 | |
| Ambac Financial Group, Inc.* (Insurance) | | | 2,373 | | | | 38,087 | |
| AMC Networks, Inc.*—Class A (Media) | | | 1,498 | | | | 51,591 | |
| American Assets Trust, Inc. (Equity Real Estate Investment Trusts) | | | 1,537 | | | | 57,684 | |
| American Axle & Manufacturing Holdings, Inc.* (Auto Components) | | | 5,845 | | | | 54,534 | |
| American Equity Investment Life Holding Co. (Insurance) | | | 4,220 | | | | 164,242 | |
| American Public Education, Inc.* (Diversified Consumer Services) | | | 958 | | | | 21,316 | |
| American States Water Co. (Water Utilities) | | | 644 | | | | 66,615 | |
| American Vanguard Corp. (Chemicals) | | | 1,380 | | | | 22,618 | |
| American Woodmark Corp.* (Building Products) | | | 850 | | | | 55,420 | |
| America's Car-Mart, Inc.* (Specialty Retail) | | | 312 | | | | 31,949 | |
| Ameris Bancorp (Banks) | | | 1,458 | | | | 72,433 | |
| AMERISAFE, Inc. (Insurance) | | | 992 | | | | 53,399 | |
| Amphastar Pharmaceuticals, Inc.* (Pharmaceuticals) | | | 604 | | | | 14,067 | |
| ANI Pharmaceuticals, Inc.* (Pharmaceuticals) | | | 227 | | | | 10,460 | |
| Anika Therapeutics, Inc.* (Health Care Equipment & Supplies) | | | 348 | | | | 12,469 | |
| Apogee Enterprises, Inc. (Building Products) | | | 1,299 | | | | 62,547 | |
| Apollo Commercial Real Estate Finance, Inc. (Mortgage Real Estate Investment Trusts) | | | 6,739 | | | | 88,685 | |
| Applied Industrial Technologies, Inc. (Trading Companies & Distributors) | | | 1,124 | | | | 115,435 | |
| Archrock, Inc. (Energy Equipment & Services) | | | 6,868 | | | | 51,373 | |
| Arconic Corp.* (Metals & Mining) | | | 5,458 | | | | 180,168 | |
| Arcosa, Inc. (Construction & Engineering) | | | 2,477 | | | | 130,538 | |
| Arlo Technologies, Inc.* (Electronic Equipment, Instruments & Components) | | | 1,900 | | | | 19,931 | |
| Armada Hoffler Properties, Inc. (Equity Real Estate Investment Trusts) | | | 1,229 | | | | 18,705 | |
| ARMOUR Residential REIT, Inc. (Mortgage Real Estate Investment Trusts) | | | 4,601 | | | | 45,136 | |
| Asbury Automotive Group, Inc.* (Specialty Retail) | | | 652 | | | | 112,621 | |
| Assured Guaranty, Ltd. (Insurance) | | | 2,075 | | | | 104,165 | |
| Astec Industries, Inc. (Machinery) | | | 1,167 | | | | 80,838 | |
| Atlas Air Worldwide Holdings, Inc.* (Air Freight & Logistics) | | | 1,386 | | | | 130,450 | |
| ATN International, Inc. (Diversified Telecommunication Services) | | | 560 | | | | 22,372 | |
| Avanos Medical, Inc.* (Health Care Equipment & Supplies) | | | 2,470 | | | | 85,635 | |
| Avista Corp. (Multi-Utilities) | | | 3,627 | | | | 154,111 | |
| AZZ, Inc. (Electrical Equipment) | | | 1,273 | | | | 70,385 | |
| B&G Foods, Inc.(a)—Class A (Food Products) | | | 3,326 | | | | 102,208 | |
| Badger Meter, Inc. (Electronic Equipment, Instruments & Components) | | | 524 | | | | 55,837 | |
| Banc of California, Inc. (Banks) | | | 1,525 | | | | 29,921 | |
| BancFirst Corp. (Banks) | | | 455 | | | | 32,105 | |
| BankUnited, Inc. (Banks) | | | 4,566 | | | | 193,188 | |
| Banner Corp. (Banks) | | | 1,001 | | | | 60,731 | |
| Barnes Group, Inc. (Machinery) | | | 2,388 | | | | 111,256 | |
| Bed Bath & Beyond, Inc.* (Specialty Retail) | | | 5,180 | | | | 75,524 | |
| Benchmark Electronics, Inc. (Electronic Equipment, Instruments & Components) | | | 1,805 | | | | 48,916 | |
| Berkshire Hills Bancorp, Inc. (Banks) | | | 2,493 | | | | 70,876 | |
| Big Lots, Inc. (Multiline Retail) | | | 1,669 | | | | 75,188 | |
| BJ's Restaurants, Inc.* (Hotels, Restaurants & Leisure) | | | 1,195 | | | | 41,287 | |
| Bloomin' Brands, Inc.* (Hotels, Restaurants & Leisure) | | | 4,163 | | | | 87,340 | |
| Blucora, Inc.* (Capital Markets) | | | 1,398 | | | | 24,213 | |
| Boise Cascade Co. (Trading Companies & Distributors) | | | 1,048 | | | | 74,618 | |
| Bottomline Technologies, Inc.* (Software) | | | 912 | | | | 51,500 | |
| Brady Corp.—Class A (Commercial Services & Supplies) | | | 1,343 | | | | 72,388 | |
| Brandywine Realty Trust (Equity Real Estate Investment Trusts) | | | 8,770 | | | | 117,693 | |
| Brinker International, Inc.* (Hotels, Restaurants & Leisure) | | | 2,327 | | | | 85,145 | |
| Bristow Group, Inc.* (Energy Equipment & Services) | | | 1,188 | | | | 37,624 | |
| Brookline Bancorp, Inc. (Banks) | | | 2,228 | | | | 36,071 | |
| CalAmp Corp.* (Communications Equipment) | | | 1,838 | | | | 12,976 | |
See accompanying notes to financial statements.
282 :: ProFund VP Small-Cap Value :: Financial Statements
Common Stocks, continued
| | | Shares | | | Value | |
| Calavo Growers, Inc. (Food Products) | | | 906 | | | $ | 38,414 | |
| Caleres, Inc. (Specialty Retail) | | | 1,961 | | | | 44,475 | |
| California Water Service Group (Water Utilities) | | | 1,106 | | | | 79,478 | |
| Cal-Maine Foods, Inc. (Food Products) | | | 1,920 | | | | 71,021 | |
| Capitol Federal Financial, Inc. (Thrifts & Mortgage Finance) | | | 6,616 | | | | 74,959 | |
| Cardiovascular Systems, Inc.* (Health Care Equipment & Supplies) | | | 1,206 | | | | 22,649 | |
| CareTrust REIT, Inc. (Equity Real Estate Investment Trusts) | | | 2,636 | | | | 60,180 | |
| Carpenter Technology Corp. (Metals & Mining) | | | 2,470 | | | | 72,099 | |
| Cars.com, Inc.* (Interactive Media & Services) | | | 1,698 | | | | 27,321 | |
| Centerspace (Equity Real Estate Investment Trusts) | | | 263 | | | | 29,167 | |
| Central Garden & Pet Co.* (Household Products) | | | 499 | | | | 26,262 | |
| Central Garden & Pet Co.*—Class A (Household Products) | | | 2,058 | | | | 98,475 | |
| Central Pacific Financial Corp. (Banks) | | | 545 | | | | 15,353 | |
| Century Aluminum Co.* (Metals & Mining) | | | 1,422 | | | | 23,548 | |
| Chatham Lodging Trust* (Equity Real Estate Investment Trusts) | | | 2,499 | | | | 34,286 | |
| Chefs' Warehouse, Inc.* (Food & Staples Retailing) | | | 1,670 | | | | 55,611 | |
| Chesapeake Utilities Corp. (Gas Utilities) | | | 433 | | | | 63,136 | |
| Chico's FAS, Inc.* (Specialty Retail) | | | 6,276 | | | | 33,765 | |
| Chuy's Holdings, Inc.* (Hotels, Restaurants & Leisure) | | | 1,015 | | | | 30,572 | |
| Cinemark Holdings, Inc.* (Entertainment) | | | 2,619 | | | | 42,218 | |
| CIRCOR International, Inc.* (Machinery) | | | 1,039 | | | | 28,240 | |
| City Holding Co. (Banks) | | | 403 | | | | 32,961 | |
| Clearwater Paper Corp.* (Paper & Forest Products) | | | 856 | | | | 31,390 | |
| Cogent Communications Holdings, Inc. (Diversified Telecommunication Services) | | | 718 | | | | 52,543 | |
| Cohu, Inc.* (Semiconductors & Semiconductor Equipment) | | | 1,048 | | | | 39,918 | |
| Columbia Banking System, Inc. (Banks) | | | 3,984 | | | | 130,356 | |
| Community Bank System, Inc. (Banks) | | | 1,492 | | | | 111,124 | |
| Community Healthcare Trust, Inc. (Equity Real Estate Investment Trusts) | | | 494 | | | | 23,351 | |
| Computer Programs & Systems, Inc.* (Health Care Technology) | | | 751 | | | | 22,004 | |
| Comtech Telecommunications Corp. (Communications Equipment) | | | 1,350 | | | | 31,982 | |
| CONMED Corp. (Health Care Equipment & Supplies) | | | 540 | | | | 76,550 | |
| Conn's, Inc.* (Specialty Retail) | | | 982 | | | | 23,097 | |
| Consensus Cloud Solutions, Inc.* (Software) | | | 823 | | | | 47,627 | |
| CONSOL Energy, Inc.* (Oil, Gas & Consumable Fuels) | | | 1,626 | | | | 36,926 | |
| Consolidated Communications Holdings, Inc.* (Diversified Telecommunication Services) | | | 3,694 | | | | 27,631 | |
| Cooper-Standard Holding, Inc.* (Auto Components) | | | 870 | | | | 19,497 | |
| Corcept Therapeutics, Inc.* (Pharmaceuticals) | | | 1,897 | | | | 37,561 | |
| Core Laboratories N.V. (Energy Equipment & Services) | | | 1,376 | | | | 30,699 | |
| CoreCivic, Inc.* (Equity Real Estate Investment Trusts) | | | 6,164 | | | | 61,455 | |
| Covetrus, Inc.* (Health Care Providers & Services) | | | 5,296 | | | | 105,761 | |
| CryoLife, Inc.* (Health Care Equipment & Supplies) | | | 2,016 | | | | 41,026 | |
| CSG Systems International, Inc. (IT Services) | | | 686 | | | | 39,527 | |
| CTS Corp. (Electronic Equipment, Instruments & Components) | | | 809 | | | | 29,706 | |
| Cutera, Inc.* (Health Care Equipment & Supplies) | | | 310 | | | | 12,809 | |
| CVB Financial Corp. (Banks) | | | 6,529 | | | | 139,786 | |
| Dave & Buster's Entertainment, Inc.* (Hotels, Restaurants & Leisure) | | | 1,088 | | | | 41,779 | |
| Deluxe Corp. (Commercial Services & Supplies) | | | 2,184 | | | | 70,128 | |
| Designer Brands, Inc.* (Specialty Retail) | | | 3,143 | | | | 44,662 | |
| DiamondRock Hospitality Co.* (Equity Real Estate Investment Trusts) | | | 10,781 | | | | 103,605 | |
| Digi International, Inc.* (Communications Equipment) | | | 927 | | | | 22,776 | |
| Dime Community Bancshares, Inc. (Banks) | | | 884 | | | | 31,081 | |
| Dine Brands Global, Inc. (Hotels, Restaurants & Leisure) | | | 406 | | | | 30,779 | |
| Diversified Healthcare Trust (Equity Real Estate Investment Trusts) | | | 12,248 | | | | 37,846 | |
| DMC Global, Inc.* (Energy Equipment & Services) | | | 959 | | | | 37,986 | |
| Dorman Products, Inc.* (Auto Components) | | | 482 | | | | 54,471 | |
| Dril-Quip, Inc.* (Energy Equipment & Services) | | | 1,814 | | | | 35,700 | |
| DXP Enterprises, Inc.* (Trading Companies & Distributors) | | | 875 | | | | 22,461 | |
| Eagle Bancorp, Inc. (Banks) | | | 672 | | | | 39,204 | |
| Eagle Pharmaceuticals, Inc.* (Biotechnology) | | | 297 | | | | 15,123 | |
| Easterly Government Properties, Inc. (Equity Real Estate Investment Trusts) | | | 4,415 | | | | 101,192 | |
| Ebix, Inc. (Software) | | | 1,221 | | | | 37,118 | |
| Edgewell Personal Care Co. (Personal Products) | | | 2,786 | | | | 127,348 | |
| eHealth, Inc.* (Insurance) | | | 1,218 | | | | 31,059 | |
| El Pollo Loco Holdings, Inc.* (Hotels, Restaurants & Leisure) | | | 993 | | | | 14,091 | |
| Ellington Financial, Inc. (Mortgage Real Estate Investment Trusts) | | | 1,566 | | | | 26,763 | |
| Emergent BioSolutions, Inc.* (Biotechnology) | | | 2,454 | | | | 106,675 | |
| Employers Holdings, Inc. (Insurance) | | | 1,433 | | | | 59,298 | |
| Enanta Pharmaceuticals, Inc.* (Biotechnology) | | | 369 | | | | 27,594 | |
| Encore Capital Group, Inc.* (Consumer Finance) | | | 661 | | | | 41,055 | |
| Enerpac Tool Group Corp. (Machinery) | | | 1,607 | | | | 32,590 | |
| EnPro Industries, Inc. (Machinery) | | | 1,056 | | | | 116,233 | |
| ePlus, Inc.* (Electronic Equipment, Instruments & Components) | | | 1,385 | | | | 74,624 | |
| ESCO Technologies, Inc. (Machinery) | | | 1,335 | | | | 120,136 | |
| Essential Properties Realty Trust, Inc. (Real Estate Management & Development) | | | 2,991 | | | | 86,231 | |
| Ethan Allen Interiors, Inc. (Household Durables) | | | 1,127 | | | | 29,629 | |
| EVERTEC, Inc. (IT Services) | | | 1,010 | | | | 50,480 | |
| EZCORP, Inc.*—Class A (Consumer Finance) | | | 2,720 | | | | 20,046 | |
See accompanying notes to financial statements.
Financial Statements :: ProFund VP Small-Cap Value :: 283
Common Stocks, continued
| | | Shares | | | Value | |
| FARO Technologies, Inc.* (Electronic Equipment, Instruments & Components) | | | 486 | | | $ | 34,030 | |
| FB Financial Corp. (Banks) | | | 953 | | | | 41,760 | |
| Federal Signal Corp. (Machinery) | | | 1,221 | | | | 52,918 | |
| Ferro Corp.* (Chemicals) | | | 2,247 | | | | 49,052 | |
| Fiesta Restaurant Group, Inc.* (Hotels, Restaurants & Leisure) | | | 879 | | | | 9,678 | |
| First Bancorp (Banks) | | | 885 | | | | 40,462 | |
| First Commonwealth Financial Corp. (Banks) | | | 2,188 | | | | 35,205 | |
| First Financial Bancorp (Banks) | | | 4,805 | | | | 117,146 | |
| First Hawaiian, Inc. (Banks) | | | 6,602 | | | | 180,433 | |
| First Midwest Bancorp, Inc. (Banks) | | | 5,851 | | | | 119,828 | |
| FormFactor, Inc.* (Semiconductors & Semiconductor Equipment) | | | 1,483 | | | | 67,803 | |
| Fossil Group, Inc.* (Textiles, Apparel & Luxury Goods) | | | 2,432 | | | | 25,025 | |
| Four Corners Property Trust, Inc. (Equity Real Estate Investment Trusts) | | | 2,022 | | | | 59,467 | |
| Franklin BSP Realty Trust, Inc. (Mortgage Real Estate Investment Trusts) | | | 2,252 | | | | 33,645 | |
| Franklin Electric Co., Inc. (Machinery) | | | 660 | | | | 62,410 | |
| Franklin Street Properties Corp. (Equity Real Estate Investment Trusts) | | | 4,871 | | | | 28,982 | |
| Fresh Del Monte Produce, Inc. (Food Products) | | | 1,706 | | | | 47,086 | |
| FutureFuel Corp. (Chemicals) | | | 1,323 | | | | 10,108 | |
| Gannett Co., Inc.* (Media) | | | 4,522 | | | | 24,102 | |
| GCP Applied Technologies, Inc.* (Chemicals) | | | 2,751 | | | | 87,097 | |
| Genesco, Inc.* (Specialty Retail) | | | 379 | | | | 24,320 | |
| Genworth Financial, Inc.* (Insurance) | | | 26,003 | | | | 105,312 | |
| Getty Realty Corp. (Equity Real Estate Investment Trusts) | | | 1,092 | | | | 35,042 | |
| Gibraltar Industries, Inc.* (Building Products) | | | 888 | | | | 59,212 | |
| G-III Apparel Group, Ltd.* (Textiles, Apparel & Luxury Goods) | | | 2,240 | | | | 61,914 | |
| Glatfelter Corp. (Paper & Forest Products) | | | 2,282 | | | | 39,250 | |
| Glaukos Corp.* (Health Care Equipment & Supplies) | | | 1,153 | | | | 51,239 | |
| Global Net Lease, Inc. (Equity Real Estate Investment Trusts) | | | 5,310 | | | | 81,137 | |
| GMS, Inc.* (Trading Companies & Distributors) | | | 973 | | | | 58,487 | |
| Granite Construction, Inc. (Construction & Engineering) | | | 2,349 | | | | 90,906 | |
| Granite Point Mortgage Trust, Inc. (Mortgage Real Estate Investment Trusts) | | | 2,756 | | | | 32,273 | |
| Green Dot Corp.*—Class A (Consumer Finance) | | | 2,803 | | | | 101,581 | |
| Green Plains, Inc.* (Oil, Gas & Consumable Fuels) | | | 2,747 | | | | 95,486 | |
| Griffon Corp. (Building Products) | | | 2,440 | | | | 69,491 | |
| Group 1 Automotive, Inc. (Specialty Retail) | | | 928 | | | | 181,165 | |
| Guess?, Inc. (Specialty Retail) | | | 1,998 | | | | 47,313 | |
| H.B. Fuller Co. (Chemicals) | | | 1,455 | | | | 117,855 | |
| Hanger, Inc.* (Health Care Providers & Services) | | | 1,885 | | | | 34,175 | |
| Hanmi Financial Corp. (Banks) | | | 685 | | | | 16,221 | |
| Harmony Biosciences Holdings, Inc.* (Pharmaceuticals) | | | 514 | | | | 21,917 | |
| Harsco Corp.* (Machinery) | | | 4,059 | | | | 67,826 | |
| Haverty Furniture Cos., Inc. (Specialty Retail) | | | 763 | | | | 23,325 | |
| Hawaiian Holdings, Inc.* (Airlines) | | | 2,625 | | | | 48,221 | |
| Hawkins, Inc. (Chemicals) | | | 443 | | | | 17,476 | |
| Haynes International, Inc. (Metals & Mining) | | | 280 | | | | 11,292 | |
| Healthcare Services Group, Inc. (Commercial Services & Supplies) | | | 3,820 | | | | 67,958 | |
| HealthStream, Inc.* (Health Care Technology) | | | 595 | | | | 15,684 | |
| Heartland Express, Inc. (Road & Rail) | | | 2,386 | | | | 40,133 | |
| Helix Energy Solutions Group, Inc.* (Energy Equipment & Services) | | | 7,269 | | | | 22,679 | |
| Helmerich & Payne, Inc. (Energy Equipment & Services) | | | 5,530 | | | | 131,060 | |
| Heritage Financial Corp. (Banks) | | | 1,802 | | | | 44,041 | |
| Hersha Hospitality Trust* (Equity Real Estate Investment Trusts) | | | 1,692 | | | | 15,516 | |
| Hillenbrand, Inc. (Machinery) | | | 1,722 | | | | 89,527 | |
| Hilltop Holdings, Inc. (Banks) | | | 1,527 | | | | 53,659 | |
| HNI Corp. (Commercial Services & Supplies) | | | 2,232 | | | | 93,856 | |
| Hope Bancorp, Inc. (Banks) | | | 6,161 | | | | 90,628 | |
| Horace Mann Educators Corp. (Insurance) | | | 2,126 | | | | 82,276 | |
| Hub Group, Inc.*—Class A (Air Freight & Logistics) | | | 1,741 | | | | 146,662 | |
| Ichor Holdings, Ltd.* (Semiconductors & Semiconductor Equipment) | | | 626 | | | | 28,815 | |
| Independent Bank Corp. (Banks) | | | 1,412 | | | | 115,120 | |
| Independent Bank Group, Inc. (Banks) | | | 1,892 | | | | 136,508 | |
| Industrial Logistics Properties Trust (Equity Real Estate Investment Trusts) | | | 1,978 | | | | 49,549 | |
| Innospec, Inc. (Chemicals) | | | 1,263 | | | | 114,099 | |
| Inogen, Inc.* (Health Care Equipment & Supplies) | | | 1,048 | | | | 35,632 | |
| Insight Enterprises, Inc.* (Electronic Equipment, Instruments & Components) | | | 1,788 | | | | 190,602 | |
| Integer Holdings Corp.* (Health Care Equipment & Supplies) | | | 1,692 | | | | 144,819 | |
| InterDigital, Inc. (Communications Equipment) | | | 755 | | | | 54,081 | |
| Interface, Inc. (Commercial Services & Supplies) | | | 1,664 | | | | 26,541 | |
| Invesco Mortgage Capital, Inc. (Mortgage Real Estate Investment Trusts) | | | 15,976 | | | | 44,413 | |
| iRobot Corp.* (Household Durables) | | | 622 | | | | 40,977 | |
| iStar, Inc. (Equity Real Estate Investment Trusts) | | | 1,567 | | | | 40,476 | |
| Itron, Inc.* (Electronic Equipment, Instruments & Components) | | | 2,320 | | | | 158,966 | |
| J & J Snack Foods Corp. (Food Products) | | | 426 | | | | 67,291 | |
| James River Group Holdings, Ltd. (Insurance) | | | 1,911 | | | | 55,056 | |
| John B Sanfilippo & Son, Inc. (Food Products) | | | 455 | | | | 41,023 | |
| John Bean Technologies Corp. (Machinery) | | | 587 | | | | 90,140 | |
| Kaiser Aluminum Corp. (Metals & Mining) | | | 813 | | | | 76,373 | |
| Kaman Corp.—Class A (Trading Companies & Distributors) | | | 1,427 | | | | 61,575 | |
| KAR Auction Services, Inc.* (Commercial Services & Supplies) | | | 6,209 | | | | 96,985 | |
| Kelly Services, Inc.—Class A (Professional Services) | | | 1,847 | | | | 30,974 | |
| KKR Real Estate Finance Trust, Inc. (Mortgage Real Estate Investment Trusts) | | | 1,388 | | | | 28,912 | |
See accompanying notes to financial statements.
284 :: ProFund VP Small-Cap Value :: Financial Statements
Common Stocks, continued
| | | Shares | | | Value | |
| Knowles Corp.* (Electronic Equipment, Instruments & Components) | | | 2,840 | | | $ | 66,314 | |
| Kontoor Brands, Inc. (Textiles, Apparel & Luxury Goods) | | | 1,195 | | | | 61,244 | |
| Koppers Holdings, Inc.* (Chemicals) | | | 1,092 | | | | 34,180 | |
| Kraton Corp.* (Chemicals) | | | 1,648 | | | | 76,335 | |
| Lantheus Holdings, Inc.* (Health Care Equipment & Supplies) | | | 1,422 | | | | 41,082 | |
| Laredo Petroleum, Inc.* (Oil, Gas & Consumable Fuels) | | | 242 | | | | 14,551 | |
| La-Z-Boy, Inc. (Household Durables) | | | 2,272 | | | | 82,496 | |
| LCI Industries (Auto Components) | | | 427 | | | | 66,555 | |
| LendingTree, Inc.* (Thrifts & Mortgage Finance) | | | 588 | | | | 72,089 | |
| Lexington Realty Trust (Equity Real Estate Investment Trusts) | | | 7,248 | | | | 113,214 | |
| Lindsay Corp. (Machinery) | | | 229 | | | | 34,808 | |
| LivePerson, Inc.* (Software) | | | 1,282 | | | | 45,793 | |
| Loyalty Ventures, Inc.* (Media) | | | 1,022 | | | | 30,732 | |
| LTC Properties, Inc. (Equity Real Estate Investment Trusts) | | | 2,018 | | | | 68,895 | |
| Lumber Liquidators Holdings, Inc.* (Specialty Retail) | | | 1,490 | | | | 25,434 | |
| M.D.C Holdings, Inc. (Household Durables) | | | 2,898 | | | | 161,796 | |
| M/I Homes, Inc.* (Household Durables) | | | 1,492 | | | | 92,773 | |
| Magellan Health, Inc.* (Health Care Providers & Services) | | | 1,193 | | | | 113,323 | |
| ManTech International Corp.—Class A (Professional Services) | | | 1,412 | | | | 102,977 | |
| Marcus & Millichap, Inc.* (Real Estate Management & Development) | | | 564 | | | | 29,023 | |
| Marten Transport, Ltd. (Road & Rail) | | | 3,061 | | | | 52,526 | |
| Materion Corp. (Metals & Mining) | | | 440 | | | | 40,454 | |
| Matthews International Corp.—Class A (Commercial Services & Supplies) | | | 1,620 | | | | 59,405 | |
| MAX Holdings, Inc. (Real Estate Management & Development) | | | 968 | | | | 29,514 | |
| MEDNAX, Inc.* (Health Care Providers & Services) | | | 4,431 | | | | 120,568 | |
| Mercer International, Inc. (Paper & Forest Products) | | | 2,064 | | | | 24,747 | |
| Meridian Bioscience, Inc.* (Health Care Equipment & Supplies) | | | 800 | | | | 16,320 | |
| Merit Medical Systems, Inc.* (Health Care Equipment & Supplies) | | | 1,120 | | | | 69,776 | |
| Meritage Homes Corp.* (Household Durables) | | | 1,014 | | | | 123,769 | |
| Meritor, Inc.* (Machinery) | | | 3,595 | | | | 89,084 | |
| Mesa Laboratories, Inc. (Health Care Equipment & Supplies) | | | 110 | | | | 36,090 | |
| Methode Electronics, Inc. (Electronic Equipment, Instruments & Components) | | | 1,096 | | | | 53,890 | |
| Middlesex Water Co. (Water Utilities) | | | 278 | | | | 33,443 | |
| ModivCare, Inc.* (Health Care Providers & Services) | | | 272 | | | | 40,335 | |
| Monro, Inc. (Specialty Retail) | | | 980 | | | | 57,105 | |
| Moog, Inc.—Class A (Aerospace & Defense) | | | 1,500 | | | | 121,455 | |
| Motorcar Parts of America, Inc.* (Auto Components) | | | 984 | | | | 16,797 | |
| Mr. Cooper Group, Inc.* (Thrifts & Mortgage Finance) | | | 3,850 | | | | 160,199 | |
| Myers Industries, Inc. (Containers & Packaging) | | | 1,058 | | | | 21,171 | |
| Myriad Genetics, Inc.* (Biotechnology) | | | 1,964 | | | | 54,206 | |
| Nabors Industries, Ltd.* (Energy Equipment & Services) | | | 397 | | | | 32,193 | |
| National Bank Holdings Corp. (Banks) | | | 652 | | | | 28,649 | |
| National Beverage Corp. (Beverages) | | | 514 | | | | 23,300 | |
| National Presto Industries, Inc. (Aerospace & Defense) | | | 260 | | | | 21,328 | |
| Natus Medical, Inc.* (Health Care Equipment & Supplies) | | | 1,751 | | | | 41,551 | |
| NBT Bancorp, Inc. (Banks) | | | 2,221 | | | | 85,553 | |
| Neenah, Inc. (Paper & Forest Products) | | | 859 | | | | 39,755 | |
| Nektar Therapeutics* (Pharmaceuticals) | | | 5,202 | | | | 70,279 | |
| NeoGenomics, Inc.* (Life Sciences Tools & Services) | | | 2,840 | | | | 96,901 | |
| NETGEAR, Inc.* (Communications Equipment) | | | 1,499 | | | | 43,786 | |
| NetScout Systems, Inc.* (Communications Equipment) | | | 3,786 | | | | 125,240 | |
| New York Mortgage Trust, Inc. (Mortgage Real Estate Investment Trusts) | | | 19,438 | | | | 72,309 | |
| NextGen Healthcare, Inc.* (Health Care Technology) | | | 2,944 | | | | 52,374 | |
| NMI Holdings, Inc.*—Class A (Thrifts & Mortgage Finance) | | | 4,394 | | | | 96,009 | |
| Northfield Bancorp, Inc. (Thrifts & Mortgage Finance) | | | 939 | | | | 15,174 | |
| Northwest Bancshares, Inc. (Thrifts & Mortgage Finance) | | | 6,486 | | | | 91,842 | |
| Northwest Natural Holding Co. (Gas Utilities) | | | 1,575 | | | | 76,829 | |
| NOW, Inc.* (Trading Companies & Distributors) | | | 5,662 | | | | 48,353 | |
| Oceaneering International, Inc.* (Energy Equipment & Services) | | | 5,114 | | | | 57,839 | |
| Office Properties Income Trust (Equity Real Estate Investment Trusts) | | | 2,482 | | | | 61,653 | |
| OFG Bancorp (Banks) | | | 1,277 | | | | 33,917 | |
| O-I Glass, Inc.* (Containers & Packaging) | | | 8,038 | | | | 96,697 | |
| Oil States International, Inc.* (Energy Equipment & Services) | | | 3,144 | | | | 15,626 | |
| Old National Bancorp (Banks) | | | 8,496 | | | | 153,948 | |
| Olympic Steel, Inc. (Metals & Mining) | | | 477 | | | | 11,210 | |
| OneSpan, Inc.* (Software) | | | 898 | | | | 15,203 | |
| OraSure Technologies, Inc.* (Health Care Equipment & Supplies) | | | 3,692 | | | | 32,083 | |
| Orion Office REIT, Inc.* (Equity Real Estate Investment Trusts) | | | 2,776 | | | | 51,828 | |
| Orthofix Medical, Inc.* (Health Care Equipment & Supplies) | | | 1,012 | | | | 31,463 | |
| OSI Systems, Inc.* (Electronic Equipment, Instruments & Components) | | | 488 | | | | 45,482 | |
| Owens & Minor, Inc. (Health Care Providers & Services) | | | 3,867 | | | | 168,216 | |
| Oxford Industries, Inc. (Textiles, Apparel & Luxury Goods) | | | 293 | | | | 29,745 | |
| Pacific Premier Bancorp, Inc. (Banks) | | | 2,708 | | | | 108,401 | |
| Pacira BioSciences, Inc.* (Pharmaceuticals) | | | 890 | | | | 53,551 | |
See accompanying notes to financial statements.
Financial Statements :: ProFund VP Small-Cap Value :: 285
Common Stocks, continued
| | | Shares | | | Value | |
| Par Pacific Holdings, Inc.* (Oil, Gas & Consumable Fuels) | | | 2,344 | | | $ | 38,653 | |
| Park Aerospace Corp. (Aerospace & Defense) | | | 558 | | | | 7,366 | |
| Park National Corp. (Banks) | | | 274 | | | | 37,623 | |
| Patrick Industries, Inc. (Auto Components) | | | 610 | | | | 49,221 | |
| Patterson-UTI Energy, Inc. (Energy Equipment & Services) | | | 11,024 | | | | 93,153 | |
| PBF Energy, Inc.*—Class A (Oil, Gas & Consumable Fuels) | | | 4,868 | | | | 63,138 | |
| PC Connection, Inc. (Electronic Equipment, Instruments & Components) | | | 564 | | | | 24,325 | |
| PDF Solutions, Inc.* (Semiconductors & Semiconductor Equipment) | | | 567 | | | | 18,025 | |
| PennyMac Mortgage Investment Trust (Mortgage Real Estate Investment Trusts) | | | 4,972 | | | | 86,165 | |
| Perdoceo Education Corp.* (Diversified Consumer Services) | | | 3,593 | | | | 42,254 | |
| PetMed Express, Inc. (Internet & Direct Marketing Retail) | | | 1,073 | | | | 27,104 | |
| PGT Innovations, Inc.* (Building Products) | | | 1,680 | | | | 37,783 | |
| Phibro Animal Health Corp.—Class A (Pharmaceuticals) | | | 1,042 | | | | 21,278 | |
| Photronics, Inc.* (Semiconductors & Semiconductor Equipment) | | | 3,134 | | | | 59,076 | |
| Pitney Bowes, Inc. (Commercial Services & Supplies) | | | 8,481 | | | | 56,229 | |
| Plantronics, Inc.* (Communications Equipment) | | | 1,138 | | | | 33,389 | |
| Plexus Corp.* (Electronic Equipment, Instruments & Components) | | | 1,448 | | | | 138,849 | |
| Powell Industries, Inc. (Electrical Equipment) | | | 462 | | | | 13,624 | |
| PRA Group, Inc.* (Consumer Finance) | | | 2,235 | | | | 112,219 | |
| Prestige Consumer Healthcare, Inc.* (Pharmaceuticals) | | | 1,207 | | | | 73,204 | |
| PriceSmart, Inc. (Food & Staples Retailing) | | | 1,233 | | | | 90,218 | |
| ProAssurance Corp. (Insurance) | | | 2,766 | | | | 69,980 | |
| ProPetro Holding Corp.* (Energy Equipment & Services) | | | 4,343 | | | | 35,178 | |
| Proto Labs, Inc.* (Machinery) | | | 1,414 | | | | 72,609 | |
| Provident Financial Services, Inc. (Thrifts & Mortgage Finance) | | | 2,136 | | | | 51,734 | |
| Quaker Chemical Corp. (Chemicals) | | | 289 | | | | 66,695 | |
| Quanex Building Products Corp. (Building Products) | | | 1,718 | | | | 42,572 | |
| QuinStreet, Inc.* (Interactive Media & Services) | | | 2,558 | | | | 46,530 | |
| Range Resources Corp.* (Oil, Gas & Consumable Fuels) | | | 3,969 | | | | 70,767 | |
| Rayonier Advanced Materials, Inc.* (Chemicals) | | | 3,266 | | | | 18,649 | |
| Ready Capital Corp. (Mortgage Real Estate Investment Trusts) | | | 3,017 | | | | 47,156 | |
| Realogy Holdings Corp.* (Real Estate Management & Development) | | | 5,975 | | | | 100,440 | |
| Red Robin Gourmet Burgers, Inc.* (Hotels, Restaurants & Leisure) | | | 805 | | | | 13,307 | |
| REGENXBIO, Inc.* (Biotechnology) | | | 1,061 | | | | 34,695 | |
| Renasant Corp. (Banks) | | | 2,857 | | | | 108,423 | |
| Renewable Energy Group, Inc.* (Oil, Gas & Consumable Fuels) | | | 2,577 | | | | 109,369 | |
| Rent-A-Center, Inc. (Specialty Retail) | | | 1,612 | | | | 77,440 | |
| Resideo Technologies, Inc.* (Building Products) | | | 7,400 | | | | 192,622 | |
| Resources Connection, Inc. (Professional Services) | | | 1,599 | | | | 28,526 | |
| Retail Opportunity Investments Corp. (Equity Real Estate Investment Trusts) | | | 3,174 | | | | 62,210 | |
| REX American Resources Corp.* (Oil, Gas & Consumable Fuels) | | | 269 | | | | 25,824 | |
| RPC, Inc.* (Energy Equipment & Services) | | | 3,656 | | | | 16,598 | |
| RPT Realty (Equity Real Estate Investment Trusts) | | | 2,116 | | | | 28,312 | |
| Ruth's Hospitality Group, Inc.* (Hotels, Restaurants & Leisure) | | | 1,631 | | | | 32,457 | |
| S&T Bancorp, Inc. (Banks) | | | 2,017 | | | | 63,576 | |
| Safety Insurance Group, Inc. (Insurance) | | | 730 | | | | 62,072 | |
| Sally Beauty Holdings, Inc.* (Specialty Retail) | | | 3,244 | | | | 59,884 | |
| Sanmina Corp.* (Electronic Equipment, Instruments & Components) | | | 3,300 | | | | 136,818 | |
| Saul Centers, Inc. (Equity Real Estate Investment Trusts) | | | 207 | | | | 10,975 | |
| ScanSource, Inc.* (Electronic Equipment, Instruments & Components) | | | 1,309 | | | | 45,920 | |
| Scholastic Corp. (Media) | | | 1,561 | | | | 62,378 | |
| Schweitzer-Mauduit International, Inc. (Paper & Forest Products) | | | 1,612 | | | | 48,199 | |
| Seacoast Banking Corporation of Florida (Banks) | | | 1,435 | | | | 50,785 | |
| Select Medical Holdings Corp. (Health Care Providers & Services) | | | 5,431 | | | | 159,671 | |
| Selectquote, Inc.* (Insurance) | | | 3,256 | | | | 29,499 | |
| Seneca Foods Corp.*—Class A (Food Products) | | | 321 | | | | 15,392 | |
| Service Properties Trust (Equity Real Estate Investment Trusts) | | | 8,461 | | | | 74,372 | |
| Shake Shack, Inc.*—Class A (Hotels, Restaurants & Leisure) | | | 903 | | | | 65,160 | |
| Shenandoah Telecommunications Co. (Wireless Telecommunication Services) | | | 2,561 | | | | 65,306 | |
| Simmons First National Corp.—Class A (Banks) | | | 5,885 | | | | 174,078 | |
| Simulations Plus, Inc. (Health Care Technology) | | | 322 | | | | 15,231 | |
| SiriusPoint, Ltd.* (Insurance) | | | 4,481 | | | | 36,431 | |
| SITE Centers Corp. (Equity Real Estate Investment Trusts) | | | 4,140 | | | | 65,536 | |
| SkyWest, Inc.* (Airlines) | | | 2,582 | | | | 101,473 | |
| SMART Global Holdings, Inc.* (Semiconductors & Semiconductor Equipment) | | | 463 | | | | 32,868 | |
| Sonic Automotive, Inc.—Class A (Specialty Retail) | | | 1,063 | | | | 52,565 | |
| South Jersey Industries, Inc. (Gas Utilities) | | | 5,763 | | | | 150,529 | |
| Southside Bancshares, Inc. (Banks) | | | 612 | | | | 25,594 | |
| Southwestern Energy Co.* (Oil, Gas & Consumable Fuels) | | | 18,726 | | | | 87,263 | |
| SpartanNash Co. (Food & Staples Retailing) | | | 1,843 | | | | 47,476 | |
| Spectrum Pharmaceuticals, Inc.* (Biotechnology) | | | 3,613 | | | | 4,589 | |
| SPX Corp.* (Machinery) | | | 1,350 | | | | 80,568 | |
| SPX FLOW, Inc. (Machinery) | | | 839 | | | | 72,557 | |
See accompanying notes to financial statements.
286 :: ProFund VP Small-Cap Value :: Financial Statements
Common Stocks, continued
| | | Shares | | | Value | |
| Standard Motor Products, Inc. (Auto Components) | | | 981 | | | $ | 51,395 | |
| Standex International Corp. (Machinery) | | | 325 | | | | 35,965 | |
| Stepan Co. (Chemicals) | | | 1,091 | | | | 135,601 | |
| Steven Madden, Ltd. (Textiles, Apparel & Luxury Goods) | | | 1,294 | | | | 60,132 | |
| Stewart Information Services Corp. (Insurance) | | | 703 | | | | 56,050 | |
| StoneX Group, Inc.* (Capital Markets) | | | 863 | | | | 52,859 | |
| Strategic Education, Inc. (Diversified Consumer Services) | | | 1,160 | | | | 67,094 | |
| Summit Hotel Properties, Inc.* (Equity Real Estate Investment Trusts) | | | 5,455 | | | | 53,241 | |
| SunCoke Energy, Inc. (Metals & Mining) | | | 4,257 | | | | 28,054 | |
| Surmodics, Inc.* (Health Care Equipment & Supplies) | | | 249 | | | | 11,989 | |
| Sylvamo Corp.* (Paper & Forest Products) | | | 1,808 | | | | 50,425 | |
| Tabula Rasa HealthCare, Inc.* (Health Care Technology) | | | 606 | | | | 9,090 | |
| Tactile Systems Technology, Inc.* (Health Care Equipment & Supplies) | | | 1,016 | | | | 19,334 | |
| Talos Energy, Inc.* (Oil, Gas & Consumable Fuels) | | | 2,097 | | | | 20,551 | |
| Telephone and Data Systems, Inc. (Wireless Telecommunication Services) | | | 5,063 | | | | 102,019 | |
| Tennant Co. (Machinery) | | | 541 | | | | 43,843 | |
| The Andersons, Inc. (Food & Staples Retailing) | | | 1,586 | | | | 61,394 | |
| The Cato Corp.—Class A (Specialty Retail) | | | 1,001 | | | | 17,177 | |
| The Cheesecake Factory, Inc.* (Hotels, Restaurants & Leisure) | | | 2,487 | | | | 97,365 | |
| The E.W. Scripps Co.*—Class A (Media) | | | 1,582 | | | | 30,612 | |
| The Ensign Group, Inc. (Health Care Providers & Services) | | | 1,237 | | | | 103,859 | |
| The GEO Group, Inc. (Equity Real Estate Investment Trusts) | | | 6,280 | | | | 48,670 | |
| The Greenbrier Cos., Inc. (Machinery) | | | 1,667 | | | | 76,499 | |
| The Marcus Corp.* (Entertainment) | | | 1,121 | | | | 20,021 | |
| The ODP Corp.* (Specialty Retail) | | | 2,352 | | | | 92,387 | |
| The Pennant Group, Inc.* (Health Care Providers & Services) | | | 679 | | | | 15,671 | |
| TimkenSteel Corp.* (Metals & Mining) | | | 2,107 | | | | 34,766 | |
| Titan International, Inc.* (Machinery) | | | 2,621 | | | | 28,726 | |
| Tivity Health, Inc.* (Health Care Providers & Services) | | | 1,203 | | | | 31,807 | |
| Tompkins Financial Corp. (Banks) | | | 341 | | | | 28,501 | |
| Tootsie Roll Industries, Inc. (Food Products) | | | 443 | | | | 16,050 | |
| Tredegar Corp. (Chemicals) | | | 1,314 | | | | 15,531 | |
| TreeHouse Foods, Inc.* (Food Products) | | | 2,859 | | | | 115,875 | |
| Trinseo PLC* (Chemicals) | | | 1,990 | | | | 104,395 | |
| TrueBlue, Inc.* (Professional Services) | | | 1,819 | | | | 50,332 | |
| TrustCo Bank Corp. (Thrifts & Mortgage Finance) | | | 985 | | | | 32,810 | |
| Trustmark Corp. (Banks) | | | 3,206 | | | | 104,067 | |
| TTM Technologies, Inc.* (Electronic Equipment, Instruments & Components) | | | 5,349 | | | | 79,700 | |
| Tupperware Brands Corp.* (Household Durables) | | | 2,505 | | | | 38,301 | |
| Two Harbors Investment Corp. (Mortgage Real Estate Investment Trusts) | | | 17,625 | | | | 101,696 | |
| U.S. Ecology, Inc.* (Commercial Services & Supplies) | | | 1,615 | | | | 51,583 | |
| U.S. Physical Therapy, Inc. (Health Care Providers & Services) | | | 364 | | | | 34,780 | |
| U.S. Silica Holdings, Inc.* (Energy Equipment & Services) | | | 3,821 | | | | 35,917 | |
| Unifi, Inc.* (Textiles, Apparel & Luxury Goods) | | | 712 | | | | 16,483 | |
| UniFirst Corp. (Commercial Services & Supplies) | | | 780 | | | | 164,111 | |
| Unisys Corp.* (IT Services) | | | 1,789 | | | | 36,800 | |
| United Community Banks, Inc. (Banks) | | | 1,931 | | | | 69,400 | |
| United Fire Group, Inc. (Insurance) | | | 1,106 | | | | 25,648 | |
| Uniti Group, Inc. (Equity Real Estate Investment Trusts) | | | 5,082 | | | | 71,199 | |
| Unitil Corp. (Multi-Utilities) | | | 819 | | | | 37,666 | |
| Universal Corp. (Tobacco) | | | 1,261 | | | | 69,254 | |
| Universal Electronics, Inc.* (Household Durables) | | | 672 | | | | 27,384 | |
| Universal Health Realty Income Trust (Equity Real Estate Investment Trusts) | | | 303 | | | | 18,019 | |
| Universal Insurance Holdings, Inc. (Insurance) | | | 1,438 | | | | 24,446 | |
| Urstadt Biddle Properties, Inc.—Class A (Equity Real Estate Investment Trusts) | | | 709 | | | | 15,102 | |
| USANA Health Sciences, Inc.* (Personal Products) | | | 198 | | | | 20,038 | |
| Vanda Pharmaceuticals, Inc.* (Biotechnology) | | | 1,028 | | | | 16,129 | |
| Varex Imaging Corp.* (Health Care Equipment & Supplies) | | | 727 | | | | 22,937 | |
| Vera Bradley, Inc.* (Textiles, Apparel & Luxury Goods) | | | 1,307 | | | | 11,123 | |
| Veris Residential, Inc.* (Equity Real Estate Investment Trusts) | | | 4,102 | | | | 75,395 | |
| Veritiv Corp.* (Trading Companies & Distributors) | | | 710 | | | | 87,025 | |
| Viad Corp.* (Commercial Services & Supplies) | | | 495 | | | | 21,181 | |
| Viavi Solutions, Inc.* (Communications Equipment) | | | 4,629 | | | | 81,563 | |
| Wabash National Corp. (Machinery) | | | 2,536 | | | | 49,503 | |
| Warrior Met Coal, Inc. (Metals & Mining) | | | 2,635 | | | | 67,746 | |
| Washington Real Estate Investment Trust (Equity Real Estate Investment Trusts) | | | 2,429 | | | | 62,790 | |
| WD-40 Co. (Household Products) | | | 295 | | | | 72,169 | |
| Westamerica Bancorp (Banks) | | | 1,377 | | | | 79,494 | |
| Whitestone REIT (Equity Real Estate Investment Trusts) | | | 2,365 | | | | 23,957 | |
| Winnebago Industries, Inc. (Automobiles) | | | 841 | | | | 63,008 | |
| WisdomTree Investments, Inc. (Capital Markets) | | | 2,119 | | | | 12,968 | |
| Wolverine World Wide, Inc. (Textiles, Apparel & Luxury Goods) | | | 2,280 | | | | 65,686 | |
| World Fuel Services Corp. (Oil, Gas & Consumable Fuels) | | | 3,237 | | | | 85,683 | |
| WSFS Financial Corp. (Thrifts & Mortgage Finance) | | | 1,879 | | | | 94,175 | |
| WW International, Inc.* (Diversified Consumer Services) | | | 2,728 | | | | 44,003 | |
| Xenia Hotels & Resorts, Inc.* (Equity Real Estate Investment Trusts) | | | 5,853 | | | | 105,998 | |
See accompanying notes to financial statements.
Financial Statements :: ProFund VP Small-Cap Value :: 287
Common Stocks, continued
| | | Shares | | | Value | |
| Xperi Holding Corp. (Software) | | | 2,572 | | | $ | 48,637 | |
| Zumiez, Inc.* (Specialty Retail) | | | 1,096 | | | | 52,597 | |
TOTAL COMMON STOCKS
(Cost $21,016,036) | | | | | | | 27,229,209 | |
Repurchase Agreements(b) (0.2%)
| | | Principal
Amount | | | Value | |
| Repurchase Agreements with various counterparties, 0.00%, dated 12/31/21, due 1/3/22, total to be received $43,000 | | $ | 43,000 | | | $ | 43,000 | |
TOTAL REPURCHASE AGREEMENTS
(Cost $43,000) | | | | | | | 43,000 | |
Collateral for Securities Loaned(c) (0.3%)
| | | Shares | | | Value | |
| BlackRock Liquidity Funds FedFund Portfolio—Institutional Shares, 0.03%(d) | | | 94,869 | | | $ | 94,869 | |
TOTAL COLLATERAL FOR SECURITIES LOANED
(Cost $94,869) | | | | | | | 94,869 | |
TOTAL INVESTMENT SECURITIES
(Cost $21,153,905)—100.9% | | | | | | | 27,367,078 | |
| Net other assets (liabilities)—(0.9)% | | | | | | | (246,963 | ) |
| NET ASSETS—100.0% | | | | | | $ | 27,120,115 | |
| * | Non-income producing security. |
| (a) | All or part of this security was on loan as of December 31, 2021. The total value of securities on loan as of December 31, 2021 was $91,821. |
| (b) | The ProFund VP invests in Repurchase Agreements jointly with other funds in the Trust. See "Repurchase Agreements" under Note 2 in the Notes to Financial Statements to view the details of each individual agreement and counterparty as well as a description of the securities subject to repurchase. |
| (c) | Securities were purchased with cash collateral held from securities on loan at December 31, 2021. |
| (d) | Rate periodically changes. Rate disclosed is the daily yield on December 31, 2021. |
See accompanying notes to financial statements.
288 :: ProFund VP Small-Cap Value :: Financial Statements
ProFund VP Small-Cap Value invested in the following industries as of December 31, 2021:
| | | Value | | | % of
Net Assets | |
| Aerospace & Defense | | $ | 336,727 | | | | 1.2 | % |
| Air Freight & Logistics | | | 277,112 | | | | 1.0 | % |
| Airlines | | | 295,211 | | | | 1.1 | % |
| Auto Components | | | 312,470 | | | | 1.2 | % |
| Automobiles | | | 63,008 | | | | 0.2 | % |
| Banks | | | 3,178,943 | | | | 11.8 | % |
| Beverages | | | 23,300 | | | | 0.1 | % |
| Biotechnology | | | 259,011 | | | | 1.0 | % |
| Building Products | | | 575,248 | | | | 2.1 | % |
| Capital Markets | | | 90,040 | | | | 0.3 | % |
| Chemicals | | | 901,065 | | | | 3.3 | % |
| Commercial Services & Supplies | | | 921,134 | | | | 3.5 | % |
| Communications Equipment | | | 405,793 | | | | 1.5 | % |
| Construction & Engineering | | | 221,444 | | | | 0.8 | % |
| Consumer Finance | | | 274,901 | | | | 1.0 | % |
| Containers & Packaging | | | 117,868 | | | | 0.4 | % |
| Diversified Consumer Services | | | 250,074 | | | | 0.9 | % |
| Diversified Telecommunication Services | | | 102,546 | | | | 0.4 | % |
| Electrical Equipment | | | 84,009 | | | | 0.3 | % |
| Electronic Equipment, Instruments & Components | | | 1,203,910 | | | | 4.4 | % |
| Energy Equipment & Services | | | 633,625 | | | | 2.3 | % |
| Entertainment | | | 62,239 | | | | 0.2 | % |
| Equity Real Estate Investment Trusts | | | 2,255,751 | | | | 8.3 | % |
| Food & Staples Retailing | | | 254,699 | | | | 0.9 | % |
| Food Products | | | 514,360 | | | | 1.9 | % |
| Gas Utilities | | | 290,494 | | | | 1.0 | % |
| Health Care Equipment & Supplies | | | 805,453 | | | | 3.0 | % |
| Health Care Providers & Services | | | 971,648 | | | | 3.5 | % |
| Health Care Technology | | | 185,083 | | | | 0.7 | % |
| Hotels, Restaurants & Leisure | | | 548,960 | | | | 2.0 | % |
| Household Durables | | | 597,125 | | | | 2.2 | % |
| Household Products | | | 196,906 | | | | 0.7 | % |
| Insurance | | | 997,020 | | | | 3.8 | % |
| Interactive Media & Services | | | 73,851 | | | | 0.3 | % |
| Internet & Direct Marketing Retail | | | 27,104 | | | | 0.1 | % |
| IT Services | | | 126,807 | | | | 0.5 | % |
| Life Sciences Tools & Services | | | 96,901 | | | | 0.4 | % |
| Machinery | | | 1,552,961 | | | | 5.8 | % |
| Media | | | 199,415 | | | | 0.7 | % |
| Metals & Mining | | | 602,851 | | | | 2.2 | % |
| Mortgage Real Estate Investment Trusts | | | 607,153 | | | | 2.2 | % |
| Multiline Retail | | | 75,188 | | | | 0.3 | % |
| Multi-Utilities | | | 191,777 | | | | 0.7 | % |
| Oil, Gas & Consumable Fuels | | | 648,211 | | | | 2.4 | % |
| Paper & Forest Products | | | 233,766 | | | | 0.9 | % |
| Personal Products | | | 147,386 | | | | 0.5 | % |
| Pharmaceuticals | | | 302,317 | | | | 1.1 | % |
| Professional Services | | | 212,809 | | | | 0.8 | % |
| Real Estate Management & Development | | | 245,208 | | | | 0.9 | % |
| Road & Rail | | | 92,659 | | | | 0.3 | % |
| Semiconductors & Semiconductor Equipment | | | 246,505 | | | | 0.9 | % |
| Software | | | 262,284 | | | | 1.0 | % |
| Specialty Retail | | | 1,172,467 | | | | 4.4 | % |
| Textiles, Apparel & Luxury Goods | | | 331,352 | | | | 1.2 | % |
| Thrifts & Mortgage Finance | | | 688,991 | | | | 2.5 | % |
| Tobacco | | | 69,254 | | | | 0.3 | % |
| Trading Companies & Distributors | | | 467,954 | | | | 1.7 | % |
| Water Utilities | | | 179,536 | | | | 0.7 | % |
| Wireless Telecommunication Services | | | 167,325 | | | | 0.6 | % |
| Other** | | | (109,094 | ) | | | (0.4 | )% |
| Total | | $ | 27,120,115 | | | | 100.0 | % |
| ** | Includes any non-equity securities and net other assets (liabilities), which includes any receivable for capital shares issued and payable for capital shares redeemed. |
See accompanying notes to financial statements.
Financial Statements :: ProFund VP Small-Cap Value :: 289
Statement of Assets and Liabilities
December 31, 2021
| ASSETS: |
| Total Investment Securities, at cost | | $ | 21,153,905 | |
| Securities, at value(a) | | | 27,324,078 | |
| Repurchase agreements, at value | | | 43,000 | |
| Total Investment Securities, at value | | | 27,367,078 | |
| Cash | | | 344 | |
| Dividends receivable | | | 38,511 | |
| Receivable for capital shares issued | | | 756 | |
| Prepaid expenses | | | 2,122 | |
| TOTAL ASSETS | | | 27,408,811 | |
| | | | | |
| LIABILITIES: | | | | |
| Payable for collateral for securities loaned | | | 94,869 | |
| Payable for capital shares redeemed | | | 80,551 | |
| Payable for investments purchased | | | 35,937 | |
| Advisory fees payable | | | 25,633 | |
| Management services fees payable | | | 3,418 | |
| Administration fees payable | | | 1,629 | |
| Administrative services fees payable | | | 12,477 | |
| Distribution fees payable | | | 11,786 | |
| Transfer agency fees payable | | | 2,750 | |
| Fund accounting fees payable | | | 1,040 | |
| Compliance services fees payable | | | 119 | |
| Other accrued expenses | | | 18,487 | |
| TOTAL LIABILITIES | | | 288,696 | |
| NET ASSETS | | $ | 27,120,115 | |
| | | | | |
| NET ASSETS CONSIST OF: | | | | |
| Capital | | $ | 20,415,421 | |
| Total distributable earnings (loss) | | | 6,704,694 | |
| NET ASSETS | | $ | 27,120,115 | |
| Shares of Beneficial Interest Outstanding (unlimited number of shares authorized, no par value) | | | 497,692 | |
| Net Asset Value (offering and redemption price per share) | | $ | 54.49 | |
| | | | |
| (a) Includes securities on loan valued at: | | $ | 91,821 | |
Statement of Operations
For the Year Ended December 31, 2021
| INVESTMENT INCOME: | | | | |
| Dividends | | $ | 528,574 | |
| Foreign tax withholding | | | (96 | ) |
| Net income from securities lending | | | 1,429 | |
| TOTAL INVESTMENT INCOME | | | 529,907 | |
| | | | | |
| EXPENSES: | | | | |
| Advisory fees | | | 238,314 | |
| Management services fees | | | 31,775 | |
| Administration fees | | | 23,519 | |
| Transfer agency fees | | | 19,509 | |
| Administrative services fees | | | 86,498 | |
| Distribution fees | | | 79,438 | |
| Custody fees | | | 5,839 | |
| Fund accounting fees | | | 14,806 | |
| Trustee fees | | | 478 | |
| Compliance services fees | | | 252 | |
| Other fees | | | 28,171 | |
| Recoupment of prior expenses reduced by the Advisor | | | 9,500 | |
| Total Gross Expenses before reductions | | | 538,099 | |
| Expenses reduced and reimbursed by the Advisor | | | (4,275 | ) |
| TOTAL NET EXPENSES | | | 533,824 | |
| NET INVESTMENT INCOME (LOSS) | | | (3,917 | ) |
| | | | | |
| REALIZED AND UNREALIZED GAINS (LOSSES) ON INVESTMENTS: | | | | |
| Net realized gains (losses) on investment securities | | | 4,951,267 | |
| Change in net unrealized appreciation/depreciation on investment securities | | | 1,542,762 | |
| NET REALIZED AND UNREALIZED GAINS (LOSSES) ON INVESTMENTS | | | 6,494,029 | |
| CHANGE IN NET ASSETS RESULTING FROM OPERATIONS | | $ | 6,490,112 | |
See accompanying notes to financial statements.
290 :: ProFund VP Small-Cap Value :: Financial Statements
| Statements of Changes in Net Assets |
| |
| | | Year Ended
December 31, 2021 | | | Year Ended
December 31, 2020 | |
| FROM INVESTMENT ACTIVITIES: | | | | | | | | |
| | | | | | | | | |
| OPERATIONS: |
| Net investment income (loss) | | $ | (3,917 | ) | | $ | 32,995 | |
| Net realized gains (losses) on investments | | | 4,951,267 | | | | (1,687,326 | ) |
| Change in net unrealized appreciation/depreciation on investments | | | 1,542,762 | | | | 1,588,065 | |
| Change in net assets resulting from operations | | | 6,490,112 | | | | (66,266 | ) |
| | | | | | | | | |
| DISTRIBUTIONS TO SHAREHOLDERS: | | | | | | | | |
| Total distributions | | | (29,211 | ) | | | (1,810,228 | ) |
| Change in net assets resulting from distributions | | | (29,211 | ) | | | (1,810,228 | ) |
| | | | | | | | | |
| CAPITAL TRANSACTIONS: | | | | | | | | |
| Proceeds from shares issued | | | 44,566,319 | | | | 23,838,861 | |
| Distributions reinvested | | | 29,211 | | | | 1,810,228 | |
| Value of shares redeemed | | | (45,725,453 | ) | | | (23,271,785 | ) |
| Change in net assets resulting from capital transactions | | | (1,129,923 | ) | | | 2,377,304 | |
| Change in net assets | | | 5,330,978 | | | | 500,810 | |
| | | | | | | | | |
| NET ASSETS: | | | | | | | | |
| Beginning of period | | | 21,789,137 | | | | 21,288,327 | |
| End of period | | $ | 27,120,115 | | | $ | 21,789,137 | |
| | | | | | | | | |
| SHARE TRANSACTIONS: | | | | | | | | |
| Issued | | | 862,205 | | | | 629,684 | |
| Reinvested | | | 558 | | | | 52,288 | |
| Redeemed | | | (878,670 | ) | | | (605,754 | ) |
| Change in shares | | | (15,907 | ) | | | 76,218 | |
See accompanying notes to financial statements.
Financial Highlights :: ProFund VP Small-Cap Value :: 291
ProFunds Financial Highlights FOR THE PERIODS INDICATED
Selected data for a share of beneficial interest outstanding throughout the periods indicated.
| | | Year Ended
Dec. 31, 2021 | | | Year Ended
Dec. 31, 2020 | | | Year Ended
Dec. 31, 2019 | | | Year Ended
Dec. 31, 2018 | | | Year Ended
Dec. 31, 2017 | |
| Net Asset Value, Beginning of Period | | $ | 42.42 | | | $ | 48.67 | | | $ | 39.71 | | | $ | 50.27 | | | $ | 46.23 | |
| | | | | | | | | | | | | | | | | | | | | |
| Investment Activities: | | | | | | | | | | | | | | | | | | | | |
| Net investment income (loss)(a) | | | (0.01 | ) | | | 0.09 | | | | 0.03 | | | | (0.01 | ) | | | (0.15 | ) |
| Net realized and unrealized gains (losses) on investments | | | 12.12 | | | | (0.82 | ) | | | 8.93 | | | | (6.21 | ) | | | 4.63 | |
| Total income (loss) from investment activities | | | 12.11 | | | | (0.73 | ) | | | 8.96 | | | | (6.22 | ) | | | 4.48 | |
| | | | | | | | | | | | | | | | | | | | | |
| Distributions to Shareholders From: | | | | | | | | | | | | | | | | | | | | |
| Net investment income | | | (0.04 | ) | | | (0.01 | ) | | | — | | | | — | | | | (0.01 | ) |
| Net realized gains on investments | | | — | | | | (5.51 | ) | | | — | | | | (4.34 | ) | | | (0.43 | ) |
| Total distributions | | | (0.04 | ) | | | (5.52 | ) | | | — | | | | (4.34 | ) | | | (0.44 | ) |
| | | | | | | | | | | | | | | | | | | | | |
| Net Asset Value, End of Period | | $ | 54.49 | | | $ | 42.42 | | | $ | 48.67 | | | $ | 39.71 | | | $ | 50.27 | |
| | | | | | | | | | | | | | | | | | | | | |
| Total Return | | | 28.56 | % | | | 1.06 | % | | | 22.56 | % | | | (14.21 | )% | | | 9.71 | % |
| | | | | | | | | | | | | | | | | | | | | |
| Ratios to Average Net Assets: | | | | | | | | | | | | | | | | | | | | |
| Gross expenses | | | 1.69 | % | | | 1.78 | % | | | 1.75 | % | | | 1.75 | % | | | 1.73 | % |
| Net expenses | | | 1.68 | % | | | 1.68 | % | | | 1.68 | % | | | 1.68 | % | | | 1.68 | % |
| Net investment income (loss) | | | (0.01 | )% | | | 0.23 | % | | | 0.07 | % | | | (0.01 | )% | | | (0.32 | )% |
| | | | | | | | | | | | | | | | | | | | | |
| Supplemental Data: | | | | | | | | | | | | | | | | | | | | |
| Net assets, end of period (000's) | | $ | 27,120 | | | $ | 21,789 | | | $ | 21,288 | | | $ | 16,346 | | | $ | 24,856 | |
| Portfolio turnover rate(b) | | | 147 | % | | | 192 | % | | | 147 | % | | | 141 | % | | | 91 | % |
| (a) | Per share net investment income (loss) has been calculated using the average daily shares method. |
| (b) | Portfolio turnover rate is calculated without regard to instruments having a maturity of less than one year from acquisition or derivative instruments (including swap agreements and futures contracts). The portfolio turnover rate can be high and volatile due to the amount and timing of sales and purchases of fund shares during the period. |
See accompanying notes to financial statements.
292 :: ProFund VP Technology :: Management Discussion of Fund Performance
ProFund VP Technology (the "Fund") seeks investment results, before fees and expenses, that correspond to the performance of the Dow Jones U.S. TechnologySM Index (the "Index"). For the year ended December 31, 2021, the Fund had a total return of 34.96%. For the same period, the Index had a total return of 37.23%1 and a volatility of 20.55%. For the year, the Fund achieved an average daily statistical correlation of over 0.99 to the daily performance of the Index.2
The Fund takes positions in financial instruments that, in combination, should have similar return characteristics as the return of the Index. The Index measures the performance of the technology sector of the U.S. equity market. Component companies include, among others, those involved in computers and office equipment, software, communications technology, semiconductors, diversified technology services and Internet services.
During the year ended December 31, 2021, the Fund invested in swap agreements as a substitute for investing directly in stocks in order to gain exposure to the Index. These derivatives generally tracked the performance of their underlying benchmark and were negatively impacted by financing costs associated with their use. The Fund entered into swap agreements with counterparties that the Fund's advisor determined to be major, global financial institutions. If a counterparty becomes insolvent or otherwise fails to perform on its obligations, the value of investments in the Fund may decline. The Fund has sought to mitigate this risk by generally requiring counterparties to post collateral for the benefit of the Fund, marked to market daily, in an amount approximately equal to the amount the counterparty owed to the Fund, subject to certain minimum thresholds.
Value of a $10,000 Investment at Net Asset Value*
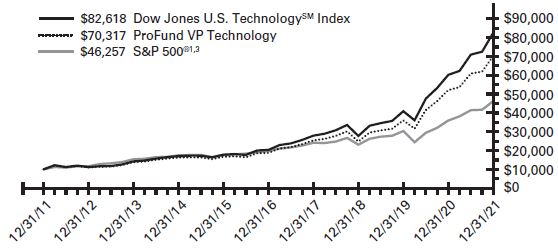
| * | The line graph represents the historical performance of a hypothetical investment of $10,000 in the ProFund VP Technology from December 31, 2011 to December 31, 2021, assuming the reinvestment of distributions. |
Average Annual Total Return as of 12/31/21
| Fund | | One Year | | | Five Year | | | Ten Year | |
| ProFund VP Technology | | | 34.96 | % | | | 30.24 | % | | | 21.54 | % |
| Dow Jones U.S. TechnologySM Index | | | 37.23 | % | | | 32.39 | % | | | 23.51 | % |
| S&P 500® | | | 28.71 | % | | | 18.47 | % | | | 16.55 | % |
Expense Ratios**
| Fund | | Gross | | | Net | | | | |
| ProFund VP Technology | | | 1.65 | % | | | 1.65 | % | | | | |
| ** | Reflects the expense ratio as reported in the Prospectus dated May 1, 2021. Contractual fee waivers are in effect through April 30, 2022. See Financial Highlights for effective expense ratios. |
Allocation of Portfolio Holdings & Index Composition
Market Exposure
| Investment Type | | % of Net Assets | |
| Equity Securities | | | 91 | % |
| Swap Agreements | | | 9 | % |
| Total Exposure | | | 100 | % |
"Market Exposure" includes the value of total investments (including the contract value of any derivatives) and excludes any instruments used for cash management.
Largest Equity Holdings
| Company | | % of Net Assets | |
| Apple, Inc. | | | 17.8 | % |
| Microsoft Corp. | | | 16.2 | % |
| Alphabet, Inc. | | | 10.8 | % |
| Meta Platforms, Inc. | | | 5.1 | % |
| NVIDIA Corp. | | | 4.7 | % |
Dow Jones U.S. TechnologySM Index – Composition
| | | % of Index | |
| Software & Services | | | 36 | % |
| Technology Hardware & Equipment | | | 24 | % |
| Semiconductors & Semiconductor Equipment | | | 20 | % |
| Media & Entertainment | | | 19 | % |
| Retailing | | | 1 | % |
| Health Care Equipment & Services | | | 0 | % |
Past performance does not guarantee future results. Return calculations assume the reinvestment of distributions and do not reflect taxes that a shareholder would pay on Fund distributions or on the redemption of Fund shares. The performance data quoted represents past performance and current returns may be lower or higher. The investment return and net asset value ("NAV") will fluctuate so that an investor's shares, when redeemed, may be worth more or less than the original cost. The performance above reflects any fee reductions during the applicable periods. If such fee reductions had not occurred, the quoted performance would be lower. Performance numbers are net of all Fund fees and expenses but do not include any insurance, sales, or administrative charges of variable annuity or life insurance contracts. If these charges were included, the returns would be lower. To obtain performance current to the most recent month-end, please call toll-free 888-776-3637.
| 1 | The graph and table reflect the theoretical reinvestment of dividends on securities in the Indexes. The impact of transaction costs and the deduction of fees and expenses associated with a mutual fund, such as investment management and accounting fees, are not reflected in calculations of the Indexes. The Fund's performance reflects the reinvestment of dividends as well as the impact of transaction costs and the deduction of fees and expenses. It is not possible to invest directly in an index. |
| 2 | 1.00 equals perfect correlation. This calculation is based on the daily total return of the Index and the performance of the daily total return of the NAV per share of the Fund. |
| 3 | The S&P 500® is an unmanaged index that consists of the common stocks of 500 major U.S. corporations selected for their size and the frequency and ease with which their stocks trade. |
The above information is not covered by the Report of the Independent Registered Public Accounting Firm.
Financial Statements :: ProFund VP Technology :: 293
Schedule of Portfolio Investments :: December 31, 2021
Common Stocks (90.9%)
| | | Shares | | | Value | |
| ACI Worldwide, Inc.* (Software) | | | 412 | | | $ | 14,296 | |
| Adobe, Inc.* (Software) | | | 1,667 | | | | 945,289 | |
| Advanced Micro Devices, Inc.* (Semiconductors & Semiconductor Equipment) | | | 4,231 | | | | 608,841 | |
| Akamai Technologies, Inc.* (IT Services) | | | 570 | | | | 66,713 | |
| Allegro MicroSystems, Inc.* (Semiconductors & Semiconductor Equipment) | | | 192 | | | | 6,947 | |
| Alphabet, Inc.*—Class A (Interactive Media & Services) | | | 1,054 | | | | 3,053,480 | |
| Alphabet, Inc.*—Class C (Interactive Media & Services) | | | 980 | | | | 2,835,718 | |
| Alteryx, Inc.* (Software) | | | 208 | | | | 12,584 | |
| Amdocs, Ltd. (IT Services) | | | 444 | | | | 33,229 | |
| Amkor Technology, Inc. (Semiconductors & Semiconductor Equipment) | | | 352 | | | | 8,726 | |
| Analog Devices, Inc. (Semiconductors & Semiconductor Equipment) | | | 1,883 | | | | 330,975 | |
| Anaplan, Inc.* (Software) | | | 512 | | | | 23,475 | |
| Angi, Inc.* (Interactive Media & Services) | | | 264 | | | | 2,431 | |
| ANSYS, Inc.* (Software) | | | 306 | | | | 122,743 | |
| Appian Corp.* (Software) | | | 138 | | | | 8,999 | |
| Apple, Inc. (Technology Hardware, Storage & Peripherals) | | | 54,586 | | | | 9,692,837 | |
| Applied Materials, Inc. (Semiconductors & Semiconductor Equipment) | | | 3,163 | | | | 497,730 | |
| AppLovin Corp.*—Class A (Software) | | | 95 | | | | 8,955 | |
| Arista Networks, Inc.* (Communications Equipment) | | | 786 | | | | 112,988 | |
| Asana, Inc.*—Class A (Software) | | | 283 | | | | 21,098 | |
| Aspen Technology, Inc.* (Software) | | | 235 | | | | 35,767 | |
| Autodesk, Inc.* (Software) | | | 770 | | | | 216,516 | |
| Avalara, Inc.* (Software) | | | 304 | | | | 39,249 | |
| Azenta, Inc. (Semiconductors & Semiconductor Equipment) | | | 260 | | | | 26,809 | |
| Bentley Systems, Inc.—Class B (Software) | | | 643 | | | | 31,076 | |
| Bill.com Holdings, Inc.* (Software) | | | 319 | | | | 79,479 | |
| Black Knight, Inc.* (IT Services) | | | 544 | | | | 45,092 | |
| Blackbaud, Inc.* (Software) | | | 144 | | | | 11,373 | |
| Blackline, Inc.* (Software) | | | 187 | | | | 19,362 | |
| Broadcom, Inc. (Semiconductors & Semiconductor Equipment) | | | 1,442 | | | | 959,520 | |
| Bumble, Inc.*—Class A (Interactive Media & Services) | | | 254 | | | | 8,600 | |
| Cadence Design Systems, Inc.* (Software) | | | 971 | | | | 180,946 | |
| Cargurus, Inc.* (Interactive Media & Services) | | | 306 | | | | 10,294 | |
| CCC Intelligent Solutions Holdings, Inc.* (Software) | | | 213 | | | | 2,426 | |
| CDK Global, Inc. (Software) | | | 415 | | | | 17,322 | |
| CDW Corp. (Electronic Equipment, Instruments & Components) | | | 475 | | | | 97,271 | |
| Ceridian HCM Holding, Inc.* (Software) | | | 476 | | | | 49,723 | |
| Cerner Corp. (Health Care Technology) | | | 1,030 | | | | 95,656 | |
| Chewy, Inc.*—Class A (Internet & Direct Marketing Retail) | | | 310 | | | | 18,281 | |
| Ciena Corp.* (Communications Equipment) | | | 542 | | | | 41,718 | |
| Cirrus Logic, Inc.* (Semiconductors & Semiconductor Equipment) | | | 199 | | | | 18,312 | |
| Cisco Systems, Inc. (Communications Equipment) | | | 14,775 | | | | 936,291 | |
| Citrix Systems, Inc. (Software) | | | 437 | | | | 41,336 | |
| Clear Secure, Inc.*—Class A (Software) | | | 47 | | | | 1,474 | |
| Cloudflare, Inc.*—Class A (Software) | | | 959 | | | | 126,109 | |
| Cognizant Technology Solutions Corp.—Class A (IT Services) | | | 1,840 | | | | 163,245 | |
| Confluent, Inc.*—Class A (Software) | | | 214 | | | | 16,315 | |
| Consensus Cloud Solutions, Inc.* (Software) | | | 56 | | | | 3,241 | |
| Coupa Software, Inc.* (Software) | | | 259 | | | | 40,935 | |
| Crowdstrike Holdings, Inc.*—Class A (Software) | | | 721 | | | | 147,625 | |
| Datadog, Inc.*—Class A (Software) | | | 901 | | | | 160,477 | |
| Dell Technologies, Inc.*—Class C (Technology Hardware, Storage & Peripherals) | | | 1,019 | | | | 57,237 | |
| Digital Turbine, Inc.* (Software) | | | 307 | | | | 18,724 | |
| DocuSign, Inc.* (Software) | | | 689 | | | | 104,942 | |
| Dolby Laboratories, Inc.—Class A (Electronic Equipment, Instruments & Components) | | | 228 | | | | 21,710 | |
| DoorDash, Inc.*—Class A (Internet & Direct Marketing Retail) | | | 568 | | | | 84,575 | |
| Dropbox, Inc.* (Software) | | | 989 | | | | 24,270 | |
| Duck Creek Technologies, Inc.* (Software) | | | 264 | | | | 7,949 | |
| DXC Technology Co.* (IT Services) | | | 883 | | | | 28,424 | |
| Dynatrace, Inc.* (Software) | | | 689 | | | | 41,581 | |
| eBay, Inc. (Internet & Direct Marketing Retail) | | | 2,193 | | | | 145,835 | |
| Elastic NV* (Software) | | | 252 | | | | 31,019 | |
| Enphase Energy, Inc.* (Semiconductors & Semiconductor Equipment) | | | 472 | | | | 86,348 | |
| Entegris, Inc. (Semiconductors & Semiconductor Equipment) | | | 475 | | | | 65,826 | |
| EPAM Systems, Inc.* (IT Services) | | | 199 | | | | 133,022 | |
| Etsy, Inc.* (Internet & Direct Marketing Retail) | | | 445 | | | | 97,428 | |
| F5, Inc.* (Communications Equipment) | | | 212 | | | | 51,879 | |
| Fair Isaac Corp.* (Software) | | | 96 | | | | 41,632 | |
| Fastly, Inc.*—Class A (IT Services) | | | 374 | | | | 13,258 | |
| Five9, Inc.* (Software) | | | 239 | | | | 32,819 | |
| Fortinet, Inc.* (Software) | | | 475 | | | | 170,715 | |
| Garmin, Ltd. (Household Durables) | | | 532 | | | | 72,442 | |
| Gartner, Inc.* (IT Services) | | | 288 | | | | 96,284 | |
| GLOBALFOUNDRIES, Inc.* (Semiconductors & Semiconductor Equipment) | | | 187 | | | | 12,149 | |
| GoDaddy, Inc.*—Class A (IT Services) | | | 582 | | | | 49,389 | |
| Guidewire Software, Inc.* (Software) | | | 292 | | | | 33,151 | |
See accompanying notes to financial statements.
294 :: ProFund VP Technology :: Financial Statements
Common Stocks, continued
| | | Shares | | | Value | |
| Hewlett Packard Enterprises Co. (Technology Hardware, Storage & Peripherals) | | | 4,583 | | | $ | 72,274 | |
| HP, Inc. (Technology Hardware, Storage & Peripherals) | | | 4,038 | | | | 152,112 | |
| HubSpot, Inc.* (Software) | | | 158 | | | | 104,146 | |
| IAC/InterActive Corp.* (Interactive Media & Services) | | | 294 | | | | 38,429 | |
| Intel Corp. (Semiconductors & Semiconductor Equipment) | | | 14,248 | | | | 733,772 | |
| International Business Machines Corp. (IT Services) | | | 3,142 | | | | 419,959 | |
| Intuit, Inc. (Software) | | | 992 | | | | 638,074 | |
| Juniper Networks, Inc. (Communications Equipment) | | | 1,139 | | | | 40,674 | |
| KLA Corp. (Semiconductors & Semiconductor Equipment) | | | 531 | | | | 228,388 | |
| Kyndryl Holdings, Inc.* (IT Services) | | | 628 | | | | 11,367 | |
| Lam Research Corp. (Semiconductors & Semiconductor Equipment) | | | 493 | | | | 354,541 | |
| Lattice Semiconductor Corp.*(Semiconductors & Semiconductor Equipment) | | | 479 | | | | 36,912 | |
| Liberty Global PLC*—Class A (Media) | | | 620 | | | | 17,199 | |
| Liberty Global PLC*—Class C (Media) | | | 1,164 | | | | 32,697 | |
| Lumen Technologies, Inc. (Diversified Telecommunication Services) | | | 3,229 | | | | 40,524 | |
| Lumentum Holdings, Inc.* (Communications Equipment) | | | 253 | | | | 26,760 | |
| Mandiant, Inc.* (Software) | | | 842 | | | | 14,769 | |
| Manhattan Associates, Inc.* (Software) | | | 221 | | | | 34,363 | |
| Marvell Technology, Inc. (Semiconductors & Semiconductor Equipment) | | | 2,885 | | | | 252,409 | |
| Match Group, Inc.* (Interactive Media & Services) | | | 992 | | | | 131,192 | |
| Matterport, Inc.* (Software) | | | 645 | | | | 13,313 | |
| McAfee Corp.—Class A (Software) | | | 263 | | | | 6,783 | |
| Meta Platforms, Inc.*—Class A (Interactive Media & Services) | | | 8,291 | | | | 2,788,678 | |
| Microchip Technology, Inc. (Semiconductors & Semiconductor Equipment) | | | 1,943 | | | | 169,158 | |
| Micron Technology, Inc. (Semiconductors & Semiconductor Equipment) | | | 3,918 | | | | 364,962 | |
| Microsoft Corp. (Software) | | | 26,303 | | | | 8,846,225 | |
| MicroStrategy, Inc.* (Software) | | | 29 | | | | 15,790 | |
| MKS Instruments, Inc. (Semiconductors & Semiconductor Equipment) | | | 194 | | | | 33,789 | |
| MongoDB, Inc.* (IT Services) | | | 232 | | | | 122,809 | |
| Monolithic Power Systems, Inc. (Semiconductors & Semiconductor Equipment) | | | 152 | | | | 74,986 | |
| Motorola Solutions, Inc. (Communications Equipment) | | | 592 | | | | 160,846 | |
| nCino, Inc.* (Software) | | | 198 | | | | 10,862 | |
| NCR Corp.* (Technology Hardware, Storage & Peripherals) | | | 462 | | | | 18,572 | |
| NetApp, Inc. (Technology Hardware, Storage & Peripherals) | | | 784 | | | | 72,120 | |
| New Relic, Inc.* (Software) | | | 206 | | | | 22,652 | |
| NortonLifelock, Inc. (Software) | | | 2,039 | | | | 52,973 | |
| Nuance Communications, Inc.* (Software) | | | 998 | | | | 55,209 | |
| Nutanix, Inc.*—Class A (Software) | | | 740 | | | | 23,576 | |
| NVIDIA Corp. (Semiconductors & Semiconductor Equipment) | | | 8,758 | | | | 2,575,814 | |
| NXP Semiconductors N.V. (Semiconductors & Semiconductor Equipment) | | | 932 | | | | 212,291 | |
| Okta, Inc.* (IT Services) | | | 518 | | | | 116,120 | |
| Omnicell, Inc.* (Health Care Technology) | | | 154 | | | | 27,788 | |
| ON Semiconductor Corp.* (Semiconductors & Semiconductor Equipment) | | | 1,508 | | | | 102,423 | |
| Oracle Corp. (Software) | | | 5,649 | | | | 492,649 | |
| Palantir Technologies, Inc.*—Class A (Software) | | | 5,613 | | | | 102,213 | |
| Palo Alto Networks, Inc.* (Software) | | | 344 | | | | 191,525 | |
| Paycom Software, Inc.* (Software) | | | 169 | | | | 70,167 | |
| Paylocity Holding Corp.* (Software) | | | 138 | | | | 32,590 | |
| Pegasystems, Inc. (Software) | | | 143 | | | | 15,990 | |
| Power Integrations, Inc. (Semiconductors & Semiconductor Equipment) | | | 212 | | | | 19,693 | |
| Procore Technologies, Inc.* (Software) | | | 31 | | | | 2,479 | |
| PTC, Inc.* (Software) | | | 369 | | | | 44,704 | |
| Pure Storage, Inc.*—Class A (Technology Hardware, Storage & Peripherals) | | | 939 | | | | 30,564 | |
| Q2 Holdings, Inc.* (Software) | | | 198 | | | | 15,729 | |
| Qorvo, Inc.* (Semiconductors & Semiconductor Equipment) | | | 386 | | | | 60,367 | |
| Qualcomm, Inc. (Semiconductors & Semiconductor Equipment) | | | 3,923 | | | | 717,399 | |
| Qualtrics International, Inc.*—Class A (Software) | | | 331 | | | | 11,717 | |
| Rapid7, Inc.* (Software) | | | 198 | | | | 23,303 | |
| RingCentral, Inc.*—Class A (Software) | | | 288 | | | | 53,957 | |
| Salesforce.com, Inc.* (Software) | | | 3,430 | | | | 871,666 | |
| Seagate Technology Holdings PLC (Technology Hardware, Storage & Peripherals) | | | 717 | | | | 81,007 | |
| Semtech Corp.* (Semiconductors & Semiconductor Equipment) | | | 225 | | | | 20,009 | |
| SentinelOne, Inc.*—Class A (Software) | | | 145 | | | | 7,321 | |
| ServiceNow, Inc.* (Software) | | | 697 | | | | 452,430 | |
| Silicon Laboratories, Inc.* (Semiconductors & Semiconductor Equipment) | | | 140 | | | | 28,899 | |
| Skyworks Solutions, Inc. (Semiconductors & Semiconductor Equipment) | | | 578 | | | | 89,671 | |
| Smartsheet, Inc.* (Software) | | | 441 | | | | 34,155 | |
| Snap, Inc.* (Interactive Media & Services) | | | 3,751 | | | | 176,410 | |
| Snowflake, Inc.*—Class A (IT Services) | | | 811 | | | | 274,726 | |
| SolarEdge Technologies, Inc.* (Semiconductors & Semiconductor Equipment) | | | 184 | | | | 51,625 | |
| SolarWinds Corp. (IT Services) | | | 157 | | | | 2,228 | |
| Splunk, Inc.* (Software) | | | 566 | | | | 65,498 | |
| Squarespace, Inc.*—Class A (IT Services) | | | 98 | | | | 2,891 | |
| SS&C Technologies Holdings, Inc. (Software) | | | 775 | | | | 63,535 | |
See accompanying notes to financial statements.
Financial Statements :: ProFund VP Technology :: 295
Common Stocks, continued
| | | Shares | | | Value | |
| SYNNEX Corp. (Electronic Equipment, Instruments & Components) | | | 145 | | | $ | 16,582 | |
| Synopsys, Inc.* (Software) | | | 534 | | | | 196,779 | |
| Teradyne, Inc. (Semiconductors & Semiconductor Equipment) | | | 572 | | | | 93,539 | |
| Texas Instruments, Inc. (Semiconductors & Semiconductor Equipment) | | | 3,236 | | | | 609,889 | |
| Trade Desk, Inc. (The)* (Software) | | | 1,528 | | | | 140,026 | |
| Twilio, Inc.* (IT Services) | | | 590 | | | | 155,371 | |
| Twitter, Inc.* (Interactive Media & Services) | | | 2,801 | | | | 121,059 | |
| Tyler Technologies, Inc.* (Software) | | | 144 | | | | 77,465 | |
| Ubiquiti, Inc. (Communications Equipment) | | | 22 | | | | 6,747 | |
| UiPath, Inc.*—Class A (Software) | | | 906 | | | | 39,076 | |
| Unity Software, Inc.* (Software) | | | 561 | | | | 80,217 | |
| Universal Display Corp. (Semiconductors & Semiconductor Equipment) | | | 152 | | | | 25,085 | |
| Varonis Systems, Inc.* (Software) | | | 375 | | | | 18,293 | |
| Veeva Systems, Inc.*—Class A (Health Care Technology) | | | 486 | | | | 124,163 | |
| Verint Systems, Inc.* (Software) | | | 229 | | | | 12,025 | |
| VeriSign, Inc.* (IT Services) | | | 338 | | | | 85,791 | |
| Viavi Solutions, Inc.* (Communications Equipment) | | | 834 | | | | 14,695 | |
| Vimeo, Inc.* (Interactive Media & Services) | | | 547 | | | | 9,824 | |
| VMware, Inc.—Class A (Software) | | | 706 | | | | 81,811 | |
| Western Digital Corp.* (Technology Hardware, Storage & Peripherals) | | | 1,092 | | | | 71,209 | |
| Wolfspeed, Inc.* (Semiconductors & Semiconductor Equipment) | | | 407 | | | | 45,490 | |
| Workday, Inc.*—Class A (Software) | | | 670 | | | | 183,031 | |
| Workiva, Inc.* (Software) | | | 159 | | | | 20,748 | |
| Xerox Holdings Corp. (Technology Hardware, Storage & Peripherals) | | | 482 | | | | 10,912 | |
| Xilinx, Inc. (Semiconductors & Semiconductor Equipment) | | | 868 | | | | 184,042 | |
| Zendesk, Inc.* (Software) | | | 423 | | | | 44,115 | |
| Ziff Davis, Inc.* (Software) | | | 170 | | | | 18,846 | |
| Zoom Video Communications, Inc.*—Class A (Software) | | | 758 | | | | 139,404 | |
| Zscaler, Inc.* (Software) | | | 277 | | | | 89,008 | |
TOTAL COMMON STOCKS
(Cost $6,565,944) | | | | | | | 49,663,161 | |
Repurchase Agreements(a) (2.7%)
| | | Principal
Amount | | | Value | |
| Repurchase Agreements with various counterparties, 0.00%, dated 12/31/21, due 1/3/22, total to be received $1,451,000 | | $ | 1,451,000 | | | $ | 1,451,000 | |
TOTAL REPURCHASE AGREEMENTS
(Cost $1,451,000) | | | | | | | 1,451,000 | |
TOTAL INVESTMENT SECURITIES
(Cost $8,016,944)—93.6% | | | | | | | 51,114,161 | |
| Net other assets (liabilities)—6.4% | | | | | | | 3,473,245 | |
| NET ASSETS—100.0% | | | | | | $ | 54,587,406 | |
| * | Non-income producing security. |
| (a) | The ProFund VP invests in Repurchase Agreements jointly with other funds in the Trust. See "Repurchase Agreements" under Note 2 in the Notes to Financial Statements to view the details of each individual agreement and counterparty as well as a description of the securities subject to repurchase. |
Total Return Swap Agreements—Long
| Underlying Instrument | | Counterparty | | Termination
Date(1) | | Rate Paid
(Received)(2) | | | Notional
Amount | | | Value and
Unrealized
Appreciation/
(Depreciation) | |
| Dow Jones U.S. Technology Index | | Goldman Sachs International | | 1/24/22 | | | 0.68 | % | | $ | 4,892,327 | | | $ | (12,722 | ) |
| (1) | Agreements may be terminated at will by either party without penalty. Payment is due at termination/maturity. |
| (2) | Reflects the floating financing rate, as of December 31, 2021, on the notional amount of the swap agreement paid to the counterparty or received from the counterparty, excluding any commissions. This amount is included as part of the unrealized appreciation/(depreciation). |
ProFund VP Technology invested in the following industries as of December 31, 2021:
| | | Value | | | % of
Net Assets | |
| Communications Equipment | | $ | 1,392,598 | | | | 2.6 | % |
| Diversified Telecommunication Services | | | 40,524 | | | | 0.1 | % |
| Electronic Equipment, Instruments & Components | | | 135,563 | | | | 0.2 | % |
| Health Care Technology | | | 247,607 | | | | 0.5 | % |
| Household Durables | | | 72,442 | | | | 0.1 | % |
| Interactive Media & Services | | | 9,176,115 | | | | 16.7 | % |
| Internet & Direct Marketing Retail | | | 346,119 | | | | 0.7 | % |
| IT Services | | | 1,819,918 | | | | 3.3 | % |
| Media | | | 49,896 | | | | 0.1 | % |
| Semiconductors & Semiconductor Equipment | | | 9,707,336 | | | | 17.8 | % |
| Software | | | 16,416,199 | | | | 30.0 | % |
| Technology Hardware, Storage & Peripherals | | | 10,258,844 | | | | 18.8 | % |
| Other** | | | 4,924,245 | | | | 9.1 | % |
| Total | | $ | 54,587,406 | | | | 100.0 | % |
| ** | Includes any non-equity securities and net other assets (liabilities), which includes any receivable for capital shares issued and payable for capital shares redeemed. |
See accompanying notes to financial statements.
296 :: ProFund VP Technology :: Financial Statements
Statement of Assets and Liabilities
December 31, 2021
| ASSETS: |
| Total Investment Securities, at cost | | $ | 8,016,944 | |
| Securities, at value | | | 49,663,161 | |
| Repurchase agreements, at value | | | 1,451,000 | |
| Total Investment Securities, at value | | | 51,114,161 | |
| Cash | | | 233 | |
| Segregated cash balances for swap agreements with custodian | | | 120,000 | |
| Dividends receivable | | | 5,389 | |
| Receivable for capital shares issued | | | 640 | |
| Receivable for investments sold | | | 3,595,666 | |
| Prepaid expenses | | | 697 | |
| TOTAL ASSETS | | | 54,836,786 | |
| | | | | |
| LIABILITIES: | | | | |
| Payable for capital shares redeemed | | | 116,762 | |
| Unrealized depreciation on swap agreements | | | 12,722 | |
| Advisory fees payable | | | 34,980 | |
| Management services fees payable | | | 4,664 | |
| Administration fees payable | | | 3,301 | |
| Administrative services fees payable | | | 17,332 | |
| Distribution fees payable | | | 27,934 | |
| Transfer agency fees payable | | | 5,358 | |
| Fund accounting fees payable | | | 1,872 | |
| Compliance services fees payable | | | 236 | |
| Other accrued expenses | | | 24,219 | |
| TOTAL LIABILITIES | | | 249,380 | |
| NET ASSETS | | $ | 54,587,406 | |
| | | | | |
| NET ASSETS CONSIST OF: | | | | |
| Capital | | $ | 6,925,064 | |
| Total distributable earnings (loss) | | | 47,662,342 | |
| NET ASSETS | | $ | 54,587,406 | |
| Shares of Beneficial Interest Outstanding (unlimited number of shares authorized, no par value) | | | 587,591 | |
| Net Asset Value (offering and redemption price per share) | | $ | 92.90 | |
Statement of Operations
For the Year Ended December 31, 2021
| INVESTMENT INCOME: | | | | |
| Dividends | | $ | 320,312 | |
| Interest | | | 9 | |
| Foreign tax withholding | | | (350 | ) |
| Net income from securities lending | | | 330 | |
| TOTAL INVESTMENT INCOME | | | 320,301 | |
| | | | | |
| EXPENSES: | | | | |
| Advisory fees | | | 366,882 | |
| Management services fees | | | 48,917 | |
| Administration fees | | | 36,071 | |
| Transfer agency fees | | | 29,509 | |
| Administrative services fees | | | 93,561 | |
| Distribution fees | | | 122,294 | |
| Custody fees | | | 7,254 | |
| Fund accounting fees | | | 20,325 | |
| Trustee fees | | | 825 | |
| Compliance services fees | | | 314 | |
| Other fees | | | 47,024 | |
| TOTAL NET EXPENSES | | | 772,976 | |
| NET INVESTMENT INCOME (LOSS) | | | (452,675 | ) |
| | | | | |
| REALIZED AND UNREALIZED GAINS (LOSSES) ON INVESTMENTS: | | | | |
| Net realized gains (losses) on investment securities | | | 6,616,702 | |
| Net realized gains (losses) on swap agreements | | | 316,095 | |
| Change in net unrealized appreciation/depreciation on investment securities | | | 8,145,785 | |
| Change in net unrealized appreciation/depreciation on swap agreements | | | (17,709 | ) |
| NET REALIZED AND UNREALIZED GAINS (LOSSES) ON INVESTMENTS | | | 15,060,873 | |
| CHANGE IN NET ASSETS RESULTING FROM OPERATIONS | | $ | 14,608,198 | |
See accompanying notes to financial statements.
Financial Statements :: ProFund VP Technology :: 297
| Statements of Changes in Net Assets |
| |
| | | Year Ended
December 31, 2021 | | | Year Ended
December 31, 2020 | |
| FROM INVESTMENT ACTIVITIES: | | | | | | | | |
| | | | | | | | | |
| OPERATIONS: |
| Net investment income (loss) | | $ | (452,675 | ) | | $ | (251,380 | ) |
| Net realized gains (losses) on investments | | | 6,932,797 | | | | 3,769,847 | |
| Change in net unrealized appreciation/depreciation on investments | | | 8,128,076 | | | | 10,413,451 | |
| Change in net assets resulting from operations | | | 14,608,198 | | | | 13,931,918 | |
| | | | | | | | | |
| DISTRIBUTIONS TO SHAREHOLDERS: | | | | | | | | |
| Total distributions | | | (3,594,551 | ) | | | (4,191,983 | ) |
| Change in net assets resulting from distributions | | | (3,594,551 | ) | | | (4,191,983 | ) |
| | | | | | | | | |
| CAPITAL TRANSACTIONS: | | | | | | | | |
| Proceeds from shares issued | | | 82,428,746 | | | | 69,129,678 | |
| Distributions reinvested | | | 3,594,551 | | | | 4,191,983 | |
| Value of shares redeemed | | | (87,710,917 | ) | | | (71,750,735 | ) |
| Change in net assets resulting from capital transactions | | | (1,687,620 | ) | | | 1,570,926 | |
| Change in net assets | | | 9,326,027 | | | | 11,310,861 | |
| | | | | | | | | |
| NET ASSETS: | | | | | | | | |
| Beginning of period | | | 45,261,379 | | | | 33,950,518 | |
| End of period | | $ | 54,587,406 | | | $ | 45,261,379 | |
| | | | | | | | | |
| SHARE TRANSACTIONS: | | | | | | | | |
| Issued | | | 990,708 | | | | 1,111,457 | |
| Reinvested | | | 51,139 | | | | 56,941 | |
| Redeemed | | | (1,054,956 | ) | | | (1,164,676 | ) |
| Change in shares | | | (13,109 | ) | | | 3,722 | |
See accompanying notes to financial statements.
298 :: ProFund VP Technology :: Financial Highlights
ProFunds Financial Highlights FOR THE PERIODS INDICATED
Selected data for a share of beneficial interest outstanding throughout the periods indicated.
| | | Year Ended
Dec. 31, 2021 | | | Year Ended
Dec. 31, 2020 | | | Year Ended
Dec. 31, 2019 | | | Year Ended
Dec. 31, 2018 | | | Year Ended
Dec. 31, 2017 | |
| Net Asset Value, Beginning of Period | | $ | 75.35 | | | $ | 56.87 | | | $ | 40.10 | | | $ | 42.06 | | | $ | 31.12 | |
| | | | | | | | | | | | | | | | | | | | | |
| Investment Activities: | | | | | | | | | | | | | | | | | | | | |
| Net investment income (loss)(a) | | | (0.76 | ) | | | (0.43 | ) | | | (0.20 | ) | | | (0.12 | ) | | | (0.09 | ) |
| Net realized and unrealized gains (losses) on investments | | | 24.96 | | | | 25.75 | | | | 18.09 | | | | (0.66 | ) | | | 11.05 | |
| Total income (loss) from investment activities | | | 24.20 | | | | 25.32 | | | | 17.89 | | | | (0.78 | ) | | | 10.96 | |
| | | | | | | | | | | | | | | | | | | | | |
| Distributions to Shareholders From: | | | | | | | | | | | | | | | | | | | | |
| Net investment income | | | — | | | | — | | | | — | | | | — | | | | (0.02 | ) |
| Net realized gains on investments | | | (6.65 | ) | | | (6.84 | ) | | | (1.12 | ) | | | (1.18 | ) | | | — | |
| Total distributions | | | (6.65 | ) | | | (6.84 | ) | | | (1.12 | ) | | | (1.18 | ) | | | (0.02 | ) |
| | | | | | | | | | | | | | | | | | | | | |
| Net Asset Value, End of Period | | $ | 92.90 | | | $ | 75.35 | | | $ | 56.87 | | | $ | 40.10 | | | $ | 42.06 | |
| | | | | | | | | | | | | | | | | | | | | |
| Total Return | | | 34.96 | % | | | 44.80 | % | | | 45.11 | % | | | (2.25 | )% | | | 35.18 | % |
| | | | | | | | | | | | | | | | | | | | | |
| Ratios to Average Net Assets: | | | | | | | | | | | | | | | | | | | | |
| Gross expenses | | | 1.58 | % | | | 1.65 | % | | | 1.62 | % | | | 1.58 | % | | | 1.56 | % |
| Net expenses | | | 1.58 | % | | | 1.65 | % | | | 1.62 | % | | | 1.58 | % | | | 1.56 | % |
| Net investment income (loss) | | | (0.92 | )% | | | (0.66 | )% | | | (0.41 | )% | | | (0.27 | )% | | | (0.25 | )% |
| | | | | | | | | | | | | | | | | | | | | |
| Supplemental Data: | | | | | | | | | | | | | | | | | | | | |
| Net assets, end of period (000's) | | $ | 54,587 | | | $ | 45,261 | | | $ | 33,951 | | | $ | 26,279 | | | $ | 33,731 | |
| Portfolio turnover rate(b) | | | 163 | % | | | 187 | % | | | 75 | % | | | 58 | % | | | 86 | % |
| (a) | Per share net investment income (loss) has been calculated using the average daily shares method. |
| (b) | Portfolio turnover rate is calculated without regard to instruments having a maturity of less than one year from acquisition or derivative instruments (including swap agreements and futures contracts). The portfolio turnover rate can be high and volatile due to the amount and timing of sales and purchases of fund shares during the period. |
See accompanying notes to financial statements.
Management Discussion of Fund Performance :: ProFund VP Telecommunications :: 299
ProFund VP Telecommunications (the "Fund") seeks investment results, before fees and expenses, that correspond to the performance of the Dow Jones U.S. Select TelecommunicationsSM Index (the "Index"). For the year ended December 31, 2021, the Fund had a total return of 18.41%. For the same period, the Index had a total return of 20.42%1 and a volatility of 12.99%. For the year, the Fund achieved an average daily statistical correlation of over 0.99 to the daily performance of the Index.2
The Fund takes positions in financial instruments that, in combination, should have similar return characteristics as the return of the Index. The Index measures the performance of the telecommunications sector of the U.S. equity market. Component companies include, among others, regional and long-distance carriers; cellular, satellite and paging service providers; producers of equipment including satellites, mobile telephones, fiber optics, switching devices, teleconferencing equipment and connectivity devices for computers.
During the year ended December 31, 2021, the Fund invested in swap agreements as a substitute for investing directly in stocks in order to gain exposure to the Index. These derivatives generally tracked the performance of their underlying benchmark and were negatively impacted by financing costs associated with their use. The Fund entered into swap agreements with counterparties that the Fund's advisor determined to be major, global financial institutions. If a counterparty becomes insolvent or otherwise fails to perform on its obligations, the value of investments in the Fund may decline. The Fund has sought to mitigate this risk by generally requiring counterparties to post collateral for the benefit of the Fund, marked to market daily, in an amount approximately equal to the amount the counterparty owed to the Fund, subject to certain minimum thresholds.
Value of a $10,000 Investment at Net Asset Value*
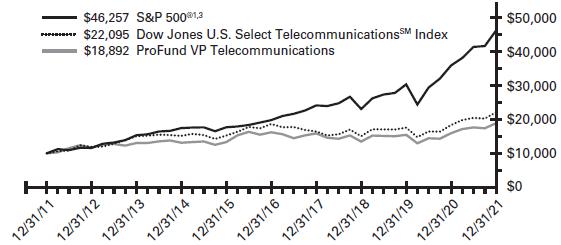
| * | The line graph represents the historical performance of a hypothetical investment of $10,000 in the ProFund VP Telecommunications from December 31, 2011 to December 31, 2021, assuming the reinvestment of distributions. |
Average Annual Total Return as of 12/31/21
| Fund | | One Year | | | Five Year | | | Ten Year | |
| ProFund VP Telecommunications | | | 18.41 | % | | | 3.10 | % | | | 6.57 | % |
| Dow Jones U.S. Select TelecommunicationsSM Index | | | 20.42 | % | | | 3.43 | % | | | 8.25 | % |
| S&P 500® | | | 28.71 | % | | | 18.47 | % | | | 16.55 | % |
Expense Ratios**
| Fund | | Gross | | | Net | | | | |
| ProFund VP Telecommunications | | | 1.77 | % | | | 1.68 | % | | | | |
| ** | Reflects the expense ratio as reported in the Prospectus dated May 1, 2021. Contractual fee waivers are in effect through April 30, 2022. See Financial Highlights for effective expense ratios. |
Allocation of Portfolio Holdings & Index Composition
Market Exposure
| Investment Type | | % of Net Assets | |
| Equity Securities | | | 98 | % |
| Swap Agreements | | | 1 | % |
| Total Exposure | | | 99 | % |
"Market Exposure" includes the value of total investments (including the contract value of any derivatives) and excludes any instruments used for cash management.
Largest Equity Holdings
| Company | | % of Net Assets | |
| Cisco Systems, Inc. | | | 23.1 | % |
| Verizon Communications, Inc. | | | 21.4 | % |
| Arista Networks, Inc. | | | 4.8 | % |
| Motorola Solutions, Inc. | | | 4.5 | % |
| AT&T, Inc. | | | 4.4 | % |
Dow Jones U.S. Select TelecommunicationsSM
Index – Composition
| | | % of Index | |
| Communications Equipment | | | 52 | % |
| Diversified Telecommunication Services | | | 39 | % |
| Wireless Telecommunication Services | | | 5 | % |
| Household Durables | | | 4 | % |
Past performance does not guarantee future results. Return calculations assume the reinvestment of distributions and do not reflect taxes that a shareholder would pay on Fund distributions or on the redemption of Fund shares. The performance data quoted represents past performance and current returns may be lower or higher. The investment return and net asset value ("NAV") will fluctuate so that an investor's shares, when redeemed, may be worth more or less than the original cost. The performance above reflects any fee reductions during the applicable periods. If such fee reductions had not occurred, the quoted performance would be lower. Performance numbers are net of all Fund fees and expenses but do not include any insurance, sales, or administrative charges of variable annuity or life insurance contracts. If these charges were included, the returns would be lower. To obtain performance current to the most recent month-end, please call toll-free 888-776-3637.
| 1 | The graph and table reflect the theoretical reinvestment of dividends on securities in the Indexes. The impact of transaction costs and the deduction of fees and expenses associated with a mutual fund, such as investment management and accounting fees, are not reflected in calculations of the Indexes. The Fund's performance reflects the reinvestment of dividends as well as the impact of transaction costs and the deduction of fees and expenses. It is not possible to invest directly in an index. |
| 2 | 1.00 equals perfect correlation. This calculation is based on the daily total return of the Index and the performance of the daily total return of the NAV per share of the Fund. |
| 3 | The S&P 500® is an unmanaged index that consists of the common stocks of 500 major U.S. corporations selected for their size and the frequency and ease with which their stocks trade. |
The above information is not covered by the Report of the Independent Registered Public Accounting Firm.
300 :: ProFund VP Telecommunications :: Financial Statements
Schedule of Portfolio Investments :: December 31, 2021
Common Stocks (98.1%)
| | | Shares | | | Value | |
| ADTRAN, Inc. (Communications Equipment) | | | 975 | | | $ | 22,259 | |
| Anterix, Inc.* (Diversified Telecommunication Services) | | | 367 | | | | 21,565 | |
| Arista Networks, Inc.* (Communications Equipment) | | | 2,467 | | | | 354,631 | |
| AT&T, Inc. (Diversified Telecommunication Services) | | | 13,359 | | | | 328,631 | |
| ATN International, Inc. (Diversified Telecommunication Services) | | | 217 | | | | 8,669 | |
| Ciena Corp.* (Communications Equipment) | | | 3,106 | | | | 239,069 | |
| Cisco Systems, Inc. (Communications Equipment) | | | 27,141 | | | | 1,719,925 | |
| CommScope Holding Co., Inc.* (Communications Equipment) | | | 4,098 | | | | 45,242 | |
| Comtech Telecommunications Corp. (Communications Equipment) | | | 528 | | | | 12,508 | |
| Consolidated Communications Holdings, Inc.* (Diversified Telecommunication Services) | | | 1,442 | | | | 10,786 | |
| EchoStar Corp.*—Class A (Communications Equipment) | | | 780 | | | | 20,553 | |
| Extreme Networks, Inc.* (Communications Equipment) | | | 2,602 | | | | 40,851 | |
| F5, Inc.* (Communications Equipment) | | | 1,210 | | | | 296,099 | |
| Frontier Communications Parent, Inc.* (Diversified Telecommunication Services) | | | 4,165 | | | | 122,826 | |
| Garmin, Ltd. (Household Durables) | | | 2,227 | | | | 303,251 | |
| Globalstar, Inc.* (Diversified Telecommunication Services) | | | 13,300 | | | | 15,428 | |
| Harmonic, Inc.* (Communications Equipment) | | | 2,054 | | | | 24,155 | |
| IDT Corp.*—Class B (Diversified Telecommunication Services) | | | 349 | | | | 15,412 | |
| Inseego Corp.* (Communications Equipment) | | | 1,579 | | | | 9,206 | |
| Iridium Communications, Inc.* (Diversified Telecommunication Services) | | | 2,652 | | | | 109,501 | |
| Juniper Networks, Inc. (Communications Equipment) | | | 6,520 | | | | 232,829 | |
| Liberty Global PLC*—Class A (Media) | | | 3,545 | | | | 98,338 | |
| Liberty Global PLC*—Class C (Media) | | | 6,658 | | | | 187,023 | |
| Liberty Latin America, Ltd.*—Class A (Media) | | | 818 | | | | 9,538 | |
| Liberty Latin America, Ltd.*—Class C (Media) | | | 3,117 | | | | 35,534 | |
| Lumen Technologies, Inc. (Diversified Telecommunication Services) | | | 18,475 | | | | 231,861 | |
| Lumentum Holdings, Inc.* (Communications Equipment) | | | 1,450 | | | | 153,367 | |
| Motorola Solutions, Inc. (Communications Equipment) | | | 1,220 | | | | 331,474 | |
| NETGEAR, Inc.* (Communications Equipment) | | | 586 | | | | 17,117 | |
| NetScout Systems, Inc.* (Communications Equipment) | | | 1,481 | | | | 48,991 | |
| Plantronics, Inc.* (Communications Equipment) | | | 857 | | | | 25,144 | |
| Radius Global Infrastructure, Inc.*—Class A (Diversified Telecommunication Services) | | | 1,168 | | | | 18,805 | |
| Ribbon Communications, Inc.* (Communications Equipment) | | | 2,413 | | | | 14,599 | |
| Shenandoah Telecommunications Co. (Wireless Telecommunication Services) | | | 1,003 | | | | 25,577 | |
| Telephone and Data Systems, Inc. (Wireless Telecommunication Services) | | | 1,980 | | | | 39,897 | |
| T-Mobile US, Inc.* (Wireless Telecommunication Services) | | | 2,697 | | | | 312,798 | |
| U.S. Cellular Corp.* (Wireless Telecommunication Services) | | | 298 | | | | 9,393 | |
| Ubiquiti, Inc. (Communications Equipment) | | | 126 | | | | 38,644 | |
| Verizon Communications, Inc. (Diversified Telecommunication Services) | | | 30,657 | | | | 1,592,938 | |
| ViaSat, Inc.* (Communications Equipment) | | | 1,474 | | | | 65,652 | |
| Viavi Solutions, Inc.* (Communications Equipment) | | | 4,764 | | | | 83,942 | |
TOTAL COMMON STOCKS
(Cost $5,006,675) | | | | | | | 7,294,028 | |
Repurchase Agreements(a) (2.1%)
| | | Principal
Amount | | | Value | |
| Repurchase Agreements with various counterparties, 0.00%, dated 12/31/21, due 1/3/22, total to be received $159,000 | | $ | 159,000 | | | $ | 159,000 | |
TOTAL REPURCHASE AGREEMENTS
(Cost $159,000) | | | | | | | 159,000 | |
TOTAL INVESTMENT SECURITIES
(Cost $5,165,675)—100.2% | | | | | | | 7,453,028 | |
| Net other assets (liabilities)—(0.2)% | | | | | | | (15,463 | ) |
| NET ASSETS—100.0% | | | | | | $ | 7,437,565 | |
| * | Non-income producing security. |
| (a) | The ProFund VP invests in Repurchase Agreements jointly with other funds in the Trust. See "Repurchase Agreements" under Note 2 in the Notes to Financial Statements to view the details of each individual agreement and counterparty as well as a description of the securities subject to repurchase. |
Total Return Swap Agreements—Long
| Underlying Instrument | | Counterparty | | Termination
Date(1) | | Rate Paid
(Received)(2) | | | Notional
Amount | | | Value and
Unrealized
Appreciation/
(Depreciation) | |
| Dow Jones U.S. Select Telecommunications Index | | Goldman Sachs International | | 1/24/22 | | | 0.68 | % | | $ | 86,564 | | | $ | 372 | |
| (1) | Agreements may be terminated at will by either party without penalty. Payment is due at termination/maturity. |
| (2) | Reflects the floating financing rate, as of December 31, 2021, on the notional amount of the swap agreement paid to the counterparty or received from the counterparty, excluding any commissions. This amount is included as part of the unrealized appreciation/(depreciation). |
See accompanying notes to financial statements.
Financial Statements :: ProFund VP Telecommunications :: 301
ProFund VP Telecommunications invested in the following industries as of December 31, 2021:
| | | Value | | | % of
Net Assets | |
| Communications Equipment | | $ | 3,796,257 | | | | 51.0 | % |
| Diversified Telecommunication Services | | | 2,476,422 | | | | 33.4 | % |
| Household Durables | | | 303,251 | | | | 4.1 | % |
| Media | | | 330,433 | | | | 4.4 | % |
| Wireless Telecommunication Services | | | 387,665 | | | | 5.2 | % |
| Other** | | | 143,537 | | | | 1.9 | % |
| Total | | $ | 7,437,565 | | | | 100.0 | % |
| ** | Includes any non-equity securities and net other assets (liabilities), which includes any receivable for capital shares issued and payable for capital shares redeemed. |
See accompanying notes to financial statements.
302 :: ProFund VP Telecommunications :: Financial Statements
Statement of Assets and Liabilities
December 31, 2021
| ASSETS: |
| Total Investment Securities, at cost | | $ | 5,165,675 | |
| Securities, at value | | | 7,294,028 | |
| Repurchase agreements, at value | | | 159,000 | |
| Total Investment Securities, at value | | | 7,453,028 | |
| Cash | | | 262 | |
| Dividends receivable | | | 944 | |
| Unrealized appreciation on swap agreements | | | 372 | |
| Receivable for capital shares issued | | | 709 | |
| Prepaid expenses | | | 95 | |
| TOTAL ASSETS | | | 7,455,410 | |
| | | | | |
| LIABILITIES: | | | | |
| Payable for capital shares redeemed | | | 2,724 | |
| Advisory fees payable | | | 4,346 | |
| Management services fees payable | | | 579 | |
| Administration fees payable | | | 394 | |
| Administrative services fees payable | | | 2,807 | |
| Distribution fees payable | | | 2,593 | |
| Transfer agency fees payable | | | 639 | |
| Fund accounting fees payable | | | 230 | |
| Compliance services fees payable | | | 30 | |
| Other accrued expenses | | | 3,503 | |
| TOTAL LIABILITIES | | | 17,845 | |
| NET ASSETS | | $ | 7,437,565 | |
| | | | | |
| NET ASSETS CONSIST OF: | | | | |
| Capital | | $ | 6,653,447 | |
| Total distributable earnings (loss) | | | 784,118 | |
| NET ASSETS | | $ | 7,437,565 | |
| Shares of Beneficial Interest Outstanding (unlimited number of shares authorized, no par value) | | | 196,922 | |
| Net Asset Value (offering and redemption price per share) | | $ | 37.77 | |
Statement of Operations
For the Year Ended December 31, 2021
| INVESTMENT INCOME: | | | | |
| Dividends | | $ | 219,638 | |
| Interest | | | 1 | |
| Net income from securities lending | | | 42 | |
| TOTAL INVESTMENT INCOME | | | 219,681 | |
| | | | | |
| EXPENSES: | | | | |
| Advisory fees | | | 51,871 | |
| Management services fees | | | 6,916 | |
| Administration fees | | | 5,221 | |
| Transfer agency fees | | | 4,227 | |
| Administrative services fees | | | 20,443 | |
| Distribution fees | | | 17,290 | |
| Custody fees | | | 1,172 | |
| Fund accounting fees | | | 2,990 | |
| Trustee fees | | | 116 | |
| Compliance services fees | | | 43 | |
| Other fees | | | 6,706 | |
| Recoupment of prior expenses reduced by the Advisor | | | 200 | |
| Total Gross Expenses before reductions | | | 117,195 | |
| Expenses reduced and reimbursed by the Advisor | | | (1,006 | ) |
| TOTAL NET EXPENSES | | | 116,189 | |
| NET INVESTMENT INCOME (LOSS) | | | 103,492 | |
| | | | | |
| REALIZED AND UNREALIZED GAINS (LOSSES) ON INVESTMENTS: | | | | |
| Net realized gains (losses) on investment securities | | | 369,223 | |
| Net realized gains (losses) on swap agreements | | | 15,124 | |
| Change in net unrealized appreciation/depreciation on investment securities | | | 642,990 | |
| Change in net unrealized appreciation/depreciation on swap agreements | | | 349 | |
| NET REALIZED AND UNREALIZED GAINS (LOSSES) ON INVESTMENTS | | | 1,027,686 | |
| CHANGE IN NET ASSETS RESULTING FROM OPERATIONS | | $ | 1,131,178 | |
See accompanying notes to financial statements.
Financial Statements :: ProFund VP Telecommunications :: 303
| Statements of Changes in Net Assets |
| |
| | | Year Ended
December 31, 2021 | | | Year Ended
December 31, 2020 | |
| FROM INVESTMENT ACTIVITIES: | | | | | | | | |
| | | | | | | | | |
| OPERATIONS: |
| Net investment income (loss) | | $ | 103,492 | | | $ | 81,611 | |
| Net realized gains (losses) on investments | | | 384,347 | | | | (269,701 | ) |
| Change in net unrealized appreciation/depreciation on investments | | | 643,339 | | | | 308,313 | |
| Change in net assets resulting from operations | | | 1,131,178 | | | | 120,223 | |
| | | | | | | | | |
| DISTRIBUTIONS TO SHAREHOLDERS: | | | | | | | | |
| Total distributions | | | (81,611 | ) | | | (61,265 | ) |
| Change in net assets resulting from distributions | | | (81,611 | ) | | | (61,265 | ) |
| | | | | | | | | |
| CAPITAL TRANSACTIONS: | | | | | | | | |
| Proceeds from shares issued | | | 7,468,687 | | | | 7,913,416 | |
| Distributions reinvested | | | 81,611 | | | | 61,265 | |
| Value of shares redeemed | | | (7,788,325 | ) | | | (7,574,704 | ) |
| Change in net assets resulting from capital transactions | | | (238,027 | ) | | | 399,977 | |
| Change in net assets | | | 811,540 | | | | 458,935 | |
| | | | | | | | | |
| NET ASSETS: | | | | | | | | |
| Beginning of period | | | 6,626,025 | | | | 6,167,090 | |
| End of period | | $ | 7,437,565 | | | $ | 6,626,025 | |
| | | | | | | | | |
| SHARE TRANSACTIONS: | | | | | | | | |
| Issued | | | 210,825 | | | | 268,260 | |
| Reinvested | | | 2,336 | | | | 1,967 | |
| Redeemed | | | (221,721 | ) | | | (260,333 | ) |
| Change in shares | | | (8,560 | ) | | | 9,894 | |
See accompanying notes to financial statements.
304 :: ProFund VP Telecommunications :: Financial Highlights
ProFunds Financial Highlights FOR THE PERIODS INDICATED
Selected data for a share of beneficial interest outstanding throughout the periods indicated.
| | | Year Ended
Dec. 31, 2021 | | | Year Ended
Dec. 31, 2020 | | | Year Ended
Dec. 31, 2019 | | | Year Ended
Dec. 31, 2018 | | | Year Ended
Dec. 31, 2017 | |
| Net Asset Value, Beginning of Period | | $ | 32.25 | | | $ | 31.53 | | | $ | 28.42 | | | $ | 35.52 | | | $ | 40.78 | |
| | | | | | | | | | | | | | | | | | | | | |
| Investment Activities: | | | | | | | | | | | | | | | | | | | | |
| Net investment income (loss)(a) | | | 0.53 | | | | 0.41 | | | | 0.28 | | | | 0.94 | | | | 1.29 | |
| Net realized and unrealized gains (losses) on investments | | | 5.38 | | | | 0.57 | | | | 3.87 | | | | (6.22 | ) | | | (2.27 | ) |
| Total income (loss) from investment activities | | | 5.91 | | | | 0.98 | | | | 4.15 | | | | (5.28 | ) | | | (0.98 | ) |
| | | | | | | | | | | | | | | | | | | | | |
| Distributions to Shareholders From: | | | | | | | | | | | | | | | | | | | | |
| Net investment income | | | (0.39 | ) | | | (0.26 | ) | | | (1.04 | ) | | | (1.82 | ) | | | (1.92 | ) |
| Net realized gains on investments | | | — | | | | — | | | | — | | | | — | | | | (2.36 | ) |
| Total distributions | | | (0.39 | ) | | | (0.26 | ) | | | (1.04 | ) | | | (1.82 | ) | | | (4.28 | ) |
| | | | | | | | | | | | | | | | | | | | | |
| Net Asset Value, End of Period | | $ | 37.77 | | | $ | 32.25 | | | $ | 31.53 | | | $ | 28.42 | | | $ | 35.52 | |
| | | | | | | | | | | | | | | | | | | | | |
| Total Return | | | 18.41 | % | | | 3.15 | % | | | 14.77 | % | | | (15.10 | )% | | | (2.12 | )% |
| | | | | | | | | | | | | | | | | | | | | |
| Ratios to Average Net Assets: | | | | | | | | | | | | | | | | | | | | |
| Gross expenses | | | 1.69 | % | | | 1.77 | % | | | 1.76 | % | | | 1.76 | % | | | 1.72 | % |
| Net expenses | | | 1.68 | % | | | 1.68 | % | | | 1.68 | % | | | 1.68 | % | | | 1.68 | % |
| Net investment income (loss) | | | 1.50 | % | | | 1.36 | % | | | 0.89 | % | | | 2.96 | % | | | 3.43 | % |
| | | | | | | | | | | | | | | | | | | | | |
| Supplemental Data: | | | | | | | | | | | | | | | | | | | | |
| Net assets, end of period (000's) | | $ | 7,438 | | | $ | 6,626 | | | $ | 6,167 | | | $ | 5,272 | | | $ | 9,372 | |
| Portfolio turnover rate(b) | | | 105 | % | | | 107 | % | | | 165 | % | | | 328 | % | | | 388 | % |
| (a) | Per share net investment income (loss) has been calculated using the average daily shares method. |
| (b) | Portfolio turnover rate is calculated without regard to instruments having a maturity of less than one year from acquisition or derivative instruments (including swap agreements and futures contracts). The portfolio turnover rate can be high and volatile due to the amount and timing of sales and purchases of fund shares during the period. |
See accompanying notes to financial statements.
Management Discussion of Fund Performance :: ProFund VP UltraBull :: 305
ProFund VP UltraBull (the "Fund") seeks daily investment results, before fees and expenses, that correspond to two times (2x) the return of the S&P 500® (the "Index") for a single day, not for any other period. A "single day" is measured from the time the Fund calculates its net asset value ("NAV") to the time of the Fund's next NAV calculation. The Fund does not seek to achieve its stated investment objective over a period of time greater than a single day. The return of the Fund for periods longer than a single day will be the result of its return for each day compounded over the period. The Fund's returns for periods longer than a single day will very likely differ in amount, and possibly even direction from the Fund's stated multiple (2x) times the return of the Fund's Index for the same period. For periods longer than a single day, the Fund will lose money if the Index's performance is flat, and it is possible that the Fund will lose money even if the level of the index rises. For the year ended December 31, 2021, the Fund had a total return of 58.14%. For the same period, the Index had a total return of 28.71%1 and a volatility of 13.10%. For the year, the Fund achieved an average daily statistical correlation of over 0.99 to twice that of the daily performance of the Index.2
The Fund takes positions in financial instruments that, in combination, should have similar daily return characteristics as twice the daily return of the Index. The Index is a measure of large-cap U.S. stock market performance. It is a float-adjusted, market capitalization-weighted index of 500 U.S. operating companies and real estate investment trusts selected through a process that factors criteria such as liquidity, price, market capitalization, and financial viability. Reconstitution occurs both on a quarterly and an ongoing basis.
During the year ended December 31, 2021, the Fund invested in swap agreements and futures contracts as a substitute for investing directly in stocks in order to gain leveraged exposure to the Index. These derivatives generally tracked the performance of their underlying benchmark and were negatively impacted by financing costs associated with their use. The Fund entered into swap agreements with counterparties that the Fund's advisor determined to be major, global financial institutions. If a counterparty becomes insolvent or otherwise fails to perform on its obligations, the value of investments in the Fund may decline. The Fund has sought to mitigate this risk by generally requiring counterparties to post collateral for the benefit of the Fund, marked to market daily, in an amount approximately equal to the amount the counterparty owed to the Fund, subject to certain minimum thresholds.
Value of a $10,000 Investment at Net Asset Value*

| * | The line graph represents the historical performance of a hypothetical investment of $10,000 in the ProFund VP UltraBull from December 31, 2011 to December 31, 2021, assuming the reinvestment of distributions. |
Average Annual Total Return as of 12/31/21
| Fund | | One Year | | | Five Year | | | Ten Year | |
| ProFund VP UltraBull | | | 58.14 | % | | | 29.32 | % | | | 27.24 | % |
| S&P 500® | | | 28.71 | % | | | 18.47 | % | | | 16.55 | % |
Expense Ratios**
| Fund | | Gross | | | Net | | | | | |
| ProFund VP UltraBull | | | 1.69 | % | | | 1.68 | % | | | | |
| ** | Reflects the expense ratio as reported in the Prospectus dated May 1, 2021. Contractual fee waivers are in effect through April 30, 2022. See Financial Highlights for effective expense ratios. |
Allocation of Portfolio Holdings & Index Composition
Market Exposure
| Investment Type | | % of Net Assets | |
| Equity Securities | | | 79 | % |
| Futures Contracts | | | 10 | % |
| Swap Agreements | | | 116 | % |
| Total Exposure | | | 205 | % |
"Market Exposure" includes the value of total investments (including the contract value of any derivatives) and excludes any instruments used for cash management or collateral for securities loaned.
Largest Equity Holdings
| Company | | % of Net Assets | |
| Apple, Inc. | | | 5.4 | % |
| Microsoft Corp. | | | 4.9 | % |
| Alphabet, Inc. | | | 3.3 | % |
| Amazon.com, Inc. | | | 2.8 | % |
| Tesla, Inc. | | | 1.7 | % |
S&P 500® Index – Composition
| | | % of Index | |
| Information Technology | | | 28 | % |
| Health Care | | | 13 | % |
| Consumer Discretionary | | | 13 | % |
| Financials | | | 11 | % |
| Communication Services | | | 10 | % |
| Industrials | | | 8 | % |
| Consumer Staples | | | 6 | % |
| Real Estate | | | 3 | % |
| Energy | | | 3 | % |
| Materials | | | 3 | % |
| Utilities | | | 2 | % |
Past performance does not guarantee future results. Return calculations assume the reinvestment of distributions and do not reflect taxes that a shareholder would pay on Fund distributions or on the redemption of Fund shares. The performance data quoted represents past performance and current returns may be lower or higher. The investment return and NAV will fluctuate so that an investor's shares, when redeemed, may be worth more or less than the original cost. The performance above reflects any fee reductions during the applicable periods. If such fee reductions had not occurred, the quoted performance would be lower. Performance numbers are net of all Fund fees and expenses but do not include any insurance, sales, or administrative charges of variable annuity or life insurance contracts. If these charges were included, the returns would be lower. To obtain performance current to the most recent month-end, please call toll-free 888-776-3637.
| 1 | The graph and table reflect the theoretical reinvestment of dividends on securities in the Index. The impact of transaction costs and the deduction of fees and expenses associated with a mutual fund, such as investment management and accounting fees, are not reflected in the index calculations. The Fund's performance reflects the reinvestment of dividends as well as the impact of transaction costs and the deduction of fees and expenses. It is not possible to invest directly in an index. |
| 2 | 1.00 equals perfect correlation. This calculation is based on the daily total return of the Index and the performance of the daily total return of the NAV per share of the Fund. |
The above information is not covered by the Report of the Independent Registered Public Accounting Firm.
306 :: ProFund VP UltraBull :: Financial Statements
Schedule of Portfolio Investments :: December 31, 2021
Common Stocks (79.1%)
| | | Shares | | | Value | |
| 3M Co. (Industrial Conglomerates) | | | 223 | | | $ | 39,611 | |
| A.O. Smith Corp. (Building Products) | | | 52 | | | | 4,464 | |
| Abbott Laboratories (Health Care Equipment & Supplies) | | | 686 | | | | 96,549 | |
| AbbVie, Inc. (Biotechnology) | | | 685 | | | | 92,750 | |
| ABIOMED, Inc.* (Health Care Equipment & Supplies) | | | 18 | | | | 6,465 | |
| Accenture PLC—Class A (IT Services) | | | 245 | | | | 101,564 | |
| Activision Blizzard, Inc. (Entertainment) | | | 302 | | | | 20,092 | |
| Adobe, Inc.* (Software) | | | 184 | | | | 104,340 | |
| Advance Auto Parts, Inc. (Specialty Retail) | | | 24 | | | | 5,757 | |
| Advanced Micro Devices, Inc.* (Semiconductors & Semiconductor Equipment) | | | 468 | | | | 67,345 | |
| Aflac, Inc. (Insurance) | | | 236 | | | | 13,780 | |
| Agilent Technologies, Inc. (Life Sciences Tools & Services) | | | 117 | | | | 18,679 | |
| Air Products & Chemicals, Inc. (Chemicals) | | | 86 | | | | 26,166 | |
| Akamai Technologies, Inc.* (IT Services) | | | 63 | | | | 7,374 | |
| Alaska Air Group, Inc.* (Airlines) | | | 49 | | | | 2,553 | |
| Albemarle Corp. (Chemicals) | | | 45 | | | | 10,520 | |
| Alexandria Real Estate Equities, Inc. (Equity Real Estate Investment Trusts) | | | 55 | | | | 12,263 | |
| Align Technology, Inc.* (Health Care Equipment & Supplies) | | | 28 | | | | 18,401 | |
| Allegion PLC (Building Products) | | | 35 | | | | 4,635 | |
| Alliant Energy Corp. (Electric Utilities) | | | 97 | | | | 5,963 | |
| Alphabet, Inc.*—Class A (Interactive Media & Services) | | | 117 | | | | 338,953 | |
| Alphabet, Inc.*—Class C (Interactive Media & Services) | | | 108 | | | | 312,508 | |
| Altria Group, Inc. (Tobacco) | | | 712 | | | | 33,742 | |
| Amazon.com, Inc.* (Internet & Direct Marketing Retail) | | | 169 | | | | 563,504 | |
| Amcor PLC (Containers & Packaging) | | | 594 | | | | 7,134 | |
| Ameren Corp. (Multi-Utilities) | | | 100 | | | | 8,901 | |
| American Airlines Group, Inc.* (Airlines) | | | 251 | | | | 4,508 | |
| American Electric Power Co., Inc. (Electric Utilities) | | | 195 | | | | 17,349 | |
| American Express Co. (Consumer Finance) | | | 243 | | | | 39,754 | |
| American International Group, Inc. (Insurance) | | | 322 | | | | 18,309 | |
| American Tower Corp. (Equity Real Estate Investment Trusts) | | | 177 | | | | 51,772 | |
| American Water Works Co., Inc. (Water Utilities) | | | 70 | | | | 13,220 | |
| Ameriprise Financial, Inc. (Capital Markets) | | | 43 | | | | 12,971 | |
| AmerisourceBergen Corp. (Health Care Providers & Services) | | | 58 | | | | 7,708 | |
| AMETEK, Inc. (Electrical Equipment) | | | 90 | | | | 13,234 | |
| Amgen, Inc. (Biotechnology) | | | 218 | | | | 49,044 | |
| Amphenol Corp.—Class A (Electronic Equipment, Instruments & Components) | | | 232 | | | | 20,291 | |
| Analog Devices, Inc. (Semiconductors & Semiconductor Equipment) | | | 208 | | | | 36,560 | |
| ANSYS, Inc.* (Software) | | | 34 | | | | 13,638 | |
| Anthem, Inc. (Health Care Providers & Services) | | | 94 | | | | 43,573 | |
| Aon PLC (Insurance) | | | 85 | | | | 25,548 | |
| APA Corp. (Oil, Gas & Consumable Fuels) | | | 141 | | | | 3,791 | |
| Apple, Inc. (Technology Hardware, Storage & Peripherals) | | | 6,042 | | | | 1,072,879 | |
| Applied Materials, Inc. (Semiconductors & Semiconductor Equipment) | | | 350 | | | | 55,076 | |
| Aptiv PLC* (Auto Components) | | | 105 | | | | 17,319 | |
| Archer-Daniels-Midland Co. (Food Products) | | | 217 | | | | 14,667 | |
| Arista Networks, Inc.* (Communications Equipment) | | | 87 | | | | 12,506 | |
| Arthur J. Gallagher & Co. (Insurance) | | | 80 | | | | 13,574 | |
| Assurant, Inc. (Insurance) | | | 22 | | | | 3,429 | |
| AT&T, Inc. (Diversified Telecommunication Services) | | | 2,769 | | | | 68,117 | |
| Atmos Energy Corp. (Gas Utilities) | | | 51 | | | | 5,343 | |
| Autodesk, Inc.* (Software) | | | 85 | | | | 23,901 | |
| Automatic Data Processing, Inc. (IT Services) | | | 163 | | | | 40,193 | |
| AutoZone, Inc.* (Specialty Retail) | | | 8 | | | | 16,771 | |
| AvalonBay Communities, Inc. (Equity Real Estate Investment Trusts) | | | 54 | | | | 13,640 | |
| Avery Dennison Corp. (Containers & Packaging) | | | 32 | | | | 6,930 | |
| Baker Hughes Co.—Class A (Energy Equipment & Services) | | | 339 | | | | 8,156 | |
| Ball Corp. (Containers & Packaging) | | | 126 | | | | 12,130 | |
| Bank of America Corp. (Banks) | | | 2,792 | | | | 124,216 | |
| Bath & Body Works, Inc. (Specialty Retail) | | | 102 | | | | 7,119 | |
| Baxter International, Inc. (Health Care Equipment & Supplies) | | | 194 | | | | 16,653 | |
| Becton, Dickinson & Co. (Health Care Equipment & Supplies) | | | 111 | | | | 27,914 | |
| Berkshire Hathaway, Inc.*—Class B (Diversified Financial Services) | | | 710 | | | | 212,290 | |
| Best Buy Co., Inc. (Specialty Retail) | | | 86 | | | | 8,738 | |
| Biogen, Inc.* (Biotechnology) | | | 57 | | | | 13,675 | |
| Bio-Rad Laboratories, Inc.*—Class A (Life Sciences Tools & Services) | | | 8 | | | | 6,045 | |
| Bio-Techne Corp. (Life Sciences Tools & Services) | | | 15 | | | | 7,760 | |
| BlackRock, Inc.—Class A (Capital Markets) | | | 55 | | | | 50,356 | |
| Booking Holdings, Inc.* (Hotels, Restaurants & Leisure) | | | 16 | | | | 38,388 | |
| BorgWarner, Inc. (Auto Components) | | | 93 | | | | 4,192 | |
| Boston Properties, Inc. (Equity Real Estate Investment Trusts) | | | 55 | | | | 6,335 | |
| Boston Scientific Corp.* (Health Care Equipment & Supplies) | | | 552 | | | | 23,449 | |
| Bristol-Myers Squibb Co. (Pharmaceuticals) | | | 861 | | | | 53,683 | |
| Broadcom, Inc. (Semiconductors & Semiconductor Equipment) | | | 160 | | | | 106,466 | |
| Broadridge Financial Solutions, Inc. (IT Services) | | | 45 | | | | 8,227 | |
| Brown & Brown, Inc. (Insurance) | | | 91 | | | | 6,395 | |
See accompanying notes to financial statements.
Financial Statements :: ProFund VP UltraBull :: 307
Common Stocks, continued
| | | Shares | | | Value | |
| Brown-Forman Corp.—Class B (Beverages) | | | 71 | | | $ | 5,173 | |
| C.H. Robinson Worldwide, Inc. (Air Freight & Logistics) | | | 50 | | | | 5,382 | |
| Cadence Design Systems, Inc.* (Software) | | | 107 | | | | 19,939 | |
| Caesars Entertainment, Inc.* (Hotels, Restaurants & Leisure) | | | 83 | | | | 7,763 | |
| Campbell Soup Co. (Food Products) | | | 78 | | | | 3,390 | |
| Capital One Financial Corp. (Consumer Finance) | | | 165 | | | | 23,940 | |
| Cardinal Health, Inc. (Health Care Providers & Services) | | | 109 | | | | 5,612 | |
| CarMax, Inc.* (Specialty Retail) | | | 63 | | | | 8,204 | |
| Carnival Corp.*—Class A (Hotels, Restaurants & Leisure) | | | 312 | | | | 6,277 | |
| Carrier Global Corp. (Building Products) | | | 336 | | | | 18,225 | |
| Catalent, Inc.* (Pharmaceuticals) | | | 66 | | | | 8,450 | |
| Caterpillar, Inc. (Machinery) | | | 210 | | | | 43,415 | |
| Cboe Global Markets, Inc. (Capital Markets) | | | 41 | | | | 5,346 | |
| CBRE Group, Inc.*—Class A (Real Estate Management & Development) | | | 130 | | | | 14,106 | |
| CDW Corp. (Electronic Equipment, Instruments & Components) | | | 53 | | | | 10,853 | |
| Celanese Corp. (Chemicals) | | | 42 | | | | 7,059 | |
| Centene Corp.* (Health Care Providers & Services) | | | 226 | | | | 18,622 | |
| CenterPoint Energy, Inc. (Multi-Utilities) | | | 244 | | | | 6,810 | |
| Ceridian HCM Holding, Inc.* (Software) | | | 53 | | | | 5,536 | |
| Cerner Corp. (Health Care Technology) | | | 114 | | | | 10,587 | |
| CF Industries Holdings, Inc. (Chemicals) | | | 83 | | | | 5,875 | |
| Charles River Laboratories International, Inc.* (Life Sciences Tools & Services) | | | 20 | | | | 7,536 | |
| Charter Communications, Inc.*—Class A (Media) | | | 48 | | | | 31,295 | |
| Chevron Corp. (Oil, Gas & Consumable Fuels) | | | 748 | | | | 87,779 | |
| Chipotle Mexican Grill, Inc.* (Hotels, Restaurants & Leisure) | | | 11 | | | | 19,231 | |
| Chubb, Ltd. (Insurance) | | | 167 | | | | 32,282 | |
| Church & Dwight Co., Inc. (Household Products) | | | 95 | | | | 9,738 | |
| Cigna Corp. (Health Care Providers & Services) | | | 128 | | | | 29,393 | |
| Cincinnati Financial Corp. (Insurance) | | | 58 | | | | 6,608 | |
| Cintas Corp. (Commercial Services & Supplies) | | | 34 | | | | 15,068 | |
| Cisco Systems, Inc. (Communications Equipment) | | | 1,635 | | | | 103,610 | |
| Citigroup, Inc. (Banks) | | | 769 | | | | 46,440 | |
| Citizens Financial Group, Inc. (Banks) | | | 165 | | | | 7,796 | |
| Citrix Systems, Inc. (Software) | | | 48 | | | | 4,540 | |
| CME Group, Inc. (Capital Markets) | | | 139 | | | | 31,756 | |
| CMS Energy Corp. (Multi-Utilities) | | | 112 | | | | 7,286 | |
| Cognizant Technology Solutions Corp.—Class A (IT Services) | | | 204 | | | | 18,099 | |
| Colgate-Palmolive Co. (Household Products) | | | 327 | | | | 27,906 | |
| Comcast Corp.—Class A (Media) | | | 1,768 | | | | 88,982 | |
| Comerica, Inc. (Banks) | | | 51 | | | | 4,437 | |
| Conagra Brands, Inc. (Food Products) | | | 186 | | | | 6,352 | |
| ConocoPhillips (Oil, Gas & Consumable Fuels) | | | 511 | | | | 36,884 | |
| Consolidated Edison, Inc. (Multi-Utilities) | | | 137 | | | | 11,689 | |
| Constellation Brands, Inc.—Class A (Beverages) | | | 64 | | | | 16,062 | |
| Copart, Inc.* (Commercial Services & Supplies) | | | 83 | | | | 12,584 | |
| Corning, Inc. (Electronic Equipment, Instruments & Components) | | | 298 | | | | 11,095 | |
| Corteva, Inc. (Chemicals) | | | 283 | | | | 13,380 | |
| Costco Wholesale Corp. (Food & Staples Retailing) | | | 171 | | | | 97,078 | |
| Coterra Energy, Inc. (Oil, Gas & Consumable Fuels) | | | 315 | | | | 5,985 | |
| Crown Castle International Corp. (Equity Real Estate Investment Trusts) | | | 168 | | | | 35,068 | |
| CSX Corp. (Road & Rail) | | | 860 | | | | 32,336 | |
| Cummins, Inc. (Machinery) | | | 55 | | | | 11,998 | |
| CVS Health Corp. (Health Care Providers & Services) | | | 512 | | | | 52,818 | |
| Danaher Corp. (Health Care Equipment & Supplies) | | | 247 | | | | 81,265 | |
| Darden Restaurants, Inc. (Hotels, Restaurants & Leisure) | | | 50 | | | | 7,532 | |
| DaVita, Inc.* (Health Care Providers & Services) | | | 25 | | | | 2,844 | |
| Deere & Co. (Machinery) | | | 109 | | | | 37,375 | |
| Delta Air Lines, Inc.* (Airlines) | | | 248 | | | | 9,692 | |
| DENTSPLY SIRONA, Inc. (Health Care Equipment & Supplies) | | | 85 | | | | 4,742 | |
| Devon Energy Corp. (Oil, Gas & Consumable Fuels) | | | 244 | | | | 10,748 | |
| DexCom, Inc.* (Health Care Equipment & Supplies) | | | 38 | | | | 20,404 | |
| Diamondback Energy, Inc. (Oil, Gas & Consumable Fuels) | | | 66 | | | | 7,118 | |
| Digital Realty Trust, Inc. (Equity Real Estate Investment Trusts) | | | 110 | | | | 19,456 | |
| Discover Financial Services (Consumer Finance) | | | 114 | | | | 13,174 | |
| Discovery, Inc.*(a) (Media) | | | 66 | | | | 1,554 | |
| Discovery, Inc.*—Class C (Media) | | | 118 | | | | 2,702 | |
| DISH Network Corp.*—Class A (Media) | | | 97 | | | | 3,147 | |
| Dollar General Corp. (Multiline Retail) | | | 90 | | | | 21,225 | |
| Dollar Tree, Inc.* (Multiline Retail) | | | 87 | | | | 12,225 | |
| Dominion Energy, Inc. (Multi-Utilities) | | | 314 | | | | 24,667 | |
| Domino's Pizza, Inc. (Hotels, Restaurants & Leisure) | | | 14 | | | | 7,901 | |
| Dover Corp. (Machinery) | | | 56 | | | | 10,170 | |
| Dow, Inc. (Chemicals) | | | 287 | | | | 16,279 | |
| DR Horton, Inc. (Household Durables) | | | 126 | | | | 13,664 | |
| DTE Energy Co. (Multi-Utilities) | | | 75 | | | | 8,966 | |
| Duke Energy Corp. (Electric Utilities) | | | 298 | | | | 31,261 | |
| Duke Realty Corp. (Equity Real Estate Investment Trusts) | | | 148 | | | | 9,715 | |
| DuPont de Nemours, Inc. (Chemicals) | | | 201 | | | | 16,237 | |
| DXC Technology Co.* (IT Services) | | | 98 | | | | 3,155 | |
| Eastman Chemical Co. (Chemicals) | | | 52 | | | | 6,287 | |
| Eaton Corp. PLC (Electrical Equipment) | | | 155 | | | | 26,787 | |
| eBay, Inc. (Internet & Direct Marketing Retail) | | | 243 | | | | 16,160 | |
See accompanying notes to financial statements.
308 :: ProFund VP UltraBull :: Financial Statements
Common Stocks, continued
| | | Shares | | | Value | |
| Ecolab, Inc. (Chemicals) | | | 97 | | | $ | 22,755 | |
| Edison International (Electric Utilities) | | | 147 | | | | 10,033 | |
| Edwards Lifesciences Corp.* (Health Care Equipment & Supplies) | | | 242 | | | | 31,351 | |
| Electronic Arts, Inc. (Entertainment) | | | 110 | | | | 14,509 | |
| Eli Lilly & Co. (Pharmaceuticals) | | | 308 | | | | 85,076 | |
| Emerson Electric Co. (Electrical Equipment) | | | 232 | | | | 21,569 | |
| Enphase Energy, Inc.* (Semiconductors & Semiconductor Equipment) | | | 52 | | | | 9,513 | |
| Entergy Corp. (Electric Utilities) | | | 78 | | | | 8,787 | |
| EOG Resources, Inc. (Oil, Gas & Consumable Fuels) | | | 227 | | | | 20,164 | |
| EPAM Systems, Inc.* (IT Services) | | | 22 | | | | 14,706 | |
| Equifax, Inc. (Professional Services) | | | 47 | | | | 13,761 | |
| Equinix, Inc. (Equity Real Estate Investment Trusts) | | | 35 | | | | 29,604 | |
| Equity Residential (Equity Real Estate Investment Trusts) | | | 132 | | | | 11,946 | |
| Essex Property Trust, Inc. (Equity Real Estate Investment Trusts) | | | 25 | | | | 8,806 | |
| Etsy, Inc.* (Internet & Direct Marketing Retail) | | | 49 | | | | 10,728 | |
| Everest Re Group, Ltd. (Insurance) | | | 15 | | | | 4,109 | |
| Evergy, Inc. (Electric Utilities) | | | 89 | | | | 6,106 | |
| Eversource Energy (Electric Utilities) | | | 133 | | | | 12,100 | |
| Exelon Corp. (Electric Utilities) | | | 379 | | | | 21,891 | |
| Expedia Group, Inc.* (Hotels, Restaurants & Leisure) | | | 57 | | | | 10,301 | |
| Expeditors International of Washington, Inc. (Air Freight & Logistics) | | | 66 | | | | 8,863 | |
| Extra Space Storage, Inc. (Equity Real Estate Investment Trusts) | | | 52 | | | | 11,790 | |
| Exxon Mobil Corp. (Oil, Gas & Consumable Fuels) | | | 1,641 | | | | 100,414 | |
| F5, Inc.* (Communications Equipment) | | | 23 | | | | 5,628 | |
| FactSet Research Systems, Inc. (Capital Markets) | | | 15 | | | | 7,290 | |
| Fastenal Co. (Trading Companies & Distributors) | | | 223 | | | | 14,286 | |
| Federal Realty Investment Trust (Equity Real Estate Investment Trusts) | | | 27 | | | | 3,681 | |
| FedEx Corp. (Air Freight & Logistics) | | | 95 | | | | 24,571 | |
| Fidelity National Information Services, Inc. (IT Services) | | | 236 | | | | 25,759 | |
| Fifth Third Bancorp (Banks) | | | 265 | | | | 11,541 | |
| First Horizon Corp. (Banks) | | | — | (b) | | | 5 | |
| First Republic Bank (Banks) | | | 69 | | | | 14,249 | |
| FirstEnergy Corp. (Electric Utilities) | | | 211 | | | | 8,775 | |
| Fiserv, Inc.* (IT Services) | | | 230 | | | | 23,872 | |
| FleetCor Technologies, Inc.* (IT Services) | | | 31 | | | | 6,939 | |
| FMC Corp. (Chemicals) | | | 49 | | | | 5,385 | |
| Ford Motor Co. (Automobiles) | | | 1,522 | | | | 31,612 | |
| Fortinet, Inc.* (Software) | | | 53 | | | | 19,048 | |
| Fortive Corp. (Machinery) | | | 139 | | | | 10,604 | |
| Fortune Brands Home & Security, Inc. (Building Products) | | | 53 | | | | 5,666 | |
| Fox Corp.—Class A (Media) | | | 124 | | | | 4,576 | |
| Fox Corp.—Class B (Media) | | | 57 | | | | 1,953 | |
| Franklin Resources, Inc. (Capital Markets) | | | 109 | | | | 3,650 | |
| Freeport-McMoRan, Inc. (Metals & Mining) | | | 569 | | | | 23,744 | |
| Garmin, Ltd. (Household Durables) | | | 59 | | | | 8,034 | |
| Gartner, Inc.* (IT Services) | | | 32 | | | | 10,698 | |
| Generac Holdings, Inc.* (Electrical Equipment) | | | 24 | | | | 8,446 | |
| General Dynamics Corp. (Aerospace & Defense) | | | 90 | | | | 18,762 | |
| General Electric Co. (Industrial Conglomerates) | | | 426 | | | | 40,244 | |
| General Mills, Inc. (Food Products) | | | 235 | | | | 15,834 | |
| General Motors Co.* (Automobiles) | | | 563 | | | | 33,009 | |
| Genuine Parts Co. (Distributors) | | | 55 | | | | 7,711 | |
| Gilead Sciences, Inc. (Biotechnology) | | | 486 | | | | 35,289 | |
| Global Payments, Inc. (IT Services) | | | 112 | | | | 15,140 | |
| Globe Life, Inc. (Insurance) | | | 36 | | | | 3,374 | |
| Halliburton Co. (Energy Equipment & Services) | | | 347 | | | | 7,936 | |
| Hartford Financial Services Group, Inc. (Insurance) | | | 132 | | | | 9,113 | |
| Hasbro, Inc. (Leisure Products) | | | 50 | | | | 5,089 | |
| HCA Healthcare, Inc. (Health Care Providers & Services) | | | 93 | | | | 23,894 | |
| Healthpeak Properties, Inc. (Equity Real Estate Investment Trusts) | | | 209 | | | | 7,543 | |
| Henry Schein, Inc.* (Health Care Providers & Services) | | | 54 | | | | 4,187 | |
| Hess Corp. (Oil, Gas & Consumable Fuels) | | | 107 | | | | 7,921 | |
| Hewlett Packard Enterprises Co. (Technology Hardware, Storage & Peripherals) | | | 507 | | | | 7,995 | |
| Hilton Worldwide Holdings, Inc.* (Hotels, Restaurants & Leisure) | | | 108 | | | | 16,847 | |
| Hologic, Inc.* (Health Care Equipment & Supplies) | | | 98 | | | | 7,503 | |
| Honeywell International, Inc. (Industrial Conglomerates) | | | 267 | | | | 55,673 | |
| Hormel Foods Corp. (Food Products) | | | 109 | | | | 5,320 | |
| Host Hotels & Resorts, Inc.* (Equity Real Estate Investment Trusts) | | | 277 | | | | 4,817 | |
| Howmet Aerospace, Inc. (Aerospace & Defense) | | | 149 | | | | 4,743 | |
| HP, Inc. (Technology Hardware, Storage & Peripherals) | | | 447 | | | | 16,839 | |
| Humana, Inc. (Health Care Providers & Services) | | | 50 | | | | 23,193 | |
| Huntington Bancshares, Inc. (Banks) | | | 561 | | | | 8,651 | |
| Huntington Ingalls Industries, Inc. (Aerospace & Defense) | | | 16 | | | | 2,988 | |
| IDEX Corp. (Machinery) | | | 29 | | | | 6,853 | |
| IDEXX Laboratories, Inc.* (Health Care Equipment & Supplies) | | | 33 | | | | 21,729 | |
| IHS Markit, Ltd. (Professional Services) | | | 155 | | | | 20,603 | |
| Illinois Tool Works, Inc. (Machinery) | | | 111 | | | | 27,395 | |
| Illumina, Inc.* (Life Sciences Tools & Services) | | | 61 | | | | 23,207 | |
| Incyte Corp.* (Biotechnology) | | | 73 | | | | 5,358 | |
| Ingersoll Rand, Inc. (Machinery) | | | 158 | | | | 9,775 | |
| Intel Corp. (Semiconductors & Semiconductor Equipment) | | | 1,577 | | | | 81,216 | |
See accompanying notes to financial statements.
Financial Statements :: ProFund VP UltraBull :: 309
Common Stocks, continued
| | | Shares | | | Value | |
| Intercontinental Exchange, Inc. (Capital Markets) | | | 218 | | | $ | 29,816 | |
| International Business Machines Corp. (IT Services) | | | 348 | | | | 46,514 | |
| International Flavors & Fragrances, Inc. (Chemicals) | | | 99 | | | | 14,914 | |
| International Paper Co. (Containers & Packaging) | | | 150 | | | | 7,047 | |
| Intuit, Inc. (Software) | | | 110 | | | | 70,754 | |
| Intuitive Surgical, Inc.* (Health Care Equipment & Supplies) | | | 138 | | | | 49,583 | |
| Invesco, Ltd. (Capital Markets) | | | 132 | | | | 3,039 | |
| IPG Photonics Corp.* (Electronic Equipment, Instruments & Components) | | | 14 | | | | 2,410 | |
| IQVIA Holdings, Inc.* (Life Sciences Tools & Services) | | | 74 | | | | 20,878 | |
| Iron Mountain, Inc. (Equity Real Estate Investment Trusts) | | | 112 | | | | 5,861 | |
| J.B. Hunt Transport Services, Inc. (Road & Rail) | | | 33 | | | | 6,745 | |
| Jack Henry & Associates, Inc. (IT Services) | | | 29 | | | | 4,843 | |
| Jacobs Engineering Group, Inc. (Professional Services) | | | 51 | | | | 7,101 | |
| Johnson & Johnson (Pharmaceuticals) | | | 1,021 | | | | 174,662 | |
| Johnson Controls International PLC (Building Products) | | | 275 | | | | 22,360 | |
| JPMorgan Chase & Co. (Banks) | | | 1,145 | | | | 181,311 | |
| Juniper Networks, Inc. (Communications Equipment) | | | 126 | | | | 4,499 | |
| Kellogg Co. (Food Products) | | | 99 | | | | 6,378 | |
| KeyCorp (Banks) | | | 361 | | | | 8,350 | |
| Keysight Technologies, Inc.* (Electronic Equipment, Instruments & Components) | | | 71 | | | | 14,662 | |
| Kimberly-Clark Corp. (Household Products) | | | 131 | | | | 18,723 | |
| Kimco Realty Corp. (Equity Real Estate Investment Trusts) | | | 239 | | | | 5,891 | |
| Kinder Morgan, Inc. (Oil, Gas & Consumable Fuels) | | | 756 | | | | 11,990 | |
| KLA Corp. (Semiconductors & Semiconductor Equipment) | | | 59 | | | | 25,376 | |
| L3Harris Technologies, Inc. (Aerospace & Defense) | | | 76 | | | | 16,206 | |
| Laboratory Corp. of America Holdings* (Health Care Providers & Services) | | | 37 | | | | 11,626 | |
| Lam Research Corp. (Semiconductors & Semiconductor Equipment) | | | 55 | | | | 39,553 | |
| Lamb Weston Holding, Inc. (Food Products) | | | 57 | | | | 3,613 | |
| Las Vegas Sands Corp.* (Hotels, Restaurants & Leisure) | | | 133 | | | | 5,006 | |
| Leidos Holdings, Inc. (Professional Services) | | | 54 | | | | 4,801 | |
| Lennar Corp.—Class A (Household Durables) | | | 105 | | | | 12,197 | |
| Lincoln National Corp. (Insurance) | | | 66 | | | | 4,505 | |
| Linde PLC (Chemicals) | | | 199 | | | | 68,940 | |
| Live Nation Entertainment, Inc.* (Entertainment) | | | 52 | | | | 6,224 | |
| LKQ Corp. (Distributors) | | | 104 | | | | 6,243 | |
| Lockheed Martin Corp. (Aerospace & Defense) | | | 95 | | | | 33,764 | |
| Loews Corp. (Insurance) | | | 78 | | | | 4,505 | |
| Lowe's Cos., Inc. (Specialty Retail) | | | 268 | | | | 69,273 | |
| Lumen Technologies, Inc. (Diversified Telecommunication Services) | | | 357 | | | | 4,480 | |
| LyondellBasell Industries N.V.—Class A (Chemicals) | | | 102 | | | | 9,407 | |
| M&T Bank Corp. (Banks) | | | 50 | | | | 7,679 | |
| Marathon Oil Corp. (Oil, Gas & Consumable Fuels) | | | 302 | | | | 4,959 | |
| Marathon Petroleum Corp. (Oil, Gas & Consumable Fuels) | | | 239 | | | | 15,294 | |
| MarketAxess Holdings, Inc. (Capital Markets) | | | 15 | | | | 6,169 | |
| Marriott International, Inc.*—Class A (Hotels, Restaurants & Leisure) | | | 106 | | | | 17,558 | |
| Marsh & McLennan Cos., Inc. (Insurance) | | | 196 | | | | 34,068 | |
| Martin Marietta Materials, Inc. (Construction Materials) | | | 24 | | | | 10,572 | |
| Masco Corp. (Building Products) | | | 95 | | | | 6,671 | |
| Mastercard, Inc.—Class A (IT Services) | | | 336 | | | | 120,731 | |
| Match Group, Inc.* (Interactive Media & Services) | | | 110 | | | | 14,548 | |
| McCormick & Co., Inc. (Food Products) | | | 97 | | | | 9,371 | |
| McDonald's Corp. (Hotels, Restaurants & Leisure) | | | 290 | | | | 77,740 | |
| McKesson Corp. (Health Care Providers & Services) | | | 59 | | | | 14,666 | |
| Medtronic PLC (Health Care Equipment & Supplies) | | | 522 | | | | 54,001 | |
| Merck & Co., Inc. (Pharmaceuticals) | | | 979 | | | | 75,031 | |
| Meta Platforms, Inc.*—Class A (Interactive Media & Services) | | | 918 | | | | 308,769 | |
| MetLife, Inc. (Insurance) | | | 277 | | | | 17,310 | |
| Mettler-Toledo International, Inc.* (Life Sciences Tools & Services) | | | 9 | | | | 15,275 | |
| MGM Resorts International (Hotels, Restaurants & Leisure) | | | 151 | | | | 6,777 | |
| Microchip Technology, Inc. (Semiconductors & Semiconductor Equipment) | | | 215 | | | | 18,718 | |
| Micron Technology, Inc. (Semiconductors & Semiconductor Equipment) | | | 434 | | | | 40,427 | |
| Microsoft Corp. (Software) | | | 2,911 | | | | 979,029 | |
| Mid-America Apartment Communities, Inc. (Equity Real Estate Investment Trusts) | | | 45 | | | | 10,325 | |
| Moderna, Inc.* (Biotechnology) | | | 137 | | | | 34,795 | |
| Mohawk Industries, Inc.* (Household Durables) | | | 21 | | | | 3,826 | |
| Molson Coors Beverage Co.—Class B (Beverages) | | | 73 | | | | 3,384 | |
| Mondelez International, Inc.—Class A (Food Products) | | | 541 | | | | 35,874 | |
| Monolithic Power Systems, Inc. (Semiconductors & Semiconductor Equipment) | | | 17 | | | | 8,387 | |
| Monster Beverage Corp.* (Beverages) | | | 146 | | | | 14,022 | |
| Moody's Corp. (Capital Markets) | | | 63 | | | | 24,607 | |
| Morgan Stanley (Capital Markets) | | | 558 | | | | 54,774 | |
| Motorola Solutions, Inc. (Communications Equipment) | | | 65 | | | | 17,661 | |
See accompanying notes to financial statements.
310 :: ProFund VP UltraBull :: Financial Statements
Common Stocks, continued
| | | Shares | | | Value | |
| MSCI, Inc.—Class A (Capital Markets) | | | 32 | | | $ | 19,606 | |
| Nasdaq, Inc. (Capital Markets) | | | 45 | | | | 9,450 | |
| NetApp, Inc. (Technology Hardware, Storage & Peripherals) | | | 87 | | | | 8,003 | |
| Netflix, Inc.* (Entertainment) | | | 172 | | | | 103,620 | |
| Newell Brands, Inc. (Household Durables) | | | 147 | | | | 3,210 | |
| Newmont Corp. (Metals & Mining) | | | 309 | | | | 19,164 | |
| News Corp.—Class A (Media) | | | 152 | | | | 3,391 | |
| News Corp.—Class B (Media) | | | 47 | | | | 1,058 | |
| NextEra Energy, Inc. (Electric Utilities) | | | 761 | | | | 71,048 | |
| Nielsen Holdings PLC (Professional Services) | | | 139 | | | | 2,851 | |
| NIKE, Inc.—Class B (Textiles, Apparel & Luxury Goods) | | | 495 | | | | 82,502 | |
| NiSource, Inc. (Multi-Utilities) | | | 152 | | | | 4,197 | |
| Norfolk Southern Corp. (Road & Rail) | | | 94 | | | | 27,985 | |
| Northern Trust Corp. (Capital Markets) | | | 81 | | | | 9,688 | |
| Northrop Grumman Corp. (Aerospace & Defense) | | | 58 | | | | 22,450 | |
| NortonLifelock, Inc. (Software) | | | 226 | | | | 5,871 | |
| Norwegian Cruise Line Holdings, Ltd.* (Hotels, Restaurants & Leisure) | | | 143 | | | | 2,966 | |
| NRG Energy, Inc. (Electric Utilities) | | | 95 | | | | 4,093 | |
| Nucor Corp. (Metals & Mining) | | | 111 | | | | 12,671 | |
| NVIDIA Corp. (Semiconductors & Semiconductor Equipment) | | | 969 | | | | 284,993 | |
| NVR, Inc.* (Household Durables) | | | 1 | | | | 5,909 | |
| NXP Semiconductors N.V. (Semiconductors & Semiconductor Equipment) | | | 103 | | | | 23,461 | |
| Occidental Petroleum Corp. (Oil, Gas & Consumable Fuels) | | | 344 | | | | 9,973 | |
| Old Dominion Freight Line, Inc. (Road & Rail) | | | 36 | | | | 12,902 | |
| Omnicom Group, Inc. (Media) | | | 82 | | | | 6,008 | |
| ONEOK, Inc. (Oil, Gas & Consumable Fuels) | | | 173 | | | | 10,165 | |
| Oracle Corp. (Software) | | | 625 | | | | 54,506 | |
| O'Reilly Automotive, Inc.* (Specialty Retail) | | | 26 | | | | 18,362 | |
| Organon & Co. (Pharmaceuticals) | | | 98 | | | | 2,984 | |
| Otis Worldwide Corp. (Machinery) | | | 165 | | | | 14,367 | |
| PACCAR, Inc. (Machinery) | | | 135 | | | | 11,915 | |
| Packaging Corp. of America (Containers & Packaging) | | | 37 | | | | 5,038 | |
| Parker-Hannifin Corp. (Machinery) | | | 50 | | | | 15,906 | |
| Paychex, Inc. (IT Services) | | | 124 | | | | 16,926 | |
| Paycom Software, Inc.* (Software) | | | 19 | | | | 7,889 | |
| PayPal Holdings, Inc.* (IT Services) | | | 455 | | | | 85,804 | |
| Penn National Gaming, Inc.* (Hotels, Restaurants & Leisure) | | | 64 | | | | 3,318 | |
| Pentair PLC (Machinery) | | | 64 | | | | 4,674 | |
| People's United Financial, Inc. (Banks) | | | 166 | | | | 2,958 | |
| PepsiCo, Inc. (Beverages) | | | 536 | | | | 93,108 | |
| PerkinElmer, Inc. (Life Sciences Tools & Services) | | | 49 | | | | 9,852 | |
| Pfizer, Inc. (Pharmaceuticals) | | | 2,176 | | | | 128,493 | |
| Philip Morris International, Inc. (Tobacco) | | | 604 | | | | 57,380 | |
| Phillips 66 (Oil, Gas & Consumable Fuels) | | | 170 | | | | 12,318 | |
| Pinnacle West Capital Corp. (Electric Utilities) | | | 44 | | | | 3,106 | |
| Pioneer Natural Resources Co. (Oil, Gas & Consumable Fuels) | | | 88 | | | | 16,005 | |
| Pool Corp. (Distributors) | | | 16 | | | | 9,056 | |
| PPG Industries, Inc. (Chemicals) | | | 92 | | | | 15,864 | |
| PPL Corp. (Electric Utilities) | | | 291 | | | | 8,747 | |
| Principal Financial Group, Inc. (Insurance) | | | 96 | | | | 6,944 | |
| Prologis, Inc. (Equity Real Estate Investment Trusts) | | | 287 | | | | 48,319 | |
| Prudential Financial, Inc. (Insurance) | | | 147 | | | | 15,911 | |
| PTC, Inc.* (Software) | | | 41 | | | | 4,967 | |
| Public Service Enterprise Group, Inc. (Multi-Utilities) | | | 196 | | | | 13,079 | |
| Public Storage (Equity Real Estate Investment Trusts) | | | 59 | | | | 22,099 | |
| PulteGroup, Inc. (Household Durables) | | | 98 | | | | 5,602 | |
| PVH Corp. (Textiles, Apparel & Luxury Goods) | | | 28 | | | | 2,986 | |
| Qorvo, Inc.* (Semiconductors & Semiconductor Equipment) | | | 43 | | | | 6,725 | |
| Qualcomm, Inc. (Semiconductors & Semiconductor Equipment) | | | 434 | | | | 79,366 | |
| Quanta Services, Inc. (Construction & Engineering) | | | 55 | | | | 6,306 | |
| Quest Diagnostics, Inc. (Health Care Providers & Services) | | | 48 | | | | 8,304 | |
| Ralph Lauren Corp. (Textiles, Apparel & Luxury Goods) | | | 19 | | | | 2,258 | |
| Raymond James Financial, Inc. (Capital Markets) | | | 72 | | | | 7,229 | |
| Raytheon Technologies Corp. (Aerospace & Defense) | | | 580 | | | | 49,915 | |
| Realty Income Corp. (Equity Real Estate Investment Trusts) | | | 219 | | | | 15,678 | |
| Regency Centers Corp. (Equity Real Estate Investment Trusts) | | | 60 | | | | 4,521 | |
| Regeneron Pharmaceuticals, Inc.* (Biotechnology) | | | 41 | | | | 25,892 | |
| Regions Financial Corp. (Banks) | | | 370 | | | | 8,066 | |
| Republic Services, Inc.—Class A (Commercial Services & Supplies) | | | 81 | | | | 11,295 | |
| ResMed, Inc. (Health Care Equipment & Supplies) | | | 56 | | | | 14,587 | |
| Robert Half International, Inc. (Professional Services) | | | 43 | | | | 4,795 | |
| Rockwell Automation, Inc. (Electrical Equipment) | | | 45 | | | | 15,698 | |
| Rollins, Inc. (Commercial Services & Supplies) | | | 88 | | | | 3,010 | |
| Roper Technologies, Inc. (Industrial Conglomerates) | | | 41 | | | | 20,166 | |
| Ross Stores, Inc. (Specialty Retail) | | | 138 | | | | 15,771 | |
| Royal Caribbean Cruises, Ltd.* (Hotels, Restaurants & Leisure) | | | 87 | | | | 6,690 | |
| S&P Global, Inc. (Capital Markets) | | | 93 | | | | 43,889 | |
| Salesforce.com, Inc.* (Software) | | | 380 | | | | 96,569 | |
| SBA Communications Corp. (Equity Real Estate Investment Trusts) | | | 42 | | | | 16,339 | |
| Schlumberger, Ltd. (Energy Equipment & Services) | | | 544 | | | | 16,293 | |
| Seagate Technology Holdings PLC (Technology Hardware, Storage & Peripherals) | | | 79 | | | | 8,925 | |
See accompanying notes to financial statements.
Financial Statements :: ProFund VP UltraBull :: 311
Common Stocks, continued
| | | Shares | | | Value | |
| Sealed Air Corp. (Containers & Packaging) | | | 57 | | | $ | 3,846 | |
| Sempra Energy (Multi-Utilities) | | | 124 | | | | 16,402 | |
| ServiceNow, Inc.* (Software) | | | 77 | | | | 49,981 | |
| Signature Bank (Banks) | | | 24 | | | | 7,763 | |
| Simon Property Group, Inc. (Equity Real Estate Investment Trusts) | | | 127 | | | | 20,291 | |
| Skyworks Solutions, Inc. (Semiconductors & Semiconductor Equipment) | | | 64 | | | | 9,929 | |
| Snap-on, Inc. (Machinery) | | | 21 | | | | 4,523 | |
| SolarEdge Technologies, Inc.* (Semiconductors & Semiconductor Equipment) | | | 20 | | | | 5,611 | |
| Southwest Airlines Co.* (Airlines) | | | 229 | | | | 9,810 | |
| Stanley Black & Decker, Inc. (Machinery) | | | 63 | | | | 11,883 | |
| Starbucks Corp. (Hotels, Restaurants & Leisure) | | | 457 | | | | 53,455 | |
| State Street Corp. (Capital Markets) | | | 142 | | | | 13,206 | |
| STERIS PLC (Health Care Equipment & Supplies) | | | 39 | | | | 9,493 | |
| Stryker Corp. (Health Care Equipment & Supplies) | | | 130 | | | | 34,765 | |
| SVB Financial Group* (Banks) | | | 23 | | | | 15,600 | |
| Synchrony Financial (Consumer Finance) | | | 212 | | | | 9,835 | |
| Synopsys, Inc.* (Software) | | | 59 | | | | 21,742 | |
| Sysco Corp. (Food & Staples Retailing) | | | 199 | | | | 15,631 | |
| T. Rowe Price Group, Inc. (Capital Markets) | | | 87 | | | | 17,108 | |
| Take-Two Interactive Software, Inc.* (Entertainment) | | | 45 | | | | 7,997 | |
| Tapestry, Inc. (Textiles, Apparel & Luxury Goods) | | | 107 | | | | 4,344 | |
| Target Corp. (Multiline Retail) | | | 189 | | | | 43,742 | |
| TE Connectivity, Ltd. (Electronic Equipment, Instruments & Components) | | | 127 | | | | 20,491 | |
| Teledyne Technologies, Inc.* (Electronic Equipment, Instruments & Components) | | | 18 | | | | 7,864 | |
| Teleflex, Inc. (Health Care Equipment & Supplies) | | | 18 | | | | 5,913 | |
| Teradyne, Inc. (Semiconductors & Semiconductor Equipment) | | | 63 | | | | 10,302 | |
| Tesla, Inc.* (Automobiles) | | | 315 | | | | 332,886 | |
| Texas Instruments, Inc. (Semiconductors & Semiconductor Equipment) | | | 358 | | | | 67,472 | |
| Textron, Inc. (Aerospace & Defense) | | | 85 | | | | 6,562 | |
| The AES Corp. (Independent Power and Renewable Electricity Producers) | | | 258 | | | | 6,269 | |
| The Allstate Corp. (Insurance) | | | 111 | | | | 13,059 | |
| The Bank of New York Mellon Corp. (Capital Markets) | | | 295 | | | | 17,134 | |
| The Boeing Co.* (Aerospace & Defense) | | | 214 | | | | 43,082 | |
| The Charles Schwab Corp. (Capital Markets) | | | 583 | | | | 49,030 | |
| The Clorox Co. (Household Products) | | | 48 | | | | 8,369 | |
| The Coca-Cola Co. (Beverages) | | | 1,507 | | | | 89,229 | |
| The Cooper Cos., Inc. (Health Care Equipment & Supplies) | | | 19 | | | | 7,960 | |
| The Estee Lauder Co., Inc. (Personal Products) | | | 90 | | | | 33,318 | |
| The Gap, Inc. (Specialty Retail) | | | 83 | | | | 1,465 | |
| The Goldman Sachs Group, Inc. (Capital Markets) | | | 132 | | | | 50,497 | |
| The Hershey Co. (Food Products) | | | 56 | | | | 10,834 | |
| The Home Depot, Inc. (Specialty Retail) | | | 409 | | | | 169,738 | |
| The Interpublic Group of Cos., Inc. (Media) | | | 153 | | | | 5,730 | |
| The JM Smucker Co.—Class A (Food Products) | | | 42 | | | | 5,704 | |
| The Kraft Heinz Co. (Food Products) | | | 275 | | | | 9,873 | |
| The Kroger Co. (Food & Staples Retailing) | | | 262 | | | | 11,858 | |
| The Mosaic Co. (Chemicals) | | | 144 | | | | 5,658 | |
| The PNC Financial Services Group, Inc. (Banks) | | | 164 | | | | 32,885 | |
| The Procter & Gamble Co. (Household Products) | | | 938 | | | | 153,438 | |
| The Progressive Corp. (Insurance) | | | 227 | | | | 23,302 | |
| The Sherwin-Williams Co. (Chemicals) | | | 94 | | | | 33,103 | |
| The Southern Co. (Electric Utilities) | | | 411 | | | | 28,186 | |
| The TJX Cos., Inc. (Specialty Retail) | | | 466 | | | | 35,379 | |
| The Travelers Cos., Inc. (Insurance) | | | 95 | | | | 14,861 | |
| The Walt Disney Co.* (Entertainment) | | | 704 | | | | 109,043 | |
| The Williams Cos., Inc. (Oil, Gas & Consumable Fuels) | | | 471 | | | | 12,265 | |
| Thermo Fisher Scientific, Inc. (Life Sciences Tools & Services) | | | 153 | | | | 102,087 | |
| T-Mobile US, Inc.* (Wireless Telecommunication Services) | | | 228 | | | | 26,443 | |
| Tractor Supply Co. (Specialty Retail) | | | 44 | | | | 10,498 | |
| Trane Technologies PLC (Building Products) | | | 92 | | | | 18,587 | |
| TransDigm Group, Inc.* (Aerospace & Defense) | | | 20 | | | | 12,726 | |
| Trimble, Inc.* (Electronic Equipment, Instruments & Components) | | | 97 | | | | 8,457 | |
| Truist Financial Corp. (Banks) | | | 517 | | | | 30,270 | |
| Twitter, Inc.* (Interactive Media & Services) | | | 310 | | | | 13,398 | |
| Tyler Technologies, Inc.* (Software) | | | 16 | | | | 8,607 | |
| Tyson Foods, Inc.—Class A (Food Products) | | | 114 | | | | 9,936 | |
| U.S. Bancorp (Banks) | | | 523 | | | | 29,377 | |
| UDR, Inc. (Equity Real Estate Investment Trusts) | | | 113 | | | | 6,779 | |
| Ulta Beauty, Inc.* (Specialty Retail) | | | 21 | | | | 8,659 | |
| Under Armour, Inc.*—Class A (Textiles, Apparel & Luxury Goods) | | | 73 | | | | 1,547 | |
| Under Armour, Inc.*—Class C (Textiles, Apparel & Luxury Goods) | | | 83 | | | | 1,497 | |
| Union Pacific Corp. (Road & Rail) | | | 249 | | | | 62,730 | |
| United Airlines Holdings , Inc.* (Airlines) | | | 126 | | | | 5,516 | |
| United Parcel Service, Inc.—Class B (Air Freight & Logistics) | | | 283 | | | | 60,658 | |
| United Rentals, Inc.* (Trading Companies & Distributors) | | | 28 | | | | 9,304 | |
| UnitedHealth Group, Inc. (Health Care Providers & Services) | | | 365 | | | | 183,280 | |
| Universal Health Services, Inc.—Class B (Health Care Providers & Services) | | | 28 | | | | 3,630 | |
| Valero Energy Corp. (Oil, Gas & Consumable Fuels) | | | 159 | | | | 11,942 | |
| Ventas, Inc. (Equity Real Estate Investment Trusts) | | | 155 | | | | 7,924 | |
| VeriSign, Inc.* (IT Services) | | | 37 | | | | 9,391 | |
| Verisk Analytics, Inc. (Professional Services) | | | 62 | | | | 14,181 | |
| Verizon Communications, Inc. (Diversified Telecommunication Services) | | | 1,605 | | | | 83,397 | |
See accompanying notes to financial statements.
312 :: ProFund VP UltraBull :: Financial Statements
Common Stocks, continued
| | | Shares | | | Value | |
| Vertex Pharmaceuticals, Inc.* (Biotechnology) | | | 99 | | | $ | 21,740 | |
| VF Corp. (Textiles, Apparel & Luxury Goods) | | | 126 | | | | 9,226 | |
| ViacomCBS, Inc.—Class B (Media) | | | 235 | | | | 7,092 | |
| Viatris, Inc. (Pharmaceuticals) | | | 469 | | | | 6,346 | |
| Visa, Inc.—Class A (IT Services) | | | 650 | | | | 140,861 | |
| Vornado Realty Trust (Equity Real Estate Investment Trusts) | | | 62 | | | | 2,595 | |
| Vulcan Materials Co. (Construction Materials) | | | 51 | | | | 10,587 | |
| W.R. Berkley Corp. (Insurance) | | | 54 | | | | 4,449 | |
| W.W. Grainger, Inc. (Trading Companies & Distributors) | | | 17 | | | | 8,810 | |
| Walgreens Boots Alliance, Inc. (Food & Staples Retailing) | | | 278 | | | | 14,500 | |
| Walmart, Inc. (Food & Staples Retailing) | | | 551 | | | | 79,724 | |
| Waste Management, Inc. (Commercial Services & Supplies) | | | 149 | | | | 24,869 | |
| Waters Corp.* (Life Sciences Tools & Services) | | | 24 | | | | 8,942 | |
| WEC Energy Group, Inc. (Multi-Utilities) | | | 122 | | | | 11,843 | |
| Wells Fargo & Co. (Banks) | | | 1,546 | | | | 74,177 | |
| Welltower, Inc. (Equity Real Estate Investment Trusts) | | | 169 | | | | 14,495 | |
| West Pharmaceutical Services, Inc. (Health Care Equipment & Supplies) | | | 29 | | | | 13,601 | |
| Western Digital Corp.* (Technology Hardware, Storage & Peripherals) | | | 121 | | | | 7,890 | |
| Westinghouse Air Brake Technologies Corp. (Machinery) | | | 72 | | | | 6,632 | |
| WestRock Co. (Containers & Packaging) | | | 104 | | | | 4,613 | |
| Weyerhaeuser Co. (Equity Real Estate Investment Trusts) | | | 290 | | | | 11,942 | |
| Whirlpool Corp. (Household Durables) | | | 24 | | | | 5,632 | |
| Willis Towers Watson PLC (Insurance) | | | 48 | | | | 11,400 | |
| Wynn Resorts, Ltd.* (Hotels, Restaurants & Leisure) | | | 41 | | | | 3,487 | |
| Xcel Energy, Inc. (Electric Utilities) | | | 209 | | | | 14,149 | |
| Xilinx, Inc. (Semiconductors & Semiconductor Equipment) | | | 96 | | | | 20,355 | |
| Xylem, Inc. (Machinery) | | | 70 | | | | 8,394 | |
| Yum! Brands, Inc. (Hotels, Restaurants & Leisure) | | | 114 | | | | 15,830 | |
| Zebra Technologies Corp.* (Electronic Equipment, Instruments & Components) | | | 21 | | | | 12,499 | |
| Zimmer Biomet Holdings, Inc. (Health Care Equipment & Supplies) | �� | | 81 | | | | 10,290 | |
| Zions Bancorp (Banks) | | | 61 | | | | 3,853 | |
| Zoetis, Inc. (Pharmaceuticals) | | | 183 | | | | 44,657 | |
TOTAL COMMON STOCKS
(Cost $6,990,164) | | | | | | | 15,643,677 | |
Repurchase Agreements(c)(d) (21.3%)
| | | Principal
Amount | | | Value | |
| Repurchase Agreements with various counterparties, 0.00%, dated 12/31/21, due 1/3/22, total to be received $4,222,000 | | $ | 4,222,000 | | | $ | 4,222,000 | |
TOTAL REPURCHASE AGREEMENTS
(Cost $4,222,000) | | | | | | | 4,222,000 | |
Collateral for Securities Loaned(e)(NM)
| | | Shares | | | Value | |
| BlackRock Liquidity Funds FedFund Portfolio—Institutional Shares, 0.03%(f) | | | 1,350 | | | $ | 1,350 | |
TOTAL COLLATERAL FOR SECURITIES LOANED
(Cost $1,350) | | | | | | | 1,350 | |
TOTAL INVESTMENT SECURITIES
(Cost $11,213,514)—100.4% | | | | | | | 19,867,027 | |
| Net other assets (liabilities)—(0.4)% | | | | | | | (86,552 | ) |
| NET ASSETS—100.0% | | | | | | $ | 19,780,475 | |
| * | Non-income producing security. |
| (a) | All or part of this security was on loan as of December 31, 2021. The total value of securities on loan as of December 31, 2021 was $1,271. |
| (b) | Number of shares is less than 0.50. |
| (c) | A portion of these securities were held in a segregated account for the benefit of swap counterparties in the event of default. At December 31, 2021, the aggregate amount held in a segregated account was $3,056,000. |
| (d) | The ProFund VP invests in Repurchase Agreements jointly with other funds in the Trust. See "Repurchase Agreements" under Note 2 in the Notes to Financial Statements to view the details of each individual agreement and counterparty as well as a description of the securities subject to repurchase. |
| (e) | Securities were purchased with cash collateral held from securities on loan at December 31, 2021. |
| (f) | Rate periodically changes. Rate disclosed is the daily yield on December 31, 2021. |
Futures Contracts Purchased
| | | Number
of
Contracts | | | Expiration
Date | | Notional
Amount | | | Value and
Unrealized
Appreciation/
(Depreciation) | |
| E-Mini S&P 500 Futures Contracts | | | 8 | | | 3/21/22 | | $ | 1,903,400 | | | $ | 22,325 | |
| | | | | | | | | | | | | | | |
See accompanying notes to financial statements.
Financial Statements :: ProFund VP UltraBull :: 313
Total Return Swap Agreements—Long
| Underlying Instrument | | Counterparty | | Termination
Date(1) | | Rate Paid
(Received)(2) | | | Notional
Amount | | | Value and
Unrealized
Appreciation/
(Depreciation) | |
| S&P 500 | | Goldman Sachs International | | 1/27/22 | | | 0.68 | % | | $ | 7,778,406 | | | $ | (36,961 | ) |
| SPDR S&P 500 ETF | | Goldman Sachs International | | 1/27/22 | | | 0.59 | % | | | 5,478,782 | | | | (26,893 | ) |
| | | | | | | | | | | $ | 13,257,188 | | | $ | (63,854 | ) |
| S&P 500 | | UBS AG | | 1/27/22 | | | 0.58 | % | | $ | 7,573,460 | | | $ | (34,566 | ) |
| SPDR S&P 500 ETF | | UBS AG | | 1/27/22 | | | 0.18 | % | | | 2,171,805 | | | | (10,562 | ) |
| | | | | | | | | | | $ | 9,745,265 | | | $ | (45,128 | ) |
| | | | | | | | | | | $ | 23,002,453 | | | $ | (108,982 | ) |
| (1) | Agreements may be terminated at will by either party without penalty. Payment is due at termination/maturity. |
| (2) | Reflects the floating financing rate, as of December 31, 2021, on the notional amount of the swap agreement paid to the counterparty or received from the counterparty, excluding any commissions. This amount is included as part of the unrealized appreciation/(depreciation). |
ProFund VP UltraBull invested in the following industries as of December 31, 2021:
| | | Value | | | % of
Net Assets | |
| Aerospace & Defense | | $ | 211,198 | | | | 1.1 | % |
| Air Freight & Logistics | | | 99,474 | | | | 0.5 | % |
| Airlines | | | 32,079 | | | | 0.2 | % |
| Auto Components | | | 21,511 | | | | 0.1 | % |
| Automobiles | | | 397,507 | | | | 2.0 | % |
| Banks | | | 619,624 | | | | 3.1 | % |
| Beverages | | | 220,978 | | | | 1.0 | % |
| Biotechnology | | | 278,543 | | | | 1.4 | % |
| Building Products | | | 80,608 | | | | 0.4 | % |
| Capital Markets | | | 466,611 | | | | 2.4 | % |
| Chemicals | | | 277,829 | | | | 1.4 | % |
| Commercial Services & Supplies | | | 66,826 | | | | 0.3 | % |
| Communications Equipment | | | 143,904 | | | | 0.7 | % |
| Construction & Engineering | | | 6,306 | | | | NM | |
| Construction Materials | | | 21,159 | | | | 0.1 | % |
| Consumer Finance | | | 86,703 | | | | 0.4 | % |
| Containers & Packaging | | | 46,738 | | | | 0.2 | % |
| Distributors | | | 23,010 | | | | 0.1 | % |
| Diversified Financial Services | | | 212,290 | | | | 1.1 | % |
| Diversified Telecommunication Services | | | 155,994 | | | | 0.8 | % |
| Electric Utilities | | | 251,594 | | | | 1.3 | % |
| Electrical Equipment | | | 85,734 | | | | 0.4 | % |
| Electronic Equipment, Instruments & Components | | | 108,622 | | | | 0.5 | % |
| Energy Equipment & Services | | | 32,385 | | | | 0.2 | % |
| Entertainment | | | 261,485 | | | | 1.3 | % |
| Equity Real Estate Investment Trusts | | | 419,495 | | | | 2.1 | % |
| Food & Staples Retailing | | | 218,791 | | | | 1.1 | % |
| Food Products | | | 137,146 | | | | 0.7 | % |
| Gas Utilities | | | 5,343 | | | | NM | |
| Health Care Equipment & Supplies | | | 556,618 | | | | 2.8 | % |
| Health Care Providers & Services | | | 433,350 | | | | 2.2 | % |
| Health Care Technology | | | 10,587 | | | | 0.1 | % |
| Hotels, Restaurants & Leisure | | | 307,067 | | | | 1.6 | % |
| Household Durables | | | 58,074 | | | | 0.3 | % |
| Household Products | | | 218,174 | | | | 1.1 | % |
| Independent Power and Renewable Electricity Producers | | | 6,269 | | | | NM | |
| Industrial Conglomerates | | | 155,694 | | | | 0.8 | % |
| Insurance | | | 286,835 | | | | 1.5 | % |
| Interactive Media & Services | | | 988,176 | | | | 5.0 | % |
| Internet & Direct Marketing Retail | | | 590,392 | | | | 3.0 | % |
| IT Services | | | 700,796 | | | | 3.5 | % |
| Leisure Products | | | 5,089 | | | | NM | |
| Life Sciences Tools & Services | | | 220,261 | | | | 1.1 | % |
| Machinery | | | 235,879 | | | | 1.3 | % |
| Media | | | 157,488 | | | | 0.8 | % |
| Metals & Mining | | | 55,579 | | | | 0.3 | % |
| Multiline Retail | | | 77,192 | | | | 0.4 | % |
| Multi-Utilities | | | 113,840 | | | | 0.6 | % |
| Oil, Gas & Consumable Fuels | | | 385,715 | | | | 1.9 | % |
| Personal Products | | | 33,318 | | | | 0.2 | % |
| Pharmaceuticals | | | 579,382 | | | | 2.9 | % |
| Professional Services | | | 68,093 | | | | 0.3 | % |
| Real Estate Management & Development | | | 14,106 | | | | 0.1 | % |
| Road & Rail | | | 142,698 | | | | 0.7 | % |
| Semiconductors & Semiconductor Equipment | | | 996,851 | | | | 5.0 | % |
| Software | | | 1,490,857 | | | | 7.6 | % |
| Specialty Retail | | | 375,734 | | | | 1.9 | % |
| Technology Hardware, Storage & Peripherals | | | 1,122,531 | | | | 5.8 | % |
| Textiles, Apparel & Luxury Goods | | | 104,360 | | | | 0.5 | % |
| Tobacco | | | 91,122 | | | | 0.5 | % |
| Trading Companies & Distributors | | | 32,400 | | | | 0.2 | % |
| Water Utilities | | | 13,220 | | | | 0.1 | % |
| Wireless Telecommunication Services | | | 26,443 | | | | 0.1 | % |
| Other** | | | 4,136,798 | | | | 20.9 | % |
| Total | | $ | 19,780,475 | | | | 100.0 | % |
| ** | Includes any non-equity securities and net other assets (liabilities), which includes any receivable for capital shares issued and payable for capital shares redeemed. |
| NM | Not meaningful, amount is less than 0.05%. |
See accompanying notes to financial statements.
314 :: ProFund VP UltraBull :: Financial Statements
Statement of Assets and Liabilities
December 31, 2021
| ASSETS: |
| Total Investment Securities, at cost | | $ | 11,213,514 | |
| Securities, at value(a) | | | 15,645,027 | |
| Repurchase agreements, at value | | | 4,222,000 | |
| Total Investment Securities, at value | | | 19,867,027 | |
| Cash | | | 616 | |
| Segregated cash balances for futures contracts with brokers | | | 101,200 | |
| Dividends receivable | | | 9,396 | |
| Receivable for capital shares issued | | | 784,010 | |
| Prepaid expenses | | | 1,369 | |
| TOTAL ASSETS | | | 20,763,618 | |
| | | | | |
| LIABILITIES: | | | | |
| Payable for collateral for securities loaned | | | 1,350 | |
| Payable for capital shares redeemed | | | 820,472 | |
| Unrealized depreciation on swap agreements | | | 108,982 | |
| Variation margin on futures contracts | | | 5,500 | |
| Advisory fees payable | | | 14,042 | |
| Management services fees payable | | | 1,872 | |
| Administration fees payable | | | 1,278 | |
| Administrative services fees payable | | | 7,795 | |
| Distribution fees payable | | | 8,251 | |
| Transfer agency fees payable | | | 2,195 | |
| Fund accounting fees payable | | | 856 | |
| Compliance services fees payable | | | 92 | |
| Other accrued expenses | | | 10,458 | |
| TOTAL LIABILITIES | | | 983,143 | |
| NET ASSETS | | $ | 19,780,475 | |
| | | | | |
| NET ASSETS CONSIST OF: | | | | |
| Capital | | $ | 21,894,912 | |
| Total distributable earnings (loss) | | | (2,114,437 | ) |
| NET ASSETS | | $ | 19,780,475 | |
| Shares of Beneficial Interest Outstanding (unlimited number of shares authorized, no par value) | | | 426,000 | |
| Net Asset Value (offering and redemption price per share) | | $ | 46.43 | |
| | | | |
| (a) Includes securities on loan valued at: | | $ | 1,271 | |
Statement of Operations
For the Year Ended December 31, 2021
| INVESTMENT INCOME: | | | | |
| Dividends | | $ | 175,295 | |
| Interest | | | 30 | |
| Foreign tax withholding | | | (17 | ) |
| Net income from securities lending | | | 120 | |
| TOTAL INVESTMENT INCOME | | | 175,428 | |
| | | | | |
| EXPENSES: | | | | |
| Advisory fees | | | 144,187 | |
| Management services fees | | | 19,225 | |
| Administration fees | | | 13,899 | |
| Transfer agency fees | | | 11,481 | |
| Administrative services fees | | | 52,783 | |
| Distribution fees | | | 48,062 | |
| Custody fees | | | 2,910 | |
| Fund accounting fees | | | 9,473 | |
| Trustee fees | | | 317 | |
| Compliance services fees | | | 134 | |
| Other fees | | | 18,308 | |
| Recoupment of prior expenses reduced by the Advisor | | | 605 | |
| Total Gross Expenses before reductions | | | 321,384 | |
| Expenses reduced and reimbursed by the Advisor | | | (605 | ) |
| TOTAL NET EXPENSES | | | 320,779 | |
| NET INVESTMENT INCOME (LOSS) | | | (145,351 | ) |
| | | | | |
| REALIZED AND UNREALIZED GAINS (LOSSES) ON INVESTMENTS: | | | | |
| Net realized gains (losses) on investment securities | | | 1,280,937 | |
| Net realized gains (losses) on futures contracts | | | 456,545 | |
| Net realized gains (losses) on swap agreements | | | 5,403,218 | |
| Change in net unrealized appreciation/depreciation on investment securities | | | 1,523,994 | |
| Change in net unrealized appreciation/depreciation on futures contracts | | | (7,272 | ) |
| Change in net unrealized appreciation/depreciation on swap agreements | | | (220,595 | ) |
| NET REALIZED AND UNREALIZED GAINS (LOSSES) ON INVESTMENTS | | | 8,436,827 | |
| CHANGE IN NET ASSETS RESULTING FROM OPERATIONS | | $ | 8,291,476 | |
See accompanying notes to financial statements.
Financial Statements :: ProFund VP UltraBull :: 315
Statements of Changes in Net Assets
| | | Year Ended
December 31, 2021 | | | Year Ended
December 31, 2020 | |
| FROM INVESTMENT ACTIVITIES: |
| |
| OPERATIONS: |
| Net investment income (loss) | | $ | (145,351 | ) | | $ | (28,046 | ) |
| Net realized gains (losses) on investments | | | 7,140,700 | | | | (8,922,300 | ) |
| Change in net unrealized appreciation/depreciation on investments | | | 1,296,127 | | | | 1,827,277 | |
| Change in net assets resulting from operations | | | 8,291,476 | | | | (7,123,069 | ) |
| | | | | | | | | |
| DISTRIBUTIONS TO SHAREHOLDERS: | | | | | | | | |
| Total distributions | | | — | | | | (9,919,111 | ) |
| Change in net assets resulting from distributions | | | — | | | | (9,919,111 | ) |
| | | | | | | | | |
| CAPITAL TRANSACTIONS: | | | | | | | | |
| Proceeds from shares issued | | | 132,380,968 | | | | 336,763,515 | |
| Distributions reinvested | | | — | | | | 9,919,111 | |
| Value of shares redeemed | | | (137,964,214 | ) | | | (342,855,065 | ) |
| Change in net assets resulting from capital transactions | | | (5,583,246 | ) | | | 3,827,561 | |
| Change in net assets | | | 2,708,230 | | | | (13,214,619 | ) |
| | | | | | | | | |
| NET ASSETS: | | | | | | | | |
| Beginning of period | | | 17,072,245 | | | | 30,286,864 | |
| End of period | | $ | 19,780,475 | | | $ | 17,072,245 | |
| | | | | | | | | |
| SHARE TRANSACTIONS: | | | | | | | | |
| Issued | | | 3,455,045 | | | | 6,053,018 | (a) |
| Reinvested | | | — | | | | 369,015 | (a) |
| Redeemed | | | (3,610,503 | ) | | | (6,307,705 | )(a) |
| Change in shares | | | (155,458 | ) | | | 114,328 | |
| (a) | As described in Note 8, share amounts have been adjusted for 1:4 reverse share split that occurred on December 14, 2020. |
See accompanying notes to financial statements.
316 :: ProFund VP UltraBull :: Financial Highlights
ProFunds Financial Highlights FOR THE PERIODS INDICATED
Selected data for a share of beneficial interest outstanding throughout the periods indicated.
| | | Year Ended
Dec. 31, 2021 | | | Year Ended
Dec. 31, 2020(a) | | | Year Ended
Dec. 31, 2019(a) | | | Year Ended
Dec. 31, 2018(a) | | | Year Ended
Dec. 31, 2017(a) | |
| Net Asset Value, Beginning of Period | | $ | 29.36 | | | $ | 64.84 | | | $ | 40.60 | | | $ | 59.07 | | | $ | 53.91 | |
| | | | | | | | | | | | | | | | | | | | | |
| Investment Activities: | | | | | | | | | | | | | | | | | | | | |
| Net investment income (loss)(b) | | | (0.28 | ) | | | (0.07 | ) | | | 0.20 | | | | 0.20 | | | | (0.08 | ) |
| Net realized and unrealized gains (losses) on investments | | | 17.35 | | | | 8.84 | (c) | | | 24.20 | | | | (7.07 | ) | | | 20.72 | |
| Total income (loss) from investment activities | | | 17.07 | | | | 8.77 | | | | 24.40 | | | | (6.87 | ) | | | 20.64 | |
| | | | | | | | | | | | | | | | | | | | | |
| Distributions to Shareholders From: | | | | | | | | | | | | | | | | | | | | |
| Net investment income | | | — | | | | (0.49 | ) | | | (0.16 | ) | | | — | | | | — | |
| Net realized gains on investments | | | — | | | | (43.76 | ) | | | — | | | | (11.60 | ) | | | (15.48 | ) |
| Total distributions | | | — | | | | (44.25 | ) | | | (0.16 | ) | | | (11.60 | ) | | | (15.48 | ) |
| | | | | | | | | | | | | | | | | | | | | |
| Net Asset Value, End of Period | | $ | 46.43 | | | $ | 29.36 | | | $ | 64.84 | | | $ | 40.60 | | | $ | 59.07 | |
| | | | | | | | | | | | | | | | | | | | | |
| Total Return | | | 58.14 | % | | | 19.83 | % | | | 60.17 | % | | | (15.50 | )% | | | 41.02 | % |
| | | | | | | | | | | | | | | | | | | | | |
| Ratios to Average Net Assets: | | | | | | | | | | | | | | | | | | | | |
| Gross expenses | | | 1.67 | % | | | 1.69 | % | | | 1.62 | % | | | 1.53 | % | | | 1.60 | % |
| Net expenses | | | 1.67 | % | | | 1.69 | %(d) | | | 1.62 | % | | | 1.53 | % | | | 1.60 | % |
| Net investment income (loss) | | | (0.76 | )% | | | (0.16 | )% | | | 0.41 | % | | | 0.37 | % | | | (0.12 | )% |
| | | | | | | | | | | | | | | | | | | | | |
| Supplemental Data: | | | | | | | | | | | | | | | | | | | | |
| Net assets, end of period (000's) | | $ | 19,780 | | | $ | 17,072 | | | $ | 30,287 | | | $ | 23,465 | | | $ | 34,995 | |
| Portfolio turnover rate(e) | | | 443 | % | | | 1,415 | % | | | 2,393 | % | | | 3,297 | % | | | 2,993 | % |
| (a) | As described in Note 8, share amounts have been adjusted for 1:4 reverse share split that occurred on December 14, 2020. |
| (b) | Per share net investment income (loss) has been calculated using the average daily shares method. |
| (c) | The amount shown for a share outstanding throughout the period does not accord with the change in aggregate gains and losses in the portfolio of securities during the period because of the timing of sales and purchases of fund shares in relation to fluctuating market values during the period. |
| (d) | The expense ratio does not correlate to the applicable expense limits in place during the period given that the annual contractual expense limitation is applied for one year periods ended April 30th of each year, instead of coinciding with the December 31st year end. Details of the current expense limitation in effect can be found in Note 4 of the accompanying Notes to Financial Statements. |
| (e) | Portfolio turnover rate is calculated without regard to instruments having a maturity of less than one year from acquisition or derivative instruments (including swap agreements and futures contracts). The portfolio turnover rate can be high and volatile due to the amount and timing of sales and purchases of fund shares during the period. |
See accompanying notes to financial statements.
Management Discussion of Fund Performance :: ProFund VP UltraMid-Cap :: 317
ProFund VP UltraMid-Cap (the "Fund") seeks daily investment results, before fees and expenses, that correspond to two times (2x) the return of the S&P MidCap 400® (the "Index") for a single day, not for any other period. A "single day" is measured from the time the Fund calculates its net asset value ("NAV") to the time of the Fund's next NAV calculation. The Fund does not seek to achieve its stated investment objective over a period of time greater than a single day. The return of the Fund for periods longer than a single day will be the result of its return for each day compounded over the period. The Fund's returns for periods longer than a single day will very likely differ in amount, and possibly even direction from the Fund's stated multiple (2x) times the return of the Fund's Index for the same period. For periods longer than a single day, the Fund will lose money if the Index's performance is flat, and it is possible that the Fund will lose money even if the level of the index rises. For the year ended December 31, 2021, the Fund had a total return of 46.67%. For the same period, the Index had a total return of 24.76%1 and a volatility of 17.93%. For the year, the Fund achieved an average daily statistical correlation of over 0.99 to twice that of the daily performance of the Index.2
The Fund takes positions in financial instruments that, in combination, should have similar daily return characteristics as twice the daily return of the Index. The Index is a measure of mid-size company U.S. stock market performance. It is a float-adjusted, market capitalization-weighted index of 400 U.S. operating companies and real estate investment trusts. Securities are selected for inclusion in the Index through a process that factors criteria such as liquidity, price, market capitalization, financial viability, and public float. Reconstitution occurs both on a quarterly and ongoing basis.
During the year ended December 31, 2021, the Fund invested in swap agreements as a substitute for investing directly in stocks in order to gain leveraged exposure to the Index. These derivatives generally tracked the performance of their underlying benchmark and were negatively impacted by financing costs associated with their use. The Fund entered into swap agreements with counterparties that the Fund's advisor determined to be major, global financial institutions. If a counterparty becomes insolvent or otherwise fails to perform on its obligations, the value of investments in the Fund may decline. The Fund has sought to mitigate this risk by generally requiring counterparties to post collateral for the benefit of the Fund, marked to market daily, in an amount approximately equal to the amount the counterparty owed to the Fund, subject to certain minimum thresholds.
Value of a $10,000 Investment at Net Asset Value*
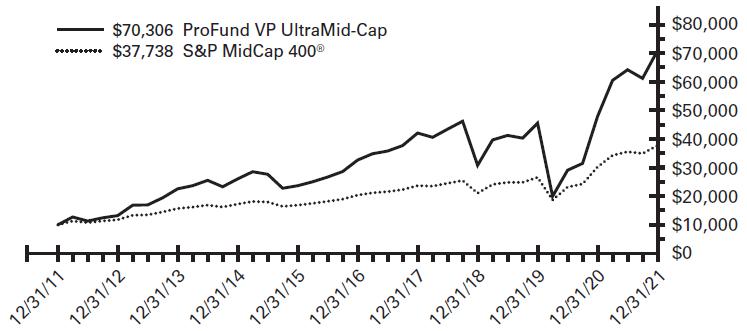
| * | The line graph represents the historical performance of a hypothetical investment of $10,000 in the ProFund VP UltraMid-Cap from December 31, 2011 to December 31, 2021, assuming the reinvestment of distributions. |
Average Annual Total Return as of 12/31/21
| Fund | | One Year | | | Five Year | | | Ten Year | |
| ProFund VP UltraMid-Cap | | | 46.67 | % | | | 16.57 | % | | | 21.53 | % |
| S&P MidCap 400® | | | 24.76 | % | | | 13.09 | % | | | 14.20 | % |
Expense Ratios**
| Fund | | Gross | | | Net | | | | | |
| ProFund VP UltraMid-Cap | | | 1.79 | % | | | 1.68 | % | | | | |
| | | | | | | | | | | | | |
| ** | Reflects the expense ratio as reported in the Prospectus dated May 1, 2021. Contractual fee waivers are in effect through April 30, 2022. See Financial Highlights for effective expense ratios. |
Allocation of Portfolio Holdings & Index Composition
Market Exposure
| Investment Type | | % of Net Assets | |
| Equity Securities | | | 75 | % |
| Swap Agreements | | | 125 | % |
| Total Exposure | | | 200 | % |
"Market Exposure" includes the value of total investments (including the contract value of any derivatives) and excludes any instruments used for cash management.
Largest Equity Holdings
| Company | | % of Net Assets | |
| Molina Healthcare, Inc. | | | 0.6 | % |
| Camden Property Trust | | | 0.6 | % |
| Builders FirstSource, Inc. | | | 0.5 | % |
| Trex Co., Inc. | | | 0.5 | % |
| Masimo Corp. | | | 0.5 | % |
S&P MidCap 400® Index – Composition
| | | % of Index | |
| Industrials | | | 20 | % |
| Consumer Discretionary | | | 15 | % |
| Information Technology | | | 14 | % |
| Financials | | | 14 | % |
| Real Estate | | | 10 | % |
| Health Care | | | 10 | % |
| Materials | | | 7 | % |
| Consumer Staples | | | 3 | % |
| Utilities | | | 3 | % |
| Energy | | | 2 | % |
| Communication Services | | | 2 | % |
Past performance does not guarantee future results. Return calculations assume the reinvestment of distributions and do not reflect taxes that a shareholder would pay on Fund distributions or on the redemption of Fund shares. The performance data quoted represents past performance and current returns may be lower or higher. The investment return and NAV will fluctuate so that an investor's shares, when redeemed, may be worth more or less than the original cost. The performance above reflects any fee reductions during the applicable periods. If such fee reductions had not occurred, the quoted performance would be lower. Performance numbers are net of all Fund fees and expenses but do not include any insurance, sales, or administrative charges of variable annuity or life insurance contracts. If these charges were included, the returns would be lower. To obtain performance current to the most recent month-end, please call toll-free 888-776-3637.
| 1 | The graph and table reflect the theoretical reinvestment of dividends on securities in the Index. The impact of transaction costs and the deduction of fees and expenses associated with a mutual fund, such as investment management and accounting fees, are not reflected in the index calculations. The Fund's performance reflects the reinvestment of dividends as well as the impact of transaction costs and the deduction of fees and expenses. It is not possible to invest directly in an index. |
| 2 | 1.00 equals perfect correlation. This calculation is based on the daily total return of the Index and the performance of the daily total return of the NAV per share of the Fund. |
The above information is not covered by the Report of the Independent Registered Public Accounting Firm.
318 :: ProFund VP UltraMid-Cap :: Financial Statements
Schedule of Portfolio Investments :: December 31, 2021
Common Stocks (75.3%)
| | | Shares | | | Value | |
| Acadia Healthcare Co., Inc.* (Health Care Providers & Services) | | | 491 | | | $ | 29,804 | |
| ACI Worldwide, Inc.* (Software) | | | 642 | | | | 22,277 | |
| Acuity Brands, Inc. (Electrical Equipment) | | | 191 | | | | 40,439 | |
| Adient PLC* (Auto Components) | | | 515 | | | | 24,658 | |
| AECOM* (Construction & Engineering) | | | 786 | | | | 60,798 | |
| Affiliated Managers Group, Inc. (Capital Markets) | | | 222 | | | | 36,521 | |
| AGCO Corp. (Machinery) | | | 335 | | | | 38,867 | |
| Alcoa Corp. (Metals & Mining) | | | 1,021 | | | | 60,831 | |
| Alleghany Corp.* (Insurance) | | | 75 | | | | 50,069 | |
| ALLETE, Inc. (Electric Utilities) | | | 287 | | | | 19,042 | |
| Alliance Data Systems Corp. (IT Services) | | | 272 | | | | 18,107 | |
| Amedisys, Inc.* (Health Care Providers & Services) | | | 178 | | | | 28,815 | |
| American Campus Communities, Inc. (Equity Real Estate Investment Trusts) | | | 760 | | | | 43,540 | |
| American Eagle Outfitters, Inc. (Specialty Retail) | | | 837 | | | | 21,193 | |
| American Financial Group, Inc. (Insurance) | | | 361 | | | | 49,573 | |
| Amkor Technology, Inc. (Semiconductors & Semiconductor Equipment) | | | 547 | | | | 13,560 | |
| Antero Midstream Corp. (Oil, Gas & Consumable Fuels) | | | 1,772 | | | | 17,153 | |
| Apartment Income REIT Corp. (Equity Real Estate Investment Trusts) | | | 857 | | | | 46,852 | |
| AptarGroup, Inc. (Containers & Packaging) | | | 359 | | | | 43,970 | |
| Arrow Electronics, Inc.* (Electronic Equipment, Instruments & Components) | | | 380 | | | | 51,023 | |
| Arrowhead Pharmaceuticals, Inc.* (Biotechnology) | | | 569 | | | | 37,725 | |
| ASGN, Inc.* (Professional Services) | | | 284 | | | | 35,046 | |
| Ashland Global Holdings, Inc. (Chemicals) | | | 308 | | | | 33,159 | |
| Aspen Technology, Inc.* (Software) | | | 365 | | | | 55,554 | |
| Associated Banc-Corp. (Banks) | | | 819 | | | | 18,501 | |
| AutoNation, Inc.* (Specialty Retail) | | | 218 | | | | 25,473 | |
| Avient Corp. (Chemicals) | | | 499 | | | | 27,919 | |
| Avis Budget Group, Inc.* (Road & Rail) | | | 219 | | | | 45,414 | |
| Avnet, Inc. (Electronic Equipment, Instruments & Components) | | | 542 | | | | 22,347 | |
| Axon Enterprise, Inc.* (Aerospace & Defense) | | | 359 | | | | 56,363 | |
| Azenta, Inc. (Semiconductors & Semiconductor Equipment) | | | 406 | | | | 41,863 | |
| Bank of Hawaii Corp. (Banks) | | | 221 | | | | 18,511 | |
| Bank OZK (Banks) | | | 660 | | | | 30,710 | |
| Belden, Inc. (Electronic Equipment, Instruments & Components) | | | 245 | | | | 16,104 | |
| BJ's Wholesale Club Holdings, Inc.* (Food & Staples Retailing) | | | 745 | | | | 49,892 | |
| Black Hills Corp. (Multi-Utilities) | | | 348 | | | | 24,558 | |
| Blackbaud, Inc.* (Software) | | | 226 | | | | 17,849 | |
| Boyd Gaming Corp.* (Hotels, Restaurants & Leisure) | | | 448 | | | | 29,375 | |
| Brighthouse Financial, Inc.* (Insurance) | | | 436 | | | | 22,585 | |
| Brixmor Property Group, Inc. (Equity Real Estate Investment Trusts) | | | 1,621 | | | | 41,190 | |
| Bruker Corp. (Life Sciences Tools & Services) | | | 555 | | | | 46,570 | |
| Brunswick Corp. (Leisure Products) | | | 421 | | | | 42,406 | |
| Builders FirstSource, Inc.* (Building Products) | | | 1,045 | | | | 89,566 | |
| Cable One, Inc. (Media) | | | 27 | | | | 47,613 | |
| Cabot Corp. (Chemicals) | | | 310 | | | | 17,422 | |
| CACI International, Inc.*—Class A (Professional Services) | | | 127 | | | | 34,190 | |
| Cadence Bank (Banks) | | | 1,069 | | | | 31,846 | |
| Callaway Golf Co.* (Leisure Products) | | | 640 | | | | 17,562 | |
| Camden Property Trust (Equity Real Estate Investment Trusts) | | | 558 | | | | 99,702 | |
| Capri Holdings, Ltd.* (Textiles, Apparel & Luxury Goods) | | | 821 | | | | 53,291 | |
| Carlisle Cos., Inc. (Industrial Conglomerates) | | | 285 | | | | 70,714 | |
| Carter's, Inc. (Textiles, Apparel & Luxury Goods) | | | 231 | | | | 23,382 | |
| Casey's General Stores, Inc. (Food & Staples Retailing) | | | 203 | | | | 40,062 | |
| Cathay General Bancorp (Banks) | | | 422 | | | | 18,142 | |
| CDK Global, Inc. (Software) | | | 646 | | | | 26,964 | |
| Cerence, Inc.* (Software) | | | 207 | | | | 15,864 | |
| ChampionX Corp.* (Energy Equipment & Services) | | | 1,103 | | | | 22,292 | |
| Chemed Corp. (Health Care Providers & Services) | | | 84 | | | | 44,439 | |
| Choice Hotels International, Inc. (Hotels, Restaurants & Leisure) | | | 179 | | | | 27,922 | |
| Churchill Downs, Inc. (Hotels, Restaurants & Leisure) | | | 188 | | | | 45,289 | |
| Ciena Corp.* (Communications Equipment) | | | 846 | | | | 65,116 | |
| Cirrus Logic, Inc.* (Semiconductors & Semiconductor Equipment) | | | 312 | | | | 28,710 | |
| CIT Group, Inc. (Banks) | | | 541 | | | | 27,775 | |
| Clean Harbors, Inc.* (Commercial Services & Supplies) | | | 273 | | | | 27,237 | |
| Cleveland-Cliffs, Inc.* (Metals & Mining) | | | 2,484 | | | | 54,077 | |
| CMC Materials, Inc. (Semiconductors & Semiconductor Equipment) | | | 155 | | | | 29,712 | |
| CNO Financial Group, Inc. (Insurance) | | | 673 | | | | 16,044 | |
| CNX Resources Corp.* (Oil, Gas & Consumable Fuels) | | | 1,153 | | | | 15,854 | |
| Cognex Corp. (Electronic Equipment, Instruments & Components) | | | 965 | | | | 75,038 | |
| Coherent, Inc.* (Electronic Equipment, Instruments & Components) | | | 134 | | | | 35,716 | |
| Colfax Corp.* (Machinery) | | | 735 | | | | 33,788 | |
| Columbia Sportswear Co. (Textiles, Apparel & Luxury Goods) | | | 189 | | | | 18,416 | |
| Commerce Bancshares, Inc. (Banks) | | | 606 | | | | 41,656 | |
| Commercial Metals Co. (Metals & Mining) | | | 658 | | | | 23,879 | |
| CommVault Systems, Inc.* (Software) | | | 248 | | | | 17,092 | |
See accompanying notes to financial statements.
Financial Statements :: ProFund VP UltraMid-Cap :: 319
Common Stocks, continued
| | | Shares | | | Value | |
| Compass Minerals International, Inc. (Metals & Mining) | | | 186 | | | $ | 9,501 | |
| Concentrix Corp. (IT Services) | | | 234 | | | | 41,797 | |
| Corporate Office Properties Trust (Equity Real Estate Investment Trusts) | | | 613 | | | | 17,146 | |
| Coty, Inc.*—Class A (Personal Products) | | | 1,832 | | | | 19,236 | |
| Cousins Properties, Inc. (Equity Real Estate Investment Trusts) | | | 812 | | | | 32,707 | |
| Cracker Barrel Old Country Store, Inc. (Hotels, Restaurants & Leisure) | | | 128 | | | | 16,466 | |
| Crane Co. (Machinery) | | | 272 | | | | 27,671 | |
| Crocs, Inc.* (Textiles, Apparel & Luxury Goods) | | | 321 | | | | 41,159 | |
| Cullen/Frost Bankers, Inc. (Banks) | | | 310 | | | | 39,082 | |
| Curtiss-Wright Corp. (Aerospace & Defense) | | | 214 | | | | 29,675 | |
| CyrusOne, Inc. (Equity Real Estate Investment Trusts) | | | 693 | | | | 62,176 | |
| Dana, Inc. (Auto Components) | | | 787 | | | | 17,959 | |
| Darling Ingredients, Inc.* (Food Products) | | | 883 | | | | 61,184 | |
| Deckers Outdoor Corp.* (Textiles, Apparel & Luxury Goods) | | | 150 | | | | 54,947 | |
| Dick's Sporting Goods, Inc. (Specialty Retail) | | | 354 | | | | 40,706 | |
| Digital Turbine, Inc.* (Software) | | | 480 | | | | 29,275 | |
| Donaldson Co., Inc. (Machinery) | | | 675 | | | | 40,001 | |
| Douglas Emmett, Inc. (Equity Real Estate Investment Trusts) | | | 958 | | | | 32,093 | |
| DT Midstream, Inc. (Oil, Gas & Consumable Fuels) | | | 528 | | | | 25,333 | |
| Dycom Industries, Inc.* (Construction & Engineering) | | | 165 | | | | 15,470 | |
| Eagle Materials, Inc. (Construction Materials) | | | 222 | | | | 36,954 | |
| East West Bancorp, Inc. (Banks) | | | 775 | | | | 60,978 | |
| EastGroup Properties, Inc. (Equity Real Estate Investment Trusts) | | | 222 | | | | 50,583 | |
| EMCOR Group, Inc. (Construction & Engineering) | | | 291 | | | | 37,071 | |
| Encompass Health Corp. (Health Care Providers & Services) | | | 543 | | | | 35,436 | |
| Energizer Holdings, Inc. (Household Products) | | | 343 | | | | 13,754 | |
| EnerSys (Electrical Equipment) | | | 229 | | | | 18,105 | |
| Envestnet, Inc.* (Software) | | | 298 | | | | 23,643 | |
| Envista Holdings Corp.* (Health Care Equipment & Supplies) | | | 881 | | | | 39,698 | |
| EPR Properties (Equity Real Estate Investment Trusts) | | | 408 | | | | 19,376 | |
| EQT Corp.* (Oil, Gas & Consumable Fuels) | | | 1,650 | | | | 35,987 | |
| Equitrans Midstream Corp. (Oil, Gas & Consumable Fuels) | | | 2,219 | | | | 22,944 | |
| Essent Group, Ltd. (Thrifts & Mortgage Finance) | | | 603 | | | | 27,455 | |
| Essential Utilities, Inc. (Water Utilities) | | | 1,255 | | | | 67,381 | |
| Evercore Partners, Inc.—Class A (Capital Markets) | | | 213 | | | | 28,936 | |
| Exelixis, Inc.* (Biotechnology) | | | 1,727 | | | | 31,570 | |
| F.N.B. Corp. (Banks) | | | 1,741 | | | | 21,118 | |
| Fair Isaac Corp.* (Software) | | | 149 | | | | 64,618 | |
| Federated Hermes, Inc.—Class B (Capital Markets) | | | 529 | | | | 19,880 | |
| First American Financial Corp. (Insurance) | | | 599 | | | | 46,860 | |
| First Financial Bankshares, Inc. (Banks) | | | 700 | | | | 35,588 | |
| First Horizon Corp. (Banks) | | | 2,951 | | | | 48,190 | |
| First Industrial Realty Trust, Inc. (Equity Real Estate Investment Trusts) | | | 711 | | | | 47,068 | |
| First Solar, Inc.* (Semiconductors & Semiconductor Equipment) | | | 540 | | | | 47,066 | |
| FirstCash Holdings, Inc. (Consumer Finance) | | | 221 | | | | 16,533 | |
| Five Below, Inc.* (Specialty Retail) | | | 306 | | | | 63,308 | |
| Flowers Foods, Inc. (Food Products) | | | 1,085 | | | | 29,805 | |
| Flowserve Corp. (Machinery) | | | 711 | | | | 21,757 | |
| Fluor Corp.* (Construction & Engineering) | | | 772 | | | | 19,122 | |
| Foot Locker, Inc. (Specialty Retail) | | | 493 | | | | 21,510 | |
| Fox Factory Holding Corp.* (Auto Components) | | | 230 | | | | 39,123 | |
| FTI Consulting, Inc.* (Professional Services) | | | 187 | | | | 28,690 | |
| Fulton Financial Corp. (Banks) | | | 881 | | | | 14,977 | |
| GameStop Corp.*—Class A (Specialty Retail) | | | 338 | | | | 50,156 | |
| GATX Corp. (Trading Companies & Distributors) | | | 194 | | | | 20,213 | |
| Genpact, Ltd. (IT Services) | | | 944 | | | | 50,108 | |
| Gentex Corp. (Auto Components) | | | 1,291 | | | | 44,991 | |
| Glacier Bancorp, Inc. (Banks) | | | 592 | | | | 33,566 | |
| Globus Medical, Inc.*—Class A (Health Care Equipment & Supplies) | | | 431 | | | | 31,118 | |
| Graco, Inc. (Machinery) | | | 928 | | | | 74,815 | |
| Graham Holdings Co.—Class B (Diversified Consumer Services) | | | 22 | | | | 13,856 | |
| Grand Canyon Education, Inc.* (Diversified Consumer Services) | | | 219 | | | | 18,770 | |
| Greif, Inc.—Class A (Containers & Packaging) | | | 145 | | | | 8,754 | |
| Grocery Outlet Holding Corp.* (Food & Staples Retailing) | | | 477 | | | | 13,490 | |
| GXO Logistics, Inc.* (Air Freight & Logistics) | | | 538 | | | | 48,866 | |
| H&R Block, Inc. (Diversified Consumer Services) | | | 959 | | | | 22,594 | |
| Haemonetics Corp.* (Health Care Equipment & Supplies) | | | 279 | | | | 14,798 | |
| Halozyme Therapeutics, Inc.* (Biotechnology) | | | 769 | | | | 30,921 | |
| Hancock Whitney Corp. (Banks) | | | 474 | | | | 23,709 | |
| Hanesbrands, Inc. (Textiles, Apparel & Luxury Goods) | | | 1,906 | | | | 31,868 | |
| Harley-Davidson, Inc. (Automobiles) | | | 840 | | | | 31,660 | |
| Hawaiian Electric Industries, Inc. (Electric Utilities) | | | 597 | | | | 24,776 | |
| Healthcare Realty Trust, Inc. (Equity Real Estate Investment Trusts) | | | 805 | | | | 25,470 | |
| HealthEquity, Inc.* (Health Care Providers & Services) | | | 456 | | | | 20,173 | |
| Helen of Troy, Ltd.* (Household Durables) | | | 132 | | | | 32,270 | |
| Hexcel Corp.* (Aerospace & Defense) | | | 458 | | | | 23,724 | |
| Highwoods Properties, Inc. (Equity Real Estate Investment Trusts) | | | 570 | | | | 25,416 | |
See accompanying notes to financial statements.
320 :: ProFund VP UltraMid-Cap :: Financial Statements
Common Stocks, continued
| | | Shares | | | Value | |
| HollyFrontier Corp. (Oil, Gas & Consumable Fuels) | | | 816 | | | $ | 26,748 | |
| Home BancShares, Inc. (Banks) | | | 823 | | | | 20,040 | |
| Hubbell, Inc. (Electrical Equipment) | | | 297 | | | | 61,856 | |
| Hudson Pacific Properties, Inc. (Equity Real Estate Investment Trusts) | | | 832 | | | | 20,559 | |
| IAA, Inc.* (Commercial Services & Supplies) | | | 736 | | | | 37,256 | |
| ICU Medical, Inc.* (Health Care Equipment & Supplies) | | | 109 | | | | 25,870 | |
| IDACORP, Inc. (Electric Utilities) | | | 276 | | | | 31,274 | |
| II-VI, Inc.* (Electronic Equipment, Instruments & Components) | | | 579 | | | | 39,563 | |
| Ingevity Corp.* (Chemicals) | | | 214 | | | | 15,344 | |
| Ingredion, Inc. (Food Products) | | | 363 | | | | 35,080 | |
| Insperity, Inc. (Professional Services) | | | 195 | | | | 23,031 | |
| Integra LifeSciences Holdings Corp.* (Health Care Equipment & Supplies) | | | 398 | | | | 26,662 | |
| Interactive Brokers Group, Inc. (Capital Markets) | | | 477 | | | | 37,883 | |
| International Bancshares Corp. (Banks) | | | 291 | | | | 12,335 | |
| Iridium Communications, Inc.* (Diversified Telecommunication Services) | | | 722 | | | | 29,811 | |
| ITT, Inc. (Machinery) | | | 467 | | | | 47,723 | |
| Jabil, Inc. (Electronic Equipment, Instruments & Components) | | | 782 | | | | 55,014 | |
| Jack in the Box, Inc. (Hotels, Restaurants & Leisure) | | | 118 | | | | 10,323 | |
| Janus Henderson Group PLC (Capital Markets) | | | 931 | | | | 39,046 | |
| Jazz Pharmaceuticals PLC* (Pharmaceuticals) | | | 336 | | | | 42,806 | |
| JBG Smith Properties (Equity Real Estate Investment Trusts) | | | 623 | | | | 17,886 | |
| Jefferies Financial Group, Inc. (Diversified Financial Services) | | | 1,072 | | | | 41,593 | |
| JetBlue Airways Corp.* (Airlines) | | | 1,736 | | | | 24,721 | |
| John Wiley & Sons, Inc.—Class A (Media) | | | 238 | | | | 13,630 | |
| Jones Lang LaSalle, Inc.* (Real Estate Management & Development) | | | 275 | | | | 74,069 | |
| KB Home (Household Durables) | | | 468 | | | | 20,934 | |
| KBR, Inc. (Professional Services) | | | 766 | | | | 36,476 | |
| Kemper Corp. (Insurance) | | | 327 | | | | 19,224 | |
| Kennametal, Inc. (Machinery) | | | 457 | | | | 16,411 | |
| Kilroy Realty Corp. (Equity Real Estate Investment Trusts) | | | 572 | | | | 38,015 | |
| Kinsale Capital Group, Inc. (Insurance) | | | 117 | | | | 27,833 | |
| Kirby Corp.* (Marine) | | | 328 | | | | 19,490 | |
| Kite Realty Group Trust (Equity Real Estate Investment Trusts) | | | 1,196 | | | | 26,049 | |
| Knight-Swift Transportation Holdings, Inc. (Road & Rail) | | | 906 | | | | 55,212 | |
| Kohl's Corp. (Multiline Retail) | | | 822 | | | | 40,599 | |
| Kyndryl Holdings, Inc.* (IT Services) | | | 978 | | | | 17,702 | |
| Lamar Advertising Co.—Class A (Equity Real Estate Investment Trusts) | | | 474 | | | | 57,496 | |
| Lancaster Colony Corp. (Food Products) | | | 108 | | | | 17,885 | |
| Landstar System, Inc. (Road & Rail) | | | 208 | | | | 37,236 | |
| Lattice Semiconductor Corp.* (Semiconductors & Semiconductor Equipment) | | | 748 | | | | 57,641 | |
| Lear Corp. (Auto Components) | | | 325 | | | | 59,460 | |
| Leggett & Platt, Inc. (Household Durables) | | | 728 | | | | 29,964 | |
| Lennox International, Inc. (Building Products) | | | 184 | | | | 59,682 | |
| LHC Group, Inc.* (Health Care Providers & Services) | | | 173 | | | | 23,741 | |
| Life Storage, Inc. (Equity Real Estate Investment Trusts) | | | 448 | | | | 68,625 | |
| Lincoln Electric Holdings, Inc. (Machinery) | | | 322 | | | | 44,909 | |
| Lithia Motors, Inc.—Class A (Specialty Retail) | | | 165 | | | | 48,997 | |
| Littelfuse, Inc. (Electronic Equipment, Instruments & Components) | | | 134 | | | | 42,167 | |
| LivaNova PLC* (Health Care Equipment & Supplies) | | | 291 | | | | 25,442 | |
| LiveRamp Holdings, Inc.* (IT Services) | | | 372 | | | | 17,837 | |
| Louisiana-Pacific Corp. (Paper & Forest Products) | | | 480 | | | | 37,608 | |
| Lumentum Holdings, Inc.* (Communications Equipment) | | | 395 | | | | 41,779 | |
| Macy's, Inc. (Multiline Retail) | | | 1,691 | | | | 44,270 | |
| Manhattan Associates, Inc.* (Software) | | | 345 | | | | 53,644 | |
| ManpowerGroup, Inc. (Professional Services) | | | 296 | | | | 28,810 | |
| Marriott Vacations Worldwide Corp. (Hotels, Restaurants & Leisure) | | | 233 | | | | 39,372 | |
| Masimo Corp.* (Health Care Equipment & Supplies) | | | 277 | | | | 81,101 | |
| MasTec, Inc.* (Construction & Engineering) | | | 312 | | | | 28,791 | |
| Mattel, Inc.* (Leisure Products) | | | 1,912 | | | | 41,223 | |
| MAXIMUS, Inc. (IT Services) | | | 336 | | | | 26,769 | |
| MDU Resources Group, Inc. (Multi-Utilities) | | | 1,110 | | | | 34,233 | |
| Medical Properties Trust, Inc. (Equity Real Estate Investment Trusts) | | | 3,255 | | | | 76,916 | |
| Medpace Holdings, Inc.* (Life Sciences Tools & Services) | | | 157 | | | | 34,169 | |
| Mercury General Corp. (Insurance) | | | 145 | | | | 7,694 | |
| Mercury Systems, Inc.* (Aerospace & Defense) | | | 309 | | | | 17,014 | |
| MGIC Investment Corp. (Thrifts & Mortgage Finance) | | | 1,777 | | | | 25,624 | |
| MillerKnoll, Inc. (Commercial Services & Supplies) | | | 414 | | | | 16,225 | |
| Mimecast, Ltd.* (Software) | | | 337 | | | | 26,815 | |
| Minerals Technologies, Inc. (Chemicals) | | | 182 | | | | 13,313 | |
| MKS Instruments, Inc. (Semiconductors & Semiconductor Equipment) | | | 303 | | | | 52,774 | |
| Molina Healthcare, Inc.* (Health Care Providers & Services) | | | 319 | | | | 101,467 | |
| MSA Safety, Inc. (Commercial Services & Supplies) | | | 199 | | | | 30,041 | |
| MSC Industrial Direct Co., Inc. (Trading Companies & Distributors) | | | 256 | | | | 21,519 | |
| Murphy Oil Corp. (Oil, Gas & Consumable Fuels) | | | 793 | | | | 20,705 | |
| Murphy USA, Inc. (Specialty Retail) | | | 129 | | | | 25,702 | |
| National Fuel Gas Co. (Gas Utilities) | | | 498 | | | | 31,842 | |
| National Instruments Corp. (Electronic Equipment, Instruments & Components) | | | 720 | | | | 31,442 | |
See accompanying notes to financial statements.
Financial Statements :: ProFund VP UltraMid-Cap :: 321
Common Stocks, continued
| | | Shares | | | Value | |
| National Retail Properties, Inc. (Equity Real Estate Investment Trusts) | | | 959 | | | $ | 46,099 | |
| National Storage Affiliates Trust (Equity Real Estate Investment Trusts) | | | 447 | | | | 30,932 | |
| Navient Corp. (Consumer Finance) | | | 880 | | | | 18,674 | |
| NCR Corp.* (Technology Hardware, Storage & Peripherals) | | | 721 | | | | 28,984 | |
| Neogen Corp.* (Health Care Equipment & Supplies) | | | 587 | | | | 26,656 | |
| Neurocrine Biosciences, Inc.* (Biotechnology) | | | 518 | | | | 44,118 | |
| New Jersey Resources Corp. (Gas Utilities) | | | 526 | | | | 21,598 | |
| New York Community Bancorp, Inc. (Thrifts & Mortgage Finance) | | | 2,538 | | | | 30,989 | |
| NewMarket Corp. (Chemicals) | | | 38 | | | | 13,023 | |
| Nordson Corp. (Machinery) | | | 295 | | | | 75,305 | |
| Nordstrom, Inc.* (Multiline Retail) | | | 607 | | | | 13,730 | |
| NorthWestern Corp. (Multi-Utilities) | | | 287 | | | | 16,405 | |
| NOV, Inc. (Energy Equipment & Services) | | | 2,132 | | | | 28,888 | |
| Nu Skin Enterprises, Inc.—Class A (Personal Products) | | | 272 | | | | 13,804 | |
| NuVasive, Inc.* (Health Care Equipment & Supplies) | | | 282 | | | | 14,799 | |
| nVent Electric PLC (Electrical Equipment) | | | 918 | | | | 34,884 | |
| OGE Energy Corp. (Electric Utilities) | | | 1,093 | | | | 41,949 | |
| Old Republic International Corp. (Insurance) | | | 1,559 | | | | 38,320 | |
| Olin Corp. (Chemicals) | | | 783 | | | | 45,038 | |
| Ollie's Bargain Outlet Holdings, Inc.* (Multiline Retail) | | | 330 | | | | 16,893 | |
| Omega Healthcare Investors, Inc. (Equity Real Estate Investment Trusts) | | | 1,304 | | | | 38,585 | |
| ONE Gas, Inc. (Gas Utilities) | | | 293 | | | | 22,734 | |
| Option Care Health, Inc.* (Health Care Providers & Services) | | | 756 | | | | 21,501 | |
| Oshkosh Corp. (Machinery) | | | 375 | | | | 42,266 | |
| Owens Corning (Building Products) | | | 549 | | | | 49,685 | |
| PacWest Bancorp (Banks) | | | 640 | | | | 28,909 | |
| Papa John's International, Inc. (Hotels, Restaurants & Leisure) | | | 177 | | | | 23,624 | |
| Park Hotels & Resorts, Inc.* (Equity Real Estate Investment Trusts) | | | 1,291 | | | | 24,374 | |
| Patterson Cos., Inc. (Health Care Providers & Services) | | | 473 | | | | 13,883 | |
| Paylocity Holding Corp.* (Software) | | | 216 | | | | 51,011 | |
| Pebblebrook Hotel Trust (Equity Real Estate Investment Trusts) | | | 717 | | | | 16,039 | |
| Penumbra, Inc.* (Health Care Equipment & Supplies) | | | 192 | | | | 55,165 | |
| Performance Food Group Co.* (Food & Staples Retailing) | | | 842 | | | | 38,639 | |
| Perrigo Co. PLC (Pharmaceuticals) | | | 730 | | | | 28,397 | |
| Physicians Realty Trust (Equity Real Estate Investment Trusts) | | | 1,202 | | | | 22,634 | |
| Pilgrim's Pride Corp.* (Food Products) | | | 266 | | | | 7,501 | |
| Pinnacle Financial Partners, Inc. (Banks) | | | 416 | | | | 39,728 | |
| PNM Resources, Inc. (Electric Utilities) | | | 469 | | | | 21,391 | |
| Polaris, Inc. (Leisure Products) | | | 311 | | | | 34,182 | |
| Post Holdings, Inc.* (Food Products) | | | 320 | | | | 36,074 | |
| PotlatchDeltic Corp. (Equity Real Estate Investment Trusts) | | | 366 | | | | 22,041 | |
| Power Integrations, Inc. (Semiconductors & Semiconductor Equipment) | | | 329 | | | | 30,561 | |
| Primerica, Inc. (Insurance) | | | 216 | | | | 33,106 | |
| PROG Holdings, Inc.* (Consumer Finance) | | | 310 | | | | 13,984 | |
| Progyny, Inc.* (Health Care Providers & Services) | | | 380 | | | | 19,133 | |
| Prosperity Bancshares, Inc. (Banks) | | | 503 | | | | 36,367 | |
| PS Business Parks, Inc. (Equity Real Estate Investment Trusts) | | | 110 | | | | 20,259 | |
| Qualys, Inc.* (Software) | | | 182 | | | | 24,974 | |
| Quidel Corp.* (Health Care Equipment & Supplies) | | | 207 | | | | 27,943 | |
| R1 RCM, Inc.* (Health Care Providers & Services) | | | 727 | | | | 18,531 | |
| Rayonier, Inc. (Equity Real Estate Investment Trusts) | | | 781 | | | | 31,521 | |
| Regal Rexnord Corp. (Electrical Equipment) | | | 370 | | | | 62,966 | |
| Reinsurance Group of America, Inc. (Insurance) | | | 369 | | | | 40,402 | |
| Reliance Steel & Aluminum Co. (Metals & Mining) | | | 342 | | | | 55,479 | |
| RenaissanceRe Holdings, Ltd. (Insurance) | | | 251 | | | | 42,502 | |
| Repligen Corp.* (Biotechnology) | | | 281 | | | | 74,420 | |
| Rexford Industrial Realty, Inc. (Equity Real Estate Investment Trusts) | | | 827 | | | | 67,078 | |
| RH* (Specialty Retail) | | | 95 | | | | 50,914 | |
| RLI Corp. (Insurance) | | | 217 | | | | 24,326 | |
| Royal Gold, Inc. (Metals & Mining) | | | 358 | | | | 37,665 | |
| RPM International, Inc. (Chemicals) | | | 708 | | | | 71,509 | |
| Ryder System, Inc. (Road & Rail) | | | 293 | | | | 24,152 | |
| Sabra Health Care REIT, Inc. (Equity Real Estate Investment Trusts) | | | 1,248 | | | | 16,898 | |
| Sabre Corp.* (IT Services) | | | 1,766 | | | | 15,170 | |
| Saia, Inc.* (Road & Rail) | | | 144 | | | | 48,532 | |
| Sailpoint Technologies Holding, Inc.* (Software) | | | 509 | | | | 24,605 | |
| Sanderson Farms, Inc. (Food Products) | | | 116 | | | | 22,165 | |
| Science Applications International Corp. (Professional Services) | | | 314 | | | | 26,247 | |
| Scientific Games Corp.* (Hotels, Restaurants & Leisure) | | | 527 | | | | 35,219 | |
| SEI Investments Co. (Capital Markets) | | | 579 | | | | 35,284 | |
| Selective Insurance Group, Inc. (Insurance) | | | 328 | | | | 26,876 | |
| Semtech Corp.* (Semiconductors & Semiconductor Equipment) | | | 352 | | | | 31,303 | |
| Sensient Technologies Corp. (Chemicals) | | | 229 | | | | 22,914 | |
| Service Corp. International (Diversified Consumer Services) | | | 900 | | | | 63,892 | |
| Silgan Holdings, Inc. (Containers & Packaging) | | | 458 | | | | 19,621 | |
| Silicon Laboratories, Inc.* (Semiconductors & Semiconductor Equipment) | | | 219 | | | | 45,206 | |
| Simpson Manufacturing Co., Inc. (Building Products) | | | 237 | | | | 32,960 | |
| SiTime Corp.* (Semiconductors & Semiconductor Equipment) | | | 82 | | | | 23,988 | |
| Six Flags Entertainment Corp.* (Hotels, Restaurants & Leisure) | | | 422 | | | | 17,969 | |
See accompanying notes to financial statements.
322 :: ProFund VP UltraMid-Cap :: Financial Statements
Common Stocks, continued
| | | Shares | | | Value | |
| Skechers U.S.A., Inc.*—Class A (Textiles, Apparel & Luxury Goods) | | | 736 | | | $ | 31,942 | |
| SL Green Realty Corp. (Equity Real Estate Investment Trusts) | | | 364 | | | | 26,099 | |
| SLM Corp. (Consumer Finance) | | | 1,600 | | | | 31,472 | |
| Sonoco Products Co. (Containers & Packaging) | | | 537 | | | | 31,087 | |
| Southwest Gas Holdings, Inc. (Gas Utilities) | | | 330 | | | | 23,117 | |
| Spire, Inc. (Gas Utilities) | | | 282 | | | | 18,392 | |
| Spirit Realty Capital, Inc. (Equity Real Estate Investment Trusts) | | | 673 | | | | 32,432 | |
| Sprouts Farmers Market, Inc.* (Food & Staples Retailing) | | | 613 | | | | 18,194 | |
| STAAR Surgical Co.* (Health Care Equipment & Supplies) | | | 260 | | | | 23,738 | |
| Steel Dynamics, Inc. (Metals & Mining) | | | 1,029 | | | | 63,870 | |
| Stericycle, Inc.* (Commercial Services & Supplies) | | | 501 | | | | 29,880 | |
| Sterling Bancorp (Banks) | | | 1,052 | | | | 27,131 | |
| Stifel Financial Corp. (Capital Markets) | | | 568 | | | | 39,999 | |
| STORE Capital Corp. (Equity Real Estate Investment Trusts) | | | 1,340 | | | | 46,096 | |
| SunPower Corp.* (Semiconductors & Semiconductor Equipment) | | | 453 | | | | 9,454 | |
| Sunrun, Inc.* (Electrical Equipment) | | | 1,130 | | | | 38,759 | |
| Synaptics, Inc.* (Semiconductors & Semiconductor Equipment) | | | 214 | | | | 61,955 | |
| Syneos Health, Inc.* (Life Sciences Tools & Services) | | | 566 | | | | 58,117 | |
| SYNNEX Corp. (Electronic Equipment, Instruments & Components) | | | 225 | | | | 25,731 | |
| Synovus Financial Corp. (Banks) | | | 794 | | | | 38,009 | |
| Tandem Diabetes Care, Inc.* (Health Care Equipment & Supplies) | | | 347 | | | | 52,230 | |
| Targa Resources Corp. (Oil, Gas & Consumable Fuels) | | | 1,250 | | | | 65,301 | |
| Taylor Morrison Home Corp.* (Household Durables) | | | 671 | | | | 23,458 | |
| TEGNA, Inc. (Media) | | | 1,208 | | | | 22,420 | |
| Tempur Sealy International, Inc. (Household Durables) | | | 1,051 | | | | 49,429 | |
| Tenet Healthcare Corp.* (Health Care Providers & Services) | | | 585 | | | | 47,789 | |
| Teradata Corp.* (IT Services) | | | 592 | | �� | | 25,142 | |
| Terex Corp. (Machinery) | | | 381 | | | | 16,745 | |
| Tetra Tech, Inc. (Commercial Services & Supplies) | | | 295 | | | | 50,091 | |
| Texas Capital Bancshares, Inc.* (Banks) | | | 276 | | | | 16,629 | |
| Texas Roadhouse, Inc.—Class A (Hotels, Restaurants & Leisure) | | | 380 | | | | 33,926 | |
| The Boston Beer Co., Inc.*—Class A (Beverages) | | | 51 | | | | 25,760 | |
| The Brink's Co. (Commercial Services & Supplies) | | | 268 | | | | 17,573 | |
| The Chemours Co. (Chemicals) | | | 890 | | | | 29,868 | |
| The Goodyear Tire & Rubber Co.* (Auto Components) | | | 1,535 | | | | 32,726 | |
| The Hain Celestial Group, Inc.* (Food Products) | | | 507 | | | | 21,603 | |
| The Hanover Insurance Group, Inc. (Insurance) | | | 194 | | | | 25,426 | |
| The Macerich Co. (Equity Real Estate Investment Trusts) | | | 1,163 | | | | 20,097 | |
| The Middleby Corp.* (Machinery) | | | 304 | | | | 59,815 | |
| The New York Times Co.—Class A (Media) | | | 912 | | | | 44,050 | |
| The Scotts Miracle-Gro Co.—Class A (Chemicals) | | | 222 | | | | 35,742 | |
| The Timken Co. (Machinery) | | | 377 | | | | 26,122 | |
| The Toro Co. (Machinery) | | | 581 | | | | 58,048 | |
| The Wendy's Co. (Hotels, Restaurants & Leisure) | | | 963 | | | | 22,968 | |
| The Western Union Co. (IT Services) | | | 2,194 | | | | 39,141 | |
| Thor Industries, Inc. (Automobiles) | | | 303 | | | | 31,442 | |
| Toll Brothers, Inc. (Household Durables) | | | 625 | | | | 45,244 | |
| TopBuild Corp.* (Household Durables) | | | 180 | | | | 49,664 | |
| Travel + Leisure Co. (Hotels, Restaurants & Leisure) | | | 471 | | | | 26,032 | |
| Trex Co., Inc.* (Building Products) | | | 628 | | | | 84,799 | |
| Tri Pointe Homes, Inc.* (Household Durables) | | | 607 | | | | 16,929 | |
| Trinity Industries, Inc. (Machinery) | | | 446 | | | | 13,469 | |
| TripAdvisor, Inc.* (Interactive Media & Services) | | | 541 | | | | 14,748 | |
| UGI Corp. (Gas Utilities) | | | 1,142 | | | | 52,428 | |
| UMB Financial Corp. (Banks) | | | 235 | | | | 24,936 | |
| Umpqua Holdings Corp. (Banks) | | | 1,182 | | | | 22,742 | |
| United Bankshares, Inc. (Banks) | | | 744 | | | | 26,992 | |
| United States Steel Corp. (Metals & Mining) | | | 1,475 | | | | 35,120 | |
| United Therapeutics Corp.* (Biotechnology) | | | 246 | | | | 53,156 | |
| Univar Solutions, Inc.* (Trading Companies & Distributors) | | | 933 | | | | 26,451 | |
| Universal Display Corp. (Semiconductors & Semiconductor Equipment) | | | 237 | | | | 39,112 | |
| Unum Group (Insurance) | | | 1,116 | | | | 27,420 | |
| Urban Edge Properties (Equity Real Estate Investment Trusts) | | | 601 | | | | 11,419 | |
| Urban Outfitters, Inc.* (Specialty Retail) | | | 360 | | | | 10,570 | |
| Valley National Bancorp (Banks) | | | 2,221 | | | | 30,539 | |
| Valmont Industries, Inc. (Construction & Engineering) | | | 116 | | | | 29,058 | |
| Valvoline, Inc. (Chemicals) | | | 987 | | | | 36,805 | |
| ViaSat, Inc.* (Communications Equipment) | | | 401 | | | | 17,861 | |
| Vicor Corp.* (Electrical Equipment) | | | 117 | | | | 14,857 | |
| Victoria's Secret & Co.* (Specialty Retail) | | | 395 | | | | 21,938 | |
| Vishay Intertechnology, Inc. (Electronic Equipment, Instruments & Components) | | | 724 | | | | 15,834 | |
| Visteon Corp.* (Auto Components) | | | 153 | | | | 17,004 | |
| Vontier Corp. (Electronic Equipment, Instruments & Components) | | | 923 | | | | 28,364 | |
| Voya Financial, Inc. (Diversified Financial Services) | | | 606 | | | | 40,184 | |
| Washington Federal, Inc. (Thrifts & Mortgage Finance) | | | 356 | | | | 11,883 | |
| Watsco, Inc. (Trading Companies & Distributors) | | | 180 | | | | 56,318 | |
| Webster Financial Corp. (Banks) | | | 494 | | | | 27,585 | |
See accompanying notes to financial statements.
Financial Statements :: ProFund VP UltraMid-Cap :: 323
Common Stocks, continued
| | | Shares | | | Value | |
| Werner Enterprises, Inc. (Road & Rail) | | | 332 | | | $ | 15,823 | |
| WEX, Inc.* (IT Services) | | | 245 | | | | 34,396 | |
| Williams-Sonoma, Inc. (Specialty Retail) | | | 406 | | | | 68,667 | |
| Wingstop, Inc. (Hotels, Restaurants & Leisure) | | | 163 | | | | 28,166 | |
| Wintrust Financial Corp. (Banks) | | | 311 | | | | 28,245 | |
| Wolfspeed, Inc.* (Semiconductors & Semiconductor Equipment) | | | 633 | | | | 70,751 | |
| Woodward, Inc. (Machinery) | | | 344 | | | | 37,654 | |
| World Wrestling Entertainment, Inc.—Class A (Entertainment) | | | 244 | | | | 12,039 | |
| Worthington Industries, Inc. (Metals & Mining) | | | 177 | | | | 9,675 | |
| Wyndham Hotels & Resorts, Inc. (Hotels, Restaurants & Leisure) | | | 509 | | | | 45,633 | |
| Xerox Holdings Corp. (Technology Hardware, Storage & Peripherals) | | | 750 | | | | 16,980 | |
| XPO Logistics, Inc.* (Air Freight & Logistics) | | | 539 | | | | 41,735 | |
| Yelp, Inc.* (Interactive Media & Services) | | | 375 | | | | 13,590 | |
| YETI Holdings, Inc.* (Leisure Products) | | | 478 | | | | 39,593 | |
| Ziff Davis, Inc.* (Software) | | | 263 | | | | 29,156 | |
TOTAL COMMON STOCKS
(Cost $8,565,075) | | | | | | | 13,454,011 | |
Repurchase Agreements(a)(b) (23.7%)
| | | Principal
Amount | | | Value | |
| Repurchase Agreements with various counterparties, 0.00%, dated 12/31/21, due 1/3/22, total to be received $4,241,000 | | $ | 4,241,000 | | | $ | 4,241,000 | |
TOTAL REPURCHASE AGREEMENTS
(Cost $4,241,000) | | | | | | | 4,241,000 | |
TOTAL INVESTMENT SECURITIES
(Cost $12,806,075)—99.0% | | | | | | | 17,695,011 | |
| Net other assets (liabilities)—1.0% | | | | | | | 174,808 | |
| NET ASSETS—100.0% | | | | | | $ | 17,869,819 | |
| * | Non-income producing security. |
| (a) | A portion of these securities were held in a segregated account for the benefit of swap counterparties in the event of default. At December 31, 2021, the aggregate amount held in a segregated account was $2,637,000. |
| (b) | The ProFund VP invests in Repurchase Agreements jointly with other funds in the Trust. See "Repurchase Agreements" under Note 2 in the Notes to Financial Statements to view the details of each individual agreement and counterparty as well as a description of the securities subject to repurchase. |
Total Return Swap Agreements—Long
| Underlying Instrument | | Counterparty | | Termination
Date(1) | | | Rate Paid
(Received)(2) | | | Notional
Amount | | | Value and
Unrealized
Appreciation/
(Depreciation) | |
| S&P MidCap 400 | | Goldman Sachs International | | 1/27/22 | | | | 0.58 | % | | $ | 14,511,820 | | | $ | 49,573 | |
| SPDR S&P MidCap 400 ETF | | Goldman Sachs International | | 1/27/22 | | | | 0.35 | % | | | 1,649,694 | | | | 5,740 | |
| | | | | | | | | | | | $ | 16,161,514 | | | $ | 55,313 | |
| S&P MidCap 400 | | UBS AG | | 1/27/22 | | | | 0.43 | % | | $ | 2,586,220 | | | $ | 9,943 | |
| SPDR S&P MidCap 400 ETF | | UBS AG | | 1/27/22 | | | | 0.38 | % | | | 3,623,101 | | | | 12,593 | |
| | | | | | | | | | | | $ | 6,209,321 | | | $ | 22,536 | |
| | | | | | | | | | | | $ | 22,370,835 | | | $ | 77,849 | |
| (1) | Agreements may be terminated at will by either party without penalty. Payment is due at termination/maturity. |
| (2) | Reflects the floating financing rate, as of December 31, 2021, on the notional amount of the swap agreement paid to the counterparty or received from the counterparty, excluding any commissions. This amount is included as part of the unrealized appreciation/(depreciation). |
See accompanying notes to financial statements.
324 :: ProFund VP UltraMid-Cap :: Financial Statements
ProFund VP UltraMid-Cap invested in the following industries as of December 31, 2021:
| | | Value | | | % of
Net Assets | |
| Aerospace & Defense | | $ | 126,776 | | | | 0.7 | % |
| Air Freight & Logistics | | | 90,601 | | | | 0.5 | % |
| Airlines | | | 24,721 | | | | 0.1 | % |
| Auto Components | | | 235,921 | | | | 1.3 | % |
| Automobiles | | | 63,102 | | | | 0.4 | % |
| Banks | | | 844,536 | | | | 4.7 | % |
| Beverages | | | 25,760 | | | | 0.1 | % |
| Biotechnology | | | 271,910 | | | | 1.5 | % |
| Building Products | | | 316,692 | | | | 1.7 | % |
| Capital Markets | | | 237,549 | | | | 1.3 | % |
| Chemicals | | | 362,056 | | | | 2.0 | % |
| Commercial Services & Supplies | | | 208,303 | | | | 1.2 | % |
| Communications Equipment | | | 124,756 | | | | 0.7 | % |
| Construction & Engineering | | | 190,310 | | | | 1.1 | % |
| Construction Materials | | | 36,954 | | | | 0.2 | % |
| Consumer Finance | | | 80,663 | | | | 0.5 | % |
| Containers & Packaging | | | 103,432 | | | | 0.6 | % |
| Diversified Consumer Services | | | 119,112 | | | | 0.7 | % |
| Diversified Financial Services | | | 81,777 | | | | 0.5 | % |
| Diversified Telecommunication Services | | | 29,811 | | | | 0.2 | % |
| Electric Utilities | | | 138,432 | | | | 0.8 | % |
| Electrical Equipment | | | 271,866 | | | | 1.5 | % |
| Electronic Equipment, Instruments & Components | | | 438,343 | | | | 2.5 | % |
| Energy Equipment & Services | | | 51,180 | | | | 0.3 | % |
| Entertainment | | | 12,039 | | | | 0.1 | % |
| Equity Real Estate Investment Trusts | | | 1,321,468 | | | | 7.4 | % |
| Food & Staples Retailing | | | 160,277 | | | | 0.9 | % |
| Food Products | | | 231,297 | | | | 1.3 | % |
| Gas Utilities | | | 170,111 | | | | 0.9 | % |
| Health Care Equipment & Supplies | | | 445,220 | | | | 2.5 | % |
| Health Care Providers & Services | | | 404,712 | | | | 2.3 | % |
| Hotels, Restaurants & Leisure | | | 402,284 | | | | 2.3 | % |
| Household Durables | | | 267,892 | | | | 1.5 | % |
| Household Products | | | 13,754 | | | | 0.1 | % |
| Industrial Conglomerates | | | 70,714 | | | | 0.4 | % |
| Insurance | | | 498,260 | | | | 2.8 | % |
| Interactive Media & Services | | | 28,338 | | | | 0.2 | % |
| IT Services | | | 286,169 | | | | 1.6 | % |
| Leisure Products | | | 174,966 | | | | 1.0 | % |
| Life Sciences Tools & Services | | | 138,856 | | | | 0.8 | % |
| Machinery | | | 675,366 | | | | 3.7 | % |
| Marine | | | 19,490 | | | | 0.1 | % |
| Media | | | 127,713 | | | | 0.6 | % |
| Metals & Mining | | | 350,097 | | | | 2.0 | % |
| Multiline Retail | | | 115,492 | | | | 0.6 | % |
| Multi-Utilities | | | 75,196 | | | | 0.4 | % |
| Oil, Gas & Consumable Fuels | | | 230,025 | | | | 1.3 | % |
| Paper & Forest Products | | | 37,608 | | | | 0.2 | % |
| Personal Products | | | 33,040 | | | | 0.2 | % |
| Pharmaceuticals | | | 71,203 | | | | 0.4 | % |
| Professional Services | | | 212,490 | | | | 1.2 | % |
| Real Estate Management & Development | | | 74,069 | | | | 0.4 | % |
| Road & Rail | | | 226,369 | | | | 1.3 | % |
| Semiconductors & Semiconductor Equipment | | | 583,656 | | | | 3.2 | % |
| Software | | | 483,341 | | | | 2.7 | % |
| Specialty Retail | | | 449,134 | | | | 2.5 | % |
| Technology Hardware, Storage & Peripherals | | | 45,964 | | | | 0.3 | % |
| Textiles, Apparel & Luxury Goods | | | 255,005 | | | | 1.4 | % |
| Thrifts & Mortgage Finance | | | 95,951 | | | | 0.5 | % |
| Trading Companies & Distributors | | | 124,501 | | | | 0.7 | % |
| Water Utilities | | | 67,381 | | | | 0.4 | % |
| Other** | | | 4,415,808 | | | | 24.7 | % |
| Total | | $ | 17,869,819 | | | | 100.0 | % |
| ** | Includes any non-equity securities and net other assets (liabilities), which includes any receivable for capital shares issued and payable for capital shares redeemed. |
See accompanying notes to financial statements.
Financial Statements :: ProFund VP UltraMid-Cap :: 325
Statement of Assets and Liabilities
December 31, 2021
| ASSETS: |
| Total Investment Securities, at cost | | $ | 12,806,075 | |
| Securities, at value | | | 13,454,011 | |
| Repurchase agreements, at value | | | 4,241,000 | |
| Total Investment Securities, at value | | | 17,695,011 | |
| Cash | | | 132,299 | |
| Dividends receivable | | | 12,330 | |
| Unrealized appreciation on swap agreements | | | 77,849 | |
| Prepaid expenses | | | 1,351 | |
| TOTAL ASSETS | | | 17,918,840 | |
| | | | | |
| LIABILITIES: | | | | |
| Payable for capital shares redeemed | | | 6,295 | |
| Advisory fees payable | | | 13,768 | |
| Management services fees payable | | | 1,836 | |
| Administration fees payable | | | 1,052 | |
| Administrative services fees payable | | | 7,376 | |
| Distribution fees payable | | | 5,431 | |
| Transfer agency fees payable | | | 1,800 | |
| Fund accounting fees payable | | | 699 | |
| Compliance services fees payable | | | 80 | |
| Other accrued expenses | | | 10,684 | |
| TOTAL LIABILITIES | | | 49,021 | |
| NET ASSETS | | $ | 17,869,819 | |
| | | | | |
| NET ASSETS CONSIST OF: | | | | |
| Capital | | $ | 9,339,184 | |
| Total distributable earnings (loss) | | | 8,530,635 | |
| NET ASSETS | | $ | 17,869,819 | |
| Shares of Beneficial Interest Outstanding (unlimited number of shares authorized, no par value) | | | 241,659 | |
| Net Asset Value (offering and redemption price per share) | | $ | 73.95 | |
Statement of Operations
For the Year Ended December 31, 2021
| INVESTMENT INCOME: | | | | |
| Dividends | | $ | 160,771 | |
| Interest | | | 99 | |
| Net income from securities lending | | | 65 | |
| TOTAL INVESTMENT INCOME | | | 160,935 | |
| | | | | |
| EXPENSES: | | | | |
| Advisory fees | | | 142,509 | |
| Management services fees | | | 19,001 | |
| Administration fees | | | 13,949 | |
| Transfer agency fees | | | 11,568 | |
| Administrative services fees | | | 55,824 | |
| Distribution fees | | | 47,503 | |
| Custody fees | | | 2,893 | |
| Fund accounting fees | | | 9,185 | |
| Trustee fees | | | 292 | |
| Compliance services fees | | | 143 | |
| Other fees | | | 16,426 | |
| Recoupment of prior expenses reduced by the Advisor | | | 3,000 | |
| Total Gross Expenses before reductions | | | 322,293 | |
| Expenses reduced and reimbursed by the Advisor | | | (3,074 | ) |
| TOTAL NET EXPENSES | | | 319,219 | |
| NET INVESTMENT INCOME (LOSS) | | | (158,284 | ) |
| | | | | |
| REALIZED AND UNREALIZED GAINS (LOSSES) ON INVESTMENTS: | | | | |
| Net realized gains (losses) on investment securities | | | 909,584 | |
| Net realized gains (losses) on futures contracts | | | 12,857 | |
| Net realized gains (losses) on swap agreements | | | 4,180,017 | |
| Change in net unrealized appreciation/depreciation on investment securities | | | 1,423,076 | |
| Change in net unrealized appreciation/depreciation on swap agreements | | | 98,904 | |
| NET REALIZED AND UNREALIZED GAINS (LOSSES) ON INVESTMENTS | | | 6,624,438 | |
| CHANGE IN NET ASSETS RESULTING FROM OPERATIONS | | $ | 6,466,154 | |
See accompanying notes to financial statements.
326 :: ProFund VP UltraMid-Cap :: Financial Statements
Statements of Changes in Net Assets
| | | Year Ended
December 31, 2021 | | | Year Ended
December 31, 2020 | |
| FROM INVESTMENT ACTIVITIES: |
| |
| OPERATIONS: |
| Net investment income (loss) | | $ | (158,284 | ) | | $ | (49,610 | ) |
| Net realized gains (losses) on investments | | | 5,102,458 | | | | (69,724 | ) |
| Change in net unrealized appreciation/depreciation on investments | | | 1,521,980 | | | | (1,186,176 | ) |
| Change in net assets resulting from operations | | | 6,466,154 | | | | (1,305,510 | ) |
| | | | | | | | | |
| DISTRIBUTIONS TO SHAREHOLDERS: | | | | | | | | |
| Total distributions | | | — | | | | (2,119,595 | ) |
| Change in net assets resulting from distributions | | | — | | | | (2,119,595 | ) |
| | | | | | | | | |
| CAPITAL TRANSACTIONS: | | | | | | | | |
| Proceeds from shares issued | | | 46,261,796 | | | | 81,827,082 | |
| Distributions reinvested | | | — | | | | 2,119,595 | |
| Value of shares redeemed | | | (47,580,050 | ) | | | (82,675,100 | ) |
| Change in net assets resulting from capital transactions | | | (1,318,254 | ) | | | 1,271,577 | |
| Change in net assets | | | 5,147,900 | | | | (2,153,528 | ) |
| | | | | | | | | |
| NET ASSETS: | | | | | | | | |
| Beginning of period | | | 12,721,919 | | | | 14,875,447 | |
| End of period | | $ | 17,869,819 | | | $ | 12,721,919 | |
| | | | | | | | | |
| SHARE TRANSACTIONS: | | | | | | | | |
| Issued | | | 733,490 | | | | 1,577,682 | |
| Reinvested | | | — | | | | 57,147 | |
| Redeemed | | | (744,151 | ) | | | (1,624,356 | ) |
| Change in shares | | | (10,661 | ) | | | 10,473 | |
See accompanying notes to financial statements.
Financial Highlights :: ProFund VP UltraMid-Cap :: 327
ProFunds Financial Highlights FOR THE PERIODS INDICATED
Selected data for a share of beneficial interest outstanding throughout the periods indicated.
| | | Year Ended
Dec. 31, 2021 | | | Year Ended
Dec. 31, 2020 | | | Year Ended
Dec. 31, 2019 | | | Year Ended
Dec. 31, 2018 | | | Year Ended
Dec. 31, 2017 | |
| Net Asset Value, Beginning of Period | | $ | 50.42 | | | $ | 61.51 | | | $ | 41.62 | | | $ | 79.70 | | | $ | 68.60 | |
| Investment Activities: | | | | | | | | | | | | | | | | | | | | |
| Net investment income (loss)(a) | | | (0.55 | ) | | | (0.21 | ) | | | 0.06 | | | | (0.06 | ) | | | (0.32 | ) |
| Net realized and unrealized gains (losses) on investments | | | 24.08 | | | | (0.36 | ) | | | 19.83 | | | | (13.41 | ) | | | 19.39 | |
| Total income (loss) from investment activities | | | 23.53 | | | | (0.57 | ) | | | 19.89 | | | | (13.47 | ) | | | 19.07 | |
| | | | | | | | | | | | | | | | | | | | | |
| Distributions to Shareholders From: | | | | | | | | | | | | | | | | | | | | |
| Net investment income | | | — | | | | (0.12 | ) | | | — | | | | — | | | | — | |
| Net realized gains on investments | | | — | | | | (10.40 | ) | | | — | | | | (24.61 | ) | | | (7.97 | ) |
| Total distributions | | | — | | | | (10.52 | ) | | | — | | | | (24.61 | ) | | | (7.97 | ) |
| | | | | | | | | | | | | | | | | | | | | |
| Net Asset Value, End of Period | | $ | 73.95 | | | $ | 50.42 | | | $ | 61.51 | | | $ | 41.62 | | | $ | 79.70 | |
| | | | | | | | | | | | | | | | | | | | | |
| Total Return | | | 46.67 | % | | | 5.22 | % | | | 47.79 | % | | | (26.77 | )% | | | 28.86 | % |
| | | | | | | | | | | | | | | | | | | | | |
| Ratios to Average Net Assets: | | | | | | | | | | | | | | | | | | | | |
| Gross expenses | | | 1.69 | % | | | 1.79 | % | | | 1.71 | % | | | 1.68 | % | | | 1.68 | % |
| Net expenses | | | 1.68 | % | | | 1.68 | % | | | 1.68 | % | | | 1.68 | % | | | 1.68 | % |
| Net investment income (loss) | | | (0.83 | )% | | | (0.48 | )% | | | 0.11 | % | | | (0.10 | )% | | | (0.43 | )% |
| | | | | | | | | | | | | | | | | | | | | |
| Supplemental Data: | | | | | | | | | | | | | | | | | | | | |
| Net assets, end of period (000's) | | $ | 17,870 | | | $ | 12,722 | | | $ | 14,875 | | | $ | 14,676 | | | $ | 25,815 | |
| Portfolio turnover rate(b) | | | 66 | % | | | 488 | % | | | 603 | % | | | 617 | % | | | 594 | % |
| (a) | Per share net investment income (loss) has been calculated using the average daily shares method. |
| (b) | Portfolio turnover rate is calculated without regard to instruments having a maturity of less than one year from acquisition or derivative instruments (including swap agreements and futures contracts). The portfolio turnover rate can be high and volatile due to the amount and timing of sales and purchases of fund shares during the period. |
See accompanying notes to financial statements.
328 :: ProFund VP UltraNasdaq-100 :: Management Discussion of Fund Performance
ProFund VP UltraNasdaq-100 (the "Fund") seeks daily investment results, before fees and expenses, that correspond to two times (2x) the return of the Nasdaq-100® Index (the "Index") for a single day, not for any other period. A "single day" is measured from the time the Fund calculates its net asset value ("NAV") to the time of the Fund's next NAV calculation, not for longer periods. The Fund does not seek to achieve its stated investment objective over a period of time greater than a single day. The return of the Fund for longer periods will be the result of its return for each day compounded over the period. The Fund's returns for periods longer than a single day will very likely differ in amount, and possibly even direction from the Fund's stated multiple (2x) times the return of the Fund's Index for the same period. For periods longer than a single day, the Fund will lose money if the Index's performance is flat, and it is possible that the Fund will lose money even if the level of the index rises. For the year ended December 31, 2021, the Fund had a total return of 52.51%. For the same period, the Index had a total return of 27.51%1 and a volatility of 18.57%. For the year, the Fund achieved an average daily statistical correlation of over 0.99 to twice that of the daily performance of the Index.2
The Fund takes positions in financial instruments that, in combination, should have similar daily return characteristics as twice the daily return of the Index. The Index, a modified market capitalization-weighted index, includes 100 of the largest non-financial domestic and international issues listed on Nasdaq.
During the year ended December 31, 2021, the Fund invested in swap agreements and futures contracts as a substitute for investing directly in stocks in order to gain leveraged exposure to the Index. These derivatives generally tracked the performance of their underlying benchmark and were negatively impacted by financing costs associated with their use. The Fund entered into swap agreements with counterparties that the Fund's advisor determined to be major, global financial institutions. If a counterparty becomes insolvent or otherwise fails to perform on its obligations, the value of investments in the Fund may decline. The Fund has sought to mitigate this risk by generally requiring counterparties to post collateral for the benefit of the Fund, marked to market daily, in an amount approximately equal to the amount the counterparty owed to the Fund, subject to certain minimum thresholds.
Value of a $10,000 Investment at Net Asset Value*
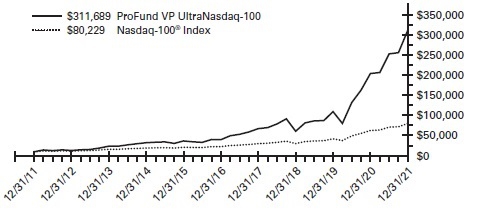
| * | The line graph represents the historical performance of a hypothetical investment of $10,000 in the ProFund VP UltraNasdaq-100 from December 31, 2011 to December 31, 2021, assuming the reinvestment of distributions. |
Average Annual Total Return as of 12/31/21
| Fund | | One Year | | | Five Year | | | Ten Year | |
| ProFund VP UltraNasdaq-100 | | | 52.51 | % | | | 50.67 | % | | | 41.05 | % |
| Nasdaq-100® Index | | | 27.51 | % | | | 28.63 | % | | | 23.15 | % |
Expense Ratios**
| Fund | | Gross | | | Net | | | | | |
| ProFund VP UltraNasdaq-100 | | | 1.74 | % | | | 1.68 | % | | | | |
| | | | | | | | | | | | | |
| ** | Reflects the expense ratio as reported in the Prospectus dated May 1, 2021. Contractual fee waivers are in effect through April 30, 2022. See Financial Highlights for effective expense ratios. |
Allocation of Portfolio Holdings & Index Composition
Market Exposure
| Investment Type | | % of Net Assets | |
| Equity Securities | | | 68 | % |
| Futures Contracts | | | — | (a) |
| Swap Agreements | | | 133 | % |
| Total Exposure | | | 201 | % |
“Market Exposure” includes the value of total investments (including the contract value of any derivatives) and excludes any instruments used for cash management or collateral for securities loaned.
(a) Amount is less than 0.5%.
Largest Equity Holdings
| Company | | % of Net Assets | |
| Apple, Inc. | | | 7.9 | % |
| Microsoft Corp. | | | 6.8 | % |
| Alphabet, Inc. | | | 4.8 | % |
| Amazon.com, Inc. | | | 4.6 | % |
| Meta Platforms, Inc. | | | 3.2 | % |
Nasdaq-100® Index – Composition
| | | % of Index | |
| Information Technology | | | 51 | % |
| Communication Services | | | 18 | % |
| Consumer Discretionary | | | 16 | % |
| Health Care | | | 6 | % |
| Consumer Staples | | | 5 | % |
| Industrials | | | 3 | % |
| Utilities | | | 1 | % |
Past performance does not guarantee future results. Return calculations assume the reinvestment of distributions and do not reflect taxes that a shareholder would pay on Fund distributions or on the redemption of Fund shares. The performance data quoted represents past performance and current returns may be lower or higher. The investment return and NAV will fluctuate so that an investor's shares, when redeemed, may be worth more or less than the original cost. The performance above reflects any fee reductions during the applicable periods. If such fee reductions had not occurred, the quoted performance would be lower. Performance numbers are net of all Fund fees and expenses but do not include any insurance, sales, or administrative charges of variable annuity or life insurance contracts. If these charges were included, the returns would be lower. To obtain performance current to the most recent month-end, please call toll-free 888-776-3637.
| 1 | The graph and table reflect the theoretical reinvestment of dividends on securities in the Index. The impact of transaction costs and the deduction of fees and expenses associated with a mutual fund, such as investment management and accounting fees, are not reflected in the index calculations. The Fund's performance reflects the reinvestment of dividends as well as the impact of transaction costs and the deduction of fees and expenses. It is not possible to invest directly in an index. |
| 2 | 1.00 equals perfect correlation. This calculation is based on the daily total return of the Index and the performance of the daily total return of the NAV per share of the Fund. |
The above information is not covered by the Report of the Independent Registered Public Accounting Firm.
Financial Statements :: ProFund VP UltraNasdaq-100 :: 329
Schedule of Portfolio Investments :: December 31, 2021
Common Stocks (67.5%)
| | | Shares | | | Value | |
| Activision Blizzard, Inc. (Entertainment) | | | 9,353 | | | $ | 622,255 | |
| Adobe, Inc.* (Software) | | | 5,714 | | | | 3,240,181 | |
| Advanced Micro Devices, Inc.* (Semiconductors & Semiconductor Equipment) | | | 14,501 | | | | 2,086,694 | |
| Airbnb, Inc.*—Class A (Hotels, Restaurants & Leisure) | | | 4,165 | | | | 693,431 | |
| Align Technology, Inc.* (Health Care Equipment & Supplies) | | | 947 | | | | 622,349 | |
| Alphabet, Inc.*—Class A (Interactive Media & Services) | | | 2,177 | | | | 6,306,856 | |
| Alphabet, Inc.*—Class C (Interactive Media & Services) | | | 2,300 | | | | 6,655,257 | |
| Amazon.com, Inc.* (Internet & Direct Marketing Retail) | | | 3,671 | | | | 12,240,363 | |
| American Electric Power Co., Inc. (Electric Utilities) | | | 6,048 | | | | 538,091 | |
| Amgen, Inc. (Biotechnology) | | | 6,768 | | | | 1,522,596 | |
| Analog Devices, Inc. (Semiconductors & Semiconductor Equipment) | | | 6,452 | | | | 1,134,068 | |
| ANSYS, Inc.* (Software) | | | 1,048 | | | | 420,374 | |
| Apple, Inc. (Technology Hardware, Storage & Peripherals) | | | 118,746 | | | | 21,085,727 | |
| Applied Materials, Inc. (Semiconductors & Semiconductor Equipment) | | | 10,843 | | | | 1,706,254 | |
| ASML Holding N.V.NYS (Semiconductors & Semiconductor Equipment) | | | 973 | | | | 774,644 | |
| Atlassian Corp. PLC*—Class A (Software) | | | 1,686 | | | | 642,855 | |
| Autodesk, Inc.* (Software) | | | 2,640 | | | | 742,342 | |
| Automatic Data Processing, Inc. (IT Services) | | | 5,060 | | | | 1,247,695 | |
| Baidu, Inc.*ADR (Interactive Media & Services) | | | 2,915 | | | | 433,723 | |
| Biogen, Inc.* (Biotechnology) | | | 1,764 | | | | 423,219 | |
| Booking Holdings, Inc.* (Hotels, Restaurants & Leisure) | | | 493 | | | | 1,182,820 | |
| Broadcom, Inc. (Semiconductors & Semiconductor Equipment) | | | 4,943 | | | | 3,289,122 | |
| Cadence Design Systems, Inc.* (Software) | | | 3,328 | | | | 620,173 | |
| Charter Communications, Inc.*—Class A (Media) | | | 2,153 | | | | 1,403,691 | |
| Cintas Corp. (Commercial Services & Supplies) | | | 1,242 | | | | 550,417 | |
| Cisco Systems, Inc. (Communications Equipment) | | | 50,648 | | | | 3,209,564 | |
| Cognizant Technology Solutions Corp.—Class A (IT Services) | | | 6,307 | | | | 559,557 | |
| Comcast Corp.—Class A (Media) | | | 54,753 | | | | 2,755,719 | |
| Copart, Inc.* (Commercial Services & Supplies) | | | 2,848 | | | | 431,814 | |
| Costco Wholesale Corp. (Food & Staples Retailing) | | | 5,306 | | | | 3,012,216 | |
| Crowdstrike Holdings, Inc.*—Class A (Software) | | | 2,472 | | | | 506,142 | |
| CSX Corp. (Road & Rail) | | | 26,635 | | | | 1,001,476 | |
| Datadog, Inc.*—Class A (Software) | | | 3,089 | | | | 550,182 | |
| DexCom, Inc.* (Health Care Equipment & Supplies) | | | 1,164 | | | | 625,010 | |
| DocuSign, Inc.* (Software) | | | 2,362 | | | | 359,756 | |
| Dollar Tree, Inc.* (Multiline Retail) | | | 2,701 | | | | 379,545 | |
| eBay, Inc. (Internet & Direct Marketing Retail) | | | 7,517 | | | | 499,881 | |
| Electronic Arts, Inc. (Entertainment) | | | 3,396 | | | | 447,932 | |
| Exelon Corp. (Electric Utilities) | | | 11,748 | | | | 678,564 | |
| Fastenal Co. (Trading Companies & Distributors) | | | 6,907 | | | | 442,462 | |
| Fiserv, Inc.* (IT Services) | | | 7,927 | | | | 822,743 | |
| Fortinet, Inc.* (Software) | | | 1,963 | | | | 705,502 | |
| Gilead Sciences, Inc. (Biotechnology) | | | 15,064 | | | | 1,093,797 | |
| Honeywell International, Inc. (Industrial Conglomerates) | | | 8,267 | | | | 1,723,752 | |
| IDEXX Laboratories, Inc.* (Health Care Equipment & Supplies) | | | 1,018 | | | | 670,312 | |
| Illumina, Inc.* (Life Sciences Tools & Services) | | | 1,877 | | | | 714,086 | |
| Intel Corp. (Semiconductors & Semiconductor Equipment) | | | 48,839 | | | | 2,515,209 | |
| Intuit, Inc. (Software) | | | 3,400 | | | | 2,186,948 | |
| Intuitive Surgical, Inc.* (Health Care Equipment & Supplies) | | | 4,292 | | | | 1,542,116 | |
| JD.com, Inc.*ADR (Internet & Direct Marketing Retail) | | | 8,905 | | | | 623,973 | |
| Keurig Dr Pepper, Inc. (Beverages) | | | 17,028 | | | | 627,652 | |
| KLA Corp. (Semiconductors & Semiconductor Equipment) | | | 1,821 | | | | 783,230 | |
| Lam Research Corp. (Semiconductors & Semiconductor Equipment) | | | 1,691 | | | | 1,216,083 | |
| Lucid Group, Inc.*(a) (Automobiles) | | | 19,771 | | | | 752,287 | |
| Lululemon Athletica, Inc.* (Textiles, Apparel & Luxury Goods) | | | 1,496 | | | | 585,609 | |
| Marriott International, Inc.*—Class A (Hotels, Restaurants & Leisure) | | | 3,911 | | | | 646,254 | |
| Marvell Technology, Inc. (Semiconductors & Semiconductor Equipment) | | | 9,891 | | | | 865,364 | |
| Match Group, Inc.* (Interactive Media & Services) | | | 3,399 | | | | 449,518 | |
| Mercadolibre, Inc.* (Internet & Direct Marketing Retail) | | | 606 | | | | 817,130 | |
| Meta Platforms, Inc.*—Class A (Interactive Media & Services) | | | 25,651 | | | | 8,627,714 | |
| Microchip Technology, Inc. (Semiconductors & Semiconductor Equipment) | | | 6,663 | | | | 580,081 | |
| Micron Technology, Inc. (Semiconductors & Semiconductor Equipment) | | | 13,432 | | | | 1,251,191 | |
| Microsoft Corp. (Software) | | | 54,344 | | | | 18,276,974 | |
| Moderna, Inc.* (Biotechnology) | | | 4,869 | | | | 1,236,629 | |
| Mondelez International, Inc.—Class A (Food Products) | | | 16,752 | | | | 1,110,825 | |
| Monster Beverage Corp.* (Beverages) | | | 6,354 | | | | 610,238 | |
See accompanying notes to financial statements.
330 :: ProFund VP UltraNasdaq-100 :: Financial Statements
Common Stocks, continued
| | | Shares | | | Value | |
| NetEase, Inc.ADR (Entertainment) | | | 3,402 | | | $ | 346,256 | |
| Netflix, Inc.* (Entertainment) | | | 5,319 | | | | 3,204,378 | |
| NVIDIA Corp. (Semiconductors & Semiconductor Equipment) | | | 25,470 | | | | 7,490,981 | |
| NXP Semiconductors N.V. (Semiconductors & Semiconductor Equipment) | | | 3,194 | | | | 727,529 | |
| Okta, Inc.* (IT Services) | | | 1,773 | | | | 397,453 | |
| O'Reilly Automotive, Inc.* (Specialty Retail) | | | 809 | | | | 571,340 | |
| PACCAR, Inc. (Machinery) | | | 4,170 | | | | 368,044 | |
| Palo Alto Networks, Inc.* (Software) | | | 1,185 | | | | 659,761 | |
| Paychex, Inc. (IT Services) | | | 4,330 | | | | 591,045 | |
| PayPal Holdings, Inc.* (IT Services) | | | 14,106 | | | | 2,660,110 | |
| Peloton Interactive, Inc.*—Class A (Leisure Products) | | | 3,616 | | | | 129,308 | |
| PepsiCo, Inc. (Beverages) | | | 16,601 | | | | 2,883,760 | |
| Pinduoduo, Inc.*ADR (Internet & Direct Marketing Retail) | | | 4,990 | | | | 290,917 | |
| Qualcomm, Inc. (Semiconductors & Semiconductor Equipment) | | | 13,450 | | | | 2,459,602 | |
| Regeneron Pharmaceuticals, Inc.* (Biotechnology) | | | 1,270 | | | | 802,030 | |
| Ross Stores, Inc. (Specialty Retail) | | | 4,267 | | | | 487,633 | |
| Seagen, Inc.* (Biotechnology) | | | 2,196 | | | | 339,502 | |
| Sirius XM Holdings, Inc.(a) (Media) | | | 48,029 | | | | 304,984 | |
| Skyworks Solutions, Inc. (Semiconductors & Semiconductor Equipment) | | | 1,986 | | | | 308,108 | |
| Splunk, Inc.* (Software) | | | 1,940 | | | | 224,497 | |
| Starbucks Corp. (Hotels, Restaurants & Leisure) | | | 14,089 | | | | 1,647,990 | |
| Synopsys, Inc.* (Software) | | | 1,831 | | | | 674,724 | |
| Tesla, Inc.* (Automobiles) | | | 7,269 | | | | 7,681,733 | |
| Texas Instruments, Inc. (Semiconductors & Semiconductor Equipment) | | | 11,090 | | | | 2,090,132 | |
| The Kraft Heinz Co. (Food Products) | | | 14,697 | | | | 527,622 | |
| T-Mobile US, Inc.* (Wireless Telecommunication Services) | | | 15,000 | | | | 1,739,700 | |
| VeriSign, Inc.* (IT Services) | | | 1,334 | | | | 338,596 | |
| Verisk Analytics, Inc. (Professional Services) | | | 1,935 | | | | 442,593 | |
| Vertex Pharmaceuticals, Inc.* (Biotechnology) | | | 3,053 | | | | 670,439 | |
| Walgreens Boots Alliance, Inc. (Food & Staples Retailing) | | | 10,393 | | | | 542,099 | |
| Workday, Inc.*—Class A (Software) | | | 2,318 | | | | 633,231 | |
| Xcel Energy, Inc. (Electric Utilities) | | | 6,469 | | | | 437,951 | |
| Xilinx, Inc. (Semiconductors & Semiconductor Equipment) | | | 2,977 | | | | 631,213 | |
| Zoom Video Communications, Inc.*—Class A (Software) | | | 2,909 | | | | 534,994 | |
| Zscaler, Inc.* (Software) | | | 1,682 | | | | 540,477 | |
TOTAL COMMON STOCKS
(Cost $79,936,363) | | | | | | | 181,060,966 | |
Repurchase Agreements(b)(c) (38.4%)
| | | Principal
Amount | | | Value | |
| Repurchase Agreements with various counterparties, 0.00%, dated 12/31/21, due 1/3/22, total to be received $103,044,000 | | $ | 103,044,000 | | | $ | 103,044,000 | |
TOTAL REPURCHASE AGREEMENTS
(Cost $103,044,000) | | | | | | | 103,044,000 | |
Collateral for Securities Loaned(d) (0.4%)
| | | Shares | | | Value | |
| BlackRock Liquidity Funds FedFund Portfolio—Institutional Shares, 0.03%(e) | | | 1,009,620 | | | $ | 1,009,620 | |
TOTAL COLLATERAL FOR SECURITIES LOANED
(Cost $1,009,620) | | | | | | | 1,009,620 | |
TOTAL INVESTMENT SECURITIES
(Cost $183,989,983)—106.3% | | | | | | | 285,114,586 | |
| Net other assets (liabilities)—(6.3)% | | | | | | | (16,880,496 | ) |
| NET ASSETS—100.0% | | | | | | $ | 268,234,090 | |
| * | Non-income producing security. |
| (a) | All or part of this security was on loan as of December 31, 2021. The total value of securities on loan as of December 31, 2021 was $951,287. |
| (b) | A portion of these securities were held in a segregated account for the benefit of swap counterparties in the event of default. At December 31, 2021, the aggregate amount held in a segregated account was $58,420,000. |
| (c) | The ProFund VP invests in Repurchase Agreements jointly with other funds in the Trust. See "Repurchase Agreements" under Note 2 in the Notes to Financial Statements to view the details of each individual agreement and counterparty as well as a description of the securities subject to repurchase. |
| (d) | Securities were purchased with cash collateral held from securities on loan at December 31, 2021. |
| (e) | Rate periodically changes. Rate disclosed is the daily yield on December 31, 2021. |
| ADR | American Depositary Receipt |
Futures Contracts Purchased
| | | Number
of
Contracts | | | Expiration
Date | | Notional
Amount | | | Value and
Unrealized
Appreciation/
(Depreciation) | |
| E-Mini Nasdaq 100 Futures Contracts | | | 1 | | | 3/21/22 | | $ | 326,415 | | | $ | (206 | ) |
See accompanying notes to financial statements.
Financial Statements :: ProFund VP UltraNasdaq-100 :: 331
Total Return Swap Agreements—Long
| Underlying Instrument | | Counterparty | | Termination
Date(1) | | Rate Paid
(Received)(2) | | | Notional
Amount | | | Value and
Unrealized
Appreciation/
(Depreciation) | |
| Invesco QQQ Trust, Series 1 ETF | | Goldman Sachs International | | 1/27/22 | | | 0.48 | % | | $ | 7,442,285 | | | $ | (242,676 | ) |
| Nasdaq-100 Index | | Goldman Sachs International | | 1/27/22 | | | 0.68 | % | | | 109,001,814 | | | | (1,414,029 | ) |
| | | | | | | | | | | $ | 116,444,099 | | | $ | (1,656,705 | ) |
| | | | | | | | | | | | | | | | | |
| Invesco QQQ Trust, Series 1 ETF | | UBS AG | | 1/27/22 | | | 0.48 | % | | $ | 98,243,116 | | | $ | (1,395,551 | ) |
| Nasdaq-100 Index | | UBS AG | | 1/27/22 | | | 0.88 | % | | | 140,850,450 | | | | (2,492,975 | ) |
| | | | | | | | | | | $ | 239,093,566 | | | $ | (3,888,526 | ) |
| | | | | | | | | | | $ | 355,537,665 | | | $ | (5,545,231 | ) |
| (1) | Agreements may be terminated at will by either party without penalty. Payment is due at termination/maturity. |
| (2) | Reflects the floating financing rate, as of December 31, 2021, on the notional amount of the swap agreement paid to the counterparty or received from the counterparty, excluding any commissions. This amount is included as part of the unrealized appreciation/(depreciation). |
ProFund VP UltraNasdaq-100 invested in the following industries as of December 31, 2021:
| | | Value | | | % of
Net Assets | |
| Automobiles | | $ | 8,434,020 | | | | 3.1 | % |
| Beverages | | | 4,121,650 | | | | 1.6 | % |
| Biotechnology | | | 6,088,212 | | | | 2.2 | % |
| Commercial Services & Supplies | | | 982,231 | | | | 0.4 | % |
| Communications Equipment | | | 3,209,564 | | | | 1.2 | % |
| Electric Utilities | | | 1,654,606 | | | | 0.6 | % |
| Entertainment | | | 4,620,821 | | | | 1.7 | % |
| Food & Staples Retailing | | | 3,554,315 | | | | 1.3 | % |
| Food Products | | | 1,638,447 | | | | 0.6 | % |
| Health Care Equipment & Supplies | | | 3,459,787 | | | | 1.3 | % |
| Hotels, Restaurants & Leisure | | | 4,170,495 | | | | 1.6 | % |
| Industrial Conglomerates | | | 1,723,752 | | | | 0.5 | % |
| Interactive Media & Services | | | 22,473,068 | | | | 8.4 | % |
| Internet & Direct Marketing Retail | | | 14,472,264 | | | | 5.5 | % |
| IT Services | | | 6,617,199 | | | | 2.5 | % |
| Leisure Products | | | 129,308 | | | | NM | |
| Life Sciences Tools & Services | | | 714,086 | | | | 0.3 | % |
| Machinery | | | 368,044 | | | | 0.1 | % |
| Media | | | 4,464,394 | | | | 1.7 | % |
| Multiline Retail | | | 379,545 | | | | 0.1 | % |
| Professional Services | | | 442,593 | | | | 0.2 | % |
| Road & Rail | | | 1,001,476 | | | | 0.4 | % |
| Semiconductors & Semiconductor Equipment | | | 29,909,505 | | | | 11.2 | % |
| Software | | | 31,519,113 | | | | 11.7 | % |
| Specialty Retail | | | 1,058,973 | | | | 0.4 | % |
| Technology Hardware, Storage & Peripherals | | | 21,085,727 | | | | 7.9 | % |
| Textiles, Apparel & Luxury Goods | | | 585,609 | | | | 0.2 | % |
| Trading Companies & Distributors | | | 442,462 | | | | 0.2 | % |
| Wireless Telecommunication Services | | | 1,739,700 | | | | 0.6 | % |
| Other** | | | 87,173,124 | | | | 32.5 | % |
| Total | | $ | 268,234,090 | | | | 100.0 | % |
| ** | Includes any non-equity securities and net other assets (liabilities), which includes any receivable for capital shares issued and payable for capital shares redeemed. |
| NM | Not meaningful, amount is less than 0.05%. |
See accompanying notes to financial statements.
332 :: ProFund VP UltraNasdaq-100 :: Financial Statements
Statement of Assets and Liabilities
December 31, 2021
| ASSETS: | | | |
| Total Investment Securities, at cost | | $ | 183,989,983 | |
| Securities, at value(a) | | | 182,070,586 | |
| Repurchase agreements, at value | | | 103,044,000 | |
| Total Investment Securities, at value | | | 285,114,586 | |
| Cash | | | 842 | |
| Segregated cash balances for futures contracts with brokers | | | 18,700 | |
| Segregated cash balances for swap agreements with custodian | | | 902 | |
| Dividends receivable | | | 43,452 | |
| Receivable for capital shares issued | | | 1,648,991 | |
| Prepaid expenses | | | 1,146 | |
| TOTAL ASSETS | | | 286,828,619 | |
| | | | | |
| LIABILITIES: | | | | |
| Payable for collateral for securities loaned | | | 1,009,620 | |
| Payable for capital shares redeemed | | | 11,395,806 | |
| Unrealized depreciation on swap agreements | | | 5,545,231 | |
| Variation margin on futures contracts | | | 2,190 | |
| Advisory fees payable | | | 184,019 | |
| Management services fees payable | | | 24,536 | |
| Administration fees payable | | | 15,870 | |
| Administrative services fees payable | | | 123,663 | |
| Distribution fees payable | | | 125,929 | |
| Transfer agency fees payable | | | 26,213 | |
| Fund accounting fees payable | | | 8,788 | |
| Compliance services fees payable | | | 1,123 | |
| Other accrued expenses | | | 131,541 | |
| TOTAL LIABILITIES | | | 18,594,529 | |
| NET ASSETS | | $ | 268,234,090 | |
| | | | | |
| NET ASSETS CONSIST OF: | | | | |
| Capital | | $ | 100,533,240 | |
| Total distributable earnings (loss) | | | 167,700,850 | |
| NET ASSETS | | $ | 268,234,090 | |
| Shares of Beneficial Interest Outstanding (unlimited number of shares authorized, no par value) | | | 2,700,594 | |
| Net Asset Value (offering and redemption price per share) | | $ | 99.32 | |
| | | | |
| (a) Includes securities on loan valued at: | | $ | 951,287 | |
Statement of Operations
For the Year Ended December 31, 2021
| INVESTMENT INCOME: | | | | |
| Dividends | | $ | 1,107,331 | |
| Interest | | | 1,567 | |
| Foreign tax withholding | | | (947 | ) |
| Net income from securities lending | | | 872 | |
| TOTAL INVESTMENT INCOME | | | 1,108,823 | |
| | | | | |
| EXPENSES: | | | | |
| Advisory fees | | | 1,742,533 | |
| Management services fees | | | 232,336 | |
| Administration fees | | | 168,934 | |
| Transfer agency fees | | | 139,622 | |
| Administrative services fees | | | 627,922 | |
| Distribution fees | | | 580,844 | |
| Custody fees | | | 38,955 | |
| Fund accounting fees | | | 93,717 | |
| Trustee fees | | | 3,816 | |
| Compliance services fees | | | 1,670 | |
| Other fees | | | 280,857 | |
| Recoupment of prior expenses reduced by the Advisor | | | 18,000 | |
| Total Gross Expenses before reductions | | | 3,929,206 | |
| Expenses reduced and reimbursed by the Advisor | | | (25,923 | ) |
| TOTAL NET EXPENSES | | | 3,903,283 | |
| NET INVESTMENT INCOME (LOSS) | | | (2,794,460 | ) |
| | | | | |
| REALIZED AND UNREALIZED GAINS (LOSSES) ON INVESTMENTS: | | | | |
| Net realized gains (losses) on investment securities | | | 3,651,179 | |
| Net realized gains (losses) on futures contracts | | | 1,832,051 | |
| Net realized gains (losses) on swap agreements | | | 71,368,416 | |
| Change in net unrealized appreciation/depreciation on investment securities | | | 34,761,572 | |
| Change in net unrealized appreciation/depreciation on futures contracts | | | (270,409 | ) |
| Change in net unrealized appreciation/depreciation on swap agreements | | | (6,673,654 | ) |
| NET REALIZED AND UNREALIZED GAINS (LOSSES) ON INVESTMENTS | | | 104,669,155 | |
| CHANGE IN NET ASSETS RESULTING FROM OPERATIONS | | $ | 101,874,695 | |
See accompanying notes to financial statements.
Financial Statements :: ProFund VP UltraNasdaq-100 :: 333
Statements of Changes in Net Assets
| | | Year Ended
December 31, 2021 | | | Year Ended
December 31, 2020 | |
| FROM INVESTMENT ACTIVITIES: | | | | | | | | |
| | | | | | | | | |
| OPERATIONS: | | | | | | | | |
| Net investment income (loss) | | $ | (2,794,460 | ) | | $ | (1,416,614 | ) |
| Net realized gains (losses) on investments | | | 76,851,646 | | | | 57,704,632 | |
| Change in net unrealized appreciation/depreciation on investments | | | 27,817,509 | | | | 19,828,872 | |
| Change in net assets resulting from operations | | | 101,874,695 | | | | 76,116,890 | |
| | | | | | | | | |
| DISTRIBUTIONS TO SHAREHOLDERS: | | | | | | | | |
| Total distributions | | | (55,696,682 | ) | | | (33,497,262 | ) |
| Change in net assets resulting from distributions | | | (55,696,682 | ) | | | (33,497,262 | ) |
| | | | | | | | | |
| CAPITAL TRANSACTIONS: | | | | | | | | |
| Proceeds from shares issued | | | 801,378,690 | | | | 830,545,450 | |
| Distributions reinvested | | | 55,664,279 | | | | 33,497,262 | |
| Value of shares redeemed | | | (841,566,970 | ) | | | (819,603,334 | ) |
| Change in net assets resulting from capital transactions | | | 15,475,999 | | | | 44,439,378 | |
| Change in net assets | | | 61,654,012 | | | | 87,059,006 | |
| | | | | | | | | |
| NET ASSETS: | | | | | | | | |
| Beginning of period | | | 206,580,078 | | | | 119,521,072 | |
| End of period | | $ | 268,234,090 | | | $ | 206,580,078 | |
| | | | | | | | | |
| SHARE TRANSACTIONS: | | | | | | | | |
| Issued | | | 8,971,821 | | | | 12,101,786 | (a) |
| Reinvested | | | 861,676 | | | | 376,649 | (a) |
| Redeemed | | | (9,357,371 | ) | | | (12,210,243 | )(a) |
| Change in shares | | | 476,126 | | | | 268,192 | |
| (a) | As described in Note 8, share amounts have been adjusted for 2:1 share split that occurred on December 11, 2020. |
See accompanying notes to financial statements.
334 :: ProFund VP UltraNasdaq-100 :: Financial Highlights
ProFunds Financial Highlights FOR THE PERIODS INDICATED
Selected data for a share of beneficial interest outstanding throughout the periods indicated.
| | | Year Ended
Dec. 31, 2021 | | | Year Ended
Dec. 31, 2020(a) | | | Year Ended
Dec. 31, 2019(a) | | | Year Ended
Dec. 31, 2018(a) | | | Year Ended
Dec. 31, 2017(a) | |
| Net Asset Value, Beginning of Period | | $ | 92.87 | | | $ | 61.10 | | | $ | 34.00 | | | $ | 56.77 | | | $ | 34.50 | |
| | | | | | | | | | | | | | | | | | | | | |
| Investment Activities: | | | | | | | | | | | | | | | | | | | | |
| Net investment income (loss)(b) | | | (1.08 | ) | | | (0.76 | ) | | | (0.12 | ) | | | (0.21 | ) | | | (0.33 | ) |
| Net realized and unrealized gains (losses) on investments | | | 35.05 | | | | 52.59 | | | | 27.22 | | | | 1.11 | | | | 23.75 | |
| Total income (loss) from investment activities | | | 33.97 | | | | 51.83 | | | | 27.10 | | | | 0.90 | | | | 23.42 | |
| | | | | | | | | | | | | | | | | | | | | |
| Distributions to Shareholders From: | | | | | | | | | | | | | | | | | | | | |
| Net realized gains on investments | | | (27.52 | ) | | | (20.06 | ) | | | — | | | | (23.67 | ) | | | (1.15 | ) |
| | | | | | | | | | | | | | | | | | | | | |
| Net Asset Value, End of Period | | $ | 99.32 | | | $ | 92.87 | | | $ | 61.10 | | | $ | 34.00 | | | $ | 56.77 | |
| | | | | | | | | | | | | | | | | | | | | |
| Total Return | | | 52.51 | % | | | 86.30 | % | | | 79.66 | % | | | (9.63 | )% | | | 68.33 | % |
| | | | | | | | | | | | | | | | | | | | | |
| Ratios to Average Net Assets: | | | | | | | | | | | | | | | | | | | | |
| Gross expenses | | | 1.69 | % | | | 1.74 | % | | | 1.76 | % | | | 1.74 | % | | | 1.69 | % |
| Net expenses | | | 1.68 | % | | | 1.68 | % | | | 1.68 | % | | | 1.68 | % | | | 1.68 | % |
| Net investment income (loss) | | | (1.20 | )% | | | (1.05 | )% | | | (0.25 | )% | | | (0.40 | )% | | | (0.68 | )% |
| | | | | | | | | | | | | | | | | | | | | |
| Supplemental Data: | | | | | | | | | | | | | | | | | | | | |
| Net assets, end of period (000's) | | $ | 268,234 | | | $ | 206,580 | | | $ | 119,521 | | | $ | 82,454 | | | $ | 131,438 | |
| Portfolio turnover rate(c) | | | 20 | % | | | 55 | % | | | 44 | % | | | 29 | % | | | 4 | % |
| (a) | As described in Note 8, share amounts have been adjusted for 2:1 share split that occurred on December 14, 2020. |
| (b) | Per share net investment income (loss) has been calculated using the average daily shares method. |
| (c) | Portfolio turnover rate is calculated without regard to instruments having a maturity of less than one year from acquisition or derivative instruments (including swap agreements and futures contracts). The portfolio turnover rate can be high and volatile due to the amount and timing of sales and purchases of fund shares during the period. |
See accompanying notes to financial statements.
Management Discussion of Fund Performance :: ProFund VP UltraShort Dow 30 :: 335
ProFund VP UltraShort Dow 30 (the "Fund") seeks daily investment results, before fees and expenses, that correspond to two times the inverse (-2x) of the return of the Dow Jones Industrial Average® (the "Index") for a single day, not for any other period. A "single day" is measured from the time the Fund calculates its net asset value ("NAV") to the time of the Fund's next NAV calculation. The Fund does not seek to achieve its stated investment objective over a period of time greater than a single day. The return of the Fund for periods longer than a single day will be the result of its return for each day compounded over the period. The Fund's returns for periods longer than a single day will very likely differ in amount, and possibly even direction from the Fund's stated multiple (-2x) times the return of the Fund's Index for the same period. For periods longer than a single day, the Fund will lose money if the Index's performance is flat, and it is possible that the Fund will lose money even if the level of the index falls. For the year ended December 31, 2021, the Fund had a total return of -35.11%. For the same period, the Index had a total return of 20.95%1 and a volatility of 12.42%. For the year, the Fund achieved an average daily statistical correlation of over 0.99 to twice the inverse of the daily performance of the Index.2
The Fund takes positions in financial instruments that, in combination, should have similar daily return characteristics as twice the inverse of the daily return of the Index. The Index is a price-weighted index. The Index includes 30 large-cap, "blue-chip" U.S. stocks, excluding utility and transportation companies. Components are selected through a discretionary process with no pre-determined criteria except that components should be established U.S. companies that are leaders in their industries, have an excellent reputation, demonstrate sustained growth, are of interest to a large number of investors, and accurately represents the sectors covered by the average. The Index is not limited to traditionally defined industrial stocks. Instead, the Index serves as a measure of the entire U.S. market, covering such diverse industries as financial services, technology, retail, entertainment, and consumer goods. Composition changes are rare, and generally occur only after corporate acquisitions or other dramatic shifts in a component's core business. When such an event necessitates that one component be replaced, the entire Index is reviewed.
During the year ended December 31, 2021, the Fund invested in swap agreements as a substitute for shorting stocks in order to gain inverse leveraged exposure to the Index. These derivatives generally tracked the performance of their underlying benchmark and benefited from financing costs associated with their use. The Fund entered into swap agreements with counterparties that the Fund's advisor determined to be major, global financial institutions. If a counterparty becomes insolvent or otherwise fails to perform on its obligations, the value of investments in the Fund may decline. The Fund has sought to mitigate this risk by generally requiring counterparties to post collateral for the benefit of the Fund, marked to market daily, in an amount approximately equal to the amount the counterparty owed to the Fund, subject to certain minimum thresholds.
Value of a $10,000 Investment at Net Asset Value*

| * | The line graph represents the historical performance of a hypothetical investment of $10,000 in the ProFund VP UltraShort Dow 30 from December 31, 2011 to December 31, 2021, assuming the reinvestment of distributions. |
Average Annual Total Return as of 12/31/21
| Fund | | One Year | | | Five Year | | | Ten Year | |
| ProFund VP UltraShort Dow 30 | | | -35.11 | % | | | -32.96 | % | | | -30.31 | % |
| Dow Jones Industrial Average® | | | 20.95 | % | | | 15.51 | % | | | 14.21 | % |
Expense Ratios**
| Fund | | Gross | | | Net | | | | | |
| ProFund VP UltraShort Dow 30 | | | 1.46 | % | | | 1.46 | % | | | | |
| ** | Reflects the expense ratio as reported in the Prospectus dated May 1, 2021. Contractual fee waivers are in effect through April 30, 2022. See Financial Highlights for effective expense ratios. |
Allocation of Portfolio Holdings & Index Composition
Market Exposure
| Investment Type | | % of Net Assets | |
| Swap Agreements | | | (200 | )% |
| Total Exposure | | | (200 | )% |
“Market Exposure” includes the value of total investments (including the contract value of any derivatives) and excludes any instruments used for cash management.
Holdings
The ProFund VP UltraShort Dow 30 primarily invests in non-equity securities, which may include: swap agreements, futures contracts, repurchase agreements and U.S. Government securities.
Dow Jones Industrial Average® Index – Composition
| | | % of Index | |
| Information Technology | | | 22 | % |
| Health Care | | | 18 | % |
| Financials | | | 16 | % |
| Consumer Discretionary | | | 15 | % |
| Industrials | | | 14 | % |
| Consumer Staples | | | 8 | % |
| Communication Services | | | 4 | % |
| Energy | | | 2 | % |
| Materials | | | 1 | % |
Past performance does not guarantee future results. Return calculations assume the reinvestment of distributions and do not reflect taxes that a shareholder would pay on Fund distributions or on the redemption of Fund shares. The performance data quoted represents past performance and current returns may be lower or higher. The investment return and NAV will fluctuate so that an investor's shares, when redeemed, may be worth more or less than the original cost. The performance above reflects any fee reductions during the applicable periods. If such fee reductions had not occurred, the quoted performance would be lower. Performance numbers are net of all Fund fees and expenses but do not include any insurance, sales, or administrative charges of variable annuity or life insurance contracts. If these charges were included, the returns would be lower. To obtain performance current to the most recent month-end, please call toll-free 888-776-3637.
| 1 | The graph and table reflect the theoretical reinvestment of dividends on securities in the Index. The impact of transaction costs and the deduction of fees and expenses associated with a mutual fund, such as investment management and accounting fees, are not reflected in the index calculations. The Fund's performance reflects the reinvestment of dividends as well as the impact of transaction costs and the deduction of fees and expenses. It is not possible to invest directly in an index. |
| 2 | 1.00 equals perfect correlation. This calculation is based on the daily total return of the Index and the performance of the daily total return of the NAV per share of the Fund. |
The above information is not covered by the Report of the Independent Registered Public Accounting Firm.
336 :: ProFund VP UltraShort Dow 30 :: Financial Statements
Schedule of Portfolio Investments :: December 31, 2021
Repurchase Agreements(a) (97.5%)
| | | Principal
Amount | | | Value | |
| Repurchase Agreements with various counterparties, 0.00%, dated 12/31/21, due 1/3/22, total to be received $4,000 | | $ | 4,000 | | | $ | 4,000 | |
TOTAL REPURCHASE AGREEMENTS
(Cost $4,000) | | | | | | | 4,000 | |
TOTAL INVESTMENT SECURITIES
(Cost $4,000)—97.5% | | | | | | | 4,000 | |
| Net other assets (liabilities)—2.5% | | | | | | | 104 | |
| NET ASSETS—100.0% | | | | | | $ | 4,104 | |
| (a) | The ProFund VP invests in Repurchase Agreements jointly with other funds in the Trust. See "Repurchase Agreements" under Note 2 in the Notes to Financial Statements to view the details of each individual agreement and counterparty as well as a description of the securities subject to repurchase. |
Total Return Swap Agreements—Short
| Underlying Instrument | | Counterparty | | Termination
Date(1) | | | Rate Paid
(Received)(2) | | | Notional
Amount | | | Value and
Unrealized
Appreciation/
(Depreciation) | |
| Dow Jones Industrial Average | | Goldman Sachs International | | 1/27/22 | | | (0.43 | )% | | $ | (5,270 | ) | | $ | (5 | ) |
| Dow Jones Industrial Average | | UBS AG | | 1/27/22 | | | (0.28 | )% | | | (2,955 | ) | | | (3 | ) |
| | | | | | | | | | | $ | (8,225 | ) | | $ | (8 | ) |
| (1) | Agreements may be terminated at will by either party without penalty. Payment is due at termination/maturity. |
| (2) | Reflects the floating financing rate, as of December 31, 2021, on the notional amount of the swap agreement paid to the counterparty or received from the counterparty, excluding any commissions. This amount is included as part of the unrealized appreciation/(depreciation). |
See accompanying notes to financial statements.
Financial Statements :: ProFund VP UltraShort Dow 30 :: 337
Statement of Assets and Liabilities
December 31, 2021
| ASSETS: |
| Total Investment Securities, at cost | | $ | 4,000 | |
| Repurchase agreements, at value | | | 4,000 | |
| Total Investment Securities, at value | | | 4,000 | |
| Cash | | | 156 | |
| Prepaid expenses | | | — | (a) |
| TOTAL ASSETS | | | 4,156 | |
| | | | | |
| LIABILITIES: | | | | |
| Payable for capital shares redeemed | | | 30 | |
| Unrealized depreciation on swap agreements | | | 8 | |
| Advisory fees payable | | | 3 | |
| Management services fees payable | | | — | (a) |
| Administration fees payable | | | — | (a) |
| Administrative services fees payable | | | 1 | |
| Distribution fees payable | | | 2 | |
| Transfer agency fees payable | | | — | (a) |
| Fund accounting fees payable | | | — | (a) |
| Compliance services fees payable | | | — | (a) |
| Other accrued expenses | | | 8 | |
| TOTAL LIABILITIES | | | 52 | |
| NET ASSETS | | $ | 4,104 | |
| | | | | |
| NET ASSETS CONSIST OF: | | | | |
| Capital | | $ | 973,019 | |
| Total distributable earnings (loss) | | | (968,915 | ) |
| NET ASSETS | | $ | 4,104 | |
| Shares of Beneficial Interest Outstanding (unlimited number of shares authorized, no par value) | | | 1,103 | |
| Net Asset Value (offering and redemption price per share) | | $ | 3.72 | |
| (a) | Amount is less than $0.50. |
Statement of Operations
For the Year Ended December 31, 2021
| INVESTMENT INCOME: | | | | |
| Interest | | $ | — | (a) |
| | | | | |
| EXPENSES: | | | | |
| Advisory fees | | | 108 | |
| Management services fees | | | 14 | |
| Administration fees | | | 10 | |
| Transfer agency fees | | | 9 | |
| Administrative services fees | | | 2 | |
| Distribution fees | | | 36 | |
| Custody fees | | | 2 | |
| Fund accounting fees | | | 6 | |
| Trustee fees | | | — | (a) |
| Compliance services fees | | | — | (a) |
| Other fees | | | 16 | |
| TOTAL NET EXPENSES | | | 203 | |
| NET INVESTMENT INCOME (LOSS) | | | (203 | ) |
| | | | | |
| REALIZED AND UNREALIZED GAINS (LOSSES) ON INVESTMENTS: | | | | |
| Gain received from non-recurring class action settlement | | | 25 | |
| Net realized gains (losses) on swap agreements | | | (14,005 | ) |
| Change in net unrealized appreciation/depreciation on swap agreements | | | 80 | |
| NET REALIZED AND UNREALIZED GAINS (LOSSES) ON INVESTMENTS | | | (13,900 | ) |
| CHANGE IN NET ASSETS RESULTING FROM OPERATIONS | | $ | (14,103 | ) |
See accompanying notes to financial statements.
338 :: ProFund VP UltraShort Dow 30 :: Financial Statements
Statements of Changes in Net Assets
| | | Year Ended
December 31, 2021 | | | Year Ended
December 31, 2020 | |
| FROM INVESTMENT ACTIVITIES: | | | | | | | | |
| | | | | | | | | |
| OPERATIONS: | | | | | | | | |
| Net investment income (loss) | | $ | (203 | ) | | $ | (238 | ) |
| Net realized gains (losses) on investments | | | (13,980 | ) | | | 111,234 | |
| Change in net unrealized appreciation/depreciation on investments | | | 80 | | | | (114 | ) |
| Change in net assets resulting from operations | | | (14,103 | ) | | | 110,882 | |
| | | | | | | | | |
| DISTRIBUTIONS TO SHAREHOLDERS: | | | | | | | | |
| Total distributions | | | (109,160 | ) | | | (185 | ) |
| Change in net assets resulting from distributions | | | (109,160 | ) | | | (185 | ) |
| | | | | | | | | |
| CAPITAL TRANSACTIONS: | | | | | | | | |
| Proceeds from shares issued | | | 2,010,525 | | | | 4,315,564 | |
| Distributions reinvested | | | 4,415 | | | | 185 | |
| Value of shares redeemed | | | (1,894,037 | ) | | | (4,423,377 | ) |
| Change in net assets resulting from capital transactions | | | 120,903 | | | | (107,628 | ) |
| Change in net assets | | | (2,360 | ) | | | 3,069 | |
| | | | | | | | | |
| NET ASSETS: | | | | | | | | |
| Beginning of period | | | 6,464 | | | | 3,395 | |
| End of period | | $ | 4,104 | | | $ | 6,464 | |
| | | | | | | | | |
| SHARE TRANSACTIONS: | | | | | | | | |
| Issued | | | 246,164 | | | | 39,938 | (a) |
| Reinvested | | | 1,027 | | | | 2 | (a) |
| Redeemed | | | (246,176 | ) | | | (39,875 | )(a) |
| Change in shares | | | 1,015 | | | | 65 | |
| (a) | As described in Note 8, share amounts have been adjusted for 1:5 reverse share split that occurred on December 14, 2020. |
See accompanying notes to financial statements.
Financial Highlights :: ProFund VP UltraShort Dow 30 :: 339
ProFunds Financial Highlights FOR THE PERIODS INDICATED
Selected data for a share of beneficial interest outstanding throughout the periods indicated.
| | | Year Ended
Dec. 31, 2021 | | | Year Ended
Dec. 31, 2020(a) | | | Year Ended
Dec. 31, 2019(a)(b) | | | Year Ended
Dec. 31, 2018(a)(b) | | | Year Ended
Dec. 31, 2017(a)(b) | |
| Net Asset Value, Beginning of Period | | $ | 73.45 | | | $ | 147.61 | | | $ | 256.37 | | | $ | 250.06 | | | $ | 415.83 | |
| | | | | | | | | | | | | | | | | | | | | |
| Investment Activities: | | | | | | | | | | | | | | | | | | | | |
| Net investment income (loss)(c) | | | (0.09 | ) | | | (1.40 | ) | | | 1.60 | | | | 1.34 | | | | (3.45 | ) |
| Net realized and unrealized gains (losses) on investments | | | (19.00 | ) | | | (64.52 | )(d) | | | (95.56 | ) | | | 4.97 | | | | (162.32 | ) |
| Total income (loss) from investment activities | | | (19.09 | ) | | | (65.92 | ) | | | (93.96 | ) | | | 6.31 | | | | (165.77 | ) |
| | | | | | | | | | | | | | | | | | | | | |
| Distributions to Shareholders From: | | | | | | | | | | | | | | | | | | | | |
| Net investment income | | | — | | | | (8.24 | ) | | | (6.30 | ) | | | — | | | | — | |
| Net realized gains on investments | | | (50.64 | ) | | | — | | | | (8.50 | ) | | | — | | | | — | |
| Total distributions | | | (50.64 | ) | | | (8.24 | ) | | | (14.80 | ) | | | — | | | | — | |
| | | | | | | | | | | | | | | | | | | | | |
| Net Asset Value, End of Period | | $ | 3.72 | | | $ | 73.45 | | | $ | 147.61 | | | $ | 256.37 | | | $ | 250.06 | |
| | | | | | | | | | | | | | | | | | | | | |
| Total Return | | | (35.11 | )%(e) | | | (45.44 | )% | | | (37.95 | )% | | | 2.56 | % | | | (39.90 | )% |
| | | | | | | | | | | | | | | | | | | | | |
| Ratios to Average Net Assets: | | | | | | | | | | | | | | | | | | | | |
| Gross expenses | | | 1.41 | % | | | 1.46 | % | | | 1.48 | % | | | 1.61 | % | | | 1.68 | % |
| Net expenses | | | 1.41 | % | | | 1.46 | % | | | 1.45 | % | | | 1.26 | % | | | 1.68 | % |
| Net investment income (loss) | | | (1.41 | )% | | | (1.28 | )% | | | 0.83 | % | | | 0.59 | % | | | (0.99 | )% |
| | | | | | | | | | | | | | | | | | | | | |
| Supplemental Data: | | | | | | | | | | | | | | | | | | | | |
| Net assets, end of period (000's) | | $ | 4 | | | $ | 6 | | | $ | 3 | | | $ | 6 | | | $ | 8 | |
| Portfolio turnover rate(f) | | | — | | | | — | | | | — | | | | — | | | | — | |
| (a) | As described in Note 8, share amounts have been adjusted for 1:5 reverse share split that occurred on December 14, 2020. |
| (b) | As described in Note 8, share amounts have been adjusted for 1:8 reverse share split that occurred on November 18, 2019. |
| (c) | Per share net investment income (loss) has been calculated using the average daily shares method. |
| (d) | The amount shown for a share outstanding throughout the period does not accord with the change in aggregate gains and losses in the portfolio of securities during the period because of the timing of sales and purchases of fund shares in relation to fluctuating market values during the period. |
| (e) | During the year ended December 31, 2021, the Fund received monies related to certain nonrecurring litigation settlements. The corresponding impact to the total return was an increase of 0.40%. |
| (f) | Portfolio turnover rate is calculated without regard to instruments having a maturity of less than one year from acquisition or derivative instruments (including swap agreements and futures contracts). |
See accompanying notes to financial statements.
340 :: ProFund VP UltraShort Nasdaq-100 :: Management Discussion of Fund Performance
ProFund VP UltraShort Nasdaq-100 (the "Fund") seeks daily investment results, before fees and expenses, that correspond to two times the inverse (-2x) of the return of the Nasdaq-100® Index (the "Index") for a single day, not for any other period. A "single day" is measured from the time the Fund calculates its net asset value ("NAV") to the time of the Fund's next NAV calculation. The Fund does not seek to achieve its stated investment objective over a period of time greater than a single day. The return of the Fund for periods longer than a single day will be the result of its return for each day compounded over the period. The Fund's returns for periods longer than a single day will very likely differ in amount, and possibly even direction from the Fund's stated multiple (-2x) times the return of the Fund's Index for the same period. For periods longer than a single day, the Fund will lose money if the Index's performance is flat, and it is possible that the Fund will lose money even if the level of the index falls. For the year ended December 31, 2021, the Fund had a total return of -42.71%. For the same period, the Index had a total return of 27.51%1 and a volatility of 18.57%. For the year, the Fund achieved an average daily statistical correlation of over 0.99 to twice the inverse of the daily performance of the Index.2
The Fund takes positions in financial instruments that, in combination, should have similar daily return characteristics as twice the inverse of the daily return of the Index. The Index, a modified market capitalization-weighted index, includes 100 of the largest non-financial domestic and international issues listed on Nasdaq.
During the year ended December 31, 2021, the Fund invested in swap agreements as a substitute for shorting stocks in order to gain inverse leveraged exposure to the Index. These derivatives generally tracked the performance of their underlying benchmark and benefited from financing costs associated with their use. The Fund entered into swap agreements with counterparties that the Fund's advisor determined to be major, global financial institutions. If a counterparty becomes insolvent or otherwise fails to perform on its obligations, the value of investments in the Fund may decline. The Fund has sought to mitigate this risk by generally requiring counterparties to post collateral for the benefit of the Fund, marked to market daily, in an amount approximately equal to the amount the counterparty owed to the Fund, subject to certain minimum thresholds.
Value of a $10,000 Investment at Net Asset Value*
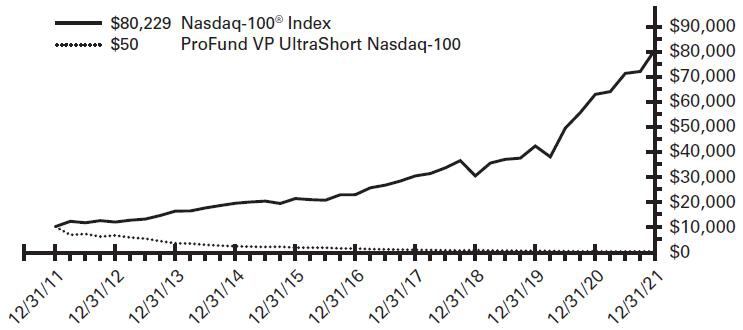
| * | The line graph represents the historical performance of a hypothetical investment of $10,000 in the ProFund VP UltraShort Nasdaq-100 from December 31, 2011 to December 31, 2021, assuming the reinvestment of distributions. |
Average Annual Total Return as of 12/31/21
| Fund | | One Year | | | Five Year | | | Ten Year | |
| ProFund VP UltraShort Nasdaq-100 | | | -42.71 | % | | | -47.63 | % | | | -41.18 | % |
| Nasdaq-100® Index | | | 27.51 | % | | | 28.63 | % | | | 23.15 | % |
Expense Ratios**
| Fund | | Gross | | | Net | |
| ProFund VP UltraShort Nasdaq-100 | | | 1.78 | % | | | 1.68 | % |
| ** | Reflects the expense ratio as reported in the Prospectus dated May 1, 2021. Contractual fee waivers are in effect through April 30, 2022. See Financial Highlights for effective expense ratios. |
Allocation of Portfolio Holdings & Index Composition
Market Exposure
| Investment Type | | % of Net Assets | |
| Swap Agreements | | | (200 | )% |
| Total Exposure | | | (200 | )% |
"Market Exposure" includes the value of total investments (including the contract value of any derivatives) and excludes any instruments used for cash management.
Holdings
The ProFund VP UltraShort Nasdaq-100 primarily invests in non-equity securities, which may include: swap agreements, futures contracts, repurchase agreements and U.S. Government securities.
Nasdaq-100® Index – Composition
| | | % of Index | |
| Information Technology | | | 51 | % |
| Communication Services | | | 18 | % |
| Consumer Discretionary | | | 16 | % |
| Health Care | | | 6 | % |
| Consumer Staples | | | 5 | % |
| Industrials | | | 3 | % |
| Utilities | | | 1 | % |
Past performance does not guarantee future results. Return calculations assume the reinvestment of distributions and do not reflect taxes that a shareholder would pay on Fund distributions or on the redemption of Fund shares. The performance data quoted represents past performance and current returns may be lower or higher. The investment return and NAV will fluctuate so that an investor's shares, when redeemed, may be worth more or less than the original cost. The performance above reflects any fee reductions during the applicable periods. If such fee reductions had not occurred, the quoted performance would be lower. Performance numbers are net of all Fund fees and expenses but do not include any insurance, sales, or administrative charges of variable annuity or life insurance contracts. If these charges were included, the returns would be lower. To obtain performance current to the most recent month-end, please call toll-free 888-776-3637.
| 1 | The graph and table reflect the theoretical reinvestment of dividends on securities in the Index. The impact of transaction costs and the deduction of fees and expenses associated with a mutual fund, such as investment management and accounting fees, are not reflected in the index calculations. The Fund's performance reflects the reinvestment of dividends as well as the impact of transaction costs and the deduction of fees and expenses. It is not possible to invest directly in an index. |
| 2 | 1.00 equals perfect correlation. This calculation is based on the daily total return of the Index and the performance of the daily total return of the NAV per share of the Fund. |
The above information is not covered by the Report of the Independent Registered Public Accounting Firm.
Financial Statements :: ProFund VP UltraShort Nasdaq-100 :: 341
Schedule of Portfolio Investments :: December 31, 2021
Repurchase Agreements(a)(b) (81.4%)
| | | Principal
Amount | | | Value | |
| Repurchase Agreements with various counterparties, 0.00%, dated 12/31/21, due 1/3/22, total to be received $365,000 | | $ | 365,000 | | | $ | 365,000 | |
TOTAL REPURCHASE AGREEMENTS
(Cost $365,000) | | | | | | | 365,000 | |
TOTAL INVESTMENT SECURITIES
(Cost $365,000)—81.4% | | | | | | | 365,000 | |
| Net other assets (liabilities)—18.6% | | | | | | | 83,574 | |
| NET ASSETS—100.0% | | | | | | $ | 448,574 | |
| (a) | A portion of these securities were held in a segregated account for the benefit of swap counterparties in the event of default. At December 31, 2021, the aggregate amount held in a segregated account was $210,000. |
| (b) | The ProFund VP invests in Repurchase Agreements jointly with other funds in the Trust. See "Repurchase Agreements" under Note 2 in the Notes to Financial Statements to view the details of each individual agreement and counterparty as well as a description of the securities subject to repurchase. |
Total Return Swap Agreements—Short
| Underlying Instrument | | Counterparty | | Termination
Date(1) | | | Rate Paid
(Received)(2) | | | Notional
Amount | | | Value and
Unrealized
Appreciation/
(Depreciation) | |
| Nasdaq-100 Index | | Goldman Sachs International | | 1/27/22 | | | (0.43 | )% | | $ | (664,248 | ) | | $ | 9,970 | |
| Nasdaq-100 Index | | UBS AG | | 1/27/22 | | | (0.23 | )% | | | (232,509 | ) | | | 910 | |
| | | | | | | | | | | $ | (896,757 | ) | | $ | 10,880 | |
| (1) | Agreements may be terminated at will by either party without penalty. Payment is due at termination/maturity. |
| (2) | Reflects the floating financing rate, as of December 31, 2021, on the notional amount of the swap agreement paid to the counterparty or received from the counterparty, excluding any commissions. This amount is included as part of the unrealized appreciation/(depreciation). |
See accompanying notes to financial statements.
342 :: ProFund VP UltraShort Nasdaq-100 :: Financial Statements
Statement of Assets and Liabilities
December 31, 2021
| ASSETS: | | | | |
| Total Investment Securities, at cost | | $ | 365,000 | |
| Repurchase agreements, at value | | | 365,000 | |
| Total Investment Securities, at value | | | 365,000 | |
| Cash | | | 173 | |
| Unrealized appreciation on swap agreements | | | 10,880 | |
| Receivable for capital shares issued | | | 78,519 | |
| Prepaid expenses | | | 16 | |
| TOTAL ASSETS | | | 454,588 | |
| | | | | |
| LIABILITIES: | | | | |
| Advisory fees payable | | | 2,085 | |
| Management services fees payable | | | 278 | |
| Administration fees payable | | | 147 | |
| Administrative services fees payable | | | 1,014 | |
| Distribution fees payable | | | 1,268 | |
| Transfer agency fees payable | | | 241 | |
| Fund accounting fees payable | | | 81 | |
| Compliance services fees payable | | | 7 | |
| Other accrued expenses | | | 893 | |
| TOTAL LIABILITIES | | | 6,014 | |
| NET ASSETS | | $ | 448,574 | |
| | | | | |
| NET ASSETS CONSIST OF: | | | | |
| Capital | | $ | 5,816,675 | |
| Total distributable earnings (loss) | | | (5,368,101 | ) |
| NET ASSETS | | $ | 448,574 | |
| Shares of Beneficial Interest Outstanding (unlimited number of shares authorized, no par value) | | | 42,053 | |
| Net Asset Value (offering and redemption price per share) | | $ | 10.67 | |
Statement of Operations
For the Year Ended December 31, 2021
| INVESTMENT INCOME: | | | | |
| Interest | | $ | 47 | |
| | | | | |
| EXPENSES: | | | | |
| Advisory fees | | | 11,581 | |
| Management services fees | | | 1,544 | |
| Administration fees | | | 1,350 | |
| Transfer agency fees | | | 1,154 | |
| Administrative services fees | | | 3,065 | |
| Distribution fees | | | 3,860 | |
| Custody fees | | | 940 | |
| Fund accounting fees | | | 775 | |
| Trustee fees | | | 34 | |
| Compliance services fees | | | 7 | |
| Other fees | | | 1,141 | |
| Recoupment of prior expenses reduced by the Advisor | | | 1,388 | |
| Total Gross Expenses before reductions | | | 26,839 | |
| Expenses reduced and reimbursed by the Advisor | | | (909 | ) |
| TOTAL NET EXPENSES | | | 25,930 | |
| NET INVESTMENT INCOME (LOSS) | | | (25,883 | ) |
| | | | | |
| REALIZED AND UNREALIZED GAINS (LOSSES) ON INVESTMENTS: | | | | |
| Net realized gains (losses) on swap agreements | | | (339,086 | ) |
| Change in net unrealized appreciation/depreciation on swap agreements | | | 12,461 | |
| NET REALIZED AND UNREALIZED GAINS (LOSSES) ON INVESTMENTS | | | (326,625 | ) |
| CHANGE IN NET ASSETS RESULTING FROM OPERATIONS | | $ | (352,508 | ) |
See accompanying notes to financial statements.
Financial Statements :: ProFund VP UltraShort Nasdaq-100 :: 343
| Statements of Changes in Net Assets |
| | | Year Ended
December 31, 2021 | | | Year Ended
December 31, 2020 | |
| FROM INVESTMENT ACTIVITIES: | | | | | | |
| | | | | | | |
| OPERATIONS: |
| Net investment income (loss) | | $ | (25,883 | ) | | $ | (27,761 | ) |
| Net realized gains (losses) on investments | | | (339,086 | ) | | | 3,208,340 | |
| Change in net unrealized appreciation/depreciation on investments | | | 12,461 | | | | (10,802 | ) |
| Change in net assets resulting from operations | | | (352,508 | | | | 3,169,777 | |
| | | | | | | | | |
| DISTRIBUTIONS TO SHAREHOLDERS: | | | | | | | | |
| Total distributions | | | (2,439,139 | ) | | | (6,414 | ) |
| Change in net assets resulting from distributions | | | (2,439,139 | ) | | | (6,414 | ) |
| | | | | | | | | |
| CAPITAL TRANSACTIONS: | | | | | | | | |
| Proceeds from shares issued | | | 242,521,359 | | | | 271,425,451 | |
| Distributions reinvested | | | 2,439,139 | | | | 6,414 | |
| Value of shares redeemed | | | (241,957,148 | ) | | | (275,384,534 | ) |
| Change in net assets resulting from capital transactions | | | 3,003,350 | | | | (3,952,669 | ) |
| Change in net assets | | | 211,703 | | | | (789,306 | ) |
| | | | | | | | | |
| NET ASSETS: | | | | | | | | |
| Beginning of period | | | 236,871 | | | | 1,026,177 | |
| End of period | | $ | 448,574 | | | $ | 236,871 | |
| | | | | | | | | |
| SHARE TRANSACTIONS: | | | | | | | | |
| Issued | | | 15,773,081 | | | | 6,970,122 | (a) |
| Reinvested | | | 134,218 | | | | 256 | (a) |
| Redeemed | | | (15,876,300 | ) | | | (6,972,814 | )(a) |
| Change in shares | | | 30,999 | | | | (2,436 | ) |
| (a) | As described in Note 8, share amounts have been adjusted for 1:4 reverse share split that occurred on December 14, 2020. |
See accompanying notes to financial statements.
344 :: ProFund VP UltraShort Nasdaq-100 :: Financial Highlights
ProFunds Financial Highlights FOR THE PERIODS INDICATED
Selected data for a share of beneficial interest outstanding throughout the periods indicated.
| | | Year Ended
Dec. 31, 2021 | | | Year Ended
Dec. 31, 2020(a) | | | Year Ended
Dec. 31, 2019(a) | | | Year Ended
Dec. 31, 2018(a) | | | Year Ended
Dec. 31, 2017(a)(b) | |
| Net Asset Value, Beginning of Period | | $ | 21.43 | | | $ | 76.07 | | | $ | 155.01 | | | $ | 175.32 | | | $ | 318.37 | |
| | | | | | | | | | | | | | | | | | | | | |
| Investment Activities: | | | | | | | | | | | | | | | | | | | | |
| Net investment income (loss)(c) | | | (0.25 | ) | | | (0.59 | ) | | | 0.52 | | | | 0.52 | | | | (1.96 | ) |
| Net realized and unrealized gains (losses) on investments | | | (7.77 | ) | | | (53.72 | )(d) | | | (78.58 | ) | | | (20.83 | ) | | | (141.09 | ) |
| Total income (loss) from investment activities | | | (8.02 | ) | | | (54.31 | ) | | | (78.06 | ) | | | (20.31 | ) | | | (143.05 | ) |
| | | | | | | | | | | | | | | | | | | | | |
| Distributions to Shareholders From: | | | | | | | | | | | | | | | | | | | | |
| Net investment income | | | — | | | | (0.33 | ) | | | (0.88 | ) | | | — | | | | — | |
| Net realized gains on investments | | | (2.74 | ) | | | — | | | | — | | | | — | | | | — | |
| Total distributions | | | (2.74 | ) | | | (0.33 | ) | | | (0.88 | ) | | | — | | | | — | |
| | | | | | | | | | | | | | | | | | | | | |
| Net Asset Value, End of Period | | $ | 10.67 | | | $ | 21.43 | | | $ | 76.07 | | | $ | 155.01 | | | $ | 175.32 | |
| | | | | | | | | | | | | | | | | | | | | |
| Total Return | | | (42.71 | )% | | | (71.46 | )% | | | (50.50 | )% | | | (11.59 | )% | | | (44.94 | )% |
| | | | | | | | | | | | | | | | | | | | | |
| Ratios to Average Net Assets: | | | | | | | | | | | | | | | | | | | | |
| Gross expenses | | | 1.74 | % | | | 1.78 | % | | | 1.68 | % | | | 1.66 | % | | | 1.68 | % |
| Net expenses | | | 1.68 | % | | | 1.68 | % | | | 1.67 | % | | | 1.66 | % | | | 1.68 | % |
| Net investment income (loss) | | | (1.68 | )% | | | (1.49 | )% | | | 0.50 | % | | | 0.40 | % | | | (0.88 | )% |
| | | | | | | | | | | | | | | | | | | | | |
| Supplemental Data: | | | | | | | | | | | | | | | | | | | | |
| Net assets, end of period (000's) | | $ | 449 | | | $ | 237 | | | $ | 1,026 | | | $ | 666 | | | $ | 324 | |
| Portfolio turnover rate(e) | | | — | | | | — | | | | — | | | | — | | | | — | |
| (a) | As described in Note 8, share amounts have been adjusted for 1:4 reverse share split that occurred on December 14, 2020. |
| (b) | As described in Note 8, share amounts have been adjusted for 1:8 reverse share split that occurred on December 11, 2017. |
| (c) | Per share net investment income (loss) has been calculated using the average daily shares method. |
| (d) | The amount shown for a share outstanding throughout the period does not accord with the change in aggregate gains and losses in the portfolio of securities during the period because of the timing of sales and purchases of fund shares in relation to fluctuating market values during the period. |
| (e) | Portfolio turnover rate is calculated without regard to instruments having a maturity of less than one year from acquisition or derivative instruments (including swap agreements and futures contracts). |
See accompanying notes to financial statements.
Management Discussion of Fund Performance :: ProFund VP UltraSmall-Cap :: 345
ProFund VP UltraSmall-Cap (the "Fund") seeks daily investment results, before fees and expenses, that correspond to two times (2x) the return of the Russell 2000® Index (the "Index") for a single day, not for any other period. A "single day" is measured from the time the Fund calculates its net asset value ("NAV") to the time of the Fund's next NAV calculation. The Fund does not seek to achieve its stated investment objective over a period of time greater than a single day. The return of the Fund for periods longer than a single day will be the result of its return for each day compounded over the period. The Fund's returns for periods longer than a single day will very likely differ in amount, and possibly even direction from the Fund's stated multiple (2x) times the return of the Fund's Index for the same period. For periods longer than a single day, the Fund will lose money if the Index's performance is flat, and it is possible that the Fund will lose money even if the level of the index rises. For the year ended December 31, 2021, the Fund had a total return of 23.30%. For the same period, the Index had a total return of 14.82%1 and a volatility of 21.98%. For the year, the Fund achieved an average daily statistical correlation of over 0.99 to twice that of the daily performance of the Index.2
The Fund takes positions in financial instruments that, in combination, should have similar daily return characteristics as twice the daily return of the Index. The Index is a measure of small-cap U.S. stock market performance. It is a float-adjusted, market capitalization-weighted index containing approximately 2,000 of the smallest companies in the Russell 3000® Index or approximately 8% of the total market capitalization of the Russell 3000® Index, which in turn represents approximately 98% of the investable U.S. equity market.
During the year ended December 31, 2021, the Fund invested in swap agreements and futures contracts as a substitute for investing directly in stocks in order to gain leveraged exposure to the Index. These derivatives generally tracked the performance of their underlying benchmark and were negatively impacted by financing costs associated with their use. The Fund entered into swap agreements with counterparties that the Fund's advisor determined to be major, global financial institutions. If a counterparty becomes insolvent or otherwise fails to perform on its obligations, the value of investments in the Fund may decline. The Fund has sought to mitigate this risk by generally requiring counterparties to post collateral for the benefit of the Fund, marked to market daily, in an amount approximately equal to the amount the counterparty owed to the Fund, subject to certain minimum thresholds.
Value of a $10,000 Investment at Net Asset Value*

| * | The line graph represents the historical performance of a hypothetical investment of $10,000 in the ProFund VP UltraSmall-Cap from December 31, 2011 to December 31, 2021, assuming the reinvestment of distributions. |
Average Annual Total Return as of 12/31/21
| Fund | | One Year | | | Five Year | | | Ten Year | |
| ProFund VP UltraSmall-Cap | | | 23.30 | % | | | 14.10 | % | | | 19.59 | % |
| Russell 2000® Index | | | 14.82 | % | | | 12.02 | % | | | 13.23 | % |
Expense Ratios**
| Fund | | Gross | | | Net | | | | | |
| ProFund VP UltraSmall-Cap | | | 1.86 | % | | | 1.68 | % | | | | |
| ** | Reflects the expense ratio as reported in the Prospectus dated May 1, 2021. Contractual fee waivers are in effect through April 30, 2022. See Financial Highlights for effective expense ratios. |
Allocation of Portfolio Holdings & Index Composition
Market Exposure
| Investment Type | | % of Net Assets | |
| Equity Securities | | | 53 | % |
| Swap Agreements | | | 147 | % |
| Total Exposure | | | 200 | % |
"Market Exposure" includes the value of total investments (including the contract value of any derivatives) and excludes any instruments used for cash management or collateral for securities loaned.
Largest Equity Holdings
| Company | | % of Net Assets | |
| AMC Entertainment Holdings, Inc. | | | 0.3 | % |
| Synaptics, Inc. | | | 0.2 | % |
| Lattice Semiconductor Corp. | | | 0.2 | % |
| EastGroup Properties, Inc. | | | 0.2 | % |
| BJ's Wholesale Club Holdings, Inc. | | | 0.2 | % |
Russell 2000® Index – Composition
| | | % of Index | |
| Health Care | | | 19 | % |
| Financials | | | 16 | % |
| Industrials | | | 15 | % |
| Information Technology | | | 15 | % |
| Consumer Discretionary | | | 11 | % |
| Real Estate | | | 7 | % |
| Energy | | | 4 | % |
| Materials | | | 4 | % |
| Consumer Staples | | | 3 | % |
| Communication Services | | | 3 | % |
| Utilities | | | 3 | % |
Past performance does not guarantee future results. Return calculations assume the reinvestment of distributions and do not reflect taxes that a shareholder would pay on Fund distributions or on the redemption of Fund shares. The performance data quoted represents past performance and current returns may be lower or higher. The investment return and NAV will fluctuate so that an investor's shares, when redeemed, may be worth more or less than the original cost. The performance above reflects any fee reductions during the applicable periods. If such fee reductions had not occurred, the quoted performance would be lower. Performance numbers are net of all Fund fees and expenses but do not include any insurance, sales, or administrative charges of variable annuity or life insurance contracts. If these charges were included, the returns would be lower. To obtain performance current to the most recent month-end, please call toll-free 888-776-3637.
| 1 | The graph and table reflect the theoretical reinvestment of dividends on securities in the Index. The impact of transaction costs and the deduction of fees and expenses associated with a mutual fund, such as investment management and accounting fees, are not reflected in the index calculations. The Fund's performance reflects the reinvestment of dividends as well as the impact of transaction costs and the deduction of fees and expenses. It is not possible to invest directly in an index. |
| 2 | 1.00 equals perfect correlation. This calculation is based on the daily total return of the Index and the performance of the daily total return of the NAV per share of the Fund. |
The above information is not covered by the Report of the Independent Registered Public Accounting Firm.
346 :: ProFund VP UltraSmall-Cap :: Financial Statements
Schedule of Portfolio Investments :: December 31, 2021
Common Stocks (53.4%)
| | | Shares | | | Value | |
| 1-800-Flowers.com, Inc.*—Class A (Internet & Direct Marketing Retail) | | | 135 | | | $ | 3,155 | |
| 1Life Healthcare, Inc.* (Health Care Providers & Services) | | | 591 | | | | 10,384 | |
| 1st Source Corp. (Banks) | | | 86 | | | | 4,266 | |
| 1stdibs.com, Inc.* (Internet & Direct Marketing Retail) | | | 34 | | | | 425 | |
| 22nd Century Group, Inc.* (Tobacco) | | | 816 | | | | 2,521 | |
| 2seventy bio, Inc.* (Biotechnology) | | | 114 | | | | 2,922 | |
| 2U, Inc.* (Diversified Consumer Services) | | | 368 | | | | 7,386 | |
| 3D Systems Corp.* (Technology Hardware, Storage & Peripherals) | | | 630 | | | | 13,571 | |
| 4D Molecular Therapeutics, Inc.* (Biotechnology) | | | 142 | | | | 3,115 | |
| 89bio, Inc.* (Biotechnology) | | | 50 | | | | 654 | |
| 8x8, Inc.* (Software) | | | 572 | | | | 9,587 | |
| 9 Meters Biopharma, Inc.* (Pharmaceuticals) | | | 1,148 | | | | 1,124 | |
| 908 Devices, Inc.* (Electronic Equipment, Instruments & Components) | | | 95 | | | | 2,458 | |
| A10 Networks, Inc. (Software) | | | 305 | | | | 5,057 | |
| AAON, Inc. (Building Products) | | | 213 | | | | 16,919 | |
| AAR Corp.* (Aerospace & Defense) | | | 172 | | | | 6,713 | |
| Aaron's Co., Inc. (The) (Specialty Retail) | | | 158 | | | | 3,895 | |
| Abercrombie & Fitch Co.*—Class A (Specialty Retail) | | | 297 | | | | 10,345 | |
| ABM Industries, Inc. (Commercial Services & Supplies) | | | 342 | | | | 13,971 | |
| Absci Corp.* (Life Sciences Tools & Services) | | | 70 | | | | 574 | |
| Acacia Research Corp.* (Professional Services) | | | 249 | | | | 1,277 | |
| Academy Sports & Outdoors, Inc.* (Leisure Products) | | | 394 | | | | 17,296 | |
| ACADIA Pharmaceuticals, Inc.* (Biotechnology) | | | 607 | | | | 14,167 | |
| Acadia Realty Trust (Equity Real Estate Investment Trusts) | | | 440 | | | | 9,605 | |
| Accel Entertainment, Inc.* (Hotels, Restaurants & Leisure) | | | 286 | | | | 3,724 | |
| Accelerate Diagnostics, Inc.* (Life Sciences Tools & Services) | | | 167 | | | | 872 | |
| ACCO Brands Corp. (Commercial Services & Supplies) | | | 473 | | | | 3,907 | |
| Accolade, Inc.* (Health Care Technology) | | | 255 | | | | 6,722 | |
| Accuray, Inc.* (Health Care Equipment & Supplies) | | | 457 | | | | 2,180 | |
| ACI Worldwide, Inc.* (Software) | | | 598 | | | | 20,751 | |
| Aclaris Therapeutics, Inc.* (Pharmaceuticals) | | | 259 | | | | 3,766 | |
| Acumen Pharmaceuticals, Inc.* (Biotechnology) | | | 51 | | | | 345 | |
| Acushnet Holdings Corp. (Leisure Products) | | | 174 | | | | 9,236 | |
| Acutus Medical, Inc.* (Health Care Equipment & Supplies) | | | 97 | | | | 331 | |
| Adagio Therapeutics, Inc.* (Biotechnology) | | | 107 | | | | 777 | |
| AdaptHealth Corp.* (Health Care Providers & Services) | | | 363 | | | | 8,879 | |
| Addus Homecare Corp.* (Health Care Providers & Services) | | | 78 | | | | 7,294 | |
| Adicet Bio, Inc.* (Pharmaceuticals) | | | 106 | | | | 1,854 | |
| Adient PLC* (Auto Components) | | | 481 | | | | 23,030 | |
| Adtalem Global Education, Inc.* (Diversified Consumer Services) | | | 251 | | | | 7,420 | |
| ADTRAN, Inc. (Communications Equipment) | | | 244 | | | | 5,571 | |
| Advanced Energy Industries, Inc. (Semiconductors & Semiconductor Equipment) | | | 191 | | | | 17,392 | |
| AdvanSix, Inc. (Chemicals) | | | 138 | | | | 6,521 | |
| Advantage Solutions, Inc.* (Media) | | | 387 | | | | 3,104 | |
| Advent Technologies Holdings, Inc.* (Electrical Equipment) | | | 80 | | | | 561 | |
| Adverum Biotechnologies, Inc.* (Biotechnology) | | | 440 | | | | 774 | |
| Aeglea BioTherapeutics, Inc.* (Biotechnology) | | | 206 | | | | 979 | |
| Aemetis, Inc.* (Oil, Gas & Consumable Fuels) | | | 137 | | | | 1,685 | |
| Aerie Pharmaceuticals, Inc.* (Pharmaceuticals) | | | 215 | | | | 1,509 | |
| Aerojet Rocketdyne Holdings, Inc. (Aerospace & Defense) | | | 380 | | | | 17,769 | |
| Aerovate Therapeutics, Inc.* (Biotechnology) | | | 51 | | | | 601 | |
| AeroVironment, Inc.* (Aerospace & Defense) | | | 114 | | | | 7,071 | |
| AerSale Corp.* (Aerospace & Defense) | | | 48 | | | | 852 | |
| Aeva Technologies, Inc.* (Electronic Equipment, Instruments & Components) | | | 536 | | | | 4,052 | |
| AFC Gamma, Inc. (Mortgage Real Estate Investment Trusts) | | | 63 | | | | 1,434 | |
| Affimed N.V.* (Biotechnology) | | | 589 | | | | 3,251 | |
| AgEagle Aerial Systems, Inc.* (Machinery) | | | 344 | | | | 540 | |
| Agenus, Inc.* (Biotechnology) | | | 1,111 | | | | 3,577 | |
| Agiliti, Inc.* (Health Care Providers & Services) | | | 119 | | | | 2,756 | |
| Agilysys, Inc.* (Software) | | | 108 | | | | 4,802 | |
| Agios Pharmaceuticals, Inc.* (Biotechnology) | | | 275 | | | | 9,039 | |
| Agree Realty Corp. (Equity Real Estate Investment Trusts) | | | 349 | | | | 24,905 | |
| Air Transport Services Group, Inc.* (Air Freight & Logistics) | | | 299 | | | | 8,785 | |
| AirSculpt Technologies, Inc.* (Health Care Providers & Services) | | | 33 | | | | 567 | |
| aka Brands Holding Corp.* (Internet & Direct Marketing Retail) | | | 48 | | | | 444 | |
| Akebia Therapeutics, Inc.* (Biotechnology) | | | 884 | | | | 1,998 | |
| Akero Therapeutics, Inc.* (Biotechnology) | | | 130 | | | | 2,750 | |
| Akouos, Inc.* (Biotechnology) | | | 122 | | | | 1,037 | |
| Akoustis Technologies, Inc.* (Electronic Equipment, Instruments & Components) | | | 248 | | | | 1,657 | |
| Akoya Biosciences, Inc.* (Life Sciences Tools & Services) | | | 68 | | | | 1,041 | |
| Alamo Group, Inc. (Machinery) | | | 50 | | | | 7,359 | |
| Alarm.com Holdings, Inc.* (Software) | | | 240 | | | | 20,354 | |
| Albany International Corp.—Class A (Machinery) | | | 156 | | | | 13,798 | |
| Albireo Pharma, Inc.* (Biotechnology) | | | 86 | | | | 2,003 | |
| Aldeyra Therapeutics, Inc.* (Biotechnology) | | | 246 | | | | 984 | |
| Alector, Inc.* (Biotechnology) | | | 296 | | | | 6,112 | |
| Alerus Financial Corp. (Diversified Financial Services) | | | 76 | | | | 2,225 | |
| Alexander & Baldwin, Inc. (Equity Real Estate Investment Trusts) | | | 368 | | | | 9,233 | |
| Alexander's, Inc. (Equity Real Estate Investment Trusts) | | | 11 | | | | 2,863 | |
| Alignment Healthcare, Inc.* (Health Care Providers & Services) | | | 402 | | | | 5,652 | |
| Aligos Therapeutics, Inc.* (Biotechnology) | | | 107 | | | | 1,270 | |
| Alkami Technology, Inc.* (Software) | | | 144 | | | | 2,889 | |
| Alkermes PLC* (Biotechnology) | | | 813 | | | | 18,910 | |
See accompanying notes to financial statements.
Financial Statements :: ProFund VP UltraSmall-Cap :: 347
Common Stocks, continued
| | | Shares | | | Value | |
| Allakos, Inc.* (Biotechnology) | | | 180 | | | $ | 1,762 | |
| Allegheny Technologies, Inc.* (Metals & Mining) | | | 646 | | | | 10,291 | |
| Allegiance Bancshares, Inc. (Banks) | | | 97 | | | | 4,094 | |
| Allegiant Travel Co.* (Airlines) | | | 78 | | | | 14,589 | |
| ALLETE, Inc. (Electric Utilities) | | | 266 | | | | 17,649 | |
| Allied Motion Technologies, Inc. (Electrical Equipment) | | | 59 | | | | 2,153 | |
| Allogene Therapeutics, Inc.* (Biotechnology) | | | 345 | | | | 5,147 | |
| Allovir, Inc.* (Biotechnology) | | | 150 | | | | 1,941 | |
| Allscripts Healthcare Solutions, Inc.* (Health Care Technology) | | | 616 | | | | 11,365 | |
| Alpha & Omega Semiconductor, Ltd.* (Semiconductors & Semiconductor Equipment) | | | 108 | | | | 6,540 | |
| Alpha Teknova, Inc.* (Biotechnology) | | | 35 | | | | 717 | |
| Alphatec Holdings, Inc.* (Health Care Equipment & Supplies) | | | 358 | | | | 4,092 | |
| Alpine Immune Sciences, Inc.* (Biotechnology) | | | 59 | | | | 817 | |
| Alta Equipment Group, Inc.* (Trading Companies & Distributors) | | | 96 | | | | 1,405 | |
| Altair Engineering, Inc.*—Class A (Software) | | | 234 | | | | 18,093 | |
| Altimmune, Inc.* (Biotechnology) | | | 201 | | | | 1,841 | |
| Alto Ingredients, Inc.* (Oil, Gas & Consumable Fuels) | | | 363 | | | | 1,746 | |
| Altra Industrial Motion Corp. (Machinery) | | | 329 | | | | 16,967 | |
| Altus Midstream Co.—Class A (Oil, Gas & Consumable Fuels) | | | 17 | | | | 1,042 | |
| ALX Oncology Holdings, Inc.* (Biotechnology) | | | 90 | | | | 1,934 | |
| Amalgamated Financial Corp. (Banks) | | | 69 | | | | 1,157 | |
| A-Mark Precious Metals, Inc. (Diversified Financial Services) | | | 45 | | | | 2,750 | |
| Ambac Financial Group, Inc.* (Insurance) | | | 231 | | | | 3,708 | |
| Ambarella, Inc.* (Semiconductors & Semiconductor Equipment) | | | 179 | | | | 36,318 | |
| AMC Entertainment Holdings, Inc.*(a) (Entertainment) | | | 2,619 | | | | 71,236 | |
| AMC Networks, Inc.*—Class A (Media) | | | 148 | | | | 5,097 | |
| Amerant Bancorp, Inc. (Banks) | | | 137 | | | | 4,733 | |
| Ameresco, Inc.*—Class A (Construction & Engineering) | | | 157 | | | | 12,786 | |
| American Assets Trust, Inc. (Equity Real Estate Investment Trusts) | | | 253 | | | | 9,495 | |
| American Axle & Manufacturing Holdings, Inc.* (Auto Components) | | | 572 | | | | 5,337 | |
| American Eagle Outfitters, Inc. (Specialty Retail) | | | 772 | | | | 19,547 | |
| American Equity Investment Life Holding Co. (Insurance) | | | 419 | | | | 16,307 | |
| American Finance Trust, Inc. (Equity Real Estate Investment Trusts) | | | 630 | | | | 5,752 | |
| American National Bankshares, Inc. (Banks) | | | 53 | | | | 1,997 | |
| American National Group, Inc. (Insurance) | | | 38 | | | | 7,176 | |
| American Outdoor Brands, Inc.* (Leisure Products) | | | 71 | | | | 1,415 | |
| American Public Education, Inc.* (Diversified Consumer Services) | | | 94 | | | | 2,092 | |
| American Software, Inc.—Class A (Software) | | | 159 | | | | 4,161 | |
| American States Water Co. (Water Utilities) | | | 187 | | | | 19,343 | |
| American Superconductor Corp.* (Electrical Equipment) | | | 140 | | | | 1,523 | |
| American Vanguard Corp. (Chemicals) | | | 149 | | | | 2,442 | |
| American Well Corp.*—Class A (Health Care Technology) | | | 928 | | | | 5,605 | |
| American Woodmark Corp.* (Building Products) | | | 84 | | | | 5,477 | |
| America's Car-Mart, Inc.* (Specialty Retail) | | | 30 | | | | 3,072 | |
| Ameris Bancorp (Banks) | | | 337 | | | | 16,742 | |
| AMERISAFE, Inc. (Insurance) | | | 97 | | | | 5,222 | |
| Amicus Therapeutics, Inc.* (Biotechnology) | | | 1,333 | | | | 15,396 | |
| Amkor Technology, Inc. (Semiconductors & Semiconductor Equipment) | | | 518 | | | | 12,841 | |
| AMMO, Inc.* (Leisure Products) | | | 442 | | | | 2,409 | |
| AMN Healthcare Services, Inc.* (Health Care Providers & Services) | | | 239 | | | | 29,237 | |
| Amneal Pharmaceuticals, Inc.* (Pharmaceuticals) | | | 506 | | | | 2,424 | |
| Amphastar Pharmaceuticals, Inc.* (Pharmaceuticals) | | | 188 | | | | 4,379 | |
| Ampio Pharmaceuticals, Inc.* (Pharmaceuticals) | | | 988 | | | | 563 | |
| Amyris, Inc.* (Oil, Gas & Consumable Fuels) | | | 897 | | | | 4,853 | |
| AnaptysBio, Inc.* (Biotechnology) | | | 98 | | | | 3,406 | |
| Anavex Life Sciences Corp.* (Biotechnology) | | | 340 | | | | 5,896 | |
| Angel Oak Mortgage, Inc. (Mortgage Real Estate Investment Trusts) | | | 37 | | | | 606 | |
| AngioDynamics, Inc.* (Health Care Equipment & Supplies) | | | 190 | | | | 5,240 | |
| Angion Biomedica Corp.* (Pharmaceuticals) | | | 110 | | | | 319 | |
| ANI Pharmaceuticals, Inc.* (Pharmaceuticals) | | | 55 | | | | 2,534 | |
| Anika Therapeutics, Inc.* (Health Care Equipment & Supplies) | | | 73 | | | | 2,616 | |
| Annexon, Inc.* (Biotechnology) | | | 158 | | | | 1,815 | |
| Antares Pharma, Inc.* (Health Care Equipment & Supplies) | | | 846 | | | | 3,020 | |
| Anterix, Inc.* (Diversified Telecommunication Services) | | | 59 | | | | 3,467 | |
| Antero Resources Corp.* (Oil, Gas & Consumable Fuels) | | | 1,451 | | | | 25,393 | |
| Apartment Investment and Management Co.* (Equity Real Estate Investment Trusts) | | | 766 | | | | 5,914 | |
| Apellis Pharmaceuticals, Inc.* (Biotechnology) | | | 362 | | | | 17,115 | |
| API Group Corp.* (Construction & Engineering) | | | 1,023 | | | | 26,364 | |
| Apogee Enterprises, Inc. (Building Products) | | | 126 | | | | 6,067 | |
| Apollo Commercial Real Estate Finance, Inc. (Mortgage Real Estate Investment Trusts) | | | 712 | | | | 9,370 | |
| Apollo Medical Holdings, Inc.* (Health Care Providers & Services) | | | 191 | | | | 14,035 | |
| Appfolio, Inc.* (Software) | | | 97 | | | | 11,743 | |
| AppHarvest, Inc.* (Food Products) | | | 354 | | | | 1,377 | |
| Appian Corp.* (Software) | | | 199 | | | | 12,977 | |
| Apple Hospitality REIT, Inc. (Equity Real Estate Investment Trusts) | | | 1,087 | | | | 17,555 | |
| Applied Industrial Technologies, Inc. (Trading Companies & Distributors) | | | 195 | | | | 20,026 | |
| Applied Molecular Transport, Inc.* (Biotechnology) | | | 127 | | | | 1,775 | |
| Applied Therapeutics, Inc.* (Biotechnology) | | | 90 | | | | 806 | |
| Apria, Inc.* (Health Care Providers & Services) | | | 100 | | | | 3,260 | |
| Apyx Medical Corp.* (Health Care Equipment & Supplies) | | | 158 | | | | 2,026 | |
| AquaBounty Technologies, Inc.* (Biotechnology) | | | 266 | | | | 559 | |
| Arbor Realty Trust, Inc. (Mortgage Real Estate Investment Trusts) | | | 730 | | | | 13,374 | |
| Arbutus Biopharma Corp.* (Biotechnology) | | | 407 | | | | 1,583 | |
| ArcBest Corp. (Road & Rail) | | | 128 | | | | 15,341 | |
See accompanying notes to financial statements.
348 :: ProFund VP UltraSmall-Cap :: Financial Statements
Common Stocks, continued
| | | Shares | | | Value | |
| Arch Resources, Inc. (Oil, Gas & Consumable Fuels) | | | 77 | | | $ | 7,032 | |
| Archrock, Inc. (Energy Equipment & Services) | | | 684 | | | | 5,116 | |
| Arcimoto, Inc.* (Automobiles) | | | 145 | | | | 1,128 | |
| Arconic Corp.* (Metals & Mining) | | | 542 | | | | 17,890 | |
| Arcosa, Inc. (Construction & Engineering) | | | 246 | | | | 12,964 | |
| Arcturus Therapeutics Holdings, Inc.* (Biotechnology) | | | 107 | | | | 3,960 | |
| Arcus Biosciences, Inc.* (Biotechnology) | | | 227 | | | | 9,187 | |
| Arcutis Biotherapeutics, Inc.* (Biotechnology) | | | 140 | | | | 2,904 | |
| Ardelyx, Inc.* (Biotechnology) | | | 490 | | | | 539 | |
| Arena Pharmaceuticals, Inc.* (Biotechnology) | | | 313 | | | | 29,090 | |
| Ares Commercial Real Estate Corp. (Mortgage Real Estate Investment Trusts) | | | 222 | | | | 3,228 | |
| Argan, Inc. (Construction & Engineering) | | | 76 | | | | 2,940 | |
| Argo Group International Holdings, Ltd. (Insurance) | | | 161 | | | | 9,356 | |
| Aris Water Solution, Inc.*—Class A (Commercial Services & Supplies) | | | 99 | | | | 1,282 | |
| Arko Corp.* (Specialty Retail) | | | 612 | | | | 5,367 | |
| Arlo Technologies, Inc.* (Electronic Equipment, Instruments & Components) | | | 428 | | | | 4,490 | |
| Armada Hoffler Properties, Inc. (Equity Real Estate Investment Trusts) | | | 306 | | | | 4,657 | |
| ARMOUR Residential REIT, Inc. (Mortgage Real Estate Investment Trusts) | | | 452 | | | | 4,434 | |
| Array Technologies, Inc.* (Electrical Equipment) | | | 648 | | | | 10,167 | |
| Arrow Financial Corp. (Banks) | | | 70 | | | | 2,466 | |
| Arrowhead Pharmaceuticals, Inc.* (Biotechnology) | | | 514 | | | | 34,078 | |
| Arteris, Inc.* (Software) | | | 26 | | | | 549 | |
| Artesian Resources Corp.—Class A (Water Utilities) | | | 41 | | | | 1,900 | |
| Artisan Partners Asset Management, Inc. (Capital Markets) | | | 297 | | | | 14,149 | |
| Arvinas, Inc.* (Pharmaceuticals) | | | 239 | | | | 19,630 | |
| Asana, Inc.*—Class A (Software) | | | 361 | | | | 26,913 | |
| Asbury Automotive Group, Inc.* (Specialty Retail) | | | 117 | | | | 20,209 | |
| Asensus Surgical, Inc.* (Health Care Equipment & Supplies) | | | 1,186 | | | | 1,316 | |
| ASGN, Inc.* (Professional Services) | | | 258 | | | | 31,837 | |
| Ashford Hospitality Trust, Inc.* (Equity Real Estate Investment Trusts) | | | 86 | | | | 826 | |
| Aspen Aerogels, Inc.* (Energy Equipment & Services) | | | 112 | | | | 5,576 | |
| Aspira Women's Health, Inc.* (Health Care Equipment & Supplies) | | | 369 | | | | 653 | |
| Assetmark Financial Holdings, Inc.* (Capital Markets) | | | 92 | | | | 2,411 | |
| Associated Banc-Corp. (Banks) | | | 754 | | | | 17,033 | |
| Associated Capital Group, Inc.—Class A (Capital Markets) | | | 9 | | | | 387 | |
| Astec Industries, Inc. (Machinery) | | | 115 | | | | 7,966 | |
| Astronics Corp.* (Aerospace & Defense) | | | 126 | | | | 1,512 | |
| Atara Biotherapeutics, Inc.* (Biotechnology) | | | 441 | | | | 6,950 | |
| Atea Pharmaceuticals, Inc.* (Biotechnology) | | | 327 | | | | 2,923 | |
| Aterian, Inc.* (Household Durables) | | | 132 | | | | 543 | |
| Athenex, Inc.* (Biotechnology) | | | 438 | | | | 596 | |
| Athersys, Inc.* (Biotechnology) | | | 1,038 | | | | 937 | |
| Athira Pharma, Inc.* (Pharmaceuticals) | | | 164 | | | | 2,137 | |
| Atkore, Inc.* (Electrical Equipment) | | | 234 | | | | 26,017 | |
| Atlantic Capital Bancshares, Inc.* (Banks) | | | 100 | | | | 2,877 | |
| Atlantic Union Bankshares (Banks) | | | 383 | | | | 14,282 | |
| Atlanticus Holdings Corp.* (Consumer Finance) | | | 25 | | | | 1,783 | |
| Atlas Air Worldwide Holdings, Inc.* (Air Freight & Logistics) | | | 146 | | | | 13,742 | |
| Atlas Technical Consultants, Inc.* (Professional Services) | | | 73 | | | | 615 | |
| ATN International, Inc. (Diversified Telecommunication Services) | | | 56 | | | | 2,237 | |
| Atomera, Inc.* (Semiconductors & Semiconductor Equipment) | | | 103 | | | | 2,072 | |
| Atossa Therapeutics, Inc.* (Health Care Equipment & Supplies) | | | 593 | | | | 949 | |
| Atreca, Inc.*—Class A (Biotechnology) | | | 132 | | | | 400 | |
| AtriCure, Inc.* (Health Care Equipment & Supplies) | | | 227 | | | | 15,783 | |
| Atrion Corp. (Health Care Equipment & Supplies) | | | 7 | | | | 4,934 | |
| Aura Biosciences, Inc.* (Biotechnology) | | | 28 | | | | 475 | |
| Avalo Therapeutics, Inc.* (Pharmaceuticals) | | | 316 | | | | 537 | |
| Avanos Medical, Inc.* (Health Care Equipment & Supplies) | | | 244 | | | | 8,459 | |
| Avaya Holdings Corp.*—Class C (Software) | | | 418 | | | | 8,276 | |
| Aveanna Healthcare Holdings, Inc.* (Health Care Providers & Services) | | | 200 | | | | 1,480 | |
| Aviat Networks, Inc.* (Communications Equipment) | | | 55 | | | | 1,764 | |
| Avid Bioservices, Inc.* (Biotechnology) | | | 306 | | | | 8,929 | |
| Avid Technology, Inc.* (Technology Hardware, Storage & Peripherals) | | | 183 | | | | 5,960 | |
| Avidity Biosciences, Inc.* (Biotechnology) | | | 191 | | | | 4,540 | |
| AvidXchange Holdings, Inc.* (Software) | | | 128 | | | | 1,928 | |
| Avient Corp. (Chemicals) | | | 462 | | | | 25,849 | |
| Avis Budget Group, Inc.* (Road & Rail) | | | 210 | | | | 43,548 | |
| Avista Corp. (Multi-Utilities) | | | 359 | | | | 15,254 | |
| Avita Medical, Inc.* (Biotechnology) | | | 123 | | | | 1,474 | |
| Avrobio, Inc.* (Biotechnology) | | | 192 | | | | 739 | |
| Axcelis Technologies, Inc.* (Semiconductors & Semiconductor Equipment) | | | 169 | | | | 12,601 | |
| AxoGen, Inc.* (Health Care Equipment & Supplies) | | | 196 | | | | 1,837 | |
| Axonics, Inc.* (Health Care Equipment & Supplies) | | | 232 | | | | 12,992 | |
| Axos Financial, Inc.*—Class I (Thrifts & Mortgage Finance) | | | 289 | | | | 16,158 | |
| Axsome Therapeutics, Inc.* (Pharmaceuticals) | | | 141 | | | | 5,327 | |
| AXT, Inc.* (Semiconductors & Semiconductor Equipment) | | | 205 | | | | 1,806 | |
| AZZ, Inc. (Electrical Equipment) | | | 126 | | | | 6,967 | |
| B Riley Financial, Inc. (Capital Markets) | | | 103 | | | | 9,153 | |
| B&G Foods, Inc.(a)—Class A (Food Products) | | | 325 | | | | 9,987 | |
| Babcock & Wilcox Enterprises, Inc.* (Electrical Equipment) | | | 281 | | | | 2,535 | |
| Badger Meter, Inc. (Electronic Equipment, Instruments & Components) | | | 148 | | | | 15,771 | |
| Balchem Corp. (Chemicals) | | | 163 | | | | 27,482 | |
| Bally's Corp.* (Hotels, Restaurants & Leisure) | | | 166 | | | | 6,318 | |
| Banc of California, Inc. (Banks) | | | 278 | | | | 5,454 | |
| BancFirst Corp. (Banks) | | | 87 | | | | 6,139 | |
See accompanying notes to financial statements.
Financial Statements :: ProFund VP UltraSmall-Cap :: 349
Common Stocks, continued
| | | Shares | | | Value | |
| Banco Latinoamericano de Comercio Exterior S.A.—Class E (Diversified Financial Services) | | | 157 | | | $ | 2,606 | |
| Bandwidth, Inc.* (Diversified Telecommunication Services) | | | 117 | | | | 8,396 | |
| Bank First Corp. (Banks) | | | 33 | | | | 2,384 | |
| Bank of Marin Bancorp (Banks) | | | 78 | | | | 2,904 | |
| BankUnited, Inc. (Banks) | | | 451 | | | | 19,082 | |
| Banner Corp. (Banks) | | | 173 | | | | 10,496 | |
| Bar Harbor Bankshares (Banks) | | | 75 | | | | 2,170 | |
| Barnes & Noble Education, Inc.* (Specialty Retail) | | | 229 | | | | 1,559 | |
| Barnes Group, Inc. (Machinery) | | | 240 | | | | 11,182 | |
| Barrett Business Services, Inc. (Professional Services) | | | 38 | | | | 2,624 | |
| Bassett Furniture Industries, Inc. (Household Durables) | | | 47 | | | | 788 | |
| Beacon Roofing Supply, Inc.* (Trading Companies & Distributors) | | | 283 | | | | 16,230 | |
| Beam Global* (Electrical Equipment) | | | 45 | | | | 837 | |
| Beam Therapeutics, Inc.* (Biotechnology) | | | 260 | | | | 20,719 | |
| Beauty Health Co. (The)* (Personal Products) | | | 437 | | | | 10,558 | |
| Beazer Homes USA, Inc.* (Household Durables) | | | 148 | | | | 3,437 | |
| Bed Bath & Beyond, Inc.* (Specialty Retail) | | | 515 | | | | 7,509 | |
| Belden, Inc. (Electronic Equipment, Instruments & Components) | | | 224 | | | | 14,724 | |
| BellRing Brands, Inc.*—Class A (Personal Products) | | | 202 | | | | 5,763 | |
| Benchmark Electronics, Inc. (Electronic Equipment, Instruments & Components) | | | 178 | | | | 4,824 | |
| Benefitfocus, Inc.* (Software) | | | 127 | | | | 1,354 | |
| Berkeley Lights, Inc.* (Life Sciences Tools & Services) | | | 246 | | | | 4,472 | |
| Berkshire Hills Bancorp, Inc. (Banks) | | | 248 | | | | 7,051 | |
| Berry Corp. (Oil, Gas & Consumable Fuels) | | | 342 | | | | 2,880 | |
| Beyondspring, Inc.* (Biotechnology) | | | 114 | | | | 516 | |
| BGC Partners, Inc.—Class A (Capital Markets) | | | 1,604 | | | | 7,459 | |
| Big 5 Sporting Goods Corp. (Specialty Retail) | | | 106 | | | | 2,015 | |
| Big Lots, Inc. (Multiline Retail) | | | 163 | | | | 7,343 | |
| BigCommerce Holdings, Inc.*—Class 1 (IT Services) | | | 245 | | | | 8,666 | |
| Biglari Holdings, Inc.*—Class B (Hotels, Restaurants & Leisure) | | | 4 | | | | 570 | |
| BioAtla, Inc.* (Biotechnology) | | | 79 | | | | 1,551 | |
| BioCryst Pharmaceuticals, Inc.* (Biotechnology) | | | 913 | | | | 12,645 | |
| BioDelivery Sciences International, Inc.* (Pharmaceuticals) | | | 472 | | | | 1,463 | |
| Biodesix, Inc.* (Health Care Providers & Services) | | | 62 | | | | 328 | |
| Biohaven Pharmaceutical Holding Co., Ltd.* (Biotechnology) | | | 282 | | | | 38,862 | |
| BioLife Solutions, Inc.* (Health Care Equipment & Supplies) | | | 53 | | | | 1,975 | |
| Biomea Fusion, Inc.* (Biotechnology) | | | 110 | | | | 820 | |
| Bionano Genomics, Inc.* (Life Sciences Tools & Services) | | | 1,479 | | | | 4,422 | |
| Bioventus, Inc.*—Class A (Health Care Equipment & Supplies) | | | 142 | | | | 2,058 | |
| Bioxcel Therapeutics, Inc.* (Biotechnology) | | | 87 | | | | 1,769 | |
| BJ's Restaurants, Inc.* (Hotels, Restaurants & Leisure) | | | 114 | | | | 3,939 | |
| BJ's Wholesale Club Holdings, Inc.* (Food & Staples Retailing) | | | 695 | | | | 46,543 | |
| Black Diamond Therapeutics, Inc.* (Biotechnology) | | | 115 | | | | 613 | |
| Black Hills Corp. (Multi-Utilities) | | | 325 | | | | 22,935 | |
| Blackbaud, Inc.* (Software) | | | 243 | | | | 19,192 | |
| Blackline, Inc.* (Software) | | | 275 | | | | 28,474 | |
| Blackstone Mortgage Trust, Inc.—Class A (Mortgage Real Estate Investment Trusts) | | | 798 | | | | 24,434 | |
| Blink Charging Co.*(a) (Specialty Retail) | | | 185 | | | | 4,904 | |
| Bloom Energy Corp.* (Electrical Equipment) | | | 721 | | | | 15,812 | |
| Bloomin' Brands, Inc.* (Hotels, Restaurants & Leisure) | | | 449 | | | | 9,420 | |
| Blucora, Inc.* (Capital Markets) | | | 246 | | | | 4,261 | |
| Blue Bird Corp.* (Machinery) | | | 80 | | | | 1,251 | |
| Blue Foundry Bancorp* (Thrifts & Mortgage Finance) | | | 142 | | | | 2,077 | |
| Blue Ridge Bankshares, Inc. (Banks) | | | 88 | | | | 1,575 | |
| Bluebird Bio, Inc.* (Biotechnology) | | | 342 | | | | 3,417 | |
| Bluegreen Vacations Holding Corp.* (Hotels, Restaurants & Leisure) | | | 73 | | | | 2,562 | |
| BlueLinx Holdings, Inc.* (Trading Companies & Distributors) | | | 47 | | | | 4,501 | |
| Blueprint Medicines Corp.* (Biotechnology) | | | 297 | | | | 31,812 | |
| BM Technologies, Inc.* (IT Services) | | | 23 | | | | 212 | |
| Boise Cascade Co. (Trading Companies & Distributors) | | | 200 | | | | 14,240 | |
| Bolt Biotherapeutics, Inc.* (Biotechnology) | | | 116 | | | | 568 | |
| Boot Barn Holdings, Inc.* (Specialty Retail) | | | 148 | | | | 18,211 | |
| Boston Omaha Corp.*—Class A (Media) | | | 103 | | | | 2,959 | |
| Bottomline Technologies, Inc.* (Software) | | | 228 | | | | 12,875 | |
| Box, Inc.*—Class A (Software) | | | 708 | | | | 18,543 | |
| Brady Corp.—Class A (Commercial Services & Supplies) | | | 239 | | | | 12,882 | |
| Braemar Hotels & Resorts, Inc.* (Equity Real Estate Investment Trusts) | | | 290 | | | | 1,479 | |
| Brandywine Realty Trust (Equity Real Estate Investment Trusts) | | | 860 | | | | 11,541 | |
| Bridgebio Pharma, Inc.* (Biotechnology) | | | 538 | | | | 8,974 | |
| Bridgewater Bancshares, Inc.* (Thrifts & Mortgage Finance) | | | 107 | | | | 1,893 | |
| Brigham Minerals, Inc. (Oil, Gas & Consumable Fuels) | | | 221 | | | | 4,661 | |
| Bright Health Group, Inc.* (Insurance) | | | 269 | | | | 925 | |
| Brightcove, Inc.* (IT Services) | | | 206 | | | | 2,105 | |
| Brightsphere Investment Group, Inc. (Capital Markets) | | | 294 | | | | 7,526 | |
| BrightSpire Capital, Inc. (Mortgage Real Estate Investment Trusts) | | | 428 | | | | 4,391 | |
| BrightView Holdings, Inc.* (Commercial Services & Supplies) | | | 208 | | | | 2,929 | |
| Brinker International, Inc.* (Hotels, Restaurants & Leisure) | | | 230 | | | | 8,416 | |
| Bristow Group, Inc.* (Energy Equipment & Services) | | | 120 | | | | 3,800 | |
| Broadmark Realty Capital, Inc. (Mortgage Real Estate Investment Trusts) | | | 651 | | | | 6,139 | |
| Broadstone Net Lease, Inc. (Equity Real Estate Investment Trusts) | | | 798 | | | | 19,806 | |
| Brookdale Senior Living, Inc.* (Health Care Providers & Services) | | | 938 | | | | 4,840 | |
See accompanying notes to financial statements.
350 :: ProFund VP UltraSmall-Cap :: Financial Statements
Common Stocks, continued
| | | Shares | | | Value | |
| Brookfield Infrastructure Corp.—Class A (Gas Utilities) | | | 313 | | | $ | 21,365 | |
| Brookline Bancorp, Inc. (Banks) | | | 389 | | | | 6,298 | |
| Brooklyn ImmunoTherapeutics, Inc.* (Entertainment) | | | 150 | | | | 626 | |
| BRP Group, Inc.*—Class A (Insurance) | | | 240 | | | | 8,666 | |
| BRT Apartments Corp. (Equity Real Estate Investment Trusts) | | | 58 | | | | 1,391 | |
| BTRS Holdings, Inc.* (Software) | | | 334 | | | | 2,612 | |
| Business First Bancshares, Inc. (Banks) | | | 97 | | | | 2,746 | |
| Butterfly Network, Inc.* (Health Care Equipment & Supplies) | | | 633 | | | | 4,235 | |
| Byline Bancorp, Inc. (Banks) | | | 126 | | | | 3,446 | |
| Byrna Technologies, Inc.* (Aerospace & Defense) | | | 93 | | | | 1,242 | |
| C4 Therapeutics, Inc.* (Biotechnology) | | | 196 | | | | 6,311 | |
| Cabot Corp. (Chemicals) | | | 285 | | | | 16,017 | |
| Cactus, Inc.—Class A (Energy Equipment & Services) | | | 281 | | | | 10,715 | |
| Cadence Bank (Banks) | | | 953 | | | | 28,391 | |
| Cadiz, Inc.* (Water Utilities) | | | 109 | | | | 421 | |
| Cadre Holdings, Inc. (Aerospace & Defense) | | | 32 | | | | 813 | |
| Caesarstone, Ltd. (Building Products) | | | 115 | | | | 1,304 | |
| CalAmp Corp.* (Communications Equipment) | | | 180 | | | | 1,271 | |
| Calavo Growers, Inc. (Food Products) | | | 87 | | | | 3,689 | |
| Caleres, Inc. (Specialty Retail) | | | 187 | | | | 4,241 | |
| California Resources Corp. (Oil, Gas & Consumable Fuels) | | | 411 | | | | 17,554 | |
| California Water Service Group (Water Utilities) | | | 267 | | | | 19,187 | |
| Calix, Inc.* (Communications Equipment) | | | 280 | | | | 22,391 | |
| Callaway Golf Co.* (Leisure Products) | | | 587 | | | | 16,107 | |
| Callon Petroleum Co.* (Oil, Gas & Consumable Fuels) | | | 241 | | | | 11,387 | |
| Cal-Maine Foods, Inc. (Food Products) | | | 207 | | | | 7,657 | |
| Cambium Networks Corp.* (Communications Equipment) | | | 55 | | | | 1,410 | |
| Cambridge Bancorp (Banks) | | | 35 | | | | 3,276 | |
| Camden National Corp. (Banks) | | | 75 | | | | 3,612 | |
| Camping World Holdings, Inc.—Class A (Specialty Retail) | | | 212 | | | | 8,565 | |
| Cannae Holdings, Inc.* (Diversified Financial Services) | | | 430 | | | | 15,115 | |
| Canoo, Inc.* (Automobiles) | | | 539 | | | | 4,161 | |
| Cantaloupe, Inc.* (IT Services) | | �� | 295 | | | | 2,620 | |
| Capital Bancorp, Inc. (Banks) | | | 39 | | | | 1,022 | |
| Capital City Bank Group, Inc. (Banks) | | | 68 | | | | 1,795 | |
| Capitol Federal Financial, Inc. (Thrifts & Mortgage Finance) | | | 659 | | | | 7,466 | |
| Capstar Financial Holdings, Inc. (Banks) | | | 104 | | | | 2,187 | |
| Cara Therapeutics, Inc.* (Biotechnology) | | | 225 | | | | 2,741 | |
| Cardiff Oncology, Inc.* (Biotechnology) | | | 193 | | | | 1,160 | |
| Cardiovascular Systems, Inc.* (Health Care Equipment & Supplies) | | | 201 | | | | 3,775 | |
| Cardlytics, Inc.* (Media) | | | 164 | | | | 10,839 | |
| CareDx, Inc.* (Biotechnology) | | | 256 | | | | 11,643 | |
| CareTrust REIT, Inc. (Equity Real Estate Investment Trusts) | | | 489 | | | | 11,164 | |
| Cargurus, Inc.* (Interactive Media & Services) | | | 484 | | | | 16,282 | |
| Caribou Biosciences, Inc.* (Biotechnology) | | | 103 | | | | 1,554 | |
| CarLotz, Inc.* (Specialty Retail) | | | 363 | | | | 824 | |
| CarParts.com, Inc.* (Internet & Direct Marketing Retail) | | | 248 | | | | 2,778 | |
| Carpenter Technology Corp. (Metals & Mining) | | | 242 | | | | 7,064 | |
| Carriage Services, Inc. (Diversified Consumer Services) | | | 78 | | | | 5,026 | |
| Carrols Restaurant Group, Inc. (Hotels, Restaurants & Leisure) | | | 169 | | | | 500 | |
| Cars.com, Inc.* (Interactive Media & Services) | | | 347 | | | | 5,583 | |
| Carter Bankshares, Inc.* (Banks) | | | 131 | | | | 2,016 | |
| Casa Systems, Inc.* (Communications Equipment) | | | 161 | | | | 913 | |
| Casella Waste Systems, Inc.*—Class A (Commercial Services & Supplies) | | | 249 | | | | 21,270 | |
| Casper Sleep, Inc.* (Household Durables) | | | 147 | | | | 982 | |
| Cass Information Systems, Inc. (IT Services) | | | 70 | | | | 2,752 | |
| Cassava Sciences, Inc.*(a) (Pharmaceuticals) | | | 194 | | | | 8,478 | |
| Castle Biosciences, Inc.* (Biotechnology) | | | 108 | | | | 4,630 | |
| Castlight Health, Inc.*—Class B (Health Care Technology) | | | 625 | | | | 963 | |
| Catalyst Pharmaceuticals, Inc.* (Biotechnology) | | | 492 | | | | 3,331 | |
| CatchMark Timber Trust, Inc.—Class A (Equity Real Estate Investment Trusts) | | | 248 | | | | 2,160 | |
| Cathay General Bancorp (Banks) | | | 376 | | | | 16,164 | |
| Cavco Industries, Inc.* (Household Durables) | | | 47 | | | | 14,930 | |
| CBIZ, Inc.* (Professional Services) | | | 249 | | | | 9,741 | |
| CBTX, Inc. (Banks) | | | 93 | | | | 2,697 | |
| CECO Environmental Corp.* (Commercial Services & Supplies) | | | 158 | | | | 984 | |
| Celcuity, Inc.* (Biotechnology) | | | 49 | | | | 646 | |
| Celldex Therapeutics, Inc.* (Biotechnology) | | | 233 | | | | 9,003 | |
| CEL-SCI Corp.* (Biotechnology) | | | 182 | | | | 1,292 | |
| Celsius Holdings, Inc.* (Beverages) | | | 274 | | | | 20,432 | |
| Centennial Resource Development, Inc.*— Class A (Oil, Gas & Consumable Fuels) | | | 934 | | | | 5,585 | |
| Centerspace (Equity Real Estate Investment Trusts) | | | 72 | | | | 7,985 | |
| Central Garden & Pet Co.* (Household Products) | | | 50 | | | | 2,632 | |
| Central Garden & Pet Co.*—Class A (Household Products) | | | 205 | | | | 9,809 | |
| Central Pacific Financial Corp. (Banks) | | | 139 | | | | 3,916 | |
| Centrus Energy Corp.*—Class A (Oil, Gas & Consumable Fuels) | | | 49 | | | | 2,446 | |
| Century Aluminum Co.* (Metals & Mining) | | | 260 | | | | 4,306 | |
| Century Casinos, Inc.* (Hotels, Restaurants & Leisure) | | | 138 | | | | 1,681 | |
| Century Communities, Inc. (Household Durables) | | | 152 | | | | 12,432 | |
| Century Therapeutics, Inc.* (Biotechnology) | | | 60 | | | | 952 | |
| Cerence, Inc.* (Software) | | | 192 | | | | 14,715 | |
| Cerevel Therapeutics Holdings, Inc.* (Biotechnology) | | | 207 | | | | 6,711 | |
| Cerus Corp.* (Health Care Equipment & Supplies) | | | 853 | | | | 5,809 | |
| CEVA, Inc.* (Semiconductors & Semiconductor Equipment) | | | 114 | | | | 4,929 | |
| ChampionX Corp.* (Energy Equipment & Services) | | | 1,028 | | | | 20,777 | |
| ChannelAdvisor Corp.* (Software) | | | 150 | | | | 3,702 | |
| Chart Industries, Inc.* (Machinery) | | | 185 | | | | 29,505 | |
| Chase Corp. (Chemicals) | | | 38 | | | | 3,783 | |
| Chatham Lodging Trust* (Equity Real Estate Investment Trusts) | | | 242 | | | | 3,320 | |
| Chefs' Warehouse, Inc.* (Food & Staples Retailing) | | | 159 | | | | 5,295 | |
| ChemoCentryx, Inc.* (Biotechnology) | | | 274 | | | | 9,976 | |
See accompanying notes to financial statements.
Financial Statements :: ProFund VP UltraSmall-Cap :: 351
Common Stocks, continued
| | | Shares | | | Value | |
| Chesapeake Energy Corp. (Oil, Gas & Consumable Fuels) | | | 532 | | | $ | 34,325 | |
| Chesapeake Utilities Corp. (Gas Utilities) | | | 87 | | | | 12,685 | |
| Chicken Soup For The Soul Entertainment, Inc.* (Entertainment) | | | 37 | | | | 512 | |
| Chico's FAS, Inc.* (Specialty Retail) | | | 610 | | | | 3,282 | |
| Chimera Investment Corp. (Mortgage Real Estate Investment Trusts) | | | 1,195 | | | | 18,020 | |
| Chimerix, Inc.* (Biotechnology) | | | 370 | | | | 2,379 | |
| Chinook Therapeutics, Inc.* (Biotechnology) | | | 198 | | | | 3,229 | |
| ChromaDex Corp.* (Life Sciences Tools & Services) | | | 238 | | | | 890 | |
| Chuy's Holdings, Inc.* (Hotels, Restaurants & Leisure) | | | 101 | | | | 3,042 | |
| Cimpress PLC* (Commercial Services & Supplies) | | | 89 | | | | 6,373 | |
| Cinemark Holdings, Inc.* (Entertainment) | | | 548 | | | | 8,834 | |
| CIRCOR International, Inc.* (Machinery) | | | 93 | | | | 2,528 | |
| CIT Group, Inc. (Banks) | | | 503 | | | | 25,824 | |
| Citi Trends, Inc.* (Specialty Retail) | | | 44 | | | | 4,169 | |
| Citius Pharmaceuticals, Inc.* (Pharmaceuticals) | | | 576 | | | | 887 | |
| Citizens & Northern Corp. (Banks) | | | 77 | | | | 2,011 | |
| Citizens, Inc.* (Insurance) | | | 253 | | | | 1,343 | |
| City Holding Co. (Banks) | | | 76 | | | | 6,216 | |
| City Office REIT, Inc. (Equity Real Estate Investment Trusts) | | | 217 | | | | 4,279 | |
| Civista Bancshares, Inc. (Banks) | | | 75 | | | | 1,830 | |
| Civitas Resources, Inc. (Oil, Gas & Consumable Fuels) | | | 220 | | | | 10,773 | |
| Clarus Corp. (Leisure Products) | | | 134 | | | | 3,714 | |
| Clean Energy Fuels Corp.* (Oil, Gas & Consumable Fuels) | | | 787 | | | | 4,824 | |
| Cleanspark, Inc.* (Software) | | | 174 | | | | 1,656 | |
| Clear Channel Outdoor Holdings, Inc.* (Media) | | | 1,841 | | | | 6,094 | |
| Clearfield, Inc.* (Communications Equipment) | | | 58 | | | | 4,896 | |
| ClearPoint Neuro, Inc.* (Health Care Equipment & Supplies) | | | 97 | | | | 1,088 | |
| Clearwater Paper Corp.* (Paper & Forest Products) | | | 84 | | | | 3,080 | |
| Clearway Energy, Inc.—Class A (Independent Power and Renewable Electricity Producers) | | | 177 | | | | 5,926 | |
| Clearway Energy, Inc.—Class C (Independent Power and Renewable Electricity Producers) | | | 416 | | | | 14,988 | |
| Clene, Inc.* (Biotechnology) | | | 104 | | | | 426 | |
| Clipper Realty, Inc. (Equity Real Estate Investment Trusts) | | | 62 | | | | 616 | |
| Clovis Oncology, Inc.* (Biotechnology) | | | 573 | | | | 1,553 | |
| CMC Materials, Inc. (Semiconductors & Semiconductor Equipment) | | | 144 | | | | 27,603 | |
| CNB Financial Corp. (Banks) | | | 82 | | | | 2,173 | |
| CNO Financial Group, Inc. (Insurance) | | | 624 | | | | 14,876 | |
| CNX Resources Corp.* (Oil, Gas & Consumable Fuels) | | | 1,064 | | | | 14,630 | |
| Coastal Financial Corp.* (Banks) | | | 48 | | | | 2,430 | |
| Coca-Cola Consolidated, Inc. (Beverages) | | | 24 | | | | 14,861 | |
| Codex DNA, Inc.* (Life Sciences Tools & Services) | | | 39 | | | | 421 | |
| Codexis, Inc.* (Life Sciences Tools & Services) | | | 305 | | | | 9,537 | |
| Codiak Biosciences, Inc.* (Biotechnology) | | | 81 | | | | 902 | |
| Coeur Mining, Inc.* (Metals & Mining) | | | 1,297 | | | | 6,537 | |
| Cogent Biosciences, Inc.* (Biotechnology) | | | 188 | | | | 1,613 | |
| Cogent Communications Holdings, Inc. (Diversified Telecommunication Services) | | | 216 | | | | 15,807 | |
| Cohen & Steers, Inc. (Capital Markets) | | | 126 | | | | 11,656 | |
| Coherus Biosciences, Inc.* (Biotechnology) | | | 330 | | | | 5,267 | |
| Cohu, Inc.* (Semiconductors & Semiconductor Equipment) | | | 243 | | | | 9,256 | |
| Collegium Pharmaceutical, Inc.* (Pharmaceuticals) | | | 175 | | | | 3,269 | |
| Columbia Banking System, Inc. (Banks) | | | 397 | | | | 12,990 | |
| Columbia Financial, Inc.* (Thrifts & Mortgage Finance) | | | 199 | | | | 4,151 | |
| Columbus McKinnon Corp. (Machinery) | | | 141 | | | | 6,523 | |
| Comfort Systems USA, Inc. (Construction & Engineering) | | | 181 | | | | 17,908 | |
| Commercial Metals Co. (Metals & Mining) | | | 609 | | | | 22,100 | |
| Commercial Vehicle Group, Inc.* (Machinery) | | | 163 | | | | 1,314 | |
| Community Bank System, Inc. (Banks) | | | 272 | | | | 20,259 | |
| Community Health Systems, Inc.* (Health Care Providers & Services) | | | 630 | | | | 8,385 | |
| Community Healthcare Trust, Inc. (Equity Real Estate Investment Trusts) | | | 121 | | | | 5,720 | |
| Community Trust Bancorp, Inc. (Banks) | | | 79 | | | | 3,445 | |
| CommVault Systems, Inc.* (Software) | | | 232 | | | | 15,989 | |
| Compass Minerals International, Inc. (Metals & Mining) | | | 173 | | | | 8,837 | |
| Computer Programs & Systems, Inc.* (Health Care Technology) | | | 71 | | | | 2,080 | |
| CompX International, Inc. (Commercial Services & Supplies) | | | 8 | | | | 180 | |
| comScore, Inc.* (Media) | | | 355 | | | | 1,186 | |
| Comstock Resources, Inc.* (Oil, Gas & Consumable Fuels) | | | 465 | | | | 3,762 | |
| Comtech Telecommunications Corp. (Communications Equipment) | | | 131 | | | | 3,103 | |
| Concrete Pumping Holdings, Inc.* (Construction & Engineering) | | | 131 | | | | 1,074 | |
| Conduent, Inc.* (IT Services) | | | 849 | | | | 4,534 | |
| CONMED Corp. (Health Care Equipment & Supplies) | | | 147 | | | | 20,839 | |
| ConnectOne Bancorp, Inc. (Banks) | | | 189 | | | | 6,182 | |
| Conn's, Inc.* (Specialty Retail) | | | 91 | | | | 2,140 | |
| Consensus Cloud Solutions, Inc.* (Software) | | | 82 | | | | 4,745 | |
| CONSOL Energy, Inc.* (Oil, Gas & Consumable Fuels) | | | 174 | | | | 3,952 | |
| Consolidated Communications Holdings, Inc.* (Diversified Telecommunication Services) | | | 370 | | | | 2,768 | |
| Constellium SE* (Metals & Mining) | | | 630 | | | | 11,283 | |
| Construction Partners, Inc.*—Class A (Construction & Engineering) | | | 148 | | | | 4,353 | |
| Convey Health Solutions Holdings, Inc.* (Health Care Technology) | | | 68 | | | | 568 | |
| Cooper-Standard Holding, Inc.* (Auto Components) | | | 85 | | | | 1,905 | |
| Corcept Therapeutics, Inc.* (Pharmaceuticals) | | | 485 | | | | 9,603 | |
| CoreCard Corp.* (Software) | | | 37 | | | | 1,436 | |
| CoreCivic, Inc.* (Equity Real Estate Investment Trusts) | | | 608 | | | | 6,062 | |
| CorePoint Lodging, Inc.* (Equity Real Estate Investment Trusts) | | | 199 | | | | 3,124 | |
| CorMedix, Inc.* (Pharmaceuticals) | | | 192 | | | | 874 | |
See accompanying notes to financial statements.
352 :: ProFund VP UltraSmall-Cap :: Financial Statements
Common Stocks, continued
| | | Shares | | | Value | |
| Cornerstone Building Brands, Inc.* (Building Products) | | | 278 | | | $ | 4,848 | |
| Corporate Office Properties Trust (Equity Real Estate Investment Trusts) | | | 573 | | | | 16,027 | |
| Corsair Gaming, Inc.*(a) (Technology Hardware, Storage & Peripherals) | | | 139 | | | | 2,920 | |
| Cortexyme, Inc.* (Biotechnology) | | | 101 | | | | 1,275 | |
| CorVel Corp.* (Health Care Providers & Services) | | | 45 | | | | 9,360 | |
| Costamare, Inc. (Marine) | | | 268 | | | | 3,390 | |
| Couchbase, Inc.* (Software) | | | 50 | | | | 1,248 | |
| Coursera, Inc.* (Diversified Consumer Services) | | | 370 | | | | 9,043 | |
| Covenant Logistics Group, Inc.*—Class A (Road & Rail) | | | 61 | | | | 1,612 | |
| Covetrus, Inc.* (Health Care Providers & Services) | | | 525 | | | | 10,484 | |
| Cowen, Inc.—Class A (Capital Markets) | | | 134 | | | | 4,837 | |
| CRA International, Inc. (Professional Services) | | | 37 | | | | 3,454 | |
| Cracker Barrel Old Country Store, Inc. (Hotels, Restaurants & Leisure) | | | 120 | | | | 15,437 | |
| Crawford & Co.—Class A (Insurance) | | | 83 | | | | 622 | |
| Crescent Energy, Inc.*—Class A (Oil, Gas & Consumable Fuels) | | | 149 | | | | 1,889 | |
| Crinetics Pharmaceuticals, Inc.* (Biotechnology) | | | 234 | | | | 6,648 | |
| Crocs, Inc.* (Textiles, Apparel & Luxury Goods) | | | 295 | | | | 37,826 | |
| Cross Country Healthcare, Inc.* (Health Care Providers & Services) | | | 182 | | | | 5,052 | |
| CrossFirst Bankshares, Inc.* (Banks) | | | 236 | | | | 3,684 | |
| CryoLife, Inc.* (Health Care Equipment & Supplies) | | | 193 | | | | 3,928 | |
| CryoPort, Inc.* (Health Care Equipment & Supplies) | | | 206 | | | | 12,189 | |
| CS Disco, Inc.* (Software) | | | 39 | | | | 1,394 | |
| CSG Systems International, Inc. (IT Services) | | | 165 | | | | 9,507 | |
| CSW Industrials, Inc. (Building Products) | | | 75 | | | | 9,065 | |
| CTO Realty Growth, Inc. (Equity Real Estate Investment Trusts) | | | 30 | | | | 1,843 | |
| CTS Corp. (Electronic Equipment, Instruments & Components) | | | 162 | | | | 5,949 | |
| Cue BioPharma, Inc.* (Biotechnology) | | | 156 | | | | 1,764 | |
| Cue Health, Inc.* (Health Care Equipment & Supplies) | | | 74 | | | | 992 | |
| Cullinan Oncology, Inc.* (Biotechnology) | | | 131 | | | | 2,021 | |
| CuriosityStream, Inc.* (Entertainment) | | | 132 | | | | 783 | |
| Curis, Inc.* (Biotechnology) | | | 439 | | | | 2,090 | |
| Curo Group Holdings Corp. (Consumer Finance) | | | 104 | | | | 1,665 | |
| Cushman & Wakefield PLC* (Real Estate Management & Development) | | | 703 | | | | 15,635 | |
| Custom Truck One Source, Inc.* (Trading Companies & Distributors) | | | 234 | | | | 1,872 | |
| Customers Bancorp, Inc. (Banks) | | | 152 | | | | 9,936 | |
| Cutera, Inc.* (Health Care Equipment & Supplies) | | | 89 | | | | 3,677 | |
| CVB Financial Corp. (Banks) | | | 655 | | | | 14,024 | |
| CVR Energy, Inc. (Oil, Gas & Consumable Fuels) | | | 150 | | | | 2,522 | |
| CVRx, Inc.* (Health Care Equipment & Supplies) | | | 41 | | | | 501 | |
| Cymabay Therapeutics, Inc.* (Pharmaceuticals) | | | 351 | | | | 1,186 | |
| Cyteir Therapeutics, Inc.* (Pharmaceuticals) | | | 42 | | | | 478 | |
| Cytek Biosciences, Inc.* (Life Sciences Tools & Services) | | | 81 | | | | 1,322 | |
| Cytokinetics, Inc.* (Biotechnology) | | | 402 | | | | 18,323 | |
| CytomX Therapeutics, Inc.* (Biotechnology) | | | 329 | | | | 1,425 | |
| CytoSorbents Corp.* (Health Care Equipment & Supplies) | | | 209 | | | | 876 | |
| Daily Journal Corp.* (Media) | | | 6 | | | | 2,140 | |
| Daktronics, Inc.* (Electronic Equipment, Instruments & Components) | | | 186 | | | | 939 | |
| Dana, Inc. (Auto Components) | | | 737 | | | | 16,818 | |
| Danimer Scientific, Inc.* (Chemicals) | | | 459 | | | | 3,911 | |
| DarioHealth Corp.* (Health Care Equipment & Supplies) | | | 68 | | | | 882 | |
| Daseke, Inc.* (Road & Rail) | | | 204 | | | | 2,048 | |
| Dave & Buster's Entertainment, Inc.* (Hotels, Restaurants & Leisure) | | | 219 | | | | 8,410 | |
| Day One Biopharmaceuticals, Inc.* (Biotechnology) | | | 56 | | | | 944 | |
| Deciphera Pharmaceuticals, Inc.* (Biotechnology) | | | 200 | | | | 1,954 | |
| Del Taco Restaurants, Inc. (Hotels, Restaurants & Leisure) | | | 151 | | | | 1,880 | |
| Delek US Holdings, Inc.* (Oil, Gas & Consumable Fuels) | | | 333 | | | | 4,992 | |
| Deluxe Corp. (Commercial Services & Supplies) | | | 214 | | | | 6,872 | |
| Denali Therapeutics, Inc.* (Biotechnology) | | | 461 | | | | 20,561 | |
| Denbury, Inc.* (Oil, Gas & Consumable Fuels) | | | 256 | | | | 19,607 | |
| Denny's Corp.* (Hotels, Restaurants & Leisure) | | | 314 | | | | 5,024 | |
| DermTech, Inc.* (Biotechnology) | | | 123 | | | | 1,943 | |
| Design Therapeutics, Inc.* (Biotechnology) | | | 135 | | | | 2,890 | |
| Designer Brands, Inc.* (Specialty Retail) | | | 305 | | | | 4,334 | |
| Desktop Metal, Inc.*—Class A (Machinery) | | | 949 | | | | 4,698 | |
| DHT Holdings, Inc. (Oil, Gas & Consumable Fuels) | | | 719 | | | | 3,732 | |
| Diamond Hill Investment Group, Inc. (Capital Markets) | | | 15 | | | | 2,913 | |
| DiamondRock Hospitality Co.* (Equity Real Estate Investment Trusts) | | | 1,059 | | | | 10,177 | |
| DICE Therapeutics, Inc.* (Pharmaceuticals) | | | 71 | | | | 1,797 | |
| Diebold Nixdorf, Inc.* (Technology Hardware, Storage & Peripherals) | | | 365 | | | | 3,303 | |
| Digi International, Inc.* (Communications Equipment) | | | 171 | | | | 4,201 | |
| Digimarc Corp.* (Software) | | | 65 | | | | 2,566 | |
| Digital Media Solutions, Inc.*—Class A (Media) | | | 16 | | | | 76 | |
| Digital Turbine, Inc.* (Software) | | | 460 | | | | 28,055 | |
| DigitalBridge Group, Inc.* (Equity Real Estate Investment Trusts) | | | 2,460 | | | | 20,492 | |
| DigitalOcean Holdings, Inc.* (IT Services) | | | 257 | | | | 20,645 | |
| Dillard's, Inc.—Class A (Multiline Retail) | | | 30 | | | | 7,351 | |
| Dime Community Bancshares, Inc. (Banks) | | | 175 | | | | 6,153 | |
| Dine Brands Global, Inc. (Hotels, Restaurants & Leisure) | | | 83 | | | | 6,292 | |
| Diodes, Inc.* (Semiconductors & Semiconductor Equipment) | | | 221 | | | | 24,268 | |
| Diversified Healthcare Trust (Equity Real Estate Investment Trusts) | | | 1,203 | | | | 3,717 | |
| DMC Global, Inc.* (Energy Equipment & Services) | | | 94 | | | | 3,723 | |
| Domo, Inc.* (Software) | | | 142 | | | | 7,043 | |
| Donegal Group, Inc.—Class A (Insurance) | | | 75 | | | | 1,072 | |
| Donnelley Financial Solutions, Inc.* (Capital Markets) | | | 149 | | | | 7,024 | |
| Dorian LPG, Ltd. (Oil, Gas & Consumable Fuels) | | | 158 | | | | 2,005 | |
| Dorman Products, Inc.* (Auto Components) | | | 134 | | | | 15,143 | |
| Douglas Dynamics, Inc. (Machinery) | | | 115 | | | | 4,492 | |
See accompanying notes to financial statements.
Financial Statements :: ProFund VP UltraSmall-Cap :: 353
Common Stocks, continued
| | | Shares | | | Value | |
| Douglas Elliman, Inc.* (Real Estate Management & Development) | | | 364 | | | $ | 4,186 | |
| Dril-Quip, Inc.* (Energy Equipment & Services) | | | 178 | | | | 3,503 | |
| Drive Shack, Inc.* (Hotels, Restaurants & Leisure) | | | 419 | | | | 599 | |
| Duckhorn Portfolio, Inc. (The)* (Beverages) | | | 182 | | | | 4,248 | |
| Ducommun, Inc.* (Aerospace & Defense) | | | 55 | | | | 2,572 | |
| Duluth Holdings, Inc.*—Class B (Internet & Direct Marketing Retail) | | | 62 | | | | 941 | |
| Durect Corp.* (Pharmaceuticals) | | | 1,147 | | | | 1,131 | |
| DXP Enterprises, Inc.* (Trading Companies & Distributors) | | | 88 | | | | 2,259 | |
| Dycom Industries, Inc.* (Construction & Engineering) | | | 149 | | | | 13,970 | |
| Dynavax Technologies Corp.* (Biotechnology) | | | 546 | | | | 7,682 | |
| Dyne Therapeutics, Inc.* (Biotechnology) | | | 152 | | | | 1,807 | |
| Dynex Capital, Inc. (Mortgage Real Estate Investment Trusts) | | | 183 | | | | 3,058 | |
| DZS, Inc.* (Communications Equipment) | | | 86 | | | | 1,395 | |
| E2open Parent Holdings, Inc.* (Software) | | | 1,008 | | | | 11,350 | |
| Eagle Bancorp, Inc. (Banks) | | | 160 | | | | 9,334 | |
| Eagle Bulk Shipping, Inc. (Marine) | | | 46 | | | | 2,093 | |
| Eagle Pharmaceuticals, Inc.* (Biotechnology) | | | 58 | | | | 2,953 | |
| Eargo, Inc.* (Health Care Equipment & Supplies) | | | 153 | | | | 780 | |
| Earthstone Energy, Inc.*—Class A (Oil, Gas & Consumable Fuels) | | | 129 | | | | 1,411 | |
| Easterly Government Properties, Inc. (Equity Real Estate Investment Trusts) | | | 439 | | | | 10,062 | |
| Eastern Bankshares, Inc. (Banks) | | | 871 | | | | 17,568 | |
| EastGroup Properties, Inc. (Equity Real Estate Investment Trusts) | | | 205 | | | | 46,708 | |
| Eastman Kodak Co.* (Technology Hardware, Storage & Peripherals) | | | 227 | | | | 1,062 | |
| Ebix, Inc. (Software) | | | 135 | | | | 4,104 | |
| EchoStar Corp.*—Class A (Communications Equipment) | | | 189 | | | | 4,980 | |
| Ecovyst, Inc. (Chemicals) | | | 260 | | | | 2,662 | |
| Edgewell Personal Care Co. (Personal Products) | | | 275 | | | | 12,570 | |
| Edgewise Therapeutics, Inc.* (Pharmaceuticals) | | | 196 | | | | 2,995 | |
| Editas Medicine, Inc.* (Biotechnology) | | | 347 | | | | 9,213 | |
| eGain Corp.* (Software) | | | 105 | | | | 1,048 | |
| eHealth, Inc.* (Insurance) | | | 125 | | | | 3,188 | |
| Eiger Biopharmaceuticals, Inc.* (Biotechnology) | | | 162 | | | | 841 | |
| El Pollo Loco Holdings, Inc.* (Hotels, Restaurants & Leisure) | | | 97 | | | | 1,376 | |
| elf Beauty, Inc.* (Personal Products) | | | 244 | | | | 8,103 | |
| Eliem Therapeutics, Inc.* (Biotechnology) | | | 36 | | | | 377 | |
| Ellington Financial, Inc. (Mortgage Real Estate Investment Trusts) | | | 273 | | | | 4,666 | |
| EMCOR Group, Inc. (Construction & Engineering) | | | 270 | | | | 34,396 | |
| EMCORE Corp.* (Communications Equipment) | | | 185 | | | | 1,291 | |
| Emerald Holding, Inc.* (Media) | | | 119 | | | | 472 | |
| Emergent BioSolutions, Inc.* (Biotechnology) | | | 248 | | | | 10,781 | |
| Empire State Realty Trust, Inc. (Equity Real Estate Investment Trusts) | | | 725 | | | | 6,453 | |
| Employers Holdings, Inc. (Insurance) | | | 142 | | | | 5,876 | |
| Enact Holdings, Inc. (Thrifts & Mortgage Finance) | | | 75 | | | | 1,550 | |
| Enanta Pharmaceuticals, Inc.* (Biotechnology) | | | 98 | | | | 7,328 | |
| Encore Capital Group, Inc.* (Consumer Finance) | | | 148 | | | | 9,192 | |
| Encore Wire Corp. (Electrical Equipment) | | | 100 | | | | 14,310 | |
| Endo International PLC* (Pharmaceuticals) | | | 1,162 | | | | 4,369 | |
| Energizer Holdings, Inc. (Household Products) | | | 345 | | | | 13,835 | |
| Energy Fuels, Inc.* (Oil, Gas & Consumable Fuels) | | | 784 | | | | 5,982 | |
| Energy Recovery, Inc.* (Machinery) | | | 211 | | | | 4,534 | |
| Enerpac Tool Group Corp. (Machinery) | | | 306 | | | | 6,206 | |
| EnerSys (Electrical Equipment) | | | 217 | | | | 17,155 | |
| Enfusion, Inc.*—Class A (Software) | | | 110 | | | | 2,303 | |
| EngageSmart, Inc.* (Software) | | | 81 | | | | 1,954 | |
| Ennis, Inc. (Commercial Services & Supplies) | | | 129 | | | | 2,519 | |
| Enova International, Inc.* (Consumer Finance) | | | 184 | | | | 7,537 | |
| EnPro Industries, Inc. (Machinery) | | | 105 | | | | 11,557 | |
| Enstar Group, Ltd.* (Insurance) | | | 63 | | | | 15,598 | |
| Entercom Communications Corp.* (Media) | | | 598 | | | | 1,537 | |
| Enterprise Bancorp, Inc. (Banks) | | | 47 | | | | 2,111 | |
| Enterprise Financial Services Corp. (Banks) | | | 180 | | | | 8,476 | |
| Entrada Therapeutics, Inc.* (Biotechnology) | | | 46 | | | | 788 | |
| Entravision Communications Corp.—Class A (Media) | | | 305 | | | | 2,068 | |
| Envestnet, Inc.* (Software) | | | 275 | | | | 21,819 | |
| Eos Energy Enterprises, Inc.* (Electrical Equipment) | | | 226 | | | | 1,700 | |
| Epizyme, Inc.* (Biotechnology) | | | 464 | | | | 1,160 | |
| ePlus, Inc.* (Electronic Equipment, Instruments & Components) | | | 135 | | | | 7,274 | |
| Equitrans Midstream Corp. (Oil, Gas & Consumable Fuels) | | | 2,074 | | | | 21,445 | |
| Equity Bancshares, Inc.—Class A (Banks) | | | 69 | | | | 2,341 | |
| Equity Commonwealth* (Equity Real Estate Investment Trusts) | | | 595 | | | | 15,411 | |
| Erasca, Inc.* (Biotechnology) | | | 107 | | | | 1,667 | |
| Eros STX Global Corp.* (Entertainment) | | | 1,611 | | | | 386 | |
| Escalade, Inc. (Leisure Products) | | | 50 | | | | 790 | |
| ESCO Technologies, Inc. (Machinery) | | | 130 | | | | 11,699 | |
| Esperion Therapeutics, Inc.* (Biotechnology) | | | 137 | | | | 685 | |
| Esports Technologies, Inc.* (Hotels, Restaurants & Leisure) | | | 56 | | | | 1,151 | |
| Essent Group, Ltd. (Thrifts & Mortgage Finance) | | | 549 | | | | 24,996 | |
| Essential Properties Realty Trust, Inc. (Real Estate Management & Development) | | | 614 | | | | 17,702 | |
| Ethan Allen Interiors, Inc. (Household Durables) | | | 114 | | | | 2,997 | |
| European Wax Center, Inc.*—Class A (Diversified Consumer Services) | | | 67 | | | | 2,033 | |
| Evelo Biosciences, Inc.* (Biotechnology) | | | 154 | | | | 935 | |
| Eventbrite, Inc.* (Interactive Media & Services) | | | 388 | | | | 6,767 | |
| EverCommerce, Inc.* (Software) | | | 84 | | | | 1,323 | |
| Everi Holdings, Inc.* (Hotels, Restaurants & Leisure) | | | 433 | | | | 9,245 | |
| EverQuote, Inc.*—Class A (Interactive Media & Services) | | | 99 | | | | 1,550 | |
| EVERTEC, Inc. (IT Services) | | | 307 | | | | 15,344 | |
| EVI Industries, Inc.* (Trading Companies & Distributors) | | | 29 | | | | 906 | |
| Evo Payments, Inc.* (IT Services) | | | 240 | | | | 6,144 | |
| Evolent Health, Inc.* (Health Care Technology) | | | 404 | | | | 11,179 | |
| Evolus, Inc.* (Pharmaceuticals) | | | 168 | | | | 1,094 | |
| Evoqua Water Technologies Corp.* (Machinery) | | | 587 | | | | 27,441 | |
| Exagen, Inc.* (Health Care Providers & Services) | | | 52 | | | | 605 | |
| ExlService Holdings, Inc.* (IT Services) | | | 167 | | | | 24,177 | |
See accompanying notes to financial statements.
354 :: ProFund VP UltraSmall-Cap :: Financial Statements
Common Stocks, continued
| | | Shares | | | Value | |
| eXp World Holdings, Inc. (Real Estate Management & Development) | | | 318 | | | $ | 10,713 | |
| Exponent, Inc. (Professional Services) | | | 263 | | | | 30,700 | |
| Expro Group Holdings N.V.* (Energy Equipment & Services) | | | 236 | | | | 3,387 | |
| Extreme Networks, Inc.* (Communications Equipment) | | | 644 | | | | 10,111 | |
| EyePoint Pharmaceuticals, Inc.* (Pharmaceuticals) | | | 107 | | | | 1,310 | |
| EZCORP, Inc.*—Class A (Consumer Finance) | | | 250 | | | | 1,843 | |
| F45 Training Holdings, Inc.* (Hotels, Restaurants & Leisure) | | | 104 | | | | 1,133 | |
| Fabrinet* (Electronic Equipment, Instruments & Components) | | | 187 | | | | 22,154 | |
| Falcon Minerals Corp. (Oil, Gas & Consumable Fuels) | | | 200 | | | | 974 | |
| Farmers National Bancorp (Banks) | | | 157 | | | | 2,912 | |
| Farmland Partners, Inc. (Equity Real Estate Investment Trusts) | | | 145 | | | | 1,733 | |
| FARO Technologies, Inc.* (Electronic Equipment, Instruments & Components) | | | 92 | | | | 6,442 | |
| Fate Therapeutics, Inc.* (Biotechnology) | | | 411 | | | | 24,048 | |
| Fathom Holdings, Inc.* (Real Estate Management & Development) | | | 31 | | | | 634 | |
| FB Financial Corp. (Banks) | | | 169 | | | | 7,406 | |
| Federal Agricultural Mortgage Corp. (Thrifts & Mortgage Finance) | | | 46 | | | | 5,701 | |
| Federal Signal Corp. (Machinery) | | | 306 | | | | 13,262 | |
| Federated Hermes, Inc.—Class B (Capital Markets) | | | 472 | | | | 17,738 | |
| Ferro Corp.* (Chemicals) | | | 417 | | | | 9,103 | |
| FibroGen, Inc.* (Biotechnology) | | | 437 | | | | 6,162 | |
| Fidelity D&D Bancorp, Inc. (Banks) | | | 20 | | | | 1,180 | |
| Fiesta Restaurant Group, Inc.* (Hotels, Restaurants & Leisure) | | | 90 | | | | 991 | |
| Finance Of America Cos., Inc.*—Class A (Thrifts & Mortgage Finance) | | | 94 | | | | 373 | |
| Financial Institutions, Inc. (Banks) | | | 79 | | | | 2,512 | |
| Finch Therapeutics Group, Inc.* (Biotechnology) | | | 38 | | | | 379 | |
| First Advantage Corp.* (Professional Services) | | | 279 | | | | 5,312 | |
| First Bancorp (Banks) | | | 174 | | | | 7,955 | |
| First Bancorp (Banks) | | | 1,028 | | | | 14,166 | |
| First Bancshares, Inc. (Banks) | | | 103 | | | | 3,978 | |
| First Bank/Hamilton NJ (Banks) | | | 79 | | | | 1,146 | |
| First Busey Corp. (Banks) | | | 255 | | | | 6,916 | |
| First Commonwealth Financial Corp. (Banks) | | | 477 | | | | 7,675 | |
| First Community Bancshares, Inc. (Banks) | | | 84 | | | | 2,807 | |
| First Financial Bancorp (Banks) | | | 470 | | | | 11,459 | |
| First Financial Bankshares, Inc. (Banks) | | | 659 | | | | 33,505 | |
| First Financial Corp. (Banks) | | | 58 | | | | 2,627 | |
| First Foundation, Inc. (Banks) | | | 201 | | | | 4,997 | |
| First Internet Bancorp (Banks) | | | 47 | | | | 2,211 | |
| First Interstate BancSystem—Class A (Banks) | | | 208 | | | | 8,459 | |
| First Merchants Corp. (Banks) | | | 289 | | | | 12,106 | |
| First Mid Bancshares, Inc. (Banks) | | | 84 | | | | 3,594 | |
| First Midwest Bancorp, Inc. (Banks) | | | 578 | | | | 11,837 | |
| First of Long Island Corp. (Banks) | | | 116 | | | | 2,504 | |
| First Watch Restaurant Group, Inc.* (Hotels, Restaurants & Leisure) | | | 56 | | | | 939 | |
| FirstCash Holdings, Inc. (Consumer Finance) | | | 201 | | | | 15,037 | |
| Fisker, Inc.*(a) (Automobiles) | | | 828 | | | | 13,025 | |
| Five Star Bancorp (Banks) | | | 63 | | | | 1,890 | |
| Flagstar Bancorp, Inc. (Thrifts & Mortgage Finance) | | | 264 | | | | 12,656 | |
| Flexsteel Industries, Inc. (Household Durables) | | | 33 | | | | 886 | |
| Fluent, Inc.* (Media) | | | 220 | | | | 438 | |
| Fluidigm Corp.* (Life Sciences Tools & Services) | | | 386 | | | | 1,513 | |
| Fluor Corp.* (Construction & Engineering) | | | 720 | | | | 17,834 | |
| Flushing Financial Corp. (Banks) | | | 150 | | | | 3,645 | |
| Flywire Corp.* (IT Services) | | | 319 | | | | 12,141 | |
| Focus Financial Partners, Inc.* (Capital Markets) | | | 302 | | | | 18,035 | |
| Foghorn Therapeutics, Inc.* (Pharmaceuticals) | | | 99 | | | | 2,264 | |
| Forestar Group, Inc.* (Real Estate Management & Development) | | | 86 | | | | 1,871 | |
| Forian, Inc.* (Health Care Technology) | | | 96 | | | | 866 | |
| Forma Therapeutics Holdings, Inc.* (Biotechnology) | | | 172 | | | | 2,446 | |
| FormFactor, Inc.* (Semiconductors & Semiconductor Equipment) | | | 394 | | | | 18,014 | |
| Forrester Research, Inc.* (Professional Services) | | | 57 | | | | 3,348 | |
| Forte Biosciences, Inc.* (Biotechnology) | | | 57 | | | | 122 | |
| Forterra, Inc.* (Construction Materials) | | | 148 | | | | 3,519 | |
| Fortress Biotech, Inc.* (Biotechnology) | | | 377 | | | | 943 | |
| Forward Air Corp. (Air Freight & Logistics) | | | 136 | | | | 16,467 | |
| Fossil Group, Inc.* (Textiles, Apparel & Luxury Goods) | | | 242 | | | | 2,490 | |
| Four Corners Property Trust, Inc. (Equity Real Estate Investment Trusts) | | | 392 | | | | 11,529 | |
| Fox Factory Holding Corp.* (Auto Components) | | | 214 | | | | 36,402 | |
| Franchise Group, Inc. (Diversified Consumer Services) | | | 144 | | | | 7,511 | |
| Franklin BSP Realty Trust, Inc. (Mortgage Real Estate Investment Trusts) | | | 183 | | | | 2,734 | |
| Franklin Covey Co.* (Professional Services) | | | 64 | | | | 2,967 | |
| Franklin Electric Co., Inc. (Machinery) | | | 235 | | | | 22,222 | |
| Franklin Street Properties Corp. (Equity Real Estate Investment Trusts) | | | 515 | | | | 3,064 | |
| Frequency Therapeutics, Inc.* (Biotechnology) | | | 162 | | | | 831 | |
| Fresh Del Monte Produce, Inc. (Food Products) | | | 170 | | | | 4,692 | |
| Frontier Group Holdings, Inc.* (Airlines) | | | 177 | | | | 2,402 | |
| Frontline, Ltd.* (Oil, Gas & Consumable Fuels) | | | 606 | | | | 4,284 | |
| FRP Holdings, Inc.* (Real Estate Management & Development) | | | 34 | | | | 1,965 | |
| FS Bancorp, Inc. (Thrifts & Mortgage Finance) | | | 36 | | | | 1,211 | |
| FTC Solar, Inc.* (Electrical Equipment) | | | 96 | | | | 726 | |
| FTS International, Inc.*—Class A (Energy Equipment & Services) | | | 45 | | | | 1,181 | |
| fuboTV, Inc.* (Software) | | | 686 | | | | 10,647 | |
| FuelCell Energy, Inc.* (Electrical Equipment) | | | 1,875 | | | | 9,750 | |
| Fulcrum Therapeutics, Inc.* (Pharmaceuticals) | | | 139 | | | | 2,459 | |
| Fulgent Genetics, Inc.* (Health Care Providers & Services) | | | 106 | | | | 10,663 | |
| Full House Resorts, Inc.* (Hotels, Restaurants & Leisure) | | | 166 | | | | 2,010 | |
| Fulton Financial Corp. (Banks) | | | 806 | | | | 13,702 | |
| Funko, Inc.* (Distributors) | | | 136 | | | | 2,557 | |
| FutureFuel Corp. (Chemicals) | | | 131 | | | | 1,001 | |
| G1 Therapeutics, Inc.* (Biotechnology) | | | 201 | | | | 2,052 | |
| GAMCO Investors, Inc.—Class A (Capital Markets) | | | 26 | | | | 649 | |
| GAN, Ltd.* (Hotels, Restaurants & Leisure) | | | 203 | | | | 1,866 | |
| Gannett Co., Inc.* (Media) | | | 713 | | | | 3,800 | |
See accompanying notes to financial statements.
Financial Statements :: ProFund VP UltraSmall-Cap :: 355
Common Stocks, continued
| | | Shares | | | Value | |
| Gatos Silver, Inc.* (Metals & Mining) | | | 235 | | | $ | 2,439 | |
| GATX Corp. (Trading Companies & Distributors) | | | 179 | | | | 18,650 | |
| GCM Grosvenor, Inc.—Class A (Capital Markets) | | | 226 | | | | 2,373 | |
| GCP Applied Technologies, Inc.* (Chemicals) | | | 249 | | | | 7,883 | |
| Gemini Therapeutics, Inc.* (Biotechnology) | | | 111 | | | | 323 | |
| Genco Shipping & Trading, Ltd. (Marine) | | | 163 | | | | 2,608 | |
| Generation Bio Co.* (Biotechnology) | | | 222 | | | | 1,572 | |
| Genesco, Inc.* (Specialty Retail) | | | 75 | | | | 4,813 | |
| Genius Brands International, Inc.*(a) (Leisure Products) | | | 1,431 | | | | 1,503 | |
| Gentherm, Inc.* (Auto Components) | | | 169 | | | | 14,686 | |
| Genworth Financial, Inc.* (Insurance) | | | 2,571 | | | | 10,413 | |
| German American Bancorp, Inc. (Banks) | | | 125 | | | | 4,873 | |
| Geron Corp.* (Biotechnology) | | | 1,545 | | | | 1,885 | |
| Getty Realty Corp. (Equity Real Estate Investment Trusts) | | | 207 | | | | 6,643 | |
| Gevo, Inc.* (Oil, Gas & Consumable Fuels) | | | 1,008 | | | | 4,314 | |
| Gibraltar Industries, Inc.* (Building Products) | | | 166 | | | | 11,069 | |
| G-III Apparel Group, Ltd.* (Textiles, Apparel & Luxury Goods) | | | 224 | | | | 6,191 | |
| Glacier Bancorp, Inc. (Banks) | | | 559 | | | | 31,696 | |
| Gladstone Commercial Corp. (Equity Real Estate Investment Trusts) | | | 187 | | | | 4,819 | |
| Gladstone Land Corp. (Equity Real Estate Investment Trusts) | | | 159 | | | | 5,368 | |
| Glatfelter Corp. (Paper & Forest Products) | | | 222 | | | | 3,818 | |
| Glaukos Corp.* (Health Care Equipment & Supplies) | | | 231 | | | | 10,266 | |
| Global Blood Therapeutics, Inc.* (Biotechnology) | | | 314 | | | | 9,191 | |
| Global Industrial Co. (Trading Companies & Distributors) | | | 65 | | | | 2,659 | |
| Global Medical REIT, Inc. (Equity Real Estate Investment Trusts) | | | 304 | | | | 5,396 | |
| Global Net Lease, Inc. (Equity Real Estate Investment Trusts) | | | 529 | | | | 8,083 | |
| Global Water Resources, Inc. (Water Utilities) | | | 64 | | | | 1,094 | |
| Globalstar, Inc.* (Diversified Telecommunication Services) | | | 3,078 | | | | 3,570 | |
| GMS, Inc.* (Trading Companies & Distributors) | | | 217 | | | | 13,044 | |
| Gogo, Inc.* (Wireless Telecommunication Services) | | | 300 | | | | 4,059 | |
| Golar LNG, Ltd.* (Oil, Gas & Consumable Fuels) | | | 513 | | | | 6,356 | |
| Golden Entertainment, Inc.* (Hotels, Restaurants & Leisure) | | | 87 | | | | 4,396 | |
| Golden Nugget Online Gaming, Inc.* (Hotels, Restaurants & Leisure) | | | 202 | | | | 2,010 | |
| Goosehead Insurance, Inc. (Insurance) | | | 92 | | | | 11,967 | |
| GoPro, Inc.*—Class A (Household Durables) | | | 653 | | | | 6,732 | |
| Gorman-Rupp Co. (Machinery) | | | 115 | | | | 5,123 | |
| Gossamer Bio, Inc.* (Biotechnology) | | | 315 | | | | 3,563 | |
| GrafTech International, Ltd. (Electrical Equipment) | | | 1,017 | | | | 12,031 | |
| Graham Holdings Co.—Class B (Diversified Consumer Services) | | | 19 | | | | 11,966 | |
| Granite Construction, Inc. (Construction & Engineering) | | | 232 | | | | 8,978 | |
| Granite Point Mortgage Trust, Inc. (Mortgage Real Estate Investment Trusts) | | | 271 | | | | 3,173 | |
| Graphite Bio, Inc.* (Biotechnology) | | | 82 | | | | 1,019 | |
| Gray Television, Inc. (Media) | | | 433 | | | | 8,729 | |
| Great Ajax Corp. (Mortgage Real Estate Investment Trusts) | | | 110 | | | | 1,448 | |
| Great Lakes Dredge & Dock Corp.* (Construction & Engineering) | | | 328 | | | | 5,156 | |
| Great Southern Bancorp, Inc. (Banks) | | | 52 | | | | 3,081 | |
| Great Western Bancorp, Inc. (Banks) | | | 281 | | | | 9,543 | |
| Green Brick Partners, Inc.* (Household Durables) | | | 156 | | | | 4,731 | |
| Green Dot Corp.*—Class A (Consumer Finance) | | | 271 | | | | 9,821 | |
| Green Plains, Inc.* (Oil, Gas & Consumable Fuels) | | | 242 | | | | 8,412 | |
| GreenBox POS* (IT Services) | | | 92 | | | | 386 | |
| Greenhill & Co., Inc. (Capital Markets) | | | 71 | | | | 1,273 | |
| Greenlane Holdings, Inc.*—Class A (Distributors) | | | 84 | | | | 81 | |
| Greenlight Capital Re, Ltd.*—Class A (Insurance) | | | 133 | | | | 1,043 | |
| Greenwich Lifesciences, Inc.* (Biotechnology) | | | 21 | | | | 511 | |
| Greif, Inc.—Class A (Containers & Packaging) | | | 131 | | | | 7,908 | |
| Greif, Inc.—Class B (Containers & Packaging) | | | 30 | | | | 1,793 | |
| Grid Dynamics Holdings, Inc.* (IT Services) | | | 231 | | | | 8,771 | |
| Griffon Corp. (Building Products) | | | 236 | | | | 6,721 | |
| Gritstone bio, Inc.* (Biotechnology) | | | 217 | | | | 2,791 | |
| Group 1 Automotive, Inc. (Specialty Retail) | | | 89 | | | | 17,375 | |
| Groupon, Inc.* (Internet & Direct Marketing Retail) | | | 120 | | | | 2,779 | |
| GrowGeneration Corp.* (Specialty Retail) | | | 281 | | | | 3,667 | |
| GT Biopharma, Inc.* (Biotechnology) | | | 90 | | | | 275 | |
| GTY Technology Holdings, Inc.* (Software) | | | 163 | | | | 1,092 | |
| Guaranty Bancshares, Inc. (Banks) | | | 40 | | | | 1,503 | |
| Guess?, Inc. (Specialty Retail) | | | 204 | | | | 4,831 | |
| H&E Equipment Services, Inc. (Trading Companies & Distributors) | | | 163 | | | | 7,216 | |
| H.B. Fuller Co. (Chemicals) | | | 265 | | | | 21,465 | |
| Haemonetics Corp.* (Health Care Equipment & Supplies) | | | 256 | | | | 13,578 | |
| Hall of Fame Resort & Entertainment Co.* (Hotels, Restaurants & Leisure) | | | 282 | | | | 429 | |
| Halozyme Therapeutics, Inc.* (Biotechnology) | | | 702 | | | | 28,227 | |
| Hamilton Beach Brands Holding Co.—Class A (Household Durables) | | | 38 | | | | 546 | |
| Hamilton Lane, Inc. (Capital Markets) | | | 177 | | | | 18,341 | |
| Hancock Whitney Corp. (Banks) | | | 439 | | | | 21,959 | |
| Hanger, Inc.* (Health Care Providers & Services) | | | 190 | | | | 3,445 | |
| Hanmi Financial Corp. (Banks) | | | 155 | | | | 3,670 | |
| Hannon Armstrong Sustainable Infrastructure Capital, Inc.—Class I (Mortgage Real Estate Investment Trusts) | | | 389 | | | | 20,663 | |
| HarborOne Bancorp, Inc. (Banks) | | | 243 | | | | 3,606 | |
| Harmonic, Inc.* (Communications Equipment) | | | 459 | | | | 5,398 | |
| Harmony Biosciences Holdings, Inc.* (Pharmaceuticals) | | | 116 | | | | 4,946 | |
| Harpoon Therapeutics, Inc.* (Biotechnology) | | | 95 | | | | 717 | |
| Harsco Corp.* (Machinery) | | | 397 | | | | 6,634 | |
| Harvard Bioscience, Inc.* (Life Sciences Tools & Services) | | | 199 | | | | 1,403 | |
| Haverty Furniture Cos., Inc. (Specialty Retail) | | | 83 | | | | 2,537 | |
| Hawaiian Holdings, Inc.* (Airlines) | | | 256 | | | | 4,703 | |
| Hawkins, Inc. (Chemicals) | | | 97 | | | | 3,827 | |
| Haynes International, Inc. (Metals & Mining) | | | 63 | | | | 2,541 | |
| HBT Financial, Inc. (Banks) | | | 52 | | | | 974 | |
| HCI Group, Inc. (Insurance) | | | 29 | | | | 2,423 | |
| Health Catalyst, Inc.* (Health Care Technology) | | | 265 | | | | 10,499 | |
See accompanying notes to financial statements.
356 :: ProFund VP UltraSmall-Cap :: Financial Statements
Common Stocks, continued
| | | Shares | | | Value | |
| Healthcare Realty Trust, Inc. (Equity Real Estate Investment Trusts) | | | 748 | | | $ | 23,667 | |
| Healthcare Services Group, Inc. (Commercial Services & Supplies) | | | 380 | | | | 6,760 | |
| HealthEquity, Inc.* (Health Care Providers & Services) | | | 415 | | | | 18,360 | |
| HealthStream, Inc.* (Health Care Technology) | | | 128 | | | | 3,374 | |
| Heartland Express, Inc. (Road & Rail) | | | 239 | | | | 4,020 | |
| Heartland Financial USA, Inc. (Banks) | | | 204 | | | | 10,324 | |
| Hecla Mining Co. (Metals & Mining) | | | 2,695 | | | | 14,068 | |
| Heidrick & Struggles International, Inc. (Professional Services) | | | 98 | | | | 4,286 | |
| Helen of Troy, Ltd.* (Household Durables) | | | 122 | | | | 29,824 | |
| Helios Technologies, Inc. (Machinery) | | | 164 | | | | 17,248 | |
| Helix Energy Solutions Group, Inc.* (Energy Equipment & Services) | | | 726 | | | | 2,265 | |
| Helmerich & Payne, Inc. (Energy Equipment & Services) | | | 534 | | | | 12,656 | |
| Hemisphere Media Group, Inc.* (Media) | | | 82 | | | | 596 | |
| Herc Holdings, Inc. (Trading Companies & Distributors) | | | 127 | | | | 19,882 | |
| Heritage Commerce Corp. (Banks) | | | 296 | | | | 3,534 | |
| Heritage Financial Corp. (Banks) | | | 176 | | | | 4,301 | |
| Heritage Insurance Holdings, Inc. (Insurance) | | | 131 | | | | 770 | |
| Heritage-Crystal Clean, Inc.* (Commercial Services & Supplies) | | | 79 | | | | 2,530 | |
| Heron Therapeutics, Inc.* (Biotechnology) | | | 468 | | | | 4,273 | |
| Hersha Hospitality Trust* (Equity Real Estate Investment Trusts) | | | 164 | | | | 1,504 | |
| Heska Corp.* (Health Care Equipment & Supplies) | | | 50 | | | | 9,125 | |
| HF Foods Group, Inc.* (Food & Staples Retailing) | | | 184 | | | | 1,557 | |
| Hibbett, Inc. (Specialty Retail) | | | 75 | | | | 5,395 | |
| HighPeak Energy, Inc. (Oil, Gas & Consumable Fuels) | | | 26 | | | | 381 | |
| Hillenbrand, Inc. (Machinery) | | | 370 | | | | 19,236 | |
| Hilltop Holdings, Inc. (Banks) | | | 314 | | | | 11,034 | |
| Hilton Grand Vacations, Inc.* (Hotels, Restaurants & Leisure) | | | 434 | | | | 22,616 | |
| Hingham Institution For Savings The (Thrifts & Mortgage Finance) | | | 7 | | | | 2,939 | |
| HireQuest, Inc. (Professional Services) | | | 26 | | | | 524 | |
| HireRight Holdings Corp.* (Professional Services) | | | 114 | | | | 1,824 | |
| HNI Corp. (Commercial Services & Supplies) | | | 221 | | | | 9,293 | |
| Home Bancorp, Inc. (Thrifts & Mortgage Finance) | | | 38 | | | | 1,577 | |
| Home BancShares, Inc. (Banks) | | | 773 | | | | 18,823 | |
| Home Point Capital, Inc. (Thrifts & Mortgage Finance) | | | 37 | | | | 167 | |
| HomeStreet, Inc. (Thrifts & Mortgage Finance) | | | 101 | | | | 5,252 | |
| HomeTrust Bancshares, Inc. (Banks) | | | 76 | | | | 2,354 | |
| Homology Medicines, Inc.* (Biotechnology) | | | 213 | | | | 775 | |
| Honest Co., Inc. (The)* (Personal Products) | | | 431 | | | | 3,487 | |
| Hooker Furnishings Corp. (Household Durables) | | | 59 | | | | 1,374 | |
| Hookipa Pharma, Inc.* (Biotechnology) | | | 97 | | | | 226 | |
| Hope Bancorp, Inc. (Banks) | | | 587 | | | | 8,635 | |
| Horace Mann Educators Corp. (Insurance) | | | 212 | | | | 8,204 | |
| Horizon Bancorp, Inc. (Banks) | | | 217 | | | | 4,524 | |
| Hostess Brands, Inc.* (Food Products) | | | 701 | | | | 14,314 | |
| Houghton Mifflin Harcourt Co.* (Diversified Consumer Services) | | | 645 | | | | 10,384 | |
| Houlihan Lokey, Inc. (Capital Markets) | | | 259 | | | | 26,813 | |
| Hovnanian Enterprises, Inc.*—Class A (Household Durables) | | | 26 | | | | 3,310 | |
| Howard Bancorp, Inc.* (Banks) | | | 67 | | | | 1,460 | |
| Hub Group, Inc.*—Class A (Air Freight & Logistics) | | | 168 | | | | 14,152 | |
| Humanigen, Inc.* (Biotechnology) | | | 247 | | | | 919 | |
| Huron Consulting Group, Inc.* (Professional Services) | | | 110 | | | | 5,489 | |
| Hydrofarm Holdings Group, Inc.* (Machinery) | | | 197 | | | | 5,573 | |
| Hyliion Holdings Corp.* (Machinery) | | | 594 | | | | 3,683 | |
| HyreCar, Inc.* (Diversified Consumer Services) | | | 90 | | | | 424 | |
| Hyster-Yale Materials Handling, Inc. (Machinery) | | | 51 | | | | 2,096 | |
| I3 Verticals, Inc.*—Class A (IT Services) | | | 108 | | | | 2,461 | |
| IBEX, Ltd.* (Commercial Services & Supplies) | | | 29 | | | | 374 | |
| iBio, Inc.* (Biotechnology) | | | 1,096 | | | | 602 | |
| iCAD, Inc.* (Health Care Technology) | | | 111 | | | | 799 | |
| ICF International, Inc. (Professional Services) | | | 94 | | | | 9,640 | |
| Ichor Holdings, Ltd.* (Semiconductors & Semiconductor Equipment) | | | 142 | | | | 6,536 | |
| Icosavax, Inc.* (Biotechnology) | | | 68 | | | | 1,556 | |
| Ideanomics, Inc.* (Software) | | | 2,229 | | | | 2,675 | |
| Ideaya Biosciences, Inc.* (Biotechnology) | | | 166 | | | | 3,924 | |
| Identiv, Inc.* (Electronic Equipment, Instruments & Components) | | | 109 | | | | 3,067 | |
| IDT Corp.*—Class B (Diversified Telecommunication Services) | | | 102 | | | | 4,504 | |
| IES Holdings, Inc.* (Construction & Engineering) | | | 44 | | | | 2,228 | |
| IGM Biosciences, Inc.* (Biotechnology) | | | 42 | | | | 1,232 | |
| iHeartMedia, Inc.*—Class A (Media) | | | 568 | | | | 11,951 | |
| II-VI, Inc.* (Electronic Equipment, Instruments & Components) | | | 537 | | | | 36,692 | |
| Ikena Oncology, Inc.* (Biotechnology) | | | 140 | | | | 1,756 | |
| Imago Biosciences, Inc.* (Biotechnology) | | | 49 | | | | 1,162 | |
| IMAX Corp.* (Entertainment) | | | 253 | | | | 4,514 | |
| Immuneering Corp.*—Class A (Biotechnology) | | | 43 | | | | 695 | |
| Immunic, Inc.* (Biotechnology) | | | 95 | | | | 909 | |
| ImmunityBio, Inc.* (Biotechnology) | | | 346 | | | | 2,104 | |
| ImmunoGen, Inc.* (Biotechnology) | | | 1,003 | | | | 7,442 | |
| Immunovant, Inc.* (Biotechnology) | | | 203 | | | | 1,730 | |
| Impel Neuropharma, Inc.* (Biotechnology) | | | 27 | | | | 233 | |
| Impinj, Inc.* (Semiconductors & Semiconductor Equipment) | | | 96 | | | | 8,515 | |
| Inari Medical, Inc.* (Health Care Equipment & Supplies) | | | 174 | | | | 15,881 | |
| Independence Holding Co. (Insurance) | | | 22 | | | | 1,247 | |
| Independence Realty Trust, Inc. (Equity Real Estate Investment Trusts) | | | 534 | | | | 13,793 | |
| Independent Bank Corp. (Banks) | | | 103 | | | | 2,459 | |
| Independent Bank Corp. (Banks) | | | 232 | | | | 18,915 | |
| Independent Bank Group, Inc. (Banks) | | | 191 | | | | 13,781 | |
| Indus Realty Trust, Inc. (Real Estate Management & Development) | | | 29 | | | | 2,351 | |
| Industrial Logistics Properties Trust (Equity Real Estate Investment Trusts) | | | 329 | | | | 8,241 | |
| Infinera Corp.* (Communications Equipment) | | | 928 | | | | 8,900 | |
| Infinity Pharmaceuticals, Inc.* (Biotechnology) | | | 444 | | | | 999 | |
| Infrastructure and Energy Alternatives, Inc.* (Construction & Engineering) | | | 139 | | | | 1,279 | |
See accompanying notes to financial statements.
Financial Statements :: ProFund VP UltraSmall-Cap :: 357
Common Stocks, continued
| | | Shares | | | Value | |
| InfuSystem Holdings, Inc.* (Health Care Providers & Services) | | | 92 | | | $ | 1,567 | |
| Ingevity Corp.* (Chemicals) | | | 201 | | | | 14,412 | |
| Ingles Markets, Inc. (Food & Staples Retailing) | | | 71 | | | | 6,130 | |
| Inhibrx, Inc.* (Biotechnology) | | | 142 | | | | 6,201 | |
| Innospec, Inc. (Chemicals) | | | 124 | | | | 11,202 | |
| Innovage Holding Corp.* (Health Care Providers & Services) | | | 93 | | | | 465 | |
| INNOVATE Corp.* (Construction & Engineering) | | | 240 | | | | 888 | |
| Innovative Industrial Properties, Inc. (Equity Real Estate Investment Trusts) | | | 120 | | | | 31,549 | |
| Innoviva, Inc.* (Pharmaceuticals) | | | 220 | | | | 3,795 | |
| Inogen, Inc.* (Health Care Equipment & Supplies) | | | 101 | | | | 3,434 | |
| Inotiv, Inc.* (Life Sciences Tools & Services) | | | 75 | | | | 3,155 | |
| Inovio Pharmaceuticals, Inc.* (Biotechnology) | | | 1,048 | | | | 5,230 | |
| Inozyme Pharma, Inc.* (Biotechnology) | | | 73 | | | | 498 | |
| Inseego Corp.* (Communications Equipment) | | | 432 | | | | 2,519 | |
| Insight Enterprises, Inc.* (Electronic Equipment, Instruments & Components) | | | 175 | | | | 18,655 | |
| Insmed, Inc.* (Biotechnology) | | | 599 | | | | 16,317 | |
| Insperity, Inc. (Professional Services) | | | 184 | | | | 21,732 | |
| Inspire Medical Systems, Inc.* (Health Care Technology) | | | 136 | | | | 31,288 | |
| Installed Building Products, Inc. (Household Durables) | | | 120 | | | | 16,766 | |
| Insteel Industries, Inc. (Building Products) | | | 95 | | | | 3,782 | |
| Instil Bio, Inc.* (Biotechnology) | | | 274 | | | | 4,688 | |
| Instructure Holdings, Inc.* (Software) | | | 62 | | | | 1,487 | |
| Intapp, Inc.* (Software) | | | 53 | | | | 1,333 | |
| Integer Holdings Corp.* (Health Care Equipment & Supplies) | | | 167 | | | | 14,294 | |
| Integral Ad Science Holding Corp.* (Technology Hardware, Storage & Peripherals) | | | 88 | | | | 1,954 | |
| Intellia Therapeutics, Inc.* (Biotechnology) | | | 354 | | | | 41,858 | |
| Inter Parfums, Inc. (Personal Products) | | | 91 | | | | 9,728 | |
| Intercept Pharmaceuticals, Inc.* (Biotechnology) | | | 127 | | | | 2,069 | |
| InterDigital, Inc. (Communications Equipment) | | | 157 | | | | 11,246 | |
| Interface, Inc. (Commercial Services & Supplies) | | | 295 | | | | 4,705 | |
| International Bancshares Corp. (Banks) | | | 273 | | | | 11,572 | |
| International Game Technology PLC (Hotels, Restaurants & Leisure) | | | 507 | | | | 14,657 | |
| International Money Express, Inc.* (IT Services) | | | 164 | | | | 2,617 | |
| International Seaways, Inc. (Oil, Gas & Consumable Fuels) | | | 233 | | | | 3,420 | |
| Intersect ENT, Inc.* (Pharmaceuticals) | | | 169 | | | | 4,615 | |
| Intra-Cellular Therapies, Inc.* (Pharmaceuticals) | | | 358 | | | | 18,737 | |
| Intrepid Potash, Inc.* (Chemicals) | | | 50 | | | | 2,137 | |
| Invacare Corp.* (Health Care Equipment & Supplies) | | | 171 | | | | 465 | |
| Invesco Mortgage Capital, Inc. (Mortgage Real Estate Investment Trusts) | | | 1,592 | | | | 4,426 | |
| Investors Bancorp, Inc. (Banks) | | | 1,160 | | | | 17,574 | |
| Investors Title Co. (Insurance) | | | 7 | | | | 1,380 | |
| Invitae Corp.* (Biotechnology) | | | 1,016 | | | | 15,514 | |
| iRadimed Corp.* (Health Care Equipment & Supplies) | | | 32 | | | | 1,479 | |
| iRhythm Technologies, Inc.* (Health Care Equipment & Supplies) | | | 150 | | | | 17,654 | |
| Iridium Communications, Inc.* (Diversified Telecommunication Services) | | | 599 | | | | 24,733 | |
| iRobot Corp.* (Household Durables) | | | 136 | | | | 8,960 | |
| Ironwood Pharmaceuticals, Inc.* (Biotechnology) | | | 744 | | | | 8,675 | |
| IsoPlexis Corp.* (Life Sciences Tools & Services) | | | 43 | | | | 395 | |
| iStar, Inc. (Equity Real Estate Investment Trusts) | | | 340 | | | | 8,782 | |
| iTeos Therapeutics, Inc.* (Biotechnology) | | | 102 | | | | 4,749 | |
| Iteris, Inc.* (Electronic Equipment, Instruments & Components) | | | 215 | | | | 860 | |
| Itron, Inc.* (Electronic Equipment, Instruments & Components) | | | 229 | | | | 15,691 | |
| IVERIC bio, Inc.* (Biotechnology) | | | 583 | | | | 9,748 | |
| J & J Snack Foods Corp. (Food Products) | | | 75 | | | | 11,847 | |
| Jack in the Box, Inc. (Hotels, Restaurants & Leisure) | | | 111 | | | | 9,710 | |
| James River Group Holdings, Ltd. (Insurance) | | | 186 | | | | 5,359 | |
| Janux Therapeutics, Inc.* (Biotechnology) | | | 67 | | | | 1,322 | |
| JELD-WEN Holding, Inc.* (Building Products) | | | 464 | | | | 12,231 | |
| JFrog, Ltd.* (Software) | | | 268 | | | | 7,960 | |
| JOANN, Inc. (Specialty Retail) | | | 58 | | | | 602 | |
| John B Sanfilippo & Son, Inc. (Food Products) | | | 45 | | | | 4,057 | |
| John Bean Technologies Corp. (Machinery) | | | 159 | | | | 24,416 | |
| John Wiley & Sons, Inc.—Class A (Media) | | | 219 | | | | 12,542 | |
| Johnson Outdoors, Inc.—Class A (Leisure Products) | | | 27 | | | | 2,530 | |
| Jounce Therapeutics, Inc.* (Biotechnology) | | | 167 | | | | 1,394 | |
| Kadant, Inc. (Machinery) | | | 58 | | | | 13,368 | |
| Kaiser Aluminum Corp. (Metals & Mining) | | | 80 | | | | 7,515 | |
| Kala Pharmaceuticals, Inc.* (Pharmaceuticals) | | | 245 | | | | 296 | |
| Kaleido Biosciences, Inc.* (Pharmaceuticals) | | | 98 | | | | 234 | |
| Kaltura, Inc.* (Software) | | | 88 | | | | 297 | |
| KalVista Pharmaceuticals, Inc.* (Biotechnology) | | | 114 | | | | 1,508 | |
| Kaman Corp.—Class A (Trading Companies & Distributors) | | | 140 | | | | 6,041 | |
| KAR Auction Services, Inc.* (Commercial Services & Supplies) | | | 613 | | | | 9,575 | |
| Karat Packaging, Inc.* (Trading Companies & Distributors) | | | 23 | | | | 465 | |
| Karuna Therapeutics, Inc.* (Biotechnology) | | | 113 | | | | 14,803 | |
| Karyopharm Therapeutics, Inc.* (Biotechnology) | | | 365 | | | | 2,347 | |
| KB Home (Household Durables) | | | 403 | | | | 18,026 | |
| KBR, Inc. (Professional Services) | | | 717 | | | | 34,143 | |
| Kearny Financial Corp. (Thrifts & Mortgage Finance) | | | 344 | | | | 4,558 | |
| Kelly Services, Inc.—Class A (Professional Services) | | | 179 | | | | 3,002 | |
| KemPharm, Inc.* (Pharmaceuticals) | | | 150 | | | | 1,307 | |
| Kennametal, Inc. (Machinery) | | | 424 | | | | 15,226 | |
| Kennedy-Wilson Holdings, Inc. (Real Estate Management & Development) | | | 602 | | | | 14,376 | |
| Keros Therapeutics, Inc.* (Biotechnology) | | | 79 | | | | 4,622 | |
| Kezar Life Sciences, Inc.* (Biotechnology) | | | 177 | | | | 2,959 | |
| Kforce, Inc. (Professional Services) | | | 103 | | | | 7,748 | |
| Kimball Electronics, Inc.* (Electronic Equipment, Instruments & Components) | | | 122 | | | | 2,655 | |
| Kimball International, Inc.—Class B (Commercial Services & Supplies) | | | 183 | | | | 1,872 | |
| Kiniksa Pharmaceuticals, Ltd.*—Class A (Biotechnology) | | | 148 | | | | 1,742 | |
| Kinnate Biopharma, Inc.* (Biotechnology) | | | 130 | | | | 2,304 | |
| Kinsale Capital Group, Inc. (Insurance) | | | 109 | | | | 25,929 | |
| Kirkland's, Inc.* (Specialty Retail) | | | 67 | | | | 1,000 | |
See accompanying notes to financial statements.
358 :: ProFund VP UltraSmall-Cap :: Financial Statements
Common Stocks, continued
| | | Shares | | | Value | |
| Kite Realty Group Trust (Equity Real Estate Investment Trusts) | | | 1,101 | | | $ | 23,980 | |
| KKR Real Estate Finance Trust, Inc. (Mortgage Real Estate Investment Trusts) | | | 179 | | | | 3,729 | |
| Knowles Corp.* (Electronic Equipment, Instruments & Components) | | | 451 | | | | 10,531 | |
| Kodiak Sciences, Inc.* (Biotechnology) | | | 170 | | | | 14,413 | |
| Kontoor Brands, Inc. (Textiles, Apparel & Luxury Goods) | | | 263 | | | | 13,479 | |
| Kopin Corp.* (Semiconductors & Semiconductor Equipment) | | | 393 | | | | 1,607 | |
| Koppers Holdings, Inc.* (Chemicals) | | | 105 | | | | 3,287 | |
| Korn Ferry (Professional Services) | | | 273 | | | | 20,674 | |
| Kosmos Energy, Ltd.* (Oil, Gas & Consumable Fuels) | | | 2,272 | | | | 7,861 | |
| Kraton Corp.* (Chemicals) | | | 159 | | | | 7,365 | |
| Kratos Defense & Security Solutions, Inc.* (Aerospace & Defense) | | | 622 | | | | 12,067 | |
| Krispy Kreme, Inc.(a) (Hotels, Restaurants & Leisure) | | | 114 | | | | 2,157 | |
| Kronos Bio, Inc.* (Chemicals) | | | 197 | | | | 2,677 | |
| Kronos Worldwide, Inc. (Chemicals) | | | 113 | | | | 1,696 | |
| Krystal Biotech, Inc.* (Biotechnology) | | | 91 | | | | 6,365 | |
| Kulicke & Soffa Industries, Inc. (Semiconductors & Semiconductor Equipment) | | | 310 | | | | 18,767 | |
| Kura Oncology, Inc.* (Biotechnology) | | | 322 | | | | 4,508 | |
| Kura Sushi USA, Inc.*—Class A (Hotels, Restaurants & Leisure) | | | 20 | | | | 1,617 | |
| KVH Industries, Inc.* (Communications Equipment) | | | 77 | | | | 708 | |
| Kymera Therapeutics, Inc.* (Biotechnology) | | | 174 | | | | 11,047 | |
| Ladder Capital Corp. (Mortgage Real Estate Investment Trusts) | | | 576 | | | | 6,906 | |
| Laird Superfood, Inc.* (Food Products) | | | 32 | | | | 417 | |
| Lakeland Bancorp, Inc. (Banks) | | | 248 | | | | 4,710 | |
| Lakeland Financial Corp. (Banks) | | | 124 | | | | 9,937 | |
| Lancaster Colony Corp. (Food Products) | | | 96 | | | | 15,898 | |
| Landec Corp.* (Food Products) | | | 133 | | | | 1,476 | |
| Landos Biopharma, Inc.* (Pharmaceuticals) | | | 24 | | | | 115 | |
| Lands' End, Inc.* (Internet & Direct Marketing Retail) | | | 73 | | | | 1,433 | |
| Landsea Homes Corp.* (Household Durables) | | | 54 | | | | 395 | |
| Lantheus Holdings, Inc.* (Health Care Equipment & Supplies) | | | 342 | | | | 9,880 | |
| Laredo Petroleum, Inc.* (Oil, Gas & Consumable Fuels) | | | 64 | | | | 3,848 | |
| Latham Group, Inc.* (Leisure Products) | | | 162 | | | | 4,055 | |
| Lattice Semiconductor Corp.* (Semiconductors & Semiconductor Equipment) | | | 688 | | | | 53,018 | |
| Laureate Education, Inc.—Class A (Diversified Consumer Services) | | | 503 | | | | 6,157 | |
| Lawson Products, Inc.* (Trading Companies & Distributors) | | | 24 | | | | 1,314 | |
| La-Z-Boy, Inc. (Household Durables) | | | 223 | | | | 8,097 | |
| Lazydays Holdings, Inc.* (Specialty Retail) | | | 39 | | | | 840 | |
| LCI Industries (Auto Components) | | | 126 | | | | 19,640 | |
| Legacy Housing Corp.* (Household Durables) | | | 41 | | | | 1,085 | |
| Lemaitre Vascular, Inc. (Health Care Equipment & Supplies) | | | 96 | | | | 4,822 | |
| LendingClub Corp.* (Consumer Finance) | | | 502 | | | | 12,138 | |
| LendingTree, Inc.* (Thrifts & Mortgage Finance) | | | 59 | | | | 7,233 | |
| Lexicon Pharmaceuticals, Inc.* (Biotechnology) | | | 355 | | | | 1,399 | |
| Lexington Realty Trust (Equity Real Estate Investment Trusts) | | | 1,417 | | | | 22,134 | |
| LGI Homes, Inc.* (Household Durables) | | | 110 | | | | 16,993 | |
| LHC Group, Inc.* (Health Care Providers & Services) | | | 155 | | | | 21,271 | |
| Liberty Latin America, Ltd.*—Class A (Media) | | | 206 | | | | 2,402 | |
| Liberty Latin America, Ltd.*—Class C (Media) | | | 784 | | | | 8,938 | |
| Liberty Media Corp-Liberty Braves*—Class A (Entertainment) | | | 51 | | | | 1,466 | |
| Liberty Media Corp-Liberty Braves*—Class C (Entertainment) | | | 185 | | | | 5,199 | |
| Liberty Oilfield Services, Inc.* (Energy Equipment & Services) | | | 461 | | | | 4,472 | |
| Liberty TripAdvisor Holdings, Inc.*—Class A (Interactive Media & Services) | | | 369 | | | | 801 | |
| Life Time Group Holdings, Inc.* (Hotels, Restaurants & Leisure) | | | 197 | | | | 3,390 | |
| LifeStance Health Group, Inc.* (Health Care Providers & Services) | | | 232 | | | | 2,209 | |
| Lifetime Brands, Inc. (Household Durables) | | | 64 | | | | 1,022 | |
| Ligand Pharmaceuticals, Inc.* (Biotechnology) | | | 76 | | | | 11,739 | |
| Limelight Networks, Inc.* (IT Services) | | | 634 | | | | 2,175 | |
| Limoneira Co. (Food Products) | | | 80 | | | | 1,200 | |
| Lindblad Expeditions Holdings, Inc.* (Hotels, Restaurants & Leisure) | | | 156 | | | | 2,434 | |
| Lindsay Corp. (Machinery) | | | 55 | | | | 8,360 | |
| Lineage Cell Therapeutics, Inc.* (Biotechnology) | | | 636 | | | | 1,558 | |
| Lions Gate Entertainment Corp.*—Class A (Entertainment) | | | 295 | | | | 4,909 | |
| Lions Gate Entertainment Corp.*—Class B (Entertainment) | | | 599 | | | | 9,218 | |
| Liquidity Services, Inc.* (Internet & Direct Marketing Retail) | | | 134 | | | | 2,959 | |
| LivaNova PLC* (Health Care Equipment & Supplies) | | | 271 | | | | 23,694 | |
| Live Oak Bancshares, Inc. (Banks) | | | 162 | | | | 14,141 | |
| Livent Corp.* (Chemicals) | | | 822 | | | | 20,040 | |
| LiveOne, Inc.* (Entertainment) | | | 299 | | | | 383 | |
| LivePerson, Inc.* (Software) | | | 333 | | | | 11,895 | |
| LiveRamp Holdings, Inc.* (IT Services) | | | 335 | | | | 16,063 | |
| Lordstown Motors Corp.*—Class A (Automobiles) | | | 787 | | | | 2,715 | |
| LTC Properties, Inc. (Equity Real Estate Investment Trusts) | | | 197 | | | | 6,726 | |
| Lucid Diagnostics, Inc.* (Health Care Equipment & Supplies) | | | 26 | | | | 140 | |
| Lulu's Fashion Lounge Holdings, Inc.* (Internet & Direct Marketing Retail) | | | 29 | | | | 297 | |
| Lumber Liquidators Holdings, Inc.* (Specialty Retail) | | | 145 | | | | 2,475 | |
| Luna Innovations, Inc.* (Electronic Equipment, Instruments & Components) | | | 156 | | | | 1,317 | |
| Luther Burbank Corp. (Thrifts & Mortgage Finance) | | | 78 | | | | 1,095 | |
| Luxfer Holdings PLC (Machinery) | | | 140 | | | | 2,703 | |
| Lyell Immunopharma, Inc.* (Biotechnology) | | | 120 | | | | 929 | |
| M.D.C Holdings, Inc. (Household Durables) | | | 290 | | | | 16,191 | |
| M/I Homes, Inc.* (Household Durables) | | | 145 | | | | 9,016 | |
See accompanying notes to financial statements.
Financial Statements :: ProFund VP UltraSmall-Cap :: 359
Common Stocks, continued
| | | Shares | | | Value | |
| Macatawa Bank Corp. (Banks) | | | 133 | | | $ | 1,173 | |
| MACOM Technology Solutions Holdings, Inc.* (Semiconductors & Semiconductor Equipment) | | | 247 | | | | 19,340 | |
| MacroGenics, Inc.* (Biotechnology) | | | 304 | | | | 4,879 | |
| Macy's, Inc. (Multiline Retail) | | | 1,593 | | | | 41,704 | |
| Madison Square Garden Entertainment Corp.* (Entertainment) | | | 132 | | | | 9,284 | |
| Madrigal Pharmaceuticals, Inc.* (Biotechnology) | | | 60 | | | | 5,084 | |
| Magellan Health, Inc.* (Health Care Providers & Services) | | | 120 | | | | 11,399 | |
| Magenta Therapeutics, Inc.* (Biotechnology) | | | 152 | | | | 673 | |
| Magnite, Inc.* (Media) | | | 658 | | | | 11,515 | |
| Magnolia Oil & Gas Corp. (Oil, Gas & Consumable Fuels) | | | 731 | | | | 13,794 | |
| Maiden Holdings, Ltd.* (Insurance) | | | 352 | | | | 1,077 | |
| Malibu Boats, Inc.* (Leisure Products) | | | 105 | | | | 7,217 | |
| MannKind Corp.* (Biotechnology) | | | 1,252 | | | | 5,471 | |
| ManTech International Corp.—Class A (Professional Services) | | | 139 | | | | 10,137 | |
| Marathon Digital Holdings, Inc.* (IT Services) | | | 484 | | | | 15,904 | |
| Marcus & Millichap, Inc.* (Real Estate Management & Development) | | | 120 | | | | 6,175 | |
| Marine Products Corp. (Leisure Products) | | | 41 | | | | 513 | |
| MarineMax, Inc.* (Specialty Retail) | | | 107 | | | | 6,317 | |
| Marinus Pharmaceuticals, Inc.* (Pharmaceuticals) | | | 187 | | | | 2,222 | |
| Marlin Business Services Corp. (Diversified Financial Services) | | | 41 | | | | 954 | |
| Marrone Bio Innovations, Inc.* (Chemicals) | | | 513 | | | | 369 | |
| Marten Transport, Ltd. (Road & Rail) | | | 302 | | | | 5,182 | |
| Masonite International Corp.* (Building Products) | | | 121 | | | | 14,272 | |
| MasterCraft Boat Holdings, Inc.* (Leisure Products) | | | 95 | | | | 2,691 | |
| Matador Resources Co. (Oil, Gas & Consumable Fuels) | | | 562 | | | | 20,749 | |
| Materion Corp. (Metals & Mining) | | | 103 | | | | 9,470 | |
| Matrix Service Co.* (Construction & Engineering) | | | 132 | | | | 993 | |
| Matson, Inc. (Marine) | | | 211 | | | | 18,997 | |
| Matthews International Corp.—Class A (Commercial Services & Supplies) | | | 157 | | | | 5,757 | |
| MAX Holdings, Inc. (Real Estate Management & Development) | | | 94 | | | | 2,866 | |
| Maxar Technologies, Inc. (Aerospace & Defense) | | | 368 | | | | 10,867 | |
| MaxCyte, Inc.* (Biotechnology) | | | 487 | | | | 4,963 | |
| MAXIMUS, Inc. (IT Services) | | | 311 | | | | 24,777 | |
| MaxLinear, Inc.*—Class A (Semiconductors & Semiconductor Equipment) | | | 360 | | | | 27,140 | |
| Mayville Engineering Co., Inc.* (Machinery) | | | 45 | | | | 671 | |
| MBIA, Inc.* (Insurance) | | | 243 | | | | 3,837 | |
| McGrath RentCorp (Commercial Services & Supplies) | | | 122 | | | | 9,792 | |
| MedAvail Holdings, Inc.* (Food & Staples Retailing) | | | 61 | | | | 85 | |
| MediaAlpha, Inc.*—Class A (Interactive Media & Services) | | | 108 | | | | 1,668 | |
| Medifast, Inc. (Personal Products) | | | 58 | | | | 12,147 | |
| MEDNAX, Inc.* (Health Care Providers & Services) | | | 386 | | | | 10,503 | |
| Medpace Holdings, Inc.* (Life Sciences Tools & Services) | | | 147 | | | | 31,994 | |
| MEI Pharma, Inc.* (Biotechnology) | | | 550 | | | | 1,469 | |
| MeiraGTx Holdings PLC* (Biotechnology) | | | 151 | | | | 3,585 | |
| Mercantile Bank Corp. (Banks) | | | 78 | | | | 2,732 | |
| Merchants Bancorp (Thrifts & Mortgage Finance) | | | 50 | | | | 2,367 | |
| Meridian Bioscience, Inc.* (Health Care Equipment & Supplies) | | | 216 | | | | 4,406 | |
| MeridianLink, Inc.* (Software) | | | 64 | | | | 1,381 | |
| Merit Medical Systems, Inc.* (Health Care Equipment & Supplies) | | | 260 | | | | 16,198 | |
| Meritage Homes Corp.* (Household Durables) | | | 187 | | | | 22,825 | |
| Meritor, Inc.* (Machinery) | | | 344 | | | | 8,524 | |
| Mersana Therapeutics, Inc.* (Biotechnology) | | | 363 | | | | 2,258 | |
| Mesa Air Group, Inc.* (Airlines) | | | 174 | | | | 974 | |
| Mesa Laboratories, Inc. (Health Care Equipment & Supplies) | | | 25 | | | | 8,202 | |
| Meta Financial Group, Inc. (Thrifts & Mortgage Finance) | | | 159 | | | | 9,486 | |
| Meta Materials, Inc.* (Oil, Gas & Consumable Fuels) | | | 1,027 | | | | 2,526 | |
| Methode Electronics, Inc. (Electronic Equipment, Instruments & Components) | | | 194 | | | | 9,539 | |
| Metrocity Bankshares, Inc. (Banks) | | | 96 | | | | 2,643 | |
| MetroMile, Inc.* (Insurance) | | | 488 | | | | 1,069 | |
| Metropolitan Bank Holding Corp.* (Banks) | | | 50 | | | | 5,327 | |
| MFA Financial, Inc. (Mortgage Real Estate Investment Trusts) | | | 2,245 | | | | 10,237 | |
| MGE Energy, Inc. (Electric Utilities) | | | 185 | | | | 15,216 | |
| MGP Ingredients, Inc. (Beverages) | | | 72 | | | | 6,119 | |
| MicroStrategy, Inc.* (Software) | | | 43 | | | | 23,413 | |
| MicroVision, Inc.* (Electronic Equipment, Instruments & Components) | | | 833 | | | | 4,173 | |
| Mid Penn Bancorp, Inc. (Banks) | | | 72 | | | | 2,285 | |
| Middlesex Water Co. (Water Utilities) | | | 88 | | | | 10,586 | |
| Midland States Bancorp, Inc. (Banks) | | | 108 | | | | 2,677 | |
| MidwestOne Financial Group, Inc. (Banks) | | | 72 | | | | 2,331 | |
| Miller Industries, Inc. (Machinery) | | | 56 | | | | 1,870 | |
| MillerKnoll, Inc. (Commercial Services & Supplies) | | | 377 | | | | 14,775 | |
| Mimecast, Ltd.* (Software) | | | 309 | | | | 24,587 | |
| MiMedx Group, Inc.* (Biotechnology) | | | 563 | | | | 3,401 | |
| Mind Medicine MindMed, Inc.* (Pharmaceuticals) | | | 1,764 | | | | 2,434 | |
| Minerals Technologies, Inc. (Chemicals) | | | 168 | | | | 12,289 | |
| MiNK Therapeutics, Inc.* (Biotechnology) | | | 10 | | | | 45 | |
| Mirum Pharmaceuticals, Inc.* (Biotechnology) | | | 18 | | | | 287 | |
| Mission Produce, Inc.* (Food Products) | | | 188 | | | | 2,952 | |
| Mistras Group, Inc.* (Professional Services) | | | 101 | | | | 750 | |
| Mitek System, Inc.* (Software) | | | 218 | | | | 3,870 | |
| Model N, Inc.* (Software) | | | 180 | | | | 5,405 | |
| Modine Manufacturing Co.* (Auto Components) | | | 254 | | | | 2,563 | |
| ModivCare, Inc.* (Health Care Providers & Services) | | | 63 | | | | 9,342 | |
| Moelis & Co. (Capital Markets) | | | 310 | | | | 19,379 | |
| Molecular Templates, Inc.* (Biotechnology) | | | 187 | | | | 733 | |
| Momentive Global, Inc.* (Software) | | | 658 | | | | 13,917 | |
| Monarch Casino & Resort, Inc.* (Hotels, Restaurants & Leisure) | | | 67 | | | | 4,955 | |
| MoneyGram International, Inc.* (IT Services) | | | 454 | | | | 3,582 | |
See accompanying notes to financial statements.
360 :: ProFund VP UltraSmall-Cap :: Financial Statements
Common Stocks, continued
| | | Shares | | | Value | |
| Monmouth Real Estate Investment Corp.— Class A (Equity Real Estate Investment Trusts) | | | 483 | | | $ | 10,148 | |
| Monro, Inc. (Specialty Retail) | | | 168 | | | | 9,789 | |
| Monte Rosa Therapeutics, Inc.* (Biotechnology) | | | 61 | | | | 1,246 | |
| Montrose Environmental Group, Inc.* (Commercial Services & Supplies) | | | 133 | | | | 9,378 | |
| Moog, Inc.—Class A (Aerospace & Defense) | | | 147 | | | | 11,903 | |
| Morphic Holding, Inc.* (Biotechnology) | | | 107 | | | | 5,070 | |
| Motorcar Parts of America, Inc.* (Auto Components) | | | 95 | | | | 1,622 | |
| Movado Group, Inc. (Textiles, Apparel & Luxury Goods) | | | 79 | | | | 3,305 | |
| MP Materials Corp.* (Metals & Mining) | | | 385 | | | | 17,487 | |
| Mr. Cooper Group, Inc.* (Thrifts & Mortgage Finance) | | | 314 | | | | 13,066 | |
| MRC Global, Inc.* (Trading Companies & Distributors) | | | 408 | | | | 2,807 | |
| Mueller Industries, Inc. (Machinery) | | | 285 | | | | 16,918 | |
| Mueller Water Products, Inc.—Class A (Machinery) | | | 799 | | | | 11,506 | |
| Multiplan Corp.* (Health Care Technology) | | | 1,931 | | | | 8,554 | |
| Murphy Oil Corp. (Oil, Gas & Consumable Fuels) | | | 743 | | | | 19,400 | |
| Murphy USA, Inc. (Specialty Retail) | | | 123 | | | | 24,507 | |
| Mustang Bio, Inc.* (Biotechnology) | | | 369 | | | | 613 | |
| MVB Financial Corp. (Banks) | | | 52 | | | | 2,159 | |
| Myers Industries, Inc. (Containers & Packaging) | | | 183 | | | | 3,662 | |
| MYR Group, Inc.* (Construction & Engineering) | | | 84 | | | | 9,286 | |
| Myriad Genetics, Inc.* (Biotechnology) | | | 402 | | | | 11,095 | |
| Nabors Industries, Ltd.* (Energy Equipment & Services) | | | 36 | | | | 2,919 | |
| NanoString Technologies, Inc.* (Life Sciences Tools & Services) | | | 230 | | | | 9,713 | |
| Nanthealth, Inc.* (Health Care Technology) | | | 136 | | | | 143 | |
| Napco Security Technologies, Inc.* (Electronic Equipment, Instruments & Components) | | | 74 | | | | 3,699 | |
| Nathan's Famous, Inc. (Hotels, Restaurants & Leisure) | | | 14 | | | | 817 | |
| National Bank Holdings Corp. (Banks) | | | 147 | | | | 6,459 | |
| National Beverage Corp. (Beverages) | | | 119 | | | | 5,394 | |
| National CineMedia, Inc. (Media) | | | 305 | | | | 857 | |
| National Energy Services Reunited Corp.* (Energy Equipment & Services) | | | 192 | | | | 1,814 | |
| National Health Investors, Inc. (Equity Real Estate Investment Trusts) | | | 222 | | | | 12,758 | |
| National Healthcare Corp. (Health Care Providers & Services) | | | 64 | | | | 4,348 | |
| National Presto Industries, Inc. (Aerospace & Defense) | | | 26 | | | | 2,133 | |
| National Research Corp. (Health Care Providers & Services) | | | 71 | | | | 2,948 | |
| National Storage Affiliates Trust (Equity Real Estate Investment Trusts) | | | 412 | | | | 28,510 | |
| National Vision Holdings, Inc.* (Specialty Retail) | | | 414 | | | | 19,868 | |
| National Western Life Group, Inc.—Class A (Insurance) | | | 13 | | | | 2,788 | |
| Natural Grocers by Vitamin Cottage, Inc. (Food & Staples Retailing) | | | 47 | | | | 670 | |
| Nature's Sunshine Products, Inc. (Personal Products) | | | 60 | | | | 1,110 | |
| Natus Medical, Inc.* (Health Care Equipment & Supplies) | | | 171 | | | | 4,058 | |
| Nautilus, Inc.* (Leisure Products) | | | 153 | | | | 938 | |
| Navient Corp. (Consumer Finance) | | | 802 | | | | 17,019 | |
| NBT Bancorp, Inc. (Banks) | | | 214 | | | | 8,243 | |
| Neenah, Inc. (Paper & Forest Products) | | | 85 | | | | 3,934 | |
| Nelnet, Inc.—Class A (Consumer Finance) | | | 86 | | | | 8,400 | |
| NEOGAMES SA* (Hotels, Restaurants & Leisure) | | | 52 | | | | 1,445 | |
| Neogen Corp.* (Health Care Equipment & Supplies) | | | 546 | | | | 24,794 | |
| NeoGenomics, Inc.* (Life Sciences Tools & Services) | | | 575 | | | | 19,619 | |
| Neoleukin Therapeutics, Inc.* (Biotechnology) | | | 179 | | | | 863 | |
| NeoPhotonics Corp.* (Semiconductors & Semiconductor Equipment) | | | 260 | | | | 3,996 | |
| NETGEAR, Inc.* (Communications Equipment) | | | 147 | | | | 4,294 | |
| NetScout Systems, Inc.* (Communications Equipment) | | | 356 | | | | 11,776 | |
| NETSTREIT Corp. (Equity Real Estate Investment Trusts) | | | 201 | | | | 4,603 | |
| Neuronetics, Inc.* (Health Care Equipment & Supplies) | | | 129 | | | | 575 | |
| NeuroPace, Inc.* (Health Care Equipment & Supplies) | | | 36 | | | | 363 | |
| Nevro Corp.* (Health Care Equipment & Supplies) | | | 175 | | | | 14,187 | |
| New Jersey Resources Corp. (Gas Utilities) | | | 490 | | | | 20,119 | |
| New York Mortgage Trust, Inc. (Mortgage Real Estate Investment Trusts) | | | 1,925 | | | | 7,161 | |
| NewAge, Inc.* (Beverages) | | | 682 | | | | 702 | |
| Newmark Group, Inc. (Real Estate Management & Development) | | | 757 | | | | 14,156 | |
| Newpark Resources, Inc.* (Energy Equipment & Services) | | | 460 | | | | 1,352 | |
| NexImmune, Inc.* (Biotechnology) | | | 89 | | | | 410 | |
| Nexpoint Residential Trust, Inc. (Equity Real Estate Investment Trusts) | | | 113 | | | | 9,473 | |
| NextGen Healthcare, Inc.* (Health Care Technology) | | | 291 | | | | 5,177 | |
| NexTier Oilfield Solutions, Inc.* (Energy Equipment & Services) | | | 877 | | | | 3,113 | |
| NGM Biopharmaceuticals, Inc.* (Pharmaceuticals) | | | 160 | | | | 2,834 | |
| NI Holdings, Inc.* (Insurance) | | | 43 | | | | 813 | |
| Nicolet Bankshares, Inc.* (Banks) | | | 63 | | | | 5,402 | |
| Nikola Corp.*(a) (Machinery) | | | 1,158 | | | | 11,429 | |
| Nkarta, Inc.* (Biotechnology) | | | 72 | | | | 1,105 | |
| NL Industries, Inc. (Commercial Services & Supplies) | | | 42 | | | | 311 | |
| nLight, Inc.* (Electronic Equipment, Instruments & Components) | | | 221 | | | | 5,293 | |
| NMI Holdings, Inc.*—Class A (Thrifts & Mortgage Finance) | | | 426 | | | | 9,308 | |
| NN, Inc.* (Machinery) | | | 217 | | | | 890 | |
| Noodles & Co.* (Hotels, Restaurants & Leisure) | | | 206 | | | | 1,868 | |
| Nordic American Tankers, Ltd. (Oil, Gas & Consumable Fuels) | | | 852 | | | | 1,440 | |
| Northern Oil And Gas, Inc. (Oil, Gas & Consumable Fuels) | | | 265 | | | | 5,454 | |
| Northfield Bancorp, Inc. (Thrifts & Mortgage Finance) | | | 223 | | | | 3,604 | |
| Northrim Bancorp, Inc. (Banks) | | | 30 | | | | 1,304 | |
See accompanying notes to financial statements.
Financial Statements :: ProFund VP UltraSmall-Cap :: 361
Common Stocks, continued
| | | Shares | | | Value | |
| Northwest Bancshares, Inc. (Thrifts & Mortgage Finance) | | | 621 | | | $ | 8,793 | |
| Northwest Natural Holding Co. (Gas Utilities) | | | 155 | | | | 7,561 | |
| Northwest Pipe Co.* (Construction & Engineering) | | | 49 | | | | 1,558 | |
| NorthWestern Corp. (Multi-Utilities) | | | 268 | | | | 15,319 | |
| Novagold Resources, Inc.* (Metals & Mining) | | | 1,203 | | | | 8,253 | |
| Novanta, Inc.* (Electronic Equipment, Instruments & Components) | | | 179 | | | | 31,562 | |
| NOW, Inc.* (Trading Companies & Distributors) | | | 559 | | | | 4,774 | |
| Nu Skin Enterprises, Inc.—Class A (Personal Products) | | | 252 | | | | 12,790 | |
| Nurix Therapeutics, Inc.* (Biotechnology) | | | 159 | | | | 4,603 | |
| Nuvalent, Inc.*—Class A (Biotechnology) | | | 54 | | | | 1,028 | |
| NuVasive, Inc.* (Health Care Equipment & Supplies) | | | 263 | | | | 13,802 | |
| Nuvation Bio, Inc.* (Pharmaceuticals) | | | 806 | | | | 6,851 | |
| NV5 Global, Inc.* (Construction & Engineering) | | | 67 | | | | 9,254 | |
| NVE Corp. (Semiconductors & Semiconductor Equipment) | | | 24 | | | | 1,639 | |
| Oasis Petroleum, Inc. (Oil, Gas & Consumable Fuels) | | | 101 | | | | 12,725 | |
| Oceaneering International, Inc.* (Energy Equipment & Services) | | | 505 | | | | 5,712 | |
| Oceanfirst Financial Corp. (Thrifts & Mortgage Finance) | | | 295 | | | | 6,549 | |
| Ocugen, Inc.* (Biotechnology) | | | 936 | | | | 4,259 | |
| Ocular Therapeutix, Inc.* (Pharmaceuticals) | | | 389 | | | | 2,711 | |
| Ocwen Financial Corp.* (Thrifts & Mortgage Finance) | | | 41 | | | | 1,639 | |
| Office Properties Income Trust (Equity Real Estate Investment Trusts) | | | 243 | | | | 6,036 | |
| OFG Bancorp (Banks) | | | 249 | | | | 6,613 | |
| O-I Glass, Inc.* (Containers & Packaging) | | | 801 | | | | 9,637 | |
| Oil States International, Inc.* (Energy Equipment & Services) | | | 307 | | | | 1,526 | |
| Oil-Dri Corp. of America (Household Products) | | | 26 | | | | 851 | |
| Old National Bancorp (Banks) | | | 838 | | | | 15,185 | |
| Old Second Bancorp, Inc. (Banks) | | | 141 | | | | 1,775 | |
| Olema Pharmaceuticals, Inc.* (Biotechnology) | | | 128 | | | | 1,198 | |
| Olympic Steel, Inc. (Metals & Mining) | | | 48 | | | | 1,128 | |
| Omega Flex, Inc. (Machinery) | | | 16 | | | | 2,031 | |
| Omega Therapeutics, Inc.* (Biotechnology) | | | 38 | | | | 431 | |
| Omeros Corp.* (Pharmaceuticals) | | | 306 | | | | 1,968 | |
| Omnicell, Inc.* (Health Care Technology) | | | 222 | | | | 40,059 | |
| ON24, Inc.* (Software) | | | 136 | | | | 2,360 | |
| Oncocyte Corp.* (Biotechnology) | | | 305 | | | | 662 | |
| Oncorus, Inc.* (Biotechnology) | | | 104 | | | | 548 | |
| Oncternal Therapeutics, Inc.* (Biotechnology) | | | 224 | | | | 508 | |
| ONE Gas, Inc. (Gas Utilities) | | | 267 | | | | 20,717 | |
| ONE Group Hospitality, Inc. (The)* (Hotels, Restaurants & Leisure) | | | 105 | | | | 1,324 | |
| One Liberty Properties, Inc. (Equity Real Estate Investment Trusts) | | | 82 | | | | 2,893 | |
| OneSpan, Inc.* (Software) | | | 179 | | | | 3,030 | |
| OneSpaWorld Holdings, Ltd.* (Diversified Consumer Services) | | | 271 | | | | 2,715 | |
| Onewater Marine, Inc. (Specialty Retail) | | | 52 | | | | 3,170 | |
| Onto Innovation, Inc.* (Semiconductors & Semiconductor Equipment) | | | 247 | | | | 25,004 | |
| Ontrak, Inc.* (Health Care Providers & Services) | | | 47 | | | | 296 | |
| Ooma, Inc.* (Diversified Telecommunication Services) | | | 112 | | | | 2,289 | |
| Open Lending Corp.*—Class A (Capital Markets) | | | 529 | | | | 11,892 | |
| OPKO Health, Inc.* (Biotechnology) | | | 2,026 | | | | 9,745 | |
| Oportun Financial Corp.* (Consumer Finance) | | | 107 | | | | 2,167 | |
| Oppenheimer Holdings, Inc.—Class A (Capital Markets) | | | 47 | | | | 2,179 | |
| OptimizeRx Corp.* (Health Care Technology) | | | 87 | | | | 5,404 | |
| Option Care Health, Inc.* (Health Care Providers & Services) | | | 806 | | | | 22,923 | |
| Oramed Pharmaceuticals, Inc.* (Pharmaceuticals) | | | 154 | | | | 2,199 | |
| OraSure Technologies, Inc.* (Health Care Equipment & Supplies) | | | 363 | | | | 3,154 | |
| Orchid Island Capital, Inc. (Mortgage Real Estate Investment Trusts) | | | 689 | | | | 3,101 | |
| Organogenesis Holdings, Inc.* (Biotechnology) | | | 193 | | | | 1,783 | |
| ORIC Pharmaceuticals, Inc.* (Biotechnology) | | | 160 | | | | 2,352 | |
| Origin Bancorp, Inc. (Banks) | | | 112 | | | | 4,807 | |
| Orion Engineered Carbons SA* (Chemicals) | | | 307 | | | | 5,637 | |
| Ormat Technologies, Inc. (Independent Power and Renewable Electricity Producers) | | | 230 | | | | 18,240 | |
| Orrstown Financial Services, Inc. (Banks) | | | 55 | | | | 1,386 | |
| Ortho Clinical Diagnostics Holdings PLC* (Health Care Equipment & Supplies) | | | 611 | | | | 13,069 | |
| Orthofix Medical, Inc.* (Health Care Equipment & Supplies) | | | 96 | | | | 2,985 | |
| OrthoPediatrics Corp.* (Health Care Equipment & Supplies) | | | 70 | | | | 4,190 | |
| OSI Systems, Inc.* (Electronic Equipment, Instruments & Components) | | | 86 | | | | 8,015 | |
| Otter Tail Corp. (Electric Utilities) | | | 209 | | | | 14,927 | |
| Ouster, Inc.* (Electronic Equipment, Instruments & Components) | | | 794 | | | | 4,129 | |
| Outbrain, Inc.* (Interactive Media & Services) | | | 42 | | | | 588 | |
| Outfront Media, Inc. (Equity Real Estate Investment Trusts) | | | 738 | | | | 19,793 | |
| Outlook Therapeutics, Inc.* (Biotechnology) | | | 452 | | | | 615 | |
| Outset Medical, Inc.* (Health Care Equipment & Supplies) | | | 238 | | | | 10,969 | |
| Overstock.com, Inc.* (Internet & Direct Marketing Retail) | | | 218 | | | | 12,864 | |
| Ovintiv, Inc. (Oil, Gas & Consumable Fuels) | | | 1,329 | | | | 44,787 | |
| Owens & Minor, Inc. (Health Care Providers & Services) | | | 368 | | | | 16,008 | |
| Oxford Industries, Inc. (Textiles, Apparel & Luxury Goods) | | | 81 | | | | 8,223 | |
| Oyster Point Pharma, Inc.* (Biotechnology) | | | 56 | | | | 1,023 | |
| Pacific Biosciences of California, Inc.* (Life Sciences Tools & Services) | | | 986 | | | | 20,175 | |
| Pacific Premier Bancorp, Inc. (Banks) | | | 475 | | | | 19,014 | |
| Pacira BioSciences, Inc.* (Pharmaceuticals) | | | 224 | | | | 13,478 | |
| Pactiv Evergreen, Inc. (Containers & Packaging) | | | 218 | | | | 2,764 | |
| PAE, Inc.* (Aerospace & Defense) | | | 352 | | | | 3,495 | |
| PagerDuty, Inc.* (Software) | | | 416 | | | | 14,456 | |
| Palomar Holdings, Inc.* (Insurance) | | | 125 | | | | 8,096 | |
| PAM Transportation Services, Inc.* (Road & Rail) | | | 18 | | | | 1,278 | |
| Papa John's International, Inc. (Hotels, Restaurants & Leisure) | | | 168 | | | | 22,423 | |
| Par Pacific Holdings, Inc.* (Oil, Gas & Consumable Fuels) | | | 227 | | | | 3,743 | |
See accompanying notes to financial statements.
362 :: ProFund VP UltraSmall-Cap :: Financial Statements
Common Stocks, continued
| | | Shares | | | Value | |
| PAR Technology Corp.* (Electronic Equipment, Instruments & Components) | | | 128 | | | $ | 6,755 | |
| Paragon 28, Inc.* (Health Care Equipment & Supplies) | | | 46 | | | | 814 | |
| Paramount Group, Inc. (Equity Real Estate Investment Trusts) | | | 947 | | | | 7,898 | |
| Paratek Pharmaceuticals, Inc.* (Pharmaceuticals) | | | 248 | | | | 1,114 | |
| Park Aerospace Corp. (Aerospace & Defense) | | | 99 | | | | 1,307 | |
| Park National Corp. (Banks) | | | 73 | | | | 10,024 | |
| Park-Ohio Holdings Corp. (Machinery) | | | 43 | | | | 910 | |
| Parsons Corp.* (Aerospace & Defense) | | | 133 | | | | 4,475 | |
| Party City Holdco, Inc.* (Specialty Retail) | | | 560 | | | | 3,119 | |
| Passage Bio, Inc.* (Biotechnology) | | | 188 | | | | 1,194 | |
| Patrick Industries, Inc. (Auto Components) | | | 115 | | | | 9,279 | |
| Patterson Cos., Inc. (Health Care Providers & Services) | | | 434 | | | | 12,738 | |
| Patterson-UTI Energy, Inc. (Energy Equipment & Services) | | | 946 | | | | 7,994 | |
| PAVmed, Inc.* (Health Care Equipment & Supplies) | | | 368 | | | | 905 | |
| Paya Holdings, Inc.* (IT Services) | | | 434 | | | | 2,752 | |
| PBF Energy, Inc.*—Class A (Oil, Gas & Consumable Fuels) | | | 488 | | | | 6,329 | |
| PC Connection, Inc. (Electronic Equipment, Instruments & Components) | | | 56 | | | | 2,415 | |
| PCSB Financial Corp. (Thrifts & Mortgage Finance) | | | 65 | | | | 1,238 | |
| PDC Energy, Inc. (Oil, Gas & Consumable Fuels) | | | 494 | | | | 24,097 | |
| PDF Solutions, Inc.* (Semiconductors & Semiconductor Equipment) | | | 152 | | | | 4,832 | |
| Peabody Energy Corp.* (Oil, Gas & Consumable Fuels) | | | 452 | | | | 4,552 | |
| Peapack Gladstone Financial Corp. (Banks) | | | 91 | | | | 3,221 | |
| Pebblebrook Hotel Trust (Equity Real Estate Investment Trusts) | | | 659 | | | | 14,742 | |
| Pennymac Financial Services, Inc. (Thrifts & Mortgage Finance) | | | 158 | | | | 11,025 | |
| PennyMac Mortgage Investment Trust (Mortgage Real Estate Investment Trusts) | | | 497 | | | | 8,613 | |
| Peoples Bancorp, Inc. (Banks) | | | 129 | | | | 4,103 | |
| Peoples Financial Services Corp. (Banks) | | | 36 | | | | 1,897 | |
| Perdoceo Education Corp.* (Diversified Consumer Services) | | | 357 | | | | 4,198 | |
| Perficient, Inc.* (IT Services) | | | 165 | | | | 21,333 | |
| Performance Food Group Co.* (Food & Staples Retailing) | | | 769 | | | | 35,289 | |
| Perpetua Resources Corp.* (Metals & Mining) | | | 165 | | | | 784 | |
| Personalis, Inc.* (Life Sciences Tools & Services) | | | 183 | | | | 2,611 | |
| Petiq, Inc.* (Health Care Providers & Services) | | | 137 | | | | 3,111 | |
| PetMed Express, Inc. (Internet & Direct Marketing Retail) | | | 103 | | | | 2,602 | |
| PGT Innovations, Inc.* (Building Products) | | | 292 | | | | 6,567 | |
| Phathom Pharmaceuticals, Inc.* (Pharmaceuticals) | | | 103 | | | | 2,026 | |
| Phibro Animal Health Corp.—Class A (Pharmaceuticals) | | | 104 | | | | 2,124 | |
| Phillips Edison & Co., Inc. (Equity Real Estate Investment Trusts) | | | 95 | | | | 3,139 | |
| Photronics, Inc.* (Semiconductors & Semiconductor Equipment) | | | 301 | | | | 5,674 | |
| Phreesia, Inc.* (Health Care Technology) | | | 252 | | | | 10,498 | |
| Physicians Realty Trust (Equity Real Estate Investment Trusts) | | | 1,118 | | | | 21,052 | |
| Piedmont Office Realty Trust, Inc.—Class A (Equity Real Estate Investment Trusts) | | | 629 | | | | 11,561 | |
| Ping Identity Holding Corp.* (Software) | | | 308 | | | | 7,047 | |
| Pioneer Bancorp, Inc.* (Thrifts & Mortgage Finance) | | | 59 | | | | 668 | |
| Piper Sandler Cos. (Capital Markets) | | | 89 | | | | 15,887 | |
| Pitney Bowes, Inc. (Commercial Services & Supplies) | | | 892 | | | | 5,914 | |
| PJT Partners, Inc.—Class A (Capital Markets) | | | 120 | | | | 8,891 | |
| Plantronics, Inc.* (Communications Equipment) | | | 214 | | | | 6,279 | |
| PlayAGS, Inc.* (Hotels, Restaurants & Leisure) | | | 139 | | | | 944 | |
| PLBY Group, Inc.* (Textiles, Apparel & Luxury Goods) | | | 146 | | | | 3,889 | |
| Plexus Corp.* (Electronic Equipment, Instruments & Components) | | | 142 | | | | 13,616 | |
| Pliant Therapeutics, Inc.* (Pharmaceuticals) | | | 122 | | | | 1,647 | |
| Plymouth Industrial REIT, Inc. (Equity Real Estate Investment Trusts) | | | 159 | | | | 5,088 | |
| PMV Pharmaceuticals, Inc.* (Pharmaceuticals) | | | 133 | | | | 3,072 | |
| PNM Resources, Inc. (Electric Utilities) | | | 434 | | | | 19,795 | |
| PolyMet Mining Corp.* (Metals & Mining) | | | 146 | | | | 365 | |
| Porch Group, Inc.* (Internet & Direct Marketing Retail) | | | 391 | | | | 6,096 | |
| Portage Biotech, Inc.* (Biotechnology) | | | 25 | | | | 268 | |
| Portillo's, Inc.*—Class A (Hotels, Restaurants & Leisure) | | | 119 | | | | 4,467 | |
| Portland General Electric Co. (Electric Utilities) | | | 456 | | | | 24,131 | |
| Poseida Therapeutics, Inc.* (Biotechnology) | | | 146 | | | | 994 | |
| Postal Realty Trust, Inc.—Class A (Equity Real Estate Investment Trusts) | | | 63 | | | | 1,247 | |
| PotlatchDeltic Corp. (Equity Real Estate Investment Trusts) | | | 335 | | | | 20,174 | |
| Powell Industries, Inc. (Electrical Equipment) | | | 46 | | | | 1,357 | |
| Power Integrations, Inc. (Semiconductors & Semiconductor Equipment) | | | 306 | | | | 28,424 | |
| PowerSchool Holdings, Inc.* (Diversified Consumer Services) | | | 273 | | | | 4,496 | |
| PRA Group, Inc.* (Consumer Finance) | | | 219 | | | | 10,996 | |
| Praxis Precision Medicines, Inc.* (Biotechnology) | | | 169 | | | | 3,329 | |
| Precigen, Inc.* (Biotechnology) | | | 481 | | | | 1,785 | |
| Precision BioSciences, Inc.* (Biotechnology) | | | 256 | | | | 1,894 | |
| Preferred Apartment Communities, Inc.— Class A (Equity Real Estate Investment Trusts) | | | 264 | | | | 4,768 | |
| Preferred Bank (Banks) | | | 70 | | | | 5,025 | |
| Preformed Line Products Co. (Electrical Equipment) | | | 15 | | | | 971 | |
| Prelude Therapeutics, Inc.* (Biotechnology) | | | 55 | | | | 685 | |
| Premier Financial Corp. (Thrifts & Mortgage Finance) | | | 188 | | | | 5,811 | |
| Prestige Consumer Healthcare, Inc.* (Pharmaceuticals) | | | 254 | | | | 15,405 | |
| PriceSmart, Inc. (Food & Staples Retailing) | | | 119 | | | | 8,707 | |
| Primis Financial Corp. (Banks) | | | 122 | | | | 1,835 | |
| Primo Water Corp. (Beverages) | | | 797 | | | | 14,051 | |
| Primoris Services Corp. (Construction & Engineering) | | | 271 | | | | 6,499 | |
| Priority Technology Holdings, Inc.* (IT Services) | | | 52 | | | | 368 | |
| Privia Health Group, Inc.* (Health Care Providers & Services) | | | 82 | | | | 2,121 | |
See accompanying notes to financial statements.
Financial Statements :: ProFund VP UltraSmall-Cap :: 363
Common Stocks, continued
| | | Shares | | | Value | |
| ProAssurance Corp. (Insurance) | | | 273 | | | $ | 6,907 | |
| PROCEPT BioRobotics Corp.* (Health Care Equipment & Supplies) | | | 37 | | | | 925 | |
| PROG Holdings, Inc.* (Consumer Finance) | | | 330 | | | | 14,886 | |
| Progress Software Corp. (Software) | | | 223 | | | | 10,764 | |
| Progyny, Inc.* (Health Care Providers & Services) | | | 327 | | | | 16,464 | |
| Prometheus Biosciences, Inc.* (Biotechnology) | | | 152 | | | | 6,010 | |
| ProPetro Holding Corp.* (Energy Equipment & Services) | | | 437 | | | | 3,540 | |
| PROS Holdings, Inc.* (Software) | | | 203 | | | | 7,001 | |
| Protagonist Therapeutics, Inc.* (Biotechnology) | | | 227 | | | | 7,763 | |
| Prothena Corp. PLC* (Biotechnology) | | | 183 | | | | 9,040 | |
| Proto Labs, Inc.* (Machinery) | | | 141 | | | | 7,240 | |
| Provention Bio, Inc.* (Pharmaceuticals) | | | 281 | | | | 1,579 | |
| Provident BanCorp, Inc. (Thrifts & Mortgage Finance) | | | 78 | | | | 1,451 | |
| Provident Financial Services, Inc. (Thrifts & Mortgage Finance) | | | 385 | | | | 9,325 | |
| PS Business Parks, Inc. (Equity Real Estate Investment Trusts) | | | 102 | | | | 18,785 | |
| PTC Therapeutics, Inc.* (Biotechnology) | | | 352 | | | | 14,020 | |
| Pulmonx Corp.* (Health Care Equipment & Supplies) | | | 132 | | | | 4,233 | |
| Pulse Biosciences, Inc.* (Health Care Equipment & Supplies) | | | 71 | | | | 1,052 | |
| Puma Biotechnology, Inc.* (Biotechnology) | | | 164 | | | | 499 | |
| Pure Cycle Corp.* (Water Utilities) | | | 98 | | | | 1,431 | |
| PureCycle Technologies, Inc.* (Chemicals) | | | 271 | | | | 2,593 | |
| Purple Innovation, Inc.* (Household Durables) | | | 292 | | | | 3,875 | |
| Pyxis Oncology, Inc.* (Biotechnology) | | | 54 | | | | 592 | |
| Pzena Investment Management, Inc.—Class A (Capital Markets) | | | 84 | | | | 795 | |
| Q2 Holdings, Inc.* (Software) | | | 277 | | | | 22,005 | |
| QCR Holdings, Inc. (Banks) | | | 77 | | | | 4,312 | |
| Quaker Chemical Corp. (Chemicals) | | | 68 | | | | 15,693 | |
| Qualys, Inc.* (Software) | | | 173 | | | | 23,739 | |
| Quanex Building Products Corp. (Building Products) | | | 170 | | | | 4,213 | |
| Quanterix Corp.* (Life Sciences Tools & Services) | | | 156 | | | | 6,614 | |
| Quantum Corp.* (Technology Hardware, Storage & Peripherals) | | | 296 | | | | 1,634 | |
| QuinStreet, Inc.* (Interactive Media & Services) | | | 255 | | | | 4,638 | |
| Quotient Technology, Inc.* (Internet & Direct Marketing Retail) | | | 456 | | | | 3,384 | |
| Quotient, Ltd.* (Health Care Equipment & Supplies) | | | 398 | | | | 1,031 | |
| R. R. Donnelley & Sons Co.* (Commercial Services & Supplies) | | | 359 | | | | 4,042 | |
| R1 RCM, Inc.* (Health Care Providers & Services) | | | 602 | | | | 15,345 | |
| Rackspace Technology, Inc.* (IT Services) | | | 277 | | | | 3,731 | |
| Radian Group, Inc. (Thrifts & Mortgage Finance) | | | 914 | | | | 19,313 | |
| Radiant Logistics, Inc.* (Air Freight & Logistics) | | | 199 | | | | 1,451 | |
| Radius Global Infrastructure, Inc.*—Class A (Diversified Telecommunication Services) | | | 299 | | | | 4,814 | |
| Radius Health, Inc.* (Biotechnology) | | | 237 | | | | 1,640 | |
| RadNet, Inc.* (Health Care Providers & Services) | | | 230 | | | | 6,925 | |
| Rafael Holdings, Inc.*—Class B (Real Estate Management & Development) | | | 49 | | | | 250 | |
| Rain Therapeutics, Inc.* (Biotechnology) | | | 81 | | | | 1,043 | |
| Rallybio Corp.* (Biotechnology) | | | 36 | | | | 343 | |
| Rambus, Inc.* (Semiconductors & Semiconductor Equipment) | | | 550 | | | | 16,165 | |
| Range Resources Corp.* (Oil, Gas & Consumable Fuels) | | | 1,212 | | | | 21,610 | |
| Ranger Oil Corp.* (Oil, Gas & Consumable Fuels) | | | 108 | | | | 2,907 | |
| Ranpak Holdings Corp.* (Containers & Packaging) | | | 191 | | | | 7,178 | |
| Rapid Micro Biosystems, Inc.*—Class A (Life Sciences Tools & Services) | | | 42 | | | | 447 | |
| Rapid7, Inc.* (Software) | | | 285 | | | | 33,541 | |
| RAPT Therapeutics, Inc.* (Biotechnology) | | | 108 | | | | 3,967 | |
| Rayonier Advanced Materials, Inc.* (Chemicals) | | | 313 | | | | 1,787 | |
| RBB Bancorp (Banks) | | | 71 | | | | 1,860 | |
| RBC Bearings, Inc.* (Machinery) | | | 142 | | | | 28,679 | |
| RCI Hospitality Holdings, Inc. (Hotels, Restaurants & Leisure) | | | 42 | | | | 3,271 | |
| Ready Capital Corp. (Mortgage Real Estate Investment Trusts) | | | 303 | | | | 4,736 | |
| Realogy Holdings Corp.* (Real Estate Management & Development) | | | 584 | | | | 9,817 | |
| Reata Pharmaceuticals, Inc.*—Class A (Pharmaceuticals) | | | 139 | | | | 3,665 | |
| Recursion Pharmaceuticals, Inc.*—Class A (Biotechnology) | | | 584 | | | | 10,004 | |
| Red River Bancshares, Inc. (Banks) | | | 23 | | | | 1,231 | |
| Red Robin Gourmet Burgers, Inc.* (Hotels, Restaurants & Leisure) | | | 79 | | | | 1,306 | |
| Red Rock Resorts, Inc.—Class A (Hotels, Restaurants & Leisure) | | | 302 | | | | 16,613 | |
| Redfin Corp.* (Real Estate Management & Development) | | | 523 | | | | 20,079 | |
| Redwood Trust, Inc. (Mortgage Real Estate Investment Trusts) | | | 582 | | | | 7,677 | |
| REGENXBIO, Inc.* (Biotechnology) | | | 200 | | | | 6,540 | |
| Regional Management Corp. (Consumer Finance) | | | 39 | | | | 2,241 | |
| Regis Corp.* (Diversified Consumer Services) | | | 217 | | | | 378 | |
| Rekor Systems, Inc.* (Professional Services) | | | 171 | | | | 1,120 | |
| Relay Therapeutics, Inc.* (Biotechnology) | | | 355 | | | | 10,902 | |
| Relmada Therapeutics, Inc.* (Pharmaceuticals) | | | 79 | | | | 1,780 | |
| Remitly Global, Inc.* (IT Services) | | | 62 | | | | 1,278 | |
| Renasant Corp. (Banks) | | | 277 | | | | 10,512 | |
| Reneo Pharmaceuticals, Inc.* (Biotechnology) | | | 44 | | | | 376 | |
| Renewable Energy Group, Inc.* (Oil, Gas & Consumable Fuels) | | | 227 | | | | 9,634 | |
| Rent The Runway, Inc.*—Class A (Internet & Direct Marketing Retail) | | | 87 | | | | 709 | |
| Rent-A-Center, Inc. (Specialty Retail) | | | 334 | | | | 16,045 | |
| Repay Holdings Corp.* (IT Services) | | | 439 | | | | 8,021 | |
| Replimune Group, Inc.* (Biotechnology) | | | 151 | | | | 4,092 | |
| Republic Bancorp, Inc.—Class A (Banks) | | | 47 | | | | 2,389 | |
| Republic First Bancorp, Inc.* (Banks) | | | 227 | | | | 844 | |
| Resideo Technologies, Inc.* (Building Products) | | | 733 | | | | 19,080 | |
| Resources Connection, Inc. (Professional Services) | | | 162 | | | | 2,890 | |
| Retail Opportunity Investments Corp. (Equity Real Estate Investment Trusts) | | | 603 | | | | 11,819 | |
| Retail Value, Inc. (Equity Real Estate Investment Trusts) | | | 88 | | | | 565 | |
See accompanying notes to financial statements.
364 :: ProFund VP UltraSmall-Cap :: Financial Statements
Common Stocks, continued
| | | Shares | | | Value | |
| Retractable Technologies, Inc.* (Health Care Equipment & Supplies) | | | 88 | | | $ | 610 | |
| REV Group, Inc. (Machinery) | | | 144 | | | | 2,038 | |
| Revance Therapeutics, Inc.* (Pharmaceuticals) | | | 356 | | | | 5,810 | |
| Revlon, Inc.*—Class A (Personal Products) | | | 36 | | | | 408 | |
| REVOLUTION Medicines, Inc.* (Biotechnology) | | | 301 | | | | 7,576 | |
| Revolve Group, Inc.* (Internet & Direct Marketing Retail) | | | 182 | | | | 10,199 | |
| REX American Resources Corp.* (Oil, Gas & Consumable Fuels) | | | 27 | | | | 2,592 | |
| Rhythm Pharmaceuticals, Inc.* (Biotechnology) | | | 223 | | | | 2,226 | |
| Ribbon Communications, Inc.* (Communications Equipment) | | | 357 | | | | 2,160 | |
| Rigel Pharmaceuticals, Inc.* (Biotechnology) | | | 866 | | | | 2,295 | |
| Riley Exploration Permian, Inc. (Oil, Gas & Consumable Fuels) | | | 13 | | | | 251 | |
| Rimini Street, Inc.* (Software) | | | 227 | | | | 1,355 | |
| Riot Blockchain, Inc.*(a) (Software) | | | 451 | | | | 10,071 | |
| Rite Aid Corp.* (Food & Staples Retailing) | | | 282 | | | | 4,143 | |
| RLI Corp. (Insurance) | | | 203 | | | | 22,756 | |
| RLJ Lodging Trust (Equity Real Estate Investment Trusts) | | | 839 | | | | 11,687 | |
| Rocket Pharmaceuticals, Inc.* (Biotechnology) | | | 209 | | | | 4,562 | |
| Rocky Brands, Inc. (Textiles, Apparel & Luxury Goods) | | | 35 | | | | 1,393 | |
| Rogers Corp.* (Electronic Equipment, Instruments & Components) | | | 95 | | | | 25,935 | |
| Romeo Power, Inc.* (Electrical Equipment) | | | 656 | | | | 2,394 | |
| RPC, Inc.* (Energy Equipment & Services) | | | 343 | | | | 1,557 | |
| RPT Realty (Equity Real Estate Investment Trusts) | | | 425 | | | | 5,687 | |
| Rubius Therapeutics, Inc.* (Biotechnology) | | | 233 | | | | 2,255 | |
| Rush Enterprises, Inc.—Class A (Trading Companies & Distributors) | | | 214 | | | | 11,907 | |
| Rush Enterprises, Inc.—Class B (Trading Companies & Distributors) | | | 33 | | | | 1,781 | |
| Rush Street Interactive, Inc.* (Hotels, Restaurants & Leisure) | | | 267 | | | | 4,406 | |
| Ruth's Hospitality Group, Inc.* (Hotels, Restaurants & Leisure) | | | 168 | | | | 3,343 | |
| RxSight, Inc.* (Health Care Equipment & Supplies) | | | 42 | | | | 473 | |
| Ryerson Holding Corp. (Metals & Mining) | | | 83 | | | | 2,162 | |
| Ryman Hospitality Properties, Inc.*—Class I (Equity Real Estate Investment Trusts) | | | 273 | | | | 25,105 | |
| S&T Bancorp, Inc. (Banks) | | | 197 | | | | 6,209 | |
| Sabra Health Care REIT, Inc. (Equity Real Estate Investment Trusts) | | | 1,158 | | | | 15,679 | |
| Safe Bulkers, Inc.* (Marine) | | | 321 | | | | 1,210 | |
| Safehold, Inc. (Equity Real Estate Investment Trusts) | | | 105 | | | | 8,384 | |
| Safety Insurance Group, Inc. (Insurance) | | | 73 | | | | 6,207 | |
| Saia, Inc.* (Road & Rail) | | | 135 | | | | 45,499 | |
| Sailpoint Technologies Holding, Inc.* (Software) | | | 464 | | | | 22,430 | |
| Sally Beauty Holdings, Inc.* (Specialty Retail) | | | 571 | | | | 10,541 | |
| Sana Biotechnology, Inc.* (Biotechnology) | | | 438 | | | | 6,780 | |
| Sanderson Farms, Inc. (Food Products) | | | 103 | | | | 19,681 | |
| Sandy Spring Bancorp, Inc. (Banks) | | | 227 | | | | 10,914 | |
| Sangamo Therapeutics, Inc.* (Biotechnology) | | | 602 | | | | 4,515 | |
| Sanmina Corp.* (Electronic Equipment, Instruments & Components) | | | 322 | | | | 13,350 | |
| Sapiens International Corp. N.V. (Software) | | | 157 | | | | 5,409 | |
| Saul Centers, Inc. (Equity Real Estate Investment Trusts) | | | 60 | | | | 3,181 | |
| ScanSource, Inc.* (Electronic Equipment, Instruments & Components) | | | 128 | | | | 4,490 | |
| Schnitzer Steel Industries, Inc.—Class A (Metals & Mining) | | | 131 | | | | 6,802 | |
| Scholar Rock Holding Corp.* (Biotechnology) | | | 143 | | | | 3,552 | |
| Scholastic Corp. (Media) | | | 134 | | | | 5,355 | |
| Schrodinger, Inc.* (Health Care Technology) | | | 230 | | | | 8,011 | |
| Schweitzer-Mauduit International, Inc. (Paper & Forest Products) | | | 159 | | | | 4,754 | |
| Scientific Games Corp.* (Hotels, Restaurants & Leisure) | | | 488 | | | | 32,612 | |
| Scorpio Tankers, Inc. (Oil, Gas & Consumable Fuels) | | | 247 | | | | 3,164 | |
| Sculptor Capital Management, Inc. (Capital Markets) | | | 112 | | | | 2,391 | |
| Seacoast Banking Corporation of Florida (Banks) | | | 264 | | | | 9,343 | |
| SeaSpine Holdings Corp.* (Health Care Equipment & Supplies) | | | 161 | | | | 2,193 | |
| SeaWorld Entertainment, Inc.* (Hotels, Restaurants & Leisure) | | | 261 | | | | 16,928 | |
| SecureWorks Corp.*—Class A (Software) | | | 51 | | | | 814 | |
| Seelos Therapeutics, Inc.* (Pharmaceuticals) | | | 498 | | | | 812 | |
| Seer, Inc.* (Life Sciences Tools & Services) | | | 211 | | | | 4,813 | |
| Select Energy Services, Inc.* (Energy Equipment & Services) | | | 317 | | | | 1,975 | |
| Select Medical Holdings Corp. (Health Care Providers & Services) | | | 560 | | | | 16,464 | |
| Selecta Biosciences, Inc.* (Biotechnology) | | | 467 | | | | 1,522 | |
| Selective Insurance Group, Inc. (Insurance) | | | 301 | | | | 24,664 | |
| Selectquote, Inc.* (Insurance) | | | 680 | | | | 6,161 | |
| Semtech Corp.* (Semiconductors & Semiconductor Equipment) | | | 328 | | | | 29,170 | |
| Seneca Foods Corp.*—Class A (Food Products) | | | 31 | | | | 1,486 | |
| Sensei Biotherapeutics, Inc.* (Biotechnology) | | | 106 | | | | 615 | |
| Senseonics Holdings, Inc.* (Health Care Equipment & Supplies) | | | 2,191 | | | | 5,850 | |
| Sensient Technologies Corp. (Chemicals) | | | 214 | | | | 21,413 | |
| Sera Prognostics, Inc.*—Class A (Biotechnology) | | | 23 | | | | 158 | |
| Seres Therapeutics, Inc.* (Biotechnology) | | | 353 | | | | 2,940 | |
| Seritage Growth Properties*—Class A (Equity Real Estate Investment Trusts) | | | 189 | | | | 2,508 | |
| Service Properties Trust (Equity Real Estate Investment Trusts) | | | 832 | | | | 7,313 | |
| ServisFirst Bancshares, Inc. (Banks) | | | 253 | | | | 21,490 | |
| Sesen Bio, Inc.*(a) (Biotechnology) | | | 1,021 | | | | 832 | |
| SFL Corp., Ltd. (Oil, Gas & Consumable Fuels) | | | 629 | | | | 5,126 | |
| Shake Shack, Inc.*—Class A (Hotels, Restaurants & Leisure) | | | 190 | | | | 13,710 | |
| Sharps Compliance Corp.* (Health Care Providers & Services) | | | 94 | | | | 670 | |
| Shattuck Labs, Inc.* (Biotechnology) | | | 135 | | | | 1,149 | |
| Shenandoah Telecommunications Co. (Wireless Telecommunication Services) | | | 245 | | | | 6,248 | |
| Shift Technologies, Inc.* (Specialty Retail) | | | 315 | | | | 1,074 | |
| Shockwave Medical, Inc.* (Health Care Equipment & Supplies) | | | 171 | | | | 30,494 | |
| Shoe Carnival, Inc. (Specialty Retail) | | | 90 | | | | 3,517 | |
| ShotSpotter, Inc.* (Software) | | | 43 | | | | 1,269 | |
See accompanying notes to financial statements.
Financial Statements :: ProFund VP UltraSmall-Cap :: 365
Common Stocks, continued
| | | Shares | | | Value | |
| Shutterstock, Inc. (Internet & Direct Marketing Retail) | | | 119 | | | $ | 13,194 | |
| SI-BONE, Inc.* (Health Care Equipment & Supplies) | | | 165 | | | | 3,665 | |
| Sientra, Inc.* (Health Care Equipment & Supplies) | | | 294 | | | | 1,079 | |
| Sierra Bancorp (Banks) | | | 71 | | | | 1,928 | |
| SIGA Technologies, Inc.* (Pharmaceuticals) | | | 245 | | | | 1,842 | |
| Sight Sciences, Inc.* (Health Care Equipment & Supplies) | | | 56 | | | | 984 | |
| Sigilon Therapeutics, Inc.* (Biotechnology) | | | 77 | | | | 213 | |
| Signet Jewelers, Ltd. (Specialty Retail) | | | 268 | | | | 23,324 | |
| Silicon Laboratories, Inc.* (Semiconductors & Semiconductor Equipment) | | | 202 | | | | 41,698 | |
| Silk Road Medical, Inc.* (Health Care Equipment & Supplies) | | | 174 | | | | 7,414 | |
| Silverback Therapeutics, Inc.* (Biotechnology) | | | 104 | | | | 693 | |
| Silvergate Capital Corp.*—Class A (Banks) | | | 140 | | | | 20,748 | |
| Simmons First National Corp.—Class A (Banks) | | | 577 | | | | 17,068 | |
| Simpson Manufacturing Co., Inc. (Building Products) | | | 221 | | | | 30,734 | |
| Simulations Plus, Inc. (Health Care Technology) | | | 78 | | | | 3,689 | |
| Sinclair Broadcast Group, Inc.—Class A (Media) | | | 233 | | | | 6,158 | |
| Singular Genomics Systems, Inc.* (Life Sciences Tools & Services) | | | 61 | | | | 705 | |
| SiriusPoint, Ltd.* (Insurance) | | | 449 | | | | 3,650 | |
| SITE Centers Corp. (Equity Real Estate Investment Trusts) | | | 879 | | | | 13,915 | |
| SiTime Corp.* (Semiconductors & Semiconductor Equipment) | | | 81 | | | | 23,696 | |
| SJW Corp. (Water Utilities) | | | 140 | | | | 10,248 | |
| Skyline Champion Corp.* (Household Durables) | | | 266 | | | | 21,009 | |
| SkyWater Technology, Inc.* (Semiconductors & Semiconductor Equipment) | | | 41 | | | | 665 | |
| SkyWest, Inc.* (Airlines) | | | 253 | | | | 9,943 | |
| Sleep Number Corp.* (Specialty Retail) | | | 112 | | | | 8,579 | |
| SM Energy Co. (Oil, Gas & Consumable Fuels) | | | 608 | | | | 17,924 | |
| SMART Global Holdings, Inc.* (Semiconductors & Semiconductor Equipment) | | | 89 | | | | 6,318 | |
| SmartFinancial, Inc. (Banks) | | | 70 | | | | 1,915 | |
| Smith & Wesson Brands, Inc. (Leisure Products) | | | 243 | | | | 4,325 | |
| Smith Micro Software, Inc.* (Software) | | | 234 | | | | 1,151 | |
| Snap One Holdings Corp.* (Household Durables) | | | 68 | | | | 1,433 | |
| SOC Telemed, Inc.* (Health Care Providers & Services) | | | 308 | | | | 394 | |
| Society Pass, Inc.* (Interactive Media & Services) | | | 16 | | | | 167 | |
| Solaris Oilfield Infrastructure, Inc. (Energy Equipment & Services) | | | 159 | | | | 1,041 | |
| Solid Biosciences, Inc.* (Biotechnology) | | | 302 | | | | 529 | |
| Solo Brands, Inc.*—Class A (Leisure Products) | | | 59 | | | | 922 | |
| Sonic Automotive, Inc.—Class A (Specialty Retail) | | | 110 | | | | 5,440 | |
| Sonos, Inc.* (Household Durables) | | | 610 | | | | 18,178 | |
| Sorrento Therapeutics, Inc.* (Biotechnology) | | | 1,515 | | | | 7,045 | |
| South Jersey Industries, Inc. (Gas Utilities) | | | 522 | | | | 13,635 | |
| South Plains Financial, Inc. (Banks) | | | 53 | | | | 1,474 | |
| Southern First Bancshares, Inc.* (Banks) | | | 38 | | | | 2,375 | |
| Southern Missouri Bancorp, Inc. (Thrifts & Mortgage Finance) | | | 39 | | | | 2,035 | |
| Southside Bancshares, Inc. (Banks) | | | 158 | | | | 6,608 | |
| SouthState Corp. (Banks) | | | 354 | | | | 28,360 | |
| Southwest Gas Holdings, Inc. (Gas Utilities) | | | 306 | | | | 21,436 | |
| Southwestern Energy Co.* (Oil, Gas & Consumable Fuels) | | | 5,153 | | | | 24,013 | |
| Sovos Brands, Inc.* (Food Products) | | | 130 | | | | 1,957 | |
| SP Plus Corp.* (Commercial Services & Supplies) | | | 117 | | | | 3,302 | |
| SpartanNash Co. (Food & Staples Retailing) | | | 182 | | | | 4,688 | |
| Spectrum Pharmaceuticals, Inc.* (Biotechnology) | | | 827 | | | | 1,050 | |
| Spero Therapeutics, Inc.* (Biotechnology) | | | 123 | | | | 1,969 | |
| Spire, Inc. (Gas Utilities) | | | 257 | | | | 16,762 | |
| Spirit Airlines, Inc.* (Airlines) | | | 499 | | | | 10,903 | |
| Spirit of Texas Bancshares, Inc. (Banks) | | | 65 | | | | 1,871 | |
| Sportsman's Warehouse Holdings, Inc.* (Specialty Retail) | | | 221 | | | | 2,608 | |
| SpringWorks Therapeutics, Inc.* (Biotechnology) | | | 148 | | | | 9,173 | |
| Sprout Social, Inc.*—Class A (Software) | | | 229 | | | | 20,768 | |
| Sprouts Farmers Market, Inc.* (Food & Staples Retailing) | | | 572 | | | | 16,977 | |
| Spruce Biosciences, Inc.* (Biotechnology) | | | 44 | | | | 196 | |
| SPS Commerce, Inc.* (Software) | | | 183 | | | | 26,050 | |
| SPX Corp.* (Machinery) | | | 222 | | | | 13,249 | |
| SPX FLOW, Inc. (Machinery) | | | 211 | | | | 18,247 | |
| SQZ Biotechnologies Co.* (Biotechnology) | | | 115 | | | | 1,027 | |
| STAAR Surgical Co.* (Health Care Equipment & Supplies) | | | 241 | | | | 22,003 | |
| STAG Industrial, Inc. (Equity Real Estate Investment Trusts) | | | 894 | | | | 42,875 | |
| Stagwell, Inc.* (Media) | | | 313 | | | | 2,714 | |
| Standard Motor Products, Inc. (Auto Components) | | | 106 | | | | 5,553 | |
| Standex International Corp. (Machinery) | | | 61 | | | | 6,750 | |
| Startek, Inc.* (IT Services) | | | 85 | | | | 444 | |
| State Auto Financial Corp. (Insurance) | | | 90 | | | | 4,652 | |
| Steelcase, Inc.—Class A (Commercial Services & Supplies) | | | 441 | | | | 5,169 | |
| Stem, Inc.* (Electrical Equipment) | | | 578 | | | | 10,965 | |
| Stepan Co. (Chemicals) | | | 109 | | | | 13,548 | |
| StepStone Group, Inc.—Class A (Capital Markets) | | | 205 | | | | 8,522 | |
| Stereotaxis, Inc.* (Health Care Equipment & Supplies) | | | 252 | | | | 1,562 | |
| Sterling Check Corp.* (Professional Services) | | | 84 | | | | 1,723 | |
| Sterling Construction Co., Inc.* (Construction & Engineering) | | | 141 | | | | 3,708 | |
| Steven Madden, Ltd. (Textiles, Apparel & Luxury Goods) | | | 409 | | | | 19,006 | |
| Stewart Information Services Corp. (Insurance) | | | 135 | | | | 10,764 | |
| Stitch Fix, Inc.*—Class A (Internet & Direct Marketing Retail) | | | 413 | | | | 7,814 | |
| Stock Yards Bancorp, Inc. (Banks) | | | 122 | | | | 7,793 | |
| Stoke Therapeutics, Inc.* (Biotechnology) | | | 97 | | | | 2,327 | |
| StoneMor, Inc.* (Diversified Consumer Services) | | | 163 | | | | 372 | |
| Stoneridge, Inc.* (Auto Components) | | | 132 | | | | 2,606 | |
| StoneX Group, Inc.* (Capital Markets) | | | 85 | | | | 5,206 | |
| Strategic Education, Inc. (Diversified Consumer Services) | | | 124 | | | | 7,172 | |
| Stride, Inc.* (Diversified Consumer Services) | | | 210 | | | | 6,999 | |
See accompanying notes to financial statements.
366 :: ProFund VP UltraSmall-Cap :: Financial Statements
Common Stocks, continued
| | | Shares | | | Value | |
| Stronghold Digital Mining, Inc.*—Class A (Software) | | | 37 | | | $ | 475 | |
| Sturm Ruger & Co., Inc. (Leisure Products) | | | 87 | | | | 5,918 | |
| Summit Financial Group, Inc. (Banks) | | | 58 | | | | 1,592 | |
| Summit Hotel Properties, Inc.* (Equity Real Estate Investment Trusts) | | | 526 | | | | 5,134 | |
| Summit Materials, Inc.*—Class A (Construction Materials) | | | 602 | | | | 24,165 | |
| Summit Therapeutics, Inc.* (Biotechnology) | | | 134 | | | | 360 | |
| Sumo Logic, Inc.* (Software) | | | 445 | | | | 6,034 | |
| Sun Country Airlines Holdings, Inc.* (Airlines) | | | 163 | | | | 4,442 | |
| SunCoke Energy, Inc. (Metals & Mining) | | | 422 | | | | 2,781 | |
| Sunnova Energy International, Inc.* (Independent Power and Renewable Electricity Producers) | | | 436 | | | | 12,173 | |
| SunPower Corp.* (Semiconductors & Semiconductor Equipment) | | | 406 | | | | 8,473 | |
| Sunstone Hotel Investors, Inc.* (Equity Real Estate Investment Trusts) | | | 1,104 | | | | 12,950 | |
| Super Micro Computer, Inc.* (Technology Hardware, Storage & Peripherals) | | | 222 | | | | 9,758 | |
| Superior Group of Cos., Inc. (Textiles, Apparel & Luxury Goods) | | | 60 | | | | 1,316 | |
| Supernus Pharmaceuticals, Inc.* (Pharmaceuticals) | | | 249 | | | | 7,261 | |
| Surface Oncology, Inc.* (Biotechnology) | | | 179 | | | | 856 | |
| Surgery Partners, Inc.* (Health Care Providers & Services) | | | 172 | | | | 9,187 | |
| Surmodics, Inc.* (Health Care Equipment & Supplies) | | | 69 | | | | 3,322 | |
| Sutro BioPharma, Inc.* (Biotechnology) | | | 220 | | | | 3,274 | |
| Synaptics, Inc.* (Semiconductors & Semiconductor Equipment) | | | 199 | | | | 57,613 | |
| Syndax Pharmaceuticals, Inc.* (Biotechnology) | | | 228 | | | | 4,991 | |
| Syros Pharmaceuticals, Inc.* (Biotechnology) | | | 292 | | | | 952 | |
| Tabula Rasa HealthCare, Inc.* (Health Care Technology) | | | 114 | | | | 1,710 | |
| Tactile Systems Technology, Inc.* (Health Care Equipment & Supplies) | | | 97 | | | | 1,846 | |
| Talaris Therapeutics, Inc.* (Biotechnology) | | | 108 | | | | 1,651 | |
| Talis Biomedical Corp.* (Health Care Equipment & Supplies) | | | 73 | | | | 293 | |
| Talos Energy, Inc.* (Oil, Gas & Consumable Fuels) | | | 187 | | | | 1,833 | |
| Tanger Factory Outlet Centers, Inc. (Equity Real Estate Investment Trusts) | | | 519 | | | | 10,006 | |
| Target Hospitality Corp.* (Hotels, Restaurants & Leisure) | | | 126 | | | | 449 | |
| Tarsus Pharmaceuticals, Inc.* (Pharmaceuticals) | | | 43 | | | | 968 | |
| Tattooed Chef, Inc.*(a) (Food Products) | | | 239 | | | | 3,714 | |
| Taylor Morrison Home Corp.* (Household Durables) | | | 607 | | | | 21,221 | |
| Taysha Gene Therapies, Inc.* (Biotechnology) | | | 115 | | | | 1,340 | |
| TCR2 Therapeutics, Inc.* (Biotechnology) | | | 155 | | | | 722 | |
| Team, Inc.* (Commercial Services & Supplies) | | | 134 | | | | 146 | |
| TechTarget, Inc.* (Media) | | | 132 | | | | 12,627 | |
| Teekay Corp.* (Oil, Gas & Consumable Fuels) | | | 352 | | | | 1,105 | |
| Teekay Tankers, Ltd.*—Class A (Oil, Gas & Consumable Fuels) | | | 121 | | | | 1,319 | |
| TEGNA, Inc. (Media) | | | 1,121 | | | | 20,805 | |
| Tejon Ranch Co.* (Real Estate Management & Development) | | | 106 | | | | 2,022 | |
| Telephone and Data Systems, Inc. (Wireless Telecommunication Services) | | | 512 | | | | 10,316 | |
| Telesat Corp.* (Diversified Telecommunication Services) | | | 65 | | | | 1,864 | |
| Tellurian, Inc.* (Oil, Gas & Consumable Fuels) | | | 1,873 | | | | 5,769 | |
| Telos Corp.* (Software) | | | 202 | | | | 3,115 | |
| Tenable Holdings, Inc.* (Software) | | | 468 | | | | 25,773 | |
| Tenaya Therapeutics, Inc.* (Biotechnology) | | | 71 | | | | 1,345 | |
| Tenet Healthcare Corp.* (Health Care Providers & Services) | | | 539 | | | | 44,031 | |
| Tennant Co. (Machinery) | | | 94 | | | | 7,618 | |
| Tenneco, Inc.* (Auto Components) | | | 345 | | | | 3,899 | |
| Terex Corp. (Machinery) | | | 347 | | | | 15,251 | |
| Terns Pharmaceuticals, Inc.* (Pharmaceuticals) | | | 70 | | | | 495 | |
| Terreno Realty Corp. (Equity Real Estate Investment Trusts) | | | 374 | | | | 31,898 | |
| Tetra Tech, Inc. (Commercial Services & Supplies) | | | 273 | | | | 46,355 | |
| TETRA Technologies, Inc.* (Energy Equipment & Services) | | | 622 | | | | 1,766 | |
| Texas Capital Bancshares, Inc.* (Banks) | | | 257 | | | | 15,484 | |
| Texas Roadhouse, Inc.—Class A (Hotels, Restaurants & Leisure) | | | 355 | | | | 31,693 | |
| Textainer Group Holdings, Ltd. (Trading Companies & Distributors) | | | 239 | | | | 8,535 | |
| TG Therapeutics, Inc.* (Biotechnology) | | | 657 | | | | 12,483 | |
| The Andersons, Inc. (Food & Staples Retailing) | | | 160 | | | | 6,194 | |
| The Bancorp, Inc.* (Banks) | | | 265 | | | | 6,707 | |
| The Bank of Nt Butterfield & Son, Ltd. (Banks) | | | 254 | | | | 9,680 | |
| The Brink's Co. (Commercial Services & Supplies) | | | 244 | | | | 15,999 | |
| The Buckle, Inc. (Specialty Retail) | | | 151 | | | | 6,389 | |
| The Cato Corp.—Class A (Specialty Retail) | | | 100 | | | | 1,716 | |
| The Cheesecake Factory, Inc.* (Hotels, Restaurants & Leisure) | | | 234 | | | | 9,161 | |
| The Children's Place, Inc.* (Specialty Retail) | | | 71 | | | | 5,630 | |
| The Container Store Group, Inc.* (Specialty Retail) | | | 161 | | | | 1,607 | |
| The E.W. Scripps Co.*—Class A (Media) | | | 291 | | | | 5,631 | |
| The Ensign Group, Inc. (Health Care Providers & Services) | | | 266 | | | | 22,333 | |
| The First Bancorp, Inc. (Banks) | | | 52 | | | | 1,633 | |
| The GEO Group, Inc. (Equity Real Estate Investment Trusts) | | | 597 | | | | 4,627 | |
| The Goodyear Tire & Rubber Co.* (Auto Components) | | | 1,402 | | | | 29,891 | |
| The Greenbrier Cos., Inc. (Machinery) | | | 162 | | | | 7,434 | |
| The Hackett Group, Inc. (IT Services) | | | 125 | | | | 2,566 | |
| The Joint Corp.* (Health Care Providers & Services) | | | 70 | | | | 4,598 | |
| The Lovesac Co.* (Household Durables) | | | 65 | | | | 4,307 | |
| The Macerich Co. (Equity Real Estate Investment Trusts) | | | 1,084 | | | | 18,732 | |
| The Manitowoc Co., Inc.* (Machinery) | | | 174 | | | | 3,235 | |
| The Marcus Corp.* (Entertainment) | | | 116 | | | | 2,072 | |
| The ODP Corp.* (Specialty Retail) | | | 234 | | | | 9,192 | |
| The Pennant Group, Inc.* (Health Care Providers & Services) | | | 130 | | | | 3,000 | |
See accompanying notes to financial statements.
Financial Statements :: ProFund VP UltraSmall-Cap :: 367
Common Stocks, continued
| | | Shares | | | Value | |
| The RealReal, Inc.* (Internet & Direct Marketing Retail) | | | 406 | | | $ | 4,714 | |
| The RMR Group, Inc.—Class A (Real Estate Management & Development) | | | 77 | | | | 2,670 | |
| The Shyft Group, Inc. (Machinery) | | | 176 | | | | 8,647 | |
| The Simply Good Foods Co.* (Food Products) | | | 432 | | | | 17,958 | |
| The St Joe Co. (Real Estate Management & Development) | | | 169 | | | | 8,796 | |
| The Vita Coco Co., Inc.* (Beverages) | | | 56 | | | | 626 | |
| TherapeuticsMD, Inc.* (Pharmaceuticals) | | | 1,977 | | | | 703 | |
| Theravance Biopharma, Inc.* (Pharmaceuticals) | | | 304 | | | | 3,359 | |
| Thermon Group Holdings, Inc.* (Electrical Equipment) | | | 167 | | | | 2,827 | |
| Theseus Pharmaceuticals, Inc.* (Pharmaceuticals) | | | 58 | | | | 735 | |
| Third Coast Bancshares, Inc.* (Banks) | | | 18 | | | | 468 | |
| Thorne HealthTech, Inc.* (Personal Products) | | | 34 | | | | 211 | |
| Thryv Holdings, Inc.* (Media) | | | 39 | | | | 1,604 | |
| Tidewater, Inc.* (Energy Equipment & Services) | | | 208 | | | | 2,228 | |
| Tilly's, Inc.—Class A (Specialty Retail) | | | 115 | | | | 1,853 | |
| TimkenSteel Corp.* (Metals & Mining) | | | 233 | | | | 3,845 | |
| Tiptree, Inc. (Insurance) | | | 119 | | | | 1,646 | |
| Titan International, Inc.* (Machinery) | | | 259 | | | | 2,839 | |
| Titan Machinery, Inc.* (Trading Companies & Distributors) | | | 98 | | | | 3,302 | |
| Tivity Health, Inc.* (Health Care Providers & Services) | | | 223 | | | | 5,896 | |
| Tompkins Financial Corp. (Banks) | | | 72 | | | | 6,018 | |
| Tonix Pharmaceuticals Holding Corp.* (Biotechnology) | | | 2,248 | | | | 804 | |
| Tootsie Roll Industries, Inc. (Food Products) | | | 78 | | | | 2,826 | |
| Torrid Holdings, Inc.* (Specialty Retail) | | | 65 | | | | 642 | |
| TowneBank (Banks) | | | 341 | | | | 10,772 | |
| TPG RE Finance Trust, Inc.—Class T (Mortgage Real Estate Investment Trusts) | | | 304 | | | | 3,745 | |
| TPI Composites, Inc.* (Electrical Equipment) | | | 184 | | | | 2,753 | |
| Traeger, Inc.* (Household Durables) | | | 114 | | | | 1,386 | |
| Transcat, Inc.* (Trading Companies & Distributors) | | | 36 | | | | 3,327 | |
| TransMedics Group, Inc.* (Health Care Equipment & Supplies) | | | 131 | | | | 2,510 | |
| TravelCenters of America, Inc.* (Specialty Retail) | | | 63 | | | | 3,252 | |
| Travere Therapeutics, Inc.* (Biotechnology) | | | 299 | | | | 9,281 | |
| Treace Medical Concepts, Inc.* (Health Care Equipment & Supplies) | | | 152 | | | | 2,833 | |
| Trean Insurance Group, Inc.* (Insurance) | | | 89 | | | | 793 | |
| Tredegar Corp. (Chemicals) | | | 133 | | | | 1,572 | |
| TreeHouse Foods, Inc.* (Food Products) | | | 264 | | | | 10,700 | |
| Trevena, Inc.* (Biotechnology) | | | 829 | | | | 483 | |
| Tri Pointe Homes, Inc.* (Household Durables) | | | 566 | | | | 15,786 | |
| TriCo Bancshares (Banks) | | | 140 | | | | 6,014 | |
| TriMas Corp. (Machinery) | | | 219 | | | | 8,103 | |
| TriNet Group, Inc.* (Professional Services) | | | 206 | | | | 19,624 | |
| Trinity Industries, Inc. (Machinery) | | | 392 | | | | 11,838 | |
| Trinseo PLC* (Chemicals) | | | 197 | | | | 10,335 | |
| Triple-S Management Corp.* (Health Care Providers & Services) | | | 115 | | | | 4,103 | |
| TriState Capital Holdings, Inc.* (Banks) | | | 147 | | | | 4,448 | |
| Triton International, Ltd. (Trading Companies & Distributors) | | | 338 | | | | 20,357 | |
| Triumph Bancorp, Inc.* (Banks) | | | 119 | | | | 14,171 | |
| Triumph Group, Inc.* (Aerospace & Defense) | | | 323 | | | | 5,985 | |
| Tronox Holdings PLC—Class A (Chemicals) | | | 581 | | | | 13,961 | |
| TrueBlue, Inc.* (Professional Services) | | | 177 | | | | 4,898 | |
| TrueCar, Inc.* (Interactive Media & Services) | | | 483 | | | | 1,642 | |
| Trupanion, Inc.* (Insurance) | | | 194 | | | | 25,614 | |
| TrustCo Bank Corp. (Thrifts & Mortgage Finance) | | | 96 | | | | 3,198 | |
| Trustmark Corp. (Banks) | | | 316 | | | | 10,257 | |
| TTEC Holdings, Inc. (IT Services) | | | 94 | | | | 8,512 | |
| TTM Technologies, Inc.* (Electronic Equipment, Instruments & Components) | | | 529 | | | | 7,882 | |
| Tucows, Inc.* (IT Services) | | | 49 | | | | 4,107 | |
| Tupperware Brands Corp.* (Household Durables) | | | 248 | | | | 3,792 | |
| Turning Point Brands, Inc. (Tobacco) | | | 74 | | | | 2,796 | |
| Turning Point Therapeutics, Inc.* (Biotechnology) | | | 233 | | | | 11,114 | |
| Turtle Beach Corp.* (Technology Hardware, Storage & Peripherals) | | | 77 | | | | 1,714 | |
| Tutor Perini Corp.* (Construction & Engineering) | | | 209 | | | | 2,585 | |
| Twist Bioscience Corp.* (Biotechnology) | | | 239 | | | | 18,496 | |
| Two Harbors Investment Corp. (Mortgage Real Estate Investment Trusts) | | | 1,745 | | | | 10,069 | |
| Tyra Biosciences, Inc.* (Biotechnology) | | | 62 | | | | 872 | |
| U.S. Cellular Corp.* (Wireless Telecommunication Services) | | | 78 | | | | 2,459 | |
| U.S. Ecology, Inc.* (Commercial Services & Supplies) | | | 160 | | | | 5,110 | |
| U.S. Lime & Minerals, Inc. (Construction Materials) | | | 10 | | | | 1,290 | |
| U.S. Physical Therapy, Inc. (Health Care Providers & Services) | | | 65 | | | | 6,211 | |
| U.S. Silica Holdings, Inc.* (Energy Equipment & Services) | | | 372 | | | | 3,497 | |
| Udemy, Inc.* (Diversified Consumer Services) | | | 70 | | | | 1,368 | |
| UFP Industries, Inc. (Building Products) | | | 305 | | | | 28,063 | |
| UFP Technologies, Inc.* (Containers & Packaging) | | | 35 | | | | 2,459 | |
| Ultra Clean Holdings, Inc.* (Semiconductors & Semiconductor Equipment) | | | 225 | | | | 12,906 | |
| UMB Financial Corp. (Banks) | | | 222 | | | | 23,556 | |
| UMH Properties, Inc. (Equity Real Estate Investment Trusts) | | | 215 | | | | 5,876 | |
| Unifi, Inc.* (Textiles, Apparel & Luxury Goods) | | | 71 | | | | 1,644 | |
| UniFirst Corp. (Commercial Services & Supplies) | | | 76 | | | | 15,990 | |
| Unisys Corp.* (IT Services) | | | 333 | | | | 6,850 | |
| United Bankshares, Inc. (Banks) | | | 668 | | | | 24,235 | |
| United Community Banks, Inc. (Banks) | | | 531 | | | | 19,084 | |
| United Fire Group, Inc. (Insurance) | | | 107 | | | | 2,481 | |
| United Insurance Holdings Corp. (Insurance) | | | 103 | | | | 447 | |
| United Natural Foods, Inc.* (Food & Staples Retailing) | | | 283 | | | | 13,890 | |
| Uniti Group, Inc. (Equity Real Estate Investment Trusts) | | | 997 | | | | 13,968 | |
| Unitil Corp. (Multi-Utilities) | | | 79 | | | | 3,633 | |
| Universal Corp. (Tobacco) | | | 123 | | | | 6,755 | |
| Universal Electronics, Inc.* (Household Durables) | | | 64 | | | | 2,608 | |
| Universal Health Realty Income Trust (Equity Real Estate Investment Trusts) | | | 65 | | | | 3,866 | |
| Universal Insurance Holdings, Inc. (Insurance) | | | 137 | | | | 2,329 | |
| Universal Logistics Holdings, Inc. (Road & Rail) | | | 39 | | | | 736 | |
| Univest Financial Corp. (Banks) | | | 147 | | | | 4,398 | |
| Upland Software, Inc.* (Software) | | | 147 | | | | 2,637 | |
| Upwork, Inc.* (Professional Services) | | | 598 | | | | 20,428 | |
See accompanying notes to financial statements.
368 :: ProFund VP UltraSmall-Cap :: Financial Statements
Common Stocks, continued
| | | Shares | | | Value | |
| Uranium Energy Corp.* (Oil, Gas & Consumable Fuels) | | | 1,299 | | | $ | 4,352 | |
| Urban Edge Properties (Equity Real Estate Investment Trusts) | | | 587 | | | | 11,153 | |
| Urban Outfitters, Inc.* (Specialty Retail) | | | 348 | | | | 10,217 | |
| Ur-Energy, Inc.* (Oil, Gas & Consumable Fuels) | | | 917 | | | | 1,119 | |
| UroGen Pharma, Ltd.* (Biotechnology) | | | 99 | | | | 941 | |
| Urstadt Biddle Properties, Inc.—Class A (Equity Real Estate Investment Trusts) | | | 151 | | | | 3,216 | |
| US Xpress Enterprises, Inc.*—Class A (Road & Rail) | | | 136 | | | | 798 | |
| USANA Health Sciences, Inc.* (Personal Products) | | | 61 | | | | 6,173 | |
| Utah Medical Products, Inc. (Health Care Equipment & Supplies) | | | 17 | | | | 1,700 | |
| Utz Brands, Inc. (Food Products) | | | 299 | | | | 4,769 | |
| Valhi, Inc. (Chemicals) | | | 12 | | | | 345 | |
| Valley National Bancorp (Banks) | | | 2,031 | | | | 27,926 | |
| Value Line, Inc. (Capital Markets) | | | 5 | | | | 234 | |
| Vanda Pharmaceuticals, Inc.* (Biotechnology) | | | 278 | | | | 4,362 | |
| Vapotherm, Inc.* (Health Care Equipment & Supplies) | | | 115 | | | | 2,382 | |
| Varex Imaging Corp.* (Health Care Equipment & Supplies) | | | 194 | | | | 6,121 | |
| Varonis Systems, Inc.* (Software) | | | 543 | | | | 26,488 | |
| Vaxart, Inc.* (Biotechnology) | | | 620 | | | | 3,887 | |
| Vaxcyte, Inc.* (Pharmaceuticals) | | | 205 | | | | 4,877 | |
| VBI Vaccines, Inc.* (Biotechnology) | | | 956 | | | | 2,237 | |
| Vector Group, Ltd. (Tobacco) | | | 728 | | | | 8,358 | |
| Vectrus, Inc.* (Aerospace & Defense) | | | 58 | | | | 2,655 | |
| Veeco Instruments, Inc.* (Semiconductors & Semiconductor Equipment) | | | 252 | | | | 7,174 | |
| Velocity Financial, Inc.* (Thrifts & Mortgage Finance) | | | 43 | | | | 589 | |
| Velodyne Lidar, Inc.* (Electronic Equipment, Instruments & Components) | | | 383 | | | | 1,777 | |
| Ventyx Biosciences, Inc.* (Pharmaceuticals) | | | 53 | | | | 1,053 | |
| Vera Bradley, Inc.* (Textiles, Apparel & Luxury Goods) | | | 132 | | | | 1,123 | |
| Vera Therapeutics, Inc.* (Biotechnology) | | | 50 | | | | 1,336 | |
| Veracyte, Inc.* (Biotechnology) | | | 342 | | | | 14,090 | |
| Verastem, Inc.* (Biotechnology) | | | 879 | | | | 1,802 | |
| Vericel Corp.* (Biotechnology) | | | 236 | | | | 9,275 | |
| Verint Systems, Inc.* (Software) | | | 327 | | | | 17,171 | |
| Veris Residential, Inc.* (Equity Real Estate Investment Trusts) | | | 445 | | | | 8,179 | |
| Veritex Holdings, Inc. (Banks) | | | 241 | | | | 9,587 | |
| Veritiv Corp.* (Trading Companies & Distributors) | | | 73 | | | | 8,948 | |
| Veritone, Inc.* (Software) | | | 144 | | | | 3,237 | |
| Verra Mobility Corp.*—Class C (IT Services) | | | 730 | | | | 11,264 | |
| Verrica Pharmaceuticals, Inc.* (Pharmaceuticals) | | | 66 | | | | 605 | |
| Verso Corp.—Class A (Paper & Forest Products) | | | 135 | | | | 3,648 | |
| Veru, Inc.* (Personal Products) | | | 327 | | | | 1,926 | |
| Verve Therapeutics, Inc.* (Biotechnology) | | | 80 | | | | 2,950 | |
| Via Renewables, Inc. (Multi-Utilities) | | | 61 | | | | 697 | |
| Viad Corp.* (Commercial Services & Supplies) | | | 103 | | | | 4,407 | |
| Viant Technology, Inc.*—Class A (Software) | | | 59 | | | | 573 | |
| Viavi Solutions, Inc.* (Communications Equipment) | | | 1,214 | | | | 21,390 | |
| Vicor Corp.* (Electrical Equipment) | | | 107 | | | | 13,587 | |
| Viemed Healthcare, Inc.* (Health Care Providers & Services) | | | 179 | | | | 934 | |
| View, Inc.*(a) (Building Products) | | | 707 | | | | 2,764 | |
| ViewRay, Inc.* (Health Care Equipment & Supplies) | | | 702 | | | | 3,868 | |
| Viking Therapeutics, Inc.* (Biotechnology) | | | 347 | | | | 1,596 | |
| Village Super Market, Inc.—Class A (Food & Staples Retailing) | | | 43 | | | | 1,006 | |
| Vincerx Pharma, Inc.* (Biotechnology) | | | 83 | | | | 846 | |
| Vir Biotechnology, Inc.* (Biotechnology) | | | 305 | | | | 12,770 | |
| Viracta Therapeutics, Inc.* (Biotechnology) | | | 184 | | | | 672 | |
| VirnetX Holding Corp.* (Software) | | | 322 | | | | 837 | |
| Virtus Investment Partners, Inc. (Capital Markets) | | | 37 | | | | 10,993 | |
| Vishay Intertechnology, Inc. (Electronic Equipment, Instruments & Components) | | | 676 | | | | 14,784 | |
| Vishay Precision Group, Inc.* (Electronic Equipment, Instruments & Components) | | | 63 | | | | 2,339 | |
| Vista Outdoor, Inc.* (Leisure Products) | | | 292 | | | | 13,452 | |
| VistaGen Therapeutics, Inc.* (Biotechnology) | | | 984 | | | | 1,919 | |
| Visteon Corp.* (Auto Components) | | | 141 | | | | 15,671 | |
| Vital Farms, Inc.* (Food Products) | | | 125 | | | | 2,258 | |
| Vivint Smart Home, Inc.* (Diversified Consumer Services) | | | 465 | | | | 4,548 | |
| Vocera Communications, Inc.* (Health Care Technology) | | | 175 | | | | 11,347 | |
| Vonage Holdings Corp.* (Software) | | | 1,226 | | | | 25,489 | |
| Vor BioPharma, Inc.* (Biotechnology) | | | 96 | | | | 1,116 | |
| VOXX International Corp.* (Auto Components) | | | 79 | | | | 803 | |
| VSE Corp. (Commercial Services & Supplies) | | | 54 | | | | 3,291 | |
| Vuzix Corp.*(a) (Household Durables) | | | 298 | | | | 2,584 | |
| W&T Offshore, Inc.* (Oil, Gas & Consumable Fuels) | | | 476 | | | | 1,537 | |
| Wabash National Corp. (Machinery) | | | 251 | | | | 4,900 | |
| Walker & Dunlop, Inc. (Thrifts & Mortgage Finance) | | | 148 | | | | 22,330 | |
| Warrior Met Coal, Inc. (Metals & Mining) | | | 261 | | | | 6,710 | |
| Washington Federal, Inc. (Thrifts & Mortgage Finance) | | | 329 | | | | 10,982 | |
| Washington Real Estate Investment Trust (Equity Real Estate Investment Trusts) | | | 429 | | | | 11,090 | |
| Washington Trust Bancorp, Inc. (Banks) | | | 87 | | | | 4,904 | |
| Waterstone Financial, Inc. (Thrifts & Mortgage Finance) | | | 108 | | | | 2,361 | |
| Watts Water Technologies, Inc.—Class A (Machinery) | | | 140 | | | | 27,183 | |
| WaVe Life Sciences, Ltd.* (Pharmaceuticals) | | | 224 | | | | 703 | |
| WD-40 Co. (Household Products) | | | 69 | | | | 16,879 | |
| Weave Communications, Inc.* (Software) | | | 24 | | | | 364 | |
| Weber, Inc.—Class A (Household Durables) | | | 90 | | | | 1,164 | |
| Weis Markets, Inc. (Food & Staples Retailing) | | | 83 | | | | 5,468 | |
| Welbilt, Inc.* (Machinery) | | | 663 | | | | 15,760 | |
| Werewolf Therapeutics, Inc.* (Biotechnology) | | | 134 | | | | 1,596 | |
| Werner Enterprises, Inc. (Road & Rail) | | | 313 | | | | 14,918 | |
| WesBanco, Inc. (Banks) | | | 311 | | | | 10,882 | |
| WESCO International, Inc.* (Trading Companies & Distributors) | | | 227 | | | | 29,870 | |
| West Bancorp, Inc. (Banks) | | | 82 | | | | 2,548 | |
| Westamerica Bancorp (Banks) | | | 132 | | | | 7,620 | |
| Whitestone REIT (Equity Real Estate Investment Trusts) | | | 233 | | | | 2,360 | |
| Whiting Petroleum Corp.* (Oil, Gas & Consumable Fuels) | | | 200 | | | | 12,936 | |
| Whole Earth Brands, Inc.* (Food Products) | | | 189 | | | | 2,030 | |
See accompanying notes to financial statements.
Financial Statements :: ProFund VP UltraSmall-Cap :: 369
Common Stocks, continued
| | | Shares | | | Value | |
| WideOpenWest, Inc.* (Media) | | | 266 | | | $ | 5,724 | |
| Willdan Group, Inc.* (Professional Services) | | | 56 | | | | 1,971 | |
| Willis Lease Finance Corp.* (Trading Companies & Distributors) | | | 15 | | | | 565 | |
| WillScot Mobile Mini Holdings Corp.* (Construction & Engineering) | | | 1,073 | | | | 43,822 | |
| Wingstop, Inc. (Hotels, Restaurants & Leisure) | | | 151 | | | | 26,093 | |
| Winmark Corp. (Specialty Retail) | | | 18 | | | | 4,469 | |
| Winnebago Industries, Inc. (Automobiles) | | | 164 | | | | 12,287 | |
| WisdomTree Investments, Inc. (Capital Markets) | | | 683 | | | | 4,180 | |
| Wolverine World Wide, Inc. (Textiles, Apparel & Luxury Goods) | | | 412 | | | | 11,870 | |
| Workhorse Group, Inc.* (Auto Components) | | | 612 | | | | 2,668 | |
| Workiva, Inc.* (Software) | | | 217 | | | | 28,316 | |
| World Acceptance Corp.* (Consumer Finance) | | | 22 | | | | 5,399 | |
| World Fuel Services Corp. (Oil, Gas & Consumable Fuels) | | | 316 | | | | 8,365 | |
| Worthington Industries, Inc. (Metals & Mining) | | | 168 | | | | 9,183 | |
| WSFS Financial Corp. (Thrifts & Mortgage Finance) | | | 329 | | | | 16,489 | |
| WW International, Inc.* (Diversified Consumer Services) | | | 267 | | | | 4,307 | |
| XBiotech, Inc. (Biotechnology) | | | 77 | | | | 857 | |
| Xencor, Inc.* (Biotechnology) | | | 287 | | | | 11,514 | |
| Xenia Hotels & Resorts, Inc.* (Equity Real Estate Investment Trusts) | | | 578 | | | | 10,468 | |
| Xilio Therapeutics, Inc.* (Biotechnology) | | | 38 | | | | 608 | |
| XL Fleet Corp.* (Auto Components) | | | 177 | | | | 586 | |
| XOMA Corp.* (Biotechnology) | | | 31 | | | | 646 | |
| Xometry, Inc.*—Class A (Internet & Direct Marketing Retail) | | | 41 | | | | 2,101 | |
| XPEL, Inc.* (Auto Components) | | | 91 | | | | 6,213 | |
| Xperi Holding Corp. (Software) | | | 532 | | | | 10,060 | |
| Xponential Fitness, Inc.*—Class A (Hotels, Restaurants & Leisure) | | | 47 | | | | 961 | |
| Yellow Corp.* (Road & Rail) | | | 255 | | | | 3,210 | |
| Yelp, Inc.* (Interactive Media & Services) | | | 363 | | | | 13,155 | |
| Yext, Inc.* (Software) | | | 571 | | | | 5,664 | |
| Y-mAbs Therapeutics, Inc.* (Biotechnology) | | | 177 | | | | 2,869 | |
| York Water Co. (Water Utilities) | | | 66 | | | | 3,285 | |
| Zentalis Pharmaceuticals, Inc.* (Biotechnology) | | | 185 | | | | 15,551 | |
| Zevia PBC*—Class A (Beverages) | | | 52 | | | | 367 | |
| Ziff Davis, Inc.* (Software) | | | 220 | | | | 24,389 | |
| ZIOPHARM Oncology, Inc.* (Biotechnology) | | | 1,063 | | | | 1,159 | |
| Zogenix, Inc.* (Pharmaceuticals) | | | 284 | | | | 4,615 | |
| Zumiez, Inc.* (Specialty Retail) | | | 108 | | | | 5,183 | |
| Zuora, Inc.*—Class A (Software) | | | 565 | | | | 10,554 | |
| Zurn Water Solutions Corp. (Building Products) | | | 615 | | | | 22,386 | |
| Zymergen, Inc.* (Chemicals) | | | 406 | | | | 2,716 | |
| Zynex, Inc.*(a) (Health Care Equipment & Supplies) | | | 99 | | | | 987 | |
TOTAL COMMON STOCKS
(Cost $11,358,609) | | | | | | | 15,072,571 | |
Trust (0.0%)
| | | Interest
Units | | | Value | |
| Ferroglobe Representation and Warranty Insurance*+ (Metals & Mining) | | | 510 | | | $ | — | |
TOTAL TRUST
(Cost $—) | | | | | | | — | |
Contingent Escrow Shares (0.0%)
| | | Shares | | | Value | |
| Wright Medical Group, Inc.*+(b); (Health Care Equipment & Supplies) | | | 442 | | | $ | — | |
TOTAL CONTINGENT ESCROW SHARES
(Cost $—) | | | | | | | — | |
Repurchase Agreements(c)(d) (48.4%)
| | | Principal
Amount | | | Value | |
| Repurchase Agreements with various counterparties, 0.00%, dated 12/31/21, due 1/3/22, total to be received $13,682,000 | | $ | 13,682,000 | | | $ | 13,682,000 | |
TOTAL REPURCHASE AGREEMENTS
(Cost $13,682,000) | | | | | | | 13,682,000 | |
Collateral for Securities Loaned(e) (0.5%)
| | | Shares | | | Value | |
| BlackRock Liquidity Funds FedFund Portfolio—Institutional Shares, 0.03%(f) | | | 140,996 | | | $ | 140,996 | |
TOTAL COLLATERAL FOR SECURITIES LOANED
(Cost $140,996) | | | | | | | 140,996 | |
TOTAL INVESTMENT SECURITIES
(Cost $25,181,605)—102.3% | | | | | | | 28,895,567 | |
| Net other assets (liabilities)—(2.3)% | | | | | | | (645,705 | ) |
| NET ASSETS—100.0% | | | | | | $ | 28,249,862 | |
| * | Non-income producing security. |
| + | These securities were fair valued based on procedures approved by the Board of Trustees. As of December 31, 2021, these securities represented 0.000% of the net assets of the Fund. |
| (a) | All or part of this security was on loan as of December 31, 2021. The total value of securities on loan as of December 31, 2021 was $129,228. |
| (b) | On November 12, 2020, Stryker Corp. acquired Wright Medical Group. As part of the acquisition, $1.85 per acquired share was allocated 1:1 to Escrow Shares, contingent on whether the $1.85 per share is determined to be payable to the Dutch Government; otherwise, the value of the Escrow Shares will be remitted to pre-acquisition shareholders of Wright Medical Group. In January 2022, all Escrow Shares were sold at a value of $1.85 per share. |
| (c) | A portion of these securities were held in a segregated account for the benefit of swap counterparties in the event of default. At December 31, 2021, the aggregate amount held in a segregated account was $5,580,000. |
| (d) | The ProFund VP invests in Repurchase Agreements jointly with other funds in the Trust. See "Repurchase Agreements" under Note 2 in the Notes to Financial Statements to view the details of each individual agreement and counterparty as well as a description of the securities subject to repurchase. |
| (e) | Securities were purchased with cash collateral held from securities on loan at December 31, 2021. |
| (f) | Rate periodically changes. Rate disclosed is the daily yield on December 31, 2021. |
See accompanying notes to financial statements.
370 :: ProFund VP UltraSmall-Cap :: Financial Statements
Total Return Swap Agreements—Long
| Underlying Instrument | | Counterparty | | Termination
Date(1) | | Rate Paid
(Received)(2) | | | Notional
Amount | | | Value and
Unrealized
Appreciation/
(Depreciation) | |
| iShares Russell 2000 ETF | | Goldman Sachs International | | 1/27/22 | | | 0.13 | % | | $ | 10,319,149 | | | $ | (77,630 | ) |
| Russell 2000 Index | | Goldman Sachs International | | 1/27/22 | | | 0.48 | % | | | 16,078,665 | | | | (117,453 | ) |
| | | | | | | | | | | $ | 26,397,814 | | | $ | (195,083 | ) |
| iShares Russell 2000 ETF | | UBS AG | | 1/27/22 | | | (0.12 | )% | | $ | 4,933,042 | | | $ | (36,973 | ) |
| Russell 2000 Index | | UBS AG | | 1/27/22 | | | 0.08 | % | | | 10,092,668 | | | | (69,568 | ) |
| | | | | | | | | | | $ | 15,025,710 | | | $ | (106,541 | ) |
| | | | | | | | | | | $ | 41,423,524 | | | $ | (301,624 | ) |
| (1) | Agreements may be terminated at will by either party without penalty. Payment is due at termination/maturity. |
| (2) | Reflects the floating financing rate, as of December 31, 2021, on the notional amount of the swap agreement paid to the counterparty or received from the counterparty, excluding any commissions. This amount is included as part of the unrealized appreciation/(depreciation). |
ProFund VP UltraSmall-Cap invested in the following industries as of December 31, 2021:
| | | Value | | | % of
Net Assets | |
| Aerospace & Defense | | $ | 93,431 | | | | 0.3 | % |
| Air Freight & Logistics | | | 54,597 | | | | 0.2 | % |
| Airlines | | | 47,956 | | | | 0.2 | % |
| Auto Components | | | 214,315 | | | | 0.8 | % |
| Automobiles | | | 33,316 | | | | 0.1 | % |
| Banks | | | 1,270,475 | | | | 4.5 | % |
| Beverages | | | 66,800 | | | | 0.2 | % |
| Biotechnology | | | 1,267,043 | | | | 4.6 | % |
| Building Products | | | 205,562 | | | | 0.7 | % |
| Capital Markets | | | 247,547 | | | | 0.9 | % |
| Chemicals | | | 297,020 | | | | 1.0 | % |
| Commercial Services & Supplies | | | 258,016 | | | | 0.9 | % |
| Communications Equipment | | | 137,967 | | | | 0.5 | % |
| Construction & Engineering | | | 240,823 | | | | 0.9 | % |
| Construction Materials | | | 28,974 | | | | 0.1 | % |
| Consumer Finance | | | 120,124 | | | | 0.4 | % |
| Containers & Packaging | | | 35,401 | | | | 0.1 | % |
| Distributors | | | 2,638 | | | | NM | |
| Diversified Consumer Services | | | 105,995 | | | | 0.4 | % |
| Diversified Financial Services | | | 23,650 | | | | 0.1 | % |
| Diversified Telecommunication Services | | | 74,449 | | | | 0.3 | % |
| Electric Utilities | | | 91,718 | | | | 0.3 | % |
| Electrical Equipment | | | 157,098 | | | | 0.6 | % |
| Electronic Equipment, Instruments & Components | | | 339,955 | | | | 1.2 | % |
| Energy Equipment & Services | | | 117,205 | | | | 0.4 | % |
| Entertainment | | | 119,422 | | | | 0.4 | % |
| Equity Real Estate Investment Trusts | | | 992,262 | | | | 3.5 | % |
| Food & Staples Retailing | | | 156,642 | | | | 0.5 | % |
| Food Products | | | 146,942 | | | | 0.5 | % |
| Gas Utilities | | | 134,280 | | | | 0.5 | % |
| Health Care Equipment & Supplies | | | 486,845 | | | | 1.7 | % |
| Health Care Providers & Services | | | 432,870 | | | | 1.5 | % |
| Health Care Technology | | | 179,900 | | | | 0.6 | % |
| Hotels, Restaurants & Leisure | | | 358,730 | | | | 1.2 | % |
| Household Durables | | | 300,231 | | | | 1.1 | % |
| Household Products | | | 44,006 | | | | 0.2 | % |
| Independent Power and Renewable Electricity Producers | | | 51,327 | | | | 0.2 | % |
| Insurance | | | 299,421 | | | | 1.1 | % |
| Interactive Media & Services | | | 52,841 | | | | 0.2 | % |
| Internet & Direct Marketing Retail | | | 78,888 | | | | 0.3 | % |
| IT Services | | | 256,809 | | | | 0.9 | % |
| Leisure Products | | | 95,031 | | | | 0.3 | % |
| Life Sciences Tools & Services | | | 126,708 | | | | 0.4 | % |
| Machinery | | | 572,470 | | | | 2.0 | % |
| Marine | | | 28,298 | | | | 0.1 | % |
| Media | | | 157,958 | | | | 0.5 | % |
| Metals & Mining | | | 183,841 | | | | 0.7 | % |
| Mortgage Real Estate Investment Trusts | | | 191,572 | | | | 0.7 | % |
| Multiline Retail | | | 56,398 | | | | 0.2 | % |
| Multi-Utilities | | | 57,838 | | | | 0.2 | % |
| Oil, Gas & Consumable Fuels | | | 547,117 | | | | 2.0 | % |
| Paper & Forest Products | | | 19,234 | | | | 0.1 | % |
| Personal Products | | | 84,974 | | | | 0.3 | % |
| Pharmaceuticals | | | 224,752 | | | | 0.8 | % |
| Professional Services | | | 264,478 | | | | 0.9 | % |
| Real Estate Management & Development | | | 136,264 | | | | 0.5 | % |
| Road & Rail | | | 138,190 | | | | 0.5 | % |
| Semiconductors & Semiconductor Equipment | | | 582,010 | | | | 2.1 | % |
| Software | | | 871,975 | | | | 3.1 | % |
| Specialty Retail | | | 355,771 | | | | 1.3 | % |
| Technology Hardware, Storage & Peripherals | | | 41,876 | | | | 0.1 | % |
| Textiles, Apparel & Luxury Goods | | | 111,755 | | | | 0.4 | % |
| Thrifts & Mortgage Finance | | | 262,680 | | | | 0.9 | % |
| Tobacco | | | 20,430 | | | | 0.1 | % |
| Trading Companies & Distributors | | | 226,883 | | | | 0.8 | % |
| Water Utilities | | | 67,495 | | | | 0.2 | % |
| Wireless Telecommunication Services | | | 23,082 | | | | 0.1 | % |
| Other** | | | 13,177,291 | | | | 46.6 | % |
| Total | | $ | 28,249,862 | | | | 100.0 | % |
| ** | Includes any non-equity securities and net other assets (liabilities), which includes any receivable for capital shares issued and payable for capital shares redeemed. |
| NM | Not meaningful, amount is less than 0.05%. |
See accompanying notes to financial statements.
Financial Statements :: ProFund VP UltraSmall-Cap :: 371
Statement of Assets and Liabilities
December 31, 2021
| ASSETS: |
| Total Investment Securities, at cost | | $ | 25,181,605 | |
| Securities, at value(a) | | | 15,213,567 | |
| Repurchase agreements, at value | | | 13,682,000 | |
| Total Investment Securities, at value | | | 28,895,567 | |
| Cash | | | 1,409 | |
| Segregated cash balances for swap agreements with custodian | | | 992 | |
| Dividends receivable | | | 12,032 | |
| Receivable for capital shares issued | | | 1,111 | |
| Receivable for investments sold | | | 7,269 | |
| Prepaid expenses | | | 174 | |
| TOTAL ASSETS | | | 28,918,554 | |
| | | | | |
| LIABILITIES: | | | | |
| Payable for collateral for securities loaned | | | 140,996 | |
| Payable for capital shares redeemed | | | 143,019 | |
| Payable for investments purchased | | | 7,329 | |
| Unrealized depreciation on swap agreements | | | 301,624 | |
| Advisory fees payable | | | 18,707 | |
| Management services fees payable | | | 2,494 | |
| Administration fees payable | | | 1,683 | |
| Administrative services fees payable | | | 15,436 | |
| Distribution fees payable | | | 15,285 | |
| Transfer agency fees payable | | | 2,936 | |
| Fund accounting fees payable | | | 1,524 | |
| Compliance services fees payable | | | 131 | |
| Other accrued expenses | | | 17,528 | |
| TOTAL LIABILITIES | | | 668,692 | |
| NET ASSETS | | $ | 28,249,862 | |
| | | | | |
| NET ASSETS CONSIST OF: | | | | |
| Capital | | $ | 21,384,569 | |
| Total distributable earnings (loss) | | | 6,865,293 | |
| NET ASSETS | | $ | 28,249,862 | |
| Shares of Beneficial Interest Outstanding (unlimited number of shares authorized, no par value) | | | 1,076,138 | |
| Net Asset Value (offering and redemption price per share) | | $ | 26.25 | |
| | | | |
| (a) Includes securities on loan valued at: | | $ | 129,228 | |
Statement of Operations
For the Year Ended December 31, 2021
| INVESTMENT INCOME: | | | | |
| Dividends | | $ | 143,364 | |
| Interest | | | 209 | |
| Foreign tax withholding | | | (203 | ) |
| Net income from securities lending | | | 1,927 | |
| TOTAL INVESTMENT INCOME | | | 145,297 | |
| | | | | |
| EXPENSES: | | | | |
| Advisory fees | | | 228,660 | |
| Management services fees | | | 30,488 | |
| Administration fees | | | 22,256 | |
| Transfer agency fees | | | 18,495 | |
| Administrative services fees | | | 82,045 | |
| Distribution fees | | | 76,220 | |
| Custody fees | | | 4,687 | |
| Fund accounting fees | | | 19,605 | |
| Trustee fees | | | 473 | |
| Compliance services fees | | | 238 | |
| Other fees | | | 40,802 | |
| Total Gross Expenses before reductions | | | 523,969 | |
| Expenses reduced and reimbursed by the Advisor | | | (11,771 | ) |
| TOTAL NET EXPENSES | | | 512,198 | |
| NET INVESTMENT INCOME (LOSS) | | | (366,901 | ) |
| | | | | |
| REALIZED AND UNREALIZED GAINS (LOSSES) ON INVESTMENTS: | | | | |
| Net realized gains (losses) on investment securities | | | 809,033 | |
| Net realized gains (losses) on futures contracts | | | 59,805 | |
| Net realized gains (losses) on swap agreements | | | 3,110,064 | |
| Change in net unrealized appreciation/depreciation on investment securities | | | 383,136 | |
| Change in net unrealized appreciation/depreciation on futures contracts | | | (21,246 | ) |
| Change in net unrealized appreciation/depreciation on swap agreements | | | 73,683 | |
| NET REALIZED AND UNREALIZED GAINS (LOSSES) ON INVESTMENTS | | | 4,414,475 | |
| CHANGE IN NET ASSETS RESULTING FROM OPERATIONS | | $ | 4,047,574 | |
See accompanying notes to financial statements.
372 :: ProFund VP UltraSmall-Cap :: Financial Statements
| Statements of Changes in Net Assets |
| |
| | | Year Ended
December 31, 2021 | | | Year Ended
December 31, 2020 | |
| FROM INVESTMENT ACTIVITIES: | | | | | | | | |
| | | | | | | | | |
| OPERATIONS: | | | | | | | | |
| Net investment income (loss) | | $ | (366,901 | ) | | $ | (129,194 | ) |
| Net realized gains (losses) on investments | | | 3,978,902 | | | | 2,490,386 | |
| Change in net unrealized appreciation/depreciation on investments | | | 435,573 | | | | (256,056 | ) |
| Change in net assets resulting from operations | | | 4,047,574 | | | | 2,105,136 | |
| | | | | | | | | |
| DISTRIBUTIONS TO SHAREHOLDERS: | | | | | | | | |
| Total distributions | | | (2,253,812 | ) | | | (2,142,018 | ) |
| Change in net assets resulting from distributions | | | (2,253,812 | ) | | | (2,142,018 | ) |
| | | | | | | | | |
| CAPITAL TRANSACTIONS: | | | | | | | | |
| Proceeds from shares issued | | | 79,631,011 | | | | 84,978,342 | |
| Distributions reinvested | | | 2,244,959 | | | | 2,142,018 | |
| Value of shares redeemed | | | (76,528,092 | ) | | | (86,084,727 | ) |
| Change in net assets resulting from capital transactions | | | 5,347,878 | | | | 1,035,633 | |
| Change in net assets | | | 7,141,640 | | | | 998,751 | |
| | | | | | | | | |
| NET ASSETS: | | | | | | | | |
| Beginning of period | | | 21,108,222 | | | | 20,109,471 | |
| End of period | | $ | 28,249,862 | | | $ | 21,108,222 | |
| | | | | | | | | |
| SHARE TRANSACTIONS: | | | | | | | | |
| Issued | | | 2,859,816 | | | | 5,043,750 | |
| Reinvested | | | 92,461 | | | | 139,545 | |
| Redeemed | | | (2,785,608 | ) | | | (5,121,528 | ) |
| Change in shares | | | 166,669 | | | | 61,767 | |
See accompanying notes to financial statements.
Financial Highlights :: ProFund VP UltraSmall-Cap :: 373
ProFunds Financial Highlights FOR THE PERIODS INDICATED
Selected data for a share of beneficial interest outstanding throughout the periods indicated.
| | | Year Ended
Dec. 31, 2021 | | | Year Ended
Dec. 31, 2020 | | | Year Ended
Dec. 31, 2019 | | | Year Ended
Dec. 31, 2018 | | | Year Ended
Dec. 31, 2017 | |
| Net Asset Value, Beginning of Period | | $ | 23.21 | | | $ | 23.72 | | | $ | 16.10 | | | $ | 28.59 | | | $ | 25.21 | |
| | | | | | | | | | | | | | | | | | | | | |
| Investment Activities: | | | | | | | | | | | | | | | | | | | | |
| Net investment income (loss)(a) | | | (0.33 | ) | | | (0.15 | ) | | | 0.01 | | | | (0.02 | ) | | | (0.20 | ) |
| Net realized and unrealized gains (losses) on investments | | | 5.56 | | | | 2.55 | | | | 7.61 | | | | (4.67 | ) | | | 6.48 | |
| Total income (loss) from investment activities | | | 5.23 | | | | 2.40 | | | | 7.62 | | | | (4.69 | ) | | | 6.28 | |
| | | | | | | | | | | | | | | | | | | | | |
| Distributions to Shareholders From: | | | | | | | | | | | | | | | | | | | | |
| Net investment income | | | — | | | | (0.03 | ) | | | — | | | | — | | | | — | |
| Net realized gains on investments | | | (2.19 | ) | | | (2.88 | ) | | | — | | | | (7.80 | ) | | | (2.90 | ) |
| Total distributions | | | (2.19 | ) | | | (2.91 | ) | | | — | | | | (7.80 | ) | | | (2.90 | ) |
| | | | | | | | | | | | | | | | | | | | | |
| Net Asset Value, End of Period | | $ | 26.25 | | | $ | 23.21 | | | $ | 23.72 | | | $ | 16.10 | | | $ | 28.59 | |
| | | | | | | | | | | | | | | | | | | | | |
| Total Return | | | 23.30 | % | | | 16.39 | % | | | 47.33 | % | | | (26.95 | )% | | | 25.20 | % |
| | | | | | | | | | | | | | | | | | | | | |
| Ratios to Average Net Assets: | | | | | | | | | | | | | | | | | | | | |
| Gross expenses | | | 1.72 | % | | | 1.86 | % | | | 1.76 | % | | | 1.74 | % | | | 1.72 | % |
| Net expenses | | | 1.68 | % | | | 1.68 | % | | | 1.68 | % | | | 1.68 | % | | | 1.68 | % |
| Net investment income (loss) | | | (1.20 | )% | | | (0.91 | )% | | | 0.07 | % | | | (0.09 | )% | | | (0.74 | )% |
| | | | | | | | | | | | | | | | | | | | | |
| Supplemental Data: | | | | | | | | | | | | | | | | | | | | |
| Net assets, end of period (000's) | | $ | 28,250 | | | $ | 21,108 | | | $ | 20,109 | | | $ | 16,736 | | | $ | 31,873 | �� |
| Portfolio turnover rate(b) | | | 24 | % | | | 34 | % | | | 66 | % | | | 18 | % | | | 27 | % |
| (a) | Per share net investment income (loss) has been calculated using the average daily shares method. |
| (b) | Portfolio turnover rate is calculated without regard to instruments having a maturity of less than one year from acquisition or derivative instruments (including swap agreements and futures contracts). The portfolio turnover rate can be high and volatile due to the amount and timing of sales and purchases of fund shares during the period. |
See accompanying notes to financial statements.
374 :: ProFund VP U.S. Government Plus :: Management Discussion of Fund Performance
ProFund VP U.S. Government Plus (the "Fund") seeks daily investment results, before fees and expenses, that correspond to one and one-quarter times (1.25x) the daily movement of the most recently issued 30-Year U.S. Treasury Bond ( the "Long Bond") for a single day, not for any other period. A "single day" is measured from the time the Fund calculates its net asset value ("NAV") to the time of the Fund's next NAV calculation. The Fund does not seek to achieve its stated investment objective over a period of time greater than a single day. The return of the Fund for periods longer than a single day will be the result of its return for each day compounded over the period. The Fund's returns for periods longer than a single day will very likely differ in amount, and possibly even direction, from the Fund's stated multiple (1.25x) times the return of the Long Bond for the same period. For periods longer than a single day, the Fund will lose money if the Long Bond's performance is flat, and it is possible that the Fund will lose money even if the level of the Long Bond rises. For the year ended December 31, 2021, the Fund had a total return of -7.08%. For the same period, the Long Bond, as measured by the Ryan Labs Returns Treasury Yield Curve 30 Year Index1, had a total return of -4.37%2 and a volatility of 16.66%. For the year, the Fund achieved an average daily statistical correlation of over 0.99 to one and one-quarter times the daily price movement of the Long Bond.3
The Fund takes positions in financial instruments that, in combination, should have similar daily return characteristics as one and one-quarter times the daily price movement of the Long Bond. The Long Bond is the longest term outstanding 30-year bond issued by the U.S. Treasury. As of December 31, 2021, the most recent Long Bond carried a maturity date of 11/15/51 and a 1.875% coupon.
During the year ended December 31, 2021, the Fund invested in swap agreements and futures contracts as a substitute for investing directly in bonds in order to gain leveraged exposure to the Long Bond. These derivatives generally tracked the performance of their underlying benchmark and were negatively impacted by financing costs associated with their use. The Fund entered into swap agreements with counterparties that the Fund's advisor determined to be major, global financial institutions. If a counterparty becomes insolvent or otherwise fails to perform on its obligations, the value of investments in the Fund may decline. The Fund has sought to mitigate this risk by generally requiring counterparties to post collateral for the benefit of the Fund, marked to market daily, in an amount approximately equal to the amount the counterparty owed to the Fund, subject to certain minimum thresholds.
Value of a $10,000 Investment at Net Asset Value*
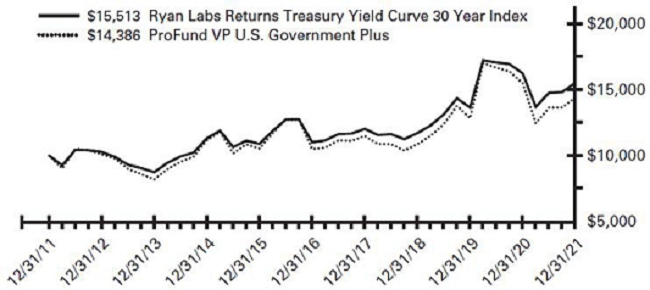
| * | The line graph represents the historical performance of a hypothetical investment of $10,000 in the ProFund VP U.S. Government Plus from December 31, 2011 to December 31, 2021, assuming the reinvestment of distributions. |
Average Annual Total Return as of 12/31/21
| Fund | | One Year | | | Five Year | | | Ten Year | |
| ProFund VP U.S. Government Plus | | | -7.08 | % | | | 6.54 | % | | | 3.70 | % |
| Ryan Labs Returns Treasury Yield Curve 30 Year Index | | | -4.37 | % | | | 7.13 | % | | | 4.49 | % |
Expense Ratios**
| Fund | | Gross | | | Net | |
| ProFund VP U.S. Government Plus | | | | 1.48 | % | | | 1.38 | % |
| ** | Reflects the expense ratio as reported in the Prospectus dated May 1, 2021. Contractual fee waivers are in effect through April 30, 2022. See Financial Highlights for effective expense ratios. |
Allocation of Portfolio Holdings
Market Exposure
| Investment Type | | % of Net Assets | |
| U.S. Treasury Obligation | | | 49 | % |
| Swap Agreements | | | 75 | % |
| Total Exposure | | | 124 | % |
"Market Exposure" includes the value of total investments (including the contract value of any derivatives) and excludes any instruments used for cash management.
Holdings
The ProFund VP U.S. Government Plus primarily invests in non-equity securities, which may include: swap agreements, futures contracts, repurchase agreements and U.S. Government securities.
Past performance does not guarantee future results. Return calculations assume the reinvestment of distributions and do not reflect taxes that a shareholder would pay on Fund distributions or on the redemption of Fund shares. The performance data quoted represents past performance and current returns may be lower or higher. The investment return and NAV will fluctuate so that an investor's shares, when redeemed, may be worth more or less than the original cost. The performance above reflects any fee reductions during the applicable periods. If such fee reductions had not occurred, the quoted performance would be lower. Performance numbers are net of all Fund fees and expenses but do not include any insurance, sales, or administrative charges of variable annuity or life insurance contracts. If these charges were included, the returns would be lower. To obtain performance current to the most recent month-end, please call toll-free 888-776-3637.
| 1 | The Ryan Labs Returns Treasury Yield Curve 30 Year Index is an index that consists of public obligations of the U.S. Treasury consisting of a single security, the latest issued on-the-run 30 Year Treasury bond. This Index reflects both price return and yield. It does not reflect the impact of transaction costs nor the deduction of fees and expenses associated with a mutual fund, such as investment management and accounting fees. It is not possible to invest directly in an index. |
| 2 | The Long Bond reflects a yield component. It does not reflect the impact of transaction and financing costs, nor the deduction of fees and expenses associated with a mutual fund, such as investment management and accounting fees. The Fund's performance reflects a yield component, the impact of transaction and financing costs and the deduction of fees and expenses. |
| 3 | 1.00 equals perfect correlation. This calculation is based on the daily total return of the Long Bond and the performance of the daily total return of the NAV per share of the Fund. |
The above information is not covered by the Report of the Independent Registered Public Accounting Firm.
Financial Statements :: ProFund VP U.S. Government Plus :: 375
Schedule of Portfolio Investments :: December 31, 2021
U.S. Treasury Obligation (49.4%)
| | | Principal
Amount | | | Value | |
| U.S. Treasury Bonds, 1.875%, 11/15/51 | | $ | 7,540,000 | | | $ | 7,518,205 | |
TOTAL U.S. TREASURY OBLIGATION
(Cost $7,330,950) | | | | | | | 7,518,205 | |
Repurchase Agreements(a)(b) (50.9%)
| Repurchase Agreements with various counterparties, 0.00%, dated 12/31/21, due 1/3/22, total to be received $7,745,000 | | | 7,745,000 | | | | 7,745,000 | |
TOTAL REPURCHASE AGREEMENTS
(Cost $7,745,000) | | | | | | | 7,745,000 | |
TOTAL INVESTMENT SECURITIES
(Cost $15,075,950)—100.3% | | | | | | | 15,263,205 | |
| Net other assets (liabilities)—(0.3)% | | | | | | | (48,423 | ) |
| NET ASSETS—100.0% | | | | | | $ | 15,214,782 | |
| (a) | A portion of these securities were held in a segregated account for the benefit of swap counterparties in the event of default. At December 31, 2021, the aggregate amount held in a segregated account was $125,000. |
| (b) | The ProFund VP invests in Repurchase Agreements jointly with other funds in the Trust. See "Repurchase Agreements" under Note 2 in the Notes to Financial Statements to view the details of each individual agreement and counterparty as well as a description of the securities subject to repurchase. |
Total Return Swap Agreements—Long
| Underlying Instrument | | Counterparty | | Termination
Date(1) | | | Rate Paid
(Received)(2) | | | Notional
Amount | | | Value and
Unrealized
Appreciation/
(Depreciation) | |
| 30-Year U.S. Treasury Bond, 1.875% due on 11/15/51 | | Citibank North America | | 1/17/22 | | | 0.10 | % | | $ | 4,566,761 | | | $ | (17,649 | ) |
| 30-Year U.S. Treasury Bond, 1.875% due on 11/15/51 | | Societe' Generale | | 1/17/22 | | | 0.22 | % | | | 6,880,055 | | | | (20,948 | ) |
| | | | | | | | | | | $ | 11,446,816 | | | $ | (38,597 | ) |
| (1) | Agreements may be terminated at will by either party without penalty. Payment is due at termination/maturity. |
| (2) | Reflects the floating financing rate, as of December 31, 2021, on the notional amount of the swap agreement paid to the counterparty or received from the counterparty, excluding any commissions. This amount is included as part of the unrealized appreciation/(depreciation). |
See accompanying notes to financial statements.
376 :: ProFund VP U.S. Government Plus :: Financial Statements
Statement of Assets and Liabilities
December 31, 2021
| ASSETS: | | | | |
| Total Investment Securities, at cost | | $ | 15,075,950 | |
| Securities, at value | | | 7,518,205 | |
| Repurchase agreements, at value | | | 7,745,000 | |
| Total Investment Securities, at value | | | 15,263,205 | |
| Segregated cash balances for swap agreements with custodian | | | 81 | |
| Interest receivable | | | 18,355 | |
| Receivable for capital shares issued | | | 20,231 | |
| Prepaid expenses | | | 97 | |
| TOTAL ASSETS | | | 15,301,969 | |
| | | | | |
| LIABILITIES: | | | | |
| Cash overdraft | | | 443 | |
| Payable for capital shares redeemed | | | 11,075 | |
| Unrealized depreciation on swap agreements | | | 38,597 | |
| Advisory fees payable | | | 9,360 | |
| Management services fees payable | | | 1,872 | |
| Administration fees payable | | | 970 | |
| Administrative services fees payable | | | 6,796 | |
| Distribution fees payable | | | 7,573 | |
| Transfer agency fees payable | | | 1,527 | |
| Fund accounting fees payable | | | 535 | |
| Compliance services fees payable | | | 70 | |
| Other accrued expenses | | | 8,369 | |
| TOTAL LIABILITIES | | | 87,187 | |
| NET ASSETS | | $ | 15,214,782 | |
| | | | | |
| NET ASSETS CONSIST OF: | | | | |
| Capital | | $ | 17,054,145 | |
| Total distributable earnings (loss) | | | (1,839,363 | ) |
| NET ASSETS | | $ | 15,214,782 | |
| Shares of Beneficial Interest Outstanding (unlimited number of shares authorized, no par value) | | | 668,550 | |
| Net Asset Value (offering and redemption price per share) | | $ | 22.76 | |
Statement of Operations
For the Year Ended December 31, 2021
| INVESTMENT INCOME: | | | | |
| Interest | | $ | 147,735 | |
| | | | | |
| EXPENSES: | | | | |
| Advisory fees | | | 82,994 | |
| Management services fees | | | 16,599 | |
| Administration fees | | | 13,059 | |
| Transfer agency fees | | | 10,269 | |
| Administrative services fees | | | 41,707 | |
| Distribution fees | | | 41,497 | |
| Custody fees | | | 2,509 | |
| Fund accounting fees | | | 6,886 | |
| Trustee fees | | | 315 | |
| Compliance services fees | | | 70 | |
| Other fees | | | 11,607 | |
| Recoupment of prior expenses reduced by the Advisor | | | 3,000 | |
| Total Gross Expenses before reductions | | | 230,512 | |
| Expenses reduced and reimbursed by the Advisor | | | (1,450 | ) |
| TOTAL NET EXPENSES | | | 229,062 | |
| NET INVESTMENT INCOME (LOSS) | | | (81,327 | ) |
| | | | | |
| REALIZED AND UNREALIZED GAINS (LOSSES) ON INVESTMENTS: | | | | |
| Net realized gains (losses) on investment securities | | | (651,157 | ) |
| Net realized gains (losses) on futures contracts | | | 6,976 | |
| Net realized gains (losses) on swap agreements | | | (1,343,840 | ) |
| Change in net unrealized appreciation/depreciation on investment securities | | | 147,285 | |
| Change in net unrealized appreciation/depreciation on swap agreements | | | (97,357 | ) |
| NET REALIZED AND UNREALIZED GAINS (LOSSES) ON INVESTMENTS | | | (1,938,093 | ) |
| CHANGE IN NET ASSETS RESULTING FROM OPERATIONS | | $ | (2,019,420 | ) |
See accompanying notes to financial statements.
Financial Statements :: ProFund VP U.S. Government Plus :: 377
Statements of Changes in Net Assets
| | | Year Ended
December 31, 2021 | | | Year Ended
December 31, 2020 | |
| FROM INVESTMENT ACTIVITIES: | | | | | | | | |
| | | | | | | | | |
| OPERATIONS: | | | | | | | | |
| Net investment income (loss) | | $ | (81,327 | ) | | $ | (213,996 | ) |
| Net realized gains (losses) on investments | | | (1,988,021 | ) | | | 3,075,680 | |
| Change in net unrealized appreciation/depreciation on investments | | | 49,928 | | | | 473,796 | |
| Change in net assets resulting from operations | | | (2,019,420 | ) | | | 3,335,480 | |
| | | | | | | | | |
| DISTRIBUTIONS TO SHAREHOLDERS: | | | | | | | | |
| Total distributions | | | (2,851,086 | ) | | | (1,890,196 | ) |
| Change in net assets resulting from distributions | | | (2,851,086 | ) | | | (1,890,196 | ) |
| | | | | | | | | |
| CAPITAL TRANSACTIONS: | | | | | | | | |
| Proceeds from shares issued | | | 25,088,789 | | | | 121,388,592 | |
| Distributions reinvested | | | 2,851,086 | | | | 1,890,196 | |
| Value of shares redeemed | | | (30,250,001 | ) | | | (121,724,663 | ) |
| Change in net assets resulting from capital transactions | | | (2,310,126 | ) | | | 1,554,125 | |
| Change in net assets | | | (7,180,632 | ) | | | 2,999,409 | |
| | | | | | | | | |
| NET ASSETS: | | | | | | | | |
| Beginning of period | | | 22,395,414 | | | | 19,396,005 | |
| End of period | | $ | 15,214,782 | | | $ | 22,395,414 | |
| | | | | | | | | |
| SHARE TRANSACTIONS: | | | | | | | | |
| Issued | | | 1,065,282 | | | | 3,561,171 | |
| Reinvested | | | 144,652 | | | | 56,986 | |
| Redeemed | | | (1,274,364 | ) | | | (3,599,595 | ) |
| Change in shares | | | (64,430 | ) | | | 18,562 | |
See accompanying notes to financial statements.
378 :: ProFund VP U.S. Government Plus :: Financial Highlights
ProFunds Financial Highlights FOR THE PERIODS INDICATED
Selected data for a share of beneficial interest outstanding throughout the periods indicated.
| | | Year Ended
Dec. 31, 2021 | | | Year Ended
Dec. 31, 2020 | | | Year Ended
Dec. 31, 2019 | | | Year Ended
Dec. 31, 2018 | | | Year Ended
Dec. 31, 2017 | |
| Net Asset Value, Beginning of Period | | $ | 30.55 | | | $ | 27.15 | | | $ | 23.16 | | | $ | 24.73 | | | $ | 22.68 | |
| | | | | | | | | | | | | | | | | | | | | |
| Investment Activities: | | | | | | | | | | | | | | | | | | | | |
| Net investment income (loss)(a) | | | (0.12 | ) | | | (0.25 | ) | | | 0.22 | | | | 0.21 | | | | 0.10 | |
| Net realized and unrealized gains (losses) on investments | | | (2.80 | ) | | | 6.06 | | | | 3.99 | | | | (1.57 | ) | | | 2.06 | |
| Total income (loss) from investment activities | | | (2.92 | ) | | | 5.81 | | | | 4.21 | | | | (1.36 | ) | | | 2.16 | |
| | | | | | | | | | | | | | | | | | | | | |
| Distributions to Shareholders From: | | | | | | | | | | | | | | | | | | | | |
| Net investment income | | | — | | | | (0.02 | ) | | | (0.22 | ) | | | (0.21 | ) | | | (0.11 | ) |
| Net realized gains on investments | | | (4.87 | ) | | | (2.39 | ) | | | — | | | | — | | | | — | |
| Total distributions | | | (4.87 | ) | | | (2.41 | ) | | | (0.22 | ) | | | (0.21 | ) | | | (0.11 | ) |
| | | | | | | | | | | | | | | | | | | | | |
| Net Asset Value, End of Period | | $ | 22.76 | | | $ | 30.55 | | | $ | 27.15 | | | $ | 23.16 | | | $ | 24.73 | |
| | | | | | | | | | | | | | | | | | | | | |
| Total Return | | | (7.08 | )% | | | 20.69 | % | | | 18.22 | % | | | (5.42 | )% | | | 9.49 | % |
| | | | | | | | | | | | | | | | | | | | | |
| Ratios to Average Net Assets: | | | | | | | | | | | | | | | | | | | | |
| Gross expenses | | | 1.39 | % | | | 1.48 | % | | | 1.44 | % | | | 1.45 | % | | | 1.43 | % |
| Net expenses | | | 1.38 | % | | | 1.38 | % | | | 1.38 | % | | | 1.38 | % | | | 1.38 | % |
| Net investment income (loss) | | | (0.49 | )% | | | (0.75 | )% | | | 0.84 | % | | | 0.92 | % | | | 0.43 | % |
| | | | | | | | | | | | | | | | | | | | | |
| Supplemental Data: | | | | | | | | | | | | | | | | | | | | |
| Net assets, end of period (000's) | | $ | 15,215 | | | $ | 22,395 | | | $ | 19,396 | | | $ | 15,853 | | | $ | 19,008 | |
| Portfolio turnover rate(b) | | | 393 | % | | | 398 | % | | | 402 | % | | | 437 | % | | | 397 | % |
| (a) | Per share net investment income (loss) has been calculated using the average daily shares method. |
| (b) | Portfolio turnover rate is calculated without regard to instruments having a maturity of less than one year from acquisition or derivative instruments (including swap agreements and futures contracts). The portfolio turnover rate can be high and volatile due to the amount and timing of sales and purchases of fund shares during the period. |
See accompanying notes to financial statements.
Management Discussion of Fund Performance :: ProFund VP Utilities :: 379
ProFund VP Utilities (the "Fund") seeks investment results, before fees and expenses, that correspond to the performance of the Dow Jones U.S. UtilitiesSM Index (the "Index"). For the year ended December 31, 2021, the Fund had a total return of 15.41%. For the same period, the Index had a return of 17.41%1 and a volatility of 14.83%. For the year, the Fund achieved an average daily statistical correlation of over 0.99 to the daily performance of the Index.2
The Fund takes positions in financial instruments that, in combination, should have similar return characteristics as the return of the Index. The Index measures the performance of the utilities sector of the U.S. equity market. Component companies include, among others, electric utilities, gas utilities, and water utilities.
During the year ended December 31, 2021, the Fund invested in swap agreements as a substitute for investing directly in stocks in order to gain exposure to the Index. These derivatives generally tracked the performance of their underlying benchmark and were negatively impacted by financing costs associated with their use. The Fund entered into swap agreements with counterparties that the Fund's advisor determined to be major, global financial institutions. If a counterparty becomes insolvent or otherwise fails to perform on its obligations, the value of investments in the Fund may decline. The Fund has sought to mitigate this risk by generally requiring counterparties to post collateral for the benefit of the Fund, marked to market daily, in an amount approximately equal to the amount the counterparty owed to the Fund, subject to certain minimum thresholds.
Value of a $10,000 Investment at Net Asset Value*

| * | The line graph represents the historical performance of a hypothetical investment of $10,000 in the ProFund VP Utilities from December 31, 2011 to December 31, 2021, assuming the reinvestment of distributions. |
Average Annual Total Return as of 12/31/21
| Fund | | One Year | | | Five Year | | | Ten Year | |
| ProFund VP Utilities | | | 15.41 | % | | | 9.52 | % | | | 9.26 | % |
| Dow Jones U.S. UtilitiesSM Index | | | 17.41 | % | | | 11.34 | % | | | 11.11 | % |
| S&P 500® | | | 28.71 | % | | | 18.47 | % | | | 16.55 | % |
Expense Ratios**
| Fund | | Gross | | | Net | |
| ProFund VP Utilities | | | 1.75 | % | | | 1.68 | % |
| ** | Reflects the expense ratio as reported in the Prospectus dated May 1, 2021. Contractual fee waivers are in effect through April 30, 2022. See Financial Highlights for effective expense ratios. |
Allocation of Portfolio Holdings & Index Composition
Market Exposure
| Investment Type | | % of Net Assets | |
| Equity Securities | | | 98 | % |
| Swap Agreements | | | 2 | % |
| Total Exposure | | | 100 | % |
"Market Exposure" includes the value of total investments (including the contract value of any derivatives) and excludes any instruments used for cash management.
Largest Equity Holdings
| Company | | % of Net Assets | |
| NextEra Energy, Inc. | | | 16.0 | % |
| Duke Energy Corp. | | | 7.0 | % |
| The Southern Co. | | | 6.3 | % |
| Dominion Energy, Inc. | | | 5.5 | % |
| Exelon Corp. | | | 4.9 | % |
Dow Jones U.S. UtilitiesSM Index – Composition
| | | % of Index | |
| Electric Utilities | | | 61 | % |
| Multi-Utilities | | | 28 | % |
| Water Utilities | | | 4 | % |
| Gas Utilities | | | 4 | % |
| Independent Power and Renewable Electricity Producers | | | 3 | % |
Past performance does not guarantee future results. Return calculations assume the reinvestment of distributions and do not reflect taxes that a shareholder would pay on Fund distributions or on the redemption of Fund shares. The performance data quoted represents past performance and current returns may be lower or higher. The investment return and net asset value ("NAV") will fluctuate so that an investor's shares, when redeemed, may be worth more or less than the original cost. The performance above reflects any fee reductions during the applicable periods. If such fee reductions had not occurred, the quoted performance would be lower. Performance numbers are net of all Fund fees and expenses but do not include any insurance, sales, or administrative charges of variable annuity or life insurance contracts. If these charges were included, the returns would be lower. To obtain performance current to the most recent month-end, please call toll-free 888-776-3637.
| 1 | The graph and table reflect the theoretical reinvestment of dividends on securities in the Indexes. The impact of transaction costs and the deduction of fees and expenses associated with a mutual fund, such as investment management and accounting fees, are not reflected in calculations of the Indexes. The Fund's performance reflects the reinvestment of dividends as well as the impact of transaction costs and the deduction of fees and expenses. It is not possible to invest directly in an index. |
| 2 | 1.00 equals perfect correlation. This calculation is based on the daily total return of the Index and the performance of the daily total return of the NAV per share of the Fund. |
| 3 | The S&P 500® is an unmanaged index that consists of the common stocks of 500 major U.S. corporations selected for their size and the frequency and ease with which their stocks trade. |
The above information is not covered by the Report of the Independent Registered Public Accounting Firm.
380 :: ProFund VP Utilities :: Financial Statements
Schedule of Portfolio Investments :: December 31, 2021
Common Stocks (98.1%)
| | | Shares | | | Value | |
| ALLETE, Inc. (Electric Utilities) | | | 1,592 | | | $ | 105,629 | |
| Alliant Energy Corp. (Electric Utilities) | | | 7,582 | | | | 466,066 | |
| Ameren Corp. (Multi-Utilities) | | | 7,801 | | | | 694,367 | |
| American Electric Power Co., Inc. (Electric Utilities) | | | 15,253 | | | | 1,357,059 | |
| American Water Works Co., Inc. (Water Utilities) | | | 5,498 | | | | 1,038,353 | |
| Atmos Energy Corp. (Gas Utilities) | | | 4,011 | | | | 420,232 | |
| Avangrid, Inc. (Electric Utilities) | | | 2,111 | | | | 105,297 | |
| Avista Corp. (Multi-Utilities) | | | 2,143 | | | | 91,056 | |
| Black Hills Corp. (Multi-Utilities) | | | 1,932 | | | | 136,341 | |
| CenterPoint Energy, Inc. (Multi-Utilities) | | | 19,059 | | | | 531,937 | |
| Clearway Energy, Inc.—Class A (Independent Power and Renewable Electricity Producers) | | | 1,048 | | | | 35,087 | |
| Clearway Energy, Inc.—Class C (Independent Power and Renewable Electricity Producers) | | | 2,477 | | | | 89,246 | |
| CMS Energy Corp. (Multi-Utilities) | | | 8,773 | | | | 570,684 | |
| Consolidated Edison, Inc. (Multi-Utilities) | | | 10,717 | | | | 914,374 | |
| Dominion Energy, Inc. (Multi-Utilities) | | | 24,527 | | | | 1,926,841 | |
| DTE Energy Co. (Multi-Utilities) | | | 5,867 | | | | 701,341 | |
| Duke Energy Corp. (Electric Utilities) | | | 23,303 | | | | 2,444,485 | |
| Edison International (Electric Utilities) | | | 11,505 | | | | 785,216 | |
| Entergy Corp. (Electric Utilities) | | | 6,087 | | | | 685,701 | |
| Essential Utilities, Inc. (Water Utilities) | | | 6,967 | | | | 374,058 | |
| Evergy, Inc. (Electric Utilities) | | | 6,944 | | | | 476,428 | |
| Eversource Energy (Electric Utilities) | | | 10,411 | | | | 947,193 | |
| Exelon Corp. (Electric Utilities) | | | 29,627 | | | | 1,711,256 | |
| FirstEnergy Corp. (Electric Utilities) | | | 16,486 | | | | 685,653 | |
| Hawaiian Electric Industries, Inc. (Electric Utilities) | | | 3,310 | | | | 137,365 | |
| IDACORP, Inc. (Electric Utilities) | | | 1,530 | | | | 173,364 | |
| MDU Resources Group, Inc. (Multi-Utilities) | | | 6,158 | | | | 189,913 | |
| National Fuel Gas Co. (Gas Utilities) | | | 2,761 | | | | 176,538 | |
| New Jersey Resources Corp. (Gas Utilities) | | | 2,922 | | | | 119,977 | |
| NextEra Energy, Inc. (Electric Utilities) | | | 59,433 | | | | 5,548,665 | |
| NiSource, Inc. (Multi-Utilities) | | | 11,892 | | | | 328,338 | |
| NorthWestern Corp. (Multi-Utilities) | | | 1,594 | | | | 91,113 | |
| NRG Energy, Inc. (Electric Utilities) | | | 7,415 | | | | 319,438 | |
| ONE Gas, Inc. (Gas Utilities) | | | 1,623 | | | | 125,929 | |
| PG&E Corp.* (Electric Utilities) | | | 45,694 | | | | 554,725 | |
| Pinnacle West Capital Corp. (Electric Utilities) | | | 3,418 | | | | 241,277 | |
| PNM Resources, Inc. (Electric Utilities) | | | 2,599 | | | | 118,540 | |
| Portland General Electric Co. (Electric Utilities) | | | 2,708 | | | | 143,307 | |
| PPL Corp. (Electric Utilities) | | | 22,741 | | | | 683,594 | |
| Public Service Enterprise Group, Inc. (Multi-Utilities) | | | 15,313 | | | | 1,021,836 | |
| Sempra Energy (Multi-Utilities) | | | 9,671 | | | | 1,279,280 | |
| Southwest Gas Holdings, Inc. (Gas Utilities) | | | 1,832 | | | | 128,332 | |
| Spire, Inc. (Gas Utilities) | | | 1,566 | | | | 102,135 | |
| The AES Corp. (Independent Power and Renewable Electricity Producers) | | | 20,191 | | | | 490,641 | |
| The Southern Co. (Electric Utilities) | | | 32,095 | | | | 2,201,075 | |
| UGI Corp. (Gas Utilities) | | | 6,332 | | | | 290,702 | |
| Vistra Corp. (Independent Power and Renewable Electricity Producers) | | | 14,615 | | | | 332,784 | |
| WEC Energy Group, Inc. (Multi-Utilities) | | | 9,552 | | | | 927,213 | |
| Xcel Energy, Inc. (Electric Utilities) | | | 16,313 | | | | 1,104,390 | |
TOTAL COMMON STOCKS
(Cost $15,066,302) | | | | | | | 34,124,371 | |
Repurchase Agreements(a) (1.6%)
| | | Principal
Amount | | | Value | |
| Repurchase Agreements with various counterparties, 0.00%, dated 12/31/21, due 1/3/22, total to be received $550,000 | | $ | 550,000 | | | $ | 550,000 | |
TOTAL REPURCHASE AGREEMENTS
(Cost $550,000) | | | | | | | 550,000 | |
TOTAL INVESTMENT SECURITIES
(Cost $15,616,302)—99.7% | | | | | | | 34,674,371 | |
| Net other assets (liabilities)—0.3% | | | | | | | 101,081 | |
| NET ASSETS—100.0% | | | | | | $ | 34,775,452 | |
| * | Non-income producing security. |
| (a) | The ProFund VP invests in Repurchase Agreements jointly with other funds in the Trust. See "Repurchase Agreements" under Note 2 in the Notes to Financial Statements to view the details of each individual agreement and counterparty as well as a description of the securities subject to repurchase. |
Total Return Swap Agreements—Long
| Underlying Instrument | | Counterparty | | Termination
Date(1) | | Rate Paid
(Received)(2) | | | Notional
Amount | | | Value and
Unrealized
Appreciation/
(Depreciation) | |
| Dow Jones U.S. Utilities Index | | Goldman Sachs International | | 1/24/22 | | | 0.68 | % | | $ | 676,102 | | | $ | 18,215 | |
| (1) | Agreements may be terminated at will by either party without penalty. Payment is due at termination/maturity. |
| (2) | Reflects the floating financing rate, as of December 31, 2021, on the notional amount of the swap agreement paid to the counterparty or received from the counterparty, excluding any commissions. This amount is included as part of the unrealized appreciation/(depreciation). |
See accompanying notes to financial statements.
Financial Statements :: ProFund VP Utilities :: 381
ProFund VP Utilities invested in the following industries as of December 31, 2021:
| | | Value | | | % of
Net Assets | |
| Electric Utilities | | $ | 20,995,723 | | | | 60.4 | % |
| Gas Utilities | | | 1,363,845 | | | | 3.9 | % |
| Independent Power and Renewable Electricity Producers | | | 947,758 | | | | 2.7 | % |
| Multi-Utilities | | | 9,404,634 | | | | 27.0 | % |
| Water Utilities | | | 1,412,411 | | | | 4.1 | % |
| Other** | | | 651,081 | | | | 1.9 | % |
| Total | | $ | 34,775,452 | | | | 100.0 | % |
| ** | Includes any non-equity securities and net other assets (liabilities), which includes any receivable for capital shares issued and payable for capital shares redeemed. |
See accompanying notes to financial statements.
382 :: ProFund VP Utilities :: Financial Statements
Statement of Assets and Liabilities
December 31, 2021
| ASSETS: | | | | |
| Total Investment Securities, at cost | | $ | 15,616,302 | |
| Securities, at value | | | 34,124,371 | |
| Repurchase agreements, at value | | | 550,000 | |
| Total Investment Securities, at value | | | 34,674,371 | |
| Cash | | | 356 | |
| Segregated cash balances for swap agreements with custodian | | | 80,000 | |
| Dividends receivable | | | 48,539 | |
| Unrealized appreciation on swap agreements | | | 18,215 | |
| Receivable for capital shares issued | | | 34,134 | |
| Prepaid expenses | | | 443 | |
| TOTAL ASSETS | | | 34,856,058 | |
| | | | | |
| LIABILITIES: | | | | |
| Payable for capital shares redeemed | | | 5,516 | |
| Advisory fees payable | | | 22,577 | |
| Management services fees payable | | | 3,010 | |
| Administration fees payable | | | 1,927 | |
| Administrative services fees payable | | | 13,756 | |
| Distribution fees payable | | | 13,093 | |
| Transfer agency fees payable | | | 3,025 | |
| Fund accounting fees payable | | | 1,078 | |
| Compliance services fees payable | | | 140 | |
| Other accrued expenses | | | 16,484 | |
| TOTAL LIABILITIES | | | 80,606 | |
| NET ASSETS | | $ | 34,775,452 | |
| | | | | |
| NET ASSETS CONSIST OF: | | | | |
| Capital | | $ | 16,888,240 | |
| Total distributable earnings (loss) | | | 17,887,212 | |
| NET ASSETS | | $ | 34,775,452 | |
| Shares of Beneficial Interest Outstanding (unlimited number of shares authorized, no par value) | | | 818,807 | |
| Net Asset Value (offering and redemption price per share) | | $ | 42.47 | |
Statement of Operations
For the Year Ended December 31, 2021
| INVESTMENT INCOME: | | | | |
| Dividends | | $ | 963,565 | |
| Interest | | | 4 | |
| TOTAL INVESTMENT INCOME | | | 963,569 | |
| | | | | |
| EXPENSES: | | | | |
| Advisory fees | | | 241,721 | |
| Management services fees | | | 32,229 | |
| Administration fees | | | 24,608 | |
| Transfer agency fees | | | 19,735 | |
| Administrative services fees | | | 93,182 | |
| Distribution fees | | | 80,574 | |
| Custody fees | | | 4,875 | |
| Fund accounting fees | | | 13,401 | |
| Trustee fees | | | 549 | |
| Compliance services fees | | | 197 | |
| Other fees | | | 30,326 | |
| Recoupment of prior expenses reduced by the Advisor | | | 2,500 | |
| Total Gross Expenses before reductions | | | 543,897 | |
| Expenses reduced and reimbursed by the Advisor | | | (2,442 | ) |
| TOTAL NET EXPENSES | | | 541,455 | |
| NET INVESTMENT INCOME (LOSS) | | | 422,114 | |
| | | | | |
| REALIZED AND UNREALIZED GAINS (LOSSES) ON INVESTMENTS: | | | | |
| Net realized gains (losses) on investment securities | | | 1,339,380 | |
| Net realized gains (losses) on swap agreements | | | 78,011 | |
| Change in net unrealized appreciation/depreciation on investment securities | | | 2,698,969 | |
| Change in net unrealized appreciation/depreciation on swap agreements | | | 8,322 | |
| NET REALIZED AND UNREALIZED GAINS (LOSSES) ON INVESTMENTS | | | 4,124,682 | |
| CHANGE IN NET ASSETS RESULTING FROM OPERATIONS | | $ | 4,546,796 | |
See accompanying notes to financial statements.
Financial Statements :: ProFund VP Utilities :: 383
| Statements of Changes in Net Assets |
| | | Year Ended
December 31, 2021 | | | Year Ended
December 31, 2020 | |
| FROM INVESTMENT ACTIVITIES: | | | | | | | | |
| | | | | | | | | |
| OPERATIONS: | | | | | | | | |
| Net investment income (loss) | | $ | 422,114 | | | $ | 464,820 | |
| Net realized gains (losses) on investments | | | 1,417,391 | | | | (798,890 | ) |
| Change in net unrealized appreciation/depreciation on investments | | | 2,707,291 | | | | (2,122,950 | ) |
| Change in net assets resulting from operations | | | 4,546,796 | | | | (2,457,020 | ) |
| | | | | | | | | |
| DISTRIBUTIONS TO SHAREHOLDERS: | | | | | | | | |
| Total distributions | | | (492,932 | ) | | | (7,985,139 | ) |
| Change in net assets resulting from distributions | | | (492,932 | ) | | | (7,985,139 | ) |
| | | | | | | | | |
| CAPITAL TRANSACTIONS: | | | | | | | | |
| Proceeds from shares issued | | | 19,019,213 | | | | 26,708,658 | |
| Distributions reinvested | | | 492,932 | | | | 7,985,139 | |
| Value of shares redeemed | | | (21,333,281 | ) | | | (35,984,865 | ) |
| Change in net assets resulting from capital transactions | | | (1,821,136 | ) | | | (1,291,068 | ) |
| Change in net assets | | | 2,232,728 | | | | (11,733,227 | ) |
| | | | | | | | | |
| NET ASSETS: | | | | | | | | |
| Beginning of period | | | 32,542,724 | | | | 44,275,951 | |
| End of period | | $ | 34,775,452 | | | $ | 32,542,724 | |
| | | | | | | | | |
| SHARE TRANSACTIONS: | | | | | | | | |
| Issued | | | 486,801 | | | | 599,643 | |
| Reinvested | | | 13,016 | | | | 225,314 | |
| Redeemed | | | (551,908 | ) | | | (831,816 | ) |
| Change in shares | | | (52,091 | ) | | | (6,859 | ) |
See accompanying notes to financial statements.
384 :: ProFund VP Utilities :: Financial Highlights
ProFunds Financial Highlights FOR THE PERIODS INDICATED
Selected data for a share of beneficial interest outstanding throughout the periods indicated.
| | | Year Ended
Dec. 31, 2021 | | | Year Ended
Dec. 31, 2020 | | | Year Ended
Dec. 31, 2019 | | | Year Ended
Dec. 31, 2018 | | | Year Ended
Dec. 31, 2017 | |
| Net Asset Value, Beginning of Period | | $ | 37.37 | | | $ | 50.44 | | | $ | 44.33 | | | $ | 45.65 | | | $ | 43.68 | |
| | | | | | | | | | | | | | | | | | | | | |
| Investment Activities: | | | | | | | | | | | | | | | | | | | | |
| Net investment income (loss)(a) | | | 0.51 | | | | 0.57 | | | | 0.67 | | | | 0.79 | | | | 0.76 | |
| Net realized and unrealized gains (losses) on investments | | | 5.18 | | | | (2.39 | ) | | | 9.18 | | | | 0.39 | | | | 3.89 | |
| Total income (loss) from investment activities | | | 5.69 | | | | (1.82 | ) | | | 9.85 | | | | 1.18 | | | | 4.65 | |
| | | | | | | | | | | | | | | | | | | | | |
| Distributions to Shareholders From: | | | | | | | | | | | | | | | | | | | | |
| Net investment income | | | (0.59 | ) | | | (0.75 | ) | | | (0.79 | ) | | | (1.00 | ) | | | (1.02 | ) |
| Net realized gains on investments | | | — | | | | (10.50 | ) | | | (2.95 | ) | | | (1.50 | ) | | | (1.66 | ) |
| Total distributions | | | (0.59 | ) | | | (11.25 | ) | | | (3.74 | ) | | | (2.50 | ) | | | (2.68 | ) |
| | | | | | | | | | | | | | | | | | | | | |
| Net Asset Value, End of Period | | $ | 42.47 | | | $ | 37.37 | | | $ | 50.44 | | | $ | 44.33 | | | $ | 45.65 | |
| | | | | | | | | | | | | | | | | | | | | |
| Total Return | | | 15.41 | % | | | (2.40 | )% | | | 22.88 | % | | | 2.89 | % | | | 10.64 | % |
| | | | | | | | | | | | | | | | | | | | | |
| Ratios to Average Net Assets: | | | | | | | | | | | | | | | | | | | | |
| Gross expenses | | | 1.69 | % | | | 1.75 | % | | | 1.74 | % | | | 1.79 | % | | | 1.72 | % |
| Net expenses | | | 1.68 | % | | | 1.68 | % | | | 1.68 | % | | | 1.68 | % | | | 1.68 | % |
| Net investment income (loss) | | | 1.31 | % | | | 1.31 | % | | | 1.38 | % | | | 1.78 | % | | | 1.62 | % |
| | | | | | | | | | | | | | | | | | | | | |
| Supplemental Data: | | | | | | | | | | | | | | | | | | | | |
| Net assets, end of period (000's) | | $ | 34,775 | | | $ | 32,543 | | | $ | 44,276 | | | $ | 40,952 | | | $ | 38,464 | |
| Portfolio turnover rate(b) | | | 24 | % | | | 50 | % | | | 209 | % | | | 108 | % | | | 60 | % |
| (a) | Per share net investment income (loss) has been calculated using the average daily shares method. |
| (b) | Portfolio turnover rate is calculated without regard to instruments having a maturity of less than one year from acquisition or derivative instruments (including swap agreements and futures contracts). The portfolio turnover rate can be high and volatile due to the amount and timing of sales and purchases of fund shares during the period. |
See accompanying notes to financial statements.
Notes to Financial Statements
386 :: Notes to Financial Statements :: December 31, 2021
1. Organization
ProFunds (the "Trust") consists of 116 separate investment portfolios and is registered as an open-end management investment company under the Investment Company Act of 1940 (the "1940 Act") and thus follows accounting and reporting guidance for investment companies. The Trust is organized as a Delaware statutory trust and is authorized to issue an unlimited number of shares of beneficial interest of no par value which may be issued in more than one class or series.
On December 10, 2020, the Trust's Board of Trustees approved an agreement and plan of reorganization and termination pursuant to which the Access VP High Yield Fund (now named the ProFund Access VP High Yield) would reorganize, tax free, into a corresponding newly created series within ProFunds (an affiliated trust). That transaction occurred on April 23, 2021.
These accompanying financial statements relate to the following portfolios of the Trust included in this report (collectively, the "ProFunds VP" and individually, a "ProFund VP"):
Classic ProFunds VP:
ProFund VP Asia 30
ProFund VP Bull
ProFund VP Dow 30
ProFund VP Emerging Markets
ProFund VP Europe 30
ProFund VP International
ProFund VP Japan
ProFund VP Large-Cap Growth
ProFund VP Large-Cap Value
ProFund VP Mid-Cap
ProFund VP Mid-Cap Growth
ProFund VP Mid-Cap Value
ProFund VP Nasdaq-100
ProFund VP Small-Cap
ProFund VP Small-Cap Growth
ProFund VP Small-Cap Value
Ultra ProFunds VP:
ProFund VP UltraBull
ProFund VP UltraMid-Cap
ProFund VP UltraNasdaq-100
ProFund VP UltraSmall-Cap
Inverse ProFunds VP:
ProFund VP Bear
ProFund VP Short Dow 30
ProFund VP Short Emerging Markets
ProFund VP Short International
ProFund VP Short Mid-Cap
ProFund VP Short Nasdaq-100
ProFund VP Short Small-Cap
ProFund VP UltraShort Dow 30
ProFund VP UltraShort Nasdaq-100
Sector ProFunds VP:
ProFund VP Banks
ProFund VP Basic Materials
ProFund VP Biotechnology
ProFund VP Consumer Goods
ProFund VP Consumer Services
ProFund VP Financials
ProFund VP Health Care
ProFund VP Industrials
ProFund VP Internet
ProFund VP Oil & Gas
ProFund VP Pharmaceuticals
ProFund VP Precious Metals
ProFund VP Real Estate
ProFund VP Semiconductor
ProFund VP Technology
ProFund VP Telecommunications
ProFund VP Utilities
Non-Equity ProFunds VP:
ProFund Access VP High Yield
ProFund VP Falling U.S. Dollar
ProFund VP Rising Rates Opportunity
ProFund VP U.S. Government Plus
Money Market ProFund VP:
ProFund VP Government Money Market
The ProFunds VP, excluding ProFund VP Government Money Market, are referred to as the "non-money market ProFunds VP." Each non-money market ProFund VP, other than ProFund VP Consumer Services, ProFund VP Europe 30, ProFund VP Industrials, ProFund VP Large-Cap Growth, ProFund VP Large-Cap Value, ProFund VP Mid-Cap Growth, ProFund VP Mid-Cap Value, ProFund VP Real Estate, ProFund VP Small-Cap Growth, ProFund VP Small-Cap Value, and ProFund VP Utilities, is classified as non-diversified under the 1940 Act. Each ProFund VP has one class of shares.
Under the Trust's organizational documents, its Officers and Trustees are indemnified against certain liabilities arising out of the performance of their duties to the Trust. In addition, in the normal course of business, the Trust enters into contracts with its vendors and others that provide for general indemnifications. The Trust and ProFunds VP's maximum exposure under these arrangements is unknown as this would involve future claims that may be made against the ProFunds VP.
December 31, 2021 :: Notes to Financial Statements :: 387
2. Significant Accounting Policies
The following is a summary of significant accounting policies followed by each ProFund VP in the preparation of its financial statements. These policies are in conformity with U.S. generally accepted accounting principles ("GAAP"). The preparation of financial statements in accordance with GAAP requires management to make estimates and assumptions that affect the reported amounts of assets and liabilities and disclosure of contingent assets and liabilities at the date of the financial statements and the reported amounts of income and expenses during the reporting period. The actual results could differ from those estimates.
Investment Valuation
The ProFunds VP record their investments at fair value. Fair value is defined as the price that would be received to sell an asset or paid to transfer a liability in an orderly transaction between market participants at the measurement date. The valuation techniques used to determine fair value are further described in Note 3.
Repurchase Agreements
Each ProFund VP may enter into repurchase agreements with financial institutions in pursuit of its investment objective, as "cover" for the investment techniques it employs, or for liquidity purposes. Repurchase agreements are primarily used by the ProFunds VP as short-term investments for cash positions. Under a repurchase agreement, a ProFund VP purchases a debt security and simultaneously agrees to sell the security back to the seller at a mutually agreed-upon future price and date, normally one business day. The resale price is typically greater than the purchase price, reflecting an agreed-upon market interest rate during the purchaser's holding period. While the maturities of the underlying securities in repurchase transactions may be more than one year, the term of each repurchase agreement will always be less than one year.
The ProFund VP follow certain procedures designed to minimize the risks inherent in such agreements. These procedures include effecting repurchase transactions generally with major, global financial institutions whose creditworthiness is continuously monitored by ProFund Advisors LLC (the "Advisor"). In addition, the value of the collateral underlying the repurchase agreement will always be at least equal to the repurchase price, including any accrued interest earned on the repurchase agreement. Funds within the Trust invest in repurchase agreements jointly. Each ProFund VP, therefore, holds a pro rata share of the collateral and interest income based upon the dollar amount of the repurchase agreements entered into by each ProFund VP. The collateral underlying the repurchase agreement is held by the ProFund VP's custodian. In the event of a default or bankruptcy by a selling financial institution, a ProFund VP will seek to liquidate such collateral which could involve certain costs or delays and, to the extent that proceeds from any sale upon a default of the obligation to repurchase were less than the repurchase price, the ProFund VP could suffer a loss. A ProFund VP also may experience difficulties and incur certain costs in exercising its rights to the collateral and may lose the interest the ProFund VP expected to receive under the repurchase agreement. Repurchase agreements usually are for short periods, such as one week or less, but may be longer. It is the current policy of the ProFunds VP not to invest in repurchase agreements that do not mature within seven days if any such investment, together with any other illiquid assets held by the ProFund VP, amounts to more than 15% of the ProFund VP's total net assets. The investments of each of the ProFunds VP in repurchase agreements at times may be substantial when, in the view of the Advisor, liquidity, investment, regulatory, or other considerations so warrant. During periods of high demand for repurchase agreements, the ProFunds VP may be unable to invest available cash in these instruments to the extent desired by the Advisor.
Information concerning the counterparties, value of, collateralization and amounts due under repurchase agreement transactions may be found in the table below.
As of December 31, 2021, the ProFunds VP had undivided interest in joint repurchase agreements with the following counterparties, for the time periods and rates indicated. Amounts shown in the table below represent principal amount, cost and value for each respective repurchase agreement.
| Fund Name | | Canadian
Imperial Bank
of Canada
0.00%
dated 12/31/21,
due 1/3/22(1) | | | Credit Agricole
CIB,
0.00%
dated 12/31/21,
due 1/3/22(2) | | | HSBC Securities
(USA), Inc.,
0.00%
dated 12/31/21,
due 1/3/22(3) | | | RBC Capital
Markets, LLC,
0.00%
dated 12/31/21,
due 1/3/22(4) | | | Societe'
Generale,
0.00%
dated 12/31/21,
due 1/3/22(5) | | | UMB Bank
N.A.,
0.00%
dated 12/31/21,
due 1/3/22(6) | |
| ProFund Access VP High Yield | | $ | 223,000 | | | $ | 2,238,000 | | | $ | 3,189,000 | | | $ | 1,119,000 | | | $ | 559,000 | | | $ | 232,000 | |
| ProFund VP Asia 30 | | | 8,000 | | | | 82,000 | | | | 117,000 | | | | 41,000 | | | | 20,000 | | | | 10,000 | |
| ProFund VP Banks | | | 2,000 | | | | 25,000 | | | | 35,000 | | | | 12,000 | | | | 6,000 | | | | 5,000 | |
| ProFund VP Basic Materials | | | 5,000 | | | | 53,000 | | | | 76,000 | | | | 26,000 | | | | 13,000 | | | | 8,000 | |
| ProFund VP Bear | | | 45,000 | | | | 459,000 | | | | 655,000 | | | | 229,000 | | | | 114,000 | | | | 53,000 | |
| ProFund VP Biotechnology | | | 11,000 | | | | 110,000 | | | | 157,000 | | | | 55,000 | | | | 27,000 | | | | 14,000 | |
| ProFund VP Bull | | | 543,000 | | | | 5,451,000 | | | | 7,768,000 | | | | 2,724,000 | | | | 1,361,000 | | | | 568,000 | |
| ProFund VP Consumer Goods | | | 26,000 | | | | 267,000 | | | | 381,000 | | | | 133,000 | | | | 66,000 | | | | 31,000 | |
| ProFund VP Consumer Services | | | 5,000 | | | | 53,000 | | | | 76,000 | | | | 26,000 | | | | 13,000 | | | | 9,000 | |
| ProFund VP Dow 30 | | | 5,000 | | | | 62,000 | | | | 90,000 | | | | 30,000 | | | | 14,000 | | | | 17,000 | |
| ProFund VP Emerging Markets | | | 20,000 | | | | 209,000 | | | | 299,000 | | | | 104,000 | | | | 51,000 | | | | 28,000 | |
388 :: Notes to Financial Statements :: December 31, 2021
| Fund Name | | Canadian
Imperial Bank
of Canada
0.00%
dated 12/31/21,
due 1/3/22(1) | | | Credit Agricole
CIB,
0.00%
dated 12/31/21,
due 1/3/22(2) | | | HSBC Securities
(USA), Inc.,
0.00%
dated 12/31/21,
due 1/3/22(3) | | | RBC Capital
Markets, LLC,
0.00%
dated 12/31/21,
due 1/3/22(4) | | | Societe'
Generale,
0.00%
dated 12/31/21,
due 1/3/22(5) | | | UMB Bank
N.A.,
0.00%
dated 12/31/21,
due 1/3/22(6) | |
| ProFund VP Europe 30 | | $ | 24,000 | | | $ | 241,000 | | | $ | 344,000 | | | $ | 120,000 | | | $ | 60,000 | | | $ | 28,000 | |
| ProFund VP Falling U.S. Dollar | | | 13,000 | | | | 141,000 | | | | 202,000 | | | | 69,000 | | | | 34,000 | | | | 26,000 | |
| ProFund VP Financials | | | 13,000 | | | | 133,000 | | | | 190,000 | | | | 66,000 | | | | 33,000 | | | | 16,000 | |
| ProFund VP Government Money Market | | | 1,134,000 | | | | 11,348,000 | | | | 16,171,000 | | | | 5,674,000 | | | | 2,837,000 | | | | 1,168,000 | |
| ProFund VP Health Care | | | 50,000 | | | | 508,000 | | | | 723,000 | | | | 254,000 | | | | 127,000 | | | | 54,000 | |
| ProFund VP Industrials | | | 22,000 | | | | 222,000 | | | | 317,000 | | | | 111,000 | | | | 55,000 | | | | 26,000 | |
| ProFund VP International | | | 360,000 | | | | 3,619,000 | | | | 5,160,000 | | | | 1,809,000 | | | | 904,000 | | | | 382,000 | |
| ProFund VP Internet | | | 10,000 | | | | 102,000 | | | | 146,000 | | | | 51,000 | | | | 25,000 | | | | 13,000 | |
| ProFund VP Japan | | | 199,000 | | | | 1,994,000 | | | | 2,842,000 | | | | 997,000 | | | | 498,000 | | | | 208,000 | |
| ProFund VP Large-Cap Growth | | | 2,000 | | | | 21,000 | | | | 30,000 | | | | 10,000 | | | | 5,000 | | | | 5,000 | |
| ProFund VP Large-Cap Value | | | 4,000 | | | | 46,000 | | | | 66,000 | | | | 23,000 | | | | 11,000 | | | | 7,000 | |
| ProFund VP Mid-Cap | | | 461,000 | | | | 4,627,000 | | | | 6,592,000 | | | | 2,313,000 | | | | 1,155,000 | | | | 482,000 | |
| ProFund VP Mid-Cap Growth | | | 1,000 | | | | 10,000 | | | | 15,000 | | | | 5,000 | | | | 2,000 | | | | 3,000 | |
| ProFund VP Mid-Cap Value | | | — | | | | 5,000 | | | | 8,000 | | | | 2,000 | | | | 1,000 | | | | 4,000 | |
| ProFund VP Nasdaq-100 | | | 1,716,000 | | | | 17,168,000 | | | | 24,465,000 | | | | 8,583,000 | | | | 4,291,000 | | | | 1,770,000 | |
| ProFund VP Oil & Gas | | | 12,000 | | | | 127,000 | | | | 181,000 | | | | 63,000 | | | | 31,000 | | | | 17,000 | |
| ProFund VP Pharmaceuticals | | | 5,000 | | | | 58,000 | | | | 83,000 | | | | 29,000 | | | | 14,000 | | | | 8,000 | |
| ProFund VP Precious Metals | | | 824,000 | | | | 8,240,000 | | | | 11,742,000 | | | | 4,120,000 | | | | 2,059,000 | | | | 849,000 | |
| ProFund VP Real Estate | | | 11,000 | | | | 116,000 | | | | 166,000 | | | | 58,000 | | | | 29,000 | | | | 15,000 | |
| ProFund VP Rising Rates Opportunity | | | 170,000 | | | | 1,712,000 | | | | 2,440,000 | | | | 855,000 | | | | 426,000 | | | | 184,000 | |
| ProFund VP Semiconductor | | | 8,000 | | | | 88,000 | | | | 125,000 | | | | 44,000 | | | | 22,000 | | | | 11,000 | |
| ProFund VP Short Dow 30 | | | — | | | | 1,000 | | | | 1,000 | | | | — | | | | — | | | | 4,000 | |
| ProFund VP Short Emerging Markets | | | 31,000 | | | | 335,000 | | | | 479,000 | | | | 166,000 | | | | 82,000 | | | | 44,000 | |
| ProFund VP Short International | | | 15,000 | | | | 157,000 | | | | 225,000 | | | | 78,000 | | | | 38,000 | | | | 23,000 | |
| ProFund VP Short Mid-Cap | | | 1,000 | | | | 15,000 | | | | 23,000 | | | | 7,000 | | | | 3,000 | | | | 6,000 | |
| ProFund VP Short Nasdaq-100 | | | 55,000 | | | | 574,000 | | | | 818,000 | | | | 286,000 | | | | 141,000 | | | | 70,000 | |
| ProFund VP Short Small-Cap | | | 34,000 | | | | 341,000 | | | | 488,000 | | | | 170,000 | | | | 84,000 | | | | 44,000 | |
| ProFund VP Small-Cap | | | 128,000 | | | | 1,293,000 | | | | 1,842,000 | | | | 645,000 | | | | 322,000 | | | | 142,000 | |
| ProFund VP Small-Cap Growth | | | 1,000 | | | | 12,000 | | | | 17,000 | | | | 6,000 | | | | 3,000 | | | | 3,000 | |
| ProFund VP Small-Cap Value | | | 1,000 | | | | 12,000 | | | | 18,000 | | | | 6,000 | | | | 3,000 | | | | 3,000 | |
| ProFund VP Technology | | | 42,000 | | | | 429,000 | | | | 612,000 | | | | 214,000 | | | | 107,000 | | | | 47,000 | |
| ProFund VP Telecommunications | | | 4,000 | | | | 47,000 | | | | 67,000 | | | | 23,000 | | | | 11,000 | | | | 7,000 | |
| ProFund VP UltraBull | | | 124,000 | | | | 1,249,000 | | | | 1,779,000 | | | | 624,000 | | | | 312,000 | | | | 134,000 | |
| ProFund VP UltraMid-Cap | | | 124,000 | | | | 1,254,000 | | | | 1,787,000 | | | | 627,000 | | | | 313,000 | | | | 136,000 | |
| ProFund VP UltraNasdaq-100 | | | 3,048,000 | | | | 30,505,000 | | | | 43,471,000 | | | | 15,251,000 | | | | 7,624,000 | | | | 3,145,000 | |
| ProFund VP UltraShort Dow 30 | | | — | | | | 1,000 | | | | 1,000 | | | | — | | | | — | | | | 2,000 | |
| ProFund VP UltraShort Nasdaq-100 | | | 9,000 | | | | 106,000 | | | | 152,000 | | | | 52,000 | | | | 25,000 | | | | 21,000 | |
| ProFund VP UltraSmall-Cap | | | 403,000 | | | | 4,049,000 | | | | 5,770,000 | | | | 2,024,000 | | | | 1,010,000 | | | | 426,000 | |
| ProFund VP U.S. Government Plus | | | 228,000 | | | | 2,292,000 | | | | 3,266,000 | | | | 1,146,000 | | | | 573,000 | | | | 240,000 | |
| ProFund VP Utilities | | | 16,000 | | | | 162,000 | | | | 232,000 | | | | 81,000 | | | | 40,000 | | | | 19,000 | |
| | | $ | 10,196,000 | | | $ | 102,369,000 | | | $ | 145,899,000 | | | $ | 51,161,000 | | | $ | 25,554,000 | | | $ | 10,767,000 | |
Each repurchase agreement was fully collateralized by U.S. government and/or agency securities as of December 31, 2021 as follows:
| (1) | U.S. Treasury Notes, 0.375%, due 1/31/2026, total value $10,404,446. |
| (2) | U.S. Treasury Inflation-Protected Securities (TIPS), 0.125%, due 4/15/22, total value $104,470,592. |
| (3) | U.S. Treasury Bonds, 2.00% to 3.375%, due 11/15/41 to 2/15/50, which had an aggregate value of $148,819,798. |
| (4) | U.S. Treasury Bonds, 2.00%, due 2/15/50, U.S. Treasury Notes, 0.375%, due 1/31/26, U.S. Treasury Inflation-Protected Securities (TIPS), 0.125%, due 4/15/22 to 4/15/25, which had an aggregate value of $52,191,250. |
| (5) | U.S. Treasury Notes, 2.875%, due 7/31/25, total value $26,069,844. |
| (6) | Federal Farm Credit Banks, 2.875%, due 12/21/23, Federal Home Loan Banks, 1.20% to 3.375%, due 12/8/23 to 12/30/24, which had an aggregate value of $11,142,991. |
December 31, 2021 :: Notes to Financial Statements :: 389
Depositary Receipts
Each ProFund VP, other than the ProFund VP Government Money Market, may invest in American Depositary Receipts ("ADRs"), New York Shares ("NYSs") and Global Depositary Receipts ("GDRs"). ADRs represent the right to receive securities of foreign issuers deposited in a bank or corresponding bank. ADRs are an alternative to purchasing the underlying securities in their national markets and currencies. For many foreign securities, U.S. dollar-denominated ADRs, which are traded in the United States on exchanges or over-the-counter ("OTC"), are issued by domestic banks. NYSs (or "direct shares") are foreign stocks denominated in U.S. dollars that trade on American exchanges without being converted to ADRs. GDRs are receipts for shares in a foreign-based corporation traded in capital markets around the world.
The ProFunds VP may invest in both sponsored and unsponsored depositary receipts. Certain depositary receipts, typically those designated as "unsponsored", require the holders thereof to bear most of the costs of such facilities, while issuers of "sponsored" facilities normally pay more of the cost thereof. The depositary of an unsponsored facility frequently is under no obligation to distribute shareholder communications received from the issuer of the deposited securities or to pass through the voting rights to facility holders with respect to the deposited securities, whereas the depository of a sponsored facility typically distributes shareholder communications and passes through the voting rights.
Real Estate Investment Trusts
Each ProFund VP (other than the Non-Equity ProFunds VP) may invest in real estate investment trusts ("REITs") which report information on the source of their distributions annually. Equity REITs invest primarily in real property while mortgage REITs invest in constructions, development and long-term mortgage loans. Their value may be affected by changes in the value of the underlying property of the REITs, the creditworthiness of the issuer, property taxes, interest rates, and tax regulatory requirements, such as those relating to the environment. REITs are dependent upon management skill, are not diversified and are subject to heavy cash flow dependency, default by borrowers, self-liquidation, the possibility of failing to qualify for tax-free pass-through of income under the Internal Revenue Code of 1986, as amended, and the possibility of failing to maintain exempt status under the 1940 Act. Certain distributions received from REITs during the year are recorded as realized gains or return of capital when such information becomes known.
Derivative Instruments
In seeking to achieve each ProFund VP's investment objective, the Advisor uses a mathematical approach to investing. Using this approach, the Advisor determines the type, quantity and mix of investment positions. Certain ProFunds VP may obtain investment exposure through derivative instruments such as futures contracts, forward currency contracts and swap agreements, that a ProFund VP should hold to approximate the daily performance, inverse performance, or multiple thereof, as applicable, of its benchmark. All derivative instruments held during the year ended December 31, 2021, were utilized to gain exposure or inverse exposure to each ProFund VP's benchmark (e.g., index, etc.) to meet its investment objective.
The ProFund Access VP High Yield maintains exposure to the high yield market (i.e., U.S. corporate high yield debt market), regardless of market conditions. This means ProFund Access VP High Yield does not adopt defensive positions in cash or other instruments in anticipation of an adverse market climate. The ProFund Access VP High Yield invests primarily in derivatives, money market instruments, and U.S. Treasury obligations that the Advisor believes, in combination, should provide investment results that correspond to the high yield market. During the year ended December 31, 2021, the ProFund Access VP High Yield held credit default swap agreements for credit exposure to the high yield market and futures contracts and/or treasury notes for interest rate exposure to meet the ProFund Access VP High Yield investment objective.
Each non-money market ProFund VP, other than the Classic ProFunds VP, the Sector ProFunds VP and the ProFund VP Falling U.S. Dollar, does not seek to achieve its investment objective over a period of time greater than a single day.
All open derivative positions at year end are reflected on each respective ProFund VP's Schedule of Portfolio Investments. The volume associated with derivative positions varies on a daily basis as each ProFund VP transacts in derivative contracts in order to achieve the appropriate exposure, as expressed in notional amount (contract value for forward currency contracts), in comparison to net assets consistent with each ProFund VP's investment objective.
Certain ProFunds VP utilized a varying level of derivative instruments in conjunction with the investment securities to meet their investment objective during the year ended December 31, 2021. With the exception of the ProFunds VP listed below, the notional amount of open derivative positions relative to each ProFund VP's net assets at year end is generally representative of the notional amount of open positions to net assets throughout the year. The volume associated with derivative positions in the ProFund VP Banks, ProFund VP Bull, ProFund VP Semiconductor and ProFund VP Small-Cap was 9%, 28%, 7% and 44%, respectively, based on average monthly notional amounts in comparison to net assets during the year ended December 31, 2021.
In connection with its management of certain series of the Trust included in this report (ProFund VP UltraShort Dow 30 and ProFund VP UltraShort Nasdaq-100 (the "Commodity Pools")), the Advisor is registered as a commodity pool operator (a "CPO") and the Commodity Pools are commodity pools under the Commodity Exchange Act (the "CEA"). The Advisor also registered as a commodity trading advisor (a "CTA") under the CEA as a result of its role as subadvisor to funds outside the Trust. Accordingly, the Advisor is subject to registration and regulation as a CPO and CTA under the CEA, and must comply with various regulatory requirements under the CEA and the rules and regulations of the Commodity Futures Trading Commission ("CFTC") and the National Futures Association ("NFA"), including investor protection requirements, antifraud provisions, disclosure requirements and reporting and recordkeeping requirements. The Advisor is also subject to periodic inspections and audits by the CFTC and NFA. Compliance with these regulatory requirements could adversely affect the Commodity Pools' total return. In this regard, any further amendment to the CEA or its related regulations that subject the Advisor or the
390 :: Notes to Financial Statements :: December 31, 2021
Commodity Pools to additional regulation may have adverse impacts on the Commodity Pools' operations and expenses.
The following is a description of the derivative instruments utilized by the ProFunds VP, including certain risks related to each instrument type.
Futures Contracts
Each non-money market ProFund VP may purchase or sell futures contracts as a substitute for a comparable market position in the underlying securities or to satisfy regulatory requirements. A cash-settled futures contract obligates the seller to deliver (and the purchaser to accept) an amount of cash equal to a specific dollar amount (the contract multiplier) multiplied by the difference between the final settlement price of a specific futures contract and the price at which the agreement is made. No physical delivery of the underlying asset is made.
Each ProFund VP generally engages in closing or offsetting transactions before final settlement of a futures contract, wherein a second identical futures contract is sold to offset a long position (or bought to offset a short position). In such cases, the obligation is to deliver (or take delivery of) cash equal to a specific dollar amount (the contract multiplier) multiplied by the difference between the price of the offsetting transaction and the price at which the original contract was entered into. If the original position entered into is a long position (futures contract purchased), there will be a gain (loss) if the offsetting sell transaction is carried out at a higher (lower) price, inclusive of commissions. If the original position entered into is a short position (futures contract sold), there will be a gain (loss) if the offsetting buy transaction is carried out at a lower (higher) price, inclusive of commissions.
Whether a ProFund VP realizes a gain or loss from futures activities depends generally upon movements in the underlying currency, commodity, security or index. The extent of a ProFund VP's loss from an unhedged short position in futures contracts is potentially unlimited and investors may lose the amount that they invest plus any profits recognized on that investment. Each ProFund VP will engage in transactions in futures contracts that are traded on a U.S. exchange or board of trade or that have been approved for sale in the U.S. by the CFTC.
Upon entering into a futures contract, each ProFund VP will be required to deposit with the broker an amount of cash or cash equivalents in the range of approximately 5% to 10% of the contract amount for equity index futures and in the range of approximately 1% to 3% of the contract amount for treasury futures (this amount is subject to change by the exchange on which the contract is traded). This amount, known as "initial margin," is in the nature of a performance bond or good faith deposit on the contract and is returned to the ProFund VP upon termination of the futures contract, assuming all contractual obligations have been satisfied. Subsequent payments, known as "variation margin," to and from the broker will be made daily as the price of the asset underlying the futures contract fluctuates, making the long and short positions in the futures contract more or less valuable, a process known as "marking-to-market." At any time prior to expiration of a futures contract, a ProFund VP may elect to close its position by taking an opposite position, which will operate to terminate the ProFund VP's existing position in the contract.
The primary risks associated with the use of futures contracts are imperfect correlation between movements in the price of futures and the market value of the underlying assets, and the possibility of an illiquid market for a futures contract. Although each ProFund VP intends to sell futures contracts only if there is an active market for such contracts, no assurance can be given that a liquid market will exist for any particular contract at any particular time. Many futures exchanges and boards of trade limit the amount of fluctuation permitted in futures contract prices during a single trading day. Once the daily limit has been reached in a particular contract, no trades may be made that day at a price beyond that limit or trading may be suspended for specified periods during the day. Futures contract prices could move to the limit for several consecutive trading days with little or no trading, thereby preventing prompt liquidation of futures positions and potentially subjecting a ProFund VP to substantial losses. If trading is not possible, or if a ProFund VP determines not to close a futures position in anticipation of adverse price movements, the ProFund VP will be required to make daily cash payments of variation margin. The risk that the ProFund VP will be unable to close out a futures position will be minimized by entering into such transactions on a national exchange with an active and liquid secondary market. In addition, although the counterparty to a futures contract is often a clearing organization, backed by a group of financial institutions, there may be instances in which the counterparty could fail to perform its obligations, causing significant losses to a ProFund VP.
Forward Currency Contracts
The ProFund VP Falling U.S. Dollar may invest in forward currency contracts for investment or risk management purposes. A forward currency contract is an obligation to buy or sell a specific currency at a future date, which may be any fixed number of days from the date of the contract agreed upon by the parties, at a price set at the time of the contract. These contracts are entered into on the interbank market conducted directly between currency traders (usually large commercial banks) and their customers.
It is possible that, under certain circumstances, this ProFund VP may have to limit its currency transactions to qualify as a "regulated investment company" ("RIC") under the Internal Revenue Code. The ProFund VP Falling U.S. Dollar does not intend to enter into a forward currency contract with a term of more than one year, or to engage in position hedging with respect to the currency of a particular country to more than the aggregate market value (at the time the hedging transaction is entered into) of their portfolio securities denominated in (or quoted in or currently convertible into or directly related through the use of forward currency contracts in conjunction with money market instruments to) that particular currency.
At or before the maturity of a forward currency contract, the ProFund VP Falling U.S. Dollar may either sell a portfolio security and make delivery of the currency, or retain the security and terminate its contractual obligation to deliver the currency by buying an "offsetting" contract obligating it to buy, on the same maturity date, the same amount of the currency. If this ProFund
December 31, 2021 :: Notes to Financial Statements :: 391
VP engages in an offsetting transaction, it may later enter into a new forward currency contract to sell the currency.
If the ProFund VP Falling U.S. Dollar engages in offsetting transactions it will incur a gain or loss, to the extent that there has been movement in forward currency contract prices. If forward prices go down during the period between the date the ProFund VP Falling U.S. Dollar enters into a forward currency contract for the sale of a currency and the date it enters into an offsetting contract for the purchase of the currency, the ProFund VP will realize a gain to the extent that the price of ProFund VP currency it has agreed to sell exceeds the price of the currency it has agreed to buy. If forward prices go up, the ProFund VP will suffer a loss to the extent the price of the currency it has agreed to buy exceeds the price of the currency it has agreed to sell.
The ProFund VP Falling U.S. Dollar collateralizes forward currency contracts with cash and certain securities as indicated on the Statement of Assets and Liabilities and the Schedule of Portfolio Investments, respectively. Such collateral is held for the benefit of the counterparty in a segregated tri-party account at the custodian, to protect the counterparty against non-payment by the respective ProFund VP. Similarly, the ProFund VP Falling U.S. Dollar has sought to mitigate credit risk by generally requiring that the counterparties to the ProFund VP post collateral for the benefit of the ProFund VP in a segregated account at the custodian, marked to market daily, in an amount equal to what the counterparty owes the ProFund VP, subject to certain minimum thresholds. In the event of a default by the counterparty, the ProFund VP will seek withdrawal of this collateral from the segregated account and may incur certain costs exercising its right with respect to the collateral. If a counterparty becomes bankrupt or fails to perform its obligations, the ProFund VP Falling U.S. Dollar may experience significant delays in obtaining any recovery in a bankruptcy or other reorganization proceeding. The ProFund VP Falling U.S. Dollar may obtain only limited recovery or may obtain no recovery in such circumstances. The ProFund VP Falling U.S. Dollar will enter into forward currency contracts only with financial institutions that meet the credit quality standards and monitoring policies established by the Advisor. As of December 31, 2021, there was no collateral posted by counterparties.
Credit Default Swap ("CDS") Agreements
As of December 31, 2021, the ProFund Access VP High Yield invested in centrally cleared CDS as a substitute for investing directly in bonds in order to gain credit exposure to the high yield market.
In a CDS, the agreement will reference one or more debt securities or reference entities. The protection "buyer" in a credit default contract is generally obligated to pay the protection "seller" a periodic stream of payments over the term of the contract until a credit event, such as a default, on a reference entity has occurred. If a credit event occurs, the seller generally must pay the buyer: a) the full notional value of the swap; or b) the difference between the notional value of the defaulted reference entity and the recovery price/rate for the defaulted reference entity. CDS are designed to reflect changes in credit quality, including events of default. A CDS may require premium (discount) payments as well as daily payments (receipts) related to the interest leg of the swap or to the default or change in price of a reference entity.
The counterparty risk for cleared swap agreements is generally lower than for uncleared over-the-counter swap agreements because, generally, a clearing organization becomes substituted for each counterparty to a cleared swap agreement and, in effect, guarantees each party's performance under the contract as each party to a trade looks only to the clearing organization for performance of financial obligations. However, there can be no assurance that the clearing organization, or its members, will satisfy its obligations to the ProFund Access VP High Yield.
If the ProFund Access VP High Yield is a seller of a CDS contract (also referred to as a seller of protection or as a buyer of risk), the ProFund Access VP High Yield would be required to pay the par (or other agreed upon) value of a referenced obligation to the counterparty in the event of a default or other credit event. In return, the ProFund Access VP High Yield would receive from the counterparty a daily stream of payments over the term of the contract provided that no event of default has occurred. If no default occurs, the ProFund Access VP High Yield would keep the stream of payments and would have no payment obligations. As the seller, the ProFund Access VP High Yield would be subject to investment exposure on the notional amount of the swap.
If the ProFund Access VP High Yield is a buyer of a CDS contract (also referred to as a buyer of protection or a seller of risk), the ProFund Access VP High Yield would have the right to deliver a reference obligation and receive the par (or other agreed-upon) value of such obligation from the counterparty in the event of a default or other credit event (such as a credit downgrade). In return, the ProFund Access VP High Yield would pay the counterparty a daily stream of payments over the term of the contract provided that no event of default has occurred. If no default occurs, the counterparty would keep the stream of payments and would have no further obligations to the ProFund Access VP High Yield.
The ProFund Access VP High Yield enters into a CDS with multiple reference entities, in which case payments and settlements in respect of any defaulting reference entity would typically be dealt with separately from the other reference entities.
Upon entering into a centrally cleared CDS, the ProFund Access VP High Yield may be required to deposit with the broker an amount of cash or cash equivalents in the range of approximately 3% to 6% of the notional amount for CDS on high yield debt issuers (this amount is subject to change by the clearing organization that clears the trade). This amount, known as "initial margin," is in the nature of a performance bond or good faith deposit on the CDS and is returned to the ProFund Access VP High Yield upon termination of the CDS, assuming all contractual obligations have been satisfied. Subsequent payments, known as "variation margin," to and from the broker will be made daily as the price of the CDS fluctuates, making the long and short positions in the CDS contract more or less valuable, a process known as "marking-to-market." The premium (discount) payments are built into the daily price of the CDS and thus are amortized through the variation margin. The variation margin payment also includes the daily portion of the periodic payment stream.
Swap Agreements (other than CDS)
Each non-money market ProFund VP may enter into swap agreements to gain exposure to an underlying asset without
392 :: Notes to Financial Statements :: December 31, 2021
actually purchasing such asset (or shorting such asset), or to hedge a position, including in circumstances in which direct investment is restricted for legal reasons or is otherwise impracticable. Swap agreements are two-party contracts entered into primarily by institutional investors for periods ranging from a day to more than one year. In a standard "swap" transaction, two parties agree to exchange the return (or differentials in rates of return) earned or realized on particular pre-determined investments or instruments. The gross return to be exchanged or "swapped" between the parties is calculated with respect to a "notional amount," e.g., the return on or increase in value of a particular dollar amount invested in a "basket" of securities or an ETF representing a particular index or group of securities.
On a typical long swap, the counterparty will generally agree to pay the ProFund VP the amount, if any, by which the notional amount of the swap agreement would have increased in value had it been invested in the particular underlying assets (e.g., securities comprising the relevant benchmark index), plus the dividends or interest that would have been received on those assets. The ProFund VP will agree to pay to the counterparty a floating rate of interest on the notional amount of the swap agreement plus the amount, if any, by which the notional amount would have decreased in value had it been invested in such assets, plus, in certain circumstances, commissions or trading spreads on the notional amount. Therefore, the return to the ProFund VP on any swap agreement should be the gain or loss on the notional amount plus dividends or interest on the assets less the interest paid by the ProFund VP on the notional amount. As a trading technique, the Advisor may substitute physical securities with a swap agreement having investment characteristics substantially similar to the underlying securities. Some ProFunds VP may also enter into swap agreements that provide the opposite return of their benchmark or security ("short" the benchmark or security). Their operations are similar to that of the swaps disclosed above except that the counterparty pays interest to each ProFund VP on the notional amount outstanding and that dividends or interest on the underlying instruments reduce the value of the swap, plus, in certain instances, each ProFund VP will agree to pay to the counterparty commissions or trading spreads on the notional amount.
Most swap agreements entered into by a ProFund VP calculate and settle the obligations of the parties to the agreement on a "net basis" with a single payment. Consequently, a ProFund VP's current obligations (or rights) under a swap agreement will generally be equal only to the net amount to be paid or received under the agreement based on the relative values of the positions held by each party to the agreement (the "net amount"). When investing in index swap agreements, the ProFunds VP may hold or gain exposure to only a representative sample of securities in the index, or to a component of the index.
A ProFund VP's current obligations under a swap agreement, will be accrued daily (offset against any amounts owed to the ProFund VP) and any accrued but unpaid net amounts owed to a swap counterparty will be covered by segregating or earmarking cash and/or securities determined to be liquid, but typically no payments will be made until the settlement date. Each ProFund VP reserves the right to modify its asset segregation policies in the future, including modifications to comply with any changes in the positions articulated by the SEC or its staff regarding asset segregation. Swap agreements that cannot be terminated of in the ordinary course of business within seven days at approximately the amount a ProFund VP has valued the asset may be considered to be illiquid for purposes of a ProFund VP's illiquid investment limitations.
A ProFund VP bears the risk of loss of the amount expected to be received under a swap agreement in the event of the default or bankruptcy of a swap agreement counterparty. If such a default occurs, a ProFund VP will have contractual remedies pursuant to the swap agreements, but such remedies may be subject to bankruptcy and insolvency laws that could affect the ProFund VP's rights as a creditor. A ProFund VP will only enter into swap agreements with counterparties that meet the ProFund VP's standard of creditworthiness (generally, such counterparties would have to be eligible counterparties under the terms of the ProFund VP's repurchase agreement guidelines). The counterparty to an uncleared swap agreement will typically be a major, global financial institution.
Payments may be made at the conclusion of a swap agreement. Swap agreements do not involve the delivery of securities or other underlying assets. Accordingly, the risk of loss with respect to swap agreements is limited to the net amount of payments that a ProFund VP is contractually obligated to make. If the other party to a swap agreement defaults, a ProFund VP's risk of loss consists of the net amount of payments that such ProFund VP is contractually entitled to receive, if any. The net amount of the excess, if any, of a ProFund VP's obligations over its entitlements with respect to each equity swap will be accrued on a daily basis and an amount of cash or liquid assets, having an aggregate NAV at least equal to such accrued excess will be earmarked or segregated by a ProFund VP's custodian.
In the normal course of business, a ProFund VP enters into International Swap Dealers Association, Inc. ("ISDA") agreements with certain counterparties for derivative transactions. These agreements contain, among other conditions, events of default and termination events, and various covenants and representations. Certain of the ProFund VP's ISDA agreements contain provisions that require the ProFund VP to maintain a pre-determined level of net assets, and/or provide limits regarding the decline of the ProFund VP's NAV over specific periods of time, which may or may not be exclusive of redemptions. If the ProFund VP were to trigger such provisions and have open derivative positions, at that time counterparties to the ISDA agreements could elect to terminate such ISDA agreements and request immediate payment in an amount equal to the net liability positions, if any, under the relevant ISDA agreement. Pursuant to the terms of its ISDA agreements, the ProFund VP will have already collateralized its liability under such agreements, in some cases only in excess of certain threshold amounts. Such collateral is held for the benefit of the counterparty in a segregated tri-party account at the custodian, to protect the counterparty against non-payment by the respective ProFund VP. The ProFunds VP seek to mitigate risks by generally requiring that the counterparties for each ProFund VP agree to post collateral for the benefit of the ProFund VP, marked to market daily, in an amount approximately equal to what the counterparty owes the ProFund VP, subject to certain minimum thresholds, although the ProFunds VP may not always be successful. To the extent any such collateral is insufficient or there are delays in accessing the collateral, the ProFunds VP will be
December 31, 2021 :: Notes to Financial Statements :: 393
exposed to the risks described above, including possible delays in recovering amounts as a result of bankruptcy proceedings. As of December 31, 2021, the collateral posted by counterparties consisted of U.S. Treasury securities.
The use of swaps, including CDS, is a highly specialized activity which involves investment techniques and risks in addition to and in some cases different from those associated with ordinary portfolio securities transactions. The primary risks associated with the use of swap agreements are mispricing or improper valuation, imperfect correlation between movements in the notional amount and the price of the underlying investments, and the inability of the counterparties to perform. If a counterparty's creditworthiness for an over-the-counter swap declines, the value of the swap would likely decline. The Advisor, under the supervision of the Trust's Board of Trustees, is responsible for determining and monitoring the liquidity of a ProFund VP's transactions in swap agreements.
Offsetting Assets and Liabilities
The ProFunds VP are subject to master netting agreements for swap agreements (other than centrally cleared CDS) and forward currency contracts that allow for amounts owed between the ProFund VP and the counterparty to be netted upon early termination. The party that has the larger payable pays the excess of the larger amount over the smaller amount to the other party. The master netting agreements do not apply to amounts owed to/from different counterparties.
As described above, the ProFunds VP utilize derivative instruments to achieve their investment objective during the year. The amounts shown in the Statements of Assets and Liabilities generally do not take into consideration the effects of legally enforceable master netting agreements.
Summary of Derivative Instruments
The following table summarizes the fair values of derivative instruments on the ProFund VP's Statement of Assets and Liabilities, categorized by risk exposure, as of December 31, 2021.
| | | Assets | | | Liabilities | |
| Fund | | Variation
Margin on
Futures
Contracts* | | | Unrealized
Appreciation
on Swap
Agreements | | | Unrealized
Appreciation
on Forward
Currency
Contracts | | | Variation
Margin on
Futures
Contracts* | | | Unrealized
Depreciation
on Swap
Agreements | | | Unrealized
Depreciation
on Forward
Currency
Contracts | |
| Credit Risk Exposure: | | | | | | | | | | | | | | | | | | | | | | | | |
| ProFund Access VP High Yield | | $ | — | | | $ | — | | | $ | — | | | $ | — | | | $ | 44,878 | | | $ | — | |
| Equity Risk Exposure: | | | | | | | | | | | | | | | | | | | | | | | | |
| ProFund VP Banks | | | — | | | | 610 | | | | — | | | | — | | | | — | | | | — | |
| ProFund VP Basic Materials | | | — | | | | 7,105 | | | | — | | | | — | | | | — | | | | — | |
| ProFund VP Bear | | | — | | | | 7,868 | | | | — | | | | — | | | | — | | | | — | |
| ProFund VP Biotechnology | | | — | | | | 823 | | | | — | | | | — | | | | — | | | | — | |
| ProFund VP Bull | | | 39,069 | | | | — | | | | — | | | | — | | | | 77,890 | | | | — | |
| ProFund VP Consumer Goods | | | — | | | | 4,204 | | | | — | | | | — | | | | — | | | | — | |
| ProFund VP Consumer Services | | | — | | | | 2,031 | | | | — | | | | — | | | | — | | | | — | |
| ProFund VP Dow 30 | | | — | | | | 200 | | | | — | | | | — | | | | — | | | | — | |
| ProFund VP Emerging Markets | | | — | | | | 4,395 | | | | — | | | | — | | | | — | | | | — | |
| ProFund VP Financials | | | — | | | | 5,305 | | | | — | | | | — | | | | — | | | | — | |
| ProFund VP Health Care | | | — | | | | 10,767 | | | | — | | | | — | | | | — | | | | — | |
| ProFund VP Industrials | | | — | | | | 8,820 | | | | — | | | | — | | | | — | | | | — | |
| ProFund VP International | | | — | | | | — | | | | — | | | | — | | | | 54,664 | | | | — | |
| ProFund VP Internet | | | — | | | | — | | | | — | | | | — | | | | 4,286 | | | | — | |
| ProFund VP Japan | | | 248,706 | | | | — | | | | — | | | | — | | | | 45 | | | | — | |
| ProFund VP Mid-Cap | | | 107,578 | | | | 37,755 | | | | — | | | | — | | | | — | | | | — | |
| ProFund VP Nasdaq-100 | | | — | | | | — | | | | — | | | | 1,647 | | | | 786,809 | | | | — | |
| ProFund VP Oil & Gas | | | — | | | | — | | | | — | | | | — | | | | 864 | | | | — | |
| ProFund VP Pharmaceuticals | | | — | | | | 124 | | | | — | | | | — | | | | — | | | | — | |
| ProFund VP Precious Metals | | | — | | | | 602,452 | | | | — | | | | — | | | | — | | | | — | |
| ProFund VP Real Estate | | | — | | | | 10,836 | | | | — | | | | — | | | | — | | | | — | |
| ProFund VP Semiconductor | | | — | | | | — | | | | — | | | | — | | | | 7,163 | | | | — | |
| ProFund VP Short Dow 30 | | | — | | | | — | | | | — | | | | — | | | | 7 | | | | — | |
| ProFund VP Short Emerging Markets | | | — | | | | — | | | | — | | | | — | | | | 11,582 | | | | — | |
| ProFund VP Short International | | | — | | | | 2,308 | | | | — | | | | — | | | | — | | | | — | |
| ProFund VP Short Mid-Cap | | | — | | | | — | | | | — | | | | — | | | | 167 | | | | — | |
| ProFund VP Short Nasdaq-100 | | | — | | | | 27,559 | | | | — | | | | — | | | | — | | | | — | |
| ProFund VP Short Small-Cap | | | — | | | | 5,086 | | | | — | | | | 1,694 | | | | — | | | | — | |
| ProFund VP Small-Cap | | | — | | | | — | | | | — | | | | — | | | | 33,573 | | | | — | |
| ProFund VP Technology | | | ��� | | | | — | | | | — | | | | — | | | | 12,722 | | | | — | |
| ProFund VP Telecommunications | | | — | | | | 372 | | | | — | | | | — | | | | — | | | | — | |
394 :: Notes to Financial Statements :: December 31, 2021
| | | Assets | | | Liabilities | |
| Fund | | Variation
Margin on
Futures
Contracts* | | | Unrealized
Appreciation
on Swap
Agreements | | | Unrealized
Appreciation
on Forward
Currency
Contracts | | | Variation
Margin on
Futures
Contracts* | | | Unrealized
Depreciation
on Swap
Agreements | | | Unrealized
Depreciation
on Forward
Currency
Contracts | |
| ProFund VP UltraBull | | $ | 22,325 | | | $ | — | | | $ | — | | | $ | — | | | $ | 108,982 | | | $ | — | |
| ProFund VP UltraMid-Cap | | | — | | | | 77,849 | | | | — | | | | — | | | | — | | | | — | |
| ProFund VP UltraNasdaq-100 | | | — | | | | — | | | | — | | | | 206 | | | | 5,545,231 | | | | — | |
| ProFund VP UltraShort Dow 30 | | | — | | | | — | | | | — | | | | — | | | | 8 | | | | — | |
| ProFund VP UltraShort Nasdaq-100 | | | — | | | | 10,880 | | | | — | | | | — | | | | — | | | | — | |
| ProFund VP UltraSmall-Cap | | | — | | | | — | | | | — | | | | — | | | | 301,624 | | | | — | |
| ProFund VP Utilities | | | — | | | | 18,215 | | | | — | | | | — | | | | — | | | | — | |
| Foreign Exchange Rate Risk Exposure: | | | | | | | | | | | | | | | | | | | | | | | | |
| ProFund VP Falling U.S. Dollar | | | — | | | | — | | | | 2,032 | | | | — | | | | — | | | | 1,432 | |
| Interest Rate Risk Exposure: | | | | | | | | | | | | | | | | | | | | | | | | |
| ProFund Access VP High Yield | | | — | | | | — | | | | — | | | | 2,978 | | | | — | | | | — | |
| ProFund VP Rising Rates Opportunity | | | — | | | | 14,318 | | | | — | | | | — | | | | — | | | | — | |
| ProFund VP U.S. Government Plus | | | — | | | | — | | | | — | | | | — | | | | 38,597 | | | | — | |
| * | Includes cumulative appreciation/depreciation of futures contracts and credit default swap agreements as reported in the Schedules of Portfolio Investments. Only current day's variation margin is reported within the Statements of Assets and Liabilities. |
The following table presents the effect of derivative instruments on the ProFund VP's Statement of Operations, categorized by risk exposure, for the year ended December 31, 2021.
| | | Realized Gain (Loss) on Derivatives
Recognized as a Result from Operations | | | Change in Net Unrealized Appreciation/
Depreciation on Derivatives
Recognized as a Result from Operations | |
| Fund | | Net
Realized
Gains (Losses)
on Futures
Contracts | | | Net
Realized
Gains (Losses)
on Swap
Agreements | | | Net
Realized
Gains (Losses)
on Forward
Currency
Contracts | | | Change in
Net
Unrealized
Appreciation/
Depreciation
on Futures
Contracts | | | Change in
Net
Unrealized
Appreciation/
Depreciation
on Swap
Agreements | | | Change in
Net
Unrealized
Appreciation/
Depreciation
on Forward
Currency
Contracts | |
| Credit Risk Exposure: | | | | | | | | | | | | | | | | | | | | | | | | |
| ProFund Access VP High Yield | | $ | — | | | $ | 1,316,483 | | | $ | — | | | $ | — | | | $ | (735,664 | ) | | $ | — | |
| Equity Risk Exposure: | | | | | | | | | | | | | | | | | | | | | | | | |
| ProFund VP Banks | | | — | | | | 103,616 | | | | — | | | | — | | | | (255 | ) | | | — | |
| ProFund VP Basic Materials | | | — | | | | 92,187 | | | | — | | | | — | | | | 2,128 | | | | — | |
| ProFund VP Bear | | | (76,638 | ) | | | (617,127 | ) | | | — | | | | 12,695 | | | | 18,165 | | | | — | |
| ProFund VP Biotechnology | | | — | | | | 86,334 | | | | — | | | | — | | | | 9,992 | | | | — | |
| ProFund VP Bull | | | 1,882,126 | | | | 3,443,200 | | | | — | | | | (185,022 | ) | | | (164,378 | ) | | | — | |
| ProFund VP Consumer Goods | | | — | | | | 60,929 | | | | — | | | | — | | | | (3,245 | ) | | | — | |
| ProFund VP Consumer Services | | | — | | | | (8,807 | ) | | | — | | | | — | | | | (6,486 | ) | | | — | |
| ProFund VP Dow 30 | | | — | | | | 36,870 | | | | — | | | | — | | | | (6,186 | ) | | | — | |
| ProFund VP Emerging Markets | | | — | | | | (195,067 | ) | | | — | | | | — | | | | (4,709 | ) | | | — | |
| ProFund VP Financials | | | — | | | | 144,777 | | | | — | | | | — | | | | (6,449 | ) | | | — | |
| ProFund VP Health Care | | | — | | | | 251,511 | | | | — | | | | — | | | | (15,044 | ) | | | — | |
| ProFund VP Industrials | | | — | | | | 31,110 | | | | — | | | | — | | | | 6,968 | | | | — | |
| ProFund VP International | | | — | | | | 1,116,774 | | | | — | | | | — | | | | (47,845 | ) | | | — | |
| ProFund VP Internet | | | — | | | | (31,815 | ) | | | — | | | | — | | | | 1,174 | | | | — | |
| ProFund VP Japan | | | 518,215 | | | | 4,315 | | | | — | | | | (24,395 | ) | | | (2,139 | ) | | | — | |
| ProFund VP Mid-Cap | | | 435,097 | | | | 2,383,706 | | | | — | | | | 90,622 | | | | 48,547 | | | | — | |
| ProFund VP Nasdaq-100 | | | 1,076,174 | | | | 9,073,697 | | | | — | | | | (209,496 | ) | | | (959,353 | ) | | | — | |
| ProFund VP Oil & Gas | | | — | | | | 228,382 | | | | — | | | | — | | | | 2,274 | | | | — | |
| ProFund VP Pharmaceuticals | | | — | | | | 49,254 | | | | — | | | | — | | | | (8,418 | ) | | | — | |
| ProFund VP Precious Metals | | | — | | | | (3,151,213 | ) | | | — | | | | — | | | | 594,004 | | | | — | |
| ProFund VP Real Estate | | | — | | | | 67,078 | | | | — | | | | — | | | | 9,326 | | | | — | |
| ProFund VP Semiconductor | | | — | | | | 222,552 | | | | — | | | | — | | | | (15,993 | ) | | | — | |
| ProFund VP Short Dow 30 | | | — | | | | (1,733 | ) | | | — | | | | — | | | | 100 | | | | — | |
| ProFund VP Short Emerging Markets | | | — | | | | 4,707 | | | | — | | | | — | | | | 2,060 | | | | — | |
| ProFund VP Short International | | | — | | | | (111,588 | ) | | | — | | | | — | | | | 1,482 | | | | — | |
| ProFund VP Short Mid-Cap | | | — | | | | (37,779 | ) | | | — | | | | — | | | | (87 | ) | | | — | |
December 31, 2021 :: Notes to Financial Statements :: 395
| | | Realized Gain (Loss) on Derivatives
Recognized as a Result from Operations | | | Change in Net Unrealized Appreciation/
Depreciation on Derivatives
Recognized as a Result from Operations | |
| Fund | | Net
Realized
Gains (Losses)
on Futures
Contracts | | | Net
Realized
Gains (Losses)
on Swap
Agreements | | | Net
Realized
Gains (Losses)
on Forward
Currency
Contracts | | | Change in
Net
Unrealized
Appreciation/
Depreciation
on Futures
Contracts | | | Change in
Net
Unrealized
Appreciation/
Depreciation
on Swap
Agreements | | | Change in
Net
Unrealized
Appreciation/
Depreciation
on Forward
Currency
Contracts | |
| ProFund VP Short Nasdaq-100 | | $ | (173,395 | ) | | $ | (155,929 | ) | | $ | — | | | $ | 62,482 | | | $ | 41,331 | | | $ | — | |
| ProFund VP Short Small-Cap | | | (16,123 | ) | | | (234,252 | ) | | | — | | | | 1,970 | | | | (1,010 | ) | | | — | |
| ProFund VP Small-Cap | | | — | | | | 1,121,454 | | | | — | | | | — | | | | 93,159 | | | | — | |
| ProFund VP Technology | | | — | | | | 316,095 | | | | — | | | | — | | | | (17,709 | ) | | | — | |
| ProFund VP Telecommunications | | | — | | | | 15,124 | | | | — | | | | — | | | | 349 | | | | — | |
| ProFund VP UltraBull | | | 456,545 | | | | 5,403,218 | | | | — | | | | (7,272 | ) | | | (220,595 | ) | | | — | |
| ProFund VP UltraMid-Cap | | | 12,857 | | | | 4,180,017 | | | | — | | | | — | | | | 98,904 | | | | — | |
| ProFund VP UltraNasdaq-100 | | | 1,832,051 | | | | 71,368,416 | | | | — | | | | (270,409 | ) | | | (6,673,654 | ) | | | — | |
| ProFund VP UltraShort Dow 30 | | | — | | | | (14,005 | ) | | | — | | | | — | | | | 80 | | | | — | |
| ProFund VP UltraShort Nasdaq-100 | | | — | | | | (339,086 | ) | | | — | | | | — | | | | 12,461 | | | | — | |
| ProFund VP UltraSmall-Cap | | | 59,805 | | | | 3,110,064 | | | | — | | | | (21,246 | ) | | | 73,683 | | | | — | |
| ProFund VP Utilities | | | — | | | | 78,011 | | | | — | | | | — | | | | 8,322 | | | | — | |
| | | | | | | | | | | | | | | | | | | | | | | | | |
| Foreign Exchange Rate Risk Exposure: | | | | | | | | | | | | | | | | | | | | | | | | |
| ProFund VP Falling U.S. Dollar | | | — | | | | — | | | | (52,276 | ) | | | — | | | | — | | | | (13,169 | ) |
| | | | | | | | | | | | | | | | | | | | | | | | | |
| Interest Rate Risk Exposure: | | | | | | | | | | | | | | | | | | | | | | | | |
| ProFund Access VP High Yield | | | (32,309 | ) | | | — | | | | — | | | | (6,309 | ) | | | — | | | | — | |
| ProFund VP Rising Rates Opportunity | | | (8,224 | ) | | | (202,026 | ) | | | — | | | | — | | | | 34,092 | | | | — | |
| ProFund VP U.S. Government Plus | | | 6,976 | | | | (1,343,840 | ) | | | — | | | | — | | | | (97,357 | ) | | | — | |
Asset (Liability) amounts shown in the table below represent amounts owed to (by) the ProFunds VP for swap agreements (other than centrally cleared CDS) and forward currency contracts as of December 31, 2021. These amounts may be collateralized by cash or financial instruments, segregated for the benefit of the ProFunds VP or the counterparties, depending on whether the related contracts are in an appreciated or depreciated position at year end. Amounts shown in the column labeled "Net Amount" represent the un-collateralized portions of these amounts at year end. Any un-collateralized amounts are due to timing differences related to market movements or subject to certain minimum thresholds for collateral movement, as further described above.
| | | Gross Amounts Not Offset in the
Statement of Assets and Liabilities* | |
| | | Gross
Asset (Liability) as
presented in
the Statement of
Assets and Liabilities | | | Financial
Instruments
(Received)
Pledged** | | | Cash
Collateral
(Received)
Pledged | | | Net Amount | |
| ProFund VP Banks | | | | | | | | | | | | | | | | |
| Swap Agreements — Goldman Sachs International | | $ | 610 | | | $ | — | | | $ | — | | | $ | 610 | |
| ProFund VP Basic Materials | | | | | | | | | | | | | | | | |
| Swap Agreements — Goldman Sachs International | | | 7,105 | | | | — | | | | — | | | | 7,105 | |
| ProFund VP Bear | | | | | | | | | | | | | | | | |
| Swap Agreements — Goldman Sachs International | | | 1,167 | | | | — | | | | — | | | | 1,167 | |
| Swap Agreements — UBS AG | | | 6,701 | | | | — | | | | — | | | | 6,701 | |
| ProFund VP Biotechnology | | | | | | | | | | | | | | | | |
| Swap Agreements — Goldman Sachs International | | | 823 | | | | — | | | | — | | | | 823 | |
| ProFund VP Bull | | | | | | | | | | | | | | | | |
| Swap Agreements — Goldman Sachs International | | | (33,703 | ) | | | 33,703 | | | | — | | | | — | |
| Swap Agreements — UBS AG | | | (44,187 | ) | | | 44,187 | | | | — | | | | — | |
| ProFund VP Consumer Goods | | | | | | | | | | | | | | | | |
| Swap Agreements — Goldman Sachs International | | | 4,204 | | | | — | | | | — | | | | 4,204 | |
| ProFund VP Consumer Services | | | | | | | | | | | | | | | | |
| Swap Agreements — Goldman Sachs International | | | 2,031 | | | | — | | | | — | | | | 2,031 | |
| ProFund VP Dow 30 | | | | | | | | | | | | | | | | |
| Swap Agreements — Goldman Sachs International | | | 141 | | | | — | | | | — | | | | 141 | |
| Swap Agreements — UBS AG | | | 59 | | | | — | | | | — | | | | 59 | |
396 :: Notes to Financial Statements :: December 31, 2021
| | | Gross Amounts Not Offset in the
Statement of Assets and Liabilities* | |
| | | Gross
Asset (Liability) as
presented in
the Statement of
Assets and Liabilities | | | Financial
Instruments
(Received)
Pledged** | | | Cash
Collateral
(Received)
Pledged | | | Net Amount | |
| ProFund VP Emerging Markets | | | | | | | | | | | | | | | | |
| Swap Agreements — Goldman Sachs International | | $ | 728 | | | $ | — | | | $ | — | | | $ | 728 | |
| Swap Agreements — UBS AG | | | 3,667 | | | | — | | | | — | | | | 3,667 | |
| ProFund VP Falling U.S. Dollar | | | | | | | | | | | | | | | | |
| Forward Currency Contracts — Goldman Sachs International | | | | | | | | | | | | | | | | |
| Appreciation | | | 1,368 | | | | | | | | | | | | | |
| Depreciation | | | (872 | ) | | | | | | | | | | | | |
| Net Appreciation | | | 496 | | | | — | | | | — | | | | 496 | |
| Forward Currency Contracts — UBS AG | | | | | | | | | | | | | | | | |
| Appreciation | | | 664 | | | | | | | | | | | | | |
| Depreciation | | | (560 | ) | | | | | | | | | | | | |
| Net Appreciation | | | 104 | | | | — | | | | — | | | | 104 | |
| ProFund VP Financials | | | | | | | | | | | | | | | | |
| Swap Agreements — Goldman Sachs International | | | 5,305 | | | | — | | | | — | | | | 5,305 | |
| ProFund VP Health Care | | | | | | | | | | | | | | | | |
| Swap Agreements — Goldman Sachs International | | | 10,767 | | | | — | | | | — | | | | 10,767 | |
| ProFund VP Industrials | | | | | | | | | | | | | | | | |
| Swap Agreements — Goldman Sachs International | | | 8,820 | | | | — | | | | — | | | | 8,820 | |
| ProFund VP International | | | | | | | | | | | | | | | | |
| Swap Agreements — Goldman Sachs International | | | (26,917 | ) | | | 26,917 | | | | — | | | | — | |
| Swap Agreements — UBS AG | | | (27,747 | ) | | | 27,747 | | | | — | | | | — | |
| ProFund VP Internet | | | | | | | | | | | | | | | | |
| Swap Agreements — Goldman Sachs International | | | (4,286 | ) | | | — | | | | — | | | | (4,286 | ) |
| ProFund VP Japan | | | | | | | | | | | | | | | | |
| Swap Agreements — Goldman Sachs International | | | (45 | ) | | | — | | | | — | | | | (45 | ) |
| ProFund VP Mid-Cap | | | | | | | | | | | | | | | | |
| Swap Agreements — Goldman Sachs International | | | 13,524 | | | | — | | | | — | | | | 13,524 | |
| Swap Agreements — UBS AG | | | 24,231 | | | | — | | | | — | | | | 24,231 | |
| ProFund VP Nasdaq-100 | | | | | | | | | | | | | | | | |
| Swap Agreements — Goldman Sachs International | | | (229,652 | ) | | | 229,652 | | | | — | | | | — | |
| Swap Agreements — UBS AG | | | (557,157 | ) | | | 557,157 | | | | — | | | | — | |
| ProFund VP Oil & Gas | | | | | | | | | | | | | | | | |
| Swap Agreements — Goldman Sachs International | | | (864 | ) | | | — | | | | 864 | | | | — | |
| ProFund VP Pharmaceuticals | | | | | | | | | | | | | | | | |
| Swap Agreements — Goldman Sachs International | | | 124 | | | | — | | | | — | | | | 124 | |
| ProFund VP Precious Metals | | | | | | | | | | | | | | | | |
| Swap Agreements — Goldman Sachs International | | | 285,903 | | | | (207,024 | ) | | | — | | | | 78,879 | |
| Swap Agreements — UBS AG | | | 316,549 | | | | — | | | | — | | | | 316,549 | |
| ProFund VP Real Estate | | | | | | | | | | | | | | | | |
| Swap Agreements — Goldman Sachs International | | | 10,836 | | | | — | | | | — | | | | 10,836 | |
| ProFund VP Rising Rates Opportunity | | | | | | | | | | | | | | | | |
| Swap Agreements — Citibank North America | | | 10,658 | | | | — | | | | — | | | | 10,658 | |
| Swap Agreements — Societe' Generale | | | 3,660 | | | | — | | | | — | | | | 3,660 | |
| ProFund VP Semiconductor | | | | | | | | | | | | | | | | |
| Swap Agreements — Goldman Sachs International | | | (7,163 | ) | | | — | | | | 7,163 | | | | — | |
| ProFund VP Short Dow 30 | | | | | | | | | | | | | | | | |
| Swap Agreements — Goldman Sachs International | | | (1 | ) | | | — | | | | — | | | | (1 | ) |
| Swap Agreements — UBS AG | | | (6 | ) | | | 6 | | | | — | | | | — | |
| ProFund VP Short Emerging Markets | | | | | | | | | | | | | | | | |
| Swap Agreements — Goldman Sachs International | | | (2,299 | ) | | | 2,299 | | | | — | | | | — | |
| Swap Agreements — UBS AG | | | (9,283 | ) | | | 9,283 | | | | — | | | | — | |
| ProFund VP Short International | | | | | | | | | | | | | | | | |
| Swap Agreements — Goldman Sachs International | | | 544 | | | | — | | | | — | | | | 544 | |
| Swap Agreements — UBS AG | | | 1,764 | | | | — | | | | — | | | | 1,764 | |
| ProFund VP Short Mid-Cap | | | | | | | | | | | | | | | | |
| Swap Agreements — Goldman Sachs International | | | (81 | ) | | | — | | | | — | | | | (81 | ) |
| Swap Agreements — UBS AG | | | (86 | ) | | | 86 | | | | — | | | | — | |
December 31, 2021 :: Notes to Financial Statements :: 397
| | | Gross Amounts Not Offset in the
Statement of Assets and Liabilities* | |
| | | Gross
Asset (Liability) as
presented in
the Statement of
Assets and Liabilities | | | Financial
Instruments
(Received)
Pledged** | | | Cash
Collateral
(Received)
Pledged | | | Net Amount | |
| ProFund VP Short Nasdaq-100 | | | | | | | | | | | | | | | | |
| Swap Agreements — Goldman Sachs International | | $ | 19,907 | | | $ | — | | | $ | — | | | $ | 19,907 | |
| Swap Agreements — UBS AG | | | 7,652 | | | | — | | | | — | | | | 7,652 | |
| ProFund VP Short Small-Cap | | | | | | | | | | | | | | | | |
| Swap Agreements — Goldman Sachs International | | | 501 | | | | — | | | | — | | | | 501 | |
| Swap Agreements — UBS AG | | | 4,585 | | | | — | | | | — | | | | 4,585 | |
| ProFund VP Small-Cap | | | | | | | | | | | | | | | | |
| Swap Agreements — Goldman Sachs International | | | (1,367 | ) | | | 1,367 | | | | — | | | | — | |
| Swap Agreements — UBS AG | | | (32,206 | ) | | | 32,206 | | | | — | | | | — | |
| ProFund VP Technology | | | | | | | | | | | | | | | | |
| Swap Agreements — Goldman Sachs International | | | (12,722 | ) | | | — | | | | 12,722 | | | | — | |
| ProFund VP Telecommunications | | | | | | | | | | | | | | | | |
| Swap Agreements — Goldman Sachs International | | | 372 | | | | — | | | | — | | | | 372 | |
| ProFund VP UltraBull | | | | | | | | | | | | | | | | |
| Swap Agreements — Goldman Sachs International | | | (63,854 | ) | | | 63,854 | | | | — | | | | — | |
| Swap Agreements — UBS AG | | | (45,128 | ) | | | 45,128 | | | | — | | | | — | |
| ProFund VP UltraMid-Cap | | | | | | | | | | | | | | | | |
| Swap Agreements — Goldman Sachs International | | | 55,313 | | | | — | | | | — | | | | 55,313 | |
| Swap Agreements — UBS AG | | | 22,536 | | | | — | | | | — | | | | 22,536 | |
| ProFund VP UltraNasdaq-100 | | | | | | | | | | | | | | | | |
| Swap Agreements — Goldman Sachs International | | | (1,656,705 | ) | | | 1,656,705 | | | | — | | | | — | |
| Swap Agreements — UBS AG | | | (3,888,526 | ) | | | 3,888,526 | | | | — | | | | — | |
| ProFund VP UltraShort Dow 30 | | | | | | | | | | | | | | | | |
| Swap Agreements — Goldman Sachs International | | | (5 | ) | | | — | | | | — | | | | (5 | ) |
| Swap Agreements — UBS AG | | | (3 | ) | | | — | | | | — | | | | (3 | ) |
| ProFund VP UltraShort Nasdaq-100 | | | | | | | | | | | | | | | | |
| Swap Agreements — Goldman Sachs International | | | 9,970 | | | | — | | | | — | | | | 9,970 | |
| Swap Agreements — UBS AG | | | 910 | | | | — | | | | — | | | | 910 | |
| ProFund VP UltraSmall-Cap | | | | | | | | | | | | | | | | |
| Swap Agreements — Goldman Sachs International | | | (195,083 | ) | | | 195,083 | | | | — | | | | — | |
| Swap Agreements — UBS AG | | | (106,541 | ) | | | 106,541 | | | | — | | | | — | |
| ProFund VP U.S. Government Plus | | | | | | | | | | | | | | | | |
| Swap Agreements — Citibank North America | | | (17,649 | ) | | | 17,649 | | | | — | | | | — | |
| Swap Agreements — Societe' Generale | | | (20,948 | ) | | | 20,948 | | | | — | | | | — | |
| ProFund VP Utilities | | | | | | | | | | | | | | | | |
| Swap Agreements — Goldman Sachs International | | | 18,215 | | | | — | | | | — | | | | 18,215 | |
| * | The actual financial instruments and cash collateral (received) pledged may be in excess of the amounts shown in the table. The table only reflects collateral amounts up to the amount of the financial instrument disclosed on the Statement of Assets and Liabilities. |
| ** | Financial instruments received are not disclosed on the Statement of Assets and Liabilities because the Fund does not have effective control of the collateral. |
Securities Lending:
Each ProFund VP may lend securities to brokers, dealers and financial organizations in exchange for initial collateral in the amount of at least 102% of the value of U.S. dollar-denominated securities loaned or at least 105% of the value of non-U.S. dollar-denominated securities loaned, marked to market daily. Each security loaned will be secured continuously by collateral in the form of cash, money market instruments or U.S. Government securities with a market value of at least 100% of the market value of the loaned securities. When a ProFund VP lends its securities, it continues to receive payments equal to the dividends and interest paid on the securities loaned and simultaneously may earn interest on the reinvestment of the cash collateral. Any cash collateral received by the ProFund VP in connection with these loans may be reinvested in a variety of short-term investments. Any non-cash collateral received by the ProFund VP in connection with these loans may not be sold or pledged by the ProFund VP and, accordingly, is not reflected in the ProFund VP's assets and liabilities. The ProFunds VP may incur fees and expenses in connection with the reinvestment of cash collateral. For security loans collateralized by cash, borrowers may be entitled to receive a fee based on the amount of collateral. The ProFunds VP are typically compensated by the difference between the amount earned on the reinvestment of cash collateral and any fees paid to the borrower. Although voting and other rights attendant to securities loaned pass to the borrower, such loans may be recalled so that the securities may be voted by the ProFund VP if a material event affecting the ProFund VP's investment in the securities on loan is to occur. Security loans are subject to termination by the ProFund VP or the borrower at any time. No securities loan shall
398 :: Notes to Financial Statements :: December 31, 2021
be made on behalf of a ProFund VP if, as a result, the aggregate value of all securities loaned by the particular ProFund VP exceeds one-third of the value of such ProFund VP's total assets (including the value of the collateral received).
Securities lending involves exposure to certain risks, including "gap" risk (i.e., the risk of a mismatch between the return on cash collateral reinvestments and any fees a ProFund VP has agreed to pay a borrower), operational risk (i.e., the risk of losses resulting from problems in the settlement and the accounting process), legal, counterparty and credit risk. If a securities lending counterparty were to default, a ProFund VP would be subject to the risk of a possible delay in receiving collateral or in recovering the loaned securities, or to a possible loss of rights in the collateral. In the event a borrower does not return a ProFund VP's securities as agreed, the ProFund VP may experience losses if the proceeds received from liquidating the collateral do not at least equal the value of the loaned security at the time the collateral is liquidated, plus the transaction costs incurred in purchasing replacement securities. This event could trigger adverse tax consequences for a ProFund VP. The investment of cash collateral deposited by the borrower is subject to inherent market risks such as interest rate risk, credit risk, liquidity risk, and other risks that are present in the market. A ProFund VP could lose money if its short-term reinvestment of the collateral declines in value over the period of the loan. The market value of the loaned securities is determined at the close of each business day of the ProFund VP and any additional required collateral is delivered to the ProFund VP, or excess collateral returned by the ProFund VP, on the next business day.
The following table is a summary of the ProFunds VP securities lending transactions as of December 31, 2021:
| | | Value
of
Securities on Loan | | | Value
of Cash
Collateral Received* | |
| ProFund VP Asia 30 | | $ | 1,710,239 | | | $ | 1,818,424 | |
| ProFund VP Bull | | | 4,732 | | | | 5,025 | |
| ProFund VP Consumer Goods | | | 149,474 | | | | 156,395 | |
| ProFund VP Consumer Services | | | 109,410 | | | | 118,871 | |
| ProFund VP Emerging Markets | | | 1,646 | | | | 1,800 | |
| ProFund VP Europe 30 | | | 810,059 | | | | 876,916 | |
| ProFund VP Industrials | | | 7,294 | | | | 8,129 | |
| ProFund VP Large-Cap Value | | | 3,201 | | | | 3,400 | |
| ProFund VP Nasdaq-100 | | | 618,921 | | | | 656,874 | |
| ProFund VP Pharmaceuticals | | | 75,688 | | | | 77,507 | |
| ProFund VP Small-Cap | | | 83,638 | | | | 91,428 | |
| ProFund VP Small-Cap Growth | | | 7,846 | | | | 8,264 | |
| ProFund VP Small-Cap Value | | | 91,821 | | | | 94,869 | |
| ProFund VP UltraBull | | | 1,271 | | | | 1,350 | |
| ProFund VP UltraNasdaq-100 | | | 951,287 | | | | 1,009,620 | |
| ProFund VP UltraSmall-Cap | | | 129,228 | | | | 140,996 | |
| * | Collateral received in the form of cash was reinvested in securities shown in the Collateral for Securities Loaned section of the Schedule of Portfolio Investments. |
Investment Transactions and Related Income
Throughout the reporting period, investment transactions are accounted for no later than one business day following the trade date. For financial reporting purposes, investment transactions are accounted for on trade date on the last business day of the reporting period. Interest income is recognized on an accrual basis and includes, where applicable, the amortization of premium or accretion of discount. Dividend income is recorded on the ex-dividend date except in the case of depositary receipts, in which case dividends are recorded as soon as such information becomes available. Pay-in-kind interest income and non-cash dividend income received in the form of securities in-lieu of cash, if any, are recorded at the fair value of the securities received. Gains or losses realized on sales of securities are determined using the specific identification method by comparing the identified cost of the security lot sold with the net sales proceeds. Gains or losses from class action settlements are recorded when such information becomes known or can be reasonably estimated; for non-recurring class action settlements, this generally occurs with the receipt or payment of cash consistent with the terms of such settlement.
Allocations
Expenses directly attributable to a ProFund VP are charged to that ProFund VP, while expenses which are attributable to more than one fund in the Trust, or jointly with an affiliate, are allocated among the respective funds in the Trust and/or affiliate based upon relative net assets or another reasonable basis.
Distributions to Shareholders
Each of the ProFunds VP (except ProFund Access VP High Yield, ProFund VP Government Money Market, ProFund VP Real Estate, and ProFund VP U.S. Government Plus) intends to declare and distribute net investment income at least annually, if any. ProFund VP Government Money Market and ProFund VP U.S. Government Plus declare dividends from net investment income daily, if any, and pay dividends on a monthly basis. ProFund Access VP High Yield and ProFund VP Real Estate declare and pay dividends from net investment income quarterly, if any. Net realized capital gains, if any, will be distributed annually.
December 31, 2021 :: Notes to Financial Statements :: 399
The amount of distributions from net investment income and net realized gains are determined in accordance with federal income tax regulations which may differ from GAAP. These "book/tax" differences are either considered temporary or permanent in nature. To the extent these differences are permanent in nature (e.g., return of capital, net operating loss, distribution reclassification, and equalization), such amounts are reclassified within the composition of net assets based on their federal tax-basis treatment; temporary differences (e.g., wash sales) do not require a reclassification. The ProFunds VP may utilize equalization accounting for tax purposes and designate earnings and profits, including net realized gains distributed to shareholders on redemption of shares, as a part of the dividends paid deduction for income tax purposes. Distributions which exceed net investment income and net realized capital gains for financial reporting purposes but not for tax purposes are reported as distributions in excess of net investment income or net realized gains. To the extent they exceed net investment income and net realized capital gains for tax purposes, they are reported as distribution of capital.
Federal Income Taxes
Each of the ProFunds VP intends to continue to qualify each year as a RIC under Subchapter M of the Internal Revenue Code of 1986, as amended. A RIC generally is not subject to federal income tax on income and gains distributed in a timely manner to its shareholders. The ProFunds VP intend to make timely distributions in order to avoid tax liability. Accordingly, no provision for federal income taxes is required in the financial statements. The ProFunds VP have a calendar tax year end.
Management of the ProFunds VP has reviewed tax positions taken in tax years that remain subject to examination by all major tax jurisdictions, including federal (i.e., the last four tax year ends and the interim tax period since then, as applicable). Management believes that there is no tax liability resulting from unrecognized tax benefits related to uncertain tax positions taken and the ProFunds VP are not aware of any tax positions for which it is reasonably possible that the total amounts of unrecognized tax benefits will significantly change in the next twelve months.
Other
Expense offsets to custody fees that arise from credits on cash balances maintained on deposit are reflected on the Statement of Operations, as applicable, as "Fees paid indirectly."
Expense Reimbursement from a Third Party
During 2018, certain ProFunds VP received a non-recurring reimbursement from a third party relating to expenses that were incurred in a prior year. The corresponding impacts to the respective ProFund VP's Total Return and Ratios to Average Net Assets in the Financial Highlights are disclosed in a footnote to that ProFund VP's Financial Highlights.
3. Investment Valuation Summary
The valuation techniques employed by the ProFunds VP, described below, maximize the use of observable inputs and minimize the use of unobservable inputs in determining fair value. These valuation techniques distinguish between market participant assumptions developed based on market data obtained from sources independent of the ProFunds VP (observable inputs) and the ProFunds' VP own assumptions about market participant assumptions developed based on the best information available under the circumstances (unobservable inputs). The inputs used for valuing the ProFunds' VP investments are summarized in the three broad levels listed below:
| ● | Level 1–quoted prices in active markets for identical assets |
| ● | Level 2–other significant observable inputs (including quoted prices for similar securities, interest rates, prepayments speeds, credit risk, etc.) |
| ● | Level 3–significant unobservable inputs (including the ProFunds' VP own assumptions in determining the fair value of investments) |
The inputs or methodology used for valuing investments are not necessarily an indication of the risk associated with investing in those investments. For example, repurchase agreements are generally valued at amortized cost. Generally, amortized cost approximates the current fair value of a security, but since the valuation is not obtained from a quoted price in an active market, such securities are reflected as Level 2. Fair value measurements may also require additional disclosure when the volume and level of activity for the asset or liability have significantly decreased, as well as when circumstances indicate that a transaction is not orderly. Changes in valuation techniques may result in transfers in or out of an assigned level within the disclosure hierarchy. The Trust determines transfers between fair value hierarchy levels at the reporting period end.
Security prices are generally valued at their market value using information provided by a third party pricing service or market quotations or other procedures approved by the Trust's Board of Trustees. The securities in the portfolio of a non-money market ProFund VP, except as otherwise noted, that are listed or traded on a stock exchange or the Nasdaq National Market System ("Nasdaq/NMS"), are valued at the official closing price, if available, or the last sale price, on the exchange or system where the security is principally traded. If there have been no sales for that day on the exchange or system where the security is principally traded, then the value may be determined with reference to the last sale price, or the official closing price, if applicable, on any other exchange or system. In each of these situations, valuations are typically categorized as a Level 1 in the fair value hierarchy. If there have been no sales for that day on any exchange or system, the security will be valued using fair value procedures in accordance with procedures approved by the Trust's Board of Trustees as described below.
Securities regularly traded in the OTC markets, including securities listed on an exchange, but that are primarily traded OTC other than those traded on the Nasdaq/NMS, are generally valued on the basis of the mean between the bid and asked quotes furnished by dealers actively trading those instruments. Fixed-income securities are generally valued according to prices as furnished by an independent pricing service, generally at the mean of the bid and asked quotes for those instruments. Short-term fixed-income securities maturing in sixty days or less, and of sufficient credit quality, may be valued at amortized cost, which approximates market value. For the ProFund VP Government Money Market,
400 :: Notes to Financial Statements :: December 31, 2021
investments are valued at amortized cost, in accordance with Rule 2a-7 of the 1940 Act. Under the amortized cost method, premium or discount, if any, is amortized or accreted, respectively, on a constant basis to the maturity of the security. In each of these situations, valuations are typically categorized as Level 2 in the fair value hierarchy.
Derivatives are generally valued using independent pricing services and/or agreements with counterparties or other procedures approved by the Trust's Board of Trustees. Futures contracts are generally valued at their last sale price prior to the time at which the net asset value per share of a ProFund VP is determined and are typically categorized as Level 1 in the fair value hierarchy. Swap agreements are generally valued using independent sources and/or agreements with counterparties. Forward currency contracts are valued at their quoted daily prices obtained from an independent pricing service. These valuations are typically categorized as Level 2 in the fair value hierarchy. If there was no sale on that day, fair valuation procedures as described below may be applied.
When the Advisor determines that the market price of a security is not readily available or deemed unreliable (e.g., an approved pricing service does not provide a price, a furnished price is in error, certain stale prices, or an event occurs that materially affects the furnished price), it may in good faith establish a fair value for that security in accordance with procedures established by and under the general supervision and responsibility of the Trust's Board of Trustees. Fair value pricing may require subjective determinations about the value of a security. While the Trust's policy is intended to result in a calculation of a ProFund VP's NAV that fairly reflects security values as of the time of pricing, the Trust cannot ensure that fair values determined by the Advisor or persons acting at their direction would accurately reflect the price that a ProFund VP could obtain for a security if it were to dispose of that security as of the time of pricing (for instance, in a forced or distressed sale). The prices used by a ProFund VP may differ from the value that would be realized if the securities were sold and the differences could be material to the financial statements. Depending on the source and relative significance of valuation inputs, these instruments may be classified as Level 2 or Level 3 in the fair value hierarchy.
For the year ended December 31, 2021, there were no Level 3 investments for which significant unobservable inputs were used to determine fair value, nor were there any transfers in or out of Level 3 investments for the year.
A summary of the valuations as of December 31, 2021, based upon the three levels defined above, is included in the table below while the breakdown, by category, of equity securities is disclosed on the Schedule of Portfolio Investments for each ProFund VP:
| | | LEVEL 1 - Quoted Prices | | | LEVEL 2 - Other Significant
Observable Inputs | | | Total | |
| | | Investment
Securities | | | Other Financial
Instruments^ | | | Investment
Securities | | | Other Financial
Instruments^ | | | Investment
Securities | | | Other Financial
Instruments^ | |
| ProFund Access VP High Yield | | | | | | | | | | | | | | | | | | | | | | | | |
| U.S. Treasury Obligation | | $ | — | | | $ | — | | | $ | 6,851,605 | | | $ | — | | | $ | 6,851,605 | | | $ | — | |
| Repurchase Agreements | | | — | | | | — | | | | 7,560,000 | | | | — | | | | 7,560,000 | | | | — | |
| Futures Contracts | | | — | | | | (2,978 | ) | | | — | | | | — | | | | — | | | | (2,978 | ) |
| Credit Default Swap Agreements | | | — | | | | — | | | | — | | | | (44,878 | ) | | | — | | | | (44,878 | ) |
| Total | | $ | — | | | $ | (2,978 | ) | | $ | 14,411,605 | | | $ | (44,878 | ) | | $ | 14,411,605 | | | $ | (47,856 | ) |
| ProFund VP Asia 30 | | | | | | | | | | | | | | | | | | | | | | | | |
| Common Stocks | | $ | 21,742,843 | | | $ | — | | | $ | — | | | $ | — | | | $ | 21,742,843 | | | $ | — | |
| Repurchase Agreements | | | — | | | | — | | | | 278,000 | | | | — | | | | 278,000 | | | | — | |
| Collateral for Securities Loaned | | | 1,818,424 | | | | — | | | | — | | | | — | | | | 1,818,424 | | | | — | |
| Total | | $ | 23,561,267 | | | $ | — | | | $ | 278,000 | | | $ | — | | | $ | 23,839,267 | | | $ | — | |
| ProFund VP Banks | | | | | | | | | | | | | | | | | | | | | | | | |
| Common Stocks | | $ | 5,919,517 | | | $ | — | | | $ | — | | | $ | — | | | $ | 5,919,517 | | | $ | — | |
| Repurchase Agreements | | | — | | | | — | | | | 85,000 | | | | — | | | | 85,000 | | | | — | |
| Swap Agreements | | | — | | | | — | | | | — | | | | 610 | | | | — | | | | 610 | |
| Total | | $ | 5,919,517 | | | $ | — | | | $ | 85,000 | | | $ | 610 | | | $ | 6,004,517 | | | $ | 610 | |
| ProFund VP Basic Materials | | | | | | | | | | | | | | | | | | | | | | | | |
| Common Stocks | | $ | 17,193,613 | | | $ | — | | | $ | — | | | $ | — | | | $ | 17,193,613 | | | $ | — | |
| Repurchase Agreements | | | — | | | | — | | | | 181,000 | | | | — | | | | 181,000 | | | | — | |
| Swap Agreements | | | — | | | | — | | | | — | | | | 7,105 | | | | — | | | | 7,105 | |
| Total | | $ | 17,193,613 | | | $ | — | | | $ | 181,000 | | | $ | 7,105 | | | $ | 17,374,613 | | | $ | 7,105 | |
| ProFund VP Bear | | | | | | | | | | | | | | | | | | | | | | | | |
| Repurchase Agreements | | $ | — | | | $ | — | | | $ | 1,555,000 | | | $ | — | | | $ | 1,555,000 | | | $ | — | |
| Swap Agreements | | | — | | | | — | | | | — | | | | 7,868 | | | | — | | | | 7,868 | |
| Total | | $ | — | | | $ | — | | | $ | 1,555,000 | | | $ | 7,868 | | | $ | 1,555,000 | | | $ | 7,868 | |
December 31, 2021 :: Notes to Financial Statements :: 401
| | | LEVEL 1 - Quoted Prices | | | LEVEL 2 - Other Significant
Observable Inputs | | | Total | |
| | | Investment
Securities | | | Other Financial
Instruments^ | | | Investment
Securities | | | Other Financial
Instruments^ | | | Investment
Securities | | | Other Financial
Instruments^ | |
| ProFund VP Biotechnology | | | | | | | | | | | | | | | | | | | | | | | | |
| Common Stocks | | $ | 61,285,325 | | | $ | — | | | $ | — | | | $ | — | | | $ | 61,285,325 | | | $ | — | |
| Repurchase Agreements | | | — | | | | — | | | | 374,000 | | | | — | | | | 374,000 | | | | — | |
| Swap Agreements | | | — | | | | — | | | | — | | | | 823 | | | | — | | | | 823 | |
| Total | | $ | 61,285,325 | | | $ | — | | | $ | 374,000 | | | $ | 823 | | | $ | 61,659,325 | | | $ | 823 | |
| ProFund VP Bull | | | | | | | | | | | | | | | | | | | | | | | | |
| Common Stocks | | $ | 54,516,545 | | | $ | — | | | $ | — | | | $ | — | | | $ | 54,516,545 | | | $ | — | |
| Repurchase Agreements | | | — | | | | — | | | | 18,415,000 | | | | — | | | | 18,415,000 | | | | — | |
| Collateral for Securities Loaned | | | 5,025 | | | | — | | | | — | | | | — | | | | 5,025 | | | | — | |
| Futures Contracts | | | — | | | | 39,069 | | | | — | | | | — | | | | — | | | | 39,069 | |
| Swap Agreements | | | — | | | | — | | | | — | | | | (77,890 | ) | | | — | | | | (77,890 | ) |
| Total | | $ | 54,521,570 | | | $ | 39,069 | | | $ | 18,415,000 | | | $ | (77,890 | ) | | $ | 72,936,570 | | | $ | (38,821 | ) |
| ProFund VP Consumer Goods | | | | | | | | | | | | | | | | | | | | | | | | |
| Common Stocks | | $ | 26,108,310 | | | $ | — | | | $ | — | | | $ | — | | | $ | 26,108,310 | | | $ | — | |
| Repurchase Agreements | | | — | | | | — | | | | 904,000 | | | | — | | | | 904,000 | | | | — | |
| Collateral for Securities Loaned | | | 156,395 | | | | — | | | | — | | | | — | | | | 156,395 | | | | — | |
| Swap Agreements | | | — | | | | — | | | | — | | | | 4,204 | | | | — | | | | 4,204 | |
| Total | | $ | 26,264,705 | | | $ | — | | | $ | 904,000 | | | $ | 4,204 | | | $ | 27,168,705 | | | $ | 4,204 | |
| ProFund VP Consumer Services | | | | | | | | | | | | | | | | | | | | | | | | |
| Common Stocks | | $ | 30,480,956 | | | $ | — | | | $ | — | | | $ | — | | | $ | 30,480,956 | | | $ | — | |
| Repurchase Agreements | | | — | | | | — | | | | 182,000 | | | | — | | | | 182,000 | | | | — | |
| Collateral for Securities Loaned | | | 118,871 | | | | — | | | | — | | | | — | | | | 118,871 | | | | — | |
| Swap Agreements | | | — | | | | — | | | | — | | | | 2,031 | | | | — | | | | 2,031 | |
| Total | | $ | 30,599,827 | | | $ | — | | | $ | 182,000 | | | $ | 2,031 | | | $ | 30,781,827 | | | $ | 2,031 | |
| ProFund VP Dow 30 | | | | | | | | | | | | | | | | | | | | | | | | |
| Repurchase Agreements | | $ | — | | | $ | — | | | $ | 218,000 | | | $ | — | | | $ | 218,000 | | | $ | — | |
| Swap Agreements | | | — | | | | — | | | | — | | | | 200 | | | | — | | | | 200 | |
| Total | | $ | — | | | $ | — | | | $ | 218,000 | | | $ | 200 | | | $ | 218,000 | | | $ | 200 | |
| ProFund VP Emerging Markets | | | | | | | | | | | | | | | | | | | | | | | | |
| Common Stocks | | $ | 18,570,279 | | | $ | — | | | $ | — | | | $ | — | | | $ | 18,570,279 | | | $ | — | |
| Preferred Stocks | | | 301,480 | | | | — | | | | — | | | | — | | | | 301,480 | | | | — | |
| Repurchase Agreements | | | — | | | | — | | | | 711,000 | | | | — | | | | 711,000 | | | | — | |
| Collateral for Securities Loaned | | | 1,800 | | | | — | | | | — | | | | — | | | | 1,800 | | | | — | |
| Swap Agreements | | | — | | | | — | | | | — | | | | 4,395 | | | | — | | | | 4,395 | |
| Total | | $ | 18,873,559 | | | $ | — | | | $ | 711,000 | | | $ | 4,395 | | | $ | 19,584,559 | | | $ | 4,395 | |
| ProFund VP Europe 30 | | | | | | | | | | | | | | | | | | | | | | | | |
| Common Stocks | | $ | 17,451,532 | | | $ | — | | | $ | — | | | $ | — | | | $ | 17,451,532 | | | $ | — | |
| Repurchase Agreements | | | — | | | | — | | | | 817,000 | | | | — | | | | 817,000 | | | | — | |
| Collateral for Securities Loaned | | | 876,916 | | | | — | | | | — | | | | — | | | | 876,916 | | | | — | |
| Total | | $ | 18,328,448 | | | $ | — | | | $ | 817,000 | | | $ | — | | | $ | 19,145,448 | | | $ | — | |
| ProFund VP Falling U.S. Dollar | | | | | | | | | | | | | | | | | | | | | | | | |
| Repurchase Agreements | | $ | — | | | $ | — | | | $ | 485,000 | | | $ | — | | | $ | 485,000 | | | $ | — | |
| Forward Currency Contracts | | | — | | | | — | | | | — | | | | 600 | | | | — | | | | 600 | |
| Total | | $ | — | | | $ | — | | | $ | 485,000 | | | $ | 600 | | | $ | 485,000 | | | $ | 600 | |
| ProFund VP Financials | | | | | | | | | | | | | | | | | | | | | | | | |
| Common Stocks | | $ | 41,328,010 | | | $ | — | | | $ | — | | | $ | — | | | $ | 41,328,010 | | | $ | — | |
| Repurchase Agreements | | | — | | | | — | | | | 451,000 | | | | — | | | | 451,000 | | | | — | |
| Swap Agreements | | | — | | | | — | | | | — | | | | 5,305 | | | | — | | | | 5,305 | |
| Total | | $ | 41,328,010 | | | $ | — | | | $ | 451,000 | | | $ | 5,305 | | | $ | 41,779,010 | | | $ | 5,305 | |
402 :: Notes to Financial Statements :: December 31, 2021
| | | LEVEL 1 - Quoted Prices | | | LEVEL 2 - Other Significant
Observable Inputs | | | Total | |
| | | Investment
Securities | | | Other Financial
Instruments^ | | | Investment
Securities | | | Other Financial
Instruments^ | | | Investment
Securities | | | Other Financial
Instruments^ | |
| ProFund VP Government Money Market | | | | | | | | | | | | | | | | | | | | | | | | |
| U.S. Treasury Obligations | | $ | — | | | $ | — | | | $ | 9,997,489 | | | $ | — | | | $ | 9,997,489 | | | $ | — | |
| Repurchase Agreements | | | — | | | | — | | | | 38,332,000 | | | | — | | | | 38,332,000 | | | | — | |
| Total | | $ | — | | | $ | — | | | $ | 48,329,489 | | | $ | — | | | $ | 48,329,489 | | | $ | — | |
| ProFund VP Health Care | | | | | | | | | | | | | | | | | | | | | | | | |
| Common Stocks | | $ | 53,866,825 | | | $ | — | | | $ | — | | | $ | — | | | $ | 53,866,825 | | | $ | — | |
| Repurchase Agreements | | | — | | | | — | | | | 1,716,000 | | | | — | | | | 1,716,000 | | | | — | |
| Swap Agreements | | | — | | | | — | | | | — | | | | 10,767 | | | | — | | | | 10,767 | |
| Total | | $ | 53,866,825 | | | $ | — | | | $ | 1,716,000 | | | $ | 10,767 | | | $ | 55,582,825 | | | $ | 10,767 | |
| ProFund VP Industrials | | | | | | | | | | | | | | | | | | | | | | | | |
| Common Stocks | | $ | 21,060,503 | | | $ | — | | | $ | — | | | $ | — | | | $ | 21,060,503 | | | $ | — | |
| Repurchase Agreements | | | — | | | | — | | | | 753,000 | | | | — | | | | 753,000 | | | | — | |
| Collateral for Securities Loaned | | | 8,129 | | | | — | | | | — | | | | — | | | | 8,129 | | | | — | |
| Swap Agreements | | | — | | | | — | | | | — | | | | 8,820 | | | | — | | | | 8,820 | |
| Total | | $ | 21,068,632 | | | $ | — | | | $ | 753,000 | | | $ | 8,820 | | | $ | 21,821,632 | | | $ | 8,820 | |
| ProFund VP International | | | | | | | | | | | | | | | | | | | | | | | | |
| Repurchase Agreements | | $ | — | | | $ | — | | | $ | 12,234,000 | | | $ | — | | | $ | 12,234,000 | | | $ | — | |
| Swap Agreements | | | — | | | | — | | | | — | | | | (54,664 | ) | | | — | | | | (54,664 | ) |
| Total | | $ | — | | | $ | — | | | $ | 12,234,000 | | | $ | (54,664 | ) | | $ | 12,234,000 | | | $ | (54,664 | ) |
| ProFund VP Internet | | | | | | | | | | | | | | | | | | | | | | | | |
| Common Stocks | | $ | 19,328,367 | | | $ | — | | | $ | — | | | $ | — | | | $ | 19,328,367 | | | $ | — | |
| Repurchase Agreements | | | — | | | | — | | | | 347,000 | | | | — | | | | 347,000 | | | | — | |
| Swap Agreements | | | — | | | | — | | | | — | | | | (4,286 | ) | | | — | | | | (4,286 | ) |
| Total | | $ | 19,328,367 | | | $ | — | | | $ | 347,000 | | | $ | (4,286 | ) | | $ | 19,675,367 | | | $ | (4,286 | ) |
| ProFund VP Japan | | | | | | | | | | | | | | | | | | | | | | | | |
| Repurchase Agreements | | $ | — | | | $ | — | | | $ | 6,738,000 | | | $ | — | | | $ | 6,738,000 | | | $ | — | |
| Futures Contracts | | | — | | | | 248,706 | | | | — | | | | — | | | | — | | | | 248,706 | |
| Swap Agreements | | | — | | | | — | | | | — | | | | (45 | ) | | | — | | | | (45 | ) |
| Total | | $ | — | | | $ | 248,706 | | | $ | 6,738,000 | | | $ | (45 | ) | | $ | 6,738,000 | | | $ | 248,661 | |
| ProFund VP Large-Cap Growth | | | | | | | | | | | | | | | | | | | | | | | | |
| Common Stocks | | $ | 37,343,841 | | | $ | — | | | $ | — | | | $ | — | | | $ | 37,343,841 | | | $ | — | |
| Repurchase Agreements | | | — | | | | — | | | | 73,000 | | | | — | | | | 73,000 | | | | — | |
| Total | | $ | 37,343,841 | | | $ | — | | | $ | 73,000 | | | $ | — | | | $ | 37,416,841 | | | $ | — | |
| ProFund VP Large-Cap Value | | | | | | | | | | | | | | | | | | | | | | | | |
| Common Stocks | | $ | 17,758,357 | | | $ | — | | | $ | — | | | $ | — | | | $ | 17,758,357 | | | $ | — | |
| Repurchase Agreements | | | — | | | | — | | | | 157,000 | | | | — | | | | 157,000 | | | | — | |
| Collateral for Securities Loaned | | | 3,400 | | | | — | | | | — | | | | — | | | | 3,400 | | | | — | |
| Total | | $ | 17,761,757 | | | $ | — | | | $ | 157,000 | | | $ | — | | | $ | 17,918,757 | | | $ | — | |
| ProFund VP Mid-Cap | | | | | | | | | | | | | | | | | | | | | | | | |
| Repurchase Agreements | | $ | — | | | $ | — | | | $ | 15,630,000 | | | $ | — | | | $ | 15,630,000 | | | $ | — | |
| Futures Contracts | | | — | | | | 107,578 | | | | — | | | | — | | | | — | | | | 107,578 | |
| Swap Agreements | | | — | | | | — | | | | — | | | | 37,755 | | | | — | | | | 37,755 | |
| Total | | $ | — | | | $ | 107,578 | | | $ | 15,630,000 | | | $ | 37,755 | | | $ | 15,630,000 | | | $ | 145,333 | |
| ProFund VP Mid-Cap Growth | | | | | | | | | | | | | | | | | | | | | | | | |
| Common Stocks | | $ | 20,629,018 | | | $ | — | | | $ | — | | | $ | — | | | $ | 20,629,018 | | | $ | — | |
| Repurchase Agreements | | | — | | | | — | | | | 36,000 | | | | — | | | | 36,000 | | | | — | |
| Total | | $ | 20,629,018 | | | $ | — | | | $ | 36,000 | | | $ | — | | | $ | 20,665,018 | | | $ | — | |
| ProFund VP Mid-Cap Value | | | | | | | | | | | | | | | | | | | | | | | | |
| Common Stocks | | $ | 18,730,464 | | | $ | — | | | $ | — | | | $ | — | | | $ | 18,730,464 | | | $ | — | |
| Repurchase Agreements | | | — | | | | — | | | | 20,000 | | | | — | | | | 20,000 | | | | — | |
| Total | | $ | 18,730,464 | | | $ | — | | | $ | 20,000 | | | $ | — | | | $ | 18,750,464 | | | $ | — | |
December 31, 2021 :: Notes to Financial Statements :: 403
| | | LEVEL 1 - Quoted Prices | | | LEVEL 2 - Other Significant
Observable Inputs | | | Total | |
| | | Investment
Securities | | | Other Financial
Instruments^ | | | Investment
Securities | | | Other Financial
Instruments^ | | | Investment
Securities | | | Other Financial
Instruments^ | |
| ProFund VP Nasdaq-100 | | | | | | | | | | | | | | | | | | | | | | | | |
| Common Stocks | | $ | 117,819,805 | | | $ | — | | | $ | — | | | $ | — | | | $ | 117,819,805 | | | $ | — | |
| Repurchase Agreements | | | — | | | | — | | | | 57,993,000 | | | | — | | | | 57,993,000 | | | | — | |
| Collateral for Securities Loaned | | | 656,874 | | | | — | | | | — | | | | — | | | | 656,874 | | | | — | |
| Futures Contracts | | | — | | | | (1,647 | ) | | | — | | | | — | | | | — | | | | (1,647 | ) |
| Swap Agreements | | | — | | | | — | | | | — | | | | (786,809 | ) | | | — | | | | (786,809 | ) |
| Total | | $ | 118,476,679 | | | $ | (1,647 | ) | | $ | 57,993,000 | | | $ | (786,809 | ) | | $ | 176,469,679 | | | $ | (788,456 | ) |
| ProFund VP Oil & Gas | | | | | | | | | | | | | | | | | | | | | | | | |
| Common Stocks | | $ | 30,271,147 | | | $ | — | | | $ | — | | | $ | — | | | $ | 30,271,147 | | | $ | — | |
| Repurchase Agreements | | | — | | | | — | | | | 431,000 | | | | — | | | | 431,000 | | | | — | |
| Swap Agreements | | | — | | | | — | | | | — | | | | (864 | ) | | | — | | | | (864 | ) |
| Total | | $ | 30,271,147 | | | $ | — | | | $ | 431,000 | | | $ | (864 | ) | | $ | 30,702,147 | | | $ | (864 | ) |
| ProFund VP Pharmaceuticals | | | | | | | | | | | | | | | | | | | | | | | | |
| Common Stocks | | $ | 16,419,726 | | | $ | — | | | $ | — | | | $ | — | | | $ | 16,419,726 | | | $ | — | |
| Repurchase Agreements | | | — | | | | — | | | | 197,000 | | | | — | | | | 197,000 | | | | — | |
| Collateral for Securities Loaned | | | 77,507 | | | | — | | | | — | | | | — | | | | 77,507 | | | | — | |
| Swap Agreements | | | — | | | | — | | | | — | | | | 124 | | | | — | | | | 124 | |
| Total | | $ | 16,497,233 | | | $ | — | | | $ | 197,000 | | | $ | 124 | | | $ | 16,694,233 | | | $ | 124 | |
| ProFund VP Precious Metals | | | | | | | | | | | | | | | | | | | | | | | | |
| Repurchase Agreements | | $ | — | | | $ | — | | | $ | 27,834,000 | | | $ | — | | | $ | 27,834,000 | | | $ | — | |
| Swap Agreements | | | — | | | | — | | | | — | | | | 602,452 | | | | — | | | | 602,452 | |
| Total | | $ | — | | | $ | — | | | $ | 27,834,000 | | | $ | 602,452 | | | $ | 27,834,000 | | | $ | 602,452 | |
| ProFund VP Real Estate | | | | | | | | | | | | | | | | | | | | | | | | |
| Common Stocks | | $ | 13,406,276 | | | $ | — | | | $ | — | | | $ | — | | | $ | 13,406,276 | | | $ | — | |
| Repurchase Agreements | | | — | | | | — | | | | 395,000 | | | | — | | | | 395,000 | | | | — | |
| Swap Agreements | | | — | | | | — | | | | — | | | | 10,836 | | | | — | | | | 10,836 | |
| Total | | $ | 13,406,276 | | | $ | — | | | $ | 395,000 | | | $ | 10,836 | | | $ | 13,801,276 | | | $ | 10,836 | |
| ProFund VP Rising Rates Opportunity | | | | | | | | | | | | | | | | | | | | | | | | |
| Repurchase Agreements | | $ | — | | | $ | — | | | $ | 5,787,000 | | | $ | — | | | $ | 5,787,000 | | | $ | — | |
| Swap Agreements | | | — | | | | — | | | | — | | | | 14,318 | | | | — | | | | 14,318 | |
| Total | | $ | — | | | $ | — | | | $ | 5,787,000 | | | $ | 14,318 | | | $ | 5,787,000 | | | $ | 14,318 | |
| ProFund VP Semiconductor | | | | | | | | | | | | | | | | | | | | | | | | |
| Common Stocks | | $ | 17,482,033 | | | $ | — | | | $ | — | | | $ | — | | | $ | 17,482,033 | | | $ | — | |
| Repurchase Agreements | | | — | | | | — | | | | 298,000 | | | | — | | | | 298,000 | | | | — | |
| Swap Agreements | | | — | | | | — | | | | — | | | | (7,163 | ) | | | — | | | | (7,163 | ) |
| Total | | $ | 17,482,033 | | | $ | — | | | $ | 298,000 | | | $ | (7,163 | ) | | $ | 17,780,033 | | | $ | (7,163 | ) |
| ProFund VP Short Dow 30 | | | | | | | | | | | | | | | | | | | | | | | | |
| Repurchase Agreements | | $ | — | | | $ | — | | | $ | 6,000 | | | $ | — | | | $ | 6,000 | | | $ | — | |
| Swap Agreements | | | — | | | | — | | | | — | | | | (7 | ) | | | — | | | | (7 | ) |
| Total | | $ | — | | | $ | — | | | $ | 6,000 | | | $ | (7 | ) | | $ | 6,000 | | | $ | (7 | ) |
| ProFund VP Short Emerging Markets | | | | | | | | | | | | | | | | | | | | | | | | |
| Repurchase Agreements | | $ | — | | | $ | — | | | $ | 1,137,000 | | | $ | — | | | $ | 1,137,000 | | | $ | — | |
| Swap Agreements | | | — | | | | — | | | | — | | | | (11,582 | ) | | | — | | | | (11,582 | ) |
| Total | | $ | — | | | $ | — | | | $ | 1,137,000 | | | $ | (11,582 | ) | | $ | 1,137,000 | | | $ | (11,582 | ) |
| ProFund VP Short International | | | | | | | | | | | | | | | | | | | | | | | | |
| Repurchase Agreements | | $ | — | | | $ | — | | | $ | 536,000 | | | $ | — | | | $ | 536,000 | | | $ | — | |
| Swap Agreements | | | — | | | | — | | | | — | | | | 2,308 | | | | — | | | | 2,308 | |
| Total | | $ | — | | | $ | — | | | $ | 536,000 | | | $ | 2,308 | | | $ | 536,000 | | | $ | 2,308 | |
404 :: Notes to Financial Statements :: December 31, 2021
| | | LEVEL 1 - Quoted Prices | | | LEVEL 2 - Other Significant
Observable Inputs | | | Total | |
| | | Investment
Securities | | | Other Financial
Instruments^ | | | Investment
Securities | | | Other Financial
Instruments^ | | | Investment
Securities | | | Other Financial
Instruments^ | |
| ProFund VP Short Mid-Cap | | | | | | | | | | | | | | | | | | | | | | | | |
| Repurchase Agreements | | $ | — | | | $ | — | | | $ | 55,000 | | | $ | — | | | $ | 55,000 | | | $ | — | |
| Swap Agreements | | | — | | | | — | | | | — | | | | (167 | ) | | | — | | | | (167 | ) |
| Total | | $ | — | | | $ | — | | | $ | 55,000 | | | $ | (167 | ) | | $ | 55,000 | | | $ | (167 | ) |
| ProFund VP Short Nasdaq-100 | | | | | | | | | | | | | | | | | | | | | | | | |
| Repurchase Agreements | | $ | — | | | $ | — | | | $ | 1,944,000 | | | $ | — | | | $ | 1,944,000 | | | $ | — | |
| Swap Agreements | | | — | | | | — | | | | — | | | | 27,559 | | | | — | | | | 27,559 | |
| Total | | $ | — | | | $ | — | | | $ | 1,944,000 | | | $ | 27,559 | | | $ | 1,944,000 | | | $ | 27,559 | |
| ProFund VP Short Small-Cap | | | | | | | | | | | | | | | | | | | | | | | | |
| Repurchase Agreements | | $ | — | | | $ | — | | | $ | 1,161,000 | | | $ | — | | | $ | 1,161,000 | | | $ | — | |
| Futures Contracts | | | — | | | | (1,694 | ) | | | — | | | | — | | | | — | | | | (1,694 | ) |
| Swap Agreements | | | — | | | | — | | | | — | | | | 5,086 | | | | — | | | | 5,086 | |
| Total | | $ | — | | | $ | (1,694 | ) | | $ | 1,161,000 | | | $ | 5,086 | | | $ | 1,161,000 | | | $ | 3,392 | |
| ProFund VP Small-Cap | | | | | | | | | | | | | | | | | | | | | | | | |
| Common Stocks | | $ | 10,324,107 | | | $ | — | | | $ | — | | | $ | — | | | $ | 10,324,107 | | | $ | — | |
| Trust* | | | — | | | | — | | | | — | | | | — | | | | — | | | | — | |
| Contingent Escrow Shares** | | | — | | | | — | | | | — | | | | — | | | | — | | | | — | |
| Repurchase Agreements | | | — | | | | — | | | | 4,372,000 | | | | — | | | | 4,372,000 | | | | — | |
| Collateral for Securities Loaned | | | 91,428 | | | | — | | | | — | | | | — | | | | 91,428 | | | | — | |
| Swap Agreements | | | — | | | | — | | | | — | | | | (33,573 | ) | | | — | | | | (33,573 | ) |
| Total | | $ | 10,415,535 | | | $ | — | | | $ | 4,372,000 | | | $ | (33,573 | ) | | $ | 14,787,535 | | | $ | (33,573 | ) |
| ProFund VP Small-Cap Growth | | | | | | | | | | | | | | | | | | | | | | | | |
| Common Stocks | | $ | 25,166,638 | | | $ | — | | | $ | — | | | $ | — | | | $ | 25,166,638 | | | $ | — | |
| Repurchase Agreements | | | — | | | | — | | | | 42,000 | | | | — | | | | 42,000 | | | | — | |
| Collateral for Securities Loaned | | | 8,264 | | | | — | | | | — | | | | — | | | | 8,264 | | | | — | |
| Total | | $ | 25,174,902 | | | $ | — | | | $ | 42,000 | | | $ | — | | | $ | 25,216,902 | | | $ | — | |
| ProFund VP Small-Cap Value | | | | | | | | | | | | | | | | | | | | | | | | |
| Common Stocks | | $ | 27,229,209 | | | $ | — | | | $ | — | | | $ | — | | | $ | 27,229,209 | | | $ | — | |
| Repurchase Agreements | | | — | | | | — | | | | 43,000 | | | | — | | | | 43,000 | | | | — | |
| Collateral for Securities Loaned | | | 94,869 | | | | — | | | | — | | | | — | | | | 94,869 | | | | — | |
| Total | | $ | 27,324,078 | | | $ | — | | | $ | 43,000 | | | $ | — | | | $ | 27,367,078 | | | $ | — | |
| ProFund VP Technology | | | | | | | | | | | | | | | | | | | | | | | | |
| Common Stocks | | $ | 49,663,161 | | | $ | — | | | $ | — | | | $ | — | | | $ | 49,663,161 | | | $ | — | |
| Repurchase Agreements | | | — | | | | — | | | | 1,451,000 | | | | — | | | | 1,451,000 | | | | — | |
| Swap Agreements | | | — | | | | — | | | | — | | | | (12,722 | ) | | | — | | | | (12,722 | ) |
| Total | | $ | 49,663,161 | | | $ | — | | | $ | 1,451,000 | | | $ | (12,722 | ) | | $ | 51,114,161 | | | $ | (12,722 | ) |
| ProFund VP Telecommunications | | | | | | | | | | | | | | | | | | | | | | | | |
| Common Stocks | | $ | 7,294,028 | | | $ | — | | | $ | — | | | $ | — | | | $ | 7,294,028 | | | $ | — | |
| Repurchase Agreements | | | — | | | | — | | | | 159,000 | | | | — | | | | 159,000 | | | | — | |
| Swap Agreements | | | — | | | | — | | | | — | | | | 372 | | | | — | | | | 372 | |
| Total | | $ | 7,294,028 | | | $ | — | | | $ | 159,000 | | | $ | 372 | | | $ | 7,453,028 | | | $ | 372 | |
| ProFund VP UltraBull | | | | | | | | | | | | | | | | | | | | | | | | |
| Common Stocks | | $ | 15,643,677 | | | $ | — | | | $ | — | | | $ | — | | | $ | 15,643,677 | | | $ | — | |
| Repurchase Agreements | | | — | | | | — | | | | 4,222,000 | | | | — | | | | 4,222,000 | | | | — | |
| Collateral for Securities Loaned | | | 1,350 | | | | — | | | | — | | | | — | | | | 1,350 | | | | — | |
| Futures Contracts | | | — | | | | 22,325 | | | | — | | | | — | | | | — | | | | 22,325 | |
| Swap Agreements | | | — | | | | — | | | | — | | | | (108,982 | ) | | | — | | | | (108,982 | ) |
| Total | | $ | 15,645,027 | | | $ | 22,325 | | | $ | 4,222,000 | | | $ | (108,982 | ) | | $ | 19,867,027 | | | $ | (86,657 | ) |
| ProFund VP UltraMid-Cap | | | | | | | | | | | | | | | | | | | | | | | | |
| Common Stocks | | $ | 13,454,011 | | | $ | — | | | $ | — | | | $ | — | | | $ | 13,454,011 | | | $ | — | |
| Repurchase Agreements | | | — | | | | — | | | | 4,241,000 | | | | — | | | | 4,241,000 | | | | — | |
| Swap Agreements | | | — | | | | — | | | | — | | | | 77,849 | | | | — | | | | 77,849 | |
| Total | | $ | 13,454,011 | | | $ | — | | | $ | 4,241,000 | | | $ | 77,849 | | | $ | 17,695,011 | | | $ | 77,849 | |
December 31, 2021 :: Notes to Financial Statements :: 405
| | | LEVEL 1 - Quoted Prices | | | LEVEL 2 - Other Significant
Observable Inputs | | | Total | |
| | | Investment
Securities | | | Other Financial
Instruments^ | | | Investment
Securities | | | Other Financial
Instruments^ | | | Investment
Securities | | | Other Financial
Instruments^ | |
| ProFund VP UltraNasdaq-100 | | | | | | | | | | | | | | | | | | | | | | | | |
| Common Stocks | | $ | 181,060,966 | | | $ | — | | | $ | — | | | $ | — | | | $ | 181,060,966 | | | $ | — | |
| Repurchase Agreements | | | — | | | | — | | | | 103,044,000 | | | | — | | | | 103,044,000 | | | | — | |
| Collateral for Securities Loaned | | | 1,009,620 | | | | — | | | | — | | | | — | | | | 1,009,620 | | | | — | |
| Futures Contracts | | | — | | | | (206 | ) | | | — | | | | — | | | | — | | | | (206 | ) |
| Swap Agreements | | | — | | | | — | | | | — | | | | (5,545,231 | ) | | | — | | | | (5,545,231 | ) |
| Total | | $ | 182,070,586 | | | $ | (206 | ) | | $ | 103,044,000 | | | $ | (5,545,231 | ) | | $ | 285,114,586 | | | $ | (5,545,437 | ) |
| ProFund VP UltraShort Dow 30 | | | | | | | | | | | | | | | | | | | | | | | | |
| Repurchase Agreements | | $ | — | | | $ | — | | | $ | 4,000 | | | $ | — | | | $ | 4,000 | | | $ | — | |
| Swap Agreements | | | — | | | | — | | | | — | | | | (8 | ) | | | — | | | | (8 | ) |
| Total | | $ | — | | | $ | — | | | $ | 4,000 | | | $ | (8 | ) | | $ | 4,000 | | | $ | (8 | ) |
| ProFund VP UltraShort Nasdaq-100 | | | | | | | | | | | | | | | | | | | | | | | | |
| Repurchase Agreements | | $ | — | | | $ | — | | | $ | 365,000 | | | $ | — | | | $ | 365,000 | | | $ | — | |
| Swap Agreements | | | — | | | | — | | | | — | | | | 10,880 | | | | — | | | | 10,880 | |
| Total | | $ | — | | | $ | — | | | $ | 365,000 | | | $ | 10,880 | | | $ | 365,000 | | | $ | 10,880 | |
| ProFund VP UltraSmall-Cap | | | | | | | | | | | | | | | | | | | | | | | | |
| Common Stocks | | $ | 15,072,571 | | | $ | — | | | $ | — | | | $ | — | | | $ | 15,072,571 | | | $ | — | |
| Trust* | | | — | | | | — | | | | — | | | | — | | | | — | | | | — | |
| Contingent Escrow Shares** | | | — | | | | — | | | | — | | | | — | | | | — | | | | — | |
| Repurchase Agreements | | | — | | | | — | | | | 13,682,000 | | | | — | | | | 13,682,000 | | | | — | |
| Collateral for Securities Loaned | | | 140,996 | | | | — | | | | — | | | | — | | | | 140,996 | | | | — | |
| Swap Agreements | | | — | | | | — | | | | — | | | | (301,624 | ) | | | — | | | | (301,624 | ) |
| Total | | $ | 15,213,567 | | | $ | — | | | $ | 13,682,000 | | | $ | (301,624 | ) | | $ | 28,895,567 | | | $ | (301,624 | ) |
| ProFund VP U.S. Government Plus | | | | | | | | | | | | | | | | | | | | | | | | |
| U.S. Treasury Obligation | | $ | — | | | $ | — | | | $ | 7,518,205 | | | $ | — | | | $ | 7,518,205 | | | $ | — | |
| Repurchase Agreements | | | — | | | | — | | | | 7,745,000 | | | | — | | | | 7,745,000 | | | | — | |
| Swap Agreements | | | — | | | | — | | | | — | | | | (38,597 | ) | | | — | | | | (38,597 | ) |
| Total | | $ | — | | | $ | — | | | $ | 15,263,205 | | | $ | (38,597 | ) | | $ | 15,263,205 | | | $ | (38,597 | ) |
| ProFund VP Utilities | | | | | | | | | | | | | | | | | | | | | | | | |
| Common Stocks | | $ | 34,124,371 | | | $ | — | | | $ | — | | | $ | — | | | $ | 34,124,371 | | | $ | — | |
| Repurchase Agreements | | | — | | | | — | | | | 550,000 | | | | — | | | | 550,000 | | | | — | |
| Swap Agreements | | | — | | | | — | | | | — | | | | 18,215 | | | | — | | | | 18,215 | |
| Total | | $ | 34,124,371 | | | $ | — | | | $ | 550,000 | | | $ | 18,215 | | | $ | 34,674,371 | | | $ | 18,215 | |
| ^ | Other financial instruments include any derivative instruments not reflected in the Schedule of Portfolio Investments as Investment Securities, such as futures contracts, forward currency contracts and swap agreements (including credit default swap agreements). These instruments are generally recorded in the financial statements at the unrealized appreciation/(depreciation) on the investment. |
| * | Ferroglobe Representation and Warranty Insurance trust was valued at $0 and categorized as Level 2 within the fair value hierarchy. |
| ** | Wright Medical Group, Inc. contingent escrow shares were valued at $0 and categorized as Level 2 within the fair value hierarchy. |
4. Fees and Transactions with Affiliates and Other Parties
The ProFunds VP have entered into an Investment Advisory Agreement with the Advisor. Under this agreement, the ProFunds VP (excluding ProFund VP U.S. Government Plus) each pay the Advisor a fee at an annualized rate of 0.75% of the average daily net assets of each respective ProFund VP. The ProFund VP U.S. Government Plus pays the Advisor a fee at an annualized rate of 0.50% of its average daily net assets.
In addition, subject to the condition that the aggregate daily net assets of the Trust be equal to or greater than $10 billion, the Advisor has agreed to the following fee reductions with respect to each individual ProFund VP: 0.025% of the ProFund VP's daily net assets in excess of $500 million to $1 billion, 0.05% of the ProFund VP's daily net assets in excess of $1 billion to $2 billion, and 0.075% of the ProFund VP's net assets in excess of $2 billion. During the year ended December 31, 2021, no Fund's annual investment advisory fee was subject to such reductions.
Citi Fund Services Ohio, Inc. ("Citi") acts as the Trust's administrator (the "Administrator"). For its services as Administrator, the Trust pays Citi an annual fee based on the Trust's aggregate average net assets at a tier rate ranging from 0.00375% to 0.05%, and a base fee for certain filings. Administration fees also include additional fees paid to Citi by the Trust for additional services provided, including support of the Trust's compliance program.
406 :: Notes to Financial Statements :: December 31, 2021
Citi also acts as fund accounting agent for the Trust. For these services, the Trust pays Citi an annual fee based on the Trust's aggregate average net assets at a tier rate ranging from 0.00375% to 0.03%, a base fee, and reimbursement of certain expenses.
FIS Investor Services LLC ("FIS") acts as transfer agent for the Trust. For these services, the Trust pays FIS a base fee, service charges, fees based on the number of VP Funds, and reimbursement of certain expenses.
ProFunds Distributors, Inc. (the "Distributor"), a wholly owned subsidiary of the Advisor, serves as the Trust's distributor. Under a Distribution and Shareholder Services Plan, adopted by the Trust's Board of Trustees pursuant to Rule 12b-1 under the 1940 Act, each ProFund VP may pay financial intermediaries such as broker-dealers, insurance companies and the Distributor up to 0.25%, on an annualized basis, of the average daily net assets as compensation for the distribution-related activities and/or shareholder services.
Distribution Fees were suspended throughout the year ended December 31, 2021 for ProFund VP Government Money Market to maintain a more competitive net yield. If ProFund VP Government Money Market had paid an amount equal to 0.25% of its average daily net assets, the Distribution Fees would have been $110,399 for the year ended December 31, 2021. The Distributor may reinstate all or a portion of the Distribution Fees for ProFund VP Government Money Market at any time.
The Advisor, pursuant to a separate Management Services Agreement, performs certain client support services and other administrative services on behalf of the ProFunds VP. For these services, each ProFund VP pays the Advisor a fee at the annual rate of 0.10% of its average daily net assets.
The Trust, on behalf of the ProFunds VP, has entered into an administrative services agreement with certain insurance companies, pursuant to which the insurance companies will provide administrative services with respect to the ProFunds VP. For these services, the ProFunds VP may pay the insurance companies administrative services fees, a monthly/quarterly fee equal on an annual basis of up to 0.35% of their average daily net assets as reflected on the Statement of Operations as "Administrative services fees." Throughout the year ended December 31, 2021, the administrative services fees of ProFund VP Government Money Market were suspended to maintain a more competitive net yield. If ProFund VP Government Money Market had paid an amount equal to the full amount per the administrative services agreements, the administrative services fees would have been $92,736 for the year ended December 31, 2021. All or a portion of the Administrative services fees of ProFund VP Government Money Market may be reinstated at any time.
Certain Officers and a Trustee of the Trust are affiliated with the Advisor or the Administrator. Except as noted below with respect to the Trust's Chief Compliance Officer, such Officers and Trustee receive no compensation from the ProFunds VP for serving in their respective roles. The Trust, together with affiliated Trusts, pays each Independent Trustee compensation for their services at an annual rate of $185,000. Independent Trustees also receive $10,000 for attending each regularly quarterly in-person meeting, $3,000 for attending each special meeting, and $3,000 for attending each telephonic meeting. Effective July 1, 2021, Independent Trustee compensation increased to an annual rate of $325,000 per Trustee, inclusive of all meetings. During the year ended December 31, 2021, actual Trustee compensation was $834,000 in aggregate from the Trust and affiliated trusts. There are certain employees of the Advisor, such as the Trust's Chief Compliance Officer and staff who administer the Trust's compliance program, in which the ProFunds VP reimburse the Advisor for their related compensation and certain other expenses incurred as reflected on the Statement of Operations as "Compliance services fees."
The Advisor has contractually agreed to waive advisory and management services fees, and if necessary, reimburse certain other expenses of the ProFunds VP in order to limit the annual operating expenses (exclusive of brokerage costs, interest, taxes, dividends (including dividend expenses on securities sold short), litigation, indemnification, and extraordinary expenses) to an annualized rate of 1.35% of the average daily net assets of ProFund VP Government Money Market, 1.38% of the average daily net assets of ProFund VP U.S. Government Plus and 1.68% of the average daily net assets of each other ProFund VP. These expense limitations remain in effect until at least April 30, 2022.
The Advisor may recoup the advisory and management services fees contractually waived or limited and other expenses reimbursed by it within three years from the contractual period; however, such recoupment will be limited to the lesser of any expense limitation in place at the time of recoupment or the expense limitation in place at the time of waiver or reimbursement. Any amounts recouped by the Advisor during the year are reflected on the Statement of Operations as "Recoupment of prior expenses reduced by the Advisor." As of December 31, 2021, the recoupments that may potentially be made by the ProFunds VP are as follows:
| | | Expires
4/30/2022 | | | Expires
4/30/2023 | | | Expires
4/30/2024 | | | Expires
4/30/2025 | | | Total | |
| ProFund Access VP High Yield | | $ | — | | | $ | — | | | $ | 31,437 | | | $ | — | | | $ | 31,437 | |
| ProFund VP Banks | | | 3,733 | | | | 1,693 | | | | 2,494 | | | | — | | | | 7,920 | |
| ProFund VP Basic Materials | | | — | | | | — | | | | 3,206 | | | | — | | | | 3,206 | |
| ProFund VP Bear | | | — | | | | 1,986 | | | | 3,281 | | | | — | | | | 5,267 | |
| ProFund VP Consumer Goods | | | 6,350 | | | | 4,224 | | | | 10,988 | | | | — | | | | 21,562 | |
| ProFund VP Consumer Services | | | — | | | | 3,673 | | | | 15,776 | | | | — | | | | 19,449 | |
| ProFund VP Emerging Markets | | | — | | | | 15,518 | | | | 1,418 | | | | 2,513 | | | | 19,449 | |
| ProFund VP Europe 30 | | | — | | | | 13,387 | | | | 10,334 | | | | — | | | | 23,721 | |
| ProFund VP Falling U.S. Dollar | | | 19,462 | | | | 18,517 | | | | 5,761 | | | | 2,362 | | | | 46,102 | |
| ProFund VP Financials | | | — | | | | — | | | | 4,255 | | | | — | | | | 4,255 | |
December 31, 2021 :: Notes to Financial Statements :: 407
| | | Expires
4/30/2022 | | | Expires
4/30/2023 | | | Expires
4/30/2024 | | | Expires
4/30/2025 | | | Total | |
| ProFund VP Health Care | | $ | — | | | $ | 13,585 | | | $ | 24,319 | | | $ | — | | | $ | 37,904 | |
| ProFund VP Industrials | | | 1,276 | | | | 3,818 | | | | 8,851 | | | | — | | | | 13,945 | |
| ProFund VP Japan | | | — | | | | — | | | | 3,915 | | | | — | | | | 3,915 | |
| ProFund VP Large-Cap Growth | | | 7,112 | | | | 12,749 | | | | 17,250 | | | | — | | | | 37,111 | |
| ProFund VP Large-Cap Value | | | 5,713 | | | | 11,285 | | | | 13,431 | | | | 851 | | | | 31,280 | |
| ProFund VP Mid-Cap Growth | | | 12,517 | | | | 10,197 | | | | 17,143 | | | | 4,913 | | | | 44,770 | |
| ProFund VP Mid-Cap Value | | | 4,250 | | | | 12,202 | | | | 11,427 | | | | 938 | | | | 28,817 | |
| ProFund VP Nasdaq-100 | | | — | | | | — | | | | 46,649 | | | | — | | | | 46,649 | |
| ProFund VP Oil & Gas | | | — | | | | — | | | | 6,748 | | | | — | | | | 6,748 | |
| ProFund VP Pharmaceuticals | | | — | | | | — | | | | 3,392 | | | | — | | | | 3,392 | |
| ProFund VP Precious Metals | | | — | | | | — | | | | 18,138 | | | | — | | | | 18,138 | |
| ProFund VP Real Estate | | | — | | | | 5,955 | | | | 7,742 | | | | — | | | | 13,697 | |
| ProFund VP Short Dow 30 | | | — | | | | — | | | | 45 | | | | — | | | | 45 | |
| ProFund VP Short Mid-Cap | | | — | | | | — | | | | 178 | | | | — | | | | 178 | |
| ProFund VP Short Nasdaq-100 | | | — | | | | 4,046 | | | | — | | | | — | | | | 4,046 | |
| ProFund VP Short Small-Cap | | | — | | | | 717 | | | | 2,179 | | | | — | | | | 2,896 | |
| ProFund VP Small-Cap | | | — | | | | 3,240 | | | | 14,995 | | | | — | | | | 18,235 | |
| ProFund VP Small-Cap Growth | | | — | | | | 9,268 | | | | 8,803 | | | | — | | | | 18,071 | |
| ProFund VP Small-Cap Value | | | — | | | | — | | | | 10,619 | | | | — | | | | 10,619 | |
| ProFund VP Telecommunications | | | — | | | | 2,061 | | | | 4,957 | | | | — | | | | 7,018 | |
| ProFund VP UltraMid-Cap | | | — | | | | 7,268 | | | | 10,517 | | | | — | | | | 17,785 | |
| ProFund VP UltraNasdaq-100 | | | — | | | | 82,374 | | | | 95,642 | | | | — | | | | 178,016 | |
| ProFund VP UltraShort Nasdaq-100 | | | — | | | | 626 | | | | — | | | | 909 | | | | 1,535 | |
| ProFund VP UltraSmall-Cap | | | — | | | | 7,809 | | | | 31,072 | | | | 2,785 | | | | 41,666 | |
| ProFund VP U.S. Government Plus | | | — | | | | 5,716 | | | | 26,056 | | | | — | | | | 31,772 | |
| ProFund VP Utilities | | | — | | | | 11,074 | | | | 21,102 | | | | — | | | | 32,176 | |
The Advisor has contractually agreed to waive advisory and management services fees, and if necessary, reimburse certain other expenses of ProFund VP Government Money Market through April 30, 2022 to the extent necessary to maintain a certain minimum net yield as determined by the Advisor.
The Advisor may recoup the advisory and management services fees contractually waived or limited and other expenses reimbursed by it within three years from the minimum yield limit period in which they were taken. Such recoupments shall be made monthly, but only to the extent that such recoupments would not cause the ProFund VP Government Money Market's net yield to fall below the highest previously determined minimum yield, and such recoupment will be limited to the lesser of any expense limitation in place at the time of recoupment or the expense limitation in place at the time of waiver or reimbursement. Any amounts recouped by the Advisor during the year are reflected on the Statement of Operations as "Recoupment of prior expenses reduced by the Advisor." As of December 31, 2021, the recoupments that may potentially be made by ProFund VP Government Money Market are as follows:
| | | Expires
4/30/2023 | | | Expires
4/30/2024 | | | Expires
4/30/2025 | | | Total | |
| ProFund VP Government Money Market | | $ | 201,617 | | | $ | 520,249 | | | $ | 314,562 | | | $ | 1,036,428 | |
5. Securities Transactions
The cost of security purchases and the proceeds from the sale of securities (excluding securities maturing less than one year from acquisition) during the year ended December 31, 2021 were as follows:
| | | Purchases | | | Sales | |
| ProFund VP Asia 30 | | $ | 38,623,582 | | | $ | 40,485,514 | |
| ProFund VP Banks | | | 40,765,554 | | | | 40,183,882 | |
| ProFund VP Basic Materials | | | 22,502,585 | | | | 22,739,893 | |
| ProFund VP Biotechnology | | | 27,344,885 | | | | 34,833,325 | |
| ProFund VP Bull | | | 26,380,806 | | | | 25,257,568 | |
| ProFund VP Consumer Goods | | | 17,417,111 | | | | 13,167,384 | |
| ProFund VP Consumer Services | | | 11,738,029 | | | | 13,166,780 | |
| ProFund VP Emerging Markets | | | 14,320,554 | | | | 14,758,559 | |
| ProFund VP Europe 30 | | | 25,087,795 | | | | 25,730,528 | |
| ProFund VP Financials | | | 16,994,016 | | | | 11,447,501 | |
| ProFund VP Health Care | | | 4,919,728 | | | | 11,491,970 | |
| ProFund VP Industrials | | | 16,186,529 | | | | 14,599,551 | |
| ProFund VP Internet | | | 12,808,513 | | | | 21,334,029 | |
| ProFund VP Large-Cap Growth | | | 37,465,769 | | | | 37,346,034 | |
| ProFund VP Large-Cap Value | | | 12,390,317 | | | | 12,367,008 | |
| ProFund VP Mid-Cap Growth | | | 22,949,425 | | | | 26,282,049 | |
408 :: Notes to Financial Statements :: December 31, 2021
| | | Purchases | | | Sales | |
| ProFund VP Mid-Cap Value | | $ | 34,806,942 | | | $ | 32,424,351 | |
| ProFund VP Nasdaq-100 | | | 14,860,273 | | | | 24,919,772 | |
| ProFund VP Oil & Gas | | | 24,763,189 | | | | 21,711,235 | |
| ProFund VP Pharmaceuticals | | | 9,108,550 | | | | 10,055,461 | |
| ProFund VP Real Estate | | | 19,481,940 | | | | 19,171,435 | |
| ProFund VP Semiconductor | | | 34,250,904 | | | | 32,863,257 | |
| ProFund VP Small-Cap | | | 4,556,796 | | | | 2,461,360 | |
| ProFund VP Small-Cap Growth | | | 28,686,275 | | | | 30,822,388 | |
| ProFund VP Small-Cap Value | | | 45,720,709 | | | | 46,509,721 | |
| ProFund VP Technology | | | 75,638,459 | | | | 82,316,589 | |
| ProFund VP Telecommunications | | | 7,094,394 | | | | 7,324,955 | |
| ProFund VP UltraBull | | | 54,775,846 | | | | 53,956,116 | |
| ProFund VP UltraMid-Cap | | | 11,248,263 | | | | 8,219,554 | |
| ProFund VP UltraNasdaq-100 | | | 74,462,974 | | | | 31,480,111 | |
| ProFund VP UltraSmall-Cap | | | 8,910,011 | | | | 3,367,998 | |
| ProFund VP Utilities | | | 7,683,276 | | | | 9,776,376 | |
The cost of U.S. government security purchases and the proceeds from the sale of U.S. government securities (excluding securities maturing less than one year from acquisition) during the year ended December 31, 2021 were as follows:
| | | Purchases | | | Sales | |
| ProFund Access VP High Yield | | $ | 119,274,584 | | | $ | 120,933,924 | |
| ProFund VP U.S. Government Plus | | | 28,842,238 | | | | 28,830,309 | |
6. Investment Risks
Some risks apply to all ProFunds VP, while others are specific to the investment strategy of certain ProFunds VP. Each ProFund VP may be subject to other risks in addition to these identified risks. This section discusses certain common principal risks encountered by the ProFunds VP. The risks are presented in an order intended to facilitate readability, and their order does not imply that the realization of one risk is likely to occur more frequently than another risk, nor does it imply that the realization of one risk is likely to have a greater adverse impact than another risk.
Risks Associated with the Use of Derivatives
Certain ProFunds VP may obtain investment exposure through derivatives. Investing in derivatives may be considered aggressive and may expose the ProFund VP to greater risks and may result in larger losses or smaller gains than investing directly in the reference asset(s) underlying those derivatives (e.g., securities in the Index). These risks include counterparty risk, liquidity risk and increased correlation risk. When the ProFund VP uses derivatives, there may be imperfect correlation between the value of the reference asset(s) underlying the derivative (e.g., securities in the Index) and the derivative, which may prevent the ProFund VP from achieving its investment objective. Because derivatives often require only a limited initial investment, the use of derivatives also may expose the ProFund VP to losses in excess of those amounts initially invested.
Certain ProFunds VP may use a combination of swaps on the Index and swaps on an ETF that is designed to track the performance of the Index. The performance of an ETF may not track the performance of the Index due to embedded costs and other factors. Thus, to the extent the ProFund VP invests in swaps that use an ETF as the reference asset, the ProFund VP may be subject to greater correlation risk and may not achieve as high a degree of correlation with the Index as it would if the ProFund VP only used swaps on the Index.
Moreover, with respect to the use of swap agreements, if the Index has a dramatic intraday move that causes a material decline in a ProFund VP's net assets, the terms of a swap agreement between the ProFund VP and its counterparty may permit the counterparty to immediately close out the transaction with the ProFund VP. In that event, the ProFund VP may be unable to enter into another swap agreement or invest in other derivatives to achieve the desired exposure consistent with the ProFund VP's investment objective. This, in turn, may prevent the ProFund VP from achieving its investment objective, even if the Index reverses all or a portion of its intraday move by the end of the day. As a result, the value of an investment in the ProFund VP may change quickly and without warning. Any costs associated with using derivatives will also have the effect of lowering the ProFund VP's return.
Compounding Risk
Certain ProFunds VP are "geared" funds ("Geared Funds") in the sense that the ProFund VP has an investment objective to match a multiple, the inverse, or an inverse multiple of the performance of a benchmark on a single day, not for any other period. A "single day" is measured from the time a ProFund VP calculates its net asset value ("NAV") to the time of the ProFund VP's next NAV calculation. These Geared Funds are subject to all of the correlation risks described below. In addition, because these ProFunds VP have a single day investment objective, for periods greater than one day, the effect of compounding may cause the performance of a ProFund VP to vary from the benchmark performance (or the inverse of the benchmark performance) times the stated multiple in the ProFund VP objective, as applicable, before accounting for fees and ProFund VP expenses. As explained in greater detail in their Prospectuses, as a result of compounding, Geared Funds are unlikely to provide a simple multiple (e.g. -1x, 2x, or -2x) of a benchmark's return over periods longer than a single day.
December 31, 2021 :: Notes to Financial Statements :: 409
Leverage Risk
Certain ProFunds VP utilize leverage (i.e., obtain investment exposure in excess of their assets) in seeking to achieve their investment objective and will lose more money in market environments adverse to their daily objective than similar funds that do not employ leverage.
Because the ProFunds VP that utilize leverage include either multipliers of 2x or 1.25x (or sometimes the inverse thereof), a single day adverse price movement of more than 50% or 80%, respectively, in a relevant benchmark, could result in the total loss of an investor's investment.
Active Investor Risk
Each ProFund VP permits short-term trading of its securities. In addition, the Advisor expects a significant portion of the assets invested in a ProFund VP to come from professional money managers and investors who use the ProFund VP as part of active trading or tactical asset allocation strategies. These strategies often call for frequent trading to take advantage of anticipated changes in market conditions, which could increase portfolio turnover, and may result in additional costs for the ProFund VP. In addition, large movements of assets into and out of the ProFund VP may have a negative impact on the ProFund VP's ability to achieve its investment objective or maintain a consistent level of operating expenses. In certain circumstances, the ProFund VP's expense ratio may vary from current estimates or the historical ratio disclosed in the ProFund VP's prospectus.
Active Management Risk
ProFund Access VP High Yield Fund is actively managed, and its performance reflects the investment decisions that ProFund Advisors make for the Fund. ProFund Advisors' judgements about the ProFund VP's investments may prove to be incorrect. If the investments selected and strategies employed by the ProFund VP fail to produce the intended results, the ProFund VP could underperform or have negative returns as compared to other funds with a similar investment objective and/or strategies.
Concentration Risk
Certain non-money market ProFunds VP may be subject to concentration risk. Concentration risk results from maintaining concentrated exposure to certain types of issuers, industries, market sectors, countries or geographical regions. A ProFund VP that concentrates its investments will be more susceptible to risks associated with that concentration. With respect to the Sector ProFunds VP, a ProFund VP may have significant exposure to an individual industry that constitutes a significant portion of that ProFund VP's benchmark. Such a ProFund VP will be more susceptible to the risks associated with that specific industry, which may be different from the risks generally associated with other benchmarks. Each ProFund VP will concentrate its investments in a particular industry or group of industries to approximately the same extent as its benchmark, up to the extent permitted by applicable regulatory guidance. Additionally, certain ProFunds VP that focus their investments in particular countries or geographic regions may be particularly susceptible to economic, political or regulatory events affecting those countries or regions. These ProFunds VP may be more volatile than a more geographically diversified ProFund VP. The Schedule of Portfolio Investments includes information on each ProFund VP's holdings, including industry and/or geographical composition, as relevant.
Correlation Risk
There is no guarantee that a ProFund VP will achieve a high degree of correlation with its benchmark. Failure to achieve a high degree of correlation may prevent a ProFund VP from achieving its investment objective, and the percentage change of the ProFund VP's NAV each day may differ, perhaps significantly, from the percentage change of the ProFund VP's benchmark on such day. This may be due, among other reasons, to the impact of a limited trading market in the underlying component securities on the calculation of the benchmark.
In order to achieve a high degree of correlation with the Index, a ProFund VP seeks to rebalance its portfolio daily to keep exposure consistent with its investment objective. Being materially under- or overexposed to the Index may prevent the ProFund VP from achieving a high degree of correlation with the Index. Market disruptions or closure, regulatory restrictions, market volatility and other factors will adversely affect the ProFund VP's ability to adjust exposure to requisite levels. The target amount of portfolio exposure is impacted dynamically by the Index's movements. Because of this, it is unlikely that the ProFund VP will have perfect leveraged exposure at the end of each day and the likelihood of being materially under- or overexposed is higher on days when the Index level is volatile at or near the close of the trading day.
A number of other factors may adversely affect a ProFund VP's correlation with its benchmark, including material over- or underexposure, fees, expenses, transaction costs, financing costs associated with the use of derivatives, income items, valuation methodology, accounting standards and disruptions or illiquidity in the markets for the securities or financial instruments in which a ProFund VP invests. A ProFund VP may not have investment exposure to all securities in its benchmark, or its weighting of investment exposure to stocks or industries may be different from that of the benchmark. In addition, a ProFund VP may invest in securities not included in the benchmark or in financial instruments. Each ProFund VP may take or refrain from taking positions in order to improve tax efficiency or comply with regulatory restrictions, either of which may negatively affect the ProFund VP's correlation with its benchmark. A ProFund VP may also be subject to large movements of assets into and out of the ProFund VP, potentially resulting in the ProFund VP being over- or underexposed to its benchmark, and may be impacted by index reconstitutions and index rebalancing events. Additionally, a ProFund VP's underlying holdings or reference assets may trade on markets that may or may not be open on the same day as the ProFund VP. Each ProFund VP (other than the Classic ProFunds VP, the Sector ProFunds VP, ProFund VP Falling U.S. Dollar and ProFund VP Government Money Market) seeks to rebalance its portfolio daily to keep its leveraged, inverse or inverse leveraged exposure to the benchmark consistent with its investment objective. Any of these factors could decrease correlation between the performance of a ProFund VP and may hinder a ProFund VP's ability to meet its investment objective on or around that day.
410 :: Notes to Financial Statements :: December 31, 2021
Credit Default Swaps (CDS) Risk
While the Profund Access VP High Yield will normally be a net "seller" of CDS, at times the ProFund Access VP High Yield may be a net "buyer" of CDS. When the ProFund VP is a seller of credit protection, upon the occurrence of a credit event, the counterparty to the ProFund VP will have an obligation to pay the full notional value of a defaulted reference entity less recovery value. Recovery values for CDS are generally determined via an auction process to determine the final price for a given reference entity. Although, the ProFund VP intends, as practicable, to obtain exposure through centrally cleared CDS, an active market may not exist for any of the CDS in which the ProFund VP invests or in the reference entities subject to the CDS. As a result, the ProFund VP's ability to maximize returns or minimize losses on such CDS may be impaired. Other risks of CDS include difficulty in valuation due to the lack of pricing transparency and the risk that changes in the value of the CDS do not reflect changes in the credit quality of the underlying reference entities or may otherwise perform differently than expected given market conditions. Because the ProFund VP may use a single counterparty or a small number of counterparties, certain CDS involve many reference entities and there are no limitations on the notional amount established for the CDS. As a result, counterparty risk may be amplified.
Counterparty Risk
A ProFund VP that will invest in financial instruments involving third parties (i.e., counterparties) is subject to counterparty risk. The use of financial instruments, such as swap agreements or futures contracts, involves risks that are different from those associated with ordinary portfolio securities transactions. Certain ProFunds VP will be subject to credit risk (i.e., the risk that a counterparty is unwilling or unable to make timely payments to meet its contractual obligations) with respect to the amount they expect to receive from counterparties to financial instruments and repurchase agreements entered into by the ProFunds VP. Each ProFund VP generally structures the agreement such that either party can terminate the contract without penalty prior to the termination date. A ProFund VP may be negatively impacted if a counterparty becomes bankrupt or otherwise fails to perform its obligations, the value of an investment in each ProFund VP may decline. A ProFund VP may experience significant delays in obtaining any recovery in a bankruptcy or other reorganization proceeding and a ProFund VP may obtain only limited recovery or may obtain no recovery in such circumstances.
The ProFunds VP typically enter into transactions with counterparties whose credit rating at the time of the transaction is investment grade, as determined by a nationally recognized statistical rating organization, or, if unrated, judged by the Advisor to be of comparable quality. These are usually major, global financial institutions. Although the counterparty to an exchange-traded futures contract is often backed by a futures commission merchant ("FCM") or clearing organization that is further backed by a group of financial institutions, there may be instances in which the FCM or the clearing organization could fail to perform its obligations, causing significant losses to the ProFund VP. For example, a ProFund VP could lose margin payments it has deposited with a clearing organization as well as gains owed but not paid to the ProFund VP if the clearing organization becomes insolvent or otherwise fails to perform its obligations.
Under current CFTC regulations, a FCM maintains customers' assets in a bulk segregated account. If a FCM fails to do so, or is unable to satisfy a substantial deficit in a customer account, its other customers may be subject to risk of loss of their funds in the event of that FCM's bankruptcy. In that event, in the case of futures, the FCM's customers are entitled to recover, even in respect of property specifically traceable to them, only a proportional share of all property available for distribution to all of that FCM's customers. In the case of cleared swaps, customers of a FCM in bankruptcy are entitled to recover assets specifically attributable to them pursuant to new CFTC regulations, but may nevertheless risk loss of some or all of their assets due to accounting or operational issues or due to legal risk in connection with the application of bankruptcy law to cleared swaps.
Natural Disaster/Epidemic Risk
Natural or environmental disasters, such as earthquakes, fires, floods, hurricanes, tsunamis and other severe weather-related phenomena generally, and widespread disease, including pandemics and epidemics (for example, the novel coronavirus (COVID-19)), have been and can be highly disruptive to economies and markets and have recently led, and may continue to lead, to increased market volatility and significant market losses. Such as natural disaster and health crises could exacerbate political, social, and economic risks previously mentioned, and result in significant breakdowns, delays, shutdowns, social isolation, and other disruptions to important global, local and regional supply chains affected, with potential corresponding results on the operating performance of the Fund and its investments. A climate of uncertainty and panic, including the contagion of infectious viruses or diseases, may adversely affect global, regional, and local economies and reduce the availability of potential investment opportunities, and increases the difficulty of performing due diligence and modeling market conditions, potentially reducing the accuracy of financial projections. Under these circumstances, the Fund may have difficulty achieving its investment objective which may adversely impact performance. Further, such events can be highly disruptive to economies and markets, significantly disrupt the operations of individual companies (including, but not limited to, the Fund's investment advisor and third party service providers), sectors, industries, markets, securities and commodity exchanges, currencies, interest and inflation rates, credit ratings, investor sentiment, and other factors affecting the value of the Fund's investments. These factors can cause substantial market volatility, exchange trading suspensions and closures and can impact the ability of the Fund to complete redemptions and otherwise affect Fund performance and Fund trading in the secondary market. A widespread crisis may also affect the global economy in ways that cannot necessarily be foreseen at the current time. How long such events will last and whether they will continue or recur cannot be predicted. Impacts from these events could have significant impact on the Fund's performance, resulting in losses to your investment.
Risk that Current Assumptions and Expectations Could Become Outdated As a Result of Global Economic Shocks
The onset of the novel coronavirus (COVID-19) has caused significant shocks to global financial markets and economies, with
December 31, 2021 :: Notes to Financial Statements :: 411
many governments taking extreme actions to slow and contain the spread of COVID-19. These actions have had, and likely will continue to have, a severe economic impact on global economies as economic activity in some instances has essentially ceased. Financial markets across the globe are experiencing severe distress at least equal to what was experienced during the global financial crisis in 2008. In March 2020, U.S. equity markets entered a bear market in the fastest such move in the history of U.S. financial markets. During much of 2020, the unemployment rate in the U.S. was extremely high by historical standards. It is not possible to predict when unemployment and market conditions will return to more normal levels. The global economic shocks being experienced as of the date hereof may cause the underlying assumptions and expectations of the Fund to quickly become outdated or inaccurate, resulting in significant losses.
Debt Instruments Risk
The ProFunds VP may invest in, or seek exposure to, debt instruments. Debt instruments are subject to adverse issuer, political, regulatory, market and economic developments, as well as developments that affect specific economic sectors, industries or segments of the fixed income market. Additionally, the credit quality of the issuer of a debt instrument (including the risk of a potential default) can also affect the price of a debt instrument. The perceived or actual inability of issuers, guarantors, or liquidity providers of debt instruments to make scheduled interest payments can negatively impact the performance of the ProFund VP. Debt instruments may have varying levels of sensitivity to changes in interest rates and other factors.
Typically, the price of outstanding debt instruments falls when interest rates rise. Without taking into account other factors, the prices of debt instruments with longer maturities may fluctuate more in response to interest rate changes than those of debt instruments with shorter maturities. Many types of debt instruments are subject to prepayment risk, which is the risk that the issuer of the security will repay principal (in part or in whole) prior to the maturity date. Debt instruments allowing prepayment may offer less potential for gains during a period of declining interest rates, as a ProFund VP may be required to reinvest the proceeds received at lower interest rates. These factors may cause the value of an investment in the ProFund VP to change. Also, the securities of certain U.S. government agencies, authorities or instrumentalities are neither issued by nor guaranteed as to principal and interest by the U.S. government, and may be exposed to more credit risk than those issued by and guaranteed as to principal and interest by the U.S. government. All U.S. government securities are subject to credit risk. It is possible that the U.S. government may not be able to meet its financial obligations or that securities issued by the U.S. government may experience credit downgrades. Such a credit event may also adversely impact the financial markets. Certain ProFunds VP are inversely correlated to bond prices and will typically respond differently to the above factors than would a ProFund VP positively correlated to bond prices.
High Yield Risk
Investment in or exposure to high yield (lower rated) debt instruments (also known as "junk bonds") may involve greater levels of interest rate, credit, liquidity and valuation risk than for higher rated instruments. High yield debt instruments may be more sensitive to economic changes, political changes, or adverse developments specific to a company than other fixed income instruments. These securities are subject to greater risk of loss, greater sensitivity to economic changes, valuation difficulties, and a potential lack of a secondary or public market for securities. High yield debt instruments are considered predominantly speculative with respect to the issuer's continuing ability to make principal and interest payments and, therefore, such instruments generally involve greater risk of default or price changes than higher rated debt instruments. An economic downturn or period of rising interest rates could adversely affect the market for these securities and reduce market liquidity (liquidity risk). Less active markets may diminish a ProFund VP's ability to obtain accurate market quotations when valuing the portfolio securities and thereby give rise to valuation risk. High yield debt instruments may also present risks based on payment expectations. For example, these instruments may contain redemption or call provisions. If an issuer exercises these provisions in a declining interest rate market, the ProFund VP would have to replace the security with a lower yielding security, resulting in a decreased return for investors. If the issuer of a security is in default with respect to interest or principal payments, the issuer's security could lose its entire value. Furthermore, the transaction costs associated with the purchase and sale of high yield debt instruments may vary greatly depending upon a number of factors and may adversely affect a ProFund VP's performance.
Index Performance Risk
Certain ProFunds VP linked to an index will be subject to index performance risk. There is no guarantee or assurance that the methodology used by the third-party provider to create the Index will result in the ProFund VP achieving high, or even positive, returns. Further, there can be no guarantee that the methodology underlying the Index or the daily calculation of the Index will be free from error. It is also possible that the value of the Index may be subject to intentional manipulation by third-party market participants. The Index may underperform, and the ProFund VP could lose value, while other indices or measures of market performance increase in value.
LIBOR Risk
Many debt securities, derivatives, and other financial instruments, including some of the Funds' investments, use the London Interbank Offered Rate ("LIBOR") as the reference or benchmark rate for variable interest rate calculations. LIBOR is being discontinued as a floating rate benchmark. The Secured Overnight Financing Rate ("SOFR") is expected to replace U.S. dollar LIBOR as the principal floating rate benchmark. The LIBOR discontinuation has affected and will continue to affect financial markets generally. The date of the LIBOR discontinuation will vary depending on the LIBOR currency and tenor.
The UK Financial Conduct Authority (the "FCA"), which is the regulator of the LIBOR administrator, has announced that, after specified dates, LIBOR settings will cease to be provided by any administrator or will no longer be representative. Those dates are: (i) June 30, 2023, in the case of the principal U.S. dollar LIBOR tenors (overnight and one, three, six and 12 month); and (ii) December 31, 2021, in all other cases (i.e., one week and two
412 :: Notes to Financial Statements :: December 31, 2021
month U.S. dollar LIBOR and all tenors of non-U.S. dollar LIBOR). Accordingly, many existing LIBOR obligations will transition to another benchmark after June 30, 2023 or, in some cases, after December 31, 2021. The FCA and certain U.S. regulators have stated that, despite expected publication of U.S. dollar LIBOR through June 30, 2023, no new contracts using U.S. dollar LIBOR should be entered into after December 31, 2021.
Although the foregoing reflects the likely timing of the LIBOR discontinuation and certain consequences, there is no assurance that LIBOR, of any particular currency or tenor, will continue to be published until any particular date or in any particular form, and there is no assurance regarding the consequences of the LIBOR discontinuation. In the United States, there have been efforts to identify alternative reference interest rates for U.S. dollar LIBOR. The cash markets have generally coalesced around recommendations from the Alternative Reference Rates Committee (the "ARRC"), which was convened by the Board of Governors of the Federal Reserve System and the Federal Reserve Bank of New York. The ARRC has recommended that U.S. dollar LIBOR be replaced by rates based on SOFR plus, in the case of existing LIBOR contracts and obligations, a spread adjustment.
For purposes of the following discussion, the term "LIBOR" refers solely to U.S. dollar LIBOR. SOFR has a limited history, having been first published in April 2018. The future performance of SOFR, and SOFR-based reference rates, cannot be predicted based on SOFR's history or otherwise. SOFR has been more volatile than other benchmark or market rates, such as three-month LIBOR, during certain periods. Future levels of SOFR may bear little or no relation to historical levels of SOFR, LIBOR or other rates. SOFR-based rates will differ from LIBOR, and the differences may be material. SOFR is intended to be a broad measure of the cost of borrowing funds overnight in transactions that are collateralized by U.S. Treasury securities. In contrast, LIBOR is intended to be an unsecured rate that represents interbank funding costs for different short-term tenors.
For these reasons, among others, there is no assurance that SOFR, or rates derived from SOFR, will perform in the same or a similar way as LIBOR would have performed at any time, and there is no assurance that SOFR-based rates will be a suitable substitute for LIBOR. Non-LIBOR floating rate obligations, including SOFR-based obligations, may have returns and values that fluctuate more than those of floating rate obligations that are based on LIBOR or other rates. Resulting changes in the financial markets may adversely affect financial markets generally and may also adversely affect a Fund's operations specifically, particularly as financial markets transition away from LIBOR.
Liquidity Risk
In certain circumstances, such as the disruption of the orderly markets for the securities or financial instruments in which a ProFund VP invests, the ProFunds VP might not be able to acquire or dispose of certain holdings quickly or at prices that represent true fair value in the judgment of the Advisor. Markets for the securities or financial instruments in which a ProFund VP invests may be disrupted by a number of events, including but not limited to economic crises, natural disasters, new legislation, or regulatory changes inside or outside of the U.S. For example, regulation limiting the ability of certain financial institutions to invest in certain securities would likely reduce the liquidity of those securities. These situations may prevent a ProFund VP from limiting losses, realizing gains, or from achieving a high correlation (or inverse correlation) with its underlying benchmark.
7. Federal Income Tax Information
The tax character of distributions paid to shareholders during the tax years ended, as noted below, were as follows:
| | | Year Ended December 31, 2021 | | | Year Ended December 31, 2020 | |
| | | Distributions
Paid from
Ordinary
Income | | | Distributions
Paid from
Net Long-Term
Gains | | | Tax Return
of Capital | | | Total
Distributions
Paid | | | Distributions
Paid from
Ordinary
Income | | | Distributions
Paid from
Net Long-Term
Gains | | | Tax Return
of Capital | | | Total
Distributions
Paid | |
| ProFund Access VP High Yield | | $ | 490,299 | | | $ | — | | | $ | — | | | $ | 490,299 | | | $ | 842,012 | | | $ | — | | | $ | — | | | $ | 842,012 | |
| ProFund VP Asia 30 | | | 177,657 | | | | 4,210,725 | | | | — | | | | 4,388,382 | | | | 627,243 | | | | 1,892,592 | | | | — | | | | 2,519,835 | |
| ProFund VP Banks | | | 82,428 | | | | — | | | | — | | | | 82,428 | | | | 92,909 | | | | — | | | | — | | | | 92,909 | |
| ProFund VP Basic Materials | | | 254,694 | | | | 295,399 | | | | — | | | | 550,093 | | | | 177,560 | | | | 771,840 | | | | — | | | | 949,400 | |
| ProFund VP Bear | | | 20,517 | | | | 1,179 | | | | — | | | | 21,696 | | | | 18,942 | | | | — | | | | — | | | | 18,942 | |
| ProFund VP Biotechnology | | | 384,376 | | | | — | | | | — | | | | 384,376 | | | | 666,520 | | | | 3,430,329 | | | | — | | | | 4,096,849 | |
| ProFund VP Bull | | | 1,730,614 | | | | 2,971,176 | | | | — | | | | 4,701,790 | | | | 1,255,930 | | | | 1,897,120 | | | | — | | | | 3,153,050 | |
| ProFund VP Consumer Goods | | | 297,851 | | | | 765,184 | | | | — | | | | 1,063,035 | | | | 255,626 | | | | 2,182 | | | | — | | | | 257,808 | |
| ProFund VP Consumer Services | | | 930,394 | | | | 1,515,195 | | | | — | | | | 2,445,589 | | | | 13,651 | | | | 9,125,605 | | | | — | | | | 9,139,256 | |
| ProFund VP Dow 30 | | | 55,117 | | | | — | | | | — | | | | 55,117 | | | | 111,280 | | | | — | | | | — | | | | 111,280 | |
| ProFund VP Emerging Markets | | | — | | | | — | | | | — | | | | — | | | | 117,347 | | | | — | | | | — | | | | 117,347 | |
| ProFund VP Europe 30 | | | 163,002 | | | | — | | | | — | | | | 163,002 | | | | 395,173 | | | | — | | | | — | | | | 395,173 | |
| ProFund VP Falling U.S. Dollar | | | 1,014 | | | | 14,881 | | | | — | | | | 15,895 | | | | 1,949 | | | | — | | | | — | | | | 1,949 | |
| ProFund VP Financials | | | 363,519 | | | | 2,335,855 | | | | — | | | | 2,699,374 | | | | 440,538 | | | | 1,689,299 | | | | — | | | | 2,129,837 | |
| ProFund VP Government Money Market | | | 5,562 | | | | — | | | | — | | | | 5,562 | | | | 55,902 | | | | — | | | | — | | | | 55,902 | |
| ProFund VP Health Care | | | 499,530 | | | | 3,738,461 | | | | — | | | | 4,237,991 | | | | — | | | | 6,154,240 | | | | — | | | | 6,154,240 | |
| ProFund VP Industrials | | | 40,631 | | | | 1,131,548 | | | | — | | | | 1,172,179 | | | | 220,540 | | | | 48,389 | | | | — | | | | 268,929 | |
| ProFund VP International | | | — | | | | — | | | | — | | | | — | | | | 26,163 | | | | — | | | | — | | | | 26,163 | |
| ProFund VP Internet | | | 769,852 | | | | 2,812,110 | | | | — | | | | 3,581,962 | | | | — | | | | 2,716,437 | | | | — | | | | 2,716,437 | |
| ProFund VP Japan | | | 387,547 | | | | 718,980 | | | | — | | | | 1,106,527 | | | | 18,886 | | | | — | | | | — | | | | 18,886 | |
December 31, 2021 :: Notes to Financial Statements :: 413
| | | Year Ended December 31, 2021 | | | Year Ended December 31, 2020 | |
| | | Distributions
Paid from
Ordinary
Income | | | Distributions
Paid from
Net Long-Term
Gains | | | Tax Return
of Capital | | | Total
Distributions
Paid | | | Distributions
Paid from
Ordinary
Income | | | Distributions
Paid from
Net Long-Term
Gains | | | Tax Return
of Capital | | | Total
Distributions
Paid | |
| ProFund VP Large-Cap Growth | | $ | 670,296 | | | $ | 3,262,142 | | | $ | — | | | $ | 3,932,438 | | | $ | 479,816 | | | $ | 2,242,710 | | | $ | — | | | $ | 2,722,526 | |
| ProFund VP Large-Cap Value | | | 149,393 | | | | — | | | | — | | | | 149,393 | | | | 1,707,270 | | | | 161,730 | | | | — | | | | 1,869,000 | |
| ProFund VP Mid-Cap | | | 607,067 | | | | — | | | | — | | | | 607,067 | | | | 2,072,210 | | | | 183,573 | | | | — | | | | 2,255,783 | |
| ProFund VP Mid-Cap Growth | | | 270,436 | | | | 1,446,994 | | | | — | | | | 1,717,430 | | | | 97,983 | | | | 1,725,066 | | | | — | | | | 1,823,049 | |
| ProFund VP Mid-Cap Value | | | 54,454 | | | | — | | | | — | | | | 54,454 | | | | 703,529 | | | | 221,502 | | | | — | | | | 925,031 | |
| ProFund VP Nasdaq-100 | | | 13,205,051 | | | | 5,754,779 | | | | — | | | | 18,959,830 | | | | 5,808,862 | | | | 3,687,764 | | | | — | | | | 9,496,626 | |
| ProFund VP Oil & Gas | | | 528,770 | | | | — | | | | — | | | | 528,770 | | | | 421,335 | | | | 186,316 | | | | — | | | | 607,651 | |
| ProFund VP Pharmaceuticals | | | 236,561 | | | | — | | | | — | | | | 236,561 | | | | 15,201 | | | | — | | | | — | | | | 15,201 | |
| ProFund VP Precious Metals | | | — | | | | — | | | | — | | | | — | | | | 89,778 | | | | — | | | | — | | | | 89,778 | |
| ProFund VP Real Estate | | | 3,298 | | | | — | | | | — | | | | 3,298 | | | | 404,416 | | | | — | | | | 28,104 | | | | 432,520 | |
| ProFund VP Rising Rates Opportunity | | | — | | | | — | | | | — | | | | — | | | | 37,790 | | | | — | | | | — | | | | 37,790 | |
| ProFund VP Semiconductor | | | 743,390 | | | | 312,175 | | | | — | | | | 1,055,565 | | | | 649,890 | | | | 46,276 | | | | — | | | | 696,166 | |
| ProFund VP Short Dow 30 | | | — | | | | — | | | | — | | | | — | | | | 43 | | | | — | | | | — | | | | 43 | |
| ProFund VP Short Emerging Markets | | | — | | | | — | | | | — | | | | — | | | | 5,130 | | | | — | | | | — | | | | 5,130 | |
| ProFund VP Short International | | | — | | | | — | | | | — | | | | — | | | | 3,789 | | | | — | | | | — | | | | 3,789 | |
| ProFund VP Short Mid-Cap | | | 139,495 | | | | — | | | | — | | | | 139,495 | | | | 1,287 | | | | — | | | | — | | | | 1,287 | |
| ProFund VP Short Nasdaq-100 | | | 148,179 | | | | 76,706 | | | | — | | | | 224,885 | | | | — | | | | — | | | | — | | | | — | |
| ProFund VP Short Small-Cap | | | — | | | | — | | | | — | | | | — | | | | 9,164 | | | | — | | | | — | | | | 9,164 | |
| ProFund VP Small-Cap | | | 492,926 | | | | 274,681 | | | | — | | | | 767,607 | | | | 288,536 | | | | 88,823 | | | | — | | | | 377,359 | |
| ProFund VP Small-Cap Growth | | | 481,395 | | | | 1,270,548 | | | | — | | | | 1,751,943 | | | | 321,867 | | | | 2,098,024 | | | | — | | | | 2,419,891 | |
| ProFund VP Small-Cap Value | | | 29,211 | | | | — | | | | — | | | | 29,211 | | | | 1,201,768 | | | | 608,459 | | | | — | | | | 1,810,227 | |
| ProFund VP Technology | | | 1,784,842 | | | | 1,809,709 | | | | — | | | | 3,594,551 | | | | 359,646 | | | | 3,832,337 | | | | — | | | | 4,191,983 | |
| ProFund VP Telecommunications | | | 81,611 | | | | — | | | | — | | | | 81,611 | | | | 61,265 | | | | — | | | | — | | | | 61,265 | |
| ProFund VP UltraBull | | | — | | | | — | | | | — | | | | — | | | | 9,177,445 | | | | 741,664 | | | | — | | | | 9,919,109 | |
| ProFund VP UltraMid-Cap | | | — | | | | — | | | | — | | | | — | | | | 2,119,595 | | | | — | | | | — | | | | 2,119,595 | |
| ProFund VP UltraNasdaq-100 | | | 49,379,390 | | | | 6,317,292 | | | | — | | | | 55,696,682 | | | | 30,350,127 | | | | 3,147,135 | | | | — | | | | 33,497,262 | |
| ProFund VP UltraShort Dow 30 | | | 109,160 | | | | — | | | | — | | | | 109,160 | | | | 185 | | | | — | | | | — | | | | 185 | |
| ProFund VP UltraShort Nasdaq-100 | | | 2,439,139 | | | | — | | | | — | | | | 2,439,139 | | | | 6,414 | | | | — | | | | — | | | | 6,414 | |
| ProFund VP UltraSmall-Cap | | | 2,071,442 | | | | 182,370 | | | | — | | | | 2,253,812 | | | | 2,142,018 | | | | — | | | | — | | | | 2,142,018 | |
| ProFund VP U.S. Government Plus | | | 2,851,086 | | | | — | | | | — | | | | 2,851,086 | | | | 1,890,196 | | | | — | | | | — | | | | 1,890,196 | |
| ProFund VP Utilities | | | 492,932 | | | | — | | | | — | | | | 492,932 | | | | 1,733,161 | | | | 6,251,978 | | | | — | | | | 7,985,139 | |
As of the latest tax year ended December 31, 2021, the components of accumulated earnings (deficit) on a tax basis were as follows:
| | | Undistributed
Ordinary
Income | | | Undistributed
Long-Term
Capital Gains | | | Distributions
Payable | | | Accumulated
Capital and
Other Losses | | | Unrealized
Appreciation/
(Depreciation) | | | Accumulated
Earnings/
(Deficit) | |
| ProFund Access VP High Yield | | $ | — | | | $ | — | | | $ | — | | | $ | (2,041,993 | ) | | $ | (20,781 | ) | | $ | (2,062,774 | ) |
| ProFund VP Asia 30 | | | 95,016 | | | | 2,232,606 | | | | — | | | | — | | | | 4,835,652 | | | | 7,163,274 | |
| ProFund VP Banks | | | 49,017 | | | | — | | | | — | | | | (2,302,000 | ) | | | 1,740,640 | | | | (512,343 | ) |
| ProFund VP Basic Materials | | | 138,447 | | | | 53,432 | | | | — | | | | — | | | | 8,538,994 | | | | 8,730,873 | |
| ProFund VP Bear | | | — | | | | — | | | | — | | | | (22,682,864 | ) | | | 7,868 | | | | (22,674,996 | ) |
| ProFund VP Biotechnology | | | 197,061 | | | | 8,620,057 | | | | — | | | | — | | | | 33,344,097 | | | | 42,161,215 | |
| ProFund VP Bull | | | 4,197,862 | | | | 1,291,440 | | | | — | | | | — | | | | 39,992,574 | | | | 45,481,876 | |
| ProFund VP Consumer Goods | | | 488,033 | | | | 48,178 | | | | — | | | | — | | | | 13,551,598 | | | | 14,087,809 | |
| ProFund VP Consumer Services | | | 60,825 | | | | 139,786 | | | | — | | | | — | | | | 14,791,387 | | | | 14,991,998 | |
| ProFund VP Dow 30 | | | 44,674 | | | | — | | | | — | | | | (1,645,752 | ) | | | 200 | | | | (1,600,878 | ) |
| ProFund VP Emerging Markets | | | 110,840 | | | | — | | | | — | | | | (6,872,829 | ) | | | 6,571,331 | | | | (190,658 | ) |
| ProFund VP Europe 30 | | | 816,976 | | | | 138,048 | | | | — | | | | — | | | | 1,686,522 | | | | 2,641,546 | |
| ProFund VP Falling U.S. Dollar | | | — | | | | — | | | | — | | | | (342,962 | ) | | | — | | | | (342,962 | ) |
| ProFund VP Financials | | | 280,926 | | | | 110,726 | | | | — | | | | — | | | | 20,446,960 | | | | 20,838,612 | |
| ProFund VP Government Money Market | | | — | | | | — | | | | — | | | | (36,237 | ) | | | — | | | | (36,237 | ) |
| ProFund VP Health Care | | | 364,507 | | | | 2,227,196 | | | | — | | | | — | | | | 38,843,966 | | | | 41,435,669 | |
| ProFund VP Industrials | | | 76,123 | | | | 114,092 | | | | — | | | | — | | | | 11,857,128 | | | | 12,047,343 | |
| ProFund VP International | | | 461,505 | | | | — | | | | — | | | | (1,069,800 | ) | | | (54,664 | ) | | | (662,959 | ) |
| ProFund VP Internet | | | — | | | | 4,335,872 | | | | — | | | | — | | | | 10,337,697 | | | | 14,673,569 | |
414 :: Notes to Financial Statements :: December 31, 2021
| | | Undistributed
Ordinary
Income | | | Undistributed
Long-Term
Capital Gains | | | Distributions
Payable | | | Accumulated
Capital and
Other Losses | | | Unrealized
Appreciation/
(Depreciation) | | | Accumulated
Earnings/
(Deficit) | |
| ProFund VP Japan | | $ | 60,554 | | | $ | 296,292 | | | $ | — | | | $ | — | | | $ | (45 | ) | | $ | 356,801 | |
| ProFund VP Large-Cap Growth | | | 120,430 | | | | 3,618,543 | | | | — | | | | — | | | | 19,641,592 | | | | 23,380,565 | |
| ProFund VP Large-Cap Value | | | 75,010 | | | | 200,882 | | | | — | | | | — | | | | 4,299,565 | | | | 4,575,457 | |
| ProFund VP Mid-Cap | | | 2,138,942 | | | | 292,513 | | | | — | | | | (205,135 | ) | | | 37,755 | | | | 2,264,075 | |
| ProFund VP Mid-Cap Growth | | | 459,881 | | | | 2,533,620 | | | | — | | | | — | | | | 5,814,231 | | | | 8,807,732 | |
| ProFund VP Mid-Cap Value | | | 704,740 | | | | 1,423,945 | | | | — | | | | — | | | | 2,771,267 | | | | 4,899,952 | |
| ProFund VP Nasdaq-100 | | | 9,788,261 | | | | 10,171,069 | | | | — | | | | — | | | | 88,724,340 | | | | 108,683,670 | |
| ProFund VP Oil & Gas | | | 660,699 | | | | — | | | | — | | | | (664,101 | ) | | | 10,698,558 | | | | 10,695,156 | |
| ProFund VP Pharmaceuticals | | | 181,043 | | | | 670,360 | | | | — | | | | — | | | | 4,593,688 | | | | 5,445,091 | |
| ProFund VP Precious Metals | | | — | | | | — | | | | — | | | | (62,075,594 | ) | | | 602,452 | | | | (61,473,142 | ) |
| ProFund VP Real Estate | | | 416,943 | | | | 152,686 | | | | — | | | | — | | | | 7,252,307 | | | | 7,821,936 | |
| ProFund VP Rising Rates Opportunity | | | — | | | | — | | | | — | | | | (28,677,965 | ) | | | 14,318 | | | | (28,663,647 | ) |
| ProFund VP Semiconductor | | | 671,423 | | | | 26,089 | | | | — | | | | — | | | | 11,726,389 | | | | 12,423,901 | |
| ProFund VP Short Dow 30 | | | — | | | | — | | | | — | | | | (119,360 | ) | | | (7 | ) | | | (119,367 | ) |
| ProFund VP Short Emerging Markets | | | 13,998 | | | | — | | | | — | | | | (2,627,061 | ) | | | (11,582 | ) | | | (2,624,645 | ) |
| ProFund VP Short International | | | — | | | | — | | | | — | | | | (2,353,275 | ) | | | 2,308 | | | | (2,350,967 | ) |
| ProFund VP Short Mid-Cap | | | — | | | | — | | | | — | | | | (2,544,093 | ) | | | (167 | ) | | | (2,544,260 | ) |
| ProFund VP Short Nasdaq-100 | | | — | | | | — | | | | — | | | | (13,990,414 | ) | | | 27,559 | | | | (13,962,855 | ) |
| ProFund VP Short Small-Cap | | | — | | | | — | | | | — | | | | (5,929,084 | ) | | | 5,086 | | | | (5,923,998 | ) |
| ProFund VP Small-Cap | | | 1,048,660 | | | | 488,847 | | | | — | | | | — | | | | 2,733,844 | | | | 4,271,351 | |
| ProFund VP Small-Cap Growth | | | 556,092 | | | | 1,987,294 | | | | — | | | | — | | | | 8,231,669 | | | | 10,775,055 | |
| ProFund VP Small-Cap Value | | | 1,869,494 | | | | 1,969,707 | | | | — | | | | — | | | | 2,865,493 | | | | 6,704,694 | |
| ProFund VP Technology | | | 1,321,853 | | | | 5,172,582 | | | | — | | | | — | | | | 41,167,907 | | | | 47,662,342 | |
| ProFund VP Telecommunications | | | 103,492 | | | | — | | | | — | | | | (833,731 | ) | | | 1,514,357 | | | | 784,118 | |
| ProFund VP UltraBull | | | 2,079,344 | | | | 948,214 | | | | — | | | | (13,108,883 | ) | | | 7,966,888 | | | | (2,114,437 | ) |
| ProFund VP UltraMid-Cap | | | 3,471,812 | | | | 588,061 | | | | — | | | | — | | | | 4,470,762 | | | | 8,530,635 | |
| ProFund VP UltraNasdaq-100 | | | 72,449,013 | | | | 1,258,151 | | | | — | | | | — | | | | 93,993,686 | | | | 167,700,850 | |
| ProFund VP UltraShort Dow 30 | | | — | | | | — | | | | — | | | | (968,907 | ) | | | (8 | ) | | | (968,915 | ) |
| ProFund VP UltraShort Nasdaq-100 | | | — | | | | — | | | | — | | | | (5,378,981 | ) | | | 10,880 | | | | (5,368,101 | ) |
| ProFund VP UltraSmall-Cap | | | 2,929,042 | | | | 638,178 | | | | — | | | | — | | | | 3,298,073 | | | | 6,865,293 | |
| ProFund VP U.S. Government Plus | | | — | | | | — | | | | — | | | | (1,988,021 | ) | | | 148,658 | | | | (1,839,363 | ) |
| ProFund VP Utilities | | | 426,395 | | | | 422,855 | | | | — | | | | — | | | | 17,037,962 | | | | 17,887,212 | |
As of the latest tax year ended December 31, 2021, the following ProFunds VP have net capital loss carryforwards ("CLCFs") as summarized in the tables below.
| | | No Expiration
Date | |
| ProFund Access VP High Yield | | $ | 2,041,993 | * |
| ProFund VP Banks | | | 2,302,000 | |
| ProFund VP Bear | | | 22,682,864 | * |
| ProFund VP Dow 30 | | | 1,645,752 | * |
| ProFund VP Emerging Markets | | | 6,872,829 | * |
| ProFund VP Falling U.S. Dollar | | | 342,962 | * |
| ProFund VP Government Money Market | | | 36,237 | |
| ProFund VP International | | | 1,069,800 | * |
| ProFund VP Mid-Cap | | | 205,135 | * |
| ProFund VP Oil & Gas | | | 664,101 | |
| ProFund VP Precious Metals | | | 62,075,594 | |
| ProFund VP Rising Rates Opportunity | | | 28,677,965 | * |
| ProFund VP Short Dow 30 | | | 119,360 | * |
| ProFund VP Short Emerging Markets | | | 2,627,061 | * |
| ProFund VP Short International | | | 2,353,275 | * |
| ProFund VP Short Mid-Cap | | | 2,544,093 | * |
| ProFund VP Short Nasdaq-100 | | | 13,990,414 | * |
| ProFund VP Short Small-Cap | | | 5,929,084 | * |
| ProFund VP Telecommunications | | | 833,731 | |
| ProFund VP UltraBull | | | 13,108,883 | * |
| ProFund VP UltraShort Dow 30 | | | 968,907 | * |
| ProFund VP UltraShort Nasdaq-100 | | | 5,378,981 | * |
| ProFund VP U.S. Government Plus | | | 1,988,021 | |
| * | All or a portion are limited as a result of changes in the ProFund VP ownership during the year and in prior years. |
December 31, 2021 :: Notes to Financial Statements :: 415
Unused limitations accumulate and increase limited CLCFs available for use in offsetting net capital gains. The Board does not intend to authorize a distribution of any realized gain for a ProFund VP until any applicable CLCF has been offset or expires.
As of December 31, 2021, the cost of securities, including derivatives, gross unrealized appreciation and gross unrealized depreciation on investment securities, for federal income tax purposes, were as follows:
| Fund Name | | Tax Cost | | | Tax
Unrealized
Appreciation | | | Tax
Unrealized
Depreciation | | | Net Unrealized
Appreciation
(Depreciation) | |
| ProFund Access VP High Yield | | $ | 14,384,530 | | | $ | — | | | $ | (20,781 | ) | | $ | (20,781 | ) |
| ProFund VP Asia 30 | | | 19,003,615 | | | | 8,772,254 | | | | (3,936,602 | ) | | | 4,835,652 | |
| ProFund VP Banks | | | 4,264,487 | | | | 4,187,154 | | | | (2,446,514 | ) | | | 1,740,640 | |
| ProFund VP Basic Materials | | | 8,842,724 | | | | 10,599,902 | | | | (2,060,908 | ) | | | 8,538,994 | |
| ProFund VP Bear | | | 1,555,000 | | | | 7,868 | | | | — | | | | 7,868 | |
| ProFund VP Biotechnology | | | 28,316,051 | | | | 36,749,212 | | | | (3,405,115 | ) | | | 33,344,097 | |
| ProFund VP Bull | | | 32,905,175 | | | | 43,778,092 | | | | (3,785,518 | ) | | | 39,992,574 | |
| ProFund VP Consumer Goods | | | 13,621,311 | | | | 15,054,451 | | | | (1,502,853 | ) | | | 13,551,598 | |
| ProFund VP Consumer Services | | | 15,992,472 | | | | 16,174,708 | | | | (1,383,321 | ) | | | 14,791,387 | |
| ProFund VP Dow 30 | | | 218,000 | | | | 200 | | | | — | | | | 200 | |
| ProFund VP Emerging Markets | | | 13,017,623 | | | | 8,830,962 | | | | (2,259,631 | ) | | | 6,571,331 | |
| ProFund VP Europe 30 | | | 17,458,926 | | | | 6,298,664 | | | | (4,612,142 | ) | | | 1,686,522 | |
| ProFund VP Falling U.S. Dollar | | | 485,600 | | | | — | | | | — | | | | — | |
| ProFund VP Financials | | | 21,337,355 | | | | 27,639,097 | | | | (7,192,137 | ) | | | 20,446,960 | |
| ProFund VP Government Money Market | | | 48,329,489 | | | | — | | | | — | | | | — | |
| ProFund VP Health Care | | | 16,749,626 | | | | 41,851,508 | | | | (3,007,542 | ) | | | 38,843,966 | |
| ProFund VP Industrials | | | 9,973,324 | | | | 13,212,486 | | | | (1,355,358 | ) | | | 11,857,128 | |
| ProFund VP International | | | 12,234,000 | | | | — | | | | (54,664 | ) | | | (54,664 | ) |
| ProFund VP Internet | | | 9,333,384 | | | | 12,118,215 | | | | (1,780,518 | ) | | | 10,337,697 | |
| ProFund VP Japan | | | 6,986,706 | | | | — | | | | (45 | ) | | | (45 | ) |
| ProFund VP Large-Cap Growth | | | 17,775,249 | | | | 20,376,206 | | | | (734,614 | ) | | | 19,641,592 | |
| ProFund VP Large-Cap Value | | | 13,619,192 | | | | 6,358,197 | | | | (2,058,632 | ) | | | 4,299,565 | |
| ProFund VP Mid-Cap | | | 15,737,578 | | | | 37,755 | | | | — | | | | 37,755 | |
| ProFund VP Mid-Cap Growth | | | 14,850,787 | | | | 6,787,992 | | | | (973,761 | ) | | | 5,814,231 | |
| ProFund VP Mid-Cap Value | | | 15,979,197 | | | | 4,702,280 | | | | (1,931,013 | ) | | | 2,771,267 | |
| ProFund VP Nasdaq-100 | | | 86,956,883 | | | | 92,228,025 | | | | (3,503,685 | ) | | | 88,724,340 | |
| ProFund VP Oil & Gas | | | 20,002,725 | | | | 16,696,755 | | | | (5,998,197 | ) | | | 10,698,558 | |
| ProFund VP Pharmaceuticals | | | 12,100,669 | | | | 6,467,866 | | | | (1,874,178 | ) | | | 4,593,688 | |
| ProFund VP Precious Metals | | | 27,834,000 | | | | 602,452 | | | | — | | | | 602,452 | |
| ProFund VP Real Estate | | | 6,559,805 | | | | 8,311,456 | | | | (1,059,149 | ) | | | 7,252,307 | |
| ProFund VP Rising Rates Opportunity | | | 5,787,000 | | | | 14,318 | | | | — | | | | 14,318 | |
| ProFund VP Semiconductor | | | 6,046,481 | | | | 12,501,643 | | | | (775,254 | ) | | | 11,726,389 | |
| ProFund VP Short Dow 30 | | | 6,000 | | | | — | | | | (7 | ) | | | (7 | ) |
| ProFund VP Short Emerging Markets | | | 1,137,000 | | | | — | | | | (11,582 | ) | | | (11,582 | ) |
| ProFund VP Short International | | | 536,000 | | | | 2,308 | | | | — | | | | 2,308 | |
| ProFund VP Short Mid-Cap | | | 55,000 | | | | — | | | | (167 | ) | | | (167 | ) |
| ProFund VP Short Nasdaq-100 | | | 1,944,000 | | | | 27,559 | | | | — | | | | 27,559 | |
| ProFund VP Short Small-Cap | | | 1,159,306 | | | | 5,086 | | | | — | | | | 5,086 | |
| ProFund VP Small-Cap | | | 12,020,118 | | | | 3,695,903 | | | | (962,059 | ) | | | 2,733,844 | |
| ProFund VP Small-Cap Growth | | | 16,985,233 | | | | 9,466,628 | | | | (1,234,959 | ) | | | 8,231,669 | |
| ProFund VP Small-Cap Value | | | 24,501,585 | | | | 6,661,537 | | | | (3,796,044 | ) | | | 2,865,493 | |
| ProFund VP Technology | | | 9,933,532 | | | | 43,234,210 | | | | (2,066,303 | ) | | | 41,167,907 | |
| ProFund VP Telecommunications | | | 5,939,043 | | | | 2,301,454 | | | | (787,097 | ) | | | 1,514,357 | |
| ProFund VP UltraBull | | | 11,813,482 | | | | 8,655,602 | | | | (688,714 | ) | | | 7,966,888 | |
| ProFund VP UltraMid-Cap | | | 13,302,098 | | | | 5,104,127 | | | | (633,365 | ) | | | 4,470,762 | |
| ProFund VP UltraNasdaq-100 | | | 185,575,463 | | | | 102,492,860 | | | | (8,499,174 | ) | | | 93,993,686 | |
| ProFund VP UltraShort Dow 30 | | | 4,000 | | | | — | | | | (8 | ) | | | (8 | ) |
| ProFund VP UltraShort Nasdaq-100 | | | 365,000 | | | | 10,880 | | | | — | | | | 10,880 | |
| ProFund VP UltraSmall-Cap | | | 25,295,870 | | | | 4,914,368 | | | | (1,616,295 | ) | | | 3,298,073 | |
| ProFund VP U.S. Government Plus | | | 15,075,950 | | | | 187,255 | | | | (38,597 | ) | | | 148,658 | |
| ProFund VP Utilities | | | 17,654,624 | | | | 19,076,284 | | | | (2,038,322 | ) | | | 17,037,962 | |
416 :: Notes to Financial Statements :: December 31, 2021
8. Stock Splits and Reverse Share Splits
Effective December 14, 2020, the ProFund VP UltraNasdaq-100 underwent a 2-for-1 share split, the ProFund VP Short Small-Cap, ProFund VP UltraBull, ProFund VP UltraShort Nasdaq-100 each underwent a 1-for-4 reverse share split and the ProFund VP UltraShort Dow 30 underwent a 1-for-5 reverse share split.
Effective November 18, 2019, the ProFund VP Internet underwent a 3-for-1 share split, the ProFund VP Short Dow 30, the ProFund VP Short International, and the ProFund VP Short Nasdaq-100 each underwent a 1-for-4 reverse share split, and the ProFund VP UltraShort Dow 30 underwent a 1-for-8 reverse share split.
Effective December 11, 2017, the ProFund VP Short Emerging Markets underwent a 1-for-5 reverse share split, and the ProFund VP UltraShort Nasdaq-100 underwent a 1-for-8 reverse share split.
The effect of the share split transactions was to multiply the number of outstanding shares of the ProFund VP by the respective split factor, with a corresponding decrease in net asset value per share; and the effect of the reverse share split transactions was to divide the number of outstanding shares of the ProFunds VP by the respective reverse split factor, with a corresponding increase in the net asset value per share. These transactions did not change the net assets of these ProFunds VP or the value of a shareholder's investment.
The historical share transactions presented in the Statements of Changes in Net Assets and per share data presented in the Financial Highlights have been adjusted retroactively to give effect to the share splits and reverse share splits.
9. Shareholder Concentration
Ownership of more than 25% of the voting securities for a fund creates presumptions of control of the fund, under Section 2(a)(9) of the 1940Act. As of December 31, 2021, the Advisor was deemed a significant shareholder of each of ProFund VP Dow 30, ProFund VP Short Dow 30, and ProFund VP UltraShort Dow 30 as the Advisor's ownership of total shares outstanding of each ProFund VP was 59%, 64%, and 87% respectively.
10. Subsequent Events
The ProFunds VP have evaluated the need for additional disclosures or adjustments resulting from subsequent events through the date these financial statements were issued. Based on this evaluation, there were no subsequent events to report that would have a material impact on the ProFunds VP's financial statements.
Report of Independent Registered Public Accounting Firm :: 417
To the Board of Trustees of ProFunds and Shareholders of each of the fifty-one funds listed below
Opinions on the Financial Statements
We have audited the accompanying statements of assets and liabilities, including the schedules of portfolio investments, of each of the funds listed below (fifty-one of the funds constituting ProFunds, hereafter collectively referred to as the "Funds") as of December 31, 2021, the related statements of operations for the year ended December 31, 2021, the statements of changes in net assets for each of the two years in the period ended December 31, 2021, including the related notes, and the financial highlights for each of the five years in the period ended December 31, 2021 (collectively referred to as the "financial statements"). In our opinion, the financial statements present fairly, in all material respects, the financial position of each of the Funds as of December 31, 2021, the results of each of their operations for the year then ended, the changes in each of their net assets for each of the two years in the period ended December 31, 2021 and each of the financial highlights for each of the five years in the period ended December 31, 2021 in conformity with accounting principles generally accepted in the United States of America.
ProFund Access VP High Yield
ProFund VP Asia 30
ProFund VP Banks
ProFund VP Basic Materials
ProFund VP Bear
ProFund VP Biotechnology
ProFund VP Bull
ProFund VP Consumer Goods
ProFund VP Consumer Services
ProFund VP Dow 30
ProFund VP Emerging Markets
ProFund VP Europe 30
ProFund VP Falling U.S. Dollar
ProFund VP Financials
ProFund VP Government Money Market
ProFund VP Health Care
ProFund VP Industrials
ProFund VP International
ProFund VP Internet
ProFund VP Japan
ProFund VP Large-Cap Growth
ProFund VP Large-Cap Value
ProFund VP Mid-Cap
ProFund VP Mid-Cap Growth
ProFund VP Mid-Cap Value
ProFund VP Nasdaq-100
ProFund VP Oil & Gas
ProFund VP Pharmaceuticals
ProFund VP Precious Metals
ProFund VP Real Estate
ProFund VP Rising Rates Opportunity
ProFund VP Semiconductor
ProFund VP Short Dow 30
ProFund VP Short Emerging Markets
ProFund VP Short International
ProFund VP Short Mid-Cap
ProFund VP Short Nasdaq-100
ProFund VP Short Small-Cap
ProFund VP Small-Cap
ProFund VP Small-Cap Growth
ProFund VP Small-Cap Value
ProFund VP Technology
ProFund VP Telecommunications
ProFund VP U.S. Government Plus
ProFund VP UltraBull
ProFund VP UltraMid-Cap
ProFund VP UltraNasdaq-100
ProFund VP UltraShort Dow 30
ProFund VP UltraShort Nasdaq-100
ProFund VP UltraSmall-Cap
ProFund VP Utilities
Basis for Opinions
These financial statements are the responsibility of the Funds' management. Our responsibility is to express an opinion on the Funds' financial statements based on our audits. We are a public accounting firm registered with the Public Company Accounting Oversight Board (United States) (PCAOB) and are required to be independent with respect to the Funds in accordance with the U.S. federal securities laws and the applicable rules and regulations of the Securities and Exchange Commission and the PCAOB.
We conducted our audits of these financial statements in accordance with the standards of the PCAOB. Those standards require that we plan and perform the audit to obtain reasonable assurance about whether the financial statements are free of material misstatement, whether due to error or fraud.
Our audits included performing procedures to assess the risks of material misstatement of the financial statements, whether due to error or fraud, and performing procedures that respond to those risks. Such procedures included examining, on a test basis, evidence regarding the amounts and disclosures in the financial statements. Our audits also included evaluating the accounting principles used and significant estimates made by management, as well as evaluating the overall presentation of the financial statements. Our procedures included confirmation of securities owned as of December 31, 2021 by correspondence with the custodian and brokers; when replies were not received from brokers, we performed other auditing procedures. We believe that our audits provide a reasonable basis for our opinions.
/s/PricewaterhouseCoopers LLP
Baltimore, Maryland
February 23, 2022
We have served as the auditor of one or more investment companies in ProFunds and ProShares Trust group since 1997.
418 :: Additional Tax Information (unaudited)
Other Federal Income Tax Information:
For corporate shareholders, the following percentage of the total ordinary income dividends paid during the fiscal year ended December 31, 2021, qualify for the corporate dividends received deduction for the following ProFunds VP:
| | | Dividend
Received
Deduction | |
| ProFund VP Banks | | | 100.00 | % |
| ProFund VP Basic Materials | | | 73.10 | % |
| ProFund VP Biotechnology | | | 100.00 | % |
| ProFund VP Bull | | | 37.38 | % |
| ProFund VP Consumer Goods | | | 97.38 | % |
| ProFund VP Consumer Services | | | 25.95 | % |
| ProFund VP Financials | | | 100.00 | % |
| ProFund VP Health Care | | | 100.00 | % |
| ProFund VP Industrials | | | 100.00 | % |
| ProFund VP Internet | | | 7.99 | % |
| ProFund VP Large-Cap Growth | | | 42.78 | % |
| ProFund VP Large-Cap Value | | | 100.00 | % |
| ProFund VP Mid-Cap Growth | | | 51.04 | % |
| ProFund VP Mid-Cap Value | | | 100.00 | % |
| ProFund VP Nasdaq-100 | | | 5.43 | % |
| ProFund VP Oil & Gas | | | 100.00 | % |
| ProFund VP Pharmaceuticals | | | 88.20 | % |
| ProFund VP Real Estate | | | 1.48 | % |
| ProFund VP Semiconductor | | | 19.07 | % |
| ProFund VP Small-Cap | | | 10.81 | % |
| ProFund VP Small-Cap Growth | | | 26.52 | % |
| ProFund VP Small-Cap Value | | | 100.00 | % |
| ProFund VP Technology | | | 19.91 | % |
| ProFund VP Telecommunications | | | 100.00 | % |
| ProFund VP UltraNasdaq-100 | | | 1.37 | % |
| ProFund VP UltraSmall-Cap | | | 3.44 | % |
| ProFund VP Utilities | | | 100.00 | % |
For the fiscal year ended December 31, 2021, the amount of long-term capital gain designated by the ProFunds VP were as follows:
| | | Long-Term
Capital Gain | |
| ProFund VP Asia 30 | | $ | 4,210,725 | |
| ProFund VP Basic Materials | | | 295,399 | |
| ProFund VP Bear | | | 1,179 | |
| ProFund VP Bull | | | 2,971,176 | |
| ProFund VP Consumer Goods | | | 765,184 | |
| ProFund VP Consumer Services | | | 1,515,195 | |
| ProFund VP Falling U.S. Dollar | | | 14,881 | |
| ProFund VP Financials | | | 2,335,855 | |
| ProFund VP Health Care | | | 3,738,461 | |
| ProFund VP Industrials | | | 1,131,548 | |
| ProFund VP Internet | | | 2,812,110 | |
| ProFund VP Japan | | | 718,980 | |
| ProFund VP Large-Cap Growth | | | 3,262,142 | |
| ProFund VP Mid-Cap Growth | | | 1,446,994 | |
| ProFund VP Nasdaq-100 | | | 5,754,779 | |
| ProFund VP Semiconductor | | | 312,175 | |
| ProFund VP Short Nasdaq-100 | | | 76,706 | |
| ProFund VP Small-Cap | | | 274,681 | |
| ProFund VP Small-Cap Growth | | | 1,270,548 | |
| ProFund VP Technology | | | 1,809,709 | |
| ProFund VP UltraNasdaq-100 | | | 6,317,292 | |
| ProFund VP UltraSmall-Cap | | | 182,370 | |
Additional Tax Information (unaudited) :: 419
For the fiscal year ended December 31, 2021, the amount of short-term capital gain designated by the ProFunds VP were as follows:
| | | Short-Term
Capital Gain | |
| ProFund VP Asia 30 | | $ | 177,657 | |
| ProFund VP Basic Materials | | | 193,760 | |
| ProFund VP Bear | | | 20,517 | |
| ProFund VP Biotechnology | | | 384,376 | |
| ProFund VP Bull | | | 1,730,614 | |
| ProFund VP Consumer Goods | | | 227,870 | |
| ProFund VP Consumer Services | | | 930,393 | |
| ProFund VP Dow 30 | | | 55,117 | |
| ProFund VP Falling U.S. Dollar | | | 1,014 | |
| ProFund VP Financials | | | 224,528 | |
| ProFund VP Health Care | | | 479,065 | |
| ProFund VP Industrials | | | 40,631 | |
| ProFund VP Internet | | | 769,852 | |
| ProFund VP Japan | | | 387,547 | |
| ProFund VP Large-Cap Growth | | | 670,296 | |
| ProFund VP Mid-Cap | | | 607,067 | |
| ProFund VP Mid-Cap Growth | | | 270,436 | |
| ProFund VP Nasdaq-100 | | | 13,205,051 | |
| ProFund VP Pharmaceuticals | | | 196,556 | |
| ProFund VP Semiconductor | | | 743,390 | |
| ProFund VP Short Mid-Cap | | | 139,495 | |
| ProFund VP Short Nasdaq-100 | | | 148,178 | |
| ProFund VP Small-Cap | | | 492,926 | |
| ProFund VP Small-Cap Growth | | | 481,395 | |
| ProFund VP Technology | | | 1,784,842 | |
| ProFund VP UltraNasdaq-100 | | | 49,379,390 | |
| ProFund VP UltraShort Dow 30 | | | 109,160 | |
| ProFund VP UltraShort Nasdaq-100 | | | 2,439,139 | |
| ProFund VP UltraSmall-Cap | | | 2,071,442 | |
| ProFund VP U.S. Government Plus | | | 2,851,085 | |
420 :: Board Approval of Investment Advisory Agreement :: December 31, 2021
At a meeting held on September 13-14, 2021, the Board of Trustees (the "Board") of ProFunds (the "Trust") considered the renewal of the Investment Advisory Agreement between ProFund Advisors LLC (the "Advisor") and the Trust, on behalf of each of its operational series (each a "Fund" and collectively the "Funds") (the "Advisory Agreement"). Certain Funds are designed to match, before fees and expenses, the performance of an underlying index both on a single day and over time (each a "Matching Fund" and, collectively, the "Matching Funds"). Certain other Funds are actively managed and are designed to meet a specified investment objective (each an "Active Fund" and, collectively, the "Active Funds"). Certain other Funds are "geared" funds that are designed to seek daily investment results, before fees and expenses, that correspond to the inverse (-1x), a multiple (i.e., 1.25x, 1.50x or 2x), or an inverse multiple (i.e., -1.25x or -2x) of the daily performance of an index or security (each a "Geared Fund" and, collectively, the "Geared Funds").
The Board did not identify any particular information that was most relevant to its consideration to approve the continuation of the Advisory Agreement and each Trustee may have afforded different weight to the various factors.
The Board received a memorandum from independent legal counsel to the Independent Trustees regarding the Board's responsibilities under state and federal law with respect to the Board's consideration of the renewal or approval of investment advisory agreements. The Independent Trustees were advised by their independent legal counsel throughout the process, including about the legal standards applicable to their review.
In response to a request from the Independent Trustees, the Advisor provided information for the Board to consider relating to the continuation of the Advisory Agreement, including information that addressed, among other things:
| (i) | the nature, extent and quality of the services that were provided or proposed to be provided by the Advisor; |
| (ii) | the costs of the services to be provided and the profits realized by the Advisor; |
| (iii) | the investment performance of the Funds and the Advisor; |
| (iv) | the extent to which economies of scale might be realized as the Funds grow and whether fee levels reflect economies of scale, if any, for the benefit of Fund shareholders; and |
| (v) | other benefits to the Advisor and/or its affiliates from the relationship to the Funds. |
It was noted that the Independent Trustees requested, and received, information from the Advisor concerning the Funds. In response to the request from the Independent Trustees, the Advisor provided information and reports relevant to the continuation of the Advisory Agreement, including, among other things:
| (i) | information about the advisory services that were being provided by the Advisor with respect to the Funds; |
| (ii) | the Advisor's Form ADV; |
| (iii) | biographies of the employees of the Advisor who are primarily responsible for providing investment advisory services to the Funds; |
| (iv) | information regarding each component of the contractual fee rates and actual fee rates for the prior fiscal year; |
| (v) | information regarding advisory fees earned versus advisory fees waived for previous periods; |
| (vi) | performance information for prior periods; |
| (vii) | comparative industry fee data; |
| (viii) | information about fees and other amounts that were received by the Advisor and its affiliates for non-advisory services with respect to the Funds; |
| (ix) | information regarding the Advisor's trade allocation and best execution policies and procedures; |
| (x) | information about the financial condition of the Advisor; |
| (xi) | information regarding how the Advisor monitors each Fund's compliance with regulatory requirements and Trust procedures; and |
| (xii) | the Advisor's reputation, expertise and resources. |
The Trustees retained the services of an independent consultant to assist in selecting a universe of peer group funds (the "Peer Group") with similar investment strategies, as well as to help them in evaluating information with respect to certain aspects of their review, including the reasonableness of fees paid by the Funds. The Board evaluated all information available to it on a Fund-by-Fund basis, and their determinations were made separately with respect to each Fund.
In addition to the information provided and discussions that occurred at the meeting at which the Board took action regarding the renewal of the Advisory Agreement, the Board also considered information they received throughout the year as part of their regular oversight of the Funds.
Nature, Extent and Quality of the Advisor's Services
The Board reviewed the nature, extent and quality of the investment advisory services performed by the Advisor. The Board noted there would be no significant differences between the scope of services provided by the Advisor in the past year and those to be provided in the upcoming year. The Board focused on the quality of the personnel and operations at the Advisor and the systems and processes required to manage the Funds effectively. In particular, the Board considered the following:
| (i) | the investment objective of each Fund, the Advisor's description of the skills needed to manage each Fund and the Advisor's success in achieving the investment objectives of each Fund; |
| (ii) | the unique features of the Funds, including the unique asset classes and investment strategies of certain Funds, as well as the employment of optimization/sampling techniques necessary to manage certain Funds; |
| (iii) | with respect to the Geared Funds, the fact that to maintain exposure consistent with each Geared Fund's daily investment objective, each Geared Fund needs to be rebalanced each day, an activity not typical of traditional index funds; |
| (iv) | the differences in managing the non-geared Funds, including the unique asset classes and investment strategies for certain Funds, as well as the employment of optimization/sampling techniques necessary to manage certain Funds; |
| (v) | the size and experience of the Advisor's portfolio staff and the Advisor's ability to recruit, train and retain personnel |
December 31, 2021 :: Board Approval of Investment Advisory Agreement :: 421
| | with relevant experience and the specific expertise necessary to manage the Funds; |
| (vi) | the structure of the portfolio staff compensation program and the incentives it is intended to provide; |
| (vii) | the collateral, credit and cash management functions at the Advisor and the enhancements made in these areas; |
| (viii) | the Advisor's development of investment strategies, including those involving the use of complex financial instruments and processes that maximize the Funds' ability to meet their stated investment objectives and minimize counterparty risk; |
| (ix) | a significant investment in personnel and state-of-the-art technology that the Advisor has made over the course of several years and, recently, instituting certain technological upgrades that would generally improve capacity and document production capabilities as well as technological upgrades that have continued to contribute to successful remote working conditions during the COVID-19 pandemic; and |
| (x) | information regarding allocation of Fund brokerage and the selection of counterparties for Fund portfolio transactions, as well as favorable terms of derivatives transactions the Advisor was able to negotiate with swap counterparties on behalf of various Funds. |
The Board considered that the Advisor oversees the operations of the Funds and provides compliance services to the Funds. The Board also reviewed the Advisor's compliance program, including specific activities associated with the Funds. The Board discussed the compliance program with the Funds' Chief Compliance Officer (the "CCO"). The Board and the CCO discussed the CCO's evaluation of the operation of the Advisor's compliance program, and efforts with respect to the Funds, changes made to the Advisor's compliance program since the CCO's last annual report to the Board, and whether the CCO believed additional enhancements to the compliance program were warranted. The Board discussed compliance issues reported to the Board during the prior year and the remediation of such issues. The Board discussed key risk areas identified by the CCO and how such risks are addressed by the compliance program.
Based upon its review, the Board, including all of the Independent Trustees, concluded with respect to each Fund that (i) the investment advisory services provided by the Advisor with respect to the Fund were of high quality, (ii) the Advisor achieved the investment goals of the Fund, (iii) the Advisor's services benefited the Fund's shareholders, particularly in light of the nature of the Fund and the services required to support each such Fund, and (iv) they were generally satisfied with the nature, quality and extent of services provided to the Fund by the Advisor.
Comparison of Services and Fees
The Advisor presented information about the fairness and reasonableness of the investment advisory fees payable to the Advisor in light of the investment advisory services provided, the costs of these services and the comparability to the fees paid by other investment companies, including mutual funds offering strategies similar in nature and extent to the Funds. The Board discussed the methodology used to prepare the comparative fee data for each Fund and the potential limitations of such data. The Board discussed the difficulty in compiling the comparative data and Peer Group information because, by design, many of the Funds are unique and few, if any, fund complexes with funds offering substantially similar investment objectives and strategies exist. The Board considered the Advisor's representation that it found the Peer Group compiled by the independent consultant to be appropriate but acknowledged the existence of certain differences between the Funds and their peers. The Board noted that the methodology used to compile the Peer Group and comparative data was identical to that used in prior years. Notwithstanding the challenge associated with Peer Group and data compilation, the Board found the comparative information it received to be useful in its evaluation of the reasonableness of the Advisor's fee. The Advisor presented information about the significant drivers of cost and also examined the costs to investors to achieve the objectives of the Funds on their own and noted that it would be more expensive or impractical to do so.
The Board reviewed information prepared by the independent consultant, comparing management and expense information for each Fund to that of its Peer Group. The Board reviewed Peer Group information prepared by the consultant comparing the contractual advisory fee rate to be paid by the Funds to other funds with investment objectives most similar to the Funds. The Board also considered the fee waiver and/or expense reimbursement arrangements currently in place for each Fund and considered the net advisory fees paid by the Funds after taking waivers and reimbursements into account.
The Board considered and discussed the sub-advisory fees charged and the services provided by the Advisor to the one mutual fund it serves as sub-adviser. The Board recognized that the scope of services provided by the Advisor to the mutual fund is narrower than the services provided to the Funds for several reasons, including that the Advisor performs only services delegated to it by the investment adviser to the mutual fund and does not provide other services like daily cash management, collateral management and counterparty management. The Board noted that for these reasons it is difficult to make comparisons of fees charged to the sub-advised mutual fund and the Funds.
The Board also recognized that it is difficult to make comparisons of fees across fund complexes because there may be variations in services that are included in the fees paid by other mutual funds.
The Board, including all of the Independent Trustees, concluded that, with respect to the Funds, the investment advisory fees and any other compensation payable to the Advisor were reasonable in relation to the nature and quality of the services provided and that the continuation of the Advisory Agreement was in the best interests of the shareholders of the Funds.
Investment Performance of the Funds and the Advisor
The Board considered total return information for each Fund and focused on the correlation of returns to benchmark information for each Geared Fund for the 3-month, 1-year, 5-year, 10-year and since inception periods ended June 30, 2021, as applicable. The Board also considered performance information provided at regular Board meetings throughout the year. The Board noted that correlation of returns for each Geared Fund remained strong during the applicable periods and that Geared Fund performance
422 :: Board Approval of Investment Advisory Agreement :: December 31, 2021
versus target performance was generally within expected ranges. The Board further noted that Matching Fund performance versus benchmark index performance was also generally within expected ranges during the applicable periods. The Board noted that, given the nature of the Funds that are Matching Funds or Geared Funds, the correlation of such Fund's performance with the performance of its underlying benchmark (or a relevant inverse or multiple thereof) was a more meaningful factor than the Fund's total return.
In regard to the Active Funds, the Board considered that, for each of the one-year, three-year, five-year and ten-year periods ended June 30, 2021, the Access Flex Bear High Yield ProFund underperformed its Peer Group and benchmark index. In regard to the Access Flex High Yield ProFund, the Board considered that for each of the one-year, three-year, five-year and ten-year periods ended June 30, 2021, the Fund underperformed its Peer Group and benchmark index.
In regard to the Access VP High Yield Fund, the Board noted that for each of the one-year-, three-year, five-year and ten-year periods ended June 30, 2021, the Fund underperformed its Peer Group and benchmark index.
After reviewing the performance of the Funds, the Board, including the Independent Trustees, concluded, in light of the foregoing factors, that the performance of the Funds was satisfactory.
Profitability
The Board considered and discussed with representatives of the Advisor the significant drivers of cost incurred by or expected to be incurred by the Advisor in managing the Funds, including, but not limited to, intellectual capital, regulatory compliance, daily portfolio rebalancing of the Geared Funds, and entrepreneurial risk, and considered the costs that investors likely would incur if they independently sought to achieve the objectives of the Funds. The Board considered and discussed with representatives of the Advisor the profitability to the Advisor of its management of each of the Funds. The Board also discussed the Advisor's profit margin, including the expense allocation methodology used in the Advisor's profitability analysis. It was noted that the methodology for determining profitability was conducted in a similar fashion as the prior year.
The Independent Trustees met in executive session to discuss and evaluate the information provided by the Advisor and the independent consultant, as well as of the information provided by a separate independent consultant retained to review profitability. Among other things, the Independent Trustees reviewed information regarding the financial condition and profitability of the Advisor, including the methodologies involved in calculating profitability.
Based on its review, the Board, including all of the Independent Trustees, concluded that the profitability to the Advisor of the Advisory Agreement was reasonable in light of the services and benefits provided to each Fund.
Economies of Scale
The Board discussed with representatives of the Advisor potential economies of scale in connection with the management and operation of each Fund as well as the effect of the contractual expense limitations undertaken by the Advisor. The Board considered that each Fund covered by the Advisory Agreement pays the Advisor an annual investment advisory fee of 0.75% of average daily net assets (other than the ProFund Ultra Japan Fund and the ProFund Ultra Short Japan Fund, each of which pay 0.90%, the ProFund Nasdaq-100 which pays 0.70%, and the ProFund V.P. U.S. Government Plus, which pays 0.50%).
The Board considered that, subject to the condition that the aggregate daily net assets of the Trust be equal to or greater than $10 billion, the Advisor has agreed to reduce each Fund's annual investment advisory fee by 0.025% on assets in excess of $500 million up to $1 billion, 0.05% on assets in excess of $1 billion up to $2 billion and 0.075% on assets in excess of $2 billion. The Board considered that for the periods presented, none of the Funds were subject to advisory fee reductions as a result of breakpoint fee reductions.
The Board indicated to the Advisor that it will continue to consider and evaluate on an ongoing basis potential economies of scale and how Fund shareholders might benefit from those economies of scale.
Other Benefits
The Board also considered the Advisor's non-advisory services, including those performed under a separate Management Services Agreement. The Board considered the fact that the Geared Funds' shareholders, and the shareholders of certain Matching Funds, tend to be active traders, which adds a level of complexity to the management of those Funds as the Advisor needs to account for significant flows in and out of the Funds. The Board also considered any indirect, or "fall-out," benefits that the Advisor or its affiliates derived from their relationship to the Funds but concluded that such benefits were relatively insignificant.
The Board considered that ProFund Distributors, Inc., a wholly-owned subsidiary of the Advisor, earns fees from the Funds for providing services under a Distribution and Shareholder Services Plan.
Conclusions
Based on, but not limited to, the above considerations and determinations, the Board, including all of the Independent Trustees, determined that the Agreement for the Funds is fair and reasonable in light of the nature, extent and quality of the services to be performed, the fee rates to be paid, the Advisor's expenses and such other matters as the Board considered relevant in the exercise of its business judgement. Accordingly, the Board concluded that the continuation of the Advisory Agreement was in the best interests of the shareholders of the Funds. On this basis, the Board unanimously voted in favor of the renewal of the Advisory Agreement.
December 31, 2021 :: Board Approval of Investment Advisory Agreement :: 423
At a meeting held on December 10, 2020, the Board of Trustees (the "Board") of ProFunds (the "Trust") considered the approval of the Investment Advisory Agreement between ProFund Advisors LLC (the "Advisor") and the Trust, on behalf of ProFund Access VP High Yield (the "New Fund").
The New Fund was approved in connection with an Agreement and Plan of Reorganization and Termination (the "Reorganization") that provides for the transfer of all of the assets of the Access VP High Yield Fund, a series of Access One Trust (an affiliated Trust) (the "Existing Fund") into a corresponding New Fund within ProFunds.
The Board noted that New Fund would (1) have the same cost and share class structures as the Existing Fund, including the same advisory and distribution fees; (2) pursue the same investment programs and investment objectives as the Existing Fund, managed by the same portfolio management team; and (3) have a substantially similar name as the Existing Fund. The Board noted that the Reorganization will not result in a material change or diminution in the level of services or resources that have been provided historically to the Existing Fund. The Board also noted that the New Fund will have no operations or public shareholders prior to the Reorganization and will adopt the performance and accounting histories of the Existing Fund.
During its review, the Board relied on materials that the Advisor had previously provided in connection with the Board's annual consideration of the investment advisory and related agreements with respect to the Existing Fund at its September 14-15, 2020 Meeting, where there had been no material change in response.
The Board did not identify any particular information that was most relevant to its consideration to approve the Advisory Agreement and each Trustee may have afforded different weight to the various factors.
The Board received a memorandum from independent legal counsel to the Independent Trustees regarding the Board's responsibilities under state and federal law with respect to the Board's consideration of the approval of investment advisory agreement. The Independent Trustees were advised by their independent legal counsel throughout the process, including about the legal standards applicable to their review. In response to a request from the Independent Trustees, the Advisor provided information for the Board to consider relating to the proposed Investment Advisory Agreement, including information that addressed, among other things:
| (i) | the nature, extent and quality of the services that were proposed to be provided by the Advisor; |
| (ii) | the costs of the services to be provided and the profits to be realized by the Advisor; |
| (iii) | the investment performance of the Existing Fund and the Advisor; |
| (iv) | the extent to which economies of scale might be realized as the New Fund grows and whether fee levels reflect economies of scale, if any, for the benefit of Fund shareholders; and |
| (v) | other benefits to the Advisor and/or its affiliates from the relationship to the New Fund. |
It was noted that the Independent Trustees requested, and received, information from the Advisor concerning the Existing Fund and the New Fund. In response to the request from the Independent Trustees, the Advisor provided information and reports relevant to the approval of the Investment Advisory Agreement, including among other things:
| (i) | information about the advisory services that were being provided by the Advisor with respect to the Existing Fund and were proposed to be provided to the New Fund; |
| (ii) | the Advisor's Form ADV; |
| (iii) | biographies of the employees of the Advisor who are primarily responsible for providing investment advisory services to the Existing Fund, who will also serve in the same capacity for the New Fund; |
| (iv) | information regarding each component of the contractual fee rates and actual fee rates for the prior fiscal year for the Existing Fund; |
| (v) | information regarding advisory fees earned versus advisory fees waived for previous periods with respect to the Existing Fund; |
| (vi) | performance information for prior periods with respect to the Existing Fund; |
| (vii) | comparative industry fee data with respect to the Existing Fund; |
| (viii) | information about fees and other amounts that were received by the Advisor and its affiliates for non-advisory services with respect to the Existing Fund; |
| (ix) | information regarding the Advisor's trade allocation and best execution policies and procedures with respect to the Existing Fund; |
| (x) | information about the financial condition of the Advisor; |
| (xi) | information regarding how the Advisor monitors the Existing Fund's compliance with regulatory requirements and Trust procedures; and |
| (xii) | the Advisor's reputation, expertise and resources. |
In addition to the information provided and discussions that occurred at the meeting, the Board also considered information they received throughout the year as part of their regular oversight of the Existing Fund.
Nature, Extent and Quality of the Advisor's Services
The Board reviewed the nature, extent and quality of the investment advisory services performed by the Advisor with respect to the Existing Fund. The Board noted there would be no significant differences between the scope of services provided by the Advisor to the Existing Fund and those to be provided to the New Fund. The Board focused on the quality of the personnel and operations at the Advisor and the systems and processes required to manage the Existing Fund effectively, which are expected to be identical for the New Fund. In particular, the Board considered the following:
| (i) | the investment objective of the Existing Fund, the Advisor's description of the skills needed to manage the Existing Fund, and the Advisor's success in achieving the investment objective of the Existing Fund; |
424 :: Board Approval of Investment Advisory Agreement :: December 31, 2021
| (ii) | the size and experience of the Advisor's portfolio staff and the Advisor's ability to recruit, train and retain personnel with relevant experience and the specific expertise necessary to manage the Existing Fund; |
| (iii) | the structure of the portfolio staff compensation program and the incentives it is intended to provide; |
| (iv) | the collateral, credit and cash management functions at the Advisor and enhancements made in these areas; |
| (v) | the Advisor's development of investment strategies, including those involving the use of complex financial instruments and processes that maximize the Existing Fund's ability to meet its stated investment objectives and minimize counterparty risk; |
| (vi) | information regarding allocation of Existing Fund brokerage and the selection of counterparties for Existing Fund portfolio transactions; |
| (vii) | a significant investment in personnel and state-of-the-art technology that the Advisor has made over the course of several years and, its recent institution of several technological upgrades that would generally improve capacity and document production capabilities as well as technological upgrades that have contributed to successful remote working conditions during the COVID-19 pandemic; and |
| (viii) | information regarding the selection of counterparties for Existing Fund portfolio transactions, as well as favorable terms of derivatives transactions the Advisor was able to negotiate with swap counterparties on behalf of the Existing Fund. |
The Board considered that the Advisor oversees the operations of the Existing Fund and provides compliance services to the Existing Fund, which are expected to be identical for the New Fund. The Board also reviewed the Advisor's compliance program, including specific activities associated with the Existing Fund.
Based upon its review, the Board, including all of the Independent Trustees, concluded that (i) the investment advisory services provided by the Advisor with respect to the New Fund were expected to be of high quality, (ii) the Advisor has successfully achieved the investment goals of the Existing Fund, (iii) the Advisor's services benefited the Existing Fund's shareholders, particularly in light of the nature of the Existing Fund and the services required to support it and (iv) it was generally satisfied with the nature, quality and extent of services provided to the Existing Fund and expected to be provided to the New Fund by the Advisor.
Comparison of Services and Fees
The Advisor presented information about the fairness and reasonableness of the investment advisory fees payable to the Advisor in light of the investment advisory services provided, the costs of these services and the comparability to the fees paid by other investment companies, including mutual funds offering strategies similar in nature and extent to the Existing Fund, noting that the New Fund is expected to be similarly situated. This information included information by an independent consultant, comparing management fee and expense information for the Existing Fund to that of a peer group of funds (the "Peer Group") determined by the consultant. The Board discussed the methodology used to prepare the comparative fee data for the Existing Fund and the potential limitations of such data. The Board discussed the difficulty in compiling the comparative data and Peer Group information because the Existing Fund is unique and few fund complexes with funds offering substantially similar investment objectives and strategies exist. The Board considered the Advisor's representation that it found the Peer Group compiled by the independent consultant to be appropriate, but acknowledged the existence of certain differences between the Existing Fund and its peers. The Board noted that the methodology used to compile the Peer Group and comparative data were identical to that used in prior years. Notwithstanding the challenge associated with Peer Group and data compilation, the Board found the comparative information it received to be useful in its evaluation of the reasonableness of the Advisor's fees. The Advisor presented information about the significant drivers of cost and also examined the costs to investors to achieve the objectives of the Existing Fund on its own, and noted that it would be more expensive or impractical to do so.
The Board reviewed information prepared by the independent consultant, comparing management and expense information for the Existing Fund to that of the Peer Group. The Board reviewed Peer Group information prepared by the consultant comparing the contractual advisory fee rate paid by the Existing Fund to other funds with investment objectives most similar to the Existing Fund. The Board also considered the fee waiver and/or expense reimbursement arrangements currently in place for the Existing Fund and considered the net advisory fees paid by the Existing Fund after taking waivers and reimbursements into account.
The Board noted that the advisory fee paid by the Existing Fund compared favorably to its Peer Group and universe average, and that the New Fund's proposed advisory fees are identical.
The Board considered and discussed the sub-advisory fees charged and the services provided by the Advisor to the one mutual fund it serves as sub-advisor. The Board recognized that the scope of services provided by the Advisor to the mutual fund is narrower than the services provided to the Fund for several reasons, including that the Advisor performs only services delegated to it by the investment adviser to the mutual fund and does not provide other services like daily cash management, collateral management and counterparty management. The Board noted that for these reasons it is difficult to make comparisons of fees charged to the sub-advised mutual fund and the Existing Fund.
The Board also recognized that it is difficult to make comparisons of fees across fund complexes because there may be variations in services that are included in the fees paid by other mutual funds.
The Board, including all of the Independent Trustees, concluded that, with respect to the New Fund, the proposed investment advisory fees and any other compensation payable to the Advisor were reasonable in relation to the nature and quality of the services proposed to be provided.
Investment Performance of the Fund and the Advisor
The Board noted that the New Fund had not yet started operations and therefore had no performance history, but determined that,
December 31, 2021 :: Board Approval of Investment Advisory Agreement :: 425
as the New Fund will have the same investment strategies and objectives as the Existing Fund, it was reasonable to consider the performance of the Existing Fund. The Board considered total return information for the Existing Fund and focused on the correlation of returns to benchmark information for the Fund for the 3-month, 1-year, 3-year, 5-year, 10-year and since inception periods ended September 30, 2020. The Board also considered performance information provided at regular Board meetings throughout the year. The Board noted that correlation of returns for the Existing Fund remained strong during the applicable periods and Existing Fund performance was generally within expected ranges.
In regard to the Existing Fund, the Board noted that for each of the one-year-, three-year, five-year and ten-year periods ended September 30, 2020, the Existing Fund closely tracked its Peer Group. It also noted that the Existing Fund underperformed its benchmark index for the one-year, three-year, five-year and ten-year periods and for the quarter ended September 30, 2020.
After reviewing the performance of the Existing Fund, the Board, including all of the Independent Trustees, concluded, in light of the foregoing factors, that the performance of the Existing Fund was satisfactory.
Profitability
The Board noted that the New Fund had not yet started operations, so that it could not yet evaluate the Advisor's profitability related to the New Fund. The Board considered and discussed with representatives of the Advisor the significant drivers of cost incurred by the Advisor or expected to be incurred by the Advisor in managing the Existing Fund or the New Fund, including, but not limited to, intellectual capital, regulatory compliance and entrepreneurial risk, and considered the costs that investors likely would incur if they independently sought to achieve the objectives of the Existing Fund or the New Fund. The Board considered and discussed with representatives of the Advisor the profitability to the Advisor of its management of the Existing Fund. The Board also discussed the Advisor's profit margin, including the expense allocation methodology used in the Advisor's profitability analysis. It was noted that the methodology for determining profitability was conducted in a similar fashion for prior reviews.
The Independent Trustees met in executive session to discuss and evaluate the information provided by the Advisor and the independent consultant.
Based on its review, the Board, including all of the Independent Trustees, concluded that the profitability to the Advisor of the Investment Advisory Agreement was reasonable in light of the services and benefits provided to the Existing Fund and expected to be provided to the New Fund.
Economies of Scale
The Board discussed with representatives of the Advisor potential economies of scale in connection with the management and operation of the Existing Fund as well as the effect of the contractual expense limitations undertaken by the Advisor. The Board considered that the Existing Fund and the New Fund are covered by the Investment Advisory Agreement which pays the Advisor an annual investment advisory fee of 0.75% of average daily net assets.
The Board considered that the Advisor has agreed to reduce the New Fund's annual investment advisory fee by 0.025% on assets in excess of $500 million up to $1 billion, 0.05% on assets in excess of $1 billion up to $2 billion and 0.075% on assets in excess of $2 billion.
The Board indicated to the Advisor that it will continue to consider and evaluate on an ongoing basis potential economies of scale and how New Fund shareholders might benefit from those economies of scale.
Other Benefits
The Board also considered the Advisor's non-advisory services, including those performed under a separate Management Services Agreement. The Independent Trustees also considered any indirect, or "fall-out," benefits that the Advisor or its affiliates derived from their relationship to the Existing Fund, or to be realized from their relationship to the New Fund, but concluded that such benefits were not material to their considerations. The Board considered that ProFund Distributors, Inc., a wholly-owned subsidiary of the Advisor, earns fees from the Existing Fund for providing services under a Distribution and Shareholder Services Plan, and will earn similar fees for the New Fund.
Conclusions
The Board, including all of the Independent Trustees, concluded that it was in the best interests of the New Fund and its prospective shareholders to approve the Investment Advisory Agreement and that the terms of the Investment Advisory Agreement for the New Fund were fair and reasonable.
Expense Examples
Expense Examples (unaudited) :: 427
As a ProFund VP shareholder, you may incur two types of costs: (1) transaction costs and (2) ongoing costs, including management fees; distribution fees; and other ProFund VP expenses. These examples are intended to help you understand your ongoing costs (in dollars) of investing in a ProFund VP and to compare these costs with the ongoing cost of investing in other mutual funds. Please note that the expenses shown in the tables are meant to highlight your ongoing costs only and do not reflect any transactional costs. Therefore, the examples are useful in comparing ongoing costs only and will not help you determine the relative total cost of owning different funds. In addition, if these transactional costs were included, your costs would have been higher. These examples also do not reflect fees associated with insurance company or insurance contracts. If those fees were reflected, expenses would be higher.
Actual Expenses
The actual examples are based on an investment of $1,000 invested at the beginning of a six-month period and held for the entire period ended December 31, 2021.
The columns below under the heading entitled "Actual" provide information about actual account values and actual expenses. You may use this information, together with the amount you invested, to estimate the expenses that you paid over the period. Simply divide your account value by $1,000 (for example, an $8,600 account value divided by $1,000 = 8.6), then multiply the result by the number in the table under the heading entitled "Actual Expenses Paid During Period" to estimate the expenses you paid on your account during this period.
Hypothetical Expenses for Comparison Purpose
The hypothetical expense examples are based on an investment of $1,000 invested at the beginning of a six-month period and held through the period ended December 31, 2021.
The columns below under the heading entitled "Hypothetical" provide information about hypothetical account values and hypothetical expenses based on each ProFund VP's actual expense ratio and an assumed rate of return of 5% per year before expenses, which is not each ProFund VP's actual return. The hypothetical account values and expenses may not be used to estimate the actual ending account balance or expenses you paid for the period. You may use this information to compare the ongoing costs of investing in your ProFund VP and other funds. To do so, compare this 5% hypothetical example with the 5% hypothetical examples that appear in the shareholder reports of the other funds.
| | | | | | | | | Actual | | | Hypothetical
(5% return before expenses) | |
| | | Annualized
Expense Ratio
During Period | | | Beginning
Account Value
7/1/21 | | | Ending
Account Value
12/31/21 | | | Expenses
Paid During
Period(1) | | | Ending
Account Value
12/31/21 | | | Expenses
Paid During
Period(1) | |
| ProFund Access VP High Yield | | | 1.68 | % | | $ | 1,000.00 | | | $ | 995.10 | | | $ | 8.45 | | | $ | 1,016.74 | | | $ | 8.54 | |
| ProFund VP Asia 30 | | | 1.67 | % | | | 1,000.00 | | | | 722.50 | | | | 7.25 | | | | 1,016.79 | | | | 8.49 | |
| ProFund VP Banks | | | 1.68 | % | | | 1,000.00 | | | | 1,042.90 | | | | 8.65 | | | | 1,016.74 | | | | 8.54 | |
| ProFund VP Basic Materials | | | 1.68 | % | | | 1,000.00 | | | | 1,093.00 | | | | 8.86 | | | | 1,016.74 | | | | 8.54 | |
| ProFund VP Bear | | | 1.68 | % | | | 1,000.00 | | | | 883.00 | | | | 7.97 | | | | 1,016.74 | | | | 8.54 | |
| ProFund VP Biotechnology | | | 1.56 | % | | | 1,000.00 | | | | 1,015.80 | | | | 7.93 | | | | 1,017.34 | | | | 7.93 | |
| ProFund VP Bull | | | 1.63 | % | | | 1,000.00 | | | | 1,106.40 | | | | 8.65 | | | | 1,016.99 | | | | 8.29 | |
| ProFund VP Consumer Goods | | | 1.68 | % | | | 1,000.00 | | | | 1,130.90 | | | | 9.02 | | | | 1,016.74 | | | | 8.54 | |
| ProFund VP Consumer Services | | | 1.68 | % | | | 1,000.00 | | | | 1,018.20 | | | | 8.55 | | | | 1,016.74 | | | | 8.54 | |
| ProFund VP Dow 30 | | | 1.43 | % | | | 1,000.00 | | | | 1,049.20 | | | | 7.39 | | | | 1,018.00 | | | | 7.27 | |
| ProFund VP Emerging Markets | | | 1.68 | % | | | 1,000.00 | | | | 797.50 | | | | 7.61 | | | | 1,016.74 | | | | 8.54 | |
| ProFund VP Europe 30 | | | 1.68 | % | | | 1,000.00 | | | | 1,038.10 | | | | 8.63 | | | | 1,016.74 | | | | 8.54 | |
| ProFund VP Falling U.S. Dollar | | | 1.68 | % | | | 1,000.00 | | | | 955.00 | | | | 8.28 | | | | 1,016.74 | | | | 8.54 | |
| ProFund VP Financials | | | 1.68 | % | | | 1,000.00 | | | | 1,074.40 | | | | 8.78 | | | | 1,016.74 | | | | 8.54 | |
| ProFund VP Government Money Market | | | — | %(2) | | | 1,000.00 | | | | 1,000.10 | | | | — | (3) | | | 1,025.21 | | | | — | (3) |
| ProFund VP Health Care | | | 1.68 | % | | | 1,000.00 | | | | 1,095.20 | | | | 8.87 | | | | 1,016.74 | | | | 8.54 | |
| ProFund VP Industrials | | | 1.68 | % | | | 1,000.00 | | | | 1,020.70 | | | | 8.56 | | | | 1,016.74 | | | | 8.54 | |
| ProFund VP International | | | 1.58 | % | | | 1,000.00 | | | | 1,005.00 | | | | 7.98 | | | | 1,017.24 | | | | 8.03 | |
| ProFund VP Internet | | | 1.67 | % | | | 1,000.00 | | | | 917.90 | | | | 8.07 | | | | 1,016.79 | | | | 8.49 | |
| ProFund VP Japan | | | 1.68 | % | | | 1,000.00 | | | | 997.90 | | | | 8.46 | | | | 1,016.74 | | | | 8.54 | |
| ProFund VP Large-Cap Growth | | | 1.68 | % | | | 1,000.00 | | | | 1,145.40 | | | | 9.08 | | | | 1,016.74 | | | | 8.54 | |
| ProFund VP Large-Cap Value | | | 1.68 | % | | | 1,000.00 | | | | 1,065.20 | | | | 8.75 | | | | 1,016.74 | | | | 8.54 | |
| ProFund VP Mid-Cap | | | 1.59 | % | | | 1,000.00 | | | | 1,050.40 | | | | 8.22 | | | | 1,017.19 | | | | 8.08 | |
| ProFund VP Mid-Cap Growth | | | 1.68 | % | | | 1,000.00 | | | | 1,049.80 | | | | 8.68 | | | | 1,016.74 | | | | 8.54 | |
| ProFund VP Mid-Cap Value | | | 1.68 | % | | | 1,000.00 | | | | 1,053.70 | | | | 8.70 | | | | 1,016.74 | | | | 8.54 | |
| ProFund VP Nasdaq-100 | | | 1.68 | % | | | 1,000.00 | | | | 1,113.00 | | | | 8.95 | | | | 1,016.74 | | | | 8.54 | |
| ProFund VP Oil & Gas | | | 1.68 | % | | | 1,000.00 | | | | 1,051.40 | | | | 8.69 | | | | 1,016.74 | | | | 8.54 | |
| ProFund VP Pharmaceuticals | | | 1.68 | % | | | 1,000.00 | | | | 1,075.80 | | | | 8.79 | | | | 1,016.74 | | | | 8.54 | |
| ProFund VP Precious Metals | | | 1.68 | % | | | 1,000.00 | | | | 948.10 | | | | 8.25 | | | | 1,016.74 | | | | 8.54 | |
| ProFund VP Real Estate | | | 1.68 | % | | | 1,000.00 | | | | 1,149.20 | | | | 9.10 | | | | 1,016.74 | | | | 8.54 | |
428 :: Expense Examples (unaudited)
| | | | | | | | | Actual | | | Hypothetical
(5% return before expenses) | |
| | | Annualized
Expense Ratio
During Period | | | Beginning
Account Value
7/1/21 | | | Ending
Account Value
12/31/21 | | | Expenses
Paid During
Period(1) | | | Ending
Account Value
12/31/21 | | | Expenses
Paid During
Period(1) | |
| ProFund VP Rising Rates Opportunity | | | 1.60 | % | | $ | 1,000.00 | | | $ | 912.00 | | | $ | 7.71 | | | $ | 1,017.14 | | | $ | 8.13 | |
| ProFund VP Semiconductor | | | 1.61 | % | | | 1,000.00 | | | | 1,227.90 | | | | 9.04 | | | | 1,017.09 | | | | 8.19 | |
| ProFund VP Short Dow 30 | | | 1.69 | % | | | 1,000.00 | | | | 933.60 | | | | 8.24 | | | | 1,016.69 | | | | 8.59 | |
| ProFund VP Short Emerging Markets | | | 1.68 | % | | | 1,000.00 | | | | 1,189.80 | | | | 9.27 | | | | 1,016.74 | | | | 8.54 | |
| ProFund VP Short International | | | 1.59 | % | | | 1,000.00 | | | | 966.60 | | | | 7.88 | | | | 1,017.19 | | | | 8.08 | |
| ProFund VP Short Mid-Cap | | | 1.68 | % | | | 1,000.00 | | | | 916.80 | | | | 8.12 | | | | 1,016.74 | | | | 8.54 | |
| ProFund VP Short Nasdaq-100 | | | 1.68 | % | | | 1,000.00 | | | | 871.40 | | | | 7.92 | | | | 1,016.74 | | | | 8.54 | |
| ProFund VP Short Small-Cap | | | 1.68 | % | | | 1,000.00 | | | | 990.30 | | | | 8.43 | | | | 1,016.74 | | | | 8.54 | |
| ProFund VP Small-Cap | | | 1.68 | % | | | 1,000.00 | | | | 968.00 | | | | 8.33 | | | | 1,016.74 | | | | 8.54 | |
| ProFund VP Small-Cap Growth | | | 1.68 | % | | | 1,000.00 | | | | 1,043.80 | | | | 8.65 | | | | 1,016.74 | | | | 8.54 | |
| ProFund VP Small-Cap Value | | | 1.68 | % | | | 1,000.00 | | | | 992.70 | | | | 8.44 | | | | 1,016.74 | | | | 8.54 | |
| ProFund VP Technology | | | 1.56 | % | | | 1,000.00 | | | | 1,155.00 | | | | 8.47 | | | | 1,017.34 | | | | 7.93 | |
| ProFund VP Telecommunications | | | 1.68 | % | | | 1,000.00 | | | | 1,070.30 | | | | 8.77 | | | | 1,016.74 | | | | 8.54 | |
| ProFund VP UltraBull | | | 1.60 | % | | | 1,000.00 | | | | 1,217.70 | | | | 8.94 | | | | 1,017.14 | | | | 8.13 | |
| ProFund VP UltraMid-Cap | | | 1.68 | % | | | 1,000.00 | | | | 1,095.10 | | | | 8.87 | | | | 1,016.74 | | | | 8.54 | |
| ProFund VP UltraNasdaq-100 | | | 1.68 | % | | | 1,000.00 | | | | 1,231.80 | | | | 9.45 | | | | 1,016.74 | | | | 8.54 | |
| ProFund VP UltraShort Dow 30 | | | 1.32 | % | | | 1,000.00 | | | | 861.10 | | | | 6.19 | | | | 1,018.55 | | | | 6.72 | |
| ProFund VP UltraShort Nasdaq-100 | | | 1.68 | % | | | 1,000.00 | | | | 744.60 | | | | 7.39 | | | | 1,016.74 | | | | 8.54 | |
| ProFund VP UltraSmall-Cap | | | 1.68 | % | | | 1,000.00 | | | | 925.30 | | | | 8.15 | | | | 1,016.74 | | | | 8.54 | |
| ProFund VP U.S. Government Plus | | | 1.38 | % | | | 1,000.00 | | | | 1,055.70 | | | | 7.15 | | | | 1,018.25 | | | | 7.02 | |
| ProFund VP Utilities | | | 1.68 | % | | | 1,000.00 | | | | 1,134.00 | | | | 9.04 | | | | 1,016.74 | | | | 8.54 | |
| (1) | Expenses are equal to the average account value, multiplied by the ProFund VP's annualized expense ratio multiplied by 184/365 (the number of days in the most recent fiscal half-year divided by the number of days in the fiscal year). |
| (2) | Amount is less than 0.005%. |
| (3) | Amount is less than $0.005. |
Trustees and Executive Officers (unaudited) :: 429
Name, Address,
and Birth Date | | Position(s)
Held with
the Trust | | Term of Office
and Length of
Time Served | | Principal Occupation(s) During Past 5 Years | | Number of
Operational
Portfolios in Fund
Complex Overseen
by Trustee* | | Other
Directorships
Held by
Trustee
During
Past 5 Years |
| | | | | | | | | | | |
| Independent Trustees | | | | | | | | |
| | | | | | | | | |
William D. Fertig
c/o ProFunds Trust
7272 Wisconsin Avenue,
21st Floor
Bethesda, MD 20814
Birth Date: 9/56 | | Trustee | | Indefinite;
June 2011
to present | | Context Capital Management (Alternative Asset Management): Chief Investment Officer (September 2002 to present). | | ProFunds (116);
ProShares
Trust (123) | | Context Capital |
| | | | | | | | | | | |
Russell S. Reynolds, III
c/o ProFunds Trust
7272 Wisconsin Avenue,
21st Floor
Bethesda, MD 20814
Birth Date: 7/57 | | Trustee | | Indefinite; October 1997
to present | | RSR Partners, Inc. (Executive Recruitment and Corporate Governance Consulting): Managing Director (February 1993 to present). | | ProFunds (116);
ProShares
Trust (123) | | RSR Partners, Inc. |
| | | | | | | | | | | |
Michael C. Wachs
c/o ProFunds Trust
7272 Wisconsin Avenue,
21st Floor
Bethesda, MD 20814
Birth Date: 10/61 | | Trustee | | Indefinite; October 1997
to present | | Linden Lane Capital Partners LLC (Real Estate Investment and Development): Managing Principal (2010 to present). | | ProFunds (116);
ProShares
Trust (123) | | NAIOP (the Commercial Real Estate Development Association) |
| | | | | | | | | | | |
| Interested Trustee | | | | | | | | |
| | | | | | | | | |
Michael L. Sapir**
7272 Wisconsin Avenue,
21st Floor
Bethesda, MD 20814
Birth Date: 5/58 | | Trustee and
Chairman
of the Board | | Indefinite; April 1997
to present | | Chairman and Chief Executive Officer of the Advisor (April 1997 to present); ProShare Advisors LLC (November 2005 to present); ProShare Capital Management LLC (June 2008 to present). | | ProFunds (116);
ProShares Trust (123) | | |
| * | The "Fund Complex" consists of all operational registered investment companies under the 1940 Act that are advised by ProFund Advisors LLC and any operational registered investment companies that have an investment adviser that is an affiliated person of ProFund Advisors LLC. Investment companies that are non-operational (and therefore, not publicly offered) as of the date of this report are excluded from these figures. |
| ** | Mr. Sapir is an "interested person," as defined by the 1940 Act, because of his ownership interest in the Advisor. |
Name, Address,
and Birth Date | | Position(s) Held
with the Trust | | Term of Office and
Length of Time Served | | Principal Occupation(s)
During the Past 5 Years |
| | | | | | | |
| Executive Officers | | | | | | |
| | | | | | | |
Todd B. Johnson
7272 Wisconsin Avenue,
21st Floor
Bethesda, MD 20814
Birth Date: 1/64 | | President | | Indefinite;
January 2014 to present | | Chief Investment Officer of the Advisor and ProShare Advisors LLC (December 2008 to present); and ProShare Capital Management LLC (February 2009 to present). |
| | | | | | | |
Victor M. Frye, Esq.
7272 Wisconsin Avenue,
21st Floor
Bethesda, MD 20814
Birth Date: 10/58 | | Chief Compliance Officer and Anti-Money Laundering Officer | | Indefinite;
September 2004 to present | | Counsel and Chief Compliance Officer of the Advisor (October 2002 to present) and ProShare Advisors LLC (December 2004 to present); Secretary of ProFunds Distributors, Inc. (April 2008 to present); Chief Compliance Officer of ProFunds Distributors, Inc. (July 2015 to present). |
| | | | | | | |
Richard F. Morris
7272 Wisconsin Avenue,
21st Floor
Bethesda, MD 20814
Birth Date: 8/67 | | Chief Legal Officer and Secretary | | Indefinite;
December 2015 to present | | General Counsel of the Advisor, ProShare Advisors, and ProShare Capital Management LLC (December 2015 to present); Chief Legal Officer of ProFunds Distributors, Inc. (December 2015 to present); Partner at Morgan Lewis & Bockius, LLP (October 2012 to November 2015). |
| | | | | | | |
Christopher E. Sabato
4400 Easton Commons,
Suite 200
Columbus, OH 43219
Birth Date: 12/68 | | Treasurer | | Indefinite;
September 2009 to present | | Senior Vice President, Fund Administration, Citi Fund Services Ohio, Inc. (2007 to present) |
The Funds' Statement of Additional Information includes additional information about the Funds' Trustees and Officers. To receive your free copy of the Statement of Additional Information, call toll-free 888-776-3637.
 | |
| | |
| P.O. Box 182800 | |
| Columbus, OH 43218-2800 | |
This report is submitted for the general information of the shareholders of the ProFunds VP. It is not authorized for distribution to prospective investors unless preceded or accompanied by an effective prospectus. To receive the most recent month end performance information for each Fund, please call toll-free 888-776-5717.
A description of the policies and procedures that the ProFunds VP uses to determine how to vote proxies relating to portfolio securities is available without charge, upon request, by calling toll-free 888-776-3637; and on the Securities and Exchange Commission's website at sec.gov. Information regarding how the ProFund VP voted proxies relating to portfolio securities during the most recent 12-month period ended June 30 is available. (i) without change by calling toll-free 888-776-3637; (ii) on the ProFunds' VP website at ProFunds.com; and (iii) on the Commission's website at sec.gov.
ProFunds VP files complete Schedules of Portfolio Holdings with the Commission for the first and third quarters of each fiscal year on Form N-Q (and successor Forms). Following the Form N-Q filing for the first quarter of 2019, the ProFund VP Government Money Market will no longer be required to file Form N-Q. Effective March 31, 2019, Form N-PORT replaced Form N-Q for all ProFunds VP (except the ProFund VP Government Money Market), and includes complete Schedules of Portfolio Holdings for the first and third fiscal quarters. Schedules of Portfolio Holdings for the Funds in this report are available without charge on the Commission's website at sec.gov, or may be reviewed and copied at the Commission's Public Reference Room in Washington, D.C. Information on the operation of the Public Reference Room may be obtained by calling 800-SEC-0330.
12/21
Item 2. Code of Ethics.
The registrant has adopted a code of ethics that applies to the registrant’s principal executive officer, principal financial officer, principal accounting officer or controller, or persons performing similar functions. This code of ethics is included as Exhibit 13(a)(1).
During the period covered by the report, with respect to the registrant’s code of ethics that applies to its principal executive officer, principal financial officer, principal accounting officer or controller, or persons performing similar functions; there have been no amendments to, nor any waivers granted from, a provision that relates to any element of the code of ethics definition enumerated in paragraph (b) of this Item 2.
Item 3. Audit Committee Financial Expert.
3(a)(1) The registrant’s board of directors has determined that the registrant has at least one audit committee financial expert serving on its audit committee.
3(a)(2) The audit committee financial experts are William D. Fertig and Michael C. Wachs, who are “independent” for purposes of this Item 3 of Form N-CSR.
Item 4. Principal Accountant Fees and Services.
2021 $666,000
2020 $667,500
The fees relate to the audit of the registrants’ annual financial statements paid to PricewaterhouseCoopers LLP.
2021 $0
2020 $0
2021 $147,800
2020 $189,800
The fees relate to the preparation of the registrant’s tax returns and review of income and capital gain distribution calculations paid to PricewaterhouseCoopers LLP.
2021 $0
2020 $0
(e)(1) The Audit Committee may pre-approve at any regularly scheduled Audit Committee meeting audit, audit-related, tax and other non-audit services to be rendered or that may be rendered by the Auditor to the Trust and certain non-audit services to be rendered by the Auditor to the Advisor which require pre-approval by the Audit Committee. In connection with such pre-approvals, the Auditor, or a Trust officer, with the assistance of the Auditor, shall provide the Audit Committee with a report containing information about each type of service to be pre-approved at the meeting.
The Trust will use a combination of the two approaches for pre-approving proposed services: (1) the proposed service be specifically pre-approved by the Audit Committee (“specific pre-approval”) or (2) may be pre-approved without consideration of specific case-by-case services by the audit committee (“general pre-approval”). Unless a type of service has received general pre-approval, it will require specific pre-approval by the Audit Committee. Additionally, any proposed services exceeding pre-approved cost levels will also require specific pre-approval by the Audit Committee.
| (e)(2) | No Services included in (b)-(d) above were approved pursuant to paragraph (c)(7)(i)(C) of Rule 2-01 of Regulation S-X. |
| (f) | Not applicable as less than 50%. |
| (g) | 2021 $147,800
2020 $189,800 |
These aggregate fees were billed in the Reporting Periods for non-audit services by the principal accountant to the Registrant and Fund Management.
(h) Not applicable.
| Item 5. | Audit Committee of Listed Registrants. |
Not applicable.
(a) Not Applicable
(b) Not Applicable
Item 7. Disclosure of Proxy Voting Policies and Procedures for Closed-End Management Investment Companies.
Not applicable
Item 8. Portfolio Managers of Closed-End Management Investment Companies.
Not applicable.
Item 9. Purchases of Equity Securities by Closed-End Management Investment Company and Affiliated Purchasers.
Not applicable
Item 10. Submission of Matters to a Vote of Security Holders.
Not applicable.
Item 11. Controls and Procedures.
| (a) | The registrant’s principal executive officer and principal financial officer have concluded, based on their evaluation of the registrant’s disclosure controls and procedures as conducted within 90 days of the filing date of this report, that those disclosure controls and procedures provide reasonable assurance that the material information required to be disclosed by the registrant on this report is recorded, processed, summarized and reported within the time periods specified in the Securities and Exchange Commission’s rules and forms. |
| (b) | There were no changes in the registrant’s internal control over financial reporting (as defined in Rule 30a-3(d) under the Act (17CFR 270.30a-3(d)) that occurred during the period covered by this report that have materially affected or are reasonably likely to materially affect, the registrant’s internal control over financial reporting. |
Item 12. Disclosure of Securities Lending Activities for Closed-End Management Investment Companies.
Not applicable.
Item 13. Exhibits.
(a) File the exhibits listed below as part of this Form. Letter or number the exhibits in the sequence indicated.
(a)(1) The code of ethics that is the subject of the disclosure required by Item 2 is attached hereto.
(a)(2) Certifications pursuant to Rule 30a-2(a) are attached hereto.
(a)(3) Not applicable.
(a)(4) Not applicable.
(b) Certifications pursuant to Rule 30a-2(b) are furnished hereto.
SIGNATURES
Pursuant to the requirements of the Securities Exchange Act of 1934 and the Investment Company Act of 1940, the registrant has duly caused this report to be signed on its behalf by the undersigned, thereunto duly authorized.
| By (Signature and Title)* | /s/ Denise Lewis | |
| | Denise Lewis, Treasurer and Principal Financial Officer | |
Pursuant to the requirements of the Securities Exchange Act of 1934 and the Investment Company Act of 1940, this report has been signed below by the following persons on behalf of the registrant and in the capacities and on the dates indicated.
| By (Signature and Title)* | /s/ Todd B. Johnson | |
| | Todd B. Johnson, President and Principal Executive Officer | |
| By (Signature and Title)* | /s/ Denise Lewis | |
| | Denise Lewis, Treasurer and Principal Financial Officer | |
* Print the name and title of each signing officer under his or her signature.