UNITED STATES
SECURITIES AND EXCHANGE COMMISSION
Washington, D.C. 20549
FORM N-CSR
CERTIFIED SHAREHOLDER REPORT OF REGISTERED
MANAGEMENT INVESTMENT COMPANIES
| Investment Company Act file number | 811-08239 |
ProFunds
(Exact name of registrant as specified in charter)
| 7272 Wisconsin Avenue, 21st Floor | Bethesda, MD | 20814 |
| (Address of principal executive offices) | (Zip code) | |
Citi Fund Services Ohio, Inc., 4400 Easton Commons, Suite 200, Columbus, OH 43219
(Name and address of agent for service)
| Registrant’s telephone number, including area code: | (240) 497-6400 |
| Date of fiscal year end: | December 31 |
| Date of reporting period: | June 30, 2024 |
Item 1. Reports to Stockholders.
| (a) | The following is a copy of the report transmitted to shareholders pursuant to Rule 30e-1 under the Investment Company Act of 1940 (17 CFR 270.30e-1) |

Fund Overview
This Semi-annual shareholder report contains important information about the Fund for the period January 1, 2024 to June 30, 2024. You can find additional information about the Fund at https://www.profunds.com/mutual-funds/government-money-market. You can also request this information by contacting us at 888-776-3637.
What were the Fund’s costs for the last 6 months?
(based on a hypothetical $10,000 investment)
| Class Name | Costs of a $10,000 investment | Costs paid as a percentage of a $10,000 investment |
|---|---|---|
| Investor Class | $49 | 0.98% |
Average Annual Total Returns*
| 6 months | 1 Year | 5 years | 10 years | |
|---|---|---|---|---|
| Fund NAV | 2.21% | 4.49% | 1.60% | 0.96% |
Fund Statistics
| Net Assets | $172,722,161 |
| Number of Holdings | 1 |
* Not annualized for periods less than one year.
Market ExposureFootnote Reference
| Investment Type | % of Net Assets |
|---|---|
| Investment in Government Cash Management Portfolio | 101% |
| Total | 101% |
| Footnote | Description |
Footnote | "Market Exposure" includes the value of total investments including any instruments used for cash management. |
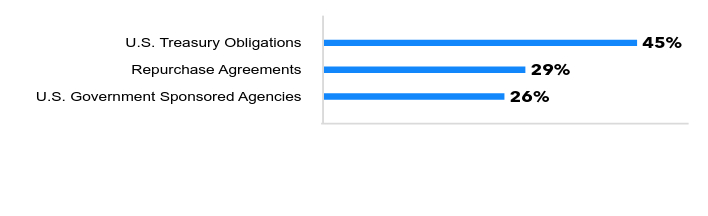
Government Cash Management Portfolio Asset Allocation

| Value | Value |
|---|---|
| U.S. Government Sponsored Agencies | 26% |
| Repurchase Agreements | 29% |
| U.S. Treasury Obligations | 45% |
An investment in this Fund is neither guaranteed nor insured by the Federal Deposit Insurance Corporation or any other government agency. Although the Fund strives to maintain the value of your investment at $1.00 per share, it is possible to lose money by investing in this Fund.
Additional information about the Fund including the Financial Statements, Prospectus and Statement of Additional Information is available:

On the Fund's website, https://www.profunds.com, or upon request, by calling 888-776-3637

Fund Overview
This Semi-annual shareholder report contains important information about the Fund for the period January 1, 2024 to June 30, 2024. You can find additional information about the Fund at https://www.profunds.com/mutual-funds/government-money-market. You can also request this information by contacting us at 888-776-3637.
What were the Fund’s costs for the last 6 months?
(based on a hypothetical $10,000 investment)
| Class Name | Costs of a $10,000 investment | Costs paid as a percentage of a $10,000 investment |
|---|---|---|
| Service Class | $99 | 1.98% |
Average Annual Total Returns*
| 6 months | 1 Year | 5 years | 10 years | |
|---|---|---|---|---|
| Fund NAV | 1.71% | 3.45% | 1.10% | 0.60% |
Fund Statistics
| Net Assets | $172,722,161 |
| Number of Holdings | 1 |
* Not annualized for periods less than one year.
Market ExposureFootnote Reference
| Investment Type | % of Net Assets |
|---|---|
| Investment in Government Cash Management Portfolio | 101% |
| Total | 101% |
| Footnote | Description |
Footnote | "Market Exposure" includes the value of total investments including any instruments used for cash management. |
Government Cash Management Portfolio Asset Allocation
| Value | Value |
|---|---|
| U.S. Government Sponsored Agencies | 26% |
| Repurchase Agreements | 29% |
| U.S. Treasury Obligations | 45% |
An investment in this Fund is neither guaranteed nor insured by the Federal Deposit Insurance Corporation or any other government agency. Although the Fund strives to maintain the value of your investment at $1.00 per share, it is possible to lose money by investing in this Fund.
Additional information about the Fund including the Financial Statements, Prospectus and Statement of Additional Information is available:

On the Fund's website, https://www.profunds.com, or upon request, by calling 888-776-3637

Fund Overview
This Semi-annual shareholder report contains important information about the Fund for the period of January 1, 2024 to June 30, 2024. You can find additional information about the Fund at https://www.profunds.com/literature/profunds-variable-products. You can also request this information by contacting us at 888-776-3637.
What were the Fund’s costs for the last 6 months?
(based on a hypothetical $10,000 investment)
| Fund Name | Costs of a $10,000 investment | Costs paid as a percentage of a $10,000 investment |
|---|---|---|
| ProFund Access VP High Yield | $84 | 1.68% |
Average Annual Total Returns*
| 6 months | 1 Year | 5 years | 10 years | |
|---|---|---|---|---|
| Fund NAV | 2.18% | 8.47% | 1.41% | 2.91% |
| Bloomberg U.S. Aggregate Bond Index | (0.71) | 2.63 | (0.23) | 1.35 |
| Markit iBoxx $ Liquid High Yield Index | 2.24 | 10.05 | 3.25 | 3.72 |
Fund Statistics
| Net Assets | $15,089,876 |
| Number of Holdings** | 7 |
| Portfolio Turnover* | 600% |
* Not annualized for periods less than one year.
** No. of Holdings excludes derivatives and collateral for securities loaned.
Market Exposure Footnote Reference
| Investment Type | % of Net Assets |
|---|---|
| Futures Contracts | 15% |
| U.S. Treasury Obligations | 48% |
| Credit Default Swap Agreements | 77% |
| Total | 140% |
| Footnote | Description |
Footnote | "Market Exposure” includes the value of total investments (including the contract value of any derivatives) and excludes any instruments used for cash management. |
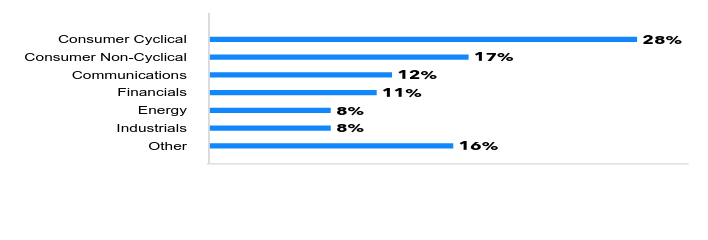
Industry Exposure
| Value | Value |
|---|---|
| Other | 16% |
| Industrials | 8% |
| Energy | 8% |
| Financials | 11% |
| Communications | 12% |
| Consumer Non-Cyclical | 17% |
| Consumer Cyclical | 28% |
Holdings
| The ProFund Access VP High Yield primarily invests in non-equity securities, which may include: credit default swap agreements, futures contracts, repurchase agreements, U.S. Government and money market securities. |
.
Additional information about the Fund including the Financial Statements, Prospectus and Statement of Additional Information is available:

On the Fund's website, https://www.profunds.com, or upon request, by calling 888-776-3637

Fund Overview
This Semi-annual shareholder report contains important information about the Fund for the period of January 1, 2024 to June 30, 2024. You can find additional information about the Fund at https://www.profunds.com/literature/profunds-variable-products. You can also request this information by contacting us at 888-776-3637.
What were the Fund’s costs for the last 6 months?
(based on a hypothetical $10,000 investment)
| Fund Name | Costs of a $10,000 investment | Costs paid as a percentage of a $10,000 investment |
|---|---|---|
| ProFund VP Asia 30 | $85 | 1.68% |
Average Annual Total Returns*
| 6 months | 1 Year | 5 years | 10 years | |
|---|---|---|---|---|
| Fund NAV | 3.55% | 6.48% | (0.32)% | 0.73% |
| S&P Global 1200 Index | 12.49 | 20.61 | 12.21 | 9.71 |
Profunds Asia 30 Index® | 1.75 | 4.70 | (0.79) | 0.37 |
| MSCI AC Asia Pacific Free Excluding Japan Index | 8.48 | 13.05 | 3.94 | 4.08 |
Fund Statistics
| Net Assets | $16,348,030 |
| Number of Holdings** | 36 |
| Portfolio Turnover* | 62% |
* Not annualized for periods less than one year.
** No. of Holdings excludes derivatives and collateral for securities loaned.
Market Exposure Footnote Reference
| Investment Type | % of Net Assets |
|---|---|
| Equity Securities | 98% |
| Total | 98% |
| Footnote | Description |
Footnote | "Market Exposure” includes the value of total investments (including the contract value of any derivatives) and excludes any instruments used for cash management or collateral for securities loaned. |
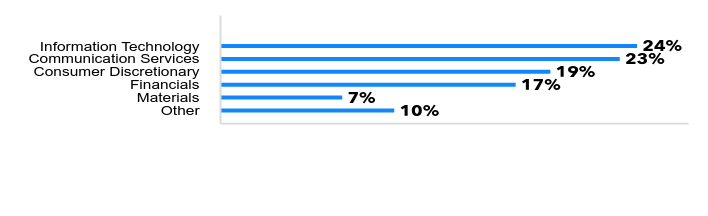
ProFunds Asia 30 Index® – Composition
| Value | Value |
|---|---|
| Other | 10% |
| Materials | 7% |
| Financials | 17% |
| Consumer Discretionary | 19% |
| Communication Services | 23% |
| Information Technology | 24% |
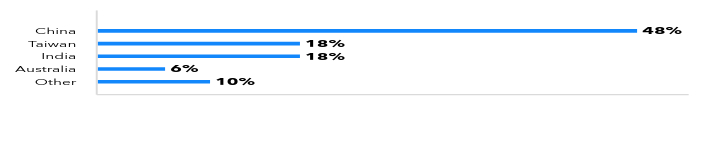
Country Composition
| Value | Value |
|---|---|
| Other | 10% |
| Australia | 6% |
| India | 18% |
| Taiwan | 18% |
| China | 48% |
Largest Equity Holdings
| Company | % of Net Assets |
|---|---|
| Taiwan Semiconductor Manufacturing Co., Ltd. | 11.9% |
| HDFC Bank, Ltd. | 6.6% |
| BHP Group, Ltd. | 5.8% |
| ICICI Bank, Ltd. | 5.3% |
| Alibaba Group Holding, Ltd. | 4.9% |
.
Additional information about the Fund including the Financial Statements, Prospectus and Statement of Additional Information is available:

On the Fund's website, https://www.profunds.com, or upon request, by calling 888-776-3637

Fund Overview
This Semi-annual shareholder report contains important information about the Fund for the period of January 1, 2024 to June 30, 2024. You can find additional information about the Fund at https://www.profunds.com/literature/profunds-variable-products. You can also request this information by contacting us at 888-776-3637.
What were the Fund’s costs for the last 6 months?
(based on a hypothetical $10,000 investment)
| Fund Name | Costs of a $10,000 investment | Costs paid as a percentage of a $10,000 investment |
|---|---|---|
| ProFund VP Banks | $84 | 1.68% |
Average Annual Total Returns*
| 6 months | 1 Year | 5 years | 10 years | |
|---|---|---|---|---|
| Fund NAV | 1.70% | 31.36% | 3.73% | 5.92% |
| S&P Total Market Index | 13.61 | 23.20 | 14.04 | 12.08 |
| S&P Banks Select Industry Index | 2.42 | 33.44 | 4.57 | 6.08 |
S&P 500® Index | 15.29 | 24.56 | 15.05 | 12.86 |
Fund Statistics
| Net Assets | $3,800,572 |
| Number of Holdings** | 92 |
| Portfolio Turnover* | 89% |
* Not annualized for periods less than one year.
** No. of Holdings excludes derivatives and collateral for securities loaned.
Market Exposure Footnote Reference
| Investment Type | % of Net Assets |
|---|---|
| Equity Securities | 98% |
| Swap Agreements | 1% |
| Total | 99% |
| Footnote | Description |
Footnote | "Market Exposure” includes the value of total investments (including the contract value of any derivatives) and excludes any instruments used for cash management. |
S&P Banks Select Industry Index – Composition

| Value | Value |
|---|---|
| Asset Management & Custody Banks | 2% |
| Other Diversified Financial Services | 6% |
| Commercial & Residential Mortgage Finance | 8% |
| Diversified Banks | 11% |
| Regional Banks | 73% |
Largest Equity Holdings
| Company | % of Net Assets |
|---|---|
| The Bancorp, Inc. | 1.2% |
| First Horizon Corp. | 1.2% |
| First Interstate BancSystem, Inc. | 1.2% |
| Webster Financial Corp. | 1.2% |
| Synovus Financial Corp. | 1.2% |
"Standard & Poor's®", "S&P®" and "S&P Banks Select Industry Index" are trademarks of Standard & Poor's Financial Services LLC ("S&P") and have been licensed for use by ProFunds. This Fund is not sponsored, licensed, sold or promoted by Standard & Poor's and Standard & Poor's makes no representation regarding the advisability of investing in ProFunds.
Additional information about the Fund including the Financial Statements, Prospectus and Statement of Additional Information is available:

On the Fund's website, https://www.profunds.com, or upon request, by calling 888-776-3637

Fund Overview
This Semi-annual shareholder report contains important information about the Fund for the period of January 1, 2024 to June 30, 2024. You can find additional information about the Fund at https://www.profunds.com/literature/profunds-variable-products. You can also request this information by contacting us at 888-776-3637.
What were the Fund’s costs for the last 6 months?
(based on a hypothetical $10,000 investment)
| Fund Name | Costs of a $10,000 investment | Costs paid as a percentage of a $10,000 investment |
|---|---|---|
| ProFund VP Bear | $80 | 1.68% |
Average Annual Total Returns*
| 6 months | 1 Year | 5 years | 10 years | |
|---|---|---|---|---|
| Fund NAV | (9.63)% | (13.07)% | (14.56)% | (12.81)% |
S&P 500® Index | 15.29 | 24.56 | 15.05 | 12.86 |
Fund Statistics
| Net Assets | $1,670,543 |
| Number of Holdings** | 6 |
| Portfolio Turnover* | -% |
* Not annualized for periods less than one year.
** No. of Holdings excludes derivatives and collateral for securities loaned.
Market Exposure Footnote Reference
| Investment Type | % of Net Assets |
|---|---|
| Futures Contracts | (17)% |
| Swap Agreements | (83)% |
| Total | (100)% |
| Footnote | Description |
Footnote | "Market Exposure” includes the value of total investments (including the contract value of any derivatives) and excludes any instruments used for cash management. |
S&P 500® Index – Composition

| Value | Value |
|---|---|
| Other | 25% |
| Communication Services | 9% |
| Consumer Discretionary | 10% |
| Health Care | 12% |
| Financials | 12% |
| Information Technology | 32% |
Holdings
| The ProFund VP Bear primarily invests in non-equity securities, which may include: swap agreements, futures contracts, repurchase agreements and U.S. Government securities. |
"Standard & Poor's®", "S&P®", "S&P 500®" and "Standard & Poor's 500TM" are trademarks of Standard & Poor's Financial Services LLC ("S&P") and have been licensed for use by ProFunds. This Fund is not sponsored, licensed, sold or promoted by Standard & Poor's and Standard & Poor's makes no representation regarding the advisability of investing in ProFunds.
Additional information about the Fund including the Financial Statements, Prospectus and Statement of Additional Information is available:

On the Fund's website, https://www.profunds.com, or upon request, by calling 888-776-3637

Fund Overview
This Semi-annual shareholder report contains important information about the Fund for the period of January 1, 2024 to June 30, 2024. You can find additional information about the Fund at https://www.profunds.com/literature/profunds-variable-products. You can also request this information by contacting us at 888-776-3637.
What were the Fund’s costs for the last 6 months?
(based on a hypothetical $10,000 investment)
| Fund Name | Costs of a $10,000 investment | Costs paid as a percentage of a $10,000 investment |
|---|---|---|
| ProFund VP Biotechnology | $84 | 1.66% |
Average Annual Total Returns*
| 6 months | 1 Year | 5 years | 10 years | |
|---|---|---|---|---|
| Fund NAV | 3.35% | 10.48% | 9.19% | 6.95% |
| S&P Total Market Index | 13.61 | 23.20 | 14.04 | 12.08 |
| S&P Biotechnology Select Industry Index | 3.95 | 11.93 | 1.28 | 6.28 |
S&P 500® Index | 15.29 | 24.56 | 15.05 | 12.86 |
Fund Statistics
| Net Assets | $42,246,686 |
| Number of Holdings** | 142 |
| Portfolio Turnover* | 64% |
* Not annualized for periods less than one year.
** No. of Holdings excludes derivatives and collateral for securities loaned.
Market Exposure Footnote Reference
| Investment Type | % of Net Assets |
|---|---|
| Equity Securities | 99% |
| Swap Agreements | 1% |
| Total | 100% |
| Footnote | Description |
Footnote | "Market Exposure” includes the value of total investments (including the contract value of any derivatives) and excludes any instruments used for cash management or collateral for securities loaned. |
S&P Biotechnology Select Industry Index – Composition

| Value | Value |
|---|---|
| Biotechnology | 100% |
Largest Equity Holdings
| Company | % of Net Assets |
|---|---|
| Sarepta Therapeutics, Inc. | 3.3% |
| United Therapeutics Corp. | 2.9% |
| Alnylam Pharmaceuticals, Inc. | 2.8% |
| Gilead Sciences, Inc. | 2.8% |
| Amgen, Inc. | 2.8% |
"Standard & Poor's®", "S&P®" and "S&P Biotechnology Select Industry Index" are trademarks of Standard & Poor's Financial Services LLC ("S&P") and have been licensed for use by ProFunds. This Fund is not sponsored, licensed, sold or promoted by Standard & Poor's and Standard & Poor's makes no representation regarding the advisability of investing in ProFunds.
Additional information about the Fund including the Financial Statements, Prospectus and Statement of Additional Information is available:

On the Fund's website, https://www.profunds.com, or upon request, by calling 888-776-3637

Fund Overview
This Semi-annual shareholder report contains important information about the Fund for the period of January 1, 2024 to June 30, 2024. You can find additional information about the Fund at https://www.profunds.com/literature/profunds-variable-products. You can also request this information by contacting us at 888-776-3637.
What were the Fund’s costs for the last 6 months?
(based on a hypothetical $10,000 investment)
| Fund Name | Costs of a $10,000 investment | Costs paid as a percentage of a $10,000 investment |
|---|---|---|
| ProFund VP Bull | $89 | 1.68% |
Average Annual Total Returns*
| 6 months | 1 Year | 5 years | 10 years | |
|---|---|---|---|---|
| Fund NAV | 14.22% | 22.10% | 12.80% | 10.66% |
S&P 500® Index | 15.29 | 24.56 | 15.05 | 12.86 |
Fund Statistics
| Net Assets | $60,298,843 |
| Number of Holdings** | 510 |
| Portfolio Turnover* | 55% |
* Not annualized for periods less than one year.
** No. of Holdings excludes derivatives and collateral for securities loaned.
Market Exposure Footnote Reference
| Investment Type | % of Net Assets |
|---|---|
| Equity Securities | 87% |
| Futures Contracts | 3% |
| Swap Agreements | 10% |
| Total | 100% |
| Footnote | Description |
Footnote | "Market Exposure” includes the value of total investments (including the contract value of any derivatives) and excludes any instruments used for cash management. |
S&P 500® Index – Composition

| Value | Value |
|---|---|
| Other | 25% |
| Communication Services | 9% |
| Consumer Discretionary | 10% |
| Health Care | 12% |
| Financials | 12% |
| Information Technology | 32% |
Largest Equity Holdings
| Company | % of Net Assets |
|---|---|
| Microsoft Corp. | 6.3% |
| NVIDIA Corp. | 5.7% |
| Apple, Inc. | 5.7% |
| Alphabet, Inc. | 3.7% |
| Amazon.com, Inc. | 3.3% |
"Standard & Poor's®", "S&P®", "S&P 500®" and "Standard & Poor's 500TM" are trademarks of Standard & Poor's Financial Services LLC ("S&P") and have been licensed for use by ProFunds. This Fund is not sponsored, licensed, sold or promoted by Standard & Poor's and Standard & Poor's makes no representation regarding the advisability of investing in ProFunds.
Additional information about the Fund including the Financial Statements, Prospectus and Statement of Additional Information is available:

On the Fund's website, https://www.profunds.com, or upon request, by calling 888-776-3637

Fund Overview
This Semi-annual shareholder report contains important information about the Fund for the period of January 1, 2024 to June 30, 2024. You can find additional information about the Fund at https://www.profunds.com/literature/profunds-variable-products. You can also request this information by contacting us at 888-776-3637.
What were the Fund’s costs for the last 6 months?
(based on a hypothetical $10,000 investment)
| Fund Name | Costs of a $10,000 investment | Costs paid as a percentage of a $10,000 investment |
|---|---|---|
| ProFund VP Communication Services | $91 | 1.68% |
Average Annual Total Returns*
| 6 months | 1 Year | 5 years | 10 years | |
|---|---|---|---|---|
| Fund NAV | 17.72% | 31.11% | 8.81% | 5.49% |
| S&P Total Market Index | 13.61 | 23.20 | 14.04 | 12.08 |
| S&P Communication Services Select Sector Index | 18.58 | 33.05 | 12.82 | 12.27 |
S&P 500® Index | 15.29 | 24.56 | 15.05 | 12.86 |
Fund Statistics
| Net Assets | $10,385,266 |
| Number of Holdings** | 28 |
| Portfolio Turnover* | 78% |
* Not annualized for periods less than one year.
** No. of Holdings excludes derivatives and collateral for securities loaned.
Market Exposure Footnote Reference
| Investment Type | % of Net Assets |
|---|---|
| Equity Securities | 97% |
| Swap Agreements | 2% |
| Total | 99% |
| Footnote | Description |
Footnote | "Market Exposure” includes the value of total investments (including the contract value of any derivatives) and excludes any instruments used for cash management. |
S&P Communication Services Select Sector Index – Composition
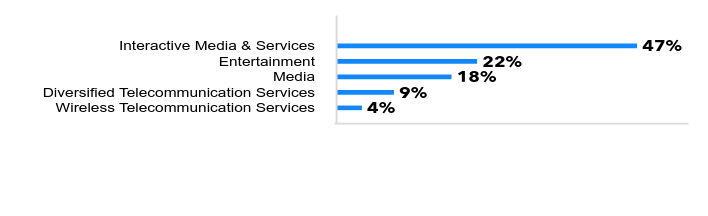
| Value | Value |
|---|---|
| Wireless Telecommunication Services | 4% |
| Diversified Telecommunication Services | 9% |
| Media | 18% |
| Entertainment | 22% |
| Interactive Media & Services | 47% |
Largest Equity Holdings
| Company | % of Net Assets |
|---|---|
| Alphabet, Inc. | 22.6% |
| Meta Platforms, Inc. | 21.9% |
| AT&T, Inc. | 4.6% |
| Comcast Corp. | 4.5% |
| Verizon Communications, Inc. | 4.5% |
"Standard & Poor's®", "S&P®" and "S&P Communication Services Select Sector Index" are trademarks of Standard & Poor's Financial Services LLC ("S&P") and have been licensed for use by ProFunds. This Fund is not sponsored, licensed, sold or promoted by Standard & Poor's and Standard & Poor's makes no representation regarding the advisability of investing in ProFunds.
Additional information about the Fund including the Financial Statements, Prospectus and Statement of Additional Information is available:

On the Fund's website, https://www.profunds.com, or upon request, by calling 888-776-3637

Fund Overview
This Semi-annual shareholder report contains important information about the Fund for the period of January 1, 2024 to June 30, 2024. You can find additional information about the Fund at https://www.profunds.com/literature/profunds-variable-products. You can also request this information by contacting us at 888-776-3637.
What were the Fund’s costs for the last 6 months?
(based on a hypothetical $10,000 investment)
| Fund Name | Costs of a $10,000 investment | Costs paid as a percentage of a $10,000 investment |
|---|---|---|
| ProFund VP Consumer Discretionary | $84 | 1.68% |
Average Annual Total Returns*
| 6 months | 1 Year | 5 years | 10 years | |
|---|---|---|---|---|
| Fund NAV | 1.56% | 6.43% | 6.17% | 8.86% |
S&P 500® Index | 15.29 | 24.56 | 15.05 | 12.86 |
| S&P Consumer Discretionary Select Sector Index | 2.44 | 8.29 | 9.95 | 12.01 |
Fund Statistics
| Net Assets | $24,910,654 |
| Number of Holdings** | 58 |
| Portfolio Turnover* | 23% |
* Not annualized for periods less than one year.
** No. of Holdings excludes derivatives and collateral for securities loaned.
Market Exposure Footnote Reference
| Investment Type | % of Net Assets |
|---|---|
| Equity Securities | 98% |
| Swap Agreements | 2% |
| Total | 100% |
| Footnote | Description |
Footnote | "Market Exposure” includes the value of total investments (including the contract value of any derivatives) and excludes any instruments used for cash management. |
S&P Consumer Discretionary Select Sector Index – Composition
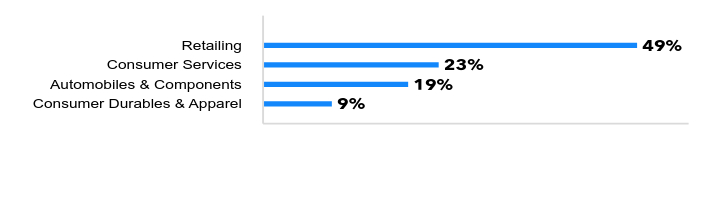
| Value | Value |
|---|---|
| Consumer Durables & Apparel | 9% |
| Automobiles & Components | 19% |
| Consumer Services | 23% |
| Retailing | 49% |
Largest Equity Holdings
| Company | % of Net Assets |
|---|---|
| Amazon.com, Inc. | 23.2% |
| Tesla, Inc. | 14.7% |
| The Home Depot, Inc. | 9.1% |
| McDonald's Corp. | 4.3% |
| Booking Holdings, Inc. | 3.7% |
"Standard & Poor's®", "S&P®" and "S&P Consumer Discretionary Select Sector Index" are trademarks of Standard & Poor's Financial Services LLC ("S&P") and have been licensed for use by ProFunds. This Fund is not sponsored, licensed, sold or promoted by Standard & Poor's and Standard & Poor's makes no representation regarding the advisability of investing in ProFunds.
Additional information about the Fund including the Financial Statements, Prospectus and Statement of Additional Information is available:

On the Fund's website, https://www.profunds.com, or upon request, by calling 888-776-3637

Fund Overview
This Semi-annual shareholder report contains important information about the Fund for the period of January 1, 2024 to June 30, 2024. You can find additional information about the Fund at https://www.profunds.com/literature/profunds-variable-products. You can also request this information by contacting us at 888-776-3637.
What were the Fund’s costs for the last 6 months?
(based on a hypothetical $10,000 investment)
| Fund Name | Costs of a $10,000 investment | Costs paid as a percentage of a $10,000 investment |
|---|---|---|
| ProFund VP Consumer Staples | $87 | 1.68% |
Average Annual Total Returns*
| 6 months | 1 Year | 5 years | 10 years | |
|---|---|---|---|---|
| Fund NAV | 7.10% | 4.59% | 7.71% | 6.41% |
S&P 500® Index | 15.29 | 24.56 | 15.05 | 12.86 |
| S&P Consumer Staples Select Sector Index | 8.01 | 6.40 | 8.66 | 8.55 |
Fund Statistics
| Net Assets | $10,615,038 |
| Number of Holdings** | 44 |
| Portfolio Turnover* | 246% |
* Not annualized for periods less than one year.
** No. of Holdings excludes derivatives and collateral for securities loaned.
Market Exposure Footnote Reference
| Investment Type | % of Net Assets |
|---|---|
| Equity Securities | 97% |
| Swap Agreements | 2% |
| Total | 99% |
| Footnote | Description |
Footnote | "Market Exposure” includes the value of total investments (including the contract value of any derivatives) and excludes any instruments used for cash management. |
S&P Consumer Staples Select Sector Index – Composition
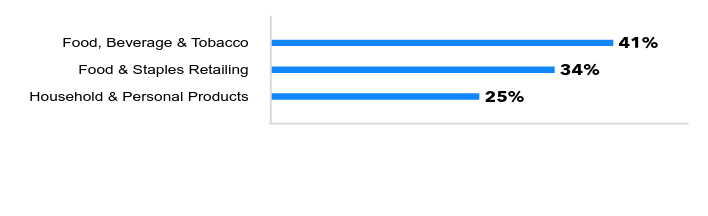
| Value | Value |
|---|---|
| Household & Personal Products | 25% |
| Food & Staples Retailing | 34% |
| Food, Beverage & Tobacco | 41% |
Largest Equity Holdings
| Company | % of Net Assets |
|---|---|
| The Procter & Gamble Co. | 14.3% |
| Costco Wholesale Corp. | 13.9% |
| Walmart, Inc. | 10.6% |
| The Coca-Cola Co. | 9.1% |
| PepsiCo, Inc. | 4.4% |
"Standard & Poor's®", "S&P®" and "S&P Consumer Staples Select Sector Index" are trademarks of Standard & Poor's Financial Services LLC ("S&P") and have been licensed for use by ProFunds. This Fund is not sponsored, licensed, sold or promoted by Standard & Poor's and Standard & Poor's makes no representation regarding the advisability of investing in ProFunds.
Additional information about the Fund including the Financial Statements, Prospectus and Statement of Additional Information is available:

On the Fund's website, https://www.profunds.com, or upon request, by calling 888-776-3637

Fund Overview
This Semi-annual shareholder report contains important information about the Fund for the period of January 1, 2024 to June 30, 2024. You can find additional information about the Fund at https://www.profunds.com/literature/profunds-variable-products. You can also request this information by contacting us at 888-776-3637.
What were the Fund’s costs for the last 6 months?
(based on a hypothetical $10,000 investment)
| Fund Name | Costs of a $10,000 investment | Costs paid as a percentage of a $10,000 investment |
|---|---|---|
| ProFund VP Dow 30 | $81 | 1.61% |
Average Annual Total Returns*
| 6 months | 1 Year | 5 years | 10 years | |
|---|---|---|---|---|
| Fund NAV | 3.52% | 13.36% | 7.70% | 8.27% |
S&P 500® Index | 15.29 | 24.56 | 15.05 | 12.86 |
Dow Jones Industrial Average® | 4.79 | 16.02 | 10.33 | 11.30 |
Fund Statistics
| Net Assets | $390,278 |
| Number of Holdings** | 6 |
| Portfolio Turnover* | -% |
* Not annualized for periods less than one year.
** No. of Holdings excludes derivatives and collateral for securities loaned.
Market Exposure Footnote Reference
| Investment Type | % of Net Assets |
|---|---|
| Swap Agreements | 100% |
| Total | 100% |
| Footnote | Description |
Footnote | "Market Exposure” includes the value of total investments (including the contract value of any derivatives) and excludes any instruments used for cash management. |
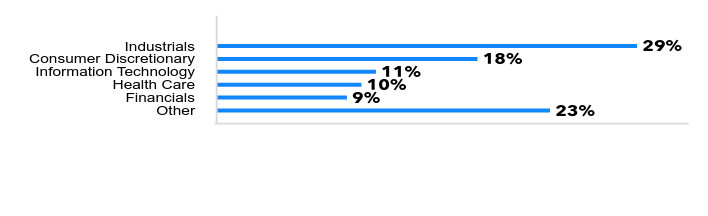
Dow Jones Industrial Average® Index – Composition

| Value | Value |
|---|---|
| Other | 10% |
| Industrials | 14% |
| Consumer Discretionary | 15% |
| Health Care | 18% |
| Information Technology | 20% |
| Financials | 23% |
Holdings
| The ProFund VP Dow 30 primarily invests in non-equity securities, which may include: swap agreements, futures contracts, repurchase agreements and U.S. Government securities. |
"The Dow 30SM" and "Dow Jones Industrial Average" are products of "Dow Jones Indexes", the marketing name and a licensed trademark of CME Group Index Services LLC ("CME Indexes"). "Dow Jones®", "DJ", "Dow Jones Indexes", "The Dow 30" and "Dow Jones Industrial Average" are service marks of Dow Jones Trademark Holdings, LLC ("Dow Jones") and have been licensed to CME Indexes and sublicensed to ProFunds. ProFunds have not been passed on by CME Indexes or Dow Jones as to their legality or suitability. ProFunds based on The Dow 30 are not sponsored, endorsed, sold or promoted by CME Indexes or Dow Jones, and they make no representation regarding the advisability of investing in ProFunds.
Additional information about the Fund including the Financial Statements, Prospectus and Statement of Additional Information is available:

On the Fund's website, https://www.profunds.com, or upon request, by calling 888-776-3637

Fund Overview
This Semi-annual shareholder report contains important information about the Fund for the period of January 1, 2024 to June 30, 2024. You can find additional information about the Fund at https://www.profunds.com/literature/profunds-variable-products. You can also request this information by contacting us at 888-776-3637.
What were the Fund’s costs for the last 6 months?
(based on a hypothetical $10,000 investment)
| Fund Name | Costs of a $10,000 investment | Costs paid as a percentage of a $10,000 investment |
|---|---|---|
| ProFund VP Emerging Markets | $86 | 1.68% |
Average Annual Total Returns*
| 6 months | 1 Year | 5 years | 10 years | |
|---|---|---|---|---|
| Fund NAV | 5.77% | 13.32% | 3.69% | 2.35% |
| S&P Global 1200 Index | 12.49 | 20.61 | 12.21 | 9.71 |
S&P® Emerging 50 ADR Index (USD) | 6.51 | 14.93 | 5.14 | 3.89 |
Fund Statistics
| Net Assets | $24,503,134 |
| Number of Holdings** | 56 |
| Portfolio Turnover* | 164% |
* Not annualized for periods less than one year.
** No. of Holdings excludes derivatives and collateral for securities loaned.
Market Exposure Footnote Reference
| Investment Type | % of Net Assets |
|---|---|
| Equity Securities | 81% |
| Swap Agreements | 19% |
| Total | 100% |
| Footnote | Description |
Footnote | "Market Exposure” includes the value of total investments (including the contract value of any derivatives) and excludes any instruments used for cash management or collateral for securities loaned. |
S&P® Emerging 50 ADR Index (USD) – Composition

| Value | Value |
|---|---|
| Other | 12% |
| Materials | 7% |
| Communication Services | 9% |
| Financials | 20% |
| Consumer Discretionary | 23% |
| Information Technology | 29% |
Country Composition
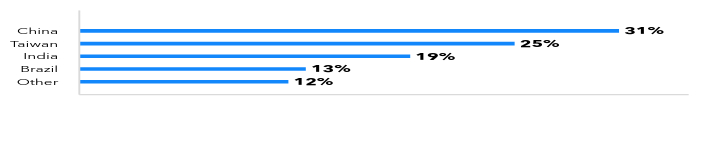
| Value | Value |
|---|---|
| Other | 12% |
| Brazil | 13% |
| India | 19% |
| Taiwan | 25% |
| China | 31% |
Largest Equity Holdings
| Company | % of Net Assets |
|---|---|
| Taiwan Semiconductor Manufacturing Co., Ltd. | 16.6% |
| Alibaba Group Holding, Ltd. | 7.6% |
| HDFC Bank, Ltd. | 6.8% |
| PDD Holdings, Inc. | 5.4% |
| Infosys, Ltd. | 3.9% |
"Standard & Poor's®", "S&P®", "S&P 500®" and "S&P Emerging 50 ADR Index" are trademarks of Standard & Poor's Financial Services LLC ("S&P") and have been licensed for use by ProFunds. This Fund is not sponsored, licensed, sold or promoted by Standard & Poor's and Standard & Poor's makes no representation regarding the advisability of investing in ProFunds.
Additional information about the Fund including the Financial Statements, Prospectus and Statement of Additional Information is available:

On the Fund's website, https://www.profunds.com, or upon request, by calling 888-776-3637

Fund Overview
This Semi-annual shareholder report contains important information about the Fund for the period of January 1, 2024 to June 30, 2024. You can find additional information about the Fund at https://www.profunds.com/literature/profunds-variable-products. You can also request this information by contacting us at 888-776-3637.
What were the Fund’s costs for the last 6 months?
(based on a hypothetical $10,000 investment)
| Fund Name | Costs of a $10,000 investment | Costs paid as a percentage of a $10,000 investment |
|---|---|---|
| ProFund VP Energy | $88 | 1.68% |
Average Annual Total Returns*
| 6 months | 1 Year | 5 years | 10 years | |
|---|---|---|---|---|
| Fund NAV | 9.65% | 14.27% | 10.56% | 0.68% |
S&P 500® Index | 15.29 | 24.56 | 15.05 | 12.86 |
| S&P Energy Select Sector Index | 10.58 | 16.26 | 13.05 | 3.16 |
Fund Statistics
| Net Assets | $44,643,050 |
| Number of Holdings** | 28 |
| Portfolio Turnover* | 135% |
* Not annualized for periods less than one year.
** No. of Holdings excludes derivatives and collateral for securities loaned.
Market Exposure Footnote Reference
| Investment Type | % of Net Assets |
|---|---|
| Equity Securities | 98% |
| Swap Agreements | 2% |
| Total | 100% |
| Footnote | Description |
Footnote | "Market Exposure” includes the value of total investments (including the contract value of any derivatives) and excludes any instruments used for cash management. |
S&P Energy Select Sector Index – Composition
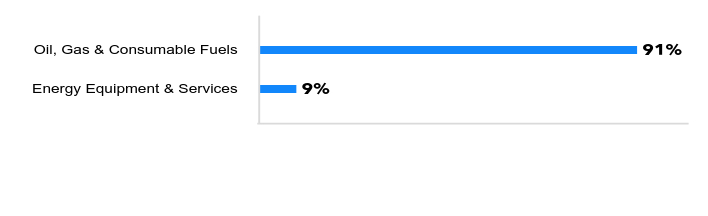
| Value | Value |
|---|---|
| Energy Equipment & Services | 9% |
| Oil, Gas & Consumable Fuels | 91% |
Largest Equity Holdings
| Company | % of Net Assets |
|---|---|
| Exxon Mobil Corp. | 22.9% |
| Chevron Corp. | 17.5% |
| EOG Resources, Inc. | 4.7% |
| Schlumberger N.V. | 4.7% |
| ConocoPhillips | 4.4% |
"Standard & Poor's®", "S&P®" and "S&P Energy Select Sector Index" are trademarks of Standard & Poor's Financial Services LLC ("S&P") and have been licensed for use by ProFunds. This Fund is not sponsored, licensed, sold or promoted by Standard & Poor's and Standard & Poor's makes no representation regarding the advisability of investing in ProFunds.
Additional information about the Fund including the Financial Statements, Prospectus and Statement of Additional Information is available:

On the Fund's website, https://www.profunds.com, or upon request, by calling 888-776-3637

Fund Overview
This Semi-annual shareholder report contains important information about the Fund for the period of January 1, 2024 to June 30, 2024. You can find additional information about the Fund at https://www.profunds.com/literature/profunds-variable-products. You can also request this information by contacting us at 888-776-3637.
What were the Fund’s costs for the last 6 months?
(based on a hypothetical $10,000 investment)
| Fund Name | Costs of a $10,000 investment | Costs paid as a percentage of a $10,000 investment |
|---|---|---|
| ProFund VP Europe 30 | $86 | 1.68% |
Average Annual Total Returns*
| 6 months | 1 Year | 5 years | 10 years | |
|---|---|---|---|---|
| Fund NAV | 5.33% | 14.57% | 5.93% | 2.85% |
| S&P Global 1200 Index | 12.49 | 20.61 | 12.21 | 9.71 |
ProFunds Europe 30 Index® | 3.66 | 12.01 | 4.63 | 1.12 |
STOXX Europe 50® Index | 8.60 | 13.25 | 8.73 | 4.64 |
Fund Statistics
| Net Assets | $14,799,408 |
| Number of Holdings** | 30 |
| Portfolio Turnover* | 50% |
* Not annualized for periods less than one year.
** No. of Holdings excludes derivatives and collateral for securities loaned.
Market Exposure Footnote Reference
| Investment Type | % of Net Assets |
|---|---|
| Equity Securities | 100% |
| Total | 100% |
| Footnote | Description |
Footnote | "Market Exposure” includes the value of total investments (including the contract value of any derivatives) and excludes any instruments used for cash management or collateral for securities loaned. |
ProFunds Europe 30 Index® – Composition
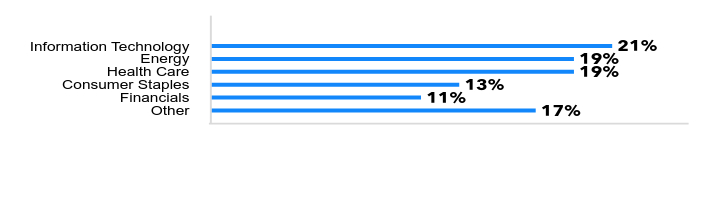
| Value | Value |
|---|---|
| Other | 17% |
| Financials | 11% |
| Consumer Staples | 13% |
| Health Care | 19% |
| Energy | 19% |
| Information Technology | 21% |
Country Composition
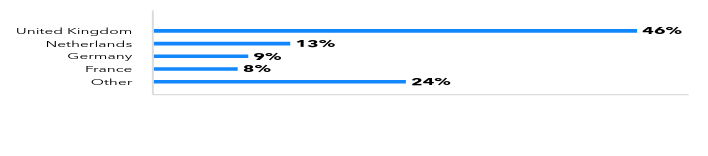
| Value | Value |
|---|---|
| Other | 24% |
| France | 8% |
| Germany | 9% |
| Netherlands | 13% |
| United Kingdom | 46% |
Largest Equity Holdings
| Company | % of Net Assets |
|---|---|
| ASML Holding N.V. | 7.2% |
| SAP SE | 6.9% |
| Shell PLC | 6.3% |
| Sanofi S.A. | 4.1% |
| HSBC Holdings PLC | 4.1% |
.
Additional information about the Fund including the Financial Statements, Prospectus and Statement of Additional Information is available:

On the Fund's website, https://www.profunds.com, or upon request, by calling 888-776-3637

Fund Overview
This Semi-annual shareholder report contains important information about the Fund for the period of January 1, 2024 to June 30, 2024. You can find additional information about the Fund at https://www.profunds.com/literature/profunds-variable-products. You can also request this information by contacting us at 888-776-3637.
What were the Fund’s costs for the last 6 months?
(based on a hypothetical $10,000 investment)
| Fund Name | Costs of a $10,000 investment | Costs paid as a percentage of a $10,000 investment |
|---|---|---|
| ProFund VP Falling U.S. Dollar | $82 | 1.68% |
Average Annual Total Returns*
| 6 months | 1 Year | 5 years | 10 years | |
|---|---|---|---|---|
| Fund NAV | (3.48)% | (1.19)% | (2.87)% | (4.28)% |
S&P 500® Index | 15.29 | 24.56 | 15.05 | 12.86 |
ICE® U.S. Dollar Index | 4.48 | 2.88 | 1.80 | 2.87 |
Fund Statistics
| Net Assets | $447,325 |
| Number of Holdings** | 6 |
| Portfolio Turnover* | -% |
* Not annualized for periods less than one year.
** No. of Holdings excludes derivatives and collateral for securities loaned.
Market Exposure Footnote Reference
| Investment Type | % of Net Assets |
|---|---|
| Forward Currency Contracts | 100% |
| Total | 100% |
| Footnote | Description |
Footnote | "Market Exposure” includes the value of total investments (including the contract value of any derivatives) and excludes any instruments used for cash management. |
U.S. Dollar Index – Composition
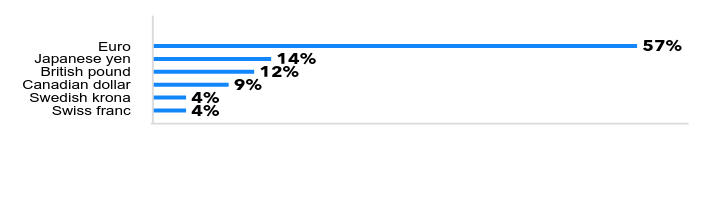
| Value | Value |
|---|---|
| Swiss franc | 4% |
| Swedish krona | 4% |
| Canadian dollar | 9% |
| British pound | 12% |
| Japanese yen | 14% |
| Euro | 57% |
Holdings
| The ProFund VP Falling U.S. Dollar primarily invests in non-equity securities, which may include: swap agreements, futures contracts, forward contracts, repurchase agreements and U.S.Government securities. |
The "U.S. Dollar Index®" is a trademark of ICE Data Indices, LLC (“IDI”) and has been licensed for use by ProFunds. ProFunds have not been passed on by IDI as to their legality or suitability. ProFunds based on IDI indexes are not sponsored, endorsed, sold or promoted by IDI or its affiliates, and they make no representation regarding the advisability of investing in ProFunds, or the ability of the index to track general financial market performance.
Additional information about the Fund including the Financial Statements, Prospectus and Statement of Additional Information is available:

On the Fund's website, https://www.profunds.com, or upon request, by calling 888-776-3637

Fund Overview
This Semi-annual shareholder report contains important information about the Fund for the period of January 1, 2024 to June 30, 2024. You can find additional information about the Fund at https://www.profunds.com/literature/profunds-variable-products. You can also request this information by contacting us at 888-776-3637.
What were the Fund’s costs for the last 6 months?
(based on a hypothetical $10,000 investment)
| Fund Name | Costs of a $10,000 investment | Costs paid as a percentage of a $10,000 investment |
|---|---|---|
| ProFund VP Financials | $87 | 1.68% |
Average Annual Total Returns*
| 6 months | 1 Year | 5 years | 10 years | |
|---|---|---|---|---|
| Fund NAV | 9.28% | 22.08% | 8.22% | 8.68% |
S&P 500® Index | 15.29 | 24.56 | 15.05 | 12.86 |
| S&P Financial Select Sector Index | 10.17 | 24.21 | 10.58 | 10.58 |
Fund Statistics
| Net Assets | $29,200,026 |
| Number of Holdings** | 78 |
| Portfolio Turnover* | 9% |
* Not annualized for periods less than one year.
** No. of Holdings excludes derivatives and collateral for securities loaned.
Market Exposure Footnote Reference
| Investment Type | % of Net Assets |
|---|---|
| Equity Securities | 98% |
| Swap Agreements | 3% |
| Total | 101% |
| Footnote | Description |
Footnote | "Market Exposure” includes the value of total investments (including the contract value of any derivatives) and excludes any instruments used for cash management. |
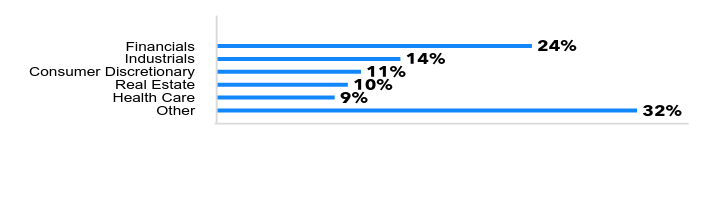
S&P Financial Select Sector Index – Composition
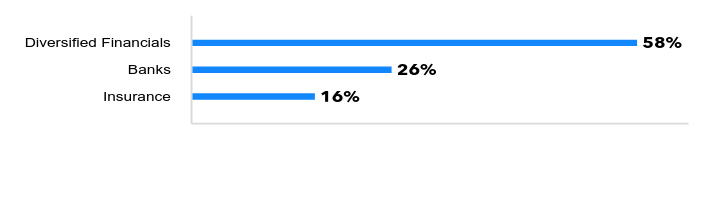
| Value | Value |
|---|---|
| Insurance | 16% |
| Banks | 26% |
| Diversified Financials | 58% |
Largest Equity Holdings
| Company | % of Net Assets |
|---|---|
| Berkshire Hathaway, Inc. | 12.7% |
| JPMorgan Chase & Co. | 10.0% |
| Visa, Inc. | 7.1% |
| Mastercard, Inc. | 6.2% |
| Bank of America Corp. | 4.7% |
"Standard & Poor's®", "S&P®" and "S&P Financial Select Sector Index" are trademarks of Standard & Poor's Financial Services LLC ("S&P") and have been licensed for use by ProFunds. This Fund is not sponsored, licensed, sold or promoted by Standard & Poor's and Standard & Poor's makes no representation regarding the advisability of investing in ProFunds.
Additional information about the Fund including the Financial Statements, Prospectus and Statement of Additional Information is available:

On the Fund's website, https://www.profunds.com, or upon request, by calling 888-776-3637

Fund Overview
This Semi-annual shareholder report contains important information about the Fund for the period of January 1, 2024 to June 30, 2024. You can find additional information about the Fund at https://www.profunds.com/literature/profunds-variable-products. You can also request this information by contacting us at 888-776-3637.
What were the Fund’s costs for the last 6 months?
(based on a hypothetical $10,000 investment)
| Fund Name | Costs of a $10,000 investment | Costs paid as a percentage of a $10,000 investment |
|---|---|---|
| ProFund VP Government Money Market | $45 | 0.90% |
Average Annual Total Returns*
| 6 Months | 1 Year | 5 Years | 10 Years | |
|---|---|---|---|---|
| Fund NAV | 2.21% | 4.50% | 1.53% | 0.86% |
Fund Statistics
| Net Assets | $30,545,323 |
| Number of Holdings | 13 |
* Not annualized for periods less than one year.
Market ExposureFootnote Reference
| Investment Type | % of Net Assets |
|---|---|
| U.S. Treasury Obligations | 46% |
| Repurchase Agreements | 55% |
| Total | 101% |
| Footnote | Description |
Footnote | "Market Exposure" includes the value of total investments including any instruments used for cash management. |
An investment in this Fund is neither guaranteed nor insured by the Federal Deposit Insurance Corporation or any other government agency. Although the Fund strives to maintain the value of your investment at $1.00 per share, it is possible to lose money by investing in this Fund.
Additional information about the Fund including the Financial Statements, Prospectus and Statement of Additional Information is available:

On the Fund's website, https://www.profunds.com, or upon request, by calling 888-776-3637

Fund Overview
This Semi-annual shareholder report contains important information about the Fund for the period of January 1, 2024 to June 30, 2024. You can find additional information about the Fund at https://www.profunds.com/literature/profunds-variable-products. You can also request this information by contacting us at 888-776-3637.
What were the Fund’s costs for the last 6 months?
(based on a hypothetical $10,000 investment)
| Fund Name | Costs of a $10,000 investment | Costs paid as a percentage of a $10,000 investment |
|---|---|---|
| ProFund VP Health Care | $86 | 1.68% |
Average Annual Total Returns*
| 6 months | 1 Year | 5 years | 10 years | |
|---|---|---|---|---|
| Fund NAV | 6.91% | 9.81% | 9.27% | 9.18% |
S&P 500® Index | 15.29 | 24.56 | 15.05 | 12.86 |
| S&P Health Care Select Sector Index | 7.81 | 11.68 | 11.53 | 11.06 |
Fund Statistics
| Net Assets | $37,673,668 |
| Number of Holdings** | 69 |
| Portfolio Turnover* | 29% |
* Not annualized for periods less than one year.
** No. of Holdings excludes derivatives and collateral for securities loaned.
Market Exposure Footnote Reference
| Investment Type | % of Net Assets |
|---|---|
| Equity Securities | 99% |
| Swap Agreements | 1% |
| Total | 100% |
| Footnote | Description |
Footnote | "Market Exposure” includes the value of total investments (including the contract value of any derivatives) and excludes any instruments used for cash management. |
S&P Health Care Select Sector Index – Composition
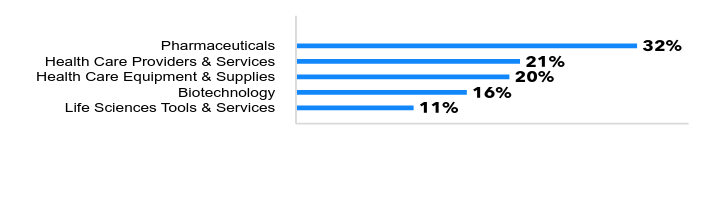
| Value | Value |
|---|---|
| Life Sciences Tools & Services | 11% |
| Biotechnology | 16% |
| Health Care Equipment & Supplies | 20% |
| Health Care Providers & Services | 21% |
| Pharmaceuticals | 32% |
Largest Equity Holdings
| Company | % of Net Assets |
|---|---|
| Eli Lilly & Co. | 13.3% |
| UnitedHealth Group, Inc. | 8.6% |
| Johnson & Johnson | 6.5% |
| Merck & Co., Inc. | 5.8% |
| AbbVie, Inc. | 5.6% |
"Standard & Poor's®", "S&P®" and "S&P Health Care Select Sector Index" are trademarks of Standard & Poor's Financial Services LLC ("S&P") and have been licensed for use by ProFunds. This Fund is not sponsored, licensed, sold or promoted by Standard & Poor's and Standard & Poor's makes no representation regarding the advisability of investing in ProFunds.
Additional information about the Fund including the Financial Statements, Prospectus and Statement of Additional Information is available:

On the Fund's website, https://www.profunds.com, or upon request, by calling 888-776-3637

Fund Overview
This Semi-annual shareholder report contains important information about the Fund for the period of January 1, 2024 to June 30, 2024. You can find additional information about the Fund at https://www.profunds.com/literature/profunds-variable-products. You can also request this information by contacting us at 888-776-3637.
What were the Fund’s costs for the last 6 months?
(based on a hypothetical $10,000 investment)
| Fund Name | Costs of a $10,000 investment | Costs paid as a percentage of a $10,000 investment |
|---|---|---|
| ProFund VP Industrials | $86 | 1.68% |
Average Annual Total Returns*
| 6 months | 1 Year | 5 years | 10 years | |
|---|---|---|---|---|
| Fund NAV | 6.86% | 13.62% | 8.58% | 8.79% |
S&P 500® Index | 15.29 | 24.56 | 15.05 | 12.86 |
| S&P Industrials Select Sector Index | 7.75 | 15.53 | 11.52 | 10.66 |
Fund Statistics
| Net Assets | $16,505,479 |
| Number of Holdings** | 84 |
| Portfolio Turnover* | 22% |
* Not annualized for periods less than one year.
** No. of Holdings excludes derivatives and collateral for securities loaned.
Market Exposure Footnote Reference
| Investment Type | % of Net Assets |
|---|---|
| Equity Securities | 98% |
| Swap Agreements | 2% |
| Total | 100% |
| Footnote | Description |
Footnote | "Market Exposure” includes the value of total investments (including the contract value of any derivatives) and excludes any instruments used for cash management. |
S&P Industrials Select Sector Index – Composition
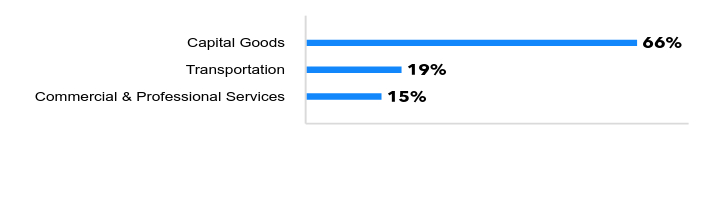
| Value | Value |
|---|---|
| Commercial & Professional Services | 15% |
| Transportation | 19% |
| Capital Goods | 66% |
Largest Equity Holdings
| Company | % of Net Assets |
|---|---|
| General Electric Co. | 4.6% |
| Caterpillar, Inc. | 4.3% |
| Uber Technologies, Inc. | 4.0% |
| Honeywell International, Inc. | 3.7% |
| Union Pacific Corp. | 3.6% |
"Standard & Poor's®", "S&P®" and "S&P Industrials Select Sector Index" are trademarks of Standard & Poor's Financial Services LLC ("S&P") and have been licensed for use by ProFunds. This Fund is not sponsored, licensed, sold or promoted by Standard & Poor's and Standard & Poor's makes no representation regarding the advisability of investing in ProFunds.
Additional information about the Fund including the Financial Statements, Prospectus and Statement of Additional Information is available:

On the Fund's website, https://www.profunds.com, or upon request, by calling 888-776-3637

Fund Overview
This Semi-annual shareholder report contains important information about the Fund for the period of January 1, 2024 to June 30, 2024. You can find additional information about the Fund at https://www.profunds.com/literature/profunds-variable-products. You can also request this information by contacting us at 888-776-3637.
What were the Fund’s costs for the last 6 months?
(based on a hypothetical $10,000 investment)
| Fund Name | Costs of a $10,000 investment | Costs paid as a percentage of a $10,000 investment |
|---|---|---|
| ProFund VP International | $85 | 1.68% |
Average Annual Total Returns*
| 6 months | 1 Year | 5 years | 10 years | |
|---|---|---|---|---|
| Fund NAV | 4.35% | 8.79% | 3.98% | 1.83% |
| MSCI EAFE Index | 5.34 | 11.54 | 6.46 | 4.33 |
Fund Statistics
| Net Assets | $10,420,266 |
| Number of Holdings** | 6 |
| Portfolio Turnover* | -% |
* Not annualized for periods less than one year.
** No. of Holdings excludes derivatives and collateral for securities loaned.
Market Exposure Footnote Reference
| Investment Type | % of Net Assets |
|---|---|
| Swap Agreements | 100% |
| Total | 100% |
| Footnote | Description |
Footnote | "Market Exposure” includes the value of total investments (including the contract value of any derivatives) and excludes any instruments used for cash management. |
MSCI EAFE Index – Composition
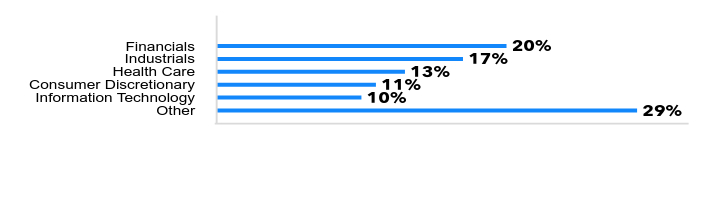
| Value | Value |
|---|---|
| Other | 29% |
| Information Technology | 10% |
| Consumer Discretionary | 11% |
| Health Care | 13% |
| Industrials | 17% |
| Financials | 20% |
Country Composition

| Value | Value |
|---|---|
| Other | 41% |
| Switzerland | 10% |
| France | 11% |
| United Kingdom | 15% |
| Japan | 23% |
Holdings
| The ProFund VP International primarily invests in non-equity securities, which may include: swap agreements, futures contracts, repurchase agreements and U.S. Government securities. |
"MSCI" and "EAFE" are service marks of MSCI and have been licensed for use by ProFunds. This Fund is not sponsored, endorsed, sold or promoted by MSCI and MSCI makes no representation regarding the advisability of investing in ProFunds.
Additional information about the Fund including the Financial Statements, Prospectus and Statement of Additional Information is available:

On the Fund's website, https://www.profunds.com, or upon request, by calling 888-776-3637

Fund Overview
This Semi-annual shareholder report contains important information about the Fund for the period of January 1, 2024 to June 30, 2024. You can find additional information about the Fund at https://www.profunds.com/literature/profunds-variable-products. You can also request this information by contacting us at 888-776-3637.
What were the Fund’s costs for the last 6 months?
(based on a hypothetical $10,000 investment)
| Fund Name | Costs of a $10,000 investment | Costs paid as a percentage of a $10,000 investment |
|---|---|---|
| ProFund VP Internet | $87 | 1.68% |
Average Annual Total Returns*
| 6 months | 1 Year | 5 years | 10 years | |
|---|---|---|---|---|
| Fund NAV | 9.17% | 24.20% | 6.15% | 11.84% |
S&P 500® Index | 15.29 | 24.56 | 15.05 | 12.86 |
| Dow Jones Internet Composite Index | 10.08 | 26.26 | 7.91 | 13.74 |
Fund Statistics
| Net Assets | $12,841,601 |
| Number of Holdings** | 47 |
| Portfolio Turnover* | 49% |
* Not annualized for periods less than one year.
** No. of Holdings excludes derivatives and collateral for securities loaned.
Market Exposure Footnote Reference
| Investment Type | % of Net Assets |
|---|---|
| Equity Securities | 98% |
| Swap Agreements | 2% |
| Total | 100% |
| Footnote | Description |
Footnote | "Market Exposure” includes the value of total investments (including the contract value of any derivatives) and excludes any instruments used for cash management. |
Dow Jones Internet Composite Index – Composition
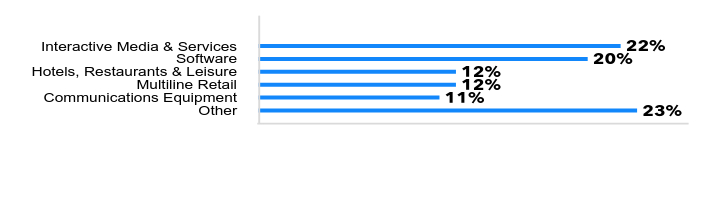
| Value | Value |
|---|---|
| Other | 23% |
| Communications Equipment | 11% |
| Multiline Retail | 12% |
| Hotels, Restaurants & Leisure | 12% |
| Software | 20% |
| Interactive Media & Services | 22% |
Largest Equity Holdings
| Company | % of Net Assets |
|---|---|
| Amazon.com, Inc. | 9.8% |
| Alphabet, Inc. | 9.3% |
| Meta Platforms, Inc. | 9.2% |
| Netflix, Inc. | 6.3% |
| Salesforce, Inc. | 5.0% |
"The Dow 30SM" and "Dow Jones Industrial Average" are products of "Dow Jones Indexes", the marketing name and a licensed trademark of CME Group Index Services LLC ("CME Indexes"). "Dow Jones®", "DJ", "Dow Jones Indexes", "The Dow 30" and "Dow Jones Internet CompositeSM Index" are service marks of Dow Jones Trademark Holdings, LLC ("Dow Jones") and have been licensed to CME Indexes and sublicensed to ProFunds. ProFunds have not been passed on by CME Indexes or Dow Jones as to their legality or suitability. ProFunds based on The Dow 30 are not sponsored, endorsed, sold or promoted by CME Indexes or Dow Jones, and they make no representation regarding the advisability of investing in ProFunds.
Additional information about the Fund including the Financial Statements, Prospectus and Statement of Additional Information is available:

On the Fund's website, https://www.profunds.com, or upon request, by calling 888-776-3637

Fund Overview
This Semi-annual shareholder report contains important information about the Fund for the period of January 1, 2024 to June 30, 2024. You can find additional information about the Fund at https://www.profunds.com/literature/profunds-variable-products. You can also request this information by contacting us at 888-776-3637.
What were the Fund’s costs for the last 6 months?
(based on a hypothetical $10,000 investment)
| Fund Name | Costs of a $10,000 investment | Costs paid as a percentage of a $10,000 investment |
|---|---|---|
| ProFund VP Japan | $93 | 1.68% |
Average Annual Total Returns*
| 6 months | 1 Year | 5 years | 10 years | |
|---|---|---|---|---|
| Fund NAV | 21.89% | 23.85% | 14.54% | 10.33% |
| S&P Global 1200 Index | 12.49 | 20.61 | 12.21 | 9.71 |
| Nikkei 225 Stock Average - Yen | 19.34 | 21.48 | 15.45 | 12.21 |
| Nikkei 225 Stock Average - USD | 4.59 | 9.15 | 6.56 | 7.14 |
Fund Statistics
| Net Assets | $14,175,299 |
| Number of Holdings** | 6 |
| Portfolio Turnover* | -% |
* Not annualized for periods less than one year.
** No. of Holdings excludes derivatives and collateral for securities loaned.
Market Exposure Footnote Reference
| Investment Type | % of Net Assets |
|---|---|
| Futures Contracts | 98% |
| Swap Agreements | 1% |
| Total | 99% |
| Footnote | Description |
Footnote | "Market Exposure” includes the value of total investments (including the contract value of any derivatives) and excludes any instruments used for cash management. |
Nikkei 225 Stock Average – Composition
| Value | Value |
|---|---|
| Other | 16% |
| Health Care | 9% |
| Communication Services | 10% |
| Industrials | 18% |
| Consumer Discretionary | 21% |
| Information Technology | 26% |
Holdings
| The ProFund VP Japan primarily invests in non-equity securities, which may include: swap agreements, futures contracts, repurchase agreements and U.S. Government securities. |
"Nikkei 225 Stock Index" is a registered trademark of The Nikkei 225 Stock Average and have been licensed for use by ProFunds. This Fund is not sponsored, endorsed, sold or promoted by The Nikkei 225 Stock Average and The Nikkei 225 Stock Average makes no representation regarding the advisability of investing in ProFunds.
Additional information about the Fund including the Financial Statements, Prospectus and Statement of Additional Information is available:

On the Fund's website, https://www.profunds.com, or upon request, by calling 888-776-3637

Fund Overview
This Semi-annual shareholder report contains important information about the Fund for the period of January 1, 2024 to June 30, 2024. You can find additional information about the Fund at https://www.profunds.com/literature/profunds-variable-products. You can also request this information by contacting us at 888-776-3637.
What were the Fund’s costs for the last 6 months?
(based on a hypothetical $10,000 investment)
| Fund Name | Costs of a $10,000 investment | Costs paid as a percentage of a $10,000 investment |
|---|---|---|
| ProFund VP Large-Cap Growth | $93 | 1.68% |
Average Annual Total Returns*
| 6 months | 1 Year | 5 years | 10 years | |
|---|---|---|---|---|
| Fund NAV | 22.48% | 30.25% | 14.83% | 12.97% |
S&P 500® Index | 15.29 | 24.56 | 15.05 | 12.86 |
S&P 500® Growth Index | 23.56 | 32.52 | 16.87 | 14.97 |
Fund Statistics
| Net Assets | $32,760,758 |
| Number of Holdings** | 238 |
| Portfolio Turnover* | 75% |
* Not annualized for periods less than one year.
** No. of Holdings excludes derivatives and collateral for securities loaned.
Market Exposure Footnote Reference
| Investment Type | % of Net Assets |
|---|---|
| Equity Securities | 100% |
| Total | 100% |
| Footnote | Description |
Footnote | "Market Exposure” includes the value of total investments (including the contract value of any derivatives) and excludes any instruments used for cash management. |
S&P 500® Growth Index – Composition

| Value | Value |
|---|---|
| Other | 11% |
| Industrials | 6% |
| Health Care | 7% |
| Communication Services | 13% |
| Consumer Discretionary | 13% |
| Information Technology | 50% |
Largest Equity Holdings
| Company | % of Net Assets |
|---|---|
| Microsoft Corp. | 12.6% |
| NVIDIA Corp. | 11.5% |
| Apple, Inc. | 11.5% |
| Alphabet, Inc. | 7.4% |
| Amazon.com, Inc. | 6.7% |
"Standard & Poor's®", "S&P®" and "S&P 500 Growth Index" are trademarks of Standard & Poor's Financial Services LLC ("S&P") and have been licensed for use by ProFunds. This Fund is not sponsored, licensed, sold or promoted by Standard & Poor's and Standard & Poor's makes no representation regarding the advisability of investing in ProFunds.
Additional information about the Fund including the Financial Statements, Prospectus and Statement of Additional Information is available:

On the Fund's website, https://www.profunds.com, or upon request, by calling 888-776-3637

Fund Overview
This Semi-annual shareholder report contains important information about the Fund for the period of January 1, 2024 to June 30, 2024. You can find additional information about the Fund at https://www.profunds.com/literature/profunds-variable-products. You can also request this information by contacting us at 888-776-3637.
What were the Fund’s costs for the last 6 months?
(based on a hypothetical $10,000 investment)
| Fund Name | Costs of a $10,000 investment | Costs paid as a percentage of a $10,000 investment |
|---|---|---|
| ProFund VP Large-Cap Value | $86 | 1.68% |
Average Annual Total Returns*
| 6 months | 1 Year | 5 years | 10 years | |
|---|---|---|---|---|
| Fund NAV | 4.91% | 13.32% | 10.08% | 8.07% |
S&P 500® Index | 15.29 | 24.56 | 15.05 | 12.86 |
S&P 500® Value Index | 5.79 | 15.29 | 11.89 | 9.89 |
Fund Statistics
| Net Assets | $15,256,416 |
| Number of Holdings** | 446 |
| Portfolio Turnover* | 32% |
* Not annualized for periods less than one year.
** No. of Holdings excludes derivatives and collateral for securities loaned.
Market Exposure Footnote Reference
| Investment Type | % of Net Assets |
|---|---|
| Equity Securities | 100% |
| Total | 100% |
| Footnote | Description |
Footnote | "Market Exposure” includes the value of total investments (including the contract value of any derivatives) and excludes any instruments used for cash management. |
S&P 500® Value Index – Composition
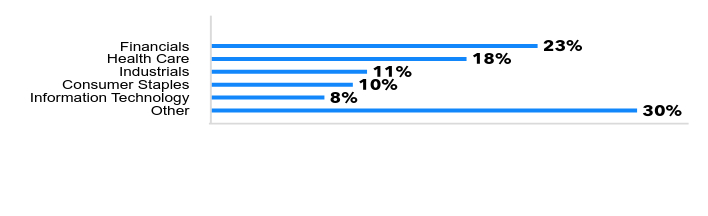
| Value | Value |
|---|---|
| Other | 30% |
| Information Technology | 8% |
| Consumer Staples | 10% |
| Industrials | 11% |
| Health Care | 18% |
| Financials | 23% |
Largest Equity Holdings
| Company | % of Net Assets |
|---|---|
| Berkshire Hathaway, Inc. | 3.8% |
| JPMorgan Chase & Co. | 3.0% |
| Exxon Mobil Corp. | 2.7% |
| Johnson & Johnson | 1.8% |
| UnitedHealth Group, Inc. | 1.5% |
"Standard & Poor's®", "S&P®" and "S&P 500 Value Index" are trademarks of Standard & Poor's Financial Services LLC ("S&P") and have been licensed for use by ProFunds. This Fund is not sponsored, licensed, sold or promoted by Standard & Poor's and Standard & Poor's makes no representation regarding the advisability of investing in ProFunds.
Additional information about the Fund including the Financial Statements, Prospectus and Statement of Additional Information is available:

On the Fund's website, https://www.profunds.com, or upon request, by calling 888-776-3637

Fund Overview
This Semi-annual shareholder report contains important information about the Fund for the period of January 1, 2024 to June 30, 2024. You can find additional information about the Fund at https://www.profunds.com/literature/profunds-variable-products. You can also request this information by contacting us at 888-776-3637.
What were the Fund’s costs for the last 6 months?
(based on a hypothetical $10,000 investment)
| Fund Name | Costs of a $10,000 investment | Costs paid as a percentage of a $10,000 investment |
|---|---|---|
| ProFund VP Materials | $85 | 1.68% |
Average Annual Total Returns*
| 6 months | 1 Year | 5 years | 10 years | |
|---|---|---|---|---|
| Fund NAV | 3.29% | 6.96% | 9.87% | 5.90% |
S&P 500® Index | 15.29 | 24.56 | 15.05 | 12.86 |
| S&P Materials Select Sector Index | 4.14 | 8.79 | 10.86 | 8.18 |
Fund Statistics
| Net Assets | $14,580,155 |
| Number of Holdings** | 34 |
| Portfolio Turnover* | 26% |
* Not annualized for periods less than one year.
** No. of Holdings excludes derivatives and collateral for securities loaned.
Market Exposure Footnote Reference
| Investment Type | % of Net Assets |
|---|---|
| Equity Securities | 99% |
| Swap Agreements | 1% |
| Total | 100% |
| Footnote | Description |
Footnote | "Market Exposure” includes the value of total investments (including the contract value of any derivatives) and excludes any instruments used for cash management. |
S&P Materials Select Sector Index – Composition
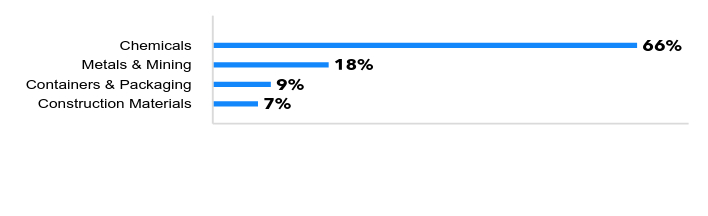
| Value | Value |
|---|---|
| Construction Materials | 7% |
| Containers & Packaging | 9% |
| Metals & Mining | 18% |
| Chemicals | 66% |
Largest Equity Holdings
| Company | % of Net Assets |
|---|---|
| Linde PLC | 21.1% |
| Freeport-McMoRan, Inc. | 7.0% |
| The Sherwin-Williams Co. | 7.0% |
| Ecolab, Inc. | 6.1% |
| Air Products and Chemicals, Inc. | 5.8% |
"Standard & Poor's®", "S&P®" and "S&P Materials Select Sector Index" are trademarks of Standard & Poor's Financial Services LLC ("S&P") and have been licensed for use by ProFunds. This Fund is not sponsored, licensed, sold or promoted by Standard & Poor's and Standard & Poor's makes no representation regarding the advisability of investing in ProFunds.
Additional information about the Fund including the Financial Statements, Prospectus and Statement of Additional Information is available:

On the Fund's website, https://www.profunds.com, or upon request, by calling 888-776-3637

Fund Overview
This Semi-annual shareholder report contains important information about the Fund for the period of January 1, 2024 to June 30, 2024. You can find additional information about the Fund at https://www.profunds.com/literature/profunds-variable-products. You can also request this information by contacting us at 888-776-3637.
What were the Fund’s costs for the last 6 months?
(based on a hypothetical $10,000 investment)
| Fund Name | Costs of a $10,000 investment | Costs paid as a percentage of a $10,000 investment |
|---|---|---|
| ProFund VP Mid-Cap | $86 | 1.68% |
Average Annual Total Returns*
| 6 months | 1 Year | 5 years | 10 years | |
|---|---|---|---|---|
| Fund NAV | 4.91% | 10.96% | 7.78% | 6.74% |
S&P Composite 1500® Index | 14.35 | 23.52 | 14.59 | 12.50 |
S&P MidCap 400® | 6.17 | 13.57 | 10.27 | 9.14 |
Fund Statistics
| Net Assets | $11,154,614 |
| Number of Holdings** | 6 |
| Portfolio Turnover* | -% |
* Not annualized for periods less than one year.
** No. of Holdings excludes derivatives and collateral for securities loaned.
Market Exposure Footnote Reference
| Investment Type | % of Net Assets |
|---|---|
| Futures Contracts | 13% |
| Swap Agreements | 87% |
| Total | 100% |
| Footnote | Description |
Footnote | "Market Exposure” includes the value of total investments (including the contract value of any derivatives) and excludes any instruments used for cash management. |
S&P MidCap 400® – Composition

| Value | Value |
|---|---|
| Other | 28% |
| Health Care | 9% |
| Information Technology | 10% |
| Consumer Discretionary | 15% |
| Financials | 16% |
| Industrials | 22% |
Holdings
| The ProFund VP Mid-Cap primarily invests in non-equity securities, which may include: swap agreements, futures contracts, repurchase agreements and U.S. Government securities. |
"Standard & Poor's®", "S&P®" and "S&P MidCap 400®" are trademarks of Standard & Poor's Financial Services LLC ("S&P") and have been licensed for use by ProFunds. This Fund is not sponsored, licensed, sold or promoted by Standard & Poor's and Standard & Poor's makes no representation regarding the advisability of investing in ProFunds.
Additional information about the Fund including the Financial Statements, Prospectus and Statement of Additional Information is available:

On the Fund's website, https://www.profunds.com, or upon request, by calling 888-776-3637

Fund Overview
This Semi-annual shareholder report contains important information about the Fund for the period of January 1, 2024 to June 30, 2024. You can find additional information about the Fund at https://www.profunds.com/literature/profunds-variable-products. You can also request this information by contacting us at 888-776-3637.
What were the Fund’s costs for the last 6 months?
(based on a hypothetical $10,000 investment)
| Fund Name | Costs of a $10,000 investment | Costs paid as a percentage of a $10,000 investment |
|---|---|---|
| ProFund VP Mid-Cap Growth | $88 | 1.68% |
Average Annual Total Returns*
| 6 months | 1 Year | 5 years | 10 years | |
|---|---|---|---|---|
| Fund NAV | 10.75% | 16.87% | 8.69% | 7.92% |
S&P Composite 1500® Index | 14.35 | 23.52 | 14.59 | 12.50 |
S&P MidCap 400® Growth Index | 11.70 | 18.82 | 10.49 | 9.71 |
Fund Statistics
| Net Assets | $14,688,801 |
| Number of Holdings** | 257 |
| Portfolio Turnover* | 96% |
* Not annualized for periods less than one year.
** No. of Holdings excludes derivatives and collateral for securities loaned.
Market Exposure Footnote Reference
| Investment Type | % of Net Assets |
|---|---|
| Equity Securities | 100% |
| Total | 100% |
| Footnote | Description |
Footnote | "Market Exposure” includes the value of total investments (including the contract value of any derivatives) and excludes any instruments used for cash management or collateral for securities loaned. |
S&P MidCap 400® Growth Index – Composition
| Value | Value |
|---|---|
| Other | 23% |
| Financials | 9% |
| Health Care | 10% |
| Information Technology | 11% |
| Consumer Discretionary | 18% |
| Industrials | 29% |
Largest Equity Holdings
| Company | % of Net Assets |
|---|---|
| Pure Storage, Inc. | 1.4% |
| Carlisle Cos., Inc. | 1.4% |
| Williams-Sonoma, Inc. | 1.3% |
| EMCOR Group, Inc. | 1.2% |
| Lennox International, Inc. | 1.2% |
"Standard & Poor's®", "S&P®" and "S&P MidCap 400® Growth Index" are trademarks of Standard & Poor's Financial Services LLC ("S&P") and have been licensed for use by ProFunds. This Fund is not sponsored, licensed, sold or promoted by Standard & Poor's and Standard & Poor's makes no representation regarding the advisability of investing in ProFunds.
Additional information about the Fund including the Financial Statements, Prospectus and Statement of Additional Information is available:

On the Fund's website, https://www.profunds.com, or upon request, by calling 888-776-3637

Fund Overview
This Semi-annual shareholder report contains important information about the Fund for the period of January 1, 2024 to June 30, 2024. You can find additional information about the Fund at https://www.profunds.com/literature/profunds-variable-products. You can also request this information by contacting us at 888-776-3637.
What were the Fund’s costs for the last 6 months?
(based on a hypothetical $10,000 investment)
| Fund Name | Costs of a $10,000 investment | Costs paid as a percentage of a $10,000 investment |
|---|---|---|
| ProFund VP Mid-Cap Value | $83 | 1.68% |
Average Annual Total Returns*
| 6 months | 1 Year | 5 years | 10 years | |
|---|---|---|---|---|
| Fund NAV | (0.33)% | 6.34% | 7.82% | 6.44% |
S&P Composite 1500® Index | 14.35 | 23.52 | 14.59 | 12.50 |
S&P MidCap 400® Value Index | 0.45 | 8.17 | 9.54 | 8.18 |
Fund Statistics
| Net Assets | $10,659,882 |
| Number of Holdings** | 300 |
| Portfolio Turnover* | 36% |
* Not annualized for periods less than one year.
** No. of Holdings excludes derivatives and collateral for securities loaned.
Market Exposure Footnote Reference
| Investment Type | % of Net Assets |
|---|---|
| Equity Securities | 100% |
| Total | 100% |
| Footnote | Description |
Footnote | "Market Exposure” includes the value of total investments (including the contract value of any derivatives) and excludes any instruments used for cash management. |
S&P MidCap 400® Value Index – Composition
| Value | Value |
|---|---|
| Other | 32% |
| Health Care | 9% |
| Real Estate | 10% |
| Consumer Discretionary | 11% |
| Industrials | 14% |
| Financials | 24% |
Largest Equity Holdings
| Company | % of Net Assets |
|---|---|
| Illumina, Inc. | 1.3% |
| Reinsurance Group of America, Inc. | 1.1% |
| Tenet Healthcare Corp. | 1.0% |
| Fidelity National Financial, Inc. | 1.0% |
| WP Carey, Inc. | 1.0% |
"Standard & Poor's®", "S&P®" and "S&P MidCap 400® Value Index" are trademarks of Standard & Poor's Financial Services LLC ("S&P") and have been licensed for use by ProFunds. This Fund is not sponsored, licensed, sold or promoted by Standard & Poor's and Standard & Poor's makes no representation regarding the advisability of investing in ProFunds.
Additional information about the Fund including the Financial Statements, Prospectus and Statement of Additional Information is available:

On the Fund's website, https://www.profunds.com, or upon request, by calling 888-776-3637

Fund Overview
This Semi-annual shareholder report contains important information about the Fund for the period of January 1, 2024 to June 30, 2024. You can find additional information about the Fund at https://www.profunds.com/literature/profunds-variable-products. You can also request this information by contacting us at 888-776-3637.
What were the Fund’s costs for the last 6 months?
(based on a hypothetical $10,000 investment)
| Fund Name | Costs of a $10,000 investment | Costs paid as a percentage of a $10,000 investment |
|---|---|---|
| ProFund VP Nasdaq-100 | $90 | 1.68% |
Average Annual Total Returns*
| 6 months | 1 Year | 5 years | 10 years | |
|---|---|---|---|---|
| Fund NAV | 16.36% | 28.26% | 19.22% | 16.50% |
Nasdaq-100® Index | 17.47 | 30.77 | 21.77 | 18.92 |
Fund Statistics
| Net Assets | $169,071,434 |
| Number of Holdings** | 108 |
| Portfolio Turnover* | 2% |
* Not annualized for periods less than one year.
** No. of Holdings excludes derivatives and collateral for securities loaned.
Market Exposure Footnote Reference
| Investment Type | % of Net Assets |
|---|---|
| Equity Securities | 68% |
| Futures Contracts | 11% |
| Swap Agreements | 22% |
| Total | 101% |
| Footnote | Description |
Footnote | "Market Exposure” includes the value of total investments (including the contract value of any derivatives) and excludes any instruments used for cash management or collateral for securities loaned. |
Nasdaq-100® Index – Composition

| Value | Value |
|---|---|
| Other | 7% |
| Consumer Staples | 6% |
| Health Care | 6% |
| Consumer Discretionary | 13% |
| Communication Services | 16% |
| Information Technology | 52% |
Largest Equity Holdings
| Company | % of Net Assets |
|---|---|
| Microsoft Corp. | 5.9% |
| Apple, Inc. | 5.7% |
| NVIDIA Corp. | 5.4% |
| Alphabet, Inc. | 3.7% |
| Amazon.com, Inc. | 3.5% |
"QQQ®", "Nasdaq-100 Index®" and "Nasdaq-100®" are registered trademarks of The Nasdaq OMX Group Inc. and have been licensed for use by ProFunds. This Fund is not sponsored, endorsed, sold or promoted by The Nasdaq OMX Group Inc. and The Nasdaq OMX Group Inc. makes no representation regarding the advisability of investing in ProFunds.
Additional information about the Fund including the Financial Statements, Prospectus and Statement of Additional Information is available:

On the Fund's website, https://www.profunds.com, or upon request, by calling 888-776-3637

Fund Overview
This Semi-annual shareholder report contains important information about the Fund for the period of January 1, 2024 to June 30, 2024. You can find additional information about the Fund at https://www.profunds.com/literature/profunds-variable-products. You can also request this information by contacting us at 888-776-3637.
What were the Fund’s costs for the last 6 months?
(based on a hypothetical $10,000 investment)
| Fund Name | Costs of a $10,000 investment | Costs paid as a percentage of a $10,000 investment |
|---|---|---|
| ProFund VP Pharmaceuticals | $82 | 1.68% |
Average Annual Total Returns*
| 6 months | 1 Year | 5 years | 10 years | |
|---|---|---|---|---|
| Fund NAV | (4.17)% | (2.87)% | 2.48% | 3.04% |
| S&P Total Market Index | 13.61 | 23.20 | 14.04 | 12.08 |
| S&P Pharmaceuticals Select Industry Index | (3.49) | (1.52) | 1.11 | (0.62) |
S&P 500® Index | 15.29 | 24.56 | 15.05 | 12.86 |
Fund Statistics
| Net Assets | $9,394,674 |
| Number of Holdings** | 49 |
| Portfolio Turnover* | 65% |
* Not annualized for periods less than one year.
** No. of Holdings excludes derivatives and collateral for securities loaned.
Market Exposure Footnote Reference
| Investment Type | % of Net Assets |
|---|---|
| Equity Securities | 99% |
| Swap Agreements | 2% |
| Total | 101% |
| Footnote | Description |
Footnote | "Market Exposure” includes the value of total investments (including the contract value of any derivatives) and excludes any instruments used for cash management or collateral for securities loaned. |
S&P Pharmaceuticals Select Industry Index – Composition
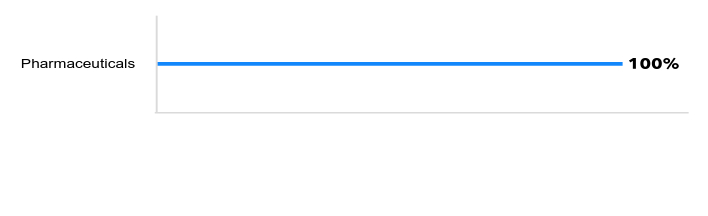
| Value | Value |
|---|---|
| Pharmaceuticals | 100% |
Largest Equity Holdings
| Company | % of Net Assets |
|---|---|
| Axsome Therapeutics, Inc. | 4.2% |
| Viatris, Inc. | 4.0% |
| Eli Lilly & Co. | 4.0% |
| Zoetis, Inc. | 3.9% |
| Pfizer, Inc. | 3.9% |
"Standard & Poor's®", "S&P®" and "S&P Pharmaceuticals Select Industry Index" are trademarks of Standard & Poor's Financial Services LLC ("S&P") and have been licensed for use by ProFunds. This Fund is not sponsored, licensed, sold or promoted by Standard & Poor's and Standard & Poor's makes no representation regarding the advisability of investing in ProFunds.
Additional information about the Fund including the Financial Statements, Prospectus and Statement of Additional Information is available:

On the Fund's website, https://www.profunds.com, or upon request, by calling 888-776-3637

Fund Overview
This Semi-annual shareholder report contains important information about the Fund for the period of January 1, 2024 to June 30, 2024. You can find additional information about the Fund at https://www.profunds.com/literature/profunds-variable-products. You can also request this information by contacting us at 888-776-3637.
What were the Fund’s costs for the last 6 months?
(based on a hypothetical $10,000 investment)
| Fund Name | Costs of a $10,000 investment | Costs paid as a percentage of a $10,000 investment |
|---|---|---|
| ProFund VP Precious Metals | $87 | 1.68% |
Average Annual Total Returns*
| 6 months | 1 Year | 5 years | 10 years | |
|---|---|---|---|---|
| Fund NAV | 7.11% | 9.44% | 5.71% | 0.18% |
S&P 500® Index | 15.29 | 24.56 | 15.05 | 12.86 |
| Dow Jones Precious Metals Index | 8.56 | 12.41 | 8.49 | 2.79 |
Fund Statistics
| Net Assets | $30,234,128 |
| Number of Holdings** | 6 |
| Portfolio Turnover* | -% |
* Not annualized for periods less than one year.
** No. of Holdings excludes derivatives and collateral for securities loaned.
Market Exposure Footnote Reference
| Investment Type | % of Net Assets |
|---|---|
| Swap Agreements | 100% |
| Total | 100% |
| Footnote | Description |
Footnote | "Market Exposure” includes the value of total investments (including the contract value of any derivatives) and excludes any instruments used for cash management. |
Dow Jones Precious Metals Index – Composition
| Value | Value |
|---|---|
| Precious Metals & Minerals | 2% |
| Silver | 6% |
| Gold | 92% |
Holdings
| The ProFund VP Precious Metals primarily invests in non-equity securities, which may include: swap agreements, futures contracts, repurchase agreements and U.S. Government securities. |
"The Dow 30SM" and "Dow Jones Industrial Average" are products of "Dow Jones Indexes", the marketing name and a licensed trademark of CME Group Index Services LLC ("CME Indexes"). "Dow Jones®", "DJ", "Dow Jones Indexes", "The Dow 30" and "Dow Jones Precious MetalsSM Index" are service marks of Dow Jones Trademark Holdings, LLC ("Dow Jones") and have been licensed to CME Indexes and sublicensed to ProFunds. ProFunds have not been passed on by CME Indexes or Dow Jones as to their legality or suitability. ProFunds based on The Dow 30 are not sponsored, endorsed, sold or promoted by CME Indexes or Dow Jones, and they make no representation regarding the advisability of investing in ProFunds.
Additional information about the Fund including the Financial Statements, Prospectus and Statement of Additional Information is available:

On the Fund's website, https://www.profunds.com, or upon request, by calling 888-776-3637

Fund Overview
This Semi-annual shareholder report contains important information about the Fund for the period of January 1, 2024 to June 30, 2024. You can find additional information about the Fund at https://www.profunds.com/literature/profunds-variable-products. You can also request this information by contacting us at 888-776-3637.
What were the Fund’s costs for the last 6 months?
(based on a hypothetical $10,000 investment)
| Fund Name | Costs of a $10,000 investment | Costs paid as a percentage of a $10,000 investment |
|---|---|---|
| ProFund VP Real Estate | $82 | 1.68% |
Average Annual Total Returns*
| 6 months | 1 Year | 5 years | 10 years | |
|---|---|---|---|---|
| Fund NAV | (3.16)% | 3.88% | 1.45% | 4.05% |
S&P 500® Index | 15.29 | 24.56 | 15.05 | 12.86 |
| S&P Real Estate Select Sector Index | (2.45) | 5.60 | 4.42 | 7.02 |
Fund Statistics
| Net Assets | $6,128,523 |
| Number of Holdings** | 38 |
| Portfolio Turnover* | 28% |
* Not annualized for periods less than one year.
** No. of Holdings excludes derivatives and collateral for securities loaned.
Market Exposure Footnote Reference
| Investment Type | % of Net Assets |
|---|---|
| Equity Securities | 99% |
| Swap Agreements | 1% |
| Total | 100% |
| Footnote | Description |
Footnote | "Market Exposure” includes the value of total investments (including the contract value of any derivatives) and excludes any instruments used for cash management. |
S&P Real Estate Select Sector Index – Composition
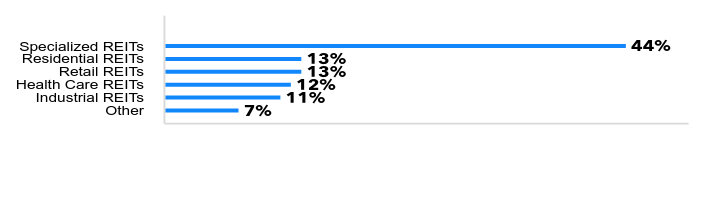
| Value | Value |
|---|---|
| Other | 7% |
| Industrial REITs | 11% |
| Health Care REITs | 12% |
| Retail REITs | 13% |
| Residential REITs | 13% |
| Specialized REITs | 44% |
Largest Equity Holdings
| Company | % of Net Assets |
|---|---|
| Prologis, Inc. | 10.4% |
| American Tower Corp. | 9.1% |
| Equinix, Inc. | 7.2% |
| Welltower, Inc. | 6.2% |
| Simon Property Group, Inc. | 4.9% |
"Standard & Poor's®", "S&P®" and "S&P Real Estate Select Sector Index" are trademarks of Standard & Poor's Financial Services LLC ("S&P") and have been licensed for use by ProFunds. This Fund is not sponsored, licensed, sold or promoted by Standard & Poor's and Standard & Poor's makes no representation regarding the advisability of investing in ProFunds.
Additional information about the Fund including the Financial Statements, Prospectus and Statement of Additional Information is available:

On the Fund's website, https://www.profunds.com, or upon request, by calling 888-776-3637

Fund Overview
This Semi-annual shareholder report contains important information about the Fund for the period of January 1, 2024 to June 30, 2024. You can find additional information about the Fund at https://www.profunds.com/literature/profunds-variable-products. You can also request this information by contacting us at 888-776-3637.
What were the Fund’s costs for the last 6 months?
(based on a hypothetical $10,000 investment)
| Fund Name | Costs of a $10,000 investment | Costs paid as a percentage of a $10,000 investment |
|---|---|---|
| ProFund VP Rising Rates Opportunity | $88 | 1.66% |
Average Annual Total Returns*
| 6 months | 1 Year | 5 years | 10 years | |
|---|---|---|---|---|
| Fund NAV | 12.27% | 17.63% | 4.58% | (2.46)% |
| ICE U.S. Treasury Core Bond Index | (0.73) | 1.53 | (0.65) | 0.91 |
| S&P U.S. Treasury Bond Current 30-Year Total Return Index | (6.20) | (7.70) | (5.60) | (0.02) |
Fund Statistics
| Net Assets | $8,674,103 |
| Number of Holdings** | 6 |
| Portfolio Turnover* | -% |
* Not annualized for periods less than one year.
** No. of Holdings excludes derivatives and collateral for securities loaned.
Market Exposure Footnote Reference
| Investment Type | % of Net Assets |
|---|---|
| Swap Agreements | (124)% |
| Total | (124)% |
| Footnote | Description |
Footnote | "Market Exposure” includes the value of total investments (including the contract value of any derivatives) and excludes any instruments used for cash management. |
Holdings
| The ProFund VP Rising Rates Opportunity primarily invests in non-equity securities, which may include: swap agreements, futures contracts, repurchase agreements and U.S. Government securities. |
.
Additional information about the Fund including the Financial Statements, Prospectus and Statement of Additional Information is available:

On the Fund's website, https://www.profunds.com, or upon request, by calling 888-776-3637

Fund Overview
This Semi-annual shareholder report contains important information about the Fund for the period of January 1, 2024 to June 30, 2024. You can find additional information about the Fund at https://www.profunds.com/literature/profunds-variable-products. You can also request this information by contacting us at 888-776-3637.
What were the Fund’s costs for the last 6 months?
(based on a hypothetical $10,000 investment)
| Fund Name | Costs of a $10,000 investment | Costs paid as a percentage of a $10,000 investment |
|---|---|---|
| ProFund VP Semiconductor | $111 | 1.68% |
Average Annual Total Returns*
| 6 months | 1 Year | 5 years | 10 years | |
|---|---|---|---|---|
| Fund NAV | 66.82% | 94.65% | 40.05% | 27.13% |
S&P 500® Index | 15.29 | 24.56 | 15.05 | 12.86 |
| Dow Jones U.S. Semiconductors Index | 68.39 | 98.17 | 42.46 | 29.39 |
Fund Statistics
| Net Assets | $93,221,257 |
| Number of Holdings** | 40 |
| Portfolio Turnover* | 118% |
* Not annualized for periods less than one year.
** No. of Holdings excludes derivatives and collateral for securities loaned.
Market Exposure Footnote Reference
| Investment Type | % of Net Assets |
|---|---|
| Equity Securities | 45% |
| Swap Agreements | 55% |
| Total | 100% |
| Footnote | Description |
Footnote | "Market Exposure” includes the value of total investments (including the contract value of any derivatives) and excludes any instruments used for cash management or collateral for securities loaned. |
Dow Jones U.S. Semiconductors Index – Composition

| Value | Value |
|---|---|
| Semiconductors & Semiconductor Equipment | 100% |
Largest Equity Holdings
| Company | % of Net Assets |
|---|---|
| NVIDIA Corp. | 24.0% |
| Broadcom, Inc. | 5.5% |
| Advanced Micro Devices, Inc. | 2.1% |
| QUALCOMM, Inc. | 1.8% |
| Applied Materials, Inc. | 1.5% |
"The Dow 30SM" and "Dow Jones Industrial Average" are products of "Dow Jones Indexes", the marketing name and a licensed trademark of CME Group Index Services LLC ("CME Indexes"). "Dow Jones®", "DJ", "Dow Jones Indexes", "The Dow 30" and "Dow Jones U.S. SemiconductorsSM Index" are service marks of Dow Jones Trademark Holdings, LLC ("Dow Jones") and have been licensed to CME Indexes and sublicensed to ProFunds. ProFunds have not been passed on by CME Indexes or Dow Jones as to their legality or suitability. ProFunds based on The Dow 30 are not sponsored, endorsed, sold or promoted by CME Indexes or Dow Jones, and they make no representation regarding the advisability of investing in ProFunds.
Additional information about the Fund including the Financial Statements, Prospectus and Statement of Additional Information is available:

On the Fund's website, https://www.profunds.com, or upon request, by calling 888-776-3637

Fund Overview
This Semi-annual shareholder report contains important information about the Fund for the period of January 1, 2024 to June 30, 2024. You can find additional information about the Fund at https://www.profunds.com/literature/profunds-variable-products. You can also request this information by contacting us at 888-776-3637.
What were the Fund’s costs for the last 6 months?
(based on a hypothetical $10,000 investment)
| Fund Name | Costs of a $10,000 investment | Costs paid as a percentage of a $10,000 investment |
|---|---|---|
| ProFund VP Short Dow 30 | $83 | 1.67% |
Average Annual Total Returns*
| 6 months | 1 Year | 5 years | 10 years | |
|---|---|---|---|---|
| Fund NAV | (0.86)% | (7.06)% | (10.75)% | (11.63)% |
S&P 500® Index | 15.29 | 24.56 | 15.05 | 12.86 |
Dow Jones Industrial Average® | 4.79 | 16.02 | 10.33 | 11.30 |
Fund Statistics
| Net Assets | $6,250 |
| Number of Holdings** | 3 |
| Portfolio Turnover* | -% |
* Not annualized for periods less than one year.
** No. of Holdings excludes derivatives and collateral for securities loaned.
Market Exposure Footnote Reference
| Investment Type | % of Net Assets |
|---|---|
| Swap Agreements | (100)% |
| Total | (100)% |
| Footnote | Description |
Footnote | "Market Exposure” includes the value of total investments (including the contract value of any derivatives) and excludes any instruments used for cash management. |
Dow Jones Industrial Average® – Composition
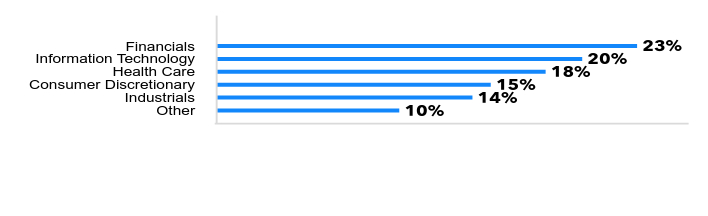
| Value | Value |
|---|---|
| Other | 10% |
| Industrials | 14% |
| Consumer Discretionary | 15% |
| Health Care | 18% |
| Information Technology | 20% |
| Financials | 23% |
Holdings
| The ProFund VP Short Dow 30 primarily invests in non-equity securities, which may include: swap agreements, futures contracts, repurchase agreements and U.S. Government securities. |
"The Dow 30SM" and "Dow Jones Industrial Average" are products of "Dow Jones Indexes", the marketing name and a licensed trademark of CME Group Index Services LLC ("CME Indexes"). "Dow Jones®", "DJ", "Dow Jones Indexes", "The Dow 30" and "Dow Jones Industrial Average" are service marks of Dow Jones Trademark Holdings, LLC ("Dow Jones") and have been licensed to CME Indexes and sublicensed to ProFunds. ProFunds have not been passed on by CME Indexes or Dow Jones as to their legality or suitability. ProFunds based on The Dow 30 are not sponsored, endorsed, sold or promoted by CME Indexes or Dow Jones, and they make no representation regarding the advisability of investing in ProFunds.
Additional information about the Fund including the Financial Statements, Prospectus and Statement of Additional Information is available:

On the Fund's website, https://www.profunds.com, or upon request, by calling 888-776-3637

Fund Overview
This Semi-annual shareholder report contains important information about the Fund for the period of January 1, 2024 to June 30, 2024. You can find additional information about the Fund at https://www.profunds.com/literature/profunds-variable-products. You can also request this information by contacting us at 888-776-3637.
What were the Fund’s costs for the last 6 months?
(based on a hypothetical $10,000 investment)
| Fund Name | Costs of a $10,000 investment | Costs paid as a percentage of a $10,000 investment |
|---|---|---|
| ProFund VP Short Emerging Markets | $82 | 1.68% |
Average Annual Total Returns*
| 6 months | 1 Year | 5 years | 10 years | |
|---|---|---|---|---|
| Fund NAV | (3.47)% | (8.88)% | (9.69)% | (8.14)% |
| S&P Global 1200 Index | 12.49 | 20.61 | 12.21 | 9.71 |
S&P® Emerging 50 ADR Index (USD) | 6.51 | 14.93 | 5.14 | 3.89 |
Fund Statistics
| Net Assets | $527,606 |
| Number of Holdings** | 6 |
| Portfolio Turnover* | -% |
* Not annualized for periods less than one year.
** No. of Holdings excludes derivatives and collateral for securities loaned.
Market Exposure Footnote Reference
| Investment Type | % of Net Assets |
|---|---|
| Swap Agreements | (100)% |
| Total | (100)% |
| Footnote | Description |
Footnote | "Market Exposure” includes the value of total investments (including the contract value of any derivatives) and excludes any instruments used for cash management. |
S&P® Emerging 50 ADR Index (USD) – Composition
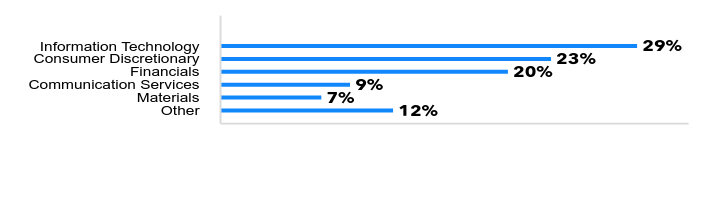
| Value | Value |
|---|---|
| Other | 12% |
| Materials | 7% |
| Communication Services | 9% |
| Financials | 20% |
| Consumer Discretionary | 23% |
| Information Technology | 29% |
Country Composition

| Value | Value |
|---|---|
| Other | 12% |
| Brazil | 13% |
| India | 19% |
| Taiwan | 25% |
| China | 31% |
Holdings
| The ProFund VP Short Emerging Markets primarily invests in non-equity securities, which may include: swap agreements, futures contracts, repurchase agreements and U.S. Government securities. |
"Standard & Poor's®", "S&P®", "S&P 500®" and "S&P Emerging 50 ADR Index" are trademarks of Standard & Poor's Financial Services LLC ("S&P") and have been licensed for use by ProFunds. This Fund is not sponsored, licensed, sold or promoted by Standard & Poor's and Standard & Poor's makes no representation regarding the advisability of investing in ProFunds.
Additional information about the Fund including the Financial Statements, Prospectus and Statement of Additional Information is available:

On the Fund's website, https://www.profunds.com, or upon request, by calling 888-776-3637

Fund Overview
This Semi-annual shareholder report contains important information about the Fund for the period of January 1, 2024 to June 30, 2024. You can find additional information about the Fund at https://www.profunds.com/literature/profunds-variable-products. You can also request this information by contacting us at 888-776-3637.
What were the Fund’s costs for the last 6 months?
(based on a hypothetical $10,000 investment)
| Fund Name | Costs of a $10,000 investment | Costs paid as a percentage of a $10,000 investment |
|---|---|---|
| ProFund VP Short International | $83 | 1.68% |
Average Annual Total Returns*
| 6 months | 1 Year | 5 years | 10 years | |
|---|---|---|---|---|
| Fund NAV | (1.81)% | (3.78)% | (7.77)% | (6.11)% |
| MSCI EAFE Index | 5.34 | 11.54 | 6.46 | 4.33 |
Fund Statistics
| Net Assets | $798,387 |
| Number of Holdings** | 6 |
| Portfolio Turnover* | -% |
* Not annualized for periods less than one year.
** No. of Holdings excludes derivatives and collateral for securities loaned.
Market Exposure Footnote Reference
| Investment Type | % of Net Assets |
|---|---|
| Swap Agreements | (100)% |
| Total | (100)% |
| Footnote | Description |
Footnote | "Market Exposure” includes the value of total investments (including the contract value of any derivatives) and excludes any instruments used for cash management. |
MSCI EAFE Index – Composition

| Value | Value |
|---|---|
| Other | 29% |
| Information Technology | 10% |
| Consumer Discretionary | 11% |
| Health Care | 13% |
| Industrials | 17% |
| Financials | 20% |
Country Composition
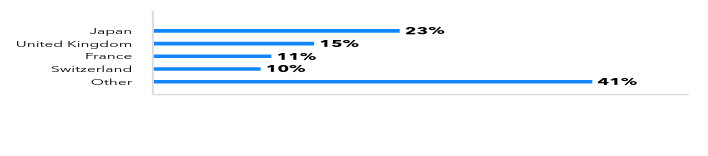
| Value | Value |
|---|---|
| Other | 41% |
| Switzerland | 10% |
| France | 11% |
| United Kingdom | 15% |
| Japan | 23% |
Holdings
| The ProFund VP Short International primarily invests in non-equity securities, which may include: swap agreements, futures contracts, repurchase agreements and U.S. Government securities. |
"MSCI" and "EAFE" are service marks of MSCI and have been licensed for use by ProFunds. This Fund is not sponsored, endorsed, sold or promoted by MSCI and MSCI makes no representation regarding the advisability of investing in ProFunds.
Additional information about the Fund including the Financial Statements, Prospectus and Statement of Additional Information is available:

On the Fund's website, https://www.profunds.com, or upon request, by calling 888-776-3637

Fund Overview
This Semi-annual shareholder report contains important information about the Fund for the period of January 1, 2024 to June 30, 2024. You can find additional information about the Fund at https://www.profunds.com/literature/profunds-variable-products. You can also request this information by contacting us at 888-776-3637.
What were the Fund’s costs for the last 6 months?
(based on a hypothetical $10,000 investment)
| Fund Name | Costs of a $10,000 investment | Costs paid as a percentage of a $10,000 investment |
|---|---|---|
| ProFund VP Short Mid-Cap | $82 | 1.68% |
Average Annual Total Returns*
| 6 months | 1 Year | 5 years | 10 years | |
|---|---|---|---|---|
| Fund NAV | (2.52)% | (5.96)% | (12.85)% | (11.29)% |
S&P Composite 1500® Index | 14.35 | 23.52 | 14.59 | 12.50 |
S&P MidCap 400® | 6.17 | 13.57 | 10.27 | 9.14 |
Fund Statistics
| Net Assets | $75,493 |
| Number of Holdings** | 6 |
| Portfolio Turnover* | -% |
* Not annualized for periods less than one year.
** No. of Holdings excludes derivatives and collateral for securities loaned.
Market Exposure Footnote Reference
| Investment Type | % of Net Assets |
|---|---|
| Swap Agreements | (99)% |
| Total | (99)% |
| Footnote | Description |
Footnote | "Market Exposure” includes the value of total investments (including the contract value of any derivatives) and excludes any instruments used for cash management. |
S&P MidCap 400® – Composition
| Value | Value |
|---|---|
| Other | 28% |
| Health Care | 9% |
| Information Technology | 10% |
| Consumer Discretionary | 15% |
| Financials | 16% |
| Industrials | 22% |
Holdings
| The ProFund VP Short Mid-Cap primarily invests in non-equity securities, which may include: swap agreements, futures contracts, repurchase agreements and U.S. Government securities. |
"Standard & Poor's®", "S&P®" and "S&P MidCap 400®" are trademarks of Standard & Poor's Financial Services LLC ("S&P") and have been licensed for use by ProFunds. This Fund is not sponsored, licensed, sold or promoted by Standard & Poor's and Standard & Poor's makes no representation regarding the advisability of investing in ProFunds.
Additional information about the Fund including the Financial Statements, Prospectus and Statement of Additional Information is available:

On the Fund's website, https://www.profunds.com, or upon request, by calling 888-776-3637

Fund Overview
This Semi-annual shareholder report contains important information about the Fund for the period of January 1, 2024 to June 30, 2024. You can find additional information about the Fund at https://www.profunds.com/literature/profunds-variable-products. You can also request this information by contacting us at 888-776-3637.
What were the Fund’s costs for the last 6 months?
(based on a hypothetical $10,000 investment)
| Fund Name | Costs of a $10,000 investment | Costs paid as a percentage of a $10,000 investment |
|---|---|---|
| ProFund VP Short Nasdaq-100 | $79 | 1.68% |
Average Annual Total Returns*
| 6 months | 1 Year | 5 years | 10 years | |
|---|---|---|---|---|
| Fund NAV | (11.91)% | (18.48)% | (21.31)% | (18.81)% |
Nasdaq-100® Index | 17.47 | 30.77 | 21.77 | 18.92 |
Fund Statistics
| Net Assets | $2,551,293 |
| Number of Holdings** | 6 |
| Portfolio Turnover* | -% |
* Not annualized for periods less than one year.
** No. of Holdings excludes derivatives and collateral for securities loaned.
Market Exposure Footnote Reference
| Investment Type | % of Net Assets |
|---|---|
| Futures Contracts | (16)% |
| Swap Agreements | (84)% |
| Total | (100)% |
| Footnote | Description |
Footnote | "Market Exposure” includes the value of total investments (including the contract value of any derivatives) and excludes any instruments used for cash management. |
Nasdaq-100® Index – Composition

| Value | Value |
|---|---|
| Other | 7% |
| Consumer Staples | 6% |
| Health Care | 6% |
| Consumer Discretionary | 13% |
| Communication Services | 16% |
| Information Technology | 52% |
Holdings
| The ProFund VP Short Nasdaq-100 primarily invests in non-equity securities, which may include: swap agreements, futures contracts, repurchase agreements and U.S. Government securities. |
"QQQ®", "Nasdaq-100 Index®" and "Nasdaq-100®" are registered trademarks of The Nasdaq OMX Group Inc. and have been licensed for use by ProFunds. This Fund is not sponsored, endorsed, sold or promoted by The Nasdaq OMX Group Inc. and The Nasdaq OMX Group Inc. makes no representation regarding the advisability of investing in ProFunds.
Additional information about the Fund including the Financial Statements, Prospectus and Statement of Additional Information is available:

On the Fund's website, https://www.profunds.com, or upon request, by calling 888-776-3637

Fund Overview
This Semi-annual shareholder report contains important information about the Fund for the period of January 1, 2024 to June 30, 2024. You can find additional information about the Fund at https://www.profunds.com/literature/profunds-variable-products. You can also request this information by contacting us at 888-776-3637.
What were the Fund’s costs for the last 6 months?
(based on a hypothetical $10,000 investment)
| Fund Name | Costs of a $10,000 investment | Costs paid as a percentage of a $10,000 investment |
|---|---|---|
| ProFund VP Short Small-Cap | $84 | 1.68% |
Average Annual Total Returns*
| 6 months | 1 Year | 5 years | 10 years | |
|---|---|---|---|---|
| Fund NAV | 0.89% | (4.46)% | (11.55)% | (10.63)% |
Russell 3000® Index | 13.56 | 23.13 | 14.14 | 12.15 |
Russell 2000® Index | 1.73 | 10.06 | 6.94 | 7.00 |
Fund Statistics
| Net Assets | $3,639,563 |
| Number of Holdings** | 6 |
| Portfolio Turnover* | -% |
* Not annualized for periods less than one year.
** No. of Holdings excludes derivatives and collateral for securities loaned.
Market Exposure Footnote Reference
| Investment Type | % of Net Assets |
|---|---|
| Futures Contracts | (6)% |
| Swap Agreements | (94)% |
| Total | (100)% |
| Footnote | Description |
Footnote | "Market Exposure” includes the value of total investments (including the contract value of any derivatives) and excludes any instruments used for cash management. |
Russell 2000® Index – Composition

| Value | Value |
|---|---|
| Other | 27% |
| Consumer Discretionary | 10% |
| Health Care | 15% |
| Information Technology | 15% |
| Financials | 16% |
| Industrials | 17% |
Holdings
| The ProFund VP Short Small-Cap primarily invests in non-equity securities, which may include: swap agreements, futures contracts, repurchase agreements and U.S. Government securities. |
"Russell 2000®" and "Russell©" are trademarks of Russell Investment Group ("Russell") and have been licensed for use by ProFunds. This Fund is not sponsored, endorsed, sold or promoted by Russell Investments and Russell Investments makes no representation regarding the advisability of investing in ProFunds.
Additional information about the Fund including the Financial Statements, Prospectus and Statement of Additional Information is available:

On the Fund's website, https://www.profunds.com, or upon request, by calling 888-776-3637

Fund Overview
This Semi-annual shareholder report contains important information about the Fund for the period of January 1, 2024 to June 30, 2024. You can find additional information about the Fund at https://www.profunds.com/literature/profunds-variable-products. You can also request this information by contacting us at 888-776-3637.
What were the Fund’s costs for the last 6 months?
(based on a hypothetical $10,000 investment)
| Fund Name | Costs of a $10,000 investment | Costs paid as a percentage of a $10,000 investment |
|---|---|---|
| ProFund VP Small-Cap | $84 | 1.68% |
Average Annual Total Returns*
| 6 months | 1 Year | 5 years | 10 years | |
|---|---|---|---|---|
| Fund NAV | 0.79% | 8.07% | 4.96% | 5.01% |
Russell 3000® Index | 13.56 | 23.13 | 14.14 | 12.15 |
Russell 2000® Index | 1.73 | 10.06 | 6.94 | 7.00 |
Fund Statistics
| Net Assets | $7,227,359 |
| Number of Holdings** | 1,995 |
| Portfolio Turnover* | 10% |
* Not annualized for periods less than one year.
** No. of Holdings excludes derivatives and collateral for securities loaned.
Market Exposure Footnote Reference
| Investment Type | % of Net Assets |
|---|---|
| Equity Securities | 85% |
| Futures Contracts | 6% |
| Swap Agreements | 9% |
| Total | 100% |
| Footnote | Description |
Footnote | "Market Exposure” includes the value of total investments (including the contract value of any derivatives) and excludes any instruments used for cash management or collateral for securities loaned. |
Russell 2000® Index – Composition
| Value | Value |
|---|---|
| Other | 27% |
| Consumer Discretionary | 10% |
| Health Care | 15% |
| Information Technology | 15% |
| Financials | 16% |
| Industrials | 17% |
Largest Equity Holdings
| Company | % of Net Assets |
|---|---|
| Insmed, Inc. | 0.4% |
| FTAI Aviation, Ltd. | 0.4% |
| Abercrombie & Fitch Co. | 0.3% |
| Fabrinet | 0.3% |
| Sprouts Farmers Market, Inc. | 0.3% |
"Russell 2000®" and "Russell©" are trademarks of Russell Investment Group ("Russell") and have been licensed for use by ProFunds. This Fund is not sponsored, endorsed, sold or promoted by Russell Investments and Russell Investments makes no representation regarding the advisability of investing in ProFunds.
Additional information about the Fund including the Financial Statements, Prospectus and Statement of Additional Information is available:

On the Fund's website, https://www.profunds.com, or upon request, by calling 888-776-3637

Fund Overview
This Semi-annual shareholder report contains important information about the Fund for the period of January 1, 2024 to June 30, 2024. You can find additional information about the Fund at https://www.profunds.com/literature/profunds-variable-products. You can also request this information by contacting us at 888-776-3637.
What were the Fund’s costs for the last 6 months?
(based on a hypothetical $10,000 investment)
| Fund Name | Costs of a $10,000 investment | Costs paid as a percentage of a $10,000 investment |
|---|---|---|
| ProFund VP Small-Cap Growth | $85 | 1.68% |
Average Annual Total Returns*
| 6 months | 1 Year | 5 years | 10 years | |
|---|---|---|---|---|
| Fund NAV | 2.48% | 11.13% | 6.52% | 7.30% |
S&P Composite 1500® Index | 14.35 | 23.52 | 14.59 | 12.50 |
S&P Small Cap 600® Growth Index | 3.30 | 13.03 | 8.34 | 9.11 |
Fund Statistics
| Net Assets | $15,633,322 |
| Number of Holdings** | 353 |
| Portfolio Turnover* | 25% |
* Not annualized for periods less than one year.
** No. of Holdings excludes derivatives and collateral for securities loaned.
Market Exposure Footnote Reference
| Investment Type | % of Net Assets |
|---|---|
| Equity Securities | 100% |
| Total | 100% |
| Footnote | Description |
Footnote | "Market Exposure” includes the value of total investments (including the contract value of any derivatives) and excludes any instruments used for cash management or collateral for securities loaned. |
S&P SmallCap 600® Growth Index – Composition
| Value | Value |
|---|---|
| Other | 27% |
| Financials | 11% |
| Health Care | 12% |
| Consumer Discretionary | 16% |
| Information Technology | 16% |
| Industrials | 18% |
Largest Equity Holdings
| Company | % of Net Assets |
|---|---|
| Abercrombie & Fitch Co. | 1.5% |
| Fabrinet | 1.5% |
| The Ensign Group, Inc. | 1.2% |
| SPS Commerce, Inc. | 1.2% |
| ATI, Inc. | 1.1% |
"Standard & Poor's®", "S&P®" and "S&P SmallCap 600 Growth Index" are trademarks of Standard & Poor's Financial Services LLC ("S&P") and have been licensed for use by ProFunds. This Fund is not sponsored, licensed, sold or promoted by Standard & Poor's and Standard & Poor's makes no representation regarding the advisability of investing in ProFunds.
Additional information about the Fund including the Financial Statements, Prospectus and Statement of Additional Information is available:

On the Fund's website, https://www.profunds.com, or upon request, by calling 888-776-3637

Fund Overview
This Semi-annual shareholder report contains important information about the Fund for the period of January 1, 2024 to June 30, 2024. You can find additional information about the Fund at https://www.profunds.com/literature/profunds-variable-products. You can also request this information by contacting us at 888-776-3637.
What were the Fund’s costs for the last 6 months?
(based on a hypothetical $10,000 investment)
| Fund Name | Costs of a $10,000 investment | Costs paid as a percentage of a $10,000 investment |
|---|---|---|
| ProFund VP Small-Cap Value | $81 | 1.68% |
Average Annual Total Returns*
| 6 months | 1 Year | 5 years | 10 years | |
|---|---|---|---|---|
| Fund NAV | (5.44)% | 2.52% | 5.70% | 5.39% |
S&P Composite 1500® Index | 14.35 | 23.52 | 14.59 | 12.50 |
S&P Small Cap 600® Value Index | (4.72) | 4.20 | 7.42 | 7.18 |
Fund Statistics
| Net Assets | $14,623,374 |
| Number of Holdings** | 467 |
| Portfolio Turnover* | 20% |
* Not annualized for periods less than one year.
** No. of Holdings excludes derivatives and collateral for securities loaned.
Market Exposure Footnote Reference
| Investment Type | % of Net Assets |
|---|---|
| Equity Securities | 100% |
| Total | 100% |
| Footnote | Description |
Footnote | "Market Exposure” includes the value of total investments (including the contract value of any derivatives) and excludes any instruments used for cash management or collateral for securities loaned. |
S&P SmallCap 600® Value Index – Composition
| Value | Value |
|---|---|
| Other | 26% |
| Real Estate | 9% |
| Information Technology | 10% |
| Consumer Discretionary | 12% |
| Industrials | 16% |
| Financials | 27% |
Largest Equity Holdings
| Company | % of Net Assets |
|---|---|
| Comerica, Inc. | 1.1% |
| Robert Half, Inc. | 1.1% |
| Organon & Co. | 0.9% |
| Lincoln National Corp. | 0.9% |
| Mr. Cooper Group, Inc. | 0.9% |
"Standard & Poor's®", "S&P®" and "S&P SmallCap 600 Value Index" are trademarks of Standard & Poor's Financial Services LLC ("S&P") and have been licensed for use by ProFunds. This Fund is not sponsored, licensed, sold or promoted by Standard & Poor's and Standard & Poor's makes no representation regarding the advisability of investing in ProFunds.
Additional information about the Fund including the Financial Statements, Prospectus and Statement of Additional Information is available:

On the Fund's website, https://www.profunds.com, or upon request, by calling 888-776-3637

Fund Overview
This Semi-annual shareholder report contains important information about the Fund for the period of January 1, 2024 to June 30, 2024. You can find additional information about the Fund at https://www.profunds.com/literature/profunds-variable-products. You can also request this information by contacting us at 888-776-3637.
What were the Fund’s costs for the last 6 months?
(based on a hypothetical $10,000 investment)
| Fund Name | Costs of a $10,000 investment | Costs paid as a percentage of a $10,000 investment |
|---|---|---|
| ProFund VP Technology | $89 | 1.65% |
Average Annual Total Returns*
| 6 months | 1 Year | 5 years | 10 years | |
|---|---|---|---|---|
| Fund NAV | 17.06% | 29.06% | 22.19% | 18.64% |
| S&P Total Market Index | 13.61 | 23.20 | 14.04 | 12.08 |
| S&P Technology Select Sector Index | 18.01 | 31.20 | 25.03 | 21.17 |
S&P 500® Index | 15.29 | 24.56 | 15.05 | 12.86 |
Fund Statistics
| Net Assets | $62,722,835 |
| Number of Holdings** | 73 |
| Portfolio Turnover* | 25% |
* Not annualized for periods less than one year.
** No. of Holdings excludes derivatives and collateral for securities loaned.
Market Exposure Footnote Reference
| Investment Type | % of Net Assets |
|---|---|
| Equity Securities | 98% |
| Swap Agreements | 2% |
| Total | 100% |
| Footnote | Description |
Footnote | "Market Exposure” includes the value of total investments (including the contract value of any derivatives) and excludes any instruments used for cash management. |
S&P Technology Select Sector Index – Composition

| Value | Value |
|---|---|
| Technology Hardware & Equipment | 13% |
| Semiconductors & Semiconductor Equipment | 43% |
| Software & Services | 44% |
Largest Equity Holdings
| Company | % of Net Assets |
|---|---|
| Microsoft Corp. | 21.7% |
| NVIDIA Corp. | 19.9% |
| Apple, Inc. | 4.4% |
| Broadcom, Inc. | 4.1% |
| Advanced Micro Devices, Inc. | 2.6% |
"Standard & Poor's®", "S&P®" and "S&P Technology Select Sector Index" are trademarks of Standard & Poor's Financial Services LLC ("S&P") and have been licensed for use by ProFunds. This Fund is not sponsored, licensed, sold or promoted by Standard & Poor's and Standard & Poor's makes no representation regarding the advisability of investing in ProFunds.
Additional information about the Fund including the Financial Statements, Prospectus and Statement of Additional Information is available:

On the Fund's website, https://www.profunds.com, or upon request, by calling 888-776-3637

Fund Overview
This Semi-annual shareholder report contains important information about the Fund for the period of January 1, 2024 to June 30, 2024. You can find additional information about the Fund at https://www.profunds.com/literature/profunds-variable-products. You can also request this information by contacting us at 888-776-3637.
What were the Fund’s costs for the last 6 months?
(based on a hypothetical $10,000 investment)
| Fund Name | Costs of a $10,000 investment | Costs paid as a percentage of a $10,000 investment |
|---|---|---|
| ProFund VP U.S. Government Plus | $66 | 1.38% |
Average Annual Total Returns*
| 6 months | 1 Year | 5 years | 10 years | |
|---|---|---|---|---|
| Fund NAV | (9.07)% | (12.28)% | (9.19)% | (2.18)% |
| ICE U.S. Treasury Core Bond Index | (0.73) | 1.53 | (0.65) | 0.91 |
| S&P U.S. Treasury Bond Current 30-Year Total Return Index | (6.20) | (7.70) | (5.60) | (0.02) |
Fund Statistics
| Net Assets | $6,353,516 |
| Number of Holdings** | 7 |
| Portfolio Turnover* | 203% |
* Not annualized for periods less than one year.
** No. of Holdings excludes derivatives and collateral for securities loaned.
Market Exposure Footnote Reference
| Investment Type | % of Net Assets |
|---|---|
| Swap Agreements | 79% |
| U.S. Treasury Obligations | 45% |
| Total | 124% |
| Footnote | Description |
Footnote | "Market Exposure” includes the value of total investments (including the contract value of any derivatives) and excludes any instruments used for cash management. |
Holdings
| The ProFund VP U.S. Government Plus primarily invests in non-equity securities, which may include: swap agreements, futures contracts, repurchase agreements and U.S. Government securities. |
.
Additional information about the Fund including the Financial Statements, Prospectus and Statement of Additional Information is available:

On the Fund's website, https://www.profunds.com, or upon request, by calling 888-776-3637

Fund Overview
This Semi-annual shareholder report contains important information about the Fund for the period of January 1, 2024 to June 30, 2024. You can find additional information about the Fund at https://www.profunds.com/literature/profunds-variable-products. You can also request this information by contacting us at 888-776-3637.
What were the Fund’s costs for the last 6 months?
(based on a hypothetical $10,000 investment)
| Fund Name | Costs of a $10,000 investment | Costs paid as a percentage of a $10,000 investment |
|---|---|---|
| ProFund VP UltraBull | $95 | 1.68% |
Average Annual Total Returns*
| 6 months | 1 Year | 5 years | 10 years | |
|---|---|---|---|---|
| Fund NAV | 26.99% | 41.46% | 20.39% | 17.77% |
S&P 500® Index | 15.29 | 24.56 | 15.05 | 12.86 |
Fund Statistics
| Net Assets | $17,784,044 |
| Number of Holdings** | 510 |
| Portfolio Turnover* | 32% |
* Not annualized for periods less than one year.
** No. of Holdings excludes derivatives and collateral for securities loaned.
Market Exposure Footnote Reference
| Investment Type | % of Net Assets |
|---|---|
| Equity Securities | 77% |
| Futures Contracts | 11% |
| Swap Agreements | 112% |
| Total | 200% |
| Footnote | Description |
Footnote | "Market Exposure” includes the value of total investments (including the contract value of any derivatives) and excludes any instruments used for cash management. |
S&P 500® Index – Composition
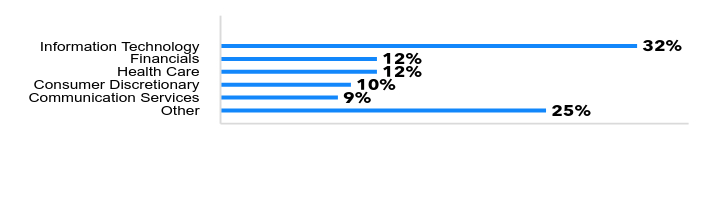
| Value | Value |
|---|---|
| Other | 25% |
| Communication Services | 9% |
| Consumer Discretionary | 10% |
| Health Care | 12% |
| Financials | 12% |
| Information Technology | 32% |
Largest Equity Holdings
| Company | % of Net Assets |
|---|---|
| Microsoft Corp. | 5.6% |
| NVIDIA Corp. | 5.1% |
| Apple, Inc. | 5.1% |
| Alphabet, Inc. | 3.3% |
| Amazon.com, Inc. | 3.0% |
"Standard & Poor's®", "S&P®", "S&P 500®" and "Standard & Poor's 500TM" are trademarks of Standard & Poor's Financial Services LLC ("S&P") and have been licensed for use by ProFunds. This Fund is not sponsored, licensed, sold or promoted by Standard & Poor's and Standard & Poor's makes no representation regarding the advisability of investing in ProFunds.
Additional information about the Fund including the Financial Statements, Prospectus and Statement of Additional Information is available:

On the Fund's website, https://www.profunds.com, or upon request, by calling 888-776-3637

Fund Overview
This Semi-annual shareholder report contains important information about the Fund for the period of January 1, 2024 to June 30, 2024. You can find additional information about the Fund at https://www.profunds.com/literature/profunds-variable-products. You can also request this information by contacting us at 888-776-3637.
What were the Fund’s costs for the last 6 months?
(based on a hypothetical $10,000 investment)
| Fund Name | Costs of a $10,000 investment | Costs paid as a percentage of a $10,000 investment |
|---|---|---|
| ProFund VP UltraMid-Cap | $87 | 1.68% |
Average Annual Total Returns*
| 6 months | 1 Year | 5 years | 10 years | |
|---|---|---|---|---|
| Fund NAV | 7.40% | 16.69% | 8.69% | 9.37% |
S&P Composite 1500® Index | 14.35 | 23.52 | 14.59 | 12.50 |
S&P MidCap 400® | 6.17 | 13.57 | 10.27 | 9.14 |
Fund Statistics
| Net Assets | $10,805,864 |
| Number of Holdings** | 407 |
| Portfolio Turnover* | 16% |
* Not annualized for periods less than one year.
** No. of Holdings excludes derivatives and collateral for securities loaned.
Market Exposure Footnote Reference
| Investment Type | % of Net Assets |
|---|---|
| Equity Securities | 71% |
| Futures Contracts | 11% |
| Swap Agreements | 118% |
| Total | 200% |
| Footnote | Description |
Footnote | "Market Exposure” includes the value of total investments (including the contract value of any derivatives) and excludes any instruments used for cash management or collateral for securities loaned. |
S&P MidCap 400® – Composition

| Value | Value |
|---|---|
| Other | 28% |
| Health Care | 9% |
| Information Technology | 10% |
| Consumer Discretionary | 15% |
| Financials | 16% |
| Industrials | 22% |
Largest Equity Holdings
| Company | % of Net Assets |
|---|---|
| Pure Storage, Inc. | 0.5% |
| Carlisle Cos., Inc. | 0.5% |
| Williams-Sonoma, Inc. | 0.5% |
| Lennox International, Inc. | 0.5% |
| EMCOR Group, Inc. | 0.5% |
"Standard & Poor's®", "S&P®" and "S&P MidCap 400®" are trademarks of Standard & Poor's Financial Services LLC ("S&P") and have been licensed for use by ProFunds. This Fund is not sponsored, licensed, sold or promoted by Standard & Poor's and Standard & Poor's makes no representation regarding the advisability of investing in ProFunds.
Additional information about the Fund including the Financial Statements, Prospectus and Statement of Additional Information is available:

On the Fund's website, https://www.profunds.com, or upon request, by calling 888-776-3637

Fund Overview
This Semi-annual shareholder report contains important information about the Fund for the period of January 1, 2024 to June 30, 2024. You can find additional information about the Fund at https://www.profunds.com/literature/profunds-variable-products. You can also request this information by contacting us at 888-776-3637.
What were the Fund’s costs for the last 6 months?
(based on a hypothetical $10,000 investment)
| Fund Name | Costs of a $10,000 investment | Costs paid as a percentage of a $10,000 investment |
|---|---|---|
| ProFund VP UltraNasdaq-100 | $97 | 1.68% |
Average Annual Total Returns*
| 6 months | 1 Year | 5 years | 10 years | |
|---|---|---|---|---|
| Fund NAV | 31.04% | 54.04% | 31.67% | 28.87% |
Nasdaq-100® Index | 17.47 | 30.77 | 21.77 | 18.92 |
Fund Statistics
| Net Assets | $236,748,256 |
| Number of Holdings** | 108 |
| Portfolio Turnover* | 6% |
* Not annualized for periods less than one year.
** No. of Holdings excludes derivatives and collateral for securities loaned.
Market Exposure Footnote Reference
| Investment Type | % of Net Assets |
|---|---|
| Equity Securities | 69% |
| Futures Contracts | 11% |
| Swap Agreements | 120% |
| Total | 200% |
| Footnote | Description |
Footnote | "Market Exposure” includes the value of total investments (including the contract value of any derivatives) and excludes any instruments used for cash management or collateral for securities loaned. |
Nasdaq-100® Index – Composition

| Value | Value |
|---|---|
| Other | 7% |
| Consumer Staples | 6% |
| Health Care | 6% |
| Consumer Discretionary | 13% |
| Communication Services | 16% |
| Information Technology | 52% |
Largest Equity Holdings
| Company | % of Net Assets |
|---|---|
| Microsoft Corp. | 6.0% |
| Apple, Inc. | 5.8% |
| NVIDIA Corp. | 5.5% |
| Alphabet, Inc. | 3.8% |
| Amazon.com, Inc. | 3.6% |
"QQQ®", "Nasdaq-100 Index®" and "Nasdaq-100®" are registered trademarks of The Nasdaq OMX Group Inc. and have been licensed for use by ProFunds. This Fund is not sponsored, endorsed, sold or promoted by The Nasdaq OMX Group Inc. and The Nasdaq OMX Group Inc. makes no representation regarding the advisability of investing in ProFunds.
Additional information about the Fund including the Financial Statements, Prospectus and Statement of Additional Information is available:

On the Fund's website, https://www.profunds.com, or upon request, by calling 888-776-3637

Fund Overview
This Semi-annual shareholder report contains important information about the Fund for the period of January 1, 2024 to June 30, 2024. You can find additional information about the Fund at https://www.profunds.com/literature/profunds-variable-products. You can also request this information by contacting us at 888-776-3637.
What were the Fund’s costs for the last 6 months?
(based on a hypothetical $10,000 investment)
| Fund Name | Costs of a $10,000 investment | Costs paid as a percentage of a $10,000 investment |
|---|---|---|
| ProFund VP UltraShort Dow 30 | $68 | 1.40% |
Average Annual Total Returns*
| 6 months | 1 Year | 5 years | 10 years | |
|---|---|---|---|---|
| Fund NAV | (4.15)% | (17.56)% | (24.37)% | (24.68)% |
S&P 500® Index | 15.29 | 24.56 | 15.05 | 12.86 |
Dow Jones Industrial Average® | 4.79 | 16.02 | 10.33 | 11.30 |
Fund Statistics
| Net Assets | $3,135 |
| Number of Holdings** | 1 |
| Portfolio Turnover* | -% |
* Not annualized for periods less than one year.
** No. of Holdings excludes derivatives and collateral for securities loaned.
Market Exposure Footnote Reference
| Investment Type | % of Net Assets |
|---|---|
| Swap Agreements | (199)% |
| Total | (199)% |
| Footnote | Description |
Footnote | "Market Exposure” includes the value of total investments (including the contract value of any derivatives) and excludes any instruments used for cash management. |
Dow Jones Industrial Average® – Composition

| Value | Value |
|---|---|
| Other | 10% |
| Industrials | 14% |
| Consumer Discretionary | 15% |
| Health Care | 18% |
| Information Technology | 20% |
| Financials | 23% |
Holdings
| The ProFund VP UltraShort Dow 30 primarily invests in non-equity securities, which may include: swap agreements, futures contracts, repurchase agreements and U.S. Government securities. |
"The Dow 30SM" and "Dow Jones Industrial Average" are products of "Dow Jones Indexes", the marketing name and a licensed trademark of CME Group Index Services LLC ("CME Indexes"). "Dow Jones®", "DJ", "Dow Jones Indexes", "The Dow 30" and "Dow Jones Industrial Average" are service marks of Dow Jones Trademark Holdings, LLC ("Dow Jones") and have been licensed to CME Indexes and sublicensed to ProFunds. ProFunds have not been passed on by CME Indexes or Dow Jones as to their legality or suitability. ProFunds based on The Dow 30 are not sponsored, endorsed, sold or promoted by CME Indexes or Dow Jones, and they make no representation regarding the advisability of investing in ProFunds.
Additional information about the Fund including the Financial Statements, Prospectus and Statement of Additional Information is available:

On the Fund's website, https://www.profunds.com, or upon request, by calling 888-776-3637

Fund Overview
This Semi-annual shareholder report contains important information about the Fund for the period of January 1, 2024 to June 30, 2024. You can find additional information about the Fund at https://www.profunds.com/literature/profunds-variable-products. You can also request this information by contacting us at 888-776-3637.
What were the Fund’s costs for the last 6 months?
(based on a hypothetical $10,000 investment)
| Fund Name | Costs of a $10,000 investment | Costs paid as a percentage of a $10,000 investment |
|---|---|---|
| ProFund VP UltraShort Nasdaq-100 | $73 | 1.68% |
Average Annual Total Returns*
| 6 months | 1 Year | 5 years | 10 years | |
|---|---|---|---|---|
| Fund NAV | (24.94)% | (37.98)% | (42.76)% | (37.53)% |
Nasdaq-100® Index | 17.47 | 30.77 | 21.77 | 18.92 |
Fund Statistics
| Net Assets | $1,604,930 |
| Number of Holdings** | 6 |
| Portfolio Turnover* | -% |
* Not annualized for periods less than one year.
** No. of Holdings excludes derivatives and collateral for securities loaned.
Market Exposure Footnote Reference
| Investment Type | % of Net Assets |
|---|---|
| Swap Agreements | (200)% |
| Total | (200)% |
| Footnote | Description |
Footnote | "Market Exposure” includes the value of total investments (including the contract value of any derivatives) and excludes any instruments used for cash management. |
Nasdaq-100® Index – Composition

| Value | Value |
|---|---|
| Other | 7% |
| Consumer Staples | 6% |
| Health Care | 6% |
| Consumer Discretionary | 13% |
| Communication Services | 16% |
| Information Technology | 52% |
Holdings
| The ProFund VP UltraShort Nasdaq-100 primarily invests in non-equity securities, which may include: swap agreements, futures contracts, repurchase agreements and U.S. Government securities. |
"QQQ®", "Nasdaq-100 Index®" and "Nasdaq-100®" are registered trademarks of The Nasdaq OMX Group Inc. and have been licensed for use by ProFunds. This Fund is not sponsored, endorsed, sold or promoted by The Nasdaq OMX Group Inc. and The Nasdaq OMX Group Inc. makes no representation regarding the advisability of investing in ProFunds.
Additional information about the Fund including the Financial Statements, Prospectus and Statement of Additional Information is available:

On the Fund's website, https://www.profunds.com, or upon request, by calling 888-776-3637

Fund Overview
This Semi-annual shareholder report contains important information about the Fund for the period of January 1, 2024 to June 30, 2024. You can find additional information about the Fund at https://www.profunds.com/literature/profunds-variable-products. You can also request this information by contacting us at 888-776-3637.
What were the Fund’s costs for the last 6 months?
(based on a hypothetical $10,000 investment)
| Fund Name | Costs of a $10,000 investment | Costs paid as a percentage of a $10,000 investment |
|---|---|---|
| ProFund VP UltraSmall-Cap | $83 | 1.68% |
Average Annual Total Returns*
| 6 months | 1 Year | 5 years | 10 years | |
|---|---|---|---|---|
| Fund NAV | (1.94)% | 8.51% | 1.63% | 4.83% |
Russell 3000® Index | 13.56 | 23.13 | 14.14 | 12.15 |
Russell 2000® Index | 1.73 | 10.06 | 6.94 | 7.00 |
Fund Statistics
| Net Assets | $12,898,659 |
| Number of Holdings** | 1,996 |
| Portfolio Turnover* | 20% |
* Not annualized for periods less than one year.
** No. of Holdings excludes derivatives and collateral for securities loaned.
Market Exposure Footnote Reference
| Investment Type | % of Net Assets |
|---|---|
| Equity Securities | 73% |
| Futures Contracts | 14% |
| Swap Agreements | 113% |
| Total | 200% |
| Footnote | Description |
Footnote | "Market Exposure” includes the value of total investments (including the contract value of any derivatives) and excludes any instruments used for cash management or collateral for securities loaned. |
Russell 2000® Index – Composition

| Value | Value |
|---|---|
| Other | 27% |
| Consumer Discretionary | 10% |
| Health Care | 15% |
| Information Technology | 15% |
| Financials | 16% |
| Industrials | 17% |
Largest Equity Holdings
| Company | % of Net Assets |
|---|---|
| Insmed, Inc. | 0.3% |
| FTAI Aviation, Ltd. | 0.3% |
| Abercrombie & Fitch Co. | 0.3% |
| Fabrinet | 0.3% |
| Sprouts Farmers Market, Inc. | 0.2% |
"Russell 2000®" and "Russell©" are trademarks of Russell Investment Group ("Russell") and have been licensed for use by ProFunds. This Fund is not sponsored, endorsed, sold or promoted by Russell Investments and Russell Investments makes no representation regarding the advisability of investing in ProFunds.
Additional information about the Fund including the Financial Statements, Prospectus and Statement of Additional Information is available:

On the Fund's website, https://www.profunds.com, or upon request, by calling 888-776-3637

Fund Overview
This Semi-annual shareholder report contains important information about the Fund for the period of January 1, 2024 to June 30, 2024. You can find additional information about the Fund at https://www.profunds.com/literature/profunds-variable-products. You can also request this information by contacting us at 888-776-3637.
What were the Fund’s costs for the last 6 months?
(based on a hypothetical $10,000 investment)
| Fund Name | Costs of a $10,000 investment | Costs paid as a percentage of a $10,000 investment |
|---|---|---|
| ProFund VP Utilities | $87 | 1.68% |
Average Annual Total Returns*
| 6 months | 1 Year | 5 years | 10 years | |
|---|---|---|---|---|
| Fund NAV | 8.51% | 6.01% | 3.81% | 6.07% |
| S&P Total Market Index | 13.61 | 23.20 | 14.04 | 12.08 |
| S&P Utilities Select Sector Index | 9.44 | 7.82 | 6.12 | 8.05 |
S&P 500® Index | 15.29 | 24.56 | 15.05 | 12.86 |
Fund Statistics
| Net Assets | $28,892,247 |
| Number of Holdings** | 37 |
| Portfolio Turnover* | 54% |
* Not annualized for periods less than one year.
** No. of Holdings excludes derivatives and collateral for securities loaned.
Market Exposure Footnote Reference
| Investment Type | % of Net Assets |
|---|---|
| Equity Securities | 97% |
| Swap Agreements | 2% |
| Total | 99% |
| Footnote | Description |
Footnote | "Market Exposure” includes the value of total investments (including the contract value of any derivatives) and excludes any instruments used for cash management. |
S&P Utilities Select Sector Index – Composition
| Value | Value |
|---|---|
| Gas Utilities | 2% |
| Water Utilities | 2% |
| Independent Power and Renewable Electricity Producers | 4% |
| Multi-Utilities | 26% |
| Electric Utilities | 66% |
Largest Equity Holdings
| Company | % of Net Assets |
|---|---|
| NextEra Energy, Inc. | 13.7% |
| The Southern Co. | 8.0% |
| Duke Energy Corp. | 7.3% |
| Constellation Energy Corp. | 5.9% |
| Sempra | 4.5% |
"Standard & Poor's®", "S&P®", "S&P 500®" and "S&P Utilities Select Sector Index" are trademarks of Standard & Poor's Financial Services LLC ("S&P") and have been licensed for use by ProFunds. This Fund is not sponsored, licensed, sold or promoted by Standard & Poor's and Standard & Poor's makes no representation regarding the advisability of investing in ProFunds.
Additional information about the Fund including the Financial Statements, Prospectus and Statement of Additional Information is available:

On the Fund's website, https://www.profunds.com, or upon request, by calling 888-776-3637
| (b) | Include a copy of each notice transmitted to stockholders in reliance on Rule 30e-3 under the Act (17 CFR 270.30e-3) that contains disclosures specified by paragraph (c)(3) of that rule. |
Not applicable
Item 2. Code of Ethics.
Not applicable – only for annual reports.
Item 3. Audit Committee Financial Expert.
Not applicable – only for annual reports.
Item 4. Principal Accountant Fees and Services.
Not applicable – only for annual reports.
Item 5. Audit Committee of Listed Registrants.
Not applicable.
Item 6. Investments.
| (a) | The Schedule of Investments in Securities of unaffiliated issuers is included as part of the Financial Statements filed under Item 7(a) of this Form. | |
| (b) | Not applicable. |
Item 7. Financial Statements and Financial Highlights for Open-End Management Investment Companies.
(a)

Semiannual Financial Statements and Other Information
JUNE 30, 2024
Government Money Market ProFund
Table of Contents
1 | |||||||
| 3 | |||||||
| 7 | |||||||
| 13 | |||||||
| 15 | |||||||
Receive investor materials electronically:
Shareholders may sign up for electronic delivery of investor materials. By doing so, you will receive the information faster and help us reduce the impact on the environment of providing these materials. To enroll in electronic delivery,
1. Go to www.icsdelivery.com
2. Select the first letter of your brokerage firm's name.
3. From the list that follows, select your brokerage firm. If your brokerage firm is not listed, electronic delivery may not be available. Please contact your brokerage firm.
4. Complete the information requested, including the e-mail address where you would like to receive notifications for electronic documents.
Your information will be kept confidential and will not be used for any purpose other than electronic delivery. If you change your mind, you can cancel electronic delivery at any time and revert to physical delivery of your materials. Just go to www.icsdelivery.com, perform the first three steps above, and follow the instructions for cancelling electronic delivery. If you have any questions, please contact your brokerage firm.
This Page Intentionally Left Blank

Dear Shareholder:
Market and investor sentiment generally turned positive over the reporting period, though lingering concerns about inflation, the timing of potential rate cuts, and geopolitics continued to weigh on investors. ProFunds remains committed to providing you, our investors, an innovative array of products and services designed to help achieve your investment objectives under a range of conditions. Following is the Government Money Market ProFund Annual Report to Shareholders for the six months ended June 30, 2024.
The Government Money Market ProFund invests substantially all of its assets in the Government Cash Management Portfolio, a separate investment company managed by DWS Investment Management Americas, Inc.
Money market rates held steady at 5.3% during the period, tracking the target of the Federal Funds Rate.
Interest Rates Remained High Amid Moderate Inflation
Combating elevated inflation and continuing to avoid a recession dominated much of U.S. economic policymaking during the period. The Federal Reserve last increased short-term rates during the middle of 2023, to a target range of 5.25% to 5.5%, and they have been unchanged since. With the Fed Funds Rate steady, inflationary pressures moderated somewhat, but inflation remained stubbornly elevated above the Federal Reserve's 2% target. As a result, rate cuts that were expected going into the reporting period did not materialize, but they are anticipated at the next Federal Open Markets Committee (FOMC) meeting in September.
While the U.S. economy has continued to demonstrate resilience, conditions seemed to cool over the reporting
period. Strong GDP growth in the second half of 2023 moderated heading into 2024, with real GDP growth coming in at 1.4% in the first quarter. The U.S. unemployment rate also rose slightly over the reporting period, ticking up to 4.1% in June. The dollar appreciated somewhat, with the Bloomberg Dollar Spot Index increasing by 4.7%.
Government Money Market ProFund
In an environment of elevated but moderating inflation and high interest rates, the Government Money Market ProFund continued to achieve its objective of maintaining a stable net asset value of $1.00 per share per investor. The fund potentially benefits investors by seeking a higher level of current income consistent with liquidity and capital preservation. It also serves investors as a vehicle for moving money between ProFunds products or for holding assets until they are ready to invest. Over the past six months, thanks to elevated interest rates, the Government Money Market ProFund provided investors who parked cash in the fund with a modest return of 2.4% (4.9% annualized), which is meaningfully above the fund's historical average.
We thank you for the trust and confidence you have placed in us by using the Government Money Market ProFund, and we appreciate the opportunity to continue serving your investment needs.
Sincerely,

Michael L. Sapir
Chairman of the Board of Trustees
1
This Page Intentionally Left Blank
4 :: Government Money Market ProFund :: Financial Statements
Statement of Assets and Liabilities (unaudited)
June 30, 2024
ASSETS: | |||||||
| Investment in Government Cash Management Portfolio, at value | $ | 174,198,686 | |||||
Receivable for capital shares issued | 9,053,769 | ||||||
Prepaid expenses | 39,633 | ||||||
TOTAL ASSETS | 183,292,088 | ||||||
LIABILITIES: | |||||||
Distributions payable | 9,432 | ||||||
Payable for capital shares redeemed | 10,303,624 | ||||||
Management services fees payable | 62,160 | ||||||
Administration fees payable | 4,094 | ||||||
| Distribution and services fees payable-Service Class | 8,642 | ||||||
Transfer agency fees payable | 33,190 | ||||||
Fund accounting fees payable | 5,000 | ||||||
Compliance services fees payable | 673 | ||||||
Service fees payable | 723 | ||||||
Other accrued expenses | 142,389 | ||||||
TOTAL LIABILITIES | 10,569,927 | ||||||
Commitments and contingencies (Note 4) | |||||||
NET ASSETS | $ | 172,722,161 | |||||
NET ASSETS CONSIST OF: | |||||||
Capital | $ | 172,964,106 | |||||
Total distributable earnings (loss) | (241,945 | ) | |||||
NET ASSETS | $ | 172,722,161 | |||||
INVESTOR CLASS: | |||||||
Net Assets | $ | 162,460,608 | |||||
| Shares of Beneficial Interest Outstanding (unlimited number of shares authorized, no par value) | 162,686,717 | ||||||
| Net Asset Value (offering and redemption price per share) | $ | 1.00 | |||||
SERVICE CLASS: | |||||||
Net Assets | $ | 10,261,553 | |||||
| Shares of Beneficial Interest Outstanding (unlimited number of shares authorized, no par value) | 10,275,713 | ||||||
| Net Asset Value (offering and redemption price per share) | $ | 1.00 | |||||
Statement of Operations (unaudited)
For the Period Ended June 30, 2024
INVESTMENT INCOME: | |||||||
Interest | $ | 4,870,807 | (a) | ||||
Expenses | (106,115 | )(a)(b) | |||||
TOTAL INVESTMENT INCOME | 4,764,692 | ||||||
EXPENSES: | |||||||
Management services fees | 316,668 | ||||||
Administration fees | 25,462 | ||||||
Distribution and services fees-Service Class | 47,041 | ||||||
Transfer agency fees | 100,825 | ||||||
Administrative services fees | 62,019 | ||||||
Registration and filing fees | 53,530 | ||||||
Fund accounting fees | 5,000 | ||||||
Trustee fees | 1,914 | ||||||
Compliance services fees | 412 | ||||||
Service fees | 4,393 | ||||||
Audit fees | 63,705 | ||||||
Other fees | 47,343 | ||||||
| Recoupment of prior expenses reimbursed by the Advisor | 98,595 | ||||||
TOTAL NET EXPENSES | 826,907 | ||||||
NET INVESTMENT INCOME | 3,937,785 | ||||||
REALIZED GAINS (LOSSES) ON INVESTMENTS: | |||||||
Net realized gains (losses) on investment securities | 13,158 | (a) | |||||
| CHANGE IN NET ASSETS RESULTING FROM OPERATIONS | $ | 3,950,943 | |||||
(a) Allocated from Government Cash Management Portfolio.
(b) For period year ended June 30, 2024, the Advisor to the Government Cash Management Portfolio waived fees, of which $16,014 was allocated to the Government Money Market ProFund on a pro-rated basis.
See accompanying notes to the financial statements.
Financial Statements :: Government Money Market ProFund :: 5
Statements of Changes in Net Assets
| Period Ended June 30, 2024 (unaudited) | Year Ended December 31, 2023 | ||||||||||
FROM INVESTMENT ACTIVITIES: | |||||||||||
OPERATIONS: | |||||||||||
Net investment income | $ | 3,937,785 | $ | 7,865,301 | |||||||
Net realized gains (losses) on investments | 13,158 | 4,403 | |||||||||
Change in net assets resulting from operations | 3,950,943 | 7,869,704 | |||||||||
DISTRIBUTIONS TO SHAREHOLDERS: | |||||||||||
Total Distributions | |||||||||||
Investor Class | (3,775,961 | ) | (7,556,580 | ) | |||||||
Service Class | (161,824 | ) | (308,480 | ) | |||||||
Change in net assets resulting from distributions | (3,937,785 | ) | (7,865,060 | ) | |||||||
CAPITAL TRANSACTIONS: | |||||||||||
Proceeds from shares issued | |||||||||||
Investor Class | 1,288,818,697 | 2,348,875,530 | |||||||||
Service Class | 23,960,601 | 47,664,969 | |||||||||
Distributions reinvested | |||||||||||
Investor Class | 3,743,584 | 7,447,969 | |||||||||
Service Class | 161,824 | 307,654 | |||||||||
Value of shares redeemed | |||||||||||
Investor Class | (1,286,404,121 | ) | (2,388,291,722 | ) | |||||||
Service Class | (23,151,290 | ) | (49,374,164 | ) | |||||||
Change in net assets resulting from capital transactions | 7,129,295 | (33,369,764 | ) | ||||||||
Change in net assets | 7,142,453 | (33,365,120 | ) | ||||||||
NET ASSETS: | |||||||||||
Beginning of period | 165,579,708 | 198,944,828 | |||||||||
End of period | $ | 172,722,161 | $ | 165,579,708 | |||||||
SHARE TRANSACTIONS: | |||||||||||
Issued | |||||||||||
Investor Class | 1,288,818,697 | 2,348,875,530 | |||||||||
Service Class | 23,960,601 | 47,664,969 | |||||||||
Reinvested | |||||||||||
Investor Class | 3,743,584 | 7,447,969 | |||||||||
Service Class | 161,824 | 307,654 | |||||||||
Redeemed | |||||||||||
Investor Class | (1,286,404,121 | ) | (2,388,291,722 | ) | |||||||
Service Class | (23,151,290 | ) | (49,374,164 | ) | |||||||
Change in shares | 7,129,295 | (33,369,764 | ) | ||||||||
See accompanying notes to the financial statements.
6 :: Government Money Market ProFund :: Financial Highlights
ProFunds Financial Highlights FOR THE PERIODS INDICATED
Selected data for a share of beneficial interest outstanding throughout the periods indicated.
Investment Activities | Distributions to Shareholders From | Ratios to Average Net Assets | Supplemental Data | ||||||||||||||||||||||||||||||||||||||||||||||||
| Net Asset Value, Beginning of Period | Net Investment Income(a)(b) | Net Realized Gains (Losses) on Investments(b) | Total from Investment Activities | Net Investment Income | Total Distributions | Net Asset Value, End of Period | Total Return(c) | Gross Expenses(b)(d)(e) | Net Expenses(b)(d) | Net Investment Income(b)(d) | Net Assets, End of Period (000's) | ||||||||||||||||||||||||||||||||||||||||
Government Money Market ProFund | |||||||||||||||||||||||||||||||||||||||||||||||||||
Investor Class | |||||||||||||||||||||||||||||||||||||||||||||||||||
| Period Ended June 30, 2024 (unaudited) | $ | 1.000 | 0.022 | — | (f) | 0.022 | (0.022 | ) | (0.022 | ) | $ | 1.000 | 2.21 | % | 0.98 | % | 0.98 | % | 4.40 | % | $ | 162,461 | |||||||||||||||||||||||||||||
Year Ended December 31, 2023 | $ | 1.000 | 0.041 | — | (f) | 0.041 | (0.041 | ) | (0.041 | ) | $ | 1.000 | 4.15 | % | 0.98 | % | 0.98 | % | 4.08 | % | $ | 156,289 | |||||||||||||||||||||||||||||
Year Ended December 31, 2022 | $ | 1.000 | 0.010 | — | (f) | 0.010 | (0.010 | ) | (0.010 | ) | $ | 1.000 | 0.99 | % | 0.86 | % | 0.68 | %(g) | 0.97 | % | $ | 188,251 | |||||||||||||||||||||||||||||
Year Ended December 31, 2021 | $ | 1.000 | — | (f) | — | (f) | — | (f) | — | (f) | — | (f) | $ | 1.000 | 0.02 | % | 0.70 | % | 0.04 | %(g) | 0.02 | % | $ | 194,082 | |||||||||||||||||||||||||||
Year Ended December 31, 2020 | $ | 1.000 | 0.001 | — | (f) | 0.001 | (0.001 | ) | (0.001 | ) | $ | 1.000 | 0.14 | % | 0.84 | % | 0.34 | %(g) | 0.14 | % | $ | 224,414 | |||||||||||||||||||||||||||||
Year Ended December 31, 2019 | $ | 1.000 | 0.013 | — | (f) | 0.013 | (0.013 | ) | (0.013 | ) | $ | 1.000 | 1.25 | % | 0.98 | % | 0.98 | % | 1.26 | % | $ | 277,733 | |||||||||||||||||||||||||||||
Service Class | |||||||||||||||||||||||||||||||||||||||||||||||||||
| Period Ended June 30, 2024 (unaudited) | $ | 1.000 | 0.017 | — | (f) | 0.017 | (0.017 | ) | (0.017 | ) | $ | 1.000 | 1.71 | % | 1.98 | % | 1.98 | % | 3.40 | % | $ | 10,262 | |||||||||||||||||||||||||||||
Year Ended December 31, 2023 | $ | 1.000 | 0.031 | — | (f) | 0.031 | (0.031 | ) | (0.031 | ) | $ | 1.000 | 3.12 | % | 1.98 | % | 1.98 | % | 3.08 | % | $ | 9,291 | |||||||||||||||||||||||||||||
Year Ended December 31, 2022 | $ | 1.000 | 0.006 | — | (f) | 0.006 | (0.006 | ) | (0.006 | ) | $ | 1.000 | 0.61 | % | 1.22 | % | 1.04 | %(g) | 0.57 | % | $ | 10,694 | |||||||||||||||||||||||||||||
Year Ended December 31, 2021 | $ | 1.000 | — | (f) | — | (f) | — | (f) | — | (f) | — | (f) | $ | 1.000 | 0.02 | % | 0.70 | % | 0.04 | %(g) | 0.02 | % | $ | 9,148 | |||||||||||||||||||||||||||
Year Ended December 31, 2020 | $ | 1.000 | — | (f) | — | (f) | — | (f) | — | (f) | — | (f) | $ | 1.000 | 0.02 | % | 1.24 | % | 0.41 | %(g) | 0.02 | % | $ | 9,637 | |||||||||||||||||||||||||||
Year Ended December 31, 2019 | $ | 1.000 | 0.003 | — | (f) | 0.003 | (0.003 | ) | (0.003 | ) | $ | 1.000 | 0.31 | % | 1.98 | % | 1.98 | % | 0.32 | % | $ | 8,436 | |||||||||||||||||||||||||||||
(a) Per share net investment income has been calculated using the average daily shares method.
(b) Per share amounts and percentages include the applicable allocation from the Government Cash Management Portfolio.
(c) Not annualized for periods less than one year.
(d) Annualized for periods less than one year.
(e) For the periods ended June 30, 2024, December 31, 2023, December 31, 2022, December 31, 2021, December 31, 2020, and December 31, 2019, the Advisor to the Government Cash Management Portfolio waived fees which were allocated to the Government Money Market ProFund on a pro-rata basis. If included, the corresponding impact to the gross expense ratio would be an increase of 0.02%, 0.05%, 0.08%, 0.11%, 0.06%, and 0.07%, respectively.
(f) Amount is less than $0.0005.
(g) The expense ratio for the period reflects the deduction of certain expenses to maintain a certain minimum net yield.
See accompanying notes to the financial statements.
8 :: Government Money Market ProFund :: Notes to Financial Statements :: June 30, 2024 (unaudited)
1. Organization
ProFunds (the "Trust") consists of 116 separate investment portfolios and is registered as an open-end management investment company under the Investment Company Act of 1940 (the "1940 Act") and thus follows accounting and reporting guidance for investment companies. The Trust is organized as a Delaware statutory trust and is authorized to issue an unlimited number of shares of beneficial interest of no par value which may be issued in more than one class or series. The accompanying financial statements relate to the Government Money Market ProFund, (the "ProFund"). The ProFund has two classes of shares: the Investor Class and Service Class. The ProFund is a feeder fund in a master-feeder fund structure and seeks to achieve its objective by investing all of its investable assets in the Government Cash Management Portfolio (the "Portfolio"), an open-end management investment company that is advised by DWS Investment Management Americas, Inc. ("DIMA") and has the same investment objective as the ProFund. As of June 30, 2024, the percentage of the Portfolio's interests owned by the ProFund was 0.5%. The financial statements of the Portfolio, including its schedule of portfolio investments, are included in this report and should be read in conjunction with the ProFund's financial statements.
The ProFund's investment objective is disclosed in its prospectus. Each class of shares has identical rights and privileges except with respect to fees paid under the Distribution and Shareholder Services Plan and voting rights on matters affecting a single class of shares.
Under the Trust's organizational documents, its Officers and Trustees are indemnified against certain liabilities arising out of the performance of their duties to the Trust. In addition, in the normal course of business, the Trust enters into contracts with its vendors and others that provide for general indemnifications. The Trust and ProFund's maximum exposure under these arrangements is unknown as this would involve future claims that may be made against the ProFund.
2. Significant Accounting Policies
The following is a summary of significant accounting policies followed by the ProFund in preparation of its financial statements. These policies are in conformity with U.S. generally accepted accounting principles ("GAAP"). The preparation of financial statements in accordance with GAAP requires management to make estimates and assumptions that affect the reported amounts of assets and liabilities and disclosure of contingent assets and liabilities at the date of the financial statements and the reported amounts of income and expenses during the reporting period. The actual results could differ from those estimates.
Investment Valuation
The ProFund records its investments in the Portfolio at fair value, which represents its proportionate ownership of the value of the Portfolio's net assets. The valuation techniques used to determine fair value are further described in Note 3. The Portfolio's Notes to Financial Statements included elsewhere in this report provide information about the Portfolio's valuation policy and its period-end security valuations.
Investment Transactions and Related Income
Investment transactions are accounted for on trade date on the last business day of the reporting period.
The ProFund records daily its proportionate share of the Portfolio's income, expenses, and realized gains and losses. In addition, the ProFund accrues its own expenses.
Allocations
Expenses directly attributable to the ProFund are charged to the ProFund, while expenses which are attributable to more than one fund in the Trust, or jointly with an affiliate, are allocated among the respective funds in the Trust and/or affiliate based upon relative net assets or another reasonable basis.
The investment income, expenses (other than class specific expenses charged to a class) and realized gains and losses on investments of the ProFund are allocated to each class of shares based upon relative net assets on the date income is earned or expenses and realized gains and losses are incurred.
Distributions to Shareholders
The ProFund declares distributions from net investment income daily and pays the dividends on a monthly basis. Net realized capital gains, if any, will be distributed annually.
The amount of distributions from net investment income and net realized gains are determined in accordance with federal income tax regulations which may differ from GAAP. These "book/tax" differences are either considered temporary or permanent in nature. To the extent these differences are permanent in nature (e.g., return of capital, distribution reclassification), such amounts are reclassified within the composition of net assets based on their federal tax-basis treatment; temporary differences do not require reclassification.
Federal Income Taxes
The ProFund intends to continue to qualify each year as a regulated investment company (a "RIC") under Subchapter M of the Internal Revenue Code of 1986, as amended. A RIC generally is not subject to federal income tax on income and gains distributed in a timely manner to its shareholders. The ProFund intends to make timely distributions in order to avoid tax liability. Accordingly, no provision for federal income taxes is required in the financial statements. The ProFund has a calendar tax year end.
Management of the ProFund has reviewed tax positions taken in tax years that remain subject to examination by all major tax jurisdictions, including federal (i.e., the last four tax year ends and the interim tax period since then, as applicable). Management believes that there is no tax liability resulting from unrecognized tax benefits related to uncertain tax positions taken and the ProFund is not aware of any tax positions for which it is reasonably possible that the total amounts of unrecognized tax benefits will significantly change in the next twelve months.
3. Investment Valuation Summary
The valuation techniques employed by the ProFund, described below, maximize the use of observable inputs and minimize the
June 30, 2024 (unaudited) :: Notes to Financial Statements :: Government Money Market ProFund :: 9
use of unobservable inputs in determining fair value. The inputs used for valuing the ProFund's investments are summarized in the three broad levels listed below:
• Level 1 – quoted prices in active markets for identical assets
• Level 2 – other significant observable inputs (including quoted prices for similar securities, interest rates, prepayments speeds, credit risk, etc.)
• Level 3 – significant unobservable inputs (including the ProFund's own assumptions in determining the fair value of investments)
The inputs or methodology used for valuing investments are not necessarily an indication of the risk associated with investing in those investments. Changes in valuation techniques may result in transfers in or out of an assigned level within the disclosure hierarchy.
As of June 30, 2024, the ProFund's $174,198,686 investment in the Portfolio, which is a registered investment company, is based on Level 2 inputs due to the ProFund's master-feeder structure. There were no Level 1 or Level 3 investments held by the ProFund during the period ended June 30, 2024.
4. Fees and Transactions with Affiliates and Other Parties
ProFund Advisors LLC (the "Advisor") serves as the investment advisor of the ProFund for an annual fee equal to 0.35% of the average daily net assets of the ProFund, although no fee is payable under the agreement unless the master-feeder relationship with the Portfolio is terminated and the Advisor directly invests the assets of the ProFund. DIMA is the investment advisor to the Portfolio in which the ProFund invests its assets.
Citi Fund Services Ohio, Inc. ("Citi") acts as the Trust's administrator (the "Administrator"). For its services as Administrator, the Trust pays Citi an annual fee based on the Trust's aggregate average net assets at an annualized tier rate ranging from 0.00375% to 0.05%, and a base fee for certain filings. Administration fees include additional fees paid to Citi by the Trust for additional services provided, including support of the Trust's compliance program.
FIS Investor Services LLC ("FIS") acts as the Trust's transfer agent. For these services, the Trust pays FIS a base fee, account and service charges, and reimbursement of certain expenses.
ProFunds Distributors, Inc. (the "Distributor"), a wholly owned subsidiary of the Advisor, serves as the Trust's distributor. Under a Distribution and Shareholder Services Plan, adopted by the Trust's Board of Trustees pursuant to Rule 12b-1 under the 1940 Act, the ProFund may pay financial intermediaries such as broker-dealers, investment advisors and the Distributor up to 1.00%, on an annualized basis, of the average daily net assets attributable to Service Class shares as compensation for service and distribution-related activities and/or shareholder services with respect to Service Class shares.
The Advisor, pursuant to a separate Management Services Agreement, performs certain client support services and other administrative services on behalf of the ProFund. For these services, the ProFund pays the Advisor a fee at the annual rate of 0.35% of its average daily net assets for providing feeder fund management and administrative services to the ProFund.
The Advisor, pursuant to a separate Services Agreement, performs certain services related to the operation and maintenance of a shareholder trading platform. For these services, the Trust pays the Advisor a monthly base fee as reflected on the Statement of Operations as "Service fees".
The ProFund pays fees to certain intermediaries or financial institutions for record keeping, sub-accounting services, transfer agency and other administrative services as reflected on the Statement of Operations as "Administrative services fees".
Certain Officers and a Trustee of the Trust are affiliated with the Advisor or the Administrator. Except as noted below with respect to the Trust's Chief Compliance Officer, such Officers and Trustee receive no compensation from the ProFund for serving in their respective roles. The Trust, together with affiliated Trusts, pays each Independent Trustee compensation for his services at the annual rate of $325,000 per Trustee, inclusive of all meetings. During the period ended June 30, 2024, actual Trustee compensation was $487,500 in aggregate from the Trust and affiliated trusts. There are certain employees of the Advisor, such as the Trust's Chief Compliance Officer and staff who administer the Trust's compliance program, in which the ProFund reimburses the Advisor for their related compensation and certain other expenses incurred as reflected on the Statement of Operations as "Compliance services fees".
The Advisor has contractually agreed to waive management services fees, and if necessary, reimburse certain other expenses of the ProFund for the periods below in order to limit the annual operating expenses (exclusive of brokerage costs, interest, taxes, litigation, indemnification, and extraordinary expenses) as follows:
| For the Period May 1, 2024 through April 30, 2025 | For the Period May 1, 2023 through April 30, 2024 | ||||||||||||||||||
Investor Class | Service Class | Investor Class | Service Class | ||||||||||||||||
Government Money Market ProFund | 0.98 | % | 1.98 | % | 0.98 | % | 1.98 | % | |||||||||||
The Advisor has also contractually agreed to waive management services fees, and if necessary, reimburse certain other expenses of the ProFund through April 30, 2025 to the extent necessary to maintain a certain minimum net yield as determined by the Advisor. The Advisor has contractually undertaken to waive its fees and/or reimburse certain expenses to maintain the minimum yield floor limit at 0.02% through April 30, 2025.
The Advisor may recoup the management services fees contractually waived or limited and other expenses reimbursed by it within three years from the expense limit period and minimum yield limit period in which they were taken. Such recoupment shall be made
10 :: Government Money Market ProFund :: Notes to Financial Statements :: June 30, 2024 (unaudited)
monthly, but only to the extent that such recoupment would not cause the net yield of each Class of the ProFund to fall below the highest previously determined minimum yield and such recoupment would not cause annualized operating expenses to exceed the expense limit in effect at the time of the waiver, and the expense limit in effect at the time of the recoupment. Any amounts recouped by the Advisor during the period are reflected on the Statement of Operations as "Recoupment of prior expenses reduced by the Advisor". As of June 30, 2024, the recoupments that may potentially be made by the ProFund are shown in the table below. As of June 30, 2024, no commitment or contingent liability is expected.
| Expires 4/30/25 | |||||||
Government Money Market ProFund | $ | 1,215,109 | |||||
5. Investment Risks
The Fund may be subject to other risks in addition to these identified risks. This section discusses certain common principal risks encountered by the Fund. The risks are presented in an order intended to facilitate readability, and their order does not imply that the realization of one risk is likely to occur more frequently than another risk, nor does it imply that the realization of one risk is likely to have a greater adverse impact than another risk.
Government Default Risk
Due to the rising U.S. government debt burden and potential limitations caused by the statutory debt ceiling, it is possible that the U.S. government may not be able to meet its financial obligations or that securities issued by the U.S. government may experience credit downgrades. In the past, U.S. sovereign credit has experienced downgrades and there can be no guarantee that it will not experience further downgrades in the future by rating agencies. Such a credit event may adversely impact the financial markets and the ProFund. From time to time, uncertainty regarding the status of negotiations in the U.S. government to increase the statutory debt ceiling and/or failure to increase the statutory debt ceiling could increase the risk that the U.S. government may default on payments on certain U.S. government securities, cause the credit rating of the U.S. government to be downgraded or increase volatility in financial markets, result in higher interest rates, reduce prices of U.S. Treasury securities and/or increase the costs of certain kinds of debt.
Cybersecurity Risk
With the increased use of technologies such as the Internet and the dependence on computer systems to perform necessary business functions, the ProFund, financial intermediaries, service providers and the relevant listing exchange are susceptible to operational, information security and related "cyber" risks. In general, cyber incidents can result from deliberate attacks or unintentional events. Cyber attacks include, but are not limited to gaining unauthorized access to digital systems for purposes of misappropriating assets or sensitive information, corrupting data, or causing operational disruption. Cyber attacks may also be carried out in a manner that does not require gaining unauthorized access, such as causing among other behaviors, stealing or corrupting data maintained online or digitally, and denial of service attacks on websites. Cybersecurity failures or
breaches of the ProFund's third party service providers (including, but not limited to, index providers, the administrator and transfer agent) or the issuers of securities and/or financial instruments in which the ProFund invests, have the ability to cause disruptions and impact business operations, potentially resulting in financial losses, the inability of ProFund shareholders to transact business, violations of applicable privacy and other laws. For instance, cyber attacks may interfere with the processing of shareholder transactions, impact the ProFund's ability to calculate its NAV, cause the release of private shareholder information or confidential ProFund information, impede trading, cause reputational damage, and subject the ProFund to regulatory fines, reputational damage, penalties or financial losses, reimbursement or other compensation costs, and/or additional compliance costs. In addition, substantial costs may be incurred in order to prevent any cyber incidents in the future. The ProFund and its shareholders could be negatively impacted as a result. While the ProFund or its service providers may have established business continuity plans and systems designed to guard against such cyber attacks or adverse effects of such attacks, there are inherent limitations in such plans and systems including the possibility that certain risks have not been identified, in large part because different unknown threats may emerge in the future. Similar types of cybersecurity risks also are present for issuers of securities in which the ProFund invests, which could result in material adverse consequences for such issuers, and may cause the ProFund's investments in such securities to lose value. The Advisor and the Trust do not control the cybersecurity plans and systems put in place by third party service providers, and such third party service providers may have no or limited indemnification obligations to the Advisor or to the ProFund.
Natural Disaster/Epidemic Risk
Natural or environmental disasters, such as earthquakes, fires, floods, hurricanes, tsunamis and other severe weather-related phenomena generally, and widespread disease, including pandemics and epidemics (for example, the novel coronavirus (COVID-19)), have been and can be highly disruptive to economies and markets and have recently led, and may continue to lead, to increased market volatility and significant market losses. Such as natural disaster and health crises could exacerbate political, social, and economic risks previously mentioned, and result in significant breakdowns, delays, shutdowns, social isolation, and other disruptions to important global, local and regional supply chains affected, with potential corresponding results on the operating performance of the ProFund and its investments. A climate of uncertainty and panic, including the contagion of infectious viruses or diseases, may adversely affect global, regional, and local economies and reduce the availability of potential investment opportunities, and increases the difficulty of performing due diligence and modeling market conditions, potentially reducing the accuracy of financial projections. Under these circumstances, the ProFund may have difficulty achieving its investment objective which may adversely impact performance. Further, such events can be highly disruptive to economies and markets, significantly disrupt the operations of individual companies (including, but not limited to, the ProFund's investment advisor and third-party service providers), sectors, industries, markets, securities and commodity exchanges, currencies, interest and inflation rates, credit ratings, investor
June 30, 2024 (unaudited) :: Notes to Financial Statements :: Government Money Market ProFund :: 11
sentiment, and other factors affecting the value of the ProFund's investments. These factors can cause substantial market volatility, exchange trading suspensions and closures and can impact the ability of the ProFund to complete redemptions and otherwise affect ProFund performance and ProFund trading in the secondary market. A widespread crisis may also affect the global economy in ways that cannot necessarily be foreseen at the current time. How long such events will last and whether they will continue or recur cannot be predicted. Impacts from these events could have significant impact on the ProFund's performance, resulting in losses to your investment.
Risk of Global Economic Shock
Widespread disease, including public health disruptions, pandemics and epidemics (for example, COVID-19 including its variants), have been and may continue to be highly disruptive to economies and markets. Health crises could exacerbate political, social, and economic risks, and result in breakdowns, delays, shutdowns, social isolation, civil unrest, periods of high unemployment, shortages in and disruptions to the medical care and consumer goods and services industries, and other disruptions to important global, local and regional supply chains, with potential corresponding results on the performance of the ProFund and its investments.
Additionally, other public health issues, war, military conflicts, sanctions, acts of terrorism, sustained elevated inflation, supply
chain issues or other events could have a significant negative impact on global financial markets and economies. Russia's recent military incursions in Ukraine have led to and may lead to additional sanctions being levied by the United States, European Union and other countries against Russia. The ongoing hostilities between the two countries could result in additional widespread conflict and could have a severe adverse effect on the region and certain markets. Sanctions on Russian exports could have a significant adverse impact on the Russian economy and related markets and could affect the value of the ProFund's investments, even beyond any direct exposure the ProFund may have to the region or to adjoining geographic regions. The extent and duration of the military action, sanctions and resulting market disruptions are impossible to predict, but could have a severe adverse effect on the region, including significant negative impacts on the economy and the markets for certain securities and commodities, such as oil and natural gas. Furthermore, the possibility of a prolonged conflict between Hamas and Israel, and the potential expansion of the conflict in the surrounding areas and the involvement of other nations in the conflict, such as the Houthi movement's attacks on marine vessels in the Red Sea, could further destabilize the Middle East region and introduce new uncertainties in global markets, including the oil and natural gas markets. How long such tensions and related events will last cannot be predicted. These tensions and any related events could have significant impact on the ProFund performance and the value of an investment in the ProFund.
6. Federal Income Tax Information
The tax character of dividends paid to shareholders during the applicable tax years ended, as noted below, were as follows:
| Ordinary Income | Total Distributions Paid | ||||||||||
December 31, 2023 | |||||||||||
Government Money Market ProFund | $ | 7,865,060 | $ | 7,865,060 | |||||||
December 31, 2022 | |||||||||||
Government Money Market ProFund | $ | 2,111,273 | $ | 2,111,273 | |||||||
As of the most recent tax year ended December 31, 2023, the components of accumulated earnings (deficit) on a tax basis were as follows:
| Undistributed Ordinary Income | Undistributed Long-Term Capital Gains | Distributions Payable | Accumulated Capital and Other Losses | Total Unrealized Appreciation (Depreciation) | Accumulated Earnings (Deficit) | ||||||||||||||||||||||
Government Money Market ProFund | $ | — | $ | — | $ | (1,131 | ) | $ | (253,972 | ) | $ | — | $ | (255,103 | ) | ||||||||||||
As of the tax year ended December 31, 2023, the ProFund had net capital loss carryforwards ("CLCFs") as summarized in the table below:
No Expiration Date | |||||||
Government Money Market ProFund | $ | 253,972 | |||||
Unused limitations accumulate and increase limited CLCFs available for use in offsetting net capital gains. The Board does not intend to authorize a distribution of any realized gain for the ProFund until any applicable CLCF has been offset or utilized.
7. Subsequent Events
Effective on or about November 4, 2024, The Ultimus Group, LLC will replace Citi as the Administrator for the Trust.
The ProFund has evaluated the need for additional disclosures or adjustments resulting from subsequent events through the date these financial statements were issued. Based on this evaluation, there were no additional subsequent events to report that have a material impact on the ProFund's financial statements.
This Page Intentionally Left Blank
14 :: Form N-CSR – Items 8-11 :: June 30, 2024 (unaudited)
Item 8. Changes in and Disagreements with Accountants for Open-End Management Investment Companies.
Not Applicable.
Item 9. Proxy Disclosures for Open-End Management Investment Companies.
Not Applicable.
Item 10. Remuneration Paid to Directors, Officers, and Others of Open-End Management Investment Companies.
Remuneration paid to Trustees, Officers, and others are part of the Financial Statements filed under Item 7(a) of this Form.
Item 11. Statement Regarding Basis for Approval of Investment Advisory Contract.
Not Applicable.
16 :: Government Cash Management Portfolio :: Investment Portfolio :: as of June 30, 2024 (unaudited)
Investment Portfolio
Government & Agency Obligations 70.5% | |||||||||||
U.S. Government Sponsored Agencies 25.6% | |||||||||||
| Principal Amount | Value | ||||||||||
Federal Farm Credit Banks: | |||||||||||
5.25%, 12/13/2024 | $ | 19,825,000 | $ | 19,823,570 | |||||||
| SOFR + 0.035%, 5.375%(a), 10/9/2024 | 67,000,000 | 67,000,000 | |||||||||
| SOFR + 0.135%, 5.475%(a), 6/3/2025 | 82,000,000 | 82,000,000 | |||||||||
| SOFR + 0.145%, 5.485%(a), 7/25/2025 | 151,500,000 | 151,500,000 | |||||||||
| Federal Farm Credit Banks Funding Corp., FEDL01 + 0.135%, 5.465%(a), 5/22/2025 | 30,000,000 | 30,000,000 | |||||||||
| Federal Home Loan Bank Discount Notes: | |||||||||||
5.272%(b), 7/1/2024 | 3,646,000 | 3,646,000 | |||||||||
5.282%(b), 10/2/2024 | 306,000,000 | 301,881,495 | |||||||||
5.298%(b), 7/1/2024 | 250,000,000 | 250,000,000 | |||||||||
5.313%(b), 8/26/2024 | 660,000,000 | 654,620,267 | |||||||||
5.313%(b), 9/11/2024 | 84,500,000 | 83,614,440 | |||||||||
5.313%(b), 9/25/2024 | 515,000,000 | 508,553,344 | |||||||||
5.318%(b), 7/29/2024 | 400,000,000 | 398,368,222 | |||||||||
5.321%(b), 9/18/2024 | 250,000,000 | 247,120,889 | |||||||||
5.323%(b), 7/19/2024 | 100,000,000 | 99,737,500 | |||||||||
5.323%(b), 8/6/2024 | 250,000,000 | 248,687,500 | |||||||||
5.323%(b), 9/6/2024 | 150,000,000 | 148,534,375 | |||||||||
5.323%(b), 9/27/2024 | 436,000,000 | 430,404,667 | |||||||||
5.329%(b), 8/9/2024 | 200,000,000 | 198,861,200 | |||||||||
5.332%(b), 8/23/2024 | 75,000,000 | 74,419,319 | |||||||||
5.333%(b), 7/24/2024 | 100,000,000 | 99,663,944 | |||||||||
5.333%(b), 7/26/2024 | 432,000,000 | 430,422,000 | |||||||||
5.338%(b), 7/16/2024 | 200,000,000 | 199,561,250 | |||||||||
5.342%(b), 7/31/2024 | 100,000,000 | 99,560,917 | |||||||||
5.343%(b), 7/19/2024 | 100,000,000 | 99,736,500 | |||||||||
5.343%(b), 7/31/2024 | 103,362,000 | 102,908,068 | |||||||||
5.348%(b), 7/16/2024 | 98,967,000 | 98,749,479 | |||||||||
Federal Home Loan Banks: | |||||||||||
5.0%, 9/18/2024 | 239,750,000 | 239,719,696 | |||||||||
5.34%, 9/26/2024 | 90,000,000 | 90,000,000 | |||||||||
| SOFR + 0.005%, 5.345%(a), 10/4/2024 | 132,000,000 | 132,000,000 | |||||||||
| SOFR + 0.01%, 5.35%(a), 8/19/2024 | 90,000,000 | 90,000,000 | |||||||||
| SOFR + 0.01%, 5.35%(a), 9/12/2024 | 88,000,000 | 88,000,000 | |||||||||
| SOFR + 0.010%, 5.35%(a), 11/14/2024 | 133,000,000 | 133,000,000 | |||||||||
| SOFR + 0.01%, 5.35%(a), 11/18/2024 | 528,000,000 | 528,000,000 | |||||||||
| SOFR + 0.010%, 5.35%(a), 11/25/2024 | 220,500,000 | 220,500,000 | |||||||||
| SOFR + 0.01%, 5.35%(a), 12/2/2024 | 134,000,000 | 134,000,000 | |||||||||
| SOFR + 0.015%, 5.355%(a), 7/3/2024 | 273,000,000 | 273,000,000 | |||||||||
| SOFR + 0.015%, 5.355%(a), 11/1/2024 | 133,000,000 | 133,000,000 | |||||||||
| SOFR + 0.015%, 5.355%(a), 12/9/2024 | 620,000,000 | 620,000,000 | |||||||||
| SOFR + 0.015%, 5.355%(a), 12/17/2024 | 333,250,000 | 333,250,000 | |||||||||
5.4%, 1/14/2025 | 184,250,000 | 184,250,000 | |||||||||
| SOFR + 0.125%, 5.465%(a), 2/24/2025 | 119,000,000 | 119,000,000 | |||||||||
5.5%, 4/17/2025 | 20,000,000 | 19,999,201 | |||||||||
U.S. Government Sponsored Agencies, continued | |||||||||||
| Principal Amount | Value | ||||||||||
| Federal National Mortgage Association, SOFR + 0.100%, 5.44%(a), 6/18/2026 | $ | 130,500,000 | $ | 130,500,000 | |||||||
8,597,593,843 | |||||||||||
U.S. Treasury Obligations 44.9% | |||||||||||
U.S. Treasury Bills: | |||||||||||
4.814%(b), 3/20/2025 | 44,900,000 | 43,348,322 | |||||||||
4.831%(b), 2/20/2025 | 50,000,000 | 48,451,375 | |||||||||
4.835%(b), 3/20/2025 | 55,100,000 | 53,187,805 | |||||||||
4.836%(b), 2/20/2025 | 50,000,000 | 48,449,913 | |||||||||
4.951%(b), 4/17/2025 | 100,000,000 | 96,066,472 | |||||||||
5.014%(b), 2/20/2025 | 100,000,000 | 96,785,425 | |||||||||
5.09%(b), 7/25/2024 | 435,750,000 | 434,291,690 | |||||||||
5.126%(b), 7/5/2024 | 78,000,000 | 77,956,181 | |||||||||
5.166%(b), 8/29/2024 | 434,000,000 | 430,375,649 | |||||||||
5.169%(b), 9/12/2024 | 338,000,000 | 334,505,888 | |||||||||
5.192%(b), 8/29/2024 | 308,000,000 | 305,415,033 | |||||||||
5.196%(b), 12/12/2024 | 438,000,000 | 427,774,916 | |||||||||
5.201%(b), 9/19/2024 | 449,500,000 | 444,375,700 | |||||||||
5.201%(b), 12/12/2024 | 372,000,000 | 363,306,360 | |||||||||
5.205%(b), 12/5/2024 | 707,000,000 | 691,171,851 | |||||||||
5.223%(b), 10/17/2024 | 294,000,000 | 289,456,818 | |||||||||
5.223%(b), 11/7/2024 | 440,000,000 | 431,878,589 | |||||||||
5.233%(b), 10/24/2024 | 345,000,000 | 339,311,597 | |||||||||
5.238%(b), 11/14/2024 | 355,000,000 | 348,071,820 | |||||||||
5.263%(b), 8/6/2024 | 423,000,000 | 420,804,207 | |||||||||
5.27%(b), 7/9/2024 | 392,000,000 | 391,547,240 | |||||||||
5.273%(b), 7/9/2024 | 50,000,000 | 49,942,211 | |||||||||
5.29%(b), 10/15/2024 | 442,000,000 | 435,209,712 | |||||||||
5.303%(b), 9/5/2024 | 175,000,000 | 173,322,042 | |||||||||
5.303%(b), 9/10/2024 | 400,000,000 | 395,874,110 | |||||||||
5.306%(b), 8/20/2024 | 370,000,000 | 367,310,820 | |||||||||
5.308%(b), 8/20/2024 | 365,000,000 | 362,346,146 | |||||||||
5.309%(b), 9/10/2024 | 360,000,000 | 356,282,440 | |||||||||
5.31%(b), 9/10/2024 | 200,000,000 | 197,934,294 | |||||||||
5.314%(b), 8/27/2024 | 300,000,000 | 297,510,288 | |||||||||
5.314%(b), 9/19/2024 | 400,000,000 | 395,340,888 | |||||||||
5.319%(b), 8/8/2024 | 440,000,000 | 437,563,292 | |||||||||
5.323%(b), 8/22/2024 | 150,000,000 | 148,862,500 | |||||||||
5.325%(b), 8/1/2024 | 400,000,000 | 398,190,806 | |||||||||
5.328%(b), 7/25/2024 | 61,600,000 | 61,384,195 | |||||||||
5.336%(b), 7/30/2024 | 300,000,000 | 298,728,108 | |||||||||
U.S. Treasury Floating Rate Notes: | |||||||||||
| 3-month U.S. Treasury Bill Money Market Yield + 0.037%, 5.342%(a), 7/31/2024 | 1,170,000,000 | 1,170,008,079 | |||||||||
| 3-month U.S. Treasury Bill Money Market Yield + 0.125%, 5.43%(a), 7/31/2025 | 605,500,000 | 605,236,626 | |||||||||
| 3-month U.S. Treasury Bill Money Market Yield + 0.14%, 5.445%(a), 10/31/2024 | 1,024,500,000 | 1,024,755,928 | |||||||||
| 3-month U.S. Treasury Bill Money Market Yield + 0.17%, 5.475%(a), 10/31/2025 | 960,000,000 | 959,607,922 | |||||||||
| 3-month U.S. Treasury Bill Money Market Yield + 0.2%, 5.505%(a), 1/31/2025 | 839,500,000 | 840,214,272 | |||||||||
15,092,157,530 | |||||||||||
| Total Government & Agency Obligations (Cost $23,689,751,373) | 23,689,751,373 | ||||||||||
The accompanying notes are an integral part of the financial statements.
as of June 30, 2024 (unaudited) :: Investment Portfolio :: Government Cash Management Portfolio :: 17
Repurchase Agreements 29.6% | |||||||||||
| Principal Amount | Value | ||||||||||
| Barclays Bank PLC, 5.32%, dated 6/28/2024, to be repurchased at $766,439,638 on 7/1/2024(c) | $ | 766,100,000 | $ | 766,100,000 | |||||||
BNP Paribas: | |||||||||||
| 5.32%, dated 6/28/2024, to be repurchased at $42,628,890 on 7/1/2024(d) | 42,610,000 | 42,610,000 | |||||||||
| 5.33%, dated 6/28/2024, to be repurchased at $136,260,496 on 7/1/2024(e) | 136,200,000 | 136,200,000 | |||||||||
| Citigroup Global Markets, Inc., 5.32%, dated 6/28/2024, to be repurchased at $118,252,402 on 7/1/2024(f) | 118,200,000 | 118,200,000 | |||||||||
| Federal Reserve Bank of New York, 5.3%, dated 6/28/2024, to be repurchased at $3,601,590,000 on 7/1/2024(g) | 3,600,000,000 | 3,600,000,000 | |||||||||
| Fixed Income Clearing Corp., 5.32%, dated 6/28/2024, to be repurchased at $2,150,953,167 on 7/1/2024(h) | 2,150,000,000 | 2,150,000,000 | |||||||||
| Goldman Sachs & Co., 5.32%, dated 6/28/2024, to be repurchased at $400,177,333 on 7/1/2024(i) | 400,000,000 | 400,000,000 | |||||||||
| HSBC Securities, Inc., 5.32%, dated 6/28/2024, to be repurchased at $322,242,798 on 7/1/2024(j) | 322,100,000 | 322,100,000 | |||||||||
JPMorgan Securities, Inc.: | |||||||||||
| 5.32%, dated 6/28/2024, to be repurchased at $129,967,593 on 7/1/2024(k) | 129,910,000 | 129,910,000 | |||||||||
| 5.33%, dated 6/28/2024, to be repurchased at $467,607,604 on 7/1/2024(l) | 467,400,000 | 467,400,000 | |||||||||
Repurchase Agreements, continued | |||||||||||
| Principal Amount | Value | ||||||||||
Merrill Lynch & Co., Inc.: | |||||||||||
| 5.25%, dated 6/28/2024, to be repurchased at $250,109,375 on 7/1/2024(m) | $ | 250,000,000 | $ | 250,000,000 | |||||||
| 5.33%, dated 6/28/2024, to be repurchased at $125,055,521 on 7/1/2024(n) | 125,000,000 | 125,000,000 | |||||||||
Royal Bank of Canada: | |||||||||||
| 5.32%, dated 6/28/2024, to be repurchased at $102,395,375 on 7/1/2024(o) | 102,350,000 | 102,350,000 | |||||||||
| 5.32%, dated 6/28/2024, to be repurchased at $502,132,513 on 7/1/2024(p) | 501,910,000 | 501,910,000 | |||||||||
| 5.33%, dated 6/28/2024, to be repurchased at $173,136,867 on 7/1/2024(q) | 173,060,000 | 173,060,000 | |||||||||
Wells Fargo Bank: | |||||||||||
| 5.32%, dated 6/28/2024, to be repurchased at $525,672,945 on 7/1/2024(r) | 525,440,000 | 525,440,000 | |||||||||
| 5.33%, dated 6/28/2024, to be repurchased at $125,425,685 on 7/1/2024(s) | 125,370,000 | 125,370,000 | |||||||||
| Total Repurchase Agreements (Cost $9,935,650,000) | 9,935,650,000 | ||||||||||
| % of Net Assets | Value | ||||||||||
| Total Investment Portfolio (Cost $33,625,401,373) | 100.1 | 33,625,401,373 | |||||||||
Other Assets and Liabilities, Net | (0.1 | ) | (32,821,189 | ) | |||||||
Net Assets | 100.0 | $ | 33,592,580,184 | ||||||||
(a) Floating rate security. These securities are shown at their current rate as of June 30, 2024.
(b) Annualized yield at time of purchase; not a coupon rate.
(c) Collateralized by:
| Principal Amount ($) | Security | Rate (%) | Maturity Date | Collateral Value ($) | |||||||||||||||
378,626,300 | U.S. Treasury Bonds | 2.0 | 11/15/2041 | 262,467,274 | |||||||||||||||
590,371,700 | U.S. Treasury Notes | 1.375–2.875 | 11/15/2031–5/15/2032 | 518,954,733 | |||||||||||||||
Total Collateral Value | 781,422,007 | ||||||||||||||||||
(d) Collateralized by:
| Principal Amount ($) | Security | Rate (%) | Maturity Date | Collateral Value ($) | |||||||||||||||
43,830,200 | U.S. Treasury Notes | 4.0–4.875 | 5/31/2026–2/15/2034 | 43,462,260 | |||||||||||||||
(e) Collateralized by:
| Principal Amount ($) | Security | Rate (%) | Maturity Date | Collateral Value ($) | |||||||||||||||
133,224,800 | U.S. Treasury Notes | 0.5–4.625 | 8/15/2025–5/15/2034 | 135,153,626 | |||||||||||||||
3,436,500 | U.S. Treasury Inflation Index Notes | 0.125 | 7/15/2030 | 3,770,379 | |||||||||||||||
Total Collateral Value | 138,924,005 | ||||||||||||||||||
The accompanying notes are an integral part of the financial statements.
18 :: Government Cash Management Portfolio :: Investment Portfolio :: as of June 30, 2024 (unaudited)
(f) Collateralized by:
| Principal Amount ($) | Security | Rate (%) | Maturity Date | Collateral Value ($) | |||||||||||||||
123,148,500 | U.S. Treasury Bills | Zero Coupon | 10/22/2024–12/19/2024 | 120,564,023 | |||||||||||||||
(g) Collateralized by:
| Principal Amount ($) | Security | Rate (%) | Maturity Date | Collateral Value ($) | |||||||||||||||
4,352,322,200 | U.S. Treasury Notes | 1.125–1.625 | 2/15/2031–5/15/2031 | 3,601,590,064 | |||||||||||||||
(h) Collateralized by:
| Principal Amount ($) | Security | Rate (%) | Maturity Date | Collateral Value ($) | |||||||||||||||
1,703,833,000 | U.S. Treasury Bonds | 1.75–4.75 | 1/15/2028–11/15/2053 | 1,788,291,304 | |||||||||||||||
362,053,800 | U.S. Treasury Notes | 0.375–1.625 | 7/15/2027–10/15/2027 | 404,709,037 | |||||||||||||||
Total Collateral Value | 2,193,000,341 | ||||||||||||||||||
(i) Collateralized by:
| Principal Amount ($) | Security | Rate (%) | Maturity Date | Collateral Value ($) | |||||||||||||||
11,489,682 | Federal Home Loan Mortgage Corporation | 2.0–6.5 | 4/1/2030–6/1/2054 | 10,628,554 | |||||||||||||||
394,487,892 | Federal National Mortgage Association | 2.0–8.0 | 5/1/2029–8/1/2053 | 349,084,024 | |||||||||||||||
47,313,902 | Government National Mortgage Association | 3.0–6.5 | 4/20/2038–6/20/2054 | 48,287,422 | |||||||||||||||
Total Collateral Value | 408,000,000 | ||||||||||||||||||
(j) Collateralized by:
| Principal Amount ($) | Security | Rate (%) | Maturity Date | Collateral Value ($) | |||||||||||||||
320,627,300 | U.S. Treasury Bonds | 1.75–3.375 | 5/15/2041–5/15/2044 | 238,269,969 | |||||||||||||||
74,562,000 | U.S. Treasury Notes | 4.0 | 1/15/2027 | 74,849,650 | |||||||||||||||
39,006,675 | U.S. Treasury Strips | Zero Coupon | 11/15/2043 | 15,422,381 | |||||||||||||||
Total Collateral Value | 328,542,000 | ||||||||||||||||||
(k) Collateralized by:
| Principal Amount ($) | Security | Rate (%) | Maturity Date | Collateral Value ($) | |||||||||||||||
133,074,800 | U.S. Treasury Notes | 3.875 | 4/30/2025 | 132,508,252 | |||||||||||||||
(l) Collateralized by:
| Principal Amount ($) | Security | Rate (%) | Maturity Date | Collateral Value ($) | |||||||||||||||
100,876,185 | Federal Home Loan Mortgage Corporation | 6.174–6.488 | 12/1/2032–10/1/2036 | 101,505,838 | |||||||||||||||
382,239,183 | Federal National Mortgage Association | 2.0–7.5 | 2/1/2032–4/1/2054 | 375,242,162 | |||||||||||||||
Total Collateral Value | 476,748,000 | ||||||||||||||||||
(m) Collateralized by:
| Principal Amount ($) | Security | Rate (%) | Maturity Date | Collateral Value ($) | |||||||||||||||
228,199,200 | U.S. Treasury Notes | 3.875–4.625 | 6/30/2025–11/30/2029 | 231,835,257 | |||||||||||||||
55,054,531 | U.S. Treasury Strips | Zero Coupon | 11/15/2042 | 23,164,744 | |||||||||||||||
Total Collateral Value | 255,000,001 | ||||||||||||||||||
The accompanying notes are an integral part of the financial statements.
as of June 30, 2024 (unaudited) :: Investment Portfolio :: Government Cash Management Portfolio :: 19
(n) Collateralized by:
| Principal Amount ($) | Security | Rate (%) | Maturity Date | Collateral Value ($) | |||||||||||||||
673,742,519 | Federal Home Loan Mortgage Corporation | 0.0–5.88 | 10/25/2028–2/25/2057 | 76,541,043 | |||||||||||||||
268,430,175 | Federal National Mortgage Association | 2.0–9.0 | 7/25/2024–6/25/2054 | 50,956,608 | |||||||||||||||
1,966 | Government National Mortgage Association | 4.0–8.0 | 3/15/2025–3/20/2049 | 1,996 | |||||||||||||||
100 | U.S. Treasury Bonds | 3.375 | 11/15/2048 | 83 | |||||||||||||||
300 | U.S. Treasury Notes | 0.625–2.75 | 2/4/2027–5/15/2030 | 271 | |||||||||||||||
Total Collateral Value | 127,500,001 | ||||||||||||||||||
(o) Collateralized by:
| Principal Amount ($) | Security | Rate (%) | Maturity Date | Collateral Value ($) | |||||||||||||||
114,453,100 | U.S. Treasury Notes | 0.5–0.75 | 3/31/2026–6/30/2027 | 104,397,078 | |||||||||||||||
(p) Collateralized by:
| Principal Amount ($) | Security | Rate (%) | Maturity Date | Collateral Value ($) | |||||||||||||||
12,107,000 | U.S. Treasury Bonds | 1.125–4.625 | 5/15/2040–5/15/2054 | 10,111,841 | |||||||||||||||
283,960,300 | U.S. Treasury Notes | 0.25–4.875 | 6/30/2025–1/31/2031 | 271,025,338 | |||||||||||||||
23,953,200 | U.S. Treasury Inflation Index Notes | 0.25–2.375 | 1/15/2025–4/15/2029 | 27,104,734 | |||||||||||||||
618,150,100 | U.S. Treasury Strips | Zero Coupon | 11/15/2043–8/15/2050 | 203,933,266 | |||||||||||||||
Total Collateral Value | 512,175,179 | ||||||||||||||||||
(q) Collateralized by:
| Principal Amount ($) | Security | Rate (%) | Maturity Date | Collateral Value ($) | |||||||||||||||
48,103,698 | Federal Home Loan Mortgage Corporation | 2.0–6.5 | 5/1/2040–2/1/2054 | 43,220,582 | |||||||||||||||
73,030,485 | Federal National Mortgage Association | 1.5–6.5 | 7/1/2041–1/1/2054 | 60,134,532 | |||||||||||||||
82,348,536 | Government National Mortgage Association | 2.0–4.5 | 3/20/2046–6/20/2052 | 73,244,491 | |||||||||||||||
Total Collateral Value | 176,599,605 | ||||||||||||||||||
(r) Collateralized by:
| Principal Amount ($) | Security | Rate (%) | Maturity Date | Collateral Value ($) | |||||||||||||||
714,352,428 | U.S. Treasury Bonds | 1.125–4.625 | 12/31/2028–2/15/2054 | 535,853,793 | |||||||||||||||
95,564 | U.S. Treasury Notes | 3.75 | 12/31/2028 | 95,033 | |||||||||||||||
Total Collateral Value | 535,948,826 | ||||||||||||||||||
(s) Collateralized by:
| Principal Amount ($) | Security | Rate (%) | Maturity Date | Collateral Value ($) | |||||||||||||||
128,971,881 | Federal Home Loan Mortgage Corporation | 1.5–5.5 | 10/1/2050–6/1/2054 | 127,877,400 | |||||||||||||||
FEDL01: U.S. Federal Funds Effective Rate
SOFR: Secured Overnight Financing Rate
STRIPS: Separate Trading of Registered Interest and Principal Securities
Fair Value Measurements
Various inputs are used in determining the value of the Portfolio's investments. These inputs are summarized in three broad levels. Level 1 includes quoted prices in active markets for identical securities. Level 2 includes other significant observable inputs (including quoted prices for similar securities, interest rates, prepayment speeds and credit risk). Level 3 includes significant unobservable inputs (including the Portfolio's own assumptions in determining the fair value of investments). The level assigned to the securities valuations may not be an indication of the risk or liquidity associated with investing in those securities. Securities held by the Portfolio are reflected as Level 2 because the securities are valued at amortized cost (which approximates fair value) and, accordingly, the inputs used to determine value are not quoted prices in an active market.
The accompanying notes are an integral part of the financial statements.
20 :: Government Cash Management Portfolio :: Investment Portfolio :: as of June 30, 2024 (unaudited)
The following is a summary of the inputs used as of June 30, 2024 in valuing the Portfolio's investments. For information on the Portfolio's policy regarding the valuation of investments, please refer to the Security Valuation section of Note A in the accompanying Notes to Financial Statements.
Assets | Level 1 | Level 2 | Level 3 | Total | |||||||||||||||
Investments in Securities(a) | $ | — | $ | 23,689,751,373 | $ | — | $ | 23,689,751,373 | |||||||||||
Repurchase Agreements | $ | — | $ | 9,935,650,000 | $ | — | $ | 9,935,650,000 | |||||||||||
Total | $ | — | $ | 33,625,401,373 | $ | — | $ | 33,625,401,373 | |||||||||||
(a) See Investment Portfolio for additional detailed categorizations.
The accompanying notes are an integral part of the financial statements.
Financial Statements :: Government Cash Management Portfolio :: 21
Statement of Assets and Liabilities (unaudited)
as of June 30, 2024
ASSETS: | |||||||
| Investments in non-affiliated securities, valued at amortized cost | $ | 23,689,751,373 | |||||
| Repurchase agreements, valued at amortized cost | 9,935,650,000 | ||||||
Interest receivable | 68,143,139 | ||||||
Other assets | 357,985 | ||||||
TOTAL ASSETS | 33,693,902,497 | ||||||
LIABILITIES: | |||||||
Cash overdraft | 97,739,700 | ||||||
Accrued investment advisory fee | 2,169,784 | ||||||
Accrued Trustees' fees | 83,850 | ||||||
Other accrued expenses and payables | 1,328,979 | ||||||
TOTAL LIABILITIES | 101,322,313 | ||||||
NET ASSETS, AT VALUE | $ | 33,592,580,184 | |||||
Statement of Operations (unaudited)
For the Six Months Ended June 30, 2024
INVESTMENT INCOME: | |||||||
Income: | |||||||
Interest | $ | 1,005,637,965 | |||||
EXPENSES: | |||||||
Management fee | 17,581,793 | ||||||
Administration fee | 5,618,179 | ||||||
Custodian fee | 149,583 | ||||||
Professional fees | 265,802 | ||||||
Reports to shareholders | 17,836 | ||||||
Trustees' fees and expenses | 754,820 | ||||||
Other | 802,653 | ||||||
Total expenses before expense reductions | 25,190,666 | ||||||
Expense reductions | (3,283,482 | ) | |||||
| TOTAL EXPENSES AFTER EXPENSE REDUCTIONS | 21,907,184 | ||||||
NET INVESTMENT INCOME | 983,730,781 | ||||||
Net realized gain (loss) from investments | 2,292,482 | ||||||
| NET INCREASE (DECREASE) IN NET ASSETS RESULTING FROM OPERATIONS | $ | 986,023,263 | |||||
The accompanying notes are an integral part of the financial statements.
22 :: Government Cash Management Portfolio :: Financial Statements
Statements of Changes in Net Assets
| Six Months Ended June 30, 2024 (unaudited) | Year Ended December 31, 2023 | ||||||||||
INCREASE (DECREASE) IN NET ASSETS | |||||||||||
OPERATIONS: | |||||||||||
Net investment income | $ | 983,730,781 | $ | 1,619,557,206 | |||||||
Net realized gain (loss) | 2,292,482 | 898,237 | |||||||||
Net increase (decrease) in net assets resulting from operations | 986,023,263 | 1,620,455,443 | |||||||||
CAPITAL TRANSACTIONS IN SHARES OF BENEFICIAL INTEREST: | |||||||||||
Proceeds from capital invested | 82,918,403,302 | 127,807,464,846 | |||||||||
Value of capital withdrawn | (88,281,925,537 | ) | (123,671,980,625 | ) | |||||||
Net increase (decrease) in net assets from capital transactions in shares of beneficial interest | (5,363,522,235 | ) | 4,135,484,221 | ||||||||
INCREASE (DECREASE) IN NET ASSETS | (4,377,498,972 | ) | 5,755,939,664 | ||||||||
Net assets at beginning of period | 37,970,079,156 | 32,214,139,492 | |||||||||
Net assets at end of period | $ | 33,592,580,184 | $ | 37,970,079,156 | |||||||
The accompanying notes are an integral part of the financial statements.
Financial Highlights :: Government Cash Management Portfolio :: 23
| Six Months Ended 6/30/24 (unaudited) | Year Ended December 31, 2023 | Year Ended December 31, 2022 | Year Ended December 31, 2021 | Year Ended December 31, 2020 | Year Ended December 31, 2019 | ||||||||||||||||||||||
| RATIOS TO AVERAGE NET ASSETS AND SUPPLEMENTAL DATA | |||||||||||||||||||||||||||
Net assets, end of period ($ millions) | 33,593 | 37,970 | 32,214 | 33,649 | 26,122 | 18,891 | |||||||||||||||||||||
| Ratio of expenses before expense reductions (%) | .13 | * | .13 | .14 | .13 | .13 | .14 | ||||||||||||||||||||
| Ratio of expenses after expense reductions (%) | .12 | * | .09 | .06 | .03 | .07 | .07 | ||||||||||||||||||||
Ratio of net investment income (%) | 5.25 | * | 5.00 | 1.67 | .03 | .36 | 2.13 | ||||||||||||||||||||
Total Return (%)(a) | 2.65 | (b)** | 5.08 | (b) | 1.62 | (b) | .03 | (b) | .41 | (c) | 2.17 | (c) | |||||||||||||||
(a) Total return would have been lower had certain expenses not been reduced.
(b) Total return for the Portfolio was derived from the performance of DWS Government Money Market Series.
(c) Total return for the Portfolio was derived from the performance of DWS Government Cash Reserves Fund Institutional.
* Annualized
** Not annualized
The accompanying notes are an integral part of the financial statements.
24 :: Government Cash Management Portfolio :: Notes to Financial Statements :: June 30, 2024 (unaudited)
A. Organization and Significant Accounting Policies
Government Cash Management Portfolio (the "Portfolio") is registered under the Investment Company Act of 1940, as amended (the "1940 Act"), as an open-end management investment company organized as a New York trust.
The Portfolio is a master fund; A master/feeder fund structure is one in which a fund (a "feeder fund"), instead of investing directly in a portfolio of securities, invests most or all of its investment assets in a separate registered investment company (the "master fund") with substantially the same investment objective and policies as the feeder fund. Such a structure permits the pooling of assets of two or more feeder funds, preserving separate identities or distribution channels at the feeder fund level. The Portfolio may have several feeder funds, including affiliated DWS feeder funds and unaffiliated feeder funds, with a significant ownership percentage of the Portfolio's net assets. Investment activities of these feeder funds could have a material impact on the Portfolio. As of June 30, 2024, DWS Government Money Market Series owned approximately 99.4% of the Portfolio.
The Portfolio's financial statements are prepared in accordance with accounting principles generally accepted in the United States of America ("U.S. GAAP") which require the use of management estimates. Actual results could differ from those estimates. The Portfolio qualifies as an investment company under Topic 946 of Accounting Standards Codification of U.S. GAAP. The policies described below are followed consistently by the Portfolio in the preparation of its financial statements.
Security Valuation
Various inputs are used in determining the value of the Portfolio's investments. These inputs are summarized in three broad levels. Level 1 includes quoted prices in active markets for identical securities. Level 2 includes other significant observable inputs (including quoted prices for similar securities, interest rates, prepayment speeds and credit risk). Level 3 includes significant unobservable inputs (including the Portfolio's own assumptions in determining the fair value of investments). The level assigned to the securities valuations may not be an indication of the risk or liquidity associated with investing in those securities.
The Portfolio values all securities utilizing the amortized cost method permitted in accordance with Rule 2a-7 under the 1940 Act and certain conditions therein. Under this method, which does not take into account unrealized capital gains or losses on securities, an instrument is initially valued at its cost and thereafter assumes a constant accretion/amortization rate to maturity of any discount or premium. Securities held by the Portfolio are reflected as Level 2 because the securities are valued at amortized cost (which approximates fair value) and, accordingly, the inputs used to determine value are not quoted prices in an active market.
Repurchase Agreements
The Portfolio may enter into repurchase agreements, under the terms of a Master Repurchase Agreement, with certain banks and broker/dealers whereby the Portfolio, through its custodian or a sub-custodian bank, receives delivery of the underlying securities, the amount of which at the time of purchase and each subsequent business day is required to be maintained at such a level that the value is equal to at least the principal amount of the repurchase price plus accrued interest. The custodian bank or another designated sub-custodian bank holds the collateral in a separate account until the agreement matures. If the value of the securities falls below the principal amount of the repurchase agreement plus accrued interest, the financial institution deposits additional collateral by the following business day. If the financial institution either fails to deposit the required additional collateral or fails to repurchase the securities as agreed, the Portfolio has the right to sell the securities and recover any resulting loss from the financial institution. If the financial institution enters into bankruptcy, the Portfolio's claims on the collateral may be subject to legal proceedings.
As of June 30, 2024, the Portfolio held repurchase agreements with a gross value of $9,935,650,000. The value of the related collateral exceeded the value of the repurchase agreements at period end. The detail of the related collateral is included in the footnotes following the Portfolio's Investment Portfolio.
Federal Income Taxes
The Portfolio is considered a Partnership under the Internal Revenue Code of 1986, as amended. Therefore, no federal income tax provision is necessary.
It is intended that the Portfolio's assets, income and distributions will be managed in such a way that an investor in the Portfolio will be able to satisfy the requirements of Subchapter M of the Code, assuming that the investor invested all of its assets in the Portfolio.
At June 30, 2024, Government Cash Management Portfolio had an aggregate cost of investments for federal income tax purposes of $33,625,401,373.
The Portfolio has reviewed the tax positions for the open tax years as of December 31, 2023 and has determined that no provision for income tax and/or uncertain tax positions is required in the Portfolio's financial statements. The Portfolio's federal tax returns for the prior three fiscal years remain open subject to examination by the Internal Revenue Service.
Contingencies
In the normal course of business, the Portfolio may enter into contracts with service providers that contain general indemnification clauses. The Portfolio's maximum exposure under these arrangements is unknown, as this would involve future claims that may be made against the Portfolio that have not yet
June 30, 2024 (unaudited) :: Notes to Financial Statements :: Government Cash Management Portfolio :: 25
been made. However, based on experience, the Portfolio expects the risk of loss to be remote.
Other
Investment transactions are accounted for on trade date. Interest income is recorded on the accrual basis. Realized gains and losses from investment transactions are recorded on an identified cost basis. All premiums and discounts are amortized/accreted for both tax and financial reporting purposes.
The Portfolio makes an allocation of its net investment income and realized gains and losses from securities transactions to its investors in proportion to their investment in the Portfolio.
B. Fees and Transactions with Affiliates
Management Agreement
Under the Investment Management Agreement with DWS Investment Management Americas, Inc. ("DIMA" or the "Advisor"), an indirect, wholly owned subsidiary of DWS Group GmbH & Co. KGaA ("DWS Group"), the Advisor determines the securities, instruments and other contracts relating to investments to be purchased, sold or entered into by the Portfolio.
Under the Investment Management Agreement with the Advisor, the Portfolio pays a monthly management fee based on its average daily net assets, computed and accrued daily and payable monthly, at the following annual rates:
| First $3.0 billion of the Portfolio's average daily net assets | .1200 | % | |||||
Next $4.5 billion of such net assets | .1025 | % | |||||
Over $7.5 billion of such net assets | .0900 | % | |||||
Accordingly, for the six months ended June 30, 2024, the fee pursuant to the Investment Management Agreement was equivalent to an annualized rate (exclusive of any applicable waivers/reimbursements) of 0.094% of the Portfolio's average daily net assets.
The Advisor agreed to voluntarily waive additional expenses. This voluntary waiver may be changed or terminated at any time without notice. Under these arrangements, the Advisor waived certain expenses of the Portfolio.
For the six months ended June 30, 2024, fees waived and/or expenses reimbursed are $3,283,482.
Administration Fee
Pursuant to an Administrative Services Agreement, DIMA provides most administrative services to the Portfolio. For all services provided under the Administrative Services Agreement, the Portfolio paid the Advisor an annual fee ("Administration Fee") of 0.03% of the Portfolio's average daily net assets, computed and accrued daily and payable monthly. For the six months ended June 30, 2024, the Administration Fee was $5,618,179, of which $877,078 is unpaid.
Other Service Fees
Under an agreement with the Portfolio, DIMA is compensated for providing regulatory filing services to the Portfolio. For the six months ended June 30, 2024, the amount charged to the Portfolio by DIMA included in the Statement of Operations under "Reports to shareholders" aggregated $420, all of which is unpaid.
Trustees' Fees and Expenses
The Portfolio paid retainer fees to each Trustee not affiliated with the Advisor, plus specified amounts to the Board Chairperson and to each committee Chairperson.
C. Line of Credit
The Portfolio and other affiliated funds (the "Participants") share in a $345 million revolving credit facility provided by a syndication of banks. The Portfolio may borrow for temporary or emergency purposes, including the meeting of redemption requests that otherwise might require the untimely disposition of securities. The Participants are charged an annual commitment fee, which is allocated based on net assets, among each of the Participants. Interest is calculated at a daily fluctuating rate per annum equal to the sum of 0.10% plus the higher of the Federal Funds Effective Rate and the Overnight Bank Funding Rate, plus 1.25%. The Portfolio may borrow up to a maximum of 33 percent of its net assets under the agreement. The Portfolio had no outstanding loans at June 30, 2024.
D. Money Market Fund Investments and Yield
Rising interest rates could cause the value of the Portfolio's investments — and therefore its share price as well — to decline. A rising interest rate environment may cause investors to move out of fixed-income securities and related markets on a large scale, which could adversely affect the price and liquidity of such securities and could also result in increased redemptions from the Portfolio. Increased redemptions from the Portfolio may force the Portfolio to sell investments at a time when it is not advantageous to do so, which could result in losses. Beginning in 2022, the US Federal Reserve ("Fed") raised interest rates significantly in response to increased inflation. It is unclear if and when the Fed may begin to implement interest rate cuts, if rates will remain at current levels for a prolonged period or if, in response to certain economic developments such as a turnaround in the decline of inflation, the Fed may consider additional rate increases. As a result, fixed-income and related markets may experience heightened levels of interest rate volatility and liquidity risk, which could impair the Portfolio's ability to maintain a stable $1.00 share price. Any decline in interest rates is likely to cause the Portfolio's yield to decline, and during periods of unusually low or negative interest rates, the Portfolio's yield may approach or fall below zero. A low or negative interest rate environment may prevent the Portfolio from providing a positive yield or paying Portfolio expenses out of current income and, at times, could impair the Portfolio's ability to maintain a stable $1.00 share price. Over time,
26 :: Government Cash Management Portfolio :: Notes to Financial Statements :: June 30, 2024 (unaudited)
the total return of a money market fund may not keep pace with inflation, which could result in a net loss of purchasing power for long-term investors. Interest rates can change in response to the supply and demand for credit, government and/or central bank monetary policy and action, inflation rates, and other factors. Recent and potential future changes in monetary policy made by central banks or governments are likely to affect the level of interest rates. Changing interest rates may have unpredictable effects on
markets, may result in heightened market volatility and potential illiquidity and may detract from Portfolio performance to the extent the Portfolio is exposed to such interest rates and/or volatility. Money market funds try to minimize interest rate risk by purchasing short-term securities. If there is an insufficient supply of U.S. government securities to meet investor demand, it could result in lower yields on such securities and increase interest rate risk for the Portfolio.

P.O. Box 182800
Columbus, OH 43218-2800
ProFunds®
Post Office Mailing Address for Investments
P.O. Box 182800
Columbus, OH 43218-2800
Phone Numbers
For Individual Investors Only: 888-776-3637 or 614-470-8122
Institutions and Financial Professionals Only: 888-776-5717 Or: 240-497-6552
Fax Number: (800) 782-4797
Website Address: ProFunds.com
This report is submitted for the general information of the shareholders of the ProFunds. It is not authorized for distribution to prospective investors unless preceded or accompanied by an effective prospectus. To receive the most recent month end performance information for each Fund, please call toll-free 888-776-5717.
A description of the policies and procedures that the ProFunds uses to determine how to vote proxies relating to portfolio securities is available without charge, upon request, by calling toll-free 888-776-3637; and on the Securities and Exchange Commission's website at sec.gov. Information regarding how the ProFund voted proxies relating to portfolio securities during the most recent 12-month period ended June 30 is available. (i) without change by calling toll-free 888-776-3637; (ii) on the ProFunds' website at ProFunds.com; and (iii) on the Commission's website at sec.gov.
The ProFund discloses on the Adviser's website that it invests substantially all of its assets in the Portfolio and includes a link to the latest available listing of holdings in the Portfolio. In addition, the ProFund will file with the SEC on Form N-MFP, within five business days after the end of each month, more detailed portfolio holdings information. The ProFund's Form N-MFP filings will be available on the SEC's website, and the Adviser's website will contain a link to such filings.
PRO0624


Semiannual Financial Statements and
Other Information
JUNE 30, 2024
ProFunds VP
Access VP High Yield
Asia 30
Banks
Bear
Biotechnology
Bull
Communication Services
Consumer Discretionary
Consumer Staples
Dow 30
Emerging Markets
Energy
Europe 30
Falling U.S. Dollar
Financials
Government Money Market
Health Care
Industrials
International
Internet
Japan
Large-Cap Growth
Large-Cap Value
Materials
Mid-Cap
Mid-Cap Growth
Mid-Cap Value
Nasdaq-100
Pharmaceuticals
Precious Metals
Real Estate
Rising Rates Opportunity
Semiconductor
Short Dow 30
Short Emerging Markets
Short International
Short Mid-Cap
Short Nasdaq-100
Short Small-Cap
Small-Cap
Small-Cap Growth
Small-Cap Value
Technology
UltraBull
UltraMid-Cap
UltraNasdaq-100
UltraShort Dow 30
UltraShort Nasdaq-100
UltraSmall-Cap
U.S. Government Plus
Utilities
Table of Contents
1 | |||||||
| 3 | |||||||
| 4 | |||||||
| 5 | |||||||
| 6 | |||||||
| 8 | |||||||
| 9 | |||||||
| 12 | |||||||
| 20 | |||||||
| 21 | |||||||
| 23 | |||||||
| 25 | |||||||
| 26 | |||||||
| 28 | |||||||
| 29 | |||||||
| 30 | |||||||
| 31 | |||||||
| 33 | |||||||
| 34 | |||||||
| 36 | |||||||
| 38 | |||||||
| 39 | |||||||
| 41 | |||||||
| 42 | |||||||
| 46 | |||||||
| 53 | |||||||
| 54 | |||||||
| 55 | |||||||
| 60 | |||||||
| 65 | |||||||
| 68 | |||||||
| 70 | |||||||
| 71 | |||||||
| 72 | |||||||
| 73 | |||||||
| 75 | |||||||
| 76 | |||||||
| 77 | |||||||
| 78 | |||||||
| 79 | |||||||
| 80 | |||||||
| 81 | |||||||
| 106 | |||||||
| 112 | |||||||
| 119 | |||||||
| 121 | |||||||
| 129 | |||||||
| 136 | |||||||
| 139 | |||||||
| 140 | |||||||
| 141 | |||||||
| 167 | |||||||
| 168 | |||||||
| 169 | |||||||
| 181 | |||||||
| 193 | |||||||
| 215 | |||||||
| 243 | |||||||
| 275 | |||||||

Dear Shareholder,
Market and investor sentiment generally turned positive over the reporting period, though lingering concerns about inflation, the timing of potential rate cuts, and geopolitical concerns continued to weigh on investors. ProFunds remains committed to providing you with an innovative array of products and services designed to help achieve your investment objectives under a range of conditions. Following is the ProFunds VP Semiannual Report for the six months ended June 30, 2024.
Interest Rates Remained High Amid Moderating Inflation
Combating elevated inflation and continuing to avoid a recession dominated much of U.S. economic policymaking during the period. The Federal Reserve last increased short-term rates during the middle of 2023, to a target range of 5.25% to 5.5%, and they have been unchanged since. With the Fed Funds Rate steady, inflationary pressures moderated somewhat, but inflation remained above the Federal Reserve's 2% target. As a result, rate cuts that were expected going into the reporting period did not materialize, but they are anticipated at the next Federal Open Markets Committee (FOMC) meeting in September.
Outside the United States, central bank responses to inflation in the developed world began to diverge slightly. The Bank of England kept interest rates on hold throughout the reporting period. European Central Bank (ECB) President Christine Lagarde commented in March that a June rate cut was possible – and the ECB did lower rates
by 25 basis points in its June 6 policy announcement – but she declined to predict further rate cuts afterward. The Bank of Japan raised its short-term rate to 0.1% in March.
Rally Produced All-Time Highs
From January through late March, markets extended a rally that began last October, with the Dow Jones Industrial Average hitting new all-time highs along the way. Markets experienced some volatility in the spring as they digested signs of cooling in the economy and the postponement of interest rate cuts. Still, the Dow crossed 40,000 for the first time in May, and returns for the full period were positive, rising a modest 4.8%. Larger companies and technology firms posted the strongest gains, benefiting from excitement around artificial intelligence (AI).The large-cap S&P 500 rose 15.3%, and the tech-heavy Nasdaq-100 Index gained 17.5%. Mid- and small-cap firms saw smaller gains, with the S&P MidCap 400 rising 6.2% and the small-cap Russell 2000 Index rising 1.7%. Across the major sectors, communication services and technology were the best performers, posting gains of 18.9% and 18.0%, respectively. The interest-rate-sensitive real estate sector was the only one to post negative returns, declining by 2.5% over the period.
Most international equity markets also posted positive results for the period, though they were not as strong as U.S. markets. The MSCI EAFE Index, which tracks developed markets outside North America, increased 5.3%, the MSCI Europe Index gained 5.8%, and the Nikkei Total Return rose 4.3%. Emerging markets posted positive returns
1
overall, with the S&P Emerging 50 ADR Index rising 6.5%. However, the S&P Latin America 35 ADR Index declined by 13.4%, and the S&P China Select ADR Index fell 9.4%.
Bonds generated mixed performance through the period and ended roughly where they began, with the Bloomberg U.S. Aggregate Total Return Index losing 0.7%. Amid uncertain interest rate forecasts, longer duration meant weaker returns: The S&P U.S. Treasury Bond Current 30-Year Index declined 6.2%, and its 10-year and 5-year counterparts lost 2.0% and 0.4%, respectively. High-yield corporate bonds, as measured by the iBoxx $ Liquid High Yield Index, rose 2.3%, and their investment-grade peers declined 1.2%.
U.S. Economy Showed Signs of Cooling
While the U.S. economy has continued to demonstrate resilience, conditions seemed to cool over the reporting period. Strong GDP growth in the second half of 2023 moderated heading into 2024, with real GDP growth coming in at 1.4% in the first quarter. The U.S. unemployment rate also rose slightly over the reporting period, ticking up about half a percentage point to 4.1% in June. The dollar appreciated somewhat, with the Bloomberg Dollar Spot Index increasing by 4.7%.
ProFunds VP Trust Results Mirror Markets
ProFunds VP index-based mutual funds offer many advantages, such as diverse market exposures, a transparent investment process, efficient fund management, and high daily correlation to their indexes. In the past six months, ProFunds VP investors saw the most significant potential for gains in domestic equity strategies, particularly those focused on large-cap companies and the technology sector.
No matter what direction the market takes going forward, ProFunds VP mutual funds offer a wide array of strategies designed to meet your investment needs, help manage risk, and potentially enhance returns. We appreciate the trust and confidence you have placed in ProFunds, and we look forward to continuing to serve you.
Sincerely,

Michael L. Sapir
Chairman of the Board of Trustees
2
U.S. Treasury Obligation (47.7%)
| Principal Amount | Value | ||||||||||
U.S. Treasury Notes, 4.50%, 5/31/29 | $ | 7,150,000 | $ | 7,199,715 | |||||||
| TOTAL U.S. TREASURY OBLIGATION (Cost $7,190,532) | 7,199,715 | ||||||||||
Repurchase Agreements(a) (46.1%)
| Repurchase Agreements with various counterparties, rates 5.12%–5.20%, dated 6/28/2024, due 7/1/24, total to be received $6,959,007 | 6,956,000 | 6,956,000 | |||||||||
| TOTAL REPURCHASE AGREEMENTS (Cost $6,956,000) | 6,956,000 | ||||||||||
| TOTAL INVESTMENT SECURITIES (Cost $14,146,532)—93.8% | 14,155,715 | ||||||||||
Net other assets (liabilities)—6.2% | 934,161 | ||||||||||
NET ASSETS—100.0% | $ | 15,089,876 | |||||||||
(a) The ProFund VP invests in Repurchase Agreements jointly with other funds in the Trust. See "Repurchase Agreements" under Note 2 in the Notes to Financial Statements to view the details of each individual agreement and counterparty as well as a description of the securities subject to repurchase.
Futures Contracts Purchased
| Number of Contracts | Expiration Date | Notional Amount | Value and Unrealized Appreciation/ (Depreciation) | ||||||||||||||||
5-Year U.S. Treasury Note Futures Contracts | 21 | 10/1/24 | $ | 2,236,992 | $ | 12,762 | |||||||||||||
Centrally Cleared Swap Agreements
Credit Default Swap Agreements—Sell Protection(1)
| Underlying Instrument | Payment Frequency | Fixed Deal Receive Rate | Maturity Date | Implied Credit Spread at June 30, 2024(2) | Notional Amount(3) | Value | Premiums Paid (Received) | Unrealized Appreciation/ (Depreciation) | Variation Margin | ||||||||||||||||||||||||||||||
| CDX North America High Yield Index Swap Agreement, Series 42 | Daily | 5.00 | % | 6/20/29 | 3.42 | % | $ | 11,610,000 | $ | 730,230 | $ | 813,002 | $ | (82,772 | ) | $ | (9,928 | ) | |||||||||||||||||||||
(1) When a credit event occurs as defined under the terms of the swap agreement, the Fund as a seller of credit protection will either (i) pay to the buyer of protection an amount equal to the par value of the defaulted reference entity and take delivery of the reference entity or (ii) pay a net amount equal to the par value of the defaulted reference entity less its recovery value.
(2) Implied credit spread, represented in absolute terms, utilized in determining the value of the credit default swap agreements as of period end will serve as an indicator of the current status of the payment/performance risk and represent the likelihood or risk of default or other credit event for the credit derivative. The implied credit spread of a referenced entity reflects the cost of buying/selling protection and may include payments required to be made to enter into the agreement. Generally, wider credit spreads represent a perceived deterioration of the referenced entity's credit soundness and a greater likelihood or risk of default or other credit event occurring as defined under the terms of the swap agreement.
(3) The notional amount represents the maximum potential amount the Fund could be required pay as a seller of credit protection if a credit event occurs, as defined under the terms of the swap agreement, for each security included in the CDX North America High Yield Index.
See accompanying notes to the financial statements.
Common Stocks (98.0%)
Shares | Value | ||||||||||
| Alibaba Group Holding, Ltd.ADR (Broadline Retail) | 11,157 | $ | 803,304 | ||||||||
| ASE Technology Holding Co., Ltd.ADR (Semiconductors & Semiconductor Equipment) | 46,186 | 527,444 | |||||||||
Baidu, Inc.*ADR (Interactive Media & Services) | 4,488 | 388,122 | |||||||||
BHP Group, Ltd.ADR (Metals & Mining) | 16,704 | 953,631 | |||||||||
Bilibili, Inc.*ADR (Entertainment) | 30,666 | 473,483 | |||||||||
| Daqo New Energy Corp.*ADR (Semiconductors & Semiconductor Equipment) | 13,214 | 192,924 | |||||||||
| Dr. Reddy's Laboratories, Ltd. (Pharmaceuticals) | 5,797 | 441,673 | |||||||||
| Full Truck Alliance Co., Ltd.ADR (Ground Transportation) | 54,039 | 434,474 | |||||||||
Futu Holdings, Ltd.*ADR (Capital Markets) | 6,919 | 453,921 | |||||||||
HDFC Bank, Ltd.ADR (Banks) | 16,767 | 1,078,622 | |||||||||
ICICI Bank, Ltd.ADR (Banks) | 30,230 | 870,926 | |||||||||
Infosys, Ltd.ADR (IT Services) | 29,606 | 551,264 | |||||||||
iQIYI, Inc.*ADR (Entertainment) | 75,169 | 275,870 | |||||||||
JD.com, Inc.ADR (Broadline Retail) | 19,197 | 496,050 | |||||||||
| JinkoSolar Holding Co., Ltd.ADR(a) (Semiconductors & Semiconductor Equipment) | 9,412 | 195,017 | |||||||||
| Kanzhun, Ltd. (Interactive Media & Services) | 22,937 | 431,445 | |||||||||
| KE Holdings, Inc.ADR (Real Estate Management & Development) | 26,677 | 377,480 | |||||||||
Li Auto, Inc.*ADR(a) (Automobiles) | 14,086 | 251,857 | |||||||||
Lufax Holding, Ltd.*ADR (Consumer Finance) | 116,618 | 276,385 | |||||||||
NetEase, Inc.ADR (Entertainment) | 6,794 | 649,371 | |||||||||
| New Oriental Education & Technology Group, Inc.*ADR (Diversified Consumer Services) | 5,547 | 431,168 | |||||||||
NIO, Inc.*ADR(a) (Automobiles) | 45,750 | 190,320 | |||||||||
| POSCO Holdings, Inc.ADR(a) (Metals & Mining) | 3,303 | 217,139 | |||||||||
Sea, Ltd.*ADR (Entertainment) | 11,032 | 787,905 | |||||||||
| Taiwan Semiconductor Manufacturing Co., Ltd.ADR (Semiconductors & Semiconductor Equipment) | 11,219 | 1,949,974 | |||||||||
| Tencent Music Entertainment GroupADR (Entertainment) | 46,996 | 660,294 | |||||||||
| Trip.com Group, Ltd.*ADR (Hotels, Restaurants & Leisure) | 12,653 | 594,691 | |||||||||
| United Microelectronics Corp.ADR (Semiconductors & Semiconductor Equipment) | 51,546 | 451,543 | |||||||||
XPeng, Inc.*ADR(a) (Automobiles) | 28,235 | 206,963 | |||||||||
| ZTO Express Cayman, Inc.ADR (Air Freight & Logistics) | 20,070 | 416,453 | |||||||||
| TOTAL COMMON STOCKS (Cost $10,197,118) | 16,029,713 | ||||||||||
Repurchase Agreements(b) (0.2%)
| Principal Amount | Value | ||||||||||
| Repurchase Agreements with various counterparties, rates 5.12%–5.20%, dated 6/28/2024, due 7/1/24, total to be received $39,017 | $ | 39,000 | $ | 39,000 | |||||||
| TOTAL REPURCHASE AGREEMENTS (Cost $39,000) | 39,000 | ||||||||||
Collateral for Securities Loaned(c) (6.4%)
Shares | Value | ||||||||||
| Invesco Government & Agency Portfolio—Institutional Shares, 5.23%(d) | 1,039,165 | $ | 1,039,165 | ||||||||
| TOTAL COLLATERAL FOR SECURITIES LOANED (Cost $1,039,165) | 1,039,165 | ||||||||||
| TOTAL INVESTMENT SECURITIES (Cost $11,275,283)—104.6% | 17,107,878 | ||||||||||
Net other assets (liabilities)—(4.6)% | (759,848 | ) | |||||||||
NET ASSETS—100.0% | $ | 16,348,030 | |||||||||
* Non-income producing security.
(a) All or part of this security was on loan as of June 30, 2024. The total value of securities on loan as of June 30, 2024 was $981,576.
(b) The ProFund VP invests in Repurchase Agreements jointly with other funds in the Trust. See "Repurchase Agreements" under Note 2 in the Notes to Financial Statements to view the details of each individual agreement and counterparty as well as a description of the securities subject to repurchase.
(c) Securities were purchased with cash collateral held from securities on loan at June 30, 2024.
(d) Rate periodically changes. Rate disclosed is the daily yield on June 30, 2024.
ADR American Depositary Receipt
ProFund VP Asia 30 invested in the following industries as of June 30, 2024:
Value | % of Net Assets | ||||||||||
Air Freight & Logistics | $ | 416,453 | 2.5 | % | |||||||
Automobiles | 649,140 | 4.0 | % | ||||||||
Banks | 1,949,548 | 11.9 | % | ||||||||
Broadline Retail | 1,299,354 | 7.9 | % | ||||||||
Capital Markets | 453,921 | 2.8 | % | ||||||||
Consumer Finance | 276,385 | 1.7 | % | ||||||||
Diversified Consumer Services | 431,168 | 2.6 | % | ||||||||
Entertainment | 2,846,923 | 17.5 | % | ||||||||
Ground Transportation | 434,474 | 2.7 | % | ||||||||
Hotels, Restaurants & Leisure | 594,691 | 3.6 | % | ||||||||
Interactive Media & Services | 819,567 | 5.0 | % | ||||||||
IT Services | 551,264 | 3.4 | % | ||||||||
Metals & Mining | 1,170,770 | 7.1 | % | ||||||||
Pharmaceuticals | 441,673 | 2.7 | % | ||||||||
Real Estate Management & Development | 377,480 | 2.3 | % | ||||||||
| Semiconductors & Semiconductor Equipment | 3,316,902 | 20.3 | % | ||||||||
Other** | 318,317 | 2.0 | % | ||||||||
Total | $ | 16,348,030 | 100.0 | % | |||||||
ProFund VP Asia 30 invested in securities with exposure to the following countries as of June 30, 2024:
Value | % of Net Assets | ||||||||||
Australia | $ | 953,631 | 5.8 | % | |||||||
China | 7,745,671 | 47.4 | % | ||||||||
Hong Kong | 453,921 | 2.8 | % | ||||||||
India | 2,942,485 | 18.0 | % | ||||||||
Singapore | 787,905 | 4.8 | % | ||||||||
South Korea | 217,139 | 1.3 | % | ||||||||
Taiwan | 2,928,961 | 17.9 | % | ||||||||
Other** | 318,317 | 2.0 | % | ||||||||
Total | $ | 16,348,030 | 100.0 | % | |||||||
** Includes any non-equity securities and net other assets (liabilities), which includes any receivable for capital shares issued and payable for capital shares redeemed.
See accompanying notes to the financial statements.
Common Stocks (98.3%)
Shares | Value | ||||||||||
Ameris Bancorp (Banks) | 870 | $ | 43,805 | ||||||||
| Apollo Global Management, Inc. (Financial Services) | 351 | 41,443 | |||||||||
Associated Banc-Corp. (Banks) | 2,035 | 43,040 | |||||||||
Atlantic Union Bankshares Corp. (Banks) | 1,182 | 38,829 | |||||||||
Axos Financial, Inc.* (Banks) | 779 | 44,520 | |||||||||
Banc of California, Inc. (Banks) | 3,169 | 40,500 | |||||||||
Bank of America Corp. (Banks) | 1,037 | 41,241 | |||||||||
Bank of Hawaii Corp. (Banks) | 728 | 41,649 | |||||||||
Bank OZK (Banks) | 1,075 | 44,075 | |||||||||
BankUnited, Inc. (Banks) | 1,504 | 44,022 | |||||||||
Banner Corp. (Banks) | 578 | 28,692 | |||||||||
BOK Financial Corp. (Banks) | 466 | 42,704 | |||||||||
Cadence Bank (Banks) | 1,511 | 42,731 | |||||||||
Cathay General Bancorp (Banks) | 1,129 | 42,586 | |||||||||
Citigroup, Inc. (Banks) | 686 | 43,534 | |||||||||
Citizens Financial Group, Inc. (Banks) | 1,194 | 43,020 | |||||||||
Columbia Banking System, Inc. (Banks) | 2,212 | 43,997 | |||||||||
Comerica, Inc. (Banks) | 869 | 44,354 | |||||||||
Commerce Bancshares, Inc. (Banks) | 769 | 42,895 | |||||||||
Community Financial System, Inc. (Banks) | 881 | 41,592 | |||||||||
Corebridge Financial, Inc. (Financial Services) | 1,436 | 41,816 | |||||||||
Cullen/Frost Bankers, Inc. (Banks) | 429 | 43,599 | |||||||||
CVB Financial Corp. (Banks) | 2,474 | 42,652 | |||||||||
East West Bancorp, Inc. (Banks) | 587 | 42,986 | |||||||||
Eastern Bankshares, Inc. (Banks) | 2,643 | 36,949 | |||||||||
Equitable Holdings, Inc. (Financial Services) | 1,026 | 41,922 | |||||||||
Essent Group, Ltd. (Financial Services) | 742 | 41,693 | |||||||||
F.N.B. Corp. (Banks) | 3,199 | 43,762 | |||||||||
Fifth Third Bancorp (Banks) | 1,156 | 42,182 | |||||||||
First Bancorp (Banks) | 2,377 | 43,475 | |||||||||
| First Citizens BancShares, Inc.—Class A (Banks) | 25 | 42,090 | |||||||||
First Financial Bancorp (Banks) | 1,108 | 24,620 | |||||||||
First Financial Bankshares, Inc. (Banks) | 1,463 | 43,202 | |||||||||
First Hawaiian, Inc. (Banks) | 2,070 | 42,973 | |||||||||
First Horizon Corp. (Banks) | 2,852 | 44,968 | |||||||||
| First Interstate BancSystem, Inc.—Class A (Banks) | 1,613 | 44,793 | |||||||||
First Merchants Corp. (Banks) | 842 | 28,030 | |||||||||
Fulton Financial Corp. (Banks) | 2,567 | 43,588 | |||||||||
Glacier Bancorp, Inc. (Banks) | 1,154 | 43,067 | |||||||||
Hancock Whitney Corp. (Banks) | 926 | 44,291 | |||||||||
Hilltop Holdings, Inc. (Banks) | 829 | 25,931 | |||||||||
Home BancShares, Inc. (Banks) | 1,784 | 42,745 | |||||||||
Huntington Bancshares, Inc. (Banks) | 3,290 | 43,362 | |||||||||
Independent Bank Corp. (Banks) | 864 | 43,822 | |||||||||
Independent Bank Group, Inc. (Banks) | 796 | 36,234 | |||||||||
International Bancshares Corp. (Banks) | 718 | 41,077 | |||||||||
| Jackson Financial, Inc.—Class A (Financial Services) | 588 | 43,666 | |||||||||
JPMorgan Chase & Co. (Banks) | 210 | 42,475 | |||||||||
KeyCorp (Banks) | 3,047 | 43,298 | |||||||||
Lakeland Financial Corp. (Banks) | 328 | 20,179 | |||||||||
Common Stocks, continued
Shares | Value | ||||||||||
M&T Bank Corp. (Banks) | 286 | $ | 43,289 | ||||||||
MGIC Investment Corp. (Financial Services) | 1,991 | 42,906 | |||||||||
Mr. Cooper Group, Inc.* (Financial Services) | 497 | 40,371 | |||||||||
New York Community Bancorp, Inc. (Banks) | 13,344 | 42,968 | |||||||||
NMI Holdings, Inc.* (Financial Services) | 1,281 | 43,605 | |||||||||
Northern Trust Corp. (Capital Markets) | 498 | 41,822 | |||||||||
Old National Bancorp (Banks) | 2,579 | 44,333 | |||||||||
Pacific Premier Bancorp, Inc. (Banks) | 1,796 | 41,254 | |||||||||
| PennyMac Financial Services, Inc. (Financial Services) | 446 | 42,192 | |||||||||
Pinnacle Financial Partners, Inc. (Banks) | 543 | 43,462 | |||||||||
Popular, Inc. (Banks) | 484 | 42,800 | |||||||||
Prosperity Bancshares, Inc. (Banks) | 708 | 43,287 | |||||||||
Radian Group, Inc. (Financial Services) | 1,358 | 42,234 | |||||||||
Regions Financial Corp. (Banks) | 2,182 | 43,727 | |||||||||
Renasant Corp. (Banks) | 700 | 21,378 | |||||||||
Seacoast Banking Corp. of Florida (Banks) | 1,329 | 31,418 | |||||||||
ServisFirst Bancshares, Inc. (Banks) | 538 | 33,996 | |||||||||
Simmons First National Corp.—Class A (Banks) | 1,535 | 26,985 | |||||||||
SouthState Corp. (Banks) | 571 | 43,636 | |||||||||
Synovus Financial Corp. (Banks) | 1,113 | 44,731 | |||||||||
Texas Capital Bancshares, Inc.* (Banks) | 714 | 43,654 | |||||||||
The Bancorp, Inc.* (Banks) | 1,242 | 46,897 | |||||||||
| The Bank of New York Mellon Corp. (Capital Markets) | 701 | 41,983 | |||||||||
The PNC Financial Services Group, Inc. (Banks) | 270 | 41,980 | |||||||||
Triumph Financial, Inc.* (Banks) | 487 | 39,812 | |||||||||
Truist Financial Corp. (Banks) | 1,150 | 44,678 | |||||||||
Trustmark Corp. (Banks) | 835 | 25,083 | |||||||||
U.S. Bancorp (Banks) | 1,048 | 41,606 | |||||||||
UMB Financial Corp. (Banks) | 509 | 42,461 | |||||||||
United Bankshares, Inc. (Banks) | 1,309 | 42,464 | |||||||||
United Community Banks, Inc. (Banks) | 1,680 | 42,773 | |||||||||
Valley National Bancorp (Banks) | 6,242 | 43,569 | |||||||||
Voya Financial, Inc. (Financial Services) | 576 | 40,982 | |||||||||
WaFd, Inc. (Banks) | 1,366 | 39,040 | |||||||||
Walker & Dunlop, Inc. (Financial Services) | 432 | 42,422 | |||||||||
Webster Financial Corp. (Banks) | 1,027 | 44,767 | |||||||||
Wells Fargo & Co. (Banks) | 709 | 42,108 | |||||||||
WesBanco, Inc. (Banks) | 633 | 17,667 | |||||||||
Western Alliance Bancorp (Banks) | 695 | 43,660 | |||||||||
Wintrust Financial Corp. (Banks) | 443 | 43,662 | |||||||||
WSFS Financial Corp. (Banks) | 785 | 36,895 | |||||||||
Zions Bancorp NA (Banks) | 998 | 43,283 | |||||||||
| TOTAL COMMON STOCKS (Cost $2,521,141) | 3,736,516 | ||||||||||
| TOTAL INVESTMENT SECURITIES (Cost $2,521,141)—98.3% | 3,736,516 | ||||||||||
Net other assets (liabilities)—1.7% | 64,056 | ||||||||||
NET ASSETS—100.0% | $ | 3,800,572 | |||||||||
* Non-income producing security.
See accompanying notes to the financial statements.
June 30, 2024 (unaudited) :: Schedule of Portfolio Investments :: ProFund VP Banks :: 7
Total Return Swap Agreements—Long
Underlying Instrument | Counterparty | Termination Date(1) | Rate Paid (Received)(2) | Notional Amount | Value and Unrealized Appreciation/ (Depreciation) | ||||||||||||||||||
S&P Banks Select Industry Index | Goldman Sachs International | 7/23/24 | 6.08 | % | $ | 49,245 | $ | 1,108 | |||||||||||||||
(1) Agreements may be terminated at will by either party without penalty. Payment is due at termination/maturity.
(2) Reflects the floating financing rate, as of June 30, 2024, on the notional amount of the swap agreement paid to the counterparty or received from the counterparty, excluding any commissions. This amount is included as part of the unrealized appreciation/(depreciation).
ProFund VP Banks invested in the following industries as of June 30, 2024:
Value | % of Net Assets | ||||||||||
Banks | $ | 3,147,459 | 82.8 | % | |||||||
Capital Markets | 83,805 | 2.2 | % | ||||||||
Financial Services | 505,252 | 13.3 | % | ||||||||
Other** | 64,056 | 1.7 | % | ||||||||
Total | $ | 3,800,572 | 100.0 | % | |||||||
** Includes any non-equity securities and net other assets (liabilities), which includes any receivable for capital shares issued and payable for capital shares redeemed.
See accompanying notes to the financial statements.
Repurchase Agreements(a)(b) (97.9%)
| Principal Amount | Value | ||||||||||
| Repurchase Agreements with various counterparties, rates 5.12%–5.20%, dated 6/28/2024, due 7/1/24, total to be received $1,636,707 | $ | 1,636,000 | $ | 1,636,000 | |||||||
| TOTAL REPURCHASE AGREEMENTS (Cost $1,636,000) | 1,636,000 | ||||||||||
| TOTAL INVESTMENT SECURITIES (Cost $1,636,000)—97.9% | 1,636,000 | ||||||||||
Net other assets (liabilities)—2.1% | 34,543 | ||||||||||
NET ASSETS—100.0% | $ | 1,670,543 | |||||||||
(a) A portion of these securities were held in a segregated account for the benefit of swap counterparties in the event of default. At June 30, 2024, the aggregate amount held in a segregated account was $264,000.
(b) The ProFund VP invests in Repurchase Agreements jointly with other funds in the Trust. See "Repurchase Agreements" under Note 2 in the Notes to Financial Statements to view the details of each individual agreement and counterparty as well as a description of the securities subject to repurchase.
Futures Contracts Sold
| Number of Contracts | Expiration Date | Notional Amount | Value and Unrealized Appreciation/ (Depreciation) | ||||||||||||||||
E-Mini S&P 500 Futures Contracts | 1 | 9/23/24 | $ | (276,075 | ) | $ | (1,450 | ) | |||||||||||
Total Return Swap Agreements—Short
Underlying Instrument | Counterparty | Termination Date(1) | Rate Paid (Received)(2) | Notional Amount | Value and Unrealized Appreciation/ (Depreciation) | ||||||||||||||||||
S&P 500 | Goldman Sachs International | 7/29/24 | (5.83 | )% | $ | (401,345 | ) | $ | 1,523 | ||||||||||||||
S&P 500 | UBS AG | 7/29/24 | (5.58 | )% | (988,893 | ) | 4,088 | ||||||||||||||||
$ | (1,390,238 | ) | $ | 5,611 | |||||||||||||||||||
(1) Agreements may be terminated at will by either party without penalty. Payment is due at termination/maturity.
(2) Reflects the floating financing rate, as of June 30, 2024, on the notional amount of the swap agreement paid to the counterparty or received from the counterparty, excluding any commissions. This amount is included as part of the unrealized appreciation/(depreciation).
See accompanying notes to the financial statements.
Common Stocks (98.7%)
Shares | Value | ||||||||||
| 4D Molecular Therapeutics, Inc.* (Biotechnology) | 5,796 | $ | 121,658 | ||||||||
89bio, Inc.* (Biotechnology) | 8,705 | 69,727 | |||||||||
AbbVie, Inc. (Biotechnology) | 6,668 | 1,143,695 | |||||||||
| ACADIA Pharmaceuticals, Inc.* (Biotechnology) | 18,503 | 300,674 | |||||||||
ADMA Biologics, Inc.* (Biotechnology) | 16,975 | 189,781 | |||||||||
| Agios Pharmaceuticals, Inc.* (Biotechnology) | 4,661 | 200,982 | |||||||||
Akero Therapeutics, Inc.* (Biotechnology) | 7,339 | 172,173 | |||||||||
Alector, Inc.* (Biotechnology) | 6,103 | 27,708 | |||||||||
Alkermes PLC* (Biotechnology) | 17,496 | 421,654 | |||||||||
Allogene Therapeutics, Inc.* (Biotechnology) | 25,298 | 58,944 | |||||||||
| Alnylam Pharmaceuticals, Inc.* (Biotechnology) | 4,919 | 1,195,317 | |||||||||
Altimmune, Inc.*(a) (Biotechnology) | 13,439 | 89,369 | |||||||||
Amgen, Inc. (Biotechnology) | 3,765 | 1,176,374 | |||||||||
Amicus Therapeutics, Inc.* (Biotechnology) | 27,697 | 274,754 | |||||||||
AnaptysBio, Inc.* (Biotechnology) | 3,013 | 75,506 | |||||||||
| Anavex Life Sciences Corp.*(a) (Biotechnology) | 13,604 | 57,409 | |||||||||
| Apellis Pharmaceuticals, Inc.* (Biotechnology) | 14,676 | 562,971 | |||||||||
Apogee Therapeutics, Inc.* (Biotechnology) | 4,539 | 178,610 | |||||||||
Arcellx, Inc.* (Biotechnology) | 5,204 | 287,209 | |||||||||
| Arcturus Therapeutics Holdings, Inc.* (Biotechnology) | 4,732 | 115,224 | |||||||||
Arcus Biosciences, Inc.* (Biotechnology) | 5,810 | 88,486 | |||||||||
| Arcutis Biotherapeutics, Inc.* (Biotechnology) | 15,737 | 146,354 | |||||||||
Ardelyx, Inc.* (Biotechnology) | 38,980 | 288,842 | |||||||||
| Arrowhead Pharmaceuticals, Inc.* (Biotechnology) | 8,888 | 230,999 | |||||||||
ARS Pharmaceuticals, Inc.* (Biotechnology) | 5,174 | 44,031 | |||||||||
Astria Therapeutics, Inc.* (Biotechnology) | 6,661 | 60,615 | |||||||||
Avid Bioservices, Inc.* (Biotechnology) | 11,178 | 79,811 | |||||||||
Avidity Biosciences, Inc.* (Biotechnology) | 6,630 | 270,836 | |||||||||
Beam Therapeutics, Inc.* (Biotechnology) | 10,023 | 234,839 | |||||||||
| BioCryst Pharmaceuticals, Inc.* (Biotechnology) | 28,247 | 174,566 | |||||||||
Biogen, Inc.* (Biotechnology) | 4,852 | 1,124,791 | |||||||||
Biohaven, Ltd.* (Biotechnology) | 11,867 | 411,904 | |||||||||
| BioMarin Pharmaceutical, Inc.* (Biotechnology) | 13,462 | 1,108,326 | |||||||||
Blueprint Medicines Corp.* (Biotechnology) | 5,759 | 620,705 | |||||||||
Bridgebio Pharma, Inc.* (Biotechnology) | 16,473 | 417,261 | |||||||||
C4 Therapeutics, Inc.* (Biotechnology) | 11,265 | 52,044 | |||||||||
Cabaletta Bio, Inc.* (Biotechnology) | 6,282 | 46,989 | |||||||||
CareDx, Inc.* (Biotechnology) | 5,424 | 84,235 | |||||||||
Cargo Therapeutics, Inc.* (Biotechnology) | 2,454 | 40,295 | |||||||||
| Catalyst Pharmaceuticals, Inc.* (Biotechnology) | 11,250 | 174,263 | |||||||||
Celldex Therapeutics, Inc.* (Biotechnology) | 7,247 | 268,211 | |||||||||
| Cerevel Therapeutics Holdings, Inc.* (Biotechnology) | 11,117 | 454,574 | |||||||||
CG Oncology, Inc.* (Biotechnology) | 3,091 | 97,583 | |||||||||
Cogent Biosciences, Inc.* (Biotechnology) | 11,157 | 94,054 | |||||||||
| Corbus Pharmaceuticals Holdings, Inc.* (Biotechnology) | 1,408 | 63,712 | |||||||||
| Crinetics Pharmaceuticals, Inc.* (Biotechnology) | 6,803 | 304,706 | |||||||||
Common Stocks, continued
Shares | Value | ||||||||||
CRISPR Therapeutics AG*(a) (Biotechnology) | 11,072 | $ | 597,999 | ||||||||
Cullinan Therapeutics, Inc.* (Biotechnology) | 6,347 | 110,692 | |||||||||
Cytokinetics, Inc.* (Biotechnology) | 15,905 | 861,733 | |||||||||
| Day One Biopharmaceuticals, Inc.* (Biotechnology) | 9,076 | 125,067 | |||||||||
Denali Therapeutics, Inc.* (Biotechnology) | 9,187 | 213,322 | |||||||||
Disc Medicine, Inc.* (Biotechnology) | 1,455 | 65,577 | |||||||||
| Dynavax Technologies Corp.* (Biotechnology) | 18,904 | 212,292 | |||||||||
Dyne Therapeutics, Inc.* (Biotechnology) | 8,817 | 311,152 | |||||||||
Editas Medicine, Inc.* (Biotechnology) | 13,033 | 60,864 | |||||||||
Exact Sciences Corp.* (Biotechnology) | 26,843 | 1,134,117 | |||||||||
Exelixis, Inc.* (Biotechnology) | 21,188 | 476,094 | |||||||||
Fate Therapeutics, Inc.* (Biotechnology) | 15,211 | 49,892 | |||||||||
Geron Corp.* (Biotechnology) | 58,675 | 248,782 | |||||||||
Gilead Sciences, Inc. (Biotechnology) | 17,279 | 1,185,512 | |||||||||
| Halozyme Therapeutics, Inc.* (Biotechnology) | 7,943 | 415,895 | |||||||||
Heron Therapeutics, Inc.* (Biotechnology) | 15,621 | 54,674 | |||||||||
Humacyte, Inc.* (Biotechnology) | 6,325 | 30,360 | |||||||||
Ideaya Biosciences, Inc.* (Biotechnology) | 7,287 | 255,847 | |||||||||
ImmunityBio, Inc.*(a) (Biotechnology) | 26,422 | 166,987 | |||||||||
Immunome, Inc.* (Biotechnology) | 7,038 | 85,160 | |||||||||
Immunovant, Inc.* (Biotechnology) | 8,533 | 225,271 | |||||||||
Incyte Corp.* (Biotechnology) | 17,152 | 1,039,754 | |||||||||
Insmed, Inc.* (Biotechnology) | 6,806 | 456,002 | |||||||||
Intellia Therapeutics, Inc.* (Biotechnology) | 12,647 | 283,040 | |||||||||
Ionis Pharmaceuticals, Inc.* (Biotechnology) | 10,241 | 488,086 | |||||||||
| Iovance Biotherapeutics, Inc.* (Biotechnology) | 40,856 | 327,665 | |||||||||
| Ironwood Pharmaceuticals, Inc.* (Biotechnology) | 23,311 | 151,988 | |||||||||
iTeos Therapeutics, Inc.* (Biotechnology) | 2,182 | 32,381 | |||||||||
Janux Therapeutics, Inc.* (Biotechnology) | 4,685 | 196,255 | |||||||||
Keros Therapeutics, Inc.* (Biotechnology) | 3,491 | 159,539 | |||||||||
| Kiniksa Pharmaceuticals International PLC* (Biotechnology) | 3,676 | 68,631 | |||||||||
Krystal Biotech, Inc.* (Biotechnology) | 2,535 | 465,527 | |||||||||
Kura Oncology, Inc.* (Biotechnology) | 7,556 | 155,578 | |||||||||
Kymera Therapeutics, Inc.* (Biotechnology) | 5,508 | 164,414 | |||||||||
| Madrigal Pharmaceuticals, Inc.* (Biotechnology) | 2,209 | 618,873 | |||||||||
MannKind Corp.* (Biotechnology) | 21,250 | 110,925 | |||||||||
MiMedx Group, Inc.* (Biotechnology) | 8,379 | 58,066 | |||||||||
| Mirum Pharmaceuticals, Inc.* (Biotechnology) | 4,176 | 142,777 | |||||||||
Moderna, Inc.* (Biotechnology) | 8,028 | 953,325 | |||||||||
Morphic Holding, Inc.* (Biotechnology) | 4,522 | 154,065 | |||||||||
Myriad Genetics, Inc.* (Biotechnology) | 5,668 | 138,639 | |||||||||
Natera, Inc.* (Biotechnology) | 9,965 | 1,079,110 | |||||||||
| Neurocrine Biosciences, Inc.* (Biotechnology) | 7,309 | 1,006,230 | |||||||||
Novavax, Inc.*(a) (Biotechnology) | 15,882 | 201,066 | |||||||||
Nurix Therapeutics, Inc.* (Biotechnology) | 8,328 | 173,805 | |||||||||
Nuvalent, Inc.*—Class A (Biotechnology) | 3,924 | 297,675 | |||||||||
Ocugen, Inc.*(a) (Biotechnology) | 48,346 | 74,936 | |||||||||
| Olema Pharmaceuticals, Inc.* (Biotechnology) | 6,187 | 66,943 | |||||||||
| ORIC Pharmaceuticals, Inc.* (Biotechnology) | 7,048 | 49,829 | |||||||||
See accompanying notes to the financial statements.
10 :: ProFund VP Biotechnology :: Schedule of Portfolio Investments :: June 30, 2024 (unaudited)
Common Stocks, continued
Shares | Value | ||||||||||
| Praxis Precision Medicines, Inc.* (Biotechnology) | 2,508 | $ | 103,731 | ||||||||
| Protagonist Therapeutics, Inc.* (Biotechnology) | 4,565 | 158,177 | |||||||||
Prothena Corp. PLC* (Biotechnology) | 5,884 | 121,446 | |||||||||
PTC Therapeutics, Inc.* (Biotechnology) | 6,093 | 186,324 | |||||||||
| Recursion Pharmaceuticals, Inc.*(a)—Class A (Biotechnology) | 24,132 | 180,990 | |||||||||
| Regeneron Pharmaceuticals, Inc.* (Biotechnology) | 1,085 | 1,140,368 | |||||||||
REGENXBIO, Inc.* (Biotechnology) | 6,258 | 73,219 | |||||||||
Relay Therapeutics, Inc.* (Biotechnology) | 11,762 | 76,688 | |||||||||
| REVOLUTION Medicines, Inc.* (Biotechnology) | 11,259 | 436,962 | |||||||||
| Rhythm Pharmaceuticals, Inc.* (Biotechnology) | 4,401 | 180,705 | |||||||||
| Rocket Pharmaceuticals, Inc.* (Biotechnology) | 7,135 | 153,617 | |||||||||
Roivant Sciences, Ltd.* (Biotechnology) | 50,313 | 531,808 | |||||||||
Sage Therapeutics, Inc.* (Biotechnology) | 7,475 | 81,179 | |||||||||
Sana Biotechnology, Inc.* (Biotechnology) | 20,647 | 112,733 | |||||||||
Sarepta Therapeutics, Inc.* (Biotechnology) | 8,749 | 1,382,341 | |||||||||
Savara, Inc.* (Biotechnology) | 8,227 | 33,155 | |||||||||
| Scholar Rock Holding Corp.* (Biotechnology) | 8,066 | 67,190 | |||||||||
Soleno Therapeutics, Inc.* (Biotechnology) | 3,271 | 133,457 | |||||||||
| SpringWorks Therapeutics, Inc.* (Biotechnology) | 9,454 | 356,132 | |||||||||
Spyre Therapeutics, Inc.* (Biotechnology) | 4,070 | 95,686 | |||||||||
Stoke Therapeutics, Inc.* (Biotechnology) | 4,845 | 65,456 | |||||||||
| Summit Therapeutics, Inc.*(a) (Biotechnology) | 10,062 | 78,484 | |||||||||
| Syndax Pharmaceuticals, Inc.* (Biotechnology) | 10,791 | 221,539 | |||||||||
Tango Therapeutics, Inc.* (Biotechnology) | 4,421 | 37,932 | |||||||||
TG Therapeutics, Inc.* (Biotechnology) | 20,437 | 363,574 | |||||||||
Travere Therapeutics, Inc.* (Biotechnology) | 11,056 | 90,880 | |||||||||
Twist Bioscience Corp.* (Biotechnology) | 6,252 | 308,099 | |||||||||
| Ultragenyx Pharmaceutical, Inc.* (Biotechnology) | 7,651 | 314,456 | |||||||||
United Therapeutics Corp.* (Biotechnology) | 3,903 | 1,243,301 | |||||||||
Vaxcyte, Inc.* (Biotechnology) | 5,742 | 433,578 | |||||||||
Vera Therapeutics, Inc.* (Biotechnology) | 7,384 | 267,153 | |||||||||
Veracyte, Inc.* (Biotechnology) | 6,678 | 144,712 | |||||||||
Vericel Corp.* (Biotechnology) | 4,010 | 183,979 | |||||||||
| Vertex Pharmaceuticals, Inc.* (Biotechnology) | 2,338 | 1,095,867 | |||||||||
Common Stocks, continued
Shares | Value | ||||||||||
Verve Therapeutics, Inc.* (Biotechnology) | 9,051 | $ | 44,169 | ||||||||
Viking Therapeutics, Inc.* (Biotechnology) | 20,352 | 1,078,860 | |||||||||
Vir Biotechnology, Inc.* (Biotechnology) | 8,846 | 78,729 | |||||||||
Viridian Therapeutics, Inc.* (Biotechnology) | 8,793 | 114,397 | |||||||||
Voyager Therapeutics, Inc.* (Biotechnology) | 5,412 | 42,809 | |||||||||
Xencor, Inc.* (Biotechnology) | 5,793 | 109,661 | |||||||||
| Zentalis Pharmaceuticals, Inc.* (Biotechnology) | 10,163 | 41,567 | |||||||||
| TOTAL COMMON STOCKS (Cost $31,467,206) | 41,670,294 | ||||||||||
Repurchase Agreements(b) (1.1%)
| Principal Amount | Value | ||||||||||
| Repurchase Agreements with various counterparties, rates 5.12%–5.20%, dated 6/28/2024, due 7/1/24, total to be received $462,200 | $ | 462,000 | $ | 462,000 | |||||||
| TOTAL REPURCHASE AGREEMENTS (Cost $462,000) | 462,000 | ||||||||||
Collateral for Securities Loaned(c) (2.4%)
Shares | Value | ||||||||||
| Invesco Government & Agency Portfolio—Institutional Shares, 5.23%(d) | 1,023,128 | $ | 1,023,128 | ||||||||
| TOTAL COLLATERAL FOR SECURITIES LOANED (Cost $1,023,128) | 1,023,128 | ||||||||||
| TOTAL INVESTMENT SECURITIES (Cost $32,952,334)—102.2% | 43,155,422 | ||||||||||
Net other assets (liabilities)—(2.2)% | (908,736 | ) | |||||||||
NET ASSETS—100.0% | $ | 42,246,686 | |||||||||
* Non-income producing security.
(a) All or part of this security was on loan as of June 30, 2024. The total value of securities on loan as of June 30, 2024 was $981,318.
(b) The ProFund VP invests in Repurchase Agreements jointly with other funds in the Trust. See "Repurchase Agreements" under Note 2 in the Notes to Financial Statements to view the details of each individual agreement and counterparty as well as a description of the securities subject to repurchase.
(c) Securities were purchased with cash collateral held from securities on loan at June 30, 2024.
(d) Rate periodically changes. Rate disclosed is the daily yield on June 30, 2024.
See accompanying notes to the financial statements.
June 30, 2024 (unaudited) :: Schedule of Portfolio Investments :: ProFund VP Biotechnology :: 11
Total Return Swap Agreements—Long
Underlying Instrument | Counterparty | Termination Date(1) | Rate Paid (Received)(2) | Notional Amount | Value and Unrealized Appreciation/ (Depreciation) | ||||||||||||||||||
| S&P Biotechnology Select Industry Index | Goldman Sachs International | 7/23/24 | 6.08 | % | $ | 585,230 | $ | (11,095 | ) | ||||||||||||||
(1) Agreements may be terminated at will by either party without penalty. Payment is due at termination/maturity.
(2) Reflects the floating financing rate, as of June 30, 2024, on the notional amount of the swap agreement paid to the counterparty or received from the counterparty, excluding any commissions. This amount is included as part of the unrealized appreciation/(depreciation).
ProFund VP Biotechnology invested in the following industries as of June 30, 2024:
Value | % of Net Assets | ||||||||||
Biotechnology | $ | 41,670,294 | 98.7 | % | |||||||
Other** | 576,392 | 1.3 | % | ||||||||
Total | $ | 42,246,686 | 100.0 | % | |||||||
** Includes any non-equity securities and net other assets (liabilities), which includes any receivable for capital shares issued and payable for capital shares redeemed.
See accompanying notes to the financial statements.
Common Stocks (86.6%)
Shares | Value | ||||||||||
3M Co. (Industrial Conglomerates) | 630 | $ | 64,380 | ||||||||
A.O. Smith Corp. (Building Products) | 138 | 11,286 | |||||||||
| Abbott Laboratories (Health Care Equipment & Supplies) | 1,981 | 205,845 | |||||||||
AbbVie, Inc. (Biotechnology) | 2,011 | 344,926 | |||||||||
Accenture PLC—Class A (IT Services) | 716 | 217,241 | |||||||||
Adobe, Inc.* (Software) | 510 | 283,325 | |||||||||
| Advanced Micro Devices, Inc.* (Semiconductors & Semiconductor Equipment) | 1,841 | 298,629 | |||||||||
Aflac, Inc. (Insurance) | 589 | 52,604 | |||||||||
| Agilent Technologies, Inc. (Life Sciences Tools & Services) | 334 | 43,296 | |||||||||
Air Products and Chemicals, Inc. (Chemicals) | 253 | 65,287 | |||||||||
| Airbnb, Inc.*—Class A (Hotels, Restaurants & Leisure) | 503 | 76,270 | |||||||||
Akamai Technologies, Inc.* (IT Services) | 173 | 15,584 | |||||||||
Albemarle Corp. (Chemicals) | 134 | 12,800 | |||||||||
| Alexandria Real Estate Equities, Inc. (Office REITs) | 179 | 20,938 | |||||||||
| Align Technology, Inc.* (Health Care Equipment & Supplies) | 80 | 19,314 | |||||||||
Allegion PLC (Building Products) | 100 | 11,815 | |||||||||
Alliant Energy Corp. (Electric Utilities) | 292 | 14,863 | |||||||||
| Alphabet, Inc.—Class A (Interactive Media & Services) | 6,689 | 1,218,401 | |||||||||
| Alphabet, Inc.—Class C (Interactive Media & Services) | 5,565 | 1,020,732 | |||||||||
Altria Group, Inc. (Tobacco) | 1,956 | 89,096 | |||||||||
Amazon.com, Inc.* (Broadline Retail) | 10,428 | 2,015,210 | |||||||||
Amcor PLC (Containers & Packaging) | 1,646 | 16,098 | |||||||||
Ameren Corp. (Multi-Utilities) | 304 | 21,617 | |||||||||
| American Airlines Group, Inc.* (Passenger Airlines) | 747 | 8,464 | |||||||||
| American Electric Power Co., Inc. (Electric Utilities) | 600 | 52,644 | |||||||||
American Express Co. (Consumer Finance) | 647 | 149,812 | |||||||||
| American International Group, Inc. (Insurance) | 756 | 56,125 | |||||||||
American Tower Corp. (Specialized REITs) | 532 | 103,409 | |||||||||
| American Water Works Co., Inc. (Water Utilities) | 222 | 28,674 | |||||||||
Ameriprise Financial, Inc. (Capital Markets) | 113 | 48,272 | |||||||||
AMETEK, Inc. (Electrical Equipment) | 264 | 44,011 | |||||||||
Amgen, Inc. (Biotechnology) | 611 | 190,907 | |||||||||
| Amphenol Corp.—Class A (Electronic Equipment, Instruments & Components) | 1,368 | 92,162 | |||||||||
| Analog Devices, Inc. (Semiconductors & Semiconductor Equipment) | 565 | 128,967 | |||||||||
ANSYS, Inc.* (Software) | 99 | 31,829 | |||||||||
Aon PLC—Class A (Insurance) | 248 | 72,808 | |||||||||
APA Corp. (Oil, Gas & Consumable Fuels) | 410 | 12,070 | |||||||||
| Apple, Inc. (Technology Hardware, Storage & Peripherals) | 16,413 | 3,456,906 | |||||||||
| Applied Materials, Inc. (Semiconductors & Semiconductor Equipment) | 946 | 223,247 | |||||||||
Aptiv PLC* (Automobile Components) | 310 | 21,830 | |||||||||
Arch Capital Group, Ltd.* (Insurance) | 426 | 42,979 | |||||||||
Archer-Daniels-Midland Co. (Food Products) | 563 | 34,033 | |||||||||
Common Stocks, continued
Shares | Value | ||||||||||
| Arista Networks, Inc.* (Communications Equipment) | 289 | $ | 101,289 | ||||||||
Arthur J. Gallagher & Co. (Insurance) | 249 | 64,568 | |||||||||
Assurant, Inc. (Insurance) | 59 | 9,809 | |||||||||
| AT&T, Inc. (Diversified Telecommunication Services) | 8,165 | 156,033 | |||||||||
Atmos Energy Corp. (Gas Utilities) | 172 | 20,064 | |||||||||
Autodesk, Inc.* (Software) | 244 | 60,378 | |||||||||
| Automatic Data Processing, Inc. (Professional Services) | 466 | 111,229 | |||||||||
AutoZone, Inc.* (Specialty Retail) | 20 | 59,282 | |||||||||
| AvalonBay Communities, Inc. (Residential REITs) | 162 | 33,515 | |||||||||
| Avery Dennison Corp. (Containers & Packaging) | 92 | 20,116 | |||||||||
| Axon Enterprise, Inc.* (Aerospace & Defense) | 81 | 23,833 | |||||||||
| Baker Hughes Co. (Energy Equipment & Services) | 1,136 | 39,953 | |||||||||
Ball Corp. (Containers & Packaging) | 353 | 21,188 | |||||||||
Bank of America Corp. (Banks) | 7,747 | 308,098 | |||||||||
Bath & Body Works, Inc. (Specialty Retail) | 255 | 9,958 | |||||||||
| Baxter International, Inc. (Health Care Equipment & Supplies) | 580 | 19,401 | |||||||||
| Becton, Dickinson & Co. (Health Care Equipment & Supplies) | 329 | 76,891 | |||||||||
| Berkshire Hathaway, Inc.*—Class B (Financial Services) | 2,061 | 838,414 | |||||||||
Best Buy Co., Inc. (Specialty Retail) | 219 | 18,460 | |||||||||
Biogen, Inc.* (Biotechnology) | 166 | 38,482 | |||||||||
| Bio-Rad Laboratories, Inc.*—Class A (Life Sciences Tools & Services) | 23 | 6,282 | |||||||||
| Bio-Techne Corp. (Life Sciences Tools & Services) | 179 | 12,825 | |||||||||
BlackRock, Inc. (Capital Markets) | 159 | 125,184 | |||||||||
Blackstone, Inc. (Capital Markets) | 814 | 100,773 | |||||||||
| Booking Holdings, Inc. (Hotels, Restaurants & Leisure) | 39 | 154,498 | |||||||||
BorgWarner, Inc. (Automobile Components) | 259 | 8,350 | |||||||||
| Boston Scientific Corp.* (Health Care Equipment & Supplies) | 1,674 | 128,915 | |||||||||
Bristol-Myers Squibb Co. (Pharmaceuticals) | 2,308 | 95,851 | |||||||||
| Broadcom, Inc. (Semiconductors & Semiconductor Equipment) | 496 | 796,343 | |||||||||
| Broadridge Financial Solutions, Inc. (Professional Services) | 135 | 26,595 | |||||||||
Brown & Brown, Inc. (Insurance) | 270 | 24,141 | |||||||||
Brown-Forman Corp.—Class B (Beverages) | 204 | 8,811 | |||||||||
Builders FirstSource, Inc.* (Building Products) | 139 | 19,239 | |||||||||
Bunge Global SA (Food Products) | 161 | 17,190 | |||||||||
BXP, Inc. (Office REITs) | 165 | 10,157 | |||||||||
| C.H. Robinson Worldwide, Inc. (Air Freight & Logistics) | 133 | 11,720 | |||||||||
Cadence Design Systems, Inc.* (Software) | 310 | 95,403 | |||||||||
| Caesars Entertainment, Inc.* (Hotels, Restaurants & Leisure) | 246 | 9,776 | |||||||||
Camden Property Trust (Residential REITs) | 121 | 13,202 | |||||||||
Campbell Soup Co. (Food Products) | 224 | 10,123 | |||||||||
| Capital One Financial Corp. (Consumer Finance) | 435 | 60,226 | |||||||||
See accompanying notes to the financial statements.
June 30, 2024 (unaudited) :: Schedule of Portfolio Investments :: ProFund VP Bull :: 13
Common Stocks, continued
Shares | Value | ||||||||||
| Cardinal Health, Inc. (Health Care Providers & Services) | 277 | $ | 27,235 | ||||||||
CarMax, Inc.* (Specialty Retail) | 179 | 13,128 | |||||||||
| Carnival Corp.* (Hotels, Restaurants & Leisure) | 1,150 | 21,528 | |||||||||
Carrier Global Corp. (Building Products) | 954 | 60,178 | |||||||||
Catalent, Inc.* (Pharmaceuticals) | 206 | 11,583 | |||||||||
Caterpillar, Inc. (Machinery) | 557 | 185,537 | |||||||||
Cboe Global Markets, Inc. (Capital Markets) | 120 | 20,407 | |||||||||
| CBRE Group, Inc.*—Class A (Real Estate Management & Development) | 343 | 30,565 | |||||||||
| CDW Corp. (Electronic Equipment, Instruments & Components) | 153 | 34,248 | |||||||||
Celanese Corp. (Chemicals) | 114 | 15,377 | |||||||||
| Cencora, Inc. (Health Care Providers & Services) | 189 | 42,582 | |||||||||
| Centene Corp.* (Health Care Providers & Services) | 608 | 40,310 | |||||||||
CenterPoint Energy, Inc. (Multi-Utilities) | 728 | 22,553 | |||||||||
CF Industries Holdings, Inc. (Chemicals) | 208 | 15,417 | |||||||||
| Charles River Laboratories International, Inc.* (Life Sciences Tools & Services) | 59 | 12,188 | |||||||||
| Charter Communications, Inc.*—Class A (Media) | 112 | 33,484 | |||||||||
Chevron Corp. (Oil, Gas & Consumable Fuels) | 1,952 | 305,332 | |||||||||
| Chipotle Mexican Grill, Inc.* (Hotels, Restaurants & Leisure) | 1,550 | 97,108 | |||||||||
Chubb, Ltd. (Insurance) | 462 | 117,847 | |||||||||
| Church & Dwight Co., Inc. (Household Products) | 278 | 28,823 | |||||||||
Cincinnati Financial Corp. (Insurance) | 178 | 21,022 | |||||||||
| Cintas Corp. (Commercial Services & Supplies) | 98 | 68,625 | |||||||||
| Cisco Systems, Inc. (Communications Equipment) | 4,611 | 219,068 | |||||||||
Citigroup, Inc. (Banks) | 2,172 | 137,835 | |||||||||
Citizens Financial Group, Inc. (Banks) | 518 | 18,664 | |||||||||
CME Group, Inc. (Capital Markets) | 410 | 80,606 | |||||||||
CMS Energy Corp. (Multi-Utilities) | 340 | 20,240 | |||||||||
| Cognizant Technology Solutions Corp.—Class A (IT Services) | 566 | 38,488 | |||||||||
Colgate-Palmolive Co. (Household Products) | 934 | 90,635 | |||||||||
Comcast Corp.—Class A (Media) | 4,457 | 174,535 | |||||||||
Conagra Brands, Inc. (Food Products) | 544 | 15,460 | |||||||||
| ConocoPhillips (Oil, Gas & Consumable Fuels) | 1,332 | 152,354 | |||||||||
Consolidated Edison, Inc. (Multi-Utilities) | 394 | 35,231 | |||||||||
| Constellation Brands, Inc.—Class A (Beverages) | 183 | 47,082 | |||||||||
Constellation Energy Corp. (Electric Utilities) | 359 | 71,897 | |||||||||
| Copart, Inc.* (Commercial Services & Supplies) | 996 | 53,943 | |||||||||
| Corning, Inc. (Electronic Equipment, Instruments & Components) | 878 | 34,110 | |||||||||
Corpay, Inc.* (Software) | 80 | 21,313 | |||||||||
Corteva, Inc. (Chemicals) | 794 | 42,828 | |||||||||
| CoStar Group, Inc.* (Real Estate Management & Development) | 465 | 34,475 | |||||||||
| Costco Wholesale Corp. (Consumer Staples Distribution & Retail) | 505 | 429,246 | |||||||||
Common Stocks, continued
Shares | Value | ||||||||||
| Coterra Energy, Inc. (Oil, Gas & Consumable Fuels) | 847 | $ | 22,589 | ||||||||
| Crowdstrike Holdings, Inc.*—Class A (Software) | 263 | 100,779 | |||||||||
Crown Castle, Inc. (Specialized REITs) | 495 | 48,362 | |||||||||
CSX Corp. (Ground Transportation) | 2,226 | 74,460 | |||||||||
Cummins, Inc. (Machinery) | 156 | 43,201 | |||||||||
| CVS Health Corp. (Health Care Providers & Services) | 1,430 | 84,456 | |||||||||
D.R. Horton, Inc. (Household Durables) | 337 | 47,494 | |||||||||
| Danaher Corp. (Life Sciences Tools & Services) | 751 | 187,638 | |||||||||
| Darden Restaurants, Inc. (Hotels, Restaurants & Leisure) | 136 | 20,580 | |||||||||
| DaVita, Inc.* (Health Care Providers & Services) | 59 | 8,176 | |||||||||
Dayforce, Inc.* (Professional Services) | 180 | 8,928 | |||||||||
| Deckers Outdoor Corp.* (Textiles, Apparel & Luxury Goods) | 29 | 28,071 | |||||||||
Deere & Co. (Machinery) | 295 | 110,221 | |||||||||
Delta Air Lines, Inc. (Passenger Airlines) | 735 | 34,868 | |||||||||
| Devon Energy Corp. (Oil, Gas & Consumable Fuels) | 720 | 34,128 | |||||||||
| Dexcom, Inc.* (Health Care Equipment & Supplies) | 453 | 51,361 | |||||||||
| Diamondback Energy, Inc. (Oil, Gas & Consumable Fuels) | 203 | 40,639 | |||||||||
Digital Realty Trust, Inc. (Specialized REITs) | 370 | 56,259 | |||||||||
| Discover Financial Services (Consumer Finance) | 285 | 37,281 | |||||||||
| Dollar General Corp. (Consumer Staples Distribution & Retail) | 250 | 33,058 | |||||||||
| Dollar Tree, Inc.* (Consumer Staples Distribution & Retail) | 236 | 25,198 | |||||||||
Dominion Energy, Inc. (Multi-Utilities) | 954 | 46,747 | |||||||||
| Domino's Pizza, Inc. (Hotels, Restaurants & Leisure) | 40 | 20,653 | |||||||||
Dover Corp. (Machinery) | 156 | 28,150 | |||||||||
Dow, Inc. (Chemicals) | 801 | 42,493 | |||||||||
DTE Energy Co. (Multi-Utilities) | 236 | 26,198 | |||||||||
Duke Energy Corp. (Electric Utilities) | 879 | 88,102 | |||||||||
DuPont de Nemours, Inc. (Chemicals) | 476 | 38,313 | |||||||||
Eastman Chemical Co. (Chemicals) | 134 | 13,128 | |||||||||
Eaton Corp. PLC (Electrical Equipment) | 455 | 142,666 | |||||||||
eBay, Inc. (Broadline Retail) | 576 | 30,943 | |||||||||
Ecolab, Inc. (Chemicals) | 289 | 68,782 | |||||||||
Edison International (Electric Utilities) | 438 | 31,453 | |||||||||
| Edwards Lifesciences Corp.* (Health Care Equipment & Supplies) | 686 | 63,366 | |||||||||
Electronic Arts, Inc. (Entertainment) | 277 | 38,594 | |||||||||
| Elevance Health, Inc. (Health Care Providers & Services) | 265 | 143,593 | |||||||||
Eli Lilly & Co. (Pharmaceuticals) | 909 | 822,991 | |||||||||
| Emerson Electric Co. (Electrical Equipment) | 651 | 71,715 | |||||||||
| Enphase Energy, Inc.* (Semiconductors & Semiconductor Equipment) | 155 | 15,455 | |||||||||
Entergy Corp. (Electric Utilities) | 243 | 26,001 | |||||||||
| EOG Resources, Inc. (Oil, Gas & Consumable Fuels) | 654 | 82,319 | |||||||||
EPAM Systems, Inc.* (IT Services) | 66 | 12,415 | |||||||||
See accompanying notes to the financial statements.
14 :: ProFund VP Bull :: Schedule of Portfolio Investments :: June 30, 2024 (unaudited)
Common Stocks, continued
Shares | Value | ||||||||||
EQT Corp. (Oil, Gas & Consumable Fuels) | 503 | $ | 18,601 | ||||||||
Equifax, Inc. (Professional Services) | 141 | 34,187 | |||||||||
Equinix, Inc. (Specialized REITs) | 108 | 81,712 | |||||||||
Equity Residential (Residential REITs) | 393 | 27,251 | |||||||||
Essex Property Trust, Inc. (Residential REITs) | 73 | 19,871 | |||||||||
Etsy, Inc.* (Broadline Retail) | 133 | 7,844 | |||||||||
Everest Group, Ltd. (Insurance) | 49 | 18,670 | |||||||||
Evergy, Inc. (Electric Utilities) | 262 | 13,878 | |||||||||
Eversource Energy (Electric Utilities) | 401 | 22,741 | |||||||||
Exelon Corp. (Electric Utilities) | 1,139 | 39,421 | |||||||||
| Expedia Group, Inc.* (Hotels, Restaurants & Leisure) | 145 | 18,269 | |||||||||
| Expeditors International of Washington, Inc. (Air Freight & Logistics) | 161 | 20,091 | |||||||||
Extra Space Storage, Inc. (Specialized REITs) | 241 | 37,454 | |||||||||
| Exxon Mobil Corp. (Oil, Gas & Consumable Fuels) | 5,108 | 588,033 | |||||||||
F5, Inc.* (Communications Equipment) | 67 | 11,539 | |||||||||
| FactSet Research Systems, Inc. (Capital Markets) | 43 | 17,556 | |||||||||
Fair Isaac Corp.* (Software) | 28 | 41,682 | |||||||||
| Fastenal Co. (Trading Companies & Distributors) | 652 | 40,972 | |||||||||
Federal Realty Investment Trust (Retail REITs) | 85 | 8,582 | |||||||||
FedEx Corp. (Air Freight & Logistics) | 258 | 77,359 | |||||||||
| Fidelity National Information Services, Inc. (Financial Services) | 633 | 47,703 | |||||||||
Fifth Third Bancorp (Banks) | 779 | 28,426 | |||||||||
First Horizon Corp. (Banks) | 1 | 9 | |||||||||
| First Solar, Inc.* (Semiconductors & Semiconductor Equipment) | 122 | 27,506 | |||||||||
FirstEnergy Corp. (Electric Utilities) | 590 | 22,579 | |||||||||
Fiserv, Inc.* (Financial Services) | 666 | 99,261 | |||||||||
FMC Corp. (Chemicals) | 142 | 8,172 | |||||||||
Ford Motor Co. (Automobiles) | 4,465 | 55,991 | |||||||||
Fortinet, Inc.* (Software) | 722 | 43,515 | |||||||||
Fortive Corp. (Machinery) | 401 | 29,714 | |||||||||
Fox Corp.—Class A (Media) | 263 | 9,039 | |||||||||
Fox Corp.—Class B (Media) | 150 | 4,803 | |||||||||
Franklin Resources, Inc. (Capital Markets) | 341 | 7,621 | |||||||||
Freeport-McMoRan, Inc. (Metals & Mining) | 1,636 | 79,510 | |||||||||
Garmin, Ltd. (Household Durables) | 175 | 28,511 | |||||||||
Gartner, Inc.* (IT Services) | 88 | 39,517 | |||||||||
| GE HealthCare Technologies, Inc. (Health Care Equipment & Supplies) | 483 | 37,635 | |||||||||
GE Vernova, Inc.* (Electrical Equipment) | 312 | 53,511 | |||||||||
Gen Digital, Inc. (Software) | 627 | 15,662 | |||||||||
Generac Holdings, Inc.* (Electrical Equipment) | 69 | 9,123 | |||||||||
| General Dynamics Corp. (Aerospace & Defense) | 259 | 75,146 | |||||||||
| General Electric Co. (Industrial Conglomerates) | 1,246 | 198,076 | |||||||||
General Mills, Inc. (Food Products) | 643 | 40,676 | |||||||||
General Motors Co. (Automobiles) | 1,299 | 60,352 | |||||||||
Genuine Parts Co. (Distributors) | 159 | 21,993 | |||||||||
Gilead Sciences, Inc. (Biotechnology) | 1,419 | 97,358 | |||||||||
Global Payments, Inc. (Financial Services) | 291 | 28,140 | |||||||||
Globe Life, Inc. (Insurance) | 96 | 7,899 | |||||||||
GoDaddy, Inc.*—Class A (IT Services) | 160 | 22,354 | |||||||||
| Halliburton Co. (Energy Equipment & Services) | 1,008 | 34,050 | |||||||||
Common Stocks, continued
Shares | Value | ||||||||||
Hasbro, Inc. (Leisure Products) | 149 | $ | 8,717 | ||||||||
| HCA Healthcare, Inc. (Health Care Providers & Services) | 221 | 71,003 | |||||||||
| Healthpeak Properties, Inc. (Health Care REITs) | 801 | 15,700 | |||||||||
| Henry Schein, Inc.* (Health Care Providers & Services) | 146 | 9,359 | |||||||||
Hess Corp. (Oil, Gas & Consumable Fuels) | 315 | 46,469 | |||||||||
| Hewlett Packard Enterprise Co. (Technology Hardware, Storage & Peripherals) | 1,480 | 31,332 | |||||||||
| Hilton Worldwide Holdings, Inc. (Hotels, Restaurants & Leisure) | 285 | 62,187 | |||||||||
| Hologic, Inc.* (Health Care Equipment & Supplies) | 266 | 19,751 | |||||||||
| Honeywell International, Inc. (Industrial Conglomerates) | 742 | 158,447 | |||||||||
Hormel Foods Corp. (Food Products) | 331 | 10,092 | |||||||||
| Host Hotels & Resorts, Inc. (Hotel & Resort REITs) | 803 | 14,438 | |||||||||
| Howmet Aerospace, Inc. (Aerospace & Defense) | 442 | 34,312 | |||||||||
| HP, Inc. (Technology Hardware, Storage & Peripherals) | 983 | 34,425 | |||||||||
Hubbell, Inc. (Electrical Equipment) | 61 | 22,294 | |||||||||
| Humana, Inc. (Health Care Providers & Services) | 137 | 51,190 | |||||||||
Huntington Bancshares, Inc. (Banks) | 1,650 | 21,747 | |||||||||
| Huntington Ingalls Industries, Inc. (Aerospace & Defense) | 45 | 11,085 | |||||||||
IDEX Corp. (Machinery) | 86 | 17,303 | |||||||||
| IDEXX Laboratories, Inc.* (Health Care Equipment & Supplies) | 94 | 45,797 | |||||||||
Illinois Tool Works, Inc. (Machinery) | 309 | 73,221 | |||||||||
Incyte Corp.* (Biotechnology) | 212 | 12,851 | |||||||||
Ingersoll Rand, Inc. (Machinery) | 459 | 41,696 | |||||||||
| Insulet Corp.* (Health Care Equipment & Supplies) | 80 | 16,144 | |||||||||
| Intel Corp. (Semiconductors & Semiconductor Equipment) | 4,847 | 150,112 | |||||||||
| Intercontinental Exchange, Inc. (Capital Markets) | 653 | 89,389 | |||||||||
| International Business Machines Corp. (IT Services) | 1,046 | 180,906 | |||||||||
| International Flavors & Fragrances, Inc. (Chemicals) | 291 | 27,706 | |||||||||
| International Paper Co. (Containers & Packaging) | 396 | 17,087 | |||||||||
Intuit, Inc. (Software) | 319 | 209,650 | |||||||||
| Intuitive Surgical, Inc.* (Health Care Equipment & Supplies) | 404 | 179,718 | |||||||||
Invesco, Ltd. (Capital Markets) | 512 | 7,660 | |||||||||
Invitation Homes, Inc. (Residential REITs) | 656 | 23,544 | |||||||||
| IQVIA Holdings, Inc.* (Life Sciences Tools & Services) | 207 | 43,768 | |||||||||
Iron Mountain, Inc. (Specialized REITs) | 334 | 29,933 | |||||||||
| J.B. Hunt Transport Services, Inc. (Ground Transportation) | 93 | 14,880 | |||||||||
| Jabil, Inc. (Electronic Equipment, Instruments & Components) | 137 | 14,904 | |||||||||
| Jack Henry & Associates, Inc. (Financial Services) | 83 | 13,780 | |||||||||
See accompanying notes to the financial statements.
June 30, 2024 (unaudited) :: Schedule of Portfolio Investments :: ProFund VP Bull :: 15
Common Stocks, continued
Shares | Value | ||||||||||
| Jacobs Solutions, Inc. (Professional Services) | 143 | $ | 19,979 | ||||||||
Johnson & Johnson (Pharmaceuticals) | 2,741 | 400,626 | |||||||||
| Johnson Controls International PLC (Building Products) | 767 | 50,982 | |||||||||
JPMorgan Chase & Co. (Banks) | 3,270 | 661,390 | |||||||||
| Juniper Networks, Inc. (Communications Equipment) | 370 | 13,490 | |||||||||
Kellanova (Food Products) | 300 | 17,304 | |||||||||
Kenvue, Inc. (Personal Care Products) | 2,180 | 39,632 | |||||||||
Keurig Dr Pepper, Inc. (Beverages) | 1,189 | 39,713 | |||||||||
KeyCorp (Banks) | 1,074 | 15,262 | |||||||||
| Keysight Technologies, Inc.* (Electronic Equipment, Instruments & Components) | 199 | 27,213 | |||||||||
Kimberly-Clark Corp. (Household Products) | 383 | 52,931 | |||||||||
Kimco Realty Corp. (Retail REITs) | 760 | 14,790 | |||||||||
| Kinder Morgan, Inc. (Oil, Gas & Consumable Fuels) | 2,199 | 43,694 | |||||||||
KKR & Co., Inc. (Capital Markets) | 758 | 79,772 | |||||||||
| KLA Corp. (Semiconductors & Semiconductor Equipment) | 153 | 126,150 | |||||||||
| L3Harris Technologies, Inc. (Aerospace & Defense) | 216 | 48,509 | |||||||||
| Labcorp Holdings, Inc. (Health Care Providers & Services) | 96 | 19,537 | |||||||||
| Lam Research Corp. (Semiconductors & Semiconductor Equipment) | 149 | 158,663 | |||||||||
Lamb Weston Holdings, Inc. (Food Products) | 164 | 13,789 | |||||||||
| Las Vegas Sands Corp. (Hotels, Restaurants & Leisure) | 416 | 18,408 | |||||||||
Leidos Holdings, Inc. (Professional Services) | 154 | 22,466 | |||||||||
Lennar Corp.—Class A (Household Durables) | 279 | 41,814 | |||||||||
Linde PLC (Chemicals) | 547 | 240,029 | |||||||||
| Live Nation Entertainment, Inc.* (Entertainment) | 162 | 15,186 | |||||||||
LKQ Corp. (Distributors) | 304 | 12,643 | |||||||||
| Lockheed Martin Corp. (Aerospace & Defense) | 243 | 113,505 | |||||||||
Loews Corp. (Insurance) | 207 | 15,471 | |||||||||
Lowe's Cos., Inc. (Specialty Retail) | 651 | 143,519 | |||||||||
| Lululemon Athletica, Inc.* (Textiles, Apparel & Luxury Goods) | 130 | 38,831 | |||||||||
| LyondellBasell Industries N.V.—Class A (Chemicals) | 293 | 28,028 | |||||||||
M&T Bank Corp. (Banks) | 190 | 28,758 | |||||||||
| Marathon Oil Corp. (Oil, Gas & Consumable Fuels) | 642 | 18,406 | |||||||||
| Marathon Petroleum Corp. (Oil, Gas & Consumable Fuels) | 401 | 69,565 | |||||||||
MarketAxess Holdings, Inc. (Capital Markets) | 43 | 8,623 | |||||||||
| Marriott International, Inc.—Class A (Hotels, Restaurants & Leisure) | 274 | 66,207 | |||||||||
Marsh & McLennan Cos., Inc. (Insurance) | 561 | 118,214 | |||||||||
| Martin Marietta Materials, Inc. (Construction Materials) | 70 | 37,926 | |||||||||
Masco Corp. (Building Products) | 251 | 16,734 | |||||||||
Mastercard, Inc.—Class A (Financial Services) | 935 | 412,485 | |||||||||
| Match Group, Inc.* (Interactive Media & Services) | 303 | 9,205 | |||||||||
McCormick & Co., Inc. (Food Products) | 287 | 20,360 | |||||||||
Common Stocks, continued
Shares | Value | ||||||||||
| McDonald's Corp. (Hotels, Restaurants & Leisure) | 821 | $ | 209,223 | ||||||||
| McKesson Corp. (Health Care Providers & Services) | 148 | 86,438 | |||||||||
| Medtronic PLC (Health Care Equipment & Supplies) | 1,512 | 119,010 | |||||||||
Merck & Co., Inc. (Pharmaceuticals) | 2,884 | 357,039 | |||||||||
| Meta Platforms, Inc.—Class A (Interactive Media & Services) | 2,495 | 1,258,030 | |||||||||
MetLife, Inc. (Insurance) | 680 | 47,729 | |||||||||
| Mettler-Toledo International, Inc.* (Life Sciences Tools & Services) | 24 | 33,542 | |||||||||
| MGM Resorts International* (Hotels, Restaurants & Leisure) | 286 | 12,710 | |||||||||
| Microchip Technology, Inc. (Semiconductors & Semiconductor Equipment) | 615 | 56,273 | |||||||||
| Micron Technology, Inc. (Semiconductors & Semiconductor Equipment) | 1,261 | 165,859 | |||||||||
Microsoft Corp. (Software) | 8,463 | 3,782,538 | |||||||||
| Mid-America Apartment Communities, Inc. (Residential REITs) | 133 | 18,967 | |||||||||
Moderna, Inc.* (Biotechnology) | 380 | 45,125 | |||||||||
| Mohawk Industries, Inc.* (Household Durables) | 60 | 6,815 | |||||||||
| Molina Healthcare, Inc.* (Health Care Providers & Services) | 67 | 19,919 | |||||||||
| Molson Coors Beverage Co.—Class B (Beverages) | 207 | 10,522 | |||||||||
| Mondelez International, Inc.—Class A (Food Products) | 1,527 | 99,927 | |||||||||
| Monolithic Power Systems, Inc. (Semiconductors & Semiconductor Equipment) | 55 | 45,192 | |||||||||
Monster Beverage Corp.* (Beverages) | 808 | 40,360 | |||||||||
Moody's Corp. (Capital Markets) | 179 | 75,346 | |||||||||
Morgan Stanley (Capital Markets) | 1,425 | 138,496 | |||||||||
| Motorola Solutions, Inc. (Communications Equipment) | 190 | 73,350 | |||||||||
MSCI, Inc. (Capital Markets) | 90 | 43,358 | |||||||||
Nasdaq, Inc. (Capital Markets) | 433 | 26,093 | |||||||||
| NetApp, Inc. (Technology Hardware, Storage & Peripherals) | 235 | 30,268 | |||||||||
Netflix, Inc.* (Entertainment) | 491 | 331,366 | |||||||||
Newmont Corp. (Metals & Mining) | 1,313 | 54,975 | |||||||||
News Corp.—Class A (Media) | 432 | 11,910 | |||||||||
News Corp.—Class B (Media) | 130 | 3,691 | |||||||||
NextEra Energy, Inc. (Electric Utilities) | 2,340 | 165,694 | |||||||||
| NIKE, Inc.—Class B (Textiles, Apparel & Luxury Goods) | 1,380 | 104,010 | |||||||||
NiSource, Inc. (Multi-Utilities) | 510 | 14,693 | |||||||||
Nordson Corp. (Machinery) | 62 | 14,380 | |||||||||
| Norfolk Southern Corp. (Ground Transportation) | 257 | 55,175 | |||||||||
Northern Trust Corp. (Capital Markets) | 233 | 19,567 | |||||||||
| Northrop Grumman Corp. (Aerospace & Defense) | 158 | 68,880 | |||||||||
| Norwegian Cruise Line Holdings, Ltd.* (Hotels, Restaurants & Leisure) | 489 | 9,188 | |||||||||
NRG Energy, Inc. (Electric Utilities) | 237 | 18,453 | |||||||||
Nucor Corp. (Metals & Mining) | 273 | 43,156 | |||||||||
See accompanying notes to the financial statements.
16 :: ProFund VP Bull :: Schedule of Portfolio Investments :: June 30, 2024 (unaudited)
Common Stocks, continued
Shares | Value | ||||||||||
| NVIDIA Corp. (Semiconductors & Semiconductor Equipment) | 28,010 | $ | 3,460,355 | ||||||||
NVR, Inc.* (Household Durables) | 4 | 30,354 | |||||||||
| NXP Semiconductors N.V. (Semiconductors & Semiconductor Equipment) | 291 | 78,305 | |||||||||
| Occidental Petroleum Corp. (Oil, Gas & Consumable Fuels) | 757 | 47,714 | |||||||||
| Old Dominion Freight Line, Inc. (Ground Transportation) | 203 | 35,850 | |||||||||
Omnicom Group, Inc. (Media) | 223 | 20,003 | |||||||||
| ON Semiconductor Corp.* (Semiconductors & Semiconductor Equipment) | 490 | 33,590 | |||||||||
ONEOK, Inc. (Oil, Gas & Consumable Fuels) | 665 | 54,231 | |||||||||
Oracle Corp. (Software) | 1,815 | 256,278 | |||||||||
O'Reilly Automotive, Inc.* (Specialty Retail) | 67 | 70,756 | |||||||||
Otis Worldwide Corp. (Machinery) | 460 | 44,280 | |||||||||
PACCAR, Inc. (Machinery) | 597 | 61,455 | |||||||||
| Packaging Corp. of America (Containers & Packaging) | 102 | 18,621 | |||||||||
Palo Alto Networks, Inc.* (Software) | 368 | 124,756 | |||||||||
Paramount Global—Class B (Media) | 563 | 5,850 | |||||||||
Parker-Hannifin Corp. (Machinery) | 146 | 73,848 | |||||||||
Paychex, Inc. (Professional Services) | 365 | 43,274 | |||||||||
| Paycom Software, Inc. (Professional Services) | 55 | 7,867 | |||||||||
PayPal Holdings, Inc.* (Financial Services) | 1,191 | 69,114 | |||||||||
Pentair PLC (Machinery) | 189 | 14,491 | |||||||||
PepsiCo, Inc. (Beverages) | 1,565 | 258,115 | |||||||||
Pfizer, Inc. (Pharmaceuticals) | 6,453 | 180,555 | |||||||||
PG&E Corp. (Electric Utilities) | 2,433 | 42,480 | |||||||||
Philip Morris International, Inc. (Tobacco) | 1,770 | 179,354 | |||||||||
Phillips 66 (Oil, Gas & Consumable Fuels) | 483 | 68,185 | |||||||||
Pinnacle West Capital Corp. (Electric Utilities) | 129 | 9,853 | |||||||||
Pool Corp. (Distributors) | 44 | 13,523 | |||||||||
PPG Industries, Inc. (Chemicals) | 268 | 33,739 | |||||||||
PPL Corp. (Electric Utilities) | 840 | 23,226 | |||||||||
Principal Financial Group, Inc. (Insurance) | 246 | 19,299 | |||||||||
Prologis, Inc. (Industrial REITs) | 1,054 | 118,375 | |||||||||
Prudential Financial, Inc. (Insurance) | 409 | 47,931 | |||||||||
PTC, Inc.* (Software) | 136 | 24,707 | |||||||||
| Public Service Enterprise Group, Inc. (Multi-Utilities) | 567 | 41,788 | |||||||||
Public Storage (Specialized REITs) | 180 | 51,777 | |||||||||
PulteGroup, Inc. (Household Durables) | 240 | 26,424 | |||||||||
| Qorvo, Inc.* (Semiconductors & Semiconductor Equipment) | 110 | 12,764 | |||||||||
| QUALCOMM, Inc. (Semiconductors & Semiconductor Equipment) | 1,273 | 253,556 | |||||||||
| Quanta Services, Inc. (Construction & Engineering) | 167 | 42,433 | |||||||||
| Quest Diagnostics, Inc. (Health Care Providers & Services) | 127 | 17,384 | |||||||||
| Ralph Lauren Corp. (Textiles, Apparel & Luxury Goods) | 44 | 7,703 | |||||||||
| Raymond James Financial, Inc. (Capital Markets) | 212 | 26,205 | |||||||||
Realty Income Corp. (Retail REITs) | 992 | 52,397 | |||||||||
Regency Centers Corp. (Retail REITs) | 187 | 11,631 | |||||||||
| Regeneron Pharmaceuticals, Inc.* (Biotechnology) | 121 | 127,175 | |||||||||
Common Stocks, continued
Shares | Value | ||||||||||
Regions Financial Corp. (Banks) | 1,043 | $ | 20,902 | ||||||||
| Republic Services, Inc. (Commercial Services & Supplies) | 233 | 45,281 | |||||||||
| ResMed, Inc. (Health Care Equipment & Supplies) | 167 | 31,967 | |||||||||
Revvity, Inc. (Life Sciences Tools & Services) | 141 | 14,785 | |||||||||
| Rockwell Automation, Inc. (Electrical Equipment) | 130 | 35,786 | |||||||||
| Rollins, Inc. (Commercial Services & Supplies) | 320 | 15,613 | |||||||||
Roper Technologies, Inc. (Software) | 122 | 68,767 | |||||||||
Ross Stores, Inc. (Specialty Retail) | 382 | 55,512 | |||||||||
| Royal Caribbean Cruises, Ltd.* (Hotels, Restaurants & Leisure) | 270 | 43,046 | |||||||||
RTX Corp. (Aerospace & Defense) | 1,514 | 151,991 | |||||||||
S&P Global, Inc. (Capital Markets) | 365 | 162,790 | |||||||||
Salesforce, Inc. (Software) | 1,106 | 284,353 | |||||||||
| SBA Communications Corp. (Specialized REITs) | 122 | 23,949 | |||||||||
| Schlumberger N.V. (Energy Equipment & Services) | 1,628 | 76,809 | |||||||||
| Seagate Technology Holdings PLC (Technology Hardware, Storage & Peripherals) | 222 | 22,926 | |||||||||
Sempra (Multi-Utilities) | 721 | 54,840 | |||||||||
ServiceNow, Inc.* (Software) | 233 | 183,294 | |||||||||
Simon Property Group, Inc. (Retail REITs) | 371 | 56,319 | |||||||||
| Skyworks Solutions, Inc. (Semiconductors & Semiconductor Equipment) | 183 | 19,504 | |||||||||
Snap-on, Inc. (Machinery) | 60 | 15,683 | |||||||||
| Solventum Corp.* (Health Care Providers & Services) | 157 | 8,302 | |||||||||
Southwest Airlines Co. (Passenger Airlines) | 681 | 19,483 | |||||||||
Stanley Black & Decker, Inc. (Machinery) | 175 | 13,981 | |||||||||
| Starbucks Corp. (Hotels, Restaurants & Leisure) | 1,290 | 100,426 | |||||||||
State Street Corp. (Capital Markets) | 343 | 25,382 | |||||||||
Steel Dynamics, Inc. (Metals & Mining) | 168 | 21,756 | |||||||||
| STERIS PLC (Health Care Equipment & Supplies) | 113 | 24,808 | |||||||||
| Stryker Corp. (Health Care Equipment & Supplies) | 386 | 131,337 | |||||||||
| Super Micro Computer, Inc.* (Technology Hardware, Storage & Peripherals) | 57 | 46,703 | |||||||||
Synchrony Financial (Consumer Finance) | 457 | 21,566 | |||||||||
Synopsys, Inc.* (Software) | 174 | 103,540 | |||||||||
| Sysco Corp. (Consumer Staples Distribution & Retail) | 567 | 40,478 | |||||||||
T. Rowe Price Group, Inc. (Capital Markets) | 254 | 29,289 | |||||||||
| Take-Two Interactive Software, Inc.* (Entertainment) | 181 | 28,144 | |||||||||
| Tapestry, Inc. (Textiles, Apparel & Luxury Goods) | 262 | 11,211 | |||||||||
| Targa Resources Corp. (Oil, Gas & Consumable Fuels) | 252 | 32,453 | |||||||||
| Target Corp. (Consumer Staples Distribution & Retail) | 527 | 78,017 | |||||||||
| TE Connectivity, Ltd. (Electronic Equipment, Instruments & Components) | 349 | 52,500 | |||||||||
| Teledyne Technologies, Inc.* (Electronic Equipment, Instruments & Components) | 54 | 20,951 | |||||||||
See accompanying notes to the financial statements.
June 30, 2024 (unaudited) :: Schedule of Portfolio Investments :: ProFund VP Bull :: 17
Common Stocks, continued
Shares | Value | ||||||||||
| Teleflex, Inc. (Health Care Equipment & Supplies) | 54 | $ | 11,358 | ||||||||
| Teradyne, Inc. (Semiconductors & Semiconductor Equipment) | 178 | 26,396 | |||||||||
Tesla, Inc.* (Automobiles) | 3,159 | 625,103 | |||||||||
| Texas Instruments, Inc. (Semiconductors & Semiconductor Equipment) | 1,037 | 201,728 | |||||||||
Textron, Inc. (Aerospace & Defense) | 217 | 18,632 | |||||||||
| The AES Corp. (Independent Power and Renewable Electricity Producers) | 809 | 14,214 | |||||||||
The Allstate Corp. (Insurance) | 301 | 48,058 | |||||||||
| The Bank of New York Mellon Corp. (Capital Markets) | 852 | 51,026 | |||||||||
The Boeing Co.* (Aerospace & Defense) | 657 | 119,581 | |||||||||
| The Charles Schwab Corp. (Capital Markets) | 1,700 | 125,273 | |||||||||
| The Cigna Group (Health Care Providers & Services) | 323 | 106,774 | |||||||||
The Clorox Co. (Household Products) | 141 | 19,242 | |||||||||
The Coca-Cola Co. (Beverages) | 4,415 | 281,014 | |||||||||
| The Cooper Cos., Inc.* (Health Care Equipment & Supplies) | 226 | 19,730 | |||||||||
| The Estee Lauder Cos., Inc. (Personal Care Products) | 265 | 28,196 | |||||||||
| The Goldman Sachs Group, Inc. (Capital Markets) | 367 | 166,002 | |||||||||
| The Hartford Financial Services Group, Inc. (Insurance) | 337 | 33,882 | |||||||||
The Hershey Co. (Food Products) | 168 | 30,883 | |||||||||
The Home Depot, Inc. (Specialty Retail) | 1,128 | 388,302 | |||||||||
The Interpublic Group of Cos., Inc. (Media) | 430 | 12,509 | |||||||||
The J M Smucker Co. (Food Products) | 121 | 13,194 | |||||||||
The Kraft Heinz Co. (Food Products) | 899 | 28,966 | |||||||||
| The Kroger Co. (Consumer Staples Distribution & Retail) | 762 | 38,047 | |||||||||
The Mosaic Co. (Chemicals) | 366 | 10,577 | |||||||||
| The PNC Financial Services Group, Inc. (Banks) | 453 | 70,432 | |||||||||
| The Procter & Gamble Co. (Household Products) | 2,688 | 443,305 | |||||||||
The Progressive Corp. (Insurance) | 667 | 138,542 | |||||||||
The Sherwin-Williams Co. (Chemicals) | 266 | 79,382 | |||||||||
The Southern Co. (Electric Utilities) | 1,245 | 96,574 | |||||||||
The TJX Cos., Inc. (Specialty Retail) | 1,290 | 142,029 | |||||||||
The Travelers Cos., Inc. (Insurance) | 261 | 53,072 | |||||||||
The Walt Disney Co. (Entertainment) | 2,076 | 206,126 | |||||||||
| The Williams Cos., Inc. (Oil, Gas & Consumable Fuels) | 1,388 | 58,990 | |||||||||
| Thermo Fisher Scientific, Inc. (Life Sciences Tools & Services) | 435 | 240,556 | |||||||||
| T-Mobile U.S., Inc. (Wireless Telecommunication Services) | 587 | 103,418 | |||||||||
Tractor Supply Co. (Specialty Retail) | 123 | 33,210 | |||||||||
Trane Technologies PLC (Building Products) | 258 | 84,865 | |||||||||
TransDigm Group, Inc. (Aerospace & Defense) | 64 | 81,767 | |||||||||
| Trimble, Inc.* (Electronic Equipment, Instruments & Components) | 278 | 15,546 | |||||||||
Truist Financial Corp. (Banks) | 1,524 | 59,207 | |||||||||
Tyler Technologies, Inc.* (Software) | 48 | 24,133 | |||||||||
Tyson Foods, Inc.—Class A (Food Products) | 326 | 18,628 | |||||||||
U.S. Bancorp (Banks) | 1,777 | 70,547 | |||||||||
Common Stocks, continued
Shares | Value | ||||||||||
| Uber Technologies, Inc.* (Ground Transportation) | 2,379 | $ | 172,905 | ||||||||
UDR, Inc. (Residential REITs) | 345 | 14,197 | |||||||||
Ulta Beauty, Inc.* (Specialty Retail) | 55 | 21,223 | |||||||||
Union Pacific Corp. (Ground Transportation) | 695 | 157,251 | |||||||||
| United Airlines Holdings, Inc.* (Passenger Airlines) | 374 | 18,199 | |||||||||
| United Parcel Service, Inc.—Class B (Air Freight & Logistics) | 831 | 113,722 | |||||||||
| United Rentals, Inc. (Trading Companies & Distributors) | 76 | 49,151 | |||||||||
| UnitedHealth Group, Inc. (Health Care Providers & Services) | 1,048 | 533,703 | |||||||||
| Universal Health Services, Inc.—Class B (Health Care Providers & Services) | 68 | 12,575 | |||||||||
| Valero Energy Corp. (Oil, Gas & Consumable Fuels) | 372 | 58,315 | |||||||||
Ventas, Inc. (Health Care REITs) | 461 | 23,631 | |||||||||
| Veralto Corp. (Commercial Services & Supplies) | 250 | 23,868 | |||||||||
VeriSign, Inc.* (IT Services) | 99 | 17,602 | |||||||||
Verisk Analytics, Inc. (Professional Services) | 162 | 43,667 | |||||||||
| Verizon Communications, Inc. (Diversified Telecommunication Services) | 4,793 | 197,663 | |||||||||
Vertex Pharmaceuticals, Inc.* (Biotechnology) | 294 | 137,804 | |||||||||
Viatris, Inc. (Pharmaceuticals) | 1,356 | 14,414 | |||||||||
VICI Properties, Inc. (Specialized REITs) | 1,188 | 34,024 | |||||||||
Visa, Inc.—Class A (Financial Services) | 1,792 | 470,345 | |||||||||
| Vistra Corp. (Independent Power and Renewable Electricity Producers) | 372 | 31,985 | |||||||||
Vulcan Materials Co. (Construction Materials) | 151 | 37,551 | |||||||||
W.R. Berkley Corp. (Insurance) | 230 | 18,073 | |||||||||
| W.W. Grainger, Inc. (Trading Companies & Distributors) | 50 | 45,112 | |||||||||
| Walgreens Boots Alliance, Inc. (Consumer Staples Distribution & Retail) | 815 | 9,857 | |||||||||
| Walmart, Inc. (Consumer Staples Distribution & Retail) | 4,864 | 329,341 | |||||||||
Warner Bros. Discovery, Inc.* (Entertainment) | 2,539 | 18,890 | |||||||||
| Waste Management, Inc. (Commercial Services & Supplies) | 416 | 88,750 | |||||||||
| Waters Corp.* (Life Sciences Tools & Services) | 68 | 19,728 | |||||||||
WEC Energy Group, Inc. (Multi-Utilities) | 360 | 28,246 | |||||||||
Wells Fargo & Co. (Banks) | 3,970 | 235,778 | |||||||||
Welltower, Inc. (Health Care REITs) | 681 | 70,994 | |||||||||
| West Pharmaceutical Services, Inc. (Life Sciences Tools & Services) | 83 | 27,339 | |||||||||
| Western Digital Corp.* (Technology Hardware, Storage & Peripherals) | 372 | 28,186 | |||||||||
| Westinghouse Air Brake Technologies Corp. (Machinery) | 201 | 31,768 | |||||||||
Westrock Co. (Containers & Packaging) | 294 | 14,776 | |||||||||
Weyerhaeuser Co. (Specialized REITs) | 830 | 23,564 | |||||||||
Willis Towers Watson PLC (Insurance) | 116 | 30,408 | |||||||||
| Wynn Resorts, Ltd. (Hotels, Restaurants & Leisure) | 108 | 9,666 | |||||||||
Xcel Energy, Inc. (Electric Utilities) | 633 | 33,809 | |||||||||
Xylem, Inc. (Machinery) | 276 | 37,434 | |||||||||
| Yum! Brands, Inc. (Hotels, Restaurants & Leisure) | 321 | 42,520 | |||||||||
See accompanying notes to the financial statements.
18 :: ProFund VP Bull :: Schedule of Portfolio Investments :: June 30, 2024 (unaudited)
Common Stocks, continued
Shares | Value | ||||||||||
| Zebra Technologies Corp.* (Electronic Equipment, Instruments & Components) | 59 | $ | 18,227 | ||||||||
| Zimmer Biomet Holdings, Inc. (Health Care Equipment & Supplies) | 234 | 25,396 | |||||||||
Zoetis, Inc. (Pharmaceuticals) | 520 | 90,147 | |||||||||
| TOTAL COMMON STOCKS (Cost $16,222,640) | 52,206,255 | ||||||||||
Repurchase Agreements(a)(b) (13.0%)
| Principal Amount | Value | ||||||||||
| Repurchase Agreements with various counterparties, rates 5.12%–5.20%, dated 6/28/2024, due 7/1/24, total to be received $7,829,384 | $ | 7,826,000 | $ | 7,826,000 | |||||||
| TOTAL REPURCHASE AGREEMENTS (Cost $7,826,000) | 7,826,000 | ||||||||||
| TOTAL INVESTMENT SECURITIES (Cost $24,048,640)—99.6% | 60,032,255 | ||||||||||
Net other assets (liabilities)—0.4% | 266,588 | ||||||||||
NET ASSETS—100.0% | $ | 60,298,843 | |||||||||
* Non-income producing security.
(a) A portion of these securities were held in a segregated account for the benefit of swap counterparties in the event of default. At June 30, 2024, the aggregate amount held in a segregated account was $666,000.
(b) The ProFund VP invests in Repurchase Agreements jointly with other funds in the Trust. See "Repurchase Agreements" under Note 2 in the Notes to Financial Statements to view the details of each individual agreement and counterparty as well as a description of the securities subject to repurchase.
REIT Real Estate Investment Trust
Futures Contracts Purchased
| Number of Contracts | Expiration Date | Notional Amount | Value and Unrealized Appreciation/ (Depreciation) | ||||||||||||||||
E-Mini S&P 500 Futures Contracts | 7 | 9/23/24 | $ | 1,932,525 | $ | 10,100 | |||||||||||||
Total Return Swap Agreements—Long
Underlying Instrument | Counterparty | Termination Date(1) | Rate Paid (Received)(2) | Notional Amount | Value and Unrealized Appreciation/ (Depreciation) | ||||||||||||||||||
S&P 500 | Goldman Sachs International | 7/29/24 | 6.08 | % | $ | 5,444,098 | $ | (23,688 | ) | ||||||||||||||
S&P 500 | UBS AG | 7/29/24 | 5.93 | % | 704,402 | (2,918 | ) | ||||||||||||||||
$ | 6,148,500 | $ | (26,606 | ) | |||||||||||||||||||
(1) Agreements may be terminated at will by either party without penalty. Payment is due at termination/maturity.
(2) Reflects the floating financing rate, as of June 30, 2024, on the notional amount of the swap agreement paid to the counterparty or received from the counterparty, excluding any commissions. This amount is included as part of the unrealized appreciation/(depreciation).
See accompanying notes to the financial statements.
June 30, 2024 (unaudited) :: Schedule of Portfolio Investments :: ProFund VP Bull :: 19
ProFund VP Bull invested in the following industries as of June 30, 2024:
Value | % of Net Assets | ||||||||||
Aerospace & Defense | $ | 747,241 | 1.2 | % | |||||||
Air Freight & Logistics | 222,892 | 0.4 | % | ||||||||
Automobile Components | 30,180 | 0.1 | % | ||||||||
Automobiles | 741,446 | 1.2 | % | ||||||||
Banks | 1,677,055 | 2.8 | % | ||||||||
Beverages | 685,617 | 1.1 | % | ||||||||
Biotechnology | 994,628 | 1.6 | % | ||||||||
Broadline Retail | 2,053,997 | 3.4 | % | ||||||||
Building Products | 255,099 | 0.4 | % | ||||||||
Capital Markets | 1,474,690 | 2.4 | % | ||||||||
Chemicals | 742,058 | 1.3 | % | ||||||||
Commercial Services & Supplies | 296,080 | 0.5 | % | ||||||||
Communications Equipment | 418,736 | 0.7 | % | ||||||||
Construction & Engineering | 42,433 | 0.1 | % | ||||||||
Construction Materials | 75,477 | 0.1 | % | ||||||||
Consumer Finance | 268,885 | 0.4 | % | ||||||||
Consumer Staples Distribution & Retail | 983,242 | 1.7 | % | ||||||||
Containers & Packaging | 107,886 | 0.2 | % | ||||||||
Distributors | 48,159 | 0.1 | % | ||||||||
Diversified Telecommunication Services | 353,696 | 0.6 | % | ||||||||
Electric Utilities | 773,668 | 1.4 | % | ||||||||
Electrical Equipment | 379,106 | 0.6 | % | ||||||||
| Electronic Equipment, Instruments & Components | 309,861 | 0.5 | % | ||||||||
Energy Equipment & Services | 150,812 | 0.3 | % | ||||||||
Entertainment | 638,306 | 1.1 | % | ||||||||
Financial Services | 1,979,242 | 3.3 | % | ||||||||
Food Products | 370,625 | 0.6 | % | ||||||||
Gas Utilities | 20,064 | NM | |||||||||
Ground Transportation | 510,521 | 0.8 | % | ||||||||
Health Care Equipment & Supplies | 1,227,744 | 2.0 | % | ||||||||
Health Care Providers & Services | 1,282,536 | 2.1 | % | ||||||||
Health Care REITs | 110,325 | 0.2 | % | ||||||||
Hotel & Resort REITs | 14,438 | NM | |||||||||
Hotels, Restaurants & Leisure | 992,263 | 1.6 | % | ||||||||
Household Durables | 181,412 | 0.3 | % | ||||||||
Household Products | 634,936 | 1.1 | % | ||||||||
| Independent Power and Renewable Electricity Producers | 46,199 | 0.1 | % | ||||||||
Industrial Conglomerates | 420,903 | 0.7 | % | ||||||||
Industrial REITs | 118,375 | 0.2 | % | ||||||||
Value | % of Net Assets | ||||||||||
Insurance | $ | 1,059,151 | 1.8 | % | |||||||
Interactive Media & Services | 3,506,368 | 5.7 | % | ||||||||
IT Services | 544,107 | 0.9 | % | ||||||||
Leisure Products | 8,717 | NM | |||||||||
Life Sciences Tools & Services | 641,947 | 1.1 | % | ||||||||
Machinery | 836,363 | 1.5 | % | ||||||||
Media | 275,824 | 0.5 | % | ||||||||
Metals & Mining | 199,397 | 0.3 | % | ||||||||
Multi-Utilities | 312,153 | 0.5 | % | ||||||||
Office REITs | 31,095 | 0.1 | % | ||||||||
Oil, Gas & Consumable Fuels | 1,754,087 | 2.9 | % | ||||||||
Passenger Airlines | 81,014 | 0.1 | % | ||||||||
Personal Care Products | 67,828 | 0.1 | % | ||||||||
Pharmaceuticals | 1,973,206 | 3.3 | % | ||||||||
Professional Services | 318,192 | 0.5 | % | ||||||||
| Real Estate Management & Development | 65,040 | 0.1 | % | ||||||||
Residential REITs | 150,547 | 0.2 | % | ||||||||
Retail REITs | 143,719 | 0.2 | % | ||||||||
| Semiconductors & Semiconductor Equipment | 6,278,594 | 10.4 | % | ||||||||
Software | 5,755,902 | 9.5 | % | ||||||||
Specialized REITs | 490,443 | 0.9 | % | ||||||||
Specialty Retail | 955,379 | 1.6 | % | ||||||||
| Technology Hardware, Storage & Peripherals | 3,650,746 | 6.1 | % | ||||||||
Textiles, Apparel & Luxury Goods | 189,826 | 0.3 | % | ||||||||
Tobacco | 268,450 | 0.4 | % | ||||||||
Trading Companies & Distributors | 135,235 | 0.2 | % | ||||||||
Water Utilities | 28,674 | NM | |||||||||
Wireless Telecommunication Services | 103,418 | 0.2 | % | ||||||||
Other** | 8,092,588 | 13.4 | % | ||||||||
Total | $ | 60,298,843 | 100.0 | % | |||||||
** Includes any non-equity securities and net other assets (liabilities), which includes any receivable for capital shares issued and payable for capital shares redeemed.
NM Not meaningful, amount is less than 0.05%
REIT Real Estate Investment Trust
See accompanying notes to the financial statements.
20 :: ProFund VP Communication Services :: Schedule of Portfolio Investments :: June 30, 2024 (unaudited)
Common Stocks (97.3%)
Shares | Value | ||||||||||
| Alphabet, Inc.—Class A (Interactive Media & Services) | 7,001 | $ | 1,275,232 | ||||||||
| Alphabet, Inc.—Class C (Interactive Media & Services) | 5,824 | 1,068,238 | |||||||||
| AT&T, Inc. (Diversified Telecommunication Services) | 25,252 | 482,566 | |||||||||
| Charter Communications, Inc.*—Class A (Media) | 1,473 | 440,367 | |||||||||
Comcast Corp.—Class A (Media) | 11,896 | 465,845 | |||||||||
Electronic Arts, Inc. (Entertainment) | 3,275 | 456,305 | |||||||||
Fox Corp.—Class A (Media) | 3,475 | 119,436 | |||||||||
Fox Corp.—Class B (Media) | 1,984 | 63,528 | |||||||||
| Live Nation Entertainment, Inc.* (Entertainment) | 2,141 | 200,697 | |||||||||
| Match Group, Inc.* (Interactive Media & Services) | 3,994 | 121,338 | |||||||||
| Meta Platforms, Inc.—Class A (Interactive Media & Services) | 4,516 | 2,277,058 | |||||||||
Netflix, Inc.* (Entertainment) | 665 | 448,795 | |||||||||
News Corp.—Class A (Media) | 5,701 | 157,177 | |||||||||
News Corp.—Class B (Media) | 1,720 | 48,831 | |||||||||
Omnicom Group, Inc. (Media) | 2,945 | 264,167 | |||||||||
Paramount Global—Class B (Media) | 7,435 | 77,250 | |||||||||
| Take-Two Interactive Software, Inc.* (Entertainment) | 2,389 | 371,466 | |||||||||
The Interpublic Group of Cos., Inc. (Media) | 5,676 | 165,115 | |||||||||
The Walt Disney Co. (Entertainment) | 4,455 | 442,337 | |||||||||
| T-Mobile U.S., Inc. (Wireless Telecommunication Services) | 2,531 | 445,912 | |||||||||
Common Stocks, continued
Shares | Value | ||||||||||
| Verizon Communications, Inc. (Diversified Telecommunication Services) | 11,227 | $ | 463,001 | ||||||||
| Warner Bros. Discovery, Inc.* (Entertainment) | 33,533 | 249,486 | |||||||||
| TOTAL COMMON STOCKS (Cost $7,062,862) | 10,104,147 | ||||||||||
Repurchase Agreements(a) (2.6%)
| Principal Amount | Value | ||||||||||
| Repurchase Agreements with various counterparties, rates 5.12%–5.20%, dated 6/28/2024, due 7/1/24, total to be received $273,118 | $ | 273,000 | $ | 273,000 | |||||||
| TOTAL REPURCHASE AGREEMENTS (Cost $273,000) | 273,000 | ||||||||||
| TOTAL INVESTMENT SECURITIES (Cost $7,335,862)—99.9% | 10,377,147 | ||||||||||
Net other assets (liabilities)—0.1% | 8,119 | ||||||||||
NET ASSETS—100.0% | $ | 10,385,266 | |||||||||
* Non-income producing security.
(a) The ProFund VP invests in Repurchase Agreements jointly with other funds in the Trust. See "Repurchase Agreements" under Note 2 in the Notes to Financial Statements to view the details of each individual agreement and counterparty as well as a description of the securities subject to repurchase.
Total Return Swap Agreements—Long
Underlying Instrument | Counterparty | Termination Date(1) | Rate Paid (Received)(2) | Notional Amount | Value and Unrealized Appreciation/ (Depreciation) | ||||||||||||||||||
| S&P Communication Services Select Sector Index | Goldman Sachs International | 7/23/24 | 6.08 | % | $ | 258,629 | $ | 1,486 | |||||||||||||||
(1) Agreements may be terminated at will by either party without penalty. Payment is due at termination/maturity.
(2) Reflects the floating financing rate, as of June 30, 2024, on the notional amount of the swap agreement paid to the counterparty or received from the counterparty, excluding any commissions. This amount is included as part of the unrealized appreciation/(depreciation).
ProFund VP Communication Services invested in the following industries as of June 30, 2024:
Value | % of Net Assets | ||||||||||
| Diversified Telecommunication Services | $ | 945,567 | 9.1 | % | |||||||
Entertainment | 2,169,086 | 20.9 | % | ||||||||
Interactive Media & Services | 4,741,865 | 45.7 | % | ||||||||
Media | 1,801,717 | 17.3 | % | ||||||||
Wireless Telecommunication Services | 445,912 | 4.3 | % | ||||||||
Other** | 281,119 | 2.7 | % | ||||||||
Total | $ | 10,385,266 | 100.0 | % | |||||||
** Includes any non-equity securities and net other assets (liabilities), which includes any receivable for capital shares issued and payable for capital shares redeemed.
See accompanying notes to the financial statements.
June 30, 2024 (unaudited) :: Schedule of Portfolio Investments :: ProFund VP Consumer Discretionary :: 21
Common Stocks (98.0%)
Shares | Value | ||||||||||
| Airbnb, Inc.*—Class A (Hotels, Restaurants & Leisure) | 2,986 | $ | 452,767 | ||||||||
Amazon.com, Inc.* (Broadline Retail) | 29,883 | 5,774,891 | |||||||||
Aptiv PLC* (Automobile Components) | 1,840 | 129,572 | |||||||||
AutoZone, Inc.* (Specialty Retail) | 117 | 346,800 | |||||||||
Bath & Body Works, Inc. (Specialty Retail) | 1,511 | 59,005 | |||||||||
Best Buy Co., Inc. (Specialty Retail) | 1,302 | 109,746 | |||||||||
| Booking Holdings, Inc. (Hotels, Restaurants & Leisure) | 230 | 911,145 | |||||||||
BorgWarner, Inc. (Automobile Components) | 1,540 | 49,650 | |||||||||
| Caesars Entertainment, Inc.* (Hotels, Restaurants & Leisure) | 1,463 | 58,140 | |||||||||
CarMax, Inc.* (Specialty Retail) | 1,064 | 78,034 | |||||||||
| Carnival Corp.* (Hotels, Restaurants & Leisure) | 6,819 | 127,652 | |||||||||
| Chipotle Mexican Grill, Inc.* (Hotels, Restaurants & Leisure) | 9,300 | 582,645 | |||||||||
D.R. Horton, Inc. (Household Durables) | 2,003 | 282,282 | |||||||||
| Darden Restaurants, Inc. (Hotels, Restaurants & Leisure) | 807 | 122,115 | |||||||||
| Deckers Outdoor Corp.* (Textiles, Apparel & Luxury Goods) | 173 | 167,455 | |||||||||
| Domino's Pizza, Inc. (Hotels, Restaurants & Leisure) | 236 | 121,854 | |||||||||
eBay, Inc. (Broadline Retail) | 3,421 | 183,776 | |||||||||
Etsy, Inc.* (Broadline Retail) | 790 | 46,594 | |||||||||
| Expedia Group, Inc.* (Hotels, Restaurants & Leisure) | 857 | 107,973 | |||||||||
Ford Motor Co. (Automobiles) | 26,521 | 332,573 | |||||||||
Garmin, Ltd. (Household Durables) | 1,038 | 169,111 | |||||||||
General Motors Co. (Automobiles) | 7,715 | 358,439 | |||||||||
Genuine Parts Co. (Distributors) | 941 | 130,159 | |||||||||
Hasbro, Inc. (Leisure Products) | 884 | 51,714 | |||||||||
| Hilton Worldwide Holdings, Inc. (Hotels, Restaurants & Leisure) | 1,691 | 368,976 | |||||||||
| Las Vegas Sands Corp. (Hotels, Restaurants & Leisure) | 2,470 | 109,298 | |||||||||
| Lennar Corp.—Class A (Household Durables) | 1,654 | 247,885 | |||||||||
LKQ Corp. (Distributors) | 1,803 | 74,987 | |||||||||
Lowe's Cos., Inc. (Specialty Retail) | 3,869 | 852,959 | |||||||||
| Lululemon Athletica, Inc.* (Textiles, Apparel & Luxury Goods) | 775 | 231,493 | |||||||||
| Marriott International, Inc.—Class A (Hotels, Restaurants & Leisure) | 1,624 | 392,602 | |||||||||
| McDonald's Corp. (Hotels, Restaurants & Leisure) | 4,232 | 1,078,483 | |||||||||
| MGM Resorts International* (Hotels, Restaurants & Leisure) | 1,694 | 75,281 | |||||||||
| Mohawk Industries, Inc.* (Household Durables) | 357 | 40,552 | |||||||||
| NIKE, Inc.—Class B (Textiles, Apparel & Luxury Goods) | 8,191 | 617,355 | |||||||||
Common Stocks, continued
Shares | Value | ||||||||||
| Norwegian Cruise Line Holdings, Ltd.* (Hotels, Restaurants & Leisure) | 2,901 | $ | 54,510 | ||||||||
NVR, Inc.* (Household Durables) | 21 | 159,360 | |||||||||
| O'Reilly Automotive, Inc.* (Specialty Retail) | 398 | 420,312 | |||||||||
Pool Corp. (Distributors) | 259 | 79,598 | |||||||||
PulteGroup, Inc. (Household Durables) | 1,421 | 156,452 | |||||||||
| Ralph Lauren Corp. (Textiles, Apparel & Luxury Goods) | 264 | 46,216 | |||||||||
Ross Stores, Inc. (Specialty Retail) | 2,267 | 329,440 | |||||||||
| Royal Caribbean Cruises, Ltd.* (Hotels, Restaurants & Leisure) | 1,601 | 255,247 | |||||||||
| Starbucks Corp. (Hotels, Restaurants & Leisure) | 7,660 | 596,331 | |||||||||
| Tapestry, Inc. (Textiles, Apparel & Luxury Goods) | 1,553 | 66,453 | |||||||||
Tesla, Inc.* (Automobiles) | 18,525 | 3,665,727 | |||||||||
The Home Depot, Inc. (Specialty Retail) | 6,619 | 2,278,524 | |||||||||
The TJX Cos., Inc. (Specialty Retail) | 7,659 | 843,256 | |||||||||
Tractor Supply Co. (Specialty Retail) | 729 | 196,830 | |||||||||
Ulta Beauty, Inc.* (Specialty Retail) | 325 | 125,408 | |||||||||
| Wynn Resorts, Ltd. (Hotels, Restaurants & Leisure) | 637 | 57,012 | |||||||||
| Yum! Brands, Inc. (Hotels, Restaurants & Leisure) | 1,904 | 252,204 | |||||||||
| TOTAL COMMON STOCKS (Cost $15,919,184) | 24,426,843 | ||||||||||
Repurchase Agreements(a) (2.0%)
| Principal Amount | Value | ||||||||||
| Repurchase Agreements with various counterparties, rates 5.12%–5.20%, dated 6/28/2024, due 7/1/24, total to be received $489,211 | $ | 489,000 | $ | 489,000 | |||||||
| TOTAL REPURCHASE AGREEMENTS (Cost $489,000) | 489,000 | ||||||||||
| TOTAL INVESTMENT SECURITIES (Cost $16,408,184)—100.0% | 24,915,843 | ||||||||||
Net other assets (liabilities)—(NM) | (5,189 | ) | |||||||||
NET ASSETS—100.0% | $ | 24,910,654 | |||||||||
* Non-income producing security.
(a) The ProFund VP invests in Repurchase Agreements jointly with other funds in the Trust. See "Repurchase Agreements" under Note 2 in the Notes to Financial Statements to view the details of each individual agreement and counterparty as well as a description of the securities subject to repurchase.
NM Not meaningful, amount is less than 0.05%.
See accompanying notes to the financial statements.
22 :: ProFund VP Consumer Discretionary :: Schedule of Portfolio Investments :: June 30, 2024 (unaudited)
Total Return Swap Agreements—Long
Underlying Instrument | Counterparty | Termination Date(1) | Rate Paid (Received)(2) | Notional Amount | Value and Unrealized Appreciation/ (Depreciation) | ||||||||||||||||||
| S&P Consumer Discretionary Select Sector Index | Goldman Sachs International | 7/23/24 | 6.08 | % | $ | 488,225 | $ | 2,297 | |||||||||||||||
(1) Agreements may be terminated at will by either party without penalty. Payment is due at termination/maturity.
(2) Reflects the floating financing rate, as of June 30, 2024, on the notional amount of the swap agreement paid to the counterparty or received from the counterparty, excluding any commissions. This amount is included as part of the unrealized appreciation/(depreciation).
ProFund VP Consumer Discretionary invested in the following industries as of June 30, 2024:
Value | % of Net Assets | ||||||||||
Automobile Components | $ | 179,222 | 0.7 | % | |||||||
Automobiles | 4,356,739 | 17.5 | % | ||||||||
Broadline Retail | 6,005,261 | 24.2 | % | ||||||||
Distributors | 284,744 | 1.1 | % | ||||||||
Hotels, Restaurants & Leisure | 5,724,235 | 23.0 | % | ||||||||
Household Durables | 1,055,642 | 4.2 | % | ||||||||
Leisure Products | 51,714 | 0.2 | % | ||||||||
Specialty Retail | 5,640,314 | 22.6 | % | ||||||||
Textiles, Apparel & Luxury Goods | 1,128,972 | 4.5 | % | ||||||||
Other** | 483,811 | 2.0 | % | ||||||||
Total | $ | 24,910,654 | 100.0 | % | |||||||
** Includes any non-equity securities and net other assets (liabilities), which includes any receivable for capital shares issued and payable for capital shares redeemed.
See accompanying notes to the financial statements.
Common Stocks (97.3%)
Shares | Value | ||||||||||
Altria Group, Inc. (Tobacco) | 7,742 | $ | 352,648 | ||||||||
Archer-Daniels-Midland Co. (Food Products) | 2,229 | 134,743 | |||||||||
Brown-Forman Corp.—Class B (Beverages) | 807 | 34,854 | |||||||||
Bunge Global SA (Food Products) | 639 | 68,226 | |||||||||
Campbell Soup Co. (Food Products) | 887 | 40,084 | |||||||||
| Church & Dwight Co., Inc. (Household Products) | 1,102 | 114,255 | |||||||||
Colgate-Palmolive Co. (Household Products) | 3,697 | 358,757 | |||||||||
Conagra Brands, Inc. (Food Products) | 2,156 | 61,274 | |||||||||
| Constellation Brands, Inc.—Class A (Beverages) | 726 | 186,785 | |||||||||
| Costco Wholesale Corp. (Consumer Staples Distribution & Retail) | 1,732 | 1,472,183 | |||||||||
| Dollar General Corp. (Consumer Staples Distribution & Retail) | 990 | 130,908 | |||||||||
| Dollar Tree, Inc.* (Consumer Staples Distribution & Retail) | 934 | 99,723 | |||||||||
General Mills, Inc. (Food Products) | 2,545 | 160,997 | |||||||||
Hormel Foods Corp. (Food Products) | 1,309 | 39,911 | |||||||||
Kellanova (Food Products) | 1,187 | 68,466 | |||||||||
Kenvue, Inc. (Personal Care Products) | 8,630 | 156,893 | |||||||||
Keurig Dr Pepper, Inc. (Beverages) | 4,704 | 157,114 | |||||||||
Kimberly-Clark Corp. (Household Products) | 1,517 | 209,649 | |||||||||
Lamb Weston Holdings, Inc. (Food Products) | 651 | 54,736 | |||||||||
McCormick & Co., Inc. (Food Products) | 1,135 | 80,517 | |||||||||
| Molson Coors Beverage Co.—Class B (Beverages) | 820 | 41,681 | |||||||||
| Mondelez International, Inc.—Class A (Food Products) | 6,045 | 395,585 | |||||||||
Monster Beverage Corp.* (Beverages) | 3,197 | 159,690 | |||||||||
PepsiCo, Inc. (Beverages) | 2,831 | 466,917 | |||||||||
Philip Morris International, Inc. (Tobacco) | 4,537 | 459,734 | |||||||||
| Sysco Corp. (Consumer Staples Distribution & Retail) | 2,244 | 160,199 | |||||||||
| Target Corp. (Consumer Staples Distribution & Retail) | 2,085 | 308,663 | |||||||||
The Clorox Co. (Household Products) | 559 | 76,287 | |||||||||
The Coca-Cola Co. (Beverages) | 15,142 | 963,788 | |||||||||
| The Estee Lauder Cos., Inc. (Personal Care Products) | 1,050 | 111,720 | |||||||||
Common Stocks, continued
Shares | Value | ||||||||||
The Hershey Co. (Food Products) | 666 | $ | 122,431 | ||||||||
The JM Smucker Co. (Food Products) | 478 | 52,121 | |||||||||
The Kraft Heinz Co. (Food Products) | 3,558 | 114,639 | |||||||||
| The Kroger Co. (Consumer Staples Distribution & Retail) | 3,017 | 150,639 | |||||||||
| The Procter & Gamble Co. (Household Products) | 9,218 | 1,520,233 | |||||||||
Tyson Foods, Inc.—Class A (Food Products) | 1,289 | 73,653 | |||||||||
| Walgreens Boots Alliance, Inc. (Consumer Staples Distribution & Retail) | 3,228 | 39,043 | |||||||||
| Walmart, Inc. (Consumer Staples Distribution & Retail) | 16,684 | 1,129,674 | |||||||||
| TOTAL COMMON STOCKS (Cost $5,212,933) | 10,329,420 | ||||||||||
Repurchase Agreements(a) (2.5%)
| Principal Amount | Value | ||||||||||
| Repurchase Agreements with various counterparties, rates 5.12%–5.20%, dated 6/28/2024, due 7/1/24, total to be received $267,115 | $ | 267,000 | $ | 267,000 | |||||||
| TOTAL REPURCHASE AGREEMENTS (Cost $267,000) | 267,000 | ||||||||||
| TOTAL INVESTMENT SECURITIES (Cost $5,479,933)—99.8% | 10,596,420 | ||||||||||
Net other assets (liabilities)—0.2% | 18,618 | ||||||||||
NET ASSETS—100.0% | $ | 10,615,038 | |||||||||
* Non-income producing security.
(a) The ProFund VP invests in Repurchase Agreements jointly with other funds in the Trust. See "Repurchase Agreements" under Note 2 in the Notes to Financial Statements to view the details of each individual agreement and counterparty as well as a description of the securities subject to repurchase.
Total Return Swap Agreements—Long
Underlying Instrument | Counterparty | Termination Date(1) | Rate Paid (Received)(2) | Notional Amount | Value and Unrealized Appreciation/ (Depreciation) | ||||||||||||||||||
| S&P Consumer Staples Select Sector Index | Goldman Sachs International | 7/23/24 | 6.08 | % | $ | 218,595 | $ | (2,563 | ) | ||||||||||||||
(1) Agreements may be terminated at will by either party without penalty. Payment is due at termination/maturity.
(2) Reflects the floating financing rate, as of June 30, 2024, on the notional amount of the swap agreement paid to the counterparty or received from the counterparty, excluding any commissions. This amount is included as part of the unrealized appreciation/(depreciation).
See accompanying notes to the financial statements.
24 :: ProFund VP Consumer Staples :: Schedule of Portfolio Investments :: June 30, 2024 (unaudited)
ProFund VP Consumer Staples invested in the following industries as of June 30, 2024:
Value | % of Net Assets | ||||||||||
Beverages | $ | 2,010,829 | 18.9 | % | |||||||
Consumer Staples Distribution & Retail | 3,491,033 | 32.9 | % | ||||||||
Food Products | 1,467,382 | 13.8 | % | ||||||||
Household Products | 2,279,181 | 21.5 | % | ||||||||
Personal Care Products | 268,613 | 2.5 | % | ||||||||
Tobacco | 812,382 | 7.7 | % | ||||||||
Other** | 285,618 | 2.7 | % | ||||||||
Total | $ | 10,615,038 | 100.0 | % | |||||||
** Includes any non-equity securities and net other assets (liabilities), which includes any receivable for capital shares issued and payable for capital shares redeemed.
See accompanying notes to the financial statements.
Repurchase Agreements(a)(b) (99.7%)
| Principal Amount | Value | ||||||||||
| Repurchase Agreements with various counterparties, rates 5.12%–5.20%, dated 6/28/2024, due 7/1/24, total to be received $389,168 | $ | 389,000 | $ | 389,000 | |||||||
| TOTAL REPURCHASE AGREEMENTS (Cost $389,000) | 389,000 | ||||||||||
| TOTAL INVESTMENT SECURITIES (Cost $389,000)—99.7% | 389,000 | ||||||||||
Net other assets (liabilities)—0.3% | 1,278 | ||||||||||
NET ASSETS—100.0% | $ | 390,278 | |||||||||
(a) A portion of these securities were held in a segregated account for the benefit of swap counterparties in the event of default. At June 30, 2024, the aggregate amount held in a segregated account was $16,000.
(b) The ProFund VP invests in Repurchase Agreements jointly with other funds in the Trust. See "Repurchase Agreements" under Note 2 in the Notes to Financial Statements to view the details of each individual agreement and counterparty as well as a description of the securities subject to repurchase.
Total Return Swap Agreements—Long
Underlying Instrument | Counterparty | Termination Date(1) | Rate Paid (Received)(2) | Notional Amount | Value and Unrealized Appreciation/ (Depreciation) | ||||||||||||||||||
Dow Jones Industrial Average | Goldman Sachs International | 7/29/24 | 6.08 | % | $ | 324,988 | $ | (430 | ) | ||||||||||||||
Dow Jones Industrial Average | UBS AG | 7/29/24 | 5.48 | % | 64,057 | (84 | ) | ||||||||||||||||
$ | 389,045 | $ | (514 | ) | |||||||||||||||||||
(1) Agreements may be terminated at will by either party without penalty. Payment is due at termination/maturity.
(2) Reflects the floating financing rate, as of June 30, 2024, on the notional amount of the swap agreement paid to the counterparty or received from the counterparty, excluding any commissions. This amount is included as part of the unrealized appreciation/(depreciation).
See accompanying notes to the financial statements.
Common Stocks (79.0%)
Shares | Value | ||||||||||
| Alibaba Group Holding, Ltd.ADR (Broadline Retail) | 25,911 | $ | 1,865,593 | ||||||||
Ambev S.A.ADR (Beverages) | 65,915 | 135,126 | |||||||||
| America Movil S.A.B. de C.V.ADR (Wireless Telecommunication Services) | 15,258 | 259,386 | |||||||||
| ASE Technology Holding Co., Ltd.ADR (Semiconductors & Semiconductor Equipment) | 25,593 | 292,272 | |||||||||
Baidu, Inc.*ADR (Interactive Media & Services) | 4,259 | 368,318 | |||||||||
Banco Bradesco S.A.ADR (Banks) | 79,356 | 177,757 | |||||||||
Banco de ChileADR(a) (Banks) | 3,245 | 73,434 | |||||||||
BeiGene, Ltd.*ADR (Biotechnology) | 901 | 128,546 | |||||||||
| Cemex S.A.B. de C.V.ADR (Construction Materials) | 22,614 | 144,503 | |||||||||
| Centrais Eletricas Brasileiras S.A.ADR(a) (Electric Utilities) | 15,444 | 99,305 | |||||||||
| Chunghwa Telecom Co., Ltd.ADR (Diversified Telecommunication Services) | 5,679 | 219,266 | |||||||||
| Cia de Saneamento Basico do Estado de Sao Paulo SABESPADR (Water Utilities) | 5,106 | 68,676 | |||||||||
| Coca-Cola Femsa S.A.B. de C.V.ADR (Beverages) | 785 | 67,384 | |||||||||
| Dr. Reddy's Laboratories, Ltd.ADR (Pharmaceuticals) | 1,819 | 138,590 | |||||||||
| Fomento Economico Mexicano S.A.B. de C.V.ADR (Beverages) | 2,725 | 293,347 | |||||||||
| Full Truck Alliance Co., Ltd.ADR (Ground Transportation) | 9,821 | 78,961 | |||||||||
Gerdau S.A.ADR (Metals & Mining) | 20,734 | 68,422 | |||||||||
Gold Fields, Ltd.ADR (Metals & Mining) | 13,349 | 198,900 | |||||||||
| Grupo Aeroportuario del Pacifico S.A.B. de C.V.ADR (Transportation Infrastructure) | 577 | 89,879 | |||||||||
| Grupo Aeroportuario del Sureste S.A.B. de C.V.ADR (Transportation Infrastructure) | 273 | 81,769 | |||||||||
| H World Group, Ltd.ADR (Hotels, Restaurants & Leisure) | 2,095 | 69,805 | |||||||||
HDFC Bank, Ltd.ADR (Banks) | 25,725 | 1,654,889 | |||||||||
ICICI Bank, Ltd.ADR (Banks) | 31,884 | 918,578 | |||||||||
Infosys, Ltd.ADR(a) (IT Services) | 50,921 | 948,149 | |||||||||
Itau Unibanco Holding S.A.ADR (Banks) | 72,394 | 422,781 | |||||||||
JD.com, Inc.ADR (Broadline Retail) | 18,805 | 485,921 | |||||||||
| Kanzhun, Ltd.ADR (Interactive Media & Services) | 4,990 | 93,862 | |||||||||
KB Financial Group, Inc.ADR (Banks) | 5,613 | 317,752 | |||||||||
| KE Holdings, Inc.ADR (Real Estate Management & Development) | 9,976 | 141,160 | |||||||||
Li Auto, Inc.*ADR(a) (Automobiles) | 8,707 | 155,681 | |||||||||
NetEase, Inc.ADR (Entertainment) | 5,219 | 498,833 | |||||||||
| New Oriental Education & Technology Group, Inc.*ADR (Diversified Consumer Services) | 2,238 | 173,959 | |||||||||
NIO, Inc.*ADR(a) (Automobiles) | 25,775 | 107,224 | |||||||||
PDD Holdings, Inc.*ADR (Broadline Retail) | 9,906 | 1,317,003 | |||||||||
| Petroleo Brasileiro S.A.ADR (Oil, Gas & Consumable Fuels) | 27,796 | 402,764 | |||||||||
POSCO Holdings, Inc.ADR(a) (Metals & Mining) | 4,447 | 292,346 | |||||||||
| PT Telekomunikasi Indonesia TbkADR (Diversified Telecommunication Services) | 7,104 | 132,845 | |||||||||
Shinhan Financial Group Co., Ltd.ADR(a) (Banks) | 7,224 | 251,467 | |||||||||
| Sociedad Quimica y Minera de Chile S.A.ADR(a) (Electrical Equipment) | 2,134 | 86,961 | |||||||||
Suzano S.A.ADR (Paper & Forest Products) | 10,910 | 112,046 | |||||||||
Common Stocks, continued
Shares | Value | ||||||||||
| Taiwan Semiconductor Manufacturing Co., Ltd.ADR (Semiconductors & Semiconductor Equipment) | 23,367 | $ | 4,061,417 | ||||||||
| TAL Education Group*ADR (Diversified Consumer Services) | 6,895 | 73,570 | |||||||||
| Tencent Music Entertainment GroupADR (Entertainment) | 9,363 | 131,550 | |||||||||
| Trip.com Group, Ltd.*ADR (Hotels, Restaurants & Leisure) | 8,361 | 392,967 | |||||||||
| United Microelectronics Corp.ADR (Semiconductors & Semiconductor Equipment) | 34,813 | 304,962 | |||||||||
Vale S.A.ADR (Metals & Mining) | 54,248 | 605,950 | |||||||||
Wipro, Ltd.ADR(a) (IT Services) | 21,086 | 128,625 | |||||||||
Woori Financial Group, Inc.ADR(a) (Banks) | 3,293 | 105,508 | |||||||||
| ZTO Express Cayman, Inc.ADR (Air Freight & Logistics) | 6,345 | 131,659 | |||||||||
| TOTAL COMMON STOCKS (Cost $10,686,274) | 19,369,668 | ||||||||||
Preferred Stock (1.9%)
| Petroleo Brasileiro S.A.ADR (Oil, Gas & Consumable Fuels) | 34,313 | 468,029 | |||||||||
| TOTAL PREFERRED STOCK (Cost $134,116) | 468,029 | ||||||||||
Repurchase Agreements(b)(c) (5.8%)
| Principal Amount | Value | ||||||||||
| Repurchase Agreements with various counterparties, rates 5.12%–5.20%, dated 6/28/2024, due 7/1/24, total to be received $1,427,617 | $ | 1,427,000 | $ | 1,427,000 | |||||||
| TOTAL REPURCHASE AGREEMENTS (Cost $1,427,000) | 1,427,000 | ||||||||||
Collateral for Securities Loaned(d) (9.0%)
Shares | Value | ||||||||||
| Invesco Government & Agency Portfolio—Institutional Shares, 5.23%(e) | 2,198,218 | $ | 2,198,218 | ||||||||
| TOTAL COLLATERAL FOR SECURITIES LOANED (Cost $2,171,895) | 2,198,218 | ||||||||||
| TOTAL INVESTMENT SECURITIES (Cost $14,419,285)—95.7% | 23,462,915 | ||||||||||
Net other assets (liabilities)—4.3% | 1,040,219 | ||||||||||
NET ASSETS—100.0% | $ | 24,503,134 | |||||||||
* Non-income producing security.
(a) All or part of this security was on loan as of June 30, 2024. The total value of securities on loan as of June 30, 2024 was $2,088,085.
(b) A portion of these securities were held in a segregated account for the benefit of swap counterparties in the event of default. At June 30, 2024, the aggregate amount held in a segregated account was $284,000.
See accompanying notes to the financial statements.
June 30, 2024 (unaudited) :: Schedule of Portfolio Investments :: ProFund VP Emerging Markets :: 27
(c) The ProFund VP invests in Repurchase Agreements jointly with other funds in the Trust. See "Repurchase Agreements" under Note 2 in the Notes to Financial Statements to view the details of each individual agreement and counterparty as well as a description of the securities subject to repurchase.
(d) Securities were purchased with cash collateral held from securities on loan at June 30, 2024.
(e) Rate periodically changes. Rate disclosed is the daily yield on June 30, 2024.
ADR American Depositary Receipt
Total Return Swap Agreements—Long
Underlying Instrument | Counterparty | Termination Date(1) | Rate Paid (Received)(2) | Notional Amount | Value and Unrealized Appreciation/ (Depreciation) | ||||||||||||||||||
S&P Emerging 50 ADR Index (USD) | Goldman Sachs International | 7/29/24 | 6.08 | % | $ | 3,870,186 | $ | (362 | ) | ||||||||||||||
S&P Emerging 50 ADR Index (USD) | UBS AG | 7/29/24 | 5.83 | % | 815,279 | 29 | |||||||||||||||||
$ | 4,685,465 | $ | (333 | ) | |||||||||||||||||||
(1) Agreements may be terminated at will by either party without penalty. Payment is due at termination/maturity.
(2) Reflects the floating financing rate, as of June 30, 2024, on the notional amount of the swap agreement paid to the counterparty or received from the counterparty, excluding any commissions. This amount is included as part of the unrealized appreciation/(depreciation).
ProFund VP Emerging Markets invested in the following industries as of June 30, 2024:
Value | % of Net Assets | ||||||||||
Air Freight & Logistics | $ | 131,659 | 0.5 | % | |||||||
Automobiles | 262,905 | 1.1 | % | ||||||||
Banks | 3,922,166 | 15.9 | % | ||||||||
Beverages | 495,857 | 2.0 | % | ||||||||
Biotechnology | 128,546 | 0.5 | % | ||||||||
Broadline Retail | 3,668,517 | 15.0 | % | ||||||||
Construction Materials | 144,503 | 0.6 | % | ||||||||
Diversified Consumer Services | 247,529 | 1.0 | % | ||||||||
Diversified Telecommunication Services | 352,111 | 1.4 | % | ||||||||
Electric Utilities | 99,305 | 0.4 | % | ||||||||
Electrical Equipment | 86,961 | 0.4 | % | ||||||||
Entertainment | 630,383 | 2.6 | % | ||||||||
Ground Transportation | 78,961 | 0.3 | % | ||||||||
Hotels, Restaurants & Leisure | 462,772 | 1.9 | % | ||||||||
Interactive Media & Services | 462,180 | 1.9 | % | ||||||||
IT Services | 1,076,774 | 4.4 | % | ||||||||
Metals & Mining | 1,165,618 | 4.7 | % | ||||||||
Oil, Gas & Consumable Fuels | 870,793 | 3.5 | % | ||||||||
Paper & Forest Products | 112,046 | 0.5 | % | ||||||||
Pharmaceuticals | 138,590 | 0.6 | % | ||||||||
Real Estate Management & Development | 141,160 | 0.6 | % | ||||||||
| Semiconductors & Semiconductor Equipment | 4,658,651 | 19.0 | % | ||||||||
Transportation Infrastructure | 171,648 | 0.7 | % | ||||||||
Water Utilities | 68,676 | 0.3 | % | ||||||||
Wireless Telecommunication Services | 259,386 | 1.1 | % | ||||||||
Other** | 4,665,437 | 19.1 | % | ||||||||
Total | $ | 24,503,134 | 100.0 | % | |||||||
ProFund VP Emerging Markets invested in securities with exposure to the following countries as of June 30, 2024:
Value | % of Net Assets | ||||||||||
Brazil | $ | 2,560,856 | 10.4 | % | |||||||
Chile | 160,395 | 0.7 | % | ||||||||
China | 4,769,063 | 19.5 | % | ||||||||
India | 3,788,831 | 15.5 | % | ||||||||
Indonesia | 132,845 | 0.5 | % | ||||||||
Ireland | 1,317,003 | 5.4 | % | ||||||||
Mexico | 936,268 | 3.8 | % | ||||||||
South Africa | 198,900 | 0.8 | % | ||||||||
South Korea | 967,073 | 3.9 | % | ||||||||
Taiwan | 4,877,917 | 19.9 | % | ||||||||
United States | 128,546 | 0.5 | % | ||||||||
Other** | 4,665,437 | 19.1 | % | ||||||||
Total | $ | 24,503,134 | 100.0 | % | |||||||
** Includes any non-equity securities and net other assets (liabilities), which includes any receivable for capital shares issued and payable for capital shares redeemed.
See accompanying notes to the financial statements.
Common Stocks (98.4%)
Shares | Value | ||||||||||
APA Corp. (Oil, Gas & Consumable Fuels) | 11,589 | $ | 341,180 | ||||||||
| Baker Hughes Co. (Energy Equipment & Services) | 32,124 | 1,129,801 | |||||||||
Chevron Corp. (Oil, Gas & Consumable Fuels) | 50,022 | 7,824,441 | |||||||||
ConocoPhillips (Oil, Gas & Consumable Fuels) | 17,308 | 1,979,689 | |||||||||
| Coterra Energy, Inc. (Oil, Gas & Consumable Fuels) | 23,956 | 638,907 | |||||||||
| Devon Energy Corp. (Oil, Gas & Consumable Fuels) | 20,343 | 964,258 | |||||||||
| Diamondback Energy, Inc. (Oil, Gas & Consumable Fuels) | 5,740 | 1,149,091 | |||||||||
| EOG Resources, Inc. (Oil, Gas & Consumable Fuels) | 16,773 | 2,111,218 | |||||||||
EQT Corp. (Oil, Gas & Consumable Fuels) | 14,213 | 525,597 | |||||||||
| Exxon Mobil Corp. (Oil, Gas & Consumable Fuels) | 88,688 | 10,209,763 | |||||||||
| Halliburton Co. (Energy Equipment & Services) | 28,496 | 962,595 | |||||||||
Hess Corp. (Oil, Gas & Consumable Fuels) | 8,897 | 1,312,485 | |||||||||
| Kinder Morgan, Inc. (Oil, Gas & Consumable Fuels) | 62,152 | 1,234,960 | |||||||||
| Marathon Oil Corp. (Oil, Gas & Consumable Fuels) | 18,155 | 520,504 | |||||||||
| Marathon Petroleum Corp. (Oil, Gas & Consumable Fuels) | 11,132 | 1,931,179 | |||||||||
| Occidental Petroleum Corp. (Oil, Gas & Consumable Fuels) | 21,405 | 1,349,157 | |||||||||
ONEOK, Inc. (Oil, Gas & Consumable Fuels) | 18,788 | 1,532,161 | |||||||||
Phillips 66 (Oil, Gas & Consumable Fuels) | 13,646 | 1,926,406 | |||||||||
| Schlumberger N.V. (Energy Equipment & Services) | 44,029 | 2,077,288 | |||||||||
Common Stocks, continued
Shares | Value | ||||||||||
| Targa Resources Corp. (Oil, Gas & Consumable Fuels) | 7,137 | $ | 919,103 | ||||||||
| The Williams Cos., Inc. (Oil, Gas & Consumable Fuels) | 39,230 | 1,667,275 | |||||||||
| Valero Energy Corp. (Oil, Gas & Consumable Fuels) | 10,526 | 1,650,056 | |||||||||
| TOTAL COMMON STOCKS (Cost $14,114,225) | 43,957,114 | ||||||||||
Repurchase Agreements(a) (1.2%)
| Principal Amount | Value | ||||||||||
| Repurchase Agreements with various counterparties, rates 5.12%–5.20%, dated 6/28/2024, due 7/1/24, total to be received $516,223 | $ | 516,000 | $ | 516,000 | |||||||
| TOTAL REPURCHASE AGREEMENTS (Cost $516,000) | 516,000 | ||||||||||
| TOTAL INVESTMENT SECURITIES (Cost $14,630,225)—99.6% | 44,473,114 | ||||||||||
Net other assets (liabilities)—0.4% | 169,936 | ||||||||||
NET ASSETS—100.0% | $ | 44,643,050 | |||||||||
(a) The ProFund VP invests in Repurchase Agreements jointly with other funds in the Trust. See "Repurchase Agreements" under Note 2 in the Notes to Financial Statements to view the details of each individual agreement and counterparty as well as a description of the securities subject to repurchase.
Total Return Swap Agreements—Long
Underlying Instrument | Counterparty | Termination Date(1) | Rate Paid (Received)(2) | Notional Amount | Value and Unrealized Appreciation/ (Depreciation) | ||||||||||||||||||
S&P Energy Select Sector Index | Goldman Sachs International | 7/23/24 | 6.08 | % | $ | 775,656 | $ | (2,215 | ) | ||||||||||||||
(1) Agreements may be terminated at will by either party without penalty. Payment is due at termination/maturity.
(2) Reflects the floating financing rate, as of June 30, 2024, on the notional amount of the swap agreement paid to the counterparty or received from the counterparty, excluding any commissions. This amount is included as part of the unrealized appreciation/(depreciation).
ProFund VP Energy invested in the following industries as of June 30, 2024:
Value | % of Net Assets | ||||||||||
Energy Equipment & Services | $ | 4,169,684 | 9.3 | % | |||||||
Oil, Gas & Consumable Fuels | 39,787,430 | 89.1 | % | ||||||||
Other** | 685,936 | 1.6 | % | ||||||||
Total | $ | 44,643,050 | 100.0 | % | |||||||
** Includes any non-equity securities and net other assets (liabilities), which includes any receivable for capital shares issued and payable for capital shares redeemed.
See accompanying notes to the financial statements.
Common Stocks (99.6%)
Shares | Value | ||||||||||
| Anheuser-Busch InBev S.A./N.V.ADR (Beverages) | 9,742 | $ | 566,497 | ||||||||
ArcelorMittal SANYS (Metals & Mining) | 12,703 | 291,280 | |||||||||
Argenx SE*ADR (Biotechnology) | 870 | 374,135 | |||||||||
Ascendis Pharma A/S*ADR (Biotechnology) | 2,611 | 356,088 | |||||||||
| ASML Holding N.V.NYS (Semiconductors & Semiconductor Equipment) | 1,044 | 1,067,730 | |||||||||
AstraZeneca PLCADR (Pharmaceuticals) | 6,438 | 502,100 | |||||||||
Barclays PLCADR (Banks) | 47,853 | 512,506 | |||||||||
BioNTech SE*ADR (Biotechnology) | 3,480 | 279,653 | |||||||||
BP PLCADR (Oil, Gas & Consumable Fuels) | 15,835 | 571,644 | |||||||||
British American Tobacco PLCADR (Tobacco) | 16,007 | 495,097 | |||||||||
Diageo PLCADR (Beverages) | 3,480 | 438,758 | |||||||||
| Equinor ASAADR(a) (Oil, Gas & Consumable Fuels) | 17,227 | 492,003 | |||||||||
GSK PLCADR (Pharmaceuticals) | 13,398 | 515,823 | |||||||||
Haleon PLCADR (Personal Care Products) | 48,201 | 398,140 | |||||||||
HSBC Holdings PLCADR(a) (Banks) | 13,921 | 605,563 | |||||||||
ING Groep N.V.ADR (Banks) | 29,234 | 501,071 | |||||||||
National Grid PLC*ADR (Multi-Utilities) | 6,264 | 355,795 | |||||||||
Nokia OyjADR (Communications Equipment) | 103,711 | 392,028 | |||||||||
Novo Nordisk A/SADR (Pharmaceuticals) | 1,044 | 149,021 | |||||||||
RELX PLCADR (Professional Services) | 12,528 | 574,785 | |||||||||
Rio Tinto PLCADR (Metals & Mining) | 8,352 | 550,647 | |||||||||
Ryanair Holdings PLCADR (Passenger Airlines) | 2,784 | 324,169 | |||||||||
Sanofi S.A.ADR (Pharmaceuticals) | 12,528 | 607,859 | |||||||||
SAP SEADR(a) (Software) | 5,046 | 1,017,828 | |||||||||
Shell PLCADR (Oil, Gas & Consumable Fuels) | 12,877 | 929,461 | |||||||||
| STMicroelectronics N.V.NYS (Semiconductors & Semiconductor Equipment) | 8,352 | 328,067 | |||||||||
| Telefonaktiebolaget LM EricssonADR(a) (Communications Equipment) | 56,205 | 346,785 | |||||||||
| Tenaris S.A.ADR (Energy Equipment & Services) | 10,093 | 308,038 | |||||||||
| TotalEnergies SEADR (Oil, Gas & Consumable Fuels) | 7,831 | 522,171 | |||||||||
| Vodafone Group PLCADR (Wireless Telecommunication Services) | 41,589 | 368,894 | |||||||||
| TOTAL COMMON STOCKS (Cost $9,245,728) | 14,743,636 | ||||||||||
Collateral for Securities Loaned(b) (15.6%)
| Invesco Government & Agency Portfolio—Institutional Shares, 5.23%(c) | 2,305,467 | 2,305,467 | |||||||||
| TOTAL COLLATERAL FOR SECURITIES LOANED (Cost $2,305,467) | 2,305,467 | ||||||||||
| TOTAL INVESTMENT SECURITIES (Cost $11,551,195)—115.2% | 17,049,103 | ||||||||||
Net other assets (liabilities)—(15.2)% | (2,249,695 | ) | |||||||||
NET ASSETS—100.0% | $ | 14,799,408 | |||||||||
* Non-income producing security.
(a) All or part of this security was on loan as of June 30, 2024. The total value of securities on loan as of June 30, 2024 was $2,249,712.
(b) Securities were purchased with cash collateral held from securities on loan at June 30, 2024.
(c) Rate periodically changes. Rate disclosed is the daily yield on June 30, 2024.
ADR American Depositary Receipt
NYS New York Shares
ProFund VP Europe 30 invested in the following industries as of June 30, 2024:
Value | % of Net Assets | ||||||||||
Banks | $ | 1,619,140 | 11.0 | % | |||||||
Beverages | 1,005,255 | 6.8 | % | ||||||||
Biotechnology | 1,009,876 | 6.8 | % | ||||||||
Communications Equipment | 738,813 | 4.9 | % | ||||||||
Energy Equipment & Services | 308,038 | 2.0 | % | ||||||||
Metals & Mining | 841,927 | 5.7 | % | ||||||||
Multi-Utilities | 355,795 | 2.4 | % | ||||||||
Oil, Gas & Consumable Fuels | 2,515,279 | 17.0 | % | ||||||||
Passenger Airlines | 324,169 | 2.2 | % | ||||||||
Personal Care Products | 398,140 | 2.7 | % | ||||||||
Pharmaceuticals | 1,774,803 | 12.0 | % | ||||||||
Professional Services | 574,785 | 3.9 | % | ||||||||
| Semiconductors & Semiconductor Equipment | 1,395,797 | 9.5 | % | ||||||||
Software | 1,017,828 | 6.9 | % | ||||||||
Tobacco | 495,097 | 3.3 | % | ||||||||
Wireless Telecommunication Services | 368,894 | 2.5 | % | ||||||||
Other** | 55,772 | 0.4 | % | ||||||||
Total | $ | 14,799,408 | 100.0 | % | |||||||
ProFund VP Europe 30 invested in securities with exposure to the following countries as of June 30, 2024:
Value | % of Net Assets | ||||||||||
Belgium | $ | 566,497 | 3.8 | % | |||||||
Denmark | 505,109 | 3.4 | % | ||||||||
Finland | 392,028 | 2.6 | % | ||||||||
France | 1,130,030 | 7.6 | % | ||||||||
Germany | 1,297,481 | 8.8 | % | ||||||||
Ireland | 324,169 | 2.2 | % | ||||||||
Luxembourg | 599,318 | 4.0 | % | ||||||||
Netherlands | 1,942,936 | 13.2 | % | ||||||||
Norway | 492,003 | 3.3 | % | ||||||||
Sweden | 346,785 | 2.3 | % | ||||||||
Switzerland | 328,067 | 2.2 | % | ||||||||
United Kingdom | 6,819,213 | 46.2 | % | ||||||||
Other** | 55,772 | 0.4 | % | ||||||||
Total | $ | 14,799,408 | 100.0 | % | |||||||
** Includes any non-equity securities and net other assets (liabilities), which includes any receivable for capital shares issued and payable for capital shares redeemed.
See accompanying notes to the financial statements.
30 :: ProFund VP Falling U.S. Dollar :: Schedule of Portfolio Investments :: June 30, 2024 (unaudited)
Repurchase Agreements(a)(b) (101.9%)
| Principal Amount | Value | ||||||||||
| Repurchase Agreements with various counterparties, rates 5.12%–5.20%, dated 6/28/2024, due 7/1/24, total to be received $456,197 | $ | 456,000 | $ | 456,000 | |||||||
| TOTAL REPURCHASE AGREEMENTS (Cost $456,000) | 456,000 | ||||||||||
| TOTAL INVESTMENT SECURITIES (Cost $456,000)—101.9% | 456,000 | ||||||||||
Net other assets (liabilities)—(1.9)% | (8,675 | ) | |||||||||
NET ASSETS—100.0% | $ | 447,325 | |||||||||
(a) A portion of these securities were held in a segregated account for the benefit of forward currency contract counterparties in the event of default. At June 30, 2024, the aggregate amount held in a segregated account was $4,000.
(b) The ProFund VP invests in Repurchase Agreements jointly with other funds in the Trust. See "Repurchase Agreements" under Note 2 in the Notes to Financial Statements to view the details of each individual agreement and counterparty as well as a description of the securities subject to repurchase.
As of June 30, 2024, the ProFund VP Falling U.S. Dollar's forward currency contracts with Goldman Sachs International, were as follows:
Description and amount of currency purchased | Description and amount of currency sold | Delivery Date | Fair Value | Unrealized Appreciation/ (Depreciation) | |||||||||||||||||||||||
Long: | |||||||||||||||||||||||||||
British pound | 31,248 | U.S. dollar | $ | 40,147 | 7/12/24 | $ | 39,497 | $ | (650 | ) | |||||||||||||||||
Canadian dollar | 40,277 | U.S. dollar | 29,430 | 7/12/24 | 29,453 | 23 | |||||||||||||||||||||
Euro | 173,758 | U.S. dollar | 188,423 | 7/12/24 | 186,168 | (2,255 | ) | ||||||||||||||||||||
Japanese yen | 6,484,969 | U.S. dollar | 41,753 | 7/12/24 | 40,388 | (1,365 | ) | ||||||||||||||||||||
Swedish krona | 141,388 | U.S. dollar | 13,750 | 7/12/24 | 13,354 | (396 | ) | ||||||||||||||||||||
Swiss franc | 10,137 | U.S. dollar | 11,410 | 7/12/24 | 11,302 | (108 | ) | ||||||||||||||||||||
Total Long Contracts | $ | 324,913 | $ | 320,162 | $ | (4,751 | ) | ||||||||||||||||||||
As of June 30, 2024, the ProFund VP Falling U.S. Dollar's forward currency contracts with UBS AG, were as follows:
| Description and amount of currency purchased | Description and amount of currency sold | Delivery Date | Fair Value | Unrealized Appreciation/ (Depreciation) | |||||||||||||||||||||||
Short: | |||||||||||||||||||||||||||
U.S. dollar | $ | 5,617 | British pound | 4,390 | 7/12/24 | $ | 5,549 | $ | 68 | ||||||||||||||||||
U.S. dollar | 4,223 | Canadian dollar | 5,794 | 7/12/24 | 4,237 | (14 | ) | ||||||||||||||||||||
U.S. dollar | 28,028 | Euro | 25,913 | 7/12/24 | 27,764 | 264 | |||||||||||||||||||||
U.S. dollar | 6,479 | Japanese yen | 1,012,271 | 7/12/24 | 6,304 | 175 | |||||||||||||||||||||
U.S. dollar | 2,107 | Swedish krona | 21,865 | 7/12/24 | 2,065 | 42 | |||||||||||||||||||||
U.S. dollar | 1,732 | Swiss franc | 1,544 | 7/12/24 | 1,722 | 10 | |||||||||||||||||||||
Total Short Contracts | $ | 48,186 | $ | 47,641 | $ | 545 | |||||||||||||||||||||
Long: | |||||||||||||||||||||||||||
British pound | 15,257 | U.S. dollar | $ | 19,584 | 7/12/24 | $ | 19,285 | $ | (299 | ) | |||||||||||||||||
Canadian dollar | 21,280 | U.S. dollar | 15,559 | 7/12/24 | 15,561 | 2 | |||||||||||||||||||||
Euro | 92,897 | U.S. dollar | 100,685 | 7/12/24 | 99,532 | (1,153 | ) | ||||||||||||||||||||
Japanese yen | 4,246,553 | U.S. dollar | 27,253 | 7/12/24 | 26,448 | (805 | ) | ||||||||||||||||||||
Swedish krona | 77,770 | U.S. dollar | 7,554 | 7/12/24 | 7,345 | (209 | ) | ||||||||||||||||||||
Swiss franc | 5,806 | U.S. dollar | 6,537 | 7/12/24 | 6,473 | (64 | ) | ||||||||||||||||||||
Total Long Contracts | $ | 177,172 | $ | 174,644 | $ | (2,528 | ) | ||||||||||||||||||||
Total unrealized appreciation | $ | 584 | |||||||||||||||||||||||||
Total unrealized (depreciation) | (7,318 | ) | |||||||||||||||||||||||||
Total net unrealized appreciation/(depreciation) | $ | (6,734 | ) | ||||||||||||||||||||||||
See accompanying notes to the financial statements.
Common Stocks (97.9%)
Shares | Value | ||||||||||
Aflac, Inc. (Insurance) | 2,597 | $ | 231,938 | ||||||||
American Express Co. (Consumer Finance) | 2,854 | 660,843 | |||||||||
American International Group, Inc. (Insurance) | 3,333 | 247,442 | |||||||||
Ameriprise Financial, Inc. (Capital Markets) | 499 | 213,168 | |||||||||
Aon PLC—Class A (Insurance) | 1,092 | 320,589 | |||||||||
Arch Capital Group, Ltd.* (Insurance) | 1,878 | 189,471 | |||||||||
Arthur J. Gallagher & Co. (Insurance) | 1,097 | 284,463 | |||||||||
Assurant, Inc. (Insurance) | 261 | 43,391 | |||||||||
Bank of America Corp. (Banks) | 34,169 | 1,358,901 | |||||||||
| Berkshire Hathaway, Inc.*—Class B (Financial Services) | 9,092 | 3,698,626 | |||||||||
BlackRock, Inc. (Capital Markets) | 701 | 551,911 | |||||||||
Blackstone, Inc. (Capital Markets) | 3,589 | 444,318 | |||||||||
Brown & Brown, Inc. (Insurance) | 1,189 | 106,308 | |||||||||
| Capital One Financial Corp. (Consumer Finance) | 1,919 | 265,686 | |||||||||
Cboe Global Markets, Inc. (Capital Markets) | 528 | 89,792 | |||||||||
Chubb, Ltd. (Insurance) | 2,039 | 520,108 | |||||||||
Cincinnati Financial Corp. (Insurance) | 786 | 92,827 | |||||||||
Citigroup, Inc. (Banks) | 9,579 | 607,883 | |||||||||
Citizens Financial Group, Inc. (Banks) | 2,285 | 82,329 | |||||||||
CME Group, Inc. (Capital Markets) | 1,808 | 355,453 | |||||||||
Corpay, Inc.* (Software) | 353 | 94,043 | |||||||||
| Discover Financial Services (Consumer Finance) | 1,259 | 164,690 | |||||||||
Everest Group, Ltd. (Insurance) | 218 | 83,062 | |||||||||
| FactSet Research Systems, Inc. (Capital Markets) | 191 | 77,980 | |||||||||
| Fidelity National Information Services, Inc. (Financial Services) | 2,794 | 210,556 | |||||||||
Fifth Third Bancorp (Banks) | 3,435 | 125,343 | |||||||||
First Horizon Corp. (Banks) | — | (a) | 6 | ||||||||
Fiserv, Inc.* (Financial Services) | 2,938 | 437,880 | |||||||||
Franklin Resources, Inc. (Capital Markets) | 1,506 | 33,659 | |||||||||
Global Payments, Inc. (Financial Services) | 1,282 | 123,969 | |||||||||
Globe Life, Inc. (Insurance) | 422 | 34,722 | |||||||||
Huntington Bancshares, Inc. (Banks) | 7,278 | 95,924 | |||||||||
| Intercontinental Exchange, Inc. (Capital Markets) | 2,881 | 394,380 | |||||||||
Invesco, Ltd. (Capital Markets) | 2,259 | 33,795 | |||||||||
| Jack Henry & Associates, Inc. (Financial Services) | 366 | 60,763 | |||||||||
JPMorgan Chase & Co. (Banks) | 14,422 | 2,916,994 | |||||||||
KeyCorp (Banks) | 4,735 | 67,284 | |||||||||
KKR & Co., Inc. (Capital Markets) | 3,342 | 351,712 | |||||||||
Loews Corp. (Insurance) | 912 | 68,163 | |||||||||
M&T Bank Corp. (Banks) | 838 | 126,840 | |||||||||
MarketAxess Holdings, Inc. (Capital Markets) | 190 | 38,101 | |||||||||
Marsh & McLennan Cos., Inc. (Insurance) | 2,474 | 521,321 | |||||||||
Mastercard, Inc.—Class A (Financial Services) | 4,123 | 1,818,903 | |||||||||
MetLife, Inc. (Insurance) | 3,000 | 210,570 | |||||||||
Moody's Corp. (Capital Markets) | 789 | 332,114 | |||||||||
Morgan Stanley (Capital Markets) | 6,284 | 610,741 | |||||||||
MSCI, Inc. (Capital Markets) | 398 | 191,737 | |||||||||
Nasdaq, Inc. (Capital Markets) | 1,911 | 115,157 | |||||||||
Northern Trust Corp. (Capital Markets) | 1,027 | 86,247 | |||||||||
PayPal Holdings, Inc.* (Financial Services) | 5,253 | 304,832 | |||||||||
Common Stocks, continued
Shares | Value | ||||||||||
Principal Financial Group, Inc. (Insurance) | 1,083 | $ | 84,961 | ||||||||
Prudential Financial, Inc. (Insurance) | 1,803 | 211,294 | |||||||||
| Raymond James Financial, Inc. (Capital Markets) | 937 | 115,823 | |||||||||
Regions Financial Corp. (Banks) | 4,599 | 92,164 | |||||||||
S&P Global, Inc. (Capital Markets) | 1,608 | 717,167 | |||||||||
State Street Corp. (Capital Markets) | 1,513 | 111,962 | |||||||||
Synchrony Financial (Consumer Finance) | 2,017 | 95,182 | |||||||||
T. Rowe Price Group, Inc. (Capital Markets) | 1,121 | 129,263 | |||||||||
The Allstate Corp. (Insurance) | 1,325 | 211,550 | |||||||||
| The Bank of New York Mellon Corp. (Capital Markets) | 3,756 | 224,947 | |||||||||
The Charles Schwab Corp. (Capital Markets) | 7,497 | 552,454 | |||||||||
| The Goldman Sachs Group, Inc. (Capital Markets) | 1,619 | 732,305 | |||||||||
| The Hartford Financial Services Group, Inc. (Insurance) | 1,485 | 149,302 | |||||||||
The PNC Financial Services Group, Inc. (Banks) | 1,998 | 310,649 | |||||||||
The Progressive Corp. (Insurance) | 2,941 | 610,876 | |||||||||
The Travelers Cos., Inc. (Insurance) | 1,150 | 233,841 | |||||||||
Truist Financial Corp. (Banks) | 6,720 | 261,072 | |||||||||
U.S. Bancorp (Banks) | 7,837 | 311,129 | |||||||||
Visa, Inc.—Class A (Financial Services) | 7,905 | 2,074,825 | |||||||||
W.R. Berkley Corp. (Insurance) | 1,014 | 79,680 | |||||||||
Wells Fargo & Co. (Banks) | 17,508 | 1,039,800 | |||||||||
Willis Towers Watson PLC (Insurance) | 513 | 134,478 | |||||||||
| TOTAL COMMON STOCKS (Cost $7,306,118) | 28,581,659 | ||||||||||
Repurchase Agreements(b) (2.5%)
| Principal Amount | Value | ||||||||||
| Repurchase Agreements with various counterparties, rates 5.12%–5.20%, dated 6/28/2024, due 7/1/24, total to be received $725,313 | $ | 725,000 | $ | 725,000 | |||||||
| TOTAL REPURCHASE AGREEMENTS (Cost $725,000) | 725,000 | ||||||||||
| TOTAL INVESTMENT SECURITIES (Cost $8,031,118)—100.4% | 29,306,659 | ||||||||||
Net other assets (liabilities)—(0.4)% | (106,633 | ) | |||||||||
NET ASSETS—100.0% | $ | 29,200,026 | |||||||||
* Non-income producing security.
(a) Number of shares is less than 0.50
(b) The ProFund VP invests in Repurchase Agreements jointly with other funds in the Trust. See "Repurchase Agreements" under Note 2 in the Notes to Financial Statements to view the details of each individual agreement and counterparty as well as a description of the securities subject to repurchase.
See accompanying notes to the financial statements.
32 :: ProFund VP Financials :: Schedule of Portfolio Investments :: June 30, 2024 (unaudited)
Total Return Swap Agreements—Long
Underlying Instrument | Counterparty | Termination Date(1) | Rate Paid (Received)(2) | Notional Amount | Value and Unrealized Appreciation/ (Depreciation) | ||||||||||||||||||
S&P Financial Select Sector Index | Goldman Sachs International | 7/23/24 | 6.08 | % | $ | 825,214 | $ | (6,182 | ) | ||||||||||||||
(1) Agreements may be terminated at will by either party without penalty. Payment is due at termination/maturity.
(2) Reflects the floating financing rate, as of June 30, 2024, on the notional amount of the swap agreement paid to the counterparty or received from the counterparty, excluding any commissions. This amount is included as part of the unrealized appreciation/(depreciation).
ProFund VP Financials invested in the following industries as of June 30, 2024:
Value | % of Net Assets | ||||||||||
Banks | $ | 7,396,318 | 25.3 | % | |||||||
Capital Markets | 6,504,186 | 22.3 | % | ||||||||
Consumer Finance | 1,186,401 | 4.1 | % | ||||||||
Financial Services | 8,730,354 | 29.9 | % | ||||||||
Insurance | 4,670,357 | 16.0 | % | ||||||||
Software | 94,043 | 0.3 | % | ||||||||
Other** | 618,367 | 2.1 | % | ||||||||
Total | $ | 29,200,026 | 100.0 | % | |||||||
** Includes any non-equity securities and net other assets (liabilities), which includes any receivable for capital shares issued and payable for capital shares redeemed.
See accompanying notes to the financial statements.
June 30, 2024 (unaudited) :: Schedule of Portfolio Investments :: ProFund VP Government Money Market :: 33
U.S. Treasury Obligations (45.6%)
| Principal Amount | Value | ||||||||||
| U.S. Treasury Bills 4.64%+, 7/9/24 | $ | 2,000,000 | $ | 1,997,683 | |||||||
4.91%+, 7/18/24 | 2,000,000 | 1,995,098 | |||||||||
5.06%+, 7/30/24 | 2,000,000 | 1,991,606 | |||||||||
5.09%+, 8/6/24 | 2,000,000 | 1,989,590 | |||||||||
5.11%+, 8/13/24 | 2,000,000 | 1,987,578 | |||||||||
5.14%+, 8/20/24 | 2,000,000 | 1,985,556 | |||||||||
5.16%+, 8/27/24 | 2,000,000 | 1,983,518 | |||||||||
| TOTAL U.S. TREASURY OBLIGATIONS (Cost $13,930,629) | 13,930,629 | ||||||||||
Repurchase Agreements(a) (54.6%) | |||||||||||
| Repurchase Agreements with various counterparties, rates 5.12%–5.20%, dated 6/28/2024, due 7/1/24, total to be received $16,671,205 | 16,664,000 | 16,664,000 | |||||||||
| TOTAL REPURCHASE AGREEMENTS (Cost $16,664,000) | 16,664,000 | ||||||||||
| TOTAL INVESTMENT SECURITIES (Cost $30,594,629)—100.2% | 30,594,629 | ||||||||||
Net other assets (liabilities)—(0.2)% | (49,306 | ) | |||||||||
NET ASSETS—100.0% | $ | 30,545,323 | |||||||||
+ Reflects the effective yield or interest rate in effect at June 30, 2024.
(a) The ProFund VP invests in Repurchase Agreements jointly with other funds in the Trust. See "Repurchase Agreements" under Note 2 in the Notes to Financial Statements to view the details of each individual agreement and counterparty as well as a description of the securities subject to repurchase.
See accompanying notes to the financial statements.
Common Stocks (99.0%)
Shares | Value | ||||||||||
| Abbott Laboratories (Health Care Equipment & Supplies) | 12,077 | $ | 1,254,921 | ||||||||
AbbVie, Inc. (Biotechnology) | 12,258 | 2,102,492 | |||||||||
| Agilent Technologies, Inc. (Life Sciences Tools & Services) | 2,034 | 263,667 | |||||||||
| Align Technology, Inc.* (Health Care Equipment & Supplies) | 486 | 117,335 | |||||||||
Amgen, Inc. (Biotechnology) | 3,724 | 1,163,564 | |||||||||
| Baxter International, Inc. (Health Care Equipment & Supplies) | 3,537 | 118,313 | |||||||||
| Becton, Dickinson & Co. (Health Care Equipment & Supplies) | 2,007 | 469,056 | |||||||||
Biogen, Inc.* (Biotechnology) | 1,010 | 234,138 | |||||||||
| Bio-Rad Laboratories, Inc.*—Class A (Life Sciences Tools & Services) | 142 | 38,782 | |||||||||
| Bio-Techne Corp. (Life Sciences Tools & Services) | 1,094 | 78,385 | |||||||||
| Boston Scientific Corp.* (Health Care Equipment & Supplies) | 10,205 | 785,887 | |||||||||
Bristol-Myers Squibb Co. (Pharmaceuticals) | 14,071 | 584,369 | |||||||||
| Cardinal Health, Inc. (Health Care Providers & Services) | 1,690 | 166,161 | |||||||||
Catalent, Inc.* (Pharmaceuticals) | 1,256 | 70,625 | |||||||||
| Cencora, Inc. (Health Care Providers & Services) | 1,149 | 258,870 | |||||||||
| Centene Corp.* (Health Care Providers & Services) | 3,704 | 245,575 | |||||||||
| Charles River Laboratories International, Inc.* (Life Sciences Tools & Services) | 358 | 73,956 | |||||||||
| CVS Health Corp. (Health Care Providers & Services) | 8,714 | 514,649 | |||||||||
| Danaher Corp. (Life Sciences Tools & Services) | 4,576 | 1,143,314 | |||||||||
| DaVita, Inc.* (Health Care Providers & Services) | 359 | 49,747 | |||||||||
| Dexcom, Inc.* (Health Care Equipment & Supplies) | 2,760 | 312,929 | |||||||||
| Edwards Lifesciences Corp.* (Health Care Equipment & Supplies) | 4,183 | 386,384 | |||||||||
| Elevance Health, Inc. (Health Care Providers & Services) | 1,614 | 874,562 | |||||||||
Eli Lilly & Co. (Pharmaceuticals) | 5,542 | 5,017,616 | |||||||||
| GE HealthCare Technologies, Inc. (Health Care Equipment & Supplies) | 2,947 | 229,630 | |||||||||
Gilead Sciences, Inc. (Biotechnology) | 8,648 | 593,339 | |||||||||
| HCA Healthcare, Inc. (Health Care Providers & Services) | 1,345 | 432,122 | |||||||||
| Henry Schein, Inc.* (Health Care Providers & Services) | 888 | 56,921 | |||||||||
| Hologic, Inc.* (Health Care Equipment & Supplies) | 1,619 | 120,211 | |||||||||
| Humana, Inc. (Health Care Providers & Services) | 837 | 312,745 | |||||||||
| IDEXX Laboratories, Inc.* (Health Care Equipment & Supplies) | 573 | 279,166 | |||||||||
Incyte Corp.* (Biotechnology) | 1,104 | 66,924 | |||||||||
| Insulet Corp.* (Health Care Equipment & Supplies) | 487 | 98,277 | |||||||||
| Intuitive Surgical, Inc.* (Health Care Equipment & Supplies) | 2,462 | 1,095,221 | |||||||||
Common Stocks, continued
Shares | Value | ||||||||||
| IQVIA Holdings, Inc.* (Life Sciences Tools & Services) | 1,265 | $ | 267,472 | ||||||||
Johnson & Johnson (Pharmaceuticals) | 16,707 | 2,441,895 | |||||||||
| Labcorp Holdings, Inc. (Health Care Providers & Services) | 585 | 119,053 | |||||||||
| McKesson Corp. (Health Care Providers & Services) | 903 | 527,388 | |||||||||
| Medtronic PLC (Health Care Equipment & Supplies) | 9,217 | 725,470 | |||||||||
Merck & Co., Inc. (Pharmaceuticals) | 17,583 | 2,176,775 | |||||||||
| Mettler-Toledo International, Inc.* (Life Sciences Tools & Services) | 149 | 208,241 | |||||||||
Moderna, Inc.* (Biotechnology) | 2,315 | 274,906 | |||||||||
| Molina Healthcare, Inc.* (Health Care Providers & Services) | 407 | 121,001 | |||||||||
Pfizer, Inc. (Pharmaceuticals) | 39,337 | 1,100,649 | |||||||||
| Quest Diagnostics, Inc. (Health Care Providers & Services) | 771 | 105,534 | |||||||||
| Regeneron Pharmaceuticals, Inc.* (Biotechnology) | 736 | 773,558 | |||||||||
| ResMed, Inc. (Health Care Equipment & Supplies) | 1,020 | 195,248 | |||||||||
Revvity, Inc. (Life Sciences Tools & Services) | 856 | 89,760 | |||||||||
| Solventum Corp.* (Health Care Providers & Services) | 958 | 50,659 | |||||||||
| STERIS PLC (Health Care Equipment & Supplies) | 686 | 150,604 | |||||||||
| Stryker Corp. (Health Care Equipment & Supplies) | 2,354 | 800,949 | |||||||||
| Teleflex, Inc. (Health Care Equipment & Supplies) | 327 | 68,778 | |||||||||
| The Cigna Group (Health Care Providers & Services) | 1,972 | 651,884 | |||||||||
| The Cooper Cos., Inc.* (Health Care Equipment & Supplies) | 1,379 | 120,387 | |||||||||
| Thermo Fisher Scientific, Inc. (Life Sciences Tools & Services) | 2,650 | 1,465,450 | |||||||||
| UnitedHealth Group, Inc. (Health Care Providers & Services) | 6,389 | 3,253,662 | |||||||||
| Universal Health Services, Inc.—Class B (Health Care Providers & Services) | 414 | 76,561 | |||||||||
Vertex Pharmaceuticals, Inc.* (Biotechnology) | 1,791 | 839,478 | |||||||||
Viatris, Inc. (Pharmaceuticals) | 8,264 | 87,846 | |||||||||
| Waters Corp.* (Life Sciences Tools & Services) | 412 | 119,529 | |||||||||
| West Pharmaceutical Services, Inc. (Life Sciences Tools & Services) | 506 | 166,671 | |||||||||
| Zimmer Biomet Holdings, Inc. (Health Care Equipment & Supplies) | 1,428 | 154,981 | |||||||||
Zoetis, Inc. (Pharmaceuticals) | 3,168 | 549,204 | |||||||||
| TOTAL COMMON STOCKS (Cost $6,213,108) | 37,293,446 | ||||||||||
See accompanying notes to the financial statements.
June 30, 2024 (unaudited) :: Schedule of Portfolio Investments :: ProFund VP Health Care :: 35
Repurchase Agreements(a) (0.7%)
| Principal Amount | Value | ||||||||||
| Repurchase Agreements with various counterparties, rates 5.12%–5.20%, dated 6/28/2024, due 7/1/24, total to be received $260,112 | $ | 260,000 | $ | 260,000 | |||||||
| TOTAL REPURCHASE AGREEMENTS (Cost $260,000) | 260,000 | ||||||||||
| TOTAL INVESTMENT SECURITIES (Cost $6,473,108)—99.7% | 37,553,446 | ||||||||||
Net other assets (liabilities)—0.3% | 120,222 | ||||||||||
NET ASSETS—100.0% | $ | 37,673,668 | |||||||||
* Non-income producing security.
(a) The ProFund VP invests in Repurchase Agreements jointly with other funds in the Trust. See "Repurchase Agreements" under Note 2 in the Notes to Financial Statements to view the details of each individual agreement and counterparty as well as a description of the securities subject to repurchase.
Total Return Swap Agreements—Long
Underlying Instrument | Counterparty | Termination Date(1) | Rate Paid (Received)(2) | Notional Amount | Value and Unrealized Appreciation/ (Depreciation) | ||||||||||||||||||
S&P Health Care Select Sector Index | Goldman Sachs International | 7/23/24 | 6.08 | % | $ | 539,605 | $ | (5,144 | ) | ||||||||||||||
(1) Agreements may be terminated at will by either party without penalty. Payment is due at termination/maturity.
(2) Reflects the floating financing rate, as of June 30, 2024, on the notional amount of the swap agreement paid to the counterparty or received from the counterparty, excluding any commissions. This amount is included as part of the unrealized appreciation/(depreciation).
ProFund VP Health Care invested in the following industries as of June 30, 2024:
Value | % of Net Assets | ||||||||||
Biotechnology | $ | 6,048,400 | 16.1 | % | |||||||
Health Care Equipment & Supplies | 7,483,745 | 19.9 | % | ||||||||
Health Care Providers & Services | 7,817,094 | 20.7 | % | ||||||||
Life Sciences Tools & Services | 3,915,227 | 10.4 | % | ||||||||
Pharmaceuticals | 12,028,980 | 31.9 | % | ||||||||
Other** | 380,222 | 1.0 | % | ||||||||
Total | $ | 37,673,668 | 100.0 | % | |||||||
** Includes any non-equity securities and net other assets (liabilities), which includes any receivable for capital shares issued and payable for capital shares redeemed.
See accompanying notes to the financial statements.
Common Stocks (98.3%)
Shares | Value | ||||||||||
3M Co. (Industrial Conglomerates) | 2,407 | $ | 245,971 | ||||||||
A.O. Smith Corp. (Building Products) | 525 | 42,935 | |||||||||
Allegion PLC (Building Products) | 380 | 44,897 | |||||||||
| American Airlines Group, Inc.* (Passenger Airlines) | 2,854 | 32,336 | |||||||||
AMETEK, Inc. (Electrical Equipment) | 1,007 | 167,877 | |||||||||
| Automatic Data Processing, Inc. (Professional Services) | 1,780 | 424,869 | |||||||||
| Axon Enterprise, Inc.* (Aerospace & Defense) | 309 | 90,920 | |||||||||
| Broadridge Financial Solutions, Inc. (Professional Services) | 514 | 101,258 | |||||||||
Builders FirstSource, Inc.* (Building Products) | 531 | 73,496 | |||||||||
| C.H. Robinson Worldwide, Inc. (Air Freight & Logistics) | 509 | 44,853 | |||||||||
Carrier Global Corp. (Building Products) | 3,645 | 229,927 | |||||||||
Caterpillar, Inc. (Machinery) | 2,127 | 708,504 | |||||||||
| Cintas Corp. (Commercial Services & Supplies) | 375 | 262,598 | |||||||||
| Copart, Inc.* (Commercial Services & Supplies) | 3,805 | 206,079 | |||||||||
CSX Corp. (Ground Transportation) | 8,503 | 284,425 | |||||||||
Cummins, Inc. (Machinery) | 595 | 164,773 | |||||||||
Dayforce, Inc.* (Professional Services) | 687 | 34,075 | |||||||||
Deere & Co. (Machinery) | 1,126 | 420,707 | |||||||||
Delta Air Lines, Inc. (Passenger Airlines) | 2,807 | 133,164 | |||||||||
Dover Corp. (Machinery) | 598 | 107,909 | |||||||||
Eaton Corp. PLC (Electrical Equipment) | 1,739 | 545,264 | |||||||||
Emerson Electric Co. (Electrical Equipment) | 2,488 | 274,078 | |||||||||
Equifax, Inc. (Professional Services) | 538 | 130,443 | |||||||||
| Expeditors International of Washington, Inc. (Air Freight & Logistics) | 614 | 76,621 | |||||||||
| Fastenal Co. (Trading Companies & Distributors) | 2,490 | 156,472 | |||||||||
FedEx Corp. (Air Freight & Logistics) | 985 | 295,342 | |||||||||
Fortive Corp. (Machinery) | 1,531 | 113,447 | |||||||||
GE Vernova, Inc.* (Electrical Equipment) | 1,192 | 204,440 | |||||||||
| Generac Holdings, Inc.* (Electrical Equipment) | 264 | 34,906 | |||||||||
| General Dynamics Corp. (Aerospace & Defense) | 989 | 286,948 | |||||||||
| General Electric Co. (Industrial Conglomerates) | 4,761 | 756,857 | |||||||||
| Honeywell International, Inc. (Industrial Conglomerates) | 2,832 | 604,745 | |||||||||
| Howmet Aerospace, Inc. (Aerospace & Defense) | 1,687 | 130,962 | |||||||||
Hubbell, Inc. (Electrical Equipment) | 234 | 85,522 | |||||||||
| Huntington Ingalls Industries, Inc. (Aerospace & Defense) | 172 | 42,369 | |||||||||
IDEX Corp. (Machinery) | 329 | 66,195 | |||||||||
Illinois Tool Works, Inc. (Machinery) | 1,181 | 279,850 | |||||||||
Ingersoll Rand, Inc. (Machinery) | 1,755 | 159,424 | |||||||||
| J.B. Hunt Transport Services, Inc. (Ground Transportation) | 355 | 56,800 | |||||||||
| Jacobs Solutions, Inc. (Professional Services) | 545 | 76,142 | |||||||||
| Johnson Controls International PLC (Building Products) | 2,930 | 194,757 | |||||||||
| L3Harris Technologies, Inc. (Aerospace & Defense) | 825 | 185,279 | |||||||||
Common Stocks, continued
Shares | Value | ||||||||||
Leidos Holdings, Inc. (Professional Services) | 588 | $ | 85,777 | ||||||||
| Lockheed Martin Corp. (Aerospace & Defense) | 929 | 433,936 | |||||||||
Masco Corp. (Building Products) | 958 | 63,870 | |||||||||
Nordson Corp. (Machinery) | 236 | 54,738 | |||||||||
| Norfolk Southern Corp. (Ground Transportation) | 983 | 211,040 | |||||||||
| Northrop Grumman Corp. (Aerospace & Defense) | 605 | 263,750 | |||||||||
| Old Dominion Freight Line, Inc. (Ground Transportation) | 775 | 136,865 | |||||||||
Otis Worldwide Corp. (Machinery) | 1,759 | 169,321 | |||||||||
PACCAR, Inc. (Machinery) | 2,280 | 234,703 | |||||||||
Parker-Hannifin Corp. (Machinery) | 559 | 282,748 | |||||||||
Paychex, Inc. (Professional Services) | 1,393 | 165,154 | |||||||||
| Paycom Software, Inc. (Professional Services) | 209 | 29,895 | |||||||||
Pentair PLC (Machinery) | 722 | 55,356 | |||||||||
| Quanta Services, Inc. (Construction & Engineering) | 637 | 161,855 | |||||||||
| Republic Services, Inc. (Commercial Services & Supplies) | 890 | 172,963 | |||||||||
| Rockwell Automation, Inc. (Electrical Equipment) | 496 | 136,539 | |||||||||
| Rollins, Inc. (Commercial Services & Supplies) | 1,222 | 59,621 | |||||||||
RTX Corp. (Aerospace & Defense) | 5,783 | 580,555 | |||||||||
Snap-on, Inc. (Machinery) | 229 | 59,858 | |||||||||
Southwest Airlines Co. (Passenger Airlines) | 2,603 | 74,472 | |||||||||
Stanley Black & Decker, Inc. (Machinery) | 669 | 53,446 | |||||||||
Textron, Inc. (Aerospace & Defense) | 829 | 71,178 | |||||||||
The Boeing Co.* (Aerospace & Defense) | 2,510 | 456,845 | |||||||||
Trane Technologies PLC (Building Products) | 985 | 323,995 | |||||||||
| TransDigm Group, Inc. (Aerospace & Defense) | 243 | 310,459 | |||||||||
| Uber Technologies, Inc.* (Ground Transportation) | 9,088 | 660,517 | |||||||||
Union Pacific Corp. (Ground Transportation) | 2,654 | 600,494 | |||||||||
| United Airlines Holdings, Inc.* (Passenger Airlines) | 1,430 | 69,584 | |||||||||
| United Parcel Service, Inc.—Class B (Air Freight & Logistics) | 3,172 | 434,089 | |||||||||
| United Rentals, Inc. (Trading Companies & Distributors) | 290 | 187,551 | |||||||||
| Veralto Corp. (Commercial Services & Supplies) | 956 | 91,269 | |||||||||
Verisk Analytics, Inc. (Professional Services) | 621 | 167,391 | |||||||||
| W.W. Grainger, Inc. (Trading Companies & Distributors) | 190 | 171,426 | |||||||||
| Waste Management, Inc. (Commercial Services & Supplies) | 1,587 | 338,570 | |||||||||
| Westinghouse Air Brake Technologies Corp. (Machinery) | 767 | 121,224 | |||||||||
Xylem, Inc. (Machinery) | 1,055 | 143,090 | |||||||||
| TOTAL COMMON STOCKS (Cost $7,029,746) | 16,212,580 | ||||||||||
See accompanying notes to the financial statements.
June 30, 2024 (unaudited) :: Schedule of Portfolio Investments :: ProFund VP Industrials :: 37
Repurchase Agreements(a) (2.1%)
| Principal Amount | Value | ||||||||||
| Repurchase Agreements with various counterparties, rates 5.12%–5.20%, dated 6/28/2024, due 7/1/24, total to be received $352,152 | $ | 352,000 | $ | 352,000 | |||||||
| TOTAL REPURCHASE AGREEMENTS (Cost $352,000) | 352,000 | ||||||||||
| TOTAL INVESTMENT SECURITIES (Cost $7,381,746)—100.4% | 16,564,580 | ||||||||||
Net other assets (liabilities)—(0.4)% | (59,101 | ) | |||||||||
NET ASSETS—100.0% | $ | 16,505,479 | |||||||||
* Non-income producing security.
(a) The ProFund VP invests in Repurchase Agreements jointly with other funds in the Trust. See "Repurchase Agreements" under Note 2 in the Notes to Financial Statements to view the details of each individual agreement and counterparty as well as a description of the securities subject to repurchase.
Total Return Swap Agreements—Long
Underlying Instrument | Counterparty | Termination Date(1) | Rate Paid (Received)(2) | Notional Amount | Value and Unrealized Appreciation/ (Depreciation) | ||||||||||||||||||
S&P Industrials Select Sector Index | Goldman Sachs International | 7/23/24 | 6.08 | % | $ | 318,508 | $ | (2,985 | ) | ||||||||||||||
(1) Agreements may be terminated at will by either party without penalty. Payment is due at termination/maturity.
(2) Reflects the floating financing rate, as of June 30, 2024, on the notional amount of the swap agreement paid to the counterparty or received from the counterparty, excluding any commissions. This amount is included as part of the unrealized appreciation/(depreciation).
ProFund VP Industrials invested in the following industries as of June 30, 2024:
Value | % of Net Assets | ||||||||||
Aerospace & Defense | $ | 2,853,201 | 17.3 | % | |||||||
Air Freight & Logistics | 850,905 | 5.2 | % | ||||||||
Building Products | 973,877 | 5.9 | % | ||||||||
Commercial Services & Supplies | 1,131,100 | 6.9 | % | ||||||||
Construction & Engineering | 161,855 | 1.0 | % | ||||||||
Electrical Equipment | 1,448,626 | 8.8 | % | ||||||||
Ground Transportation | 1,950,141 | 11.8 | % | ||||||||
Industrial Conglomerates | 1,607,573 | 9.7 | % | ||||||||
Machinery | 3,195,293 | 19.3 | % | ||||||||
Passenger Airlines | 309,556 | 1.9 | % | ||||||||
Professional Services | 1,215,004 | 7.4 | % | ||||||||
Trading Companies & Distributors | 515,449 | 3.1 | % | ||||||||
Other** | 292,899 | 1.7 | % | ||||||||
Total | $ | 16,505,479 | 100.0 | % | |||||||
** Includes any non-equity securities and net other assets (liabilities), which includes any receivable for capital shares issued and payable for capital shares redeemed.
See accompanying notes to the financial statements.
Repurchase Agreements(a)(b) (100.2%)
| Principal Amount | Value | ||||||||||
| Repurchase Agreements with various counterparties, rates 5.12%–5.20%, dated 6/28/2024, due 7/1/24, total to be received $10,447,515 | $ | 10,443,000 | $ | 10,443,000 | |||||||
| TOTAL REPURCHASE AGREEMENTS (Cost $10,443,000) | 10,443,000 | ||||||||||
| TOTAL INVESTMENT SECURITIES (Cost $10,443,000)—100.2% | 10,443,000 | ||||||||||
Net other assets (liabilities)—(0.2)% | (22,734 | ) | |||||||||
NET ASSETS—100.0% | $ | 10,420,266 | |||||||||
(a) A portion of these securities were held in a segregated account for the benefit of swap counterparties in the event of default. At June 30, 2024, the aggregate amount held in a segregated account was $1,497,000.
(b) The ProFund VP invests in Repurchase Agreements jointly with other funds in the Trust. See "Repurchase Agreements" under Note 2 in the Notes to Financial Statements to view the details of each individual agreement and counterparty as well as a description of the securities subject to repurchase.
Total Return Swap Agreements—Long
Underlying Instrument | Counterparty | Termination Date(1) | Rate Paid (Received)(2) | Notional Amount | Value and Unrealized Appreciation/ (Depreciation) | ||||||||||||||||||
MSCI EAFE Index | Goldman Sachs International | 7/29/24 | 5.98 | % | $ | 5,394,554 | $ | 8,074 | |||||||||||||||
MSCI EAFE Index | UBS AG | 7/29/24 | 6.13 | % | 5,021,505 | 7,363 | |||||||||||||||||
$ | 10,416,059 | $ | 15,437 | ||||||||||||||||||||
(1) Agreements may be terminated at will by either party without penalty. Payment is due at termination/maturity.
(2) Reflects the floating financing rate, as of June 30, 2024, on the notional amount of the swap agreement paid to the counterparty or received from the counterparty, excluding any commissions. This amount is included as part of the unrealized appreciation/(depreciation).
See accompanying notes to the financial statements.
Common Stocks (97.6%)
Shares | Value | ||||||||||
| Airbnb, Inc.—Class A (Hotels, Restaurants & Leisure) | 3,676 | $ | 557,392 | ||||||||
Akamai Technologies, Inc.* (IT Services) | 1,238 | 111,519 | |||||||||
| Alphabet, Inc.—Class A (Interactive Media & Services) | 3,565 | 649,364 | |||||||||
| Alphabet, Inc.—Class C (Interactive Media & Services) | 2,966 | 544,024 | |||||||||
Amazon.com, Inc. (Broadline Retail) | 6,528 | 1,261,536 | |||||||||
| Arista Networks, Inc.* (Communications Equipment) | 1,763 | 617,896 | |||||||||
Atlassian Corp.*—Class A (Software) | 1,560 | 275,933 | |||||||||
| Booking Holdings, Inc. (Hotels, Restaurants & Leisure) | 142 | 562,533 | |||||||||
Box, Inc.*—Class A (Software) | 1,294 | 34,213 | |||||||||
Carvana Co.* (Specialty Retail) | 967 | 124,472 | |||||||||
Ciena Corp.* (Communications Equipment) | 1,272 | 61,285 | |||||||||
| Cisco Systems, Inc. (Communications Equipment) | 11,918 | 566,224 | |||||||||
Cloudflare, Inc.*—Class A (IT Services) | 2,535 | 209,974 | |||||||||
Confluent, Inc.*—Class A (Software) | 2,455 | 72,496 | |||||||||
Datadog, Inc.*—Class A (Software) | 2,310 | 299,584 | |||||||||
DocuSign, Inc.* (Software) | 1,872 | 100,152 | |||||||||
| DoorDash, Inc.*—Class A (Hotels, Restaurants & Leisure) | 2,482 | 269,992 | |||||||||
| DraftKings, Inc.* (Hotels, Restaurants & Leisure) | 4,300 | 164,131 | |||||||||
Dropbox, Inc.*—Class A (Software) | 2,083 | 46,805 | |||||||||
eBay, Inc. (Broadline Retail) | 4,505 | 242,009 | |||||||||
GoDaddy, Inc.*—Class A (IT Services) | 1,358 | 189,726 | |||||||||
HubSpot, Inc.* (Software) | 483 | 284,869 | |||||||||
| Juniper Networks, Inc. (Communications Equipment) | 2,606 | 95,015 | |||||||||
Marathon Digital Holdings, Inc.* (Software) | 2,427 | 48,176 | |||||||||
| Meta Platforms, Inc.—Class A (Interactive Media & Services) | 2,348 | 1,183,908 | |||||||||
Netflix, Inc.* (Entertainment) | 1,202 | 811,206 | |||||||||
Nutanix, Inc.*—Class A (Software) | 2,034 | 115,633 | |||||||||
Okta, Inc.* (IT Services) | 1,300 | 121,693 | |||||||||
Paycom Software, Inc. (Professional Services) | 486 | 69,517 | |||||||||
PayPal Holdings, Inc.* (Financial Services) | 8,074 | 468,534 | |||||||||
Common Stocks, continued
Shares | Value | ||||||||||
| Pinterest, Inc.*—Class A (Interactive Media & Services) | 5,388 | $ | 237,449 | ||||||||
ROBLOX Corp.*—Class A (Entertainment) | 3,995 | 148,654 | |||||||||
Salesforce, Inc. (Software) | 2,476 | 636,580 | |||||||||
Smartsheet, Inc.*—Class A (Software) | 1,014 | 44,697 | |||||||||
| Snap, Inc.*—Class A (Interactive Media & Services) | 8,301 | 137,880 | |||||||||
Snowflake, Inc.*—Class A (IT Services) | 2,888 | 390,140 | |||||||||
Teladoc Health, Inc.* (Health Care Technology) | 1,403 | 13,721 | |||||||||
| Veeva Systems, Inc.*—Class A (Health Care Technology) | 1,332 | 243,770 | |||||||||
Workday, Inc.*—Class A (Software) | 1,581 | 353,448 | |||||||||
| Zoom Video Communications, Inc.*—Class A (Software) | 2,301 | 136,196 | |||||||||
| ZoomInfo Technologies, Inc.* (Interactive Media & Services) | 2,484 | 31,721 | |||||||||
| TOTAL COMMON STOCKS (Cost $5,562,210) | 12,534,067 | ||||||||||
Repurchase Agreements(a) (1.9%)
| Principal Amount | Value | ||||||||||
| Repurchase Agreements with various counterparties, rates 5.12%–5.20%, dated 6/28/2024, due 7/1/24, total to be received $239,103 | $ | 239,000 | $ | 239,000 | |||||||
| TOTAL REPURCHASE AGREEMENTS (Cost $239,000) | 239,000 | ||||||||||
| TOTAL INVESTMENT SECURITIES (Cost $5,801,210)—99.5% | 12,773,067 | ||||||||||
Net other assets (liabilities)—0.5% | 68,534 | ||||||||||
NET ASSETS—100.0% | $ | 12,841,601 | |||||||||
* Non-income producing security.
(a) The ProFund VP invests in Repurchase Agreements jointly with other funds in the Trust. See "Repurchase Agreements" under Note 2 in the Notes to Financial Statements to view the details of each individual agreement and counterparty as well as a description of the securities subject to repurchase.
Total Return Swap Agreements—Long
Underlying Instrument | Counterparty | Termination Date(1) | Rate Paid (Received)(2) | Notional Amount | Value and Unrealized Appreciation/ (Depreciation) | ||||||||||||||||||
| Dow Jones Internet Composite Index | Goldman Sachs International | 7/23/24 | 6.08 | % | $ | 315,398 | $ | 6,968 | |||||||||||||||
(1) Agreements may be terminated at will by either party without penalty. Payment is due at termination/maturity.
(2) Reflects the floating financing rate, as of June 30, 2024, on the notional amount of the swap agreement paid to the counterparty or received from the counterparty, excluding any commissions. This amount is included as part of the unrealized appreciation/(depreciation).
See accompanying notes to the financial statements.
40 :: ProFund VP Internet :: Schedule of Portfolio Investments :: June 30, 2024 (unaudited)
ProFund VP Internet invested in the following industries as of June 30, 2024:
Value | % of Net Assets | ||||||||||
Broadline Retail | $ | 1,503,545 | 11.7 | % | |||||||
Communications Equipment | 1,340,420 | 10.4 | % | ||||||||
Entertainment | 959,860 | 7.5 | % | ||||||||
Financial Services | 468,534 | 3.6 | % | ||||||||
Health Care Technology | 257,491 | 2.0 | % | ||||||||
Hotels, Restaurants & Leisure | 1,554,048 | 12.1 | % | ||||||||
Interactive Media & Services | 2,784,346 | 21.7 | % | ||||||||
IT Services | 1,023,052 | 8.0 | % | ||||||||
Professional Services | 69,517 | 0.5 | % | ||||||||
Software | 2,448,782 | 19.1 | % | ||||||||
Specialty Retail | 124,472 | 1.0 | % | ||||||||
Other** | 307,534 | 2.4 | % | ||||||||
Total | $ | 12,841,601 | 100.0 | % | |||||||
** Includes any non-equity securities and net other assets (liabilities), which includes any receivable for capital shares issued and payable for capital shares redeemed.
See accompanying notes to the financial statements.
Repurchase Agreements(a) (95.0%)
| Principal Amount | Value | ||||||||||
| Repurchase Agreements with various counterparties, rates 5.12%–5.20%, dated 6/28/2024, due 7/1/24, total to be received $13,477,825 | $ | 13,472,000 | $ | 13,472,000 | |||||||
| TOTAL REPURCHASE AGREEMENTS (Cost $13,472,000) | 13,472,000 | ||||||||||
| TOTAL INVESTMENT SECURITIES (Cost $13,472,000)—95.0% | 13,472,000 | ||||||||||
Net other assets (liabilities)—5.0% | 703,299 | ||||||||||
NET ASSETS—100.0% | $ | 14,175,299 | |||||||||
(a) The ProFund VP invests in Repurchase Agreements jointly with other funds in the Trust. See "Repurchase Agreements" under Note 2 in the Notes to Financial Statements to view the details of each individual agreement and counterparty as well as a description of the securities subject to repurchase.
Futures Contracts Purchased
| Number of Contracts | Expiration Date | Notional Amount | Value and Unrealized Appreciation/ (Depreciation) | ||||||||||||||||
Nikkei 225 Futures Contracts | 70 | 9/13/24 | $ | 13,942,250 | $ | 383,020 | |||||||||||||
Total Return Swap Agreements—Long
Underlying Instrument | Counterparty | Termination Date(1) | Rate Paid (Received)(2) | Notional Amount | Value and Unrealized Appreciation/ (Depreciation) | ||||||||||||||||||
Nikkei 225 Stock Average | Goldman Sachs International | 7/29/24 | 5.78 | % | $ | 129,031 | $ | 1,245 | |||||||||||||||
(1) Agreements may be terminated at will by either party without penalty. Payment is due at termination/maturity.
(2) Reflects the floating financing rate, as of June 30, 2024, on the notional amount of the swap agreement paid to the counterparty or received from the counterparty, excluding any commissions. This amount is included as part of the unrealized appreciation/(depreciation).
See accompanying notes to the financial statements.
Common Stocks (100.0%)
Shares | Value | ||||||||||
A.O. Smith Corp. (Building Products) | 89 | $ | 7,278 | ||||||||
AbbVie, Inc. (Biotechnology) | 810 | 138,931 | |||||||||
Accenture PLC—Class A (IT Services) | 421 | 127,736 | |||||||||
Adobe, Inc.* (Software) | 556 | 308,880 | |||||||||
| Advanced Micro Devices, Inc.* (Semiconductors & Semiconductor Equipment) | 2,002 | 324,744 | |||||||||
| Airbnb, Inc.*—Class A (Hotels, Restaurants & Leisure) | 274 | 41,547 | |||||||||
Akamai Technologies, Inc.* (IT Services) | 84 | 7,567 | |||||||||
| Align Technology, Inc.* (Health Care Equipment & Supplies) | 47 | 11,347 | |||||||||
Allegion PLC (Building Products) | 40 | 4,726 | |||||||||
| Alphabet, Inc.—Class A (Interactive Media & Services) | 7,281 | 1,326,234 | |||||||||
| Alphabet, Inc.—Class C (Interactive Media & Services) | 6,057 | 1,110,975 | |||||||||
Amazon.com, Inc.* (Broadline Retail) | 11,353 | 2,193,967 | |||||||||
American Express Co. (Consumer Finance) | 493 | 114,155 | |||||||||
American Tower Corp. (Specialized REITs) | 238 | 46,261 | |||||||||
Ameriprise Financial, Inc. (Capital Markets) | 65 | 27,767 | |||||||||
AMETEK, Inc. (Electrical Equipment) | 137 | 22,839 | |||||||||
| Amphenol Corp.—Class A (Electronic Equipment, Instruments & Components) | 829 | 55,849 | |||||||||
| Analog Devices, Inc. (Semiconductors & Semiconductor Equipment) | 364 | 83,087 | |||||||||
ANSYS, Inc.* (Software) | 62 | 19,933 | |||||||||
Aon PLC—Class A (Insurance) | 138 | 40,514 | |||||||||
APA Corp. (Oil, Gas & Consumable Fuels) | 442 | 13,012 | |||||||||
| Apple, Inc. (Technology Hardware, Storage & Peripherals) | 17,867 | 3,763,148 | |||||||||
| Applied Materials, Inc. (Semiconductors & Semiconductor Equipment) | 1,030 | 243,070 | |||||||||
Arch Capital Group, Ltd.* (Insurance) | 460 | 46,409 | |||||||||
| Arista Networks, Inc.* (Communications Equipment) | 316 | 110,752 | |||||||||
Arthur J. Gallagher & Co. (Insurance) | 139 | 36,044 | |||||||||
Autodesk, Inc.* (Software) | 138 | 34,148 | |||||||||
| Automatic Data Processing, Inc. (Professional Services) | 199 | 47,500 | |||||||||
AutoZone, Inc.* (Specialty Retail) | 14 | 41,497 | |||||||||
Axon Enterprise, Inc.* (Aerospace & Defense) | 89 | 26,187 | |||||||||
Blackstone, Inc. (Capital Markets) | 638 | 78,984 | |||||||||
| Booking Holdings, Inc. (Hotels, Restaurants & Leisure) | 42 | 166,383 | |||||||||
| Boston Scientific Corp.* (Health Care Equipment & Supplies) | 999 | 76,933 | |||||||||
| Broadcom, Inc. (Semiconductors & Semiconductor Equipment) | 541 | 868,591 | |||||||||
| Broadridge Financial Solutions, Inc. (Professional Services) | 84 | 16,548 | |||||||||
Brown & Brown, Inc. (Insurance) | 224 | 20,028 | |||||||||
Builders FirstSource, Inc.* (Building Products) | 151 | 20,900 | |||||||||
Cadence Design Systems, Inc.* (Software) | 338 | 104,020 | |||||||||
| Caesars Entertainment, Inc.* (Hotels, Restaurants & Leisure) | 154 | 6,120 | |||||||||
Carnival Corp.* (Hotels, Restaurants & Leisure) | 880 | 16,474 | |||||||||
Carrier Global Corp. (Building Products) | 494 | 31,162 | |||||||||
Caterpillar, Inc. (Machinery) | 353 | 117,585 | |||||||||
Cboe Global Markets, Inc. (Capital Markets) | 84 | 14,285 | |||||||||
Common Stocks, continued
Shares | Value | ||||||||||
| CDW Corp. (Electronic Equipment, Instruments & Components) | 71 | $ | 15,893 | ||||||||
Celanese Corp. (Chemicals) | 124 | 16,726 | |||||||||
CF Industries Holdings, Inc. (Chemicals) | 117 | 8,672 | |||||||||
| Charter Communications, Inc.*—Class A (Media) | 57 | 17,041 | |||||||||
| Chipotle Mexican Grill, Inc.* (Hotels, Restaurants & Leisure) | 1,699 | 106,442 | |||||||||
| Church & Dwight Co., Inc. (Household Products) | 138 | 14,308 | |||||||||
Cintas Corp. (Commercial Services & Supplies) | 59 | 41,315 | |||||||||
CME Group, Inc. (Capital Markets) | 162 | 31,849 | |||||||||
Colgate-Palmolive Co. (Household Products) | 391 | 37,943 | |||||||||
ConocoPhillips (Oil, Gas & Consumable Fuels) | 996 | 113,923 | |||||||||
Constellation Energy Corp. (Electric Utilities) | 178 | 35,648 | |||||||||
Copart, Inc.* (Commercial Services & Supplies) | 1,081 | 58,548 | |||||||||
Corpay, Inc.* (Software) | 88 | 23,444 | |||||||||
| CoStar Group, Inc.* (Real Estate Management & Development) | 212 | 15,718 | |||||||||
| Costco Wholesale Corp. (Consumer Staples Distribution & Retail) | 231 | 196,348 | |||||||||
| Coterra Energy, Inc. (Oil, Gas & Consumable Fuels) | 605 | 16,135 | |||||||||
| Crowdstrike Holdings, Inc.*—Class A (Software) | 287 | 109,976 | |||||||||
CSX Corp. (Ground Transportation) | 1,209 | 40,441 | |||||||||
D.R. Horton, Inc. (Household Durables) | 367 | 51,721 | |||||||||
| Darden Restaurants, Inc. (Hotels, Restaurants & Leisure) | 77 | 11,652 | |||||||||
| DaVita, Inc.* (Health Care Providers & Services) | 35 | 4,850 | |||||||||
Dayforce, Inc.* (Professional Services) | 104 | 5,158 | |||||||||
| Deckers Outdoor Corp.* (Textiles, Apparel & Luxury Goods) | 32 | 30,974 | |||||||||
Deere & Co. (Machinery) | 184 | 68,748 | |||||||||
Delta Air Lines, Inc. (Passenger Airlines) | 444 | 21,063 | |||||||||
| Dexcom, Inc.* (Health Care Equipment & Supplies) | 300 | 34,014 | |||||||||
| Diamondback Energy, Inc. (Oil, Gas & Consumable Fuels) | 221 | 44,242 | |||||||||
Digital Realty Trust, Inc. (Specialized REITs) | 165 | 25,088 | |||||||||
| Discover Financial Services (Consumer Finance) | 166 | 21,714 | |||||||||
| Domino's Pizza, Inc. (Hotels, Restaurants & Leisure) | 18 | 9,294 | |||||||||
Eaton Corp. PLC (Electrical Equipment) | 308 | 96,574 | |||||||||
Ecolab, Inc. (Chemicals) | 162 | 38,556 | |||||||||
| Edwards Lifesciences Corp.* (Health Care Equipment & Supplies) | 272 | 25,125 | |||||||||
Electronic Arts, Inc. (Entertainment) | 133 | 18,531 | |||||||||
Eli Lilly & Co. (Pharmaceuticals) | 991 | 897,232 | |||||||||
| Enphase Energy, Inc.* (Semiconductors & Semiconductor Equipment) | 60 | 5,983 | |||||||||
| EOG Resources, Inc. (Oil, Gas & Consumable Fuels) | 469 | 59,033 | |||||||||
EPAM Systems, Inc.* (IT Services) | 29 | 5,455 | |||||||||
Equifax, Inc. (Professional Services) | 60 | 14,548 | |||||||||
Equinix, Inc. (Specialized REITs) | 56 | 42,370 | |||||||||
Etsy, Inc.* (Broadline Retail) | 59 | 3,480 | |||||||||
| Expedia Group, Inc.* (Hotels, Restaurants & Leisure) | 156 | 19,654 | |||||||||
See accompanying notes to the financial statements.
June 30, 2024 (unaudited) :: Schedule of Portfolio Investments :: ProFund VP Large-Cap Growth :: 43
Common Stocks, continued
Shares | Value | ||||||||||
| Expeditors International of Washington, Inc. (Air Freight & Logistics) | 64 | $ | 7,987 | ||||||||
| FactSet Research Systems, Inc. (Capital Markets) | 22 | 8,982 | |||||||||
Fair Isaac Corp.* (Software) | 31 | 46,148 | |||||||||
| Fastenal Co. (Trading Companies & Distributors) | 351 | 22,057 | |||||||||
First Horizon Corp. (Banks) | — | (a) | — | (b) | |||||||
Fiserv, Inc.* (Financial Services) | 378 | 56,337 | |||||||||
Fortinet, Inc.* (Software) | 782 | 47,131 | |||||||||
Fortive Corp. (Machinery) | 432 | 32,011 | |||||||||
Freeport-McMoRan, Inc. (Metals & Mining) | 887 | 43,108 | |||||||||
Garmin, Ltd. (Household Durables) | 103 | 16,781 | |||||||||
Gartner, Inc.* (IT Services) | 96 | 43,110 | |||||||||
GE Vernova, Inc.* (Electrical Equipment) | 148 | 25,383 | |||||||||
Generac Holdings, Inc.* (Electrical Equipment) | 47 | 6,214 | |||||||||
General Electric Co. (Industrial Conglomerates) | 582 | 92,521 | |||||||||
GoDaddy, Inc.*—Class A (IT Services) | 173 | 24,170 | |||||||||
| HCA Healthcare, Inc. (Health Care Providers & Services) | 117 | 37,590 | |||||||||
Hess Corp. (Oil, Gas & Consumable Fuels) | 342 | 50,452 | |||||||||
| Hilton Worldwide Holdings, Inc. (Hotels, Restaurants & Leisure) | 311 | 67,860 | |||||||||
| Host Hotels & Resorts, Inc. (Hotel & Resort REITs) | 522 | 9,386 | |||||||||
| Howmet Aerospace, Inc. (Aerospace & Defense) | 273 | 21,193 | |||||||||
Hubbell, Inc. (Electrical Equipment) | 31 | 11,330 | |||||||||
| IDEXX Laboratories, Inc.* (Health Care Equipment & Supplies) | 58 | 28,258 | |||||||||
Illinois Tool Works, Inc. (Machinery) | 156 | 36,966 | |||||||||
Ingersoll Rand, Inc. (Machinery) | 380 | 34,519 | |||||||||
| Insulet Corp.* (Health Care Equipment & Supplies) | 33 | 6,659 | |||||||||
Intuit, Inc. (Software) | 348 | 228,709 | |||||||||
| Intuitive Surgical, Inc.* (Health Care Equipment & Supplies) | 291 | 129,452 | |||||||||
| IQVIA Holdings, Inc.* (Life Sciences Tools & Services) | 87 | 18,395 | |||||||||
Iron Mountain, Inc. (Specialized REITs) | 180 | 16,132 | |||||||||
| Jabil, Inc. (Electronic Equipment, Instruments & Components) | 78 | 8,486 | |||||||||
KKR & Co., Inc. (Capital Markets) | 821 | 86,402 | |||||||||
| KLA Corp. (Semiconductors & Semiconductor Equipment) | 168 | 138,518 | |||||||||
| Lam Research Corp. (Semiconductors & Semiconductor Equipment) | 163 | 173,571 | |||||||||
Lamb Weston Holdings, Inc. (Food Products) | 113 | 9,501 | |||||||||
| Las Vegas Sands Corp. (Hotels, Restaurants & Leisure) | 272 | 12,036 | |||||||||
Lennar Corp.—Class A (Household Durables) | 169 | 25,328 | |||||||||
Linde PLC (Chemicals) | 311 | 136,470 | |||||||||
| Live Nation Entertainment, Inc.* (Entertainment) | 172 | 16,123 | |||||||||
| Lululemon Athletica, Inc.* (Textiles, Apparel & Luxury Goods) | 142 | 42,415 | |||||||||
| Marathon Oil Corp. (Oil, Gas & Consumable Fuels) | 367 | 10,522 | |||||||||
| Marathon Petroleum Corp. (Oil, Gas & Consumable Fuels) | 240 | 41,635 | |||||||||
Common Stocks, continued
Shares | Value | ||||||||||
| Marriott International, Inc.—Class A (Hotels, Restaurants & Leisure) | 297 | $ | 71,884 | ||||||||
Marsh & McLennan Cos., Inc. (Insurance) | 319 | 67,220 | |||||||||
| Martin Marietta Materials, Inc. (Construction Materials) | 51 | 27,632 | |||||||||
Masco Corp. (Building Products) | 143 | 9,534 | |||||||||
Mastercard, Inc.—Class A (Financial Services) | 734 | 323,811 | |||||||||
| McDonald's Corp. (Hotels, Restaurants & Leisure) | 394 | 100,407 | |||||||||
Merck & Co., Inc. (Pharmaceuticals) | 1,253 | 155,121 | |||||||||
| Meta Platforms, Inc.—Class A (Interactive Media & Services) | 2,716 | 1,369,461 | |||||||||
| Mettler-Toledo International, Inc.* (Life Sciences Tools & Services) | 10 | 13,976 | |||||||||
| MGM Resorts International* (Hotels, Restaurants & Leisure) | 206 | 9,155 | |||||||||
| Microchip Technology, Inc. (Semiconductors & Semiconductor Equipment) | 391 | 35,777 | |||||||||
Microsoft Corp. (Software) | 9,212 | 4,117,303 | |||||||||
| Molina Healthcare, Inc.* (Health Care Providers & Services) | 43 | 12,784 | |||||||||
| Mondelez International, Inc.—Class A (Food Products) | 694 | 45,416 | |||||||||
| Monolithic Power Systems, Inc. (Semiconductors & Semiconductor Equipment) | 61 | 50,122 | |||||||||
Monster Beverage Corp.* (Beverages) | 523 | 26,124 | |||||||||
Moody's Corp. (Capital Markets) | 92 | 38,726 | |||||||||
| Motorola Solutions, Inc. (Communications Equipment) | 121 | 46,712 | |||||||||
MSCI, Inc. (Capital Markets) | 57 | 27,460 | |||||||||
| NetApp, Inc. (Technology Hardware, Storage & Peripherals) | 94 | 12,107 | |||||||||
Netflix, Inc.* (Entertainment) | 535 | 361,061 | |||||||||
| NIKE, Inc.—Class B (Textiles, Apparel & Luxury Goods) | 641 | 48,313 | |||||||||
| Norwegian Cruise Line Holdings, Ltd.* (Hotels, Restaurants & Leisure) | 527 | 9,902 | |||||||||
Nucor Corp. (Metals & Mining) | 187 | 29,561 | |||||||||
| NVIDIA Corp. (Semiconductors & Semiconductor Equipment) | 30,490 | 3,766,734 | |||||||||
NVR, Inc.* (Household Durables) | 4 | 30,354 | |||||||||
| NXP Semiconductors N.V. (Semiconductors & Semiconductor Equipment) | 238 | 64,043 | |||||||||
| Old Dominion Freight Line, Inc. (Ground Transportation) | 221 | 39,029 | |||||||||
| ON Semiconductor Corp.* (Semiconductors & Semiconductor Equipment) | 229 | 15,698 | |||||||||
ONEOK, Inc. (Oil, Gas & Consumable Fuels) | 444 | 36,208 | |||||||||
Oracle Corp. (Software) | 1,974 | 278,729 | |||||||||
O'Reilly Automotive, Inc.* (Specialty Retail) | 53 | 55,971 | |||||||||
Otis Worldwide Corp. (Machinery) | 194 | 18,674 | |||||||||
PACCAR, Inc. (Machinery) | 472 | 48,588 | |||||||||
Palo Alto Networks, Inc.* (Software) | 401 | 135,943 | |||||||||
Parker-Hannifin Corp. (Machinery) | 125 | 63,226 | |||||||||
Paychex, Inc. (Professional Services) | 157 | 18,614 | |||||||||
Paycom Software, Inc. (Professional Services) | 26 | 3,719 | |||||||||
Pentair PLC (Machinery) | 140 | 10,734 | |||||||||
PepsiCo, Inc. (Beverages) | 613 | 101,102 | |||||||||
Philip Morris International, Inc. (Tobacco) | 710 | 71,944 | |||||||||
Pool Corp. (Distributors) | 28 | 8,605 | |||||||||
See accompanying notes to the financial statements.
44 :: ProFund VP Large-Cap Growth :: Schedule of Portfolio Investments :: June 30, 2024 (unaudited)
Common Stocks, continued
Shares | Value | ||||||||||
PTC, Inc.* (Software) | 90 | $ | 16,350 | ||||||||
Public Storage (Specialized REITs) | 83 | 23,875 | |||||||||
PulteGroup, Inc. (Household Durables) | 259 | 28,516 | |||||||||
| QUALCOMM, Inc. (Semiconductors & Semiconductor Equipment) | 721 | 143,609 | |||||||||
| Quanta Services, Inc. (Construction & Engineering) | 126 | 32,015 | |||||||||
| Ralph Lauren Corp. (Textiles, Apparel & Luxury Goods) | 27 | 4,727 | |||||||||
| Regeneron Pharmaceuticals, Inc.* (Biotechnology) | 79 | 83,031 | |||||||||
| Republic Services, Inc. (Commercial Services & Supplies) | 144 | 27,985 | |||||||||
| Rockwell Automation, Inc. (Electrical Equipment) | 68 | 18,719 | |||||||||
Rollins, Inc. (Commercial Services & Supplies) | 146 | 7,123 | |||||||||
Roper Technologies, Inc. (Software) | 58 | 32,692 | |||||||||
Ross Stores, Inc. (Specialty Retail) | 416 | 60,453 | |||||||||
| Royal Caribbean Cruises, Ltd.* (Hotels, Restaurants & Leisure) | 293 | 46,713 | |||||||||
S&P Global, Inc. (Capital Markets) | 175 | 78,050 | |||||||||
Salesforce, Inc. (Software) | 1,205 | 309,806 | |||||||||
| SBA Communications Corp. (Specialized REITs) | 53 | 10,404 | |||||||||
| Seagate Technology Holdings PLC (Technology Hardware, Storage & Peripherals) | 97 | 10,017 | |||||||||
ServiceNow, Inc.* (Software) | 255 | 200,601 | |||||||||
Simon Property Group, Inc. (Retail REITs) | 150 | 22,770 | |||||||||
Snap-on, Inc. (Machinery) | 30 | 7,842 | |||||||||
| Starbucks Corp. (Hotels, Restaurants & Leisure) | 824 | 64,148 | |||||||||
Steel Dynamics, Inc. (Metals & Mining) | 115 | 14,893 | |||||||||
| STERIS PLC (Health Care Equipment & Supplies) | 68 | 14,929 | |||||||||
| Stryker Corp. (Health Care Equipment & Supplies) | 269 | 91,527 | |||||||||
| Super Micro Computer, Inc.* (Technology Hardware, Storage & Peripherals) | 63 | 51,619 | |||||||||
Synopsys, Inc.* (Software) | 190 | 113,061 | |||||||||
| Take-Two Interactive Software, Inc.* (Entertainment) | 98 | 15,238 | |||||||||
| Targa Resources Corp. (Oil, Gas & Consumable Fuels) | 274 | 35,286 | |||||||||
| TE Connectivity, Ltd. (Electronic Equipment, Instruments & Components) | 149 | 22,414 | |||||||||
Tesla, Inc.* (Automobiles) | 3,440 | 680,707 | |||||||||
| Texas Instruments, Inc. (Semiconductors & Semiconductor Equipment) | 418 | 81,314 | |||||||||
The Boeing Co.* (Aerospace & Defense) | 316 | 57,515 | |||||||||
The Coca-Cola Co. (Beverages) | 1,871 | 119,089 | |||||||||
| The Cooper Cos., Inc.* (Health Care Equipment & Supplies) | 98 | 8,555 | |||||||||
The Hershey Co. (Food Products) | 70 | 12,868 | |||||||||
The Home Depot, Inc. (Specialty Retail) | 455 | 156,630 | |||||||||
| The Procter & Gamble Co. (Household Products) | 1,141 | 188,173 | |||||||||
The Progressive Corp. (Insurance) | 364 | 75,606 | |||||||||
The Sherwin-Williams Co. (Chemicals) | 144 | 42,974 | |||||||||
The TJX Cos., Inc. (Specialty Retail) | 908 | 99,971 | |||||||||
| The Williams Cos., Inc. (Oil, Gas & Consumable Fuels) | 585 | 24,863 | |||||||||
Common Stocks, continued
Shares | Value | ||||||||||
| Thermo Fisher Scientific, Inc. (Life Sciences Tools & Services) | 181 | $ | 100,094 | ||||||||
Tractor Supply Co. (Specialty Retail) | 57 | 15,390 | |||||||||
Trane Technologies PLC (Building Products) | 195 | 64,141 | |||||||||
| TransDigm Group, Inc. (Aerospace & Defense) | 70 | 89,433 | |||||||||
Tyler Technologies, Inc.* (Software) | 53 | 26,647 | |||||||||
| Uber Technologies, Inc.* (Ground Transportation) | 2,584 | 187,804 | |||||||||
Ulta Beauty, Inc.* (Specialty Retail) | 40 | 15,435 | |||||||||
| Union Pacific Corp. (Ground Transportation) | 341 | 77,155 | |||||||||
| United Rentals, Inc. (Trading Companies & Distributors) | 83 | 53,678 | |||||||||
| UnitedHealth Group, Inc. (Health Care Providers & Services) | 433 | 220,509 | |||||||||
VeriSign, Inc.* (IT Services) | 52 | 9,246 | |||||||||
Verisk Analytics, Inc. (Professional Services) | 97 | 26,146 | |||||||||
| Vertex Pharmaceuticals, Inc.* (Biotechnology) | 204 | 95,619 | |||||||||
Visa, Inc.—Class A (Financial Services) | 1,288 | 338,061 | |||||||||
| Vistra Corp. (Independent Power and Renewable Electricity Producers) | 400 | 34,392 | |||||||||
| Vulcan Materials Co. (Construction Materials) | 105 | 26,111 | |||||||||
| W.W. Grainger, Inc. (Trading Companies & Distributors) | 41 | 36,992 | |||||||||
| Waste Management, Inc. (Commercial Services & Supplies) | 213 | 45,441 | |||||||||
| Waters Corp.* (Life Sciences Tools & Services) | 28 | 8,123 | |||||||||
| West Pharmaceutical Services, Inc. (Life Sciences Tools & Services) | 91 | 29,974 | |||||||||
| Wynn Resorts, Ltd. (Hotels, Restaurants & Leisure) | 112 | 10,024 | |||||||||
| Yum! Brands, Inc. (Hotels, Restaurants & Leisure) | 159 | 21,061 | |||||||||
Zoetis, Inc. (Pharmaceuticals) | 311 | 53,915 | |||||||||
| TOTAL COMMON STOCKS (Cost $16,030,129) | 32,738,947 | ||||||||||
Repurchase Agreements(c) (0.2%)
| Principal Amount | Value | ||||||||||
| Repurchase Agreements with various counterparties, rates 5.12%–5.20%, dated 6/28/2024, due 7/1/24, total to be received $75,032 | $ | 75,000 | $ | 75,000 | |||||||
| TOTAL REPURCHASE AGREEMENTS (Cost $75,000) | 75,000 | ||||||||||
| TOTAL INVESTMENT SECURITIES (Cost $16,105,129)—100.2% | 32,813,947 | ||||||||||
Net other assets (liabilities)—(0.2)% | (53,189 | ) | |||||||||
NET ASSETS—100.0% | $ | 32,760,758 | |||||||||
* Non-income producing security.
(a) Number of shares is less than 0.50
(b) Amount is less than $0.50.
See accompanying notes to the financial statements.
June 30, 2024 (unaudited) :: Schedule of Portfolio Investments :: ProFund VP Large-Cap Growth :: 45
(c) The ProFund VP invests in Repurchase Agreements jointly with other funds in the Trust. See "Repurchase Agreements" under Note 2 in the Notes to Financial Statements to view the details of each individual agreement and counterparty as well as a description of the securities subject to repurchase.
REIT Real Estate Investment Trust
ProFund VP Large-Cap Growth invested in the following industries as of June 30, 2024:
Value | % of | ||||||||||
Aerospace & Defense | $ | 194,328 | 0.6 | % | |||||||
Air Freight & Logistics | 7,987 | NM | |||||||||
Automobiles | 680,707 | 2.1 | % | ||||||||
Banks | — | ^ | NM | ||||||||
Beverages | 246,315 | 0.8 | % | ||||||||
Biotechnology | 317,581 | 1.0 | % | ||||||||
Broadline Retail | 2,197,447 | 6.6 | % | ||||||||
Building Products | 137,741 | 0.4 | % | ||||||||
Capital Markets | 392,505 | 1.2 | % | ||||||||
Chemicals | 243,398 | 0.7 | % | ||||||||
Commercial Services & Supplies | 180,412 | 0.6 | % | ||||||||
Communications Equipment | 157,464 | 0.5 | % | ||||||||
Construction & Engineering | 32,015 | 0.1 | % | ||||||||
Construction Materials | 53,743 | 0.2 | % | ||||||||
Consumer Finance | 135,869 | 0.4 | % | ||||||||
Consumer Staples Distribution & Retail | 196,348 | 0.6 | % | ||||||||
Distributors | 8,605 | NM | |||||||||
Electric Utilities | 35,648 | 0.1 | % | ||||||||
Electrical Equipment | 181,059 | 0.6 | % | ||||||||
Electronic Equipment, Instruments & | 102,642 | 0.3 | % | ||||||||
Entertainment | 410,953 | 1.3 | % | ||||||||
Financial Services | 718,210 | 2.2 | % | ||||||||
Food Products | 67,785 | 0.2 | % | ||||||||
Ground Transportation | 344,429 | 1.1 | % | ||||||||
Health Care Equipment & Supplies | 426,799 | 1.3 | % | ||||||||
Health Care Providers & Services | 275,733 | 0.8 | % | ||||||||
Hotel & Resort REITs | 9,386 | NM | |||||||||
Hotels, Restaurants & Leisure | 790,756 | 2.4 | % | ||||||||
Household Durables | 152,700 | 0.5 | % | ||||||||
Household Products | 240,424 | 0.7 | % | ||||||||
Independent Power and Renewable | 34,392 | 0.1 | % | ||||||||
Value | % of Net Assets | ||||||||||
Industrial Conglomerates | $ | 92,521 | 0.3 | % | |||||||
Insurance | 285,821 | 0.9 | % | ||||||||
Interactive Media & Services | 3,806,670 | 11.5 | % | ||||||||
IT Services | 217,283 | 0.7 | % | ||||||||
Life Sciences Tools & Services | 170,562 | 0.5 | % | ||||||||
Machinery | 438,893 | 1.2 | % | ||||||||
Media | 17,041 | 0.1 | % | ||||||||
Metals & Mining | 87,562 | 0.3 | % | ||||||||
Oil, Gas & Consumable Fuels | 445,311 | 1.4 | % | ||||||||
Passenger Airlines | 21,063 | 0.1 | % | ||||||||
Pharmaceuticals | 1,106,268 | 3.4 | % | ||||||||
Professional Services | 132,233 | 0.4 | % | ||||||||
Real Estate Management & Development | 15,718 | NM | |||||||||
Retail REITs | 22,770 | 0.1 | % | ||||||||
| Semiconductors & Semiconductor Equipment | 5,994,861 | 18.3 | % | ||||||||
Software | 6,153,521 | 18.9 | % | ||||||||
Specialized REITs | 164,130 | 0.5 | % | ||||||||
Specialty Retail | 445,347 | 1.4 | % | ||||||||
| Technology Hardware, Storage & Peripherals | 3,836,891 | 11.7 | % | ||||||||
Textiles, Apparel & Luxury Goods | 126,429 | 0.4 | % | ||||||||
Tobacco | 71,944 | 0.2 | % | ||||||||
Trading Companies & Distributors | 112,727 | 0.3 | % | ||||||||
Other** | 21,811 | NM | |||||||||
Total | $ | 32,760,758 | 100.0 | % | |||||||
^ Amount is less than $0.50
** Includes any non-equity securities and net other assets (liabilities), which includes any receivable for capital shares issued and payable for capital shares redeemed.
NM Not meaningful, amount is less than 0.05%
REIT Real Estate Investment Trust
See accompanying notes to the financial statements.
Common Stocks (99.7%)
Shares | Value | ||||||||||
3M Co. (Industrial Conglomerates) | 433 | $ | 44,248 | ||||||||
A.O. Smith Corp. (Building Products) | 35 | 2,862 | |||||||||
| Abbott Laboratories (Health Care Equipment & Supplies) | 1,363 | 141,630 | |||||||||
AbbVie, Inc. (Biotechnology) | 872 | 149,565 | |||||||||
Accenture PLC—Class A (IT Services) | 227 | 68,874 | |||||||||
Aflac, Inc. (Insurance) | 405 | 36,171 | |||||||||
| Agilent Technologies, Inc. (Life Sciences Tools & Services) | 230 | 29,815 | |||||||||
Air Products and Chemicals, Inc. (Chemicals) | 174 | 44,901 | |||||||||
| Airbnb, Inc.*—Class A (Hotels, Restaurants & Leisure) | 173 | 26,232 | |||||||||
Akamai Technologies, Inc.* (IT Services) | 63 | 5,675 | |||||||||
Albemarle Corp. (Chemicals) | 92 | 8,788 | |||||||||
| Alexandria Real Estate Equities, Inc. (Office REITs) | 123 | 14,388 | |||||||||
| Align Technology, Inc.* (Health Care Equipment & Supplies) | 25 | 6,036 | |||||||||
Allegion PLC (Building Products) | 42 | 4,962 | |||||||||
Alliant Energy Corp. (Electric Utilities) | 201 | 10,231 | |||||||||
Altria Group, Inc. (Tobacco) | 1,346 | 61,310 | |||||||||
Amcor PLC (Containers & Packaging) | 1,132 | 11,071 | |||||||||
Ameren Corp. (Multi-Utilities) | 209 | 14,862 | |||||||||
| American Airlines Group, Inc.* (Passenger Airlines) | 514 | 5,824 | |||||||||
| American Electric Power Co., Inc. (Electric Utilities) | 413 | 36,237 | |||||||||
American Express Co. (Consumer Finance) | 134 | 31,028 | |||||||||
American International Group, Inc. (Insurance) | 520 | 38,605 | |||||||||
American Tower Corp. (Specialized REITs) | 216 | 41,985 | |||||||||
| American Water Works Co., Inc. (Water Utilities) | 153 | 19,761 | |||||||||
Ameriprise Financial, Inc. (Capital Markets) | 37 | 15,806 | |||||||||
AMETEK, Inc. (Electrical Equipment) | 94 | 15,671 | |||||||||
Amgen, Inc. (Biotechnology) | 420 | 131,229 | |||||||||
| Amphenol Corp.—Class A (Electronic Equipment, Instruments & Components) | 414 | 27,892 | |||||||||
| Analog Devices, Inc. (Semiconductors & Semiconductor Equipment) | 159 | 36,293 | |||||||||
ANSYS, Inc.* (Software) | 29 | 9,324 | |||||||||
Aon PLC—Class A (Insurance) | 83 | 24,367 | |||||||||
Aptiv PLC* (Automobile Components) | 213 | 14,999 | |||||||||
Archer-Daniels-Midland Co. (Food Products) | 387 | 23,394 | |||||||||
Arthur J. Gallagher & Co. (Insurance) | 84 | 21,782 | |||||||||
Assurant, Inc. (Insurance) | 41 | 6,816 | |||||||||
| AT&T, Inc. (Diversified Telecommunication Services) | 5,617 | 107,341 | |||||||||
Atmos Energy Corp. (Gas Utilities) | 118 | 13,765 | |||||||||
Autodesk, Inc.* (Software) | 80 | 19,796 | |||||||||
| Automatic Data Processing, Inc. (Professional Services) | 196 | 46,782 | |||||||||
AutoZone, Inc.* (Specialty Retail) | 4 | 11,856 | |||||||||
| AvalonBay Communities, Inc. (Residential REITs) | 111 | 22,965 | |||||||||
| Avery Dennison Corp. (Containers & Packaging) | 63 | 13,775 | |||||||||
| Baker Hughes Co. (Energy Equipment & Services) | 782 | 27,503 | |||||||||
Ball Corp. (Containers & Packaging) | 243 | 14,584 | |||||||||
Bank of America Corp. (Banks) | 5,329 | 211,934 | |||||||||
Bath & Body Works, Inc. (Specialty Retail) | 175 | 6,834 | |||||||||
Common Stocks, continued
Shares | Value | ||||||||||
| Baxter International, Inc. (Health Care Equipment & Supplies) | 399 | $ | 13,347 | ||||||||
| Becton, Dickinson & Co. (Health Care Equipment & Supplies) | 226 | 52,818 | |||||||||
| Berkshire Hathaway, Inc.*—Class B (Financial Services) | 1,418 | 576,842 | |||||||||
Best Buy Co., Inc. (Specialty Retail) | 151 | 12,728 | |||||||||
Biogen, Inc.* (Biotechnology) | 114 | 26,427 | |||||||||
| Bio-Rad Laboratories, Inc.*—Class A (Life Sciences Tools & Services) | 16 | 4,370 | |||||||||
| Bio-Techne Corp. (Life Sciences Tools & Services) | 123 | 8,813 | |||||||||
BlackRock, Inc. (Capital Markets) | 109 | 85,818 | |||||||||
Blackstone, Inc. (Capital Markets) | 157 | 19,437 | |||||||||
BorgWarner, Inc. (Automobile Components) | 178 | 5,739 | |||||||||
| Boston Scientific Corp.* (Health Care Equipment & Supplies) | 518 | 39,891 | |||||||||
Bristol-Myers Squibb Co. (Pharmaceuticals) | 1,588 | 65,950 | |||||||||
| Broadridge Financial Solutions, Inc. (Professional Services) | 40 | 7,880 | |||||||||
Brown & Brown, Inc. (Insurance) | 41 | 3,666 | |||||||||
Brown-Forman Corp.—Class B (Beverages) | 140 | 6,047 | |||||||||
Bunge Global SA (Food Products) | 111 | 11,851 | |||||||||
BXP, Inc. (Office REITs) | 113 | 6,956 | |||||||||
| C.H. Robinson Worldwide, Inc. (Air Freight & Logistics) | 92 | 8,107 | |||||||||
| Caesars Entertainment, Inc.* (Hotels, Restaurants & Leisure) | 71 | 2,822 | |||||||||
Camden Property Trust (Residential REITs) | 83 | 9,056 | |||||||||
Campbell Soup Co. (Food Products) | 154 | 6,959 | |||||||||
| Capital One Financial Corp. (Consumer Finance) | 299 | 41,396 | |||||||||
| Cardinal Health, Inc. (Health Care Providers & Services) | 191 | 18,779 | |||||||||
CarMax, Inc.* (Specialty Retail) | 123 | 9,021 | |||||||||
Carnival Corp.* (Hotels, Restaurants & Leisure) | 229 | 4,287 | |||||||||
Carrier Global Corp. (Building Products) | 341 | 21,510 | |||||||||
Catalent, Inc.* (Pharmaceuticals) | 142 | 7,985 | |||||||||
Caterpillar, Inc. (Machinery) | 161 | 53,629 | |||||||||
Cboe Global Markets, Inc. (Capital Markets) | 30 | 5,102 | |||||||||
| CBRE Group, Inc.*—Class A (Real Estate Management & Development) | 236 | 21,030 | |||||||||
| CDW Corp. (Electronic Equipment, Instruments & Components) | 61 | 13,654 | |||||||||
| Cencora, Inc. (Health Care Providers & Services) | 130 | 29,289 | |||||||||
| Centene Corp.* (Health Care Providers & Services) | 418 | 27,713 | |||||||||
CenterPoint Energy, Inc. (Multi-Utilities) | 501 | 15,521 | |||||||||
CF Industries Holdings, Inc. (Chemicals) | 66 | 4,892 | |||||||||
| Charles River Laboratories International, Inc.* (Life Sciences Tools & Services) | 40 | 8,263 | |||||||||
| Charter Communications, Inc.*—Class A (Media) | 41 | 12,257 | |||||||||
Chevron Corp. (Oil, Gas & Consumable Fuels) | 1,343 | 210,072 | |||||||||
Chubb, Ltd. (Insurance) | 318 | 81,115 | |||||||||
| Church & Dwight Co., Inc. (Household Products) | 103 | 10,679 | |||||||||
Cincinnati Financial Corp. (Insurance) | 123 | 14,526 | |||||||||
| Cintas Corp. (Commercial Services & Supplies) | 30 | 21,008 | |||||||||
See accompanying notes to the financial statements.
June 30, 2024 (unaudited) :: Schedule of Portfolio Investments :: ProFund VP Large-Cap Value :: 47
Common Stocks, continued
Shares | Value | ||||||||||
| Cisco Systems, Inc. (Communications Equipment) | 3,172 | $ | 150,701 | ||||||||
Citigroup, Inc. (Banks) | 1,494 | 94,809 | |||||||||
Citizens Financial Group, Inc. (Banks) | 356 | 12,827 | |||||||||
CME Group, Inc. (Capital Markets) | 181 | 35,585 | |||||||||
CMS Energy Corp. (Multi-Utilities) | 234 | 13,930 | |||||||||
| Cognizant Technology Solutions Corp.—Class A (IT Services) | 389 | 26,452 | |||||||||
Colgate-Palmolive Co. (Household Products) | 392 | 38,040 | |||||||||
Comcast Corp.—Class A (Media) | 3,066 | 120,065 | |||||||||
Conagra Brands, Inc. (Food Products) | 375 | 10,658 | |||||||||
ConocoPhillips (Oil, Gas & Consumable Fuels) | 284 | 32,484 | |||||||||
Consolidated Edison, Inc. (Multi-Utilities) | 271 | 24,233 | |||||||||
| Constellation Brands, Inc.—Class A (Beverages) | 126 | 32,417 | |||||||||
Constellation Energy Corp. (Electric Utilities) | 136 | 27,237 | |||||||||
| Corning, Inc. (Electronic Equipment, Instruments & Components) | 604 | 23,465 | |||||||||
Corteva, Inc. (Chemicals) | 546 | 29,451 | |||||||||
| CoStar Group, Inc.* (Real Estate Management & Development) | 182 | 13,493 | |||||||||
| Costco Wholesale Corp. (Consumer Staples Distribution & Retail) | 202 | 171,698 | |||||||||
| Coterra Energy, Inc. (Oil, Gas & Consumable Fuels) | 198 | 5,281 | |||||||||
Crown Castle, Inc. (Specialized REITs) | 340 | 33,218 | |||||||||
CSX Corp. (Ground Transportation) | 766 | 25,623 | |||||||||
Cummins, Inc. (Machinery) | 107 | 29,632 | |||||||||
| CVS Health Corp. (Health Care Providers & Services) | 983 | 58,056 | |||||||||
Danaher Corp. (Life Sciences Tools & Services) | 516 | 128,923 | |||||||||
| Darden Restaurants, Inc. (Hotels, Restaurants & Leisure) | 45 | 6,809 | |||||||||
| DaVita, Inc.* (Health Care Providers & Services) | 18 | 2,494 | |||||||||
Dayforce, Inc.* (Professional Services) | 56 | 2,778 | |||||||||
Deere & Co. (Machinery) | 87 | 32,506 | |||||||||
Delta Air Lines, Inc. (Passenger Airlines) | 222 | 10,532 | |||||||||
| Devon Energy Corp. (Oil, Gas & Consumable Fuels) | 495 | 23,463 | |||||||||
| Dexcom, Inc.* (Health Care Equipment & Supplies) | 121 | 13,719 | |||||||||
Digital Realty Trust, Inc. (Specialized REITs) | 150 | 22,808 | |||||||||
| Discover Financial Services (Consumer Finance) | 90 | 11,773 | |||||||||
| Dollar General Corp. (Consumer Staples Distribution & Retail) | 172 | 22,744 | |||||||||
| Dollar Tree, Inc.* (Consumer Staples Distribution & Retail) | 162 | 17,297 | |||||||||
Dominion Energy, Inc. (Multi-Utilities) | 657 | 32,193 | |||||||||
| Domino's Pizza, Inc. (Hotels, Restaurants & Leisure) | 16 | 8,261 | |||||||||
Dover Corp. (Machinery) | 108 | 19,489 | |||||||||
Dow, Inc. (Chemicals) | 551 | 29,231 | |||||||||
DTE Energy Co. (Multi-Utilities) | 162 | 17,984 | |||||||||
Duke Energy Corp. (Electric Utilities) | 605 | 60,639 | |||||||||
DuPont de Nemours, Inc. (Chemicals) | 328 | 26,401 | |||||||||
Eastman Chemical Co. (Chemicals) | 92 | 9,013 | |||||||||
Eaton Corp. PLC (Electrical Equipment) | 119 | 37,312 | |||||||||
eBay, Inc. (Broadline Retail) | 396 | 21,273 | |||||||||
Ecolab, Inc. (Chemicals) | 98 | 23,324 | |||||||||
Common Stocks, continued
Shares | Value | ||||||||||
Edison International (Electric Utilities) | 301 | $ | 21,615 | ||||||||
| Edwards Lifesciences Corp.* (Health Care Equipment & Supplies) | 297 | 27,434 | |||||||||
Electronic Arts, Inc. (Entertainment) | 107 | 14,908 | |||||||||
| Elevance Health, Inc. (Health Care Providers & Services) | 182 | 98,619 | |||||||||
Emerson Electric Co. (Electrical Equipment) | 448 | 49,352 | |||||||||
| Enphase Energy, Inc.* (Semiconductors & Semiconductor Equipment) | 67 | 6,681 | |||||||||
Entergy Corp. (Electric Utilities) | 167 | 17,869 | |||||||||
| EOG Resources, Inc. (Oil, Gas & Consumable Fuels) | 153 | 19,258 | |||||||||
EPAM Systems, Inc.* (IT Services) | 27 | 5,079 | |||||||||
EQT Corp. (Oil, Gas & Consumable Fuels) | 346 | 12,795 | |||||||||
Equifax, Inc. (Professional Services) | 59 | 14,305 | |||||||||
Equinix, Inc. (Specialized REITs) | 39 | 29,507 | |||||||||
Equity Residential (Residential REITs) | 270 | 18,722 | |||||||||
Essex Property Trust, Inc. (Residential REITs) | 50 | 13,610 | |||||||||
Etsy, Inc.* (Broadline Retail) | 51 | 3,008 | |||||||||
Everest Group, Ltd. (Insurance) | 34 | 12,955 | |||||||||
Evergy, Inc. (Electric Utilities) | 180 | 9,535 | |||||||||
Eversource Energy (Electric Utilities) | 276 | 15,652 | |||||||||
Exelon Corp. (Electric Utilities) | 783 | 27,100 | |||||||||
| Expeditors International of Washington, Inc. (Air Freight & Logistics) | 70 | 8,735 | |||||||||
Extra Space Storage, Inc. (Specialized REITs) | 166 | 25,798 | |||||||||
| Exxon Mobil Corp. (Oil, Gas & Consumable Fuels) | 3,514 | 404,531 | |||||||||
F5, Inc.* (Communications Equipment) | 46 | 7,923 | |||||||||
| FactSet Research Systems, Inc. (Capital Markets) | 16 | 6,532 | |||||||||
| Fastenal Co. (Trading Companies & Distributors) | 224 | 14,076 | |||||||||
Federal Realty Investment Trust (Retail REITs) | 58 | 5,856 | |||||||||
FedEx Corp. (Air Freight & Logistics) | 177 | 53,072 | |||||||||
| Fidelity National Information Services, Inc. (Financial Services) | 436 | 32,857 | |||||||||
Fifth Third Bancorp (Banks) | 536 | 19,559 | |||||||||
First Horizon Corp. (Banks) | — | (a) | 7 | ||||||||
| First Solar, Inc.* (Semiconductors & Semiconductor Equipment) | 84 | 18,939 | |||||||||
FirstEnergy Corp. (Electric Utilities) | 406 | 15,538 | |||||||||
Fiserv, Inc.* (Financial Services) | 220 | 32,789 | |||||||||
FMC Corp. (Chemicals) | 98 | 5,640 | |||||||||
Ford Motor Co. (Automobiles) | 3,072 | 38,523 | |||||||||
Fox Corp.—Class A (Media) | 181 | 6,221 | |||||||||
Fox Corp.—Class B (Media) | 103 | 3,298 | |||||||||
Franklin Resources, Inc. (Capital Markets) | 235 | 5,252 | |||||||||
Freeport-McMoRan, Inc. (Metals & Mining) | 563 | 27,361 | |||||||||
Garmin, Ltd. (Household Durables) | 55 | 8,961 | |||||||||
| GE HealthCare Technologies, Inc. (Health Care Equipment & Supplies) | 333 | 25,947 | |||||||||
GE Vernova, Inc.* (Electrical Equipment) | 122 | 20,924 | |||||||||
Gen Digital, Inc. (Software) | 432 | 10,791 | |||||||||
Generac Holdings, Inc.* (Electrical Equipment) | 19 | 2,512 | |||||||||
| General Dynamics Corp. (Aerospace & Defense) | 178 | 51,645 | |||||||||
General Electric Co. (Industrial Conglomerates) | 489 | 77,736 | |||||||||
General Mills, Inc. (Food Products) | 442 | 27,961 | |||||||||
General Motors Co. (Automobiles) | 894 | 41,535 | |||||||||
See accompanying notes to the financial statements.
48 :: ProFund VP Large-Cap Value :: Schedule of Portfolio Investments :: June 30, 2024 (unaudited)
Common Stocks, continued
Shares | Value | ||||||||||
Genuine Parts Co. (Distributors) | 109 | $ | 15,077 | ||||||||
Gilead Sciences, Inc. (Biotechnology) | 976 | 66,963 | |||||||||
Global Payments, Inc. (Financial Services) | 200 | 19,340 | |||||||||
Globe Life, Inc. (Insurance) | 66 | 5,430 | |||||||||
| Halliburton Co. (Energy Equipment & Services) | 694 | 23,443 | |||||||||
Hasbro, Inc. (Leisure Products) | 103 | 6,026 | |||||||||
| HCA Healthcare, Inc. (Health Care Providers & Services) | 79 | 25,381 | |||||||||
Healthpeak Properties, Inc. (Health Care REITs) | 551 | 10,800 | |||||||||
| Henry Schein, Inc.* (Health Care Providers & Services) | 100 | 6,410 | |||||||||
| Hewlett Packard Enterprise Co. (Technology Hardware, Storage & Peripherals) | 1,018 | 21,551 | |||||||||
| Hologic, Inc.* (Health Care Equipment & Supplies) | 183 | 13,588 | |||||||||
| Honeywell International, Inc. (Industrial Conglomerates) | 510 | 108,906 | |||||||||
Hormel Foods Corp. (Food Products) | 227 | 6,921 | |||||||||
| Host Hotels & Resorts, Inc. (Hotel & Resort REITs) | 221 | 3,974 | |||||||||
| Howmet Aerospace, Inc. (Aerospace & Defense) | 128 | 9,937 | |||||||||
| HP, Inc. (Technology Hardware, Storage & Peripherals) | 676 | 23,674 | |||||||||
Hubbell, Inc. (Electrical Equipment) | 23 | 8,406 | |||||||||
| Humana, Inc. (Health Care Providers & Services) | 94 | 35,123 | |||||||||
Huntington Bancshares, Inc. (Banks) | 1,135 | 14,959 | |||||||||
| Huntington Ingalls Industries, Inc. (Aerospace & Defense) | 31 | 7,636 | |||||||||
IDEX Corp. (Machinery) | 59 | 11,871 | |||||||||
| IDEXX Laboratories, Inc.* (Health Care Equipment & Supplies) | 28 | 13,642 | |||||||||
Illinois Tool Works, Inc. (Machinery) | 115 | 27,250 | |||||||||
Incyte Corp.* (Biotechnology) | 146 | 8,851 | |||||||||
Ingersoll Rand, Inc. (Machinery) | 73 | 6,631 | |||||||||
| Insulet Corp.* (Health Care Equipment & Supplies) | 34 | 6,861 | |||||||||
| Intel Corp. (Semiconductors & Semiconductor Equipment) | 3,335 | 103,284 | |||||||||
| Intercontinental Exchange, Inc. (Capital Markets) | 449 | 61,464 | |||||||||
| International Business Machines Corp. (IT Services) | 720 | 124,524 | |||||||||
| International Flavors & Fragrances, Inc. (Chemicals) | 200 | 19,042 | |||||||||
| International Paper Co. (Containers & Packaging) | 272 | 11,737 | |||||||||
| Intuitive Surgical, Inc.* (Health Care Equipment & Supplies) | 94 | 41,816 | |||||||||
Invesco, Ltd. (Capital Markets) | 352 | 5,266 | |||||||||
Invitation Homes, Inc. (Residential REITs) | 451 | 16,186 | |||||||||
| IQVIA Holdings, Inc.* (Life Sciences Tools & Services) | 88 | 18,607 | |||||||||
Iron Mountain, Inc. (Specialized REITs) | 113 | 10,127 | |||||||||
| J.B. Hunt Transport Services, Inc. (Ground Transportation) | 64 | 10,240 | |||||||||
| Jabil, Inc. (Electronic Equipment, Instruments & Components) | 43 | 4,678 | |||||||||
Common Stocks, continued
Shares | Value | ||||||||||
| Jack Henry & Associates, Inc. (Financial Services) | 57 | $ | 9,463 | ||||||||
Jacobs Solutions, Inc. (Professional Services) | 98 | 13,692 | |||||||||
Johnson & Johnson (Pharmaceuticals) | 1,885 | 275,511 | |||||||||
| Johnson Controls International PLC (Building Products) | 528 | 35,097 | |||||||||
JPMorgan Chase & Co. (Banks) | 2,250 | 455,086 | |||||||||
| Juniper Networks, Inc. (Communications Equipment) | 255 | 9,297 | |||||||||
Kellanova (Food Products) | 206 | 11,882 | |||||||||
Kenvue, Inc. (Personal Care Products) | 1,500 | 27,270 | |||||||||
Keurig Dr Pepper, Inc. (Beverages) | 818 | 27,321 | |||||||||
KeyCorp (Banks) | 739 | 10,501 | |||||||||
| Keysight Technologies, Inc.* (Electronic Equipment, Instruments & Components) | 137 | 18,735 | |||||||||
Kimberly-Clark Corp. (Household Products) | 264 | 36,485 | |||||||||
Kimco Realty Corp. (Retail REITs) | 523 | 10,178 | |||||||||
| Kinder Morgan, Inc. (Oil, Gas & Consumable Fuels) | 1,513 | 30,063 | |||||||||
| L3Harris Technologies, Inc. (Aerospace & Defense) | 149 | 33,462 | |||||||||
| Labcorp Holdings, Inc. (Health Care Providers & Services) | 66 | 13,432 | |||||||||
Lamb Weston Holdings, Inc. (Food Products) | 38 | 3,195 | |||||||||
| Las Vegas Sands Corp. (Hotels, Restaurants & Leisure) | 112 | 4,956 | |||||||||
Leidos Holdings, Inc. (Professional Services) | 106 | 15,463 | |||||||||
Lennar Corp.—Class A (Household Durables) | 84 | 12,588 | |||||||||
Linde PLC (Chemicals) | 181 | 79,424 | |||||||||
LKQ Corp. (Distributors) | 209 | 8,692 | |||||||||
Lockheed Martin Corp. (Aerospace & Defense) | 167 | 78,006 | |||||||||
Loews Corp. (Insurance) | 142 | 10,613 | |||||||||
Lowe's Cos., Inc. (Specialty Retail) | 448 | 98,766 | |||||||||
| LyondellBasell Industries N.V.—Class A (Chemicals) | 202 | 19,323 | |||||||||
M&T Bank Corp. (Banks) | 131 | 19,828 | |||||||||
| Marathon Oil Corp. (Oil, Gas & Consumable Fuels) | 208 | 5,963 | |||||||||
| Marathon Petroleum Corp. (Oil, Gas & Consumable Fuels) | 124 | 21,512 | |||||||||
MarketAxess Holdings, Inc. (Capital Markets) | 30 | 6,016 | |||||||||
| Marriott International, Inc.—Class A (Hotels, Restaurants & Leisure) | — | (a) | 75 | ||||||||
Marsh & McLennan Cos., Inc. (Insurance) | 185 | 38,983 | |||||||||
| Martin Marietta Materials, Inc. (Construction Materials) | 16 | 8,669 | |||||||||
Masco Corp. (Building Products) | 79 | 5,267 | |||||||||
Mastercard, Inc.—Class A (Financial Services) | 180 | 79,409 | |||||||||
| Match Group, Inc.* (Interactive Media & Services) | 208 | 6,319 | |||||||||
McCormick & Co., Inc. (Food Products) | 197 | 13,975 | |||||||||
| McDonald's Corp. (Hotels, Restaurants & Leisure) | 316 | 80,530 | |||||||||
| McKesson Corp. (Health Care Providers & Services) | 102 | 59,572 | |||||||||
| Medtronic PLC (Health Care Equipment & Supplies) | 1,040 | 81,859 | |||||||||
Merck & Co., Inc. (Pharmaceuticals) | 1,190 | 147,322 | |||||||||
MetLife, Inc. (Insurance) | 468 | 32,849 | |||||||||
| Mettler-Toledo International, Inc.* (Life Sciences Tools & Services) | 10 | 13,976 | |||||||||
See accompanying notes to the financial statements.
June 30, 2024 (unaudited) :: Schedule of Portfolio Investments :: ProFund VP Large-Cap Value :: 49
Common Stocks, continued
Shares | Value | ||||||||||
| MGM Resorts International* (Hotels, Restaurants & Leisure) | 63 | $ | 2,800 | ||||||||
| Microchip Technology, Inc. (Semiconductors & Semiconductor Equipment) | 174 | 15,921 | |||||||||
| Micron Technology, Inc. (Semiconductors & Semiconductor Equipment) | 867 | 114,036 | |||||||||
| Mid-America Apartment Communities, Inc. (Residential REITs) | 92 | 13,120 | |||||||||
Moderna, Inc.* (Biotechnology) | 261 | 30,994 | |||||||||
| Mohawk Industries, Inc.* (Household Durables) | 42 | 4,771 | |||||||||
| Molina Healthcare, Inc.* (Health Care Providers & Services) | 19 | 5,649 | |||||||||
| Molson Coors Beverage Co.—Class B (Beverages) | 142 | 7,218 | |||||||||
| Mondelez International, Inc.—Class A (Food Products) | 609 | 39,854 | |||||||||
Monster Beverage Corp.* (Beverages) | 222 | 11,089 | |||||||||
Moody's Corp. (Capital Markets) | 65 | 27,360 | |||||||||
Morgan Stanley (Capital Markets) | 980 | 95,246 | |||||||||
| Motorola Solutions, Inc. (Communications Equipment) | 55 | 21,233 | |||||||||
MSCI, Inc. (Capital Markets) | 27 | 13,007 | |||||||||
Nasdaq, Inc. (Capital Markets) | 298 | 17,957 | |||||||||
| NetApp, Inc. (Technology Hardware, Storage & Peripherals) | 102 | 13,138 | |||||||||
Newmont Corp. (Metals & Mining) | 903 | 37,808 | |||||||||
News Corp.—Class A (Media) | 297 | 8,188 | |||||||||
News Corp.—Class B (Media) | 90 | 2,555 | |||||||||
NextEra Energy, Inc. (Electric Utilities) | 1,609 | 113,933 | |||||||||
| NIKE, Inc.—Class B (Textiles, Apparel & Luxury Goods) | 541 | 40,775 | |||||||||
NiSource, Inc. (Multi-Utilities) | 351 | 10,112 | |||||||||
Nordson Corp. (Machinery) | 43 | 9,973 | |||||||||
| Norfolk Southern Corp. (Ground Transportation) | 177 | 38,000 | |||||||||
Northern Trust Corp. (Capital Markets) | 160 | 13,437 | |||||||||
| Northrop Grumman Corp. (Aerospace & Defense) | 109 | 47,519 | |||||||||
NRG Energy, Inc. (Electric Utilities) | 163 | 12,691 | |||||||||
Nucor Corp. (Metals & Mining) | 69 | 10,908 | |||||||||
| NXP Semiconductors N.V. (Semiconductors & Semiconductor Equipment) | 50 | 13,455 | |||||||||
| Occidental Petroleum Corp. (Oil, Gas & Consumable Fuels) | 521 | 32,839 | |||||||||
Omnicom Group, Inc. (Media) | 153 | 13,724 | |||||||||
| ON Semiconductor Corp.* (Semiconductors & Semiconductor Equipment) | 189 | 12,956 | |||||||||
ONEOK, Inc. (Oil, Gas & Consumable Fuels) | 174 | 14,190 | |||||||||
O'Reilly Automotive, Inc.* (Specialty Retail) | 12 | 12,673 | |||||||||
Otis Worldwide Corp. (Machinery) | 193 | 18,578 | |||||||||
PACCAR, Inc. (Machinery) | 111 | 11,426 | |||||||||
| Packaging Corp. of America (Containers & Packaging) | 70 | 12,779 | |||||||||
Paramount Global—Class B (Media) | 387 | 4,021 | |||||||||
Parker-Hannifin Corp. (Machinery) | 22 | 11,128 | |||||||||
Paychex, Inc. (Professional Services) | 151 | 17,903 | |||||||||
Paycom Software, Inc. (Professional Services) | 21 | 3,004 | |||||||||
PayPal Holdings, Inc.* (Financial Services) | 819 | 47,527 | |||||||||
Pentair PLC (Machinery) | 39 | 2,990 | |||||||||
Common Stocks, continued
Shares | Value | ||||||||||
PepsiCo, Inc. (Beverages) | 689 | $ | 113,637 | ||||||||
Pfizer, Inc. (Pharmaceuticals) | 4,439 | 124,203 | |||||||||
PG&E Corp. (Electric Utilities) | 1,674 | 29,228 | |||||||||
Philip Morris International, Inc. (Tobacco) | 767 | 77,720 | |||||||||
Phillips 66 (Oil, Gas & Consumable Fuels) | 332 | 46,868 | |||||||||
Pinnacle West Capital Corp. (Electric Utilities) | 89 | 6,798 | |||||||||
Pool Corp. (Distributors) | 13 | 3,995 | |||||||||
PPG Industries, Inc. (Chemicals) | 184 | 23,164 | |||||||||
PPL Corp. (Electric Utilities) | 578 | 15,982 | |||||||||
Principal Financial Group, Inc. (Insurance) | 169 | 13,258 | |||||||||
Prologis, Inc. (Industrial REITs) | 725 | 81,425 | |||||||||
Prudential Financial, Inc. (Insurance) | 281 | 32,930 | |||||||||
PTC, Inc.* (Software) | 38 | 6,903 | |||||||||
| Public Service Enterprise Group, Inc. (Multi-Utilities) | 390 | 28,743 | |||||||||
Public Storage (Specialized REITs) | 72 | 20,711 | |||||||||
| Qorvo, Inc.* (Semiconductors & Semiconductor Equipment) | 76 | 8,819 | |||||||||
| QUALCOMM, Inc. (Semiconductors & Semiconductor Equipment) | 420 | 83,656 | |||||||||
| Quanta Services, Inc. (Construction & Engineering) | 36 | 9,147 | |||||||||
| Quest Diagnostics, Inc. (Health Care Providers & Services) | 87 | 11,909 | |||||||||
| Ralph Lauren Corp. (Textiles, Apparel & Luxury Goods) | 14 | 2,451 | |||||||||
| Raymond James Financial, Inc. (Capital Markets) | 146 | 18,047 | |||||||||
Realty Income Corp. (Retail REITs) | 682 | 36,023 | |||||||||
Regency Centers Corp. (Retail REITs) | 129 | 8,024 | |||||||||
| Regeneron Pharmaceuticals, Inc.* (Biotechnology) | 33 | 34,684 | |||||||||
Regions Financial Corp. (Banks) | 717 | 14,369 | |||||||||
| Republic Services, Inc. (Commercial Services & Supplies) | 69 | 13,409 | |||||||||
| ResMed, Inc. (Health Care Equipment & Supplies) | 115 | 22,013 | |||||||||
Revvity, Inc. (Life Sciences Tools & Services) | 97 | 10,171 | |||||||||
| Rockwell Automation, Inc. (Electrical Equipment) | 46 | 12,663 | |||||||||
| Rollins, Inc. (Commercial Services & Supplies) | 125 | 6,099 | |||||||||
Roper Technologies, Inc. (Software) | 48 | 27,056 | |||||||||
RTX Corp. (Aerospace & Defense) | 1,042 | 104,606 | |||||||||
S&P Global, Inc. (Capital Markets) | 140 | 62,440 | |||||||||
| SBA Communications Corp. (Specialized REITs) | 51 | 10,011 | |||||||||
| Schlumberger N.V. (Energy Equipment & Services) | 1,120 | 52,842 | |||||||||
| Seagate Technology Holdings PLC (Technology Hardware, Storage & Peripherals) | 90 | 9,294 | |||||||||
Sempra (Multi-Utilities) | 496 | 37,725 | |||||||||
Simon Property Group, Inc. (Retail REITs) | 161 | 24,440 | |||||||||
| Skyworks Solutions, Inc. (Semiconductors & Semiconductor Equipment) | 126 | 13,429 | |||||||||
Snap-on, Inc. (Machinery) | 23 | 6,012 | |||||||||
| Solventum Corp.* (Health Care Providers & Services) | 108 | 5,711 | |||||||||
Southwest Airlines Co. (Passenger Airlines) | 469 | 13,418 | |||||||||
Stanley Black & Decker, Inc. (Machinery) | 121 | 9,667 | |||||||||
See accompanying notes to the financial statements.
50 :: ProFund VP Large-Cap Value :: Schedule of Portfolio Investments :: June 30, 2024 (unaudited)
Common Stocks, continued
Shares | Value | ||||||||||
| Starbucks Corp. (Hotels, Restaurants & Leisure) | 364 | $ | 28,337 | ||||||||
State Street Corp. (Capital Markets) | 236 | 17,464 | |||||||||
Steel Dynamics, Inc. (Metals & Mining) | 43 | 5,569 | |||||||||
| STERIS PLC (Health Care Equipment & Supplies) | 34 | 7,464 | |||||||||
| Stryker Corp. (Health Care Equipment & Supplies) | 96 | 32,664 | |||||||||
Synchrony Financial (Consumer Finance) | 315 | 14,865 | |||||||||
| Sysco Corp. (Consumer Staples Distribution & Retail) | 390 | 27,842 | |||||||||
T. Rowe Price Group, Inc. (Capital Markets) | 175 | 20,179 | |||||||||
| Take-Two Interactive Software, Inc.* (Entertainment) | 62 | 9,640 | |||||||||
| Tapestry, Inc. (Textiles, Apparel & Luxury Goods) | 180 | 7,702 | |||||||||
| Target Corp. (Consumer Staples Distribution & Retail) | 362 | 53,590 | |||||||||
| TE Connectivity, Ltd. (Electronic Equipment, Instruments & Components) | 146 | 21,963 | |||||||||
| Teledyne Technologies, Inc.* (Electronic Equipment, Instruments & Components) | 37 | 14,355 | |||||||||
| Teleflex, Inc. (Health Care Equipment & Supplies) | 37 | 7,782 | |||||||||
| Teradyne, Inc. (Semiconductors & Semiconductor Equipment) | 122 | 18,091 | |||||||||
| Texas Instruments, Inc. (Semiconductors & Semiconductor Equipment) | 449 | 87,344 | |||||||||
Textron, Inc. (Aerospace & Defense) | 149 | 12,793 | |||||||||
| The AES Corp. (Independent Power and Renewable Electricity Producers) | 557 | 9,786 | |||||||||
The Allstate Corp. (Insurance) | 207 | 33,050 | |||||||||
| The Bank of New York Mellon Corp. (Capital Markets) | 586 | 35,096 | |||||||||
The Boeing Co.* (Aerospace & Defense) | 253 | 46,049 | |||||||||
The Charles Schwab Corp. (Capital Markets) | 1,170 | 86,217 | |||||||||
| The Cigna Group (Health Care Providers & Services) | 223 | 73,717 | |||||||||
The Clorox Co. (Household Products) | 97 | 13,238 | |||||||||
The Coca-Cola Co. (Beverages) | 1,853 | 117,943 | |||||||||
| The Cooper Cos., Inc.* (Health Care Equipment & Supplies) | 90 | 7,857 | |||||||||
| The Estee Lauder Cos., Inc. (Personal Care Products) | 183 | 19,471 | |||||||||
| The Goldman Sachs Group, Inc. (Capital Markets) | 253 | 114,437 | |||||||||
| The Hartford Financial Services Group, Inc. (Insurance) | 232 | 23,325 | |||||||||
The Hershey Co. (Food Products) | 72 | 13,236 | |||||||||
The Home Depot, Inc. (Specialty Retail) | 489 | 168,334 | |||||||||
The Interpublic Group of Cos., Inc. (Media) | 296 | 8,611 | |||||||||
The J M Smucker Co. (Food Products) | 83 | 9,050 | |||||||||
The Kraft Heinz Co. (Food Products) | 618 | 19,912 | |||||||||
| The Kroger Co. (Consumer Staples Distribution & Retail) | 524 | 26,163 | |||||||||
The Mosaic Co. (Chemicals) | 252 | 7,283 | |||||||||
The PNC Financial Services Group, Inc. (Banks) | 312 | 48,510 | |||||||||
| The Procter & Gamble Co. (Household Products) | 1,128 | 186,029 | |||||||||
The Progressive Corp. (Insurance) | 229 | 47,566 | |||||||||
The Sherwin-Williams Co. (Chemicals) | 91 | 27,157 | |||||||||
Common Stocks, continued
Shares | Value | ||||||||||
The Southern Co. (Electric Utilities) | 857 | $ | 66,477 | ||||||||
The TJX Cos., Inc. (Specialty Retail) | 311 | 34,241 | |||||||||
The Travelers Cos., Inc. (Insurance) | 179 | 36,398 | |||||||||
The Walt Disney Co. (Entertainment) | 1,428 | 141,786 | |||||||||
| The Williams Cos., Inc. (Oil, Gas & Consumable Fuels) | 582 | 24,735 | |||||||||
| Thermo Fisher Scientific, Inc. (Life Sciences Tools & Services) | 185 | 102,305 | |||||||||
| T-Mobile U.S., Inc. (Wireless Telecommunication Services) | 404 | 71,177 | |||||||||
Tractor Supply Co. (Specialty Retail) | 49 | 13,230 | |||||||||
Trane Technologies PLC (Building Products) | 55 | 18,091 | |||||||||
| Trimble, Inc.* (Electronic Equipment, Instruments & Components) | 191 | 10,681 | |||||||||
Truist Financial Corp. (Banks) | 1,048 | 40,715 | |||||||||
Tyson Foods, Inc.—Class A (Food Products) | 224 | 12,799 | |||||||||
U.S. Bancorp (Banks) | 1,222 | 48,513 | |||||||||
UDR, Inc. (Residential REITs) | 237 | 9,753 | |||||||||
Ulta Beauty, Inc.* (Specialty Retail) | 13 | 5,016 | |||||||||
Union Pacific Corp. (Ground Transportation) | 263 | 59,506 | |||||||||
| United Airlines Holdings, Inc.* (Passenger Airlines) | 258 | 12,554 | |||||||||
| United Parcel Service, Inc.—Class B (Air Freight & Logistics) | 571 | 78,141 | |||||||||
| UnitedHealth Group, Inc. (Health Care Providers & Services) | 447 | 227,638 | |||||||||
| Universal Health Services, Inc.—Class B (Health Care Providers & Services) | 47 | 8,692 | |||||||||
| Valero Energy Corp. (Oil, Gas & Consumable Fuels) | 256 | 40,131 | |||||||||
Ventas, Inc. (Health Care REITs) | 317 | 16,249 | |||||||||
| Veralto Corp. (Commercial Services & Supplies) | 172 | 16,421 | |||||||||
VeriSign, Inc.* (IT Services) | 35 | 6,223 | |||||||||
Verisk Analytics, Inc. (Professional Services) | 50 | 13,478 | |||||||||
| Verizon Communications, Inc. (Diversified Telecommunication Services) | 3,297 | 135,968 | |||||||||
Vertex Pharmaceuticals, Inc.* (Biotechnology) | 73 | 34,217 | |||||||||
Viatris, Inc. (Pharmaceuticals) | 933 | 9,918 | |||||||||
VICI Properties, Inc. (Specialized REITs) | 817 | 23,399 | |||||||||
Visa, Inc.—Class A (Financial Services) | 419 | 109,975 | |||||||||
Vulcan Materials Co. (Construction Materials) | 37 | 9,201 | |||||||||
W.R. Berkley Corp. (Insurance) | 158 | 12,416 | |||||||||
| W.W. Grainger, Inc. (Trading Companies & Distributors) | 9 | 8,120 | |||||||||
| Walgreens Boots Alliance, Inc. (Consumer Staples Distribution & Retail) | 561 | 6,785 | |||||||||
| Walmart, Inc. (Consumer Staples Distribution & Retail) | 3,346 | 226,559 | |||||||||
Warner Bros. Discovery, Inc.* (Entertainment) | 1,747 | 12,998 | |||||||||
| Waste Management, Inc. (Commercial Services & Supplies) | 152 | 32,428 | |||||||||
Waters Corp.* (Life Sciences Tools & Services) | 29 | 8,413 | |||||||||
WEC Energy Group, Inc. (Multi-Utilities) | 247 | 19,380 | |||||||||
Wells Fargo & Co. (Banks) | 2,731 | 162,194 | |||||||||
Welltower, Inc. (Health Care REITs) | 468 | 48,789 | |||||||||
| Western Digital Corp.* (Technology Hardware, Storage & Peripherals) | 256 | 19,397 | |||||||||
| Westinghouse Air Brake Technologies Corp. (Machinery) | 138 | 21,811 | |||||||||
Westrock Co. (Containers & Packaging) | 202 | 10,153 | |||||||||
See accompanying notes to the financial statements.
June 30, 2024 (unaudited) :: Schedule of Portfolio Investments :: ProFund VP Large-Cap Value :: 51
Common Stocks, continued
Shares | Value | ||||||||||
Weyerhaeuser Co. (Specialized REITs) | 571 | $ | 16,211 | ||||||||
Willis Towers Watson PLC (Insurance) | 80 | 20,971 | |||||||||
Xcel Energy, Inc. (Electric Utilities) | 435 | 23,233 | |||||||||
Xylem, Inc. (Machinery) | 190 | 25,770 | |||||||||
| Yum! Brands, Inc. (Hotels, Restaurants & Leisure) | 119 | 15,763 | |||||||||
| Zebra Technologies Corp.* (Electronic Equipment, Instruments & Components) | 40 | 12,357 | |||||||||
| Zimmer Biomet Holdings, Inc. (Health Care Equipment & Supplies) | 161 | 17,473 | |||||||||
Zoetis, Inc. (Pharmaceuticals) | 161 | 27,911 | |||||||||
| TOTAL COMMON STOCKS (Cost $10,139,101) | 15,220,738 | ||||||||||
Repurchase Agreements(b) (0.4%)
| Principal Amount | Value | ||||||||||
| Repurchase Agreements with various counterparties, rates 5.12%–5.20%, dated 6/28/2024, due 7/1/24, total to be received $56,024 | $ | 56,000 | $ | 56,000 | |||||||
| TOTAL REPURCHASE AGREEMENTS (Cost $56,000) | 56,000 | ||||||||||
| TOTAL INVESTMENT SECURITIES (Cost $10,195,101)—100.1% | 15,276,738 | ||||||||||
Net other assets (liabilities)—(0.1)% | (20,322 | ) | |||||||||
NET ASSETS—100.0% | $ | 15,256,416 | |||||||||
* Non-income producing security.
(a) Number of shares is less than 0.50
(b) The ProFund VP invests in Repurchase Agreements jointly with other funds in the Trust. See "Repurchase Agreements" under Note 2 in the Notes to Financial Statements to view the details of each individual agreement and counterparty as well as a description of the securities subject to repurchase.
REIT Real Estate Investment Trust
See accompanying notes to the financial statements.
52 :: ProFund VP Large-Cap Value :: Schedule of Portfolio Investments :: June 30, 2024 (unaudited)
ProFund VP Large-Cap Value invested in the following industries as of June 30, 2024:
Value | % of Net Assets | ||||||||||
Aerospace & Defense | $ | 391,653 | 2.5 | % | |||||||
Air Freight & Logistics | 148,055 | 1.0 | % | ||||||||
Automobile Components | 20,738 | 0.1 | % | ||||||||
Automobiles | 80,058 | 0.5 | % | ||||||||
Banks | 1,153,811 | 7.5 | % | ||||||||
Beverages | 315,672 | 2.1 | % | ||||||||
Biotechnology | 482,930 | 3.2 | % | ||||||||
Broadline Retail | 24,281 | 0.2 | % | ||||||||
Building Products | 87,789 | 0.6 | % | ||||||||
Capital Markets | 767,165 | 5.0 | % | ||||||||
Chemicals | 357,034 | 2.4 | % | ||||||||
Commercial Services & Supplies | 89,365 | 0.6 | % | ||||||||
Communications Equipment | 189,154 | 1.2 | % | ||||||||
Construction & Engineering | 9,147 | 0.1 | % | ||||||||
Construction Materials | 17,870 | 0.1 | % | ||||||||
Consumer Finance | 99,062 | 0.6 | % | ||||||||
Consumer Staples Distribution & Retail | 552,678 | 3.6 | % | ||||||||
Containers & Packaging | 74,099 | 0.5 | % | ||||||||
Distributors | 27,764 | 0.2 | % | ||||||||
Diversified Telecommunication Services | 243,309 | 1.6 | % | ||||||||
Electric Utilities | 509,995 | 3.3 | % | ||||||||
Electrical Equipment | 146,840 | 1.0 | % | ||||||||
| Electronic Equipment, Instruments & Components | 147,780 | 1.0 | % | ||||||||
Energy Equipment & Services | 103,788 | 0.7 | % | ||||||||
Entertainment | 179,332 | 1.2 | % | ||||||||
Financial Services | 908,202 | 6.0 | % | ||||||||
Food Products | 211,647 | 1.4 | % | ||||||||
Gas Utilities | 13,765 | 0.1 | % | ||||||||
Ground Transportation | 133,369 | 0.9 | % | ||||||||
Health Care Equipment & Supplies | 573,841 | 3.8 | % | ||||||||
Health Care Providers & Services | 708,184 | 4.5 | % | ||||||||
Health Care REITs | 75,838 | 0.5 | % | ||||||||
Hotel & Resort REITs | 3,974 | NM | |||||||||
Hotels, Restaurants & Leisure | 180,872 | 1.2 | % | ||||||||
Household Durables | 26,320 | 0.2 | % | ||||||||
Household Products | 284,471 | 1.9 | % | ||||||||
| Independent Power and Renewable Electricity Producers | 9,786 | 0.1 | % | ||||||||
Value | % of Net Assets | ||||||||||
Industrial Conglomerates | $ | 230,890 | 1.5 | % | |||||||
Industrial REITs | 81,425 | 0.5 | % | ||||||||
Insurance | 547,792 | 3.6 | % | ||||||||
Interactive Media & Services | 6,319 | NM | |||||||||
IT Services | 236,827 | 1.6 | % | ||||||||
Leisure Products | 6,026 | NM | |||||||||
Life Sciences Tools & Services | 333,656 | 2.2 | % | ||||||||
Machinery | 298,363 | 1.9 | % | ||||||||
Media | 178,940 | 1.2 | % | ||||||||
Metals & Mining | 81,646 | 0.5 | % | ||||||||
Multi-Utilities | 214,683 | 1.4 | % | ||||||||
Office REITs | 21,344 | 0.1 | % | ||||||||
Oil, Gas & Consumable Fuels | 924,185 | 6.0 | % | ||||||||
Passenger Airlines | 42,328 | 0.3 | % | ||||||||
Personal Care Products | 46,741 | 0.3 | % | ||||||||
Pharmaceuticals | 658,800 | 4.3 | % | ||||||||
Professional Services | 135,285 | 0.9 | % | ||||||||
Real Estate Management & Development | 34,523 | 0.2 | % | ||||||||
Residential REITs | 103,412 | 0.7 | % | ||||||||
Retail REITs | 84,521 | 0.6 | % | ||||||||
| Semiconductors & Semiconductor Equipment | 532,904 | 3.4 | % | ||||||||
Software | 73,870 | 0.5 | % | ||||||||
Specialized REITs | 233,775 | 1.6 | % | ||||||||
Specialty Retail | 372,699 | 2.5 | % | ||||||||
| Technology Hardware, Storage & Peripherals | 87,054 | 0.6 | % | ||||||||
Textiles, Apparel & Luxury Goods | 50,928 | 0.3 | % | ||||||||
Tobacco | 139,030 | 0.9 | % | ||||||||
Trading Companies & Distributors | 22,196 | 0.1 | % | ||||||||
Water Utilities | 19,761 | 0.1 | % | ||||||||
Wireless Telecommunication Services | 71,177 | 0.5 | % | ||||||||
Other** | 35,678 | 0.3 | % | ||||||||
Total | $ | 15,256,416 | 100.0 | % | |||||||
** Includes any non-equity securities and net other assets (liabilities), which includes any receivable for capital shares issued and payable for capital shares redeemed.
NM Not meaningful, amount is less than 0.05%
REIT Real Estate Investment Trust
See accompanying notes to the financial statements.
Common Stocks (99.1%)
Shares | Value | ||||||||||
Air Products and Chemicals, Inc. (Chemicals) | 3,250 | $ | 838,663 | ||||||||
Albemarle Corp. (Chemicals) | 1,732 | 165,441 | |||||||||
Amcor PLC (Containers & Packaging) | 21,298 | 208,294 | |||||||||
| Avery Dennison Corp. (Containers & Packaging) | 1,187 | 259,538 | |||||||||
Ball Corp. (Containers & Packaging) | 4,574 | 274,531 | |||||||||
Celanese Corp. (Chemicals) | 1,481 | 199,772 | |||||||||
CF Industries Holdings, Inc. (Chemicals) | 2,693 | 199,605 | |||||||||
Corteva, Inc. (Chemicals) | 10,270 | �� | 553,964 | ||||||||
Dow, Inc. (Chemicals) | 10,362 | 549,704 | |||||||||
DuPont de Nemours, Inc. (Chemicals) | 6,161 | 495,899 | |||||||||
Eastman Chemical Co. (Chemicals) | 1,734 | 169,880 | |||||||||
Ecolab, Inc. (Chemicals) | 3,715 | 884,170 | |||||||||
FMC Corp. (Chemicals) | 1,839 | 105,834 | |||||||||
| Freeport-McMoRan, Inc. (Metals & Mining) | 20,998 | 1,020,502 | |||||||||
| International Flavors & Fragrances, Inc. (Chemicals) | 3,763 | 358,275 | |||||||||
| International Paper Co. (Containers & Packaging) | 5,118 | 220,842 | |||||||||
Linde PLC (Chemicals) | 7,027 | 3,083,517 | |||||||||
| LyondellBasell Industries N.V.—Class A (Chemicals) | 3,791 | 362,647 | |||||||||
| Martin Marietta Materials, Inc. (Construction Materials) | 908 | 491,956 | |||||||||
Newmont Corp. (Metals & Mining) | 15,533 | 650,367 | |||||||||
Nucor Corp. (Metals & Mining) | 3,533 | 558,497 | |||||||||
| Packaging Corp. of America (Containers & Packaging) | 1,314 | 239,884 | |||||||||
PPG Industries, Inc. (Chemicals) | 3,468 | 436,587 | |||||||||
Common Stocks, continued
Shares | Value | ||||||||||
Steel Dynamics, Inc. (Metals & Mining) | 2,177 | $ | 281,922 | ||||||||
The Mosaic Co. (Chemicals) | 4,736 | 136,870 | |||||||||
The Sherwin-Williams Co. (Chemicals) | 3,410 | 1,017,646 | |||||||||
| Vulcan Materials Co. (Construction Materials) | 1,949 | 484,677 | |||||||||
Westrock Co. (Containers & Packaging) | 3,804 | 191,189 | |||||||||
| TOTAL COMMON STOCKS (Cost $5,663,268) | 14,440,673 | ||||||||||
Repurchase Agreements(a) (0.6%)
| Principal Amount | Value | ||||||||||
| Repurchase Agreements with various counterparties, rates 5.12%–5.20%, dated 6/28/2024, due 7/1/24, total to be received $89,038 | $ | 89,000 | $ | 89,000 | |||||||
| TOTAL REPURCHASE AGREEMENTS (Cost $89,000) | 89,000 | ||||||||||
| TOTAL INVESTMENT SECURITIES (Cost $5,752,268)—99.7% | 14,529,673 | ||||||||||
Net other assets (liabilities)—0.3% | 50,482 | ||||||||||
NET ASSETS—100.0% | $ | 14,580,155 | |||||||||
(a) The ProFund VP invests in Repurchase Agreements jointly with other funds in the Trust. See "Repurchase Agreements" under Note 2 in the Notes to Financial Statements to view the details of each individual agreement and counterparty as well as a description of the securities subject to repurchase.
Total Return Swap Agreements—Long
Underlying Instrument | Counterparty | Termination Date(1) | Rate Paid (Received)(2) | Notional Amount | Value and Unrealized Appreciation/ (Depreciation) | ||||||||||||||||||
S&P Materials Select Sector Index | Goldman Sachs International | 7/23/24 | 6.08 | % | $ | 145,429 | $ | (1,403 | ) | ||||||||||||||
(1) Agreements may be terminated at will by either party without penalty. Payment is due at termination/maturity.
(2) Reflects the floating financing rate, as of June 30, 2024, on the notional amount of the swap agreement paid to the counterparty or received from the counterparty, excluding any commissions. This amount is included as part of the unrealized appreciation/(depreciation).
ProFund VP Materials invested in the following industries as of June 30, 2024:
Value | % of Net Assets | ||||||||||
Chemicals | $ | 9,558,474 | 65.6 | % | |||||||
Construction Materials | 976,632 | 6.7 | % | ||||||||
Containers & Packaging | 1,394,278 | 9.6 | % | ||||||||
Metals & Mining | 2,511,288 | 17.2 | % | ||||||||
Other** | 139,483 | 0.9 | % | ||||||||
Total | $ | 14,580,155 | 100.0 | % | |||||||
** Includes any non-equity securities and net other assets (liabilities), which includes any receivable for capital shares issued and payable for capital shares redeemed.
See accompanying notes to the financial statements.
Repurchase Agreements(a)(b) (99.1%)
| Principal Amount | Value | ||||||||||
| Repurchase Agreements with various counterparties, rates 5.12%–5.20%, dated 6/28/2024, due 7/1/24, total to be received $11,053,777 | $ | 11,049,000 | $ | 11,049,000 | |||||||
| TOTAL REPURCHASE AGREEMENTS (Cost $11,049,000) | 11,049,000 | ||||||||||
| TOTAL INVESTMENT SECURITIES (Cost $11,049,000)—99.1% | 11,049,000 | ||||||||||
Net other assets (liabilities)—0.9% | 105,614 | ||||||||||
NET ASSETS—100.0% | $ | 11,154,614 | |||||||||
(a) A portion of these securities were held in a segregated account for the benefit of swap counterparties in the event of default. At June 30, 2024, the aggregate amount held in a segregated account was $1,440,000.
(b) The ProFund VP invests in Repurchase Agreements jointly with other funds in the Trust. See "Repurchase Agreements" under Note 2 in the Notes to Financial Statements to view the details of each individual agreement and counterparty as well as a description of the securities subject to repurchase.
Futures Contracts Purchased
| Number of Contracts | Expiration Date | Notional Amount | Value and Unrealized Appreciation/ (Depreciation) | ||||||||||||||||
E-Mini S&P MidCap 400 Futures Contracts | 5 | 9/23/24 | $ | 1,479,050 | $ | (14,761 | ) | ||||||||||||
Total Return Swap Agreements—Long
Underlying Instrument | Counterparty | Termination Date(1) | Rate Paid (Received)(2) | Notional Amount | Value and Unrealized Appreciation/ (Depreciation) | ||||||||||||||||||
S&P MidCap 400 | Goldman Sachs International | 7/29/24 | 5.98 | % | $ | 4,365,688 | $ | 12,441 | |||||||||||||||
S&P MidCap 400 | UBS AG | 7/29/24 | 5.68 | % | 5,292,915 | 15,148 | |||||||||||||||||
$ | 9,658,603 | $ | 27,589 | ||||||||||||||||||||
(1) Agreements may be terminated at will by either party without penalty. Payment is due at termination/maturity.
(2) Reflects the floating financing rate, as of June 30, 2024, on the notional amount of the swap agreement paid to the counterparty or received from the counterparty, excluding any commissions. This amount is included as part of the unrealized appreciation/(depreciation).
See accompanying notes to the financial statements.
Common Stocks (100.0%)
Shares | Value | ||||||||||
AAON, Inc. (Building Products) | 717 | $ | 62,551 | ||||||||
| Acadia Healthcare Co., Inc.* (Health Care Providers & Services) | 975 | 65,852 | |||||||||
Acuity Brands, Inc. (Electrical Equipment) | 163 | 39,355 | |||||||||
| Advanced Drainage Systems, Inc. (Building Products) | 716 | 114,839 | |||||||||
AECOM (Construction & Engineering) | 658 | 57,996 | |||||||||
| Allegro MicroSystems, Inc.* (Semiconductors & Semiconductor Equipment) | 263 | 7,427 | |||||||||
Altair Engineering, Inc.*—Class A (Software) | 598 | 58,652 | |||||||||
| Amedisys, Inc.* (Health Care Providers & Services) | 144 | 13,219 | |||||||||
| American Homes 4 Rent—Class A (Residential REITs) | 2,028 | 75,360 | |||||||||
| Antero Midstream Corp. (Oil, Gas & Consumable Fuels) | 2,082 | 30,689 | |||||||||
Appfolio, Inc.*—Class A (Software) | 220 | 53,805 | |||||||||
| Applied Industrial Technologies, Inc. (Trading Companies & Distributors) | 406 | 78,764 | |||||||||
AptarGroup, Inc. (Containers & Packaging) | 411 | 57,873 | |||||||||
Arcadium Lithium PLC* (Chemicals) | 6,614 | 22,223 | |||||||||
| Arrowhead Pharmaceuticals, Inc.* (Biotechnology) | 1,305 | 33,917 | |||||||||
Aspen Technology, Inc.* (Software) | 146 | 29,000 | |||||||||
Autoliv, Inc. (Automobile Components) | 456 | 48,787 | |||||||||
| Avis Budget Group, Inc. (Ground Transportation) | 191 | 19,963 | |||||||||
Axalta Coating Systems, Ltd.* (Chemicals) | 2,318 | 79,206 | |||||||||
Azenta, Inc.* (Life Sciences Tools & Services) | 363 | 19,101 | |||||||||
Bank OZK (Banks) | 576 | 23,616 | |||||||||
| BellRing Brands, Inc.* (Personal Care Products) | 726 | 41,483 | |||||||||
| BioMarin Pharmaceutical, Inc.* (Biotechnology) | 1,117 | 91,963 | |||||||||
Blackbaud, Inc.* (Software) | 263 | 20,033 | |||||||||
| Boyd Gaming Corp. (Hotels, Restaurants & Leisure) | 708 | 39,011 | |||||||||
Brixmor Property Group, Inc. (Retail REITs) | 1,393 | 32,164 | |||||||||
Bruker Corp. (Life Sciences Tools & Services) | 614 | 39,179 | |||||||||
Brunswick Corp. (Leisure Products) | 433 | 31,510 | |||||||||
Burlington Stores, Inc.* (Specialty Retail) | 403 | 96,720 | |||||||||
| BWX Technologies, Inc. (Aerospace & Defense) | 960 | 91,200 | |||||||||
Cabot Corp. (Chemicals) | 389 | 35,745 | |||||||||
| CACI International, Inc.*—Class A (Professional Services) | 87 | 37,421 | |||||||||
| Capri Holdings, Ltd.* (Textiles, Apparel & Luxury Goods) | 588 | 19,451 | |||||||||
Carlisle Cos., Inc. (Building Products) | 499 | 202,200 | |||||||||
| Casey's General Stores, Inc. (Consumer Staples Distribution & Retail) | 389 | 148,427 | |||||||||
Celsius Holdings, Inc.* (Beverages) | 1,567 | 89,460 | |||||||||
| ChampionX Corp. (Energy Equipment & Services) | 1,340 | 44,501 | |||||||||
Chart Industries, Inc.* (Machinery) | 442 | 63,798 | |||||||||
| Chemed Corp. (Health Care Providers & Services) | 95 | 51,545 | |||||||||
| Choice Hotels International, Inc.(a) (Hotels, Restaurants & Leisure) | 123 | 14,637 | |||||||||
Common Stocks, continued
Shares | Value | ||||||||||
| Chord Energy Corp. (Oil, Gas & Consumable Fuels) | 653 | $ | 109,495 | ||||||||
| Churchill Downs, Inc. (Hotels, Restaurants & Leisure) | 703 | 98,139 | |||||||||
Ciena Corp.* (Communications Equipment) | 623 | 30,016 | |||||||||
| Cirrus Logic, Inc.* (Semiconductors & Semiconductor Equipment) | 323 | 41,234 | |||||||||
| Civitas Resources, Inc. (Oil, Gas & Consumable Fuels) | 967 | 66,723 | |||||||||
| Clean Harbors, Inc.* (Commercial Services & Supplies) | 527 | 119,181 | |||||||||
| CNX Resources Corp.* (Oil, Gas & Consumable Fuels) | 1,610 | 39,123 | |||||||||
Coca-Cola Consolidated, Inc. (Beverages) | 49 | 53,165 | |||||||||
| Cognex Corp. (Electronic Equipment, Instruments & Components) | 793 | 37,081 | |||||||||
| Columbia Sportswear Co. (Textiles, Apparel & Luxury Goods) | 170 | 13,444 | |||||||||
| Comfort Systems USA, Inc. (Construction & Engineering) | 374 | 113,741 | |||||||||
Commerce Bancshares, Inc. (Banks) | 508 | 28,336 | |||||||||
CommVault Systems, Inc.* (Software) | 274 | 33,310 | |||||||||
COPT Defense Properties (Office REITs) | 461 | 11,539 | |||||||||
| Core & Main, Inc.*—Class A (Trading Companies & Distributors) | 1,024 | 50,115 | |||||||||
Coty, Inc.*—Class A (Personal Care Products) | 3,829 | 38,367 | |||||||||
Crane Co. (Machinery) | 516 | 74,810 | |||||||||
Crocs, Inc.* (Textiles, Apparel & Luxury Goods) | 638 | 93,110 | |||||||||
Crown Holdings, Inc. (Containers & Packaging) | 589 | 43,816 | |||||||||
CubeSmart (Specialized REITs) | 1,300 | 58,721 | |||||||||
Cullen/Frost Bankers, Inc. (Banks) | 283 | 28,761 | |||||||||
Curtiss-Wright Corp. (Aerospace & Defense) | 262 | 70,997 | |||||||||
Cytokinetics, Inc.* (Biotechnology) | 542 | 29,366 | |||||||||
Dick's Sporting Goods, Inc. (Specialty Retail) | 324 | 69,611 | |||||||||
Dolby Laboratories, Inc.—Class A (Software) | 358 | 28,364 | |||||||||
Donaldson Co., Inc. (Machinery) | 721 | 51,595 | |||||||||
| Doximity, Inc.*—Class A (Health Care Technology) | 642 | 17,957 | |||||||||
Dropbox, Inc.*—Class A (Software) | 2,538 | 57,029 | |||||||||
| DT Midstream, Inc. (Oil, Gas & Consumable Fuels) | 643 | 45,672 | |||||||||
| Duolingo, Inc.* (Diversified Consumer Services) | 389 | 81,173 | |||||||||
Dynatrace, Inc.* (Software) | 2,527 | 113,058 | |||||||||
Eagle Materials, Inc. (Construction Materials) | 362 | 78,721 | |||||||||
East West Bancorp, Inc. (Banks) | 789 | 57,779 | |||||||||
EastGroup Properties, Inc. (Industrial REITs) | 313 | 53,242 | |||||||||
elf Beauty, Inc.* (Personal Care Products) | 583 | 122,849 | |||||||||
| EMCOR Group, Inc. (Construction & Engineering) | 494 | 180,350 | |||||||||
| Encompass Health Corp. (Health Care Providers & Services) | 476 | 40,836 | |||||||||
EnerSys (Electrical Equipment) | 183 | 18,944 | |||||||||
EPR Properties (Specialized REITs) | 493 | 20,696 | |||||||||
Equitable Holdings, Inc. (Financial Services) | 1,702 | 69,544 | |||||||||
| Equitrans Midstream Corp. (Oil, Gas & Consumable Fuels) | 1,868 | 24,247 | |||||||||
| Equity LifeStyle Properties, Inc. (Residential REITs) | 1,254 | 81,674 | |||||||||
Erie Indemnity Co.—Class A (Insurance) | 152 | 55,085 | |||||||||
Esab Corp. (Machinery) | 597 | 56,375 | |||||||||
See accompanying notes to the financial statements.
56 :: ProFund VP Mid-Cap Growth :: Schedule of Portfolio Investments :: June 30, 2024 (unaudited)
Common Stocks, continued
Shares | Value | ||||||||||
Essential Utilities, Inc. (Water Utilities) | 1,269 | $ | 47,372 | ||||||||
Euronet Worldwide, Inc.* (Financial Services) | 247 | 25,565 | |||||||||
Evercore, Inc. (Capital Markets) | 257 | 53,567 | |||||||||
Exelixis, Inc.* (Biotechnology) | 3,060 | 68,758 | |||||||||
| ExlService Holdings, Inc.* (Professional Services) | 973 | 30,513 | |||||||||
Exponent, Inc. (Professional Services) | 271 | 25,778 | |||||||||
First Financial Bankshares, Inc. (Banks) | 540 | 15,946 | |||||||||
| First Industrial Realty Trust, Inc. (Industrial REITs) | 667 | 31,689 | |||||||||
FirstCash Holdings, Inc. (Consumer Finance) | 392 | 41,113 | |||||||||
Five Below, Inc.* (Specialty Retail) | 580 | 63,203 | |||||||||
| Floor & Decor Holdings, Inc.*—Class A (Specialty Retail) | 1,124 | 111,737 | |||||||||
Flowserve Corp. (Machinery) | 622 | 29,918 | |||||||||
| Fortune Brands Innovations, Inc. (Building Products) | 526 | 34,158 | |||||||||
FTI Consulting, Inc.* (Professional Services) | 368 | 79,315 | |||||||||
| Gaming and Leisure Properties, Inc. (Specialized REITs) | 1,226 | 55,427 | |||||||||
| GATX Corp. (Trading Companies & Distributors) | 138 | 18,266 | |||||||||
Gentex Corp. (Automobile Components) | 1,554 | 52,386 | |||||||||
Graco, Inc. (Machinery) | 1,777 | 140,880 | |||||||||
| Grand Canyon Education, Inc.* (Diversified Consumer Services) | 308 | 43,092 | |||||||||
GXO Logistics, Inc.* (Air Freight & Logistics) | 790 | 39,895 | |||||||||
| H&R Block, Inc. (Diversified Consumer Services) | 1,466 | 79,501 | |||||||||
| Haemonetics Corp.* (Health Care Equipment & Supplies) | 320 | 26,474 | |||||||||
Halozyme Therapeutics, Inc.* (Biotechnology) | 1,337 | 70,005 | |||||||||
Hancock Whitney Corp. (Banks) | 473 | 22,624 | |||||||||
| HealthEquity, Inc.* (Health Care Providers & Services) | 466 | 40,169 | |||||||||
Hexcel Corp. (Aerospace & Defense) | 428 | 26,729 | |||||||||
| Hilton Grand Vacations, Inc.* (Hotels, Restaurants & Leisure) | 446 | 18,032 | |||||||||
Houlihan Lokey, Inc. (Capital Markets) | 550 | 74,173 | |||||||||
| Hyatt Hotels Corp.—Class A (Hotels, Restaurants & Leisure) | 475 | 72,162 | |||||||||
IDACORP, Inc. (Electric Utilities) | 208 | 19,375 | |||||||||
Ingredion, Inc. (Food Products) | 248 | 28,446 | |||||||||
Insperity, Inc. (Professional Services) | 188 | 17,147 | |||||||||
| Interactive Brokers Group, Inc. (Capital Markets) | 664 | 81,406 | |||||||||
International Bancshares Corp. (Banks) | 242 | 13,845 | |||||||||
| IPG Photonics Corp.* (Electronic Equipment, Instruments & Components) | 136 | 11,477 | |||||||||
| Iridium Communications, Inc. (Diversified Telecommunication Services) | 638 | 16,984 | |||||||||
ITT, Inc. (Machinery) | 865 | 111,741 | |||||||||
Jazz Pharmaceuticals PLC* (Pharmaceuticals) | 278 | 29,671 | |||||||||
KB Home (Household Durables) | 386 | 27,089 | |||||||||
KBR, Inc. (Professional Services) | 649 | 41,627 | |||||||||
Kinsale Capital Group, Inc. (Insurance) | 232 | 89,386 | |||||||||
Kirby Corp.* (Marine Transportation) | 257 | 30,771 | |||||||||
Knife River Corp.* (Construction Materials) | 422 | 29,599 | |||||||||
| Lamar Advertising Co.—Class A (Specialized REITs) | 535 | 63,948 | |||||||||
Lancaster Colony Corp. (Food Products) | 103 | 19,464 | |||||||||
Common Stocks, continued
Shares | Value | ||||||||||
Landstar System, Inc. (Ground Transportation) | 255 | $ | 47,042 | ||||||||
| Lantheus Holdings, Inc.* (Health Care Equipment & Supplies) | 728 | 58,451 | |||||||||
| Lattice Semiconductor Corp.* (Semiconductors & Semiconductor Equipment) | 1,445 | 83,796 | |||||||||
Lennox International, Inc. (Building Products) | 337 | 180,288 | |||||||||
| Light & Wonder, Inc.* (Hotels, Restaurants & Leisure) | 947 | 99,321 | |||||||||
Lincoln Electric Holdings, Inc. (Machinery) | 598 | 112,806 | |||||||||
| Littelfuse, Inc. (Electronic Equipment, Instruments & Components) | 182 | 46,517 | |||||||||
| LivaNova PLC* (Health Care Equipment & Supplies) | 210 | 11,512 | |||||||||
| Louisiana-Pacific Corp. (Paper & Forest Products) | 436 | 35,896 | |||||||||
| MACOM Technology Solutions Holdings, Inc.* (Semiconductors & Semiconductor Equipment) | 363 | 40,464 | |||||||||
Manhattan Associates, Inc.* (Software) | 647 | 159,602 | |||||||||
| Masimo Corp.* (Health Care Equipment & Supplies) | 290 | 36,523 | |||||||||
| Matador Resources Co. (Oil, Gas & Consumable Fuels) | 1,219 | 72,652 | |||||||||
Mattel, Inc.* (Leisure Products) | 1,590 | 25,853 | |||||||||
Maximus, Inc. (Professional Services) | 466 | 39,936 | |||||||||
| Medpace Holdings, Inc.* (Life Sciences Tools & Services) | 247 | 101,727 | |||||||||
MGIC Investment Corp. (Financial Services) | 1,064 | 22,929 | |||||||||
| MKS Instruments, Inc. (Semiconductors & Semiconductor Equipment) | 325 | 42,439 | |||||||||
Morningstar, Inc. (Capital Markets) | 274 | 81,063 | |||||||||
MP Materials Corp.* (Metals & Mining) | 563 | 7,167 | |||||||||
| MSA Safety, Inc. (Commercial Services & Supplies) | 389 | 73,011 | |||||||||
| MSC Industrial Direct Co., Inc. (Trading Companies & Distributors) | 259 | 20,541 | |||||||||
| Murphy Oil Corp. (Oil, Gas & Consumable Fuels) | 655 | 27,012 | |||||||||
Murphy USA, Inc. (Specialty Retail) | 198 | 92,953 | |||||||||
| National Storage Affiliates Trust (Specialized REITs) | 359 | 14,798 | |||||||||
Neurocrine Biosciences, Inc.* (Biotechnology) | 1,057 | 145,516 | |||||||||
NewMarket Corp. (Chemicals) | 73 | 37,637 | |||||||||
| NEXTracker, Inc.*—Class A (Electrical Equipment) | 1,291 | 60,522 | |||||||||
NNN REIT, Inc. (Retail REITs) | 713 | 30,374 | |||||||||
| Novanta, Inc.* (Electronic Equipment, Instruments & Components) | 219 | 35,721 | |||||||||
nVent Electric PLC (Electrical Equipment) | 1,742 | 133,455 | |||||||||
Olin Corp. (Chemicals) | 514 | 24,235 | |||||||||
| Ollie's Bargain Outlet Holdings, Inc.* (Broadline Retail) | 644 | 63,221 | |||||||||
| Omega Healthcare Investors, Inc. (Health Care REITs) | 1,064 | 36,442 | |||||||||
| Onto Innovation, Inc.* (Semiconductors & Semiconductor Equipment) | 518 | 113,731 | |||||||||
| Option Care Health, Inc.* (Health Care Providers & Services) | 1,004 | 27,811 | |||||||||
Ovintiv, Inc. (Oil, Gas & Consumable Fuels) | 2,615 | 122,566 | |||||||||
Owens Corning (Building Products) | 910 | 158,085 | |||||||||
See accompanying notes to the financial statements.
June 30, 2024 (unaudited) :: Schedule of Portfolio Investments :: ProFund VP Mid-Cap Growth :: 57
Common Stocks, continued
Shares | Value | ||||||||||
| Park Hotels & Resorts, Inc. (Hotel & Resort REITs) | 2,212 | $ | 33,136 | ||||||||
| Paylocity Holding Corp.* (Professional Services) | 456 | 60,124 | |||||||||
| Penumbra, Inc.* (Health Care Equipment & Supplies) | 407 | 73,247 | |||||||||
| Permian Resources Corp. (Oil, Gas & Consumable Fuels) | 5,395 | 87,129 | |||||||||
Pinnacle Financial Partners, Inc. (Banks) | 329 | 26,333 | |||||||||
| Planet Fitness, Inc.*—Class A (Hotels, Restaurants & Leisure) | 919 | 67,629 | |||||||||
| Power Integrations, Inc. (Semiconductors & Semiconductor Equipment) | 298 | 20,917 | |||||||||
Primerica, Inc. (Insurance) | 361 | 85,405 | |||||||||
| Progyny, Inc.* (Health Care Providers & Services) | 870 | 24,891 | |||||||||
| Pure Storage, Inc.*—Class A (Technology Hardware, Storage & Peripherals) | 3,210 | 206,114 | |||||||||
Qualys, Inc.* (Software) | 388 | 55,329 | |||||||||
| Rambus, Inc.* (Semiconductors & Semiconductor Equipment) | 1,132 | 66,516 | |||||||||
| Range Resources Corp. (Oil, Gas & Consumable Fuels) | 2,549 | 85,468 | |||||||||
Rayonier, Inc. (Specialized REITs) | 547 | 15,912 | |||||||||
| Rb Global, Inc. (Commercial Services & Supplies) | 1,930 | 147,375 | |||||||||
RBC Bearings, Inc.* (Machinery) | 305 | 82,283 | |||||||||
Reliance, Inc. (Metals & Mining) | 603 | 172,217 | |||||||||
RenaissanceRe Holdings, Ltd. (Insurance) | 306 | 68,394 | |||||||||
| Repligen Corp.* (Life Sciences Tools & Services) | 546 | 68,829 | |||||||||
Rexford Industrial Realty, Inc. (Industrial REITs) | 891 | 39,730 | |||||||||
RH* (Specialty Retail) | 73 | 17,844 | |||||||||
RLI Corp. (Insurance) | 275 | 38,690 | |||||||||
Roivant Sciences, Ltd.* (Biotechnology) | 2,204 | 23,296 | |||||||||
Royal Gold, Inc. (Metals & Mining) | 359 | 44,932 | |||||||||
RPM International, Inc. (Chemicals) | 730 | 78,606 | |||||||||
| Ryan Specialty Holdings, Inc.—Class A (Insurance) | 1,076 | 62,311 | |||||||||
Saia, Inc.* (Ground Transportation) | 279 | 132,328 | |||||||||
Sarepta Therapeutics, Inc.* (Biotechnology) | 794 | 125,452 | |||||||||
| Science Applications International Corp. (Professional Services) | 189 | 22,217 | |||||||||
SEI Investments Co. (Capital Markets) | 524 | 33,898 | |||||||||
Selective Insurance Group, Inc. (Insurance) | 351 | 32,934 | |||||||||
| Service Corp. International (Diversified Consumer Services) | 780 | 55,481 | |||||||||
| Silicon Laboratories, Inc.* (Semiconductors & Semiconductor Equipment) | 335 | 37,061 | |||||||||
| Simpson Manufacturing Co., Inc. (Building Products) | 443 | 74,659 | |||||||||
| Skechers U.S.A., Inc.*—Class A (Textiles, Apparel & Luxury Goods) | 1,391 | 96,145 | |||||||||
SLM Corp. (Consumer Finance) | 923 | 19,189 | |||||||||
| Sotera Health Co.* (Life Sciences Tools & Services) | 1,308 | 15,526 | |||||||||
| Southwestern Energy Co.* (Oil, Gas & Consumable Fuels) | 11,584 | 77,960 | |||||||||
| Sprouts Farmers Market, Inc.* (Consumer Staples Distribution & Retail) | 433 | 36,225 | |||||||||
STAG Industrial, Inc. (Industrial REITs) | 956 | 34,473 | |||||||||
Common Stocks, continued
Shares | Value | ||||||||||
| Synaptics, Inc.* (Semiconductors & Semiconductor Equipment) | 170 | $ | 14,994 | ||||||||
| Tempur Sealy International, Inc. (Household Durables) | 1,824 | 86,348 | |||||||||
Teradata Corp.* (Software) | 1,016 | 35,113 | |||||||||
Terex Corp. (Machinery) | 396 | 21,717 | |||||||||
| Tetra Tech, Inc. (Commercial Services & Supplies) | 562 | 114,918 | |||||||||
| Texas Pacific Land Corp. (Oil, Gas & Consumable Fuels) | 131 | 96,189 | |||||||||
| Texas Roadhouse, Inc. (Hotels, Restaurants & Leisure) | 702 | 120,540 | |||||||||
| The Boston Beer Co., Inc.*—Class A (Beverages) | 44 | 13,422 | |||||||||
| The Brink's Co. (Commercial Services & Supplies) | 467 | 47,821 | |||||||||
The Carlyle Group, Inc. (Capital Markets) | 1,089 | 43,723 | |||||||||
The Middleby Corp.* (Machinery) | 282 | 34,576 | |||||||||
The New York Times Co.—Class A (Media) | 1,718 | 87,978 | |||||||||
The Scotts Miracle-Gro Co. (Chemicals) | 168 | 10,930 | |||||||||
The Timken Co. (Machinery) | 265 | 21,234 | |||||||||
The Toro Co. (Machinery) | 526 | 49,186 | |||||||||
| The Wendy's Co. (Hotels, Restaurants & Leisure) | 943 | 15,993 | |||||||||
TKO Group Holdings, Inc. (Entertainment) | 266 | 28,725 | |||||||||
Toll Brothers, Inc. (Household Durables) | 1,094 | 126,007 | |||||||||
TopBuild Corp.* (Household Durables) | 332 | 127,910 | |||||||||
| Travel + Leisure Co. (Hotels, Restaurants & Leisure) | 524 | 23,570 | |||||||||
Trex Co., Inc.* (Building Products) | 1,142 | 84,645 | |||||||||
UFP Industries, Inc. (Building Products) | 649 | 72,688 | |||||||||
United Therapeutics Corp.* (Biotechnology) | 210 | 66,896 | |||||||||
| Universal Display Corp. (Semiconductors & Semiconductor Equipment) | 458 | 96,294 | |||||||||
| Vail Resorts, Inc. (Hotels, Restaurants & Leisure) | 263 | 47,374 | |||||||||
Valaris, Ltd.* (Energy Equipment & Services) | 654 | 48,723 | |||||||||
Valvoline, Inc.* (Specialty Retail) | 1,354 | 58,493 | |||||||||
Visteon Corp.* (Automobile Components) | 130 | 13,871 | |||||||||
| Vontier Corp. (Electronic Equipment, Instruments & Components) | 1,622 | 61,961 | |||||||||
Voya Financial, Inc. (Financial Services) | 423 | 30,096 | |||||||||
| Warner Music Group Corp.—Class A (Entertainment) | 1,145 | 35,095 | |||||||||
| Watsco, Inc. (Trading Companies & Distributors) | 336 | 155,648 | |||||||||
| Watts Water Technologies, Inc.—Class A (Machinery) | 288 | 52,811 | |||||||||
| Weatherford International PLC* (Energy Equipment & Services) | 768 | 94,042 | |||||||||
Westlake Corp. (Chemicals) | 338 | 48,949 | |||||||||
WEX, Inc.* (Financial Services) | 440 | 77,942 | |||||||||
Williams-Sonoma, Inc. (Specialty Retail) | 675 | 190,600 | |||||||||
| Wingstop, Inc. (Hotels, Restaurants & Leisure) | 309 | 130,603 | |||||||||
| Wolfspeed, Inc.* (Semiconductors & Semiconductor Equipment) | 621 | 14,134 | |||||||||
Woodward, Inc. (Aerospace & Defense) | 640 | 111,603 | |||||||||
| Wyndham Hotels & Resorts, Inc. (Hotels, Restaurants & Leisure) | 559 | 41,366 | |||||||||
XPO, Inc.* (Ground Transportation) | 574 | 60,930 | |||||||||
See accompanying notes to the financial statements.
58 :: ProFund VP Mid-Cap Growth :: Schedule of Portfolio Investments :: June 30, 2024 (unaudited)
Common Stocks, continued
Shares | Value | ||||||||||
YETI Holdings, Inc.* (Leisure Products) | 573 | $ | 21,860 | ||||||||
| ZoomInfo Technologies, Inc.* (Interactive Media & Services) | 985 | 12,578 | |||||||||
| TOTAL COMMON STOCKS (Cost $10,498,705) | 14,680,373 | ||||||||||
Repurchase Agreements(b) (0.3%)
| Principal Amount | Value | ||||||||||
| Repurchase Agreements with various counterparties, rates 5.12%–5.20%, dated 6/28/2024, due 7/1/24, total to be received $49,021 | $ | 49,000 | $ | 49,000 | |||||||
| TOTAL REPURCHASE AGREEMENTS (Cost $49,000) | 49,000 | ||||||||||
Collateral for Securities Loaned(c) (0.1%)
Shares | Value | ||||||||||
| Invesco Government & Agency Portfolio—Institutional Shares, 5.23%(d) | 13,858 | $ | 13,858 | ||||||||
| TOTAL COLLATERAL FOR SECURITIES LOANED (Cost $13,858) | 13,858 | ||||||||||
| TOTAL INVESTMENT SECURITIES (Cost $10,561,563)—100.4% | 14,743,231 | ||||||||||
Net other assets (liabilities)—(0.4)% | (54,430 | ) | |||||||||
NET ASSETS—100.0% | $ | 14,688,801 | |||||||||
* Non-income producing security.
(a) All or part of this security was on loan as of June 30, 2024. The total value of securities on loan as of June 30, 2024 was $13,685.
(b) The ProFund VP invests in Repurchase Agreements jointly with other funds in the Trust. See "Repurchase Agreements" under Note 2 in the Notes to Financial Statements to view the details of each individual agreement and counterparty as well as a description of the securities subject to repurchase.
(c) Securities were purchased with cash collateral held from securities on loan at June 30, 2024.
(d) Rate periodically changes. Rate disclosed is the daily yield on June 30, 2024.
REIT Real Estate Investment Trust
See accompanying notes to the financial statements.
June 30, 2024 (unaudited) :: Schedule of Portfolio Investments :: ProFund VP Mid-Cap Growth :: 59
ProFund VP Mid-Cap Growth invested in the following industries as of June 30, 2024:
Value | % of Net Assets | ||||||||||
Aerospace & Defense | $ | 300,529 | 2.0 | % | |||||||
Air Freight & Logistics | 39,895 | 0.3 | % | ||||||||
Automobile Components | 115,044 | 0.8 | % | ||||||||
Banks | 217,240 | 1.5 | % | ||||||||
Beverages | 156,047 | 1.1 | % | ||||||||
Biotechnology | 655,169 | 4.5 | % | ||||||||
Broadline Retail | 63,221 | 0.4 | % | ||||||||
Building Products | 984,113 | 6.7 | % | ||||||||
Capital Markets | 367,830 | 2.5 | % | ||||||||
Chemicals | 337,531 | 2.4 | % | ||||||||
Commercial Services & Supplies | 502,306 | 3.4 | % | ||||||||
Communications Equipment | 30,016 | 0.2 | % | ||||||||
Construction & Engineering | 352,087 | 2.4 | % | ||||||||
Construction Materials | 108,320 | 0.7 | % | ||||||||
Consumer Finance | 60,302 | 0.4 | % | ||||||||
Consumer Staples Distribution & Retail | 184,652 | 1.3 | % | ||||||||
Containers & Packaging | 101,689 | 0.7 | % | ||||||||
Diversified Consumer Services | 259,247 | 1.8 | % | ||||||||
Diversified Telecommunication Services | 16,984 | 0.1 | % | ||||||||
Electric Utilities | 19,375 | 0.1 | % | ||||||||
Electrical Equipment | 252,276 | 1.7 | % | ||||||||
| Electronic Equipment, Instruments & Components | 192,757 | 1.3 | % | ||||||||
Energy Equipment & Services | 187,266 | 1.3 | % | ||||||||
Entertainment | 63,820 | 0.4 | % | ||||||||
Financial Services | 226,075 | 1.5 | % | ||||||||
Food Products | 47,910 | 0.3 | % | ||||||||
Ground Transportation | 260,263 | 1.8 | % | ||||||||
Health Care Equipment & Supplies | 206,207 | 1.4 | % | ||||||||
Health Care Providers & Services | 264,323 | 1.8 | % | ||||||||
Health Care REITs | 36,442 | 0.2 | % | ||||||||
Health Care Technology | 17,957 | 0.1 | % | ||||||||
Hotel & Resort REITs | 33,136 | 0.2 | % | ||||||||
Hotels, Restaurants & Leisure | 788,377 | 5.4 | % | ||||||||
Household Durables | 367,354 | 2.5 | % | ||||||||
Industrial REITs | 159,134 | 1.1 | % | ||||||||
Value | % of Net Assets | ||||||||||
Insurance | $ | 432,205 | 3.0 | % | |||||||
Interactive Media & Services | 12,578 | 0.1 | % | ||||||||
Leisure Products | 79,223 | 0.5 | % | ||||||||
Life Sciences Tools & Services | 244,362 | 1.7 | % | ||||||||
Machinery | 903,730 | 6.2 | % | ||||||||
Marine Transportation | 30,771 | 0.2 | % | ||||||||
Media | 87,978 | 0.6 | % | ||||||||
Metals & Mining | 224,316 | 1.5 | % | ||||||||
Office REITs | 11,539 | 0.1 | % | ||||||||
Oil, Gas & Consumable Fuels | 884,925 | 6.0 | % | ||||||||
Paper & Forest Products | 35,896 | 0.2 | % | ||||||||
Personal Care Products | 202,699 | 1.3 | % | ||||||||
Pharmaceuticals | 29,671 | 0.2 | % | ||||||||
Professional Services | 354,078 | 2.4 | % | ||||||||
Residential REITs | 157,034 | 1.1 | % | ||||||||
Retail REITs | 62,538 | 0.4 | % | ||||||||
| Semiconductors & Semiconductor Equipment | 579,007 | 3.9 | % | ||||||||
Software | 643,295 | 4.4 | % | ||||||||
Specialized REITs | 229,502 | 1.6 | % | ||||||||
Specialty Retail | 701,161 | 4.8 | % | ||||||||
| Technology Hardware, Storage & Peripherals | 206,114 | 1.4 | % | ||||||||
Textiles, Apparel & Luxury Goods | 222,150 | 1.5 | % | ||||||||
Trading Companies & Distributors | 323,334 | 2.2 | % | ||||||||
Water Utilities | 47,372 | 0.4 | % | ||||||||
Other** | 8,429 | NM | |||||||||
Total | $ | 14,688,801 | 100.0 | % | |||||||
** Includes any non-equity securities and net other assets (liabilities), which includes any receivable for capital shares issued and payable for capital shares redeemed.
NM Not meaningful, amount is less than 0.05%
REIT Real Estate Investment Trust
See accompanying notes to the financial statements.
Common Stocks (99.7%)
Shares | Value | ||||||||||
Acuity Brands, Inc. (Electrical Equipment) | 126 | $ | 30,421 | ||||||||
Adient PLC* (Automobile Components) | 756 | 18,681 | |||||||||
AECOM (Construction & Engineering) | 618 | 54,471 | |||||||||
| Affiliated Managers Group, Inc. (Capital Markets) | 268 | 41,870 | |||||||||
AGCO Corp. (Machinery) | 521 | 50,995 | |||||||||
Agree Realty Corp. (Retail REITs) | 844 | 52,277 | |||||||||
Alcoa Corp. (Metals & Mining) | 1,510 | 60,068 | |||||||||
| Allegro MicroSystems, Inc.* (Semiconductors & Semiconductor Equipment) | 391 | 11,042 | |||||||||
ALLETE, Inc. (Electric Utilities) | 485 | 30,240 | |||||||||
Ally Financial, Inc. (Consumer Finance) | 2,301 | 91,281 | |||||||||
| Amedisys, Inc.* (Health Care Providers & Services) | 159 | 14,596 | |||||||||
American Financial Group, Inc. (Insurance) | 550 | 67,661 | |||||||||
| American Homes 4 Rent—Class A (Residential REITs) | 1,083 | 40,244 | |||||||||
| Amkor Technology, Inc. (Semiconductors & Semiconductor Equipment) | 870 | 34,817 | |||||||||
| Annaly Capital Management, Inc. (Mortgage REITs) | 4,210 | 80,242 | |||||||||
| Antero Midstream Corp. (Oil, Gas & Consumable Fuels) | 1,207 | 17,791 | |||||||||
| Antero Resources Corp.* (Oil, Gas & Consumable Fuels) | 2,458 | 80,204 | |||||||||
AptarGroup, Inc. (Containers & Packaging) | 229 | 32,245 | |||||||||
Aramark (Hotels, Restaurants & Leisure) | 2,212 | 75,253 | |||||||||
Arcadium Lithium PLC* (Chemicals) | 3,386 | 11,377 | |||||||||
| Arrow Electronics, Inc.* (Electronic Equipment, Instruments & Components) | 448 | 54,100 | |||||||||
ASGN, Inc.* (Professional Services) | 386 | 34,034 | |||||||||
Ashland, Inc. (Chemicals) | 422 | 39,875 | |||||||||
Aspen Technology, Inc.* (Software) | 117 | 23,240 | |||||||||
Associated Banc-Corp. (Banks) | 1,247 | 26,374 | |||||||||
Autoliv, Inc. (Automobile Components) | 244 | 26,106 | |||||||||
AutoNation, Inc.* (Specialty Retail) | 207 | 32,992 | |||||||||
Avient Corp. (Chemicals) | 768 | 33,523 | |||||||||
| Avnet, Inc. (Electronic Equipment, Instruments & Components) | 760 | 39,132 | |||||||||
Azenta, Inc.* (Life Sciences Tools & Services) | 163 | 8,577 | |||||||||
Bank OZK (Banks) | 426 | 17,466 | |||||||||
| Belden, Inc. (Electronic Equipment, Instruments & Components) | 342 | 32,080 | |||||||||
BellRing Brands, Inc.* (Personal Care Products) | 516 | 29,484 | |||||||||
| Berry Global Group, Inc. (Containers & Packaging) | 962 | 56,614 | |||||||||
BioMarin Pharmaceutical, Inc.* (Biotechnology) | 703 | 57,878 | |||||||||
| BJ's Wholesale Club Holdings, Inc.* (Household Products) | 1,118 | 98,205 | |||||||||
Black Hills Corp. (Multi-Utilities) | 580 | 31,541 | |||||||||
Blackbaud, Inc.* (Software) | 129 | 9,826 | |||||||||
Brighthouse Financial, Inc.* (Insurance) | 522 | 22,623 | |||||||||
Brixmor Property Group, Inc. (Retail REITs) | 1,419 | 32,765 | |||||||||
Bruker Corp. (Life Sciences Tools & Services) | 328 | 20,930 | |||||||||
Brunswick Corp. (Leisure Products) | 222 | 16,155 | |||||||||
Burlington Stores, Inc.* (Specialty Retail) | 215 | 51,600 | |||||||||
Cabot Corp. (Chemicals) | 153 | 14,059 | |||||||||
| CACI International, Inc.*—Class A (Professional Services) | 118 | 50,755 | |||||||||
Cadence Bank (Banks) | 1,537 | 43,466 | |||||||||
Common Stocks, continued
Shares | Value | ||||||||||
| Capri Holdings, Ltd.* (Textiles, Apparel & Luxury Goods) | 510 | $ | 16,871 | ||||||||
Carter's, Inc. (Textiles, Apparel & Luxury Goods) | 307 | 19,025 | |||||||||
| ChampionX Corp. (Energy Equipment & Services) | 529 | 17,568 | |||||||||
| Chemed Corp. (Health Care Providers & Services) | 51 | 27,672 | |||||||||
| Chesapeake Energy Corp. (Oil, Gas & Consumable Fuels) | 937 | 77,012 | |||||||||
| Choice Hotels International, Inc. (Hotels, Restaurants & Leisure) | 103 | 12,257 | |||||||||
Ciena Corp.* (Communications Equipment) | 718 | 34,594 | |||||||||
| Cirrus Logic, Inc.* (Semiconductors & Semiconductor Equipment) | 195 | 24,894 | |||||||||
Cleveland-Cliffs, Inc.* (Metals & Mining) | 4,000 | 61,561 | |||||||||
CNO Financial Group, Inc. (Insurance) | 911 | 25,253 | |||||||||
| Cognex Corp. (Electronic Equipment, Instruments & Components) | 809 | 37,829 | |||||||||
| Coherent Corp.* (Electronic Equipment, Instruments & Components) | 1,116 | 80,865 | |||||||||
Columbia Banking System, Inc. (Banks) | 1,761 | 35,026 | |||||||||
| Columbia Sportswear Co. (Textiles, Apparel & Luxury Goods) | 147 | 11,625 | |||||||||
Commerce Bancshares, Inc. (Banks) | 585 | 32,631 | |||||||||
Commercial Metals Co. (Metals & Mining) | 973 | 53,505 | |||||||||
CommVault Systems, Inc.* (Software) | 146 | 17,749 | |||||||||
Concentrix Corp. (Professional Services) | 394 | 24,932 | |||||||||
COPT Defense Properties (Office REITs) | 577 | 14,442 | |||||||||
| Core & Main, Inc.*—Class A (Trading Companies & Distributors) | 619 | 30,294 | |||||||||
Cousins Properties, Inc. (Office REITs) | 1,279 | 29,609 | |||||||||
| Crane NXT Co. (Electronic Equipment, Instruments & Components) | 408 | 25,059 | |||||||||
Crown Holdings, Inc. (Containers & Packaging) | 532 | 39,575 | |||||||||
CubeSmart (Specialized REITs) | 852 | 38,485 | |||||||||
Cullen/Frost Bankers, Inc. (Banks) | 313 | 31,810 | |||||||||
Curtiss-Wright Corp. (Aerospace & Defense) | 113 | 30,620 | |||||||||
Cytokinetics, Inc.* (Biotechnology) | 530 | 28,715 | |||||||||
Darling Ingredients, Inc.* (Food Products) | 1,344 | 49,392 | |||||||||
| DENTSPLY SIRONA, Inc. (Health Care Equipment & Supplies) | 1,747 | 43,518 | |||||||||
Dick's Sporting Goods, Inc. (Specialty Retail) | 230 | 49,416 | |||||||||
Dolby Laboratories, Inc.—Class A (Software) | 216 | 17,114 | |||||||||
Donaldson Co., Inc. (Machinery) | 435 | 31,129 | |||||||||
| Doximity, Inc.*—Class A (Health Care Technology) | 514 | 14,377 | |||||||||
| DT Midstream, Inc. (Oil, Gas & Consumable Fuels) | 302 | 21,451 | |||||||||
East West Bancorp, Inc. (Banks) | 538 | 39,398 | |||||||||
EastGroup Properties, Inc. (Industrial REITs) | 154 | 26,195 | |||||||||
| Encompass Health Corp. (Health Care Providers & Services) | 466 | 39,977 | |||||||||
EnerSys (Electrical Equipment) | 194 | 20,083 | |||||||||
| Enovis Corp.* (Health Care Equipment & Supplies) | 420 | 18,984 | |||||||||
| Envista Holdings Corp.* (Health Care Equipment & Supplies) | 1,446 | 24,047 | |||||||||
EPR Properties (Specialized REITs) | 242 | 10,159 | |||||||||
Equitable Holdings, Inc. (Financial Services) | 1,209 | 49,400 | |||||||||
| Equitrans Midstream Corp. (Oil, Gas & Consumable Fuels) | 2,152 | 27,933 | |||||||||
See accompanying notes to the financial statements.
June 30, 2024 (unaudited) :: Schedule of Portfolio Investments :: ProFund VP Mid-Cap Value :: 61
Common Stocks, continued
Shares | Value | ||||||||||
| Equity LifeStyle Properties, Inc. (Residential REITs) | 565 | $ | 36,798 | ||||||||
Erie Indemnity Co.—Class A (Insurance) | 88 | 31,891 | |||||||||
Essent Group, Ltd. (Financial Services) | 897 | 50,401 | |||||||||
Essential Utilities, Inc. (Water Utilities) | 1,101 | 41,100 | |||||||||
Euronet Worldwide, Inc.* (Financial Services) | 169 | 17,492 | |||||||||
Evercore, Inc. (Capital Markets) | 92 | 19,176 | |||||||||
| ExlService Holdings, Inc.* (Professional Services) | 588 | 18,440 | |||||||||
Exponent, Inc. (Professional Services) | 209 | 19,880 | |||||||||
F.N.B. Corp. (Banks) | 3,026 | 41,396 | |||||||||
Federated Hermes, Inc. (Capital Markets) | 675 | 22,194 | |||||||||
Fidelity National Financial, Inc. (Insurance) | 2,183 | 107,884 | |||||||||
First American Financial Corp. (Insurance) | 873 | 47,098 | |||||||||
First Financial Bankshares, Inc. (Banks) | 649 | 19,165 | |||||||||
First Horizon Corp. (Banks) | 4,600 | 72,543 | |||||||||
| First Industrial Realty Trust, Inc. (Industrial REITs) | 579 | 27,508 | |||||||||
Flowers Foods, Inc. (Food Products) | 1,616 | 35,875 | |||||||||
Flowserve Corp. (Machinery) | 609 | 29,293 | |||||||||
Fluor Corp.* (Construction & Engineering) | 1,440 | 62,711 | |||||||||
| Fortune Brands Innovations, Inc. (Building Products) | 631 | 40,977 | |||||||||
| Frontier Communications Parent, Inc.* (Diversified Telecommunication Services) | 1,882 | 49,271 | |||||||||
GameStop Corp.*—Class A (Specialty Retail) | 2,267 | 55,972 | |||||||||
| Gaming and Leisure Properties, Inc. (Specialized REITs) | 1,302 | 58,863 | |||||||||
GATX Corp. (Trading Companies & Distributors) | 189 | 25,016 | |||||||||
Genpact, Ltd. (Professional Services) | 1,393 | 44,841 | |||||||||
Gentex Corp. (Automobile Components) | 700 | 23,597 | |||||||||
Glacier Bancorp, Inc. (Banks) | 954 | 35,603 | |||||||||
| Globus Medical, Inc.* (Health Care Equipment & Supplies) | 947 | 64,860 | |||||||||
| Graham Holdings Co.—Class B (Diversified Consumer Services) | 29 | 20,287 | |||||||||
Grail, Inc.* (Biotechnology) | — | (a) | 5 | ||||||||
| Graphic Packaging Holding Co. (Containers & Packaging) | 2,585 | 67,754 | |||||||||
Greif, Inc.—Class A (Containers & Packaging) | 217 | 12,471 | |||||||||
GXO Logistics, Inc.* (Air Freight & Logistics) | 372 | 18,786 | |||||||||
| Haemonetics Corp.* (Health Care Equipment & Supplies) | 171 | 14,147 | |||||||||
Hancock Whitney Corp. (Banks) | 350 | 16,741 | |||||||||
Harley-Davidson, Inc. (Automobiles) | 1,030 | 34,546 | |||||||||
Healthcare Realty Trust, Inc. (Health Care REITs) | 3,184 | 52,472 | |||||||||
| HealthEquity, Inc.* (Health Care Providers & Services) | 359 | 30,946 | |||||||||
Helen of Troy, Ltd.* (Household Durables) | 200 | 18,548 | |||||||||
Hexcel Corp. (Aerospace & Defense) | 357 | 22,295 | |||||||||
HF Sinclair Corp. (Oil, Gas & Consumable Fuels) | 1,261 | 67,262 | |||||||||
| Hilton Grand Vacations, Inc.* (Hotels, Restaurants & Leisure) | 219 | 8,854 | |||||||||
Home BancShares, Inc. (Banks) | 1,567 | 37,545 | |||||||||
IDACORP, Inc. (Electric Utilities) | 260 | 24,219 | |||||||||
Illumina, Inc.* (Life Sciences Tools & Services) | 1,340 | 139,869 | |||||||||
| Independence Realty Trust, Inc. (Residential REITs) | 1,890 | 35,419 | |||||||||
Ingredion, Inc. (Food Products) | 353 | 40,489 | |||||||||
Insperity, Inc. (Professional Services) | 150 | 13,682 | |||||||||
Interactive Brokers Group, Inc. (Capital Markets) | 369 | 45,239 | |||||||||
Common Stocks, continued
Shares | Value | ||||||||||
International Bancshares Corp. (Banks) | 256 | $ | 14,646 | ||||||||
| IPG Photonics Corp.* (Electronic Equipment, Instruments & Components) | 133 | 11,224 | |||||||||
| Iridium Communications, Inc. (Diversified Telecommunication Services) | 511 | 13,603 | |||||||||
Janus Henderson Group PLC (Capital Markets) | 1,080 | 36,407 | |||||||||
Jazz Pharmaceuticals PLC* (Pharmaceuticals) | 308 | 32,873 | |||||||||
Jefferies Financial Group, Inc. (Capital Markets) | 1,427 | 71,008 | |||||||||
| Jones Lang LaSalle, Inc.* (Real Estate Management & Development) | 400 | 82,112 | |||||||||
KB Home (Household Durables) | 309 | 21,686 | |||||||||
KBR, Inc. (Professional Services) | 610 | 39,125 | |||||||||
Kemper Corp. (Insurance) | 509 | 30,199 | |||||||||
Kilroy Realty Corp. (Office REITs) | 898 | 27,991 | |||||||||
Kirby Corp.* (Marine Transportation) | 284 | 34,003 | |||||||||
Kite Realty Group Trust (Retail REITs) | 1,847 | 41,336 | |||||||||
Knife River Corp.* (Construction Materials) | 138 | 9,679 | |||||||||
| Knight-Swift Transportation Holdings, Inc. (Ground Transportation) | 1,359 | 67,841 | |||||||||
Kyndryl Holdings, Inc.* (IT Services) | 1,936 | 50,936 | |||||||||
| Lamar Advertising Co.—Class A (Specialized REITs) | 310 | 37,054 | |||||||||
Lancaster Colony Corp. (Food Products) | 89 | 16,818 | |||||||||
Landstar System, Inc. (Ground Transportation) | 96 | 17,710 | |||||||||
Lear Corp. (Automobile Components) | 478 | 54,592 | |||||||||
Lithia Motors, Inc. (Specialty Retail) | 231 | 58,316 | |||||||||
| Littelfuse, Inc. (Electronic Equipment, Instruments & Components) | 63 | 16,102 | |||||||||
| LivaNova PLC* (Health Care Equipment & Supplies) | 287 | 15,733 | |||||||||
Louisiana-Pacific Corp. (Paper & Forest Products) | 188 | 15,478 | |||||||||
| Lumentum Holdings, Inc.* (Communications Equipment) | 569 | 28,973 | |||||||||
| MACOM Technology Solutions Holdings, Inc.* (Semiconductors & Semiconductor Equipment) | 171 | 19,061 | |||||||||
Macy's, Inc. (Broadline Retail) | 2,315 | 44,448 | |||||||||
ManpowerGroup, Inc. (Professional Services) | 401 | 27,990 | |||||||||
| Marriott Vacations Worldwide Corp. (Hotels, Restaurants & Leisure) | 275 | 24,013 | |||||||||
| Masimo Corp.* (Health Care Equipment & Supplies) | 143 | 18,009 | |||||||||
MasTec, Inc.* (Construction & Engineering) | 511 | 54,671 | |||||||||
Mattel, Inc.* (Leisure Products) | 1,621 | 26,357 | |||||||||
Maximus, Inc. (Professional Services) | 138 | 11,827 | |||||||||
| MDU Resources Group, Inc. (Construction & Engineering) | 1,715 | 43,047 | |||||||||
MGIC Investment Corp. (Financial Services) | 1,390 | 29,955 | |||||||||
| MKS Instruments, Inc. (Semiconductors & Semiconductor Equipment) | 271 | 35,388 | |||||||||
MP Materials Corp.* (Metals & Mining) | 676 | 8,605 | |||||||||
| MSC Industrial Direct Co., Inc. (Trading Companies & Distributors) | 176 | 13,959 | |||||||||
Murphy Oil Corp. (Oil, Gas & Consumable Fuels) | 695 | 28,662 | |||||||||
National Fuel Gas Co. (Gas Utilities) | 773 | 41,889 | |||||||||
| National Storage Affiliates Trust (Specialized REITs) | 299 | 12,325 | |||||||||
| Neogen Corp.* (Health Care Equipment & Supplies) | 1,658 | 25,915 | |||||||||
New Jersey Resources Corp. (Gas Utilities) | 831 | 35,517 | |||||||||
New York Community Bancorp, Inc. (Banks) | 6,558 | 21,117 | |||||||||
Nexstar Media Group, Inc. (Media) | 262 | 43,495 | |||||||||
See accompanying notes to the financial statements.
62 :: ProFund VP Mid-Cap Value :: Schedule of Portfolio Investments :: June 30, 2024 (unaudited)
Common Stocks, continued
Shares | Value | ||||||||||
NNN REIT, Inc. (Retail REITs) | 972 | $ | 41,407 | ||||||||
Nordstrom, Inc. (Broadline Retail) | 824 | 17,485 | |||||||||
| Northwestern Energy Group, Inc. (Multi-Utilities) | 516 | 25,841 | |||||||||
NOV, Inc. (Energy Equipment & Services) | 3,327 | 63,246 | |||||||||
| Novanta, Inc.* (Electronic Equipment, Instruments & Components) | 127 | 20,715 | |||||||||
OGE Energy Corp. (Electric Utilities) | 1,687 | 60,225 | |||||||||
Old National Bancorp (Banks) | 2,656 | 45,657 | |||||||||
Old Republic International Corp. (Insurance) | 2,127 | 65,724 | |||||||||
Olin Corp. (Chemicals) | 593 | 27,960 | |||||||||
| Omega Healthcare Investors, Inc. (Health Care REITs) | 1,226 | 41,991 | |||||||||
ONE Gas, Inc. (Gas Utilities) | 476 | 30,393 | |||||||||
| Option Care Health, Inc.* (Health Care Providers & Services) | 658 | 18,227 | |||||||||
| Ormat Technologies, Inc. (Independent Power and Renewable Electricity Producers) | 452 | 32,408 | |||||||||
Oshkosh Corp. (Machinery) | 550 | 59,511 | |||||||||
| PBF Energy, Inc.—Class A (Oil, Gas & Consumable Fuels) | 888 | 40,866 | |||||||||
| Penske Automotive Group, Inc. (Specialty Retail) | 163 | 24,290 | |||||||||
| Performance Food Group Co.* (Consumer Staples Distribution & Retail) | 1,309 | 86,538 | |||||||||
Perrigo Co. PLC (Pharmaceuticals) | 1,147 | 29,455 | |||||||||
Pilgrim's Pride Corp.* (Food Products) | 339 | 13,048 | |||||||||
Pinnacle Financial Partners, Inc. (Banks) | 380 | 30,415 | |||||||||
PNM Resources, Inc. (Electric Utilities) | 759 | 28,053 | |||||||||
Polaris, Inc. (Leisure Products) | 447 | 35,005 | |||||||||
Portland General Electric Co. (Electric Utilities) | 867 | 37,489 | |||||||||
Post Holdings, Inc.* (Food Products) | 423 | 44,060 | |||||||||
PotlatchDeltic Corp. (Specialized REITs) | 669 | 26,352 | |||||||||
| Power Integrations, Inc. (Semiconductors & Semiconductor Equipment) | 239 | 16,775 | |||||||||
Prosperity Bancshares, Inc. (Banks) | 807 | 49,340 | |||||||||
PVH Corp. (Textiles, Apparel & Luxury Goods) | 476 | 50,393 | |||||||||
| QuidelOrtho Corp.* (Health Care Equipment & Supplies) | 417 | 13,853 | |||||||||
| R1 RCM, Inc.* (Health Care Providers & Services) | 1,665 | 20,912 | |||||||||
Rayonier, Inc. (Specialized REITs) | 714 | 20,770 | |||||||||
Regal Rexnord Corp. (Electrical Equipment) | 560 | 75,723 | |||||||||
Reinsurance Group of America, Inc. (Insurance) | 553 | 113,515 | |||||||||
RenaissanceRe Holdings, Ltd. (Insurance) | 200 | 44,702 | |||||||||
Rexford Industrial Realty, Inc. (Industrial REITs) | 1,115 | 49,719 | |||||||||
RH* (Specialty Retail) | 71 | 17,355 | |||||||||
RLI Corp. (Insurance) | 118 | 16,601 | |||||||||
Roivant Sciences, Ltd.* (Biotechnology) | 1,082 | 11,437 | |||||||||
Royal Gold, Inc. (Metals & Mining) | 265 | 33,167 | |||||||||
RPM International, Inc. (Chemicals) | 498 | 53,624 | |||||||||
Ryder System, Inc. (Ground Transportation) | 369 | 45,712 | |||||||||
Sabra Health Care REIT, Inc. (Health Care REITs) | 1,947 | 29,984 | |||||||||
Sarepta Therapeutics, Inc.* (Biotechnology) | 159 | 25,122 | |||||||||
| Science Applications International Corp. (Professional Services) | 280 | 32,914 | |||||||||
SEI Investments Co. (Capital Markets) | 420 | 27,170 | |||||||||
Selective Insurance Group, Inc. (Insurance) | 230 | 21,581 | |||||||||
| Sensata Technologies Holding PLC (Electrical Equipment) | 1,268 | 47,411 | |||||||||
Common Stocks, continued
Shares | Value | ||||||||||
| Service Corp. International (Diversified Consumer Services) | 600 | $ | 42,678 | ||||||||
Silgan Holdings, Inc. (Containers & Packaging) | 683 | 28,911 | |||||||||
SLM Corp. (Consumer Finance) | 1,109 | 23,056 | |||||||||
Sonoco Products Co. (Containers & Packaging) | 827 | 41,945 | |||||||||
SouthState Corp. (Banks) | 641 | 48,985 | |||||||||
Southwest Gas Holdings, Inc. (Gas Utilities) | 506 | 35,612 | |||||||||
Spire, Inc. (Gas Utilities) | 486 | 29,515 | |||||||||
| Sprouts Farmers Market, Inc.* (Consumer Staples Distribution & Retail) | 499 | 41,746 | |||||||||
STAG Industrial, Inc. (Industrial REITs) | 766 | 27,622 | |||||||||
Starwood Property Trust, Inc. (Mortgage REITs) | 2,525 | 47,824 | |||||||||
| Stericycle, Inc.* (Commercial Services & Supplies) | 780 | 45,341 | |||||||||
Stifel Financial Corp. (Capital Markets) | 862 | 72,536 | |||||||||
| Synaptics, Inc.* (Semiconductors & Semiconductor Equipment) | 196 | 17,287 | |||||||||
Synovus Financial Corp. (Banks) | 1,232 | 49,514 | |||||||||
| Taylor Morrison Home Corp.* (Household Durables) | 890 | 49,341 | |||||||||
| TD SYNNEX Corp. (Electronic Equipment, Instruments & Components) | 654 | 75,472 | |||||||||
TEGNA, Inc. (Media) | 1,427 | 19,892 | |||||||||
| Tenet Healthcare Corp.* (Health Care Providers & Services) | 822 | 109,350 | |||||||||
Terex Corp. (Machinery) | 249 | 13,655 | |||||||||
Texas Capital Bancshares, Inc.* (Banks) | 392 | 23,967 | |||||||||
| Texas Pacific Land Corp. (Oil, Gas & Consumable Fuels) | 52 | 38,182 | |||||||||
| The Boston Beer Co., Inc.*—Class A (Beverages) | 42 | 12,812 | |||||||||
The Carlyle Group, Inc. (Capital Markets) | 944 | 37,902 | |||||||||
The Chemours Co. (Chemicals) | 1,252 | 28,258 | |||||||||
The Gap, Inc. (Specialty Retail) | 1,822 | 43,528 | |||||||||
| The Goodyear Tire & Rubber Co.* (Automobile Components) | 2,395 | 27,183 | |||||||||
The Hanover Insurance Group, Inc. (Insurance) | 302 | 37,883 | |||||||||
The Middleby Corp.* (Machinery) | 226 | 27,710 | |||||||||
The Scotts Miracle-Gro Co. (Chemicals) | 219 | 14,248 | |||||||||
The Timken Co. (Machinery) | 332 | 26,603 | |||||||||
The Toro Co. (Machinery) | 457 | 42,734 | |||||||||
The Wendy's Co. (Hotels, Restaurants & Leisure) | 643 | 10,905 | |||||||||
The Western Union Co. (Financial Services) | 2,846 | 34,778 | |||||||||
Thor Industries, Inc. (Automobiles) | 449 | 41,959 | |||||||||
TKO Group Holdings, Inc. (Entertainment) | 282 | 30,453 | |||||||||
| Travel + Leisure Co. (Hotels, Restaurants & Leisure) | 180 | 8,096 | |||||||||
UGI Corp. (Gas Utilities) | 1,763 | 40,373 | |||||||||
UMB Financial Corp. (Banks) | 369 | 30,782 | |||||||||
| Under Armour, Inc.*—Class A (Textiles, Apparel & Luxury Goods) | 1,588 | 10,592 | |||||||||
| Under Armour, Inc.*—Class C (Textiles, Apparel & Luxury Goods) | 1,605 | 10,481 | |||||||||
United Bankshares, Inc. (Banks) | 1,135 | 36,819 | |||||||||
United States Steel Corp. (Metals & Mining) | 1,882 | 71,141 | |||||||||
United Therapeutics Corp.* (Biotechnology) | 205 | 65,303 | |||||||||
Unum Group (Insurance) | 1,497 | 76,512 | |||||||||
| US Foods Holding Corp.* (Consumer Staples Distribution & Retail) | 1,903 | 100,822 | |||||||||
Vail Resorts, Inc. (Hotels, Restaurants & Leisure) | 109 | 19,634 | |||||||||
Valley National Bancorp (Banks) | 3,598 | 25,114 | |||||||||
See accompanying notes to the financial statements.
June 30, 2024 (unaudited) :: Schedule of Portfolio Investments :: ProFund VP Mid-Cap Value :: 63
Common Stocks, continued
Shares | Value | ||||||||||
| Valmont Industries, Inc. (Construction & Engineering) | 170 | $ | 46,657 | ||||||||
| Vishay Intertechnology, Inc. (Electronic Equipment, Instruments & Components) | 1,053 | 23,482 | |||||||||
Visteon Corp.* (Automobile Components) | 128 | 13,658 | |||||||||
Vornado Realty Trust (Office REITs) | 1,346 | 35,386 | |||||||||
Voya Financial, Inc. (Financial Services) | 508 | 36,144 | |||||||||
| Warner Music Group Corp.—Class A (Entertainment) | 274 | 8,398 | |||||||||
Webster Financial Corp. (Banks) | 1,443 | 62,900 | |||||||||
| WESCO International, Inc. (Trading Companies & Distributors) | 368 | 58,335 | |||||||||
Whirlpool Corp. (Household Durables) | 460 | 47,012 | |||||||||
Wintrust Financial Corp. (Banks) | 519 | 51,153 | |||||||||
| Wolfspeed, Inc.* (Semiconductors & Semiconductor Equipment) | 561 | 12,768 | |||||||||
WP Carey, Inc. (Diversified REITs) | 1,841 | 101,347 | |||||||||
| Wyndham Hotels & Resorts, Inc. (Hotels, Restaurants & Leisure) | 230 | 17,020 | |||||||||
XPO, Inc.* (Ground Transportation) | 519 | 55,092 | |||||||||
YETI Holdings, Inc.* (Leisure Products) | 258 | 9,843 | |||||||||
Ziff Davis, Inc.* (Interactive Media & Services) | 388 | 21,359 | |||||||||
Zions Bancorp NA (Banks) | 1,242 | 53,866 | |||||||||
| ZoomInfo Technologies, Inc.* (Interactive Media & Services) | 1,602 | 20,458 | |||||||||
| TOTAL COMMON STOCKS (Cost $8,279,163) | 10,628,418 | ||||||||||
Repurchase Agreements(b) (0.4%)
| Principal Amount | Value | ||||||||||
| Repurchase Agreements with various counterparties, rates 5.12%–5.20%, dated 6/28/2024, due 7/1/24, total to be received $40,017 | $ | 40,000 | $ | 40,000 | |||||||
| TOTAL REPURCHASE AGREEMENTS (Cost $40,000) | 40,000 | ||||||||||
| TOTAL INVESTMENT SECURITIES (Cost $8,319,163)—100.1% | 10,668,418 | ||||||||||
Net other assets (liabilities)—(0.1)% | (8,536 | ) | |||||||||
NET ASSETS—100.0% | $ | 10,659,882 | |||||||||
* Non-income producing security.
(a) Number of shares is less than 0.50
(b) The ProFund VP invests in Repurchase Agreements jointly with other funds in the Trust. See "Repurchase Agreements" under Note 2 in the Notes to Financial Statements to view the details of each individual agreement and counterparty as well as a description of the securities subject to repurchase.
REIT Real Estate Investment Trust
See accompanying notes to the financial statements.
64 :: ProFund VP Mid-Cap Value :: Schedule of Portfolio Investments :: June 30, 2024 (unaudited)
ProFund VP Mid-Cap Value invested in the following industries as of June 30, 2024:
Value | % of Net Assets | ||||||||||
Aerospace & Defense | $ | 52,915 | 0.5 | % | |||||||
Air Freight & Logistics | 18,786 | 0.2 | % | ||||||||
Automobile Components | 163,817 | 1.5 | % | ||||||||
Automobiles | 76,505 | 0.7 | % | ||||||||
Banks | 993,439 | 9.3 | % | ||||||||
Beverages | 12,812 | 0.1 | % | ||||||||
Biotechnology | 188,460 | 1.8 | % | ||||||||
Broadline Retail | 61,933 | 0.6 | % | ||||||||
Building Products | 40,977 | 0.4 | % | ||||||||
Capital Markets | 373,502 | 3.5 | % | ||||||||
Chemicals | 222,924 | 2.1 | % | ||||||||
Commercial Services & Supplies | 45,341 | 0.4 | % | ||||||||
Communications Equipment | 63,567 | 0.6 | % | ||||||||
Construction & Engineering | 261,557 | 2.5 | % | ||||||||
Construction Materials | 9,679 | 0.1 | % | ||||||||
Consumer Finance | 114,337 | 1.1 | % | ||||||||
Consumer Staples Distribution & Retail | 229,106 | 2.1 | % | ||||||||
Containers & Packaging | 279,515 | 2.6 | % | ||||||||
Diversified Consumer Services | 62,965 | 0.6 | % | ||||||||
Diversified REITs | 101,347 | 1.0 | % | ||||||||
Diversified Telecommunication Services | 62,874 | 0.6 | % | ||||||||
Electric Utilities | 180,226 | 1.7 | % | ||||||||
Electrical Equipment | 173,638 | 1.6 | % | ||||||||
| Electronic Equipment, Instruments & Components | 416,060 | 3.9 | % | ||||||||
Energy Equipment & Services | 80,814 | 0.8 | % | ||||||||
Entertainment | 38,851 | 0.4 | % | ||||||||
Financial Services | 218,170 | 2.0 | % | ||||||||
Food Products | 199,682 | 1.9 | % | ||||||||
Gas Utilities | 213,299 | 2.0 | % | ||||||||
Ground Transportation | 186,355 | 1.7 | % | ||||||||
Health Care Equipment & Supplies | 239,066 | 2.2 | % | ||||||||
Health Care Providers & Services | 261,680 | 2.5 | % | ||||||||
Health Care REITs | 124,447 | 1.2 | % | ||||||||
Health Care Technology | 14,377 | 0.1 | % | ||||||||
Hotels, Restaurants & Leisure | 176,032 | 1.7 | % | ||||||||
Household Durables | 136,587 | 1.3 | % | ||||||||
Household Products | 98,205 | 0.9 | % | ||||||||
Value | % of Net Assets | ||||||||||
| Independent Power and Renewable Electricity Producers | $ | 32,408 | 0.3 | % | |||||||
Industrial REITs | 131,044 | 1.2 | % | ||||||||
Insurance | 709,127 | 6.7 | % | ||||||||
Interactive Media & Services | 41,817 | 0.4 | % | ||||||||
IT Services | 50,936 | 0.5 | % | ||||||||
Leisure Products | 87,360 | 0.8 | % | ||||||||
Life Sciences Tools & Services | 169,376 | 1.6 | % | ||||||||
Machinery | 281,630 | 2.6 | % | ||||||||
Marine Transportation | 34,003 | 0.3 | % | ||||||||
Media | 63,387 | 0.5 | % | ||||||||
Metals & Mining | 288,047 | 2.8 | % | ||||||||
Mortgage REITs | 128,066 | 1.2 | % | ||||||||
Multi-Utilities | 57,382 | 0.5 | % | ||||||||
Office REITs | 107,428 | 1.0 | % | ||||||||
Oil, Gas & Consumable Fuels | 399,363 | 3.7 | % | ||||||||
Paper & Forest Products | 15,478 | 0.1 | % | ||||||||
Personal Care Products | 29,484 | 0.3 | % | ||||||||
Pharmaceuticals | 62,328 | 0.6 | % | ||||||||
Professional Services | 318,420 | 3.1 | % | ||||||||
Real Estate Management & Development | 82,112 | 0.8 | % | ||||||||
Residential REITs | 112,461 | 1.1 | % | ||||||||
Retail REITs | 167,785 | 1.6 | % | ||||||||
| Semiconductors & Semiconductor Equipment | 172,032 | 1.6 | % | ||||||||
Software | 67,929 | 0.6 | % | ||||||||
Specialized REITs | 204,008 | 1.8 | % | ||||||||
Specialty Retail | 333,469 | 3.1 | % | ||||||||
Textiles, Apparel & Luxury Goods | 118,987 | 1.1 | % | ||||||||
Trading Companies & Distributors | 127,604 | 1.2 | % | ||||||||
Water Utilities | 41,100 | 0.4 | % | ||||||||
Other** | 31,464 | 0.3 | % | ||||||||
Total | $ | 10,659,882 | 100.0 | % | |||||||
** Includes any non-equity securities and net other assets (liabilities), which includes any receivable for capital shares issued and payable for capital shares redeemed.
REIT Real Estate Investment Trust
See accompanying notes to the financial statements.
Common Stocks (67.8%)
Shares | Value | ||||||||||
Adobe, Inc.* (Software) | 3,450 | $ | 1,916,613 | ||||||||
| Advanced Micro Devices, Inc.* (Semiconductors & Semiconductor Equipment) | 12,447 | 2,019,028 | |||||||||
| Airbnb, Inc.*—Class A (Hotels, Restaurants & Leisure) | 3,400 | 515,542 | |||||||||
| Alphabet, Inc.—Class A (Interactive Media & Services) | 17,514 | 3,190,175 | |||||||||
| Alphabet, Inc.—Class C (Interactive Media & Services) | 16,748 | 3,071,918 | |||||||||
Amazon.com, Inc.* (Broadline Retail) | 31,028 | 5,996,161 | |||||||||
| American Electric Power Co., Inc. (Electric Utilities) | 4,059 | 356,137 | |||||||||
Amgen, Inc. (Biotechnology) | 4,131 | 1,290,732 | |||||||||
| Analog Devices, Inc. (Semiconductors & Semiconductor Equipment) | 3,821 | 872,181 | |||||||||
ANSYS, Inc.* (Software) | 672 | 216,048 | |||||||||
| Apple, Inc. (Technology Hardware, Storage & Peripherals) | 45,720 | 9,629,546 | |||||||||
| Applied Materials, Inc. (Semiconductors & Semiconductor Equipment) | 6,376 | 1,504,672 | |||||||||
| Arm Holdings PLC* (Semiconductors & Semiconductor Equipment) | 910 | 148,894 | |||||||||
| ASML Holding N.V.NYS (Semiconductors & Semiconductor Equipment) | 701 | 716,934 | |||||||||
AstraZeneca PLCADR (Pharmaceuticals) | 4,484 | 349,707 | |||||||||
Atlassian Corp.*—Class A (Software) | 1,227 | 217,032 | |||||||||
Autodesk, Inc.* (Software) | 1,659 | 410,520 | |||||||||
| Automatic Data Processing, Inc. (Professional Services) | 3,152 | 752,351 | |||||||||
| Baker Hughes Co. (Energy Equipment & Services) | 7,686 | 270,317 | |||||||||
Biogen, Inc.* (Biotechnology) | 1,121 | 259,870 | |||||||||
| Booking Holdings, Inc. (Hotels, Restaurants & Leisure) | 261 | 1,033,952 | |||||||||
| Broadcom, Inc. (Semiconductors & Semiconductor Equipment) | 3,569 | 5,730,137 | |||||||||
Cadence Design Systems, Inc.* (Software) | 2,096 | 645,044 | |||||||||
| CDW Corp. (Electronic Equipment, Instruments & Components) | 1,035 | 231,674 | |||||||||
| Charter Communications, Inc.*—Class A (Media) | 1,109 | 331,547 | |||||||||
Cintas Corp. (Commercial Services & Supplies) | 781 | 546,903 | |||||||||
| Cisco Systems, Inc. (Communications Equipment) | 31,026 | 1,474,045 | |||||||||
| Coca-Cola Europacific Partners PLC (Beverages) | 3,536 | 257,668 | |||||||||
| Cognizant Technology Solutions Corp.—Class A (IT Services) | 3,829 | 260,372 | |||||||||
Comcast Corp.—Class A (Media) | 30,143 | 1,180,400 | |||||||||
Constellation Energy Corp. (Electric Utilities) | 2,428 | 486,255 | |||||||||
Copart, Inc.* (Commercial Services & Supplies) | 7,411 | 401,380 | |||||||||
| CoStar Group, Inc.* (Real Estate Management & Development) | 3,146 | 233,244 | |||||||||
| Costco Wholesale Corp. (Consumer Staples Distribution & Retail) | 3,415 | 2,902,716 | |||||||||
| Crowdstrike Holdings, Inc.*—Class A (Software) | 1,776 | 680,545 | |||||||||
CSX Corp. (Ground Transportation) | 15,055 | 503,590 | |||||||||
Datadog, Inc.*—Class A (Software) | 2,375 | 308,014 | |||||||||
| Dexcom, Inc.* (Health Care Equipment & Supplies) | 3,063 | 347,283 | |||||||||
Common Stocks, continued
Shares | Value | ||||||||||
| Diamondback Energy, Inc. (Oil, Gas & Consumable Fuels) | 1,373 | $ | 274,860 | ||||||||
| Dollar Tree, Inc.* (Consumer Staples Distribution & Retail) | 1,680 | 179,374 | |||||||||
| DoorDash, Inc.*—Class A (Hotels, Restaurants & Leisure) | 2,939 | 319,704 | |||||||||
Electronic Arts, Inc. (Entertainment) | 2,051 | 285,766 | |||||||||
Exelon Corp. (Electric Utilities) | 7,701 | 266,532 | |||||||||
| Fastenal Co. (Trading Companies & Distributors) | 4,409 | 277,062 | |||||||||
Fortinet, Inc.* (Software) | 5,883 | 354,568 | |||||||||
| GE HealthCare Technologies, Inc. (Health Care Equipment & Supplies) | 3,515 | 273,889 | |||||||||
Gilead Sciences, Inc. (Biotechnology) | 9,594 | 658,244 | |||||||||
| GLOBALFOUNDRIES, Inc.*(a) (Semiconductors & Semiconductor Equipment) | 4,248 | 214,779 | |||||||||
Grail, Inc.*(a) (Biotechnology) | 204 | 3,143 | |||||||||
| Honeywell International, Inc. (Industrial Conglomerates) | 5,015 | 1,070,903 | |||||||||
| IDEXX Laboratories, Inc.* (Health Care Equipment & Supplies) | 636 | 309,859 | |||||||||
Illumina, Inc.* (Life Sciences Tools & Services) | 1,227 | 128,074 | |||||||||
| Intel Corp. (Semiconductors & Semiconductor Equipment) | 32,783 | 1,015,290 | |||||||||
Intuit, Inc. (Software) | 2,153 | 1,414,973 | |||||||||
| Intuitive Surgical, Inc.* (Health Care Equipment & Supplies) | 2,732 | 1,215,330 | |||||||||
Keurig Dr Pepper, Inc. (Beverages) | 10,439 | 348,663 | |||||||||
| KLA Corp. (Semiconductors & Semiconductor Equipment) | 1,037 | 855,017 | |||||||||
| Lam Research Corp. (Semiconductors & Semiconductor Equipment) | 1,007 | 1,072,304 | |||||||||
Linde PLC (Chemicals) | 3,702 | 1,624,475 | |||||||||
| Lululemon Athletica, Inc.* (Textiles, Apparel & Luxury Goods) | 930 | 277,791 | |||||||||
| Marriott International, Inc.—Class A (Hotels, Restaurants & Leisure) | 2,200 | 531,894 | |||||||||
| Marvell Technology, Inc. (Semiconductors & Semiconductor Equipment) | 6,666 | 465,953 | |||||||||
MercadoLibre, Inc.* (Broadline Retail) | 390 | 640,926 | |||||||||
| Meta Platforms, Inc.—Class A (Interactive Media & Services) | 10,395 | 5,241,367 | |||||||||
| Microchip Technology, Inc. (Semiconductors & Semiconductor Equipment) | 4,135 | 378,353 | |||||||||
| Micron Technology, Inc. (Semiconductors & Semiconductor Equipment) | 8,528 | 1,121,688 | |||||||||
Microsoft Corp. (Software) | 22,160 | 9,904,413 | |||||||||
Moderna, Inc.* (Biotechnology) | 2,951 | 350,431 | |||||||||
| Mondelez International, Inc.—Class A (Food Products) | 10,330 | 675,995 | |||||||||
MongoDB, Inc.* (IT Services) | 565 | 141,227 | |||||||||
Monster Beverage Corp.* (Beverages) | 8,022 | 400,699 | |||||||||
Netflix, Inc.* (Entertainment) | 3,318 | 2,239,251 | |||||||||
| NVIDIA Corp. (Semiconductors & Semiconductor Equipment) | 73,342 | 9,060,671 | |||||||||
| NXP Semiconductors N.V. (Semiconductors & Semiconductor Equipment) | 1,969 | 529,838 | |||||||||
| Old Dominion Freight Line, Inc. (Ground Transportation) | 1,673 | 295,452 | |||||||||
See accompanying notes to the financial statements.
66 :: ProFund VP Nasdaq-100 :: Schedule of Portfolio Investments :: June 30, 2024 (unaudited)
Common Stocks, continued
Shares | Value | ||||||||||
| ON Semiconductor Corp.* (Semiconductors & Semiconductor Equipment) | 3,313 | $ | 227,106 | ||||||||
O'Reilly Automotive, Inc.* (Specialty Retail) | 454 | 479,451 | |||||||||
PACCAR, Inc. (Machinery) | 4,036 | 415,466 | |||||||||
Palo Alto Networks, Inc.* (Software) | 2,494 | 845,491 | |||||||||
Paychex, Inc. (Professional Services) | 2,772 | 328,648 | |||||||||
PayPal Holdings, Inc.* (Financial Services) | 8,056 | 467,490 | |||||||||
PDD Holdings, Inc.*ADR (Broadline Retail) | 5,144 | 683,895 | |||||||||
PepsiCo, Inc. (Beverages) | 10,587 | 1,746,114 | |||||||||
| QUALCOMM, Inc. (Semiconductors & Semiconductor Equipment) | 8,594 | 1,711,753 | |||||||||
| Regeneron Pharmaceuticals, Inc.* (Biotechnology) | 835 | 877,610 | |||||||||
Roper Technologies, Inc. (Software) | 824 | 464,456 | |||||||||
Ross Stores, Inc. (Specialty Retail) | 2,582 | 375,216 | |||||||||
| Starbucks Corp. (Hotels, Restaurants & Leisure) | 8,724 | 679,163 | |||||||||
Synopsys, Inc.* (Software) | 1,180 | 702,171 | |||||||||
| Take-Two Interactive Software, Inc.* (Entertainment) | 1,320 | 205,247 | |||||||||
Tesla, Inc.* (Automobiles) | 14,393 | 2,848,087 | |||||||||
| Texas Instruments, Inc. (Semiconductors & Semiconductor Equipment) | 7,012 | 1,364,044 | |||||||||
The Kraft Heinz Co. (Food Products) | 9,351 | 301,289 | |||||||||
The Trade Desk, Inc.*—Class A (Media) | 3,429 | 334,910 | |||||||||
| T-Mobile U.S., Inc. (Wireless Telecommunication Services) | 9,025 | 1,590,025 | |||||||||
Verisk Analytics, Inc. (Professional Services) | 1,099 | 296,235 | |||||||||
Vertex Pharmaceuticals, Inc.* (Biotechnology) | 1,987 | 931,347 | |||||||||
| Walgreens Boots Alliance, Inc. (Consumer Staples Distribution & Retail) | 6,644 | 80,359 | |||||||||
Warner Bros. Discovery, Inc.* (Entertainment) | 18,870 | 140,393 | |||||||||
Workday, Inc.*—Class A (Software) | 1,633 | 365,073 | |||||||||
Xcel Energy, Inc. (Electric Utilities) | 4,279 | 228,541 | |||||||||
Zscaler, Inc.* (Software) | 1,154 | 221,787 | |||||||||
| TOTAL COMMON STOCKS (Cost $34,481,835) | 114,589,272 | ||||||||||
Repurchase Agreements(b)(c) (31.5%)
| Principal Amount | Value | ||||||||||
| Repurchase Agreements with various counterparties, rates 5.12%–5.20%, dated 6/28/2024, due 7/1/24, total to be received $53,288,030 | $ | 53,265,000 | $ | 53,265,000 | |||||||
| TOTAL REPURCHASE AGREEMENTS (Cost $53,265,000) | 53,265,000 | ||||||||||
Collateral for Securities Loaned(d) (0.1%)
Shares | Value | ||||||||||
| Invesco Government & Agency Portfolio—Institutional Shares, 5.23%(e) | 209,873 | $ | 209,873 | ||||||||
| TOTAL COLLATERAL FOR SECURITIES LOANED (Cost $209,873) | 209,873 | ||||||||||
| TOTAL INVESTMENT SECURITIES (Cost $87,956,708)—99.4% | 168,064,145 | ||||||||||
Net other assets (liabilities)—0.6% | 1,007,289 | ||||||||||
NET ASSETS—100.0% | $ | 169,071,434 | |||||||||
* Non-income producing security.
(a) All or part of this security was on loan as of June 30, 2024. The total value of securities on loan as of June 30, 2024 was $205,090.
(b) A portion of these securities were held in a segregated account for the benefit of swap counterparties in the event of default. At June 30, 2024, the aggregate amount held in a segregated account was $3,849,000.
(c) The ProFund VP invests in Repurchase Agreements jointly with other funds in the Trust. See "Repurchase Agreements" under Note 2 in the Notes to Financial Statements to view the details of each individual agreement and counterparty as well as a description of the securities subject to repurchase.
(d) Securities were purchased with cash collateral held from securities on loan at June 30, 2024.
(e) Rate periodically changes. Rate disclosed is the daily yield on June 30, 2024.
ADR American Depositary Receipt
NYS New York Shares
Futures Contracts Purchased
| Number of Contracts | Expiration Date | Notional Amount | Value and Unrealized Appreciation/ (Depreciation) | ||||||||||||||||
E-Mini Nasdaq-100 Futures Contracts | 45 | 9/23/24 | $ | 17,934,525 | $ | 153,011 | |||||||||||||
Total Return Swap Agreements—Long
Underlying Instrument | Counterparty | Termination Date(1) | Rate Paid (Received)(2) | Notional Amount | Value and Unrealized Appreciation/ (Depreciation) | ||||||||||||||||||
Nasdaq-100 Index | Goldman Sachs International | 7/29/24 | 6.08 | % | $ | 36,413,310 | $ | (208,642 | ) | ||||||||||||||
Nasdaq-100 Index | UBS AG | 7/29/24 | 6.13 | % | 196,829 | (1,084 | ) | ||||||||||||||||
$ | 36,610,139 | $ | (209,726 | ) | |||||||||||||||||||
(1) Agreements may be terminated at will by either party without penalty. Payment is due at termination/maturity.
(2) Reflects the floating financing rate, as of June 30, 2024, on the notional amount of the swap agreement paid to the counterparty or received from the counterparty, excluding any commissions. This amount is included as part of the unrealized appreciation/(depreciation).
See accompanying notes to the financial statements.
June 30, 2024 (unaudited) :: Schedule of Portfolio Investments :: ProFund VP Nasdaq-100 :: 67
ProFund VP Nasdaq-100 invested in the following industries as of June 30, 2024:
Value | % of Net Assets | ||||||||||
Automobiles | $ | 2,848,087 | 1.7 | % | |||||||
Beverages | 2,753,144 | 1.6 | % | ||||||||
Biotechnology | 4,371,377 | 2.5 | % | ||||||||
Broadline Retail | 7,320,982 | 4.3 | % | ||||||||
Chemicals | 1,624,475 | 1.0 | % | ||||||||
Commercial Services & Supplies | 948,283 | 0.6 | % | ||||||||
Communications Equipment | 1,474,045 | 0.9 | % | ||||||||
Consumer Staples Distribution & Retail | 3,162,449 | 1.9 | % | ||||||||
Electric Utilities | 1,337,465 | 0.8 | % | ||||||||
| Electronic Equipment, Instruments & Components | 231,674 | 0.1 | % | ||||||||
Energy Equipment & Services | 270,317 | 0.2 | % | ||||||||
Entertainment | 2,870,657 | 1.7 | % | ||||||||
Financial Services | 467,490 | 0.3 | % | ||||||||
Food Products | 977,284 | 0.6 | % | ||||||||
Ground Transportation | 799,042 | 0.5 | % | ||||||||
Health Care Equipment & Supplies | 2,146,361 | 1.3 | % | ||||||||
Hotels, Restaurants & Leisure | 3,080,255 | 1.8 | % | ||||||||
Industrial Conglomerates | 1,070,903 | 0.6 | % | ||||||||
Interactive Media & Services | 11,503,460 | 6.8 | % | ||||||||
IT Services | 401,599 | 0.2 | % | ||||||||
Life Sciences Tools & Services | 128,074 | 0.1 | % | ||||||||
Value | % of Net Assets | ||||||||||
Machinery | $ | 415,466 | 0.2 | % | |||||||
Media | 1,846,857 | 1.1 | % | ||||||||
Oil, Gas & Consumable Fuels | 274,860 | 0.1 | % | ||||||||
Pharmaceuticals | 349,707 | 0.2 | % | ||||||||
Professional Services | 1,377,234 | 0.8 | % | ||||||||
| Real Estate Management & Development | 233,244 | 0.1 | % | ||||||||
| Semiconductors & Semiconductor Equipment | 29,008,642 | 17.3 | % | ||||||||
Software | 18,666,748 | 11.0 | % | ||||||||
Specialty Retail | 854,667 | 0.5 | % | ||||||||
| Technology Hardware, Storage & Peripherals | 9,629,546 | 5.7 | % | ||||||||
Textiles, Apparel & Luxury Goods | 277,791 | 0.2 | % | ||||||||
Trading Companies & Distributors | 277,062 | 0.2 | % | ||||||||
Wireless Telecommunication Services | 1,590,025 | 0.9 | % | ||||||||
Other** | 54,482,162 | 32.2 | % | ||||||||
Total | $ | 169,071,434 | 100.0 | % | |||||||
** Includes any non-equity securities and net other assets (liabilities), which includes any receivable for capital shares issued and payable for capital shares redeemed.
See accompanying notes to the financial statements.
Common Stocks (98.7%)
Shares | Value | ||||||||||
| Amneal Pharmaceuticals, Inc.* (Pharmaceuticals) | 15,482 | $ | 98,311 | ||||||||
| Amphastar Pharmaceuticals, Inc.* (Pharmaceuticals) | 5,171 | 206,840 | |||||||||
ANI Pharmaceuticals, Inc.* (Pharmaceuticals) | 2,130 | 135,638 | |||||||||
Arvinas, Inc.* (Pharmaceuticals) | 11,740 | 312,519 | |||||||||
Axsome Therapeutics, Inc.* (Pharmaceuticals) | 4,917 | 395,818 | |||||||||
Bristol-Myers Squibb Co. (Pharmaceuticals) | 8,787 | 364,924 | |||||||||
Cassava Sciences, Inc.*(a) (Pharmaceuticals) | 10,104 | 124,784 | |||||||||
Catalent, Inc.* (Pharmaceuticals) | 6,526 | 366,957 | |||||||||
| Collegium Pharmaceutical, Inc.* (Pharmaceuticals) | 5,660 | 182,252 | |||||||||
Corcept Therapeutics, Inc.* (Pharmaceuticals) | 10,273 | 333,770 | |||||||||
Edgewise Therapeutics, Inc.* (Pharmaceuticals) | 7,967 | 143,486 | |||||||||
Elanco Animal Health, Inc.* (Pharmaceuticals) | 20,078 | 289,726 | |||||||||
Eli Lilly & Co. (Pharmaceuticals) | 413 | 373,922 | |||||||||
Enliven Therapeutics, Inc.* (Pharmaceuticals) | 2,924 | 68,334 | |||||||||
Evolus, Inc.* (Pharmaceuticals) | 8,715 | 94,558 | |||||||||
| EyePoint Pharmaceuticals, Inc.* (Pharmaceuticals) | 9,437 | 82,102 | |||||||||
Fulcrum Therapeutics, Inc.* (Pharmaceuticals) | 7,748 | 48,038 | |||||||||
| Harmony Biosciences Holdings, Inc.* (Pharmaceuticals) | 4,794 | 144,635 | |||||||||
Harrow, Inc.* (Pharmaceuticals) | 3,526 | 73,658 | |||||||||
Innoviva, Inc.* (Pharmaceuticals) | 6,966 | 114,242 | |||||||||
Intra-Cellular Therapies, Inc.* (Pharmaceuticals) | 5,342 | 365,874 | |||||||||
Jazz Pharmaceuticals PLC* (Pharmaceuticals) | 3,207 | 342,283 | |||||||||
Johnson & Johnson (Pharmaceuticals) | 2,488 | 363,646 | |||||||||
| Ligand Pharmaceuticals, Inc.* (Pharmaceuticals) | 1,872 | 157,735 | |||||||||
Liquidia Corp.* (Pharmaceuticals) | 10,628 | 127,536 | |||||||||
| Longboard Pharmaceuticals, Inc.* (Pharmaceuticals) | 5,193 | 140,367 | |||||||||
Merck & Co., Inc. (Pharmaceuticals) | 2,796 | 346,145 | |||||||||
| Mind Medicine Mindmed, Inc.* (Pharmaceuticals) | 15,529 | 111,964 | |||||||||
Nuvation Bio, Inc.* (Pharmaceuticals) | 14,516 | 42,387 | |||||||||
Ocular Therapeutix, Inc.* (Pharmaceuticals) | 32,065 | 219,325 | |||||||||
Organon & Co. (Pharmaceuticals) | 17,746 | 367,342 | |||||||||
Pacira BioSciences, Inc.* (Pharmaceuticals) | 6,664 | 190,657 | |||||||||
Perrigo Co. PLC (Pharmaceuticals) | 13,482 | 346,218 | |||||||||
Pfizer, Inc. (Pharmaceuticals) | 13,150 | 367,937 | |||||||||
Pliant Therapeutics, Inc.* (Pharmaceuticals) | 5,252 | 56,459 | |||||||||
| Prestige Consumer Healthcare, Inc.* (Pharmaceuticals) | 3,293 | 226,723 | |||||||||
| Royalty Pharma PLC—Class A (Pharmaceuticals) | 13,447 | 354,597 | |||||||||
Common Stocks, continued
Shares | Value | ||||||||||
| Supernus Pharmaceuticals, Inc.* (Pharmaceuticals) | 6,833 | $ | 182,783 | ||||||||
Tarsus Pharmaceuticals, Inc.* (Pharmaceuticals) | 6,715 | 182,514 | |||||||||
Viatris, Inc. (Pharmaceuticals) | 35,596 | 378,384 | |||||||||
WaVe Life Sciences, Ltd.* (Pharmaceuticals) | 7,265 | 36,252 | |||||||||
| Xeris Biopharma Holdings, Inc.* (Pharmaceuticals) | 17,536 | 39,456 | |||||||||
Zoetis, Inc. (Pharmaceuticals) | 2,123 | 368,043 | |||||||||
| TOTAL COMMON STOCKS (Cost $6,875,853) | 9,269,141 | ||||||||||
Repurchase Agreements(b) (1.8%)
| Principal Amount | Value | ||||||||||
| Repurchase Agreements with various counterparties, rates 5.12%–5.20%, dated 6/28/2024, due 7/1/24, total to be received $165,071 | $ | 165,000 | $ | 165,000 | |||||||
| TOTAL REPURCHASE AGREEMENTS (Cost $165,000) | 165,000 | ||||||||||
Collateral for Securities Loaned(c) (1.9%)
Shares | Value | ||||||||||
| Invesco Government & Agency Portfolio—Institutional Shares, 5.23%(d) | 182,208 | $ | 182,208 | ||||||||
| TOTAL COLLATERAL FOR SECURITIES LOANED (Cost $182,208) | 182,208 | ||||||||||
| TOTAL INVESTMENT SECURITIES (Cost $7,223,061)—102.4% | 9,616,349 | ||||||||||
Net other assets (liabilities)—(2.4)% | (221,675 | ) | |||||||||
NET ASSETS—100.0% | $ | 9,394,674 | |||||||||
* Non-income producing security.
(a) All or part of this security was on loan as of June 30, 2024. The total value of securities on loan as of June 30, 2024 was $115,398.
(b) The ProFund VP invests in Repurchase Agreements jointly with other funds in the Trust. See "Repurchase Agreements" under Note 2 in the Notes to Financial Statements to view the details of each individual agreement and counterparty as well as a description of the securities subject to repurchase.
(c) Securities were purchased with cash collateral held from securities on loan at June 30, 2024.
(d) Rate periodically changes. Rate disclosed is the daily yield on June 30, 2024.
Total Return Swap Agreements—Long
Underlying Instrument | Counterparty | Termination Date(1) | Rate Paid (Received)(2) | Notional Amount | Value and Unrealized Appreciation/ (Depreciation) | ||||||||||||||||||
| S&P Pharmaceuticals Select Industry Index | Goldman Sachs International | 7/23/24 | 6.08 | % | $ | 174,019 | $ | (3,516 | ) | ||||||||||||||
(1) Agreements may be terminated at will by either party without penalty. Payment is due at termination/maturity.
(2) Reflects the floating financing rate, as of June 30, 2024, on the notional amount of the swap agreement paid to the counterparty or received from the counterparty, excluding any commissions. This amount is included as part of the unrealized appreciation/(depreciation).
See accompanying notes to the financial statements.
June 30, 2024 (unaudited) :: Schedule of Portfolio Investments :: ProFund VP Pharmaceuticals :: 69
ProFund VP Pharmaceuticals invested in the following industries as of June 30, 2024:
Value | % of Net Assets | ||||||||||
Pharmaceuticals | $ | 9,269,141 | 98.7 | % | |||||||
Other** | 125,533 | 1.3 | % | ||||||||
Total | $ | 9,394,674 | 100.0 | % | |||||||
** Includes any non-equity securities and net other assets (liabilities), which includes any receivable for capital shares issued and payable for capital shares redeemed.
See accompanying notes to the financial statements.
Repurchase Agreements(a)(b) (80.0%)
| Principal Amount | Value | ||||||||||
| Repurchase Agreements with various counterparties, rates 5.12%–5.20%, dated 6/28/2024, due 7/1/24, total to be received $24,211,463 | $ | 24,201,000 | $ | 24,201,000 | |||||||
| TOTAL REPURCHASE AGREEMENTS (Cost $24,201,000) | 24,201,000 | ||||||||||
| TOTAL INVESTMENT SECURITIES (Cost $24,201,000)—80.0% | 24,201,000 | ||||||||||
Net other assets (liabilities)—20.0% | 6,033,128 | ||||||||||
NET ASSETS—100.0% | $ | 30,234,128 | |||||||||
(a) A portion of these securities were held in a segregated account for the benefit of swap counterparties in the event of default. At June 30, 2024, the aggregate amount held in a segregated account was $3,326,000.
(b) The ProFund VP invests in Repurchase Agreements jointly with other funds in the Trust. See "Repurchase Agreements" under Note 2 in the Notes to Financial Statements to view the details of each individual agreement and counterparty as well as a description of the securities subject to repurchase.
Total Return Swap Agreements—Long
Underlying Instrument | Counterparty | Termination Date(1) | Rate Paid (Received)(2) | Notional Amount | Value and Unrealized Appreciation/ (Depreciation) | ||||||||||||||||||
| Dow Jones Precious Metals Index | Goldman Sachs International | 7/23/24 | 6.08 | % | $ | 17,439,638 | $ | (51,847 | ) | ||||||||||||||
| Dow Jones Precious Metals Index | UBS AG | 7/23/24 | 6.08 | % | 12,686,926 | (54,953 | ) | ||||||||||||||||
$ | 30,126,564 | $ | (106,800 | ) | |||||||||||||||||||
(1) Agreements may be terminated at will by either party without penalty. Payment is due at termination/maturity.
(2) Reflects the floating financing rate, as of June 30, 2024, on the notional amount of the swap agreement paid to the counterparty or received from the counterparty, excluding any commissions. This amount is included as part of the unrealized appreciation/(depreciation).
See accompanying notes to the financial statements.
Common Stocks (98.6%)
Shares | Value | ||||||||||
| Alexandria Real Estate Equities, Inc. (Office REITs) | 964 | $ | 112,759 | ||||||||
American Tower Corp. (Specialized REITs) | 2,860 | 555,927 | |||||||||
| AvalonBay Communities, Inc. (Residential REITs) | 871 | 180,201 | |||||||||
BXP, Inc. (Office REITs) | 884 | 54,419 | |||||||||
Camden Property Trust (Residential REITs) | 652 | 71,140 | |||||||||
| CBRE Group, Inc.*—Class A (Real Estate Management & Development) | 1,848 | 164,675 | |||||||||
| CoStar Group, Inc.* (Real Estate Management & Development) | 2,501 | 185,424 | |||||||||
Crown Castle, Inc. (Specialized REITs) | 2,659 | 259,784 | |||||||||
Digital Realty Trust, Inc. (Specialized REITs) | 1,987 | 302,123 | |||||||||
Equinix, Inc. (Specialized REITs) | 581 | 439,585 | |||||||||
Equity Commonwealth* (Office REITs) | 1 | 15 | |||||||||
Equity Residential (Residential REITs) | 2,111 | 146,377 | |||||||||
Essex Property Trust, Inc. (Residential REITs) | 394 | 107,247 | |||||||||
Extra Space Storage, Inc. (Specialized REITs) | 1,296 | 201,411 | |||||||||
| Federal Realty Investment Trust (Retail REITs) | 458 | 46,244 | |||||||||
| Healthpeak Properties, Inc. (Health Care REITs) | 4,309 | 84,456 | |||||||||
| Host Hotels & Resorts, Inc. (Hotel & Resort REITs) | 4,317 | 77,620 | |||||||||
Invitation Homes, Inc. (Residential REITs) | 3,525 | 126,512 | |||||||||
Iron Mountain, Inc. (Specialized REITs) | 1,796 | 160,958 | |||||||||
Kimco Realty Corp. (Retail REITs) | 4,085 | 79,494 | |||||||||
| Mid-America Apartment Communities, Inc. (Residential REITs) | 715 | 101,966 | |||||||||
Prologis, Inc. (Industrial REITs) | 5,669 | 636,685 | |||||||||
Public Storage (Specialized REITs) | 967 | 278,158 | |||||||||
Realty Income Corp. (Retail REITs) | 5,332 | 281,636 | |||||||||
Regency Centers Corp. (Retail REITs) | 1,006 | 62,573 | |||||||||
Common Stocks, continued
Shares | Value | ||||||||||
| SBA Communications Corp. (Specialized REITs) | 658 | $ | 129,165 | ||||||||
Simon Property Group, Inc. (Retail REITs) | 1,996 | 302,994 | |||||||||
UDR, Inc. (Residential REITs) | 1,855 | 76,333 | |||||||||
Ventas, Inc. (Health Care REITs) | 2,478 | 127,022 | |||||||||
VICI Properties, Inc. (Specialized REITs) | 6,387 | 182,924 | |||||||||
Welltower, Inc. (Health Care REITs) | 3,662 | 381,764 | |||||||||
Weyerhaeuser Co. (Specialized REITs) | 4,464 | 126,733 | |||||||||
| TOTAL COMMON STOCKS (Cost $2,851,301) | 6,044,324 | ||||||||||
Repurchase Agreements(a) (1.4%)
| Principal Amount | Value | ||||||||||
| Repurchase Agreements with various counterparties, rates 5.12%–5.20%, dated 6/28/2024, due 7/1/24, total to be received $83,036 | $ | 83,000 | $ | 83,000 | |||||||
| TOTAL REPURCHASE AGREEMENTS (Cost $83,000) | 83,000 | ||||||||||
| TOTAL INVESTMENT SECURITIES (Cost $2,934,301)—100.0% | 6,127,324 | ||||||||||
Net other assets (liabilities)—(NM) | 1,199 | ||||||||||
NET ASSETS—100.0% | $ | 6,128,523 | |||||||||
* Non-income producing security.
(a) The ProFund VP invests in Repurchase Agreements jointly with other funds in the Trust. See "Repurchase Agreements" under Note 2 in the Notes to Financial Statements to view the details of each individual agreement and counterparty as well as a description of the securities subject to repurchase.
NM Not meaningful, amount is less than 0.05%.
REIT Real Estate Investment Trust
Total Return Swap Agreements—Long
Underlying Instrument | Counterparty | Termination Date(1) | Rate Paid (Received)(2) | Notional Amount | Value and Unrealized Appreciation/ (Depreciation) | ||||||||||||||||||
| S&P Real Estate Select Sector Index | Goldman Sachs International | 7/23/24 | 6.08 | % | $ | 86,052 | $ | (698 | ) | ||||||||||||||
(1) Agreements may be terminated at will by either party without penalty. Payment is due at termination/maturity.
(2) Reflects the floating financing rate, as of June 30, 2024, on the notional amount of the swap agreement paid to the counterparty or received from the counterparty, excluding any commissions. This amount is included as part of the unrealized appreciation/(depreciation).
ProFund VP Real Estate invested in the following industries as of June 30, 2024:
Value | % of Net Assets | ||||||||||
Health Care REITs | $ | 593,242 | 9.7 | % | |||||||
Hotel & Resort REITs | 77,620 | 1.3 | % | ||||||||
Industrial REITs | 636,685 | 10.4 | % | ||||||||
Office REITs | 167,193 | 2.7 | % | ||||||||
Real Estate Management & Development | 350,099 | 5.7 | % | ||||||||
Residential REITs | 809,776 | 13.2 | % | ||||||||
Retail REITs | 772,941 | 12.6 | % | ||||||||
Value | % of Net Assets | ||||||||||
Specialized REITs | $ | 2,636,768 | 43.0 | % | |||||||
Other** | 84,199 | 1.4 | % | ||||||||
Total | $ | 6,128,523 | 100.0 | % | |||||||
** Includes any non-equity securities and net other assets (liabilities), which includes any receivable for capital shares issued and payable for capital shares redeemed.
REIT Real Estate Investment Trust
See accompanying notes to the financial statements.
72 :: ProFund VP Rising Rates Opportunity :: Schedule of Portfolio Investments :: June 30, 2024 (unaudited)
Repurchase Agreements(a)(b) (98.0%)
| Principal Amount | Value | ||||||||||
| Repurchase Agreements with various counterparties, rates 5.12%–5.20%, dated 6/28/2024, due 7/1/24, total to be received $8,507,677 | $ | 8,504,000 | $ | 8,504,000 | |||||||
| TOTAL REPURCHASE AGREEMENTS (Cost $8,504,000) | 8,504,000 | ||||||||||
| TOTAL INVESTMENT SECURITIES (Cost $8,504,000)—98.0% | 8,504,000 | ||||||||||
Net other assets (liabilities)—2.0% | 170,103 | ||||||||||
NET ASSETS—100.0% | $ | 8,674,103 | |||||||||
(a) A portion of these securities were held in a segregated account for the benefit of swap counterparties in the event of default. At June 30, 2024, the aggregate amount held in a segregated account was $373,000.
(b) The ProFund VP invests in Repurchase Agreements jointly with other funds in the Trust. See "Repurchase Agreements" under Note 2 in the Notes to Financial Statements to view the details
of each individual agreement and counterparty as well as a description of the securities subject to repurchase.
Total Return Swap Agreements—Short
Underlying Instrument | Counterparty | Termination Date(1) | Rate Paid (Received)(2) | Notional Amount | Value and Unrealized Appreciation/ (Depreciation) | ||||||||||||||||||
| 30-Year U.S. Treasury Bond, 4.625% due on 5/15/54 | Citibank North America | 7/15/24 | (5.25 | )% | $ | (5,475,516 | ) | $ | 121,110 | ||||||||||||||
| 30-Year U.S. Treasury Bond, 4.625% due on 5/15/54 | Societe' Generale | 7/15/24 | (5.17 | )% | (5,252,439 | ) | 113,983 | ||||||||||||||||
$ | (10,727,955 | ) | $ | 235,093 | |||||||||||||||||||
(1) Agreements may be terminated at will by either party without penalty. Payment is due at termination/maturity.
(2) Reflects the floating financing rate, as of June 30, 2024, on the notional amount of the swap agreement paid to the counterparty or received from the counterparty, excluding any commissions. This amount is included as part of the unrealized appreciation/(depreciation).
See accompanying notes to the financial statements.
Common Stocks (44.5%)
Shares | Value | ||||||||||
| Advanced Micro Devices, Inc.* (Semiconductors & Semiconductor Equipment) | 11,896 | $ | 1,929,650 | ||||||||
| Allegro MicroSystems, Inc.* (Semiconductors & Semiconductor Equipment) | 526 | 14,854 | |||||||||
| Amkor Technology, Inc. (Semiconductors & Semiconductor Equipment) | 761 | 30,455 | |||||||||
| Analog Devices, Inc. (Semiconductors & Semiconductor Equipment) | 3,650 | 833,149 | |||||||||
| Applied Materials, Inc. (Semiconductors & Semiconductor Equipment) | 6,115 | 1,443,079 | |||||||||
| Axcelis Technologies, Inc.* (Semiconductors & Semiconductor Equipment) | 239 | 33,983 | |||||||||
| Broadcom, Inc. (Semiconductors & Semiconductor Equipment) | 3,206 | 5,147,329 | |||||||||
| Cirrus Logic, Inc.* (Semiconductors & Semiconductor Equipment) | 397 | 50,681 | |||||||||
| Enphase Energy, Inc.* (Semiconductors & Semiconductor Equipment) | 1,001 | 99,810 | |||||||||
| Entegris, Inc. (Semiconductors & Semiconductor Equipment) | 1,110 | 150,294 | |||||||||
| GLOBALFOUNDRIES, Inc.*(a) (Semiconductors & Semiconductor Equipment) | 613 | 30,993 | |||||||||
| Intel Corp. (Semiconductors & Semiconductor Equipment) | 31,330 | 970,290 | |||||||||
| KLA Corp. (Semiconductors & Semiconductor Equipment) | 991 | 817,089 | |||||||||
| Lam Research Corp. (Semiconductors & Semiconductor Equipment) | 962 | 1,024,386 | |||||||||
| Lattice Semiconductor Corp.* (Semiconductors & Semiconductor Equipment) | 1,012 | 58,686 | |||||||||
| Marvell Technology, Inc. (Semiconductors & Semiconductor Equipment) | 6,370 | 445,263 | |||||||||
| Microchip Technology, Inc. (Semiconductors & Semiconductor Equipment) | 3,977 | 363,896 | |||||||||
| Micron Technology, Inc. (Semiconductors & Semiconductor Equipment) | 8,150 | 1,071,970 | |||||||||
| MKS Instruments, Inc. (Semiconductors & Semiconductor Equipment) | 465 | 60,720 | |||||||||
| Monolithic Power Systems, Inc. (Semiconductors & Semiconductor Equipment) | 358 | 294,161 | |||||||||
| NVIDIA Corp. (Semiconductors & Semiconductor Equipment) | 181,037 | 22,365,312 | |||||||||
| NXP Semiconductors N.V. (Semiconductors & Semiconductor Equipment) | 1,882 | 506,427 | |||||||||
| ON Semiconductor Corp.* (Semiconductors & Semiconductor Equipment) | 3,166 | 217,029 | |||||||||
| Power Integrations, Inc. (Semiconductors & Semiconductor Equipment) | 418 | 29,339 | |||||||||
| Qorvo, Inc.* (Semiconductors & Semiconductor Equipment) | 711 | 82,504 | |||||||||
| QUALCOMM, Inc. (Semiconductors & Semiconductor Equipment) | 8,228 | 1,638,853 | |||||||||
| Rambus, Inc.* (Semiconductors & Semiconductor Equipment) | 793 | 46,597 | |||||||||
Common Stocks, continued
Shares | Value | ||||||||||
| Silicon Laboratories, Inc.* (Semiconductors & Semiconductor Equipment) | 235 | $ | 25,998 | ||||||||
| Skyworks Solutions, Inc. (Semiconductors & Semiconductor Equipment) | 1,181 | 125,871 | |||||||||
| SolarEdge Technologies, Inc.* (Semiconductors & Semiconductor Equipment) | 422 | 10,660 | |||||||||
| Teradyne, Inc. (Semiconductors & Semiconductor Equipment) | 1,149 | 170,385 | |||||||||
| Texas Instruments, Inc. (Semiconductors & Semiconductor Equipment) | 6,701 | 1,303,546 | |||||||||
| Universal Display Corp. (Semiconductors & Semiconductor Equipment) | 321 | 67,490 | |||||||||
| Wolfspeed, Inc.* (Semiconductors & Semiconductor Equipment) | 926 | 21,076 | |||||||||
| TOTAL COMMON STOCKS (Cost $8,115,538) | 41,481,825 | ||||||||||
Repurchase Agreements(b) (1.8%)
| Principal Amount | Value | ||||||||||
| Repurchase Agreements with various counterparties, rates 5.12%–5.20%, dated 6/28/2024, due 7/1/24, total to be received $1,705,737 | $ | 1,705,000 | $ | 1,705,000 | |||||||
| TOTAL REPURCHASE AGREEMENTS (Cost $1,705,000) | 1,705,000 | ||||||||||
Collateral for Securities Loaned(c) (0.1%)
Shares | Value | ||||||||||
| Invesco Government & Agency Portfolio—Institutional Shares, 5.23%(d) | 49,421 | $ | 49,421 | ||||||||
| TOTAL COLLATERAL FOR SECURITIES LOANED (Cost $49,421) | 49,421 | ||||||||||
| TOTAL INVESTMENT SECURITIES (Cost $9,869,959)—46.4% | 43,236,246 | ||||||||||
Net other assets (liabilities)—53.6% | 49,985,011 | ||||||||||
NET ASSETS—100.0% | $ | 93,221,257 | |||||||||
* Non-income producing security.
(a) All or part of this security was on loan as of June 30, 2024. The total value of securities on loan as of June 30, 2024 was $30,993.
(b) The ProFund VP invests in Repurchase Agreements jointly with other funds in the Trust. See "Repurchase Agreements" under Note 2 in the Notes to Financial Statements to view the details of each individual agreement and counterparty as well as a description of the securities subject to repurchase.
(c) Securities were purchased with cash collateral held from securities on loan at June 30, 2024.
(d) Rate periodically changes. Rate disclosed is the daily yield on June 30, 2024.
See accompanying notes to the financial statements.
74 :: ProFund VP Semiconductor :: Schedule of Portfolio Investments :: June 30, 2024 (unaudited)
Total Return Swap Agreements—Long
Underlying Instrument | Counterparty | Termination Date(1) | Rate Paid (Received)(2) | Notional Amount | Value and Unrealized Appreciation/ (Depreciation) | ||||||||||||||||||
| Dow Jones U.S. Semiconductors Index | Goldman Sachs International | 7/23/24 | 6.08 | % | $ | 51,191,806 | $ | 95,739 | |||||||||||||||
(1) Agreements may be terminated at will by either party without penalty. Payment is due at termination/maturity.
(2) Reflects the floating financing rate, as of June 30, 2024, on the notional amount of the swap agreement paid to the counterparty or received from the counterparty, excluding any commissions. This amount is included as part of the unrealized appreciation/(depreciation).
ProFund VP Semiconductor invested in the following industries as of June 30, 2024:
Value | % of Net Assets | ||||||||||
| Semiconductors & Semiconductor Equipment | $ | 41,481,825 | 44.5 | % | |||||||
Other** | 51,739,432 | 55.5 | % | ||||||||
Total | $ | 93,221,257 | 100.0 | % | |||||||
** Includes any non-equity securities and net other assets (liabilities), which includes any receivable for capital shares issued and payable for capital shares redeemed.
See accompanying notes to the financial statements.
Repurchase Agreements(a)(b) (96.0%)
| Principal Amount | Value | ||||||||||
| Repurchase Agreements with various counterparties, rates 5.12%–5.20%, dated 6/28/2024, due 7/1/24, total to be received $6,003 | $ | 6,000 | $ | 6,000 | |||||||
| TOTAL REPURCHASE AGREEMENTS (Cost $6,000) | 6,000 | ||||||||||
| TOTAL INVESTMENT SECURITIES (Cost $6,000)—96.0% | 6,000 | ||||||||||
Net other assets (liabilities)—4.0% | 250 | ||||||||||
NET ASSETS—100.0% | $ | 6,250 | |||||||||
(a) A portion of these securities were held in a segregated account for the benefit of swap counterparties in the event of default. At June 30, 2024, the aggregate amount held in a segregated account was $4,000.
(b) The ProFund VP invests in Repurchase Agreements jointly with other funds in the Trust. See "Repurchase Agreements" under Note 2 in the Notes to Financial Statements to view the details of each individual agreement and counterparty as well as a description of the securities subject to repurchase.
Total Return Swap Agreements—Short
Underlying Instrument | Counterparty | Termination Date(1) | Rate Paid (Received)(2) | Notional Amount | Value and Unrealized Appreciation/ (Depreciation) | ||||||||||||||||||
Dow Jones Industrial Average | Goldman Sachs International | 7/29/24 | (5.83 | )% | $ | (599 | ) | $ | 1 | ||||||||||||||
Dow Jones Industrial Average | UBS AG | 7/29/24 | (5.18 | )% | (5,627 | ) | 7 | ||||||||||||||||
$ | (6,226 | ) | $ | 8 | |||||||||||||||||||
(1) Agreements may be terminated at will by either party without penalty. Payment is due at termination/maturity.
(2) Reflects the floating financing rate, as of June 30, 2024, on the notional amount of the swap agreement paid to the counterparty or received from the counterparty, excluding any commissions. This amount is included as part of the unrealized appreciation/(depreciation).
See accompanying notes to the financial statements.
76 :: ProFund VP Short Emerging Markets :: Schedule of Portfolio Investments :: June 30, 2024 (unaudited)
Repurchase Agreements(a)(b) (98.4%)
| Principal Amount | Value | ||||||||||
| Repurchase Agreements with various counterparties, rates 5.12%–5.20%, dated 6/28/2024, due 7/1/24, total to be received $519,224 | $ | 519,000 | $ | 519,000 | |||||||
| TOTAL REPURCHASE AGREEMENTS (Cost $519,000) | 519,000 | ||||||||||
| TOTAL INVESTMENT SECURITIES (Cost $519,000)—98.4% | 519,000 | ||||||||||
Net other assets (liabilities)—1.6% | 8,606 | ||||||||||
NET ASSETS—100.0% | $ | 527,606 | |||||||||
(a) A portion of these securities were held in a segregated account for the benefit of swap counterparties in the event of default. At June 30, 2024, the aggregate amount held in a segregated account was $41,000.
(b) The ProFund VP invests in Repurchase Agreements jointly with other funds in the Trust. See "Repurchase Agreements" under Note 2 in the Notes to Financial Statements to view the details of each individual agreement and counterparty as well as a description of the securities subject to repurchase.
Total Return Swap Agreements—Short
Underlying Instrument | Counterparty | Termination Date(1) | Rate Paid (Received)(2) | Notional Amount | Value and Unrealized Appreciation/ (Depreciation) | ||||||||||||||||||
S&P Emerging 50 ADR Index (USD) | Goldman Sachs International | 7/29/24 | (5.13 | )% | $ | (330,352 | ) | $ | (19 | ) | |||||||||||||
S&P Emerging 50 ADR Index (USD) | UBS AG | 7/29/24 | (4.83 | )% | (197,285 | ) | (12 | ) | |||||||||||||||
$ | (527,637 | ) | $ | (31 | ) | ||||||||||||||||||
(1) Agreements may be terminated at will by either party without penalty. Payment is due at termination/maturity.
(2) Reflects the floating financing rate, as of June 30, 2024, on the notional amount of the swap agreement paid to the counterparty or received from the counterparty, excluding any commissions. This amount is included as part of the unrealized appreciation/(depreciation).
See accompanying notes to the financial statements.
June 30, 2024 (unaudited) :: Schedule of Portfolio Investments :: ProFund VP Short International :: 77
Repurchase Agreements(a)(b) (98.2%)
| Principal Amount | Value | ||||||||||
| Repurchase Agreements with various counterparties, rates 5.12%–5.20%, dated 6/28/2024, due 7/1/24, total to be received $784,339 | $ | 784,000 | $ | 784,000 | |||||||
| TOTAL REPURCHASE AGREEMENTS (Cost $784,000) | 784,000 | ||||||||||
| TOTAL INVESTMENT SECURITIES (Cost $784,000)—98.2% | 784,000 | ||||||||||
Net other assets (liabilities)—1.8% | 14,387 | ||||||||||
NET ASSETS—100.0% | $ | 798,387 | |||||||||
(a) A portion of these securities were held in a segregated account for the benefit of swap counterparties in the event of default. At June 30, 2024, the aggregate amount held in a segregated account was $179,000.
(b) The ProFund VP invests in Repurchase Agreements jointly with other funds in the Trust. See "Repurchase Agreements" under Note 2 in the Notes to Financial Statements to view the details of each individual agreement and counterparty as well as a description of the securities subject to repurchase.
Total Return Swap Agreements—Short
Underlying Instrument | Counterparty | Termination Date(1) | Rate Paid (Received)(2) | Notional Amount | Value and Unrealized Appreciation/ (Depreciation) | ||||||||||||||||||
MSCI EAFE Index | Goldman Sachs International | 7/29/24 | (5.28 | )% | $ | (315,519 | ) | $ | (470 | ) | |||||||||||||
MSCI EAFE Index | UBS AG | 7/29/24 | (5.03 | )% | (481,865 | ) | (721 | ) | |||||||||||||||
$ | (797,384 | ) | $ | (1,191 | ) | ||||||||||||||||||
(1) Agreements may be terminated at will by either party without penalty. Payment is due at termination/maturity.
(2) Reflects the floating financing rate, as of June 30, 2024, on the notional amount of the swap agreement paid to the counterparty or received from the counterparty, excluding any commissions. This amount is included as part of the unrealized appreciation/(depreciation).
See accompanying notes to the financial statements.
Repurchase Agreements(a)(b) (111.3%)
| Principal Amount | Value | ||||||||||
| Repurchase Agreements with various counterparties, rates 5.12%–5.20%, dated 6/28/2024, due 7/1/24, total to be received $84,036 | $ | 84,000 | $ | 84,000 | |||||||
| TOTAL REPURCHASE AGREEMENTS (Cost $84,000) | 84,000 | ||||||||||
| TOTAL INVESTMENT SECURITIES (Cost $84,000)—111.3% | 84,000 | ||||||||||
Net other assets (liabilities)—(11.3)% | (8,507 | ) | |||||||||
NET ASSETS—100.0% | $ | 75,493 | |||||||||
(a) A portion of these securities were held in a segregated account for the benefit of swap counterparties in the event of default. At June 30, 2024, the aggregate amount held in a segregated account was $21,000.
(b) The ProFund VP invests in Repurchase Agreements jointly with other funds in the Trust. See "Repurchase Agreements" under Note 2 in the Notes to Financial Statements to view the details of each individual agreement and counterparty as well as a description of the securities subject to repurchase.
Total Return Swap Agreements—Short
Underlying Instrument | Counterparty | Termination Date(1) | Rate Paid (Received)(2) | Notional Amount | Value and Unrealized Appreciation/ (Depreciation) | ||||||||||||||||||
S&P MidCap 400 | Goldman Sachs International | 7/29/24 | (5.58 | )% | $ | (10,375 | ) | $ | (60 | ) | |||||||||||||
S&P MidCap 400 | UBS AG | 7/29/24 | (5.33 | )% | (64,414 | ) | (185 | ) | |||||||||||||||
$ | (74,789 | ) | $ | (245 | ) | ||||||||||||||||||
(1) Agreements may be terminated at will by either party without penalty. Payment is due at termination/maturity.
(2) Reflects the floating financing rate, as of June 30, 2024, on the notional amount of the swap agreement paid to the counterparty or received from the counterparty, excluding any commissions. This amount is included as part of the unrealized appreciation/(depreciation).
See accompanying notes to the financial statements.
Repurchase Agreements(a)(b) (98.2%)
| Principal Amount | Value | ||||||||||
| Repurchase Agreements with various counterparties, rates 5.12%–5.20%, dated 6/28/2024, due 7/1/24, total to be received $2,507,083 | $ | 2,506,000 | $ | 2,506,000 | |||||||
| TOTAL REPURCHASE AGREEMENTS (Cost $2,506,000) | 2,506,000 | ||||||||||
| TOTAL INVESTMENT SECURITIES (Cost $2,506,000)—98.2% | 2,506,000 | ||||||||||
Net other assets (liabilities)—1.8% | 45,293 | ||||||||||
NET ASSETS—100.0% | $ | 2,551,293 | |||||||||
(a) A portion of these securities were held in a segregated account for the benefit of swap counterparties in the event of default. At June 30, 2024, the aggregate amount held in a segregated account was $413,000.
(b) The ProFund VP invests in Repurchase Agreements jointly with other funds in the Trust. See "Repurchase Agreements" under Note 2 in the Notes to Financial Statements to view the details of each individual agreement and counterparty as well as a description of the securities subject to repurchase.
Futures Contracts Sold
| Number of Contracts | Expiration Date | Notional Amount | Value and Unrealized Appreciation/ (Depreciation) | ||||||||||||||||
E-Mini Nasdaq-100 Futures Contracts | 1 | 9/23/24 | $ | (398,545 | ) | $ | (3,404 | ) | |||||||||||
Total Return Swap Agreements—Short
Underlying Instrument | Counterparty | Termination Date(1) | Rate Paid (Received)(2) | Notional Amount | Value and Unrealized Appreciation/ (Depreciation) | ||||||||||||||||||
Nasdaq-100 Index | Goldman Sachs International | 7/29/24 | (5.83 | )% | $ | (649,535 | ) | $ | 3,463 | ||||||||||||||
Nasdaq-100 Index | UBS AG | 7/29/24 | (5.48 | )% | (1,495,898 | ) | 8,210 | ||||||||||||||||
$ | (2,145,433 | ) | $ | 11,673 | |||||||||||||||||||
(1) Agreements may be terminated at will by either party without penalty. Payment is due at termination/maturity.
(2) Reflects the floating financing rate, as of June 30, 2024, on the notional amount of the swap agreement paid to the counterparty or received from the counterparty, excluding any commissions. This amount is included as part of the unrealized appreciation/(depreciation).
See accompanying notes to the financial statements.
Repurchase Agreements(a)(b) (83.3%)
| Principal Amount | Value | ||||||||||
| Repurchase Agreements with various counterparties, rates 5.12%–5.20%, dated 6/28/2024, due 7/1/24, total to be received $3,031,310 | $ | 3,030,000 | $ | 3,030,000 | |||||||
| TOTAL REPURCHASE AGREEMENTS (Cost $3,030,000) | 3,030,000 | ||||||||||
| TOTAL INVESTMENT SECURITIES (Cost $3,030,000)—83.3% | 3,030,000 | ||||||||||
Net other assets (liabilities)—16.7% | 609,563 | ||||||||||
NET ASSETS—100.0% | $ | 3,639,563 | |||||||||
(a) A portion of these securities were held in a segregated account for the benefit of swap counterparties in the event of default. At June 30, 2024, the aggregate amount held in a segregated account was $352,000.
(b) The ProFund VP invests in Repurchase Agreements jointly with other funds in the Trust. See "Repurchase Agreements" under Note 2 in the Notes to Financial Statements to view the details of each individual agreement and counterparty as well as a description of the securities subject to repurchase.
Futures Contracts Sold
| Number of Contracts | Expiration Date | Notional Amount | Value and Unrealized Appreciation/ (Depreciation) | ||||||||||||||||
E-Mini Russell 2000 Index Futures Contracts | 2 | 9/23/24 | $ | (206,500 | ) | $ | 1,781 | ||||||||||||
Total Return Swap Agreements—Short
Underlying Instrument | Counterparty | Termination Date(1) | Rate Paid (Received)(2) | Notional Amount | Value and Unrealized Appreciation/ (Depreciation) | ||||||||||||||||||
Russell 2000 Index | Goldman Sachs International | 7/29/24 | (5.48 | )% | $ | (1,789,682 | ) | $ | (6,153 | ) | |||||||||||||
Russell 2000 Index | UBS AG | 7/29/24 | (5.18 | )% | (1,638,152 | ) | (8,080 | ) | |||||||||||||||
$ | (3,427,834 | ) | $ | (14,233 | ) | ||||||||||||||||||
(1) Agreements may be terminated at will by either party without penalty. Payment is due at termination/maturity.
(2) Reflects the floating financing rate, as of June 30, 2024, on the notional amount of the swap agreement paid to the counterparty or received from the counterparty, excluding any commissions. This amount is included as part of the unrealized appreciation/(depreciation).
See accompanying notes to the financial statements.
Common Stocks (85.0%)
Shares | Value | ||||||||||
| 1-800-Flowers.com, Inc.*—Class A (Specialty Retail) | 65 | $ | 619 | ||||||||
1st Source Corp. (Banks) | 46 | 2,467 | |||||||||
1stdibs.com, Inc.* (Broadline Retail) | 64 | 287 | |||||||||
2seventy bio, Inc.* (Biotechnology) | 122 | 470 | |||||||||
374Water, Inc.* (Machinery) | 164 | 197 | |||||||||
3D Systems Corp.* (Machinery) | 319 | 979 | |||||||||
| 4D Molecular Therapeutics, Inc.* (Biotechnology) | 125 | 2,624 | |||||||||
89bio, Inc.* (Biotechnology) | 203 | 1,626 | |||||||||
8x8, Inc.* (Software) | 293 | 650 | |||||||||
| 908 Devices, Inc.* (Electronic Equipment, Instruments & Components) | 59 | 304 | |||||||||
A10 Networks, Inc. (Software) | 178 | 2,465 | |||||||||
AAR Corp.* (Aerospace & Defense) | 86 | 6,252 | |||||||||
Abercrombie & Fitch Co.* (Specialty Retail) | 126 | 22,407 | |||||||||
| ABM Industries, Inc. (Commercial Services & Supplies) | 158 | 7,990 | |||||||||
Absci Corp.* (Biotechnology) | 200 | 616 | |||||||||
Acacia Research Corp.* (Financial Services) | 95 | 476 | |||||||||
| Academy Sports & Outdoors, Inc. (Specialty Retail) | 181 | 9,638 | |||||||||
| ACADIA Pharmaceuticals, Inc.* (Biotechnology) | 300 | 4,875 | |||||||||
Acadia Realty Trust (Retail REITs) | 253 | 4,534 | |||||||||
| Accel Entertainment, Inc.* (Hotels, Restaurants & Leisure) | 131 | 1,344 | |||||||||
| ACCO Brands Corp. (Commercial Services & Supplies) | 234 | 1,100 | |||||||||
| Accolade, Inc.* (Health Care Providers & Services) | 185 | 662 | |||||||||
| Accuray, Inc.* (Health Care Equipment & Supplies) | 240 | 437 | |||||||||
ACELYRIN, Inc.* (Biotechnology) | 183 | 807 | |||||||||
Achieve Life Sciences, Inc.* (Biotechnology) | 86 | 404 | |||||||||
ACI Worldwide, Inc.* (Software) | 264 | 10,452 | |||||||||
| ACM Research, Inc.*—Class A (Semiconductors & Semiconductor Equipment) | 128 | 2,952 | |||||||||
ACNB Corp. (Banks) | 21 | 762 | |||||||||
Acrivon Therapeutics, Inc.* (Biotechnology) | 30 | 174 | |||||||||
| Actinium Pharmaceuticals, Inc.* (Biotechnology) | 75 | 555 | |||||||||
| Acumen Pharmaceuticals, Inc.* (Biotechnology) | 105 | 254 | |||||||||
Acushnet Holdings Corp. (Leisure Products) | 73 | 4,634 | |||||||||
| ACV Auctions, Inc.*—Class A (Commercial Services & Supplies) | 371 | 6,771 | |||||||||
| AdaptHealth Corp.* (Health Care Providers & Services) | 255 | 2,550 | |||||||||
| Adaptive Biotechnologies Corp.* (Life Sciences Tools & Services) | 290 | 1,050 | |||||||||
ADC Therapeutics SA* (Biotechnology) | 175 | 553 | |||||||||
| Addus HomeCare Corp.* (Health Care Providers & Services) | 39 | 4,528 | |||||||||
Adeia, Inc. (Software) | 272 | 3,042 | |||||||||
Adient PLC* (Automobile Components) | 228 | 5,634 | |||||||||
ADMA Biologics, Inc.* (Biotechnology) | 564 | 6,306 | |||||||||
| Adtalem Global Education, Inc.* (Diversified Consumer Services) | 98 | 6,684 | |||||||||
Common Stocks, continued
Shares | Value | ||||||||||
| ADTRAN Holdings, Inc. (Communications Equipment) | 197 | $ | 1,036 | ||||||||
| Advanced Energy Industries, Inc. (Electronic Equipment, Instruments & Components) | 94 | 10,223 | |||||||||
AdvanSix, Inc. (Chemicals) | 64 | 1,467 | |||||||||
Advantage Solutions, Inc.* (Media) | 268 | 863 | |||||||||
| Adverum Biotechnologies, Inc.* (Biotechnology) | 52 | 357 | |||||||||
| Aehr Test Systems* (Semiconductors & Semiconductor Equipment) | 69 | 771 | |||||||||
Aemetis, Inc.* (Oil, Gas & Consumable Fuels) | 91 | 274 | |||||||||
Aerovate Therapeutics, Inc.* (Biotechnology) | 34 | 56 | |||||||||
AeroVironment, Inc.* (Aerospace & Defense) | 66 | 12,023 | |||||||||
AerSale Corp.* (Aerospace & Defense) | 84 | 581 | |||||||||
| Aeva Technologies, Inc.* (Electronic Equipment, Instruments & Components) | 57 | 144 | |||||||||
AFC Gamma, Inc. (Mortgage REITs) | 42 | 512 | |||||||||
| AG Mortgage Investment Trust, Inc. (Mortgage REITs) | 72 | 478 | |||||||||
Agenus, Inc.* (Biotechnology) | 51 | 854 | |||||||||
| agilon health, Inc.* (Health Care Providers & Services) | 772 | 5,049 | |||||||||
Agilysys, Inc.* (Software) | 55 | 5,728 | |||||||||
Agios Pharmaceuticals, Inc.* (Biotechnology) | 142 | 6,123 | |||||||||
| Air Transport Services Group, Inc.* (Air Freight & Logistics) | 128 | 1,775 | |||||||||
| AirSculpt Technologies, Inc.* (Health Care Providers & Services) | 33 | 132 | |||||||||
Airship Ai Holdings, Inc.* (Software) | 8 | 29 | |||||||||
Aka Brands Holding Corp.* (Specialty Retail) | 2 | 31 | |||||||||
Akebia Therapeutics, Inc.* (Biotechnology) | 521 | 531 | |||||||||
Akero Therapeutics, Inc.* (Biotechnology) | 170 | 3,988 | |||||||||
| Akoya Biosciences, Inc.* (Life Sciences Tools & Services) | 67 | 157 | |||||||||
Alamo Group, Inc. (Machinery) | 26 | 4,498 | |||||||||
Alarm.com Holdings, Inc.* (Software) | 121 | 7,688 | |||||||||
Albany International Corp. (Machinery) | 78 | 6,587 | |||||||||
Aldeyra Therapeutics, Inc.* (Biotechnology) | 125 | 414 | |||||||||
Alector, Inc.* (Biotechnology) | 202 | 917 | |||||||||
Alerus Financial Corp. (Financial Services) | 45 | 882 | |||||||||
Alexander & Baldwin, Inc. (Diversified REITs) | 182 | 3,087 | |||||||||
Alexander's, Inc. (Retail REITs) | 5 | 1,124 | |||||||||
Alico, Inc. (Food Products) | 18 | 466 | |||||||||
Alight, Inc.*—Class A (Professional Services) | 1,189 | 8,775 | |||||||||
| Alignment Healthcare, Inc.* (Health Care Providers & Services) | 251 | 1,963 | |||||||||
Alimera Sciences, Inc.* (Pharmaceuticals) | 54 | 300 | |||||||||
Alkami Technology, Inc.* (Software) | 110 | 3,133 | |||||||||
Alkermes PLC* (Biotechnology) | 422 | 10,170 | |||||||||
Allegiant Travel Co. (Passenger Airlines) | 39 | 1,959 | |||||||||
ALLETE, Inc. (Electric Utilities) | 145 | 9,041 | |||||||||
Allient, Inc. (Electrical Equipment) | 36 | 910 | |||||||||
Allogene Therapeutics, Inc.* (Biotechnology) | 263 | 613 | |||||||||
| Alpha & Omega Semiconductor, Ltd.* (Semiconductors & Semiconductor Equipment) | 58 | 2,167 | |||||||||
| Alpha Metallurgical Resources, Inc. (Metals & Mining) | 28 | 7,855 | |||||||||
| Alphatec Holdings, Inc.* (Health Care Equipment & Supplies) | 257 | 2,686 | |||||||||
See accompanying notes to the financial statements.
82 :: ProFund VP Small-Cap :: Schedule of Portfolio Investments :: June 30, 2024 (unaudited)
Common Stocks, continued
Shares | Value | ||||||||||
| Alpine Income Property Trust, Inc. (Diversified REITs) | 31 | $ | 482 | ||||||||
| Alta Equipment Group, Inc. (Trading Companies & Distributors) | 67 | 539 | |||||||||
Altair Engineering, Inc.*—Class A (Software) | 143 | 14,026 | |||||||||
AlTi Global, Inc.* (Capital Markets) | 84 | 438 | |||||||||
Altimmune, Inc.*(a) (Biotechnology) | 178 | 1,184 | |||||||||
Alto Neuroscience, Inc.* (Pharmaceuticals) | 22 | 235 | |||||||||
| Altus Power, Inc.* (Independent Power and Renewable Electricity Producers) | 190 | 745 | |||||||||
ALX Oncology Holdings, Inc.* (Biotechnology) | 83 | 500 | |||||||||
Amalgamated Financial Corp. (Banks) | 45 | 1,233 | |||||||||
| A-Mark Precious Metals, Inc. (Financial Services) | 44 | 1,424 | |||||||||
Ambac Financial Group, Inc.* (Insurance) | 109 | 1,397 | |||||||||
| Ambarella, Inc.* (Semiconductors & Semiconductor Equipment) | 95 | 5,125 | |||||||||
| AMC Entertainment Holdings, Inc.* (Entertainment) | 697 | 3,471 | |||||||||
AMC Networks, Inc.*—Class A (Media) | 80 | 773 | |||||||||
Amerant Bancorp, Inc. (Banks) | 74 | 1,680 | |||||||||
| Ameresco, Inc.*—Class A (Construction & Engineering) | 81 | 2,334 | |||||||||
American Assets Trust, Inc. (Diversified REITs) | 120 | 2,686 | |||||||||
| American Axle & Manufacturing Holdings, Inc.* (Automobile Components) | 288 | 2,013 | |||||||||
American Coastal Insurance Corp.* (Insurance) | 61 | 644 | |||||||||
| American Eagle Outfitters, Inc. (Specialty Retail) | 457 | 9,122 | |||||||||
| American Healthcare REIT, Inc. (Health Care REITs) | 163 | 2,381 | |||||||||
| American Public Education, Inc.* (Diversified Consumer Services) | 39 | 686 | |||||||||
| American Realty Investors, Inc.* (Real Estate Management & Development) | 4 | 57 | |||||||||
American Software, Inc.—Class A (Software) | 79 | 721 | |||||||||
American States Water Co. (Water Utilities) | 93 | 6,749 | |||||||||
| American Superconductor Corp.* (Electrical Equipment) | 85 | 1,988 | |||||||||
American Vanguard Corp. (Chemicals) | 63 | 542 | |||||||||
| American Woodmark Corp.* (Building Products) | 40 | 3,144 | |||||||||
America's Car-Mart, Inc.* (Specialty Retail) | 15 | 903 | |||||||||
Ameris Bancorp (Banks) | 165 | 8,308 | |||||||||
AMERISAFE, Inc. (Insurance) | 48 | 2,107 | |||||||||
Ames National Corp. (Banks) | 22 | 451 | |||||||||
Amicus Therapeutics, Inc.* (Biotechnology) | 735 | 7,291 | |||||||||
AMMO, Inc.* (Leisure Products) | 225 | 378 | |||||||||
| AMN Healthcare Services, Inc.* (Health Care Providers & Services) | 95 | 4,867 | |||||||||
| Amneal Pharmaceuticals, Inc.* (Pharmaceuticals) | 398 | 2,527 | |||||||||
| Amphastar Pharmaceuticals, Inc.* (Pharmaceuticals) | 96 | 3,840 | |||||||||
| Amplify Energy Corp.* (Oil, Gas & Consumable Fuels) | 98 | 664 | |||||||||
Amplitude, Inc.*—Class A (Software) | 191 | 1,700 | |||||||||
| Amprius Technologies, Inc.* (Electrical Equipment) | 35 | 44 | |||||||||
AnaptysBio, Inc.* (Biotechnology) | 49 | 1,228 | |||||||||
Anavex Life Sciences Corp.*(a) (Biotechnology) | 182 | 768 | |||||||||
Common Stocks, continued
Shares | Value | ||||||||||
| Angel Oak Mortgage REIT, Inc. (Mortgage REITs) | 30 | $ | 393 | ||||||||
| AngioDynamics, Inc.* (Health Care Equipment & Supplies) | 96 | 581 | |||||||||
ANI Pharmaceuticals, Inc.* (Pharmaceuticals) | 46 | 2,929 | |||||||||
Anika Therapeutics, Inc.* (Biotechnology) | 37 | 937 | |||||||||
Annexon, Inc.* (Biotechnology) | 211 | 1,034 | |||||||||
| Anterix, Inc.* (Diversified Telecommunication Services) | 32 | 1,267 | |||||||||
| Anywhere Real Estate, Inc.* (Real Estate Management & Development) | 246 | 814 | |||||||||
| Apartment Investment and Management Co.* (Residential REITs) | 356 | 2,951 | |||||||||
Apogee Enterprises, Inc. (Building Products) | 55 | 3,456 | |||||||||
Apogee Therapeutics, Inc.* (Biotechnology) | 91 | 3,581 | |||||||||
| Apollo Commercial Real Estate Finance, Inc. (Mortgage REITs) | 357 | 3,495 | |||||||||
Appian Corp.*—Class A (Software) | 101 | 3,117 | |||||||||
| Apple Hospitality REIT, Inc. (Hotel & Resort REITs) | 571 | 8,302 | |||||||||
Applied Digital Corp.*(a) (IT Services) | 247 | 1,470 | |||||||||
| Applied Industrial Technologies, Inc. (Trading Companies & Distributors) | 96 | 18,624 | |||||||||
| Applied Optoelectronics, Inc.* (Communications Equipment) | 93 | 771 | |||||||||
Applied Therapeutics, Inc.* (Biotechnology) | 241 | 1,125 | |||||||||
| Aquestive Therapeutics, Inc.* (Pharmaceuticals) | 186 | 484 | |||||||||
Arbor Realty Trust, Inc.(a) (Mortgage REITs) | 461 | 6,615 | |||||||||
Arbutus Biopharma Corp.* (Biotechnology) | 349 | 1,078 | |||||||||
Arcadium Lithium PLC* (Chemicals) | 2,714 | 9,119 | |||||||||
ArcBest Corp. (Ground Transportation) | 59 | 6,317 | |||||||||
Arcellx, Inc.* (Biotechnology) | 108 | 5,961 | |||||||||
Arch Resources, Inc. (Metals & Mining) | 44 | 6,698 | |||||||||
| Archer Aviation, Inc.*(a)—Class A (Aerospace & Defense) | 585 | 2,059 | |||||||||
Archrock, Inc. (Energy Equipment & Services) | 387 | 7,825 | |||||||||
Arcosa, Inc. (Construction & Engineering) | 122 | 10,176 | |||||||||
| Arcturus Therapeutics Holdings, Inc.* (Biotechnology) | 57 | 1,388 | |||||||||
Arcus Biosciences, Inc.* (Biotechnology) | 136 | 2,071 | |||||||||
Arcutis Biotherapeutics, Inc.* (Biotechnology) | 266 | 2,474 | |||||||||
| Ardagh Metal Packaging SA (Containers & Packaging) | 362 | 1,231 | |||||||||
Ardelyx, Inc.* (Biotechnology) | 582 | 4,313 | |||||||||
| Ardmore Shipping Corp. (Oil, Gas & Consumable Fuels) | 104 | 2,343 | |||||||||
| Ares Commercial Real Estate Corp. (Mortgage REITs) | 134 | 891 | |||||||||
Argan, Inc. (Construction & Engineering) | 31 | 2,268 | |||||||||
Arhaus, Inc. (Specialty Retail) | 128 | 2,168 | |||||||||
| Aris Water Solutions, Inc.—Class A (Commercial Services & Supplies) | 67 | 1,050 | |||||||||
Arko Corp. (Specialty Retail) | 202 | 1,267 | |||||||||
| Arlo Technologies, Inc.* (Electronic Equipment, Instruments & Components) | 238 | 3,104 | |||||||||
| Armada Hoffler Properties, Inc. (Diversified REITs) | 166 | 1,841 | |||||||||
| ARMOUR Residential REIT, Inc. (Mortgage REITs) | 123 | 2,384 | |||||||||
Arq, Inc.* (Chemicals) | 62 | 376 | |||||||||
See accompanying notes to the financial statements.
June 30, 2024 (unaudited) :: Schedule of Portfolio Investments :: ProFund VP Small-Cap :: 83
Common Stocks, continued
Shares | Value | ||||||||||
| Array Technologies, Inc.* (Electrical Equipment) | 382 | $ | 3,919 | ||||||||
ArriVent Biopharma, Inc.* (Biotechnology) | 25 | 464 | |||||||||
Arrow Financial Corp. (Banks) | 41 | 1,068 | |||||||||
| Arrowhead Pharmaceuticals, Inc.* (Biotechnology) | 299 | 7,771 | |||||||||
ARS Pharmaceuticals, Inc.* (Biotechnology) | 123 | 1,047 | |||||||||
Arteris, Inc.* (Software) | 69 | 518 | |||||||||
| Artisan Partners Asset Management, Inc.—Class A (Capital Markets) | 158 | 6,521 | |||||||||
| Artivion, Inc.* (Health Care Equipment & Supplies) | 99 | 2,539 | |||||||||
Arvinas, Inc.* (Pharmaceuticals) | 161 | 4,286 | |||||||||
Asana, Inc.*—Class A (Software) | 199 | 2,784 | |||||||||
| Asbury Automotive Group, Inc.* (Specialty Retail) | 51 | 11,620 | |||||||||
ASGN, Inc.* (Professional Services) | 113 | 9,963 | |||||||||
Asp Isotopes, Inc.* (Chemicals) | 99 | 303 | |||||||||
Aspen Aerogels, Inc.* (Chemicals) | 146 | 3,482 | |||||||||
| AssetMark Financial Holdings, Inc.* (Capital Markets) | 57 | 1,969 | |||||||||
Associated Banc-Corp. (Banks) | 375 | 7,931 | |||||||||
| AST SpaceMobile, Inc.* (Diversified Telecommunication Services) | 295 | 3,425 | |||||||||
Astec Industries, Inc. (Machinery) | 57 | 1,691 | |||||||||
| Astrana Health, Inc.* (Health Care Providers & Services) | 108 | 4,380 | |||||||||
Astria Therapeutics, Inc.* (Biotechnology) | 113 | 1,028 | |||||||||
Astronics Corp.* (Aerospace & Defense) | 72 | 1,442 | |||||||||
Asure Software, Inc.* (Professional Services) | 59 | 496 | |||||||||
Atea Pharmaceuticals, Inc.* (Pharmaceuticals) | 193 | 639 | |||||||||
Atkore, Inc. (Electrical Equipment) | 92 | 12,413 | |||||||||
Atlanta Braves Holdings, Inc.* (Entertainment) | 26 | 1,075 | |||||||||
Atlanta Braves Holdings, Inc.* (Entertainment) | 126 | 4,969 | |||||||||
Atlantic Union Bankshares Corp. (Banks) | 224 | 7,358 | |||||||||
| Atlanticus Holdings Corp.* (Consumer Finance) | 14 | 395 | |||||||||
| Atlas Energy Solutions, Inc. (Energy Equipment & Services) | 170 | 3,388 | |||||||||
| Atmus Filtration Technologies, Inc.* (Automobile Components) | 210 | 6,044 | |||||||||
| ATN International, Inc. (Diversified Telecommunication Services) | 26 | 593 | |||||||||
Atossa Therapeutics, Inc.* (Biotechnology) | 317 | 377 | |||||||||
| AtriCure, Inc.* (Health Care Equipment & Supplies) | 119 | 2,710 | |||||||||
| Atrion Corp. (Health Care Equipment & Supplies) | 3 | 1,357 | |||||||||
Audioeye, Inc.* (Software) | 17 | 299 | |||||||||
Aura Biosciences, Inc.* (Biotechnology) | 116 | 877 | |||||||||
Aurinia Pharmaceuticals, Inc.* (Biotechnology) | 360 | 2,056 | |||||||||
Aurora Innovation, Inc.* (Software) | 2,106 | 5,834 | |||||||||
| Avadel Pharmaceuticals PLC* (Pharmaceuticals) | 231 | 3,248 | |||||||||
| Avanos Medical, Inc.* (Health Care Equipment & Supplies) | 114 | 2,271 | |||||||||
| Aveanna Healthcare Holdings, Inc.* (Health Care Providers & Services) | 131 | 362 | |||||||||
AvePoint, Inc.* (Software) | 318 | 3,314 | |||||||||
| Aviat Networks, Inc.* (Communications Equipment) | 28 | 803 | |||||||||
Common Stocks, continued
Shares | Value | ||||||||||
Avid Bioservices, Inc.* (Biotechnology) | 156 | $ | 1,114 | ||||||||
Avidity Biosciences, Inc.* (Biotechnology) | 253 | 10,335 | |||||||||
| AvidXchange Holdings, Inc.* (Financial Services) | 435 | 5,246 | |||||||||
Avient Corp. (Chemicals) | 226 | 9,865 | |||||||||
Avista Corp. (Multi-Utilities) | 196 | 6,784 | |||||||||
Avita Medical, Inc.* (Biotechnology) | 64 | 507 | |||||||||
| Axcelis Technologies, Inc.* (Semiconductors & Semiconductor Equipment) | 82 | 11,659 | |||||||||
| Axogen, Inc.* (Health Care Equipment & Supplies) | 106 | 767 | |||||||||
| Axonics, Inc.* (Health Care Equipment & Supplies) | 128 | 8,605 | |||||||||
Axos Financial, Inc.* (Banks) | 137 | 7,830 | |||||||||
Axsome Therapeutics, Inc.* (Pharmaceuticals) | 91 | 7,325 | |||||||||
AZZ, Inc. (Building Products) | 74 | 5,717 | |||||||||
B Riley Financial, Inc.(a) (Capital Markets) | 51 | 900 | |||||||||
B&G Foods, Inc. (Food Products) | 195 | 1,576 | |||||||||
Backblaze, Inc.*—Class A (IT Services) | 100 | 616 | |||||||||
| Badger Meter, Inc. (Electronic Equipment, Instruments & Components) | 74 | 13,790 | |||||||||
Balchem Corp. (Chemicals) | 81 | 12,470 | |||||||||
Bally's Corp.* (Hotels, Restaurants & Leisure) | 60 | 718 | |||||||||
Banc of California, Inc. (Banks) | 348 | 4,447 | |||||||||
BancFirst Corp. (Banks) | 50 | 4,385 | |||||||||
| Banco Latinoamericano de Comercio Exterior S.A.—Class E (Financial Services) | 69 | 2,047 | |||||||||
| Bandwidth, Inc.*—Class A (Diversified Telecommunication Services) | 62 | 1,047 | |||||||||
Bank First Corp. (Banks) | 25 | 2,065 | |||||||||
Bank of Hawaii Corp. (Banks) | 98 | 5,607 | |||||||||
Bank of Marin Bancorp (Banks) | 40 | 648 | |||||||||
Bank7 Corp. (Banks) | 10 | 313 | |||||||||
BankUnited, Inc. (Banks) | 187 | 5,473 | |||||||||
Bankwell Financial Group, Inc. (Banks) | 16 | 406 | |||||||||
Banner Corp. (Banks) | 86 | 4,269 | |||||||||
Bar Harbor Bankshares (Banks) | 37 | 995 | |||||||||
BARK, Inc.* (Specialty Retail) | 332 | 601 | |||||||||
Barnes Group, Inc. (Machinery) | 116 | 4,804 | |||||||||
| Barrett Business Services, Inc. (Professional Services) | 64 | 2,097 | |||||||||
BayCom Corp. (Banks) | 27 | 549 | |||||||||
BCB Bancorp, Inc. (Banks) | 37 | 393 | |||||||||
| Beacon Roofing Supply, Inc.* (Trading Companies & Distributors) | 159 | 14,390 | |||||||||
Beam Therapeutics, Inc.* (Biotechnology) | 191 | 4,475 | |||||||||
| Beazer Homes USA, Inc.* (Household Durables) | 74 | 2,034 | |||||||||
| Bel Fuse, Inc.—Class B (Electronic Equipment, Instruments & Components) | 26 | 1,696 | |||||||||
| BEL Fuse, Inc.—Class A (Electronic Equipment, Instruments & Components) | 4 | 324 | |||||||||
| Belden, Inc. (Electronic Equipment, Instruments & Components) | 102 | 9,568 | |||||||||
| Benchmark Electronics, Inc. (Electronic Equipment, Instruments & Components) | 89 | 3,512 | |||||||||
Berkshire Hills Bancorp, Inc. (Banks) | 109 | 2,485 | |||||||||
Berry Corp. (Oil, Gas & Consumable Fuels) | 192 | 1,240 | |||||||||
Beyond Meat, Inc.*(a) (Food Products) | 150 | 1,007 | |||||||||
Beyond, Inc.* (Specialty Retail) | 114 | 1,491 | |||||||||
BGC Group, Inc.—Class A (Capital Markets) | 925 | 7,678 | |||||||||
See accompanying notes to the financial statements.
84 :: ProFund VP Small-Cap :: Schedule of Portfolio Investments :: June 30, 2024 (unaudited)
Common Stocks, continued
Shares | Value | ||||||||||
BigBear.ai Holdings, Inc.* (IT Services) | 254 | $ | 384 | ||||||||
| BigCommerce Holdings, Inc.*—Class 1 (IT Services) | 177 | 1,427 | |||||||||
| Biglari Holdings, Inc.*—Class B (Hotels, Restaurants & Leisure) | 2 | 387 | |||||||||
| BioCryst Pharmaceuticals, Inc.* (Biotechnology) | 517 | 3,195 | |||||||||
Biohaven, Ltd.* (Biotechnology) | 188 | 6,525 | |||||||||
| BioLife Solutions, Inc.* (Life Sciences Tools & Services) | 89 | 1,907 | |||||||||
Biomea Fusion, Inc.* (Biotechnology) | 69 | 311 | |||||||||
Biote Corp.*—Class A (Pharmaceuticals) | 68 | 508 | |||||||||
| Bioventus, Inc.*—Class A (Health Care Equipment & Supplies) | 94 | 541 | |||||||||
Bit Digital, Inc.* (Software) | 293 | 932 | |||||||||
| BJ's Restaurants, Inc.* (Hotels, Restaurants & Leisure) | 47 | 1,631 | |||||||||
| Black Diamond Therapeutics, Inc.* (Biotechnology) | 93 | 433 | |||||||||
Black Hills Corp. (Multi-Utilities) | 172 | 9,353 | |||||||||
Blackbaud, Inc.* (Software) | 103 | 7,846 | |||||||||
BlackLine, Inc.* (Software) | 145 | 7,025 | |||||||||
| BlackSky Technology, Inc.* (Professional Services) | 267 | 286 | |||||||||
| Blackstone Mortgage Trust, Inc.(a)—Class A (Mortgage REITs) | 435 | 7,578 | |||||||||
Blade Air Mobility, Inc.* (Passenger Airlines) | 142 | 494 | |||||||||
Blend Labs, Inc.*—Class A (Software) | 578 | 1,364 | |||||||||
Blink Charging Co.* (Electrical Equipment) | 241 | 660 | |||||||||
| Bloom Energy Corp.*(a)—Class A (Electrical Equipment) | 498 | 6,096 | |||||||||
| Bloomin' Brands, Inc. (Hotels, Restaurants & Leisure) | 198 | 3,808 | |||||||||
Blue Bird Corp.* (Machinery) | 81 | 4,362 | |||||||||
Blue Foundry Bancorp* (Banks) | 52 | 472 | |||||||||
Bluebird Bio, Inc.* (Biotechnology) | 480 | 472 | |||||||||
| BlueLinx Holdings, Inc.* (Trading Companies & Distributors) | 21 | 1,955 | |||||||||
Blueprint Medicines Corp.* (Biotechnology) | 157 | 16,921 | |||||||||
| Boise Cascade Co. (Trading Companies & Distributors) | 99 | 11,803 | |||||||||
Boot Barn Holdings, Inc.* (Specialty Retail) | 74 | 9,541 | |||||||||
| Borr Drilling, Ltd. (Energy Equipment & Services) | 594 | 3,831 | |||||||||
Boston Omaha Corp.*—Class A (Media) | 62 | 835 | |||||||||
Boundless Bio, Inc.* (Biotechnology) | 16 | 62 | |||||||||
| Bowman Consulting Group, Ltd.* (Construction & Engineering) | 33 | 1,049 | |||||||||
Box, Inc.*—Class A (Software) | 353 | 9,333 | |||||||||
| Braemar Hotels & Resorts, Inc. (Hotel & Resort REITs) | 165 | 421 | |||||||||
Brandywine Realty Trust (Office REITs) | 424 | 1,900 | |||||||||
Braze, Inc.*—Class A (Software) | 131 | 5,088 | |||||||||
BRC, Inc.*(a)—Class A (Food Products) | 130 | 797 | |||||||||
| Bread Financial Holdings, Inc. (Consumer Finance) | 125 | 5,570 | |||||||||
Bridgebio Pharma, Inc.* (Biotechnology) | 352 | 8,916 | |||||||||
| Bridger Aerospace Group Holdings, Inc.* (Commercial Services & Supplies) | 22 | 82 | |||||||||
Bridgewater Bancshares, Inc.* (Banks) | 50 | 581 | |||||||||
Common Stocks, continued
Shares | Value | ||||||||||
| Brightsphere Investment Group, Inc. (Capital Markets) | 69 | $ | 1,530 | ||||||||
BrightSpire Capital, Inc. (Mortgage REITs) | 323 | 1,841 | |||||||||
| BrightSpring Health Services, Inc.* (Health Care Providers & Services) | 135 | 1,534 | |||||||||
| BrightView Holdings, Inc.* (Commercial Services & Supplies) | 111 | 1,476 | |||||||||
| Brinker International, Inc.* (Hotels, Restaurants & Leisure) | 110 | 7,963 | |||||||||
| Bristow Group, Inc.* (Energy Equipment & Services) | 62 | 2,079 | |||||||||
Broadstone Net Lease, Inc. (Diversified REITs) | 472 | 7,491 | |||||||||
| Brookdale Senior Living, Inc.* (Health Care Providers & Services) | 479 | 3,272 | |||||||||
| Brookfield Business Corp.—Class A (Industrial Conglomerates) | 65 | 1,327 | |||||||||
| Brookfield Infrastructure Corp.—Class A (Gas Utilities) | 301 | 10,132 | |||||||||
Brookline Bancorp, Inc. (Banks) | 221 | 1,845 | |||||||||
BRT Apartments Corp. (Residential REITs) | 28 | 489 | |||||||||
Build-A-Bear Workshop, Inc. (Specialty Retail) | 32 | 809 | |||||||||
| Bumble, Inc.*—Class A (Interactive Media & Services) | 241 | 2,533 | |||||||||
Burford Capital, Ltd. (Financial Services) | 502 | 6,551 | |||||||||
| Burke & Herbert Financial Services Corp. (Banks) | 32 | 1,631 | |||||||||
Business First Bancshares, Inc. (Banks) | 60 | 1,306 | |||||||||
Byline Bancorp, Inc. (Banks) | 78 | 1,852 | |||||||||
| Byrna Technologies, Inc.* (Aerospace & Defense) | 43 | 429 | |||||||||
C3.ai, Inc.*—Class A (Software) | 207 | 5,995 | |||||||||
C4 Therapeutics, Inc.* (Biotechnology) | 147 | 679 | |||||||||
Cabaletta Bio, Inc.* (Biotechnology) | 108 | 808 | |||||||||
Cable One, Inc. (Media) | 14 | 4,956 | |||||||||
Cabot Corp. (Chemicals) | 136 | 12,496 | |||||||||
| Cactus, Inc.—Class A (Energy Equipment & Services) | 164 | 8,649 | |||||||||
Cadence Bank (Banks) | 456 | 12,896 | |||||||||
Cadiz, Inc.* (Water Utilities) | 105 | 324 | |||||||||
Cadre Holdings, Inc. (Aerospace & Defense) | 65 | 2,181 | |||||||||
Caesarstone, Ltd.* (Building Products) | 52 | 260 | |||||||||
Calavo Growers, Inc. (Food Products) | 42 | 953 | |||||||||
| Caledonia Mining Corp. PLC (Metals & Mining) | 41 | 399 | |||||||||
Caleres, Inc. (Specialty Retail) | 86 | 2,890 | |||||||||
California BanCorp* (Banks) | 19 | 409 | |||||||||
| California Resources Corp. (Oil, Gas & Consumable Fuels) | 173 | 9,207 | |||||||||
| California Water Service Group (Water Utilities) | 145 | 7,031 | |||||||||
Calix, Inc.* (Communications Equipment) | 147 | 5,209 | |||||||||
Cal-Maine Foods, Inc. (Food Products) | 103 | 6,294 | |||||||||
Cambridge Bancorp (Banks) | 19 | 1,311 | |||||||||
Camden National Corp. (Banks) | 36 | 1,188 | |||||||||
| Camping World Holdings, Inc.—Class A (Specialty Retail) | 106 | 1,893 | |||||||||
Candel Therapeutics, Inc.* (Biotechnology) | 50 | 310 | |||||||||
Cannae Holdings, Inc. (Financial Services) | 141 | 2,558 | |||||||||
Canoo, Inc.* (Automobiles) | 149 | 317 | |||||||||
Cantaloupe, Inc.* (Financial Services) | 146 | 964 | |||||||||
Capital Bancorp, Inc. (Banks) | 23 | 472 | |||||||||
See accompanying notes to the financial statements.
June 30, 2024 (unaudited) :: Schedule of Portfolio Investments :: ProFund VP Small-Cap :: 85
Common Stocks, continued
Shares | Value | ||||||||||
Capital City Bank Group, Inc. (Banks) | 35 | $ | 995 | ||||||||
Capitol Federal Financial, Inc. (Banks) | 311 | 1,707 | |||||||||
Capricor Therapeutics, Inc.* (Biotechnology) | 64 | 305 | |||||||||
Cardiff Oncology, Inc.* (Biotechnology) | 98 | 218 | |||||||||
Cardlytics, Inc.* (Media) | 101 | 829 | |||||||||
CareDx, Inc.* (Biotechnology) | 125 | 1,941 | |||||||||
CareTrust REIT, Inc. (Health Care REITs) | 339 | 8,509 | |||||||||
Cargo Therapeutics, Inc.* (Biotechnology) | 49 | 805 | |||||||||
Cargurus, Inc.* (Interactive Media & Services) | 221 | 5,790 | |||||||||
Caribou Biosciences, Inc.* (Biotechnology) | 206 | 338 | |||||||||
Carpenter Technology Corp. (Metals & Mining) | 119 | 13,041 | |||||||||
| Carriage Services, Inc. (Diversified Consumer Services) | 34 | 913 | |||||||||
Cars.com, Inc.* (Interactive Media & Services) | 165 | 3,251 | |||||||||
Carter Bankshares, Inc.* (Banks) | 57 | 862 | |||||||||
Cartesian Therapeutics, Inc.* (Biotechnology) | 18 | 486 | |||||||||
| Casella Waste Systems, Inc.* (Commercial Services & Supplies) | 143 | 14,188 | |||||||||
| Cass Information Systems, Inc. (Financial Services) | 34 | 1,362 | |||||||||
Cassava Sciences, Inc.*(a) (Pharmaceuticals) | 102 | 1,260 | |||||||||
| Castle Biosciences, Inc.* (Health Care Providers & Services) | 65 | 1,415 | |||||||||
| Catalyst Pharmaceuticals, Inc.* (Biotechnology) | 291 | 4,508 | |||||||||
Cathay General Bancorp (Banks) | 174 | 6,563 | |||||||||
Cavco Industries, Inc.* (Household Durables) | 21 | 7,270 | |||||||||
CBIZ, Inc.* (Professional Services) | 120 | 8,892 | |||||||||
| CBL & Associates Properties, Inc. (Retail REITs) | 57 | 1,333 | |||||||||
| CECO Environmental Corp.* (Commercial Services & Supplies) | 73 | 2,106 | |||||||||
Celcuity, Inc.* (Biotechnology) | 58 | 950 | |||||||||
Celldex Therapeutics, Inc.* (Biotechnology) | 162 | 5,996 | |||||||||
Centerspace (Residential REITs) | 37 | 2,502 | |||||||||
| Central Garden & Pet Co.* (Household Products) | 24 | 924 | |||||||||
| Central Garden & Pet Co.*—Class A (Household Products) | 131 | 4,327 | |||||||||
Central Pacific Financial Corp. (Banks) | 67 | 1,420 | |||||||||
| Centrus Energy Corp.*—Class A (Oil, Gas & Consumable Fuels) | 35 | 1,496 | |||||||||
| Centuri Holdings, Inc.* (Construction & Engineering) | 34 | 662 | |||||||||
Century Aluminum Co.* (Metals & Mining) | 132 | 2,211 | |||||||||
| Century Communities, Inc. (Household Durables) | 71 | 5,798 | |||||||||
Century Therapeutics, Inc.* (Biotechnology) | 115 | 293 | |||||||||
Cerence, Inc.* (Software) | 103 | 291 | |||||||||
| Cerus Corp.* (Health Care Equipment & Supplies) | 452 | 796 | |||||||||
Cervomed, Inc.* (Biotechnology) | 14 | 240 | |||||||||
| CEVA, Inc.* (Semiconductors & Semiconductor Equipment) | 58 | 1,119 | |||||||||
CG Oncology, Inc.* (Biotechnology) | 58 | 1,831 | |||||||||
| ChampionX Corp. (Energy Equipment & Services) | 478 | 15,873 | |||||||||
| ChargePoint Holdings, Inc.* (Electrical Equipment) | 972 | 1,468 | |||||||||
Chart Industries, Inc.* (Machinery) | 106 | 15,299 | |||||||||
Chatham Lodging Trust (Hotel & Resort REITs) | 121 | 1,031 | |||||||||
Common Stocks, continued
Shares | Value | ||||||||||
Chegg, Inc.* (Diversified Consumer Services) | 249 | $ | 787 | ||||||||
Chemung Financial Corp. (Banks) | 8 | 384 | |||||||||
Chesapeake Utilities Corp. (Gas Utilities) | 55 | 5,841 | |||||||||
| Chicago Atlantic Real Estate Finance, Inc. (Mortgage REITs) | 42 | 645 | |||||||||
Chimera Investment Corp. (Mortgage REITs) | 202 | 2,586 | |||||||||
ChoiceOne Financial Services, Inc. (Banks) | 18 | 516 | |||||||||
| ChromaDex Corp.* (Life Sciences Tools & Services) | 123 | 336 | |||||||||
| Chuy's Holdings, Inc.* (Hotels, Restaurants & Leisure) | 43 | 1,115 | |||||||||
Cibus, Inc.* (Biotechnology) | 37 | 364 | |||||||||
| Cimpress PLC* (Commercial Services & Supplies) | 45 | 3,942 | |||||||||
Cinemark Holdings, Inc.* (Entertainment) | 276 | 5,967 | |||||||||
Cipher Mining, Inc.* (Software) | 432 | 1,793 | |||||||||
Citi Trends, Inc.* (Specialty Retail) | 20 | 425 | |||||||||
Citizens & Northern Corp. (Banks) | 37 | 662 | |||||||||
Citizens Financial Services, Inc. (Banks) | 11 | 494 | |||||||||
City Holding Co. (Banks) | 37 | 3,931 | |||||||||
City Office REIT, Inc. (Office REITs) | 98 | 488 | |||||||||
Civista Bancshares, Inc. (Banks) | 38 | 589 | |||||||||
Claros Mortgage Trust, Inc. (Mortgage REITs) | 216 | 1,732 | |||||||||
Clarus Corp. (Leisure Products) | 76 | 511 | |||||||||
| Clean Energy Fuels Corp.* (Oil, Gas & Consumable Fuels) | 427 | 1,140 | |||||||||
Cleanspark, Inc.* (Software) | 555 | 8,852 | |||||||||
Clear Channel Outdoor Holdings, Inc.* (Media) | 874 | 1,232 | |||||||||
Clear Secure, Inc.—Class A (Software) | 220 | 4,116 | |||||||||
Clearfield, Inc.* (Communications Equipment) | 31 | 1,195 | |||||||||
| Clearwater Analytics Holdings, Inc.*—Class A (Software) | 351 | 6,501 | |||||||||
| Clearwater Paper Corp.* (Paper & Forest Products) | 41 | 1,987 | |||||||||
| Climb Global Solutions, Inc. (Electronic Equipment, Instruments & Components) | 11 | 691 | |||||||||
Clipper Realty, Inc. (Residential REITs) | 30 | 108 | |||||||||
CNB Financial Corp. (Banks) | 52 | 1,061 | |||||||||
CNO Financial Group, Inc. (Insurance) | 269 | 7,457 | |||||||||
| CNX Resources Corp.* (Oil, Gas & Consumable Fuels) | 375 | 9,113 | |||||||||
Coastal Financial Corp.* (Banks) | 28 | 1,292 | |||||||||
Codexis, Inc.* (Life Sciences Tools & Services) | 175 | 543 | |||||||||
Coeur Mining, Inc.* (Metals & Mining) | 989 | 5,558 | |||||||||
Cogent Biosciences, Inc.* (Biotechnology) | 230 | 1,939 | |||||||||
| Cogent Communications Holdings, Inc. (Diversified Telecommunication Services) | 110 | 6,207 | |||||||||
Cohen & Steers, Inc. (Capital Markets) | 69 | 5,007 | |||||||||
Coherus Biosciences, Inc.* (Biotechnology) | 276 | 477 | |||||||||
| Cohu, Inc.* (Semiconductors & Semiconductor Equipment) | 116 | 3,840 | |||||||||
| Collegium Pharmaceutical, Inc.* (Pharmaceuticals) | 82 | 2,640 | |||||||||
Colony Bankcorp, Inc. (Banks) | 41 | 502 | |||||||||
Columbia Financial, Inc.* (Banks) | 68 | 1,018 | |||||||||
Columbus McKinnon Corp. (Machinery) | 71 | 2,452 | |||||||||
Commercial Metals Co. (Metals & Mining) | 290 | 15,948 | |||||||||
Commercial Vehicle Group, Inc.* (Machinery) | 82 | 402 | |||||||||
| CommScope Holding Co., Inc.* (Communications Equipment) | 529 | 651 | |||||||||
Community Financial System, Inc. (Banks) | 131 | 6,185 | |||||||||
See accompanying notes to the financial statements.
86 :: ProFund VP Small-Cap :: Schedule of Portfolio Investments :: June 30, 2024 (unaudited)
Common Stocks, continued
Shares | Value | ||||||||||
| Community Health Systems, Inc.* (Health Care Providers & Services) | 314 | $ | 1,055 | ||||||||
| Community Healthcare Trust, Inc. (Health Care REITs) | 67 | 1,567 | |||||||||
Community Trust Bancorp, Inc. (Banks) | 38 | 1,659 | |||||||||
Community West Bancshares (Banks) | 42 | 777 | |||||||||
CommVault Systems, Inc.* (Software) | 109 | 13,251 | |||||||||
| Compass Diversified Holdings (Financial Services) | 167 | 3,656 | |||||||||
| Compass Minerals International, Inc. (Metals & Mining) | 86 | 888 | |||||||||
Compass Therapeutics, Inc.* (Biotechnology) | 255 | 255 | |||||||||
| Compass, Inc.*—Class A (Real Estate Management & Development) | 913 | 3,287 | |||||||||
| CompoSecure, Inc.—Class A (Technology Hardware, Storage & Peripherals) | 44 | 299 | |||||||||
| CompX International, Inc. (Commercial Services & Supplies) | 4 | 99 | |||||||||
| Comstock Resources, Inc. (Oil, Gas & Consumable Fuels) | 231 | 2,398 | |||||||||
| Concrete Pumping Holdings, Inc.* (Construction & Engineering) | 60 | 361 | |||||||||
Conduent, Inc.* (Professional Services) | 404 | 1,317 | |||||||||
| Conduit Pharmaceuticals, Inc.* (Life Sciences Tools & Services) | 58 | 61 | |||||||||
| CONMED Corp. (Health Care Equipment & Supplies) | 77 | 5,338 | |||||||||
ConnectOne Bancorp, Inc. (Banks) | 91 | 1,719 | |||||||||
Consensus Cloud Solutions, Inc.* (Software) | 45 | 773 | |||||||||
| CONSOL Energy, Inc.* (Oil, Gas & Consumable Fuels) | 73 | 7,448 | |||||||||
| Consolidated Communications Holdings, Inc.* (Diversified Telecommunication Services) | 192 | 845 | |||||||||
Consolidated Water Co., Ltd. (Water Utilities) | 38 | 1,009 | |||||||||
Constellium SE* (Metals & Mining) | 324 | 6,107 | |||||||||
| Construction Partners, Inc.*—Class A (Construction & Engineering) | 108 | 5,963 | |||||||||
| Consumer Portfolio Services, Inc.* (Consumer Finance) | 21 | 206 | |||||||||
Contango ORE, Inc.* (Metals & Mining) | 20 | 361 | |||||||||
| Contineum Therapeutics, Inc.*—Class A (Pharmaceuticals) | 17 | 299 | |||||||||
| Cooper-Standard Holdings, Inc.* (Automobile Components) | 42 | 522 | |||||||||
COPT Defense Properties (Office REITs) | 282 | 7,058 | |||||||||
| Corbus Pharmaceuticals Holdings, Inc.* (Biotechnology) | 25 | 1,131 | |||||||||
Corcept Therapeutics, Inc.* (Pharmaceuticals) | 202 | 6,563 | |||||||||
| Core Laboratories, Inc. (Energy Equipment & Services) | 118 | 2,394 | |||||||||
Core Molding Technologies, Inc.* (Chemicals) | 19 | 303 | |||||||||
Core Scientific, Inc.* (IT Services) | 447 | 4,157 | |||||||||
| CoreCivic, Inc.* (Commercial Services & Supplies) | 276 | 3,582 | |||||||||
CorMedix, Inc.* (Pharmaceuticals) | 138 | 598 | |||||||||
| Corsair Gaming, Inc.* (Technology Hardware, Storage & Peripherals) | 112 | 1,236 | |||||||||
| CorVel Corp.* (Health Care Providers & Services) | 22 | 5,594 | |||||||||
Costamare, Inc. (Marine Transportation) | 108 | 1,774 | |||||||||
Couchbase, Inc.* (IT Services) | 97 | 1,771 | |||||||||
Common Stocks, continued
Shares | Value | ||||||||||
| Coursera, Inc.* (Diversified Consumer Services) | 345 | $ | 2,470 | ||||||||
| Covenant Logistics Group, Inc. (Ground Transportation) | 20 | 986 | |||||||||
| CPI Card Group, Inc.* (Technology Hardware, Storage & Peripherals) | 13 | 354 | |||||||||
CRA International, Inc. (Professional Services) | 17 | 2,928 | |||||||||
| Cracker Barrel Old Country Store, Inc. (Hotels, Restaurants & Leisure) | 55 | 2,319 | |||||||||
Crawford & Co.—Class A (Insurance) | 38 | 328 | |||||||||
| Credo Technology Group Holding, Ltd.* (Semiconductors & Semiconductor Equipment) | 319 | 10,189 | |||||||||
| Crescent Energy Co.—Class A (Oil, Gas & Consumable Fuels) | 240 | 2,844 | |||||||||
Cricut, Inc.—Class A (Household Durables) | 116 | 695 | |||||||||
| Crinetics Pharmaceuticals, Inc.* (Biotechnology) | 195 | 8,734 | |||||||||
Critical Metals Corp.* (Metals & Mining) | 18 | 203 | |||||||||
| Cross Country Healthcare, Inc.* (Health Care Providers & Services) | 83 | 1,149 | |||||||||
CrossFirst Bankshares, Inc.* (Banks) | 114 | 1,598 | |||||||||
CryoPort, Inc.* (Life Sciences Tools & Services) | 109 | 753 | |||||||||
CS Disco, Inc.* (Software) | 74 | 441 | |||||||||
| CSG Systems International, Inc. (Professional Services) | 74 | 3,047 | |||||||||
CSW Industrials, Inc. (Building Products) | 39 | 10,347 | |||||||||
CTO Realty Growth, Inc. (Diversified REITs) | 55 | 960 | |||||||||
| CTS Corp. (Electronic Equipment, Instruments & Components) | 76 | 3,848 | |||||||||
Cullinan Therapeutics, Inc.* (Biotechnology) | 97 | 1,692 | |||||||||
| Cushman & Wakefield PLC* (Real Estate Management & Development) | 573 | 5,958 | |||||||||
| Custom Truck One Source, Inc.* (Trading Companies & Distributors) | 128 | 557 | |||||||||
Customers Bancorp, Inc.* (Banks) | 74 | 3,551 | |||||||||
CVB Financial Corp. (Banks) | 332 | 5,724 | |||||||||
| CVR Energy, Inc. (Oil, Gas & Consumable Fuels) | 86 | 2,302 | |||||||||
| CVRx, Inc.* (Health Care Equipment & Supplies) | 33 | 396 | |||||||||
| Cytek Biosciences, Inc.* (Life Sciences Tools & Services) | 304 | 1,696 | |||||||||
Cytokinetics, Inc.* (Biotechnology) | 280 | 15,170 | |||||||||
Daily Journal Corp.* (Media) | 3 | 1,183 | |||||||||
Dakota Gold Corp.* (Metals & Mining) | 164 | 418 | |||||||||
| Daktronics, Inc.* (Electronic Equipment, Instruments & Components) | 93 | 1,297 | |||||||||
Dana, Inc. (Automobile Components) | 327 | 3,963 | |||||||||
| Dave & Buster's Entertainment, Inc.* (Hotels, Restaurants & Leisure) | 82 | 3,264 | |||||||||
Dave, Inc.* (Software) | 20 | 606 | |||||||||
| Day One Biopharmaceuticals, Inc.* (Biotechnology) | 130 | 1,791 | |||||||||
| Definitive Healthcare Corp.* (Health Care Technology) | 134 | 732 | |||||||||
| Delek US Holdings, Inc. (Oil, Gas & Consumable Fuels) | 159 | 3,937 | |||||||||
| Deluxe Corp. (Commercial Services & Supplies) | 111 | 2,493 | |||||||||
Denali Therapeutics, Inc.* (Biotechnology) | 311 | 7,221 | |||||||||
See accompanying notes to the financial statements.
June 30, 2024 (unaudited) :: Schedule of Portfolio Investments :: ProFund VP Small-Cap :: 87
Common Stocks, continued
Shares | Value | ||||||||||
Denny's Corp.* (Hotels, Restaurants & Leisure) | 128 | $ | 909 | ||||||||
Design Therapeutics, Inc.* (Biotechnology) | 79 | 265 | |||||||||
| Designer Brands, Inc.—Class A (Specialty Retail) | 105 | 717 | |||||||||
| Despegar.Com Corp.* (Hotels, Restaurants & Leisure) | 154 | 2,037 | |||||||||
Destination XL Group, Inc.* (Specialty Retail) | 134 | 488 | |||||||||
| DHT Holdings, Inc. (Oil, Gas & Consumable Fuels) | 338 | 3,911 | |||||||||
| Diamond Hill Investment Group, Inc. (Capital Markets) | 7 | 985 | |||||||||
| Diamond Offshore Drilling, Inc.* (Energy Equipment & Services) | 256 | 3,965 | |||||||||
| DiamondRock Hospitality Co. (Hotel & Resort REITs) | 527 | 4,453 | |||||||||
Dianthus Therapeutics, Inc.* (Biotechnology) | 60 | 1,553 | |||||||||
| Diebold Nixdorf, Inc.* (Technology Hardware, Storage & Peripherals) | 63 | 2,424 | |||||||||
| Digi International, Inc.* (Communications Equipment) | 89 | 2,041 | |||||||||
Digimarc Corp.* (Software) | 38 | 1,178 | |||||||||
Digital Turbine, Inc.* (Software) | 240 | 398 | |||||||||
| DigitalBridge Group, Inc. (Real Estate Management & Development) | 398 | 5,453 | |||||||||
DigitalOcean Holdings, Inc.* (IT Services) | 164 | 5,699 | |||||||||
Dime Community Bancshares, Inc. (Banks) | 89 | 1,816 | |||||||||
| Dine Brands Global, Inc. (Hotels, Restaurants & Leisure) | 38 | 1,376 | |||||||||
| Diodes, Inc.* (Semiconductors & Semiconductor Equipment) | 114 | 8,200 | |||||||||
Disc Medicine, Inc.* (Biotechnology) | 41 | 1,848 | |||||||||
| Distribution Solutions Group, Inc.* (Building Products) | 27 | 810 | |||||||||
| Diversified Energy Co. PLC (Oil, Gas & Consumable Fuels) | 118 | 1,592 | |||||||||
| Diversified Healthcare Trust (Health Care REITs) | 547 | 1,668 | |||||||||
Dlh Holdings Corp.* (Professional Services) | 21 | 222 | |||||||||
| DMC Global, Inc.* (Energy Equipment & Services) | 49 | 707 | |||||||||
| DNOW, Inc.* (Trading Companies & Distributors) | 270 | 3,707 | |||||||||
| DocGo, Inc.* (Health Care Providers & Services) | 255 | 788 | |||||||||
Dole PLC (Food Products) | 188 | 2,301 | |||||||||
Domo, Inc.*—Class B (Software) | 85 | 656 | |||||||||
Donegal Group, Inc.—Class A (Insurance) | 39 | 502 | |||||||||
| Donnelley Financial Solutions, Inc.* (Capital Markets) | 66 | 3,935 | |||||||||
| Dorian LPG, Ltd. (Oil, Gas & Consumable Fuels) | 87 | 3,651 | |||||||||
| Dorman Products, Inc.* (Automobile Components) | 66 | 6,038 | |||||||||
Douglas Dynamics, Inc. (Machinery) | 57 | 1,334 | |||||||||
Douglas Emmett, Inc. (Office REITs) | 404 | 5,377 | |||||||||
| Dream Finders Homes, Inc.*—Class A (Household Durables) | 70 | 1,807 | |||||||||
| Drilling Tools International Corp.* (Energy Equipment & Services) | 24 | 135 | |||||||||
Dril-Quip, Inc.* (Energy Equipment & Services) | 86 | 1,600 | |||||||||
Common Stocks, continued
Shares | Value | ||||||||||
| Driven Brands Holdings, Inc.* (Commercial Services & Supplies) | 150 | $ | 1,910 | ||||||||
Ducommun, Inc.* (Aerospace & Defense) | 34 | 1,974 | |||||||||
D-Wave Quantum, Inc.* (Software) | 219 | 250 | |||||||||
| DXP Enterprises, Inc.* (Trading Companies & Distributors) | 31 | 1,421 | |||||||||
| Dycom Industries, Inc.* (Construction & Engineering) | 71 | 11,982 | |||||||||
Dynavax Technologies Corp.* (Biotechnology) | 330 | 3,706 | |||||||||
Dyne Therapeutics, Inc.* (Biotechnology) | 202 | 7,129 | |||||||||
Dynex Capital, Inc. (Mortgage REITs) | 160 | 1,910 | |||||||||
E2open Parent Holdings, Inc.* (Software) | 427 | 1,917 | |||||||||
Eagle Bancorp, Inc. (Banks) | 74 | 1,399 | |||||||||
| Easterly Government Properties, Inc. (Office REITs) | 243 | 3,006 | |||||||||
Eastern Bankshares, Inc. (Banks) | 389 | 5,438 | |||||||||
| Eastman Kodak Co.* (Technology Hardware, Storage & Peripherals) | 151 | 812 | |||||||||
| EchoStar Corp.*—Class A (Diversified Telecommunication Services) | 305 | 5,432 | |||||||||
Ecovyst, Inc.* (Chemicals) | 291 | 2,610 | |||||||||
| Edgewell Personal Care Co. (Personal Care Products) | 123 | 4,943 | |||||||||
Edgewise Therapeutics, Inc.* (Pharmaceuticals) | 182 | 3,278 | |||||||||
Editas Medicine, Inc.* (Biotechnology) | 208 | 971 | |||||||||
eGain Corp.* (Software) | 51 | 322 | |||||||||
| El Pollo Loco Holdings, Inc.* (Hotels, Restaurants & Leisure) | 67 | 758 | |||||||||
Elevation Oncology, Inc.* (Biotechnology) | 131 | 354 | |||||||||
Eliem Therapeutics, Inc.* (Biotechnology) | 18 | 128 | |||||||||
Ellington Financial, Inc. (Mortgage REITs) | 207 | 2,501 | |||||||||
Elme Communities (Residential REITs) | 220 | 3,505 | |||||||||
| Embecta Corp. (Health Care Equipment & Supplies) | 145 | 1,813 | |||||||||
Emerald Holding, Inc.* (Media) | 38 | 216 | |||||||||
| Empire Petroleum Corp.* (Oil, Gas & Consumable Fuels) | 35 | 181 | |||||||||
| Empire State Realty Trust, Inc. (Diversified REITs) | 336 | 3,152 | |||||||||
Employers Holdings, Inc. (Insurance) | 63 | 2,686 | |||||||||
Enact Holdings, Inc. (Financial Services) | 73 | 2,238 | |||||||||
Enanta Pharmaceuticals, Inc.* (Biotechnology) | 50 | 649 | |||||||||
| Encore Capital Group, Inc.* (Consumer Finance) | 59 | 2,462 | |||||||||
| Encore Energy Corp.* (Oil, Gas & Consumable Fuels) | 446 | 1,757 | |||||||||
Energizer Holdings, Inc. (Household Products) | 180 | 5,317 | |||||||||
| Energy Fuels, Inc.* (Oil, Gas & Consumable Fuels) | 406 | 2,460 | |||||||||
Energy Recovery, Inc.* (Machinery) | 142 | 1,887 | |||||||||
| Energy Vault Holdings, Inc.* (Electrical Equipment) | 258 | 245 | |||||||||
Enerpac Tool Group Corp. (Machinery) | 136 | 5,192 | |||||||||
EnerSys (Electrical Equipment) | 100 | 10,352 | |||||||||
Enfusion, Inc.*—Class A (Software) | 121 | 1,031 | |||||||||
| Enhabit, Inc.* (Health Care Providers & Services) | 125 | 1,115 | |||||||||
Enliven Therapeutics, Inc.* (Pharmaceuticals) | 88 | 2,057 | |||||||||
Ennis, Inc. (Commercial Services & Supplies) | 64 | 1,401 | |||||||||
Enova International, Inc.* (Consumer Finance) | 66 | 4,109 | |||||||||
Enovix Corp.*(a) (Electrical Equipment) | 372 | 5,751 | |||||||||
See accompanying notes to the financial statements.
88 :: ProFund VP Small-Cap :: Schedule of Portfolio Investments :: June 30, 2024 (unaudited)
Common Stocks, continued
Shares | Value | ||||||||||
Enpro, Inc. (Machinery) | 53 | $ | 7,715 | ||||||||
Enstar Group, Ltd.* (Insurance) | 32 | 9,782 | |||||||||
Enterprise Bancorp, Inc. (Banks) | 24 | 597 | |||||||||
Enterprise Financial Services Corp. (Banks) | 93 | 3,805 | |||||||||
Entrada Therapeutics, Inc.* (Biotechnology) | 62 | 884 | |||||||||
| Entravision Communications Corp.—Class A (Media) | 154 | 313 | |||||||||
Envestnet, Inc.* (Software) | 127 | 7,949 | |||||||||
Enviri Corp.* (Commercial Services & Supplies) | 198 | 1,709 | |||||||||
| ePlus, Inc.* (Electronic Equipment, Instruments & Components) | 66 | 4,863 | |||||||||
| Equitrans Midstream Corp. (Oil, Gas & Consumable Fuels) | 1,088 | 14,121 | |||||||||
Equity Bancshares, Inc.—Class A (Banks) | 36 | 1,267 | |||||||||
Equity Commonwealth* (Office REITs) | 265 | 5,141 | |||||||||
Erasca, Inc.* (Biotechnology) | 282 | 666 | |||||||||
Escalade, Inc. (Leisure Products) | 25 | 345 | |||||||||
ESCO Technologies, Inc. (Machinery) | 65 | 6,828 | |||||||||
Esperion Therapeutics, Inc.* (Pharmaceuticals) | 473 | 1,050 | |||||||||
Esquire Financial Holdings, Inc. (Banks) | 18 | 857 | |||||||||
ESSA Bancorp, Inc. (Banks) | 21 | 369 | |||||||||
Essent Group, Ltd. (Financial Services) | 261 | 14,665 | |||||||||
| Essential Properties Realty Trust, Inc. (Diversified REITs) | 439 | 12,165 | |||||||||
| Ethan Allen Interiors, Inc. (Household Durables) | 57 | 1,590 | |||||||||
| European Wax Center, Inc.*—Class A (Diversified Consumer Services) | 85 | 844 | |||||||||
Eve Holding, Inc.* (Aerospace & Defense) | 44 | 178 | |||||||||
| Eventbrite, Inc.*—Class A (Interactive Media & Services) | 207 | 1,002 | |||||||||
EverCommerce, Inc.* (Software) | 53 | 582 | |||||||||
| Everi Holdings, Inc.* (Hotels, Restaurants & Leisure) | 198 | 1,663 | |||||||||
| EverQuote, Inc.*—Class A (Interactive Media & Services) | 63 | 1,314 | |||||||||
| Everspin Technologies, Inc.* (Semiconductors & Semiconductor Equipment) | 49 | 294 | |||||||||
EVERTEC, Inc. (Financial Services) | 161 | 5,353 | |||||||||
EVgo, Inc.* (Specialty Retail) | 252 | 617 | |||||||||
| EVI Industries, Inc. (Trading Companies & Distributors) | 13 | 246 | |||||||||
| Evolent Health, Inc.*—Class A (Health Care Technology) | 289 | 5,525 | |||||||||
Evolus, Inc.* (Pharmaceuticals) | 138 | 1,497 | |||||||||
| Evolution Petroleum Corp. (Oil, Gas & Consumable Fuels) | 77 | 406 | |||||||||
| Evolv Technologies Holdings, Inc.* (Electronic Equipment, Instruments & Components) | 327 | 834 | |||||||||
| Excelerate Energy, Inc.—Class A (Oil, Gas & Consumable Fuels) | 44 | 811 | |||||||||
| ExlService Holdings, Inc.* (Professional Services) | 394 | 12,356 | |||||||||
| eXp World Holdings, Inc.(a) (Real Estate Management & Development) | 203 | 2,291 | |||||||||
Exponent, Inc. (Professional Services) | 127 | 12,080 | |||||||||
| Expro Group Holdings N.V.* (Energy Equipment & Services) | 237 | 5,432 | |||||||||
| Extreme Networks, Inc.* (Communications Equipment) | 315 | 4,237 | |||||||||
Common Stocks, continued
Shares | Value | ||||||||||
| EyePoint Pharmaceuticals, Inc.* (Pharmaceuticals) | 125 | $ | 1,088 | ||||||||
F&G Annuities & Life, Inc. (Insurance) | 47 | 1,788 | |||||||||
| Fabrinet* (Electronic Equipment, Instruments & Components) | 91 | 22,275 | |||||||||
Farmers & Merchants Bancorp, Inc. (Banks) | 32 | 743 | |||||||||
Farmers National Banc Corp. (Banks) | 91 | 1,137 | |||||||||
Farmland Partners, Inc. (Specialized REITs) | 110 | 1,268 | |||||||||
| FARO Technologies, Inc.* (Electronic Equipment, Instruments & Components) | 44 | 704 | |||||||||
Fastly, Inc.*—Class A (IT Services) | 323 | 2,381 | |||||||||
Fate Therapeutics, Inc.* (Biotechnology) | 251 | 823 | |||||||||
FB Financial Corp. (Banks) | 89 | 3,474 | |||||||||
| Federal Agricultural Mortgage Corp.—Class C (Financial Services) | 23 | 4,159 | |||||||||
Federal Signal Corp. (Machinery) | 151 | 12,634 | |||||||||
Fennec Pharmaceuticals, Inc.* (Biotechnology) | 59 | 360 | |||||||||
Fibrobiologics, Inc.* (Biotechnology) | 64 | 319 | |||||||||
Fidelis Insurance Holdings, Ltd. (Insurance) | 121 | 1,974 | |||||||||
Fidelity D&D Bancorp, Inc. (Banks) | 12 | 526 | |||||||||
| Figs, Inc.*—Class A (Textiles, Apparel & Luxury Goods) | 325 | 1,732 | |||||||||
Financial Institutions, Inc. (Banks) | 38 | 734 | |||||||||
First Advantage Corp. (Professional Services) | 127 | 2,041 | |||||||||
First Bancorp (Banks) | 100 | 3,192 | |||||||||
First Bancorp (Banks) | 412 | 7,535 | |||||||||
First Bank/Hamilton NJ (Banks) | 53 | 675 | |||||||||
First Busey Corp. (Banks) | 133 | 3,220 | |||||||||
First Business Financial Services, Inc. (Banks) | 20 | 740 | |||||||||
First Commonwealth Financial Corp. (Banks) | 253 | 3,494 | |||||||||
First Community Bankshares, Inc. (Banks) | 43 | 1,584 | |||||||||
First Financial Bancorp (Banks) | 236 | 5,244 | |||||||||
First Financial Bankshares, Inc. (Banks) | 326 | 9,627 | |||||||||
First Financial Corp. (Banks) | 29 | 1,070 | |||||||||
First Financial Northwest, Inc. (Banks) | 18 | 380 | |||||||||
First Foundation, Inc. (Banks) | 131 | 858 | |||||||||
First Internet Bancorp (Banks) | 20 | 540 | |||||||||
| First Interstate BancSystem, Inc.—Class A (Banks) | 196 | 5,443 | |||||||||
First Merchants Corp. (Banks) | 146 | 4,860 | |||||||||
First Mid Bancshares, Inc. (Banks) | 57 | 1,874 | |||||||||
| First Watch Restaurant Group, Inc.* (Hotels, Restaurants & Leisure) | 76 | 1,335 | |||||||||
First Western Financial, Inc.* (Banks) | 20 | 340 | |||||||||
FirstCash Holdings, Inc. (Consumer Finance) | 98 | 10,277 | |||||||||
| FiscalNote Holdings, Inc.* (Professional Services) | 151 | 220 | |||||||||
Five Star Bancorp (Banks) | 41 | 970 | |||||||||
FLEX LNG, Ltd. (Oil, Gas & Consumable Fuels) | 76 | 2,055 | |||||||||
Flexsteel Industries, Inc. (Household Durables) | 12 | 373 | |||||||||
Fluence Energy, Inc.* (Electrical Equipment) | 152 | 2,636 | |||||||||
Fluor Corp.* (Construction & Engineering) | 428 | 18,639 | |||||||||
Flushing Financial Corp. (Banks) | 69 | 907 | |||||||||
Flywire Corp.* (Financial Services) | 302 | 4,950 | |||||||||
Foghorn Therapeutics, Inc.* (Biotechnology) | 63 | 362 | |||||||||
Foot Locker, Inc. (Specialty Retail) | 209 | 5,208 | |||||||||
Forafric Global PLC* (Food Products) | 14 | 149 | |||||||||
| Forestar Group, Inc.* (Real Estate Management & Development) | 48 | 1,536 | |||||||||
Forge Global Holdings, Inc.* (Capital Markets) | 287 | 419 | |||||||||
See accompanying notes to the financial statements.
June 30, 2024 (unaudited) :: Schedule of Portfolio Investments :: ProFund VP Small-Cap :: 89
Common Stocks, continued
Shares | Value | ||||||||||
| FormFactor, Inc.* (Semiconductors & Semiconductor Equipment) | 194 | $ | 11,742 | ||||||||
| Forrester Research, Inc.* (Professional Services) | 30 | 512 | |||||||||
| Forum Energy Technologies, Inc.* (Energy Equipment & Services) | 29 | 489 | |||||||||
Forward Air Corp. (Air Freight & Logistics) | 63 | 1,200 | |||||||||
| Four Corners Property Trust, Inc. (Specialized REITs) | 230 | 5,674 | |||||||||
| Fox Factory Holding Corp.* (Automobile Components) | 106 | 5,108 | |||||||||
| Fractyl Health, Inc.* (Health Care Equipment & Supplies) | 19 | 81 | |||||||||
| Franklin BSP Realty Trust, Inc. (Mortgage REITs) | 206 | 2,596 | |||||||||
Franklin Covey Co.* (Professional Services) | 29 | 1,102 | |||||||||
Franklin Electric Co., Inc. (Machinery) | 113 | 10,884 | |||||||||
Franklin Street Properties Corp. (Office REITs) | 244 | 373 | |||||||||
| Fresh Del Monte Produce, Inc. (Food Products) | 85 | 1,857 | |||||||||
Freshworks, Inc.*—Class A (Software) | 510 | 6,472 | |||||||||
Freyr Battery, Inc.* (Electrical Equipment) | 281 | 478 | |||||||||
| Frontdoor, Inc.* (Diversified Consumer Services) | 197 | 6,657 | |||||||||
| Frontier Group Holdings, Inc.* (Passenger Airlines) | 106 | 523 | |||||||||
| FRP Holdings, Inc.* (Real Estate Management & Development) | 33 | 941 | |||||||||
FS Bancorp, Inc. (Banks) | 17 | 620 | |||||||||
| FTAI Aviation, Ltd. (Trading Companies & Distributors) | 249 | 25,703 | |||||||||
| FTAI Infrastructure, Inc. (Ground Transportation) | 252 | 2,175 | |||||||||
fuboTV, Inc.* (Interactive Media & Services) | 735 | 911 | |||||||||
FuelCell Energy, Inc.* (Electrical Equipment) | 1,136 | 726 | |||||||||
Fulcrum Therapeutics, Inc.* (Pharmaceuticals) | 155 | 961 | |||||||||
| Fulgent Genetics, Inc.* (Health Care Providers & Services) | 51 | 1,001 | |||||||||
| Full House Resorts, Inc.* (Hotels, Restaurants & Leisure) | 82 | 410 | |||||||||
Fulton Financial Corp. (Banks) | 447 | 7,590 | |||||||||
Funko, Inc.*—Class A (Leisure Products) | 77 | 752 | |||||||||
| FutureFuel Corp. (Oil, Gas & Consumable Fuels) | 65 | 333 | |||||||||
FVCBankcorp, Inc.* (Banks) | 41 | 448 | |||||||||
G1 Therapeutics, Inc.* (Biotechnology) | 124 | 283 | |||||||||
Galectin Therapeutics, Inc.* (Biotechnology) | 51 | 115 | |||||||||
Gambling.com Group, Ltd.* (Media) | 43 | 353 | |||||||||
Gannett Co., Inc.* (Media) | 355 | 1,637 | |||||||||
| GATX Corp. (Trading Companies & Distributors) | 89 | 11,780 | |||||||||
| GCM Grosvenor, Inc.—Class A (Capital Markets) | 104 | 1,015 | |||||||||
| Gct Semiconductor Holding, Inc.* (Semiconductors & Semiconductor Equipment) | 19 | 99 | |||||||||
| Genco Shipping & Trading, Ltd. (Marine Transportation) | 106 | 2,259 | |||||||||
Gencor Industries, Inc.* (Machinery) | 26 | 503 | |||||||||
| GeneDx Holdings Corp.* (Health Care Providers & Services) | 30 | 784 | |||||||||
Common Stocks, continued
Shares | Value | ||||||||||
Generation Bio Co.* (Biotechnology) | 124 | $ | 350 | ||||||||
Genesco, Inc.* (Specialty Retail) | 27 | 698 | |||||||||
Genie Energy, Ltd.—Class B (Electric Utilities) | 32 | 468 | |||||||||
Gentherm, Inc.* (Automobile Components) | 79 | 3,896 | |||||||||
Genworth Financial, Inc.* (Insurance) | 1,092 | 6,596 | |||||||||
| Geospace Technologies Corp.* (Energy Equipment & Services) | 31 | 278 | |||||||||
German American Bancorp, Inc. (Banks) | 71 | 2,510 | |||||||||
Geron Corp.* (Biotechnology) | 1,442 | 6,114 | |||||||||
| Getty Images Holdings, Inc.* (Interactive Media & Services) | 251 | 818 | |||||||||
Getty Realty Corp. (Retail REITs) | 124 | 3,306 | |||||||||
Gibraltar Industries, Inc.* (Building Products) | 77 | 5,278 | |||||||||
| Gigacloud Technology, Inc.*—Class A (Distributors) | 59 | 1,795 | |||||||||
| G-III Apparel Group, Ltd.* (Textiles, Apparel & Luxury Goods) | 101 | 2,734 | |||||||||
Glacier Bancorp, Inc. (Banks) | 285 | 10,636 | |||||||||
| Gladstone Commercial Corp. (Diversified REITs) | 100 | 1,427 | |||||||||
Gladstone Land Corp. (Specialized REITs) | 84 | 1,150 | |||||||||
| Glaukos Corp.* (Health Care Equipment & Supplies) | 123 | 14,556 | |||||||||
| Global Business Travel Group I* (Hotels, Restaurants & Leisure) | 314 | 2,072 | |||||||||
| Global Industrial Co. (Trading Companies & Distributors) | 34 | 1,066 | |||||||||
Global Medical REIT, Inc. (Health Care REITs) | 152 | 1,380 | |||||||||
Global Net Lease, Inc. (Diversified REITs) | 503 | 3,697 | |||||||||
Global Water Resources, Inc. (Water Utilities) | 29 | 351 | |||||||||
| Globalstar, Inc.* (Diversified Telecommunication Services) | 1,827 | 2,046 | |||||||||
GMS, Inc.* (Trading Companies & Distributors) | 100 | 8,061 | |||||||||
| Gogo, Inc.* (Wireless Telecommunication Services) | 162 | 1,558 | |||||||||
GoHealth, Inc.*—Class A (Insurance) | 11 | 107 | |||||||||
Golar LNG, Ltd. (Oil, Gas & Consumable Fuels) | 248 | 7,775 | |||||||||
| Golden Entertainment, Inc. (Hotels, Restaurants & Leisure) | 51 | 1,587 | |||||||||
Golden Matrix Group, Inc.* (Entertainment) | 50 | 124 | |||||||||
| Golden Ocean Group, Ltd. (Marine Transportation) | 305 | 4,209 | |||||||||
| Goosehead Insurance, Inc.*—Class A (Insurance) | 59 | 3,389 | |||||||||
GoPro, Inc.*—Class A (Household Durables) | 313 | 444 | |||||||||
| GrafTech International, Ltd.* (Electrical Equipment) | 648 | 629 | |||||||||
Graham Corp.* (Machinery) | 26 | 732 | |||||||||
| Graham Holdings Co.—Class B (Diversified Consumer Services) | 8 | 5,596 | |||||||||
| Granite Construction, Inc. (Construction & Engineering) | 110 | 6,817 | |||||||||
| Granite Point Mortgage Trust, Inc. (Mortgage REITs) | 126 | 374 | |||||||||
| Granite Ridge Resources, Inc. (Oil, Gas & Consumable Fuels) | 132 | 836 | |||||||||
Gray Television, Inc. (Media) | 214 | 1,113 | |||||||||
| Great Lakes Dredge & Dock Corp.* (Construction & Engineering) | 165 | 1,449 | |||||||||
Great Southern Bancorp, Inc. (Banks) | 22 | 1,223 | |||||||||
See accompanying notes to the financial statements.
90 :: ProFund VP Small-Cap :: Schedule of Portfolio Investments :: June 30, 2024 (unaudited)
Common Stocks, continued
Shares | Value | ||||||||||
| Green Brick Partners, Inc.* (Household Durables) | 79 | $ | 4,522 | ||||||||
| Green Dot Corp.*—Class A (Consumer Finance) | 133 | 1,257 | |||||||||
| Green Plains, Inc.* (Oil, Gas & Consumable Fuels) | 160 | 2,538 | |||||||||
Greene County Bancorp, Inc. (Banks) | 18 | 607 | |||||||||
| Greenlight Capital Re, Ltd.*—Class A (Insurance) | 69 | 904 | |||||||||
Greenwich Lifesciences, Inc.* (Biotechnology) | 15 | 259 | |||||||||
Greif, Inc.—Class A (Containers & Packaging) | 62 | 3,563 | |||||||||
Greif, Inc.—Class B (Containers & Packaging) | 12 | 750 | |||||||||
Grid Dynamics Holdings, Inc.* (IT Services) | 143 | 1,503 | |||||||||
Griffon Corp. (Building Products) | 97 | 6,194 | |||||||||
Grindr, Inc.* (Interactive Media & Services) | 61 | 747 | |||||||||
Group 1 Automotive, Inc. (Specialty Retail) | 33 | 9,810 | |||||||||
Groupon, Inc.* (Broadline Retail) | 57 | 873 | |||||||||
GrowGeneration Corp.* (Specialty Retail) | 146 | 314 | |||||||||
Guaranty Bancshares, Inc. (Banks) | 20 | 631 | |||||||||
| Guardant Health, Inc.* (Health Care Providers & Services) | 296 | 8,548 | |||||||||
| Gulfport Energy Corp.* (Oil, Gas & Consumable Fuels) | 32 | 4,832 | |||||||||
Gyre Therapeutics, Inc.* (Biotechnology) | 17 | 203 | |||||||||
| H&E Equipment Services, Inc. (Trading Companies & Distributors) | 81 | 3,578 | |||||||||
H.B. Fuller Co. (Chemicals) | 137 | 10,544 | |||||||||
| Haemonetics Corp.* (Health Care Equipment & Supplies) | 126 | 10,424 | |||||||||
| Hallador Energy Co.* (Oil, Gas & Consumable Fuels) | 63 | 490 | |||||||||
Halozyme Therapeutics, Inc.* (Biotechnology) | 312 | 16,336 | |||||||||
| Hamilton Beach Brands Holding Co.—Class A (Household Durables) | 21 | 361 | |||||||||
| Hamilton Insurance Group, Ltd.*—Class B (Insurance) | 42 | 699 | |||||||||
Hamilton Lane, Inc.—Class A (Capital Markets) | 96 | 11,864 | |||||||||
Hancock Whitney Corp. (Banks) | 217 | 10,379 | |||||||||
| Hanesbrands, Inc.* (Textiles, Apparel & Luxury Goods) | 885 | 4,363 | |||||||||
Hanmi Financial Corp. (Banks) | 75 | 1,254 | |||||||||
| Hannon Armstrong Sustainable Infrastructure Capital, Inc. (Mortgage REITs) | 282 | 8,347 | |||||||||
HarborOne Bancorp, Inc. (Banks) | 99 | 1,102 | |||||||||
Harmonic, Inc.* (Communications Equipment) | 277 | 3,260 | |||||||||
| Harmony Biosciences Holdings, Inc.* (Pharmaceuticals) | 76 | 2,293 | |||||||||
Harrow, Inc.* (Pharmaceuticals) | 76 | 1,588 | |||||||||
| Harvard Bioscience, Inc.* (Life Sciences Tools & Services) | 102 | 291 | |||||||||
Haverty Furniture Cos., Inc. (Specialty Retail) | 36 | 910 | |||||||||
| Hawaiian Electric Industries, Inc. (Electric Utilities) | 278 | 2,508 | |||||||||
Hawaiian Holdings, Inc.* (Passenger Airlines) | 128 | 1,591 | |||||||||
Hawkins, Inc. (Chemicals) | 48 | 4,368 | |||||||||
Haynes International, Inc. (Metals & Mining) | 32 | 1,878 | |||||||||
HBT Financial, Inc. (Banks) | 32 | 653 | |||||||||
HCI Group, Inc. (Insurance) | 20 | 1,843 | |||||||||
Health Catalyst, Inc.* (Health Care Technology) | 146 | 933 | |||||||||
| Healthcare Services Group, Inc.* (Commercial Services & Supplies) | 184 | 1,947 | |||||||||
Common Stocks, continued
Shares | Value | ||||||||||
| HealthEquity, Inc.* (Health Care Providers & Services) | 212 | $ | 18,273 | ||||||||
HealthStream, Inc. (Health Care Technology) | 61 | 1,702 | |||||||||
Heartland Express, Inc. (Ground Transportation) | 117 | 1,443 | |||||||||
Heartland Financial USA, Inc. (Banks) | 106 | 4,712 | |||||||||
Hecla Mining Co. (Metals & Mining) | 1,449 | 7,028 | |||||||||
| Heidrick & Struggles International, Inc. (Professional Services) | 50 | 1,579 | |||||||||
Helen of Troy, Ltd.* (Household Durables) | 60 | 5,564 | |||||||||
Helios Technologies, Inc. (Machinery) | 83 | 3,963 | |||||||||
| Helix Energy Solutions Group, Inc.* (Energy Equipment & Services) | 361 | 4,310 | |||||||||
| Helmerich & Payne, Inc. (Energy Equipment & Services) | 242 | 8,746 | |||||||||
Herbalife, Ltd.* (Personal Care Products) | 250 | 2,598 | |||||||||
| Herc Holdings, Inc. (Trading Companies & Distributors) | 70 | 9,330 | |||||||||
Heritage Commerce Corp. (Banks) | 149 | 1,296 | |||||||||
Heritage Financial Corp. (Banks) | 86 | 1,551 | |||||||||
Heritage Insurance Holdings, Inc.* (Insurance) | 57 | 404 | |||||||||
Heron Therapeutics, Inc.* (Biotechnology) | 294 | 1,029 | |||||||||
| Hertz Global Holdings, Inc.* (Ground Transportation) | 307 | 1,084 | |||||||||
| HF Foods Group, Inc.* (Consumer Staples Distribution & Retail) | 100 | 300 | |||||||||
Hibbett, Inc. (Specialty Retail) | 29 | 2,529 | |||||||||
| HighPeak Energy, Inc. (Oil, Gas & Consumable Fuels) | 36 | 506 | |||||||||
Hillenbrand, Inc. (Machinery) | 176 | 7,044 | |||||||||
HilleVax, Inc.* (Biotechnology) | 79 | 1,142 | |||||||||
Hillman Solutions Corp.* (Machinery) | 492 | 4,354 | |||||||||
Hilltop Holdings, Inc. (Banks) | 117 | 3,660 | |||||||||
| Hilton Grand Vacations, Inc.* (Hotels, Restaurants & Leisure) | 185 | 7,480 | |||||||||
| Himalaya Shipping, Ltd. (Marine Transportation) | 74 | 678 | |||||||||
| Hims & Hers Health, Inc.* (Health Care Providers & Services) | 475 | 9,590 | |||||||||
Hingham Institution For Savings The (Banks) | 4 | 716 | |||||||||
Hippo Holdings, Inc.* (Insurance) | 49 | 842 | |||||||||
HireQuest, Inc. (Professional Services) | 14 | 173 | |||||||||
HNI Corp. (Commercial Services & Supplies) | 118 | 5,312 | |||||||||
Holley, Inc.* (Automobile Components) | 117 | 419 | |||||||||
Home Bancorp, Inc. (Banks) | 18 | 720 | |||||||||
Home BancShares, Inc. (Banks) | 472 | 11,309 | |||||||||
HomeStreet, Inc. (Banks) | 46 | 524 | |||||||||
HomeTrust Bancshares, Inc. (Banks) | 37 | 1,111 | |||||||||
| Hooker Furnishings Corp. (Household Durables) | 27 | 391 | |||||||||
Hope Bancorp, Inc. (Banks) | 290 | 3,115 | |||||||||
Horace Mann Educators Corp. (Insurance) | 103 | 3,360 | |||||||||
Horizon Bancorp, Inc. (Banks) | 109 | 1,348 | |||||||||
| Hovnanian Enterprises, Inc.*—Class A (Household Durables) | 12 | 1,703 | |||||||||
| Hub Group, Inc.—Class A (Air Freight & Logistics) | 153 | 6,587 | |||||||||
Hudson Pacific Properties, Inc. (Office REITs) | 342 | 1,645 | |||||||||
| Hudson Technologies, Inc.* (Trading Companies & Distributors) | 111 | 976 | |||||||||
Humacyte, Inc.* (Biotechnology) | 220 | 1,056 | |||||||||
See accompanying notes to the financial statements.
June 30, 2024 (unaudited) :: Schedule of Portfolio Investments :: ProFund VP Small-Cap :: 91
Common Stocks, continued
Shares | Value | ||||||||||
| Huron Consulting Group, Inc.* (Professional Services) | 45 | $ | 4,433 | ||||||||
Hut 8 Corp.* (Software) | 201 | 3,013 | |||||||||
Hyliion Holdings Corp.* (Machinery) | 353 | 572 | |||||||||
Hyster-Yale, Inc. (Machinery) | 29 | 2,022 | |||||||||
I3 Verticals, Inc.*—Class A (Financial Services) | 57 | 1,259 | |||||||||
i-80 Gold Corp.* (Metals & Mining) | 649 | 701 | |||||||||
IBEX Holdings, Ltd.* (Professional Services) | 22 | 356 | |||||||||
Ibotta, Inc.*—Class A (Media) | 19 | 1,428 | |||||||||
ICF International, Inc. (Professional Services) | 47 | 6,978 | |||||||||
| Ichor Holdings, Ltd.* (Semiconductors & Semiconductor Equipment) | 82 | 3,161 | |||||||||
| ICU Medical, Inc.* (Health Care Equipment & Supplies) | 54 | 6,413 | |||||||||
Ideaya Biosciences, Inc.* (Biotechnology) | 187 | 6,566 | |||||||||
| IDT Corp.—Class B (Diversified Telecommunication Services) | 39 | 1,401 | |||||||||
| IES Holdings, Inc.* (Construction & Engineering) | 21 | 2,926 | |||||||||
IGM Biosciences, Inc.* (Biotechnology) | 38 | 261 | |||||||||
iHeartMedia, Inc.*—Class A (Media) | 259 | 282 | |||||||||
Ilearningengines Holdings, Inc.* (Software) | 73 | 663 | |||||||||
IMAX Corp.* (Entertainment) | 107 | 1,794 | |||||||||
| Immersion Corp. (Technology Hardware, Storage & Peripherals) | 76 | 715 | |||||||||
ImmunityBio, Inc.*(a) (Biotechnology) | 355 | 2,244 | |||||||||
Immunome, Inc.* (Biotechnology) | 129 | 1,561 | |||||||||
Immunovant, Inc.* (Biotechnology) | 145 | 3,828 | |||||||||
| Impinj, Inc.* (Semiconductors & Semiconductor Equipment) | 57 | 8,936 | |||||||||
| Inari Medical, Inc.* (Health Care Equipment & Supplies) | 133 | 6,404 | |||||||||
| Independence Realty Trust, Inc. (Residential REITs) | 566 | 10,608 | |||||||||
Independent Bank Corp. (Banks) | 50 | 1,350 | |||||||||
Independent Bank Corp. (Banks) | 106 | 5,376 | |||||||||
Independent Bank Group, Inc. (Banks) | 91 | 4,142 | |||||||||
| indie Semiconductor, Inc.*—Class A (Semiconductors & Semiconductor Equipment) | 411 | 2,536 | |||||||||
| Industrial Logistics Properties Trust (Industrial REITs) | 163 | 600 | |||||||||
Infinera Corp.* (Communications Equipment) | 499 | 3,039 | |||||||||
Information Services Group, Inc. (IT Services) | 88 | 259 | |||||||||
| InfuSystem Holdings, Inc.* (Health Care Providers & Services) | 50 | 342 | |||||||||
Ingevity Corp.* (Chemicals) | 91 | 3,978 | |||||||||
| Ingles Markets, Inc.—Class A (Consumer Staples Distribution & Retail) | 36 | 2,470 | |||||||||
Inhibrx Biosciences, Inc.* (Biotechnology) | 26 | 368 | |||||||||
| Inmode, Ltd.* (Health Care Equipment & Supplies) | 199 | 3,630 | |||||||||
Inmune Bio, Inc.* (Biotechnology) | 31 | 273 | |||||||||
Innodata, Inc.* (Professional Services) | 68 | 1,008 | |||||||||
Innospec, Inc. (Chemicals) | 62 | 7,663 | |||||||||
| Innovage Holding Corp.* (Health Care Providers & Services) | 48 | 238 | |||||||||
| Innovative Industrial Properties, Inc. (Industrial REITs) | 71 | 7,755 | |||||||||
Innovid Corp.* (Media) | 267 | 494 | |||||||||
Innoviva, Inc.* (Pharmaceuticals) | 139 | 2,280 | |||||||||
Common Stocks, continued
Shares | Value | ||||||||||
| Inogen, Inc.* (Health Care Equipment & Supplies) | 59 | $ | 480 | ||||||||
Inovio Pharmaceuticals, Inc.* (Biotechnology) | 64 | 517 | |||||||||
Inozyme Pharma, Inc.* (Biotechnology) | 129 | 575 | |||||||||
| Insight Enterprises, Inc.* (Electronic Equipment, Instruments & Components) | 70 | 13,884 | |||||||||
Insmed, Inc.* (Biotechnology) | 389 | 26,064 | |||||||||
Insperity, Inc. (Professional Services) | 90 | 8,209 | |||||||||
| Inspired Entertainment, Inc.* (Hotels, Restaurants & Leisure) | 55 | 503 | |||||||||
| Installed Building Products, Inc. (Household Durables) | 60 | 12,341 | |||||||||
Insteel Industries, Inc. (Building Products) | 47 | 1,455 | |||||||||
Instructure Holdings, Inc.* (Software) | 55 | 1,288 | |||||||||
Intapp, Inc.* (Software) | 98 | 3,594 | |||||||||
| Integer Holdings Corp.* (Health Care Equipment & Supplies) | 83 | 9,611 | |||||||||
| Integra LifeSciences Holdings Corp.* (Health Care Equipment & Supplies) | 172 | 5,012 | |||||||||
Integral Ad Science Holding Corp.* (Media) | 181 | 1,759 | |||||||||
Intellia Therapeutics, Inc.* (Biotechnology) | 241 | 5,394 | |||||||||
Inter Parfums, Inc. (Personal Care Products) | 46 | 5,338 | |||||||||
InterDigital, Inc. (Software) | 63 | 7,343 | |||||||||
| Interface, Inc. (Commercial Services & Supplies) | 144 | 2,114 | |||||||||
International Bancshares Corp. (Banks) | 135 | 7,723 | |||||||||
| International Game Technology PLC (Hotels, Restaurants & Leisure) | 285 | 5,831 | |||||||||
| International Money Express, Inc.* (Financial Services) | 79 | 1,646 | |||||||||
| International Seaways, Inc. (Oil, Gas & Consumable Fuels) | 101 | 5,972 | |||||||||
Intrepid Potash, Inc.* (Chemicals) | 27 | 633 | |||||||||
| Intuitive Machines, Inc.* (Aerospace & Defense) | 71 | 234 | |||||||||
InvenTrust Properties Corp. (Retail REITs) | 171 | 4,234 | |||||||||
| Invesco Mortgage Capital, Inc. (Mortgage REITs) | 123 | 1,153 | |||||||||
Investar Holding Corp. (Banks) | 23 | 354 | |||||||||
Investors Title Co. (Insurance) | 4 | 721 | |||||||||
Invivyd, Inc.* (Biotechnology) | 199 | 219 | |||||||||
| IonQ, Inc.*(a) (Technology Hardware, Storage & Peripherals) | 497 | 3,495 | |||||||||
Iovance Biotherapeutics, Inc.* (Biotechnology) | 634 | 5,085 | |||||||||
| iRadimed Corp. (Health Care Equipment & Supplies) | 20 | 879 | |||||||||
| iRhythm Technologies, Inc.* (Health Care Equipment & Supplies) | 78 | 8,396 | |||||||||
iRobot Corp.* (Household Durables) | 71 | 647 | |||||||||
| Ironwood Pharmaceuticals, Inc.* (Biotechnology) | 354 | 2,308 | |||||||||
Ispire Technology, Inc.* (Tobacco) | 48 | 384 | |||||||||
iTeos Therapeutics, Inc.* (Biotechnology) | 65 | 965 | |||||||||
| Iteris, Inc.* (Electronic Equipment, Instruments & Components) | 107 | 463 | |||||||||
| Itron, Inc.* (Electronic Equipment, Instruments & Components) | 115 | 11,380 | |||||||||
Ivanhoe Electric, Inc.* (Metals & Mining) | 209 | 1,960 | |||||||||
J & J Snack Foods Corp. (Food Products) | 38 | 6,170 | |||||||||
J Jill, Inc. (Specialty Retail) | 12 | 420 | |||||||||
See accompanying notes to the financial statements.
92 :: ProFund VP Small-Cap :: Schedule of Portfolio Investments :: June 30, 2024 (unaudited)
Common Stocks, continued
Shares | Value | ||||||||||
| Jack in the Box, Inc. (Hotels, Restaurants & Leisure) | 49 | $ | 2,496 | ||||||||
| Jackson Financial, Inc.—Class A (Financial Services) | 191 | 14,184 | |||||||||
JAKKS Pacific, Inc.* (Leisure Products) | 20 | 358 | |||||||||
James River Group Holdings, Ltd. (Insurance) | 78 | 603 | |||||||||
Jamf Holding Corp.* (Software) | 186 | 3,069 | |||||||||
| Janus International Group, Inc.* (Building Products) | 355 | 4,484 | |||||||||
Janux Therapeutics, Inc.* (Biotechnology) | 70 | 2,932 | |||||||||
Jasper Therapeutics, Inc.* (Biotechnology) | 28 | 636 | |||||||||
JBG SMITH Properties (Office REITs) | 222 | 3,381 | |||||||||
JELD-WEN Holding, Inc.* (Building Products) | 215 | 2,896 | |||||||||
JetBlue Airways Corp.* (Passenger Airlines) | 767 | 4,671 | |||||||||
Joby Aviation, Inc.*(a) (Passenger Airlines) | 1,006 | 5,131 | |||||||||
John B Sanfilippo & Son, Inc. (Food Products) | 22 | 2,138 | |||||||||
John Bean Technologies Corp. (Machinery) | 80 | 7,598 | |||||||||
John Marshall Bancorp, Inc. (Banks) | 31 | 541 | |||||||||
John Wiley & Sons, Inc.—Class A (Media) | 90 | 3,663 | |||||||||
| Johnson Outdoors, Inc.—Class A (Leisure Products) | 12 | 420 | |||||||||
Kadant, Inc. (Machinery) | 29 | 8,520 | |||||||||
Kaiser Aluminum Corp. (Metals & Mining) | 40 | 3,516 | |||||||||
Kaltura, Inc.* (Software) | 241 | 289 | |||||||||
KalVista Pharmaceuticals, Inc.* (Biotechnology) | 95 | 1,119 | |||||||||
| Karat Packaging, Inc. (Trading Companies & Distributors) | 17 | 503 | |||||||||
KB Home (Household Durables) | 169 | 11,860 | |||||||||
Kearny Financial Corp. (Banks) | 137 | 843 | |||||||||
| Kelly Services, Inc.—Class A (Professional Services) | 78 | 1,670 | |||||||||
Kennametal, Inc. (Machinery) | 198 | 4,661 | |||||||||
| Kennedy-Wilson Holdings, Inc. (Real Estate Management & Development) | 285 | 2,770 | |||||||||
Keros Therapeutics, Inc.* (Biotechnology) | 74 | 3,382 | |||||||||
Kforce, Inc. (Professional Services) | 47 | 2,920 | |||||||||
| Kimball Electronics, Inc.* (Electronic Equipment, Instruments & Components) | 61 | 1,341 | |||||||||
| Kinetik Holdings, Inc. (Oil, Gas & Consumable Fuels) | 96 | 3,978 | |||||||||
Kingsway Financial Services, Inc.* (Insurance) | 32 | 264 | |||||||||
| Kiniksa Pharmaceuticals International PLC* (Biotechnology) | 93 | 1,736 | |||||||||
Kite Realty Group Trust (Retail REITs) | 544 | 12,174 | |||||||||
| KKR Real Estate Finance Trust, Inc. (Mortgage REITs) | 147 | 1,330 | |||||||||
Knife River Corp.* (Construction Materials) | 142 | 9,960 | |||||||||
| Knowles Corp.* (Electronic Equipment, Instruments & Components) | 221 | 3,814 | |||||||||
| Kodiak Gas Services, Inc. (Energy Equipment & Services) | 50 | 1,363 | |||||||||
Kodiak Sciences, Inc.* (Biotechnology) | 82 | 193 | |||||||||
| Kontoor Brands, Inc. (Textiles, Apparel & Luxury Goods) | 139 | 9,195 | |||||||||
Koppers Holdings, Inc. (Chemicals) | 51 | 1,886 | |||||||||
Korn Ferry (Professional Services) | 130 | 8,728 | |||||||||
Korro Bio, Inc.* (Biotechnology) | 15 | 508 | |||||||||
| Kosmos Energy, Ltd.* (Oil, Gas & Consumable Fuels) | 1,172 | 6,493 | |||||||||
| Kratos Defense & Security Solutions, Inc.* (Aerospace & Defense) | 371 | 7,424 | |||||||||
Common Stocks, continued
Shares | Value | ||||||||||
| Krispy Kreme, Inc. (Hotels, Restaurants & Leisure) | 214 | $ | 2,303 | ||||||||
Kronos Worldwide, Inc. (Chemicals) | 55 | 690 | |||||||||
Krystal Biotech, Inc.* (Biotechnology) | 62 | 11,386 | |||||||||
| Kulicke & Soffa Industries, Inc. (Semiconductors & Semiconductor Equipment) | 137 | 6,739 | |||||||||
Kura Oncology, Inc.* (Biotechnology) | 182 | 3,747 | |||||||||
| Kura Sushi USA, Inc.*—Class A (Hotels, Restaurants & Leisure) | 15 | 946 | |||||||||
Kymera Therapeutics, Inc.* (Biotechnology) | 111 | 3,313 | |||||||||
Kyverna Therapeutics, Inc.* (Biotechnology) | 42 | 315 | |||||||||
L B Foster Co.*—Class A (Machinery) | 23 | 495 | |||||||||
Ladder Capital Corp. (Mortgage REITs) | 284 | 3,206 | |||||||||
Lakeland Financial Corp. (Banks) | 62 | 3,814 | |||||||||
Lancaster Colony Corp. (Food Products) | 49 | 9,261 | |||||||||
Lands' End, Inc.* (Specialty Retail) | 36 | 489 | |||||||||
Landsea Homes Corp.* (Household Durables) | 45 | 414 | |||||||||
| Lantheus Holdings, Inc.* (Health Care Equipment & Supplies) | 170 | 13,648 | |||||||||
| LanzaTech Global, Inc.* (Commercial Services & Supplies) | 280 | 518 | |||||||||
Larimar Therapeutics, Inc.* (Biotechnology) | 105 | 761 | |||||||||
Latham Group, Inc.* (Leisure Products) | 101 | 306 | |||||||||
| Laureate Education, Inc. (Diversified Consumer Services) | 336 | 5,020 | |||||||||
La-Z-Boy, Inc. (Household Durables) | 107 | 3,989 | |||||||||
LCI Industries (Automobile Components) | 62 | 6,410 | |||||||||
LCNB Corp. (Banks) | 31 | 431 | |||||||||
Legacy Housing Corp.* (Household Durables) | 28 | 642 | |||||||||
Legalzoom.com, Inc.* (Professional Services) | 345 | 2,895 | |||||||||
| LeMaitre Vascular, Inc. (Health Care Equipment & Supplies) | 51 | 4,196 | |||||||||
Lemonade, Inc.*(a) (Insurance) | 129 | 2,129 | |||||||||
LendingClub Corp.* (Consumer Finance) | 274 | 2,318 | |||||||||
LendingTree, Inc.* (Consumer Finance) | 25 | 1,040 | |||||||||
LENZ Therapeutics, Inc.* (Biotechnology) | 31 | 536 | |||||||||
Leonardo DRS, Inc.* (Aerospace & Defense) | 184 | 4,694 | |||||||||
Leslie's, Inc.* (Specialty Retail) | 450 | 1,886 | |||||||||
Lexeo Therapeutics, Inc.* (Biotechnology) | 26 | 417 | |||||||||
Lexicon Pharmaceuticals, Inc.* (Biotechnology) | 287 | 482 | |||||||||
LGI Homes, Inc.* (Household Durables) | 52 | 4,653 | |||||||||
| Liberty Energy, Inc. (Energy Equipment & Services) | 404 | 8,440 | |||||||||
| Liberty Latin America, Ltd.*—Class A (Diversified Telecommunication Services) | 83 | 798 | |||||||||
| Liberty Latin America, Ltd.*—Class C (Diversified Telecommunication Services) | 337 | 3,242 | |||||||||
| Life Time Group Holdings, Inc.* (Hotels, Restaurants & Leisure) | 147 | 2,768 | |||||||||
| Lifecore Biomedical, Inc.* (Life Sciences Tools & Services) | 53 | 272 | |||||||||
Lifemd, Inc.* (Health Care Technology) | 87 | 597 | |||||||||
| LifeStance Health Group, Inc.* (Health Care Providers & Services) | 299 | 1,468 | |||||||||
Lifetime Brands, Inc. (Household Durables) | 31 | 266 | |||||||||
Lifeway Foods, Inc.* (Food Products) | 11 | 140 | |||||||||
Lifezone Metals, Ltd.* (Metals & Mining) | 91 | 699 | |||||||||
| Ligand Pharmaceuticals, Inc.* (Pharmaceuticals) | 43 | 3,623 | |||||||||
See accompanying notes to the financial statements.
June 30, 2024 (unaudited) :: Schedule of Portfolio Investments :: ProFund VP Small-Cap :: 93
Common Stocks, continued
Shares | Value | ||||||||||
| Lightwave Logic, Inc.* (Electronic Equipment, Instruments & Components) | 301 | $ | 900 | ||||||||
| Limbach Holdings, Inc.* (Construction & Engineering) | 26 | 1,480 | |||||||||
Limoneira Co. (Food Products) | 41 | 853 | |||||||||
| Lincoln Educational Services Corp.* (Diversified Consumer Services) | 65 | 771 | |||||||||
| Lindblad Expeditions Holdings, Inc.* (Hotels, Restaurants & Leisure) | 89 | 859 | |||||||||
Lindsay Corp. (Machinery) | 27 | 3,318 | |||||||||
| Lineage Cell Therapeutics, Inc.* (Biotechnology) | 370 | 369 | |||||||||
Linkbancorp, Inc. (Banks) | 55 | 337 | |||||||||
| Lions Gate Entertainment Corp.*—Class A (Entertainment) | 149 | 1,404 | |||||||||
| Lions Gate Entertainment Corp.*—Class B (Entertainment) | 305 | 2,614 | |||||||||
Liquidia Corp.* (Pharmaceuticals) | 144 | 1,728 | |||||||||
| Liquidity Services, Inc.* (Commercial Services & Supplies) | 54 | 1,079 | |||||||||
| LivaNova PLC* (Health Care Equipment & Supplies) | 137 | 7,510 | |||||||||
Live Oak Bancshares, Inc. (Banks) | 87 | 3,050 | |||||||||
LiveOne, Inc.* (Entertainment) | 170 | 267 | |||||||||
LiveRamp Holdings, Inc.* (Software) | 163 | 5,043 | |||||||||
Livewire Group, Inc.* (Automobiles) | 46 | 352 | |||||||||
| Longboard Pharmaceuticals, Inc.* (Pharmaceuticals) | 81 | 2,189 | |||||||||
LSB Industries, Inc.* (Chemicals) | 134 | 1,096 | |||||||||
LSI Industries, Inc. (Electrical Equipment) | 70 | 1,013 | |||||||||
LTC Properties, Inc. (Health Care REITs) | 108 | 3,726 | |||||||||
| Lumen Technologies, Inc.* (Diversified Telecommunication Services) | 2,535 | 2,789 | |||||||||
| Luminar Technologies, Inc.*(a) (Automobile Components) | 840 | 1,252 | |||||||||
Luxfer Holdings PLC (Machinery) | 67 | 777 | |||||||||
LXP Industrial Trust (Industrial REITs) | 728 | 6,639 | |||||||||
Lyell Immunopharma, Inc.* (Biotechnology) | 402 | 583 | |||||||||
Lyra Therapeutics, Inc.* (Pharmaceuticals) | 121 | 33 | |||||||||
M/I Homes, Inc.* (Household Durables) | 68 | 8,306 | |||||||||
Macatawa Bank Corp. (Banks) | 66 | 964 | |||||||||
MacroGenics, Inc.* (Biotechnology) | 154 | 655 | |||||||||
| Madison Square Garden Entertainment Corp.* (Entertainment) | 98 | 3,355 | |||||||||
| Madrigal Pharmaceuticals, Inc.* (Biotechnology) | 44 | 12,327 | |||||||||
Magnite, Inc.* (Media) | 315 | 4,186 | |||||||||
| Magnolia Oil & Gas Corp.—Class A (Oil, Gas & Consumable Fuels) | 434 | 10,998 | |||||||||
Maiden Holdings, Ltd.* (Insurance) | 220 | 453 | |||||||||
| Malibu Boats, Inc.*—Class A (Leisure Products) | 51 | 1,787 | |||||||||
Mama's Creations, Inc.* (Food Products) | 82 | 553 | |||||||||
| Mammoth Energy Services, Inc.* (Energy Equipment & Services) | 61 | 200 | |||||||||
MannKind Corp.* (Biotechnology) | 664 | 3,466 | |||||||||
Marathon Digital Holdings, Inc.* (Software) | 685 | 13,598 | |||||||||
| Maravai LifeSciences Holdings, Inc.*—Class A (Life Sciences Tools & Services) | 277 | 1,984 | |||||||||
| Marcus & Millichap, Inc. (Real Estate Management & Development) | 59 | 1,860 | |||||||||
Common Stocks, continued
Shares | Value | ||||||||||
Marine Products Corp. (Leisure Products) | 22 | $ | 222 | ||||||||
MarineMax, Inc.* (Specialty Retail) | 54 | 1,748 | |||||||||
MarketWise, Inc. (Capital Markets) | 97 | 113 | |||||||||
Marqeta, Inc.*—Class A (Financial Services) | 1,167 | 6,395 | |||||||||
Marten Transport, Ltd. (Ground Transportation) | 145 | 2,675 | |||||||||
Masterbrand, Inc.* (Building Products) | 317 | 4,654 | |||||||||
| MasterCraft Boat Holdings, Inc.* (Leisure Products) | 42 | 793 | |||||||||
Materion Corp. (Metals & Mining) | 52 | 5,623 | |||||||||
Mativ Holdings, Inc. (Chemicals) | 135 | 2,290 | |||||||||
| Matrix Service Co.* (Construction & Engineering) | 66 | 655 | |||||||||
Matson, Inc. (Marine Transportation) | 85 | 11,132 | |||||||||
Matterport, Inc.* (Software) | 656 | 2,932 | |||||||||
| Matthews International Corp.—Class A (Commercial Services & Supplies) | 74 | 1,854 | |||||||||
| Maui Land & Pineapple Co., Inc.* (Real Estate Management & Development) | 19 | 419 | |||||||||
MaxCyte, Inc.* (Life Sciences Tools & Services) | 262 | 1,027 | |||||||||
Maximus, Inc. (Professional Services) | 153 | 13,112 | |||||||||
| MaxLinear, Inc.* (Semiconductors & Semiconductor Equipment) | 198 | 3,988 | |||||||||
Mayville Engineering Co., Inc.* (Machinery) | 32 | 533 | |||||||||
MBIA, Inc. (Insurance) | 112 | 615 | |||||||||
| McGrath RentCorp (Trading Companies & Distributors) | 61 | 6,500 | |||||||||
Medallion Financial Corp. (Consumer Finance) | 47 | 361 | |||||||||
| MediaAlpha, Inc.*—Class A (Interactive Media & Services) | 62 | 817 | |||||||||
Medifast, Inc. (Personal Care Products) | 27 | 589 | |||||||||
Mediwound, Ltd.* (Pharmaceuticals) | 20 | 310 | |||||||||
MeiraGTx Holdings PLC* (Biotechnology) | 97 | 408 | |||||||||
Mercantile Bank Corp. (Banks) | 40 | 1,623 | |||||||||
Merchants Bancorp (Financial Services) | 43 | 1,743 | |||||||||
Mercury General Corp. (Insurance) | 67 | 3,560 | |||||||||
Mercury Systems, Inc.* (Aerospace & Defense) | 137 | 3,698 | |||||||||
MeridianLink, Inc.* (Software) | 68 | 1,452 | |||||||||
| Merit Medical Systems, Inc.* (Health Care Equipment & Supplies) | 143 | 12,290 | |||||||||
Meritage Homes Corp. (Household Durables) | 90 | 14,566 | |||||||||
Mersana Therapeutics, Inc.* (Biotechnology) | 284 | 571 | |||||||||
| Mesa Laboratories, Inc. (Life Sciences Tools & Services) | 13 | 1,128 | |||||||||
Metagenomi, Inc.* (Biotechnology) | 16 | 65 | |||||||||
Metallus, Inc.* (Metals & Mining) | 107 | 2,169 | |||||||||
| Metals Acquisition, Ltd.*—Class A (Metals & Mining) | 135 | 1,848 | |||||||||
| Methode Electronics, Inc. (Electronic Equipment, Instruments & Components) | 85 | 880 | |||||||||
Metrocity Bankshares, Inc. (Banks) | 46 | 1,214 | |||||||||
Metropolitan Bank Holding Corp.* (Banks) | 26 | 1,094 | |||||||||
MFA Financial, Inc. (Mortgage REITs) | 256 | 2,724 | |||||||||
MGE Energy, Inc. (Electric Utilities) | 91 | 6,800 | |||||||||
MGP Ingredients, Inc. (Beverages) | 35 | 2,604 | |||||||||
| MicroVision, Inc.*(a) (Electronic Equipment, Instruments & Components) | 517 | 548 | |||||||||
Mid Penn Bancorp, Inc. (Banks) | 37 | 812 | |||||||||
Middlefield Banc Corp. (Banks) | 18 | 433 | |||||||||
Middlesex Water Co. (Water Utilities) | 44 | 2,299 | |||||||||
Midland States Bancorp, Inc. (Banks) | 53 | 1,200 | |||||||||
MidWestOne Financial Group, Inc. (Banks) | 36 | 810 | |||||||||
See accompanying notes to the financial statements.
94 :: ProFund VP Small-Cap :: Schedule of Portfolio Investments :: June 30, 2024 (unaudited)
Common Stocks, continued
Shares | Value | ||||||||||
Miller Industries, Inc. (Machinery) | 28 | $ | 1,541 | ||||||||
| MillerKnoll, Inc. (Commercial Services & Supplies) | 179 | 4,742 | |||||||||
MiMedx Group, Inc.* (Biotechnology) | 297 | 2,058 | |||||||||
| Mind Medicine Mindmed, Inc.* (Pharmaceuticals) | 180 | 1,298 | |||||||||
Minerals Technologies, Inc. (Chemicals) | 80 | 6,653 | |||||||||
Mineralys Therapeutics, Inc.* (Biotechnology) | 72 | 842 | |||||||||
| Mirion Technologies, Inc.* (Electronic Equipment, Instruments & Components) | 500 | 5,370 | |||||||||
Mirum Pharmaceuticals, Inc.* (Biotechnology) | 98 | 3,351 | |||||||||
Mission Produce, Inc.* (Food Products) | 109 | 1,077 | |||||||||
| Mister Car Wash, Inc.* (Diversified Consumer Services) | 234 | 1,666 | |||||||||
Mistras Group, Inc.* (Professional Services) | 52 | 431 | |||||||||
Mitek Systems, Inc.* (Software) | 116 | 1,297 | |||||||||
| Modine Manufacturing Co.* (Automobile Components) | 129 | 12,924 | |||||||||
| ModivCare, Inc.* (Health Care Providers & Services) | 28 | 735 | |||||||||
Moelis & Co.—Class A (Capital Markets) | 177 | 10,064 | |||||||||
| Monarch Casino & Resort, Inc. (Hotels, Restaurants & Leisure) | 33 | 2,248 | |||||||||
| Mondee Holdings, Inc.* (Hotels, Restaurants & Leisure) | 95 | 228 | |||||||||
Moneylion, Inc.* (Consumer Finance) | 21 | 1,544 | |||||||||
Monro, Inc. (Specialty Retail) | 75 | 1,790 | |||||||||
| Montauk Renewables, Inc.* (Independent Power and Renewable Electricity Producers) | 165 | 941 | |||||||||
| Monte Rosa Therapeutics, Inc.* (Biotechnology) | 76 | 284 | |||||||||
| Montrose Environmental Group, Inc.* (Commercial Services & Supplies) | 80 | 3,565 | |||||||||
Moog, Inc.—Class A (Aerospace & Defense) | 71 | 11,878 | |||||||||
Morphic Holding, Inc.* (Biotechnology) | 100 | 3,407 | |||||||||
| Movado Group, Inc. (Textiles, Apparel & Luxury Goods) | 38 | 945 | |||||||||
Mr. Cooper Group, Inc.* (Financial Services) | 160 | 12,997 | |||||||||
| MRC Global, Inc.* (Trading Companies & Distributors) | 211 | 2,724 | |||||||||
Mueller Industries, Inc. (Machinery) | 280 | 15,942 | |||||||||
| Mueller Water Products, Inc.—Class A (Machinery) | 389 | 6,971 | |||||||||
| Murphy Oil Corp. (Oil, Gas & Consumable Fuels) | 363 | 14,969 | |||||||||
MVB Financial Corp. (Banks) | 29 | 541 | |||||||||
Myers Industries, Inc. (Containers & Packaging) | 92 | 1,231 | |||||||||
MYR Group, Inc.* (Construction & Engineering) | 42 | 5,700 | |||||||||
Myriad Genetics, Inc.* (Biotechnology) | 224 | 5,479 | |||||||||
N-able, Inc.* (Software) | 179 | 2,726 | |||||||||
| Nabors Industries, Ltd.* (Energy Equipment & Services) | 23 | 1,637 | |||||||||
| NACCO Industries, Inc.—Class A (Oil, Gas & Consumable Fuels) | 10 | 277 | |||||||||
| Nano-X Imaging, Ltd.* (Health Care Equipment & Supplies) | 136 | 998 | |||||||||
| Napco Security Technologies, Inc. (Electronic Equipment, Instruments & Components) | 88 | 4,572 | |||||||||
| Nathan's Famous, Inc. (Hotels, Restaurants & Leisure) | 7 | 474 | |||||||||
Common Stocks, continued
Shares | Value | ||||||||||
| National Bank Holdings Corp.—Class A (Banks) | 92 | $ | 3,593 | ||||||||
National Bankshares, Inc. (Banks) | 14 | 396 | |||||||||
National Beverage Corp. (Beverages) | 59 | 3,023 | |||||||||
National CineMedia, Inc.* (Media) | 177 | 777 | |||||||||
| National Health Investors, Inc. (Health Care REITs) | 105 | 7,112 | |||||||||
| National HealthCare Corp. (Health Care Providers & Services) | 31 | 3,360 | |||||||||
| National Presto Industries, Inc. (Aerospace & Defense) | 13 | 977 | |||||||||
| National Research Corp. (Health Care Providers & Services) | 38 | 872 | |||||||||
| National Vision Holdings, Inc.* (Specialty Retail) | 195 | 2,553 | |||||||||
| National Western Life Group, Inc.—Class A (Insurance) | 6 | 2,982 | |||||||||
| Natural Gas Services Group, Inc.* (Energy Equipment & Services) | 27 | 543 | |||||||||
| Natural Grocers by Vitamin Cottage, Inc. (Consumer Staples Distribution & Retail) | 23 | 488 | |||||||||
| Nature's Sunshine Products, Inc.* (Personal Care Products) | 32 | 482 | |||||||||
| Nautilus Biotechnology, Inc.* (Life Sciences Tools & Services) | 122 | 285 | |||||||||
Navient Corp. (Consumer Finance) | 202 | 2,941 | |||||||||
| Navitas Semiconductor Corp.* (Semiconductors & Semiconductor Equipment) | 316 | 1,242 | |||||||||
Nb BanCorp, Inc.* (Banks) | 97 | 1,463 | |||||||||
NBT Bancorp, Inc. (Banks) | 115 | 4,439 | |||||||||
NCR Atleos Corp.* (Financial Services) | 181 | 4,891 | |||||||||
NCR Voyix Corp.* (Software) | 364 | 4,495 | |||||||||
Nektar Therapeutics* (Pharmaceuticals) | 447 | 554 | |||||||||
Nelnet, Inc.—Class A (Consumer Finance) | 36 | 3,631 | |||||||||
| Neogen Corp.* (Health Care Equipment & Supplies) | 546 | 8,534 | |||||||||
| NeoGenomics, Inc.* (Health Care Providers & Services) | 319 | 4,425 | |||||||||
| NerdWallet, Inc.*—Class A (Consumer Finance) | 97 | 1,416 | |||||||||
Nerdy, Inc.* (Diversified Consumer Services) | 182 | 304 | |||||||||
Net Lease Office Properties* (Office REITs) | 37 | 911 | |||||||||
Net Power, Inc.* (Electrical Equipment) | 53 | 521 | |||||||||
NETGEAR, Inc.* (Communications Equipment) | 71 | 1,086 | |||||||||
| NetScout Systems, Inc.* (Communications Equipment) | 173 | 3,164 | |||||||||
NETSTREIT Corp. (Retail REITs) | 185 | 2,979 | |||||||||
Neumora Therapeutics, Inc.* (Pharmaceuticals) | 211 | 2,074 | |||||||||
Neurogene, Inc.* (Biotechnology) | 26 | 946 | |||||||||
| NeuroPace, Inc.* (Health Care Equipment & Supplies) | 34 | 257 | |||||||||
| Nevro Corp.* (Health Care Equipment & Supplies) | 91 | 766 | |||||||||
New Jersey Resources Corp. (Gas Utilities) | 246 | 10,514 | |||||||||
New York Community Bancorp, Inc. (Banks) | 1,905 | 6,134 | |||||||||
| New York Mortgage Trust, Inc. (Mortgage REITs) | 227 | 1,326 | |||||||||
| Newmark Group, Inc.—Class A (Real Estate Management & Development) | 342 | 3,499 | |||||||||
See accompanying notes to the financial statements.
June 30, 2024 (unaudited) :: Schedule of Portfolio Investments :: ProFund VP Small-Cap :: 95
Common Stocks, continued
Shares | Value | ||||||||||
| Newpark Resources, Inc.* (Energy Equipment & Services) | 207 | $ | 1,720 | ||||||||
NewtekOne, Inc. (Financial Services) | 58 | 729 | |||||||||
| NexPoint Diversified Real Estate Trust* (Diversified REITs) | 80 | 442 | |||||||||
| Nexpoint Real Estate Finance, Inc. (Mortgage REITs) | 20 | 274 | |||||||||
| NexPoint Residential Trust, Inc. (Residential REITs) | 57 | 2,252 | |||||||||
| NextDecade Corp.* (Oil, Gas & Consumable Fuels) | 290 | 2,303 | |||||||||
| Nextdoor Holdings, Inc.* (Interactive Media & Services) | 437 | 1,215 | |||||||||
NextNav, Inc.* (Software) | 188 | 1,525 | |||||||||
| NEXTracker, Inc.*—Class A (Electrical Equipment) | 292 | 13,688 | |||||||||
NI Holdings, Inc.* (Insurance) | 20 | 306 | |||||||||
Nicolet Bankshares, Inc. (Banks) | 33 | 2,740 | |||||||||
Nikola Corp.* (Machinery) | 1 | 5 | |||||||||
Nkarta, Inc.* (Biotechnology) | 132 | 780 | |||||||||
| NL Industries, Inc. (Commercial Services & Supplies) | 21 | 127 | |||||||||
| nLight, Inc.* (Electronic Equipment, Instruments & Components) | 115 | 1,257 | |||||||||
NMI Holdings, Inc.* (Financial Services) | 199 | 6,774 | |||||||||
NN, Inc.* (Machinery) | 115 | 345 | |||||||||
| Noble Corp. PLC (Energy Equipment & Services) | 286 | 12,770 | |||||||||
| Nordic American Tankers, Ltd. (Oil, Gas & Consumable Fuels) | 510 | 2,030 | |||||||||
Northeast Bank (Banks) | 17 | 1,035 | |||||||||
Northeast Community Bancorp, Inc. (Banks) | 31 | 552 | |||||||||
| Northern Oil and Gas, Inc. (Oil, Gas & Consumable Fuels) | 248 | 9,218 | |||||||||
| Northern Technologies International Corp. (Chemicals) | 20 | 331 | |||||||||
Northfield Bancorp, Inc. (Banks) | 98 | 929 | |||||||||
Northrim Bancorp, Inc. (Banks) | 13 | 749 | |||||||||
Northwest Bancshares, Inc. (Banks) | 319 | 3,684 | |||||||||
Northwest Natural Holding Co. (Gas Utilities) | 95 | 3,430 | |||||||||
| Northwest Pipe Co.* (Construction & Engineering) | 24 | 815 | |||||||||
| Northwestern Energy Group, Inc. (Multi-Utilities) | 154 | 7,712 | |||||||||
Norwood Financial Corp. (Banks) | 19 | 482 | |||||||||
Novagold Resources, Inc.* (Metals & Mining) | 611 | 2,114 | |||||||||
| Novanta, Inc.* (Electronic Equipment, Instruments & Components) | 90 | 14,679 | |||||||||
Novavax, Inc.*(a) (Biotechnology) | 354 | 4,482 | |||||||||
| Novocure, Ltd.* (Health Care Equipment & Supplies) | 267 | 4,574 | |||||||||
| Nu Skin Enterprises, Inc.—Class A (Personal Care Products) | 124 | 1,307 | |||||||||
Nurix Therapeutics, Inc.* (Biotechnology) | 152 | 3,172 | |||||||||
NuScale Power Corp.*(a) (Electrical Equipment) | 194 | 2,268 | |||||||||
Nuvalent, Inc.*—Class A (Biotechnology) | 80 | 6,069 | |||||||||
Nuvation Bio, Inc.* (Pharmaceuticals) | 449 | 1,311 | |||||||||
NV5 Global, Inc.* (Professional Services) | 36 | 3,347 | |||||||||
| NVE Corp. (Semiconductors & Semiconductor Equipment) | 12 | 896 | |||||||||
Oak Valley Bancorp (Banks) | 17 | 424 | |||||||||
Common Stocks, continued
Shares | Value | ||||||||||
| Oceaneering International, Inc.* (Energy Equipment & Services) | 253 | $ | 5,986 | ||||||||
OceanFirst Financial Corp. (Banks) | 144 | 2,288 | |||||||||
Ocugen, Inc.* (Biotechnology) | 641 | 994 | |||||||||
Ocular Therapeutix, Inc.* (Pharmaceuticals) | 390 | 2,668 | |||||||||
| Offerpad Solutions, Inc.* (Real Estate Management & Development) | 26 | 115 | |||||||||
OFG Bancorp (Banks) | 116 | 4,344 | |||||||||
O-I Glass, Inc.* (Containers & Packaging) | 388 | 4,319 | |||||||||
| Oil States International, Inc.* (Energy Equipment & Services) | 154 | 684 | |||||||||
Oil-Dri Corp. of America (Household Products) | 12 | 769 | |||||||||
| Olaplex Holdings, Inc.* (Personal Care Products) | 347 | 534 | |||||||||
Old National Bancorp (Banks) | 788 | 13,545 | |||||||||
Old Second Bancorp, Inc. (Banks) | 109 | 1,614 | |||||||||
Olema Pharmaceuticals, Inc.* (Biotechnology) | 100 | 1,082 | |||||||||
Olo, Inc.*—Class A (Software) | 262 | 1,158 | |||||||||
Olympic Steel, Inc. (Metals & Mining) | 28 | 1,255 | |||||||||
Omega Flex, Inc. (Machinery) | 9 | 462 | |||||||||
Omeros Corp.* (Pharmaceuticals) | 140 | 568 | |||||||||
OmniAb, Inc.* (Life Sciences Tools & Services) | 231 | 866 | |||||||||
| Omnicell, Inc.* (Health Care Equipment & Supplies) | 114 | 3,086 | |||||||||
ON24, Inc.* (Software) | 69 | 415 | |||||||||
ONE Gas, Inc. (Gas Utilities) | 141 | 9,003 | |||||||||
One Liberty Properties, Inc. (Diversified REITs) | 40 | 939 | |||||||||
OneSpan, Inc.* (Software) | 95 | 1,218 | |||||||||
| OneSpaWorld Holdings, Ltd.* (Diversified Consumer Services) | 252 | 3,873 | |||||||||
OneWater Marine, Inc.* (Specialty Retail) | 30 | 827 | |||||||||
Onity Group, Inc.* (Financial Services) | 16 | 384 | |||||||||
| Ooma, Inc.* (Diversified Telecommunication Services) | 62 | 616 | |||||||||
Open Lending Corp.* (Capital Markets) | 256 | 1,428 | |||||||||
| Opendoor Technologies, Inc.* (Real Estate Management & Development) | 1,552 | 2,856 | |||||||||
| OPENLANE, Inc.* (Commercial Services & Supplies) | 269 | 4,463 | |||||||||
| OPKO Health, Inc.*(a) (Health Care Providers & Services) | 816 | 1,020 | |||||||||
OppFi, Inc. (Consumer Finance) | 45 | 153 | |||||||||
OptimizeRx Corp.* (Health Care Technology) | 44 | 440 | |||||||||
| Option Care Health, Inc.* (Health Care Providers & Services) | 437 | 12,105 | |||||||||
Orange County Bancorp, Inc. (Banks) | 13 | 687 | |||||||||
| OraSure Technologies, Inc.* (Health Care Equipment & Supplies) | 187 | 797 | |||||||||
| Orchestra BioMed Holdings, Inc.* (Health Care Equipment & Supplies) | 58 | 473 | |||||||||
Orchid Island Capital, Inc. (Mortgage REITs) | 133 | 1,109 | |||||||||
Organogenesis Holdings, Inc.* (Biotechnology) | 181 | 507 | |||||||||
ORIC Pharmaceuticals, Inc.* (Biotechnology) | 154 | 1,089 | |||||||||
Origin Bancorp, Inc. (Banks) | 74 | 2,347 | |||||||||
| Orion Group Holdings, Inc.* (Construction & Engineering) | 77 | 732 | |||||||||
Orion Office REIT, Inc. (Office REITs) | 141 | 506 | |||||||||
Orion SA (Chemicals) | 144 | 3,159 | |||||||||
| Ormat Technologies, Inc. (Independent Power and Renewable Electricity Producers) | 135 | 9,679 | |||||||||
Orrstown Financial Services, Inc. (Banks) | 46 | 1,259 | |||||||||
See accompanying notes to the financial statements.
96 :: ProFund VP Small-Cap :: Schedule of Portfolio Investments :: June 30, 2024 (unaudited)
Common Stocks, continued
Shares | Value | ||||||||||
| Orthofix Medical, Inc.* (Health Care Equipment & Supplies) | 84 | $ | 1,114 | ||||||||
| OrthoPediatrics Corp.* (Health Care Equipment & Supplies) | 41 | 1,179 | |||||||||
Oscar Health, Inc.*—Class A (Insurance) | 487 | 7,704 | |||||||||
| OSI Systems, Inc.* (Electronic Equipment, Instruments & Components) | 41 | 5,638 | |||||||||
Otter Tail Corp. (Electric Utilities) | 104 | 9,109 | |||||||||
| Ouster, Inc.* (Electronic Equipment, Instruments & Components) | 108 | 1,062 | |||||||||
Outbrain, Inc.* (Interactive Media & Services) | 97 | 483 | |||||||||
Outfront Media, Inc. (Specialized REITs) | 371 | 5,305 | |||||||||
Outlook Therapeutics, Inc.* (Biotechnology) | 20 | 148 | |||||||||
| Overseas Shipholding Group, Inc.—Class A (Oil, Gas & Consumable Fuels) | 122 | 1,035 | |||||||||
Ovid Therapeutics, Inc.* (Biotechnology) | 147 | 113 | |||||||||
| Owens & Minor, Inc.* (Health Care Providers & Services) | 189 | 2,552 | |||||||||
| Oxford Industries, Inc. (Textiles, Apparel & Luxury Goods) | 37 | 3,706 | |||||||||
P10, Inc.—Class A (Capital Markets) | 104 | 882 | |||||||||
| Pacific Biosciences of California, Inc.* (Life Sciences Tools & Services) | 685 | 938 | |||||||||
Pacific Premier Bancorp, Inc. (Banks) | 240 | 5,513 | |||||||||
Pacira BioSciences, Inc.* (Pharmaceuticals) | 115 | 3,290 | |||||||||
| Pacs Group, Inc.* (Health Care Providers & Services) | 62 | 1,829 | |||||||||
Pactiv Evergreen, Inc. (Containers & Packaging) | 101 | 1,143 | |||||||||
| Pagaya Technologies, Ltd.*—Class A (Software) | 101 | 1,289 | |||||||||
PagerDuty, Inc.* (Software) | 223 | 5,113 | |||||||||
| Pagseguro Digital, Ltd.*—Class A (Financial Services) | 472 | 5,518 | |||||||||
Palomar Holdings, Inc.* (Insurance) | 61 | 4,950 | |||||||||
| PAM Transportation Services, Inc.* (Ground Transportation) | 15 | 261 | |||||||||
| Pangaea Logistics Solutions, Ltd. (Marine Transportation) | 78 | 611 | |||||||||
| Papa John's International, Inc. (Hotels, Restaurants & Leisure) | 83 | 3,899 | |||||||||
| Par Pacific Holdings, Inc.* (Oil, Gas & Consumable Fuels) | 143 | 3,611 | |||||||||
| PAR Technology Corp.* (Electronic Equipment, Instruments & Components) | 84 | 3,956 | |||||||||
| Paragon 28, Inc.* (Health Care Equipment & Supplies) | 118 | 807 | |||||||||
Paramount Group, Inc. (Office REITs) | 462 | 2,139 | |||||||||
Park Aerospace Corp. (Aerospace & Defense) | 47 | 643 | |||||||||
Park National Corp. (Banks) | 36 | 5,124 | |||||||||
Parke Bancorp, Inc. (Banks) | 26 | 452 | |||||||||
Park-Ohio Holdings Corp. (Machinery) | 22 | 570 | |||||||||
Pathward Financial, Inc. (Banks) | 64 | 3,620 | |||||||||
| Patria Investments, Ltd.—Class A (Capital Markets) | 138 | 1,664 | |||||||||
| Patrick Industries, Inc. (Automobile Components) | 54 | 5,862 | |||||||||
| Patterson Cos., Inc. (Health Care Providers & Services) | 201 | 4,848 | |||||||||
| Patterson-UTI Energy, Inc. (Energy Equipment & Services) | 1,000 | 10,360 | |||||||||
Payoneer Global, Inc.* (Financial Services) | 709 | 3,928 | |||||||||
Common Stocks, continued
Shares | Value | ||||||||||
Paysafe, Ltd.* (Financial Services) | 81 | $ | 1,432 | ||||||||
Paysign, Inc.* (Financial Services) | 82 | 353 | |||||||||
| PBF Energy, Inc.—Class A (Oil, Gas & Consumable Fuels) | 260 | 11,965 | |||||||||
| PC Connection, Inc. (Electronic Equipment, Instruments & Components) | 29 | 1,862 | |||||||||
PCB Bancorp (Banks) | 27 | 440 | |||||||||
| PDF Solutions, Inc.* (Semiconductors & Semiconductor Equipment) | 78 | 2,838 | |||||||||
| Peabody Energy Corp. (Oil, Gas & Consumable Fuels) | 321 | 7,101 | |||||||||
Peakstone Realty Trust (Office REITs) | 91 | 965 | |||||||||
Peapack-Gladstone Financial Corp. (Banks) | 42 | 951 | |||||||||
Pebblebrook Hotel Trust (Hotel & Resort REITs) | 299 | 4,111 | |||||||||
| Pediatrix Medical Group, Inc.* (Health Care Providers & Services) | 211 | 1,593 | |||||||||
| Peloton Interactive, Inc.*—Class A (Leisure Products) | 847 | 2,863 | |||||||||
| PennyMac Financial Services, Inc. (Financial Services) | 67 | 6,338 | |||||||||
| PennyMac Mortgage Investment Trust (Mortgage REITs) | 218 | 2,998 | |||||||||
| Peoples Bancorp of North Carolina, Inc. (Banks) | 11 | 321 | |||||||||
Peoples Bancorp, Inc. (Banks) | 87 | 2,610 | |||||||||
Peoples Financial Services Corp. (Banks) | 23 | 1,047 | |||||||||
PepGen, Inc.* (Biotechnology) | 39 | 622 | |||||||||
| Perdoceo Education Corp. (Diversified Consumer Services) | 164 | 3,513 | |||||||||
Perella Weinberg Partners (Capital Markets) | 132 | 2,145 | |||||||||
Perficient, Inc.* (IT Services) | 87 | 6,506 | |||||||||
| Performant Financial Corp.* (Commercial Services & Supplies) | 177 | 513 | |||||||||
Perimeter Solutions SA* (Chemicals) | 335 | 2,623 | |||||||||
| Perma-Fix Environmental Services, Inc.* (Commercial Services & Supplies) | 31 | 314 | |||||||||
Perpetua Resources Corp.* (Metals & Mining) | 96 | 499 | |||||||||
Perspective Therapeutics, Inc.* (Biotechnology) | 118 | 1,176 | |||||||||
| Petco Health & Wellness Co., Inc.* (Specialty Retail) | 208 | 786 | |||||||||
PetIQ, Inc.* (Health Care Providers & Services) | 68 | 1,500 | |||||||||
| Phathom Pharmaceuticals, Inc.*(a) (Pharmaceuticals) | 85 | 876 | |||||||||
| Phibro Animal Health Corp.—Class A (Pharmaceuticals) | 51 | 855 | |||||||||
Phillips Edison & Co., Inc. (Retail REITs) | 307 | 10,041 | |||||||||
Phinia, Inc. (Automobile Components) | 114 | 4,487 | |||||||||
| Photronics, Inc.* (Semiconductors & Semiconductor Equipment) | 154 | 3,799 | |||||||||
Phreesia, Inc.* (Health Care Technology) | 128 | 2,714 | |||||||||
Piedmont Lithium, Inc.* (Metals & Mining) | 45 | 449 | |||||||||
| Piedmont Office Realty Trust, Inc.—Class A (Office REITs) | 309 | 2,240 | |||||||||
Pioneer Bancorp, Inc.* (Banks) | 29 | 290 | |||||||||
Piper Sandler Cos. (Capital Markets) | 43 | 9,897 | |||||||||
| Pitney Bowes, Inc. (Commercial Services & Supplies) | 402 | 2,042 | |||||||||
PJT Partners, Inc.—Class A (Capital Markets) | 59 | 6,367 | |||||||||
Planet Labs PBC* (Professional Services) | 422 | 785 | |||||||||
PlayAGS, Inc.* (Hotels, Restaurants & Leisure) | 98 | 1,127 | |||||||||
Playstudios, Inc.* (Entertainment) | 220 | 455 | |||||||||
See accompanying notes to the financial statements.
June 30, 2024 (unaudited) :: Schedule of Portfolio Investments :: ProFund VP Small-Cap :: 97
Common Stocks, continued
Shares | Value | ||||||||||
| Plexus Corp.* (Electronic Equipment, Instruments & Components) | 68 | $ | 7,016 | ||||||||
Pliant Therapeutics, Inc.* (Pharmaceuticals) | 143 | 1,537 | |||||||||
Plug Power, Inc.* (Electrical Equipment) | 1,580 | 3,681 | |||||||||
Plumas Bancorp (Banks) | 14 | 504 | |||||||||
Plymouth Industrial REIT, Inc. (Industrial REITs) | 100 | 2,138 | |||||||||
PNM Resources, Inc. (Electric Utilities) | 225 | 8,316 | |||||||||
Ponce Financial Group, Inc.* (Banks) | 48 | 439 | |||||||||
Porch Group, Inc.* (Software) | 193 | 291 | |||||||||
| Portillo's, Inc.*—Class A (Hotels, Restaurants & Leisure) | 135 | 1,312 | |||||||||
Portland General Electric Co. (Electric Utilities) | 255 | 11,025 | |||||||||
Poseida Therapeutics, Inc.* (Biotechnology) | 172 | 502 | |||||||||
Postal Realty Trust, Inc.—Class A (Office REITs) | 54 | 720 | |||||||||
Potbelly Corp.* (Hotels, Restaurants & Leisure) | 69 | 554 | |||||||||
PotlatchDeltic Corp. (Specialized REITs) | 199 | 7,839 | |||||||||
Powell Industries, Inc. (Electrical Equipment) | 23 | 3,298 | |||||||||
| Power Integrations, Inc. (Semiconductors & Semiconductor Equipment) | 142 | 9,967 | |||||||||
| Powerfleet, Inc.* (Electronic Equipment, Instruments & Components) | 227 | 1,037 | |||||||||
PowerSchool Holdings, Inc.* (Software) | 149 | 3,336 | |||||||||
PRA Group, Inc.* (Consumer Finance) | 97 | 1,907 | |||||||||
Prairie Operating Co.* (Software) | 10 | 109 | |||||||||
| Praxis Precision Medicines, Inc.* (Biotechnology) | 43 | 1,778 | |||||||||
Precigen, Inc.* (Biotechnology) | 317 | 501 | |||||||||
Preferred Bank (Banks) | 31 | 2,340 | |||||||||
| Preformed Line Products Co. (Electrical Equipment) | 6 | 747 | |||||||||
Prelude Therapeutics, Inc.* (Biotechnology) | 33 | 126 | |||||||||
Premier Financial Corp. (Banks) | 89 | 1,821 | |||||||||
| Prestige Consumer Healthcare, Inc.* (Pharmaceuticals) | 124 | 8,536 | |||||||||
| PriceSmart, Inc. (Consumer Staples Distribution & Retail) | 63 | 5,116 | |||||||||
Prime Medicine, Inc.* (Biotechnology) | 142 | 730 | |||||||||
| PrimeEnergy Resources Corp.* (Oil, Gas & Consumable Fuels) | 2 | 213 | |||||||||
Primis Financial Corp. (Banks) | 51 | 534 | |||||||||
Primo Water Corp. (Beverages) | 395 | 8,635 | |||||||||
| Primoris Services Corp. (Construction & Engineering) | 134 | 6,685 | |||||||||
Princeton Bancorp, Inc. (Banks) | 13 | 430 | |||||||||
| Priority Technology Holdings, Inc.* (Financial Services) | 45 | 238 | |||||||||
| Privia Health Group, Inc.* (Health Care Providers & Services) | 255 | 4,432 | |||||||||
ProAssurance Corp.* (Insurance) | 135 | 1,650 | |||||||||
| PROCEPT BioRobotics Corp.* (Health Care Equipment & Supplies) | 106 | 6,476 | |||||||||
| ProFrac Holding Corp.*—Class A (Energy Equipment & Services) | 56 | 415 | |||||||||
PROG Holdings, Inc. (Consumer Finance) | 106 | 3,676 | |||||||||
Progress Software Corp. (Software) | 108 | 5,860 | |||||||||
| Progyny, Inc.* (Health Care Providers & Services) | 211 | 6,037 | |||||||||
ProKidney Corp.* (Biotechnology) | 158 | 389 | |||||||||
| ProPetro Holding Corp.* (Energy Equipment & Services) | 227 | 1,968 | |||||||||
PROS Holdings, Inc.* (Software) | 115 | 3,295 | |||||||||
Common Stocks, continued
Shares | Value | ||||||||||
Protagonist Therapeutics, Inc.* (Biotechnology) | 146 | $ | 5,059 | ||||||||
Prothena Corp. PLC* (Biotechnology) | 106 | 2,188 | |||||||||
Proto Labs, Inc.* (Machinery) | 64 | 1,977 | |||||||||
Provident Bancorp, Inc.* (Banks) | 39 | 397 | |||||||||
Provident Financial Services, Inc. (Banks) | 315 | 4,520 | |||||||||
PTC Therapeutics, Inc.* (Biotechnology) | 191 | 5,841 | |||||||||
PubMatic, Inc.*—Class A (Media) | 105 | 2,133 | |||||||||
| Pulmonx Corp.* (Health Care Equipment & Supplies) | 95 | 602 | |||||||||
| Pulse Biosciences, Inc.*(a) (Health Care Equipment & Supplies) | 46 | 515 | |||||||||
Puma Biotechnology, Inc.* (Biotechnology) | 104 | 339 | |||||||||
Pure Cycle Corp.* (Water Utilities) | 52 | 497 | |||||||||
PureCycle Technologies, Inc.* (Chemicals) | 309 | 1,829 | |||||||||
Purple Innovation, Inc.* (Household Durables) | 142 | 148 | |||||||||
Pyxis Oncology, Inc.* (Biotechnology) | 122 | 404 | |||||||||
Q2 Holdings, Inc.* (Software) | 147 | 8,869 | |||||||||
Q32 Bio, Inc.* (Biotechnology) | 15 | 269 | |||||||||
QCR Holdings, Inc. (Banks) | 41 | 2,460 | |||||||||
| Quad/Graphics, Inc. (Commercial Services & Supplies) | 75 | 409 | |||||||||
Quaker Chemical Corp. (Chemicals) | 35 | 5,940 | |||||||||
Qualys, Inc.* (Software) | 93 | 13,262 | |||||||||
| Quanex Building Products Corp. (Building Products) | 83 | 2,295 | |||||||||
| Quanterix Corp.* (Life Sciences Tools & Services) | 90 | 1,189 | |||||||||
| Quantum-Si, Inc.* (Life Sciences Tools & Services) | 251 | 264 | |||||||||
| Quest Resource Holding Corp.* (Commercial Services & Supplies) | 43 | 378 | |||||||||
| Quicklogic Corp.* (Semiconductors & Semiconductor Equipment) | 35 | 364 | |||||||||
QuinStreet, Inc.* (Interactive Media & Services) | 132 | 2,190 | |||||||||
| Quipt Home Medical Corp.* (Health Care Providers & Services) | 102 | 328 | |||||||||
Qurate Retail, Inc.*—Class B (Broadline Retail) | 2 | 8 | |||||||||
Rackspace Technology, Inc.* (IT Services) | 167 | 498 | |||||||||
Radian Group, Inc. (Financial Services) | 379 | 11,787 | |||||||||
Radiant Logistics, Inc.* (Air Freight & Logistics) | 89 | 506 | |||||||||
Radius Recycling, Inc. (Metals & Mining) | 66 | 1,008 | |||||||||
| RadNet, Inc.* (Health Care Providers & Services) | 166 | 9,781 | |||||||||
| Ramaco Resources, Inc.—Class A (Metals & Mining) | 66 | 822 | |||||||||
| Ramaco Resources, Inc.—Class B (Metals & Mining) | 12 | 130 | |||||||||
| Rambus, Inc.* (Semiconductors & Semiconductor Equipment) | 273 | 16,040 | |||||||||
| Ranger Energy Services, Inc. (Energy Equipment & Services) | 42 | 442 | |||||||||
| Ranpak Holdings Corp.* (Containers & Packaging) | 108 | 694 | |||||||||
Rapid7, Inc.* (Software) | 155 | 6,701 | |||||||||
RAPT Therapeutics, Inc.* (Biotechnology) | 75 | 229 | |||||||||
| Rayonier Advanced Materials, Inc.* (Chemicals) | 160 | 870 | |||||||||
RBB Bancorp (Banks) | 43 | 809 | |||||||||
| RCI Hospitality Holdings, Inc. (Hotels, Restaurants & Leisure) | 22 | 958 | |||||||||
See accompanying notes to the financial statements.
98 :: ProFund VP Small-Cap :: Schedule of Portfolio Investments :: June 30, 2024 (unaudited)
Common Stocks, continued
Shares | Value | ||||||||||
| RE/MAX Holdings, Inc. (Real Estate Management & Development) | 45 | $ | 365 | ||||||||
Ready Capital Corp. (Mortgage REITs) | 405 | 3,313 | |||||||||
| Recursion Pharmaceuticals, Inc.*(a)—Class A (Biotechnology) | 518 | 3,885 | |||||||||
Red River Bancshares, Inc. (Banks) | 12 | 576 | |||||||||
| Red Rock Resorts, Inc.—Class A (Hotels, Restaurants & Leisure) | 123 | 6,756 | |||||||||
Red Violet, Inc.* (Software) | 28 | 711 | |||||||||
| Redfin Corp.* (Real Estate Management & Development) | 294 | 1,767 | |||||||||
Redwire Corp.* (Aerospace & Defense) | 56 | 402 | |||||||||
Redwood Trust, Inc. (Mortgage REITs) | 330 | 2,142 | |||||||||
REGENXBIO, Inc.* (Biotechnology) | 115 | 1,346 | |||||||||
| Regional Management Corp. (Consumer Finance) | 20 | 575 | |||||||||
Regulus Therapeutics, Inc.* (Biotechnology) | 158 | 282 | |||||||||
Rekor Systems, Inc.* (Software) | 178 | 276 | |||||||||
Relay Therapeutics, Inc.* (Biotechnology) | 249 | 1,623 | |||||||||
Remitly Global, Inc.* (Financial Services) | 363 | 4,400 | |||||||||
Renasant Corp. (Banks) | 139 | 4,245 | |||||||||
Renovaro, Inc.* (Biotechnology) | 122 | 214 | |||||||||
Repay Holdings Corp.* (Financial Services) | 227 | 2,397 | |||||||||
Replimune Group, Inc.* (Biotechnology) | 126 | 1,134 | |||||||||
ReposiTrak, Inc. (Software) | 29 | 443 | |||||||||
Republic Bancorp, Inc.—Class A (Banks) | 21 | 1,126 | |||||||||
Reservoir Media, Inc.* (Entertainment) | 49 | 387 | |||||||||
| Resideo Technologies, Inc.* (Building Products) | 366 | 7,159 | |||||||||
| Resources Connection, Inc. (Professional Services) | 81 | 894 | |||||||||
| Retail Opportunity Investments Corp. (Retail REITs) | 310 | 3,853 | |||||||||
REV Group, Inc. (Machinery) | 129 | 3,211 | |||||||||
Revance Therapeutics, Inc.* (Pharmaceuticals) | 261 | 671 | |||||||||
REVOLUTION Medicines, Inc.* (Biotechnology) | 382 | 14,825 | |||||||||
Revolve Group, Inc.* (Specialty Retail) | 96 | 1,527 | |||||||||
| REX American Resources Corp.* (Oil, Gas & Consumable Fuels) | 39 | 1,778 | |||||||||
RGC Resources, Inc. (Gas Utilities) | 21 | 429 | |||||||||
Rhythm Pharmaceuticals, Inc.* (Biotechnology) | 137 | 5,625 | |||||||||
| Ribbon Communications, Inc.* (Communications Equipment) | 227 | 747 | |||||||||
| Richardson Electronics, Ltd. (Electronic Equipment, Instruments & Components) | 31 | 369 | |||||||||
Rigel Pharmaceuticals, Inc.* (Biotechnology) | 45 | 369 | |||||||||
| Rigetti Computing, Inc.* (Semiconductors & Semiconductor Equipment) | 354 | 379 | |||||||||
| Riley Exploration Permian, Inc. (Oil, Gas & Consumable Fuels) | 28 | 793 | |||||||||
Rimini Street, Inc.* (Software) | 133 | 408 | |||||||||
| Ring Energy, Inc.* (Oil, Gas & Consumable Fuels) | 371 | 627 | |||||||||
Riot Platforms, Inc.* (Software) | 680 | 6,215 | |||||||||
RLJ Lodging Trust (Hotel & Resort REITs) | 382 | 3,679 | |||||||||
Roadzen, Inc.* (Software) | 38 | 84 | |||||||||
Rocket Lab USA, Inc.* (Aerospace & Defense) | 871 | 4,181 | |||||||||
Rocket Pharmaceuticals, Inc.* (Biotechnology) | 165 | 3,552 | |||||||||
| Rocky Brands, Inc. (Textiles, Apparel & Luxury Goods) | 18 | 665 | |||||||||
Common Stocks, continued
Shares | Value | ||||||||||
| Rogers Corp.* (Electronic Equipment, Instruments & Components) | 47 | $ | 5,669 | ||||||||
Root, Inc.*—Class A (Insurance) | 22 | 1,135 | |||||||||
RPC, Inc. (Energy Equipment & Services) | 213 | 1,331 | |||||||||
RumbleON, Inc.*—Class B (Specialty Retail) | 40 | 164 | |||||||||
| Rush Enterprises, Inc.—Class A (Trading Companies & Distributors) | 152 | 6,364 | |||||||||
| Rush Enterprises, Inc.—Class B (Trading Companies & Distributors) | 22 | 863 | |||||||||
| Rush Street Interactive, Inc.* (Hotels, Restaurants & Leisure) | 190 | 1,822 | |||||||||
RXO, Inc.* (Ground Transportation) | 292 | 7,635 | |||||||||
| RxSight, Inc.* (Health Care Equipment & Supplies) | 85 | 5,114 | |||||||||
Ryerson Holding Corp. (Metals & Mining) | 73 | 1,424 | |||||||||
| Ryman Hospitality Properties, Inc. (Hotel & Resort REITs) | 147 | 14,680 | |||||||||
S&T Bancorp, Inc. (Banks) | 95 | 3,172 | |||||||||
| Sable Offshore Corp.* (Oil, Gas & Consumable Fuels) | 126 | 1,899 | |||||||||
| Sabra Health Care REIT, Inc. (Health Care REITs) | 580 | 8,933 | |||||||||
Sabre Corp.* (Hotels, Restaurants & Leisure) | 942 | 2,515 | |||||||||
Safe Bulkers, Inc. (Marine Transportation) | 158 | 920 | |||||||||
Safehold, Inc. (Specialized REITs) | 130 | 2,508 | |||||||||
Safety Insurance Group, Inc. (Insurance) | 37 | 2,776 | |||||||||
Sage Therapeutics, Inc.* (Biotechnology) | 135 | 1,466 | |||||||||
Sally Beauty Holdings, Inc.* (Specialty Retail) | 261 | 2,801 | |||||||||
Sana Biotechnology, Inc.* (Biotechnology) | 331 | 1,807 | |||||||||
| Sanara Medtech, Inc.* (Health Care Equipment & Supplies) | 10 | 282 | |||||||||
| SandRidge Energy, Inc. (Oil, Gas & Consumable Fuels) | 81 | 1,047 | |||||||||
Sandy Spring Bancorp, Inc. (Banks) | 110 | 2,680 | |||||||||
| Sanmina Corp.* (Electronic Equipment, Instruments & Components) | 137 | 9,076 | |||||||||
Sapiens International Corp. N.V. (Software) | 77 | 2,613 | |||||||||
Saul Centers, Inc. (Retail REITs) | 26 | 956 | |||||||||
Savara, Inc.* (Biotechnology) | 243 | 979 | |||||||||
Savers Value Village, Inc.* (Broadline Retail) | 59 | 722 | |||||||||
| ScanSource, Inc.* (Electronic Equipment, Instruments & Components) | 63 | 2,792 | |||||||||
Scholar Rock Holding Corp.* (Biotechnology) | 172 | 1,433 | |||||||||
Scholastic Corp. (Media) | 59 | 2,093 | |||||||||
Schrodinger, Inc.* (Health Care Technology) | 139 | 2,688 | |||||||||
Scilex Holding Co.* (Pharmaceuticals) | 198 | 382 | |||||||||
| Scorpio Tankers, Inc. (Oil, Gas & Consumable Fuels) | 117 | 9,511 | |||||||||
scPharmaceuticals, Inc.* (Pharmaceuticals) | 71 | 309 | |||||||||
Seacoast Banking Corp. of Florida (Banks) | 212 | 5,012 | |||||||||
| SEACOR Marine Holdings, Inc.* (Energy Equipment & Services) | 61 | 823 | |||||||||
Seadrill, Ltd.* (Energy Equipment & Services) | 186 | 9,579 | |||||||||
| Select Medical Holdings Corp. (Health Care Providers & Services) | 268 | 9,396 | |||||||||
| Select Water Solutions, Inc. (Energy Equipment & Services) | 228 | 2,440 | |||||||||
Selective Insurance Group, Inc. (Insurance) | 152 | 14,261 | |||||||||
Selectquote, Inc.* (Insurance) | 335 | 925 | |||||||||
| Semler Scientific, Inc.* (Health Care Equipment & Supplies) | 12 | 413 | |||||||||
See accompanying notes to the financial statements.
June 30, 2024 (unaudited) :: Schedule of Portfolio Investments :: ProFund VP Small-Cap :: 99
Common Stocks, continued
Shares | Value | ||||||||||
SEMrush Holdings, Inc.*—Class A (Software) | 91 | $ | 1,218 | ||||||||
| Semtech Corp.* (Semiconductors & Semiconductor Equipment) | 162 | 4,841 | |||||||||
| Seneca Foods Corp.*—Class A (Food Products) | 12 | 689 | |||||||||
Sensient Technologies Corp. (Chemicals) | 106 | 7,864 | |||||||||
| Sera Prognostics, Inc.*—Class A (Biotechnology) | 69 | 408 | |||||||||
Service Properties Trust (Hotel & Resort REITs) | 413 | 2,123 | |||||||||
ServisFirst Bancshares, Inc. (Banks) | 127 | 8,025 | |||||||||
SES AI Corp.* (Electrical Equipment) | 326 | 408 | |||||||||
Seven Hills Realty Trust (Mortgage REITs) | 32 | 406 | |||||||||
Sezzle, Inc.* (Financial Services) | 6 | 529 | |||||||||
SFL Corp., Ltd. (Oil, Gas & Consumable Fuels) | 282 | 3,914 | |||||||||
| Shake Shack, Inc.*—Class A (Hotels, Restaurants & Leisure) | 95 | 8,550 | |||||||||
Shattuck Labs, Inc.* (Biotechnology) | 98 | 378 | |||||||||
| Shenandoah Telecommunications Co. (Diversified Telecommunication Services) | 122 | 1,992 | |||||||||
| Shoals Technologies Group, Inc.*—Class A (Electrical Equipment) | 430 | 2,683 | |||||||||
Shoe Carnival, Inc. (Specialty Retail) | 45 | 1,660 | |||||||||
Shore Bancshares, Inc. (Banks) | 77 | 882 | |||||||||
| Shutterstock, Inc. (Interactive Media & Services) | 63 | 2,438 | |||||||||
| SI-BONE, Inc.* (Health Care Equipment & Supplies) | 102 | 1,319 | |||||||||
Sierra Bancorp (Banks) | 33 | 739 | |||||||||
SIGA Technologies, Inc. (Pharmaceuticals) | 116 | 880 | |||||||||
| Sight Sciences, Inc.* (Health Care Equipment & Supplies) | 88 | 587 | |||||||||
Signet Jewelers, Ltd. (Specialty Retail) | 107 | 9,585 | |||||||||
| Silicon Laboratories, Inc.* (Semiconductors & Semiconductor Equipment) | 79 | 8,740 | |||||||||
| Silk Road Medical, Inc.* (Health Care Equipment & Supplies) | 98 | 2,650 | |||||||||
| SilverBow Resources, Inc.* (Oil, Gas & Consumable Fuels) | 54 | 2,043 | |||||||||
| Silvercrest Asset Management Group, Inc.—Class A (Capital Markets) | 24 | 374 | |||||||||
Simmons First National Corp.—Class A (Banks) | 311 | 5,467 | |||||||||
| Simulations Plus, Inc. (Health Care Technology) | 40 | 1,945 | |||||||||
Sinclair, Inc. (Media) | 80 | 1,066 | |||||||||
SiriusPoint, Ltd.* (Insurance) | 247 | 3,013 | |||||||||
SITE Centers Corp. (Retail REITs) | 476 | 6,902 | |||||||||
| SiTime Corp.* (Semiconductors & Semiconductor Equipment) | 46 | 5,721 | |||||||||
| Sitio Royalties Corp.—Class A (Oil, Gas & Consumable Fuels) | 207 | 4,887 | |||||||||
| Six Flags Entertainment Corp. (Hotels, Restaurants & Leisure) | 183 | 6,065 | |||||||||
SJW Group (Water Utilities) | 81 | 4,392 | |||||||||
| Sky Harbour Group Corp.* (Transportation Infrastructure) | 28 | 259 | |||||||||
Skye Bioscience, Inc.* (Biotechnology) | 43 | 344 | |||||||||
| Skyline Champion Corp.* (Household Durables) | 134 | 9,079 | |||||||||
| Skyward Specialty Insurance Group, Inc.* (Insurance) | 93 | 3,365 | |||||||||
Common Stocks, continued
Shares | Value | ||||||||||
| SkyWater Technology, Inc.* (Semiconductors & Semiconductor Equipment) | 68 | $ | 520 | ||||||||
SkyWest, Inc.* (Passenger Airlines) | 99 | 8,125 | |||||||||
SL Green Realty Corp. (Office REITs) | 166 | 9,403 | |||||||||
Sleep Number Corp.* (Specialty Retail) | 54 | 517 | |||||||||
SM Energy Co. (Oil, Gas & Consumable Fuels) | 287 | 12,406 | |||||||||
| SMART Global Holdings, Inc.* (Semiconductors & Semiconductor Equipment) | 129 | 2,950 | |||||||||
SmartFinancial, Inc. (Banks) | 40 | 947 | |||||||||
| SmartRent, Inc.* (Electronic Equipment, Instruments & Components) | 484 | 1,157 | |||||||||
| Smith & Wesson Brands, Inc. (Leisure Products) | 114 | 1,635 | |||||||||
Smith-Midland Corp.* (Construction Materials) | 11 | 305 | |||||||||
| Solaris Oilfield Infrastructure, Inc.—Class A (Energy Equipment & Services) | 63 | 541 | |||||||||
| Solarmax Technology, Inc.* (Electrical Equipment) | 13 | 43 | |||||||||
SolarWinds Corp. (Software) | 136 | 1,639 | |||||||||
Soleno Therapeutics, Inc.* (Biotechnology) | 55 | 2,244 | |||||||||
Solid Biosciences, Inc.* (Biotechnology) | 56 | 318 | |||||||||
Solid Power, Inc.* (Automobile Components) | 390 | 644 | |||||||||
| Solidion Technology, Inc.* (Electrical Equipment) | 22 | 12 | |||||||||
Solo Brands, Inc.*—Class A (Leisure Products) | 41 | 93 | |||||||||
| Sonic Automotive, Inc.—Class A (Specialty Retail) | 36 | 1,961 | |||||||||
| Sonida Senior Living, Inc.* (Health Care Providers & Services) | 9 | 248 | |||||||||
Sonos, Inc.* (Household Durables) | 309 | 4,561 | |||||||||
SoundHound AI, Inc.*—Class A (Software) | 711 | 2,808 | |||||||||
SoundThinking, Inc.* (Software) | 25 | 305 | |||||||||
South Plains Financial, Inc. (Banks) | 29 | 783 | |||||||||
Southern California BanCorp* (Banks) | 30 | 404 | |||||||||
Southern First Bancshares, Inc.* (Banks) | 19 | 556 | |||||||||
Southern Missouri Bancorp, Inc. (Banks) | 24 | 1,080 | |||||||||
Southern States Bancshares, Inc. (Banks) | 21 | 570 | |||||||||
| Southland Holdings, Inc.* (Construction & Engineering) | 25 | 115 | |||||||||
Southside Bancshares, Inc. (Banks) | 72 | 1,988 | |||||||||
SouthState Corp. (Banks) | 190 | 14,519 | |||||||||
Southwest Gas Holdings, Inc. (Gas Utilities) | 153 | 10,768 | |||||||||
| SpartanNash Co. (Consumer Staples Distribution & Retail) | 86 | 1,613 | |||||||||
Sphere Entertainment Co.* (Entertainment) | 67 | 2,349 | |||||||||
Spire Global, Inc.* (Professional Services) | 56 | 607 | |||||||||
Spire, Inc. (Gas Utilities) | 135 | 8,199 | |||||||||
Spirit Airlines, Inc.(a) (Passenger Airlines) | 275 | 1,007 | |||||||||
| Spok Holdings, Inc. (Wireless Telecommunication Services) | 46 | 681 | |||||||||
| SpringWorks Therapeutics, Inc.* (Biotechnology) | 172 | 6,479 | |||||||||
Sprinklr, Inc.*—Class A (Software) | 257 | 2,472 | |||||||||
Sprout Social, Inc.*—Class A (Software) | 124 | 4,424 | |||||||||
| Sprouts Farmers Market, Inc.* (Consumer Staples Distribution & Retail) | 252 | 21,081 | |||||||||
SPS Commerce, Inc.* (Software) | 93 | 17,500 | |||||||||
SPX Technologies, Inc.* (Machinery) | 113 | 16,061 | |||||||||
Spyre Therapeutics, Inc.* (Biotechnology) | 87 | 2,045 | |||||||||
See accompanying notes to the financial statements.
100 :: ProFund VP Small-Cap :: Schedule of Portfolio Investments :: June 30, 2024 (unaudited)
Common Stocks, continued
Shares | Value | ||||||||||
Squarespace, Inc.*—Class A (IT Services) | 152 | $ | 6,631 | ||||||||
SSR Mining, Inc. (Metals & Mining) | 508 | 2,291 | |||||||||
| STAAR Surgical Co.* (Health Care Equipment & Supplies) | 124 | 5,904 | |||||||||
Stagwell, Inc.* (Media) | 227 | 1,548 | |||||||||
| Standard BioTools, Inc.* (Life Sciences Tools & Services) | 755 | 1,336 | |||||||||
| Standard Motor Products, Inc. (Automobile Components) | 54 | 1,497 | |||||||||
Standex International Corp. (Machinery) | 29 | 4,673 | |||||||||
Star Holdings* (Diversified REITs) | 32 | 386 | |||||||||
| Steelcase, Inc.—Class A (Commercial Services & Supplies) | 232 | 3,007 | |||||||||
Stellar Bancorp, Inc. (Banks) | 123 | 2,824 | |||||||||
Stem, Inc.*(a) (Electrical Equipment) | 380 | 422 | |||||||||
Stepan Co. (Chemicals) | 53 | 4,450 | |||||||||
| StepStone Group, Inc.—Class A (Capital Markets) | 134 | 6,149 | |||||||||
| Stereotaxis, Inc.* (Health Care Equipment & Supplies) | 137 | 249 | |||||||||
Sterling Bancorp, Inc.* (Banks) | 53 | 277 | |||||||||
Sterling Check Corp.* (Professional Services) | 83 | 1,228 | |||||||||
| Sterling Infrastructure, Inc.* (Construction & Engineering) | 76 | 8,994 | |||||||||
| Steven Madden, Ltd. (Textiles, Apparel & Luxury Goods) | 182 | 7,699 | |||||||||
Stewart Information Services Corp. (Insurance) | 68 | 4,221 | |||||||||
Stitch Fix, Inc.*—Class A (Specialty Retail) | 225 | 934 | |||||||||
Stock Yards Bancorp, Inc. (Banks) | 64 | 3,179 | |||||||||
Stoke Therapeutics, Inc.* (Biotechnology) | 89 | 1,202 | |||||||||
StoneCo, Ltd.*—Class A (Financial Services) | 717 | 8,597 | |||||||||
Stoneridge, Inc.* (Automobile Components) | 68 | 1,085 | |||||||||
StoneX Group, Inc.* (Capital Markets) | 69 | 5,196 | |||||||||
| Strategic Education, Inc. (Diversified Consumer Services) | 56 | 6,197 | |||||||||
| Stratus Properties, Inc.* (Real Estate Management & Development) | 14 | 353 | |||||||||
| Strawberry Fields REIT, Inc. (Health Care REITs) | 15 | 171 | |||||||||
Stride, Inc.* (Diversified Consumer Services) | 107 | 7,543 | |||||||||
Sturm Ruger & Co., Inc. (Leisure Products) | 42 | 1,749 | |||||||||
| Summit Hotel Properties, Inc. (Hotel & Resort REITs) | 263 | 1,575 | |||||||||
| Summit Materials, Inc.*—Class A (Construction Materials) | 303 | 11,092 | |||||||||
Summit Therapeutics, Inc.*(a) (Biotechnology) | 219 | 1,708 | |||||||||
| Sun Country Airlines Holdings, Inc.* (Passenger Airlines) | 99 | 1,243 | |||||||||
SunCoke Energy, Inc. (Metals & Mining) | 210 | 2,058 | |||||||||
| Sunnova Energy International, Inc.* (Independent Power and Renewable Electricity Producers) | 272 | 1,518 | |||||||||
SunOpta, Inc.* (Food Products) | 230 | 1,242 | |||||||||
SunPower Corp.*(a) (Electrical Equipment) | 220 | 651 | |||||||||
Sunrun, Inc.* (Electrical Equipment) | 547 | 6,487 | |||||||||
| Sunstone Hotel Investors, Inc. (Hotel & Resort REITs) | 509 | 5,324 | |||||||||
| Super Group SGHC, Ltd.* (Hotels, Restaurants & Leisure) | 375 | 1,211 | |||||||||
| Superior Group of Cos., Inc. (Textiles, Apparel & Luxury Goods) | 33 | 624 | |||||||||
Common Stocks, continued
Shares | Value | ||||||||||
| Supernus Pharmaceuticals, Inc.* (Pharmaceuticals) | 126 | $ | 3,371 | ||||||||
| Surgery Partners, Inc.* (Health Care Providers & Services) | 192 | 4,568 | |||||||||
| Surmodics, Inc.* (Health Care Equipment & Supplies) | 35 | 1,471 | |||||||||
Sutro Biopharma, Inc.* (Biotechnology) | 205 | 601 | |||||||||
| Sweetgreen, Inc.*—Class A (Hotels, Restaurants & Leisure) | 247 | 7,445 | |||||||||
SWK Holdings Corp.* (Financial Services) | 8 | 136 | |||||||||
Sylvamo Corp. (Paper & Forest Products) | 88 | 6,037 | |||||||||
| Synaptics, Inc.* (Semiconductors & Semiconductor Equipment) | 98 | 8,644 | |||||||||
Syndax Pharmaceuticals, Inc.* (Biotechnology) | 206 | 4,229 | |||||||||
System1, Inc.* (Interactive Media & Services) | 59 | 90 | |||||||||
| Tactile Systems Technology, Inc.* (Health Care Equipment & Supplies) | 59 | 704 | |||||||||
| Talkspace, Inc.* (Health Care Providers & Services) | 308 | 708 | |||||||||
| Talos Energy, Inc.* (Oil, Gas & Consumable Fuels) | 371 | 4,508 | |||||||||
| Tandem Diabetes Care, Inc.* (Health Care Equipment & Supplies) | 162 | 6,527 | |||||||||
Tanger, Inc. (Retail REITs) | 267 | 7,238 | |||||||||
Tango Therapeutics, Inc.* (Biotechnology) | 119 | 1,021 | |||||||||
| Target Hospitality Corp.* (Hotels, Restaurants & Leisure) | 83 | 723 | |||||||||
| Tarsus Pharmaceuticals, Inc.* (Pharmaceuticals) | 92 | 2,501 | |||||||||
Taylor Devices, Inc.* (Machinery) | 6 | 270 | |||||||||
| Taylor Morrison Home Corp.* (Household Durables) | 260 | 14,414 | |||||||||
Taysha Gene Therapies, Inc.* (Biotechnology) | 401 | 898 | |||||||||
TechTarget, Inc.* (Media) | 65 | 2,026 | |||||||||
Tecnoglass, Inc. (Building Products) | 56 | 2,810 | |||||||||
Teekay Corp.* (Oil, Gas & Consumable Fuels) | 143 | 1,283 | |||||||||
| Teekay Tankers, Ltd.—Class A (Oil, Gas & Consumable Fuels) | 60 | 4,129 | |||||||||
TEGNA, Inc. (Media) | 441 | 6,148 | |||||||||
| Tejon Ranch Co.* (Real Estate Management & Development) | 52 | 887 | |||||||||
Teladoc Health, Inc.* (Health Care Technology) | 426 | 4,166 | |||||||||
| Telephone and Data Systems, Inc. (Wireless Telecommunication Services) | 247 | 5,121 | |||||||||
| Telomir Pharmaceuticals, Inc.* (Pharmaceuticals) | 12 | 58 | |||||||||
Telos Corp.* (Software) | 141 | 567 | |||||||||
Tenable Holdings, Inc.* (Software) | 295 | 12,856 | |||||||||
Tenaya Therapeutics, Inc.* (Biotechnology) | 138 | 428 | |||||||||
Tennant Co. (Machinery) | 47 | 4,627 | |||||||||
Terawulf, Inc.* (Software) | 576 | 2,563 | |||||||||
Terex Corp. (Machinery) | 167 | 9,158 | |||||||||
Terns Pharmaceuticals, Inc.* (Pharmaceuticals) | 144 | 981 | |||||||||
Terran Orbital Corp.* (Aerospace & Defense) | 386 | 317 | |||||||||
Terreno Realty Corp. (Industrial REITs) | 239 | 14,144 | |||||||||
| TETRA Technologies, Inc.* (Energy Equipment & Services) | 314 | 1,086 | |||||||||
Tevogen Bio Holdings, Inc.* (Biotechnology) | 55 | 40 | |||||||||
Texas Capital Bancshares, Inc.* (Banks) | 116 | 7,092 | |||||||||
TG Therapeutics, Inc.* (Biotechnology) | 350 | 6,227 | |||||||||
The Aaron's Co., Inc. (Specialty Retail) | 78 | 778 | |||||||||
See accompanying notes to the financial statements.
June 30, 2024 (unaudited) :: Schedule of Portfolio Investments :: ProFund VP Small-Cap :: 101
Common Stocks, continued
Shares | Value | ||||||||||
| The Andersons, Inc. (Consumer Staples Distribution & Retail) | 82 | $ | 4,067 | ||||||||
| The Baldwin Insurance Group, Inc.* (Insurance) | 165 | 5,853 | |||||||||
The Bancorp, Inc.* (Banks) | 125 | 4,720 | |||||||||
The Bank of NT Butterfield & Son, Ltd. (Banks) | 116 | 4,074 | |||||||||
| The Beauty Health Co.* (Personal Care Products) | 186 | 357 | |||||||||
| The Brink's Co. (Commercial Services & Supplies) | 113 | 11,571 | |||||||||
The Buckle, Inc. (Specialty Retail) | 77 | 2,844 | |||||||||
| The Cheesecake Factory, Inc. (Hotels, Restaurants & Leisure) | 121 | 4,754 | |||||||||
| The Chefs' Warehouse, Inc.* (Consumer Staples Distribution & Retail) | 88 | 3,442 | |||||||||
The Duckhorn Portfolio, Inc.* (Beverages) | 133 | 944 | |||||||||
The E.W. Scripps Co.*—Class A (Media) | 152 | 477 | |||||||||
The Eastern Co. (Machinery) | 13 | 331 | |||||||||
| The Ensign Group, Inc. (Health Care Providers & Services) | 139 | 17,192 | |||||||||
The First Bancorp, Inc. (Banks) | 27 | 671 | |||||||||
The First Bancshares, Inc. (Banks) | 77 | 2,000 | |||||||||
The First of Long Island Corp. (Banks) | 54 | 541 | |||||||||
| The GEO Group, Inc.* (Commercial Services & Supplies) | 311 | 4,466 | |||||||||
| The Goodyear Tire & Rubber Co.* (Automobile Components) | 714 | 8,104 | |||||||||
The Gorman-Rupp Co. (Machinery) | 52 | 1,909 | |||||||||
The Greenbrier Cos., Inc. (Machinery) | 77 | 3,815 | |||||||||
The Hackett Group, Inc. (IT Services) | 63 | 1,368 | |||||||||
The Hain Celestial Group, Inc.* (Food Products) | 225 | 1,555 | |||||||||
The Honest Co., Inc.* (Personal Care Products) | 201 | 587 | |||||||||
| The Joint Corp.* (Health Care Providers & Services) | 27 | 380 | |||||||||
The Lovesac Co.* (Household Durables) | 36 | 813 | |||||||||
The Macerich Co. (Retail REITs) | 543 | 8,384 | |||||||||
The Manitowoc Co., Inc.* (Machinery) | 87 | 1,003 | |||||||||
The Marcus Corp. (Entertainment) | 60 | 682 | |||||||||
The ODP Corp.* (Specialty Retail) | 89 | 3,495 | |||||||||
| The ONE Group Hospitality, Inc.* (Hotels, Restaurants & Leisure) | 52 | 221 | |||||||||
| The Pennant Group, Inc.* (Health Care Providers & Services) | 72 | 1,670 | |||||||||
| The Real Brokerage, Inc.* (Real Estate Management & Development) | 238 | 966 | |||||||||
The RealReal, Inc.* (Specialty Retail) | 245 | 782 | |||||||||
| The RMR Group, Inc.—Class A (Real Estate Management & Development) | 39 | 881 | |||||||||
The Shyft Group, Inc. (Machinery) | 85 | 1,008 | |||||||||
The Simply Good Foods Co.* (Food Products) | 229 | 8,274 | |||||||||
| The St. Joe Co. (Real Estate Management & Development) | 90 | 4,923 | |||||||||
The Vita Coco Co., Inc.* (Beverages) | 98 | 2,729 | |||||||||
The York Water Co. (Water Utilities) | 36 | 1,335 | |||||||||
Theravance Biopharma, Inc.* (Pharmaceuticals) | 92 | 780 | |||||||||
| Thermon Group Holdings, Inc.* (Electrical Equipment) | 84 | 2,584 | |||||||||
Third Coast Bancshares, Inc.* (Banks) | 28 | 596 | |||||||||
Third Harmonic Bio, Inc.* (Pharmaceuticals) | 50 | 650 | |||||||||
Thoughtworks Holding, Inc.* (IT Services) | 251 | 713 | |||||||||
ThredUp, Inc.*—Class A (Specialty Retail) | 197 | 335 | |||||||||
Common Stocks, continued
Shares | Value | ||||||||||
Thryv Holdings, Inc.* (Media) | 80 | $ | 1,426 | ||||||||
Tidewater, Inc.* (Energy Equipment & Services) | 122 | 11,616 | |||||||||
Tile Shop Holdings, Inc.* (Specialty Retail) | 72 | 499 | |||||||||
Tilly's, Inc.*—Class A (Specialty Retail) | 37 | 223 | |||||||||
Timberland Bancorp, Inc. (Banks) | 19 | 515 | |||||||||
Tiptree, Inc. (Insurance) | 63 | 1,039 | |||||||||
Titan International, Inc.* (Machinery) | 125 | 926 | |||||||||
| Titan Machinery, Inc.* (Trading Companies & Distributors) | 52 | 827 | |||||||||
Tompkins Financial Corp. (Banks) | 32 | 1,565 | |||||||||
| Topgolf Callaway Brands Corp.* (Leisure Products) | 355 | 5,432 | |||||||||
Torrid Holdings, Inc.*(a) (Specialty Retail) | 31 | 232 | |||||||||
Tourmaline Bio, Inc.* (Biotechnology) | 58 | 746 | |||||||||
Towne Bank (Banks) | 176 | 4,800 | |||||||||
Townsquare Media, Inc.—Class A (Media) | 33 | 362 | |||||||||
TPG RE Finance Trust, Inc. (Mortgage REITs) | 144 | 1,244 | |||||||||
TPI Composites, Inc.* (Electrical Equipment) | 115 | 459 | |||||||||
Traeger, Inc.* (Household Durables) | 86 | 206 | |||||||||
| Transcat, Inc.* (Trading Companies & Distributors) | 22 | 2,633 | |||||||||
| Transcontinental Realty Investors, Inc.* (Real Estate Management & Development) | 3 | 83 | |||||||||
| TransMedics Group, Inc.* (Health Care Equipment & Supplies) | 80 | 12,050 | |||||||||
| Transocean, Ltd.* (Energy Equipment & Services) | 1,826 | 9,769 | |||||||||
Travere Therapeutics, Inc.* (Biotechnology) | 184 | 1,512 | |||||||||
| Treace Medical Concepts, Inc.* (Health Care Equipment & Supplies) | 122 | 811 | |||||||||
Tredegar Corp.* (Metals & Mining) | 67 | 321 | |||||||||
TreeHouse Foods, Inc.* (Food Products) | 123 | 4,507 | |||||||||
Trevi Therapeutics, Inc.* (Pharmaceuticals) | 147 | 438 | |||||||||
Tri Pointe Homes, Inc.* (Household Durables) | 234 | 8,717 | |||||||||
TriCo Bancshares (Banks) | 80 | 3,166 | |||||||||
TriMas Corp. (Containers & Packaging) | 102 | 2,607 | |||||||||
TriNet Group, Inc. (Professional Services) | 81 | 8,100 | |||||||||
Trinity Industries, Inc. (Machinery) | 205 | 6,134 | |||||||||
Triumph Financial, Inc.* (Banks) | 55 | 4,496 | |||||||||
Triumph Group, Inc.* (Aerospace & Defense) | 162 | 2,496 | |||||||||
Tronox Holdings PLC (Chemicals) | 297 | 4,660 | |||||||||
TrueBlue, Inc.* (Professional Services) | 77 | 793 | |||||||||
TrueCar, Inc.* (Interactive Media & Services) | 214 | 670 | |||||||||
Trupanion, Inc.*(a) (Insurance) | 83 | 2,440 | |||||||||
TrustCo Bank Corp. (Banks) | 47 | 1,352 | |||||||||
Trustmark Corp. (Banks) | 152 | 4,566 | |||||||||
Tscan Therapeutics, Inc.* (Biotechnology) | 96 | 562 | |||||||||
TTEC Holdings, Inc. (Professional Services) | 49 | 288 | |||||||||
| TTM Technologies, Inc.* (Electronic Equipment, Instruments & Components) | 253 | 4,916 | |||||||||
Tucows, Inc.*—Class A (IT Services) | 20 | 386 | |||||||||
Turning Point Brands, Inc. (Tobacco) | 43 | 1,380 | |||||||||
| Turtle Beach Corp.* (Technology Hardware, Storage & Peripherals) | 43 | 617 | |||||||||
| Tutor Perini Corp.* (Construction & Engineering) | 108 | 2,352 | |||||||||
Twin Disc, Inc. (Machinery) | 28 | 330 | |||||||||
Twist Bioscience Corp.* (Biotechnology) | 144 | 7,096 | |||||||||
| Two Harbors Investment Corp. (Mortgage REITs) | 260 | 3,435 | |||||||||
Tyra Biosciences, Inc.* (Biotechnology) | 51 | 815 | |||||||||
See accompanying notes to the financial statements.
102 :: ProFund VP Small-Cap :: Schedule of Portfolio Investments :: June 30, 2024 (unaudited)
Common Stocks, continued
Shares | Value | ||||||||||
| U.S. Physical Therapy, Inc. (Health Care Providers & Services) | 37 | $ | 3,420 | ||||||||
| U.S. Silica Holdings, Inc.* (Energy Equipment & Services) | 190 | 2,936 | |||||||||
Udemy, Inc.* (Diversified Consumer Services) | 239 | 2,063 | |||||||||
UFP Industries, Inc. (Building Products) | 152 | 17,023 | |||||||||
| UFP Technologies, Inc.* (Health Care Equipment & Supplies) | 18 | 4,750 | |||||||||
| Ultra Clean Holdings, Inc.* (Semiconductors & Semiconductor Equipment) | 111 | 5,439 | |||||||||
Ultralife Corp.* (Electrical Equipment) | 25 | 266 | |||||||||
UMB Financial Corp. (Banks) | 112 | 9,343 | |||||||||
UMH Properties, Inc. (Residential REITs) | 160 | 2,558 | |||||||||
| UniFirst Corp. (Commercial Services & Supplies) | 38 | 6,518 | |||||||||
Unisys Corp.* (IT Services) | 165 | 681 | |||||||||
United Bankshares, Inc. (Banks) | 331 | 10,738 | |||||||||
United Community Banks, Inc. (Banks) | 300 | 7,638 | |||||||||
United Fire Group, Inc. (Insurance) | 53 | 1,139 | |||||||||
| United Homes Group, Inc.* (Household Durables) | 13 | 74 | |||||||||
| United Natural Foods, Inc.* (Consumer Staples Distribution & Retail) | 147 | 1,926 | |||||||||
| United Parks & Resorts, Inc.* (Hotels, Restaurants & Leisure) | 89 | 4,834 | |||||||||
| United States Lime & Minerals, Inc. (Construction Materials) | 5 | 1,821 | |||||||||
Uniti Group, Inc. (Specialized REITs) | 599 | 1,749 | |||||||||
Unitil Corp. (Multi-Utilities) | 40 | 2,072 | |||||||||
Unity Bancorp, Inc. (Banks) | 18 | 532 | |||||||||
Universal Corp. (Tobacco) | 60 | 2,891 | |||||||||
| Universal Health Realty Income Trust (Health Care REITs) | 32 | 1,252 | |||||||||
Universal Insurance Holdings, Inc. (Insurance) | 60 | 1,126 | |||||||||
| Universal Logistics Holdings, Inc. (Ground Transportation) | 17 | 690 | |||||||||
| Universal Stainless & Alloy Products, Inc.* (Metals & Mining) | 22 | 602 | |||||||||
| Universal Technical Institute, Inc.* (Diversified Consumer Services) | 99 | 1,557 | |||||||||
Univest Financial Corp. (Banks) | 72 | 1,644 | |||||||||
Upbound Group, Inc. (Specialty Retail) | 134 | 4,114 | |||||||||
Upstart Holdings, Inc.* (Consumer Finance) | 193 | 4,553 | |||||||||
Upwork, Inc.* (Professional Services) | 312 | 3,354 | |||||||||
| Uranium Energy Corp.* (Oil, Gas & Consumable Fuels) | 985 | 5,920 | |||||||||
Urban Edge Properties (Retail REITs) | 300 | 5,541 | |||||||||
Urban Outfitters, Inc.* (Specialty Retail) | 160 | 6,568 | |||||||||
Ur-Energy, Inc.* (Oil, Gas & Consumable Fuels) | 689 | 965 | |||||||||
UroGen Pharma, Ltd.* (Biotechnology) | 86 | 1,443 | |||||||||
| USANA Health Sciences, Inc.* (Personal Care Products) | 29 | 1,312 | |||||||||
USCB Financial Holdings, Inc. (Banks) | 26 | 334 | |||||||||
| Utah Medical Products, Inc. (Health Care Equipment & Supplies) | 8 | 534 | |||||||||
Utz Brands, Inc. (Food Products) | 163 | 2,712 | |||||||||
V2X, Inc.* (Aerospace & Defense) | 31 | 1,487 | |||||||||
| VAALCO Energy, Inc. (Oil, Gas & Consumable Fuels) | 261 | 1,636 | |||||||||
| Vacasa, Inc.*—Class A (Hotels, Restaurants & Leisure) | 23 | 112 | |||||||||
Common Stocks, continued
Shares | Value | ||||||||||
Valaris, Ltd.* (Energy Equipment & Services) | 157 | $ | 11,697 | ||||||||
Valhi, Inc. (Chemicals) | 6 | 107 | |||||||||
Valley National Bancorp (Banks) | 1,081 | 7,545 | |||||||||
Value Line, Inc. (Capital Markets) | 2 | 86 | |||||||||
Vanda Pharmaceuticals, Inc.* (Biotechnology) | 143 | 808 | |||||||||
| Varex Imaging Corp.* (Health Care Equipment & Supplies) | 97 | 1,429 | |||||||||
Varonis Systems, Inc.* (Software) | 276 | 13,240 | |||||||||
Vaxcyte, Inc.* (Biotechnology) | 273 | 20,615 | |||||||||
Vector Group, Ltd. (Tobacco) | 368 | 3,890 | |||||||||
| Veeco Instruments, Inc.* (Semiconductors & Semiconductor Equipment) | 139 | 6,493 | |||||||||
Velo3d, Inc.* (Machinery) | 1 | 3 | |||||||||
Velocity Financial, Inc.* (Financial Services) | 23 | 412 | |||||||||
Ventyx Biosciences, Inc.* (Pharmaceuticals) | 152 | 351 | |||||||||
| Vera Bradley, Inc.* (Textiles, Apparel & Luxury Goods) | 67 | 419 | |||||||||
Vera Therapeutics, Inc.* (Biotechnology) | 98 | 3,546 | |||||||||
Veracyte, Inc.* (Biotechnology) | 192 | 4,161 | |||||||||
Verastem, Inc.* (Biotechnology) | 64 | 191 | |||||||||
| Verde Clean Fuels, Inc.* (Oil, Gas & Consumable Fuels) | 8 | 33 | |||||||||
Vericel Corp.* (Biotechnology) | 121 | 5,551 | |||||||||
Verint Systems, Inc.* (Software) | 155 | 4,991 | |||||||||
Veris Residential, Inc. (Residential REITs) | 197 | 2,955 | |||||||||
Veritex Holdings, Inc. (Banks) | 132 | 2,784 | |||||||||
Verra Mobility Corp.* (Professional Services) | 417 | 11,342 | |||||||||
| Verrica Pharmaceuticals, Inc.* (Pharmaceuticals) | 47 | 343 | |||||||||
Vertex, Inc.*—Class A (Software) | 136 | 4,903 | |||||||||
Veru, Inc.* (Personal Care Products) | 331 | 278 | |||||||||
Verve Therapeutics, Inc.* (Biotechnology) | 178 | 869 | |||||||||
Viad Corp.* (Commercial Services & Supplies) | 51 | 1,734 | |||||||||
Viant Technology, Inc.*—Class A (Software) | 39 | 385 | |||||||||
Viasat, Inc.* (Communications Equipment) | 304 | 3,861 | |||||||||
| Viavi Solutions, Inc.* (Communications Equipment) | 551 | 3,785 | |||||||||
Vicor Corp.* (Electrical Equipment) | 56 | 1,857 | |||||||||
Victoria's Secret & Co.* (Specialty Retail) | 197 | 3,481 | |||||||||
| Victory Capital Holdings, Inc.—Class A (Capital Markets) | 103 | 4,916 | |||||||||
| Viemed Healthcare, Inc.* (Health Care Providers & Services) | 86 | 563 | |||||||||
| Village Super Market, Inc.—Class A (Consumer Staples Distribution & Retail) | 22 | 581 | |||||||||
Vimeo, Inc.* (Interactive Media & Services) | 371 | 1,384 | |||||||||
Vir Biotechnology, Inc.* (Biotechnology) | 224 | 1,994 | |||||||||
| Virco Mfg. Corp. (Commercial Services & Supplies) | 26 | 362 | |||||||||
| Virgin Galactic Holdings, Inc.* (Aerospace & Defense) | 48 | 403 | |||||||||
Virginia National Bankshares Corp. (Banks) | 12 | 394 | |||||||||
Viridian Therapeutics, Inc.* (Biotechnology) | 157 | 2,043 | |||||||||
Virtra, Inc.* (Aerospace & Defense) | 26 | 200 | |||||||||
| Virtus Investment Partners, Inc. (Capital Markets) | 17 | 3,839 | |||||||||
| Vishay Intertechnology, Inc. (Electronic Equipment, Instruments & Components) | 316 | 7,047 | |||||||||
| Vishay Precision Group, Inc.* (Electronic Equipment, Instruments & Components) | 30 | 913 | |||||||||
Vista Outdoor, Inc.* (Leisure Products) | 146 | 5,497 | |||||||||
See accompanying notes to the financial statements.
June 30, 2024 (unaudited) :: Schedule of Portfolio Investments :: ProFund VP Small-Cap :: 103
Common Stocks, continued
Shares | Value | ||||||||||
Visteon Corp.* (Automobile Components) | 68 | $ | 7,256 | ||||||||
| Vital Energy, Inc.* (Oil, Gas & Consumable Fuels) | 72 | 3,227 | |||||||||
Vital Farms, Inc.* (Food Products) | 82 | 3,835 | |||||||||
| Vitesse Energy, Inc. (Oil, Gas & Consumable Fuels) | 63 | 1,493 | |||||||||
Vivid Seats, Inc.*—Class A (Entertainment) | 196 | 1,127 | |||||||||
| Vizio Holding Corp.*—Class A (Household Durables) | 223 | 2,408 | |||||||||
Voyager Therapeutics, Inc.* (Biotechnology) | 115 | 910 | |||||||||
VSE Corp. (Commercial Services & Supplies) | 34 | 3,002 | |||||||||
| W&T Offshore, Inc. (Oil, Gas & Consumable Fuels) | 247 | 529 | |||||||||
Wabash National Corp. (Machinery) | 112 | 2,446 | |||||||||
WaFd, Inc. (Banks) | 167 | 4,773 | |||||||||
| Waldencast PLC*—Class A (Personal Care Products) | 61 | 219 | |||||||||
Walker & Dunlop, Inc. (Financial Services) | 80 | 7,856 | |||||||||
Warby Parker, Inc.*—Class A (Specialty Retail) | 218 | 3,501 | |||||||||
Warrior Met Coal, Inc. (Metals & Mining) | 130 | 8,160 | |||||||||
Washington Trust Bancorp, Inc. (Banks) | 42 | 1,151 | |||||||||
Waterstone Financial, Inc. (Financial Services) | 41 | 524 | |||||||||
| Watts Water Technologies, Inc.—Class A (Machinery) | 69 | 12,653 | |||||||||
WaVe Life Sciences, Ltd.* (Pharmaceuticals) | 194 | 968 | |||||||||
WD-40 Co. (Household Products) | 34 | 7,468 | |||||||||
Weave Communications, Inc.* (Software) | 98 | 884 | |||||||||
| Weis Markets, Inc. (Consumer Staples Distribution & Retail) | 41 | 2,574 | |||||||||
Werewolf Therapeutics, Inc.* (Biotechnology) | 76 | 185 | |||||||||
| Werner Enterprises, Inc. (Ground Transportation) | 158 | 5,661 | |||||||||
WesBanco, Inc. (Banks) | 144 | 4,019 | |||||||||
West Bancorp, Inc. (Banks) | 40 | 716 | |||||||||
Westamerica Bancorp (Banks) | 64 | 3,106 | |||||||||
Westrock Coffee Co.* (Food Products) | 85 | 870 | |||||||||
Weyco Group, Inc. (Distributors) | 15 | 455 | |||||||||
| Wheels Up Experience, Inc.* (Passenger Airlines) | 225 | 425 | |||||||||
Whitestone REIT (Retail REITs) | 122 | 1,624 | |||||||||
Whole Earth Brands, Inc.* (Food Products) | 81 | 394 | |||||||||
WideOpenWest, Inc.* (Media) | 123 | 665 | |||||||||
Willdan Group, Inc.* (Professional Services) | 32 | 923 | |||||||||
| Willis Lease Finance Corp. (Trading Companies & Distributors) | 8 | 554 | |||||||||
Winmark Corp. (Specialty Retail) | 7 | 2,468 | |||||||||
Winnebago Industries, Inc. (Automobiles) | 72 | 3,903 | |||||||||
WisdomTree, Inc. (Capital Markets) | 349 | 3,459 | |||||||||
WK Kellogg Co. (Food Products) | 164 | 2,699 | |||||||||
WM Technology, Inc.* (Software) | 209 | 217 | |||||||||
Wns Holdings, Ltd.* (Professional Services) | 116 | 6,090 | |||||||||
| Wolverine World Wide, Inc. (Textiles, Apparel & Luxury Goods) | 199 | 2,690 | |||||||||
Workiva, Inc.* (Software) | 126 | 9,197 | |||||||||
World Acceptance Corp.* (Consumer Finance) | 9 | 1,112 | |||||||||
| World Kinect Corp. (Oil, Gas & Consumable Fuels) | 148 | 3,818 | |||||||||
| Worthington Enterprises, Inc. (Household Durables) | 79 | 3,739 | |||||||||
Worthington Steel, Inc. (Metals & Mining) | 81 | 2,702 | |||||||||
Common Stocks, continued
Shares | Value | ||||||||||
WSFS Financial Corp. (Banks) | 150 | $ | 7,050 | ||||||||
X4 Pharmaceuticals, Inc.* (Biotechnology) | 421 | 244 | |||||||||
XBiotech, Inc.* (Biotechnology) | 46 | 236 | |||||||||
Xencor, Inc.* (Biotechnology) | 149 | 2,821 | |||||||||
| Xenia Hotels & Resorts, Inc. (Hotel & Resort REITs) | 255 | 3,654 | |||||||||
| Xeris Biopharma Holdings, Inc.* (Pharmaceuticals) | 352 | 792 | |||||||||
| Xerox Holdings Corp. (Technology Hardware, Storage & Peripherals) | 291 | 3,382 | |||||||||
XOMA Corp.* (Biotechnology) | 20 | 474 | |||||||||
| Xometry, Inc.*—Class A (Trading Companies & Distributors) | 105 | 1,214 | |||||||||
XPEL, Inc.* (Automobile Components) | 63 | 2,240 | |||||||||
Xperi, Inc.* (Software) | 113 | 928 | |||||||||
| Xponential Fitness, Inc.*—Class A (Hotels, Restaurants & Leisure) | 60 | 936 | |||||||||
Yelp, Inc.* (Interactive Media & Services) | 164 | 6,059 | |||||||||
Yext, Inc.* (Software) | 262 | 1,402 | |||||||||
Y-mAbs Therapeutics, Inc.* (Biotechnology) | 92 | 1,111 | |||||||||
Zentalis Pharmaceuticals, Inc.* (Biotechnology) | 143 | 585 | |||||||||
| Zeta Global Holdings Corp.*—Class A (Software) | 412 | 7,272 | |||||||||
Zevra Therapeutics, Inc.* (Pharmaceuticals) | 105 | 515 | |||||||||
Ziff Davis, Inc.* (Interactive Media & Services) | 114 | 6,275 | |||||||||
| Zimvie, Inc.* (Health Care Equipment & Supplies) | 68 | 1,241 | |||||||||
| ZipRecruiter, Inc.* (Interactive Media & Services) | 180 | 1,636 | |||||||||
Zumiez, Inc.* (Specialty Retail) | 41 | 799 | |||||||||
Zuora, Inc.*—Class A (Software) | 324 | 3,217 | |||||||||
Zura Bio, Ltd.* (Biotechnology) | 50 | 175 | |||||||||
| Zurn Elkay Water Solutions Corp. (Building Products) | 364 | 10,702 | |||||||||
Zymeworks, Inc.* (Biotechnology) | 140 | 1,191 | |||||||||
| Zynex, Inc.*(a) (Health Care Equipment & Supplies) | 38 | 354 | |||||||||
| TOTAL COMMON STOCKS (Cost $4,289,155) | 6,148,509 | ||||||||||
Rights(NM)
| Cartesian Therapeutics, Inc., CVR*+(Pharmaceuticals) | 445 | 80 | |||||||||
| Chinook Therapeutics CVR*+(Health Care Providers & Services) | 222 | — | |||||||||
| TOTAL RIGHTS (Cost $—) | 80 | ||||||||||
Trust (0.0%)
| Interest Units | Value | ||||||||||
| Ferroglobe Representation and Warranty Insurance*+ (Metals & Mining) | 250 | $ | — | ||||||||
| TOTAL TRUST (Cost $—) | — | ||||||||||
See accompanying notes to the financial statements.
104 :: ProFund VP Small-Cap :: Schedule of Portfolio Investments :: June 30, 2024 (unaudited)
Repurchase Agreements(b)(c) (14.4%)
| Principal Amount | Value | ||||||||||
| Repurchase Agreements with various counterparties, rates 5.12%–5.20%, dated 6/28/2024, due 7/1/24, total to be received $1,041,450 | $ | 1,041,000 | $ | 1,041,000 | |||||||
| TOTAL REPURCHASE AGREEMENTS (Cost $1,041,000) | 1,041,000 | ||||||||||
Collateral for Securities Loaned(d) (0.9%)
Shares | Value | ||||||||||
| Invesco Government & Agency Portfolio—Institutional Shares, 5.23%(e) | 62,883 | $ | 62,883 | ||||||||
| TOTAL COLLATERAL FOR SECURITIES LOANED (Cost $62,883) | 62,883 | ||||||||||
| TOTAL INVESTMENT SECURITIES (Cost $5,393,038)—100.3% | 7,252,472 | ||||||||||
Net other assets (liabilities)—(0.3)% | (25,113 | ) | |||||||||
NET ASSETS—100.0% | $ | 7,227,359 | |||||||||
* Non-income producing security.
+ These securities were fair valued based on procedures approved by the Board of Trustees. As of June 30, 2024, these securities represented less than 0.005% of the net assets of the Fund.
(a) All or part of this security was on loan as of June 30, 2024. The total value of securities on loan as of June 30, 2024 was $58,435.
(b) A portion of these securities were held in a segregated account for the benefit of swap counterparties in the event of default. At June 30, 2024, the aggregate amount held in a segregated account was $73,000.
(c) The ProFund VP invests in Repurchase Agreements jointly with other funds in the Trust. See "Repurchase Agreements" under Note 2 in the Notes to Financial Statements to view the details of each individual agreement and counterparty as well as a description of the securities subject to repurchase.
(d) Securities were purchased with cash collateral held from securities on loan at June 30, 2024.
(e) Rate periodically changes. Rate disclosed is the daily yield on June 30, 2024.
NM Not meaningful, amount is less than 0.05%
CVR Contingent Value Rights
REIT Real Estate Investment Trust
Futures Contracts Purchased
| Number of Contracts | Expiration Date | Notional Amount | Value and Unrealized Appreciation/ (Depreciation) | ||||||||||||||||
E-Mini Russell 2000 Index Futures Contracts | 4 | 9/23/24 | $ | 413,000 | $ | (3,578 | ) | ||||||||||||
Total Return Swap Agreements—Long
Underlying Instrument | Counterparty | Termination Date(1) | Rate Paid (Received)(2) | Notional Amount | Value and Unrealized Appreciation/ (Depreciation) | ||||||||||||||||||
Russell 2000 Index | Goldman Sachs International | 7/29/24 | 5.88 | % | $ | 313,297 | $ | 1,539 | |||||||||||||||
Russell 2000 Index | UBS AG | 7/29/24 | 5.68 | % | 358,346 | 1,763 | |||||||||||||||||
$ | 671,643 | $ | 3,302 | ||||||||||||||||||||
(1) Agreements may be terminated at will by either party without penalty. Payment is due at termination/maturity.
(2) Reflects the floating financing rate, as of June 30, 2024, on the notional amount of the swap agreement paid to the counterparty or received from the counterparty, excluding any commissions. This amount is included as part of the unrealized appreciation/(depreciation).
See accompanying notes to the financial statements.
June 30, 2024 (unaudited) :: Schedule of Portfolio Investments :: ProFund VP Small-Cap :: 105
ProFund VP Small-Cap invested in the following industries as of June 30, 2024:
Value | % of Net Assets | ||||||||||
Aerospace & Defense | $ | 66,153 | 0.9 | % | |||||||
Air Freight & Logistics | 10,068 | 0.1 | % | ||||||||
Automobile Components | 85,398 | 1.2 | % | ||||||||
Automobiles | 4,572 | 0.1 | % | ||||||||
Banks | 565,675 | 7.8 | % | ||||||||
Beverages | 17,935 | 0.2 | % | ||||||||
Biotechnology | 538,577 | 7.4 | % | ||||||||
Broadline Retail | 1,890 | NM | |||||||||
Building Products | 88,684 | 1.2 | % | ||||||||
Capital Markets | 98,840 | 1.4 | % | ||||||||
Chemicals | 124,667 | 1.8 | % | ||||||||
Commercial Services & Supplies | 109,936 | 1.5 | % | ||||||||
Communications Equipment | 34,885 | 0.5 | % | ||||||||
Construction & Engineering | 92,154 | 1.3 | % | ||||||||
Construction Materials | 23,178 | 0.3 | % | ||||||||
Consumer Finance | 49,503 | 0.7 | % | ||||||||
Consumer Staples Distribution & Retail | 43,658 | 0.6 | % | ||||||||
Containers & Packaging | 15,538 | 0.2 | % | ||||||||
Distributors | 2,250 | NM | |||||||||
Diversified Consumer Services | 57,144 | 0.8 | % | ||||||||
Diversified REITs | 38,755 | 0.5 | % | ||||||||
Diversified Telecommunication Services | 31,700 | 0.4 | % | ||||||||
Electric Utilities | 47,267 | 0.7 | % | ||||||||
Electrical Equipment | 89,403 | 1.2 | % | ||||||||
| Electronic Equipment, Instruments & Components | 188,775 | 2.6 | % | ||||||||
Energy Equipment & Services | 168,047 | 2.3 | % | ||||||||
Entertainment | 30,040 | 0.4 | % | ||||||||
Financial Services | 161,978 | 2.2 | % | ||||||||
Food Products | 62,369 | 0.9 | % | ||||||||
Gas Utilities | 58,316 | 0.7 | % | ||||||||
Ground Transportation | 28,927 | 0.4 | % | ||||||||
Health Care Equipment & Supplies | 210,934 | 2.9 | % | ||||||||
Health Care Providers & Services | 174,221 | 2.4 | % | ||||||||
Health Care REITs | 36,699 | 0.5 | % | ||||||||
Health Care Technology | 21,442 | 0.3 | % | ||||||||
Hotel & Resort REITs | 49,353 | 0.7 | % | ||||||||
Hotels, Restaurants & Leisure | 114,626 | 1.6 | % | ||||||||
Household Durables | 134,395 | 1.9 | % | ||||||||
Household Products | 18,805 | 0.3 | % | ||||||||
| Independent Power and Renewable Electricity Producers | 12,883 | 0.2 | % | ||||||||
Industrial Conglomerates | 1,327 | NM | |||||||||
Value | % of Net Assets | ||||||||||
Industrial REITs | $ | 31,276 | 0.4 | % | |||||||
Insurance | 114,039 | 1.6 | % | ||||||||
Interactive Media & Services | 39,623 | 0.5 | % | ||||||||
IT Services | 36,450 | 0.5 | % | ||||||||
Leisure Products | 27,775 | 0.4 | % | ||||||||
Life Sciences Tools & Services | 16,083 | 0.2 | % | ||||||||
Machinery | 229,208 | 3.3 | % | ||||||||
Marine Transportation | 21,583 | 0.3 | % | ||||||||
Media | 44,836 | 0.7 | % | ||||||||
Metals & Mining | 108,944 | 1.5 | % | ||||||||
Mortgage REITs | 69,538 | 1.0 | % | ||||||||
Multi-Utilities | 25,921 | 0.4 | % | ||||||||
Office REITs | 45,253 | 0.6 | % | ||||||||
Oil, Gas & Consumable Fuels | 239,270 | 3.3 | % | ||||||||
Paper & Forest Products | 8,024 | 0.1 | % | ||||||||
Passenger Airlines | 25,169 | 0.3 | % | ||||||||
Personal Care Products | 18,544 | 0.3 | % | ||||||||
Pharmaceuticals | 99,293 | 1.4 | % | ||||||||
Professional Services | 156,577 | 2.2 | % | ||||||||
Real Estate Management & Development | 42,081 | 0.6 | % | ||||||||
Residential REITs | 27,928 | 0.4 | % | ||||||||
Retail REITs | 74,223 | 1.0 | % | ||||||||
| Semiconductors & Semiconductor Equipment | 162,390 | 2.2 | % | ||||||||
Software | 367,443 | 5.1 | % | ||||||||
Specialized REITs | 25,493 | 0.4 | % | ||||||||
Specialty Retail | 156,483 | 2.1 | % | ||||||||
| Technology Hardware, Storage & Peripherals | 13,334 | 0.2 | % | ||||||||
Textiles, Apparel & Luxury Goods | 34,772 | 0.5 | % | ||||||||
Tobacco | 8,545 | 0.1 | % | ||||||||
Trading Companies & Distributors | 135,918 | 1.9 | % | ||||||||
Transportation Infrastructure | 259 | NM | |||||||||
Water Utilities | 23,987 | 0.3 | % | ||||||||
Wireless Telecommunication Services | 7,360 | 0.1 | % | ||||||||
Other** | 1,078,770 | 15.0 | % | ||||||||
Total | $ | 7,227,359 | 100.0 | % | |||||||
** Includes any non-equity securities and net other assets (liabilities), which includes any receivable for capital shares issued and payable for capital shares redeemed.
NM Not meaningful, amount is less than 0.05%
REIT Real Estate Investment Trust
See accompanying notes to the financial statements.
106 :: ProFund VP Small-Cap Growth :: Schedule of Portfolio Investments :: June 30, 2024 (unaudited)
Common Stocks (99.8%)
Shares | Value | ||||||||||
A10 Networks, Inc. (Software) | 850 | $ | 11,773 | ||||||||
AAR Corp.* (Aerospace & Defense) | 617 | 44,856 | |||||||||
Abercrombie & Fitch Co.* (Specialty Retail) | 1,322 | 235,105 | |||||||||
ACI Worldwide, Inc.* (Software) | 1,718 | 68,016 | |||||||||
| Addus HomeCare Corp.* (Health Care Providers & Services) | 192 | 22,293 | |||||||||
Adeia, Inc. (Software) | 1,121 | 12,538 | |||||||||
| Adtalem Global Education, Inc.* (Diversified Consumer Services) | 973 | 66,368 | |||||||||
| Advanced Energy Industries, Inc. (Electronic Equipment, Instruments & Components) | 600 | 65,256 | |||||||||
AeroVironment, Inc.* (Aerospace & Defense) | 723 | 131,701 | |||||||||
Agilysys, Inc.* (Software) | 523 | 54,465 | |||||||||
| Air Lease Corp. (Trading Companies & Distributors) | 563 | 26,759 | |||||||||
Alamo Group, Inc. (Machinery) | 268 | 46,364 | |||||||||
Alarm.com Holdings, Inc.* (Software) | 1,298 | 82,475 | |||||||||
Albany International Corp. (Machinery) | 387 | 32,682 | |||||||||
Alkermes PLC* (Biotechnology) | 2,802 | 67,528 | |||||||||
| Alpha Metallurgical Resources, Inc. (Metals & Mining) | 299 | 83,878 | |||||||||
Ambac Financial Group, Inc.* (Insurance) | 1,169 | 14,987 | |||||||||
| American Eagle Outfitters, Inc. (Specialty Retail) | 4,784 | 95,489 | |||||||||
American States Water Co. (Water Utilities) | 510 | 37,011 | |||||||||
| American Woodmark Corp.* (Building Products) | 230 | 18,078 | |||||||||
AMERISAFE, Inc. (Insurance) | 213 | 9,349 | |||||||||
| AMN Healthcare Services, Inc.* (Health Care Providers & Services) | 531 | 27,203 | |||||||||
| Amphastar Pharmaceuticals, Inc.* (Pharmaceuticals) | 986 | 39,440 | |||||||||
ANI Pharmaceuticals, Inc.* (Pharmaceuticals) | 397 | 25,281 | |||||||||
Apogee Enterprises, Inc. (Building Products) | 257 | 16,149 | |||||||||
| Apollo Commercial Real Estate Finance, Inc. (Mortgage REITs) | 2,097 | 20,530 | |||||||||
| Apple Hospitality REIT, Inc. (Hotel & Resort REITs) | 5,831 | 84,783 | |||||||||
ArcBest Corp. (Ground Transportation) | 606 | 64,890 | |||||||||
Arch Resources, Inc. (Metals & Mining) | 324 | 49,323 | |||||||||
Archrock, Inc. (Energy Equipment & Services) | 3,558 | 71,943 | |||||||||
Arcosa, Inc. (Construction & Engineering) | 742 | 61,890 | |||||||||
Arcus Biosciences, Inc.* (Biotechnology) | 579 | 8,818 | |||||||||
| Arlo Technologies, Inc.* (Electronic Equipment, Instruments & Components) | 2,524 | 32,913 | |||||||||
| Armada Hoffler Properties, Inc. (Diversified REITs) | 745 | 8,262 | |||||||||
| ARMOUR Residential REIT, Inc. (Mortgage REITs) | 870 | 16,868 | |||||||||
| Armstrong World Industries, Inc. (Building Products) | 1,132 | 128,189 | |||||||||
| Artisan Partners Asset Management, Inc.—Class A (Capital Markets) | 1,013 | 41,807 | |||||||||
| Artivion, Inc.* (Health Care Equipment & Supplies) | 554 | 14,210 | |||||||||
| Asbury Automotive Group, Inc.* (Specialty Retail) | 256 | 58,335 | |||||||||
Assured Guaranty, Ltd. (Insurance) | 802 | 61,874 | |||||||||
| Astrana Health, Inc.* (Health Care Providers & Services) | 1,095 | 44,413 | |||||||||
Common Stocks, continued
Shares | Value | ||||||||||
ATI, Inc.* (Metals & Mining) | 3,220 | $ | 178,548 | ||||||||
| Axcelis Technologies, Inc.* (Semiconductors & Semiconductor Equipment) | 842 | 119,724 | |||||||||
Axos Financial, Inc.* (Banks) | 826 | 47,207 | |||||||||
AZZ, Inc. (Building Products) | 769 | 59,405 | |||||||||
| Badger Meter, Inc. (Electronic Equipment, Instruments & Components) | 761 | 141,812 | |||||||||
Balchem Corp. (Chemicals) | 469 | 72,203 | |||||||||
BancFirst Corp. (Banks) | 233 | 20,434 | |||||||||
Bank of Hawaii Corp. (Banks) | 411 | 23,513 | |||||||||
Berkshire Hills Bancorp, Inc. (Banks) | 539 | 12,289 | |||||||||
BGC Group, Inc.—Class A (Capital Markets) | 5,760 | 47,808 | |||||||||
| BioLife Solutions, Inc.* (Life Sciences Tools & Services) | 564 | 12,087 | |||||||||
BlackLine, Inc.* (Software) | 889 | 43,072 | |||||||||
| Bloomin' Brands, Inc. (Hotels, Restaurants & Leisure) | 1,096 | 21,076 | |||||||||
| Boise Cascade Co. (Trading Companies & Distributors) | 1,022 | 121,843 | |||||||||
Boot Barn Holdings, Inc.* (Specialty Retail) | 786 | 101,339 | |||||||||
Box, Inc.*—Class A (Software) | 2,278 | 60,230 | |||||||||
| Brady Corp.—Class A (Commercial Services & Supplies) | 755 | 49,845 | |||||||||
| Brightsphere Investment Group, Inc. (Capital Markets) | 457 | 10,132 | |||||||||
| Brinker International, Inc.* (Hotels, Restaurants & Leisure) | 483 | 34,964 | |||||||||
| Cactus, Inc.—Class A (Energy Equipment & Services) | 1,054 | 55,588 | |||||||||
| California Resources Corp. (Oil, Gas & Consumable Fuels) | 1,660 | 88,345 | |||||||||
| California Water Service Group (Water Utilities) | 598 | 28,997 | |||||||||
Calix, Inc.* (Communications Equipment) | 740 | 26,218 | |||||||||
Cal-Maine Foods, Inc. (Food Products) | 1,053 | 64,349 | |||||||||
CareTrust REIT, Inc. (Health Care REITs) | 2,315 | 58,106 | |||||||||
Cargurus, Inc.* (Interactive Media & Services) | 2,031 | 53,212 | |||||||||
Carpenter Technology Corp. (Metals & Mining) | 1,283 | 140,591 | |||||||||
Cars.com, Inc.* (Interactive Media & Services) | 1,590 | 31,323 | |||||||||
| Catalyst Pharmaceuticals, Inc.* (Biotechnology) | 2,902 | 44,952 | |||||||||
Cathay General Bancorp (Banks) | 885 | 33,382 | |||||||||
Cavco Industries, Inc.* (Household Durables) | 201 | 69,580 | |||||||||
| Century Communities, Inc. (Household Durables) | 373 | 30,459 | |||||||||
Certara, Inc.* (Health Care Technology) | 1,617 | 22,396 | |||||||||
| CEVA, Inc.* (Semiconductors & Semiconductor Equipment) | 262 | 5,054 | |||||||||
Chesapeake Utilities Corp. (Gas Utilities) | 259 | 27,506 | |||||||||
| Chuy's Holdings, Inc.* (Hotels, Restaurants & Leisure) | 255 | 6,610 | |||||||||
Cinemark Holdings, Inc.* (Entertainment) | 2,760 | 59,671 | |||||||||
City Holding Co. (Banks) | 229 | 24,331 | |||||||||
| Cogent Communications Holdings, Inc. (Diversified Telecommunication Services) | 1,092 | 61,633 | |||||||||
Cohen & Steers, Inc. (Capital Markets) | 333 | 24,162 | |||||||||
| Cohu, Inc.* (Semiconductors & Semiconductor Equipment) | 499 | 16,517 | |||||||||
| Collegium Pharmaceutical, Inc.* (Pharmaceuticals) | 847 | 27,273 | |||||||||
See accompanying notes to the financial statements.
June 30, 2024 (unaudited) :: Schedule of Portfolio Investments :: ProFund VP Small-Cap Growth :: 107
Common Stocks, continued
Shares | Value | ||||||||||
| Community Healthcare Trust, Inc. (Health Care REITs) | 254 | $ | 5,941 | ||||||||
| Comstock Resources, Inc. (Oil, Gas & Consumable Fuels) | 1,272 | 13,203 | |||||||||
| CONMED Corp. (Health Care Equipment & Supplies) | 797 | 55,248 | |||||||||
| CONSOL Energy, Inc.* (Oil, Gas & Consumable Fuels) | 684 | 69,789 | |||||||||
Corcept Therapeutics, Inc.* (Pharmaceuticals) | 1,541 | 50,068 | |||||||||
| Core Laboratories, Inc. (Energy Equipment & Services) | 534 | 10,835 | |||||||||
| CorVel Corp.* (Health Care Providers & Services) | 235 | 59,753 | |||||||||
| CSG Systems International, Inc. (Professional Services) | 360 | 14,821 | |||||||||
| CTS Corp. (Electronic Equipment, Instruments & Components) | 443 | 22,429 | |||||||||
Customers Bancorp, Inc.* (Banks) | 737 | 35,361 | |||||||||
| CVR Energy, Inc. (Oil, Gas & Consumable Fuels) | 415 | 11,110 | |||||||||
| Dave & Buster's Entertainment, Inc.* (Hotels, Restaurants & Leisure) | 834 | 33,202 | |||||||||
| DiamondRock Hospitality Co. (Hotel & Resort REITs) | 5,434 | 45,917 | |||||||||
DigitalOcean Holdings, Inc.* (IT Services) | 765 | 26,584 | |||||||||
| Dine Brands Global, Inc. (Hotels, Restaurants & Leisure) | 171 | 6,190 | |||||||||
| Diodes, Inc.* (Semiconductors & Semiconductor Equipment) | 728 | 52,365 | |||||||||
| Donnelley Financial Solutions, Inc.* (Capital Markets) | 645 | 38,455 | |||||||||
| Dorian LPG, Ltd. (Oil, Gas & Consumable Fuels) | 882 | 37,009 | |||||||||
| Dorman Products, Inc.* (Automobile Components) | 498 | 45,557 | |||||||||
DoubleVerify Holdings, Inc.* (Software) | 3,644 | 70,949 | |||||||||
Dynavax Technologies Corp.* (Biotechnology) | 3,385 | 38,014 | |||||||||
Ellington Financial, Inc. (Mortgage REITs) | 2,200 | 26,576 | |||||||||
Encore Wire Corp. (Electrical Equipment) | 408 | 118,250 | |||||||||
Energizer Holdings, Inc. (Household Products) | 794 | 23,455 | |||||||||
Enerpac Tool Group Corp. (Machinery) | 941 | 35,927 | |||||||||
Enpro, Inc. (Machinery) | 244 | 35,519 | |||||||||
Envestnet, Inc.* (Software) | 545 | 34,112 | |||||||||
| ePlus, Inc.* (Electronic Equipment, Instruments & Components) | 421 | 31,019 | |||||||||
ESCO Technologies, Inc. (Machinery) | 667 | 70,062 | |||||||||
| Essential Properties Realty Trust, Inc. (Diversified REITs) | 2,358 | 65,340 | |||||||||
| Ethan Allen Interiors, Inc. (Household Durables) | 243 | 6,777 | |||||||||
EVERTEC, Inc. (Financial Services) | 1,667 | 55,428 | |||||||||
| eXp World Holdings, Inc. (Real Estate Management & Development) | 2,003 | 22,604 | |||||||||
| Extreme Networks, Inc.* (Communications Equipment) | 2,017 | 27,128 | |||||||||
| Fabrinet* (Electronic Equipment, Instruments & Components) | 935 | 228,879 | |||||||||
Federal Signal Corp. (Machinery) | 1,581 | 132,283 | |||||||||
First Bancorp (Banks) | 4,279 | 78,264 | |||||||||
First Commonwealth Financial Corp. (Banks) | 1,214 | 16,765 | |||||||||
Common Stocks, continued
Shares | Value | ||||||||||
| FormFactor, Inc.* (Semiconductors & Semiconductor Equipment) | 1,997 | $ | 120,878 | ||||||||
| Four Corners Property Trust, Inc. (Specialized REITs) | 1,047 | 25,829 | |||||||||
| Fox Factory Holding Corp.* (Automobile Components) | 409 | 19,710 | |||||||||
Franklin Electric Co., Inc. (Machinery) | 1,025 | 98,728 | |||||||||
| Frontdoor, Inc.* (Diversified Consumer Services) | 2,012 | 67,985 | |||||||||
Gentherm, Inc.* (Automobile Components) | 376 | 18,544 | |||||||||
Getty Realty Corp. (Retail REITs) | 547 | 14,583 | |||||||||
Gibraltar Industries, Inc.* (Building Products) | 788 | 54,017 | |||||||||
| Glaukos Corp.* (Health Care Equipment & Supplies) | 1,303 | 154,209 | |||||||||
GMS, Inc.* (Trading Companies & Distributors) | 1,031 | 83,109 | |||||||||
| Gogo, Inc.* (Wireless Telecommunication Services) | 741 | 7,128 | |||||||||
| Golden Entertainment, Inc. (Hotels, Restaurants & Leisure) | 343 | 10,671 | |||||||||
| Goosehead Insurance, Inc.*—Class A (Insurance) | 653 | 37,508 | |||||||||
| Granite Construction, Inc. (Construction & Engineering) | 582 | 36,067 | |||||||||
| Green Brick Partners, Inc.* (Household Durables) | 651 | 37,263 | |||||||||
Griffon Corp. (Building Products) | 656 | 41,892 | |||||||||
Group 1 Automotive, Inc. (Specialty Retail) | 342 | 101,670 | |||||||||
Guess?, Inc. (Specialty Retail) | 705 | 14,382 | |||||||||
H.B. Fuller Co. (Chemicals) | 691 | 53,179 | |||||||||
Harmonic, Inc.* (Communications Equipment) | 1,628 | 19,162 | |||||||||
| Harmony Biosciences Holdings, Inc.* (Pharmaceuticals) | 354 | 10,680 | |||||||||
Hawkins, Inc. (Chemicals) | 492 | 44,772 | |||||||||
Haynes International, Inc. (Metals & Mining) | 184 | 10,801 | |||||||||
HCI Group, Inc. (Insurance) | 190 | 17,512 | |||||||||
HealthStream, Inc. (Health Care Technology) | 329 | 9,179 | |||||||||
| Heartland Express, Inc. (Ground Transportation) | 652 | 8,039 | |||||||||
| Helix Energy Solutions Group, Inc.* (Energy Equipment & Services) | 3,707 | 44,262 | |||||||||
| Helmerich & Payne, Inc. (Energy Equipment & Services) | 1,380 | 49,873 | |||||||||
HNI Corp. (Commercial Services & Supplies) | 734 | 33,045 | |||||||||
IAC, Inc.* (Interactive Media & Services) | 723 | 33,873 | |||||||||
| Inari Medical, Inc.* (Health Care Equipment & Supplies) | 763 | 36,738 | |||||||||
Innospec, Inc. (Chemicals) | 406 | 50,178 | |||||||||
| Innovative Industrial Properties, Inc. (Industrial REITs) | 403 | 44,016 | |||||||||
Innoviva, Inc.* (Pharmaceuticals) | 711 | 11,660 | |||||||||
| Insight Enterprises, Inc.* (Electronic Equipment, Instruments & Components) | 465 | 92,237 | |||||||||
| Installed Building Products, Inc. (Household Durables) | 607 | 124,848 | |||||||||
Insteel Industries, Inc. (Building Products) | 318 | 9,845 | |||||||||
| Integer Holdings Corp.* (Health Care Equipment & Supplies) | 867 | 100,390 | |||||||||
Inter Parfums, Inc. (Personal Care Products) | 463 | 53,722 | |||||||||
InterDigital, Inc. (Software) | 653 | 76,114 | |||||||||
| Ironwood Pharmaceuticals, Inc.* (Biotechnology) | 2,062 | 13,444 | |||||||||
See accompanying notes to the financial statements.
108 :: ProFund VP Small-Cap Growth :: Schedule of Portfolio Investments :: June 30, 2024 (unaudited)
Common Stocks, continued
Shares | Value | ||||||||||
| Itron, Inc.* (Electronic Equipment, Instruments & Components) | 581 | $ | 57,496 | ||||||||
J & J Snack Foods Corp. (Food Products) | 401 | 65,111 | |||||||||
| Jack in the Box, Inc. (Hotels, Restaurants & Leisure) | 502 | 25,572 | |||||||||
| John B Sanfilippo & Son, Inc. (Food Products) | 124 | 12,049 | |||||||||
John Bean Technologies Corp. (Machinery) | 494 | 46,915 | |||||||||
| Knowles Corp.* (Electronic Equipment, Instruments & Components) | 952 | 16,432 | |||||||||
| Kontoor Brands, Inc. (Textiles, Apparel & Luxury Goods) | 1,285 | 85,002 | |||||||||
Koppers Holdings, Inc. (Chemicals) | 291 | 10,764 | |||||||||
Korn Ferry (Professional Services) | 783 | 52,571 | |||||||||
Krystal Biotech, Inc.* (Biotechnology) | 424 | 77,863 | |||||||||
| Kulicke & Soffa Industries, Inc. (Semiconductors & Semiconductor Equipment) | 904 | 44,468 | |||||||||
Lakeland Financial Corp. (Banks) | 310 | 19,071 | |||||||||
La-Z-Boy, Inc. (Household Durables) | 596 | 22,219 | |||||||||
LCI Industries (Automobile Components) | 415 | 42,903 | |||||||||
| LeMaitre Vascular, Inc. (Health Care Equipment & Supplies) | 517 | 42,539 | |||||||||
LGI Homes, Inc.* (Household Durables) | 318 | 28,458 | |||||||||
| Liberty Energy, Inc. (Energy Equipment & Services) | 3,924 | 81,972 | |||||||||
Lindsay Corp. (Machinery) | 140 | 17,203 | |||||||||
| Liquidity Services, Inc.* (Commercial Services & Supplies) | 575 | 11,489 | |||||||||
LiveRamp Holdings, Inc.* (Software) | 1,712 | 52,969 | |||||||||
LTC Properties, Inc. (Health Care REITs) | 483 | 16,664 | |||||||||
M/I Homes, Inc.* (Household Durables) | 718 | 87,697 | |||||||||
| Madison Square Garden Sports Corp.* (Entertainment) | 432 | 81,272 | |||||||||
| Magnolia Oil & Gas Corp.—Class A (Oil, Gas & Consumable Fuels) | 4,681 | 118,617 | |||||||||
Marathon Digital Holdings, Inc.* (Software) | 7,062 | 140,181 | |||||||||
| Marcus & Millichap, Inc. (Real Estate Management & Development) | 255 | 8,038 | |||||||||
| Marten Transport, Ltd. (Ground Transportation) | 702 | 12,952 | |||||||||
Materion Corp. (Metals & Mining) | 537 | 58,066 | |||||||||
Matson, Inc. (Marine Transportation) | 884 | 115,777 | |||||||||
| Matthews International Corp.—Class A (Commercial Services & Supplies) | 508 | 12,725 | |||||||||
| MaxLinear, Inc.* (Semiconductors & Semiconductor Equipment) | 1,212 | 24,410 | |||||||||
| Merit Medical Systems, Inc.* (Health Care Equipment & Supplies) | 887 | 76,238 | |||||||||
Meritage Homes Corp. (Household Durables) | 940 | 152,139 | |||||||||
Metallus, Inc.* (Metals & Mining) | 575 | 11,655 | |||||||||
MGE Energy, Inc. (Electric Utilities) | 515 | 38,481 | |||||||||
MGP Ingredients, Inc. (Beverages) | 235 | 17,484 | |||||||||
Middlesex Water Co. (Water Utilities) | 212 | 11,079 | |||||||||
Minerals Technologies, Inc. (Chemicals) | 417 | 34,678 | |||||||||
| Mister Car Wash, Inc.* (Diversified Consumer Services) | 1,101 | 7,839 | |||||||||
Moelis & Co.—Class A (Capital Markets) | 983 | 55,892 | |||||||||
| Monarch Casino & Resort, Inc. (Hotels, Restaurants & Leisure) | 340 | 23,164 | |||||||||
Moog, Inc.—Class A (Aerospace & Defense) | 744 | 124,471 | |||||||||
Common Stocks, continued
Shares | Value | ||||||||||
Mueller Industries, Inc. (Machinery) | 2,939 | $ | 167,348 | ||||||||
| Myers Industries, Inc. (Containers & Packaging) | 471 | 6,302 | |||||||||
| MYR Group, Inc.* (Construction & Engineering) | 434 | 58,898 | |||||||||
Myriad Genetics, Inc.* (Biotechnology) | 1,148 | 28,080 | |||||||||
N-able, Inc.* (Software) | 1,163 | 17,712 | |||||||||
National Beverage Corp. (Beverages) | 333 | 17,063 | |||||||||
| National HealthCare Corp. (Health Care Providers & Services) | 164 | 17,778 | |||||||||
| National Presto Industries, Inc. (Aerospace & Defense) | 59 | 4,433 | |||||||||
| NeoGenomics, Inc.* (Health Care Providers & Services) | 3,303 | 45,813 | |||||||||
| New York Mortgage Trust, Inc. (Mortgage REITs) | 2,360 | 13,782 | |||||||||
NMI Holdings, Inc.* (Financial Services) | 1,350 | 45,954 | |||||||||
| Northern Oil and Gas, Inc. (Oil, Gas & Consumable Fuels) | 2,367 | 87,981 | |||||||||
| Oceaneering International, Inc.* (Energy Equipment & Services) | 2,623 | 62,060 | |||||||||
OFG Bancorp (Banks) | 1,216 | 45,539 | |||||||||
Olympic Steel, Inc. (Metals & Mining) | 124 | 5,559 | |||||||||
| OSI Systems, Inc.* (Electronic Equipment, Instruments & Components) | 406 | 55,833 | |||||||||
Otter Tail Corp. (Electric Utilities) | 1,081 | 94,684 | |||||||||
Outfront Media, Inc. (Specialized REITs) | 1,586 | 22,680 | |||||||||
| Oxford Industries, Inc. (Textiles, Apparel & Luxury Goods) | 380 | 38,057 | |||||||||
Palomar Holdings, Inc.* (Insurance) | 645 | 52,342 | |||||||||
| Papa John's International, Inc. (Hotels, Restaurants & Leisure) | 401 | 18,839 | |||||||||
| Par Pacific Holdings, Inc.* (Oil, Gas & Consumable Fuels) | 1,379 | 34,820 | |||||||||
Park National Corp. (Banks) | 153 | 21,778 | |||||||||
Pathward Financial, Inc. (Banks) | 654 | 36,997 | |||||||||
| Patrick Industries, Inc. (Automobile Components) | 545 | 59,159 | |||||||||
| Patterson-UTI Energy, Inc. (Energy Equipment & Services) | 4,400 | 45,584 | |||||||||
Payoneer Global, Inc.* (Financial Services) | 2,620 | 14,515 | |||||||||
| PDF Solutions, Inc.* (Semiconductors & Semiconductor Equipment) | 795 | 28,922 | |||||||||
| Peabody Energy Corp. (Oil, Gas & Consumable Fuels) | 1,230 | 27,208 | |||||||||
| Perdoceo Education Corp. (Diversified Consumer Services) | 951 | 20,370 | |||||||||
Perficient, Inc.* (IT Services) | 555 | 41,508 | |||||||||
Phillips Edison & Co., Inc. (Retail REITs) | 1,615 | 52,827 | |||||||||
| Photronics, Inc.* (Semiconductors & Semiconductor Equipment) | 1,148 | 28,321 | |||||||||
Piper Sandler Cos. (Capital Markets) | 197 | 45,343 | |||||||||
PJT Partners, Inc.—Class A (Capital Markets) | 326 | 35,179 | |||||||||
| Plexus Corp.* (Electronic Equipment, Instruments & Components) | 312 | 32,192 | |||||||||
Powell Industries, Inc. (Electrical Equipment) | 239 | 34,273 | |||||||||
Preferred Bank (Banks) | 319 | 24,081 | |||||||||
| Prestige Consumer Healthcare, Inc.* (Pharmaceuticals) | 620 | 42,687 | |||||||||
| Privia Health Group, Inc.* (Health Care Providers & Services) | 2,686 | 46,683 | |||||||||
See accompanying notes to the financial statements.
June 30, 2024 (unaudited) :: Schedule of Portfolio Investments :: ProFund VP Small-Cap Growth :: 109
Common Stocks, continued
Shares | Value | ||||||||||
PROG Holdings, Inc. (Consumer Finance) | 1,117 | $ | 38,738 | ||||||||
Progress Software Corp. (Software) | 1,118 | 60,663 | |||||||||
Proto Labs, Inc.* (Machinery) | 426 | 13,159 | |||||||||
Quaker Chemical Corp. (Chemicals) | 186 | 31,564 | |||||||||
| Quanex Building Products Corp. (Building Products) | 591 | 16,341 | |||||||||
Radian Group, Inc. (Financial Services) | 2,143 | 66,647 | |||||||||
| RadNet, Inc.* (Health Care Providers & Services) | 1,720 | 101,342 | |||||||||
Redwood Trust, Inc. (Mortgage REITs) | 3,418 | 22,183 | |||||||||
REGENXBIO, Inc.* (Biotechnology) | 504 | 5,897 | |||||||||
| REX American Resources Corp.* (Oil, Gas & Consumable Fuels) | 394 | 17,962 | |||||||||
| Rogers Corp.* (Electronic Equipment, Instruments & Components) | 291 | 35,098 | |||||||||
RPC, Inc. (Energy Equipment & Services) | 2,185 | 13,656 | |||||||||
| Rush Enterprises, Inc.—Class A (Trading Companies & Distributors) | 721 | 30,188 | |||||||||
RXO, Inc.* (Ground Transportation) | 1,399 | 36,584 | |||||||||
S&T Bancorp, Inc. (Banks) | 524 | 17,496 | |||||||||
Sabre Corp.* (Hotels, Restaurants & Leisure) | 5,237 | 13,983 | |||||||||
Saul Centers, Inc. (Retail REITs) | 164 | 6,030 | |||||||||
Schrodinger, Inc.* (Health Care Technology) | 800 | 15,472 | |||||||||
Sealed Air Corp. (Containers & Packaging) | 1,507 | 52,429 | |||||||||
| Semtech Corp.* (Semiconductors & Semiconductor Equipment) | 752 | 22,470 | |||||||||
Sensient Technologies Corp. (Chemicals) | 471 | 34,943 | |||||||||
ServisFirst Bancshares, Inc. (Banks) | 584 | 36,903 | |||||||||
| Shake Shack, Inc.*—Class A (Hotels, Restaurants & Leisure) | 975 | 87,749 | |||||||||
| Shenandoah Telecommunications Co. (Diversified Telecommunication Services) | 1,298 | 21,196 | |||||||||
| Shutterstock, Inc. (Interactive Media & Services) | 317 | 12,268 | |||||||||
Signet Jewelers, Ltd. (Specialty Retail) | 1,156 | 103,554 | |||||||||
| Simulations Plus, Inc. (Health Care Technology) | 244 | 11,863 | |||||||||
SiriusPoint, Ltd.* (Insurance) | 2,381 | 29,048 | |||||||||
SITE Centers Corp. (Retail REITs) | 2,191 | 31,770 | |||||||||
| SiTime Corp.* (Semiconductors & Semiconductor Equipment) | 264 | 32,836 | |||||||||
| Six Flags Entertainment Corp. (Hotels, Restaurants & Leisure) | 1,875 | 62,138 | |||||||||
SJW Group (Water Utilities) | 327 | 17,730 | |||||||||
SkyWest, Inc.* (Passenger Airlines) | 563 | 46,205 | |||||||||
| SM Energy Co. (Oil, Gas & Consumable Fuels) | 2,976 | 128,651 | |||||||||
| SMART Global Holdings, Inc.* (Semiconductors & Semiconductor Equipment) | 555 | 12,693 | |||||||||
| SolarEdge Technologies, Inc.* (Semiconductors & Semiconductor Equipment) | 578 | 14,600 | |||||||||
Southside Bancshares, Inc. (Banks) | 290 | 8,007 | |||||||||
SPS Commerce, Inc.* (Software) | 958 | 180,257 | |||||||||
SPX Technologies, Inc.* (Machinery) | 1,196 | 170,000 | |||||||||
| STAAR Surgical Co.* (Health Care Equipment & Supplies) | 775 | 36,898 | |||||||||
Standex International Corp. (Machinery) | 307 | 49,473 | |||||||||
| StepStone Group, Inc.—Class A (Capital Markets) | 404 | 18,540 | |||||||||
Common Stocks, continued
Shares | Value | ||||||||||
| Steven Madden, Ltd. (Textiles, Apparel & Luxury Goods) | 1,785 | $ | 75,506 | ||||||||
| Strategic Education, Inc. (Diversified Consumer Services) | 233 | 25,784 | |||||||||
Stride, Inc.* (Diversified Consumer Services) | 1,034 | 72,898 | |||||||||
| Summit Hotel Properties, Inc. (Hotel & Resort REITs) | 1,426 | 8,542 | |||||||||
| Sun Country Airlines Holdings, Inc.* (Passenger Airlines) | 441 | 5,539 | |||||||||
| Sunstone Hotel Investors, Inc. (Hotel & Resort REITs) | 5,269 | 55,114 | |||||||||
| Supernus Pharmaceuticals, Inc.* (Pharmaceuticals) | 568 | 15,194 | |||||||||
| Tandem Diabetes Care, Inc.* (Health Care Equipment & Supplies) | 769 | 30,983 | |||||||||
Tanger, Inc. (Retail REITs) | 2,829 | 76,693 | |||||||||
TechTarget, Inc.* (Media) | 390 | 12,156 | |||||||||
| Telephone and Data Systems, Inc. (Wireless Telecommunication Services) | 1,275 | 26,431 | |||||||||
Tennant Co. (Machinery) | 492 | 48,432 | |||||||||
| The Andersons, Inc. (Consumer Staples Distribution & Retail) | 436 | 21,626 | |||||||||
The Bancorp, Inc.* (Banks) | 1,339 | 50,562 | |||||||||
The Buckle, Inc. (Specialty Retail) | 474 | 17,510 | |||||||||
| The Cheesecake Factory, Inc. (Hotels, Restaurants & Leisure) | 558 | 21,924 | |||||||||
| The Ensign Group, Inc. (Health Care Providers & Services) | 1,461 | 180,712 | |||||||||
The Simply Good Foods Co.* (Food Products) | 1,484 | 53,617 | |||||||||
| The St. Joe Co. (Real Estate Management & Development) | 922 | 50,433 | |||||||||
| Tidewater, Inc.* (Energy Equipment & Services) | 1,256 | 119,584 | |||||||||
Tootsie Roll Industries, Inc. (Food Products) | 279 | 8,529 | |||||||||
Tri Pointe Homes, Inc.* (Household Durables) | 1,497 | 55,763 | |||||||||
Trinity Industries, Inc. (Machinery) | 1,059 | 31,685 | |||||||||
| TripAdvisor, Inc.* (Interactive Media & Services) | 2,814 | 50,117 | |||||||||
Triumph Financial, Inc.* (Banks) | 559 | 45,698 | |||||||||
Trupanion, Inc.*(a) (Insurance) | 449 | 13,201 | |||||||||
| Two Harbors Investment Corp. (Mortgage REITs) | 2,677 | 35,363 | |||||||||
| U.S. Physical Therapy, Inc. (Health Care Providers & Services) | 215 | 19,870 | |||||||||
| UFP Technologies, Inc.* (Health Care Equipment & Supplies) | 182 | 48,024 | |||||||||
| UniFirst Corp. (Commercial Services & Supplies) | 159 | 27,273 | |||||||||
Uniti Group, Inc. (Specialized REITs) | 3,231 | 9,435 | |||||||||
Unitil Corp. (Multi-Utilities) | 188 | 9,737 | |||||||||
| Universal Health Realty Income Trust (Health Care REITs) | 157 | 6,145 | |||||||||
Upbound Group, Inc. (Specialty Retail) | 649 | 19,924 | |||||||||
Urban Edge Properties (Retail REITs) | 1,813 | 33,486 | |||||||||
Urban Outfitters, Inc.* (Specialty Retail) | 1,468 | 60,261 | |||||||||
Vector Group, Ltd. (Tobacco) | 1,557 | 16,457 | |||||||||
| Veeco Instruments, Inc.* (Semiconductors & Semiconductor Equipment) | 1,466 | 68,477 | |||||||||
Vericel Corp.* (Biotechnology) | 1,258 | 57,717 | |||||||||
Veris Residential, Inc. (Residential REITs) | 833 | 12,495 | |||||||||
Verra Mobility Corp.* (Professional Services) | 4,308 | 117,177 | |||||||||
See accompanying notes to the financial statements.
110 :: ProFund VP Small-Cap Growth :: Schedule of Portfolio Investments :: June 30, 2024 (unaudited)
Common Stocks, continued
Shares | Value | ||||||||||
| Vestis Corp. (Commercial Services & Supplies) | 1,802 | $ | 22,038 | ||||||||
| Viad Corp.* (Commercial Services & Supplies) | 547 | 18,598 | |||||||||
Vicor Corp.* (Electrical Equipment) | 310 | 10,280 | |||||||||
| Virtus Investment Partners, Inc. (Capital Markets) | 109 | 24,618 | |||||||||
| Vital Energy, Inc.* (Oil, Gas & Consumable Fuels) | 317 | 14,208 | |||||||||
Walker & Dunlop, Inc. (Financial Services) | 375 | 36,825 | |||||||||
Warrior Met Coal, Inc. (Metals & Mining) | 1,353 | 84,928 | |||||||||
WD-40 Co. (Household Products) | 351 | 77,093 | |||||||||
Westamerica Bancorp (Banks) | 421 | 20,431 | |||||||||
Whitestone REIT (Retail REITs) | 602 | 8,013 | |||||||||
Winnebago Industries, Inc. (Automobiles) | 424 | 22,981 | |||||||||
WisdomTree, Inc. (Capital Markets) | 2,887 | 28,610 | |||||||||
| World Acceptance Corp.* (Consumer Finance) | 87 | 10,751 | |||||||||
| Worthington Enterprises, Inc. (Household Durables) | 546 | 25,842 | |||||||||
Worthington Steel, Inc. (Metals & Mining) | 549 | 18,315 | |||||||||
WSFS Financial Corp. (Banks) | 699 | 32,853 | |||||||||
Xencor, Inc.* (Biotechnology) | 830 | 15,712 | |||||||||
| Xenia Hotels & Resorts, Inc. (Hotel & Resort REITs) | 1,556 | 22,297 | |||||||||
XPEL, Inc.* (Automobile Components) | 551 | 19,594 | |||||||||
Yelp, Inc.* (Interactive Media & Services) | 1,745 | 64,478 | |||||||||
| TOTAL COMMON STOCKS (Cost $11,220,537) | 15,606,340 | ||||||||||
Repurchase Agreements(b) (0.3%)
| Principal Amount | Value | ||||||||||
| Repurchase Agreements with various counterparties, rates 5.12%–5.20%, dated 6/28/2024, due 7/1/24, total to be received $53,023 | $ | 53,000 | $ | 53,000 | |||||||
| TOTAL REPURCHASE AGREEMENTS (Cost $53,000) | 53,000 | ||||||||||
Collateral for Securities Loaned(c) (0.1%)
Shares | Value | ||||||||||
| Invesco Government & Agency Portfolio—Institutional Shares, 5.23%(d) | 12,963 | $ | 12,963 | ||||||||
| TOTAL COLLATERAL FOR SECURITIES LOANED (Cost $12,963) | 12,963 | ||||||||||
| TOTAL INVESTMENT SECURITIES (Cost $11,286,500)—100.2% | 15,672,303 | ||||||||||
Net other assets (liabilities)—(0.2)% | (38,981 | ) | |||||||||
NET ASSETS—100.0% | $ | 15,633,322 | |||||||||
* Non-income producing security.
(a) All or part of this security was on loan as of June 30, 2024. The total value of securities on loan as of June 30, 2024 was $12,495.
(b) The ProFund VP invests in Repurchase Agreements jointly with other funds in the Trust. See "Repurchase Agreements" under Note 2 in the Notes to Financial Statements to view the details of each individual agreement and counterparty as well as a description of the securities subject to repurchase.
(c) Securities were purchased with cash collateral held from securities on loan at June 30, 2024.
(d) Rate periodically changes. Rate disclosed is the daily yield on June 30, 2024.
REIT Real Estate Investment Trust
See accompanying notes to the financial statements.
June 30, 2024 (unaudited) :: Schedule of Portfolio Investments :: ProFund VP Small-Cap Growth :: 111
ProFund VP Small-Cap Growth invested in the following industries as of June 30, 2024:
Value | % of Net Assets | ||||||||||
Aerospace & Defense | $ | 305,461 | 2.0 | % | |||||||
Automobile Components | 205,467 | 1.3 | % | ||||||||
Automobiles | 22,981 | 0.1 | % | ||||||||
Banks | 650,962 | 4.1 | % | ||||||||
Beverages | 34,547 | 0.2 | % | ||||||||
Biotechnology | 358,025 | 2.3 | % | ||||||||
Building Products | 343,916 | 2.2 | % | ||||||||
Capital Markets | 370,546 | 2.4 | % | ||||||||
Chemicals | 332,281 | 2.1 | % | ||||||||
Commercial Services & Supplies | 175,013 | 1.1 | % | ||||||||
Communications Equipment | 72,508 | 0.5 | % | ||||||||
Construction & Engineering | 156,855 | 1.0 | % | ||||||||
Consumer Finance | 49,489 | 0.3 | % | ||||||||
Consumer Staples Distribution & Retail | 21,626 | 0.1 | % | ||||||||
Containers & Packaging | 58,731 | 0.4 | % | ||||||||
Diversified Consumer Services | 261,244 | 1.7 | % | ||||||||
Diversified REITs | 73,602 | 0.5 | % | ||||||||
Diversified Telecommunication Services | 82,829 | 0.5 | % | ||||||||
Electric Utilities | 133,165 | 0.8 | % | ||||||||
Electrical Equipment | 162,803 | 1.0 | % | ||||||||
| Electronic Equipment, Instruments & Components | 811,596 | 5.2 | % | ||||||||
Energy Equipment & Services | 555,357 | 3.6 | % | ||||||||
Entertainment | 140,943 | 0.9 | % | ||||||||
Financial Services | 219,369 | 1.4 | % | ||||||||
Food Products | 203,655 | 1.4 | % | ||||||||
Gas Utilities | 27,506 | 0.2 | % | ||||||||
Ground Transportation | 122,465 | 0.8 | % | ||||||||
Health Care Equipment & Supplies | 595,477 | 3.8 | % | ||||||||
Health Care Providers & Services | 565,860 | 3.6 | % | ||||||||
Health Care REITs | 86,856 | 0.6 | % | ||||||||
Health Care Technology | 58,910 | 0.4 | % | ||||||||
Hotel & Resort REITs | 216,653 | 1.4 | % | ||||||||
Hotels, Restaurants & Leisure | 366,082 | 2.3 | % | ||||||||
Household Durables | 641,045 | 4.1 | % | ||||||||
Household Products | 100,548 | 0.7 | % | ||||||||
Industrial REITs | 44,016 | 0.3 | % | ||||||||
Insurance | 235,821 | 1.5 | % | ||||||||
Value | % of Net Assets | ||||||||||
Interactive Media & Services | $ | 245,271 | 1.6 | % | |||||||
IT Services | 68,092 | 0.4 | % | ||||||||
Life Sciences Tools & Services | 12,087 | 0.1 | % | ||||||||
Machinery | 995,780 | 6.3 | % | ||||||||
Marine Transportation | 115,777 | 0.7 | % | ||||||||
Media | 12,156 | 0.1 | % | ||||||||
Metals & Mining | 641,664 | 4.1 | % | ||||||||
Mortgage REITs | 135,302 | 0.9 | % | ||||||||
Multi-Utilities | 9,737 | 0.1 | % | ||||||||
Oil, Gas & Consumable Fuels | 648,903 | 4.1 | % | ||||||||
Passenger Airlines | 51,744 | 0.3 | % | ||||||||
Personal Care Products | 53,722 | 0.3 | % | ||||||||
Pharmaceuticals | 222,283 | 1.4 | % | ||||||||
Professional Services | 184,569 | 1.2 | % | ||||||||
Real Estate Management & Development | 81,075 | 0.5 | % | ||||||||
Residential REITs | 12,495 | 0.1 | % | ||||||||
Retail REITs | 223,402 | 1.3 | % | ||||||||
| Semiconductors & Semiconductor Equipment | 591,735 | 3.8 | % | ||||||||
Software | 965,526 | 6.2 | % | ||||||||
Specialized REITs | 57,944 | 0.4 | % | ||||||||
Specialty Retail | 807,569 | 5.2 | % | ||||||||
Textiles, Apparel & Luxury Goods | 198,565 | 1.3 | % | ||||||||
Tobacco | 16,457 | 0.1 | % | ||||||||
Trading Companies & Distributors | 261,899 | 1.7 | % | ||||||||
Water Utilities | 94,817 | 0.6 | % | ||||||||
Wireless Telecommunication Services | 33,559 | 0.2 | % | ||||||||
Other** | 26,982 | 0.2 | % | ||||||||
Total | $ | 15,633,322 | 100.0 | % | |||||||
** Includes any non-equity securities and net other assets (liabilities), which includes any receivable for capital shares issued and payable for capital shares redeemed.
REIT Real Estate Investment Trust
See accompanying notes to the financial statements.
Common Stocks (99.8%)
Shares | Value | ||||||||||
3D Systems Corp.* (Machinery) | 3,304 | $ | 10,143 | ||||||||
A10 Networks, Inc. (Software) | 918 | 12,714 | |||||||||
AAR Corp.* (Aerospace & Defense) | 230 | 16,721 | |||||||||
| ABM Industries, Inc. (Commercial Services & Supplies) | 1,568 | 79,293 | |||||||||
| Academy Sports & Outdoors, Inc. (Specialty Retail) | 1,828 | 97,342 | |||||||||
Acadia Realty Trust (Retail REITs) | 2,556 | 45,804 | |||||||||
ACI Worldwide, Inc.* (Software) | 967 | 38,284 | |||||||||
| AdaptHealth Corp.* (Health Care Providers & Services) | 1,934 | 19,340 | |||||||||
| Addus HomeCare Corp.* (Health Care Providers & Services) | 253 | 29,376 | |||||||||
Adeia, Inc. (Software) | 1,611 | 18,019 | |||||||||
Advance Auto Parts, Inc. (Specialty Retail) | 1,477 | 93,539 | |||||||||
| Advanced Energy Industries, Inc. (Electronic Equipment, Instruments & Components) | 354 | 38,501 | |||||||||
AdvanSix, Inc. (Chemicals) | 664 | 15,219 | |||||||||
| Air Lease Corp. (Trading Companies & Distributors) | 2,028 | 96,391 | |||||||||
Alaska Air Group, Inc.* (Passenger Airlines) | 3,145 | 127,058 | |||||||||
Albany International Corp. (Machinery) | 402 | 33,949 | |||||||||
Alexander & Baldwin, Inc. (Diversified REITs) | 1,797 | 30,477 | |||||||||
Alkermes PLC* (Biotechnology) | 1,510 | 36,391 | |||||||||
Allegiant Travel Co. (Passenger Airlines) | 359 | 18,033 | |||||||||
| Alpha & Omega Semiconductor, Ltd.* (Semiconductors & Semiconductor Equipment) | 576 | 21,525 | |||||||||
AMC Networks, Inc.*—Class A (Media) | 764 | 7,380 | |||||||||
American Assets Trust, Inc. (Diversified REITs) | 1,207 | 27,013 | |||||||||
| American Axle & Manufacturing Holdings, Inc.* (Automobile Components) | 2,910 | 20,341 | |||||||||
American States Water Co. (Water Utilities) | 434 | 31,495 | |||||||||
| American Woodmark Corp.* (Building Products) | 173 | 13,598 | |||||||||
Ameris Bancorp (Banks) | 1,604 | 80,761 | |||||||||
AMERISAFE, Inc. (Insurance) | 271 | 11,894 | |||||||||
| AMN Healthcare Services, Inc.* (Health Care Providers & Services) | 433 | 22,183 | |||||||||
Apogee Enterprises, Inc. (Building Products) | 302 | 18,976 | |||||||||
| Apollo Commercial Real Estate Finance, Inc. (Mortgage REITs) | 1,229 | 12,032 | |||||||||
Arbor Realty Trust, Inc.(a) (Mortgage REITs) | 4,669 | 67,000 | |||||||||
Arch Resources, Inc. (Metals & Mining) | 139 | 21,160 | |||||||||
Arcosa, Inc. (Construction & Engineering) | 494 | 41,205 | |||||||||
Arcus Biosciences, Inc.* (Biotechnology) | 797 | 12,138 | |||||||||
| Armada Hoffler Properties, Inc. (Diversified REITs) | 945 | 10,480 | |||||||||
| ARMOUR Residential REIT, Inc. (Mortgage REITs) | 373 | 7,229 | |||||||||
| Artisan Partners Asset Management, Inc.—Class A (Capital Markets) | 761 | 31,406 | |||||||||
| Artivion, Inc.* (Health Care Equipment & Supplies) | 451 | 11,568 | |||||||||
| Asbury Automotive Group, Inc.* (Specialty Retail) | 256 | 58,335 | |||||||||
Assured Guaranty, Ltd. (Insurance) | 513 | 39,578 | |||||||||
Astec Industries, Inc. (Machinery) | 564 | 16,728 | |||||||||
Atlantic Union Bankshares Corp. (Banks) | 2,224 | 73,058 | |||||||||
Common Stocks, continued
Shares | Value | ||||||||||
| Avanos Medical, Inc.* (Health Care Equipment & Supplies) | 1,137 | $ | 22,649 | ||||||||
Avista Corp. (Multi-Utilities) | 1,938 | 67,074 | |||||||||
Axos Financial, Inc.* (Banks) | 465 | 26,575 | |||||||||
B Riley Financial, Inc.(a) (Capital Markets) | 404 | 7,127 | |||||||||
B&G Foods, Inc. (Food Products) | 1,956 | 15,804 | |||||||||
Balchem Corp. (Chemicals) | 355 | 54,651 | |||||||||
Banc of California, Inc. (Banks) | 3,439 | 43,950 | |||||||||
BancFirst Corp. (Banks) | 137 | 12,015 | |||||||||
Bank of Hawaii Corp. (Banks) | 591 | 33,811 | |||||||||
BankUnited, Inc. (Banks) | 1,852 | 54,208 | |||||||||
Banner Corp. (Banks) | 853 | 42,343 | |||||||||
Barnes Group, Inc. (Machinery) | 1,256 | 52,011 | |||||||||
| Benchmark Electronics, Inc. (Electronic Equipment, Instruments & Components) | 893 | 35,238 | |||||||||
Berkshire Hills Bancorp, Inc. (Banks) | 536 | 12,221 | |||||||||
BGC Group, Inc.—Class A (Capital Markets) | 3,993 | 33,142 | |||||||||
| BioLife Solutions, Inc.* (Life Sciences Tools & Services) | 359 | 7,693 | |||||||||
| BJ's Restaurants, Inc.* (Hotels, Restaurants & Leisure) | 580 | 20,126 | |||||||||
BlackLine, Inc.* (Software) | 420 | 20,349 | |||||||||
| Blackstone Mortgage Trust, Inc.(a)—Class A (Mortgage REITs) | 4,301 | 74,923 | |||||||||
| Bloomin' Brands, Inc. (Hotels, Restaurants & Leisure) | 1,092 | 20,999 | |||||||||
Box, Inc.*—Class A (Software) | 1,395 | 36,884 | |||||||||
| Brady Corp.—Class A (Commercial Services & Supplies) | 389 | 25,682 | |||||||||
Brandywine Realty Trust (Office REITs) | 4,266 | 19,112 | |||||||||
| Bread Financial Holdings, Inc. (Consumer Finance) | 1,228 | 54,720 | |||||||||
| Brightsphere Investment Group, Inc. (Capital Markets) | 291 | 6,451 | |||||||||
| Brinker International, Inc.* (Hotels, Restaurants & Leisure) | 640 | 46,330 | |||||||||
| Bristow Group, Inc.* (Energy Equipment & Services) | 598 | 20,051 | |||||||||
Brookline Bancorp, Inc. (Banks) | 2,200 | 18,370 | |||||||||
Cable One, Inc. (Media) | 113 | 40,002 | |||||||||
| Cactus, Inc.—Class A (Energy Equipment & Services) | 619 | 32,646 | |||||||||
Calavo Growers, Inc. (Food Products) | 439 | 9,965 | |||||||||
Caleres, Inc. (Specialty Retail) | 819 | 27,518 | |||||||||
| California Water Service Group (Water Utilities) | 858 | 41,605 | |||||||||
Calix, Inc.* (Communications Equipment) | 737 | 26,112 | |||||||||
Capitol Federal Financial, Inc. (Banks) | 3,056 | 16,777 | |||||||||
CareTrust REIT, Inc. (Health Care REITs) | 1,302 | 32,680 | |||||||||
Cathay General Bancorp (Banks) | 956 | 36,060 | |||||||||
Centerspace (Residential REITs) | 369 | 24,955 | |||||||||
| Central Garden & Pet Co.* (Household Products) | 237 | 9,125 | |||||||||
| Central Garden & Pet Co.*—Class A (Household Products) | 1,342 | 44,326 | |||||||||
Central Pacific Financial Corp. (Banks) | 670 | 14,204 | |||||||||
Century Aluminum Co.* (Metals & Mining) | 1,286 | 21,541 | |||||||||
| Century Communities, Inc. (Household Durables) | 345 | 28,173 | |||||||||
Certara, Inc.* (Health Care Technology) | 1,120 | 15,512 | |||||||||
See accompanying notes to the financial statements.
June 30, 2024 (unaudited) :: Schedule of Portfolio Investments :: ProFund VP Small-Cap Value :: 113
Common Stocks, continued
Shares | Value | ||||||||||
| CEVA, Inc.* (Semiconductors & Semiconductor Equipment) | 332 | $ | 6,404 | ||||||||
Chesapeake Utilities Corp. (Gas Utilities) | 304 | 32,285 | |||||||||
| Chuy's Holdings, Inc.* (Hotels, Restaurants & Leisure) | 184 | 4,769 | |||||||||
City Holding Co. (Banks) | 146 | 15,513 | |||||||||
| Clearwater Paper Corp.* (Paper & Forest Products) | 413 | 20,018 | |||||||||
| Clearway Energy, Inc.—Class A (Independent Power and Renewable Electricity Producers) | 857 | 19,420 | |||||||||
| Clearway Energy, Inc.—Class C (Independent Power and Renewable Electricity Producers) | 2,042 | 50,417 | |||||||||
Cohen & Steers, Inc. (Capital Markets) | 333 | 24,162 | |||||||||
| Cohu, Inc.* (Semiconductors & Semiconductor Equipment) | 687 | 22,740 | |||||||||
Comerica, Inc. (Banks) | 3,285 | 167,667 | |||||||||
Community Financial System, Inc. (Banks) | 1,308 | 61,751 | |||||||||
| Community Healthcare Trust, Inc. (Health Care REITs) | 362 | 8,467 | |||||||||
| Compass Minerals International, Inc. (Metals & Mining) | 837 | 8,646 | |||||||||
| Comstock Resources, Inc. (Oil, Gas & Consumable Fuels) | 1,169 | 12,134 | |||||||||
| Consolidated Communications Holdings, Inc.* (Diversified Telecommunication Services) | 1,876 | 8,254 | |||||||||
Corcept Therapeutics, Inc.* (Pharmaceuticals) | 794 | 25,797 | |||||||||
| Core Laboratories, Inc. (Energy Equipment & Services) | 650 | 13,189 | |||||||||
| CoreCivic, Inc.* (Commercial Services & Supplies) | 2,755 | 35,760 | |||||||||
| Corsair Gaming, Inc.* (Technology Hardware, Storage & Peripherals) | 1,079 | 11,912 | |||||||||
| Cracker Barrel Old Country Store, Inc. (Hotels, Restaurants & Leisure) | 550 | 23,188 | |||||||||
| Cross Country Healthcare, Inc.* (Health Care Providers & Services) | 809 | 11,197 | |||||||||
| CSG Systems International, Inc. (Professional Services) | 360 | 14,821 | |||||||||
| CTS Corp. (Electronic Equipment, Instruments & Components) | 334 | 16,910 | |||||||||
| Cushman & Wakefield PLC* (Real Estate Management & Development) | 4,879 | 50,742 | |||||||||
CVB Financial Corp. (Banks) | 3,286 | 56,651 | |||||||||
| CVR Energy, Inc. (Oil, Gas & Consumable Fuels) | 326 | 8,727 | |||||||||
| Cytek Biosciences, Inc.* (Life Sciences Tools & Services) | 2,372 | 13,236 | |||||||||
Dana, Inc. (Automobile Components) | 3,196 | 38,736 | |||||||||
| Deluxe Corp. (Commercial Services & Supplies) | 1,090 | 24,481 | |||||||||
| Designer Brands, Inc.—Class A (Specialty Retail) | 1,076 | 7,349 | |||||||||
| Digi International, Inc.* (Communications Equipment) | 901 | 20,660 | |||||||||
DigitalOcean Holdings, Inc.* (IT Services) | 599 | 20,815 | |||||||||
Dime Community Bancshares, Inc. (Banks) | 869 | 17,728 | |||||||||
Common Stocks, continued
Shares | Value | ||||||||||
| Dine Brands Global, Inc. (Hotels, Restaurants & Leisure) | 218 | $ | 7,892 | ||||||||
| Diodes, Inc.* (Semiconductors & Semiconductor Equipment) | 445 | 32,009 | |||||||||
| DNOW, Inc.* (Trading Companies & Distributors) | 2,646 | 36,330 | |||||||||
| Dorman Products, Inc.* (Automobile Components) | 215 | 19,668 | |||||||||
Douglas Emmett, Inc. (Office REITs) | 4,146 | 55,183 | |||||||||
| Dril-Quip, Inc.* (Energy Equipment & Services) | 852 | 15,847 | |||||||||
DXC Technology Co.* (IT Services) | 4,432 | 84,608 | |||||||||
| DXP Enterprises, Inc.* (Trading Companies & Distributors) | 324 | 14,852 | |||||||||
| Dycom Industries, Inc.* (Construction & Engineering) | 720 | 121,507 | |||||||||
Eagle Bancorp, Inc. (Banks) | 748 | 14,137 | |||||||||
| Easterly Government Properties, Inc. (Office REITs) | 2,550 | 31,544 | |||||||||
| EchoStar Corp.*—Class A (Diversified Telecommunication Services) | 2,985 | 53,163 | |||||||||
| Edgewell Personal Care Co. (Personal Care Products) | 1,228 | 49,354 | |||||||||
Elme Communities (Residential REITs) | 2,180 | 34,728 | |||||||||
| Embecta Corp. (Health Care Equipment & Supplies) | 1,427 | 17,838 | |||||||||
Employers Holdings, Inc. (Insurance) | 628 | 26,772 | |||||||||
| Encore Capital Group, Inc.* (Consumer Finance) | 588 | 24,537 | |||||||||
| Energizer Holdings, Inc. (Household Products) | 893 | 26,379 | |||||||||
Enerpac Tool Group Corp. (Machinery) | 443 | 16,914 | |||||||||
| Enhabit, Inc.* (Health Care Providers & Services) | 1,240 | 11,061 | |||||||||
Enova International, Inc.* (Consumer Finance) | 673 | 41,894 | |||||||||
Enpro, Inc. (Machinery) | 286 | 41,633 | |||||||||
Envestnet, Inc.* (Software) | 720 | 45,065 | |||||||||
| Enviri Corp.* (Commercial Services & Supplies) | 1,983 | 17,113 | |||||||||
| ePlus, Inc.* (Electronic Equipment, Instruments & Components) | 258 | 19,009 | |||||||||
| Essential Properties Realty Trust, Inc. (Diversified REITs) | 2,084 | 57,747 | |||||||||
| Ethan Allen Interiors, Inc. (Household Durables) | 335 | 9,343 | |||||||||
| Extreme Networks, Inc.* (Communications Equipment) | 1,287 | 17,310 | |||||||||
EZCORP, Inc.*—Class A (Consumer Finance) | 1,286 | 13,464 | |||||||||
FB Financial Corp. (Banks) | 873 | 34,073 | |||||||||
First Bancorp (Banks) | 1,020 | 32,558 | |||||||||
First Commonwealth Financial Corp. (Banks) | 1,364 | 18,837 | |||||||||
First Financial Bancorp (Banks) | 2,365 | 52,550 | |||||||||
First Hawaiian, Inc. (Banks) | 3,166 | 65,726 | |||||||||
Foot Locker, Inc. (Specialty Retail) | 2,036 | 50,737 | |||||||||
| Fortrea Holdings, Inc.* (Life Sciences Tools & Services) | 2,215 | 51,698 | |||||||||
Forward Air Corp. (Air Freight & Logistics) | 782 | 14,889 | |||||||||
| Four Corners Property Trust, Inc. (Specialized REITs) | 1,276 | 31,479 | |||||||||
| Fox Factory Holding Corp.* (Automobile Components) | 640 | 30,842 | |||||||||
See accompanying notes to the financial statements.
114 :: ProFund VP Small-Cap Value :: Schedule of Portfolio Investments :: June 30, 2024 (unaudited)
Common Stocks, continued
Shares | Value | ||||||||||
| Franklin BSP Realty Trust, Inc. (Mortgage REITs) | 2,028 | $ | 25,553 | ||||||||
| Fresh Del Monte Produce, Inc. (Food Products) | 831 | 18,157 | |||||||||
| Fulgent Genetics, Inc.* (Health Care Providers & Services) | 504 | 9,888 | |||||||||
Fulton Financial Corp. (Banks) | 4,503 | 76,461 | |||||||||
Gentherm, Inc.* (Automobile Components) | 424 | 20,912 | |||||||||
Genworth Financial, Inc.* (Insurance) | 10,843 | 65,492 | |||||||||
Getty Realty Corp. (Retail REITs) | 693 | 18,475 | |||||||||
| G-III Apparel Group, Ltd.* (Textiles, Apparel & Luxury Goods) | 992 | 26,853 | |||||||||
Global Net Lease, Inc. (Diversified REITs) | 4,839 | 35,567 | |||||||||
| Gogo, Inc.* (Wireless Telecommunication Services) | 799 | 7,686 | |||||||||
| Golden Entertainment, Inc. (Hotels, Restaurants & Leisure) | 210 | 6,533 | |||||||||
| Granite Construction, Inc. (Construction & Engineering) | 536 | 33,216 | |||||||||
| Green Dot Corp.*—Class A (Consumer Finance) | 1,131 | 10,688 | |||||||||
| Green Plains, Inc.* (Oil, Gas & Consumable Fuels) | 1,600 | 25,376 | |||||||||
Griffon Corp. (Building Products) | 296 | 18,903 | |||||||||
| Grocery Outlet Holding Corp.* (Consumer Staples Distribution & Retail) | 2,474 | 54,726 | |||||||||
H.B. Fuller Co. (Chemicals) | 689 | 53,025 | |||||||||
| Hanesbrands, Inc.* (Textiles, Apparel & Luxury Goods) | 8,708 | 42,930 | |||||||||
Hanmi Financial Corp. (Banks) | 748 | 12,507 | |||||||||
| Hannon Armstrong Sustainable Infrastructure Capital, Inc. (Mortgage REITs) | 2,818 | 83,413 | |||||||||
| Harmonic, Inc.* (Communications Equipment) | 1,326 | 15,607 | |||||||||
| Harmony Biosciences Holdings, Inc.* (Pharmaceuticals) | 449 | 13,546 | |||||||||
Haverty Furniture Cos., Inc. (Specialty Retail) | 330 | 8,346 | |||||||||
Haynes International, Inc. (Metals & Mining) | 138 | 8,101 | |||||||||
Hayward Holdings, Inc.* (Building Products) | 3,140 | 38,622 | |||||||||
| Healthcare Services Group, Inc.* (Commercial Services & Supplies) | 1,823 | 19,287 | |||||||||
HealthStream, Inc. (Health Care Technology) | 280 | 7,812 | |||||||||
| Heartland Express, Inc. (Ground Transportation) | 511 | 6,301 | |||||||||
| Heidrick & Struggles International, Inc. (Professional Services) | 502 | 15,853 | |||||||||
| Helmerich & Payne, Inc. (Energy Equipment & Services) | 1,125 | 40,657 | |||||||||
Heritage Financial Corp. (Banks) | 858 | 15,470 | |||||||||
| Hertz Global Holdings, Inc.* (Ground Transportation) | 3,255 | 11,490 | |||||||||
Hibbett, Inc. (Specialty Retail) | 296 | 25,814 | |||||||||
Highwoods Properties, Inc. (Office REITs) | 2,626 | 68,984 | |||||||||
Hillenbrand, Inc. (Machinery) | 1,740 | 69,635 | |||||||||
Hilltop Holdings, Inc. (Banks) | 1,148 | 35,909 | |||||||||
HNI Corp. (Commercial Services & Supplies) | 469 | 21,114 | |||||||||
Hope Bancorp, Inc. (Banks) | 2,987 | 32,080 | |||||||||
Horace Mann Educators Corp. (Insurance) | 1,015 | 33,109 | |||||||||
| Hub Group, Inc.—Class A (Air Freight & Logistics) | 1,530 | 65,867 | |||||||||
Hudson Pacific Properties, Inc. (Office REITs) | 3,141 | 15,108 | |||||||||
Common Stocks, continued
Shares | Value | ||||||||||
IAC, Inc.* (Interactive Media & Services) | 1,039 | $ | 48,678 | ||||||||
| Ichor Holdings, Ltd.* (Semiconductors & Semiconductor Equipment) | 830 | 31,997 | |||||||||
| ICU Medical, Inc.* (Health Care Equipment & Supplies) | 508 | 60,324 | |||||||||
| Inari Medical, Inc.* (Health Care Equipment & Supplies) | 551 | 26,531 | |||||||||
Independent Bank Corp. (Banks) | 1,053 | 53,408 | |||||||||
Independent Bank Group, Inc. (Banks) | 892 | 40,604 | |||||||||
Ingevity Corp.* (Chemicals) | 837 | 36,585 | |||||||||
Innospec, Inc. (Chemicals) | 229 | 28,302 | |||||||||
| Innovative Industrial Properties, Inc. (Industrial REITs) | 316 | 34,514 | |||||||||
Innoviva, Inc.* (Pharmaceuticals) | 680 | 11,152 | |||||||||
| Insight Enterprises, Inc.* (Electronic Equipment, Instruments & Components) | 240 | 47,606 | |||||||||
Insteel Industries, Inc. (Building Products) | 179 | 5,542 | |||||||||
| Integra LifeSciences Holdings Corp.* (Health Care Equipment & Supplies) | 1,700 | 49,538 | |||||||||
| Interface, Inc. (Commercial Services & Supplies) | 1,442 | 21,169 | |||||||||
| Ironwood Pharmaceuticals, Inc.* (Biotechnology) | 1,488 | 9,702 | |||||||||
| Itron, Inc.* (Electronic Equipment, Instruments & Components) | 580 | 57,397 | |||||||||
| Jackson Financial, Inc.—Class A (Financial Services) | 1,682 | 124,905 | |||||||||
JBG SMITH Properties (Office REITs) | 2,072 | 31,557 | |||||||||
JetBlue Airways Corp.* (Passenger Airlines) | 8,425 | 51,308 | |||||||||
John B Sanfilippo & Son, Inc. (Food Products) | 105 | 10,203 | |||||||||
John Bean Technologies Corp. (Machinery) | 316 | 30,011 | |||||||||
John Wiley & Sons, Inc.—Class A (Media) | 1,042 | 42,409 | |||||||||
Kaiser Aluminum Corp. (Metals & Mining) | 394 | 34,632 | |||||||||
| Kelly Services, Inc.—Class A (Professional Services) | 798 | 17,085 | |||||||||
Kennametal, Inc. (Machinery) | 1,949 | 45,879 | |||||||||
| Kennedy-Wilson Holdings, Inc. (Real Estate Management & Development) | 2,895 | 28,139 | |||||||||
| KKR Real Estate Finance Trust, Inc. (Mortgage REITs) | 1,441 | 13,041 | |||||||||
| Knowles Corp.* (Electronic Equipment, Instruments & Components) | 1,312 | 22,645 | |||||||||
Kohl's Corp. (Broadline Retail) | 2,748 | 63,177 | |||||||||
Koppers Holdings, Inc. (Chemicals) | 247 | 9,137 | |||||||||
Korn Ferry (Professional Services) | 543 | 36,457 | |||||||||
Krystal Biotech, Inc.* (Biotechnology) | 209 | 38,381 | |||||||||
| Kulicke & Soffa Industries, Inc. (Semiconductors & Semiconductor Equipment) | 509 | 25,038 | |||||||||
Lakeland Financial Corp. (Banks) | 336 | 20,671 | |||||||||
La-Z-Boy, Inc. (Household Durables) | 486 | 18,118 | |||||||||
LCI Industries (Automobile Components) | 234 | 24,191 | |||||||||
Leggett & Platt, Inc. (Household Durables) | 3,320 | 38,047 | |||||||||
Leslie's, Inc.* (Specialty Retail) | 4,576 | 19,173 | |||||||||
LGI Homes, Inc.* (Household Durables) | 203 | 18,166 | |||||||||
| Ligand Pharmaceuticals, Inc.* (Pharmaceuticals) | 419 | 35,305 | |||||||||
Lincoln National Corp. (Insurance) | 4,213 | 131,024 | |||||||||
Lindsay Corp. (Machinery) | 140 | 17,203 | |||||||||
LTC Properties, Inc. (Health Care REITs) | 614 | 21,183 | |||||||||
See accompanying notes to the financial statements.
June 30, 2024 (unaudited) :: Schedule of Portfolio Investments :: ProFund VP Small-Cap Value :: 115
Common Stocks, continued
Shares | Value | ||||||||||
| Lumen Technologies, Inc.* (Diversified Telecommunication Services) | 25,146 | $ | 27,661 | ||||||||
LXP Industrial Trust (Industrial REITs) | 7,290 | 66,484 | |||||||||
| Marcus & Millichap, Inc. (Real Estate Management & Development) | 352 | 11,095 | |||||||||
MarineMax, Inc.* (Specialty Retail) | 503 | 16,282 | |||||||||
| Marten Transport, Ltd. (Ground Transportation) | 758 | 13,985 | |||||||||
Masterbrand, Inc.* (Building Products) | 3,146 | 46,183 | |||||||||
Mativ Holdings, Inc. (Chemicals) | 1,346 | 22,828 | |||||||||
| Matthews International Corp.—Class A (Commercial Services & Supplies) | 275 | 6,889 | |||||||||
| MaxLinear, Inc.* (Semiconductors & Semiconductor Equipment) | 711 | 14,320 | |||||||||
| Medical Properties Trust, Inc.(a) (Health Care REITs) | 14,872 | 64,099 | |||||||||
| Mercer International, Inc. (Paper & Forest Products) | 1,089 | 9,300 | |||||||||
Mercury General Corp. (Insurance) | 659 | 35,019 | |||||||||
| Mercury Systems, Inc.* (Aerospace & Defense) | 1,294 | 34,926 | |||||||||
| Merit Medical Systems, Inc.* (Health Care Equipment & Supplies) | 591 | 50,796 | |||||||||
| Mesa Laboratories, Inc. (Life Sciences Tools & Services) | 127 | 11,020 | |||||||||
Metallus, Inc.* (Metals & Mining) | 415 | 8,412 | |||||||||
MGE Energy, Inc. (Electric Utilities) | 403 | 30,112 | |||||||||
MGP Ingredients, Inc. (Beverages) | 163 | 12,127 | |||||||||
Middlesex Water Co. (Water Utilities) | 239 | 12,490 | |||||||||
| MillerKnoll, Inc. (Commercial Services & Supplies) | 1,775 | 47,020 | |||||||||
Minerals Technologies, Inc. (Chemicals) | 399 | 33,181 | |||||||||
| Mister Car Wash, Inc.* (Diversified Consumer Services) | 1,237 | 8,807 | |||||||||
Moelis & Co.—Class A (Capital Markets) | 802 | 45,602 | |||||||||
Monro, Inc. (Specialty Retail) | 741 | 17,680 | |||||||||
| Movado Group, Inc. (Textiles, Apparel & Luxury Goods) | 387 | 9,621 | |||||||||
Mr. Cooper Group, Inc.* (Financial Services) | 1,604 | 130,293 | |||||||||
| Myers Industries, Inc. (Containers & Packaging) | 469 | 6,275 | |||||||||
Myriad Genetics, Inc.* (Biotechnology) | 1,143 | 27,958 | |||||||||
N-able, Inc.* (Software) | 626 | 9,534 | |||||||||
| Nabors Industries, Ltd.* (Energy Equipment & Services) | 222 | 15,798 | |||||||||
| National Bank Holdings Corp.—Class A (Banks) | 937 | 36,590 | |||||||||
National Beverage Corp. (Beverages) | 262 | 13,425 | |||||||||
| National HealthCare Corp. (Health Care Providers & Services) | 179 | 19,404 | |||||||||
| National Presto Industries, Inc. (Aerospace & Defense) | 73 | 5,484 | |||||||||
| National Vision Holdings, Inc.* (Specialty Retail) | 1,946 | 25,473 | |||||||||
Navient Corp. (Consumer Finance) | 1,994 | 29,033 | |||||||||
NBT Bancorp, Inc. (Banks) | 1,167 | 45,046 | |||||||||
NCR Atleos Corp.* (Financial Services) | 1,698 | 45,880 | |||||||||
NCR Voyix Corp.* (Software) | 3,412 | 42,138 | |||||||||
| NetScout Systems, Inc.* (Communications Equipment) | 1,768 | 32,337 | |||||||||
Newell Brands, Inc. (Household Durables) | 9,462 | 60,652 | |||||||||
Common Stocks, continued
Shares | Value | ||||||||||
| NexPoint Residential Trust, Inc. (Residential REITs) | 566 | $ | 22,363 | ||||||||
NMI Holdings, Inc.* (Financial Services) | 695 | 23,658 | |||||||||
Northwest Bancshares, Inc. (Banks) | 3,151 | 36,394 | |||||||||
Northwest Natural Holding Co. (Gas Utilities) | 942 | 34,015 | |||||||||
| Nu Skin Enterprises, Inc.—Class A (Personal Care Products) | 1,230 | 12,964 | |||||||||
NV5 Global, Inc.* (Professional Services) | 321 | 29,843 | |||||||||
O-I Glass, Inc.* (Containers & Packaging) | 3,857 | 42,928 | |||||||||
Olympic Steel, Inc. (Metals & Mining) | 124 | 5,559 | |||||||||
| Omnicell, Inc.* (Health Care Equipment & Supplies) | 1,138 | 30,806 | |||||||||
| OPENLANE, Inc.* (Commercial Services & Supplies) | 2,683 | 44,511 | |||||||||
Organon & Co. (Pharmaceuticals) | 6,371 | 131,881 | |||||||||
Outfront Media, Inc. (Specialized REITs) | 2,098 | 30,001 | |||||||||
| Owens & Minor, Inc.* (Health Care Providers & Services) | 1,815 | 24,503 | |||||||||
Pacific Premier Bancorp, Inc. (Banks) | 2,389 | 54,875 | |||||||||
Pacira BioSciences, Inc.* (Pharmaceuticals) | 1,153 | 32,987 | |||||||||
| Papa John's International, Inc. (Hotels, Restaurants & Leisure) | 433 | 20,342 | |||||||||
Park National Corp. (Banks) | 210 | 29,891 | |||||||||
| Patterson Cos., Inc. (Health Care Providers & Services) | 1,975 | 47,636 | |||||||||
| Patterson-UTI Energy, Inc. (Energy Equipment & Services) | 3,447 | 35,710 | |||||||||
Payoneer Global, Inc.* (Financial Services) | 3,763 | 20,847 | |||||||||
| PC Connection, Inc. (Electronic Equipment, Instruments & Components) | 281 | 18,040 | |||||||||
| Peabody Energy Corp. (Oil, Gas & Consumable Fuels) | 1,440 | 31,853 | |||||||||
| Pebblebrook Hotel Trust (Hotel & Resort REITs) | 2,985 | 41,043 | |||||||||
| Pediatrix Medical Group, Inc.* (Health Care Providers & Services) | 2,049 | 15,470 | |||||||||
| Penn Entertainment, Inc.* (Hotels, Restaurants & Leisure) | 3,703 | 71,671 | |||||||||
| PennyMac Mortgage Investment Trust (Mortgage REITs) | 2,151 | 29,576 | |||||||||
| Perdoceo Education Corp. (Diversified Consumer Services) | 715 | 15,315 | |||||||||
Perficient, Inc.* (IT Services) | 341 | 25,503 | |||||||||
| Phibro Animal Health Corp.—Class A (Pharmaceuticals) | 503 | 8,435 | |||||||||
Phillips Edison & Co., Inc. (Retail REITs) | 1,486 | 48,607 | |||||||||
Phinia, Inc. (Automobile Components) | 1,131 | 44,515 | |||||||||
| Photronics, Inc.* (Semiconductors & Semiconductor Equipment) | 470 | 11,595 | |||||||||
Piper Sandler Cos. (Capital Markets) | 197 | 45,343 | |||||||||
| Pitney Bowes, Inc. (Commercial Services & Supplies) | 3,853 | 19,573 | |||||||||
PJT Partners, Inc.—Class A (Capital Markets) | 236 | 25,467 | |||||||||
| Plexus Corp.* (Electronic Equipment, Instruments & Components) | 380 | 39,208 | |||||||||
PRA Group, Inc.* (Consumer Finance) | 974 | 19,149 | |||||||||
| Premier, Inc.—Class A (Health Care Providers & Services) | 2,596 | 48,466 | |||||||||
| Prestige Consumer Healthcare, Inc.* (Pharmaceuticals) | 644 | 44,339 | |||||||||
See accompanying notes to the financial statements.
116 :: ProFund VP Small-Cap Value :: Schedule of Portfolio Investments :: June 30, 2024 (unaudited)
Common Stocks, continued
Shares | Value | ||||||||||
| PriceSmart, Inc. (Consumer Staples Distribution & Retail) | 624 | $ | 50,669 | ||||||||
ProAssurance Corp.* (Insurance) | 1,262 | 15,422 | |||||||||
| ProPetro Holding Corp.* (Energy Equipment & Services) | 2,040 | 17,687 | |||||||||
Proto Labs, Inc.* (Machinery) | 220 | 6,796 | |||||||||
Provident Financial Services, Inc. (Banks) | 3,232 | 46,379 | |||||||||
Quaker Chemical Corp. (Chemicals) | 165 | 28,001 | |||||||||
| Quanex Building Products Corp. (Building Products) | 255 | 7,051 | |||||||||
| QuinStreet, Inc.* (Interactive Media & Services) | 1,300 | 21,567 | |||||||||
Radian Group, Inc. (Financial Services) | 1,680 | 52,248 | |||||||||
Ready Capital Corp. (Mortgage REITs) | 3,848 | 31,477 | |||||||||
REGENXBIO, Inc.* (Biotechnology) | 639 | 7,476 | |||||||||
Renasant Corp. (Banks) | 1,396 | 42,634 | |||||||||
| Resideo Technologies, Inc.* (Building Products) | 3,618 | 70,767 | |||||||||
| Retail Opportunity Investments Corp. (Retail REITs) | 3,156 | 39,229 | |||||||||
Robert Half, Inc. (Professional Services) | 2,561 | 163,854 | |||||||||
| Rogers Corp.* (Electronic Equipment, Instruments & Components) | 137 | 16,524 | |||||||||
| Rush Enterprises, Inc.—Class A (Trading Companies & Distributors) | 843 | 35,296 | |||||||||
RXO, Inc.* (Ground Transportation) | 1,573 | 41,134 | |||||||||
S&T Bancorp, Inc. (Banks) | 445 | 14,859 | |||||||||
Sabre Corp.* (Hotels, Restaurants & Leisure) | 4,446 | 11,871 | |||||||||
Safehold, Inc. (Specialized REITs) | 1,114 | 21,489 | |||||||||
Safety Insurance Group, Inc. (Insurance) | 367 | 27,536 | |||||||||
Sally Beauty Holdings, Inc.* (Specialty Retail) | 2,563 | 27,501 | |||||||||
| Sanmina Corp.* (Electronic Equipment, Instruments & Components) | 1,374 | 91,028 | |||||||||
Saul Centers, Inc. (Retail REITs) | 164 | 6,030 | |||||||||
| ScanSource, Inc.* (Electronic Equipment, Instruments & Components) | 612 | 27,118 | |||||||||
Scholastic Corp. (Media) | 631 | 22,382 | |||||||||
Schrodinger, Inc.* (Health Care Technology) | 601 | 11,623 | |||||||||
Seacoast Banking Corp. of Florida (Banks) | 2,085 | 49,289 | |||||||||
Sealed Air Corp. (Containers & Packaging) | 2,164 | 75,286 | |||||||||
| Select Medical Holdings Corp. (Health Care Providers & Services) | 2,642 | 92,628 | |||||||||
| Semtech Corp.* (Semiconductors & Semiconductor Equipment) | 880 | 26,294 | |||||||||
Sensient Technologies Corp. (Chemicals) | 598 | 44,366 | |||||||||
| Service Properties Trust (Hotel & Resort REITs) | 4,104 | 21,095 | |||||||||
ServisFirst Bancshares, Inc. (Banks) | 657 | 41,516 | |||||||||
Shoe Carnival, Inc. (Specialty Retail) | 443 | 16,342 | |||||||||
| Shutterstock, Inc. (Interactive Media & Services) | 292 | 11,300 | |||||||||
| Simmons First National Corp.—Class A (Banks) | 3,108 | 54,639 | |||||||||
| Simulations Plus, Inc. (Health Care Technology) | 163 | 7,925 | |||||||||
SITE Centers Corp. (Retail REITs) | 2,365 | 34,293 | |||||||||
| SiTime Corp.* (Semiconductors & Semiconductor Equipment) | 184 | 22,886 | |||||||||
SJW Group (Water Utilities) | 414 | 22,447 | |||||||||
SkyWest, Inc.* (Passenger Airlines) | 459 | 37,670 | |||||||||
SL Green Realty Corp. (Office REITs) | 1,606 | 90,963 | |||||||||
Common Stocks, continued
Shares | Value | ||||||||||
| SMART Global Holdings, Inc.* (Semiconductors & Semiconductor Equipment) | 764 | $ | 17,473 | ||||||||
| SolarEdge Technologies, Inc.* (Semiconductors & Semiconductor Equipment) | 866 | 21,875 | |||||||||
| Sonic Automotive, Inc.—Class A (Specialty Retail) | 368 | 20,045 | |||||||||
Sonos, Inc.* (Household Durables) | 3,044 | 44,929 | |||||||||
Southside Bancshares, Inc. (Banks) | 435 | 12,010 | |||||||||
| SpartanNash Co. (Consumer Staples Distribution & Retail) | 853 | 16,002 | |||||||||
Sprinklr, Inc.*—Class A (Software) | 2,965 | 28,523 | |||||||||
| STAAR Surgical Co.* (Health Care Equipment & Supplies) | 475 | 22,615 | |||||||||
| Standard Motor Products, Inc. (Automobile Components) | 465 | 12,894 | |||||||||
Stellar Bancorp, Inc. (Banks) | 1,167 | 26,794 | |||||||||
Stepan Co. (Chemicals) | 529 | 44,415 | |||||||||
| StepStone Group, Inc.—Class A (Capital Markets) | 902 | 41,393 | |||||||||
| Stewart Information Services Corp. (Insurance) | 683 | 42,401 | |||||||||
StoneX Group, Inc.* (Capital Markets) | 677 | 50,985 | |||||||||
| Strategic Education, Inc. (Diversified Consumer Services) | 321 | 35,523 | |||||||||
Sturm Ruger & Co., Inc. (Leisure Products) | 431 | 17,951 | |||||||||
| Summit Hotel Properties, Inc. (Hotel & Resort REITs) | 1,311 | 7,853 | |||||||||
| Sun Country Airlines Holdings, Inc.* (Passenger Airlines) | 516 | 6,481 | |||||||||
SunCoke Energy, Inc. (Metals & Mining) | 2,082 | 20,404 | |||||||||
SunPower Corp.*(a) (Electrical Equipment) | 2,128 | 6,299 | |||||||||
Sunrun, Inc.* (Electrical Equipment) | 5,491 | 65,123 | |||||||||
| Supernus Pharmaceuticals, Inc.* (Pharmaceuticals) | 817 | 21,855 | |||||||||
Sylvamo Corp. (Paper & Forest Products) | 866 | 59,408 | |||||||||
| Talos Energy, Inc.* (Oil, Gas & Consumable Fuels) | 3,871 | 47,032 | |||||||||
| Tandem Diabetes Care, Inc.* (Health Care Equipment & Supplies) | 864 | 34,811 | |||||||||
TechTarget, Inc.* (Media) | 271 | 8,447 | |||||||||
| Telephone and Data Systems, Inc. (Wireless Telecommunication Services) | 1,221 | 25,312 | |||||||||
| The Andersons, Inc. (Consumer Staples Distribution & Retail) | 369 | 18,302 | |||||||||
The Buckle, Inc. (Specialty Retail) | 279 | 10,306 | |||||||||
| The Cheesecake Factory, Inc. (Hotels, Restaurants & Leisure) | 627 | 24,635 | |||||||||
| The Chefs' Warehouse, Inc.* (Consumer Staples Distribution & Retail) | 877 | 34,299 | |||||||||
| The GEO Group, Inc.* (Commercial Services & Supplies) | 3,302 | 47,417 | |||||||||
The Greenbrier Cos., Inc. (Machinery) | 771 | 38,203 | |||||||||
| The Hain Celestial Group, Inc.* (Food Products) | 2,224 | 15,368 | |||||||||
The Macerich Co. (Retail REITs) | 5,345 | 82,527 | |||||||||
The ODP Corp.* (Specialty Retail) | 791 | 31,063 | |||||||||
The Simply Good Foods Co.* (Food Products) | 834 | 30,132 | |||||||||
Thryv Holdings, Inc.* (Media) | 781 | 13,917 | |||||||||
Titan International, Inc.* (Machinery) | 1,261 | 9,344 | |||||||||
See accompanying notes to the financial statements.
June 30, 2024 (unaudited) :: Schedule of Portfolio Investments :: ProFund VP Small-Cap Value :: 117
Common Stocks, continued
Shares | Value | ||||||||||
Tompkins Financial Corp. (Banks) | 311 | $ | 15,208 | ||||||||
Tootsie Roll Industries, Inc. (Food Products) | 172 | 5,258 | |||||||||
| Topgolf Callaway Brands Corp.* (Leisure Products) | 3,502 | 53,581 | |||||||||
TreeHouse Foods, Inc.* (Food Products) | 1,185 | 43,419 | |||||||||
Tri Pointe Homes, Inc.* (Household Durables) | 917 | 34,158 | |||||||||
Trinity Industries, Inc. (Machinery) | 1,014 | 30,339 | |||||||||
Triumph Group, Inc.* (Aerospace & Defense) | 1,903 | 29,325 | |||||||||
Trupanion, Inc.*(a) (Insurance) | 465 | 13,671 | |||||||||
TrustCo Bank Corp. (Banks) | 471 | 13,551 | |||||||||
Trustmark Corp. (Banks) | 1,517 | 45,571 | |||||||||
| TTM Technologies, Inc.* (Electronic Equipment, Instruments & Components) | 2,521 | 48,983 | |||||||||
| U.S. Physical Therapy, Inc. (Health Care Providers & Services) | 168 | 15,527 | |||||||||
| U.S. Silica Holdings, Inc.* (Energy Equipment & Services) | 1,935 | 29,896 | |||||||||
| Ultra Clean Holdings, Inc.* (Semiconductors & Semiconductor Equipment) | 1,112 | 54,487 | |||||||||
| UniFirst Corp. (Commercial Services & Supplies) | 221 | 37,908 | |||||||||
United Community Banks, Inc. (Banks) | 2,952 | 75,158 | |||||||||
United Fire Group, Inc. (Insurance) | 525 | 11,282 | |||||||||
| United Natural Foods, Inc.* (Consumer Staples Distribution & Retail) | 1,471 | 19,270 | |||||||||
Uniti Group, Inc. (Specialized REITs) | 2,855 | 8,337 | |||||||||
Unitil Corp. (Multi-Utilities) | 221 | 11,446 | |||||||||
Universal Corp. (Tobacco) | 609 | 29,347 | |||||||||
| Universal Health Realty Income Trust (Health Care REITs) | 164 | 6,419 | |||||||||
Upbound Group, Inc. (Specialty Retail) | 489 | 15,012 | |||||||||
Urban Edge Properties (Retail REITs) | 1,207 | 22,293 | |||||||||
| USANA Health Sciences, Inc.* (Personal Care Products) | 275 | 12,441 | |||||||||
| Varex Imaging Corp.* (Health Care Equipment & Supplies) | 1,012 | 14,907 | |||||||||
Vector Group, Ltd. (Tobacco) | 1,822 | 19,259 | |||||||||
Veris Residential, Inc. (Residential REITs) | 1,195 | 17,925 | |||||||||
Veritex Holdings, Inc. (Banks) | 1,351 | 28,493 | |||||||||
| Vestis Corp. (Commercial Services & Supplies) | 1,529 | 18,700 | |||||||||
VF Corp. (Textiles, Apparel & Luxury Goods) | 8,188 | 110,539 | |||||||||
Viasat, Inc.* (Communications Equipment) | 1,862 | 23,647 | |||||||||
| Viavi Solutions, Inc.* (Communications Equipment) | 5,528 | 37,977 | |||||||||
Vicor Corp.* (Electrical Equipment) | 264 | 8,754 | |||||||||
Victoria's Secret & Co.* (Specialty Retail) | 1,939 | 34,262 | |||||||||
Vir Biotechnology, Inc.* (Biotechnology) | 2,156 | 19,188 | |||||||||
| Virtu Financial, Inc.—Class A (Capital Markets) | 2,193 | 49,233 | |||||||||
| Virtus Investment Partners, Inc. (Capital Markets) | 61 | 13,777 | |||||||||
Vista Outdoor, Inc.* (Leisure Products) | 1,442 | 54,291 | |||||||||
| Vital Energy, Inc.* (Oil, Gas & Consumable Fuels) | 330 | 14,791 | |||||||||
Wabash National Corp. (Machinery) | 1,114 | 24,330 | |||||||||
WaFd, Inc. (Banks) | 1,675 | 47,872 | |||||||||
Walker & Dunlop, Inc. (Financial Services) | 476 | 46,743 | |||||||||
| Werner Enterprises, Inc. (Ground Transportation) | 1,571 | 56,289 | |||||||||
Common Stocks, continued
Shares | Value | ||||||||||
Westamerica Bancorp (Banks) | 259 | $ | 12,569 | ||||||||
Whitestone REIT (Retail REITs) | 599 | 7,973 | |||||||||
Winnebago Industries, Inc. (Automobiles) | 320 | 17,344 | |||||||||
WK Kellogg Co. (Food Products) | 1,636 | 26,929 | |||||||||
| Wolverine World Wide, Inc. (Textiles, Apparel & Luxury Goods) | 1,979 | 26,756 | |||||||||
| World Kinect Corp. (Oil, Gas & Consumable Fuels) | 1,485 | 38,313 | |||||||||
| Worthington Enterprises, Inc. (Household Durables) | 235 | 11,123 | |||||||||
Worthington Steel, Inc. (Metals & Mining) | 237 | 7,906 | |||||||||
WSFS Financial Corp. (Banks) | 819 | 38,493 | |||||||||
Xencor, Inc.* (Biotechnology) | 733 | 13,876 | |||||||||
| Xenia Hotels & Resorts, Inc. (Hotel & Resort REITs) | 1,035 | 14,832 | |||||||||
| Xerox Holdings Corp. (Technology Hardware, Storage & Peripherals) | 2,830 | 32,885 | |||||||||
| TOTAL COMMON STOCKS (Cost $12,981,777) | 14,586,387 | ||||||||||
Repurchase Agreements(b) (0.3%)
| Principal Amount | Value | ||||||||||
| Repurchase Agreements with various counterparties, rates 5.12%–5.20%, dated 6/28/2024, due 7/1/24, total to be received $49,021 | $ | 49,000 | $ | 49,000 | |||||||
| TOTAL REPURCHASE AGREEMENTS (Cost $49,000) | 49,000 | ||||||||||
Collateral for Securities Loaned(c) (1.6%)
Shares | Value | ||||||||||
| Invesco Government & Agency Portfolio—Institutional Shares, 5.23%(d) | 237,439 | $ | 237,439 | ||||||||
| TOTAL COLLATERAL FOR SECURITIES LOANED (Cost $237,439) | 237,439 | ||||||||||
| TOTAL INVESTMENT SECURITIES (Cost $13,268,216)—101.7% | 14,872,826 | ||||||||||
Net other assets (liabilities)—(1.7)% | (249,452 | ) | |||||||||
NET ASSETS—100.0% | $ | 14,623,374 | |||||||||
* Non-income producing security.
(a) All or part of this security was on loan as of June 30, 2024. The total value of securities on loan as of June 30, 2024 was $221,407.
(b) The ProFund VP invests in Repurchase Agreements jointly with other funds in the Trust. See "Repurchase Agreements" under Note 2 in the Notes to Financial Statements to view the details of each individual agreement and counterparty as well as a description of the securities subject to repurchase.
(c) Securities were purchased with cash collateral held from securities on loan at June 30, 2024.
(d) Rate periodically changes. Rate disclosed is the daily yield on June 30, 2024.
REIT Real Estate Investment Trust
See accompanying notes to the financial statements.
118 :: ProFund VP Small-Cap Value :: Schedule of Portfolio Investments :: June 30, 2024 (unaudited)
ProFund VP Small-Cap Value invested in the following industries as of June 30, 2024:
Value | % of Net Assets | ||||||||||
Aerospace & Defense | $ | 86,456 | 0.6 | % | |||||||
Air Freight & Logistics | 80,756 | 0.6 | % | ||||||||
Automobile Components | 212,099 | 1.5 | % | ||||||||
Automobiles | 17,344 | 0.1 | % | ||||||||
Banks | 2,056,485 | 14.1 | % | ||||||||
Beverages | 25,552 | 0.2 | % | ||||||||
Biotechnology | 165,110 | 1.1 | % | ||||||||
Broadline Retail | 63,177 | 0.4 | % | ||||||||
Building Products | 219,642 | 1.5 | % | ||||||||
Capital Markets | 374,088 | 2.6 | % | ||||||||
Chemicals | 369,710 | 2.5 | % | ||||||||
Commercial Services & Supplies | 465,917 | 3.3 | % | ||||||||
Communications Equipment | 173,650 | 1.2 | % | ||||||||
Construction & Engineering | 195,928 | 1.3 | % | ||||||||
Consumer Finance | 193,485 | 1.3 | % | ||||||||
Consumer Staples Distribution & Retail | 193,268 | 1.4 | % | ||||||||
Containers & Packaging | 124,489 | 0.9 | % | ||||||||
Diversified Consumer Services | 59,645 | 0.4 | % | ||||||||
Diversified REITs | 161,284 | 1.1 | % | ||||||||
Diversified Telecommunication Services | 89,078 | 0.6 | % | ||||||||
Electric Utilities | 30,112 | 0.2 | % | ||||||||
Electrical Equipment | 80,176 | 0.5 | % | ||||||||
| Electronic Equipment, Instruments & Components | 478,207 | 3.3 | % | ||||||||
Energy Equipment & Services | 221,481 | 1.5 | % | ||||||||
Financial Services | 444,574 | 3.0 | % | ||||||||
Food Products | 175,235 | 1.2 | % | ||||||||
Gas Utilities | 66,300 | 0.5 | % | ||||||||
Ground Transportation | 129,199 | 0.9 | % | ||||||||
Health Care Equipment & Supplies | 342,383 | 2.3 | % | ||||||||
Health Care Providers & Services | 366,679 | 2.6 | % | ||||||||
Health Care REITs | 132,848 | 0.9 | % | ||||||||
Health Care Technology | 42,872 | 0.3 | % | ||||||||
Hotel & Resort REITs | 84,823 | 0.6 | % | ||||||||
Hotels, Restaurants & Leisure | 258,356 | 1.8 | % | ||||||||
Household Durables | 262,709 | 1.8 | % | ||||||||
Household Products | 79,830 | 0.5 | % | ||||||||
| Independent Power and Renewable Electricity Producers | 69,837 | 0.5 | % | ||||||||
Industrial REITs | 100,998 | 0.7 | % | ||||||||
Value | % of Net Assets | ||||||||||
Insurance | $ | 453,200 | 3.1 | % | |||||||
Interactive Media & Services | 81,545 | 0.6 | % | ||||||||
IT Services | 130,926 | 0.9 | % | ||||||||
Leisure Products | 125,823 | 0.9 | % | ||||||||
Life Sciences Tools & Services | 83,647 | 0.6 | % | ||||||||
Machinery | 443,118 | 3.0 | % | ||||||||
Media | 134,537 | 0.9 | % | ||||||||
Metals & Mining | 136,361 | 0.9 | % | ||||||||
Mortgage REITs | 344,244 | 2.4 | % | ||||||||
Multi-Utilities | 78,520 | 0.5 | % | ||||||||
Office REITs | 312,451 | 2.1 | % | ||||||||
Oil, Gas & Consumable Fuels | 178,226 | 1.2 | % | ||||||||
Paper & Forest Products | 88,726 | 0.6 | % | ||||||||
Passenger Airlines | 240,550 | 1.6 | % | ||||||||
Personal Care Products | 74,759 | 0.5 | % | ||||||||
Pharmaceuticals | 325,297 | 2.2 | % | ||||||||
Professional Services | 277,913 | 1.9 | % | ||||||||
Real Estate Management & Development | 89,976 | 0.6 | % | ||||||||
Residential REITs | 99,971 | 0.7 | % | ||||||||
Retail REITs | 305,231 | 2.1 | % | ||||||||
| Semiconductors & Semiconductor Equipment | 308,643 | 2.1 | % | ||||||||
Software | 251,510 | 1.7 | % | ||||||||
Specialized REITs | 91,306 | 0.6 | % | ||||||||
Specialty Retail | 602,119 | 4.0 | % | ||||||||
| Technology Hardware, Storage & Peripherals | 44,797 | 0.3 | % | ||||||||
Textiles, Apparel & Luxury Goods | 216,699 | 1.5 | % | ||||||||
Tobacco | 48,606 | 0.3 | % | ||||||||
Trading Companies & Distributors | 182,869 | 1.3 | % | ||||||||
Water Utilities | 108,037 | 0.7 | % | ||||||||
Wireless Telecommunication Services | 32,998 | 0.2 | % | ||||||||
Other** | 36,987 | 0.2 | % | ||||||||
Total | $ | 14,623,374 | 100.0 | % | |||||||
** Includes any non-equity securities and net other assets (liabilities), which includes any receivable for capital shares issued and payable for capital shares redeemed.
REIT Real Estate Investment Trust
See accompanying notes to the financial statements.
Common Stocks (97.8%)
Shares | Value | ||||||||||
Accenture PLC—Class A (IT Services) | 3,937 | $ | 1,194,526 | ||||||||
Adobe, Inc.* (Software) | 2,805 | 1,558,290 | |||||||||
| Advanced Micro Devices, Inc.* (Semiconductors & Semiconductor Equipment) | 10,121 | 1,641,727 | |||||||||
Akamai Technologies, Inc.* (IT Services) | 954 | 85,936 | |||||||||
| Amphenol Corp.—Class A (Electronic Equipment, Instruments & Components) | 7,521 | 506,691 | |||||||||
| Analog Devices, Inc. (Semiconductors & Semiconductor Equipment) | 3,106 | 708,976 | |||||||||
ANSYS, Inc.* (Software) | 547 | 175,861 | |||||||||
| Apple, Inc. (Technology Hardware, Storage & Peripherals) | 13,069 | 2,752,593 | |||||||||
| Applied Materials, Inc. (Semiconductors & Semiconductor Equipment) | 5,203 | 1,227,856 | |||||||||
| Arista Networks, Inc.* (Communications Equipment) | 1,589 | 556,913 | |||||||||
Autodesk, Inc.* (Software) | 1,339 | 331,336 | |||||||||
| Broadcom, Inc. (Semiconductors & Semiconductor Equipment) | 1,601 | 2,570,454 | |||||||||
Cadence Design Systems, Inc.* (Software) | 1,704 | 524,406 | |||||||||
| CDW Corp. (Electronic Equipment, Instruments & Components) | 841 | 188,249 | |||||||||
| Cisco Systems, Inc. (Communications Equipment) | 25,354 | 1,204,569 | |||||||||
| Cognizant Technology Solutions Corp.—Class A (IT Services) | 3,113 | 211,684 | |||||||||
| Corning, Inc. (Electronic Equipment, Instruments & Components) | 4,827 | 187,529 | |||||||||
| Crowdstrike Holdings, Inc.*—Class A (Software) | 1,444 | 553,326 | |||||||||
| Enphase Energy, Inc.* (Semiconductors & Semiconductor Equipment) | 852 | 84,953 | |||||||||
EPAM Systems, Inc.* (IT Services) | 363 | 68,284 | |||||||||
F5, Inc.* (Communications Equipment) | 367 | 63,208 | |||||||||
Fair Isaac Corp.* (Software) | 155 | 230,742 | |||||||||
| First Solar, Inc.* (Semiconductors & Semiconductor Equipment) | 671 | 151,284 | |||||||||
Fortinet, Inc.* (Software) | 3,970 | 239,272 | |||||||||
Gartner, Inc.* (IT Services) | 486 | 218,243 | |||||||||
Gen Digital, Inc. (Software) | 3,449 | 86,156 | |||||||||
GoDaddy, Inc.*—Class A (IT Services) | 883 | 123,364 | |||||||||
| Hewlett Packard Enterprise Co. (Technology Hardware, Storage & Peripherals) | 8,140 | 172,324 | |||||||||
| HP, Inc. (Technology Hardware, Storage & Peripherals) | 5,403 | 189,213 | |||||||||
| Intel Corp. (Semiconductors & Semiconductor Equipment) | 26,656 | 825,536 | |||||||||
| International Business Machines Corp. (IT Services) | 5,752 | 994,808 | |||||||||
Intuit, Inc. (Software) | 1,753 | 1,152,089 | |||||||||
| Jabil, Inc. (Electronic Equipment, Instruments & Components) | 755 | 82,136 | |||||||||
| Juniper Networks, Inc. (Communications Equipment) | 2,034 | 74,160 | |||||||||
| Keysight Technologies, Inc.* (Electronic Equipment, Instruments & Components) | 1,093 | 149,468 | |||||||||
| KLA Corp. (Semiconductors & Semiconductor Equipment) | 843 | 695,062 | |||||||||
| Lam Research Corp. (Semiconductors & Semiconductor Equipment) | 818 | 871,047 | |||||||||
Common Stocks, continued
Shares | Value | ||||||||||
| Microchip Technology, Inc. (Semiconductors & Semiconductor Equipment) | 3,383 | $ | 309,545 | ||||||||
| Micron Technology, Inc. (Semiconductors & Semiconductor Equipment) | 6,934 | 912,029 | |||||||||
Microsoft Corp. (Software) | 30,499 | 13,631,528 | |||||||||
| Monolithic Power Systems, Inc. (Semiconductors & Semiconductor Equipment) | 305 | 250,612 | |||||||||
| Motorola Solutions, Inc. (Communications Equipment) | 1,044 | 403,036 | |||||||||
| NetApp, Inc. (Technology Hardware, Storage & Peripherals) | 1,292 | 166,410 | |||||||||
| NVIDIA Corp. (Semiconductors & Semiconductor Equipment) | 100,941 | 12,470,250 | |||||||||
| NXP Semiconductors N.V. (Semiconductors & Semiconductor Equipment) | 1,601 | 430,813 | |||||||||
| ON Semiconductor Corp.* (Semiconductors & Semiconductor Equipment) | 2,693 | 184,605 | |||||||||
Oracle Corp. (Software) | 9,983 | 1,409,600 | |||||||||
Palo Alto Networks, Inc.* (Software) | 2,024 | 686,156 | |||||||||
PTC, Inc.* (Software) | 750 | 136,253 | |||||||||
| Qorvo, Inc.* (Semiconductors & Semiconductor Equipment) | 604 | 70,088 | |||||||||
| QUALCOMM, Inc. (Semiconductors & Semiconductor Equipment) | 7,001 | 1,394,459 | |||||||||
Roper Technologies, Inc. (Software) | 671 | 378,216 | |||||||||
Salesforce, Inc. (Software) | 6,081 | 1,563,425 | |||||||||
| Seagate Technology Holdings PLC (Technology Hardware, Storage & Peripherals) | 1,223 | 126,299 | |||||||||
ServiceNow, Inc.* (Software) | 1,284 | 1,010,084 | |||||||||
| Skyworks Solutions, Inc. (Semiconductors & Semiconductor Equipment) | 1,005 | 107,113 | |||||||||
| Super Micro Computer, Inc.* (Technology Hardware, Storage & Peripherals) | 315 | 258,095 | |||||||||
Synopsys, Inc.* (Software) | 955 | 568,282 | |||||||||
| TE Connectivity, Ltd. (Electronic Equipment, Instruments & Components) | 1,917 | 288,374 | |||||||||
| Teledyne Technologies, Inc.* (Electronic Equipment, Instruments & Components) | 297 | 115,230 | |||||||||
| Teradyne, Inc. (Semiconductors & Semiconductor Equipment) | 978 | 145,028 | |||||||||
| Texas Instruments, Inc. (Semiconductors & Semiconductor Equipment) | 5,702 | 1,109,210 | |||||||||
| Trimble, Inc.* (Electronic Equipment, Instruments & Components) | 1,529 | 85,502 | |||||||||
Tyler Technologies, Inc.* (Software) | 266 | 133,739 | |||||||||
VeriSign, Inc.* (IT Services) | 543 | 96,545 | |||||||||
| Western Digital Corp.* (Technology Hardware, Storage & Peripherals) | 2,044 | 154,874 | |||||||||
| Zebra Technologies Corp.* (Electronic Equipment, Instruments & Components) | 322 | 99,475 | |||||||||
| TOTAL COMMON STOCKS (Cost $28,114,959) | 61,347,146 | ||||||||||
See accompanying notes to the financial statements.
120 :: ProFund VP Technology :: Schedule of Portfolio Investments :: June 30, 2024 (unaudited)
Repurchase Agreements(a) (2.0%)
| Principal Amount | Value | ||||||||||
| Repurchase Agreements with various counterparties, rates 5.12%–5.20%, dated 6/28/2024, due 7/1/24, total to be received $1,253,542 | $ | 1,253,000 | $ | 1,253,000 | |||||||
| TOTAL REPURCHASE AGREEMENTS (Cost $1,253,000) | 1,253,000 | ||||||||||
| TOTAL INVESTMENT SECURITIES (Cost $29,367,959)—99.8% | 62,600,146 | ||||||||||
Net other assets (liabilities)—0.2% | 122,689 | ||||||||||
NET ASSETS—100.0% | $ | 62,722,835 | |||||||||
* Non-income producing security.
(a) The ProFund VP invests in Repurchase Agreements jointly with other funds in the Trust. See "Repurchase Agreements" under Note 2 in the Notes to Financial Statements to view the details of each individual agreement and counterparty as well as a description of the securities subject to repurchase.
Total Return Swap Agreements—Long
Underlying Instrument | Counterparty | Termination Date(1) | Rate Paid (Received)(2) | Notional Amount | Value and Unrealized Appreciation/ (Depreciation) | ||||||||||||||||||
| S&P Technology Select Sector Index | Goldman Sachs International | 7/23/24 | 6.08 | % | $ | 1,119,225 | $ | 6,802 | |||||||||||||||
(1) Agreements may be terminated at will by either party without penalty. Payment is due at termination/maturity.
(2) Reflects the floating financing rate, as of June 30, 2024, on the notional amount of the swap agreement paid to the counterparty or received from the counterparty, excluding any commissions. This amount is included as part of the unrealized appreciation/(depreciation).
ProFund VP Technology invested in the following industries as of June 30, 2024:
Value | % of Net Assets | ||||||||||
Communications Equipment | $ | 2,301,886 | 3.7 | % | |||||||
| Electronic Equipment, Instruments & Components | 1,702,654 | 2.7 | % | ||||||||
IT Services | 2,993,390 | 4.8 | % | ||||||||
| Semiconductors & Semiconductor Equipment | 26,160,647 | 41.6 | % | ||||||||
Software | 24,368,761 | 38.9 | % | ||||||||
| Technology Hardware, Storage & Peripherals | 3,819,808 | 6.1 | % | ||||||||
Other** | 1,375,689 | 2.2 | % | ||||||||
Total | $ | 62,722,835 | 100.0 | % | |||||||
** Includes any non-equity securities and net other assets (liabilities), which includes any receivable for capital shares issued and payable for capital shares redeemed.
See accompanying notes to the financial statements.
Common Stocks (76.7%)
Shares | Value | ||||||||||
3M Co. (Industrial Conglomerates) | 165 | $ | 16,861 | ||||||||
A.O. Smith Corp. (Building Products) | 36 | 2,944 | |||||||||
| Abbott Laboratories (Health Care Equipment & Supplies) | 518 | 53,826 | |||||||||
AbbVie, Inc. (Biotechnology) | 526 | 90,221 | |||||||||
Accenture PLC—Class A (IT Services) | 187 | 56,737 | |||||||||
Adobe, Inc.* (Software) | 133 | 73,887 | |||||||||
| Advanced Micro Devices, Inc.* (Semiconductors & Semiconductor Equipment) | 481 | 78,023 | |||||||||
Aflac, Inc. (Insurance) | 154 | 13,754 | |||||||||
| Agilent Technologies, Inc. (Life Sciences Tools & Services) | 87 | 11,278 | |||||||||
Air Products and Chemicals, Inc. (Chemicals) | 66 | 17,031 | |||||||||
| Airbnb, Inc.*—Class A (Hotels, Restaurants & Leisure) | 131 | 19,864 | |||||||||
Akamai Technologies, Inc.* (IT Services) | 45 | 4,054 | |||||||||
Albemarle Corp. (Chemicals) | 35 | 3,343 | |||||||||
| Alexandria Real Estate Equities, Inc. (Office REITs) | 47 | 5,498 | |||||||||
| Align Technology, Inc.* (Health Care Equipment & Supplies) | 21 | 5,070 | |||||||||
Allegion PLC (Building Products) | 26 | 3,072 | |||||||||
Alliant Energy Corp. (Electric Utilities) | 76 | 3,868 | |||||||||
| Alphabet, Inc.—Class A (Interactive Media & Services) | 1,748 | 318,398 | |||||||||
| Alphabet, Inc.—Class C (Interactive Media & Services) | 1,454 | 266,693 | |||||||||
Altria Group, Inc. (Tobacco) | 511 | 23,276 | |||||||||
Amazon.com, Inc.* (Broadline Retail) | 2,725 | 526,607 | |||||||||
Amcor PLC (Containers & Packaging) | 430 | 4,205 | |||||||||
Ameren Corp. (Multi-Utilities) | 79 | 5,618 | |||||||||
| American Airlines Group, Inc.* (Passenger Airlines) | 195 | 2,209 | |||||||||
| American Electric Power Co., Inc. (Electric Utilities) | 157 | 13,775 | |||||||||
American Express Co. (Consumer Finance) | 169 | 39,132 | |||||||||
American International Group, Inc. (Insurance) | 198 | 14,700 | |||||||||
American Tower Corp. (Specialized REITs) | 139 | 27,018 | |||||||||
| American Water Works Co., Inc. (Water Utilities) | 58 | 7,491 | |||||||||
Ameriprise Financial, Inc. (Capital Markets) | 30 | 12,816 | |||||||||
AMETEK, Inc. (Electrical Equipment) | 69 | 11,503 | |||||||||
Amgen, Inc. (Biotechnology) | 160 | 49,992 | |||||||||
| Amphenol Corp.—Class A (Electronic Equipment, Instruments & Components) | 357 | 24,051 | |||||||||
| Analog Devices, Inc. (Semiconductors & Semiconductor Equipment) | 148 | 33,782 | |||||||||
ANSYS, Inc.* (Software) | 26 | 8,359 | |||||||||
Aon PLC—Class A (Insurance) | 65 | 19,083 | |||||||||
APA Corp. (Oil, Gas & Consumable Fuels) | 107 | 3,150 | |||||||||
| Apple, Inc. (Technology Hardware, Storage & Peripherals) | 4,290 | 903,559 | |||||||||
| Applied Materials, Inc. (Semiconductors & Semiconductor Equipment) | 247 | 58,290 | |||||||||
Aptiv PLC* (Automobile Components) | 81 | 5,704 | |||||||||
Arch Capital Group, Ltd.* (Insurance) | 111 | 11,199 | |||||||||
Archer-Daniels-Midland Co. (Food Products) | 147 | 8,886 | |||||||||
| Arista Networks, Inc.* (Communications Equipment) | 76 | 26,636 | |||||||||
Arthur J. Gallagher & Co. (Insurance) | 65 | 16,855 | |||||||||
Common Stocks, continued
Shares | Value | ||||||||||
Assurant, Inc. (Insurance) | 15 | $ | 2,494 | ||||||||
| AT&T, Inc. (Diversified Telecommunication Services) | 2,134 | 40,781 | |||||||||
Atmos Energy Corp. (Gas Utilities) | 45 | 5,249 | |||||||||
Autodesk, Inc.* (Software) | 64 | 15,837 | |||||||||
| Automatic Data Processing, Inc. (Professional Services) | 122 | 29,121 | |||||||||
AutoZone, Inc.* (Specialty Retail) | 5 | 14,821 | |||||||||
| AvalonBay Communities, Inc. (Residential REITs) | 42 | 8,688 | |||||||||
| Avery Dennison Corp. (Containers & Packaging) | 24 | 5,248 | |||||||||
Axon Enterprise, Inc.* (Aerospace & Defense) | 21 | 6,179 | |||||||||
| Baker Hughes Co. (Energy Equipment & Services) | 297 | 10,445 | |||||||||
Ball Corp. (Containers & Packaging) | 92 | 5,522 | |||||||||
Bank of America Corp. (Banks) | 2,025 | 80,534 | |||||||||
Bath & Body Works, Inc. (Specialty Retail) | 67 | 2,616 | |||||||||
| Baxter International, Inc. (Health Care Equipment & Supplies) | 152 | 5,084 | |||||||||
| Becton, Dickinson & Co. (Health Care Equipment & Supplies) | 86 | 20,099 | |||||||||
| Berkshire Hathaway, Inc.*—Class B (Financial Services) | 539 | 219,265 | |||||||||
Best Buy Co., Inc. (Specialty Retail) | 57 | 4,805 | |||||||||
Biogen, Inc.* (Biotechnology) | 43 | 9,968 | |||||||||
| Bio-Rad Laboratories, Inc.*—Class A (Life Sciences Tools & Services) | 6 | 1,639 | |||||||||
| Bio-Techne Corp. (Life Sciences Tools & Services) | 47 | 3,368 | |||||||||
BlackRock, Inc. (Capital Markets) | 42 | 33,067 | |||||||||
Blackstone, Inc. (Capital Markets) | 213 | 26,369 | |||||||||
| Booking Holdings, Inc. (Hotels, Restaurants & Leisure) | 10 | 39,615 | |||||||||
BorgWarner, Inc. (Automobile Components) | 68 | 2,192 | |||||||||
| Boston Scientific Corp.* (Health Care Equipment & Supplies) | 438 | 33,730 | |||||||||
Bristol-Myers Squibb Co. (Pharmaceuticals) | 603 | 25,043 | |||||||||
| Broadcom, Inc. (Semiconductors & Semiconductor Equipment) | 130 | 208,719 | |||||||||
| Broadridge Financial Solutions, Inc. (Professional Services) | 35 | 6,895 | |||||||||
Brown & Brown, Inc. (Insurance) | 70 | 6,259 | |||||||||
Brown-Forman Corp.—Class B (Beverages) | 53 | 2,289 | |||||||||
Builders FirstSource, Inc.* (Building Products) | 36 | 4,983 | |||||||||
Bunge Global SA (Food Products) | 42 | 4,484 | |||||||||
BXP, Inc. (Office REITs) | 43 | 2,647 | |||||||||
| C.H. Robinson Worldwide, Inc. (Air Freight & Logistics) | 35 | 3,084 | |||||||||
Cadence Design Systems, Inc.* (Software) | 81 | 24,928 | |||||||||
| Caesars Entertainment, Inc.* (Hotels, Restaurants & Leisure) | 64 | 2,543 | |||||||||
Camden Property Trust (Residential REITs) | 32 | 3,492 | |||||||||
Campbell Soup Co. (Food Products) | 59 | 2,666 | |||||||||
| Capital One Financial Corp. (Consumer Finance) | 114 | 15,783 | |||||||||
| Cardinal Health, Inc. (Health Care Providers & Services) | 72 | 7,079 | |||||||||
CarMax, Inc.* (Specialty Retail) | 47 | 3,447 | |||||||||
Carnival Corp.* (Hotels, Restaurants & Leisure) | 301 | 5,635 | |||||||||
Carrier Global Corp. (Building Products) | 249 | 15,707 | |||||||||
See accompanying notes to the financial statements.
122 :: ProFund VP UltraBull :: Schedule of Portfolio Investments :: June 30, 2024 (unaudited)
Common Stocks, continued
Shares | Value | ||||||||||
Catalent, Inc.* (Pharmaceuticals) | 54 | $ | 3,036 | ||||||||
Caterpillar, Inc. (Machinery) | 146 | 48,632 | |||||||||
Cboe Global Markets, Inc. (Capital Markets) | 31 | 5,272 | |||||||||
| CBRE Group, Inc.*—Class A (Real Estate Management & Development) | 90 | 8,020 | |||||||||
| CDW Corp. (Electronic Equipment, Instruments & Components) | 40 | 8,954 | |||||||||
Celanese Corp. (Chemicals) | 30 | 4,047 | |||||||||
| Cencora, Inc. (Health Care Providers & Services) | 49 | 11,040 | |||||||||
| Centene Corp.* (Health Care Providers & Services) | 159 | 10,542 | |||||||||
CenterPoint Energy, Inc. (Multi-Utilities) | 190 | 5,886 | |||||||||
CF Industries Holdings, Inc. (Chemicals) | 54 | 4,002 | |||||||||
| Charles River Laboratories International, Inc.* (Life Sciences Tools & Services) | 15 | 3,099 | |||||||||
| Charter Communications, Inc.*—Class A (Media) | 29 | 8,670 | |||||||||
Chevron Corp. (Oil, Gas & Consumable Fuels) | 510 | 79,774 | |||||||||
| Chipotle Mexican Grill, Inc.* (Hotels, Restaurants & Leisure) | 400 | 25,060 | |||||||||
Chubb, Ltd. (Insurance) | 121 | 30,864 | |||||||||
| Church & Dwight Co., Inc. (Household Products) | 73 | 7,569 | |||||||||
Cincinnati Financial Corp. (Insurance) | 47 | 5,551 | |||||||||
Cintas Corp. (Commercial Services & Supplies) | 26 | 18,207 | |||||||||
| Cisco Systems, Inc. (Communications Equipment) | 1,205 | 57,249 | |||||||||
Citigroup, Inc. (Banks) | 568 | 36,045 | |||||||||
Citizens Financial Group, Inc. (Banks) | 135 | 4,864 | |||||||||
CME Group, Inc. (Capital Markets) | 107 | 21,036 | |||||||||
CMS Energy Corp. (Multi-Utilities) | 89 | 5,298 | |||||||||
| Cognizant Technology Solutions Corp.—Class A (IT Services) | 148 | 10,064 | |||||||||
Colgate-Palmolive Co. (Household Products) | 244 | 23,678 | |||||||||
Comcast Corp.—Class A (Media) | 1,165 | 45,621 | |||||||||
Conagra Brands, Inc. (Food Products) | 142 | 4,036 | |||||||||
ConocoPhillips (Oil, Gas & Consumable Fuels) | 348 | 39,804 | |||||||||
Consolidated Edison, Inc. (Multi-Utilities) | 103 | 9,210 | |||||||||
| Constellation Brands, Inc.—Class A (Beverages) | 48 | 12,349 | |||||||||
Constellation Energy Corp. (Electric Utilities) | 94 | 18,825 | |||||||||
Copart, Inc.* (Commercial Services & Supplies) | 260 | 14,082 | |||||||||
| Corning, Inc. (Electronic Equipment, Instruments & Components) | 229 | 8,897 | |||||||||
Corpay, Inc.* (Software) | 21 | 5,595 | |||||||||
Corteva, Inc. (Chemicals) | 207 | 11,166 | |||||||||
| CoStar Group, Inc.* (Real Estate Management & Development) | 122 | 9,045 | |||||||||
| Costco Wholesale Corp. (Consumer Staples Distribution & Retail) | 132 | 112,198 | |||||||||
| Coterra Energy, Inc. (Oil, Gas & Consumable Fuels) | 221 | 5,894 | |||||||||
| Crowdstrike Holdings, Inc.*—Class A (Software) | 69 | 26,440 | |||||||||
Crown Castle, Inc. (Specialized REITs) | 129 | 12,603 | |||||||||
CSX Corp. (Ground Transportation) | 582 | 19,468 | |||||||||
Cummins, Inc. (Machinery) | 41 | 11,354 | |||||||||
| CVS Health Corp. (Health Care Providers & Services) | 374 | 22,088 | |||||||||
D.R. Horton, Inc. (Household Durables) | 88 | 12,402 | |||||||||
Common Stocks, continued
Shares | Value | ||||||||||
Danaher Corp. (Life Sciences Tools & Services) | 196 | $ | 48,970 | ||||||||
| Darden Restaurants, Inc. (Hotels, Restaurants & Leisure) | 36 | 5,448 | |||||||||
DaVita, Inc.* (Health Care Providers & Services) | 15 | 2,079 | |||||||||
Dayforce, Inc.* (Professional Services) | 47 | 2,331 | |||||||||
| Deckers Outdoor Corp.* (Textiles, Apparel & Luxury Goods) | 8 | 7,744 | |||||||||
Deere & Co. (Machinery) | 77 | 28,769 | |||||||||
Delta Air Lines, Inc. (Passenger Airlines) | 192 | 9,108 | |||||||||
| Devon Energy Corp. (Oil, Gas & Consumable Fuels) | 188 | 8,911 | |||||||||
| Dexcom, Inc.* (Health Care Equipment & Supplies) | 118 | 13,379 | |||||||||
| Diamondback Energy, Inc. (Oil, Gas & Consumable Fuels) | 53 | 10,610 | |||||||||
Digital Realty Trust, Inc. (Specialized REITs) | 97 | 14,749 | |||||||||
| Discover Financial Services (Consumer Finance) | 75 | 9,811 | |||||||||
| Dollar General Corp. (Consumer Staples Distribution & Retail) | 65 | 8,595 | |||||||||
| Dollar Tree, Inc.* (Consumer Staples Distribution & Retail) | 62 | 6,620 | |||||||||
Dominion Energy, Inc. (Multi-Utilities) | 249 | 12,201 | |||||||||
| Domino's Pizza, Inc. (Hotels, Restaurants & Leisure) | 10 | 5,163 | |||||||||
Dover Corp. (Machinery) | 41 | 7,398 | |||||||||
Dow, Inc. (Chemicals) | 209 | 11,087 | |||||||||
DTE Energy Co. (Multi-Utilities) | 62 | 6,883 | |||||||||
Duke Energy Corp. (Electric Utilities) | 230 | 23,053 | |||||||||
DuPont de Nemours, Inc. (Chemicals) | 124 | 9,981 | |||||||||
Eastman Chemical Co. (Chemicals) | 35 | 3,429 | |||||||||
Eaton Corp. PLC (Electrical Equipment) | 119 | 37,312 | |||||||||
eBay, Inc. (Broadline Retail) | 151 | 8,112 | |||||||||
Ecolab, Inc. (Chemicals) | 76 | 18,088 | |||||||||
Edison International (Electric Utilities) | 115 | 8,258 | |||||||||
| Edwards Lifesciences Corp.* (Health Care Equipment & Supplies) | 179 | 16,534 | |||||||||
Electronic Arts, Inc. (Entertainment) | 72 | 10,032 | |||||||||
| Elevance Health, Inc. (Health Care Providers & Services) | 69 | 37,388 | |||||||||
Eli Lilly & Co. (Pharmaceuticals) | 238 | 215,481 | |||||||||
Emerson Electric Co. (Electrical Equipment) | 170 | 18,727 | |||||||||
| Enphase Energy, Inc.* (Semiconductors & Semiconductor Equipment) | 40 | 3,988 | |||||||||
Entergy Corp. (Electric Utilities) | 64 | 6,848 | |||||||||
| EOG Resources, Inc. (Oil, Gas & Consumable Fuels) | 171 | 21,524 | |||||||||
EPAM Systems, Inc.* (IT Services) | 17 | 3,198 | |||||||||
EQT Corp. (Oil, Gas & Consumable Fuels) | 131 | 4,844 | |||||||||
Equifax, Inc. (Professional Services) | 37 | 8,971 | |||||||||
Equinix, Inc. (Specialized REITs) | 28 | 21,184 | |||||||||
Equity Residential (Residential REITs) | 103 | 7,142 | |||||||||
Essex Property Trust, Inc. (Residential REITs) | 19 | 5,172 | |||||||||
Etsy, Inc.* (Broadline Retail) | 35 | 2,064 | |||||||||
Everest Group, Ltd. (Insurance) | 13 | 4,953 | |||||||||
Evergy, Inc. (Electric Utilities) | 68 | 3,602 | |||||||||
Eversource Energy (Electric Utilities) | 105 | 5,955 | |||||||||
Exelon Corp. (Electric Utilities) | 298 | 10,314 | |||||||||
| Expedia Group, Inc.* (Hotels, Restaurants & Leisure) | 38 | 4,788 | |||||||||
See accompanying notes to the financial statements.
June 30, 2024 (unaudited) :: Schedule of Portfolio Investments :: ProFund VP UltraBull :: 123
Common Stocks, continued
Shares | Value | ||||||||||
| Expeditors International of Washington, Inc. (Air Freight & Logistics) | 42 | $ | 5,241 | ||||||||
Extra Space Storage, Inc. (Specialized REITs) | 63 | 9,791 | |||||||||
| Exxon Mobil Corp. (Oil, Gas & Consumable Fuels) | 1,335 | 153,686 | |||||||||
F5, Inc.* (Communications Equipment) | 17 | 2,928 | |||||||||
| FactSet Research Systems, Inc. (Capital Markets) | 11 | 4,491 | |||||||||
Fair Isaac Corp.* (Software) | 7 | 10,421 | |||||||||
| Fastenal Co. (Trading Companies & Distributors) | 170 | 10,683 | |||||||||
Federal Realty Investment Trust (Retail REITs) | 22 | 2,221 | |||||||||
FedEx Corp. (Air Freight & Logistics) | 67 | 20,089 | |||||||||
| Fidelity National Information Services, Inc. (Financial Services) | 166 | 12,510 | |||||||||
Fifth Third Bancorp (Banks) | 204 | 7,444 | |||||||||
First Horizon Corp. (Banks) | — | (a) | 5 | ||||||||
| First Solar, Inc.* (Semiconductors & Semiconductor Equipment) | 32 | 7,215 | |||||||||
FirstEnergy Corp. (Electric Utilities) | 154 | 5,894 | |||||||||
Fiserv, Inc.* (Financial Services) | 174 | 25,933 | |||||||||
FMC Corp. (Chemicals) | 37 | 2,129 | |||||||||
Ford Motor Co. (Automobiles) | 1,167 | 14,634 | |||||||||
Fortinet, Inc.* (Software) | 189 | 11,391 | |||||||||
Fortive Corp. (Machinery) | 105 | 7,781 | |||||||||
Fox Corp.—Class A (Media) | 69 | 2,372 | |||||||||
Fox Corp.—Class B (Media) | 39 | 1,249 | |||||||||
Franklin Resources, Inc. (Capital Markets) | 89 | 1,989 | |||||||||
Freeport-McMoRan, Inc. (Metals & Mining) | 428 | 20,801 | |||||||||
Garmin, Ltd. (Household Durables) | 46 | 7,494 | |||||||||
Gartner, Inc.* (IT Services) | 23 | 10,328 | |||||||||
| GE HealthCare Technologies, Inc. (Health Care Equipment & Supplies) | 126 | 9,818 | |||||||||
GE Vernova, Inc.* (Electrical Equipment) | 82 | 14,064 | |||||||||
Gen Digital, Inc. (Software) | 164 | 4,097 | |||||||||
Generac Holdings, Inc.* (Electrical Equipment) | 18 | 2,380 | |||||||||
| General Dynamics Corp. (Aerospace & Defense) | 68 | 19,730 | |||||||||
General Electric Co. (Industrial Conglomerates) | 326 | 51,824 | |||||||||
General Mills, Inc. (Food Products) | 168 | 10,628 | |||||||||
General Motors Co. (Automobiles) | 340 | 15,796 | |||||||||
Genuine Parts Co. (Distributors) | 41 | 5,670 | |||||||||
Gilead Sciences, Inc. (Biotechnology) | 371 | 25,454 | |||||||||
Global Payments, Inc. (Financial Services) | 76 | 7,349 | |||||||||
Globe Life, Inc. (Insurance) | 25 | 2,057 | |||||||||
GoDaddy, Inc.*—Class A (IT Services) | 42 | 5,868 | |||||||||
Halliburton Co. (Energy Equipment & Services) | 263 | 8,884 | |||||||||
Hasbro, Inc. (Leisure Products) | 39 | 2,282 | |||||||||
| HCA Healthcare, Inc. (Health Care Providers & Services) | 58 | 18,634 | |||||||||
Healthpeak Properties, Inc. (Health Care REITs) | 209 | 4,096 | |||||||||
| Henry Schein, Inc.* (Health Care Providers & Services) | 38 | 2,436 | |||||||||
Hess Corp. (Oil, Gas & Consumable Fuels) | 82 | 12,097 | |||||||||
| Hewlett Packard Enterprise Co. (Technology Hardware, Storage & Peripherals) | 387 | 8,193 | |||||||||
| Hilton Worldwide Holdings, Inc. (Hotels, Restaurants & Leisure) | 74 | 16,147 | |||||||||
| Hologic, Inc.* (Health Care Equipment & Supplies) | 69 | 5,123 | |||||||||
Common Stocks, continued
Shares | Value | ||||||||||
| Honeywell International, Inc. (Industrial Conglomerates) | 194 | $ | 41,427 | ||||||||
Hormel Foods Corp. (Food Products) | 86 | 2,622 | |||||||||
| Host Hotels & Resorts, Inc. (Hotel & Resort REITs) | 210 | 3,776 | |||||||||
| Howmet Aerospace, Inc. (Aerospace & Defense) | 115 | 8,927 | |||||||||
| HP, Inc. (Technology Hardware, Storage & Peripherals) | 257 | 9,000 | |||||||||
Hubbell, Inc. (Electrical Equipment) | 16 | 5,848 | |||||||||
| Humana, Inc. (Health Care Providers & Services) | 36 | 13,451 | |||||||||
Huntington Bancshares, Inc. (Banks) | 431 | 5,681 | |||||||||
| Huntington Ingalls Industries, Inc. (Aerospace & Defense) | 12 | 2,956 | |||||||||
IDEX Corp. (Machinery) | 23 | 4,628 | |||||||||
| IDEXX Laboratories, Inc.* (Health Care Equipment & Supplies) | 25 | 12,180 | |||||||||
Illinois Tool Works, Inc. (Machinery) | 81 | 19,194 | |||||||||
Incyte Corp.* (Biotechnology) | 55 | 3,334 | |||||||||
Ingersoll Rand, Inc. (Machinery) | 120 | 10,901 | |||||||||
| Insulet Corp.* (Health Care Equipment & Supplies) | 21 | 4,238 | |||||||||
| Intel Corp. (Semiconductors & Semiconductor Equipment) | 1,267 | 39,239 | |||||||||
| Intercontinental Exchange, Inc. (Capital Markets) | 171 | 23,408 | |||||||||
| International Business Machines Corp. (IT Services) | 273 | 47,215 | |||||||||
| International Flavors & Fragrances, Inc. (Chemicals) | 76 | 7,236 | |||||||||
| International Paper Co. (Containers & Packaging) | 103 | 4,444 | |||||||||
Intuit, Inc. (Software) | 83 | 54,548 | |||||||||
| Intuitive Surgical, Inc.* (Health Care Equipment & Supplies) | 106 | 47,155 | |||||||||
Invesco, Ltd. (Capital Markets) | 134 | 2,005 | |||||||||
Invitation Homes, Inc. (Residential REITs) | 171 | 6,137 | |||||||||
| IQVIA Holdings, Inc.* (Life Sciences Tools & Services) | 54 | 11,417 | |||||||||
Iron Mountain, Inc. (Specialized REITs) | 87 | 7,797 | |||||||||
| J.B. Hunt Transport Services, Inc. (Ground Transportation) | 24 | 3,840 | |||||||||
| Jabil, Inc. (Electronic Equipment, Instruments & Components) | 36 | 3,916 | |||||||||
| Jack Henry & Associates, Inc. (Financial Services) | 22 | 3,652 | |||||||||
Jacobs Solutions, Inc. (Professional Services) | 37 | 5,169 | |||||||||
Johnson & Johnson (Pharmaceuticals) | 716 | 104,651 | |||||||||
| Johnson Controls International PLC (Building Products) | 200 | 13,294 | |||||||||
JPMorgan Chase & Co. (Banks) | 855 | 172,932 | |||||||||
| Juniper Networks, Inc. (Communications Equipment) | 97 | 3,537 | |||||||||
Kellanova (Food Products) | 78 | 4,499 | |||||||||
Kenvue, Inc. (Personal Care Products) | 570 | 10,362 | |||||||||
Keurig Dr Pepper, Inc. (Beverages) | 311 | 10,387 | |||||||||
KeyCorp (Banks) | 281 | 3,993 | |||||||||
| Keysight Technologies, Inc.* (Electronic Equipment, Instruments & Components) | 52 | 7,111 | |||||||||
Kimberly-Clark Corp. (Household Products) | 100 | 13,820 | |||||||||
See accompanying notes to the financial statements.
124 :: ProFund VP UltraBull :: Schedule of Portfolio Investments :: June 30, 2024 (unaudited)
Common Stocks, continued
Shares | Value | ||||||||||
Kimco Realty Corp. (Retail REITs) | 199 | $ | 3,873 | ||||||||
| Kinder Morgan, Inc. (Oil, Gas & Consumable Fuels) | 575 | 11,425 | |||||||||
KKR & Co., Inc. (Capital Markets) | 198 | 20,838 | |||||||||
| KLA Corp. (Semiconductors & Semiconductor Equipment) | 40 | 32,980 | |||||||||
| L3Harris Technologies, Inc. (Aerospace & Defense) | 56 | 12,576 | |||||||||
| Labcorp Holdings, Inc. (Health Care Providers & Services) | 25 | 5,088 | |||||||||
| Lam Research Corp. (Semiconductors & Semiconductor Equipment) | 39 | 41,529 | |||||||||
Lamb Weston Holdings, Inc. (Food Products) | 43 | 3,615 | |||||||||
| Las Vegas Sands Corp. (Hotels, Restaurants & Leisure) | 109 | 4,823 | |||||||||
Leidos Holdings, Inc. (Professional Services) | 40 | 5,835 | |||||||||
Lennar Corp.—Class A (Household Durables) | 73 | 10,941 | |||||||||
Linde PLC (Chemicals) | 143 | 62,751 | |||||||||
| Live Nation Entertainment, Inc.* (Entertainment) | 42 | 3,937 | |||||||||
LKQ Corp. (Distributors) | 79 | 3,286 | |||||||||
Lockheed Martin Corp. (Aerospace & Defense) | 64 | 29,894 | |||||||||
Loews Corp. (Insurance) | 54 | 4,036 | |||||||||
Lowe's Cos., Inc. (Specialty Retail) | 170 | 37,478 | |||||||||
| Lululemon Athletica, Inc.* (Textiles, Apparel & Luxury Goods) | 34 | 10,155 | |||||||||
| LyondellBasell Industries N.V.—Class A (Chemicals) | 77 | 7,366 | |||||||||
M&T Bank Corp. (Banks) | 50 | 7,568 | |||||||||
| Marathon Oil Corp. (Oil, Gas & Consumable Fuels) | 168 | 4,817 | |||||||||
| Marathon Petroleum Corp. (Oil, Gas & Consumable Fuels) | 105 | 18,215 | |||||||||
MarketAxess Holdings, Inc. (Capital Markets) | 11 | 2,206 | |||||||||
| Marriott International, Inc.—Class A (Hotels, Restaurants & Leisure) | 71 | 17,227 | |||||||||
Marsh & McLennan Cos., Inc. (Insurance) | 147 | 30,975 | |||||||||
| Martin Marietta Materials, Inc. (Construction Materials) | 18 | 9,752 | |||||||||
Masco Corp. (Building Products) | 66 | 4,400 | |||||||||
Mastercard, Inc.—Class A (Financial Services) | 244 | 107,643 | |||||||||
| Match Group, Inc.* (Interactive Media & Services) | 79 | 2,400 | |||||||||
McCormick & Co., Inc. (Food Products) | 75 | 5,321 | |||||||||
| McDonald's Corp. (Hotels, Restaurants & Leisure) | 214 | 54,536 | |||||||||
| McKesson Corp. (Health Care Providers & Services) | 39 | 22,778 | |||||||||
| Medtronic PLC (Health Care Equipment & Supplies) | 395 | 31,090 | |||||||||
Merck & Co., Inc. (Pharmaceuticals) | 754 | 93,345 | |||||||||
| Meta Platforms, Inc.—Class A (Interactive Media & Services) | 652 | 328,752 | |||||||||
MetLife, Inc. (Insurance) | 178 | 12,494 | |||||||||
| Mettler-Toledo International, Inc.* (Life Sciences Tools & Services) | 6 | 8,386 | |||||||||
| MGM Resorts International* (Hotels, Restaurants & Leisure) | 75 | 3,333 | |||||||||
| Microchip Technology, Inc. (Semiconductors & Semiconductor Equipment) | 161 | 14,732 | |||||||||
Common Stocks, continued
Shares | Value | ||||||||||
| Micron Technology, Inc. (Semiconductors & Semiconductor Equipment) | 330 | $ | 43,405 | ||||||||
Microsoft Corp. (Software) | 2,212 | 988,652 | |||||||||
| Mid-America Apartment Communities, Inc. (Residential REITs) | 35 | 4,991 | |||||||||
Moderna, Inc.* (Biotechnology) | 99 | 11,756 | |||||||||
Mohawk Industries, Inc.* (Household Durables) | 16 | 1,817 | |||||||||
| Molina Healthcare, Inc.* (Health Care Providers & Services) | 17 | 5,054 | |||||||||
| Molson Coors Beverage Co.—Class B (Beverages) | 54 | 2,745 | |||||||||
| Mondelez International, Inc.—Class A (Food Products) | 399 | 26,110 | |||||||||
| Monolithic Power Systems, Inc. (Semiconductors & Semiconductor Equipment) | 14 | 11,504 | |||||||||
Monster Beverage Corp.* (Beverages) | 211 | 10,539 | |||||||||
Moody's Corp. (Capital Markets) | 47 | 19,784 | |||||||||
Morgan Stanley (Capital Markets) | 372 | 36,155 | |||||||||
| Motorola Solutions, Inc. (Communications Equipment) | 50 | 19,303 | |||||||||
MSCI, Inc. (Capital Markets) | 24 | 11,562 | |||||||||
Nasdaq, Inc. (Capital Markets) | 113 | 6,809 | |||||||||
| NetApp, Inc. (Technology Hardware, Storage & Peripherals) | 61 | 7,857 | |||||||||
Netflix, Inc.* (Entertainment) | 128 | 86,385 | |||||||||
Newmont Corp. (Metals & Mining) | 343 | 14,361 | |||||||||
News Corp.—Class A (Media) | 113 | 3,115 | |||||||||
News Corp.—Class B (Media) | 34 | 965 | |||||||||
NextEra Energy, Inc. (Electric Utilities) | 611 | 43,265 | |||||||||
| NIKE, Inc.—Class B (Textiles, Apparel & Luxury Goods) | 361 | 27,208 | |||||||||
NiSource, Inc. (Multi-Utilities) | 133 | 3,832 | |||||||||
Nordson Corp. (Machinery) | 16 | 3,711 | |||||||||
| Norfolk Southern Corp. (Ground Transportation) | 67 | 14,384 | |||||||||
Northern Trust Corp. (Capital Markets) | 61 | 5,123 | |||||||||
| Northrop Grumman Corp. (Aerospace & Defense) | 41 | 17,874 | |||||||||
| Norwegian Cruise Line Holdings, Ltd.* (Hotels, Restaurants & Leisure) | 128 | 2,405 | |||||||||
NRG Energy, Inc. (Electric Utilities) | 62 | 4,827 | |||||||||
Nucor Corp. (Metals & Mining) | 71 | 11,224 | |||||||||
| NVIDIA Corp. (Semiconductors & Semiconductor Equipment) | 7,320 | 904,312 | |||||||||
NVR, Inc.* (Household Durables) | 1 | 7,589 | |||||||||
| NXP Semiconductors N.V. (Semiconductors & Semiconductor Equipment) | 76 | 20,451 | |||||||||
| Occidental Petroleum Corp. (Oil, Gas & Consumable Fuels) | 198 | 12,480 | |||||||||
| Old Dominion Freight Line, Inc. (Ground Transportation) | 53 | 9,360 | |||||||||
Omnicom Group, Inc. (Media) | 58 | 5,203 | |||||||||
| ON Semiconductor Corp.* (Semiconductors & Semiconductor Equipment) | 128 | 8,774 | |||||||||
ONEOK, Inc. (Oil, Gas & Consumable Fuels) | 174 | 14,190 | |||||||||
Oracle Corp. (Software) | 474 | 66,929 | |||||||||
O'Reilly Automotive, Inc.* (Specialty Retail) | 18 | 19,009 | |||||||||
Otis Worldwide Corp. (Machinery) | 120 | 11,551 | |||||||||
PACCAR, Inc. (Machinery) | 156 | 16,059 | |||||||||
See accompanying notes to the financial statements.
June 30, 2024 (unaudited) :: Schedule of Portfolio Investments :: ProFund VP UltraBull :: 125
Common Stocks, continued
Shares | Value | ||||||||||
| Packaging Corp. of America (Containers & Packaging) | 27 | $ | 4,929 | ||||||||
Palo Alto Networks, Inc.* (Software) | 96 | 32,545 | |||||||||
Paramount Global—Class B (Media) | 147 | 1,527 | |||||||||
Parker-Hannifin Corp. (Machinery) | 38 | 19,221 | |||||||||
Paychex, Inc. (Professional Services) | 95 | 11,263 | |||||||||
Paycom Software, Inc. (Professional Services) | 14 | 2,003 | |||||||||
PayPal Holdings, Inc.* (Financial Services) | 311 | 18,047 | |||||||||
Pentair PLC (Machinery) | 49 | 3,757 | |||||||||
PepsiCo, Inc. (Beverages) | 409 | 67,457 | |||||||||
Pfizer, Inc. (Pharmaceuticals) | 1,686 | 47,174 | |||||||||
PG&E Corp. (Electric Utilities) | 636 | 11,105 | |||||||||
Philip Morris International, Inc. (Tobacco) | 463 | 46,916 | |||||||||
Phillips 66 (Oil, Gas & Consumable Fuels) | 126 | 17,787 | |||||||||
Pinnacle West Capital Corp. (Electric Utilities) | 34 | 2,597 | |||||||||
Pool Corp. (Distributors) | 11 | 3,381 | |||||||||
PPG Industries, Inc. (Chemicals) | 70 | 8,812 | |||||||||
PPL Corp. (Electric Utilities) | 220 | 6,083 | |||||||||
Principal Financial Group, Inc. (Insurance) | 64 | 5,021 | |||||||||
Prologis, Inc. (Industrial REITs) | 276 | 30,998 | |||||||||
Prudential Financial, Inc. (Insurance) | 107 | 12,539 | |||||||||
PTC, Inc.* (Software) | 36 | 6,540 | |||||||||
| Public Service Enterprise Group, Inc. (Multi-Utilities) | 148 | 10,908 | |||||||||
Public Storage (Specialized REITs) | 47 | 13,520 | |||||||||
PulteGroup, Inc. (Household Durables) | 63 | 6,936 | |||||||||
| Qorvo, Inc.* (Semiconductors & Semiconductor Equipment) | 29 | 3,365 | |||||||||
| QUALCOMM, Inc. (Semiconductors & Semiconductor Equipment) | 333 | 66,327 | |||||||||
| Quanta Services, Inc. (Construction & Engineering) | 44 | 11,180 | |||||||||
| Quest Diagnostics, Inc. (Health Care Providers & Services) | 33 | 4,517 | |||||||||
| Ralph Lauren Corp. (Textiles, Apparel & Luxury Goods) | 12 | 2,101 | |||||||||
| Raymond James Financial, Inc. (Capital Markets) | 56 | 6,922 | |||||||||
Realty Income Corp. (Retail REITs) | 259 | 13,680 | |||||||||
Regency Centers Corp. (Retail REITs) | 49 | 3,048 | |||||||||
| Regeneron Pharmaceuticals, Inc.* (Biotechnology) | 32 | 33,633 | |||||||||
Regions Financial Corp. (Banks) | 273 | 5,471 | |||||||||
| Republic Services, Inc. (Commercial Services & Supplies) | 61 | 11,855 | |||||||||
| ResMed, Inc. (Health Care Equipment & Supplies) | 44 | 8,422 | |||||||||
Revvity, Inc. (Life Sciences Tools & Services) | 37 | 3,880 | |||||||||
| Rockwell Automation, Inc. (Electrical Equipment) | 34 | 9,360 | |||||||||
Rollins, Inc. (Commercial Services & Supplies) | 84 | 4,098 | |||||||||
Roper Technologies, Inc. (Software) | 32 | 18,037 | |||||||||
Ross Stores, Inc. (Specialty Retail) | 100 | 14,532 | |||||||||
| Royal Caribbean Cruises, Ltd.* (Hotels, Restaurants & Leisure) | 70 | 11,160 | |||||||||
RTX Corp. (Aerospace & Defense) | 396 | 39,755 | |||||||||
S&P Global, Inc. (Capital Markets) | 95 | 42,370 | |||||||||
Salesforce, Inc. (Software) | 289 | 74,302 | |||||||||
SBA Communications Corp. (Specialized REITs) | 32 | 6,282 | |||||||||
| Schlumberger N.V. (Energy Equipment & Services) | 425 | 20,052 | |||||||||
Common Stocks, continued
Shares | Value | ||||||||||
| Seagate Technology Holdings PLC (Technology Hardware, Storage & Peripherals) | 58 | $ | 5,990 | ||||||||
Sempra (Multi-Utilities) | 188 | 14,299 | |||||||||
ServiceNow, Inc.* (Software) | 61 | 47,987 | |||||||||
Simon Property Group, Inc. (Retail REITs) | 97 | 14,725 | |||||||||
| Skyworks Solutions, Inc. (Semiconductors & Semiconductor Equipment) | 48 | 5,116 | |||||||||
Snap-on, Inc. (Machinery) | 16 | 4,182 | |||||||||
| Solventum Corp.* (Health Care Providers & Services) | 41 | 2,168 | |||||||||
Southwest Airlines Co. (Passenger Airlines) | 178 | 5,093 | |||||||||
Stanley Black & Decker, Inc. (Machinery) | 46 | 3,675 | |||||||||
| Starbucks Corp. (Hotels, Restaurants & Leisure) | 337 | 26,235 | |||||||||
State Street Corp. (Capital Markets) | 90 | 6,660 | |||||||||
Steel Dynamics, Inc. (Metals & Mining) | 44 | 5,698 | |||||||||
| STERIS PLC (Health Care Equipment & Supplies) | 29 | 6,367 | |||||||||
| Stryker Corp. (Health Care Equipment & Supplies) | 101 | 34,365 | |||||||||
| Super Micro Computer, Inc.* (Technology Hardware, Storage & Peripherals) | 15 | 12,290 | |||||||||
Synchrony Financial (Consumer Finance) | 119 | 5,616 | |||||||||
Synopsys, Inc.* (Software) | 45 | 26,778 | |||||||||
| Sysco Corp. (Consumer Staples Distribution & Retail) | 148 | 10,566 | |||||||||
T. Rowe Price Group, Inc. (Capital Markets) | 66 | 7,610 | |||||||||
| Take-Two Interactive Software, Inc.* (Entertainment) | 47 | 7,308 | |||||||||
Tapestry, Inc. (Textiles, Apparel & Luxury Goods) | 68 | 2,910 | |||||||||
| Targa Resources Corp. (Oil, Gas & Consumable Fuels) | 66 | 8,499 | |||||||||
| Target Corp. (Consumer Staples Distribution & Retail) | 138 | 20,430 | |||||||||
| TE Connectivity, Ltd. (Electronic Equipment, Instruments & Components) | 91 | 13,689 | |||||||||
| Teledyne Technologies, Inc.* (Electronic Equipment, Instruments & Components) | 14 | 5,432 | |||||||||
| Teleflex, Inc. (Health Care Equipment & Supplies) | 14 | 2,945 | |||||||||
| Teradyne, Inc. (Semiconductors & Semiconductor Equipment) | 46 | 6,821 | |||||||||
Tesla, Inc.* (Automobiles) | 826 | 163,449 | |||||||||
| Texas Instruments, Inc. (Semiconductors & Semiconductor Equipment) | 271 | 52,718 | |||||||||
Textron, Inc. (Aerospace & Defense) | 57 | 4,894 | |||||||||
| The AES Corp. (Independent Power and Renewable Electricity Producers) | 211 | 3,707 | |||||||||
The Allstate Corp. (Insurance) | 79 | 12,613 | |||||||||
| The Bank of New York Mellon Corp. (Capital Markets) | 223 | 13,355 | |||||||||
The Boeing Co.* (Aerospace & Defense) | 172 | 31,306 | |||||||||
The Charles Schwab Corp. (Capital Markets) | 444 | 32,718 | |||||||||
| The Cigna Group (Health Care Providers & Services) | 85 | 28,098 | |||||||||
The Clorox Co. (Household Products) | 37 | 5,049 | |||||||||
The Coca-Cola Co. (Beverages) | 1,154 | 73,453 | |||||||||
| The Cooper Cos., Inc.* (Health Care Equipment & Supplies) | 59 | 5,151 | |||||||||
| The Estee Lauder Cos., Inc. (Personal Care Products) | 69 | 7,342 | |||||||||
See accompanying notes to the financial statements.
126 :: ProFund VP UltraBull :: Schedule of Portfolio Investments :: June 30, 2024 (unaudited)
Common Stocks, continued
Shares | Value | ||||||||||
| The Goldman Sachs Group, Inc. (Capital Markets) | 96 | $ | 43,424 | ||||||||
| The Hartford Financial Services Group, Inc. (Insurance) | 88 | 8,848 | |||||||||
The Hershey Co. (Food Products) | 44 | 8,089 | |||||||||
The Home Depot, Inc. (Specialty Retail) | 295 | 101,550 | |||||||||
The Interpublic Group of Cos., Inc. (Media) | 112 | 3,258 | |||||||||
The J M Smucker Co. (Food Products) | 32 | 3,489 | |||||||||
The Kraft Heinz Co. (Food Products) | 235 | 7,572 | |||||||||
| The Kroger Co. (Consumer Staples Distribution & Retail) | 199 | 9,936 | |||||||||
The Mosaic Co. (Chemicals) | 96 | 2,774 | |||||||||
The PNC Financial Services Group, Inc. (Banks) | 118 | 18,347 | |||||||||
| The Procter & Gamble Co. (Household Products) | 702 | 115,774 | |||||||||
The Progressive Corp. (Insurance) | 174 | 36,141 | |||||||||
The Sherwin-Williams Co. (Chemicals) | 69 | 20,592 | |||||||||
The Southern Co. (Electric Utilities) | 325 | 25,210 | |||||||||
The TJX Cos., Inc. (Specialty Retail) | 337 | 37,104 | |||||||||
The Travelers Cos., Inc. (Insurance) | 68 | 13,827 | |||||||||
The Walt Disney Co. (Entertainment) | 543 | 53,914 | |||||||||
| The Williams Cos., Inc. (Oil, Gas & Consumable Fuels) | 363 | 15,428 | |||||||||
| Thermo Fisher Scientific, Inc. (Life Sciences Tools & Services) | 114 | 63,041 | |||||||||
| T-Mobile U.S., Inc. (Wireless Telecommunication Services) | 153 | 26,956 | |||||||||
Tractor Supply Co. (Specialty Retail) | 32 | 8,640 | |||||||||
Trane Technologies PLC (Building Products) | 67 | 22,038 | |||||||||
TransDigm Group, Inc. (Aerospace & Defense) | 17 | 21,719 | |||||||||
| Trimble, Inc.* (Electronic Equipment, Instruments & Components) | 73 | 4,082 | |||||||||
Truist Financial Corp. (Banks) | 398 | 15,462 | |||||||||
Tyler Technologies, Inc.* (Software) | 13 | 6,536 | |||||||||
Tyson Foods, Inc.—Class A (Food Products) | 85 | 4,857 | |||||||||
U.S. Bancorp (Banks) | 464 | 18,421 | |||||||||
| Uber Technologies, Inc.* (Ground Transportation) | 622 | 45,207 | |||||||||
UDR, Inc. (Residential REITs) | 90 | 3,704 | |||||||||
Ulta Beauty, Inc.* (Specialty Retail) | 14 | 5,402 | |||||||||
Union Pacific Corp. (Ground Transportation) | 182 | 41,179 | |||||||||
| United Airlines Holdings, Inc.* (Passenger Airlines) | 98 | 4,769 | |||||||||
| United Parcel Service, Inc.—Class B (Air Freight & Logistics) | 217 | 29,697 | |||||||||
| United Rentals, Inc. (Trading Companies & Distributors) | 20 | 12,935 | |||||||||
| UnitedHealth Group, Inc. (Health Care Providers & Services) | 274 | 139,537 | |||||||||
| Universal Health Services, Inc.—Class B (Health Care Providers & Services) | 18 | 3,329 | |||||||||
| Valero Energy Corp. (Oil, Gas & Consumable Fuels) | 97 | 15,206 | |||||||||
Ventas, Inc. (Health Care REITs) | 120 | 6,151 | |||||||||
Veralto Corp. (Commercial Services & Supplies) | 65 | 6,206 | |||||||||
VeriSign, Inc.* (IT Services) | 26 | 4,623 | |||||||||
Verisk Analytics, Inc. (Professional Services) | 42 | 11,321 | |||||||||
| Verizon Communications, Inc. (Diversified Telecommunication Services) | 1,253 | 51,673 | |||||||||
Vertex Pharmaceuticals, Inc.* (Biotechnology) | 77 | 36,091 | |||||||||
Viatris, Inc. (Pharmaceuticals) | 354 | 3,763 | |||||||||
Common Stocks, continued
Shares | Value | ||||||||||
VICI Properties, Inc. (Specialized REITs) | 310 | $ | 8,878 | ||||||||
Visa, Inc.—Class A (Financial Services) | 468 | 122,836 | |||||||||
| Vistra Corp. (Independent Power and Renewable Electricity Producers) | 97 | 8,340 | |||||||||
Vulcan Materials Co. (Construction Materials) | 39 | 9,699 | |||||||||
W.R. Berkley Corp. (Insurance) | 60 | 4,715 | |||||||||
| W.W. Grainger, Inc. (Trading Companies & Distributors) | 13 | 11,729 | |||||||||
| Walgreens Boots Alliance, Inc. (Consumer Staples Distribution & Retail) | 213 | 2,576 | |||||||||
| Walmart, Inc. (Consumer Staples Distribution & Retail) | 1,271 | 86,059 | |||||||||
Warner Bros. Discovery, Inc.* (Entertainment) | 664 | 4,940 | |||||||||
| Waste Management, Inc. (Commercial Services & Supplies) | 109 | 23,253 | |||||||||
Waters Corp.* (Life Sciences Tools & Services) | 18 | 5,222 | |||||||||
WEC Energy Group, Inc. (Multi-Utilities) | 94 | 7,375 | |||||||||
Wells Fargo & Co. (Banks) | 1,038 | 61,647 | |||||||||
Welltower, Inc. (Health Care REITs) | 178 | 18,557 | |||||||||
| West Pharmaceutical Services, Inc. (Life Sciences Tools & Services) | 22 | 7,247 | |||||||||
| Western Digital Corp.* (Technology Hardware, Storage & Peripherals) | 97 | 7,350 | |||||||||
| Westinghouse Air Brake Technologies Corp. (Machinery) | 52 | 8,219 | |||||||||
Westrock Co. (Containers & Packaging) | 77 | 3,870 | |||||||||
Weyerhaeuser Co. (Specialized REITs) | 217 | 6,161 | |||||||||
Willis Towers Watson PLC (Insurance) | 30 | 7,864 | |||||||||
| Wynn Resorts, Ltd. (Hotels, Restaurants & Leisure) | 28 | 2,506 | |||||||||
Xcel Energy, Inc. (Electric Utilities) | 165 | 8,813 | |||||||||
Xylem, Inc. (Machinery) | 72 | 9,765 | |||||||||
| Yum! Brands, Inc. (Hotels, Restaurants & Leisure) | 84 | 11,127 | |||||||||
| Zebra Technologies Corp.* (Electronic Equipment, Instruments & Components) | 15 | 4,634 | |||||||||
| Zimmer Biomet Holdings, Inc. (Health Care Equipment & Supplies) | 61 | 6,620 | |||||||||
Zoetis, Inc. (Pharmaceuticals) | 136 | 23,577 | |||||||||
| TOTAL COMMON STOCKS (Cost $4,313,682) | 13,643,493 | ||||||||||
Repurchase Agreements(b)(c) (20.3%)
| Principal Amount | Value | ||||||||||
| Repurchase Agreements with various counterparties, rates 5.12%–5.20%, dated 6/28/2024, due 7/1/24, total to be received $3,604,558 | $ | 3,603,000 | $ | 3,603,000 | |||||||
| TOTAL REPURCHASE AGREEMENTS (Cost $3,603,000) | 3,603,000 | ||||||||||
| TOTAL INVESTMENT SECURITIES (Cost $7,916,682)—97.0% | 17,246,493 | ||||||||||
Net other assets (liabilities)—3.0% | 537,551 | ||||||||||
NET ASSETS—100.0% | $ | 17,784,044 | |||||||||
See accompanying notes to the financial statements.
June 30, 2024 (unaudited) :: Schedule of Portfolio Investments :: ProFund VP UltraBull :: 127
* Non-income producing security.
(a) Number of shares is less than 0.50
(b) A portion of these securities were held in a segregated account for the benefit of swap counterparties in the event of default. At June 30, 2024, the aggregate amount held in a segregated account was $2,880,000.
(c) The ProFund VP invests in Repurchase Agreements jointly with other funds in the Trust. See "Repurchase Agreements" under Note 2 in the Notes to Financial Statements to view the details of each individual agreement and counterparty as well as a description of the securities subject to repurchase.
REIT Real Estate Investment Trust
Futures Contracts Purchased
| Number of Contracts | Expiration Date | Notional Amount | Value and Unrealized Appreciation/ (Depreciation) | ||||||||||||||||
E-Mini S&P 500 Futures Contracts | 7 | 9/23/24 | $ | 1,932,525 | $ | 10,100 | |||||||||||||
Total Return Swap Agreements—Long
Underlying Instrument | Counterparty | Termination Date(1) | Rate Paid (Received)(2) | Notional Amount | Value and Unrealized Appreciation/ (Depreciation) | ||||||||||||||||||
S&P 500 | Goldman Sachs International | 7/29/24 | 6.08 | % | $ | 6,031,100 | $ | (25,729 | ) | ||||||||||||||
SPDR S&P 500 ETF | Goldman Sachs International | 7/29/24 | 5.99 | % | 1,251,950 | (5,156 | ) | ||||||||||||||||
$ | 7,283,050 | $ | (30,885 | ) | |||||||||||||||||||
S&P 500 | UBS AG | 7/29/24 | 5.93 | % | $ | 9,206,369 | $ | (38,143 | ) | ||||||||||||||
SPDR S&P 500 ETF | UBS AG | 7/29/24 | 5.43 | % | 3,507,335 | (14,392 | ) | ||||||||||||||||
$ | 12,713,704 | $ | (52,535 | ) | |||||||||||||||||||
$ | 19,996,754 | $ | (83,420 | ) | |||||||||||||||||||
(1) Agreements may be terminated at will by either party without penalty. Payment is due at termination/maturity.
(2) Reflects the floating financing rate, as of June 30, 2024, on the notional amount of the swap agreement paid to the counterparty or received from the counterparty, excluding any commissions. This amount is included as part of the unrealized appreciation/(depreciation).
See accompanying notes to the financial statements.
128 :: ProFund VP UltraBull :: Schedule of Portfolio Investments :: June 30, 2024 (unaudited)
ProFund VP UltraBull invested in the following industries as of June 30, 2024:
Value | % of Net Assets | ||||||||||
Aerospace & Defense | $ | 195,810 | 1.1 | % | |||||||
Air Freight & Logistics | 58,111 | 0.3 | % | ||||||||
Automobile Components | 7,896 | NM | |||||||||
Automobiles | 193,879 | 1.1 | % | ||||||||
Banks | 438,414 | 2.5 | % | ||||||||
Beverages | 179,219 | 1.0 | % | ||||||||
Biotechnology | 260,449 | 1.5 | % | ||||||||
Broadline Retail | 536,783 | 3.0 | % | ||||||||
Building Products | 66,438 | 0.4 | % | ||||||||
Capital Markets | 385,989 | 2.2 | % | ||||||||
Chemicals | 193,834 | 1.1 | % | ||||||||
Commercial Services & Supplies | 77,701 | 0.4 | % | ||||||||
Communications Equipment | 109,653 | 0.6 | % | ||||||||
Construction & Engineering | 11,180 | 0.1 | % | ||||||||
Construction Materials | 19,451 | 0.1 | % | ||||||||
Consumer Finance | 70,342 | 0.4 | % | ||||||||
Consumer Staples Distribution & Retail | 256,980 | 1.5 | % | ||||||||
Containers & Packaging | 28,218 | 0.2 | % | ||||||||
Distributors | 12,337 | 0.1 | % | ||||||||
Diversified Telecommunication Services | 92,454 | 0.5 | % | ||||||||
Electric Utilities | 202,292 | 1.1 | % | ||||||||
Electrical Equipment | 99,194 | 0.6 | % | ||||||||
| Electronic Equipment, Instruments & Components | 80,766 | 0.5 | % | ||||||||
Energy Equipment & Services | 39,381 | 0.2 | % | ||||||||
Entertainment | 166,516 | 0.9 | % | ||||||||
Financial Services | 517,235 | 2.8 | % | ||||||||
Food Products | 96,874 | 0.5 | % | ||||||||
Gas Utilities | 5,249 | NM | |||||||||
Ground Transportation | 133,438 | 0.8 | % | ||||||||
Health Care Equipment & Supplies | 321,196 | 1.8 | % | ||||||||
Health Care Providers & Services | 335,306 | 1.9 | % | ||||||||
Health Care REITs | 28,804 | 0.2 | % | ||||||||
Hotel & Resort REITs | 3,776 | NM | |||||||||
Hotels, Restaurants & Leisure | 257,615 | 1.4 | % | ||||||||
Household Durables | 47,179 | 0.3 | % | ||||||||
Household Products | 165,890 | 0.9 | % | ||||||||
| Independent Power and Renewable Electricity Producers | 12,047 | 0.1 | % | ||||||||
Industrial Conglomerates | 110,112 | 0.6 | % | ||||||||
Industrial REITs | 30,998 | 0.2 | % | ||||||||
Insurance | 276,842 | 1.6 | % | ||||||||
Interactive Media & Services | 916,243 | 5.2 | % | ||||||||
Value | % of Net Assets | ||||||||||
IT Services | $ | 142,087 | 0.8 | % | |||||||
Leisure Products | 2,282 | NM | |||||||||
Life Sciences Tools & Services | 167,547 | 0.9 | % | ||||||||
Machinery | 218,797 | 1.1 | % | ||||||||
Media | 71,980 | 0.4 | % | ||||||||
Metals & Mining | 52,084 | 0.3 | % | ||||||||
Multi-Utilities | 81,510 | 0.5 | % | ||||||||
Office REITs | 8,145 | NM | |||||||||
Oil, Gas & Consumable Fuels | 458,341 | 2.6 | % | ||||||||
Passenger Airlines | 21,179 | 0.1 | % | ||||||||
Personal Care Products | 17,704 | 0.1 | % | ||||||||
Pharmaceuticals | 516,070 | 2.9 | % | ||||||||
Professional Services | 82,909 | 0.5 | % | ||||||||
Real Estate Management & Development | 17,065 | 0.1 | % | ||||||||
Residential REITs | 39,326 | 0.2 | % | ||||||||
Retail REITs | 37,547 | 0.2 | % | ||||||||
| Semiconductors & Semiconductor Equipment | 1,641,290 | 9.1 | % | ||||||||
Software | 1,503,809 | 8.5 | % | ||||||||
Specialized REITs | 127,983 | 0.8 | % | ||||||||
Specialty Retail | 249,404 | 1.4 | % | ||||||||
| Technology Hardware, Storage & Peripherals | 954,239 | 5.4 | % | ||||||||
Textiles, Apparel & Luxury Goods | 50,118 | 0.3 | % | ||||||||
Tobacco | 70,192 | 0.4 | % | ||||||||
Trading Companies & Distributors | 35,347 | 0.2 | % | ||||||||
Water Utilities | 7,491 | NM | |||||||||
Wireless Telecommunication Services | 26,956 | 0.2 | % | ||||||||
Other** | 4,140,551 | 23.3 | % | ||||||||
Total | $ | 17,784,044 | 100.0 | % | |||||||
** Includes any non-equity securities and net other assets (liabilities), which includes any receivable for capital shares issued and payable for capital shares redeemed.
NM Not meaningful, amount is less than 0.05%
REIT Real Estate Investment Trust
See accompanying notes to the financial statements.
Common Stocks (71.4%)
Shares | Value | ||||||||||
AAON, Inc. (Building Products) | 198 | $ | 17,274 | ||||||||
| Acadia Healthcare Co., Inc.* (Health Care Providers & Services) | 269 | 18,168 | |||||||||
Acuity Brands, Inc. (Electrical Equipment) | 89 | 21,488 | |||||||||
Adient PLC* (Automobile Components) | 261 | 6,449 | |||||||||
| Advanced Drainage Systems, Inc. (Building Products) | 198 | 31,757 | |||||||||
AECOM (Construction & Engineering) | 395 | 34,815 | |||||||||
| Affiliated Managers Group, Inc. (Capital Markets) | 92 | 14,373 | |||||||||
AGCO Corp. (Machinery) | 180 | 17,618 | |||||||||
Agree Realty Corp. (Retail REITs) | 291 | 18,025 | |||||||||
Alcoa Corp. (Metals & Mining) | 521 | 20,725 | |||||||||
| Allegro MicroSystems, Inc.* (Semiconductors & Semiconductor Equipment) | 207 | 5,846 | |||||||||
ALLETE, Inc. (Electric Utilities) | 167 | 10,412 | |||||||||
Ally Financial, Inc. (Consumer Finance) | 794 | 31,498 | |||||||||
Altair Engineering, Inc.*—Class A (Software) | 165 | 16,183 | |||||||||
| Amedisys, Inc.* (Health Care Providers & Services) | 95 | 8,721 | |||||||||
American Financial Group, Inc. (Insurance) | 190 | 23,374 | |||||||||
| American Homes 4 Rent—Class A (Residential REITs) | 934 | 34,707 | |||||||||
| Amkor Technology, Inc. (Semiconductors & Semiconductor Equipment) | 300 | 12,006 | |||||||||
| Annaly Capital Management, Inc. (Mortgage REITs) | 1,453 | 27,694 | |||||||||
| Antero Midstream Corp. (Oil, Gas & Consumable Fuels) | 992 | 14,622 | |||||||||
| Antero Resources Corp.* (Oil, Gas & Consumable Fuels) | 848 | 27,670 | |||||||||
Appfolio, Inc.*—Class A (Software) | 61 | 14,919 | |||||||||
| Applied Industrial Technologies, Inc. (Trading Companies & Distributors) | 112 | 21,728 | |||||||||
AptarGroup, Inc. (Containers & Packaging) | 192 | 27,036 | |||||||||
Aramark (Hotels, Restaurants & Leisure) | 763 | 25,957 | |||||||||
Arcadium Lithium PLC* (Chemicals) | 2,996 | 10,067 | |||||||||
| Arrow Electronics, Inc.* (Electronic Equipment, Instruments & Components) | 155 | 18,718 | |||||||||
| Arrowhead Pharmaceuticals, Inc.* (Biotechnology) | 361 | 9,382 | |||||||||
ASGN, Inc.* (Professional Services) | 133 | 11,727 | |||||||||
Ashland, Inc. (Chemicals) | 146 | 13,796 | |||||||||
Aspen Technology, Inc.* (Software) | 81 | 16,089 | |||||||||
Associated Banc-Corp. (Banks) | 430 | 9,095 | |||||||||
Autoliv, Inc. (Automobile Components) | 210 | 22,468 | |||||||||
AutoNation, Inc.* (Specialty Retail) | 71 | 11,316 | |||||||||
Avient Corp. (Chemicals) | 265 | 11,567 | |||||||||
| Avis Budget Group, Inc. (Ground Transportation) | 53 | 5,540 | |||||||||
| Avnet, Inc. (Electronic Equipment, Instruments & Components) | 262 | 13,490 | |||||||||
Axalta Coating Systems, Ltd.* (Chemicals) | 641 | 21,904 | |||||||||
Azenta, Inc.* (Life Sciences Tools & Services) | 157 | 8,261 | |||||||||
Bank OZK (Banks) | 306 | 12,546 | |||||||||
| Belden, Inc. (Electronic Equipment, Instruments & Components) | 118 | 11,068 | |||||||||
| BellRing Brands, Inc.* (Personal Care Products) | 379 | 21,656 | |||||||||
Common Stocks, continued
Shares | Value | ||||||||||
| Berry Global Group, Inc. (Containers & Packaging) | 332 | $ | 19,538 | ||||||||
| BioMarin Pharmaceutical, Inc.* (Biotechnology) | 551 | 45,363 | |||||||||
| BJ's Wholesale Club Holdings, Inc.* (Household Products) | 386 | 33,906 | |||||||||
Black Hills Corp. (Multi-Utilities) | 200 | 10,876 | |||||||||
Blackbaud, Inc.* (Software) | 117 | 8,912 | |||||||||
| Boyd Gaming Corp. (Hotels, Restaurants & Leisure) | 196 | 10,800 | |||||||||
Brighthouse Financial, Inc.* (Insurance) | 180 | 7,801 | |||||||||
Brixmor Property Group, Inc. (Retail REITs) | 875 | 20,204 | |||||||||
Bruker Corp. (Life Sciences Tools & Services) | 283 | 18,058 | |||||||||
Brunswick Corp. (Leisure Products) | 196 | 14,263 | |||||||||
Burlington Stores, Inc.* (Specialty Retail) | 185 | 44,400 | |||||||||
| BWX Technologies, Inc. (Aerospace & Defense) | 265 | 25,175 | |||||||||
Cabot Corp. (Chemicals) | 160 | 14,702 | |||||||||
| CACI International, Inc.*—Class A (Professional Services) | 65 | 27,958 | |||||||||
Cadence Bank (Banks) | 530 | 14,988 | |||||||||
| Capri Holdings, Ltd.* (Textiles, Apparel & Luxury Goods) | 338 | 11,181 | |||||||||
Carlisle Cos., Inc. (Building Products) | 138 | 55,919 | |||||||||
Carter's, Inc. (Textiles, Apparel & Luxury Goods) | 106 | 6,569 | |||||||||
| Casey's General Stores, Inc. (Consumer Staples Distribution & Retail) | 107 | 40,827 | |||||||||
Celsius Holdings, Inc.* (Beverages) | 433 | 24,720 | |||||||||
| ChampionX Corp. (Energy Equipment & Services) | 553 | 18,365 | |||||||||
Chart Industries, Inc.* (Machinery) | 122 | 17,609 | |||||||||
| Chemed Corp. (Health Care Providers & Services) | 44 | 23,874 | |||||||||
| Chesapeake Energy Corp. (Oil, Gas & Consumable Fuels) | 323 | 26,547 | |||||||||
| Choice Hotels International, Inc.(a) (Hotels, Restaurants & Leisure) | 69 | 8,211 | |||||||||
| Chord Energy Corp. (Oil, Gas & Consumable Fuels) | 181 | 30,350 | |||||||||
| Churchill Downs, Inc. (Hotels, Restaurants & Leisure) | 194 | 27,082 | |||||||||
Ciena Corp.* (Communications Equipment) | 420 | 20,236 | |||||||||
| Cirrus Logic, Inc.* (Semiconductors & Semiconductor Equipment) | 157 | 20,043 | |||||||||
| Civitas Resources, Inc. (Oil, Gas & Consumable Fuels) | 267 | 18,423 | |||||||||
| Clean Harbors, Inc.* (Commercial Services & Supplies) | 146 | 33,018 | |||||||||
Cleveland-Cliffs, Inc.* (Metals & Mining) | 1,380 | 21,238 | |||||||||
CNO Financial Group, Inc. (Insurance) | 314 | 8,704 | |||||||||
| CNX Resources Corp.* (Oil, Gas & Consumable Fuels) | 445 | 10,814 | |||||||||
Coca-Cola Consolidated, Inc. (Beverages) | 14 | 15,190 | |||||||||
| Cognex Corp. (Electronic Equipment, Instruments & Components) | 498 | 23,287 | |||||||||
| Coherent Corp.* (Electronic Equipment, Instruments & Components) | 385 | 27,898 | |||||||||
Columbia Banking System, Inc. (Banks) | 608 | 12,093 | |||||||||
| Columbia Sportswear Co. (Textiles, Apparel & Luxury Goods) | 98 | 7,750 | |||||||||
See accompanying notes to the financial statements.
130 :: ProFund VP UltraMid-Cap :: Schedule of Portfolio Investments :: June 30, 2024 (unaudited)
Common Stocks, continued
Shares | Value | ||||||||||
| Comfort Systems USA, Inc. (Construction & Engineering) | 103 | $ | 31,324 | ||||||||
Commerce Bancshares, Inc. (Banks) | 342 | 19,077 | |||||||||
Commercial Metals Co. (Metals & Mining) | 336 | 18,477 | |||||||||
CommVault Systems, Inc.* (Software) | 126 | 15,318 | |||||||||
Concentrix Corp. (Professional Services) | 136 | 8,606 | |||||||||
COPT Defense Properties (Office REITs) | 326 | 8,160 | |||||||||
| Core & Main, Inc.*—Class A (Trading Companies & Distributors) | 496 | 24,274 | |||||||||
Coty, Inc.*—Class A (Personal Care Products) | 1,058 | 10,601 | |||||||||
Cousins Properties, Inc. (Office REITs) | 441 | 10,209 | |||||||||
Crane Co. (Machinery) | 143 | 20,732 | |||||||||
| Crane NXT Co. (Electronic Equipment, Instruments & Components) | 141 | 8,660 | |||||||||
Crocs, Inc.* (Textiles, Apparel & Luxury Goods) | 176 | 25,685 | |||||||||
Crown Holdings, Inc. (Containers & Packaging) | 346 | 25,739 | |||||||||
CubeSmart (Specialized REITs) | 653 | 29,496 | |||||||||
Cullen/Frost Bankers, Inc. (Banks) | 187 | 19,005 | |||||||||
Curtiss-Wright Corp. (Aerospace & Defense) | 111 | 30,079 | |||||||||
Cytokinetics, Inc.* (Biotechnology) | 333 | 18,042 | |||||||||
Darling Ingredients, Inc.* (Food Products) | 464 | 17,052 | |||||||||
| DENTSPLY SIRONA, Inc. (Health Care Equipment & Supplies) | 603 | 15,021 | |||||||||
Dick's Sporting Goods, Inc. (Specialty Retail) | 169 | 36,310 | |||||||||
Dolby Laboratories, Inc.—Class A (Software) | 173 | 13,707 | |||||||||
Donaldson Co., Inc. (Machinery) | 349 | 24,974 | |||||||||
| Doximity, Inc.*—Class A (Health Care Technology) | 355 | 9,929 | |||||||||
Dropbox, Inc.*—Class A (Software) | 701 | 15,751 | |||||||||
| DT Midstream, Inc. (Oil, Gas & Consumable Fuels) | 282 | 20,030 | |||||||||
Duolingo, Inc.* (Diversified Consumer Services) | 107 | 22,328 | |||||||||
Dynatrace, Inc.* (Software) | 698 | 31,229 | |||||||||
Eagle Materials, Inc. (Construction Materials) | 100 | 21,746 | |||||||||
East West Bancorp, Inc. (Banks) | 404 | 29,585 | |||||||||
EastGroup Properties, Inc. (Industrial REITs) | 140 | 23,814 | |||||||||
elf Beauty, Inc.* (Personal Care Products) | 161 | 33,926 | |||||||||
| EMCOR Group, Inc. (Construction & Engineering) | 136 | 49,652 | |||||||||
| Encompass Health Corp. (Health Care Providers & Services) | 292 | 25,050 | |||||||||
EnerSys (Electrical Equipment) | 117 | 12,112 | |||||||||
| Enovis Corp.* (Health Care Equipment & Supplies) | 145 | 6,554 | |||||||||
| Envista Holdings Corp.* (Health Care Equipment & Supplies) | 499 | 8,298 | |||||||||
EPR Properties (Specialized REITs) | 220 | 9,236 | |||||||||
Equitable Holdings, Inc. (Financial Services) | 887 | 36,242 | |||||||||
| Equitrans Midstream Corp. (Oil, Gas & Consumable Fuels) | 1,259 | 16,342 | |||||||||
| Equity LifeStyle Properties, Inc. (Residential REITs) | 541 | 35,236 | |||||||||
Erie Indemnity Co.—Class A (Insurance) | 72 | 26,093 | |||||||||
Esab Corp. (Machinery) | 165 | 15,581 | |||||||||
Essent Group, Ltd. (Financial Services) | 310 | 17,419 | |||||||||
Essential Utilities, Inc. (Water Utilities) | 730 | 27,251 | |||||||||
Euronet Worldwide, Inc.* (Financial Services) | 126 | 13,041 | |||||||||
Evercore, Inc. (Capital Markets) | 103 | 21,468 | |||||||||
Exelixis, Inc.* (Biotechnology) | 846 | 19,010 | |||||||||
| ExlService Holdings, Inc.* (Professional Services) | 472 | 14,802 | |||||||||
Common Stocks, continued
Shares | Value | ||||||||||
Exponent, Inc. (Professional Services) | 147 | $ | 13,983 | ||||||||
F.N.B. Corp. (Banks) | 1,044 | 14,282 | |||||||||
Federated Hermes, Inc. (Capital Markets) | 233 | 7,661 | |||||||||
Fidelity National Financial, Inc. (Insurance) | 754 | 37,262 | |||||||||
First American Financial Corp. (Insurance) | 301 | 16,239 | |||||||||
First Financial Bankshares, Inc. (Banks) | 373 | 11,015 | |||||||||
First Horizon Corp. (Banks) | 1,587 | 25,027 | |||||||||
| First Industrial Realty Trust, Inc. (Industrial REITs) | 384 | 18,244 | |||||||||
FirstCash Holdings, Inc. (Consumer Finance) | 108 | 11,327 | |||||||||
Five Below, Inc.* (Specialty Retail) | 160 | 17,435 | |||||||||
| Floor & Decor Holdings, Inc.*—Class A (Specialty Retail) | 311 | 30,917 | |||||||||
Flowers Foods, Inc. (Food Products) | 558 | 12,388 | |||||||||
Flowserve Corp. (Machinery) | 382 | 18,374 | |||||||||
Fluor Corp.* (Construction & Engineering) | 497 | 21,644 | |||||||||
| Fortune Brands Innovations, Inc. (Building Products) | 363 | 23,573 | |||||||||
| Frontier Communications Parent, Inc.* (Diversified Telecommunication Services) | 649 | 16,991 | |||||||||
FTI Consulting, Inc.* (Professional Services) | 102 | 21,984 | |||||||||
GameStop Corp.*—Class A (Specialty Retail) | 782 | 19,308 | |||||||||
| Gaming and Leisure Properties, Inc. (Specialized REITs) | 788 | 35,625 | |||||||||
GATX Corp. (Trading Companies & Distributors) | 103 | 13,633 | |||||||||
Genpact, Ltd. (Professional Services) | 481 | 15,483 | |||||||||
Gentex Corp. (Automobile Components) | 671 | 22,619 | |||||||||
Glacier Bancorp, Inc. (Banks) | 329 | 12,278 | |||||||||
| Globus Medical, Inc.* (Health Care Equipment & Supplies) | 327 | 22,397 | |||||||||
Graco, Inc. (Machinery) | 491 | 38,927 | |||||||||
| Graham Holdings Co.—Class B (Diversified Consumer Services) | 10 | 6,996 | |||||||||
| Grand Canyon Education, Inc.* (Diversified Consumer Services) | 85 | 11,892 | |||||||||
| Graphic Packaging Holding Co. (Containers & Packaging) | 892 | 23,379 | |||||||||
Greif, Inc.—Class A (Containers & Packaging) | 75 | 4,310 | |||||||||
GXO Logistics, Inc.* (Air Freight & Logistics) | 347 | 17,524 | |||||||||
| H&R Block, Inc. (Diversified Consumer Services) | 405 | 21,963 | |||||||||
| Haemonetics Corp.* (Health Care Equipment & Supplies) | 147 | 12,161 | |||||||||
Halozyme Therapeutics, Inc.* (Biotechnology) | 369 | 19,321 | |||||||||
Hancock Whitney Corp. (Banks) | 251 | 12,005 | |||||||||
Harley-Davidson, Inc. (Automobiles) | 355 | 11,907 | |||||||||
| Healthcare Realty Trust, Inc. (Health Care REITs) | 1,099 | 18,112 | |||||||||
| HealthEquity, Inc.* (Health Care Providers & Services) | 253 | 21,809 | |||||||||
Helen of Troy, Ltd.* (Household Durables) | 69 | 6,399 | |||||||||
Hexcel Corp. (Aerospace & Defense) | 241 | 15,050 | |||||||||
| HF Sinclair Corp. (Oil, Gas & Consumable Fuels) | 435 | 23,203 | |||||||||
| Hilton Grand Vacations, Inc.* (Hotels, Restaurants & Leisure) | 199 | 8,046 | |||||||||
Home BancShares, Inc. (Banks) | 541 | 12,962 | |||||||||
Houlihan Lokey, Inc. (Capital Markets) | 152 | 20,499 | |||||||||
| Hyatt Hotels Corp.—Class A (Hotels, Restaurants & Leisure) | 131 | 19,902 | |||||||||
IDACORP, Inc. (Electric Utilities) | 147 | 13,693 | |||||||||
See accompanying notes to the financial statements.
June 30, 2024 (unaudited) :: Schedule of Portfolio Investments :: ProFund VP UltraMid-Cap :: 131
Common Stocks, continued
Shares | Value | ||||||||||
Illumina, Inc.* (Life Sciences Tools & Services) | 462 | $ | 48,224 | ||||||||
| Independence Realty Trust, Inc. (Residential REITs) | 652 | 12,218 | |||||||||
Ingredion, Inc. (Food Products) | 191 | 21,908 | |||||||||
Insperity, Inc. (Professional Services) | 104 | 9,486 | |||||||||
| Interactive Brokers Group, Inc. (Capital Markets) | 311 | 38,128 | |||||||||
International Bancshares Corp. (Banks) | 155 | 8,868 | |||||||||
| IPG Photonics Corp.* (Electronic Equipment, Instruments & Components) | 83 | 7,004 | |||||||||
| Iridium Communications, Inc. (Diversified Telecommunication Services) | 352 | 9,370 | |||||||||
ITT, Inc. (Machinery) | 239 | 30,874 | |||||||||
Janus Henderson Group PLC (Capital Markets) | 373 | 12,574 | |||||||||
Jazz Pharmaceuticals PLC* (Pharmaceuticals) | 183 | 19,532 | |||||||||
Jefferies Financial Group, Inc. (Capital Markets) | 492 | 24,482 | |||||||||
| Jones Lang LaSalle, Inc.* (Real Estate Management & Development) | 138 | 28,329 | |||||||||
KB Home (Household Durables) | 213 | 14,948 | |||||||||
KBR, Inc. (Professional Services) | 390 | 25,015 | |||||||||
Kemper Corp. (Insurance) | 176 | 10,442 | |||||||||
Kilroy Realty Corp. (Office REITs) | 310 | 9,663 | |||||||||
Kinsale Capital Group, Inc. (Insurance) | 64 | 24,658 | |||||||||
Kirby Corp.* (Marine Transportation) | 169 | 20,234 | |||||||||
Kite Realty Group Trust (Retail REITs) | 637 | 14,256 | |||||||||
Knife River Corp.* (Construction Materials) | 164 | 11,503 | |||||||||
| Knight-Swift Transportation Holdings, Inc. (Ground Transportation) | 469 | 23,412 | |||||||||
Kyndryl Holdings, Inc.* (IT Services) | 668 | 17,575 | |||||||||
| Lamar Advertising Co.—Class A (Specialized REITs) | 255 | 30,480 | |||||||||
Lancaster Colony Corp. (Food Products) | 59 | 11,149 | |||||||||
Landstar System, Inc. (Ground Transportation) | 104 | 19,186 | |||||||||
| Lantheus Holdings, Inc.* (Health Care Equipment & Supplies) | 201 | 16,138 | |||||||||
| Lattice Semiconductor Corp.* (Semiconductors & Semiconductor Equipment) | 399 | 23,138 | |||||||||
Lear Corp. (Automobile Components) | 165 | 18,845 | |||||||||
Lennox International, Inc. (Building Products) | 93 | 49,753 | |||||||||
| Light & Wonder, Inc.* (Hotels, Restaurants & Leisure) | 262 | 27,479 | |||||||||
Lincoln Electric Holdings, Inc. (Machinery) | 165 | 31,126 | |||||||||
Lithia Motors, Inc. (Specialty Retail) | 80 | 20,196 | |||||||||
| Littelfuse, Inc. (Electronic Equipment, Instruments & Components) | 72 | 18,402 | |||||||||
| LivaNova PLC* (Health Care Equipment & Supplies) | 157 | 8,607 | |||||||||
| Louisiana-Pacific Corp. (Paper & Forest Products) | 185 | 15,231 | |||||||||
| Lumentum Holdings, Inc.* (Communications Equipment) | 196 | 9,980 | |||||||||
| MACOM Technology Solutions Holdings, Inc.* (Semiconductors & Semiconductor Equipment) | 159 | 17,724 | |||||||||
Macy's, Inc. (Broadline Retail) | 799 | 15,341 | |||||||||
Manhattan Associates, Inc.* (Software) | 179 | 44,156 | |||||||||
ManpowerGroup, Inc. (Professional Services) | 138 | 9,632 | |||||||||
| Marriott Vacations Worldwide Corp. (Hotels, Restaurants & Leisure) | 95 | 8,295 | |||||||||
Common Stocks, continued
Shares | Value | ||||||||||
| Masimo Corp.* (Health Care Equipment & Supplies) | 129 | $ | 16,246 | ||||||||
MasTec, Inc.* (Construction & Engineering) | 176 | 18,830 | |||||||||
| Matador Resources Co. (Oil, Gas & Consumable Fuels) | 337 | 20,085 | |||||||||
Mattel, Inc.* (Leisure Products) | 999 | 16,243 | |||||||||
Maximus, Inc. (Professional Services) | 176 | 15,083 | |||||||||
| MDU Resources Group, Inc. (Construction & Engineering) | 592 | 14,859 | |||||||||
| Medpace Holdings, Inc.* (Life Sciences Tools & Services) | 68 | 28,006 | |||||||||
MGIC Investment Corp. (Financial Services) | 774 | 16,680 | |||||||||
| MKS Instruments, Inc. (Semiconductors & Semiconductor Equipment) | 183 | 23,896 | |||||||||
Morningstar, Inc. (Capital Markets) | 76 | 22,485 | |||||||||
MP Materials Corp.* (Metals & Mining) | 389 | 4,952 | |||||||||
| MSA Safety, Inc. (Commercial Services & Supplies) | 107 | 20,083 | |||||||||
| MSC Industrial Direct Co., Inc. (Trading Companies & Distributors) | 132 | 10,469 | |||||||||
| Murphy Oil Corp. (Oil, Gas & Consumable Fuels) | 421 | 17,362 | |||||||||
Murphy USA, Inc. (Specialty Retail) | 55 | 25,820 | |||||||||
National Fuel Gas Co. (Gas Utilities) | 267 | 14,469 | |||||||||
| National Storage Affiliates Trust (Specialized REITs) | 202 | 8,326 | |||||||||
| Neogen Corp.* (Health Care Equipment & Supplies) | 572 | 8,940 | |||||||||
Neurocrine Biosciences, Inc.* (Biotechnology) | 292 | 40,200 | |||||||||
New Jersey Resources Corp. (Gas Utilities) | 287 | 12,266 | |||||||||
New York Community Bancorp, Inc. (Banks) | 2,263 | 7,287 | |||||||||
NewMarket Corp. (Chemicals) | 20 | 10,311 | |||||||||
Nexstar Media Group, Inc. (Media) | 91 | 15,107 | |||||||||
| NEXTracker, Inc.*—Class A (Electrical Equipment) | 357 | 16,736 | |||||||||
NNN REIT, Inc. (Retail REITs) | 532 | 22,663 | |||||||||
Nordstrom, Inc. (Broadline Retail) | 284 | 6,026 | |||||||||
| Northwestern Energy Group, Inc. (Multi-Utilities) | 178 | 8,914 | |||||||||
NOV, Inc. (Energy Equipment & Services) | 1,148 | 21,823 | |||||||||
| Novanta, Inc.* (Electronic Equipment, Instruments & Components) | 104 | 16,963 | |||||||||
nVent Electric PLC (Electrical Equipment) | 482 | 36,926 | |||||||||
OGE Energy Corp. (Electric Utilities) | 582 | 20,777 | |||||||||
Old National Bancorp (Banks) | 917 | 15,763 | |||||||||
Old Republic International Corp. (Insurance) | 734 | 22,681 | |||||||||
Olin Corp. (Chemicals) | 347 | 16,361 | |||||||||
| Ollie's Bargain Outlet Holdings, Inc.* (Broadline Retail) | 178 | 17,475 | |||||||||
| Omega Healthcare Investors, Inc. (Health Care REITs) | 717 | 24,557 | |||||||||
ONE Gas, Inc. (Gas Utilities) | 164 | 10,471 | |||||||||
| Onto Innovation, Inc.* (Semiconductors & Semiconductor Equipment) | 143 | 31,396 | |||||||||
| Option Care Health, Inc.* (Health Care Providers & Services) | 505 | 13,989 | |||||||||
| Ormat Technologies, Inc. (Independent Power and Renewable Electricity Producers) | 156 | 11,185 | |||||||||
Oshkosh Corp. (Machinery) | 190 | 20,558 | |||||||||
Ovintiv, Inc. (Oil, Gas & Consumable Fuels) | 723 | 33,887 | |||||||||
Owens Corning (Building Products) | 252 | 43,777 | |||||||||
See accompanying notes to the financial statements.
132 :: ProFund VP UltraMid-Cap :: Schedule of Portfolio Investments :: June 30, 2024 (unaudited)
Common Stocks, continued
Shares | Value | ||||||||||
| Park Hotels & Resorts, Inc. (Hotel & Resort REITs) | 611 | $ | 9,153 | ||||||||
Paylocity Holding Corp.* (Professional Services) | 126 | 16,613 | |||||||||
| PBF Energy, Inc.—Class A (Oil, Gas & Consumable Fuels) | 306 | 14,082 | |||||||||
| Penske Automotive Group, Inc. (Specialty Retail) | 56 | 8,345 | |||||||||
| Penumbra, Inc.* (Health Care Equipment & Supplies) | 113 | 20,337 | |||||||||
| Performance Food Group Co.* (Consumer Staples Distribution & Retail) | 452 | 29,882 | |||||||||
| Permian Resources Corp. (Oil, Gas & Consumable Fuels) | 1,491 | 24,080 | |||||||||
Perrigo Co. PLC (Pharmaceuticals) | 396 | 10,169 | |||||||||
Pilgrim's Pride Corp.* (Food Products) | 117 | 4,503 | |||||||||
Pinnacle Financial Partners, Inc. (Banks) | 222 | 17,769 | |||||||||
| Planet Fitness, Inc.*—Class A (Hotels, Restaurants & Leisure) | 254 | 18,692 | |||||||||
PNM Resources, Inc. (Electric Utilities) | 262 | 9,684 | |||||||||
Polaris, Inc. (Leisure Products) | 154 | 12,060 | |||||||||
Portland General Electric Co. (Electric Utilities) | 299 | 12,929 | |||||||||
Post Holdings, Inc.* (Food Products) | 146 | 15,207 | |||||||||
PotlatchDeltic Corp. (Specialized REITs) | 231 | 9,099 | |||||||||
| Power Integrations, Inc. (Semiconductors & Semiconductor Equipment) | 165 | 11,581 | |||||||||
Primerica, Inc. (Insurance) | 100 | 23,658 | |||||||||
| Progyny, Inc.* (Health Care Providers & Services) | 240 | 6,866 | |||||||||
Prosperity Bancshares, Inc. (Banks) | 278 | 16,997 | |||||||||
| Pure Storage, Inc.*—Class A (Technology Hardware, Storage & Peripherals) | 887 | 56,954 | |||||||||
PVH Corp. (Textiles, Apparel & Luxury Goods) | 164 | 17,363 | |||||||||
Qualys, Inc.* (Software) | 107 | 15,258 | |||||||||
| QuidelOrtho Corp.* (Health Care Equipment & Supplies) | 144 | 4,784 | |||||||||
| R1 RCM, Inc.* (Health Care Providers & Services) | 575 | 7,222 | |||||||||
| Rambus, Inc.* (Semiconductors & Semiconductor Equipment) | 313 | 18,392 | |||||||||
| Range Resources Corp. (Oil, Gas & Consumable Fuels) | 704 | 23,605 | |||||||||
Rayonier, Inc. (Specialized REITs) | 398 | 11,578 | |||||||||
| Rb Global, Inc. (Commercial Services & Supplies) | 533 | 40,700 | |||||||||
RBC Bearings, Inc.* (Machinery) | 84 | 22,662 | |||||||||
Regal Rexnord Corp. (Electrical Equipment) | 193 | 26,097 | |||||||||
| Reinsurance Group of America, Inc. (Insurance) | 191 | 39,206 | |||||||||
Reliance, Inc. (Metals & Mining) | 167 | 47,695 | |||||||||
RenaissanceRe Holdings, Ltd. (Insurance) | 153 | 34,197 | |||||||||
| Repligen Corp.* (Life Sciences Tools & Services) | 151 | 19,035 | |||||||||
Rexford Industrial Realty, Inc. (Industrial REITs) | 631 | 28,135 | |||||||||
RH* (Specialty Retail) | 45 | 11,000 | |||||||||
RLI Corp. (Insurance) | 117 | 16,461 | |||||||||
Roivant Sciences, Ltd.* (Biotechnology) | 982 | 10,380 | |||||||||
Royal Gold, Inc. (Metals & Mining) | 191 | 23,906 | |||||||||
RPM International, Inc. (Chemicals) | 374 | 40,273 | |||||||||
| Ryan Specialty Holdings, Inc.—Class A (Insurance) | 298 | 17,257 | |||||||||
Ryder System, Inc. (Ground Transportation) | 127 | 15,733 | |||||||||
Common Stocks, continued
Shares | Value | ||||||||||
| Sabra Health Care REIT, Inc. (Health Care REITs) | 672 | $ | 10,349 | ||||||||
Saia, Inc.* (Ground Transportation) | 77 | 36,520 | |||||||||
Sarepta Therapeutics, Inc.* (Biotechnology) | 274 | 43,292 | |||||||||
| Science Applications International Corp. (Professional Services) | 149 | 17,515 | |||||||||
SEI Investments Co. (Capital Markets) | 290 | 18,760 | |||||||||
Selective Insurance Group, Inc. (Insurance) | 176 | 16,514 | |||||||||
| Sensata Technologies Holding PLC (Electrical Equipment) | 438 | 16,377 | |||||||||
| Service Corp. International (Diversified Consumer Services) | 423 | 30,088 | |||||||||
Silgan Holdings, Inc. (Containers & Packaging) | 236 | 9,990 | |||||||||
| Silicon Laboratories, Inc.* (Semiconductors & Semiconductor Equipment) | 93 | 10,289 | |||||||||
| Simpson Manufacturing Co., Inc. (Building Products) | 122 | 20,561 | |||||||||
| Skechers U.S.A., Inc.*—Class A (Textiles, Apparel & Luxury Goods) | 384 | 26,542 | |||||||||
SLM Corp. (Consumer Finance) | 638 | 13,264 | |||||||||
Sonoco Products Co. (Containers & Packaging) | 285 | 14,455 | |||||||||
| Sotera Health Co.* (Life Sciences Tools & Services) | 362 | 4,297 | |||||||||
SouthState Corp. (Banks) | 221 | 16,889 | |||||||||
Southwest Gas Holdings, Inc. (Gas Utilities) | 175 | 12,317 | |||||||||
| Southwestern Energy Co.* (Oil, Gas & Consumable Fuels) | 3,201 | 21,543 | |||||||||
Spire, Inc. (Gas Utilities) | 168 | 10,203 | |||||||||
| Sprouts Farmers Market, Inc.* (Consumer Staples Distribution & Retail) | 292 | 24,429 | |||||||||
STAG Industrial, Inc. (Industrial REITs) | 529 | 19,076 | |||||||||
Starwood Property Trust, Inc. (Mortgage REITs) | 871 | 16,497 | |||||||||
| Stericycle, Inc.* (Commercial Services & Supplies) | 269 | 15,637 | |||||||||
Stifel Financial Corp. (Capital Markets) | 297 | 24,993 | |||||||||
| Synaptics, Inc.* (Semiconductors & Semiconductor Equipment) | 115 | 10,143 | |||||||||
Synovus Financial Corp. (Banks) | 425 | 17,081 | |||||||||
| Taylor Morrison Home Corp.* (Household Durables) | 307 | 17,020 | |||||||||
| TD SYNNEX Corp. (Electronic Equipment, Instruments & Components) | 226 | 26,081 | |||||||||
TEGNA, Inc. (Media) | 492 | 6,858 | |||||||||
| Tempur Sealy International, Inc. (Household Durables) | 504 | 23,859 | |||||||||
| Tenet Healthcare Corp.* (Health Care Providers & Services) | 284 | 37,780 | |||||||||
Teradata Corp.* (Software) | 281 | 9,711 | |||||||||
Terex Corp. (Machinery) | 195 | 10,694 | |||||||||
| Tetra Tech, Inc. (Commercial Services & Supplies) | 155 | 31,694 | |||||||||
Texas Capital Bancshares, Inc.* (Banks) | 135 | 8,254 | |||||||||
| Texas Pacific Land Corp. (Oil, Gas & Consumable Fuels) | 54 | 39,650 | |||||||||
| Texas Roadhouse, Inc. (Hotels, Restaurants & Leisure) | 194 | 33,312 | |||||||||
| The Boston Beer Co., Inc.*—Class A (Beverages) | 27 | 8,236 | |||||||||
| The Brink's Co. (Commercial Services & Supplies) | 129 | 13,210 | |||||||||
The Carlyle Group, Inc. (Capital Markets) | 627 | 25,174 | |||||||||
See accompanying notes to the financial statements.
June 30, 2024 (unaudited) :: Schedule of Portfolio Investments :: ProFund VP UltraMid-Cap :: 133
Common Stocks, continued
Shares | Value | ||||||||||
The Chemours Co. (Chemicals) | 432 | $ | 9,750 | ||||||||
The Gap, Inc. (Specialty Retail) | 629 | 15,027 | |||||||||
| The Goodyear Tire & Rubber Co.* (Automobile Components) | 826 | 9,375 | |||||||||
The Hanover Insurance Group, Inc. (Insurance) | 104 | 13,046 | |||||||||
The Middleby Corp.* (Machinery) | 156 | 19,127 | |||||||||
The New York Times Co.—Class A (Media) | 475 | 24,326 | |||||||||
The Scotts Miracle-Gro Co. (Chemicals) | 122 | 7,937 | |||||||||
The Timken Co. (Machinery) | 188 | 15,064 | |||||||||
The Toro Co. (Machinery) | 303 | 28,334 | |||||||||
| The Wendy's Co. (Hotels, Restaurants & Leisure) | 482 | 8,175 | |||||||||
The Western Union Co. (Financial Services) | 982 | 12,000 | |||||||||
Thor Industries, Inc. (Automobiles) | 155 | 14,484 | |||||||||
TKO Group Holdings, Inc. (Entertainment) | 171 | 18,466 | |||||||||
Toll Brothers, Inc. (Household Durables) | 302 | 34,784 | |||||||||
TopBuild Corp.* (Household Durables) | 92 | 35,446 | |||||||||
| Travel + Leisure Co. (Hotels, Restaurants & Leisure) | 207 | 9,311 | |||||||||
Trex Co., Inc.* (Building Products) | 316 | 23,422 | |||||||||
UFP Industries, Inc. (Building Products) | 179 | 20,048 | |||||||||
UGI Corp. (Gas Utilities) | 609 | 13,946 | |||||||||
UMB Financial Corp. (Banks) | 127 | 10,594 | |||||||||
| Under Armour, Inc.*—Class A (Textiles, Apparel & Luxury Goods) | 548 | 3,655 | |||||||||
| Under Armour, Inc.*—Class C (Textiles, Apparel & Luxury Goods) | 554 | 3,618 | |||||||||
United Bankshares, Inc. (Banks) | 392 | 12,716 | |||||||||
United States Steel Corp. (Metals & Mining) | 649 | 24,532 | |||||||||
United Therapeutics Corp.* (Biotechnology) | 129 | 41,093 | |||||||||
| Universal Display Corp. (Semiconductors & Semiconductor Equipment) | 127 | 26,702 | |||||||||
Unum Group (Insurance) | 517 | 26,424 | |||||||||
| US Foods Holding Corp.* (Consumer Staples Distribution & Retail) | 657 | 34,808 | |||||||||
| Vail Resorts, Inc. (Hotels, Restaurants & Leisure) | 110 | 19,814 | |||||||||
Valaris, Ltd.* (Energy Equipment & Services) | 181 | 13,485 | |||||||||
Valley National Bancorp (Banks) | 1,242 | 8,669 | |||||||||
| Valmont Industries, Inc. (Construction & Engineering) | 59 | 16,193 | |||||||||
Valvoline, Inc.* (Specialty Retail) | 374 | 16,157 | |||||||||
| Vishay Intertechnology, Inc. (Electronic Equipment, Instruments & Components) | 363 | 8,095 | |||||||||
Visteon Corp.* (Automobile Components) | 80 | 8,536 | |||||||||
| Vontier Corp. (Electronic Equipment, Instruments & Components) | 448 | 17,114 | |||||||||
Vornado Realty Trust (Office REITs) | 464 | 12,198 | |||||||||
Voya Financial, Inc. (Financial Services) | 292 | 20,776 | |||||||||
| Warner Music Group Corp.—Class A (Entertainment) | 411 | 12,597 | |||||||||
| Watsco, Inc. (Trading Companies & Distributors) | 93 | 43,082 | |||||||||
| Watts Water Technologies, Inc.—Class A (Machinery) | 80 | 14,670 | |||||||||
| Weatherford International PLC* (Energy Equipment & Services) | 212 | 25,960 | |||||||||
Webster Financial Corp. (Banks) | 498 | 21,708 | |||||||||
| WESCO International, Inc. (Trading Companies & Distributors) | 127 | 20,132 | |||||||||
Westlake Corp. (Chemicals) | 93 | 13,468 | |||||||||
Common Stocks, continued
Shares | Value | ||||||||||
WEX, Inc.* (Financial Services) | 122 | $ | 21,611 | ||||||||
Whirlpool Corp. (Household Durables) | 159 | 16,250 | |||||||||
Williams-Sonoma, Inc. (Specialty Retail) | 187 | 52,802 | |||||||||
Wingstop, Inc. (Hotels, Restaurants & Leisure) | 85 | 35,925 | |||||||||
Wintrust Financial Corp. (Banks) | 179 | 17,642 | |||||||||
| Wolfspeed, Inc.* (Semiconductors & Semiconductor Equipment) | 365 | 8,307 | |||||||||
Woodward, Inc. (Aerospace & Defense) | 177 | 30,865 | |||||||||
WP Carey, Inc. (Diversified REITs) | 635 | 34,957 | |||||||||
| Wyndham Hotels & Resorts, Inc. (Hotels, Restaurants & Leisure) | 234 | 17,316 | |||||||||
XPO, Inc.* (Ground Transportation) | 338 | 35,879 | |||||||||
YETI Holdings, Inc.* (Leisure Products) | 247 | 9,423 | |||||||||
Ziff Davis, Inc.* (Interactive Media & Services) | 134 | 7,377 | |||||||||
Zions Bancorp NA (Banks) | 429 | 18,606 | |||||||||
| ZoomInfo Technologies, Inc.* (Interactive Media & Services) | 825 | 10,535 | |||||||||
| TOTAL COMMON STOCKS (Cost $4,790,786) | 7,724,275 | ||||||||||
Repurchase Agreements(b)(c) (27.7%)
| Principal Amount | Value | ||||||||||
| Repurchase Agreements with various counterparties, rates 5.12%–5.20%, dated 6/28/2024, due 7/1/24, total to be received $2,989,292 | $ | 2,988,000 | $ | 2,988,000 | |||||||
| TOTAL REPURCHASE AGREEMENTS (Cost $2,988,000) | 2,988,000 | ||||||||||
Collateral for Securities Loaned(d) (0.1%)
Shares | Value | ||||||||||
| Invesco Government & Agency Portfolio—Institutional Shares, 5.23%(e) | 7,712 | $ | 7,712 | ||||||||
| TOTAL COLLATERAL FOR SECURITIES LOANED (Cost $7,712) | 7,712 | ||||||||||
| TOTAL INVESTMENT SECURITIES (Cost $7,786,498)—99.2% | 10,719,987 | ||||||||||
Net other assets (liabilities)—0.8% | 85,877 | ||||||||||
NET ASSETS—100.0% | $ | 10,805,864 | |||||||||
* Non-income producing security.
(a) All or part of this security was on loan as of June 30, 2024. The total value of securities on loan as of June 30, 2024 was $7,616.
(b) A portion of these securities were held in a segregated account for the benefit of swap counterparties in the event of default. At June 30, 2024, the aggregate amount held in a segregated account was $1,830,000.
(c) The ProFund VP invests in Repurchase Agreements jointly with other funds in the Trust. See "Repurchase Agreements" under Note 2 in the Notes to Financial Statements to view the details of each individual agreement and counterparty as well as a description of the securities subject to repurchase.
(d) Securities were purchased with cash collateral held from securities on loan at June 30, 2024.
(e) Rate periodically changes. Rate disclosed is the daily yield on June 30, 2024.
REIT Real Estate Investment Trust
See accompanying notes to the financial statements.
134 :: ProFund VP UltraMid-Cap :: Schedule of Portfolio Investments :: June 30, 2024 (unaudited)
Futures Contracts Purchased
| Number of Contracts | Expiration Date | Notional Amount | Value and Unrealized Appreciation/ (Depreciation) | ||||||||||||||||
E-Mini S&P MidCap 400 Futures Contracts | 4 | 9/23/24 | $ | 1,183,240 | $ | (11,809 | ) | ||||||||||||
Total Return Swap Agreements—Long
Underlying Instrument | Counterparty | Termination Date(1) | Rate Paid (Received)(2) | Notional Amount | Value and Unrealized Appreciation/ (Depreciation) | ||||||||||||||||||
S&P MidCap 400 | Goldman Sachs International | 7/29/24 | 5.98 | % | $ | 4,772,384 | $ | 13,437 | |||||||||||||||
SPDR S&P MidCap 400 ETF | Goldman Sachs International | 7/29/24 | 5.75 | % | 1,611,519 | 4,293 | |||||||||||||||||
$ | 6,383,903 | $ | 17,730 | ||||||||||||||||||||
S&P MidCap 400 | UBS AG | 7/29/24 | 5.68 | % | $ | 4,757,001 | $ | 13,614 | |||||||||||||||
SPDR S&P MidCap 400 ETF | UBS AG | 7/29/24 | 5.63 | % | 1,565,001 | 4,174 | |||||||||||||||||
$ | 6,322,002 | $ | 17,788 | ||||||||||||||||||||
$ | 12,705,905 | $ | 35,518 | ||||||||||||||||||||
(1) Agreements may be terminated at will by either party without penalty. Payment is due at termination/maturity.
(2) Reflects the floating financing rate, as of June 30, 2024, on the notional amount of the swap agreement paid to the counterparty or received from the counterparty, excluding any commissions. This amount is included as part of the unrealized appreciation/(depreciation).
See accompanying notes to the financial statements.
June 30, 2024 (unaudited) :: Schedule of Portfolio Investments :: ProFund VP UltraMid-Cap :: 135
ProFund VP UltraMid-Cap invested in the following industries as of June 30, 2024:
Value | % of Net Assets | ||||||||||
Aerospace & Defense | $ | 101,169 | 0.9 | % | |||||||
Air Freight & Logistics | 17,524 | 0.2 | % | ||||||||
Automobile Components | 88,292 | 0.8 | % | ||||||||
Automobiles | 26,391 | 0.2 | % | ||||||||
Banks | 402,801 | 3.6 | % | ||||||||
Beverages | 48,146 | 0.4 | % | ||||||||
Biotechnology | 246,083 | 2.3 | % | ||||||||
Broadline Retail | 38,842 | 0.4 | % | ||||||||
Building Products | 286,084 | 2.6 | % | ||||||||
Capital Markets | 230,597 | 2.1 | % | ||||||||
Chemicals | 170,136 | 1.6 | % | ||||||||
Commercial Services & Supplies | 154,342 | 1.4 | % | ||||||||
Communications Equipment | 30,216 | 0.3 | % | ||||||||
Construction & Engineering | 187,317 | 1.7 | % | ||||||||
Construction Materials | 33,249 | 0.3 | % | ||||||||
Consumer Finance | 56,089 | 0.5 | % | ||||||||
Consumer Staples Distribution & Retail | 129,946 | 1.2 | % | ||||||||
Containers & Packaging | 124,447 | 1.2 | % | ||||||||
Diversified Consumer Services | 93,267 | 0.9 | % | ||||||||
Diversified REITs | 34,957 | 0.3 | % | ||||||||
Diversified Telecommunication Services | 26,361 | 0.2 | % | ||||||||
Electric Utilities | 67,495 | 0.6 | % | ||||||||
Electrical Equipment | 129,736 | 1.2 | % | ||||||||
| Electronic Equipment, Instruments & Components | 196,780 | 1.8 | % | ||||||||
Energy Equipment & Services | 79,633 | 0.7 | % | ||||||||
Entertainment | 31,063 | 0.3 | % | ||||||||
Financial Services | 137,769 | 1.3 | % | ||||||||
Food Products | 82,207 | 0.8 | % | ||||||||
Gas Utilities | 73,672 | 0.7 | % | ||||||||
Ground Transportation | 136,270 | 1.3 | % | ||||||||
Health Care Equipment & Supplies | 139,483 | 1.3 | % | ||||||||
Health Care Providers & Services | 163,479 | 1.5 | % | ||||||||
Health Care REITs | 53,018 | 0.5 | % | ||||||||
Health Care Technology | 9,929 | 0.1 | % | ||||||||
Hotel & Resort REITs | 9,153 | 0.1 | % | ||||||||
Hotels, Restaurants & Leisure | 278,317 | 2.6 | % | ||||||||
Household Durables | 148,706 | 1.4 | % | ||||||||
Household Products | 33,906 | 0.3 | % | ||||||||
| Independent Power and Renewable Electricity Producers | 11,185 | 0.1 | % | ||||||||
Industrial REITs | 89,269 | 0.8 | % | ||||||||
Insurance | 364,017 | 3.4 | % | ||||||||
Value | % of Net Assets | ||||||||||
Interactive Media & Services | $ | 17,912 | 0.2 | % | |||||||
IT Services | 17,575 | 0.2 | % | ||||||||
Leisure Products | 51,989 | 0.5 | % | ||||||||
Life Sciences Tools & Services | 125,881 | 1.2 | % | ||||||||
Machinery | 346,924 | 3.2 | % | ||||||||
Marine Transportation | 20,234 | 0.2 | % | ||||||||
Media | 46,291 | 0.4 | % | ||||||||
Metals & Mining | 161,525 | 1.5 | % | ||||||||
Mortgage REITs | 44,191 | 0.4 | % | ||||||||
Multi-Utilities | 19,790 | 0.2 | % | ||||||||
Office REITs | 40,230 | 0.4 | % | ||||||||
Oil, Gas & Consumable Fuels | 382,295 | 3.5 | % | ||||||||
Paper & Forest Products | 15,231 | 0.1 | % | ||||||||
Personal Care Products | 66,183 | 0.6 | % | ||||||||
Pharmaceuticals | 29,701 | 0.3 | % | ||||||||
Professional Services | 207,887 | 1.9 | % | ||||||||
| Real Estate Management & Development | 28,329 | 0.3 | % | ||||||||
Residential REITs | 82,161 | 0.8 | % | ||||||||
Retail REITs | 75,148 | 0.7 | % | ||||||||
| Semiconductors & Semiconductor Equipment | 219,463 | 2.0 | % | ||||||||
Software | 201,233 | 1.9 | % | ||||||||
Specialized REITs | 133,840 | 1.2 | % | ||||||||
Specialty Retail | 309,033 | 2.9 | % | ||||||||
| Technology Hardware, Storage & Peripherals | 56,954 | 0.5 | % | ||||||||
Textiles, Apparel & Luxury Goods | 102,363 | 0.9 | % | ||||||||
Trading Companies & Distributors | 133,318 | 1.2 | % | ||||||||
Water Utilities | 27,251 | 0.3 | % | ||||||||
Other** | 3,081,589 | 28.6 | % | ||||||||
Total | $ | 10,805,864 | 100.0 | % | |||||||
** Includes any non-equity securities and net other assets (liabilities), which includes any receivable for capital shares issued and payable for capital shares redeemed.
REIT Real Estate Investment Trust
See accompanying notes to the financial statements.
Common Stocks (69.1%)
Shares | Value | ||||||||||
Adobe, Inc.* (Software) | 4,924 | $ | 2,735,478 | ||||||||
| Advanced Micro Devices, Inc.* (Semiconductors & Semiconductor Equipment) | 17,763 | 2,881,336 | |||||||||
| Airbnb, Inc.*—Class A (Hotels, Restaurants & Leisure) | 4,852 | 735,709 | |||||||||
| Alphabet, Inc.—Class A (Interactive Media & Services) | 24,994 | 4,552,657 | |||||||||
| Alphabet, Inc.—Class C (Interactive Media & Services) | 23,900 | 4,383,738 | |||||||||
Amazon.com, Inc.* (Broadline Retail) | 44,280 | 8,557,109 | |||||||||
| American Electric Power Co., Inc. (Electric Utilities) | 5,793 | 508,278 | |||||||||
Amgen, Inc. (Biotechnology) | 5,895 | 1,841,893 | |||||||||
| Analog Devices, Inc. (Semiconductors & Semiconductor Equipment) | 5,453 | 1,244,702 | |||||||||
ANSYS, Inc.* (Software) | 959 | 308,319 | |||||||||
| Apple, Inc. (Technology Hardware, Storage & Peripherals) | 65,247 | 13,742,323 | |||||||||
| Applied Materials, Inc. (Semiconductors & Semiconductor Equipment) | 9,100 | 2,147,509 | |||||||||
| Arm Holdings PLC* (Semiconductors & Semiconductor Equipment) | 1,299 | 212,542 | |||||||||
| ASML Holding N.V.NYS (Semiconductors & Semiconductor Equipment) | 1,000 | 1,022,730 | |||||||||
AstraZeneca PLCADR (Pharmaceuticals) | 6,400 | 499,136 | |||||||||
Atlassian Corp.*—Class A (Software) | 1,751 | 309,717 | |||||||||
Autodesk, Inc.* (Software) | 2,368 | 585,962 | |||||||||
| Automatic Data Processing, Inc. (Professional Services) | 4,498 | 1,073,629 | |||||||||
| Baker Hughes Co. (Energy Equipment & Services) | 10,968 | 385,745 | |||||||||
Biogen, Inc.* (Biotechnology) | 1,600 | 370,912 | |||||||||
| Booking Holdings, Inc. (Hotels, Restaurants & Leisure) | 373 | 1,477,639 | |||||||||
| Broadcom, Inc. (Semiconductors & Semiconductor Equipment) | 5,093 | 8,176,965 | |||||||||
Cadence Design Systems, Inc.* (Software) | 2,991 | 920,480 | |||||||||
| CDW Corp. (Electronic Equipment, Instruments & Components) | 1,477 | 330,612 | |||||||||
| Charter Communications, Inc.*—Class A (Media) | 1,583 | 473,254 | |||||||||
| Cintas Corp. (Commercial Services & Supplies) | 1,115 | 780,790 | |||||||||
| Cisco Systems, Inc. (Communications Equipment) | 44,277 | 2,103,600 | |||||||||
| Coca-Cola Europacific Partners PLC (Beverages) | 5,047 | 367,775 | |||||||||
| Cognizant Technology Solutions Corp.— Class A (IT Services) | 5,464 | 371,552 | |||||||||
Comcast Corp.—Class A (Media) | 43,017 | 1,684,546 | |||||||||
Constellation Energy Corp. (Electric Utilities) | 3,464 | 693,735 | |||||||||
| Copart, Inc.* (Commercial Services & Supplies) | 10,576 | 572,796 | |||||||||
| CoStar Group, Inc.* (Real Estate Management & Development) | 4,489 | 332,814 | |||||||||
| Costco Wholesale Corp. (Consumer Staples Distribution & Retail) | 4,874 | 4,142,851 | |||||||||
| Crowdstrike Holdings, Inc.*—Class A (Software) | 2,535 | 971,387 | |||||||||
Common Stocks, continued
Shares | Value | ||||||||||
CSX Corp. (Ground Transportation) | 21,485 | $ | 718,673 | ||||||||
Datadog, Inc.*—Class A (Software) | 3,390 | 439,649 | |||||||||
| Dexcom, Inc.* (Health Care Equipment & Supplies) | 4,371 | 495,584 | |||||||||
| Diamondback Energy, Inc. (Oil, Gas & Consumable Fuels) | 1,960 | 392,372 | |||||||||
| Dollar Tree, Inc.* (Consumer Staples Distribution & Retail) | 2,397 | 255,928 | |||||||||
| DoorDash, Inc.*—Class A (Hotels, Restaurants & Leisure) | 4,195 | 456,332 | |||||||||
Electronic Arts, Inc. (Entertainment) | 2,928 | 407,958 | |||||||||
Exelon Corp. (Electric Utilities) | 10,990 | 380,364 | |||||||||
| Fastenal Co. (Trading Companies & Distributors) | 6,292 | 395,389 | |||||||||
Fortinet, Inc.* (Software) | 8,396 | 506,027 | |||||||||
| GE HealthCare Technologies, Inc. (Health Care Equipment & Supplies) | 5,017 | 390,925 | |||||||||
Gilead Sciences, Inc. (Biotechnology) | 13,692 | 939,408 | |||||||||
| GLOBALFOUNDRIES, Inc.*(a) (Semiconductors & Semiconductor Equipment) | 6,062 | 306,495 | |||||||||
Grail, Inc.*(a) (Biotechnology) | 292 | 4,485 | |||||||||
| Honeywell International, Inc. (Industrial Conglomerates) | 7,157 | 1,528,306 | |||||||||
| IDEXX Laboratories, Inc.* (Health Care Equipment & Supplies) | 908 | 442,378 | |||||||||
Illumina, Inc.* (Life Sciences Tools & Services) | 1,751 | 182,769 | |||||||||
| Intel Corp. (Semiconductors & Semiconductor Equipment) | 46,785 | 1,448,931 | |||||||||
Intuit, Inc. (Software) | 3,072 | 2,018,949 | |||||||||
| Intuitive Surgical, Inc.* (Health Care Equipment & Supplies) | 3,898 | 1,734,025 | |||||||||
Keurig Dr Pepper, Inc. (Beverages) | 14,898 | 497,593 | |||||||||
| KLA Corp. (Semiconductors & Semiconductor Equipment) | 1,480 | 1,220,275 | |||||||||
| Lam Research Corp. (Semiconductors & Semiconductor Equipment) | 1,437 | 1,530,189 | |||||||||
Linde PLC (Chemicals) | 5,283 | 2,318,233 | |||||||||
| Lululemon Athletica, Inc.* (Textiles, Apparel & Luxury Goods) | 1,328 | 396,674 | |||||||||
| Marriott International, Inc.—Class A (Hotels, Restaurants & Leisure) | 3,139 | 758,916 | |||||||||
| Marvell Technology, Inc. (Semiconductors & Semiconductor Equipment) | 9,513 | 664,959 | |||||||||
MercadoLibre, Inc.* (Broadline Retail) | 557 | 915,374 | |||||||||
| Meta Platforms, Inc.—Class A (Interactive Media & Services) | 14,834 | 7,479,599 | |||||||||
| Microchip Technology, Inc. (Semiconductors & Semiconductor Equipment) | 5,900 | 539,850 | |||||||||
| Micron Technology, Inc. (Semiconductors & Semiconductor Equipment) | 12,170 | 1,600,720 | |||||||||
Microsoft Corp. (Software) | 31,625 | 14,134,793 | |||||||||
Moderna, Inc.* (Biotechnology) | 4,212 | 500,175 | |||||||||
| Mondelez International, Inc.—Class A (Food Products) | 14,742 | 964,716 | |||||||||
MongoDB, Inc.* (IT Services) | 806 | 201,468 | |||||||||
Monster Beverage Corp.* (Beverages) | 11,449 | 571,878 | |||||||||
Netflix, Inc.* (Entertainment) | 4,736 | 3,196,232 | |||||||||
| NVIDIA Corp. (Semiconductors & Semiconductor Equipment) | 104,666 | 12,930,439 | |||||||||
See accompanying notes to the financial statements.
June 30, 2024 (unaudited) :: Schedule of Portfolio Investments :: ProFund VP UltraNasdaq-100 :: 137
Common Stocks, continued
Shares | Value | ||||||||||
| NXP Semiconductors N.V. (Semiconductors & Semiconductor Equipment) | 2,810 | $ | 756,143 | ||||||||
| Old Dominion Freight Line, Inc. (Ground Transportation) | 2,388 | 421,721 | |||||||||
| ON Semiconductor Corp.* (Semiconductors & Semiconductor Equipment) | 4,728 | 324,104 | |||||||||
O'Reilly Automotive, Inc.* (Specialty Retail) | 647 | 683,271 | |||||||||
PACCAR, Inc. (Machinery) | 5,760 | 592,934 | |||||||||
Palo Alto Networks, Inc.* (Software) | 3,559 | 1,206,537 | |||||||||
Paychex, Inc. (Professional Services) | 3,956 | 469,023 | |||||||||
PayPal Holdings, Inc.* (Financial Services) | 11,496 | 667,113 | |||||||||
PDD Holdings, Inc.*ADR (Broadline Retail) | 7,341 | 975,986 | |||||||||
PepsiCo, Inc. (Beverages) | 15,109 | 2,491,927 | |||||||||
| QUALCOMM, Inc. (Semiconductors & Semiconductor Equipment) | 12,265 | 2,442,943 | |||||||||
| Regeneron Pharmaceuticals, Inc.* (Biotechnology) | 1,191 | 1,251,777 | |||||||||
Roper Technologies, Inc. (Software) | 1,176 | 662,864 | |||||||||
Ross Stores, Inc. (Specialty Retail) | 3,685 | 535,504 | |||||||||
| Starbucks Corp. (Hotels, Restaurants & Leisure) | 12,450 | 969,233 | |||||||||
Synopsys, Inc.* (Software) | 1,684 | 1,002,081 | |||||||||
| Take-Two Interactive Software, Inc.* (Entertainment) | 1,884 | 292,943 | |||||||||
Tesla, Inc.* (Automobiles) | 20,540 | 4,064,455 | |||||||||
| Texas Instruments, Inc. (Semiconductors & Semiconductor Equipment) | 10,006 | 1,946,467 | |||||||||
The Kraft Heinz Co. (Food Products) | 13,345 | 429,976 | |||||||||
The Trade Desk, Inc.*—Class A (Media) | 4,893 | 477,899 | |||||||||
| T-Mobile U.S., Inc. (Wireless Telecommunication Services) | 12,879 | 2,269,022 | |||||||||
Verisk Analytics, Inc. (Professional Services) | 1,568 | 422,654 | |||||||||
| Vertex Pharmaceuticals, Inc.* (Biotechnology) | 2,836 | 1,329,290 | |||||||||
| Walgreens Boots Alliance, Inc. (Consumer Staples Distribution & Retail) | 9,481 | 114,673 | |||||||||
Warner Bros. Discovery, Inc.* (Entertainment) | 26,929 | 200,352 | |||||||||
Workday, Inc.*—Class A (Software) | 2,330 | 520,895 | |||||||||
Xcel Energy, Inc. (Electric Utilities) | 6,107 | 326,175 | |||||||||
Zscaler, Inc.* (Software) | 1,647 | 316,537 | |||||||||
| TOTAL COMMON STOCKS (Cost $67,397,156) | 163,531,749 | ||||||||||
Repurchase Agreements(b)(c) (25.5%)
| Principal Amount | Value | ||||||||||
| Repurchase Agreements with various counterparties, rates 5.12%–5.20%, dated 6/28/2024, due 7/1/24, total to be received $60,403,104 | $ | 60,377,000 | $ | 60,377,000 | |||||||
| TOTAL REPURCHASE AGREEMENTS (Cost $60,377,000) | 60,377,000 | ||||||||||
Collateral for Securities Loaned(d) (0.1%)
Shares | Value | ||||||||||
| Invesco Government & Agency Portfolio—Institutional Shares, 5.23%(e) | 299,548 | $ | 299,548 | ||||||||
| TOTAL COLLATERAL FOR SECURITIES LOANED (Cost $299,548) | 299,548 | ||||||||||
| TOTAL INVESTMENT SECURITIES (Cost $128,073,704)—94.7% | 224,208,297 | ||||||||||
Net other assets (liabilities)—5.3% | 12,539,959 | ||||||||||
NET ASSETS—100.0% | $ | 236,748,256 | |||||||||
* Non-income producing security.
(a) All or part of this security was on loan as of June 30, 2024. The total value of securities on loan as of June 30, 2024 was $292,722.
(b) A portion of these securities were held in a segregated account for the benefit of swap counterparties in the event of default. At June 30, 2024, the aggregate amount held in a segregated account was $34,895,000.
(c) The ProFund VP invests in Repurchase Agreements jointly with other funds in the Trust. See "Repurchase Agreements" under Note 2 in the Notes to Financial Statements to view the details of each individual agreement and counterparty as well as a description of the securities subject to repurchase.
(d) Securities were purchased with cash collateral held from securities on loan at June 30, 2024.
(e) Rate periodically changes. Rate disclosed is the daily yield on June 30, 2024.
ADR American Depositary Receipt
NYS New York Shares
See accompanying notes to the financial statements.
138 :: ProFund VP UltraNasdaq-100 :: Schedule of Portfolio Investments :: June 30, 2024 (unaudited)
Futures Contracts Purchased
| Number of Contracts | Expiration Date | Notional Amount | Value and Unrealized Appreciation/ (Depreciation) | ||||||||||||||||
E-Mini Nasdaq-100 Futures Contracts | 67 | 9/23/24 | $ | 26,702,515 | $ | 227,816 | |||||||||||||
Total Return Swap Agreements—Long
Underlying Instrument | Counterparty | Termination Date(1) | Rate Paid (Received)(2) | Notional Amount | Value and Unrealized Appreciation/ (Depreciation) | ||||||||||||||||||
Invesco QQQ Trust, Series 1 ETF | Goldman Sachs International | 7/29/24 | 5.88 | % | $ | 56,867,552 | $ | (306,055 | ) | ||||||||||||||
Nasdaq-100 Index | Goldman Sachs International | 7/29/24 | 6.08 | % | 130,654,891 | (719,853 | ) | ||||||||||||||||
$ | 187,522,443 | $ | (1,025,908 | ) | |||||||||||||||||||
Invesco QQQ Trust, Series 1 ETF | UBS AG | 7/29/24 | 5.83 | % | $ | 22,584,475 | $ | (121,516 | ) | ||||||||||||||
Nasdaq-100 Index | UBS AG | 7/29/24 | 6.13 | % | 73,092,338 | (402,505 | ) | ||||||||||||||||
$ | 95,676,813 | $ | (524,021 | ) | |||||||||||||||||||
$ | 283,199,256 | $ | (1,549,929 | ) | |||||||||||||||||||
(1) Agreements may be terminated at will by either party without penalty. Payment is due at termination/maturity.
(2) Reflects the floating financing rate, as of June 30, 2024, on the notional amount of the swap agreement paid to the counterparty or received from the counterparty, excluding any commissions. This amount is included as part of the unrealized appreciation/(depreciation).
ProFund VP UltraNasdaq-100 invested in the following industries as of June 30, 2024:
Value | % of Net Assets | ||||||||||
Automobiles | $ | 4,064,455 | 1.7 | % | |||||||
Beverages | 3,929,173 | 1.7 | % | ||||||||
Biotechnology | 6,237,940 | 2.6 | % | ||||||||
Broadline Retail | 10,448,469 | 4.4 | % | ||||||||
Chemicals | 2,318,233 | 1.0 | % | ||||||||
Commercial Services & Supplies | 1,353,586 | 0.6 | % | ||||||||
Communications Equipment | 2,103,600 | 0.9 | % | ||||||||
Consumer Staples Distribution & Retail | 4,513,452 | 1.9 | % | ||||||||
Electric Utilities | 1,908,552 | 0.8 | % | ||||||||
| Electronic Equipment, Instruments & Components | 330,612 | 0.1 | % | ||||||||
Energy Equipment & Services | 385,745 | 0.2 | % | ||||||||
Entertainment | 4,097,485 | 1.7 | % | ||||||||
Financial Services | 667,113 | 0.3 | % | ||||||||
Food Products | 1,394,692 | 0.6 | % | ||||||||
Ground Transportation | 1,140,394 | 0.5 | % | ||||||||
Health Care Equipment & Supplies | 3,062,912 | 1.3 | % | ||||||||
Hotels, Restaurants & Leisure | 4,397,829 | 1.9 | % | ||||||||
Industrial Conglomerates | 1,528,306 | 0.6 | % | ||||||||
Interactive Media & Services | 16,415,994 | 6.9 | % | ||||||||
IT Services | 573,020 | 0.2 | % | ||||||||
Life Sciences Tools & Services | 182,769 | 0.1 | % | ||||||||
Machinery | 592,934 | 0.3 | % | ||||||||
Value | % of Net Assets | ||||||||||
Media | $ | 2,635,699 | 1.1 | % | |||||||
Oil, Gas & Consumable Fuels | 392,372 | 0.1 | % | ||||||||
Pharmaceuticals | 499,136 | 0.2 | % | ||||||||
Professional Services | 1,965,306 | 0.7 | % | ||||||||
| Real Estate Management & Development | 332,814 | 0.1 | % | ||||||||
| Semiconductors & Semiconductor Equipment | 41,397,299 | 17.6 | % | ||||||||
Software | 26,639,675 | 11.3 | % | ||||||||
Specialty Retail | 1,218,775 | 0.5 | % | ||||||||
| Technology Hardware, Storage & Peripherals | 13,742,323 | 5.8 | % | ||||||||
Textiles, Apparel & Luxury Goods | 396,674 | 0.2 | % | ||||||||
Trading Companies & Distributors | 395,389 | 0.2 | % | ||||||||
Wireless Telecommunication Services | 2,269,022 | 1.0 | % | ||||||||
Other** | 73,216,507 | 30.9 | % | ||||||||
Total | $ | 236,748,256 | 100.0 | % | |||||||
** Includes any non-equity securities and net other assets (liabilities), which includes any receivable for capital shares issued and payable for capital shares redeemed.
See accompanying notes to the financial statements.
June 30, 2024 (unaudited) :: Schedule of Portfolio Investments :: ProFund VP UltraShort Dow 30 :: 139
Repurchase Agreement (63.8%)(a)
| Principal Amount | Value | ||||||||||
| Repurchase Agreements with UMB Bank N.A., 5.12%, dated 6/28/2024, due 7/1/24, total to be received $2,001 | $ | 2,000 | $ | 2,000 | |||||||
(Cost $2,000) | 2,000 | ||||||||||
| TOTAL INVESTMENT SECURITIES (Cost $2,000)—63.8% | 2,000 | ||||||||||
Net other assets (liabilities)—36.2% | 1,135 | ||||||||||
NET ASSETS—100.0% | $ | 3,135 | |||||||||
(a) The ProFund VP invests in Repurchase Agreements jointly with other funds in the Trust. See "Repurchase Agreements" under Note 2 in the Notes to Financial Statements to view the details of each individual agreement and counterparty as well as a description of the securities subject to repurchase.
Total Return Swap Agreements—Short
Underlying Instrument | Counterparty | Termination Date(1) | Rate Paid (Received)(2) | Notional Amount | Value and Unrealized Appreciation/ (Depreciation) | ||||||||||||||||||
Dow Jones Industrial Average | Goldman Sachs International | 7/29/24 | (5.83 | )% | $ | (3,446 | ) | $ | 4 | ||||||||||||||
Dow Jones Industrial Average | UBS AG | 7/29/24 | (5.18 | )% | (2,789 | ) | 4 | ||||||||||||||||
$ | (6,235 | ) | $ | 8 | |||||||||||||||||||
(1) Agreements may be terminated at will by either party without penalty. Payment is due at termination/maturity.
(2) Reflects the floating financing rate, as of June 30, 2024, on the notional amount of the swap agreement paid to the counterparty or received from the counterparty, excluding any commissions. This amount is included as part of the unrealized appreciation/(depreciation).
See accompanying notes to the financial statements.
140 :: ProFund VP UltraShort Nasdaq-100 :: Schedule of Portfolio Investments :: June 30, 2024 (unaudited)
Repurchase Agreements(a)(b) (98.9%)
| Principal Amount | Value | ||||||||||
| Repurchase Agreements with various counterparties, rates 5.12%–5.20%, dated 6/28/2024, due 7/1/24, total to be received $1,588,687 | $ | 1,588,000 | $ | 1,588,000 | |||||||
| TOTAL REPURCHASE AGREEMENTS (Cost $1,588,000) | 1,588,000 | ||||||||||
| TOTAL INVESTMENT SECURITIES (Cost $1,588,000)—98.9% | 1,588,000 | ||||||||||
Net other assets (liabilities)—1.1% | 16,930 | ||||||||||
NET ASSETS—100.0% | $ | 1,604,930 | |||||||||
(a) A portion of these securities were held in a segregated account for the benefit of swap counterparties in the event of default. At June 30, 2024, the aggregate amount held in a segregated account was $434,000.
(b) The ProFund VP invests in Repurchase Agreements jointly with other funds in the Trust. See "Repurchase Agreements" under Note 2 in the Notes to Financial Statements to view the details of each individual agreement and counterparty as well as a description of the securities subject to repurchase.
Total Return Swap Agreements—Short
Underlying Instrument | Counterparty | Termination Date(1) | Rate Paid (Received)(2) | Notional Amount | Value and Unrealized Appreciation/ (Depreciation) | ||||||||||||||||||
Nasdaq-100 Index | Goldman Sachs International | 7/29/24 | (5.83 | )% | $ | (2,110,423 | ) | $ | 11,278 | ||||||||||||||
Nasdaq-100 Index | UBS AG | 7/29/24 | (5.48 | )% | (1,107,099 | ) | 6,076 | ||||||||||||||||
$ | (3,217,522 | ) | $ | 17,354 | |||||||||||||||||||
(1) Agreements may be terminated at will by either party without penalty. Payment is due at termination/maturity.
(2) Reflects the floating financing rate, as of June 30, 2024, on the notional amount of the swap agreement paid to the counterparty or received from the counterparty, excluding any commissions. This amount is included as part of the unrealized appreciation/(depreciation).
See accompanying notes to the financial statements.
Common Stocks (72.6%)
Shares | Value | ||||||||||
| 1-800-Flowers.com, Inc.*—Class A (Specialty Retail) | 99 | $ | 942 | ||||||||
1st Source Corp. (Banks) | 70 | 3,753 | |||||||||
1stdibs.com, Inc.* (Broadline Retail) | 97 | 436 | |||||||||
2seventy bio, Inc.* (Biotechnology) | 187 | 720 | |||||||||
374Water, Inc.* (Machinery) | 249 | 299 | |||||||||
3D Systems Corp.* (Machinery) | 486 | 1,492 | |||||||||
| 4D Molecular Therapeutics, Inc.* (Biotechnology) | 190 | 3,988 | |||||||||
89bio, Inc.* (Biotechnology) | 309 | 2,475 | |||||||||
8x8, Inc.* (Software) | 446 | 990 | |||||||||
| 908 Devices, Inc.* (Electronic Equipment, Instruments & Components) | 91 | 469 | |||||||||
A10 Networks, Inc. (Software) | 271 | 3,753 | |||||||||
AAR Corp.* (Aerospace & Defense) | 132 | 9,596 | |||||||||
Abercrombie & Fitch Co.* (Specialty Retail) | 192 | 34,146 | |||||||||
| ABM Industries, Inc. (Commercial Services & Supplies) | 241 | 12,187 | |||||||||
Absci Corp.* (Biotechnology) | 305 | 939 | |||||||||
Acacia Research Corp.* (Financial Services) | 144 | 721 | |||||||||
| Academy Sports & Outdoors, Inc. (Specialty Retail) | 276 | 14,697 | |||||||||
| ACADIA Pharmaceuticals, Inc.* (Biotechnology) | 457 | 7,426 | |||||||||
Acadia Realty Trust (Retail REITs) | 386 | 6,917 | |||||||||
| Accel Entertainment, Inc.* (Hotels, Restaurants & Leisure) | 200 | 2,052 | |||||||||
| ACCO Brands Corp. (Commercial Services & Supplies) | 357 | 1,678 | |||||||||
| Accolade, Inc.* (Health Care Providers & Services) | 283 | 1,013 | |||||||||
| Accuray, Inc.* (Health Care Equipment & Supplies) | 366 | 666 | |||||||||
ACELYRIN, Inc.* (Biotechnology) | 279 | 1,230 | |||||||||
Achieve Life Sciences, Inc.* (Biotechnology) | 131 | 616 | |||||||||
ACI Worldwide, Inc.* (Software) | 403 | 15,955 | |||||||||
| ACM Research, Inc.*—Class A (Semiconductors & Semiconductor Equipment) | 194 | 4,474 | |||||||||
ACNB Corp. (Banks) | 32 | 1,161 | |||||||||
Acrivon Therapeutics, Inc.* (Biotechnology) | 45 | 261 | |||||||||
| Actinium Pharmaceuticals, Inc.* (Biotechnology) | 115 | 851 | |||||||||
| Acumen Pharmaceuticals, Inc.* (Biotechnology) | 160 | 387 | |||||||||
Acushnet Holdings Corp. (Leisure Products) | 111 | 7,046 | |||||||||
| ACV Auctions, Inc.*—Class A (Commercial Services & Supplies) | 565 | 10,311 | |||||||||
| AdaptHealth Corp.* (Health Care Providers & Services) | 389 | 3,890 | |||||||||
| Adaptive Biotechnologies Corp.* (Life Sciences Tools & Services) | 442 | 1,600 | |||||||||
ADC Therapeutics SA* (Biotechnology) | 267 | 844 | |||||||||
| Addus HomeCare Corp.* (Health Care Providers & Services) | 60 | 6,967 | |||||||||
Adeia, Inc. (Software) | 415 | 4,642 | |||||||||
Adient PLC* (Automobile Components) | 347 | 8,574 | |||||||||
ADMA Biologics, Inc.* (Biotechnology) | 860 | 9,615 | |||||||||
| Adtalem Global Education, Inc.* (Diversified Consumer Services) | 149 | 10,163 | |||||||||
Common Stocks, continued
Shares | Value | ||||||||||
| ADTRAN Holdings, Inc. (Communications Equipment) | 301 | $ | 1,583 | ||||||||
| Advanced Energy Industries, Inc. (Electronic Equipment, Instruments & Components) | 143 | 15,553 | |||||||||
AdvanSix, Inc. (Chemicals) | 98 | 2,246 | |||||||||
Advantage Solutions, Inc.* (Media) | 408 | 1,314 | |||||||||
| Adverum Biotechnologies, Inc.* (Biotechnology) | 79 | 542 | |||||||||
| Aehr Test Systems* (Semiconductors & Semiconductor Equipment) | 106 | 1,184 | |||||||||
Aemetis, Inc.* (Oil, Gas & Consumable Fuels) | 138 | 415 | |||||||||
Aerovate Therapeutics, Inc.* (Biotechnology) | 51 | 85 | |||||||||
AeroVironment, Inc.* (Aerospace & Defense) | 100 | 18,217 | |||||||||
AerSale Corp.* (Aerospace & Defense) | 128 | 886 | |||||||||
| Aeva Technologies, Inc.* (Electronic Equipment, Instruments & Components) | 87 | 219 | |||||||||
AFC Gamma, Inc. (Mortgage REITs) | 65 | 793 | |||||||||
| AG Mortgage Investment Trust, Inc. (Mortgage REITs) | 110 | 730 | |||||||||
Agenus, Inc.* (Biotechnology) | 78 | 1,307 | |||||||||
| agilon health, Inc.* (Health Care Providers & Services) | 1,177 | 7,698 | |||||||||
Agilysys, Inc.* (Software) | 84 | 8,748 | |||||||||
Agios Pharmaceuticals, Inc.* (Biotechnology) | 216 | 9,314 | |||||||||
| Air Transport Services Group, Inc.* (Air Freight & Logistics) | 196 | 2,719 | |||||||||
| AirSculpt Technologies, Inc.* (Health Care Providers & Services) | 51 | 204 | |||||||||
Airship Ai Holdings, Inc.* (Software) | 12 | 43 | |||||||||
Aka Brands Holding Corp.* (Specialty Retail) | 2 | 31 | |||||||||
Akebia Therapeutics, Inc.* (Biotechnology) | 794 | 810 | |||||||||
Akero Therapeutics, Inc.* (Biotechnology) | 259 | 6,076 | |||||||||
| Akoya Biosciences, Inc.* (Life Sciences Tools & Services) | 101 | 236 | |||||||||
Alamo Group, Inc. (Machinery) | 39 | 6,747 | |||||||||
Alarm.com Holdings, Inc.* (Software) | 184 | 11,691 | |||||||||
Albany International Corp. (Machinery) | 119 | 10,050 | |||||||||
Aldeyra Therapeutics, Inc.* (Biotechnology) | 190 | 629 | |||||||||
Alector, Inc.* (Biotechnology) | 308 | 1,398 | |||||||||
Alerus Financial Corp. (Financial Services) | 68 | 1,333 | |||||||||
Alexander & Baldwin, Inc. (Diversified REITs) | 278 | 4,715 | |||||||||
Alexander's, Inc. (Retail REITs) | 8 | 1,799 | |||||||||
Alico, Inc. (Food Products) | 27 | 700 | |||||||||
Alight, Inc.*—Class A (Professional Services) | 1,813 | 13,380 | |||||||||
| Alignment Healthcare, Inc.* (Health Care Providers & Services) | 382 | 2,987 | |||||||||
Alimera Sciences, Inc.* (Pharmaceuticals) | 82 | 456 | |||||||||
Alkami Technology, Inc.* (Software) | 168 | 4,785 | |||||||||
Alkermes PLC* (Biotechnology) | 643 | 15,496 | |||||||||
Allegiant Travel Co. (Passenger Airlines) | 59 | 2,964 | |||||||||
ALLETE, Inc. (Electric Utilities) | 222 | 13,842 | |||||||||
Allient, Inc. (Electrical Equipment) | 56 | 1,415 | |||||||||
Allogene Therapeutics, Inc.* (Biotechnology) | 401 | 934 | |||||||||
| Alpha & Omega Semiconductor, Ltd.* (Semiconductors & Semiconductor Equipment) | 89 | 3,326 | |||||||||
| Alpha Metallurgical Resources, Inc. (Metals & Mining) | 42 | 11,782 | |||||||||
See accompanying notes to the financial statements.
142 :: ProFund VP UltraSmall-Cap :: Schedule of Portfolio Investments :: June 30, 2024 (unaudited)
Common Stocks, continued
Shares | Value | ||||||||||
| Alphatec Holdings, Inc.* (Health Care Equipment & Supplies) | 392 | $ | 4,096 | ||||||||
| Alpine Income Property Trust, Inc. (Diversified REITs) | 48 | 747 | |||||||||
| Alta Equipment Group, Inc. (Trading Companies & Distributors) | 102 | 820 | |||||||||
Altair Engineering, Inc.*—Class A (Software) | 218 | 21,382 | |||||||||
AlTi Global, Inc.* (Capital Markets) | 129 | 672 | |||||||||
Altimmune, Inc.*(a) (Biotechnology) | 271 | 1,802 | |||||||||
Alto Neuroscience, Inc.* (Pharmaceuticals) | 34 | 363 | |||||||||
| Altus Power, Inc.* (Independent Power and Renewable Electricity Producers) | 290 | 1,137 | |||||||||
ALX Oncology Holdings, Inc.* (Biotechnology) | 126 | 760 | |||||||||
Amalgamated Financial Corp. (Banks) | 68 | 1,863 | |||||||||
| A-Mark Precious Metals, Inc. (Financial Services) | 67 | 2,169 | |||||||||
Ambac Financial Group, Inc.* (Insurance) | 166 | 2,128 | |||||||||
| Ambarella, Inc.* (Semiconductors & Semiconductor Equipment) | 145 | 7,823 | |||||||||
| AMC Entertainment Holdings, Inc.* (Entertainment) | 1,062 | 5,289 | |||||||||
AMC Networks, Inc.*—Class A (Media) | 122 | 1,179 | |||||||||
Amerant Bancorp, Inc. (Banks) | 113 | 2,565 | |||||||||
| Ameresco, Inc.*—Class A (Construction & Engineering) | 123 | 3,544 | |||||||||
American Assets Trust, Inc. (Diversified REITs) | 183 | 4,096 | |||||||||
| American Axle & Manufacturing Holdings, Inc.* (Automobile Components) | 439 | 3,069 | |||||||||
| American Coastal Insurance Corp.* (Insurance) | 92 | 971 | |||||||||
| American Eagle Outfitters, Inc. (Specialty Retail) | 696 | 13,892 | |||||||||
| American Healthcare REIT, Inc. (Health Care REITs) | 248 | 3,623 | |||||||||
| American Public Education, Inc.* (Diversified Consumer Services) | 60 | 1,055 | |||||||||
| American Realty Investors, Inc.* (Real Estate Management & Development) | 6 | 85 | |||||||||
American Software, Inc.—Class A (Software) | 120 | 1,096 | |||||||||
American States Water Co. (Water Utilities) | 142 | 10,306 | |||||||||
| American Superconductor Corp.* (Electrical Equipment) | 130 | 3,041 | |||||||||
American Vanguard Corp. (Chemicals) | 96 | 826 | |||||||||
| American Woodmark Corp.* (Building Products) | 60 | 4,716 | |||||||||
America's Car-Mart, Inc.* (Specialty Retail) | 23 | 1,385 | |||||||||
Ameris Bancorp (Banks) | 251 | 12,638 | |||||||||
AMERISAFE, Inc. (Insurance) | 73 | 3,204 | |||||||||
Ames National Corp. (Banks) | 34 | 697 | |||||||||
Amicus Therapeutics, Inc.* (Biotechnology) | 1,120 | 11,110 | |||||||||
AMMO, Inc.* (Leisure Products) | 342 | 575 | |||||||||
| AMN Healthcare Services, Inc.* (Health Care Providers & Services) | 145 | 7,428 | |||||||||
| Amneal Pharmaceuticals, Inc.* (Pharmaceuticals) | 607 | 3,854 | |||||||||
| Amphastar Pharmaceuticals, Inc.* (Pharmaceuticals) | 147 | 5,880 | |||||||||
| Amplify Energy Corp.* (Oil, Gas & Consumable Fuels) | 150 | 1,017 | |||||||||
Amplitude, Inc.*—Class A (Software) | 292 | 2,599 | |||||||||
Common Stocks, continued
Shares | Value | ||||||||||
| Amprius Technologies, Inc.* (Electrical Equipment) | 53 | $ | 67 | ||||||||
AnaptysBio, Inc.* (Biotechnology) | 75 | 1,880 | |||||||||
Anavex Life Sciences Corp.*(a) (Biotechnology) | 278 | 1,173 | |||||||||
| Angel Oak Mortgage REIT, Inc. (Mortgage REITs) | 45 | 590 | |||||||||
| AngioDynamics, Inc.* (Health Care Equipment & Supplies) | 146 | 883 | |||||||||
ANI Pharmaceuticals, Inc.* (Pharmaceuticals) | 71 | 4,521 | |||||||||
Anika Therapeutics, Inc.* (Biotechnology) | 56 | 1,418 | |||||||||
Annexon, Inc.* (Biotechnology) | 322 | 1,578 | |||||||||
| Anterix, Inc.* (Diversified Telecommunication Services) | 48 | 1,900 | |||||||||
| Anywhere Real Estate, Inc.* (Real Estate Management & Development) | 375 | 1,241 | |||||||||
| Apartment Investment and Management Co.* (Residential REITs) | 543 | 4,501 | |||||||||
Apogee Enterprises, Inc. (Building Products) | 83 | 5,215 | |||||||||
Apogee Therapeutics, Inc.* (Biotechnology) | 138 | 5,430 | |||||||||
| Apollo Commercial Real Estate Finance, Inc. (Mortgage REITs) | 544 | 5,326 | |||||||||
Appian Corp.*—Class A (Software) | 154 | 4,752 | |||||||||
| Apple Hospitality REIT, Inc. (Hotel & Resort REITs) | 870 | 12,650 | |||||||||
Applied Digital Corp.*(a) (IT Services) | 376 | 2,237 | |||||||||
| Applied Industrial Technologies, Inc. (Trading Companies & Distributors) | 147 | 28,519 | |||||||||
| Applied Optoelectronics, Inc.* (Communications Equipment) | 141 | 1,169 | |||||||||
Applied Therapeutics, Inc.* (Biotechnology) | 367 | 1,714 | |||||||||
| Aquestive Therapeutics, Inc.* (Pharmaceuticals) | 283 | 736 | |||||||||
Arbor Realty Trust, Inc.(a) (Mortgage REITs) | 703 | 10,088 | |||||||||
Arbutus Biopharma Corp.* (Biotechnology) | 532 | 1,644 | |||||||||
Arcadium Lithium PLC* (Chemicals) | 4,136 | 13,897 | |||||||||
ArcBest Corp. (Ground Transportation) | 90 | 9,637 | |||||||||
Arcellx, Inc.* (Biotechnology) | 165 | 9,106 | |||||||||
Arch Resources, Inc. (Metals & Mining) | 67 | 10,199 | |||||||||
| Archer Aviation, Inc.*(a)—Class A (Aerospace & Defense) | 891 | 3,136 | |||||||||
Archrock, Inc. (Energy Equipment & Services) | 589 | 11,910 | |||||||||
Arcosa, Inc. (Construction & Engineering) | 185 | 15,430 | |||||||||
| Arcturus Therapeutics Holdings, Inc.* (Biotechnology) | 87 | 2,118 | |||||||||
Arcus Biosciences, Inc.* (Biotechnology) | 208 | 3,168 | |||||||||
Arcutis Biotherapeutics, Inc.* (Biotechnology) | 405 | 3,767 | |||||||||
| Ardagh Metal Packaging SA (Containers & Packaging) | 552 | 1,877 | |||||||||
Ardelyx, Inc.* (Biotechnology) | 887 | 6,573 | |||||||||
| Ardmore Shipping Corp. (Oil, Gas & Consumable Fuels) | 158 | 3,560 | |||||||||
| Ares Commercial Real Estate Corp. (Mortgage REITs) | 204 | 1,357 | |||||||||
Argan, Inc. (Construction & Engineering) | 47 | 3,439 | |||||||||
Arhaus, Inc. (Specialty Retail) | 196 | 3,320 | |||||||||
| Aris Water Solutions, Inc.—Class A (Commercial Services & Supplies) | 102 | 1,598 | |||||||||
Arko Corp. (Specialty Retail) | 307 | 1,925 | |||||||||
| Arlo Technologies, Inc.* (Electronic Equipment, Instruments & Components) | 363 | 4,734 | |||||||||
See accompanying notes to the financial statements.
June 30, 2024 (unaudited) :: Schedule of Portfolio Investments :: ProFund VP UltraSmall-Cap :: 143
Common Stocks, continued
Shares | Value | ||||||||||
| Armada Hoffler Properties, Inc. (Diversified REITs) | 253 | $ | 2,806 | ||||||||
| ARMOUR Residential REIT, Inc. (Mortgage REITs) | 187 | 3,624 | |||||||||
Arq, Inc.* (Chemicals) | 94 | 571 | |||||||||
| Array Technologies, Inc.* (Electrical Equipment) | 583 | 5,982 | |||||||||
ArriVent Biopharma, Inc.* (Biotechnology) | 37 | 686 | |||||||||
Arrow Financial Corp. (Banks) | 63 | 1,641 | |||||||||
| Arrowhead Pharmaceuticals, Inc.* (Biotechnology) | 456 | 11,851 | |||||||||
ARS Pharmaceuticals, Inc.* (Biotechnology) | 188 | 1,600 | |||||||||
Arteris, Inc.* (Software) | 105 | 789 | |||||||||
| Artisan Partners Asset Management, Inc.—Class A (Capital Markets) | 240 | 9,905 | |||||||||
| Artivion, Inc.* (Health Care Equipment & Supplies) | 152 | 3,899 | |||||||||
Arvinas, Inc.* (Pharmaceuticals) | 245 | 6,522 | |||||||||
Asana, Inc.*—Class A (Software) | 303 | 4,239 | |||||||||
| Asbury Automotive Group, Inc.* (Specialty Retail) | 77 | 17,547 | |||||||||
ASGN, Inc.* (Professional Services) | 172 | 15,165 | |||||||||
Asp Isotopes, Inc.* (Chemicals) | 151 | 462 | |||||||||
Aspen Aerogels, Inc.* (Chemicals) | 222 | 5,295 | |||||||||
| AssetMark Financial Holdings, Inc.* (Capital Markets) | 87 | 3,006 | |||||||||
Associated Banc-Corp. (Banks) | 572 | 12,098 | |||||||||
| AST SpaceMobile, Inc.* (Diversified Telecommunication Services) | 450 | 5,225 | |||||||||
Astec Industries, Inc. (Machinery) | 87 | 2,580 | |||||||||
| Astrana Health, Inc.* (Health Care Providers & Services) | 164 | 6,652 | |||||||||
Astria Therapeutics, Inc.* (Biotechnology) | 172 | 1,565 | |||||||||
Astronics Corp.* (Aerospace & Defense) | 109 | 2,183 | |||||||||
Asure Software, Inc.* (Professional Services) | 90 | 756 | |||||||||
Atea Pharmaceuticals, Inc.* (Pharmaceuticals) | 295 | 976 | |||||||||
Atkore, Inc. (Electrical Equipment) | 140 | 18,889 | |||||||||
Atlanta Braves Holdings, Inc.* (Entertainment) | 39 | 1,612 | |||||||||
Atlanta Braves Holdings, Inc.* (Entertainment) | 191 | 7,533 | |||||||||
Atlantic Union Bankshares Corp. (Banks) | 341 | 11,202 | |||||||||
| Atlanticus Holdings Corp.* (Consumer Finance) | 21 | 592 | |||||||||
| Atlas Energy Solutions, Inc. (Energy Equipment & Services) | 259 | 5,162 | |||||||||
| Atmus Filtration Technologies, Inc.* (Automobile Components) | 320 | 9,210 | |||||||||
| ATN International, Inc. (Diversified Telecommunication Services) | 40 | 912 | |||||||||
Atossa Therapeutics, Inc.* (Biotechnology) | 483 | 575 | |||||||||
| AtriCure, Inc.* (Health Care Equipment & Supplies) | 181 | 4,121 | |||||||||
| Atrion Corp. (Health Care Equipment & Supplies) | 5 | 2,262 | |||||||||
Audioeye, Inc.* (Software) | 27 | 475 | |||||||||
Aura Biosciences, Inc.* (Biotechnology) | 177 | 1,338 | |||||||||
Aurinia Pharmaceuticals, Inc.* (Biotechnology) | 548 | 3,129 | |||||||||
Aurora Innovation, Inc.* (Software) | 3,209 | 8,889 | |||||||||
| Avadel Pharmaceuticals PLC* (Pharmaceuticals) | 353 | 4,963 | |||||||||
| Avanos Medical, Inc.* (Health Care Equipment & Supplies) | 173 | 3,446 | |||||||||
Common Stocks, continued
Shares | Value | ||||||||||
| Aveanna Healthcare Holdings, Inc.* (Health Care Providers & Services) | 199 | $ | 549 | ||||||||
AvePoint, Inc.* (Software) | 484 | 5,043 | |||||||||
| Aviat Networks, Inc.* (Communications Equipment) | 43 | 1,234 | |||||||||
Avid Bioservices, Inc.* (Biotechnology) | 237 | 1,692 | |||||||||
Avidity Biosciences, Inc.* (Biotechnology) | 386 | 15,768 | |||||||||
| AvidXchange Holdings, Inc.* (Financial Services) | 663 | 7,996 | |||||||||
Avient Corp. (Chemicals) | 345 | 15,059 | |||||||||
Avista Corp. (Multi-Utilities) | 299 | 10,348 | |||||||||
Avita Medical, Inc.* (Biotechnology) | 98 | 776 | |||||||||
| Axcelis Technologies, Inc.* (Semiconductors & Semiconductor Equipment) | 124 | 17,632 | |||||||||
| Axogen, Inc.* (Health Care Equipment & Supplies) | 162 | 1,173 | |||||||||
| Axonics, Inc.* (Health Care Equipment & Supplies) | 194 | 13,043 | |||||||||
Axos Financial, Inc.* (Banks) | 209 | 11,944 | |||||||||
Axsome Therapeutics, Inc.* (Pharmaceuticals) | 139 | 11,191 | |||||||||
AZZ, Inc. (Building Products) | 112 | 8,652 | |||||||||
B Riley Financial, Inc.(a) (Capital Markets) | 78 | 1,376 | |||||||||
B&G Foods, Inc. (Food Products) | 297 | 2,400 | |||||||||
Backblaze, Inc.*—Class A (IT Services) | 152 | 936 | |||||||||
| Badger Meter, Inc. (Electronic Equipment, Instruments & Components) | 112 | 20,871 | |||||||||
Balchem Corp. (Chemicals) | 123 | 18,935 | |||||||||
Bally's Corp.* (Hotels, Restaurants & Leisure) | 91 | 1,089 | |||||||||
Banc of California, Inc. (Banks) | 530 | 6,773 | |||||||||
BancFirst Corp. (Banks) | 76 | 6,665 | |||||||||
| Banco Latinoamericano de Comercio Exterior S.A.—Class E (Financial Services) | 104 | 3,086 | |||||||||
| Bandwidth, Inc.*—Class A (Diversified Telecommunication Services) | 94 | 1,587 | |||||||||
Bank First Corp. (Banks) | 37 | 3,056 | |||||||||
Bank of Hawaii Corp. (Banks) | 149 | 8,524 | |||||||||
Bank of Marin Bancorp (Banks) | 61 | 988 | |||||||||
Bank7 Corp. (Banks) | 15 | 470 | |||||||||
BankUnited, Inc. (Banks) | 285 | 8,342 | |||||||||
Bankwell Financial Group, Inc. (Banks) | 25 | 634 | |||||||||
Banner Corp. (Banks) | 131 | 6,503 | |||||||||
Bar Harbor Bankshares (Banks) | 57 | 1,532 | |||||||||
BARK, Inc.* (Specialty Retail) | 506 | 916 | |||||||||
Barnes Group, Inc. (Machinery) | 177 | 7,330 | |||||||||
| Barrett Business Services, Inc. (Professional Services) | 98 | 3,211 | |||||||||
BayCom Corp. (Banks) | 40 | 814 | |||||||||
BCB Bancorp, Inc. (Banks) | 57 | 606 | |||||||||
| Beacon Roofing Supply, Inc.* (Trading Companies & Distributors) | 243 | 21,992 | |||||||||
Beam Therapeutics, Inc.* (Biotechnology) | 292 | 6,842 | |||||||||
| Beazer Homes USA, Inc.* (Household Durables) | 113 | 3,105 | |||||||||
| Bel Fuse, Inc.—Class B (Electronic Equipment, Instruments & Components) | 39 | 2,544 | |||||||||
| BEL Fuse, Inc.—Class A (Electronic Equipment, Instruments & Components) | 7 | 566 | |||||||||
| Belden, Inc. (Electronic Equipment, Instruments & Components) | 155 | 14,539 | |||||||||
| Benchmark Electronics, Inc. (Electronic Equipment, Instruments & Components) | 136 | 5,367 | |||||||||
See accompanying notes to the financial statements.
144 :: ProFund VP UltraSmall-Cap :: Schedule of Portfolio Investments :: June 30, 2024 (unaudited)
Common Stocks, continued
Shares | Value | ||||||||||
Berkshire Hills Bancorp, Inc. (Banks) | 166 | $ | 3,785 | ||||||||
Berry Corp. (Oil, Gas & Consumable Fuels) | 292 | 1,886 | |||||||||
Beyond Meat, Inc.*(a) (Food Products) | 228 | 1,530 | |||||||||
Beyond, Inc.* (Specialty Retail) | 174 | 2,276 | |||||||||
BGC Group, Inc.—Class A (Capital Markets) | 1,411 | 11,711 | |||||||||
BigBear.ai Holdings, Inc.* (IT Services) | 388 | 586 | |||||||||
| BigCommerce Holdings, Inc.*—Class 1 (IT Services) | 269 | 2,168 | |||||||||
| Biglari Holdings, Inc.*—Class B (Hotels, Restaurants & Leisure) | 3 | 580 | |||||||||
| BioCryst Pharmaceuticals, Inc.* (Biotechnology) | 789 | 4,876 | |||||||||
Biohaven, Ltd.* (Biotechnology) | 287 | 9,962 | |||||||||
| BioLife Solutions, Inc.* (Life Sciences Tools & Services) | 135 | 2,893 | |||||||||
Biomea Fusion, Inc.* (Biotechnology) | 105 | 473 | |||||||||
Biote Corp.*—Class A (Pharmaceuticals) | 103 | 769 | |||||||||
| Bioventus, Inc.*—Class A (Health Care Equipment & Supplies) | 143 | 822 | |||||||||
Bit Digital, Inc.* (Software) | 447 | 1,421 | |||||||||
| BJ's Restaurants, Inc.* (Hotels, Restaurants & Leisure) | 72 | 2,498 | |||||||||
| Black Diamond Therapeutics, Inc.* (Biotechnology) | 142 | 662 | |||||||||
Black Hills Corp. (Multi-Utilities) | 262 | 14,248 | |||||||||
Blackbaud, Inc.* (Software) | 158 | 12,035 | |||||||||
BlackLine, Inc.* (Software) | 220 | 10,659 | |||||||||
| BlackSky Technology, Inc.* (Professional Services) | 406 | 434 | |||||||||
| Blackstone Mortgage Trust, Inc.(a)—Class A (Mortgage REITs) | 663 | 11,550 | |||||||||
Blade Air Mobility, Inc.* (Passenger Airlines) | 216 | 752 | |||||||||
Blend Labs, Inc.*—Class A (Software) | 881 | 2,079 | |||||||||
Blink Charging Co.* (Electrical Equipment) | 367 | 1,006 | |||||||||
| Bloom Energy Corp.*(a)—Class A (Electrical Equipment) | 759 | 9,290 | |||||||||
| Bloomin' Brands, Inc. (Hotels, Restaurants & Leisure) | 301 | 5,788 | |||||||||
Blue Bird Corp.* (Machinery) | 123 | 6,624 | |||||||||
Blue Foundry Bancorp* (Banks) | 79 | 717 | |||||||||
Bluebird Bio, Inc.* (Biotechnology) | 731 | 719 | |||||||||
| BlueLinx Holdings, Inc.* (Trading Companies & Distributors) | 32 | 2,979 | |||||||||
Blueprint Medicines Corp.* (Biotechnology) | 240 | 25,866 | |||||||||
Bluerock Homes Trust, Inc. (Residential REITs) | 1 | 13 | |||||||||
| Boise Cascade Co. (Trading Companies & Distributors) | 151 | 18,002 | |||||||||
Boot Barn Holdings, Inc.* (Specialty Retail) | 113 | 14,569 | |||||||||
| Borr Drilling, Ltd. (Energy Equipment & Services) | 905 | 5,837 | |||||||||
Boston Omaha Corp.*—Class A (Media) | 94 | 1,265 | |||||||||
Boundless Bio, Inc.* (Biotechnology) | 24 | 93 | |||||||||
| Bowman Consulting Group, Ltd.* (Construction & Engineering) | 51 | 1,621 | |||||||||
Box, Inc.*—Class A (Software) | 538 | 14,225 | |||||||||
| Braemar Hotels & Resorts, Inc. (Hotel & Resort REITs) | 252 | 643 | |||||||||
Brandywine Realty Trust (Office REITs) | 647 | 2,899 | |||||||||
Braze, Inc.*—Class A (Software) | 200 | 7,768 | |||||||||
BRC, Inc.*(a)—Class A (Food Products) | 199 | 1,220 | |||||||||
Common Stocks, continued
Shares | Value | ||||||||||
| Bread Financial Holdings, Inc. (Consumer Finance) | 190 | $ | 8,467 | ||||||||
Bridgebio Pharma, Inc.* (Biotechnology) | 537 | 13,602 | |||||||||
| Bridger Aerospace Group Holdings, Inc.* (Commercial Services & Supplies) | 34 | 127 | |||||||||
Bridgewater Bancshares, Inc.* (Banks) | 77 | 894 | |||||||||
| Brightsphere Investment Group, Inc. (Capital Markets) | 105 | 2,328 | |||||||||
BrightSpire Capital, Inc. (Mortgage REITs) | 493 | 2,810 | |||||||||
| BrightSpring Health Services, Inc.* (Health Care Providers & Services) | 206 | 2,340 | |||||||||
| BrightView Holdings, Inc.* (Commercial Services & Supplies) | 169 | 2,248 | |||||||||
| Brinker International, Inc.* (Hotels, Restaurants & Leisure) | 168 | 12,162 | |||||||||
| Bristow Group, Inc.* (Energy Equipment & Services) | 94 | 3,152 | |||||||||
Broadstone Net Lease, Inc. (Diversified REITs) | 720 | 11,426 | |||||||||
| Brookdale Senior Living, Inc.* (Health Care Providers & Services) | 731 | 4,993 | |||||||||
| Brookfield Business Corp.—Class A (Industrial Conglomerates) | 99 | 2,022 | |||||||||
| Brookfield Infrastructure Corp.—Class A (Gas Utilities) | 458 | 15,416 | |||||||||
Brookline Bancorp, Inc. (Banks) | 337 | 2,814 | |||||||||
BRT Apartments Corp. (Residential REITs) | 43 | 751 | |||||||||
Build-A-Bear Workshop, Inc. (Specialty Retail) | 49 | 1,238 | |||||||||
| Bumble, Inc.*—Class A (Interactive Media & Services) | 367 | 3,857 | |||||||||
Burford Capital, Ltd. (Financial Services) | 765 | 9,983 | |||||||||
| Burke & Herbert Financial Services Corp. (Banks) | 50 | 2,549 | |||||||||
Business First Bancshares, Inc. (Banks) | 92 | 2,002 | |||||||||
Byline Bancorp, Inc. (Banks) | 119 | 2,825 | |||||||||
| Byrna Technologies, Inc.* (Aerospace & Defense) | 66 | 659 | |||||||||
C3.ai, Inc.*—Class A (Software) | 315 | 9,122 | |||||||||
C4 Therapeutics, Inc.* (Biotechnology) | 224 | 1,035 | |||||||||
Cabaletta Bio, Inc.* (Biotechnology) | 164 | 1,227 | |||||||||
Cable One, Inc. (Media) | 22 | 7,788 | |||||||||
Cabot Corp. (Chemicals) | 207 | 19,020 | |||||||||
| Cactus, Inc.—Class A (Energy Equipment & Services) | 250 | 13,185 | |||||||||
Cadence Bank (Banks) | 695 | 19,654 | |||||||||
Cadiz, Inc.* (Water Utilities) | 161 | 497 | |||||||||
Cadre Holdings, Inc. (Aerospace & Defense) | 99 | 3,322 | |||||||||
Caesarstone, Ltd.* (Building Products) | 79 | 395 | |||||||||
Calavo Growers, Inc. (Food Products) | 64 | 1,453 | |||||||||
| Caledonia Mining Corp. PLC (Metals & Mining) | 63 | 612 | |||||||||
Caleres, Inc. (Specialty Retail) | 130 | 4,368 | |||||||||
California BanCorp* (Banks) | 30 | 645 | |||||||||
| California Resources Corp. (Oil, Gas & Consumable Fuels) | 263 | 13,997 | |||||||||
| California Water Service Group (Water Utilities) | 221 | 10,717 | |||||||||
Calix, Inc.* (Communications Equipment) | 224 | 7,937 | |||||||||
Cal-Maine Foods, Inc. (Food Products) | 157 | 9,594 | |||||||||
Cambridge Bancorp (Banks) | 29 | 2,001 | |||||||||
Camden National Corp. (Banks) | 55 | 1,815 | |||||||||
See accompanying notes to the financial statements.
June 30, 2024 (unaudited) :: Schedule of Portfolio Investments :: ProFund VP UltraSmall-Cap :: 145
Common Stocks, continued
Shares | Value | ||||||||||
| Camping World Holdings, Inc.—Class A (Specialty Retail) | 162 | $ | 2,893 | ||||||||
Candel Therapeutics, Inc.* (Biotechnology) | 76 | 471 | |||||||||
Cannae Holdings, Inc. (Financial Services) | 215 | 3,900 | |||||||||
Canoo, Inc.* (Automobiles) | 227 | 484 | |||||||||
Cantaloupe, Inc.* (Financial Services) | 223 | 1,472 | |||||||||
Capital Bancorp, Inc. (Banks) | 35 | 718 | |||||||||
Capital City Bank Group, Inc. (Banks) | 53 | 1,507 | |||||||||
Capitol Federal Financial, Inc. (Banks) | 474 | 2,602 | |||||||||
Capricor Therapeutics, Inc.* (Biotechnology) | 97 | 463 | |||||||||
Cardiff Oncology, Inc.* (Biotechnology) | 150 | 333 | |||||||||
Cardlytics, Inc.* (Media) | 153 | 1,256 | |||||||||
CareDx, Inc.* (Biotechnology) | 190 | 2,951 | |||||||||
CareTrust REIT, Inc. (Health Care REITs) | 517 | 12,977 | |||||||||
Cargo Therapeutics, Inc.* (Biotechnology) | 75 | 1,232 | |||||||||
Cargurus, Inc.* (Interactive Media & Services) | 337 | 8,829 | |||||||||
Caribou Biosciences, Inc.* (Biotechnology) | 314 | 515 | |||||||||
Carpenter Technology Corp. (Metals & Mining) | 182 | 19,943 | |||||||||
| Carriage Services, Inc. (Diversified Consumer Services) | 52 | 1,396 | |||||||||
Cars.com, Inc.* (Interactive Media & Services) | 251 | 4,945 | |||||||||
Carter Bankshares, Inc.* (Banks) | 87 | 1,315 | |||||||||
Cartesian Therapeutics, Inc.* (Biotechnology) | 28 | 756 | |||||||||
| Casella Waste Systems, Inc.* (Commercial Services & Supplies) | 218 | 21,629 | |||||||||
| Cass Information Systems, Inc. (Financial Services) | 52 | 2,084 | |||||||||
Cassava Sciences, Inc.*(a) (Pharmaceuticals) | 155 | 1,914 | |||||||||
| Castle Biosciences, Inc.* (Health Care Providers & Services) | 99 | 2,155 | |||||||||
| Catalyst Pharmaceuticals, Inc.* (Biotechnology) | 444 | 6,878 | |||||||||
Cathay General Bancorp (Banks) | 266 | 10,034 | |||||||||
Cavco Industries, Inc.* (Household Durables) | 32 | 11,077 | |||||||||
CBIZ, Inc.* (Professional Services) | 183 | 13,560 | |||||||||
| CBL & Associates Properties, Inc. (Retail REITs) | 87 | 2,034 | |||||||||
| CECO Environmental Corp.* (Commercial Services & Supplies) | 112 | 3,231 | |||||||||
Celcuity, Inc.* (Biotechnology) | 89 | 1,458 | |||||||||
Celldex Therapeutics, Inc.* (Biotechnology) | 247 | 9,141 | |||||||||
Centerspace (Residential REITs) | 57 | 3,855 | |||||||||
| Central Garden & Pet Co.* (Household Products) | 37 | 1,425 | |||||||||
| Central Garden & Pet Co.*—Class A (Household Products) | 199 | 6,573 | |||||||||
Central Pacific Financial Corp. (Banks) | 102 | 2,162 | |||||||||
| Centrus Energy Corp.*—Class A (Oil, Gas & Consumable Fuels) | 54 | 2,309 | |||||||||
| Centuri Holdings, Inc.* (Construction & Engineering) | 52 | 1,013 | |||||||||
Century Aluminum Co.* (Metals & Mining) | 201 | 3,367 | |||||||||
| Century Communities, Inc. (Household Durables) | 108 | 8,819 | |||||||||
Century Therapeutics, Inc.* (Biotechnology) | 175 | 446 | |||||||||
Cerence, Inc.* (Software) | 157 | 444 | |||||||||
| Cerus Corp.* (Health Care Equipment & Supplies) | 689 | 1,213 | |||||||||
Cervomed, Inc.* (Biotechnology) | 21 | 360 | |||||||||
| CEVA, Inc.* (Semiconductors & Semiconductor Equipment) | 89 | 1,717 | |||||||||
Common Stocks, continued
Shares | Value | ||||||||||
CG Oncology, Inc.* (Biotechnology) | 89 | $ | 2,810 | ||||||||
| ChampionX Corp. (Energy Equipment & Services) | 728 | 24,176 | |||||||||
| ChargePoint Holdings, Inc.* (Electrical Equipment) | 1,482 | 2,238 | |||||||||
Chart Industries, Inc.* (Machinery) | 161 | 23,239 | |||||||||
Chatham Lodging Trust (Hotel & Resort REITs) | 184 | 1,568 | |||||||||
Chegg, Inc.* (Diversified Consumer Services) | 379 | 1,198 | |||||||||
Chemung Financial Corp. (Banks) | 12 | 576 | |||||||||
Chesapeake Utilities Corp. (Gas Utilities) | 84 | 8,921 | |||||||||
| Chicago Atlantic Real Estate Finance, Inc. (Mortgage REITs) | 65 | 998 | |||||||||
Chimera Investment Corp. (Mortgage REITs) | 307 | 3,930 | |||||||||
ChoiceOne Financial Services, Inc. (Banks) | 27 | 774 | |||||||||
| ChromaDex Corp.* (Life Sciences Tools & Services) | 187 | 511 | |||||||||
| Chuy's Holdings, Inc.* (Hotels, Restaurants & Leisure) | 66 | 1,711 | |||||||||
Cibus, Inc.* (Biotechnology) | 57 | 561 | |||||||||
| Cimpress PLC* (Commercial Services & Supplies) | 69 | 6,045 | |||||||||
Cinemark Holdings, Inc.* (Entertainment) | 421 | 9,101 | |||||||||
Cipher Mining, Inc.* (Software) | 659 | 2,735 | |||||||||
Citi Trends, Inc.* (Specialty Retail) | 31 | 659 | |||||||||
Citizens & Northern Corp. (Banks) | 57 | 1,020 | |||||||||
Citizens Financial Services, Inc. (Banks) | 17 | 764 | |||||||||
City Holding Co. (Banks) | 56 | 5,950 | |||||||||
City Office REIT, Inc. (Office REITs) | 149 | 742 | |||||||||
Civista Bancshares, Inc. (Banks) | 59 | 914 | |||||||||
Claros Mortgage Trust, Inc. (Mortgage REITs) | 329 | 2,639 | |||||||||
Clarus Corp. (Leisure Products) | 116 | 781 | |||||||||
| Clean Energy Fuels Corp.* (Oil, Gas & Consumable Fuels) | 652 | 1,741 | |||||||||
Cleanspark, Inc.* (Software) | 846 | 13,494 | |||||||||
| Clear Channel Outdoor Holdings, Inc.* (Media) | 1,332 | 1,878 | |||||||||
Clear Secure, Inc.—Class A (Software) | 335 | 6,268 | |||||||||
Clearfield, Inc.* (Communications Equipment) | 48 | 1,851 | |||||||||
| Clearwater Analytics Holdings, Inc.*—Class A (Software) | 534 | 9,890 | |||||||||
| Clearwater Paper Corp.* (Paper & Forest Products) | 62 | 3,005 | |||||||||
| Climb Global Solutions, Inc. (Electronic Equipment, Instruments & Components) | 16 | 1,005 | |||||||||
Clipper Realty, Inc. (Residential REITs) | 45 | 162 | |||||||||
CNB Financial Corp. (Banks) | 79 | 1,612 | |||||||||
CNO Financial Group, Inc. (Insurance) | 410 | 11,365 | |||||||||
| CNX Resources Corp.* (Oil, Gas & Consumable Fuels) | 572 | 13,900 | |||||||||
Coastal Financial Corp.* (Banks) | 43 | 1,984 | |||||||||
Codexis, Inc.* (Life Sciences Tools & Services) | 267 | 828 | |||||||||
Coeur Mining, Inc.* (Metals & Mining) | 1,508 | 8,475 | |||||||||
Cogent Biosciences, Inc.* (Biotechnology) | 350 | 2,951 | |||||||||
| Cogent Communications Holdings, Inc. (Diversified Telecommunication Services) | 168 | 9,483 | |||||||||
Cohen & Steers, Inc. (Capital Markets) | 105 | 7,619 | |||||||||
Coherus Biosciences, Inc.* (Biotechnology) | 420 | 727 | |||||||||
| Cohu, Inc.* (Semiconductors & Semiconductor Equipment) | 177 | 5,859 | |||||||||
| Collegium Pharmaceutical, Inc.* (Pharmaceuticals) | 124 | 3,993 | |||||||||
See accompanying notes to the financial statements.
146 :: ProFund VP UltraSmall-Cap :: Schedule of Portfolio Investments :: June 30, 2024 (unaudited)
Common Stocks, continued
Shares | Value | ||||||||||
Colony Bankcorp, Inc. (Banks) | 63 | $ | 772 | ||||||||
Columbia Financial, Inc.* (Banks) | 104 | 1,557 | |||||||||
Columbus McKinnon Corp. (Machinery) | 108 | 3,730 | |||||||||
Commercial Metals Co. (Metals & Mining) | 442 | 24,305 | |||||||||
Commercial Vehicle Group, Inc.* (Machinery) | 126 | 617 | |||||||||
| CommScope Holding Co., Inc.* (Communications Equipment) | 806 | 991 | |||||||||
Community Financial System, Inc. (Banks) | 200 | 9,442 | |||||||||
| Community Health Systems, Inc.* (Health Care Providers & Services) | 479 | 1,609 | |||||||||
| Community Healthcare Trust, Inc. (Health Care REITs) | 102 | 2,386 | |||||||||
Community Trust Bancorp, Inc. (Banks) | 59 | 2,576 | |||||||||
Community West Bancshares (Banks) | 65 | 1,203 | |||||||||
CommVault Systems, Inc.* (Software) | 167 | 20,302 | |||||||||
| Compass Diversified Holdings (Financial Services) | 254 | 5,560 | |||||||||
| Compass Minerals International, Inc. (Metals & Mining) | 132 | 1,364 | |||||||||
Compass Therapeutics, Inc.* (Biotechnology) | 389 | 389 | |||||||||
| Compass, Inc.*—Class A (Real Estate Management & Development) | 1,392 | 5,011 | |||||||||
| CompoSecure, Inc.—Class A (Technology Hardware, Storage & Peripherals) | 68 | 462 | |||||||||
| CompX International, Inc. (Commercial Services & Supplies) | 6 | 148 | |||||||||
| Comstock Resources, Inc. (Oil, Gas & Consumable Fuels) | 353 | 3,664 | |||||||||
| Concrete Pumping Holdings, Inc.* (Construction & Engineering) | 91 | 547 | |||||||||
Conduent, Inc.* (Professional Services) | 616 | 2,008 | |||||||||
| Conduit Pharmaceuticals, Inc.* (Life Sciences Tools & Services) | 88 | 93 | |||||||||
| CONMED Corp. (Health Care Equipment & Supplies) | 118 | 8,180 | |||||||||
ConnectOne Bancorp, Inc. (Banks) | 138 | 2,607 | |||||||||
Consensus Cloud Solutions, Inc.* (Software) | 69 | 1,185 | |||||||||
| CONSOL Energy, Inc.* (Oil, Gas & Consumable Fuels) | 112 | 11,427 | |||||||||
| Consolidated Communications Holdings, Inc.* (Diversified Telecommunication Services) | 293 | 1,289 | |||||||||
Consolidated Water Co., Ltd. (Water Utilities) | 57 | 1,513 | |||||||||
Constellium SE* (Metals & Mining) | 494 | 9,312 | |||||||||
| Construction Partners, Inc.*—Class A (Construction & Engineering) | 164 | 9,054 | |||||||||
| Consumer Portfolio Services, Inc.* (Consumer Finance) | 32 | 314 | |||||||||
Contango ORE, Inc.* (Metals & Mining) | 30 | 542 | |||||||||
| Contineum Therapeutics, Inc.*—Class A (Pharmaceuticals) | 26 | 458 | |||||||||
| Cooper-Standard Holdings, Inc.* (Automobile Components) | 64 | 796 | |||||||||
COPT Defense Properties (Office REITs) | 430 | 10,763 | |||||||||
| Corbus Pharmaceuticals Holdings, Inc.* (Biotechnology) | 39 | 1,765 | |||||||||
Corcept Therapeutics, Inc.* (Pharmaceuticals) | 309 | 10,039 | |||||||||
| Core Laboratories, Inc. (Energy Equipment & Services) | 179 | 3,632 | |||||||||
Core Molding Technologies, Inc.* (Chemicals) | 29 | 462 | |||||||||
Core Scientific, Inc.* (IT Services) | 681 | 6,333 | |||||||||
Common Stocks, continued
Shares | Value | ||||||||||
| CoreCivic, Inc.* (Commercial Services & Supplies) | 421 | $ | 5,465 | ||||||||
CorMedix, Inc.* (Pharmaceuticals) | 210 | 909 | |||||||||
| Corsair Gaming, Inc.* (Technology Hardware, Storage & Peripherals) | 171 | 1,888 | |||||||||
| CorVel Corp.* (Health Care Providers & Services) | 34 | 8,645 | |||||||||
Costamare, Inc. (Marine Transportation) | 164 | 2,695 | |||||||||
Couchbase, Inc.* (IT Services) | 148 | 2,702 | |||||||||
| Coursera, Inc.* (Diversified Consumer Services) | 525 | 3,759 | |||||||||
| Covenant Logistics Group, Inc. (Ground Transportation) | 31 | 1,528 | |||||||||
| CPI Card Group, Inc.* (Technology Hardware, Storage & Peripherals) | 19 | 518 | |||||||||
CRA International, Inc. (Professional Services) | 25 | 4,306 | |||||||||
| Cracker Barrel Old Country Store, Inc. (Hotels, Restaurants & Leisure) | 84 | 3,541 | |||||||||
Crawford & Co.—Class A (Insurance) | 58 | 501 | |||||||||
| Credo Technology Group Holding, Ltd.* (Semiconductors & Semiconductor Equipment) | 486 | 15,523 | |||||||||
| Crescent Energy Co.—Class A (Oil, Gas & Consumable Fuels) | 365 | 4,325 | |||||||||
Cricut, Inc.—Class A (Household Durables) | 177 | 1,060 | |||||||||
| Crinetics Pharmaceuticals, Inc.* (Biotechnology) | 297 | 13,303 | |||||||||
Critical Metals Corp.* (Metals & Mining) | 28 | 316 | |||||||||
| Cross Country Healthcare, Inc.* (Health Care Providers & Services) | 127 | 1,758 | |||||||||
CrossFirst Bankshares, Inc.* (Banks) | 173 | 2,425 | |||||||||
| CryoPort, Inc.* (Life Sciences Tools & Services) | 166 | 1,147 | |||||||||
CS Disco, Inc.* (Software) | 112 | 668 | |||||||||
| CSG Systems International, Inc. (Professional Services) | 113 | 4,652 | |||||||||
CSW Industrials, Inc. (Building Products) | 59 | 15,653 | |||||||||
CTO Realty Growth, Inc. (Diversified REITs) | 84 | 1,467 | |||||||||
| CTS Corp. (Electronic Equipment, Instruments & Components) | 116 | 5,873 | |||||||||
Cullinan Therapeutics, Inc.* (Biotechnology) | 148 | 2,581 | |||||||||
| Cushman & Wakefield PLC* (Real Estate Management & Development) | 874 | 9,089 | |||||||||
| Custom Truck One Source, Inc.* (Trading Companies & Distributors) | 195 | 848 | |||||||||
Customers Bancorp, Inc.* (Banks) | 113 | 5,422 | |||||||||
CVB Financial Corp. (Banks) | 506 | 8,723 | |||||||||
| CVR Energy, Inc. (Oil, Gas & Consumable Fuels) | 130 | 3,480 | |||||||||
| CVRx, Inc.* (Health Care Equipment & Supplies) | 51 | 611 | |||||||||
| Cytek Biosciences, Inc.* (Life Sciences Tools & Services) | 463 | 2,584 | |||||||||
Cytokinetics, Inc.* (Biotechnology) | 426 | 23,080 | |||||||||
Daily Journal Corp.* (Media) | 5 | 1,972 | |||||||||
Dakota Gold Corp.* (Metals & Mining) | 250 | 638 | |||||||||
| Daktronics, Inc.* (Electronic Equipment, Instruments & Components) | 141 | 1,967 | |||||||||
Dana, Inc. (Automobile Components) | 498 | 6,036 | |||||||||
| Dave & Buster's Entertainment, Inc.* (Hotels, Restaurants & Leisure) | 126 | 5,016 | |||||||||
See accompanying notes to the financial statements.
June 30, 2024 (unaudited) :: Schedule of Portfolio Investments :: ProFund VP UltraSmall-Cap :: 147
Common Stocks, continued
Shares | Value | ||||||||||
Dave, Inc.* (Software) | 30 | $ | 909 | ||||||||
| Day One Biopharmaceuticals, Inc.* (Biotechnology) | 198 | 2,728 | |||||||||
| Definitive Healthcare Corp.* (Health Care Technology) | 204 | 1,114 | |||||||||
| Delek US Holdings, Inc. (Oil, Gas & Consumable Fuels) | 242 | 5,992 | |||||||||
| Deluxe Corp. (Commercial Services & Supplies) | 169 | 3,796 | |||||||||
Denali Therapeutics, Inc.* (Biotechnology) | 474 | 11,006 | |||||||||
| Denny's Corp.* (Hotels, Restaurants & Leisure) | 195 | 1,385 | |||||||||
Design Therapeutics, Inc.* (Biotechnology) | 120 | 402 | |||||||||
| Designer Brands, Inc.—Class A (Specialty Retail) | 160 | 1,093 | |||||||||
| Despegar.Com Corp.* (Hotels, Restaurants & Leisure) | 235 | 3,109 | |||||||||
Destination XL Group, Inc.* (Specialty Retail) | 205 | 746 | |||||||||
| DHT Holdings, Inc. (Oil, Gas & Consumable Fuels) | 515 | 5,959 | |||||||||
| Diamond Hill Investment Group, Inc. (Capital Markets) | 10 | 1,408 | |||||||||
| Diamond Offshore Drilling, Inc.* (Energy Equipment & Services) | 390 | 6,041 | |||||||||
| DiamondRock Hospitality Co. (Hotel & Resort REITs) | 803 | 6,785 | |||||||||
Dianthus Therapeutics, Inc.* (Biotechnology) | 91 | 2,355 | |||||||||
| Diebold Nixdorf, Inc.* (Technology Hardware, Storage & Peripherals) | 96 | 3,694 | |||||||||
| Digi International, Inc.* (Communications Equipment) | 136 | 3,118 | |||||||||
Digimarc Corp.* (Software) | 58 | 1,799 | |||||||||
Digital Turbine, Inc.* (Software) | 366 | 608 | |||||||||
| DigitalBridge Group, Inc. (Real Estate Management & Development) | 607 | 8,316 | |||||||||
DigitalOcean Holdings, Inc.* (IT Services) | 251 | 8,722 | |||||||||
Dime Community Bancshares, Inc. (Banks) | 135 | 2,754 | |||||||||
| Dine Brands Global, Inc. (Hotels, Restaurants & Leisure) | 58 | 2,100 | |||||||||
| Diodes, Inc.* (Semiconductors & Semiconductor Equipment) | 174 | 12,516 | |||||||||
Disc Medicine, Inc.* (Biotechnology) | 63 | 2,839 | |||||||||
| Distribution Solutions Group, Inc.* (Building Products) | 41 | 1,230 | |||||||||
| Diversified Energy Co. PLC (Oil, Gas & Consumable Fuels) | 179 | 2,415 | |||||||||
| Diversified Healthcare Trust (Health Care REITs) | 834 | 2,544 | |||||||||
Dlh Holdings Corp.* (Professional Services) | 32 | 338 | |||||||||
| DMC Global, Inc.* (Energy Equipment & Services) | 75 | 1,082 | |||||||||
| DNOW, Inc.* (Trading Companies & Distributors) | 412 | 5,657 | |||||||||
| DocGo, Inc.* (Health Care Providers & Services) | 388 | 1,199 | |||||||||
Dole PLC (Food Products) | 286 | 3,501 | |||||||||
Domo, Inc.*—Class B (Software) | 129 | 996 | |||||||||
Donegal Group, Inc.—Class A (Insurance) | 59 | 760 | |||||||||
| Donnelley Financial Solutions, Inc.* (Capital Markets) | 100 | 5,962 | |||||||||
Common Stocks, continued
Shares | Value | ||||||||||
| Dorian LPG, Ltd. (Oil, Gas & Consumable Fuels) | 132 | $ | 5,539 | ||||||||
| Dorman Products, Inc.* (Automobile Components) | 100 | 9,148 | |||||||||
Douglas Dynamics, Inc. (Machinery) | 87 | 2,036 | |||||||||
Douglas Emmett, Inc. (Office REITs) | 616 | 8,199 | |||||||||
| Dream Finders Homes, Inc.*—Class A (Household Durables) | 107 | 2,763 | |||||||||
| Drilling Tools International Corp.* (Energy Equipment & Services) | 36 | 202 | |||||||||
Dril-Quip, Inc.* (Energy Equipment & Services) | 131 | 2,437 | |||||||||
| Driven Brands Holdings, Inc.* (Commercial Services & Supplies) | 229 | 2,915 | |||||||||
Ducommun, Inc.* (Aerospace & Defense) | 52 | 3,019 | |||||||||
D-Wave Quantum, Inc.* (Software) | 334 | 381 | |||||||||
| DXP Enterprises, Inc.* (Trading Companies & Distributors) | 48 | 2,200 | |||||||||
| Dycom Industries, Inc.* (Construction & Engineering) | 108 | 18,225 | |||||||||
Dynavax Technologies Corp.* (Biotechnology) | 503 | 5,649 | |||||||||
Dyne Therapeutics, Inc.* (Biotechnology) | 308 | 10,869 | |||||||||
Dynex Capital, Inc. (Mortgage REITs) | 244 | 2,913 | |||||||||
E2open Parent Holdings, Inc.* (Software) | 652 | 2,927 | |||||||||
Eagle Bancorp, Inc. (Banks) | 113 | 2,136 | |||||||||
| Easterly Government Properties, Inc. (Office REITs) | 371 | 4,589 | |||||||||
Eastern Bankshares, Inc. (Banks) | 593 | 8,290 | |||||||||
| Eastman Kodak Co.* (Technology Hardware, Storage & Peripherals) | 231 | 1,243 | |||||||||
| EchoStar Corp.*—Class A (Diversified Telecommunication Services) | 465 | 8,282 | |||||||||
Ecovyst, Inc.* (Chemicals) | 444 | 3,983 | |||||||||
| Edgewell Personal Care Co. (Personal Care Products) | 188 | 7,555 | |||||||||
Edgewise Therapeutics, Inc.* (Pharmaceuticals) | 277 | 4,989 | |||||||||
Editas Medicine, Inc.* (Biotechnology) | 316 | 1,476 | |||||||||
eGain Corp.* (Software) | 77 | 486 | |||||||||
| El Pollo Loco Holdings, Inc.* (Hotels, Restaurants & Leisure) | 103 | 1,165 | |||||||||
Elevation Oncology, Inc.* (Biotechnology) | 199 | 537 | |||||||||
Eliem Therapeutics, Inc.* (Biotechnology) | 28 | 199 | |||||||||
Ellington Financial, Inc. (Mortgage REITs) | 315 | 3,805 | |||||||||
Elme Communities (Residential REITs) | 336 | 5,352 | |||||||||
| Embecta Corp. (Health Care Equipment & Supplies) | 221 | 2,763 | |||||||||
Emerald Holding, Inc.* (Media) | 58 | 330 | |||||||||
| Empire Petroleum Corp.* (Oil, Gas & Consumable Fuels) | 54 | 279 | |||||||||
| Empire State Realty Trust, Inc. (Diversified REITs) | 512 | 4,803 | |||||||||
Employers Holdings, Inc. (Insurance) | 96 | 4,092 | |||||||||
Enact Holdings, Inc. (Financial Services) | 112 | 3,434 | |||||||||
Enanta Pharmaceuticals, Inc.* (Biotechnology) | 77 | 999 | |||||||||
| Encore Capital Group, Inc.* (Consumer Finance) | 89 | 3,714 | |||||||||
| Encore Energy Corp.* (Oil, Gas & Consumable Fuels) | 680 | 2,679 | |||||||||
Energizer Holdings, Inc. (Household Products) | 274 | 8,094 | |||||||||
| Energy Fuels, Inc.* (Oil, Gas & Consumable Fuels) | 619 | 3,751 | |||||||||
See accompanying notes to the financial statements.
148 :: ProFund VP UltraSmall-Cap :: Schedule of Portfolio Investments :: June 30, 2024 (unaudited)
Common Stocks, continued
Shares | Value | ||||||||||
Energy Recovery, Inc.* (Machinery) | 217 | $ | 2,884 | ||||||||
| Energy Vault Holdings, Inc.* (Electrical Equipment) | 393 | 373 | |||||||||
Enerpac Tool Group Corp. (Machinery) | 208 | 7,941 | |||||||||
EnerSys (Electrical Equipment) | 153 | 15,839 | |||||||||
Enfusion, Inc.*—Class A (Software) | 185 | 1,576 | |||||||||
| Enhabit, Inc.* (Health Care Providers & Services) | 190 | 1,695 | |||||||||
Enliven Therapeutics, Inc.* (Pharmaceuticals) | 134 | 3,132 | |||||||||
Ennis, Inc. (Commercial Services & Supplies) | 97 | 2,123 | |||||||||
Enova International, Inc.* (Consumer Finance) | 100 | 6,225 | |||||||||
Enovix Corp.*(a) (Electrical Equipment) | 567 | 8,766 | |||||||||
Enpro, Inc. (Machinery) | 80 | 11,646 | |||||||||
Enstar Group, Ltd.* (Insurance) | 48 | 14,674 | |||||||||
Enterprise Bancorp, Inc. (Banks) | 37 | 921 | |||||||||
Enterprise Financial Services Corp. (Banks) | 141 | 5,768 | |||||||||
Entrada Therapeutics, Inc.* (Biotechnology) | 94 | 1,340 | |||||||||
| Entravision Communications Corp.—Class A (Media) | 235 | 477 | |||||||||
Envestnet, Inc.* (Software) | 193 | 12,080 | |||||||||
| Enviri Corp.* (Commercial Services & Supplies) | 303 | 2,615 | |||||||||
| ePlus, Inc.* (Electronic Equipment, Instruments & Components) | 100 | 7,368 | |||||||||
| Equitrans Midstream Corp. (Oil, Gas & Consumable Fuels) | 1,659 | 21,534 | |||||||||
Equity Bancshares, Inc.—Class A (Banks) | 55 | 1,936 | |||||||||
Equity Commonwealth* (Office REITs) | 404 | 7,838 | |||||||||
Erasca, Inc.* (Biotechnology) | 430 | 1,015 | |||||||||
Escalade, Inc. (Leisure Products) | 38 | 524 | |||||||||
ESCO Technologies, Inc. (Machinery) | 99 | 10,399 | |||||||||
Esperion Therapeutics, Inc.* (Pharmaceuticals) | 721 | 1,601 | |||||||||
Esquire Financial Holdings, Inc. (Banks) | 27 | 1,285 | |||||||||
ESSA Bancorp, Inc. (Banks) | 32 | 563 | |||||||||
Essent Group, Ltd. (Financial Services) | 398 | 22,363 | |||||||||
| Essential Properties Realty Trust, Inc. (Diversified REITs) | 670 | 18,565 | |||||||||
| Ethan Allen Interiors, Inc. (Household Durables) | 87 | 2,426 | |||||||||
| European Wax Center, Inc.*—Class A (Diversified Consumer Services) | 129 | 1,281 | |||||||||
Eve Holding, Inc.* (Aerospace & Defense) | 68 | 275 | |||||||||
| Eventbrite, Inc.*—Class A (Interactive Media & Services) | 316 | 1,529 | |||||||||
EverCommerce, Inc.* (Software) | 81 | 889 | |||||||||
| Everi Holdings, Inc.* (Hotels, Restaurants & Leisure) | 302 | 2,537 | |||||||||
| EverQuote, Inc.*—Class A (Interactive Media & Services) | 96 | 2,003 | |||||||||
| Everspin Technologies, Inc.* (Semiconductors & Semiconductor Equipment) | 74 | 443 | |||||||||
EVERTEC, Inc. (Financial Services) | 246 | 8,180 | |||||||||
EVgo, Inc.* (Specialty Retail) | 384 | 941 | |||||||||
| EVI Industries, Inc. (Trading Companies & Distributors) | 20 | 378 | |||||||||
| Evolent Health, Inc.*—Class A (Health Care Technology) | 441 | 8,431 | |||||||||
Evolus, Inc.* (Pharmaceuticals) | 211 | 2,289 | |||||||||
| Evolution Petroleum Corp. (Oil, Gas & Consumable Fuels) | 117 | 617 | |||||||||
Common Stocks, continued
Shares | Value | ||||||||||
| Evolv Technologies Holdings, Inc.* (Electronic Equipment, Instruments & Components) | 499 | $ | 1,272 | ||||||||
| Excelerate Energy, Inc.—Class A (Oil, Gas & Consumable Fuels) | 67 | 1,235 | |||||||||
| ExlService Holdings, Inc.* (Professional Services) | 600 | 18,816 | |||||||||
| eXp World Holdings, Inc. (Real Estate Management & Development) | 309 | 3,487 | |||||||||
Exponent, Inc. (Professional Services) | 193 | 18,358 | |||||||||
| Expro Group Holdings N.V.* (Energy Equipment & Services) | 361 | 8,274 | |||||||||
| Extreme Networks, Inc.* (Communications Equipment) | 479 | 6,443 | |||||||||
| EyePoint Pharmaceuticals, Inc.* (Pharmaceuticals) | 191 | 1,662 | |||||||||
F&G Annuities & Life, Inc. (Insurance) | 71 | 2,702 | |||||||||
| Fabrinet* (Electronic Equipment, Instruments & Components) | 139 | 34,026 | |||||||||
Farmers & Merchants Bancorp, Inc. (Banks) | 49 | 1,138 | |||||||||
Farmers National Banc Corp. (Banks) | 139 | 1,736 | |||||||||
Farmland Partners, Inc. (Specialized REITs) | 168 | 1,937 | |||||||||
| FARO Technologies, Inc.* (Electronic Equipment, Instruments & Components) | 67 | 1,072 | |||||||||
Fastly, Inc.*—Class A (IT Services) | 492 | 3,626 | |||||||||
Fate Therapeutics, Inc.* (Biotechnology) | 382 | 1,253 | |||||||||
FB Financial Corp. (Banks) | 136 | 5,308 | |||||||||
| Federal Agricultural Mortgage Corp.—Class C (Financial Services) | 35 | 6,329 | |||||||||
Federal Signal Corp. (Machinery) | 230 | 19,244 | |||||||||
Fennec Pharmaceuticals, Inc.* (Biotechnology) | 89 | 544 | |||||||||
Fibrobiologics, Inc.* (Biotechnology) | 97 | 484 | |||||||||
Fidelis Insurance Holdings, Ltd. (Insurance) | 184 | 3,001 | |||||||||
Fidelity D&D Bancorp, Inc. (Banks) | 18 | 788 | |||||||||
| Figs, Inc.*—Class A (Textiles, Apparel & Luxury Goods) | 496 | 2,644 | |||||||||
Financial Institutions, Inc. (Banks) | 58 | 1,121 | |||||||||
First Advantage Corp. (Professional Services) | 194 | 3,118 | |||||||||
First Bancorp (Banks) | 153 | 4,884 | |||||||||
First Bancorp (Banks) | 628 | 11,486 | |||||||||
First Bank/Hamilton NJ (Banks) | 80 | 1,019 | |||||||||
First Busey Corp. (Banks) | 203 | 4,915 | |||||||||
First Business Financial Services, Inc. (Banks) | 30 | 1,110 | |||||||||
First Commonwealth Financial Corp. (Banks) | 386 | 5,331 | |||||||||
First Community Bankshares, Inc. (Banks) | 65 | 2,395 | |||||||||
First Financial Bancorp (Banks) | 360 | 7,999 | |||||||||
First Financial Bankshares, Inc. (Banks) | 497 | 14,676 | |||||||||
First Financial Corp. (Banks) | 44 | 1,623 | |||||||||
First Financial Northwest, Inc. (Banks) | 27 | 571 | |||||||||
First Foundation, Inc. (Banks) | 200 | 1,310 | |||||||||
First Internet Bancorp (Banks) | 31 | 838 | |||||||||
| First Interstate BancSystem, Inc.—Class A (Banks) | 299 | 8,303 | |||||||||
First Merchants Corp. (Banks) | 223 | 7,424 | |||||||||
First Mid Bancshares, Inc. (Banks) | 87 | 2,861 | |||||||||
| First Watch Restaurant Group, Inc.* (Hotels, Restaurants & Leisure) | 116 | 2,037 | |||||||||
First Western Financial, Inc.* (Banks) | 30 | 510 | |||||||||
FirstCash Holdings, Inc. (Consumer Finance) | 149 | 15,628 | |||||||||
| FiscalNote Holdings, Inc.* (Professional Services) | 230 | 336 | |||||||||
Five Star Bancorp (Banks) | 62 | 1,466 | |||||||||
See accompanying notes to the financial statements.
June 30, 2024 (unaudited) :: Schedule of Portfolio Investments :: ProFund VP UltraSmall-Cap :: 149
Common Stocks, continued
Shares | Value | ||||||||||
FLEX LNG, Ltd. (Oil, Gas & Consumable Fuels) | 117 | $ | 3,164 | ||||||||
Flexsteel Industries, Inc. (Household Durables) | 18 | 559 | |||||||||
Fluence Energy, Inc.* (Electrical Equipment) | 232 | 4,023 | |||||||||
Fluor Corp.* (Construction & Engineering) | 652 | 28,394 | |||||||||
Flushing Financial Corp. (Banks) | 105 | 1,381 | |||||||||
Flywire Corp.* (Financial Services) | 461 | 7,556 | |||||||||
Foghorn Therapeutics, Inc.* (Biotechnology) | 96 | 552 | |||||||||
Foot Locker, Inc. (Specialty Retail) | 318 | 7,925 | |||||||||
Forafric Global PLC* (Food Products) | 21 | 224 | |||||||||
| Forestar Group, Inc.* (Real Estate Management & Development) | 73 | 2,335 | |||||||||
Forge Global Holdings, Inc.* (Capital Markets) | 438 | 639 | |||||||||
| FormFactor, Inc.* (Semiconductors & Semiconductor Equipment) | 296 | 17,917 | |||||||||
| Forrester Research, Inc.* (Professional Services) | 46 | 786 | |||||||||
| Forum Energy Technologies, Inc.* (Energy Equipment & Services) | 45 | 759 | |||||||||
Forward Air Corp. (Air Freight & Logistics) | 96 | 1,828 | |||||||||
| Four Corners Property Trust, Inc. (Specialized REITs) | 350 | 8,635 | |||||||||
| Fox Factory Holding Corp.* (Automobile Components) | 161 | 7,759 | |||||||||
| Fractyl Health, Inc.* (Health Care Equipment & Supplies) | 29 | 124 | |||||||||
| Franklin BSP Realty Trust, Inc. (Mortgage REITs) | 313 | 3,944 | |||||||||
Franklin Covey Co.* (Professional Services) | 43 | 1,634 | |||||||||
Franklin Electric Co., Inc. (Machinery) | 173 | 16,663 | |||||||||
Franklin Street Properties Corp. (Office REITs) | 372 | 569 | |||||||||
| Fresh Del Monte Produce, Inc. (Food Products) | 129 | 2,819 | |||||||||
Freshworks, Inc.*—Class A (Software) | 778 | 9,873 | |||||||||
Freyr Battery, Inc.* (Electrical Equipment) | 428 | 728 | |||||||||
| Frontdoor, Inc.* (Diversified Consumer Services) | 300 | 10,137 | |||||||||
| Frontier Group Holdings, Inc.* (Passenger Airlines) | 161 | 794 | |||||||||
| FRP Holdings, Inc.* (Real Estate Management & Development) | 51 | 1,455 | |||||||||
FS Bancorp, Inc. (Banks) | 25 | 911 | |||||||||
| FTAI Aviation, Ltd. (Trading Companies & Distributors) | 380 | 39,228 | |||||||||
| FTAI Infrastructure, Inc. (Ground Transportation) | 384 | 3,314 | |||||||||
fuboTV, Inc.* (Interactive Media & Services) | 1,121 | 1,390 | |||||||||
FuelCell Energy, Inc.* (Electrical Equipment) | 1,731 | 1,106 | |||||||||
Fulcrum Therapeutics, Inc.* (Pharmaceuticals) | 237 | 1,469 | |||||||||
| Fulgent Genetics, Inc.* (Health Care Providers & Services) | 78 | 1,530 | |||||||||
| Full House Resorts, Inc.* (Hotels, Restaurants & Leisure) | 125 | 625 | |||||||||
Fulton Financial Corp. (Banks) | 682 | 11,580 | |||||||||
Funko, Inc.*—Class A (Leisure Products) | 117 | 1,142 | |||||||||
| FutureFuel Corp. (Oil, Gas & Consumable Fuels) | 100 | 513 | |||||||||
FVCBankcorp, Inc.* (Banks) | 63 | 688 | |||||||||
G1 Therapeutics, Inc.* (Biotechnology) | 188 | 429 | |||||||||
Galectin Therapeutics, Inc.* (Biotechnology) | 78 | 176 | |||||||||
Gambling.com Group, Ltd.* (Media) | 66 | 543 | |||||||||
Gannett Co., Inc.* (Media) | 542 | 2,499 | |||||||||
Common Stocks, continued
Shares | Value | ||||||||||
| GATX Corp. (Trading Companies & Distributors) | 136 | $ | 18,001 | ||||||||
| GCM Grosvenor, Inc.—Class A (Capital Markets) | 158 | 1,542 | |||||||||
| Gct Semiconductor Holding, Inc.* (Semiconductors & Semiconductor Equipment) | 29 | 151 | |||||||||
| Genco Shipping & Trading, Ltd. (Marine Transportation) | 161 | 3,431 | |||||||||
Gencor Industries, Inc.* (Machinery) | 39 | 754 | |||||||||
| GeneDx Holdings Corp.* (Health Care Providers & Services) | 46 | 1,202 | |||||||||
Generation Bio Co.* (Biotechnology) | 189 | 533 | |||||||||
Genesco, Inc.* (Specialty Retail) | 41 | 1,060 | |||||||||
Genie Energy, Ltd.—Class B (Electric Utilities) | 49 | 716 | |||||||||
Gentherm, Inc.* (Automobile Components) | 120 | 5,918 | |||||||||
Genworth Financial, Inc.* (Insurance) | 1,664 | 10,051 | |||||||||
| Geospace Technologies Corp.* (Energy Equipment & Services) | 48 | 431 | |||||||||
German American Bancorp, Inc. (Banks) | 109 | 3,853 | |||||||||
Geron Corp.* (Biotechnology) | 2,198 | 9,320 | |||||||||
| Getty Images Holdings, Inc.* (Interactive Media & Services) | 383 | 1,249 | |||||||||
Getty Realty Corp. (Retail REITs) | 189 | 5,039 | |||||||||
Gibraltar Industries, Inc.* (Building Products) | 117 | 8,020 | |||||||||
| Gigacloud Technology, Inc.*—Class A (Distributors) | 90 | 2,738 | |||||||||
| G-III Apparel Group, Ltd.* (Textiles, Apparel & Luxury Goods) | 154 | 4,169 | |||||||||
Glacier Bancorp, Inc. (Banks) | 435 | 16,234 | |||||||||
| Gladstone Commercial Corp. (Diversified REITs) | 153 | 2,183 | |||||||||
Gladstone Land Corp. (Specialized REITs) | 128 | 1,752 | |||||||||
| Glaukos Corp.* (Health Care Equipment & Supplies) | 187 | 22,132 | |||||||||
| Global Business Travel Group I* (Hotels, Restaurants & Leisure) | 479 | 3,161 | |||||||||
| Global Industrial Co. (Trading Companies & Distributors) | 52 | 1,631 | |||||||||
Global Medical REIT, Inc. (Health Care REITs) | 232 | 2,107 | |||||||||
Global Net Lease, Inc. (Diversified REITs) | 766 | 5,630 | |||||||||
Global Water Resources, Inc. (Water Utilities) | 44 | 532 | |||||||||
| Globalstar, Inc.* (Diversified Telecommunication Services) | 2,784 | 3,118 | |||||||||
GMS, Inc.* (Trading Companies & Distributors) | 153 | 12,333 | |||||||||
| Gogo, Inc.* (Wireless Telecommunication Services) | 247 | 2,376 | |||||||||
GoHealth, Inc.*—Class A (Insurance) | 17 | 165 | |||||||||
Golar LNG, Ltd. (Oil, Gas & Consumable Fuels) | 378 | 11,850 | |||||||||
| Golden Entertainment, Inc. (Hotels, Restaurants & Leisure) | 77 | 2,395 | |||||||||
Golden Matrix Group, Inc.* (Entertainment) | 76 | 188 | |||||||||
| Golden Ocean Group, Ltd. (Marine Transportation) | 464 | 6,403 | |||||||||
| Goosehead Insurance, Inc.*—Class A (Insurance) | 89 | 5,112 | |||||||||
GoPro, Inc.*—Class A (Household Durables) | 478 | 679 | |||||||||
| GrafTech International, Ltd.* (Electrical Equipment) | 988 | 958 | |||||||||
Graham Corp.* (Machinery) | 39 | 1,098 | |||||||||
See accompanying notes to the financial statements.
150 :: ProFund VP UltraSmall-Cap :: Schedule of Portfolio Investments :: June 30, 2024 (unaudited)
Common Stocks, continued
Shares | Value | ||||||||||
| Graham Holdings Co.—Class B (Diversified Consumer Services) | 13 | $ | 9,094 | ||||||||
| Granite Construction, Inc. (Construction & Engineering) | 168 | 10,411 | |||||||||
| Granite Point Mortgage Trust, Inc. (Mortgage REITs) | 192 | 570 | |||||||||
| Granite Ridge Resources, Inc. (Oil, Gas & Consumable Fuels) | 201 | 1,272 | |||||||||
Gray Television, Inc. (Media) | 327 | 1,700 | |||||||||
| Great Lakes Dredge & Dock Corp.* (Construction & Engineering) | 252 | 2,213 | |||||||||
Great Southern Bancorp, Inc. (Banks) | 33 | 1,835 | |||||||||
| Green Brick Partners, Inc.* (Household Durables) | 120 | 6,869 | |||||||||
| Green Dot Corp.*—Class A (Consumer Finance) | 203 | 1,918 | |||||||||
| Green Plains, Inc.* (Oil, Gas & Consumable Fuels) | 243 | 3,854 | |||||||||
Greene County Bancorp, Inc. (Banks) | 27 | 910 | |||||||||
| Greenlight Capital Re, Ltd.*—Class A (Insurance) | 105 | 1,376 | |||||||||
Greenwich Lifesciences, Inc.* (Biotechnology) | 23 | 397 | |||||||||
Greif, Inc.—Class A (Containers & Packaging) | 95 | 5,460 | |||||||||
Greif, Inc.—Class B (Containers & Packaging) | 18 | 1,125 | |||||||||
Grid Dynamics Holdings, Inc.* (IT Services) | 218 | 2,291 | |||||||||
Griffon Corp. (Building Products) | 148 | 9,451 | |||||||||
Grindr, Inc.* (Interactive Media & Services) | 94 | 1,151 | |||||||||
Group 1 Automotive, Inc. (Specialty Retail) | 51 | 15,162 | |||||||||
Groupon, Inc.* (Broadline Retail) | 87 | 1,331 | |||||||||
GrowGeneration Corp.* (Specialty Retail) | 222 | 477 | |||||||||
Guaranty Bancshares, Inc. (Banks) | 30 | 946 | |||||||||
| Guardant Health, Inc.* (Health Care Providers & Services) | 450 | 12,996 | |||||||||
| Gulfport Energy Corp.* (Oil, Gas & Consumable Fuels) | 49 | 7,399 | |||||||||
Gyre Therapeutics, Inc.* (Biotechnology) | 27 | 322 | |||||||||
| H&E Equipment Services, Inc. (Trading Companies & Distributors) | 123 | 5,433 | |||||||||
H.B. Fuller Co. (Chemicals) | 209 | 16,085 | |||||||||
| Haemonetics Corp.* (Health Care Equipment & Supplies) | 192 | 15,884 | |||||||||
| Hallador Energy Co.* (Oil, Gas & Consumable Fuels) | 95 | 738 | |||||||||
Halozyme Therapeutics, Inc.* (Biotechnology) | 476 | 24,922 | |||||||||
| Hamilton Beach Brands Holding Co.—Class A (Household Durables) | 33 | 567 | |||||||||
| Hamilton Insurance Group, Ltd.*—Class B (Insurance) | 64 | 1,066 | |||||||||
| Hamilton Lane, Inc.—Class A (Capital Markets) | 147 | 18,165 | |||||||||
Hancock Whitney Corp. (Banks) | 331 | 15,832 | |||||||||
| Hanesbrands, Inc.* (Textiles, Apparel & Luxury Goods) | 1,349 | 6,650 | |||||||||
Hanmi Financial Corp. (Banks) | 115 | 1,923 | |||||||||
| Hannon Armstrong Sustainable Infrastructure Capital, Inc. (Mortgage REITs) | 429 | 12,699 | |||||||||
HarborOne Bancorp, Inc. (Banks) | 152 | 1,692 | |||||||||
Harmonic, Inc.* (Communications Equipment) | 422 | 4,967 | |||||||||
| Harmony Biosciences Holdings, Inc.* (Pharmaceuticals) | 115 | 3,470 | |||||||||
Harrow, Inc.* (Pharmaceuticals) | 117 | 2,444 | |||||||||
Common Stocks, continued
Shares | Value | ||||||||||
| Harvard Bioscience, Inc.* (Life Sciences Tools & Services) | 156 | $ | 445 | ||||||||
Haverty Furniture Cos., Inc. (Specialty Retail) | 55 | 1,391 | |||||||||
| Hawaiian Electric Industries, Inc. (Electric Utilities) | 424 | 3,824 | |||||||||
Hawaiian Holdings, Inc.* (Passenger Airlines) | 195 | 2,424 | |||||||||
Hawkins, Inc. (Chemicals) | 74 | 6,734 | |||||||||
Haynes International, Inc. (Metals & Mining) | 48 | 2,818 | |||||||||
HBT Financial, Inc. (Banks) | 49 | 1,001 | |||||||||
HCI Group, Inc. (Insurance) | 31 | 2,857 | |||||||||
| Health Catalyst, Inc.* (Health Care Technology) | 223 | 1,425 | |||||||||
| Healthcare Services Group, Inc.* (Commercial Services & Supplies) | 281 | 2,973 | |||||||||
| HealthEquity, Inc.* (Health Care Providers & Services) | 323 | 27,843 | |||||||||
HealthStream, Inc. (Health Care Technology) | 93 | 2,595 | |||||||||
| Heartland Express, Inc. (Ground Transportation) | 178 | 2,195 | |||||||||
Heartland Financial USA, Inc. (Banks) | 162 | 7,201 | |||||||||
Hecla Mining Co. (Metals & Mining) | 2,208 | 10,709 | |||||||||
| Heidrick & Struggles International, Inc. (Professional Services) | 77 | 2,432 | |||||||||
Helen of Troy, Ltd.* (Household Durables) | 91 | 8,439 | |||||||||
Helios Technologies, Inc. (Machinery) | 127 | 6,064 | |||||||||
| Helix Energy Solutions Group, Inc.* (Energy Equipment & Services) | 550 | 6,567 | |||||||||
| Helmerich & Payne, Inc. (Energy Equipment & Services) | 369 | 13,336 | |||||||||
Herbalife, Ltd.* (Personal Care Products) | 381 | 3,959 | |||||||||
| Herc Holdings, Inc. (Trading Companies & Distributors) | 107 | 14,262 | |||||||||
Heritage Commerce Corp. (Banks) | 227 | 1,975 | |||||||||
Heritage Financial Corp. (Banks) | 131 | 2,362 | |||||||||
Heritage Insurance Holdings, Inc.* (Insurance) | 87 | 616 | |||||||||
Heron Therapeutics, Inc.* (Biotechnology) | 448 | 1,568 | |||||||||
| Hertz Global Holdings, Inc.* (Ground Transportation) | 468 | 1,652 | |||||||||
| HF Foods Group, Inc.* (Consumer Staples Distribution & Retail) | 152 | 456 | |||||||||
Hibbett, Inc. (Specialty Retail) | 44 | 3,837 | |||||||||
| HighPeak Energy, Inc. (Oil, Gas & Consumable Fuels) | 55 | 773 | |||||||||
Hillenbrand, Inc. (Machinery) | 268 | 10,725 | |||||||||
HilleVax, Inc.* (Biotechnology) | 120 | 1,735 | |||||||||
Hillman Solutions Corp.* (Machinery) | 750 | 6,638 | |||||||||
Hilltop Holdings, Inc. (Banks) | 178 | 5,568 | |||||||||
| Hilton Grand Vacations, Inc.* (Hotels, Restaurants & Leisure) | 282 | 11,401 | |||||||||
| Himalaya Shipping, Ltd. (Marine Transportation) | 114 | 1,044 | |||||||||
| Hims & Hers Health, Inc.* (Health Care Providers & Services) | 724 | 14,618 | |||||||||
Hingham Institution For Savings The (Banks) | 6 | 1,073 | |||||||||
Hippo Holdings, Inc.* (Insurance) | 75 | 1,289 | |||||||||
HireQuest, Inc. (Professional Services) | 21 | 259 | |||||||||
HNI Corp. (Commercial Services & Supplies) | 179 | 8,059 | |||||||||
Holley, Inc.* (Automobile Components) | 178 | 637 | |||||||||
Home Bancorp, Inc. (Banks) | 27 | 1,080 | |||||||||
Home BancShares, Inc. (Banks) | 719 | 17,226 | |||||||||
HomeStreet, Inc. (Banks) | 70 | 798 | |||||||||
See accompanying notes to the financial statements.
June 30, 2024 (unaudited) :: Schedule of Portfolio Investments :: ProFund VP UltraSmall-Cap :: 151
Common Stocks, continued
Shares | Value | ||||||||||
HomeTrust Bancshares, Inc. (Banks) | 56 | $ | 1,682 | ||||||||
| Hooker Furnishings Corp. (Household Durables) | 40 | 579 | |||||||||
Hope Bancorp, Inc. (Banks) | 443 | 4,758 | |||||||||
Horace Mann Educators Corp. (Insurance) | 157 | 5,121 | |||||||||
Horizon Bancorp, Inc. (Banks) | 165 | 2,041 | |||||||||
| Hovnanian Enterprises, Inc.*—Class A (Household Durables) | 19 | 2,696 | |||||||||
| Hub Group, Inc.—Class A (Air Freight & Logistics) | 233 | 10,030 | |||||||||
Hudson Pacific Properties, Inc. (Office REITs) | 522 | 2,511 | |||||||||
| Hudson Technologies, Inc.* (Trading Companies & Distributors) | 170 | 1,494 | |||||||||
Humacyte, Inc.* (Biotechnology) | 336 | 1,613 | |||||||||
| Huron Consulting Group, Inc.* (Professional Services) | 68 | 6,698 | |||||||||
Hut 8 Corp.* (Software) | 306 | 4,587 | |||||||||
Hyliion Holdings Corp.* (Machinery) | 538 | 872 | |||||||||
Hyster-Yale, Inc. (Machinery) | 44 | 3,068 | |||||||||
I3 Verticals, Inc.*—Class A (Financial Services) | 86 | 1,899 | |||||||||
i-80 Gold Corp.* (Metals & Mining) | 990 | 1,069 | |||||||||
IBEX Holdings, Ltd.* (Professional Services) | 34 | 550 | |||||||||
Ibotta, Inc.*—Class A (Media) | 29 | 2,180 | |||||||||
ICF International, Inc. (Professional Services) | 71 | 10,541 | |||||||||
| Ichor Holdings, Ltd.* (Semiconductors & Semiconductor Equipment) | 124 | 4,780 | |||||||||
| ICU Medical, Inc.* (Health Care Equipment & Supplies) | 82 | 9,738 | |||||||||
Ideaya Biosciences, Inc.* (Biotechnology) | 285 | 10,006 | |||||||||
| IDT Corp.—Class B (Diversified Telecommunication Services) | 59 | 2,119 | |||||||||
| IES Holdings, Inc.* (Construction & Engineering) | 32 | 4,459 | |||||||||
IGM Biosciences, Inc.* (Biotechnology) | 58 | 398 | |||||||||
iHeartMedia, Inc.*—Class A (Media) | 394 | 429 | |||||||||
Ilearningengines Holdings, Inc.* (Software) | 112 | 1,017 | |||||||||
IMAX Corp.* (Entertainment) | 164 | 2,750 | |||||||||
| Immersion Corp. (Technology Hardware, Storage & Peripherals) | 115 | 1,082 | |||||||||
ImmunityBio, Inc.*(a) (Biotechnology) | 541 | 3,419 | |||||||||
Immunome, Inc.* (Biotechnology) | 196 | 2,372 | |||||||||
Immunovant, Inc.* (Biotechnology) | 222 | 5,861 | |||||||||
| Impinj, Inc.* (Semiconductors & Semiconductor Equipment) | 86 | 13,482 | |||||||||
| Inari Medical, Inc.* (Health Care Equipment & Supplies) | 202 | 9,726 | |||||||||
| Independence Realty Trust, Inc. (Residential REITs) | 863 | 16,174 | |||||||||
Independent Bank Corp. (Banks) | 76 | 2,052 | |||||||||
Independent Bank Corp. (Banks) | 162 | 8,217 | |||||||||
Independent Bank Group, Inc. (Banks) | 138 | 6,282 | |||||||||
| indie Semiconductor, Inc.*—Class A (Semiconductors & Semiconductor Equipment) | 626 | 3,862 | |||||||||
| Industrial Logistics Properties Trust (Industrial REITs) | 249 | 916 | |||||||||
Infinera Corp.* (Communications Equipment) | 760 | 4,628 | |||||||||
Information Services Group, Inc. (IT Services) | 134 | 394 | |||||||||
| InfuSystem Holdings, Inc.* (Health Care Providers & Services) | 76 | 519 | |||||||||
Ingevity Corp.* (Chemicals) | 139 | 6,076 | |||||||||
Common Stocks, continued
Shares | Value | ||||||||||
| Ingles Markets, Inc.—Class A (Consumer Staples Distribution & Retail) | 55 | $ | 3,774 | ||||||||
Inhibrx Biosciences, Inc.* (Biotechnology) | 40 | 567 | |||||||||
| Inmode, Ltd.* (Health Care Equipment & Supplies) | 303 | 5,527 | |||||||||
Inmune Bio, Inc.* (Biotechnology) | 47 | 415 | |||||||||
Innodata, Inc.* (Professional Services) | 103 | 1,527 | |||||||||
Innospec, Inc. (Chemicals) | 95 | 11,741 | |||||||||
| Innovage Holding Corp.* (Health Care Providers & Services) | 73 | 362 | |||||||||
| Innovative Industrial Properties, Inc. (Industrial REITs) | 108 | 11,796 | |||||||||
Innovid Corp.* (Media) | 407 | 753 | |||||||||
Innoviva, Inc.* (Pharmaceuticals) | 211 | 3,460 | |||||||||
| Inogen, Inc.* (Health Care Equipment & Supplies) | 90 | 732 | |||||||||
Inovio Pharmaceuticals, Inc.* (Biotechnology) | 97 | 784 | |||||||||
Inozyme Pharma, Inc.* (Biotechnology) | 197 | 879 | |||||||||
| Insight Enterprises, Inc.* (Electronic Equipment, Instruments & Components) | 106 | 21,026 | |||||||||
Insmed, Inc.* (Biotechnology) | 593 | 39,730 | |||||||||
Insperity, Inc. (Professional Services) | 137 | 12,496 | |||||||||
| Inspired Entertainment, Inc.* (Hotels, Restaurants & Leisure) | 84 | 769 | |||||||||
| Installed Building Products, Inc. (Household Durables) | 91 | 18,718 | |||||||||
Insteel Industries, Inc. (Building Products) | 71 | 2,198 | |||||||||
Instructure Holdings, Inc.* (Software) | 84 | 1,966 | |||||||||
Intapp, Inc.* (Software) | 149 | 5,464 | |||||||||
| Integer Holdings Corp.* (Health Care Equipment & Supplies) | 127 | 14,705 | |||||||||
| Integra LifeSciences Holdings Corp.* (Health Care Equipment & Supplies) | 262 | 7,635 | |||||||||
Integral Ad Science Holding Corp.* (Media) | 276 | 2,683 | |||||||||
Intellia Therapeutics, Inc.* (Biotechnology) | 368 | 8,236 | |||||||||
Inter Parfums, Inc. (Personal Care Products) | 70 | 8,121 | |||||||||
InterDigital, Inc. (Software) | 97 | 11,306 | |||||||||
| Interface, Inc. (Commercial Services & Supplies) | 219 | 3,215 | |||||||||
International Bancshares Corp. (Banks) | 206 | 11,785 | |||||||||
| International Game Technology PLC (Hotels, Restaurants & Leisure) | 434 | 8,880 | |||||||||
| International Money Express, Inc.* (Financial Services) | 121 | 2,522 | |||||||||
| International Seaways, Inc. (Oil, Gas & Consumable Fuels) | 154 | 9,106 | |||||||||
Intrepid Potash, Inc.* (Chemicals) | 42 | 984 | |||||||||
| Intuitive Machines, Inc.* (Aerospace & Defense) | 109 | 360 | |||||||||
InvenTrust Properties Corp. (Retail REITs) | 260 | 6,438 | |||||||||
| Invesco Mortgage Capital, Inc. (Mortgage REITs) | 187 | 1,752 | |||||||||
Investar Holding Corp. (Banks) | 35 | 539 | |||||||||
Investors Title Co. (Insurance) | 5 | 901 | |||||||||
Invivyd, Inc.* (Biotechnology) | 303 | 333 | |||||||||
| IonQ, Inc.*(a) (Technology Hardware, Storage & Peripherals) | 757 | 5,322 | |||||||||
Iovance Biotherapeutics, Inc.* (Biotechnology) | 966 | 7,747 | |||||||||
| iRadimed Corp. (Health Care Equipment & Supplies) | 31 | 1,362 | |||||||||
See accompanying notes to the financial statements.
152 :: ProFund VP UltraSmall-Cap :: Schedule of Portfolio Investments :: June 30, 2024 (unaudited)
Common Stocks, continued
Shares | Value | ||||||||||
| iRhythm Technologies, Inc.* (Health Care Equipment & Supplies) | 119 | $ | 12,809 | ||||||||
iRobot Corp.* (Household Durables) | 109 | 993 | |||||||||
| Ironwood Pharmaceuticals, Inc.* (Biotechnology) | 540 | 3,521 | |||||||||
Ispire Technology, Inc.* (Tobacco) | 73 | 584 | |||||||||
iTeos Therapeutics, Inc.* (Biotechnology) | 99 | 1,469 | |||||||||
| Iteris, Inc.* (Electronic Equipment, Instruments & Components) | 162 | 701 | |||||||||
| Itron, Inc.* (Electronic Equipment, Instruments & Components) | 175 | 17,318 | |||||||||
Ivanhoe Electric, Inc.* (Metals & Mining) | 319 | 2,992 | |||||||||
J & J Snack Foods Corp. (Food Products) | 58 | 9,417 | |||||||||
J Jill, Inc. (Specialty Retail) | 18 | 629 | |||||||||
| Jack in the Box, Inc. (Hotels, Restaurants & Leisure) | 75 | 3,821 | |||||||||
| Jackson Financial, Inc.—Class A (Financial Services) | 292 | 21,683 | |||||||||
JAKKS Pacific, Inc.* (Leisure Products) | 30 | 537 | |||||||||
James River Group Holdings, Ltd. (Insurance) | 120 | 928 | |||||||||
Jamf Holding Corp.* (Software) | 283 | 4,670 | |||||||||
| Janus International Group, Inc.* (Building Products) | 541 | 6,833 | |||||||||
Janux Therapeutics, Inc.* (Biotechnology) | 107 | 4,482 | |||||||||
Jasper Therapeutics, Inc.* (Biotechnology) | 43 | 976 | |||||||||
JBG SMITH Properties (Office REITs) | 339 | 5,163 | |||||||||
JELD-WEN Holding, Inc.* (Building Products) | 328 | 4,418 | |||||||||
JetBlue Airways Corp.* (Passenger Airlines) | 1,169 | 7,119 | |||||||||
Joby Aviation, Inc.*(a) (Passenger Airlines) | 1,534 | 7,822 | |||||||||
John B Sanfilippo & Son, Inc. (Food Products) | 34 | 3,304 | |||||||||
John Bean Technologies Corp. (Machinery) | 121 | 11,491 | |||||||||
John Marshall Bancorp, Inc. (Banks) | 48 | 837 | |||||||||
John Wiley & Sons, Inc.—Class A (Media) | 138 | 5,617 | |||||||||
| Johnson Outdoors, Inc.—Class A (Leisure Products) | 18 | 630 | |||||||||
Kadant, Inc. (Machinery) | 45 | 13,220 | |||||||||
Kaiser Aluminum Corp. (Metals & Mining) | 61 | 5,362 | |||||||||
Kaltura, Inc.* (Software) | 367 | 440 | |||||||||
| KalVista Pharmaceuticals, Inc.* (Biotechnology) | 145 | 1,708 | |||||||||
| Karat Packaging, Inc. (Trading Companies & Distributors) | 26 | 769 | |||||||||
KB Home (Household Durables) | 257 | 18,037 | |||||||||
Kearny Financial Corp. (Banks) | 209 | 1,285 | |||||||||
| Kelly Services, Inc.—Class A (Professional Services) | 118 | 2,526 | |||||||||
Kennametal, Inc. (Machinery) | 302 | 7,109 | |||||||||
| Kennedy-Wilson Holdings, Inc. (Real Estate Management & Development) | 434 | 4,218 | |||||||||
Keros Therapeutics, Inc.* (Biotechnology) | 112 | 5,118 | |||||||||
Kforce, Inc. (Professional Services) | 71 | 4,411 | |||||||||
| Kimball Electronics, Inc.* (Electronic Equipment, Instruments & Components) | 94 | 2,066 | |||||||||
| Kinetik Holdings, Inc. (Oil, Gas & Consumable Fuels) | 146 | 6,050 | |||||||||
Kingsway Financial Services, Inc.* (Insurance) | 49 | 404 | |||||||||
| Kiniksa Pharmaceuticals International PLC* (Biotechnology) | 142 | 2,651 | |||||||||
Kite Realty Group Trust (Retail REITs) | 829 | 18,552 | |||||||||
| KKR Real Estate Finance Trust, Inc. (Mortgage REITs) | 224 | 2,027 | |||||||||
Common Stocks, continued
Shares | Value | ||||||||||
Knife River Corp.* (Construction Materials) | 217 | $ | 15,220 | ||||||||
| Knowles Corp.* (Electronic Equipment, Instruments & Components) | 337 | 5,817 | |||||||||
| Kodiak Gas Services, Inc. (Energy Equipment & Services) | 77 | 2,099 | |||||||||
Kodiak Sciences, Inc.* (Biotechnology) | 125 | 294 | |||||||||
| Kontoor Brands, Inc. (Textiles, Apparel & Luxury Goods) | 212 | 14,023 | |||||||||
Koppers Holdings, Inc. (Chemicals) | 78 | 2,885 | |||||||||
Korn Ferry (Professional Services) | 198 | 13,294 | |||||||||
Korro Bio, Inc.* (Biotechnology) | 23 | 779 | |||||||||
| Kosmos Energy, Ltd.* (Oil, Gas & Consumable Fuels) | 1,786 | 9,894 | |||||||||
| Kratos Defense & Security Solutions, Inc.* (Aerospace & Defense) | 565 | 11,306 | |||||||||
| Krispy Kreme, Inc. (Hotels, Restaurants & Leisure) | 327 | 3,519 | |||||||||
Kronos Worldwide, Inc. (Chemicals) | 83 | 1,042 | |||||||||
Krystal Biotech, Inc.* (Biotechnology) | 95 | 17,446 | |||||||||
| Kulicke & Soffa Industries, Inc. (Semiconductors & Semiconductor Equipment) | 209 | 10,281 | |||||||||
Kura Oncology, Inc.* (Biotechnology) | 277 | 5,703 | |||||||||
| Kura Sushi USA, Inc.*—Class A (Hotels, Restaurants & Leisure) | 23 | 1,451 | |||||||||
Kymera Therapeutics, Inc.* (Biotechnology) | 170 | 5,075 | |||||||||
Kyverna Therapeutics, Inc.* (Biotechnology) | 64 | 480 | |||||||||
L B Foster Co.*—Class A (Machinery) | 35 | 753 | |||||||||
Ladder Capital Corp. (Mortgage REITs) | 433 | 4,889 | |||||||||
Lakeland Financial Corp. (Banks) | 95 | 5,844 | |||||||||
Lancaster Colony Corp. (Food Products) | 75 | 14,172 | |||||||||
Lands' End, Inc.* (Specialty Retail) | 54 | 734 | |||||||||
Landsea Homes Corp.* (Household Durables) | 69 | 634 | |||||||||
| Lantheus Holdings, Inc.* (Health Care Equipment & Supplies) | 260 | 20,875 | |||||||||
| LanzaTech Global, Inc.* (Commercial Services & Supplies) | 427 | 790 | |||||||||
Larimar Therapeutics, Inc.* (Biotechnology) | 161 | 1,167 | |||||||||
Latham Group, Inc.* (Leisure Products) | 155 | 470 | |||||||||
| Laureate Education, Inc. (Diversified Consumer Services) | 512 | 7,649 | |||||||||
La-Z-Boy, Inc. (Household Durables) | 164 | 6,114 | |||||||||
LCI Industries (Automobile Components) | 95 | 9,821 | |||||||||
LCNB Corp. (Banks) | 47 | 654 | |||||||||
Legacy Housing Corp.* (Household Durables) | 43 | 986 | |||||||||
Legalzoom.com, Inc.* (Professional Services) | 526 | 4,413 | |||||||||
| LeMaitre Vascular, Inc. (Health Care Equipment & Supplies) | 77 | 6,336 | |||||||||
Lemonade, Inc.*(a) (Insurance) | 197 | 3,251 | |||||||||
LendingClub Corp.* (Consumer Finance) | 417 | 3,528 | |||||||||
LendingTree, Inc.* (Consumer Finance) | 38 | 1,580 | |||||||||
LENZ Therapeutics, Inc.* (Biotechnology) | 48 | 830 | |||||||||
Leonardo DRS, Inc.* (Aerospace & Defense) | 281 | 7,168 | |||||||||
Leslie's, Inc.* (Specialty Retail) | 686 | 2,874 | |||||||||
Lexeo Therapeutics, Inc.* (Biotechnology) | 39 | 626 | |||||||||
| Lexicon Pharmaceuticals, Inc.* (Biotechnology) | 438 | 736 | |||||||||
LGI Homes, Inc.* (Household Durables) | 80 | 7,159 | |||||||||
| Liberty Energy, Inc. (Energy Equipment & Services) | 616 | 12,868 | |||||||||
See accompanying notes to the financial statements.
June 30, 2024 (unaudited) :: Schedule of Portfolio Investments :: ProFund VP UltraSmall-Cap :: 153
Common Stocks, continued
Shares | Value | ||||||||||
| Liberty Latin America, Ltd.*—Class A (Diversified Telecommunication Services) | 127 | $ | 1,220 | ||||||||
| Liberty Latin America, Ltd.*—Class C (Diversified Telecommunication Services) | 514 | 4,945 | |||||||||
| Life Time Group Holdings, Inc.* (Hotels, Restaurants & Leisure) | 225 | 4,237 | |||||||||
| Lifecore Biomedical, Inc.* (Life Sciences Tools & Services) | 81 | 416 | |||||||||
Lifemd, Inc.* (Health Care Technology) | 132 | 906 | |||||||||
| LifeStance Health Group, Inc.* (Health Care Providers & Services) | 455 | 2,234 | |||||||||
Lifetime Brands, Inc. (Household Durables) | 47 | 404 | |||||||||
Lifeway Foods, Inc.* (Food Products) | 17 | 217 | |||||||||
Lifezone Metals, Ltd.* (Metals & Mining) | 139 | 1,068 | |||||||||
Ligand Pharmaceuticals, Inc.* (Pharmaceuticals) | 65 | 5,477 | |||||||||
| Lightwave Logic, Inc.* (Electronic Equipment, Instruments & Components) | 458 | 1,369 | |||||||||
| Limbach Holdings, Inc.* (Construction & Engineering) | 39 | 2,220 | |||||||||
Limoneira Co. (Food Products) | 63 | 1,311 | |||||||||
| Lincoln Educational Services Corp.* (Diversified Consumer Services) | 100 | 1,186 | |||||||||
| Lindblad Expeditions Holdings, Inc.* (Hotels, Restaurants & Leisure) | 135 | 1,303 | |||||||||
Lindsay Corp. (Machinery) | 42 | 5,161 | |||||||||
| Lineage Cell Therapeutics, Inc.* (Biotechnology) | 564 | 562 | |||||||||
Linkbancorp, Inc. (Banks) | 84 | 514 | |||||||||
| Lions Gate Entertainment Corp.*—Class A (Entertainment) | 227 | 2,138 | |||||||||
| Lions Gate Entertainment Corp.*—Class B (Entertainment) | 465 | 3,985 | |||||||||
Liquidia Corp.* (Pharmaceuticals) | 220 | 2,640 | |||||||||
| Liquidity Services, Inc.* (Commercial Services & Supplies) | 82 | 1,638 | |||||||||
| LivaNova PLC* (Health Care Equipment & Supplies) | 208 | 11,403 | |||||||||
Live Oak Bancshares, Inc. (Banks) | 132 | 4,628 | |||||||||
LiveOne, Inc.* (Entertainment) | 260 | 408 | |||||||||
LiveRamp Holdings, Inc.* (Software) | 249 | 7,704 | |||||||||
Livewire Group, Inc.* (Automobiles) | 69 | 529 | |||||||||
| Longboard Pharmaceuticals, Inc.* (Pharmaceuticals) | 123 | 3,325 | |||||||||
LSB Industries, Inc.* (Chemicals) | 204 | 1,669 | |||||||||
LSI Industries, Inc. (Electrical Equipment) | 107 | 1,548 | |||||||||
LTC Properties, Inc. (Health Care REITs) | 164 | 5,658 | |||||||||
| Lumen Technologies, Inc.* (Diversified Telecommunication Services) | 3,863 | 4,249 | |||||||||
| Luminar Technologies, Inc.*(a) (Automobile Components) | 1,280 | 1,907 | |||||||||
Luxfer Holdings PLC (Machinery) | 102 | 1,182 | |||||||||
LXP Industrial Trust (Industrial REITs) | 1,109 | 10,114 | |||||||||
Lyell Immunopharma, Inc.* (Biotechnology) | 613 | 889 | |||||||||
Lyra Therapeutics, Inc.* (Pharmaceuticals) | 185 | 51 | |||||||||
M/I Homes, Inc.* (Household Durables) | 103 | 12,580 | |||||||||
Macatawa Bank Corp. (Banks) | 100 | 1,460 | |||||||||
MacroGenics, Inc.* (Biotechnology) | 235 | 999 | |||||||||
| Madison Square Garden Entertainment Corp.* (Entertainment) | 149 | 5,100 | |||||||||
Common Stocks, continued
Shares | Value | ||||||||||
| Madrigal Pharmaceuticals, Inc.* (Biotechnology) | 67 | $ | 18,770 | ||||||||
Magnite, Inc.* (Media) | 480 | 6,379 | |||||||||
| Magnolia Oil & Gas Corp.—Class A (Oil, Gas & Consumable Fuels) | 661 | 16,750 | |||||||||
Maiden Holdings, Ltd.* (Insurance) | 336 | 692 | |||||||||
| Malibu Boats, Inc.*—Class A (Leisure Products) | 77 | 2,698 | |||||||||
Mama's Creations, Inc.* (Food Products) | 126 | 849 | |||||||||
| Mammoth Energy Services, Inc.* (Energy Equipment & Services) | 93 | 305 | |||||||||
MannKind Corp.* (Biotechnology) | 1,012 | 5,283 | |||||||||
Marathon Digital Holdings, Inc.* (Software) | 1,044 | 20,723 | |||||||||
| Maravai LifeSciences Holdings, Inc.*—Class A (Life Sciences Tools & Services) | 422 | 3,021 | |||||||||
| Marcus & Millichap, Inc. (Real Estate Management & Development) | 90 | 2,837 | |||||||||
Marine Products Corp. (Leisure Products) | 34 | 343 | |||||||||
MarineMax, Inc.* (Specialty Retail) | 82 | 2,654 | |||||||||
MarketWise, Inc. (Capital Markets) | 147 | 171 | |||||||||
Marqeta, Inc.*—Class A (Financial Services) | 1,779 | 9,749 | |||||||||
Marten Transport, Ltd. (Ground Transportation) | 222 | 4,096 | |||||||||
Masterbrand, Inc.* (Building Products) | 484 | 7,105 | |||||||||
| MasterCraft Boat Holdings, Inc.* (Leisure Products) | 64 | 1,208 | |||||||||
Materion Corp. (Metals & Mining) | 79 | 8,542 | |||||||||
Mativ Holdings, Inc. (Chemicals) | 206 | 3,494 | |||||||||
| Matrix Service Co.* (Construction & Engineering) | 101 | 1,003 | |||||||||
Matson, Inc. (Marine Transportation) | 130 | 17,025 | |||||||||
Matterport, Inc.* (Software) | 1,000 | 4,470 | |||||||||
| Matthews International Corp.—Class A (Commercial Services & Supplies) | 113 | 2,831 | |||||||||
| Maui Land & Pineapple Co., Inc.* (Real Estate Management & Development) | 29 | 639 | |||||||||
| MaxCyte, Inc.* (Life Sciences Tools & Services) | 399 | 1,564 | |||||||||
Maximus, Inc. (Professional Services) | 233 | 19,969 | |||||||||
| MaxLinear, Inc.* (Semiconductors & Semiconductor Equipment) | 302 | 6,082 | |||||||||
Mayville Engineering Co., Inc.* (Machinery) | 49 | 816 | |||||||||
MBIA, Inc. (Insurance) | 170 | 933 | |||||||||
| McGrath RentCorp (Trading Companies & Distributors) | 93 | 9,909 | |||||||||
Medallion Financial Corp. (Consumer Finance) | 71 | 545 | |||||||||
| MediaAlpha, Inc.*—Class A (Interactive Media & Services) | 95 | 1,251 | |||||||||
Medifast, Inc. (Personal Care Products) | 41 | 895 | |||||||||
Mediwound, Ltd.* (Pharmaceuticals) | 31 | 481 | |||||||||
MeiraGTx Holdings PLC* (Biotechnology) | 148 | 623 | |||||||||
Mercantile Bank Corp. (Banks) | 60 | 2,434 | |||||||||
Merchants Bancorp (Financial Services) | 65 | 2,635 | |||||||||
Mercury General Corp. (Insurance) | 102 | 5,420 | |||||||||
| Mercury Systems, Inc.* (Aerospace & Defense) | 209 | 5,641 | |||||||||
MeridianLink, Inc.* (Software) | 103 | 2,200 | |||||||||
| Merit Medical Systems, Inc.* (Health Care Equipment & Supplies) | 218 | 18,737 | |||||||||
Meritage Homes Corp. (Household Durables) | 137 | 22,174 | |||||||||
Mersana Therapeutics, Inc.* (Biotechnology) | 433 | 870 | |||||||||
See accompanying notes to the financial statements.
154 :: ProFund VP UltraSmall-Cap :: Schedule of Portfolio Investments :: June 30, 2024 (unaudited)
Common Stocks, continued
Shares | Value | ||||||||||
| Mesa Laboratories, Inc. (Life Sciences Tools & Services) | 20 | $ | 1,735 | ||||||||
Metagenomi, Inc.* (Biotechnology) | 24 | 98 | |||||||||
Metallus, Inc.* (Metals & Mining) | 163 | 3,304 | |||||||||
| Metals Acquisition, Ltd.*—Class A (Metals & Mining) | 206 | 2,820 | |||||||||
| Methode Electronics, Inc. (Electronic Equipment, Instruments & Components) | 129 | 1,335 | |||||||||
Metrocity Bankshares, Inc. (Banks) | 70 | 1,848 | |||||||||
Metropolitan Bank Holding Corp.* (Banks) | 40 | 1,684 | |||||||||
MFA Financial, Inc. (Mortgage REITs) | 391 | 4,160 | |||||||||
MGE Energy, Inc. (Electric Utilities) | 139 | 10,386 | |||||||||
MGP Ingredients, Inc. (Beverages) | 54 | 4,018 | |||||||||
| MicroVision, Inc.*(a) (Electronic Equipment, Instruments & Components) | 788 | 835 | |||||||||
Mid Penn Bancorp, Inc. (Banks) | 57 | 1,251 | |||||||||
Middlefield Banc Corp. (Banks) | 28 | 673 | |||||||||
Middlesex Water Co. (Water Utilities) | 67 | 3,501 | |||||||||
Midland States Bancorp, Inc. (Banks) | 80 | 1,812 | |||||||||
MidWestOne Financial Group, Inc. (Banks) | 56 | 1,259 | |||||||||
Miller Industries, Inc. (Machinery) | 42 | 2,311 | |||||||||
| MillerKnoll, Inc. (Commercial Services & Supplies) | 273 | 7,232 | |||||||||
MiMedx Group, Inc.* (Biotechnology) | 453 | 3,139 | |||||||||
| Mind Medicine Mindmed, Inc.* (Pharmaceuticals) | 275 | 1,983 | |||||||||
Minerals Technologies, Inc. (Chemicals) | 123 | 10,229 | |||||||||
Mineralys Therapeutics, Inc.* (Biotechnology) | 109 | 1,275 | |||||||||
| Mirion Technologies, Inc.* (Electronic Equipment, Instruments & Components) | 763 | 8,195 | |||||||||
Mirum Pharmaceuticals, Inc.* (Biotechnology) | 150 | 5,129 | |||||||||
Mission Produce, Inc.* (Food Products) | 166 | 1,640 | |||||||||
| Mister Car Wash, Inc.* (Diversified Consumer Services) | 357 | 2,542 | |||||||||
Mistras Group, Inc.* (Professional Services) | 79 | 655 | |||||||||
Mitek Systems, Inc.* (Software) | 177 | 1,979 | |||||||||
| Modine Manufacturing Co.* (Automobile Components) | 197 | 19,736 | |||||||||
| ModivCare, Inc.* (Health Care Providers & Services) | 43 | 1,128 | |||||||||
Moelis & Co.—Class A (Capital Markets) | 270 | 15,352 | |||||||||
| Monarch Casino & Resort, Inc. (Hotels, Restaurants & Leisure) | 50 | 3,407 | |||||||||
| Mondee Holdings, Inc.* (Hotels, Restaurants & Leisure) | 145 | 348 | |||||||||
Moneylion, Inc.* (Consumer Finance) | 32 | 2,353 | |||||||||
Monro, Inc. (Specialty Retail) | 114 | 2,720 | |||||||||
| Montauk Renewables, Inc.* (Independent Power and Renewable Electricity Producers) | 252 | 1,436 | |||||||||
| Monte Rosa Therapeutics, Inc.* (Biotechnology) | 116 | 434 | |||||||||
| Montrose Environmental Group, Inc.* (Commercial Services & Supplies) | 121 | 5,392 | |||||||||
Moog, Inc.—Class A (Aerospace & Defense) | 108 | 18,068 | |||||||||
Morphic Holding, Inc.* (Biotechnology) | 152 | 5,179 | |||||||||
| Movado Group, Inc. (Textiles, Apparel & Luxury Goods) | 58 | 1,442 | |||||||||
Mr. Cooper Group, Inc.* (Financial Services) | 244 | 19,819 | |||||||||
| MRC Global, Inc.* (Trading Companies & Distributors) | 322 | 4,157 | |||||||||
Mueller Industries, Inc. (Machinery) | 427 | 24,313 | |||||||||
Common Stocks, continued
Shares | Value | ||||||||||
| Mueller Water Products, Inc.—Class A (Machinery) | 593 | $ | 10,627 | ||||||||
| Murphy Oil Corp. (Oil, Gas & Consumable Fuels) | 554 | 22,846 | |||||||||
MVB Financial Corp. (Banks) | 44 | 820 | |||||||||
| Myers Industries, Inc. (Containers & Packaging) | 140 | 1,873 | |||||||||
| MYR Group, Inc.* (Construction & Engineering) | 63 | 8,550 | |||||||||
Myriad Genetics, Inc.* (Biotechnology) | 341 | 8,341 | |||||||||
N-able, Inc.* (Software) | 273 | 4,158 | |||||||||
| Nabors Industries, Ltd.* (Energy Equipment & Services) | 35 | 2,491 | |||||||||
| NACCO Industries, Inc.—Class A (Oil, Gas & Consumable Fuels) | 16 | 443 | |||||||||
| Nano-X Imaging, Ltd.* (Health Care Equipment & Supplies) | 207 | 1,519 | |||||||||
| Napco Security Technologies, Inc. (Electronic Equipment, Instruments & Components) | 134 | 6,961 | |||||||||
| Nathan's Famous, Inc. (Hotels, Restaurants & Leisure) | 11 | 746 | |||||||||
| National Bank Holdings Corp.—Class A (Banks) | 141 | 5,506 | |||||||||
National Bankshares, Inc. (Banks) | 22 | 622 | |||||||||
National Beverage Corp. (Beverages) | 90 | 4,612 | |||||||||
National CineMedia, Inc.* (Media) | 271 | 1,190 | |||||||||
| National Health Investors, Inc. (Health Care REITs) | 160 | 10,837 | |||||||||
| National HealthCare Corp. (Health Care Providers & Services) | 48 | 5,203 | |||||||||
| National Presto Industries, Inc. (Aerospace & Defense) | 20 | 1,503 | |||||||||
| National Research Corp. (Health Care Providers & Services) | 58 | 1,331 | |||||||||
| National Vision Holdings, Inc.* (Specialty Retail) | 297 | 3,888 | |||||||||
| National Western Life Group, Inc.—Class A (Insurance) | 9 | 4,472 | |||||||||
| Natural Gas Services Group, Inc.* (Energy Equipment & Services) | 41 | 825 | |||||||||
| Natural Grocers by Vitamin Cottage, Inc. (Consumer Staples Distribution & Retail) | 36 | 763 | |||||||||
| Nature's Sunshine Products, Inc.* (Personal Care Products) | 49 | 738 | |||||||||
| Nautilus Biotechnology, Inc.* (Life Sciences Tools & Services) | 186 | 435 | |||||||||
Navient Corp. (Consumer Finance) | 308 | 4,484 | |||||||||
| Navitas Semiconductor Corp.* (Semiconductors & Semiconductor Equipment) | 482 | 1,894 | |||||||||
Nb BanCorp, Inc.* (Banks) | 149 | 2,247 | |||||||||
NBT Bancorp, Inc. (Banks) | 176 | 6,794 | |||||||||
NCR Atleos Corp.* (Financial Services) | 275 | 7,431 | |||||||||
NCR Voyix Corp.* (Software) | 555 | 6,854 | |||||||||
Nektar Therapeutics* (Pharmaceuticals) | 681 | 844 | |||||||||
Nelnet, Inc.—Class A (Consumer Finance) | 55 | 5,547 | |||||||||
| Neogen Corp.* (Health Care Equipment & Supplies) | 833 | 13,020 | |||||||||
| NeoGenomics, Inc.* (Health Care Providers & Services) | 487 | 6,755 | |||||||||
See accompanying notes to the financial statements.
June 30, 2024 (unaudited) :: Schedule of Portfolio Investments :: ProFund VP UltraSmall-Cap :: 155
Common Stocks, continued
Shares | Value | ||||||||||
| NerdWallet, Inc.*—Class A (Consumer Finance) | 148 | $ | 2,161 | ||||||||
Nerdy, Inc.* (Diversified Consumer Services) | 278 | 464 | |||||||||
Net Lease Office Properties* (Office REITs) | 57 | 1,403 | |||||||||
Net Power, Inc.* (Electrical Equipment) | 81 | 796 | |||||||||
| NETGEAR, Inc.* (Communications Equipment) | 108 | 1,652 | |||||||||
| NetScout Systems, Inc.* (Communications Equipment) | 264 | 4,829 | |||||||||
NETSTREIT Corp. (Retail REITs) | 281 | 4,524 | |||||||||
Neumora Therapeutics, Inc.* (Pharmaceuticals) | 321 | 3,155 | |||||||||
Neurogene, Inc.* (Biotechnology) | 39 | 1,419 | |||||||||
| NeuroPace, Inc.* (Health Care Equipment & Supplies) | 52 | 393 | |||||||||
| Nevro Corp.* (Health Care Equipment & Supplies) | 138 | 1,162 | |||||||||
New Jersey Resources Corp. (Gas Utilities) | 375 | 16,028 | |||||||||
New York Community Bancorp, Inc. (Banks) | 2,904 | 9,351 | |||||||||
| New York Mortgage Trust, Inc. (Mortgage REITs) | 346 | 2,022 | |||||||||
| Newmark Group, Inc.—Class A (Real Estate Management & Development) | 521 | 5,330 | |||||||||
| Newpark Resources, Inc.* (Energy Equipment & Services) | 316 | 2,626 | |||||||||
NewtekOne, Inc. (Financial Services) | 89 | 1,119 | |||||||||
| NexPoint Diversified Real Estate Trust* (Diversified REITs) | 122 | 675 | |||||||||
| Nexpoint Real Estate Finance, Inc. (Mortgage REITs) | 31 | 425 | |||||||||
| NexPoint Residential Trust, Inc. (Residential REITs) | 87 | 3,437 | |||||||||
| NextDecade Corp.* (Oil, Gas & Consumable Fuels) | 441 | 3,502 | |||||||||
| Nextdoor Holdings, Inc.* (Interactive Media & Services) | 666 | 1,851 | |||||||||
NextNav, Inc.* (Software) | 286 | 2,319 | |||||||||
| NEXTracker, Inc.*—Class A (Electrical Equipment) | 445 | 20,861 | |||||||||
NI Holdings, Inc.* (Insurance) | 30 | 459 | |||||||||
Nicolet Bankshares, Inc. (Banks) | 51 | 4,235 | |||||||||
Nikola Corp.* (Machinery) | 1 | 8 | |||||||||
Nkarta, Inc.* (Biotechnology) | 202 | 1,194 | |||||||||
| NL Industries, Inc. (Commercial Services & Supplies) | 32 | 193 | |||||||||
| nLight, Inc.* (Electronic Equipment, Instruments & Components) | 176 | 1,924 | |||||||||
NMI Holdings, Inc.* (Financial Services) | 303 | 10,314 | |||||||||
NN, Inc.* (Machinery) | 176 | 528 | |||||||||
| Noble Corp. PLC (Energy Equipment & Services) | 437 | 19,511 | |||||||||
| Nordic American Tankers, Ltd. (Oil, Gas & Consumable Fuels) | 778 | 3,096 | |||||||||
Northeast Bank (Banks) | 25 | 1,522 | |||||||||
Northeast Community Bancorp, Inc. (Banks) | 47 | 838 | |||||||||
| Northern Oil and Gas, Inc. (Oil, Gas & Consumable Fuels) | 379 | 14,087 | |||||||||
| Northern Technologies International Corp. (Chemicals) | 30 | 497 | |||||||||
Northfield Bancorp, Inc. (Banks) | 150 | 1,422 | |||||||||
Northrim Bancorp, Inc. (Banks) | 20 | 1,153 | |||||||||
Common Stocks, continued
Shares | Value | ||||||||||
Northwest Bancshares, Inc. (Banks) | 486 | $ | 5,613 | ||||||||
Northwest Natural Holding Co. (Gas Utilities) | 145 | 5,236 | |||||||||
| Northwest Pipe Co.* (Construction & Engineering) | 37 | 1,257 | |||||||||
| Northwestern Energy Group, Inc. (Multi-Utilities) | 235 | 11,769 | |||||||||
Norwood Financial Corp. (Banks) | 28 | 711 | |||||||||
Novagold Resources, Inc.* (Metals & Mining) | 931 | 3,221 | |||||||||
| Novanta, Inc.* (Electronic Equipment, Instruments & Components) | 137 | 22,346 | |||||||||
Novavax, Inc.*(a) (Biotechnology) | 539 | 6,824 | |||||||||
| Novocure, Ltd.* (Health Care Equipment & Supplies) | 406 | 6,955 | |||||||||
| Nu Skin Enterprises, Inc.—Class A (Personal Care Products) | 189 | 1,992 | |||||||||
Nurix Therapeutics, Inc.* (Biotechnology) | 231 | 4,821 | |||||||||
NuScale Power Corp.*(a) (Electrical Equipment) | 296 | 3,460 | |||||||||
Nuvalent, Inc.*—Class A (Biotechnology) | 122 | 9,255 | |||||||||
Nuvation Bio, Inc.* (Pharmaceuticals) | 685 | 2,000 | |||||||||
NV5 Global, Inc.* (Professional Services) | 55 | 5,113 | |||||||||
| NVE Corp. (Semiconductors & Semiconductor Equipment) | 18 | 1,344 | |||||||||
Oak Valley Bancorp (Banks) | 26 | 649 | |||||||||
| Oceaneering International, Inc.* (Energy Equipment & Services) | 386 | 9,133 | |||||||||
OceanFirst Financial Corp. (Banks) | 220 | 3,496 | |||||||||
Ocugen, Inc.* (Biotechnology) | 977 | 1,514 | |||||||||
Ocular Therapeutix, Inc.* (Pharmaceuticals) | 594 | 4,063 | |||||||||
| Offerpad Solutions, Inc.* (Real Estate Management & Development) | 40 | 177 | |||||||||
OFG Bancorp (Banks) | 177 | 6,629 | |||||||||
O-I Glass, Inc.* (Containers & Packaging) | 591 | 6,577 | |||||||||
| Oil States International, Inc.* (Energy Equipment & Services) | 234 | 1,039 | |||||||||
Oil-Dri Corp. of America (Household Products) | 19 | 1,218 | |||||||||
| Olaplex Holdings, Inc.* (Personal Care Products) | 529 | 815 | |||||||||
Old National Bancorp (Banks) | 1,201 | 20,644 | |||||||||
Old Second Bancorp, Inc. (Banks) | 166 | 2,458 | |||||||||
Olema Pharmaceuticals, Inc.* (Biotechnology) | 152 | 1,645 | |||||||||
Olo, Inc.*—Class A (Software) | 400 | 1,768 | |||||||||
Olympic Steel, Inc. (Metals & Mining) | 42 | 1,883 | |||||||||
Omega Flex, Inc. (Machinery) | 14 | 718 | |||||||||
Omeros Corp.* (Pharmaceuticals) | 213 | 865 | |||||||||
OmniAb, Inc.* (Life Sciences Tools & Services) | 352 | 1,320 | |||||||||
| Omnicell, Inc.* (Health Care Equipment & Supplies) | 174 | 4,710 | |||||||||
ON24, Inc.* (Software) | 105 | 631 | |||||||||
ONE Gas, Inc. (Gas Utilities) | 215 | 13,728 | |||||||||
One Liberty Properties, Inc. (Diversified REITs) | 61 | 1,432 | |||||||||
OneSpan, Inc.* (Software) | 145 | 1,859 | |||||||||
| OneSpaWorld Holdings, Ltd.* (Diversified Consumer Services) | 383 | 5,887 | |||||||||
OneWater Marine, Inc.* (Specialty Retail) | 46 | 1,268 | |||||||||
Onity Group, Inc.* (Financial Services) | 25 | 600 | |||||||||
| Ooma, Inc.* (Diversified Telecommunication Services) | 94 | 933 | |||||||||
Open Lending Corp.* (Capital Markets) | 390 | 2,176 | |||||||||
| Opendoor Technologies, Inc.* (Real Estate Management & Development) | 2,365 | 4,352 | |||||||||
See accompanying notes to the financial statements.
156 :: ProFund VP UltraSmall-Cap :: Schedule of Portfolio Investments :: June 30, 2024 (unaudited)
Common Stocks, continued
Shares | Value | ||||||||||
| OPENLANE, Inc.* (Commercial Services & Supplies) | 410 | $ | 6,802 | ||||||||
| OPKO Health, Inc.*(a) (Health Care Providers & Services) | 1,243 | 1,554 | |||||||||
OppFi, Inc. (Consumer Finance) | 69 | 234 | |||||||||
OptimizeRx Corp.* (Health Care Technology) | 67 | 670 | |||||||||
| Option Care Health, Inc.* (Health Care Providers & Services) | 666 | 18,448 | |||||||||
Orange County Bancorp, Inc. (Banks) | 20 | 1,058 | |||||||||
| OraSure Technologies, Inc.* (Health Care Equipment & Supplies) | 285 | 1,214 | |||||||||
| Orchestra BioMed Holdings, Inc.* (Health Care Equipment & Supplies) | 89 | 725 | |||||||||
Orchid Island Capital, Inc. (Mortgage REITs) | 203 | 1,693 | |||||||||
| Organogenesis Holdings, Inc.* (Biotechnology) | 276 | 773 | |||||||||
ORIC Pharmaceuticals, Inc.* (Biotechnology) | 235 | 1,661 | |||||||||
Origin Bancorp, Inc. (Banks) | 112 | 3,553 | |||||||||
| Orion Group Holdings, Inc.* (Construction & Engineering) | 117 | 1,113 | |||||||||
Orion Office REIT, Inc. (Office REITs) | 214 | 768 | |||||||||
Orion SA (Chemicals) | 220 | 4,827 | |||||||||
| Ormat Technologies, Inc. (Independent Power and Renewable Electricity Producers) | 206 | 14,770 | |||||||||
Orrstown Financial Services, Inc. (Banks) | 70 | 1,915 | |||||||||
| Orthofix Medical, Inc.* (Health Care Equipment & Supplies) | 129 | 1,711 | |||||||||
| OrthoPediatrics Corp.* (Health Care Equipment & Supplies) | 62 | 1,783 | |||||||||
Oscar Health, Inc.*—Class A (Insurance) | 742 | 11,738 | |||||||||
| OSI Systems, Inc.* (Electronic Equipment, Instruments & Components) | 62 | 8,526 | |||||||||
Otter Tail Corp. (Electric Utilities) | 158 | 13,839 | |||||||||
| Ouster, Inc.* (Electronic Equipment, Instruments & Components) | 165 | 1,622 | |||||||||
Outbrain, Inc.* (Interactive Media & Services) | 147 | 732 | |||||||||
Outfront Media, Inc. (Specialized REITs) | 565 | 8,080 | |||||||||
Outlook Therapeutics, Inc.* (Biotechnology) | 30 | 221 | |||||||||
| Overseas Shipholding Group, Inc.—Class A (Oil, Gas & Consumable Fuels) | 186 | 1,577 | |||||||||
Ovid Therapeutics, Inc.* (Biotechnology) | 225 | 173 | |||||||||
| Owens & Minor, Inc.* (Health Care Providers & Services) | 288 | 3,888 | |||||||||
| Oxford Industries, Inc. (Textiles, Apparel & Luxury Goods) | 57 | 5,709 | |||||||||
P10, Inc.—Class A (Capital Markets) | 159 | 1,348 | |||||||||
| Pacific Biosciences of California, Inc.* (Life Sciences Tools & Services) | 1,044 | 1,430 | |||||||||
Pacific Premier Bancorp, Inc. (Banks) | 366 | 8,407 | |||||||||
Pacira BioSciences, Inc.* (Pharmaceuticals) | 175 | 5,007 | |||||||||
| Pacs Group, Inc.* (Health Care Providers & Services) | 95 | 2,803 | |||||||||
| Pactiv Evergreen, Inc. (Containers & Packaging) | 154 | 1,743 | |||||||||
| Pagaya Technologies, Ltd.*—Class A (Software) | 154 | 1,965 | |||||||||
PagerDuty, Inc.* (Software) | 341 | 7,819 | |||||||||
| Pagseguro Digital, Ltd.*—Class A (Financial Services) | 720 | 8,417 | |||||||||
Palomar Holdings, Inc.* (Insurance) | 93 | 7,547 | |||||||||
Common Stocks, continued
Shares | Value | ||||||||||
| PAM Transportation Services, Inc.* (Ground Transportation) | 23 | $ | 400 | ||||||||
| Pangaea Logistics Solutions, Ltd. (Marine Transportation) | 120 | 940 | |||||||||
| Papa John's International, Inc. (Hotels, Restaurants & Leisure) | 127 | 5,966 | |||||||||
| Par Pacific Holdings, Inc.* (Oil, Gas & Consumable Fuels) | 219 | 5,530 | |||||||||
| PAR Technology Corp.* (Electronic Equipment, Instruments & Components) | 129 | 6,075 | |||||||||
| Paragon 28, Inc.* (Health Care Equipment & Supplies) | 180 | 1,231 | |||||||||
Paramount Group, Inc. (Office REITs) | 704 | 3,260 | |||||||||
Park Aerospace Corp. (Aerospace & Defense) | 71 | 971 | |||||||||
Park National Corp. (Banks) | 55 | 7,829 | |||||||||
Parke Bancorp, Inc. (Banks) | 40 | 696 | |||||||||
Park-Ohio Holdings Corp. (Machinery) | 33 | 854 | |||||||||
Pathward Financial, Inc. (Banks) | 98 | 5,544 | |||||||||
| Patria Investments, Ltd.—Class A (Capital Markets) | 210 | 2,533 | |||||||||
| Patrick Industries, Inc. (Automobile Components) | 82 | 8,901 | |||||||||
| Patterson Cos., Inc. (Health Care Providers & Services) | 307 | 7,405 | |||||||||
| Patterson-UTI Energy, Inc. (Energy Equipment & Services) | 1,524 | 15,789 | |||||||||
Payoneer Global, Inc.* (Financial Services) | 1,081 | 5,989 | |||||||||
Paysafe, Ltd.* (Financial Services) | 123 | 2,175 | |||||||||
Paysign, Inc.* (Financial Services) | 126 | 543 | |||||||||
| PBF Energy, Inc.—Class A (Oil, Gas & Consumable Fuels) | 396 | 18,224 | |||||||||
| PC Connection, Inc. (Electronic Equipment, Instruments & Components) | 44 | 2,825 | |||||||||
PCB Bancorp (Banks) | 42 | 684 | |||||||||
| PDF Solutions, Inc.* (Semiconductors & Semiconductor Equipment) | 119 | 4,329 | |||||||||
| Peabody Energy Corp. (Oil, Gas & Consumable Fuels) | 489 | 10,817 | |||||||||
Peakstone Realty Trust (Office REITs) | 139 | 1,473 | |||||||||
Peapack-Gladstone Financial Corp. (Banks) | 64 | 1,450 | |||||||||
| Pebblebrook Hotel Trust (Hotel & Resort REITs) | 456 | 6,270 | |||||||||
| Pediatrix Medical Group, Inc.* (Health Care Providers & Services) | 322 | 2,431 | |||||||||
| Peloton Interactive, Inc.*—Class A (Leisure Products) | 1,291 | 4,364 | |||||||||
| PennyMac Financial Services, Inc. (Financial Services) | 102 | 9,649 | |||||||||
| PennyMac Mortgage Investment Trust (Mortgage REITs) | 332 | 4,565 | |||||||||
| Peoples Bancorp of North Carolina, Inc. (Banks) | 17 | 496 | |||||||||
Peoples Bancorp, Inc. (Banks) | 132 | 3,960 | |||||||||
Peoples Financial Services Corp. (Banks) | 35 | 1,594 | |||||||||
PepGen, Inc.* (Biotechnology) | 59 | 942 | |||||||||
| Perdoceo Education Corp. (Diversified Consumer Services) | 250 | 5,355 | |||||||||
Perella Weinberg Partners (Capital Markets) | 201 | 3,266 | |||||||||
Perficient, Inc.* (IT Services) | 132 | 9,872 | |||||||||
See accompanying notes to the financial statements.
June 30, 2024 (unaudited) :: Schedule of Portfolio Investments :: ProFund VP UltraSmall-Cap :: 157
Common Stocks, continued
Shares | Value | ||||||||||
| Performant Financial Corp.* (Commercial Services & Supplies) | 270 | $ | 783 | ||||||||
Perimeter Solutions SA* (Chemicals) | 511 | 4,001 | |||||||||
| Perma-Fix Environmental Services, Inc.* (Commercial Services & Supplies) | 48 | 486 | |||||||||
Perpetua Resources Corp.* (Metals & Mining) | 147 | 764 | |||||||||
| Perspective Therapeutics, Inc.* (Biotechnology) | 180 | 1,795 | |||||||||
| Petco Health & Wellness Co., Inc.* (Specialty Retail) | 317 | 1,198 | |||||||||
PetIQ, Inc.* (Health Care Providers & Services) | 103 | 2,272 | |||||||||
| Phathom Pharmaceuticals, Inc.*(a) (Pharmaceuticals) | 130 | 1,339 | |||||||||
| Phibro Animal Health Corp.—Class A (Pharmaceuticals) | 78 | 1,308 | |||||||||
Phillips Edison & Co., Inc. (Retail REITs) | 469 | 15,341 | |||||||||
Phinia, Inc. (Automobile Components) | 173 | 6,809 | |||||||||
| Photronics, Inc.* (Semiconductors & Semiconductor Equipment) | 235 | 5,797 | |||||||||
Phreesia, Inc.* (Health Care Technology) | 194 | 4,113 | |||||||||
Piedmont Lithium, Inc.* (Metals & Mining) | 69 | 689 | |||||||||
| Piedmont Office Realty Trust, Inc.—Class A (Office REITs) | 471 | 3,415 | |||||||||
Pioneer Bancorp, Inc.* (Banks) | 44 | 440 | |||||||||
Piper Sandler Cos. (Capital Markets) | 66 | 15,191 | |||||||||
| Pitney Bowes, Inc. (Commercial Services & Supplies) | 613 | 3,114 | |||||||||
PJT Partners, Inc.—Class A (Capital Markets) | 90 | 9,712 | |||||||||
Planet Labs PBC* (Professional Services) | 643 | 1,196 | |||||||||
| PlayAGS, Inc.* (Hotels, Restaurants & Leisure) | 150 | 1,725 | |||||||||
Playstudios, Inc.* (Entertainment) | 336 | 696 | |||||||||
| Plexus Corp.* (Electronic Equipment, Instruments & Components) | 104 | 10,731 | |||||||||
Pliant Therapeutics, Inc.* (Pharmaceuticals) | 217 | 2,333 | |||||||||
Plug Power, Inc.* (Electrical Equipment) | 2,409 | 5,613 | |||||||||
Plumas Bancorp (Banks) | 21 | 756 | |||||||||
| Plymouth Industrial REIT, Inc. (Industrial REITs) | 153 | 3,271 | |||||||||
PNM Resources, Inc. (Electric Utilities) | 344 | 12,714 | |||||||||
Ponce Financial Group, Inc.* (Banks) | 74 | 676 | |||||||||
Porch Group, Inc.* (Software) | 295 | 445 | |||||||||
| Portillo's, Inc.*—Class A (Hotels, Restaurants & Leisure) | 206 | 2,002 | |||||||||
Portland General Electric Co. (Electric Utilities) | 388 | 16,778 | |||||||||
Poseida Therapeutics, Inc.* (Biotechnology) | 262 | 765 | |||||||||
| Postal Realty Trust, Inc.—Class A (Office REITs) | 82 | 1,093 | |||||||||
Potbelly Corp.* (Hotels, Restaurants & Leisure) | 105 | 843 | |||||||||
PotlatchDeltic Corp. (Specialized REITs) | 303 | 11,935 | |||||||||
Powell Industries, Inc. (Electrical Equipment) | 36 | 5,162 | |||||||||
| Power Integrations, Inc. (Semiconductors & Semiconductor Equipment) | 216 | 15,161 | |||||||||
| Powerfleet, Inc.* (Electronic Equipment, Instruments & Components) | 345 | 1,577 | |||||||||
PowerSchool Holdings, Inc.* (Software) | 227 | 5,083 | |||||||||
PRA Group, Inc.* (Consumer Finance) | 148 | 2,910 | |||||||||
Prairie Operating Co.* (Software) | 16 | 174 | |||||||||
| Praxis Precision Medicines, Inc.* (Biotechnology) | 66 | 2,730 | |||||||||
Precigen, Inc.* (Biotechnology) | 483 | 763 | |||||||||
Common Stocks, continued
Shares | Value | ||||||||||
Preferred Bank (Banks) | 47 | $ | 3,548 | ||||||||
| Preformed Line Products Co. (Electrical Equipment) | 9 | 1,121 | |||||||||
Prelude Therapeutics, Inc.* (Biotechnology) | 50 | 191 | |||||||||
Premier Financial Corp. (Banks) | 135 | 2,762 | |||||||||
| Prestige Consumer Healthcare, Inc.* (Pharmaceuticals) | 189 | 13,014 | |||||||||
| PriceSmart, Inc. (Consumer Staples Distribution & Retail) | 96 | 7,795 | |||||||||
Prime Medicine, Inc.* (Biotechnology) | 216 | 1,110 | |||||||||
| PrimeEnergy Resources Corp.* (Oil, Gas & Consumable Fuels) | 3 | 319 | |||||||||
Primis Financial Corp. (Banks) | 77 | 807 | |||||||||
Primo Water Corp. (Beverages) | 603 | 13,181 | |||||||||
| Primoris Services Corp. (Construction & Engineering) | 204 | 10,178 | |||||||||
Princeton Bancorp, Inc. (Banks) | 19 | 629 | |||||||||
| Priority Technology Holdings, Inc.* (Financial Services) | 69 | 364 | |||||||||
| Privia Health Group, Inc.* (Health Care Providers & Services) | 389 | 6,761 | |||||||||
ProAssurance Corp.* (Insurance) | 206 | 2,517 | |||||||||
| PROCEPT BioRobotics Corp.* (Health Care Equipment & Supplies) | 162 | 9,897 | |||||||||
| ProFrac Holding Corp.*—Class A (Energy Equipment & Services) | 85 | 630 | |||||||||
PROG Holdings, Inc. (Consumer Finance) | 162 | 5,618 | |||||||||
Progress Software Corp. (Software) | 164 | 8,899 | |||||||||
| Progyny, Inc.* (Health Care Providers & Services) | 322 | 9,212 | |||||||||
ProKidney Corp.* (Biotechnology) | 241 | 593 | |||||||||
| ProPetro Holding Corp.* (Energy Equipment & Services) | 346 | 3,000 | |||||||||
PROS Holdings, Inc.* (Software) | 175 | 5,014 | |||||||||
| Protagonist Therapeutics, Inc.* (Biotechnology) | 223 | 7,727 | |||||||||
Prothena Corp. PLC* (Biotechnology) | 162 | 3,344 | |||||||||
Proto Labs, Inc.* (Machinery) | 98 | 3,027 | |||||||||
Provident Bancorp, Inc.* (Banks) | 60 | 611 | |||||||||
Provident Financial Services, Inc. (Banks) | 481 | 6,902 | |||||||||
PTC Therapeutics, Inc.* (Biotechnology) | 291 | 8,899 | |||||||||
PubMatic, Inc.*—Class A (Media) | 160 | 3,250 | |||||||||
| Pulmonx Corp.* (Health Care Equipment & Supplies) | 145 | 919 | |||||||||
| Pulse Biosciences, Inc.*(a) (Health Care Equipment & Supplies) | 70 | 783 | |||||||||
Puma Biotechnology, Inc.* (Biotechnology) | 158 | 515 | |||||||||
Pure Cycle Corp.* (Water Utilities) | 79 | 754 | |||||||||
PureCycle Technologies, Inc.* (Chemicals) | 471 | 2,788 | |||||||||
Purple Innovation, Inc.* (Household Durables) | 217 | 226 | |||||||||
Pyxis Oncology, Inc.* (Biotechnology) | 186 | 616 | |||||||||
Q2 Holdings, Inc.* (Software) | 225 | 13,574 | |||||||||
Q32 Bio, Inc.* (Biotechnology) | 23 | 413 | |||||||||
QCR Holdings, Inc. (Banks) | 63 | 3,780 | |||||||||
| Quad/Graphics, Inc. (Commercial Services & Supplies) | 115 | 627 | |||||||||
Quaker Chemical Corp. (Chemicals) | 53 | 8,994 | |||||||||
Qualys, Inc.* (Software) | 142 | 20,249 | |||||||||
| Quanex Building Products Corp. (Building Products) | 126 | 3,484 | |||||||||
See accompanying notes to the financial statements.
158 :: ProFund VP UltraSmall-Cap :: Schedule of Portfolio Investments :: June 30, 2024 (unaudited)
Common Stocks, continued
Shares | Value | ||||||||||
| Quanterix Corp.* (Life Sciences Tools & Services) | 137 | $ | 1,810 | ||||||||
| Quantum-Si, Inc.* (Life Sciences Tools & Services) | 382 | 401 | |||||||||
| Quest Resource Holding Corp.* (Commercial Services & Supplies) | 66 | 581 | |||||||||
| Quicklogic Corp.* (Semiconductors & Semiconductor Equipment) | 53 | 551 | |||||||||
| QuinStreet, Inc.* (Interactive Media & Services) | 201 | 3,335 | |||||||||
| Quipt Home Medical Corp.* (Health Care Providers & Services) | 156 | 502 | |||||||||
Qurate Retail, Inc.*—Class B (Broadline Retail) | 4 | 17 | |||||||||
Rackspace Technology, Inc.* (IT Services) | 255 | 760 | |||||||||
Radian Group, Inc. (Financial Services) | 578 | 17,975 | |||||||||
| Radiant Logistics, Inc.* (Air Freight & Logistics) | 136 | 774 | |||||||||
Radius Recycling, Inc. (Metals & Mining) | 101 | 1,542 | |||||||||
| RadNet, Inc.* (Health Care Providers & Services) | 252 | 14,848 | |||||||||
| Ramaco Resources, Inc.—Class A (Metals & Mining) | 101 | 1,257 | |||||||||
| Ramaco Resources, Inc.—Class B (Metals & Mining) | 19 | 206 | |||||||||
| Rambus, Inc.* (Semiconductors & Semiconductor Equipment) | 415 | 24,384 | |||||||||
| Ranger Energy Services, Inc. (Energy Equipment & Services) | 63 | 663 | |||||||||
| Ranpak Holdings Corp.* (Containers & Packaging) | 164 | 1,055 | |||||||||
Rapid7, Inc.* (Software) | 236 | 10,202 | |||||||||
RAPT Therapeutics, Inc.* (Biotechnology) | 115 | 351 | |||||||||
| Rayonier Advanced Materials, Inc.* (Chemicals) | 244 | 1,327 | |||||||||
RBB Bancorp (Banks) | 65 | 1,223 | |||||||||
| RCI Hospitality Holdings, Inc. (Hotels, Restaurants & Leisure) | 33 | 1,437 | |||||||||
| RE/MAX Holdings, Inc. (Real Estate Management & Development) | 68 | 551 | |||||||||
Ready Capital Corp. (Mortgage REITs) | 617 | 5,047 | |||||||||
| Recursion Pharmaceuticals, Inc.*(a)—Class A (Biotechnology) | 789 | 5,918 | |||||||||
Red River Bancshares, Inc. (Banks) | 18 | 864 | |||||||||
| Red Rock Resorts, Inc.—Class A (Hotels, Restaurants & Leisure) | 188 | 10,327 | |||||||||
Red Violet, Inc.* (Software) | 42 | 1,067 | |||||||||
| Redfin Corp.* (Real Estate Management & Development) | 448 | 2,692 | |||||||||
Redwire Corp.* (Aerospace & Defense) | 86 | 617 | |||||||||
Redwood Trust, Inc. (Mortgage REITs) | 503 | 3,264 | |||||||||
REGENXBIO, Inc.* (Biotechnology) | 176 | 2,059 | |||||||||
| Regional Management Corp. (Consumer Finance) | 31 | 891 | |||||||||
Regulus Therapeutics, Inc.* (Biotechnology) | 241 | 430 | |||||||||
Rekor Systems, Inc.* (Software) | 271 | 420 | |||||||||
Relay Therapeutics, Inc.* (Biotechnology) | 380 | 2,478 | |||||||||
Remitly Global, Inc.* (Financial Services) | 554 | 6,714 | |||||||||
Renasant Corp. (Banks) | 211 | 6,444 | |||||||||
Renovaro, Inc.* (Biotechnology) | 186 | 326 | |||||||||
Repay Holdings Corp.* (Financial Services) | 345 | 3,643 | |||||||||
Replimune Group, Inc.* (Biotechnology) | 192 | 1,728 | |||||||||
Common Stocks, continued
Shares | Value | ||||||||||
ReposiTrak, Inc. (Software) | 45 | $ | 688 | ||||||||
Republic Bancorp, Inc.—Class A (Banks) | 32 | 1,716 | |||||||||
Reservoir Media, Inc.* (Entertainment) | 74 | 585 | |||||||||
| Resideo Technologies, Inc.* (Building Products) | 557 | 10,895 | |||||||||
| Resources Connection, Inc. (Professional Services) | 123 | 1,358 | |||||||||
| Retail Opportunity Investments Corp. (Retail REITs) | 473 | 5,879 | |||||||||
REV Group, Inc. (Machinery) | 196 | 4,878 | |||||||||
Revance Therapeutics, Inc.* (Pharmaceuticals) | 397 | 1,020 | |||||||||
| REVOLUTION Medicines, Inc.* (Biotechnology) | 582 | 22,586 | |||||||||
Revolve Group, Inc.* (Specialty Retail) | 146 | 2,323 | |||||||||
| REX American Resources Corp.* (Oil, Gas & Consumable Fuels) | 59 | 2,690 | |||||||||
RGC Resources, Inc. (Gas Utilities) | 32 | 654 | |||||||||
| Rhythm Pharmaceuticals, Inc.* (Biotechnology) | 209 | 8,582 | |||||||||
| Ribbon Communications, Inc.* (Communications Equipment) | 346 | 1,138 | |||||||||
| Richardson Electronics, Ltd. (Electronic Equipment, Instruments & Components) | 47 | 559 | |||||||||
Rigel Pharmaceuticals, Inc.* (Biotechnology) | 67 | 547 | |||||||||
| Rigetti Computing, Inc.* (Semiconductors & Semiconductor Equipment) | 540 | 578 | |||||||||
| Riley Exploration Permian, Inc. (Oil, Gas & Consumable Fuels) | 43 | 1,217 | |||||||||
Rimini Street, Inc.* (Software) | 203 | 623 | |||||||||
| Ring Energy, Inc.* (Oil, Gas & Consumable Fuels) | 566 | 957 | |||||||||
Riot Platforms, Inc.* (Software) | 1,036 | 9,469 | |||||||||
RLJ Lodging Trust (Hotel & Resort REITs) | 582 | 5,605 | |||||||||
Roadzen, Inc.* (Software) | 58 | 129 | |||||||||
Rocket Lab USA, Inc.* (Aerospace & Defense) | 1,328 | 6,374 | |||||||||
Rocket Pharmaceuticals, Inc.* (Biotechnology) | 251 | 5,404 | |||||||||
| Rocky Brands, Inc. (Textiles, Apparel & Luxury Goods) | 28 | 1,035 | |||||||||
| Rogers Corp.* (Electronic Equipment, Instruments & Components) | 72 | 8,684 | |||||||||
Root, Inc.*—Class A (Insurance) | 33 | 1,703 | |||||||||
RPC, Inc. (Energy Equipment & Services) | 324 | 2,025 | |||||||||
RumbleON, Inc.*—Class B (Specialty Retail) | 61 | 250 | |||||||||
| Rush Enterprises, Inc.—Class A (Trading Companies & Distributors) | 232 | 9,714 | |||||||||
| Rush Enterprises, Inc.—Class B (Trading Companies & Distributors) | 34 | 1,334 | |||||||||
| Rush Street Interactive, Inc.* (Hotels, Restaurants & Leisure) | 290 | 2,781 | |||||||||
RXO, Inc.* (Ground Transportation) | 445 | 11,636 | |||||||||
| RxSight, Inc.* (Health Care Equipment & Supplies) | 130 | 7,822 | |||||||||
Ryerson Holding Corp. (Metals & Mining) | 111 | 2,165 | |||||||||
| Ryman Hospitality Properties, Inc. (Hotel & Resort REITs) | 224 | 22,368 | |||||||||
S&T Bancorp, Inc. (Banks) | 145 | 4,842 | |||||||||
| Sable Offshore Corp.* (Oil, Gas & Consumable Fuels) | 193 | 2,909 | |||||||||
| Sabra Health Care REIT, Inc. (Health Care REITs) | 883 | 13,597 | |||||||||
Sabre Corp.* (Hotels, Restaurants & Leisure) | 1,436 | 3,834 | |||||||||
See accompanying notes to the financial statements.
June 30, 2024 (unaudited) :: Schedule of Portfolio Investments :: ProFund VP UltraSmall-Cap :: 159
Common Stocks, continued
Shares | Value | ||||||||||
Safe Bulkers, Inc. (Marine Transportation) | 241 | $ | 1,403 | ||||||||
Safehold, Inc. (Specialized REITs) | 198 | 3,819 | |||||||||
Safety Insurance Group, Inc. (Insurance) | 56 | 4,202 | |||||||||
Sage Therapeutics, Inc.* (Biotechnology) | 206 | 2,237 | |||||||||
Sally Beauty Holdings, Inc.* (Specialty Retail) | 399 | 4,281 | |||||||||
Sana Biotechnology, Inc.* (Biotechnology) | 505 | 2,757 | |||||||||
| Sanara Medtech, Inc.* (Health Care Equipment & Supplies) | 15 | 423 | |||||||||
| SandRidge Energy, Inc. (Oil, Gas & Consumable Fuels) | 123 | 1,590 | |||||||||
Sandy Spring Bancorp, Inc. (Banks) | 168 | 4,092 | |||||||||
| Sanmina Corp.* (Electronic Equipment, Instruments & Components) | 209 | 13,846 | |||||||||
Sapiens International Corp. N.V. (Software) | 117 | 3,970 | |||||||||
Saul Centers, Inc. (Retail REITs) | 40 | 1,471 | |||||||||
Savara, Inc.* (Biotechnology) | 370 | 1,491 | |||||||||
Savers Value Village, Inc.* (Broadline Retail) | 89 | 1,089 | |||||||||
| ScanSource, Inc.* (Electronic Equipment, Instruments & Components) | 95 | 4,209 | |||||||||
Scholar Rock Holding Corp.* (Biotechnology) | 261 | 2,174 | |||||||||
Scholastic Corp. (Media) | 90 | 3,192 | |||||||||
Schrodinger, Inc.* (Health Care Technology) | 212 | 4,100 | |||||||||
Scilex Holding Co.* (Pharmaceuticals) | 279 | 538 | |||||||||
| Scorpio Tankers, Inc. (Oil, Gas & Consumable Fuels) | 179 | 14,551 | |||||||||
scPharmaceuticals, Inc.* (Pharmaceuticals) | 108 | 470 | |||||||||
Seacoast Banking Corp. of Florida (Banks) | 322 | 7,612 | |||||||||
| SEACOR Marine Holdings, Inc.* (Energy Equipment & Services) | 93 | 1,255 | |||||||||
Seadrill, Ltd.* (Energy Equipment & Services) | 284 | 14,626 | |||||||||
| Select Medical Holdings Corp. (Health Care Providers & Services) | 408 | 14,304 | |||||||||
| Select Water Solutions, Inc. (Energy Equipment & Services) | 348 | 3,724 | |||||||||
Selective Insurance Group, Inc. (Insurance) | 232 | 21,769 | |||||||||
Selectquote, Inc.* (Insurance) | 511 | 1,410 | |||||||||
| Semler Scientific, Inc.* (Health Care Equipment & Supplies) | 18 | 619 | |||||||||
SEMrush Holdings, Inc.*—Class A (Software) | 138 | 1,848 | |||||||||
| Semtech Corp.* (Semiconductors & Semiconductor Equipment) | 247 | 7,380 | |||||||||
| Seneca Foods Corp.*—Class A (Food Products) | 18 | 1,033 | |||||||||
Sensient Technologies Corp. (Chemicals) | 161 | 11,945 | |||||||||
| Sera Prognostics, Inc.*—Class A (Biotechnology) | 105 | 622 | |||||||||
| Service Properties Trust (Hotel & Resort REITs) | 630 | 3,238 | |||||||||
ServisFirst Bancshares, Inc. (Banks) | 194 | 12,259 | |||||||||
SES AI Corp.* (Electrical Equipment) | 497 | 621 | |||||||||
Seven Hills Realty Trust (Mortgage REITs) | 49 | 621 | |||||||||
Sezzle, Inc.* (Financial Services) | 9 | 794 | |||||||||
| SFL Corp., Ltd. (Oil, Gas & Consumable Fuels) | 430 | 5,968 | |||||||||
| Shake Shack, Inc.*—Class A (Hotels, Restaurants & Leisure) | 145 | 13,049 | |||||||||
Shattuck Labs, Inc.* (Biotechnology) | 149 | 575 | |||||||||
| Shenandoah Telecommunications Co. (Diversified Telecommunication Services) | 186 | 3,037 | |||||||||
| Shoals Technologies Group, Inc.*—Class A (Electrical Equipment) | 655 | 4,087 | |||||||||
Common Stocks, continued
Shares | Value | ||||||||||
Shoe Carnival, Inc. (Specialty Retail) | 68 | $ | 2,509 | ||||||||
Shore Bancshares, Inc. (Banks) | 117 | 1,340 | |||||||||
| Shutterstock, Inc. (Interactive Media & Services) | 95 | 3,677 | |||||||||
| SI-BONE, Inc.* (Health Care Equipment & Supplies) | 155 | 2,004 | |||||||||
Sierra Bancorp (Banks) | 50 | 1,119 | |||||||||
SIGA Technologies, Inc. (Pharmaceuticals) | 177 | 1,343 | |||||||||
| Sight Sciences, Inc.* (Health Care Equipment & Supplies) | 134 | 894 | |||||||||
Signet Jewelers, Ltd. (Specialty Retail) | 163 | 14,602 | |||||||||
| Silicon Laboratories, Inc.* (Semiconductors & Semiconductor Equipment) | 121 | 13,386 | |||||||||
| Silk Road Medical, Inc.* (Health Care Equipment & Supplies) | 150 | 4,056 | |||||||||
| SilverBow Resources, Inc.* (Oil, Gas & Consumable Fuels) | 82 | 3,102 | |||||||||
| Silvercrest Asset Management Group, Inc.—Class A (Capital Markets) | 36 | 561 | |||||||||
| Simmons First National Corp.—Class A (Banks) | 474 | 8,333 | |||||||||
| Simulations Plus, Inc. (Health Care Technology) | 61 | 2,966 | |||||||||
Sinclair, Inc. (Media) | 122 | 1,626 | |||||||||
SiriusPoint, Ltd.* (Insurance) | 376 | 4,587 | |||||||||
SITE Centers Corp. (Retail REITs) | 725 | 10,513 | |||||||||
| SiTime Corp.* (Semiconductors & Semiconductor Equipment) | 70 | 8,707 | |||||||||
| Sitio Royalties Corp.—Class A (Oil, Gas & Consumable Fuels) | 315 | 7,437 | |||||||||
| Six Flags Entertainment Corp. (Hotels, Restaurants & Leisure) | 279 | 9,246 | |||||||||
SJW Group (Water Utilities) | 124 | 6,723 | |||||||||
| Sky Harbour Group Corp.* (Transportation Infrastructure) | 43 | 398 | |||||||||
Skye Bioscience, Inc.* (Biotechnology) | 66 | 529 | |||||||||
| Skyline Champion Corp.* (Household Durables) | 205 | 13,889 | |||||||||
| Skyward Specialty Insurance Group, Inc.* (Insurance) | 142 | 5,138 | |||||||||
| SkyWater Technology, Inc.* (Semiconductors & Semiconductor Equipment) | 104 | 796 | |||||||||
SkyWest, Inc.* (Passenger Airlines) | 151 | 12,392 | |||||||||
SL Green Realty Corp. (Office REITs) | 254 | 14,386 | |||||||||
Sleep Number Corp.* (Specialty Retail) | 82 | 785 | |||||||||
SM Energy Co. (Oil, Gas & Consumable Fuels) | 437 | 18,892 | |||||||||
| SMART Global Holdings, Inc.* (Semiconductors & Semiconductor Equipment) | 196 | 4,483 | |||||||||
SmartFinancial, Inc. (Banks) | 61 | 1,444 | |||||||||
| SmartRent, Inc.* (Electronic Equipment, Instruments & Components) | 737 | 1,761 | |||||||||
| Smith & Wesson Brands, Inc. (Leisure Products) | 174 | 2,495 | |||||||||
| Smith-Midland Corp.* (Construction Materials) | 17 | 471 | |||||||||
| Solaris Oilfield Infrastructure, Inc.—Class A (Energy Equipment & Services) | 96 | 824 | |||||||||
| Solarmax Technology, Inc.* (Electrical Equipment) | 19 | 63 | |||||||||
See accompanying notes to the financial statements.
160 :: ProFund VP UltraSmall-Cap :: Schedule of Portfolio Investments :: June 30, 2024 (unaudited)
Common Stocks, continued
Shares | Value | ||||||||||
SolarWinds Corp. (Software) | 208 | $ | 2,506 | ||||||||
Soleno Therapeutics, Inc.* (Biotechnology) | 84 | 3,427 | |||||||||
Solid Biosciences, Inc.* (Biotechnology) | 86 | 488 | |||||||||
Solid Power, Inc.* (Automobile Components) | 595 | 982 | |||||||||
| Solidion Technology, Inc.* (Electrical Equipment) | 34 | 19 | |||||||||
Solo Brands, Inc.*—Class A (Leisure Products) | 62 | 141 | |||||||||
| Sonic Automotive, Inc.—Class A (Specialty Retail) | 56 | 3,050 | |||||||||
| Sonida Senior Living, Inc.* (Health Care Providers & Services) | 13 | 358 | |||||||||
Sonos, Inc.* (Household Durables) | 470 | 6,937 | |||||||||
SoundHound AI, Inc.*—Class A (Software) | 1,083 | 4,278 | |||||||||
SoundThinking, Inc.* (Software) | 38 | 463 | |||||||||
South Plains Financial, Inc. (Banks) | 45 | 1,215 | |||||||||
Southern California BanCorp* (Banks) | 46 | 620 | |||||||||
Southern First Bancshares, Inc.* (Banks) | 29 | 848 | |||||||||
Southern Missouri Bancorp, Inc. (Banks) | 36 | 1,620 | |||||||||
Southern States Bancshares, Inc. (Banks) | 32 | 868 | |||||||||
| Southland Holdings, Inc.* (Construction & Engineering) | 38 | 174 | |||||||||
Southside Bancshares, Inc. (Banks) | 110 | 3,037 | |||||||||
SouthState Corp. (Banks) | 290 | 22,161 | |||||||||
Southwest Gas Holdings, Inc. (Gas Utilities) | 232 | 16,328 | |||||||||
| SpartanNash Co. (Consumer Staples Distribution & Retail) | 131 | 2,458 | |||||||||
Sphere Entertainment Co.* (Entertainment) | 101 | 3,541 | |||||||||
Spire Global, Inc.* (Professional Services) | 85 | 921 | |||||||||
Spire, Inc. (Gas Utilities) | 206 | 12,510 | |||||||||
Spirit Airlines, Inc.(a) (Passenger Airlines) | 419 | 1,534 | |||||||||
| Spok Holdings, Inc. (Wireless Telecommunication Services) | 70 | 1,037 | |||||||||
| SpringWorks Therapeutics, Inc.* (Biotechnology) | 262 | 9,870 | |||||||||
Sprinklr, Inc.*—Class A (Software) | 392 | 3,771 | |||||||||
Sprout Social, Inc.*—Class A (Software) | 189 | 6,744 | |||||||||
| Sprouts Farmers Market, Inc.* (Consumer Staples Distribution & Retail) | 385 | 32,208 | |||||||||
SPS Commerce, Inc.* (Software) | 142 | 26,720 | |||||||||
SPX Technologies, Inc.* (Machinery) | 172 | 24,449 | |||||||||
Spyre Therapeutics, Inc.* (Biotechnology) | 132 | 3,103 | |||||||||
Squarespace, Inc.*—Class A (IT Services) | 232 | 10,123 | |||||||||
SSR Mining, Inc. (Metals & Mining) | 775 | 3,495 | |||||||||
| STAAR Surgical Co.* (Health Care Equipment & Supplies) | 189 | 8,998 | |||||||||
Stagwell, Inc.* (Media) | 346 | 2,360 | |||||||||
| Standard BioTools, Inc.* (Life Sciences Tools & Services) | 1,152 | 2,039 | |||||||||
| Standard Motor Products, Inc. (Automobile Components) | 83 | 2,302 | |||||||||
Standex International Corp. (Machinery) | 44 | 7,091 | |||||||||
Star Holdings* (Diversified REITs) | 49 | 591 | |||||||||
| Steelcase, Inc.—Class A (Commercial Services & Supplies) | 353 | 4,575 | |||||||||
Stellar Bancorp, Inc. (Banks) | 188 | 4,316 | |||||||||
Stem, Inc.* (Electrical Equipment) | 579 | 643 | |||||||||
Stepan Co. (Chemicals) | 82 | 6,885 | |||||||||
| StepStone Group, Inc.—Class A (Capital Markets) | 204 | 9,362 | |||||||||
| Stereotaxis, Inc.* (Health Care Equipment & Supplies) | 209 | 380 | |||||||||
Common Stocks, continued
Shares | Value | ||||||||||
Sterling Bancorp, Inc.* (Banks) | 81 | $ | 424 | ||||||||
Sterling Check Corp.* (Professional Services) | 126 | 1,865 | |||||||||
| Sterling Infrastructure, Inc.* (Construction & Engineering) | 115 | 13,609 | |||||||||
| Steven Madden, Ltd. (Textiles, Apparel & Luxury Goods) | 277 | 11,716 | |||||||||
Stewart Information Services Corp. (Insurance) | 103 | 6,394 | |||||||||
Stitch Fix, Inc.*—Class A (Specialty Retail) | 343 | 1,423 | |||||||||
Stock Yards Bancorp, Inc. (Banks) | 98 | 4,868 | |||||||||
Stoke Therapeutics, Inc.* (Biotechnology) | 136 | 1,837 | |||||||||
StoneCo, Ltd.*—Class A (Financial Services) | 1,093 | 13,105 | |||||||||
Stoneridge, Inc.* (Automobile Components) | 104 | 1,660 | |||||||||
StoneX Group, Inc.* (Capital Markets) | 105 | 7,908 | |||||||||
| Strategic Education, Inc. (Diversified Consumer Services) | 85 | 9,406 | |||||||||
| Stratus Properties, Inc.* (Real Estate Management & Development) | 21 | 530 | |||||||||
| Strawberry Fields REIT, Inc. (Health Care REITs) | 22 | 251 | |||||||||
Stride, Inc.* (Diversified Consumer Services) | 163 | 11,491 | |||||||||
Sturm Ruger & Co., Inc. (Leisure Products) | 65 | 2,707 | |||||||||
| Summit Hotel Properties, Inc. (Hotel & Resort REITs) | 401 | 2,402 | |||||||||
| Summit Materials, Inc.*—Class A (Construction Materials) | 462 | 16,914 | |||||||||
Summit Therapeutics, Inc.*(a) (Biotechnology) | 334 | 2,605 | |||||||||
| Sun Country Airlines Holdings, Inc.* (Passenger Airlines) | 151 | 1,897 | |||||||||
SunCoke Energy, Inc. (Metals & Mining) | 320 | 3,136 | |||||||||
| Sunnova Energy International, Inc.* (Independent Power and Renewable Electricity Producers) | 415 | 2,316 | |||||||||
SunOpta, Inc.* (Food Products) | 350 | 1,890 | |||||||||
SunPower Corp.*(a) (Electrical Equipment) | 335 | 992 | |||||||||
Sunrun, Inc.* (Electrical Equipment) | 834 | 9,891 | |||||||||
| Sunstone Hotel Investors, Inc. (Hotel & Resort REITs) | 776 | 8,117 | |||||||||
| Super Group SGHC, Ltd.* (Hotels, Restaurants & Leisure) | 572 | 1,848 | |||||||||
| Superior Group of Cos., Inc. (Textiles, Apparel & Luxury Goods) | 50 | 946 | |||||||||
| Supernus Pharmaceuticals, Inc.* (Pharmaceuticals) | 192 | 5,136 | |||||||||
| Surgery Partners, Inc.* (Health Care Providers & Services) | 293 | 6,970 | |||||||||
| Surmodics, Inc.* (Health Care Equipment & Supplies) | 53 | 2,228 | |||||||||
Sutro Biopharma, Inc.* (Biotechnology) | 312 | 914 | |||||||||
| Sweetgreen, Inc.*—Class A (Hotels, Restaurants & Leisure) | 377 | 11,363 | |||||||||
SWK Holdings Corp.* (Financial Services) | 13 | 221 | |||||||||
Sylvamo Corp. (Paper & Forest Products) | 134 | 9,193 | |||||||||
| Synaptics, Inc.* (Semiconductors & Semiconductor Equipment) | 149 | 13,142 | |||||||||
Syndax Pharmaceuticals, Inc.* (Biotechnology) | 314 | 6,446 | |||||||||
System1, Inc.* (Interactive Media & Services) | 89 | 135 | |||||||||
| Tactile Systems Technology, Inc.* (Health Care Equipment & Supplies) | 90 | 1,075 | |||||||||
| Talkspace, Inc.* (Health Care Providers & Services) | 469 | 1,079 | |||||||||
See accompanying notes to the financial statements.
June 30, 2024 (unaudited) :: Schedule of Portfolio Investments :: ProFund VP UltraSmall-Cap :: 161
Common Stocks, continued
Shares | Value | ||||||||||
| Talos Energy, Inc.* (Oil, Gas & Consumable Fuels) | 565 | $ | 6,865 | ||||||||
| Tandem Diabetes Care, Inc.* (Health Care Equipment & Supplies) | 247 | 9,952 | |||||||||
Tanger, Inc. (Retail REITs) | 406 | 11,007 | |||||||||
Tango Therapeutics, Inc.* (Biotechnology) | 182 | 1,562 | |||||||||
| Target Hospitality Corp.* (Hotels, Restaurants & Leisure) | 126 | 1,097 | |||||||||
| Tarsus Pharmaceuticals, Inc.* (Pharmaceuticals) | 140 | 3,805 | |||||||||
Taylor Devices, Inc.* (Machinery) | 9 | 405 | |||||||||
| Taylor Morrison Home Corp.* (Household Durables) | 396 | 21,955 | |||||||||
Taysha Gene Therapies, Inc.* (Biotechnology) | 611 | 1,369 | |||||||||
TechTarget, Inc.* (Media) | 99 | 3,086 | |||||||||
Tecnoglass, Inc. (Building Products) | 86 | 4,315 | |||||||||
Teekay Corp.* (Oil, Gas & Consumable Fuels) | 218 | 1,955 | |||||||||
| Teekay Tankers, Ltd.—Class A (Oil, Gas & Consumable Fuels) | 92 | 6,331 | |||||||||
TEGNA, Inc. (Media) | 673 | 9,382 | |||||||||
| Tejon Ranch Co.* (Real Estate Management & Development) | 80 | 1,365 | |||||||||
Teladoc Health, Inc.* (Health Care Technology) | 650 | 6,357 | |||||||||
| Telephone and Data Systems, Inc. (Wireless Telecommunication Services) | 376 | 7,794 | |||||||||
| Telomir Pharmaceuticals, Inc.* (Pharmaceuticals) | 18 | 87 | |||||||||
Telos Corp.* (Software) | 215 | 864 | |||||||||
Tenable Holdings, Inc.* (Software) | 450 | 19,611 | |||||||||
Tenaya Therapeutics, Inc.* (Biotechnology) | 211 | 654 | |||||||||
Tennant Co. (Machinery) | 72 | 7,088 | |||||||||
Terawulf, Inc.* (Software) | 878 | 3,907 | |||||||||
Terex Corp. (Machinery) | 254 | 13,929 | |||||||||
Terns Pharmaceuticals, Inc.* (Pharmaceuticals) | 220 | 1,498 | |||||||||
Terran Orbital Corp.* (Aerospace & Defense) | 588 | 482 | |||||||||
Terreno Realty Corp. (Industrial REITs) | 365 | 21,601 | |||||||||
| TETRA Technologies, Inc.* (Energy Equipment & Services) | 479 | 1,657 | |||||||||
Tevogen Bio Holdings, Inc.* (Biotechnology) | 84 | 61 | |||||||||
Texas Capital Bancshares, Inc.* (Banks) | 177 | 10,822 | |||||||||
TG Therapeutics, Inc.* (Biotechnology) | 533 | 9,482 | |||||||||
The Aaron's Co., Inc. (Specialty Retail) | 118 | 1,178 | |||||||||
| The Andersons, Inc. (Consumer Staples Distribution & Retail) | 125 | 6,200 | |||||||||
| The Baldwin Insurance Group, Inc.* (Insurance) | 251 | 8,903 | |||||||||
The Bancorp, Inc.* (Banks) | 191 | 7,212 | |||||||||
| The Bank of NT Butterfield & Son, Ltd. (Banks) | 178 | 6,251 | |||||||||
| The Beauty Health Co.* (Personal Care Products) | 284 | 545 | |||||||||
| The Brink's Co. (Commercial Services & Supplies) | 172 | 17,612 | |||||||||
The Buckle, Inc. (Specialty Retail) | 118 | 4,359 | |||||||||
| The Cheesecake Factory, Inc. (Hotels, Restaurants & Leisure) | 184 | 7,229 | |||||||||
| The Chefs' Warehouse, Inc.* (Consumer Staples Distribution & Retail) | 134 | 5,241 | |||||||||
The Duckhorn Portfolio, Inc.* (Beverages) | 203 | 1,441 | |||||||||
The E.W. Scripps Co.*—Class A (Media) | 231 | 725 | |||||||||
Common Stocks, continued
Shares | Value | ||||||||||
The Eastern Co. (Machinery) | 20 | $ | 509 | ||||||||
| The Ensign Group, Inc. (Health Care Providers & Services) | 212 | 26,222 | |||||||||
The First Bancorp, Inc. (Banks) | 41 | 1,019 | |||||||||
The First Bancshares, Inc. (Banks) | 117 | 3,040 | |||||||||
The First of Long Island Corp. (Banks) | 82 | 822 | |||||||||
| The GEO Group, Inc.* (Commercial Services & Supplies) | 474 | 6,807 | |||||||||
| The Goodyear Tire & Rubber Co.* (Automobile Components) | 1,088 | 12,349 | |||||||||
The Gorman-Rupp Co. (Machinery) | 80 | 2,937 | |||||||||
The Greenbrier Cos., Inc. (Machinery) | 117 | 5,797 | |||||||||
The Hackett Group, Inc. (IT Services) | 97 | 2,107 | |||||||||
| The Hain Celestial Group, Inc.* (Food Products) | 342 | 2,363 | |||||||||
| The Honest Co., Inc.* (Personal Care Products) | 306 | 894 | |||||||||
| The Joint Corp.* (Health Care Providers & Services) | 42 | 591 | |||||||||
The Lovesac Co.* (Household Durables) | 54 | 1,219 | |||||||||
The Macerich Co. (Retail REITs) | 827 | 12,769 | |||||||||
The Manitowoc Co., Inc.* (Machinery) | 133 | 1,533 | |||||||||
The Marcus Corp. (Entertainment) | 92 | 1,046 | |||||||||
The ODP Corp.* (Specialty Retail) | 136 | 5,341 | |||||||||
| The ONE Group Hospitality, Inc.* (Hotels, Restaurants & Leisure) | 79 | 336 | |||||||||
| The Pennant Group, Inc.* (Health Care Providers & Services) | 110 | 2,551 | |||||||||
| The Real Brokerage, Inc.* (Real Estate Management & Development) | 363 | 1,474 | |||||||||
The RealReal, Inc.* (Specialty Retail) | 374 | 1,193 | |||||||||
| The RMR Group, Inc.—Class A (Real Estate Management & Development) | 59 | 1,333 | |||||||||
The Shyft Group, Inc. (Machinery) | 129 | 1,530 | |||||||||
The Simply Good Foods Co.* (Food Products) | 348 | 12,573 | |||||||||
| The St. Joe Co. (Real Estate Management & Development) | 138 | 7,549 | |||||||||
The Vita Coco Co., Inc.* (Beverages) | 150 | 4,178 | |||||||||
The York Water Co. (Water Utilities) | 55 | 2,040 | |||||||||
Theravance Biopharma, Inc.* (Pharmaceuticals) | 140 | 1,187 | |||||||||
| Thermon Group Holdings, Inc.* (Electrical Equipment) | 127 | 3,907 | |||||||||
Third Coast Bancshares, Inc.* (Banks) | 43 | 915 | |||||||||
Third Harmonic Bio, Inc.* (Pharmaceuticals) | 76 | 988 | |||||||||
Thoughtworks Holding, Inc.* (IT Services) | 382 | 1,085 | |||||||||
ThredUp, Inc.*—Class A (Specialty Retail) | 300 | 510 | |||||||||
Thryv Holdings, Inc.* (Media) | 121 | 2,156 | |||||||||
| Tidewater, Inc.* (Energy Equipment & Services) | 186 | 17,708 | |||||||||
Tile Shop Holdings, Inc.* (Specialty Retail) | 109 | 755 | |||||||||
Tilly's, Inc.*—Class A (Specialty Retail) | 57 | 344 | |||||||||
Timberland Bancorp, Inc. (Banks) | 29 | 786 | |||||||||
Tiptree, Inc. (Insurance) | 96 | 1,583 | |||||||||
Titan International, Inc.* (Machinery) | 190 | 1,408 | |||||||||
| Titan Machinery, Inc.* (Trading Companies & Distributors) | 79 | 1,256 | |||||||||
Tompkins Financial Corp. (Banks) | 49 | 2,396 | |||||||||
| Topgolf Callaway Brands Corp.* (Leisure Products) | 541 | 8,277 | |||||||||
Torrid Holdings, Inc.*(a) (Specialty Retail) | 47 | 352 | |||||||||
Tourmaline Bio, Inc.* (Biotechnology) | 88 | 1,132 | |||||||||
See accompanying notes to the financial statements.
162 :: ProFund VP UltraSmall-Cap :: Schedule of Portfolio Investments :: June 30, 2024 (unaudited)
Common Stocks, continued
Shares | Value | ||||||||||
Towne Bank (Banks) | 268 | $ | 7,308 | ||||||||
Townsquare Media, Inc.—Class A (Media) | 50 | 548 | |||||||||
TPG RE Finance Trust, Inc. (Mortgage REITs) | 219 | 1,892 | |||||||||
TPI Composites, Inc.* (Electrical Equipment) | 176 | 702 | |||||||||
Traeger, Inc.* (Household Durables) | 131 | 314 | |||||||||
| Transcat, Inc.* (Trading Companies & Distributors) | 33 | 3,949 | |||||||||
| Transcontinental Realty Investors, Inc.* (Real Estate Management & Development) | 5 | 139 | |||||||||
| TransMedics Group, Inc.* (Health Care Equipment & Supplies) | 123 | 18,526 | |||||||||
| Transocean, Ltd.* (Energy Equipment & Services) | 2,784 | 14,894 | |||||||||
Travere Therapeutics, Inc.* (Biotechnology) | 281 | 2,310 | |||||||||
| Treace Medical Concepts, Inc.* (Health Care Equipment & Supplies) | 186 | 1,237 | |||||||||
Tredegar Corp.* (Metals & Mining) | 102 | 489 | |||||||||
TreeHouse Foods, Inc.* (Food Products) | 187 | 6,852 | |||||||||
Trevi Therapeutics, Inc.* (Pharmaceuticals) | 224 | 668 | |||||||||
Tri Pointe Homes, Inc.* (Household Durables) | 357 | 13,298 | |||||||||
TriCo Bancshares (Banks) | 122 | 4,828 | |||||||||
TriMas Corp. (Containers & Packaging) | 155 | 3,962 | |||||||||
TriNet Group, Inc. (Professional Services) | 124 | 12,400 | |||||||||
Trinity Industries, Inc. (Machinery) | 312 | 9,335 | |||||||||
Triumph Financial, Inc.* (Banks) | 84 | 6,867 | |||||||||
Triumph Group, Inc.* (Aerospace & Defense) | 246 | 3,791 | |||||||||
Tronox Holdings PLC (Chemicals) | 453 | 7,108 | |||||||||
TrueBlue, Inc.* (Professional Services) | 117 | 1,205 | |||||||||
TrueCar, Inc.* (Interactive Media & Services) | 327 | 1,024 | |||||||||
Trupanion, Inc.*(a) (Insurance) | 126 | 3,704 | |||||||||
TrustCo Bank Corp. (Banks) | 71 | 2,043 | |||||||||
Trustmark Corp. (Banks) | 232 | 6,969 | |||||||||
Tscan Therapeutics, Inc.* (Biotechnology) | 147 | 860 | |||||||||
TTEC Holdings, Inc. (Professional Services) | 75 | 441 | |||||||||
| TTM Technologies, Inc.* (Electronic Equipment, Instruments & Components) | 385 | 7,481 | |||||||||
Tucows, Inc.*—Class A (IT Services) | 30 | 580 | |||||||||
Turning Point Brands, Inc. (Tobacco) | 65 | 2,086 | |||||||||
| Turtle Beach Corp.* (Technology Hardware, Storage & Peripherals) | 65 | 932 | |||||||||
| Tutor Perini Corp.* (Construction & Engineering) | 165 | 3,594 | |||||||||
Twin Disc, Inc. (Machinery) | 43 | 507 | |||||||||
Twist Bioscience Corp.* (Biotechnology) | 220 | 10,842 | |||||||||
| Two Harbors Investment Corp. (Mortgage REITs) | 396 | 5,231 | |||||||||
Tyra Biosciences, Inc.* (Biotechnology) | 78 | 1,247 | |||||||||
| U.S. Physical Therapy, Inc. (Health Care Providers & Services) | 57 | 5,268 | |||||||||
| U.S. Silica Holdings, Inc.* (Energy Equipment & Services) | 290 | 4,481 | |||||||||
| Udemy, Inc.* (Diversified Consumer Services) | 365 | 3,150 | |||||||||
UFP Industries, Inc. (Building Products) | 231 | 25,873 | |||||||||
| UFP Technologies, Inc.* (Health Care Equipment & Supplies) | 28 | 7,388 | |||||||||
| Ultra Clean Holdings, Inc.* (Semiconductors & Semiconductor Equipment) | 169 | 8,281 | |||||||||
Ultralife Corp.* (Electrical Equipment) | 38 | 404 | |||||||||
UMB Financial Corp. (Banks) | 171 | 14,265 | |||||||||
UMH Properties, Inc. (Residential REITs) | 244 | 3,902 | |||||||||
Common Stocks, continued
Shares | Value | ||||||||||
| UniFirst Corp. (Commercial Services & Supplies) | 57 | $ | 9,777 | ||||||||
Unisys Corp.* (IT Services) | 251 | 1,037 | |||||||||
United Bankshares, Inc. (Banks) | 505 | 16,381 | |||||||||
United Community Banks, Inc. (Banks) | 457 | 11,635 | |||||||||
United Fire Group, Inc. (Insurance) | 80 | 1,719 | |||||||||
| United Homes Group, Inc.* (Household Durables) | 20 | 114 | |||||||||
| United Natural Foods, Inc.* (Consumer Staples Distribution & Retail) | 224 | 2,934 | |||||||||
| United Parks & Resorts, Inc.* (Hotels, Restaurants & Leisure) | 136 | 7,386 | |||||||||
| United States Lime & Minerals, Inc. (Construction Materials) | 8 | 2,913 | |||||||||
Uniti Group, Inc. (Specialized REITs) | 913 | 2,666 | |||||||||
Unitil Corp. (Multi-Utilities) | 61 | 3,159 | |||||||||
Unity Bancorp, Inc. (Banks) | 27 | 798 | |||||||||
Universal Corp. (Tobacco) | 92 | 4,433 | |||||||||
| Universal Health Realty Income Trust (Health Care REITs) | 49 | 1,918 | |||||||||
Universal Insurance Holdings, Inc. (Insurance) | 91 | 1,707 | |||||||||
| Universal Logistics Holdings, Inc. (Ground Transportation) | 26 | 1,055 | |||||||||
| Universal Stainless & Alloy Products, Inc.* (Metals & Mining) | 33 | 904 | |||||||||
| Universal Technical Institute, Inc.* (Diversified Consumer Services) | 151 | 2,375 | |||||||||
Univest Financial Corp. (Banks) | 110 | 2,511 | |||||||||
Upbound Group, Inc. (Specialty Retail) | 205 | 6,294 | |||||||||
Upstart Holdings, Inc.* (Consumer Finance) | 294 | 6,935 | |||||||||
Upwork, Inc.* (Professional Services) | 475 | 5,106 | |||||||||
| Uranium Energy Corp.* (Oil, Gas & Consumable Fuels) | 1,501 | 9,021 | |||||||||
Urban Edge Properties (Retail REITs) | 457 | 8,441 | |||||||||
Urban Outfitters, Inc.* (Specialty Retail) | 245 | 10,057 | |||||||||
| Ur-Energy, Inc.* (Oil, Gas & Consumable Fuels) | 1,050 | 1,470 | |||||||||
UroGen Pharma, Ltd.* (Biotechnology) | 131 | 2,198 | |||||||||
| USANA Health Sciences, Inc.* (Personal Care Products) | 44 | 1,991 | |||||||||
USCB Financial Holdings, Inc. (Banks) | 40 | 513 | |||||||||
| Utah Medical Products, Inc. (Health Care Equipment & Supplies) | 13 | 869 | |||||||||
Utz Brands, Inc. (Food Products) | 248 | 4,127 | |||||||||
V2X, Inc.* (Aerospace & Defense) | 47 | 2,254 | |||||||||
| VAALCO Energy, Inc. (Oil, Gas & Consumable Fuels) | 398 | 2,495 | |||||||||
| Vacasa, Inc.*—Class A (Hotels, Restaurants & Leisure) | 36 | 175 | |||||||||
Valaris, Ltd.* (Energy Equipment & Services) | 240 | 17,879 | |||||||||
Valhi, Inc. (Chemicals) | 9 | 160 | |||||||||
Valley National Bancorp (Banks) | 1,647 | 11,496 | |||||||||
Value Line, Inc. (Capital Markets) | 3 | 129 | |||||||||
Vanda Pharmaceuticals, Inc.* (Biotechnology) | 218 | 1,232 | |||||||||
| Varex Imaging Corp.* (Health Care Equipment & Supplies) | 148 | 2,180 | |||||||||
Varonis Systems, Inc.* (Software) | 421 | 20,195 | |||||||||
Vaxcyte, Inc.* (Biotechnology) | 417 | 31,487 | |||||||||
Vector Group, Ltd. (Tobacco) | 561 | 5,930 | |||||||||
| Veeco Instruments, Inc.* (Semiconductors & Semiconductor Equipment) | 212 | 9,903 | |||||||||
See accompanying notes to the financial statements.
June 30, 2024 (unaudited) :: Schedule of Portfolio Investments :: ProFund VP UltraSmall-Cap :: 163
Common Stocks, continued
Shares | Value | ||||||||||
Velo3d, Inc.* (Machinery) | 1 | $ | 3 | ||||||||
Velocity Financial, Inc.* (Financial Services) | 34 | 610 | |||||||||
Ventyx Biosciences, Inc.* (Pharmaceuticals) | 232 | 536 | |||||||||
| Vera Bradley, Inc.* (Textiles, Apparel & Luxury Goods) | 102 | 639 | |||||||||
Vera Therapeutics, Inc.* (Biotechnology) | 149 | 5,391 | |||||||||
Veracyte, Inc.* (Biotechnology) | 293 | 6,349 | |||||||||
Verastem, Inc.* (Biotechnology) | 97 | 289 | |||||||||
| Verde Clean Fuels, Inc.* (Oil, Gas & Consumable Fuels) | 13 | 54 | |||||||||
Vericel Corp.* (Biotechnology) | 185 | 8,488 | |||||||||
Verint Systems, Inc.* (Software) | 236 | 7,599 | |||||||||
Veris Residential, Inc. (Residential REITs) | 300 | 4,500 | |||||||||
Veritex Holdings, Inc. (Banks) | 200 | 4,218 | |||||||||
Verra Mobility Corp.* (Professional Services) | 636 | 17,299 | |||||||||
| Verrica Pharmaceuticals, Inc.* (Pharmaceuticals) | 72 | 525 | |||||||||
Vertex, Inc.*—Class A (Software) | 207 | 7,462 | |||||||||
Veru, Inc.* (Personal Care Products) | 504 | 424 | |||||||||
Verve Therapeutics, Inc.* (Biotechnology) | 271 | 1,322 | |||||||||
Viad Corp.* (Commercial Services & Supplies) | 78 | 2,652 | |||||||||
Viant Technology, Inc.*—Class A (Software) | 59 | 582 | |||||||||
Viasat, Inc.* (Communications Equipment) | 463 | 5,880 | |||||||||
| Viavi Solutions, Inc.* (Communications Equipment) | 840 | 5,771 | |||||||||
Vicor Corp.* (Electrical Equipment) | 86 | 2,852 | |||||||||
Victoria's Secret & Co.* (Specialty Retail) | 300 | 5,301 | |||||||||
| Victory Capital Holdings, Inc.—Class A (Capital Markets) | 157 | 7,494 | |||||||||
| Viemed Healthcare, Inc.* (Health Care Providers & Services) | 131 | 858 | |||||||||
| Village Super Market, Inc.—Class A (Consumer Staples Distribution & Retail) | 33 | 872 | |||||||||
Vimeo, Inc.* (Interactive Media & Services) | 565 | 2,107 | |||||||||
Vir Biotechnology, Inc.* (Biotechnology) | 342 | 3,044 | |||||||||
| Virco Mfg. Corp. (Commercial Services & Supplies) | 40 | 558 | |||||||||
| Virgin Galactic Holdings, Inc.* (Aerospace & Defense) | 72 | 611 | |||||||||
Virginia National Bankshares Corp. (Banks) | 18 | 590 | |||||||||
Viridian Therapeutics, Inc.* (Biotechnology) | 239 | 3,109 | |||||||||
Virtra, Inc.* (Aerospace & Defense) | 40 | 308 | |||||||||
| Virtus Investment Partners, Inc. (Capital Markets) | 26 | 5,872 | |||||||||
| Vishay Intertechnology, Inc. (Electronic Equipment, Instruments & Components) | 482 | 10,749 | |||||||||
| Vishay Precision Group, Inc.* (Electronic Equipment, Instruments & Components) | 46 | 1,400 | |||||||||
Vista Outdoor, Inc.* (Leisure Products) | 223 | 8,396 | |||||||||
Visteon Corp.* (Automobile Components) | 104 | 11,097 | |||||||||
| Vital Energy, Inc.* (Oil, Gas & Consumable Fuels) | 109 | 4,885 | |||||||||
Vital Farms, Inc.* (Food Products) | 124 | 5,799 | |||||||||
| Vitesse Energy, Inc. (Oil, Gas & Consumable Fuels) | 95 | 2,252 | |||||||||
Vivid Seats, Inc.*—Class A (Entertainment) | 298 | 1,714 | |||||||||
| Vizio Holding Corp.*—Class A (Household Durables) | 339 | 3,661 | |||||||||
Voyager Therapeutics, Inc.* (Biotechnology) | 176 | 1,392 | |||||||||
VSE Corp. (Commercial Services & Supplies) | 52 | 4,591 | |||||||||
Common Stocks, continued
Shares | Value | ||||||||||
| W&T Offshore, Inc. (Oil, Gas & Consumable Fuels) | 376 | $ | 805 | ||||||||
Wabash National Corp. (Machinery) | 170 | 3,713 | |||||||||
WaFd, Inc. (Banks) | 255 | 7,288 | |||||||||
| Waldencast PLC*—Class A (Personal Care Products) | 93 | 334 | |||||||||
Walker & Dunlop, Inc. (Financial Services) | 123 | 12,079 | |||||||||
Warby Parker, Inc.*—Class A (Specialty Retail) | 333 | 5,348 | |||||||||
Warrior Met Coal, Inc. (Metals & Mining) | 198 | 12,428 | |||||||||
Washington Trust Bancorp, Inc. (Banks) | 65 | 1,782 | |||||||||
Waterstone Financial, Inc. (Financial Services) | 63 | 806 | |||||||||
| Watts Water Technologies, Inc.—Class A (Machinery) | 105 | 19,254 | |||||||||
WaVe Life Sciences, Ltd.* (Pharmaceuticals) | 296 | 1,477 | |||||||||
WD-40 Co. (Household Products) | 52 | 11,420 | |||||||||
Weave Communications, Inc.* (Software) | 149 | 1,344 | |||||||||
| Weis Markets, Inc. (Consumer Staples Distribution & Retail) | 63 | 3,955 | |||||||||
Werewolf Therapeutics, Inc.* (Biotechnology) | 116 | 283 | |||||||||
| Werner Enterprises, Inc. (Ground Transportation) | 242 | 8,671 | |||||||||
WesBanco, Inc. (Banks) | 220 | 6,140 | |||||||||
West Bancorp, Inc. (Banks) | 62 | 1,110 | |||||||||
Westamerica Bancorp (Banks) | 98 | 4,756 | |||||||||
Westrock Coffee Co.* (Food Products) | 129 | 1,320 | |||||||||
Weyco Group, Inc. (Distributors) | 23 | 697 | |||||||||
| Wheels Up Experience, Inc.* (Passenger Airlines) | 342 | 646 | |||||||||
Whitestone REIT (Retail REITs) | 187 | 2,489 | |||||||||
Whole Earth Brands, Inc.* (Food Products) | 124 | 603 | |||||||||
WideOpenWest, Inc.* (Media) | 188 | 1,017 | |||||||||
Willdan Group, Inc.* (Professional Services) | 48 | 1,385 | |||||||||
| Willis Lease Finance Corp. (Trading Companies & Distributors) | 12 | 832 | |||||||||
Winmark Corp. (Specialty Retail) | 11 | 3,879 | |||||||||
Winnebago Industries, Inc. (Automobiles) | 109 | 5,907 | |||||||||
WisdomTree, Inc. (Capital Markets) | 533 | 5,282 | |||||||||
WK Kellogg Co. (Food Products) | 250 | 4,115 | |||||||||
WM Technology, Inc.* (Software) | 319 | 332 | |||||||||
Wns Holdings, Ltd.* (Professional Services) | 177 | 9,293 | |||||||||
| Wolverine World Wide, Inc. (Textiles, Apparel & Luxury Goods) | 303 | 4,097 | |||||||||
Workiva, Inc.* (Software) | 193 | 14,087 | |||||||||
World Acceptance Corp.* (Consumer Finance) | 14 | 1,730 | |||||||||
| World Kinect Corp. (Oil, Gas & Consumable Fuels) | 225 | 5,805 | |||||||||
| Worthington Enterprises, Inc. (Household Durables) | 120 | 5,680 | |||||||||
Worthington Steel, Inc. (Metals & Mining) | 124 | 4,137 | |||||||||
WSFS Financial Corp. (Banks) | 229 | 10,763 | |||||||||
X4 Pharmaceuticals, Inc.* (Biotechnology) | 641 | 372 | |||||||||
XBiotech, Inc.* (Biotechnology) | 71 | 365 | |||||||||
Xencor, Inc.* (Biotechnology) | 227 | 4,297 | |||||||||
| Xenia Hotels & Resorts, Inc. (Hotel & Resort REITs) | 389 | 5,574 | |||||||||
| Xeris Biopharma Holdings, Inc.* (Pharmaceuticals) | 536 | 1,206 | |||||||||
| Xerox Holdings Corp. (Technology Hardware, Storage & Peripherals) | 444 | 5,159 | |||||||||
XOMA Corp.* (Biotechnology) | 31 | 734 | |||||||||
See accompanying notes to the financial statements.
164 :: ProFund VP UltraSmall-Cap :: Schedule of Portfolio Investments :: June 30, 2024 (unaudited)
Common Stocks, continued
Shares | Value | ||||||||||
| Xometry, Inc.*—Class A (Trading Companies & Distributors) | 161 | $ | 1,861 | ||||||||
XPEL, Inc.* (Automobile Components) | 96 | 3,414 | |||||||||
Xperi, Inc.* (Software) | 172 | 1,412 | |||||||||
| Xponential Fitness, Inc.*—Class A (Hotels, Restaurants & Leisure) | 91 | 1,420 | |||||||||
Yelp, Inc.* (Interactive Media & Services) | 250 | 9,237 | |||||||||
Yext, Inc.* (Software) | 400 | 2,140 | |||||||||
Y-mAbs Therapeutics, Inc.* (Biotechnology) | 140 | 1,691 | |||||||||
Zentalis Pharmaceuticals, Inc.* (Biotechnology) | 218 | 892 | |||||||||
| Zeta Global Holdings Corp.*—Class A (Software) | 628 | 11,084 | |||||||||
Zevra Therapeutics, Inc.* (Pharmaceuticals) | 161 | 789 | |||||||||
Ziff Davis, Inc.* (Interactive Media & Services) | 174 | 9,578 | |||||||||
| Zimvie, Inc.* (Health Care Equipment & Supplies) | 103 | 1,880 | |||||||||
| ZipRecruiter, Inc.* (Interactive Media & Services) | 274 | 2,491 | |||||||||
Zumiez, Inc.* (Specialty Retail) | 63 | 1,227 | |||||||||
Zuora, Inc.*—Class A (Software) | 494 | 4,905 | |||||||||
Zura Bio, Ltd.* (Biotechnology) | 76 | 266 | |||||||||
| Zurn Elkay Water Solutions Corp. (Building Products) | 556 | 16,347 | |||||||||
Zymeworks, Inc.* (Biotechnology) | 213 | 1,813 | |||||||||
| Zynex, Inc.*(a) (Health Care Equipment & Supplies) | 58 | 541 | |||||||||
| TOTAL COMMON STOCKS (Cost $6,286,372) | 9,373,203 | ||||||||||
Rights(NM)
| Cartesian Therapeutics, Inc., CVR*+(Pharmaceuticals) | 403 | 73 | |||||||||
| Chinook Therapeutics CVR*+(Health Care Providers & Services) | 243 | — | |||||||||
| TOTAL RIGHTS (Cost $—) | 73 | ||||||||||
Trust (0.0%)
| Interest Units | Value | ||||||||||
| Ferroglobe Representation and Warranty Insurance*+ (Metals & Mining) | 510 | $ | — | ||||||||
| TOTAL TRUST (Cost $—) | — | ||||||||||
Repurchase Agreements(b)(c) (25.9%)
| Principal Amount | Value | ||||||||||
| Repurchase Agreements with various counterparties, rates 5.12%–5.20%, dated 6/28/2024, due 7/1/24, total to be received $3,336,442 | $ | 3,335,000 | $ | 3,335,000 | |||||||
| TOTAL REPURCHASE AGREEMENTS (Cost $3,335,000) | 3,335,000 | ||||||||||
Collateral for Securities Loaned(d) (0.7%)
Shares | Value | ||||||||||
| Invesco Government & Agency Portfolio—Institutional Shares, 5.23%(e) | 93,158 | $ | 93,158 | ||||||||
| TOTAL COLLATERAL FOR SECURITIES LOANED (Cost $93,158) | 93,158 | ||||||||||
| TOTAL INVESTMENT SECURITIES (Cost $9,714,530)—99.2% | 12,801,434 | ||||||||||
Net other assets (liabilities)—0.8% | 97,225 | ||||||||||
NET ASSETS—100.0% | $ | 12,898,659 | |||||||||
* Non-income producing security.
+ These securities were fair valued based on procedures approved by the Board of Trustees. As of June 30, 2024, these securities represented less than 0.005% of the net assets of the Fund.
(a) All or part of this security was on loan as of June 30, 2024. The total value of securities on loan as of June 30, 2024 was $86,334.
(b) A portion of these securities were held in a segregated account for the benefit of swap counterparties in the event of default. At June 30, 2024, the aggregate amount held in a segregated account was $2,751,000.
(c) The ProFund VP invests in Repurchase Agreements jointly with other funds in the Trust. See "Repurchase Agreements" under Note 2 in the Notes to Financial Statements to view the details of each individual agreement and counterparty as well as a description of the securities subject to repurchase.
(d) Securities were purchased with cash collateral held from securities on loan at June 30, 2024.
(e) Rate periodically changes. Rate disclosed is the daily yield on June 30, 2024.
NM Not meaningful, amount is less than 0.05%
CVR Contingent Value Rights
REIT Real Estate Investment Trust
See accompanying notes to the financial statements.
June 30, 2024 (unaudited) :: Schedule of Portfolio Investments :: ProFund VP UltraSmall-Cap :: 165
Futures Contracts Purchased
| Number of Contracts | Expiration Date | Notional Amount | Value and Unrealized Appreciation/ (Depreciation) | ||||||||||||||||
E-Mini Russell 2000 Index Futures Contracts | 18 | 9/23/24 | $ | 1,858,500 | $ | (4,367 | ) | ||||||||||||
Total Return Swap Agreements—Long
Underlying Instrument | Counterparty | Termination Date(1) | Rate Paid (Received)(2) | Notional Amount | Value and Unrealized Appreciation/ (Depreciation) | ||||||||||||||||||
iShares Russell 2000 ETF | Goldman Sachs International | 7/29/24 | 5.53 | % | $ | 2,526,918 | $ | 9,949 | |||||||||||||||
Russell 2000 Index | Goldman Sachs International | 7/29/24 | 5.88 | % | 935,791 | 5,218 | |||||||||||||||||
$ | 3,462,709 | $ | 15,167 | ||||||||||||||||||||
iShares Russell 2000 ETF | UBS AG | 7/29/24 | 5.13 | % | $ | 1,221,250 | $ | 4,822 | |||||||||||||||
Russell 2000 Index | UBS AG | 7/29/24 | 5.68 | % | 9,886,247 | 48,625 | |||||||||||||||||
$ | 11,107,497 | $ | 53,447 | ||||||||||||||||||||
$ | 14,570,206 | $ | 68,614 | ||||||||||||||||||||
(1) Agreements may be terminated at will by either party without penalty. Payment is due at termination/maturity.
(2) Reflects the floating financing rate, as of June 30, 2024, on the notional amount of the swap agreement paid to the counterparty or received from the counterparty, excluding any commissions. This amount is included as part of the unrealized appreciation/(depreciation).
See accompanying notes to the financial statements.
166 :: ProFund VP UltraSmall-Cap :: Schedule of Portfolio Investments :: June 30, 2024 (unaudited)
ProFund VP UltraSmall-Cap invested in the following industries as of June 30, 2024:
Value | % of Net Assets | ||||||||||
Aerospace & Defense | $ | 100,747 | 0.8 | % | |||||||
Air Freight & Logistics | 15,351 | 0.1 | % | ||||||||
Automobile Components | 130,125 | 1.0 | % | ||||||||
Automobiles | 6,920 | 0.1 | % | ||||||||
Banks | 862,498 | 6.7 | % | ||||||||
Beverages | 27,430 | 0.2 | % | ||||||||
Biotechnology | 821,273 | 6.3 | % | ||||||||
Broadline Retail | 2,873 | NM | |||||||||
Building Products | 134,800 | 1.0 | % | ||||||||
Capital Markets | 150,690 | 1.2 | % | ||||||||
Chemicals | 190,227 | 1.4 | % | ||||||||
Commercial Services & Supplies | 167,404 | 1.3 | % | ||||||||
Communications Equipment | 53,191 | 0.4 | % | ||||||||
Construction & Engineering | 140,048 | 1.1 | % | ||||||||
Construction Materials | 35,518 | 0.3 | % | ||||||||
Consumer Finance | 75,374 | 0.6 | % | ||||||||
Consumer Staples Distribution & Retail | 66,656 | 0.5 | % | ||||||||
Containers & Packaging | 23,672 | 0.2 | % | ||||||||
Distributors | 3,435 | NM | |||||||||
Diversified Consumer Services | 87,588 | 0.7 | % | ||||||||
Diversified REITs | 59,136 | 0.5 | % | ||||||||
Diversified Telecommunication Services | 48,299 | 0.4 | % | ||||||||
Electric Utilities | 72,099 | 0.6 | % | ||||||||
Electrical Equipment | 136,463 | 1.1 | % | ||||||||
| Electronic Equipment, Instruments & Components | 287,383 | 2.2 | % | ||||||||
Energy Equipment & Services | 256,235 | 2.0 | % | ||||||||
Entertainment | 45,686 | 0.4 | % | ||||||||
Financial Services | 247,021 | 1.9 | % | ||||||||
Food Products | 95,026 | 0.8 | % | ||||||||
Gas Utilities | 88,821 | 0.6 | % | ||||||||
Ground Transportation | 44,184 | 0.3 | % | ||||||||
Health Care Equipment & Supplies | 321,997 | 2.4 | % | ||||||||
Health Care Providers & Services | 265,828 | 2.1 | % | ||||||||
Health Care REITs | 55,898 | 0.4 | % | ||||||||
Health Care Technology | 32,677 | 0.3 | % | ||||||||
Hotel & Resort REITs | 75,220 | 0.6 | % | ||||||||
Hotels, Restaurants & Leisure | 174,897 | 1.4 | % | ||||||||
Household Durables | 204,730 | 1.6 | % | ||||||||
Household Products | 28,730 | 0.2 | % | ||||||||
| Independent Power and Renewable Electricity Producers | 19,659 | 0.2 | % | ||||||||
Industrial Conglomerates | 2,022 | NM | |||||||||
Value | % of Net Assets | ||||||||||
Industrial REITs | $ | 47,698 | 0.4 | % | |||||||
Insurance | 173,132 | 1.3 | % | ||||||||
Interactive Media & Services | 60,371 | 0.5 | % | ||||||||
IT Services | 55,559 | 0.4 | % | ||||||||
Leisure Products | 42,334 | 0.3 | % | ||||||||
Life Sciences Tools & Services | 24,508 | 0.2 | % | ||||||||
Machinery | 349,224 | 2.8 | % | ||||||||
Marine Transportation | 32,941 | 0.3 | % | ||||||||
Media | 68,774 | 0.4 | % | ||||||||
Metals & Mining | 165,855 | 1.3 | % | ||||||||
Mortgage REITs | 105,954 | 0.8 | % | ||||||||
Multi-Utilities | 39,524 | 0.3 | % | ||||||||
Office REITs | 69,071 | 0.5 | % | ||||||||
Oil, Gas & Consumable Fuels | 364,776 | 2.8 | % | ||||||||
Paper & Forest Products | 12,198 | 0.1 | % | ||||||||
Passenger Airlines | 38,344 | 0.3 | % | ||||||||
Personal Care Products | 28,263 | 0.2 | % | ||||||||
Pharmaceuticals | 151,291 | 1.2 | % | ||||||||
Professional Services | 238,211 | 1.8 | % | ||||||||
| Real Estate Management & Development | 64,205 | 0.5 | % | ||||||||
Residential REITs | 42,647 | 0.3 | % | ||||||||
Retail REITs | 113,213 | 0.9 | % | ||||||||
| Semiconductors & Semiconductor Equipment | 247,168 | 1.9 | % | ||||||||
Software | 560,449 | 4.4 | % | ||||||||
Specialized REITs | 38,824 | 0.3 | % | ||||||||
Specialty Retail | 238,762 | 1.8 | % | ||||||||
| Technology Hardware, Storage & Peripherals | 20,300 | 0.2 | % | ||||||||
Textiles, Apparel & Luxury Goods | 53,070 | 0.4 | % | ||||||||
Tobacco | 13,033 | 0.1 | % | ||||||||
Trading Companies & Distributors | 207,558 | 1.6 | % | ||||||||
Transportation Infrastructure | 398 | NM | |||||||||
Water Utilities | 36,583 | 0.3 | % | ||||||||
Wireless Telecommunication Services | 11,207 | 0.1 | % | ||||||||
Other** | 3,525,383 | 27.4 | % | ||||||||
Total | $ | 12,898,659 | 100.0 | % | |||||||
** Includes any non-equity securities and net other assets (liabilities), which includes any receivable for capital shares issued and payable for capital shares redeemed.
NM Not meaningful, amount is less than 0.05%
REIT Real Estate Investment Trust
See accompanying notes to the financial statements.
June 30, 2024 (unaudited) :: Schedule of Portfolio Investments :: ProFund VP U.S. Government Plus :: 167
U.S. Treasury Obligation (45.3%)
| Principal Amount | Value | ||||||||||
U.S. Treasury Bonds, 4.63%, 5/15/54 | $ | 2,840,000 | $ | 2,879,716 | |||||||
| TOTAL U.S. TREASURY OBLIGATION (Cost $2,881,630) | 2,879,716 | ||||||||||
Repurchase Agreements(a)(b) (56.0%)
| Repurchase Agreements with various counterparties, rates 5.12%–5.20%, dated 6/28/2024, due 7/1/24, total to be received $3,559,538 | 3,558,000 | 3,558,000 | |||||||||
| TOTAL REPURCHASE AGREEMENTS (Cost $3,558,000) | 3,558,000 | ||||||||||
| TOTAL INVESTMENT SECURITIES (Cost $6,439,630)—101.3% | 6,437,716 | ||||||||||
Net other assets (liabilities)—(1.3)% | (84,200 | ) | |||||||||
NET ASSETS—100.0% | $ | 6,353,516 | |||||||||
(a) A portion of these securities were held in a segregated account for the benefit of swap counterparties in the event of default. At June 30, 2024, the aggregate amount held in a segregated account was $100,000.
(b) The ProFund VP invests in Repurchase Agreements jointly with other funds in the Trust. See "Repurchase Agreements" under Note 2 in the Notes to Financial Statements to view the details of each individual agreement and counterparty as well as a description of the securities subject to repurchase.
Total Return Swap Agreements—Long
Underlying Instrument | Counterparty | Termination Date(1) | Rate Paid (Received)(2) | Notional Amount | Value and Unrealized Appreciation/ (Depreciation) | ||||||||||||||||||
| 30-Year U.S. Treasury Bond, 4.625% due on 5/15/54 | Citibank North America | 7/15/24 | 5.55 | % | $ | 1,257,341 | $ | (24,125 | ) | ||||||||||||||
| 30-Year U.S. Treasury Bond, 4.625% due on 5/15/54 | Societe' Generale | 7/15/24 | 5.61 | % | 3,731,463 | (86,856 | ) | ||||||||||||||||
$ | 4,988,804 | $ | (110,981 | ) | |||||||||||||||||||
(1) Agreements may be terminated at will by either party without penalty. Payment is due at termination/maturity.
(2) Reflects the floating financing rate, as of June 30, 2024, on the notional amount of the swap agreement paid to the counterparty or received from the counterparty, excluding any commissions. This amount is included as part of the unrealized appreciation/(depreciation).
See accompanying notes to the financial statements.
Common Stocks (97.4%)
Shares | Value | ||||||||||
Alliant Energy Corp. (Electric Utilities) | 6,960 | $ | 354,264 | ||||||||
Ameren Corp. (Multi-Utilities) | 7,239 | 514,765 | |||||||||
| American Electric Power Co., Inc. (Electric Utilities) | 14,310 | 1,255,559 | |||||||||
| American Water Works Co., Inc. (Water Utilities) | 5,288 | 682,998 | |||||||||
Atmos Energy Corp. (Gas Utilities) | 4,096 | 477,798 | |||||||||
CenterPoint Energy, Inc. (Multi-Utilities) | 17,367 | 538,030 | |||||||||
CMS Energy Corp. (Multi-Utilities) | 8,107 | 482,610 | |||||||||
Consolidated Edison, Inc. (Multi-Utilities) | 9,388 | 839,475 | |||||||||
Constellation Energy Corp. (Electric Utilities) | 8,557 | 1,713,710 | |||||||||
Dominion Energy, Inc. (Multi-Utilities) | 22,754 | 1,114,946 | |||||||||
DTE Energy Co. (Multi-Utilities) | 5,618 | 623,654 | |||||||||
Duke Energy Corp. (Electric Utilities) | 20,951 | 2,099,919 | |||||||||
Edison International (Electric Utilities) | 10,445 | 750,055 | |||||||||
Entergy Corp. (Electric Utilities) | 5,797 | 620,279 | |||||||||
Evergy, Inc. (Electric Utilities) | 6,242 | 330,639 | |||||||||
Eversource Energy (Electric Utilities) | 9,562 | 542,261 | |||||||||
Exelon Corp. (Electric Utilities) | 27,147 | 939,558 | |||||||||
FirstEnergy Corp. (Electric Utilities) | 14,061 | 538,114 | |||||||||
NextEra Energy, Inc. (Electric Utilities) | 55,773 | 3,949,286 | |||||||||
NiSource, Inc. (Multi-Utilities) | 12,170 | 350,618 | |||||||||
NRG Energy, Inc. (Electric Utilities) | 5,660 | 440,688 | |||||||||
PG&E Corp. (Electric Utilities) | 58,014 | 1,012,924 | |||||||||
Pinnacle West Capital Corp. (Electric Utilities) | 3,083 | 235,480 | |||||||||
PPL Corp. (Electric Utilities) | 20,027 | 553,747 | |||||||||
| Public Service Enterprise Group, Inc. (Multi-Utilities) | 13,521 | 996,498 | |||||||||
Sempra (Multi-Utilities) | 17,179 | 1,306,634 | |||||||||
Common Stocks, continued
Shares | Value | ||||||||||
| The AES Corp. (Independent Power and Renewable Electricity Producers) | 19,293 | $ | 338,978 | ||||||||
The Southern Co. (Electric Utilities) | 29,682 | 2,302,433 | |||||||||
| Vistra Corp. (Independent Power and Renewable Electricity Producers) | 8,866 | 762,299 | |||||||||
WEC Energy Group, Inc. (Multi-Utilities) | 8,573 | 672,638 | |||||||||
Xcel Energy, Inc. (Electric Utilities) | 15,083 | 805,583 | |||||||||
| TOTAL COMMON STOCKS (Cost $12,133,024) | 28,146,440 | ||||||||||
Repurchase Agreements(a) (2.3%)
| Principal Amount | Value | ||||||||||
| Repurchase Agreements with various counterparties, rates 5.12%–5.20%, dated 6/28/2024, due 7/1/24, total to be received $671,290 | $ | 671,000 | $ | 671,000 | |||||||
| TOTAL REPURCHASE AGREEMENTS (Cost $671,000) | 671,000 | ||||||||||
| TOTAL INVESTMENT SECURITIES (Cost $12,804,024)—99.7% | 28,817,440 | ||||||||||
Net other assets (liabilities)—0.3% | 74,807 | ||||||||||
NET ASSETS—100.0% | $ | 28,892,247 | |||||||||
(a) The ProFund VP invests in Repurchase Agreements jointly with other funds in the Trust. See "Repurchase Agreements" under Note 2 in the Notes to Financial Statements to view the details of each individual agreement and counterparty as well as a description of the securities subject to repurchase.
Total Return Swap Agreements—Long
Underlying Instrument | Counterparty | Termination Date(1) | Rate Paid (Received)(2) | Notional Amount | Value and Unrealized Appreciation/ (Depreciation) | ||||||||||||||||||
S&P Utilities Select Sector Index | Goldman Sachs International | 7/23/24 | 6.08 | % | $ | 622,849 | $ | (10,692 | ) | ||||||||||||||
(1) Agreements may be terminated at will by either party without penalty. Payment is due at termination/maturity.
(2) Reflects the floating financing rate, as of June 30, 2024, on the notional amount of the swap agreement paid to the counterparty or received from the counterparty, excluding any commissions. This amount is included as part of the unrealized appreciation/(depreciation).
ProFund VP Utilities invested in the following industries as of June 30, 2024:
Value | % of Net Assets | ||||||||||
Electric Utilities | $ | 18,444,499 | 63.7 | % | |||||||
Gas Utilities | 477,798 | 1.7 | % | ||||||||
| Independent Power and Renewable Electricity Producers | 1,101,277 | 3.8 | % | ||||||||
Multi-Utilities | 7,439,868 | 25.8 | % | ||||||||
Water Utilities | 682,998 | 2.4 | % | ||||||||
Other** | 745,807 | 2.6 | % | ||||||||
Total | $ | 28,892,247 | 100.0 | % | |||||||
** Includes any non-equity securities and net other assets (liabilities), which includes any receivable for capital shares issued and payable for capital shares redeemed.
See accompanying notes to the financial statements.
170 :: Statements of Assets and Liabilities :: June 30, 2024 (unaudited)
| ProFund Access VP High Yield | ProFund VP Asia 30 | ProFund VP Banks | ProFund VP Bear | ProFund VP Biotechnology | |||||||||||||||||||
ASSETS: | |||||||||||||||||||||||
Total Investment Securities, at cost | $ | 14,146,532 | $ | 11,275,283 | $ | 2,521,141 | $ | 1,636,000 | $ | 32,952,334 | |||||||||||||
Securities, at value(a) | 7,199,715 | 17,068,878 | 3,736,516 | — | 42,693,422 | ||||||||||||||||||
Repurchase agreements, at value | 6,956,000 | 39,000 | — | 1,636,000 | 462,000 | ||||||||||||||||||
Total Investment Securities, at value | 14,155,715 | 17,107,878 | 3,736,516 | 1,636,000 | 43,155,422 | ||||||||||||||||||
Cash | 9,909 | 461 | — | 584 | 922 | ||||||||||||||||||
Segregated cash balances for futures contracts with brokers | 30,030 | — | — | 12,980 | — | ||||||||||||||||||
| Segregated cash balances for credit default swap agreements with brokers | 941,281 | — | — | — | — | ||||||||||||||||||
Segregated cash balances for swap agreements with custodian | — | — | 60,000 | 491 | 143,000 | ||||||||||||||||||
Dividends and interest receivable | 30,260 | 294,670 | 8,467 | 707 | 6,487 | ||||||||||||||||||
Receivable for capital shares issued | — | 46,248 | 11,208 | 16,961 | 86,944 | ||||||||||||||||||
Unrealized appreciation on swap agreements | — | — | 1,108 | 5,611 | — | ||||||||||||||||||
Variation margin on futures contracts | — | — | — | 1,225 | — | ||||||||||||||||||
Prepaid expenses | 88 | 98 | 26 | 88 | 297 | ||||||||||||||||||
Receivable for tax reclaims | — | 702 | — | — | — | ||||||||||||||||||
TOTAL ASSETS | 15,167,283 | 17,450,057 | 3,817,325 | 1,674,647 | 43,393,072 | ||||||||||||||||||
LIABILITIES: | |||||||||||||||||||||||
Cash overdraft | — | — | 6,999 | — | — | ||||||||||||||||||
Payable for collateral for securities loaned | — | 1,039,165 | — | — | 1,023,128 | ||||||||||||||||||
Payable for capital shares redeemed | 32,170 | 29,054 | 663 | 54 | 19,211 | ||||||||||||||||||
Unrealized depreciation on swap agreements | — | — | — | — | 11,095 | ||||||||||||||||||
Variation margin on futures contracts | 3,445 | — | — | — | — | ||||||||||||||||||
Variation margin on credit default swap agreements | 9,928 | — | — | — | — | ||||||||||||||||||
Advisory fees payable | 9,116 | 8,899 | 2,101 | 989 | 25,844 | ||||||||||||||||||
Management services fees payable | 1,216 | 1,186 | 280 | 132 | 3,446 | ||||||||||||||||||
Administration fees payable | 973 | 1,030 | 240 | 108 | 2,681 | ||||||||||||||||||
Administrative services fees payable | 2,964 | 2,535 | 907 | 357 | 6,329 | ||||||||||||||||||
Distribution fees payable | 3,088 | 3,272 | 762 | 343 | 8,615 | ||||||||||||||||||
Transfer agency fees payable | 1,815 | 1,938 | 469 | 204 | 5,041 | ||||||||||||||||||
Fund accounting fees payable | 532 | 582 | 189 | 61 | 1,549 | ||||||||||||||||||
Compliance services fees payable | 57 | 59 | 15 | 7 | 170 | ||||||||||||||||||
Other accrued expenses | 12,103 | 14,307 | 4,128 | 1,849 | 39,277 | ||||||||||||||||||
TOTAL LIABILITIES | 77,407 | 1,102,027 | 16,753 | 4,104 | 1,146,386 | ||||||||||||||||||
Commitments and contingencies (Note 4) | |||||||||||||||||||||||
NET ASSETS | $ | 15,089,876 | $ | 16,348,030 | $ | 3,800,572 | $ | 1,670,543 | $ | 42,246,686 | |||||||||||||
NET ASSETS CONSIST OF: | |||||||||||||||||||||||
Capital | $ | 19,047,474 | $ | 16,564,323 | $ | 8,544,128 | $ | 25,584,809 | $ | 32,170,767 | |||||||||||||
Total distributable earnings (loss) | (3,957,598 | ) | (216,293 | ) | (4,743,556 | ) | (23,914,266 | ) | 10,075,919 | ||||||||||||||
NET ASSETS | $ | 15,089,876 | $ | 16,348,030 | $ | 3,800,572 | $ | 1,670,543 | $ | 42,246,686 | |||||||||||||
| SHARES OF BENEFICIAL INTEREST OUTSTANDING (unlimited number of shares authorized, no par value): | 596,357 | 448,536 | 139,864 | 145,034 | 1,005,099 | ||||||||||||||||||
| NET ASSET VALUE (offering and redemption price per share): | $ | 25.30 | $ | 36.45 | $ | 27.17 | $ | 11.52 | $ | 42.03 | |||||||||||||
| (a) Includes securities on loan valued at: | $ | — | $ | 981,576 | $ | — | $ | — | $ | 981,318 | |||||||||||||
Amounts designated as " – " are $0 or have been rounded to $0.
See accompanying notes to the financial statements.
June 30, 2024 (unaudited) :: Statements of Assets and Liabilities :: 171
| ProFund VP Bull | ProFund VP Communication Services | ProFund VP Consumer Discretionary | ProFund VP Consumer Staples | ProFund VP Dow 30 | |||||||||||||||||||
ASSETS: | |||||||||||||||||||||||
Total Investment Securities, at cost | $ | 24,048,640 | $ | 7,335,862 | $ | 16,408,184 | $ | 5,479,933 | $ | 389,000 | |||||||||||||
Securities, at value(a) | 52,206,255 | 10,104,147 | 24,426,843 | 10,329,420 | — | ||||||||||||||||||
Repurchase agreements, at value | 7,826,000 | 273,000 | 489,000 | 267,000 | 389,000 | ||||||||||||||||||
Total Investment Securities, at value | 60,032,255 | 10,377,147 | 24,915,843 | 10,596,420 | 389,000 | ||||||||||||||||||
Cash | 301,120 | 650 | 913 | 362 | 2,422 | ||||||||||||||||||
Segregated cash balances for futures contracts with brokers | 90,860 | — | — | — | — | ||||||||||||||||||
| Segregated cash balances for credit default swap agreements with brokers | — | — | — | — | — | ||||||||||||||||||
Segregated cash balances for swap agreements with custodian | 882 | — | 110,000 | 20,000 | — | ||||||||||||||||||
Dividends and interest receivable | 30,409 | 2,380 | 5,243 | 26,835 | 168 | ||||||||||||||||||
Receivable for capital shares issued | 14,710 | 31,252 | 113 | 4,866 | — | ||||||||||||||||||
Unrealized appreciation on swap agreements | — | 1,486 | 2,297 | — | — | ||||||||||||||||||
Variation margin on futures contracts | — | — | — | — | — | ||||||||||||||||||
Prepaid expenses | 2,807 | 52 | 139 | 77 | 2 | ||||||||||||||||||
Receivable for tax reclaims | — | — | — | — | — | ||||||||||||||||||
TOTAL ASSETS | 60,473,043 | 10,412,967 | 25,034,548 | 10,648,560 | 391,592 | ||||||||||||||||||
LIABILITIES: | |||||||||||||||||||||||
Cash overdraft | — | — | — | — | — | ||||||||||||||||||
Payable for collateral for securities loaned | — | — | — | — | — | ||||||||||||||||||
Payable for capital shares redeemed | 6,658 | 5,894 | 72,923 | 6,051 | 58 | ||||||||||||||||||
Unrealized depreciation on swap agreements | 26,606 | — | — | 2,563 | 514 | ||||||||||||||||||
Variation margin on futures contracts | 8,575 | — | — | — | — | ||||||||||||||||||
Variation margin on credit default swap agreements | — | — | — | — | — | ||||||||||||||||||
Advisory fees payable | 38,533 | 5,822 | 13,202 | 6,138 | 237 | ||||||||||||||||||
Management services fees payable | 5,138 | 776 | 1,760 | 818 | 32 | ||||||||||||||||||
Administration fees payable | 4,036 | 642 | 1,436 | 673 | 23 | ||||||||||||||||||
Administrative services fees payable | 12,823 | 2,280 | 5,007 | 2,420 | 47 | ||||||||||||||||||
Distribution fees payable | 12,823 | 2,036 | 4,570 | 2,161 | 79 | ||||||||||||||||||
Transfer agency fees payable | 7,277 | 1,162 | 2,646 | 1,292 | 44 | ||||||||||||||||||
Fund accounting fees payable | 2,522 | 365 | 818 | 392 | 14 | ||||||||||||||||||
Compliance services fees payable | 233 | 37 | 87 | 43 | 1 | ||||||||||||||||||
Other accrued expenses | 48,976 | 8,687 | 21,445 | 10,971 | 265 | ||||||||||||||||||
TOTAL LIABILITIES | 174,200 | 27,701 | 123,894 | 33,522 | 1,314 | ||||||||||||||||||
Commitments and contingencies (Note 4) | |||||||||||||||||||||||
NET ASSETS | $ | 60,298,843 | $ | 10,385,266 | $ | 24,910,654 | $ | 10,615,038 | $ | 390,278 | |||||||||||||
NET ASSETS CONSIST OF: | |||||||||||||||||||||||
Capital | $ | 26,384,134 | $ | 8,005,126 | $ | 16,658,665 | $ | 5,844,774 | $ | 2,024,230 | |||||||||||||
Total distributable earnings (loss) | 33,914,709 | 2,380,140 | 8,251,989 | 4,770,264 | (1,633,952 | ) | |||||||||||||||||
NET ASSETS | $ | 60,298,843 | $ | 10,385,266 | $ | 24,910,654 | $ | 10,615,038 | $ | 390,278 | |||||||||||||
| SHARES OF BENEFICIAL INTEREST OUTSTANDING (unlimited number of shares authorized, no par value): | 1,105,924 | 231,338 | 412,501 | 343,710 | 18,782 | ||||||||||||||||||
| NET ASSET VALUE (offering and redemption price per share): | $ | 54.52 | $ | 44.89 | $ | 60.39 | $ | 30.88 | $ | 20.78 | |||||||||||||
| (a) Includes securities on loan valued at: | $ | — | $ | — | $ | — | $ | — | $ | — | |||||||||||||
See accompanying notes to the financial statements.
172 :: Statements of Assets and Liabilities :: June 30, 2024 (unaudited)
| ProFund VP Emerging Markets | ProFund VP Energy | ProFund VP Europe 30 | ProFund VP Falling U.S. Dollar | ProFund VP Financials | |||||||||||||||||||
ASSETS: | |||||||||||||||||||||||
Total Investment Securities, at cost | $ | 14,419,285 | $ | 14,630,225 | $ | 11,551,195 | $ | 456,000 | $ | 8,031,118 | |||||||||||||
Securities, at value(a) | 22,035,915 | 43,957,114 | 17,049,103 | — | 28,581,659 | ||||||||||||||||||
Repurchase agreements, at value | 1,427,000 | 516,000 | — | 456,000 | 725,000 | ||||||||||||||||||
Total Investment Securities, at value | 23,462,915 | 44,473,114 | 17,049,103 | 456,000 | 29,306,659 | ||||||||||||||||||
Cash | — | 242 | — | 794 | 375 | ||||||||||||||||||
Segregated cash balances for swap agreements with custodian | 138 | 170,000 | — | 345 | 160,000 | ||||||||||||||||||
Dividends and interest receivable | 106,187 | 16,968 | 95,150 | 197 | 14,160 | ||||||||||||||||||
Receivable for investments sold | 647,598 | — | 70,113 | — | — | ||||||||||||||||||
Receivable for capital shares issued | 3,129,955 | 89,301 | 44,946 | — | 365 | ||||||||||||||||||
Due from Advisor under an expense limitation agreement | — | — | — | 256 | — | ||||||||||||||||||
Unrealized appreciation on forward currency contracts | — | — | — | 584 | — | ||||||||||||||||||
Unrealized appreciation on swap agreements | 29 | — | — | — | — | ||||||||||||||||||
Prepaid expenses | 139 | 309 | 98 | 3 | 188 | ||||||||||||||||||
Receivable for tax reclaims | 1,529 | — | 29,201 | — | — | ||||||||||||||||||
TOTAL ASSETS | 27,348,490 | 44,749,934 | 17,288,611 | 458,179 | 29,481,747 | ||||||||||||||||||
LIABILITIES: | |||||||||||||||||||||||
Cash overdraft | 575,503 | — | 42,508 | — | — | ||||||||||||||||||
Payable for collateral for securities loaned | 2,198,218 | — | 2,305,467 | — | — | ||||||||||||||||||
Payable for capital shares redeemed | 23,435 | 1,284 | 110,005 | 259 | 209,161 | ||||||||||||||||||
Unrealized depreciation on forward currency contracts | — | — | — | 7,318 | — | ||||||||||||||||||
Unrealized depreciation on swap agreements | 362 | 2,215 | — | — | 6,182 | ||||||||||||||||||
Advisory fees payable | 12,693 | 26,453 | 9,249 | — | 18,143 | ||||||||||||||||||
Management services fees payable | 1,692 | 3,527 | 1,233 | — | 2,419 | ||||||||||||||||||
Administration fees payable | 1,413 | 2,902 | 1,145 | 29 | 1,875 | ||||||||||||||||||
Administrative services fees payable | 4,128 | 9,476 | 3,353 | 81 | 5,735 | ||||||||||||||||||
Distribution fees payable | 4,487 | 9,240 | 3,644 | 93 | 5,974 | ||||||||||||||||||
Transfer agency fees payable | 2,716 | 5,610 | 2,025 | 55 | 3,515 | ||||||||||||||||||
Fund accounting fees payable | 804 | 1,602 | 645 | 16 | 1,071 | ||||||||||||||||||
Compliance services fees payable | 85 | 175 | 63 | 2 | 113 | ||||||||||||||||||
Other accrued expenses | 19,820 | 44,400 | 9,866 | 3,001 | 27,533 | ||||||||||||||||||
TOTAL LIABILITIES | 2,845,356 | 106,884 | 2,489,203 | 10,854 | 281,721 | ||||||||||||||||||
Commitments and contingencies (Note 4) | |||||||||||||||||||||||
NET ASSETS | $ | 24,503,134 | $ | 44,643,050 | $ | 14,799,408 | $ | 447,325 | $ | 29,200,026 | |||||||||||||
NET ASSETS CONSIST OF: | |||||||||||||||||||||||
Capital | $ | 25,998,253 | $ | 17,416,289 | $ | 12,966,772 | $ | 866,374 | $ | 13,123,765 | |||||||||||||
Total distributable earnings (loss) | (1,495,119 | ) | 27,226,761 | 1,832,636 | (419,049 | ) | 16,076,261 | ||||||||||||||||
NET ASSETS | $ | 24,503,134 | $ | 44,643,050 | $ | 14,799,408 | $ | 447,325 | $ | 29,200,026 | |||||||||||||
| SHARES OF BENEFICIAL INTEREST OUTSTANDING (unlimited number of shares authorized, no par value): | 831,826 | 1,032,609 | 572,105 | 31,793 | 646,601 | ||||||||||||||||||
| NET ASSET VALUE (offering and redemption price per share): | $ | 29.46 | $ | 43.23 | $ | 25.87 | $ | 14.07 | $ | 45.16 | |||||||||||||
| (a) Includes securities on loan valued at: | $ | 2,088,085 | $ | — | $ | 2,249,712 | $ | — | $ | — | |||||||||||||
Amounts designated as "—" are $0 or have been rounded to $0.
See accompanying notes to the financial statements.
June 30, 2024 (unaudited) :: Statements of Assets and Liabilities :: 173
| ProFund VP Government Money Market | ProFund VP Health Care | ProFund VP Industrials | ProFund VP International | ProFund VP Internet | |||||||||||||||||||
ASSETS: | |||||||||||||||||||||||
Total Investment Securities, at cost | $ | 30,594,629 | $ | 6,473,108 | $ | 7,381,746 | $ | 10,443,000 | $ | 5,801,210 | |||||||||||||
Securities, at value(a) | 13,930,629 | 37,293,446 | 16,212,580 | — | 12,534,067 | ||||||||||||||||||
Repurchase agreements, at value | 16,664,000 | 260,000 | 352,000 | 10,443,000 | 239,000 | ||||||||||||||||||
Total Investment Securities, at value | 30,594,629 | 37,553,446 | 16,564,580 | 10,443,000 | 12,773,067 | ||||||||||||||||||
Cash | 257 | 831 | 174 | 537 | 187 | ||||||||||||||||||
Segregated cash balances for swap agreements with custodian | — | 190,000 | — | 546 | 110,000 | ||||||||||||||||||
Dividends and interest receivable | 7,205 | 26,916 | 10,367 | 4,515 | 103 | ||||||||||||||||||
Receivable for investments sold | — | 11,455 | — | — | — | ||||||||||||||||||
Receivable for capital shares issued | 1,708 | 6,998 | 745 | — | — | ||||||||||||||||||
Due from Advisor under an expense limitation agreement | — | — | — | — | — | ||||||||||||||||||
Unrealized appreciation on forward currency contracts | — | — | — | — | — | ||||||||||||||||||
Unrealized appreciation on swap agreements | — | — | — | 15,437 | 6,968 | ||||||||||||||||||
Prepaid expenses | 204 | 251 | 109 | 72 | 79 | ||||||||||||||||||
Receivable for tax reclaims | — | — | — | — | — | ||||||||||||||||||
TOTAL ASSETS | 30,604,003 | 37,789,897 | 16,575,975 | 10,464,107 | 12,890,404 | ||||||||||||||||||
LIABILITIES: | |||||||||||||||||||||||
Cash overdraft | — | — | — | — | — | ||||||||||||||||||
Payable for collateral for securities loaned | — | — | — | — | — | ||||||||||||||||||
Payable for capital shares redeemed | 1,991 | 28,341 | 29,346 | 21,311 | 20,852 | ||||||||||||||||||
Unrealized depreciation on forward currency contracts | — | — | — | — | — | ||||||||||||||||||
Unrealized depreciation on swap agreements | — | 5,144 | 2,985 | — | — | ||||||||||||||||||
Advisory fees payable | 14,898 | 22,278 | 9,911 | 6,659 | 7,339 | ||||||||||||||||||
Management services fees payable | 1,986 | 2,970 | 1,322 | 888 | 979 | ||||||||||||||||||
Administration fees payable | 943 | 2,449 | 1,066 | 639 | 802 | ||||||||||||||||||
Administrative services fees payable | — | 7,781 | 3,536 | 2,214 | 2,746 | ||||||||||||||||||
Distribution fees payable | — | 7,781 | 3,400 | 2,214 | 2,543 | ||||||||||||||||||
Transfer agency fees payable | 3,671 | 4,594 | 2,037 | 1,316 | 1,540 | ||||||||||||||||||
Fund accounting fees payable | 1,253 | 1,380 | 632 | 381 | 464 | ||||||||||||||||||
Compliance services fees payable | 117 | 149 | 66 | 42 | 49 | ||||||||||||||||||
Other accrued expenses | 33,821 | 33,362 | 16,195 | 8,177 | 11,489 | ||||||||||||||||||
TOTAL LIABILITIES | 58,680 | 116,229 | 70,496 | 43,841 | 48,803 | ||||||||||||||||||
Commitments and contingencies (Note 4) | |||||||||||||||||||||||
NET ASSETS | $ | 30,545,323 | $ | 37,673,668 | $ | 16,505,479 | $ | 10,420,266 | $ | 12,841,601 | |||||||||||||
NET ASSETS CONSIST OF: | |||||||||||||||||||||||
Capital | $ | 30,584,689 | $ | 6,733,204 | $ | 7,982,335 | $ | 11,938,771 | $ | 7,179,259 | |||||||||||||
Total distributable earnings (loss) | (39,366 | ) | 30,940,464 | 8,523,144 | (1,518,505 | ) | 5,662,342 | ||||||||||||||||
NET ASSETS | $ | 30,545,323 | $ | 37,673,668 | $ | 16,505,479 | $ | 10,420,266 | $ | 12,841,601 | |||||||||||||
| SHARES OF BENEFICIAL INTEREST OUTSTANDING (unlimited number of shares authorized, no par value): | 30,584,689 | 553,345 | 201,299 | 502,680 | 570,479 | ||||||||||||||||||
| NET ASSET VALUE (offering and redemption price per share): | $ | 1.00 | $ | 68.08 | $ | 81.99 | $ | 20.73 | $ | 22.51 | |||||||||||||
| (a) Includes securities on loan valued at: | $ | — | $ | — | $ | — | $ | — | $ | — | |||||||||||||
See accompanying notes to the financial statements.
174 :: Statements of Assets and Liabilities :: June 30, 2024 (unaudited)
| ProFund VP Japan | ProFund VP Large-Cap Growth | ProFund VP Large-Cap Value | ProFund VP Materials | ProFund VP Mid-Cap | |||||||||||||||||||
ASSETS: | |||||||||||||||||||||||
Total Investment Securities, at cost | $ | 13,472,000 | $ | 16,105,129 | $ | 10,195,101 | $ | 5,752,268 | $ | 11,049,000 | |||||||||||||
Securities, at value(a) | — | 32,738,947 | 15,220,738 | 14,440,673 | — | ||||||||||||||||||
Repurchase agreements, at value | 13,472,000 | 75,000 | 56,000 | 89,000 | 11,049,000 | ||||||||||||||||||
Total Investment Securities, at value | 13,472,000 | 32,813,947 | 15,276,738 | 14,529,673 | 11,049,000 | ||||||||||||||||||
Cash | 2,206 | 553 | 385 | 53 | 263 | ||||||||||||||||||
Segregated cash balances for futures contracts with brokers | 654,500 | — | — | — | 83,050 | ||||||||||||||||||
Segregated cash balances for swap agreements with custodian | — | — | — | 84,000 | 867 | ||||||||||||||||||
Dividends and interest receivable | 5,825 | 5,996 | 14,276 | 11,392 | 4,777 | ||||||||||||||||||
Receivable for investments sold | — | 49,804 | — | 55,624 | — | ||||||||||||||||||
Receivable for capital shares issued | 921 | — | 5,270 | 411 | 40,214 | ||||||||||||||||||
Unrealized appreciation on swap agreements | 1,245 | — | — | — | 27,589 | ||||||||||||||||||
Variation margin on futures contracts | 75,250 | — | — | — | 1,700 | ||||||||||||||||||
Prepaid expenses | 91 | 1,311 | 755 | 101 | 620 | ||||||||||||||||||
TOTAL ASSETS | 14,212,038 | 32,871,611 | 15,297,424 | 14,681,254 | 11,208,080 | ||||||||||||||||||
LIABILITIES: | |||||||||||||||||||||||
Payable for investments purchased | — | — | — | 55,723 | — | ||||||||||||||||||
Payable for collateral for securities loaned | — | — | — | — | — | ||||||||||||||||||
Payable for capital shares redeemed | 6,401 | 50,596 | 8,198 | 8,534 | 27,370 | ||||||||||||||||||
Unrealized depreciation on swap agreements | — | — | — | 1,403 | — | ||||||||||||||||||
Variation margin on futures contracts | — | — | — | — | — | ||||||||||||||||||
Advisory fees payable | 8,548 | 17,262 | 8,471 | 9,055 | 7,717 | ||||||||||||||||||
Management services fees payable | 1,140 | 2,302 | 1,129 | 1,207 | 1,029 | ||||||||||||||||||
Administration fees payable | 893 | 1,936 | 984 | 972 | 808 | ||||||||||||||||||
Administrative services fees payable | 2,887 | 7,118 | 3,811 | 3,215 | 2,466 | ||||||||||||||||||
Distribution fees payable | 2,846 | 6,136 | 3,137 | 3,091 | 2,569 | ||||||||||||||||||
Transfer agency fees payable | 1,738 | 3,450 | 1,847 | 1,849 | 1,552 | ||||||||||||||||||
Fund accounting fees payable | 490 | 1,201 | 813 | 549 | 444 | ||||||||||||||||||
Compliance services fees payable | 58 | 111 | 64 | 60 | 43 | ||||||||||||||||||
Other accrued expenses | 11,738 | 20,741 | 12,554 | 15,441 | 9,468 | ||||||||||||||||||
TOTAL LIABILITIES | 36,739 | 110,853 | 41,008 | 101,099 | 53,466 | ||||||||||||||||||
Commitments and contingencies (Note 4) | |||||||||||||||||||||||
NET ASSETS | $ | 14,175,299 | $ | 32,760,758 | $ | 15,256,416 | $ | 14,580,155 | $ | 11,154,614 | |||||||||||||
NET ASSETS CONSIST OF: | |||||||||||||||||||||||
Capital | $ | 11,762,791 | $ | 16,640,682 | $ | 11,895,867 | $ | 7,012,169 | $ | 12,586,965 | |||||||||||||
Total distributable earnings (loss) | 2,412,508 | 16,120,076 | 3,360,549 | 7,567,986 | (1,432,351 | ) | |||||||||||||||||
NET ASSETS | $ | 14,175,299 | $ | 32,760,758 | $ | 15,256,416 | $ | 14,580,155 | $ | 11,154,614 | |||||||||||||
| SHARES OF BENEFICIAL INTEREST OUTSTANDING (unlimited number of shares authorized, no par value): | 209,084 | 527,781 | 329,982 | 165,981 | 654,751 | ||||||||||||||||||
| NET ASSET VALUE (offering and redemption price per share): | $ | 67.80 | $ | 62.07 | $ | 46.23 | $ | 87.84 | $ | 17.04 | |||||||||||||
| (a) Includes securities on loan valued at: | $ | — | $ | — | $ | — | $ | — | $ | — | |||||||||||||
Amounts designated as " – " are $0 or have been rounded to $0.
See accompanying notes to the financial statements.
June 30, 2024 (unaudited) :: Statements of Assets and Liabilities :: 175
| ProFund VP Mid-Cap Growth | ProFund VP Mid-Cap Value | ProFund VP Nasdaq-100 | ProFund VP Pharmaceuticals | ProFund VP Precious Metals | |||||||||||||||||||
ASSETS: | |||||||||||||||||||||||
Total Investment Securities, at cost | $ | 10,561,563 | $ | 8,319,163 | $ | 87,956,708 | $ | 7,223,061 | $ | 24,201,000 | |||||||||||||
Securities, at value(a) | 14,694,231 | 10,628,418 | 114,799,145 | 9,451,349 | — | ||||||||||||||||||
Repurchase agreements, at value | 49,000 | 40,000 | 53,265,000 | 165,000 | 24,201,000 | ||||||||||||||||||
Total Investment Securities, at value | 14,743,231 | 10,668,418 | 168,064,145 | 9,616,349 | 24,201,000 | ||||||||||||||||||
Cash | 511 | 782 | 1,571,066 | 708 | 521 | ||||||||||||||||||
Segregated cash balances for futures contracts with brokers | — | — | 1,752,300 | — | — | ||||||||||||||||||
Segregated cash balances for swap agreements with custodian | — | — | 111 | 30,000 | 793 | ||||||||||||||||||
Dividends and interest receivable | 6,441 | 16,093 | 40,737 | 4,086 | 10,463 | ||||||||||||||||||
Receivable for investments sold | — | — | — | — | — | ||||||||||||||||||
Receivable for capital shares issued | 12 | — | 889 | 209 | 6,200,869 | ||||||||||||||||||
Unrealized appreciation on swap agreements | — | — | — | — | — | ||||||||||||||||||
Variation margin on futures contracts | — | — | — | — | — | ||||||||||||||||||
Prepaid expenses | 750 | 523 | 889 | 67 | 156 | ||||||||||||||||||
TOTAL ASSETS | 14,750,945 | 10,685,816 | 171,430,137 | 9,651,419 | 30,413,802 | ||||||||||||||||||
LIABILITIES: | |||||||||||||||||||||||
Payable for investments purchased | — | 250 | — | — | — | ||||||||||||||||||
Payable for collateral for securities loaned | 13,858 | — | 209,873 | 182,208 | — | ||||||||||||||||||
Payable for capital shares redeemed | 17,121 | 3,973 | 1,497,449 | 48,376 | 18,311 | ||||||||||||||||||
Unrealized depreciation on swap agreements | — | — | 209,726 | 3,516 | 106,800 | ||||||||||||||||||
Variation margin on futures contracts | — | — | 101,025 | — | — | ||||||||||||||||||
Advisory fees payable | 8,186 | 5,558 | 97,066 | 5,659 | 14,692 | ||||||||||||||||||
Management services fees payable | 1,091 | 741 | 12,942 | 754 | 1,959 | ||||||||||||||||||
Administration fees payable | 969 | 669 | 10,667 | 601 | 1,452 | ||||||||||||||||||
Administrative services fees payable | 3,866 | 2,723 | 33,936 | 1,945 | 5,431 | ||||||||||||||||||
Distribution fees payable | 3,083 | 2,127 | 33,936 | 1,917 | 5,028 | ||||||||||||||||||
Transfer agency fees payable | 1,851 | 1,273 | 19,327 | 1,134 | 3,018 | ||||||||||||||||||
Fund accounting fees payable | 682 | 549 | 5,899 | 354 | 865 | ||||||||||||||||||
Compliance services fees payable | 57 | 41 | 605 | 37 | 94 | ||||||||||||||||||
Other accrued expenses | 11,380 | 8,030 | 126,252 | 10,244 | 22,024 | ||||||||||||||||||
TOTAL LIABILITIES | 62,144 | 25,934 | 2,358,703 | 256,745 | 179,674 | ||||||||||||||||||
Commitments and contingencies (Note 4) | |||||||||||||||||||||||
NET ASSETS | $ | 14,688,801 | $ | 10,659,882 | $ | 169,071,434 | $ | 9,394,674 | $ | 30,234,128 | |||||||||||||
NET ASSETS CONSIST OF: | |||||||||||||||||||||||
Capital | $ | 10,451,541 | $ | 9,735,514 | $ | 82,461,725 | $ | 8,442,636 | $ | 94,058,293 | |||||||||||||
Total distributable earnings (loss) | 4,237,260 | 924,368 | 86,609,709 | 952,038 | (63,824,165 | ) | |||||||||||||||||
NET ASSETS | $ | 14,688,801 | $ | 10,659,882 | $ | 169,071,434 | $ | 9,394,674 | $ | 30,234,128 | |||||||||||||
| SHARES OF BENEFICIAL INTEREST OUTSTANDING (unlimited number of shares authorized, no par value): | 378,850 | 266,890 | 2,847,626 | 320,133 | 1,149,992 | ||||||||||||||||||
| NET ASSET VALUE (offering and redemption price per share): | $ | 38.77 | $ | 39.94 | $ | 59.37 | $ | 29.35 | $ | 26.29 | |||||||||||||
| (a) Includes securities on loan valued at: | $ | 13,685 | $ | — | $ | 205,090 | $ | 115,398 | $ | — | |||||||||||||
See accompanying notes to the financial statements.
176 :: Statements of Assets and Liabilities :: June 30, 2024 (unaudited)
| ProFund VP Real Estate | ProFund VP Rising Rates Opportunity | ProFund VP Semiconductor | ProFund VP Short Dow 30 | ProFund VP Short Emerging Markets | |||||||||||||||||||
ASSETS: | |||||||||||||||||||||||
Total Investment Securities, at cost | $ | 2,934,301 | $ | 8,504,000 | $ | 9,869,959 | $ | 6,000 | $ | 519,000 | |||||||||||||
Securities, at value(a) | 6,044,324 | — | 41,531,246 | — | — | ||||||||||||||||||
Repurchase agreements, at value | 83,000 | 8,504,000 | 1,705,000 | 6,000 | 519,000 | ||||||||||||||||||
Total Investment Securities, at value | 6,127,324 | 8,504,000 | 43,236,246 | 6,000 | 519,000 | ||||||||||||||||||
Cash | 453 | 736 | 430 | 246 | 5,333 | ||||||||||||||||||
Segregated cash balances for futures contracts with brokers | — | — | — | — | — | ||||||||||||||||||
Segregated cash balances for swap agreements with custodian | — | 90 | 340,000 | — | 867 | ||||||||||||||||||
Dividends and interest receivable | 17,103 | 3,677 | 10,152 | 3 | 224 | ||||||||||||||||||
Receivable for investments sold | — | — | 49,931,851 | — | — | ||||||||||||||||||
Receivable for capital shares issued | 10,695 | — | 13,781 | — | 3,734 | ||||||||||||||||||
Unrealized appreciation on swap agreements | — | 235,093 | 95,739 | 8 | — | ||||||||||||||||||
Variation margin on futures contracts | — | — | — | — | — | ||||||||||||||||||
Prepaid expenses | 38 | 58 | 465 | — | 4 | ||||||||||||||||||
TOTAL ASSETS | 6,155,613 | 8,743,654 | 93,628,664 | 6,257 | 529,162 | ||||||||||||||||||
LIABILITIES: | |||||||||||||||||||||||
Payable for investments purchased | — | — | — | — | — | ||||||||||||||||||
Payable for collateral for securities loaned | — | — | 49,421 | — | — | ||||||||||||||||||
Payable for capital shares redeemed | 12,208 | 50,389 | 177,420 | — | 241 | ||||||||||||||||||
Unrealized depreciation on swap agreements | 698 | — | — | — | 31 | ||||||||||||||||||
Variation margin on futures contracts | — | — | — | — | — | ||||||||||||||||||
Advisory fees payable | 3,584 | 5,307 | 58,093 | 4 | 340 | ||||||||||||||||||
Management services fees payable | 478 | 707 | 7,746 | 1 | 45 | ||||||||||||||||||
Administration fees payable | 406 | 553 | 6,101 | — | 33 | ||||||||||||||||||
Administrative services fees payable | 1,546 | 1,486 | 17,031 | — | 108 | ||||||||||||||||||
Distribution fees payable | 1,288 | 1,769 | 19,353 | 1 | 113 | ||||||||||||||||||
Transfer agency fees payable | 750 | 1,109 | 10,962 | — | 65 | ||||||||||||||||||
Fund accounting fees payable | 242 | 303 | 3,359 | — | 19 | ||||||||||||||||||
Compliance services fees payable | 24 | 33 | 345 | — | 2 | ||||||||||||||||||
Other accrued expenses | 5,866 | 7,895 | 57,576 | 1 | 559 | ||||||||||||||||||
TOTAL LIABILITIES | 27,090 | 69,551 | 407,407 | 7 | 1,556 | ||||||||||||||||||
Commitments and contingencies (Note 4) | |||||||||||||||||||||||
NET ASSETS | $ | 6,128,523 | $ | 8,674,103 | $ | 93,221,257 | $ | 6,250 | $ | 527,606 | |||||||||||||
NET ASSETS CONSIST OF: | |||||||||||||||||||||||
Capital | $ | 3,092,015 | $ | 37,976,284 | $ | 34,446,505 | $ | 126,069 | $ | 3,334,858 | |||||||||||||
Total distributable earnings (loss) | 3,036,508 | (29,302,181 | ) | 58,774,752 | (119,819 | ) | (2,807,252 | ) | |||||||||||||||
NET ASSETS | $ | 6,128,523 | $ | 8,674,103 | $ | 93,221,257 | $ | 6,250 | $ | 527,606 | |||||||||||||
| SHARES OF BENEFICIAL INTEREST OUTSTANDING (unlimited number of shares authorized, no par value): | 133,727 | 317,459 | 470,398 | 302 | 24,699 | ||||||||||||||||||
| NET ASSET VALUE (offering and redemption price per share): | $ | 45.83 | $ | 27.32 | $ | 198.18 | $ | 20.70 | $ | 21.36 | |||||||||||||
| (a) Includes securities on loan valued at: | $ | — | $ | — | $ | 30,993 | $ | — | $ | — | |||||||||||||
Amounts designated as " – " are $0 or have been rounded to $0.
See accompanying notes to the financial statements.
June 30, 2024 (unaudited) :: Statements of Assets and Liabilities :: 177
| ProFund VP Short International | ProFund VP Short Mid-Cap | ProFund VP Short Nasdaq-100 | ProFund VP Short Small-Cap | ProFund VP Small-Cap | |||||||||||||||||||
ASSETS: | |||||||||||||||||||||||
Total Investment Securities, at cost | $ | 784,000 | $ | 84,000 | $ | 2,506,000 | $ | 3,030,000 | $ | 5,393,038 | |||||||||||||
Securities, at value(a) | — | — | — | — | 6,211,472 | ||||||||||||||||||
Repurchase agreements, at value | 784,000 | 84,000 | 2,506,000 | 3,030,000 | 1,041,000 | ||||||||||||||||||
Total Investment Securities, at value | 784,000 | 84,000 | 2,506,000 | 3,030,000 | 7,252,472 | ||||||||||||||||||
Cash | 15,402 | 1,244 | 610 | 25,763 | 4,613 | ||||||||||||||||||
Segregated cash balances for futures contracts with brokers | — | — | 38,940 | 28,600 | 57,200 | ||||||||||||||||||
Segregated cash balances for swap agreements with custodian | 449 | 639 | — | 762 | 603 | ||||||||||||||||||
Dividends and interest receivable | 339 | 36 | 1,083 | 1,310 | 7,059 | ||||||||||||||||||
Receivable for investments sold | — | — | — | — | 632,627 | ||||||||||||||||||
Receivable for capital shares issued | 1,866 | — | — | 573,236 | 2,482 | ||||||||||||||||||
Unrealized appreciation on swap agreements | — | — | 11,673 | — | 3,302 | ||||||||||||||||||
Variation margin on futures contracts | — | — | 2,245 | — | 980 | ||||||||||||||||||
Prepaid expenses | 4 | 5 | 30 | 12 | 75 | ||||||||||||||||||
TOTAL ASSETS | 802,060 | 85,924 | 2,560,581 | 3,659,683 | 7,961,413 | ||||||||||||||||||
LIABILITIES: | |||||||||||||||||||||||
Payable for investments purchased | — | — | — | — | 642,692 | ||||||||||||||||||
Payable for collateral for securities loaned | — | — | — | — | 62,883 | ||||||||||||||||||
Payable for capital shares redeemed | 982 | 10,010 | 1,822 | 8 | 3,066 | ||||||||||||||||||
Unrealized depreciation on swap agreements | 1,191 | 245 | — | 14,233 | — | ||||||||||||||||||
Variation margin on futures contracts | — | — | — | 490 | — | ||||||||||||||||||
Advisory fees payable | 491 | 42 | 1,696 | 1,175 | 4,358 | ||||||||||||||||||
Management services fees payable | 66 | 5 | 226 | 157 | 581 | ||||||||||||||||||
Administration fees payable | 47 | 4 | 184 | 137 | 598 | ||||||||||||||||||
Administrative services fees payable | 157 | 18 | 555 | 443 | 1,695 | ||||||||||||||||||
Distribution fees payable | 164 | 15 | 586 | 436 | 1,902 | ||||||||||||||||||
Transfer agency fees payable | 82 | 10 | 386 | 223 | 1,204 | ||||||||||||||||||
Fund accounting fees payable | 28 | 3 | 102 | 77 | 1,531 | ||||||||||||||||||
Compliance services fees payable | 2 | — | 13 | 7 | 41 | ||||||||||||||||||
Other accrued expenses | 463 | 79 | 3,718 | 2,734 | 13,503 | ||||||||||||||||||
TOTAL LIABILITIES | 3,673 | 10,431 | 9,288 | 20,120 | 734,054 | ||||||||||||||||||
Commitments and contingencies (Note 4) | |||||||||||||||||||||||
NET ASSETS | $ | 798,387 | $ | 75,493 | $ | 2,551,293 | $ | 3,639,563 | $ | 7,227,359 | |||||||||||||
NET ASSETS CONSIST OF: | |||||||||||||||||||||||
Capital | $ | 3,459,801 | $ | 2,688,172 | $ | 21,184,747 | $ | 10,055,658 | $ | 5,832,931 | |||||||||||||
Total distributable earnings (loss) | (2,661,414 | ) | (2,612,679 | ) | (18,633,454 | ) | (6,416,095 | ) | 1,394,428 | ||||||||||||||
NET ASSETS | $ | 798,387 | $ | 75,493 | $ | 2,551,293 | $ | 3,639,563 | $ | 7,227,359 | |||||||||||||
| SHARES OF BENEFICIAL INTEREST OUTSTANDING (unlimited number of shares authorized, no par value): | 33,956 | 11,561 | 254,114 | 172,057 | 212,024 | ||||||||||||||||||
| NET ASSET VALUE (offering and redemption price per share): | $ | 23.51 | $ | 6.53 | $ | 10.04 | $ | 21.15 | $ | 34.09 | |||||||||||||
| (a) Includes securities on loan valued at: | $ | — | $ | — | $ | — | $ | — | $ | 58,435 | |||||||||||||
See accompanying notes to the financial statements.
178 :: Statements of Assets and Liabilities :: June 30, 2024 (unaudited)
| ProFund VP Small-Cap Growth | ProFund VP Small-Cap Value | ProFund VP Technology | ProFund VP UltraBull | ProFund VP UltraMid-Cap | |||||||||||||||||||
ASSETS: | |||||||||||||||||||||||
Total Investment Securities, at cost | $ | 11,286,500 | $ | 13,268,216 | $ | 29,367,959 | $ | 7,916,682 | $ | 7,786,498 | |||||||||||||
Securities, at value(a) | 15,619,303 | 14,823,826 | 61,347,146 | 13,643,493 | 7,731,987 | ||||||||||||||||||
Repurchase agreements, at value | 53,000 | 49,000 | 1,253,000 | 3,603,000 | 2,988,000 | ||||||||||||||||||
Total Investment Securities, at value | 15,672,303 | 14,872,826 | 62,600,146 | 17,246,493 | 10,719,987 | ||||||||||||||||||
Cash | 228 | 86 | 807 | 578,535 | 703 | ||||||||||||||||||
Segregated cash balances for futures contracts with brokers | — | — | — | 90,860 | 66,440 | ||||||||||||||||||
Segregated cash balances for swap agreements with custodian | — | — | 230,000 | 552 | 69 | ||||||||||||||||||
Dividends and interest receivable | 10,789 | 24,219 | 9,117 | 8,530 | 8,708 | ||||||||||||||||||
Receivable for investments sold | — | — | — | — | — | ||||||||||||||||||
Receivable for capital shares issued | 964 | 2,587 | 21,759 | — | 2,786 | ||||||||||||||||||
Unrealized appreciation on swap agreements | — | — | 6,802 | — | 35,518 | ||||||||||||||||||
Variation margin on futures contracts | — | — | — | — | 1,360 | ||||||||||||||||||
Prepaid expenses | 773 | 778 | 339 | 813 | 507 | ||||||||||||||||||
TOTAL ASSETS | 15,685,057 | 14,900,496 | 62,868,970 | 17,925,783 | 10,836,078 | ||||||||||||||||||
LIABILITIES: | |||||||||||||||||||||||
Payable for investments purchased | 1,974 | 2,322 | — | — | — | ||||||||||||||||||
Payable for collateral for securities loaned | 12,963 | 237,439 | — | — | 7,712 | ||||||||||||||||||
Payable for capital shares redeemed | 3,744 | 4,356 | 17,680 | 13,230 | 773 | ||||||||||||||||||
Unrealized depreciation on swap agreements | — | — | — | 83,420 | — | ||||||||||||||||||
Variation margin on futures contracts | — | — | — | 8,575 | — | ||||||||||||||||||
Advisory fees payable | 9,146 | 8,592 | 37,878 | 10,226 | 5,673 | ||||||||||||||||||
Management services fees payable | 1,219 | 1,146 | 5,050 | 1,363 | 756 | ||||||||||||||||||
Administration fees payable | 1,018 | 960 | 3,977 | 1,141 | 654 | ||||||||||||||||||
Administrative services fees payable | 3,545 | 3,297 | 9,091 | 3,906 | 2,496 | ||||||||||||||||||
Distribution fees payable | 3,239 | 3,053 | 12,626 | 3,617 | 2,080 | ||||||||||||||||||
Transfer agency fees payable | 1,916 | 1,864 | 7,201 | 2,086 | 1,246 | ||||||||||||||||||
Fund accounting fees payable | 771 | 812 | 2,216 | 938 | 609 | ||||||||||||||||||
Compliance services fees payable | 61 | 59 | 230 | 67 | 40 | ||||||||||||||||||
Other accrued expenses | 12,139 | 13,222 | 50,186 | 13,170 | 8,175 | ||||||||||||||||||
TOTAL LIABILITIES | 51,735 | 277,122 | 146,135 | 141,739 | 30,214 | ||||||||||||||||||
Commitments and contingencies (Note 4) | |||||||||||||||||||||||
NET ASSETS | $ | 15,633,322 | $ | 14,623,374 | $ | 62,722,835 | $ | 17,784,044 | $ | 10,805,864 | |||||||||||||
NET ASSETS CONSIST OF: | |||||||||||||||||||||||
Capital | $ | 11,354,871 | $ | 15,247,882 | $ | 21,188,847 | $ | 20,639,057 | $ | 9,091,721 | |||||||||||||
Total distributable earnings (loss) | 4,278,451 | (624,508 | ) | 41,533,988 | (2,855,013 | ) | 1,714,143 | ||||||||||||||||
NET ASSETS | $ | 15,633,322 | $ | 14,623,374 | $ | 62,722,835 | $ | 17,784,044 | $ | 10,805,864 | |||||||||||||
| SHARES OF BENEFICIAL INTEREST OUTSTANDING (unlimited number of shares authorized, no par value): | 533,909 | 363,799 | 832,243 | 469,572 | 288,953 | ||||||||||||||||||
| NET ASSET VALUE (offering and redemption price per share): | $ | 29.28 | $ | 40.20 | $ | 75.37 | $ | 37.87 | $ | 37.40 | |||||||||||||
| (a) Includes securities on loan valued at: | $ | 12,495 | $ | 221,407 | $ | — | $ | — | $ | 7,616 | |||||||||||||
Amounts designated as " – " are $0 or have been rounded to $0.
See accompanying notes to the financial statements.
June 30, 2024 (unaudited) :: Statements of Assets and Liabilities :: 179
| ProFund VP UltraNasdaq-100 | ProFund VP UltraShort Dow 30 | ProFund VP UltraShort Nasdaq-100 | ProFund VP UltraSmall-Cap | ProFund VP U.S. Government Plus | |||||||||||||||||||
ASSETS: | |||||||||||||||||||||||
Total Investment Securities, at cost | $ | 128,073,704 | $ | 2,000 | $ | 1,588,000 | $ | 9,714,530 | $ | 6,439,630 | |||||||||||||
Securities, at value(a) | 163,831,297 | — | — | 9,466,434 | 2,879,716 | ||||||||||||||||||
Repurchase agreements, at value | 60,377,000 | 2,000 | 1,588,000 | 3,335,000 | 3,558,000 | ||||||||||||||||||
Total Investment Securities, at value | 224,208,297 | 2,000 | 1,588,000 | 12,801,434 | 6,437,716 | ||||||||||||||||||
Cash | 11,109,346 | 660 | 907 | 18,338 | 25 | ||||||||||||||||||
Segregated cash balances for futures contracts with brokers | 2,608,980 | — | — | 257,400 | — | ||||||||||||||||||
Segregated cash balances for swap agreements with custodian | 478 | 471 | 667 | 871 | 81 | ||||||||||||||||||
Dividends and interest receivable | 51,353 | 1 | 687 | 10,658 | 18,314 | ||||||||||||||||||
Receivable for investments sold | — | — | — | 961,026 | — | ||||||||||||||||||
Receivable for capital shares issued | 1,551,025 | — | 363 | 56,023 | 30,657 | ||||||||||||||||||
Unrealized appreciation on swap agreements | — | 8 | 17,354 | 68,614 | — | ||||||||||||||||||
Variation margin on futures contracts | — | — | — | 4,410 | — | ||||||||||||||||||
Prepaid expenses | 1,187 | — | 11 | 93 | 45 | ||||||||||||||||||
TOTAL ASSETS | 239,530,666 | 3,140 | 1,607,989 | 14,178,867 | 6,486,838 | ||||||||||||||||||
LIABILITIES: | |||||||||||||||||||||||
Payable for investments purchased | — | — | — | 977,818 | — | ||||||||||||||||||
Payable for collateral for securities loaned | 299,548 | — | — | 93,158 | — | ||||||||||||||||||
Payable for capital shares redeemed | 325,351 | — | 205 | 174,431 | 9,202 | ||||||||||||||||||
Unrealized depreciation on swap agreements | 1,549,929 | — | — | — | 110,981 | ||||||||||||||||||
Variation margin on futures contracts | 150,415 | — | — | — | — | ||||||||||||||||||
Advisory fees payable | 130,654 | 2 | 868 | 6,086 | 2,510 | ||||||||||||||||||
Management services fees payable | 17,420 | — | 116 | 811 | 502 | ||||||||||||||||||
Administration fees payable | 14,675 | — | 92 | 842 | 417 | ||||||||||||||||||
Administrative services fees payable | 51,993 | — | 210 | 2,891 | 1,269 | ||||||||||||||||||
Distribution fees payable | 46,422 | 1 | 294 | 2,677 | 1,322 | ||||||||||||||||||
Transfer agency fees payable | 25,976 | — | 144 | 1,638 | 759 | ||||||||||||||||||
Fund accounting fees payable | 8,092 | — | 51 | 1,665 | 229 | ||||||||||||||||||
Compliance services fees payable | 828 | — | 5 | 54 | 25 | ||||||||||||||||||
Other accrued expenses | 161,107 | 2 | 1,074 | 18,137 | 6,106 | ||||||||||||||||||
TOTAL LIABILITIES | 2,782,410 | 5 | 3,059 | 1,280,208 | 133,322 | ||||||||||||||||||
Commitments and contingencies (Note 4) | |||||||||||||||||||||||
NET ASSETS | $ | 236,748,256 | $ | 3,135 | $ | 1,604,930 | $ | 12,898,659 | $ | 6,353,516 | |||||||||||||
NET ASSETS CONSIST OF: | |||||||||||||||||||||||
Capital | $ | 134,190,566 | $ | 972,785 | $ | 10,729,347 | $ | 18,581,604 | $ | 15,712,812 | |||||||||||||
Total distributable earnings (loss) | 102,557,690 | (969,650 | ) | (9,124,417 | ) | (5,682,945 | ) | (9,359,296 | ) | ||||||||||||||
NET ASSETS | $ | 236,748,256 | $ | 3,135 | $ | 1,604,930 | $ | 12,898,659 | $ | 6,353,516 | |||||||||||||
| SHARES OF BENEFICIAL INTEREST OUTSTANDING (unlimited number of shares authorized, no par value): | 5,856,309 | 1,052 | 63,247 | 960,259 | 558,675 | ||||||||||||||||||
| NET ASSET VALUE (offering and redemption price per share): | $ | 40.43 | $ | 2.98 | $ | 25.38 | $ | 13.43 | $ | 11.37 | |||||||||||||
| (a) Includes securities on loan valued at: | $ | 292,722 | $ | — | $ | — | $ | 86,334 | $ | — | |||||||||||||
See accompanying notes to the financial statements.
180 :: Statements of Assets and Liabilities :: June 30, 2024 (unaudited)
| ProFund VP Utilities | |||||||
ASSETS: | |||||||
Total Investment Securities, at cost | $ | 12,804,024 | |||||
Securities, at value | 28,146,440 | ||||||
Repurchase agreements, at value | 671,000 | ||||||
Total Investment Securities, at value | 28,817,440 | ||||||
Cash | 572 | ||||||
Segregated cash balances for swap agreements with custodian | 160,000 | ||||||
Dividends and interest receivable | 30,693 | ||||||
Receivable for capital shares issued | 40,121 | ||||||
Prepaid expenses | 170 | ||||||
TOTAL ASSETS | 29,048,996 | ||||||
LIABILITIES: | |||||||
Payable for capital shares redeemed | 76,000 | ||||||
Unrealized depreciation on swap agreements | 10,692 | ||||||
Advisory fees payable | 17,847 | ||||||
Management services fees payable | 2,380 | ||||||
Administration fees payable | 1,894 | ||||||
Administrative services fees payable | 6,509 | ||||||
Distribution fees payable | 6,027 | ||||||
Transfer agency fees payable | 3,529 | ||||||
Fund accounting fees payable | 1,055 | ||||||
Compliance services fees payable | 103 | ||||||
Other accrued expenses | 30,713 | ||||||
TOTAL LIABILITIES | 156,749 | ||||||
Commitments and contingencies (Note 4) | |||||||
NET ASSETS | $ | 28,892,247 | |||||
NET ASSETS CONSIST OF: | |||||||
Capital | $ | 14,611,734 | |||||
Total distributable earnings (loss) | 14,280,513 | ||||||
NET ASSETS | $ | 28,892,247 | |||||
| SHARES OF BENEFICIAL INTEREST OUTSTANDING (unlimited number of shares authorized, no par value): | 723,237 | ||||||
| NET ASSET VALUE (offering and redemption price per share): | $ | 39.95 | |||||
Amounts designated as " – " are $0 or have been rounded to $0.
See accompanying notes to the financial statements.
182 :: Statements of Operations :: For the Periods Indicated (unaudited)
| ProFund Access VP High Yield | ProFund VP Asia 30 | ProFund VP Banks | ProFund VP Bear | ProFund VP Biotechnology | |||||||||||||||||||
| Six Months Ended June 30, 2024 | Six Months Ended June 30, 2024 | Six Months Ended June 30, 2024 | Six Months Ended June 30, 2024 | Six Months Ended June 30, 2024 | |||||||||||||||||||
INVESTMENT INCOME: | |||||||||||||||||||||||
Dividends | $ | — | $ | 385,839 | $ | 62,982 | $ | — | $ | 26,822 | |||||||||||||
Interest | 358,455 | 2,330 | 503 | 51,841 | 21,325 | ||||||||||||||||||
Foreign tax withholding | — | (1,873 | ) | — | — | — | |||||||||||||||||
Net income from securities lending | — | 10,650 | 9 | — | 50,931 | ||||||||||||||||||
TOTAL INVESTMENT INCOME | 358,455 | 396,946 | 63,494 | 51,841 | 99,078 | ||||||||||||||||||
EXPENSES: | |||||||||||||||||||||||
Advisory fees | 56,969 | 56,355 | 15,602 | 7,358 | 165,332 | ||||||||||||||||||
Management services fees | 7,596 | 7,514 | 2,080 | 981 | 22,044 | ||||||||||||||||||
Administration fees | 6,009 | 6,068 | 1,772 | 814 | 18,180 | ||||||||||||||||||
Distribution fees | 18,990 | 18,785 | 5,201 | 2,453 | 55,111 | ||||||||||||||||||
Transfer agency fees | 5,483 | 5,504 | 1,636 | 732 | 16,499 | ||||||||||||||||||
Administrative services fees | 17,975 | 14,667 | 6,164 | 2,521 | 40,771 | ||||||||||||||||||
Custody fees | 1,181 | 13,328 | 478 | 161 | 4,737 | ||||||||||||||||||
Fund accounting fees | 3,323 | 3,387 | 1,186 | 450 | 10,250 | ||||||||||||||||||
Trustee fees | 161 | 164 | 47 | 21 | 482 | ||||||||||||||||||
Compliance services fees | 40 | 52 | 15 | 6 | 154 | ||||||||||||||||||
Other fees | 8,605 | 8,669 | 3,301 | 1,347 | 34,240 | ||||||||||||||||||
Recoupment of prior expenses reduced by the Advisor | 1,583 | — | — | — | — | ||||||||||||||||||
Total Gross Expenses before reductions | 127,915 | 134,493 | 37,482 | 16,844 | 367,800 | ||||||||||||||||||
Expenses reduced and reimbursed by the Advisor | (192 | ) | (8,182 | ) | (2,219 | ) | (343 | ) | — | ||||||||||||||
Fees paid indirectly | (112 | ) | (13 | ) | (314 | ) | (19 | ) | (2,460 | ) | |||||||||||||
TOTAL NET EXPENSES | 127,611 | 126,298 | 34,949 | 16,482 | 365,340 | ||||||||||||||||||
NET INVESTMENT INCOME (LOSS) | 230,844 | 270,648 | 28,545 | 35,359 | (266,262 | ) | |||||||||||||||||
| REALIZED AND UNREALIZED GAINS (LOSSES) ON INVESTMENTS: | |||||||||||||||||||||||
Net realized gains (losses) on investment securities | (72,965 | ) | (628,862 | ) | 474,096 | — | 2,000,304 | ||||||||||||||||
Net realized gains (losses) on futures contracts | (31,327 | ) | — | — | (53,290 | ) | — | ||||||||||||||||
Net realized gains (losses) on swap agreements | 985,370 | — | (11,442 | ) | (211,058 | ) | 30,967 | ||||||||||||||||
| Change in net unrealized appreciation/depreciation on investment securities | (112,988 | ) | 854,424 | (525,628 | ) | — | (527,009 | ) | |||||||||||||||
| Change in net unrealized appreciation/depreciation on futures contracts | (35,764 | ) | — | — | 18,029 | — | |||||||||||||||||
| Change in net unrealized appreciation/depreciation on swap agreements | (642,796 | ) | — | 3,090 | (1,240 | ) | (6,780 | ) | |||||||||||||||
| NET REALIZED AND UNREALIZED GAINS (LOSSES) ON INVESTMENTS | 89,530 | 225,562 | (59,884 | ) | (247,559 | ) | 1,497,482 | ||||||||||||||||
| CHANGE IN NET ASSETS RESULTING FROM OPERATIONS | $ | 320,374 | $ | 496,210 | $ | (31,339 | ) | $ | (212,200 | ) | $ | 1,231,220 | |||||||||||
Amounts designated as " – " are $0 or have been rounded to $0.
See accompanying notes to the financial statements.
For the Periods Indicated (unaudited) :: Statements of Operations :: 183
ProFund VP Bull | ProFund VP Communication Services | ProFund VP Consumer Discretionary | ProFund VP Consumer Staples | ProFund VP Dow 30 | |||||||||||||||||||
| Six Months Ended June 30, 2024 | Six Months Ended June 30, 2024 | Six Months Ended June 30, 2024 | Six Months Ended June 30, 2024 | Six Months Ended June 30, 2024 | |||||||||||||||||||
INVESTMENT INCOME: | |||||||||||||||||||||||
Dividends | $ | 336,779 | $ | 52,703 | $ | 104,429 | $ | 144,207 | $ | — | |||||||||||||
Interest | 300,398 | 5,434 | 6,609 | 5,524 | 9,136 | ||||||||||||||||||
Foreign tax withholding | (82 | ) | — | — | — | — | |||||||||||||||||
Net income from securities lending | — | — | — | — | — | ||||||||||||||||||
TOTAL INVESTMENT INCOME | 637,095 | 58,137 | 111,038 | 149,731 | 9,136 | ||||||||||||||||||
EXPENSES: | |||||||||||||||||||||||
Advisory fees | 220,368 | 35,210 | 84,531 | 41,716 | 1,301 | ||||||||||||||||||
Management services fees | 29,382 | 4,695 | 11,271 | 5,562 | 174 | ||||||||||||||||||
Administration fees | 25,258 | 4,020 | 9,715 | 4,776 | 130 | ||||||||||||||||||
Distribution fees | 73,456 | 11,737 | 28,177 | 13,905 | 434 | ||||||||||||||||||
Transfer agency fees | 22,900 | 3,661 | 8,829 | 4,328 | 129 | ||||||||||||||||||
Administrative services fees | 72,725 | 13,196 | 30,958 | 15,642 | 260 | ||||||||||||||||||
Custody fees | 5,256 | 802 | 2,529 | 1,034 | 31 | ||||||||||||||||||
Fund accounting fees | 14,861 | 2,258 | 5,448 | 2,699 | 78 | ||||||||||||||||||
Trustee fees | 680 | 111 | 267 | 127 | 4 | ||||||||||||||||||
Compliance services fees | 222 | 36 | 84 | 40 | 1 | ||||||||||||||||||
Other fees | 39,311 | 7,118 | 17,900 | 8,784 | 262 | ||||||||||||||||||
Recoupment of prior expenses reduced by the Advisor | — | — | — | — | — | ||||||||||||||||||
Total Gross Expenses before reductions | 504,419 | 82,844 | 199,709 | 98,613 | 2,804 | ||||||||||||||||||
Expenses reduced and reimbursed by the Advisor | (9,844 | ) | (3,965 | ) | (8,980 | ) | (4,903 | ) | — | ||||||||||||||
Fees paid indirectly | (950 | ) | (8 | ) | (1,381 | ) | (267 | ) | (7 | ) | |||||||||||||
TOTAL NET EXPENSES | 493,625 | 78,871 | 189,348 | 93,443 | 2,797 | ||||||||||||||||||
NET INVESTMENT INCOME (LOSS) | 143,470 | (20,734 | ) | (78,310 | ) | 56,288 | 6,339 | ||||||||||||||||
| REALIZED AND UNREALIZED GAINS (LOSSES) ON INVESTMENTS: | |||||||||||||||||||||||
Net realized gains (losses) on investment securities | (149,620 | ) | 397,610 | 452,414 | 114,323 | — | |||||||||||||||||
Net realized gains (losses) on futures contracts | 379,609 | — | — | — | — | ||||||||||||||||||
Net realized gains (losses) on swap agreements | 910,357 | 33,641 | (13,477 | ) | 9,449 | 6,545 | |||||||||||||||||
| Change in net unrealized appreciation/depreciation on investment securities | 6,623,915 | 1,108,508 | (83,429 | ) | 427,156 | — | |||||||||||||||||
| Change in net unrealized appreciation/depreciation on futures contracts | (106,696 | ) | — | — | — | — | |||||||||||||||||
| Change in net unrealized appreciation/depreciation on swap agreements | (756 | ) | 2,307 | 4,375 | (4,032 | ) | (694 | ) | |||||||||||||||
| NET REALIZED AND UNREALIZED GAINS (LOSSES) ON INVESTMENTS | 7,656,809 | 1,542,066 | 359,883 | 546,896 | 5,851 | ||||||||||||||||||
| CHANGE IN NET ASSETS RESULTING FROM OPERATIONS | $ | 7,800,279 | $ | 1,521,332 | $ | 281,573 | $ | 603,184 | $ | 12,190 | |||||||||||||
See accompanying notes to the financial statements.
184 :: Statements of Operations :: For the Periods Indicated (unaudited)
| ProFund VP Emerging Markets | ProFund VP Energy | ProFund VP Europe 30 | ProFund VP Falling U.S. Dollar | ProFund VP Financials | |||||||||||||||||||
| Six Months Ended June 30, 2024 | Six Months Ended June 30, 2024 | Six Months Ended June 30, 2024 | Six Months Ended June 30, 2024 | Six Months Ended June 30, 2024 | |||||||||||||||||||
INVESTMENT INCOME: | |||||||||||||||||||||||
Dividends | $ | 309,935 | $ | 744,334 | $ | 391,702 | $ | — | $ | 241,020 | |||||||||||||
Interest | 37,402 | 17,527 | 810 | 12,469 | 11,385 | ||||||||||||||||||
Foreign tax withholding | (10,016 | ) | — | (16,293 | ) | — | — | ||||||||||||||||
Net income from securities lending | 10,476 | — | 6,779 | — | — | ||||||||||||||||||
TOTAL INVESTMENT INCOME | 347,797 | 761,861 | 382,998 | 12,469 | 252,405 | ||||||||||||||||||
EXPENSES: | |||||||||||||||||||||||
Advisory fees | 80,959 | 172,091 | 57,899 | 1,767 | 109,314 | ||||||||||||||||||
Management services fees | 10,794 | 22,945 | 7,720 | 236 | 14,575 | ||||||||||||||||||
Administration fees | 8,998 | 19,403 | 5,958 | 199 | 12,452 | ||||||||||||||||||
Distribution fees | 26,986 | 57,364 | 19,300 | 589 | 36,438 | ||||||||||||||||||
Transfer agency fees | 8,191 | 17,626 | 5,409 | 186 | 11,330 | ||||||||||||||||||
Administrative services fees | 24,881 | 58,777 | 17,294 | 516 | 35,677 | ||||||||||||||||||
Custody fees | 11,993 | 4,676 | 8,153 | 3,708 | 3,221 | ||||||||||||||||||
Fund accounting fees | 5,051 | 10,719 | 3,329 | 113 | 7,005 | ||||||||||||||||||
Trustee fees | 247 | 520 | 156 | 5 | 336 | ||||||||||||||||||
Compliance services fees | 79 | 156 | 53 | 2 | 109 | ||||||||||||||||||
Audit fees | 8,448 | 18,474 | 5,883 | 167 | 11,571 | ||||||||||||||||||
Licensing fees | 2,677 | 7,579 | — | 1,066 | 4,829 | ||||||||||||||||||
Other fees | 4,666 | 10,139 | 3,280 | 111 | 6,505 | ||||||||||||||||||
Recoupment of prior expenses reduced by the Advisor | — | — | — | — | — | ||||||||||||||||||
Total Gross Expenses before reductions | 193,970 | 400,469 | 134,434 | 8,665 | 253,362 | ||||||||||||||||||
Expenses reduced and reimbursed by the Advisor | (12,584 | ) | (12,996 | ) | (4,736 | ) | (4,695 | ) | (6,690 | ) | |||||||||||||
Fees paid indirectly | (38 | ) | (1,988 | ) | (4 | ) | (11 | ) | (1,809 | ) | |||||||||||||
TOTAL NET EXPENSES | 181,348 | 385,485 | 129,694 | 3,959 | 244,863 | ||||||||||||||||||
NET INVESTMENT INCOME (LOSS) | 166,449 | 376,376 | 253,304 | 8,510 | 7,542 | ||||||||||||||||||
| REALIZED AND UNREALIZED GAINS (LOSSES) ON INVESTMENTS: | |||||||||||||||||||||||
Net realized gains (losses) on investment securities | 804,409 | 2,040,016 | 84,614 | — | 160,954 | ||||||||||||||||||
Net realized gains (losses) on swap agreements | (36,918 | ) | (971 | ) | — | — | 72,360 | ||||||||||||||||
Net realized gains (losses) on forward currency contracts | — | — | — | (734 | ) | — | |||||||||||||||||
| Change in net unrealized appreciation/depreciation on investment securities | 7,567 | 1,632,339 | 386,882 | — | 2,320,958 | ||||||||||||||||||
| Change in net unrealized appreciation/depreciation on swap agreements | (4,730 | ) | 31,230 | — | — | (7,922 | ) | ||||||||||||||||
| Change in net unrealized appreciation/depreciation on forward currency contracts | — | — | — | (31,120 | ) | — | |||||||||||||||||
| NET REALIZED AND UNREALIZED GAINS (LOSSES) ON INVESTMENTS | 770,328 | 3,702,614 | 471,496 | (31,854 | ) | 2,546,350 | |||||||||||||||||
| CHANGE IN NET ASSETS RESULTING FROM OPERATIONS | $ | 936,777 | $ | 4,078,990 | $ | 724,800 | $ | (23,344 | ) | $ | 2,553,892 | ||||||||||||
Amounts designated as " – " are $0 or have been rounded to $0.
See accompanying notes to the financial statements.
For the Periods Indicated (unaudited) :: Statements of Operations :: 185
| ProFund VP Government Money Market | ProFund VP Health Care | ProFund VP Industrials | ProFund VP International | ProFund VP Internet | |||||||||||||||||||
| Six Months Ended June 30, 2024 | Six Months Ended June 30, 2024 | Six Months Ended June 30, 2024 | Six Months Ended June 30, 2024 | Six Months Ended June 30, 2024 | |||||||||||||||||||
INVESTMENT INCOME: | |||||||||||||||||||||||
Dividends | $ | — | $ | 315,705 | $ | 122,748 | $ | — | $ | 19,126 | |||||||||||||
Interest | 812,118 | 17,194 | 8,883 | 287,011 | 3,657 | ||||||||||||||||||
Foreign tax withholding | — | — | — | — | — | ||||||||||||||||||
Net income from securities lending | — | — | — | — | 1 | ||||||||||||||||||
TOTAL INVESTMENT INCOME | 812,118 | 332,899 | 131,631 | 287,011 | 22,784 | ||||||||||||||||||
EXPENSES: | |||||||||||||||||||||||
Advisory fees | 114,639 | 144,980 | 63,437 | 40,776 | 48,747 | ||||||||||||||||||
Management services fees | 15,285 | 19,330 | 8,458 | 5,437 | 6,500 | ||||||||||||||||||
Administration fees | 7,193 | 15,827 | 7,344 | 3,961 | 5,485 | ||||||||||||||||||
Distribution fees | — | 48,327 | 21,146 | 13,592 | 16,249 | ||||||||||||||||||
Transfer agency fees | 13,722 | 14,341 | 6,693 | 3,920 | 5,008 | ||||||||||||||||||
Administrative services fees | — | 48,790 | 21,925 | 13,357 | 17,365 | ||||||||||||||||||
Custody fees | 3,302 | 4,278 | 1,429 | 919 | 1,508 | ||||||||||||||||||
Fund accounting fees | 8,924 | 8,810 | 4,216 | 2,374 | 3,113 | ||||||||||||||||||
Trustee fees | 405 | 421 | 197 | 115 | 149 | ||||||||||||||||||
Compliance services fees | 123 | 133 | 64 | 37 | 47 | ||||||||||||||||||
Audit fees | 14,331 | 14,838 | 6,926 | 4,033 | 5,078 | ||||||||||||||||||
Licensing fees | — | 6,150 | 2,891 | — | 1,352 | ||||||||||||||||||
Other fees | 7,875 | 8,271 | 3,856 | 2,247 | 2,834 | ||||||||||||||||||
Recoupment of prior expenses reduced by the Advisor | — | — | — | 757 | — | ||||||||||||||||||
Total Gross Expenses before reductions | 185,799 | 334,496 | 148,582 | 91,525 | 113,435 | ||||||||||||||||||
Expenses reduced and reimbursed by the Advisor | (48,089 | ) | (7,425 | ) | (6,472 | ) | — | (3,260 | ) | ||||||||||||||
Fees paid indirectly | (144 | ) | (2,314 | ) | (10 | ) | (186 | ) | (981 | ) | |||||||||||||
TOTAL NET EXPENSES | 137,566 | 324,757 | 142,100 | 91,339 | 109,194 | ||||||||||||||||||
NET INVESTMENT INCOME (LOSS) | 674,552 | 8,142 | (10,469 | ) | 195,672 | (86,410 | ) | ||||||||||||||||
| REALIZED AND UNREALIZED GAINS (LOSSES) ON INVESTMENTS: | |||||||||||||||||||||||
Net realized gains (losses) on investment securities | — | 1,193,639 | 60,679 | — | 860,485 | ||||||||||||||||||
Net realized gains (losses) on swap agreements | — | 108,995 | 19,685 | 188,041 | 23,799 | ||||||||||||||||||
Net realized gains (losses) on forward currency contracts | — | — | — | — | — | ||||||||||||||||||
| Change in net unrealized appreciation/depreciation on investment securities | — | 1,269,200 | 1,075,386 | — | 293,058 | ||||||||||||||||||
| Change in net unrealized appreciation/depreciation on swap agreements | — | (11,877 | ) | (2,836 | ) | 49,806 | 8,333 | ||||||||||||||||
| Change in net unrealized appreciation/depreciation on forward currency contracts | — | — | — | — | — | ||||||||||||||||||
| NET REALIZED AND UNREALIZED GAINS (LOSSES) ON INVESTMENTS | — | 2,559,957 | 1,152,914 | 237,847 | 1,185,675 | ||||||||||||||||||
| CHANGE IN NET ASSETS RESULTING FROM OPERATIONS | $ | 674,552 | $ | 2,568,099 | $ | 1,142,445 | $ | 433,519 | $ | 1,099,265 | |||||||||||||
See accompanying notes to the financial statements.
186 :: Statements of Operations :: For the Periods Indicated (unaudited)
ProFund VP Japan | ProFund VP Large-Cap Growth | ProFund VP Large-Cap Value | ProFund VP Materials | ProFund VP Mid-Cap | |||||||||||||||||||
| Six Months Ended June 30, 2024 | Six Months Ended June 30, 2024 | Six Months Ended June 30, 2024 | Six Months Ended June 30, 2024 | Six Months Ended June 30, 2024 | |||||||||||||||||||
INVESTMENT INCOME: | |||||||||||||||||||||||
Dividends | $ | — | $ | 93,907 | $ | 197,178 | $ | 133,459 | $ | — | |||||||||||||
Interest | 379,682 | 2,504 | 1,448 | 6,133 | 297,110 | ||||||||||||||||||
Foreign tax withholding | — | (60 | ) | (27 | ) | — | — | ||||||||||||||||
Net income from securities lending | — | — | — | — | — | ||||||||||||||||||
TOTAL INVESTMENT INCOME | 379,682 | 96,351 | 198,599 | 139,592 | 297,110 | ||||||||||||||||||
EXPENSES: | |||||||||||||||||||||||
Advisory fees | 54,612 | 103,099 | 64,232 | 56,614 | 42,199 | ||||||||||||||||||
Management services fees | 7,282 | 13,746 | 8,564 | 7,548 | 5,626 | ||||||||||||||||||
Administration fees | 6,134 | 11,486 | 6,955 | 6,651 | 4,815 | ||||||||||||||||||
Distribution fees | 18,204 | 34,366 | 21,411 | 18,871 | 14,066 | ||||||||||||||||||
Transfer agency fees | 5,574 | 10,419 | 6,327 | 6,044 | 4,436 | ||||||||||||||||||
Administrative services fees | 18,721 | 40,228 | 25,171 | 19,834 | 13,641 | ||||||||||||||||||
Custody fees | 1,373 | 2,245 | 1,352 | 1,703 | 1,001 | ||||||||||||||||||
Fund accounting fees | 3,381 | 6,711 | 4,727 | 3,718 | 2,690 | ||||||||||||||||||
Trustee fees | 166 | 319 | 183 | 177 | 128 | ||||||||||||||||||
Compliance services fees | 54 | 104 | 58 | 57 | 42 | ||||||||||||||||||
Other fees | 8,635 | 17,711 | 11,061 | 12,444 | 7,847 | ||||||||||||||||||
Total Gross Expenses before reductions | 124,136 | 240,434 | 150,041 | 133,661 | 96,491 | ||||||||||||||||||
Expenses reduced and reimbursed by the Advisor | (1,370 | ) | (9,482 | ) | (6,138 | ) | (5,849 | ) | (1,817 | ) | |||||||||||||
Fees paid indirectly | (435 | ) | (9 | ) | (22 | ) | (998 | ) | (148 | ) | |||||||||||||
TOTAL NET EXPENSES | 122,331 | 230,943 | 143,881 | 126,814 | 94,526 | ||||||||||||||||||
NET INVESTMENT INCOME (LOSS) | 257,351 | (134,592 | ) | 54,718 | 12,778 | 202,584 | |||||||||||||||||
| REALIZED AND UNREALIZED GAINS (LOSSES) ON INVESTMENTS: | |||||||||||||||||||||||
Net realized gains (losses) on investment securities | — | 112,501 | 474,041 | 229,133 | — | ||||||||||||||||||
Net realized gains (losses) on futures contracts | 1,674,964 | — | — | — | 140,268 | ||||||||||||||||||
Net realized gains (losses) on swap agreements | 33,417 | — | — | 4,881 | 43,266 | ||||||||||||||||||
| Change in net unrealized appreciation/depreciation on investment securities | — | 5,420,338 | 307,224 | 209,963 | — | ||||||||||||||||||
| Change in net unrealized appreciation/depreciation on futures contracts | 445,529 | — | — | — | (98,911 | ) | |||||||||||||||||
| Change in net unrealized appreciation/depreciation on swap agreements | 2,039 | — | — | 233 | 113,312 | ||||||||||||||||||
| NET REALIZED AND UNREALIZED GAINS (LOSSES) ON INVESTMENTS | 2,155,949 | 5,532,839 | 781,265 | 444,210 | 197,935 | ||||||||||||||||||
| CHANGE IN NET ASSETS RESULTING FROM OPERATIONS | $ | 2,413,300 | $ | 5,398,247 | $ | 835,983 | $ | 456,988 | $ | 400,519 | |||||||||||||
Amounts designated as " – " are $0 or have been rounded to $0.
See accompanying notes to the financial statements.
For the Periods Indicated (unaudited) :: Statements of Operations :: 187
| ProFund VP Mid-Cap Growth | ProFund VP Mid-Cap Value | ProFund VP Nasdaq-100 | ProFund VP Pharmaceuticals | ProFund VP Precious Metals | |||||||||||||||||||
| Six Months Ended June 30, 2024 | Six Months Ended June 30, 2024 | Six Months Ended June 30, 2024 | Six Months Ended June 30, 2024 | Six Months Ended June 30, 2024 | |||||||||||||||||||
INVESTMENT INCOME: | |||||||||||||||||||||||
Dividends | $ | 73,636 | $ | 118,340 | $ | 444,419 | $ | 79,633 | $ | — | |||||||||||||
Interest | 1,660 | 989 | 1,289,797 | 4,285 | 627,184 | ||||||||||||||||||
Foreign tax withholding | — | — | (592 | ) | — | — | |||||||||||||||||
Net income from securities lending | 10 | 126 | 13,138 | 13,587 | — | ||||||||||||||||||
TOTAL INVESTMENT INCOME | 75,306 | 119,455 | 1,746,762 | 97,505 | 627,184 | ||||||||||||||||||
EXPENSES: | |||||||||||||||||||||||
Advisory fees | 54,734 | 40,989 | 577,759 | 37,546 | 90,351 | ||||||||||||||||||
Management services fees | 7,298 | 5,465 | 77,033 | 5,006 | 12,047 | ||||||||||||||||||
Administration fees | 6,035 | 4,416 | 61,552 | 4,422 | 9,314 | ||||||||||||||||||
Distribution fees | 18,245 | 13,663 | 192,586 | 12,515 | 30,117 | ||||||||||||||||||
Transfer agency fees | 5,544 | 4,020 | 56,176 | 4,007 | 9,242 | ||||||||||||||||||
Administrative services fees | 23,547 | 17,601 | 192,247 | 12,769 | 32,280 | ||||||||||||||||||
Custody fees | 1,254 | 958 | 12,868 | 1,002 | 2,168 | ||||||||||||||||||
Fund accounting fees | 3,834 | 3,005 | 34,196 | 2,511 | 5,598 | ||||||||||||||||||
Trustee fees | 163 | 118 | 1,692 | 118 | 272 | ||||||||||||||||||
Compliance services fees | 53 | 37 | 547 | 35 | 88 | ||||||||||||||||||
Other fees | 9,708 | 7,150 | 121,926 | 8,256 | 17,327 | ||||||||||||||||||
Total Gross Expenses before reductions | 130,415 | 97,422 | 1,328,582 | 88,187 | 208,804 | ||||||||||||||||||
Expenses reduced and reimbursed by the Advisor | (7,785 | ) | (5,598 | ) | (32,664 | ) | (3,723 | ) | (5,964 | ) | |||||||||||||
Fees paid indirectly | (25 | ) | (8 | ) | (1,737 | ) | (361 | ) | (454 | ) | |||||||||||||
TOTAL NET EXPENSES | 122,605 | 91,816 | 1,294,181 | 84,103 | 202,386 | ||||||||||||||||||
NET INVESTMENT INCOME (LOSS) | (47,299 | ) | 27,639 | 452,581 | 13,402 | 424,798 | |||||||||||||||||
| REALIZED AND UNREALIZED GAINS (LOSSES) ON INVESTMENTS: | |||||||||||||||||||||||
Net realized gains (losses) on investment securities | 655,706 | (67,955 | ) | 676,562 | (7,249 | ) | — | ||||||||||||||||
Net realized gains (losses) on futures contracts | — | — | 3,017,907 | — | — | ||||||||||||||||||
Net realized gains (losses) on swap agreements | — | — | 4,485,385 | 10,851 | 1,112,471 | ||||||||||||||||||
| Change in net unrealized appreciation/depreciation on investment securities | 578,013 | (48,394 | ) | 15,955,322 | (413,036 | ) | — | ||||||||||||||||
| Change in net unrealized appreciation/depreciation on futures contracts | — | — | (758,668 | ) | — | — | |||||||||||||||||
| Change in net unrealized appreciation/depreciation on swap agreements | — | — | (47,987 | ) | (4,987 | ) | 321,191 | ||||||||||||||||
| NET REALIZED AND UNREALIZED GAINS (LOSSES) ON INVESTMENTS | 1,233,719 | (116,349 | ) | 23,328,521 | (414,421 | ) | 1,433,662 | ||||||||||||||||
| CHANGE IN NET ASSETS RESULTING FROM OPERATIONS | $ | 1,186,420 | $ | (88,710 | ) | $ | 23,781,102 | $ | (401,019 | ) | $ | 1,858,460 | |||||||||||
See accompanying notes to the financial statements.
188 :: Statements of Operations :: For the Periods Indicated (unaudited)
ProFund VP Real Estate | ProFund VP Rising Rates Opportunity | ProFund VP Semiconductor | ProFund VP Short Dow 30 | ProFund VP Short Emerging Markets | |||||||||||||||||||
| Six Months Ended June 30, 2024 | Six Months Ended June 30, 2024 | Six Months Ended June 30, 2024 | Six Months Ended June 30, 2024 | Six Months Ended June 30, 2024 | |||||||||||||||||||
INVESTMENT INCOME: | |||||||||||||||||||||||
Dividends | $ | 88,606 | $ | — | $ | 253,220 | $ | — | $ | — | |||||||||||||
Interest | 2,929 | 235,020 | 53,279 | 155 | 13,667 | ||||||||||||||||||
Foreign tax withholding | — | — | (1,382 | ) | — | — | |||||||||||||||||
Net income from securities lending | — | — | 90 | — | — | ||||||||||||||||||
TOTAL INVESTMENT INCOME | 91,535 | 235,020 | 305,207 | 155 | 13,667 | ||||||||||||||||||
EXPENSES: | |||||||||||||||||||||||
Advisory fees | 22,739 | 33,528 | 303,051 | 23 | 1,940 | ||||||||||||||||||
Management services fees | 3,032 | 4,470 | 40,406 | 4 | 259 | ||||||||||||||||||
Administration fees | 2,585 | 3,878 | 31,938 | 1 | 210 | ||||||||||||||||||
Distribution fees | 7,580 | 11,176 | 101,017 | 7 | 647 | ||||||||||||||||||
Transfer agency fees | 2,353 | 3,476 | 29,063 | 1 | 202 | ||||||||||||||||||
Administrative services fees | 9,270 | 9,184 | 89,619 | 2 | 626 | ||||||||||||||||||
Custody fees | 498 | 780 | 8,544 | — | 52 | ||||||||||||||||||
Fund accounting fees | 1,489 | 2,105 | 17,648 | 1 | 122 | ||||||||||||||||||
Trustee fees | 69 | 102 | 877 | — | 6 | ||||||||||||||||||
Compliance services fees | 23 | 29 | 304 | — | 2 | ||||||||||||||||||
Licensing fees | 985 | — | 8,288 | — | 86 | ||||||||||||||||||
Other fees | 3,673 | 5,422 | 46,721 | 1 | 332 | ||||||||||||||||||
Recoupment of prior expenses reduced by the Advisor | — | — | 5,857 | 12 | — | ||||||||||||||||||
Total Gross Expenses before reductions | 54,296 | 74,150 | 683,333 | 52 | 4,484 | ||||||||||||||||||
Expenses reduced and reimbursed by the Advisor | (3,353 | ) | — | — | — | (119 | ) | ||||||||||||||||
Fees paid indirectly | (8 | ) | (107 | ) | (4,498 | ) | — | (19 | ) | ||||||||||||||
TOTAL NET EXPENSES | 50,935 | 74,043 | 678,835 | 52 | 4,346 | ||||||||||||||||||
NET INVESTMENT INCOME (LOSS) | 40,600 | 160,977 | (373,628 | ) | 103 | 9,321 | |||||||||||||||||
| REALIZED AND UNREALIZED GAINS (LOSSES) ON INVESTMENTS: | |||||||||||||||||||||||
Net realized gains (losses) on investment securities | (31,842 | ) | — | 27,394,389 | — | — | |||||||||||||||||
Net realized gains (losses) on futures contracts | — | — | — | — | — | ||||||||||||||||||
Net realized gains (losses) on swap agreements | (15,454 | ) | 453,879 | 323,822 | (167 | ) | (27,694 | ) | |||||||||||||||
| Change in net unrealized appreciation/depreciation on investment securities | (218,352 | ) | — | 12,181,801 | — | — | |||||||||||||||||
| Change in net unrealized appreciation/depreciation on futures contracts | — | — | — | — | — | ||||||||||||||||||
| Change in net unrealized appreciation/depreciation on swap agreements | (902 | ) | 325,658 | 103,838 | 12 | 1,248 | |||||||||||||||||
| NET REALIZED AND UNREALIZED GAINS (LOSSES) ON INVESTMENTS | (266,550 | ) | 779,537 | 40,003,850 | (155 | ) | (26,446 | ) | |||||||||||||||
| CHANGE IN NET ASSETS RESULTING FROM OPERATIONS | $ | (225,950 | ) | $ | 940,514 | $ | 39,630,222 | $ | (52 | ) | $ | (17,125 | ) | ||||||||||
Amounts designated as " – " are $0 or have been rounded to $0.
See accompanying notes to the financial statements.
For the Periods Indicated (unaudited) :: Statements of Operations :: 189
| ProFund VP Short International | ProFund VP Short Mid-Cap | ProFund VP Short Nasdaq-100 | ProFund VP Short Small-Cap | ProFund VP Small-Cap | |||||||||||||||||||
| Six Months Ended June 30, 2024 | Six Months Ended June 30, 2024 | Six Months Ended June 30, 2024 | Six Months Ended June 30, 2024 | Six Months Ended June 30, 2024 | |||||||||||||||||||
INVESTMENT INCOME: | |||||||||||||||||||||||
Dividends | $ | — | $ | — | $ | — | $ | — | $ | 55,984 | |||||||||||||
Interest | 14,875 | 2,229 | 103,937 | 45,208 | 78,392 | ||||||||||||||||||
Foreign tax withholding | — | — | — | — | (76 | ) | |||||||||||||||||
Net income from securities lending | — | — | — | — | 2,441 | ||||||||||||||||||
TOTAL INVESTMENT INCOME | 14,875 | 2,229 | 103,937 | 45,208 | 136,741 | ||||||||||||||||||
EXPENSES: | |||||||||||||||||||||||
Advisory fees | 2,127 | 323 | 14,910 | 6,553 | 42,975 | ||||||||||||||||||
Management services fees | 284 | 43 | 1,988 | 874 | 5,730 | ||||||||||||||||||
Administration fees | 203 | 32 | 1,637 | 765 | 4,405 | ||||||||||||||||||
Distribution fees | 709 | 108 | 4,970 | 2,184 | 14,325 | ||||||||||||||||||
Transfer agency fees | 198 | 32 | 1,486 | 692 | 4,040 | ||||||||||||||||||
Administrative services fees | 677 | 129 | 4,865 | 2,248 | 12,833 | ||||||||||||||||||
Custody fees | 50 | 9 | 382 | 166 | 885 | ||||||||||||||||||
Fund accounting fees | 120 | 20 | 907 | 424 | 6,757 | ||||||||||||||||||
Trustee fees | 6 | 1 | 41 | 23 | 107 | ||||||||||||||||||
Compliance services fees | 2 | — | 11 | 6 | 36 | ||||||||||||||||||
Licensing fees | — | 18 | 778 | 855 | 5,243 | ||||||||||||||||||
Other fees | 320 | 53 | 2,634 | 1,064 | 6,470 | ||||||||||||||||||
Recoupment of prior expenses reduced by the Advisor | 72 | — | — | — | — | ||||||||||||||||||
Total Gross Expenses before reductions | 4,768 | 768 | 34,609 | 15,854 | 103,806 | ||||||||||||||||||
Expenses reduced and reimbursed by the Advisor | — | (39 | ) | (1,018 | ) | (1,142 | ) | (7,492 | ) | ||||||||||||||
Fees paid indirectly | (14 | ) | (6 | ) | (193 | ) | (33 | ) | (49 | ) | |||||||||||||
TOTAL NET EXPENSES | 4,754 | 723 | 33,398 | 14,679 | 96,265 | ||||||||||||||||||
NET INVESTMENT INCOME (LOSS) | 10,121 | 1,506 | 70,539 | 30,529 | 40,476 | ||||||||||||||||||
| REALIZED AND UNREALIZED GAINS (LOSSES) ON INVESTMENTS: | |||||||||||||||||||||||
Net realized gains (losses) on investment securities | — | — | — | — | (59,430 | ) | |||||||||||||||||
Net realized gains (losses) on futures contracts | — | — | (129,347 | ) | (15,679 | ) | 31,250 | ||||||||||||||||
Net realized gains (losses) on swap agreements | (11,141 | ) | (4,513 | ) | (341,831 | ) | (31,827 | ) | (291,847 | ) | |||||||||||||
| Change in net unrealized appreciation/depreciation on investment securities | — | — | — | — | 84,718 | ||||||||||||||||||
| Change in net unrealized appreciation/depreciation on futures contracts | — | — | 33,065 | 18,600 | (37,181 | ) | |||||||||||||||||
| Change in net unrealized appreciation/depreciation on swap agreements | (2,809 | ) | (897 | ) | (9,580 | ) | (56,364 | ) | 101,119 | ||||||||||||||
| NET REALIZED AND UNREALIZED GAINS (LOSSES) ON INVESTMENTS | (13,950 | ) | (5,410 | ) | (447,693 | ) | (85,270 | ) | (171,371 | ) | |||||||||||||
| CHANGE IN NET ASSETS RESULTING FROM OPERATIONS | $ | (3,829 | ) | $ | (3,904 | ) | $ | (377,154 | ) | $ | (54,741 | ) | $ | (130,895 | ) | ||||||||
See accompanying notes to the financial statements.
190 :: Statements of Operations :: For the Periods Indicated (unaudited)
| ProFund VP Small-Cap Growth | ProFund VP Small-Cap Value | ProFund VP Technology | ProFund VP UltraBull | ProFund VP UltraMid-Cap | |||||||||||||||||||
| Six Months Ended June 30, 2024 | Six Months Ended June 30, 2024 | Six Months Ended June 30, 2024 | Six Months Ended June 30, 2024 | Six Months Ended June 30, 2024 | |||||||||||||||||||
INVESTMENT INCOME: | |||||||||||||||||||||||
Dividends | $ | 97,447 | $ | 172,747 | $ | 238,216 | $ | 90,312 | $ | 59,871 | |||||||||||||
Interest | 1,658 | 1,173 | 15,413 | 126,535 | 72,065 | ||||||||||||||||||
Foreign tax withholding | — | — | (478 | ) | (23 | ) | — | ||||||||||||||||
Net income from securities lending | 85 | 3,697 | — | — | 95 | ||||||||||||||||||
TOTAL INVESTMENT INCOME | 99,190 | 177,617 | 253,151 | 216,824 | 132,031 | ||||||||||||||||||
EXPENSES: | |||||||||||||||||||||||
Advisory fees | 59,704 | 60,746 | 219,624 | 65,882 | 38,013 | ||||||||||||||||||
Management services fees | 7,960 | 8,099 | 29,283 | 8,784 | 5,068 | ||||||||||||||||||
Administration fees | 6,591 | 6,818 | 24,335 | 7,199 | 4,265 | ||||||||||||||||||
Distribution fees | 19,901 | 20,249 | 73,208 | 21,960 | 12,671 | ||||||||||||||||||
Transfer agency fees | 5,992 | 6,219 | 22,095 | 6,550 | 3,898 | ||||||||||||||||||
Administrative services fees | 22,000 | 22,135 | 52,278 | 23,114 | 15,421 | ||||||||||||||||||
Custody fees | 1,365 | 1,501 | 5,676 | 1,523 | 888 | ||||||||||||||||||
Fund accounting fees | 4,302 | 4,725 | 13,502 | 4,923 | 3,146 | ||||||||||||||||||
Trustee fees | 176 | 179 | 661 | 194 | 115 | ||||||||||||||||||
Compliance services fees | 57 | 57 | 213 | 61 | 38 | ||||||||||||||||||
Audit fees | 6,096 | 6,595 | 22,510 | 6,498 | 3,976 | ||||||||||||||||||
Licensing fees | 983 | 1,175 | 9,481 | 1,083 | 604 | ||||||||||||||||||
Other fees | 3,424 | 3,526 | 12,869 | 3,744 | 2,232 | ||||||||||||||||||
Recoupment of prior expenses reduced by the Advisor | — | — | — | — | — | ||||||||||||||||||
Total Gross Expenses before reductions | 138,551 | 142,024 | 485,735 | 151,515 | 90,335 | ||||||||||||||||||
Expenses reduced and reimbursed by the Advisor | (4,790 | ) | (5,938 | ) | — | (3,645 | ) | (5,052 | ) | ||||||||||||||
Fees paid indirectly | (25 | ) | (15 | ) | (2,050 | ) | (295 | ) | (132 | ) | |||||||||||||
TOTAL NET EXPENSES | 133,736 | 136,071 | 483,685 | 147,575 | 85,151 | ||||||||||||||||||
NET INVESTMENT INCOME (LOSS) | (34,546 | ) | 41,546 | (230,534 | ) | 69,249 | 46,880 | ||||||||||||||||
| REALIZED AND UNREALIZED GAINS (LOSSES) ON INVESTMENTS: | |||||||||||||||||||||||
Net realized gains (losses) on investment securities | 527,729 | (313,772 | ) | 9,586,500 | 172,646 | 197,364 | |||||||||||||||||
Net realized gains (losses) on futures contracts | — | — | — | 261,231 | 112,214 | ||||||||||||||||||
Net realized gains (losses) on swap agreements | — | — | 80,523 | 2,406,908 | (7,570 | ) | |||||||||||||||||
| Change in net unrealized appreciation/depreciation on investment securities | (166,211 | ) | (766,678 | ) | (255,651 | ) | 1,528,284 | 196,352 | |||||||||||||||
| Change in net unrealized appreciation/depreciation on futures contracts | — | — | — | (48,298 | ) | (79,129 | ) | ||||||||||||||||
| Change in net unrealized appreciation/depreciation on swap agreements | — | — | 8,354 | (17,634 | ) | 174,608 | |||||||||||||||||
| NET REALIZED AND UNREALIZED GAINS (LOSSES) ON INVESTMENTS | 361,518 | (1,080,450 | ) | 9,419,726 | 4,303,137 | 593,839 | |||||||||||||||||
| CHANGE IN NET ASSETS RESULTING FROM OPERATIONS | $ | 326,972 | $ | (1,038,904 | ) | $ | 9,189,192 | $ | 4,372,386 | $ | 640,719 | ||||||||||||
Amounts designated as " – " are $0 or have been rounded to $0.
See accompanying notes to the financial statements.
For the Periods Indicated (unaudited) :: Statements of Operations :: 191
| ProFund VP UltraNasdaq-100 | ProFund VP UltraShort Dow 30 | ProFund VP UltraShort Nasdaq-100 | ProFund VP ProFund VP UltraSmall-Cap | U.S. Government Plus | |||||||||||||||||||
| Six Months Ended June 30, 2024 | Six Months Ended June 30, 2024 | Six Months Ended June 30, 2024 | Six Months Ended June 30, 2024 | Six Months Ended June 30, 2024 | |||||||||||||||||||
INVESTMENT INCOME: | |||||||||||||||||||||||
Dividends | $ | 628,164 | $ | — | $ | — | $ | 71,487 | $ | — | |||||||||||||
Interest | 1,426,416 | 51 | 33,692 | 102,002 | 167,295 | ||||||||||||||||||
Foreign tax withholding | (818 | ) | — | — | (86 | ) | — | ||||||||||||||||
Net income from securities lending | 17,975 | — | — | 2,712 | — | ||||||||||||||||||
TOTAL INVESTMENT INCOME | 2,071,737 | 51 | 33,692 | 176,115 | 167,295 | ||||||||||||||||||
EXPENSES: | |||||||||||||||||||||||
Advisory fees | 762,565 | 12 | 4,720 | 54,044 | 17,360 | ||||||||||||||||||
Management services fees | 101,674 | 2 | 629 | 7,206 | 3,472 | ||||||||||||||||||
Administration fees | 81,007 | 1 | 545 | 5,971 | 2,874 | ||||||||||||||||||
Distribution fees | 254,188 | 4 | 1,573 | 18,015 | 8,680 | ||||||||||||||||||
Transfer agency fees | 73,614 | 1 | 478 | 5,475 | 2,640 | ||||||||||||||||||
Administrative services fees | 280,836 | — | 1,199 | 19,578 | 8,394 | ||||||||||||||||||
Custody fees | 18,153 | — | 95 | 1,574 | 683 | ||||||||||||||||||
Fund accounting fees | 44,749 | 1 | 290 | 7,328 | 1,601 | ||||||||||||||||||
Trustee fees | 2,230 | — | 15 | 158 | 76 | ||||||||||||||||||
Compliance services fees | 734 | — | 5 | 52 | 24 | ||||||||||||||||||
Audit fees | 75,558 | 1 | 407 | 5,858 | 2,718 | ||||||||||||||||||
Licensing fees | 41,882 | — | 268 | 7,137 | — | ||||||||||||||||||
Other fees | 43,870 | — | 255 | 3,747 | 1,471 | ||||||||||||||||||
Recoupment of prior expenses reduced by the Advisor | — | — | 125 | — | — | ||||||||||||||||||
Total Gross Expenses before reductions | 1,781,060 | 22 | 10,604 | 136,143 | 49,993 | ||||||||||||||||||
Expenses reduced and reimbursed by the Advisor | (68,274 | ) | — | (17 | ) | (14,675 | ) | (1,797 | ) | ||||||||||||||
Fees paid indirectly | (4,640 | ) | — | (13 | ) | (411 | ) | (283 | ) | ||||||||||||||
TOTAL NET EXPENSES | 1,708,146 | 22 | 10,574 | 121,057 | 47,913 | ||||||||||||||||||
NET INVESTMENT INCOME (LOSS) | 363,591 | 29 | 23,118 | 55,058 | 119,382 | ||||||||||||||||||
| REALIZED AND UNREALIZED GAINS (LOSSES) ON INVESTMENTS: | |||||||||||||||||||||||
Net realized gains (losses) on investment securities | (567,969 | ) | — | — | 113,921 | 85,255 | |||||||||||||||||
Net realized gains (losses) on futures contracts | 4,280,031 | — | — | 14,236 | 2,051 | ||||||||||||||||||
Net realized gains (losses) on swap agreements | 29,089,917 | (180 | ) | (316,275 | ) | (1,067,475 | ) | (510,304 | ) | ||||||||||||||
| Change in net unrealized appreciation/depreciation on investment securities | 23,335,079 | — | — | (88,922 | ) | (375,852 | ) | ||||||||||||||||
| Change in net unrealized appreciation/depreciation on futures contracts | (683,863 | ) | — | — | (29,569 | ) | — | ||||||||||||||||
| Change in net unrealized appreciation/depreciation on swap agreements | (345,714 | ) | 12 | 11,382 | 505,674 | (147,188 | ) | ||||||||||||||||
| NET REALIZED AND UNREALIZED GAINS (LOSSES) ON INVESTMENTS | 55,107,481 | (168 | ) | (304,893 | ) | (552,135 | ) | (946,038 | ) | ||||||||||||||
| CHANGE IN NET ASSETS RESULTING FROM OPERATIONS | $ | 55,471,072 | $ | (139 | ) | $ | (281,775 | ) | $ | (497,077 | ) | $ | (826,656 | ) | |||||||||
See accompanying notes to the financial statements.
192 :: Statements of Operations :: For the Periods Indicated (unaudited)
| ProFund VP Utilities | |||||||
| Six Months Ended June 30, 2024 | |||||||
INVESTMENT INCOME: | |||||||
Dividends | $ | 448,859 | |||||
Interest | 8,906 | ||||||
TOTAL INVESTMENT INCOME | 457,765 | ||||||
EXPENSES: | |||||||
Advisory fees | 99,292 | ||||||
Management services fees | 13,239 | ||||||
Administration fees | 12,253 | ||||||
Distribution fees | 33,097 | ||||||
Transfer agency fees | 11,134 | ||||||
Administrative services fees | 36,410 | ||||||
Custody fees | 3,029 | ||||||
Fund accounting fees | 6,803 | ||||||
Trustee fees | 329 | ||||||
Compliance services fees | 104 | ||||||
Other fees | 22,797 | ||||||
Total Gross Expenses before reductions | 238,487 | ||||||
Expenses reduced and reimbursed by the Advisor | (14,605 | ) | |||||
Fees paid indirectly | (1,467 | ) | |||||
TOTAL NET EXPENSES | 222,415 | ||||||
NET INVESTMENT INCOME (LOSS) | 235,350 | ||||||
| REALIZED AND UNREALIZED GAINS (LOSSES) ON INVESTMENTS: | |||||||
Net realized gains (losses) on investment securities | 305,517 | ||||||
Net realized gains (losses) on swap agreements | 46,797 | ||||||
| Change in net unrealized appreciation/depreciation on investment securities | 1,524,010 | ||||||
| Change in net unrealized appreciation/depreciation on swap agreements | (13,752 | ) | |||||
| NET REALIZED AND UNREALIZED GAINS (LOSSES) ON INVESTMENTS | 1,862,572 | ||||||
| CHANGE IN NET ASSETS RESULTING FROM OPERATIONS | $ | 2,097,922 | |||||
Amounts designated as " – " are $0 or have been rounded to $0.
See accompanying notes to the financial statements.
194 :: Statements of Changes in Net Assets :: For the Periods Indicated
ProFund Access VP High Yield | ProFund VP Asia 30 | ProFund VP Banks | |||||||||||||||||||||||||
| Six Months Ended June 30, 2024 (unaudited) | Year Ended December 31, 2023 | Six Months Ended June 30, 2024 (unaudited) | Year Ended December 31, 2023 | Six Months Ended June 30, 2024 (unaudited) | Year Ended December 31, 2023 | ||||||||||||||||||||||
FROM INVESTMENT ACTIVITIES: | |||||||||||||||||||||||||||
OPERATIONS: | |||||||||||||||||||||||||||
Net investment income (loss) | $ | 230,844 | $ | 368,316 | $ | 270,648 | $ | (15,732 | ) | $ | 28,545 | $ | 86,224 | ||||||||||||||
Net realized gains (losses) on investments | 881,078 | 515,256 | (628,862 | ) | 760,861 | 462,654 | 1,395,863 | ||||||||||||||||||||
| Change in net unrealized appreciation/depreciation on investments | (791,548 | ) | 315,683 | 854,424 | 28,769 | (522,538 | ) | (967,354 | ) | ||||||||||||||||||
Change in net assets resulting from operations | 320,374 | 1,199,255 | 496,210 | 773,898 | (31,339 | ) | 514,733 | ||||||||||||||||||||
DISTRIBUTIONS TO SHAREHOLDERS: | |||||||||||||||||||||||||||
Total distributions | — | (811,910 | ) | (132,757 | ) | (687,226 | ) | (85,083 | ) | (65,310 | ) | ||||||||||||||||
Change in net assets resulting from distributions | — | (811,910 | ) | (132,757 | ) | (687,226 | ) | (85,083 | ) | (65,310 | ) | ||||||||||||||||
CAPITAL TRANSACTIONS: | |||||||||||||||||||||||||||
Proceeds from shares issued | 2,720,661 | 22,420,442 | 11,594,301 | 26,284,747 | 3,749,017 | 17,768,471 | |||||||||||||||||||||
Distributions reinvested | — | 811,910 | 132,757 | 687,226 | 85,083 | 65,310 | |||||||||||||||||||||
Value of shares redeemed | (4,431,694 | ) | (24,154,285 | ) | (10,987,520 | ) | (29,554,525 | ) | (5,532,437 | ) | (17,163,970 | ) | |||||||||||||||
Change in net assets resulting from capital transactions | (1,711,033 | ) | (921,933 | ) | 739,538 | (2,582,552 | ) | (1,698,337 | ) | 669,811 | |||||||||||||||||
Change in net assets | (1,390,659 | ) | (534,588 | ) | 1,102,991 | (2,495,880 | ) | (1,814,759 | ) | 1,119,234 | |||||||||||||||||
NET ASSETS: | |||||||||||||||||||||||||||
Beginning of period | 16,480,535 | 17,015,123 | 15,245,039 | 17,740,919 | 5,615,331 | 4,496,097 | |||||||||||||||||||||
End of period | $ | 15,089,876 | $ | 16,480,535 | $ | 16,348,030 | $ | 15,245,039 | $ | 3,800,572 | $ | 5,615,331 | |||||||||||||||
SHARE TRANSACTIONS: | |||||||||||||||||||||||||||
Issued | 108,671 | 927,714 | 331,271 | 710,106 | 138,088 | 760,184 | |||||||||||||||||||||
Reinvested | — | 33,694 | 3,581 | 18,664 | 3,247 | 2,738 | |||||||||||||||||||||
Redeemed | (177,861 | ) | (1,017,129 | ) | (316,053 | ) | (799,368 | ) | (206,698 | ) | (736,795 | ) | |||||||||||||||
Change in shares | (69,190 | ) | (55,721 | ) | 18,799 | (70,598 | ) | (65,363 | ) | 26,127 | |||||||||||||||||
Amounts designated as " – " are $0 or have been rounded to $0.
See accompanying notes to the financial statements.
For the Periods Indicated :: Statements of Changes in Net Assets :: 195
ProFund VP Bear | ProFund VP Biotechnology | ||||||||||||||||||
| Six Months Ended June 30, 2024 (unaudited) | Year Ended December 31, 2023 | Six Months Ended June 30, 2024 (unaudited) | Year Ended December 31, 2023 | ||||||||||||||||
FROM INVESTMENT ACTIVITIES: | |||||||||||||||||||
OPERATIONS: | |||||||||||||||||||
Net investment income (loss) | $ | 35,359 | $ | 131,745 | $ | (266,262 | ) | $ | (436,020 | ) | |||||||||
Net realized gains (losses) on investments | (264,348 | ) | (1,009,155 | ) | 2,031,271 | 18,452,724 | |||||||||||||
| Change in net unrealized appreciation/depreciation on investments | 16,789 | (11,141 | ) | (533,789 | ) | (14,276,273 | ) | ||||||||||||
Change in net assets resulting from operations | (212,200 | ) | (888,551 | ) | 1,231,220 | 3,740,431 | |||||||||||||
DISTRIBUTIONS TO SHAREHOLDERS: | |||||||||||||||||||
Total distributions | (205,227 | ) | (7,959 | ) | (16,706,394 | ) | (6,518,064 | ) | |||||||||||
Change in net assets resulting from distributions | (205,227 | ) | (7,959 | ) | (16,706,394 | ) | (6,518,064 | ) | |||||||||||
CAPITAL TRANSACTIONS: | |||||||||||||||||||
Proceeds from shares issued | 5,490,704 | 27,476,028 | 15,243,096 | 14,614,174 | |||||||||||||||
Distributions reinvested | 205,227 | 7,959 | 16,706,394 | 6,518,064 | |||||||||||||||
Value of shares redeemed | (6,361,631 | ) | (28,791,566 | ) | (18,761,724 | ) | (23,215,452 | ) | |||||||||||
Change in net assets resulting from capital transactions | (665,700 | ) | (1,307,579 | ) | 13,187,766 | (2,083,214 | ) | ||||||||||||
Change in net assets | (1,083,127 | ) | (2,204,089 | ) | (2,287,408 | ) | (4,860,847 | ) | |||||||||||
NET ASSETS: | |||||||||||||||||||
Beginning of period | 2,753,670 | 4,957,759 | 44,534,094 | 49,394,941 | |||||||||||||||
End of period | $ | 1,670,543 | $ | 2,753,670 | $ | 42,246,686 | $ | 44,534,094 | |||||||||||
SHARE TRANSACTIONS: | |||||||||||||||||||
Issued | 401,985 | 1,735,673 | 227,048 | 224,669 | |||||||||||||||
Reinvested | 17,140 | 543 | 395,605 | 104,607 | |||||||||||||||
Redeemed | (465,376 | ) | (1,835,810 | ) | (284,705 | ) | (360,853 | ) | |||||||||||
Change in shares | (46,251 | ) | (99,594 | ) | 337,948 | (31,577 | ) | ||||||||||||
See accompanying notes to the financial statements.
196 :: Statements of Changes in Net Assets :: For the Periods Indicated
ProFund VP Bull | ProFund VP Communication Services | ProFund VP Consumer Discretionary | |||||||||||||||||||||||||
| Six Months Ended June 30, 2024 (unaudited) | Year Ended December 31, 2023 | Six Months Ended June 30, 2024 (unaudited) | Year Ended December 31, 2023 | Six Months Ended June 30, 2024 (unaudited) | Year Ended December 31, 2023 | ||||||||||||||||||||||
FROM INVESTMENT ACTIVITIES: | |||||||||||||||||||||||||||
OPERATIONS: | |||||||||||||||||||||||||||
Net investment income (loss) | $ | 143,470 | $ | 436,204 | $ | (20,734 | ) | $ | (15,983 | ) | $ | (78,310 | ) | $ | (136,645 | ) | |||||||||||
Net realized gains (losses) on investments | 1,140,346 | 2,669,286 | 431,251 | 563,499 | 438,937 | 3,119,226 | |||||||||||||||||||||
| Change in net unrealized appreciation/depreciation on investments | 6,516,463 | 7,484,213 | 1,110,815 | 1,093,954 | (79,054 | ) | 2,213,844 | ||||||||||||||||||||
Change in net assets resulting from operations | 7,800,279 | 10,589,703 | 1,521,332 | 1,641,470 | 281,573 | 5,196,425 | |||||||||||||||||||||
DISTRIBUTIONS TO SHAREHOLDERS: | |||||||||||||||||||||||||||
Total distributions | (3,350,805 | ) | (8,734,170 | ) | — | (58,848 | ) | (2,497,722 | ) | (1,013,997 | ) | ||||||||||||||||
Change in net assets resulting from distributions | (3,350,805 | ) | (8,734,170 | ) | — | (58,848 | ) | (2,497,722 | ) | (1,013,997 | ) | ||||||||||||||||
CAPITAL TRANSACTIONS: | |||||||||||||||||||||||||||
Proceeds from shares issued | 93,048,562 | 253,581,624 | 10,657,936 | 14,277,364 | 9,422,983 | 20,804,904 | |||||||||||||||||||||
Distributions reinvested | 3,350,805 | 8,734,170 | — | 58,848 | 2,497,722 | 1,013,997 | |||||||||||||||||||||
Value of shares redeemed | (94,927,276 | ) | (253,403,377 | ) | (10,262,106 | ) | (11,314,338 | ) | (8,579,530 | ) | (17,670,071 | ) | |||||||||||||||
Change in net assets resulting from capital transactions | 1,472,091 | 8,912,417 | 395,830 | 3,021,874 | 3,341,175 | 4,148,830 | |||||||||||||||||||||
Change in net assets | 5,921,565 | 10,767,950 | 1,917,162 | 4,604,496 | 1,125,026 | 8,331,258 | |||||||||||||||||||||
NET ASSETS: | |||||||||||||||||||||||||||
Beginning of period | 54,377,278 | 43,609,328 | 8,468,104 | 3,863,608 | 23,785,628 | 15,454,370 | |||||||||||||||||||||
End of period | $ | 60,298,843 | $ | 54,377,278 | $ | 10,385,266 | $ | 8,468,104 | $ | 24,910,654 | $ | 23,785,628 | |||||||||||||||
SHARE TRANSACTIONS: | |||||||||||||||||||||||||||
Issued | 1,715,458 | 5,150,134 | 254,125 | 420,816 | 142,546 | 341,729 | |||||||||||||||||||||
Reinvested | 61,348 | 180,160 | — | 1,699 | 41,754 | 15,948 | |||||||||||||||||||||
Redeemed | (1,747,111 | ) | (5,150,006 | ) | (244,804 | ) | (332,842 | ) | (132,227 | ) | (292,307 | ) | |||||||||||||||
Change in shares | 29,695 | 180,288 | 9,321 | 89,673 | 52,073 | 65,370 | |||||||||||||||||||||
Amounts designated as " – " are $0 or have been rounded to $0.
See accompanying notes to the financial statements.
For the Periods Indicated :: Statements of Changes in Net Assets :: 197
ProFund VP Consumer Staples | ProFund VP Dow 30 | ||||||||||||||||||
| Six Months Ended June 30, 2024 (unaudited) | Year Ended December 31, 2023 | Six Months Ended June 30, 2024 (unaudited) | Year Ended December 31, 2023 | ||||||||||||||||
FROM INVESTMENT ACTIVITIES: | |||||||||||||||||||
OPERATIONS: | |||||||||||||||||||
Net investment income (loss) | $ | 56,288 | $ | 155,942 | $ | 6,339 | $ | 10,184 | |||||||||||
Net realized gains (losses) on investments | 123,772 | 3,973,853 | 6,545 | 27,755 | |||||||||||||||
| Change in net unrealized appreciation/depreciation on investments | 423,124 | (3,476,026 | ) | (694 | ) | 1,061 | |||||||||||||
Change in net assets resulting from operations | 603,184 | 653,769 | 12,190 | 39,000 | |||||||||||||||
DISTRIBUTIONS TO SHAREHOLDERS: | |||||||||||||||||||
Total distributions | (3,510,813 | ) | (1,806,155 | ) | (10,184 | ) | (129 | ) | |||||||||||
Change in net assets resulting from distributions | (3,510,813 | ) | (1,806,155 | ) | (10,184 | ) | (129 | ) | |||||||||||
CAPITAL TRANSACTIONS: | |||||||||||||||||||
Proceeds from shares issued | 28,979,724 | 21,587,164 | 78,796 | 66,036 | |||||||||||||||
Distributions reinvested | 3,510,813 | 1,806,155 | 10,184 | 129 | |||||||||||||||
Value of shares redeemed | (29,716,653 | ) | (22,952,398 | ) | (27,444 | ) | (47,363 | ) | |||||||||||
Change in net assets resulting from capital transactions | 2,773,884 | 440,921 | 61,536 | 18,802 | |||||||||||||||
Change in net assets | (133,745 | ) | (711,465 | ) | 63,542 | 57,673 | |||||||||||||
NET ASSETS: | |||||||||||||||||||
Beginning of period | 10,748,783 | 11,460,248 | 326,736 | 269,063 | |||||||||||||||
End of period | $ | 10,615,038 | $ | 10,748,783 | $ | 390,278 | $ | 326,736 | |||||||||||
SHARE TRANSACTIONS: | |||||||||||||||||||
Issued | 635,639 | 430,243 | 3,720 | 3,576 | |||||||||||||||
Reinvested | 112,526 | 39,137 | 490 | 7 | |||||||||||||||
Redeemed | (648,063 | ) | (453,961 | ) | (1,289 | ) | (2,546 | ) | |||||||||||
Change in shares | 100,102 | 15,419 | 2,921 | 1,037 | |||||||||||||||
See accompanying notes to the financial statements.
198 :: Statements of Changes in Net Assets :: For the Periods Indicated
ProFund VP Emerging Markets | ProFund VP Energy | ProFund VP Europe 30 | |||||||||||||||||||||||||
| Six Months Ended June 30, 2024 (unaudited) | Year Ended December 31, 2023 | Six Months Ended June 30, 2024 (unaudited) | Year Ended December 31, 2023 | Six Months Ended June 30, 2024 (unaudited) | Year Ended December 31, 2023 | ||||||||||||||||||||||
FROM INVESTMENT ACTIVITIES: | |||||||||||||||||||||||||||
OPERATIONS: | |||||||||||||||||||||||||||
Net investment income (loss) | $ | 166,449 | $ | 252,618 | $ | 376,376 | $ | 919,340 | $ | 253,304 | $ | 276,152 | |||||||||||||||
Net realized gains (losses) on investments | 767,491 | (939,146 | ) | 2,039,045 | 4,913,603 | 84,614 | 1,625,865 | ||||||||||||||||||||
| Change in net unrealized appreciation/depreciation on investments | 2,837 | 2,936,648 | 1,663,569 | (8,025,103 | ) | 386,882 | 439,201 | ||||||||||||||||||||
Change in net assets resulting from operations | 936,777 | 2,250,120 | 4,078,990 | (2,192,160 | ) | 724,800 | 2,341,218 | ||||||||||||||||||||
DISTRIBUTIONS TO SHAREHOLDERS: | |||||||||||||||||||||||||||
Total distributions | (333,422 | ) | (422,942 | ) | (2,921,465 | ) | (1,187,917 | ) | (773,495 | ) | (314,873 | ) | |||||||||||||||
Change in net assets resulting from distributions | (333,422 | ) | (422,942 | ) | (2,921,465 | ) | (1,187,917 | ) | (773,495 | ) | (314,873 | ) | |||||||||||||||
CAPITAL TRANSACTIONS: | |||||||||||||||||||||||||||
Proceeds from shares issued | 44,755,682 | 42,111,695 | 73,443,671 | 63,553,956 | 8,396,067 | 18,506,199 | |||||||||||||||||||||
Distributions reinvested | 333,422 | 422,942 | 2,921,465 | 1,187,917 | 773,495 | 314,873 | |||||||||||||||||||||
Value of shares redeemed | (41,982,452 | ) | (42,322,174 | ) | (77,310,909 | ) | (80,016,805 | ) | (9,625,491 | ) | (19,922,531 | ) | |||||||||||||||
Change in net assets resulting from capital transactions | 3,106,652 | 212,463 | (945,773 | ) | (15,274,932 | ) | (455,929 | ) | (1,101,459 | ) | |||||||||||||||||
Change in net assets | 3,710,007 | 2,039,641 | 211,752 | (18,655,009 | ) | (504,624 | ) | 924,886 | |||||||||||||||||||
NET ASSETS: | |||||||||||||||||||||||||||
Beginning of period | 20,793,127 | 18,753,486 | 44,431,298 | 63,086,307 | 15,304,032 | 14,379,146 | |||||||||||||||||||||
End of period | $ | 24,503,134 | $ | 20,793,127 | $ | 44,643,050 | $ | 44,431,298 | $ | 14,799,408 | $ | 15,304,032 | |||||||||||||||
SHARE TRANSACTIONS: | |||||||||||||||||||||||||||
Issued | 1,532,600 | 1,558,819 | 1,595,536 | 1,488,405 | 309,223 | 770,224 | |||||||||||||||||||||
Reinvested | 11,230 | 15,035 | 67,377 | 27,665 | 29,693 | 12,926 | |||||||||||||||||||||
Redeemed | (1,446,970 | ) | (1,588,522 | ) | (1,683,477 | ) | (1,887,214 | ) | (357,721 | ) | (830,659 | ) | |||||||||||||||
Change in shares | 96,860 | (14,668 | ) | (20,564 | ) | (371,144 | ) | (18,805 | ) | (47,509 | ) | ||||||||||||||||
Amounts designated as " – " are $0 or have been rounded to $0.
See accompanying notes to the financial statements.
For the Periods Indicated :: Statements of Changes in Net Assets :: 199
ProFund VP Falling U.S. Dollar | ProFund VP Financials | ||||||||||||||||||
| Six Months Ended June 30, 2024 (unaudited) | Year Ended December 31, 2023 | Six Months Ended June 30, 2024 (unaudited) | Year Ended December 31, 2023 | ||||||||||||||||
FROM INVESTMENT ACTIVITIES: | |||||||||||||||||||
OPERATIONS: | |||||||||||||||||||
Net investment income (loss) | $ | 8,510 | $ | 29,158 | $ | 7,542 | $ | 80,068 | |||||||||||
Net realized gains (losses) on investments | (734 | ) | (29,550 | ) | 233,314 | 3,857,729 | |||||||||||||
| Change in net unrealized appreciation/depreciation on investments | (31,120 | ) | 18,107 | 2,313,036 | (805,109 | ) | |||||||||||||
Change in net assets resulting from operations | (23,344 | ) | 17,715 | 2,553,892 | 3,132,688 | ||||||||||||||
DISTRIBUTIONS TO SHAREHOLDERS: | |||||||||||||||||||
Total distributions | (29,158 | ) | — | (2,922,656 | ) | (1,185,841 | ) | ||||||||||||
Change in net assets resulting from distributions | (29,158 | ) | — | (2,922,656 | ) | (1,185,841 | ) | ||||||||||||
CAPITAL TRANSACTIONS: | |||||||||||||||||||
Proceeds from shares issued | 114,470 | 4,147,988 | 12,799,612 | 14,981,050 | |||||||||||||||
Distributions reinvested | 29,158 | — | 2,922,656 | 1,185,841 | |||||||||||||||
Value of shares redeemed | (794,318 | ) | (3,520,351 | ) | (13,058,221 | ) | (18,603,936 | ) | |||||||||||
Change in net assets resulting from capital transactions | (650,690 | ) | 627,637 | 2,664,047 | (2,437,045 | ) | |||||||||||||
Change in net assets | (703,192 | ) | 645,352 | 2,295,283 | (490,198 | ) | |||||||||||||
NET ASSETS: | |||||||||||||||||||
Beginning of period | 1,150,517 | 505,165 | 26,904,743 | 27,394,941 | |||||||||||||||
End of period | $ | 447,325 | $ | 1,150,517 | $ | 29,200,026 | $ | 26,904,743 | |||||||||||
SHARE TRANSACTIONS: | |||||||||||||||||||
Issued | 7,538 | 272,172 | 261,730 | 351,510 | |||||||||||||||
Reinvested | 2,068 | — | 64,504 | 27,533 | |||||||||||||||
Redeemed | (51,620 | ) | (231,825 | ) | (265,486 | ) | (441,916 | ) | |||||||||||
Change in shares | (42,014 | ) | 40,347 | 60,748 | (62,873 | ) | |||||||||||||
See accompanying notes to the financial statements.
200 :: Statements of Changes in Net Assets :: For the Periods Indicated
| ProFund VP Government Money Market | ProFund VP Health Care | ProFund VP Industrials | |||||||||||||||||||||||||
| Six Months Ended June 30, 2024 (unaudited) | Year Ended December 31, 2023 | Six Months Ended June 30, 2024 (unaudited) | Year Ended December 31, 2023 | Six Months Ended June 30, 2024 (unaudited) | Year Ended December 31, 2023 | ||||||||||||||||||||||
FROM INVESTMENT ACTIVITIES: | |||||||||||||||||||||||||||
OPERATIONS: | |||||||||||||||||||||||||||
Net investment income (loss) | $ | 674,552 | $ | 1,426,790 | $ | 8,142 | $ | 26,298 | $ | (10,469 | ) | $ | 30,591 | ||||||||||||||
Net realized gains (losses) on investments | — | (3,129 | ) | 1,302,634 | 2,510,901 | 80,364 | 2,551,975 | ||||||||||||||||||||
| Change in net unrealized appreciation/depreciation on investments | — | — | 1,257,323 | (2,447,230 | ) | 1,072,550 | (481,719 | ) | |||||||||||||||||||
Change in net assets resulting from operations | 674,552 | 1,423,661 | 2,568,099 | 89,969 | 1,142,445 | 2,100,847 | |||||||||||||||||||||
DISTRIBUTIONS TO SHAREHOLDERS: | |||||||||||||||||||||||||||
Total distributions | (674,552 | ) | (1,426,790 | ) | (1,733,204 | ) | (4,450,779 | ) | (2,225,904 | ) | (1,349,793 | ) | |||||||||||||||
Change in net assets resulting from distributions | (674,552 | ) | (1,426,790 | ) | (1,733,204 | ) | (4,450,779 | ) | (2,225,904 | ) | (1,349,793 | ) | |||||||||||||||
CAPITAL TRANSACTIONS: | |||||||||||||||||||||||||||
Proceeds from shares issued | 11,411,476 | 61,053,891 | 16,238,969 | 14,323,232 | 8,087,859 | 14,836,576 | |||||||||||||||||||||
Distributions reinvested | 674,552 | 1,426,790 | 1,733,204 | 4,450,779 | 2,225,904 | 1,349,793 | |||||||||||||||||||||
Value of shares redeemed | (12,481,248 | ) | (68,159,276 | ) | (18,374,082 | ) | (20,807,961 | ) | (8,457,593 | ) | (15,398,360 | ) | |||||||||||||||
Change in net assets resulting from capital transactions | (395,220 | ) | (5,678,595 | ) | (401,909 | ) | (2,033,950 | ) | 1,856,170 | 788,009 | |||||||||||||||||
Change in net assets | (395,220 | ) | (5,681,724 | ) | 432,986 | (6,394,760 | ) | 772,711 | 1,539,063 | ||||||||||||||||||
NET ASSETS: | |||||||||||||||||||||||||||
Beginning of period | 30,940,543 | 36,622,267 | 37,240,682 | 43,635,442 | 15,732,768 | 14,193,705 | |||||||||||||||||||||
End of period | $ | 30,545,323 | $ | 30,940,543 | $ | 37,673,668 | $ | 37,240,682 | $ | 16,505,479 | $ | 15,732,768 | |||||||||||||||
SHARE TRANSACTIONS: | |||||||||||||||||||||||||||
Issued | 11,411,476 | 61,053,891 | 229,629 | 208,135 | 85,922 | 173,517 | |||||||||||||||||||||
Reinvested | 674,552 | 1,426,790 | 25,306 | 67,040 | 27,115 | 15,858 | |||||||||||||||||||||
Redeemed | (12,481,248 | ) | (68,159,276 | ) | (259,914 | ) | (303,072 | ) | (89,212 | ) | (182,874 | ) | |||||||||||||||
Change in shares | (395,220 | ) | (5,678,595 | ) | (4,979 | ) | (27,897 | ) | 23,825 | 6,501 | |||||||||||||||||
Amounts designated as " – " are $0 or have been rounded to $0.
See accompanying notes to the financial statements.
For the Periods Indicated :: Statements of Changes in Net Assets :: 201
ProFund VP International | ProFund VP Internet | ||||||||||||||||||
| Six Months Ended June 30, 2024 (unaudited) | Year Ended December 31, 2023 | Six Months Ended June 30, 2024 (unaudited) | Year Ended December 31, 2023 | ||||||||||||||||
FROM INVESTMENT ACTIVITIES: | |||||||||||||||||||
OPERATIONS: | |||||||||||||||||||
Net investment income (loss) | $ | 195,672 | $ | 371,382 | $ | (86,410 | ) | $ | (140,154 | ) | |||||||||
Net realized gains (losses) on investments | 188,041 | 1,289,268 | 884,284 | (534,947 | ) | ||||||||||||||
| Change in net unrealized appreciation/depreciation on investments | 49,806 | 49,724 | 301,391 | 4,729,701 | |||||||||||||||
Change in net assets resulting from operations | 433,519 | 1,710,374 | 1,099,265 | 4,054,600 | |||||||||||||||
DISTRIBUTIONS TO SHAREHOLDERS: | |||||||||||||||||||
Total distributions | (371,382 | ) | — | (257,577 | ) | (1,717,154 | ) | ||||||||||||
Change in net assets resulting from distributions | (371,382 | ) | — | (257,577 | ) | (1,717,154 | ) | ||||||||||||
CAPITAL TRANSACTIONS: | |||||||||||||||||||
Proceeds from shares issued | 11,718,143 | 25,815,900 | 6,380,485 | 16,807,660 | |||||||||||||||
Distributions reinvested | 371,382 | — | 257,577 | 1,717,154 | |||||||||||||||
Value of shares redeemed | (12,190,503 | ) | (29,839,567 | ) | (7,129,610 | ) | (16,503,992 | ) | |||||||||||
Change in net assets resulting from capital transactions | (100,978 | ) | (4,023,667 | ) | (491,548 | ) | 2,020,822 | ||||||||||||
Change in net assets | (38,841 | ) | (2,313,293 | ) | 350,140 | 4,358,268 | |||||||||||||
NET ASSETS: | |||||||||||||||||||
Beginning of period | 10,459,107 | 12,772,400 | 12,491,461 | 8,133,193 | |||||||||||||||
End of period | $ | 10,420,266 | $ | 10,459,107 | $ | 12,841,601 | $ | 12,491,461 | |||||||||||
SHARE TRANSACTIONS: | |||||||||||||||||||
Issued | 552,898 | 1,336,784 | 283,700 | 864,806 | |||||||||||||||
Reinvested | 17,829 | — | 11,613 | 89,669 | |||||||||||||||
Redeemed | (576,250 | ) | (1,545,832 | ) | (318,325 | ) | (856,985 | ) | |||||||||||
Change in shares | (5,523 | ) | (209,048 | ) | (23,012 | ) | 97,490 | ||||||||||||
See accompanying notes to the financial statements.
202 :: Statements of Changes in Net Assets :: For the Periods Indicated
ProFund VP Japan | ProFund VP Large-Cap Growth | ProFund VP Large-Cap Value | |||||||||||||||||||||||||
| Six Months Ended June 30, 2024 (unaudited) | Year Ended December 31, 2023 | Six Months Ended June 30, 2024 (unaudited) | Year Ended December 31, 2023 | Six Months Ended June 30, 2024 (unaudited) | Year Ended December 31, 2023 | ||||||||||||||||||||||
FROM INVESTMENT ACTIVITIES: | |||||||||||||||||||||||||||
OPERATIONS: | |||||||||||||||||||||||||||
Net investment income (loss) | $ | 257,351 | $ | 332,742 | $ | (134,592 | ) | $ | (76,320 | ) | $ | 54,718 | $ | 56,453 | |||||||||||||
Net realized gains (losses) on investments | 1,708,381 | 2,151,313 | 112,501 | 502,885 | 474,041 | 1,750,291 | |||||||||||||||||||||
| Change in net unrealized appreciation/depreciation on investments | 447,568 | 398,834 | 5,420,338 | 4,578,455 | 307,224 | 1,221,262 | |||||||||||||||||||||
Change in net assets resulting from operations | 2,413,300 | 2,882,889 | 5,398,247 | 5,005,020 | 835,983 | 3,028,006 | |||||||||||||||||||||
DISTRIBUTIONS TO SHAREHOLDERS: | |||||||||||||||||||||||||||
Total distributions | (2,031,226 | ) | — | (530,748 | ) | (3,728,772 | ) | (1,916,765 | ) | (1,320,536 | ) | ||||||||||||||||
Change in net assets resulting from distributions | (2,031,226 | ) | — | (530,748 | ) | (3,728,772 | ) | (1,916,765 | ) | (1,320,536 | ) | ||||||||||||||||
CAPITAL TRANSACTIONS: | |||||||||||||||||||||||||||
Proceeds from shares issued | 15,481,123 | 27,283,643 | 24,600,473 | 41,392,771 | 5,834,736 | 23,347,451 | |||||||||||||||||||||
Distributions reinvested | 2,031,226 | — | 530,748 | 3,728,772 | 1,916,765 | 1,320,536 | |||||||||||||||||||||
Value of shares redeemed | (14,466,757 | ) | (26,867,059 | ) | (23,323,495 | ) | (36,111,609 | ) | (11,713,103 | ) | (22,062,238 | ) | |||||||||||||||
Change in net assets resulting from capital transactions | 3,045,592 | 416,584 | 1,807,726 | 9,009,934 | (3,961,602 | ) | 2,605,749 | ||||||||||||||||||||
Change in net assets | 3,427,666 | 3,299,473 | 6,675,225 | 10,286,182 | (5,042,384 | ) | 4,313,219 | ||||||||||||||||||||
NET ASSETS: | |||||||||||||||||||||||||||
Beginning of period | 10,747,633 | 7,448,160 | 26,085,533 | 15,799,351 | 20,298,800 | 15,985,581 | |||||||||||||||||||||
End of period | $ | 14,175,299 | $ | 10,747,633 | $ | 32,760,758 | $ | 26,085,533 | $ | 15,256,416 | $ | 20,298,800 | |||||||||||||||
SHARE TRANSACTIONS: | |||||||||||||||||||||||||||
Issued | 205,680 | 464,023 | 425,695 | 818,298 | 112,796 | 489,591 | |||||||||||||||||||||
Reinvested | 30,353 | — | 8,548 | 75,131 | 41,310 | 27,511 | |||||||||||||||||||||
Redeemed | (191,723 | ) | (452,888 | ) | (411,979 | ) | (719,484 | ) | (227,089 | ) | (468,527 | ) | |||||||||||||||
Change in shares | 44,310 | 11,135 | 22,264 | 173,945 | (72,983 | ) | 48,575 | ||||||||||||||||||||
Amounts designated as " – " are $0 or have been rounded to $0.
See accompanying notes to the financial statements.
For the Periods Indicated :: Statements of Changes in Net Assets :: 203
ProFund VP Materials | ProFund VP Mid-Cap | ||||||||||||||||||
| Six Months Ended June 30, 2024 (unaudited) | Year Ended December 31, 2023 | Six Months Ended June 30, 2024 (unaudited) | Year Ended December 31, 2023 | ||||||||||||||||
FROM INVESTMENT ACTIVITIES: | |||||||||||||||||||
OPERATIONS: | |||||||||||||||||||
Net investment income (loss) | $ | 12,778 | $ | 62,256 | $ | 202,584 | $ | 316,090 | |||||||||||
Net realized gains (losses) on investments | 234,014 | 1,273,992 | 183,534 | 821,690 | |||||||||||||||
| Change in net unrealized appreciation/depreciation on investments | 210,196 | 107,355 | 14,401 | 42,094 | |||||||||||||||
Change in net assets resulting from operations | 456,988 | 1,443,603 | 400,519 | 1,179,874 | |||||||||||||||
DISTRIBUTIONS TO SHAREHOLDERS: | |||||||||||||||||||
Total distributions | (73,395 | ) | (72,950 | ) | (316,090 | ) | — | ||||||||||||
Change in net assets resulting from distributions | (73,395 | ) | (72,950 | ) | (316,090 | ) | — | ||||||||||||
CAPITAL TRANSACTIONS: | |||||||||||||||||||
Proceeds from shares issued | 7,784,995 | 16,838,021 | 4,733,802 | 6,141,545 | |||||||||||||||
Distributions reinvested | 73,395 | 72,950 | 316,090 | — | |||||||||||||||
Value of shares redeemed | (8,271,384 | ) | (17,240,316 | ) | (4,314,606 | ) | (6,979,186 | ) | |||||||||||
Change in net assets resulting from capital transactions | (412,994 | ) | (329,345 | ) | 735,286 | (837,641 | ) | ||||||||||||
Change in net assets | (29,401 | ) | 1,041,308 | 819,715 | 342,233 | ||||||||||||||
NET ASSETS: | |||||||||||||||||||
Beginning of period | 14,609,556 | 13,568,248 | 10,334,899 | 9,992,666 | |||||||||||||||
End of period | $ | 14,580,155 | $ | 14,609,556 | $ | 11,154,614 | $ | 10,334,899 | |||||||||||
SHARE TRANSACTIONS: | |||||||||||||||||||
Issued | 86,809 | 207,340 | 266,866 | 393,098 | |||||||||||||||
Reinvested | 832 | 858 | 18,615 | — | |||||||||||||||
Redeemed | (92,578 | ) | (214,872 | ) | (249,046 | ) | (455,664 | ) | |||||||||||
Change in shares | (4,937 | ) | (6,674 | ) | 36,435 | (62,566 | ) | ||||||||||||
See accompanying notes to the financial statements.
204 :: Statements of Changes in Net Assets :: For the Periods Indicated
ProFund VP Mid-Cap Growth | ProFund VP Mid-Cap Value | ProFund VP Nasdaq-100 | |||||||||||||||||||||||||
| Six Months Ended June 30, 2024 (unaudited) | Year Ended December 31, 2023 | Six Months Ended June 30, 2024 (unaudited) | Year Ended December 31, 2023 | Six Months Ended June 30, 2024 (unaudited) | Year Ended December 31, 2023 | ||||||||||||||||||||||
FROM INVESTMENT ACTIVITIES: | |||||||||||||||||||||||||||
OPERATIONS: | |||||||||||||||||||||||||||
Net investment income (loss) | $ | (47,299 | ) | $ | (51,398 | ) | $ | 27,639 | $ | 22,096 | $ | 452,581 | $ | 652,615 | |||||||||||||
Net realized gains (losses) on investments | 655,706 | 776,856 | (67,955 | ) | 952,080 | 8,179,854 | 18,292,535 | ||||||||||||||||||||
| Change in net unrealized appreciation/depreciation on investments | 578,013 | 1,066,370 | (48,394 | ) | 483,647 | 15,148,667 | 24,702,405 | ||||||||||||||||||||
Change in net assets resulting from operations | 1,186,420 | 1,791,828 | (88,710 | ) | 1,457,823 | 23,781,102 | 43,647,555 | ||||||||||||||||||||
DISTRIBUTIONS TO SHAREHOLDERS: | |||||||||||||||||||||||||||
Total distributions | (596,396 | ) | (81,372 | ) | (502,670 | ) | (729,248 | ) | (19,907,326 | ) | (620,919 | ) | |||||||||||||||
Change in net assets resulting from distributions | (596,396 | ) | (81,372 | ) | (502,670 | ) | (729,248 | ) | (19,907,326 | ) | (620,919 | ) | |||||||||||||||
CAPITAL TRANSACTIONS: | |||||||||||||||||||||||||||
Proceeds from shares issued | 13,803,170 | 15,462,109 | 3,897,031 | 12,290,011 | 142,465,593 | 360,891,421 | |||||||||||||||||||||
Distributions reinvested | 596,396 | 81,372 | 502,670 | 729,248 | 19,907,326 | 620,919 | |||||||||||||||||||||
Value of shares redeemed | (15,236,635 | ) | (14,272,417 | ) | (5,434,812 | ) | (14,653,488 | ) | (144,623,022 | ) | (333,625,941 | ) | |||||||||||||||
Change in net assets resulting from capital transactions | (837,069 | ) | 1,271,064 | (1,035,111 | ) | (1,634,229 | ) | 17,749,897 | 27,886,399 | ||||||||||||||||||
Change in net assets | (247,045 | ) | 2,981,520 | (1,626,491 | ) | (905,654 | ) | 21,623,673 | 70,913,035 | ||||||||||||||||||
NET ASSETS: | |||||||||||||||||||||||||||
Beginning of period | 14,935,846 | 11,954,326 | 12,286,373 | 13,192,027 | 147,447,761 | 76,534,726 | |||||||||||||||||||||
End of period | $ | 14,688,801 | $ | 14,935,846 | $ | 10,659,882 | $ | 12,286,373 | $ | 169,071,434 | $ | 147,447,761 | |||||||||||||||
SHARE TRANSACTIONS: | |||||||||||||||||||||||||||
Issued | 338,950 | 454,821 | 92,872 | 299,831 | 2,328,703 | 7,535,148 | |||||||||||||||||||||
Reinvested | 15,395 | 2,272 | 12,662 | 17,896 | 334,915 | 11,550 | |||||||||||||||||||||
Redeemed | (384,724 | ) | (424,420 | ) | (130,725 | ) | (359,525 | ) | (2,363,837 | ) | (7,001,820 | ) | |||||||||||||||
Change in shares | (30,379 | ) | 32,673 | (25,191 | ) | (41,798 | ) | 299,781 | 544,878 | ||||||||||||||||||
Amounts designated as " – " are $0 or have been rounded to $0.
See accompanying notes to the financial statements.
For the Periods Indicated :: Statements of Changes in Net Assets :: 205
ProFund VP Pharmaceuticals | ProFund VP Precious Metals | ||||||||||||||||||
| Six Months Ended June 30, 2024 (unaudited) | Year Ended December 31, 2023 | Six Months Ended June 30, 2024 (unaudited) | Year Ended December 31, 2023 | ||||||||||||||||
FROM INVESTMENT ACTIVITIES: | |||||||||||||||||||
OPERATIONS: | |||||||||||||||||||
Net investment income (loss) | $ | 13,402 | $ | 9,854 | $ | 424,798 | $ | 809,641 | |||||||||||
Net realized gains (losses) on investments | 3,602 | 866,683 | 1,112,471 | (524,896 | ) | ||||||||||||||
| Change in net unrealized appreciation/depreciation on investments | (418,023 | ) | (1,683,599 | ) | 321,191 | (142,864 | ) | ||||||||||||
Change in net assets resulting from operations | (401,019 | ) | (807,062 | ) | 1,858,460 | 141,881 | |||||||||||||
DISTRIBUTIONS TO SHAREHOLDERS: | |||||||||||||||||||
Total distributions | (1,036,921 | ) | (289,591 | ) | (809,641 | ) | — | ||||||||||||
Change in net assets resulting from distributions | (1,036,921 | ) | (289,591 | ) | (809,641 | ) | — | ||||||||||||
CAPITAL TRANSACTIONS: | |||||||||||||||||||
Proceeds from shares issued | 7,331,067 | 13,170,954 | 182,251,371 | 80,804,420 | |||||||||||||||
Distributions reinvested | 1,036,921 | 289,591 | 809,641 | — | |||||||||||||||
Value of shares redeemed | (7,674,685 | ) | (15,751,659 | ) | (178,566,740 | ) | (83,483,270 | ) | |||||||||||
Change in net assets resulting from capital transactions | 693,303 | (2,291,114 | ) | 4,494,272 | (2,678,850 | ) | |||||||||||||
Change in net assets | (744,637 | ) | (3,387,767 | ) | 5,543,091 | (2,536,969 | ) | ||||||||||||
NET ASSETS: | |||||||||||||||||||
Beginning of period | 10,139,311 | 13,527,078 | 24,691,037 | 27,228,006 | |||||||||||||||
End of period | $ | 9,394,674 | $ | 10,139,311 | $ | 30,234,128 | $ | 24,691,037 | |||||||||||
SHARE TRANSACTIONS: | |||||||||||||||||||
Issued | 212,083 | 380,619 | 7,610,658 | 3,251,531 | |||||||||||||||
Reinvested | 35,162 | 8,324 | 30,997 | — | |||||||||||||||
Redeemed | (221,948 | ) | (456,701 | ) | (7,463,610 | ) | (3,367,491 | ) | |||||||||||
Change in shares | 25,297 | (67,758 | ) | 178,045 | (115,960 | ) | |||||||||||||
See accompanying notes to the financial statements.
206 :: Statements of Changes in Net Assets :: For the Periods Indicated
ProFund VP Real Estate | ProFund VP Rising Rates Opportunity | ProFund VP Semiconductor | |||||||||||||||||||||||||
| Six Months Ended June 30, 2024 (unaudited) | Year Ended December 31, 2023 | Six Months Ended June 30, 2024 (unaudited) | Year Ended December 31, 2023 | Six Months Ended June 30, 2024 (unaudited) | Year Ended December 31, 2023 | ||||||||||||||||||||||
FROM INVESTMENT ACTIVITIES: | |||||||||||||||||||||||||||
OPERATIONS: | |||||||||||||||||||||||||||
Net investment income (loss) | $ | 40,600 | $ | 77,856 | $ | 160,977 | $ | 372,109 | $ | (373,628 | ) | $ | (209,405 | ) | |||||||||||||
Net realized gains (losses) on investments | (47,296 | ) | 484,759 | 453,879 | 1,488,761 | 27,718,211 | 4,980,644 | ||||||||||||||||||||
| Change in net unrealized appreciation/depreciation on investments | (219,254 | ) | 23,106 | 325,658 | (1,838,575 | ) | 12,285,639 | 16,029,875 | |||||||||||||||||||
Change in net assets resulting from operations | (225,950 | ) | 585,721 | 940,514 | 22,295 | 39,630,222 | 20,801,114 | ||||||||||||||||||||
DISTRIBUTIONS TO SHAREHOLDERS: | |||||||||||||||||||||||||||
Total distributions | (11,434 | ) | (1,257,502 | ) | (4,486,965 | ) | (16,031 | ) | (5,758,274 | ) | (397,743 | ) | |||||||||||||||
Change in net assets resulting from distributions | (11,434 | ) | (1,257,502 | ) | (4,486,965 | ) | (16,031 | ) | (5,758,274 | ) | (397,743 | ) | |||||||||||||||
CAPITAL TRANSACTIONS: | |||||||||||||||||||||||||||
Proceeds from shares issued | 2,446,152 | 6,733,360 | 6,750,715 | 18,407,181 | 40,721,284 | 56,390,693 | |||||||||||||||||||||
Distributions reinvested | 11,434 | 1,257,502 | 4,486,965 | 16,031 | 5,758,274 | 397,743 | |||||||||||||||||||||
Value of shares redeemed | (2,578,829 | ) | (6,427,445 | ) | (7,237,014 | ) | (27,199,202 | ) | (45,352,676 | ) | (26,873,463 | ) | |||||||||||||||
Change in net assets resulting from capital transactions | (121,243 | ) | 1,563,417 | 4,000,666 | (8,775,990 | ) | 1,126,882 | 29,914,973 | |||||||||||||||||||
Change in net assets | (358,627 | ) | 891,636 | 454,215 | (8,769,726 | ) | 34,998,830 | 50,318,344 | |||||||||||||||||||
NET ASSETS: | |||||||||||||||||||||||||||
Beginning of period | 6,487,150 | 5,595,514 | 8,219,888 | 16,989,614 | 58,222,427 | 7,904,083 | |||||||||||||||||||||
End of period | $ | 6,128,523 | $ | 6,487,150 | $ | 8,674,103 | $ | 8,219,888 | $ | 93,221,257 | $ | 58,222,427 | |||||||||||||||
SHARE TRANSACTIONS: | |||||||||||||||||||||||||||
Issued | 53,721 | 140,697 | 162,094 | 408,381 | 241,944 | 607,421 | |||||||||||||||||||||
Reinvested | 248 | 27,533 | 144,433 | 367 | 28,765 | 3,516 | |||||||||||||||||||||
Redeemed | (57,087 | ) | (134,577 | ) | (172,975 | ) | (611,063 | ) | (260,914 | ) | (270,402 | ) | |||||||||||||||
Change in shares | (3,118 | ) | 33,653 | 133,552 | (202,315 | ) | 9,795 | 340,535 | |||||||||||||||||||
Amounts designated as " – " are $0 or have been rounded to $0.
See accompanying notes to the financial statements.
For the Periods Indicated :: Statements of Changes in Net Assets :: 207
ProFund VP Short Dow 30 | ProFund VP Short Emerging Markets | ||||||||||||||||||
| Six Months Ended June 30, 2024 (unaudited) | Year Ended December 31, 2023 | Six Months Ended June 30, 2024 (unaudited) | Year Ended December 31, 2023 | ||||||||||||||||
FROM INVESTMENT ACTIVITIES: | |||||||||||||||||||
OPERATIONS: | |||||||||||||||||||
Net investment income (loss) | $ | 103 | $ | 200 | $ | 9,321 | $ | 29,923 | |||||||||||
Net realized gains (losses) on investments | (167 | ) | (725 | ) | (27,694 | ) | (171,679 | ) | |||||||||||
| Change in net unrealized appreciation/depreciation on investments | 12 | (25 | ) | 1,248 | (10,176 | ) | |||||||||||||
Change in net assets resulting from operations | (52 | ) | (550 | ) | (17,125 | ) | (151,932 | ) | |||||||||||
DISTRIBUTIONS TO SHAREHOLDERS: | |||||||||||||||||||
Total distributions | (200 | ) | — | (29,923 | ) | (4,519 | ) | ||||||||||||
Change in net assets resulting from distributions | (200 | ) | — | (29,923 | ) | (4,519 | ) | ||||||||||||
CAPITAL TRANSACTIONS: | |||||||||||||||||||
Proceeds from shares issued | — | — | 968,784 | 7,523,971 | |||||||||||||||
Distributions reinvested | 200 | — | 29,923 | 4,519 | |||||||||||||||
Value of shares redeemed | (21 | ) | (163 | ) | (937,240 | ) | (7,721,018 | ) | |||||||||||
Change in net assets resulting from capital transactions | 179 | (163 | ) | 61,467 | (192,528 | ) | |||||||||||||
Change in net assets | (73 | ) | (713 | ) | 14,419 | (348,979 | ) | ||||||||||||
NET ASSETS: | |||||||||||||||||||
Beginning of period | 6,323 | 7,036 | 513,187 | 862,166 | |||||||||||||||
End of period | $ | 6,250 | $ | 6,323 | $ | 527,606 | $ | 513,187 | |||||||||||
SHARE TRANSACTIONS: | |||||||||||||||||||
Issued | — | — | 41,213 | 302,966 | |||||||||||||||
Reinvested | 10 | — | 1,413 | 193 | |||||||||||||||
Redeemed | (1 | ) | (7 | ) | (39,775 | ) | (313,569 | ) | |||||||||||
Change in shares | 9 | (7 | ) | 2,851 | (10,410 | ) | |||||||||||||
See accompanying notes to the financial statements.
208 :: Statements of Changes in Net Assets :: For the Periods Indicated
ProFund VP Short International | ProFund VP Short Mid-Cap | ProFund VP Short Nasdaq-100 | |||||||||||||||||||||||||
| Six Months Ended June 30, 2024 (unaudited) | Year Ended December 31, 2023 | Six Months Ended June 30, 2024 (unaudited) | Year Ended December 31, 2023 | Six Months Ended June 30, 2024 (unaudited) | Year Ended December 31, 2023 | ||||||||||||||||||||||
FROM INVESTMENT ACTIVITIES: | |||||||||||||||||||||||||||
OPERATIONS: | |||||||||||||||||||||||||||
Net investment income (loss) | $ | 10,121 | $ | 29,900 | $ | 1,506 | $ | 7,165 | $ | 70,539 | $ | 205,004 | |||||||||||||||
Net realized gains (losses) on investments | (11,141 | ) | (266,232 | ) | (4,513 | ) | (15,901 | ) | (471,178 | ) | (3,079,720 | ) | |||||||||||||||
| Change in net unrealized appreciation/depreciation on investments | (2,809 | ) | (15,871 | ) | (897 | ) | 539 | 23,485 | 10,116 | ||||||||||||||||||
Change in net assets resulting from operations | (3,829 | ) | (252,203 | ) | (3,904 | ) | (8,197 | ) | (377,154 | ) | (2,864,600 | ) | |||||||||||||||
DISTRIBUTIONS TO SHAREHOLDERS: | |||||||||||||||||||||||||||
Total distributions | (29,900 | ) | (13,615 | ) | (7,165 | ) | (1,059 | ) | (205,004 | ) | (8,999 | ) | |||||||||||||||
Change in net assets resulting from distributions | (29,900 | ) | (13,615 | ) | (7,165 | ) | (1,059 | ) | (205,004 | ) | (8,999 | ) | |||||||||||||||
CAPITAL TRANSACTIONS: | |||||||||||||||||||||||||||
Proceeds from shares issued | 870,434 | 3,523,124 | 417,707 | 2,041,899 | 26,680,313 | 121,194,164 | |||||||||||||||||||||
Distributions reinvested | 29,900 | 13,615 | 7,165 | 1,059 | 205,004 | 8,999 | |||||||||||||||||||||
Value of shares redeemed | (585,445 | ) | (5,770,068 | ) | (407,666 | ) | (2,060,041 | ) | (28,121,252 | ) | (121,444,444 | ) | |||||||||||||||
Change in net assets resulting from capital transactions | 314,889 | (2,233,329 | ) | 17,206 | (17,083 | ) | (1,235,935 | ) | (241,281 | ) | |||||||||||||||||
Change in net assets | 281,160 | (2,499,147 | ) | 6,137 | (26,339 | ) | (1,818,093 | ) | (3,114,880 | ) | |||||||||||||||||
NET ASSETS: | |||||||||||||||||||||||||||
Beginning of period | 517,227 | 3,016,374 | 69,356 | 95,695 | 4,369,386 | 7,484,266 | |||||||||||||||||||||
End of period | $ | 798,387 | $ | 517,227 | $ | 75,493 | $ | 69,356 | $ | 2,551,293 | $ | 4,369,386 | |||||||||||||||
SHARE TRANSACTIONS: | |||||||||||||||||||||||||||
Issued | 35,546 | 132,021 | 57,464 | 251,733 | 2,245,518 | 8,043,954 | |||||||||||||||||||||
Reinvested | 1,279 | 545 | 1,094 | 141 | 20,460 | 691 | |||||||||||||||||||||
Redeemed | (23,657 | ) | (218,479 | ) | (56,304 | ) | (254,105 | ) | (2,367,175 | ) | (8,100,140 | ) | |||||||||||||||
Change in shares | 13,168 | (85,913 | ) | 2,254 | (2,231 | ) | (101,197 | ) | (55,495 | ) | |||||||||||||||||
Amounts designated as " – " are $0 or have been rounded to $0.
See accompanying notes to the financial statements.
For the Periods Indicated :: Statements of Changes in Net Assets :: 209
ProFund VP Short Small-Cap | ProFund VP Small-Cap | ||||||||||||||||||
| Six Months Ended June 30, 2024 (unaudited) | Year Ended December 31, 2023 | Six Months Ended June 30, 2024 (unaudited) | Year Ended December 31, 2023 | ||||||||||||||||
FROM INVESTMENT ACTIVITIES: | |||||||||||||||||||
OPERATIONS: | |||||||||||||||||||
Net investment income (loss) | $ | 30,529 | $ | 109,373 | $ | 40,476 | $ | 92,778 | |||||||||||
Net realized gains (losses) on investments | (47,506 | ) | (513,386 | ) | (320,027 | ) | 742,470 | ||||||||||||
| Change in net unrealized appreciation/depreciation on investments | (37,764 | ) | 51,526 | 148,656 | 922,157 | ||||||||||||||
Change in net assets resulting from operations | (54,741 | ) | (352,487 | ) | (130,895 | ) | 1,757,405 | ||||||||||||
DISTRIBUTIONS TO SHAREHOLDERS: | |||||||||||||||||||
Total distributions | (109,373 | ) | (143,290 | ) | (99,601 | ) | — | ||||||||||||
Change in net assets resulting from distributions | (109,373 | ) | (143,290 | ) | (99,601 | ) | — | ||||||||||||
CAPITAL TRANSACTIONS: | |||||||||||||||||||
Proceeds from shares issued | 13,174,294 | 23,299,052 | 4,698,126 | 15,723,555 | |||||||||||||||
Distributions reinvested | 109,373 | 143,290 | 99,601 | — | |||||||||||||||
Value of shares redeemed | (11,673,820 | ) | (23,798,158 | ) | (12,497,616 | ) | (12,543,958 | ) | |||||||||||
Change in net assets resulting from capital transactions | 1,609,847 | (355,816 | ) | (7,699,889 | ) | 3,179,597 | |||||||||||||
Change in net assets | 1,445,733 | (851,593 | ) | (7,930,385 | ) | 4,937,002 | |||||||||||||
NET ASSETS: | |||||||||||||||||||
Beginning of period | 2,193,830 | 3,045,423 | 15,157,744 | 10,220,742 | |||||||||||||||
End of period | $ | 3,639,563 | $ | 2,193,830 | $ | 7,227,359 | $ | 15,157,744 | |||||||||||
SHARE TRANSACTIONS: | |||||||||||||||||||
Issued | 591,434 | 915,751 | 135,990 | 502,315 | |||||||||||||||
Reinvested | 5,109 | 6,371 | 2,959 | — | |||||||||||||||
Redeemed | (523,763 | ) | (938,483 | ) | (368,841 | ) | (402,761 | ) | |||||||||||
Change in shares | 72,780 | (16,361 | ) | (229,892 | ) | 99,554 | |||||||||||||
See accompanying notes to the financial statements.
210 :: Statements of Changes in Net Assets :: For the Periods Indicated
ProFund VP Small-Cap Growth | ProFund VP Small-Cap Value | ProFund VP Technology | |||||||||||||||||||||||||
| Six Months Ended June 30, 2024 (unaudited) | Year Ended December 31, 2023 | Six Months Ended June 30, 2024 (unaudited) | Year Ended December 31, 2023 | Six Months Ended June 30, 2024 (unaudited) | Year Ended December 31, 2023 | ||||||||||||||||||||||
FROM INVESTMENT ACTIVITIES: | |||||||||||||||||||||||||||
OPERATIONS: | |||||||||||||||||||||||||||
Net investment income (loss) | $ | (34,546 | ) | $ | (35,684 | ) | $ | 41,546 | $ | 48,857 | $ | (230,534 | ) | $ | (289,297 | ) | |||||||||||
Net realized gains (losses) on investments | 527,729 | 1,029,511 | (313,772 | ) | 1,656,001 | 9,667,023 | 5,777,297 | ||||||||||||||||||||
| Change in net unrealized appreciation/depreciation on investments | (166,211 | ) | 1,107,875 | (766,678 | ) | 316,339 | (247,297 | ) | 12,774,065 | ||||||||||||||||||
Change in net assets resulting from operations | 326,972 | 2,101,702 | (1,038,904 | ) | 2,021,197 | 9,189,192 | 18,262,065 | ||||||||||||||||||||
DISTRIBUTIONS TO SHAREHOLDERS: | |||||||||||||||||||||||||||
Total distributions | (752,384 | ) | (435,031 | ) | (151,910 | ) | (792,188 | ) | (4,305,449 | ) | (5,510,738 | ) | |||||||||||||||
Change in net assets resulting from distributions | (752,384 | ) | (435,031 | ) | (151,910 | ) | (792,188 | ) | (4,305,449 | ) | (5,510,738 | ) | |||||||||||||||
CAPITAL TRANSACTIONS: | |||||||||||||||||||||||||||
Proceeds from shares issued | 3,657,982 | 7,248,051 | 2,487,132 | 9,826,288 | 11,796,652 | 41,449,117 | |||||||||||||||||||||
Distributions reinvested | 752,384 | 435,031 | 151,910 | 792,188 | 4,305,449 | 5,510,738 | |||||||||||||||||||||
Value of shares redeemed | (4,549,585 | ) | (6,996,217 | ) | (6,271,747 | ) | (10,804,155 | ) | (15,372,024 | ) | (29,634,467 | ) | |||||||||||||||
Change in net assets resulting from capital transactions | (139,219 | ) | 686,865 | (3,632,705 | ) | (185,679 | ) | 730,077 | 17,325,388 | ||||||||||||||||||
Change in net assets | (564,631 | ) | 2,353,536 | (4,823,519 | ) | 1,043,330 | 5,613,820 | 30,076,715 | |||||||||||||||||||
NET ASSETS: | |||||||||||||||||||||||||||
Beginning of period | 16,197,953 | 13,844,417 | 19,446,893 | 18,403,563 | 57,109,015 | 27,032,300 | |||||||||||||||||||||
End of period | $ | 15,633,322 | $ | 16,197,953 | $ | 14,623,374 | $ | 19,446,893 | $ | 62,722,835 | $ | 57,109,015 | |||||||||||||||
SHARE TRANSACTIONS: | |||||||||||||||||||||||||||
Issued | 119,899 | 263,927 | 59,385 | 239,197 | 157,439 | 670,435 | |||||||||||||||||||||
Reinvested | 26,025 | 15,184 | 3,836 | 19,191 | 57,056 | 85,704 | |||||||||||||||||||||
Redeemed | (151,680 | ) | (255,714 | ) | (152,113 | ) | (267,807 | ) | (207,800 | ) | (486,710 | ) | |||||||||||||||
Change in shares | (5,756 | ) | 23,397 | (88,892 | ) | (9,419 | ) | 6,695 | 269,429 | ||||||||||||||||||
Amounts designated as " – " are $0 or have been rounded to $0.
See accompanying notes to the financial statements.
For the Periods Indicated :: Statements of Changes in Net Assets :: 211
ProFund VP UltraBull | ProFund VP UltraMid-Cap | ||||||||||||||||||
| Six Months Ended June 30, 2024 (unaudited) | Year Ended December 31, 2023 | Six Months Ended June 30, 2024 (unaudited) | Year Ended December 31, 2023 | ||||||||||||||||
FROM INVESTMENT ACTIVITIES: | |||||||||||||||||||
OPERATIONS: | |||||||||||||||||||
Net investment income (loss) | $ | 69,249 | $ | 123,416 | $ | 46,880 | $ | 66,404 | |||||||||||
Net realized gains (losses) on investments | 2,840,785 | 2,958,397 | 302,008 | 1,027,034 | |||||||||||||||
| Change in net unrealized appreciation/depreciation on investments | 1,462,352 | 2,225,624 | 291,831 | 543,990 | |||||||||||||||
Change in net assets resulting from operations | 4,372,386 | 5,307,437 | 640,719 | 1,637,428 | |||||||||||||||
DISTRIBUTIONS TO SHAREHOLDERS: | |||||||||||||||||||
Total distributions | (123,401 | ) | — | (69,792 | ) | — | |||||||||||||
Change in net assets resulting from distributions | (123,401 | ) | — | (69,792 | ) | — | |||||||||||||
CAPITAL TRANSACTIONS: | |||||||||||||||||||
Proceeds from shares issued | 13,618,039 | 41,663,119 | 8,531,518 | 5,744,267 | |||||||||||||||
Distributions reinvested | 123,401 | — | 69,792 | — | |||||||||||||||
Value of shares redeemed | (18,866,223 | ) | (38,563,254 | ) | (9,157,637 | ) | (4,992,273 | ) | |||||||||||
Change in net assets resulting from capital transactions | (5,124,783 | ) | 3,099,865 | (556,327 | ) | 751,994 | |||||||||||||
Change in net assets | (875,798 | ) | 8,407,302 | 14,600 | 2,389,422 | ||||||||||||||
NET ASSETS: | |||||||||||||||||||
Beginning of period | 18,659,842 | 10,252,540 | 10,791,264 | 8,401,842 | |||||||||||||||
End of period | $ | 17,784,044 | $ | 18,659,842 | $ | 10,805,864 | $ | 10,791,264 | |||||||||||
SHARE TRANSACTIONS: | |||||||||||||||||||
Issued | 405,397 | 1,681,961 | 228,911 | 176,949 | |||||||||||||||
Reinvested | 3,247 | — | 1,878 | — | |||||||||||||||
Redeemed | (560,683 | ) | (1,556,396 | ) | (249,714 | ) | (162,074 | ) | |||||||||||
Change in shares | (152,039 | ) | 125,565 | (18,925 | ) | 14,875 | |||||||||||||
See accompanying notes to the financial statements.
212 :: Statements of Changes in Net Assets :: For the Periods Indicated
ProFund VP UltraNasdaq-100 | ProFund VP UltraShort Dow 30 | ProFund VP UltraShort Nasdaq-100 | |||||||||||||||||||||||||
| Six Months Ended June 30, 2024 (unaudited) | Year Ended December 31, 2023 | Six Months Ended June 30, 2024 (unaudited) | Year Ended December 31, 2023 | Six Months Ended June 30, 2024 (unaudited) | Year Ended December 31, 2023 | ||||||||||||||||||||||
FROM INVESTMENT ACTIVITIES: | |||||||||||||||||||||||||||
OPERATIONS: | |||||||||||||||||||||||||||
Net investment income (loss) | $ | 363,591 | $ | 662,573 | $ | 29 | $ | 108 | $ | 23,118 | $ | 71,933 | |||||||||||||||
Net realized gains (losses) on investments | 32,801,979 | 63,768,545 | (180 | ) | (852 | ) | (316,275 | ) | (3,436,585 | ) | |||||||||||||||||
| Change in net unrealized appreciation/depreciation on investments | 22,305,502 | 32,275,373 | 12 | (28 | ) | 11,382 | 115,117 | ||||||||||||||||||||
Change in net assets resulting from operations | 55,471,072 | 96,706,491 | (139 | ) | (772 | ) | (281,775 | ) | (3,249,535 | ) | |||||||||||||||||
DISTRIBUTIONS TO SHAREHOLDERS: | |||||||||||||||||||||||||||
Total distributions | (662,578 | ) | — | (108 | ) | (6 | ) | (71,933 | ) | — | |||||||||||||||||
Change in net assets resulting from distributions | (662,578 | ) | — | (108 | ) | (6 | ) | (71,933 | ) | — | |||||||||||||||||
CAPITAL TRANSACTIONS: | |||||||||||||||||||||||||||
Proceeds from shares issued | 112,504,933 | 323,415,012 | — | — | 19,823,977 | 141,542,552 | |||||||||||||||||||||
Distributions reinvested | 662,578 | — | 108 | 6 | 71,933 | — | |||||||||||||||||||||
Value of shares redeemed | (118,160,647 | ) | (317,716,556 | ) | (62 | ) | (68 | ) | (18,551,594 | ) | (142,342,839 | ) | |||||||||||||||
Change in net assets resulting from capital transactions | (4,993,136 | ) | 5,698,456 | 46 | (62 | ) | 1,344,316 | (800,287 | ) | ||||||||||||||||||
Change in net assets | 49,815,358 | 102,404,947 | (201 | ) | (840 | ) | 990,608 | (4,049,822 | ) | ||||||||||||||||||
NET ASSETS: | |||||||||||||||||||||||||||
Beginning of period | 186,932,898 | 84,527,951 | 3,336 | 4,176 | 614,322 | 4,664,144 | |||||||||||||||||||||
End of period | $ | 236,748,256 | $ | 186,932,898 | $ | 3,135 | $ | 3,336 | $ | 1,604,930 | $ | 614,322 | |||||||||||||||
SHARE TRANSACTIONS: | |||||||||||||||||||||||||||
Issued | 3,266,839 | 14,964,711 | — | — | 620,646 | 2,503,641 | (a) | ||||||||||||||||||||
Reinvested | 16,348 | — | 36 | 2 | 2,843 | — | |||||||||||||||||||||
Redeemed | (3,468,799 | ) | (14,807,922 | ) | (19 | ) | (18 | ) | (577,599 | ) | (2,542,259 | )(a) | |||||||||||||||
Change in shares | (185,612 | ) | 156,789 | 17 | (16 | ) | 45,890 | (38,618 | ) | ||||||||||||||||||
(a) As described in Note 8, share amounts have been adjusted for 1:5 reverse share split that occurred on March 13, 2023.
Amounts designated as " – " are $0 or have been rounded to $0.
See accompanying notes to the financial statements.
For the Periods Indicated :: Statements of Changes in Net Assets :: 213
ProFund VP UltraSmall-Cap | ProFund VP U.S. Government Plus | ||||||||||||||||||
| Six Months Ended June 30, 2024 (unaudited) | Year Ended December 31, 2023 | Six Months Ended June 30, 2024 (unaudited) | Year Ended December 31, 2023 | ||||||||||||||||
FROM INVESTMENT ACTIVITIES: | |||||||||||||||||||
OPERATIONS: | |||||||||||||||||||
Net investment income (loss) | $ | 55,058 | $ | 96,401 | $ | 119,382 | $ | 282,360 | |||||||||||
Net realized gains (losses) on investments | (939,318 | ) | 2,012,423 | (422,998 | ) | (1,431,104 | ) | ||||||||||||
| Change in net unrealized appreciation/depreciation on investments | 387,183 | 682,615 | (523,040 | ) | 954,650 | ||||||||||||||
Change in net assets resulting from operations | (497,077 | ) | 2,791,439 | (826,656 | ) | (194,094 | ) | ||||||||||||
DISTRIBUTIONS TO SHAREHOLDERS: | |||||||||||||||||||
Total distributions | (104,681 | ) | — | (119,382 | ) | (362,530 | ) | ||||||||||||
Change in net assets resulting from distributions | (104,681 | ) | — | (119,382 | ) | (362,530 | ) | ||||||||||||
CAPITAL TRANSACTIONS: | |||||||||||||||||||
Proceeds from shares issued | 16,928,559 | 31,994,847 | 6,239,806 | 22,927,382 | |||||||||||||||
Distributions reinvested | 104,681 | — | 119,365 | 362,530 | |||||||||||||||
Value of shares redeemed | (20,532,599 | ) | (30,374,685 | ) | (8,900,250 | ) | (20,506,373 | ) | |||||||||||
Change in net assets resulting from capital transactions | (3,499,359 | ) | 1,620,162 | (2,541,079 | ) | 2,783,539 | |||||||||||||
Change in net assets | (4,101,117 | ) | 4,411,601 | (3,487,117 | ) | 2,226,915 | |||||||||||||
NET ASSETS: | |||||||||||||||||||
Beginning of period | 16,999,776 | 12,588,175 | 9,840,633 | 7,613,718 | |||||||||||||||
End of period | $ | 12,898,659 | $ | 16,999,776 | $ | 6,353,516 | $ | 9,840,633 | |||||||||||
SHARE TRANSACTIONS: | |||||||||||||||||||
Issued | 1,244,042 | 2,700,348 | 527,279 | 1,738,086 | |||||||||||||||
Reinvested | 7,985 | — | 10,299 | 28,514 | |||||||||||||||
Redeemed | (1,522,911 | ) | (2,585,689 | ) | (752,316 | ) | (1,567,010 | ) | |||||||||||
Change in shares | (270,884 | ) | 114,659 | (214,738 | ) | 199,590 | |||||||||||||
See accompanying notes to the financial statements.
214 :: Statements of Changes in Net Assets :: For the Periods Indicated
ProFund VP Utilities | |||||||||||
| Six Months Ended June 30, 2024 (unaudited) | Year Ended December 31, 2023 | ||||||||||
FROM INVESTMENT ACTIVITIES: | |||||||||||
OPERATIONS: | |||||||||||
Net investment income (loss) | $ | 235,350 | $ | 459,597 | |||||||
Net realized gains (losses) on investments | 352,314 | 697,485 | |||||||||
| Change in net unrealized appreciation/depreciation on investments | 1,510,258 | (4,316,049 | ) | ||||||||
Change in net assets resulting from operations | 2,097,922 | (3,158,967 | ) | ||||||||
DISTRIBUTIONS TO SHAREHOLDERS: | |||||||||||
Total distributions | (470,058 | ) | (406,380 | ) | |||||||
Change in net assets resulting from distributions | (470,058 | ) | (406,380 | ) | |||||||
CAPITAL TRANSACTIONS: | |||||||||||
Proceeds from shares issued | 23,094,839 | 19,259,030 | |||||||||
Distributions reinvested | 470,058 | 406,380 | |||||||||
Value of shares redeemed | (22,419,505 | ) | (28,999,049 | ) | |||||||
Change in net assets resulting from capital transactions | 1,145,392 | (9,333,639 | ) | ||||||||
Change in net assets | 2,773,256 | (12,898,986 | ) | ||||||||
NET ASSETS: | |||||||||||
Beginning of period | 26,118,991 | 39,017,977 | |||||||||
End of period | $ | 28,892,247 | $ | 26,118,991 | |||||||
SHARE TRANSACTIONS: | |||||||||||
Issued | 601,054 | 519,449 | |||||||||
Reinvested | 11,615 | 10,160 | |||||||||
Redeemed | (587,227 | ) | (771,974 | ) | |||||||
Change in shares | 25,442 | (242,365 | ) | ||||||||
Amounts designated as " – " are $0 or have been rounded to $0.
See accompanying notes to the financial statements.
216 :: Financial Highlights
ProFunds Financial Highlights FOR THE PERIODS INDICATED
Selected data for a share of beneficial interest outstanding throughout the periods indicated.
Investment Activities | Distributions to Shareholders From | ||||||||||||||||||||||||||||||||||
| Net Asset Value, Beginning of Period | Net Investment Income (Loss)(a) | Net Realized and Unrealized Gains (Losses) on Investments | Total from Investment Activities | Net Investment Income | In excess of net investment income | Net Realized Gains on Investments | Total Distributions | ||||||||||||||||||||||||||||
ProFund Access VP High Yield | |||||||||||||||||||||||||||||||||||
| Six Months Ended June 30, 2024 (unaudited) | $ | 24.76 | 0.38 | 0.16 | 0.54 | — | — | — | — | ||||||||||||||||||||||||||
| Year Ended December 31, 2023 | $ | 23.59 | 0.67 | 1.75 | 2.42 | (0.67 | ) | (0.58 | ) | — | (1.25 | ) | |||||||||||||||||||||||
| Year Ended December 31, 2022 | $ | 26.51 | 0.11 | (2.22 | ) | (2.11 | ) | (0.11 | ) | (0.70 | ) | — | (0.81 | ) | |||||||||||||||||||||
| Year Ended December 31, 2021 | $ | 27.10 | (0.34 | ) | 0.41 | 0.07 | — | (0.66 | ) | — | (0.66 | ) | |||||||||||||||||||||||
| Year Ended December 31, 2020 | $ | 28.71 | (0.31 | ) | 0.16 | (0.15 | ) | — | (1.46 | ) | — | (1.46 | ) | ||||||||||||||||||||||
| Year Ended December 31, 2019 | $ | 26.74 | 0.06 | 3.21 | 3.27 | (0.06 | ) | (1.24 | ) | — | (1.30 | ) | |||||||||||||||||||||||
ProFund VP Asia 30 | |||||||||||||||||||||||||||||||||||
| Six Months Ended June 30, 2024 (unaudited) | $ | 35.48 | 0.63 | 0.63 | 1.26 | (0.29 | ) | — | — | (0.29 | ) | ||||||||||||||||||||||||
| Year Ended December 31, 2023 | $ | 35.46 | (0.03 | ) | 1.62 | 1.59 | (0.04 | ) | — | (1.53 | ) | (1.57 | ) | ||||||||||||||||||||||
| Year Ended December 31, 2022 | $ | 53.26 | (0.17 | ) | (12.40 | ) | (12.57 | ) | (0.21 | ) | — | (5.02 | ) | (5.23 | ) | ||||||||||||||||||||
| Year Ended December 31, 2021 | $ | 75.87 | 0.24 | (12.05 | ) | (11.81 | ) | — | — | (10.80 | ) | (10.80 | ) | ||||||||||||||||||||||
| Year Ended December 31, 2020 | $ | 62.15 | (0.11 | ) | 21.13 | 21.02 | (0.72 | ) | — | (6.58 | ) | (7.30 | ) | ||||||||||||||||||||||
| Year Ended December 31, 2019 | $ | 49.34 | 0.39 | 12.56 | 12.95 | (0.14 | ) | — | — | (0.14 | ) | ||||||||||||||||||||||||
| Ratios to Average Net Assets | Supplemental Data | ||||||||||||||||||||||||||||||
| Net Asset Value, End of Period | Total Return(b)(c) | Gross Expenses(c)(d) | Net Expenses(c)(d) | Net Investment Income (Loss)(c)(d) | Net Assets, End of Period (000's) | Portfolio Turnover Rate(b)(e) | |||||||||||||||||||||||||
ProFund Access VP High Yield | |||||||||||||||||||||||||||||||
| Six Months Ended June 30, 2024 (unaudited) | $ | 25.30 | 2.18 | % | 1.68 | % | 1.68 | % | 3.04 | % | $ | 15,090 | 600 | % | |||||||||||||||||
| Year Ended December 31, 2023 | $ | 24.76 | 10.43 | % | 1.72 | % | 1.68 | % | 2.77 | % | $ | 16,481 | 1,254 | % | |||||||||||||||||
| Year Ended December 31, 2022 | $ | 23.59 | (7.97 | )% | 1.69 | % | 1.68 | % | 0.46 | % | $ | 17,015 | 1,532 | % | |||||||||||||||||
| Year Ended December 31, 2021 | $ | 26.51 | 0.27 | % | 1.72 | % | 1.68 | % | (1.28 | )% | $ | 15,325 | 1,351 | % | |||||||||||||||||
| Year Ended December 31, 2020 | $ | 27.10 | 0.06 | % | 1.87 | % | 1.68 | % | (1.16 | )% | $ | 19,923 | 1,447 | % | |||||||||||||||||
| Year Ended December 31, 2019 | $ | 28.71 | 12.43 | % | 1.73 | % | 1.70 | %(f) | 0.23 | % | $ | 32,038 | 1,459 | % | |||||||||||||||||
ProFund VP Asia 30 | |||||||||||||||||||||||||||||||
| Six Months Ended June 30, 2024 (unaudited) | $ | 36.45 | 3.55 | % | 1.79 | % | 1.68 | % | 3.60 | % | $ | 16,348 | 62 | % | |||||||||||||||||
| Year Ended December 31, 2023 | $ | 35.48 | 4.32 | % | 1.83 | % | 1.68 | % | (0.09 | )% | $ | 15,245 | 151 | % | |||||||||||||||||
| Year Ended December 31, 2022 | $ | 35.46 | (24.42 | )% | 1.74 | % | 1.68 | % | (0.44 | )% | $ | 17,741 | 202 | % | |||||||||||||||||
| Year Ended December 31, 2021 | $ | 53.26 | (18.52 | )%(g) | 1.68 | % | 1.68 | % | 0.33 | % | $ | 21,907 | 125 | % | |||||||||||||||||
| Year Ended December 31, 2020 | $ | 75.87 | 35.55 | % | 1.71 | % | 1.68 | % | (0.18 | )% | $ | 29,494 | 130 | % | |||||||||||||||||
| Year Ended December 31, 2019 | $ | 62.15 | 26.31 | % | 1.72 | % | 1.68 | % | 0.68 | % | $ | 29,057 | 111 | % | |||||||||||||||||
(a) Per share net investment income (loss) has been calculated using the average daily shares method.
(b) Not annualized for periods less than one year.
(c) Does not reflect the fees and expenses associated with the separate account that invests in the Fund or any variable annuity or variable insurance contract for which the Fund serves as an investment option.
(d) Annualized for periods less than one year.
(e) Portfolio turnover rate is calculated without regard to instruments having a maturity of less than one year from acquisition or derivative instruments (including swap agreements and futures contracts). The portfolio turnover rate can be high and volatile due to the amount and timing of sales and purchases of fund shares during the period.
(f) The expense ratio does not correlate to the applicable expense limits in place during the period given that the annual contractual expense limitation is applied for the one year periods ended April 30th of each year, instead of coinciding with the December 31st year end. Details of the current expense limitation in effect can be found in Note 4 of the accompanying Notes to Financial Statements.
(g) During the year ended December 31, 2021, the Fund received monies related to certain nonrecurring litigation settlements. The corresponding impact to the total return was an increase of 0.34%.
See accompanying notes to the financial statements.
Financial Highlights :: 217
ProFunds Financial Highlights FOR THE PERIODS INDICATED
Selected data for a share of beneficial interest outstanding throughout the periods indicated.
Investment Activities | Distributions to Shareholders From | ||||||||||||||||||||||||||||||
| Net Asset Value, Beginning of Period | Net Investment Income (Loss)(a) | Net Realized and Unrealized Gains (Losses) on Investments | Total from Investment Activities | Net Investment Income | Net Realized Gains on Investments | Total Distributions | |||||||||||||||||||||||||
ProFund VP Banks | |||||||||||||||||||||||||||||||
| Six Months Ended June 30, 2024 (unaudited) | $ | 27.36 | 0.18 | 0.25 | (f) | 0.43 | (0.62 | ) | — | (0.62 | ) | ||||||||||||||||||||
Year Ended December 31, 2023 | $ | 25.10 | 0.46 | 2.11 | 2.57 | (0.31 | ) | — | (0.31 | ) | |||||||||||||||||||||
Year Ended December 31, 2022 | $ | 31.63 | 0.20 | (6.49 | ) | (6.29 | ) | (0.24 | ) | — | (0.24 | ) | |||||||||||||||||||
Year Ended December 31, 2021 | $ | 23.77 | 0.17 | 7.93 | 8.10 | (0.24 | ) | — | (0.24 | ) | |||||||||||||||||||||
Year Ended December 31, 2020 | $ | 28.74 | 0.36 | (4.85 | ) | (4.49 | ) | (0.48 | ) | — | (0.48 | ) | |||||||||||||||||||
Year Ended December 31, 2019 | $ | 21.31 | 0.31 | 7.39 | 7.70 | (0.27 | ) | — | (0.27 | ) | |||||||||||||||||||||
ProFund VP Bear | |||||||||||||||||||||||||||||||
| Six Months Ended June 30, 2024 (unaudited) | $ | 14.40 | 0.24 | (1.62 | ) | (1.38 | ) | (1.00 | ) | (0.50 | ) | (1.50 | ) | ||||||||||||||||||
Year Ended December 31, 2023 | $ | 17.04 | 0.52 | (3.11 | ) | (2.59 | ) | (0.05 | ) | — | (0.05 | ) | |||||||||||||||||||
Year Ended December 31, 2022 | $ | 14.56 | 0.03 | 2.45 | 2.48 | — | — | — | |||||||||||||||||||||||
Year Ended December 31, 2021 | $ | 19.59 | (0.28 | ) | (4.49 | ) | (4.77 | ) | — | (0.26 | ) | (0.26 | ) | ||||||||||||||||||
Year Ended December 31, 2020 | $ | 26.47 | (0.35 | ) | (6.41 | ) | (6.76 | ) | (0.12 | ) | — | (0.12 | ) | ||||||||||||||||||
Year Ended December 31, 2019 | $ | 34.40 | 0.13 | (8.03 | ) | (7.90 | ) | (0.03 | ) | — | (0.03 | ) | |||||||||||||||||||
| Ratios to Average Net Assets | Supplemental Data | ||||||||||||||||||||||||||||||
| Net Asset Value, End of Period | Total Return(b)(c) | Gross Expenses(c)(d) | Net Expenses(c)(d) | Net Investment Income (Loss)(c)(d) | Net Assets, End of Period (000's) | Portfolio Turnover Rate(b)(e) | |||||||||||||||||||||||||
ProFund VP Banks | |||||||||||||||||||||||||||||||
| Six Months Ended June 30, 2024 (unaudited) | $ | 27.17 | 1.70 | % | 1.80 | % | 1.68 | % | 1.37 | % | $ | 3,801 | 89 | % | |||||||||||||||||
Year Ended December 31, 2023 | $ | 27.36 | 10.39 | % | 1.79 | % | 1.68 | % | 1.98 | % | $ | 5,615 | 430 | % | |||||||||||||||||
Year Ended December 31, 2022 | $ | 25.10 | (19.88 | )% | 1.74 | % | 1.68 | % | 0.69 | % | $ | 4,496 | 599 | % | |||||||||||||||||
Year Ended December 31, 2021 | $ | 31.63 | 34.09 | % | 1.68 | % | 1.68 | % | 0.57 | % | $ | 7,500 | 551 | % | |||||||||||||||||
Year Ended December 31, 2020 | $ | 23.77 | (15.21 | )% | 1.74 | % | 1.68 | % | 1.74 | % | $ | 4,823 | 478 | % | |||||||||||||||||
Year Ended December 31, 2019 | $ | 28.74 | 36.43 | % | 1.70 | % | 1.68 | % | 1.24 | % | $ | 9,333 | 293 | % | |||||||||||||||||
ProFund VP Bear | |||||||||||||||||||||||||||||||
| Six Months Ended June 30, 2024 (unaudited) | $ | 11.52 | (9.63 | )% | 1.72 | % | 1.68 | % | 3.61 | % | $ | 1,671 | — | ||||||||||||||||||
Year Ended December 31, 2023 | $ | 14.40 | (15.27 | )% | 1.72 | % | 1.68 | % | 3.31 | % | $ | 2,754 | — | ||||||||||||||||||
Year Ended December 31, 2022 | $ | 17.04 | 17.03 | % | 1.70 | % | 1.68 | % | 0.20 | % | $ | 4,958 | — | ||||||||||||||||||
Year Ended December 31, 2021 | $ | 14.56 | (24.57 | )% | 1.69 | % | 1.68 | % | (1.68 | )% | $ | 1,557 | — | ||||||||||||||||||
Year Ended December 31, 2020 | $ | 19.59 | (25.61 | )% | 1.79 | % | 1.68 | % | (1.40 | )% | $ | 2,352 | — | ||||||||||||||||||
Year Ended December 31, 2019 | $ | 26.47 | (22.95 | )% | 1.74 | % | 1.71 | %(g) | 0.43 | % | $ | 3,207 | — | ||||||||||||||||||
(a) Per share net investment income (loss) has been calculated using the average daily shares method.
(b) Not annualized for periods less than one year.
(c) Does not reflect the fees and expenses associated with the separate account that invests in the Fund or any variable annuity or variable insurance contract for which the Fund serves as an investment option.
(d) Annualized for periods less than one year.
(e) Portfolio turnover rate is calculated without regard to instruments having a maturity of less than one year from acquisition or derivative instruments (including swap agreements and futures contracts). The portfolio turnover rate can be high and volatile due to the amount and timing of sales and purchases of fund shares during the period.
(f) The amount shown for a share outstanding throughout the period does not accord with the change in aggregate gains and losses in the portfolio of securities during the period because of timing of sales and purchases of fund shares in relation to fluctuating market values during the period.
(g) The expense ratio does not correlate to the applicable expense limits in place during the period given that the annual contractual expense limitation is applied for the one year periods ended April 30th of each year, instead of coinciding with the December 31st year end. Details of the current expense limitation in effect can be found in Note 4 of the accompanying Notes to Financial Statements.
See accompanying notes to the financial statements.
218 :: Financial Highlights
ProFunds Financial Highlights FOR THE PERIODS INDICATED
Selected data for a share of beneficial interest outstanding throughout the periods indicated.
Investment Activities | Distributions to Shareholders From | ||||||||||||||||||||||||||||||
| Net Asset Value, Beginning of Period | Net Investment Income (Loss)(a) | Net Realized and Unrealized Gains (Losses) on Investments | Total from Investment Activities | Net Investment Income | Net Realized Gains on Investments | Total Distributions | |||||||||||||||||||||||||
ProFund VP Biotechnology | |||||||||||||||||||||||||||||||
| Six Months Ended June 30, 2024 (unaudited) | $ | 66.75 | (0.40 | ) | 2.76 | 2.36 | — | (27.08 | ) | (27.08 | ) | ||||||||||||||||||||
Year Ended December 31, 2023 | $ | 70.69 | (0.64 | ) | 7.07 | 6.43 | — | (10.37 | ) | (10.37 | ) | ||||||||||||||||||||
Year Ended December 31, 2022 | $ | 94.46 | (0.14 | ) | (8.78 | ) | (8.92 | ) | — | (14.85 | ) | (14.85 | ) | ||||||||||||||||||
Year Ended December 31, 2021 | $ | 82.13 | (0.14 | ) | 13.01 | 12.87 | — | (0.54 | ) | (0.54 | ) | ||||||||||||||||||||
Year Ended December 31, 2020 | $ | 76.13 | (0.05 | ) | 11.57 | 11.52 | (0.01 | ) | (5.51 | ) | (5.52 | ) | |||||||||||||||||||
Year Ended December 31, 2019 | $ | 65.65 | 0.01 | 10.75 | 10.76 | — | (0.28 | ) | (0.28 | ) | |||||||||||||||||||||
ProFund VP Bull | |||||||||||||||||||||||||||||||
| Six Months Ended June 30, 2024 (unaudited) | $ | 50.53 | 0.13 | 7.05 | 7.18 | (0.42 | ) | (2.77 | ) | (3.19 | ) | ||||||||||||||||||||
Year Ended December 31, 2023 | $ | 48.67 | 0.43 | 10.74 | 11.17 | — | (9.31 | ) | (9.31 | ) | |||||||||||||||||||||
Year Ended December 31, 2022 | $ | 70.29 | (0.05 | ) | (13.46 | ) | (13.51 | ) | — | (8.11 | ) | (8.11 | ) | ||||||||||||||||||
Year Ended December 31, 2021 | $ | 59.38 | (0.42 | ) | 15.37 | 14.95 | — | (4.04 | ) | (4.04 | ) | ||||||||||||||||||||
Year Ended December 31, 2020 | $ | 53.62 | (0.23 | ) | 8.70 | 8.47 | (0.05 | ) | (2.66 | ) | (2.71 | ) | |||||||||||||||||||
Year Ended December 31, 2019 | $ | 42.46 | 0.16 | 11.98 | 12.14 | (0.13 | ) | (0.85 | ) | (0.98 | ) | ||||||||||||||||||||
| Ratios to Average Net Assets | Supplemental Data | ||||||||||||||||||||||||||||||
| Net Asset Value, End of Period | Total Return(b)(c) | Gross Expenses(c)(d) | Net Expenses(c)(d) | Net Investment Income (Loss)(c)(d) | Net Assets, End of Period (000's) | Portfolio Turnover Rate(b)(e) | |||||||||||||||||||||||||
ProFund VP Biotechnology | |||||||||||||||||||||||||||||||
| Six Months Ended June 30, 2024 (unaudited) | $ | 42.03 | 3.35 | % | 1.67 | % | 1.66 | % | (1.21 | )% | $ | 42,247 | 64 | % | |||||||||||||||||
Year Ended December 31, 2023 | $ | 66.75 | 10.14 | % | 1.68 | % | 1.67 | % | (0.99 | )% | $ | 44,534 | 130 | % | |||||||||||||||||
Year Ended December 31, 2022 | $ | 70.69 | (7.71 | )% | 1.63 | % | 1.63 | % | (0.19 | )% | $ | 49,395 | 29 | % | |||||||||||||||||
Year Ended December 31, 2021 | $ | 94.46 | 15.73 | % | 1.58 | % | 1.58 | % | (0.15 | )% | $ | 61,798 | 43 | % | |||||||||||||||||
Year Ended December 31, 2020 | $ | 82.13 | 15.38 | % | 1.67 | % | 1.67 | % | (0.06 | )% | $ | 60,969 | 70 | % | |||||||||||||||||
Year Ended December 31, 2019 | $ | 76.13 | 16.46 | % | �� | 1.63 | % | 1.63 | % | 0.02 | % | $ | 57,767 | 81 | % | ||||||||||||||||
ProFund VP Bull | |||||||||||||||||||||||||||||||
| Six Months Ended June 30, 2024 (unaudited) | $ | 54.52 | 14.22 | % | 1.72 | % | 1.68 | % | 0.49 | % | $ | 60,299 | 55 | % | |||||||||||||||||
Year Ended December 31, 2023 | $ | 50.53 | 23.74 | % | 1.75 | % | 1.68 | % | 0.86 | % | $ | 54,377 | 125 | % | |||||||||||||||||
Year Ended December 31, 2022 | $ | 48.67 | (19.74 | )% | 1.71 | % | 1.68 | % | (0.10 | )% | $ | 43,609 | 199 | % | |||||||||||||||||
Year Ended December 31, 2021 | $ | 70.29 | 26.33 | % | 1.65 | % | 1.65 | % | (0.66 | )% | $ | 65,540 | 49 | % | |||||||||||||||||
Year Ended December 31, 2020 | $ | 59.38 | 16.03 | % | 1.72 | % | 1.69 | %(f) | (0.44 | )% | $ | 66,044 | 4 | % | |||||||||||||||||
Year Ended December 31, 2019 | $ | 53.62 | 28.88 | % | 1.70 | % | 1.70 | %(f) | 0.32 | % | $ | 65,972 | 56 | % | |||||||||||||||||
(a) Per share net investment income (loss) has been calculated using the average daily shares method.
(b) Not annualized for periods less than one year.
(c) Does not reflect the fees and expenses associated with the separate account that invests in the Fund or any variable annuity or variable insurance contract for which the Fund serves as an investment option.
(d) Annualized for periods less than one year.
(e) Portfolio turnover rate is calculated without regard to instruments having a maturity of less than one year from acquisition or derivative instruments (including swap agreements and futures contracts). The portfolio turnover rate can be high and volatile due to the amount and timing of sales and purchases of fund shares during the period.
(f) The expense ratio does not correlate to the applicable expense limits in place during the period given that the annual contractual expense limitation is applied for the one year periods ended April 30th of each year, instead of coinciding with the December 31st year end. Details of the current expense limitation in effect can be found in Note 4 of the accompanying Notes to Financial Statements.
See accompanying notes to the financial statements.
Financial Highlights :: 219
ProFunds Financial Highlights FOR THE PERIODS INDICATED
Selected data for a share of beneficial interest outstanding throughout the periods indicated.
Investment Activities | Distributions to Shareholders From | ||||||||||||||||||||||||||||||
| Net Asset Value, Beginning of Period | Net Investment Income (Loss)(a) | Net Realized and Unrealized Gains (Losses) on Investments | Total from Investment Activities | Net Investment Income | Net Realized Gains on Investments | Total Distributions | |||||||||||||||||||||||||
ProFund VP Communication Services | |||||||||||||||||||||||||||||||
| Six Months Ended June 30, 2024 (unaudited) | $ | 38.14 | (0.09 | ) | 6.84 | 6.75 | — | — | — | ||||||||||||||||||||||
Year Ended December 31, 2023 | $ | 29.19 | (0.09 | ) | 9.36 | 9.27 | (0.32 | ) | — | (0.32 | ) | ||||||||||||||||||||
Year Ended December 31, 2022 | $ | 37.77 | 0.36 | (8.35 | ) | (7.99 | ) | (0.59 | ) | — | (0.59 | ) | |||||||||||||||||||
Year Ended December 31, 2021 | $ | 32.25 | 0.53 | 5.38 | 5.91 | (0.39 | ) | — | (0.39 | ) | |||||||||||||||||||||
Year Ended December 31, 2020 | $ | 31.53 | 0.41 | 0.57 | 0.98 | (0.26 | ) | — | (0.26 | ) | |||||||||||||||||||||
Year Ended December 31, 2019 | $ | 28.42 | 0.28 | 3.87 | 4.15 | (1.04 | ) | — | (1.04 | ) | |||||||||||||||||||||
ProFund VP Consumer Discretionary | |||||||||||||||||||||||||||||||
| Six Months Ended June 30, 2024 (unaudited) | $ | 65.99 | (0.23 | ) | 1.21 | 0.98 | — | (6.58 | ) | (6.58 | ) | ||||||||||||||||||||
Year Ended December 31, 2023 | $ | 52.38 | (0.42 | ) | 17.08 | 16.66 | — | (3.05 | ) | (3.05 | ) | ||||||||||||||||||||
Year Ended December 31, 2022 | $ | 77.36 | (0.43 | ) | (23.92 | ) | (24.35 | ) | — | (0.63 | ) | (0.63 | ) | ||||||||||||||||||
Year Ended December 31, 2021 | $ | 76.15 | (0.76 | ) | 8.12 | 7.36 | — | (6.15 | ) | (6.15 | ) | ||||||||||||||||||||
Year Ended December 31, 2020 | $ | 82.97 | (0.56 | ) | 22.85 | 22.29 | — | (29.11 | ) | (29.11 | ) | ||||||||||||||||||||
Year Ended December 31, 2019 | $ | 69.55 | (0.40 | ) | 17.30 | 16.90 | — | (3.48 | ) | (3.48 | ) | ||||||||||||||||||||
| Ratios to Average Net Assets | Supplemental Data | ||||||||||||||||||||||||||||||
| Net Asset Value, End of Period | Total Return(b)(c) | Gross Expenses(c)(d) | Net Expenses(c)(d) | Net Investment Income (Loss)(c)(d) | Net Assets, End of Period (000's) | Portfolio Turnover Rate(b)(e) | |||||||||||||||||||||||||
ProFund VP Communication Services | |||||||||||||||||||||||||||||||
| Six Months Ended June 30, 2024 (unaudited) | $ | 44.89 | 17.72 | % | 1.76 | % | 1.68 | % | (0.44 | )% | $ | 10,385 | 78 | % | |||||||||||||||||
Year Ended December 31, 2023 | $ | 38.14 | 31.82 | % | 1.77 | % | 1.68 | % | (0.26 | )% | $ | 8,468 | 186 | % | |||||||||||||||||
Year Ended December 31, 2022 | $ | 29.19 | (21.22 | )% | 1.73 | % | 1.68 | % | 1.14 | % | $ | 3,864 | 56 | % | |||||||||||||||||
Year Ended December 31, 2021 | $ | 37.77 | 18.41 | % | 1.69 | % | 1.68 | % | 1.50 | % | $ | 7,438 | 105 | % | |||||||||||||||||
Year Ended December 31, 2020 | $ | 32.25 | 3.15 | % | 1.77 | % | 1.68 | % | 1.36 | % | $ | 6,626 | 107 | % | |||||||||||||||||
Year Ended December 31, 2019 | $ | 31.53 | 14.77 | % | 1.76 | % | 1.68 | % | 0.89 | % | $ | 6,167 | 165 | % | |||||||||||||||||
ProFund VP Consumer Discretionary | |||||||||||||||||||||||||||||||
| Six Months Ended June 30, 2024 (unaudited) | $ | 60.39 | 1.56 | % | 1.77 | % | 1.68 | % | (0.70 | )% | $ | 24,911 | 23 | % | |||||||||||||||||
Year Ended December 31, 2023 | $ | 65.99 | 32.05 | % | 1.77 | % | 1.68 | % | (0.70 | )% | $ | 23,786 | 91 | % | |||||||||||||||||
Year Ended December 31, 2022 | $ | 52.38 | (31.53 | )% | 1.72 | % | 1.68 | % | (0.71 | )% | $ | 15,454 | 19 | % | |||||||||||||||||
Year Ended December 31, 2021 | $ | 77.36 | 10.23 | % | 1.68 | % | 1.68 | % | (0.99 | )% | $ | 30,884 | 39 | % | |||||||||||||||||
Year Ended December 31, 2020 | $ | 76.15 | 28.34 | % | 1.75 | % | 1.68 | % | (0.72 | )% | $ | 31,935 | 116 | % | |||||||||||||||||
Year Ended December 31, 2019 | $ | 82.97 | 24.64 | % | 1.72 | % | 1.71 | %(f) | (0.50 | )% | $ | 26,846 | 182 | % | |||||||||||||||||
(a) Per share net investment income (loss) has been calculated using the average daily shares method.
(b) Not annualized for periods less than one year.
(c) Does not reflect the fees and expenses associated with the separate account that invests in the Fund or any variable annuity or variable insurance contract for which the Fund serves as an investment option.
(d) Annualized for periods less than one year.
(e) Portfolio turnover rate is calculated without regard to instruments having a maturity of less than one year from acquisition or derivative instruments (including swap agreements and futures contracts). The portfolio turnover rate can be high and volatile due to the amount and timing of sales and purchases of fund shares during the period.
(f) The expense ratio does not correlate to the applicable expense limits in place during the period given that the annual contractual expense limitation is applied for the one year periods ended April 30th of each year, instead of coinciding with the December 31st year end. Details of the current expense limitation in effect can be found in Note 4 of the accompanying Notes to Financial Statements.
See accompanying notes to the financial statements.
220 :: Financial Highlights
ProFunds Financial Highlights FOR THE PERIODS INDICATED
Selected data for a share of beneficial interest outstanding throughout the periods indicated.
Investment Activities | Distributions to Shareholders From | ||||||||||||||||||||||||||||||
| Net Asset Value, Beginning of Period | Net Investment Income (Loss)(a) | Net Realized and Unrealized Gains (Losses) on Investments | Total from Investment Activities | Net Investment Income | Net Realized Gains on Investments | Total Distributions | |||||||||||||||||||||||||
ProFund VP Consumer Staples | |||||||||||||||||||||||||||||||
| Six Months Ended June 30, 2024 (unaudited) | $ | 44.12 | 0.23 | 3.07 | 3.30 | (0.74 | ) | (15.80 | ) | (16.54 | ) | ||||||||||||||||||||
Year Ended December 31, 2023 | $ | 50.22 | 0.59 | 1.74 | 2.33 | (0.11 | ) | (8.32 | ) | (8.43 | ) | ||||||||||||||||||||
Year Ended December 31, 2022 | $ | 69.45 | 0.09 | (17.04 | ) | (16.95 | ) | (0.03 | ) | (2.25 | ) | (2.28 | ) | ||||||||||||||||||
Year Ended December 31, 2021 | $ | 62.19 | 0.02 | 11.42 | 11.44 | (0.27 | ) | (3.91 | ) | (4.18 | ) | ||||||||||||||||||||
Year Ended December 31, 2020 | $ | 48.21 | 0.25 | 14.61 | 14.86 | (0.38 | ) | (0.50 | ) | (0.88 | ) | ||||||||||||||||||||
Year Ended December 31, 2019 | $ | 46.16 | 0.49 | 10.83 | 11.32 | (0.80 | ) | (8.47 | ) | (9.27 | ) | ||||||||||||||||||||
ProFund VP Dow 30 | |||||||||||||||||||||||||||||||
| Six Months Ended June 30, 2024 (unaudited) | $ | 20.60 | 0.38 | 0.36 | 0.74 | (0.56 | ) | — | (0.56 | ) | |||||||||||||||||||||
Year Ended December 31, 2023 | $ | 18.15 | 0.61 | 1.85 | 2.46 | (0.01 | ) | — | (0.01 | ) | |||||||||||||||||||||
Year Ended December 31, 2022 | $ | 23.90 | 0.01 | (2.22 | ) | (2.21 | ) | — | (3.54 | ) | (3.54 | ) | |||||||||||||||||||
Year Ended December 31, 2021 | $ | 23.26 | (0.34 | ) | 4.18 | 3.84 | — | (3.20 | ) | (3.20 | ) | ||||||||||||||||||||
Year Ended December 31, 2020 | $ | 28.16 | (0.31 | ) | 2.05 | 1.74 | (0.13 | ) | (6.51 | ) | (6.64 | ) | |||||||||||||||||||
Year Ended December 31, 2019 | $ | 23.07 | 0.15 | 4.97 | 5.12 | (0.03 | ) | — | (0.03 | ) | |||||||||||||||||||||
| Ratios to Average Net Assets | Supplemental Data | ||||||||||||||||||||||||||||||
| Net Asset Value, End of Period | Total Return(b)(c) | Gross Expenses(c)(d) | Net Expenses(c)(d) | Net Investment Income (Loss)(c)(d) | Net Assets, End of Period (000's) | Portfolio Turnover Rate(b)(e) | |||||||||||||||||||||||||
ProFund VP Consumer Staples | |||||||||||||||||||||||||||||||
| Six Months Ended June 30, 2024 (unaudited) | $ | 30.88 | 7.10 | % | 1.78 | % | 1.68 | % | 1.01 | % | $ | 10,615 | 246 | % | |||||||||||||||||
Year Ended December 31, 2023 | $ | 44.12 | 3.92 | % | 1.77 | % | 1.68 | % | 1.21 | % | $ | 10,749 | 167 | % | |||||||||||||||||
Year Ended December 31, 2022 | $ | 50.22 | (24.70 | )% | 1.73 | % | 1.68 | % | 0.15 | % | $ | 11,460 | 88 | % | |||||||||||||||||
Year Ended December 31, 2021 | $ | 69.45 | 19.65 | % | 1.69 | % | 1.68 | % | 0.03 | % | $ | 26,376 | 65 | % | |||||||||||||||||
Year Ended December 31, 2020 | $ | 62.19 | 31.05 | % | 1.75 | % | 1.68 | % | 0.50 | % | $ | 18,373 | 141 | % | |||||||||||||||||
Year Ended December 31, 2019 | $ | 48.21 | 26.56 | % | 1.73 | % | 1.68 | % | 1.01 | % | $ | 12,137 | 71 | % | |||||||||||||||||
ProFund VP Dow 30 | |||||||||||||||||||||||||||||||
| Six Months Ended June 30, 2024 (unaudited) | $ | 20.78 | 3.52 | % | 1.62 | % | 1.61 | % | 3.65 | % | $ | 390 | — | ||||||||||||||||||
Year Ended December 31, 2023 | $ | 20.60 | 13.54 | % | 1.64 | % | 1.63 | % | 3.26 | % | $ | 327 | — | ||||||||||||||||||
Year Ended December 31, 2022 | $ | 18.15 | (8.85 | )% | 1.57 | % | 1.57 | % | 0.05 | % | $ | 269 | — | ||||||||||||||||||
Year Ended December 31, 2021 | $ | 23.90 | 17.51 | % | 1.47 | % | 1.47 | % | (1.47 | )% | $ | 218 | — | ||||||||||||||||||
Year Ended December 31, 2020 | $ | 23.26 | 7.41 | % | 1.58 | % | 1.58 | % | (1.31 | )% | $ | 385 | — | ||||||||||||||||||
Year Ended December 31, 2019 | $ | 28.16 | 22.18 | % | 1.47 | % | 1.47 | % | 0.56 | % | $ | 316 | — | ||||||||||||||||||
(a) Per share net investment income (loss) has been calculated using the average daily shares method.
(b) Not annualized for periods less than one year.
(c) Does not reflect the fees and expenses associated with the separate account that invests in the Fund or any variable annuity or variable insurance contract for which the Fund serves as an investment option.
(d) Annualized for periods less than one year.
(e) Portfolio turnover rate is calculated without regard to instruments having a maturity of less than one year from acquisition or derivative instruments (including swap agreements and futures contracts). The portfolio turnover rate can be high and volatile due to the amount and timing of sales and purchases of fund shares during the period.
See accompanying notes to the financial statements.
Financial Highlights :: 221
ProFunds Financial Highlights FOR THE PERIODS INDICATED
Selected data for a share of beneficial interest outstanding throughout the periods indicated.
Investment Activities | Distributions to Shareholders From | ||||||||||||||||||||||||||||||
| Net Asset Value, Beginning of Period | Net Investment Income (Loss)(a) | Net Realized and Unrealized Gains (Losses) on Investments | Total from Investment Activities | Net Investment Income | Net Realized Gains on Investments | Total Distributions | |||||||||||||||||||||||||
ProFund VP Emerging Markets | |||||||||||||||||||||||||||||||
| Six Months Ended June 30, 2024 (unaudited) | $ | 28.29 | 0.22 | 1.42 | 1.64 | (0.47 | ) | — | (0.47 | ) | |||||||||||||||||||||
Year Ended December 31, 2023 | $ | 25.02 | 0.34 | 3.49 | 3.83 | (0.56 | ) | — | (0.56 | ) | |||||||||||||||||||||
Year Ended December 31, 2022 | $ | 30.04 | 0.63 | (5.48 | ) | (4.85 | ) | (0.17 | ) | — | (0.17 | ) | |||||||||||||||||||
Year Ended December 31, 2021 | $ | 36.64 | 0.15 | (6.75 | ) | (6.60 | ) | — | — | — | |||||||||||||||||||||
Year Ended December 31, 2020 | $ | 29.08 | (0.08 | ) | 7.82 | 7.74 | (0.18 | ) | — | (0.18 | ) | ||||||||||||||||||||
Year Ended December 31, 2019 | $ | 23.54 | 0.15 | 5.53 | 5.68 | (0.14 | ) | — | (0.14 | ) | |||||||||||||||||||||
ProFund VP Energy | |||||||||||||||||||||||||||||||
| Six Months Ended June 30, 2024 (unaudited) | $ | 42.19 | 0.37 | 3.70 | 4.07 | (0.95 | ) | (2.08 | ) | (3.03 | ) | ||||||||||||||||||||
Year Ended December 31, 2023 | $ | 44.29 | 0.75 | (1.84 | ) | (1.09 | ) | (1.01 | ) | — | (1.01 | ) | |||||||||||||||||||
Year Ended December 31, 2022 | $ | 28.04 | 0.82 | 15.85 | 16.67 | (0.42 | ) | — | (0.42 | ) | |||||||||||||||||||||
Year Ended December 31, 2021 | $ | 18.78 | 0.58 | 9.13 | 9.71 | (0.45 | ) | — | (0.45 | ) | |||||||||||||||||||||
Year Ended December 31, 2020 | $ | 29.86 | 0.57 | (10.93 | ) | (10.36 | ) | (0.50 | ) | (0.22 | ) | (0.72 | ) | ||||||||||||||||||
Year Ended December 31, 2019 | $ | 28.99 | 0.45 | 1.90 | 2.35 | (0.44 | ) | (1.04 | ) | (1.48 | ) | ||||||||||||||||||||
| Ratios to Average Net Assets | Supplemental Data | ||||||||||||||||||||||||||||||
| Net Asset Value, End of Period | Total Return(b)(c) | Gross Expenses(c)(d) | Net Expenses(c)(d) | Net Investment Income (Loss)(c)(d) | Net Assets, End of Period (000's) | Portfolio Turnover Rate(b)(e) | |||||||||||||||||||||||||
ProFund VP Emerging Markets | |||||||||||||||||||||||||||||||
| Six Months Ended June 30, 2024 (unaudited) | $ | 29.46 | 5.77 | % | 1.80 | % | 1.68 | % | 1.54 | % | $ | 24,503 | 164 | % | |||||||||||||||||
Year Ended December 31, 2023 | $ | 28.29 | 15.31 | %(f) | 1.81 | % | 1.68 | % | 1.26 | % | $ | 20,793 | 141 | % | |||||||||||||||||
Year Ended December 31, 2022 | $ | 25.02 | (16.19 | )% | 1.78 | % | 1.68 | % | 2.38 | % | $ | 18,753 | 53 | % | |||||||||||||||||
Year Ended December 31, 2021 | $ | 30.04 | (18.01 | )% | 1.69 | % | 1.68 | % | 0.43 | % | $ | 19,702 | 60 | % | |||||||||||||||||
Year Ended December 31, 2020 | $ | 36.64 | 26.72 | %(g) | 1.74 | % | 1.68 | % | (0.29 | )% | $ | 26,509 | 108 | % | |||||||||||||||||
Year Ended December 31, 2019 | $ | 29.08 | 24.23 | %(h) | 1.74 | % | 1.68 | % | 0.58 | % | $ | 25,952 | 83 | % | |||||||||||||||||
ProFund VP Energy | |||||||||||||||||||||||||||||||
| Six Months Ended June 30, 2024 (unaudited) | $ | 43.23 | 9.65 | % | 1.75 | % | 1.68 | % | 1.64 | % | $ | 44,643 | 135 | % | |||||||||||||||||
Year Ended December 31, 2023 | $ | 42.19 | (2.49 | )% | 1.75 | % | 1.68 | % | 1.74 | % | $ | 44,431 | 72 | % | |||||||||||||||||
Year Ended December 31, 2022 | $ | 44.29 | 59.43 | % | 1.71 | % | 1.68 | % | 2.09 | % | $ | 63,086 | 48 | % | |||||||||||||||||
Year Ended December 31, 2021 | $ | 28.04 | 51.93 | % | 1.69 | % | 1.68 | % | 2.30 | % | $ | 30,740 | 80 | % | |||||||||||||||||
Year Ended December 31, 2020 | $ | 18.78 | (34.46 | )% | 1.76 | % | 1.68 | % | 3.00 | % | $ | 18,535 | 130 | % | |||||||||||||||||
Year Ended December 31, 2019 | $ | 29.86 | 8.52 | % | 1.72 | % | 1.72 | %(i) | 1.46 | % | $ | 26,442 | 38 | % | |||||||||||||||||
(a) Per share net investment income (loss) has been calculated using the average daily shares method.
(b) Not annualized for periods less than one year.
(c) Does not reflect the fees and expenses associated with the separate account that invests in the Fund or any variable annuity or variable insurance contract for which the Fund serves as an investment option.
(d) Annualized for periods less than one year.
(e) Portfolio turnover rate is calculated without regard to instruments having a maturity of less than one year from acquisition or derivative instruments (including swap agreements and futures contracts). The portfolio turnover rate can be high and volatile due to the amount and timing of sales and purchases of fund shares during the period.
(f) During the year ended December 31, 2023, the Fund received monies related to certain nonrecurring litigation settlements. The corresponding impact to the total return was an increase of 0.13%.
(g) During the year ended December 31, 2020, the Fund received monies related to certain nonrecurring litigation settlements. The corresponding impact to the total return was an increase of 0.20%.
(h) During the year ended December 31, 2019, the Fund received monies related to certain nonrecurring litigation settlements. The corresponding impact to the total return was an increase of 0.69%.
(i) The expense ratio does not correlate to the applicable expense limits in place during the period given that the annual contractual expense limitation is applied for the one year periods ended April 30th of each year, instead of coinciding with the December 31st year end. Details of the current expense limitation in effect can be found in Note 4 of the accompanying Notes to Financial Statements.
See accompanying notes to the financial statements.
222 :: Financial Highlights
ProFunds Financial Highlights FOR THE PERIODS INDICATED
Selected data for a share of beneficial interest outstanding throughout the periods indicated.
Investment Activities | Distributions to Shareholders From | ||||||||||||||||||||||||||||||
| Net Asset Value, Beginning of Period | Net Investment Income (Loss)(a) | Net Realized and Unrealized Gains (Losses) on Investments | Total from Investment Activities | Net Investment Income | Net Realized Gains on Investments | Total Distributions | |||||||||||||||||||||||||
ProFund VP Europe 30 | |||||||||||||||||||||||||||||||
| Six Months Ended June 30, 2024 (unaudited) | $ | 25.90 | 0.43 | 0.96 | 1.39 | (0.51 | ) | (0.91 | ) | (1.42 | ) | ||||||||||||||||||||
Year Ended December 31, 2023 | $ | 22.52 | 0.44 | 3.46 | 3.90 | (0.52 | ) | — | (0.52 | ) | |||||||||||||||||||||
Year Ended December 31, 2022 | $ | 25.62 | 0.43 | (2.37 | ) | (1.94 | ) | (0.29 | ) | (0.87 | ) | (1.16 | ) | ||||||||||||||||||
Year Ended December 31, 2021 | $ | 20.76 | 0.32 | 4.76 | 5.08 | (0.22 | ) | — | (0.22 | ) | |||||||||||||||||||||
Year Ended December 31, 2020 | $ | 23.50 | 0.22 | (2.43 | ) | (2.21 | ) | (0.53 | ) | — | (0.53 | ) | |||||||||||||||||||
Year Ended December 31, 2019 | $ | 20.55 | 0.45 | 3.15 | 3.60 | (0.65 | ) | — | (0.65 | ) | |||||||||||||||||||||
ProFund VP Falling U.S. Dollar | |||||||||||||||||||||||||||||||
| Six Months Ended June 30, 2024 (unaudited) | $ | 15.59 | 0.27 | (0.81 | ) | (0.54 | ) | (0.98 | ) | — | (0.98 | ) | |||||||||||||||||||
Year Ended December 31, 2023 | $ | 15.10 | 0.50 | (0.01 | ) | 0.49 | — | — | — | ||||||||||||||||||||||
Year Ended December 31, 2022 | $ | 16.55 | (0.01 | ) | (1.44 | ) | (1.45 | ) | — | — | — | ||||||||||||||||||||
Year Ended December 31, 2021 | $ | 18.37 | (0.30 | ) | (1.15 | ) | (1.45 | ) | — | (0.37 | ) | (0.37 | ) | ||||||||||||||||||
Year Ended December 31, 2020 | $ | 17.60 | (0.25 | ) | 1.09 | 0.84 | (0.07 | ) | — | (0.07 | ) | ||||||||||||||||||||
Year Ended December 31, 2019 | $ | 18.03 | 0.08 | (0.50 | ) | (0.42 | ) | (0.01 | ) | — | (0.01 | ) | |||||||||||||||||||
| Ratios to Average Net Assets | Supplemental Data | ||||||||||||||||||||||||||||||
| Net Asset Value, End of Period | Total Return(b)(c) | Gross Expenses(c)(d) | Net Expenses(c)(d) | Net Investment Income (Loss)(c)(d) | Net Assets, End of Period (000's) | Portfolio Turnover Rate(b)(e) | |||||||||||||||||||||||||
ProFund VP Europe 30 | |||||||||||||||||||||||||||||||
| Six Months Ended June 30, 2024 (unaudited) | $ | 25.87 | 5.33 | % | 1.74 | % | 1.68 | % | 3.28 | % | $ | 14,799 | 50 | % | |||||||||||||||||
Year Ended December 31, 2023 | $ | 25.90 | 17.47 | % | 1.77 | % | 1.68 | % | 1.83 | % | $ | 15,304 | 120 | % | |||||||||||||||||
Year Ended December 31, 2022 | $ | 22.52 | (7.76 | )% | 1.75 | % | 1.68 | % | 1.82 | % | $ | 14,379 | 131 | % | |||||||||||||||||
Year Ended December 31, 2021 | $ | 25.62 | 24.53 | % | 1.69 | % | 1.68 | % | 1.30 | % | $ | 17,489 | 138 | % | |||||||||||||||||
Year Ended December 31, 2020 | $ | 20.76 | (9.23 | )% | 1.77 | % | 1.68 | % | 1.10 | % | $ | 14,729 | 63 | % | |||||||||||||||||
Year Ended December 31, 2019 | $ | 23.50 | 17.79 | % | 1.79 | % | 1.68 | % | 1.97 | % | $ | 19,526 | 85 | % | |||||||||||||||||
ProFund VP Falling U.S. Dollar | |||||||||||||||||||||||||||||||
| Six Months Ended June 30, 2024 (unaudited) | $ | 14.07 | (3.48 | )% | 3.68 | % | 1.68 | % | 3.61 | % | $ | 447 | — | ||||||||||||||||||
Year Ended December 31, 2023 | $ | 15.59 | 3.25 | % | 2.97 | % | 1.68 | % | 3.28 | % | $ | 1,151 | — | ||||||||||||||||||
Year Ended December 31, 2022 | $ | 15.10 | (8.76 | )% | 2.41 | % | 1.68 | % | (0.05 | )% | $ | 505 | — | ||||||||||||||||||
Year Ended December 31, 2021 | $ | 16.55 | (8.03 | )% | 2.23 | % | 1.68 | % | (1.68 | )% | $ | 481 | — | ||||||||||||||||||
Year Ended December 31, 2020 | $ | 18.37 | 4.80 | % | 3.18 | % | 1.68 | % | (1.44 | )% | $ | 1,336 | — | ||||||||||||||||||
Year Ended December 31, 2019 | $ | 17.60 | (2.34 | )% | 5.49 | % | 1.68 | % | 0.44 | % | $ | 615 | — | ||||||||||||||||||
(a) Per share net investment income (loss) has been calculated using the average daily shares method.
(b) Not annualized for periods less than one year.
(c) Does not reflect the fees and expenses associated with the separate account that invests in the Fund or any variable annuity or variable insurance contract for which the Fund serves as an investment option.
(d) Annualized for periods less than one year.
(e) Portfolio turnover rate is calculated without regard to instruments having a maturity of less than one year from acquisition or derivative instruments (including swap agreements and futures contracts). The portfolio turnover rate can be high and volatile due to the amount and timing of sales and purchases of fund shares during the period.
See accompanying notes to the financial statements.
Financial Highlights :: 223
ProFunds Financial Highlights FOR THE PERIODS INDICATED
Selected data for a share of beneficial interest outstanding throughout the periods indicated.
Investment Activities | Distributions to Shareholders From | ||||||||||||||||||||||||||||||
| Net Asset Value, Beginning of Period | Net Investment Income (Loss)(a) | Net Realized and Unrealized Gains (Losses) on Investments | Total from Investment Activities | Net Investment Income | Net Realized Gains on Investments | Total Distributions | |||||||||||||||||||||||||
ProFund VP Financials | |||||||||||||||||||||||||||||||
| Six Months Ended June 30, 2024 (unaudited) | $ | 45.92 | 0.01 | 4.28 | 4.29 | (0.15 | ) | (4.90 | ) | (5.05 | ) | ||||||||||||||||||||
Year Ended December 31, 2023 | $ | 42.23 | 0.13 | 5.59 | 5.72 | (0.20 | ) | (1.83 | ) | (2.03 | ) | ||||||||||||||||||||
Year Ended December 31, 2022 | $ | 50.42 | 0.15 | (7.78 | ) | (7.63 | ) | (0.04 | ) | (0.52 | ) | (0.56 | ) | ||||||||||||||||||
Year Ended December 31, 2021 | $ | 41.61 | 0.03 | 12.16 | 12.19 | (0.17 | ) | (3.21 | ) | (3.38 | ) | ||||||||||||||||||||
Year Ended December 31, 2020 | $ | 46.06 | 0.23 | (1.41 | ) | (1.18 | ) | (0.28 | ) | (2.99 | ) | (3.27 | ) | ||||||||||||||||||
Year Ended December 31, 2019 | $ | 37.39 | 0.21 | 10.83 | 11.04 | (0.23 | ) | (2.14 | ) | (2.37 | ) | ||||||||||||||||||||
ProFund VP Government Money Market | |||||||||||||||||||||||||||||||
| Six Months Ended June 30, 2024 (unaudited) | $ | 1.000 | 0.022 | — | (g) | 0.022 | (0.022 | ) | — | (0.022 | ) | ||||||||||||||||||||
Year Ended December 31, 2023 | $ | 1.000 | 0.041 | — | (g) | 0.041 | (0.041 | ) | — | (0.041 | ) | ||||||||||||||||||||
Year Ended December 31, 2022 | $ | 1.000 | 0.010 | — | 0.010 | (0.010 | ) | — | (0.010 | ) | |||||||||||||||||||||
Year Ended December 31, 2021 | $ | 1.000 | — | (g) | — | (g) | — | (g) | — | (g) | — | — | (g) | ||||||||||||||||||
Year Ended December 31, 2020 | $ | 1.000 | 0.001 | — | (g) | 0.001 | (0.001 | ) | — | (0.001 | ) | ||||||||||||||||||||
Year Ended December 31, 2019 | $ | 1.000 | 0.008 | — | (g) | 0.008 | (0.008 | ) | — | (0.008 | ) | ||||||||||||||||||||
| Ratios to Average Net Assets | Supplemental Data | ||||||||||||||||||||||||||||||
| Net Asset Value, End of Period | Total Return(b)(c) | Gross Expenses(c)(d) | Net Expenses(c)(d) | Net Investment Income (Loss)(c)(d) | Net Assets, End of Period (000's) | Portfolio Turnover Rate(b)(e) | |||||||||||||||||||||||||
ProFund VP Financials | |||||||||||||||||||||||||||||||
| Six Months Ended June 30, 2024 (unaudited) | $ | 45.16 | 9.28 | % | 1.74 | % | 1.68 | % | 0.05 | % | $ | 29,200 | 9 | % | |||||||||||||||||
Year Ended December 31, 2023 | $ | 45.92 | 13.88 | % | 1.75 | % | 1.68 | % | 0.31 | % | $ | 26,905 | 48 | % | |||||||||||||||||
Year Ended December 31, 2022 | $ | 42.23 | (15.14 | )% | 1.71 | % | 1.68 | % | 0.33 | % | $ | 27,395 | 14 | % | |||||||||||||||||
Year Ended December 31, 2021 | $ | 50.42 | 30.10 | % | 1.68 | % | 1.68 | % | 0.07 | % | $ | 41,801 | 31 | % | |||||||||||||||||
Year Ended December 31, 2020 | $ | 41.61 | (1.77 | )% | 1.74 | % | 1.68 | % | 0.58 | % | $ | 27,234 | 145 | % | |||||||||||||||||
Year Ended December 31, 2019 | $ | 46.06 | 30.27 | % | 1.71 | % | 1.71 | %(f) | 0.50 | % | $ | 36,747 | 52 | % | |||||||||||||||||
ProFund VP Government Money Market | |||||||||||||||||||||||||||||||
| Six Months Ended June 30, 2024 (unaudited) | $ | 1.000 | 2.21 | % | 1.22 | % | 0.90 | % | 4.41 | % | $ | 30,545 | — | ||||||||||||||||||
Year Ended December 31, 2023 | $ | 1.000 | 4.15 | % | 1.28 | % | 0.90 | %(h) | 4.06 | % | $ | 30,941 | — | ||||||||||||||||||
Year Ended December 31, 2022 | $ | 1.000 | 1.02 | % | 1.16 | % | 0.49 | %(i)(j) | 1.01 | % | $ | 36,622 | — | ||||||||||||||||||
Year Ended December 31, 2021 | $ | 1.000 | 0.01 | % | 1.07 | % | — | %(i)(k) | 0.01 | % | $ | 46,350 | — | ||||||||||||||||||
Year Ended December 31, 2020 | $ | 1.000 | 0.04 | % | 1.16 | % | 0.52 | %(i) | 0.05 | % | $ | 48,075 | — | ||||||||||||||||||
Year Ended December 31, 2019 | $ | 1.000 | 0.77 | % | 1.35 | % | 1.35 | % | 0.78 | % | $ | 145,715 | — | ||||||||||||||||||
(a) Per share net investment income (loss) has been calculated using the average daily shares method.
(b) Not annualized for periods less than one year.
(c) Does not reflect the fees and expenses associated with the separate account that invests in the Fund or any variable annuity or variable insurance contract for which the Fund serves as an investment option.
(d) Annualized for periods less than one year.
(e) Portfolio turnover rate is calculated without regard to instruments having a maturity of less than one year from acquisition or derivative instruments (including swap agreements and futures contracts). The portfolio turnover rate can be high and volatile due to the amount and timing of sales and purchases of fund shares during the period.
(f) The expense ratio does not correlate to the applicable expense limits in place during the period given that the annual contractual expense limitation is applied for the one year periods ended April 30th of each year, instead of coinciding with the December 31st year end. Details of the current expense limitation in effect can be found in Note 4 of the accompanying Notes to Financial Statements.
(g) Amount is less than $0.0005.
(h) The Advisor voluntarily waived fees and expenses to limit the annual expense ratio to 0.90% through September 30, 2023. Effective October 1, 2023, the contractual expense limit was reduced from 1.35% to 0.90%.
(i) The expense ratio for the period reflects the reduction of certain expenses to maintain a certain minimum net yield.
(j) The Advisor voluntarily waived fees and expenses to limit the annual expense ratio to 0.90% (excluding amounts contractually waived to support a minimum net yield).
(k) Amount is less than 0.005%.
See accompanying notes to the financial statements.
224 :: Financial Highlights
ProFunds Financial Highlights FOR THE PERIODS INDICATED
Selected data for a share of beneficial interest outstanding throughout the periods indicated.
Investment Activities | Distributions to Shareholders From | ||||||||||||||||||||||||||||||
| Net Asset Value, Beginning of Period | Net Investment Income (Loss)(a) | Net Realized and Unrealized Gains (Losses) on Investments | Total from Investment Activities | Net Investment Income | Net Realized Gains on Investments | Total Distributions | |||||||||||||||||||||||||
ProFund VP Health Care | |||||||||||||||||||||||||||||||
| Six Months Ended June 30, 2024 (unaudited) | $ | 66.70 | 0.01 | 4.62 | 4.63 | (0.05 | ) | (3.20 | ) | (3.25 | ) | ||||||||||||||||||||
Year Ended December 31, 2023 | $ | 74.44 | 0.05 | 0.51 | 0.56 | — | (8.30 | ) | (8.30 | ) | |||||||||||||||||||||
Year Ended December 31, 2022 | $ | 84.07 | (0.15 | ) | (5.18 | ) | (5.33 | ) | — | (4.30 | ) | (4.30 | ) | ||||||||||||||||||
Year Ended December 31, 2021 | $ | 75.46 | (0.24 | ) | 15.51 | 15.27 | (0.03 | ) | (6.63 | ) | (6.66 | ) | |||||||||||||||||||
Year Ended December 31, 2020 | $ | 74.91 | 0.03 | 10.27 | 10.30 | — | (9.75 | ) | (9.75 | ) | |||||||||||||||||||||
Year Ended December 31, 2019 | $ | 71.82 | (0.01 | ) | 12.63 | 12.62 | — | (9.53 | ) | (9.53 | ) | ||||||||||||||||||||
ProFund VP Industrials | |||||||||||||||||||||||||||||||
| Six Months Ended June 30, 2024 (unaudited) | $ | 88.65 | (0.06 | ) | 6.16 | 6.10 | (0.18 | ) | (12.58 | ) | (12.76 | ) | |||||||||||||||||||
Year Ended December 31, 2023 | $ | 83.02 | 0.18 | 13.02 | 13.20 | — | (7.57 | ) | (7.57 | ) | |||||||||||||||||||||
Year Ended December 31, 2022 | $ | 99.95 | (0.18 | ) | (15.43 | ) | (15.61 | ) | — | (1.32 | ) | (1.32 | ) | ||||||||||||||||||
Year Ended December 31, 2021 | $ | 90.68 | (0.44 | ) | 15.06 | 14.62 | — | (5.35 | ) | (5.35 | ) | ||||||||||||||||||||
Year Ended December 31, 2020 | $ | 79.25 | (0.15 | ) | 13.24 | 13.09 | (0.14 | ) | (1.52 | ) | (1.66 | ) | |||||||||||||||||||
Year Ended December 31, 2019 | $ | 72.70 | 0.10 | 20.77 | 20.87 | — | (14.32 | ) | (14.32 | ) | |||||||||||||||||||||
| Ratios to Average Net Assets | Supplemental Data | ||||||||||||||||||||||||||||||
| Net Asset Value, End of Period | Total Return(b)(c) | Gross Expenses(c)(d) | Net Expenses(c)(d) | Net Investment Income (Loss)(c)(d) | Net Assets, End of Period (000's) | Portfolio Turnover Rate(b)(e) | |||||||||||||||||||||||||
ProFund VP Health Care | |||||||||||||||||||||||||||||||
| Six Months Ended June 30, 2024 (unaudited) | $ | 68.08 | 6.91 | % | 1.73 | % | 1.68 | % | 0.04 | % | $ | 37,674 | 29 | % | |||||||||||||||||
Year Ended December 31, 2023 | $ | 66.70 | 0.82 | % | 1.74 | % | 1.68 | % | 0.07 | % | $ | 37,241 | 13 | % | |||||||||||||||||
Year Ended December 31, 2022 | $ | 74.44 | (6.03 | )% | 1.69 | % | 1.68 | % | (0.20 | )% | $ | 43,635 | 30 | % | |||||||||||||||||
Year Ended December 31, 2021 | $ | 84.07 | 21.54 | % | 1.68 | % | 1.68 | % | (0.30 | )% | $ | 55,677 | 10 | % | |||||||||||||||||
Year Ended December 31, 2020 | $ | 75.46 | 14.44 | % | 1.73 | % | 1.68 | % | 0.04 | % | $ | 52,001 | 58 | % | |||||||||||||||||
Year Ended December 31, 2019 | $ | 74.91 | 19.37 | % | 1.72 | % | 1.68 | % | (0.01 | )% | $ | 49,409 | 33 | % | |||||||||||||||||
ProFund VP Industrials | |||||||||||||||||||||||||||||||
| Six Months Ended June 30, 2024 (unaudited) | $ | 81.99 | 6.86 | % | 1.76 | % | 1.68 | % | (0.12 | )% | $ | 16,505 | 22 | % | |||||||||||||||||
Year Ended December 31, 2023 | $ | 88.65 | 16.30 | % | 1.76 | % | 1.68 | % | 0.21 | % | $ | 15,733 | 82 | % | |||||||||||||||||
Year Ended December 31, 2022 | $ | 83.02 | (15.60 | )% | 1.72 | % | 1.68 | % | (0.21 | )% | $ | 14,194 | 73 | % | |||||||||||||||||
Year Ended December 31, 2021 | $ | 99.95 | 16.40 | % | 1.69 | % | 1.68 | % | (0.45 | )% | $ | 21,804 | 72 | % | |||||||||||||||||
Year Ended December 31, 2020 | $ | 90.68 | 16.76 | % | 1.75 | % | 1.68 | % | (0.20 | )% | $ | 17,080 | 123 | % | |||||||||||||||||
Year Ended December 31, 2019 | $ | 79.25 | 30.49 | % | 1.71 | % | 1.68 | % | 0.12 | % | $ | 17,879 | 71 | % | |||||||||||||||||
(a) Per share net investment income (loss) has been calculated using the average daily shares method.
(b) Not annualized for periods less than one year.
(c) Does not reflect the fees and expenses associated with the separate account that invests in the Fund or any variable annuity or variable insurance contract for which the Fund serves as an investment option.
(d) Annualized for periods less than one year.
(e) Portfolio turnover rate is calculated without regard to instruments having a maturity of less than one year from acquisition or derivative instruments (including swap agreements and futures contracts). The portfolio turnover rate can be high and volatile due to the amount and timing of sales and purchases of fund shares during the period.
See accompanying notes to the financial statements.
Financial Highlights :: 225
ProFunds Financial Highlights FOR THE PERIODS INDICATED
Selected data for a share of beneficial interest outstanding throughout the periods indicated.
Investment Activities | Distributions to Shareholders From | ||||||||||||||||||||||||||||||
| Net Asset Value, Beginning of Period | Net Investment Income (Loss)(a) | Net Realized and Unrealized Gains (Losses) on Investments | Total from Investment Activities | Net Investment Income | Net Realized Gains on Investments | Total Distributions | |||||||||||||||||||||||||
ProFund VP International | |||||||||||||||||||||||||||||||
| Six Months Ended June 30, 2024 (unaudited) | $ | 20.58 | 0.38 | 0.52 | 0.90 | (0.75 | ) | — | (0.75 | ) | |||||||||||||||||||||
Year Ended December 31, 2023 | $ | 17.81 | 0.62 | 2.15 | 2.77 | — | — | — | |||||||||||||||||||||||
Year Ended December 31, 2022 | $ | 22.33 | (0.03 | ) | (3.63 | ) | (3.66 | ) | — | (0.86 | ) | (0.86 | ) | ||||||||||||||||||
Year Ended December 31, 2021 | $ | 20.52 | (0.35 | ) | 2.16 | 1.81 | — | — | — | ||||||||||||||||||||||
Year Ended December 31, 2020 | $ | 19.66 | (0.24 | ) | 1.19 | 0.95 | (0.09 | ) | — | (0.09 | ) | ||||||||||||||||||||
Year Ended December 31, 2019 | $ | 16.53 | 0.08 | 3.10 | 3.18 | (0.05 | ) | — | (0.05 | ) | |||||||||||||||||||||
ProFund VP Internet | |||||||||||||||||||||||||||||||
| Six Months Ended June 30, 2024 (unaudited) | $ | 21.05 | (0.15 | ) | 2.07 | 1.92 | — | (0.46 | ) | (0.46 | ) | ||||||||||||||||||||
Year Ended December 31, 2023 | $ | 16.40 | (0.26 | ) | 8.12 | 7.86 | — | (3.21 | ) | (3.21 | ) | ||||||||||||||||||||
Year Ended December 31, 2022 | $ | 51.30 | (0.36 | ) | (21.75 | ) | (22.11 | ) | — | (12.79 | ) | (12.79 | ) | ||||||||||||||||||
Year Ended December 31, 2021 | $ | 58.55 | (0.84 | ) | 3.30 | 2.46 | — | (9.71 | ) | (9.71 | ) | ||||||||||||||||||||
Year Ended December 31, 2020 | $ | 43.10 | (0.69 | ) | 22.44 | 21.75 | — | (6.30 | ) | (6.30 | ) | ||||||||||||||||||||
Year Ended December 31, 2019(g) | $ | 37.40 | (0.54 | ) | 7.27 | 6.73 | — | (1.03 | ) | (1.03 | ) | ||||||||||||||||||||
| Ratios to Average Net Assets | Supplemental Data | ||||||||||||||||||||||||||||||
| Net Asset Value, End of Period | Total Return(b)(c) | Gross Expenses(c)(d) | Net Expenses(c)(d) | Net Investment Income (Loss)(c)(d) | Net Assets, End of Period (000's) | Portfolio Turnover Rate(b)(e) | |||||||||||||||||||||||||
ProFund VP International | |||||||||||||||||||||||||||||||
| Six Months Ended June 30, 2024 (unaudited) | $ | 20.73 | 4.35 | % | 1.68 | % | 1.68 | % | 3.60 | % | $ | 10,420 | — | ||||||||||||||||||
Year Ended December 31, 2023 | $ | 20.58 | 15.55 | % | 1.71 | % | 1.68 | % | 3.19 | % | $ | 10,459 | — | ||||||||||||||||||
Year Ended December 31, 2022 | $ | 17.81 | (16.45 | )% | 1.68 | % | 1.65 | % | (0.16 | )% | $ | 12,772 | — | ||||||||||||||||||
Year Ended December 31, 2021 | $ | 22.33 | 8.82 | % | 1.60 | % | 1.60 | % | (1.60 | )% | $ | 12,151 | — | ||||||||||||||||||
Year Ended December 31, 2020 | $ | 20.52 | 4.90 | % | 1.68 | % | 1.68 | % | (1.36 | )% | $ | 5,532 | — | ||||||||||||||||||
Year Ended December 31, 2019 | $ | 19.66 | 19.27 | % | 1.65 | % | 1.65 | % | 0.43 | % | $ | 5,679 | — | ||||||||||||||||||
ProFund VP Internet | |||||||||||||||||||||||||||||||
| Six Months Ended June 30, 2024 (unaudited) | $ | 22.51 | 9.17 | % | 1.74 | % | 1.68 | % | (1.33 | )% | $ | 12,842 | 49 | % | |||||||||||||||||
Year Ended December 31, 2023 | $ | 21.05 | 49.85 | % | 1.76 | % | 1.68 | % | (1.34 | )% | $ | 12,491 | 83 | % | |||||||||||||||||
Year Ended December 31, 2022 | $ | 16.40 | (46.13 | )% | 1.70 | % | 1.69 | %(f) | (1.40 | )% | $ | 8,133 | 28 | % | |||||||||||||||||
Year Ended December 31, 2021 | $ | 51.30 | 5.30 | % | 1.68 | % | 1.68 | % | (1.47 | )% | $ | 19,532 | 57 | % | |||||||||||||||||
Year Ended December 31, 2020 | $ | 58.55 | 50.82 | % | 1.71 | % | 1.68 | % | (1.36 | )% | $ | 26,399 | 116 | % | |||||||||||||||||
Year Ended December 31, 2019(g) | $ | 43.10 | 18.03 | % | 1.69 | % | 1.69 | %(f) | (1.24 | )% | $ | 16,593 | 163 | % | |||||||||||||||||
(a) Per share net investment income (loss) has been calculated using the average daily shares method.
(b) Not annualized for periods less than one year.
(c) Does not reflect the fees and expenses associated with the separate account that invests in the Fund or any variable annuity or variable insurance contract for which the Fund serves as an investment option.
(d) Annualized for periods less than one year.
(e) Portfolio turnover rate is calculated without regard to instruments having a maturity of less than one year from acquisition or derivative instruments (including swap agreements and futures contracts). The portfolio turnover rate can be high and volatile due to the amount and timing of sales and purchases of fund shares during the period.
(f) The expense ratio does not correlate to the applicable expense limits in place during the period given that the annual contractual expense limitation is applied for the one year periods ended April 30th of each year, instead of coinciding with the December 31st year end. Details of the current expense limitation in effect can be found in Note 4 of the accompanying Notes to Financial Statements.
(g) As described in Note 8, share amounts have been adjusted for 3:1 share split that occurred on November 18, 2019.
See accompanying notes to the financial statements.
226 :: Financial Highlights
ProFunds Financial Highlights FOR THE PERIODS INDICATED
Selected data for a share of beneficial interest outstanding throughout the periods indicated.
Investment Activities | Distributions to Shareholders From | ||||||||||||||||||||||||||||||
| Net Asset Value, Beginning of Period | Net Investment Income (Loss)(a) | Net Realized and Unrealized Gains (Losses) on Investments | Total from Investment Activities | Net Investment Income | Net Realized Gains on Investments | Total Distributions | |||||||||||||||||||||||||
ProFund VP Japan | |||||||||||||||||||||||||||||||
| Six Months Ended June 30, 2024 (unaudited) | $ | 65.23 | 1.32 | 12.81 | 14.13 | (1.89 | ) | (9.67 | ) | (11.56 | ) | ||||||||||||||||||||
Year Ended December 31, 2023 | $ | 48.48 | 1.93 | 14.82 | 16.75 | — | — | — | |||||||||||||||||||||||
Year Ended December 31, 2022 | $ | 56.77 | (0.12 | ) | (5.32 | ) | (5.44 | ) | — | (2.85 | ) | (2.85 | ) | ||||||||||||||||||
Year Ended December 31, 2021 | $ | 63.65 | (1.02 | ) | 3.20 | 2.18 | — | (9.06 | ) | (9.06 | ) | ||||||||||||||||||||
Year Ended December 31, 2020 | $ | 55.06 | (0.73 | ) | 9.48 | 8.75 | (0.16 | ) | — | (0.16 | ) | ||||||||||||||||||||
Year Ended December 31, 2019 | $ | 45.95 | 0.12 | 9.06 | 9.18 | (0.07 | ) | — | (0.07 | ) | |||||||||||||||||||||
ProFund VP Large-Cap Growth | |||||||||||||||||||||||||||||||
| Six Months Ended June 30, 2024 (unaudited) | $ | 51.60 | (0.28 | ) | 11.88 | 11.60 | — | (1.13 | ) | (1.13 | ) | ||||||||||||||||||||
Year Ended December 31, 2023 | $ | 47.65 | (0.18 | ) | 13.09 | 12.91 | — | (8.96 | ) | (8.96 | ) | ||||||||||||||||||||
Year Ended December 31, 2022 | $ | 85.95 | (0.46 | ) | (24.71 | ) | (25.17 | ) | — | (13.13 | ) | (13.13 | ) | ||||||||||||||||||
Year Ended December 31, 2021 | $ | 77.23 | (0.75 | ) | 20.84 | 20.09 | — | (11.37 | ) | (11.37 | ) | ||||||||||||||||||||
Year Ended December 31, 2020 | $ | 64.35 | (0.35 | ) | 20.11 | 19.76 | — | (6.88 | ) | (6.88 | ) | ||||||||||||||||||||
Year Ended December 31, 2019 | $ | 65.02 | (0.10 | ) | 17.13 | 17.03 | — | (17.70 | ) | (17.70 | ) | ||||||||||||||||||||
| Ratios to Average Net Assets | Supplemental Data | ||||||||||||||||||||||||||||||
| Net Asset Value, End of Period | Total Return(b)(c) | Gross Expenses(c)(d) | Net Expenses(c)(d) | Net Investment Income (Loss)(c)(d) | Net Assets, End of Period (000's) | Portfolio Turnover Rate(b)(e) | |||||||||||||||||||||||||
ProFund VP Japan | |||||||||||||||||||||||||||||||
| Six Months Ended June 30, 2024 (unaudited) | $ | 67.80 | 21.89 | % | 1.70 | % | 1.68 | % | 3.53 | % | $ | 14,175 | — | ||||||||||||||||||
Year Ended December 31, 2023 | $ | 65.23 | 34.51 | % | 1.73 | % | 1.68 | % | 3.26 | % | $ | 10,748 | — | ||||||||||||||||||
Year Ended December 31, 2022 | $ | 48.48 | (9.92 | )% | 1.69 | % | 1.68 | % | (0.22 | )% | $ | 7,448 | — | ||||||||||||||||||
Year Ended December 31, 2021 | $ | 56.77 | 3.89 | % | 1.69 | % | 1.68 | % | (1.68 | )% | $ | 7,261 | — | ||||||||||||||||||
Year Ended December 31, 2020 | $ | 63.65 | 15.93 | % | 1.75 | % | 1.68 | % | (1.38 | )% | $ | 11,668 | — | ||||||||||||||||||
Year Ended December 31, 2019 | $ | 55.06 | 20.00 | % | 1.74 | % | 1.74 | %(f) | 0.23 | % | $ | 9,319 | — | ||||||||||||||||||
ProFund VP Large-Cap Growth | |||||||||||||||||||||||||||||||
| Six Months Ended June 30, 2024 (unaudited) | $ | 62.07 | 22.48 | % | 1.75 | % | 1.68 | % | (0.98 | )% | $ | 32,761 | 75 | % | |||||||||||||||||
Year Ended December 31, 2023 | $ | 51.60 | 27.86 | % | 1.78 | % | 1.68 | % | (0.36 | )% | $ | 26,086 | 178 | % | |||||||||||||||||
Year Ended December 31, 2022 | $ | 47.65 | (30.64 | )% | 1.73 | % | 1.68 | % | (0.76 | )% | $ | 15,799 | 132 | % | |||||||||||||||||
Year Ended December 31, 2021 | $ | 85.95 | 29.86 | % | 1.69 | % | 1.68 | % | (0.94 | )% | $ | 37,180 | 122 | % | |||||||||||||||||
Year Ended December 31, 2020 | $ | 77.23 | 30.93 | % | 1.75 | % | 1.68 | % | (0.52 | )% | $ | 29,963 | 150 | % | |||||||||||||||||
Year Ended December 31, 2019 | $ | 64.35 | 28.89 | % | 1.73 | % | 1.68 | % | (0.14 | )% | $ | 28,941 | 136 | % | |||||||||||||||||
(a) Per share net investment income (loss) has been calculated using the average daily shares method.
(b) Not annualized for periods less than one year.
(c) Does not reflect the fees and expenses associated with the separate account that invests in the Fund or any variable annuity or variable insurance contract for which the Fund serves as an investment option.
(d) Annualized for periods less than one year.
(e) Portfolio turnover rate is calculated without regard to instruments having a maturity of less than one year from acquisition or derivative instruments (including swap agreements and futures contracts). The portfolio turnover rate can be high and volatile due to the amount and timing of sales and purchases of fund shares during the period.
(f) The expense ratio does not correlate to the applicable expense limits in place during the period given that the annual contractual expense limitation is applied for the one year periods ended April 30th of each year, instead of coinciding with the December 31st year end. Details of the current expense limitation in effect can be found in Note 4 of the accompanying Notes to Financial Statements.
See accompanying notes to the financial statements.
Financial Highlights :: 227
ProFunds Financial Highlights FOR THE PERIODS INDICATED
Selected data for a share of beneficial interest outstanding throughout the periods indicated.
Investment Activities | Distributions to Shareholders From | ||||||||||||||||||||||||||||||
| Net Asset Value, Beginning of Period | Net Investment Income (Loss)(a) | Net Realized and Unrealized Gains (Losses) on Investments | Total from Investment Activities | Net Investment Income | Net Realized Gains on Investments | Total Distributions | |||||||||||||||||||||||||
ProFund VP Large-Cap Value | |||||||||||||||||||||||||||||||
| Six Months Ended June 30, 2024 (unaudited) | $ | 50.37 | 0.16 | 2.34 | 2.50 | (0.20 | ) | (6.44 | ) | (6.64 | ) | ||||||||||||||||||||
Year Ended December 31, 2023 | $ | 45.11 | 0.16 | 8.71 | 8.87 | (0.24 | ) | (3.37 | ) | (3.61 | ) | ||||||||||||||||||||
Year Ended December 31, 2022 | $ | 49.32 | 0.23 | (3.59 | ) | (3.36 | ) | (0.23 | ) | (0.62 | ) | (0.85 | ) | ||||||||||||||||||
Year Ended December 31, 2021 | $ | 40.50 | 0.22 | 9.03 | 9.25 | (0.43 | ) | — | (0.43 | ) | |||||||||||||||||||||
Year Ended December 31, 2020 | $ | 47.60 | 0.43 | (1.06 | ) | (0.63 | ) | (0.50 | ) | (5.97 | ) | (6.47 | ) | ||||||||||||||||||
Year Ended December 31, 2019 | $ | 41.32 | 0.37 | 11.15 | 11.52 | (0.46 | ) | (4.78 | ) | (5.24 | ) | ||||||||||||||||||||
ProFund VP Materials | |||||||||||||||||||||||||||||||
| Six Months Ended June 30, 2024 (unaudited) | $ | 85.48 | 0.07 | 2.73 | 2.80 | (0.37 | ) | (0.07 | ) | (0.44 | ) | ||||||||||||||||||||
Year Ended December 31, 2023 | $ | 76.40 | 0.33 | 9.12 | 9.45 | (0.37 | ) | — | (0.37 | ) | |||||||||||||||||||||
Year Ended December 31, 2022 | $ | 84.94 | 0.36 | (8.08 | ) | (7.72 | ) | (0.13 | ) | (0.69 | ) | (0.82 | ) | ||||||||||||||||||
Year Ended December 31, 2021 | $ | 69.36 | 0.14 | 17.52 | 17.66 | (0.23 | ) | (1.85 | ) | (2.08 | ) | ||||||||||||||||||||
Year Ended December 31, 2020 | $ | 64.71 | 0.32 | 9.87 | 10.19 | (0.42 | ) | (5.12 | ) | (5.54 | ) | ||||||||||||||||||||
Year Ended December 31, 2019 | $ | 56.94 | 0.37 | 9.53 | 9.90 | (0.22 | ) | (1.91 | ) | (2.13 | ) | ||||||||||||||||||||
| Ratios to Average Net Assets | Supplemental Data | ||||||||||||||||||||||||||||||
| Net Asset Value, End of Period | Total Return(b)(c) | Gross Expenses(c)(d) | Net Expenses(c)(d) | Net Investment Income (Loss)(c)(d) | Net Assets, End of Period (000's) | Portfolio Turnover Rate(b)(e) | |||||||||||||||||||||||||
ProFund VP Large-Cap Value | |||||||||||||||||||||||||||||||
| Six Months Ended June 30, 2024 (unaudited) | $ | 46.23 | 4.91 | % | 1.75 | % | 1.68 | % | 0.64 | % | $ | 15,256 | 32 | % | |||||||||||||||||
Year Ended December 31, 2023 | $ | 50.37 | 20.09 | % | 1.78 | % | 1.68 | % | 0.34 | % | $ | 20,299 | 151 | % | |||||||||||||||||
Year Ended December 31, 2022 | $ | 45.11 | (6.82 | )% | 1.73 | % | 1.68 | % | 0.51 | % | $ | 15,986 | 214 | % | |||||||||||||||||
Year Ended December 31, 2021 | $ | 49.32 | 22.93 | % | 1.70 | % | 1.68 | % | 0.48 | % | $ | 17,877 | 79 | % | |||||||||||||||||
Year Ended December 31, 2020 | $ | 40.50 | (0.06 | )% | 1.77 | % | 1.68 | % | 1.05 | % | $ | 14,607 | 97 | % | |||||||||||||||||
Year Ended December 31, 2019 | $ | 47.60 | 29.77 | % | 1.74 | % | 1.68 | % | 0.81 | % | $ | 22,202 | 110 | % | |||||||||||||||||
ProFund VP Materials | |||||||||||||||||||||||||||||||
| Six Months Ended June 30, 2024 (unaudited) | $ | 87.84 | 3.29 | % | 1.77 | % | 1.68 | % | 0.17 | % | $ | 14,580 | 26 | % | |||||||||||||||||
Year Ended December 31, 2023 | $ | 85.48 | 12.38 | % | 1.77 | % | 1.68 | % | 0.40 | % | $ | 14,610 | 69 | % | |||||||||||||||||
Year Ended December 31, 2022 | $ | 76.40 | (9.14 | )% | 1.71 | % | 1.68 | % | 0.46 | % | $ | 13,568 | 65 | % | |||||||||||||||||
Year Ended December 31, 2021 | $ | 84.94 | 25.63 | % | 1.68 | % | 1.68 | % | 0.18 | % | $ | 17,284 | 134 | % | |||||||||||||||||
Year Ended December 31, 2020 | $ | 69.36 | 16.49 | % | 1.73 | % | 1.68 | % | 0.53 | % | $ | 16,416 | 135 | % | |||||||||||||||||
Year Ended December 31, 2019 | $ | 64.71 | 17.72 | % | 1.71 | % | 1.68 | % | 0.60 | % | $ | 11,884 | 58 | % | |||||||||||||||||
(a) Per share net investment income (loss) has been calculated using the average daily shares method.
(b) Not annualized for periods less than one year.
(c) Does not reflect the fees and expenses associated with the separate account that invests in the Fund or any variable annuity or variable insurance contract for which the Fund serves as an investment option.
(d) Annualized for periods less than one year.
(e) Portfolio turnover rate is calculated without regard to instruments having a maturity of less than one year from acquisition or derivative instruments (including swap agreements and futures contracts). The portfolio turnover rate can be high and volatile due to the amount and timing of sales and purchases of fund shares during the period.
See accompanying notes to the financial statements.
228 :: Financial Highlights
ProFunds Financial Highlights FOR THE PERIODS INDICATED
Selected data for a share of beneficial interest outstanding throughout the periods indicated.
Investment Activities | Distributions to Shareholders From | ||||||||||||||||||||||||||||||
| Net Asset Value, Beginning of Period | Net Investment Income (Loss)(a) | Net Realized and Unrealized Gains (Losses) on Investments | Total from Investment Activities | Net Investment Income | Net Realized Gains on Investments | Total Distributions | |||||||||||||||||||||||||
ProFund VP Mid-Cap | |||||||||||||||||||||||||||||||
| Six Months Ended June 30, 2024 (unaudited) | $ | 16.71 | 0.31 | 0.52 | 0.83 | (0.50 | ) | — | (0.50 | ) | |||||||||||||||||||||
Year Ended December 31, 2023 | $ | 14.68 | 0.49 | 1.54 | 2.03 | — | — | — | |||||||||||||||||||||||
Year Ended December 31, 2022 | $ | 21.47 | (0.04 | ) | (3.10 | ) | (3.14 | ) | — | (3.65 | ) | (3.65 | ) | ||||||||||||||||||
Year Ended December 31, 2021 | $ | 18.15 | (0.33 | ) | 4.31 | 3.98 | — | (0.66 | ) | (0.66 | ) | ||||||||||||||||||||
Year Ended December 31, 2020 | $ | 23.89 | (0.26 | ) | 1.63 | 1.37 | (0.22 | ) | (6.89 | ) | (7.11 | ) | |||||||||||||||||||
Year Ended December 31, 2019 | $ | 19.37 | 0.11 | 4.44 | 4.55 | (0.03 | ) | — | (0.03 | ) | |||||||||||||||||||||
ProFund VP Mid-Cap Growth | |||||||||||||||||||||||||||||||
| Six Months Ended June 30, 2024 (unaudited) | $ | 36.50 | (0.13 | ) | 4.04 | 3.91 | — | (1.64 | ) | (1.64 | ) | ||||||||||||||||||||
Year Ended December 31, 2023 | $ | 31.75 | (0.13 | ) | 5.07 | 4.94 | — | (0.19 | ) | (0.19 | ) | ||||||||||||||||||||
Year Ended December 31, 2022 | $ | 50.76 | (0.21 | ) | (9.92 | ) | (10.13 | ) | — | (8.88 | ) | (8.88 | ) | ||||||||||||||||||
Year Ended December 31, 2021 | $ | 47.68 | (0.51 | ) | 8.14 | 7.63 | — | (4.55 | ) | (4.55 | ) | ||||||||||||||||||||
Year Ended December 31, 2020 | $ | 43.13 | (0.28 | ) | 8.71 | 8.43 | — | (3.88 | ) | (3.88 | ) | ||||||||||||||||||||
Year Ended December 31, 2019 | $ | 38.51 | (0.16 | ) | 9.17 | 9.01 | — | (4.39 | ) | (4.39 | ) | ||||||||||||||||||||
| Ratios to Average Net Assets | Supplemental Data | ||||||||||||||||||||||||||||||
| Net Asset Value, End of Period | Total Return(b)(c) | Gross Expenses(c)(d) | Net Expenses(c)(d) | Net Investment Income (Loss)(c)(d) | Net Assets, End of Period (000's) | Portfolio Turnover Rate(b)(e) | |||||||||||||||||||||||||
ProFund VP Mid-Cap | |||||||||||||||||||||||||||||||
| Six Months Ended June 30, 2024 (unaudited) | $ | 17.04 | 4.91 | % | 1.71 | % | 1.68 | % | 3.60 | % | $ | 11,155 | — | ||||||||||||||||||
Year Ended December 31, 2023 | $ | 16.71 | 13.83 | % | 1.74 | % | 1.68 | % | 3.19 | % | $ | 10,335 | — | ||||||||||||||||||
Year Ended December 31, 2022 | $ | 14.68 | (14.92 | )% | 1.70 | % | 1.67 | % | (0.22 | )% | $ | 9,993 | — | ||||||||||||||||||
Year Ended December 31, 2021 | $ | 21.47 | 22.21 | % | 1.61 | % | 1.61 | % | (1.61 | )% | $ | 15,850 | — | ||||||||||||||||||
Year Ended December 31, 2020 | $ | 18.15 | 10.76 | % | 1.70 | % | 1.70 | %(f) | (1.34 | )% | $ | 10,731 | — | ||||||||||||||||||
Year Ended December 31, 2019 | $ | 23.89 | 23.53 | % | 1.64 | % | 1.64 | % | 0.50 | % | $ | 11,332 | — | ||||||||||||||||||
ProFund VP Mid-Cap Growth | |||||||||||||||||||||||||||||||
| Six Months Ended June 30, 2024 (unaudited) | $ | 38.77 | 10.75 | % | 1.79 | % | 1.68 | % | (0.65 | )% | $ | 14,689 | 96 | % | |||||||||||||||||
Year Ended December 31, 2023 | $ | 36.50 | 15.56 | % | 1.82 | % | 1.68 | % | (0.40 | )% | $ | 14,936 | 150 | % | |||||||||||||||||
Year Ended December 31, 2022 | $ | 31.75 | (20.34 | )% | 1.76 | % | 1.68 | % | (0.57 | )% | $ | 11,954 | 94 | % | |||||||||||||||||
Year Ended December 31, 2021 | $ | 50.76 | 16.97 | % | 1.73 | % | 1.68 | % | (1.02 | )% | $ | 20,702 | 113 | % | |||||||||||||||||
Year Ended December 31, 2020 | $ | 47.68 | 20.90 | % | 1.78 | % | 1.68 | % | (0.68 | )% | $ | 21,028 | 184 | % | |||||||||||||||||
Year Ended December 31, 2019 | $ | 43.13 | 24.24 | % | 1.75 | % | 1.68 | % | (0.38 | )% | $ | 20,792 | 191 | % | |||||||||||||||||
(a) Per share net investment income (loss) has been calculated using the average daily shares method.
(b) Not annualized for periods less than one year.
(c) Does not reflect the fees and expenses associated with the separate account that invests in the Fund or any variable annuity or variable insurance contract for which the Fund serves as an investment option.
(d) Annualized for periods less than one year.
(e) Portfolio turnover rate is calculated without regard to instruments having a maturity of less than one year from acquisition or derivative instruments (including swap agreements and futures contracts). The portfolio turnover rate can be high and volatile due to the amount and timing of sales and purchases of fund shares during the period.
(f) The expense ratio does not correlate to the applicable expense limits in place during the period given that the annual contractual expense limitation is applied for the one year periods ended April 30th of each year, instead of coinciding with the December 31st year end. Details of the current expense limitation in effect can be found in Note 4 of the accompanying Notes to Financial Statements.
See accompanying notes to the financial statements.
Financial Highlights :: 229
ProFunds Financial Highlights FOR THE PERIODS INDICATED
Selected data for a share of beneficial interest outstanding throughout the periods indicated.
Investment Activities | Distributions to Shareholders From | ||||||||||||||||||||||||||||||
| Net Asset Value, Beginning of Period | Net Investment Income (Loss)(a) | Net Realized and Unrealized Gains (Losses) on Investments | Total from Investment Activities | Net Investment Income | Net Realized Gains on Investments | Total Distributions | |||||||||||||||||||||||||
ProFund VP Mid-Cap Value | |||||||||||||||||||||||||||||||
| Six Months Ended June 30, 2024 (unaudited) | $ | 42.06 | 0.10 | (0.24 | ) | (0.14 | ) | (0.11 | ) | (1.87 | ) | (1.98 | ) | ||||||||||||||||||
Year Ended December 31, 2023 | $ | 39.51 | 0.07 | 5.15 | 5.22 | (0.12 | ) | (2.55 | ) | (2.67 | ) | ||||||||||||||||||||
Year Ended December 31, 2022 | $ | 50.46 | 0.11 | (4.32 | ) | (4.21 | ) | (0.07 | ) | (6.67 | ) | (6.74 | ) | ||||||||||||||||||
Year Ended December 31, 2021 | $ | 39.36 | 0.04 | 11.18 | 11.22 | (0.12 | ) | — | (0.12 | ) | |||||||||||||||||||||
Year Ended December 31, 2020 | $ | 42.15 | 0.21 | 0.13 | 0.34 | (0.15 | ) | (2.98 | ) | (3.13 | ) | ||||||||||||||||||||
Year Ended December 31, 2019 | $ | 35.25 | 0.10 | 8.22 | 8.32 | (0.08 | ) | (1.34 | ) | (1.42 | ) | ||||||||||||||||||||
ProFund VP Nasdaq-100 | |||||||||||||||||||||||||||||||
| Six Months Ended June 30, 2024 (unaudited) | $ | 57.87 | 0.18 | 9.29 | 9.47 | (0.26 | ) | (7.71 | ) | (7.97 | ) | ||||||||||||||||||||
Year Ended December 31, 2023 | $ | 38.21 | 0.28 | 19.64 | 19.92 | — | (0.26 | ) | (0.26 | ) | |||||||||||||||||||||
Year Ended December 31, 2022 | $ | 73.87 | (0.34 | ) | (23.34 | ) | (23.68 | ) | — | (11.98 | ) | (11.98 | ) | ||||||||||||||||||
Year Ended December 31, 2021 | $ | 70.73 | (0.81 | ) | 15.53 | 14.72 | — | (11.58 | ) | (11.58 | ) | ||||||||||||||||||||
Year Ended December 31, 2020 | $ | 51.68 | (0.59 | ) | 24.00 | 23.41 | — | (4.36 | ) | (4.36 | ) | ||||||||||||||||||||
Year Ended December 31, 2019 | $ | 38.09 | (0.13 | ) | 14.06 | 13.93 | — | (0.34 | ) | (0.34 | ) | ||||||||||||||||||||
| Ratios to Average Net Assets | Supplemental Data | ||||||||||||||||||||||||||||||
| Net Asset Value, End of Period | Total Return(b)(c) | Gross Expenses(c)(d) | Net Expenses(c)(d) | Net Investment Income (Loss)(c)(d) | Net Assets, End of Period (000's) | Portfolio Turnover Rate(b)(e) | |||||||||||||||||||||||||
ProFund VP Mid-Cap Value | |||||||||||||||||||||||||||||||
| Six Months Ended June 30, 2024 (unaudited) | $ | 39.94 | (0.33 | )% | 1.78 | % | 1.68 | % | 0.51 | % | $ | 10,660 | 36 | % | |||||||||||||||||
Year Ended December 31, 2023 | $ | 42.06 | 13.45 | % | 1.81 | % | 1.68 | % | 0.19 | % | $ | 12,286 | 130 | % | |||||||||||||||||
Year Ended December 31, 2022 | $ | 39.51 | (8.45 | )% | 1.74 | % | 1.68 | % | 0.25 | % | $ | 13,192 | 175 | % | |||||||||||||||||
Year Ended December 31, 2021 | $ | 50.46 | 28.53 | % | 1.70 | % | 1.68 | % | 0.08 | % | $ | 18,681 | 172 | % | |||||||||||||||||
Year Ended December 31, 2020 | $ | 39.36 | 2.30 | % | 1.80 | % | 1.68 | % | 0.60 | % | $ | 12,472 | 163 | % | |||||||||||||||||
Year Ended December 31, 2019 | $ | 42.15 | 24.08 | % | 1.75 | % | 1.68 | % | 0.26 | % | $ | 17,712 | 232 | % | |||||||||||||||||
ProFund VP Nasdaq-100 | |||||||||||||||||||||||||||||||
| Six Months Ended June 30, 2024 (unaudited) | $ | 59.37 | 16.36 | % | 1.72 | % | 1.68 | % | 0.59 | % | $ | 169,071 | 2 | % | |||||||||||||||||
Year Ended December 31, 2023 | $ | 57.87 | 52.17 | % | 1.76 | % | 1.68 | % | 0.57 | % | $ | 147,448 | 22 | % | |||||||||||||||||
Year Ended December 31, 2022 | $ | 38.21 | (33.91 | )% | 1.74 | % | 1.68 | % | (0.67 | )% | $ | 76,535 | 9 | % | |||||||||||||||||
Year Ended December 31, 2021 | $ | 73.87 | 24.80 | % | 1.68 | % | 1.68 | % | (1.15 | )% | $ | 177,581 | 13 | % | |||||||||||||||||
Year Ended December 31, 2020 | $ | 70.73 | 45.57 | % | 1.73 | % | 1.68 | % | (0.99 | )% | $ | 155,209 | 10 | % | |||||||||||||||||
Year Ended December 31, 2019 | $ | 51.68 | 36.70 | % | 1.72 | % | 1.69 | %(f) | (0.29 | )% | $ | 103,193 | 9 | % | |||||||||||||||||
(a) Per share net investment income (loss) has been calculated using the average daily shares method.
(b) Not annualized for periods less than one year.
(c) Does not reflect the fees and expenses associated with the separate account that invests in the Fund or any variable annuity or variable insurance contract for which the Fund serves as an investment option.
(d) Annualized for periods less than one year.
(e) Portfolio turnover rate is calculated without regard to instruments having a maturity of less than one year from acquisition or derivative instruments (including swap agreements and futures contracts). The portfolio turnover rate can be high and volatile due to the amount and timing of sales and purchases of fund shares during the period.
(f) The expense ratio does not correlate to the applicable expense limits in place during the period given that the annual contractual expense limitation is applied for the one year periods ended April 30th of each year, instead of coinciding with the December 31st year end. Details of the current expense limitation in effect can be found in Note 4 of the accompanying Notes to Financial Statements.
See accompanying notes to the financial statements.
230 :: Financial Highlights
ProFunds Financial Highlights FOR THE PERIODS INDICATED
Selected data for a share of beneficial interest outstanding throughout the periods indicated.
Investment Activities | Distributions to Shareholders From | ||||||||||||||||||||||||||||||
| Net Asset Value, Beginning of Period | Net Investment Income (Loss)(a) | Net Realized and Unrealized Gains (Losses) on Investments | Total from Investment Activities | Net Investment Income | Net Realized Gains on Investments | Total Distributions | |||||||||||||||||||||||||
ProFund VP Pharmaceuticals | |||||||||||||||||||||||||||||||
| Six Months Ended June 30, 2024 (unaudited) | $ | 34.39 | 0.05 | (1.47 | ) | (1.42 | ) | — | (3.62 | ) | (3.62 | ) | |||||||||||||||||||
Year Ended December 31, 2023 | $ | 37.31 | 0.03 | (2.07 | ) | (2.04 | ) | (0.19 | ) | (0.69 | ) | (0.88 | ) | ||||||||||||||||||
Year Ended December 31, 2022 | $ | 42.16 | 0.16 | (2.71 | ) | (2.55 | ) | (0.03 | ) | (2.27 | ) | (2.30 | ) | ||||||||||||||||||
Year Ended December 31, 2021 | $ | 38.54 | 0.07 | 4.18 | 4.25 | (0.11 | ) | (0.52 | ) | (0.63 | ) | ||||||||||||||||||||
Year Ended December 31, 2020 | $ | 34.29 | — | (f) | 4.29 | 4.29 | (0.04 | ) | — | (0.04 | ) | ||||||||||||||||||||
Year Ended December 31, 2019 | $ | 34.85 | 0.04 | 4.22 | 4.26 | (0.31 | ) | (4.51 | ) | (4.82 | ) | ||||||||||||||||||||
ProFund VP Precious Metals | |||||||||||||||||||||||||||||||
| Six Months Ended June 30, 2024 (unaudited) | $ | 25.40 | 0.44 | 1.36 | 1.80 | (0.91 | ) | — | (0.91 | ) | |||||||||||||||||||||
Year Ended December 31, 2023 | $ | 25.03 | 0.82 | (0.45 | ) | 0.37 | — | — | — | ||||||||||||||||||||||
Year Ended December 31, 2022 | $ | 28.13 | (0.09 | ) | (3.01 | ) | (3.10 | ) | — | — | — | ||||||||||||||||||||
Year Ended December 31, 2021 | $ | 30.89 | (0.49 | ) | (2.27 | ) | (2.76 | ) | — | — | — | ||||||||||||||||||||
Year Ended December 31, 2020 | $ | 24.94 | (0.42 | ) | 6.44 | 6.02 | (0.07 | ) | — | (0.07 | ) | ||||||||||||||||||||
Year Ended December 31, 2019 | $ | 17.10 | 0.07 | 7.78 | 7.85 | (0.01 | ) | — | (0.01 | ) | |||||||||||||||||||||
| Ratios to Average Net Assets | Supplemental Data | ||||||||||||||||||||||||||||||
| Net Asset Value, End of Period | Total Return(b)(c) | Gross Expenses(c)(d) | Net Expenses(c)(d) | Net Investment Income (Loss)(c)(d) | Net Assets, End of Period (000's) | Portfolio Turnover Rate(b)(e) | |||||||||||||||||||||||||
ProFund VP Pharmaceuticals | |||||||||||||||||||||||||||||||
| Six Months Ended June 30, 2024 (unaudited) | $ | 29.35 | (4.17 | )% | 1.76 | % | 1.68 | % | 0.27 | % | $ | 9,395 | 65 | % | |||||||||||||||||
Year Ended December 31, 2023 | $ | 34.39 | (5.49 | )% | 1.77 | % | 1.68 | % | 0.09 | % | $ | 10,139 | 128 | % | |||||||||||||||||
Year Ended December 31, 2022 | $ | 37.31 | (6.13 | )% | 1.70 | % | 1.68 | % | 0.41 | % | $ | 13,527 | 64 | % | |||||||||||||||||
Year Ended December 31, 2021 | $ | 42.16 | 11.20 | % | 1.68 | % | 1.68 | % | 0.18 | % | $ | 16,790 | 60 | % | |||||||||||||||||
Year Ended December 31, 2020 | $ | 38.54 | 12.51 | % | 1.73 | % | 1.68 | % | 0.01 | % | $ | 16,271 | 91 | % | |||||||||||||||||
Year Ended December 31, 2019 | $ | 34.29 | 14.04 | % | 1.74 | % | 1.68 | % | 0.12 | % | $ | 13,604 | 126 | % | |||||||||||||||||
ProFund VP Precious Metals | |||||||||||||||||||||||||||||||
| Six Months Ended June 30, 2024 (unaudited) | $ | 26.29 | 7.11 | % | 1.73 | % | 1.68 | % | 3.53 | % | $ | 30,234 | — | ||||||||||||||||||
Year Ended December 31, 2023 | $ | 25.40 | 1.48 | % | 1.76 | % | 1.68 | % | 3.25 | % | $ | 24,691 | — | ||||||||||||||||||
Year Ended December 31, 2022 | $ | 25.03 | (11.02 | )% | 1.71 | % | 1.68 | % | (0.33 | )% | $ | 27,228 | — | ||||||||||||||||||
Year Ended December 31, 2021 | $ | 28.13 | (8.94 | )% | 1.68 | % | 1.68 | % | (1.68 | )% | $ | 30,204 | — | ||||||||||||||||||
Year Ended December 31, 2020 | $ | 30.89 | 24.10 | % | 1.74 | % | 1.68 | % | (1.43 | )% | $ | 38,371 | — | ||||||||||||||||||
Year Ended December 31, 2019 | $ | 24.94 | 45.98 | % | 1.72 | % | 1.68 | % | 0.37 | % | $ | 32,395 | — | ||||||||||||||||||
(a) Per share net investment income (loss) has been calculated using the average daily shares method.
(b) Not annualized for periods less than one year.
(c) Does not reflect the fees and expenses associated with the separate account that invests in the Fund or any variable annuity or variable insurance contract for which the Fund serves as an investment option.
(d) Annualized for periods less than one year.
(e) Portfolio turnover rate is calculated without regard to instruments having a maturity of less than one year from acquisition or derivative instruments (including swap agreements and futures contracts). The portfolio turnover rate can be high and volatile due to the amount and timing of sales and purchases of fund shares during the period.
(f) Amount is less than $0.005.
See accompanying notes to the financial statements.
Financial Highlights :: 231
ProFunds Financial Highlights FOR THE PERIODS INDICATED
Selected data for a share of beneficial interest outstanding throughout the periods indicated.
Investment Activities | Distributions to Shareholders From | ||||||||||||||||||||||||||||||||||
| Net Asset Value, Beginning of Period | Net Investment Income (Loss)(a) | Net Realized and Unrealized Gains (Losses) on Investments | Total from Investment Activities | Net Investment Income | Net Realized Gains on Investments | Return of Capital | Total Distributions | ||||||||||||||||||||||||||||
ProFund VP Real Estate | |||||||||||||||||||||||||||||||||||
| Six Months Ended June 30, 2024 (unaudited) | $ | 47.41 | 0.30 | (1.80 | ) | (1.50 | ) | (0.08 | ) | — | — | (0.08 | ) | ||||||||||||||||||||||
Year Ended December 31, 2023 | $ | 54.22 | 0.68 | 4.03 | 4.71 | (0.57 | ) | (10.95 | ) | — | (11.52 | ) | |||||||||||||||||||||||
Year Ended December 31, 2022 | $ | 79.69 | 0.32 | (21.06 | ) | (20.74 | ) | (0.48 | ) | (4.25 | ) | — | (4.73 | ) | |||||||||||||||||||||
Year Ended December 31, 2021 | $ | 58.15 | 0.19 | 21.37 | 21.56 | (0.02 | ) | — | — | (0.02 | ) | ||||||||||||||||||||||||
Year Ended December 31, 2020 | $ | 65.05 | 0.42 | (4.66 | ) | (4.24 | ) | (0.78 | ) | (1.71 | ) | (0.17 | ) | (2.66 | ) | ||||||||||||||||||||
Year Ended December 31, 2019 | $ | 54.51 | 0.75 | 13.65 | 14.40 | (1.06 | ) | (2.80 | ) | — | (3.86 | ) | |||||||||||||||||||||||
ProFund VP Rising Rates Opportunity | |||||||||||||||||||||||||||||||||||
| Six Months Ended June 30, 2024 (unaudited) | $ | 44.70 | 0.72 | 4.84 | 5.56 | (1.45 | ) | (21.49 | ) | — | (22.94 | ) | |||||||||||||||||||||||
Year Ended December 31, 2023 | $ | 43.99 | 1.44 | (0.67 | ) | 0.77 | (0.06 | ) | — | — | (0.06 | ) | |||||||||||||||||||||||
Year Ended December 31, 2022 | $ | 27.76 | 0.04 | 16.19 | 16.23 | — | — | — | — | ||||||||||||||||||||||||||
Year Ended December 31, 2021 | $ | 27.78 | (0.50 | ) | 0.48 | (0.02 | ) | — | — | — | — | ||||||||||||||||||||||||
Year Ended December 31, 2020 | $ | 38.21 | (0.37 | ) | (9.84 | ) | (10.21 | ) | (0.22 | ) | — | — | (0.22 | ) | |||||||||||||||||||||
Year Ended December 31, 2019 | $ | 48.56 | 0.21 | (8.70 | ) | (8.49 | ) | (0.08 | ) | (1.78 | ) | — | (1.86 | ) | |||||||||||||||||||||
| Ratios to Average Net Assets | Supplemental Data | ||||||||||||||||||||||||||||||
| Net Asset Value, End of Period | Total Return(b)(c) | Gross Expenses(c)(d) | Net Expenses(c)(d) | Net Investment Income (Loss)(c)(d) | Net Assets, End of Period (000's) | Portfolio Turnover Rate(b)(e) | |||||||||||||||||||||||||
ProFund VP Real Estate | |||||||||||||||||||||||||||||||
| Six Months Ended June 30, 2024 (unaudited) | $ | 45.83 | (3.16 | )%(f) | 1.79 | % | 1.68 | % | 1.34 | % | $ | 6,129 | 28 | % | |||||||||||||||||
Year Ended December 31, 2023 | $ | 47.41 | 9.73 | % | 1.80 | % | 1.68 | % | 1.38 | % | $ | 6,487 | 114 | % | |||||||||||||||||
Year Ended December 31, 2022 | $ | 54.22 | (26.56 | )% | 1.74 | % | 1.68 | % | 0.49 | % | $ | 5,596 | 85 | % | |||||||||||||||||
Year Ended December 31, 2021 | $ | 79.69 | 37.07 | % | 1.69 | % | 1.68 | % | 0.27 | % | $ | 13,927 | 147 | % | |||||||||||||||||
Year Ended December 31, 2020 | $ | 58.15 | (6.29 | )%(g) | 1.76 | % | 1.68 | % | 0.72 | % | $ | 9,729 | 150 | % | |||||||||||||||||
Year Ended December 31, 2019 | $ | 65.05 | 26.76 | % | 1.71 | % | 1.68 | % | 1.18 | % | $ | 15,945 | 126 | % | |||||||||||||||||
ProFund VP Rising Rates Opportunity | |||||||||||||||||||||||||||||||
| Six Months Ended June 30, 2024 (unaudited) | $ | 27.32 | 12.27 | % | 1.66 | % | 1.66 | % | 3.61 | % | $ | 8,674 | — | ||||||||||||||||||
Year Ended December 31, 2023 | $ | 44.70 | 1.75 | % | 1.68 | % | 1.67 | % | 3.21 | % | $ | 8,220 | — | ||||||||||||||||||
Year Ended December 31, 2022 | $ | 43.99 | 58.47 | % | 1.66 | % | 1.66 | % | 0.10 | % | $ | 16,990 | — | ||||||||||||||||||
Year Ended December 31, 2021 | $ | 27.76 | (0.07 | )% | 1.64 | % | 1.64 | % | (1.64 | )% | $ | 5,890 | — | ||||||||||||||||||
Year Ended December 31, 2020 | $ | 27.78 | (26.70 | )% | 1.73 | % | 1.68 | % | (1.30 | )% | $ | 4,441 | — | ||||||||||||||||||
Year Ended December 31, 2019 | $ | 38.21 | (17.41 | )% | 1.70 | % | 1.67 | % | 0.50 | % | $ | 5,962 | — | ||||||||||||||||||
(a) Per share net investment income (loss) has been calculated using the average daily shares method.
(b) Not annualized for periods less than one year.
(c) Does not reflect the fees and expenses associated with the separate account that invests in the Fund or any variable annuity or variable insurance contract for which the Fund serves as an investment option.
(d) Annualized for periods less than one year.
(e) Portfolio turnover rate is calculated without regard to instruments having a maturity of less than one year from acquisition or derivative instruments (including swap agreements and futures contracts). The portfolio turnover rate can be high and volatile due to the amount and timing of sales and purchases of fund shares during the period.
(f) During the period ended June 30, 2024, the Fund received monies related to certain nonrecurring litigation settlements. The corresponding impact to the total return was an increase of 0.08%.
(g) During the year ended December 31, 2020, the Fund received monies related to certain nonrecurring litigation settlements. The corresponding impact to the total return was an increase of 0.29%.
See accompanying notes to the financial statements.
232 :: Financial Highlights
ProFunds Financial Highlights FOR THE PERIODS INDICATED
Selected data for a share of beneficial interest outstanding throughout the periods indicated.
Investment Activities | Distributions to Shareholders From | ||||||||||||||||||||||||||||||
| Net Asset Value, Beginning of Period | Net Investment Income (Loss)(a) | Net Realized and Unrealized Gains (Losses) on Investments | Total from Investment Activities | Net Investment Income | Net Realized Gains on Investments | Total Distributions | |||||||||||||||||||||||||
ProFund VP Semiconductor | |||||||||||||||||||||||||||||||
| Six Months Ended June 30, 2024 (unaudited) | $ | 126.40 | (0.77 | ) | 85.38 | 84.61 | — | (12.83 | ) | (12.83 | ) | ||||||||||||||||||||
Year Ended December 31, 2023 | $ | 65.83 | (0.57 | ) | 62.10 | 61.53 | — | (0.96 | ) | (0.96 | ) | ||||||||||||||||||||
Year Ended December 31, 2022 | $ | 111.54 | (0.29 | ) | (40.90 | ) | (41.19 | ) | — | (4.52 | ) | (4.52 | ) | ||||||||||||||||||
Year Ended December 31, 2021 | $ | 82.52 | (0.51 | ) | 36.96 | 36.45 | — | (7.43 | ) | (7.43 | ) | ||||||||||||||||||||
Year Ended December 31, 2020 | $ | 60.61 | (0.06 | ) | 26.68 | 26.62 | (0.23 | ) | (4.48 | ) | (4.71 | ) | |||||||||||||||||||
Year Ended December 31, 2019 | $ | 44.36 | 0.22 | 20.66 | 20.88 | (0.15 | ) | (4.48 | ) | (4.63 | ) | ||||||||||||||||||||
ProFund VP Short Dow 30 | |||||||||||||||||||||||||||||||
| Six Months Ended June 30, 2024 (unaudited) | $ | 21.58 | 0.35 | (0.55 | ) | (0.20 | ) | (0.68 | ) | — | (0.68 | ) | |||||||||||||||||||
Year Ended December 31, 2023 | $ | 23.45 | 0.68 | (2.55 | ) | (1.87 | ) | — | — | — | |||||||||||||||||||||
Year Ended December 31, 2022 | $ | 22.35 | (0.04 | ) | 1.14 | 1.10 | — | — | — | ||||||||||||||||||||||
Year Ended December 31, 2021 | $ | 27.63 | (0.41 | ) | (4.87 | ) | (5.28 | ) | — | — | — | ||||||||||||||||||||
Year Ended December 31, 2020 | $ | 35.04 | (0.56 | ) | (6.78 | ) | (7.34 | ) | (0.07 | ) | — | — | |||||||||||||||||||
Year Ended December 31, 2019(h) | $ | 43.37 | 0.13 | (8.44 | ) | (8.31 | ) | (0.02 | ) | — | — | ||||||||||||||||||||
| Ratios to Average Net Assets | Supplemental Data | ||||||||||||||||||||||||||||||
| Net Asset Value, End of Period | Total Return(b)(c) | Gross Expenses(c)(d) | Net Expenses(c)(d) | Net Investment Income (Loss)(c)(d) | Net Assets, End of Period (000's) | Portfolio Turnover Rate(b)(e) | |||||||||||||||||||||||||
ProFund VP Semiconductor | |||||||||||||||||||||||||||||||
| Six Months Ended June 30, 2024 (unaudited) | $ | 198.18 | 66.82 | % | 1.69 | % | 1.68 | % | (0.92 | )% | $ | 93,221 | 118 | % | |||||||||||||||||
Year Ended December 31, 2023 | $ | 126.40 | 93.66 | % | 1.70 | % | 1.68 | % | (0.55 | )% | $ | 58,222 | 176 | % | |||||||||||||||||
Year Ended December 31, 2022 | $ | 65.83 | (37.50 | )% | 1.70 | % | 1.69 | %(f) | (0.36 | )% | $ | 7,904 | 276 | % | |||||||||||||||||
Year Ended December 31, 2021 | $ | 111.54 | 48.49 | % | 1.64 | % | 1.64 | % | (0.55 | )% | $ | 21,310 | 230 | % | |||||||||||||||||
Year Ended December 31, 2020 | $ | 82.52 | 44.85 | % | 1.72 | % | 1.70 | %(f) | (0.09 | )% | $ | 13,106 | 348 | % | |||||||||||||||||
Year Ended December 31, 2019 | $ | 60.61 | 49.77 | % | 1.67 | % | 1.66 | % | 0.41 | % | $ | 9,517 | 561 | % | |||||||||||||||||
ProFund VP Short Dow 30 | |||||||||||||||||||||||||||||||
| Six Months Ended June 30, 2024 (unaudited) | $ | 20.70 | (0.86 | )% | 1.67 | % | 1.67 | % | 3.32 | % | $ | 6 | — | ||||||||||||||||||
Year Ended December 31, 2023 | $ | 21.58 | (8.01 | )% | 1.69 | % | 1.68 | % | 2.91 | % | $ | 6 | — | ||||||||||||||||||
Year Ended December 31, 2022 | $ | 23.45 | 4.92 | % | 1.74 | % | 1.68 | % | (0.17 | )% | $ | 7 | — | ||||||||||||||||||
Year Ended December 31, 2021 | $ | 22.35 | (19.12 | )%(g) | 1.68 | % | 1.68 | % | (1.68 | )% | $ | 7 | — | ||||||||||||||||||
Year Ended December 31, 2020 | $ | 27.63 | (20.89 | )% | 1.75 | % | 1.68 | % | (1.63 | )% | $ | 16 | — | ||||||||||||||||||
Year Ended December 31, 2019(h) | $ | 35.04 | (19.25 | )% | 1.76 | % | 1.68 | % | 0.34 | % | $ | 12 | — | ||||||||||||||||||
(a) Per share net investment income (loss) has been calculated using the average daily shares method.
(b) Not annualized for periods less than one year.
(c) Does not reflect the fees and expenses associated with the separate account that invests in the Fund or any variable annuity or variable insurance contract for which the Fund serves as an investment option.
(d) Annualized for periods less than one year.
(e) Portfolio turnover rate is calculated without regard to instruments having a maturity of less than one year from acquisition or derivative instruments (including swap agreements and futures contracts). The portfolio turnover rate can be high and volatile due to the amount and timing of sales and purchases of fund shares during the period.
(f) The expense ratio does not correlate to the applicable expense limits in place during the period given that the annual contractual expense limitation is applied for the one year periods ended April 30th of each year, instead of coinciding with the December 31st year end. Details of the current expense limitation in effect can be found in Note 4 of the accompanying Notes to Financial Statements.
(g) During the year ended December 31, 2021, the Fund received monies related to certain nonrecurring litigation settlements. The corresponding impact to the total return was an increase of 0.60%.
(h) As described in Note 8, share amounts have been adjusted for 1:4 reverse share split that occurred on November 18, 2019.
See accompanying notes to the financial statements.
Financial Highlights :: 233
ProFunds Financial Highlights FOR THE PERIODS INDICATED
Selected data for a share of beneficial interest outstanding throughout the periods indicated.
Investment Activities | Distributions to Shareholders From | ||||||||||||||||||||||||||||||
| Net Asset Value, Beginning of Period | Net Investment Income (Loss)(a) | Net Realized and Unrealized Gains (Losses) on Investments | Total from Investment Activities | Net Investment Income | Net Realized Gains on Investments | Total Distributions | |||||||||||||||||||||||||
ProFund VP Short Emerging Markets | |||||||||||||||||||||||||||||||
| Six Months Ended June 30, 2024 (unaudited) | $ | 23.49 | 0.42 | (1.26 | ) | (0.84 | ) | (1.29 | ) | — | (1.29 | ) | |||||||||||||||||||
Year Ended December 31, 2023 | $ | 26.73 | 0.83 | (3.97 | ) | (3.14 | ) | (0.05 | ) | (0.05 | ) | (0.10 | ) | ||||||||||||||||||
Year Ended December 31, 2022 | $ | 25.52 | 0.04 | 1.64 | 1.68 | — | (0.47 | ) | (0.47 | ) | |||||||||||||||||||||
Year Ended December 31, 2021 | $ | 23.20 | (0.39 | ) | 2.71 | 2.32 | — | — | — | ||||||||||||||||||||||
Year Ended December 31, 2020 | $ | 34.35 | (0.51 | ) | (10.35 | ) | (10.86 | ) | (0.29 | ) | — | (0.29 | ) | ||||||||||||||||||
Year Ended December 31, 2019 | $ | 47.77 | 0.20 | (9.52 | ) | (9.32 | ) | (0.23 | ) | (3.87 | ) | (4.10 | ) | ||||||||||||||||||
ProFund VP Short International | |||||||||||||||||||||||||||||||
| Six Months Ended June 30, 2024 (unaudited) | $ | 24.88 | 0.43 | (0.88 | ) | (0.45 | ) | (0.92 | ) | — | (0.92 | ) | |||||||||||||||||||
Year Ended December 31, 2023 | $ | 28.27 | 0.86 | (3.77 | ) | (2.91 | ) | (0.48 | ) | — | (0.48 | ) | |||||||||||||||||||
Year Ended December 31, 2022 | $ | 25.14 | 0.21 | 2.92 | 3.13 | — | — | — | |||||||||||||||||||||||
Year Ended December 31, 2021 | $ | 29.03 | (0.43 | ) | (3.46 | ) | (3.89 | ) | — | — | — | ||||||||||||||||||||
Year Ended December 31, 2020 | $ | 35.17 | (0.53 | ) | (5.40 | ) | (5.93 | ) | (0.21 | ) | — | (0.21 | ) | ||||||||||||||||||
Year Ended December 31, 2019(g) | $ | 43.87 | 0.19 | (7.70 | ) | (7.51 | ) | (0.20 | ) | (0.99 | ) | (1.19 | ) | ||||||||||||||||||
| Ratios to Average Net Assets | Supplemental Data | ||||||||||||||||||||||||||||||
| Net Asset Value, End of Period | Total Return(b)(c) | Gross Expenses(c)(d) | Net Expenses(c)(d) | Net Investment Income (Loss)(c)(d) | Net Assets, End of Period (000's) | Portfolio Turnover Rate(b)(e) | |||||||||||||||||||||||||
ProFund VP Short Emerging Markets | |||||||||||||||||||||||||||||||
| Six Months Ended June 30, 2024 (unaudited) | $ | 21.36 | (3.47 | )% | 1.73 | % | 1.68 | % | 3.60 | % | $ | 528 | — | ||||||||||||||||||
Year Ended December 31, 2023 | $ | 23.49 | (11.78 | )% | 1.75 | % | 1.68 | % | 3.32 | % | $ | 513 | — | ||||||||||||||||||
Year Ended December 31, 2022 | $ | 26.73 | 6.69 | % | 1.70 | % | 1.67 | % | 0.14 | % | $ | 862 | — | ||||||||||||||||||
Year Ended December 31, 2021 | $ | 25.52 | 9.96 | % | 1.68 | % | 1.68 | % | (1.68 | )% | $ | 711 | — | ||||||||||||||||||
Year Ended December 31, 2020 | $ | 23.20 | (31.76 | )% | 1.72 | % | 1.69 | %(f) | (1.43 | )% | $ | 366 | — | ||||||||||||||||||
Year Ended December 31, 2019 | $ | 34.35 | (20.99 | )% | 1.67 | % | 1.67 | % | 0.48 | % | $ | 845 | — | ||||||||||||||||||
ProFund VP Short International | |||||||||||||||||||||||||||||||
| Six Months Ended June 30, 2024 (unaudited) | $ | 23.51 | (1.81 | )% | 1.68 | % | 1.68 | % | 3.57 | % | $ | 798 | — | ||||||||||||||||||
Year Ended December 31, 2023 | $ | 24.88 | (10.29 | )% | 1.72 | % | 1.68 | % | 3.27 | % | $ | 517 | — | ||||||||||||||||||
Year Ended December 31, 2022 | $ | 28.27 | 12.45 | % | 1.68 | % | 1.67 | % | 0.71 | % | $ | 3,016 | — | ||||||||||||||||||
Year Ended December 31, 2021 | $ | 25.14 | (13.40 | )% | 1.63 | % | 1.63 | % | (1.63 | )% | $ | 537 | — | ||||||||||||||||||
Year Ended December 31, 2020 | $ | 29.03 | (16.94 | )% | 1.70 | % | 1.68 | % | (1.43 | )% | $ | 685 | — | ||||||||||||||||||
Year Ended December 31, 2019(g) | $ | 35.17 | (17.42 | )% | 1.69 | % | 1.68 | % | 0.48 | % | $ | 596 | — | ||||||||||||||||||
(a) Per share net investment income (loss) has been calculated using the average daily shares method.
(b) Not annualized for periods less than one year.
(c) Does not reflect the fees and expenses associated with the separate account that invests in the Fund or any variable annuity or variable insurance contract for which the Fund serves as an investment option.
(d) Annualized for periods less than one year.
(e) Portfolio turnover rate is calculated without regard to instruments having a maturity of less than one year from acquisition or derivative instruments (including swap agreements and futures contracts). The portfolio turnover rate can be high and volatile due to the amount and timing of sales and purchases of fund shares during the period.
(f) The expense ratio does not correlate to the applicable expense limits in place during the period given that the annual contractual expense limitation is applied for the one year periods ended April 30th of each year, instead of coinciding with the December 31st year end. Details of the current expense limitation in effect can be found in Note 4 of the accompanying Notes to Financial Statements.
(g) As described in Note 8, share amounts have been adjusted for 1:4 reverse share split that occurred on November 18, 2019.
See accompanying notes to the financial statements.
234 :: Financial Highlights
ProFunds Financial Highlights FOR THE PERIODS INDICATED
Selected data for a share of beneficial interest outstanding throughout the periods indicated.
Investment Activities | Distributions to Shareholders From | ||||||||||||||||||||||||||||||
| Net Asset Value, Beginning of Period | Net Investment Income (Loss)(a) | Net Realized and Unrealized Gains (Losses) on Investments | Total from Investment Activities | Net Investment Income | Net Realized Gains on Investments | Total Distributions | |||||||||||||||||||||||||
ProFund VP Short Mid-Cap | |||||||||||||||||||||||||||||||
| Six Months Ended June 30, 2024 (unaudited) | $ | 7.45 | 0.13 | (0.32 | ) | (0.19 | ) | (0.73 | ) | — | (0.73 | ) | |||||||||||||||||||
Year Ended December 31, 2023 | $ | 8.29 | 0.26 | (1.03 | ) | (0.77 | ) | (0.07 | ) | — | (0.07 | ) | |||||||||||||||||||
Year Ended December 31, 2022 | $ | 7.60 | 0.03 | 0.66 | 0.69 | — | — | — | |||||||||||||||||||||||
Year Ended December 31, 2021 | $ | 20.13 | (0.18 | ) | (4.08 | ) | (4.26 | ) | — | (8.27 | ) | (8.27 | ) | ||||||||||||||||||
Year Ended December 31, 2020 | $ | 27.75 | (0.44 | ) | (6.91 | ) | (7.35 | ) | (0.27 | ) | — | (0.27 | ) | ||||||||||||||||||
Year Ended December 31, 2019 | $ | 35.30 | 0.18 | (7.64 | ) | (7.46 | ) | (0.09 | ) | — | (0.09 | ) | |||||||||||||||||||
ProFund VP Short Nasdaq-100 | |||||||||||||||||||||||||||||||
| Six Months Ended June 30, 2024 (unaudited) | $ | 12.30 | 0.21 | (1.68 | ) | (1.47 | ) | (0.79 | ) | — | (0.79 | ) | |||||||||||||||||||
Year Ended December 31, 2023 | $ | 18.22 | 0.47 | (6.36 | ) | (5.89 | ) | — | (0.03 | ) | (0.03 | ) | |||||||||||||||||||
Year Ended December 31, 2022 | $ | 13.49 | (0.01 | ) | 4.74 | 4.73 | — | — | — | ||||||||||||||||||||||
Year Ended December 31, 2021 | $ | 18.22 | (0.27 | ) | (4.26 | ) | (4.53 | ) | — | (0.20 | ) | (0.20 | ) | ||||||||||||||||||
Year Ended December 31, 2020 | $ | 31.90 | (0.32 | ) | (13.32 | ) | (13.64 | ) | (0.04 | ) | — | (0.04 | ) | ||||||||||||||||||
Year Ended December 31, 2019(h) | $ | 44.38 | 0.12 | (12.55 | ) | (12.43 | ) | (0.05 | ) | — | (0.05 | ) | |||||||||||||||||||
| Ratios to Average Net Assets | Supplemental Data | ||||||||||||||||||||||||||||||
| Net Asset Value, End of Period | Total Return(b)(c) | Gross Expenses(c)(d) | Net Expenses(c)(d) | Net Investment Income (Loss)(c)(d) | Net Assets, End of Period (000's) | Portfolio Turnover Rate(b)(e) | |||||||||||||||||||||||||
ProFund VP Short Mid-Cap | |||||||||||||||||||||||||||||||
| Six Months Ended June 30, 2024 (unaudited) | $ | 6.53 | (2.52 | )% | 1.79 | % | 1.68 | % | 3.50 | % | $ | 75 | — | ||||||||||||||||||
Year Ended December 31, 2023 | $ | 7.45 | (9.35 | )% | 1.80 | % | 1.68 | % | 3.27 | % | $ | 69 | — | ||||||||||||||||||
Year Ended December 31, 2022 | $ | 8.29 | 9.08 | % | 1.71 | % | 1.68 | % | 0.41 | % | $ | 96 | — | ||||||||||||||||||
Year Ended December 31, 2021 | $ | 7.60 | (23.87 | )%(f) | 1.69 | % | 1.68 | % | (1.68 | )% | $ | 45 | — | ||||||||||||||||||
Year Ended December 31, 2020 | $ | 20.13 | (26.65 | )% | 1.76 | % | 1.69 | %(g) | (1.49 | )% | $ | 68 | — | ||||||||||||||||||
Year Ended December 31, 2019 | $ | 27.75 | (21.17 | )% | 1.66 | % | 1.66 | % | 0.59 | % | $ | 142 | — | ||||||||||||||||||
ProFund VP Short Nasdaq-100 | |||||||||||||||||||||||||||||||
| Six Months Ended June 30, 2024 (unaudited) | $ | 10.04 | (11.91 | )% | 1.74 | % | 1.68 | % | 3.55 | % | $ | 2,551 | — | ||||||||||||||||||
Year Ended December 31, 2023 | $ | 12.30 | (32.40 | )% | 1.78 | % | 1.68 | % | 3.24 | % | $ | 4,369 | — | ||||||||||||||||||
Year Ended December 31, 2022 | $ | 18.22 | 35.06 | % | 1.73 | % | 1.68 | % | (0.04 | )% | $ | 7,484 | — | ||||||||||||||||||
Year Ended December 31, 2021 | $ | 13.49 | (25.13 | )% | 1.68 | % | 1.68 | % | (1.68 | )% | $ | 1,823 | — | ||||||||||||||||||
Year Ended December 31, 2020 | $ | 18.22 | (42.77 | )% | 1.75 | % | 1.68 | % | (1.33 | )% | $ | 5,120 | — | ||||||||||||||||||
Year Ended December 31, 2019(h) | $ | 31.90 | (28.05 | )% | 1.73 | % | 1.69 | %(g) | 0.32 | % | $ | 7,353 | — | ||||||||||||||||||
(a) Per share net investment income (loss) has been calculated using the average daily shares method.
(b) Not annualized for periods less than one year.
(c) Does not reflect the fees and expenses associated with the separate account that invests in the Fund or any variable annuity or variable insurance contract for which the Fund serves as an investment option.
(d) Annualized for periods less than one year.
(e) Portfolio turnover rate is calculated without regard to instruments having a maturity of less than one year from acquisition or derivative instruments (including swap agreements and futures contracts). The portfolio turnover rate can be high and volatile due to the amount and timing of sales and purchases of fund shares during the period.
(f) During the year ended December 31, 2021, the Fund received monies related to certain nonrecurring litigation settlements. The corresponding impact to the total return was an increase of 0.16%.
(g) The expense ratio does not correlate to the applicable expense limits in place during the period given that the annual contractual expense limitation is applied for the one year periods ended April 30th of each year, instead of coinciding with the December 31st year end. Details of the current expense limitation in effect can be found in Note 4 of the accompanying Notes to Financial Statements.
(h) As described in Note 8, share amounts have been adjusted for 1:4 reverse share split that occurred on November 18, 2019.
See accompanying notes to the financial statements.
Financial Highlights :: 235
ProFunds Financial Highlights FOR THE PERIODS INDICATED
Selected data for a share of beneficial interest outstanding throughout the periods indicated.
Investment Activities | Distributions to Shareholders From | ||||||||||||||||||||||||||||||
| Net Asset Value, Beginning of Period | Net Investment Income (Loss)(a) | Net Realized and Unrealized Gains (Losses) on Investments | Total from Investment Activities | Net Investment Income | Net Realized Gains on Investments | Total Distributions | |||||||||||||||||||||||||
ProFund VP Short Small-Cap | |||||||||||||||||||||||||||||||
| Six Months Ended June 30, 2024 (unaudited) | $ | 22.10 | 0.39 | (0.19 | ) | 0.20 | (1.15 | ) | — | (1.15 | ) | ||||||||||||||||||||
Year Ended December 31, 2023 | $ | 26.34 | 0.83 | (3.67 | ) | (2.84 | ) | (0.07 | ) | (1.33 | ) | (1.40 | ) | ||||||||||||||||||
Year Ended December 31, 2022 | $ | 22.35 | 0.08 | 3.91 | 3.99 | — | — | — | |||||||||||||||||||||||
Year Ended December 31, 2021 | $ | 27.61 | (0.39 | ) | (4.87 | ) | (5.26 | ) | — | — | — | ||||||||||||||||||||
Year Ended December 31, 2020(f) | $ | 40.78 | (0.56 | ) | (12.42 | ) | (12.98 | ) | (0.19 | ) | — | (0.19 | ) | ||||||||||||||||||
Year Ended December 31, 2019(f) | $ | 57.35 | 0.20 | (11.57 | ) | (11.37 | ) | (0.04 | ) | (5.16 | ) | (5.20 | ) | ||||||||||||||||||
ProFund VP Small-Cap | |||||||||||||||||||||||||||||||
| Six Months Ended June 30, 2024 (unaudited) | $ | 34.30 | 0.12 | 0.15 | (g) | 0.27 | (0.48 | ) | — | (0.48 | ) | ||||||||||||||||||||
Year Ended December 31, 2023 | $ | 29.85 | 0.26 | 4.19 | 4.45 | — | — | — | |||||||||||||||||||||||
Year Ended December 31, 2022 | $ | 43.20 | (0.07 | ) | (9.16 | ) | (9.23 | ) | — | (4.12 | ) | (4.12 | ) | ||||||||||||||||||
Year Ended December 31, 2021 | $ | 39.82 | (0.50 | ) | 5.55 | 5.05 | — | (1.67 | ) | (1.67 | ) | ||||||||||||||||||||
Year Ended December 31, 2020 | $ | 35.40 | (0.28 | ) | 6.01 | 5.73 | (0.02 | ) | (1.29 | ) | (1.31 | ) | |||||||||||||||||||
Year Ended December 31, 2019 | $ | 28.64 | 0.01 | 6.75 | 6.76 | — | — | — | |||||||||||||||||||||||
| Ratios to Average Net Assets | Supplemental Data | ||||||||||||||||||||||||||||||
| Net Asset Value, End of Period | Total Return(b)(c) | Gross Expenses(c)(d) | Net Expenses(c)(d) | Net Investment Income (Loss)(c)(d) | Net Assets, End of Period (000's) | Portfolio Turnover Rate(b)(e) | |||||||||||||||||||||||||
ProFund VP Short Small-Cap | |||||||||||||||||||||||||||||||
| Six Months Ended June 30, 2024 (unaudited) | $ | 21.15 | 0.89 | % | 1.82 | % | 1.68 | % | 3.50 | % | $ | 3,640 | — | ||||||||||||||||||
Year Ended December 31, 2023 | $ | 22.10 | (10.88 | )% | 1.81 | % | 1.68 | % | 3.32 | % | $ | 2,194 | — | ||||||||||||||||||
Year Ended December 31, 2022 | $ | 26.34 | 17.81 | % | 1.79 | % | 1.68 | % | 0.32 | % | $ | 3,045 | — | ||||||||||||||||||
Year Ended December 31, 2021 | $ | 22.35 | (19.05 | )% | 1.69 | % | 1.68 | % | (1.68 | )% | $ | 996 | — | ||||||||||||||||||
Year Ended December 31, 2020(f) | $ | 27.61 | (31.96 | )% | 1.83 | % | 1.68 | % | (1.36 | )% | $ | 1,084 | — | ||||||||||||||||||
Year Ended December 31, 2019(f) | $ | 40.78 | (20.78 | )% | 1.77 | % | 1.68 | % | 0.42 | % | $ | 1,855 | — | ||||||||||||||||||
ProFund VP Small-Cap | |||||||||||||||||||||||||||||||
| Six Months Ended June 30, 2024 (unaudited) | $ | 34.09 | 0.79 | % | 1.81 | % | 1.68 | % | 0.71 | % | $ | 7,227 | 10 | % | |||||||||||||||||
Year Ended December 31, 2023 | $ | 34.30 | 14.91 | % | 1.87 | % | 1.68 | % | 0.84 | % | $ | 15,158 | 15 | % | |||||||||||||||||
Year Ended December 31, 2022 | $ | 29.85 | (21.85 | )% | 1.80 | % | 1.68 | % | (0.19 | )% | $ | 10,221 | 12 | % | |||||||||||||||||
Year Ended December 31, 2021 | $ | 43.20 | 12.88 | % | 1.70 | % | 1.68 | % | (1.13 | )% | $ | 14,587 | 24 | % | |||||||||||||||||
Year Ended December 31, 2020 | $ | 39.82 | 17.06 | % | 1.82 | % | 1.68 | % | (0.85 | )% | $ | 18,385 | 26 | % | |||||||||||||||||
Year Ended December 31, 2019 | $ | 35.40 | 23.60 | % | 1.74 | % | 1.68 | % | 0.03 | % | $ | 16,075 | 22 | % | |||||||||||||||||
(a) Per share net investment income (loss) has been calculated using the average daily shares method.
(b) Not annualized for periods less than one year.
(c) Does not reflect the fees and expenses associated with the separate account that invests in the Fund or any variable annuity or variable insurance contract for which the Fund serves as an investment option.
(d) Annualized for periods less than one year.
(e) Portfolio turnover rate is calculated without regard to instruments having a maturity of less than one year from acquisition or derivative instruments (including swap agreements and futures contracts). The portfolio turnover rate can be high and volatile due to the amount and timing of sales and purchases of fund shares during the period.
(f) As described in Note 8, share amounts have been adjusted for 1:4 reverse share split that occurred on December 14, 2020.
(g) The amount shown for a share outstanding throughout the period does not accord with the change in aggregate gains and losses in the portfolio of securities during the period because of the timing of sales and purchases of fund shares in relation to fluctuating market values during the period.
See accompanying notes to the financial statements.
236 :: Financial Highlights
ProFunds Financial Highlights FOR THE PERIODS INDICATED
Selected data for a share of beneficial interest outstanding throughout the periods indicated.
Investment Activities | Distributions to Shareholders From | ||||||||||||||||||||||||||||||
| Net Asset Value, Beginning of Period | Net Investment Income (Loss)(a) | Net Realized and Unrealized Gains (Losses) on Investments | Total from Investment Activities | Net Investment Income | Net Realized Gains on Investments | Total Distributions | |||||||||||||||||||||||||
ProFund VP Small-Cap Growth | |||||||||||||||||||||||||||||||
| Six Months Ended June 30, 2024 (unaudited) | $ | 30.01 | (0.07 | ) | 0.80 | 0.73 | — | (1.46 | ) | (1.46 | ) | ||||||||||||||||||||
Year Ended December 31, 2023 | $ | 26.82 | (0.07 | ) | 4.10 | 4.03 | — | (0.84 | ) | (0.84 | ) | ||||||||||||||||||||
Year Ended December 31, 2022 | $ | 40.99 | (0.16 | ) | (8.79 | ) | (8.95 | ) | — | (5.22 | ) | (5.22 | ) | ||||||||||||||||||
Year Ended December 31, 2021 | $ | 36.56 | (0.33 | ) | 7.53 | 7.20 | — | (2.77 | ) | (2.77 | ) | ||||||||||||||||||||
Year Ended December 31, 2020 | $ | 35.85 | (0.22 | ) | 5.52 | 5.30 | — | (4.59 | ) | (4.59 | ) | ||||||||||||||||||||
Year Ended December 31, 2019 | $ | 34.55 | (0.19 | ) | 6.37 | 6.18 | — | (4.88 | ) | (4.88 | ) | ||||||||||||||||||||
ProFund VP Small-Cap Value | |||||||||||||||||||||||||||||||
| Six Months Ended June 30, 2024 (unaudited) | $ | 42.96 | 0.11 | (2.45 | ) | (2.34 | ) | (0.16 | ) | (0.26 | ) | (0.42 | ) | ||||||||||||||||||
Year Ended December 31, 2023 | $ | 39.83 | 0.11 | 4.96 | 5.07 | (0.01 | ) | (1.93 | ) | (1.94 | ) | ||||||||||||||||||||
Year Ended December 31, 2022 | $ | 54.49 | 0.02 | (6.33 | ) | (6.31 | ) | — | (8.35 | ) | (8.35 | ) | |||||||||||||||||||
Year Ended December 31, 2021 | $ | 42.42 | (0.01 | ) | 12.12 | 12.11 | (0.04 | ) | — | (0.04 | ) | ||||||||||||||||||||
Year Ended December 31, 2020 | $ | 48.67 | 0.09 | (0.82 | ) | (0.73 | ) | (0.01 | ) | (5.51 | ) | (5.52 | ) | ||||||||||||||||||
Year Ended December 31, 2019 | $ | 39.71 | 0.03 | 8.93 | 8.96 | — | — | — | |||||||||||||||||||||||
| Ratios to Average Net Assets | Supplemental Data | ||||||||||||||||||||||||||||||
| Net Asset Value, End of Period | Total Return(b)(c) | Gross Expenses(c)(d) | Net Expenses(c)(d) | Net Investment Income (Loss)(c)(d) | Net Assets, End of Period (000's) | Portfolio Turnover Rate(b)(e) | |||||||||||||||||||||||||
ProFund VP Small-Cap Growth | |||||||||||||||||||||||||||||||
| Six Months Ended June 30, 2024 (unaudited) | $ | 29.28 | 2.48 | % | 1.74 | % | 1.68 | % | (0.43 | )% | $ | 15,633 | 25 | % | |||||||||||||||||
Year Ended December 31, 2023 | $ | 30.01 | 15.19 | %(f) | 1.77 | % | 1.68 | % | (0.25 | )% | $ | 16,198 | 95 | % | |||||||||||||||||
Year Ended December 31, 2022 | $ | 26.82 | (22.41 | )% | 1.71 | % | 1.68 | % | (0.52 | )% | $ | 13,844 | 73 | % | |||||||||||||||||
Year Ended December 31, 2021 | $ | 40.99 | 20.64 | % | 1.68 | % | 1.68 | % | (0.82 | )% | $ | 25,215 | 112 | % | |||||||||||||||||
Year Ended December 31, 2020 | $ | 36.56 | 17.39 | % | 1.74 | % | 1.68 | % | (0.69 | )% | $ | 22,530 | 148 | % | |||||||||||||||||
Year Ended December 31, 2019 | $ | 35.85 | 19.12 | % | 1.73 | % | 1.68 | % | (0.51 | )% | $ | 18,070 | 108 | % | |||||||||||||||||
ProFund VP Small-Cap Value | |||||||||||||||||||||||||||||||
| Six Months Ended June 30, 2024 (unaudited) | $ | 40.20 | (5.44 | )% | 1.75 | % | 1.68 | % | 0.51 | % | $ | 14,623 | 20 | % | |||||||||||||||||
Year Ended December 31, 2023 | $ | 42.96 | 12.94 | % | 1.78 | % | 1.68 | % | 0.28 | % | $ | 19,447 | 98 | % | |||||||||||||||||
Year Ended December 31, 2022 | $ | 39.83 | (12.41 | )% | 1.71 | % | 1.68 | % | 0.04 | % | $ | 18,404 | 102 | % | |||||||||||||||||
Year Ended December 31, 2021 | $ | 54.49 | 28.56 | % | 1.69 | % | 1.68 | % | (0.01 | )% | $ | 27,120 | 147 | % | |||||||||||||||||
Year Ended December 31, 2020 | $ | 42.42 | 1.06 | % | 1.78 | % | 1.68 | % | 0.23 | % | $ | 21,789 | 192 | % | |||||||||||||||||
Year Ended December 31, 2019 | $ | 48.67 | 22.56 | % | 1.75 | % | 1.68 | % | 0.07 | % | $ | 21,288 | 147 | % | |||||||||||||||||
(a) Per share net investment income (loss) has been calculated using the average daily shares method.
(b) Not annualized for periods less than one year.
(c) Does not reflect the fees and expenses associated with the separate account that invests in the Fund or any variable annuity or variable insurance contract for which the Fund serves as an investment option.
(d) Annualized for periods less than one year.
(e) Portfolio turnover rate is calculated without regard to instruments having a maturity of less than one year from acquisition or derivative instruments (including swap agreements and futures contracts). The portfolio turnover rate can be high and volatile due to the amount and timing of sales and purchases of fund shares during the period.
(f) During the year ended December 31, 2023, the Fund received monies related to certain nonrecurring litigation settlements. The corresponding impact to the total return was 0.11%.
See accompanying notes to the financial statements.
Financial Highlights :: 237
ProFunds Financial Highlights FOR THE PERIODS INDICATED
Selected data for a share of beneficial interest outstanding throughout the periods indicated.
Investment Activities | Distributions to Shareholders From | ||||||||||||||||||||||||||||||
| Net Asset Value, Beginning of Period | Net Investment Income (Loss)(a) | Net Realized and Unrealized Gains (Losses) on Investments | Total from Investment Activities | Net Investment Income | Net Realized Gains on Investments | Total Distributions | |||||||||||||||||||||||||
ProFund VP Technology | |||||||||||||||||||||||||||||||
| Six Months Ended June 30, 2024 (unaudited) | $ | 69.18 | (0.29 | ) | 12.10 | 11.81 | — | (5.62 | ) | (5.62 | ) | ||||||||||||||||||||
Year Ended December 31, 2023 | $ | 48.61 | (0.40 | ) | 28.03 | 27.63 | — | (7.06 | ) | (7.06 | ) | ||||||||||||||||||||
Year Ended December 31, 2022 | $ | 92.90 | (0.57 | ) | (30.90 | ) | (31.47 | ) | — | (12.82 | ) | (12.82 | ) | ||||||||||||||||||
Year Ended December 31, 2021 | $ | 75.35 | (0.76 | ) | 24.96 | 24.20 | — | (6.65 | ) | (6.65 | ) | ||||||||||||||||||||
Year Ended December 31, 2020 | $ | 56.87 | (0.43 | ) | 25.75 | 25.32 | — | (6.84 | ) | (6.84 | ) | ||||||||||||||||||||
Year Ended December 31, 2019 | $ | 40.10 | (0.20 | ) | 18.09 | 17.89 | — | (1.12 | ) | (1.12 | ) | ||||||||||||||||||||
ProFund VP UltraBull | |||||||||||||||||||||||||||||||
| Six Months Ended June 30, 2024 (unaudited) | $ | 30.02 | 0.13 | 7.97 | 8.10 | (0.25 | ) | — | (0.25 | ) | |||||||||||||||||||||
Year Ended December 31, 2023 | $ | 20.67 | 0.20 | 9.15 | 9.35 | — | — | — | |||||||||||||||||||||||
Year Ended December 31, 2022 | $ | 46.43 | (0.06 | ) | (17.03 | ) | (17.09 | ) | — | (8.67 | ) | (8.67 | ) | ||||||||||||||||||
Year Ended December 31, 2021 | $ | 29.36 | (0.28 | ) | 17.35 | 17.07 | — | — | — | ||||||||||||||||||||||
Year Ended December 31, 2020(g) | $ | 64.84 | (0.07 | ) | 8.84 | 8.77 | (0.49 | ) | (43.76 | ) | (44.25 | ) | |||||||||||||||||||
Year Ended December 31, 2019(g) | $ | 40.60 | 0.20 | 24.20 | 24.40 | (0.16 | ) | — | (0.16 | ) | |||||||||||||||||||||
| Ratios to Average Net Assets | Supplemental Data | ||||||||||||||||||||||||||||||
| Net Asset Value, End of Period | Total Return(b)(c) | Gross Expenses(c)(d) | Net Expenses(c)(d) | Net Investment Income (Loss)(c)(d) | Net Assets, End of Period (000's) | Portfolio Turnover Rate(b)(e) | |||||||||||||||||||||||||
ProFund VP Technology | |||||||||||||||||||||||||||||||
| Six Months Ended June 30, 2024 (unaudited) | $ | 75.37 | 17.06 | % | 1.66 | % | 1.65 | % | (0.79 | )% | $ | 62,723 | 25 | % | |||||||||||||||||
Year Ended December 31, 2023 | $ | 69.18 | 57.95 | % | 1.67 | % | 1.66 | % | (0.65 | )% | $ | 57,109 | 33 | % | |||||||||||||||||
Year Ended December 31, 2022 | $ | 48.61 | (35.72 | )% | 1.63 | % | 1.63 | % | (0.90 | )% | $ | 27,032 | 179 | % | |||||||||||||||||
Year Ended December 31, 2021 | $ | 92.90 | 34.96 | % | 1.58 | % | 1.58 | % | (0.92 | )% | $ | 54,587 | 163 | % | |||||||||||||||||
Year Ended December 31, 2020 | $ | 75.35 | 44.80 | % | 1.65 | % | 1.65 | % | (0.66 | )% | $ | 45,261 | 187 | % | |||||||||||||||||
Year Ended December 31, 2019 | $ | 56.87 | 45.11 | % | 1.62 | % | 1.62 | % | (0.41 | )% | $ | 33,951 | 75 | % | |||||||||||||||||
ProFund VP UltraBull | |||||||||||||||||||||||||||||||
| Six Months Ended June 30, 2024 (unaudited) | $ | 37.87 | 26.99 | % | 1.72 | % | 1.68 | % | 0.79 | % | $ | 17,784 | 32 | % | |||||||||||||||||
Year Ended December 31, 2023 | $ | 30.02 | 45.23 | % | 1.74 | % | 1.70 | %(f) | 0.80 | % | $ | 18,660 | 44 | % | |||||||||||||||||
Year Ended December 31, 2022 | $ | 20.67 | (39.12 | )% | 1.72 | % | 1.72 | %(f) | (0.21 | )% | $ | 10,253 | 31 | % | |||||||||||||||||
Year Ended December 31, 2021 | $ | 46.43 | 58.14 | % | 1.67 | % | 1.67 | % | (0.76 | )% | $ | 19,780 | 443 | % | |||||||||||||||||
Year Ended December 31, 2020(g) | $ | 29.36 | 19.83 | % | 1.69 | % | 1.69 | %(f) | (0.16 | )% | $ | 17,072 | 1,415 | % | |||||||||||||||||
Year Ended December 31, 2019(g) | $ | 64.84 | 60.17 | % | 1.62 | % | 1.62 | % | 0.41 | % | $ | 30,287 | 2,393 | % | |||||||||||||||||
(a) Per share net investment income (loss) has been calculated using the average daily shares method.
(b) Not annualized for periods less than one year.
(c) Does not reflect the fees and expenses associated with the separate account that invests in the Fund or any variable annuity or variable insurance contract for which the Fund serves as an investment option.
(d) Annualized for periods less than one year.
(e) Portfolio turnover rate is calculated without regard to instruments having a maturity of less than one year from acquisition or derivative instruments (including swap agreements and futures contracts). The portfolio turnover rate can be high and volatile due to the amount and timing of sales and purchases of fund shares during the period.
(f) The expense ratio does not correlate to the applicable expense limits in place during the period given that the annual contractual expense limitation is applied for the one year periods ended April 30th of each year, instead of coinciding with the December 31st year end. Details of the current expense limitation in effect can be found in Note 4 of the accompanying Notes to Financial Statements.
(g) As described in Note 8, share amounts have been adjusted for 1:4 reverse share split that occurred on December 14, 2020.
See accompanying notes to the financial statements.
238 :: Financial Highlights
ProFunds Financial Highlights FOR THE PERIODS INDICATED
Selected data for a share of beneficial interest outstanding throughout the periods indicated.
Investment Activities | Distributions to Shareholders From | ||||||||||||||||||||||||||||||
| Net Asset Value, Beginning of Period | Net Investment Income (Loss)(a) | Net Realized and Unrealized Gains (Losses) on Investments | Total from Investment Activities | Net Investment Income | Net Realized Gains on Investments | Total Distributions | |||||||||||||||||||||||||
ProFund VP UltraMid-Cap | |||||||||||||||||||||||||||||||
| Six Months Ended June 30, 2024 (unaudited) | $ | 35.05 | 0.17 | 2.42 | 2.59 | (0.24 | ) | — | (0.24 | ) | |||||||||||||||||||||
Year Ended December 31, 2023 | $ | 28.67 | 0.23 | 6.15 | 6.38 | — | — | — | |||||||||||||||||||||||
Year Ended December 31, 2022 | $ | 73.95 | (0.10 | ) | (21.97 | ) | (22.07 | ) | — | (23.21 | ) | (23.21 | ) | ||||||||||||||||||
Year Ended December 31, 2021 | $ | 50.42 | (0.55 | ) | 24.08 | 23.53 | — | — | — | ||||||||||||||||||||||
Year Ended December 31, 2020 | $ | 61.51 | (0.21 | ) | (0.36 | ) | (0.57 | ) | (0.12 | ) | (10.40 | ) | (10.52 | ) | |||||||||||||||||
Year Ended December 31, 2019 | $ | 41.62 | 0.06 | 19.83 | 19.89 | — | — | — | |||||||||||||||||||||||
ProFund VP UltraNasdaq-100 | |||||||||||||||||||||||||||||||
| Six Months Ended June 30, 2024 (unaudited) | $ | 30.94 | 0.06 | 9.54 | 9.60 | (0.11 | ) | — | (0.11 | ) | |||||||||||||||||||||
Year Ended December 31, 2023 | $ | 14.36 | 0.11 | 16.47 | 16.58 | — | — | — | |||||||||||||||||||||||
Year Ended December 31, 2022 | $ | 99.32 | (0.21 | ) | (51.50 | ) | (51.71 | ) | — | (33.25 | ) | (33.25 | ) | ||||||||||||||||||
Year Ended December 31, 2021 | $ | 92.87 | (1.08 | ) | 35.05 | 33.97 | — | (27.52 | ) | (27.52 | ) | ||||||||||||||||||||
Year Ended December 31, 2020(f) | $ | 61.10 | (0.76 | ) | 52.59 | 51.83 | — | (20.06 | ) | (20.06 | ) | ||||||||||||||||||||
Year Ended December 31, 2019(f) | $ | 34.00 | (0.12 | ) | 27.22 | 27.10 | — | — | — | ||||||||||||||||||||||
| Ratios to Average Net Assets | Supplemental Data | ||||||||||||||||||||||||||||||
| Net Asset Value, End of Period | Total Return(b)(c) | Gross Expenses(c)(d) | Net Expenses(c)(d) | Net Investment Income (Loss)(c)(d) | Net Assets, End of Period (000's) | Portfolio Turnover Rate(b)(e) | |||||||||||||||||||||||||
ProFund VP UltraMid-Cap | |||||||||||||||||||||||||||||||
| Six Months Ended June 30, 2024 (unaudited) | $ | 37.40 | 7.40 | % | 1.78 | % | 1.68 | % | 0.92 | % | $ | 10,806 | 16 | % | |||||||||||||||||
Year Ended December 31, 2023 | $ | 35.05 | 22.21 | % | 1.80 | % | 1.68 | % | 0.75 | % | $ | 10,791 | 31 | % | |||||||||||||||||
Year Ended December 31, 2022 | $ | 28.67 | (32.17 | )% | 1.73 | % | 1.68 | % | (0.24 | )% | $ | 8,402 | 42 | % | |||||||||||||||||
Year Ended December 31, 2021 | $ | 73.95 | 46.67 | % | 1.69 | % | 1.68 | % | (0.83 | )% | $ | 17,870 | 66 | % | |||||||||||||||||
Year Ended December 31, 2020 | $ | 50.42 | 5.22 | % | 1.79 | % | 1.68 | % | (0.48 | )% | $ | 12,722 | 488 | % | |||||||||||||||||
Year Ended December 31, 2019 | $ | 61.51 | 47.79 | % | 1.71 | % | 1.68 | % | 0.11 | % | $ | 14,875 | 603 | % | |||||||||||||||||
ProFund VP UltraNasdaq-100 | |||||||||||||||||||||||||||||||
| Six Months Ended June 30, 2024 (unaudited) | $ | 40.43 | 31.04 | % | 1.75 | % | 1.68 | % | 0.36 | % | $ | 236,748 | 6 | % | |||||||||||||||||
Year Ended December 31, 2023 | $ | 30.94 | 115.46 | % | 1.78 | % | 1.68 | % | 0.46 | % | $ | 186,933 | 39 | % | |||||||||||||||||
Year Ended December 31, 2022 | $ | 14.36 | (60.93 | )% | 1.77 | % | 1.68 | % | (0.69 | )% | $ | 84,528 | 25 | % | |||||||||||||||||
Year Ended December 31, 2021 | $ | 99.32 | 52.51 | % | 1.69 | % | 1.68 | % | (1.20 | )% | $ | 268,234 | 20 | % | |||||||||||||||||
Year Ended December 31, 2020(f) | $ | 92.87 | 86.30 | % | 1.74 | % | 1.68 | % | (1.05 | )% | $ | 206,580 | 55 | % | |||||||||||||||||
Year Ended December 31, 2019(f) | $ | 61.10 | 79.66 | % | 1.76 | % | 1.68 | % | (0.25 | )% | $ | 119,521 | 44 | % | |||||||||||||||||
(a) Per share net investment income (loss) has been calculated using the average daily shares method.
(b) Not annualized for periods less than one year.
(c) Does not reflect the fees and expenses associated with the separate account that invests in the Fund or any variable annuity or variable insurance contract for which the Fund serves as an investment option.
(d) Annualized for periods less than one year.
(e) Portfolio turnover rate is calculated without regard to instruments having a maturity of less than one year from acquisition or derivative instruments (including swap agreements and futures contracts). The portfolio turnover rate can be high and volatile due to the amount and timing of sales and purchases of fund shares during the period.
(f) As described in Note 8, share amounts have been adjusted for 2:1 share split that occurred on December 14, 2020.
See accompanying notes to the financial statements.
Financial Highlights :: 239
ProFunds Financial Highlights FOR THE PERIODS INDICATED
Selected data for a share of beneficial interest outstanding throughout the periods indicated.
Investment Activities | Distributions to Shareholders From | ||||||||||||||||||||||||||||||
| Net Asset Value, Beginning of Period | Net Investment Income (Loss)(a) | Net Realized and Unrealized Gains (Losses) on Investments | Total from Investment Activities | Net Investment Income | Net Realized Gains on Investments | Total Distributions | |||||||||||||||||||||||||
ProFund VP UltraShort Dow 30 | |||||||||||||||||||||||||||||||
| Six Months Ended June 30, 2024 (unaudited) | $ | 3.22 | 0.03 | (0.16 | ) | (0.13 | ) | (0.11 | ) | — | (0.11 | ) | |||||||||||||||||||
Year Ended December 31, 2023 | $ | 3.97 | 0.10 | (0.84 | ) | (0.74 | ) | (0.01 | ) | — | (0.01 | ) | |||||||||||||||||||
Year Ended December 31, 2022 | $ | 3.72 | 0.01 | 0.24 | 0.25 | — | — | — | |||||||||||||||||||||||
Year Ended December 31, 2021 | $ | 73.45 | (0.09 | ) | (19.00 | ) | (19.09 | ) | — | (50.64 | ) | (50.64 | ) | ||||||||||||||||||
Year Ended December 31, 2020(g) | $ | 147.61 | (1.40 | ) | (64.52 | ) | (65.92 | ) | (8.24 | ) | — | (8.24 | ) | ||||||||||||||||||
Year Ended December 31, 2019(g)(h) | $ | 256.37 | 1.60 | (95.56 | ) | (93.96 | ) | (6.30 | ) | (8.50 | ) | (14.80 | ) | ||||||||||||||||||
ProFund VP UltraShort Nasdaq-100 | |||||||||||||||||||||||||||||||
| Six Months Ended June 30, 2024 (unaudited) | $ | 35.39 | 0.56 | (9.38 | ) | (8.82 | ) | (1.19 | ) | — | (1.19 | ) | |||||||||||||||||||
Year Ended December 31, 2023(i) | $ | 83.33 | 1.90 | (49.84 | ) | (47.94 | ) | — | — | — | |||||||||||||||||||||
Year Ended December 31, 2022(i) | $ | 53.33 | (0.10 | ) | 30.10 | 30.00 | — | — | — | ||||||||||||||||||||||
Year Ended December 31, 2021(i) | $ | 107.14 | (1.25 | ) | (38.86 | ) | (40.11 | ) | — | (13.70 | ) | (13.70 | ) | ||||||||||||||||||
Year Ended December 31, 2020(i)(j) | $ | 380.35 | (2.95 | ) | (268.61 | ) | (271.56 | ) | (1.65 | ) | — | (1.65 | ) | ||||||||||||||||||
Year Ended December 31, 2019(i)(j) | $ | 775.07 | 2.60 | (392.92 | ) | (390.32 | ) | (4.40 | ) | — | (4.40 | ) | |||||||||||||||||||
| Ratios to Average Net Assets | Supplemental Data | ||||||||||||||||||||||||||||||
| Net Asset Value, End of Period | Total Return(b)(c) | Gross Expenses(c)(d) | Net Expenses(c)(d) | Net Investment Income (Loss)(c)(d) | Net Assets, End of Period (000's) | Portfolio Turnover Rate(b)(e) | |||||||||||||||||||||||||
ProFund VP UltraShort Dow 30 | |||||||||||||||||||||||||||||||
| Six Months Ended June 30, 2024 (unaudited) | $ | 2.98 | (4.15 | )% | 1.40 | % | 1.40 | % | 1.84 | % | $ | 3 | — | ||||||||||||||||||
Year Ended December 31, 2023 | $ | 3.22 | (18.76 | )% | 1.54 | % | 1.51 | % | 2.72 | % | $ | 3 | — | ||||||||||||||||||
Year Ended December 31, 2022 | $ | 3.97 | 6.72 | % | 1.37 | % | 1.35 | % | 0.13 | % | $ | 4 | — | ||||||||||||||||||
Year Ended December 31, 2021 | $ | 3.72 | (35.11 | )%(f) | 1.41 | % | 1.41 | % | (1.41 | )% | $ | 4 | — | ||||||||||||||||||
Year Ended December 31, 2020(g) | $ | 73.45 | (45.44 | )% | 1.46 | % | 1.46 | % | (1.28 | )% | $ | 6 | — | ||||||||||||||||||
Year Ended December 31, 2019(g)(h) | $ | 147.61 | (37.95 | )% | 1.48 | % | 1.45 | % | 0.83 | % | $ | 3 | — | ||||||||||||||||||
ProFund VP UltraShort Nasdaq-100 | |||||||||||||||||||||||||||||||
| Six Months Ended June 30, 2024 (unaudited) | $ | 25.38 | (24.94 | )% | 1.69 | % | 1.68 | % | 3.68 | % | $ | 1,605 | — | ||||||||||||||||||
Year Ended December 31, 2023(i) | $ | 35.39 | (57.49 | )% | 1.82 | % | 1.68 | % | 3.40 | % | $ | 614 | — | ||||||||||||||||||
Year Ended December 31, 2022(i) | $ | 83.33 | 56.04 | % | 1.75 | % | 1.68 | % | (0.10 | )% | $ | 4,664 | — | ||||||||||||||||||
Year Ended December 31, 2021(i) | $ | 53.33 | (42.71 | )% | 1.74 | % | 1.68 | % | (1.68 | )% | $ | 449 | — | ||||||||||||||||||
Year Ended December 31, 2020(i)(j) | $ | 107.14 | (71.46 | )% | 1.78 | % | 1.68 | % | (1.49 | )% | $ | 237 | — | ||||||||||||||||||
Year Ended December 31, 2019(i)(j) | $ | 380.35 | (50.50 | )% | 1.68 | % | 1.67 | % | 0.50 | % | $ | 1,026 | — | ||||||||||||||||||
(a) Per share net investment income (loss) has been calculated using the average daily shares method.
(b) Not annualized for periods less than one year.
(c) Does not reflect the fees and expenses associated with the separate account that invests in the Fund or any variable annuity or variable insurance contract for which the Fund serves as an investment option.
(d) Annualized for periods less than one year.
(e) Portfolio turnover rate is calculated without regard to instruments having a maturity of less than one year from acquisition or derivative instruments (including swap agreements and futures contracts). The portfolio turnover rate can be high and volatile due to the amount and timing of sales and purchases of fund shares during the period.
(f) During the year ended December 31, 2021, the Fund received monies related to certain nonrecurring litigation settlements. The corresponding impact to the total return was an increase of 0.40%.
(g) As described in Note 8, share amounts have been adjusted for 1:5 reverse share split that occurred on December 14, 2020
(h) As described in Note 8, share amounts have been adjusted for 1:8 reverse share split that occurred on November 18, 2019.
(i) As described in Note 8, share amounts have been adjusted for 1:5 reverse share split that occurred on March 13, 2023.
(j) As described in Note 8, share amounts have been adjusted for 1:4 reverse share split that occurred on December 14, 2020.
See accompanying notes to the financial statements.
240 :: Financial Highlights
ProFunds Financial Highlights FOR THE PERIODS INDICATED
Selected data for a share of beneficial interest outstanding throughout the periods indicated.
Investment Activities | Distributions to Shareholders From | ||||||||||||||||||||||||||||||||||
| Net Asset Value, Beginning of Period | Net Investment Income (Loss)(a) | Net Realized and Unrealized Gains (Losses) on Investments | Total from Investment Activities | Net Investment Income | Net Realized Gains on Investments | Return of Capital | Total Distributions | ||||||||||||||||||||||||||||
ProFund VP UltraSmall-Cap | |||||||||||||||||||||||||||||||||||
| Six Months Ended June 30, 2024 (unaudited) | $ | 13.81 | 0.05 | (0.32 | ) | (0.27 | ) | (0.11 | ) | — | — | (0.11 | ) | ||||||||||||||||||||||
Year Ended December 31, 2023 | $ | 11.27 | 0.09 | 2.45 | 2.54 | — | — | — | — | ||||||||||||||||||||||||||
Year Ended December 31, 2022 | $ | 26.25 | (0.05 | ) | (10.86 | ) | (10.91 | ) | — | (4.07 | ) | — | (4.07 | ) | |||||||||||||||||||||
Year Ended December 31, 2021 | $ | 23.21 | (0.33 | ) | 5.56 | 5.23 | — | (2.19 | ) | — | (2.19 | ) | |||||||||||||||||||||||
Year Ended December 31, 2020 | $ | 23.72 | (0.15 | ) | 2.55 | 2.40 | (0.03 | ) | (2.88 | ) | — | (2.91 | ) | ||||||||||||||||||||||
Year Ended December 31, 2019 | $ | 16.10 | 0.01 | 7.61 | 7.62 | — | — | — | — | ||||||||||||||||||||||||||
ProFund VP U.S. Government Plus | |||||||||||||||||||||||||||||||||||
| Six Months Ended June 30, 2024 (unaudited) | $ | 12.72 | 0.20 | (1.35 | ) | (1.15 | ) | (0.20 | ) | — | — | (0.20 | ) | ||||||||||||||||||||||
Year Ended December 31, 2023 | $ | 13.27 | 0.42 | (0.43 | ) | (0.01 | ) | (0.54 | ) | — | — | (f) | (0.54 | ) | |||||||||||||||||||||
Year Ended December 31, 2022 | $ | 22.76 | 0.13 | (9.62 | ) | (9.49 | ) | — | — | — | — | ||||||||||||||||||||||||
Year Ended December 31, 2021 | $ | 30.55 | (0.12 | ) | (2.80 | ) | (2.92 | ) | — | (4.87 | ) | — | (4.87 | ) | |||||||||||||||||||||
Year Ended December 31, 2020 | $ | 27.15 | (0.25 | ) | 6.06 | 5.81 | (0.02 | ) | (2.39 | ) | — | (2.41 | ) | ||||||||||||||||||||||
Year Ended December 31, 2019 | $ | 23.16 | 0.22 | 3.99 | 4.21 | (0.22 | ) | — | — | (0.22 | ) | ||||||||||||||||||||||||
| Ratios to Average Net Assets | Supplemental Data | ||||||||||||||||||||||||||||||
| Net Asset Value, End of Period | Total Return(b)(c) | Gross Expenses(c)(d) | Net Expenses(c)(d) | Net Investment Income (Loss)(c)(d) | Net Assets, End of Period (000's) | Portfolio Turnover Rate(b)(e) | |||||||||||||||||||||||||
ProFund VP UltraSmall-Cap | |||||||||||||||||||||||||||||||
| Six Months Ended June 30, 2024 (unaudited) | $ | 13.43 | (1.94 | )% | 1.89 | % | 1.68 | % | 0.76 | % | $ | 12,899 | 20 | % | |||||||||||||||||
Year Ended December 31, 2023 | $ | 13.81 | 22.54 | % | 1.90 | % | 1.68 | % | 0.72 | % | $ | 17,000 | 33 | % | |||||||||||||||||
Year Ended December 31, 2022 | $ | 11.27 | (43.68 | )% | 1.84 | % | 1.68 | % | (0.35 | )% | $ | 12,588 | 51 | % | |||||||||||||||||
Year Ended December 31, 2021 | $ | 26.25 | 23.30 | % | 1.72 | % | 1.68 | % | (1.20 | )% | $ | 28,250 | 24 | % | |||||||||||||||||
Year Ended December 31, 2020 | $ | 23.21 | 16.39 | % | 1.86 | % | 1.68 | % | (0.91 | )% | $ | 21,108 | 34 | % | |||||||||||||||||
Year Ended December 31, 2019 | $ | 23.72 | 47.33 | % | 1.76 | % | 1.68 | % | 0.07 | % | $ | 20,109 | 66 | % | |||||||||||||||||
ProFund VP U.S. Government Plus | |||||||||||||||||||||||||||||||
| Six Months Ended June 30, 2024 (unaudited) | $ | 11.37 | (9.07 | )% | 1.44 | % | 1.38 | % | 3.44 | % | $ | 6,354 | 203 | % | |||||||||||||||||
Year Ended December 31, 2023 | $ | 12.72 | 0.04 | % | 1.48 | % | 1.38 | % | 3.20 | % | $ | 9,841 | 394 | % | |||||||||||||||||
Year Ended December 31, 2022 | $ | 13.27 | (41.70 | )% | 1.43 | % | 1.38 | % | 0.76 | % | $ | 7,614 | 395 | % | |||||||||||||||||
Year Ended December 31, 2021 | $ | 22.76 | (7.08 | )% | 1.39 | % | 1.38 | % | (0.49 | )% | $ | 15,215 | 393 | % | |||||||||||||||||
Year Ended December 31, 2020 | $ | 30.55 | 20.69 | % | 1.48 | % | 1.38 | % | (0.75 | )% | $ | 22,395 | 398 | % | |||||||||||||||||
Year Ended December 31, 2019 | $ | 27.15 | 18.22 | % | 1.44 | % | 1.38 | % | 0.84 | % | $ | 19,396 | 402 | % | |||||||||||||||||
(a) Per share net investment income (loss) has been calculated using the average daily shares method.
(b) Not annualized for periods less than one year.
(c) Does not reflect the fees and expenses associated with the separate account that invests in the Fund or any variable annuity or variable insurance contract for which the Fund serves as an investment option.
(d) Annualized for periods less than one year.
(e) Portfolio turnover rate is calculated without regard to instruments having a maturity of less than one year from acquisition or derivative instruments (including swap agreements and futures contracts). The portfolio turnover rate can be high and volatile due to the amount and timing of sales and purchases of fund shares during the period.
(f) Amount is less than $0.005.
See accompanying notes to the financial statements.
Financial Highlights :: 241
ProFunds Financial Highlights FOR THE PERIODS INDICATED
Selected data for a share of beneficial interest outstanding throughout the periods indicated.
Investment Activities | Distributions to Shareholders From | ||||||||||||||||||||||||||||||
| Net Asset Value, Beginning of Period | Net Investment Income (Loss)(a) | Net Realized and Unrealized Gains (Losses) on Investments | Total from Investment Activities | Net Investment Income | Net Realized Gains on Investments | Total Distributions | |||||||||||||||||||||||||
ProFund VP Utilities | |||||||||||||||||||||||||||||||
| Six Months Ended June 30, 2024 (unaudited) | $ | 37.43 | 0.34 | 2.85 | 3.19 | (0.67 | ) | — | (0.67 | ) | |||||||||||||||||||||
Year Ended December 31, 2023 | $ | 41.50 | 0.58 | (4.11 | ) | (3.53 | ) | (0.54 | ) | — | (0.54 | ) | |||||||||||||||||||
Year Ended December 31, 2022 | $ | 42.47 | 0.41 | (0.51 | ) | (0.10 | ) | (0.42 | ) | (0.45 | ) | (0.87 | ) | ||||||||||||||||||
Year Ended December 31, 2021 | $ | 37.37 | 0.51 | 5.18 | 5.69 | (0.59 | ) | — | (0.59 | ) | |||||||||||||||||||||
Year Ended December 31, 2020 | $ | 50.44 | 0.57 | (2.39 | ) | (1.82 | ) | (0.75 | ) | (10.50 | ) | (11.25 | ) | ||||||||||||||||||
Year Ended December 31, 2019 | $ | 44.33 | 0.67 | 9.18 | 9.85 | (0.79 | ) | (2.95 | ) | (3.74 | ) | ||||||||||||||||||||
| Ratios to Average Net Assets | Supplemental Data | ||||||||||||||||||||||||||||||
| Net Asset Value, End of Period | Total Return(b)(c) | Gross Expenses(c)(d) | Net Expenses(c)(d) | Net Investment Income (Loss)(c)(d) | Net Assets, End of Period (000's) | Portfolio Turnover Rate(b)(e) | |||||||||||||||||||||||||
ProFund VP Utilities | |||||||||||||||||||||||||||||||
| Six Months Ended June 30, 2024 (unaudited) | $ | 39.95 | 8.51 | % | 1.80 | % | 1.68 | % | 1.78 | % | $ | 28,892 | 54 | % | |||||||||||||||||
Year Ended December 31, 2023 | $ | 37.43 | (8.59 | )% | 1.78 | % | 1.68 | % | 1.49 | % | $ | 26,119 | 29 | % | |||||||||||||||||
Year Ended December 31, 2022 | $ | 41.50 | (0.25 | )% | 1.71 | % | 1.68 | % | 0.99 | % | $ | 39,018 | 29 | % | |||||||||||||||||
Year Ended December 31, 2021 | $ | 42.47 | 15.41 | % | 1.69 | % | 1.68 | % | 1.31 | % | $ | 34,775 | 24 | % | |||||||||||||||||
Year Ended December 31, 2020 | $ | 37.37 | (2.40 | )% | 1.75 | % | 1.68 | % | 1.31 | % | $ | 32,543 | 50 | % | |||||||||||||||||
Year Ended December 31, 2019 | $ | 50.44 | 22.88 | % | 1.74 | % | 1.68 | % | 1.38 | % | $ | 44,276 | 209 | % | |||||||||||||||||
(a) Per share net investment income (loss) has been calculated using the average daily shares method.
(b) Not annualized for periods less than one year.
(c) Does not reflect the fees and expenses associated with the separate account that invests in the Fund or any variable annuity or variable insurance contract for which the Fund serves as an investment option.
(d) Annualized for periods less than one year.
(e) Portfolio turnover rate is calculated without regard to instruments having a maturity of less than one year from acquisition or derivative instruments (including swap agreements and futures contracts). The portfolio turnover rate can be high and volatile due to the amount and timing of sales and purchases of fund shares during the period.
See accompanying notes to the financial statements.
This Page Intentionally Left Blank
244 :: Notes to Financial Statements :: June 30, 2024 (unaudited)
1. Organization
ProFunds (the "Trust") consists of 116 separate investment portfolios and is registered as an open-end management investment company under the Investment Company Act of 1940 (the "1940 Act") and thus follows accounting and reporting guidance for investment companies. The Trust is organized as a Delaware statutory trust and is authorized to issue an unlimited number of shares of beneficial interest of no par value which may be issued in more than one class or series.
These accompanying financial statements relate to the following portfolios of the Trust included in this report (collectively, the "ProFunds VP" and individually, a "ProFund VP"):
Classic ProFunds VP:
ProFund VP Asia 30 | ProFund VP Large-Cap Value | ||||||
ProFund VP Bull | ProFund VP Mid-Cap | ||||||
ProFund VP Dow 30 | ProFund VP Mid-Cap Growth | ||||||
ProFund VP Emerging Markets | ProFund VP Mid-Cap Value | ||||||
ProFund VP Europe 30 | ProFund VP Nasdaq-100 | ||||||
ProFund VP International | ProFund VP Small-Cap | ||||||
ProFund VP Japan | ProFund VP Small-Cap Growth | ||||||
ProFund VP Large-Cap Growth | ProFund VP Small-Cap Value | ||||||
Ultra ProFunds VP:
ProFund VP UltraBull | ProFund VP UltraNasdaq-100 | ||||||
ProFund VP UltraMid-Cap | ProFund VP UltraSmall-Cap | ||||||
Inverse ProFunds VP:
ProFund VP Bear | ProFund VP Short Nasdaq-100 | ||||||
ProFund VP Short Dow 30 | ProFund VP Short Small-Cap | ||||||
ProFund VP Short Emerging Markets | ProFund VP UltraShort Dow 30 | ||||||
ProFund VP Short International | ProFund VP UltraShort Nasdaq-100 | ||||||
ProFund VP Short Mid-Cap | |||||||
Sector ProFunds VP:
ProFund VP Banks | ProFund VP Internet | ||||||
ProFund VP Biotechnology | ProFund VP Materials | ||||||
ProFund VP Communication Services | ProFund VP Pharmaceuticals | ||||||
ProFund VP Consumer Discretionary | ProFund VP Precious Metals | ||||||
ProFund VP Consumer Staples | ProFund VP Real Estate | ||||||
ProFund VP Energy | ProFund VP Semiconductor | ||||||
ProFund VP Financials | ProFund VP Technology | ||||||
ProFund VP Health Care | ProFund VP Utilities | ||||||
ProFund VP Industrials | |||||||
Non-Equity ProFunds VP:
ProFund Access VP High Yield | ProFund VP Rising Rates Opportunity | ||||||
ProFund VP Falling U.S. Dollar | ProFund VP U.S. Government Plus | ||||||
Money Market ProFund VP:
ProFund VP Government Money Market | |||
Each ProFund VP's investment objective is disclosed in its prospectus. The ProFunds VP, excluding ProFund VP Government Money Market, are referred to as the "non-money market ProFunds VP." Each non-money market ProFund VP, other than ProFund VP Consumer Discretionary, ProFund VP Europe 30, ProFund VP Industrials, ProFund VP Large-Cap Growth, ProFund VP Large-Cap Value, ProFund VP Mid-Cap Growth, ProFund VP Mid-Cap Value, ProFund VP Real Estate, ProFund VP Small-Cap Growth, ProFund VP Small-Cap Value, and ProFund VP Utilities, is classified as non-diversified under the 1940 Act. Each ProFund VP has one class of shares.
Under the Trust's organizational documents, its Officers and Trustees are indemnified against certain liabilities arising out of the performance of their duties to the Trust. In addition, in the normal course of business, the Trust enters into contracts with its vendors and others that provide for general indemnifications. The Trust and ProFunds VP's maximum exposure under these arrangements is unknown as this would involve future claims that may be made against the ProFunds VP.
June 30, 2024 (unaudited) :: Notes to Financial Statements :: 245
2. Significant Accounting Policies
The following is a summary of significant accounting policies followed by each ProFund VP in the preparation of its financial statements. These policies are in conformity with U.S. generally accepted accounting principles ("GAAP"). The preparation of financial statements in accordance with GAAP requires management to make estimates and assumptions that affect the reported amounts of assets and liabilities and disclosure of contingent assets and liabilities at the date of the financial statements and the reported amounts of income and expenses during the reporting period. The actual results could differ from those estimates.
Investment Valuation
The ProFunds VP record their investments at fair value. Fair value is defined as the price that would be received to sell an asset or paid to transfer a liability in an orderly transaction between market participants at the measurement date. The valuation techniques used to determine fair value are further described in Note 3.
Cash
Cash is held at major financial institutions and is subject to credit risk to the extent those balances exceed applicable Federal Deposit Insurance Corporation (FDIC) or Securities Investor Protection Corporation (SIPC) limitations.
Repurchase Agreements
Each ProFund VP may enter into repurchase agreements with financial institutions in pursuit of its investment objective, as "cover" for the investment techniques it employs, or for liquidity purposes. Repurchase agreements are primarily used by the ProFunds VP as short-term investments for cash positions. Under a repurchase agreement, a ProFund VP purchases a debt security and simultaneously agrees to sell the security back to the seller at a mutually agreed-upon future price and date, normally one business day. The resale price is typically greater than the purchase price, reflecting an agreed-upon market interest rate during the purchaser's holding period. While the maturities of the underlying securities in repurchase transactions may be more than one year, the term of each repurchase agreement will always be less than one year.
The ProFunds VP follow certain procedures designed to minimize the risks inherent in such agreements. These procedures include effecting repurchase transactions generally with major, global financial institutions whose creditworthiness is continuously monitored by ProFund Advisors LLC (the "Advisor"). In addition, the value of the collateral underlying the repurchase agreement will always be at least equal to the repurchase price, including any accrued interest earned on the repurchase agreement. ProFunds VP within the Trust invest in repurchase agreements jointly. Each ProFund VP, therefore, holds a pro rata share of the collateral and interest income based upon the dollar amount of the repurchase agreements entered into by each ProFund VP. The collateral underlying the repurchase agreement is held by the ProFund VP's custodian. In the event of a default or bankruptcy by a selling financial institution, a ProFund VP will seek to liquidate such collateral which could involve certain costs or delays and, to the extent that proceeds from any sale upon a default of the obligation to repurchase were less than the repurchase price, the ProFund VP could suffer a loss. A ProFund VP also may experience difficulties and incur certain costs in exercising its rights to the collateral and may lose the interest the ProFund VP expected to receive under the repurchase agreement. Repurchase agreements usually are for short periods, such as one week or less, but may be longer. It is the current policy of the ProFunds VP not to invest in repurchase agreements that do not mature within seven days if any such investment, together with any other illiquid assets held by the ProFund VP, amounts to more than 15% of the ProFund VP's total net assets. The investments of each of the ProFunds VP in repurchase agreements at times may be substantial when, in the view of the Advisor, liquidity, investment, regulatory, or other considerations so warrant. During periods of high demand for repurchase agreements, the ProFunds VP may be unable to invest available cash in these instruments to the extent desired by the Advisor.
Information concerning the counterparties, value of, collateralization and amounts due under repurchase agreement transactions may be found in the table below.
As of June 30, 2024, the ProFunds VP had undivided interest in joint repurchase agreements with the following counterparties, for the time periods and rates indicated. Amounts shown in the table below represent principal amount, cost and value for each respective repurchase agreement.
| Credit Agricole CIB, 5.20% dated 6/28/24, due 7/1/24(1) | HSBC Securities (USA), Inc., 5.20% dated 6/28/24, due 7/1/24(2) | Natwest Markets, PLC 5.18% dated 6/28/24, due 7/1/24(3) | RBC Capital Markets, LLC, 5.17% dated 6/28/24, due 7/1/24(4) | Societe' Generale, 5.18% dated 6/28/24, due 7/1/24(5) | UMB Bank N.A., 5.12% dated 6/28/24, due 7/1/24(6) | ||||||||||||||||||||||
ProFund Access VP High Yield | $ | 1,173,000 | $ | 2,209,000 | $ | 1,035,000 | $ | 690,000 | $ | 1,795,000 | $ | 54,000 | |||||||||||||||
ProFund VP Asia 30 | 6,000 | 12,000 | 5,000 | 3,000 | 10,000 | 3,000 | |||||||||||||||||||||
ProFund VP Bear | 274,000 | 518,000 | 242,000 | 161,000 | 421,000 | 20,000 | |||||||||||||||||||||
ProFund VP Biotechnology | 77,000 | 146,000 | 68,000 | 45,000 | 119,000 | 7,000 | |||||||||||||||||||||
ProFund VP Bull | 1,319,000 | 2,485,000 | 1,164,000 | 775,000 | 2,019,000 | 64,000 | |||||||||||||||||||||
| ProFund VP Communication Services | 46,000 | 86,000 | 40,000 | 27,000 | 70,000 | 4,000 | |||||||||||||||||||||
ProFund VP Consumer Discretionary | 82,000 | 155,000 | 72,000 | 48,000 | 126,000 | 6,000 | |||||||||||||||||||||
ProFund VP Consumer Staples | 45,000 | 84,000 | 39,000 | 26,000 | 68,000 | 5,000 | |||||||||||||||||||||
ProFund VP Dow 30 | 64,000 | 123,000 | 57,000 | 38,000 | 100,000 | 7,000 | |||||||||||||||||||||
ProFund VP Emerging Markets | 239,000 | 452,000 | 211,000 | 140,000 | 368,000 | 17,000 | |||||||||||||||||||||
ProFund VP Energy | 87,000 | 163,000 | 76,000 | 51,000 | 133,000 | 6,000 | |||||||||||||||||||||
246 :: Notes to Financial Statements :: June 30, 2024 (unaudited)
| Credit Agricole CIB, 5.20% dated 6/28/24, due 7/1/24(1) | HSBC Securities (USA), Inc., 5.20% dated 6/28/24, due 7/1/24(2) | Natwest Markets, PLC 5.18% dated 6/28/24, due 7/1/24(3) | RBC Capital Markets, LLC, 5.17% dated 6/28/24, due 7/1/24(4) | Societe' Generale, 5.18% dated 6/28/24, due 7/1/24(5) | UMB Bank N.A., 5.12% dated 6/28/24, due 7/1/24(6) | ||||||||||||||||||||||
ProFund VP Falling U.S. Dollar | $ | 76,000 | $ | 144,000 | $ | 67,000 | $ | 44,000 | $ | 117,000 | $ | 8,000 | |||||||||||||||
ProFund VP Financials | 122,000 | 230,000 | 107,000 | 71,000 | 187,000 | 8,000 | |||||||||||||||||||||
| ProFund VP Government Money Market | 2,812,000 | 5,293,000 | 2,481,000 | 1,654,000 | 4,301,000 | 123,000 | |||||||||||||||||||||
ProFund VP Health Care | 43,000 | 82,000 | 38,000 | 25,000 | 67,000 | 5,000 | |||||||||||||||||||||
ProFund VP Industrials | 59,000 | 111,000 | 52,000 | 34,000 | 90,000 | 6,000 | |||||||||||||||||||||
ProFund VP International | 1,761,000 | 3,315,000 | 1,554,000 | 1,036,000 | 2,695,000 | 82,000 | |||||||||||||||||||||
ProFund VP Internet | 40,000 | 75,000 | 35,000 | 23,000 | 61,000 | 5,000 | |||||||||||||||||||||
ProFund VP Japan | 2,273,000 | 4,279,000 | 2,006,000 | 1,337,000 | 3,477,000 | 100,000 | |||||||||||||||||||||
ProFund VP Large-Cap Growth | 12,000 | 23,000 | 11,000 | 7,000 | 19,000 | 3,000 | |||||||||||||||||||||
ProFund VP Large-Cap Value | 9,000 | 17,000 | 8,000 | 5,000 | 14,000 | 3,000 | |||||||||||||||||||||
ProFund VP Materials | 15,000 | 28,000 | 13,000 | 8,000 | 22,000 | 3,000 | |||||||||||||||||||||
ProFund VP Mid-Cap | 1,863,000 | 3,508,000 | 1,643,000 | 1,095,000 | 2,850,000 | 90,000 | |||||||||||||||||||||
ProFund VP Mid-Cap Growth | 8,000 | 15,000 | 7,000 | 4,000 | 12,000 | 3,000 | |||||||||||||||||||||
ProFund VP Mid-Cap Value | 6,000 | 12,000 | 5,000 | 3,000 | 10,000 | 4,000 | |||||||||||||||||||||
ProFund VP Nasdaq-100 | 8,987,000 | 16,919,000 | 7,931,000 | 5,286,000 | 13,746,000 | 396,000 | |||||||||||||||||||||
ProFund VP Pharmaceuticals | 27,000 | 52,000 | 24,000 | 16,000 | 42,000 | 4,000 | |||||||||||||||||||||
ProFund VP Precious Metals | 4,083,000 | 7,687,000 | 3,603,000 | 2,401,000 | 6,245,000 | 182,000 | |||||||||||||||||||||
ProFund VP Real Estate | 14,000 | 26,000 | 12,000 | 8,000 | 21,000 | 2,000 | |||||||||||||||||||||
| ProFund VP Rising Rates Opportunity | 1,434,000 | 2,700,000 | 1,264,000 | 843,000 | 2,194,000 | 69,000 | |||||||||||||||||||||
ProFund VP Semiconductor | 287,000 | 541,000 | 253,000 | 169,000 | 440,000 | 15,000 | |||||||||||||||||||||
ProFund VP Short Dow 30 | — | 1,000 | — | — | 1,000 | 4,000 | |||||||||||||||||||||
ProFund VP Short Emerging Markets | 86,000 | 164,000 | 77,000 | 51,000 | 133,000 | 8,000 | |||||||||||||||||||||
ProFund VP Short International | 132,000 | 248,000 | 116,000 | 76,000 | 201,000 | 11,000 | |||||||||||||||||||||
ProFund VP Short Mid-Cap | 13,000 | 26,000 | 12,000 | 8,000 | 21,000 | 4,000 | |||||||||||||||||||||
ProFund VP Short Nasdaq-100 | 422,000 | 795,000 | 371,000 | 247,000 | 645,000 | 26,000 | |||||||||||||||||||||
ProFund VP Short Small-Cap | 509,000 | 961,000 | 449,000 | 299,000 | 781,000 | 31,000 | |||||||||||||||||||||
ProFund VP Small-Cap | 174,000 | 329,000 | 154,000 | 102,000 | 267,000 | 15,000 | |||||||||||||||||||||
ProFund VP Small-Cap Growth | 8,000 | 16,000 | 7,000 | 5,000 | 13,000 | 4,000 | |||||||||||||||||||||
ProFund VP Small-Cap Value | 8,000 | 15,000 | 7,000 | 4,000 | 12,000 | 3,000 | |||||||||||||||||||||
ProFund VP Technology | 211,000 | 398,000 | 186,000 | 124,000 | 323,000 | 11,000 | |||||||||||||||||||||
ProFund VP UltraBull | 607,000 | 1,143,000 | 535,000 | 356,000 | 929,000 | 33,000 | |||||||||||||||||||||
ProFund VP UltraMid-Cap | 503,000 | 947,000 | 444,000 | 295,000 | 770,000 | 29,000 | |||||||||||||||||||||
ProFund VP UltraNasdaq-100 | 10,188,000 | 19,179,000 | 8,990,000 | 5,992,000 | 15,583,000 | 445,000 | |||||||||||||||||||||
ProFund VP UltraShort Dow 30 | — | — | — | — | — | 2,000 | |||||||||||||||||||||
ProFund VP UltraShort Nasdaq-100 | 266,000 | 503,000 | 235,000 | 156,000 | 408,000 | 20,000 | |||||||||||||||||||||
ProFund VP UltraSmall-Cap | 561,000 | 1,058,000 | 495,000 | 329,000 | 859,000 | 33,000 | |||||||||||||||||||||
ProFund VP U.S. Government Plus | 599,000 | 1,129,000 | 528,000 | 352,000 | 917,000 | 33,000 | |||||||||||||||||||||
ProFund VP Utilities | 113,000 | 213,000 | 99,000 | 66,000 | 173,000 | 7,000 | |||||||||||||||||||||
$ | 41,743,000 | $ | 78,615,000 | $ | 36,828,000 | $ | 24,535,000 | $ | 63,875,000 | $ | 2,023,000 | ||||||||||||||||
Each repurchase agreement was fully collateralized by U.S. government securities as of June 30, 2024 as follows:
(1) U.S. Treasury Notes, 4.125%, due 1/31/2025, U.S. Treasury Inflation-Protected Securities (TIPS), 1.625%, due 10/15/2027, which had an aggregate value of $42,619,228.
(2) U.S. Treasury Bonds, 4.00%, due 11/15/2042, total value $80,191,447.
(3) U.S. Treasury Notes, 2.375 to 2.625%, due 12/31/2025 to 4/30/2026, which had an aggregate value of $37,568,793.
(4) U.S. Treasury Floating Rate Notes, coupon rate in effect at June 30, 2024, 5.44%, due 10/31/2024, total value $25,030,208.
(5) U.S. Treasury Notes, 2.75% to 3.875%, due 8/15/2032 to 8/15/2033, which had an aggregate value of $65,156,684.
(6) U.S. Treasury Notes, 4.25%, due 1/31/2026, total value $2,068,174.
Investments in Other Investment Companies
Each non money-market ProFund VP may invest in other investment companies, including exchange-traded funds ("ETFs") and unit investment trusts ("UITs"), to the extent that such an investment would be consistent with the requirements of the 1940 Act. If the ProFund VP invests in, and thus, is a shareholder of, another investment company, the ProFund VP's shareholders will indirectly bear the ProFund VP's proportionate share of the
fees and expenses paid by such other investment company, including advisory fees, in addition to both the management fees payable directly by the ProFund VP to the ProFund VP's own investment adviser and the other expenses that the ProFund VP bears directly in connection with the ProFund VP's own operations. Because most ETFs are investment companies, the ProFund VP's investments in such investment companies generally would be limited under applicable federal statutory provisions. Those provisions typically restrict the ProFund VP's investment in the
June 30, 2024 (unaudited) :: Notes to Financial Statements :: 247
shares of another investment company to up to 5% of its assets (which may represent no more than 3% of the securities of such other investment company) and limit aggregate investments in all investment companies to 10% of assets. The ProFund VP may invest in certain ETFs in excess of the statutory limit in reliance on Rule 12d1-4. Rule 12d1-4 outlines the requirements of fund of funds agreements and specifies the responsibilities of the board related to "funds of funds" arrangements.
Depositary Receipts
Each non-money market ProFund VP, may invest in American Depositary Receipts ("ADRs"), New York Shares ("NYSs") and Global Depositary Receipts ("GDRs"). ADRs represent the right to receive securities of foreign issuers deposited in a bank or corresponding bank. ADRs are an alternative to purchasing the underlying securities in their national markets and currencies. For many foreign securities, U.S. dollar-denominated ADRs, which are traded in the United States on exchanges or over-the-counter ("OTC"), are issued by domestic banks. NYSs (or "direct shares") are foreign stocks denominated in U.S. dollars that trade on American exchanges without being converted to ADRs. GDRs are receipts for shares in a foreign-based corporation traded in capital markets around the world.
Real Estate Investment Trusts
Each non-money market ProFund VP (other than the Non-Equity ProFunds VP) may invest in real estate investment trusts ("REITs") which report information on the source of their distributions annually. Equity REITs invest primarily in real property while mortgage REITs invest in constructions, development, and long-term mortgage loans. Their value may be affected by changes in the value of the underlying property of the REITs, the creditworthiness of the issuer, property taxes, interest rates, and tax regulatory requirements, such as those relating to the environment. REITs are dependent upon management skill, are not diversified and are subject to heavy cash flow dependency, default by borrowers, self-liquidation, the possibility of failing to qualify for tax-free pass-through of income under the Internal Revenue Code of 1986, as amended, and the possibility of failing to maintain exempt status under the 1940 Act. Certain distributions received from REITs during the year are recorded as realized gains or return of capital when such information becomes known.
Derivative Instruments
In seeking to achieve each ProFund VP's investment objective, the Advisor uses a mathematical approach to investing. Using this approach, the Advisor determines the type, quantity and mix of investment positions. Certain ProFunds VP may obtain investment exposure through derivative instruments such as futures contracts, forward currency contracts and swap agreements that a ProFund VP should hold to approximate the daily performance, inverse performance, or multiple thereof, as applicable, of its benchmark. All derivative instruments held during the period ended June 30, 2024 were utilized to gain exposure or inverse exposure to each ProFund VP's benchmark (e.g., index, etc.) to meet its investment objective.
The ProFund Access VP High Yield maintains exposure to the high yield market (i.e., U.S. corporate high yield debt market),
regardless of market conditions. This means ProFund Access VP High Yield does not adopt defensive positions in cash or other instruments in anticipation of an adverse market climate. The ProFund Access VP High Yield invests primarily in derivatives, money market instruments, and U.S. Treasury obligations that the Advisor believes, in combination, should provide investment results that correspond to the high yield market. During the period ended June 30, 2024, the ProFund Access VP High Yield held credit default swap agreements for credit exposure to the high yield market and futures contracts and/or treasury notes for interest rate exposure to meet the ProFund Access VP High Yield's investment objective.
Each non-money market ProFund VP, other than the Classic ProFunds VP, the Sector ProFunds VP and the ProFund VP Falling U.S. Dollar, does not seek to achieve its investment objective over a period of time greater than a single day.
All open derivative positions at period end are reflected on each respective ProFund VP's Schedule of Portfolio Investments. The volume associated with derivative positions varies on a daily basis as each ProFund VP transacts in derivative contracts in order to achieve the appropriate exposure, as expressed in notional amount (contract value for forward currency contracts), in comparison to net assets consistent with each ProFund VP's investment objective.
Certain ProFunds VP utilized a varying level of derivative instruments in conjunction with the investment securities to meet their investment objective during the period ended June 30, 2024. With the exception of the ProFunds VP listed below, the notional amount of open derivative positions relative to each ProFund VP's net assets at year end is generally representative of the notional amount of open positions to net assets throughout the year. The volume associated with swap agreements in the ProFund VP Emerging Markets, ProFund VP Semiconductor, and ProFund VP Small-Cap was 8%, 19%, and 20%, respectively, based on average monthly notional amounts in comparison to net assets during the period ended June 30, 2024.
In connection with its management of certain series of the Trust included in this report (ProFund VP UltraShort Dow 30 and ProFund VP UltraShort Nasdaq-100 (the "Commodity Pools")), the Advisor is registered as a commodity pool operator (a "CPO") and the Commodity Pools are commodity pools under the Commodity Exchange Act (the "CEA"). The Advisor also registered as a commodity trading advisor (a "CTA") under the CEA as a result of its role as subadvisor to funds outside the Trust. Accordingly, the Advisor is subject to registration and regulation as a CPO and CTA under the CEA and must comply with various regulatory requirements under the CEA and the rules and regulations of the Commodity Futures Trading Commission ("CFTC") and the National Futures Association ("NFA"), including investor protection requirements, antifraud provisions, disclosure requirements and reporting and recordkeeping requirements. The Advisor is also subject to periodic inspections and audits by the CFTC and NFA. Compliance with these regulatory requirements could adversely affect the Commodity Pools' total return. In this regard, any further amendment to the CEA or its related regulations that subject the Advisor or the Commodity Pools to additional regulation may have adverse impacts on the Commodity Pools' operations and expenses.
248 :: Notes to Financial Statements :: June 30, 2024 (unaudited)
The following is a description of the derivative instruments utilized by the ProFunds VP, including certain risks related to each instrument type.
Futures Contracts
Each non-money market ProFund VP may purchase or sell futures contracts as a substitute for a comparable market position in the underlying securities or to satisfy regulatory requirements. A cash-settled futures contract obligates the seller to deliver (and the purchaser to accept) an amount of cash equal to a specific dollar amount (the contract multiplier) multiplied by the difference between the final settlement price of a specific futures contract and the price at which the agreement is made. No physical delivery of the underlying asset is made.
Each ProFund VP generally engages in closing or offsetting transactions before final settlement of a futures contract, wherein a second identical futures contract is sold to offset a long position (or bought to offset a short position). In such cases, the obligation is to deliver (or take delivery of) cash equal to a specific dollar amount (the contract multiplier) multiplied by the difference between the price of the offsetting transaction and the price at which the original contract was entered into. If the original position entered into is a long position (futures contract purchased), there will be a gain (loss) if the offsetting sell transaction is carried out at a higher (lower) price, inclusive of commissions. If the original position entered into is a short position (futures contract sold), there will be a gain (loss) if the offsetting buy transaction is carried out at a lower (higher) price, inclusive of commissions.
Whether a ProFund VP realizes a gain or loss from futures activities depends generally upon movements in the underlying currency, commodity, security, or index. The extent of a ProFund VP's loss from an unhedged short position in futures contracts is potentially unlimited and investors may lose the amount that they invest plus any profits recognized on that investment. Each ProFund VP will engage in transactions in futures contracts that are traded on a U.S. exchange or board of trade or that have been approved for sale in the U.S. by the CFTC.
Upon entering into a futures contract, each ProFund VP will be required to deposit with the broker an amount of cash or cash equivalents in the range of approximately 5% to 10% of the contract amount for equity index futures and in the range of approximately 1% to 3% of the contract amount for treasury futures (this amount is subject to change by the exchange on which the contract is traded). This amount, known as "initial margin," is in the nature of a performance bond or good faith deposit on the contract and is returned to the ProFund VP upon termination of the futures contract, assuming all contractual obligations have been satisfied. Subsequent payments, known as "variation margin," to and from the broker will be made daily as the price of the asset underlying the futures contract fluctuates, making the long and short positions in the futures contract more or less valuable, a process known as "marking-to-market." At any time prior to expiration of a futures contract, a ProFund VP may elect to close its position by taking an opposite position, which will operate to terminate the ProFund VP's existing position in the contract.
The primary risks associated with the use of futures contracts are imperfect correlation between movements in the price of futures and the market value of the underlying assets, and the possibility of an illiquid market for a futures contract. Although each ProFund VP intends to sell futures contracts only if there is an active market for such contracts, no assurance can be given that a liquid market will exist for any particular contract at any particular time. Many futures exchanges and boards of trade limit the amount of fluctuation permitted in futures contract prices during a single trading day. Once the daily limit has been reached in a particular contract, no trades may be made that day at a price beyond that limit or trading may be suspended for specified periods during the day. Futures contract prices could move to the limit for several consecutive trading days with little or no trading, thereby preventing prompt liquidation of futures positions and potentially subjecting a ProFund VP to substantial losses. If trading is not possible, or if a ProFund VP determines not to close a futures position in anticipation of adverse price movements, the ProFund VP will be required to make daily cash payments of variation margin. The risk that the ProFund VP will be unable to close out a futures position will be minimized by entering into such transactions on a national exchange with an active and liquid secondary market. In addition, although the counterparty to a futures contract is often a clearing organization, backed by a group of financial institutions, there may be instances in which the counterparty could fail to perform its obligations, causing significant losses to a ProFund VP.
Forward Currency Contracts
The ProFund VP Falling U.S. Dollar may invest in forward currency contracts for investment or risk management purposes. A forward currency contract is an obligation to buy or sell a specific currency at a future date, which may be any fixed number of days from the date of the contract agreed upon by the parties, at a price set at the time of the contract. These contracts are entered into on the interbank market conducted directly between currency traders (usually large commercial banks) and their customers.
It is possible that, under certain circumstances, this ProFund VP may have to limit its currency transactions to qualify as a "regulated investment company" ("RIC") under the Internal Revenue Code. The ProFund VP Falling U.S. Dollar does not intend to enter into a forward currency contract with a term of more than one year, or to engage in position hedging with respect to the currency of a particular country to more than the aggregate market value (at the time the hedging transaction is entered into) of their portfolio securities denominated in (or quoted in or currently convertible into or directly related through the use of forward currency contracts in conjunction with money market instruments to) that particular currency.
At or before the maturity of a forward currency contract, the ProFund VP Falling U.S. Dollar may either sell a portfolio security and make delivery of the currency, or retain the security and terminate its contractual obligation to deliver the currency by buying an "offsetting" contract obligating it to buy, on the same maturity date, the same amount of the currency. If this ProFund VP engages in an offsetting transaction, it may later enter into a new forward currency contract to sell the currency.
June 30, 2024 (unaudited) :: Notes to Financial Statements :: 249
If the ProFund VP Falling U.S. Dollar engages in offsetting transactions it will incur a gain or loss, to the extent that there has been movement in forward currency contract prices. If forward prices go down during the period between the date the ProFund VP Falling U.S. Dollar enters into a forward currency contract for the sale of a currency and the date it enters into an offsetting contract for the purchase of the currency, the ProFund VP will realize a gain to the extent that the price of ProFund VP currency it has agreed to sell exceeds the price of the currency it has agreed to buy. If forward prices go up, the ProFund VP will suffer a loss to the extent the price of the currency it has agreed to buy exceeds the price of the currency it has agreed to sell.
The ProFund VP Falling U.S. Dollar collateralizes forward currency contracts with cash and certain securities as indicated on the Statement of Assets and Liabilities and the Schedule of Portfolio Investments, respectively. Such collateral is held for the benefit of the counterparty in a segregated tri-party account at the custodian, to protect the counterparty against non-payment by the respective ProFund VP. Similarly, the ProFund VP Falling U.S. Dollar has sought to mitigate credit risk by generally requiring that the counterparties to the ProFund VP post collateral for the benefit of the ProFund VP in a segregated account at the custodian, marked to market daily, in an amount equal to what the counterparty owes the ProFund VP, subject to certain minimum thresholds. In the event of a default by the counterparty, the ProFund VP will seek withdrawal of this collateral from the segregated account and may incur certain costs exercising its right with respect to the collateral. If a counterparty becomes bankrupt or fails to perform its obligations, the ProFund VP Falling U.S. Dollar may experience significant delays in obtaining any recovery in a bankruptcy or other reorganization proceeding. The ProFund VP Falling U.S. Dollar may obtain only limited recovery or may obtain no recovery in such circumstances. The ProFund VP Falling U.S. Dollar will enter into forward currency contracts only with financial institutions that meet the credit quality standards and monitoring policies established by the Advisor. As of June 30, 2024, there was no collateral posted by counterparties.
Credit Default Swap ("CDS") Agreements
As of June 30, 2024, the ProFund Access VP High Yield invested in centrally cleared CDS as a substitute for investing directly in bonds in order to gain credit exposure to the high yield market.
In a CDS, the agreement will reference one or more debt securities or reference entities. The protection "buyer" in a credit default contract is generally obligated to pay the protection "seller" a periodic stream of payments over the term of the contract until a credit event, such as a default, on a reference entity has occurred. If a credit event occurs, the seller generally must pay the buyer: a) the full notional value of the swap; or b) the difference between the notional value of the defaulted reference entity and the recovery price/rate for the defaulted reference entity. CDS are designed to reflect changes in credit quality, including events of default. A CDS may require premium (discount) payments as well as daily payments (receipts) related to the interest leg of the swap or to the default or change in price of a reference entity.
The counterparty risk for cleared swap agreements is generally lower than for uncleared over-the-counter swap agreements because, generally, a clearing organization becomes substituted for
each counterparty to a cleared swap agreement and, in effect, guarantees each party's performance under the contract as each party to a trade looks only to the clearing organization for performance of financial obligations. However, there can be no assurance that the clearing organization, or its members, will satisfy its obligations to the ProFund Access VP High Yield.
If the ProFund Access VP High Yield is a seller of a CDS contract (also referred to as a seller of protection or as a buyer of risk), the ProFund Access VP High Yield would be required to pay the par (or other agreed upon) value of a referenced obligation to the counterparty in the event of a default or other credit event. In return, the ProFund Access VP High Yield would receive from the counterparty a daily stream of payments over the term of the contract provided that no event of default has occurred. If no default occurs, the ProFund Access VP High Yield would keep the stream of payments and would have no payment obligations. As the seller, the ProFund Access VP High Yield would be subject to investment exposure on the notional amount of the swap.
If the ProFund Access VP High Yield is a buyer of a CDS contract (also referred to as a buyer of protection or a seller of risk), the ProFund Access VP High Yield would have the right to deliver a reference obligation and receive the par (or other agreed-upon) value of such obligation from the counterparty in the event of a default or other credit event (such as a credit downgrade). In return, the ProFund Access VP High Yield would pay the counterparty a daily stream of payments over the term of the contract provided that no event of default has occurred. If no default occurs, the counterparty would keep the stream of payments and would have no further obligations to the ProFund Access VP High Yield.
The ProFund Access VP High Yield enters into a CDS with multiple reference entities, in which case payments and settlements in respect of any defaulting reference entity would typically be dealt with separately from the other reference entities.
Upon entering into a centrally cleared CDS, the ProFund Access VP High Yield may be required to deposit with the broker an amount of cash or cash equivalents in the range of approximately 6% to 10% of the notional amount for CDS on high yield debt issuers (this amount is subject to change by the clearing organization that clears the trade). This amount, known as "initial margin," is in the nature of a performance bond or good faith deposit on the CDS and is returned to the ProFund Access VP High Yield upon termination of the CDS, assuming all contractual obligations have been satisfied. Subsequent payments, known as "variation margin," to and from the broker will be made daily as the price of the CDS fluctuates, making the long and short positions in the CDS contract more or less valuable, a process known as "marking-to-market." The premium (discount) payments are built into the daily price of the CDS and thus are amortized through the variation margin. The variation margin payment also includes the daily portion of the periodic payment stream.
Swap Agreements (other than CDS)
Each non-money market ProFund VP may enter into swap agreements to gain exposure to an underlying asset without actually purchasing such asset (or shorting such asset), or to hedge a position, including in circumstances in which direct investment is restricted for legal reasons or is otherwise impracticable. Swap
250 :: Notes to Financial Statements :: June 30, 2024 (unaudited)
agreements are two-party contracts entered into primarily by institutional investors for periods ranging from a day to more than one year. In a standard "swap" transaction, two parties agree to exchange the return (or differentials in rates of return) earned or realized on particular pre-determined investments or instruments. The gross return to be exchanged or "swapped" between the parties is calculated with respect to a "notional amount," e.g., the return on or increase in value of a particular dollar amount invested in a "basket" of securities or an ETF representing a particular index or group of securities.
On a typical long swap, the counterparty will generally agree to pay the ProFund VP the amount, if any, by which the notional amount of the swap agreement would have increased in value had it been invested in the particular underlying assets (e.g., securities comprising the relevant benchmark index), plus the dividends or interest that would have been received on those assets. The ProFund VP will agree to pay to the counterparty a floating rate of interest on the notional amount of the swap agreement plus the amount, if any, by which the notional amount would have decreased in value had it been invested in such assets, plus, in certain circumstances, commissions or trading spreads on the notional amount. Therefore, the return to the ProFund VP on any swap agreement should be the gain or loss on the notional amount plus dividends or interest on the assets less the interest paid by the ProFund VP on the notional amount. As a trading technique, the Advisor may substitute physical securities with a swap agreement having investment characteristics substantially similar to the underlying securities. Some ProFunds VP may also enter into swap agreements that provide the opposite return of their benchmark or security ("short" the benchmark or security). Their operations are similar to that of the swaps disclosed above except that the counterparty pays interest to each ProFund VP on the notional amount outstanding and that dividends or interest on the underlying instruments reduce the value of the swap, plus, in certain instances, each ProFund VP will agree to pay to the counterparty commissions or trading spreads on the notional amount.
Most swap agreements entered into by a ProFund VP calculate and settle the obligations of the parties to the agreement on a "net basis" with a single payment. Consequently, a ProFund VP's current obligations (or rights) under a swap agreement will generally be equal only to the net amount to be paid or received under the agreement based on the relative values of the positions held by each party to the agreement (the "net amount"). When investing in index swap agreements, the ProFunds VP may hold or gain exposure to only a representative sample of securities in the index, or to a component of the index.
A ProFund VP's current obligations under a swap agreement, will be accrued daily (offset against any amounts owed to the ProFund VP) and any accrued but unpaid net amounts owed to a swap counterparty will be covered by segregating or earmarking cash and/or securities determined to be liquid, but typically no payments will be made until the settlement date. Each ProFund VP reserves the right to modify its asset segregation policies in the future, including modifications to comply with any changes in the positions articulated by the SEC or its staff regarding asset segregation. Swap agreements that cannot be terminated of in the ordinary course of business within seven days at approximately the amount a ProFund VP has valued the asset may be considered
to be illiquid for purposes of a ProFund VP's illiquid investment limitations.
A ProFund VP bears the risk of loss of the amount expected to be received under a swap agreement in the event of the default or bankruptcy of a swap agreement counterparty. If such a default occurs, a ProFund VP will have contractual remedies pursuant to the swap agreements, but such remedies may be subject to bankruptcy and insolvency laws that could affect the ProFund VP's rights as a creditor. A ProFund VP will only enter into swap agreements with counterparties that meet the ProFund VP's standard of creditworthiness (generally, such counterparties would have to be eligible counterparties under the terms of the ProFund VP's repurchase agreement guidelines). The counterparty to an uncleared swap agreement will typically be a major, global financial institution.
Payments may be made at the conclusion of a swap agreement. Swap agreements do not involve the delivery of securities or other underlying assets. Accordingly, the risk of loss with respect to swap agreements is limited to the net amount of payments that a ProFund VP is contractually obligated to make. If the other party to a swap agreement defaults, a ProFund VP's risk of loss consists of the net amount of payments that such ProFund VP is contractually entitled to receive, if any. The net amount of the excess, if any, of a ProFund VP's obligations over its entitlements with respect to each equity swap will be accrued on a daily basis and an amount of cash or liquid assets, having an aggregate NAV at least equal to such accrued excess will be earmarked or segregated by a ProFund VP's custodian.
In the normal course of business, a ProFund VP enters into International Swap Dealers Association, Inc. ("ISDA") agreements with certain counterparties for derivative transactions. These agreements contain, among other conditions, events of default and termination events, and various covenants and representations. Certain of the ProFund VP's ISDA agreements contain provisions that require the ProFund VP to maintain a pre-determined level of net assets, and/or provide limits regarding the decline of the ProFund VP's NAV over specific periods of time, which may or may not be exclusive of redemptions. If the ProFund VP were to trigger such provisions and have open derivative positions, at that time counterparties to the ISDA agreements could elect to terminate such ISDA agreements and request immediate payment in an amount equal to the net liability positions, if any, under the relevant ISDA agreement. Pursuant to the terms of its ISDA agreements, the ProFund VP will have already collateralized its liability under such agreements, in some cases only in excess of certain threshold amounts. Such collateral is held for the benefit of the counterparty in a segregated tri-party account at the custodian, to protect the counterparty against non-payment by the respective ProFund VP. The ProFunds VP seek to mitigate risks by generally requiring that the counterparties for each ProFund VP agree to post collateral for the benefit of the ProFund VP, marked to market daily, in an amount approximately equal to what the counterparty owes the ProFund VP, subject to certain minimum thresholds, although the ProFunds VP may not always be successful. To the extent any such collateral is insufficient or there are delays in accessing the collateral, the ProFunds VP will be exposed to the risks described above, including possible delays in recovering amounts as a result of bankruptcy proceedings.
June 30, 2024 (unaudited) :: Notes to Financial Statements :: 251
The use of swaps, including CDS, is a highly specialized activity which involves investment techniques and risks in addition to and in some cases different from those associated with ordinary portfolio securities transactions. The primary risks associated with the use of swap agreements are mispricing or improper valuation, imperfect correlation between movements in the notional amount and the price of the underlying investments, and the inability of the counterparties to perform. If a counterparty's creditworthiness for an over-the-counter swap declines, the value of the swap would likely decline. The Advisor, under the supervision of the Trust's Board of Trustees, is responsible for determining and monitoring the liquidity of a ProFund VP's transactions in swap agreements.
Offsetting Assets and Liabilities
The ProFunds VP are subject to master netting agreements for swap agreements (other than centrally cleared CDS) and forward currency contracts that allow for amounts owed between the ProFund VP and the counterparty to be netted upon early termination. The party that has the larger payable pays the excess of the larger amount over the smaller amount to the other party. The master netting agreements do not apply to amounts owed to/from different counterparties.
As described above, the ProFunds VP utilize derivative instruments to achieve their investment objective during the period. The amounts shown in the Statements of Assets and Liabilities generally do not take into consideration the effects of legally enforceable master netting agreements.
Summary of Derivative Instruments
The following table summarizes the fair values of derivative instruments on the ProFund VP's Statement of Assets and Liabilities, categorized by risk exposure, as of June 30, 2024.
Assets | Liabilities | ||||||||||||||||||||||||||
Fund | Variation Margin on Futures Contracts* | Unrealized Appreciation on Swap Agreements* | Unrealized Appreciation on Forward Currency Contracts | Variation Margin on Futures Contracts* | Unrealized Depreciation on Swap Agreements* | Unrealized Depreciation on Forward Currency Contracts | |||||||||||||||||||||
Credit Risk Exposure: | |||||||||||||||||||||||||||
ProFund Access VP High Yield | $ | — | $ | — | $ | — | $ | — | $ | 82,772 | $ | — | |||||||||||||||
Equity Risk Exposure: | |||||||||||||||||||||||||||
ProFund VP Banks | — | 1,108 | — | — | — | — | |||||||||||||||||||||
ProFund VP Bear | — | 5,611 | — | 1,450 | — | — | |||||||||||||||||||||
ProFund VP Biotechnology | — | — | — | — | 11,095 | — | |||||||||||||||||||||
ProFund VP Bull | 10,100 | — | — | — | 26,606 | — | |||||||||||||||||||||
ProFund VP Communication Services | — | 1,486 | — | — | — | — | |||||||||||||||||||||
ProFund VP Consumer Discretionary | — | 2,297 | — | — | — | — | |||||||||||||||||||||
ProFund VP Consumer Staples | — | — | — | — | 2,563 | — | |||||||||||||||||||||
ProFund VP Dow 30 | — | — | — | — | 514 | — | |||||||||||||||||||||
ProFund VP Emerging Markets | — | 29 | — | — | 362 | — | |||||||||||||||||||||
ProFund VP Energy | — | — | — | — | 2,215 | — | |||||||||||||||||||||
ProFund VP Financials | — | — | — | — | 6,182 | — | |||||||||||||||||||||
ProFund VP Health Care | — | — | — | — | 5,144 | — | |||||||||||||||||||||
ProFund VP Industrials | — | — | — | — | 2,985 | — | |||||||||||||||||||||
ProFund VP International | — | 15,437 | — | — | — | — | |||||||||||||||||||||
ProFund VP Internet | — | 6,968 | — | — | — | — | |||||||||||||||||||||
ProFund VP Japan | 383,020 | 1,245 | — | — | — | — | |||||||||||||||||||||
ProFund VP Materials | — | — | — | — | 1,403 | — | |||||||||||||||||||||
ProFund VP Mid-Cap | — | 27,589 | — | 14,761 | — | — | |||||||||||||||||||||
ProFund VP Nasdaq-100 | 153,011 | — | — | — | 209,726 | — | |||||||||||||||||||||
ProFund VP Pharmaceuticals | — | — | — | — | 3,516 | — | |||||||||||||||||||||
ProFund VP Precious Metals | — | — | — | — | 106,800 | — | |||||||||||||||||||||
ProFund VP Real Estate | — | — | — | — | 698 | — | |||||||||||||||||||||
ProFund VP Semiconductor | — | 95,739 | — | — | — | — | |||||||||||||||||||||
ProFund VP Short Dow 30 | — | 8 | — | — | — | — | |||||||||||||||||||||
ProFund VP Short Emerging Markets | — | — | — | — | 31 | — | |||||||||||||||||||||
ProFund VP Short International | — | — | — | — | 1,191 | — | |||||||||||||||||||||
ProFund VP Short Mid-Cap | — | — | — | — | 245 | — | |||||||||||||||||||||
ProFund VP Short Nasdaq-100 | — | 11,673 | — | 3,404 | — | — | |||||||||||||||||||||
ProFund VP Short Small-Cap | 1,781 | — | — | — | 14,233 | — | |||||||||||||||||||||
ProFund VP Small-Cap | — | 3,302 | — | 3,578 | — | — | |||||||||||||||||||||
ProFund VP Technology | — | 6,802 | — | — | — | — | |||||||||||||||||||||
ProFund VP UltraBull | 10,100 | — | — | — | 83,420 | — | |||||||||||||||||||||
ProFund VP UltraMid-Cap | — | 35,518 | — | 11,809 | — | — | |||||||||||||||||||||
ProFund VP UltraNasdaq-100 | 227,816 | — | — | — | 1,549,929 | — | |||||||||||||||||||||
252 :: Notes to Financial Statements :: June 30, 2024 (unaudited)
Assets | Liabilities | ||||||||||||||||||||||||||
Fund | Variation Margin on Futures Contracts* | Unrealized Appreciation on Swap Agreements* | Unrealized Appreciation on Forward Currency Contracts | Variation Margin on Futures Contracts* | Unrealized Depreciation on Swap Agreements* | Unrealized Depreciation on Forward Currency Contracts | |||||||||||||||||||||
ProFund VP UltraShort Dow 30 | $ | — | $ | 8 | $ | — | $ | — | $ | — | $ | — | |||||||||||||||
ProFund VP UltraShort Nasdaq-100 | — | 17,354 | — | — | — | — | |||||||||||||||||||||
ProFund VP UltraSmall-Cap | — | 68,614 | — | 4,367 | — | — | |||||||||||||||||||||
ProFund VP Utilities | — | — | — | — | 10,692 | — | |||||||||||||||||||||
Foreign Exchange Rate Risk Exposure: | |||||||||||||||||||||||||||
ProFund VP Falling U.S. Dollar | — | — | 584 | — | — | 7,318 | |||||||||||||||||||||
Interest Rate Risk Exposure: | |||||||||||||||||||||||||||
ProFund Access VP High Yield | 12,762 | — | — | — | — | — | |||||||||||||||||||||
ProFund VP Rising Rates Opportunity | — | 235,093 | — | — | — | — | |||||||||||||||||||||
ProFund VP U.S. Government Plus | — | — | — | — | 110,981 | — | |||||||||||||||||||||
* Includes cumulative appreciation/depreciation of futures contracts and credit default swap agreements as reported in the Schedules of Portfolio Investments. Only current day's variation margin is reported within the Statements of Assets and Liabilities.
The following table presents the effect of derivative instruments on the ProFund VP's Statement of Operations, categorized by risk exposure, for the period ended June 30, 2024.
| Realized Gain (Loss) on Derivatives Recognized as a Result from Operations | Change in Net Unrealized Appreciation/ Depreciation on Derivatives Recognized as a Result from Operations | ||||||||||||||||||||||||||
Fund | Net Realized Gains (Losses) on Futures Contracts | Net Realized Gains (Losses) on Swap Agreements | Net Realized Gains (Losses) on Forward Currency Contracts | Change in Net Unrealized Appreciation/ Depreciation on Futures Contracts | Change in Net Unrealized Appreciation/ Depreciation on Swap Agreements | Change in Net Unrealized Appreciation/ Depreciation on Forward Curency Contracts | |||||||||||||||||||||
Credit Risk Exposure: | |||||||||||||||||||||||||||
ProFund Access VP High Yield | $ | — | $ | 985,370 | $ | — | $ | — | $ | (642,796 | ) | $ | — | ||||||||||||||
Equity Risk Exposure: | |||||||||||||||||||||||||||
ProFund VP Banks | — | (11,442 | ) | — | — | 3,090 | — | ||||||||||||||||||||
ProFund VP Bear | (53,290 | ) | (211,058 | ) | — | 18,029 | (1,240 | ) | — | ||||||||||||||||||
ProFund VP Biotechnology | — | 30,967 | — | — | (6,780 | ) | — | ||||||||||||||||||||
ProFund VP Bull | 379,609 | 910,357 | — | (106,696 | ) | (756 | ) | — | |||||||||||||||||||
ProFund VP Communication Services | — | 33,641 | — | — | 2,307 | — | |||||||||||||||||||||
ProFund VP Consumer Discretionary | — | (13,477 | ) | — | — | 4,375 | — | ||||||||||||||||||||
ProFund VP Consumer Staples | — | 9,449 | — | — | (4,032 | ) | — | ||||||||||||||||||||
ProFund VP Dow 30 | — | 6,545 | — | — | (694 | ) | — | ||||||||||||||||||||
ProFund VP Emerging Markets | — | (36,918 | ) | — | — | (4,730 | ) | — | |||||||||||||||||||
ProFund VP Energy | — | (971 | ) | — | — | 31,230 | — | ||||||||||||||||||||
ProFund VP Financials | — | 72,360 | — | — | (7,922 | ) | — | ||||||||||||||||||||
ProFund VP Health Care | — | 108,995 | — | — | (11,877 | ) | — | ||||||||||||||||||||
ProFund VP Industrials | — | 19,685 | — | — | (2,836 | ) | — | ||||||||||||||||||||
ProFund VP International | — | 188,041 | — | — | 49,806 | — | |||||||||||||||||||||
ProFund VP Internet | — | 23,799 | — | — | 8,333 | — | |||||||||||||||||||||
ProFund VP Japan | 1,674,964 | 33,417 | — | 445,529 | 2,039 | — | |||||||||||||||||||||
ProFund VP Materials | — | 4,881 | — | — | 233 | — | |||||||||||||||||||||
ProFund VP Mid-Cap | 140,268 | 43,266 | — | (98,911 | ) | 113,312 | — | ||||||||||||||||||||
ProFund VP Nasdaq-100 | 3,017,907 | 4,485,385 | — | (758,668 | ) | (47,987 | ) | — | |||||||||||||||||||
ProFund VP Pharmaceuticals | — | 10,851 | — | — | (4,987 | ) | — | ||||||||||||||||||||
ProFund VP Precious Metals | — | 1,112,471 | — | — | 321,191 | — | |||||||||||||||||||||
ProFund VP Real Estate | — | (15,454 | ) | — | — | (902 | ) | — | |||||||||||||||||||
ProFund VP Semiconductor | — | 323,822 | — | — | 103,838 | — | |||||||||||||||||||||
ProFund VP Short Dow 30 | — | (167 | ) | — | — | 12 | — | ||||||||||||||||||||
ProFund VP Short Emerging Markets | — | (27,694 | ) | — | — | 1,248 | — | ||||||||||||||||||||
ProFund VP Short International | — | (11,141 | ) | — | — | (2,809 | ) | — | |||||||||||||||||||
ProFund VP Short Mid-Cap | — | (4,513 | ) | — | — | (897 | ) | — | |||||||||||||||||||
ProFund VP Short Nasdaq-100 | (129,347 | ) | (341,831 | ) | — | 33,065 | (9,580 | ) | — | ||||||||||||||||||
June 30, 2024 (unaudited) :: Notes to Financial Statements :: 253
| Realized Gain (Loss) on Derivatives Recognized as a Result from Operations | Change in Net Unrealized Appreciation/ Depreciation on Derivatives Recognized as a Result from Operations | ||||||||||||||||||||||||||
Fund | Net Realized Gains (Losses) on Futures Contracts | Net Realized Gains (Losses) on Swap Agreements | Net Realized Gains (Losses) on Forward Currency Contracts | Change in Net Unrealized Appreciation/ Depreciation on Futures Contracts | Change in Net Unrealized Appreciation/ Depreciation on Swap Agreements | Change in Net Unrealized Appreciation/ Depreciation on Forward Curency Contracts | |||||||||||||||||||||
ProFund VP Short Small-Cap | $ | (15,679 | ) | $ | (31,827 | ) | $ | — | $ | 18,600 | $ | (56,364 | ) | $ | — | ||||||||||||
ProFund VP Small-Cap | 31,250 | (291,847 | ) | — | (37,181 | ) | 101,119 | — | |||||||||||||||||||
ProFund VP Technology | — | 80,523 | — | — | 8,354 | — | |||||||||||||||||||||
ProFund VP UltraBull | 261,231 | 2,406,908 | — | (48,298 | ) | (17,634 | ) | — | |||||||||||||||||||
ProFund VP UltraMid-Cap | 112,214 | (7,570 | ) | — | (79,129 | ) | 174,608 | — | |||||||||||||||||||
ProFund VP UltraNasdaq-100 | 4,280,031 | 29,089,917 | — | (683,863 | ) | (345,714 | ) | — | |||||||||||||||||||
ProFund VP UltraShort Dow 30 | — | (180 | ) | — | — | 12 | — | ||||||||||||||||||||
ProFund VP UltraShort Nasdaq-100 | — | (316,275 | ) | — | — | 11,382 | — | ||||||||||||||||||||
ProFund VP UltraSmall-Cap | 14,236 | (1,067,475 | ) | — | (29,569 | ) | 505,674 | — | |||||||||||||||||||
ProFund VP Utilities | — | 46,797 | — | — | (13,752 | ) | — | ||||||||||||||||||||
Foreign Exchange Rate Risk Exposure: | |||||||||||||||||||||||||||
ProFund VP Falling U.S. Dollar | — | — | (734 | ) | — | — | (31,120 | ) | |||||||||||||||||||
Interest Rate Risk Exposure: | |||||||||||||||||||||||||||
ProFund Access VP High Yield | (31,327 | ) | — | — | (35,764 | ) | — | — | |||||||||||||||||||
ProFund VP Rising Rates Opportunity | — | 453,879 | — | — | 325,658 | — | |||||||||||||||||||||
ProFund VP U.S. Government Plus | 2,051 | (510,304 | ) | — | — | (147,188 | ) | — | |||||||||||||||||||
Asset (Liability) amounts shown in the table below represent amounts owed to (by) the ProFunds VP for swap agreements (other than centrally cleared CDS) and forward currency contracts as of June 30, 2024. These amounts may be collateralized by cash or financial instruments, segregated for the benefit of the ProFunds VP or the counterparties, depending on whether the related contracts are in an appreciated or depreciated position at period end. Amounts shown in the column labeled "Net Amount" represent the un-collateralized portions of these amounts at period end. Any un-collateralized amounts are due to timing differences related to market movements or subject to certain minimum thresholds for collateral movement, as further described above.
| Gross Amounts Not Offset in the Statement of Assets and Liabilities* | |||||||||||||||||||
| Gross Asset (Liability) as presented in the Statement of Assets and Liabilities | Financial Instruments (Received) Pledged | Cash Collateral (Received) Pledged | Net Amount | ||||||||||||||||
ProFund VP Banks | |||||||||||||||||||
Swap Agreements — Goldman Sachs International | $ | 1,108 | $ | — | $ | — | $ | 1,108 | |||||||||||
ProFund VP Bear | |||||||||||||||||||
Swap Agreements — Goldman Sachs International | 1,523 | — | — | 1,523 | |||||||||||||||
Swap Agreements — UBS AG | 4,088 | — | — | 4,088 | |||||||||||||||
ProFund VP Biotechnology | |||||||||||||||||||
Swap Agreements — Goldman Sachs International | (11,095 | ) | — | 11,095 | — | ||||||||||||||
ProFund VP Bull | |||||||||||||||||||
Swap Agreements — Goldman Sachs International | (23,688 | ) | 23,688 | — | — | ||||||||||||||
Swap Agreements — UBS AG | (2,918 | ) | 2,918 | — | — | ||||||||||||||
ProFund VP Communication Services | |||||||||||||||||||
Swap Agreements — Goldman Sachs International | 1,486 | — | — | 1,486 | |||||||||||||||
ProFund VP Consumer Discretionary | |||||||||||||||||||
Swap Agreements — Goldman Sachs International | 2,297 | — | — | 2,297 | |||||||||||||||
ProFund VP Consumer Staples | |||||||||||||||||||
Swap Agreements — Goldman Sachs International | (2,563 | ) | — | 2,563 | — | ||||||||||||||
ProFund VP Dow 30 | |||||||||||||||||||
Swap Agreements — Goldman Sachs International | (430 | ) | — | — | (430 | ) | |||||||||||||
Swap Agreements — UBS AG | (84 | ) | 84 | — | — | ||||||||||||||
ProFund VP Emerging Markets | |||||||||||||||||||
Swap Agreements — Goldman Sachs International | (362 | ) | 362 | — | — | ||||||||||||||
Swap Agreements — UBS AG | 29 | — | — | 29 | |||||||||||||||
254 :: Notes to Financial Statements :: June 30, 2024 (unaudited)
| Gross Amounts Not Offset in the Statement of Assets and Liabilities* | |||||||||||||||||||
| Gross Asset (Liability) as presented in the Statement of Assets and Liabilities | Financial Instruments (Received) Pledged | Cash Collateral (Received) Pledged | Net Amount | ||||||||||||||||
ProFund VP Energy | |||||||||||||||||||
Swap Agreements — Goldman Sachs International | $ | (2,215 | ) | $ | — | $ | 2,215 | $ | — | ||||||||||
ProFund VP Falling U.S. Dollar | |||||||||||||||||||
Forward Currency Contracts — Goldman Sachs International | |||||||||||||||||||
Appreciation | 23 | ||||||||||||||||||
Depreciation | (4,774 | ) | |||||||||||||||||
Net Depreciation | (4,571 | ) | — | — | (4,751 | ) | |||||||||||||
Forward Currency Contracts — UBS AG | |||||||||||||||||||
Appreciation | 561 | ||||||||||||||||||
Depreciation | (2,544 | ) | |||||||||||||||||
Net Depreciation | (1,983 | ) | 1,983 | — | — | ||||||||||||||
ProFund VP Financials | |||||||||||||||||||
Swap Agreements — Goldman Sachs International | (6,182 | ) | — | 6,182 | — | ||||||||||||||
ProFund VP Health Care | |||||||||||||||||||
Swap Agreements — Goldman Sachs International | (5,144 | ) | — | 5,144 | — | ||||||||||||||
ProFund VP Industrials | |||||||||||||||||||
Swap Agreements — Goldman Sachs International | (2,985 | ) | — | — | (2,985 | ) | |||||||||||||
ProFund VP International | |||||||||||||||||||
Swap Agreements — Goldman Sachs International | 8,074 | — | — | 8,074 | |||||||||||||||
Swap Agreements — UBS AG | 7,363 | — | — | 7,363 | |||||||||||||||
ProFund VP Internet | |||||||||||||||||||
Swap Agreements — Goldman Sachs International | 6,968 | — | — | 6,968 | |||||||||||||||
ProFund VP Japan | |||||||||||||||||||
Swap Agreements — Goldman Sachs International | 1,245 | — | — | 1,245 | |||||||||||||||
ProFund VP Materials | |||||||||||||||||||
Swap Agreements — Goldman Sachs International | (1,403 | ) | — | 1,403 | — | ||||||||||||||
ProFund VP Mid-Cap | |||||||||||||||||||
Swap Agreements — Goldman Sachs International | 12,441 | — | — | 12,441 | |||||||||||||||
Swap Agreements — UBS AG | 15,148 | — | — | 15,148 | |||||||||||||||
ProFund VP Nasdaq-100 | |||||||||||||||||||
Swap Agreements — Goldman Sachs International | (208,642 | ) | 208,642 | — | — | ||||||||||||||
Swap Agreements — UBS AG | (1,084 | ) | 1,084 | — | — | ||||||||||||||
ProFund VP Pharmaceuticals | |||||||||||||||||||
Swap Agreements — Goldman Sachs International | (3,516 | ) | — | 3,516 | — | ||||||||||||||
ProFund VP Precious Metals | |||||||||||||||||||
Swap Agreements — Goldman Sachs International | (51,847 | ) | 51,847 | — | — | ||||||||||||||
Swap Agreements — UBS AG | (54,953 | ) | 54,953 | — | — | ||||||||||||||
ProFund VP Real Estate | |||||||||||||||||||
Swap Agreements — Goldman Sachs International | (698 | ) | — | — | (698 | ) | |||||||||||||
ProFund VP Rising Rates Opportunity | |||||||||||||||||||
Swap Agreements — Citibank North America | 121,110 | — | — | 121,110 | |||||||||||||||
Swap Agreements — Societe' Generale | 113,983 | — | — | 113,983 | |||||||||||||||
ProFund VP Semiconductor | |||||||||||||||||||
Swap Agreements — Goldman Sachs International | 95,739 | — | — | 95,739 | |||||||||||||||
ProFund VP Short Dow 30 | |||||||||||||||||||
Swap Agreements — Goldman Sachs International | 1 | — | — | 1 | |||||||||||||||
Swap Agreements — UBS AG | 7 | — | — | 7 | |||||||||||||||
ProFund VP Short Emerging Markets | |||||||||||||||||||
Swap Agreements — Goldman Sachs International | (19 | ) | — | — | (19 | ) | |||||||||||||
Swap Agreements — UBS AG | (12 | ) | 12 | — | — | ||||||||||||||
ProFund VP Short International | |||||||||||||||||||
Swap Agreements — Goldman Sachs International | (470 | ) | 470 | — | — | ||||||||||||||
Swap Agreements — UBS AG | (721 | ) | 721 | — | — | ||||||||||||||
ProFund VP Short Mid-Cap | |||||||||||||||||||
Swap Agreements — Goldman Sachs International | (60 | ) | — | — | (60 | ) | |||||||||||||
Swap Agreements — UBS AG | (185 | ) | 185 | — | — | ||||||||||||||
ProFund VP Short Nasdaq-100 | |||||||||||||||||||
Swap Agreements — Goldman Sachs International | 3,463 | — | — | 3,463 | |||||||||||||||
Swap Agreements — UBS AG | 8,210 | — | — | 8,210 | |||||||||||||||
June 30, 2024 (unaudited) :: Notes to Financial Statements :: 255
| Gross Amounts Not Offset in the Statement of Assets and Liabilities* | |||||||||||||||||||
| Gross Asset (Liability) as presented in the Statement of Assets and Liabilities | Financial Instruments (Received) Pledged | Cash Collateral (Received) Pledged | Net Amount | ||||||||||||||||
ProFund VP Short Small-Cap | |||||||||||||||||||
Swap Agreements — Goldman Sachs International | $ | (6,153 | ) | $ | 6,153 | $ | — | $ | — | ||||||||||
Swap Agreements — UBS AG | (8,080 | ) | 8,080 | — | — | ||||||||||||||
ProFund VP Small-Cap | |||||||||||||||||||
Swap Agreements — Goldman Sachs International | 1,539 | — | — | 1,539 | |||||||||||||||
Swap Agreements — UBS AG | 1,763 | — | — | 1,763 | |||||||||||||||
ProFund VP Technology | |||||||||||||||||||
Swap Agreements — Goldman Sachs International | 6,802 | — | — | 6,802 | |||||||||||||||
ProFund VP UltraBull | |||||||||||||||||||
Swap Agreements — Goldman Sachs International | (30,885 | ) | 30,885 | — | — | ||||||||||||||
Swap Agreements — UBS AG | (52,535 | ) | 52,535 | — | — | ||||||||||||||
ProFund VP UltraMid-Cap | |||||||||||||||||||
Swap Agreements — Goldman Sachs International | 17,730 | — | — | 17,730 | |||||||||||||||
Swap Agreements — UBS AG | 17,788 | — | — | 17,788 | |||||||||||||||
ProFund VP UltraNasdaq-100 | |||||||||||||||||||
Swap Agreements — Goldman Sachs International | (1,025,908 | ) | 1,025,908 | — | — | ||||||||||||||
Swap Agreements — UBS AG | (524,021 | ) | 524,021 | — | — | ||||||||||||||
ProFund VP UltraShort Dow 30 | |||||||||||||||||||
Swap Agreements — Goldman Sachs International | 4 | — | — | 4 | |||||||||||||||
Swap Agreements — UBS AG | 4 | — | — | 4 | |||||||||||||||
ProFund VP UltraShort Nasdaq-100 | |||||||||||||||||||
Swap Agreements — Goldman Sachs International | 11,278 | — | — | 11,278 | |||||||||||||||
Swap Agreements — UBS AG | 6,076 | — | — | 6,076 | |||||||||||||||
ProFund VP UltraSmall-Cap | |||||||||||||||||||
Swap Agreements — Goldman Sachs International | 15,167 | — | — | 15,167 | |||||||||||||||
Swap Agreements — UBS AG | 53,447 | — | — | 53,447 | |||||||||||||||
ProFund VP U.S. Government Plus | |||||||||||||||||||
Swap Agreements — Citibank North America | (24,125 | ) | 24,125 | — | — | ||||||||||||||
Swap Agreements — Societe' Generale | (86,856 | ) | 45,000 | — | (41,856 | ) | |||||||||||||
ProFund VP Utilities | |||||||||||||||||||
Swap Agreements — Goldman Sachs International | (10,692 | ) | — | 10,692 | — | ||||||||||||||
* The actual financial instruments and cash collateral (received) pledged may be in excess of the amounts shown in the table. The table only reflects collateral amounts up to the amount of the financial instrument disclosed on the Statement of Assets and Liabilities.
Securities Lending
Each ProFund VP may lend securities to brokers, dealers and financial organizations in exchange for initial collateral in the amount of at least 102% of the value of U.S. dollar-denominated securities loaned or at least 105% of the value of non-U.S. dollar-denominated securities loaned, marked to market daily. Each security loaned will be secured continuously by collateral in the form of cash, money market instruments or U.S. Government securities with a market value of at least 100% of the market value of the loaned securities. When a ProFund VP lends its securities, it continues to receive payments equal to the dividends and interest paid on the securities loaned and simultaneously may earn interest on the reinvestment of the cash collateral. Any cash collateral received by the ProFund VP in connection with these loans may be reinvested in a variety of short-term investments. Any non-cash collateral received by the ProFund VP in connection with these loans may not be sold or pledged by the ProFund VP and, accordingly, is not reflected in the ProFund VP's assets and liabilities. The ProFunds VP may incur fees and expenses in connection with the reinvestment of cash collateral. For security loans collateralized by cash, borrowers may be entitled to receive
a fee based on the amount of collateral. The ProFunds VP are typically compensated by the difference between the amount earned on the reinvestment of cash collateral and any fees paid to the borrower. Although voting and other rights attendant to securities loaned pass to the borrower, such loans may be recalled so that the securities may be voted by the ProFund VP if a material event affecting the ProFund VP's investment in the securities on loan is to occur. Security loans are subject to termination by the ProFund VP or the borrower at any time. No securities loan shall be made on behalf of a ProFund VP if, as a result, the aggregate value of all securities loaned by the particular ProFund VP exceeds one-third of the value of such ProFund VP's total assets (including the value of the collateral received).
Securities lending involves exposure to certain risks, including "gap" risk (i.e., the risk of a mismatch between the return on cash collateral reinvestments and any fees a ProFund VP has agreed to pay a borrower), operational risk (i.e., the risk of losses resulting from problems in the settlement and the accounting process), legal, counterparty and credit risk. If a securities lending counterparty were to default, a ProFund VP would be subject to the risk of a possible delay in receiving collateral or in recovering
256 :: Notes to Financial Statements :: June 30, 2024 (unaudited)
the loaned securities, or to a possible loss of rights in the collateral. In the event a borrower does not return a ProFund VP's securities as agreed, the ProFund VP may experience losses if the proceeds received from liquidating the collateral do not at least equal the value of the loaned security at the time the collateral is liquidated, plus the transaction costs incurred in purchasing replacement securities. This event could trigger adverse tax consequences for a ProFund VP. The investment of cash collateral deposited by the borrower is subject to inherent market risks such as interest rate risk, credit risk, liquidity risk, and other risks that are present in the market. A ProFund VP could lose money if its short-term reinvestment of the collateral declines in value over the period of the loan. The market value of the loaned securities is determined at the close of each business day of the ProFund VP and any additional required collateral is delivered to the ProFund VP, or excess collateral returned by the ProFund VP, on the next business day.
The following table is a summary of the ProFunds VP securities lending transactions as of June 30, 2024:
| Value of Securities on Loan | Value of Cash Collateral received* | ||||||||||
ProFund VP Asia 30 | $ | 981,576 | $ | 1,039,165 | |||||||
ProFund VP Biotechnology | 981,318 | 1,023,128 | |||||||||
ProFund VP Emerging Markets | 2,088,085 | 2,198,218 | |||||||||
ProFund VP Europe 30 | 2,249,712 | 2,305,467 | |||||||||
ProFund VP Mid-Cap Growth | 13,685 | 13,858 | |||||||||
ProFund VP Nasdaq-100 | 205,090 | 209,873 | |||||||||
ProFund VP Pharmaceuticals | 115,398 | 182,208 | |||||||||
ProFund VP Semiconductor | 30,993 | 49,421 | |||||||||
ProFund VP Small-Cap | 58,435 | 62,883 | |||||||||
ProFund VP Small-Cap Growth | 12,495 | 12,963 | |||||||||
ProFund VP Small-Cap Value | 221,407 | 237,439 | |||||||||
ProFund VP UltraMid-Cap | 7,616 | 7,712 | |||||||||
ProFund VP UltraNasdaq-100 | 292,722 | 299,548 | |||||||||
ProFund VP UltraSmall-Cap | 86,334 | 93,158 | |||||||||
* Collateral received in the form of cash was reinvested in securities shown in the Collateral for Securities Loaned section of the Schedule of Portfolio Investments.
Investment Transactions and Related Income
Throughout the reporting period, investment transactions are accounted for no later than one business day following the trade date. For financial reporting purposes, investment transactions are accounted for on trade date on the last business day of the reporting period. Interest income is recognized on an accrual basis and includes, where applicable, the amortization of premium or accretion of discount. Dividend income is recorded on the ex-dividend date except in the case of depositary receipts, in which case dividends are recorded as soon as such information becomes available. Pay-in-kind interest income and non-cash dividend income received in the form of securities in-lieu of cash, if any, are recorded at the fair value of the securities received. Gains or losses realized on sales of securities are determined using the specific identification method by comparing the identified cost of the security lot sold with the net sales proceeds. Gains or losses from class action settlements are recorded when such information becomes known or can be reasonably estimated; for non-recurring class action settlements, this generally occurs with the receipt or payment of cash consistent with the terms of such settlement.
Allocations
Expenses directly attributable to a ProFund VP are charged to that ProFund VP, while expenses which are attributable to more than one fund in the Trust, or jointly with an affiliate, are allocated among the respective funds in the Trust and/or affiliate based upon relative net assets or another reasonable basis.
Distributions to Shareholders
Each of the ProFunds VP (except ProFund Access VP High Yield, ProFund VP Government Money Market, ProFund VP Real Estate, and ProFund VP U.S. Government Plus) intends to declare and distribute net investment income at least annually, if any. ProFund VP Government Money Market and ProFund VP U.S. Government Plus declare dividends from net investment income daily, if any, and pay dividends on a monthly basis. ProFund Access VP High Yield and ProFund VP Real Estate declare and pay dividends from net investment income quarterly, if any. Net realized capital gains, if any, will be distributed annually.
The amount of distributions from net investment income and net realized gains are determined in accordance with federal income tax regulations which may differ from GAAP. These "book/tax" differences are either considered temporary or permanent in nature. To the extent these differences are permanent in nature (e.g., return of capital, net operating loss, distribution reclassification, and equalization), such amounts are reclassified within the composition of net assets based on their federal tax-basis treatment; temporary differences (e.g., wash sales and mark-to-market on derivative instruments) do not require a reclassification. The ProFunds VP may utilize equalization accounting for tax purposes and designate earnings and profits, including net realized gains distributed to shareholders on redemption of shares, as a part of the dividends paid deduction for income tax purposes. Distributions which exceed net investment income and net realized capital gains for financial reporting purposes but not for tax purposes are reported as distributions in excess of net investment income or net realized
June 30, 2024 (unaudited) :: Notes to Financial Statements :: 257
gains. To the extent they exceed net investment income and net realized capital gains for tax purposes, they are reported as distribution of capital.
Federal Income Taxes
Each of the ProFunds VP intends to continue to qualify each year as a RIC under Subchapter M of the Internal Revenue Code of 1986, as amended. A RIC generally is not subject to federal income tax on income and gains distributed in a timely manner to its shareholders. The ProFunds VP intend to make timely distributions in order to avoid tax liability. Accordingly, no provision for federal income taxes is required in the financial statements. The ProFunds VP have a calendar tax year end.
Management of the ProFunds VP has reviewed tax positions taken in tax years that remain subject to examination by all major tax jurisdictions, including federal (i.e., the last four tax year ends and the interim tax period since then, as applicable). Management believes that there is no tax liability resulting from unrecognized tax benefits related to uncertain tax positions taken and the ProFunds VP are not aware of any tax positions for which it is reasonably possible that the total amounts of unrecognized tax benefits will significantly change in the next twelve months.
Other
Expense offsets to custody fees that arise from credits on cash balances maintained on deposit are reflected on the Statement of Operations, as applicable, as "Fees paid indirectly."
3. Investment Valuation Summary
Pursuant to Rule 2a-5 (the "Rule"), the Trust's Board of Trustees designated the Advisor the "Valuation Designee" as contemplated by the Rule. The Valuation Designee is responsible for assessing and managing valuation risks, administering the pricing and valuation guidelines approved by the Board of Trustees, and overseeing pricing services utilized in valuing the Trust's security holdings, among other responsibilities outlined in the Rule. When the Advisor determines that the market price of a security is not readily available or deemed unreliable (e.g., an approved pricing service does not provide a price, a furnished price is in error, certain stale prices, or an event occurs that materially affects the furnished price), it may in good faith establish a fair value for that security in accordance with the pricing and valuation guidelines. Fair value pricing may require subjective determinations about the value of a security. While the Trust's policy is intended to result in a calculation of a ProFund's NAV that fairly reflects security values as of the time of pricing, the Trust cannot ensure that fair values determined by the Advisor or persons acting at their direction would accurately reflect the price that a ProFund could obtain for a security if it were to dispose of that security as of the time of pricing (for instance, in a forced or distressed sale). The prices used by a ProFund may differ from the value that would be realized if the securities were sold and the differences could be material to the financial statements. Depending on the source and relative significance of valuation inputs, these instruments may be classified as Level 2 or Level 3 in the fair value hierarchy, as described below.
The valuation techniques employed by the ProFunds VP, described below, maximize the use of observable inputs and minimize the use of unobservable inputs in determining fair value. These valuation techniques distinguish between market participant assumptions developed based on market data obtained from sources independent of the ProFunds VP (observable inputs) and the ProFunds' VP own assumptions about market participant assumptions developed based on the best information available under the circumstances (unobservable inputs). The inputs used for valuing the ProFunds' VP investments are summarized in the three broad levels listed below:
• Level 1–quoted prices in active markets for identical assets
• Level 2–other significant observable inputs (including quoted prices for similar securities, interest rates, prepayments speeds, credit risk, etc.)
• Level 3–significant unobservable inputs (including the ProFunds' VP own assumptions in determining the fair value of investments)
The inputs or methodology used for valuing investments are not necessarily an indication of the risk associated with investing in those investments. For example, repurchase agreements are generally valued at amortized cost. Generally, amortized cost approximates the current fair value of a security, but since the valuation is not obtained from a quoted price in an active market, such securities are reflected as Level 2. Fair value measurements may also require additional disclosure when the volume and level of activity for the asset or liability have significantly decreased, as well as when circumstances indicate that a transaction is not orderly. Changes in valuation techniques may result in transfers in or out of an assigned level within the disclosure hierarchy. The Trust determines transfers between fair value hierarchy levels at the reporting period end.
Security prices are generally valued at their market value using information provided by a third party pricing service or market quotations or other procedures approved by the Trust's Board of Trustees. The securities in the portfolio of a non-money market ProFund VP, except as otherwise noted, that are listed or traded on a stock exchange or the Nasdaq National Market System ("Nasdaq/NMS"), are valued at the official closing price, if available, or the last sale price, on the exchange or system where the security is principally traded. If there have been no sales for that day on the exchange or system where the security is principally traded, then the value may be determined with reference to the last sale price, or the official closing price, if applicable, on any other exchange or system. In each of these situations, valuations are typically categorized as a Level 1 in the fair value hierarchy. If there have been no sales for that day on any exchange or system, the security will be valued using fair value procedures in accordance with procedures approved by the Trust's Board of Trustees as described above.
Securities regularly traded in the OTC markets, including securities listed on an exchange, but that are primarily traded OTC other than those traded on the Nasdaq/NMS, are generally valued on the basis of the mean between the bid and asked quotes furnished by dealers actively trading those instruments. Fixed-income securities are generally valued according to prices as furnished by an independent pricing service, generally at the mean of the bid
258 :: Notes to Financial Statements :: June 30, 2024 (unaudited)
and asked quotes for those instruments. Short-term fixed-income securities maturing in sixty days or less, and of sufficient credit quality, may be valued at amortized cost, which approximates market value. For the ProFund VP Government Money Market, investments are valued at amortized cost, in accordance with Rule 2a-7 of the 1940 Act. Under the amortized cost method, premium or discount, if any, is amortized or accreted, respectively, on a constant basis to the maturity of the security. In each of these situations, valuations are typically categorized as Level 2 in the fair value hierarchy.
Derivatives are generally valued using independent pricing services and/or agreements with counterparties or other procedures approved by the Trust's Board of Trustees. Futures contracts are generally valued at their last sale price prior to the time at which the net asset value per share of a ProFund VP is determined and are typically categorized as Level 1 in the fair value hierarchy. Swap agreements are generally valued using independent sources and/or agreements with counterparties. Forward currency contracts are valued at their quoted daily prices obtained from an independent pricing service. These valuations are typically categorized as Level 2 in the fair value hierarchy. If there was no sale on that day, fair valuation procedures as described above may be applied.
For the period ended June 30, 2024, there were no Level 3 investments for which significant unobservable inputs were used to determine fair value, nor were there any transfers in or out of Level 3 investments for the year.
A summary of the valuations as of June 30, 2024, based upon the three levels defined above, is included in the table below while the breakdown, by category, of equity securities is disclosed on the Schedule of Portfolio Investments for each ProFund VP:
LEVEL 1 - Quoted Prices | LEVEL 2 - Other Significant Observable Inputs | Total | |||||||||||||||||||||||||
| Investment Securities | Other Financial Instruments^ | Investment Securities | Other Financial Instruments^ | Investment Securities | Other Financial Instruments^ | ||||||||||||||||||||||
ProFund Access VP High Yield | |||||||||||||||||||||||||||
U.S. Treasury Obligation | $ | — | $ | — | $ | 7,199,715 | $ | — | $ | 7,199,715 | $ | — | |||||||||||||||
Repurchase Agreements | — | — | 6,956,000 | — | 6,956,000 | — | |||||||||||||||||||||
Futures Contracts | — | 12,762 | — | — | — | 12,762 | |||||||||||||||||||||
Credit Default Swap Agreements | — | — | — | (82,772 | ) | — | (82,772 | ) | |||||||||||||||||||
Total | $ | — | $ | 12,762 | $ | 14,155,715 | $ | (82,772 | ) | $ | 14,155,715 | $ | (70,010 | ) | |||||||||||||
ProFund VP Asia 30 | |||||||||||||||||||||||||||
Common Stocks | $ | 16,029,713 | $ | — | $ | — | $ | — | $ | 16,029,713 | $ | — | |||||||||||||||
Repurchase Agreements | — | — | 39,000 | — | 39,000 | — | |||||||||||||||||||||
Collateral for Securities Loaned | 1,039,165 | — | — | — | 1,039,165 | — | |||||||||||||||||||||
Total | $ | 17,068,878 | $ | — | $ | 39,000 | $ | — | $ | 17,107,878 | $ | — | |||||||||||||||
ProFund VP Banks | |||||||||||||||||||||||||||
Common Stocks | $ | 3,736,516 | $ | — | $ | — | $ | — | $ | 3,736,516 | $ | — | |||||||||||||||
Swap Agreements | — | — | — | 1,108 | — | 1,108 | |||||||||||||||||||||
Total | $ | 3,736,516 | $ | — | $ | — | $ | 1,108 | $ | 3,736,516 | $ | 1,108 | |||||||||||||||
ProFund VP Bear | |||||||||||||||||||||||||||
Repurchase Agreements | $ | — | $ | — | $ | 1,636,000 | $ | — | $ | 1,636,000 | $ | — | |||||||||||||||
Futures Contracts | — | (1,450 | ) | — | — | — | (1,450 | ) | |||||||||||||||||||
Swap Agreements | — | — | — | 5,611 | — | 5,611 | |||||||||||||||||||||
Total | $ | — | $ | (1,450 | ) | $ | 1,636,000 | $ | 5,611 | $ | 1,636,000 | $ | 4,161 | ||||||||||||||
ProFund VP Biotechnology | |||||||||||||||||||||||||||
Common Stocks | $ | 41,670,294 | $ | — | $ | — | $ | — | $ | 41,670,294 | $ | — | |||||||||||||||
Repurchase Agreements | — | — | 462,000 | — | 462,000 | — | |||||||||||||||||||||
Collateral for Securities Loaned | 1,023,128 | — | — | — | 1,023,128 | — | |||||||||||||||||||||
Swap Agreements | — | — | — | (11,095 | ) | — | (11,095 | ) | |||||||||||||||||||
Total | $ | 42,693,422 | $ | — | $ | 462,000 | $ | (11,095 | ) | $ | 43,155,422 | $ | (11,095 | ) | |||||||||||||
ProFund VP Bull | |||||||||||||||||||||||||||
Common Stocks | $ | 52,206,255 | $ | — | $ | — | $ | — | $ | 52,206,255 | $ | — | |||||||||||||||
Repurchase Agreements | — | — | 7,826,000 | — | 7,826,000 | — | |||||||||||||||||||||
Futures Contracts | — | 10,100 | — | — | — | 10,100 | |||||||||||||||||||||
Swap Agreements | — | — | — | (26,606 | ) | — | (26,606 | ) | |||||||||||||||||||
Total | $ | 52,206,255 | $ | 10,100 | $ | 7,826,000 | $ | (26,606 | ) | $ | 60,032,255 | $ | (16,506 | ) | |||||||||||||
June 30, 2024 (unaudited) :: Notes to Financial Statements :: 259
LEVEL 1 - Quoted Prices | LEVEL 2 - Other Significant Observable Inputs | Total | |||||||||||||||||||||||||
| Investment Securities | Other Financial Instruments^ | Investment Securities | Other Financial Instruments^ | Investment Securities | Other Financial Instruments^ | ||||||||||||||||||||||
ProFund VP Communication Services | |||||||||||||||||||||||||||
Common Stocks | $ | 10,104,147 | $ | — | $ | — | $ | — | $ | 10,104,147 | $ | — | |||||||||||||||
Repurchase Agreements | — | — | 273,000 | — | 273,000 | — | |||||||||||||||||||||
Swap Agreements | — | — | — | 1,486 | — | 1,486 | |||||||||||||||||||||
Total | $ | 10,104,147 | $ | — | $ | 273,000 | $ | 1,486 | $ | 10,377,147 | $ | 1,486 | |||||||||||||||
ProFund VP Consumer Discretionary | |||||||||||||||||||||||||||
Common Stocks | $ | 24,426,843 | $ | — | $ | — | $ | — | $ | 24,426,843 | $ | — | |||||||||||||||
Repurchase Agreements | — | — | 489,000 | — | 489,000 | — | |||||||||||||||||||||
Swap Agreements | — | — | — | 2,297 | — | 2,297 | |||||||||||||||||||||
Total | $ | 24,426,843 | $ | — | $ | 489,000 | $ | 2,297 | $ | 24,915,843 | $ | 2,297 | |||||||||||||||
ProFund VP Consumer Staples | |||||||||||||||||||||||||||
Common Stocks | $ | 10,329,420 | $ | — | $ | — | $ | — | $ | 10,329,420 | $ | — | |||||||||||||||
Repurchase Agreements | — | — | 267,000 | — | 267,000 | — | |||||||||||||||||||||
Swap Agreements | — | — | — | (2,563 | ) | — | (2,563 | ) | |||||||||||||||||||
Total | $ | 10,329,420 | $ | — | $ | 267,000 | $ | (2,563 | ) | $ | 10,596,420 | $ | (2,563 | ) | |||||||||||||
ProFund VP Dow 30 | |||||||||||||||||||||||||||
Repurchase Agreements | $ | — | $ | — | $ | 389,000 | $ | — | $ | 389,000 | $ | — | |||||||||||||||
Swap Agreements | — | — | — | (514 | ) | — | (514 | ) | |||||||||||||||||||
Total | $ | — | $ | — | $ | 389,000 | $ | (514 | ) | $ | 389,000 | $ | (514 | ) | |||||||||||||
ProFund VP Emerging Markets | |||||||||||||||||||||||||||
Common Stocks | $ | 19,369,668 | $ | — | $ | — | $ | — | $ | 19,369,668 | $ | — | |||||||||||||||
Preferred Stocks | 468,029 | — | — | — | 468,029 | — | |||||||||||||||||||||
Repurchase Agreements | — | — | 1,427,000 | — | 1,427,000 | — | |||||||||||||||||||||
Collateral for Securities Loaned | 2,198,218 | — | — | — | 2,198,218 | — | |||||||||||||||||||||
Swap Agreements | — | — | — | (333 | ) | — | (333 | ) | |||||||||||||||||||
Total | $ | 22,035,915 | $ | — | $ | 1,427,000 | $ | (333 | ) | $ | 23,462,915 | $ | (333 | ) | |||||||||||||
ProFund VP Energy | |||||||||||||||||||||||||||
Common Stocks | $ | 43,957,114 | $ | — | $ | — | $ | — | $ | 43,957,114 | $ | — | |||||||||||||||
Repurchase Agreements | — | — | 516,000 | — | 516,000 | — | |||||||||||||||||||||
Swap Agreements | — | — | — | (2,215 | ) | — | (2,215 | ) | |||||||||||||||||||
Total | $ | 43,957,114 | $ | — | $ | 516,000 | $ | (2,215 | ) | $ | 44,473,114 | $ | (2,215 | ) | |||||||||||||
ProFund VP Europe 30 | |||||||||||||||||||||||||||
Common Stocks | $ | 14,743,636 | $ | — | $ | — | $ | — | $ | 14,743,636 | $ | — | |||||||||||||||
Collateral for Securities Loaned | 2,305,467 | — | — | — | 2,305,467 | — | |||||||||||||||||||||
Total | $ | 17,049,103 | $ | — | $ | — | $ | — | $ | 17,049,103 | $ | — | |||||||||||||||
ProFund VP Falling U.S. Dollar | |||||||||||||||||||||||||||
Repurchase Agreements | $ | — | $ | — | $ | 456,000 | $ | — | $ | 456,000 | $ | — | |||||||||||||||
Forward Currency Contracts | — | — | — | (6,734 | ) | — | (6,734 | ) | |||||||||||||||||||
Total | $ | — | $ | — | $ | 456,000 | $ | (6,734 | ) | $ | 456,000 | $ | (6,734 | ) | |||||||||||||
ProFund VP Financials | |||||||||||||||||||||||||||
Common Stocks | $ | 28,581,659 | $ | — | $ | — | $ | — | $ | 28,581,659 | $ | — | |||||||||||||||
Repurchase Agreements | — | — | 725,000 | — | 725,000 | — | |||||||||||||||||||||
Swap Agreements | — | — | — | (6,182 | ) | — | (6,182 | ) | |||||||||||||||||||
Total | $ | 28,581,659 | $ | — | $ | 725,000 | $ | (6,182 | ) | $ | 29,306,659 | $ | (6,182 | ) | |||||||||||||
ProFund VP Government Money Market | |||||||||||||||||||||||||||
U.S. Treasury Obligations | $ | — | $ | — | $ | 13,930,629 | $ | — | $ | 13,930,629 | $ | — | |||||||||||||||
Repurchase Agreements | — | — | 16,664,000 | — | 16,664,000 | — | |||||||||||||||||||||
Total | $ | — | $ | — | $ | 30,594,629 | $ | — | $ | 30,594,629 | $ | — | |||||||||||||||
260 :: Notes to Financial Statements :: June 30, 2024 (unaudited)
LEVEL 1 - Quoted Prices | LEVEL 2 - Other Significant Observable Inputs | Total | |||||||||||||||||||||||||
| Investment Securities | Other Financial Instruments^ | Investment Securities | Other Financial Instruments^ | Investment Securities | Other Financial Instruments^ | ||||||||||||||||||||||
ProFund VP Health Care | |||||||||||||||||||||||||||
Common Stocks | $ | 37,293,446 | $ | — | $ | — | $ | — | $ | 37,293,446 | $ | — | |||||||||||||||
Repurchase Agreements | — | — | 260,000 | — | 260,000 | — | |||||||||||||||||||||
Swap Agreements | — | — | — | (5,144 | ) | — | (5,144 | ) | |||||||||||||||||||
Total | $ | 37,293,446 | $ | — | $ | 260,000 | $ | (5,144 | ) | $ | 37,553,446 | $ | (5,144 | ) | |||||||||||||
ProFund VP Industrials | |||||||||||||||||||||||||||
Common Stocks | $ | 16,212,580 | $ | — | $ | — | $ | — | $ | 16,212,580 | $ | — | |||||||||||||||
Repurchase Agreements | — | — | 352,000 | — | 352,000 | — | |||||||||||||||||||||
Swap Agreements | — | — | — | (2,985 | ) | — | (2,985 | ) | |||||||||||||||||||
Total | $ | 16,212,580 | $ | — | $ | 352,000 | $ | (2,985 | ) | $ | 16,564,580 | $ | (2,985 | ) | |||||||||||||
ProFund VP International | |||||||||||||||||||||||||||
Repurchase Agreements | $ | — | $ | — | $ | 10,443,000 | $ | — | $ | 10,443,000 | $ | — | |||||||||||||||
Swap Agreements | — | — | — | 15,437 | — | 15,437 | |||||||||||||||||||||
Total | $ | — | $ | — | $ | 10,443,000 | $ | 15,437 | $ | 10,443,000 | $ | 15,437 | |||||||||||||||
ProFund VP Internet | |||||||||||||||||||||||||||
Common Stocks | $ | 12,534,067 | $ | — | $ | — | $ | — | $ | 12,534,067 | $ | — | |||||||||||||||
Repurchase Agreements | — | — | 239,000 | — | 239,000 | — | |||||||||||||||||||||
Swap Agreements | — | — | — | 6,968 | — | 6,968 | |||||||||||||||||||||
Total | $ | 12,534,067 | $ | — | $ | 239,000 | $ | 6,968 | $ | 12,773,067 | $ | 6,968 | |||||||||||||||
ProFund VP Japan | |||||||||||||||||||||||||||
Repurchase Agreements | $ | — | $ | — | $ | 13,472,000 | $ | — | $ | 13,472,000 | $ | — | |||||||||||||||
Futures Contracts | — | 383,020 | — | — | — | 383,020 | |||||||||||||||||||||
Swap Agreements | — | — | — | 1,245 | — | 1,245 | |||||||||||||||||||||
Total | $ | — | $ | 383,020 | $ | 13,472,000 | $ | 1,245 | $ | 13,472,000 | $ | 384,265 | |||||||||||||||
ProFund VP Large-Cap Growth | |||||||||||||||||||||||||||
Common Stocks | $ | 32,738,947 | $ | — | $ | — | $ | — | $ | 32,738,947 | $ | — | |||||||||||||||
Repurchase Agreements | — | — | 75,000 | — | 75,000 | — | |||||||||||||||||||||
Total | $ | 32,738,947 | $ | — | $ | 75,000 | $ | — | $ | 32,813,947 | $ | — | |||||||||||||||
ProFund VP Large-Cap Value | |||||||||||||||||||||||||||
Common Stocks | $ | 15,220,738 | $ | — | $ | — | $ | — | $ | 15,220,738 | $ | — | |||||||||||||||
Repurchase Agreements | — | — | 56,000 | — | 56,000 | — | |||||||||||||||||||||
Total | $ | 15,220,738 | $ | — | $ | 56,000 | $ | — | $ | 15,276,738 | $ | — | |||||||||||||||
ProFund VP Materials | |||||||||||||||||||||||||||
Common Stocks | $ | 14,440,673 | $ | — | $ | — | $ | — | $ | 14,440,673 | $ | — | |||||||||||||||
Repurchase Agreements | — | — | 89,000 | — | 89,000 | — | |||||||||||||||||||||
Swap Agreements | — | — | — | (1,403 | ) | — | (1,403 | ) | |||||||||||||||||||
Total | $ | 14,440,673 | $ | — | $ | 89,000 | $ | (1,403 | ) | $ | 14,529,673 | $ | (1,403 | ) | |||||||||||||
ProFund VP Mid-Cap | |||||||||||||||||||||||||||
Repurchase Agreements | $ | — | $ | — | $ | 11,049,000 | $ | — | $ | 11,049,000 | $ | — | |||||||||||||||
Futures Contracts | — | (14,761 | ) | — | — | — | (14,761 | ) | |||||||||||||||||||
Swap Agreements | — | — | — | 27,589 | — | 27,589 | |||||||||||||||||||||
Total | $ | — | $ | (14,761 | ) | $ | 11,049,000 | $ | 27,589 | $ | 11,049,000 | $ | 12,828 | ||||||||||||||
ProFund VP Mid-Cap Growth | |||||||||||||||||||||||||||
Common Stocks | $ | 14,680,373 | $ | — | $ | — | $ | — | $ | 14,680,373 | $ | — | |||||||||||||||
Repurchase Agreements | — | — | 49,000 | — | 49,000 | — | |||||||||||||||||||||
Collateral for Securities Loaned | 13,858 | — | — | — | 13,858 | — | |||||||||||||||||||||
Total | $ | 14,694,231 | $ | — | $ | 49,000 | $ | — | $ | 14,743,231 | $ | — | |||||||||||||||
ProFund VP Mid-Cap Value | |||||||||||||||||||||||||||
Common Stocks | $ | 10,628,418 | $ | — | $ | — | $ | — | $ | 10,628,418 | $ | — | |||||||||||||||
Repurchase Agreements | — | — | 40,000 | — | 40,000 | — | |||||||||||||||||||||
Total | $ | 10,628,418 | $ | — | $ | 40,000 | $ | — | $ | 10,668,418 | $ | — | |||||||||||||||
June 30, 2024 (unaudited) :: Notes to Financial Statements :: 261
LEVEL 1 - Quoted Prices | LEVEL 2 - Other Significant Observable Inputs | Total | |||||||||||||||||||||||||
| Investment Securities | Other Financial Instruments^ | Investment Securities | Other Financial Instruments^ | Investment Securities | Other Financial Instruments^ | ||||||||||||||||||||||
ProFund VP Nasdaq-100 | |||||||||||||||||||||||||||
Common Stocks | $ | 114,589,272 | $ | — | $ | — | $ | — | $ | 114,589,272 | $ | — | |||||||||||||||
Repurchase Agreements | — | — | 53,265,000 | — | 53,265,000 | — | |||||||||||||||||||||
Collateral for Securities Loaned | 209,873 | — | — | — | 209,873 | — | |||||||||||||||||||||
Futures Contracts | — | 153,011 | — | — | — | 153,011 | |||||||||||||||||||||
Swap Agreements | — | — | — | (209,726 | ) | — | (209,726 | ) | |||||||||||||||||||
Total | $ | 114,799,145 | $ | 153,011 | $ | 53,265,000 | $ | (209,726 | ) | $ | 168,064,145 | $ | (56,715 | ) | |||||||||||||
ProFund VP Pharmaceuticals | |||||||||||||||||||||||||||
Common Stocks | $ | 9,269,141 | $ | — | $ | — | $ | — | $ | 9,269,141 | $ | — | |||||||||||||||
Repurchase Agreements | — | — | 165,000 | — | 165,000 | — | |||||||||||||||||||||
Collateral for Securities Loaned | 182,208 | — | — | — | 182,208 | — | |||||||||||||||||||||
Swap Agreements | — | — | — | (3,516 | ) | — | (3,516 | ) | |||||||||||||||||||
Total | $ | 9,451,349 | $ | — | $ | 165,000 | $ | (3,516 | ) | $ | 9,616,349 | $ | (3,516 | ) | |||||||||||||
ProFund VP Precious Metals | |||||||||||||||||||||||||||
Repurchase Agreements | $ | — | $ | — | $ | 24,201,000 | $ | — | $ | 24,201,000 | $ | — | |||||||||||||||
Swap Agreements | — | — | — | (106,800 | ) | — | (106,800 | ) | |||||||||||||||||||
Total | $ | — | $ | — | $ | 24,201,000 | $ | (106,800 | ) | $ | 24,201,000 | $ | (106,800 | ) | |||||||||||||
ProFund VP Real Estate | |||||||||||||||||||||||||||
Common Stocks | $ | 6,044,324 | $ | — | $ | — | $ | — | $ | 6,044,324 | $ | — | |||||||||||||||
Repurchase Agreements | — | — | 83,000 | — | 83,000 | — | |||||||||||||||||||||
Swap Agreements | — | — | — | (698 | ) | — | (698 | ) | |||||||||||||||||||
Total | $ | 6,044,324 | $ | — | $ | 83,000 | $ | (698 | ) | $ | 6,127,324 | $ | (698 | ) | |||||||||||||
ProFund VP Rising Rates Opportunity | |||||||||||||||||||||||||||
Repurchase Agreements | $ | — | $ | — | $ | 8,504,000 | $ | — | $ | 8,504,000 | $ | — | |||||||||||||||
Swap Agreements | — | — | — | 235,093 | — | 235,093 | |||||||||||||||||||||
Total | $ | — | $ | — | $ | 8,504,000 | $ | 235,093 | $ | 8,504,000 | $ | 235,093 | |||||||||||||||
ProFund VP Semiconductor | |||||||||||||||||||||||||||
Common Stocks | $ | 41,481,825 | $ | — | $ | — | $ | — | $ | 41,481,825 | $ | — | |||||||||||||||
Repurchase Agreements | — | — | 1,705,000 | — | 1,705,000 | — | |||||||||||||||||||||
Collateral for Securities Loaned | 49,421 | — | — | — | 49,421 | — | |||||||||||||||||||||
Swap Agreements | — | — | — | 95,739 | — | 95,739 | |||||||||||||||||||||
Total | $ | 41,531,246 | $ | — | $ | 1,705,000 | $ | 95,739 | $ | 43,236,246 | $ | 95,739 | |||||||||||||||
ProFund VP Short Dow 30 | |||||||||||||||||||||||||||
Repurchase Agreements | $ | — | $ | — | $ | 6,000 | $ | — | $ | 6,000 | $ | — | |||||||||||||||
Swap Agreements | — | — | — | 8 | — | 8 | |||||||||||||||||||||
Total | $ | — | $ | — | $ | 6,000 | $ | 8 | $ | 6,000 | $ | 8 | |||||||||||||||
ProFund VP Short Emerging Markets | |||||||||||||||||||||||||||
Repurchase Agreements | $ | — | $ | — | $ | 519,000 | $ | — | $ | 519,000 | $ | — | |||||||||||||||
Swap Agreements | — | — | — | (31 | ) | — | (31 | ) | |||||||||||||||||||
Total | $ | — | $ | — | $ | 519,000 | $ | (31 | ) | $ | 519,000 | $ | (31 | ) | |||||||||||||
ProFund VP Short International | |||||||||||||||||||||||||||
Repurchase Agreements | $ | — | $ | — | $ | 784,000 | $ | — | $ | 784,000 | $ | — | |||||||||||||||
Swap Agreements | — | — | — | (1,191 | ) | — | (1,191 | ) | |||||||||||||||||||
Total | $ | — | $ | — | $ | 784,000 | $ | (1,191 | ) | $ | 784,000 | $ | (1,191 | ) | |||||||||||||
ProFund VP Short Mid-Cap | |||||||||||||||||||||||||||
Repurchase Agreements | $ | — | $ | — | $ | 84,000 | $ | — | $ | 84,000 | $ | — | |||||||||||||||
Swap Agreements | — | — | — | (245 | ) | — | (245 | ) | |||||||||||||||||||
Total | $ | — | $ | — | $ | 84,000 | $ | (245 | ) | $ | 84,000 | $ | (245 | ) | |||||||||||||
262 :: Notes to Financial Statements :: June 30, 2024 (unaudited)
LEVEL 1 - Quoted Prices | LEVEL 2 - Other Significant Observable Inputs | Total | |||||||||||||||||||||||||
| Investment Securities | Other Financial Instruments^ | Investment Securities | Other Financial Instruments^ | Investment Securities | Other Financial Instruments^ | ||||||||||||||||||||||
ProFund VP Short Nasdaq-100 | |||||||||||||||||||||||||||
Repurchase Agreements | $ | — | $ | — | $ | 2,506,000 | $ | — | $ | 2,506,000 | $ | — | |||||||||||||||
Futures Contracts | — | (3,404 | ) | — | — | — | (3,404 | ) | |||||||||||||||||||
Swap Agreements | — | — | — | 11,673 | — | 11,673 | |||||||||||||||||||||
Total | $ | — | $ | (3,404 | ) | $ | 2,506,000 | $ | 11,673 | $ | 2,506,000 | $ | 8,269 | ||||||||||||||
ProFund VP Short Small-Cap | |||||||||||||||||||||||||||
Repurchase Agreements | $ | — | $ | — | $ | 3,030,000 | $ | — | $ | 3,030,000 | $ | — | |||||||||||||||
Futures Contracts | — | 1,781 | — | — | — | 1,781 | |||||||||||||||||||||
Swap Agreements | — | — | — | (14,233 | ) | — | (14,233 | ) | |||||||||||||||||||
Total | $ | — | $ | 1,781 | $ | 3,030,000 | $ | (14,233 | ) | $ | 3,030,000 | $ | (12,452 | ) | |||||||||||||
ProFund VP Small-Cap | |||||||||||||||||||||||||||
Common Stocks | $ | 6,148,509 | $ | — | $ | — | $ | — | $ | 6,148,509 | $ | — | |||||||||||||||
Rights | — | — | 80 | — | 80 | — | |||||||||||||||||||||
Trust* | — | — | — | — | — | — | |||||||||||||||||||||
Repurchase Agreements | — | — | 1,041,000 | — | 1,041,000 | — | |||||||||||||||||||||
Collateral for Securities Loaned | 62,883 | — | — | — | 62,883 | — | |||||||||||||||||||||
Futures Contracts | — | (3,578 | ) | — | — | — | (3,578 | ) | |||||||||||||||||||
Swap Agreements | — | — | — | 3,302 | — | 3,302 | |||||||||||||||||||||
Total | $ | 6,211,392 | $ | (3,578 | ) | $ | 1,041,080 | $ | 3,302 | $ | 7,252,472 | $ | (276 | ) | |||||||||||||
ProFund VP Small-Cap Growth | |||||||||||||||||||||||||||
Common Stocks | $ | 15,606,340 | $ | — | $ | — | $ | — | $ | 15,606,340 | $ | — | |||||||||||||||
Repurchase Agreements | — | — | 53,000 | — | 53,000 | — | |||||||||||||||||||||
Collateral for Securities Loaned | 12,963 | — | — | — | 12,963 | — | |||||||||||||||||||||
Total | $ | 15,619,303 | $ | — | $ | 53,000 | $ | — | $ | 15,672,303 | $ | — | |||||||||||||||
ProFund VP Small-Cap Value | |||||||||||||||||||||||||||
Common Stocks | $ | 14,586,387 | $ | — | $ | — | $ | — | $ | 14,586,387 | $ | — | |||||||||||||||
Repurchase Agreements | — | — | 49,000 | — | 49,000 | — | |||||||||||||||||||||
Collateral for Securities Loaned | 237,439 | — | — | — | 237,439 | — | |||||||||||||||||||||
Total | $ | 14,823,826 | $ | — | $ | 49,000 | $ | — | $ | 14,872,826 | $ | — | |||||||||||||||
ProFund VP Technology | |||||||||||||||||||||||||||
Common Stocks | $ | 61,347,146 | $ | — | $ | — | $ | — | $ | 61,347,146 | $ | — | |||||||||||||||
Repurchase Agreements | — | — | 1,253,000 | — | 1,253,000 | — | |||||||||||||||||||||
Swap Agreements | — | — | — | 6,802 | — | 6,802 | |||||||||||||||||||||
Total | $ | 61,347,146 | $ | — | $ | 1,253,000 | $ | 6,802 | $ | 62,600,146 | $ | 6,802 | |||||||||||||||
ProFund VP UltraBull | |||||||||||||||||||||||||||
Common Stocks | $ | 13,643,493 | $ | — | $ | — | $ | — | $ | 13,643,493 | $ | — | |||||||||||||||
Repurchase Agreements | — | — | 3,603,000 | — | 3,603,000 | — | |||||||||||||||||||||
Futures Contracts | — | 10,100 | — | — | — | 10,100 | |||||||||||||||||||||
Swap Agreements | — | — | — | (83,420 | ) | — | (83,420 | ) | |||||||||||||||||||
Total | $ | 13,643,493 | $ | 10,100 | $ | 3,603,000 | $ | (83,420 | ) | $ | 17,246,493 | $ | (73,320 | ) | |||||||||||||
ProFund VP UltraMid-Cap | |||||||||||||||||||||||||||
Common Stocks | $ | 7,724,275 | $ | — | $ | — | $ | — | $ | 7,724,275 | $ | — | |||||||||||||||
Repurchase Agreements | — | — | 2,988,000 | — | 2,988,000 | — | |||||||||||||||||||||
Collateral for Securities Loaned | 7,712 | — | — | — | 7,712 | — | |||||||||||||||||||||
Futures Contracts | — | (11,809 | ) | — | — | — | (11,809 | ) | |||||||||||||||||||
Swap Agreements | — | — | — | 35,518 | — | 35,518 | |||||||||||||||||||||
Total | $ | 7,731,987 | $ | (11,809 | ) | $ | 2,988,000 | $ | 35,518 | $ | 10,719,987 | $ | 23,709 | ||||||||||||||
ProFund VP UltraNasdaq-100 | |||||||||||||||||||||||||||
Common Stocks | $ | 163,531,749 | $ | — | $ | — | $ | — | $ | 163,531,749 | $ | — | |||||||||||||||
Repurchase Agreements | — | — | 60,377,000 | — | 60,377,000 | — | |||||||||||||||||||||
Collateral for Securities Loaned | 299,548 | — | — | — | 299,548 | — | |||||||||||||||||||||
Futures Contracts | — | 227,816 | — | — | — | 227,816 | |||||||||||||||||||||
Swap Agreements | — | — | — | (1,549,929 | ) | — | (1,549,929 | ) | |||||||||||||||||||
Total | $ | 163,831,297 | $ | 227,816 | $ | 60,377,000 | $ | (1,549,929 | ) | $ | 224,208,297 | $ | (1,322,113 | ) | |||||||||||||
June 30, 2024 (unaudited) :: Notes to Financial Statements :: 263
LEVEL 1 - Quoted Prices | LEVEL 2 - Other Significant Observable Inputs | Total | |||||||||||||||||||||||||
| Investment Securities | Other Financial Instruments^ | Investment Securities | Other Financial Instruments^ | Investment Securities | Other Financial Instruments^ | ||||||||||||||||||||||
ProFund VP UltraShort Dow 30 | |||||||||||||||||||||||||||
Repurchase Agreements | $ | — | $ | — | $ | 2,000 | $ | — | $ | 2,000 | $ | — | |||||||||||||||
Swap Agreements | — | — | — | 8 | — | 8 | |||||||||||||||||||||
Total | $ | — | $ | — | $ | 2,000 | $ | 8 | $ | 2,000 | $ | 8 | |||||||||||||||
ProFund VP UltraShort Nasdaq-100 | |||||||||||||||||||||||||||
Repurchase Agreements | $ | — | $ | — | $ | 1,588,000 | $ | — | $ | 1,588,000 | $ | — | |||||||||||||||
Swap Agreements | — | — | — | 17,354 | — | 17,354 | |||||||||||||||||||||
Total | $ | — | $ | — | $ | 1,588,000 | $ | 17,354 | $ | 1,588,000 | $ | 17,354 | |||||||||||||||
ProFund VP UltraSmall-Cap | |||||||||||||||||||||||||||
Common Stocks | $ | 9,373,203 | $ | — | $ | — | $ | — | $ | 9,373,203 | $ | — | |||||||||||||||
Rights | — | — | 73 | — | 73 | — | |||||||||||||||||||||
Trust* | — | — | — | — | — | — | |||||||||||||||||||||
Repurchase Agreements | — | — | 3,335,000 | — | 3,335,000 | — | |||||||||||||||||||||
Collateral for Securities Loaned | 93,158 | — | — | — | 93,158 | — | |||||||||||||||||||||
Futures Contracts | — | (4,367 | ) | — | — | — | (4,367 | ) | |||||||||||||||||||
Swap Agreements | — | — | — | 68,614 | — | 68,614 | |||||||||||||||||||||
Total | $ | 9,466,361 | $ | (4,367 | ) | $ | 3,335,073 | $ | 68,614 | $ | 12,801,434 | $ | 64,247 | ||||||||||||||
ProFund VP U.S. Government Plus | |||||||||||||||||||||||||||
U.S. Treasury Obligation | $ | — | $ | — | $ | 2,879,716 | $ | — | $ | 2,879,716 | $ | — | |||||||||||||||
Repurchase Agreements | — | — | 3,558,000 | — | 3,558,000 | — | |||||||||||||||||||||
Swap Agreements | — | — | — | (110,981 | ) | — | (110,981 | ) | |||||||||||||||||||
Total | $ | — | $ | — | $ | 6,437,716 | $ | (110,981 | ) | $ | 6,437,716 | $ | (110,981 | ) | |||||||||||||
ProFund VP Utilities | |||||||||||||||||||||||||||
Common Stocks | $ | 28,146,440 | $ | — | $ | — | $ | — | $ | 28,146,440 | $ | — | |||||||||||||||
Repurchase Agreements | — | — | 671,000 | — | 671,000 | — | |||||||||||||||||||||
Swap Agreements | — | — | — | (10,692 | ) | — | (10,692 | ) | |||||||||||||||||||
Total | $ | 28,146,440 | $ | — | $ | 671,000 | $ | (10,692 | ) | $ | 28,817,440 | $ | (10,692 | ) | |||||||||||||
^ Other financial instruments include any derivative instruments not reflected in the Schedule of Portfolio Investments as Investment Securities, such as futures contracts, forward currency contracts and swap agreements (including credit default swap agreements). These instruments are generally recorded in the financial statements at the unrealized appreciation/(depreciation) on the investment.
* Ferroglobe Representation and Warranty Insurance trust was valued at $0 and categorized as Level 2 within the fair value hierarchy.
4. Fees and Transactions with Affiliates and Other Parties
The ProFunds VP have entered into an Investment Advisory Agreement with the Advisor. Under this agreement, the ProFunds VP (excluding ProFund VP U.S. Government Plus) each pay the Advisor a fee at an annualized rate of 0.75% of the average daily net assets of each respective ProFund VP. The ProFund VP U.S. Government Plus pays the Advisor a fee at an annualized rate of 0.50% of its average daily net assets.
In addition, subject to the condition that the aggregate daily net assets of the Trust be equal to or greater than $10 billion, the Advisor has agreed to the following fee reductions with respect to each individual ProFund VP: 0.025% of the ProFund VP's daily net assets in excess of $500 million to $1 billion, 0.05% of the ProFund VP's daily net assets in excess of $1 billion to $2 billion, and 0.075% of the ProFund VP's net assets in excess of $2 billion. During the period ended June 30, 2024, no Fund's annual investment advisory fee was subject to such reductions.
Citi Fund Services Ohio, Inc. ("Citi") acts as the Trust's administrator (the "Administrator"). For its services as
Administrator, the Trust paid Citi an annual fee based on the Trust's aggregate average net assets at a tier rate ranging from 0.00375% to 0.05%, and a base fee for certain filings. Administration fees also include additional fees paid to Citi by the Trust for additional services provided, including support of the Trust's compliance program.
Citi also acts as fund accounting agent for the Trust. For these services, the Trust pays Citi an annual fee based on the Trust's aggregate average net assets at a tier rate ranging from 0.00375% to 0.03%, a base fee, and reimbursement of certain expenses.
FIS Investor Services LLC ("FIS") acts as transfer agent for the Trust. For these services, the Trust pays FIS a base fee, service charges, fees based on the number of VP Funds, and reimbursement of certain expenses.
ProFunds Distributors, Inc. (the "Distributor"), a wholly owned subsidiary of the Advisor, serves as the Trust's distributor. Under a Distribution and Shareholder Services Plan, adopted by the Trust's Board of Trustees pursuant to Rule 12b-1 under the 1940 Act, each ProFund VP may pay financial intermediaries such as broker-dealers,
264 :: Notes to Financial Statements :: June 30, 2024 (unaudited)
insurance companies and the Distributor up to 0.25%, on an annualized basis, of the average daily net assets as compensation for the distribution-related activities and/or shareholder services.
Distribution Fees were suspended throughout the period ended June 30, 2024 for ProFund VP Government Money Market to maintain a more competitive net yield. If ProFund VP Government Money Market had paid an amount equal to 0.25% of its average daily net assets, the Distribution Fees would have been $38,213 for the period ended June 30, 2024. The Distributor may reinstate all or a portion of the Distribution Fees for ProFund VP Government Money Market at any time.
The Advisor, pursuant to a separate Management Services Agreement, performs certain client support services and other administrative services on behalf of the ProFunds VP. For these services, each ProFund VP pays the Advisor a fee at the annual rate of 0.10% of its average daily net assets.
The Trust, on behalf of the ProFunds VP, has entered into an administrative services agreement with certain insurance companies, pursuant to which the insurance companies will provide administrative services with respect to the ProFunds VP. For these services, the ProFunds VP may pay the insurance companies administrative services fees, a monthly/quarterly fee equal on an annual basis of up to 0.35% of their average daily net assets as reflected on the Statement of Operations as "Administrative services fees." Throughout the period ended June 30, 2024, the administrative services fees of ProFund VP Government Money Market were suspended to maintain a more competitive net yield. If ProFund VP Government Money Market had paid an amount equal to the full amount per the administrative services agreements, the administrative services fees would have been $37,357 for the period ended June 30, 2024. All or a portion of the Administrative services fees of ProFund VP Government Money Market may be reinstated at any time.
Certain Officers and a Trustee of the Trust are affiliated with the Advisor or the Administrator. Except as noted below with respect to the Trust's Chief Compliance Officer, such Officers and Trustee receive no compensation from the ProFunds VP for serving in their respective roles. The Trust, together with affiliated Trusts, pays each Independent Trustee compensation for their services at an annual rate of $325,000, inclusive of all meetings. During the period ended June 30, 2024, actual Trustee compensation was $487,500 in aggregate from the Trust and affiliated trusts. There are certain employees of the Advisor, such as the Trust's Chief Compliance Officer and staff who administer the Trust's compliance program, in which the ProFunds VP reimburse the Advisor for their related compensation and certain other expenses incurred as reflected on the Statement of Operations as "Compliance services fees."
The Advisor has contractually agreed to waive advisory and management services fees, and if necessary, reimburse certain other expenses of the ProFunds VP in order to limit the annual operating expenses (exclusive of brokerage costs, interest, taxes, dividends (including dividend expenses on securities sold short), litigation, indemnification, and extraordinary expenses) to an annualized rate of 0.90% of the average daily net assets of ProFund VP Government Money Market, 1.38% of the average daily net assets of ProFund VP U.S. Government Plus and 1.68% of the average daily net assets of each other ProFund VP. For the non-money market ProFunds VP, these expense limitations remain in effect until at least April 30, 2025.
The Advisor may recoup the advisory and management services fees contractually waived or limited and other expenses reimbursed by it within three years from the contractual period; however, such recoupment will be limited to the lesser of any expense limitation in place at the time of recoupment or the expense limitation in place at the time of waiver or reimbursement. Any amounts recouped by the Advisor during the period are reflected on the Statement of Operations as "Recoupment of prior expenses reduced by the Advisor." As of June 30, 2024, the recoupments that may potentially be made by the ProFunds VP are as follows:
| Expires 4/30/25 | Expires 4/30/26 | Expires 4/30/27 | Expires 4/30/28 | Total | |||||||||||||||||||
ProFund Access VP High Yield | $ | — | $ | 3,223 | $ | 2,316 | $ | 192 | $ | 5,731 | |||||||||||||
ProFund VP Asia 30 | — | 15,415 | 25,206 | 1,909 | 42,530 | ||||||||||||||||||
ProFund VP Banks | — | 6,886 | 4,317 | 479 | 11,682 | ||||||||||||||||||
ProFund VP Bear | — | 565 | 1,200 | 89 | 1,854 | ||||||||||||||||||
ProFund VP Bull | — | 21,942 | 34,434 | — | 56,376 | ||||||||||||||||||
ProFund VP Communication Services | 329 | 3,195 | 7,684 | 667 | 11,875 | ||||||||||||||||||
ProFund VP Consumer Discretionary | 369 | 6,182 | 21,213 | 1,154 | 28,918 | ||||||||||||||||||
ProFund VP Consumer Staples | 536 | 7,736 | 12,311 | 811 | 21,394 | ||||||||||||||||||
ProFund VP Emerging Markets | — | 25,649 | 28,104 | 1,795 | 55,548 | ||||||||||||||||||
ProFund VP Energy | — | 23,266 | 29,540 | 2,925 | 55,731 | ||||||||||||||||||
ProFund VP Europe 30 | — | 15,452 | 11,637 | 2,262 | 29,351 | ||||||||||||||||||
ProFund VP Falling U.S. Dollar | 4,215 | 4,514 | 12,693 | 1,262 | 22,684 | ||||||||||||||||||
ProFund VP Financials | — | 15,820 | 19,042 | — | 34,862 | ||||||||||||||||||
ProFund VP Government Money Market | — | — | 81,574 | 9,223 | 90,797 | ||||||||||||||||||
ProFund VP Health Care | — | 9,366 | 20,257 | 2,235 | 31,858 | ||||||||||||||||||
ProFund VP Industrials | 390 | 4,461 | 15,135 | 648 | 20,634 | ||||||||||||||||||
ProFund VP International | — | 5,551 | 548 | — | 6,099 | ||||||||||||||||||
ProFund VP Internet | — | 3,370 | 8,967 | 694 | 13,031 | ||||||||||||||||||
ProFund VP Japan | — | 1,092 | 4,677 | — | 5,769 | ||||||||||||||||||
ProFund VP Large-Cap Growth | 1,329 | 12,667 | 21,702 | 2,513 | 38,211 | ||||||||||||||||||
ProFund VP Large-Cap Value | 2,302 | 10,632 | 15,437 | 1,936 | 30,307 | ||||||||||||||||||
June 30, 2024 (unaudited) :: Notes to Financial Statements :: 265
| Expires 4/30/25 | Expires 4/30/26 | Expires 4/30/27 | Expires 4/30/28 | Total | |||||||||||||||||||
ProFund VP Materials | $ | — | $ | 6,866 | $ | 12,928 | $ | 533 | $ | 20,327 | |||||||||||||
ProFund VP Mid-Cap | — | 5,489 | 5,855 | — | 11,344 | ||||||||||||||||||
ProFund VP Mid-Cap Growth | 7,817 | 12,813 | 18,465 | 2,613 | 41,708 | ||||||||||||||||||
ProFund VP Mid-Cap Value | 3,158 | 10,985 | 14,821 | 1,878 | 30,842 | ||||||||||||||||||
ProFund VP Nasdaq-100 | — | 65,747 | 81,574 | 11,000 | 158,321 | ||||||||||||||||||
ProFund VP Pharmaceuticals | — | 6,166 | 8,879 | 273 | 15,318 | ||||||||||||||||||
ProFund VP Precious Metals | — | 12,968 | 18,972 | 718 | 32,658 | ||||||||||||||||||
ProFund VP Real Estate | 268 | 2,821 | 8,241 | 627 | 11,957 | ||||||||||||||||||
ProFund VP Short Emerging Markets | — | 560 | 478 | — | 1,038 | ||||||||||||||||||
ProFund VP Short International | — | 328 | — | — | 328 | ||||||||||||||||||
ProFund VP Short Mid-Cap | — | 178 | 147 | 13 | 338 | ||||||||||||||||||
ProFund VP Short Nasdaq-100 | — | 6,338 | 4,372 | 78 | 10,788 | ||||||||||||||||||
ProFund VP Short Small-Cap | 82 | 3,055 | 4,004 | 270 | 7,411 | ||||||||||||||||||
ProFund VP Small-Cap | 1,008 | 18,514 | 20,201 | 3,152 | 42,875 | ||||||||||||||||||
ProFund VP Small-Cap Growth | 140 | 2,546 | 14,265 | 1,331 | 18,282 | ||||||||||||||||||
ProFund VP Small-Cap Value | — | 5,595 | 16,930 | 1,206 | 23,731 | ||||||||||||||||||
ProFund VP UltraBull | — | 1,022 | 6,763 | 1,337 | 9,122 | ||||||||||||||||||
ProFund VP UltraMid-Cap | 773 | 3,796 | 12,122 | 1,368 | 18,059 | ||||||||||||||||||
ProFund VP UltraNasdaq-100 | 6,645 | 136,878 | 142,350 | 21,579 | 307,452 | ||||||||||||||||||
ProFund VP UltraShort Nasdaq-100 | 534 | 4,774 | 1,846 | 17 | 7,171 | ||||||||||||||||||
ProFund VP UltraSmall-Cap | 6,878 | 31,072 | 28,036 | 4,522 | 70,508 | ||||||||||||||||||
ProFund VP U.S. Government Plus | — | 5,622 | 7,199 | 387 | 13,208 | ||||||||||||||||||
ProFund VP Utilities | 511 | 18,146 | 32,709 | 306 | 51,672 | ||||||||||||||||||
The Advisor has contractually agreed to waive advisory and management services fees, and if necessary, reimburse certain other expenses of ProFund VP Government Money Market through April 30, 2025 to the extent necessary to maintain a certain minimum net yield as determined by the Advisor.
The Advisor may recoup the advisory and management services fees contractually waived or limited and other expenses reimbursed by it within three years from the minimum yield limit period in which they were taken. Such recoupments shall be made monthly, but only to the extent that such recoupments would not cause the ProFund VP Government Money Market's net yield to fall below the highest previously determined minimum yield, and such recoupment will be limited to the lesser of any expense limitation in place at the time of recoupment or the expense limitation in place at the time of waiver or reimbursement. Any amounts recouped by the Advisor during the period are reflected on the Statement of Operations as "Recoupment of prior expenses reduced by the Advisor." As of June 30, 2024, the recoupments that may potentially be made by ProFund VP Government Money Market are as follows:
| Expires 4/30/25 | Expires 4/30/26 | Total | |||||||||||||
ProFund VP Government Money Market | $ | 437,473 | $ | 28,512 | $ | 465,985 | |||||||||
5. Securities Transactions
The cost of security purchases and the proceeds from the sale of securities (excluding securities maturing less than one year from acquisition) during the period ended June 30, 2024 were as follows:
Purchases | Sales | ||||||||||
ProFund VP Asia 30 | $ | 9,884,697 | $ | 9,350,835 | |||||||
ProFund VP Banks | 3,782,445 | 5,564,841 | |||||||||
ProFund VP Biotechnology | 27,639,652 | 31,240,044 | |||||||||
ProFund VP Bull | 30,498,573 | 26,525,505 | |||||||||
ProFund VP Communication Services | 7,438,868 | 7,072,384 | |||||||||
ProFund VP Consumer Discretionary | 5,872,432 | 5,349,273 | |||||||||
ProFund VP Consumer Staples | 26,543,050 | 27,233,405 | |||||||||
ProFund VP Emerging Markets | 33,129,987 | 32,985,083 | |||||||||
ProFund VP Energy | 59,897,432 | 63,118,758 | |||||||||
ProFund VP Europe 30 | 7,515,478 | 8,514,250 | |||||||||
ProFund VP Financials | 2,655,112 | 3,073,509 | |||||||||
ProFund VP Health Care | 10,815,105 | 12,197,730 | |||||||||
ProFund VP Industrials | 3,632,052 | 3,923,057 | |||||||||
ProFund VP Internet | 6,170,217 | 7,262,830 | |||||||||
ProFund VP Large-Cap Growth | 22,674,066 | 21,541,855 | |||||||||
ProFund VP Large-Cap Value | 5,611,017 | 11,446,015 | |||||||||
ProFund VP Materials | 3,842,718 | 4,278,309 | |||||||||
266 :: Notes to Financial Statements :: June 30, 2024 (unaudited)
Purchases | Sales | ||||||||||
ProFund VP Mid-Cap Growth | $ | 14,897,880 | $ | 16,353,321 | |||||||
ProFund VP Mid-Cap Value | 4,019,530 | 5,481,179 | |||||||||
ProFund VP Nasdaq-100 | 2,169,491 | 2,162,833 | |||||||||
ProFund VP Pharmaceuticals | 6,485,647 | 6,874,843 | |||||||||
ProFund VP Real Estate | 1,694,644 | 1,662,973 | |||||||||
ProFund VP Semiconductor | 74,657,325 | 112,318,485 | |||||||||
ProFund VP Small-Cap | 820,189 | 4,300,797 | |||||||||
ProFund VP Small-Cap Growth | 4,042,757 | 4,954,163 | |||||||||
ProFund VP Small-Cap Value | 3,346,424 | 7,103,091 | |||||||||
ProFund VP Technology | 14,640,449 | 19,384,073 | |||||||||
ProFund VP UltraBull | 4,344,354 | 4,143,672 | |||||||||
ProFund VP UltraMid-Cap | 1,849,302 | 1,172,886 | |||||||||
ProFund VP UltraNasdaq-100 | 23,175,508 | 8,180,738 | |||||||||
ProFund VP UltraSmall-Cap | 2,205,165 | 4,603,374 | |||||||||
ProFund VP Utilities | 14,855,680 | 14,103,889 | |||||||||
The cost of U.S. government security purchases and the proceeds from the sale of U.S. government securities (excluding securities maturing less than one year from acquisition) during the period ended June 30, 2024 were as follows:
Purchases | Sales | ||||||||||
ProFund Access VP High Yield | $ | 44,842,256 | $ | 45,293,199 | |||||||
ProFund VP U.S. Government Plus | 6,840,556 | 7,321,255 | |||||||||
6. Investment Risks
Some risks apply to all ProFunds VP, while others are specific to the investment strategy of certain ProFunds VP. Each ProFund VP may be subject to other risks in addition to these identified risks. This section discusses certain common principal risks encountered by the ProFunds VP. The risks are presented in an order intended to facilitate readability, and their order does not imply that the realization of one risk is likely to occur more frequently than another risk, nor does it imply that the realization of one risk is likely to have a greater adverse impact than another risk.
Risks Associated with the Use of Derivatives
Certain ProFunds VP may obtain investment exposure through derivatives. Investing in derivatives may be considered aggressive and may expose the ProFund VP to greater risks and may result in larger losses or smaller gains than investing directly in the reference asset(s) underlying those derivatives (e.g., securities in the Index). These risks include counterparty risk, liquidity risk and increased correlation risk. When the ProFund VP uses derivatives, there may be imperfect correlation between the value of the reference asset(s) underlying the derivative (e.g., securities in the Index) and the derivative, which may prevent the ProFund VP from achieving its investment objective. Because derivatives often require only a limited initial investment, the use of derivatives also may expose the ProFund VP to losses in excess of those amounts initially invested.
Certain ProFunds VP may use a combination of swaps on the Index and swaps on an ETF that is designed to track the performance of the Index. The performance of an ETF may not track the performance of the Index due to embedded costs and other factors. Thus, to the extent the ProFund VP invests in swaps that use an ETF as the reference asset, the ProFund VP may be subject to greater correlation risk and may not achieve as high a degree of correlation with the Index as it would if the ProFund VP only used swaps on the Index.
Moreover, with respect to the use of swap agreements, if the Index has a dramatic intraday move that causes a material decline in a ProFund VP's net assets, the terms of a swap agreement between the ProFund VP and its counterparty may permit the counterparty to immediately close out the transaction with the ProFund VP. In that event, the ProFund VP may be unable to enter into another swap agreement or invest in other derivatives to achieve the desired exposure consistent with the ProFund VP's investment objective. This, in turn, may prevent the ProFund VP from achieving its investment objective, even if the Index reverses all or a portion of its intraday move by the end of the day. As a result, the value of an investment in the ProFund VP may change quickly and without warning. Any costs associated with using derivatives will also have the effect of lowering the ProFund VP's return.
Holding Period Risk
Certain ProFunds VP are "geared" funds ("Geared Funds") in the sense that the ProFund VP has an investment objective to match a multiple, the inverse, or an inverse multiple of the performance of a benchmark. A Geared Fund does not seek to achieve its stated multiple, inverse, or an inverse multiple of the daily performance of its underlying benchmark (the "Daily Target") for any period other than a day. The performance of a Geared Fund over periods other than a day may be higher or lower than the Daily Target, and this difference may be significant. Factors that contribute to returns that are worse than the Daily Target include smaller index gains or losses and higher index volatility, as well as longer holding periods when these factors apply. Factors that contribute to returns that are better than the Daily Target include larger index gains or losses and lower index volatility, as well as longer holding periods when these factors apply. The more extreme these factors are, and the more they occur together, the more returns will tend to deviate from the Daily Target.
Leverage Risk
Certain ProFunds VP utilize leverage (i.e., obtain investment exposure in excess of their assets) in seeking to achieve their
June 30, 2024 (unaudited) :: Notes to Financial Statements :: 267
investment objective and will lose more money in market environments adverse to their daily objective than similar funds that do not employ leverage.
Because the ProFunds VP that utilize leverage include either multipliers of 2x or 1.25x (or sometimes the inverse thereof), a single day adverse price movement of more than 50% or 80%, respectively, in a relevant benchmark, could result in the total loss of an investor's investment.
Active Investor Risk
Each ProFund VP permits short-term trading of its securities. In addition, the Advisor expects a significant portion of the assets invested in a ProFund VP to come from professional money managers and investors who use the ProFund VP as part of active trading or tactical asset allocation strategies. These strategies often call for frequent trading to take advantage of anticipated changes in market conditions, which could increase portfolio turnover, and may result in additional costs for the ProFund VP. In addition, large movements of assets into and out of the ProFund VP may have a negative impact on the ProFund VP's ability to achieve its investment objective or maintain a consistent level of operating expenses. In certain circumstances, the ProFund VP's expense ratio may vary from current estimates or the historical ratio disclosed in the ProFund VP's prospectus.
Active Management Risk
ProFund Access VP High Yield Fund is actively managed, and its performance reflects the investment decisions that the Advisor makes for the ProFund. The Advisor's judgements about the ProFund VP's investments may prove to be incorrect. If the investments selected and strategies employed by the ProFund VP fail to produce the intended results, the ProFund VP could underperform or have negative returns as compared to other funds with a similar investment objective and/or strategies.
Concentration Risk
Certain non-money market ProFunds VP may be subject to concentration risk. Concentration risk results from maintaining concentrated exposure to certain types of issuers, industries, market sectors, countries or geographical regions. A ProFund VP that concentrates its investments will be more susceptible to risks associated with that concentration. With respect to the Sector ProFunds VP, a ProFund VP may have significant exposure to an individual industry that constitutes a significant portion of that ProFund VP's benchmark. Such a ProFund VP will be more susceptible to the risks associated with that specific industry, which may be different from the risks generally associated with other benchmarks. Each ProFund VP will concentrate its investments in a particular industry or group of industries to approximately the same extent as its benchmark, up to the extent permitted by applicable regulatory guidance. Additionally, certain ProFunds VP that focus their investments in particular countries or geographic regions may be particularly susceptible to economic, political or regulatory events affecting those countries or regions. These ProFunds VP may be more volatile than a more geographically diversified ProFund VP. The Schedule of Portfolio Investments includes information on each ProFund VP's holdings, including industry and/or geographical composition, as relevant.
Correlation Risk
There is no guarantee that a ProFund VP will achieve a high degree of correlation with its benchmark. Failure to achieve a high degree of correlation may prevent a ProFund VP from achieving its investment objective, and the percentage change of the ProFund VP's NAV each day may differ, perhaps significantly, from the percentage change of the ProFund VP's benchmark on such day. This may be due, among other reasons, to the impact of a limited trading market in the underlying component securities on the calculation of the benchmark.
In order to achieve a high degree of correlation with the Index, a ProFund VP seeks to rebalance its portfolio daily to keep exposure consistent with its investment objective. Being materially under- or overexposed to the Index may prevent the ProFund VP from achieving a high degree of correlation with the Index. Market disruptions or closure, regulatory restrictions, market volatility and other factors will adversely affect the ProFund VP's ability to adjust exposure to requisite levels. The target amount of portfolio exposure is impacted dynamically by the Index's movements. Because of this, it is unlikely that the ProFund VP will have perfect leveraged exposure at the end of each day and the likelihood of being materially under- or overexposed is higher on days when the Index level is volatile at or near the close of the trading day.
A number of other factors may adversely affect a ProFund VP's correlation with its benchmark, including material over- or underexposure, fees, expenses, transaction costs, financing costs associated with the use of derivatives, income items, valuation methodology, accounting standards and disruptions or illiquidity in the markets for the securities or financial instruments in which a ProFund VP invests. A ProFund VP may not have investment exposure to all securities in its benchmark, or its weighting of investment exposure to stocks or industries may be different from that of the benchmark. In addition, a ProFund VP may invest in securities not included in the benchmark or in financial instruments. Each ProFund VP may take or refrain from taking positions in order to improve tax efficiency or comply with regulatory restrictions, either of which may negatively affect the ProFund VP's correlation with its benchmark. A ProFund VP may also be subject to large movements of assets into and out of the ProFund VP, potentially resulting in the ProFund VP being over- or underexposed to its benchmark, and may be impacted by index reconstitutions and index rebalancing events. Additionally, a ProFund VP's underlying holdings or reference assets may trade on markets that may or may not be open on the same day as the ProFund VP. Each ProFund VP (other than the ProFund Access VP High Yield, the Classic ProFunds VP, the Sector ProFunds VP, ProFund VP Falling U.S. Dollar and ProFund VP Government Money Market) seeks to rebalance its portfolio daily to keep its leveraged, inverse or inverse leveraged exposure to the benchmark consistent with its investment objective. Any of these factors could decrease correlation between the performance of a ProFund VP and may hinder a ProFund VP's ability to meet its investment objective on or around that day.
Credit Default Swaps (CDS) Risk
While the Profund Access VP High Yield will normally be a net "seller" of CDS, at times the ProFund Access VP High Yield may be a net "buyer" of CDS. When the ProFund VP is a seller of credit
268 :: Notes to Financial Statements :: June 30, 2024 (unaudited)
protection, upon the occurrence of a credit event, the counterparty to the ProFund VP will have an obligation to pay the full notional value of a defaulted reference entity less recovery value. When the ProFund VP is a buyer of credit protection, upon the occurrence of a credit event, the counterparty to the ProFund VP will have an obligation to pay the full notional value of a defaulted reference entity less recovery value. Recovery values for CDS are generally determined via an auction process to determine the final price for a given reference entity. Although, the ProFund VP intends, as practicable, to obtain exposure through centrally cleared CDS, an active market may not exist for any of the CDS in which the ProFund VP invests or in the reference entities subject to the CDS. As a result, the ProFund VP's ability to maximize returns or minimize losses on such CDS may be impaired. Other risks of CDS include difficulty in valuation due to the lack of pricing transparency and the risk that changes in the value of the CDS do not reflect changes in the credit quality of the underlying reference entities or may otherwise perform differently than expected given market conditions. Because the ProFund VP may use a single counterparty or a small number of counterparties, certain CDS involve many reference entities and there are no limitations on the notional amount established for the CDS. As a result, counterparty risk may be amplified.
Counterparty Risk
A ProFund VP that will invest in financial instruments involving third parties (i.e., counterparties) is subject to counterparty risk. The use of financial instruments, such as swap agreements or futures contracts, involves risks that are different from those associated with ordinary portfolio securities transactions. Certain ProFunds VP will be subject to credit risk (i.e., the risk that a counterparty is unwilling or unable to make timely payments to meet its contractual obligations) with respect to the amount they expect to receive from counterparties to financial instruments and repurchase agreements entered into by the ProFunds VP. Each ProFund VP generally structures the agreement such that either party can terminate the contract without penalty prior to the termination date. A ProFund VP may be negatively impacted if a counterparty becomes bankrupt or otherwise fails to perform its obligations, the value of an investment in each ProFund VP may decline. A ProFund VP may experience significant delays in obtaining any recovery in a bankruptcy or other reorganization proceeding and a ProFund VP may obtain only limited recovery or may obtain no recovery in such circumstances.
The ProFunds VP typically enter into transactions with counterparties whose credit rating at the time of the transaction is investment grade, as determined by a nationally recognized statistical rating organization, or, if unrated, judged by the Advisor to be of comparable quality. These are usually major, global financial institutions. Although the counterparty to an exchange-traded futures contract is often backed by a futures commission merchant ("FCM") or clearing organization that is further backed by a group of financial institutions, there may be instances in which the FCM or the clearing organization could fail to perform its obligations, causing significant losses to the ProFund VP. For example, a ProFund VP could lose margin payments it has deposited with a clearing organization as well as gains owed but not paid to the ProFund VP if the clearing organization becomes insolvent or otherwise fails to perform its obligations.
Under current CFTC regulations, a FCM maintains customers' assets in a bulk segregated account. If a FCM fails to do so, or is unable to satisfy a substantial deficit in a customer account, its other customers may be subject to risk of loss of their funds in the event of that FCM's bankruptcy. In that event, in the case of futures, the FCM's customers are entitled to recover, even in respect of property specifically traceable to them, only a proportional share of all property available for distribution to all of that FCM's customers. In the case of cleared swaps, customers of a FCM in bankruptcy are entitled to recover assets specifically attributable to them pursuant to new CFTC regulations, but may nevertheless risk loss of some or all of their assets due to accounting or operational issues or due to legal risk in connection with the application of bankruptcy law to cleared swaps.
Cybersecurity Risk
With the increased use of technologies such as the Internet and the dependence on computer systems to perform necessary business functions, each ProFund VP, financial intermediaries, service providers and the relevant listing exchange are susceptible to operational, information security and related "cyber" risks. In general, cyber incidents can result from deliberate attacks or unintentional events. Cyber attacks include, but are not limited to gaining unauthorized access to digital systems for purposes of misappropriating assets or sensitive information, corrupting data, or causing operational disruption. Cyber attacks may also be carried out in a manner that does not require gaining unauthorized access, such as causing among other behaviors, stealing or corrupting data maintained online or digitally, and denial of service attacks on websites. Cybersecurity failures or breaches of a ProFund VP's third party service provider (including, but not limited to, index providers, the administrator and transfer agent) or the issuers of securities and/or financial instruments in which the ProFund VP invests, have the ability to cause disruptions and impact business operations, potentially resulting in financial losses, the inability of ProFund VP shareholders to transact business, violations of applicable privacy and other laws. For instance, cyber attacks may interfere with the processing of shareholder transactions, impact the ProFund VP's ability to calculate its NAV, cause the release of private shareholder information or confidential ProFund VP information, impede trading, cause reputational damage, and subject the ProFund VP to regulatory fines, reputational damage, penalties or financial losses, reimbursement or other compensation costs, and/or additional compliance costs. In addition, substantial costs may be incurred in order to prevent any cyber incidents in the future. A ProFund VP and its shareholders could be negatively impacted as a result. While a ProFund VP or its service providers may have established business continuity plans and systems designed to guard against such cyber attacks or adverse effects of such attacks, there are inherent limitations in such plans and systems including the possibility that certain risks have not been identified, in large part because different unknown threats may emerge in the future. Similar types of cybersecurity risks also are present for issuers of securities in which a ProFund VP invests, which could result in material adverse consequences for such issuers, and may cause the ProFund VP's investments in such securities to lose value. In addition, cyber attacks involving a counterparty to a ProFund VP could affect such a counterparty's ability to meets it obligations to the ProFund VP, which may result in losses to the ProFund VP and its shareholders. The Advisor and
June 30, 2024 (unaudited) :: Notes to Financial Statements :: 269
the Trust do not control the cybersecurity plans and systems put in place by third party service providers, and such third party service providers may have no or limited indemnification obligations to the Advisor or to a ProFund VP.
Natural Disaster/Epidemic Risk
Natural or environmental disasters, such as earthquakes, fires, floods, hurricanes, tsunamis and other severe weather-related phenomena generally, and widespread disease, including pandemics and epidemics (for example, the novel coronavirus (COVID-19)), have been and can be highly disruptive to economies and markets and have recently led, and may continue to lead, to increased market volatility and significant market losses. Such as natural disaster and health crises could exacerbate political, social, and economic risks previously mentioned, and result in significant breakdowns, delays, shutdowns, social isolation, and other disruptions to important global, local and regional supply chains affected, with potential corresponding results on the operating performance of the ProFund VP and its investments. A climate of uncertainty and panic, including the contagion of infectious viruses or diseases, may adversely affect global, regional, and local economies and reduce the availability of potential investment opportunities, and increases the difficulty of performing due diligence and modeling market conditions, potentially reducing the accuracy of financial projections. Under these circumstances, the ProFund VP may have difficulty achieving its investment objective which may adversely impact performance. Further, such events can be highly disruptive to economies and markets, significantly disrupt the operations of individual companies (including, but not limited to, the ProFund VP's investment advisor and third party service providers), sectors, industries, markets, securities and commodity exchanges, currencies, interest and inflation rates, credit ratings, investor sentiment, and other factors affecting the value of the ProFund VP's investments. These factors can cause substantial market volatility, exchange trading suspensions and closures and can impact the ability of the ProFund VP to complete redemptions and otherwise affect ProFund VP performance and ProFund VP trading in the secondary market. A widespread crisis may also affect the global economy in ways that cannot necessarily be foreseen at the current time. How long such events will last and whether they will continue or recur cannot be predicted. Impacts from these events could have significant impact on the ProFund VP's performance, resulting in losses to your investment.
Risk of Global Economic Shock
Widespread disease, including public health disruptions, pandemics and epidemics (for example, COVID-19 including its variants), have been and may continue to be highly disruptive to economies and markets. Health crises could exacerbate political, social, and economic risks, and result in breakdowns, delays, shutdowns, social isolation, civil unrest, periods of high unemployment, shortages in and disruptions to the medical care and consumer goods and services industries, and other disruptions to important global, local and regional supply chains, with potential corresponding results on the performance of a ProFund VP and its investments.
Additionally, war, military conflicts, sanctions, acts of terrorism, sustained elevated inflation, supply chain issues or other events
could have a significant negative impact on global financial markets and economies. Russia's military incursions in Ukraine have led to, and may lead to additional sanctions being levied by the United States, European Union, and other countries against Russia. The ongoing hostilities between the two countries could result in additional widespread conflict and could have a severe adverse effect on the region and certain markets. Sanctions on Russian exports could have a significant adverse impact on the Russian economy and related markets and could affect the value of a ProFund VP's investments, even beyond any direct exposure a ProFund VP may have to the region or to adjoining geographic regions. The extent and duration of the military action, sanctions and resulting market disruptions are impossible to predict, but could have a severe adverse effect on the region, including significant negative impacts on the economy and the markets for certain securities and commodities, such as oil and natural gas. Furthermore, the possibility of a prolonged conflict between Hamas and Israel, and the potential expansion of the conflict in the surrounding areas and the involvement of other nations in the conflict, such as the Houthi movement's attacks on marine vessels in the Red Sea, could further destabilize the Middle East region and introduce new uncertainties in global markets, including the oil and natural gas markets. How long such tensions and related events will last cannot be predicted. These tensions and any related events could have significant impact on the ProFund VP performance and the value of an investment in the ProFund VP.
Debt Instruments Risk
The ProFunds VP may invest in, or seek exposure to, debt instruments. Debt instruments are subject to adverse issuer, political, regulatory, market and economic developments, as well as developments that affect specific economic sectors, industries or segments of the fixed income market. Additionally, the credit quality of the issuer of a debt instrument (including the risk of a potential default) can also affect the price of a debt instrument. The perceived or actual inability of issuers, guarantors, or liquidity providers of debt instruments to make scheduled interest payments can negatively impact the performance of the ProFund VP. Debt instruments may have varying levels of sensitivity to changes in interest rates and other factors.
Typically, the price of outstanding debt instruments falls when interest rates rise. Without taking into account other factors, the prices of debt instruments with longer maturities may fluctuate more in response to interest rate changes than those of debt instruments with shorter maturities. Many types of debt instruments are subject to prepayment risk, which is the risk that the issuer of the security will repay principal (in part or in whole) prior to the maturity date. Debt instruments allowing prepayment may offer less potential for gains during a period of declining interest rates, as a ProFund VP may be required to reinvest the proceeds received at lower interest rates. These factors may cause the value of an investment in the ProFund VP to change. Also, the securities of certain U.S. government agencies, authorities or instrumentalities are neither issued by nor guaranteed as to principal and interest by the U.S. government, and may be exposed to more credit risk than those issued by and guaranteed as to principal and interest by the U.S. government. All U.S. government securities are subject to credit risk. It is possible that the U.S. government may not be able to meet its financial obligations or
270 :: Notes to Financial Statements :: June 30, 2024 (unaudited)
that securities issued by the U.S. government may experience credit downgrades. Such a credit event may also adversely impact the financial markets. Certain ProFunds VP are inversely correlated to bond prices and will typically respond differently to the above factors than would a ProFund VP positively correlated to bond prices.
High Yield Risk
Investment in or exposure to high yield (lower rated) debt instruments (also known as "junk bonds") may involve greater levels of interest rate, credit, liquidity and valuation risk than for higher rated instruments. High yield debt instruments may be more sensitive to economic changes, political changes, or adverse developments specific to a company than other fixed income instruments. These securities are subject to greater risk of loss, greater sensitivity to economic changes, valuation difficulties, and a potential lack of a secondary or public market for securities. High yield debt instruments are considered predominantly speculative with respect to the issuer's continuing ability to make principal and interest payments and, therefore, such instruments generally involve greater risk of default or price changes than higher rated debt instruments. An economic downturn or period of rising interest rates could adversely affect the market for these securities and reduce market liquidity (liquidity risk). Less active markets may diminish a ProFund VP's ability to obtain accurate market quotations when valuing the portfolio securities and thereby give rise to valuation risk. High yield debt instruments may also present risks based on payment expectations. For example, these instruments may contain redemption or call provisions. If an issuer exercises these provisions in a declining interest rate market, the ProFund VP would have to replace the security with a lower yielding security, resulting in a decreased return for investors. If the issuer of a security is in default with respect to interest or principal payments, the issuer's security could lose its entire value. Furthermore, the transaction costs associated with the purchase and sale of high yield debt instruments may vary greatly depending upon a number of factors and may adversely affect a ProFund VP's performance.
Index Performance Risk
Certain ProFunds VP linked to an index will be subject to index performance risk. There is no guarantee or assurance that the methodology used by the third-party provider to create the Index will result in the ProFund VP achieving high, or even positive, returns. Further, there can be no guarantee that the methodology underlying the Index or the daily calculation of the Index will be
free from error. It is also possible that the value of the Index may be subject to intentional manipulation by third-party market participants. The Index may underperform, and the ProFund VP could lose value, while other indices or measures of market performance increase in value.
Financing Rates Associated with Derivatives
The performance of ProFunds VP that use derivatives was impacted by the related financing costs. Financial instruments such as futures contracts carry implied financing costs. Forward and swap financing rates are negotiated between the ProFunds VP and their counterparties, and are set at the Fed Funds rate ("FEDL01") plus or minus a negotiated spread. The Fed Funds rate remained around 5.33% during the period. Each ProFund VP with long exposure via derivatives was generally negatively affected by financing rates. Conversely, most ProFunds VP with short/inverse derivative exposure generally benefited from financing rates.
Inflation Risk
Inflation risk is the risk that the value of assets or income from a ProFund VP's investments will be worth less in the future as inflation decreases the value of payments at future dates. As inflation increases, the real value of a ProFund VP's portfolio could decline. Inflation rates may change frequently and drastically as a result of various factors and the ProFund VP's investment may not keep pace with inflation, which may result in losses to the ProFund VP investors or adversely affect the real value of shareholder's investments in a ProFund VP. Inflation has recently increased and it cannot be predicted whether it may decline.
Liquidity Risk
In certain circumstances, such as the disruption of the orderly markets for the securities or financial instruments in which a ProFund VP invests, the ProFunds VP might not be able to acquire or dispose of certain holdings quickly or at prices that represent true fair value in the judgment of the Advisor. Markets for the securities or financial instruments in which a ProFund VP invests may be disrupted by a number of events, including but not limited to economic crises, natural disasters, new legislation, or regulatory changes inside or outside of the U.S. For example, regulation limiting the ability of certain financial institutions to invest in certain securities would likely reduce the liquidity of those securities. These situations may prevent a ProFund VP from limiting losses, realizing gains, or from achieving a high correlation (or inverse correlation) with its underlying benchmark.
7. Federal Income Tax Information
The tax character of distributions paid to shareholders during the tax years ended, as noted below, were as follows:
Year Ended December 31, 2023 | Year Ended December 31, 2022 | ||||||||||||||||||||||||||||||||||
| Distributions Paid from Ordinary Income | Distributions Paid from Net Long-Term Capital Gains | Tax Return of Capital | Total Distributions Paid | Distributions Paid from Ordinary Income | Distributions Paid from Net Long-Term Capital Gains | Tax Return of Capital | Total Distributions Paid | ||||||||||||||||||||||||||||
ProFund Access VP High Yield | $ | 811,910 | $ | — | $ | — | $ | 811,910 | $ | 595,085 | $ | — | $ | — | $ | 595,085 | |||||||||||||||||||
ProFund VP Asia 30 | 17,533 | 669,693 | — | 687,226 | 95,017 | 2,232,606 | — | 2,327,623 | |||||||||||||||||||||||||||
ProFund VP Banks | 65,310 | — | — | 65,310 | 49,018 | — | — | 49,018 | |||||||||||||||||||||||||||
ProFund VP Bear | 7,959 | — | — | 7,959 | — | — | — | — | |||||||||||||||||||||||||||
ProFund VP Biotechnology | — | 6,518,064 | — | 6,518,064 | 197,061 | 8,620,057 | — | 8,817,118 | |||||||||||||||||||||||||||
June 30, 2024 (unaudited) :: Notes to Financial Statements :: 271
Year Ended December 31, 2023 | Year Ended December 31, 2022 | ||||||||||||||||||||||||||||||||||
| Distributions Paid from Ordinary Income | Distributions Paid from Net Long-Term Capital Gains | Tax Return of Capital | Total Distributions Paid | Distributions Paid from Ordinary Income | Distributions Paid from Net Long-Term Capital Gains | Tax Return of Capital | Total Distributions Paid | ||||||||||||||||||||||||||||
ProFund VP Bull | $ | — | $ | 8,734,170 | $ | — | $ | 8,734,170 | $ | 4,194,088 | $ | 1,291,627 | $ | — | $ | 5,485,715 | |||||||||||||||||||
| ProFund VP Communication Services | 58,848 | — | — | 58,848 | 103,492 | — | — | 103,492 | |||||||||||||||||||||||||||
| ProFund VP Consumer Discretionary | — | 1,013,997 | — | 1,013,997 | 60,825 | 139,786 | — | 200,611 | |||||||||||||||||||||||||||
ProFund VP Consumer Staples | 343,272 | 1,462,883 | — | 1,806,155 | 488,033 | 48,178 | — | 536,211 | |||||||||||||||||||||||||||
ProFund VP Dow 30 | 129 | — | — | 129 | 44,674 | — | — | 44,674 | |||||||||||||||||||||||||||
ProFund VP Emerging Markets | 422,942 | — | — | 422,942 | 110,840 | — | — | 110,840 | |||||||||||||||||||||||||||
ProFund VP Energy | 1,187,917 | — | — | 1,187,917 | 658,231 | — | — | 658,231 | |||||||||||||||||||||||||||
ProFund VP Europe 30 | 314,873 | — | — | 314,873 | 816,976 | 138,048 | — | 955,024 | |||||||||||||||||||||||||||
ProFund VP Financials | 118,059 | 1,067,782 | — | 1,185,841 | 265,645 | 116,404 | — | 382,049 | |||||||||||||||||||||||||||
| ProFund VP Government Money Market | 1,426,790 | — | — | 1,426,790 | 375,075 | — | — | 375,075 | |||||||||||||||||||||||||||
ProFund VP Health Care | — | 4,450,779 | — | 4,450,779 | 364,507 | 2,227,197 | — | 2,591,704 | |||||||||||||||||||||||||||
ProFund VP Industrials | — | 1,349,793 | — | 1,349,793 | 74,737 | 115,158 | — | 189,895 | |||||||||||||||||||||||||||
ProFund VP International | — | — | — | — | 461,505 | — | — | 461,505 | |||||||||||||||||||||||||||
ProFund VP Internet | — | 1,717,154 | — | 1,717,154 | — | 3,971,476 | — | 3,971,476 | |||||||||||||||||||||||||||
ProFund VP Japan | — | — | — | — | 60,553 | 296,292 | — | 356,845 | |||||||||||||||||||||||||||
ProFund VP Large-Cap Growth | — | 3,728,772 | — | 3,728,772 | 120,408 | 3,618,565 | — | 3,738,973 | |||||||||||||||||||||||||||
ProFund VP Large-Cap Value | 87,129 | 1,233,407 | — | 1,320,536 | 72,492 | 201,284 | — | 273,776 | |||||||||||||||||||||||||||
ProFund VP Materials | 72,950 | — | — | 72,950 | 138,448 | 53,432 | — | 191,880 | |||||||||||||||||||||||||||
ProFund VP Mid-Cap | — | — | — | — | 2,138,942 | 292,514 | — | 2,431,456 | |||||||||||||||||||||||||||
ProFund VP Mid-Cap Growth | — | 81,372 | — | 81,372 | 455,295 | 2,534,042 | — | 2,989,337 | |||||||||||||||||||||||||||
ProFund VP Mid-Cap Value | 33,606 | 695,642 | — | 729,248 | 700,703 | 1,426,381 | — | 2,127,084 | |||||||||||||||||||||||||||
ProFund VP Nasdaq-100 | — | 620,919 | — | 620,919 | 9,788,260 | 10,171,071 | — | 19,959,331 | |||||||||||||||||||||||||||
ProFund VP Pharmaceuticals | 61,386 | 228,205 | — | 289,591 | 181,043 | 670,360 | — | 851,403 | |||||||||||||||||||||||||||
ProFund VP Real Estate | 65,712 | 1,191,790 | — | 1,257,502 | 440,861 | 162,329 | — | 603,190 | |||||||||||||||||||||||||||
| ProFund VP Rising Rates Opportunity | 16,031 | — | — | 16,031 | — | — | — | — | |||||||||||||||||||||||||||
ProFund VP Semiconductor | — | 397,743 | — | 397,743 | 671,419 | 26,089 | — | 697,508 | |||||||||||||||||||||||||||
| ProFund VP Short Emerging Markets | 4,519 | — | — | 4,519 | 13,998 | — | — | 13,998 | |||||||||||||||||||||||||||
ProFund VP Short International | 13,615 | — | — | 13,615 | — | — | — | — | |||||||||||||||||||||||||||
ProFund VP Short Mid-Cap | 1,059 | — | — | 1,059 | — | — | — | — | |||||||||||||||||||||||||||
ProFund VP Short Nasdaq-100 | 3,135 | 5,864 | — | 8,999 | — | — | — | — | |||||||||||||||||||||||||||
ProFund VP Short Small-Cap | 131,293 | 11,997 | — | 143,290 | — | — | — | — | |||||||||||||||||||||||||||
ProFund VP Small-Cap | — | — | — | — | 1,044,374 | 490,095 | — | 1,534,469 | |||||||||||||||||||||||||||
ProFund VP Small-Cap Growth | — | 435,031 | — | 435,031 | 552,099 | 1,989,453 | — | 2,541,552 | |||||||||||||||||||||||||||
ProFund VP Small-Cap Value | 3,178 | 789,010 | — | 792,188 | 1,850,348 | 1,973,977 | — | 3,824,325 | |||||||||||||||||||||||||||
ProFund VP Technology | — | 5,510,738 | — | 5,510,738 | 1,317,218 | 5,172,582 | — | 6,489,800 | |||||||||||||||||||||||||||
ProFund VP UltraBull | — | — | — | — | 2,078,580 | 948,359 | — | 3,026,939 | |||||||||||||||||||||||||||
ProFund VP UltraMid-Cap | — | — | — | — | 3,468,388 | 589,136 | — | 4,057,524 | |||||||||||||||||||||||||||
ProFund VP UltraNasdaq-100 | — | — | — | — | 72,449,015 | 1,258,151 | — | 73,707,166 | |||||||||||||||||||||||||||
ProFund VP UltraShort Dow 30 | 6 | — | — | 6 | — | — | — | — | |||||||||||||||||||||||||||
ProFund VP UltraSmall-Cap | — | — | — | — | 2,923,886 | 639,688 | — | 3,563,574 | |||||||||||||||||||||||||||
| ProFund VP U.S. Government Plus | 362,281 | — | 249 | 362,530 | — | — | — | — | |||||||||||||||||||||||||||
ProFund VP Utilities | 406,380 | — | — | 406,380 | 391,040 | 426,398 | — | 817,438 | |||||||||||||||||||||||||||
As of the latest tax year ended December 31, 2023, the components of accumulated earnings (deficit) on a tax basis were as follows:
| Undistributed Ordinary Income | Undistributed Long-Term Capital Gains | Distributions Payable | Accumulated Capital and Other Losses | Unrealized Appreciation/ (Depreciation) | Total Accumulated Earnings/ (Deficit) | ||||||||||||||||||||||
ProFund Access VP High Yield | $ | 612,963 | $ | — | $ | — | $ | (5,018,349 | ) | $ | 127,414 | $ | (4,277,972 | ) | |||||||||||||
ProFund VP Asia 30 | 117,552 | — | — | (592,481 | ) | (104,817 | ) | (579,746 | ) | ||||||||||||||||||
ProFund VP Banks | 86,224 | — | — | (5,580,049 | ) | 866,691 | (4,627,134 | ) | |||||||||||||||||||
ProFund VP Bear | 131,745 | — | — | (23,635,435 | ) | 6,851 | (23,496,839 | ) | |||||||||||||||||||
ProFund VP Biotechnology | — | 16,706,392 | — | — | 8,844,701 | 25,551,093 | |||||||||||||||||||||
ProFund VP Bull | 3,046,029 | 304,498 | — | — | 26,118,021 | 29,468,548 | |||||||||||||||||||||
272 :: Notes to Financial Statements :: June 30, 2024 (unaudited)
| Undistributed Ordinary Income | Undistributed Long-Term Capital Gains | Distributions Payable | Accumulated Capital and Other Losses | Unrealized Appreciation/ (Depreciation) | Total Accumulated Earnings/ (Deficit) | ||||||||||||||||||||||
ProFund VP Communication Services | $ | — | $ | — | $ | — | $ | (870,404 | ) | $ | 1,729,212 | $ | 858,808 | ||||||||||||||
ProFund VP Consumer Discretionary | 48,875 | 2,448,847 | — | — | 7,970,416 | 10,468,138 | |||||||||||||||||||||
ProFund VP Consumer Staples | 214,461 | 3,296,352 | — | — | 4,167,080 | 7,677,893 | |||||||||||||||||||||
ProFund VP Dow 30 | 10,184 | — | — | (1,646,322 | ) | 180 | (1,635,958 | ) | |||||||||||||||||||
ProFund VP Emerging Markets | 334,637 | — | — | (8,537,805 | ) | 6,104,694 | (2,098,474 | ) | |||||||||||||||||||
ProFund VP Energy | 919,340 | 2,002,124 | — | — | 23,147,772 | 26,069,236 | |||||||||||||||||||||
ProFund VP Europe 30 | 276,152 | 495,778 | — | — | 1,109,401 | 1,881,331 | |||||||||||||||||||||
ProFund VP Falling U.S. Dollar | 29,158 | — | — | (395,705 | ) | — | (366,547 | ) | |||||||||||||||||||
ProFund VP Financials | 319,014 | 2,603,640 | — | — | 13,522,371 | 16,445,025 | |||||||||||||||||||||
| ProFund VP Government Money Market | — | — | — | (39,366 | ) | — | (39,366 | ) | |||||||||||||||||||
ProFund VP Health Care | 23,646 | 1,709,557 | — | — | 28,372,366 | 30,105,569 | |||||||||||||||||||||
ProFund VP Industrials | 117,573 | 2,108,331 | — | — | 7,380,699 | 9,606,603 | |||||||||||||||||||||
ProFund VP International | 371,382 | — | — | (1,917,655 | ) | (34,369 | ) | (1,580,642 | ) | ||||||||||||||||||
ProFund VP Internet | 257,577 | — | — | — | 4,563,077 | 4,820,654 | |||||||||||||||||||||
ProFund VP Japan | 1,012,848 | 1,018,380 | — | — | (794 | ) | 2,030,434 | ||||||||||||||||||||
ProFund VP Large-Cap Growth | 294,317 | 236,429 | — | — | 10,721,831 | 11,252,577 | |||||||||||||||||||||
ProFund VP Large-Cap Value | 1,512,254 | 404,250 | — | — | 2,524,827 | 4,441,331 | |||||||||||||||||||||
ProFund VP Materials | 62,256 | 11,137 | — | — | 7,111,000 | 7,184,393 | |||||||||||||||||||||
ProFund VP Mid-Cap | 316,090 | — | — | (1,747,147 | ) | (85,723 | ) | (1,516,780 | ) | ||||||||||||||||||
ProFund VP Mid-Cap Growth | 21,136 | 575,482 | — | — | 3,050,618 | 3,647,236 | |||||||||||||||||||||
ProFund VP Mid-Cap Value | 410,021 | 92,955 | — | — | 1,012,772 | 1,515,748 | |||||||||||||||||||||
ProFund VP Nasdaq-100 | 11,487,728 | 8,419,597 | — | — | 62,828,608 | 82,735,933 | |||||||||||||||||||||
ProFund VP Pharmaceuticals | — | 1,036,922 | — | — | 1,353,056 | 2,389,978 | |||||||||||||||||||||
ProFund VP Precious Metals | 809,641 | — | — | (65,254,634 | ) | (427,991 | ) | (64,872,984 | ) | ||||||||||||||||||
ProFund VP Real Estate | 89,738 | 144,890 | — | — | 3,039,264 | 3,273,892 | |||||||||||||||||||||
ProFund VP Rising Rates Opportunity | 1,635,069 | 16,086 | — | (27,316,320 | ) | (90,565 | ) | (25,755,730 | ) | ||||||||||||||||||
ProFund VP Semiconductor | 5,756,750 | 1,524 | — | — | 19,144,530 | 24,902,804 | |||||||||||||||||||||
ProFund VP Short Dow 30 | 200 | — | — | (119,763 | ) | (4 | ) | (119,567 | ) | ||||||||||||||||||
ProFund VP Short Emerging Markets | 29,923 | — | — | (2,788,848 | ) | (1,279 | ) | (2,760,204 | ) | ||||||||||||||||||
ProFund VP Short International | 29,900 | — | — | (2,659,203 | ) | 1,618 | (2,627,685 | ) | |||||||||||||||||||
ProFund VP Short Mid-Cap | 7,165 | — | — | (2,609,427 | ) | 652 | (2,601,610 | ) | |||||||||||||||||||
ProFund VP Short Nasdaq-100 | 205,004 | — | — | (18,277,553 | ) | 21,253 | (18,051,296 | ) | |||||||||||||||||||
ProFund VP Short Small-Cap | 109,373 | — | — | (6,403,485 | ) | 42,131 | (6,251,981 | ) | |||||||||||||||||||
ProFund VP Small-Cap | 106,123 | — | — | (128,360 | ) | 1,647,161 | 1,624,924 | ||||||||||||||||||||
ProFund VP Small-Cap Growth | 47,305 | 708,603 | — | — | 3,947,955 | 4,703,863 | |||||||||||||||||||||
ProFund VP Small-Cap Value | 159,421 | — | — | — | 406,885 | 566,306 | |||||||||||||||||||||
ProFund VP Technology | 224,890 | 4,080,560 | — | — | 32,344,795 | 36,650,245 | |||||||||||||||||||||
ProFund VP UltraBull | 123,404 | — | — | (14,479,872 | ) | 7,252,470 | (7,103,998 | ) | |||||||||||||||||||
ProFund VP UltraMid-Cap | 70,221 | — | — | (1,239,405 | ) | 2,312,400 | 1,143,216 | ||||||||||||||||||||
ProFund VP UltraNasdaq-100 | 662,573 | — | — | (22,172,081 | ) | 69,258,704 | 47,749,196 | ||||||||||||||||||||
ProFund VP UltraShort Dow 30 | 108 | — | — | (969,507 | ) | (4 | ) | (969,403 | ) | ||||||||||||||||||
ProFund VP UltraShort Nasdaq-100 | 71,933 | — | — | (8,848,614 | ) | 5,972 | (8,770,709 | ) | |||||||||||||||||||
ProFund VP UltraSmall-Cap | 112,671 | — | — | (7,269,435 | ) | 2,075,577 | (5,081,187 | ) | |||||||||||||||||||
ProFund VP U.S. Government Plus | — | — | — | (8,823,403 | ) | 410,145 | (8,413,258 | ) | |||||||||||||||||||
ProFund VP Utilities | 470,058 | — | — | (93,795 | ) | 12,276,386 | 12,652,649 | ||||||||||||||||||||
As of the latest tax year ended December 31, 2023, the following ProFunds VP have net capital loss carryforwards ("CLCFs") as summarized in the tables below.
Fund | No Expiration Date | ||||||
ProFund Access VP High Yield | $ | 5,018,349 | * | ||||
ProFund VP Asia 30 | 592,481 | ||||||
ProFund VP Banks | 5,580,049 | * | |||||
ProFund VP Bear | 23,635,435 | * | |||||
ProFund VP Communication Services | 870,404 | * | |||||
ProFund VP Dow 30 | 1,646,322 | * | |||||
ProFund VP Emerging Markets | 8,537,805 | * | |||||
ProFund VP Falling U.S. Dollar | 395,705 | * | |||||
ProFund VP Government Money Market | 39,366 | ||||||
ProFund VP International | 1,917,655 | * | |||||
ProFund VP Mid-Cap | 1,747,147 | * | |||||
June 30, 2024 (unaudited) :: Notes to Financial Statements :: 273
Fund | No Expiration Date | ||||||
ProFund VP Precious Metals | $ | 65,254,634 | * | ||||
ProFund VP Rising Rates Opportunity | 27,316,320 | * | |||||
ProFund VP Short Dow 30 | 119,763 | * | |||||
ProFund VP Short Emerging Markets | 2,788,848 | * | |||||
ProFund VP Short International | 2,659,203 | * | |||||
ProFund VP Short Mid-Cap | 2,609,427 | * | |||||
ProFund VP Short Nasdaq-100 | 18,277,553 | * | |||||
ProFund VP Short Small-Cap | 6,403,485 | * | |||||
ProFund VP Small-Cap | 128,360 | ||||||
ProFund VP UltraBull | 14,479,872 | * | |||||
ProFund VP UltraMid-Cap | 1,239,405 | ||||||
ProFund VP UltraNasdaq-100 | 22,172,081 | * | |||||
ProFund VP UltraShort Dow 30 | 969,507 | * | |||||
ProFund VP UltraShort Nasdaq-100 | 8,848,614 | * | |||||
ProFund VP UltraSmall-Cap | 7,269,435 | ||||||
ProFund VP U.S. Government Plus | 8,823,403 | * | |||||
ProFund VP Utilities | 93,795 | ||||||
* All or a portion are limited as a result of changes in the ProFund VP ownership during the year and in prior years.
Unused limitations accumulate and increase limited CLCFs available for use in offsetting net capital gains. The tax character of current year distribution paid and the tax basis of the current components of accumulated earnings (deficit) and any CLCFs will be determined at the end of the current tax year. The Board does not intend to authorize a distribution of any realized gain for a ProFund VP until any applicable CLCF has been offset or expires.
As of December 31, 2023, the cost, gross unrealized appreciation and gross unrealized depreciation on investment securities, for federal income tax purposes, were as follows:
Tax Cost | Tax Unrealized Appreciation | Tax Unrealized Depreciation | Net Unrealized Appreciation (Depreciation) | ||||||||||||||||
ProFund Access VP High Yield | $ | 15,894,904 | $ | 127,414 | $ | — | $ | 127,414 | |||||||||||
ProFund VP Asia 30 | 16,965,218 | 5,183,459 | (5,288,276 | ) | (104,817 | ) | |||||||||||||
ProFund VP Banks | 4,832,203 | 1,742,190 | (875,499 | ) | 866,691 | ||||||||||||||
ProFund VP Bear | 3,094,521 | 6,851 | — | 6,851 | |||||||||||||||
ProFund VP Biotechnology | 38,601,424 | 13,337,969 | (4,493,268 | ) | 8,844,701 | ||||||||||||||
ProFund VP Bull | 28,319,959 | 29,375,703 | (3,257,682 | ) | 26,118,021 | ||||||||||||||
ProFund VP Communication Services | 6,761,415 | 1,964,599 | (235,387 | ) | 1,729,212 | ||||||||||||||
ProFund VP Consumer Discretionary | 15,770,852 | 8,728,723 | (758,307 | ) | 7,970,416 | ||||||||||||||
ProFund VP Consumer Staples | 6,534,223 | 4,775,830 | (608,750 | ) | 4,167,080 | ||||||||||||||
ProFund VP Dow 30 | 327,000 | 180 | — | 180 | |||||||||||||||
ProFund VP Emerging Markets | 15,273,795 | 9,050,696 | (2,946,002 | ) | 6,104,694 | ||||||||||||||
ProFund VP Energy | 21,302,148 | 28,210,550 | (5,062,778 | ) | 23,147,772 | ||||||||||||||
ProFund VP Europe 30 | 17,463,275 | 5,206,622 | (4,097,221 | ) | 1,109,401 | ||||||||||||||
ProFund VP Falling U.S. Dollar | 1,152,386 | — | — | — | |||||||||||||||
ProFund VP Financials | 13,386,664 | 19,014,907 | (5,492,536 | ) | 13,522,371 | ||||||||||||||
ProFund VP Government Money Market | 30,815,526 | — | — | — | |||||||||||||||
ProFund VP Health Care | 8,716,063 | 29,829,552 | (1,457,186 | ) | 28,372,366 | ||||||||||||||
ProFund VP Industrials | 8,532,221 | 8,130,787 | (750,088 | ) | 7,380,699 | ||||||||||||||
ProFund VP International | 10,711,000 | — | (34,369 | ) | (34,369 | ) | |||||||||||||
ProFund VP Internet | 7,965,979 | 6,782,139 | (2,219,062 | ) | 4,563,077 | ||||||||||||||
ProFund VP Japan | 10,302,491 | — | (794 | ) | (794 | ) | |||||||||||||
ProFund VP Large-Cap Growth | 15,406,687 | 11,301,685 | (579,854 | ) | 10,721,831 | ||||||||||||||
ProFund VP Large-Cap Value | 17,796,680 | 4,816,118 | (2,291,291 | ) | 2,524,827 | ||||||||||||||
ProFund VP Materials | 7,551,534 | 8,590,123 | (1,479,123 | ) | 7,111,000 | ||||||||||||||
ProFund VP Mid-Cap | 10,458,150 | — | (85,723 | ) | (85,723 | ) | |||||||||||||
ProFund VP Mid-Cap Growth | 12,048,281 | 3,645,289 | (594,671 | ) | 3,050,618 | ||||||||||||||
ProFund VP Mid-Cap Value | 11,320,050 | 2,564,798 | (1,552,026 | ) | 1,012,772 | ||||||||||||||
ProFund VP Nasdaq-100 | 83,493,208 | 64,697,640 | (1,869,032 | ) | 62,828,608 | ||||||||||||||
ProFund VP Pharmaceuticals | 9,227,255 | 3,311,143 | (1,958,087 | ) | 1,353,056 | ||||||||||||||
ProFund VP Precious Metals | 22,668,000 | — | (427,991 | ) | (427,991 | ) | |||||||||||||
ProFund VP Real Estate | 3,456,286 | 3,411,579 | (372,315 | ) | 3,039,264 | ||||||||||||||
ProFund VP Rising Rates Opportunity | 8,319,000 | — | (90,565 | ) | (90,565 | ) | |||||||||||||
ProFund VP Semiconductor | 22,297,452 | 21,229,847 | (2,085,317 | ) | 19,144,530 | ||||||||||||||
ProFund VP Short Dow 30 | 6,000 | — | (4 | ) | (4 | ) | |||||||||||||
ProFund VP Short Emerging Markets | 515,000 | — | (1,279 | ) | (1,279 | ) | |||||||||||||
274 :: Notes to Financial Statements :: June 30, 2024 (unaudited)
Tax Cost | Tax Unrealized Appreciation | Tax Unrealized Depreciation | Net Unrealized Appreciation (Depreciation) | ||||||||||||||||
ProFund VP Short International | $ | 518,000 | $ | 1,618 | $ | — | $ | 1,618 | |||||||||||
ProFund VP Short Mid-Cap | 68,000 | 652 | — | 652 | |||||||||||||||
ProFund VP Short Nasdaq-100 | 4,791,531 | 21,253 | — | 21,253 | |||||||||||||||
ProFund VP Short Small-Cap | 2,249,181 | 42,131 | — | 42,131 | |||||||||||||||
ProFund VP Small-Cap | 13,708,052 | 2,990,082 | (1,342,921 | ) | 1,647,161 | ||||||||||||||
ProFund VP Small-Cap Growth | 12,277,283 | 4,720,176 | (772,221 | ) | 3,947,955 | ||||||||||||||
ProFund VP Small-Cap Value | 19,557,435 | 2,981,871 | (2,574,986 | ) | 406,885 | ||||||||||||||
ProFund VP Technology | 24,809,935 | 33,517,099 | (1,172,304 | ) | 32,344,795 | ||||||||||||||
ProFund VP UltraBull | 11,453,511 | 7,816,946 | (564,476 | ) | 7,252,470 | ||||||||||||||
ProFund VP UltraMid-Cap | 8,570,305 | 2,897,170 | (584,770 | ) | 2,312,400 | ||||||||||||||
ProFund VP UltraNasdaq-100 | 118,827,742 | 73,100,622 | (3,841,918 | ) | 69,258,704 | ||||||||||||||
ProFund VP UltraShort Dow 30 | 2,000 | — | (4 | ) | (4 | ) | |||||||||||||
ProFund VP UltraShort Nasdaq-100 | 595,000 | 5,972 | — | 5,972 | |||||||||||||||
ProFund VP UltraSmall-Cap | 15,017,808 | 3,789,328 | (1,713,751 | ) | 2,075,577 | ||||||||||||||
ProFund VP U.S. Government Plus | 10,063,884 | 410,145 | — | 410,145 | |||||||||||||||
ProFund VP Utilities | 13,671,795 | 14,492,466 | (2,216,080 | ) | 12,276,386 | ||||||||||||||
8. Stock Splits and Reverse Share Splits
Effective March 13, 2023, the ProFund VP UltraShort Nasdaq-100 underwent a 1-for-5 reverse share split.
Effective December 14, 2020, the ProFund VP UltraNasdaq-100 underwent a 2-for-1 share split, the ProFund VP Short Small-Cap, the ProFund VP UltraBull, and the ProFund VP UltraShort Nasdaq-100 each underwent a 1-for-4 reverse share split and the ProFund VP UltraShort Dow 30 underwent a 1-for-5 reverse share split.
Effective November 18, 2019, the ProFund VP Internet underwent a 3-for-1 share split, the ProFund VP Short Dow 30, the ProFund VP Short International, and the ProFund VP Short Nasdaq-100 each underwent a 1-for-4 reverse share split, and the ProFund VP UltraShort Dow 30 underwent a 1-for-8 reverse share split.
The effect of the share split transactions was to multiply the number of outstanding shares of the ProFund VP by the respective split factor, with a corresponding decrease in net asset value per share; and the effect of the reverse share split transactions was to divide the number of outstanding shares of the ProFunds VP by the respective reverse split factor, with a corresponding increase in the net asset value per share. These transactions did not change the net assets of these ProFunds VP or the value of a shareholder's investment.
The historical share transactions presented in the Statements of Changes in Net Assets and per share data presented in the Financial Highlights have been adjusted retroactively to give effect to the share splits and reverse share splits.
9. Shareholder Concentration
Ownership of more than 25% of the voting securities for a fund creates presumptions of control of the fund, under Section 2(a)(9) of the 1940 Act. As of June 30, 2024, the Advisor was deemed a significant shareholder of each of ProFund VP Dow 30, ProFund VP Short Dow 30, and ProFund VP UltraShort Dow 30 as the Advisor's ownership of total shares outstanding of each ProFund VP was 35%, 66%, and 95% respectively.
10. Subsequent Events
Effective on or about November 4, 2024, The Ultimus Group, LLC will replace Citi both as the Administrator and as fund accounting agent for the Trust.
The ProFunds VP have evaluated the need for additional disclosures or adjustments resulting from subsequent events through the date these financial statements were issued. Based on this evaluation, there were no subsequent events to report that would have a material impact on the ProFunds VP's financial statements.
276 :: Form N-CSR – Items 8-11 :: June 30, 2024 (unaudited)
Item 8. Changes in and Disagreements with Accountants for Open-End Management Investment Companies.
Not Applicable.
Item 9. Proxy Disclosures for Open-End Management Investment Companies.
Not Applicable.
Item 10. Remuneration Paid to Directors, Officers, and Others of Open-End Management Investment Companies.
Remuneration paid to Trustees, Officers, and others are part of the Financial Statements filed under Item 7(a) of this Form.
Item 11. Statement Regarding Basis for Approval of Investment Advisory Contract.
Not Applicable.

P.O. Box 182800
Columbus, OH 43218-2800
This report is submitted for the general information of the shareholders of the ProFunds VP. It is not authorized for distribution to prospective investors unless preceded or accompanied by an effective prospectus. To receive the most recent month end performance information for each Fund, please call toll-free 888-776-5717.
A description of the policies and procedures that the ProFunds VP uses to determine how to vote proxies relating to portfolio securities is available without charge, upon request, by calling toll-free 888-776-3637; and on the Securities and Exchange Commission's website at sec.gov. Information regarding how the ProFund VP voted proxies relating to portfolio securities during the most recent 12-month period ended June 30 is available. (i) without change by calling toll-free 888-776-3637; (ii) on the ProFunds' VP website at ProFunds.com; and (iii) on the Commission's website at sec.gov.
ProFunds VP files complete Schedules of Portfolio Holdings with the Commission for the first and third quarters of each fiscal year on Form N-PORT. Schedules of Portfolio Holdings for the Funds in this report are available without charge on the Commission's website at sec.gov, or may be reviewed and copied at the Commission's Public Reference Room in Washington, D.C. Information on the operation of the Public Reference Room may be obtained by calling 800-SEC-0330.
06/24
| (b) | The Financial Highlights are included as a part of the Financial Statements filed under Item 7(a) of this Form. |
Item 8. Changes in and Disagreements with Accountants for Open-End Management Investment Companies.
Changes in and disagreements with accountants, if any, are included as part of the Financial Statements filed under Item 7(a) of this Form.
Item 9. Proxy Disclosures for Open-End Management Investment Companies.
Proxy disclosures, if any, are included as part of the Financial Statements filed under Item 7(a) of this Form.
Item 10. Remuneration Paid to Directors, Officers, and Others of Open-End Management Investment Companies.
Remuneration paid to Trustees, Officers and others are part of the Financial Statements filed under Item 7(a) of this Form.
Item 11. Statement Regarding Basis for Approval of Investment Advisory Contract.
Approval of Investment Advisory Contract, if approved by the Board of Directors in the most recent half-year, is a part of the Financial Statements filed under Item 7(a) of this Form.
Item 12. Disclosure of Proxy Voting Policies and Procedures for Closed-End Management Investment Companies.
Not applicable.
Item 13. Portfolio Managers of Closed-End Management Investment Companies.
Not applicable.
Item 14. Purchases of Equity Securities by Closed-End Management Investment Company and Affiliated Purchasers.
Not applicable.
Item 15. Submission of Matters to a Vote of Security Holders.
Not applicable.
Item 16. Controls and Procedures.
| (a) | The registrant’s principal executive officer and principal financial officer have concluded, based on their evaluation of the registrant’s disclosure controls and procedures as conducted within 90 days of the filing date of this report, that those disclosure controls and procedures provide reasonable assurance that material information required to be disclosed by the registrant on this report is recorded, processed, summarized and reported within the time periods specified in the Securities and Exchange Commission's rules and forms. |
| (b) | There were no changes in the registrant’s internal control over financial reporting (as defined in Rule 30a-3(d) under the Act (17CFR 270.30a-3(d)) that occurred during the period covered by this report that have materially affected or are reasonably likely to materially affect, the registrant’s internal control over financial reporting. |
Item 17. Disclosure of Securities Lending Activities for Closed-End Management Investment Companies.
Not applicable.
Item 18. Recovery of Erroneously Awarded Compensation.
Not applicable.
Item 19. Exhibits.
| (a)(1) | Not applicable – only for annual reports. |
| (a)(2) | Not applicable |
| (a)(3) | The certifications required by Rule 30a-2(a) of the Investment Company Act of 1940 are attached hereto |
| (b) | The certifications required by Rule 30a-2(b) of the Investment Company Act of 1940 and Section 906 of the Sarbanes- Oxley Act of 2002 are attached hereto |
SIGNATURES
Pursuant to the requirements of the Securities Exchange Act of 1934 and the Investment Company Act of 1940, the registrant has duly caused this report to be signed on its behalf by the undersigned, thereunto duly authorized.
| (Registrant) | ProFunds |
| By (Signature and Title)* | /s/ Todd B. Johnson | |
| Todd B. Johnson, President and Principal Executive Officer | ||
| Date | September 4, 2024 |
Pursuant to the requirements of the Securities Exchange Act of 1934 and the Investment Company Act of 1940, this report has been signed below by the following persons on behalf of the registrant and in the capacities and on the dates indicated.
| By (Signature and Title)* | /s/ Todd B. Johnson | |
| Todd B. Johnson, President and Principal Executive Officer | ||
| Date | September 4, 2024 |
| By (Signature and Title)* | /s/ Denise Lewis | |
| Denise Lewis, Treasurer and Principal Financial Officer | ||
| Date | August 29, 2024 |
* Print the name and title of each signing officer under his or her signature.