                                  UNITED STATES
                       SECURITIES AND EXCHANGE COMMISSION
                             WASHINGTON, D. C. 20549

                                   FORM N-CSR

Investment Company Act file number 811-8227

                          SCUDDER INVESTORS FUNDS, INC.
                        --------------------------------
               (Exact Name of Registrant as Specified in Charter)

                                  One South Street
                                Baltimore, MD 21202
                  --------------------------------------------
               (Address of Principal Executive Offices) (Zip Code)

        Registrant's Telephone Number, including Area Code: (617) 295-2663
                                                            --------------

                               Salvatore Schiavone
                             Two International Place
                           Boston, Massachusetts 02110
                     ---------------------------------------
                     (Name and Address of Agent for Service)

Date of fiscal year end:        8/31

Date of reporting period:       8/31/03


ITEM 1.  REPORT TO STOCKHOLDERS
[Scudder Investments logo]
Scudder
Global Biotechnology Fund
|
| |
| Annual Report to Shareholders |
| August 31, 2003 |
|
Scudder Investments is part of Deutsche Asset Management, which is the marketing name in the US for the asset management activities of Deutsche Bank AG, Deutsche Investment Management Americas Inc., Deutsche Asset Management Inc., Deutsche Asset Management Investment Services Ltd., Deutsche Bank Trust Company Americas and Scudder Trust Company.
This report must be preceded or accompanied by a prospectus. To obtain a prospectus for any of our funds, refer to the Account Management Resources information provided in the back of this booklet. The prospectus contains more complete information, including a description of the risks of investing in the fund, management fees and expenses. Please read it carefully before you invest or send money.
Fund shares are not FDIC-insured and are not deposits or other obligations of, or guaranteed by, any bank. Fund shares involve investment risk, including possible loss of principal.
Performance Summary August 31, 2003 |
|
Average Annual Total Returns* (Unadjusted for Sales Charge) |
Scudder Global Biotechnology Fund | 1-Year | Life of Fund** |
Class A
| 41.94% | -4.01% |
Class B
| 40.98% | -4.67% |
Class C
| 40.82% | -4.71% |
MSCI World Index+
| 10.92%
| -4.92%
|
NASDAQ Biotechnology Index++
| 51.41%
| -1.42%
|
MSCI Bio-Technology Select Index+++
| 57.47%
| -.34%
|
Sources: Lipper Inc. and Investment Company Capital Corp.
Net Asset Value |
| Class A | Class B | Class C |
Net Asset Value:
8/31/03
| $ 9.07 | $ 8.91 | $ 8.90 |
8/31/02
| $ 6.39 | $ 6.32 | $ 6.32 |
Class A Lipper Rankings* - Health & Biotechnology Funds Category |
Period | Rank | | Number of Funds Tracked | Percentile Ranking |
1-Year
| 15 | of | 188 | 8 |
Rankings are historical and do not guarantee future results. Rankings are based on total return unadjusted for sales charges with distributions reinvested. If sales charges had been included, results might have been less favorable.
Source: Lipper Inc.
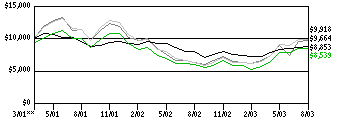
Growth of an Assumed $10,000 Investment(a)* (Adjusted for Sales Charge) |
[] Scudder Global Biotechnology Fund - Class A(b) [] MSCI World Index+
[] NASDAQ Biotechnology Index++
[] MSCI Bio-Technology Select Index+++
|
 |
|
Comparative Results* (Adjusted for Sales Charge) |
Scudder Global Biotechnology Fund | 1-Year | Life of Fund** |
Class A(b) | Growth of $10,000
| $13,363 | $8,539 |
Average annual total return
| 33.63% | -6.33% |
Class B(b) | Growth of $10,000
| $13,798 | $8,643 |
Average annual total return
| 37.98% | -5.86% |
Class C(b) | Growth of $10,000
| $13,941 | $8,811 |
Average annual total return
| 39.41% | -5.11% |
MSCI World Index+
| Growth of $10,000
| $11,092 | $8,853 |
Average annual total return
| 10.92% | -4.92% |
NASDAQ Biotechnology Index++
| Growth of $10,000
| $15,141 | $9,664 |
Average annual total return
| 51.41% | -1.42% |
MSCI Bio-Technology Select Index+++
| Growth of $10,000
| $15,747 | $9,918 |
Average annual total return
| 57.47% | -.34% |
The growth of $10,000 is cumulative.
Notes to Performance Summary |
* Returns and rankings during all periods shown reflect a fee waiver and/or expense reimbursement. Without this waiver/reimbursement, returns and rankings would have been lower.** The Fund commenced operations on March 30, 2001. Index returns begin March 31, 2001.a The Fund's growth of an assumed $10,000 investment is adjusted for the maximum sales charge of 5.75%. This results in a net initial investment of $9,425.b Returns shown for Class A, B and C shares have been adjusted to reflect the current applicable sales charges of each specific class. Returns for Class A reflect the current maximum initial sales charge of 5.75%. Class B share performance is adjusted for the applicable contingent deferred sales charge ("CDSC"), which is 4% within the first year after purchase, declining to 0% after six years. Returns for Class C reflect an initial sales charge of 1%. Redemptions on Class C shares within one year of purchase may be subject to a CDSC of 1%. Any difference in expenses will affect performance.+ The MSCI World Index is an unmanaged, capitalization-weighted measure of stock markets around the world, including North America, Europe, Australia and Asia.++ The NASDAQ Biotechnology Index is a modified capitalization-weighted index designed to measure the performance of all NASDAQ stocks in the biotechnology sector. On December 17, 2002, the Board of Directors approved replacing the MSCI Bio-Technology Select Index with the NASDAQ Biotechnology Index as the Fund's secondary benchmark. The NASDAQ Biotechnology Index provides shareholders with better performance information to assess the Fund's performance since it more closely corresponds to the Fund's investment strategy.+++ The MSCI Bio-Technology Select Index is an unmanaged index composed of 40 of the largest biotech securities that have annual average daily trading volume of at least $10 million (USD).Index returns assume reinvestment of dividends and, unlike Fund returns, do not reflect any fees or expenses. It is not possible to invest directly in an index.
All performance is historical, assumes reinvestment of all dividends and capital gains, and is not indicative of future results. Investment return and principal value will fluctuate, so an investor's shares, when redeemed, may be worth more or less than when purchased. Performance figures do not reflect the deduction of taxes that a shareholder would pay on fund distributions or the redemption of fund shares. Returns and rankings may differ by share class.
Investments in funds involve risk. Some funds have more risk than others. These include funds that allow exposure to or otherwise concentrate investments in certain sectors, geographic regions, security types, market capitalization or foreign securities (e.g., political or economic instability, which can be accentuated in emerging market countries). Please read this fund's prospectus for specific details regarding its investments and risk profile.
Please call (800) 621-1048 for the Fund's most up-to-date performance. On the Web, go to scudder.com.
Portfolio Management Review |
|
Scudder Global Biotechnology Fund: A Team Approach to Investing
Investment Company Capital Corp. ("ICCC"), is the investment advisor for Scudder Global Biotechnology Fund. DWS International Portfolio Management GmbH ("DWS"), the fund's investment subadvisor, is responsible for selecting brokers and dealers and for negotiating brokerage commissions and dealer charges.
ICCC and DWS are indirect, wholly owned subsidiaries of Deutsche Bank AG. Deutsche Bank AG is a major global banking institution that is engaged in a wide range of financial services, including investment management, mutual funds, retail, private and commercial banking, investment banking and insurance.
Effective September 1, 2003, Deutsche Asset Management International GmbH, an affiliate of ICCC and DWS, is the subadvisor to the fund. The new portfolio managers to the fund are Dr. Noushin Irani and Thomas E. Bucher.
Portfolio Management Team
Dr. Noushin Irani
Lead Manager of the fund.
• Joined Deutsche Asset Management International GmbH in 2003 and DWS Investment GmbH in 2002.
• Over 7 years of biotechnology experience.
• Ph.D in cell culture and molecular biology, Technical University Braunschweig & German Federal Research Institute for Biotechnology (Germany).
Thomas E. Bucher
CFA, Director, Deutsche Asset Management and Co-Manager of the fund.
• Joined Deutsche Asset Management International GmbH in 1995.
• Head of global equity research team for Health Care sector: Frankfurt.
• Previously analyst for European Chemical, Oil, Steel and Engineering sectors.
• MA from University of Tuegingen (Germany).
In the following interview, Lead Portfolio Manager Noushin Irani discusses Scudder Global Biotechnology Fund's strategy and the market environment during the 12-month period ended August 31, 2003.
Q: What were the major factors affecting the biotechnology sector over the fiscal year?
A: Following a challenging time during the first six months of the fiscal period, the biotechnology sector in general soared during the second half to end the fiscal year with impressive double-digit returns. Indeed, throughout the year, the biotechnology sector performed well relative to the broader equity markets. The fund's primary benchmark, the MSCI World Index, returned 10.92% for the 12-month period ended August 31, 2003, and the fund's secondary benchmark, the NASDAQ Biotechnology Index, produced a 12-month return of 51.41%, compared with the Standard & Poor's 500 index annual return of 12.07%1. The Morgan Stanley Capital International (MSCI) Bio-Technology Select Index gained 57.47% for the 12-month period.2 Several factors accounted for such strong relative performance.
1 The Standard & Poor's 500 index is an unmanaged group of stocks generally representative of the US stock market. It is not possible to invest directly in an index.2 On December 17, 2002, the Board of Directors approved replacing the MSCI Bio-Technology Select Index with the NASDAQ Biotechnology Index as the fund's secondary benchmark.First, the biotechnology sector's fundamentals continued to improve as the top-tier companies in the group demonstrated rather robust revenue and earnings growth. New products continued to be approved and come to market, several companies reported positive clinical data, and valuations remained at historically reasonable levels even with the strong rally in stock prices. Second, the confirmation in October 2002 of a new Food and Drug Administration (FDA) commissioner proved positive for the sector. It appeared that Dr. Mark McClellan would affect structural changes to the FDA and help accelerate its approval process for biotechnology products.
Industry consolidation also led to strong performance from several biotechnology stocks. For example, two top-tier, large-cap companies, Biogen and IDEC Pharmaceuticals, announced plans to merge during the period. Johnson & Johnson bought Scios Inc., Genzyme acquired Sangstat, and Chiron purchased Powderject. In each acquisition, the stocks of the acquired companies rose. The sector was further buoyed by several multimillion-dollar deals. These included an agreement between Amylin Pharmaceuticals and Eli Lilly to develop a new diabetes treatment, another between Neurocrine Biosciences and Pfizer to develop a new insomnia drug, and one between Genentech, Serono and XOMA to develop and market worldwide a new psoriasis drug known as Raptiva. Toward the end of the fiscal year, the biotechnology sector was boosted by several initial public offering filings. (As of August 31, 2003, positions in Johnson & Johnson, Eli Lilly, Pfizer, Genetech and Serono were sold.)
Finally, as equity prices across the broader market moved into positive territory, and economic prospects began to improve during the second half of the fiscal year, investors embraced what are considered the more high-risk, high-beta sectors of the equity market. High-beta sectors are those considered more volatile than the equity market as a whole.3 Industries such as biotechnology were favored.
3 Beta is a historical measure of a stock's sensitivity to benchmark movements. A stock with a beta greater than 1 is more volatile than its benchmark index. A stock with a beta less than 1 is less volatile than its benchmark index.Within the biotechnology sector, the pattern was similar. During the first half of the period, large-capitalization companies with proven profitability and strong near- to mid-term earnings growth potential outperformed, as investors shied away from higher-risk names and companies that could have financing problems in the future. This put pressure on many of the previously popular genomic and antibody companies, causing these companies to underperform. Beginning in March 2003, as news flow became positive and several new product approvals were announced, investor risk aversion abated and the smaller and mid-cap biotechnology companies outperformed.
Q: Will you describe Scudder Global Biotechnology Fund's performance against this backdrop?
A: Scudder Global Biotechnology Fund rose 41.94% (Class A shares unadjusted for sales charges) for the 12 months ended August 31, 2003. (Please see pages 4 through 6 for performance of other share classes.) The fund underperformed the 51.41% return of its secondary benchmark, the NASDAQ Biotechnology Index, and the 57.47% return of the MSCI Bio-Technology Select Index for the annual period. However, the fund significantly outperformed the Lipper Health/Biotechnology Funds category average return of 19.34% for the same time frame.4 It also outstripped the 10.92% annual return of its primary benchmark, the MSCI World Index.
4 The Lipper Health/Biotechnology Funds category represents funds that invests their equity portfolio primarily in shares of companies engaged in health care, medicine and biotechnology. Returns reflect the reinvestment of distributions. It is not possible to invest directly into a Lipper category.The fund's relative underperformance to its secondary benchmark was primarily due to its overweightings in two specific stocks that disappointed. Transkaryotic Therapies, a company that develops and markets treatments for a variety of diseases, including hemophilia, was negatively affected primarily by the delay of a panel scheduled to meet in September 2002, on a new enzyme that the company had developed. La Jolla Pharmaceuticals, which researches and develops specialized therapeutics for the treatment of diseases caused by antibodies, reported negative clinical trial outcome data in February on its new lupus treatment. Relative performance was also affected by the outperformance of the more speculative, higher-risk names in the sector versus companies with proven profitability, which the fund emphasizes, during the second half of the fiscal year. On the other hand, the fund's strong outperformance compared with its Lipper peer group was primarily due to effective stock selection.
Q: What were some of the stronger performers for the fund?
A: Top performers for the fund included several new purchases during the annual period, such as Onyx Pharmaceuticals and Invitrogen. Onyx discovers and develops therapeutics based upon the genetics of human disease, with an emphasis on cancer. Invitrogen is a supply company primarily for molecular biology research. Other strong performers for the fund during the period benefited either from positive news flow regarding new drugs, from acquisition activity, or from joint venture deals made to develop or market new drugs. These included Amylin Pharmaceuticals, Chiron, OSI Pharmaceuticals, United Therapeutics and XOMA.
There were, of course, disappointments. CV Therapeutics lost ground because its cardiovascular drug panel got canceled due to lack of proper and timely documentation. Exelixis declined based on lengthier-than-expected clinical trial procedures and, thus, a delay in its new product introduction. Other poor performers during the annual period included Enzon, Cephalon and QLT. We continued to hold these stocks in the fund at the end of the period, as we remain optimistic about their prospects.
Q: Will you provide us with some specific examples of your investment strategies during the annual period?
A: We enhanced the diversification of the fund, which held approximately 60 securities as of August 31, 2003, up from about 40 as of August 31, 2002. We believe a range of 40 to 60 holdings should help fund performance remain relatively consistent over time. We also actively bought and sold companies throughout, as we continued to seek to maximize total return. We focused the fund's new purchases on later-stage, product-based companies that we believe can show profitability as well as strong new product pipelines. We also sought promising smaller companies. Besides those mentioned above, new purchases for the fund during the annual period included:
• Barr Laboratories, which develops, manufactures and markets generic and proprietary prescription pharmaceuticals concentrated on female health care, oncology and other generic drugs.
• Forest Laboratories, a specialty pharmaceutical company, which rose on its expanded antidepressant product line and its promising new Alzheimer's compound currently pending FDA approval.
• Sepracor, a research-based pharmaceutical company, which recently announced positive data on its new insomnia drug, Estorra.
• DOV Pharmaceuticals, which currently has six product candidates in clinical trials and is expected to soon announce positive results for a drug addressing postsurgical dental pain, developed in a joint venture with Elan.
Other new purchases included Angiotech Pharmaceuticals, BioMarin Pharmaceutical, Cerus, EPIX Medical, ICOS, Ligand Pharmaceuticals and Neurocrine Biosciences.
Q: What stocks did you sell?
A: We sold stocks that had either deteriorating fundamentals or what we determined to be high valuations, as well as stocks that had reached the price we had targeted for them. We eliminated the fund's positions in Affymetrix, Allos Therapeutics, Genentech, Ivax, King Pharmaceuticals, Kos Pharmaceuticals, Qiagen and Regeneron Pharmaceuticals. We also reduced the fund's positions in several stocks, taking profits in Amylin Pharmaceuticals, Gilead Sciences and La Jolla Pharmaceutical.
On August 31, 2003, the fund's holdings were divided rather evenly among large-cap, mid-cap and small-cap biotechnology stocks. We continued to be primarily invested in biotechnology companies headquartered or with primary operations in the United States and Europe.
Q: What investment strategies do you intend to pursue in the fund?
A: Overall, we believe the biotechnology sector remains a stock picker's market. As a result, we remain disciplined in our process. We are particularly focused on innovative companies that are expected to produce positive news flow and bring new products into the market over the next 12 months. We believe the fund's investment strategy positions it well to pursue its objective of seeking to maximize total return.
The views expressed in this report reflect those of the portfolio managers only through the end of the period of the report as stated on the cover. The managers' views are subject to change at any time based on market and other conditions and should not be construed as a recommendation.
Portfolio Summary August 31, 2003 |
|
Asset Allocation | 8/31/03 | 8/31/02 |
|
|
Common Stocks
| 89%
| 83%
|
Preferred Stocks
| 3%
| 8%
|
Cash, net*
| 8%
| 9%
|
| 100%
| 100%
|
* Includes other assets and liabilities.Geographical (Excludes Cash) | 8/31/03 | 8/31/02 |
|
|
United States
| 93%
| 96%
|
Canada
| 4%
| 1%
|
Switzerland
| 1%
| 2%
|
Israel
| 2%
| -
|
Netherlands
| -
| 1%
|
| 100%
| 100%
|
Asset allocation and geographical diversification are subject to change.
Ten Largest Holdings at August 31, 2003 (33.0% of Portfolio) |
1. Amgen, Inc.
Developer of pharmaceuticals
| United States
| 5.2% |
2. Biogen, Inc.
Researcher and developer of biotechnology products
| United States
| 4.4% |
3. IDEC Pharmaceuticals Corp.
Developer and researcher for the treatment of cancer and other diseases
| United States
| 3.5% |
4. Cephalon, Inc.
Developer of biopharmaceutical products
| United States
| 3.5% |
5. Bioenvision, Inc.
Developer of products for treatment of cancer
| United States
| 3.3% |
6. NPS Pharmaceuticals, Inc.
Developer of small molecule drugs
| United States
| 2.8% |
7. MedImmune, Inc.
Developer and marketer of products for the prevention and treatment of infectious diseases
| United States
| 2.7% |
8. Gilead Sciences, Inc.
Developer of nucleotide pharmaceuticals
| United States
| 2.6% |
9. MGI Pharma, Inc.
Provider of pharmaceuticals
| United States
| 2.6% |
10. ILEX Oncology, Inc.
Developer of drugs for treatment and prevention of cancer
| United States
| 2.4% |
Portfolio holdings are subject to change.
For more complete details about the fund's investment portfolio, see page 16. A quarterly Fact Sheet and Portfolio Holdings are available upon request.
Investment Portfolio as of August 31, 2003 | |
|
|
Shares
| Value ($) |
|
|
Common Stocks 89.3% |
Canada 3.4%
|
Angiotech Pharmaceuticals, Inc.*
| 3,900
| 167,700
|
Biovail Corp.*
| 1,000
| 41,530
|
ID Biomedical Corp.*
| 5,000
| 67,250
|
QLT, Inc.*
| 4,000
| 54,320
|
(Cost $239,845)
| 330,800 |
Israel 1.5%
|
Teva Pharmaceutical Industries Ltd. (ADR) (Cost $134,782)
| 2,500
| 146,780 |
Switzerland 1.1%
|
Actelion Ltd.* (Cost $48,273)
| 1,500
| 107,101 |
United States 83.3%
|
Abgenix, Inc.*
| 15,000
| 194,999
|
Adolor Corp.*
| 6,000
| 85,440
|
Amgen, Inc.*
| 7,000
| 461,300
|
Amylin Pharmaceuticals, Inc.*
| 3,000
| 85,650
|
Andrx Corp.*
| 7,500
| 135,000
|
Array Biopharma, Inc.*
| 20,000
| 106,600
|
Barr Laboratories, Inc.*
| 1,500
| 101,505
|
Biogen, Inc.*
| 10,000
| 394,600
|
BioMarin Pharmaceutical, Inc.*
| 10,000
| 94,500
|
Celgene Corp.*
| 4,250
| 163,583
|
Cell Genesys, Inc.*
| 10,000
| 120,300
|
Cell Therapeutics, Inc.*
| 15,000
| 163,950
|
Cephalon, Inc.*
| 7,000
| 310,450
|
Cerus Corp.*
| 7,500
| 57,375
|
Chiron Corp.*
| 3,000
| 152,460
|
Cubist Pharmaceuticals, Inc.*
| 5,000
| 66,000
|
CV Therapeutics, Inc.*
| 2,000
| 51,300
|
DOV Pharmaceutical, Inc.*
| 7,000
| 102,970
|
Enzon Pharmaceuticals, Inc.*
| 7,000
| 79,590
|
EPIX Medical, Inc.*
| 7,000
| 133,210
|
Exelixis, Inc.*
| 11,000
| 79,750
|
Forest Laboratories, Inc.*
| 2,750
| 129,250
|
Genzyme Corp. (General Division)*
| 4,000
| 188,600
|
Gilead Sciences, Inc.*
| 3,500
| 233,450
|
Human Genome Sciences, Inc.*
| 8,000
| 113,920
|
ICOS Corp.*
| 3,000
| 116,820
|
IDEC Pharmaceuticals Corp.*
| 9,000
| 312,750
|
ILEX Oncology, Inc.*
| 13,000
| 216,060
|
ImClone Systems Inc.*
| 2,500
| 105,075
|
Inspire Pharmaceuticals, Inc.*
| 8,500
| 124,525
|
InterMune, Inc.*
| 5,000
| 95,200
|
Invitrogen Corp.*
| 2,500
| 144,175
|
Isis Pharmaceuticals, Inc.*
| 9,000
| 59,580
|
La Jolla Pharmaceutical Co.*
| 10,000
| 39,400
|
Ligand Pharmaceuticals "B"*
| 12,000
| 166,680
|
Medarex, Inc.*
| 17,800
| 106,978
|
Medicines Co.*
| 5,000
| 143,250
|
MedImmune, Inc.*
| 7,000
| 244,090
|
MGI Pharma, Inc.*
| 6,000
| 231,540
|
Millennium Pharmaceuticals, Inc.*
| 12,500
| 173,750
|
Neurocrine Biosciences, Inc.*
| 2,500
| 133,775
|
NPS Pharmaceuticals, Inc.*
| 9,000
| 247,140
|
Onyx Pharmaceuticals, Inc.*
| 10,000
| 178,500
|
OSI Pharmaceuticals, Inc.*
| 4,500
| 171,450
|
Protein Design Labs, Inc.*
| 16,500
| 202,950
|
Sepracor, Inc.*
| 4,000
| 107,680
|
Telik, Inc.*
| 5,000
| 95,900
|
Transkaryotic Therapies, Inc.*
| 13,000
| 163,137
|
Trimeris, Inc.*
| 2,000
| 85,300
|
United Therapeutics Corp.*
| 4,000
| 91,680
|
Vertex Pharmaceuticals, Inc.*
| 8,500
| 107,100
|
Vicuron Pharmaceuticals, Inc.*
| 10,500
| 156,870
|
XOMA Ltd.*
| 20,000
| 187,400
|
(Cost $7,189,562)
| 8,014,507 |
Total Common Stocks (Cost $7,612,462)
| 8,599,188 |
|
Units
| Value ($) |
|
|
Preferred Stocks 3.1% |
United States
|
Bioenvision, Inc.*,** (Cost $199,998)
| 66,666
| 296,664 |
| % of Net Assets | Value ($) |
|
|
Total Investment Portfolio (Cost $7,812,460) (a)
| 92.4 | 8,895,852 |
Other Assets and Liabilities, Net
| 7.6 | 728,421 |
Net Assets
| 100.0 | 9,624,273 |
* Non-income producing security.** Each unit consists of one preferred share convertible to two shares of common stock and one warrant to purchase one share of common stock.(a) The cost for federal income tax purposes was $7,895,935. At August 31, 2003, net unrealized appreciation for all securities based on tax cost was $999,917. This consisted of aggregate gross unrealized appreciation for all securities in which there was an excess of value over tax cost of $1,629,778 and aggregate gross unrealized depreciation for all securities in which there was an excess of tax cost over value of $629,861.The accompanying notes are an integral part of the financial statements.
Statement of Assets and Liabilities as of August 31, 2003 |
Assets
|
Investments in securities, at value (cost $7,812,460)
| $ 8,895,852 |
Cash
| 523,327 |
Receivable for investments sold
| 101,754 |
Dividend receivable
| 152 |
Receivable for Fund shares sold
| 96,148 |
Due from Advisor
| 74,382 |
Other assets
| 17,585 |
Total assets
| 9,709,200 |
Liabilities
|
Payable for Fund shares redeemed
| 556 |
Other accrued expenses and payables
| 84,371 |
Total liabilities
| 84,927 |
Net assets, at value
| $ 9,624,273 |
Net Assets
|
Net assets consist of:
Accumulated net investment loss
| (2,851) |
Net unrealized appreciation (depreciation) on investments
| 1,083,392 |
Accumulated net realized gain (loss)
| (1,270,272) |
Paid-in capital
| 9,814,004 |
Net assets, at value
| $ 9,624,273 |
The accompanying notes are an integral part of the financial statements.
Statement of Assets and Liabilities as of August 31, 2003 (continued) |
Net Asset Value
|
Class A
Net Asset Value and redemption price per share ($7,347,834 / 810,475 shares of capital stock outstanding, $.001 par value, 6,000,000 shares authorized)
| $ 9.07 |
Maximum offering price per share (100 / 94.25 of $9.07)
| $ 9.62 |
Class B
Net Asset Value, offering and redemption price (subject to contingent deferred sales charge) per share ($1,379,114 / 154,864 shares of capital stock outstanding, $.001 par value, 3,000,000 shares authorized)
| $ 8.91 |
Class C
Net Asset Value and redemption price (subject to contingent deferred sales charge) per share ($897,325 / 100,789 shares of capital stock outstanding, $.001 par value, 1,000,000 shares authorized)
| $ 8.90 |
Maximum offering price per share (100 / 99.00 of $8.90)
| $ 8.99 |
The accompanying notes are an integral part of the financial statements.
Statement of Operations for the year ended August 31, 2003 |
Investment Income
|
Dividend (net of foreign taxes withheld of $36)
| $ 152 |
Interest
| 1,212 |
Total income
| 1,364 |
Expenses:
Investment advisory fee
| 42,301 |
Administrator service fee
| 7,482 |
Custody fees
| 66,923 |
Distribution and shareholder servicing fees
| 18,550 |
Auditing
| 42,166 |
Accounting fees
| 24,766 |
Legal
| 18,130 |
Transfer agent fees
| 15,386 |
Directors' fees and expenses
| 915 |
Reports to shareholders
| 28,260 |
Registration fees
| 24,215 |
Other
| 4,284 |
Total expenses, before expense reductions
| 293,378 |
Expense reductions
| (212,493) |
Total expenses, after expense reductions
| 80,885 |
Net investment income (loss)
| (79,521) |
Realized and Unrealized Gain (Loss) on Investment Transactions
|
Net realized gain (loss) from:
Investments
| (340,157) |
Foreign currency related transactions
| (2,996) |
| (343,153) |
Net unrealized appreciation (depreciation) during the period on:
Investments
| 2,291,574 |
Foreign currency related transactions
| 89 |
| 2,291,663 |
Net gain (loss) on investment transactions
| 1,948,510 |
Net increase (decrease) in net assets resulting from operations
| $ 1,868,989 |
The accompanying notes are an integral part of the financial statements.
Statement of Changes in Net Assets |
| Years Ended August 31, |
2003 | 2002 |
Operations:
Net investment income (loss)
| $ (79,521) | $ (77,028) |
Net realized gain (loss) on investment transactions
| (343,153) | (860,152) |
Net unrealized appreciation (depreciation) on investment transactions during the period
| 2,291,663 | (1,527,002) |
Net increase (decrease) in net assets resulting from operations
| 1,868,989 | (2,464,182) |
Fund share transactions:
Proceeds from shares sold
| 6,066,894 | 707,434 |
Cost of shares redeemed
| (1,957,666) | (278,408) |
Net increase (decrease) in net assets from Fund share transactions
| 4,109,228 | 429,026 |
Increase (decrease) in net assets
| 5,978,217 | (2,035,156) |
Net assets at beginning of period
| 3,646,056 | 5,681,212 |
Net assets at end of period (including accumulated net investment loss of $2,851, and $657, respectively)
| $ 9,624,273 | $ 3,646,056 |
The accompanying notes are an integral part of the financial statements.
Class A |
Years Ended August 31, | 2003 | 2002 | 2001a |
Selected Per Share Data
|
Net asset value, beginning of period
| $ 6.39 | $ 10.61 | $ 10.00 |
Income (loss) from investment operations:
Net investment income (loss)
| (.11)b | (.13)b | (.03) |
Net realized and unrealized gain (loss) on investment transactions
| 2.79 | (4.09) | .64 |
Total from investment operations | 2.68 | (4.22) | .61 |
Net asset value, end of period
| $ 9.07 | $ 6.39 | $ 10.61 |
Total Return (%)c
| 41.94 | (39.77) | 6.10** |
Ratios to Average Net Assets and Supplemental Data
|
Net assets, end of period ($ thousands)
| 7,348 | 3,147 | 5,021 |
Ratio of expenses before expense reductions (%)
| 5.77 | 5.81 | 6.39* |
Ratio of expenses after expense reductions (%)
| 1.50 | 1.50 | 1.50* |
Ratio of net investment income (loss) (%)
| (1.47) | (1.42) | (.62)* |
Portfolio turnover rate (%)
| 104 | 91 | 53 |
a For the period March 30, 2001 (commencement of sales of Class A shares) to August 31, 2001.
b Based on average shares outstanding during the period.
c Total return would have been lower had certain expenses not been reduced. Total return does not reflect the effect of any sales charges.
* Annualized
** Not annualized
|
|
Class B |
Years Ended August 31, | 2003 | 2002 | 2001a |
Selected Per Share Data
|
Net asset value, beginning of period
| $ 6.32 | $ 10.58 | $ 10.00 |
Income (loss) from investment operations:
Net investment income (loss)
| (.16)b | (.19)b | (.06) |
Net realized and unrealized gain (loss) on investment transactions
| 2.75 | (4.07) | .64 |
Total from investment operations | 2.59 | (4.26) | .58 |
Net asset value, end of period
| $ 8.91 | $ 6.32 | $ 10.58 |
Total Return (%)c
| 40.98 | (40.26) | 5.80** |
Ratios to Average Net Assets and Supplemental Data
|
Net assets, end of period ($ thousands)
| 1,379 | 273 | 382 |
Ratio of expenses before expense reductions (%)
| 6.52 | 6.56 | 7.14* |
Ratio of expenses after expense reductions (%)
| 2.25 | 2.25 | 2.25* |
Ratio of net investment income (loss) (%)
| (2.22) | (2.17) | (1.45)* |
Portfolio turnover rate (%)
| 104 | 91 | 53 |
a For the period March 30, 2001 (commencement of sales of Class B shares) to August 31, 2001.
b Based on average shares outstanding during the period.
c Total return would have been lower had certain expenses not been reduced. Total return does not reflect the effect of any sales charges.
* Annualized
** Not annualized
|
|
Class C |
Years Ended August 31, | 2003 | 2002 | 2001a |
Selected Per Share Data
|
Net asset value, beginning of period
| $ 6.32 | $ 10.58 | $ 10.00 |
Income (loss) from investment operations:
Net investment income (loss)
| (.16)b | (.19)b | (.06) |
Net realized and unrealized gain (loss) on investment transactions
| 2.74 | (4.07) | .64 |
Total from investment operations | 2.58 | (4.26) | .58 |
Net asset value, end of period
| $ 8.90 | $ 6.32 | $ 10.58 |
Total Return (%)c
| 40.82 | (40.26) | 5.80** |
Ratios to Average Net Assets and Supplemental Data
|
Net assets, end of period ($ thousands)
| 897 | 226 | 279 |
Ratio of expenses before expense reductions (%)
| 6.52 | 6.56 | 7.14* |
Ratio of expenses after expense reductions (%)
| 2.25 | 2.25 | 2.25* |
Ratio of net investment income (loss) (%)
| (2.22) | (2.17) | (1.37)* |
Portfolio turnover rate (%)
| 104 | 91 | 53 |
a For the period March 30, 2001 (commencement of sales of Class C shares) to August 31, 2001.
b Based on average shares outstanding during the period.
c Total return would have been lower had certain expenses not been reduced. Total return does not reflect the effect of any sales charges.
* Annualized
** Not annualized
|
Notes to Financial Statements |
|
A. Significant Accounting Policies
Global Biotechnology Fund ("Scudder Global Biotechnology Fund" or the "Fund"), a non-diversified series of the Scudder Investors Funds, Inc., (formerly Deutsche Investors Funds, Inc.) (the "Company"), is registered under the Investment Company Act of 1940, as amended (the "1940 Act"), as an open-end management investment company organized as a Maryland Corporation.
The Fund offers multiple classes of shares which provide investors with different purchase options. Class A shares are offered to investors subject to an initial sales charge. Class B shares are offered without an initial sales charge but are subject to higher ongoing expenses than Class A shares and a contingent deferred sales charge payable upon certain redemptions. Class B shares automatically convert to Class A shares six years after issuance. Class C shares are offered to investors subject to an initial sales charge and are subject to higher ongoing expenses than Class A shares and a contingent deferred sales charge payable upon certain redemptions within one year of purchase. Prior to February 3, 2003, Class C shares were offered without an initial sales charge. Class C shares do not convert into another class.
Investment income, realized and unrealized gains and losses, and certain fund-level expenses and expense reductions, if any, are borne pro rata on the basis of relative net assets by the holders of all classes of shares, except that each class bears certain expenses unique to that class such as distribution fees, service fees and certain other class-specific expenses. Differences in class-level expenses may result in payment of different per share dividends by class. All shares of the Fund have equal rights with respect to voting subject to class-specific arrangements.
The Fund's financial statements are prepared in accordance with accounting principles generally accepted in the United States of America which require the use of management estimates. Actual results could differ from those estimates. The policies described below are followed consistently by the Fund in the preparation of its financial statements.
Security Valuation. Investments are stated at value determined as of the close of regular trading on the New York Stock Exchange on each day the exchange is open for trading. Equity securities are valued at the most recent sale price reported on the exchange (US or foreign) or over-the-counter market on which the security is traded most extensively. Securities for which no sales are reported are valued at the calculated mean between the most recent bid and asked quotations on the relevant market or, if a mean cannot be determined, at the most recent bid quotation.
Securities and other assets for which market quotations are not readily available or for which the above valuation procedures are deemed not to reflect fair value are valued in a manner that is intended to reflect their fair value as determined in accordance with procedures approved by the Directors.
Foreign Currency Translations. The books and records of the Fund are maintained in US dollars. Investment securities and other assets and liabilities denominated in a foreign currency are translated into US dollars at the prevailing exchange rates at period end. Purchases and sales of investment securities, income and expenses are translated into US dollars at the prevailing exchange rates on the respective dates of the transactions.
Net realized and unrealized gains and losses on foreign currency transactions represent net gains and losses between trade and settlement dates on securities transactions, the disposition of forward foreign currency exchange contracts and foreign currencies, and the difference between the amount of net investment income accrued and the US dollar amount actually received. That portion of both realized and unrealized gains and losses on investments that results from fluctuations in foreign currency exchange rates is not separately disclosed but is included with net realized and unrealized gains and losses on investment securities.
Federal Income Taxes. The Fund's policy is to comply with the requirements of the Internal Revenue Code, as amended, which are applicable to regulated investment companies, and to distribute all of its taxable income to its shareholders. Accordingly, the Fund paid no federal income taxes and no federal income tax provision was required.
At August 31, 2003 the Fund had a net tax basis capital loss carryforward of approximately $1,099,000 which may be applied against any realized net taxable capital gains of each succeeding year until fully utilized or until August 31, 2011.
In addition, from November 1, 2002 through August 31, 2003, the Fund incurred approximately $91,000 of net realized capital and currency losses. As permitted by tax regulations, the Fund intends to elect to defer these losses and treat them as arising in the fiscal year ending August 31, 2004.
Distribution of Income and Gains. Distributions of net investment income, if any, are made annually. Net realized gains from investment transactions, in excess of available capital loss carryforwards, would be taxable to the Fund if not distributed, and, therefore, will be distributed to shareholders at least annually.
The timing and characterization of certain income and capital gains distributions are determined annually in accordance with federal tax regulations which may differ from accounting principles generally accepted in the United States of America. These differences primarily relate to certain securities sold at a loss. As a result, net investment income (loss) and net realized gain (loss) on investment transactions for a reporting period may differ significantly from distributions during such period. Accordingly, the Fund may periodically make reclassifications among certain of its capital accounts without impacting the net asset value of the Fund.
At August 31, 2003, the Fund's components of distributable earnings (accumulated losses) on a tax-basis were as follows:
Undistributed ordinary income*
| $ - |
Undistributed net long-term capital gains
| $ - |
Capital loss carryforwards
| $ (1,099,000) |
Net unrealized appreciation (depreciation) on investments
| $ 999,917 |
* For tax purposes, short-term capital gains distributions are considered ordinary income distributions.Cash. Cash includes deposits held at the Fund's custodian in a variable rate account at the applicable interest rate.
Other. Investment transactions are accounted for on the trade date. Interest income is recorded on the accrual basis. Dividend income is recorded on the ex-dividend date net of foreign withholding taxes. Certain dividends from foreign securities may be recorded subsequent to the ex-dividend date as soon as the Fund is informed of such dividends. Realized gains and losses from investment transactions are recorded on an identified cost basis.
B. Purchases and Sales of Securities
During the year ended August 31, 2003, purchases and sales of investment securities (excluding short-term investments) aggregated $8,590,408 and $4,957,517, respectively.
C. Related Parties
Scudder Investments is part of Deutsche Asset Management, which is the marketing name in the US for the asset management activities of Deutsche Bank AG. Investment Company Capital Corp. ("ICCC" or the "Advisor"), an indirect, wholly owned subsidiary of Deutsche Bank AG, is the Advisor and Administrator for the Fund.
Investment Advisory Agreement. Under the Investment Advisory Agreement the Advisor directs the investments of the Fund in accordance with its investment objectives, policies and restrictions. The advisory fee payable under the Investment Advisory Agreement is equal to an annual rate of 0.85% of the first $250,000,000 of the Fund's average daily net assets, 0.80% of the next $250,000,000 of such net assets and 0.75% of such net assets in excess of $500,000,000, computed and accrued daily and payable monthly. Accordingly, for the year ended August 31, 2003, the fee pursuant to the Investment Advisory Agreement was equivalent to an annual effective rate of 0.85% of the Fund's average daily net assets. DWS International Portfolio Management GmbH, an affiliate of the Advisor, serves as subadvisor and is responsible for the day to day management of the Fund. Effective September 1, 2003, Deutsche Asset Management International GmbH ("DeAMi"), an indirect, wholly owned subsidiary of Deutsche Bank AG, became the subadvisor of the Fund, and is paid by the Advisor for its services.
ICCC, in its capacity as Advisor and Administrator, has contractually agreed for the year ended August 31, 2003, to waive its annual fees, if necessary, or to make payments to the Fund to the extent that its annual expenses exceed the following: Class A shares 1.50%, Class B shares 2.25% and Class C shares 2.25%. Accordingly, for the year ended August 31, 2003, the fee pursuant to the Investment Advisory Agreement was $42,301, all of which was waived. In addition, under these agreements, the Advisor reimbursed additional expenses of $162,710.
Administrator Service Fee. ICCC also serves as the Fund's Administrator. Under the Administration Services Appendix to the Master Services Agreement, the Fund pays ICCC an annual fee (the "Administrator Service Fee") of 0.15% of the Fund's average daily net assets, computed and accrued daily and payable monthly. For the year ended August 31, 2003, the Administrator Service Fee was $7,482, all of which was waived.
Accounting Fees. ICCC is responsible for computing the daily net asset value per share and maintaining the portfolio and general accounting records of the Fund. At its expense, ICCC has delegated its fund accounting and related duties to Scudder Fund Accounting Corporation ("SFAC"), an affiliate of the Advisor. In turn, as of April 1, 2003, SFAC and ICCC have retained State Street Bank and Trust Company to provide certain administrative, fund accounting and record-keeping services to the Fund. The amount charged to the Fund by ICCC for accounting services aggregated $24,766, of which $1,889 is unpaid at August 31, 2003.
Effective December 16, 2002, Scudder Investments Service Company ("SISC"), an affiliate of the Advisor, is the Fund's transfer agent. SISC provides the same services that ICCC provided to the Fund and is entitled to receive the same rate of compensation. Prior to December 16, 2002, ICCC served as the Fund's transfer agent. Effective January 15, 2003, pursuant to a sub-transfer agency agreement between SISC and DST Systems, Inc. ("DST"), SISC has delegated certain transfer agent and dividend paying agent functions to DST. The cost and expenses of such delegation are borne by SISC, not by the Fund. Transfer agent charges to the Fund by SISC and ICCC aggregated $13,460, of which $2,493 is unpaid at August 31, 2003.
Distribution Agreement. Under the Distribution Agreement, in accordance with Rule 12b-1 under the 1940 Act, Scudder Distributors, Inc. ("SDI"), an affiliate of the Advisor, receives a fee ("Distribution Fee") of 0.25% of the average daily net assets of the Class A shares and 0.75% of average daily net assets of the Class B and C shares. Pursuant to the agreement, SDI enters into related selling group agreements with various firms at various rates for sales of Class B and C shares. For the year ended August 31, 2003, the Distribution Fee was as follows:
Distribution Fee | Total Aggregated | Unpaid at August 31, 2003 |
Class A
| $ 10,443 | $ 1,464 |
Class B
| 3,477 | 828 |
Class C
| 2,603 | 505 |
| $ 16,523 | $ 2,797 |
In addition, SDI provides information and administrative services ("Shareholder Servicing Fee") to Class B and C shareholders at an annual rate of 0.25% of average daily net assets for each such class. SDI in turn has various agreements with financial services firms that provide these services and pays these fees based upon the assets of shareholder accounts the firms service. For the year ended August 31, 2003, the Shareholder Servicing Fee was as follows:
Shareholder Servicing Fee | Total Aggregated | Unpaid at August 31, 2003 | Effective
Rate |
Class B
| $ 1,159 | $ 336 | .25% |
Class C
| 868 | 221 | .25% |
| $ 2,027 | $ 557 | |
Underwriting Agreement and Contingent Deferred Sales Charge. SDI is the principal underwriter for Class A, B and C shares. Underwriting commissions paid to SDI in connection with the distribution of Class A and C shares for the year ended August 31, 2003 aggregated $4,816 and $20, respectively.
In addition, SDI receives any contingent deferred sales charge ("CDSC") from Class B share redemptions occurring within six years of purchase and Class C share redemptions occurring within one year of purchase. There is no such charge upon redemption of any share appreciation or reinvested dividends. The CDSC is based on declining rates ranging from 4% to 1% for Class B and 1% for Class C, of the value of the shares redeemed. For the year ended August 31, 2003, the CDSC for Class B and C shares aggregated $745 and $466, respectively.
Directors' Fees and Expenses. The Fund pays each Director not affiliated with the Advisor retainer fees plus specified amounts for attended board and committee meetings.
D. Ownership of the Fund
At August 31, 2003, DWS International Portfolio Management GmbH, an indirect wholly owned subsidiary of Deutsche Bank, AG, held 47% of the outstanding shares of the Fund.
E. Share Transactions
The following table summarizes share and dollar activity in the Fund:
| Year Ended
August 31, 2003 | Year Ended
August 31, 2002 |
| Shares | Dollars | Shares | Dollars |
Shares sold
|
Class A
| 498,858 | $ 3,971,539 | 47,110 | $ 451,203 |
Class B
| 178,526 | 1,475,640 | 15,257 | 147,488 |
Class C
| 73,692 | 619,715 | 11,038 | 108,743 |
| | $ 6,066,894 | | $ 707,434 |
Shares redeemed
|
Class A
| (180,754) | $ (1,372,320) | (27,899) | $ (203,794) |
Class B
| (66,910) | (514,529) | (8,093) | (61,571) |
Class C
| (8,580) | (70,817) | (1,744) | (13,043) |
| | $ (1,957,666) | | $ (278,408) |
Net increase (decrease)
|
Class A
| 318,104 | $ 2,599,219 | 19,211 | $ 247,409 |
Class B
| 111,616 | 961,111 | 7,164 | 85,917 |
Class C
| 65,112 | 548,898 | 9,294 | 95,700 |
| | $ 4,109,228 | | $ 429,026 |
F. Line of Credit
Effective April 11, 2003, the Fund and several other affiliated funds (the "Participants") entered into a $1.25 billion revolving credit facility administered by J.P. Morgan Chase Bank for temporary or emergency purposes, including the meeting of redemption requests that otherwise might require the untimely disposition of securities. The Participants are charged an annual commitment fee which is allocated, pro rata based upon net assets, among each of the Participants. Interest is calculated at the Federal Funds Rate plus 0.5 percent. The Fund may borrow up to a maximum of 33 percent of its net assets under the agreement.
Report of Independent Auditors |
|
To the Board of Directors of Scudder Investors Funds, Inc., formerly Deutsche Investors Funds, Inc. and Shareholders of the Global Biotechnology Fund:
In our opinion, the accompanying statement of assets and liabilities, including the investment portfolio, and the related statements of operations and of changes in net assets and the financial highlights present fairly, in all material respects, the financial position of Global Biotechnology Fund (hereafter referred to as the "Fund") at August 31, 2003 and the results of its operations, the changes its net assets and the financial highlights for each of the periods indicated therein, in conformity with accounting principles generally accepted in the United States of America. These financial statements and financial highlights (hereafter referred to as "financial statements") are the responsibility of the Fund's management; our responsibility is to express an opinion on these financial statements based on our audits. We conducted our audits of these financial statements in accordance with auditing standards generally accepted in the United States of America, which require that we plan and perform the audit to obtain reasonable assurance about whether the financial statements are free of material misstatement. An audit includes examining, on a test basis, evidence supporting the amounts and disclosures in the financial statements, assessing the accounting principles used and significant estimates made by management, and evaluating the overall financial statement presentation. We believe that our audits, which included confirmation of securities at August 31, 2003 by correspondence with the custodian and brokers, provide a reasonable basis for our opinion.
Boston, Massachusetts
October 23, 2003 | PricewaterhouseCoopers LLP |
Please consult a tax advisor if you have questions about federal or state income tax laws, or on how to prepare your tax returns. If you have specific questions about your account, please call 1-800-SCUDDER.
Independent Directors |
Name, Date of Birth, Position with the Fund and Length of Time Served1,2
| Business Experience and Directorships
During the Past 5 Years
| Number of Funds in the Fund Complex Overseen
|
Richard R. Burt
2/3/47
Director since 1998
| Chairman, Diligence LLC (international information-collection and risk-management firm) (September 2000 to present); Chairman, IEP Advisors, Inc. (July 1998 to present); Chairman of the Board, Weirton Steel Corporation3 (April 1996 to present); Member of the Board, Hollinger International, Inc.3 (publishing) (1995 to present), HCL Technologies Limited (information technology) (April 1999 to present), UBS Mutual Funds (formerly known as Brinson and Mitchell Hutchins families of funds) (registered investment companies) (September 1995 to present); and Member, Textron Inc.3 International Advisory Council (July 1996 to present). Formerly, Partner, McKinsey & Company (consulting) (1991-1994) and US Chief Negotiator in Strategic Arms Reduction Talks (START) with former Soviet Union and US Ambassador to the Federal Republic of Germany (1985-1991); Member of the Board, Homestake Mining3 (mining and exploration) (1998-February 2001), Archer Daniels Midland Company3 (agribusiness operations) (October 1996-June 2001) and Anchor Gaming (gaming software and equipment) (March 1999-December 2001).
| 68 |
S. Leland Dill
3/28/30
Director since 2002
| Trustee, Phoenix Zweig Series Trust (since September 1989), Phoenix Euclid Market Neutral Funds (since May 1998) (registered investment companies); Retired (since 1986). Formerly, Partner, KPMG Peat Marwick (June 1956-June 1986); Director, Vintners International Company Inc. (wine vintner) (June 1989-May 1992), Coutts (USA) International (January 1992-March 2000), Coutts Trust Holdings Ltd., Coutts Group (private bank) (March 1991-March 1999); General Partner, Pemco (investment company) (June 1979-June 1986).
| 66 |
Martin J. Gruber
7/15/37
Director since 2002
| Nomura Professor of Finance, Leonard N. Stern School of Business, New York University (since September 1964); Trustee, CREF (pension fund) (since January 2000); Director, Japan Equity Fund, Inc. (since January 1992), Thai Capital Fund, Inc. (since January 2000) and Singapore Fund, Inc. (since January 2000) (registered investment companies). Formerly, Trustee, TIAA (pension fund) (January 1996-January 2000); Director, S.G. Cowen Mutual Funds (January 1985-January 2001).
| 66 |
Joseph R. Hardiman
5/27/37
Director since 2000
| Private Equity Investor (January 1997 to present); Director, Soundview Technology Group Inc. (investment banking) (July 1998 to present), Corvis Corporation3 (optical networking equipment) (July 2000 to present), Brown Investment Advisory & Trust Company (investment advisor) (February 2001 to present), The Nevis Fund (registered investment company) (July 1999 to present), and ISI Family of Funds (registered investment companies) (March 1998 to present). Formerly, Director, Circon Corp.3 (medical instruments) (November 1998-January 1999); President and Chief Executive Officer, The National Association of Securities Dealers, Inc. and The NASDAQ Stock Market, Inc. (1987-1997); Chief Operating Officer of Alex. Brown & Sons Incorporated (now Deutsche Bank Securities Inc.) (1985-1987); General Partner, Alex. Brown & Sons Incorporated (now Deutsche Bank Securities Inc.) (1976-1985).
| 66 |
Richard J. Herring
2/18/46
Director since 2002
| Jacob Safra Professor of International Banking and Professor, Finance Department, The Wharton School, University of Pennsylvania (since July 1972); Director, Lauder Institute of International Management Studies (since July 2000); Co-Director, Wharton Financial Institutions Center (since July 2000). Formerly, Vice Dean and Director, Wharton Undergraduate Division (July 1995-June 2000).
| 66 |
Graham E. Jones
1/31/33
Director since 2002
| Senior Vice President, BGK Realty, Inc. (commercial real estate) (since 1995); Trustee, 8 open-end mutual funds managed by Weiss, Peck & Greer (since 1985) and Trustee of 18 open-end mutual funds managed by Sun Capital Advisers, Inc. (since 1998).
| 66 |
Rebecca W. Rimel
4/10/51
Director since 2000
| President and Chief Executive Officer, The Pew Charitable Trusts (charitable foundation) (1994 to present); Executive Vice President, The Glenmede Trust Company (investment trust and wealth management) (1983 to present). Formerly, Executive Director, The Pew Charitable Trusts (1988-1994); Director, ISI Family of Funds (registered investment companies) (1997-1999) and Director, The Glenmede Trust Company (investment trust and wealth management) (1994-2002).
| 66 |
Philip Saunders, Jr.
10/11/35
Director since 2002
| Principal, Philip Saunders Associates (economic and financial consulting) (since November 1988). Formerly, Director, Financial Industry Consulting, Wolf & Company (consulting) (1987-1988); President, John Hancock Home Mortgage Corporation (1984-1986); Senior Vice President of Treasury and Financial Services, John Hancock Mutual Life Insurance Company, Inc. (1982-1986).
| 66 |
William N. Searcy
9/03/46
Director since 2002
| Pension & Savings Trust Officer, Sprint Corporation3 (telecommunications) (since November 1989); Trustee of 22 open-end mutual funds managed by Sun Capital Advisers, Inc. (since October 1998).
| 66 |
Robert H. Wadsworth
1/29/40
Director since 1997
| President, Robert H. Wadsworth Associates, Inc. (consulting firm) (May 1982 to present). Formerly, President and Trustee, Trust for Investment Managers (registered investment company) (April 1999-June 2002); President, Investment Company Administration, L.L.C. (January 1992*-July 2001); President, Treasurer and Director, First Fund Distributors, Inc. (June 1990-January 2002); Vice President, Professionally Managed Portfolios (May 1991-January 2002) and Advisors Series Trust (October 1996-January 2002) (registered investment companies); President, Guinness Flight Investment Funds, Inc. (registered investment company) (June 1994-November1998).
* Inception date of the corporation which was the predecessor to the L.L.C.
| 69 |
Interested Director |
Name, Date of Birth, Position with the Fund and Length of Time Served1,2
| Business Experience and Directorships
During the Past 5 Years
| Number of Funds in the Fund Complex Overseen
|
Richard T. Hale4
7/17/45
Chairman since 2002 and
Director since 2000
| Managing Director, Deutsche Investment Management Americas Inc. (2003-present); Managing Director, Deutsche Bank Securities Inc. (formerly Deutsche Banc Alex. Brown Inc.) and Deutsche Asset Management (1999 to present); Director and President, Investment Company Capital Corp. (registered investment advisor) (1996 to present); Director, Deutsche Global Funds, Ltd. (2000 to present), CABEI Fund (2000 to present), North American Income Fund (2000 to present) (registered investment companies); Director, Scudder Global Opportunities Fund (since 2003); Director/Officer Deutsche/Scudder Mutual Funds (various dates); President, Montgomery Street Income Securities, Inc. (2002 to present) (registered investment companies); Vice President, Deutsche Asset Management, Inc. (2000 to present). Formerly, Director, ISI Family of Funds (registered investment companies; 4 funds overseen) (1992-1999).
| 201 |
Officers |
Name, Date of Birth,
Position with the Fund and Length of Time Served1,2
| Business Experience and Directorships
During the Past 5 Years
|
Richard T. Hale4
7/17/45
President since 2003
| See information presented under Interested Director.
|
Kenneth Murphy5
10/13/63
Vice President and Anti-Money Laundering Compliance Officer since 2002
| Vice President, Deutsche Asset Management (September 2000-present); Vice President, Scudder Distributors, Inc. (December 2002-present). Formerly, Director, John Hancock Signature Services (1992-2000).
|
Daniel O. Hirsch
3/27/54
Vice President since 2003 and Secretary since 2002
| Managing Director, Deutsche Asset Management (2002-present) and Director, Deutsche Global Funds Ltd. (2002-present). Formerly, Director, Deutsche Asset Management (1999-2002); Principal, BT Alex. Brown Incorporated (now Deutsche Bank Securities Inc.) (1998-1999); Assistant General Counsel, United States Securities and Exchange Commission (1993-1998).
|
Charles A. Rizzo5
8/5/57
Treasurer since 2002
| Director, Deutsche Asset Management (April 2000 to present); Formerly, Vice President and Department Head, BT Alex. Brown Incorporated (now Deutsche Bank Securities Inc.) (1998-1999); Senior Manager, Coopers & Lybrand L.L.P. (now PricewaterhouseCoopers LLP) (1993-1998).
|
Salvatore Schiavone5
11/03/65
Assistant Treasurer since 2003
| Director, Deutsche Asset Management.
|
Lucinda H. Stebbins5
11/19/45
Assistant Treasurer since 2003
| Director, Deutsche Asset Management.
|
Kathleen Sullivan D'Eramo5
1/25/57
Assistant Treasurer since 2003
| Director, Deutsche Asset Management.
|
John Millette5
8/23/62
Assistant Secretary since 2003
| Director, Deutsche Asset Management.
|
Caroline Pearson5
4/01/62
Assistant Secretary since 2002
| Managing Director, Deutsche Asset Management.
|
Bruce A. Rosenblum
9/14/60
Assistant Secretary since 2002
| Director, Deutsche Asset Management.
|
1 Unless otherwise indicated, the mailing address of each Director and Officer with respect to fund operations is One South Street, Baltimore, MD 21202.2 Length of time served represents the date that each Director or Officer first began serving in that position with Scudder Investors Funds, Inc. of which this fund is a series.3 A publicly held company with securities registered pursuant to Section 12 of the Securities Exchange Act of 1934.4 Mr. Hale is a Director who is an "interested person" within the meaning of Section 2(a)(19) of the 1940 Act. Mr. Hale is President of Investment Company Capital Corp. and a Managing Director of Deutsche Asset Management, the US asset management unit of Deutsche Bank AG and its affiliates.5 Address: Two International Place, Boston, Massachusetts.The fund's Statement of Additional Information includes additional information about the fund's directors. To receive your free copy of the Statement of Additional Information, call toll-free: 1-800-621-1048.
Growth Funds
Scudder 21st Century Growth Fund Scudder Aggressive Growth Fund Scudder Blue Chip Fund Scudder Capital Growth Fund Scudder Development Fund Scudder Dynamic Growth Fund Scudder Flag Investors
Communications Fund Scudder Gold & Precious Metals Fund Scudder Global Biotechnology Fund Scudder Growth Fund Scudder Health Care Fund Scudder Large Company Growth Fund Scudder Micro Cap Fund Scudder Mid Cap Fund Scudder Small Cap Fund Scudder Strategic Growth Fund Scudder Technology Fund Scudder Technology Innovation Fund Scudder Top 50 US Fund Value Funds
Scudder Contrarian Fund Scudder-Dreman Financial Services Fund Scudder-Dreman High Return Equity Fund Scudder-Dreman Small Cap Value Fund Scudder Flag Investors Equity
Partners Fund Scudder Growth and Income Fund Scudder Large Company Value Fund Scudder-RREEF Real Estate Securities Fund Scudder Small Company Stock Fund Scudder Small Company Value Fund Scudder Tax Advantaged Dividend Fund Multicategory/Asset Allocation Funds
Scudder Balanced Fund Scudder Flag Investors Value Builder Fund Scudder Focus Value+Growth Fund Scudder Lifecycle Mid Range Fund Scudder Lifecycle Long Range Fund Scudder Lifecycle Short Range Fund Scudder Pathway Conservative Portfolio Scudder Pathway Growth Portfolio Scudder Pathway Moderate Portfolio Scudder Target 2013 Fund Scudder Total Return Fund International/Global Funds
Scudder Emerging Markets Growth Fund Scudder Emerging Markets Income Fund Scudder European Equity Fund Scudder Global Fund Scudder Global Bond Fund Scudder Global Discovery Fund Scudder Greater Europe Growth Fund Scudder International Fund Scudder International Equity Fund Scudder International Select Equity Fund Scudder Japanese Equity Fund Scudder Latin America Fund Scudder New Europe Fund Scudder Pacific Opportunities Fund Income Funds
Scudder Cash Reserves Fund Scudder Fixed Income Fund Scudder GNMA Fund Scudder High Income Plus Fund (formerly Deutsche High Yield Bond Fund) Scudder High Income Fund (formerly Scudder High Yield Fund) Scudder High Income Opportunity Fund (formerly Scudder High Yield Opportunity Fund) Scudder Income Fund Scudder PreservationPlus Fund Scudder PreservationPlus Income Fund Scudder Short Duration Fund (formerly Scudder Short-Term Fixed Income Fund) Scudder Short-Term Bond Fund Scudder Strategic Income Fund Scudder U.S. Government Securities Fund |
Scudder Funds (continued) |
Tax-Free Income Funds
Scudder California Tax-Free Income Fund Scudder Florida Tax-Free Income Fund Scudder High Yield Tax-Free Fund Scudder Intermediate Tax/AMT Free Fund (formerly Scudder Medium Term Tax-Free Fund) Scudder Managed Municipal Bond Fund Scudder Massachusetts Tax-Free Fund Scudder Municipal Bond Fund Scudder New York Tax-Free Income Fund Scudder Short-Term Municipal Bond Fund Index-Related Funds
Scudder EAFE ® Equity Index Fund Scudder Equity 500 Index Fund Scudder S&P 500 Index Fund Scudder S&P 500 Stock Fund Scudder Select 500 Fund Scudder US Bond Index Fund Money Market
A large number of money market funds are available through Scudder Investments.
|
Retirement Programs and Education Accounts |
Retirement Programs
Traditional IRA Roth IRA SEP-IRA Inherited IRA Keogh Plan 401(k), 403(b) Plans Variable Annuities Education Accounts
Coverdell Education Savings Account UGMA/UTMA IRA for Minors |
Closed-End Funds |
The Brazil Fund, Inc. The Korea Fund, Inc. Montgomery Street Income Securities, Inc. Scudder Global High Income Fund, Inc. Scudder New Asia Fund, Inc. Scudder High Income Trust Scudder Intermediate Government Trust Scudder Multi-Market Income Trust Scudder Municipal Income Trust Scudder RREEF Real Estate Fund, Inc. Scudder RREEF Real Estate Fund II, Inc. Scudder Strategic Income Trust Scudder Strategic Municipal Income Trust The Central Europe and Russia Fund, Inc. (formerly The Central European Equity Fund, Inc.) The Germany Fund, Inc. The New Germany Fund, Inc. The SMALLCap Fund, Inc. |
Not all funds are available in all share classes.
Scudder open-end funds are offered by prospectus only. For more complete information on any fund or variable annuity registered in your state, including information about a fund's objectives, strategies, risks, advisory fees, distribution charges, and other expenses, please order a free prospectus. Read the prospectus before investing in any fund to ensure the fund is appropriate for your goals and risk tolerance.
A money market mutual fund investment is not insured or guaranteed by the Federal Deposit Insurance Corporation or any other government agency. Although a money market mutual fund seeks to preserve the value of your investment at $1 per share, it is possible to lose money by investing in such a fund.
The products described should not be considered a solicitation to buy or an offer to sell a security to any person in any jurisdiction where such offer, solicitation, purchase, or sale would be unlawful under the securities laws of such jurisdiction.
Account Management Resources |
|
Automated Information Lines | ScudderACCESS (800) 972-3060 Personalized account information, information on other Scudder funds and services via touchtone telephone and for Classes A, B, and C only, the ability to exchange or redeem shares.
|
Web Site | scudder.com View your account transactions and balances, trade shares, monitor your asset allocation, and change your address, 24 hours a day.
Obtain prospectuses and applications, blank forms, interactive worksheets, news about Scudder funds, subscription to fund updates by e-mail, retirement planning information, and more.
|
For more information | (800) 621-1048 To speak with a Scudder service representative.
|
Written correspondence | Scudder Investments PO Box 219356
Kansas City, MO
64121-9356
|
Principal Underwriter | If you have questions, comments or complaints, contact:
Scudder Distributors, Inc. 222 South Riverside Plaza
Chicago, IL 60606
(800) 621-1148
|
| Class A | Class B | Class C |
Nasdaq Symbol | DBBTX
| DBBBX
| DBBCX
|
CUSIP Number | 81116R-705
| 81116R-804
| 81116R-887
|
Fund Number | 475
| 675
| 775
|

INSERT HTML FILE
ITEM 2.         CODE OF ETHICS.

As of the end of the period,  August 31, 2003, the Scudder Global  Biotechnology
Fund has  adopted a code of ethics,  as defined  in Item 2 of Form  N-CSR,  that
applies to its President and Treasurer and its Chief Financial  Officer.  A copy
of the code of ethics is filed as an exhibit to this Form N-CSR.

ITEM 3.         AUDIT COMMITTEE FINANCIAL EXPERT.

The Fund's Board of Directors/Trustees has determined that the Fund has at least
one "audit committee financial expert" serving on its audit committee: Mr. S.
Leland Dill. This audit committee member is "independent," meaning that he is
not an "interested person" of the Fund (as that term is defined in Section
2(a)(19) of the Investment Company Act of 1940) and he does not accept any
consulting, advisory, or other compensatory fee from the Fund (except in the
capacity as a Board or committee member).

An "audit committee financial expert" is not an "expert" for any purpose,
including for purposes of Section 11 of the Securities Act of 1933, as a result
of being designated as an "audit committee financial expert." Further, the
designation of a person as an "audit committee financial expert" does not mean
that the person has any greater duties, obligations, or liability than those
imposed on the person without the "audit committee financial expert"
designation. Similarly, the designation of a person as an "audit committee
financial expert" does not affect the duties, obligations, or liability of any
other member of the audit committee or board of directors.

ITEM 4.         PRINCIPAL ACCOUNTANT FEES AND SERVICES.

                        Not currently applicable.

ITEM 5.         [RESERVED]

ITEM 6.         [RESERVED]

ITEM 7.         DISCLOSURE OF PROXY VOTING POLICIES AND PROCEDURES FOR
                CLOSED-END MANAGEMENT INVESTMENT COMPANIES.

ITEM 8.         [RESERVED]

ITEM 9.         CONTROLS AND PROCEDURES.


(a) The Chief Executive and Financial Officers concluded that the
Registrant's Disclosure Controls and Procedures are effective based on the
evaluation of the Disclosure Controls and Procedures as of a date within 90 days
of the filing date of this report.


(b) There have been no significant changes in the Registrant's internal controls
or in other factors that could significantly affect these controls subsequent to
the date of their evaluation and until the filing of this report, including any
corrective actions with regard to significant deficiencies and material
weaknesses.

ITEM 10.        EXHIBITS.

(a)(1)   Code of Ethics  pursuant to Item 2 of Form N-CSR is filed and  attached
         hereto as EX-99.CODE ETH.

(a)(2)   Certification  pursuant to Rule 30a-2(a) under the  Investment  Company
         Act of 1940 (17 CFR  270.30a-2(a))  is filed  and  attached  hereto  as
         Exhibit 99.CERT.

(b)      Certification  pursuant to Rule 30a-2(b) under the  Investment  Company
         Act of 1940 (17 CFR  270.30a-2(b))  is furnished and attached hereto as
         Exhibit 99.906CERT.


Form N-CSR Item F

                                   SIGNATURES

Pursuant to the requirements of the Securities Exchange Act of 1934 and the
Investment Company Act of 1940, the registrant has duly caused this report to be
signed on its behalf by the undersigned, thereunto duly authorized.

Registrant:                         Scudder Global Biotechnology Fund


By:                                 /s/Richard T. Hale
                                    ---------------------------
                                    Richard T. Hale
                                    Chief Executive Officer

Date:                               October 22, 2003
                                    ---------------------------


Pursuant to the requirements of the Securities Exchange Act of 1934 and the
Investment Company Act of 1940, this report has been signed below by the
following persons on behalf of the registrant and in the capacities and on the
dates indicated.

Registrant:                          Scudder Global Biotechnology Fund


By:                                 /s/Richard T. Hale
                                    ---------------------------
                                    Richard T. Hale
                                    Chief Executive Officer

Date:                               October 22, 2003
                                    ---------------------------


By:                                 /s/Charles A. Rizzo
                                    ---------------------------
                                    Charles A. Rizzo
                                    Chief Financial Officer

Date:                               October 22, 2003
                                    ---------------------------