Table of Contents
UNITED STATES
SECURITIES AND EXCHANGE COMMISSION
Washington, D.C. 20549
FORM N-CSR
CERTIFIED SHAREHOLDER REPORT OF REGISTERED
MANAGEMENT INVESTMENT COMPANIES
Investment Company Act file number: 811-08257
GE INSTITUTIONAL FUNDS
(Exact name of registrant as specified in charter)
1600 Summer Street
Stamford, Connecticut 06905
(Address of principal executive offices)(Zip code)
GE Asset Management, Inc.
1600 Summer Street
Stamford, Connecticut 06905
(Name and Address of Agent for Service)
Registrant’s telephone number, including area code: 800-242-0134
Date of fiscal year end: 09/30
Date of reporting period: 09/30/15
Table of Contents
| Item 1. | Reports to Stockholders |
Table of Contents
GE Institutional Funds
Annual Report
September 30, 2015

Table of Contents
GE Institutional Funds
| 1 | ||||
Manager Reviews and Schedules of Investments | ||||
| 2 | ||||
| 9 | ||||
| 21 | ||||
| 27 | ||||
| 33 | ||||
| 43 | ||||
| 50 | ||||
| 73 | ||||
| 87 | ||||
Financial Statements | ||||
| 88 | ||||
| 96 | ||||
| 98 | ||||
| 100 | ||||
| 102 | ||||
| 106 | ||||
| 120 | ||||
| 121 | ||||
| 122 | ||||
| 124 | ||||
This report has been prepared for shareholders and may be distributed to others only if accompanied with a current prospectus and/or summary prospectus.
Table of Contents
| Notes to Performance | September 30, 2015 (Unaudited) |
The information provided on the following performance pages relates to the GE Institutional Funds (the “Funds”, and individually, the “Fund”).
Total returns take into account changes in share price and assume reinvestment of dividends and capital gains distributions, if any. Total returns shown are net of Fund expenses.
The performance data quoted represents past performance; past performance does not guarantee future results. Investment return and principal value will fluctuate. Accordingly, your shares, when redeemed, may be worth more or less than their original cost. Current performance may be higher or lower than the performance data quoted. Periods less than one year are not annualized. Please call toll-free (800) 242-0134 or visit the Fund’s website at http://www.geam.com for the most recent month-end performance data.
An investment in a Fund is not a deposit of any bank and is not insured or guaranteed by the Federal Deposit Insurance Corporation (FDIC) or any other government agency. An investment in a Fund is subject to risk, including possible loss of principal invested.
The Standard & Poor’s (“S&P”) 500® Composite Price Index of stocks (“S&P 500 Index”) is an unmanaged market capitalization-weighted index of stocks of 500 large U.S. companies, which is widely used as a measure of large-cap U.S. stock market performance.
The Russell 1000® Growth Index measures the performance of the large-cap growth segment of the U.S. equity universe. It includes companies in the Russell 1000® Index with higher price-to-book ratios and higher forecasted growth values. It is a subset of the Russell 3000® Index and includes approximately 1,000 of the largest securities based on a combination of their market cap and current index membership.
The Russell 2000® Index is a market capitalization-weighted index consisting of 2,000 of the smallest U.S.-domiciled publicly traded common stocks that are included in the Russell 3000® Index. The Russell 3000® Index is comprised of the 3,000 largest U.S.-domiciled companies.
The Morgan Stanley Capital International Europe, Australasia, and Far East Index (MSCI® EAFE®) is a market capitalization-weighted index of equity securities of companies domiciled in various countries. The index is designed to represent the performance of developed stock markets outside the U.S. and Canada and excludes certain market segments unavailable to U.S. based investors.
GE Investment Distributors, Inc., member of FINRA & SIPC is the principal underwriter and distributor of the GE Institutional Funds and a wholly owned subsidiary of GE Asset Management Incorporated, the investment adviser of the Funds.
The Morgan Stanley Capital International All Country World Index Ex-U.S. (MSCI® ACWI Ex-U.S.) is a market capitalization-weighted index designed to provide a broad measure of stock performance throughout the world, with the exception of U.S.-based companies. The MSCI ACWI Ex-U.S. Index includes both developed and emerging markets.
The Barclays U.S. Aggregate Bond Index is an unmanaged market value-weighted index of taxable investment grade debt issues, including government, corporate, asset-backed and mortgage-backed securities, with maturities of one year or more. The index is designed to represent performance of the U.S. investment-grade fixed rate bond market.
The 90 Day U.S. T-Bill is an unmanaged measure/index of the performance of the most recently auctioned 90 day U.S. Treasury bills (i.e., having a total maturity of 90 days) currently available in the marketplace.
The results shown for the foregoing indices assume the reinvestment of net dividends or interest and do not reflect fees, expenses, or taxes. As such, index returns do not reflect the actual cost of investing in the instruments that comprise an index.
The peer universe of the underlying open end funds used for the peer group average annual total return calculation is based on a blend of Morningstar peer categories, as shown. Morningstar is an independent mutual fund rating service. A Fund’s performance may be compared to or ranked within a universe of mutual funds with investment objectives and policies similar but not necessarily identical to that of the Fund.
©2015 Morningstar, Inc. All Rights Reserved. The Morningstar information contained herein: (1) is proprietary to Morningstar and/or its content providers; (2) may not be copied or distributed; and (3) is not warranted to be accurate, complete or timely. Neither Morningstar nor its content providers are responsible for any damage or losses relating from any use of this information. Past performance does not guarantee future results.
The S&P 500 Index Fund is not sponsored, endorsed, sold or promoted by Standard & Poor’s, and Standard & Poor’s makes no representation or warranty, express or implied, to the investors of the Fund or any member of the public regarding the advisability of investing in the securities generally or in this Fund particularly or the ability of the S&P 500 Index Fund to track general stock market performance.
Russell Investment Group owns the Russell Index data, including all applicable trademarks and copyrights, used by GE Asset Management Incorporated in these materials. Any unauthorized use or redistribution of such Russell Index data is strictly prohibited. Russell Investment Group is not responsible for the configuration of this material or for any inaccuracy in GE Asset Management Incorporated’s presentation thereof.
The views, expressed in this document, reflect our judgment as of the publication date and are subject to change at any time without notice.
1
Table of Contents
| U.S. Equity Fund | (Unaudited) |

David B. Carlson
Chief Investment
Officer — U.S. Equities

Stephen V. Gelhaus
Senior Vice President

Paul C. Reinhardt
Senior Vice President
The U.S. Equity Fund is managed by a team of portfolio managers that includes David B. Carlson, Stephen V. Gelhaus and Paul C. Reinhardt. Each of the foregoing portfolio managers manages one of three sub-portfolios, which comprise the Fund. A sub-portfolio refers to the portion of the Fund’s assets that are allocated to, and managed by, a particular portfolio manager on the Fund’s portfolio management team. The three sub-portfolios are managed independently of each other and the portfolio managers have full discretion over their sub-portfolio. However, as lead portfolio manager for the Fund, Mr. Carlson is vested with the authority to adjust the allocation of assets to each sub-portfolio. See portfolio managers’ biographical information beginning on page 124.
| Q. | How did the GE Institutional U.S. Equity Fund perform compared to its benchmark and Morningstar peer group for the twelve-month period ended September 30, 2015? |
| A. | For the twelve-month period ended September 30, 2015, the GE Institutional U.S. Equity Fund returned -3.57% for the Investment Class shares and -3.83% for the Service Class shares. The Fund’s benchmark, the S&P 500 Index returned -0.61% and the Fund’s Morningstar peer group of 1,658 US Large Blend funds returned an average of -2.67% over the same period. |
| Q. | What market conditions impacted the Fund’s performance? |
| A. | In the past year the growth style of investing has significantly outperformed value. Several macro themes have driven the market, including the strengthening U.S. dollar, and falling interest rates and energy prices. Energy dropped close to 30% — the worst performing S&P 500 sector. Growth concerns stemming from China and the emerging markets exacerbated commodity weakness, creating headwinds for many multi-national companies. In this risk-off environment, consumer staples and utilities (both +7%) were the best-performing S&P 500 sectors — and |
| defensive positioning mattered. Portfolios that were tilted to higher interest rates struggled on a relative basis, as the Federal Reserve’s initial rate hike was pushed out. |
| Q. | What were the primary drivers behind Fund performance? |
| A. | The Fund’s sector allocation effect was positive, bolstered by overweights in consumer discretionary and health care; two of the period’s strongest performing S&P 500 sectors. In these sectors, Boston Scientific (+24%), Advance Auto Parts (+19%) and Actavis (+6%) contributed most positively to portfolio returns. Underweighting the struggling energy and materials sectors was another positive factor. Underperformance for the Fund, therefore, was driven mostly by positioning for higher interest rates and individual stock selections within sectors. |
| Fed tightening expectations receded over the year, and we were not positioned for this scenario, with an underweight in the high yielding REITs, and a tilt toward interest-rate and market sensitive financials holdings (e.g., Invesco -19%, Ameriprise -10% and State Street -7%). American Express underperformed as profit outlook dimmed, losing key customers (we eliminated the name). Stock selection among technology companies was a key driver of Fund performance relative to the S&P 500. Baidu (-40%) weighed most on returns as the Chinese Internet search provider invested in new businesses to bolster its leading on-line presence. We believe its margin compression will be short lived and added to the position on weakness. Qualcomm (-26%) suffered unexpected market share losses and we reduced the position. Other lagging older-line tech names included Hewlett Packard (-35% and eliminated) and EMC (-18% and reduced). As oil prices pulled back, commodity-sensitive companies like United Rentals (-34%), Hess (-31%) and Monsanto (-27%) underperformed. |
2
Table of Contents

| (Unaudited) |
| Q. | Were there any significant changes in the Fund during the period? |
| A. | During the twelve-month period the Fund reduced its exposure to areas of the market negatively impacted by weak oil and other commodities, including materials, a new energy sector underweight. The Fund added to the industrials sector, with a focus on more domestically-oriented industries including defense/aerospace, professional services, and the airlines which benefitted from falling oil prices. The Fund reduced it overweight in financials, reflecting the heightened volatility around the Fed’s course of action on interest rate normalization. Many proceeds were invested into the consumer discretionary sector — a new overweight in the last 12-months (with the thought consumers are benefiting from improving employment statistics and the “tax break” of lower gasoline prices). At year-end, the Fund’s largest sector overweights were in health care and consumer discretionary. Despite any changes in positioning, the Fund maintained its bottom-up stock selection approach with a focus on the long-term investment horizon. We believe the Fund is well-positioned to add value through active stock selection going into the next year. |
3
Table of Contents
| U.S. Equity Fund | (Unaudited) |
Understanding Your Fund’s Expenses
As a shareholder of the Fund you incur ongoing costs. Ongoing costs include portfolio management fees, distribution and service fees (for Service Class shares), professional fees, administrative fees and other Fund expenses. The following example is intended to help you understand your ongoing costs (in dollars) of investing in the Fund and to compare these costs with the ongoing costs of investing in other mutual funds.
To illustrate these ongoing costs, we have provided an example and calculated the expenses paid by investors in each share class of the Fund during the period. The information in the following table is based on an investment of $1,000, which is invested at the beginning of the period and held for the entire six-month period ended September 30, 2015.
Actual Expenses
The first section of the table provides information about actual account values and actual expenses. You may use the information in this section, together with the amount you invested, to estimate the expenses that you paid over the period. To do so, simply divide your account value by $1,000 (for example, an $8,600 account value divided by $1,000 = 8.6), then multiply the result by the
number given for your class under the heading “Expenses paid during the period” to estimate the expenses you paid on your account during the period.
Hypothetical Example for Comparison Purposes
The second section of the table provides information about hypothetical account values and hypothetical expenses based on the Fund’s actual expense ratio and an assumed rate of return of 5% per year before expenses, which is not the Fund’s actual return. The hypothetical account values and expenses may not be used to estimate the actual ending account balance or expenses you paid for the period. You may use this information to compare the ongoing costs of investing in the Fund and other funds. To do so, compare this 5% hypothetical example with the 5% hypothetical examples that appear in the shareholders reports of other funds.
Please note that the expenses shown in the table are meant to highlight and help you compare ongoing costs only and do not reflect transaction costs, such as sales charges or redemption fees, if any. Therefore, the second section of the table is useful in comparing ongoing costs only, and will not help you determine the relative total costs of owning different funds.
April 1, 2015 – September 30, 2015
| Account value at the beginning of the period ($) | Account value at the end of the period ($) | Expenses paid during the period ($)* | |||||||||||||
Actual Fund Return | |||||||||||||||
Investment Class | 1,000.00 | 921.60 | 1.78 | ||||||||||||
Service Class | 1,000.00 | 920.50 | 2.98 | ||||||||||||
Hypothetical 5% Return (2.5% for the period) |
| ||||||||||||||
Investment Class | 1,000.00 | 1,023.21 | 1.88 | ||||||||||||
Service Class | 1,000.00 | 1,021.96 | 3.14 | ||||||||||||
| * | Expenses are equal to the Fund’s annualized net expense ratio of 0.37% for Investment Class shares and 0.62% for Service Class shares (for the period April 1, 2015 – September 30, 2015), multiplied by the average account value over the period, multiplied by 183/365 (to reflect the one-half year period). |
4
Table of Contents
| U.S. Equity Fund | (Unaudited) |
| Investment Profile |
A mutual fund designed for investors who seek long-term growth of capital. The Fund seeks to achieve its investment objective by investing at least 80% of its net assets under normal circumstances in equity securities of U.S. companies, such as common and preferred stocks.
| Morningstar Performance Comparison |
Based on average annual returns for periods ended September 30, 2015
| One Year | Five Year | Ten Year | ||||||||||
Number of funds in peer group | 1,658 | 1,419 | 1,201 | |||||||||
Peer group average annual total return | -2.67 | % | 11.20 | % | 5.62 | % | ||||||
Morningstar Category in peer group: Large Blend |
| |||||||||||
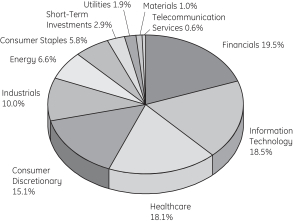
| Top Ten Largest Holdings | ||||||
as of September 30, 2015 (as a % of Fair Value) (a)(b)
Allergan PLC | 3.04% | |||
Apple Inc. | 2.67% | |||
JPMorgan Chase & Co. | 2.64% | |||
Amgen Inc. | 2.53% | |||
Cisco Systems Inc. | 2.13% | |||
PepsiCo Inc. | 1.99% | |||
QUALCOMM Inc. | 1.81% | |||
Comcast Corp., Class A | 1.81% | |||
Lowe’s Companies Inc. | 1.80% | |||
American International Group Inc. | 1.78% |
| Sector Allocation as of September 30, 2015 |
Portfolio composition as a % of Fair Value of $614,250 (in thousands) as of September 30, 2015 (a)(b)
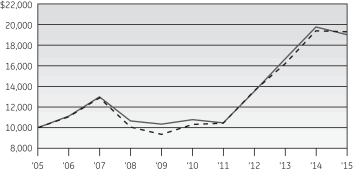
| Change in Value of a $10,000 Investment |
Investment Class Shares

| Average Annual Total Return |
for the periods ended September 30, 2015
| Investment Class Shares (Inception date: 11/25/97) | ||||||||||||||||||||
| One Year | Five Year | Ten Year | Ending Value of a $10,000 Investment | |||||||||||||||||
U.S. Equity Fund | -3.57% | 12.12% | 6.77% | $19,252 | ||||||||||||||||
S&P 500 Index | -0.61% | 13.34% | 6.80% | $19,304 | ||||||||||||||||
Service Class Shares
| Average Annual Total Return |
for the periods ended September 30, 2015
| Service Class Shares (Inception date: 1/3/01) | ||||||||||||||||||||
| One Year | Five Year | Ten Year | Ending value of a $10,000 investment | |||||||||||||||||
U.S. Equity Fund | -3.83% | 11.98% | 6.65% | $19,032 | ||||||||||||||||
S&P 500 Index | -0.61% | 13.34% | 6.80% | $19,304 | ||||||||||||||||

| (a) | Fair Value basis is inclusive of short-term investment in State Street Institutional U.S. Government Money Market Fund Premier Class. |
| (b) | The securities information regarding holdings, allocations and other characteristics is presented to illustrate examples of securities that the Fund has bought and the diversity of areas in which the Fund may invest as of a particular date. It may not be representative of the Fund’s current or future investments and should not be construed as a recommendation to purchase or sell a particular security. |
See Notes to Performance beginning on page 1 for further information, including an explanation of Morningstar peer categories.
Past performance does not predict future performance. The performance shown in the graphs and tables does not reflect the deduction of taxes that a shareholder would pay on Fund distributions or the redemption of Fund shares.
5
Table of Contents
U.S. Equity Fund
| Schedule of Investments | September 30, 2015 |
| U.S. Equity Fund |
| Number of Shares | Fair Value | |||||||||
Common Stock — 95.6%† |
| |||||||||
Aerospace & Defense — 4.0% |
| |||||||||
General Dynamics Corp. | 54,493 | $ | 7,517,310 | |||||||
Hexcel Corp. | 106,662 | 4,784,857 | ||||||||
Honeywell International Inc. | 91,006 | 8,617,358 | ||||||||
The Boeing Co. | 26,002 | 3,404,962 | ||||||||
| 24,324,487 | ||||||||||
Agricultural Products — 1.1% |
| |||||||||
Archer-Daniels-Midland Co. | 159,882 | 6,627,109 | ||||||||
Air Freight & Logistics — 0.4% |
| |||||||||
United Parcel Service Inc., Class B | 24,895 | 2,456,888 | ||||||||
Airlines — 1.1% |
| |||||||||
Delta Air Lines Inc. | 156,286 | 7,012,553 | ||||||||
Apparel, Accessories & Luxury Goods — 0.1% |
| |||||||||
Coach Inc. | 11,065 | 320,110 | ||||||||
Application Software — 0.7% |
| |||||||||
Intuit Inc. | 47,024 | 4,173,380 | ||||||||
Asset Management & Custody Banks — 4.3% |
| |||||||||
Ameriprise Financial Inc. | 81,601 | 8,905,117 | ||||||||
Invesco Ltd. | 274,953 | 8,586,782 | ||||||||
State Street Corp. | 137,753 | 9,258,379 | (e) | |||||||
| 26,750,278 | ||||||||||
Auto Parts & Equipment — 0.8% |
| |||||||||
BorgWarner Inc. | 20,614 | 857,336 | ||||||||
Delphi Automotive PLC | 51,173 | 3,891,195 | ||||||||
| 4,748,531 | ||||||||||
Automobile Manufacturers — 0.6% |
| |||||||||
Ford Motor Co. | 276,613 | 3,753,638 | (h) | |||||||
Automotive Retail — 0.7% |
| |||||||||
Advance Auto Parts Inc. | 22,129 | 4,194,109 | ||||||||
Biotechnology — 5.0% |
| |||||||||
Alexion Pharmaceuticals Inc. | 30,981 | 4,845,119 | (a) | |||||||
Amgen Inc. | 112,305 | 15,534,028 | ||||||||
Gilead Sciences Inc. | 107,602 | 10,565,440 | ||||||||
| 30,944,587 | ||||||||||
Broadcasting — 0.2% |
| |||||||||
CBS Corp., Class B | 35,960 | 1,434,804 | ||||||||
| Number of Shares | Fair Value | |||||||||
Cable & Satellite — 4.3% |
| |||||||||
Comcast Corp., Class A | 195,012 | $ | 11,092,283 | |||||||
Comcast Corp., Special Class A | 110,645 | 6,333,320 | ||||||||
Liberty Global PLC, Class C | 163,202 | 6,694,546 | (a) | |||||||
Sirius XM Holdings Inc. | 553,226 | 2,069,065 | (a) | |||||||
| 26,189,214 | ||||||||||
Casinos & Gaming — 0.3% |
| |||||||||
Las Vegas Sands Corp. | 45,918 | 1,743,506 | ||||||||
Communications Equipment — 3.9% |
| |||||||||
Cisco Systems Inc. | 497,903 | 13,069,954 | ||||||||
QUALCOMM Inc. | 206,906 | 11,117,059 | ||||||||
| 24,187,013 | ||||||||||
Consumer Finance — 0.7% |
| |||||||||
Discover Financial Services | 80,218 | 4,170,534 | ||||||||
Data Processing & Outsourced Services — 1.9% |
| |||||||||
PayPal Holdings Inc. | 99,581 | 3,090,994 | (a) | |||||||
Visa Inc., Class A | 121,710 | 8,478,319 | ||||||||
| 11,569,313 | ||||||||||
Diversified Banks — 5.5% |
| |||||||||
Bank of America Corp. | 550,460 | 8,576,167 | ||||||||
Citigroup Inc. | 38,726 | 1,921,197 | ||||||||
JPMorgan Chase & Co. | 265,548 | 16,190,461 | ||||||||
Wells Fargo & Co. | 136,923 | 7,030,996 | ||||||||
| 33,718,821 | ||||||||||
Drug Retail — 1.7% |
| |||||||||
CVS Health Corp. | 107,879 | 10,408,166 | ||||||||
Electric Utilities — 0.6% |
| |||||||||
NextEra Energy Inc. | 38,726 | 3,777,721 | ||||||||
Electrical Components & Equipment — 0.5% |
| |||||||||
Rockwell Automation Inc. | 27,661 | 2,806,762 | ||||||||
Fertilizers & Agricultural Chemicals — 0.8% |
| |||||||||
Monsanto Co. | 58,089 | 4,957,315 | ||||||||
General Merchandise Stores — 2.4% |
| |||||||||
Dollar General Corp. | 103,730 | 7,514,201 | ||||||||
Target Corp. | 91,282 | 7,180,242 | ||||||||
| 14,694,443 | ||||||||||
Healthcare Distributors — 0.6% |
| |||||||||
Cardinal Health Inc. | 48,407 | 3,718,626 | ||||||||
Healthcare Equipment — 4.2% |
| |||||||||
Abbott Laboratories | 124,476 | 5,006,424 | ||||||||
Boston Scientific Corp. | 508,968 | 8,352,165 | (a) | |||||||
See Notes to Schedules of Investments and Notes to Financial Statements.
6
Table of Contents
U.S. Equity Fund
| Schedule of Investments | September 30, 2015 |
| Number of Shares | Fair Value | |||||||||
Medtronic PLC | 156,286 | $ | 10,461,785 | |||||||
Stryker Corp. | 23,789 | 2,238,545 | ||||||||
| 26,058,919 | ||||||||||
Healthcare Supplies — 0.7% |
| |||||||||
The Cooper Companies Inc. | 30,427 | 4,529,363 | ||||||||
Home Improvement Retail — 1.8% |
| |||||||||
Lowe’s Companies Inc. | 160,436 | 11,057,249 | ||||||||
Independent Power Producers & Energy Traders — 0.4% |
| |||||||||
Calpine Corp. | 96,815 | 1,413,499 | (a) | |||||||
NRG Energy Inc. | 77,452 | 1,150,162 | ||||||||
| 2,563,661 | ||||||||||
Industrial Machinery — 0.8% |
| |||||||||
Ingersoll-Rand PLC | 98,198 | 4,985,512 | ||||||||
Integrated Oil & Gas — 3.3% |
| |||||||||
Cenovus Energy Inc. | 254,484 | 3,857,977 | ||||||||
Exxon Mobil Corp. | 103,730 | 7,712,326 | ||||||||
Occidental Petroleum Corp. | 135,540 | 8,965,971 | ||||||||
| 20,536,274 | ||||||||||
Integrated Telecommunication Services — 0.5% |
| |||||||||
Verizon Communications Inc. | 77,452 | 3,369,937 | ||||||||
Internet Retail — 1.3% |
| |||||||||
Amazon.com Inc. | 16,044 | 8,212,763 | (a) | |||||||
Internet Software & Services — 5.3% |
| |||||||||
Baidu Inc. ADR | 38,173 | 5,245,352 | (a,h) | |||||||
eBay Inc. | 143,839 | 3,515,425 | (a) | |||||||
Facebook Inc., Class A | 44,258 | 3,978,794 | (a) | |||||||
Google Inc., Class A | 13,831 | 8,829,296 | (a) | |||||||
Google Inc., Class C | 13,831 | 8,415,057 | (a) | |||||||
LinkedIn Corp., Class A | 13,277 | 2,524,356 | (a) | |||||||
| 32,508,280 | ||||||||||
Investment Banking & Brokerage — 0.9% |
| |||||||||
The Charles Schwab Corp. | 199,161 | 5,688,038 | ||||||||
Life & Health Insurance — 0.5% |
| |||||||||
Lincoln National Corp. | 60,855 | 2,888,178 | ||||||||
Life Sciences Tools & Services — 0.2% |
| |||||||||
PerkinElmer Inc. | 23,512 | 1,080,612 | (h) | |||||||
Movies & Entertainment — 2.2% |
| |||||||||
The Walt Disney Co. | 53,110 | 5,427,842 | ||||||||
Time Warner Inc. | 114,794 | 7,892,088 | ||||||||
| 13,319,930 | ||||||||||
| Number of Shares | Fair Value | |||||||||
Multi-Line Insurance — 3.4% |
| |||||||||
American International Group Inc. | 192,246 | $ | 10,923,417 | |||||||
The Hartford Financial Services Group Inc. | 212,992 | 9,750,774 | ||||||||
| 20,674,191 | ||||||||||
Multi-Utilities — 0.8% |
| |||||||||
Dominion Resources Inc. | 72,473 | 5,100,650 | ||||||||
Oil & Gas Equipment & Services — 1.8% |
| |||||||||
FMC Technologies Inc. | 65,004 | 2,015,124 | (a,h) | |||||||
Schlumberger Ltd. | 128,902 | 8,890,371 | ||||||||
| 10,905,495 | ||||||||||
Oil & Gas Exploration & Production — 1.4% |
| |||||||||
Hess Corp. | 141,073 | 7,062,114 | ||||||||
Marathon Oil Corp. | 113,411 | 1,746,530 | ||||||||
| 8,808,644 | ||||||||||
Packaged Foods & Meats — 1.1% |
| |||||||||
Mondelez International Inc., Class A | 157,669 | 6,601,601 | ||||||||
Paper Packaging — 0.2% |
| |||||||||
Packaging Corporation of America | 19,363 | 1,164,878 | ||||||||
Pharmaceuticals — 7.3% |
| |||||||||
Allergan PLC | 68,600 | 18,646,166 | (a) | |||||||
Johnson & Johnson | 60,855 | 5,680,814 | (h) | |||||||
Merck & Company Inc. | 214,375 | 10,587,982 | ||||||||
Pfizer Inc. | 323,637 | 10,165,438 | ||||||||
| 45,080,400 | ||||||||||
Railroads — 0.3% |
| |||||||||
CSX Corp. | 69,153 | 1,860,216 | ||||||||
Research & Consulting Services — 1.3% |
| |||||||||
Nielsen Holdings PLC | 182,565 | 8,118,666 | ||||||||
Semiconductor Equipment — 0.8% |
| |||||||||
Applied Materials Inc. | 351,298 | 5,160,568 | ||||||||
Soft Drinks — 2.0% |
| |||||||||
PepsiCo Inc. | 129,731 | 12,233,633 | ||||||||
Specialized Finance — 2.1% |
| |||||||||
CME Group Inc. | 80,218 | 7,439,417 | ||||||||
McGraw Hill Financial Inc. | 60,855 | 5,263,958 | ||||||||
| 12,703,375 | ||||||||||
Specialized REITs — 1.9% |
| |||||||||
American Tower Corp. | 113,411 | 9,977,900 | ||||||||
Extra Space Storage Inc. | 22,129 | 1,707,473 | (h) | |||||||
| 11,685,373 | ||||||||||
See Notes to Schedules of Investments and Notes to Financial Statements.
7
Table of Contents
U.S. Equity Fund
| Schedule of Investments | September 30, 2015 |
| Number of Shares | Fair Value | |||||||||
Specialty Stores — 0.5% |
| |||||||||
Dick’s Sporting Goods Inc. | 60,855 | $ | 3,019,017 | |||||||
Systems Software — 0.6% |
| |||||||||
Oracle Corp. | 99,581 | 3,596,866 | ||||||||
Technology Hardware, Storage & Peripherals — 5.3% |
| |||||||||
Apple Inc. | 148,818 | 16,414,625 | ||||||||
EMC Corp. | 105,113 | 2,539,530 | ||||||||
Hewlett-Packard Co. | 237,887 | 6,092,286 | ||||||||
Western Digital Corp. | 94,049 | 7,471,253 | ||||||||
| 32,517,694 | ||||||||||
Trading Companies & Distributors — 0.5% |
| |||||||||
United Rentals Inc. | 55,323 | 3,322,146 | (a) | |||||||
Total Common Stock | 588,034,037 | |||||||||
Exchange Traded Funds — 1.4% |
| |||||||||
Financial Select Sector SPDR Fund | 72,629 | 1,645,773 | (m) | |||||||
Industrial Select Sector SPDR Fund | 131,838 | 6,577,398 | (m) | |||||||
Total Exchange Traded Funds | 8,223,171 | |||||||||
Total Investments in Securities | 596,257,208 | |||||||||
| Fair Value | ||||||||
Short-Term Investments — 2.9% | ||||||||
State Street Institutional U.S. Government Money Market Fund — Premier Class 0.00% | $ | 17,993,117 | (d,m) | |||||
Total Investments | 614,250,325 | |||||||
Other Assets and Liabilities, | 877,374 | |||||||
|
| |||||||
NET ASSETS — 100.0% | $ | 615,127,699 | ||||||
|
| |||||||
Other Information: | ||||||||
The Fund had the following long futures contracts open at September 30, 2015:
| Description | Expiration date | Number of Contracts | Current Notional Value | Unrealized Depreciation | |||||||||||||
S&P 500 Emini Index Futures | December 2015 | 80 | $ | 7,634,800 | $ | (201,251 | ) | ||||||||||
See Notes to Schedules of Investments and Notes to Financial Statements.
8
Table of Contents
| S&P 500 Index Fund | (Unaudited) |
SSgA Funds Management, Inc. (“SSgA FM”) is the sub-adviser to the S&P 500 Index Fund. SSgA FM is registered with the SEC as an investment adviser under the Investment Advisers Act of 1940, as amended, and is a wholly owned subsidiary of State Street Corporation (“State Street”), a publicly held bank holding company. SSgA FM, State Street and other advisory affiliates of State Street make up State Street Global Advisors (“SSgA”), the investment management arm of State Street.
SSgA FM manages portfolios using a team of investment professionals. The team approach is used to create an environment that encourages the flow of investment ideas. The portfolio managers within the team work together in a cohesive manner to develop and enhance techniques that drive the investment process for the respective investment strategy. This approach requires portfolio managers to share a variety of responsibilities including investment strategy and analysis while retaining responsibility for the implementation of the strategy within any particular portfolio. The approach also enables the team to draw upon the resources of other groups within the firm. Each portfolio management team is overseen by the SSgA FM Investment Committee. Key professionals involved in the day-to-day portfolio management for the Fund include Karl A. Schneider, CAIA and John Tucker, CFA. See portfolio managers’ biographical information beginning on page 124.
| Q. | How did the GE Institutional S&P 500 Index Fund perform compared to its benchmark and Morningstar peer group for the twelve-month period ended September 30, 2015? |
| A. | For the twelve-month period ended September 30, 2015, the GE Institutional S&P 500 Index Fund returned -0.68% for the Investment Class shares and -0.95% for the Service Class shares. The Fund’s benchmark, the S&P 500 Index returned -0.61% and the Fund’s Morningstar peer group of 1,658 U.S. Large Blend funds returned an average of -2.67% over the same period. |
| Q. | What market conditions impacted the Fund’s performance? |
| A. | After mixed performance in the beginning of the year, markets for much of July returned focus to some of the themes that dominated the first half of 2015. In a month where Canada and Sweden both cut interest |
| rates and the U.S. Federal Reserve being seen as ready to move towards a rate liftoff sometime before the end of the year, the U.S. dollar index rose to a three month high on a renewed policy divergence thematic. Commodities resumed their descent in July after some stabilization in the second quarter. A primary contributor to that decline was energy generally and crude oil specifically where total production remained at record high levels and new supply was expected to hit the market in coming months with the removal of sanctions on Iran. Both WTI and Brent Crude fell into new bear markets in July, falling 21% and 18% respectively for the month in addition to small declines in June. After the market selloff in August, expectations that the Federal Reserve would make good on the median forecast of Federal Reserve Board members and bank presidents in June that rates would increase in two increments for the remainder of the year beginning in September 2015 were brought into question. That the Federal Reserve had concerns similar to the market was highlighted by the U.S. Federal Reserve Open Market Committee statement of September 17th that cited “recent global and financial developments” that “may restrain economic activity somewhat and are likely to put further downward pressure on inflation.” These concerns prompted the Fed to abstain from a long awaited “liftoff” in interest rates at the September meeting and the cautionary language of the post meeting statement challenged expectations that the Fed would raise rates at all in the near term. |
| Q. | What were the primary drivers behind Fund performance? |
| A. | Consumer discretionary and consumer staples were the strongest contributing sectors for the reporting period. Energy and materials were the main detractors from the Fund’s performance. On a security level, Apple, Amazon.com and Home Depot were the strongest contributors to the Fund’s performance. Exxon mobile, Chevron, and IBM were the main detractors from the Fund’s performance. |
9
Table of Contents
| S&P 500 Index Fund | (Unaudited) |
Understanding Your Fund’s Expenses
As a shareholder of the Fund you incur ongoing costs. Ongoing costs include portfolio management fees, distribution and service fees (for Service Class shares), professional fees, administrative fees and other Fund expenses. The following example is intended to help you understand your ongoing costs (in dollars) of investing in the Fund and to compare these costs with the ongoing costs of investing in other mutual funds.
To illustrate these ongoing costs, we have provided an example and calculated the expenses paid by investors in each share class of the Fund during the period. The information in the following table is based on an investment of $1,000, which is invested at the beginning of the period and held for the entire six-month period ended September 30, 2015.
Actual Expenses
The first section of the table provides information about actual account values and actual expenses. You may use the information in this section, together with the amount you invested, to estimate the expenses that you paid over the period. To do so, simply divide your account value by $1,000 (for example, an $8,600 account value divided by $1,000 = 8.6), then multiply the result by the
number given for your class under the heading “Expenses paid during the period” to estimate the expenses you paid on your account during the period.
Hypothetical Example for Comparison Purposes
The second section of the table provides information about hypothetical account values and hypothetical expenses based on the Fund’s actual expense ratio and an assumed rate of return of 5% per year before expenses, which is not the Fund’s actual return. The hypothetical account values and expenses may not be used to estimate the actual ending account balance or expenses you paid for the period. You may use this information to compare the ongoing costs of investing in the Fund and other funds. To do so, compare this 5% hypothetical example with the 5% hypothetical examples that appear in the shareholders reports of other funds.
Please note that the expenses shown in the table are meant to highlight and help you compare ongoing costs only and do not reflect transaction costs, such as sales charges or redemption fees, if any. Therefore, the second section of the table is useful in comparing ongoing costs only, and will not help you determine the relative total costs of owning different funds.
April 1, 2015 – September 30, 2015
| Account value at the beginning of the period ($) | Account value at the end of the period ($) | Expenses paid during the period ($)* | |||||||||||||
Actual Fund Return |
| ||||||||||||||
Investment Class | 1,000.00 | 939.50 | 0.78 | ||||||||||||
Service Class | 1,000.00 | 937.80 | 1.99 | ||||||||||||
Hypothetical 5% Return (2.5% for the period) |
| ||||||||||||||
Investment Class | 1,000.00 | 1,024.27 | 0.81 | ||||||||||||
Service Class | 1,000.00 | 1,023.01 | 2.08 | ||||||||||||
| * | Expenses are equal to the Fund’s annualized net expense ratio of 0.16% for Investment Class shares and 0.41% for Service Class shares (for the period April 1, 2015 – September 30, 2015), multiplied by the average account value over the period, multiplied by 183/365 (to reflect the one-half year period). |
10
Table of Contents
| S&P 500 Index Fund | (Unaudited) |
| Investment Profile |
A mutual fund designed for investors who seek growth of capital and accumulation of income that corresponds to the investment return of the S&P 500® Composite Stock Index (S&P 500® Index). The Fund seeks to replicate the return of the S&P 500® Index while holding transaction costs low and minimizing portfolio turnover.
| Morningstar Performance Comparison |
Based on average annual returns for periods ended September 30, 2015
One Year | Five Year | Ten Year | ||||||||||
Number of funds in peer group | 1,658 | 1,419 | 1,201 | |||||||||
Peer group average annual total return | -2.67 | % | 11.20 | % | 5.62 | % | ||||||
| Morningstar Category in peer group: Large Blend | ||||||||||||
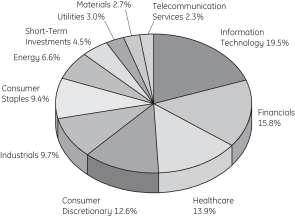
| Top Ten Largest Holdings |
as of September 30, 2015 (as a % of Fair Value) (a)(b)
Apple Inc. | 3.55% | |||
Microsoft Corp. | 2.00% | |||
Exxon Mobil Corp. | 1.74% | |||
Johnson & Johnson | 1.46% | |||
General Electric Co. | 1.44% | |||
Berkshire Hathaway Inc., Class B | 1.38% | |||
Wells Fargo & Co. | 1.36% | |||
JPMorgan Chase & Co. | 1.27% | |||
Facebook Inc., Class A | 1.15% | |||
AT&T Inc. | 1.13% |
| Sector Allocation as of September 30, 2015 |
Portfolio composition as a % of Fair Value of $26,878 (in thousands) as of September 30, 2015 (a)(b)
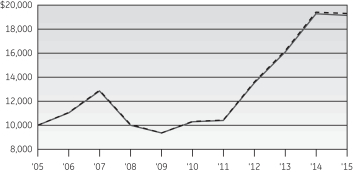
| Change in Value of a $10,000 Investment |
Investment Class Shares
| Average Annual Total Return |
for the periods ended September 30, 2015
| Investment Class Shares (Inception date: 11/25/97) | ||||||||||||||||||||
One Year | Five Year | Ten Year | Ending Value of a $10,000 Investment | |||||||||||||||||
S&P 500 Index Fund | -0.68% | 13.20% | 6.71% | $19,140 | ||||||||||||||||
S&P 500 Index | -0.61% | 13.34% | 6.80% | $19,304 | ||||||||||||||||
Service Class Shares

| Average Annual Total Return |
for the periods ended September 30, 2015
| Service Class Shares (Inception date: 9/30/05) | ||||||||||||||||||||
One Year | Five Year | Ten Year | Ending value of a $10,000 investment | |||||||||||||||||
S&P 500 Index Fund | -0.95% | 12.92% | 6.43% | $18,652 | ||||||||||||||||
S&P 500 Index | -0.61% | 13.34% | 6.80% | $19,304 | ||||||||||||||||

| (a) | Fair Value basis is inclusive of short-term investment in State Street Institutional U.S. Government Money Market Fund Premier Class. |
| (b) | The securities information regarding holdings, allocations and other characteristics is presented to illustrate examples of securities that the Fund has bought and the diversity of areas in which the Fund may invest as of a particular date. It may not be representative of the Fund’s current or future investments and should not be construed as a recommendation to purchase or sell a particular security. |
See Notes to Performance beginning on page 1 for further information, including an explanation of Morningstar peer categories.
Past performance does not predict future performance. The performance shown in the graphs and tables does not reflect the deduction of taxes that a shareholder would pay on Fund distributions or the redemption of Fund shares.
11
Table of Contents
S&P 500 Index Fund
| Schedule of Investments | September 30, 2015 |
| S&P 500 Index Fund |
| Number of Shares | Fair Value | |||||||||
Common Stock — 95.1%† |
| |||||||||
Advertising — 0.1% | ||||||||||
Omnicom Group Inc. | 354 | $ | 23,328 | |||||||
The Interpublic Group of Companies Inc. | 714 | 13,659 | ||||||||
| 36,987 | ||||||||||
Aerospace & Defense — 2.6% |
| |||||||||
General Dynamics Corp. | 472 | 65,112 | ||||||||
Honeywell International Inc. | 1,187 | 112,397 | ||||||||
L-3 Communications Holdings Inc. | 119 | 12,438 | ||||||||
Lockheed Martin Corp. | 401 | 83,131 | ||||||||
Northrop Grumman Corp. | 304 | 50,449 | ||||||||
Precision Castparts Corp. | 218 | 50,077 | ||||||||
Raytheon Co. | 464 | 50,697 | ||||||||
Rockwell Collins Inc. | 233 | 19,069 | ||||||||
Textron Inc. | 386 | 14,529 | ||||||||
The Boeing Co. | 967 | 126,629 | ||||||||
United Technologies Corp. | 1,242 | 110,525 | ||||||||
| 695,053 | ||||||||||
Agricultural & Farm Machinery — 0.1% |
| |||||||||
Deere & Co. | 473 | 35,002 | ||||||||
Agricultural Products — 0.1% |
| |||||||||
Archer-Daniels-Midland Co. | 983 | 40,745 | ||||||||
Air Freight & Logistics — 0.7% |
| |||||||||
CH Robinson Worldwide Inc. | 253 | 17,148 | ||||||||
Expeditors International of Washington Inc. | 332 | 15,621 | ||||||||
FedEx Corp. | 392 | 56,440 | ||||||||
United Parcel Service Inc., Class B | 1,034 | 102,046 | ||||||||
| 191,255 | ||||||||||
Airlines — 0.6% |
| |||||||||
American Airlines Group Inc. | 1,100 | 42,713 | ||||||||
Delta Air Lines Inc. | 1,256 | 56,357 | ||||||||
Southwest Airlines Co. | 1,022 | 38,877 | ||||||||
United Continental Holdings Inc. | 600 | 31,830 | (a) | |||||||
| 169,777 | ||||||||||
Alternative Carriers — 0.1% |
| |||||||||
Level 3 Communications Inc. | 444 | 19,398 | (a) | |||||||
Aluminum — 0.1% |
| |||||||||
Alcoa Inc. | 1,893 | 18,286 | ||||||||
Apparel Retail — 0.6% |
| |||||||||
L Brands Inc. | 390 | 35,151 | ||||||||
| Number of Shares | Fair Value | |||||||||
Ross Stores Inc. | 644 | $ | 31,215 | |||||||
The Gap Inc. | 371 | 10,573 | ||||||||
The TJX Companies Inc. | 1,031 | 73,634 | ||||||||
Urban Outfitters Inc. | 218 | 6,405 | (a) | |||||||
| 156,978 | ||||||||||
Apparel, Accessories & Luxury Goods — 0.5% |
| |||||||||
Coach Inc. | 385 | 11,138 | ||||||||
Fossil Group Inc. | 75 | 4,191 | (a) | |||||||
Hanesbrands Inc. | 600 | 17,364 | ||||||||
Michael Kors Holdings Ltd. | 290 | 12,250 | (a) | |||||||
PVH Corp. | 113 | 11,519 | ||||||||
Ralph Lauren Corp. | 83 | 9,807 | ||||||||
Under Armour Inc., Class A | 253 | 24,486 | (a) | |||||||
VF Corp. | 496 | 33,832 | ||||||||
| 124,587 | ||||||||||
Application Software — 0.7% |
| |||||||||
Adobe Systems Inc. | 756 | 62,158 | (a) | |||||||
Autodesk Inc. | 320 | 14,125 | (a) | |||||||
Citrix Systems Inc. | 223 | 15,450 | (a) | |||||||
Intuit Inc. | 436 | 38,695 | ||||||||
salesforce.com Inc. | 919 | 63,806 | (a) | |||||||
| 194,234 | ||||||||||
Asset Management & Custody Banks — 1.1% |
| |||||||||
Affiliated Managers Group Inc. | 96 | 16,415 | (a) | |||||||
Ameriprise Financial Inc. | 283 | 30,884 | ||||||||
BlackRock Inc. | 191 | 56,817 | ||||||||
Franklin Resources Inc. | 560 | 20,866 | ||||||||
Invesco Ltd. | 611 | 19,081 | ||||||||
Legg Mason Inc. | 199 | 8,280 | ||||||||
Northern Trust Corp. | 313 | 21,334 | ||||||||
State Street Corp. | 637 | 42,813 | (e) | |||||||
T Rowe Price Group Inc. | 401 | 27,869 | ||||||||
The Bank of New York Mellon Corp. | 1,685 | 65,968 | ||||||||
| 310,327 | ||||||||||
Auto Parts & Equipment — 0.3% |
| |||||||||
BorgWarner Inc. | 320 | 13,309 | ||||||||
Delphi Automotive PLC | 424 | 32,241 | ||||||||
Johnson Controls Inc. | 1,002 | 41,442 | ||||||||
| 86,992 | ||||||||||
Automobile Manufacturers — 0.5% |
| |||||||||
Ford Motor Co. | 5,992 | 81,311 | ||||||||
General Motors Co. | 2,189 | 65,714 | ||||||||
| 147,025 | ||||||||||
Automotive Retail — 0.4% |
| |||||||||
Advance Auto Parts Inc. | 100 | 18,953 | ||||||||
AutoNation Inc. | 155 | 9,018 | (a) | |||||||
AutoZone Inc. | 46 | 33,296 | (a) | |||||||
CarMax Inc. | 304 | 18,033 | (a) | |||||||
O’Reilly Automotive Inc. | 145 | 36,250 | (a) | |||||||
| 115,550 | ||||||||||
See Notes to Schedules of Investments and Notes to Financial Statements.
12
Table of Contents
S&P 500 Index Fund
| Schedule of Investments | September 30, 2015 |
| Number of Shares | Fair Value | |||||||||
Biotechnology — 3.4% |
| |||||||||
AbbVie Inc. | 2,503 | $ | 136,188 | |||||||
Alexion Pharmaceuticals Inc. | 343 | 53,642 | (a) | |||||||
Amgen Inc. | 1,146 | 158,515 | ||||||||
Baxalta Inc. | 814 | 25,649 | ||||||||
Biogen Inc. | 356 | 103,884 | (a) | |||||||
Celgene Corp. | 1,204 | 130,237 | (a) | |||||||
Gilead Sciences Inc. | 2,210 | 217,000 | (h) | |||||||
Regeneron Pharmaceuticals Inc. | 113 | 52,561 | (a) | |||||||
Vertex Pharmaceuticals Inc. | 367 | 38,219 | (a) | |||||||
| 915,895 | ||||||||||
Brewers — 0.1% |
| |||||||||
Molson Coors Brewing Co., Class B | 276 | 22,914 | ||||||||
Broadcasting — 0.2% |
| |||||||||
CBS Corp., Class B | 719 | 28,688 | ||||||||
Discovery Communications Inc., Class A | 240 | 6,247 | (a) | |||||||
Discovery Communications Inc., Class C | 466 | 11,319 | (a) | |||||||
Scripps Networks Interactive Inc., Class A | 137 | 6,739 | ||||||||
TEGNA Inc. | 378 | 8,464 | ||||||||
| 61,457 | ||||||||||
Building Products — 0.1% |
| |||||||||
Allegion PLC | 177 | 10,206 | ||||||||
Masco Corp. | 491 | 12,363 | ||||||||
| 22,569 | ||||||||||
Cable & Satellite — 1.1% |
| |||||||||
Cablevision Systems Corp., Class A | 388 | 12,598 | ||||||||
Comcast Corp., Class A | 3,779 | 214,950 | (h) | |||||||
Time Warner Cable Inc. | 420 | 75,335 | ||||||||
| 302,883 | ||||||||||
Casinos & Gaming — 0.0%* |
| |||||||||
Wynn Resorts Ltd. | 113 | 6,003 | ||||||||
Coal & Consumable Fuels — 0.0%* |
| |||||||||
CONSOL Energy Inc. | 312 | 3,058 | ||||||||
Commodity Chemicals — 0.2% |
| |||||||||
LyondellBasell Industries N.V., Class A | 563 | 46,932 | ||||||||
Communications Equipment — 1.5% |
| |||||||||
Cisco Systems Inc. | 7,697 | 202,046 | (h) | |||||||
F5 Networks Inc. | 127 | 14,707 | (a) | |||||||
Harris Corp. | 194 | 14,191 | ||||||||
Juniper Networks Inc. | 528 | 13,575 | ||||||||
Motorola Solutions Inc. | 244 | 16,685 | ||||||||
QUALCOMM Inc. | 2,450 | 131,638 | ||||||||
| 392,842 | ||||||||||
| Number of Shares | Fair Value | |||||||||
Computer & Electronics Retail — 0.1% |
| |||||||||
Best Buy Company Inc. | 405 | $ | 15,033 | |||||||
GameStop Corp., Class A | 137 | 5,646 | ||||||||
| 20,679 | ||||||||||
Construction & Engineering — 0.1% |
| |||||||||
Fluor Corp. | 202 | 8,555 | ||||||||
Jacobs Engineering Group Inc. | 173 | 6,475 | (a) | |||||||
Quanta Services Inc. | 291 | 7,045 | (a) | |||||||
| 22,075 | ||||||||||
Construction Machinery & Heavy Trucks — 0.4% |
| |||||||||
Caterpillar Inc. | 906 | 59,216 | ||||||||
Cummins Inc. | 261 | 28,339 | ||||||||
Joy Global Inc. | 151 | 2,255 | ||||||||
PACCAR Inc. | 506 | 26,398 | ||||||||
| 116,208 | ||||||||||
Construction Materials — 0.1% |
| |||||||||
Martin Marietta Materials Inc. | 102 | 15,499 | ||||||||
Vulcan Materials Co. | 222 | 19,802 | ||||||||
| 35,301 | ||||||||||
Consumer Electronics — 0.1% |
| |||||||||
Garmin Ltd. | 202 | 7,248 | ||||||||
Harman International Industries Inc. | 114 | 10,943 | ||||||||
| 18,191 | ||||||||||
Consumer Finance — 0.7% |
| |||||||||
American Express Co. | 1,319 | 97,778 | ||||||||
Capital One Financial Corp. | 832 | 60,337 | ||||||||
Discover Financial Services | 694 | 36,081 | ||||||||
Navient Corp. | 564 | 6,339 | ||||||||
| 200,535 | ||||||||||
Data Processing & Outsourced Services — 2.3% |
| |||||||||
Alliance Data Systems Corp. | 91 | 23,567 | (a) | |||||||
Automatic Data Processing Inc. | 722 | 58,020 | ||||||||
Computer Sciences Corp. | 194 | 11,908 | ||||||||
Fidelity National Information Services Inc. | 404 | 27,100 | ||||||||
Fiserv Inc. | 347 | 30,054 | (a) | |||||||
Mastercard Inc., Class A | 1,516 | 136,622 | ||||||||
Paychex Inc. | 462 | 22,005 | ||||||||
PayPal Holdings Inc. | 1,677 | 52,054 | (a) | |||||||
The Western Union Co. | 906 | 16,634 | ||||||||
Total System Services Inc. | 313 | 14,220 | ||||||||
Visa Inc., Class A | 2,940 | 204,800 | ||||||||
Xerox Corp. | 1,511 | 14,702 | ||||||||
| 611,686 | ||||||||||
Department Stores — 0.2% |
| |||||||||
Kohl’s Corp. | 285 | 13,198 | ||||||||
Macy’s Inc. | 493 | 25,301 | ||||||||
Nordstrom Inc. | 245 | 17,569 | ||||||||
| 56,068 | ||||||||||
See Notes to Schedules of Investments and Notes to Financial Statements.
13
Table of Contents
S&P 500 Index Fund
| Schedule of Investments | September 30, 2015 |
| Number of Shares | Fair Value | |||||||||
Distillers & Vintners — 0.2% |
| |||||||||
Brown-Forman Corp., Class B | 160 | $ | 15,504 | |||||||
Constellation Brands Inc., Class A | 261 | 32,680 | ||||||||
| 48,184 | ||||||||||
Distributors — 0.1% |
| |||||||||
Genuine Parts Co. | 216 | 17,904 | ||||||||
Diversified Banks — 4.8% |
| |||||||||
Bank of America Corp. | 15,820 | 246,476 | (h) | |||||||
Citigroup Inc. | 4,558 | 226,122 | (h) | |||||||
Comerica Inc. | 306 | 12,577 | ||||||||
JPMorgan Chase & Co. | 5,619 | 342,590 | ||||||||
U.S. Bancorp | 2,451 | 100,515 | ||||||||
Wells Fargo & Co. | 7,093 | 364,226 | ||||||||
| 1,292,506 | ||||||||||
Diversified Chemicals — 0.6% |
| |||||||||
Eastman Chemical Co. | 258 | 16,698 | ||||||||
EI du Pont de Nemours & Co. | 1,343 | 64,733 | ||||||||
The Dow Chemical Co. | 1,759 | 74,581 | ||||||||
| 156,012 | ||||||||||
Diversified Metals & Mining — 0.1% |
| |||||||||
Freeport-McMoRan Inc. | 1,484 | 14,380 | ||||||||
Diversified Support Services — 0.0%* |
| |||||||||
Cintas Corp. | 133 | 11,405 | ||||||||
Drug Retail — 1.0% |
| |||||||||
CVS Health Corp. | 1,697 | 163,726 | (h) | |||||||
Walgreens Boots Alliance Inc. | 1,327 | 110,274 | ||||||||
| 274,000 | ||||||||||
Electric Utilities — 1.7% |
| |||||||||
American Electric Power Company Inc. | 748 | 42,531 | ||||||||
Duke Energy Corp. | 1,057 | 76,041 | ||||||||
Edison International | 465 | 29,328 | ||||||||
Entergy Corp. | 254 | 16,535 | ||||||||
Eversource Energy | 449 | 22,728 | ||||||||
Exelon Corp. | 1,314 | 39,026 | ||||||||
FirstEnergy Corp. | 594 | 18,598 | ||||||||
NextEra Energy Inc. | 699 | 68,187 | ||||||||
Pepco Holdings Inc. | 476 | 11,529 | ||||||||
Pinnacle West Capital Corp. | 149 | 9,557 | ||||||||
PPL Corp. | 1,023 | 33,647 | ||||||||
The Southern Co. | 1,349 | 60,300 | ||||||||
Xcel Energy Inc. | 718 | 25,424 | ||||||||
| 453,431 | ||||||||||
Electrical Components & Equipment — 0.4% |
| |||||||||
AMETEK Inc. | 345 | 18,051 | ||||||||
Eaton Corporation PLC | 724 | 37,141 | ||||||||
Emerson Electric Co. | 1,041 | 45,981 | ||||||||
| Number of Shares | Fair Value | |||||||||
Rockwell Automation Inc. | 192 | $ | 19,482 | |||||||
| 120,655 | ||||||||||
Electronic Components — 0.2% |
| |||||||||
Amphenol Corp., Class A | 439 | 22,371 | ||||||||
Corning Inc. | 1,957 | 33,504 | ||||||||
| 55,875 | ||||||||||
Electronic Equipment & Instruments — 0.0%* |
| |||||||||
FLIR Systems Inc. | 308 | 8,621 | ||||||||
Electronic Manufacturing Services — 0.1% |
| |||||||||
TE Connectivity Ltd. | 621 | 37,192 | ||||||||
Environmental & Facilities Services — 0.2% |
| |||||||||
Republic Services Inc. | 350 | 14,420 | ||||||||
Stericycle Inc. | 146 | 20,339 | (a) | |||||||
Waste Management Inc. | 609 | 30,335 | ||||||||
| 65,094 | ||||||||||
Fertilizers & Agricultural Chemicals — 0.4% |
| |||||||||
CF Industries Holdings Inc. | 350 | 15,715 | ||||||||
FMC Corp. | 223 | 7,562 | ||||||||
Monsanto Co. | 723 | 61,701 | ||||||||
The Mosaic Co. | 447 | 13,906 | ||||||||
| 98,884 | ||||||||||
Food Distributors — 0.1% |
| |||||||||
Sysco Corp. | 909 | 35,424 | ||||||||
Food Retail — 0.3% |
| |||||||||
The Kroger Co. | 1,474 | 53,167 | ||||||||
Whole Foods Market Inc. | 513 | 16,237 | ||||||||
| 69,404 | ||||||||||
Footwear — 0.5% |
| |||||||||
NIKE Inc., Class B | 1,035 | 127,274 | ||||||||
Gas Utilities — 0.0%* |
| |||||||||
AGL Resources Inc. | 197 | 12,025 | ||||||||
General Merchandise Stores — 0.5% |
| |||||||||
Dollar General Corp. | 466 | 33,757 | ||||||||
Dollar Tree Inc. | 323 | 21,531 | (a) | |||||||
Target Corp. | 948 | 74,570 | ||||||||
| 129,858 | ||||||||||
Gold — 0.0%* | ||||||||||
Newmont Mining Corp. | 700 | 11,249 | ||||||||
Health Care REITs — 0.3% | ||||||||||
HCP Inc. | 654 | 24,362 | ||||||||
Ventas Inc. | 508 | 28,478 | ||||||||
Welltower Inc. | 528 | 35,756 | ||||||||
| 88,596 | ||||||||||
See Notes to Schedules of Investments and Notes to Financial Statements.
14
Table of Contents
S&P 500 Index Fund
| Schedule of Investments | September 30, 2015 |
| Number of Shares | Fair Value | |||||||||
Healthcare Distributors — 0.6% |
| |||||||||
AmerisourceBergen Corp. | 320 | $ | 30,397 | |||||||
Cardinal Health Inc. | 505 | 38,794 | ||||||||
Henry Schein Inc. | 131 | 17,386 | (a) | |||||||
McKesson Corp. | 345 | 63,836 | ||||||||
Patterson Companies Inc. | 145 | 6,271 | ||||||||
| 156,684 | ||||||||||
Healthcare Equipment — 1.9% |
| |||||||||
Abbott Laboratories | 2,233 | 89,811 | ||||||||
Baxter International Inc. | 814 | 26,740 | ||||||||
Becton Dickinson and Co. | 303 | 40,196 | ||||||||
Boston Scientific Corp. | 2,038 | 33,443 | (a) | |||||||
CR Bard Inc. | 112 | 20,867 | ||||||||
Edwards Lifesciences Corp. | 151 | 21,468 | (a) | |||||||
Intuitive Surgical Inc. | 52 | 23,898 | (a) | |||||||
Medtronic PLC | 2,136 | 142,984 | ||||||||
St Jude Medical Inc. | 407 | 25,677 | ||||||||
Stryker Corp. | 457 | 43,004 | ||||||||
Varian Medical Systems Inc. | 138 | 10,182 | (a) | |||||||
Zimmer Biomet Holdings Inc. | 241 | 22,637 | ||||||||
| 500,907 | ||||||||||
Healthcare Facilities — 0.2% |
| |||||||||
HCA Holdings Inc. | 486 | 37,597 | (a) | |||||||
Tenet Healthcare Corp. | 149 | 5,501 | (a) | |||||||
Universal Health Services Inc., Class B | 126 | 15,726 | ||||||||
| 58,824 | ||||||||||
Healthcare Services — 0.5% |
| |||||||||
DaVita Healthcare Partners Inc. | 298 | 21,554 | (a) | |||||||
Express Scripts Holding Co. | 1,026 | 83,065 | (a) | |||||||
Laboratory Corporation of America Holdings | 144 | 15,620 | (a) | |||||||
Quest Diagnostics Inc. | 246 | 15,122 | ||||||||
| 135,361 | ||||||||||
Healthcare Supplies — 0.0%* |
| |||||||||
DENTSPLY International Inc. | 259 | 13,098 | ||||||||
Healthcare Technology — 0.1% |
| |||||||||
Cerner Corp. | 434 | 26,023 | (a) | |||||||
Home Building — 0.1% |
| |||||||||
DR Horton Inc. | 456 | 13,388 | ||||||||
Lennar Corp., Class A | 301 | 14,487 | ||||||||
PulteGroup Inc. | 453 | 8,548 | ||||||||
| 36,423 | ||||||||||
Home Entertainment Software — 0.2% |
| |||||||||
Activision Blizzard Inc. | 800 | 24,712 | ||||||||
Electronic Arts Inc. | 442 | 29,945 | (a) | |||||||
| 54,657 | ||||||||||
Home Furnishing Retail — 0.1% |
| |||||||||
Bed Bath & Beyond Inc. | 260 | 14,825 | (a) | |||||||
| Number of Shares | Fair Value | |||||||||
Home Furnishings — 0.1% |
| |||||||||
Leggett & Platt Inc. | 265 | $ | 10,931 | |||||||
Mohawk Industries Inc. | 106 | 19,270 | (a) | |||||||
| 30,201 | ||||||||||
Home Improvement Retail — 1.2% |
| |||||||||
Lowe’s Companies Inc. | 1,443 | 99,452 | ||||||||
The Home Depot Inc. | 1,953 | 225,552 | ||||||||
| 325,004 | ||||||||||
Hotel & Resort REITs — 0.1% |
| |||||||||
Host Hotels & Resorts Inc. | 1,071 | 16,933 | ||||||||
Hotels, Resorts & Cruise Lines — 0.4% |
| |||||||||
Carnival Corp. | 703 | 34,939 | ||||||||
Marriott International Inc., Class A | 302 | 20,596 | ||||||||
Royal Caribbean Cruises Ltd. | 234 | 20,847 | ||||||||
Starwood Hotels & Resorts Worldwide Inc. | 251 | 16,687 | ||||||||
Wyndham Worldwide Corp. | 216 | 15,530 | ||||||||
| 108,599 | ||||||||||
Household Appliances — 0.1% |
| |||||||||
Whirlpool Corp. | 110 | 16,199 | ||||||||
Household Products — 1.7% |
| |||||||||
Colgate-Palmolive Co. | 1,367 | 86,750 | ||||||||
Kimberly-Clark Corp. | 559 | 60,953 | ||||||||
The Clorox Co. | 182 | 21,026 | ||||||||
The Procter & Gamble Co. | 4,120 | 296,393 | ||||||||
| 465,122 | ||||||||||
Housewares & Specialties — 0.1% |
| |||||||||
Newell Rubbermaid Inc. | 377 | 14,971 | ||||||||
Human Resource & Employment Services — 0.0%* |
| |||||||||
Robert Half International Inc. | 186 | 9,516 | ||||||||
Hypermarkets & Super Centers — 0.9% |
| |||||||||
Costco Wholesale Corp. | 650 | 93,970 | ||||||||
Wal-Mart Stores Inc. | 2,378 | 154,190 | ||||||||
| 248,160 | ||||||||||
Independent Power Producers & Energy Traders — 0.1% |
| |||||||||
AES Corp. | 1,134 | 11,102 | ||||||||
NRG Energy Inc. | 462 | 6,861 | ||||||||
| 17,963 | ||||||||||
Industrial Conglomerates — 2.3% |
| |||||||||
3M Co. | 966 | 136,950 | ||||||||
Danaher Corp. | 914 | 77,882 | ||||||||
General Electric Co. | 15,333 | 386,698 | (h,k) | |||||||
Roper Technologies Inc. | 142 | 22,251 | ||||||||
| 623,781 | ||||||||||
See Notes to Schedules of Investments and Notes to Financial Statements.
15
Table of Contents
S&P 500 Index Fund
| Schedule of Investments | September 30, 2015 |
| Number of Shares | Fair Value | |||||||||
Industrial Gases — 0.3% |
| |||||||||
Air Products & Chemicals Inc. | 294 | $ | 37,509 | |||||||
Airgas Inc. | 92 | 8,218 | ||||||||
Praxair Inc. | 437 | 44,513 | ||||||||
| 90,240 | ||||||||||
Industrial Machinery — 0.6% |
| |||||||||
Dover Corp. | 231 | 13,209 | ||||||||
Flowserve Corp. | 229 | 9,421 | ||||||||
Illinois Tool Works Inc. | 540 | 44,447 | ||||||||
Ingersoll-Rand PLC | 377 | 19,140 | ||||||||
Parker-Hannifin Corp. | 211 | 20,530 | ||||||||
Pentair PLC | 262 | 13,373 | ||||||||
Snap-on Inc. | 98 | 14,792 | ||||||||
Stanley Black & Decker Inc. | 221 | 21,433 | ||||||||
Xylem Inc. | 244 | 8,015 | ||||||||
| 164,360 | ||||||||||
Industrial REITs — 0.1% |
| |||||||||
Prologis Inc. | 788 | 30,653 | ||||||||
Insurance Brokers — 0.3% |
| |||||||||
Aon PLC | 436 | 38,634 | ||||||||
Marsh & McLennan Companies Inc. | 815 | 42,559 | ||||||||
| 81,193 | ||||||||||
Integrated Oil & Gas — 2.9% |
| |||||||||
Chevron Corp. | 2,843 | 224,256 | (h) | |||||||
Exxon Mobil Corp. | 6,307 | 468,925 | (h) | |||||||
Occidental Petroleum Corp. | 1,152 | 76,205 | ||||||||
| 769,386 | ||||||||||
Integrated Telecommunication Services — 2.2% |
| |||||||||
AT&T Inc. | 9,342 | 304,362 | (h) | |||||||
CenturyLink Inc. | 815 | 20,473 | ||||||||
Frontier Communications Corp. | 1,366 | 6,489 | ||||||||
Verizon Communications Inc. | 6,132 | 266,803 | ||||||||
| 598,127 | ||||||||||
Internet Retail — 1.8% |
| |||||||||
Amazon.com Inc. | 582 | 297,920 | (a) | |||||||
Expedia Inc. | 168 | 19,770 | ||||||||
Netflix Inc. | 644 | 66,500 | (a) | |||||||
The Priceline Group Inc. | 78 | 96,475 | (a) | |||||||
TripAdvisor Inc. | 154 | 9,705 | (a) | |||||||
| 490,370 | ||||||||||
Internet Software & Services — 3.6% |
| |||||||||
Akamai Technologies Inc. | 249 | 17,196 | (a) | |||||||
eBay Inc. | 1,677 | 40,986 | (a,h) | |||||||
Facebook Inc., Class A | 3,432 | 308,537 | (a,h) | |||||||
Google Inc., Class A | 440 | 280,883 | (a) | |||||||
Google Inc., Class C | 445 | 270,747 | (a) | |||||||
VeriSign Inc. | 147 | 10,372 | (a) | |||||||
Yahoo! Inc. | 1,322 | 38,219 | (a) | |||||||
| 966,940 | ||||||||||
| Number of Shares | Fair Value | |||||||||
Investment Banking & Brokerage — 0.9% |
| |||||||||
E*TRADE Financial Corp. | 511 | $ | 13,455 | (a) | ||||||
Morgan Stanley | 2,336 | 73,584 | ||||||||
The Charles Schwab Corp. | 1,726 | 49,294 | ||||||||
The Goldman Sachs Group Inc. | 612 | 106,341 | ||||||||
| 242,674 | ||||||||||
IT Consulting & Other Services — 1.3% |
| |||||||||
Accenture PLC, Class A | 937 | 92,070 | ||||||||
Cognizant Technology Solutions Corp., Class A | 914 | 57,226 | (a) | |||||||
International Business Machines Corp. | 1,385 | 200,783 | ||||||||
Teradata Corp. | 266 | 7,703 | (a) | |||||||
| 357,782 | ||||||||||
Leisure Products — 0.1% |
| |||||||||
Hasbro Inc. | 153 | 11,037 | ||||||||
Mattel Inc. | 581 | 12,236 | ||||||||
| 23,273 | ||||||||||
Life & Health Insurance — 0.9% |
| |||||||||
Aflac Inc. | 689 | 40,052 | ||||||||
Lincoln National Corp. | 367 | 17,418 | ||||||||
MetLife Inc. | 1,687 | 79,542 | ||||||||
Principal Financial Group Inc. | 384 | 18,178 | ||||||||
Prudential Financial Inc. | 687 | 52,356 | ||||||||
Torchmark Corp. | 190 | 10,716 | ||||||||
Unum Group | 432 | 13,859 | ||||||||
| 232,121 | ||||||||||
Life Sciences Tools & Services — 0.4% |
| |||||||||
Agilent Technologies Inc. | 469 | 16,101 | ||||||||
PerkinElmer Inc. | 148 | 6,802 | ||||||||
Thermo Fisher Scientific Inc. | 598 | 73,123 | ||||||||
Waters Corp. | 115 | 13,594 | (a) | |||||||
| 109,620 | ||||||||||
Managed Healthcare — 1.4% |
| |||||||||
Aetna Inc. | 528 | 57,769 | ||||||||
Anthem Inc. | 405 | 56,700 | ||||||||
Cigna Corp. | 399 | 53,873 | ||||||||
Humana Inc. | 235 | 42,065 | ||||||||
UnitedHealth Group Inc. | �� | 1,446 | 167,750 | |||||||
| 378,157 | ||||||||||
Metal & Glass Containers — 0.1% |
| |||||||||
Ball Corp. | 236 | 14,679 | ||||||||
Owens-Illinois Inc. | 210 | 4,351 | (a) | |||||||
| 19,030 | ||||||||||
Motorcycle Manufacturers — 0.1% |
| |||||||||
Harley-Davidson Inc. | 301 | 16,525 | ||||||||
See Notes to Schedules of Investments and Notes to Financial Statements.
16
Table of Contents
S&P 500 Index Fund
| Schedule of Investments | September 30, 2015 |
| Number of Shares | Fair Value | |||||||||
Movies & Entertainment — 1.6% |
| |||||||||
The Walt Disney Co. | 2,347 | $ | 239,863 | |||||||
Time Warner Inc. | 1,243 | 85,456 | ||||||||
Twenty-First Century Fox Inc., Class A | 2,552 | 68,853 | ||||||||
Twenty-First Century Fox Inc., Class B | 100 | 2,707 | ||||||||
Viacom Inc., Class B | 566 | 24,423 | ||||||||
| 421,302 | ||||||||||
Multi-Line Insurance — 0.6% |
| |||||||||
American International Group Inc. | 2,005 | 113,924 | ||||||||
Assurant Inc. | 102 | 8,059 | ||||||||
Genworth Financial Inc., Class A | 912 | 4,214 | (a) | |||||||
Loews Corp. | 528 | 19,082 | ||||||||
The Hartford Financial Services Group Inc. | 612 | 28,017 | ||||||||
| 173,296 | ||||||||||
Multi-Sector Holdings — 1.4% |
| |||||||||
Berkshire Hathaway Inc., Class B | 2,845 | 370,988 | (a,h) | |||||||
Leucadia National Corp. | 430 | 8,712 | ||||||||
| 379,700 | ||||||||||
Multi-Utilities — 1.1% |
| |||||||||
Ameren Corp. | 336 | 14,203 | ||||||||
CenterPoint Energy Inc. | 737 | 13,295 | ||||||||
CMS Energy Corp. | 380 | 13,422 | ||||||||
Consolidated Edison Inc. | 416 | 27,810 | ||||||||
Dominion Resources Inc. | 875 | 61,582 | ||||||||
DTE Energy Co. | 249 | 20,012 | ||||||||
NiSource Inc. | 547 | 10,147 | ||||||||
PG&E Corp. | 728 | 38,438 | ||||||||
Public Service Enterprise Group Inc. | 722 | 30,439 | ||||||||
SCANA Corp. | 195 | 10,971 | ||||||||
Sempra Energy | 354 | 34,239 | ||||||||
TECO Energy Inc. | 302 | 7,931 | ||||||||
WEC Energy Group Inc. | 535 | 27,938 | ||||||||
| 310,427 | ||||||||||
Office REITs — 0.2% |
| |||||||||
Boston Properties Inc. | 218 | 25,811 | ||||||||
SL Green Realty Corp. | 154 | 16,657 | ||||||||
Vornado Realty Trust | 248 | 22,424 | ||||||||
| 64,892 | ||||||||||
Office Services & Supplies — 0.0%* |
| |||||||||
Pitney Bowes Inc. | 320 | 6,352 | ||||||||
Oil & Gas Drilling — 0.1% |
| |||||||||
Diamond Offshore Drilling Inc. | 177 | 3,062 | ||||||||
Ensco PLC, Class A | 467 | 6,575 | ||||||||
Helmerich & Payne Inc. | 146 | 6,900 | ||||||||
Transocean Ltd. | 700 | 9,044 | ||||||||
| 25,581 | ||||||||||
| Number of Shares | Fair Value | |||||||||
Oil & Gas Equipment & Services — 1.0% |
| |||||||||
Baker Hughes Inc. | 663 | $ | 34,502 | |||||||
Cameron International Corp. | 272 | 16,679 | (a) | |||||||
FMC Technologies Inc. | 322 | 9,982 | (a) | |||||||
Halliburton Co. | 1,273 | 45,001 | ||||||||
National Oilwell Varco Inc. | 616 | 23,192 | ||||||||
Schlumberger Ltd. | 1,940 | 133,802 | ||||||||
| 263,158 | ||||||||||
Oil & Gas Exploration & Production — 1.5% |
| |||||||||
Anadarko Petroleum Corp. | 760 | 45,897 | ||||||||
Apache Corp. | 539 | 21,107 | ||||||||
Cabot Oil & Gas Corp. | 577 | 12,613 | ||||||||
Chesapeake Energy Corp. | 713 | 5,226 | ||||||||
Cimarex Energy Co. | 148 | 15,167 | ||||||||
ConocoPhillips | 1,825 | 87,527 | ||||||||
Devon Energy Corp. | 592 | 21,957 | ||||||||
EOG Resources Inc. | 820 | 59,696 | ||||||||
EQT Corp. | 264 | 17,099 | ||||||||
Hess Corp. | 362 | 18,122 | ||||||||
Marathon Oil Corp. | 960 | 14,784 | ||||||||
Murphy Oil Corp. | 282 | 6,825 | ||||||||
Newfield Exploration Co. | 338 | 11,120 | (a) | |||||||
Noble Energy Inc. | 632 | 19,074 | ||||||||
Pioneer Natural Resources Co. | 213 | 25,909 | ||||||||
Range Resources Corp. | 231 | 7,420 | ||||||||
Southwestern Energy Co. | 525 | 6,662 | (a) | |||||||
| 396,205 | ||||||||||
Oil & Gas Refining & Marketing — 0.6% |
| |||||||||
Marathon Petroleum Corp. | 858 | 39,751 | ||||||||
Phillips 66 | 730 | 56,093 | ||||||||
Tesoro Corp. | 176 | 17,114 | ||||||||
Valero Energy Corp. | 796 | 47,840 | ||||||||
| 160,798 | ||||||||||
Oil & Gas Storage & Transportation — 0.6% |
| |||||||||
Columbia Pipeline Group Inc. | 547 | 10,005 | ||||||||
Kinder Morgan Inc. | 2,730 | 75,566 | ||||||||
ONEOK Inc. | 358 | 11,528 | ||||||||
Spectra Energy Corp. | 960 | 25,219 | ||||||||
The Williams Companies Inc. | 1,026 | 37,808 | ||||||||
| 160,126 | ||||||||||
Packaged Foods & Meats — 1.5% |
| |||||||||
Campbell Soup Co. | 245 | 12,417 | ||||||||
ConAgra Foods Inc. | 599 | 24,265 | ||||||||
General Mills Inc. | 921 | 51,696 | ||||||||
Hormel Foods Corp. | 203 | 12,852 | ||||||||
Kellogg Co. | 357 | 23,758 | ||||||||
Keurig Green Mountain Inc. | 172 | 8,968 | ||||||||
McCormick & Company Inc. | 178 | 14,628 | ||||||||
Mead Johnson Nutrition Co. | 288 | 20,275 | ||||||||
Mondelez International Inc., Class A | 2,495 | 104,466 | ||||||||
The Hershey Co. | 209 | 19,203 | ||||||||
See Notes to Schedules of Investments and Notes to Financial Statements.
17
Table of Contents
S&P 500 Index Fund
| Schedule of Investments | September 30, 2015 |
| Number of Shares | Fair Value | |||||||||
The JM Smucker Co. | 146 | $ | 16,657 | |||||||
The Kraft Heinz Co. | 884 | 62,393 | ||||||||
Tyson Foods Inc., Class A | 507 | 21,852 | ||||||||
| 393,430 | ||||||||||
Paper Packaging — 0.2% |
| |||||||||
Avery Dennison Corp. | 170 | 9,617 | ||||||||
Sealed Air Corp. | 292 | 13,689 | ||||||||
WestRock Co. | 398 | 20,473 | ||||||||
| 43,779 | ||||||||||
Paper Products — 0.1% |
| |||||||||
International Paper Co. | 606 | 22,901 | ||||||||
Personal Products — 0.1% |
| |||||||||
The Estee Lauder Companies Inc., Class A | 318 | 25,656 | ||||||||
Pharmaceuticals — 5.4% |
| |||||||||
Allergan PLC | 589 | 160,096 | (a) | |||||||
Bristol-Myers Squibb Co. | 2,499 | 147,941 | ||||||||
Eli Lilly & Co. | 1,454 | 121,685 | ||||||||
Endo International PLC | 316 | 21,893 | (a) | |||||||
Johnson & Johnson | 4,205 | 392,537 | (h) | |||||||
Mallinckrodt PLC | 164 | 10,486 | (a) | |||||||
Merck & Company Inc. | 4,289 | 211,834 | ||||||||
Mylan N.V. | 621 | 25,001 | (a) | |||||||
Perrigo Company PLC | 216 | 33,970 | ||||||||
Pfizer Inc. | 9,366 | 294,186 | ||||||||
Zoetis Inc. | 769 | 31,667 | ||||||||
| 1,451,296 | ||||||||||
Property & Casualty Insurance — 0.9% |
| |||||||||
ACE Ltd. | 498 | 51,493 | ||||||||
Cincinnati Financial Corp. | 200 | 10,760 | ||||||||
The Allstate Corp. | 641 | 37,332 | ||||||||
The Chubb Corp. | 338 | 41,456 | ||||||||
The Progressive Corp. | 890 | 27,270 | ||||||||
The Travelers Companies Inc. | 498 | 49,566 | ||||||||
XL Group PLC | 473 | 17,179 | ||||||||
| 235,056 | ||||||||||
Publishing — 0.0%* |
| |||||||||
News Corp., Class A | 684 | 8,632 | ||||||||
Railroads — 0.8% |
| |||||||||
CSX Corp. | 1,496 | 40,242 | ||||||||
Kansas City Southern | 155 | 14,086 | ||||||||
Norfolk Southern Corp. | 465 | 35,526 | ||||||||
Union Pacific Corp. | 1,340 | 118,470 | ||||||||
| 208,324 | ||||||||||
Real Estate Services — 0.0%* |
| |||||||||
CBRE Group Inc., Class A | 386 | 12,352 | (a) | |||||||
| Number of Shares | Fair Value | |||||||||
Regional Banks — 0.9% | ||||||||||
BB&T Corp. | 1,184 | $ | 42,150 | |||||||
Fifth Third Bancorp | 1,166 | 22,049 | ||||||||
Huntington Bancshares Inc. | 1,382 | 14,649 | ||||||||
KeyCorp | 1,212 | 15,768 | ||||||||
M&T Bank Corp. | 187 | 22,805 | ||||||||
People’s United Financial Inc. | 561 | 8,825 | ||||||||
Regions Financial Corp. | 1,932 | 17,407 | ||||||||
SunTrust Banks Inc. | 805 | 30,783 | ||||||||
The PNC Financial Services Group Inc. | 783 | 69,844 | ||||||||
Zions Bancorporation | 266 | 7,326 | ||||||||
| 251,606 | ||||||||||
Research & Consulting Services — 0.2% |
| |||||||||
Equifax Inc. | 168 | 16,326 | ||||||||
Nielsen Holdings PLC | 574 | 25,526 | ||||||||
The Dun & Bradstreet Corp. | 47 | 4,935 | ||||||||
| 46,787 | ||||||||||
Residential REITs — 0.4% |
| |||||||||
Apartment Investment & Management Co., Class A | 235 | 8,700 | ||||||||
AvalonBay Communities Inc. | 189 | 33,041 | ||||||||
Equity Residential | 547 | 41,091 | ||||||||
Essex Property Trust Inc. | 110 | 24,576 | ||||||||
| 107,408 | ||||||||||
Restaurants — 1.4% |
| |||||||||
Chipotle Mexican Grill Inc. | 47 | 33,852 | (a) | |||||||
Darden Restaurants Inc. | 169 | 11,583 | ||||||||
McDonald’s Corp. | 1,468 | 144,642 | ||||||||
Starbucks Corp. | 2,268 | 128,913 | ||||||||
Yum! Brands Inc. | 658 | 52,607 | ||||||||
| 371,597 | ||||||||||
Retail REITs — 0.6% |
| |||||||||
General Growth Properties Inc. | 891 | 23,139 | ||||||||
Kimco Realty Corp. | 706 | 17,247 | ||||||||
Realty Income Corp. | 357 | 16,918 | ||||||||
Simon Property Group Inc. | 462 | 84,879 | ||||||||
The Macerich Co. | 196 | 15,057 | ||||||||
| 157,240 | ||||||||||
Security & Alarm Services — 0.1% |
| |||||||||
The ADT Corp. | 235 | 7,027 | ||||||||
Tyco International PLC | 594 | 19,875 | ||||||||
| 26,902 | ||||||||||
Semiconductor Equipment — 0.2% |
| |||||||||
Applied Materials Inc. | 1,861 | 27,338 | ||||||||
KLA-Tencor Corp. | 285 | 14,250 | ||||||||
Lam Research Corp. | 223 | 14,569 | ||||||||
| 56,157 | ||||||||||
See Notes to Schedules of Investments and Notes to Financial Statements.
18
Table of Contents
S&P 500 Index Fund
| Schedule of Investments | September 30, 2015 |
| Number of Shares | Fair Value | |||||||||
Semiconductors — 2.1% |
| |||||||||
Altera Corp. | 424 | $ | 21,234 | |||||||
Analog Devices Inc. | 479 | 27,020 | ||||||||
Avago Technologies Ltd. | 381 | 47,629 | ||||||||
Broadcom Corp., Class A | 832 | 42,790 | ||||||||
First Solar Inc. | 139 | 5,942 | (a) | |||||||
Intel Corp. | 7,220 | 217,611 | ||||||||
Linear Technology Corp. | 333 | 13,437 | ||||||||
Microchip Technology Inc. | 341 | 14,694 | ||||||||
Micron Technology Inc. | 1,639 | 24,552 | (a) | |||||||
NVIDIA Corp. | 720 | 17,748 | ||||||||
Qorvo Inc. | 200 | 9,010 | (a) | |||||||
Skyworks Solutions Inc. | 300 | 25,263 | ||||||||
Texas Instruments Inc. | 1,577 | 78,093 | ||||||||
Xilinx Inc. | 368 | 15,603 | ||||||||
| 560,626 | ||||||||||
Soft Drinks — 1.9% |
| |||||||||
Coca-Cola Enterprises Inc. | 322 | 15,569 | ||||||||
Dr Pepper Snapple Group Inc. | 274 | 21,660 | ||||||||
Monster Beverage Corp. | 225 | 30,406 | (a) | |||||||
PepsiCo Inc. | 2,219 | 209,251 | ||||||||
The Coca-Cola Co. | 5,932 | 237,992 | ||||||||
| 514,878 | ||||||||||
Specialized Consumer Services — 0.1% |
| |||||||||
H&R Block Inc. | 469 | 16,978 | ||||||||
Specialized Finance — 0.6% | ||||||||||
CME Group Inc. | 513 | 47,576 | ||||||||
Intercontinental Exchange Inc. | 173 | 40,653 | ||||||||
McGraw Hill Financial Inc. | 415 | 35,898 | ||||||||
Moody’s Corp. | 261 | 25,630 | ||||||||
Nasdaq Inc. | 156 | 8,319 | ||||||||
| 158,076 | ||||||||||
Specialized REITs — 0.8% |
| |||||||||
American Tower Corp. | 630 | 55,427 | ||||||||
Crown Castle International Corp. | 510 | 40,224 | ||||||||
Equinix Inc. | 86 | 23,512 | ||||||||
Iron Mountain Inc. | 251 | 7,786 | ||||||||
Plum Creek Timber Company Inc. | 297 | 11,735 | ||||||||
Public Storage | 222 | 46,982 | ||||||||
Weyerhaeuser Co. | 745 | 20,368 | ||||||||
| 206,034 | ||||||||||
Specialty Chemicals — 0.5% |
| |||||||||
Ecolab Inc. | 412 | 45,205 | ||||||||
International Flavors & Fragrances Inc. | 112 | 11,565 | ||||||||
PPG Industries Inc. | 418 | 36,654 | ||||||||
Sigma-Aldrich Corp. | 169 | 23,478 | ||||||||
The Sherwin-Williams Co. | 117 | 26,065 | ||||||||
| 142,967 | ||||||||||
| Number of Shares | Fair Value | |||||||||
Specialty Stores — 0.2% |
| |||||||||
Signet Jewelers Ltd. | 121 | $ | 16,472 | |||||||
Staples Inc. | 888 | 10,416 | ||||||||
Tiffany & Co. | 195 | 15,058 | ||||||||
Tractor Supply Co. | 236 | 19,899 | ||||||||
| 61,845 | ||||||||||
Steel — 0.1% |
| |||||||||
Nucor Corp. | 450 | 16,897 | ||||||||
Systems Software — 2.8% | ||||||||||
CA Inc. | 549 | 14,988 | ||||||||
Microsoft Corp. | 12,163 | 538,334 | (h) | |||||||
Oracle Corp. | 4,870 | 175,904 | ||||||||
Red Hat Inc. | 276 | 19,839 | (a) | |||||||
Symantec Corp. | 979 | 19,061 | ||||||||
| 768,126 | ||||||||||
Technology Hardware, Storage & Peripherals — 4.4% |
| |||||||||
Apple Inc. | 8,661 | 955,308 | (h) | |||||||
EMC Corp. | 3,041 | 73,471 | ||||||||
Hewlett-Packard Co. | 2,786 | 71,349 | ||||||||
NetApp Inc. | 436 | 12,906 | ||||||||
SanDisk Corp. | 313 | 17,005 | ||||||||
Seagate Technology PLC | 466 | 20,877 | ||||||||
Western Digital Corp. | 350 | 27,804 | ||||||||
| 1,178,720 | ||||||||||
Thrifts & Mortgage Finance — 0.0%* |
| |||||||||
Hudson City Bancorp Inc. | 945 | 9,611 | ||||||||
Tires & Rubber — 0.0%* | ||||||||||
The Goodyear Tire & Rubber Co. | 372 | 10,911 | ||||||||
Tobacco — 1.5% | ||||||||||
Altria Group Inc. | 2,980 | 162,112 | ||||||||
Philip Morris International Inc. | 2,340 | 185,632 | ||||||||
Reynolds American Inc. | 1,202 | 53,213 | ||||||||
| 400,957 | ||||||||||
Trading Companies & Distributors — 0.2% |
| |||||||||
Fastenal Co. | 473 | 17,316 | ||||||||
United Rentals Inc. | 138 | 8,287 | (a) | |||||||
WW Grainger Inc. | 86 | 18,491 | ||||||||
| 44,094 | ||||||||||
Trucking — 0.1% | ||||||||||
JB Hunt Transport Services Inc. | 139 | 9,924 | ||||||||
Ryder System Inc. | 69 | 5,109 | ||||||||
| 15,033 | ||||||||||
Total Common Stock | 25,655,880 | |||||||||
See Notes to Schedules of Investments and Notes to Financial Statements.
19
Table of Contents
S&P 500 Index Fund
| Schedule of Investments | September 30, 2015 |
| Fair Value | ||||||||
Short-Term Investments — 4.5% |
| |||||||
State Street Institutional U.S. | $ | 1,221,898 | (d,h,m) | |||||
Total Investments | 26,877,778 | |||||||
Other Assets and Liabilities, | 99,639 | |||||||
|
| |||||||
NET ASSETS — 100.0% | $ | 26,977,417 | ||||||
|
| |||||||
Other Information: | ||||||
The Fund had the following long futures contracts open at September 30, 2015:
| Description | Expiration date | Number of Contracts | Current Notional Value | Unrealized Depreciation | |||||||||||||
S&P 500 Emini Index Futures | December 2015 | 15 | $ | 1,431,525 | $ | (46,443 | ) | ||||||||||
See Notes to Schedules of Investments and Notes to Financial Statements.
20
Table of Contents
| U.S. Large-Cap Core Equity Fund | (Unaudited) |
Stephen V. Gelhaus
Senior Vice President
Paul C. Reinhardt
Senior Vice President
The U.S. Large-Cap Core Equity Fund is co-managed by Paul C. Reinhardt and Stephen V. Gelhaus. Messrs. Reinhardt and Gelhaus both manage the Fund as a collaborative team. Both portfolio managers have the authority to increase or decrease existing positions in the Fund; however, Mr. Reinhardt, as lead manager, is vested with the authority to purchase securities that are new to the Fund or to divest the Fund of its entire position in a security. Mr. Reinhardt also has veto authority over Mr. Gelhaus’ trade decisions. See portfolio managers’ biographical information beginning on page 124.
| Q. | How did the GE Institutional U.S. Large-Cap Core Equity Fund perform compared to its benchmark and Morningstar peer group for the twelve-month period ended September 30, 2015? |
| A. | For the twelve-month period ended September 30, 2015, the GE Institutional U.S. Large-Cap Core Equity Fund returned -5.31% for the Investment Class shares and -5.51% for the Service Class shares. The Fund’s benchmark, the S&P 500 Index returned -0.61% and the Fund’s Morningstar peer group of 1,658 US Large Blend funds returned an average of -2.67% over the same period. |
| Q. | What market conditions impacted the Fund’s performance? |
| A. | Market developments for the fiscal year included: 1) a sharp drop in crude-oil and other commodity prices; 2) concerns about a slowdown in emerging markets specifically China and 3) a decline in the 10-year US Treasury rate from 2.49% a year ago to 2.04%. In the three-month period ending September 30, 2015, market volatility increased dramatically, and the US Equity market experienced its first 10% correction in 4 years. Investors worried about China’s slowing economy and the Federal Reserve’s pending interest-rate actions. S&P 500 sectors had a significant divergence in performance, with the defensive consumer and utility stocks generating positive |
| twelve-month returns, while energy, materials and industrial sectors generated negative performance. In the past year, the growth style of investing significantly outperformed value. |
| Q. | What were the primary drivers behind Fund performance? |
| A. | The underperformance compared to the S&P 500 Index benchmark was driven by a sector overweight in energy, and stock selection in energy, IT, utilities and financials. With respect to energy, the S&P 500 energy sector declined 30% for the Fund’s fiscal year, and the Fund started the fiscal year overweight vs benchmark. In addition, the Fund was overweight energy service and energy & exploration companies that underperformed the average energy stock. Within the IT sector, an overweight in Applied Materials detracted from performance, as a proposed merger with Tokyo Electron fell through. In addition, global GDP and IT market-specific growth concerns caused underperformance in EMC Corp., Hewlett-Packard and Western Digital, all over-weighted holdings. Positions in independent power producers NRG Energy and Calpine caused utility-sector underperformance, as independent power producers underperformed regulated utilities. Within financials, an underweight in the defensive, outperforming REIT industry weighed on returns, as did an overweight in American Express (-14% return). In general, defensive consumer, REIT and utility companies were outperformers for the fiscal year and were underweighted in the portfolio. |
| The Fund’s retailer holdings, including Advance Auto Parts (+40%), Lowe’s (+32%), Target (+29%), CVS (+23%) and Dollar General (+20%), were key contributors for the year. In addition, the Fund had positive stock selection in health care driven by the overweight in Boston Scientific (+39%). This holding’s fundamentals were boosted by margin-improvement initiatives and introduction of new, high-growth medical products. |
21
Table of Contents
| U.S. Large-Cap Core Equity Fund | (Unaudited) |
| To sum up, the portfolio is being managed with a relative-value discipline, with exposure to all economic sectors. We believed that several defensive sectors of the market were overvalued, as were some of the high-growth internet and technology stocks. This approach and viewpoint weighed on returns over the last 12 months. In addition, the portfolio has several stock-specific holdings that had fundamental and regulatory events that detracted from returns. Finally, we believed that crude-oil prices would stay in a trading range above $80, when in fact they dropped through that level starting in the December quarter of 2014. |
| Q. | Were there any significant changes in the Fund during the period? |
| A. | The Fund continues to invest in companies with attractive valuations, high free-cash flow generation, and strong management teams. The Fund stood at 67 holdings at September 30th — down from 74 at the beginning of the year — as the Fund managers continued to increase the focus on the high-conviction stocks we believe have the best long-term performance prospects. In our opinion, the high volatility and correlations among stocks in the September quarter will gradually decline, and we will again be rewarded for stock selection. At the fiscal year-end, the Fund was positioned for continued global GDP growth, given the over-benchmark weights in industrials and financials. We believe this view will add positive attribution over the long term, and we remain confident our stock selection will generate positive results within the economic sectors. |
| In terms of positioning changes, the Fund neutralized its overweight in energy in light of recent volatility, and decreased its overweight exposure to the financials sector amid lingering interest rate and regulatory uncertainties. Consumer staples and telecom exposures were also reduced further. The Fund used proceeds to increase its industrials exposure, finding many quality large-cap multi-nationals at attractive valuations. We also bolstered holdings in health care and consumer discretionary — adding to medical products and auto parts retailers & suppliers. The Fund maintained its underweight in information technology, given high valuations relative to fundamentals. |
22
Table of Contents
| U.S. Large-Cap Core Equity Fund | (Unaudited) |
Understanding Your Fund’s Expenses
As a shareholder of the Fund you incur ongoing costs. Ongoing costs include portfolio management fees, distribution and service fees (for Service Class shares), professional fees, administrative fees and other Fund expenses. The following example is intended to help you understand your ongoing costs (in dollars) of investing in the Fund and to compare these costs with the ongoing costs of investing in other mutual funds.
To illustrate these ongoing costs, we have provided an example and calculated the expenses paid by investors in each share class of the Fund during the period. The information in the following table is based on an investment of $1,000, which is invested at the beginning of the period and held for the entire six-month period ended September 30, 2015.
Actual Expenses
The first section of the table provides information about actual account values and actual expenses. You may use the information in this section, together with the amount you invested, to estimate the expenses that you paid over the period. To do so, simply divide your account value by $1,000 (for example, an $8,600 account value divided by $1,000 = 8.6), then multiply the result by the
number given for your class under the heading “Expenses paid during the period” to estimate the expenses you paid on your account during the period.
Hypothetical Example for Comparison Purposes
The second section of the table provides information about hypothetical account values and hypothetical expenses based on the Fund’s actual expense ratio and an assumed rate of return of 5% per year before expenses, which is not the Fund’s actual return. The hypothetical account values and expenses may not be used to estimate the actual ending account balance or expenses you paid for the period. You may use this information to compare the ongoing costs of investing in the Fund and other funds. To do so, compare this 5% hypothetical example with the 5% hypothetical examples that appear in the shareholders reports of other funds.
Please note that the expenses shown in the table are meant to highlight and help you compare ongoing costs only and do not reflect transaction costs, such as sales charges or redemption fees, if any. Therefore, the second section of the table is useful in comparing ongoing costs only, and will not help you determine the relative total costs of owning different funds.
April 1, 2015 – September 30, 2015
| Account value at the beginning of the period ($) | Account value at the end of the period ($) | Expenses paid during the period ($)* | |||||||||||||
Actual Fund Return |
| ||||||||||||||
Investment Class | 1,000.00 | 915.20 | 2.11 | ||||||||||||
Service Class | 1,000.00 | 914.50 | 3.31 | ||||||||||||
Hypothetical 5% Return (2.5% for the period) |
| ||||||||||||||
Investment Class | 1,000.00 | 1,022.86 | 2.23 | ||||||||||||
Service Class | 1,000.00 | 1,021.61 | 3.50 | ||||||||||||
| * | Expenses are equal to the Fund’s annualized net expense ratio of 0.44%** for Investment Class shares and 0.69%** for Service Class shares (for the period April 1, 2015 - September 30, 2015), multiplied by the average account value over the period, multiplied by 183/365 (to reflect the one-half year period). |
| ** | May differ from expense ratio disclosed in the financial highlights, which is calculated based on the entire fiscal year’s data. |
23
Table of Contents
| U.S. Large-Cap Core Equity Fund | (Unaudited) |
| Investment Profile |
A mutual fund designed for investors who seek long-term growth of capital and future income. The Fund seeks to achieve its investment objectives by investing at least 80% of its net assets under normal circumstances in equity securities of large-capitalization U.S. companies, such as common and preferred stocks. The Fund invests in U.S. large-cap companies (meaning companies with a market capitalization of $8 billion or more) that the portfolio managers believe are undervalued by the market but have solid growth prospects.
| Morningstar Performance Comparison |
Based on average annual returns for periods ended September 30, 2015
| One Year | Five Year | Ten Year | ||||||||||
Number of funds in peer group | 1,658 | 1,419 | 1,201 | |||||||||
Peer group average annual total return | -2.67 | % | 11.20 | % | 5.62 | % | ||||||
Morningstar Category in peer group: Large Blend |
| |||||||||||
| Top Ten Largest Holdings |
as of September 30, 2015 (as a % of Fair Value) (a)(b)
Google Inc., Class A | 3.74% | |||
Apple Inc. | 3.07% | |||
JPMorgan Chase & Co. | 3.07% | |||
Cisco Systems Inc. | 2.55% | |||
PepsiCo Inc. | 2.48% | |||
Johnson & Johnson | 2.40% | |||
Pfizer Inc. | 2.32% | |||
Comcast Corp., Class A | 2.30% | |||
American International Group Inc. | 2.16% | |||
CVS Health Corp. | 2.15% |
| Sector Allocation as of September 30, 2015 |
Portfolio composition as a % of Fair Value of $61,964 (in thousands) as of September 30, 2014 (a)(b)
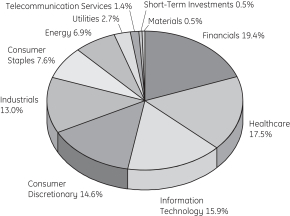
| Change in Value of a $10,000 Investment |
Investment Class Shares
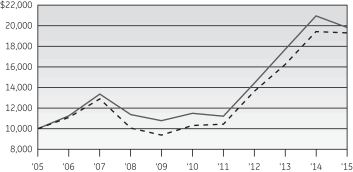
| Average Annual Total Return |
for the periods ended September 30, 2015
| Investment Class Shares (Inception date: 2/2/00) | ||||||||||||||||||||
| One Year | Five Year | Ten Year | Ending Value of a $10,000 Investment | |||||||||||||||||
U.S. Large-Cap Core Equity Fund | -5.31% | 11.57% | 7.09% | $19,843 | ||||||||||||||||
S&P 500 Index | -0.61% | 13.34% | 6.80% | $19,304 | ||||||||||||||||
Service Class Shares
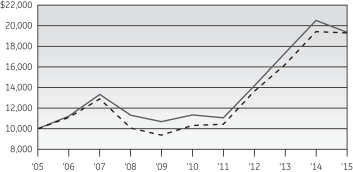
| Average Annual Total Return |
for the periods ended September 30, 2015
Service Class Shares (Inception date: 9/30/05) | ||||||||||||||||||||
| One Year | Five Year | Since Inception | Ending value of a $10,000 investment | |||||||||||||||||
U.S. Large-Cap Core Equity Fund | -5.51% | 11.29% | 6.84% | $19,376 | ||||||||||||||||
S&P 500 Index | -0.61% | 13.34% | 6.80% | $19,304 | ||||||||||||||||

| (a) | Fair Value basis is inclusive of short-term investment in State Street Institutional U.S. Government Money Market Fund Premier Class. |
| (b) | The securities information regarding holdings, allocations and other characteristics is presented to illustrate examples of securities that the Fund has bought and the diversity of areas in which the Fund may invest as of a particular date. It may not be representative of the Fund’s current or future investments and should not be construed as a recommendation to purchase or sell a particular security. |
See Notes to Performance beginning on page 1 for further information, including an explanation of Morningstar peer categories.
Past performance does not predict future performance. The performance shown in the graphs and tables does not reflect the deduction of taxes that a shareholder would pay on Fund distributions or the redemption of Fund shares.
24
Table of Contents
U.S. Large-Cap Core Equity Fund
| Schedule of Investments | September 30, 2015 |
| U.S. Large-Cap Core Equity Fund |
| Number of Shares | Fair Value | |||||||||
Common Stock — 95.5%† |
| |||||||||
Aerospace & Defense — 5.4% | ||||||||||
General Dynamics Corp. | 4,715 | $ | 650,434 | |||||||
Hexcel Corp. | 12,332 | 553,214 | ||||||||
Honeywell International Inc. | 13,928 | 1,318,842 | (h) | |||||||
The Boeing Co. | 6,819 | 892,948 | ||||||||
| 3,415,438 | ||||||||||
Agricultural Products — 1.4% |
| |||||||||
Archer-Daniels-Midland Co. | 22,125 | 917,081 | ||||||||
Airlines — 1.2% |
| |||||||||
Delta Air Lines Inc. | 17,410 | 781,187 | ||||||||
Apparel, Accessories & Luxury Goods — 0.1% |
| |||||||||
Coach Inc. | 2,902 | 83,955 | ||||||||
Asset Management & Custody Banks — 4.7% |
| |||||||||
Ameriprise Financial Inc. | 9,793 | 1,068,710 | ||||||||
Invesco Ltd. | 30,467 | 951,484 | ||||||||
State Street Corp. | 14,508 | 975,083 | (e) | |||||||
| 2,995,277 | ||||||||||
Auto Parts & Equipment — 2.0% |
| |||||||||
BorgWarner Inc. | 5,406 | 224,835 | ||||||||
Delphi Automotive PLC | 13,420 | 1,020,457 | ||||||||
| 1,245,292 | ||||||||||
Automobile Manufacturers — 1.5% |
| |||||||||
Ford Motor Co. | 72,540 | 984,368 | ||||||||
Automotive Retail — 1.7% |
| |||||||||
Advance Auto Parts Inc. | 5,803 | 1,099,843 | ||||||||
Biotechnology — 3.6% |
| |||||||||
Amgen Inc. | 8,705 | 1,204,076 | ||||||||
Gilead Sciences Inc. | 10,881 | 1,068,405 | ||||||||
| 2,272,481 | ||||||||||
Broadcasting — 0.6% |
| |||||||||
CBS Corp., Class B | 9,430 | 376,257 | ||||||||
Cable & Satellite — 2.2% |
| |||||||||
Comcast Corp., Class A | 25,026 | 1,423,479 | ||||||||
Communications Equipment — 3.5% |
| |||||||||
Cisco Systems Inc. | 60,208 | 1,580,460 | ||||||||
QUALCOMM Inc. | 12,332 | 662,598 | ||||||||
| 2,243,058 | ||||||||||
| Number of Shares | Fair Value | |||||||||
Diversified Banks — 6.7% |
| |||||||||
Bank of America Corp. | 54,405 | $ | 847,630 | |||||||
Citigroup Inc. | 10,156 | 503,839 | ||||||||
JPMorgan Chase & Co. | 31,192 | 1,901,776 | ||||||||
Wells Fargo & Co. | 19,223 | 987,101 | ||||||||
| 4,240,346 | ||||||||||
Drug Retail — 2.1% |
| |||||||||
CVS Health Corp. | 13,783 | 1,329,784 | ||||||||
Electric Utilities — 1.6% |
| |||||||||
NextEra Energy Inc. | 10,156 | 990,718 | ||||||||
Electrical Components & Equipment — 1.2% |
| |||||||||
Rockwell Automation Inc. | 7,254 | 736,063 | ||||||||
General Merchandise Stores — 2.6% |
| |||||||||
Dollar General Corp. | 13,783 | 998,441 | ||||||||
Target Corp. | 8,705 | 684,735 | ||||||||
| 1,683,176 | ||||||||||
Healthcare Distributors — 1.5% |
| |||||||||
Cardinal Health Inc. | 12,694 | 975,153 | ||||||||
Healthcare Equipment — 2.9% |
| |||||||||
Boston Scientific Corp. | 74,716 | 1,226,089 | (a) | |||||||
Stryker Corp. | 6,238 | 586,996 | ||||||||
| 1,813,085 | ||||||||||
Home Improvement Retail — 1.7% |
| |||||||||
Lowe’s Companies Inc. | 15,959 | 1,099,894 | ||||||||
Independent Power Producers & Energy Traders — 1.1% |
| |||||||||
Calpine Corp. | 25,389 | 370,680 | (a,h) | |||||||
NRG Energy Inc. | 20,311 | 301,618 | ||||||||
| 672,298 | ||||||||||
Industrial Machinery — 1.4% |
| |||||||||
Ingersoll-Rand PLC | 17,772 | 902,284 | ||||||||
Integrated Oil & Gas — 2.8% |
| |||||||||
Cenovus Energy Inc. | 21,762 | 329,912 | ||||||||
Exxon Mobil Corp. | 4,352 | 323,571 | ||||||||
Occidental Petroleum Corp. | 17,410 | 1,151,672 | ||||||||
| 1,805,155 | ||||||||||
Integrated Telecommunication Services — 1.4% |
| |||||||||
Verizon Communications Inc. | 20,311 | 883,732 | ||||||||
Internet Software & Services — 3.6% |
| |||||||||
Google Inc., Class A | 3,627 | 2,315,368 | (a) | |||||||
See Notes to Schedules of Investments and Notes to Financial Statements.
25
Table of Contents
U.S. Large-Cap Core Equity Fund
| Schedule of Investments | September 30, 2015 |
| Number of Shares | Fair Value | |||||||||
Life & Health Insurance — 1.2% |
| |||||||||
Lincoln National Corp. | 15,959 | $ | 757,414 | |||||||
Life Sciences Tools & Services — 0.4% |
| |||||||||
PerkinElmer Inc. | 6,166 | 283,389 | ||||||||
Movies & Entertainment — 1.6% |
| |||||||||
Time Warner Inc. | 15,233 | 1,047,269 | ||||||||
Multi-Line Insurance — 3.7% |
| |||||||||
American International Group Inc. | 23,575 | 1,339,532 | ||||||||
The Hartford Financial Services Group Inc. | 21,762 | 996,264 | ||||||||
| 2,335,796 | ||||||||||
Oil & Gas Equipment & Services — 1.7% |
| |||||||||
Schlumberger Ltd. | 15,959 | 1,100,692 | ||||||||
Oil & Gas Exploration & Production — 2.2% |
| |||||||||
Hess Corp. | 18,498 | 926,010 | ||||||||
Marathon Oil Corp. | 29,741 | 458,011 | ||||||||
| 1,384,021 | ||||||||||
Packaged Foods & Meats — 1.4% |
| |||||||||
Mondelez International Inc., Class A | 21,036 | 880,777 | ||||||||
Paper Packaging — 0.5% |
| |||||||||
Packaging Corporation of America | 5,078 | 305,493 | ||||||||
Pharmaceuticals — 8.7% |
| |||||||||
Allergan PLC | 4,715 | 1,281,584 | (a) | |||||||
Johnson & Johnson | 15,959 | 1,489,773 | ||||||||
Merck & Company Inc. | 26,477 | 1,307,699 | ||||||||
Pfizer Inc. | 45,700 | 1,435,437 | ||||||||
| 5,514,493 | ||||||||||
Railroads — 0.8% |
| |||||||||
CSX Corp. | 18,135 | 487,832 | ||||||||
Research & Consulting Services — 1.6% |
| |||||||||
Nielsen Holdings PLC | 22,850 | 1,016,140 | ||||||||
Semiconductor Equipment — 1.3% |
| |||||||||
Applied Materials Inc. | 54,405 | 799,209 | ||||||||
Soft Drinks — 2.4% |
| |||||||||
PepsiCo Inc. | 16,321 | 1,539,070 | ||||||||
Specialized REITs — 2.4% |
| |||||||||
American Tower Corp. | 12,332 | 1,084,969 | ||||||||
Extra Space Storage Inc. | 5,803 | 447,760 | ||||||||
| 1,532,729 | ||||||||||
| Number of Shares | Fair Value | |||||||||
Systems Software — 1.5% |
| |||||||||
Oracle Corp. | 26,114 | $ | 943,238 | |||||||
Technology Hardware, Storage & Peripherals — 5.6% |
| |||||||||
Apple Inc. | 17,264 | 1,904,219 | ||||||||
EMC Corp. | 27,565 | 665,970 | ||||||||
Hewlett-Packard Co. | 17,410 | 445,870 | ||||||||
Western Digital Corp. | 6,529 | 518,664 | ||||||||
| 3,534,723 | ||||||||||
Total Common Stock | 60,747,057 | |||||||||
Exchange Traded Funds — 1.4% | ||||||||||
Financial Select Sector SPDR Fund | 7,859 | 178,085 | (m) | |||||||
Industrial Select Sector SPDR Fund | 14,295 | 713,178 | (m) | |||||||
Total Exchange Traded Funds | 891,263 | |||||||||
Total Investments in Securities | 61,638,320 | |||||||||
Short-Term Investments — 0.5% | ||||||||||
State Street Institutional U.S. | 326,019 | (d,h,m) | ||||||||
Total Investments | 61,964,339 | |||||||||
Other Assets and Liabilities, net — 2.6% | 1,635,224 | |||||||||
|
| |||||||||
NET ASSETS — 100.0% | $ | 63,599,563 | ||||||||
|
| |||||||||
Other Information: | ||||||||||
The Fund had the following long futures contracts open at September 30, 2015:
| Description | Expiration date | Number of Contracts | Current Notional Value | Unrealized Appreciation | |||||||||||||
S&P 500 Emini Index Futures | December 2015 | 14 | $ | 1,336,090 | $ | 5,446 | |||||||||||
See Notes to Schedules of Investments and Notes to Financial Statements.
26
Table of Contents

David B. Carlson
Chief Investment
Officer – U.S. Equities
The Premier Growth Equity Fund is managed by David B. Carlson. See portfolio managers’ biographical information beginning on page 124.
| Q. | How did the GE Institutional Premier Growth Equity Fund perform compared to its benchmarks and Morningstar peer group for the twelve-month period ended September 30, 2015? |
| A. | For the twelve-month period ended September 30, 2015, the GE Institutional Premier Growth Equity Fund returned -0.47% for the Investment Class shares and -0.77% for the Service Class shares. The Fund’s benchmarks, the S&P 500 Index and the Russell 1000 Growth Index returned -0.61% and 3.18%, respectively, and the Fund’s Morningstar peer group of 1,730 US Large Growth funds returned an average of 1.29% over the same period. |
| Q. | What market conditions impacted the Fund’s performance? |
| A. | In the past year the growth style of investing has significantly outperformed value. Several macro themes have driven the market, including the strengthening U.S. dollar, and falling interest rates and energy prices. Energy dropped close to 30% — the worst performing S&P 500 sector. Growth concerns stemming from China and the emerging markets exacerbated commodity weakness, creating headwinds for many multi-national companies. In this risk-off environment, consumer staples and utilities (both +7%) were the best-performing S&P 500 sectors — and defensive positioning mattered. Portfolios that were tilted to higher interest rates struggled on a relative basis, as the Federal Reserve’s initial rate hike was pushed out. |
| Q. | What were the primary drivers behind Fund performance? |
| A. | Given a continued outlook for slow U.S. economic growth, the Fund was underweight |
| the winning defensive/higher-yielding sectors, namely utilities and consumer staples. As our initial expectation for a mid-2015 Fed interest rate hike was delayed, the Fund’s rate-sensitive financials, including State Street (-7%) and Charles Schwab (-2%), weighed on performance. The Fund benefited from minimal energy sector exposure during the course of the year, however global energy services leader Schlumberger (-31%) lagged. |
| More than sector allocation, individual stock selections drove the concentrated Fund’s results, with particular strength in consumer discretionary (e.g., Amazon.com +59%, Lowe’s +32%, Disney +17% and Dick’s Sporting Goods +14%). Health care stocks, including Covidien (+24% before Medtronic’s acquisition closed) and Actavis (+12%) were key contributors. With fits and starts over the timing of prospective rate increases, market volatility rose, benefitting over-the-counter derivatives exchange, CME (+21%). Despite strength in payment processor, Visa (+32%), the Fund’s tech holdings weighted on returns — especially Baidu (-37%), Paypal (-23%) and Qualcomm (-26%). Equipment rentals company, United Rentals (-34%) swooned on its energy sector exposure (approximately 11% of its revenues); and Macao gaming company Las Vegas Sands (-36%) fell on China growth and government anti-corruption campaign concerns. |
| Q. | Were there any significant changes in the Fund during the period? |
| A. | Fund changes were relatively modest during the 12-month period. The Fund ended the year with 35 stocks, down net one position, and with a decreased allocation to energy. At September 30, 2015, technology remained the largest sector in the Fund, followed by consumer discretionary, health care and financials. The Fund maintained underweight positioning in the slower-growing utilities, telecommunications and consumer staples sectors at the end of the 12-month period. |
27
Table of Contents
| Premier Growth Equity Fund | (Unaudited) |
| Early in the year, as oil prices fell, we eliminated the Fund’s sole oil exploration/production holding, Anadarko — a strong contributor last year. M&A and corporate actions impacted selected portfolio holdings, as Medtronic bought Covidien, acquisitive Actavis took the name Allergan and EBay spun out Paypal (the Fund held both at year-end). |
| We continue to focus on what we believe are financially strong companies with great management teams at attractive valuations. We favor companies with innovative products and services rather than business models tied to GDP growth. In a slow growth world, we believe the Fund’s collection of companies with above-average earnings growth rates will do well over the long term. |
28
Table of Contents
| Premier Growth Equity Fund | (Unaudited) |
Understanding Your Fund’s Expenses
As a shareholder of the Fund you incur ongoing costs. Ongoing costs include portfolio management fees, distribution and service fees (for Service Class shares), professional fees, administrative fees and other Fund expenses. The following example is intended to help you understand your ongoing costs (in dollars) of investing in the Fund and to compare these costs with the ongoing costs of investing in other mutual funds.
To illustrate these ongoing costs, we have provided an example and calculated the expenses paid by investors in each share class of the Fund during the period. The information in the following table is based on an investment of $1,000, which is invested at the beginning of the period and held for the entire six-month period ended September 30, 2015.
Actual Expenses
The first section of the table provides information about actual account values and actual expenses. You may use the information in this section, together with the amount you invested, to estimate the expenses that you paid over the period. To do so, simply divide your account value by $1,000 (for example, an $8,600 account value divided by $1,000 = 8.6), then multiply the result by the
number given for your class under the heading “Expenses paid during period” to estimate the expenses you paid on your account during the period.
Hypothetical Example for Comparison Purposes
The second section of the table provides information about hypothetical account values and hypothetical expenses based on the Fund’s actual expense ratio and an assumed rate of return of 5% per year before expenses, which is not the Fund’s actual return. The hypothetical account values and expenses may not be used to estimate the actual ending account balance or expenses you paid for the period. You may use this information to compare the ongoing costs of investing in the Fund and other funds. To do so, compare this 5% hypothetical example with the 5% hypothetical examples that appear in the shareholders reports of other funds.
Please note that the expenses shown in the table are meant to highlight and help you compare ongoing costs only and do not reflect transaction costs, such as sales charges or redemption fees, if any. Therefore, the second section of the table is useful in comparing ongoing costs only, and will not help you determine the relative total costs of owning different funds.
April 1, 2015 – September 30, 2015
| Account value at the beginning of the period ($) | Account value at the end of the period ($) | Expenses paid during the period ($)* | |||||||||||||
Actual Fund Return | |||||||||||||||
Investment Class | 1,000.00 | 921.50 | 1.83 | ||||||||||||
Service Class | 1,000.00 | 920.70 | 3.03 | ||||||||||||
Hypothetical 5% Return (2.5% for the period) |
| ||||||||||||||
Investment Class | 1,000.00 | 1,023.16 | 1.93 | ||||||||||||
Service Class | 1,000.00 | 1,021.91 | 3.19 | ||||||||||||
| * | Expenses are equal to the Fund’s annualized net expense ratio of 0.38% for Investment Class shares and 0.63% for Service Class shares (for the period April 1, 2015 – September 30, 2015), multiplied by the average account value over the period, multiplied by 183/365 (to reflect the one-half year period). |
29
Table of Contents
| Premier Growth Equity Fund | (Unaudited) |
| Investment Profile |
A mutual fund designed for investors who seek long-term growth of capital and future income. The Fund seeks to achieve its investment objectives by investing at least 80% of its net assets under normal circumstances in equity securities, such as common and preferred stocks. The Fund invests primarily in a limited number of large and medium-sized companies (meaning companies with a market capitalization of $2 billion or more) that the portfolio manager believes have above-average growth histories and/or growth potential.
| Morningstar Performance Comparison | ||||||
Based on average annual returns for periods ended
September 30, 2015
| One Year | Five Year | Ten Year | ||||||||||
Number of funds in peer group | 1,730 | 1,547 | 1,321 | |||||||||
Peer group average annual total return | 1.29 | % | 12.37 | % | 6.37 | % | ||||||
Morningstar Category in peer group: Large Growth |
| |||||||||||
| Top Ten Largest Holdings |
as of September 30, 2015 (as a % of Fair Value) (a)(b)
Apple Inc. | 4.87% | |||
Visa Inc., Class A | 4.51% | |||
Google Inc., Class C | 4.48% | |||
Amazon.com Inc. | 4.37% | |||
Allergan PLC | 4.20% | |||
CME Group Inc. | 3.96% | |||
Lowe’s Companies Inc. | 3.65% | |||
Liberty Global PLC, Class C | 3.56% | |||
PepsiCo Inc. | 3.39% | |||
Amgen Inc. | 3.38% |
| Sector Allocation as of September 30, 2015 |
Portfolio composition as a % of Fair Value of $340,991 (in thousands) as of September 30, 2015 (a)(b)
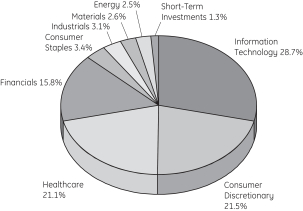
| Change in Value of a $10,000 Investment |
Investment Class Shares
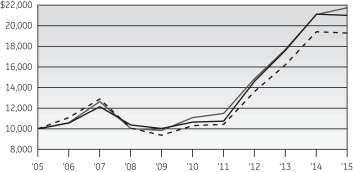
| Average Annual Total Return |
for the periods ended September 30, 2015
| Investment Class Shares (Inception date: 10/29/99) | ||||||||||||||||||||
| One Year | Five Year | Ten Year | Ending Value of a $10,000 Investment | |||||||||||||||||
Premier Growth Equity Fund | -0.47% | 14.54% | 7.71% | $21,025 | ||||||||||||||||
S&P 500 Index | -0.61% | 13.34% | 6.80% | $19,304 | ||||||||||||||||
Russell 1000 Growth Index | 3.18% | 14.48% | 8.09% | $21,764 | ||||||||||||||||
Service Class Shares
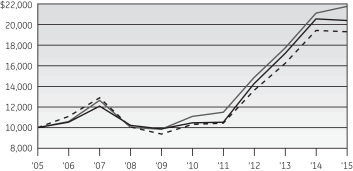
| Average Annual Total Return |
for the periods ended September 30, 2015
| Service Class Shares (Inception date: 1/3/01) | ||||||||||||||||||||
| One Year | Five Year | Ten Year | Ending value of a $10,000 investment | |||||||||||||||||
Premier Growth Equity Fund | -0.77% | 14.25% | 7.38% | $20,391 | ||||||||||||||||
S&P 500 Index | -0.61% | 13.34% | 6.80% | $19,304 | ||||||||||||||||
Russell 1000 Growth Index | 3.18% | 14.48% | 8.09% | $21,764 | ||||||||||||||||

| (a) | Fair Value basis is inclusive of short-term investment in State Street Institutional U.S. Government Money Market Fund Premier Class. |
| (b) | The securities information regarding holdings, allocations and other characteristics is presented to illustrate examples of securities that the Fund has bought and the diversity of areas in which the Fund may invest as of a particular date. It may not be representative of the Fund’s current or future investments and should not be construed as a recommendation to purchase or sell a particular security. |
See Notes to Performance beginning on page 1 for further information, including an explanation of Morningstar peer categories.
Past performance does not predict future performance. The performance shown in the graphs and tables does not reflect the deduction of taxes that a shareholder would pay on Fund distributions or the redemption of Fund shares.
30
Table of Contents
Premier Growth Equity Fund
| Schedule of Investments | September 30, 2015 |
| Premier Growth Equity Fund |
| Number of Shares | Fair Value | |||||||||
Common Stock — 99.0%† | ||||||||||
Air Freight & Logistics — 1.3% | ||||||||||
United Parcel Service Inc., Class B | 45,177 | $ | 4,458,518 | |||||||
Application Software — 2.2% | ||||||||||
Intuit Inc. | 85,334 | 7,573,392 | ||||||||
Asset Management & Custody Banks — 3.0% | ||||||||||
State Street Corp. | 149,585 | 10,053,608 | (e) | |||||||
Biotechnology — 8.5% | ||||||||||
Alexion Pharmaceuticals Inc. | 56,221 | 8,792,402 | (a) | |||||||
Amgen Inc. | 83,326 | 11,525,652 | ||||||||
Gilead Sciences Inc. | 88,345 | 8,674,596 | ||||||||
| 28,992,650 | ||||||||||
Cable & Satellite — 8.1% | ||||||||||
Comcast Corp., Special Class A | 200,786 | 11,492,991 | ||||||||
Liberty Global PLC, Class C | 296,158 | 12,148,401 | (a) | |||||||
Sirius XM Holdings Inc. | 1,003,976 | 3,754,870 | (a) | |||||||
| 27,396,262 | ||||||||||
Casinos & Gaming — 0.9% | ||||||||||
Las Vegas Sands Corp. | 83,326 | 3,163,888 | (h) | |||||||
Communications Equipment — 2.8% | ||||||||||
QUALCOMM Inc. | 179,703 | 9,655,442 | ||||||||
Data Processing & Outsourced Services — 6.2% | ||||||||||
PayPal Holdings Inc. | 180,707 | 5,609,145 | (a) | |||||||
Visa Inc., Class A | 220,863 | 15,385,317 | ||||||||
| 20,994,462 | ||||||||||
Fertilizers & Agricultural Chemicals — 2.7% | ||||||||||
Monsanto Co. | 105,412 | 8,995,860 | ||||||||
Healthcare Equipment — 6.0% | ||||||||||
Abbott Laboratories | 225,883 | 9,085,014 | ||||||||
Medtronic PLC | 170,671 | 11,424,717 | ||||||||
| 20,509,731 | ||||||||||
Healthcare Supplies — 2.4% | ||||||||||
The Cooper Companies Inc. | 55,217 | 8,219,603 | ||||||||
Home Improvement Retail — 3.7% | ||||||||||
Lowe’s Companies Inc. | 180,706 | 12,454,258 | ||||||||
Internet Retail — 4.4% | ||||||||||
Amazon.com Inc. | 29,114 | 14,903,165 | (a) | |||||||
| Number of Shares | Fair Value | |||||||||
Internet Software & Services — 12.6% | ||||||||||
Baidu Inc. ADR | 69,272 | $ | 9,518,665 | (a) | ||||||
eBay Inc. | 261,026 | 6,379,475 | (a) | |||||||
Facebook Inc., Class A | 80,314 | 7,220,229 | (a) | |||||||
Google Inc., Class C | 25,099 | 15,270,734 | (a) | |||||||
LinkedIn Corp., Class A | 24,094 | 4,580,992 | (a) | |||||||
| 42,970,095 | ||||||||||
Investment Banking & Brokerage — 3.0% | ||||||||||
The Charles Schwab Corp. | 361,415 | 10,322,012 | ||||||||
Movies & Entertainment — 2.9% | ||||||||||
The Walt Disney Co. | 96,377 | 9,849,729 | ||||||||
Oil & Gas Equipment & Services — 2.5% | ||||||||||
Schlumberger Ltd. | 123,479 | 8,516,347 | ||||||||
Pharmaceuticals — 4.2% | ||||||||||
Allergan PLC | 52,706 | 14,326,018 | (a) | |||||||
Soft Drinks — 3.4% | ||||||||||
PepsiCo Inc. | 122,479 | 11,549,770 | ||||||||
Specialized Finance — 6.8% | ||||||||||
CME Group Inc. | 145,568 | 13,499,976 | ||||||||
McGraw Hill Financial Inc. | 110,432 | 9,552,368 | ||||||||
| 23,052,344 | ||||||||||
Specialized REITs — 3.1% | ||||||||||
American Tower Corp. | 120,471 | 10,599,039 | ||||||||
Specialty Stores — 1.6% | ||||||||||
Dick’s Sporting Goods Inc. | 110,429 | 5,478,383 | ||||||||
Technology Hardware, Storage & Peripherals — 4.9% | ||||||||||
Apple Inc. | 150,589 | 16,609,967 | ||||||||
Trading Companies & Distributors — 1.8% | ||||||||||
United Rentals Inc. | 100,399 | 6,028,960 | (a) | |||||||
Total Common Stock | 336,673,503 | |||||||||
Short-Term Investments — 1.3% | ||||||||||
State Street Institutional U.S. Government Money Market | 4,317,388 | (d,m) | ||||||||
Total Investments | 340,990,891 | |||||||||
See Notes to Schedules of Investments and Notes to Financial Statements.
31
Table of Contents
Premier Growth Equity Fund
| Schedule of Investments | September 30, 2015 |
| Fair Value | ||||||||
Liabilities in Excess of Other Assets, net — (0.3)% | $ | (944,052 | ) | |||||
|
| |||||||
NET ASSETS — 100.0% | $ | 340,046,839 | ||||||
|
| |||||||
Other Information: | ||||||||
The Fund had the following short futures contracts open at September 30, 2015:
| Description | Expiration date | Number of Contracts | Current Notional Value | Unrealized Appreciation | |||||||||||||
S&P 500 Emini Index Futures | December 2015 | 28 | $ | (2,672,180 | ) | $ | 64,390 | ||||||||||
See Notes to Schedules of Investments and Notes to Financial Statements.
32
Table of Contents

David Wiederecht
President and Chief
Investment Officer –
Investment Solutions

Mike Cervi
Senior Vice President
The Small-Cap Equity Fund is managed by David Wiederecht and Mike Cervi who are vested with oversight authority over the Fund’s sub-advisers that provide day-to-day management of the assets of the Fund allocated to them. Messrs. Wiederecht and Cervi have full discretion in determining the assets that are allocated to each sub-adviser. The current sub-advisers of the Fund are as follows: Champlain Investment Partners, LLC; GlobeFlex Capital, LP; Kennedy Capital Management, Inc.; Palisade Capital Management L.L.C., and SouthernSun Asset Management, LLC. See portfolio managers’ biographical information beginning on page 124.
| Q. | How did the GE Institutional Small-Cap Equity Fund perform compared to its benchmark and Morningstar peer group for the twelve-month period ended September 30, 2015? |
| A. | For the twelve-month period ended September 30, 2015, the GE Institutional Small-Cap Equity Fund returned -0.90% for the Investment Class shares and -1.12% for the Service Class shares. The Fund’s benchmark, the Russell 2000 Index returned 1.25% and the Fund’s Morningstar peer group of 818 US Small Blend funds returned an average of -1.09% over the same period. |
| Q. | What market conditions impacted the Fund’s performance? |
| A. | Growth led the way from the fourth quarter of 2014 through the first two quarters of 2015, particularly the highest beta growth stocks in the index. This created a challenging environment for our sub-advisers which are more cash flow sensitive and tend to invest in growth names that have a lower beta and higher earnings quality. This consistent head wind shifted direction into a tail wind in the third quarter of 2015 and is now adding to performance as the higher quality of earnings has been rewarded during a period of market volatility. |
| Q. | What were the primary drivers behind Fund performance? |
| A. | The bio-tech rally in Q4 of 2014 which lasted through the first two quarters of 2015 detracted from relative performance as bio-techs don’t possess the quality of earnings necessary for our sub-advisers to invest in. Another detractor from performance was the weakness in the energy sector as one of sub-advisers had high concentrations of energy related exposure which resulted in negative excess return. Despite those headwinds, a number of acquisitions help buoy performance resulting in positive excess return year-to-date in 2015. |
| Q. | Were there any significant changes in the Fund during the period? |
| A. | There were no significant changes to the portfolio managers at GEAM or at the sub-advisers. Nor were there significant changes to weightings of the managers during this period despite some of their styles being out of favor. This is largely due to our belief as portfolio managers that the investment styles present in the Fund will protect capital in down-markets and will add positive excess returns over a market cycle despite the short-term underperformance. |
33
Table of Contents
| Small-Cap Equity Fund | (Unaudited) |
Understanding Your Fund’s Expenses
As a shareholder of the Fund you incur ongoing costs. Ongoing costs include portfolio management fees, distribution and service fees (for Service Class shares), professional fees, administrative fees and other Fund expenses. The following example is intended to help you understand your ongoing costs (in dollars) of investing in the Fund and to compare these costs with the ongoing costs of investing in other mutual funds.
To illustrate these ongoing costs, we have provided an example and calculated the expenses paid by investors in each share class of the Fund during the period. The information in the following table is based on an investment of $1,000, which is invested at the beginning of the period and held for the entire six-month period ended September 30, 2015.
Actual Expenses
The first section of the table provides information about actual account values and actual expenses. You may use the information in this section, together with the amount you invested, to estimate the expenses that you paid over the period. To do so, simply divide your account value by $1,000 (for example, an $8,600 account value divided by $1,000 = 8.6), then multiply the result by the
number given for your class under the heading “Expenses paid during the period” to estimate the expenses you paid on your account during the period.
Hypothetical Example for Comparison Purposes
The second section of the table provides information about hypothetical account values and hypothetical expenses based on the Fund’s actual expense ratio and an assumed rate of return of 5% per year before expenses, which is not the Fund’s actual return. The hypothetical account values and expenses may not be used to estimate the actual ending account balance or expenses you paid for the period. You may use this information to compare the ongoing costs of investing in the Fund and other funds. To do so, compare this 5% hypothetical example with the 5% hypothetical examples that appear in the shareholders reports of other funds.
Please note that the expenses shown in the table are meant to highlight and help you compare ongoing costs only and do not reflect transaction costs, such as sales charges or redemption fees, if any. Therefore, the second section of the table is useful in comparing ongoing costs only, and will not help you determine the relative total costs of owning different funds.
April 1, 2015 – September 30, 2015
| Account value at the beginning of the period ($) | Account value at the end of the period ($) | Expenses paid during the period ($)* | |||||||||||||
Actual Fund Return | |||||||||||||||
Investment Class | 1,000.00 | 893.90 | 4.23 | ||||||||||||
Service Class | 1,000.00 | 892.60 | 5.41 | ||||||||||||
Hypothetical 5% Return (2.5% for the period) |
| ||||||||||||||
Investment Class | 1,000.00 | 1,020.61 | 4.51 | ||||||||||||
Service Class | 1,000.00 | 1,019.35 | 5.77 | ||||||||||||
| * | Expenses are equal to the Fund’s annualized net expense ratio of 0.89% for Investment Class shares and 1.14% for Service Class shares (for the period April 1, 2015 – September 30, 2015), multiplied by the average account value over the period, multiplied by 183/365 (to reflect the one-half year period). |
34
Table of Contents
| Small-Cap Equity Fund | (Unaudited) |
| Investment Profile |
A mutual fund designed for investors who seek long-term growth of capital. The Fund seeks to achieve its investment objective by investing at least 80% of its net assets under normal circumstances in equity securities of small-cap companies, such as common and preferred stocks. The Fund uses a multi- sub-adviser investment strategy that combines growth, value and core investment management styles, which allows the Fund the potential to benefit from both value and growth cycles in the marketplace.
| Morningstar Performance Comparison |
Based on average annual returns for periods ended
September 30, 2015
| One Year | Five Year | Ten Year | ||||||||||
Number of funds in peer group | 818 | 689 | 561 | |||||||||
Peer group average annual total return | -1.09 | % | 10.98 | % | 5.76 | % | ||||||
Morningstar Category in peer group: Small Blend |
| |||||||||||
| Top Ten Largest Holdings |
as of September 30, 2015 (as a % of Fair Value) (a)(b)
Blackbaud Inc. | 1.32% | |||
John Wiley & Sons Inc., Class A | 1.22% | |||
MEDNAX Inc. | 1.02% | |||
Endurance Specialty Holdings Ltd. | 0.88% | |||
Woodward Inc. | 0.88% | |||
ICON PLC | 0.88% | |||
UMB Financial Corp. | 0.87% | |||
CLARCOR Inc. | 0.85% | |||
Integra LifeSciences Holdings Corp. | 0.83% | |||
Microsemi Corp. | 0.81% |
| Sector Allocation as of September 30, 2015 |
Portfolio composition as a % of Fair Value of $1,176,010 (in thousands) as of September 30, 2015 (a)(b)
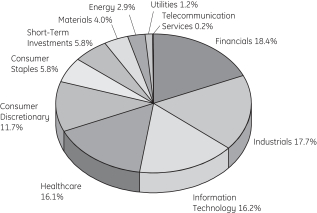
| Change in Value of a $10,000 Investment |
Investment Class Shares
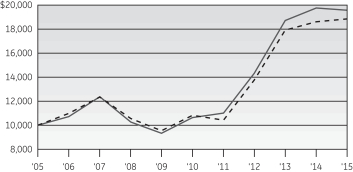
| Average Annual Total Return |
for the periods ended September 30, 2015
| Investment Class Shares (Inception date: 8/3/98) | ||||||||||||||||||||
| One Year | Five Year | Ten Year | Ending Value of a $10,000 Investment | |||||||||||||||||
Small-Cap Equity Fund | -0.90% | 12.97% | 6.96% | $19,591 | ||||||||||||||||
Russell 2000 Index | 1.25% | 11.74% | 6.55% | $18,855 | ||||||||||||||||
Service Class Shares
| Average Annual Total Return |
for the periods ended September 30, 2015
| Service Class Shares (Inception date: 9/30/05) | ||||||||||||||||||||
| One Year | Five Year | Ten Year | Ending value of a $10,000 investment | |||||||||||||||||
Small-Cap Equity Fund | -1.12% | 12.68% | 6.70% | $19,118 | ||||||||||||||||
Russell 2000 Index | 1.25% | 11.74% | 6.55% | $18,855 | ||||||||||||||||

| (a) | Fair Value basis is inclusive of short-term investment in State Street Institutional U.S. Government Money Market Fund Premier Class. |
| (b) | The securities information regarding holdings, allocations and other characteristics is presented to illustrate examples of securities that the Fund has bought and the diversity of areas in which the Fund may invest as of a particular date. It may not be representative of the Fund’s current or future investments and should not be construed as a recommendation to purchase or sell a particular security. |
See Notes to Performance beginning on page 1 for further information, including an explanation of Morningstar peer categories.
Past performance does not predict future performance. The performance shown in the graphs and tables does not reflect the deduction of taxes that a shareholder would pay on Fund distributions or the redemption of Fund shares.
35
Table of Contents
Small-Cap Equity Fund
| Schedule of Investments | September 30, 2015 |
| Small-Cap Equity Fund | ||||
| Number of Shares | Fair Value | |||||||||
Common Stock — 94.4%† |
| |||||||||
Advertising — 0.1% |
| |||||||||
MDC Partners Inc., Class A | 37,700 | $ | 694,811 | |||||||
National CineMedia Inc. | 42,500 | 570,350 | ||||||||
| 1,265,161 | ||||||||||
Aerospace & Defense — 0.8% | ||||||||||
Esterline Technologies Corp. | 73,910 | 5,313,390 | (a) | |||||||
Teledyne Technologies Inc. | 42,477 | 3,835,673 | (a) | |||||||
| 9,149,063 | ||||||||||
Agricultural & Farm Machinery — 0.7% |
| |||||||||
AGCO Corp. | 181,240 | 8,451,221 | ||||||||
Agricultural Products — 0.8% | ||||||||||
Darling Ingredients Inc. | 801,420 | 9,007,961 | (a) | |||||||
Fresh Del Monte Produce Inc. | 16,127 | 637,178 | ||||||||
| 9,645,139 | ||||||||||
Alternative Carriers — 0.1% | ||||||||||
Inteliquent Inc. | 38,500 | 859,705 | ||||||||
Aluminum — 0.0%* | ||||||||||
Century Aluminum Co. | 52,077 | 239,554 | (a) | |||||||
Apparel Retail — 1.1% | ||||||||||
Abercrombie & Fitch Co., Class A | 50,090 | 1,061,407 | ||||||||
Citi Trends Inc. | 27,400 | 640,612 | ||||||||
Genesco Inc. | 80,809 | 4,611,770 | (a) | |||||||
The Buckle Inc. | 149,992 | 5,545,204 | ||||||||
The Children’s Place Inc. | 12,550 | 723,759 | ||||||||
Tilly’s Inc., Class A | 25,993 | 191,308 | (a) | |||||||
| 12,774,060 | ||||||||||
Apparel, Accessories & Luxury Goods — 0.9% |
| |||||||||
Columbia Sportswear Co. | 71,855 | 4,224,355 | ||||||||
G-III Apparel Group Ltd. | 22,110 | 1,363,303 | (a) | |||||||
Iconix Brand Group Inc. | 360,505 | 4,874,028 | (a) | |||||||
Oxford Industries Inc. | 7,496 | 553,804 | ||||||||
| 11,015,490 | ||||||||||
Application Software — 5.4% | ||||||||||
ACI Worldwide Inc. | 235,446 | 4,972,620 | (a) | |||||||
Blackbaud Inc. | 276,786 | 15,533,231 | (h) | |||||||
Fair Isaac Corp. | 9,940 | 839,930 | ||||||||
Guidewire Software Inc. | 135,500 | 7,124,590 | (a) | |||||||
Jive Software Inc. | 479,390 | 2,238,751 | (a) | |||||||
Mentor Graphics Corp. | 158,500 | 3,903,855 | ||||||||
MicroStrategy Inc., Class A | 4,900 | 962,703 | (a) | |||||||
PROS Holdings Inc. | 243,500 | 5,391,090 | (a) | |||||||
| Number of Shares | Fair Value | |||||||||
PTC Inc. | 110,223 | $ | 3,498,478 | (a) | ||||||
Qlik Technologies Inc. | 74,000 | 2,697,300 | (a) | |||||||
RealPage Inc. | 302,444 | 5,026,619 | (a) | |||||||
Solera Holdings Inc. | 87,971 | 4,750,434 | ||||||||
SS&C Technologies Holdings Inc. | 86,452 | 6,055,098 | ||||||||
Zix Corp. | 149,600 | 629,816 | (a) | |||||||
| 63,624,515 | ||||||||||
Asset Management & Custody Banks — 0.6% |
| |||||||||
Financial Engines Inc. | 197,500 | 5,820,325 | ||||||||
Westwood Holdings Group Inc. | 11,678 | 634,699 | ||||||||
| 6,455,024 | ||||||||||
Auto Parts & Equipment — 0.8% |
| |||||||||
American Axle & Manufacturing Holdings Inc. | 31,751 | 633,115 | (a) | |||||||
Cooper-Standard Holding Inc. | 12,067 | 699,886 | (a) | |||||||
Stoneridge Inc. | 55,217 | 681,378 | (a) | |||||||
Tenneco Inc. | 163,850 | 7,335,564 | (a) | |||||||
| 9,349,943 | ||||||||||
Automobile Manufacturers — 0.6% | ||||||||||
Thor Industries Inc. | 115,795 | 5,998,181 | ||||||||
Winnebago Industries Inc. | 63,471 | 1,215,470 | ||||||||
| 7,213,651 | ||||||||||
Automotive Retail — 1.3% | ||||||||||
CST Brands Inc. | 247,500 | 8,330,850 | ||||||||
Group 1 Automotive Inc. | 44,325 | 3,774,274 | ||||||||
Monro Muffler Brake Inc. | 40,080 | 2,707,404 | ||||||||
| 14,812,528 | ||||||||||
Biotechnology — 1.6% | ||||||||||
Aduro Biotech Inc. | 14,800 | 286,676 | (a) | |||||||
Agios Pharmaceuticals Inc. | 7,000 | 494,130 | (a) | |||||||
Anacor Pharmaceuticals Inc. | 6,500 | 765,115 | �� | (a) | ||||||
Cepheid | 114,000 | 5,152,800 | (a) | |||||||
Concert Pharmaceuticals Inc. | 17,800 | 334,106 | (a) | |||||||
Eagle Pharmaceuticals Inc. | 4,800 | 355,344 | (a) | |||||||
FibroGen Inc. | 20,700 | 453,744 | (a) | |||||||
Five Prime Therapeutics Inc. | 25,100 | 386,289 | (a) | |||||||
Halozyme Therapeutics Inc. | 43,100 | 578,833 | (a) | |||||||
Infinity Pharmaceuticals Inc. | 53,400 | 451,230 | (a) | |||||||
Ligand Pharmaceuticals Inc., Class B | 4,500 | 385,425 | (a) | |||||||
MacroGenics Inc. | 28,800 | 616,896 | (a) | |||||||
Merrimack Pharmaceuticals Inc. | 34,900 | 296,999 | (a) | |||||||
MiMedx Group Inc. | 36,600 | 353,190 | (a) | |||||||
Neurocrine Biosciences Inc. | 19,800 | 787,842 | (a) | |||||||
NewLink Genetics Corp. | 10,100 | 361,984 | (a) | |||||||
Ophthotech Corp. | 8,500 | 344,420 | (a) | |||||||
Raptor Pharmaceutical Corp. | 63,700 | 385,385 | (a) | |||||||
Repligen Corp. | 170,193 | 4,739,875 | (a) | |||||||
Retrophin Inc. | 20,800 | 421,408 | (a) | |||||||
Sangamo Biosciences Inc. | 68,600 | 386,904 | (a) | |||||||
| 18,338,595 | ||||||||||
See Notes to Schedules of Investments and Notes to Financial Statements.
36
Table of Contents
Small-Cap Equity Fund
| Schedule of Investments | September 30, 2015 |
| Number of Shares | Fair Value | |||||||||
Brewers — 0.1% | ||||||||||
The Boston Beer Company Inc., Class A | 6,500 | $ | 1,368,965 | (a) | ||||||
Broadcasting — 0.0%* | ||||||||||
Gray Television Inc. | 42,579 | 543,308 | (a) | |||||||
Building Products — 0.3% | ||||||||||
Apogee Enterprises Inc. | 9,219 | 411,629 | ||||||||
Builders FirstSource Inc. | 88,696 | 1,124,665 | (a) | |||||||
Universal Forest Products Inc. | 30,465 | 1,757,221 | ||||||||
| 3,293,515 | ||||||||||
Cable & Satellite — 0.1% | ||||||||||
Starz, Class A | 21,900 | 817,746 | (a) | |||||||
Casinos & Gaming — 0.3% | ||||||||||
Churchill Downs Inc. | 6,300 | 843,003 | ||||||||
Eldorado Resorts Inc. | 68,600 | 618,772 | (a) | |||||||
Isle of Capri Casinos Inc. | 45,400 | 791,776 | (a) | |||||||
Pinnacle Entertainment Inc. | 28,588 | 967,418 | (a) | |||||||
| 3,220,969 | ||||||||||
Commercial Printing — 0.3% | ||||||||||
Brady Corp., Class A | 198,000 | 3,892,680 | ||||||||
Commodity Chemicals — 0.2% | ||||||||||
Core Molding Technologies Inc. | 32,200 | 594,090 | (a) | |||||||
Koppers Holdings Inc. | 41,920 | 845,526 | ||||||||
Trinseo S.A. | 23,451 | 592,138 | (a) | |||||||
| 2,031,754 | ||||||||||
Communications Equipment — 0.4% |
| |||||||||
ADTRAN Inc. | 62,728 | 915,829 | ||||||||
CalAmp Corp. | 62,749 | 1,009,631 | (a) | |||||||
Ciena Corp. | 44,835 | 928,981 | (a) | |||||||
Finisar Corp. | 50,011 | 556,623 | (a) | |||||||
Polycom Inc. | 45,900 | 481,032 | (a) | |||||||
Ruckus Wireless Inc. | 90,806 | 1,078,775 | (a) | |||||||
| 4,970,871 | ||||||||||
Construction & Engineering — 0.9% |
| |||||||||
Chicago Bridge & Iron Company N.V. | 201,005 | 7,971,858 | ||||||||
Comfort Systems USA Inc. | 40,295 | 1,098,442 | ||||||||
Dycom Industries Inc. | 11,108 | 803,775 | (a) | |||||||
Granite Construction Inc. | 20,707 | 614,377 | ||||||||
| 10,488,452 | ||||||||||
Construction Machinery & Heavy Trucks — 1.0% |
| |||||||||
Alamo Group Inc. | 34,505 | 1,613,109 | ||||||||
Astec Industries Inc. | 42,481 | 1,423,538 | ||||||||
FreightCar America Inc. | 19,559 | 335,632 | ||||||||
The Greenbrier Companies Inc. | 16,980 | 545,228 | ||||||||
| Number of Shares | Fair Value | |||||||||
Trinity Industries Inc. | 271,680 | $ | 6,158,986 | |||||||
Wabash National Corp. | 129,940 | 1,376,065 | (a) | |||||||
| 11,452,558 | ||||||||||
Consumer Electronics — 0.1% | ||||||||||
Skullcandy Inc. | 66,443 | 367,430 | (a) | |||||||
ZAGG Inc. | 62,000 | 420,980 | (a) | |||||||
| 788,410 | ||||||||||
Data Processing & Outsourced Services — 2.4% |
| |||||||||
Broadridge Financial Solutions Inc. | 146,995 | 8,136,173 | ||||||||
CoreLogic Inc. | 152,326 | 5,671,097 | (a) | |||||||
CSG Systems International Inc. | 94,980 | 2,925,384 | ||||||||
Everi Holdings Inc. | 404,405 | 2,074,598 | (a) | |||||||
Higher One Holdings Inc. | 309,917 | 610,536 | (a) | |||||||
WEX Inc. | 104,500 | 9,074,780 | (a) | |||||||
| 28,492,568 | ||||||||||
Distributors — 0.7% | ||||||||||
LKQ Corp. | 296,977 | 8,422,268 | (a) | |||||||
Diversified Metals & Mining — 0.0%* |
| |||||||||
Materion Corp. | 16,869 | 506,407 | ||||||||
Diversified REITs — 0.3% | ||||||||||
Cousins Properties Inc. | 392,376 | 3,617,707 | ||||||||
Diversified Support Services — 1.5% |
| |||||||||
Healthcare Services Group Inc. | 217,786 | 7,339,388 | ||||||||
Ritchie Bros Auctioneers Inc. | 332,539 | 8,606,109 | ||||||||
UniFirst Corp. | 11,232 | 1,199,690 | ||||||||
| 17,145,187 | ||||||||||
Education Services — 0.6% | ||||||||||
Bright Horizons Family Solutions Inc. | 24,000 | 1,541,760 | (a) | |||||||
Capella Education Co. | 8,800 | 435,776 | ||||||||
Grand Canyon Education Inc. | 15,700 | 596,443 | (a) | |||||||
ITT Educational Services Inc. | 222,728 | 763,957 | (a) | |||||||
K12 Inc. | 293,185 | 3,647,221 | (a) | |||||||
Strayer Education Inc. | 11,500 | 632,155 | (a) | |||||||
| 7,617,312 | ||||||||||
Electric Utilities — 1.0% | ||||||||||
ALLETE Inc. | 22,411 | 1,131,531 | ||||||||
IDACORP Inc. | 142,193 | 9,201,309 | ||||||||
PNM Resources Inc. | 40,594 | 1,138,662 | ||||||||
| 11,471,502 | ||||||||||
Electrical Components & Equipment — 0.3% |
| |||||||||
Encore Wire Corp. | 66,405 | 2,169,451 | ||||||||
EnerSys | 19,672 | 1,054,026 | ||||||||
Regal Beloit Corp. | 10,008 | 564,952 | ||||||||
| 3,788,429 | ||||||||||
See Notes to Schedules of Investments and Notes to Financial Statements.
37
Table of Contents
Small-Cap Equity Fund
| Schedule of Investments | September 30, 2015 |
| Number of Shares | Fair Value | |||||||||
Electronic Components — 0.6% |
| |||||||||
Belden Inc. | 11,296 | $ | 527,410 | |||||||
DTS Inc. | 21,100 | 563,370 | (a) | |||||||
Littelfuse Inc. | 48,973 | 4,463,889 | ||||||||
Rogers Corp. | 24,737 | 1,315,514 | (a) | |||||||
| 6,870,183 | ||||||||||
Electronic Equipment & Instruments — 0.4% |
| |||||||||
Coherent Inc. | 14,617 | 799,550 | (a) | |||||||
Control4 Corp. | 139,345 | 1,137,055 | (a) | |||||||
FARO Technologies Inc. | 17,213 | 602,455 | (a) | |||||||
Rofin-Sinar Technologies Inc. | 34,355 | 890,825 | (a) | |||||||
Zebra Technologies Corp., Class A | 23,360 | 1,788,208 | (a) | |||||||
| 5,218,093 | ||||||||||
Electronic Manufacturing Services — 0.3% |
| |||||||||
Methode Electronics Inc. | 40,519 | 1,292,556 | ||||||||
Plexus Corp. | 45,628 | 1,760,328 | (a) | |||||||
| 3,052,884 | ||||||||||
Environmental & Facilities Services — 0.8% |
| |||||||||
Clean Harbors Inc. | 190,855 | 8,391,894 | (a) | |||||||
SP Plus Corp. | 33,200 | 768,580 | (a) | |||||||
| 9,160,474 | ||||||||||
Fertilizers & Agricultural Chemicals — 0.3% |
| |||||||||
American Vanguard Corp. | 76,000 | 878,560 | ||||||||
Intrepid Potash Inc. | 384,388 | 2,129,510 | (a) | |||||||
| 3,008,070 | ||||||||||
Food Distributors — 0.5% | ||||||||||
SpartanNash Co. | 222,663 | 5,755,839 | ||||||||
Food Retail — 1.2% | ||||||||||
Casey’s General Stores Inc. | 62,910 | 6,474,697 | ||||||||
The Fresh Market Inc. | 318,000 | 7,183,620 | (a) | |||||||
| 13,658,317 | ||||||||||
Footwear — 1.0% | ||||||||||
Crocs Inc. | 49,958 | 645,707 | (a) | |||||||
Deckers Outdoor Corp. | 66,099 | 3,837,708 | (a) | |||||||
Wolverine World Wide Inc. | 347,000 | 7,509,080 | ||||||||
| 11,992,495 | ||||||||||
Gas Utilities — 0.1% | ||||||||||
South Jersey Industries Inc. | 53,748 | 1,357,137 | ||||||||
Health Care REITs — 0.4% | ||||||||||
National Health Investors Inc. | 10,772 | 619,282 | ||||||||
Omega Healthcare Investors Inc. | 109,485 | 3,848,398 | ||||||||
| 4,467,680 | ||||||||||
Healthcare Distributors — 0.5% | ||||||||||
Aceto Corp. | 97,500 | 2,676,375 | ||||||||
| Number of Shares | Fair Value | |||||||||
Owens & Minor Inc. | 85,578 | $ | 2,733,361 | |||||||
| 5,409,736 | ||||||||||
Healthcare Equipment — 5.1% | ||||||||||
ABIOMED Inc. | 5,000 | 463,800 | (a) | |||||||
Analogic Corp. | 9,800 | 803,992 | ||||||||
Cantel Medical Corp. | 91,000 | 5,159,700 | ||||||||
Cardiovascular Systems Inc. | 72,500 | 1,148,400 | (a) | |||||||
Exactech Inc. | 20,707 | 360,923 | (a) | |||||||
Globus Medical Inc., Class A | 238,184 | 4,920,881 | (a) | |||||||
Greatbatch Inc. | 11,074 | 624,795 | (a) | |||||||
Hill-Rom Holdings Inc. | 165,317 | 8,594,831 | ||||||||
Inogen Inc. | 23,100 | 1,121,505 | (a) | |||||||
Insulet Corp. | 154,000 | 3,990,140 | (a) | |||||||
Integra LifeSciences Holdings Corp. | 164,500 | 9,795,975 | (a) | |||||||
iRadimed Corp. | 30,300 | 738,108 | (a) | |||||||
K2M Group Holdings Inc. | 34,400 | 639,840 | (a) | |||||||
LeMaitre Vascular Inc. | 61,900 | 754,561 | ||||||||
Masimo Corp. | 165,800 | 6,393,248 | (a) | |||||||
Natus Medical Inc. | 51,533 | 2,032,977 | (a) | |||||||
NuVasive Inc. | 135,700 | 6,543,454 | (a) | |||||||
Orthofix International N.V. | 8,780 | 296,325 | (a) | |||||||
STERIS Corp. | 71,500 | 4,645,355 | ||||||||
Zeltiq Aesthetics Inc. | 23,800 | 762,314 | (a) | |||||||
| 59,791,124 | ||||||||||
Healthcare Facilities — 0.9% | ||||||||||
Amsurg Corp. | 117,360 | 9,120,046 | (a) | |||||||
Genesis Healthcare Inc. | 103,150 | 632,309 | (a) | |||||||
Kindred Healthcare Inc. | 38,067 | 599,555 | ||||||||
| 10,351,910 | ||||||||||
Healthcare Services — 1.8% | ||||||||||
Addus HomeCare Corp. | 16,000 | 498,400 | (a) | |||||||
Air Methods Corp. | 76,343 | 2,602,533 | (a) | |||||||
Amedisys Inc. | 13,700 | 520,189 | (a) | |||||||
AMN Healthcare Services Inc. | 17,516 | 525,655 | (a) | |||||||
BioTelemetry Inc. | 79,200 | 969,408 | (a) | |||||||
Cross Country Healthcare Inc. | 57,000 | 775,770 | (a) | |||||||
LHC Group Inc. | 21,200 | 949,124 | (a) | |||||||
MEDNAX Inc. | 156,283 | 12,000,972 | (a) | |||||||
RadNet Inc. | 100,300 | 556,665 | (a) | |||||||
Team Health Holdings Inc. | 40,700 | 2,199,021 | (a) | |||||||
| 21,597,737 | ||||||||||
Healthcare Supplies — 1.4% | ||||||||||
Endologix Inc. | 373,692 | 4,581,464 | (a) | |||||||
Halyard Health Inc. | 95,500 | 2,716,020 | (a) | |||||||
ICU Medical Inc. | 58,400 | 6,394,800 | (a) | |||||||
Merit Medical Systems Inc. | 9,943 | 237,737 | (a) | |||||||
OraSure Technologies Inc. | 148,200 | 658,008 | (a) | |||||||
Vascular Solutions Inc. | 21,800 | 706,538 | (a) | |||||||
West Pharmaceutical Services Inc. | 25,500 | 1,380,060 | ||||||||
| 16,674,627 | ||||||||||
Healthcare Technology — 1.4% | ||||||||||
HMS Holdings Corp. | 394,359 | 3,458,528 | (a) | |||||||
See Notes to Schedules of Investments and Notes to Financial Statements.
38
Table of Contents
Small-Cap Equity Fund
| Schedule of Investments | September 30, 2015 |
| Number of Shares | Fair Value | |||||||||
MedAssets Inc. | 52,177 | $ | 1,046,671 | (a) | ||||||
Medidata Solutions Inc. | 125,500 | 5,284,805 | (a) | |||||||
Omnicell Inc. | 156,500 | 4,867,150 | (a) | |||||||
Quality Systems Inc. | 45,006 | 561,675 | ||||||||
Veeva Systems Inc., Class A | 19,713 | 461,481 | (a) | |||||||
Vocera Communications Inc. | 73,822 | 842,309 | (a) | |||||||
| 16,522,619 | ||||||||||
Home Building — 0.2% | ||||||||||
Meritage Homes Corp. | 32,441 | 1,184,745 | (a) | |||||||
TopBuild Corp. | 23,447 | 726,154 | (a) | |||||||
| 1,910,899 | ||||||||||
Home Furnishings — 0.1% | ||||||||||
Ethan Allen Interiors Inc. | 52,113 | 1,376,304 | ||||||||
Hotel & Resort REITs — 0.4% | ||||||||||
Ashford Hospitality Trust Inc. | 92,737 | 565,696 | ||||||||
Hersha Hospitality Trust | 53,385 | 1,209,704 | ||||||||
RLJ Lodging Trust | 99,525 | 2,514,997 | ||||||||
Summit Hotel Properties Inc. | 27,681 | 323,037 | ||||||||
| 4,613,434 | ||||||||||
Hotels, Resorts & Cruise Lines — 0.3% | ||||||||||
Interval Leisure Group Inc. | 168,075 | 3,085,857 | ||||||||
Household Appliances — 0.1% | ||||||||||
Helen of Troy Ltd. | 13,648 | 1,218,766 | (a) | |||||||
Housewares & Specialties — 0.7% | ||||||||||
Jarden Corp. | 171,234 | 8,369,918 | (a) | |||||||
Human Resource & Employment Services — 0.1% | ||||||||||
Insperity Inc. | 15,519 | 681,750 | ||||||||
TrueBlue Inc. | 40,797 | 916,708 | (a) | |||||||
| 1,598,458 | ||||||||||
Industrial Conglomerates — 0.3% | ||||||||||
Raven Industries Inc. | 193,500 | 3,279,825 | ||||||||
Industrial Machinery — 6.6% | ||||||||||
Actuant Corp., Class A | 268,000 | 4,928,520 | ||||||||
Altra Industrial Motion Corp. | 36,865 | 852,319 | ||||||||
Barnes Group Inc. | 64,860 | 2,338,203 | ||||||||
CLARCOR Inc. | 209,623 | 9,994,825 | ||||||||
IDEX Corp. | 98,900 | 7,051,570 | ||||||||
John Bean Technologies Corp. | 48,800 | 1,866,600 | ||||||||
LB Foster Co., Class A | 27,126 | 333,107 | ||||||||
Luxfer Holdings PLC ADR | 210,134 | 2,267,346 | ||||||||
Lydall Inc. | 121,500 | 3,461,535 | (a) | |||||||
Mueller Industries Inc. | 184,062 | 5,444,554 | ||||||||
NN Inc. | 13,152 | 243,312 | ||||||||
Nordson Corp. | 64,165 | 4,038,545 | ||||||||
RBC Bearings Inc. | 97,500 | 5,823,675 | (a) | |||||||
Standex International Corp. | 71,000 | 5,349,850 | ||||||||
| Number of Shares | Fair Value | |||||||||
The Gorman-Rupp Co. | 61,900 | $ | 1,483,743 | |||||||
The Timken Co. | 220,750 | 6,068,417 | ||||||||
TriMas Corp. | 371,300 | 6,070,755 | (a) | |||||||
Woodward Inc. | 253,301 | 10,309,351 | ||||||||
| 77,926,227 | ||||||||||
Industrial REITs — 0.2% | ||||||||||
Rexford Industrial Realty Inc. | 61,243 | 844,541 | ||||||||
STAG Industrial Inc. | 61,293 | 1,116,146 | ||||||||
| 1,960,687 | ||||||||||
Internet Retail — 0.2% | ||||||||||
1-800-Flowers.com Inc., Class A | 74,500 | 677,950 | (a) | |||||||
Liberty TripAdvisor Holdings Inc., Class A | 23,900 | 529,863 | (a) | |||||||
Overstock.com Inc. | 37,800 | 648,648 | (a) | |||||||
| 1,856,461 | ||||||||||
Internet Software & Services — 2.2% | ||||||||||
Angie’s List Inc. | 58,200 | 293,328 | (a) | |||||||
Brightcove Inc. | 58,400 | 287,328 | (a) | |||||||
Constant Contact Inc. | 29,700 | 719,928 | (a) | |||||||
Cornerstone OnDemand Inc. | 125,945 | 4,156,185 | (a) | |||||||
Endurance International Group Holdings Inc. | 42,500 | 567,800 | (a) | |||||||
GrubHub Inc. | 20,534 | 499,798 | (a) | |||||||
LogMeIn Inc. | 137,500 | 9,372,000 | (a) | |||||||
NIC Inc. | 389,319 | 6,894,839 | ||||||||
SPS Commerce Inc. | 33,000 | 2,240,370 | (a) | |||||||
XO Group Inc. | 52,583 | 742,998 | (a) | |||||||
| 25,774,574 | ||||||||||
Investment Banking & Brokerage — 1.0% | ||||||||||
Greenhill & Company Inc. | 44,582 | 1,269,250 | ||||||||
Piper Jaffray Cos. | 35,244 | 1,274,775 | (a) | |||||||
Raymond James Financial Inc. | 178,993 | 8,883,423 | ||||||||
Stifel Financial Corp. | 18,705 | 787,480 | (a) | |||||||
| 12,214,928 | ||||||||||
IT Consulting & Other Services — 0.1% | ||||||||||
Lionbridge Technologies Inc. | 139,900 | 691,106 | (a) | |||||||
Perficient Inc. | 50,241 | 775,219 | (a) | |||||||
| 1,466,325 | ||||||||||
Leisure Facilities — 0.1% | ||||||||||
Vail Resorts Inc. | 6,463 | 676,547 | ||||||||
Life & Health Insurance — 0.2% | ||||||||||
American Equity Investment Life Holding Co. | 63,377 | 1,477,318 | ||||||||
StanCorp Financial Group Inc. | 11,916 | 1,360,807 | ||||||||
| 2,838,125 | ||||||||||
Life Sciences Tools & Services — 1.9% | ||||||||||
Albany Molecular Research Inc. | 238,780 | 4,159,548 | (a) | |||||||
Bruker Corp. | 192,899 | 3,169,331 | (a) | |||||||
See Notes to Schedules of Investments and Notes to Financial Statements.
39
Table of Contents
Small-Cap Equity Fund
| Schedule of Investments | September 30, 2015 |
| Number of Shares | Fair Value | |||||||||
Cambrex Corp. | 31,386 | $ | 1,245,396 | (a) | ||||||
Charles River Laboratories International Inc. | 12,983 | 824,680 | (a) | |||||||
ICON PLC | 145,122 | 10,299,308 | (a) | |||||||
INC Research Holdings Inc., Class A | 15,700 | 628,000 | (a) | |||||||
NeoGenomics Inc. | 137,300 | 786,729 | (a) | |||||||
PAREXEL International Corp. | 15,274 | 945,766 | (a) | |||||||
PRA Health Sciences Inc. | 13,300 | 516,439 | (a) | |||||||
| 22,575,197 | ||||||||||
Managed Healthcare — 1.1% | ||||||||||
Centene Corp. | 147,545 | 8,001,365 | (a) | |||||||
Molina Healthcare Inc. | 65,497 | 4,509,469 | (a) | |||||||
| 12,510,834 | ||||||||||
Marine — 0.1% | ||||||||||
Matson Inc. | 21,909 | 843,277 | ||||||||
Multi-Line Insurance — 0.4% | ||||||||||
HCC Insurance Holdings Inc. | 55,897 | 4,330,341 | ||||||||
Horace Mann Educators Corp. | 18,251 | 606,298 | ||||||||
| 4,936,639 | ||||||||||
Multi-Utilities — 0.1% | ||||||||||
Avista Corp. | 32,786 | 1,090,135 | ||||||||
Office REITs — 0.8% | ||||||||||
BioMed Realty Trust Inc. | 374,477 | 7,482,051 | ||||||||
Corporate Office Properties Trust | 37,191 | 782,127 | ||||||||
Franklin Street Properties Corp. | 62,064 | 667,188 | ||||||||
Gramercy Property Trust Inc. | 44,616 | 926,674 | ||||||||
| 9,858,040 | ||||||||||
Office Services & Supplies — 1.1% | ||||||||||
ARC Document Solutions Inc. | 74,692 | 444,418 | (a) | |||||||
Herman Miller Inc. | 168,155 | 4,849,590 | ||||||||
Steelcase Inc., Class A | 61,427 | 1,130,871 | ||||||||
West Corp. | 308,128 | 6,902,067 | ||||||||
| 13,326,946 | ||||||||||
Oil & Gas Drilling — 0.0%* | ||||||||||
Nabors Industries Ltd. | 43,203 | 408,268 | ||||||||
Oil & Gas Equipment & Services — 1.1% | ||||||||||
CARBO Ceramics Inc. | 147,765 | 2,806,057 | ||||||||
Dril-Quip Inc. | 31,618 | 1,840,800 | (a) | |||||||
Forum Energy Technologies Inc. | 339,650 | 4,147,127 | (a) | |||||||
Geospace Technologies Corp. | 17,005 | 234,839 | (a) | |||||||
Hornbeck Offshore Services Inc. | 53,002 | 717,117 | (a) | |||||||
Natural Gas Services Group Inc. | 30,965 | 597,625 | (a) | |||||||
Oil States International Inc. | 103,032 | 2,692,226 | (a) | |||||||
Seventy Seven Energy Inc. | 171,451 | 236,602 | (a) | |||||||
| 13,272,393 | ||||||||||
Oil & Gas Exploration & Production — 1.5% | ||||||||||
Bonanza Creek Energy Inc. | 54,225 | 220,696 | (a) | |||||||
| Number of Shares | Fair Value | |||||||||
Carrizo Oil & Gas Inc. | 18,511 | $ | 565,326 | (a) | ||||||
Denbury Resources Inc. | 1,052,948 | 2,569,193 | ||||||||
Newfield Exploration Co. | 237,590 | 7,816,711 | (a) | |||||||
Parsley Energy Inc., Class A | 46,744 | 704,432 | (a) | |||||||
Sanchez Energy Corp. | 156,583 | 962,985 | (a) | |||||||
SM Energy Co. | 123,411 | 3,954,088 | ||||||||
Synergy Resources Corp. | 95,901 | 939,830 | (a) | |||||||
TransAtlantic Petroleum Ltd. | 86,714 | 220,254 | (a) | |||||||
| 17,953,515 | ||||||||||
Oil & Gas Refining & Marketing — 0.2% | ||||||||||
Alon USA Energy Inc. | 45,782 | 827,281 | ||||||||
Pacific Ethanol Inc. | 78,100 | 506,869 | (a) | |||||||
Western Refining Inc. | 26,951 | 1,189,078 | ||||||||
| 2,523,228 | ||||||||||
Packaged Foods & Meats — 3.1% | ||||||||||
B&G Foods Inc. | 160,500 | 5,850,225 | ||||||||
Cal-Maine Foods Inc. | 21,956 | 1,199,017 | ||||||||
J&J Snack Foods Corp. | 3,390 | 385,308 | ||||||||
Lancaster Colony Corp. | 67,500 | 6,579,900 | ||||||||
Sanderson Farms Inc. | 105,039 | 7,202,524 | ||||||||
Snyder’s-Lance Inc. | 187,900 | 6,337,867 | ||||||||
TreeHouse Foods Inc. | 111,000 | 8,634,690 | (a) | |||||||
| 36,189,531 | ||||||||||
Paper Packaging — 0.3% | ||||||||||
Packaging Corporation of America | 59,884 | 3,602,621 | ||||||||
Paper Products — 0.1% | ||||||||||
Neenah Paper Inc. | 28,080 | 1,636,502 | ||||||||
Personal Products — 0.2% | ||||||||||
Elizabeth Arden Inc. | 112,500 | 1,315,125 | (a) | |||||||
USANA Health Sciences Inc. | 5,452 | 730,732 | (a) | |||||||
| 2,045,857 | ||||||||||
Pharmaceuticals — 0.5% | ||||||||||
Corcept Therapeutics Inc. | 89,600 | 336,896 | (a) | |||||||
Intersect ENT Inc. | 31,100 | 727,740 | (a) | |||||||
Lannett Company Inc. | 8,800 | 365,376 | (a) | |||||||
Pernix Therapeutics Holdings Inc. | 158,100 | 499,596 | (a) | |||||||
Phibro Animal Health Corp., Class A | 72,400 | 2,290,012 | ||||||||
Prestige Brands Holdings Inc. | 16,604 | 749,837 | (a) | |||||||
Sucampo Pharmaceuticals Inc., Class A | 23,700 | 470,919 | (a) | |||||||
| 5,440,376 | ||||||||||
Property & Casualty Insurance — 2.2% | ||||||||||
Allied World Assurance Company Holdings AG | 197,500 | 7,538,575 | ||||||||
Argo Group International Holdings Ltd. | 139,681 | 7,904,548 | ||||||||
Federated National Holding Co. | 17,500 | 420,350 | ||||||||
HCI Group Inc. | 19,992 | 775,090 | ||||||||
James River Group Holdings Ltd. | 56,000 | 1,505,840 | ||||||||
See Notes to Schedules of Investments and Notes to Financial Statements.
40
Table of Contents
Small-Cap Equity Fund
| Schedule of Investments | September 30, 2015 |
| Number of Shares | Fair Value | |||||||||
RLI Corp. | 66,278 | $ | 3,547,861 | |||||||
The Navigators Group Inc. | 48,000 | 3,743,040 | (a) | |||||||
| 25,435,304 | ||||||||||
Publishing — 1.2% | ||||||||||
John Wiley & Sons Inc., Class A | 285,913 | 14,304,227 | ||||||||
Railroads — 0.5% | ||||||||||
Genesee & Wyoming Inc., Class A | 90,649 | 5,355,543 | (a) | |||||||
Real Estate Services — 0.1% | ||||||||||
Altisource Portfolio Solutions S.A. | 27,800 | 662,752 | (a) | |||||||
Marcus & Millichap Inc. | 17,316 | 796,363 | (a) | |||||||
| 1,459,115 | ||||||||||
Regional Banks — 9.2% | ||||||||||
Bank of the Ozarks Inc. | 34,052 | 1,490,116 | ||||||||
BankUnited Inc. | 34,543 | 1,234,912 | ||||||||
Banner Corp. | 23,280 | 1,112,086 | ||||||||
Bryn Mawr Bank Corp. | 124,000 | 3,852,680 | ||||||||
Camden National Corp. | 16,646 | 672,498 | ||||||||
Cascade Bancorp | 73,706 | 398,749 | (a) | |||||||
CoBiz Financial Inc. | 27,233 | 354,301 | ||||||||
Columbia Banking System Inc. | 25,570 | 798,040 | ||||||||
Community Bank System Inc. | 137,500 | 5,110,875 | ||||||||
Cullen/Frost Bankers Inc. | 45,252 | 2,877,122 | ||||||||
CVB Financial Corp. | 358,500 | 5,986,950 | ||||||||
Enterprise Financial Services Corp. | 22,136 | 557,163 | ||||||||
FCB Financial Holdings Inc., Class A | 40,510 | 1,321,436 | (a) | |||||||
Fidelity Southern Corp. | 30,339 | 641,366 | ||||||||
First Financial Bankshares Inc. | 160,500 | 5,100,690 | ||||||||
First Foundation Inc. | 16,253 | 370,081 | (a) | |||||||
Fulton Financial Corp. | 409,614 | 4,956,329 | ||||||||
German American Bancorp Inc. | 3,200 | 93,664 | ||||||||
Great Southern Bancorp Inc. | 12,114 | 524,536 | ||||||||
Home BancShares Inc. | 31,531 | 1,277,006 | ||||||||
Iberiabank Corp. | 78,069 | 4,544,397 | ||||||||
Independent Bank Corp. | 80,000 | 3,688,000 | ||||||||
Lakeland Financial Corp. | 9,946 | 449,062 | ||||||||
LegacyTexas Financial Group Inc. | 44,159 | 1,345,966 | ||||||||
NBT Bancorp Inc. | 74,000 | 1,993,560 | ||||||||
Old National Bancorp | 47,317 | 659,126 | ||||||||
PacWest Bancorp | 53,948 | 2,309,514 | ||||||||
PrivateBancorp Inc. | 178,405 | 6,838,264 | ||||||||
Prosperity Bancshares Inc. | 168,844 | 8,291,929 | ||||||||
Renasant Corp. | 248,587 | 8,166,083 | ||||||||
South State Corp. | 8,883 | 682,836 | ||||||||
Southwest Bancorp Inc. | 39,124 | 642,025 | ||||||||
Stock Yards Bancorp Inc. | 50,500 | 1,835,675 | ||||||||
SVB Financial Group | 46,567 | 5,380,351 | (a) | |||||||
UMB Financial Corp. | 202,500 | 10,289,025 | ||||||||
Umpqua Holdings Corp. | 96,979 | 1,580,758 | ||||||||
Union Bankshares Corp. | 38,340 | 920,160 | ||||||||
United Community Banks Inc. | 26,053 | 532,523 | ||||||||
Washington Trust Bancorp Inc. | 105,000 | 4,037,250 | ||||||||
Westamerica Bancorporation | 78,737 | 3,499,072 | ||||||||
Wintrust Financial Corp. | 28,269 | 1,510,413 | ||||||||
| 107,926,589 | ||||||||||
| Number of Shares | Fair Value | |||||||||
Reinsurance — 1.0% | ||||||||||
Endurance Specialty Holdings Ltd. | 169,500 | $ | 10,344,585 | |||||||
Maiden Holdings Ltd. | 89,700 | 1,245,036 | ||||||||
| 11,589,621 | ||||||||||
Research & Consulting Services — 0.3% | ||||||||||
Resources Connection Inc. | 220,722 | 3,326,281 | ||||||||
Residential REITs — 0.4% | ||||||||||
Education Realty Trust Inc. | 158,345 | 5,217,468 | ||||||||
Restaurants — 0.9% | ||||||||||
BJ’s Restaurants Inc. | 15,313 | 658,918 | (a) | |||||||
Cracker Barrel Old Country Store Inc. | 28,420 | 4,185,698 | ||||||||
Texas Roadhouse Inc. | 144,104 | 5,360,669 | ||||||||
| 10,205,285 | ||||||||||
Retail REITs — 0.2% | ||||||||||
Inland Real Estate Corp. | 128,071 | 1,037,375 | ||||||||
Retail Opportunity Investments Corp. | 58,589 | 969,062 | ||||||||
Tanger Factory Outlet Centers Inc. | 25,810 | 850,956 | ||||||||
| 2,857,393 | ||||||||||
Security & Alarm Services — 0.6% | ||||||||||
The Brink’s Co. | 275,630 | 7,444,766 | ||||||||
Semiconductor Equipment — 0.7% | ||||||||||
Advanced Energy Industries Inc. | 24,500 | 644,350 | (a) | |||||||
Brooks Automation Inc. | 37,020 | 433,504 | ||||||||
Cabot Microelectronics Corp. | 16,300 | 631,462 | (a) | |||||||
Cascade Microtech Inc. | 60,400 | 854,056 | (a) | |||||||
Rudolph Technologies Inc. | 406,964 | 5,066,702 | (a) | |||||||
| 7,630,074 | ||||||||||
Semiconductors — 1.5% | ||||||||||
Ambarella Inc. | 9,000 | 520,110 | (a) | |||||||
Cirrus Logic Inc. | 20,100 | 633,351 | (a) | |||||||
Diodes Inc. | 37,510 | 801,588 | (a) | |||||||
Exar Corp. | 104,366 | 620,978 | (a) | |||||||
Integrated Device Technology Inc. | 37,500 | 761,250 | (a) | |||||||
Lattice Semiconductor Corp. | 80,100 | 308,385 | (a) | |||||||
Microsemi Corp. | 288,556 | 9,470,408 | (a) | |||||||
PMC-Sierra Inc. | 76,700 | 519,259 | (a) | |||||||
Semtech Corp. | 226,618 | 3,421,932 | (a) | |||||||
| 17,057,261 | ||||||||||
Soft Drinks — 0.0%* | ||||||||||
National Beverage Corp. | 5,600 | 172,088 | (a) | |||||||
Specialized Finance — 0.1% | ||||||||||
MarketAxess Holdings Inc. | 8,800 | 817,344 | ||||||||
NewStar Financial Inc. | 40,316 | 330,591 | (a) | |||||||
| 1,147,935 | ||||||||||
See Notes to Schedules of Investments and Notes to Financial Statements.
41
Table of Contents
Small-Cap Equity Fund
| Schedule of Investments | September 30, 2015 |
| Number of Shares | Fair Value | |||||||||
Specialized REITs — 0.5% | ||||||||||
CoreSite Realty Corp. | 90,172 | $ | 4,638,448 | |||||||
Potlatch Corp. | 22,893 | 659,089 | ||||||||
| 5,297,537 | ||||||||||
Specialty Chemicals — 2.5% | ||||||||||
Balchem Corp. | 48,534 | 2,949,411 | ||||||||
HB Fuller Co. | 121,893 | 4,137,049 | ||||||||
Innospec Inc. | 97,500 | 4,534,725 | ||||||||
OM Group Inc. | 9,870 | 324,624 | ||||||||
PolyOne Corp. | 171,279 | 5,025,326 | ||||||||
Quaker Chemical Corp. | 56,577 | 4,360,955 | ||||||||
Sensient Technologies Corp. | 135,301 | 8,293,951 | ||||||||
| 29,626,041 | ||||||||||
Specialty Stores — 0.4% | ||||||||||
Build-A-Bear Workshop Inc. | 16,060 | 303,373 | (a) | |||||||
Cabela’s Inc. | 13,211 | 602,422 | (a) | |||||||
Hibbett Sports Inc. | 97,000 | 3,395,970 | (a) | |||||||
| 4,301,765 | ||||||||||
Steel — 0.5% | ||||||||||
Commercial Metals Co. | 199,370 | 2,701,463 | ||||||||
Ryerson Holding Corp. | 106,968 | 561,582 | (a) | |||||||
Schnitzer Steel Industries Inc., Class A | 26,816 | 363,089 | ||||||||
TimkenSteel Corp. | 248,452 | 2,514,334 | ||||||||
| 6,140,468 | ||||||||||
Systems Software — 1.4% | ||||||||||
Barracuda Networks Inc. | 20,237 | 315,292 | (a) | |||||||
FleetMatics Group PLC | 138,500 | 6,798,965 | (a) | |||||||
Gigamon Inc. | 25,857 | 517,399 | (a) | |||||||
Qualys Inc. | 271,000 | 7,712,660 | (a) | |||||||
The Rubicon Project Inc. | 51,331 | 745,839 | (a) | |||||||
| 16,090,155 | ||||||||||
Technology Distributors — 0.1% | ||||||||||
Insight Enterprises Inc. | 23,876 | 617,195 | (a) | |||||||
ScanSource Inc. | 29,116 | 1,032,453 | (a) | |||||||
| 1,649,648 | ||||||||||
Technology Hardware, Storage & Peripherals — 0.7% | ||||||||||
Diebold Inc. | 261,470 | 7,783,962 | ||||||||
QLogic Corp. | 26,001 | 266,510 | (a) | |||||||
Super Micro Computer Inc. | 15,061 | 410,563 | (a) | |||||||
| 8,461,035 | ||||||||||
Thrifts & Mortgage Finance — 0.4% | ||||||||||
Essent Group Ltd. | 31,739 | 788,714 | (a) | |||||||
HomeStreet Inc. | 40,152 | 927,511 | (a) | |||||||
LendingTree Inc. | 6,900 | 641,907 | (a) | |||||||
Walker & Dunlop Inc. | 30,624 | 798,674 | (a) | |||||||
Washington Federal Inc. | 53,211 | 1,210,551 | ||||||||
| 4,367,357 | ||||||||||
| Number of Shares | Fair Value | |||||||||
Trading Companies & Distributors — 0.7% | ||||||||||
Applied Industrial Technologies Inc. | 224,082 | $ | 8,548,728 | |||||||
Trucking — 0.9% | ||||||||||
ArcBest Corp. | 14,100 | 363,357 | ||||||||
Heartland Express Inc. | 50,428 | 1,005,534 | ||||||||
Old Dominion Freight Line Inc. | 110,324 | 6,729,764 | (a) | |||||||
Saia Inc. | 44,140 | 1,366,133 | (a) | |||||||
USA Truck Inc. | 25,300 | 435,919 | (a) | |||||||
YRC Worldwide Inc. | 33,400 | 442,884 | (a) | |||||||
| 10,343,591 | ||||||||||
Wireless Telecommunication Services — 0.1% | ||||||||||
Shenandoah Telecommunications Co. | 24,600 | 1,053,126 | ||||||||
Total Common Stock | 1,107,402,277 | |||||||||
Short-Term Investments — 5.8% | ||||||||||
State Street Institutional U.S. | 68,607,689 | (d,h,m) | ||||||||
Total Investments | 1,176,009,966 | |||||||||
Liabilities in Excess of Other Assets, net — (0.2)% | (2,284,490 | ) | ||||||||
|
| |||||||||
NET ASSETS — 100.0% | $ | 1,173,725,476 | ||||||||
|
| |||||||||
Other Information: | ||||||||||
The Fund had the following long futures contracts open at September 30, 2015:
| Description | Expiration date | Number of Contracts | Current Notional Value | Unrealized Depreciation | |||||||||||||
Russell 2000 Mini Index Futures | December 2015 | 175 | $ | 19,178,250 | $ | (830,268 | ) | ||||||||||
See Notes to Schedules of Investments and Notes to Financial Statements.
42
Table of Contents
| International Equity Fund | (Unaudited) |

Ralph R. Layman
Executive Vice
President and Chief
Investment Officer
Emeritus

Michael J. Solecki
Senior Vice President
and Chief Investment
Officer International
Equities
The International Equity Fund is managed by a team of portfolio managers that includes Ralph R. Layman and Michael J. Solecki. As lead portfolio manager for the Fund, Mr. Layman oversees the entire team and assigns a portion of the Fund to Mr. Solecki and himself. Each portfolio manager is limited to the management of his portion of the Fund, the size of the portion which Mr. Layman determines on an annual basis. The portfolio managers do not operate independently of each other, rather, the team operates collaboratively, communicating purchases or sales of securities on behalf of the Fund. See portfolio managers’ biographical information beginning on page 124.
| Q. | How did the GE Institutional International Equity Fund perform compared to its benchmark and Morningstar peer group for the twelve-month period ended September 30, 2015? |
| A. | For the twelve-month period ended September 30, 2015, the GE Institutional International Equity Fund returned -7.80% for the Investment Class shares and -7.95% for the Service Class shares. The Fund’s benchmark, the MSCI EAFE Index (the “Index”) returned -8.66% and the Fund’s Morningstar peer group of 825 Foreign Large Blend funds returned an average of -8.07% over the same period. |
| Q. | What market conditions impacted the Fund’s performance? |
| A. | The twelve-month period through September 30, 2015 was marked by a divergence in central bank policy. The U.S., showing stronger economic growth, finally ended its third round of quantitative easing (QE) in late 2014 and began to set the stage for its first interest rate rise in several years (yet to be realized). About that same time, Japan, heading in the opposite direction, began a massive expansion of its QE policy. And the European Central Bank, after much dithering, commenced QE in early 2015. The immediate and most notable result of this |
| divergence in policy was a strong surge in the U.S. dollar versus the euro and the yen, which lasted through the first quarter of 2015. Fueled by central bank liquidity, international markets surged in 1Q of 2015. |
| The positive sentiment was not to last however. The election in Greece of the anti-austerity party Syriza, set in motion what some saw as an existential crisis in the Eurozone. As an imperfect resolution of the situation in Greece was realized, hard-landing fears in China fueled by a very volatile stock-market took the baton. Added to this were concerns about global economic slowdown, plunging commodity prices, and a rising belligerence from Russia. The Index, which peaked in May 2015, fell nearly 20% by the end of September, wiping out the positive performance from the start of the year. |
| As the year through September 30 ended, investor sentiment was at a negative extreme. But looking through the noise, international equity fundamentals looked surprisingly healthy especially in the Eurozone and Japan, both of which were seeing strong earnings growth, at least outside of the beleaguered energy and materials sectors, coupled with reasonable valuations. |
| For the twelve-months as a whole, the Index fell -8.66%, but all of the negative return can be attributed to the U.S. dollar strength in the first 6 months of the period, which hurt foreign currency returns when translated back to dollars. (In local currency the Index was up slightly.) |
| Q. | What were the primary drivers behind Fund performance? |
| A. | The Fund’s performance for the twelve-month period was negative. However, the Fund was down less than the market was, and so delivered outperformance in a volatile environment. The Fund was well-positioned |
43
Table of Contents
| International Equity Fund | (Unaudited) |
| for two of the macro themes of the past year. First, the Fund had positions in many global exporters that benefited from local currency weakness in Japan and the Eurozone. Second, the Fund has been underweight in the energy and materials sectors, both of which were very weak due to falling commodity prices. In addition, the Fund had strong stock picking in European and Japanese banks, investing in banks that benefited from local economic conditions and were less exposed to emerging markets. One negative for the Fund was its underexposure to consumer staples companies, which we viewed as generally overpriced. Unfortunately this was the top performing sector in the Index during this period. Beyond this, the Fund also had some holdings which did not do well this year. In most of these cases, we continue to hold the stocks as we see potential future upside. |
| Q. | Were there any significant changes in the Fund during the period? |
| A. | The Fund began the twelve-month period with a moderate overweight to Japan, which we increased early in the period and later pared back. This was a good call as Japan was the top performing region during the period. The Fund’s exposure to emerging markets was reduced throughout the period. Sector positioning relative to the Index was not changed significantly. The consumer discretionary sector, however, went from overweight to underweight on the selling of a few names on stock-specific issues. And the Fund’s weighting in financials went from being about the same as the Index to a small overweight with additions to banks and insurance. |
44
Table of Contents
| International Equity Fund | (Unaudited) |
Understanding Your Fund’s Expenses
As a shareholder of the Fund you incur ongoing costs. Ongoing costs include portfolio management fees, distribution and service fees (for Service Class shares), professional fees, administrative fees and other Fund expenses. The following example is intended to help you understand your ongoing costs (in dollars) of investing in the Fund and to compare these costs with the ongoing costs of investing in other mutual funds.
To illustrate these ongoing costs, we have provided an example and calculated the expenses paid by investors in each share class of the Fund during the period. The information in the following table is based on an investment of $1,000, which is invested at the beginning of the period and held for the entire six-month period ended September 30, 2015.
Actual Expenses
The first section of the table provides information about actual account values and actual expenses. You may use the information in this section, together with the amount you invested, to estimate the expenses that you paid over the period. To do so, simply divide your account value by $1,000 (for example, an $8,600 account value divided by $1,000 = 8.6), then multiply the result by the
number given for your class under the heading “Expenses paid during the period” to estimate the expenses you paid on your account during the period.
Hypothetical Example for Comparison Purposes
The second section of the table provides information about hypothetical account values and hypothetical expenses based on the Fund’s actual expense ratio and an assumed rate of return of 5% per year before expenses, which is not the Fund’s actual return. The hypothetical account values and expenses may not be used to estimate the actual ending account balance or expenses you paid for the period. You may use this information to compare the ongoing costs of investing in the Fund and other funds. To do so, compare this 5% hypothetical example with the 5% hypothetical examples that appear in the shareholders reports of other funds.
Please note that the expenses shown in the table are meant to highlight and help you compare ongoing costs only and do not reflect transaction costs, such as sales charges or redemption fees, if any. Therefore, the second section of the table is useful in comparing ongoing costs only, and will not help you determine the relative total costs of owning different funds.
April 1, 2015 – September 30, 2015
| Account value at the beginning of the period ($) | Account value at the end of the period ($) | Expenses paid during the period ($)* | |||||||||||||
Actual Fund Return | |||||||||||||||
Investment Class | 1,000.00 | 886.60 | 2.65 | ||||||||||||
Service Class | 1,000.00 | 885.80 | 3.83 | ||||||||||||
Hypothetical 5% Return (2.5% for the period) |
| ||||||||||||||
Investment Class | 1,000.00 | 1,022.26 | 2.84 | ||||||||||||
Service Class | 1,000.00 | 1,021.01 | 4.10 | ||||||||||||
| * | Expenses are equal to the Fund’s annualized net expense ratio of 0.56% for Investment Class shares and 0.81% for Service Class shares (for the period April 1, 2015 – September 30, 2015), multiplied by the average account value over the period, multiplied by 183/365 (to reflect the one-half year period). |
45
Table of Contents
| International Equity Fund | (Unaudited) |
| Investment Profile |
A mutual fund designed for investors who seek long-term growth of capital. The Fund seeks to achieve its investment objective by investing at least 80% of its net assets under normal circumstances in equity securities, such as common and preferred stocks. The Fund invests primarily (meaning at least 65%) in companies in both developed and emerging market countries outside the United States.
| Morningstar Performance Comparison |
Based on average annual returns for periods ended September 30, 2015
| One Year | Five Year | Ten Year | ||||||||||
Number of funds in peer group | 825 | 691 | 517 | |||||||||
Peer group average annual total return | -8.07 | % | 3.28 | % | 2.65 | % | ||||||
Morningstar Category in peer group: Foreign Large Blend |
| |||||||||||
| Top Ten Largest Holdings |
as of September 30, 2015 (as a % of Fair Value) (a)(b)
Roche Holding AG | 3.12% | |||
Sanofi | 2.48% | |||
Continental AG | 2.39% | |||
Nidec Corp. | 2.39% | |||
AIA Group Ltd. | 2.28% | |||
Mitsui Fudosan Company Ltd. | 2.17% | |||
Barclays PLC | 1.99% | |||
Vodafone Group PLC | 1.90% | |||
Intesa Sanpaolo S.p.A. | 1.90% | |||
Rakuten Inc. | 1.84% |
| Regional Allocation as of September 30, 2015 |
Portfolio composition as a % of Fair Value of $1,299,804 (in thousands) as of September 30, 2015 (a)(b)
| Change in Value of a $10,000 Investment |
Investment Class Shares
| Average Annual Total Return |
for the periods ended September 30, 2015
| Investment Class Shares (Inception date: 11/25/97) | ||||||||||||||||||||
| One Year | Five Year | Ten Year | Ending Value of a $10,000 Investment | |||||||||||||||||
International Equity Fund | -7.80% | 3.07% | 2.99% | $13,432 | ||||||||||||||||
MSCI EAFE Index | -8.66% | 3.98% | 2.97% | $13,398 | ||||||||||||||||
Service Class Shares
| Average Annual Total Return |
for the periods ended September 30, 2015
| Service Class Shares (Inception date: 1/3/01) | ||||||||||||||||||||
One Year | Five Year | Ten Year | Ending value of a $10,000 | |||||||||||||||||
International Equity Fund | -7.95% | 2.82% | 2.73% | $13,090 | ||||||||||||||||
MSCI EAFE Index | -8.66% | 3.98% | 2.97% | $13,398 | ||||||||||||||||

| (a) | Fair Value basis is inclusive of short-term investment in State Street Institutional U.S. Government Money Market Fund Premier Class. |
| (b) | The securities information regarding holdings, allocations and other characteristics is presented to illustrate examples of securities that the Fund has bought and the diversity of areas in which the Fund may invest as of a particular date. It may not be representative of the Fund’s current or future investments and should not be construed as a recommendation to purchase or sell a particular security. |
See Notes to Performance beginning on page 1 for further information, including an explanation of Morningstar peer categories.
Past performance does not predict future performance. The performance shown in the graphs and tables does not reflect the deduction of taxes that a shareholder would pay on Fund distributions or the redemption of Fund shares.
46
Table of Contents
International Equity Fund
| Schedule of Investments | September 30, 2015 |
| International Equity Fund | ||||||
| Number of Shares | Fair Value | |||||||||
Common Stock — 96.6%† | ||||||||||
Australia — 1.7% | ||||||||||
CSL Ltd. | 126,484 | $ | 7,923,048 | |||||||
Insurance Australia Group Ltd. | 4,375,467 | 14,871,734 | ||||||||
| 22,794,782 | ||||||||||
Belgium — 1.8% | ||||||||||
Anheuser-Busch InBev S.A. | 219,284 | 23,234,107 | ||||||||
Canada — 2.1% | ||||||||||
Brookfield Asset Management Inc., Class A | 197,266 | 6,178,265 | ||||||||
Cenovus Energy Inc. | 757,225 | 11,431,516 | ||||||||
Valeant Pharmaceuticals International Inc. | 52,422 | 9,313,732 | (a) | |||||||
| 26,923,513 | ||||||||||
China — 1.5% | ||||||||||
Baidu Inc. ADR | 145,768 | 20,029,981 | (a) | |||||||
France — 13.1% | ||||||||||
Airbus Group SE | 164,051 | 9,688,978 | ||||||||
AXA S.A. | 837,530 | 20,226,400 | ||||||||
BNP Paribas S.A. | 395,045 | 23,133,224 | ||||||||
Credit Agricole S.A. | 1,371,516 | 15,699,935 | ||||||||
Safran S.A. | 172,485 | 12,957,694 | ||||||||
Sanofi | 340,712 | 32,285,333 | ||||||||
Schneider Electric SE | 219,182 | 12,235,537 | ||||||||
Technip S.A. | 339,847 | 15,995,464 | ||||||||
Total S.A. | 309,084 | 13,869,598 | ||||||||
Vivendi S.A. | 303,095 | 7,148,906 | ||||||||
Zodiac Aerospace | 336,460 | 7,697,375 | ||||||||
| 170,938,444 | ||||||||||
Germany — 9.4% | ||||||||||
Bayer AG | 174,820 | 22,334,088 | ||||||||
Continental AG | 146,355 | 31,056,391 | ||||||||
Fresenius SE & Company KGaA | 344,909 | 23,100,271 | ||||||||
HeidelbergCement AG | 231,541 | 15,833,109 | ||||||||
Linde AG | 101,708 | 16,456,393 | ||||||||
SAP SE | 205,498 | 13,292,980 | ||||||||
| 122,073,232 | ||||||||||
Hong Kong — 2.3% | ||||||||||
AIA Group Ltd. | 5,743,402 | 29,680,228 | ||||||||
India — 2.1% | ||||||||||
ICICI Bank Ltd. | 3,290,064 | 13,513,121 | ||||||||
Larsen & Toubro Ltd. | 405,840 | 9,057,824 | ||||||||
Power Grid Corporation of India Ltd. | 2,572,496 | 5,198,684 | ||||||||
| 27,769,629 | ||||||||||
| Number of Shares | Fair Value | |||||||||
Italy — 1.9% | ||||||||||
Intesa Sanpaolo S.p.A. | 6,999,725 | $ | 24,659,217 | |||||||
Japan — 27.4% | ||||||||||
Astellas Pharma Inc. | 789,800 | 10,188,628 | ||||||||
East Japan Railway Co. | 177,200 | 14,877,018 | ||||||||
FANUC Corp. | 110,549 | 16,905,648 | ||||||||
Fast Retailing Company Ltd. | 30,559 | 12,372,612 | ||||||||
Fuji Heavy Industries Ltd. | 216,400 | 7,738,832 | ||||||||
Hitachi Ltd. | 3,701,200 | 18,570,126 | ||||||||
Kao Corp. | 223,900 | 10,100,878 | ||||||||
Keyence Corp. | 28,200 | 12,526,531 | ||||||||
Mitsubishi Estate Company Ltd. | 1,053,724 | 21,428,170 | ||||||||
Mitsubishi Heavy Industries Ltd. | 3,739,400 | 16,623,025 | ||||||||
Mitsubishi UFJ Financial Group Inc. | 3,696,200 | 22,109,612 | ||||||||
Mitsui Fudosan Company Ltd. | 1,034,825 | 28,193,829 | ||||||||
Murata Manufacturing Company Ltd. | 111,979 | 14,370,786 | ||||||||
Nidec Corp. | 454,274 | 31,049,864 | ||||||||
Rakuten Inc. | 1,874,578 | 23,853,854 | ||||||||
Secom Company Ltd. | 143,900 | 8,613,694 | ||||||||
Shimano Inc. | 26,200 | 3,662,072 | ||||||||
SoftBank Group Corp. | 426,001 | 19,481,547 | ||||||||
Sumitomo Mitsui Financial Group Inc. | 545,000 | 20,532,209 | ||||||||
Tokio Marine Holdings Inc. | 536,246 | 19,888,989 | ||||||||
Toyota Motor Corp. | 407,181 | 23,700,236 | (h) | |||||||
| 356,788,160 | ||||||||||
Mexico — 0.4% | ||||||||||
Grupo Financiero Banorte SAB de C.V., Class O | 1,018,790 | 4,984,913 | ||||||||
Netherlands — 2.9% | ||||||||||
ASML Holding N.V. | 211,075 | 18,415,464 | ||||||||
ING Groep N.V. | 1,405,171 | 19,841,797 | ||||||||
| 38,257,261 | ||||||||||
Norway — 1.1% | ||||||||||
Statoil ASA | 966,485 | 14,061,054 | ||||||||
South Korea — 0.8% | ||||||||||
Samsung Electronics Company Ltd. | 11,457 | 10,961,139 | ||||||||
Spain — 0.8% | ||||||||||
Banco Bilbao Vizcaya Argentaria S.A. | 1,155,629 | 9,777,976 | ||||||||
Sweden — 4.7% | ||||||||||
Assa Abloy AB, Class B | 900,324 | 16,091,303 | ||||||||
Hexagon AB, Class B | 480,734 | 14,633,440 | ||||||||
Svenska Cellulosa AB SCA, Class B | 313,057 | 8,726,874 | ||||||||
Telefonaktiebolaget LM Ericsson, Class B | 2,263,593 | 22,185,076 | ||||||||
| 61,636,693 | ||||||||||
See Notes to Schedules of Investments and Notes to Financial Statements.
47
Table of Contents
International Equity Fund
| Schedule of Investments | September 30, 2015 |
| Number of Shares | Fair Value | |||||||||
Switzerland — 7.3% | ||||||||||
Geberit AG | 32,173 | $ | 9,802,377 | |||||||
Givaudan S.A. | 11,627 | 18,860,705 | ||||||||
Nestle S.A. | 198,097 | 14,850,686 | ||||||||
Roche Holding AG | 154,361 | 40,600,529 | (h) | |||||||
The Swatch Group AG | 31,526 | 11,647,616 | ||||||||
| 95,761,913 | ||||||||||
Taiwan — 1.4% | ||||||||||
Taiwan Semiconductor Manufacturing Company Ltd. | 4,557,548 | 17,993,508 | ||||||||
United Kingdom — 13.9% | ||||||||||
Barclays PLC | 6,994,146 | 25,866,183 | ||||||||
BHP Billiton PLC | 883,639 | 13,451,845 | ||||||||
Capita PLC | 682,042 | 12,376,814 | ||||||||
Experian PLC | 568,667 | 9,113,488 | ||||||||
HSBC Holdings PLC | 1,087,040 | 8,211,563 | ||||||||
International Consolidated Airlines Group S.A. | 1,452,587 | 12,937,799 | (a) | |||||||
Johnson Matthey PLC | 298,976 | 11,086,352 | ||||||||
Prudential PLC | 796,503 | 16,812,617 | ||||||||
Shire PLC | 224,012 | 15,283,070 | ||||||||
Smith & Nephew PLC | 952,549 | 16,636,331 | ||||||||
Vodafone Group PLC | 7,837,413 | 24,746,601 | ||||||||
WPP PLC | 720,435 | 14,983,258 | ||||||||
| 181,505,921 | ||||||||||
Total Common Stock | 1,259,831,671 | |||||||||
Preferred Stock — 0.2% | ||||||||||
Germany — 0.2% | ||||||||||
Volkswagen AG | 20,706 | 2,259,302 | ||||||||
Total Investments in Securities | 1,262,090,973 | |||||||||
Short-Term Investments — 2.9% | ||||||||||
State Street Institutional U.S. Government Money Market | 37,712,664 | (d,h,m) | ||||||||
Total Investments | 1,299,803,637 | |||||||||
Other Assets and Liabilities, | 4,170,990 | |||||||||
|
| |||||||||
NET ASSETS — 100.0% | $ | 1,303,974,627 | ||||||||
|
| |||||||||
Other Information: |
The Fund had the following long futures contracts open at September 30, 2015:
| Description | Expiration date | Number of Contracts | Current Notional Value | Unrealized Depreciation | |||||||||||||
EURO Stoxx 50 Index Futures | December 2015 | 152 | $ | 5,244,498 | $ | (146,393 | ) | ||||||||||
FTSE 100 Index Futures | December 2015 | 16 | 1,458,643 | (5,590 | ) | ||||||||||||
Topix Index Futures | December 2015 | 42 | 4,949,944 | (158,076 | ) | ||||||||||||
|
| ||||||||||||||||
| $ | (310,059 | ) | |||||||||||||||
|
| ||||||||||||||||
The Fund was invested in the following sectors at September 30, 2015 (unaudited):
| Sector | Percentage (based on Fair Value) | ||||
Diversified Banks | 14.49% | ||||
Pharmaceuticals | 10.00% | ||||
Diversified Real Estate Activities | 4.29% | ||||
Life & Health Insurance | 3.58% | ||||
Electronic Equipment & Instruments | 3.52% | ||||
Wireless Telecommunication Services | 3.40% | ||||
Electrical Components & Equipment | 3.33% | ||||
Integrated Oil & Gas | 3.03% | ||||
Property & Casualty Insurance | 2.67% | ||||
Automobile Manufacturers | 2.59% | ||||
Industrial Machinery | 2.58% | ||||
Auto Parts & Equipment | 2.39% | ||||
Aerospace & Defense | 2.33% | ||||
Specialty Chemicals | 2.30% | ||||
Building Products | 1.99% | ||||
Internet Retail | 1.84% | ||||
Brewers | 1.79% | ||||
Healthcare Services | 1.78% | ||||
Communications Equipment | 1.71% | ||||
Multi-Line Insurance | 1.56% | ||||
Internet Software & Services | 1.54% | ||||
Semiconductor Equipment | 1.42% | ||||
Semiconductors | 1.38% | ||||
Healthcare Equipment | 1.28% | ||||
Industrial Gases | 1.27% | ||||
Oil & Gas Equipment & Services | 1.23% | ||||
Construction Materials | 1.22% | ||||
Advertising | 1.15% | ||||
Railroads | 1.14% | ||||
Packaged Foods & Meats | 1.14% | ||||
Electronic Components | 1.11% | ||||
Diversified Metals & Mining | 1.04% | ||||
Application Software | 1.02% | ||||
See Notes to Schedules of Investments and Notes to Financial Statements.
48
Table of Contents
International Equity Fund
| Schedule of Investments | September 30, 2015 |
| Sector | Percentage (based on Fair Value) | ||||
Airlines | 1.00% | ||||
Human Resource & Employment Services | 0.95% | ||||
Apparel Retail | 0.95% | ||||
Apparel, Accessories & Luxury Goods | 0.90% | ||||
Technology Hardware, Storage & Peripherals | 0.84% | ||||
Personal Products | 0.78% | ||||
Research & Consulting Services | 0.70% | ||||
Construction & Engineering | 0.70% | ||||
Household Products | 0.67% | ||||
Security & Alarm Services | 0.66% | ||||
Biotechnology | 0.61% | ||||
Movies & Entertainment | 0.55% | ||||
Electric Utilities | 0.40% | ||||
Leisure Products | 0.28% | ||||
|
| ||||
| 97.10% | |||||
|
| ||||
| Short-Term Investments | |||||
Short-Term Investments | 2.90% | ||||
|
| ||||
| 2.90% | |||||
|
| ||||
| 100.00% | |||||
|
| ||||
See Notes to Schedules of Investments and Notes to Financial Statements.
49
Table of Contents
| Strategic Investment Fund |
David Wiederecht
President and Chief
Investment Officer –
Investment Solutions

Jeffrey Palma
Senior Vice President
and Chief Market
Strategist
The Strategic Investment Fund is managed by a team of portfolio managers that includes Jeffrey Palma and David Wiederecht. Messrs. Palma and Wiederecht are vested with oversight authority for determining asset allocations for the Fund. Each of the U.S. equity, international equity and fixed income portions of the Fund are managed by separate teams of portfolio managers and analysts. The sub-portfolios underlying the Fund are managed independently of each other, and the portfolio managers have full discretion over their particular sub-portfolio; however, the portfolio management team is collaborative to ensure strict adherence to seek the Fund’s objective. See portfolio managers’ biographical information beginning on page 124.
| Q. | How did the GE Institutional Strategic Investment Fund perform compared to its benchmarks and Morningstar peer group for the twelve-month period ended September 30, 2015? |
| A. | For the twelve-month period ended September 30, 2015, the GE Institutional Strategic Investment Fund returned -2.46% for the Investment Class shares and -2.72% for the Service Class shares. The Fund’s broad based benchmarks, the S&P 500 Index, the MSCI All Country World ex-U.S. Index, and the Barclays U.S. Aggregate Bond Index returned -0.61%, -12.16%, and 2.94%, respectively. The Fund’s Morningstar peer group of 947 U.S. moderate allocation funds returned an average of -2.64% over the same period. |
| Q. | What market conditions impacted the Fund’s performance? |
| A. | The latter part of this period proved to be one of the most volatile for financial markets that we have seen in some time. Equity markets posted their biggest quarterly losses in several years, volatility spiked, credit spreads moved wider, and bond yields fell. While pinpointing the exact causes of the market disruptions is not easy, it seems safe to say that concerns about global growth played a |
| central role. Adding to that uncertainty was the specific worry about the outlook for China, which culminated in an announcement of depreciation of the yuan, as well as lack of clarity about whether and when the Federal Reserve in the U.S. would raise interest rates. |
| As we have highlighted for some time, relatively expensive valuations across asset classes combined with still challenging fundamentals raises the risk of elevated volatility and periods of weak returns. After several years of solid returns across most asset classes, the return of volatility highlighted the fragility that can come when there are fundamental setbacks. |
| Economic conditions played a central role in driving markets toward the end of this period. With increased worries about China’s growth trajectory, culminated by the announcement of currency depreciation, broader fears about global growth intensified. These growth concerns fed through in to market concerns about the potential for additional slowing of corporate earnings growth. In the U.S. growth appears to have moderated in the last three months after a strong reading for the prior three months. Payroll growth remained solid during most of the latter part of this period, though the September jobs report was soft, while the ISM purchasing manager survey slipped recently. |
| Market volatility and growth concerns certainly influenced Fed policy and market expectations for interest rate moves this year. Indeed, market pricing for one rate hike (or more) in 2015 fell sharply in August and September amid the market turbulence and following the September FOMC meeting. Clearly these swings in interest rate expectations have had a spillover effect across other asset classes. |
While robust returns in recent years should be some consolation to long-term multi-asset |
50
Table of Contents
| (Unaudited) |
| class investors, thus far in 2015 the weakness in equity markets has not been offset by strong returns in other parts of the portfolio, resulting in weak portfolio-level returns. In this environment, a focus on volatility becomes more important. Indeed, without the ability to produce robust returns, adding risk to a portfolio may not lead to better outcomes. In recent quarters we have highlighted our desire to remain focused on asset allocation and to keep a prudent cap on risk at this stage of the cycle — a framework we will continue to adhere to so long as business cycle uncertainty remains elevated and valuations in markets are not compelling. |
| Assessing fundamentals, the drop in equity prices has resulted in a commensurate decline in PE ratios. These lower valuations certainly provide some relief. Indeed, in the months leading up to the recent correction, these ratios were at multi-year high levels. However, earnings growth remains challenging. While this overall result is being distorted a bit by severe earnings declines in the energy sector, growth in other sectors has also been in the low to mid-single digits, with overall economic growth, already high margins, and U.S. dollar strength offering headwinds. Outside of the U.S., Japanese earnings growth has been stronger, while growth in European earnings has fallen short of market forecasts this year. |
| In government bond markets, particularly the U.S., focus for much of this period has been on the Federal Reserve and the outlook for a possible rise in interest rates. With central bank rates effectively at zero since the financial crisis, questions about the liftoff for rates have been around for some time. For much of this period, forecasts for growth have led the Fed to expect a rise in rates in 2015. To a lesser extent, bond markets have been pricing in rate hikes, albeit at a slower pace than the Fed has suggested. Before the spike in market volatility this summer, consensus was growing that the Fed would raise rates between September and December. However, at the September FOMC meeting, the Fed did not raise rates given the volatility in markets and the ongoing uncertainty in the global growth backdrop. We continue to believe that a modest rate rise cycle does not pose a material risk to growth. |
| Alongside less Fed tightening and greater concerns about growth, the decline in equity markets helped underpin government bonds in Q3 with lower interest rates. In corporate bond markets, though, there has been continued weakness with further widening in credit spreads. These moves extend the relative weakness that has been evident for much of this period. Like equities, credit markets have been impacted by weaker growth expectations and energy markets. Also, liquidity conditions and concerns about the rise in corporate balance sheet leverage in recent years have played a role in driving spreads wider. |
| Q. | What were the primary drivers behind Fund performance? |
| A. | The Fund’s performance was primarily driven by its asset allocation and underlying security selection. A lower allocation to fixed income detracted from performance as fixed income outperformed equity during the period. A higher allocation to cash positively impacted performance as cash outperformed equity during the period. The S&P 500 Index outperformed the MSCI All Country World ex-U.S. Index, and both of these equity indices underperformed the Barclays U.S. Aggregate Bond Index over the twelve-month period. Security selection in international equity positively impacted performance and security selection in U.S. equity and fixed income detracted from performance. |
| Q. | Were there any significant changes in the Fund during the period? |
| A. | During the twelve-month period the Fund’s exposure to equity decreased and exposure to fixed income and cash increased. Allocations within the Fund were periodically rebalanced to stay within guidelines. |
| Earlier in the period, we reduced multistyle equity and increased fixed income. As the year progressed, we reduced U.S. equity and cash and purchased an oil exchange traded fund. Later in the year, we sold the oil exchange traded fund and increased cash. Toward the end of the period, we reduced our exposure to U.S. equity and raised cash. We then used cash to purchase an oil exchange traded fund. We also reduced multistyle equity and increased emerging markets equity. |
51
Table of Contents
| Strategic Investment Fund | (Unaudited) |
| Reasonable equity valuations and a positive macro outlook provide the rationale for continuing to favor equity over bonds. Nevertheless, we believe short-term setbacks in the equity markets are likely to continue to occur thus our overweight to cash. We, therefore, favor being disciplined in rebalancing the Fund, rather than simply letting the Fund’s allocation to equity increase significantly. We believe returns in both bond and equity markets may be more modest and range-bound going forward. We continue to believe it prudent to maintain a diversified portfolio and remain diligent in the search for attractive investment opportunities. By tactically allocating between U.S. equity, international equity, and fixed income, we believe the Fund will continue to seek to produce attractive returns while maintaining a prudent level of risk. |
52
Table of Contents
| Strategic Investment Fund | (Unaudited) |
Understanding Your Fund’s Expenses
As a shareholder of the Fund you incur ongoing costs. Ongoing costs include portfolio management fees, distribution and service fees (for Service Class shares), professional fees, administrative fees and other Fund expenses. The following example is intended to help you understand your ongoing costs (in dollars) of investing in the Fund and to compare these costs with the ongoing costs of investing in other mutual funds.
To illustrate these ongoing costs, we have provided an example and calculated the expenses paid by investors in each share class of the Fund during the period. The information in the following table is based on an investment of $1,000, which is invested at the beginning of the period and held for the entire six-month period ended September 30, 2015.
Actual Expenses
The first section of the table provides information about actual account values and actual expenses. You may use the information in this section, together with the amount you invested, to estimate the expenses that you paid over the period. To do so, simply divide your account value by $1,000 (for example, an $8,600 account value divided by $1,000 = 8.6), then multiply the result by the
number given for your class under the heading “Expenses paid during the period” to estimate the expenses you paid on your account during the period.
Hypothetical Example for Comparison Purposes
The second section of the table provides information about hypothetical account values and hypothetical expenses based on the Fund’s actual expense ratio and an assumed rate of return of 5% per year before expenses, which is not the Fund’s actual return. The hypothetical account values and expenses may not be used to estimate the actual ending account balance or expenses you paid for the period. You may use this information to compare the ongoing costs of investing in the Fund and other funds. To do so, compare this 5% hypothetical example with the 5% hypothetical examples that appear in the shareholders reports of other funds.
Please note that the expenses shown in the table are meant to highlight and help you compare ongoing costs only and do not reflect transaction costs, such as sales charges or redemption fees, if any. Therefore, the second section of the table is useful in comparing ongoing costs only, and will not help you determine the relative total costs of owning different funds.
April 1, 2015 – September 30, 2015
| Account value at the beginning of the period ($) | Account value at the end of the period ($) | Expenses paid during the period ($)* | |||||||||||||
Actual Fund Return |
| ||||||||||||||
Investment Class | 1,000.00 | 939.30 | 1.75 | ||||||||||||
Service Class | 1,000.00 | 938.00 | 2.96 | ||||||||||||
Hypothetical 5% Return (2.5% for the period) |
| ||||||||||||||
Investment Class | 1,000.00 | 1,023.26 | 1.83 | ||||||||||||
Service Class | 1,000.00 | 1,022.01 | 3.09 | ||||||||||||
| * | Expenses are equal to the Fund’s annualized net expense ratio of 0.36% for Investment Class shares and 0.61% for Service Class shares (for the period April 1, 2015 – September 30, 2015), multiplied by the average account value over the period, multiplied by 183/365 (to reflect the one-half year period). |
53
Table of Contents
| Strategic Investment Fund | (Unaudited) |
| Investment Profile |
A mutual fund designed for investors who seek to maximize total return. The Fund seeks to achieve its investment objective by investing primarily in a combination of U.S. and foreign equity and debt securities and cash. The Fund’s asset allocation process utilizes information from GE Asset Management’s Asset Allocation Committee to diversify holdings across these asset classes. The Fund adjusts its weightings based on market and economic conditions to meet its objective.
| Morningstar Performance Comparison |
Based on average annual returns for periods ended September 30, 2015
| One Year | Five Year | Ten Year | ||||||||||
Number of funds in peer group | 947 | 799 | 630 | |||||||||
Peer group average annual total return | -2.64 | % | 6.82 | % | 4.54 | % | ||||||
Morningstar Category in peer group: Moderate Allocation |
| |||||||||||
| Top Ten Largest Equity Holdings |
as of September 30, 2015 (as a % of Fair Value) (a)(b)
Allergan PLC | 1.01% | |||
Apple Inc. | 0.89% | |||
JPMorgan Chase & Co. | 0.88% | |||
Amgen Inc. | 0.84% | |||
Cisco Systems Inc. | 0.71% | |||
PepsiCo Inc. | 0.67% | |||
QUALCOMM Inc. | 0.60% | |||
Comcast Corp., Class A | 0.60% | |||
Roche Holding AG | 0.60% | |||
Lowe’s Companies Inc. | 0.60% |
| Sector Allocation as of September 30, 2015 |
Portfolio Composition as a % of Fair Value of $771,955 (in thousands) as of September 30, 2015 (a)(b)

| Change in Value of a $10,000 Investment |
Investment Class Shares
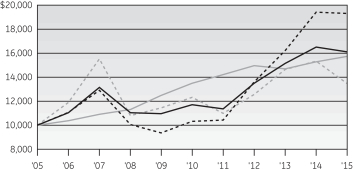
| Average Annual Total Return |
for the periods ended September 30, 2015
Investment Class Shares (Inception date: 10/29/99)
| ||||||||||||||||||||
| One Year | Five Year | Ten Year | Ending Value of a $10,000 Investment | |||||||||||||||||
Strategic Investment Fund | -2.46% | 6.61% | 4.89% | $16,117 | ||||||||||||||||
S&P 500 Index | -0.61% | 13.34% | 6.80% | $19,304 | ||||||||||||||||
Barclays U.S. Aggregate Bond Index | 2.94% | 3.10% | 4.64% | $15,734 | ||||||||||||||||
MSCI All Country World Index ex U.S. | -12.16% | 1.82% | 3.03% | $13,481 | ||||||||||||||||
Service Class Shares

Average Annual Total Return |
for the periods ended September 30, 2015
Service Class Shares (Inception date: 9/30/05)
| ||||||||||||||||||||
| One Year | Five Year | Ten Year | Ending value of a $10,000 | |||||||||||||||||
Strategic Investment Fund | -2.72% | 6.35% | 4.56% | $15,626 | ||||||||||||||||
S&P 500 Index | -0.61% | 13.34% | 6.80% | $19,304 | ||||||||||||||||
Barclays U.S. Aggregate Bond Index | 2.94% | 3.10% | 4.64% | $15,734 | ||||||||||||||||
MSCI All Country World Index ex U.S. | -12.16% | 1.82% | 3.03% | $13,481 | ||||||||||||||||
| (a) | Fair Value basis is inclusive of short-term investment in State Street Institutional U.S. Government Money Market Fund Premier Class. |
| (b) | The securities information regarding holdings, allocations and other characteristics is presented to illustrate examples of securities that the Fund has bought and the diversity of areas in which the Fund may invest as of a particular date. It may not be representative of the Fund’s current or future investments and should not be construed as a recommendation to purchase or sell a particular security. |
See Notes to Performance beginning on page 1 for further information, including an explanation of Morningstar peer categories.
Past performance does not predict future performance. The performance shown in the graphs and tables does not reflect the deduction of taxes that a shareholder would pay on Fund distributions or the redemption of Fund shares.
54
Table of Contents
Strategic Investment Fund
| Schedule of Investments | September 30, 2015 |
| Strategic Investment Fund | ||||
| Number of Shares | Fair Value | |||||||||
Domestic Equity — 31.6%† | ||||||||||
Common Stock — 31.6% | ||||||||||
Aerospace & Defense — 1.4% | ||||||||||
General Dynamics Corp. | 22,871 | $ | 3,155,054 | |||||||
Hexcel Corp. | 44,767 | 2,008,248 | ||||||||
Honeywell International Inc. | 38,197 | 3,616,874 | ||||||||
The Boeing Co. | 10,913 | 1,429,057 | ||||||||
| 10,209,233 | ||||||||||
Agricultural Products — 0.4% | ||||||||||
Archer-Daniels-Midland Co. | 67,104 | 2,781,461 | ||||||||
Air Freight & Logistics — 0.1% | ||||||||||
United Parcel Service Inc., Class B | 10,391 | 1,025,488 | ||||||||
Airlines — 0.4% | ||||||||||
Delta Air Lines Inc. | 65,594 | 2,943,203 | ||||||||
Apparel, Accessories & Luxury Goods — 0.0%* | ||||||||||
Coach Inc. | 4,644 | 134,351 | ||||||||
Application Software — 0.2% | ||||||||||
Intuit Inc. | 19,716 | 1,749,795 | ||||||||
Asset Management & Custody Banks — 1.5% | ||||||||||
Ameriprise Financial Inc. | 34,247 | 3,737,375 | ||||||||
Invesco Ltd. | 115,399 | 3,603,911 | ||||||||
State Street Corp. | 57,816 | 3,885,813 | (e) | |||||||
| 11,227,099 | ||||||||||
Auto Parts & Equipment — 0.3% | ||||||||||
BorgWarner Inc. | 8,654 | 359,920 | ||||||||
Delphi Automotive PLC | 21,477 | 1,633,111 | ||||||||
| 1,993,031 | ||||||||||
Automobile Manufacturers — 0.2% | ||||||||||
Ford Motor Co. | 116,096 | 1,575,423 | ||||||||
Automotive Retail — 0.2% | ||||||||||
Advance Auto Parts Inc. | 9,288 | 1,760,355 | ||||||||
Biotechnology — 1.7% | ||||||||||
Alexion Pharmaceuticals Inc. | 13,002 | 2,033,383 | (a) | |||||||
Amgen Inc. | 47,134 | 6,519,575 | ||||||||
Gilead Sciences Inc. | 45,161 | 4,434,358 | ||||||||
| 12,987,316 | ||||||||||
Broadcasting — 0.1% | ||||||||||
CBS Corp., Class B | 15,092 | 602,171 | ||||||||
| Number of Shares | Fair Value | |||||||||
Cable & Satellite — 1.5% | ||||||||||
Comcast Corp., Class A | 81,848 | $ | 4,655,514 | |||||||
Comcast Corp., Special Class A | 46,438 | 2,658,111 | ||||||||
Liberty Global PLC, Class C | 68,454 | 2,807,983 | (a) | |||||||
Sirius XM Holdings Inc. | 232,192 | 868,398 | (a) | |||||||
| 10,990,006 | ||||||||||
Casinos & Gaming — 0.1% | ||||||||||
Las Vegas Sands Corp. | 19,252 | 730,998 | ||||||||
Communications Equipment — 1.3% | ||||||||||
Cisco Systems Inc. | 208,973 | 5,485,541 | ||||||||
QUALCOMM Inc. | 86,840 | 4,665,913 | ||||||||
| 10,151,454 | ||||||||||
Consumer Finance — 0.2% | ||||||||||
Discover Financial Services | 33,668 | 1,750,399 | ||||||||
Data Processing & Outsourced Services — 0.6% | ||||||||||
PayPal Holdings Inc. | 41,763 | 1,296,324 | (a) | |||||||
Visa Inc., Class A | 51,082 | 3,558,372 | ||||||||
| 4,854,696 | ||||||||||
Diversified Banks — 1.9% | ||||||||||
Bank of America Corp. | 231,018 | 3,599,261 | ||||||||
Citigroup Inc. | 16,253 | 806,311 | ||||||||
JPMorgan Chase & Co. | 111,454 | 6,795,350 | ||||||||
Wells Fargo & Co. | 57,468 | 2,950,982 | ||||||||
| 14,151,904 | ||||||||||
Drug Retail — 0.6% | ||||||||||
CVS Health Corp. | 45,277 | 4,368,325 | ||||||||
Electric Utilities — 0.2% | ||||||||||
NextEra Energy Inc. | 16,253 | 1,585,480 | ||||||||
Electrical Components & Equipment — 0.2% | ||||||||||
Rockwell Automation Inc. | 11,610 | 1,178,067 | ||||||||
Fertilizers & Agricultural Chemicals — 0.3% | ||||||||||
Monsanto Co. | 24,355 | 2,078,456 | ||||||||
General Merchandise Stores — 0.8% | ||||||||||
Dollar General Corp. | 43,537 | 3,153,820 | ||||||||
Target Corp. | 38,313 | 3,013,701 | ||||||||
| 6,167,521 | ||||||||||
Healthcare Distributors — 0.2% | ||||||||||
Cardinal Health Inc. | 20,317 | 1,560,752 | ||||||||
Healthcare Equipment — 0.9% | ||||||||||
Abbott Laboratories | 52,189 | 2,099,042 | ||||||||
See Notes to Schedules of Investments and Notes to Financial Statements.
55
Table of Contents
Strategic Investment Fund
| Schedule of Investments | September 30, 2015 |
| Number of Shares | Fair Value | |||||||||
Boston Scientific Corp. | 213,617 | $ | 3,505,455 | (a) | ||||||
Stryker Corp. | 9,984 | 939,494 | ||||||||
| 6,543,991 | ||||||||||
Healthcare Supplies — 0.2% | ||||||||||
The Cooper Companies Inc. | 12,769 | 1,900,793 | ||||||||
Home Improvement Retail — 0.6% | ||||||||||
Lowe’s Companies Inc. | 67,336 | 4,640,797 | ||||||||
Independent Power Producers & Energy Traders — 0.1% | ||||||||||
Calpine Corp. | 40,634 | 593,256 | (a) | |||||||
NRG Energy Inc. | 32,507 | 482,729 | ||||||||
| 1,075,985 | ||||||||||
Industrial Machinery — 0.3% | ||||||||||
Ingersoll-Rand PLC | 41,214 | 2,092,435 | ||||||||
Integrated Oil & Gas — 0.9% | ||||||||||
Exxon Mobil Corp. | 43,536 | 3,236,901 | ||||||||
Occidental Petroleum Corp. | 56,886 | 3,763,009 | ||||||||
| 6,999,910 | ||||||||||
Integrated Telecommunication Services — 0.2% | ||||||||||
Verizon Communications Inc. | 32,507 | 1,414,380 | ||||||||
Internet Retail — 0.5% | ||||||||||
Amazon.com Inc. | 6,734 | 3,447,067 | (a) | |||||||
Internet Software & Services — 1.5% | ||||||||||
eBay Inc. | 60,369 | 1,475,418 | (a) | |||||||
Facebook Inc., Class A | 18,575 | 1,669,893 | (a) | |||||||
Google Inc., Class A | 5,805 | 3,705,738 | (a) | |||||||
Google Inc., Class C | 5,805 | 3,531,878 | (a) | |||||||
LinkedIn Corp., Class A | 5,573 | 1,059,594 | (a) | |||||||
| 11,442,521 | ||||||||||
Investment Banking & Brokerage — 0.3% | ||||||||||
The Charles Schwab Corp. | 83,508 | 2,384,988 | ||||||||
Life & Health Insurance — 0.2% | ||||||||||
Lincoln National Corp. | 25,541 | 1,212,176 | ||||||||
Life Sciences Tools & Services — 0.1% | ||||||||||
PerkinElmer Inc. | 9,869 | 453,579 | ||||||||
Movies & Entertainment — 0.7% | ||||||||||
The Walt Disney Co. | 22,290 | 2,278,038 | ||||||||
Time Warner Inc. | 48,180 | 3,312,375 | ||||||||
| 5,590,413 | ||||||||||
Multi-Line Insurance — 1.1% | ||||||||||
American International Group Inc. | 80,687 | 4,584,636 | ||||||||
| Number of Shares | Fair Value | |||||||||
The Hartford Financial Services Group Inc. | 89,394 | $ | 4,092,457 | |||||||
| 8,677,093 | ||||||||||
Multi-Utilities — 0.3% | ||||||||||
Dominion Resources Inc. | 30,416 | 2,140,678 | ||||||||
Oil & Gas Equipment & Services — 0.6% | ||||||||||
FMC Technologies Inc. | 27,283 | 845,773 | (a) | |||||||
Schlumberger Ltd. | 54,101 | 3,731,346 | ||||||||
| 4,577,119 | ||||||||||
Oil & Gas Exploration & Production — 0.5% | ||||||||||
Hess Corp. | 59,208 | 2,963,952 | ||||||||
Marathon Oil Corp. | 47,599 | 733,025 | ||||||||
| 3,696,977 | ||||||||||
Packaged Foods & Meats — 0.4% | ||||||||||
Mondelez International Inc., Class A | 66,178 | 2,770,873 | ||||||||
Paper Packaging — 0.1% | ||||||||||
Packaging Corporation of America | 8,127 | 488,920 | ||||||||
Pharmaceuticals — 2.5% |
| |||||||||
Allergan PLC | 28,792 | 7,825,954 | (a) | |||||||
Johnson & Johnson | 25,541 | 2,384,252 | ||||||||
Merck & Company Inc. | 89,974 | 4,443,816 | ||||||||
Pfizer Inc. | 135,832 | 4,266,483 | ||||||||
| 18,920,505 | ||||||||||
Railroads — 0.1% |
| |||||||||
CSX Corp. | 29,024 | 780,746 | ||||||||
Research & Consulting Services — 0.4% |
| |||||||||
Nielsen Holdings PLC | 76,625 | 3,407,514 | ||||||||
Semiconductor Equipment — 0.3% |
| |||||||||
Applied Materials Inc. | 147,442 | 2,165,923 | ||||||||
Soft Drinks — 0.7% |
| |||||||||
PepsiCo Inc. | 54,449 | 5,134,541 | ||||||||
Specialized Finance — 0.7% |
| |||||||||
CME Group Inc. | 33,594 | 3,115,508 | ||||||||
McGraw Hill Financial Inc. | 25,515 | 2,207,047 | ||||||||
| 5,322,555 | ||||||||||
Specialized REITs — 0.6% |
| |||||||||
American Tower Corp. | 47,599 | 4,187,760 | ||||||||
Extra Space Storage Inc. | 9,288 | 716,662 | ||||||||
| 4,904,422 | ||||||||||
Specialty Stores — 0.2% |
| |||||||||
Dick’s Sporting Goods Inc. | 25,093 | 1,244,864 | ||||||||
See Notes to Schedules of Investments and Notes to Financial Statements.
56
Table of Contents
Strategic Investment Fund
| Schedule of Investments | September 30, 2015 |
| Number of Shares | Fair Value | |||||||||
Systems Software — 0.2% |
| |||||||||
Oracle Corp. | 41,795 | $ | 1,509,635 | |||||||
Technology Hardware, Storage & Peripherals — 1.8% |
| |||||||||
Apple Inc. | 62,460 | 6,889,338 | ||||||||
EMC Corp. | 44,117 | 1,065,867 | ||||||||
Hewlett-Packard Co. | 99,838 | 2,556,851 | ||||||||
Western Digital Corp. | 39,472 | 3,135,656 | ||||||||
| 13,647,712 | ||||||||||
Trading Companies & Distributors — 0.2% |
| |||||||||
United Rentals Inc. | 23,219 | 1,394,301 | (a) | |||||||
Total Common Stock | 238,540,397 | |||||||||
Preferred Stock — 0.0%* |
| |||||||||
Diversified Banks — 0.0%* |
| |||||||||
Wells Fargo & Co. | 9,802 | 249,951 | ||||||||
Total Preferred Stock | 249,951 | |||||||||
Total Domestic Equity | 238,790,348 | |||||||||
Foreign Equity — 21.2% | ||||||||||
Common Stock — 21.2% |
| |||||||||
Advertising — 0.2% |
| |||||||||
WPP PLC | 82,429 | 1,714,318 | ||||||||
Aerospace & Defense — 0.5% | ||||||||||
Airbus Group SE | 18,771 | 1,108,630 | ||||||||
Safran S.A. | 19,735 | 1,482,564 | ||||||||
Zodiac Aerospace | 38,496 | 880,693 | ||||||||
| 3,471,887 | ||||||||||
Airlines — 0.2% | ||||||||||
China Southern Airlines Company Ltd., H Shares | 44,000 | 32,418 | ||||||||
International Consolidated Airlines Group S.A. | 166,199 | 1,480,289 | (a) | |||||||
| 1,512,707 | ||||||||||
Apparel Retail — 0.2% |
| |||||||||
Fast Retailing Company Ltd. | 3,488 | 1,412,208 | ||||||||
Apparel, Accessories & Luxury Goods — 0.2% |
| |||||||||
Makalot Industrial Company Ltd. | 12,349 | 101,447 | ||||||||
The Swatch Group AG | 3,607 | 1,332,645 | ||||||||
| 1,434,092 | ||||||||||
| Number of Shares | Fair Value | |||||||||
Application Software — 0.2% |
| |||||||||
SAP SE | 23,512 | $ | 1,520,913 | |||||||
Auto Parts & Equipment — 0.5% | ||||||||||
Continental AG | 16,745 | 3,553,273 | ||||||||
Superalloy Industrial Company Ltd. | 7,987 | 27,046 | ||||||||
| 3,580,319 | ||||||||||
Automobile Manufacturers — 0.5% | ||||||||||
Fuji Heavy Industries Ltd. | 24,800 | 886,890 | ||||||||
Great Wall Motor Company Ltd., Class H | 57,402 | 63,920 | ||||||||
Hyundai Motor Co. | 439 | 60,741 | ||||||||
Toyota Motor Corp. | 46,580 | 2,711,219 | ||||||||
| 3,722,770 | ||||||||||
Biotechnology — 0.1% | ||||||||||
CSL Ltd. | 14,472 | 906,536 | ||||||||
Brewers — 0.4% | ||||||||||
AMBEV S.A. ADR | 14,925 | 73,133 | ||||||||
Anheuser-Busch InBev S.A. | 25,089 | 2,658,290 | ||||||||
SABMiller PLC | 1,622 | 91,815 | ||||||||
| 2,823,238 | ||||||||||
Building Products — 0.4% | ||||||||||
Assa Abloy AB, Class B | 103,011 | 1,841,094 | ||||||||
Geberit AG | 3,681 | 1,121,517 | ||||||||
| 2,962,611 | ||||||||||
Cable & Satellite — 0.0%* | ||||||||||
Naspers Ltd., Class N | 692 | 86,614 | ||||||||
Coal & Consumable Fuels — 0.0%* | ||||||||||
Coal India Ltd. | 22,189 | 109,863 | ||||||||
Communications Equipment — 0.3% | ||||||||||
Telefonaktiebolaget LM Ericsson, Class B | 258,990 | 2,538,315 | ||||||||
Construction & Engineering — 0.2% | ||||||||||
Hyundai Engineering & Construction Company Ltd. | 946 | 27,295 | ||||||||
Larsen & Toubro Ltd. | 48,743 | 1,087,881 | ||||||||
| 1,115,176 | ||||||||||
Construction Machinery & Heavy Trucks — 0.0%* |
| |||||||||
CRRC Corporation Ltd., Class H | 36,000 | 45,569 | (a) | |||||||
Construction Materials — 0.3% | ||||||||||
Cemex SAB de C.V. ADR | 17,943 | 125,422 | (a) | |||||||
HeidelbergCement AG | 26,491 | 1,811,493 | ||||||||
Indocement Tunggal Prakarsa Tbk PT | 50,700 | 56,929 | ||||||||
| 1,993,844 | ||||||||||
See Notes to Schedules of Investments and Notes to Financial Statements.
57
Table of Contents
Strategic Investment Fund
| Schedule of Investments | September 30, 2015 |
| Number of Shares | Fair Value | |||||||||
Department Stores — 0.0%* | ||||||||||
Matahari Department Store Tbk PT | 45,576 | $ | 50,087 | |||||||
SACI Falabella | 6,332 | 39,158 | ||||||||
Woolworths Holdings Ltd. | 16,501 | 115,520 | ||||||||
| 204,765 | ||||||||||
Diversified Banks — 3.1% | ||||||||||
Banco Bilbao Vizcaya Argentaria S.A. | 132,216 | 1,118,702 | ||||||||
Bancolombia S.A. ADR | 1,686 | 54,289 | ||||||||
Bank Negara Indonesia Persero Tbk PT | 136,100 | 38,415 | ||||||||
Bank of China Ltd., Class H | 240,978 | 103,542 | ||||||||
Barclays PLC | 800,241 | 2,959,501 | ||||||||
BNP Paribas S.A. | 45,199 | 2,646,784 | ||||||||
China Construction Bank Corp., Class H | 177,000 | 117,619 | ||||||||
Credicorp Ltd. | 289 | 30,738 | ||||||||
Credit Agricole S.A. | 156,765 | 1,794,511 | ||||||||
CTBC Financial Holding Company Ltd. | 261,830 | 134,782 | ||||||||
Grupo Financiero Banorte SAB de C.V., Class O | 138,690 | 678,606 | ||||||||
HSBC Holdings PLC | 124,374 | 939,528 | ||||||||
ICICI Bank Ltd. | 417,597 | 1,715,176 | ||||||||
Industrial & Commercial Bank of China Ltd., Class H | 338,203 | 194,629 | ||||||||
ING Groep N.V. | 160,774 | 2,270,218 | ||||||||
Intesa Sanpaolo S.p.A. | 800,885 | 2,821,425 | ||||||||
Kasikornbank PCL | 15,900 | 74,692 | ||||||||
Malayan Banking Bhd | 37,099 | 72,244 | ||||||||
Metropolitan Bank & Trust Co. | 82,864 | 144,666 | ||||||||
Mitsubishi UFJ Financial Group Inc. | 423,000 | 2,530,265 | ||||||||
Qatar National Bank SAQ | 1,505 | 77,480 | ||||||||
Sberbank of Russia ADR | 22,154 | 109,341 | ||||||||
Shinhan Financial Group Company Ltd. | 4,659 | 162,729 | ||||||||
Sumitomo Mitsui Financial Group Inc. | 62,400 | 2,350,844 | ||||||||
| 23,140,726 | ||||||||||
Diversified Metals & Mining — 0.2% |
| |||||||||
BHP Billiton PLC | 101,102 | 1,539,100 | ||||||||
Korea Zinc Company Ltd. | 135 | 53,018 | ||||||||
MMC Norilsk Nickel PJSC ADR | 4,235 | 60,751 | ||||||||
| 1,652,869 | ||||||||||
Diversified Real Estate Activities — 0.8% |
| |||||||||
Brookfield Asset Management Inc., Class A | 22,572 | 706,943 | ||||||||
Mitsubishi Estate Company Ltd. | 120,588 | 2,452,236 | ||||||||
Mitsui Fudosan Company Ltd. | 118,399 | 3,225,783 | ||||||||
| 6,384,962 | ||||||||||
Drug Retail — 0.0%* |
| |||||||||
Raia Drogasil S.A. | 1,398 | 13,727 | ||||||||
| Number of Shares | Fair Value | |||||||||
Education Services — 0.0%* |
| |||||||||
Kroton Educacional S.A. | 37,721 | $ | 73,037 | |||||||
Electric Utilities — 0.1% |
| |||||||||
Power Grid Corporation of India Ltd. | 365,339 | 738,303 | ||||||||
Electrical Components & Equipment — 0.7% |
| |||||||||
Nidec Corp. | 51,900 | 3,547,392 | ||||||||
Schneider Electric SE | 25,077 | 1,399,890 | ||||||||
| 4,947,282 | ||||||||||
Electronic Components — 0.2% |
| |||||||||
Largan Precision Company Ltd. | 2,000 | 155,493 | ||||||||
Murata Manufacturing Company Ltd. | 12,699 | 1,629,722 | ||||||||
| 1,785,215 | ||||||||||
Electronic Equipment & Instruments — 0.7% |
| |||||||||
China Railway Signal & Communication Corporation Ltd. | 55,000 | 44,284 | (a,b) | |||||||
Flytech Technology Company Ltd. | 10,902 | 31,023 | ||||||||
Hexagon AB, Class B | 55,001 | 1,674,219 | ||||||||
Hitachi Ltd. | 424,000 | 2,127,346 | ||||||||
Keyence Corp. | 3,200 | 1,421,450 | ||||||||
| 5,298,322 | ||||||||||
Food Retail — 0.0%* |
| |||||||||
Magnit PJSC GDR | 1,680 | 80,254 | ||||||||
Healthcare Equipment — 0.8% |
| |||||||||
i-SENS Inc. | 1,165 | 36,809 | (a) | |||||||
Medtronic PLC | 65,594 | 4,390,862 | ||||||||
Smith & Nephew PLC | 108,981 | 1,903,360 | ||||||||
| 6,331,031 | ||||||||||
Healthcare Services — 0.4% |
| |||||||||
Fresenius SE & Company KGaA | 39,463 | 2,643,033 | ||||||||
Household Appliances — 0.0%* |
| |||||||||
Techtronic Industries Company Ltd. | 28,380 | 104,548 | ||||||||
Household Products — 0.2% |
| |||||||||
LG Household & Health Care Ltd. | 232 | 167,154 | ||||||||
Svenska Cellulosa AB SCA, Class B | 35,818 | 998,474 | ||||||||
| 1,165,628 | ||||||||||
Human Resource & Employment Services — 0.2% |
| |||||||||
Capita PLC | 78,036 | 1,416,096 | ||||||||
Hypermarkets & Super Centers — 0.0%* |
| |||||||||
Puregold Price Club Inc. | 51,400 | 34,091 | ||||||||
See Notes to Schedules of Investments and Notes to Financial Statements.
58
Table of Contents
Strategic Investment Fund
| Schedule of Investments | September 30, 2015 |
| Number of Shares | Fair Value | |||||||||
Independent Power Producers & Energy Traders — 0.0%* |
| |||||||||
China Resources Power Holdings Company Ltd. | 20,000 | $ | 45,316 | |||||||
Industrial Conglomerates — 0.0%* |
| |||||||||
Alfa SAB de C.V., Class A | 38,231 | 74,176 | ||||||||
Industrial Gases — 0.3% |
| |||||||||
Linde AG | 11,637 | 1,882,871 | ||||||||
Industrial Machinery — 0.5% |
| |||||||||
FANUC Corp. | 12,700 | 1,942,141 | ||||||||
Mitsubishi Heavy Industries Ltd. | 428,000 | 1,902,619 | ||||||||
| 3,844,760 | ||||||||||
Integrated Oil & Gas — 0.9% |
| |||||||||
Cenovus Energy Inc. | 106,808 | 1,619,209 | ||||||||
Cenovus Energy Inc. | 86,604 | 1,307,425 | ||||||||
China Petroleum & Chemical Corp., Class H | 183,725 | 112,131 | ||||||||
Lukoil PJSC ADR | 900 | 30,654 | ||||||||
Sasol Ltd. | 4,879 | 136,769 | ||||||||
Statoil ASA | 110,576 | 1,608,732 | ||||||||
Total S.A. | 35,365 | 1,586,942 | ||||||||
| 6,401,862 | ||||||||||
Integrated Telecommunication Services — 0.0%* |
| |||||||||
China Unicom Hong Kong Ltd. | 22,000 | 27,819 | ||||||||
Internet Retail — 0.4% |
| |||||||||
Rakuten Inc. | 214,498 | 2,729,470 | ||||||||
Internet Software & Services — 0.7% |
| |||||||||
Alibaba Group Holding Ltd. ADR | 1,321 | 77,899 | (a) | |||||||
Baidu Inc. ADR | 33,504 | 4,603,785 | (a) | |||||||
NAVER Corp. | 260 | 112,529 | ||||||||
Tencent Holdings Ltd. | 18,155 | 303,362 | ||||||||
Yandex N.V., Class A | 4,947 | 53,081 | (a) | |||||||
| 5,150,656 | ||||||||||
IT Consulting & Other Services — 0.0%* |
| |||||||||
HCL Technologies Ltd. | 13,104 | 196,640 | ||||||||
Leisure Products — 0.1% |
| |||||||||
Shimano Inc. | 3,000 | 419,321 | ||||||||
Life & Health Insurance — 0.8% |
| |||||||||
AIA Group Ltd. | 693,020 | 3,581,325 | ||||||||
China Life Insurance Company Ltd., Class H | 32,000 | 110,657 | ||||||||
Ping An Insurance Group Company of China Ltd., Class H | 28,000 | 138,735 | ||||||||
Prudential PLC | 91,132 | 1,923,618 | ||||||||
| 5,754,335 | ||||||||||
| Number of Shares | Fair Value | |||||||||
Movies & Entertainment — 0.1% |
| |||||||||
Vivendi S.A. | 34,678 | $ | 817,928 | |||||||
Multi-Line Insurance — 0.3% |
| |||||||||
AXA S.A. | 95,826 | 2,314,204 | ||||||||
BB Seguridade Participacoes S.A. | 15,940 | 99,316 | ||||||||
| 2,413,520 | ||||||||||
Oil & Gas Equipment & Services — 0.2% |
| |||||||||
Technip S.A. | 38,883 | 1,830,093 | ||||||||
Oil & Gas Exploration & Production — 0.0%* |
| |||||||||
CNOOC Ltd. | 135,000 | 138,309 | ||||||||
Parex Resources Inc. | 15,322 | 105,712 | (a) | |||||||
| 244,021 | ||||||||||
Packaged Foods & Meats — 0.2% |
| |||||||||
China Mengniu Dairy Company Ltd. | 16,802 | 59,295 | ||||||||
Nestle S.A. | 22,665 | 1,699,121 | ||||||||
| 1,758,416 | ||||||||||
Personal Products — 0.2% |
| |||||||||
Kao Corp. | 25,600 | 1,154,902 | ||||||||
Pharmaceuticals — 2.0% |
| |||||||||
Aspen Pharmacare Holdings Ltd. | 2,893 | 61,513 | ||||||||
Astellas Pharma Inc. | 90,300 | 1,164,894 | ||||||||
Bayer AG | 20,002 | 2,555,351 | ||||||||
CSPC Pharmaceutical Group Ltd. | 152,095 | 133,254 | ||||||||
Roche Holding AG | 17,662 | 4,645,516 | ||||||||
Sanofi | 38,982 | 3,693,873 | ||||||||
Shire PLC | 25,630 | 1,748,590 | ||||||||
Valeant Pharmaceuticals International Inc. | 5,996 | 1,065,299 | (a) | |||||||
| 15,068,290 | ||||||||||
Property & Casualty Insurance — 0.5% |
| |||||||||
Insurance Australia Group Ltd. | 500,622 | 1,701,560 | ||||||||
PICC Property & Casualty Company Ltd., Class H | 38,000 | 74,038 | ||||||||
Tokio Marine Holdings Inc. | 61,200 | 2,269,865 | ||||||||
| 4,045,463 | ||||||||||
Railroads — 0.2% |
| |||||||||
East Japan Railway Co. | 20,200 | 1,695,913 | ||||||||
Real Estate Development — 0.0%* |
| |||||||||
China Resources Land Ltd. | 24,000 | 56,237 | ||||||||
Research & Consulting Services — 0.1% |
| |||||||||
Experian PLC | 65,064 | 1,042,719 | ||||||||
See Notes to Schedules of Investments and Notes to Financial Statements.
59
Table of Contents
Strategic Investment Fund
| Schedule of Investments | September 30, 2015 |
| Number of Shares | Fair Value | |||||||||
Residential REITs — 0.0%* |
| |||||||||
Emlak Konut Gayrimenkul Yatirim Ortakligi AS | 46,660 | $ | 38,681 | |||||||
Restaurants — 0.0%* | ||||||||||
Alsea SAB de C.V. | 16,640 | 48,987 | ||||||||
Security & Alarm Services — 0.1% | ||||||||||
Secom Company Ltd. | �� | 16,500 | 987,672 | |||||||
Semiconductor Equipment — 0.3% | ||||||||||
ASML Holding N.V. | 24,150 | 2,106,993 | ||||||||
Semiconductors — 0.3% | ||||||||||
Taiwan Semiconductor Manufacturing Company Ltd. | 628,876 | 2,482,845 | ||||||||
Soft Drinks — 0.0%* | ||||||||||
Coca-Cola Icecek AS | 4,374 | 49,984 | ||||||||
Specialty Chemicals — 0.5% | ||||||||||
Givaudan S.A. | 1,331 | 2,159,078 | (h) | |||||||
Johnson Matthey PLC | 34,210 | 1,268,544 | ||||||||
| 3,427,622 | ||||||||||
Technology Hardware, Storage & Peripherals — 0.2% |
| |||||||||
Samsung Electronics Company Ltd. | 1,744 | 1,668,519 | ||||||||
Thrifts & Mortgage Finance — 0.0%* |
| |||||||||
Housing Development Finance Corporation Ltd. | 17,532 | 323,717 | ||||||||
Wireless Telecommunication Services — 0.7% |
| |||||||||
China Mobile Ltd. | 16,790 | 198,229 | ||||||||
MTN Group Ltd. | 11,322 | 145,752 | ||||||||
SK Telecom Company Ltd. | 667 | 147,997 | ||||||||
SoftBank Group Corp. | 48,700 | 2,227,111 | ||||||||
Vodafone Group PLC | 896,703 | 2,831,336 | ||||||||
| 5,550,425 | ||||||||||
Total Common Stock | 160,305,042 | |||||||||
Preferred Stock — 0.0%* | ||||||||||
Automobile Manufacturers — 0.0%* | ||||||||||
Volkswagen AG | 2,370 | 258,599 | ||||||||
| Number of Shares | Fair Value | |||||||||
Diversified Banks — 0.0%* | ||||||||||
Itau Unibanco Holding S.A. | 11,225 | $ | 74,731 | |||||||
Integrated Oil & Gas — 0.0%* | ||||||||||
Petroleo Brasileiro S.A. | 19,953 | 36,278 | (a) | |||||||
Total Preferred Stock | 369,608 | |||||||||
Total Foreign Equity | 160,674,650 | |||||||||
| Principal Amount | Fair Value | |||||||||||
Bonds and Notes — 32.3% | ||||||||||||
U.S. Treasuries — 5.9% |
| |||||||||||
U.S. Treasury Bonds | ||||||||||||
| 2.50% | 02/15/45 | $ | 2,821,800 | $ | 2,597,746 | |||||||
| 3.13% | 11/15/41 | 6,717,000 | 7,082,935 | |||||||||
U.S. Treasury Notes | ||||||||||||
| 0.63% | 05/31/17 | 3,424,400 | 3,426,941 | |||||||||
| 1.38% | 07/31/18 - 05/31/20 | 16,183,300 | 16,262,200 | |||||||||
| 1.88% | 08/31/22 | 9,540,000 | 9,620,747 | |||||||||
| 2.13% | 05/15/25 | 5,578,900 | 5,612,463 | |||||||||
| 44,603,032 | ||||||||||||
Agency Mortgage Backed — 8.8% |
| |||||||||||
Federal Home Loan Mortgage Corp. |
| |||||||||||
| 4.50% | 06/01/33 - 02/01/35 | 6,084 | 6,611 | |||||||||
| 5.00% | 07/01/35 - 06/01/41 | 719,661 | 803,644 | |||||||||
| 5.50% | 05/01/20 - 04/01/39 | 150,337 | 169,846 | |||||||||
| 6.00% | 04/01/17 - 11/01/37 | 209,062 | 237,564 | |||||||||
| 6.50% | 06/01/29 | 924 | 1,056 | |||||||||
| 7.00% | 10/01/16 - 08/01/36 | 142,450 | 153,360 | |||||||||
| 7.50% | 09/01/33 | 446 | 476 | |||||||||
| 8.00% | 04/01/30 - 11/01/30 | 790 | 868 | |||||||||
| 9.00% | 04/01/16 - 06/01/21 | 117 | 119 | |||||||||
Federal National Mortgage Assoc. |
| |||||||||||
| 2.22% | 04/01/37 | 724 | 738 | (i) | ||||||||
| 3.00% | 02/01/43 - 06/01/43 | 9,556,226 | 9,716,378 | |||||||||
| 3.50% | 11/01/42 - 08/01/45 | 9,372,903 | 9,788,909 | |||||||||
| 4.00% | 05/01/19 - 03/01/44 | 5,411,146 | 5,807,238 | |||||||||
| 4.50% | 05/01/18 - 01/01/41 | 5,824,119 | 6,328,152 | |||||||||
| 5.00% | 07/01/20 - 06/01/41 | 1,124,781 | 1,265,393 | |||||||||
| 5.50% | 06/01/20 - 01/01/39 | 1,147,969 | 1,287,909 | |||||||||
| 6.00% | 02/01/20 - 05/01/41 | 1,559,079 | 1,773,618 | |||||||||
| 6.50% | 02/01/16 - 08/01/34 | 141,378 | 160,411 | |||||||||
| 7.00% | 10/01/16 - 12/01/33 | 10,357 | 10,461 | |||||||||
| 7.50% | 12/01/23 - 12/01/33 | 4,973 | 5,568 | |||||||||
| 8.00% | 11/01/25 - 01/01/33 | 864 | 981 | |||||||||
See Notes to Schedules of Investments and Notes to Financial Statements.
60
Table of Contents
Strategic Investment Fund
| Schedule of Investments | September 30, 2015 |
| Principal Amount | Fair Value | |||||||||||
| 9.00% | 12/01/17 - 12/01/22 | $ | 711 | $ | 774 | |||||||
| 2.50% | TBA | 6,461,076 | 6,586,865 | (c) | ||||||||
| 3.00% | TBA | 1,201,000 | 1,214,605 | (c) | ||||||||
| 4.00% | TBA | 2,967,562 | 3,159,643 | (c) | ||||||||
| 4.50% | TBA | 2,900,000 | 3,004,899 | (c) | ||||||||
| 5.00% | TBA | 1,925,000 | 2,119,793 | (c) | ||||||||
| 6.50% | TBA | 568,000 | 650,194 | (c) | ||||||||
Government National Mortgage Assoc. |
| |||||||||||
| 3.00% | 04/20/43 - 06/20/43 | 2,759,669 | 2,831,503 | |||||||||
| 3.50% | 05/20/43 | 1,816,755 | 1,908,949 | |||||||||
| 4.00% | 01/20/41 - 04/20/43 | 2,164,892 | 2,325,674 | |||||||||
| 4.50% | 08/15/33 - 03/20/41 | 1,094,016 | 1,189,584 | |||||||||
| 5.00% | 08/15/33 | 14,207 | 15,854 | |||||||||
| 6.00% | 06/15/33 - 09/15/36 | 60,546 | 70,878 | |||||||||
| 6.50% | 04/15/28 - 06/15/34 | 13,369 | 15,333 | |||||||||
| 7.00% | 04/15/28 - 10/15/36 | 9,051 | 9,958 | |||||||||
| 8.00% | 06/15/30 | 33 | 34 | |||||||||
| 8.50% | 10/15/17 | 1,519 | 1,578 | |||||||||
| 9.00% | 11/15/16 - 12/15/21 | 2,235 | 2,314 | |||||||||
| 3.00% | TBA | 1,400,000 | 1,428,629 | (c) | ||||||||
| 3.50% | TBA | 1,782,694 | 1,867,859 | (c) | ||||||||
| 4.00% | TBA | 169,190 | 180,341 | (c) | ||||||||
| 5.00% | TBA | 75,000 | 82,418 | (c) | ||||||||
| 66,186,979 | ||||||||||||
Agency Collateralized Mortgage Obligations — 0.1% | ||||||||||||
Collateralized Mortgage Obligation Trust | ||||||||||||
| 0.01% | 11/01/18 | 67 | 67 | (d,f) | ||||||||
Federal Home Loan Mortgage Corp. |
| |||||||||||
| 0.08% | 09/25/43 | 88,988 | 261 | (g,i) | ||||||||
Federal Home Loan Mortgage Corp. REMIC |
| |||||||||||
| 3.50% | 11/15/24 - 11/15/30 | 685,591 | 50,868 | (g) | ||||||||
| 4.50% | 03/15/18 | 298 | — | (**,g) | ||||||||
| 5.00% | 10/15/18 - 02/15/38 | 7,212 | 137 | (g) | ||||||||
| 5.50% | 06/15/33 | 4,477 877 | (g) | |||||||||
| 6.39% | 08/15/25 | 273,793 | 30,246 | (g,i) | ||||||||
| 7.50% | 07/15/27 | 1,672 | 229 | (g) | ||||||||
| 8.00% | 04/15/20 | 21 | 22 | |||||||||
Federal Home Loan Mortgage Corp. STRIPS |
| |||||||||||
| 1.47% | 08/01/27 | 152 | 146 | (d,f) | ||||||||
| 5.74% | 08/15/43 | 673,263 | 153,093 | (g,i) | ||||||||
| 8.00% | 02/01/23 - 07/01/24 | 599 | 127 | (g) | ||||||||
Federal National Mortgage Assoc. REMIC |
| |||||||||||
| 0.51% | 12/25/22 | 191 | 188 | (d,f) | ||||||||
| 1.22% | 12/25/42 | 34,836 | 1,218 | (g,i) | ||||||||
| 5.00% | 02/25/40 - 09/25/40 | 350,254 | 37,710 | (g) | ||||||||
| 5.81% | 07/25/38 | 69,439 | 10,149 | (g,i) | ||||||||
Federal National Mortgage Assoc. STRIPS |
| |||||||||||
| 4.50% | 08/25/35 - 01/25/36 | 71,164 | 11,680 | (g) | ||||||||
| 5.00% | 03/25/38 - 05/25/38 | 40,743 | 7,121 | (g) | ||||||||
| 5.50% | 12/25/33 | 8,058 | 1,591 | (g) | ||||||||
| 6.00% | 01/25/35 | 37,528 | 7,257 | (g) | ||||||||
| Principal Amount | Fair Value | |||||||||||
| 7.50% | 11/25/23 | $ | 3,798 | $ | 788 | (g) | ||||||
| 8.00% | 08/25/23 - 07/25/24 | 1,240 | 263 | (g) | ||||||||
| 8.50% | 03/25/17 - 07/25/22 | 231 | 27 | (g) | ||||||||
| 9.00% | 05/25/22 | 162 | 29 | (g) | ||||||||
Government National Mortgage Assoc. |
| |||||||||||
| 4.50% | 10/20/37 - 08/16/39 | 565,466 | 35,135 | (g) | ||||||||
| 5.00% | 12/20/35 - 09/20/38 | 213,407 | 11,993 | (g) | ||||||||
| 6.03% | 02/20/40 | 288,323 | 48,973 | (g,i) | ||||||||
| 6.59% | 01/16/40 | 492,031 | 91,678 | (g,i) | ||||||||
| 501,873 | ||||||||||||
Asset Backed — 0.0%* | ||||||||||||
Ford Credit Auto Lease Trust 2013-A |
| |||||||||||
| 1.28% | 06/15/16 | 100,000 | 100,039 | |||||||||
Corporate Notes — 14.0% | ||||||||||||
21st Century Fox America Inc. | ||||||||||||
| 6.65% | 11/15/37 | 160,000 | 190,933 | (h) | ||||||||
3M Co. |
| |||||||||||
| 2.00% | 08/07/20 | 337,000 | 341,524 | |||||||||
ABB Finance USA Inc. | ||||||||||||
| 1.63% | 05/08/17 | 166,000 | 166,953 | |||||||||
AbbVie Inc. |
| |||||||||||
| 1.75% | 11/06/17 | 234,000 | 234,695 | (h) | ||||||||
| 2.00% | 11/06/18 | 211,000 | 211,805 | (h) | ||||||||
| 2.50% | 05/14/20 | 335,000 | 333,149 | (h) | ||||||||
| 3.60% | 05/14/25 | 138,000 | 136,105 | (h) | ||||||||
| 4.70% | 05/14/45 | 70,000 | 67,917 | (h) | ||||||||
ACCO Brands Corp. | ||||||||||||
| 6.75% | 04/30/20 | 339,000 | 352,560 | |||||||||
ACE INA Holdings Inc. | ||||||||||||
| 3.15% | 03/15/25 | 237,000 | 231,137 | |||||||||
Actavis Funding SCS | ||||||||||||
| 1.30% | 06/15/17 | 399,000 | 395,391 | (h) | ||||||||
| 3.00% | 03/12/20 | 169,000 | 169,148 | (h) | ||||||||
| 3.45% | 03/15/22 | 236,000 | 233,295 | (h) | ||||||||
| 3.80% | 03/15/25 | 338,000 | 326,521 | (h) | ||||||||
Activision Blizzard Inc. |
| |||||||||||
| 5.63% | 09/15/21 | 367,000 | 386,267 | (b) | ||||||||
Aetna Inc. |
| |||||||||||
| 3.50% | 11/15/24 | 379,000 | 377,017 | |||||||||
Agrium Inc. |
| |||||||||||
| 3.38% | 03/15/25 | 84,000 | 79,526 | |||||||||
| 4.90% | 06/01/43 | 147,000 | 143,444 | |||||||||
Alibaba Group Holding Ltd. | ||||||||||||
| 4.50% | 11/28/34 | 205,000 | 190,524 | (b) | ||||||||
Altria Group Inc. | ||||||||||||
| 2.95% | 05/02/23 | 141,000 | 136,879 | |||||||||
| 4.50% | 05/02/43 | 141,000 | 134,685 | |||||||||
America Movil SAB de C.V. | ||||||||||||
| 3.13% | 07/16/22 | 200,000 | 194,180 | |||||||||
See Notes to Schedules of Investments and Notes to Financial Statements.
61
Table of Contents
Strategic Investment Fund
| Schedule of Investments | September 30, 2015 |
| Principal Amount | Fair Value | |||||||||||
American Axle & Manufacturing Inc. |
| |||||||||||
| 6.25% | 03/15/21 | $ | 187,000 | $ | 186,533 | |||||||
| 6.63% | 10/15/22 | 53,000 | 53,265 | |||||||||
American Campus Communities Inc. |
| |||||||||||
| 3.35% | 10/01/20 | 136,000 | 137,623 | |||||||||
American Campus Communities Operating Partnership LP |
| |||||||||||
| 4.13% | 07/01/24 | 103,000 | 103,546 | |||||||||
American Electric Power Company Inc. |
| |||||||||||
| 2.95% | 12/15/22 | 270,000 | 262,180 | |||||||||
American Express Co. |
| |||||||||||
| 3.63% | 12/05/24 | 337,000 | 333,424 | |||||||||
American Express Credit Corp. |
| |||||||||||
| 2.60% | 09/14/20 | 337,000 | 338,536 | |||||||||
American International Group Inc. |
| |||||||||||
| 3.75% | 07/10/25 | 337,000 | 342,234 | |||||||||
| 4.13% | 02/15/24 | 102,000 | 107,159 | |||||||||
| 4.50% | 07/16/44 | 67,000 | 65,787 | |||||||||
| 4.80% | 07/10/45 | 169,000 | 172,526 | |||||||||
American Tower Corp. (REIT) |
| |||||||||||
| 3.40% | 02/15/19 | 515,000 | 530,128 | |||||||||
Amgen Inc. |
| |||||||||||
| 2.20% | 05/22/19 | 449,000 | 450,855 | |||||||||
| 3.13% | 05/01/25 | 215,000 | 205,863 | |||||||||
Amkor Technology Inc. |
| |||||||||||
| 6.63% | 06/01/21 | 368,000 | 349,600 | |||||||||
Anadarko Petroleum Corp. |
| |||||||||||
| 6.20% | 03/15/40 | 271,000 | 286,712 | |||||||||
Anheuser-Busch InBev Worldwide Inc. |
| |||||||||||
| 2.50% | 07/15/22 | 453,000 | 433,468 | |||||||||
Anthem Inc. |
| |||||||||||
| 3.30% | 01/15/23 | 185,000 | 183,074 | (h) | ||||||||
Apache Corp. |
| |||||||||||
| 5.10% | 09/01/40 | 169,000 | 161,378 | |||||||||
Apple Inc. |
| |||||||||||
| 2.50% | 02/09/25 | 480,000 | 455,938 | (h) | ||||||||
| 2.85% | 05/06/21 | 499,000 | 511,764 | (h) | ||||||||
| 3.45% | 02/09/45 | 170,000 | 143,918 | (h) | ||||||||
Aramark Services Inc. |
| |||||||||||
| 5.75% | 03/15/20 | 370,000 | 384,569 | |||||||||
Ascension Health |
| |||||||||||
| 4.85% | 11/15/53 | 235,000 | 255,050 | |||||||||
AT&T Inc. |
| |||||||||||
| 2.38% | 11/27/18 | 438,000 | 442,654 | (h) | ||||||||
| 2.45% | 06/30/20 | 505,000 | 497,217 | (h) | ||||||||
| 3.40% | 05/15/25 | 508,000 | 484,884 | (h) | ||||||||
| 4.50% | 05/15/35 | 169,000 | 154,604 | (h) | ||||||||
| 4.75% | 05/15/46 | 86,000 | 78,802 | (h) | ||||||||
| 4.80% | 06/15/44 | 135,000 | 124,807 | (h) | ||||||||
AutoNation Inc. |
| |||||||||||
| 4.50% | 10/01/25 | 236,000 | 240,535 | |||||||||
AutoZone Inc. |
| |||||||||||
| 3.25% | 04/15/25 | 337,000 | 330,574 | |||||||||
| Principal Amount | Fair Value | |||||||||||
Bank of America Corp. |
| |||||||||||
| 1.70% | 08/25/17 | $ | 849,000 | $ | 851,231 | (h) | ||||||
| 2.60% | 01/15/19 | 293,000 | 295,977 | (h) | ||||||||
| 3.88% | 08/01/25 | 67,000 | 67,931 | (h) | ||||||||
| 3.95% | 04/21/25 | 382,000 | 371,623 | (h) | ||||||||
| 4.00% | 01/22/25 | 166,000 | 162,691 | (h) | ||||||||
| 4.10% | 07/24/23 | 163,000 | 169,355 | (h) | ||||||||
| 4.25% | 10/22/26 | 305,000 | 301,528 | (h) | ||||||||
Barclays Bank PLC |
| |||||||||||
| 2.25% | 05/10/17 | 815,000 | 830,278 | (b,h) | ||||||||
Barclays PLC |
| |||||||||||
| 5.25% | 08/17/45 | 200,000 | 201,423 | |||||||||
Barrick Gold Corp. |
| |||||||||||
| 4.10% | 05/01/23 | 170,000 | 150,435 | |||||||||
Baxalta Inc. |
| |||||||||||
| 2.88% | 06/23/20 | 337,000 | 336,874 | (b) | ||||||||
| 4.00% | 06/23/25 | 337,000 | 337,522 | (b) | ||||||||
Bed Bath & Beyond Inc. |
| |||||||||||
| 4.92% | 08/01/34 | 51,000 | 48,480 | |||||||||
Berkshire Hathaway Energy Co. |
| |||||||||||
| 6.13% | 04/01/36 | 789,000 | 950,063 | (h) | ||||||||
Berkshire Hathaway Finance Corp. |
| |||||||||||
| 3.00% | 05/15/22 | 236,000 | 239,154 | |||||||||
Berry Plastics Corp. |
| |||||||||||
| 5.13% | 07/15/23 | 220,000 | 207,350 | |||||||||
BHP Billiton Finance USA Ltd. |
| |||||||||||
| 5.00% | 09/30/43 | 174,000 | 175,993 | |||||||||
Biogen Inc. |
| |||||||||||
| 2.90% | 09/15/20 | 504,000 | 509,100 | |||||||||
| 4.05% | 09/15/25 | 335,000 | 338,411 | |||||||||
| 5.20% | 09/15/45 | 235,000 | 237,126 | |||||||||
Bombardier Inc. |
| |||||||||||
| 4.75% | 04/15/19 | 208,000 | 167,440 | (b) | ||||||||
| 5.50% | 09/15/18 | 74,000 | 64,010 | (b) | ||||||||
| 6.00% | 10/15/22 | 198,000 | 147,015 | (b) | ||||||||
| 7.75% | 03/15/20 | 212,000 | 181,260 | (b) | ||||||||
Boston Scientific Corp. |
| |||||||||||
| 3.85% | 05/15/25 | 170,000 | 167,212 | |||||||||
BP Capital Markets PLC |
| |||||||||||
| 1.38% | 05/10/18 | 291,000 | 288,936 | (h) | ||||||||
| 3.81% | 02/10/24 | 430,000 | 439,119 | (h) | ||||||||
Branch Banking & Trust Co. |
| |||||||||||
| 3.63% | 09/16/25 | 350,000 | 350,283 | |||||||||
| 3.80% | 10/30/26 | 255,000 | 258,713 | |||||||||
Building Materials Corporation of America |
| |||||||||||
| 5.38% | 11/15/24 | 442,000 | 436,475 | (b) | ||||||||
Burlington Northern Santa Fe LLC |
| |||||||||||
| 3.65% | 09/01/25 | 120,000 | 121,354 | |||||||||
Calpine Corp. |
| |||||||||||
| 5.75% | 01/15/25 | 205,000 | 191,675 | |||||||||
| 5.88% | 01/15/24 | 289,000 | 297,670 | (b) | ||||||||
See Notes to Schedules of Investments and Notes to Financial Statements.
62
Table of Contents
Strategic Investment Fund
| Schedule of Investments | September 30, 2015 |
| Principal Amount | Fair Value | |||||||||||
Calumet Specialty Products Partners LP/Calumet Finance Corp. |
| |||||||||||
| 6.50% | 04/15/21 | $ | 370,000 | $ | 333,000 | |||||||
Canadian Pacific Railway Co. |
| |||||||||||
| 2.90% | 02/01/25 | 400,000 | 377,696 | |||||||||
Caterpillar Inc. |
| |||||||||||
| 4.30% | 05/15/44 | 175,000 | 169,818 | |||||||||
Catholic Health Initiatives |
| |||||||||||
| 2.60% | 08/01/18 | 105,000 | 107,205 | |||||||||
| 4.35% | 11/01/42 | 82,000 | 76,226 | |||||||||
CBS Corp. |
| |||||||||||
| 3.70% | 08/15/24 | 266,000 | 261,089 | |||||||||
CCO Safari II LLC | ||||||||||||
| 3.58% | 07/23/20 | 253,000 | 251,136 | (b) | ||||||||
| 4.91% | 07/23/25 | 253,000 | 251,786 | (b) | ||||||||
| 6.38% | 10/23/35 | 34,000 | 34,399 | (b) | ||||||||
| 6.48% | 10/23/45 | 67,000 | 67,593 | (b) | ||||||||
Celgene Corp. |
| |||||||||||
| 2.88% | 08/15/20 | 236,000 | 238,141 | |||||||||
| 3.88% | 08/15/25 | 337,000 | 337,063 | |||||||||
| 5.00% | 08/15/45 | 169,000 | 167,631 | |||||||||
CenturyLink Inc. |
| |||||||||||
| 5.80% | 03/15/22 | 741,000 | 633,555 | |||||||||
Cequel Capital Corp. |
| |||||||||||
| 5.13% | 12/15/21 | 347,000 | 305,577 | (b) | ||||||||
Chesapeake Energy Corp. |
| |||||||||||
| 3.25% | 03/15/16 | 166,000 | 162,713 | |||||||||
Cigna Corp. |
| |||||||||||
| 3.25% | 04/15/25 | 338,000 | 327,262 | |||||||||
Cinemark USA Inc. |
| |||||||||||
| 4.88% | 06/01/23 | 370,000 | 353,350 | |||||||||
Citigroup Inc. |
| |||||||||||
| 1.55% | 08/14/17 | 742,000 | 742,828 | (h) | ||||||||
| 1.75% | 05/01/18 | 582,000 | 578,352 | (h) | ||||||||
| 1.85% | 11/24/17 | 160,000 | 160,375 | (h) | ||||||||
| 3.30% | 04/27/25 | 169,000 | 164,611 | (h) | ||||||||
| 4.40% | 06/10/25 | 337,000 | 338,933 | (h) | ||||||||
| 4.65% | 07/30/45 | 270,000 | 269,310 | (h) | ||||||||
CMS Energy Corp. |
| |||||||||||
| 4.88% | 03/01/44 | 171,000 | 177,571 | |||||||||
CNA Financial Corp. |
| |||||||||||
| 5.88% | 08/15/20 | 206,000 | 234,312 | |||||||||
CNOOC Nexen Finance 2014 ULC |
| |||||||||||
| 4.25% | 04/30/24 | 349,000 | 351,652 | |||||||||
Cogeco Cable Inc. |
| |||||||||||
| 4.88% | 05/01/20 | 270,000 | 267,300 | (b) | ||||||||
Colgate-Palmolive Co. |
| |||||||||||
| 4.00% | 08/15/45 | 169,000 | 168,933 | |||||||||
Columbia Pipeline Group Inc. |
| |||||||||||
| 3.30% | 06/01/20 | 236,000 | 236,704 | (b) | ||||||||
| 4.50% | 06/01/25 | 169,000 | 164,050 | (b) | ||||||||
Comcast Corp. |
| |||||||||||
| 3.38% | 08/15/25 | 741,000 | 746,699 | |||||||||
| Principal Amount | Fair Value | |||||||||||
| 4.20% | 08/15/34 | $ | 171,000 | $ | 168,670 | |||||||
| 4.60% | 08/15/45 | 170,000 | 173,774 | |||||||||
Commonwealth Bank of Australia |
| |||||||||||
| 0.75% | 01/15/16 | 354,000 | 353,940 | (b,h) | ||||||||
ConocoPhillips Co. |
| |||||||||||
| 3.35% | 11/15/24 | 337,000 | 329,221 | |||||||||
Continental Resources Inc. |
| |||||||||||
| 3.80% | 06/01/24 | 73,000 | 59,210 | |||||||||
| 4.50% | 04/15/23 | 65,000 | 56,444 | |||||||||
| 4.90% | 06/01/44 | 40,000 | 28,597 | |||||||||
Corp Andina de Fomento |
| |||||||||||
| 4.38% | 06/15/22 | 425,000 | 461,286 | |||||||||
Corp Nacional del Cobre de Chile |
| |||||||||||
| 4.50% | 09/16/25 | 200,000 | 192,125 | (b) | ||||||||
COX Communications Inc. |
| |||||||||||
| 4.70% | 12/15/42 | 59,000 | 50,143 | (b) | ||||||||
Credit Suisse AG |
| |||||||||||
| 1.70% | 04/27/18 | 334,000 | 332,685 | |||||||||
| 2.60% | 05/27/16 | 253,000 | 255,805 | (b,h) | ||||||||
Credit Suisse Group Funding Guernsey Ltd. |
| |||||||||||
| 3.75% | 03/26/25 | 502,000 | 487,519 | (b) | ||||||||
Crown Americas LLC/Crown Americas Capital Corp. IV |
| |||||||||||
| 4.50% | 01/15/23 | 434,000 | 425,320 | |||||||||
CSX Corp. |
| |||||||||||
| 4.50% | 08/01/54 | 104,000 | 96,432 | |||||||||
CVS Health Corp. |
| |||||||||||
| 2.25% | 08/12/19 | 364,000 | 367,924 | |||||||||
| 3.88% | 07/20/25 | 338,000 | 348,413 | |||||||||
| 5.13% | 07/20/45 | 253,000 | 271,963 | |||||||||
Daimler Finance North America LLC |
| |||||||||||
| 2.38% | 08/01/18 | 778,000 | 779,125 | (b) | ||||||||
Danaher Corp. |
| |||||||||||
| 2.40% | 09/15/20 | 235,000 | 237,188 | |||||||||
| 3.35% | 09/15/25 | 335,000 | 341,724 | |||||||||
| 4.38% | 09/15/45 | 155,000 | 160,319 | |||||||||
Denbury Resources Inc. |
| |||||||||||
| 5.50% | 05/01/22 | 370,000 | 220,150 | |||||||||
| 6.38% | 08/15/21 | 150,000 | 94,500 | |||||||||
Deutsche Bank AG |
| |||||||||||
| 4.50% | 04/01/25 | 342,000 | 331,355 | |||||||||
Dexia Credit Local S.A. |
| |||||||||||
| 2.25% | 01/30/19 | 715,000 | 729,208 | (b) | ||||||||
Diageo Investment Corp. |
| |||||||||||
| 2.88% | 05/11/22 | 346,000 | 342,271 | |||||||||
DigitalGlobe Inc. |
| |||||||||||
| 5.25% | 02/01/21 | 280,000 | 265,300 | (b) | ||||||||
DIRECTV Holdings LLC |
| |||||||||||
| 4.45% | 04/01/24 | 262,000 | 268,767 | |||||||||
Discover Bank |
| |||||||||||
| 3.10% | 06/04/20 | 250,000 | 252,420 | |||||||||
Dollar General Corp. |
| |||||||||||
| 1.88% | 04/15/18 | 335,000 | 334,691 | |||||||||
See Notes to Schedules of Investments and Notes to Financial Statements.
63
Table of Contents
Strategic Investment Fund
| Schedule of Investments | September 30, 2015 |
| Principal Amount | Fair Value | |||||||||||
| 4.13% | 07/15/17 | $ | 341,000 | $ | 351,610 | |||||||
Dollar Tree Inc. |
| |||||||||||
| 5.75% | 03/01/23 | 444,000 | 460,650 | (b) | ||||||||
Dominion Resources Inc. |
| |||||||||||
| 1.95% | 08/15/16 | 368,000 | 370,493 | |||||||||
Duke Energy Corp. |
| |||||||||||
| 3.75% | 04/15/24 | 157,000 | 161,637 | |||||||||
Duke Energy Progress LLC |
| |||||||||||
| 4.15% | 12/01/44 | 100,000 | 100,610 | |||||||||
Eastman Chemical Co. |
| |||||||||||
| 3.60% | 08/15/22 | 336,000 | 338,029 | |||||||||
Ecopetrol S.A. |
| |||||||||||
| 5.88% | 05/28/45 | 85,000 | 64,813 | |||||||||
Electricite de France S.A. |
| |||||||||||
| 2.15% | 01/22/19 | 704,000 | 711,277 | (b) | ||||||||
Eli Lilly & Co. |
| |||||||||||
| 2.75% | 06/01/25 | 169,000 | 166,396 | (h) | ||||||||
| 3.70% | 03/01/45 | 33,000 | 31,071 | (h) | ||||||||
EMD Finance LLC |
| |||||||||||
| 3.25% | 03/19/25 | 169,000 | 163,823 | (b,h) | ||||||||
Energizer Holdings Inc. |
| |||||||||||
| 5.50% | 06/15/25 | 373,000 | 363,209 | (b,h) | ||||||||
Energy Transfer Equity LP |
| |||||||||||
| 5.88% | 01/15/24 | 714,000 | 642,957 | (h) | ||||||||
Energy Transfer Partners LP |
| |||||||||||
| 4.05% | 03/15/25 | 68,000 | 60,094 | (h) | ||||||||
| 5.15% | 03/15/45 | 118,000 | 92,050 | (h) | ||||||||
| 6.50% | 02/01/42 | 217,000 | 199,128 | (h) | ||||||||
Ensco PLC |
| |||||||||||
| 4.50% | 10/01/24 | 168,000 | 124,107 | (h) | ||||||||
| 5.20% | 03/15/25 | 271,000 | 206,251 | (h) | ||||||||
| 5.75% | 10/01/44 | 69,000 | 47,734 | (h) | ||||||||
Enterprise Products Operating LLC |
| |||||||||||
| 3.70% | 02/15/26 | 335,000 | 316,558 | (h) | ||||||||
ERP Operating LP |
| |||||||||||
| 4.50% | 07/01/44 | 68,000 | 68,497 | (h) | ||||||||
European Investment Bank |
| |||||||||||
| 4.88% | 01/17/17 | 535,000 | 564,055 | |||||||||
FedEx Corp. |
| |||||||||||
| 3.20% | 02/01/25 | 106,000 | 102,828 | (h) | ||||||||
| 4.10% | 02/01/45 | 2,000 | 1,812 | (h) | ||||||||
Fiat Chrysler Automobiles N.V. |
| |||||||||||
| 4.50% | 04/15/20 | 220,000 | 209,000 | (h) | ||||||||
| 5.25% | 04/15/23 | 200,000 | 186,500 | (h) | ||||||||
Five Corners Funding Trust |
| |||||||||||
| 4.42% | 11/15/23 | 373,000 | 390,128 | (b,h) | ||||||||
Florida Power & Light Co. |
| |||||||||||
| 4.13% | 02/01/42 | 131,000 | 132,329 | (h) | ||||||||
Ford Motor Credit Company LLC |
| |||||||||||
| 2.46% | 03/27/20 | 506,000 | 495,467 | (h) | ||||||||
| 3.22% | 01/09/22 | 360,000 | 348,442 | (h) | ||||||||
| 5.88% | 08/02/21 | 261,000 | 295,453 | (h) | ||||||||
| Principal Amount | Fair Value | |||||||||||
Freeport-McMoRan Inc. |
| |||||||||||
| 4.55% | 11/14/24 | $ | 152,000 | $ | 113,240 | (h) | ||||||
Fresenius Medical Care US Finance Inc. |
| |||||||||||
| 5.75% | 02/15/21 | 247,000 | 266,143 | (b,h) | ||||||||
Frontier Communications Corp. |
| |||||||||||
| 7.13% | 03/15/19 | 367,000 | 360,334 | (h) | ||||||||
| 11.00% | 09/15/25 | 190,000 | 183,825 | (b) | ||||||||
General Motors Co. |
| |||||||||||
| 5.20% | 04/01/45 | 34,000 | 31,907 | (h) | ||||||||
General Motors Financial Company Inc. |
| |||||||||||
| 3.15% | 01/15/20 | 236,000 | 233,984 | (h) | ||||||||
| 3.20% | 07/13/20 | 675,000 | 665,908 | (h) | ||||||||
| 4.30% | 07/13/25 | 337,000 | 326,018 | (h) | ||||||||
Georgia-Pacific LLC |
| |||||||||||
| 3.60% | 03/01/25 | 480,000 | 479,579 | (b,h) | ||||||||
Gilead Sciences Inc. |
| |||||||||||
| 2.55% | 09/01/20 | 170,000 | 171,063 | |||||||||
| 3.65% | 03/01/26 | 190,000 | 190,884 | |||||||||
| 4.75% | 03/01/46 | 155,000 | 155,715 | |||||||||
| 4.80% | 04/01/44 | 189,000 | 190,102 | (h) | ||||||||
Grupo Televisa SAB |
| |||||||||||
| 5.00% | 05/13/45 | 200,000 | 180,676 | (h) | ||||||||
HCA Inc. |
| |||||||||||
| 4.75% | 05/01/23 | 576,000 | 578,016 | (h) | ||||||||
| 6.50% | 02/15/20 | 444,000 | 483,960 | (h) | ||||||||
HSBC Holdings PLC |
| |||||||||||
| 4.25% | 08/18/25 | 200,000 | 197,079 | (h) | ||||||||
HSBC USA Inc. |
| |||||||||||
| 2.75% | 08/07/20 | 505,000 | 506,830 | (h) | ||||||||
Humana Inc. |
| |||||||||||
| 3.85% | 10/01/24 | 146,000 | 146,881 | (h) | ||||||||
Hyundai Capital America |
| |||||||||||
| 2.13% | 10/02/17 | 118,000 | 118,409 | (b,h) | ||||||||
Illinois Tool Works Inc. |
| |||||||||||
| 3.50% | 03/01/24 | 343,000 | 350,851 | (h) | ||||||||
ING Bank N.V. |
| |||||||||||
| 2.70% | 08/17/20 | 200,000 | 202,569 | (b,h) | ||||||||
Ingersoll-Rand Luxembourg Finance S.A. |
| |||||||||||
| 3.55% | 11/01/24 | 236,000 | 231,727 | (h) | ||||||||
Ingles Markets Inc. |
| |||||||||||
| 5.75% | 06/15/23 | 350,000 | 359,625 | (h) | ||||||||
Intel Corp. |
| |||||||||||
| 2.45% | 07/29/20 | 169,000 | 171,241 | (h) | ||||||||
Intelsat Jackson Holdings S.A. |
| |||||||||||
| 5.50% | 08/01/23 | 347,000 | 286,275 | (h) | ||||||||
International Business Machines Corp. |
| |||||||||||
| 3.63% | 02/12/24 | 361,000 | 371,994 | (h) | ||||||||
Interstate Power & Light Co. |
| |||||||||||
| 3.40% | 08/15/25 | 335,000 | 340,803 | (h) | ||||||||
Intesa Sanpaolo S.p.A. |
| |||||||||||
| 5.02% | 06/26/24 | 66,000 | 65,129 | (b,h) | ||||||||
See Notes to Schedules of Investments and Notes to Financial Statements.
64
Table of Contents
Strategic Investment Fund
| Schedule of Investments | September 30, 2015 |
| Principal Amount | Fair Value | |||||||||||
Invesco Finance PLC |
| |||||||||||
| 3.13% | 11/30/22 | $ | 366,000 | $ | 371,001 | (h) | ||||||
JB Poindexter & Company Inc. |
| |||||||||||
| 9.00% | 04/01/22 | 83,000 | 87,358 | (b,h) | ||||||||
JBS USA LLC/JBS USA Finance Inc. |
| |||||||||||
| 5.75% | 06/15/25 | 296,000 | 272,320 | (b,h) | ||||||||
| 5.88% | 07/15/24 | 190,000 | 178,125 | (b,h) | ||||||||
Jefferies Group LLC |
| |||||||||||
| 5.13% | 01/20/23 | 283,000 | 283,558 | (h) | ||||||||
| 6.50% | 01/20/43 | 90,000 | 85,444 | (h) | ||||||||
Johnson Controls Inc. |
| |||||||||||
| 4.63% | 07/02/44 | 166,000 | 152,332 | (h) | ||||||||
JPMorgan Chase & Co. |
| |||||||||||
| 1.70% | 03/01/18 | 337,000 | 336,233 | (h) | ||||||||
| 3.88% | 09/10/24 | 481,000 | 476,404 | (h) | ||||||||
| 3.90% | 07/15/25 | 169,000 | 172,130 | (h) | ||||||||
| 5.00% | 12/29/49 | 244,000 | 237,290 | (h,i) | ||||||||
| 6.10% | 10/29/49 | 405,000 | 402,367 | (h,i) | ||||||||
KB Home |
| |||||||||||
| 7.00% | 12/15/21 | 423,000 | 424,057 | (h) | ||||||||
Keysight Technologies Inc. |
| |||||||||||
| 4.55% | 10/30/24 | 335,000 | 326,294 | (b,h) | ||||||||
KFW |
| |||||||||||
| 4.50% | 07/16/18 | 446,000 | 487,898 | |||||||||
Kilroy Realty LP |
| |||||||||||
| 4.38% | 10/01/25 | 85,000 | 85,773 | |||||||||
Kinder Morgan Energy Partners LP |
| |||||||||||
| 3.50% | 09/01/23 | 75,000 | 66,354 | (h) | ||||||||
| 4.30% | 05/01/24 | 180,000 | 164,328 | |||||||||
Kinder Morgan Inc. |
| |||||||||||
| 5.55% | 06/01/45 | 101,000 | 83,894 | (h) | ||||||||
Kinross Gold Corp. |
| |||||||||||
| 6.88% | 09/01/41 | 20,000 | 15,074 | (h) | ||||||||
Korea National Oil Corp. |
| |||||||||||
| 2.88% | 11/09/15 | 289,000 | 289,598 | (b) | ||||||||
Kraft Heinz Foods Co. |
| |||||||||||
| 2.80% | 07/02/20 | 506,000 | 509,315 | (b,h) | ||||||||
| 3.95% | 07/15/25 | 439,000 | 449,177 | (b,h) | ||||||||
L Brands Inc. |
| |||||||||||
| 5.63% | 02/15/22 | 369,000 | 390,217 | (h) | ||||||||
L-3 Communications Corp. |
| |||||||||||
| 1.50% | 05/28/17 | 211,000 | 209,071 | (h) | ||||||||
Lee Enterprises Inc. |
| |||||||||||
| 9.50% | 03/15/22 | 300,000 | 273,750 | (b,h) | ||||||||
Lennar Corp. |
| |||||||||||
| 4.50% | 11/15/19 | 442,000 | 445,757 | (h) | ||||||||
| 4.75% | 05/30/25 | 150,000 | 143,250 | (h) | ||||||||
Levi Strauss & Co. |
| |||||||||||
| 5.00% | 05/01/25 | 222,000 | 217,560 | (h) | ||||||||
Liberty Mutual Group Inc. |
| |||||||||||
| 4.25% | 06/15/23 | 314,000 | 324,747 | (b,h) | ||||||||
| Principal Amount | Fair Value | |||||||||||
Lockheed Martin Corp. |
| |||||||||||
| 3.80% | 03/01/45 | $ | 169,000 | $ | 154,122 | (h) | ||||||
Lowe’s Companies Inc. |
| |||||||||||
| 4.38% | 09/15/45 | 135,000 | 136,559 | |||||||||
LyondellBasell Industries N.V. |
| |||||||||||
| 4.63% | 02/26/55 | 67,000 | 56,822 | (h) | ||||||||
Macquarie Bank Ltd. |
| |||||||||||
| 4.88% | 06/10/25 | 342,000 | 341,415 | (b,h) | ||||||||
Marathon Petroleum Corp. |
| |||||||||||
| 3.63% | 09/15/24 | 340,000 | 328,579 | (h) | ||||||||
Marsh & McLennan Companies Inc. |
| |||||||||||
| 3.50% | 03/10/25 | 236,000 | 235,803 | (h) | ||||||||
| 3.75% | 03/14/26 | 235,000 | 236,298 | |||||||||
Mattel Inc. |
| |||||||||||
| 2.35% | 05/06/19 | 499,000 | 498,677 | (h) | ||||||||
Medtronic Inc. |
| |||||||||||
| 2.50% | 03/15/20 | 101,000 | 102,360 | |||||||||
| 3.50% | 03/15/25 | 379,000 | 386,710 | |||||||||
| 4.63% | 03/15/45 | 170,000 | 175,286 | |||||||||
Memorial Sloan-Kettering Cancer Center |
| |||||||||||
| 4.13% | 07/01/52 | 105,000 | 97,128 | (h) | ||||||||
Merck & Company Inc. |
| |||||||||||
| 2.75% | 02/10/25 | 335,000 | 326,069 | (h) | ||||||||
MetLife Inc. |
| |||||||||||
| 4.05% | 03/01/45 | 85,000 | 79,452 | (h) | ||||||||
| 4.72% | 12/15/44 | 104,000 | 107,530 | (h) | ||||||||
MGM Resorts International |
| |||||||||||
| 5.25% | 03/31/20 | 222,000 | 218,670 | (h) | ||||||||
| 6.63% | 12/15/21 | 370,000 | 379,250 | (h) | ||||||||
Microsoft Corp. |
| |||||||||||
| 4.00% | 02/12/55 | 160,000 | 144,948 | (h) | ||||||||
Mizuho Bank Ltd. |
| |||||||||||
| 2.45% | 04/16/19 | 420,000 | 422,853 | (b,h) | ||||||||
Monsanto Co. |
| |||||||||||
| 3.38% | 07/15/24 | 165,000 | 158,675 | (h) | ||||||||
| 4.70% | 07/15/64 | 98,000 | 84,337 | (h) | ||||||||
Morgan Stanley |
| |||||||||||
| 2.65% | 01/27/20 | 145,000 | 145,685 | (h) | ||||||||
| 3.70% | 10/23/24 | 335,000 | 336,598 | (h) | ||||||||
| 3.95% | 04/23/27 | 337,000 | 324,557 | (h) | ||||||||
| 4.00% | 07/23/25 | 199,000 | 203,377 | (h) | ||||||||
| 4.10% | 05/22/23 | 325,000 | 328,937 | (h) | ||||||||
| 4.88% | 11/01/22 | 256,000 | 272,749 | (h) | ||||||||
| 5.00% | 11/24/25 | 131,000 | 139,282 | (h) | ||||||||
Motorola Solutions Inc. |
| |||||||||||
| 4.00% | 09/01/24 | 121,000 | 109,189 | (h) | ||||||||
National Agricultural Cooperative Federation |
| |||||||||||
| 4.25% | 01/28/16 | 135,000 | 136,225 | (b) | ||||||||
NCL Corporation Ltd. |
| |||||||||||
| 5.00% | 02/15/18 | 150,000 | 152,250 | (h) | ||||||||
Newfield Exploration Co. |
| |||||||||||
| 5.63% | 07/01/24 | 301,000 | 284,445 | (h) | ||||||||
| 5.75% | 01/30/22 | 287,000 | 278,390 | (h) | ||||||||
See Notes to Schedules of Investments and Notes to Financial Statements.
65
Table of Contents
Strategic Investment Fund
| Schedule of Investments | September 30, 2015 |
| Principal Amount | Fair Value | |||||||||||
Newmont Mining Corp. |
| |||||||||||
| 4.88% | 03/15/42 | $ | 131,000 | $ | 101,163 | (h) | ||||||
Nexen Energy ULC |
| |||||||||||
| 6.40% | 05/15/37 | 144,000 | 169,364 | |||||||||
Noble Energy Inc. |
| |||||||||||
| 3.90% | 11/15/24 | 202,000 | 187,862 | (h) | ||||||||
Northern States Power Co. |
| |||||||||||
| 2.20% | 08/15/20 | 337,000 | 339,126 | (h) | ||||||||
Northrop Grumman Corp. |
| |||||||||||
| 3.85% | 04/15/45 | 39,000 | 35,099 | (h) | ||||||||
NRG Energy Inc. |
| |||||||||||
| 6.25% | 07/15/22 | 184,000 | 167,440 | (h) | ||||||||
Occidental Petroleum Corp. |
| |||||||||||
| 3.50% | 06/15/25 | 337,000 | 336,053 | (h) | ||||||||
Omnicom Group Inc. |
| |||||||||||
| 3.63% | 05/01/22 | 105,000 | 106,242 | (h) | ||||||||
Oracle Corp. |
| |||||||||||
| 2.25% | 10/08/19 | 649,000 | 656,484 | (h) | ||||||||
| 2.95% | 05/15/25 | 335,000 | 326,599 | (h) | ||||||||
| 4.13% | 05/15/45 | 68,000 | 64,164 | (h) | ||||||||
Owens & Minor Inc. |
| |||||||||||
| 3.88% | 09/15/21 | 310,000 | 312,756 | (h) | ||||||||
Pacific Gas & Electric Co. |
| |||||||||||
| 3.40% | 08/15/24 | 506,000 | 507,470 | (h) | ||||||||
PacifiCorp |
| |||||||||||
| 6.25% | 10/15/37 | 3,000 | 3,822 | (h) | ||||||||
Penn National Gaming Inc. |
| |||||||||||
| 5.88% | 11/01/21 | 225,000 | 226,969 | (h) | ||||||||
People’s United Bank NA |
| |||||||||||
| 4.00% | 07/15/24 | 391,000 | 391,371 | (h) | ||||||||
PepsiCo Inc. |
| |||||||||||
| 3.10% | 07/17/22 | 169,000 | 173,088 | (h) | ||||||||
| 4.25% | 10/22/44 | 100,000 | 98,886 | (h) | ||||||||
| 4.60% | 07/17/45 | 101,000 | 105,548 | (h) | ||||||||
Petrobras Global Finance BV |
| |||||||||||
| 3.50% | 02/06/17 | 7,000 | 6,230 | |||||||||
| 3.88% | 01/27/16 | 103,000 | 101,198 | |||||||||
Petroleos Mexicanos |
| |||||||||||
| 3.50% | 01/30/23 | 147,000 | 132,300 | |||||||||
Philip Morris International Inc. |
| |||||||||||
| 4.13% | 03/04/43 | 140,000 | 132,490 | (h) | ||||||||
Phillips 66 Partners LP |
| |||||||||||
| 2.65% | 02/15/20 | 101,000 | 99,356 | (h) | ||||||||
| 3.61% | 02/15/25 | 144,000 | 132,067 | (h) | ||||||||
Pitney Bowes Inc. |
| |||||||||||
| 4.63% | 03/15/24 | 295,000 | 297,324 | (h) | ||||||||
Plains All American Pipeline LP/PAA Finance Corp. |
| |||||||||||
| 4.65% | 10/15/25 | 101,000 | 101,375 | (h) | ||||||||
PNC Bank NA |
| |||||||||||
| 2.40% | 10/18/19 | 346,000 | 349,056 | (h) | ||||||||
Precision Castparts Corp. |
| |||||||||||
| 4.38% | 06/15/45 | 101,000 | 101,108 | (h) | ||||||||
| Principal Amount | Fair Value | |||||||||||
Principal Financial Group Inc. |
| |||||||||||
| 4.70% | 05/15/55 | $ | 335,000 | $ | 332,488 | (h,i) | ||||||
Prudential Financial Inc. |
| |||||||||||
| 5.38% | 05/15/45 | 169,000 | 167,733 | (h,i) | ||||||||
| 5.63% | 06/15/43 | 166,000 | 171,312 | (h,i) | ||||||||
QUALCOMM Inc. |
| |||||||||||
| 2.25% | 05/20/20 | 135,000 | 134,659 | (h) | ||||||||
| 3.45% | 05/20/25 | 119,000 | 112,369 | (h) | ||||||||
| 4.80% | 05/20/45 | 119,000 | 104,064 | (h) | ||||||||
Quest Diagnostics Inc. |
| |||||||||||
| 4.70% | 03/30/45 | 101,000 | 91,972 | (h) | ||||||||
Regency Energy Partners LP/Regency Energy Finance Corp. |
| |||||||||||
| 4.50% | 11/01/23 | 236,000 | 218,171 | (h) | ||||||||
Revlon Consumer Products Corp. |
| |||||||||||
| 5.75% | 02/15/21 | 852,000 | 826,440 | (h) | ||||||||
Reynolds American Inc. |
| |||||||||||
| 4.45% | 06/12/25 | 169,000 | 176,834 | (h) | ||||||||
Rio Tinto Finance USA Ltd. |
| |||||||||||
| 3.75% | 06/15/25 | 85,000 | 82,909 | (h) | ||||||||
Roche Holdings Inc. |
| |||||||||||
| 3.35% | 09/30/24 | 365,000 | 373,300 | (b,h) | ||||||||
Rowan Companies Inc. |
| |||||||||||
| 5.85% | 01/15/44 | 70,000 | 43,740 | (h) | ||||||||
Royal Bank of Canada |
| |||||||||||
| 1.20% | 09/19/17 | 773,000 | 773,070 | (h) | ||||||||
Ryder System Inc. |
| |||||||||||
| 2.45% | 09/03/19 | 394,000 | 395,203 | (h) | ||||||||
Santander Bank NA |
| |||||||||||
| 2.00% | 01/12/18 | 411,000 | 409,616 | (h) | ||||||||
Schaeffler Holding Finance BV (6.88% Cash/7.63% PIK) |
| |||||||||||
| 6.88% | 08/15/18 | 260,000 | 268,125 | (b,h,n) | ||||||||
Sealed Air Corp. |
| |||||||||||
| 4.88% | 12/01/22 | 221,000 | 218,514 | (b,h) | ||||||||
| 5.13% | 12/01/24 | 221,000 | 216,580 | (b,h) | ||||||||
Sinclair Television Group Inc. |
| |||||||||||
| 5.38% | 04/01/21 | 387,000 | 378,292 | (h) | ||||||||
Southern California Edison Co. |
| |||||||||||
| 2.40% | 02/01/22 | 135,000 | 133,582 | (h) | ||||||||
Spectra Energy Partners LP |
| |||||||||||
| 4.75% | 03/15/24 | 175,000 | 180,891 | (h) | ||||||||
Sprint Corp. |
| |||||||||||
| 7.25% | 09/15/21 | 191,000 | 156,381 | (h) | ||||||||
| 7.63% | 02/15/25 | 248,000 | 192,045 | (h) | ||||||||
State Street Corp. |
| |||||||||||
| 3.55% | 08/18/25 | 335,000 | 341,779 | (e) | ||||||||
Sunoco LP/Sunoco Finance Corp. |
| |||||||||||
| 5.50% | 08/01/20 | 148,000 | 145,780 | (b,h) | ||||||||
SUPERVALU Inc. |
| |||||||||||
| 6.75% | 06/01/21 | 374,000 | 362,780 | |||||||||
T-Mobile USA Inc. |
| |||||||||||
| 6.25% | 04/01/21 | 300,000 | 298,950 | (h) | ||||||||
| 6.63% | 04/01/23 | 370,000 | 366,300 | (h) | ||||||||
See Notes to Schedules of Investments and Notes to Financial Statements.
66
Table of Contents
Strategic Investment Fund
| Schedule of Investments | September 30, 2015 |
| Principal Amount | Fair Value | |||||||||||
Talisman Energy Inc. |
| |||||||||||
| 6.25% | 02/01/38 | $ | 119,000 | $ | 101,483 | (h) | ||||||
Tampa Electric Co. |
| |||||||||||
| 4.35% | 05/15/44 | 169,000 | 173,079 | (h) | ||||||||
Target Corp. |
| |||||||||||
| 3.50% | 07/01/24 | 213,000 | 222,363 | (h) | ||||||||
TD Ameritrade Holding Corp. |
| |||||||||||
| 2.95% | 04/01/22 | 166,000 | 167,168 | (h) | ||||||||
Teachers Insurance & Annuity Association of America |
| |||||||||||
| 4.90% | 09/15/44 | 335,000 | 344,613 | (b,h) | ||||||||
Teck Resources Ltd. |
| |||||||||||
| 2.50% | 02/01/18 | 98,000 | 79,319 | |||||||||
| 3.75% | 02/01/23 | 12,000 | 7,320 | (h) | ||||||||
Telecom Italia S.p.A. |
| |||||||||||
| 5.30% | 05/30/24 | 600,000 | 586,500 | (b,h) | ||||||||
Tenet Healthcare Corp. |
| |||||||||||
| 4.75% | 06/01/20 | 921,000 | 930,210 | (h) | ||||||||
| 6.00% | 10/01/20 | 347,000 | 366,085 | (h) | ||||||||
The Allstate Corp. |
| |||||||||||
| 5.75% | 08/15/53 | 186,000 | 192,575 | (i) | ||||||||
The Bank of Tokyo-Mitsubishi UFJ Ltd. |
| |||||||||||
| 2.30% | 03/10/19 | 400,000 | 400,888 | (b) | ||||||||
The Boeing Co. |
| |||||||||||
| 2.85% | 10/30/24 | 211,000 | 209,484 | |||||||||
The Dow Chemical Co. |
| |||||||||||
| 3.50% | 10/01/24 | 130,000 | 124,141 | |||||||||
| 4.25% | 10/01/34 | 172,000 | 160,705 | |||||||||
The Goldman Sachs Group Inc. |
| |||||||||||
| 2.38% | 01/22/18 | 299,000 | 302,905 | (h) | ||||||||
| 2.60% | 04/23/20 | 335,000 | 335,912 | (h) | ||||||||
| 2.63% | 01/31/19 | 191,000 | 193,365 | (h) | ||||||||
| 2.90% | 07/19/18 | 223,000 | 228,787 | (h) | ||||||||
| 3.75% | 05/22/25 | 288,000 | 288,598 | (h) | ||||||||
| 4.00% | 03/03/24 | 411,000 | 423,027 | (h) | ||||||||
| 4.80% | 07/08/44 | 199,000 | 201,727 | (h) | ||||||||
| 5.15% | 05/22/45 | 169,000 | 165,883 | (h) | ||||||||
The Home Depot Inc. |
| |||||||||||
| 3.35% | 09/15/25 | 236,000 | 240,334 | |||||||||
The Korea Development Bank |
| |||||||||||
| 3.25% | 03/09/16 | 348,000 | 351,251 | |||||||||
| 3.38% | 09/16/25 | 200,000 | 202,800 | |||||||||
The Kroger Co. |
| |||||||||||
| 2.95% | 11/01/21 | 236,000 | 236,507 | (h) | ||||||||
The Progressive Corp. |
| |||||||||||
| 3.70% | 01/26/45 | 226,000 | 202,127 | (h) | ||||||||
The Williams Companies Inc. |
| |||||||||||
| 8.75% | 03/15/32 | 68,000 | 64,698 | (h) | ||||||||
TIAA Asset Management Finance Company LLC |
| |||||||||||
| 4.13% | 11/01/24 | 335,000 | 341,490 | (b,h) | ||||||||
Time Inc. |
| |||||||||||
| 5.75% | 04/15/22 | 371,000 | 346,885 | (b,h) | ||||||||
| Principal Amount | Fair Value | |||||||||||
Time Warner Cable Inc. |
| |||||||||||
| 4.50% | 09/15/42 | $ | 34,000 | $ | 26,881 | (h) | ||||||
| 6.55% | 05/01/37 | 101,000 | 99,241 | (h) | ||||||||
Time Warner Inc. |
| |||||||||||
| 3.60% | 07/15/25 | 186,000 | 182,131 | (h) | ||||||||
| 5.35% | 12/15/43 | 306,000 | 321,939 | (h) | ||||||||
Tyco Electronics Group S.A. |
| |||||||||||
| 2.35% | 08/01/19 | 344,000 | 346,444 | (h) | ||||||||
Tyco International Finance S.A. |
| |||||||||||
| 5.13% | 09/14/45 | 100,000 | 104,563 | |||||||||
Tyson Foods Inc. |
| |||||||||||
| 2.65% | 08/15/19 | 171,000 | 172,289 | (h) | ||||||||
| 3.95% | 08/15/24 | 114,000 | 116,122 | (h) | ||||||||
| 5.15% | 08/15/44 | 114,000 | 119,595 | (h) | ||||||||
U.S. Bancorp |
| |||||||||||
| 3.44% | 02/01/16 | 411,000 | 414,481 | (h) | ||||||||
UBS Group Funding Jersey Ltd. |
| |||||||||||
| 2.95% | 09/24/20 | 200,000 | 200,381 | (b) | ||||||||
| 4.13% | 09/24/25 | 250,000 | 248,799 | (b) | ||||||||
Ultra Petroleum Corp. |
| |||||||||||
| 6.13% | 10/01/24 | 366,000 | 208,620 | (b,h) | ||||||||
United Rentals North America Inc. |
| |||||||||||
| 6.13% | 06/15/23 | 287,000 | 286,103 | (h) | ||||||||
UnitedHealth Group Inc. |
| |||||||||||
| 2.70% | 07/15/20 | 406,000 | 415,431 | (h) | ||||||||
| 4.75% | 07/15/45 | 268,000 | 282,905 | (h) | ||||||||
US Bank NA |
| |||||||||||
| 2.80% | 01/27/25 | 250,000 | 242,747 | (h) | ||||||||
Valeant Pharmaceuticals International Inc. |
| |||||||||||
| 6.13% | 04/15/25 | 296,000 | 281,940 | (b,h) | ||||||||
| 6.38% | 10/15/20 | 207,000 | 205,836 | (b,h) | ||||||||
Ventas Realty LP |
| |||||||||||
| 4.13% | 01/15/26 | 135,000 | 136,080 | (h) | ||||||||
Verizon Communications Inc. |
| |||||||||||
| 1.35% | 06/09/17 | 682,000 | 681,045 | (h) | ||||||||
| 3.50% | 11/01/24 | 168,000 | 165,179 | (h) | ||||||||
| 4.15% | 03/15/24 | 337,000 | 348,586 | (h) | ||||||||
| 4.40% | 11/01/34 | 168,000 | 156,317 | (h) | ||||||||
| 4.67% | 03/15/55 | 118,000 | 101,610 | (h) | ||||||||
| 4.86% | 08/21/46 | 169,000 | 158,474 | (h) | ||||||||
| 5.05% | 03/15/34 | 105,000 | 104,757 | (h) | ||||||||
| 5.15% | 09/15/23 | 215,000 | 237,508 | (h) | ||||||||
| 6.55% | 09/15/43 | 114,000 | 134,685 | (h) | ||||||||
Virgin Media Finance PLC |
| |||||||||||
| 5.75% | 01/15/25 | 202,000 | 189,880 | (b,h) | ||||||||
Volkswagen Group of America Finance LLC |
| |||||||||||
| 0.77% | 11/20/17 | 200,000 | 185,736 | (b,i) | ||||||||
| 2.13% | 05/23/19 | 297,000 | 277,131 | (b,h) | ||||||||
| 2.45% | 11/20/19 | 205,000 | 191,583 | (b,h) | ||||||||
W.R. Grace & Co. |
| |||||||||||
| 5.13% | 10/01/21 | 140,000 | 138,250 | (b,h) | ||||||||
| 5.63% | 10/01/24 | 367,000 | 359,660 | (b,h) | ||||||||
See Notes to Schedules of Investments and Notes to Financial Statements.
67
Table of Contents
Strategic Investment Fund
| Schedule of Investments | September 30, 2015 |
| Principal Amount | Fair Value | |||||||||||
Wal-Mart Stores Inc. |
| |||||||||||
| 4.30% | 04/22/44 | $ | 314,000 | $ | 320,993 | (h) | ||||||
Weatherford International Ltd. |
| |||||||||||
| 6.75% | 09/15/40 | 68,000 | 51,902 | (h) | ||||||||
Wells Fargo & Co. |
| |||||||||||
| 3.00% | 02/19/25 | 169,000 | 162,615 | (h) | ||||||||
| 3.55% | 09/29/25 | 255,000 | 255,096 | |||||||||
| 3.90% | 05/01/45 | 169,000 | 155,308 | (h) | ||||||||
| 4.10% | 06/03/26 | 386,000 | 389,410 | (h) | ||||||||
| 4.30% | 07/22/27 | 136,000 | 138,603 | (h) | ||||||||
| 5.88% | 12/29/49 | 234,000 | 239,558 | (h,i) | ||||||||
| 5.90% | 12/29/49 | 226,000 | 226,000 | (h,i) | ||||||||
Williams Partners LP |
| |||||||||||
| 5.40% | 03/04/44 | 34,000 | 27,144 | (h) | ||||||||
Windstream Services LLC |
| |||||||||||
| 6.38% | 08/01/23 | 259,000 | 186,635 | (h) | ||||||||
WMG Acquisition Corp. |
| |||||||||||
| 6.00% | 01/15/21 | 78,000 | 78,000 | (b,h) | ||||||||
WPP Finance 2010 |
| |||||||||||
| 3.75% | 09/19/24 | 335,000 | 333,831 | (h) | ||||||||
WPX Energy Inc. |
| |||||||||||
| 5.25% | 01/15/17 | 266,000 | 264,670 | (h) | ||||||||
XLIT Ltd. |
| |||||||||||
| 5.25% | 12/15/43 | 143,000 | 151,071 | (h) | ||||||||
Yamana Gold Inc. |
| |||||||||||
| 4.95% | 07/15/24 | 142,000 | 126,883 | (h) | ||||||||
Zimmer Biomet Holdings Inc. |
| |||||||||||
| 3.55% | 04/01/25 | 169,000 | 165,489 | (h) | ||||||||
| 105,425,861 | ||||||||||||
Non-Agency Collateralized Mortgage Obligations — 2.9% |
| |||||||||||
American Tower Trust I (REIT) |
| |||||||||||
| 1.55% | 03/15/43 | 420,000 | 416,740 | (b) | ||||||||
Banc of America Commercial Mortgage Trust 2006-4 |
| |||||||||||
| 5.63% | 07/10/46 | 42,992 | 43,700 | |||||||||
Banc of America Commercial Mortgage Trust 2007-1 |
| |||||||||||
| 5.48% | 01/15/49 | 600,000 | 621,890 | (i) | ||||||||
Banc of America Commercial Mortgage Trust 2007-4 |
| |||||||||||
| 5.93% | 02/10/51 | 97,423 | 103,739 | (i) | ||||||||
Banc of America Commercial Mortgage Trust 2008-1 |
| |||||||||||
| 6.42% | 02/10/51 | 508,052 | 547,752 | (i) | ||||||||
Banc of America Merrill Lynch Commercial Mortgage Inc. 2005-1 |
| |||||||||||
| 5.52% | 11/10/42 | 64,700 | 64,643 | (i) | ||||||||
Banc of America Merrill Lynch Commercial Mortgage Inc. 2005-6 |
| |||||||||||
| 5.32% | 09/10/47 | 46,699 | 46,650 | (i) | ||||||||
Banc of America Merrill Lynch Commercial Mortgage Trust 2014-520M |
| |||||||||||
| 4.33% | 08/15/46 | 137,514 | 143,451 | (b,i) | ||||||||
Bear Stearns Commercial Mortgage Securities Trust 2006-T22 |
| |||||||||||
| 5.80% | 04/12/38 | 140,000 | 142,489 | (i) | ||||||||
Bear Stearns Commercial Mortgage Securities Trust 2007-PW18 |
| |||||||||||
| 6.09% | 06/11/50 | 290,000 | 312,134 | (i) | ||||||||
| Principal Amount | Fair Value | |||||||||||
Citigroup Commercial Mortgage Trust 2014-GC23 |
| |||||||||||
| 4.66% | 07/10/47 | $ | 692,000 | $ | 614,832 | (b,i) | ||||||
Citigroup Commercial Mortgage Trust 2015-GC33 |
| |||||||||||
| 3.17% | 09/10/58 | 146,638 | 110,138 | |||||||||
Citigroup Commercial Mortgage Trust 2015-P1 |
| |||||||||||
| 3.72% | 09/15/48 | 604,059 | 633,908 | |||||||||
COMM 2013-LC13 Mortgage Trust |
| |||||||||||
| 4.56% | 08/10/46 | 140,000 | 154,195 | (b,i) | ||||||||
COMM 2014-CR14 Mortgage Trust |
| |||||||||||
| 4.53% | 02/10/47 | 200,000 | 219,263 | (i) | ||||||||
COMM 2014-CR19 Mortgage Trust |
| |||||||||||
| 4.88% | 08/10/47 | 332,639 | 298,661 | (b,i) | ||||||||
COMM 2014-CR20 Mortgage Trust |
| |||||||||||
| 4.66% | 11/10/47 | 169,443 | 167,654 | (i) | ||||||||
COMM 2014-CR21 Mortgage Trust |
| |||||||||||
| 3.99% | 12/10/47 | 332,372 | 347,194 | |||||||||
COMM 2015-CR23 Mortgage Trust |
| |||||||||||
| 4.40% | 05/10/48 | 161,100 | 152,513 | (i) | ||||||||
COMM 2015-CR24 Mortgage Trust |
| |||||||||||
| 3.46% | 08/10/55 | 293,578 | 223,898 | |||||||||
| 3.70% | 08/10/55 | 293,105 | 306,234 | |||||||||
| 4.52% | 08/10/55 | 263,981 | 254,531 | (i) | ||||||||
COMM 2015-PC1 Mortgage Trust |
| |||||||||||
| 4.59% | 07/10/50 | 160,441 | 163,065 | (i) | ||||||||
Core Industrial Trust 2015-CALW |
| |||||||||||
| 3.25% | 02/10/34 | 322,321 | 326,040 | (b) | ||||||||
Credit Suisse Commercial Mortgage Trust 2006-C1 |
| |||||||||||
| 5.65% | 02/15/39 | 580,000 | 583,860 | (i) | ||||||||
CSAIL 2015-C3 Commercial Mortgage Trust |
| |||||||||||
| 3.51% | 08/15/48 | 175,977 | 138,677 | (i) | ||||||||
| 4.26% | 08/15/48 | 234,636 | 239,316 | (i) | ||||||||
GS Mortgage Securities Corp. Trust 2012-ALOH |
| |||||||||||
| 3.55% | 04/10/34 | 150,000 | 157,445 | (b) | ||||||||
GS Mortgage Securities Trust 2011-GC5 |
| |||||||||||
| 3.00% | 08/10/44 | 239,484 | 242,272 | |||||||||
| 5.47% | 08/10/44 | 120,000 | 135,268 | (b,i) | ||||||||
GS Mortgage Securities Trust 2014-GC20 |
| |||||||||||
| 4.26% | 04/10/47 | 175,000 | 186,000 | |||||||||
GS Mortgage Securities Trust 2014-NEW |
| |||||||||||
| 3.79% | 01/10/31 | 345,000 | 349,612 | (b) | ||||||||
GS Mortgage Securities Trust 2015-GC28 |
| |||||||||||
| 1.32% | 02/10/48 | 2,279,520 | 166,036 | (g,i) | ||||||||
GS Mortgage Securities Trust 2015-GC32 |
| |||||||||||
| 3.35% | 07/10/48 | 161,291 | 124,167 | |||||||||
| 4.56% | 07/10/48 | 75,719 | 74,403 | (i) | ||||||||
JP Morgan Chase Commercial Mortgage Securities Corp. 2012-LC9 |
| |||||||||||
| 2.02% | 12/15/47 | 1,064,709 | 87,572 | (g,i) | ||||||||
JP Morgan Chase Commercial Mortgage Securities Trust 2006-LDP8 |
| |||||||||||
| 5.44% | 05/15/45 | 70,000 | 71,914 | |||||||||
JP Morgan Chase Commercial Mortgage Securities Trust 2007-CB18 |
| |||||||||||
| 5.44% | 06/12/47 | 272,673 | 282,458 | |||||||||
See Notes to Schedules of Investments and Notes to Financial Statements.
68
Table of Contents
Strategic Investment Fund
| Schedule of Investments | September 30, 2015 |
| Principal Amount | Fair Value | |||||||||||
JPMBB Commercial Mortgage Securities Trust 2013-C12 |
| |||||||||||
| 4.16% | 07/15/45 | $ | 90,000 | $ | 95,822 | (i) | ||||||
JPMBB Commercial Mortgage Securities Trust 2013-C15 |
| |||||||||||
| 5.25% | 11/15/45 | 140,000 | 149,178 | (i) | ||||||||
JPMBB Commercial Mortgage Securities Trust 2013-C17 | ||||||||||||
| 5.05% | 01/15/47 | 260,000 | 269,465 | (i) | ||||||||
JPMBB Commercial Mortgage Securities Trust 2014-C18 | ||||||||||||
| 4.97% | 02/15/47 | 180,000 | 185,287 | (i) | ||||||||
JPMBB Commercial Mortgage Securities Trust 2015-C29 | ||||||||||||
| 3.84% | 05/15/48 | 307,309 | 245,076 | (i) | ||||||||
JPMBB Commercial Mortgage Securities Trust 2015-C30 | ||||||||||||
| 4.46% | 07/15/48 | 733,143 | 711,914 | (i) | ||||||||
JPMBB Commercial Mortgage Securities Trust 2015-C31 |
| |||||||||||
| 3.80% | 08/15/48 | 439,886 | 462,815 | |||||||||
LB-UBS Commercial Mortgage Trust 2004-C8 |
| |||||||||||
| 0.75% | 12/15/39 | 18,328 | 76 | (b,g,i) | ||||||||
LB-UBS Commercial Mortgage Trust 2006-C1 | ||||||||||||
| 5.16% | 02/15/31 | 78,709 | 78,829 | |||||||||
LB-UBS Commercial Mortgage Trust 2006-C4 |
| |||||||||||
| 6.03% | 06/15/38 | 108,150 | 110,105 | (i) | ||||||||
LB-UBS Commercial Mortgage Trust 2007-C6 |
| |||||||||||
| 6.11% | 07/15/40 | 430,000 | 456,224 | (b) | ||||||||
| 6.11% | 07/15/40 | 192,914 | 204,679 | (i) | ||||||||
ML-CFC Commercial Mortgage Trust 2006-3 |
| |||||||||||
| 5.46% | 07/12/46 | 350,000 | 361,015 | (i) | ||||||||
Morgan Stanley Bank of America Merrill Lynch Trust 2013-C10 |
| |||||||||||
| 4.22% | 07/15/46 | 326,000 | 324,297 | (i) | ||||||||
Morgan Stanley Bank of America Merrill Lynch Trust 2014-C14 |
| |||||||||||
| 4.99% | 02/15/47 | 160,799 | 152,285 | (b,i) | ||||||||
Morgan Stanley Bank of America Merrill Lynch Trust 2014-C18 |
| |||||||||||
| 3.39% | 10/15/47 | 673,132 | 552,879 | (b) | ||||||||
Morgan Stanley Bank of America Merrill Lynch Trust 2014-C19 |
| |||||||||||
| 3.25% | 12/15/47 | 199,711 | 162,899 | (b) | ||||||||
Morgan Stanley Bank of America Merrill Lynch Trust 2015-C20 |
| |||||||||||
| 1.57% | 02/15/48 | 2,556,266 | 234,673 | (g,i) | ||||||||
Morgan Stanley Bank of America Merrill Lynch Trust 2015-C21 |
| |||||||||||
| 1.13% | 03/15/48 | 3,121,356 | 213,357 | (g,i) | ||||||||
Morgan Stanley Bank of America Merrill Lynch Trust 2015-C22 |
| |||||||||||
| 3.88% | 04/15/48 | 290,007 | 290,066 | (i) | ||||||||
| 4.38% | 04/15/48 | 161,115 | 135,045 | (b,i) | ||||||||
Morgan Stanley Bank of America Merrill Lynch Trust 2015-C23 |
| |||||||||||
| 4.27% | 07/15/50 | 146,650 | 124,050 | (b,i) | ||||||||
Morgan Stanley Bank of America Merrill Lynch Trust 2015-C24 |
| |||||||||||
| 3.73% | 05/15/48 | 641,574 | 670,345 | |||||||||
| 4.50% | 05/15/48 | 586,623 | 592,922 | (i) | ||||||||
Morgan Stanley Capital I Trust 2005-T17 |
| |||||||||||
| 4.84% | 12/13/41 | 52,131 | 52,467 | (i) | ||||||||
Morgan Stanley Capital I Trust 2006-IQ11 |
| |||||||||||
| 5.89% | 10/15/42 | 110,000 | 110,991 | (i) | ||||||||
Morgan Stanley Capital I Trust 2006-T21 |
| |||||||||||
| 5.16% | 10/12/52 | 5,625 | 5,619 | (i) | ||||||||
| 5.27% | 10/12/52 | 210,000 | 211,148 | (i) | ||||||||
| Principal Amount | Fair Value | |||||||||||
Morgan Stanley Capital I Trust 2006-T23 |
| |||||||||||
| 6.02% | 08/12/41 | $ | 363,353 | $ | 370,513 | (i) | ||||||
Morgan Stanley Capital I Trust 2007-IQ16 |
| |||||||||||
| 6.27% | 12/12/49 | 290,000 | 309,418 | (i) | ||||||||
Morgan Stanley Capital I Trust 2008-T29 |
| |||||||||||
| 6.46% | 01/11/43 | 110,000 | 120,779 | (i) | ||||||||
Morgan Stanley Capital I Trust 2012-C4 |
| |||||||||||
| 5.21% | 03/15/45 | 120,000 | 132,232 | (b,i) | ||||||||
Morgan Stanley Capital I Trust 2015-MS1 |
| |||||||||||
| 4.16% | 05/15/48 | 220,000 | 180,869 | (b,i) | ||||||||
Wells Fargo Commercial Mortgage Trust 2015-C26 |
| |||||||||||
| 1.56% | 02/15/48 | 2,652,088 | 244,159 | (g,i) | ||||||||
Wells Fargo Commercial Mortgage Trust 2015-C29 |
| |||||||||||
| 4.01% | 06/15/48 | 481,783 | 497,321 | |||||||||
| 4.37% | 06/15/48 | 239,622 | 198,399 | (i) | ||||||||
Wells Fargo Commercial Mortgage Trust 2015-C30 |
| |||||||||||
| 4.65% | 09/15/58 | 146,644 | 128,068 | (b,i) | ||||||||
Wells Fargo Commercial Mortgage Trust 2015-LC22 |
| |||||||||||
| 4.54% | 09/15/58 | 146,742 | 125,992 | (i) | ||||||||
Wells Fargo Commercial Mortgage Trust 2015-NXS2 |
| |||||||||||
| 4.39% | 07/15/58 | 146,643 | 121,477 | (i) | ||||||||
Wells Fargo Commercial Mortgage Trust 2015-SG1 |
| |||||||||||
| 3.79% | 12/15/47 | 381,206 | 400,805 | |||||||||
| 4.62% | 12/15/47 | 146,629 | 142,308 | (i) | ||||||||
Wells Fargo Mortgage Backed Securities Trust 2006-3 |
| |||||||||||
| 5.50% | 03/25/36 | 30,588 | 570 | |||||||||
WFRBS Commercial Mortgage Trust 2013-C17 |
| |||||||||||
| 4.26% | 12/15/46 | 190,000 | 203,494 | |||||||||
| 5.30% | 12/15/46 | 140,000 | 138,057 | (b,i) | ||||||||
WFRBS Commercial Mortgage Trust 2013-C18 | ||||||||||||
| 4.83% | 12/15/46 | 166,621 | 159,885 | (b,i) | ||||||||
WFRBS Commercial Mortgage Trust 2014-C19 | ||||||||||||
| 4.23% | 03/15/47 | 293,728 | 261,630 | (b) | ||||||||
| 4.72% | 03/15/47 | 240,000 | 255,708 | (i) | ||||||||
WFRBS Commercial Mortgage Trust 2014-C22 | ||||||||||||
| 4.06% | 09/15/57 | 443,071 | 371,999 | (b,i) | ||||||||
WFRBS Commercial Mortgage Trust 2014-LC14 | ||||||||||||
| 4.35% | 03/15/47 | 447,000 | 480,534 | (i) | ||||||||
| 4.59% | 03/15/47 | 464,977 | 407,194 | (b,i) | ||||||||
| 21,669,253 | ||||||||||||
Sovereign Bonds — 0.4% | ||||||||||||
Government of Brazil | ||||||||||||
| 4.25% | 01/07/25 | 200,000 | 175,000 | |||||||||
Government of Chile | ||||||||||||
| 3.63% | 10/30/42 | 250,000 | 213,125 | |||||||||
Government of Colombia | ||||||||||||
| 2.63% | 03/15/23 | 236,000 | 209,804 | |||||||||
| 5.63% | 02/26/44 | 282,000 | 263,670 | |||||||||
Government of Mexico | ||||||||||||
| 3.60% | 01/30/25 | 510,000 | 499,162 | (h) | ||||||||
| 4.00% | 10/02/23 | 168,000 | 171,108 | |||||||||
See Notes to Schedules of Investments and Notes to Financial Statements.
69
Table of Contents
Strategic Investment Fund
| Schedule of Investments | September 30, 2015 |
| Principal Amount | Fair Value | |||||||||||
| 4.60% | 01/23/46 | $ | 245,000 | $ | 218,050 | (h) | ||||||
| 4.75% | 03/08/44 | 322,000 | 293,825 | (h) | ||||||||
Government of Panama | ||||||||||||
| 4.00% | 09/22/24 | 200,000 | 197,250 | |||||||||
Government of Peru | ||||||||||||
| 4.13% | 08/25/27 | 99,000 | 97,020 | |||||||||
| 5.63% | 11/18/50 | 55,000 | 56,788 | |||||||||
Government of Philippines | ||||||||||||
| 4.20% | 01/21/24 | 200,000 | 219,239 | |||||||||
Government of Turkey | ||||||||||||
| 3.25% | 03/23/23 | 73,000 | 64,953 | |||||||||
| 4.88% | 04/16/43 | 200,000 | 166,500 | |||||||||
| 6.63% | 02/17/45 | 76,000 | 81,102 | |||||||||
| 2,926,596 | ||||||||||||
Municipal Bonds and Notes — 0.2% | ||||||||||||
American Municipal Power Inc. | ||||||||||||
| 6.27% | 02/15/50 | 95,000 | 113,246 | |||||||||
Commonwealth of Puerto Rico | ||||||||||||
| 5.00% | 07/01/35 | 485,000 | 454,964 | |||||||||
Municipal Electric Authority of Georgia | ||||||||||||
| 6.64% | 04/01/57 | 169,000 | 198,093 | |||||||||
New Jersey Transportation Trust Fund Authority | ||||||||||||
| 6.88% | 12/15/39 | 65,000 | 68,256 | |||||||||
Port Authority of New York & New Jersey | ||||||||||||
| 4.46% | 10/01/62 | 350,000 | 338,667 | |||||||||
South Carolina State Public Service Authority | ||||||||||||
| 6.45% | 01/01/50 | 120,000 | 151,253 | |||||||||
State of California | ||||||||||||
| 5.70% | 11/01/21 | 175,000 | 204,547 | |||||||||
State of Illinois | ||||||||||||
| 5.10% | 06/01/33 | 100,000 | 93,680 | |||||||||
| 1,622,706 | ||||||||||||
FNMA (TBA) — 0.0%* | ||||||||||||
Lehman TBA | ||||||||||||
| 5.50% | TBA | 64,117 | 3,527 | (l,o) | ||||||||
Total Bonds and Notes | 243,039,866 | |||||||||||
| Number of Shares | Fair Value | |||||||||||
Exchange Traded Funds — 3.6% |
| |||||||||||
Financial Select Sector SPDR Fund | 28,982 | $ | 656,732 | (m) | ||||||||
Industrial Select Sector SPDR Fund | 52,114 | 2,599,967 | (m) | |||||||||
United States Oil Fund LP | 277,500 | 4,073,700 | (a) | |||||||||
Vanguard FTSE Emerging Markets ETF | 599,383 | 19,833,584 | ||||||||||
Total Exchange Traded Funds | 27,163,983 | |||||||||||
Total Investments in Securities | 669,668,847 | |||||||||||
Short-Term Investments – 13.6% |
| |||||||||||
State Street Institutional U.S. Government Money Market Fund — Premier Class 0.00% | 102,285,749 | (d,m) | ||||||||||
Total Investments | 771,954,596 | |||||||||||
Liabilities in Excess of Other Assets, net — (2.3)% | (17,526,928 | ) | ||||||||||
|
| |||||||||||
NET ASSETS — 100.0% | $ | 754,427,668 | ||||||||||
|
| |||||||||||
Other Information: | ||||||||
Centrally Cleared Credit Default Swaps — Sell Protection
| Reference Entity | Counterparty | Notional Amount (000s omitted) | Contract annual Fixed Rate | Termination Date | Market Value | Unamortized Upfront Payments Received | Unrealized Depreciation | |||||||||||||||||||||||||
Markit CDX North America High Yield Index | CME Group Inc. | $ | 10,544 | 5.00 | % | 06/20/20 | $ | 303,029 | $ | 503,804 | $ | (200,775 | ) | |||||||||||||||||||
See Notes to Schedules of Investments and Notes to Financial Statements.
70
Table of Contents
Strategic Investment Fund
| Schedule of Investments | September 30, 2015 |
The Fund had the following long futures contracts open at September 30, 2015:
| Description | Expiration date | Number of Contracts | Current Notional Value | Unrealized Appreciation (Depreciation) | |||||||||||||
EURO Stoxx 50 Index Futures | December 2015 | 15 | $ | 517,549 | $ | (13,445 | ) | ||||||||||
FTSE 100 Index Futures | December 2015 | 1 | 91,165 | 1,232 | |||||||||||||
S&P 500 Emini Index Futures | December 2015 | 12 | 1,145,220 | (25,238 | ) | ||||||||||||
S&P Mid 400 Emini Index Futures | December 2015 | 162 | 22,078,980 | (617,677 | ) | ||||||||||||
Topix Index Futures | December 2015 | 2 | 235,712 | (7,609 | ) | ||||||||||||
2 Yr. U.S. Treasury Notes Futures | December 2015 | 53 | 11,608,656 | 23,896 | |||||||||||||
5 Yr. U.S. Treasury Notes Futures | December 2015 | 6 | 723,094 | 2,514 | |||||||||||||
|
| ||||||||||||||||
| $ | (636,327 | ) | |||||||||||||||
|
| ||||||||||||||||
The Fund had the following short futures contracts open at September 30, 2015:
| Description | Expiration date | Number of Contracts | Current Notional Value | Unrealized Appreciation (Depreciation) | |||||||||||||
S&P 500 Emini Index Futures | December 2015 | 157 | $ | (14,983,295 | ) | $ | 478,864 | ||||||||||
Ultra Long-Term U.S. Treasury Bond Futures | December 2015 | 24 | (3,849,750 | ) | (51,772 | ) | |||||||||||
U.S. Long Bond Futures | December 2015 | 9 | (1,416,094 | ) | (28,141 | ) | |||||||||||
10 Yr. U.S. Treasury Notes Futures | December 2015 | 164 | (21,112,437 | ) | (169,279 | ) | |||||||||||
|
| ||||||||||||||||
| $ | 229,672 | ||||||||||||||||
|
| ||||||||||||||||
| $ | (406,655 | ) | |||||||||||||||
|
| ||||||||||||||||
The Fund was invested in the following countries/territories at September 30, 2015 (unaudited):
| Country/Territory | Percentage (based on Fair Value) | ||||
United States | 76.01% | ||||
Japan | 5.39% | ||||
United Kingdom | 3.22% | ||||
France | 2.72% | ||||
Germany | 2.12% | ||||
Switzerland | 1.52% | ||||
Canada | 1.08% | ||||
Sweden | 0.91% | ||||
China | 0.87% | ||||
| Country/Territory | Percentage (based on Fair Value) | ||||
Netherlands | 0.59% | ||||
Ireland | 0.57% | ||||
India | 0.54% | ||||
Hong Kong | 0.50% | ||||
Australia | 0.46% | ||||
Italy | 0.45% | ||||
South Korea | 0.43% | ||||
Taiwan | 0.38% | ||||
Belgium | 0.34% | ||||
Mexico | 0.34% | ||||
Luxembourg | 0.27% | ||||
Norway | 0.21% | ||||
Spain | 0.15% | ||||
Supranational | 0.13% | ||||
Brazil | 0.08% | ||||
Colombia | 0.08% | ||||
South Africa | 0.07% | ||||
Guernsey | 0.06% | ||||
Puerto Rico | 0.06% | ||||
Jersey | 0.06% | ||||
Chile | 0.06% | ||||
Turkey | 0.05% | ||||
Philippines | 0.05% | ||||
Cayman Islands | 0.04% | ||||
Russian Federation | 0.04% | ||||
Republic of Korea | 0.03% | ||||
Panama | 0.03% | ||||
Peru | 0.02% | ||||
Bermuda | 0.02% | ||||
Indonesia | 0.02% | ||||
Qatar | 0.01% | ||||
Thailand | 0.01% | ||||
Malaysia | 0.01% | ||||
|
| ||||
| 100.00% | |||||
|
| ||||
The Fund’s % share of investment in the various categories, based on Fair Value, is as follows at September 30, 2015 (unaudited):
| Industry | Domestic | Foreign | Total | ||||||||||||
Diversified Banks | 1.86% | 3.01% | 4.87% | ||||||||||||
Pharmaceuticals | 2.45% | 1.95% | 4.40% | ||||||||||||
Exchange Traded Funds | 3.52% | 0.00% | 3.52% | ||||||||||||
Internet Software & Services | 1.49% | 0.66% | 2.15% | ||||||||||||
Technology Hardware, Storage & Peripherals | 1.77% | 0.21% | 1.98% | ||||||||||||
Biotechnology | 1.67% | 0.13% | 1.80% | ||||||||||||
Aerospace & Defense | 1.33% | 0.44% | 1.77% | ||||||||||||
Integrated Oil & Gas | 0.91% | 0.83% | 1.74% | ||||||||||||
Healthcare Equipment | 0.84% | 0.83% | 1.67% | ||||||||||||
Communications Equipment | 1.31% | 0.33% | 1.64% | ||||||||||||
See Notes to Schedules of Investments and Notes to Financial Statements.
71
Table of Contents
Strategic Investment Fund
| Schedule of Investments | September 30, 2015 |
| Industry | Domestic | Foreign | Total | ||||||||||||
Asset Management & Custody Banks | 1.45% | 0.00% | 1.45% | ||||||||||||
Multi-Line Insurance | 1.12% | 0.32% | 1.44% | ||||||||||||
Cable & Satellite | 1.41% | 0.03% | 1.44% | ||||||||||||
Life & Health Insurance | 0.16% | 0.74% | 0.90% | ||||||||||||
Movies & Entertainment | 0.73% | 0.10% | 0.83% | ||||||||||||
Oil & Gas Equipment & Services | 0.59% | 0.24% | 0.83% | ||||||||||||
Diversified Real Estate Activities | 0.00% | 0.83% | 0.83% | ||||||||||||
Internet Retail | 0.45% | 0.35% | 0.80% | ||||||||||||
General Merchandise Stores | 0.80% | 0.00% | 0.80% | ||||||||||||
Electrical Components & Equipment | 0.15% | 0.64% | 0.79% | ||||||||||||
Industrial Machinery | 0.27% | 0.50% | 0.77% | ||||||||||||
Auto Parts & Equipment | 0.26% | 0.46% | 0.72% | ||||||||||||
Automobile Manufacturers | 0.20% | 0.52% | 0.72% | ||||||||||||
Wireless Telecommunication Services | 0.00% | 0.72% | 0.72% | ||||||||||||
Specialized Finance | 0.69% | 0.00% | 0.69% | ||||||||||||
Electronic Equipment & Instruments | 0.00% | 0.69% | 0.69% | ||||||||||||
Soft Drinks | 0.67% | 0.00% | 0.67% | ||||||||||||
Specialized REITs | 0.64% | 0.00% | 0.64% | ||||||||||||
Data Processing & Outsourced Services | 0.63% | 0.00% | 0.63% | ||||||||||||
Home Improvement Retail | 0.60% | 0.00% | 0.60% | ||||||||||||
Packaged Foods & Meats | 0.36% | 0.23% | 0.59% | ||||||||||||
Airlines | 0.38% | 0.20% | 0.58% | ||||||||||||
Research & Consulting Services | 0.44% | 0.14% | 0.58% | ||||||||||||
Drug Retail | 0.57% | 0.00% | 0.57% | ||||||||||||
Semiconductor Equipment | 0.28% | 0.27% | 0.55% | ||||||||||||
Property & Casualty Insurance | 0.00% | 0.52% | 0.52% | ||||||||||||
Oil & Gas Exploration & Production | 0.48% | 0.03% | 0.51% | ||||||||||||
Specialty Chemicals | 0.00% | 0.44% | 0.44% | ||||||||||||
Application Software | 0.23% | 0.19% | 0.42% | ||||||||||||
Building Products | 0.00% | 0.38% | 0.38% | ||||||||||||
Brewers | 0.00% | 0.37% | 0.37% | ||||||||||||
Agricultural Products | 0.36% | 0.00% | 0.36% | ||||||||||||
Healthcare Services | 0.00% | 0.34% | 0.34% | ||||||||||||
Semiconductors | 0.00% | 0.32% | 0.32% | ||||||||||||
Railroads | 0.10% | 0.22% | 0.32% | ||||||||||||
Investment Banking & Brokerage | 0.31% | 0.00% | 0.31% | ||||||||||||
Electric Utilities | 0.21% | 0.09% | 0.30% | ||||||||||||
Multi-Utilities | 0.28% | 0.00% | 0.28% | ||||||||||||
Fertilizers & Agricultural Chemicals | 0.27% | 0.00% | 0.27% | ||||||||||||
Construction Materials | 0.00% | 0.26% | 0.26% | ||||||||||||
Healthcare Supplies | 0.25% | 0.00% | 0.25% | ||||||||||||
Industrial Gases | 0.00% | 0.24% | 0.24% | ||||||||||||
Electronic Components | 0.00% | 0.23% | 0.23% | ||||||||||||
Automotive Retail | 0.23% | 0.00% | 0.23% | ||||||||||||
Consumer Finance | 0.23% | 0.00% | 0.23% | ||||||||||||
Advertising | 0.00% | 0.22% | 0.22% | ||||||||||||
Diversified Metals & Mining | 0.00% | 0.21% | 0.21% | ||||||||||||
Apparel, Accessories & Luxury Goods | 0.02% | 0.18% | 0.20% | ||||||||||||
Healthcare Distributors | 0.20% | 0.00% | 0.20% | ||||||||||||
Systems Software | 0.20% | 0.00% | 0.20% | ||||||||||||
Integrated Telecommunication Services | 0.18% | 0.01% | 0.19% | ||||||||||||
| Industry | Domestic | Foreign | Total | ||||||||||||
Human Resource & Employment Services | 0.00% | 0.18% | 0.18% | ||||||||||||
Apparel Retail | 0.00% | 0.18% | 0.18% | ||||||||||||
Trading Companies & Distributors | 0.18% | 0.00% | 0.18% | ||||||||||||
Specialty Stores | 0.16% | 0.00% | 0.16% | ||||||||||||
Household Products | 0.00% | 0.15% | 0.15% | ||||||||||||
Personal Products | 0.00% | 0.15% | 0.15% | ||||||||||||
Independent Power Producers & Energy Traders | 0.14% | 0.01% | 0.15% | ||||||||||||
Construction & Engineering | 0.00% | 0.15% | 0.15% | ||||||||||||
Air Freight & Logistics | 0.13% | 0.00% | 0.13% | ||||||||||||
Security & Alarm Services | 0.00% | 0.13% | 0.13% | ||||||||||||
Casinos & Gaming | 0.10% | 0.00% | 0.10% | ||||||||||||
Broadcasting | 0.08% | 0.00% | 0.08% | ||||||||||||
Paper Packaging | 0.06% | 0.00% | 0.06% | ||||||||||||
Life Sciences Tools & Services | 0.06% | 0.00% | 0.06% | ||||||||||||
Leisure Products | 0.00% | 0.05% | 0.05% | ||||||||||||
Thrifts & Mortgage Finance | 0.00% | 0.04% | 0.04% | ||||||||||||
Department Stores | 0.00% | 0.03% | 0.03% | ||||||||||||
IT Consulting & Other Services | 0.00% | 0.03% | 0.03% | ||||||||||||
Coal & Consumable Fuels | 0.00% | 0.01% | 0.01% | ||||||||||||
Household Appliances | 0.00% | 0.01% | 0.01% | ||||||||||||
Food Retail | 0.00% | 0.01% | 0.01% | ||||||||||||
Industrial Conglomerates | 0.00% | 0.01% | 0.01% | ||||||||||||
Education Services | 0.00% | 0.01% | 0.01% | ||||||||||||
Real Estate Development | 0.00% | 0.01% | 0.01% | ||||||||||||
Restaurants | 0.00% | 0.01% | 0.01% | ||||||||||||
Construction Machinery & Heavy Trucks | 0.00% | 0.01% | 0.01% | ||||||||||||
Residential REITs | 0.00% | 0.01% | 0.01% | ||||||||||||
Hypermarkets & Super Centers | 0.00% | 0.00% | 0.00% | *** | |||||||||||
|
| ||||||||||||||
| 55.27% | |||||||||||||||
|
| ||||||||||||||
| Sector | Percentage (based on Fair Value) | ||||
Corporate Notes | 13.66% | ||||
Agency Mortgage Backed | 8.57% | ||||
U.S. Treasuries | 5.78% | ||||
Non-Agency Collateralized Mortgage Obligations | 2.81% | ||||
Sovereign Bonds | 0.38% | ||||
Municipal Bonds and Notes | 0.21% | ||||
Agency Collateralized Mortgage Obligations | 0.06% | ||||
Asset Backed | 0.01% | ||||
FNMA (TBA) | 0.00% | *** | |||
|
| ||||
| 31.48% | |||||
|
| ||||
| Short-Term Investments | |||||
Short-Term Investments | 13.25% | ||||
|
| ||||
| 13.25% | |||||
|
| ||||
| 100.00% | |||||
|
| ||||
See Notes to Schedules of Investments and Notes to Financial Statements.
72
Table of Contents
| Income Fund | (Unaudited) |

William M. Healey
Senior Vice President
and Chief Investment
Officer Core Fixed
Income

Mark H. Johnson
Senior Vice President
and Chief Investment
Officer Insurance and
Long Duration
The Income Fund is managed by a team of portfolio managers that includes William M. Healey and Mark H. Johnson. Mr. Healey and Mr. Johnson are each responsible for a portion of the Fund, the size of which is determined by team consensus and adjusted on a periodic basis, if necessary. Although each portfolio manager manages his portion of the Fund independent of the other team members, the team is highly collaborative and communicative. See portfolio managers’ biographical information beginning on page 124.
| Q. | How did the GE Institutional Income Fund perform compared to its benchmark and Morningstar peer group for the twelve-month period ended September 30, 2015? |
| A. | For the twelve-month period ended September 30, 2015, the GE Institutional Income Fund returned 2.05% for the Investment Class shares and 1.81% for the Service Class shares. The Fund’s benchmark, the Barclays Capital U.S. Aggregate Bond Index returned 2.94% and the Fund’s Morningstar peer group of 1,093 U.S. Intermediate-Term Bond funds returned an average of 1.44% over the same period. |
| Q. | What market conditions impacted the Fund’s performance? |
| A. | During the period, the US Treasury yield curve flattened as short rates rose and longer rates fell. The move in short rates was dictated primarily by Fed policy expectations which pointed to a first rate hike mid-year. By the end of the September, the expected timing of a hike moved further out but the 2-year note yield ended at 0.63%, 6 bps higher than at the end of September 2014. Long end rates were influenced more by growth and inflation expectations. On a quarterly basis, US GDP held within an unspectacular range of 2.5-3% then appeared to soften in the third quarter of 2015. Global growth remained moderate as the Chinese economy |
| showed signs of slowing. Reported inflation data and expectations continued to stay well below the Fed’s target of 2%. Treasury 10 and 30-year yields dropped by 45 and 34 bps to 2.04% and 2.85% respectively. While Treasury yields fell, corporate bond yield spreads widened negatively impacting their returns. The option adjusted spread for the Barclays US Credit Index widened over 50 bps during the period and the Barclays US High Yield Index spread widened roughly 200 bps. |
| Q. | What were the primary drivers behind Fund performance? |
| A. | Duration and yield curve positioning together contributed positively to the Fund’s performance over the period as rates fell and the yield curve flattened. This was offset, however, by overweight allocations in investment grade credit and commercial MBS and the non-index exposure to high yield as credit spreads widened. Security selection also negatively impacted the Fund’s return relative to its benchmark. |
| Q. | Were there any significant changes in the Fund during the period? |
| A. | The Fund’s duration relative to the benchmark started the period 0.5 years short and ended neutral. However, during the period, the duration position was tactically traded from neutral to 0.5 years long in 2015. The Fund’s yield curve positioning remained biased to a flattening throughout the period. The Fund’s exposure to high grade credit was increased from 1% overweight to 6% overweight as credit spreads widened. Likewise, the allocation to commercial mortgage-backed securities was increased form 5% overweight to 8% overweight on spread widening. The Fund’s exposure to high yield credit ranged between 8 and 10% during the period, ending at 9%. |
73
Table of Contents
| Income Fund | (Unaudited) |
Understanding Your Fund’s Expenses
As a shareholder of the Fund you incur ongoing costs. Ongoing costs include portfolio management fees, distribution and service fees (for Service Class shares), professional fees, administrative fees and other Fund expenses. The following example is intended to help you understand your ongoing costs (in dollars) of investing in the Fund and to compare these costs with the ongoing costs of investing in other mutual funds.
To illustrate these ongoing costs, we have provided an example and calculated the expenses paid by investors in each share class of the Fund during the period. The information in the following table is based on an investment of $1,000, which is invested at the beginning of the period and held for the entire six-month period ended September 30, 2015.
Actual Expenses
The first section of the table provides information about actual account values and actual expenses. You may use the information in this section, together with the amount you invested, to estimate the expenses that you paid over the period. To do so, simply divide your account value by $1,000 (for example, an $8,600 account value divided by $1,000 = 8.6), then multiply the result by the
number given for your class under the heading “Expenses paid during the period” to estimate the expenses you paid on your account during the period.
Hypothetical Example for Comparison Purposes
The second section of the table provides information about hypothetical account values and hypothetical expenses based on the Fund’s actual expense ratio and an assumed rate of return of 5% per year before expenses, which is not the Fund’s actual return. The hypothetical account values and expenses may not be used to estimate the actual ending account balance or expenses you paid for the period. You may use this information to compare the ongoing costs of investing in the Fund and other funds. To do so, compare this 5% hypothetical example with the 5% hypothetical examples that appear in the shareholders reports of other funds.
Please note that the expenses shown in the table are meant to highlight and help you compare ongoing costs only and do not reflect transaction costs, such as sales charges or redemption fees, if any. Therefore, the second section of the table is useful in comparing ongoing costs only, and will not help you determine the relative total costs of owning different funds.
April 1, 2015 – September 30, 2015
| Account value at the beginning of the period ($) | Account value at the end of the period ($) | Expenses paid during the period ($)* | |||||||||||||
Actual Fund Return |
| ||||||||||||||
Investment Class | 1,000.00 | 986.90 | 1.20 | ||||||||||||
Service Class | 1,000.00 | 985.30 | 2.44 | ||||||||||||
Hypothetical 5% Return (2.5% for the period) |
| ||||||||||||||
Investment Class | 1,000.00 | 1,023.87 | 1.22 | ||||||||||||
Service Class | 1,000.00 | 1,022.61 | 2.48 | ||||||||||||
| * | Expenses are equal to the Fund’s annualized net expense ratio of 0.24%** for Investment Class shares and 0.49%** for Service Class shares (for the period April 1, 2015 – September 30, 2015), multiplied by the average account value over the period, multiplied by 183/365 (to reflect the one-half year period). |
| ** | May differ from expense ratio disclosed in the financial highlights, which is calculated based on the entire fiscal year’s data. |
74
Table of Contents
| Income Fund | (Unaudited) |
| Investment Profile |
A mutual fund designed for investors who seek maximum income consistent with prudent investment management and the preservation of capital. The Fund seeks to achieve its investment objective by investing at least 80% of its net assets under normal circumstances in debt securities and investing primarily in a variety of investment-grade debt securities, such as mortgage-backed securities, corporate bonds, U.S. Government securities and money market instruments.
| Morningstar Performance Comparison |
Based on average annual returns for periods ended September 30, 2015
| One Year | Five Year | Ten Year | ||||||||||
Number of funds in peer group | 1,093 | 991 | 861 | |||||||||
Peer group average annual total return | 1.44 | % | 3.11 | % | 4.08 | % | ||||||
Morningstar Category in peer group: Intermediate-Term Bond |
| |||||||||||
| Quality Ratings |
as of September 30, 2015 as a % of Fair Value (a)(b)
Moody’s / S&P / Rating * | Percentage of Fair Value | |||
Aaa / AAA | 9.55% | |||
Aa / AA | 46.12% | |||
A / A | 10.39% | |||
Baa / BBB | 19.94% | |||
Ba / BB and lower | 10.18% | |||
NR / Other | 3.82% | |||
| Sector Allocation |
Portfolio composition as a % of Fair Value of $304,500 (in thousands) as of September 30, 2015 (a)(b)
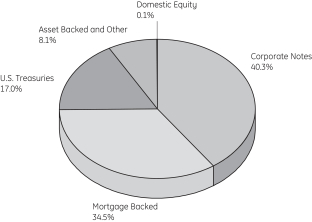
| Change in Value of a $10,000 Investment |
Investment Class Shares
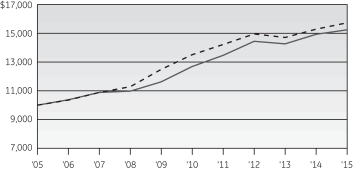
| Average Annual Total Return |
for the periods ended September 30, 2015
| Investment Class Shares (Inception date: 11/21/97) | ||||||||||||||||||||
| One Year | Five Year | Ten Year | Ending value of a $10,000 investment | |||||||||||||||||
Income Fund | 2.05% | 3.72% | 4.30% | $15,241 | ||||||||||||||||
Barclays U.S. Aggregate Bond Index | 2.94% | 3.10% | 4.64% | $15,734 | ||||||||||||||||
Service Class Shares
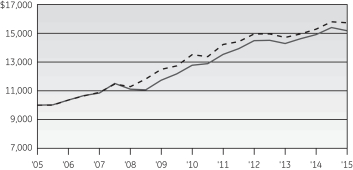
| Average Annual Total Return |
for the periods ended September 30, 2015
| Service Class Shares (Inception date: 9/30/05) | ||||||||||||||||||||
| One Year | Five Year | Ten Year | Ending value of a $10,000 investment | |||||||||||||||||
Income Fund | 1.81% | 3.49% | 4.26% | $15,174 | ||||||||||||||||
Barclays U.S. Aggregate Bond Index | 2.94% | 3.10% | 4.64% | $15,734 | ||||||||||||||||

An investment in the GE Institutional Income Fund is not insured or guaranteed by the Federal Deposit Insurance Corporation or any other Government agency. It is possible to lose money by investing in the Fund.
| (a) | Fair Value basis is inclusive of short-term investment in State Street Institutional U.S. Government Money Market Fund Premier Class. |
| (b) | The securities information regarding holdings, allocations and other characteristics is presented to illustrate examples of securities that the Fund has bought and the diversity of areas in which the Fund may invest as of a particular date. It may not be representative of the Fund’s current or future investments and should not be construed as a recommendation to purchase or sell a particular security. |
| * | Moody’s Investors Services, Inc. (“Moody’s”) and Standard & Poor’s Corporation (“S&P”) are nationally recognized statistical rating organizations. The quality ratings represent the lower of Moody’s or S&P credit ratings. When a rating from only one of the rating agencies is available, that rating is used. Securities not rated by Moody’s or S&P are categorized as not rated. Credit quality measures a bond issuer’s ability to repay interest and principal in a timely manner. Credit quality ratings assigned by a rating agency are subject to change periodically and are not absolute standards of quality. In formulating investment decisions for the Fund, GEAM develops its own analysis of the credit quality and risks associated with individual debt instruments, rather than relying exclusively on rating agency ratings. |
See Notes to Performance beginning on page 1 for further information, including an explanation of Morningstar peer categories.
Past performance does not predict future performance. The performance shown in the graphs and tables does not reflect the deduction of taxes that a shareholder would pay on Fund distributions or the redemption of Fund shares.
75
Table of Contents
Income Fund
| Schedule of Investments | September 30, 2015 |
| Income Fund | ||||||||
| Principal Amount | Fair Value | |||||||||||
Bonds and Notes — 98.1%† |
| |||||||||||
U.S. Treasuries — 17.8% |
| |||||||||||
U.S. Treasury Bonds |
| |||||||||||
| 2.50% | 02/15/45 | $ | 602,900 | $ | 555,029 | |||||||
| 3.13% | 11/15/41 | 5,818,000 | 6,134,959 | |||||||||
U.S. Treasury Notes |
| |||||||||||
| 0.63% | 05/31/17 | 2,603,600 | 2,605,532 | (h) | ||||||||
| 1.38% | 07/31/18 | 8,021,200 | 8,128,668 | (h) | ||||||||
| 1.38% | 05/31/20 | 14,865,000 | 14,891,713 | |||||||||
| 1.88% | 08/31/22 | 11,085,300 | 11,179,126 | |||||||||
| 2.13% | 05/15/25 | 8,254,200 | 8,303,857 | (h) | ||||||||
| 51,798,884 | ||||||||||||
Agency Mortgage Backed — 25.7% |
| |||||||||||
Federal Home Loan Mortgage Corp. |
| |||||||||||
| 4.50% | 06/01/33 - 02/01/35 | 17,298 | 18,794 | |||||||||
| 5.00% | 07/01/35 - 06/01/41 | 1,349,750 | 1,506,876 | |||||||||
| 5.50% | 05/01/20 - 04/01/39 | 423,783 | 477,819 | |||||||||
| 6.00% | 04/01/17 - 11/01/37 | 703,507 | 799,335 | |||||||||
| 6.50% | 07/01/29 - 10/01/33 | 2,968 | 3,393 | |||||||||
| 7.00% | 10/01/16 - 08/01/36 | 80,103 | 91,692 | |||||||||
| 7.50% | 01/01/30 - 09/01/33 | 2,276 | 2,424 | |||||||||
| 8.00% | 11/01/30 | 19,631 | 21,513 | |||||||||
| 8.50% | 04/01/30 | 20,388 | 25,325 | |||||||||
| 9.00% | 12/01/16 | 178 | 183 | |||||||||
| 9.50% | 04/01/21 | 33 | 36 | |||||||||
Federal National Mortgage Assoc. |
| |||||||||||
| 2.22% | 04/01/37 | 2,576 | 2,626 | (i) | ||||||||
| 3.00% | 02/01/43 - 06/01/43 | 11,023,182 | 11,208,910 | (h) | ||||||||
| 3.50% | 11/01/42 | 3,254,973 | 3,403,289 | (h) | ||||||||
| 3.50% | 07/01/45 - 08/01/45 | 6,568,075 | 6,858,051 | |||||||||
| 4.00% | 05/01/19 - 12/01/41 | 2,388,513 | 2,553,435 | |||||||||
| 4.00% | 01/01/41 - 03/01/44 | 5,819,706 | 6,249,739 | (h) | ||||||||
| 4.50% | 05/01/18 - 01/01/41 | 6,848,239 | 7,437,729 | |||||||||
| 5.00% | 07/01/20 - 06/01/41 | 2,263,443 | 2,541,899 | |||||||||
| 5.50% | 06/01/20 - 04/01/38 | 2,059,646 | 2,305,345 | |||||||||
| 5.50% | 10/01/24 | 7,451 | 7,523 | (i) | ||||||||
| 6.00% | 05/01/19 - 08/01/35 | 1,333,161 | 1,517,045 | |||||||||
| 6.50% | 07/01/17 - 08/01/36 | 126,967 | 142,965 | |||||||||
| 7.00% | 10/01/16 - 02/01/34 | 18,388 | 19,743 | |||||||||
| 7.50% | 12/01/23 - 12/01/33 | 67,761 | 77,910 | |||||||||
| 8.00% | 07/01/25 - 01/01/33 | 11,943 | 13,326 | |||||||||
| 8.00% | 10/01/31 | 4,217 | 4,909 | (h) | ||||||||
| 9.00% | 12/01/17 - 12/01/22 | 3,239 | 3,522 | |||||||||
| 2.50% | TBA | 7,676,364 | 7,825,813 | (c) | ||||||||
| 3.00% | TBA | 175,000 | 176,982 | (c) | ||||||||
| 4.00% | TBA | 2,722,129 | 2,898,324 | (c) | ||||||||
| Principal Amount | Fair Value | |||||||||||
Government National Mortgage Assoc. |
| |||||||||||
| 3.00% | 04/20/43 - 06/20/43 | $ | 3,124,055 | $ | 3,205,373 | |||||||
| 3.50% | 05/20/43 | 3,466,410 | 3,642,318 | |||||||||
| 4.00% | 01/20/41 - 04/20/43 | 3,818,263 | 4,101,824 | |||||||||
| 4.50% | 08/15/33 - 05/20/40 | 781,348 | 850,258 | |||||||||
| 5.00% | 08/15/33 | 50,703 | 56,580 | |||||||||
| 6.00% | 04/15/27 - 09/15/36 | 295,809 | 342,761 | |||||||||
| 6.50% | 04/15/19 - 09/15/36 | 116,220 | 133,433 | |||||||||
| 7.00% | 10/15/27 - 10/15/36 | 59,533 | 67,322 | |||||||||
| 7.50% | 01/15/23 - 11/15/31 | 10,592 | 11,123 | |||||||||
| 8.00% | 05/15/30 - 09/15/30 | 571 | 652 | |||||||||
| 8.50% | 10/15/17 | 1,123 | 1,166 | |||||||||
| 9.00% | 11/15/16 - 12/15/21 | 8,131 | 8,467 | |||||||||
| 3.50% | TBA | 2,725,768 | 2,855,987 | (c) | ||||||||
| 4.00% | TBA | 1,070,691 | 1,141,259 | (c) | ||||||||
| 5.50% | TBA | 255,000 | 285,147 | (c) | ||||||||
| 74,900,145 | ||||||||||||
Agency Collateralized Mortgage Obligations — 0.3% |
| |||||||||||
Collateralized Mortgage Obligation Trust |
| |||||||||||
| 0.01% | 11/01/18 | 143 | 143 | (d,f) | ||||||||
Federal Home Loan Mortgage Corp. |
| |||||||||||
| 0.08% | 09/25/43 | 1,039,697 | 3,048 | (g,i) | ||||||||
Federal Home Loan Mortgage Corp. REMIC |
| |||||||||||
| 3.50% | 11/15/24 - 11/15/30 | 1,187,324 | 88,299 | (g) | ||||||||
| 4.50% | 03/15/18 | 3,641 | 5 | (g) | ||||||||
| 5.00% | 10/15/18 - 02/15/38 | 19,895 | 361 | (g) | ||||||||
| 5.50% | 06/15/33 | 54,360 | 10,649 | (g) | ||||||||
| 6.39% | 08/15/25 | 430,526 | 47,560 | (g,i) | ||||||||
| 7.50% | 07/15/27 | 5,113 | 700 | (g) | ||||||||
| 8.00% | 04/15/20 | 38 | 40 | |||||||||
Federal Home Loan Mortgage Corp. STRIPS |
| |||||||||||
| 1.47% | 08/01/27 | 1,200 | 1,152 | (d,f) | ||||||||
| 5.74% | 08/15/43 | 837,990 | 190,550 | (g,i) | ||||||||
| 8.00% | 02/01/23 - 07/01/24 | 4,506 | 950 | (g) | ||||||||
Federal National Mortgage Assoc. REMIC |
| |||||||||||
| 0.51% | 12/25/22 | 271 | 266 | (d,f) | ||||||||
| 1.22% | 12/25/42 | 199,121 | 6,962 | (g,i) | ||||||||
| 5.00% | 02/25/40 - 09/25/40 | 579,846 | 63,162 | (g) | ||||||||
| 5.81% | 07/25/38 | 133,186 | 19,467 | (g,i) | ||||||||
| 7.31% | 05/25/18 | 45,623 | 3,008 | (g,i) | ||||||||
| 8.00% | 05/25/22 | 6 | 98 | (g) | ||||||||
Federal National Mortgage Assoc. STRIPS |
| |||||||||||
| 1.87% | 12/25/34 | 26,005 | 24,372 | (d,f) | ||||||||
| 4.50% | 08/25/35 - 01/25/36 | 192,526 | 31,570 | (g) | ||||||||
| 5.00% | 03/25/38 - 05/25/38 | 109,486 | 19,147 | (g) | ||||||||
| 5.50% | 12/25/33 | 23,930 | 4,724 | (g) | ||||||||
| 6.00% | 01/25/35 | 101,520 | 19,632 | (g) | ||||||||
| 7.50% | 11/25/23 | 23,588 | 4,892 | (g) | ||||||||
| 8.00% | 08/25/23 - 07/25/24 | 9,072 | 1,929 | (g) | ||||||||
| 8.50% | 03/25/17 - 07/25/22 | 461 | 56 | (g) | ||||||||
| 9.00% | 05/25/22 | 230 | 42 | (g) | ||||||||
See Notes to Schedules of Investments and Notes to Financial Statements.
76
Table of Contents
Income Fund
| Schedule of Investments | September 30, 2015 |
| Principal Amount | Fair Value | |||||||||||
Government National Mortgage Assoc. |
| |||||||||||
| 4.50% | 10/20/37 - 08/16/39 | $ | 1,083,873 | $ | 68,102 | (g) | ||||||
| 5.00% | 12/20/35 - 09/20/38 | 552,823 | 31,276 | (g) | ||||||||
| 6.03% | 02/20/40 | 354,779 | 60,261 | (g,i) | ||||||||
| 6.59% | 01/16/40 | 612,889 | 114,197 | (g,i) | ||||||||
| 816,620 | ||||||||||||
Asset Backed — 0.2% |
| |||||||||||
Chase Funding Trust 2004-1 |
| |||||||||||
| 3.99% | 11/25/33 | 287,413 | 293,283 | (j) | ||||||||
Ford Credit Auto Lease Trust 2013-A | ||||||||||||
| 1.28% | 06/15/16 | 160,000 | 160,062 | |||||||||
| 453,345 | ||||||||||||
Corporate Notes — 42.1% |
| |||||||||||
21st Century Fox America Inc. |
| |||||||||||
| 6.65% | 11/15/37 | 213,000 | 254,180 | (h) | ||||||||
3M Co. | ||||||||||||
| 2.00% | 08/07/20 | 427,000 | 432,732 | |||||||||
ABB Finance USA Inc. | ||||||||||||
| 1.63% | 05/08/17 | 158,000 | 158,907 | (h) | ||||||||
AbbVie Inc. | ||||||||||||
| 1.75% | 11/06/17 | 370,000 | 371,099 | (h) | ||||||||
| 2.00% | 11/06/18 | 304,000 | 305,159 | (h) | ||||||||
| 2.50% | 05/14/20 | 425,000 | 422,652 | (h) | ||||||||
| 3.60% | 05/14/25 | 170,000 | 167,665 | (h) | ||||||||
| 4.70% | 05/14/45 | 85,000 | 82,470 | (h) | ||||||||
ACCO Brands Corp. | ||||||||||||
| 6.75% | 04/30/20 | 400,000 | 416,000 | (h) | ||||||||
ACE INA Holdings Inc. | ||||||||||||
| 3.15% | 03/15/25 | 300,000 | 292,579 | (h) | ||||||||
Actavis Funding SCS | ||||||||||||
| 1.30% | 06/15/17 | 400,000 | 396,382 | (h) | ||||||||
| 3.00% | 03/12/20 | 214,000 | 214,187 | (h) | ||||||||
| 3.45% | 03/15/22 | 299,000 | 295,573 | (h) | ||||||||
| 3.80% | 03/15/25 | 426,000 | 411,533 | (h) | ||||||||
Activision Blizzard Inc. | ||||||||||||
| 5.63% | 09/15/21 | 438,000 | 460,995 | (b,h) | ||||||||
Aetna Inc. | ||||||||||||
| 3.50% | 11/15/24 | 480,000 | 477,489 | (h) | ||||||||
Agrium Inc. | ||||||||||||
| 3.38% | 03/15/25 | 107,000 | 101,301 | (h) | ||||||||
| 4.90% | 06/01/43 | 187,000 | 182,477 | (h) | ||||||||
Alibaba Group Holding Ltd. | ||||||||||||
| 4.50% | 11/28/34 | 205,000 | 190,524 | (b,h) | ||||||||
Altria Group Inc. | ||||||||||||
| 2.95% | 05/02/23 | 209,000 | 202,891 | (h) | ||||||||
| 4.50% | 05/02/43 | 209,000 | 199,639 | (h) | ||||||||
America Movil SAB de C.V. | ||||||||||||
| 3.13% | 07/16/22 | 211,000 | 204,860 | (h) | ||||||||
American Axle & Manufacturing Inc. |
| |||||||||||
| 6.25% | 03/15/21 | 283,000 | 282,292 | (h) | ||||||||
| 6.63% | 10/15/22 | 56,000 | 56,280 | (h) | ||||||||
| Principal Amount | Fair Value | |||||||||||
American Campus Communities Inc. |
| |||||||||||
| 3.35% | 10/01/20 | $ | 172,000 | $ | 174,053 | |||||||
American Campus Communities Operating Partnership LP |
| |||||||||||
| 4.13% | 07/01/24 | 127,000 | 127,673 | (h) | ||||||||
American Electric Power Company Inc. |
| |||||||||||
| 2.95% | 12/15/22 | 341,000 | 331,123 | (h) | ||||||||
American Express Co. |
| |||||||||||
| 3.63% | 12/05/24 | 476,000 | 470,950 | (h) | ||||||||
American Express Credit Corp. |
| |||||||||||
| 2.60% | 09/14/20 | 428,000 | 429,951 | |||||||||
American International Group Inc. |
| |||||||||||
| 3.75% | 07/10/25 | 250,000 | 253,883 | (h) | ||||||||
| 4.13% | 02/15/24 | 129,000 | 135,525 | (h) | ||||||||
| 4.50% | 07/16/44 | 85,000 | 83,461 | (h) | ||||||||
| 4.80% | 07/10/45 | 214,000 | 218,464 | (h) | ||||||||
American Tower Corp. (REIT) |
| |||||||||||
| 3.40% | 02/15/19 | 550,000 | 566,156 | (h) | ||||||||
Amgen Inc. |
| |||||||||||
| 2.20% | 05/22/19 | 476,000 | 477,966 | (h) | ||||||||
| 3.13% | 05/01/25 | 270,000 | 258,525 | (h) | ||||||||
Amkor Technology Inc. |
| |||||||||||
| 6.63% | 06/01/21 | 438,000 | 416,100 | (h) | ||||||||
Anadarko Petroleum Corp. |
| |||||||||||
| 6.20% | 03/15/40 | 233,000 | 246,509 | (h) | ||||||||
Anheuser-Busch InBev Worldwide Inc. |
| |||||||||||
| 2.50% | 07/15/22 | 395,000 | 377,969 | (h) | ||||||||
Anthem Inc. |
| |||||||||||
| 3.30% | 01/15/23 | 218,000 | 215,730 | (h) | ||||||||
Apache Corp. |
| |||||||||||
| 5.10% | 09/01/40 | 213,000 | 203,394 | (h) | ||||||||
Apple Inc. |
| |||||||||||
| 2.50% | 02/09/25 | 465,000 | 441,690 | (h) | ||||||||
| 2.85% | 05/06/21 | 375,000 | 384,592 | (h) | ||||||||
| 3.45% | 02/09/45 | 215,000 | 182,014 | (h) | ||||||||
Ascension Health |
| |||||||||||
| 4.85% | 11/15/53 | 327,000 | 354,900 | (h) | ||||||||
AT&T Inc. |
| |||||||||||
| 2.38% | 11/27/18 | 250,000 | 252,656 | (h) | ||||||||
| 2.45% | 06/30/20 | 640,000 | 630,136 | (h) | ||||||||
| 3.40% | 05/15/25 | 641,000 | 611,832 | (h) | ||||||||
| 4.50% | 05/15/35 | 213,000 | 194,856 | (h) | ||||||||
| 4.75% | 05/15/46 | 108,000 | 98,960 | (h) | ||||||||
| 4.80% | 06/15/44 | 167,000 | 154,391 | (h) | ||||||||
AutoNation Inc. |
| |||||||||||
| 4.50% | 10/01/25 | 299,000 | 304,746 | |||||||||
AutoZone Inc. |
| |||||||||||
| 3.25% | 04/15/25 | 426,000 | 417,877 | (h) | ||||||||
Bank of America Corp. |
| |||||||||||
| 1.70% | 08/25/17 | 1,075,000 | 1,077,825 | (h) | ||||||||
| 2.60% | 01/15/19 | 17,000 | 17,173 | (h) | ||||||||
| 3.88% | 08/01/25 | 85,000 | 86,181 | (h) | ||||||||
| 3.95% | 04/21/25 | 484,000 | 470,852 | (h) | ||||||||
See Notes to Schedules of Investments and Notes to Financial Statements.
77
Table of Contents
Income Fund
| Schedule of Investments | September 30, 2015 |
| Principal Amount | Fair Value | |||||||||||
| 4.00% | 01/22/25 | $ | 211,000 | $ | 206,794 | (h) | ||||||
| 4.10% | 07/24/23 | 190,000 | 197,408 | (h) | ||||||||
| 4.25% | 10/22/26 | 385,000 | 380,617 | (h) | ||||||||
Barclays Bank PLC |
| |||||||||||
| 2.25% | 05/10/17 | 1,281,000 | 1,305,014 | (b,h) | ||||||||
Barrick Gold Corp. |
| |||||||||||
| 4.10% | 05/01/23 | 215,000 | 190,256 | (h) | ||||||||
Baxalta Inc. |
| |||||||||||
| 2.88% | 06/23/20 | 428,000 | 427,840 | (b,h) | ||||||||
| 4.00% | 06/23/25 | 428,000 | 428,663 | (b,h) | ||||||||
Bed Bath & Beyond Inc. |
| |||||||||||
| 4.92% | 08/01/34 | 62,000 | 58,936 | (h) | ||||||||
Berkshire Hathaway Energy Co. |
| |||||||||||
| 6.13% | 04/01/36 | 495,000 | 596,047 | (h,) | ||||||||
Berkshire Hathaway Finance Corp. |
| |||||||||||
| 3.00% | 05/15/22 | 134,000 | 135,791 | (h) | ||||||||
Berry Plastics Corp. |
| |||||||||||
| 5.13% | 07/15/23 | 260,000 | 245,050 | (h) | ||||||||
BHP Billiton Finance USA Ltd. |
| |||||||||||
| 5.00% | 09/30/43 | 119,000 | 120,363 | (h) | ||||||||
Biogen Inc. |
| |||||||||||
| 2.90% | 09/15/20 | 639,000 | 645,467 | |||||||||
| 4.05% | 09/15/25 | 425,000 | 429,328 | |||||||||
| 5.20% | 09/15/45 | 300,000 | 302,714 | |||||||||
Bombardier Inc. |
| |||||||||||
| 4.75% | 04/15/19 | 255,000 | 205,275 | (b,h) | ||||||||
| 5.50% | 09/15/18 | 87,000 | 75,255 | (b,h) | ||||||||
| 6.00% | 10/15/22 | 249,000 | 184,883 | (b,h) | ||||||||
| 7.75% | 03/15/20 | 288,000 | 246,240 | (b,h) | ||||||||
Boston Scientific Corp. |
| |||||||||||
| 3.85% | 05/15/25 | 215,000 | 211,474 | (h) | ||||||||
BP Capital Markets PLC |
| |||||||||||
| 1.38% | 05/10/18 | 210,000 | 208,511 | (h) | ||||||||
| 3.81% | 02/10/24 | 526,000 | 537,155 | (h) | ||||||||
Branch Banking & Trust Co. |
| |||||||||||
| 3.63% | 09/16/25 | 450,000 | 450,364 | |||||||||
| 3.80% | 10/30/26 | 255,000 | 258,713 | (h) | ||||||||
Building Materials Corporation of America |
| |||||||||||
| 5.38% | 11/15/24 | 525,000 | 518,437 | (b,h) | ||||||||
Calpine Corp. |
| |||||||||||
| 5.75% | 01/15/25 | 255,000 | 238,425 | (h) | ||||||||
| 5.88% | 01/15/24 | 262,000 | 269,860 | (b,h) | ||||||||
Calumet Specialty Products Partners LP/Calumet Finance Corp. |
| |||||||||||
| 6.50% | 04/15/21 | 438,000 | 394,200 | (h) | ||||||||
Canadian Pacific Railway Co. |
| |||||||||||
| 2.90% | 02/01/25 | 500,000 | 472,120 | (h) | ||||||||
Caterpillar Inc. |
| |||||||||||
| 4.30% | 05/15/44 | 217,000 | 210,574 | (h) | ||||||||
Catholic Health Initiatives |
| |||||||||||
| 2.60% | 08/01/18 | 130,000 | 132,730 | |||||||||
| 4.35% | 11/01/42 | 129,000 | 119,917 | |||||||||
| Principal Amount | Fair Value | |||||||||||
CBS Corp. |
| |||||||||||
| 3.70% | 08/15/24 | $ | 325,000 | $ | 319,000 | (h) | ||||||
CCO Safari II LLC |
| |||||||||||
| 3.58% | 07/23/20 | 321,000 | 318,636 | (b,h) | ||||||||
| 4.91% | 07/23/25 | 320,000 | 318,465 | (b,h) | ||||||||
| 6.38% | 10/23/35 | 43,000 | 43,505 | (b,h) | ||||||||
| 6.48% | 10/23/45 | 86,000 | 86,761 | (b,h) | ||||||||
Celgene Corp. |
| |||||||||||
| 2.88% | 08/15/20 | 300,000 | 302,722 | (h) | ||||||||
| 3.88% | 08/15/25 | 428,000 | 428,080 | (h) | ||||||||
| 5.00% | 08/15/45 | 214,000 | 212,266 | (h) | ||||||||
CenturyLink Inc. |
| |||||||||||
| 5.80% | 03/15/22 | 876,000 | 748,980 | (h) | ||||||||
Cequel Capital Corp. |
| |||||||||||
| 5.13% | 12/15/21 | 485,000 | 427,103 | (b,h) | ||||||||
Chesapeake Energy Corp. |
| |||||||||||
| 3.25% | 03/15/16 | 242,000 | 237,208 | (h) | ||||||||
Cigna Corp. |
| |||||||||||
| 3.25% | 04/15/25 | 427,000 | 413,435 | (h) | ||||||||
Cinemark USA Inc. |
| |||||||||||
| 4.88% | 06/01/23 | 437,000 | 417,335 | (h) | ||||||||
Citigroup Inc. |
| |||||||||||
| 1.55% | 08/14/17 | 940,000 | 941,049 | (h) | ||||||||
| 1.75% | 05/01/18 | 419,000 | 416,374 | (h) | ||||||||
| 1.85% | 11/24/17 | 205,000 | 205,480 | (h) | ||||||||
| 3.30% | 04/27/25 | 213,000 | 207,469 | (h) | ||||||||
| 4.40% | 06/10/25 | 428,000 | 430,455 | (h) | ||||||||
| 4.45% | 09/29/27 | 250,000 | 248,652 | |||||||||
| 4.65% | 07/30/45 | 342,000 | 341,127 | (h) | ||||||||
CMS Energy Corp. |
| |||||||||||
| 4.88% | 03/01/44 | 215,000 | 223,262 | (h) | ||||||||
CNA Financial Corp. |
| |||||||||||
| 5.88% | 08/15/20 | 366,000 | 416,302 | (h) | ||||||||
CNOOC Nexen Finance 2014 ULC |
| |||||||||||
| 4.25% | 04/30/24 | 433,000 | 436,291 | (h) | ||||||||
Cogeco Cable Inc. |
| |||||||||||
| 4.88% | 05/01/20 | 400,000 | 396,000 | (b,h) | ||||||||
Colgate-Palmolive Co. |
| |||||||||||
| 4.00% | 08/15/45 | 214,000 | 213,915 | (h) | ||||||||
Columbia Pipeline Group Inc. |
| |||||||||||
| 3.30% | 06/01/20 | 299,000 | 299,892 | (b,h) | ||||||||
| 4.50% | 06/01/25 | 214,000 | 207,732 | (b,h) | ||||||||
Comcast Corp. |
| |||||||||||
| 3.38% | 08/15/25 | 939,000 | 946,222 | (h) | ||||||||
| 4.20% | 08/15/34 | 210,000 | 207,139 | (h) | ||||||||
| 4.60% | 08/15/45 | 215,000 | 219,773 | (h) | ||||||||
Commonwealth Bank of Australia |
| |||||||||||
| 0.75% | 01/15/16 | 559,000 | 558,905 | (b,h) | ||||||||
ConocoPhillips Co. |
| |||||||||||
| 3.35% | 11/15/24 | 397,000 | 387,836 | (h) | ||||||||
See Notes to Schedules of Investments and Notes to Financial Statements.
78
Table of Contents
Income Fund
| Schedule of Investments | September 30, 2015 |
| Principal Amount | Fair Value | |||||||||||
Continental Resources Inc. |
| |||||||||||
| 3.80% | 06/01/24 | $ | 93,000 | $ | 75,432 | (h) | ||||||
| 4.50% | 04/15/23 | 86,000 | 74,680 | (h) | ||||||||
| 4.90% | 06/01/44 | 47,000 | 33,601 | (h) | ||||||||
Corp Andina de Fomento |
| |||||||||||
| 4.38% | 06/15/22 | 646,000 | 701,155 | (h) | ||||||||
Corp Nacional del Cobre de Chile |
| |||||||||||
| 4.50% | 09/16/25 | 200,000 | 192,125 | (b) | ||||||||
COX Communications Inc. |
| |||||||||||
| 4.70% | 12/15/42 | 93,000 | 79,039 | (b,h) | ||||||||
Credit Suisse AG |
| |||||||||||
| 1.70% | 04/27/18 | 421,000 | 419,343 | (h) | ||||||||
| 2.60% | 05/27/16 | 416,000 | 420,612 | (b,h) | ||||||||
Credit Suisse Group Funding Guernsey Ltd. |
| |||||||||||
| 3.75% | 03/26/25 | 502,000 | 487,519 | (b,h) | ||||||||
Crown Americas LLC/Crown Americas Capital Corp. IV |
| |||||||||||
| 4.50% | 01/15/23 | 520,000 | 509,600 | (h) | ||||||||
CSX Corp. |
| |||||||||||
| 4.50% | 08/01/54 | 125,000 | 115,904 | (h) | ||||||||
CVS Health Corp. |
| |||||||||||
| 2.25% | 08/12/19 | 430,000 | 434,636 | (h) | ||||||||
| 3.88% | 07/20/25 | 428,000 | 441,186 | (h) | ||||||||
| 5.13% | 07/20/45 | 323,000 | 347,210 | (h) | ||||||||
Daimler Finance North America LLC |
| |||||||||||
| 2.38% | 08/01/18 | 633,000 | 633,915 | (b,h) | ||||||||
Danaher Corp. |
| |||||||||||
| 2.40% | 09/15/20 | 300,000 | 302,793 | |||||||||
| 3.35% | 09/15/25 | 425,000 | 433,531 | |||||||||
| 4.38% | 09/15/45 | 200,000 | 206,863 | |||||||||
Denbury Resources Inc. |
| |||||||||||
| 5.50% | 05/01/22 | 438,000 | 260,610 | (h) | ||||||||
| 6.38% | 08/15/21 | 263,000 | 165,690 | (h) | ||||||||
Deutsche Bank AG |
| |||||||||||
| 4.50% | 04/01/25 | 433,000 | 419,522 | (h) | ||||||||
Dexia Credit Local S.A. |
| |||||||||||
| 2.25% | 01/30/19 | 869,000 | 886,269 | (b,h) | ||||||||
Diageo Investment Corp. |
| |||||||||||
| 2.88% | 05/11/22 | 509,000 | 503,514 | (h) | ||||||||
DigitalGlobe Inc. |
| |||||||||||
| 5.25% | 02/01/21 | 438,000 | 415,005 | (b,h) | ||||||||
DIRECTV Holdings LLC |
| |||||||||||
| 4.45% | 04/01/24 | 328,000 | 336,471 | (h) | ||||||||
Discover Bank |
| |||||||||||
| 3.10% | 06/04/20 | 298,000 | 300,885 | (h) | ||||||||
Dollar General Corp. |
| |||||||||||
| 1.88% | 04/15/18 | 425,000 | 424,609 | (h) | ||||||||
| 4.13% | 07/15/17 | 427,000 | 440,285 | (h) | ||||||||
Dollar Tree Inc. |
| |||||||||||
| 5.75% | 03/01/23 | 525,000 | 544,687 | (b,h) | ||||||||
Dominion Resources Inc. |
| |||||||||||
| 1.95% | 08/15/16 | 243,000 | 244,646 | (h) | ||||||||
| Principal Amount | Fair Value | |||||||||||
Duke Energy Corp. |
| |||||||||||
| 3.75% | 04/15/24 | $ | 194,000 | $ | 199,729 | (h) | ||||||
Duke Energy Progress LLC |
| |||||||||||
| 4.15% | 12/01/44 | 130,000 | 130,793 | (h) | ||||||||
Eastman Chemical Co. |
| |||||||||||
| 3.60% | 08/15/22 | 426,000 | 428,573 | (h) | ||||||||
Ecopetrol S.A. |
| |||||||||||
| 5.88% | 05/28/45 | 106,000 | 80,825 | (h) | ||||||||
Electricite de France S.A. |
| |||||||||||
| 2.15% | 01/22/19 | 857,000 | 865,859 | (b,h) | ||||||||
Eli Lilly & Co. |
| |||||||||||
| 2.75% | 06/01/25 | 214,000 | 210,703 | (h) | ||||||||
| 3.70% | 03/01/45 | 42,000 | 39,545 | (h,) | ||||||||
EMD Finance LLC |
| |||||||||||
| 3.25% | 03/19/25 | 214,000 | 207,444 | (b,h) | ||||||||
Energizer Holdings Inc. |
| |||||||||||
| 5.50% | 06/15/25 | 440,000 | 428,450 | (b,h) | ||||||||
Energy Transfer Equity LP |
| |||||||||||
| 5.88% | 01/15/24 | 862,000 | 776,231 | (h) | ||||||||
Energy Transfer Partners LP |
| |||||||||||
| 4.05% | 03/15/25 | 85,000 | 75,117 | (h) | ||||||||
| 5.15% | 03/15/45 | 149,000 | 116,232 | (h) | ||||||||
| 6.50% | 02/01/42 | 352,000 | 323,010 | (h) | ||||||||
Ensco PLC |
| |||||||||||
| 4.50% | 10/01/24 | 213,000 | 157,351 | (h) | ||||||||
| 5.20% | 03/15/25 | 342,000 | 260,288 | (h) | ||||||||
| 5.75% | 10/01/44 | 87,000 | 60,186 | (h) | ||||||||
Enterprise Products Operating LLC |
| |||||||||||
| 3.70% | 02/15/26 | 425,000 | 401,603 | (h) | ||||||||
ERP Operating LP |
| |||||||||||
| 4.50% | 07/01/44 | 85,000 | 85,622 | (h) | ||||||||
European Investment Bank |
| |||||||||||
| 4.88% | 01/17/17 | 490,000 | 516,611 | (h) | ||||||||
FedEx Corp. |
| |||||||||||
| 3.20% | 02/01/25 | 138,000 | 133,870 | (h) | ||||||||
| 4.10% | 02/01/45 | 2,000 | 1,812 | (h) | ||||||||
| Fiat Chrysler Automobiles N.V. | ||||||||||||
| 4.50% | 04/15/20 | 265,000 | 251,750 | (h) | ||||||||
| 5.25% | 04/15/23 | 200,000 | 186,500 | (h) | ||||||||
Five Corners Funding Trust |
| |||||||||||
| 4.42% | 11/15/23 | 465,000 | 486,353 | (b,h) | ||||||||
Florida Power & Light Co. |
| |||||||||||
| 4.13% | 02/01/42 | 234,000 | 236,374 | (h) | ||||||||
Ford Motor Credit Company LLC |
| |||||||||||
| 2.46% | 03/27/20 | 640,000 | 626,678 | (h) | ||||||||
| 3.22% | 01/09/22 | 455,000 | 440,392 | (h) | ||||||||
| 5.88% | 08/02/21 | 329,000 | 372,429 | (h) | ||||||||
Freeport-McMoRan Inc. |
| |||||||||||
| 4.55% | 11/14/24 | 192,000 | 143,040 | (h) | ||||||||
Fresenius Medical Care US Finance Inc. |
| |||||||||||
| 5.75% | 02/15/21 | 349,000 | 376,047 | (b,h) | ||||||||
See Notes to Schedules of Investments and Notes to Financial Statements.
79
Table of Contents
Income Fund
| Schedule of Investments | September 30, 2015 |
| Principal Amount | Fair Value | |||||||||||
Frontier Communications Corp. |
| |||||||||||
| 7.13% | 03/15/19 | $ | 538,000 | $ | 528,228 | (h) | ||||||
| 11.00% | 09/15/25 | 220,000 | 212,850 | (b) | ||||||||
General Motors Co. |
| |||||||||||
| 5.20% | 04/01/45 | 43,000 | 40,353 | (h) | ||||||||
General Motors Financial Company Inc. |
| |||||||||||
| 3.15% | 01/15/20 | 300,000 | 297,438 | (h) | ||||||||
| 3.20% | 07/13/20 | 855,000 | 843,484 | (h) | ||||||||
| 4.30% | 07/13/25 | 428,000 | 414,053 | (h) | ||||||||
Georgia-Pacific LLC |
| |||||||||||
| 3.60% | 03/01/25 | 425,000 | 424,627 | (b,h) | ||||||||
Gilead Sciences Inc. |
| |||||||||||
| 2.55% | 09/01/20 | 215,000 | 216,344 | |||||||||
| 3.65% | 03/01/26 | 240,000 | 241,117 | |||||||||
| 4.75% | 03/01/46 | 200,000 | 200,922 | |||||||||
| 4.80% | 04/01/44 | 297,000 | 298,732 | (h) | ||||||||
Grupo Televisa SAB |
| |||||||||||
| 5.00% | 05/13/45 | 209,000 | 188,807 | (h) | ||||||||
HCA Inc. |
| |||||||||||
| 4.75% | 05/01/23 | 205,000 | 205,717 | (h) | ||||||||
| 6.50% | 02/15/20 | 85,000 | 92,650 | (h) | ||||||||
HSBC USA Inc. |
| |||||||||||
| 2.75% | 08/07/20 | 640,000 | 642,319 | (h) | ||||||||
Humana Inc. |
| |||||||||||
| 3.85% | 10/01/24 | 167,000 | 168,008 | (h) | ||||||||
Hyundai Capital America |
| |||||||||||
| 2.13% | 10/02/17 | 207,000 | 207,717 | (b,h) | ||||||||
Illinois Tool Works Inc. |
| |||||||||||
| 3.50% | 03/01/24 | 431,000 | 440,865 | (h) | ||||||||
Ingersoll-Rand Luxembourg Finance S.A. |
| |||||||||||
| 3.55% | 11/01/24 | 299,000 | 293,586 | (h) | ||||||||
Ingles Markets Inc. |
| |||||||||||
| 5.75% | 06/15/23 | 525,000 | 539,437 | (h) | ||||||||
Intelsat Jackson Holdings S.A. |
| |||||||||||
| 5.50% | 08/01/23 | 424,000 | 349,800 | (h) | ||||||||
International Business Machines Corp. |
| |||||||||||
| 3.63% | 02/12/24 | 439,000 | 452,370 | (h) | ||||||||
Interstate Power & Light Co. |
| |||||||||||
| 3.40% | 08/15/25 | 100,000 | 101,732 | (h) | ||||||||
Intesa Sanpaolo S.p.A. |
| |||||||||||
| 5.02% | 06/26/24 | 133,000 | 131,244 | (b,h) | ||||||||
Invesco Finance PLC |
| |||||||||||
| 3.13% | 11/30/22 | 460,000 | 466,286 | (h) | ||||||||
JB Poindexter & Company Inc. |
| |||||||||||
| 9.00% | 04/01/22 | 120,000 | 126,300 | (b,h) | ||||||||
JBS USA LLC/JBS USA Finance Inc. |
| |||||||||||
| 5.75% | 06/15/25 | 350,000 | 322,000 | (b,h) | ||||||||
| 5.88% | 07/15/24 | 237,000 | 222,187 | (b,h) | ||||||||
Jefferies Group LLC |
| |||||||||||
| 5.13% | 01/20/23 | 131,000 | 131,258 | (h) | ||||||||
| 6.50% | 01/20/43 | 142,000 | 134,811 | (h) | ||||||||
| Principal Amount | Fair Value | |||||||||||
JPMorgan Chase & Co. |
| |||||||||||
| 1.70% | 03/01/18 | $ | 428,000 | $ | 427,026 | (h) | ||||||
| 3.88% | 09/10/24 | 715,000 | 708,167 | (h) | ||||||||
| 3.90% | 07/15/25 | 214,000 | 217,964 | (h) | ||||||||
| 4.25% | 10/01/27 | 250,000 | 248,977 | |||||||||
| 6.10% | 10/29/49 | 510,000 | 506,685 | (h,i) | ||||||||
KB Home |
| |||||||||||
| 7.00% | 12/15/21 | 515,000 | 516,287 | (h) | ||||||||
Keysight Technologies Inc. |
| |||||||||||
| 4.55% | 10/30/24 | 425,000 | 413,955 | (b,h) | ||||||||
KFW |
| |||||||||||
| 4.50% | 07/16/18 | 169,000 | 184,876 | (h) | ||||||||
Kilroy Realty LP |
| |||||||||||
| 4.38% | 10/01/25 | 105,000 | 105,955 | |||||||||
Kinder Morgan Energy Partners LP |
| |||||||||||
| 3.50% | 09/01/23 | 139,000 | 122,977 | (h) | ||||||||
| 4.30% | 05/01/24 | 119,000 | 108,639 | (h) | ||||||||
Kinder Morgan Inc. |
| |||||||||||
| 5.55% | 06/01/45 | 128,000 | 106,321 | (h) | ||||||||
Kinross Gold Corp. |
| |||||||||||
| 6.88% | 09/01/41 | 30,000 | 22,611 | (h) | ||||||||
Korea National Oil Corp. |
| |||||||||||
| 2.88% | 11/09/15 | 358,000 | 358,741 | (b,h) | ||||||||
Kraft Heinz Foods Co. |
| |||||||||||
| 2.80% | 07/02/20 | 642,000 | 646,206 | (b,h) | ||||||||
| 3.95% | 07/15/25 | 556,000 | 568,890 | (b,h) | ||||||||
L Brands Inc. |
| |||||||||||
| 5.63% | 02/15/22 | 175,000 | 185,063 | (h) | ||||||||
L-3 Communications Corp. |
| |||||||||||
| 1.50% | 05/28/17 | 167,000 | 165,474 | (h) | ||||||||
Lee Enterprises Inc. |
| |||||||||||
| 9.50% | 03/15/22 | 353,000 | 322,112 | (b,h) | ||||||||
Lennar Corp. |
| |||||||||||
| 4.50% | 11/15/19 | 525,000 | 529,462 | (h) | ||||||||
| 4.75% | 05/30/25 | 176,000 | 168,080 | (h) | ||||||||
Levi Strauss & Co. |
| |||||||||||
| 5.00% | 05/01/25 | 262,000 | 256,760 | (h) | ||||||||
Liberty Mutual Group Inc. |
| |||||||||||
| 4.25% | 06/15/23 | 270,000 | 279,241 | (b,h) | ||||||||
Lockheed Martin Corp. |
| |||||||||||
| 3.80% | 03/01/45 | 213,000 | 194,248 | (h) | ||||||||
Lowe’s Companies Inc. |
| |||||||||||
| 4.38% | 09/15/45 | 170,000 | 171,963 | |||||||||
LyondellBasell Industries N.V. |
| |||||||||||
| 4.63% | 02/26/55 | 85,000 | 72,087 | (h) | ||||||||
Macquarie Bank Ltd. |
| |||||||||||
| 4.88% | 06/10/25 | 433,000 | 432,259 | (b,h) | ||||||||
Marathon Petroleum Corp. |
| |||||||||||
| 3.63% | 09/15/24 | 425,000 | 410,724 | (h) | ||||||||
Marsh & McLennan Companies Inc. |
| |||||||||||
| 3.50% | 03/10/25 | 300,000 | 299,750 | (h) | ||||||||
| 3.75% | 03/14/26 | 300,000 | 301,657 | |||||||||
See Notes to Schedules of Investments and Notes to Financial Statements.
80
Table of Contents
Income Fund
| Schedule of Investments | September 30, 2015 |
| Principal Amount | Fair Value | |||||||||||
Mattel Inc. |
| |||||||||||
| 2.35% | 05/06/19 | $ | 475,000 | $ | 474,693 | (h) | ||||||
Medtronic Inc. |
| |||||||||||
| 2.50% | 03/15/20 | 128,000 | 129,724 | |||||||||
| 3.50% | 03/15/25 | 462,000 | 471,399 | |||||||||
| 4.63% | 03/15/45 | 215,000 | 221,686 | |||||||||
Memorial Sloan-Kettering Cancer Center |
| |||||||||||
| 4.13% | 07/01/52 | 165,000 | 152,630 | (h) | ||||||||
Merck & Company Inc. |
| |||||||||||
| 2.75% | 02/10/25 | 425,000 | 413,669 | (h) | ||||||||
MetLife Inc. |
| |||||||||||
| 4.05% | 03/01/45 | 107,000 | 100,016 | (h) | ||||||||
| 4.72% | 12/15/44 | 131,000 | 135,446 | (h) | ||||||||
MGM Resorts International |
| |||||||||||
| 5.25% | 03/31/20 | 267,000 | 262,995 | (h) | ||||||||
| 6.63% | 12/15/21 | 438,000 | 448,950 | (h) | ||||||||
Microsoft Corp. |
| |||||||||||
| 4.00% | 02/12/55 | 225,000 | 203,834 | (h) | ||||||||
Mizuho Bank Ltd. |
| |||||||||||
| 2.45% | 04/16/19 | 523,000 | 526,553 | (b,h) | ||||||||
Monsanto Co. |
| |||||||||||
| 3.38% | 07/15/24 | 208,000 | 200,027 | (h) | ||||||||
| 4.70% | 07/15/64 | 123,000 | 105,852 | (h) | ||||||||
Morgan Stanley |
| |||||||||||
| 2.65% | 01/27/20 | 90,000 | 90,425 | (h) | ||||||||
| 3.70% | 10/23/24 | 426,000 | 428,032 | (h) | ||||||||
| 3.95% | 04/23/27 | 427,000 | 411,234 | (h) | ||||||||
| 4.00% | 07/23/25 | 100,000 | 102,199 | (h) | ||||||||
| 4.10% | 05/22/23 | 399,000 | 403,833 | (h) | ||||||||
| 4.88% | 11/01/22 | 406,000 | 432,563 | (h) | ||||||||
| 5.00% | 11/24/25 | 171,000 | 181,811 | (h) | ||||||||
Motorola Solutions Inc. |
| |||||||||||
| 4.00% | 09/01/24 | 143,000 | 129,042 | (h) | ||||||||
National Agricultural Cooperative Federation |
| |||||||||||
| 4.25% | 01/28/16 | 256,000 | 258,322 | (b,h) | ||||||||
NCL Corporation Ltd. |
| |||||||||||
| 5.00% | 02/15/18 | 227,000 | 230,405 | (h) | ||||||||
Newfield Exploration Co. |
| |||||||||||
| 5.63% | 07/01/24 | 779,000 | 736,155 | (h) | ||||||||
| 5.75% | 01/30/22 | 467,000 | 452,990 | (h) | ||||||||
Newmont Mining Corp. |
| |||||||||||
| 4.88% | 03/15/42 | 163,000 | 125,875 | (h,) | ||||||||
Nexen Energy ULC |
| |||||||||||
| 6.40% | 05/15/37 | 232,000 | 272,864 | (h) | ||||||||
Noble Energy Inc. |
| |||||||||||
| 3.90% | 11/15/24 | 256,000 | 238,082 | (h) | ||||||||
Northern States Power Co. |
| |||||||||||
| 2.20% | 08/15/20 | 427,000 | 429,694 | (h) | ||||||||
Northrop Grumman Corp. |
| |||||||||||
| 3.85% | 04/15/45 | 50,000 | 44,999 | (h) | ||||||||
NRG Energy Inc. |
| |||||||||||
| 6.25% | 07/15/22 | 227,000 | 206,570 | (h) | ||||||||
| Principal Amount | Fair Value | |||||||||||
Occidental Petroleum Corp. |
| |||||||||||
| 3.50% | 06/15/25 | $ | 428,000 | $ | 426,797 | (h) | ||||||
Omnicom Group Inc. |
| |||||||||||
| 3.63% | 05/01/22 | 187,000 | 189,212 | (h) | ||||||||
Oracle Corp. |
| |||||||||||
| 2.25% | 10/08/19 | 610,000 | 617,035 | (h) | ||||||||
| 2.95% | 05/15/25 | 425,000 | 414,341 | (h) | ||||||||
| 4.13% | 05/15/45 | 86,000 | 81,148 | (h) | ||||||||
Owens & Minor Inc. |
| |||||||||||
| 3.88% | 09/15/21 | 350,000 | 353,111 | (h) | ||||||||
Pacific Gas & Electric Co. |
| |||||||||||
| 3.40% | 08/15/24 | 640,000 | 641,860 | (h) | ||||||||
PacifiCorp |
| |||||||||||
| 6.25% | 10/15/37 | 258,000 | 328,659 | (h) | ||||||||
Penn National Gaming Inc. |
| |||||||||||
| 5.88% | 11/01/21 | 265,000 | 267,319 | (h) | ||||||||
People’s United Bank NA |
| |||||||||||
| 4.00% | 07/15/24 | 488,000 | 488,464 | (h) | ||||||||
PepsiCo Inc. |
| |||||||||||
| 3.10% | 07/17/22 | 214,000 | 219,176 | (h) | ||||||||
| 4.25% | 10/22/44 | 127,000 | 125,585 | (h) | ||||||||
| 4.60% | 07/17/45 | 128,000 | 133,764 | (h) | ||||||||
Petrobras Global Finance BV |
| |||||||||||
| 3.50% | 02/06/17 | 64,000 | 56,960 | (h) | ||||||||
| 3.88% | 01/27/16 | 187,000 | 183,728 | (h) | ||||||||
Petroleos Mexicanos |
| |||||||||||
| 3.50% | 01/30/23 | 278,000 | 250,200 | (h) | ||||||||
Philip Morris International Inc. |
| |||||||||||
| 4.13% | 03/04/43 | 214,000 | 202,520 | (h) | ||||||||
Phillips 66 Partners LP |
| |||||||||||
| 2.65% | 02/15/20 | 128,000 | 125,916 | (h) | ||||||||
| 3.61% | 02/15/25 | 139,000 | 127,481 | (h) | ||||||||
Pitney Bowes Inc. |
| |||||||||||
| 4.63% | 03/15/24 | 368,000 | 370,899 | (h) | ||||||||
Plains All American Pipeline LP/PAA Finance Corp. |
| |||||||||||
| 4.65% | 10/15/25 | 128,000 | 128,475 | (h) | ||||||||
PNC Bank NA |
| |||||||||||
| 2.40% | 10/18/19 | 441,000 | 444,895 | (h) | ||||||||
Precision Castparts Corp. |
| |||||||||||
| 4.38% | 06/15/45 | 128,000 | 128,137 | (h) | ||||||||
Principal Financial Group Inc. |
| |||||||||||
| 4.70% | 05/15/55 | 306,000 | 303,705 | (h,i) | ||||||||
Prudential Financial Inc. |
| |||||||||||
| 5.38% | 05/15/45 | 214,000 | 212,395 | (h,i) | ||||||||
| 5.63% | 06/15/43 | 260,000 | 268,320 | (h,i) | ||||||||
QUALCOMM Inc. | ||||||||||||
| 2.25% | 05/20/20 | 171,000 | 170,569 | (h) | ||||||||
| 3.45% | 05/20/25 | 152,000 | 143,530 | (h) | ||||||||
| 4.80% | 05/20/45 | 154,000 | 134,671 | (h) | ||||||||
Quest Diagnostics Inc. | ||||||||||||
| 4.70% | 03/30/45 | 128,000 | 116,558 | (h) | ||||||||
See Notes to Schedules of Investments and Notes to Financial Statements.
81
Table of Contents
Income Fund
| Schedule of Investments | September 30, 2015 |
| Principal Amount | Fair Value | |||||||||||
Regency Energy Partners LP/Regency Energy Finance Corp. |
| |||||||||||
| 4.50% | 11/01/23 | $ | 300,000 | $ | 277,336 | (h) | ||||||
Revlon Consumer Products Corp. | ||||||||||||
| 5.75% | 02/15/21 | 1,515,000 | 1,469,550 | (h) | ||||||||
Reynolds American Inc. | ||||||||||||
| 4.45% | 06/12/25 | 215,000 | 224,966 | (h) | ||||||||
Rio Tinto Finance USA Ltd. | ||||||||||||
| 3.75% | 06/15/25 | 107,000 | 104,368 | (h) | ||||||||
Roche Holdings Inc. | ||||||||||||
| 3.35% | 09/30/24 | 455,000 | 465,347 | (b,h) | ||||||||
Rowan Companies Inc. | ||||||||||||
| 5.85% | 01/15/44 | 86,000 | 53,738 | (h) | ||||||||
Royal Bank of Canada | ||||||||||||
| 1.20% | 09/19/17 | 717,000 | 717,065 | (h) | ||||||||
Ryder System Inc. | ||||||||||||
| 2.45% | 09/03/19 | 345,000 | 346,054 | (h) | ||||||||
Santander Bank NA | ||||||||||||
| 2.00% | 01/12/18 | 520,000 | 518,249 | (h) | ||||||||
Schaeffler Holding Finance BV (6.25% Cash/7.00% PIK) |
| |||||||||||
| 6.25% | 11/15/19 | 230,000 | 243,800 | (b,h,n) | ||||||||
Schaeffler Holding Finance BV (6.75% Cash/7.50% PIK) |
| |||||||||||
| 6.75% | 11/15/22 | 260,000 | 279,500 | (b,h,n) | ||||||||
Sealed Air Corp. | ||||||||||||
| 4.88% | 12/01/22 | 262,000 | 259,052 | (b,h) | ||||||||
| 5.13% | 12/01/24 | 262,000 | 256,760 | (b,h) | ||||||||
Sinclair Television Group Inc. | ||||||||||||
| 5.38% | 04/01/21 | 459,000 | 448,672 | (h) | ||||||||
Sinopec Capital 2013 Ltd. | ||||||||||||
| 3.13% | 04/24/23 | 335,000 | 319,010 | (b,h) | ||||||||
Southern California Edison Co. | ||||||||||||
| 2.40% | 02/01/22 | 170,000 | 168,215 | (h) | ||||||||
Spectra Energy Partners LP | ||||||||||||
| 4.75% | 03/15/24 | 207,000 | 213,968 | (h) | ||||||||
Sprint Corp. | ||||||||||||
| 7.25% | 09/15/21 | 242,000 | 198,138 | (h) | ||||||||
| 7.63% | 02/15/25 | 275,000 | 212,953 | (h) | ||||||||
State Street Corp. | ||||||||||||
| 3.55% | 08/18/25 | 150,000 | 153,036 | (e,h) | ||||||||
Sunoco LP/Sunoco Finance Corp. | ||||||||||||
| 5.50% | 08/01/20 | 175,000 | 172,375 | (b,h) | ||||||||
SUPERVALU Inc. | ||||||||||||
| 6.75% | 06/01/21 | 441,000 | 427,770 | |||||||||
T-Mobile USA Inc. | ||||||||||||
| 6.25% | 04/01/21 | 100,000 | 99,650 | (h) | ||||||||
| 6.63% | 04/01/23 | 438,000 | 433,620 | (h) | ||||||||
Talisman Energy Inc. | ||||||||||||
| 6.25% | 02/01/38 | 175,000 | 149,240 | (h) | ||||||||
Tampa Electric Co. | ||||||||||||
| 4.35% | 05/15/44 | 209,000 | 214,045 | (h) | ||||||||
Target Corp. | ||||||||||||
| 3.50% | 07/01/24 | 265,000 | 276,648 | (h) | ||||||||
| Principal Amount | Fair Value | |||||||||||
TD Ameritrade Holding Corp. | ||||||||||||
| 2.95% | 04/01/22 | $ | 211,000 | $ | 212,484 | (h) | ||||||
Teachers Insurance & Annuity Association of America |
| |||||||||||
| 4.90% | 09/15/44 | 250,000 | 257,174 | (b,h) | ||||||||
Teck Resources Ltd. | ||||||||||||
| 2.50% | 02/01/18 | 125,000 | 101,172 | |||||||||
Telecom Italia S.p.A. | ||||||||||||
| 5.30% | 05/30/24 | 650,000 | 635,375 | (b,h) | ||||||||
Tenet Healthcare Corp. | ||||||||||||
| 4.75% | 06/01/20 | 160,000 | 161,600 | (h) | ||||||||
| 6.00% | 10/01/20 | 424,000 | 447,320 | (h) | ||||||||
The Allstate Corp. | ||||||||||||
| 5.75% | 08/15/53 | 240,000 | 248,484 | (h,i) | ||||||||
The Bank of Tokyo-Mitsubishi UFJ Ltd. | ||||||||||||
| 2.30% | 03/10/19 | 400,000 | 400,888 | (b,h) | ||||||||
The Boeing Co. | ||||||||||||
| 2.85% | 10/30/24 | 224,000 | 222,390 | (h) | ||||||||
The Dow Chemical Co. | ||||||||||||
| 3.50% | 10/01/24 | 77,000 | 73,530 | (h) | ||||||||
| 4.25% | 10/01/34 | 218,000 | 203,684 | (h) | ||||||||
The Goldman Sachs Group Inc. | ||||||||||||
| 2.38% | 01/22/18 | 335,000 | 339,375 | (h) | ||||||||
| 2.60% | 04/23/20 | 425,000 | 426,156 | (h) | ||||||||
| 2.63% | 01/31/19 | 140,000 | 141,733 | (h) | ||||||||
| 2.90% | 07/19/18 | 296,000 | 303,682 | (h) | ||||||||
| 3.75% | 05/22/25 | 365,000 | 365,757 | (h) | ||||||||
| 4.00% | 03/03/24 | 442,000 | 454,934 | (h) | ||||||||
| 4.80% | 07/08/44 | 250,000 | 253,426 | (h) | ||||||||
| 5.15% | 05/22/45 | 214,000 | 210,053 | (h) | ||||||||
The Home Depot Inc. | ||||||||||||
| 3.35% | 09/15/25 | 299,000 | 304,491 | |||||||||
The Korea Development Bank | ||||||||||||
| 3.25% | 03/09/16 | 223,000 | 225,083 | (h) | ||||||||
| 3.38% | 09/16/25 | 211,000 | 213,954 | |||||||||
| 4.00% | 09/09/16 | 245,000 | 251,431 | (h) | ||||||||
The Kroger Co. | ||||||||||||
| 2.95% | 11/01/21 | 299,000 | 299,642 | (h) | ||||||||
The Progressive Corp. | ||||||||||||
| 3.70% | 01/26/45 | 172,000 | 153,831 | (h) | ||||||||
The Williams Companies Inc. | ||||||||||||
| 8.75% | 03/15/32 | 84,000 | 79,921 | (h) | ||||||||
TIAA Asset Management Finance Company LLC |
| |||||||||||
| 4.13% | 11/01/24 | 425,000 | 433,233 | (b,h) | ||||||||
Time Inc. | ||||||||||||
| 5.75% | 04/15/22 | 443,000 | 414,205 | (b,h) | ||||||||
Time Warner Cable Inc. | ||||||||||||
| 4.50% | 09/15/42 | 43,000 | 33,997 | (h) | ||||||||
| 6.55% | 05/01/37 | 127,000 | 124,788 | (h) | ||||||||
Time Warner Inc. | ||||||||||||
| 3.60% | 07/15/25 | 235,000 | 230,112 | (h) | ||||||||
| 5.35% | 12/15/43 | 361,000 | 379,804 | (h) | ||||||||
See Notes to Schedules of Investments and Notes to Financial Statements.
82
Table of Contents
Income Fund
| Schedule of Investments | September 30, 2015 |
| Principal Amount | Fair Value | |||||||||||
Tyco Electronics Group S.A. | ||||||||||||
| 2.35% | 08/01/19 | $ | 421,000 | $ | 423,992 | (h) | ||||||
Tyco International Finance S.A. | ||||||||||||
| 5.13% | 09/14/45 | 130,000 | 135,932 | |||||||||
Tyson Foods Inc. | ||||||||||||
| 2.65% | 08/15/19 | 210,000 | 211,583 | (h) | ||||||||
| 3.95% | 08/15/24 | 140,000 | 142,605 | (h) | ||||||||
| 5.15% | 08/15/44 | 140,000 | 146,871 | (h) | ||||||||
U.S. Bancorp | ||||||||||||
| 3.44% | 02/01/16 | 648,000 | 653,488 | (h) | ||||||||
UBS Group Funding Jersey Ltd. | ||||||||||||
| 2.95% | 09/24/20 | 200,000 | 200,381 | (b) | ||||||||
| 4.13% | 09/24/25 | 250,000 | 248,798 | (b) | ||||||||
Ultra Petroleum Corp. | ||||||||||||
| 6.13% | 10/01/24 | 437,000 | 249,090 | (b,h) | ||||||||
United Rentals North America Inc. | ||||||||||||
| 6.13% | 06/15/23 | 345,000 | 343,922 | (h) | ||||||||
UnitedHealth Group Inc. | ||||||||||||
| 2.70% | 07/15/20 | 410,000 | 419,524 | (h) | ||||||||
| 4.75% | 07/15/45 | 275,000 | 290,294 | (h) | ||||||||
US Bank NA | ||||||||||||
| 2.80% | 01/27/25 | 315,000 | 305,862 | (h) | ||||||||
Valeant Pharmaceuticals International Inc. |
| |||||||||||
| 6.13% | 04/15/25 | 350,000 | 333,375 | (b,h) | ||||||||
| 6.38% | 10/15/20 | 137,000 | 136,229 | (b,h) | ||||||||
Ventas Realty LP | ||||||||||||
| 4.13% | 01/15/26 | 171,000 | 172,368 | (h) | ||||||||
Verizon Communications Inc. | ||||||||||||
| 1.35% | 06/09/17 | 593,000 | 592,169 | (h) | ||||||||
| 3.50% | 11/01/24 | 213,000 | 209,424 | (h) | ||||||||
| 4.15% | 03/15/24 | 426,000 | 440,646 | (h) | ||||||||
| 4.40% | 11/01/34 | 213,000 | 198,188 | (h) | ||||||||
| 4.67% | 03/15/55 | 150,000 | 129,165 | (h) | ||||||||
| 4.86% | 08/21/46 | 214,000 | 200,671 | (h) | ||||||||
| 5.05% | 03/15/34 | 131,000 | 130,697 | (h) | ||||||||
| 5.15% | 09/15/23 | 256,000 | 282,801 | (h) | ||||||||
| 6.55% | 09/15/43 | 144,000 | 170,128 | (h) | ||||||||
Virgin Media Finance PLC | ||||||||||||
| 5.75% | 01/15/25 | 439,000 | 412,660 | (b,h) | ||||||||
Volkswagen Group of America Finance LLC |
| |||||||||||
| 0.77% | 11/20/17 | 211,000 | 195,952 | (b,i) | ||||||||
| 2.13% | 05/23/19 | 200,000 | 186,620 | (b,h) | ||||||||
| 2.45% | 11/20/19 | 205,000 | 191,583 | (b,h) | ||||||||
W.R. Grace & Co. | ||||||||||||
| 5.13% | 10/01/21 | 165,000 | 162,938 | (b,h) | ||||||||
| 5.63% | 10/01/24 | 438,000 | 429,240 | (b,h) | ||||||||
Weatherford International Ltd. | ||||||||||||
| 6.75% | 09/15/40 | 107,000 | 81,669 | (h) | ||||||||
Wells Fargo & Co. | ||||||||||||
| 3.00% | 02/19/25 | 214,000 | 205,915 | (h) | ||||||||
| 3.55% | 09/29/25 | 323,000 | 323,121 | |||||||||
| Principal Amount | Fair Value | |||||||||||
| 3.90% | 05/01/45 | $ | 214,000 | $ | 196,663 | (h) | ||||||
| 4.10% | 06/03/26 | 235,000 | 237,076 | (h) | ||||||||
| 4.30% | 07/22/27 | 172,000 | 175,292 | (h) | ||||||||
| 5.88% | 12/29/49 | 297,000 | 304,054 | (h,i) | ||||||||
| 5.90% | 12/29/49 | 281,000 | 281,000 | (h,i) | ||||||||
Williams Partners LP | ||||||||||||
| 5.40% | 03/04/44 | 43,000 | 34,329 | (h) | ||||||||
Windstream Services LLC | ||||||||||||
| 6.38% | 08/01/23 | 409,000 | 294,725 | (h) | ||||||||
WMG Acquisition Corp. | ||||||||||||
| 6.00% | 01/15/21 | 92,000 | 92,000 | (b,h) | ||||||||
WPP Finance 2010 | ||||||||||||
| 3.75% | 09/19/24 | 425,000 | 423,517 | (h) | ||||||||
WPX Energy Inc. | ||||||||||||
| 5.25% | 01/15/17 | 408,000 | 405,960 | (h) | ||||||||
XLIT Ltd. | ||||||||||||
| 5.25% | 12/15/43 | 184,000 | 194,385 | (h) | ||||||||
Yamana Gold Inc. | ||||||||||||
| 4.95% | 07/15/24 | 176,000 | 157,263 | (h) | ||||||||
Zimmer Biomet Holdings Inc. | ||||||||||||
| 3.55% | 04/01/25 | 213,000 | 208,574 | (h) | ||||||||
| 122,636,496 | ||||||||||||
Non-Agency Collateralized Mortgage Obligations — 10.0% |
| |||||||||||
American Tower Trust I (REIT) | ||||||||||||
| 1.55% | 03/15/43 | 644,000 | 639,002 | (b) | ||||||||
Banc of America Commercial Mortgage Trust 2006-4 |
| |||||||||||
| 5.68% | 07/10/46 | 1,050,000 | 1,083,580 | |||||||||
Banc of America Commercial Mortgage Trust 2007-1 |
| |||||||||||
| 5.48% | 01/15/49 | 905,000 | 938,017 | (i) | ||||||||
Banc of America Commercial Mortgage Trust 2007-4 |
| |||||||||||
| 5.93% | 02/10/51 | 62,629 | 66,689 | (i) | ||||||||
Banc of America Commercial Mortgage Trust 2008-1 |
| |||||||||||
| 6.42% | 02/10/51 | 142,890 | 154,055 | (i) | ||||||||
Banc of America Merrill Lynch Commercial Mortgage Inc. 2005-1 |
| |||||||||||
| 5.52% | 11/10/42 | 42,304 | 42,267 | (i) | ||||||||
Banc of America Merrill Lynch Commercial Mortgage Inc. 2005-6 |
| |||||||||||
| 5.32% | 09/10/47 | 84,642 | 84,553 | (i) | ||||||||
Banc of America Merrill Lynch Commercial Mortgage |
| |||||||||||
| 4.33% | 08/15/46 | 168,401 | 175,671 | (b,i) | ||||||||
Bear Stearns Commercial Mortgage Securities Trust 2006-T22 |
| |||||||||||
| 5.80% | 04/12/38 | 220,000 | 223,911 | (i) | ||||||||
Bear Stearns Commercial Mortgage Securities Trust 2007-PW18 |
| |||||||||||
| 6.09% | 06/11/50 | 190,000 | 204,501 | (i) | ||||||||
Citigroup Commercial Mortgage Trust 2014-GC23 |
| |||||||||||
| 4.66% | 07/10/47 | 848,000 | 753,436 | (b,h,i) | ||||||||
Citigroup Commercial Mortgage Trust 2015-GC33 |
| |||||||||||
| 3.17% | 09/10/58 | 206,012 | 154,733 | |||||||||
Citigroup Commercial Mortgage Trust 2015-P1 |
| |||||||||||
| 3.72% | 09/15/48 | 848,321 | 890,240 | |||||||||
See Notes to Schedules of Investments and Notes to Financial Statements.
83
Table of Contents
Income Fund
| Schedule of Investments | September 30, 2015 |
| Principal Amount | Fair Value | |||||||||||
COMM 2013-LC13 Mortgage Trust | ||||||||||||
| 4.56% | 08/10/46 | $ | 175,000 | $ | 192,744 | (b,i) | ||||||
COMM 2014-CR14 Mortgage Trust | ||||||||||||
| 4.53% | 02/10/47 | 245,000 | 268,597 | (i) | ||||||||
COMM 2014-CR19 Mortgage Trust | ||||||||||||
| 4.88% | 08/10/47 | 413,823 | 371,553 | (b,i) | ||||||||
COMM 2014-CR20 Mortgage Trust | ||||||||||||
| 4.66% | 11/10/47 | 208,404 | 206,204 | (i) | ||||||||
COMM 2014-CR21 Mortgage Trust | ||||||||||||
| 3.99% | 12/10/47 | 418,316 | 436,970 | |||||||||
COMM 2015-CR23 Mortgage Trust | ||||||||||||
| 4.40% | 05/10/48 | 189,546 | 179,443 | (i) | ||||||||
COMM 2015-CR24 Mortgage Trust | ||||||||||||
| 3.46% | 08/10/55 | 412,335 | 314,469 | |||||||||
| 3.70% | 08/10/55 | 411,768 | 430,212 | |||||||||
| 4.52% | 08/10/55 | 370,677 | 357,408 | (i) | ||||||||
COMM 2015-PC1 Mortgage Trust | ||||||||||||
| 4.59% | 07/10/50 | 185,864 | 188,904 | (i) | ||||||||
Core Industrial Trust 2015-CALW | ||||||||||||
| 3.25% | 02/10/34 | 381,065 | 385,462 | (b) | ||||||||
Credit Suisse Commercial Mortgage Trust 2006-C1 |
| |||||||||||
| 5.65% | 02/15/39 | 740,000 | 744,925 | (i) | ||||||||
CSAIL 2015-C3 Commercial Mortgage Trust |
| |||||||||||
| 3.51% | 08/15/48 | 247,064 | 194,696 | (i) | ||||||||
| 4.26% | 08/15/48 | 329,419 | 335,990 | (i) | ||||||||
GS Mortgage Securities Corp. II 2012-GCJ9 |
| |||||||||||
| 2.50% | 11/10/45 | 960,931 | 99,753 | (g,i) | ||||||||
GS Mortgage Securities Corp. Trust 2012-ALOH |
| |||||||||||
| 3.55% | 04/10/34 | 280,000 | 293,898 | (b) | ||||||||
GS Mortgage Securities Trust 2011-GC5 |
| |||||||||||
| 3.00% | 08/10/44 | 419,098 | 423,975 | |||||||||
| 5.47% | 08/10/44 | 100,000 | 112,724 | (b,i) | ||||||||
GS Mortgage Securities Trust 2014-GC20 |
| |||||||||||
| 4.26% | 04/10/47 | 220,000 | 233,829 | |||||||||
GS Mortgage Securities Trust 2014-NEW |
| |||||||||||
| 3.79% | 01/10/31 | 430,000 | 435,748 | (b) | ||||||||
GS Mortgage Securities Trust 2015-GC28 |
| |||||||||||
| 1.32% | 02/10/48 | 2,857,543 | 208,138 | (g,i) | ||||||||
GS Mortgage Securities Trust 2015-GC32 |
| |||||||||||
| 3.35% | 07/10/48 | 226,593 | 174,439 | |||||||||
| 4.56% | 07/10/48 | 106,375 | 104,526 | (i) | ||||||||
JP Morgan Chase Commercial Mortgage Securities Corp. 2012-LC9 |
| |||||||||||
| 2.02% | 12/15/47 | 1,246,956 | 102,562 | (g,i) | ||||||||
JP Morgan Chase Commercial Mortgage Securities Trust 2006-LDP8 |
| |||||||||||
| 5.44% | 05/15/45 | 380,000 | 390,390 | |||||||||
JP Morgan Chase Commercial Mortgage Securities |
| |||||||||||
| 5.44% | 06/12/47 | 282,075 | 292,198 | |||||||||
JPMBB Commercial Mortgage Securities Trust 2013-C12 |
| |||||||||||
| 4.16% | 07/15/45 | 125,000 | 133,087 | (i) | ||||||||
JPMBB Commercial Mortgage Securities Trust 2013-C15 |
| |||||||||||
| 5.25% | 11/15/45 | 170,000 | 181,145 | (i) | ||||||||
| Principal Amount | Fair Value | |||||||||||
JPMBB Commercial Mortgage Securities Trust 2013-C17 |
| |||||||||||
| 5.05% | 01/15/47 | $ | 317,000 | $ | 328,540 | (i) | ||||||
JPMBB Commercial Mortgage Securities Trust 2014-C18 |
| |||||||||||
| 4.97% | 02/15/47 | 210,000 | 216,168 | (i) | ||||||||
JPMBB Commercial Mortgage Securities Trust 2015-C29 |
| |||||||||||
| 3.84% | 05/15/48 | 392,595 | 313,090 | (i) | ||||||||
JPMBB Commercial Mortgage Securities Trust 2015-C30 |
| |||||||||||
| 4.46% | 07/15/48 | 1,029,968 | 1,000,145 | (i) | ||||||||
JPMBB Commercial Mortgage Securities Trust 2015-C31 |
| |||||||||||
| 3.80% | 08/15/48 | 617,747 | 649,947 | |||||||||
LB-UBS Commercial Mortgage Trust 2004-C8 |
| |||||||||||
| 0.75% | 12/15/39 | 159,498 | 665 | (b,g,i) | ||||||||
LB-UBS Commercial Mortgage Trust 2006-C1 |
| |||||||||||
| 5.16% | 02/15/31 | 168,662 | 168,919 | |||||||||
LB-UBS Commercial Mortgage Trust 2006-C4 |
| |||||||||||
| 6.03% | 06/15/38 | 189,263 | 192,685 | (i) | ||||||||
LB-UBS Commercial Mortgage Trust 2007-C6 |
| |||||||||||
| 6.11% | 07/15/40 | 269,803 | 286,257 | (i) | ||||||||
| 6.11% | 07/15/40 | 530,000 | 562,322 | (b) | ||||||||
MASTR Alternative Loan Trust 2003-5 | ||||||||||||
| 5.00% | 08/25/18 | 24,909 | 1,236 | (g) | ||||||||
ML-CFC Commercial Mortgage Trust 2006-3 |
| |||||||||||
| 5.46% | 07/12/46 | 1,029,000 | 1,061,385 | (h,i) | ||||||||
Morgan Stanley Bank of America Merrill Lynch Trust 2013-C10 |
| |||||||||||
| 4.22% | 07/15/46 | 396,000 | 393,931 | (i) | ||||||||
Morgan Stanley Bank of America Merrill Lynch Trust 2014-C14 |
| |||||||||||
| 4.99% | 02/15/47 | 225,766 | 213,813 | (b,i) | ||||||||
Morgan Stanley Bank of America Merrill Lynch Trust 2014-C18 |
| |||||||||||
| 3.39% | 10/15/47 | 835,411 | 686,167 | (b) | ||||||||
Morgan Stanley Bank of America Merrill Lynch Trust 2014-C19 |
| |||||||||||
| 3.25% | 12/15/47 | 251,885 | 205,456 | (b) | ||||||||
Morgan Stanley Bank of America Merrill Lynch Trust 2015-C20 |
| |||||||||||
| 1.57% | 02/15/48 | 3,242,898 | 297,708 | (g,i) | ||||||||
Morgan Stanley Bank of America Merrill Lynch Trust 2015-C21 |
| |||||||||||
| 1.13% | 03/15/48 | 3,902,645 | 266,761 | (g,i) | ||||||||
Morgan Stanley Bank of America Merrill Lynch Trust 2015-C22 |
| |||||||||||
| 3.88% | 04/15/48 | 342,479 | 342,549 | (i) | ||||||||
| 4.38% | 04/15/48 | 190,266 | 159,478 | (b,i) | ||||||||
Morgan Stanley Bank of America Merrill Lynch Trust 2015-C23 |
| |||||||||||
| 4.27% | 07/15/50 | 205,991 | 174,247 | (b,i) | ||||||||
Morgan Stanley Bank of America Merrill Lynch Trust 2015-C24 |
| |||||||||||
| 3.73% | 05/15/48 | 751,116 | 784,800 | |||||||||
| 4.50% | 05/15/48 | 823,726 | 832,571 | (i) | ||||||||
Morgan Stanley Capital I Trust 2005-T17 |
| |||||||||||
| 4.84% | 12/13/41 | 80,104 | 80,620 | (i) | ||||||||
| Morgan Stanley Capital I Trust 2006-IQ11 | ||||||||||||
| 5.89% | 10/15/42 | 270,000 | 272,433 | (i) | ||||||||
| Morgan Stanley Capital I Trust 2006-T21 | ||||||||||||
| 5.16% | 10/12/52 | 24,611 | 24,584 | (i) | ||||||||
| 5.27% | 10/12/52 | 150,000 | 150,820 | (i) | ||||||||
| Morgan Stanley Capital I Trust 2006-T23 | ||||||||||||
| 6.02% | 08/12/41 | 157,599 | 160,705 | (i) | ||||||||
See Notes to Schedules of Investments and Notes to Financial Statements.
84
Table of Contents
Income Fund
| Schedule of Investments | September 30, 2015 |
| Principal Amount | Fair Value | |||||||||||
| Morgan Stanley Capital I Trust 2007-IQ16 | ||||||||||||
| 6.27% | 12/12/49 | $ | 190,000 | $ | 202,722 | (i) | ||||||
| Morgan Stanley Capital I Trust 2008-T29 | ||||||||||||
| 6.46% | 01/11/43 | 250,000 | 274,499 | (i) | ||||||||
| Morgan Stanley Capital I Trust 2012-C4 | ||||||||||||
| 5.21% | 03/15/45 | 190,000 | 209,367 | (b,i) | ||||||||
| Morgan Stanley Capital I Trust 2015-MS1 | ||||||||||||
| 4.16% | 05/15/48 | 260,000 | 213,754 | (b,i) | ||||||||
| Wells Fargo Commercial Mortgage Trust 2015-C26 | ||||||||||||
| 1.56% | 02/15/48 | 3,300,499 | 303,854 | (g,i) | ||||||||
| Wells Fargo Commercial Mortgage Trust 2015-C29 | ||||||||||||
| 4.01% | 06/15/48 | 565,872 | 584,121 | |||||||||
| 4.37% | 06/15/48 | 336,512 | 278,621 | (i) | ||||||||
| Wells Fargo Commercial Mortgage Trust 2015-C30 | ||||||||||||
| 4.65% | 09/15/58 | 205,915 | 179,830 | (b,i) | ||||||||
| Wells Fargo Commercial Mortgage Trust 2015-LC22 | ||||||||||||
| 4.54% | 09/15/58 | 206,161 | 177,008 | (i) | ||||||||
| Wells Fargo Commercial Mortgage Trust 2015-NXS2 | ||||||||||||
| 4.39% | 07/15/58 | 206,028 | 170,671 | (i) | ||||||||
| Wells Fargo Commercial Mortgage Trust 2015-SG1 | ||||||||||||
| 3.79% | 12/15/47 | 535,543 | 563,076 | |||||||||
| 4.62% | 12/15/47 | 205,916 | 199,848 | (i) | ||||||||
| Wells Fargo Mortgage Backed Securities Trust 2006-3 | ||||||||||||
| 5.50% | 03/25/36 | 93,677 | 1,744 | |||||||||
| WFRBS Commercial Mortgage Trust 2013-C17 | ||||||||||||
| 4.26% | 12/15/46 | 240,000 | 257,045 | |||||||||
| 5.30% | 12/15/46 | 175,000 | 172,571 | (b,i) | ||||||||
| WFRBS Commercial Mortgage Trust 2013-C18 | ||||||||||||
| 4.83% | 12/15/46 | 194,760 | 186,887 | (b,i) | ||||||||
| WFRBS Commercial Mortgage Trust 2014-C19 | ||||||||||||
| 4.23% | 03/15/47 | 412,226 | 367,179 | (b) | ||||||||
| 4.72% | 03/15/47 | 300,000 | 319,634 | (i) | ||||||||
| WFRBS Commercial Mortgage Trust 2014-C22 | ||||||||||||
| 4.06% | 09/15/57 | 532,045 | 446,701 | (b,i) | ||||||||
| WFRBS Commercial Mortgage Trust 2014-LC14 | ||||||||||||
| 4.35% | 03/15/47 | 544,000 | 584,810 | (h,i) | ||||||||
| 4.59% | 03/15/47 | 582,134 | 509,792 | (b,h,i) | ||||||||
| 29,236,380 | ||||||||||||
Sovereign Bonds — 1.1% | ||||||||||||
Government of Brazil |
| |||||||||||
| 4.25% | 01/07/25 | 200,000 | 175,000 | (h) | ||||||||
Government of Colombia |
| |||||||||||
| 2.63% | 03/15/23 | 327,000 | 290,703 | |||||||||
| 5.63% | 02/26/44 | 143,000 | 133,705 | (h) | ||||||||
Government of Mexico | ||||||||||||
| 3.60% | 01/30/25 | 336,000 | 328,860 | (h) | ||||||||
| 4.00% | 10/02/23 | 214,000 | 217,959 | (h) | ||||||||
| 4.60% | 01/23/46 | 310,000 | 275,900 | (h) | ||||||||
| 4.75% | 03/08/44 | 466,000 | 425,225 | (h) | ||||||||
| Principal Amount | Fair Value | |||||||||||
Government of Panama | ||||||||||||
| 4.00% | 09/22/24 | $ | 203,000 | $ | 200,209 | (h) | ||||||
Government of Peru | ||||||||||||
| 4.13% | 08/25/27 | 129,000 | 126,420 | |||||||||
| 5.63% | 11/18/50 | 69,000 | 71,243 | (h) | ||||||||
Government of Philippines | ||||||||||||
| 3.95% | 01/20/40 | 200,000 | 202,211 | |||||||||
| 4.20% | 01/21/24 | 200,000 | 219,239 | (h) | ||||||||
Government of Turkey | ||||||||||||
| 3.25% | 03/23/23 | 296,000 | 263,372 | (h) | ||||||||
| 4.88% | 04/16/43 | 211,000 | 175,657 | |||||||||
| 6.63% | 02/17/45 | 147,000 | 156,868 | (h) | ||||||||
| 3,262,571 | ||||||||||||
Municipal Bonds and Notes — 0.9% |
| |||||||||||
American Municipal Power Inc. |
| |||||||||||
| 6.27% | 02/15/50 | 295,000 | 351,658 | |||||||||
Commonwealth of Puerto Rico |
| |||||||||||
| 5.00% | 07/01/35 | 580,000 | 544,081 | |||||||||
Municipal Electric Authority of Georgia |
| |||||||||||
| 6.64% | 04/01/57 | 336,000 | 393,842 | |||||||||
Port Authority of New York & New Jersey |
| |||||||||||
| 4.46% | 10/01/62 | 525,000 | 508,000 | |||||||||
| South Carolina State Public Service Authority | ||||||||||||
| 6.45% | 01/01/50 | 235,000 | 296,203 | |||||||||
| State of California | ||||||||||||
| 5.70% | 11/01/21 | 290,000 | 338,964 | |||||||||
| State of Illinois | ||||||||||||
| 5.10% | 06/01/33 | 130,000 | 121,784 | |||||||||
| 2,554,532 | ||||||||||||
FNMA (TBA) — 0.0% * |
| |||||||||||
Lehman TBA |
| |||||||||||
| 5.50% | TBA | 216,625 | 11,914 | (l,o) | ||||||||
Total Bonds and Notes | 285,670,887 | |||||||||||
| Number of Shares | Fair Value | |||||||||||
Domestic Equity — 0.1% |
| |||||||||||
Preferred Stock — 0.1% |
| |||||||||||
Wells Fargo & Co. | 13,044 | $ | 332,622 | |||||||||
Total Investments in Securities | 286,003,509 | |||||||||||
See Notes to Schedules of Investments and Notes to Financial Statements.
85
Table of Contents
Income Fund
| Schedule of Investments | September 30, 2015 |
| Fair Value | ||||||||||
Short-Term Investments — 6.3% |
| |||||||||
State Street Institutional U.S. Government Money Market Fund — Premier Class 0.00% | $ | 18,496,948 | (d,m) | |||||||
Total Investments | 304,500,457 | |||||||||
Liabilities in Excess of Other Assets, net — (4.5)% | (13,000,953 | ) | ||||||||
|
| |||||||||
NET ASSETS — 100.0% | $ | 291,499,504 | ||||||||
|
| |||||||||
Other Information: |
Centrally Cleared Credit Default Swaps — Sell Protection
| Reference Entity | Counterparty | Notional Amount (000s omitted) | Contract annual Fixed Rate | Termination Date | Market Value | Unamortized Upfront Payments Received | Unrealized Depreciation | |||||||||||||||||||||||||
Markit CDX North America High Yield Index | CME Group Inc. | $ | 12,401 | 5.00 | % | 06/20/20 | $ | 356,412 | $ | 593,656 | $ | (237,244 | ) | |||||||||||||||||||
The Fund had the following long futures contracts open at September 30, 2015:
| Description | Expiration date | Number of Contracts | Current Notional Value | Unrealized Appreciation (Depreciation) | |||||||||||||
Ultra Long-Term U.S. Treasury Bond Futures | December 2015 | 5 | $ | 802,031 | $ | (878 | ) | ||||||||||
2 Yr. U.S. Treasury Notes Futures | December 2015 | 49 | 10,732,532 | 22,092 | |||||||||||||
5 Yr. U.S. Treasury Notes Futures | December 2015 | 117 | 14,100,328 | 35,458 | |||||||||||||
|
| ||||||||||||||||
| $ | 56,672 | ||||||||||||||||
|
| ||||||||||||||||
The Fund had the following short futures contracts open at September 30, 2015:
| Description | Expiration date | Number of Contracts | Current Value | Unrealized Depreciation | |||||||||||||
U.S. Long Bond Futures | December 2015 | 6 | $ | (944,063 | ) | $ | (21,201 | ) | |||||||||
10 Yr. U.S. Treasury Notes Futures | December 2015 | 333 | (42,868,547 | ) | (390,628 | ) | |||||||||||
|
| ||||||||||||||||
| $ | (411,829 | ) | |||||||||||||||
|
| ||||||||||||||||
| $ | (355,157 | ) | |||||||||||||||
|
| ||||||||||||||||
See Notes to Schedules of Investments and Notes to Financial Statements.
86
Table of Contents
| Notes to Schedules of Investments | September 30, 2015 |
The views expressed in this document reflect our judgment as of the publication date and are subject to change at any time without notice. The securities cited may not be representative of the Funds’ future investments and should not be construed as a recommendation to purchase or sell a particular security. See each Fund’s summary prospectus and the Funds’ statutory prospectus for complete descriptions of investment objectives, policies, risks and permissible investments.
| (a) | Non-income producing security. |
| (b) | Pursuant to Rule 144A of the Securities Act of 1933, as amended, these securities may be resold in transactions exempt from registration, normally to qualified institutional buyers. At September 30, 2015, these securities amounted to $26,895,374 and $33,070,565 or 3.57% and 11.34% of the net assets of the GE Institutional Strategic Investment Fund and GE Institutional Income Fund, respectively. These securities have been determined to be liquid using procedures established by the Fund’s Board of Trustees. |
| (c) | Settlement is on a delayed delivery or when-issued basis with final maturity to be announced (“TBA”) in the future. |
| (d) | Coupon amount represents effective yield. |
| (e) | State Street Corp. is the parent company of State Street Bank & Trust Co., the Fund’s sub-administrator, custodian and accounting agent. |
| (f) | Principal only security. These securities represent the right to receive the monthly principal payments on an underlying pool of mortgages. No payments of interest on the pool are passed through to the “principal only” holder. |
| (g) | Interest only security. These securities represent the right to receive the monthly interest payments on an underlying pool of mortgages. Payments of principal on the pool reduce the value of the “interest only” holding. |
| (h) | At September 30, 2015, all or a portion of this security was pledged to cover collateral requirements for futures, swaps and/or TBA’s. |
| (i) | Variable or floating rate security. The stated rate represents the rate at September 30, 2015. |
| (j) | Step coupon bond. |
| (k) | General Electric Co. is the parent company of GE Asset Management Incorporated (GEAM), the Fund’s investment adviser. |
| (l) | Security is in default. |
| (m) | Sponsored by SSGA Funds Management, Inc., the S&P 500 Index Fund’s sub-advisor, and an affiliate of State Street Bank & Trust Co., the Funds’ sub-administrator, custodian and accounting agent. |
| (n) | Represents a payment-in-kind (PIK) security which may pay all or a portion of interest in additional par. |
| (o) | Security is fair valued by the Valuation Committee, in accordance with the procedures approved by the Board of Trustees. |
| † | Percentages are based on net assets as of September 30, 2015. |
| * | Less than 0.05%. |
| ** | Less than $0.50 |
| *** | Less than 0.005%. |
Abbreviations:
| ADR | — | American Depository Receipt | ||
| GDR | — | Global Depositary Receipt | ||
| REIT | — | Real Estate Investment Trust | ||
| REMIC | — | Real Estate Mortgage Investment Conduit | ||
| SPDR | — | Standard and Poor’s Depositary Receipt | ||
| STRIPS | — | Separate Trading of Registered Interest and Principal of Security | ||
| TBA | — | To Be Announced | ||
87
Table of Contents
Selected data based on a share outstanding throughout the fiscal years indicated
| U.S. Equity Fund | ||||||||||||||||||||||||||||||||||||||||||
| Investment Class | Service Class | |||||||||||||||||||||||||||||||||||||||||
| 9/30/15 | 9/30/14 | 9/30/13 | 9/30/12 | 9/30/11 | 9/30/15 | 9/30/14 | 9/30/13 | 9/30/12 | 9/30/11 | |||||||||||||||||||||||||||||||||
| Inception date | 11/25/97 | 1/3/01 | ||||||||||||||||||||||||||||||||||||||||
Net asset value, beginning of period | $ | 17.32 | $ | 15.59 | $ | 12.90 | $ | 10.07 | $ | 10.50 | $ | 17.95 | $ | 15.96 | $ | 13.12 | $ | 10.24 | $ | 10.67 | ||||||||||||||||||||||
Income/(loss) from investment operations: | ||||||||||||||||||||||||||||||||||||||||||
Net investment income | 0.21 | * | 0.22 | * | 0.22 | * | 0.16 | * | 0.13 | 0.18 | * | 0.19 | * | 0.18 | * | 0.14 | * | 0.10 | * | |||||||||||||||||||||||
Net realized and unrealized gains/(losses) on investments | (0.65) | * | 2.60 | * | 2.67 | * | 2.80 | * | (0.42) | (0.69) | * | 2.67 | * | 2.83 | * | 2.84 | * | (0.41) | * | |||||||||||||||||||||||
Total income/(loss) from investment operations | (0.44) | 2.82 | 2.89 | 2.96 | (0.29) | (0.51) | 2.86 | 3.01 | 2.98 | (0.31) | ||||||||||||||||||||||||||||||||
Less distributions from: | ||||||||||||||||||||||||||||||||||||||||||
Net investment income | 0.25 | 0.22 | 0.20 | 0.13 | 0.14 | 0.21 | — | 0.17 | 0.10 | 0.12 | ||||||||||||||||||||||||||||||||
Net realized gains | 2.17 | 0.87 | — | — | — | 2.17 | 0.87 | — | — | — | ||||||||||||||||||||||||||||||||
Total distributions | 2.42 | 1.09 | 0.20 | 0.13 | 0.14 | 2.38 | 0.87 | 0.17 | 0.10 | 0.12 | ||||||||||||||||||||||||||||||||
Net asset value, end of period | $ | 14.46 | $ | 17.32 | $ | 15.59 | $ | 12.90 | $ | 10.07 | $ | 15.06 | $ | 17.95 | $ | 15.96 | $ | 13.12 | $ | 10.24 | ||||||||||||||||||||||
TOTAL RETURN (a) | (3.57)% | 18.88% | 22.76% | 29.68% | (2.92)% | (3.83)% | 18.55% | 23.23% | 29.33% | (3.08)% | ||||||||||||||||||||||||||||||||
RATIOS/SUPPLEMENTAL DATA: | ||||||||||||||||||||||||||||||||||||||||||
Net assets, end of period (in thousands) | $ | 615,024 | $ | 836,752 | $ | 767,603 | $ | 658,065 | $ | 522,532 | $ | 104 | $ | 117 | $ | 84 | $ | 3,133 | $ | 2,402 | ||||||||||||||||||||||
Ratios to average net assets: | ||||||||||||||||||||||||||||||||||||||||||
Net expenses | 0.37% | 0.36% | (b) | 0.36% | (b) | 0.36% | (b) | 0.36% | (b) | 0.62% | 0.61% | (b) | 0.61% | (b) | 0.61% | (b) | 0.61% | (b) | ||||||||||||||||||||||||
Gross expenses | 0.37% | 0.36% | 0.36% | 0.37% | 0.37% | 0.62% | 0.61% | 0.61% | 0.62% | 0.62% | ||||||||||||||||||||||||||||||||
Net investment income | 1.32% | 1.36% | 1.60% | 1.39% | 1.13% | 1.07% | 1.11% | 1.33% | 1.14% | 0.87% | ||||||||||||||||||||||||||||||||
Portfolio turnover rate | 41% | 38% | 37% | 71% | 44% | 41% | 38% | 37% | 71% | 44% | ||||||||||||||||||||||||||||||||
See Notes to Financial Highlights and Notes to Financial Statements.
88
Table of Contents
| S&P 500 Index Fund | ||||||||||||||||||||||||||||||||||||||||
Investment Class | Service Class | |||||||||||||||||||||||||||||||||||||||
| 9/30/15 | 9/30/14 | 9/30/13 | 9/30/12 | 9/30/11 | 9/30/15 | 9/30/14 | 9/30/13 | 9/30/12 | 9/30/11 | |||||||||||||||||||||||||||||||
| 11/25/97 | 9/30/05 | |||||||||||||||||||||||||||||||||||||||
| $ | 18.84 | $ | 16.01 | $ | 13.71 | $ | 10.91 | $ | 10.98 | $ | 19.20 | $ | 16.31 | $ | 13.97 | $ | 10.86 | $ | 10.93 | |||||||||||||||||||||
| 0.37 | * | 0.32 | * | 0.30 | * | 0.26 | * | 0.23 | * | 0.33 | * | 0.28 | * | 0.27 | * | 0.22 | * | 0.20 | * | |||||||||||||||||||||
| (0.48) | * | 2.76 | * | 2.27 | * | 2.95 | * | (0.09) | * | (0.49) | * | 2.83 | * | 2.31 | * | 2.98 | * | (0.09) | * | ||||||||||||||||||||
| (0.11) |
| 3.08 | 2.57 | 3.21 | 0.14 | (0.16) | 3.11 | 2.58 | 3.20 | 0.11 | |||||||||||||||||||||||||||||
| 0.39 | 0.25 | 0.27 | 0.41 | 0.21 | 0.35 | 0.22 | 0.24 | 0.09 | 0.18 | |||||||||||||||||||||||||||||||
| — | — | — | — | — | — | — | — | — | — | |||||||||||||||||||||||||||||||
| 0.39 | 0.25 | 0.27 | 0.41 | 0.21 | 0.35 | 0.22 | 0.24 | 0.09 | 0.18 | |||||||||||||||||||||||||||||||
| $ | 18.34 | $ | 18.84 | $ | 16.01 | $ | 13.71 | $ | 10.91 | $ | 18.69 | $ | 19.20 | $ | 16.31 | $ | 13.97 | $ | 10.86 | |||||||||||||||||||||
| (0.68)% | 19.54% | 19.11% | 30.07% | 1.07% | (0.95)% | 19.28% | 18.81% | 29.65% | 0.88% | |||||||||||||||||||||||||||||||
$ | 20,017 |
| $ | 32,326 | $ | 42,753 | $ | 31,997 | $ | 25,664 | $ | 6,960 | $ | 7,150 | $ | 5,922 | $ | 4,496 | $ | 1,742 | ||||||||||||||||||||
| 0.16% | 0.19% | (b) | 0.15% | (b) | 0.15% | (b) | 0.15% | (b) | 0.41% | 0.44% | (b) | 0.40% | (b) | 0.40% | (b) | 0.36% | (b) | |||||||||||||||||||||||
| 0.16% | 0.19% | 0.15% | 0.16% | 0.16% | 0.41% | 0.44% | 0.40% | 0.41% | 0.40% | |||||||||||||||||||||||||||||||
| 1.91% | 1.79% | 2.05% | 2.03% | 1.86% | 1.65% | 1.52% | 1.80% | 1.76% | 1.60% | |||||||||||||||||||||||||||||||
| 7% | 16% | 2% | 11% | 4% | 7% | 16% | 2% | 11% | 4% | |||||||||||||||||||||||||||||||
See Notes to Financial Highlights and Notes to Financial Statements.
89
Table of Contents
Financial Highlights
Selected data based on a share outstanding throughout the fiscal years indicated
| U.S. Large-Cap Core Equity Fund | ||||||||||||||||||||||||||||||||||||||||||
Investment Class | Service Class | |||||||||||||||||||||||||||||||||||||||||
| 9/30/15 | 9/30/14 | 9/30/13 | 9/30/12 | 9/30/11 | 9/30/15 | 9/30/14 | 9/30/13 | 9/30/12 | 9/30/11 | |||||||||||||||||||||||||||||||||
| Inception date | 2/2/00 | 9/30/05 | ||||||||||||||||||||||||||||||||||||||||
Net asset value, beginning of period | $ | 11.15 | $ | 11.64 | $ | 10.94 | $ | 8.76 | $ | 9.11 | $ | 11.06 | $ | 11.56 | $ | 10.87 | $ | 8.71 | $ | 9.06 | ||||||||||||||||||||||
Income/(loss) from investment operations: | ||||||||||||||||||||||||||||||||||||||||||
Net investment income | 0.18 | 0.17 | 0.21 | 0.18 | 0.16 | * | 0.11 | 0.13 | 0.17 | 0.17 | 0.14 | * | ||||||||||||||||||||||||||||||
Net realized and unrealized gains/(losses) on investments | (0.62) | 1.73 | 1.94 | 2.25 | (0.35) | * | (0.57) | 1.73 | 1.94 | 2.22 | (0.35) | * | ||||||||||||||||||||||||||||||
Total income/(loss) from investment operations | (0.44) | 1.90 | 2.15 | 2.43 | (0.19) | (0.46) | 1.86 | 2.11 | 2.39 | (0.21) | ||||||||||||||||||||||||||||||||
Less distributions from: |
| |||||||||||||||||||||||||||||||||||||||||
Net investment income | 0.16 | 0.15 | 0.25 | 0.14 | 0.16 | 0.13 | 0.12 | 0.22 | 0.12 | 0.14 | ||||||||||||||||||||||||||||||||
Net realized gains | 1.70 | 2.24 | 1.20 | 0.11 | — | 1.70 | 2.24 | 1.20 | 0.11 | — | ||||||||||||||||||||||||||||||||
Total distributions | 1.86 | 2.39 | 1.45 | 0.25 | 0.16 | 1.83 | 2.36 | 1.42 | 0.23 | 0.14 | ||||||||||||||||||||||||||||||||
Net asset value, end of period | $ | 8.85 | $ | 11.15 | $ | 11.64 | $ | 10.94 | $ | 8.76 | $ | 8.77 | $ | 11.06 | $ | 11.56 | $ | 10.87 | $ | 8.71 | ||||||||||||||||||||||
TOTAL RETURN (a) | (5.31)% | 18.60% | 22.84% | 28.27% | (2.32)% | (5.51)% | 18.32% | 22.56% | 27.88% | (2.54)% | ||||||||||||||||||||||||||||||||
RATIOS/SUPPLEMENTAL DATA: |
| |||||||||||||||||||||||||||||||||||||||||
Net assets, end of period (in thousands) | $ | 59,483 | $ | 95,740 | $ | 90,668 | $ | 185,990 | $ | 159,556 | $ | 4,117 | $ | 4,391 | $ | 3,583 | $ | 3,191 | $ | 2,769 | ||||||||||||||||||||||
Ratios to average net assets: | ||||||||||||||||||||||||||||||||||||||||||
Net expenses | 0.43% | 0.43% | (b) | 0.43% | (b) | 0.39% | (b) | 0.39% | (b) | 0.68% | 0.68% | (b) | 0.68% | (b) | 0.64% | (b) | 0.64% | (b) | ||||||||||||||||||||||||
Gross expenses | 0.43% | 0.43% | 0.43% | 0.39% | 0.40% | 0.68% | 0.68% | 0.68% | 0.64% | 0.65% | ||||||||||||||||||||||||||||||||
Net investment income | 1.44% | 1.46% | 1.78% | 1.80% | 1.63% | 1.20% | 1.21% | 1.44% | 1.55% | 1.37% | ||||||||||||||||||||||||||||||||
Portfolio turnover rate | 48% | 45% | 44% | 83% | 44% | 48% | 45% | 44% | 83% | 44% | ||||||||||||||||||||||||||||||||
See Notes to Financial Highlights and Notes to Financial Statements.
90
Table of Contents
| Premier Growth Equity Fund | ||||||||||||||||||||||||||||||||||||||||
| Investment Class | Service Class | |||||||||||||||||||||||||||||||||||||||
| 9/30/15 | 9/30/14 | 9/30/13 | 9/30/12 | 9/30/11 | 9/30/15 | 9/30/14 | 9/30/13 | 9/30/12 | 9/30/11 | |||||||||||||||||||||||||||||||
| 10/29/99 | 1/3/01 | |||||||||||||||||||||||||||||||||||||||
$ | 14.96 |
| $ | 12.92 | $ | 10.83 | $ | 8.05 | $ | 8.03 | $ | 14.82 | $ | 12.80 | $ | 10.74 | $ | 7.98 | $ | 7.95 | ||||||||||||||||||||
| 0.13 | * | 0.13 | * | 0.14 | * | 0.10 | * | 0.06 | * | 0.09 | * | 0.10 | * | 0.11 | * | 0.07 | * | 0.04 | * | |||||||||||||||||||||
| (0.11) | * | 2.38 | * | 2.09 | * | 2.77 | * | (0.01) | * | (0.12) | * | 2.36 | * | 2.07 | * | 2.76 | * | (0.01) | * | ||||||||||||||||||||
| 0.02 |
| 2.51 | 2.23 | 2.87 | 0.05 | (0.03) | 2.46 | 2.18 | 2.83 | 0.03 | |||||||||||||||||||||||||||||
| 0.13 | 0.11 | 0.14 | 0.09 | 0.03 | 0.09 | 0.08 | 0.12 | 0.07 | — | |||||||||||||||||||||||||||||||
| 1.24 | 0.36 | — | — | — | 1.24 | 0.36 | — | — | — | |||||||||||||||||||||||||||||||
| 1.37 | 0.47 | 0.14 | 0.09 | 0.03 | 1.33 | 0.44 | 0.12 | 0.07 | — | |||||||||||||||||||||||||||||||
| $ | 13.61 | $ | 14.96 | $ | 12.92 | $ | 10.83 | $ | 8.05 | $ | 13.46 | $ | 14.82 | $ | 12.80 | $ | 10.74 | $ | 7.98 | |||||||||||||||||||||
| (0.47)% | 19.80% | 20.85% | 35.95% | 0.64% | (0.77)% | 19.56% | 20.49% | 35.65% | 0.38% | |||||||||||||||||||||||||||||||
$ | 334,227 |
| $ | 428,536 | $ | 369,286 | $ | 257,923 | $ | 221,273 | $ | 5,820 | $ | 3,836 | $ | 3,216 | $ | 2,148 | $ | 1,692 | ||||||||||||||||||||
| 0.38% | 0.37% | (b) | 0.38% | (b) | 0.38% | (b) | 0.38% | (b) | 0.63% | 0.62% | (b) | 0.63% | (b) | 0.63% | (b) | 0.63% | (b) | |||||||||||||||||||||||
| 0.38% | 0.37% | 0.38% | 0.38% | 0.38% | 0.63% | 0.62% | 0.63% | 0.63% | 0.63% | |||||||||||||||||||||||||||||||
| 0.89% | 0.94% | 1.20% | 0.98% | 0.66% | 0.61% | 0.69% | 0.93% | 0.73% | 0.41% | |||||||||||||||||||||||||||||||
| 21% | 21% | 25% | 15% | 26% | 21% | 21% | 25% | 15% | 26% | |||||||||||||||||||||||||||||||
See Notes to Financial Highlights and Notes to Financial Statements.
91
Table of Contents
Financial Highlights
Selected data based on a share outstanding throughout the fiscal years indicated
| Small-Cap Equity Fund | ||||||||||||||||||||||||||||||||||||||||||
Investment Class | Service Class | |||||||||||||||||||||||||||||||||||||||||
| 9/30/15 | 9/30/14 | 9/30/13 | 9/30/12 | 9/30/11 | 9/30/15 | 9/30/14 | 9/30/13 | 9/30/12 | 9/30/11 | |||||||||||||||||||||||||||||||||
| Inception date | 8/3/98 | 9/30/05 | ||||||||||||||||||||||||||||||||||||||||
Net asset value, beginning of period | $ | 19.32 | $ | 20.19 | $ | 16.80 | $ | 13.05 | $ | 12.61 | $ | 19.37 | $ | 20.27 | $ | 16.87 | $ | 13.11 | $ | 12.69 | ||||||||||||||||||||||
Income/(loss) from investment operations: | ||||||||||||||||||||||||||||||||||||||||||
Net investment income | 0.03 | * | 0.01 | * | 0.07 | * | 0.04 | 0.05 | (0.01) | * | (0.04) | * | 0.02 | * | 0.00 | (c) | 0.01 | * | ||||||||||||||||||||||||
Net realized and unrealized gains/(losses) on investments | (0.08) | * | 1.12 | * | 4.69 | * | 3.86 | 0.40 | (0.08) | * | 1.12 | * | 4.72 | * | 3.87 | 0.41 | * | |||||||||||||||||||||||||
Total income/(loss) from investment operations | (0.05) | 1.13 | 4.76 | 3.90 | 0.45 | (0.09) | 1.08 | 4.74 | 3.87 | 0.42 | ||||||||||||||||||||||||||||||||
Less distributions from: | ||||||||||||||||||||||||||||||||||||||||||
Net investment income | 0.02 | 0.02 | 0.07 | 0.06 | 0.01 | — | — | 0.04 | 0.02 | — | ||||||||||||||||||||||||||||||||
Net realized gains | 2.07 | 1.98 | 1.30 | 0.09 | — | 2.07 | 1.98 | 1.30 | 0.09 | — | ||||||||||||||||||||||||||||||||
Total distributions | 2.09 | 2.00 | 1.37 | 0.15 | 0.01 | 2.07 | 1.98 | 1.34 | 0.11 | 0.00 | (c) | |||||||||||||||||||||||||||||||
Net asset value, end of period | $ | 17.18 | $ | 19.32 | $ | 20.19 | $ | 16.80 | $ | 13.05 | $ | 17.21 | $ | 19.37 | $ | 20.27 | $ | 16.87 | $ | 13.11 | ||||||||||||||||||||||
TOTAL RETURN (a) | (0.90)% | 5.61% | 30.57% | 30.03% | 3.53% | (1.12)% | 5.32% | 30.26% | 29.63% | 3.31% | ||||||||||||||||||||||||||||||||
RATIOS/SUPPLEMENTAL DATA: | ||||||||||||||||||||||||||||||||||||||||||
Net assets, end of period (in thousands) | $ | 1,171,984 | $ | 1,264,304 | $ | 1,249,146 | $ | 966,702 | $ | 759,833 | $ | 1,741 | $ | 71 | $ | 87 | $ | 44 | $ | 32 | ||||||||||||||||||||||
Ratios to average net assets: | ||||||||||||||||||||||||||||||||||||||||||
Net expenses | 0.89% | 0.88% | (b) | 0.88% | (b) | 0.89% | (b) | 0.89% | (b) | 1.14% | 1.13% | (b) | 1.13% | (b) | 1.14% | (b) | 1.13% | (b) | ||||||||||||||||||||||||
Gross expenses | 0.89% | 0.88% | 0.89% | 0.90% | 0.89% | 1.14% | 1.13% | 1.14% | 1.15% | 1.14% | ||||||||||||||||||||||||||||||||
Net investment income | 0.17% | 0.07% | 0.37% | 0.27% | 0.31% | (0.07)% | (0.19)% | 0.09% | 0.04% | 0.07% | ||||||||||||||||||||||||||||||||
Portfolio turnover rate | 40% | 37% | 37% | 36% | 46% | 40% | 37% | �� | 37% | 36% | 46% | |||||||||||||||||||||||||||||||
See Notes to Financial Highlights and Notes to Financial Statements.
92
Table of Contents
| International Equity Fund | ||||||||||||||||||||||||||||||||||||||||
Investment Class | Service Class | |||||||||||||||||||||||||||||||||||||||
| 9/30/15 | 9/30/14 | 9/30/13 | 9/30/12 | 9/30/11 | 9/30/15 | 9/30/14 | 9/30/13 | 9/30/12 | 9/30/11 | |||||||||||||||||||||||||||||||
| 11/25/97 | 1/3/01 | |||||||||||||||||||||||||||||||||||||||
$ | 12.72 |
| $ | 12.71 | $ | 10.68 | $ | 9.25 | $ | 10.90 | $ | 12.62 | $ | 12.61 | $ | 10.59 | $ | 9.17 | $ | 10.80 | ||||||||||||||||||||
| 0.18 | * | 0.30 | * | 0.18 | * | 0.20 | * | 0.23 | 0.08 | * | 0.26 | * | 0.15 | * | 0.14 | * | 0.19 | |||||||||||||||||||||||
| (1.15) | * | (0.08) | * | 2.09 | * | 1.47 | * | (1.70) | (1.06) | * | (0.08) | * | 2.07 | * | 1.49 | * | (1.68) | ||||||||||||||||||||||
| (0.97) |
| 0.22 | 2.27 | 1.67 | (1.47) | (0.98) | 0.18 | 2.22 | 1.63 | (1.49) | |||||||||||||||||||||||||||||
| 0.34 | 0.21 | 0.24 | 0.24 | 0.18 | 0.31 | 0.17 | 0.20 | 0.21 | 0.14 | |||||||||||||||||||||||||||||||
| — | — | — | — | — | — | — | — | — | — | |||||||||||||||||||||||||||||||
| 0.34 | 0.21 | 0.24 | 0.24 | 0.18 | 0.31 | 0.17 | 0.20 | 0.21 | 0.14 | |||||||||||||||||||||||||||||||
| $ | 11.41 | $ | 12.72 | $ | 12.71 | $ | 10.68 | $ | 9.25 | $ | 11.33 | $ | 12.62 | $ | 12.61 | $ | 10.59 | $ | 9.17 | |||||||||||||||||||||
| (7.80)% | 1.69% | 21.57% | 18.43% | (13.83)% | (7.95)% | 1.42% | 21.19% | 18.11% | (14.01)% | |||||||||||||||||||||||||||||||
$ | 1,284,412 |
| $ | 1,724,647 | $ | 1,836,243 | $ | 1,984,087 | $ | 1,876,948 | $ | 19,562 | $ | 92,749 | $ | 101,204 | $ | 119,576 | $ | 344,024 | ||||||||||||||||||||
| 0.56% | 0.56% | (b) | 0.56% | (b) | 0.56% | (b) | 0.55% | (b) | 0.81% | 0.81% | (b) | 0.81% | (b) | 0.81% | (b) | 0.80% | (b) | |||||||||||||||||||||||
| 0.56% | 0.56% | 0.56% | 0.56% | 0.56% | 0.81% | 0.81% | 0.81% | 0.81% | 0.81% | |||||||||||||||||||||||||||||||
| 1.38% | 2.29% | 1.57% | 2.03% | 1.95% | 0.63% | 2.03% | 1.31% | 1.39% | 1.68% | |||||||||||||||||||||||||||||||
| 26% | 39% | 47% | 50% | 41% | 26% | 39% | 47% | 50% | 41% | |||||||||||||||||||||||||||||||
See Notes to Financial Highlights and Notes to Financial Statements.
93
Table of Contents
Financial Highlights
Selected data based on a share outstanding throughout the fiscal years indicated
| Strategic Investment Fund | ||||||||||||||||||||||||||||||||||||||||||
Investment Class | Service Class | |||||||||||||||||||||||||||||||||||||||||
| 9/30/15 | 9/30/14 | 9/30/13 | 9/30/12 | 9/30/11 | 9/30/15 | 9/30/14 | 9/30/13 | 9/30/12 | 9/30/11 | |||||||||||||||||||||||||||||||||
| Inception date | 10/29/99 | 9/30/05 | ||||||||||||||||||||||||||||||||||||||||
Net asset value, beginning of period | $ | 13.54 | $ | 13.09 | $ | 11.88 | $ | 10.23 | $ | 10.71 | $ | 13.44 | $ | 12.99 | $ | 11.80 | $ | 10.17 | $ | 10.58 | ||||||||||||||||||||||
Income/(loss) from investment operations: | ||||||||||||||||||||||||||||||||||||||||||
Net investment income | 0.21 | * | 0.25 | * | 0.22 | * | 0.22 | * | 0.22 | 0.17 | * | 0.21 | * | 0.18 | * | 0.18 | * | 0.19 | * | |||||||||||||||||||||||
Net realized and unrealized gains/(losses) on investments | (0.49) | * | 0.90 | * | 1.22 | * | 1.66 | * | (0.51) | (0.48) | * | 0.90 | * | 1.21 | * | 1.66 | * | (0.50) | * | |||||||||||||||||||||||
Total income/(loss) from investment operations | (0.28) | 1.15 | 1.44 | 1.88 | (0.29) | (0.31) | 1.11 | 1.39 | 1.84 | (0.31) | ||||||||||||||||||||||||||||||||
Less distributions from: | ||||||||||||||||||||||||||||||||||||||||||
Net investment income | 0.25 | 0.22 | 0.23 | 0.23 | 0.19 | 0.22 | 0.18 | 0.20 | 0.21 | 0.10 | ||||||||||||||||||||||||||||||||
Net realized gains | 1.10 | 0.48 | — | — | — | 1.10 | 0.48 | — | — | — | ||||||||||||||||||||||||||||||||
Total distributions | 1.35 | 0.70 | 0.23 | 0.23 | 0.19 | 1.32 | 0.66 | 0.20 | 0.21 | 0.10 | ||||||||||||||||||||||||||||||||
Net asset value, end of period | $ | 11.91 | $ | 13.54 | $ | 13.09 | $ | 11.88 | $ | 10.23 | $ | 11.81 | $ | 13.44 | $ | 12.99 | $ | 11.80 | $ | 10.17 | ||||||||||||||||||||||
TOTAL RETURN (a) | (2.46)% | 8.98% | 12.34% | 18.67% | (2.85)% | (2.72)% | 8.79% | 11.98% | 18.39% | (3.04)% | ||||||||||||||||||||||||||||||||
RATIOS/SUPPLEMENTAL DATA: | ||||||||||||||||||||||||||||||||||||||||||
Net assets, end of period (in thousands) | $ | 754,367 | $ | 835,338 | $ | 827,998 | $ | 742,918 | $ | 629,230 | $ | 60 | $ | 62 | $ | 57 | $ | 61 | $ | 34 | ||||||||||||||||||||||
Ratios to average net assets: | ||||||||||||||||||||||||||||||||||||||||||
Net expenses | 0.36% | 0.35% | (b) | 0.34% | (b) | 0.34% | (b) | 0.34% | (b) | 0.61% | 0.60% | (b) | 0.59% | (b) | 0.59% | (b) | 0.59% | (b) | ||||||||||||||||||||||||
Gross expenses | 0.36% | 0.35% | 0.36% | 0.36% | 0.36% | 0.61% | 0.60% | 0.61% | 0.61% | 0.61% | ||||||||||||||||||||||||||||||||
Net investment income | 1.61% | 1.84% | 1.74% | 1.93% | 1.95% | 1.36% | 1.60% | 1.48% | 1.69% | 1.70% | ||||||||||||||||||||||||||||||||
Portfolio turnover rate | 144% | 185% | 153% | 188% | 187% | 144% | 185% | 153% | 188% | 187% | ||||||||||||||||||||||||||||||||
See Notes to Financial Highlights and Notes to Financial Statements.
94
Table of Contents
| Income Fund | ||||||||||||||||||||||||||||||||||||||||
Investment Class | Service Class | |||||||||||||||||||||||||||||||||||||||
| 9/30/15 | 9/30/14 | 9/30/13 | 9/30/12 | 9/30/11 | 9/30/15 | 9/30/14 | 9/30/13 | 9/30/12 | 9/30/11 | |||||||||||||||||||||||||||||||
| 11/21/97 | 9/30/05 | |||||||||||||||||||||||||||||||||||||||
| $ | 9.51 | $ | 9.34 | $ | 10.01 | $ | 9.73 | $ | 9.51 | $ | 9.72 | $ | 9.55 | $ | 10.23 | $ | 9.94 | $ | 9.70 | |||||||||||||||||||||
| 0.25 | 0.26 | 0.21 | 0.25 | 0.34 | 0.23 | 0.24 | 0.19 | 0.24 | 0.32 | |||||||||||||||||||||||||||||||
| (0.05) |
| 0.17 | (0.32) | 0.44 | 0.22 | (0.05) | 0.17 | (0.33) | 0.44 | 0.24 | |||||||||||||||||||||||||||||
| 0.20 |
| 0.43 | (0.11) | 0.69 | 0.56 | 0.18 | 0.41 | (0.14) | 0.68 | 0.56 | |||||||||||||||||||||||||||||
| 0.26 | 0.26 | 0.21 | 0.26 | 0.34 | 0.24 | 0.24 | 0.19 | 0.24 | 0.32 | |||||||||||||||||||||||||||||||
| — | — | 0.35 | 0.15 | — | — | — | 0.35 | 0.15 | — | |||||||||||||||||||||||||||||||
| 0.26 | 0.26 | 0.56 | 0.41 | 0.34 | 0.24 | 0.24 | 0.54 | 0.39 | 0.32 | |||||||||||||||||||||||||||||||
| $ | 9.45 | $ | 9.51 | $ | 9.34 | $ | 10.01 | $ | 9.73 | $ | 9.66 | $ | 9.72 | $ | 9.55 | $ | 10.23 | $ | 9.94 | |||||||||||||||||||||
| 2.05% | 4.61% | (1.13)% | 7.28% | 6.01% | 1.81% | 4.32% | (1.40)% | 7.02% | 5.91% | |||||||||||||||||||||||||||||||
$ | 291,252 |
| $ | 322,946 | $ | 341,603 | $ | 372,643 | $ | 375,669 | $ | 248 | $ | 327 | $ | 316 | $ | 320 | $ | 306 | ||||||||||||||||||||
| 0.23% | 0.23% | (b) | 0.21% | (b) | 0.21% | (b) | 0.20% | (b) | 0.48% | 0.48% | (b) | 0.46% | (b) | 0.46% | (b) | 0.45% | (b) | |||||||||||||||||||||||
| 0.23% | 0.23% | 0.23% | 0.23% | 0.23% | 0.48% | 0.48% | 0.48% | 0.48% | 0.48% | |||||||||||||||||||||||||||||||
| 2.65% | 2.73% | 2.21% | 2.58% | 3.59% | 2.40% | 2.47% | 2.00% | 2.33% | 3.33% | |||||||||||||||||||||||||||||||
| 297% | 308% | 348% | 403% | 393% | 297% | 308% | 348% | 403% | 393% | |||||||||||||||||||||||||||||||
See Notes to Financial Highlights and Notes to Financial Statements.
95
Table of Contents
| Notes to Financial Highlights |
| (a) | Total returns are historical and assume changes in share price and reinvestment of dividends and capital gains distributions. |
| (b) | Includes contractual management fee waiver related to the Fund’s investments in the GE Institutional Money Market Fund (the “Money Market Fund”). The fee waiver agreement was terminated effective June 30, 2014 with the closure of the Money Market Fund. |
| (c) | Less than $0.005. |
| * | Per share values have been calculated using the average share method. |
96
Table of Contents
[This page intentionally left blank.]
97
Table of Contents
| (1) | Deposits at broker for futures contracts. |
The accompanying Notes are an integral part of these financial statements.
98
Table of Contents
| Premier Growth Equity Fund | Small-Cap Equity Fund | International Equity Fund | Strategic Investment Fund | Income Fund | ||||||||||||||||||||
$ | 336,673,503 |
| $ | 1,107,402,277 | $ | 1,262,090,973 | $ | 669,668,847 | $ | 286,003,509 | ||||||||||||||
| — |
| — | — | — | — | ||||||||||||||||||
| 4,317,388 | 68,607,689 | 37,712,664 | 102,285,749 | 18,496,948 | ||||||||||||||||||||
| — | 455,117 | 567,977 | 76,757 | — | ||||||||||||||||||||
| — | 1,470,000 | 1,614,608 | 1,233,294 | — | ||||||||||||||||||||
| — |
| — | 288,258 | 107,597 | — | ||||||||||||||||||
| 704,875 | 2,100,939 | 2,212,227 | 7,521,183 | 3,476,831 | ||||||||||||||||||||
| 232,959 | 1,118,965 | 5,372,226 | 2,732,798 | 1,918,408 | ||||||||||||||||||||
| 52,406 | 4,554 | 243 | 7,959 | 296,251 | ||||||||||||||||||||
| — |
| — | — | 41,346 | 48,632 | ||||||||||||||||||
| — | 315,223 | 46,543 | 101,356 | 19,233 | ||||||||||||||||||||
| 1,156 | 10,058 | 33,206 | 8,654 | 5,592 | ||||||||||||||||||||
| 341,982,287 | 1,181,484,822 | 1,309,938,925 | 783,785,540 | 310,265,404 | ||||||||||||||||||||
| 1,250,555 | 6,333,833 | 4,975,360 | 28,336,423 | 18,608,469 | ||||||||||||||||||||
| 531,972 | 543,005 | 369,519 | 797,470 | 102,617 | ||||||||||||||||||||
| 107,686 | 882,508 | 619,419 | 223,979 | 54,814 | ||||||||||||||||||||
| 45,235 | — | — | — | — | ||||||||||||||||||||
| 1,935,448 | 7,759,346 | 5,964,298 | 29,357,872 | 18,765,900 | ||||||||||||||||||||
| $ | 340,046,839 | $ | 1,173,725,476 | $ | 1,303,974,627 | $ | 754,427,668 | $ | 291,499,504 | |||||||||||||||
| $ | 260,830,339 | $ | 968,443,471 | $ | 1,517,307,985 | $ | 703,597,047 | $ | 291,784,946 | |||||||||||||||
| 2,189,133 | 859,333 | 19,466,797 | 10,031,155 | 322,669 | ||||||||||||||||||||
| 23,726,848 | 116,837,954 | (196,869,045 | ) | 31,325,595 | 818,068 | |||||||||||||||||||
| 53,236,129 | 88,414,986 | (35,518,063 | ) | 10,089,709 | (833,778 | ) | ||||||||||||||||||
| 64,390 | (830,268 | ) | (310,059 | ) | (406,655 | ) | (355,157 | ) | ||||||||||||||||
| — | — | — | (200,775 | ) | (237,244 | ) | ||||||||||||||||||
| — | — | (102,988 | ) | (8,408 | ) | — | ||||||||||||||||||
| $ | 340,046,839 | $ | 1,173,725,476 | $ | 1,303,974,627 | $ | 754,427,668 | $ | 291,499,504 | |||||||||||||||
| $334,227,165 | $1,171,984,187 | $1,284,412,139 | $754,367,458 | $291,251,635 | ||||||||||||||||||||
| 24,566,158 | 68,226,137 | 112,542,706 | 63,356,990 | 30,826,765 | ||||||||||||||||||||
| $13.61 | $17.18 | $11.41 | $11.91 | $9.45 | ||||||||||||||||||||
| $5,819,674 | $1,741,289 | $19,562,488 | $60,210 | $247,869 | ||||||||||||||||||||
| 432,433 | 101,203 | 1,726,176 | 5,100 | 25,654 | ||||||||||||||||||||
| $13.46 | $17.21 | $11.33 | $11.81 | $9.66 | ||||||||||||||||||||
The accompanying Notes are an integral part of these financial statements.
99
Table of Contents
For the year ended September 30, 2015 | U.S. Equity Fund | S&P 500 Index Fund | U.S. Large-Cap Core Equity Fund | ||||||||||||
INVESTMENT INCOME | |||||||||||||||
Income | |||||||||||||||
Dividend | $ | 12,460,122 | $ | 648,209 | $ | 1,731,329 | |||||||||
Interest | 1,043 | 74 | 92 | ||||||||||||
Income from affiliated investments | — | 15,345 | — | ||||||||||||
Less: Foreign taxes withheld | (49,252 | ) | (66 | ) | (8,568 | ) | |||||||||
Total income | 12,411,913 | 663,562 | 1,722,853 | ||||||||||||
Expenses | |||||||||||||||
Advisory and administration fees | 2,646,505 | 48,145 | 394,616 | ||||||||||||
Distribution and service: | |||||||||||||||
Service Class | 309 | 18,581 | 11,151 | ||||||||||||
Trustees’ fees | 53,088 | 2,083 | — | ||||||||||||
Other expenses | 1,427 | 24 | 6 | ||||||||||||
Total Expenses | 2,701,329 | 68,833 | 405,773 | ||||||||||||
Net investment income | $ | 9,710,584 | $ | 594,729 | $ | 1,317,080 | |||||||||
NET REALIZED AND UNREALIZED GAIN (LOSS) ON INVESTMENTS | |||||||||||||||
Realized gain (loss) on: | |||||||||||||||
Investments | $ | 115,906,695 | $ | 6,150,128 | $ | 12,195,578 | |||||||||
Affiliated investments | — | 61,369 | — | ||||||||||||
Futures | (1,018,057 | ) | 94,723 | 200,069 | |||||||||||
Swap contracts | — | — | — | ||||||||||||
Foreign currency transactions | (322 | ) | — | (49 | ) | ||||||||||
Increase (decrease) in unrealized appreciation/depreciation on: | |||||||||||||||
Investments | (140,499,696 | ) | (6,236,412 | ) | (15,698,837 | ) | |||||||||
Futures | (241,113 | ) | (36,185 | ) | 27,147 | ||||||||||
Swap contracts | — | — | — | ||||||||||||
Foreign currency translations | (205 | ) | — | (18 | ) | ||||||||||
Net realized and unrealized gain (loss) on investments | (25,852,698 | ) | 33,623 | (3,276,110 | ) | ||||||||||
Net increase (decrease) in net assets resulting from operations | $ | (16,142,114 | ) | $ | 628,352 | $ | (1,959,030 | ) | |||||||
| * | Includes $53,149,863 of net realized gains from redemptions in-kind. |
The accompanying Notes are an integral part of these financial statements.
100
Table of Contents
| Premier Growth Equity Fund | Small-Cap Equity Fund | International Equity Fund | Strategic Investment Fund | Income Fund | ||||||||||||||||||||
| $ | 4,964,869 | $ | 13,760,796 | $ | 33,588,633 | $ | 9,452,112 | $ | 24,142 | |||||||||||||||
| 529 | 3,663 | 1,798 | 7,039,316 | 8,911,418 | ||||||||||||||||||||
| — | — | — | — | — | ||||||||||||||||||||
| — | (40,353 | ) | (3,208,461 | ) | (399,048 | ) | — | |||||||||||||||||
| 4,965,398 | 13,724,106 | 30,381,970 | 16,092,380 | 8,935,560 | ||||||||||||||||||||
| 1,449,225 | 11,455,500 | 8,782,452 | 2,901,498 | 706,901 | ||||||||||||||||||||
| 13,356 | 1,932 | 138,554 | 159 | 792 | ||||||||||||||||||||
| 26,441 | 90,546 | 39,467 | 54,457 | 14,074 | ||||||||||||||||||||
| — | — | 177 | 38 | 206 | ||||||||||||||||||||
| 1,489,022 | 11,547,978 | 8,960,650 | 2,956,152 | 721,973 | ||||||||||||||||||||
| $ | 3,476,376 | $ | 2,176,128 | $ | 21,421,320 | $ | 13,136,228 | $ | 8,213,587 | |||||||||||||||
| $ | 81,109,749 | * | $ | 131,862,997 | $ | 112,212,626 | $ | 38,295,263 | $ | 3,228,030 | ||||||||||||||
| — | — | — | — | — | ||||||||||||||||||||
| 577,871 | (56,941 | ) | (998,155 | ) | (150,841 | ) | (650,120 | ) | ||||||||||||||||
| — | — | — | 80,693 | 95,710 | ||||||||||||||||||||
| — | — | (1,103,715 | ) | (113,300 | ) | — | ||||||||||||||||||
| (82,902,871 | ) | (140,224,610 | ) | (232,786,399 | ) | (69,306,574 | ) | (3,257,231 | ) | |||||||||||||||
| 98,134 | (51,580 | ) | (284,230 | ) | 508,814 | (253,514 | ) | |||||||||||||||||
| — | — | — | (200,775 | ) | (237,244 | ) | ||||||||||||||||||
| — | — | 51,423 | 5,528 | — | ||||||||||||||||||||
| (1,117,117 | ) | (8,470,134 | ) | (122,908,450 | ) | (30,881,192 | ) | (1,074,369 | ) | |||||||||||||||
| $ | 2,359,259 | | $ | (6,294,006 | ) | $ | (101,487,130 | ) | $ | (17,744,964 | ) | $ | 7,139,218 | |||||||||||
The accompanying Notes are an integral part of these financial statements.
101
Table of Contents
| * | Includes $53,149,863 of net realized gains from redemptions in-kind. |
The accompanying Notes are an integral part of these financial statements.
102
Table of Contents
| U.S. Large-Cap Core Equity Fund | Premier Growth Equity Fund | Small-Cap Equity Fund | |||||||||||||||||||||||||||
| Year Ended September 30, 2015 | Year Ended September 30, 2014 | Year Ended September 30, 2015 | Year Ended September 30, 2014 | Year Ended September 30, 2015 | Year Ended September 30, 2014 | ||||||||||||||||||||||||
| $ | 1,317,080 | $ | 1,452,604 | $ | 3,476,376 | $ | 3,829,861 | $ | 2,176,128 | $ | 915,309 | ||||||||||||||||||
| | 12,395,598 | | 14,884,990 | 81,687,620 | * | 35,823,177 | 131,806,056 | 141,794,891 | |||||||||||||||||||||
| (15,671,708 | ) | 847,029 | (82,804,737 | ) | 33,583,042 | (140,276,190 | ) | (72,318,505 | ) | |||||||||||||||||||
| (1,959,030 | ) | 17,184,623 | 2,359,259 | 73,236,080 | (6,294,006 | ) | 70,391,695 | ||||||||||||||||||||||
| (1,342,057 | ) | (1,158,271 | ) | (3,720,776 | ) | (3,141,777 | ) | (1,374,532 | ) | (1,300,365 | ) | ||||||||||||||||||
| (52,746 | ) | (37,701 | ) | (26,469 | ) | (19,790 | ) | — | — | ||||||||||||||||||||
| (14,455,771 | ) | (17,427,031 | ) | (35,918,312 | ) | (10,172,708 | ) | (132,249,163 | ) | (121,161,646 | ) | ||||||||||||||||||
| (683,259 | ) | (706,418 | ) | (346,446 | ) | (89,483 | ) | (7,659 | ) | (8,667 | ) | ||||||||||||||||||
| (16,533,833 | ) | (19,329,421 | ) | (40,012,003 | ) | (13,423,758 | ) | (133,631,354 | ) | (122,470,678 | ) | ||||||||||||||||||
| (18,492,863 | ) | (2,144,798 | ) | (37,652,744 | ) | 59,812,322 | (139,925,360 | ) | (52,078,983 | ) | ||||||||||||||||||
| 10,054,919 | 12,935,678 | 106,044,404 | 51,707,180 | 84,339,060 | 96,764,538 | ||||||||||||||||||||||||
| 516,762 | 480,957 | 3,538,979 | 513,832 | 1,899,623 | 34,178 | ||||||||||||||||||||||||
| 15,793,694 | 18,579,989 | 38,382,651 | 13,209,115 | 133,620,989 | 122,459,420 | ||||||||||||||||||||||||
| 735,986 | 744,095 | 372,773 | 109,227 | 7,659 | 8,667 | ||||||||||||||||||||||||
| (44,589,061 | ) | (24,366,962 | ) | (201,640,905 | ) | (64,960,247 | ) | (170,538,400 | ) | (151,990,603 | ) | ||||||||||||||||||
| (551,232 | ) | (348,499 | ) | (1,370,477 | ) | (521,159 | ) | (53,119 | ) | (54,564 | ) | ||||||||||||||||||
| (18,038,932 | ) | 8,025,258 | (54,672,575 | ) | 57,948 | 49,275,812 | 67,221,636 | |||||||||||||||||||||
| (36,531,795 | ) | 5,880,460 | (92,325,319 | ) | 59,870,270 | (90,649,548 | ) | 15,142,653 | |||||||||||||||||||||
| 100,131,358 | 94,250,898 | 432,372,158 | 372,501,888 | 1,264,375,024 | 1,249,232,371 | ||||||||||||||||||||||||
| $ | 63,599,563 | $ | 100,131,358 | $ | 340,046,839 | $ | 432,372,158 | $ | 1,173,725,476 | $ | 1,264,375,024 | ||||||||||||||||||
$ | 986,347 |
| $ | 1,115,030 | $ | 2,189,133 | $ | 2,460,002 | $ | 859,333 | $ | 434,995 | |||||||||||||||||
| 1,007,527 | 1,177,675 | 7,079,612 | 3,730,498 | 4,486,265 | 4,831,811 | ||||||||||||||||||||||||
| 1,641,756 | 1,854,290 | 2,645,255 | 980,632 | 7,301,693 | 6,328,652 | ||||||||||||||||||||||||
| (4,511,311 | ) | (2,238,774 | ) | (13,797,090 | ) | (4,662,645 | ) | (9,002,090 | ) | (7,595,150 | ) | ||||||||||||||||||
| (1,862,028 | ) | 793,191 | (4,072,223 | ) | 48,485 | 2,785,868 | 3,565,313 | ||||||||||||||||||||||
| 53,845 | 44,370 | 237,641 | 37,197 | 99,952 | 1,708 | ||||||||||||||||||||||||
| 77,067 | 74,708 | 25,923 | 8,176 | 417 | 446 | ||||||||||||||||||||||||
| (58,177 | ) | (32,171 | ) | (90,000 | ) | (37,770 | ) | (2,852 | ) | (2,742 | ) | ||||||||||||||||||
| 72,735 | 86,907 | 173,564 | 7,603 | 97,517 | (588 | ) | |||||||||||||||||||||||
The accompanying Notes are an integral part of these financial statements.
103
Table of Contents
| Statements of Changes in Net Assets | International Equity Fund | |||||||||
| Year Ended September 30, 2015 | Year Ended September 30, 2014 | |||||||||
INCREASE (DECREASE) IN NET ASSETS | ||||||||||
Operations: | ||||||||||
Net investment income | $ | 21,421,320 | $ | 44,081,412 | ||||||
Net realized gain (loss) on investments, futures, swap contracts and foreign currency transactions | 110,110,756 | 148,793,690 | ||||||||
Net increase (decrease) in unrealized appreciation/depreciation on investments, futures, swap contracts and foreign currency translations | (233,019,206 | ) | (159,201,927 | ) | ||||||
Net increase (decrease) from operations | (101,487,130 | ) | 33,673,175 | |||||||
Distributions to shareholders from: | ||||||||||
Net investment income | ||||||||||
Investment Class | (40,074,208 | ) | (29,089,517 | ) | ||||||
Service Class | (2,200,814 | ) | (1,380,383 | ) | ||||||
Net realized gains | ||||||||||
Investment Class | — | — | ||||||||
Service Class | — | — | ||||||||
Total distributions | (42,275,022 | ) | (30,469,900 | ) | ||||||
Increase (decrease) in assets from operations and distributions | (143,762,152 | ) | 3,203,275 | |||||||
Share transactions: | ||||||||||
Proceeds from sale of shares | ||||||||||
Investment Class | 88,160,235 | 114,344,931 | ||||||||
Service Class | 423,186 | 245,130 | ||||||||
Value of distributions reinvested | ||||||||||
Investment Class | 39,960,532 | 29,022,015 | ||||||||
Service Class | 2,200,320 | 1,380,070 | ||||||||
Cost of shares redeemed | ||||||||||
Investment Class | (425,151,525 | ) | (257,873,009 | ) | ||||||
Service Class | (75,251,629 | ) | (10,373,233 | ) | ||||||
Net increase (decrease) from share transactions | (369,658,881 | ) | (123,254,096 | ) | ||||||
Total increase (decrease) in net assets | (513,421,033 | ) | (120,050,821 | ) | ||||||
NET ASSETS | ||||||||||
Beginning of year | 1,817,395,660 | 1,937,446,481 | ||||||||
End of year | $ | 1,303,974,627 | $ | 1,817,395,660 | ||||||
Undistributed (distributions in excess of) net investment income, end of year | $ | 19,466,797 | $ | 41,541,740 | ||||||
CHANGES IN FUND SHARES | ||||||||||
Investment Class | ||||||||||
Shares sold | 6,898,008 | 8,765,740 | ||||||||
Issued for distributions reinvested | 3,288,933 | 2,237,627 | ||||||||
Shares redeemed | (33,274,173 | ) | (19,887,117 | ) | ||||||
Net increase (decrease) in fund shares | (23,087,232 | ) | (8,883,750 | ) | ||||||
Service Class | ||||||||||
Shares sold | 32,902 | 18,951 | ||||||||
Issued for distributions reinvested | 181,995 | 106,899 | ||||||||
Shares redeemed | (5,835,339 | ) | (802,277 | ) | ||||||
Net increase (decrease) in fund shares | (5,620,442 | ) | (676,427 | ) | ||||||
The accompanying Notes are an integral part of these financial statements.
104
Table of Contents
| Strategic Investment Fund | Income Fund | ||||||||||||||||||
| Year Ended September 30, 2015 | Year Ended September 30, 2014 | Year Ended September 30, 2015 | Year Ended September 30, 2014 | ||||||||||||||||
| $ | 13,136,228 | $ | 15,880,600 | $ | 8,213,587 | $ | 9,033,775 | ||||||||||||
| 38,111,815 |
| 70,617,208 | 2,673,620 | (592,003 | ) | |||||||||||||
| (68,993,007 | ) | (12,802,500 | ) | (3,747,989 | ) | 6,358,680 | ||||||||||||
| (17,744,964 | ) | 73,695,308 | 7,139,218 | 14,800,452 | |||||||||||||||
| (15,273,876 | ) | (13,471,250 | ) | (8,238,729 | ) | (9,018,850 | ) | ||||||||||||
| (1,030 | ) | (856 | ) | (7,616 | ) | (7,907 | ) | ||||||||||||
| (66,200,278 | ) | (29,582,200 | ) | — | — | ||||||||||||||
| (5,115 | ) | (2,199 | ) | — | — | ||||||||||||||
| (81,480,299 | ) | (43,056,505 | ) | (8,246,345 | ) | (9,026,757 | ) | ||||||||||||
| (99,225,263 | ) | 30,638,803 | (1,107,127 | ) | 5,773,695 | ||||||||||||||
| 60,984,889 | 51,978,867 | 78,967,884 | 12,837,474 | ||||||||||||||||
| 250 | 6,633 | 4,700 | 63,481 | ||||||||||||||||
| 81,473,065 | 43,052,892 | 8,186,024 | 9,004,773 | ||||||||||||||||
| 5,390 | 2,677 | 7,616 | 7,907 | ||||||||||||||||
| (124,210,613 | ) | (118,328,879 | ) | (117,742,658 | ) | (46,268,264 | ) | ||||||||||||
| (25 | ) | (6,179 | ) | (89,998 | ) | (65,013 | ) | ||||||||||||
| 18,252,956 | (23,293,989 | ) | (30,666,432 | ) | (24,419,642 | ) | |||||||||||||
| (80,972,307 | ) | 7,344,814 | (31,773,559 | ) | (18,645,947 | ) | |||||||||||||
| 835,399,975 | 828,055,161 | 323,273,063 | 341,919,010 | ||||||||||||||||
| $ | 754,427,668 | $ | 835,399,975 | $ | 291,499,504 | $ | 323,273,063 | ||||||||||||
| $ | 10,031,155 | $ | 12,400,695 | $ | 322,669 | $ | 295,679 | ||||||||||||
| 4,767,694 | 3,898,959 | 8,248,670 | 1,352,756 | ||||||||||||||||
| 6,575,711 | 3,337,433 | 853,674 | 950,880 | ||||||||||||||||
| (9,660,957 | ) | (8,822,526 | ) | (12,247,001 | ) | (4,908,128 | ) | ||||||||||||
| 1,682,448 | (1,586,134 | ) | (3,144,657 | ) | (2,604,492 | ) | |||||||||||||
| 19 | 500 | 482 | 6,550 | ||||||||||||||||
| 438 | 209 | 777 | 816 | ||||||||||||||||
| (2 | ) | (461 | ) | (9,284 | ) | (6,732 | ) | ||||||||||||
| 455 | 248 | (8,025 | ) | 634 | |||||||||||||||
The accompanying Notes are an integral part of these financial statements.
105
Table of Contents
| Notes to Financial Statements | September 30, 2015 |
| 1. | Organization of the Funds |
GE Institutional Funds (the “Trust”) is registered under the Investment Company Act of 1940, as amended (the “1940 Act”), as an open-end management investment company. The Trust was organized as a Delaware business trust on May 23, 1997, and is authorized to issue an unlimited number of shares. It is currently comprised of ten investment funds (each a “Fund” and collectively the “Funds”), although only the following eight Funds are currently being offered: U.S. Equity Fund, S&P 500 Index Fund, U.S. Large-Cap Core Equity Fund, Premier Growth Equity Fund, Small-Cap Equity Fund, International Equity Fund, Strategic Investment Fund and Income Fund. The Funds presently offer two classes of shares — the Investment Class and the Service Class. The Trust expects that most of the time, each Fund will have relatively few shareholders (as compared with most mutual funds), but that these shareholders will invest substantial amounts in a Fund (minimum initial investment requirements are described in the current summary prospectus for each Fund and in the Funds’ statutory prospectus). Each Fund is an investment company and accordingly follows the investment company accounting and reporting guidance of the Financial Accounting Standards Board (“FASB”) Accounting Standard Codification (“ASC”) Topic 946 Financial Services — Investment Companies.
| 2. | Summary of Significant Accounting Policies |
The preparation of financial statements in conformity with U.S. generally accepted accounting principles (“GAAP”) requires management to make estimates and assumptions that affect the reported amounts of assets and liabilities and disclosure of contingent assets and liabilities at the date of the financial statements and the reported amounts of increases and decreases in net assets from operations during the reporting period. Actual results may differ from those estimates.
Subsequent events after the balance sheet date through the date the financial statements were issued have been evaluated in the preparation of the financial statements. There are no items to report.
The following summarizes the significant accounting policies of the Trust.
Securities Valuation and Transactions All investments in securities are recorded at their estimated fair value, as described in Note 3.
Securities transactions are accounted for as of the trade date. Realized gains and losses on investments sold are recorded on the basis of identified cost for both financial statement and federal tax purposes.
Each Fund’s income, expenses (other than distribution and service fees) and realized and unrealized gains and losses are allocated proportionally each day among the share classes based upon the relative net assets of each class.
Foreign Currency Accounting records of the Funds are maintained in U.S. dollars. Investment securities and other assets and liabilities denominated in a foreign currency are translated to U.S. dollars at the prevailing rates of exchange at period end. Purchases and sales of securities, income receipts and expense payments denominated in foreign currencies are translated into U.S. dollars at the prevailing exchange rate on the respective dates of such transactions.
All assets and liabilities of the Funds initially expressed in foreign currency values will be converted into U.S. dollars at the WM/Reuters exchange rate computed at 11:00 a.m., Eastern time.
The Funds do not isolate the portion of the results of operations resulting from changes in foreign exchange rates from the fluctuations arising from changes in the market prices of securities during the year. Such fluctuations are included in the net realized or unrealized gain or loss from investments. Net realized gains or losses on foreign currency transactions represent net gains or losses on sales and maturities of foreign currency contracts, disposition of foreign currencies, the difference between the amount of net investment income and withholding taxes accrued and the U.S. dollar amount actually received or paid, and gains or losses between the trade and settlement date on purchases and sales of foreign securities. Net unrealized foreign exchange gains and losses arising from changes in the value of other assets and liabilities (including foreign currencies and open foreign currency contracts) as a result of changes in foreign exchange rates are included as increases or decreases in unrealized appreciation/depreciation on foreign currency related transactions.
106
Table of Contents
| Notes to Financial Statements | September 30, 2015 |
Derivatives The Funds are subject to equity price risk, interest rate risk, credit risk and foreign currency exchange rate risk in the normal course of pursuing their investment objectives. Certain Funds may enter into various types of derivatives transactions (such as options, futures, options on futures, interest rate futures, interest rate swaps and credit default swaps) to gain or hedge exposure to certain types of securities as an alternative to investing directly in or selling such securities, or to manage: yield, interest rate exposure (also known as duration), exposure to credit quality, and to gain exposure to certain market segments.
Futures Contracts A futures contract is an agreement to buy or sell a specific amount of a commodity, financial instrument, currency or index at a particular price and future date. Certain Funds may invest in interest rate, financial and stock or bond index futures contracts subject to certain limitations. During the year ended September 30, 2015, the U.S. Equity Fund, S&P 500 Index Fund, U.S. Large-Cap Core Equity Fund, Premier Growth Equity Fund, Small-Cap Equity Fund and International Equity Fund invested in stock index future contracts to gain equity exposure for accumulating and residual cash positions. The Strategic Investment Fund invested in futures contracts on various stock indices, bonds and notes to gain equity exposure and to manage duration of fixed income securities. The Income Fund invested in futures contracts on bonds and notes to manage duration of fixed income securities. Buying futures tends to increase a Fund’s exposure to the underlying instrument while selling futures tends to decrease a Fund’s exposure to the underlying instrument, or hedge other Fund investments. With futures contracts, there is minimal counterparty credit risk to a Fund since futures contracts are exchange traded and the exchange’s clearinghouse, as counterparty to all traded futures, guarantees the futures against default. A Fund’s risks in using these contracts include changes in the
value of the underlying instruments, non-performance of the counterparties under the contracts’ terms and changes in the liquidity of the secondary market for the contracts. Futures contracts are valued at the settlement price established each day by the board of trade or exchange on which they principally trade.
Upon entering into a financial futures contract, a Fund is required to pledge to the broker an amount of cash and/or other assets equal to a certain percentage of the
contract amount, known as initial margin deposit. Subsequent payments, known as variation margin, are made or received by a Fund each day, depending on the daily fluctuation in the fair value of the underlying security. A Fund records an unrealized gain or loss equal to the daily variation margin. Should market conditions move unexpectedly, a Fund may not achieve the anticipated benefits of the futures contracts and may incur a loss. A Fund recognizes a realized gain or loss on the expiration or closing of a futures contract.
Credit Default Swaps
During the period ended September 30, 2015, the Strategic Investment Fund and Income Fund engaged in credit default swaps to manage credit risk. When a Fund is the buyer in a credit default swap contract, a Fund is entitled to receive the par (or other agreed upon) value (full notional value) of a referenced debt obligation (or basket of debt obligations) from the counterparty (or central clearing party (“CCP”) in the case of a centrally cleared swap) to the contract if a credit event by a third party, such as a U.S. or foreign corporate issuer or sovereign issuer, on the debt obligation occurs. In return, a Fund pays the counterparty a periodic stream of payments over the term of the contract provided that no credit event has occurred. If no credit event occurs, a Fund loses its investment and recovers nothing. However, if a credit event occurs, a Fund receives full notional value for a referenced debt obligation that may have little or no value. When a Fund is the seller of a credit default swap, it receives a fixed rate of income throughout the term of the contract, provided there is no credit event. If a credit event occurs, a Fund is obligated to pay the notional amount of the swap and in certain instances take delivery of securities of the reference entity upon the occurrence of a credit event, as defined under the terms of that particular swap agreement. Credit events are contract specific but may include bankruptcy, failure to pay, restructuring, obligation acceleration and repudiation/moratorium. If a Fund is a seller of protection and a credit event occurs, the maximum potential amount of future payments that a Fund could be required to make would be an amount equal to the notional amount of the agreement. This potential amount would be partially offset by any recovery value of the respective referenced obligation, or net amount received from the settlement of a buy protection credit default swap agreement entered into by a Fund for the same referenced obligation. As the seller, a Fund may create
107
Table of Contents
| Notes to Financial Statements | September 30, 2015 |
economic leverage to its portfolio because, in addition to its total net assets, a Fund is subject to investment exposure on the notional amount of the swap. The interest fee paid or received on the swap, which is based on a specified interest rate on a fixed notional amount, is accrued daily as a component of unrealized appreciation (depreciation) and is recorded as realized gain upon receipt or realized loss upon payment. A Fund also records an increase or decrease to unrealized appreciation (depreciation) in an amount equal to the daily valuation. For centrally cleared swaps, the daily change in valuation is recorded as a receivable or payable for variation margin and settled in cash with the CCP daily. All upfront payments, if any, are amortized over the life of the swap as realized gains or losses. Those upfront payments that are paid or received, typically for non-centrally cleared swaps, are recorded as other assets or other liabilities, respectively, net of amortization. For financial reporting purposes, unamortized upfront payments, if any, are netted with unrealized appreciation or depreciation on swaps to determine the market value of swaps. A Fund segregates assets in the form of cash or liquid securities in an amount equal to the notional amount of the credit default swaps of which it is the seller. A Fund segregates assets in the form of cash or liquid securities in an amount equal to any unrealized depreciation of the credit default swaps of which it is the buyer, marked to market on a daily basis. Credit default swaps involve greater risks than if a Fund had invested in the referenced debt obligation directly. If a Fund is a buyer of a credit default swap and no credit event occurs, a Fund will not earn any return on its investment. If a Fund is a seller of a credit default swap, a Fund’s risk of loss may be the entire notional amount of the swap. Swaps may also subject a Fund to the risk that the counterparty to the transaction may not fulfill its obligation. In the case of centrally cleared swaps, counterparty risk is minimal due to protections provided by the CCP.
When-Issued Securities and Forward Commitments The Strategic Investment Fund and Income Fund may purchase or sell securities on a when issued or forward commitment basis. These transactions are arrangements in which a Fund purchases and sells securities with payment and delivery scheduled a month or more after entering into the transaction. The price of the underlying securities and the date when these securities will be
delivered and paid for are fixed at the time the transaction is negotiated. Losses may arise due to changes in the market value of the underlying securities or if the counterparty does not perform under the commitments. In connection with such purchases, a Fund maintains cash or liquid assets in an amount equal to the purchase commitments for such underlying securities until settlement date and for sales commitments a Fund maintains equivalent deliverable securities as “cover” for the transaction. Unsettled commitments are valued at the current market value of the underlying security. Daily fluctuations in the value of such commitments are recorded as unrealized gains or losses. The Funds will not enter into such commitments for the purpose of investment leverage.
Forward Foreign Currency Exchange Contracts Certain Funds may enter into forward foreign currency exchange contracts to facilitate transactions in foreign denominated securities and to manage currency exposure. Forward foreign currency exchange contracts are valued at the mean between the bid and the offered forward rates as last quoted by a recognized dealer. The aggregate principal amounts of the contracts are not recorded in a Fund’s financial statements. Such amounts appear under the caption Forward Foreign Currency Contracts in the Schedules of Investments. Fluctuations in the value of the contracts are recorded in the Statements of Assets and Liabilities as an asset (or liability) and in the Statements of Operations as unrealized appreciation (depreciation) until the contracts are closed, when they are recorded as realized gains or losses on foreign currency related transactions. A Fund’s risks in using these contracts include changes in the value of foreign currency or the possibility that the counterparties do not perform under the contracts’ terms. When a Fund enters into a forward foreign currency exchange contract, it is required to segregate cash or liquid securities with its custodian in an amount equal to the value of a Fund’s total assets committed to the consummation of the forward contract. If the value of the segregated securities declines, additional cash or securities are segregated so that the value of the account will equal the amount of a Fund’s commitment with respect to the contract.
Investments in Foreign Markets Investments in foreign markets involve special risks and considerations not typically associated with investing in the United States. These risks include revaluation of currencies, high rates of
108
Table of Contents
| Notes to Financial Statements | September 30, 2015 |
inflation, restrictions on repatriation of income and capital, and adverse political and economic developments. Moreover, securities issued in these markets may be less liquid, subject to government ownership controls, tariffs and taxes, subject to delays in settlements, and their prices may be more volatile.
A Fund may be subject to capital gains and repatriation taxes imposed by certain countries in which it invests. Such taxes are generally based upon income and/or capital gains earned or repatriated. Taxes are accrued based on net investment income, net realized gains and net unrealized appreciation as income and/or capital gains are earned.
Investment Income Corporate actions (including cash dividends) are recorded on the ex-dividend date, net of applicable withholding taxes, except for certain foreign corporate actions which are recorded as soon after the ex-dividend date as such information becomes available. Withholding taxes on foreign dividends, if any, have been provided for in accordance with a Fund’s understanding of the applicable country’s tax rules and rates. Interest income is recorded on the accrual basis. Accretion of discounts and amortization of premiums on taxable bonds are to the call or maturity date, whichever is shorter, using the effective yield method.
Expenses Each Fund pays a “unitary fee” to GEAM equivalent to the Fund’s advisory and administration fee. This fee includes any normal operating expenses payable by a Fund, except for fees paid to the Trust’s independent Trustees, distribution and shareholder servicing fees, brokerage fees and commissions and expenses that are not normal operating expenses of the Funds (such as extraordinary expenses, interest and taxes).
Federal Income Taxes The Funds intend to comply with all sections of the Internal Revenue Code of 1986, as amended (the “Internal Revenue Code”), applicable to regulated investment companies including the distribution of substantially all of their taxable net investment income, tax-exempt income and net realized capital gains to their shareholders. Therefore, no provision for federal income tax has been made. Each Fund is treated as a separate taxpayer for federal income tax purposes.
| 3. | Security Valuation and Transactions |
The Funds utilize various methods to measure the fair value of most of their investments on a recurring basis.
GAAP establishes a framework for measuring fair value and providing related disclosures. Broadly, the framework requires fair value to be determined based on the exchange price that would be received for an asset or paid to transfer a liability (an exit price) in the principal or most advantageous market for the asset or liability in an orderly transaction between market participants at the measurement date. In the absence of active markets for the identical assets or liabilities, such measurements involve developing assumptions based on market observable data and, in the absence of such data, internal information that is consistent with what market participants would use in a hypothetical transaction that occurs at the measurement date. It also establishes a three-level valuation hierarchy based upon observable and non-observable inputs.
Observable inputs reflect market data obtained from independent sources, while unobservable inputs reflect our market assumptions. Preference is given to observable inputs. These two types of inputs create the following fair value hierarchy:
Level 1 – Quoted prices for identical investments in active markets.
Level 2 – Quoted prices for similar investments in active markets; quoted prices for identical or similar investments in markets that are not active; and model-derived valuations whose inputs are observable or whose significant value drivers are observable.
Level 3 – Significant inputs to the valuation model are unobservable.
Policies and procedures are maintained to value investments using the best and most relevant data available. In addition, pricing vendors are utilized to assist in valuing investments. GEAM performs periodic reviews of the methodologies used by independent pricing services including price validation of individual securities.
Fair Value Measurement The following section describes the valuation methodologies the Funds use to measure different financial investments at fair value.
A Fund’s portfolio securities are valued generally on the basis of market quotations. Equity securities generally are valued at the last reported sale price on the primary market in which they are traded. Portfolio securities listed on NASDAQ are valued using the NASDAQ Official Closing Price. Level 1 securities primarily include publicly-traded
109
Table of Contents
| Notes to Financial Statements | September 30, 2015 |
equity securities, which may not necessarily represent the last sales price. If no sales occurred on the exchange or NASDAQ that day, the portfolio security generally is valued using the last reported bid price. In those circumstances, the Fund typically classifies the investment securities in Level 2.
Debt securities (other than short-term securities described below) generally are valued at an evaluated bid price as reported by independent pricing services. The pricing services use various pricing models for each asset class. The inputs and assumptions to the model of the pricing services are derived from market observable sources, which may include: benchmark yields, reported trades, broker/dealer quotes, issuer spreads, benchmark securities, bids, offers and other market related data. Since many fixed income securities do not trade on a daily basis, the methodology of the pricing service may also use other available information such as benchmark curves, benchmarking of similar securities, sector groupings and matrix pricing, as applicable. Thus, certain securities may not be priced using market
quotations, but rather determined from market observable information. These investments are included in Level 2 and are primarily comprised of corporate fixed income, government, mortgage and asset-backed securities. In the absence of a reliable bid price from such a pricing service, debt securities may be valued based on broker or dealer supplied valuations or quotations. In these infrequent circumstances, pricing services may provide the Funds with valuations that are based on significant unobservable inputs, and in those circumstances the investment securities are classified as Level 3.
A Fund may use non-binding broker or dealer quotes for valuation when there is limited or no relevant market activity for a specific investment or for other investments that share similar characteristics and a price is not provided by a pricing service or is deemed not to be reliable. The Funds have not adjusted the prices obtained. Investment securities priced using non-binding broker or dealer quotes are included in Level 3.
Investments in registered investment companies are valued at the published daily net asset value (“NAV”) and classified in Level 1.
Short-term securities of sufficient credit quality with remaining maturities of sixty days or less at the time of
purchase are typically valued on the basis of amortized cost which approximates fair value and these are included in Level 2. If it is determined that amortized cost does not approximate fair value, securities may be valued based on dealer supplied valuations or quotations. In these infrequent circumstances, pricing services may provide the Funds with valuations that are based on significant unobservable inputs, and in those circumstances the investment securities are classified in Level 3.
If prices are not readily available for a portfolio security, or if it is believed that a price for a portfolio security does not represent its fair value, the security may be valued using procedures approved by the Funds’ Board of Trustees that are designed to establish its “fair” value. These securities are typically classified in Level 3. Those procedures require that the fair value of a security be established by a valuation committee of GEAM. The valuation committee follows different protocols for different types of investments and circumstances. The fair value procedures may be used to value any investment of any Fund in the appropriate circumstances.
Foreign securities may be valued with the assistance of an independent fair value pricing service in circumstances where it is believed that they have been or would be materially affected by events occurring after the close of the portfolio security’s primary market and before the close of regular trading on the New York Stock Exchange. In these circumstances, the Funds classify the investment securities in Level 2. This independent fair value pricing service uses a proprietary model to identify affected securities, taking into consideration various factors, and the fair value of such securities may be something other than the last available quotation or other market price.
All assets and liabilities of the Funds initially expressed in foreign currency values will be converted into U.S. dollars at the WM/Reuters exchange rate computed at 11:00 a.m. Eastern time.
Fair value determinations generally are used for securities whose value is affected by a significant event that will materially affect the value of a security and which occurs subsequent to the time of the close of the principal market on which such security trades but prior to the calculation of a Fund’s NAV.
110
Table of Contents
| Notes to Financial Statements | September 30, 2015 |
The value established for such a portfolio security valued other than by use of a market quotation (as described above) may be different than what would be produced through the use of market quotations or another methodology. Portfolio securities that are valued using techniques other than market quotations, including “fair valued” securities, may be subject to greater fluctuation in their value from one day to the next than would be the case if market quotations were used. In addition, there is no assurance that a Fund could sell a portfolio security for the value established for it at any time and it is possible that a Fund would incur a loss because a portfolio security is sold at a discount to its established value.
Other financial investments are derivative instruments that are not reflected in total investments, such as
futures, forwards, swaps and written options contracts, which are valued based on fair value as discussed above.
The Funds use closing prices for derivatives included in Level 1, which are traded either on exchanges or liquid over-the-counter markets. Derivative assets and liabilities included in Level 2 primarily represent interest rate swaps, cross-currency swaps, credit default swaps and foreign currency and commodity forward and option contracts. Derivative assets and liabilities included in Level 3 primarily represent interest rate products that contain embedded optionality or prepayment features.
The inputs or methodology used for valuing securities are not an indication of the risk associated with investing in those securities.
The following tables present each Fund’s investments measured at fair value on a recurring basis at September 30, 2015:
| Fund | Investments | Level 1 | Level 2 | Level 3 | Total | |||||||||||||
| U.S. Equity Fund | Investments in Securities† | |||||||||||||||||
Common Stock | $ | 588,034,037 | $ | — | $ | — | $ | 588,034,037 | ||||||||||
Exchange Traded Funds | 8,223,171 | — | — | 8,223,171 | ||||||||||||||
Short-Term Investments | 17,993,117 | — | — | 17,993,117 | ||||||||||||||
|
|
|
|
|
|
|
| |||||||||||
| Total Investments in Securities | $ | 614,250,325 | $ | — | $ | — | $ | 614,250,325 | ||||||||||
|
|
|
|
|
|
|
| |||||||||||
| Other Financial Instruments* | ||||||||||||||||||
Long Futures Contracts — Unrealized Depreciation | $ | (201,251 | ) | $ | — | $ | — | $ | (201,251 | ) | ||||||||
|
|
|
|
|
|
|
| |||||||||||
| S&P 500 Index Fund | Investments in Securities† | |||||||||||||||||
Common Stock | $ | 25,655,880 | $ | — | $ | — | $ | 25,655,880 | ||||||||||
Short-Term Investments | 1,221,898 | — | — | 1,221,898 | ||||||||||||||
|
|
|
|
|
|
|
| |||||||||||
| Total Investments in Securities | $ | 26,877,778 | $ | — | $ | — | $ | 26,877,778 | ||||||||||
|
|
|
|
|
|
|
| |||||||||||
| Other Financial Instruments* | ||||||||||||||||||
Long Futures Contracts — Unrealized Depreciation | $ | (46,443 | ) | $ | — | $ | — | $ | (46,443 | ) | ||||||||
|
|
|
|
|
|
|
| |||||||||||
| U.S. Large-Cap Core Equity Fund | Investments in Securities† | |||||||||||||||||
Common Stock | $ | 60,747,057 | $ | — | $ | — | $ | 60,747,057 | ||||||||||
Exchange Traded Funds | 891,263 | — | — | 891,263 | ||||||||||||||
Short-Term Investments | 326,019 | — | — | 326,019 | ||||||||||||||
|
|
|
|
|
|
|
| |||||||||||
| Total Investments in Securities | $ | 61,964,339 | $ | — | $ | — | $ | 61,964,339 | ||||||||||
|
|
|
|
|
|
|
| |||||||||||
| Other Financial Instruments* | ||||||||||||||||||
Long Futures Contracts — Unrealized Appreciation | $ | 5,446 | $ | — | $ | — | $ | 5,446 | ||||||||||
|
|
|
|
|
|
|
| |||||||||||
111
Table of Contents
| Notes to Financial Statements | September 30, 2015 |
| Fund | Investments | Level 1 | Level 2 | Level 3 | Total | |||||||||||||
| Premier Growth Equity Fund | Investments in Securities† | |||||||||||||||||
Common Stock | $ | 336,673,503 | $ | — | $ | — | $ | 336,673,503 | ||||||||||
Short-Term Investments | 4,317,388 | — | — | 4,317,388 | ||||||||||||||
|
|
|
|
|
|
|
| |||||||||||
| Total Investments in Securities | $ | 340,990,891 | $ | — | $ | — | $ | 340,990,891 | ||||||||||
|
|
|
|
|
|
|
| |||||||||||
| Other Financial Instruments* | ||||||||||||||||||
Short Futures Contracts — Unrealized Appreciation | $ | 64,390 | $ | — | $ | — | $ | 64,390 | ||||||||||
|
|
|
|
|
|
|
| |||||||||||
| Small-Cap Equity Fund | Investments in Securities† | |||||||||||||||||
Common Stock | $ | 1,107,402,277 | $ | — | $ | — | $ | 1,107,402,277 | ||||||||||
Short-Term Investments | 68,607,689 | — | — | 68,607,689 | ||||||||||||||
|
|
|
|
|
|
|
| |||||||||||
| Total Investments in Securities | 1,176,009,966 | $ | — | $ | — | $ | 1,176,009,966 | |||||||||||
|
|
|
|
|
|
|
| |||||||||||
| Other Financial Instruments* | ||||||||||||||||||
Long Futures Contracts — Unrealized Depreciation | (830,268 | ) | $ | — | $ | — | $ | (830,268 | ) | |||||||||
|
|
|
|
|
|
|
| |||||||||||
| International Equity Fund | Investments in Securities† | |||||||||||||||||
Common Stock | $ | 1,259,831,671 | $ | — | $ | — | $ | 1,259,831,671 | ||||||||||
Preferred Stock | 2,259,302 | — | — | 2,259,302 | ||||||||||||||
Short-Term Investments | 37,712,664 | — | — | 37,712,664 | ||||||||||||||
|
|
|
|
|
|
|
| |||||||||||
| Total Investments in Securities | $ | 1,299,803,637 | $ | — | $ | — | $ | 1,299,803,637 | ||||||||||
|
|
|
|
|
|
|
| |||||||||||
| Other Financial Instruments* | ||||||||||||||||||
Long Futures Contracts — Unrealized Depreciation | $ | (310,059 | ) | $ | — | $ | — | $ | (310,059 | ) | ||||||||
|
|
|
|
|
|
|
| |||||||||||
| Strategic Investment Fund | Investments in Securities† | |||||||||||||||||
Domestic Equity | $ | 238,790,348 | $ | — | $ | — | $ | 238,790,348 | ||||||||||
Foreign Equity | 160,674,650 | — | — | 160,674,650 | ||||||||||||||
U.S. Treasuries | — | 44,603,032 | — | 44,603,032 | ||||||||||||||
Agency Mortgage Backed | — | 66,186,979 | — | 66,186,979 | ||||||||||||||
Agency Collateralized Mortgage Obligations | — | 501,873 | — | 501,873 | ||||||||||||||
Asset Backed | — | 100,039 | — | 100,039 | ||||||||||||||
Corporate Notes | — | 105,425,861 | — | 105,425,861 | ||||||||||||||
Non-Agency Collateralized Mortgage Obligations | — | 21,669,253 | — | 21,669,253 | ||||||||||||||
Sovereign Bonds | — | 2,926,596 | — | 2,926,596 | ||||||||||||||
Municipal Bonds and Notes | — | 1,622,706 | — | 1,622,706 | ||||||||||||||
FNMA (TBA) | — | — | 3,527 | 3,527 | ||||||||||||||
Exchange Traded Funds | 27,163,983 | — | — | 27,163,983 | ||||||||||||||
Short-Term Investments | 102,285,749 | — | — | 102,285,749 | ||||||||||||||
|
|
|
|
|
|
|
| |||||||||||
| Total Investments in Securities | $ | 528,914,730 | $ | 243,036,339 | $ | 3,527 | $ | 771,954,596 | ||||||||||
|
|
|
|
|
|
|
| |||||||||||
112
Table of Contents
| Notes to Financial Statements | September 30, 2015 |
| Fund | Investments | Level 1 | Level 2 | Level 3 | Total | |||||||||||||
| Other Financial Instruments* | ||||||||||||||||||
Credit Default Swap Contracts — Unrealized Depreciation | $ | (200,775 | ) | $ | — | $ | — | $ | (200,775 | ) | ||||||||
Long Futures Contracts — Unrealized Appreciation | 27,642 | — | — | 27,642 | ||||||||||||||
Long Futures Contracts — Unrealized Depreciation | (663,969 | ) | — | — | (663,969 | ) | ||||||||||||
Short Futures Contracts — Unrealized Appreciation | 478,864 | — | — | 478,864 | ||||||||||||||
Short Futures Contracts — Unrealized Depreciation | (249,192 | ) | — | — | (249,192 | ) | ||||||||||||
|
|
|
|
|
|
|
| |||||||||||
| Total Other Financial Instruments | $ | (607,430 | ) | $ | — | $ | — | $ | (607,430 | ) | ||||||||
|
|
|
|
|
|
|
| |||||||||||
| Income Fund | Investments in Securities† | |||||||||||||||||
U.S. Treasuries | $ | — | $ | 51,798,884 | $ | — | $ | 51,798,884 | ||||||||||
Agency Mortgage Backed | — | 74,900,145 | — | 74,900,145 | ||||||||||||||
Agency Collateralized Mortgage Obligations | — | 816,620 | — | 816,620 | ||||||||||||||
Asset Backed | — | 453,345 | — | 453,345 | ||||||||||||||
Corporate Notes | — | 122,636,496 | — | 122,636,496 | ||||||||||||||
Non-Agency Collateralized Mortgage Obligations | — | 29,236,380 | — | 29,236,380 | ||||||||||||||
Sovereign Bonds | — | 3,262,571 | — | 3,262,571 | ||||||||||||||
Municipal Bonds and Notes | — | 2,554,532 | — | 2,554,532 | ||||||||||||||
FNMA (TBA) | — | — | 11,914 | 11,914 | ||||||||||||||
Preferred Stock | 332,622 | — | — | 332,622 | ||||||||||||||
Short-Term Investments | 18,496,948 | — | — | 18,496,948 | ||||||||||||||
|
|
|
|
|
|
|
| |||||||||||
| Total Investments in Securities | $ | 18,829,570 | $ | 285,658,973 | $ | 11,914 | $ | 304,500,457 | ||||||||||
|
|
|
|
|
|
|
| |||||||||||
| Other Financial Instruments* | ||||||||||||||||||
Credit Default Swap Contracts — Unrealized Depreciation | $ | (237,244 | ) | $ | — | $ | — | $ | (237,244 | ) | ||||||||
Long Futures Contracts — Unrealized Appreciation | 57,550 | — | — | 57,550 | ||||||||||||||
Long Futures Contracts — Unrealized Depreciation | (878 | ) | — | — | (878 | ) | ||||||||||||
Short Futures Contracts — Unrealized Depreciation | (411,829 | ) | — | — | (411,829 | ) | ||||||||||||
|
|
|
|
|
|
|
| |||||||||||
| Total Other Financial Instruments | $ | (592,401 | ) | $ | — | $ | — | $ | (592,401 | ) | ||||||||
|
|
|
|
|
|
|
| |||||||||||
| † | See Schedule of Investments for Industry Classification. |
| * | Other financial instruments include derivative instruments such as futures contracts and credit default swaps. Amounts shown represent unrealized appreciation (depreciation), at period end. |
The International Equity Fund and Strategic Investment Fund utilized the fair value pricing service on September 30, 2014 due to events occurring after the close of foreign local markets and before the close of regular trading on the NYSE. This resulted in certain foreign securities being classified as Level 2 at the beginning of the period which were classified as Level 1 at September 30, 2015. The value of securities that were transferred to Level 1 from Level 2 as a result was $1,553,081,815 and $150,771,502 for the International
Equity Fund and Strategic Investment Fund, respectively. Other transfers between fair value levels during the period were insignificant in relation to net assets. Transfers between fair value levels are considered to occur at the beginning of the period.
Level 3 investments at the beginning and/or end of the period in relation to net assets were not significant and, accordingly, a reconciliation of Level 3 assets for the year ended September 30, 2015 is not presented.
113
Table of Contents
| Notes to Financial Statements | September 30, 2015 |
| 4. | Derivatives Disclosure |
Shown below are the derivative contracts entered into by each Fund, summarized by primary risk exposure as they appear on the Statements of Assets and Liabilities, none of which are accounted for as hedging instruments under FASB ASC No. 815 Derivatives and Hedging (“ASC 815”) as of September 30, 2015.
Asset Derivatives September 30, 2015 | Liability Derivatives September 30, 2015 | |||||||||||
Derivatives not accounted for as hedging instruments under ASC 815 | Location in the Statements of Assets and Liabilities | Fair Value ($) | Location in the Statements of Assets and Liabilities | Fair Value ($) | ||||||||
| U.S. Equity Fund | ||||||||||||
Equity Contracts | Assets, Net Assets — Net Unrealized Appreciation/ (Depreciation) on Futures | — | Liabilities, Net Assets — Net Unrealized Appreciation/ (Depreciation) on Futures | (201,251 | )* | |||||||
| S&P 500 Index Fund | ||||||||||||
Equity Contracts | Assets, Net Assets — Net Unrealized Appreciation/ (Depreciation) on Futures | — | Liabilities, Net Assets — Net Unrealized Appreciation/ (Depreciation) on Futures | (46,443 | )* | |||||||
| U.S. Large-Cap Core Equity Fund | ||||||||||||
Equity Contracts | Assets, Net Assets — Net Unrealized Appreciation/ (Depreciation) on Futures | 5,446 | * | Liabilities, Net Assets — Net Unrealized Appreciation/ (Depreciation) on Futures | — | |||||||
| Premier Growth Equity Fund | ||||||||||||
Equity Contracts | Assets, Net Assets — Net Unrealized Appreciation/ (Depreciation) on Futures | 64,390 | * | Liabilities, Net Assets — Net Unrealized Appreciation/ (Depreciation) on Futures | — | |||||||
| Small-Cap Equity Fund | ||||||||||||
Equity Contracts | Assets, Net Assets — Net Unrealized Appreciation/ (Depreciation) on Futures | — | Liabilities, Net Assets — Net Unrealized Appreciation/ (Depreciation) on Futures | (830,268 | )* | |||||||
| International Equity Fund | ||||||||||||
Equity Contracts | Assets, Net Assets — Net Unrealized Appreciation/ (Depreciation) on Futures | — | Liabilities, Net Assets — Net Unrealized Appreciation/ (Depreciation) on Futures | (310,059 | )* | |||||||
| Strategic Investment Fund | ||||||||||||
Equity Contracts | Assets, Net Assets — Net Unrealized Appreciation/ (Depreciation) on Futures | 480,096 | * | Liabilities, Net Assets — Net Unrealized Appreciation/ (Depreciation) on Futures | (663,969 | )* | ||||||
Interest Rate Contracts | Assets, Net Assets — Net Unrealized Appreciation/ (Depreciation) on Futures | 26,410 | * | Liabilities, Net Assets — Net Unrealized Appreciation/ (Depreciation) on Futures | (249,192 | )* | ||||||
Credit Risk Contracts | Assets, Net Assets — Net Unrealized Appreciation/ (Depreciation) on Credit Default Swaps | — | Liabilities, Net Assets — Net Unrealized Appreciation/ (Depreciation) on Credit Default Swaps | (200,775 | )* | |||||||
| Income Fund | ||||||||||||
Interest Rate Contracts | Assets, Net Assets — Net Unrealized Appreciation/ (Depreciation) on Futures | 57,550 | * | Liabilities, Net Assets — Net Unrealized Appreciation/ (Depreciation) on Futures | (412,707 | )* | ||||||
Credit Risk Contracts | Assets, Net Assets — Net Unrealized Appreciation/ (Depreciation) on Credit Default Swaps | — | Liabilities, Net Assets — Net Unrealized Appreciation/ (Depreciation) on Credit Default Swaps | (237,244 | )* | |||||||
| * | Includes cumulative unrealized appreciation/(depreciation) of futures and credit default swap contracts as reported in the Schedule of Investments and within the components of the net assets section of the Statement of Assets and Liabilities. Only the current day’s variation margin is reported within the Assets and/or Liabilities section on the Statement of Assets and Liabilities. |
114
Table of Contents
| Notes to Financial Statements | September 30, 2015 |
Shown below are the effects of derivative instruments on each Fund’s Statements of Operation, summarized by primary risk exposure, none of which are accounted for as hedging instruments under ASC 815.
Derivatives not accounted for as hedging instruments under ASC 815 | Location in the Statements of Operations | Total Notional Amount of | Realized Gain (Loss) on Derivatives Recognized in Income($) | Change in Unrealized Recognized in Income($) | ||||||||
Realized Gain/(Loss) | Unrealized Gain/(Loss) | |||||||||||
| U.S. Equity Fund | ||||||||||||
Equity Contracts | Realized gain (loss) on Futures, Increase (decrease) in unrealized appreciation/(depreciation) on Futures | 115,400,718/ (100,119,116) | (1,018,057 | ) | (241,113 | ) | ||||||
| S&P 500 Index Fund | ||||||||||||
Equity Contracts | Realized gain (loss) on Futures, Increase (decrease) in unrealized appreciation/(depreciation) on Futures | 7,793,313/ (8,189,749) | 94,723 | (36,185 | ) | |||||||
| U.S. Large-Cap Core Equity Fund | ||||||||||||
Equity Contracts | Realized gain (loss) on Futures, Increase (decrease) in unrealized appreciation/(depreciation) on Futures | 17,486,493/ (20,210,413) | 200,069 | 27,147 | ||||||||
| Premier Growth Equity Fund | ||||||||||||
Equity Contracts | Realized gain (loss) on Futures, Increase (decrease) in unrealized appreciation/(depreciation) on Futures | 70,653,037/ (79,406,714) | 577,871 | 98,134 | ||||||||
| Small-Cap Equity Fund | ||||||||||||
Equity Contracts | Realized gain (loss) on Futures, Increase (decrease) in unrealized appreciation/(depreciation) on Futures | 217,815,101/ (223,424,455) | (56,941 | ) | (51,580 | ) | ||||||
| International Equity Fund | ||||||||||||
Equity Contracts | Realized gain (loss) on Futures, Increase (decrease) in unrealized appreciation/(depreciation) on Futures | 578,295,054/ (533,701,545) | (998,155 | ) | (284,230 | ) | ||||||
| Strategic Investment Fund | ||||||||||||
Equity Contracts | Realized gain (loss) on Futures, Increase (decrease) in unrealized appreciation/(depreciation) on Futures | 193,180,877/ (216,394,450) | 127,834 | 707,868 | ||||||||
Interest Rate Contracts | Realized gain/(loss) on futures, Increase/(decrease) in unrealized appreciation/(depreciation) on Futures | 910,294,886/ (909,905,438) | (278,675 | ) | (199,054 | ) | ||||||
Credit Risk Contracts | Realized gain/(loss) on credit default swaps Increase/(decrease) in unrealized appreciation/(depreciation) on credit default swaps | —/— | 80,693 | (200,775 | ) | |||||||
| Income Fund | ||||||||||||
Interest Rate Contracts | Realized gain/(loss) on futures, Increase/(decrease) in unrealized appreciation/(depreciation) on Futures | 1,177,741,314/ (1,173,281,535) | (650,120 | ) | (253,514 | ) | ||||||
Credit Risk Contracts | Realized gain/(loss) on credit default swaps Increase/(decrease) in unrealized appreciation/(depreciation) on credit default swaps | —/— | 95,710 | (237,244 | ) | |||||||
115
Table of Contents
| Notes to Financial Statements | September 30, 2015 |
During the year ended September 30, 2015, the Funds had an average notional value of long and short futures contracts as shown below. The Strategic Investment Fund and Income Fund had average notional values of $5,837,667 and $6,911,167 on credit default swaps, respectively. Please refer to the table following the Portfolio of Investments for open credit default swaps and futures contracts at September 30, 2015.
| Fund | Long Contracts | Short Contracts | ||||||
U.S. Equity Fund | $ | 10,113,942 | $ | (3,067,911 | ) | |||
S&P 500 Index Fund | 1,364,921 | — | ||||||
U.S. Large-Cap Core Equity Fund | 1,705,302 | — | ||||||
Premier Growth Equity Fund | 5,959,998 | (2,987,940 | ) | |||||
Small-Cap Equity Fund | 17,121,552 | — | ||||||
International Equity Fund | 25,689,237 | (10,782,045 | ) | |||||
Strategic Investment Fund | 47,515,598 | (36,478,119 | ) | |||||
Income Fund | 30,764,448 | (46,459,165 | ) | |||||
| 5. | Line of Credit |
The Trust (excluding the S&P 500 Index Fund) shares a revolving credit facility of up to $150 million with a number of its affiliates. The credit facility is with the Trust’s custodian bank, State Street Bank and Trust Company (“State Street”). The revolving credit facility requires the payment of a commitment fee equal to 0.125% (became 0.20% effective October 28, 2015) per annum on the daily unused portion of the credit facility, payable quarterly by GEAM and included in the “unitary fee” paid by the Funds. In addition, the Trust has a $100 million uncommitted,
unsecured line of credit with State Street (the uncommitted, unsecured line of credit expired effective October 28, 2015).
Generally, borrowings under the credit facilities would accrue interest at the higher of the Overnight LIBOR plus 1.25% and the Overnight Federal Funds Rate plus 1.25% and would be borne by the borrowing Fund. The maximum borrowing allowed by any one Fund is the lesser of (i) 33.33% of the Fund’s total assets or (ii) 20% of its net assets. The credit facilities were not utilized by the Trust during the year ended September 30, 2015.
| 6. | Fees and Compensation Paid to Affiliates |
The advisory and administration fees paid to GEAM (“Management Fee”), a wholly-owned subsidiary of General Electric Company, for investment advisory and administrative services is paid monthly based on the average daily net assets of each Fund. The Management Fee is stated in the following schedule:
| Fund | Average Daily Net Assets of Fund | Management Fee | ||
U.S. Equity Fund | First $25 million | 0.55% | ||
U.S. Large-Cap Core Equity Fund | Next $25 million | 0.45% | ||
Premier Growth Equity Fund | Over $50 million | 0.35% | ||
S&P 500 Index Fund | All assets | 0.15% | ||
Small-Cap Equity Fund | First $250 million | 0.95% | ||
| Next $250 million | 0.90% | |||
| Over $500 million | 0.85% | |||
International Equity Fund | First $25 million | 0.75% | ||
| Next $50 million | 0.65% | |||
| Over $75 million | 0.55% | |||
Strategic Investment Fund | First $25 million | 0.45% | ||
| Next $25 million | 0.40% | |||
| Over $50 million | 0.35% | |||
Income Fund | First $25 million | 0.35% | ||
| Next $25 million | 0.30% | |||
| Next $50 million | 0.25% | |||
| Over $100 million | 0.20% |
116
Table of Contents
| Notes to Financial Statements | September 30, 2015 |
Distribution and Shareholder Servicing Fees The Funds have adopted a Shareholder Servicing and Distribution Plan (the “Plan”) pursuant to Rule 12b-1 under the 1940 Act with respect to the Service Class shares of each Fund. Each Fund pays GE Investment Distributors, Inc. (“GEID”), a wholly-owned subsidiary of GEAM and the Funds’ principal underwriter, a monthly fee for distribution and/or shareholder services provided, at an annual rate of 0.25% of the average daily net assets of such Fund attributable to the Service Class shares. Currently, Investment Class shares are not subject to a 12b-1 fee.
Trustee Compensation The Funds pay no compensation to their Trustees who are officers or employees of GEAM or its affiliates. Trustees who are not such officers or employees also serve in a similar capacity for other funds advised by GEAM. Compensation paid to unaffiliated Trustees is reflected on the Statements of Operations. These fees are allocated pro rata across funds and share classes served by the Trustees and are based upon the relative net assets of each fund. (For additional information about Trustees compensation please refer to the Funds’ Statement of Additional Information).
| 7. | Sub-Advisory Fees |
For certain funds that have retained sub-advisers to manage all or a portion of the respective Fund’s assets, GEAM pays each sub-adviser an investment sub-advisory fee out of the Management Fee that it receives from the respective Fund. The investment sub-advisory fee is paid by GEAM monthly and is based upon the average daily net assets of the respective Fund’s assets that are allocated to and managed by the sub-adviser. Each such sub-adviser is responsible for the day-to-day management of those assets of the Fund that are allocated to the sub-adviser, including the responsibility for making decisions to buy, sell or hold a particular security with respect to those assets. For their services, GEAM pays an investment sub-advisory fee to each of Palisade Capital Management, L.L.C., Champlain Investment Partners, LLC, GlobeFlex Capital, L.P., SouthernSun Asset Management, LLC and Kennedy Capital Management, Inc., sub-advisers to the Small-Cap Equity Fund, and SSGA Funds Management, Inc., sub-adviser to the S&P 500 Index Fund.
| 8. | Investment Transactions |
Purchases and Sales of Securities The cost of purchases and the proceeds from sales of investments, other than short-term securities, for the year ended September 30, 2015, were as follows:
| U.S. Government Securities | Other Securities | |||||||||||||||
| Fund | Purchases | Sales | Purchases | Sales | ||||||||||||
U.S. Equity Fund | $ | — | $ | — | $ | 289,153,355 | $ | 496,496,839 | ||||||||
S&P 500 Index Fund | — | — | 2,206,658 | 14,110,459 | ||||||||||||
U.S. Large-Cap Core Equity Fund | — | — | 42,037,283 | 72,151,995 | ||||||||||||
Premier Growth Equity Fund | — | — | 114,137,608 | 81,200,215 | ||||||||||||
Small-Cap Equity Fund | — | — | 497,820,748 | 567,566,474 | ||||||||||||
International Equity Fund | — | — | 398,172,569 | 813,743,194 | ||||||||||||
Strategic Investment Fund | 760,683,343 | 794,445,763 | 285,350,126 | 288,390,311 | ||||||||||||
Income Fund | 776,848,103 | 834,682,960 | 129,432,706 | 104,517,228 | ||||||||||||
Redemptions In-Kind In accordance with guidelines described in a Fund’s prospectus, a Fund may distribute portfolio securities rather than cash as payment for a redemption of Fund shares (in-kind redemption). For financial reporting purposes, a Fund recognizes a gain on in-kind redemptions to the extent the value of the distributed securities on the date of redemption exceeds the cost of those securities. Gains and losses realized on in-kind redemptions are not recognized for tax purposes and are reclassified from undistributed realized gain (loss)
to paid-in capital. These reclassifications have no effect on net assets or NAV per share. The net realized in-kind gains or losses for the year ended September 30, 2015 are disclosed in a Fund’s Statement of Operations.
During the year ended September 30, 2015, the Premier Growth Equity Fund had a redemption in-kind that resulted in a redemption from the Fund of $117,759,692. The redemption was paid in securities and cash in the amounts of $111,190,306 and $6,569,386, respectively.
117
Table of Contents
| Notes to Financial Statements | September 30, 2015 |
Affiliated Investments Transactions with affiliated investments for the year ended September 30, 2015 were as follows:
S&P 500 Index Fund
| Security | Value, beginning of period | Cost of purchases | Proceeds from sales | Dividend/ Interest income | Realized gain (loss) | Value, end of period | ||||||||||||||||||
General Electric Co., Common Stock | $ | 550,881 | $ | 32,557 | $ | (193,430 | ) | $ | 15,345 | $ | 61,369 | $ | 386,698 | |||||||||||
| 9. | Income Taxes |
The Funds are subject to ASC 740, Income Taxes (“ASC 740”). ASC 740 provides guidance for financial accounting and reporting for the effects of income taxes that result from an entity’s activities during the year. ASC 740 also provides guidance regarding how uncertain tax positions should be recognized, measured, presented and disclosed in the financial statements. ASC 740 requires
evaluation of tax positions taken or expected to be taken in the course of preparing each Fund’s tax returns to determine whether the tax positions are “more likely than not” of being sustained by the applicable tax authority. There are no adjustments to any Fund’s net assets required under ASC 740. Each Fund’s 2011, 2012, 2013 and 2014 fiscal year tax returns are still open to examination by the Federal and applicable state tax authorities.
At September 30, 2015, information on the tax cost of investments and distributable earnings on a tax basis was as follows:
| Fund | Cost of for Tax Purposes | Gross Tax | Net Tax Appreciation/ (Depreciation) | Undistributed Accum. Capital | Qualified Late-Year Losses | |||||||||||||||||||||||||||
| Appreciation | Depreciation | Investments | Derivatives/ Currency | Undistributed Income | ||||||||||||||||||||||||||||
U.S. Equity Fund | $ | 566,171,504 | $ | 82,765,088 | $ | (34,686,267 | ) | $ | 48,078,821 | $ | (201,456 | ) | $ | 7,099,723 | $ | 92,030,008 | $ | (322 | ) | |||||||||||||
S&P 500 Index Fund | 21,985,572 | 5,875,739 | (983,533 | ) | 4,892,206 | (46,443 | ) | 413,632 | (13,961,074 | ) | — | |||||||||||||||||||||
U.S. Large-Cap Core Equity Fund | 60,139,301 | 6,989,239 | (5,164,201 | ) | 1,825,038 | 5,428 | 1,084,003 | (11,198,177 | ) | (49 | ) | |||||||||||||||||||||
Premier Growth Equity Fund | 288,672,490 | 61,423,238 | (9,104,837 | ) | 52,318,401 | 64,390 | 2,748,533 | 24,149,565 | — | |||||||||||||||||||||||
Small-Cap Equity Fund | 1,092,826,057 | 200,385,003 | (117,201,094 | ) | 83,183,909 | (830,268 | ) | 859,333 | 121,633,401 | (394,638 | ) | |||||||||||||||||||||
International Equity Fund | 1,350,323,552 | 111,462,058 | (161,981,973 | ) | (50,519,915 | ) | (413,047 | ) | 20,715,785 | (174,684,806 | ) | (8,576,981 | ) | |||||||||||||||||||
Strategic Investment Fund | 765,134,771 | 46,597,502 | (39,777,677 | ) | 6,819,825 | (615,838 | ) | 11,276,948 | 33,110,754 | (159,386 | ) | |||||||||||||||||||||
Income Fund | 305,876,555 | 4,007,223 | (5,383,321 | ) | (1,376,098 | ) | (592,401 | ) | 3,174,694 | — | (1,846,794 | ) | ||||||||||||||||||||
As of September 30, 2015, the following Funds have capital loss carryovers as indicated below. The capital loss carryover is available to offset future realized capital gains to the extent provided in the Internal Revenue Code and regulations thereunder. To the extent that these carryover losses are used to offset future capital gains, it is probable that the gains offset will not be distributed to shareholders.
| Fund | Short Term | Long Term | Expires | |||||||||
S&P 500 Index Fund | $ | 12,758,327 | $ | — | 9/30/2018 | |||||||
| 1,202,747 | — | 9/30/2019 | ||||||||||
International Equity Fund | 34,429,113 | — | 9/30/2018 | |||||||||
| 140,255,693 | — | 9/30/2019 | ||||||||||
These amounts will be available to offset future taxable capital gains. Under the Regulated Investment Company Modernization Act of 2010, a Fund is permitted to carry forward capital losses incurred in taxable years beginning after December 22, 2010 for an unlimited period. However, any losses incurred during those future years will be required to be utilized prior to the losses incurred in pre-enactment tax years. As a result of this ordering rule, pre-enactment capital loss carryforwards may be more likely to expire unused. Additionally, post-enactment capital losses that are carried forward will retain their character as either short-term or long-term capital losses rather than being considered all short-term as under previous law.
118
Table of Contents
| Notes to Financial Statements | September 30, 2015 |
Fund capital loss carryovers were utilized as follows:
| Fund | Amount | |||
S&P 500 Index Fund | $ | 6,252,474 | ||
International Equity Fund | 122,618,768 | |||
Any qualified late-year loss is deemed to arise on the first day of a Fund’s next tax year (if the Fund elects to defer such loss). Under this regime, generally, a Fund can elect to defer any post-October capital loss and/or any late-year ordinary loss as defined by the Internal Revenue Code.
The following Funds elected to defer qualified late-year losses for the year ended September 30, 2015 as follows:
| Fund | Capital | Ordinary | ||||||
U.S. Equity Fund | $ | — | $ | (322 | ) | |||
S&P 500 Index Fund | — | — | ||||||
U.S. Large-Cap Core Equity Fund | — | (49 | ) | |||||
Premier Growth Equity Fund | — | — | ||||||
Small-Cap Equity Fund | (394,638 | ) | — | |||||
International Equity Fund | (7,334,371 | ) | (1,242,610 | ) | ||||
Strategic Investment Fund | — | (159,386 | ) | |||||
Income Fund | (1,846,794 | ) | — | |||||
Distributions to Shareholders The Income Fund declares net investment income dividends daily and pays them monthly. All other Funds declare and pay dividends from net investment income, if any, annually. All Funds declare and pay distributions annually from net realized capital gains in excess of capital loss carryforwards, if any. The character of income and gains to be distributed is determined in accordance with income tax regulations which may differ from GAAP. These differences include (but are not limited to) gains and losses on foreign currency, foreign taxes payable, investments in futures, investments in swap contracts, investments in passive foreign investment companies, losses deferred to offsetting positions, losses deferred due to wash sale transactions, investments in underlying securities and redemptions in kind.
The tax character of distributions paid during the years ended September 30, 2015 and September 30, 2014 is as follows:
| September 30, 2015 | September 30, 2014 | |||||||||||||||
| Fund | Ordinary Income | Long Term Capital Gains | Ordinary Income | Long Term Capital Gains | ||||||||||||
U.S. Equity Fund | $ | 14,371,167 | $ | 88,684,050 | $ | 15,343,882 | $ | 35,383,526 | ||||||||
S&P 500 Index Fund | 660,014 | — | 750,000 | — | ||||||||||||
U.S. Large-Cap Core Equity Fund | 2,468,416 | 14,065,417 | 5,493,995 | 13,835,426 | ||||||||||||
Premier Growth Equity Fund | 4,234,095 | 35,777,908 | 3,289,862 | 10,133,896 | ||||||||||||
Small-Cap Equity Fund | 11,492,443 | 122,138,911 | 20,072,748 | 102,397,930 | ||||||||||||
International Equity Fund | 42,275,022 | — | 30,469,900 | — | ||||||||||||
Strategic Investment Fund | 22,748,238 | 58,732,061 | 15,207,126 | 27,849,379 | ||||||||||||
Income Fund | 8,246,345 | — | 9,026,757 | — | ||||||||||||
Reclassifications are made to a Fund’s capital accounts to reflect income and gains available for distribution (or available capital loss carryovers) under income tax regulations. These reclassifications have no impact on net investment income, realized gains or losses, or the NAV of any of the Funds. The calculation of net investment income per share in the Financial Highlights table excludes these adjustments.
The reclassifications for year ended September 30, 2015 are as follows:
| Fund | Undistributed Net Investment Income | Accumulated Net Realized Gain (Loss) | Unrealized Loss | Paid In Capital | ||||||||||||
U.S. Equity Fund | $ | (231,880 | ) | $ | 231,880 | $ | — | $ | — | |||||||
S&P 500 Index Fund | 13,588 | (13,588 | ) | — | — | |||||||||||
U.S. Large-Cap Core Equity Fund | (50,960 | ) | 50,960 | — | — | |||||||||||
Premier Growth Equity Fund | — | (52,622,633 | ) | — | 52,622,633 | |||||||||||
Small-Cap Equity Fund | (377,258 | ) | 437,547 | (60,289 | ) | — | ||||||||||
International Equity Fund | (1,221,241 | ) | 1,221,241 | — | — | |||||||||||
Strategic Investment Fund | (230,862 | ) | 230,862 | — | — | |||||||||||
Income Fund | 59,748 | (59,748 | ) | — | — | |||||||||||
119
Table of Contents
| Report of Independent Registered Public Accounting Firm |

The Board of Trustees and Shareholders
GE Institutional Funds:
We have audited the accompanying statements of assets and liabilities, including the schedules of investments, of the GE Institutional U.S. Equity Fund, GE Institutional S&P 500 Index Fund, GE Institutional U.S. Large-Cap Core Equity Fund, GE Institutional Premier Growth Equity Fund, GE Institutional Small-Cap Equity Fund, GE Institutional International Equity Fund, GE Institutional Strategic Investment Fund, and GE Institutional Income Fund, each a series of GE Institutional Funds (collectively, “the Funds”), as of September 30, 2015, and the related statements of operations for the year then ended, the statements of changes in net assets for each of the years in the two-year period then ended, and the financial highlights for each of the years in the five-year period then ended. These financial statements and financial highlights are the responsibility of the Funds’ management. Our responsibility is to express an opinion on these financial statements and financial highlights based on our audits.
We conducted our audits in accordance with the standards of the Public Company Accounting Oversight Board (United States). Those standards require that we plan and perform the audit to obtain reasonable assurance about whether the financial statements and financial highlights are free of material misstatement. An audit includes examining, on a test basis, evidence supporting the amounts and disclosures in the financial statements. Our procedures included confirmation of securities owned as of September 30, 2015, by correspondence with the custodian and brokers, or by other appropriate auditing procedures where replies from brokers were not received. An audit also includes assessing the accounting principles used and significant estimates made by management, as well as evaluating the overall financial statement presentation. We believe that our audits provide a reasonable basis for our opinion.
In our opinion, the financial statements and financial highlights referred to above present fairly, in all material respects, the financial position of the GE Institutional U.S. Equity Fund, GE Institutional S&P 500 Index Fund, GE Institutional U.S. Large-Cap Core Equity Fund, GE Institutional Premier Growth Equity Fund, GE Institutional Small-Cap Equity Fund, GE Institutional International Equity Fund, GE Institutional Strategic Investment Fund, and GE Institutional Income Fund as of September 30, 2015, the results of their operations for the year then ended, the changes in their net assets for each of the years in the two-year period then ended, and the financial highlights for each of the years in the five-year period then ended, in conformity with U.S. generally accepted accounting principles.

Boston, Massachusetts
November 20, 2015
120
Table of Contents
| Tax Information | (Unaudited) |
The following fund intends to make an election under Internal Revenue Code Section 853. The election will allow shareholders to treat their attributable share of foreign taxes paid by the Fund to be paid by them directly. For the fiscal year ended September 30, 2015, the total amount of income received by the Fund from sources within foreign countries and possessions of the United States and the total amount of taxes paid by the Fund follows:
| Fund | Total Foreign | Total Foreign Taxes Paid | ||||||||
International Equity Fund | $ | 33,580,878 | $ | 3,208,459 | ||||||
For the fiscal year ended September 30, 2015, certain dividends paid by the Funds may be subject to a maximum income tax rate of 20% as provided for by the American Taxpayer Relief Act of 2012. The following represent the amounts that may be considered qualified dividend income:
| Fund | QDI | ||||
U.S. Equity Fund | $ | 12,147,277 | |||
S&P 500 Index Fund | 622,878 | ||||
U.S. Large-Cap Core Equity Fund | 1,660,570 | ||||
Premier Growth Equity Fund | 4,706,936 | ||||
Small-Cap Equity Fund | 12,289,121 | ||||
International Equity Fund | 32,453,224 | ||||
Strategic Investment Fund | 8,968,047 | ||||
Income Fund | 19,077 | ||||
For corporate shareholders the following represent the percentages of respective fund distributions that may be eligible for the dividends received deduction:
| Fund | DRD | ||||
U.S. Equity Fund | 65.33% | ||||
S&P 500 Index Fund | 99.22% | ||||
U.S. Large-Cap Core Equity Fund | 62.38% | ||||
Premier Growth Equity Fund | 100.00% | ||||
Small-Cap Equity Fund | 88.19% | ||||
Strategic Investment Fund | 28.84% | ||||
Income Fund | 0.17% | ||||
For the year ended September 30, 2015, the following Funds hereby designate as capital gain dividends the amounts set forth, or the amount ultimately treated as capital gain net income:
| Fund | Gross Amount | ||||
U.S. Equity Fund | $ | 88,684,050 | |||
U.S. Large-Cap Core Equity Fund | 14,065,417 | ||||
Premier Growth Equity Fund | 35,777,908 | ||||
Small-Cap Equity Fund | 122,138,911 | ||||
Strategic Investment Fund | 58,732,061 | ||||
The amounts presented herein may differ from amounts presented elsewhere in the financial statements due to differences between tax and financial accounting principles. Please consult a tax advisor if you have any questions about Federal or State income tax laws or on how to prepare your tax returns. If you have specific questions about your Fund account, please consult your investment representative.
121
Table of Contents
| Additional Information | (Unaudited) |
Information about Directors and Executive Officers:
The business and affairs of the Funds are managed under the direction of the Funds’ Board of Trustees. Information pertaining to the Trustees and Officers of the Funds is set forth below.
Interested Trustees and Executive Officers
Jeanne M. La Porta
Address c/o GEAM 1600 Summer St. Stamford, CT 06905
Age 50
Position(s) Held with Fund Trustee and President
Term of Office and Length of Time Served Until successor is elected and qualified – 1 year
Principal Occupation(s) During Past 5 Years Senior Vice President and Commercial Operations Leader at GEAM since March 2014; President of GE Institutional Funds and GE Investments Funds, Inc. since April 2014; President and Trustee of GEAM’s UCITs Funds since March 2014; Senior Vice President and Commercial Administrative Officer at GEAM from April 2010 to March 2014; Vice President of GE Institutional Funds since July 2003; Vice President of Elfun Funds and GE Retirement Savings Plan Funds (formerly GE Savings & Security Funds) since October 2003; Secretary of GE Funds from July 2007 to September 2010 and Vice President from July 2007 to February 2011; Senior Vice President and Deputy General Counsel of GEAM from October 2007 to April 2010; Vice President and Assistant Secretary of Elfun Funds and GE Retirement Savings Plan Funds from July 2003 to June 2010; and Vice President and Associate General Counsel – Marketing and Client Services (formerly Asset Management Services) at GEAM from May 1997 to October 2007.
Number of Portfolios in Fund Complex Overseen by Trustee 24
Other Directorships Held by Trustee Director and President of GE Investments Funds, Inc. since 2014; Trustee of Elfun Funds, GE Retirement Savings Plan and General Electric Pension Trust since 2014; and Director of GE Investment Distributors, Inc. since June 2011.
Matthew J. Simpson
Address c/o GEAM 1600 Summer St. Stamford, CT 06905
Age 54
Position(s) Held with Fund Trustee and Executive Vice President
Term of Office and Length of Time Served Until successor is elected and qualified – 8 years
Principal Occupation(s) During Past 5 Years Executive Vice President, General Counsel and Secretary of GEAM since July 2007; Secretary of Elfun Funds and GE Retirement Savings Plan Funds (formerly GE Savings & Security Funds) since July 2007; Senior Vice President and General Counsel – Marketing and Client Services (formerly Asset Management Services) of GEAM and Senior Vice President and General Counsel of GE Asset Management Services from February 1997 to July 2007; Vice President and Associate General Counsel of GEAM from October 1992 to February 1997; Secretary of GE Institutional Funds and GE Investments Funds, Inc. from 1997 to July 2007 and Vice President from September 2003 to July 2007; Assistant Secretary of Elfun Funds and GE Retirement Savings Plan Funds from 1998 to July 2007 and Vice President from October 2003 to July 2007; and Secretary of GE Funds from 1993 to July 2007 and Vice President from September 2003 to July 2007.
Number of Portfolios in Fund Complex Overseen by Trustee 24
Other Directorships Held by Trustee Trustee of Elfun Funds, GE Retirement Savings Plan Funds and General Electric Pension Trust since July 2007; Director and Executive Vice President of GE Investments Funds, Inc. since July 2007; Director of GEAM since July 2007; Trustee and Executive Vice President of GE Funds from July 2007 to February 2011; and Director of GE Investment Distributors, Inc. since June 2011.
JoonWon Choe
Address c/o GEAM 1600 Summer St. Stamford, CT 06905
Age 46
Position(s) Held with Fund Vice President & Secretary
Term of Office and Length of Time Served Until successor is elected and qualified – 5 years
Principal Occupation(s) During Past 5 Years Senior Vice President and Deputy General Counsel of GEAM since March 2011; Vice President and Secretary of GE Investments Funds, Inc. since September 2010; Vice President and Assistant Secretary of Elfun Funds and GE Retirement Savings Plan Funds (formerly GE Savings & Security Funds) since September 2010; Senior Vice President and Associate General Counsel of GEAM from June 2010 to March 2011; Vice President and Associate General Counsel of GEAM from November 2005 to June 2010 and Vice President and Secretary of GE Funds from September 2010 to February 2011.
Number of Portfolios in Fund Complex Overseen by Officer N/A
Other Directorships Held by Officer N/A
Robert Herlihy
Address c/o GEAM 1600 Summer St. Stamford, CT 06905
Age 48
Position(s) Held with Fund Chief Compliance Officer
Term of Office and Length of Time Served Until successor is elected and qualified – 10 years
Principal Occupation(s) During Past 5 Years Chief Compliance Officer of GEAM, GE Investments Funds, Inc., Elfun Funds, and GE Retirement Savings Plan Funds (formerly GE Savings & Security Funds) since July 2005; Chief Compliance Officer of GE Funds from July 2005 to February 2011 and Manager of Fund Administration at GEAM from 2002 to 2005.
Number of Portfolios in Fund Complex Overseen by Officer N/A
Other Directorships Held by Officer N/A
Arthur A. Jensen
Address c/o GEAM 1600 Summer St. Stamford, CT 06905
Age 49
Position(s) Held with Fund Treasurer
Term of Office and Length of Time Served Until successor is elected and qualified – 4 years
Principal Occupation(s) During Past 5 Years Treasurer of GE Investments Funds, Inc., Elfun Funds and GE Retirement Savings Plan Funds (formerly GE Savings & Security Funds) since June 2011; Mutual Funds Controller of GEAM since April 2011; Senior Vice President at Citigroup from 2008 to 2010 and Vice President at JPMorgan from 2005 to 2008.
Number of Portfolios in Fund Complex Overseen by Officer N/A
Other Directorships Held by Officer N/A
122
Table of Contents
| Additional Information | (Unaudited) |
Non-Interested Trustees
John R. Costantino
Address c/o GEAM 1600 Summer St. Stamford, CT 06905
Age 69
Position(s) Held with Fund Chairman of the Board
Term of Office and Length of Time Served Until successor is elected and qualified – 18 years
Principal Occupation(s) During Past 5 Years General Partner, NGN Capital LLC since 2006; and Managing Director, Vice President of Walden Capital Management since 1996.
Number of Portfolios in Fund Complex Overseen by Trustee 16
Other Directorships Held by Trustee Director of GE Investments Funds, Inc. since 1997; Trustee of Fordham University from 1989 to 1995 and from 2001 to 2007 and Trustee Emeritus since 2007; Trustee of NeuroScience Research Institute since 1986; Trustee of GE Funds from 1993 to February 2011; Director of Artes Medical from 2006 to 2008 and Trustee of Gregorian University Foundation from 1992 to 2007.
R. Sheldon Johnson
Address c/o GEAM 1600 Summer St. Stamford, CT 06905
Age 69
Position(s) Held with Fund Trustee
Term of Office and Length of Time Served Until successor is elected and qualified – 4 years
Principal Occupation(s) During Past 5 Years Retired, 2006 to present; Head of Global Institutional Equity Sales and Marketing at Morgan Stanley & Co., Inc. from 2002 to 2006 and Managing Director at Morgan Stanley & Co., Inc. from 1988 to 2006.
Number of Portfolios in Fund Complex Overseen by Trustee 16
Other Directorships Held by Trustee Director of GE Investments Funds, Inc. since April 2011 and Trustee of St. Lawrence University since 2003.
Donna M. Rapaccioli
Address c/o GEAM 1600 Summer St. Stamford, CT 06905
Age 52
Position(s) Held with Fund Trustee
Term of Office and Length of Time Served Until successor is elected and qualified – 3 years
Principal Occupation(s) During Past 5 Years Dean of the Gabelli School of Business since 2007 and Accounting Professor since 1987 at Fordham University.
Number of Portfolios in Fund Complex Overseen by Officer 16
Other Directorships Held by Officer Director of GE Investments Funds, Inc. since January 2012 and Trustee of Emmanuel College since 2010.
The Statement of Additional Information for the Funds includes additional information about the Trustees and Officers and is available, without charge, upon request by calling 1-800-242-0134.
123
Table of Contents
| Investment Team | (Unaudited) |
Portfolio Manager Biographies
The following sets forth biographical information for those individuals who are primarily responsible for managing the specified Fund’s investments. The portfolio managers may change from time to time.
David B. Carlson is Chief Investment Officer – U.S. Equities at GE Asset Management. He manages the overall U.S. equity investments for GE Asset Management. Mr. Carlson has served as the portfolio manager for the Premier Growth Equity Fund since the Fund’s commencement and as a portfolio manager for the U.S. Equity Fund since May 2011. Mr. Carlson joined GE Asset Management in 1982 as a securities analyst for investment operations. He became a Vice President for Mutual Fund Portfolios in 1987, a Senior Vice President in 1989 and an Executive Vice President in 2003.
Mike Cervi is a Senior Vice President of GE Asset Management and is a Managing Director of Portfolio Construction within GE Asset Management’s Investment Solutions team. He has been a member of the portfolio management team for the Small-Cap Equity Fund since May 2013. Mr. Cervi focuses on portfolio construction and manager research for a number of GE Asset Management’s portfolios including responsibility for defined benefit, defined contribution and sub-advised mutual funds accounts. Prior to his current position, Mr. Cervi led investment oversight of GE Asset Management’s multi-asset class client relationships. Mr. Cervi joined GE Asset Management in 2000 and has held several other roles within GE Asset Management including Shareholder Services Representative from 2000 to 2001, Institutional Marketing Analyst from 2001 to 2003, Director, Product Management – U.S. Equities from 2003 to 2005, Product Portfolio Manager – U.S. Equities from 2005 to 2006, Vice President, Manager of Investment Relationships from 2006 to 2009 and Managing Director, Total Plan Management from 2009 to 2013. He became a Senior Vice President in 2009 and has served as the Managing Director of Portfolio Construction since April 2013.
Stephen V. Gelhaus is a Senior Vice President of GE Asset Management. He has been a member of the portfolio management teams for the U.S. Equity Fund and the U.S. Large-Cap Core Equity Fund since January 2002. Mr. Gelhaus joined GE Asset Management in June 1991
and was a research analyst in the U.S. Equities group from 1995 through 2001 and became an associate portfolio manager for the U.S. Large-Cap Core Equity Fund in August 1999.
William M. Healey is a Senior Vice President and Chief Investment Officer – Core Fixed Income Investments of GE Asset Management. He has served on the portfolio management team for the Income Fund since September 1997. Mr. Healey joined GE Asset Management in April 1996 as a portfolio manager, became Vice President in June 2001, Senior Vice President in January 2007 and Chief Investment Officer – Core Fixed Income Investments in April 2012. Prior to joining GE Asset Management, Mr. Healey spent over 10 years in the fixed income group at MetLife.
Mark H. Johnson is a Senior Vice President and Chief Investment Officer – Long Duration Fixed Income & Insurance Investments of GE Asset Management. He has been a member of the portfolio management team for the Income Fund since 2007. Mr. Johnson joined GE in 1998 and GE Asset Management as a Vice President and portfolio manager in 2002. He became Senior Vice President in 2007 and Chief Investment Officer – Long Duration Fixed Income & Insurance Investments in April 2012. Prior to joining GE Asset Management, Mr. Johnson held positions at various insurance companies and public accounting firms.
Ralph R. Layman is an Executive Vice President; Chief Investment Officer Emeritus – Public Equities and a Director of GE Asset Management. Mr. Layman has led the team of portfolio managers for the International Equity Fund since the Fund’s commencement. Mr. Layman joined GE Asset Management in 1991 as Senior Vice President for International Investments, became an Executive Vice President in 1992, served as President – International Equities from March 2007 to July 2009, President and Chief Investment Officer – Public Equities from July 2009 to March 2012, and has served as Chief Investment Officer Emeritus – Public Equities since March 2012.
Jeffrey Palma is a Senior Vice President and Chief Market Strategist of GE Asset Management and is a portfolio manager for Strategic Investment Fund. He has been a member of the portfolio management team for the
124
Table of Contents
| Investment Team | (Unaudited) |
Portfolio Manager Biographies (continued)
Strategic Investment Fund since May 2013. Prior to joining GE Asset Management since 2012, Mr. Palma worked for UBS Investment Bank where he held a variety of global research and macro strategy roles supporting UBS’ global equities and fixed income businesses including Managing Director, Head of Global Equity Strategy from 2007 to 2012, Executive Director, Global Asset Allocation Strategist from 2001 to 2007 and Director, U.S. Economist from 1999 to 2001.
Paul C. Reinhardt is a Senior Vice President of GE Asset Management. He has been a portfolio manager for the U.S. Equity Fund since January 2001 and for the U.S. Large-Cap Core Equity Fund since April 2002. Mr. Reinhardt joined GE Asset Management in 1982 as an equity analyst and has been a portfolio manager since 1987.
Michael J. Solecki is a Senior Vice President and Chief Investment Officer – International Equities of GE Asset Management. He has served as a portfolio manager for the International Equity Fund since August 1999. He joined GE Asset Management in 1990 as an international equity analyst. He became a Vice President for international equity portfolios in 1996, Senior Vice President in 2000, Co-Chief Investment Officer – International Equities in March 2009 and Chief Investment Officer – International Equities since March 2012.
David Wiederecht is the President and Chief Investment Officer – Investment Solutions and a Director of GE Asset Management. He has served as a portfolio manager for the Small-Cap Equity Fund since September 2010, and has served as portfolio manager for the Strategic Investment Fund since January 2011. Mr. Wiederecht joined GE Asset Management in 1988 and has held various positions at GE Asset Management including Vice President – Alternative Investments/Private Equity/Hedge Fund from 1998 to 2004, Managing Director – Alternative Investments from 2004 to 2008, and President and Chief Investment Officer – Investment Solutions since 2008.
Portfolio Manager Biographies (Sub-Advisers)
Karl A. Schneider, CAIA is a portfolio manager for the S&P 500 Index Fund. Mr. Schneider is a Vice President of SSgA FM and Head of U.S. Equity Strategies for the Global
Equity Beta Solutions Team (GEBS), where in addition to overseeing the management of the U.S. equity index strategies, he also serves as a portfolio manager for a number of the group’s passive equity portfolios. Previously within GEBS, he served as a portfolio manager and product specialist for synthetic beta strategies, including commodities, buy/write, and hedge fund replication. Mr. Schneider is also a member of the SSgA Derivatives Committee. Prior to joining GEBS, Mr. Schneider worked as a portfolio manager in SSgA’s Currency Management Group, managing both active currency selection and traditional passive hedging overlay portfolios. He joined State Street in 1996. Mr. Schneider holds a BS in Finance and Investments from Babson College and a MS in Finance from Boston College. He has earned the Chartered Alternative Investment Analyst designation and is a member of the CAIA Association.
John Tucker, CFA is a Portfolio Manager for the S&P 500 Index Fund. Mr. Tucker is a Senior Managing Director of SSgA FM and Co-Head of Passive Equity Strategies in North America for GEBS. He is responsible for overseeing the management of all equity index strategies and exchange traded funds managed in North America. He is a member of the Senior Leadership Team. Previously, Mr. Tucker was head of the Structured Products group in SSgA’s London office, where he was responsible for the management of all index strategies in the firm’s second largest investment center. He joined State Street in 1988. Mr. Tucker received a BA in Economics from Trinity College and a MS in Finance from Boston College. He has also earned the Chartered Financial Analyst designation and is a member of the Boston Security Analysts Society and the CFA Institute. In addition, Mr. Tucker is a member of The Russell Index Client Advisory Board and The S&P U.S. Index Advisory Panel.
Marc Shapiro is a portfolio manager for the Small-Cap Equity Fund. Mr. Shapiro joined Palisade in March 2004 and serves as the portfolio manager for Palisade’s Institutional Small Cap Core Equity portfolios. Mr. Shapiro became a senior portfolio manager in March 2012, has served as the strategy’s associate portfolio manager and as a Senior Vice President of Research for Palisade’s Small Cap Core Equity portfolio since October 2006, with
125
Table of Contents
| Investment Team | (Unaudited) |
Portfolio Manager Biographies (concluded)
lead research responsibility for a number of sectors, including Information Technology and Telecom Services. Prior to joining Palisade, Mr. Shapiro was a senior equity analyst at Awad Asset Management and a small cap analyst at Schroders. Mr. Shapiro received his M.S. in Finance from Drexel University and his B.S. in Finance from the College of New Jersey.
Dennison T. (“Dan”) Veru is a portfolio manager for the Small-Cap Equity Fund. Mr. Veru is Executive Vice President and Chief Investment Officer – Institutional, of Palisade. Since joining Palisade in March 2000, Mr. Veru has been a member of Palisade’s Investment Policy Committee and became a principal of Palisade in July 2004. Prior to joining Palisade, he was President and Director of Research of Awad Asset Management, a division of Raymond James Financial. Mr. Veru has been a frequent guest on CNBC, CNN, Fox and Bloomberg television. Prior to Awad, Mr. Veru worked with the Palisade team from 1984 through 1992. Mr. Veru graduated from Franklin & Marshall College.
Scott T. Brayman, CFA, is a portfolio manager for the Small-Cap Equity Fund. Mr. Brayman is a Managing Partner and Chief Investment Officer at Champlain and has more than 29 years of investment management experience. Mr. Brayman leads the investment team for both the small and mid-cap strategies at Champlain. Prior to joining Champlain in 2004, Mr. Brayman was a Senior Vice President and served as a portfolio manager at NL Capital Management, Inc. from 2003 to 2004, and served as a portfolio manager with Sentinel Advisers, Inc. from 1996 to 2004, where he was responsible for managing the small-cap and core mid-cap strategies. Mr. Brayman began his career as a credit analyst with the First National Bank of Maryland.
Robert J. Anslow, is a portfolio manager for the Small-Cap Equity Fund. Mr. Anslow is the Partner and Chief Investment Officer responsible for all portfolio management and research activities at GlobeFlex and has more than 31 years of investment management experience. Prior to co-founding GlobeFlex in 1994, Mr. Anslow was a Director of the Systematic and Global Portfolio Management/Research Group at Nicholas-Applegate Capital Management (“Nicholas-Applegate”) from 1986 to 1994, where he built the first systematic
process for international investing. Prior to Nicholas-Applegate, Mr. Anslow was responsible for systematic portfolio management and research processes at two major investment institutions: the California Public Employee’s Retirement System (CalPERS) and BayBanks Investment Management of Boston.
Michael W. Cook, CFA, is a portfolio manager for the Small-Cap Equity Fund. Mr. Cook is the Chief Executive Officer and Chief Investment Officer at SouthernSun responsible for all portfolio management activities for the firm and has more than 26 years of investment management experience. Prior to founding SouthernSun in 1989, Mr. Cook was a portfolio manager/analyst at Front Street Capital Management from 1986 to 1988, and was an account executive at Merrill Lynch from 1985 to 1986.
Frank Latuda, Jr., CFA, is a portfolio manager for the Small-Cap Equity Fund. Mr. Latuda is a Vice President, Director and Chief Investment Officer at Kennedy as well as portfolio manager of Kennedy’s Small Cap Value I, Mid Cap Value, All Cap Value and SMID Cap Value separately-managed portfolios. As Chief Investment Officer, Mr. Latuda also serves as Chairman of Kennedy’s Investment Policy Committee. Mr. Latuda joined Kennedy as an equity analyst in 1997 and served as Director of Research from 1998 until 2000. He has been portfolio manager since October 2000, when he took over the Small Cap Value I portfolio. Prior to joining Kennedy, he was an analyst with Burns, Pauli, Mahoney Company. Mr. Latuda earned a B.S. in Electrical Engineering from the University of Notre Dame, as well as an M.S. in Electrical Engineering and an M.B.A. from the University of Illinois.
126
Table of Contents
| Investment Team | (Unaudited) |
Investment Adviser and Administrator
GE Asset Management Incorporated
Trustees
John R. Costantino, Chairman
R. Sheldon Johnson
Jeanne M. La Porta
Donna M. Rapaccioli
Matthew J. Simpson
Secretary
JoonWon Choe
Assistant Secretary
Michelle Matzelle
Treasurer
Arthur A. Jensen
Assistant Treasurer
Ryan Hunter*
Distributor
GE Investment Distributors, Inc.
Member FINRA and SIPC
Custodian
State Street Bank & Trust Company
| (* | Effective November 2015, no longer with GE Asset Management, Inc.) |
At GE Asset Management, we’re dedicated to providing the investment options you’ll need to tailor your financial portfolio to every stage of your life. Each member of the GE Family of Funds is managed according to the same principles of integrity and quality that have guided GE over the past century, and have made it the world-class company that it is today. Each fund draws strength from a heritage of investment management experience that spans more than 80 years. Whether you’re creating a new investment portfolio or adding to an established one, the GE Family of Funds offers an array of professionally managed investment options that will help you meet a lifetime of financial needs.
127
Table of Contents
| GE Institutional Funds | (Unaudited) |
M O R N I N G S T A R R A T I N G S TM Through September 30, 2015
| FUND (CATEGORY) | NUMBER OF FUNDS IN CATEGORY | STAR RATING | ||||||||
| GE Institutional S&P 500 Index Fund, Investment Class (Large Blend) | ||||||||||
Overall Rating | 1,658 | ¶ ¶ ¶ ¶ | ||||||||
| 3-year | 1,517 | ¶ ¶ ¶ ¶ | ||||||||
| 5-year | 1,419 | ¶ ¶ ¶ ¶ | ||||||||
| 10-year | 1,201 | ¶ ¶ ¶ ¶ | ||||||||
| GE Institutional U.S. Large-Cap Core Equity Fund, Investment Class (Large Blend) | ||||||||||
Overall Rating | 1,658 | ¶ ¶ ¶ ¶ | ||||||||
| 3-year | 1,517 | ¶ ¶ ¶ | ||||||||
| 5-year | 1,419 | ¶ ¶ ¶ | ||||||||
| 10-year | 1,201 | ¶ ¶ ¶ ¶ | ||||||||
| GE Institutional U.S. Large-Cap Core Equity Fund, Service Class (Large Blend) | ||||||||||
Overall Rating | 1,658 | ¶ ¶ ¶ ¶ | ||||||||
| 3-year | 1,517 | ¶ ¶ ¶ ¶ | ||||||||
| 5-year | 1,419 | ¶ ¶ ¶ | ||||||||
| 10-year | 1,201 | ¶ ¶ ¶ ¶ | ||||||||
| GE Institutional Small-Cap Equity Fund, Investment Class (Small Blend) | ||||||||||
Overall Rating | 845 | ¶ ¶ ¶ ¶ | ||||||||
| 3-year | 740 | ¶ ¶ ¶ | ||||||||
| 5-year | 689 | ¶ ¶ ¶ ¶ | ||||||||
| 10-year | 561 | ¶ ¶ ¶ ¶ | ||||||||
| GE Institutional Small-Cap Equity Fund, Service Class (Small Blend) | ||||||||||
Overall Rating | 845 | ¶ ¶ ¶ | ||||||||
| 3-year | 740 | ¶ ¶ ¶ | ||||||||
| 5-year | 689 | ¶ ¶ ¶ ¶ | ||||||||
| 10-year | 561 | ¶ ¶ ¶ | ||||||||
Past performance is no guarantee of future results. ©2015 Morningstar, Inc. All Rights Reserved. The information contained herein: (1) is proprietary to Morningstar and/or its content providers; (2) may not be copied or distributed; and (3) is not warranted to be accurate, complete or timely. Neither Morningstar nor its content providers are responsible for any damages or losses arising from any use of this information. For each fund with at least a three-year history, Morningstar calculates a Morningstar Rating based on a Morningstar Risk-Adjusted Return measure that accounts for variation in a fund’s monthly performance (including the effects of sales charges, loads, and redemption fees), placing more emphasis on downward variations and rewarding consistent performance. The Overall Morningstar Rating for a fund is derived from a weighted average of the performance figures associated with its three-, five- and ten-year (if applicable) Morningstar Rating metrics. Ratings for other GE Institutional Funds or other classes of shares may be different. The top 10% of funds in each category receive 5 stars, the next 22.5% receive 4 stars, the next 35% receive 3 stars, the next 22.5% receive 2 stars and the bottom 10% receive 1 star. (Each share class is counted as a fraction of one fund within this scale and rated separately, which may cause slight variations in the distribution percentages.) The overall Morningstar RatingTM for a fund is derived from a weighted average of the performance figures associated with its three-, five- and 10-year (if applicable) Morningstar Rating metrics.
Before investing in a GE Institutional Fund, you should carefully consider the investment objectives, risks and charges and expenses of the Fund. For a free copy of a Fund’s prospectus and summary prospectus, which contain this and other information, please visit our website at www.geam.com or call 1-800-242-0134. Please read the Fund prospectus carefully before you invest.
GE Investment Distributors, Inc., Member FINRA/SIPC, is a wholly owned subsidiary of GE Asset Management Incorporated, the investment adviser of the GE Institutional Funds.
This does not constitute a part of the Funds’ Shareholder Report
Table of Contents
Investment Adviser
GE Asset Management Incorporated
1600 Summer Street
P.O. Box 7900
Stamford, CT 06904-7900
Distributor
GE Investment Distributors, Inc.
Member FINRA and SIPC
1600 Summer Street
Stamford, CT 06905-5125
or at
P.O. Box 7900
Stamford, CT 06904-7900
www.geam.com
The Funds file their complete schedules of portfolio holdings with the Securities and Exchange Commission for the first, second and third quarters of each fiscal year on Form N-Q. The Funds’ Forms N-Q, as well as a description of the policies and procedures that the Funds use to determine how to vote proxies (if any) relating to portfolio securities is available without charge (i) upon request, by calling 1-800-242-0134; (ii) on the Funds’ website at http://www.geam.com; and (iii) on the Commission’s website at http://www.sec.gov. The Funds’ Forms N-Q may be reviewed and copied at the Commission’s Public Reference Room in Washington, DC — information on the operation of the Public Reference Room may be obtained by calling 1-800-SEC-0330.
Information (if any) regarding how the Funds voted proxies relating to portfolio securities during the most recently disclosed 12-months period ended June 30 is available without charge (i) through the Funds’ website at http://www.geam.com; and (ii) on the Commission’s website at http://www.sec.gov.

GEIN-1 (9/15)
This does not constitute a part of the Funds’ Shareholder Report
Table of Contents
| Item 2. | Code of Ethics. |
The Registrant has adopted a code of ethics, as defined in Item 2 of Form N-CSR, applicable to its principal executive officer, principal financial officer, principal accounting officer or controller, or persons performing similar functions. A copy of this code of ethics is filed as an exhibit to this Form N-CSR and is included in the following link:
https://www.geam.com/ExternalWar/common/docs/pdf/Spirit_Letter.pdf
There have been no amendments to, nor any waivers granted from, a provision that relates to any element of the code of ethics definition set forth in paragraph (b) of Item 2 of Form N-CSR during the period covered by this report.
| Item 3. | Audit Committee Financial Expert. |
The Board of Trustees of the Registrant has determined that John R. Costantino and Donna M. Rapaccioli are designated as the audit committee financial experts for the Registrant; and further that it is the finding of the Board of Trustees that Mr. Costantino and Ms. Rapaccioli, the audit committee financial experts, qualify as being “independent” pursuant to paragraph (a)(2) of Item 3 to Form N-CSR.
| Item 4. | Principal Accountant Fees and Services. |
(a) AUDIT FEES. The aggregate fees billed for each of the last two fiscal years (the “Reporting Periods”) for professional services rendered by the Registrant’s principal accountant (the “Auditor”) for the audit of the Registrant’s annual financial statements, or services that are normally provided by the Auditor in connection with the statutory and regulatory filings or engagements for the Reporting Periods were $153,700 in 2014 and $156,700 in 2015.
(b) AUDIT RELATED FEES. There were no fees billed by the Auditor for assurance and related services that were related to the performance of the audit of the Registrant during the Reporting Periods.
(c) TAX FEES. There were no fees billed for professional services rendered by the Auditor for tax compliance, tax advice or tax planning for the Registrant during the Reporting Periods.
(d) ALL OTHER FEES. There were no fees billed for products and services provided by the Auditor, other than the services reported in paragraphs (a) through (c) of this Item for the Registrant during the Reporting Periods.
Table of Contents
(e)(1) AUDIT COMMITTEE PRE-APPROVAL POLICIES AND PROCEDURES. The Audit Committee of the GE Institutional Funds (the “Funds”) Board of Trustees is responsible for, among other things, the appointment, compensation and oversight of the work of the Funds’ Auditor. As part of this responsibility and to ensure that the Auditor’s independence is not impaired, the Audit Committee (1) pre-approves the audit and non-audit services provided to the Funds by the Auditor, and (2) all non-audit services provided to the Funds’ investment adviser and Covered Affiliates (as defined in the Audit Committee Charter) that provide ongoing services to the Funds if the services directly impact the Funds’ operations or financial reporting, in accordance with the Audit Committee Charter. The following excerpt from the Audit Committee Charter sets forth the pre-approval policies and procedures:
Pre-Approval of Audit Related Services and Permissible Non-Audit Services. The Audit Committee shall pre-approve both audit (including audit, review, and attest) services and permissible non-audit services provided to the Fund and, if the nature of the engagement relates directly to the operations and financial reporting of the Fund, permissible non-audit services provided to any Covered Affiliate.
The Audit Committee may determine to delegate the authority to grant pre-approvals to one or more Audit Committee members, each acting on behalf of the Audit Committee. In this event, the member of the Audit Committee so delegated shall report each delegated pre-approval to the Audit Committee at its next regularly scheduled meeting. The Audit Committee may also adopt and follow, in lieu of explicit pre-approval described above, written policies and procedures detailed as to the particular service, designed to safeguard the continued independence of the Auditor, consistent with the requirements of the Investment Company Act of 1940, as amended, and SEC regulations there under.
Notwithstanding the foregoing, the pre-approval requirement concerning permissible non-audit services provided to the Fund or any Covered Affiliate is waived if: (1) the aggregate amount of all such non-audit services provided constitutes no more than five percent (5%) of the total amount of revenues paid to the Auditor by the Fund and the Covered Affiliates during the fiscal year in which the services are provided that would have to be pre-approved by the Audit Committee, (2) the non-audit services were not recognized as non-audit services at the time of the engagement, and (3) such non-audit services are promptly brought to the attention of the Audit Committee and approved by the Audit Committee or one or more designated members of the Audit Committee prior to the completion of the audit.
(2) PERCENTAGE OF SERVICES DESCRIBED IN PARAGRAPHS (b) THROUGH (d) APPROVED BY AUDIT COMMITTEE. No fees were charged during the Reporting Periods for audit related, tax or other services as indicated in sections (b) through (d) of this Item.
(f) Not applicable.
(g) NON-AUDIT FEES. The aggregate non-audit fees billed by the Auditor for services rendered to the Registrant, and rendered to the Registrant’s investment adviser and any entity controlling, controlled by, or under common control with the Registrant’s adviser (“Service Affiliates”), for the Reporting Periods were $0 in 2014 and $0 in 2015.
(h) AUDITOR INDEPENDENCE. There were no non-audit services rendered to Service Affiliates during the Reporting Periods that were not pre-approved.
Table of Contents
| Item 5. | Audit Committee of Listed Registrants. |
Applicable only to Closed-End Management Investment Companies.
| Item 6. | Schedule of Investments. |
(a) Schedule of Investments is included as part of the Report to Shareholders filed under Item 1 of this Form N-CSR.
(b) Not applicable.
| Item 7. | Disclosure of Proxy Voting Policies and Procedures for Closed-End Management Investment Companies. |
Applicable only to Closed-End Management Investment Companies.
| Item 8. | Portfolio Managers of Closed-End Management Investment Companies. |
Applicable only to Closed-End Management Investment Companies.
| Item 9. | Purchases of Equity Securities by Closed-End Management Investment Company and Affiliated Purchasers. |
Applicable only to Closed-End Management Investment Companies.
| Item 10. | Submission of Matters to a Vote of Security Holders. |
During the reporting period, there have been no material changes to the procedures by which the shareholders may recommend nominees to the Registrant’s Board of Trustees.
| Item 11. | Controls and Procedures. |
(a) The Registrant’s principal executive officer and principal financial officer have concluded that the Registrant’s disclosure controls and procedures (as defined in Rule 30a-3(c) under the Investment Company Act of 1940, as amended (the “1940 Act”)), are effective as of a date within 90 days of the filing date of the report included in Item 1 of this Form N-CSR, based on the evaluation of these controls and procedures required by Rule 30a-3(b) under the 1940 Act and Rules 13a-15(b) or 15d-15(b) under the Securities Exchange Act of 1934, as amended.
(b) There were no changes in the Registrant’s internal control over financial reporting (as defined in Rule 30a-3(d) under the 1940 Act) that occurred during the Registrant’s second fiscal quarter of the period covered by this Form N-CSR that have materially affected, or are reasonably likely to materially affect, the Registrant’s internal control over financial reporting.
Table of Contents
| Item 12. | Exhibits. |
(a)(1) The Code of Ethics that applies to the Registrant’s principal executive officer and principal financial officer is attached hereto.
(a)(2) The certifications required by Rule 30a-2(a) under the 1940 Act and Section 302 of the Sarbanes-Oxley Act of 2002 are attached hereto.
(a)(3) Not applicable.
(b) The certifications by the Registrant’s principal executive officer and principal financial officer, as required by Rule 30a-2(b) under the 1940 Act and Section 906 of the Sarbanes-Oxley Act of 2002, are attached hereto.
Table of Contents
SIGNATURES
Pursuant to the requirements of the Securities Exchange Act of 1934 and the Investment Company Act of 1940, the Registrant has duly caused this report to be signed on its behalf by the undersigned, thereunto duly authorized.
GE Institutional Funds
By: | /s/ Jeanne M. La Porta | |
| Jeanne M. La Porta | ||
| President, GE Institutional Funds |
Date: November 20, 2015
Pursuant to the requirements of the Securities Exchange Act of 1934 and the Investment Company Act of 1940, this report has been signed below by the following persons on behalf of the Registrant and in the capacities and on the dates indicated.
By: | /s/ Jeanne M. La Porta | |
| Jeanne M. La Porta | ||
| President, GE Institutional Funds |
Date: November 20, 2015
By: | /s/ Arthur A. Jensen | |
| Arthur A. Jensen | ||
| Treasurer, GE Institutional Funds |
Date: November 20, 2015