UNITED STATES
SECURITIES AND EXCHANGE COMMISSION
Washington, D.C. 20549
FORM N-CSR
CERTIFIED SHAREHOLDER REPORT OF REGISTERED
MANAGEMENT INVESTMENT COMPANIES
Investment Company Act file number: 811-08257
STATE STREET INSTITUTIONAL FUNDS
(Exact name of registrant as specified in charter)
One Iron Street
Boston, Massachusetts 02210
(Address of principal executive offices)(Zip code)
Copy to:
Sean O’Malley, Esq. Senior Vice President and Deputy General Counsel c/o SSGA Funds Management, Inc. One Iron Street Boston, Massachusetts 02210 | Timothy W. Diggins, Esq. Ropes & Gray LLP Prudential Tower 800 Boylston Street Boston, Massachusetts 02199-3600 | |
| (Name and Address of Agent for Service) | ||
Registrant’s telephone number, including area code: 800-242-0134
Date of fiscal year end: September 30
Date of reporting period: September 30, 2021
Item 1. Shareholder Report.
(a) The Report to Shareholders is attached herewith.
| State Street Institutional Funds |
| State Street Institutional U.S. Equity Fund |
| State Street Institutional Premier Growth Equity Fund |
| State Street Institutional Small-Cap Equity Fund |
| State Street Institutional International Equity Fund |
| State Street Active Core Bond Fund |

| Page | |
| 1 | |
| Manager Reviews and Schedules of Investments | |
| 2 | |
| 10 | |
| 17 | |
| 29 | |
| 37 | |
| Financial Statements | |
| 61 | |
| 72 | |
| 74 | |
| 76 | |
| 78 | |
| 90 | |
| 91 |
| Notes to Performance | 1 |
| 2 | State Street Institutional U.S. Equity Fund |
| Sector Allocation |
| Portfolio Composition as a % of Fair Value of $572,549 (in thousands) as of September 30, 2021 (a)(b) |
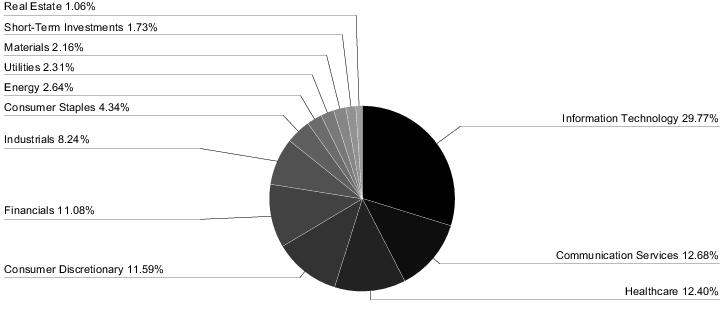
| Top Ten Largest Holdings | |
| as of September 30, 2021 (as a % of Fair Value) (a)(b) | |
| Microsoft Corp. | 6.15% |
| Apple Inc. | 4.87% |
| Amazon.com Inc. | 4.81% |
| Alphabet Inc., Class A | 3.70% |
| Visa Inc., Class A | 2.76% |
| Facebook Inc., Class A | 2.75% |
| JPMorgan Chase & Co. | 2.61% |
| UnitedHealth Group Inc. | 1.95% |
| Lowe's Companies Inc. | 1.76% |
| Alphabet Inc., Class C | 1.75% |
| (a) | Fair Value basis is inclusive of short-term investment in State Street Institutional U.S. Government Money Market Fund – Class G Shares. |
| (b) | The securities information regarding holdings, allocations and other characteristics is presented to illustrate examples of securities that the Fund has bought and the diversity of areas in which the Fund may invest as of a particular date. It may not be representative of the Fund’s current or future investments and should not be construed as a recommendation to purchase or sell a particular security. |
| State Street Institutional U.S. Equity Fund | 3 |
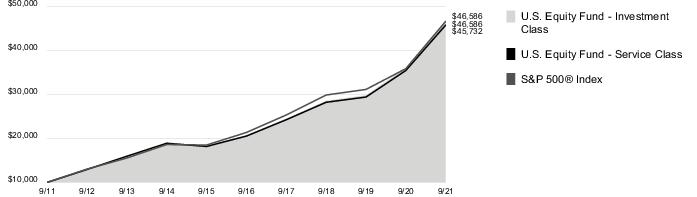
| Average Annual Total Return for the years ended September 30, 2021 | |||||||
| Investment Class Shares (Inception date: 11/25/97) | |||||||
| One Year | Five Year | Ten Year | Ending Value of a $10,000 Investment | ||||
| State Street Institutional U.S. Equity Fund | 29.41% | 17.64% | 16.63% | $46,586 | |||
| S&P 500® Index | 30.00% | 16.90% | 16.64% | $46,586 | |||
| Service Class Shares (Inception date: 1/3/01) | |||||||
| One Year | Five Year | Ten Year | Ending Value of a $10,000 Investment | ||||
| State Street Institutional U.S. Equity Fund | 29.10% | 17.38% | 16.42% | $45,732 | |||
| S&P 500® Index | 30.00% | 16.90% | 16.64% | $46,586 | |||
| 4 | State Street Institutional U.S. Equity Fund |
| Investment Class | Actual Fund Return | Hypothetical 5% Return (2.5% for the period) | ||
| Actual Fund Return | ||||
| Begining Account Value April 1, 2021 | $1,000.00 | $1,000.00 | ||
| Ending Account Value September 30, 2021 | $1,089.00 | $1,023.20 | ||
| Expenses Paid During Period* | $ 1.94 | $ 1.88 |
| * | Expenses are equal to the Fund's annualized expense ratio of 0.37% for Investment Class shares and 0.62% for Service Class shares (for the period April 1, 2021 - September 30, 2021), multiplied by the average account value over the period, multiplied by 183/365 (to reflect the one-half year period). |
| Service Class | Actual Fund Return | Hypothetical 5% Return (2.5% for the period) | ||
| Actual Fund Return | ||||
| Begining Account Value April 1, 2021 | $1,000.00 | $1,000.00 | ||
| Ending Account Value September 30, 2021 | $1,087.70 | $1,022.00 | ||
| Expenses Paid During Period* | $ 3.24 | $ 3.14 |
| * | Expenses are equal to the Fund's annualized expense ratio of 0.37% for Investment Class shares and 0.62% for Service Class shares (for the period April 1, 2021 - September 30, 2021), multiplied by the average account value over the period, multiplied by 183/365 (to reflect the one-half year period). |
| State Street Institutional U.S. Equity Fund | 5 |
| Number of Shares | Fair Value | |
| Common Stock - 98.3% † | ||
| Aerospace & Defense - 0.6% | ||
| Raytheon Technologies Corp. | 38,419 | $ 3,302,497 |
| Apparel Retail - 1.3% | ||
| Ross Stores Inc. | 68,403 | 7,445,667 |
| Application Software - 3.2% | ||
| Adobe Inc. (a) | 6,788 | 3,907,987 |
| Intuit Inc. | 2,445 | 1,319,102 |
| salesforce.com Inc. (a) | 32,653 | 8,856,147 |
| Splunk Inc. (a) | 31,253 | 4,522,622 |
| 18,605,858 | ||
| Asset Management & Custody Banks - 0.2% | ||
| Blackstone Inc. | 11,810 | 1,373,975 |
| Auto Parts & Equipment - 0.7% | ||
| Magna International Inc. | 53,546 | 4,028,801 |
| Automotive Retail - 0.6% | ||
| O'Reilly Automotive Inc. (a) | 5,679 | 3,470,210 |
| Biotechnology - 1.5% | ||
| Biogen Inc. (a) | 4,487 | 1,269,776 |
| BioMarin Pharmaceutical Inc. (a) | 25,541 | 1,974,064 |
| Vertex Pharmaceuticals Inc. (a) | 28,531 | 5,175,238 |
| 8,419,078 | ||
| Building Products - 0.9% | ||
| Allegion PLC | 12,584 | 1,663,353 |
| Trane Technologies PLC | 19,818 | 3,421,578 |
| 5,084,931 | ||
| Cable & Satellite - 1.6% | ||
| Charter Communications Inc., Class A (a) | 3,164 | 2,302,000 |
| Comcast Corp., Class A | 124,441 | 6,959,985 |
| 9,261,985 | ||
| Communications Equipment - 0.2% | ||
| Cisco Systems Inc. | 22,662 | 1,233,493 |
| Construction Materials - 0.3% | ||
| Martin Marietta Materials Inc. | 4,770 | 1,629,814 |
| Number of Shares | Fair Value | |
| Data Processing & Outsourced Services - 5.7% | ||
| Fidelity National Information Services Inc. | 56,429 | $ 6,866,281 |
| Mastercard Inc., Class A | 17,935 | 6,235,641 |
| PayPal Holdings Inc. (a) | 14,302 | 3,721,523 |
| Visa Inc., Class A | 70,991 | 15,813,245 |
| 32,636,690 | ||
| Diversified Banks - 2.6% | ||
| JPMorgan Chase & Co. | 91,350 | 14,953,081 |
| Diversified Support Services - 1.0% | ||
| Cintas Corp. | 6,400 | 2,436,224 |
| IAA Inc. (a) | 61,011 | 3,329,370 |
| 5,765,594 | ||
| Electric Utilities - 0.9% | ||
| NextEra Energy Inc. | 64,074 | 5,031,090 |
| Electronic Components - 2.2% | ||
| Amphenol Corp., Class A | 75,197 | 5,506,676 |
| Corning Inc. | 193,683 | 7,067,493 |
| 12,574,169 | ||
| Environmental & Facilities Services - 1.0% | ||
| Waste Management Inc. | 37,657 | 5,624,450 |
| Financial Exchanges & Data - 1.1% | ||
| CME Group Inc. | 10,889 | 2,105,715 |
| MSCI Inc. | 2,011 | 1,223,372 |
| S&P Global Inc. | 5,459 | 2,319,474 |
| Tradeweb Markets Inc., Class A | 8,856 | 715,388 |
| 6,363,949 | ||
| Footwear - 0.4% | ||
| NIKE Inc., Class B | 15,348 | 2,228,990 |
| Healthcare Equipment - 3.4% | ||
| Becton Dickinson & Co. | 11,770 | 2,893,301 |
| Boston Scientific Corp. (a)(b) | 160,797 | 6,976,982 |
| Edwards Lifesciences Corp. (a) | 16,846 | 1,907,136 |
| Medtronic PLC | 33,549 | 4,205,367 |
| Zimmer Biomet Holdings Inc. | 23,864 | 3,492,735 |
| 19,475,521 | ||
| Healthcare Services - 0.6% | ||
| Cigna Corp. | 18,507 | 3,704,361 |
| 6 | State Street Institutional U.S. Equity Fund |
| Number of Shares | Fair Value | |
| Home Improvement Retail - 2.1% | ||
| Lowe's Companies Inc. | 49,665 | $ 10,075,042 |
| The Home Depot Inc. | 5,654 | 1,855,982 |
| 11,931,024 | ||
| Hotels, Resorts & Cruise Lines - 1.1% | ||
| Marriott International Inc., Class A (a) | 41,796 | 6,189,570 |
| Household Products - 1.3% | ||
| Colgate-Palmolive Co. | 25,752 | 1,946,336 |
| The Procter & Gamble Co. | 40,344 | 5,640,091 |
| 7,586,427 | ||
| Hypermarkets & Super Centers - 0.4% | ||
| Walmart Inc. | 14,647 | 2,041,499 |
| Industrial Conglomerates - 1.5% | ||
| Honeywell International Inc. | 41,233 | 8,752,941 |
| Industrial Gases - 1.4% | ||
| Air Products & Chemicals Inc. | 30,330 | 7,767,816 |
| Industrial Machinery - 1.5% | ||
| Parker-Hannifin Corp. | 22,763 | 6,364,990 |
| Xylem Inc. | 16,779 | 2,075,227 |
| 8,440,217 | ||
| Insurance Brokers - 0.3% | ||
| Marsh & McLennan Companies Inc. | 10,261 | 1,553,823 |
| Integrated Oil & Gas - 0.8% | ||
| Chevron Corp. | 27,445 | 2,784,295 |
| Exxon Mobil Corp. | 33,640 | 1,978,705 |
| 4,763,000 | ||
| Interactive Home Entertainment - 0.2% | ||
| Activision Blizzard Inc. | 17,840 | 1,380,638 |
| Interactive Media & Services - 8.2% | ||
| Alphabet Inc., Class C (a) | 3,766 | 10,037,557 |
| Alphabet Inc., Class A (a) | 7,913 | 21,155,564 |
| Facebook Inc., Class A (a) | 46,361 | 15,734,460 |
| 46,927,581 | ||
| Internet & Direct Marketing Retail - 4.8% | ||
| Amazon.com Inc. (a) | 8,391 | 27,564,771 |
| Number of Shares | Fair Value | |
| Investment Banking & Brokerage - 0.7% | ||
| The Charles Schwab Corp. | 52,695 | $ 3,838,304 |
| IT Consulting & Other Services - 0.4% | ||
| Accenture PLC, Class A | 6,650 | 2,127,468 |
| Life & Health Insurance - 0.2% | ||
| Lincoln National Corp. | 12,921 | 888,319 |
| Life Sciences Tools & Services - 0.6% | ||
| IQVIA Holdings Inc. (a) | 15,442 | 3,698,977 |
| Managed Healthcare - 2.6% | ||
| Humana Inc. | 9,139 | 3,556,442 |
| UnitedHealth Group Inc. | 28,529 | 11,147,421 |
| 14,703,863 | ||
| Movies & Entertainment - 2.3% | ||
| Netflix Inc. (a) | 8,960 | 5,468,647 |
| The Walt Disney Co. (a) | 46,814 | 7,919,524 |
| 13,388,171 | ||
| Multi-Line Insurance - 0.3% | ||
| American International Group Inc. | 31,182 | 1,711,580 |
| Multi-Sector Holdings - 1.1% | ||
| Berkshire Hathaway Inc., Class B (a) | 23,604 | 6,442,476 |
| Multi-Utilities - 1.4% | ||
| Sempra Energy | 64,610 | 8,173,165 |
| Oil & Gas Equipment & Services - 0.3% | ||
| Schlumberger N.V. | 49,473 | 1,466,380 |
| Oil & Gas Exploration & Production - 1.5% | ||
| ConocoPhillips | 101,634 | 6,887,736 |
| Pioneer Natural Resources Co. | 11,921 | 1,984,966 |
| 8,872,702 | ||
| Packaged Foods & Meats - 1.4% | ||
| Mondelez International Inc., Class A | 139,136 | 8,094,932 |
| Personal Products - 0.4% | ||
| The Estee Lauder Companies Inc., Class A | 8,042 | 2,412,037 |
| State Street Institutional U.S. Equity Fund | 7 |
| Number of Shares | Fair Value | |
| Pharmaceuticals - 3.7% | ||
| Bristol-Myers Squibb Co. | 64,420 | $ 3,811,731 |
| Elanco Animal Health Inc. (a) | 29,811 | 950,673 |
| Johnson & Johnson | 30,063 | 4,855,175 |
| Merck & Company Inc. | 121,339 | 9,113,772 |
| Viatris Inc. | 164,184 | 2,224,693 |
| 20,956,044 | ||
| Property & Casualty Insurance - 1.1% | ||
| Chubb Ltd. | 38,098 | 6,609,241 |
| Railroads - 0.5% | ||
| Union Pacific Corp. | 15,871 | 3,110,875 |
| Regional Banks - 3.5% | ||
| First Republic Bank | 33,087 | 6,381,821 |
| Regions Financial Corp. | 423,045 | 9,015,089 |
| SVB Financial Group (a) | 6,833 | 4,420,131 |
| 19,817,041 | ||
| Restaurants - 0.6% | ||
| McDonald's Corp. | 14,630 | 3,527,439 |
| Semiconductor Equipment - 1.3% | ||
| Applied Materials Inc. | 57,860 | 7,448,318 |
| Semiconductors - 4.9% | ||
| Advanced Micro Devices Inc. (a) | 28,158 | 2,897,458 |
| NVIDIA Corp. | 32,520 | 6,736,843 |
| QUALCOMM Inc. | 71,124 | 9,173,574 |
| Texas Instruments Inc. | 46,782 | 8,991,968 |
| 27,799,843 | ||
| Soft Drinks - 0.8% | ||
| PepsiCo Inc. | 31,545 | 4,744,683 |
| Specialized REITs - 1.1% | ||
| American Tower Corp. | 22,864 | 6,068,334 |
| Number of Shares | Fair Value | |
| Specialty Chemicals - 0.5% | ||
| DuPont de Nemours Inc. | 19,261 | $ 1,309,555 |
| Ecolab Inc. | 3,583 | 747,485 |
| PPG Industries Inc. | 6,452 | 922,701 |
| 2,979,741 | ||
| Systems Software - 7.0% | ||
| Microsoft Corp. | 124,876 | 35,205,042 |
| Oracle Corp. | 25,140 | 2,190,448 |
| ServiceNow Inc. (a) | 4,327 | 2,692,562 |
| 40,088,052 | ||
| Technology Hardware, Storage & Peripherals - 4.9% | ||
| Apple Inc. (b) | 197,230 | 27,908,045 |
| Trading Companies & Distributors - 1.2% | ||
| United Rentals Inc. (a) | 19,065 | 6,690,480 |
| Trucking - 0.1% | ||
| Lyft Inc., Class A (a) | 7,435 | 398,442 |
| Wireless Telecommunication Services - 0.3% | ||
| T-Mobile US Inc. (a) | 12,400 | 1,584,224 |
| Total Common Stock (Cost $347,985,138) | 562,662,687 | |
| Short-Term Investments - 1.7% | ||
| State Street Institutional U.S. Government Money Market Fund - Class G Shares 0.03% (b)(c)(d) (Cost $9,885,922) | 9,885,922 | 9,885,922 |
| Total Investments (Cost $357,871,060) | 572,548,609 | |
| Other Assets and Liabilities, net - 0.0%* | 48,392 | |
| NET ASSETS - 100.0% | $ 572,597,001 | |
| The Fund had the following long futures contracts open at September 30, 2021: |
| Description | Expiration Date | Number of Contracts | Notional Amount | Value | Unrealized Appreciation (Depreciation) |
| S&P 500 E-Mini Index Futures | December 2021 | 24 | $ 5,347,333 | $ 5,157,300 | $ (190,033) |
| 8 | State Street Institutional U.S. Equity Fund |
| (a) | Non-income producing security. |
| (b) | At September 30, 2021, all or a portion of this security was pledged to cover collateral requirements for futures. |
| (c) | Sponsored by SSGA Funds Management, Inc., the Fund’s investment adviser and administrator, and an affiliate of State Street Bank & Trust Co., the Fund’s sub-administrator, custodian and accounting agent. |
| (d) | Coupon amount represents effective yield. |
| † | Percentages are based on net assets as of September 30, 2021. |
| * | Less than 0.05%. |
| Abbreviations: |
| REIT - Real Estate Investment Trust |
| Investments | Level 1 | Level 2 | Level 3 | Total | |||
| Investments in Securities | |||||||
| Common Stock | $ 562,662,687 | $ — | $ — | $ 562,662,687 | |||
| Short-Term Investments | 9,885,922 | — | — | 9,885,922 | |||
| Total Investments in Securities | $ 572,548,609 | $ — | $ — | $ 572,548,609 | |||
| Other Financial Instruments | |||||||
| Long Futures Contracts - Unrealized Depreciation | $ (190,033) | $ — | $ — | $ (190,033) | |||
| Total Other Financial Instruments | $ (190,033) | $ — | $ — | $ (190,033) |
| Affiliate Table |
| Number of Shares Held at 9/30/20 | Value at 9/30/20 | Cost of Purchases | Proceeds from Shares Sold | Realized Gain (Loss) | Change in Unrealized Appreciation (Depreciation) | Number of Shares Held at 9/30/21 | Value at 9/30/21 | Dividend Income | |
| State Street Institutional U.S. Government Money Market Fund - Class G Shares | 5,363,497 | $5,363,497 | $84,299,347 | $79,776,922 | $— | $— | 9,885,922 | $9,885,922 | $3,566 |
| State Street Institutional U.S. Equity Fund | 9 |
| 10 | State Street Institutional Premier Growth Equity Fund |
| Sector Allocation |
| Portfolio Composition as a % of Fair Value of $94,732 (in thousands) as of September 30, 2021 (a)(b) |

| Top Ten Largest Holdings | |
| as of September 30, 2021 (as a % of Fair Value) (a)(b) | |
| Microsoft Corp. | 9.62% |
| Apple Inc. | 8.88% |
| Alphabet Inc., Class C | 6.15% |
| Amazon.com Inc. | 5.59% |
| Facebook Inc., Class A | 5.48% |
| Visa Inc., Class A | 4.43% |
| NVIDIA Corp. | 3.20% |
| Lowe's Companies Inc. | 2.90% |
| salesforce.com Inc. | 2.88% |
| QUALCOMM Inc. | 2.76% |
| (a) | Fair Value basis is inclusive of short-term investment in State Street Institutional U.S. Government Money Market Fund – Class G Shares. |
| (b) | The securities information regarding holdings, allocations and other characteristics is presented to illustrate examples of securities that the Fund has bought and the diversity of areas in which the Fund may invest as of a particular date. It may not be representative of the Fund’s current or future investments and should not be construed as a recommendation to purchase or sell a particular security. |
| State Street Institutional Premier Growth Equity Fund | 11 |
| Average Annual Total Return for the years ended September 30, 2021 | |||||||
| Investment Class Shares (Inception date: 10/29/99) | |||||||
| One Year | Five Year | Ten Year | Ending Value of a $10,000 Investment | ||||
| State Street Institutional Premier Growth Equity Fund | 25.85% | 21.35% | 19.50% | $59,408 | |||
| S&P 500® Index | 30.00% | 16.90% | 16.64% | $46,586 | |||
| Russell 1000® Growth Index | 27.32% | 22.84% | 19.68% | $60,263 | |||
| Service Class Shares (Inception date: 1/3/01) | |||||||
| One Year | Five Year | Ten Year | Ending Value of a $10,000 Investment | ||||
| State Street Institutional Premier Growth Equity Fund | 25.58% | 21.04% | 19.21% | $57,938 | |||
| S&P 500® Index | 30.00% | 16.90% | 16.64% | $46,586 | |||
| Russell 1000® Growth Index | 27.32% | 22.84% | 19.68% | $60,263 | |||

| 12 | State Street Institutional Premier Growth Equity Fund |
| Investment Class | Actual Fund Return | Hypothetical 5% Return (2.5% for the period) | ||
| Actual Fund Return | ||||
| Begining Account Value April 1, 2021 | $1,000.00 | $1,000.00 | ||
| Ending Account Value September 30, 2021 | $1,106.10 | $1,022.80 | ||
| Expenses Paid During Period* | $ 2.38 | $ 2.28 |
| * | Expenses are equal to the Fund's annualized expense ratio of 0.45% for Investment Class shares and 0.70% for Service Class shares (for the period April 1, 2021 - September 30, 2021), multiplied by the average account value over the period, multiplied by 183/365 (to reflect the one-half year period). |
| Service Class | Actual Fund Return | Hypothetical 5% Return (2.5% for the period) | ||
| Actual Fund Return | ||||
| Begining Account Value April 1, 2021 | $1,000.00 | $1,000.00 | ||
| Ending Account Value September 30, 2021 | $1,105.10 | $1,021.60 | ||
| Expenses Paid During Period* | $ 3.69 | $ 3.55 |
| * | Expenses are equal to the Fund's annualized expense ratio of 0.45% for Investment Class shares and 0.70% for Service Class shares (for the period April 1, 2021 - September 30, 2021), multiplied by the average account value over the period, multiplied by 183/365 (to reflect the one-half year period). |
| State Street Institutional Premier Growth Equity Fund | 13 |
| Number of Shares | Fair Value | |
| Common Stock - 94.3% † | ||
| Apparel Retail - 2.0% | ||
| Ross Stores Inc. | 17,029 | $ 1,853,607 |
| Application Software - 5.5% | ||
| Adobe Inc. (a) | 1,129 | 649,988 |
| salesforce.com Inc. (a) | 10,053 | 2,726,575 |
| Splunk Inc. (a) | 12,996 | 1,880,651 |
| 5,257,214 | ||
| Biotechnology - 2.4% | ||
| BioMarin Pharmaceutical Inc. (a) | 13,686 | 1,057,791 |
| Vertex Pharmaceuticals Inc. (a) | 6,569 | 1,191,551 |
| 2,249,342 | ||
| Cable & Satellite - 1.4% | ||
| Charter Communications Inc., Class A (a) | 1,852 | 1,347,441 |
| Data Processing & Outsourced Services - 8.9% | ||
| Fidelity National Information Services Inc. | 11,044 | 1,343,834 |
| Mastercard Inc., Class A | 4,378 | 1,522,143 |
| PayPal Holdings Inc. (a) | 5,220 | 1,358,296 |
| Visa Inc., Class A | 18,855 | 4,199,951 |
| 8,424,224 | ||
| Financial Exchanges & Data - 1.3% | ||
| S&P Global Inc. | 2,990 | 1,270,421 |
| Healthcare Equipment - 1.8% | ||
| Boston Scientific Corp. (a) | 40,084 | 1,739,245 |
| Home Improvement Retail - 2.9% | ||
| Lowe's Companies Inc. | 13,563 | 2,751,390 |
| Industrial Conglomerates - 1.6% | ||
| Honeywell International Inc. | 7,108 | 1,508,886 |
| Industrial Gases - 1.0% | ||
| Air Products & Chemicals Inc. | 3,661 | 937,619 |
| Industrial Machinery - 1.6% | ||
| Parker-Hannifin Corp. | 5,564 | 1,555,806 |
| Interactive Media & Services - 13.8% | ||
| Alphabet Inc., Class C (a) | 2,185 | 5,823,702 |
| Alphabet Inc., Class A (a) | 785 | 2,098,713 |
| Number of Shares | Fair Value | |
| Facebook Inc., Class A (a) | 15,305 | $ 5,194,364 |
| 13,116,779 | ||
| Internet & Direct Marketing Retail - 7.3% | ||
| Alibaba Group Holding Ltd. ADR (a)(b) | 4,568 | 676,292 |
| Amazon.com Inc. (a) | 1,611 | 5,292,200 |
| Chewy Inc., Class A (a) | 13,694 | 932,698 |
| 6,901,190 | ||
| Investment Banking & Brokerage - 1.6% | ||
| The Charles Schwab Corp. | 21,287 | 1,550,545 |
| Managed Healthcare - 1.7% | ||
| UnitedHealth Group Inc. | 4,201 | 1,641,499 |
| Movies & Entertainment - 1.3% | ||
| The Walt Disney Co. (a) | 7,136 | 1,207,197 |
| Pharmaceuticals - 1.2% | ||
| Elanco Animal Health Inc. (a) | 35,888 | 1,144,468 |
| Regional Banks - 1.1% | ||
| First Republic Bank | 5,587 | 1,077,621 |
| Semiconductor Equipment - 2.2% | ||
| Applied Materials Inc. | 15,875 | 2,043,589 |
| Semiconductors - 7.0% | ||
| Advanced Micro Devices Inc. (a) | 10,270 | 1,056,783 |
| NVIDIA Corp. | 14,642 | 3,033,237 |
| QUALCOMM Inc. | 20,255 | 2,612,490 |
| 6,702,510 | ||
| Soft Drinks - 1.8% | ||
| PepsiCo Inc. | 11,149 | 1,676,921 |
| Specialized REITs - 1.2% | ||
| American Tower Corp. | 4,326 | 1,148,164 |
| Systems Software - 12.1% | ||
| Microsoft Corp. | 32,307 | 9,107,989 |
| ServiceNow Inc. (a) | 3,884 | 2,416,897 |
| 11,524,886 | ||
| Technology Hardware, Storage & Peripherals - 8.8% | ||
| Apple Inc. | 59,447 | 8,411,750 |
| 14 | State Street Institutional Premier Growth Equity Fund |
| Number of Shares | Fair Value | |
| Trading Companies & Distributors - 1.7% | ||
| United Rentals Inc. (a) | 4,732 | $ 1,660,601 |
| Trucking - 1.1% | ||
| Lyft Inc., Class A (a) | 19,117 | 1,024,480 |
| Total Common Stock (Cost $43,394,100) | 89,727,395 | |
| Exchange Traded & Mutual Funds - 3.3% | ||
| The Consumer Discretionary Select Sector SPDR Fund (b)(c) | 12,585 | 2,258,378 |
| The Technology Select Sector SPDR Fund (b)(c) | 5,819 | 868,893 |
| Total Exchange Traded & Mutual Funds (Cost $2,751,098) | 3,127,271 | |
| Total Investments in Securities (Cost $46,145,198) | 92,854,666 | |
| Number of Shares | Fair Value | |
| Short-Term Investments - 2.0% | ||
| State Street Institutional U.S. Government Money Market Fund - Class G Shares 0.03% (b)(c)(d) (Cost $1,877,600) | 1,877,600 | $ 1,877,600 |
| Total Investments (Cost $48,022,798) | 94,732,266 | |
| Other Assets and Liabilities, net - 0.4% | 382,595 | |
| NET ASSETS - 100.0% | $ 95,114,861 | |
| The Fund had the following long futures contracts open at September 30, 2021: |
| Description | Expiration Date | Number of Contracts | Notional Amount | Value | Unrealized Appreciation (Depreciation) |
| S&P 500 E-Mini Index Futures | December 2021 | 7 | $ 1,559,839 | $ 1,504,213 | $ (55,626) |
| (a) | Non-income producing security. |
| (b) | At September 30, 2021, all or a portion of this security was pledged to cover collateral requirements for futures. |
| (c) | Sponsored by SSGA Funds Management, Inc., the Fund’s investment adviser and administrator, and an affiliate of State Street Bank & Trust Co., the Fund’s sub-administrator, custodian and accounting agent. |
| (d) | Coupon amount represents effective yield. |
| † | Percentages are based on net assets as of September 30, 2021. |
| Abbreviations: |
| ADR - American Depositary Receipt |
| REIT - Real Estate Investment Trust |
| SPDR - Standard and Poor's Depositary Receipt |
| State Street Institutional Premier Growth Equity Fund | 15 |
| Investments | Level 1 | Level 2 | Level 3 | Total | |||
| Investments in Securities | |||||||
| Common Stock | $ 89,727,395 | $ — | $ — | $ 89,727,395 | |||
| Exchange Traded & Mutual Funds | 3,127,271 | — | — | 3,127,271 | |||
| Short-Term Investments | 1,877,600 | — | — | 1,877,600 | |||
| Total Investments in Securities | $ 94,732,266 | $ — | $ — | $ 94,732,266 | |||
| Other Financial Instruments | |||||||
| Long Futures Contracts - Unrealized Depreciation | $ (55,626) | $ — | $ — | $ (55,626) | |||
| Total Other Financial Instruments | $ (55,626) | $ — | $ — | $ (55,626) |
| Affiliate Table |
| Number of Shares Held at 9/30/20 | Value at 9/30/20 | Cost of Purchases | Proceeds from Shares Sold | Realized Gain (Loss) | Change in Unrealized Appreciation (Depreciation) | Number of Shares Held at 9/30/21 | Value at 9/30/21 | Dividend Income | ||||||
| State Street Institutional U.S. Government Money Market Fund - Class G Shares | 1,019,025 | $1,019,025 | $13,106,217 | $12,247,642 | $ — | $ — | 1,877,600 | $1,877,600 | $ 889 | |||||
| The Consumer Discretionary Select Sector SPDR Fund | 6,161 | 905,544 | 1,776,742 | 678,231 | 225,626 | 28,697 | 12,585 | 2,258,378 | 10,240 | |||||
| The Technology Select Sector SPDR Fund | 1,111 | 129,653 | 656,550 | 27,179 | 1,033 | 108,836 | 5,819 | 868,893 | 5,088 | |||||
| TOTAL | $2,054,222 | $15,539,509 | $12,953,052 | $226,659 | $137,533 | $5,004,871 | $16,217 |
| 16 | State Street Institutional Premier Growth Equity Fund |
| State Street Institutional Small-Cap Equity Fund | 17 |
| Sector Allocation |
| Portfolio Composition as a % of Fair Value of $1,309,626 (in thousands) as of September 30, 2021 (a)(b) |

| Top Ten Largest Holdings | |
| as of September 30, 2021 (as a % of Fair Value) (a)(b) | |
| Darling Ingredients Inc. | 1.31% |
| MGP Ingredients Inc. | 1.27% |
| Altra Industrial Motion Corp. | 1.14% |
| Ritchie Bros Auctioneers Inc. | 1.13% |
| Thor Industries Inc. | 1.12% |
| Ingevity Corp. | 1.11% |
| Dycom Industries Inc. | 1.05% |
| The Brink's Co. | 1.00% |
| Repligen Corp. | 0.98% |
| John Wiley & Sons Inc., Class A | 0.95% |
| (a) | Fair Value basis is inclusive of short-term investment in State Street Institutional U.S. Government Money Market Fund – Class G Shares. |
| (b) | The securities information regarding holdings, allocations and other characteristics is presented to illustrate examples of securities that the Fund has bought and the diversity of areas in which the Fund may invest as of a particular date. It may not be representative of the Fund’s current or future investments and should not be construed as a recommendation to purchase or sell a particular security. |
| 18 | State Street Institutional Small-Cap Equity Fund |
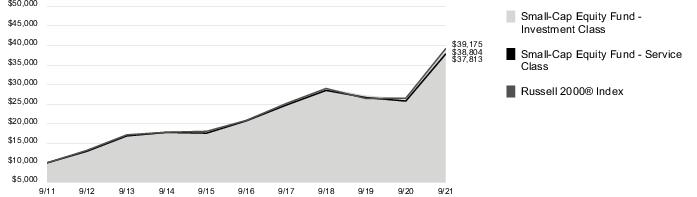
| Average Annual Total Return for the years ended September 30, 2021 | |||||||
| Investment Class Shares (Inception date: 8/3/98) | |||||||
| One Year | Five Year | Ten Year | Ending Value of a $10,000 Investment | ||||
| State Street Institutional Small-Cap Equity Fund | 46.98% | 13.05% | 14.52% | $38,804 | |||
| Russell 2000® Index | 47.68% | 13.45% | 14.63% | $39,175 | |||
| Service Class Shares (Inception date: 9/30/05) | |||||||
| One Year | Five Year | Ten Year | Ending Value of a $10,000 Investment | ||||
| State Street Institutional Small-Cap Equity Fund | 46.60% | 12.76% | 14.23% | $37,813 | |||
| Russell 2000® Index | 47.68% | 13.45% | 14.63% | $39,175 | |||
| State Street Institutional Small-Cap Equity Fund | 19 |
| Investment Class | Actual Fund Return | Hypothetical 5% Return (2.5% for the period) | ||
| Actual Fund Return | ||||
| Begining Account Value April 1, 2021 | $1,000.00 | $1,000.00 | ||
| Ending Account Value September 30, 2021 | $1,011.40 | $1,020.70 | ||
| Expenses Paid During Period* | $ 4.44 | $ 4.46 |
| * | Expenses are equal to the Fund's annualized expense ratio of 0.88% for Investment Class shares and 1.13% for Service Class shares (for the period April 1, 2021 - September 30, 2021), multiplied by the average account value over the period, multiplied by 183/365 (to reflect the one-half year period). |
| Service Class | Actual Fund Return | Hypothetical 5% Return (2.5% for the period) | ||
| Actual Fund Return | ||||
| Begining Account Value April 1, 2021 | $1,000.00 | $1,000.00 | ||
| Ending Account Value September 30, 2021 | $1,009.60 | $1,019.40 | ||
| Expenses Paid During Period* | $ 5.69 | $ 5.72 |
| * | Expenses are equal to the Fund's annualized expense ratio of 0.88% for Investment Class shares and 1.13% for Service Class shares (for the period April 1, 2021 - September 30, 2021), multiplied by the average account value over the period, multiplied by 183/365 (to reflect the one-half year period). |
| 20 | State Street Institutional Small-Cap Equity Fund |
| Number of Shares | Fair Value | |
| Common Stock - 96.1% † | ||
| Agricultural & Farm Machinery - 0.7% | ||
| AGCO Corp. | 73,971 | $ 9,063,667 |
| Agricultural Products - 1.3% | ||
| Darling Ingredients Inc. (a) | 237,861 | 17,102,206 |
| Airlines - 0.1% | ||
| Allegiant Travel Co. (a) | 7,828 | 1,530,217 |
| Aluminum - 0.2% | ||
| Alcoa Corp. (a) | 62,007 | 3,034,623 |
| Apparel Retail - 0.4% | ||
| American Eagle Outfitters Inc. | 81,961 | 2,114,594 |
| The Buckle Inc. | 90,653 | 3,588,952 |
| 5,703,546 | ||
| Application Software - 6.9% | ||
| ACI Worldwide Inc. (a) | 161,138 | 4,951,771 |
| Alarm.com Holdings Inc. (a) | 33,004 | 2,580,583 |
| Altair Engineering Inc., Class A (a) | 60,393 | 4,163,493 |
| Asana Inc., Class A (a) | 9,500 | 986,480 |
| Blackbaud Inc. (a) | 129,965 | 9,143,038 |
| Blackline Inc. (a) | 88,721 | 10,474,401 |
| Cerence Inc. (a) | 30,039 | 2,887,048 |
| Envestnet Inc. (a) | 46,500 | 3,731,160 |
| Medallia Inc. (a) | 75,650 | 2,562,265 |
| Model N Inc. (a) | 38,937 | 1,304,390 |
| New Relic Inc. (a) | 128,500 | 9,222,445 |
| Paylocity Holding Corp. (a) | 16,411 | 4,601,644 |
| Pegasystems Inc. | 22,674 | 2,881,865 |
| PROS Holdings Inc. (a) | 23,099 | 819,553 |
| Q2 Holdings Inc. (a) | 70,000 | 5,609,800 |
| SPS Commerce Inc. (a) | 28,632 | 4,618,628 |
| Sumo Logic Inc. (a) | 225,000 | 3,627,000 |
| The Descartes Systems Group Inc. (a) | 21,249 | 1,726,694 |
| Workiva Inc. (a) | 70,145 | 9,887,639 |
| Yext Inc. (a) | 361,500 | 4,348,845 |
| 90,128,742 | ||
| Auto Parts & Equipment - 1.3% | ||
| Dana Inc. | 94,661 | 2,105,261 |
| Dorman Products Inc. (a) | 114,090 | 10,800,900 |
| Gentex Corp. | 51,212 | 1,688,972 |
| LCI Industries | 12,989 | 1,748,709 |
| 16,343,842 | ||
| Automobile Manufacturers - 1.1% | ||
| Thor Industries Inc. | 119,852 | 14,713,032 |
| Number of Shares | Fair Value | |
| Automotive Retail - 1.6% | ||
| America's Car-Mart Inc. (a) | 18,480 | $ 2,158,094 |
| Group 1 Automotive Inc. | 40,026 | 7,520,085 |
| Monro Inc. | 30,043 | 1,727,773 |
| Murphy USA Inc. | 59,210 | 9,903,465 |
| 21,309,417 | ||
| Biotechnology - 1.1% | ||
| Avid Bioservices Inc. (a) | 123,631 | 2,666,721 |
| Emergent BioSolutions Inc. (a) | 74,191 | 3,714,743 |
| Halozyme Therapeutics Inc. (a) | 38,347 | 1,559,956 |
| Heron Therapeutics Inc. (a) | 344,083 | 3,678,247 |
| Veracyte Inc. (a) | 69,000 | 3,205,050 |
| 14,824,717 | ||
| Building Products - 1.1% | ||
| American Woodmark Corp. (a) | 12,628 | 825,492 |
| CSW Industrials Inc. | 31,285 | 3,995,095 |
| Gibraltar Industries Inc. (a) | 110,560 | 7,700,504 |
| Insteel Industries Inc. | 15,767 | 599,934 |
| UFP Industries Inc. | 27,562 | 1,873,665 |
| 14,994,690 | ||
| Commodity Chemicals - 0.6% | ||
| Hawkins Inc. | 27,953 | 975,001 |
| Koppers Holdings Inc. (a) | 213,678 | 6,679,574 |
| 7,654,575 | ||
| Communications Equipment - 0.3% | ||
| Extreme Networks Inc. (a) | 196,342 | 1,933,969 |
| Plantronics Inc. (a) | 71,059 | 1,826,927 |
| 3,760,896 | ||
| Computer & Electronics Retail - 0.1% | ||
| Rent-A-Center Inc. | 32,486 | 1,826,038 |
| Construction & Engineering - 1.5% | ||
| Dycom Industries Inc. (a) | 193,136 | 13,759,008 |
| IES Holdings Inc. (a) | 4,723 | 215,794 |
| Valmont Industries Inc. | 12,923 | 3,038,456 |
| WillScot Mobile Mini Holdings Corp. (a) | 65,296 | 2,071,189 |
| 19,084,447 | ||
| Construction Machinery & Heavy Trucks - 1.0% | ||
| Alamo Group Inc. | 13,673 | 1,907,794 |
| Astec Industries Inc. | 51,432 | 2,767,556 |
| Meritor Inc. (a) | 121,071 | 2,580,023 |
| The Greenbrier Companies Inc. | 58,520 | 2,515,775 |
| State Street Institutional Small-Cap Equity Fund | 21 |
| Number of Shares | Fair Value | |
| The Manitowoc Company Inc. (a) | 65,375 | $ 1,400,332 |
| Wabash National Corp. | 116,886 | 1,768,485 |
| 12,939,965 | ||
| Construction Materials - 0.1% | ||
| Eagle Materials Inc. | 11,644 | 1,527,227 |
| Consumer Finance - 0.4% | ||
| PRA Group Inc. (a) | 30,995 | 1,306,129 |
| PROG Holdings Inc. | 87,689 | 3,683,815 |
| 4,989,944 | ||
| Data Processing & Outsourced Services - 0.7% | ||
| Cass Information Systems Inc. | 16,125 | 674,831 |
| CSG Systems International Inc. | 72,343 | 3,486,933 |
| Maximus Inc. | 16,880 | 1,404,416 |
| Verra Mobility Corp. (a) | 230,335 | 3,471,148 |
| 9,037,328 | ||
| Distillers & Vintners - 1.3% | ||
| MGP Ingredients Inc. | 256,108 | 16,672,631 |
| Distributors - 0.6% | ||
| LKQ Corp. (a) | 150,748 | 7,585,639 |
| Diversified Metals & Mining - 0.3% | ||
| Compass Minerals International Inc. | 47,619 | 3,066,663 |
| Materion Corp. | 13,120 | 900,557 |
| 3,967,220 | ||
| Diversified REITs - 0.3% | ||
| Alpine Income Property Trust Inc. | 72,396 | 1,329,915 |
| American Assets Trust Inc. | 49,397 | 1,848,436 |
| Essential Properties Realty Trust Inc. | 39,032 | 1,089,773 |
| 4,268,124 | ||
| Diversified Support Services - 2.0% | ||
| Healthcare Services Group Inc. | 214,550 | 5,361,604 |
| IAA Inc. (a) | 44,673 | 2,437,806 |
| Matthews International Corp., Class A | 68,506 | 2,376,473 |
| Ritchie Bros Auctioneers Inc. | 240,276 | 14,815,418 |
| UniFirst Corp. | 6,035 | 1,283,162 |
| 26,274,463 | ||
| Number of Shares | Fair Value | |
| Education Services - 0.6% | ||
| 2U Inc. (a) | 48,012 | $ 1,611,763 |
| Grand Canyon Education Inc. (a) | 35,183 | 3,094,696 |
| Stride Inc. (a) | 100,138 | 3,598,960 |
| 8,305,419 | ||
| Electric Utilities - 0.8% | ||
| ALLETE Inc. | 15,285 | 909,763 |
| IDACORP Inc. | 87,961 | 9,093,408 |
| 10,003,171 | ||
| Electrical Components & Equipment - 0.3% | ||
| Acuity Brands Inc. | 7,052 | 1,222,605 |
| Regal Beloit Corp. | 18,408 | 2,767,459 |
| 3,990,064 | ||
| Electronic Components - 1.6% | ||
| Belden Inc. | 154,650 | 9,009,909 |
| II-VI Inc. (a) | 30,471 | 1,808,759 |
| Littelfuse Inc. | 25,090 | 6,856,344 |
| Rogers Corp. (a) | 17,878 | 3,333,889 |
| 21,008,901 | ||
| Electronic Equipment & Instruments - 0.4% | ||
| National Instruments Corp. | 135,235 | 5,305,269 |
| Electronic Manufacturing Services - 0.3% | ||
| Methode Electronics Inc. | 36,146 | 1,519,939 |
| Plexus Corp. (a) | 23,551 | 2,105,695 |
| 3,625,634 | ||
| Environmental & Facilities Services - 0.5% | ||
| Clean Harbors Inc. (a) | 63,914 | 6,638,747 |
| Food Distributors - 0.3% | ||
| Performance Food Group Co. (a) | 93,424 | 4,340,479 |
| Footwear - 0.7% | ||
| Deckers Outdoor Corp. (a) | 9,306 | 3,352,021 |
| Wolverine World Wide Inc. | 172,500 | 5,147,400 |
| 8,499,421 | ||
| Gas Utilities - 0.1% | ||
| Spire Inc. | 20,238 | 1,238,161 |
| General Merchandise Stores - 0.1% | ||
| Ollie's Bargain Outlet Holdings Inc. (a) | 19,282 | 1,162,319 |
| 22 | State Street Institutional Small-Cap Equity Fund |
| Number of Shares | Fair Value | |
| Health Care REITs - 0.1% | ||
| Community Healthcare Trust Inc. | 27,796 | $ 1,256,101 |
| Healthcare Distributors - 0.7% | ||
| AdaptHealth Corp. (a) | 138,550 | 3,226,830 |
| Covetrus Inc. (a) | 246,379 | 4,469,315 |
| PetIQ Inc. (a) | 42,062 | 1,050,288 |
| 8,746,433 | ||
| Healthcare Equipment - 5.3% | ||
| AtriCure Inc. (a) | 53,500 | 3,720,925 |
| Axonics Inc. (a) | 14,000 | 911,260 |
| Cardiovascular Systems Inc. (a) | 152,500 | 5,006,575 |
| CONMED Corp. | 65,500 | 8,569,365 |
| Envista Holdings Corp. (a) | 35,700 | 1,492,617 |
| Glaukos Corp. (a) | 19,695 | 948,708 |
| Globus Medical Inc., Class A (a) | 71,500 | 5,478,330 |
| Heska Corp. (a) | 10,472 | 2,707,431 |
| Hill-Rom Holdings Inc. | 53,255 | 7,988,250 |
| Inogen Inc. (a) | 10,199 | 439,475 |
| Integra LifeSciences Holdings Corp. (a) | 128,000 | 8,765,440 |
| IntriCon Corp. (a) | 67,660 | 1,228,705 |
| LeMaitre Vascular Inc. | 24,797 | 1,316,473 |
| Masimo Corp. (a) | 7,500 | 2,030,325 |
| Outset Medical Inc. (a) | 81,500 | 4,029,360 |
| Penumbra Inc. (a) | 19,500 | 5,196,750 |
| STERIS PLC | 25,500 | 5,209,140 |
| Tactile Systems Technology Inc. (a) | 78,000 | 3,467,100 |
| Vapotherm Inc. (a) | 67,000 | 1,492,090 |
| 69,998,319 | ||
| Healthcare Facilities - 1.1% | ||
| Acadia Healthcare Company Inc. (a) | 109,773 | 7,001,322 |
| Hanger Inc. (a) | 120,380 | 2,643,545 |
| The Ensign Group Inc. | 34,502 | 2,583,855 |
| The Pennat Group Inc. (a) | 45,556 | 1,279,668 |
| U.S. Physical Therapy Inc. | 13,410 | 1,483,146 |
| 14,991,536 | ||
| Healthcare Services - 0.8% | ||
| Addus HomeCare Corp. (a) | 21,911 | 1,747,402 |
| Amedisys Inc. (a) | 12,983 | 1,935,765 |
| AMN Healthcare Services Inc. (a) | 27,286 | 3,131,069 |
| Chemed Corp. | 3,499 | 1,627,455 |
| Number of Shares | Fair Value | |
| MEDNAX Inc. (a) | 91,708 | $ 2,607,258 |
| 11,048,949 | ||
| Healthcare Supplies - 1.1% | ||
| Avanos Medical Inc. (a) | 93,900 | 2,929,680 |
| BioLife Solutions Inc. (a)(b) | 82,887 | 3,507,778 |
| ICU Medical Inc. (a) | 7,753 | 1,809,395 |
| Neogen Corp. (a) | 38,354 | 1,665,714 |
| OrthoPediatrics Corp. (a) | 18,336 | 1,201,192 |
| Pulmonx Corp. (a) | 81,500 | 2,932,370 |
| 14,046,129 | ||
| Healthcare Technology - 1.5% | ||
| Certara Inc. (a) | 53,301 | 1,764,263 |
| Health Catalyst Inc. (a) | 38,360 | 1,918,384 |
| Inspire Medical Systems Inc. (a) | 29,500 | 6,869,960 |
| NextGen Healthcare Inc. (a) | 116,128 | 1,637,405 |
| Omnicell Inc. (a) | 34,678 | 5,147,255 |
| Phreesia Inc. (a) | 30,987 | 1,911,898 |
| 19,249,165 | ||
| Home Building - 0.6% | ||
| Cavco Industries Inc. (a) | 7,969 | 1,886,581 |
| Green Brick Partners Inc. (a) | 46,417 | 952,477 |
| Taylor Morrison Home Corp. (a) | 134,132 | 3,457,923 |
| TopBuild Corp. (a) | 9,208 | 1,885,890 |
| 8,182,871 | ||
| Home Furnishing Retail - 0.3% | ||
| The Aaron's Company Inc. | 126,411 | 3,481,359 |
| Home Furnishings - 0.2% | ||
| La-Z-Boy Inc. | 66,334 | 2,137,945 |
| Home Improvement Retail - 0.1% | ||
| Floor & Decor Holdings Inc., Class A (a) | 15,297 | 1,847,725 |
| Hotel & Resort REITs - 0.3% | ||
| RLJ Lodging Trust | 222,939 | 3,312,874 |
| Household Appliances - 0.1% | ||
| Helen of Troy Ltd. (a) | 4,225 | 949,273 |
| Household Products - 0.2% | ||
| Central Garden & Pet Co., Class A (a) | 72,000 | 3,096,000 |
| Industrial Machinery - 7.5% | ||
| Albany International Corp., Class A | 23,500 | 1,806,445 |
| State Street Institutional Small-Cap Equity Fund | 23 |
| Number of Shares | Fair Value | |
| Altra Industrial Motion Corp. | 270,582 | $ 14,976,714 |
| Barnes Group Inc. | 230,588 | 9,622,437 |
| Crane Co. | 122,229 | 11,588,531 |
| Enerpac Tool Group Corp. | 331,145 | 6,864,636 |
| ESCO Technologies Inc. | 45,500 | 3,503,500 |
| Evoqua Water Technologies Corp. (a) | 238,500 | 8,958,060 |
| John Bean Technologies Corp. | 76,500 | 10,752,075 |
| Kadant Inc. | 8,044 | 1,641,780 |
| Kornit Digital Ltd. (a) | 26,975 | 3,904,362 |
| Lydall Inc. (a) | 45,297 | 2,812,491 |
| Mueller Industries Inc. | 126,531 | 5,200,424 |
| Proto Labs Inc. (a) | 7,556 | 503,230 |
| Standex International Corp. | 29,500 | 2,917,845 |
| The Timken Co. | 167,113 | 10,932,532 |
| Woodward Inc. | 22,304 | 2,524,813 |
| 98,509,875 | ||
| Industrial REITs - 0.7% | ||
| EastGroup Properties Inc. | 45,477 | 7,577,832 |
| Innovative Industrial Properties Inc. | 4,175 | 965,135 |
| 8,542,967 | ||
| Insurance Brokers - 0.4% | ||
| BRP Group Inc., Class A (a) | 105,435 | 3,509,931 |
| Goosehead Insurance Inc., Class A | 13,608 | 2,072,362 |
| 5,582,293 | ||
| Interactive Media & Services - 0.1% | ||
| Vimeo Inc. (a) | 39,361 | 1,156,033 |
| Internet & Direct Marketing Retail - 0.6% | ||
| Fiverr International Ltd. (a) | 13,307 | 2,430,922 |
| Overstock.com Inc. (a) | 17,639 | 1,374,431 |
| Porch Group Inc. (a) | 83,169 | 1,470,428 |
| Revolve Group Inc. (a) | 49,131 | 3,034,822 |
| 8,310,603 | ||
| Internet Services & Infrastructure - 0.1% | ||
| Switch Inc., Class A | 38,704 | 982,695 |
| Investment Banking & Brokerage - 1.0% | ||
| Piper Sandler Cos. | 23,223 | 3,215,457 |
| Raymond James Financial Inc. | 71,273 | 6,577,072 |
| Stifel Financial Corp. | 46,544 | 3,163,130 |
| 12,955,659 | ||
| IT Consulting & Other Services - 1.0% | ||
| Globant S.A. (a) | 16,030 | 4,504,590 |
| Number of Shares | Fair Value | |
| Grid Dynamics Holdings Inc. (a) | 67,529 | $ 1,973,198 |
| Unisys Corp. (a) | 240,942 | 6,057,282 |
| 12,535,070 | ||
| Leisure Products - 1.6% | ||
| Malibu Boats Inc., Class A (a) | 134,054 | 9,381,099 |
| Polaris Inc. | 91,387 | 10,935,368 |
| 20,316,467 | ||
| Life & Health Insurance - 0.3% | ||
| American Equity Investment Life Holding Co. | 62,780 | 1,856,404 |
| Trupanion Inc. (a) | 31,498 | 2,446,450 |
| 4,302,854 | ||
| Life Sciences Tools & Services - 3.2% | ||
| Bruker Corp. | 93,488 | 7,301,413 |
| ICON PLC (a) | 32,951 | 8,633,821 |
| Medpace Holdings Inc. (a) | 10,389 | 1,966,430 |
| Repligen Corp. (a) | 44,565 | 12,878,839 |
| Syneos Health Inc. (a) | 121,258 | 10,607,650 |
| 41,388,153 | ||
| Marine - 0.1% | ||
| Kirby Corp. (a) | 30,635 | 1,469,255 |
| Metal & Glass Containers - 0.4% | ||
| TriMas Corp. (a) | 151,500 | 4,902,540 |
| Multi-Line Insurance - 0.2% | ||
| Horace Mann Educators Corp. | 78,583 | 3,126,818 |
| Office REITs - 0.7% | ||
| Corporate Office Properties Trust | 51,004 | 1,376,088 |
| Cousins Properties Inc. | 143,070 | 5,335,080 |
| Easterly Government Properties Inc. | 122,475 | 2,530,334 |
| 9,241,502 | ||
| Office Services & Supplies - 0.9% | ||
| HNI Corp. | 35,523 | 1,304,405 |
| MSA Safety Inc. | 73,805 | 10,753,388 |
| 12,057,793 | ||
| Oil & Gas Drilling - 0.2% | ||
| Helmerich & Payne Inc. | 76,392 | 2,093,905 |
| Oil & Gas Equipment & Services - 0.3% | ||
| ChampionX Corp. (a) | 69,274 | 1,548,967 |
| 24 | State Street Institutional Small-Cap Equity Fund |
| Number of Shares | Fair Value | |
| Oil States International Inc. (a) | 447,142 | $ 2,857,237 |
| 4,406,204 | ||
| Oil & Gas Exploration & Production - 1.0% | ||
| Cimarex Energy Co. | 14,693 | 1,281,230 |
| Denbury Inc. (a) | 27,846 | 1,956,181 |
| Northern Oil & Gas Inc. | 137,509 | 2,942,692 |
| PDC Energy Inc. | 132,795 | 6,293,155 |
| Southwestern Energy Co. (a) | 218,679 | 1,211,482 |
| 13,684,740 | ||
| Packaged Foods & Meats - 3.6% | ||
| Calavo Growers Inc. | 12,705 | 485,839 |
| Freshpet Inc. (a) | 18,478 | 2,636,626 |
| Hostess Brands Inc. (a) | 482,000 | 8,372,340 |
| J&J Snack Foods Corp. | 26,500 | 4,049,730 |
| John B Sanfilippo & Son Inc. | 8,954 | 731,721 |
| Lancaster Colony Corp. | 47,000 | 7,934,070 |
| Sanderson Farms Inc. | 59,971 | 11,286,542 |
| The Simply Good Foods Co. (a) | 224,900 | 7,756,801 |
| Utz Brands Inc. | 189,390 | 3,244,251 |
| 46,497,920 | ||
| Paper Packaging - 0.1% | ||
| UFP Technologies Inc. (a) | 17,705 | 1,090,451 |
| Personal Products - 0.4% | ||
| elf Beauty Inc. (a) | 153,000 | 4,444,650 |
| The Honest Company Inc. (a) | 86,500 | 897,870 |
| 5,342,520 | ||
| Pharmaceuticals - 0.2% | ||
| Prestige Consumer Healthcare Inc. (a) | 47,500 | 2,665,225 |
| Property & Casualty Insurance - 1.8% | ||
| AMERISAFE Inc. | 45,999 | 2,583,304 |
| Argo Group International Holdings Ltd. | 122,355 | 6,389,378 |
| James River Group Holdings Ltd. | 85,200 | 3,214,596 |
| Palomar Holdings Inc. (a) | 36,500 | 2,950,295 |
| RLI Corp. | 39,539 | 3,964,576 |
| Selective Insurance Group Inc. | 66,500 | 5,022,745 |
| 24,124,894 | ||
| Publishing - 0.9% | ||
| John Wiley & Sons Inc., Class A | 237,448 | 12,397,160 |
| Number of Shares | Fair Value | |
| Regional Banks - 7.7% | ||
| 1st Source Corp. | 44,042 | $ 2,080,544 |
| Atlantic Union Bankshares Corp. | 39,524 | 1,456,459 |
| Bank OZK | 54,908 | 2,359,946 |
| BankUnited Inc. | 25,256 | 1,056,206 |
| Banner Corp. | 18,046 | 996,320 |
| Bryn Mawr Bank Corp. | 44,500 | 2,044,775 |
| Cadence BanCorp | 119,521 | 2,624,681 |
| Community Bank System Inc. | 43,000 | 2,942,060 |
| Cullen/Frost Bankers Inc. | 37,150 | 4,406,733 |
| CVB Financial Corp. | 117,000 | 2,383,290 |
| Enterprise Financial Services Corp. | 42,247 | 1,912,944 |
| Equity Bancshares Inc., Class A | 39,524 | 1,319,311 |
| FB Financial Corp. | 22,731 | 974,705 |
| First Interstate BancSystem Inc., Class A | 28,506 | 1,147,652 |
| Fulton Financial Corp. | 223,734 | 3,418,656 |
| German American Bancorp Inc. | 61,000 | 2,356,430 |
| Great Western Bancorp Inc. | 65,108 | 2,131,636 |
| Independent Bank Corp. | 134,930 | 10,274,919 |
| Investors Bancorp Inc. | 62,714 | 947,609 |
| Lakeland Financial Corp. | 6,193 | 441,189 |
| National Bank Holdings Corp., Class A | 38,775 | 1,569,612 |
| Origin Bancorp Inc. | 56,908 | 2,410,054 |
| PacWest Bancorp | 69,110 | 3,132,065 |
| Peapack-Gladstone Financial Corp. | 17,679 | 589,771 |
| Pinnacle Financial Partners Inc. | 22,206 | 2,089,140 |
| Prosperity Bancshares Inc. | 124,132 | 8,829,509 |
| Renasant Corp. | 156,157 | 5,629,460 |
| Sandy Spring Bancorp Inc. | 40,836 | 1,871,106 |
| Stock Yards Bancorp Inc. | 40,000 | 2,346,000 |
| Texas Capital Bancshares Inc. (a) | 34,734 | 2,084,735 |
| UMB Financial Corp. | 61,500 | 5,947,665 |
| United Community Banks Inc. | 48,872 | 1,603,979 |
| Washington Trust Bancorp Inc. | 33,000 | 1,748,340 |
| Westamerica BanCorp | 67,807 | 3,814,822 |
| Western Alliance Bancorp | 61,375 | 6,678,827 |
| Wintrust Financial Corp. | 40,642 | 3,266,398 |
| 100,887,548 | ||
| Research & Consulting Services - 0.4% | ||
| Exponent Inc. | 19,894 | 2,251,006 |
| Resources Connection Inc. | 192,116 | 3,031,591 |
| 5,282,597 | ||
| State Street Institutional Small-Cap Equity Fund | 25 |
| Number of Shares | Fair Value | |
| Residential REITs - 0.2% | ||
| NexPoint Residential Trust Inc. | 43,624 | $ 2,699,453 |
| Restaurants - 1.2% | ||
| Brinker International Inc. (a) | 28,284 | 1,387,330 |
| Cracker Barrel Old Country Store Inc. | 11,941 | 1,669,830 |
| Shake Shack Inc., Class A (a) | 25,500 | 2,000,730 |
| Texas Roadhouse Inc. | 41,543 | 3,794,122 |
| The Cheesecake Factory Inc. (a) | 54,533 | 2,563,051 |
| Wingstop Inc. | 29,000 | 4,753,970 |
| 16,169,033 | ||
| Retail REITs - 0.3% | ||
| Kite Realty Group Trust | 101,350 | 2,063,486 |
| Retail Opportunity Investments Corp. | 59,461 | 1,035,810 |
| The Macerich Co. | 56,646 | 946,555 |
| 4,045,851 | ||
| Security & Alarm Services - 1.0% | ||
| The Brink's Co. | 207,255 | 13,119,242 |
| Semiconductor Equipment - 1.7% | ||
| Brooks Automation Inc. | 58,842 | 6,022,478 |
| CMC Materials Inc. | 71,277 | 8,783,465 |
| Ichor Holdings Ltd. (a) | 44,280 | 1,819,465 |
| Onto Innovation Inc. (a) | 72,311 | 5,224,470 |
| 21,849,878 | ||
| Semiconductors - 1.0% | ||
| Diodes Inc. (a) | 20,566 | 1,863,074 |
| MaxLinear Inc. (a) | 28,569 | 1,407,023 |
| Power Integrations Inc. | 23,202 | 2,296,766 |
| Semtech Corp. (a) | 87,822 | 6,847,481 |
| SMART Global Holdings Inc. (a) | 23,493 | 1,045,439 |
| 13,459,783 | ||
| Soft Drinks - 0.3% | ||
| Primo Water Corp. | 260,595 | 4,096,553 |
| Specialized Consumer Services - 0.9% | ||
| OneSpaWorld Holdings Ltd. (a) | 169,105 | 1,685,977 |
| Terminix Global Holdings Inc. (a) | 235,932 | 9,831,286 |
| 11,517,263 | ||
| Specialized REITs - 0.4% | ||
| CoreSite Realty Corp. | 22,971 | 3,182,402 |
| Number of Shares | Fair Value | |
| PotlatchDeltic Corp. | 35,195 | $ 1,815,358 |
| 4,997,760 | ||
| Specialty Chemicals - 3.9% | ||
| Avient Corp. | 165,356 | 7,664,251 |
| Chase Corp. | 14,000 | 1,430,100 |
| Clariant AG | — | — |
| Danimer Scientific Inc. (a) | 81,389 | 1,329,896 |
| HB Fuller Co. | 16,531 | 1,067,241 |
| Ingevity Corp. (a) | 203,928 | 14,554,341 |
| Innospec Inc. | 37,000 | 3,116,140 |
| Minerals Technologies Inc. | 15,022 | 1,049,136 |
| Quaker Chemical Corp. | 20,069 | 4,770,803 |
| Sensient Technologies Corp. | 60,000 | 5,464,800 |
| Stepan Co. | 98,574 | 11,132,948 |
| 51,579,656 | ||
| Specialty Stores - 0.8% | ||
| Dick's Sporting Goods Inc. | 14,621 | 1,751,157 |
| Five Below Inc. (a) | 18,247 | 3,226,252 |
| National Vision Holdings Inc. (a) | 47,061 | 2,671,653 |
| Sally Beauty Holdings Inc. (a) | 199,500 | 3,361,575 |
| 11,010,637 | ||
| Steel - 0.4% | ||
| Carpenter Technology Corp. | 35,293 | 1,155,493 |
| Commercial Metals Co. | 103,616 | 3,156,143 |
| Steel Dynamics Inc. | 24,216 | 1,416,152 |
| 5,727,788 | ||
| Systems Software - 1.4% | ||
| Ping Identity Holding Corp. (a) | 138,722 | 3,408,399 |
| Qualys Inc. (a) | 21,030 | 2,340,429 |
| Sailpoint Technologies Holdings Inc. (a) | 134,000 | 5,745,920 |
| Tenable Holdings Inc. (a) | 139,500 | 6,436,530 |
| 17,931,278 | ||
| Technology Hardware, Storage & Peripherals - 0.7% | ||
| Pure Storage Inc., Class A (a) | 389,080 | 9,789,253 |
| Thrifts & Mortgage Finance - 1.1% | ||
| Flagstar Bancorp Inc. | 21,548 | 1,094,207 |
| HomeStreet Inc. | 41,623 | 1,712,787 |
| Kearny Financial Corp. | 39,849 | 495,323 |
| Meta Financial Group Inc. | 30,254 | 1,587,730 |
| Premier Financial Corp. | 51,222 | 1,630,909 |
| Washington Federal Inc. | 38,835 | 1,332,429 |
| WSFS Financial Corp. | 115,453 | 5,923,893 |
| 13,777,278 | ||
| 26 | State Street Institutional Small-Cap Equity Fund |
| Number of Shares | Fair Value | |
| Trading Companies & Distributors - 1.6% | ||
| Applied Industrial Technologies Inc. | 100,588 | $ 9,065,997 |
| Boise Cascade Co. | 9,807 | 529,382 |
| McGrath RentCorp. | 18,335 | 1,319,203 |
| Transcat Inc. (a) | 14,000 | 902,720 |
| Univar Solutions Inc. (a) | 378,061 | 9,005,413 |
| 20,822,715 | ||
| Trucking - 0.7% | ||
| Marten Transport Ltd. | 92,631 | 1,453,380 |
| Saia Inc. (a) | 30,152 | 7,177,081 |
| 8,630,461 | ||
| Total Common Stock (Cost $870,996,384) | 1,259,877,083 | |
| Number of Shares | Fair Value | |
| Short-Term Investments - 3.8% | ||
| State Street Institutional U.S. Government Money Market Fund - Class G Shares 0.03% (b)(c)(d) (Cost $49,748,651) | 49,748,651 | $ 49,748,651 |
| Total Investments (Cost $920,745,035) | 1,309,625,734 | |
| Other Assets and Liabilities, net - 0.1% | 862,416 | |
| NET ASSETS - 100.0% | $ 1,310,488,150 | |
| The Fund had the following long futures contracts open at September 30, 2021: |
| Description | Expiration Date | Number of Contracts | Notional Amount | Value | Unrealized Appreciation (Depreciation) |
| E-mini Russell 2000 Index Futures | December 2021 | 141 | $ 15,665,263 | $ 15,515,640 | $ (149,623) |
| (a) | Non-income producing security. |
| (b) | At September 30, 2021, all or a portion of this security was pledged to cover collateral requirements for futures. |
| (c) | Coupon amount represents effective yield. |
| (d) | Sponsored by SSGA Funds Management, Inc., the Fund's investment adviser and administrator of State Street Bank & Trust Co., the Fund's sub-administrator, custodian and accounting agent. |
| † | Percentages are based on net assets as of September 30, 2021. |
| Abbreviations: |
| REIT - Real Estate Investment Trust |
| State Street Institutional Small-Cap Equity Fund | 27 |
| Investments | Level 1 | Level 2 | Level 3 | Total | |||
| Investments in Securities | |||||||
| Common Stock | $ 1,259,877,083 | $ — | $ — | $ 1,259,877,083 | |||
| Short-Term Investments | 49,748,651 | — | — | 49,748,651 | |||
| Total Investments in Securities | $ 1,309,625,734 | $ — | $ — | $ 1,309,625,734 | |||
| Other Financial Instruments | |||||||
| Long Futures Contracts - Unrealized Depreciation | $ (149,623) | $ — | $ — | $ (149,623) | |||
| Total Other Financial Instruments | $ (149,623) | $ — | $ — | $ (149,623) |
| Affiliate Table |
| Number of Shares Held at 9/30/20 | Value at 9/30/20 | Cost of Purchases | Proceeds from Shares Sold | Realized Gain (Loss) | Change in Unrealized Appreciation (Depreciation) | Number of Shares Held at 9/30/21 | Value at 9/30/21 | Dividend Income | |
| State Street Institutional U.S. Government Money Market Fund - Class G Shares | 29,664,602 | $29,664,602 | $394,401,189 | $374,317,140 | $— | $— | 49,748,651 | $49,748,651 | $21,519 |
| 28 | State Street Institutional Small-Cap Equity Fund |
| State Street Institutional International Equity Fund | 29 |
| Regional Allocation |
| Portfolio Composition as a % of Fair Value of $113,076 (in thousands) as of September 30, 2021 (a)(b) |

| Top Ten Largest Holdings | |
| as of September 30, 2021 (as a % of Fair Value) (a)(b) | |
| ASML Holding N.V. | 3.60% |
| Nestle S.A. | 3.49% |
| Schneider Electric SE | 3.31% |
| Recruit Holdings Company Ltd. | 2.97% |
| Hoya Corp. | 2.88% |
| LVMH Moet Hennessy Louis Vuitton SE | 2.86% |
| AstraZeneca PLC | 2.83% |
| Roche Holding AG | 2.81% |
| AIA Group Ltd. | 2.72% |
| Novartis AG | 2.67% |
| (a) | Fair Value basis is inclusive of short-term investment in State Street Institutional U.S. Government Money Market Fund – Class G Shares. |
| (b) | The securities information regarding holdings, allocations and other characteristics is presented to illustrate examples of securities that the Fund has bought and the diversity of areas in which the Fund may invest as of a particular date. It may not be representative of the Fund’s current or future investments and should not be construed as a recommendation to purchase or sell a particular security. |
| 30 | State Street Institutional International Equity Fund |
| Average Annual Total Return for the years ended September 30, 2021 | |||||||
| Investment Class Shares (Inception date: 11/25/97) | |||||||
| One Year | Five Year | Ten Year | Ending Value of a $10,000 Investment | ||||
| State Street Institutional International Equity Fund | 24.53% | 10.19% | 8.73% | $23,091 | |||
| MSCI EAFE Index | 25.73% | 8.81% | 8.10% | $21,785 | |||
| Service Class Shares (Inception date: 1/3/01) | |||||||
| One Year | Five Year | Ten Year | Ending Value of a $10,000 Investment | ||||
| State Street Institutional International Equity Fund | 24.17% | 9.92% | 8.46% | $22,520 | |||
| MSCI EAFE Index | 25.73% | 8.81% | 8.10% | $21,785 | |||

| State Street Institutional International Equity Fund | 31 |
| Investment Class | Actual Fund Return | Hypothetical 5% Return (2.5% for the period) | ||
| Actual Fund Return | ||||
| Begining Account Value April 1, 2021 | $1,000.00 | $1,000.00 | ||
| Ending Account Value September 30, 2021 | $1,062.90 | $1,022.30 | ||
| Expenses Paid During Period* | $ 2.84 | $ 2.79 |
| * | Expenses are equal to the Fund's annualized expense ratio of 0.55% for Investment Class shares and 0.80% for Service Class shares (for the period April 1, 2021 - September 30, 2021), multiplied by the average account value over the period, multiplied by 183/365 (to reflect the one-half year period). |
| Service Class | Actual Fund Return | Hypothetical 5% Return (2.5% for the period) | ||
| Actual Fund Return | ||||
| Begining Account Value April 1, 2021 | $1,000.00 | $1,000.00 | ||
| Ending Account Value September 30, 2021 | $1,061.20 | $1,021.10 | ||
| Expenses Paid During Period* | $ 4.13 | $ 4.05 |
| * | Expenses are equal to the Fund's annualized expense ratio of 0.55% for Investment Class shares and 0.80% for Service Class shares (for the period April 1, 2021 - September 30, 2021), multiplied by the average account value over the period, multiplied by 183/365 (to reflect the one-half year period). |
| 32 | State Street Institutional International Equity Fund |
| Number of Shares | Fair Value | |
| Common Stock - 98.0% † | ||
| Australia - 1.6% | ||
| BHP Group PLC | 71,260 | $ 1,796,615 |
| Brazil - 0.5% | ||
| Itau Unibanco Holding S.A. ADR (a) | 102,462 | 539,975 |
| Canada - 1.2% | ||
| Brookfield Asset Management Inc., Class A | 25,742 | 1,379,097 |
| France - 16.4% | ||
| Air Liquide S.A. | 17,745 | 2,843,513 |
| AXA S.A. | 72,370 | 2,006,647 |
| BNP Paribas S.A. | 37,409 | 2,394,693 |
| Cie de Saint-Gobain | 21,457 | 1,444,740 |
| Dassault Systemes SE | 30,605 | 1,611,438 |
| LVMH Moet Hennessy Louis Vuitton SE | 4,513 | 3,234,172 |
| Safran S.A. | 17,698 | 2,239,613 |
| Vivendi SE | 60,523 | 762,376 |
| Worldline S.A. (b)(c) | 28,720 | 2,190,345 |
| 18,727,537 | ||
| Germany - 6.8% | ||
| adidas AG (a) | 4,462 | 1,402,939 |
| HeidelbergCement AG | 22,087 | 1,648,618 |
| Infineon Technologies AG | 63,265 | 2,588,763 |
| SAP SE | 15,627 | 2,114,320 |
| 7,754,640 | ||
| Hong Kong - 2.7% | ||
| AIA Group Ltd. | 267,802 | 3,080,901 |
| Ireland - 1.4% | ||
| Kerry Group PLC, Class A | 12,135 | 1,631,408 |
| Japan - 26.2% | ||
| Daikin Industries Ltd. | 13,500 | 2,936,130 |
| Disco Corp. | 6,100 | 1,704,246 |
| FANUC Corp. | 4,449 | 973,048 |
| Fast Retailing Company Ltd. | 2,300 | 1,692,029 |
| Hoya Corp. | 20,954 | 3,261,012 |
| Kao Corp. | 24,900 | 1,478,169 |
| Komatsu Ltd. | 76,400 | 1,825,067 |
| Mitsubishi UFJ Financial Group Inc. | 429,374 | 2,531,801 |
| Murata Manufacturing Company Ltd. | 26,537 | 2,341,372 |
| Nidec Corp. | 8,058 | 886,085 |
| Recruit Holdings Company Ltd. | 55,100 | 3,359,581 |
| Secom Company Ltd. | 14,600 | 1,053,339 |
| Number of Shares | Fair Value | |
| Shimadzu Corp. | 43,443 | $ 1,903,062 |
| Shiseido Company Ltd. | 31,338 | 2,100,923 |
| Tokio Marine Holdings Inc. | 34,649 | 1,852,698 |
| 29,898,562 | ||
| Netherlands - 9.1% | ||
| ASML Holding N.V. | 5,443 | 4,068,344 |
| ING Groep N.V. | 169,545 | 2,466,207 |
| Koninklijke DSM N.V. | 11,168 | 2,234,488 |
| Universal Music Group N.V. (c) | 60,523 | 1,621,358 |
| 10,390,397 | ||
| Norway - 1.8% | ||
| Equinor ASA | 79,921 | 2,035,366 |
| Portugal - 1.0% | ||
| Galp Energia SGPS S.A. | 103,070 | 1,171,274 |
| Spain - 3.9% | ||
| Cellnex Telecom S.A. (b) | 30,095 | 1,859,029 |
| Industria de Diseno Textil S.A. | 70,160 | 2,582,927 |
| 4,441,956 | ||
| Sweden - 2.1% | ||
| Assa Abloy AB, Class B | 84,988 | 2,466,862 |
| Switzerland - 8.9% | ||
| Nestle S.A. | 32,790 | 3,947,056 |
| Novartis AG | 36,851 | 3,018,836 |
| Roche Holding AG | 8,713 | 3,176,913 |
| 10,142,805 | ||
| Taiwan - 1.3% | ||
| Taiwan Semiconductor Manufacturing Company Ltd. | 74,548 | 1,541,808 |
| United Kingdom - 9.8% | ||
| Ashtead Group PLC | 32,676 | 2,471,830 |
| AstraZeneca PLC | 26,553 | 3,202,364 |
| London Stock Exchange Group PLC | 21,536 | 2,159,605 |
| Prudential PLC | 97,416 | 1,891,730 |
| Vodafone Group PLC | 941,909 | 1,434,307 |
| 11,159,836 | ||
| United States - 3.3% | ||
| Schneider Electric SE | 22,461 | 3,742,904 |
| Total Common Stock (Cost $82,460,060) | 111,901,943 | |
| State Street Institutional International Equity Fund | 33 |
| Number of Shares | Fair Value | |
| Short-Term Investments - 1.0% | ||
| State Street Institutional U.S. Government Money Market Fund - Class G Shares 0.03% (d)(e) (Cost $1,174,331) | 1,174,331 | $ 1,174,330 |
| Total Investments (Cost $83,634,391) | 113,076,273 | |
| Other Assets and Liabilities, net - 1.0% | 1,127,683 | |
| NET ASSETS - 100.0% | $ 114,203,956 | |
| The Fund had the following long futures contracts open at September 30, 2021: |
| Description | Expiration Date | Number of Contracts | Notional Amount | Value | Unrealized Appreciation (Depreciation) |
| MSCI EAFE Mini Index Futures | December 2021 | 4 | $ 474,112 | $ 453,400 | $ (20,712) |
| (a) | At September 30, 2021, all or a portion of this security was pledged to cover collateral requirements for futures. |
| (b) | Pursuant to Rule 144A of the Securities Act of 1933, as amended, these securities may be resold in transactions exempt from registration, normally to qualified institutional buyers. At September 30, 2021, these securities amounted to $4,049,374 or 3.55% of the net assets of the State Street Institutional International Equity Fund. These securities have been determined to be liquid using procedures established by the Fund's Board of Trustees. |
| (c) | Non-income producing security. |
| (d) | Sponsored by SSGA Funds Management, Inc., the Fund’s investment adviser and administrator, and an affiliate of State Street Bank & Trust Co., the Fund’s sub-administrator, custodian and accounting agent. |
| (e) | Coupon amount represents effective yield. |
| † | Percentages are based on net assets as of September 30, 2021. |
| Abbreviations: |
| ADR - American Depositary Receipt |
| 34 | State Street Institutional International Equity Fund |
| Investments | Level 1 | Level 2 | Level 3 | Total | |||
| Investments in Securities | |||||||
| Common Stock | $ 7,030,867 | $ 104,871,076 | $ — | $ 111,901,943 | |||
| Short-Term Investments | 1,174,330 | — | — | 1,174,330 | |||
| Total Investments in Securities | $ 8,205,197 | $ 104,871,076 | $ — | $ 113,076,273 | |||
| Other Financial Instruments | |||||||
| Long Futures Contracts - Unrealized Depreciation | $ (20,712) | $ — | $ — | $ (20,712) | |||
| Total Other Financial Instruments | $ (20,712) | $ — | $ — | $ (20,712) |
| Sector | Percentage (based on Fair Value) | ||
| Pharmaceuticals | 8.31% | ||
| Diversified Banks | 7.02% | ||
| Building Products | 6.06% | ||
| Semiconductor Equipment | 5.11% | ||
| Packaged Foods & Meats | 4.93% | ||
| Life & Health Insurance | 4.39% | ||
| Apparel, Accessories & Luxury Goods | 4.10% | ||
| Electrical Components & Equipment | 4.09% | ||
| Apparel Retail | 3.79% | ||
| Semiconductors | 3.65% | ||
| Application Software | 3.30% | ||
| Personal Products | 3.17% | ||
| Human Resource & Employment Services | 2.97% | ||
| Healthcare Supplies | 2.88% | ||
| Integrated Oil & Gas | 2.84% | ||
| Industrial Gases | 2.51% | ||
| Trading Companies & Distributors | 2.19% | ||
| Electronic Components | 2.07% | ||
| Aerospace & Defense | 1.98% | ||
| Specialty Chemicals | 1.98% | ||
| Data Processing & Outsourced Services | 1.94% | ||
| Financial Exchanges & Data | 1.91% | ||
| Multi-Line Insurance | 1.77% | ||
| Electronic Equipment & Instruments | 1.68% | ||
| Property & Casualty Insurance | 1.64% | ||
| Integrated Telecommunication Services | 1.64% | ||
| Construction Machinery & Heavy Trucks | 1.61% | ||
| Diversified Metals & Mining | 1.59% | ||
| Construction Materials | 1.46% | ||
| Movies & Entertainment | 1.43% | ||
| Wireless Telecommunication Services | 1.27% | ||
| Asset Management & Custody Banks | 1.22% | ||
| Security & Alarm Services | 0.93% | ||
| Industrial Machinery | 0.86% | ||
| Broadcasting | 0.67% | ||
| 98.96% | |||
| State Street Institutional International Equity Fund | 35 |
| Sector | Percentage (based on Fair Value) | ||
| Short-Term Investments | |||
| Short-Term Investments | 1.04% | ||
| 100.00% | |||
| Affiliate Table |
| Number of Shares Held at 9/30/20 | Value at 9/30/20 | Cost of Purchases | Proceeds from Shares Sold | Realized Gain (Loss) | Change in Unrealized Appreciation (Depreciation) | Number of Shares Held at 9/30/21 | Value at 9/30/21 | Dividend Income | |
| State Street Institutional U.S. Government Money Market Fund - Class G Shares | 1,143,904 | $1,143,904 | $12,856,421 | $12,825,995 | $— | $— | 1,174,331 | $1,174,330 | $488 |
| 36 | State Street Institutional International Equity Fund |
| State Street Active Core Bond Fund | 37 |
| Sector Allocation |
| Portfolio Composition as a % of Fair Value of $162,815 (in thousands) as of September 30, 2021 (a)(b) |

| Quality Ratings | ||
| as of September 30, 2021 as a % of Fair Value (a)(b)* | ||
| Moody’s / S&P / Rating | Percentage of Fair Value | |
| Aaa / AAA | 17.72% | |
| Aa / AA | 48.70% | |
| A / A | 6.53% | |
| Baa / BBB | 23.73% | |
| Ba / BB and lower | 2.53% | |
| NR / Other | 0.79% | |
| 100.00% | ||
| (a) | Fair Value basis is inclusive of short-term investment in State Street Institutional U.S. Government Money Market Fund – Class G Shares. |
| (b) | The securities information regarding holdings, allocations and other characteristics is presented to illustrate examples of securities that the Fund has bought and the diversity of areas in which the Fund may invest as of a particular date. It may not be representative of the Fund’s current or future investments and should not be construed as a recommendation to purchase or sell a particular security. |
| * | Moody’s Investors Services, Inc. (“Moody’s”) and S&P Global Ratings (“S&P”) are nationally recognized statistical rating organizations. The quality ratings represent the lower of Moody’s or S&P credit ratings. When a rating from only one of the rating agencies is available, that rating is used. Securities not rated by Moody’s or S&P are categorized as not rated. Credit quality measures a bond issuer’s ability to repay interest and principal in a timely manner. Credit quality ratings assigned by a rating agency are subject to change periodically and are not absolute standard of quality. In formulating investment decisions for the Fund, SSGA Funds Management, Inc. (“SSGA FM”) develops its own analysis of the credit quality and risks associated with individual debt instruments, rather than relying exclusively on rating agency ratings. |
| 38 | State Street Active Core Bond Fund |
| Average Annual Total Return for the years ended September 30, 2021 | |||||||
| Investment Class Shares (Inception date: 11/21/97) | |||||||
| One Year | Five Year | Ten Year | Ending Value of a $10,000 Investment | ||||
| State Street Active Core Bond Fund | 0.27% | 3.23% | 3.49% | $14,094 | |||
| Bloomberg U.S. Aggregate Bond Index | (0.90)% | 2.94% | 3.01% | $13,455 | |||
| Service Class Shares (Inception date: 9/30/05) | |||||||
| One Year | Five Year | Ten Year | Ending Value of a $10,000 Investment | ||||
| State Street Active Core Bond Fund | 0.06% | 2.99% | 3.24% | $13,760 | |||
| Bloomberg U.S. Aggregate Bond Index | (0.90)% | 2.94% | 3.01% | $13,455 | |||

| State Street Active Core Bond Fund | 39 |
| Investment Class | Actual Fund Return | Hypothetical 5% Return (2.5% for the period) | ||
| Actual Fund Return | ||||
| Begining Account Value April 1, 2021 | $1,000.00 | $1,000.00 | ||
| Ending Account Value September 30, 2021 | $1,020.90 | $1,023.70 | ||
| Expenses Paid During Period* | $ 1.37 | $ 1.37 |
| * | Expenses are equal to the Fund's annualized expense ratio of 0.27% for Investment Class shares and 0.52% for Service Class shares (for the period April 1, 2021 - September 30, 2021), multiplied by the average account value over the period, multiplied by 183/365 (to reflect the one-half year period). |
| Service Class | Actual Fund Return | Hypothetical 5% Return (2.5% for the period) | ||
| Actual Fund Return | ||||
| Begining Account Value April 1, 2021 | $1,000.00 | $1,000.00 | ||
| Ending Account Value September 30, 2021 | $1,019.40 | $1,022.50 | ||
| Expenses Paid During Period* | $ 2.63 | $ 2.64 |
| * | Expenses are equal to the Fund's annualized expense ratio of 0.27% for Investment Class shares and 0.52% for Service Class shares (for the period April 1, 2021 - September 30, 2021), multiplied by the average account value over the period, multiplied by 183/365 (to reflect the one-half year period). |
| 40 | State Street Active Core Bond Fund |
| Principal Amount | Fair Value | |
| Bonds and Notes - 96.8% † | ||
| U.S. Treasuries - 26.2% | ||
| U.S. Treasury Bonds | ||
| 1.13%, 05/15/40 (a) | $ 2,757,000 | $ 2,383,513 |
| 1.25%, 05/15/50 (a) | 649,900 | 531,801 |
| 2.25%, 08/15/46 (a) | 883,600 | 912,731 |
| 3.00%, 08/15/48 (a) | 1,978,400 | 2,358,006 |
| U.S. Treasury Notes | ||
| 0.13%, 07/15/23 - 12/15/23 (a) | 3,983,900 | 3,966,815 |
| 0.25%, 07/31/25 (a) | 4,051,100 | 3,974,192 |
| 0.75%, 04/30/26 - 01/31/28 (a) | 14,768,000 | 14,421,868 |
| 1.38%, 01/31/22 (a) | 4,964,000 | 4,985,524 |
| 1.63%, 05/15/31 (a) | 3,996,000 | 4,043,453 |
| 2.63%, 02/15/29 (a) | 1,022,300 | 1,114,946 |
| 38,692,849 | ||
| Agency Mortgage Backed - 26.3% | ||
| Federal Home Loan Mortgage Corp. | ||
| 3.00%, 04/01/43 - 10/01/49 (a) | 2,857,094 | 3,030,733 |
| 4.50%, 06/01/33 - 02/01/35 (a) | 5,561 | 6,190 |
| 5.00%, 07/01/35 (a) | 49,180 | 55,970 |
| 5.50%, 01/01/38 - 04/01/39 (a) | 111,851 | 129,087 |
| 6.00%, 02/01/29 - 11/01/37 (a) | 140,498 | 161,593 |
| 6.50%, 10/01/33 (a) | 694 | 812 |
| 7.00%, 12/01/29 - 08/01/36 (a) | 36,896 | 43,176 |
| 7.50%, 01/01/30 - 09/01/33 (a) | 1,627 | 1,813 |
| 8.00%, 11/01/30 (a) | 8,051 | 9,077 |
| 8.50%, 04/01/30 (a) | 8,821 | 11,046 |
| Federal National Mortgage Assoc. | ||
| 2.50%, 02/01/51 - 03/01/51 (a) | 6,122,694 | 6,346,037 |
| 3.00%, 03/01/50 (a) | 656,330 | 686,159 |
| 3.50%, 08/01/45 - 01/01/48 (a) | 3,042,809 | 3,272,516 |
| 4.00%, 01/01/41 - 01/01/50 (a) | 2,087,718 | 2,276,974 |
| 4.50%, 07/01/33 - 12/01/48 (a) | 1,084,991 | 1,203,483 |
| 5.00%, 03/01/34 - 05/01/39 (a) | 133,906 | 152,345 |
| 5.50%, 12/01/32 - 04/01/38 (a) | 215,767 | 246,273 |
| 6.00%, 02/01/29 - 07/01/35 (a) | 265,903 | 305,102 |
| Principal Amount | Fair Value | |
| 6.50%, 10/01/28 - 08/01/36 (a) | $ 28,393 | $ 31,592 |
| 7.00%, 10/01/32 - 02/01/34 (a) | 5,697 | 6,331 |
| 7.50%, 12/01/23 - 03/01/33 (a) | 20,085 | 22,885 |
| 8.00%, 07/01/25 - 10/01/31 (a) | 4,558 | 5,015 |
| 9.00%, 12/01/22 (a) | 57 | 58 |
| Federal National Mortgage Assoc. 1.25% + COF 11 | ||
| 5.50%, 10/01/24 (a)(b) | 3,054 | 3,150 |
| Federal National Mortgage Assoc. 1.60% + 12 month USD LIBOR | ||
| 1.85%, 04/01/37 (a)(b) | 1,960 | 2,007 |
| Federal National Mortgage Assoc. TBA | ||
| 2.00%, 10/01/36 - 10/01/51 (c) | 4,898,558 | 4,942,965 |
| 3.00%, 10/01/51 (c) | 6,571,615 | 6,875,618 |
| Government National Mortgage Assoc. | ||
| 3.00%, 12/20/42 - 05/20/45 (a) | 3,297,282 | 3,493,952 |
| 3.50%, 08/20/48 (a) | 547,949 | 580,047 |
| 4.00%, 01/20/41 - 04/20/43 (a) | 905,448 | 996,960 |
| 4.50%, 08/15/33 - 05/20/40 (a) | 152,592 | 171,069 |
| 5.00%, 08/15/33 (a) | 12,628 | 14,029 |
| 6.00%, 04/15/27 - 04/15/35 (a) | 103,391 | 118,775 |
| 6.50%, 02/15/24 - 09/15/36 (a) | 41,279 | 45,989 |
| 7.00%, 10/15/27 - 10/15/36 (a) | 21,558 | 24,701 |
| 7.50%, 01/15/23 - 03/15/28 (a) | 1,216 | 1,247 |
| 8.00%, 05/15/30 - 09/15/30 (a) | 106 | 111 |
| Government National Mortgage Assoc. TBA | ||
| 2.50%, 10/01/51 (c) | 1,833,000 | 1,891,821 |
| 3.00%, 10/01/51 (c) | 1,533,328 | 1,601,929 |
| 38,768,637 | ||
| Agency Collateralized Mortgage Obligations - 0.4% | ||
| Federal Home Loan Mortgage Corp. | ||
| 0.08%, 09/25/43 (b)(d) | 475,665 | 2,024 |
| 2.51%, 07/25/29 (a) | 290,000 | 309,177 |
| Federal Home Loan Mortgage Corp. REMIC | ||
| 3.50%, 11/15/30 (d) | 55,450 | 1,416 |
| State Street Active Core Bond Fund | 41 |
| Principal Amount | Fair Value | |
| 5.50%, 06/15/33 (d) | $ 15,008 | $ 2,364 |
| 7.50%, 07/15/27 (d) | 1,442 | 211 |
| Federal Home Loan Mortgage Corp. REMIC 6.60% - 1 month USD LIBOR | ||
| 6.50%, 08/15/25 (b)(d)** | 1,817 | — |
| Federal Home Loan Mortgage Corp. STRIPS | ||
| 0.00%, 08/01/27 (e) | 343 | 327 |
| 8.00%, 02/01/23 - 07/01/24 (d) | 642 | 49 |
| Federal National Mortgage Assoc. REMIC | ||
| 1.10%, 12/25/42 (b)(d) | 87,445 | 2,796 |
| 5.00%, 02/25/40 - 09/25/40 (d) | 54,614 | 5,933 |
| Federal National Mortgage Assoc. REMIC 6.00% - 1 month USD LIBOR | ||
| 5.91%, 07/25/38 (b)(d) | 26,872 | 3,547 |
| Federal National Mortgage Assoc. REMIC 6.55% - 1 month USD LIBOR | ||
| 6.46%, 11/25/41 (b)(d) | 1,112,281 | 218,683 |
| Federal National Mortgage Assoc. STRIPS | ||
| 0.01%, 12/25/34 (e) | 6,565 | 5,902 |
| 4.50%, 08/25/35 - 01/25/36 (d) | 42,324 | 5,593 |
| 5.00%, 03/25/38 - 05/25/38 (d) | 26,170 | 4,811 |
| 5.50%, 12/25/33 (d) | 6,864 | 1,350 |
| 6.00%, 01/25/35 (d) | 30,243 | 4,783 |
| 7.50%, 11/25/23 (d) | 2,083 | 108 |
| 8.00%, 08/25/23 - 07/25/24 (d) | 1,192 | 95 |
| 8.50%, 07/25/22 (d)** | 3 | — |
| 569,169 | ||
| Asset Backed - 0.7% | ||
| CarMax Auto Owner Trust 2018-3 | ||
| 3.13%, 06/15/23 (a) | 21,468 | 21,597 |
| Chase Funding Trust 2004-1 | ||
| 4.99%, 11/25/33 (a)(f) | 93,025 | 93,025 |
| Enterprise Fleet Financing 2019-1 LLC | ||
| 3.07%, 10/20/24 (a)(g) | 473,000 | 478,912 |
| Ford Credit Auto Owner Trust 2020-B | ||
| 0.56%, 10/15/24 (a) | 264,000 | 264,730 |
| Santander Retail Auto Lease Trust 2019-B | ||
| 2.30%, 01/20/23 (a)(g) | 265,634 | 266,815 |
| 1,125,079 | ||
| Principal Amount | Fair Value | |
| Corporate Notes - 35.4% | ||
| 3M Co. | ||
| 3.13%, 09/19/46 (a) | $ 38,000 | $ 39,252 |
| 7-Eleven Inc. | ||
| 0.95%, 02/10/26 (a)(g) | 195,000 | 191,073 |
| Abbott Laboratories | ||
| 3.75%, 11/30/26 (a) | 223,000 | 250,077 |
| 4.90%, 11/30/46 (a) | 34,000 | 46,026 |
| AbbVie Inc. | ||
| 2.60%, 11/21/24 (a) | 65,000 | 68,326 |
| 2.95%, 11/21/26 (a) | 99,000 | 106,078 |
| 3.20%, 05/14/26 - 11/21/29 (a) | 97,000 | 104,532 |
| 3.25%, 10/01/22 (a) | 29,000 | 29,631 |
| 3.45%, 03/15/22 (a) | 87,000 | 87,781 |
| 4.05%, 11/21/39 (a) | 26,000 | 29,866 |
| 4.25%, 11/21/49 (a) | 65,000 | 76,959 |
| 4.63%, 10/01/42 (a) | 2,000 | 2,414 |
| 4.70%, 05/14/45 (a) | 5,000 | 6,172 |
| 4.88%, 11/14/48 (a) | 5,000 | 6,408 |
| Advance Auto Parts Inc. | ||
| 3.90%, 04/15/30 (a) | 114,000 | 126,102 |
| AEP Texas Inc. | ||
| 3.45%, 05/15/51 (a) | 91,000 | 94,579 |
| Aetna Inc. | ||
| 3.50%, 11/15/24 (a) | 29,000 | 31,183 |
| Aircastle Ltd. | ||
| 4.25%, 06/15/26 (a) | 53,000 | 57,903 |
| Alcon Finance Corp. | ||
| 2.60%, 05/27/30 (a)(g) | 201,000 | 205,637 |
| Alexandria Real Estate Equities Inc. | ||
| 1.88%, 02/01/33 (a) | 29,000 | 27,350 |
| 4.70%, 07/01/30 (a) | 36,000 | 42,702 |
| Ally Financial Inc. | ||
| 5.75%, 11/20/25 (a) | 12,000 | 13,718 |
| Altria Group Inc. | ||
| 3.40%, 05/06/30 - 02/04/41 (a) | 40,000 | 38,928 |
| 4.00%, 02/04/61 (a) | 18,000 | 17,318 |
| 4.45%, 05/06/50 (a) | 19,000 | 20,029 |
| 4.50%, 05/02/43 (a) | 9,000 | 9,652 |
| Amazon.com Inc. | ||
| 1.50%, 06/03/30 (a) | 24,000 | 23,330 |
| 2.50%, 06/03/50 (a) | 44,000 | 41,296 |
| 2.70%, 06/03/60 (a) | 23,000 | 21,639 |
| 2.88%, 05/12/41 (a) | 53,000 | 54,550 |
| 3.15%, 08/22/27 (a) | 24,000 | 26,386 |
| 3.25%, 05/12/61 (a) | 39,000 | 41,414 |
| 4.05%, 08/22/47 (a) | 8,000 | 9,700 |
| 4.25%, 08/22/57 (a) | 4,000 | 5,081 |
| Ameren Corp. | ||
| 2.50%, 09/15/24 (a) | 75,000 | 78,370 |
| 42 | State Street Active Core Bond Fund |
| Principal Amount | Fair Value | |
| American Electric Power Company Inc. | ||
| 2.30%, 03/01/30 (a) | $ 23,000 | $ 22,911 |
| 3.25%, 03/01/50 (a) | 23,000 | 22,997 |
| American International Group Inc. | ||
| 4.25%, 03/15/29 (a) | 75,000 | 85,856 |
| 4.50%, 07/16/44 (a) | 96,000 | 117,215 |
| American International Group Inc. (5.75% fixed rate until 04/01/28; 2.87% + 3 month USD LIBOR thereafter) | ||
| 5.75%, 04/01/48 (a)(b) | 36,000 | 41,324 |
| American Tower Corp. | ||
| 1.50%, 01/31/28 (a) | 92,000 | 89,227 |
| 2.90%, 01/15/30 (a) | 103,000 | 107,203 |
| 3.70%, 10/15/49 (a) | 24,000 | 25,930 |
| 3.80%, 08/15/29 (a) | 24,000 | 26,576 |
| 4.70%, 03/15/22 (a) | 200,000 | 203,492 |
| American Water Capital Corp. | ||
| 2.95%, 09/01/27 (a) | 56,000 | 60,235 |
| Amgen Inc. | ||
| 2.00%, 01/15/32 (a) | 180,000 | 173,547 |
| 2.45%, 02/21/30 (a) | 114,000 | 116,500 |
| 3.00%, 01/15/52 (a) | 60,000 | 57,941 |
| 3.15%, 02/21/40 (a) | 50,000 | 50,968 |
| 3.38%, 02/21/50 (a) | 14,000 | 14,483 |
| 4.56%, 06/15/48 (a) | 18,000 | 22,242 |
| 4.66%, 06/15/51 (a) | 5,000 | 6,312 |
| Anheuser-Busch Companies LLC/Anheuser-Busch InBev Worldwide Inc. | ||
| 3.65%, 02/01/26 (a) | 239,000 | 262,257 |
| 4.70%, 02/01/36 (a) | 12,000 | 14,506 |
| 4.90%, 02/01/46 (a) | 20,000 | 24,837 |
| Anheuser-Busch InBev Worldwide Inc. | ||
| 3.50%, 06/01/30 (a) | 70,000 | 76,695 |
| 4.00%, 04/13/28 (a) | 31,000 | 34,984 |
| 4.35%, 06/01/40 (a) | 65,000 | 75,769 |
| 4.38%, 04/15/38 (a) | 36,000 | 42,027 |
| 4.50%, 06/01/50 (a) | 80,000 | 95,717 |
| 4.60%, 04/15/48 (a) | 17,000 | 20,351 |
| 4.75%, 04/15/58 (a) | 10,000 | 12,274 |
| 5.55%, 01/23/49 (a) | 12,000 | 16,247 |
| Anthem Inc. | ||
| 2.88%, 09/15/29 (a) | 16,000 | 16,847 |
| 3.30%, 01/15/23 (a) | 27,000 | 28,007 |
| 3.60%, 03/15/51 (a) | 22,000 | 24,027 |
| 3.70%, 09/15/49 (a) | 16,000 | 17,596 |
| Aon Corp./Aon Global Holdings PLC | ||
| 2.90%, 08/23/51 (a) | 60,000 | 57,901 |
| Principal Amount | Fair Value | |
| Apollo Management Holdings LP | ||
| 2.65%, 06/05/30 (a)(g) | $ 35,000 | $ 35,344 |
| Apollo Management Holdings LP (4.95% fixed rate until 12/17/24; 3.27% + 5 year CMT Rate thereafter) | ||
| 4.95%, 01/14/50 (a)(b)(g) | 50,000 | 52,133 |
| Apple Inc. | ||
| 2.20%, 09/11/29 (a) | 57,000 | 58,675 |
| 2.65%, 02/08/51 (a) | 60,000 | 57,733 |
| 2.80%, 02/08/61 (a) | 44,000 | 42,311 |
| 2.95%, 09/11/49 (a) | 14,000 | 14,225 |
| 3.35%, 02/09/27 (a) | 10,000 | 11,021 |
| 3.45%, 02/09/45 (a) | 27,000 | 29,834 |
| 3.85%, 08/04/46 (a) | 31,000 | 36,189 |
| Applied Materials Inc. | ||
| 4.35%, 04/01/47 (a) | 73,000 | 90,955 |
| Aptiv PLC | ||
| 4.40%, 10/01/46 (a) | 17,000 | 20,076 |
| Archer-Daniels-Midland Co. | ||
| 2.50%, 08/11/26 (a) | 9,000 | 9,576 |
| Ares Capital Corp. | ||
| 2.88%, 06/15/28 (a) | 132,000 | 134,001 |
| 3.25%, 07/15/25 (a) | 202,000 | 212,209 |
| Arthur J Gallagher & Co. | ||
| 3.50%, 05/20/51 (a) | 68,000 | 72,304 |
| Ascension Health | ||
| 4.85%, 11/15/53 (a) | 16,000 | 22,743 |
| Ashtead Capital Inc. | ||
| 1.50%, 08/12/26 (a)(g) | 200,000 | 197,734 |
| Astrazeneca Finance LLC | ||
| 1.75%, 05/28/28 (a) | 87,000 | 87,515 |
| AstraZeneca PLC | ||
| 3.00%, 05/28/51 (a) | 41,000 | 42,259 |
| 4.00%, 01/17/29 (a) | 10,000 | 11,421 |
| 4.38%, 08/17/48 (a) | 4,000 | 5,065 |
| AT&T Inc. | ||
| 1.70%, 03/25/26 (a) | 229,000 | 231,966 |
| 2.30%, 06/01/27 (a) | 47,000 | 48,682 |
| 2.75%, 06/01/31 (a) | 205,000 | 210,531 |
| 3.30%, 02/01/52 (a) | 121,000 | 116,527 |
| 3.85%, 06/01/60 (a) | 63,000 | 65,196 |
| 4.35%, 03/01/29 (a) | 62,000 | 71,094 |
| 4.50%, 05/15/35 (a) | 64,000 | 74,874 |
| 4.55%, 03/09/49 (a) | 24,000 | 27,929 |
| 4.75%, 05/15/46 (a) | 33,000 | 39,418 |
| 4.80%, 06/15/44 (a) | 18,000 | 21,441 |
| 4.85%, 03/01/39 (a) | 28,000 | 33,553 |
| 5.25%, 03/01/37 (a) | 21,000 | 26,000 |
| 5.35%, 12/15/43 (a) | 14,000 | 17,367 |
| Athene Holding Ltd. | ||
| 6.15%, 04/03/30 (a) | 49,000 | 61,739 |
| State Street Active Core Bond Fund | 43 |
| Principal Amount | Fair Value | |
| Avangrid Inc. | ||
| 3.15%, 12/01/24 (a) | $ 45,000 | $ 47,949 |
| Bain Capital Specialty Finance Inc. | ||
| 2.95%, 03/10/26 (a) | 87,000 | 88,690 |
| Bank of America Corp. | ||
| 3.25%, 10/21/27 (a) | 4,000 | 4,318 |
| 4.18%, 11/25/27 (a) | 118,000 | 131,469 |
| Bank of America Corp. (2.09% fixed rate until 06/14/28; 1.06% + SOFR thereafter) | ||
| 2.09%, 06/14/29 (a)(b) | 132,000 | 131,886 |
| Bank of America Corp. (2.59% fixed rate until 04/29/30; 2.15% + SOFR thereafter) | ||
| 2.59%, 04/29/31 (a)(b) | 290,000 | 295,812 |
| Bank of America Corp. (3.12% fixed rate until 01/20/22; 1.16% + 3 month USD LIBOR thereafter) | ||
| 3.12%, 01/20/23 (a)(b) | 31,000 | 31,256 |
| Bank of America Corp. (3.37% fixed rate until 01/23/25; 0.81% + 3 month USD LIBOR thereafter) | ||
| 3.37%, 01/23/26 (a)(b) | 17,000 | 18,165 |
| Bank of America Corp. (3.56% fixed rate until 04/23/26; 1.06% + 3 month USD LIBOR thereafter) | ||
| 3.56%, 04/23/27 (a)(b) | 109,000 | 118,566 |
| Bank of America Corp. (3.71% fixed rate until 04/24/27; 1.51% + 3 month USD LIBOR thereafter) | ||
| 3.71%, 04/24/28 (a)(b) | 66,000 | 72,525 |
| Bank of America Corp. (3.95% fixed rate until 01/23/48; 1.19% + 3 month USD LIBOR thereafter) | ||
| 3.95%, 01/23/49 (a)(b) | 45,000 | 52,254 |
| Bank of America Corp. (4.24% fixed rate until 04/24/37; 1.81% + 3 month USD LIBOR thereafter) | ||
| 4.24%, 04/24/38 (a)(b) | 85,000 | 99,322 |
| Bank of America Corp. (4.27% fixed rate until 07/23/28; 1.31% + 3 month USD LIBOR thereafter) | ||
| 4.27%, 07/23/29 (a)(b) | 72,000 | 81,642 |
| Bank of America Corp. (4.30% fixed rate until 01/28/25; 2.66% + 3 month USD LIBOR thereafter) | ||
| 4.30%, 12/31/99 (a)(b) | 59,000 | 60,316 |
| Principal Amount | Fair Value | |
| Barclays PLC | ||
| 4.84%, 05/09/28 (a) | $ 200,000 | $ 226,320 |
| Barclays PLC (2.65% fixed rate until 06/24/30; 1.90% + 1 year CMT Rate thereafter) | ||
| 2.65%, 06/24/31 (a)(b) | 633,000 | 637,804 |
| Barclays PLC (2.85% fixed rate until 05/07/25; 2.71% + SOFR thereafter) | ||
| 2.85%, 05/07/26 (a)(b) | 200,000 | 209,894 |
| Barrick North America Finance LLC | ||
| 5.70%, 05/30/41 (a) | 3,000 | 4,058 |
| BAT Capital Corp. | ||
| 2.73%, 03/25/31 (a) | 55,000 | 54,207 |
| 4.39%, 08/15/37 (a) | 27,000 | 28,833 |
| 4.54%, 08/15/47 (a) | 14,000 | 14,586 |
| 4.70%, 04/02/27 (a) | 31,000 | 35,003 |
| 4.91%, 04/02/30 (a) | 33,000 | 37,828 |
| BAT International Finance PLC | ||
| 1.67%, 03/25/26 (a) | 32,000 | 32,016 |
| Baylor Scott & White Holdings | ||
| 2.84%, 11/15/50 (a) | 9,000 | 8,912 |
| Becton Dickinson & Co. | ||
| 3.70%, 06/06/27 (a) | 24,000 | 26,534 |
| 3.73%, 12/15/24 | 2,000 | 2,162 |
| 4.67%, 06/06/47 (a) | 3,000 | 3,736 |
| Berkshire Hathaway Energy Co. | ||
| 3.25%, 04/15/28 (a) | 14,000 | 15,262 |
| 3.70%, 07/15/30 (a) | 74,000 | 83,304 |
| 3.80%, 07/15/48 (a) | 35,000 | 39,505 |
| 4.25%, 10/15/50 (a) | 30,000 | 36,310 |
| 6.13%, 04/01/36 (a) | 58,000 | 80,291 |
| Berkshire Hathaway Finance Corp. | ||
| 1.45%, 10/15/30 (a) | 38,000 | 36,581 |
| 2.85%, 10/15/50 (a) | 25,000 | 24,554 |
| Berry Global Inc. | ||
| 4.88%, 07/15/26 (a)(g) | 101,000 | 106,013 |
| Biogen Inc. | ||
| 2.25%, 05/01/30 (a) | 18,000 | 17,880 |
| 3.15%, 05/01/50 (a) | 12,000 | 11,524 |
| Block Financial LLC | ||
| 2.50%, 07/15/28 (a) | 55,000 | 55,683 |
| 3.88%, 08/15/30 (a) | 14,000 | 15,228 |
| BNP Paribas S.A. (2.82% fixed rate until 11/19/24; 1.11% + 3 month USD LIBOR thereafter) | ||
| 2.82%, 11/19/25 (a)(b)(g) | 204,000 | 213,668 |
| Boardwalk Pipelines LP | ||
| 4.80%, 05/03/29 (a) | 21,000 | 24,026 |
| 44 | State Street Active Core Bond Fund |
| Principal Amount | Fair Value | |
| Boston Scientific Corp. | ||
| 4.70%, 03/01/49 (a) | $ 7,000 | $ 8,922 |
| BP Capital Markets America Inc. | ||
| 3.00%, 02/24/50 (a) | 40,000 | 38,517 |
| 3.02%, 01/16/27 (a) | 51,000 | 54,801 |
| 3.38%, 02/08/61 (a) | 82,000 | 81,582 |
| BP Capital Markets PLC (4.38% fixed rate until 06/22/25; 4.04% + 5 year CMT Rate thereafter) | ||
| 4.38%, 12/31/99 (a)(b) | 66,000 | 70,385 |
| BP Capital Markets PLC (4.88% fixed rate until 03/22/30; 4.40% + 5 year CMT Rate thereafter) | ||
| 4.88%, 12/31/99 (a)(b) | 48,000 | 52,704 |
| Bristol-Myers Squibb Co. | ||
| 1.45%, 11/13/30 (a) | 32,000 | 30,661 |
| 2.35%, 11/13/40 (a) | 59,000 | 56,025 |
| 3.20%, 06/15/26 (a) | 21,000 | 22,896 |
| 3.40%, 07/26/29 (a) | 38,000 | 42,113 |
| 3.45%, 11/15/27 (a) | 10,000 | 11,100 |
| 4.13%, 06/15/39 (a) | 17,000 | 20,307 |
| 4.25%, 10/26/49 (a) | 17,000 | 21,093 |
| 4.35%, 11/15/47 (a) | 2,000 | 2,490 |
| 4.55%, 02/20/48 (a) | 42,000 | 53,886 |
| 5.00%, 08/15/45 (a) | 19,000 | 25,534 |
| Brixmor Operating Partnership LP | ||
| 2.25%, 04/01/28 (a) | 78,000 | 78,704 |
| Broadcom Inc. | ||
| 3.14%, 11/15/35 (g) | 18,000 | 17,943 |
| 3.19%, 11/15/36 (g) | 2,000 | 1,997 |
| 3.42%, 04/15/33 (a)(g) | 32,000 | 33,162 |
| 3.47%, 04/15/34 (a)(g) | 3,000 | 3,102 |
| 4.15%, 11/15/30 (a) | 46,000 | 51,012 |
| 4.30%, 11/15/32 (a) | 34,000 | 38,057 |
| Brown-Forman Corp. | ||
| 4.00%, 04/15/38 (a) | 4,000 | 4,666 |
| Brunswick Corp. | ||
| 2.40%, 08/18/31 (a) | 185,000 | 178,336 |
| Bunge Limited Finance Corp. | ||
| 3.75%, 09/25/27 (a) | 8,000 | 8,834 |
| Burlington Northern Santa Fe LLC | ||
| 4.15%, 12/15/48 (a) | 56,000 | 68,057 |
| 4.55%, 09/01/44 (a) | 28,000 | 35,254 |
| Cameron LNG LLC | ||
| 3.30%, 01/15/35 (a)(g) | 15,000 | 16,005 |
| Canadian Natural Resources Ltd. | ||
| 3.85%, 06/01/27 (a) | 38,000 | 41,605 |
| 4.95%, 06/01/47 (a) | 3,000 | 3,715 |
| Principal Amount | Fair Value | |
| Canadian Pacific Railway Co. | ||
| 2.90%, 02/01/25 (a) | $ 13,000 | $ 13,732 |
| Capital One Financial Corp. | ||
| 3.75%, 07/28/26 (a) | 603,000 | 661,931 |
| Cardinal Health Inc. | ||
| 3.08%, 06/15/24 (a) | 12,000 | 12,676 |
| Carlisle Cos. Inc. | ||
| 2.20%, 03/01/32 | 152,000 | 147,653 |
| Carrier Global Corp. | ||
| 2.72%, 02/15/30 (a) | 33,000 | 34,120 |
| 3.58%, 04/05/50 (a) | 33,000 | 35,032 |
| Caterpillar Inc. | ||
| 3.25%, 09/19/49 - 04/09/50 (a) | 81,000 | 87,946 |
| Cenovus Energy Inc. | ||
| 2.65%, 01/15/32 | 40,000 | 39,281 |
| 3.75%, 02/15/52 | 45,000 | 43,884 |
| Centene Corp. | ||
| 3.38%, 02/15/30 (a) | 63,000 | 65,208 |
| 4.25%, 12/15/27 (a) | 164,000 | 171,636 |
| CenterPoint Energy Inc. | ||
| 2.65%, 06/01/31 (a) | 59,000 | 60,278 |
| Charter Communications Operating LLC/Charter Communications Operating Capital | ||
| 3.50%, 06/01/41 (a) | 53,000 | 52,164 |
| 3.70%, 04/01/51 (a) | 79,000 | 76,484 |
| 4.80%, 03/01/50 (a) | 76,000 | 85,609 |
| 4.91%, 07/23/25 (a) | 63,000 | 70,818 |
| 5.05%, 03/30/29 (a) | 36,000 | 42,043 |
| 5.75%, 04/01/48 (a) | 12,000 | 15,178 |
| Cheniere Corpus Christi Holdings LLC | ||
| 5.88%, 03/31/25 (a) | 81,000 | 91,487 |
| 7.00%, 06/30/24 (a) | 176,000 | 198,857 |
| Chevron Corp. | ||
| 2.24%, 05/11/30 (a) | 13,000 | 13,329 |
| 2.98%, 05/11/40 (a) | 23,000 | 23,742 |
| 3.08%, 05/11/50 (a) | 10,000 | 10,356 |
| Chevron USA Inc. | ||
| 3.85%, 01/15/28 (a) | 31,000 | 35,010 |
| 3.90%, 11/15/24 (a) | 16,000 | 17,473 |
| 4.20%, 10/15/49 (a) | 4,000 | 4,865 |
| 5.05%, 11/15/44 (a) | 2,000 | 2,669 |
| Choice Hotels International Inc. | ||
| 3.70%, 01/15/31 (a) | 33,000 | 35,345 |
| Chubb INA Holdings Inc. | ||
| 4.35%, 11/03/45 (a) | 43,000 | 54,060 |
| Cigna Corp. | ||
| 2.40%, 03/15/30 (a) | 29,000 | 29,488 |
| 3.25%, 04/15/25 (a) | 24,000 | 25,657 |
| State Street Active Core Bond Fund | 45 |
| Principal Amount | Fair Value | |
| 3.40%, 03/01/27 - 03/15/51 (a) | $ 39,000 | $ 40,880 |
| 3.75%, 07/15/23 (a) | 26,000 | 27,480 |
| 3.88%, 10/15/47 (a) | 2,000 | 2,211 |
| 4.13%, 11/15/25 (a) | 31,000 | 34,435 |
| 4.38%, 10/15/28 (a) | 10,000 | 11,557 |
| 4.80%, 08/15/38 (a) | 8,000 | 9,791 |
| 4.90%, 12/15/48 (a) | 2,000 | 2,553 |
| Cisco Systems Inc. | ||
| 5.90%, 02/15/39 (a) | 11,000 | 15,900 |
| Citigroup Inc. | ||
| 4.13%, 07/25/28 (a) | 177,000 | 197,682 |
| 4.65%, 07/23/48 (a) | 83,000 | 107,248 |
| Citigroup Inc. (0.98% fixed rate until 05/01/24; 0.67% + SOFR thereafter) | ||
| 0.98%, 05/01/25 (a)(b) | 56,000 | 56,214 |
| Citigroup Inc. (1.68% fixed rate until 05/15/23; 1.67% + SOFR thereafter) | ||
| 1.68%, 05/15/24 (a)(b) | 220,000 | 224,310 |
| Citigroup Inc. (2.56% fixed rate until 05/01/31; 1.17% + SOFR thereafter) | ||
| 2.56%, 05/01/32 (a)(b) | 59,000 | 59,676 |
| Citigroup Inc. (2.88% fixed rate until 07/24/22; 0.95% + 3 month USD LIBOR thereafter) | ||
| 2.88%, 07/24/23 (a)(b) | 65,000 | 66,267 |
| Citigroup Inc. (2.98% fixed rate until 11/05/29; 1.42% + SOFR thereafter) | ||
| 2.98%, 11/05/30 (a)(b) | 367,000 | 386,014 |
| Citigroup Inc. (3.88% fixed rate until 01/24/38; 1.17% + 3 month USD LIBOR thereafter) | ||
| 3.88%, 01/24/39 (a)(b) | 28,000 | 32,016 |
| Citigroup Inc. (4.70% fixed rate until 01/30/25; 3.23% + SOFR thereafter) | ||
| 4.70%, 12/31/99 (a)(b) | 22,000 | 22,560 |
| CMS Energy Corp. | ||
| 4.88%, 03/01/44 (a) | 39,000 | 49,963 |
| CNA Financial Corp. | ||
| 3.45%, 08/15/27 (a) | 27,000 | 29,645 |
| 3.90%, 05/01/29 (a) | 63,000 | 70,304 |
| CNH Industrial Capital LLC | ||
| 1.95%, 07/02/23 (a) | 70,000 | 71,574 |
| CNOOC Finance 2014 ULC | ||
| 4.25%, 04/30/24 (a) | 233,000 | 251,589 |
| CNOOC Petroleum North America ULC | ||
| 6.40%, 05/15/37 (a) | 69,000 | 91,876 |
| Principal Amount | Fair Value | |
| Comcast Corp. | ||
| 2.65%, 08/15/62 (a) | $ 20,000 | $ 17,697 |
| 2.80%, 01/15/51 (a) | 44,000 | 41,584 |
| 2.94%, 11/01/56 (a)(g) | 52,000 | 49,353 |
| 2.99%, 11/01/63 (a)(g) | 5,000 | 4,687 |
| 3.10%, 04/01/25 (a) | 35,000 | 37,444 |
| 3.20%, 07/15/36 (a) | 20,000 | 21,292 |
| 3.25%, 11/01/39 (a) | 46,000 | 48,644 |
| 3.45%, 02/01/50 (a) | 40,000 | 42,502 |
| 3.97%, 11/01/47 (a) | 26,000 | 29,641 |
| 4.15%, 10/15/28 (a) | 10,000 | 11,508 |
| CommonSpirit Health | ||
| 4.35%, 11/01/42 (a) | 129,000 | 147,733 |
| Conagra Brands Inc. | ||
| 5.30%, 11/01/38 (a) | 10,000 | 12,710 |
| 5.40%, 11/01/48 (a) | 8,000 | 10,712 |
| ConocoPhillips | ||
| 3.75%, 10/01/27 (a)(g) | 8,000 | 8,924 |
| 4.30%, 08/15/28 (a)(g) | 43,000 | 49,485 |
| 4.88%, 10/01/47 (a)(g) | 7,000 | 9,080 |
| ConocoPhillips Co. | ||
| 4.30%, 11/15/44 (a) | 20,000 | 23,994 |
| Consolidated Edison Company of New York Inc. | ||
| 2.90%, 12/01/26 (a) | 22,000 | 23,278 |
| 3.35%, 04/01/30 (a) | 14,000 | 15,319 |
| 3.88%, 06/15/47 (a) | 47,000 | 52,325 |
| 3.95%, 04/01/50 (a) | 40,000 | 45,737 |
| Constellation Brands Inc. | ||
| 3.15%, 08/01/29 (a) | 210,000 | 224,771 |
| 3.70%, 12/06/26 (a) | 42,000 | 46,397 |
| 4.50%, 05/09/47 (a) | 17,000 | 20,285 |
| Continental Resources Inc. | ||
| 3.80%, 06/01/24 (a) | 290,000 | 304,807 |
| 4.50%, 04/15/23 (a) | 122,000 | 126,320 |
| Corning Inc. | ||
| 4.38%, 11/15/57 (a) | 18,000 | 21,663 |
| Corporate Nacional del Cobre de Chile | ||
| 3.15%, 01/15/51 (a)(g) | 85,000 | 78,307 |
| Corporate Office Properties LP | ||
| 2.00%, 01/15/29 (a) | 65,000 | 63,660 |
| 2.25%, 03/15/26 (a) | 50,000 | 51,192 |
| 2.75%, 04/15/31 (a) | 33,000 | 33,358 |
| Crown Castle International Corp. | ||
| 3.30%, 07/01/30 (a) | 251,000 | 267,591 |
| 4.15%, 07/01/50 (a) | 33,000 | 37,464 |
| 5.20%, 02/15/49 (a) | 32,000 | 41,436 |
| CSX Corp. | ||
| 4.50%, 03/15/49 - 08/01/54 (a) | 62,000 | 77,664 |
| 46 | State Street Active Core Bond Fund |
| Principal Amount | Fair Value | |
| CubeSmart LP | ||
| 4.38%, 02/15/29 (a) | $ 86,000 | $ 97,988 |
| CVS Health Corp. | ||
| 3.00%, 08/15/26 (a) | 17,000 | 18,249 |
| 3.25%, 08/15/29 (a) | 19,000 | 20,431 |
| 3.63%, 04/01/27 (a) | 29,000 | 31,991 |
| 3.75%, 04/01/30 (a) | 23,000 | 25,559 |
| 3.88%, 07/20/25 (a) | 13,000 | 14,236 |
| 4.25%, 04/01/50 (a) | 19,000 | 22,479 |
| 4.30%, 03/25/28 (a) | 3,000 | 3,421 |
| 4.78%, 03/25/38 (a) | 9,000 | 11,016 |
| 5.00%, 12/01/24 (a) | 28,000 | 31,280 |
| 5.13%, 07/20/45 (a) | 20,000 | 25,761 |
| 5.30%, 12/05/43 (a) | 32,000 | 42,037 |
| Dell International LLC/EMC Corp. | ||
| 4.00%, 07/15/24 (a) | 34,000 | 36,784 |
| 5.45%, 06/15/23 (a) | 269,000 | 288,715 |
| 6.02%, 06/15/26 (a) | 9,000 | 10,734 |
| 8.35%, 07/15/46 (a) | 25,000 | 40,825 |
| Devon Energy Corp. | ||
| 5.00%, 06/15/45 (a) | 10,000 | 11,734 |
| DH Europe Finance II Sarl | ||
| 2.60%, 11/15/29 (a) | 26,000 | 27,110 |
| 3.25%, 11/15/39 (a) | 15,000 | 16,022 |
| 3.40%, 11/15/49 (a) | 7,000 | 7,571 |
| Diamondback Energy Inc. | ||
| 2.88%, 12/01/24 (a) | 50,000 | 52,456 |
| 3.13%, 03/24/31 (a) | 53,000 | 54,955 |
| 3.25%, 12/01/26 (a) | 26,000 | 27,791 |
| 3.50%, 12/01/29 (a) | 24,000 | 25,675 |
| 4.40%, 03/24/51 (a) | 25,000 | 28,347 |
| Digital Realty Trust LP | ||
| 3.60%, 07/01/29 (a) | 33,000 | 36,171 |
| Discovery Communications LLC | ||
| 2.95%, 03/20/23 (a) | 65,000 | 67,236 |
| 3.95%, 03/20/28 (a) | 40,000 | 44,324 |
| 4.95%, 05/15/42 (a) | 3,000 | 3,544 |
| 5.00%, 09/20/37 (a) | 5,000 | 6,007 |
| Dollar General Corp. | ||
| 3.50%, 04/03/30 (a) | 52,000 | 57,210 |
| 4.13%, 04/03/50 (a) | 28,000 | 32,679 |
| Dollar Tree Inc. | ||
| 4.00%, 05/15/25 (a) | 51,000 | 55,757 |
| Dominion Energy Inc. | ||
| 3.07%, 08/15/24 (a)(f) | 26,000 | 27,498 |
| 3.38%, 04/01/30 (a) | 86,000 | 93,209 |
| Dover Corp. | ||
| 2.95%, 11/04/29 (a) | 29,000 | 30,835 |
| DTE Energy Co. | ||
| 2.85%, 10/01/26 (a) | 22,000 | 23,305 |
| Principal Amount | Fair Value | |
| Duke Energy Carolinas LLC | ||
| 3.95%, 03/15/48 (a) | $ 12,000 | $ 13,854 |
| Duke Energy Corp. | ||
| 2.55%, 06/15/31 (a) | 87,000 | 88,367 |
| 3.30%, 06/15/41 (a) | 79,000 | 80,759 |
| 3.50%, 06/15/51 (a) | 79,000 | 81,523 |
| 3.75%, 09/01/46 (a) | 114,000 | 121,710 |
| Duke Energy Corp. (4.88% fixed rate until 09/16/24; 3.39% + 5 year CMT Rate thereafter) | ||
| 4.88%, 12/31/99 (a)(b) | 75,000 | 80,101 |
| Duke Energy Progress LLC | ||
| 4.15%, 12/01/44 (a) | 16,000 | 18,934 |
| Duke Realty LP | ||
| 3.05%, 03/01/50 (a) | 14,000 | 13,766 |
| DuPont de Nemours Inc. | ||
| 5.42%, 11/15/48 (a) | 5,000 | 6,858 |
| Duquesne Light Holdings Inc. | ||
| 3.62%, 08/01/27 (a)(g) | 16,000 | 17,293 |
| Eastman Chemical Co. | ||
| 4.65%, 10/15/44 (a) | 32,000 | 38,347 |
| Eaton Corp. | ||
| 3.10%, 09/15/27 (a) | 37,000 | 40,089 |
| Ecolab Inc. | ||
| 1.30%, 01/30/31 (a) | 27,000 | 25,392 |
| Edison International | ||
| 4.95%, 04/15/25 (a) | 75,000 | 82,706 |
| 5.75%, 06/15/27 (a) | 6,000 | 6,910 |
| EI du Pont de Nemours & Co. | ||
| 2.30%, 07/15/30 (a) | 60,000 | 61,031 |
| Electronic Arts Inc. | ||
| 1.85%, 02/15/31 (a) | 47,000 | 45,448 |
| Emera US Finance LP | ||
| 2.64%, 06/15/31 (a)(g) | 87,000 | 87,418 |
| Emerson Electric Co. | ||
| 1.80%, 10/15/27 (a) | 24,000 | 24,415 |
| 2.75%, 10/15/50 (a) | 17,000 | 16,522 |
| Empower Finance 2020 LP | ||
| 1.36%, 09/17/27 (a)(g) | 56,000 | 54,987 |
| 1.78%, 03/17/31 (a)(g) | 166,000 | 159,460 |
| Enbridge Energy Partners LP | ||
| 5.50%, 09/15/40 (a) | 2,000 | 2,560 |
| Enbridge Inc. | ||
| 1.60%, 10/04/26 | 165,000 | 165,691 |
| Enbridge Inc. (5.75% fixed rate until 04/15/30; 5.31% + 5 year CMT Rate thereafter) | ||
| 5.75%, 07/15/80 (a)(b) | 81,000 | 91,490 |
| Energy Transfer LP | ||
| 4.25%, 03/15/23 (a) | 52,000 | 54,191 |
| 4.50%, 04/15/24 (a) | 8,000 | 8,656 |
| 4.95%, 06/15/28 (a) | 9,000 | 10,337 |
| State Street Active Core Bond Fund | 47 |
| Principal Amount | Fair Value | |
| 5.30%, 04/01/44 - 04/15/47 (a) | $ 46,000 | $ 53,666 |
| 5.35%, 05/15/45 (a) | 53,000 | 61,855 |
| 6.13%, 12/15/45 (a) | 4,000 | 5,091 |
| 6.50%, 02/01/42 (a) | 19,000 | 24,738 |
| Energy Transfer LP (6.75% fixed rate until 05/15/25; 5.13% + 5 year CMT Rate thereafter) | ||
| 6.75%, 12/31/99 (a)(b) | 123,000 | 126,263 |
| Energy Transfer LP/Regency Energy Finance Corp. | ||
| 4.50%, 11/01/23 (a) | 18,000 | 19,169 |
| Enstar Group Ltd. | ||
| 3.10%, 09/01/31 (a) | 55,000 | 54,172 |
| Enterprise Products Operating LLC | ||
| 4.25%, 02/15/48 (a) | 31,000 | 35,122 |
| Enterprise Products Operating LLC (5.25% fixed rate until 08/16/27; 3.03% + 3 month USD LIBOR thereafter) | ||
| 5.25%, 08/16/77 (a)(b) | 9,000 | 9,408 |
| EOG Resources Inc. | ||
| 4.15%, 01/15/26 (a) | 4,000 | 4,464 |
| 4.38%, 04/15/30 (a) | 74,000 | 86,395 |
| 4.95%, 04/15/50 (a) | 14,000 | 18,517 |
| 5.10%, 01/15/36 (a) | 7,000 | 8,583 |
| Equinix Inc. | ||
| 1.25%, 07/15/25 (a) | 60,000 | 59,813 |
| 2.15%, 07/15/30 (a) | 47,000 | 45,975 |
| Equinor ASA | ||
| 3.25%, 11/18/49 (a) | 20,000 | 21,080 |
| ERP Operating LP | ||
| 4.50%, 07/01/44 (a) | 27,000 | 33,816 |
| Everest Reinsurance Holdings Inc. | ||
| 3.13%, 10/15/52 | 151,000 | 147,495 |
| Eversource Energy | ||
| 3.45%, 01/15/50 (a) | 28,000 | 29,352 |
| Exelon Corp. | ||
| 3.50%, 06/01/22 (a) | 30,000 | 30,525 |
| 4.05%, 04/15/30 (a) | 49,000 | 55,468 |
| 4.45%, 04/15/46 (a) | 36,000 | 43,509 |
| 4.70%, 04/15/50 (a) | 33,000 | 41,658 |
| Exxon Mobil Corp. | ||
| 2.61%, 10/15/30 (a) | 99,000 | 103,691 |
| 3.45%, 04/15/51 (a) | 52,000 | 55,615 |
| FedEx Corp. | ||
| 4.10%, 02/01/45 (a) | 77,000 | 86,315 |
| Fidelity National Financial Inc. | ||
| 3.20%, 09/17/51 | 95,000 | 90,631 |
| Principal Amount | Fair Value | |
| Fidelity National Information Services Inc. | ||
| 1.15%, 03/01/26 (a) | $ 48,000 | $ 47,590 |
| 1.65%, 03/01/28 (a) | 44,000 | 43,424 |
| 3.10%, 03/01/41 (a) | 10,000 | 10,121 |
| FirstEnergy Transmission LLC | ||
| 4.55%, 04/01/49 (a)(g) | 80,000 | 93,537 |
| Fiserv Inc. | ||
| 3.50%, 07/01/29 (a) | 180,000 | 196,031 |
| 4.40%, 07/01/49 (a) | 8,000 | 9,560 |
| Florida Power & Light Co. | ||
| 2.85%, 04/01/25 (a) | 80,000 | 84,909 |
| 4.13%, 02/01/42 (a) | 54,000 | 65,101 |
| Flowers Foods Inc. | ||
| 2.40%, 03/15/31 (a) | 47,000 | 46,873 |
| Flowserve Corp. | ||
| 2.80%, 01/15/32 | 95,000 | 94,059 |
| Fox Corp. | ||
| 3.50%, 04/08/30 (a) | 32,000 | 34,860 |
| GA Global Funding Trust | ||
| 1.63%, 01/15/26 (a)(g) | 70,000 | 70,463 |
| General Dynamics Corp. | ||
| 4.25%, 04/01/50 (a) | 82,000 | 103,613 |
| General Mills Inc. | ||
| 3.00%, 02/01/51 (a)(g) | 16,000 | 15,978 |
| General Motors Co. | ||
| 5.20%, 04/01/45 (a) | 2,000 | 2,430 |
| 5.40%, 10/02/23 - 04/01/48 (a) | 15,000 | 17,118 |
| 6.13%, 10/01/25 (a) | 60,000 | 70,324 |
| 6.80%, 10/01/27 (a) | 26,000 | 32,477 |
| General Motors Financial Company Inc. | ||
| 1.25%, 01/08/26 (a) | 87,000 | 85,953 |
| 2.35%, 01/08/31 (a) | 39,000 | 38,223 |
| 3.45%, 01/14/22 - 04/10/22 (a) | 441,000 | 445,456 |
| 5.25%, 03/01/26 (a) | 22,000 | 25,139 |
| Georgia-Pacific LLC | ||
| 1.75%, 09/30/25 (a)(g) | 82,000 | 83,883 |
| 3.60%, 03/01/25 (a)(g) | 41,000 | 44,244 |
| Gilead Sciences Inc. | ||
| 1.65%, 10/01/30 (a) | 23,000 | 22,106 |
| 2.60%, 10/01/40 (a) | 46,000 | 43,795 |
| 2.80%, 10/01/50 (a) | 40,000 | 37,902 |
| 2.95%, 03/01/27 (a) | 4,000 | 4,299 |
| 3.50%, 02/01/25 (a) | 13,000 | 13,988 |
| 3.65%, 03/01/26 (a) | 90,000 | 98,575 |
| 4.15%, 03/01/47 (a) | 6,000 | 7,029 |
| GlaxoSmithKline Capital Inc. | ||
| 3.38%, 05/15/23 (a) | 29,000 | 30,418 |
| 3.63%, 05/15/25 (a) | 28,000 | 30,586 |
| GlaxoSmithKline Capital PLC | ||
| 3.38%, 06/01/29 (a) | 24,000 | 26,406 |
| 48 | State Street Active Core Bond Fund |
| Principal Amount | Fair Value | |
| Glencore Funding LLC | ||
| 3.88%, 04/27/51 (a)(g) | $ 49,000 | $ 51,162 |
| Graphic Packaging International LLC | ||
| 1.51%, 04/15/26 (a)(g) | 88,000 | 87,941 |
| Gray Oak Pipeline LLC | ||
| 2.00%, 09/15/23 (a)(g) | 125,000 | 127,482 |
| 2.60%, 10/15/25 (a)(g) | 82,000 | 84,156 |
| Halliburton Co. | ||
| 3.80%, 11/15/25 (a) | 2,000 | 2,190 |
| 5.00%, 11/15/45 (a) | 11,000 | 13,168 |
| HCA Inc. | ||
| 3.50%, 09/01/30 - 07/15/51 (a) | 210,000 | 218,419 |
| 5.38%, 02/01/25 (a) | 120,000 | 134,075 |
| Health Care Service Corp. | ||
| 2.20%, 06/01/30 (a)(g) | 38,000 | 37,991 |
| 3.20%, 06/01/50 (a)(g) | 17,000 | 17,495 |
| Healthcare Trust of America Holdings LP | ||
| 2.00%, 03/15/31 (a) | 29,000 | 27,862 |
| Helmerich & Payne Inc. | ||
| 2.90%, 09/29/31 (g) | 30,000 | 30,087 |
| Hess Corp. | ||
| 5.60%, 02/15/41 (a) | 4,000 | 4,972 |
| 5.80%, 04/01/47 (a) | 3,000 | 3,901 |
| Hewlett Packard Enterprise Co. | ||
| 6.35%, 10/15/45 (a) | 5,000 | 6,735 |
| Highwoods Realty LP | ||
| 4.13%, 03/15/28 (a) | 31,000 | 34,559 |
| 4.20%, 04/15/29 (a) | 94,000 | 105,269 |
| Honeywell International Inc. | ||
| 1.75%, 09/01/31 (a) | 84,000 | 81,785 |
| 2.70%, 08/15/29 (a) | 39,000 | 41,420 |
| Hormel Foods Corp. | ||
| 1.80%, 06/11/30 (a) | 69,000 | 67,913 |
| HSBC Holdings PLC (2.01% fixed rate until 09/22/27; 1.73% + SOFR thereafter) | ||
| 2.01%, 09/22/28 (a)(b) | 400,000 | 399,744 |
| HSBC Holdings PLC (4.00% fixed rate until 03/09/26; 3.22% + 5 year CMT Rate thereafter) | ||
| 4.00%, 12/31/99 (a)(b) | 200,000 | 199,652 |
| Humana Inc. | ||
| 1.35%, 02/03/27 (a) | 95,000 | 93,672 |
| 2.15%, 02/03/32 (a) | 50,000 | 48,817 |
| Huntington Bancshares Inc. | ||
| 2.55%, 02/04/30 (a) | 62,000 | 64,086 |
| Huntington Ingalls Industries Inc. | ||
| 2.04%, 08/16/28 (a)(g) | 151,000 | 149,025 |
| Principal Amount | Fair Value | |
| Hyundai Capital America | ||
| 1.30%, 01/08/26 (a)(g) | $ 148,000 | $ 145,638 |
| 3.10%, 04/05/22 (a)(g) | 17,000 | 17,214 |
| Imperial Brands Finance PLC | ||
| 3.50%, 02/11/23 (a)(g) | 203,000 | 209,092 |
| Indiana Michigan Power Co. | ||
| 3.25%, 05/01/51 (a) | 41,000 | 42,751 |
| ING Groep N.V. | ||
| 4.10%, 10/02/23 (a) | 204,000 | 218,362 |
| ING Groep N.V. (1.06% fixed rate until 04/01/26; 1.01% + SOFR thereafter) | ||
| 1.06%, 04/01/27 (b) | 288,000 | 291,056 |
| Ingredion Inc. | ||
| 3.90%, 06/01/50 (a) | 14,000 | 15,784 |
| Intel Corp. | ||
| 2.00%, 08/12/31 (a) | 61,000 | 60,617 |
| 2.45%, 11/15/29 (a) | 53,000 | 55,233 |
| 2.60%, 05/19/26 (a) | 30,000 | 31,959 |
| 2.80%, 08/12/41 (a) | 70,000 | 69,772 |
| 3.10%, 02/15/60 (a) | 50,000 | 49,123 |
| 3.20%, 08/12/61 (a) | 31,000 | 31,340 |
| Intercontinental Exchange Inc. | ||
| 1.85%, 09/15/32 (a) | 14,000 | 13,232 |
| 2.65%, 09/15/40 (a) | 14,000 | 13,399 |
| International Business Machines Corp. | ||
| 4.15%, 05/15/39 (a) | 141,000 | 166,211 |
| 4.25%, 05/15/49 (a) | 141,000 | 170,924 |
| International Paper Co. | ||
| 4.40%, 08/15/47 (a) | 33,000 | 40,194 |
| Interstate Power & Light Co. | ||
| 3.40%, 08/15/25 (a) | 24,000 | 25,714 |
| ITC Holdings Corp. | ||
| 2.95%, 05/14/30 (a)(g) | 82,000 | 86,134 |
| Jabil Inc. | ||
| 3.95%, 01/12/28 (a) | 18,000 | 19,835 |
| John Deere Capital Corp. | ||
| 2.45%, 01/09/30 (a) | 110,000 | 114,405 |
| Johnson & Johnson | ||
| 3.63%, 03/03/37 (a) | 28,000 | 32,265 |
| Johnson Controls International PLC | ||
| 4.50%, 02/15/47 (a) | 4,000 | 4,927 |
| JPMorgan Chase & Co. (1.58% fixed rate until 04/22/26; 0.89% + SOFR thereafter) | ||
| 1.58%, 04/22/27 (a)(b) | 109,000 | 109,202 |
| JPMorgan Chase & Co. (2.96% fixed rate until 05/13/30; 2.52% + SOFR thereafter) | ||
| 2.96%, 05/13/31 (a)(b) | 52,000 | 54,149 |
| State Street Active Core Bond Fund | 49 |
| Principal Amount | Fair Value | |
| JPMorgan Chase & Co. (3.16% fixed rate until 04/22/41; 1.46% + SOFR thereafter) | ||
| 3.16%, 04/22/42 (a)(b) | $ 53,000 | $ 55,042 |
| JPMorgan Chase & Co. (3.88% fixed rate until 07/24/37; 1.36% + 3 month USD LIBOR thereafter) | ||
| 3.88%, 07/24/38 (a)(b) | 82,000 | 93,710 |
| JPMorgan Chase & Co. (3.90% fixed rate until 01/23/48; 1.22% + 3 month USD LIBOR thereafter) | ||
| 3.90%, 01/23/49 (a)(b) | 70,000 | 80,587 |
| JPMorgan Chase & Co. (3.96% fixed rate until 01/29/26; 1.25% + 3 month USD LIBOR thereafter) | ||
| 3.96%, 01/29/27 (a)(b) | 112,000 | 123,639 |
| JPMorgan Chase & Co. (4.01% fixed rate until 04/23/28; 1.12% + 3 month USD LIBOR thereafter) | ||
| 4.01%, 04/23/29 (a)(b) | 57,000 | 63,765 |
| JPMorgan Chase & Co. (4.49% fixed rate until 03/24/30; 3.79% + SOFR thereafter) | ||
| 4.49%, 03/24/31 (a)(b) | 261,000 | 304,657 |
| JPMorgan Chase & Co. (4.60% fixed rate until 02/01/25; 3.13% + SOFR thereafter) | ||
| 4.60%, 12/31/99 (a)(b) | 81,000 | 82,861 |
| JPMorgan Chase & Co. (6.10% fixed rate until 10/01/24; 3.33% + 3 month USD LIBOR thereafter) | ||
| 6.10%, 10/29/49 (a)(b) | 170,000 | 184,737 |
| Kaiser Foundation Hospitals | ||
| 3.00%, 06/01/51 (a) | 55,000 | 56,174 |
| Kansas City Southern | ||
| 3.50%, 05/01/50 (a) | 30,000 | 31,474 |
| Keurig Dr Pepper Inc. | ||
| 3.20%, 05/01/30 (a) | 55,000 | 59,124 |
| 3.80%, 05/01/50 (a) | 42,000 | 47,258 |
| 4.50%, 11/15/45 (a) | 8,000 | 9,712 |
| 4.60%, 05/25/28 (a) | 14,000 | 16,243 |
| Kinder Morgan Energy Partners LP | ||
| 4.70%, 11/01/42 (a) | 3,000 | 3,429 |
| 5.00%, 03/01/43 (a) | 12,000 | 14,262 |
| 6.38%, 03/01/41 (a) | 10,000 | 13,672 |
| Kinder Morgan Inc. | ||
| 5.05%, 02/15/46 (a) | 10,000 | 12,095 |
| Principal Amount | Fair Value | |
| KLA Corp. | ||
| 3.30%, 03/01/50 (a) | $ 70,000 | $ 73,774 |
| 4.65%, 11/01/24 (a) | 66,000 | 72,856 |
| Kohl's Corp. | ||
| 3.38%, 05/01/31 (a) | 99,000 | 102,107 |
| 5.55%, 07/17/45 (a) | 37,000 | 44,044 |
| L3Harris Technologies Inc. | ||
| 3.85%, 12/15/26 (a) | 142,000 | 157,383 |
| Lear Corp. | ||
| 4.25%, 05/15/29 (a) | 5,000 | 5,588 |
| Leidos Inc. | ||
| 2.95%, 05/15/23 (a) | 88,000 | 91,102 |
| 3.63%, 05/15/25 (a) | 25,000 | 26,992 |
| 4.38%, 05/15/30 (a) | 82,000 | 92,819 |
| Liberty Mutual Group Inc. | ||
| 3.95%, 05/15/60 (a)(g) | 15,000 | 16,636 |
| Life Storage LP | ||
| 2.20%, 10/15/30 (a) | 52,000 | 51,509 |
| Lincoln National Corp. | ||
| 4.35%, 03/01/48 (a) | 114,000 | 135,744 |
| Lloyds Banking Group PLC | ||
| 3.75%, 01/11/27 (a) | 400,000 | 439,900 |
| Lockheed Martin Corp. | ||
| 3.55%, 01/15/26 (a) | 7,000 | 7,691 |
| 3.80%, 03/01/45 (a) | 13,000 | 15,039 |
| 4.50%, 05/15/36 (a) | 20,000 | 24,750 |
| Lowe's Companies Inc. | ||
| 1.30%, 04/15/28 (a) | 23,000 | 22,332 |
| 1.70%, 10/15/30 (a) | 16,000 | 15,310 |
| 3.00%, 10/15/50 (a) | 57,000 | 55,523 |
| 3.50%, 04/01/51 (a) | 44,000 | 46,808 |
| 3.70%, 04/15/46 (a) | 10,000 | 10,903 |
| 4.05%, 05/03/47 (a) | 12,000 | 13,723 |
| Lowe's Cos. Inc. | ||
| 1.70%, 09/15/28 | 120,000 | 118,964 |
| LYB International Finance II BV | ||
| 3.50%, 03/02/27 (a) | 5,000 | 5,451 |
| LYB International Finance III LLC | ||
| 1.25%, 10/01/25 (a) | 27,000 | 26,949 |
| 3.63%, 04/01/51 (a) | 39,000 | 40,742 |
| 3.80%, 10/01/60 (a) | 19,000 | 19,792 |
| Marvell Technology Inc. | ||
| 1.65%, 04/15/26 (a)(g) | 115,000 | 115,194 |
| 2.45%, 04/15/28 (a)(g) | 87,000 | 88,683 |
| 2.95%, 04/15/31 (a)(g) | 48,000 | 49,176 |
| Masco Corp. | ||
| 3.50%, 11/15/27 (a) | 5,000 | 5,453 |
| McCormick & Company Inc. | ||
| 1.85%, 02/15/31 (a) | 26,000 | 25,113 |
| 3.25%, 11/15/25 (a) | 228,000 | 244,975 |
| 50 | State Street Active Core Bond Fund |
| Principal Amount | Fair Value | |
| McDonald's Corp. | ||
| 3.60%, 07/01/30 (a) | $ 50,000 | $ 55,620 |
| 3.63%, 09/01/49 (a) | 9,000 | 9,826 |
| 4.88%, 12/09/45 (a) | 13,000 | 16,610 |
| Medtronic Inc. | ||
| 4.63%, 03/15/45 (a) | 2,000 | 2,609 |
| Memorial Sloan-Kettering Cancer Center | ||
| 4.13%, 07/01/52 (a) | 31,000 | 38,739 |
| Merck & Company Inc. | ||
| 2.45%, 06/24/50 (a) | 96,000 | 89,237 |
| 2.75%, 02/10/25 (a) | 23,000 | 24,343 |
| 4.00%, 03/07/49 (a) | 4,000 | 4,794 |
| MetLife Inc. | ||
| 4.72%, 12/15/44 (a) | 47,000 | 60,558 |
| Microchip Technology Inc. | ||
| 2.67%, 09/01/23 (a) | 471,000 | 488,436 |
| Micron Technology Inc. | ||
| 2.50%, 04/24/23 (a) | 65,000 | 66,916 |
| Microsoft Corp. | ||
| 2.40%, 08/08/26 (a) | 47,000 | 49,938 |
| 2.68%, 06/01/60 (a) | 7,000 | 6,801 |
| 2.88%, 02/06/24 (a) | 150,000 | 157,768 |
| 2.92%, 03/17/52 (a) | 125,000 | 130,042 |
| 3.04%, 03/17/62 (a) | 51,000 | 53,680 |
| 3.45%, 08/08/36 (a) | 7,000 | 8,022 |
| 3.50%, 02/12/35 (a) | 16,000 | 18,444 |
| Mid-America Apartments LP | ||
| 2.88%, 09/15/51 (a) | 60,000 | 57,639 |
| Morgan Stanley | ||
| 3.70%, 10/23/24 (a) | 130,000 | 141,019 |
| 3.95%, 04/23/27 (a) | 135,000 | 150,144 |
| 4.35%, 09/08/26 (a) | 49,000 | 55,254 |
| 5.00%, 11/24/25 (a) | 534,000 | 610,186 |
| Morgan Stanley (2.48% fixed rate until 09/16/31; 1.36% + SOFR thereafter) | ||
| 2.48%, 09/16/36 (b) | 243,000 | 237,686 |
| Morgan Stanley (2.80% fixed rate until 01/25/51; 1.43% + SOFR thereafter) | ||
| 2.80%, 01/25/52 (a)(b) | 52,000 | 50,397 |
| Morgan Stanley (3.62% fixed rate until 04/01/30; 3.12% + SOFR thereafter) | ||
| 3.62%, 04/01/31 (a)(b) | 186,000 | 205,024 |
| Morgan Stanley (3.97% fixed rate until 07/22/37; 1.46% + 3 month USD LIBOR thereafter) | ||
| 3.97%, 07/22/38 (a)(b) | 104,000 | 119,676 |
| MPLX LP | ||
| 2.65%, 08/15/30 (a) | 36,000 | 36,168 |
| 3.38%, 03/15/23 (a) | 164,000 | 170,222 |
| Principal Amount | Fair Value | |
| 5.20%, 12/01/47 (a) | $ 4,000 | $ 4,829 |
| Mylan Inc. | ||
| 5.20%, 04/15/48 (a) | 10,000 | 12,236 |
| National Retail Properties Inc. | ||
| 4.00%, 11/15/25 (a) | 75,000 | 82,735 |
| NewMarket Corp. | ||
| 2.70%, 03/18/31 (a) | 36,000 | 36,029 |
| Newmont Corp. | ||
| 4.88%, 03/15/42 (a) | 15,000 | 18,791 |
| NextEra Energy Capital Holdings Inc. | ||
| 3.25%, 04/01/26 (a) | 36,000 | 38,672 |
| NextEra Energy Capital Holdings Inc. (5.65% fixed rate until 05/01/29; 3.16% + 3 month USD LIBOR thereafter) | ||
| 5.65%, 05/01/79 (a)(b) | 59,000 | 69,001 |
| NGPL PipeCo LLC | ||
| 3.25%, 07/15/31 (a)(g) | 82,000 | 84,226 |
| NIKE Inc. | ||
| 3.38%, 03/27/50 (a) | 17,000 | 19,027 |
| NiSource Inc. | ||
| 3.60%, 05/01/30 (a) | 35,000 | 38,411 |
| 3.95%, 03/30/48 (a) | 10,000 | 11,374 |
| Nordstrom Inc. | ||
| 4.00%, 03/15/27 (a) | 131,000 | 135,209 |
| Norfolk Southern Corp. | ||
| 3.95%, 10/01/42 (a) | 14,000 | 16,098 |
| NOV Inc. | ||
| 3.60%, 12/01/29 (a) | 45,000 | 47,356 |
| Novant Health Inc. | ||
| 3.32%, 11/01/61 (a) | 36,000 | 37,999 |
| Novartis Capital Corp. | ||
| 2.20%, 08/14/30 (a) | 86,000 | 88,229 |
| Nucor Corp. | ||
| 2.98%, 12/15/55 (a)(g) | 19,000 | 18,509 |
| 3.95%, 05/01/28 (a) | 19,000 | 21,344 |
| Nutrien Ltd. | ||
| 4.90%, 06/01/43 (a) | 10,000 | 12,577 |
| NVIDIA Corp. | ||
| 2.85%, 04/01/30 (a) | 33,000 | 35,363 |
| 3.50%, 04/01/50 (a) | 76,000 | 84,594 |
| NXP BV/NXP Funding LLC/NXP USA Inc. | ||
| 2.50%, 05/11/31 (a)(g) | 76,000 | 76,594 |
| 2.70%, 05/01/25 (a)(g) | 95,000 | 99,325 |
| 3.25%, 05/11/41 (a)(g) | 60,000 | 62,090 |
| Occidental Petroleum Corp. | ||
| 2.90%, 08/15/24 (a) | 17,000 | 17,312 |
| Oklahoma Gas & Electric Co. | ||
| 3.25%, 04/01/30 (a) | 26,000 | 28,095 |
| State Street Active Core Bond Fund | 51 |
| Principal Amount | Fair Value | |
| Oncor Electric Delivery Company LLC | ||
| 3.80%, 09/30/47 (a) | $ 14,000 | $ 16,203 |
| ONEOK Inc. | ||
| 4.35%, 03/15/29 (a) | 28,000 | 31,554 |
| Oracle Corp. | ||
| 1.65%, 03/25/26 (a) | 73,000 | 74,031 |
| 2.30%, 03/25/28 (a) | 25,000 | 25,577 |
| 2.40%, 09/15/23 (a) | 18,000 | 18,624 |
| 2.65%, 07/15/26 (a) | 21,000 | 22,144 |
| 2.88%, 03/25/31 (a) | 36,000 | 37,099 |
| 2.95%, 04/01/30 (a) | 105,000 | 109,832 |
| 3.60%, 04/01/50 (a) | 88,000 | 88,094 |
| 3.65%, 03/25/41 (a) | 41,000 | 42,624 |
| 3.80%, 11/15/37 (a) | 4,000 | 4,295 |
| 3.95%, 03/25/51 (a) | 41,000 | 43,435 |
| 4.00%, 07/15/46 - 11/15/47 (a) | 34,000 | 36,075 |
| 4.10%, 03/25/61 (a) | 50,000 | 53,496 |
| Otis Worldwide Corp. | ||
| 2.06%, 04/05/25 (a) | 55,000 | 56,805 |
| 2.57%, 02/15/30 (a) | 23,000 | 23,608 |
| 3.36%, 02/15/50 (a) | 19,000 | 19,887 |
| Ovintiv Exploration Inc. | ||
| 5.63%, 07/01/24 (a) | 217,000 | 240,490 |
| Owens Corning | ||
| 4.40%, 01/30/48 (a) | 13,000 | 15,197 |
| Pacific Gas & Electric Co. | ||
| 2.10%, 08/01/27 (a) | 26,000 | 25,370 |
| 2.50%, 02/01/31 (a) | 48,000 | 45,659 |
| 3.00%, 06/15/28 (a) | 55,000 | 55,476 |
| 3.30%, 08/01/40 (a) | 48,000 | 44,296 |
| 3.50%, 08/01/50 (a) | 23,000 | 20,902 |
| 4.30%, 03/15/45 (a) | 39,000 | 38,469 |
| PacifiCorp | ||
| 2.70%, 09/15/30 (a) | 29,000 | 30,227 |
| 2.90%, 06/15/52 (a) | 87,000 | 84,434 |
| 6.25%, 10/15/37 (a) | 103,000 | 145,862 |
| Packaging Corp. of America | ||
| 3.05%, 10/01/51 | 55,000 | 54,304 |
| Parker-Hannifin Corp. | ||
| 3.25%, 06/14/29 (a) | 19,000 | 20,433 |
| PartnerRe Finance B LLC (4.50% fixed rate until 04/01/30; 3.82% + 5 year CMT Rate thereafter) | ||
| 4.50%, 10/01/50 (a)(b) | 69,000 | 72,567 |
| PayPal Holdings Inc. | ||
| 2.65%, 10/01/26 (a) | 33,000 | 35,260 |
| 3.25%, 06/01/50 (a) | 63,000 | 67,702 |
| PepsiCo Inc. | ||
| 1.63%, 05/01/30 (a) | 67,000 | 65,748 |
| 2.63%, 07/29/29 (a) | 47,000 | 49,854 |
| 3.45%, 10/06/46 (a) | 13,000 | 14,364 |
| Principal Amount | Fair Value | |
| Pfizer Inc. | ||
| 2.70%, 05/28/50 (a) | $ 110,000 | $ 108,361 |
| 3.45%, 03/15/29 (a) | 26,000 | 28,898 |
| 3.60%, 09/15/28 (a) | 26,000 | 29,215 |
| 3.90%, 03/15/39 (a) | 12,000 | 14,032 |
| 4.13%, 12/15/46 (a) | 6,000 | 7,310 |
| 4.40%, 05/15/44 (a) | 4,000 | 5,003 |
| Philip Morris International Inc. | ||
| 1.50%, 05/01/25 (a) | 25,000 | 25,367 |
| 2.10%, 05/01/30 (a) | 15,000 | 14,926 |
| Phillips 66 | ||
| 2.15%, 12/15/30 (a) | 161,000 | 157,150 |
| Phillips 66 Partners LP | ||
| 3.15%, 12/15/29 (a) | 98,000 | 102,216 |
| 3.75%, 03/01/28 (a) | 10,000 | 10,845 |
| 4.68%, 02/15/45 (a) | 11,000 | 12,678 |
| Pioneer Natural Resources Co. | ||
| 1.13%, 01/15/26 (a) | 114,000 | 112,606 |
| 2.15%, 01/15/31 (a) | 36,000 | 34,960 |
| Plains All American Pipeline LP/PAA Finance Corp. | ||
| 3.55%, 12/15/29 (a) | 25,000 | 26,293 |
| 3.65%, 06/01/22 (a) | 40,000 | 40,531 |
| PPL Capital Funding Inc. | ||
| 3.10%, 05/15/26 (a) | 65,000 | 69,263 |
| Precision Castparts Corp. | ||
| 4.38%, 06/15/45 (a) | 12,000 | 14,557 |
| Prospect Capital Corp. | ||
| 3.36%, 11/15/26 (a) | 73,000 | 74,131 |
| Prudential Financial Inc. | ||
| 3.94%, 12/07/49 (a) | 69,000 | 81,134 |
| Prudential Financial Inc. (5.70% fixed rate until 09/15/28; 2.67% + 3 month USD LIBOR thereafter) | ||
| 5.70%, 09/15/48 (a)(b) | 76,000 | 88,697 |
| PVH Corp. | ||
| 4.63%, 07/10/25 (a) | 80,000 | 88,066 |
| QUALCOMM Inc. | ||
| 1.30%, 05/20/28 (a) | 4,000 | 3,910 |
| 4.30%, 05/20/47 (a) | 2,000 | 2,486 |
| Quanta Services Inc. | ||
| 2.35%, 01/15/32 | 65,000 | 63,643 |
| 3.05%, 10/01/41 | 70,000 | 67,674 |
| Quest Diagnostics Inc. | ||
| 2.95%, 06/30/30 (a) | 10,000 | 10,563 |
| Ralph Lauren Corp. | ||
| 1.70%, 06/15/22 (a) | 15,000 | 15,149 |
| Raytheon Technologies Corp. | ||
| 1.90%, 09/01/31 (a) | 75,000 | 72,804 |
| 2.82%, 09/01/51 (a) | 89,000 | 84,878 |
| 3.13%, 05/04/27 (a) | 178,000 | 193,144 |
| 52 | State Street Active Core Bond Fund |
| Principal Amount | Fair Value | |
| 3.50%, 03/15/27 (a) | $ 14,000 | $ 15,371 |
| 3.95%, 08/16/25 (a) | 14,000 | 15,421 |
| 4.15%, 05/15/45 (a) | 13,000 | 15,191 |
| 4.45%, 11/16/38 (a) | 10,000 | 12,108 |
| Realty Income Corp. | ||
| 3.00%, 01/15/27 (a) | 37,000 | 39,618 |
| 3.25%, 01/15/31 (a) | 29,000 | 31,463 |
| Regeneron Pharmaceuticals Inc. | ||
| 1.75%, 09/15/30 (a) | 56,000 | 53,216 |
| Regions Financial Corp. | ||
| 1.80%, 08/12/28 (a) | 151,000 | 149,307 |
| Reliance Steel & Aluminum Co. | ||
| 2.15%, 08/15/30 (a) | 96,000 | 93,835 |
| Rio Tinto Finance USA PLC | ||
| 4.13%, 08/21/42 (a) | 10,000 | 12,063 |
| Rockwell Automation Inc. | ||
| 2.80%, 08/15/61 (a) | 20,000 | 19,088 |
| 4.20%, 03/01/49 (a) | 45,000 | 55,564 |
| Rogers Communications Inc. | ||
| 5.00%, 03/15/44 (a) | 5,000 | 6,162 |
| Roper Technologies Inc. | ||
| 2.95%, 09/15/29 (a) | 78,000 | 82,689 |
| Ross Stores Inc. | ||
| 4.70%, 04/15/27 (a) | 12,000 | 13,786 |
| Royalty Pharma PLC | ||
| 0.75%, 09/02/23 (a) | 35,000 | 35,112 |
| 1.20%, 09/02/25 (a) | 45,000 | 44,688 |
| 1.75%, 09/02/27 (a) | 25,000 | 24,884 |
| 2.15%, 09/02/31 (a) | 50,000 | 48,148 |
| 2.20%, 09/02/30 (a) | 12,000 | 11,753 |
| 3.35%, 09/02/51 (a) | 50,000 | 47,404 |
| RPM International Inc. | ||
| 3.75%, 03/15/27 (a) | 15,000 | 16,411 |
| Ryder System Inc. | ||
| 2.90%, 12/01/26 (a) | 78,000 | 82,993 |
| Sabine Pass Liquefaction LLC | ||
| 4.20%, 03/15/28 (a) | 10,000 | 11,172 |
| 4.50%, 05/15/30 (a) | 19,000 | 21,918 |
| 5.00%, 03/15/27 (a) | 4,000 | 4,604 |
| 5.88%, 06/30/26 (a) | 61,000 | 71,735 |
| Salesforce.com Inc. | ||
| 1.95%, 07/15/31 (a) | 87,000 | 86,676 |
| 2.70%, 07/15/41 (a) | 64,000 | 63,772 |
| 2.90%, 07/15/51 (a) | 60,000 | 60,041 |
| Schlumberger Holdings Corp. | ||
| 3.90%, 05/17/28 (a)(g) | 11,000 | 12,147 |
| Sealed Air Corp. | ||
| 1.57%, 10/15/26 (g) | 285,000 | 283,541 |
| Sempra Energy | ||
| 3.80%, 02/01/38 (a) | 7,000 | 7,748 |
| 4.00%, 02/01/48 (a) | 19,000 | 21,229 |
| Principal Amount | Fair Value | |
| Shell International Finance BV | ||
| 2.38%, 08/21/22 (a) | $ 2,000 | $ 2,039 |
| 3.13%, 11/07/49 (a) | 49,000 | 50,958 |
| 3.75%, 09/12/46 (a) | 7,000 | 7,949 |
| 4.13%, 05/11/35 (a) | 11,000 | 12,954 |
| Shire Acquisitions Investments Ireland DAC | ||
| 2.88%, 09/23/23 (a) | 2,000 | 2,085 |
| 3.20%, 09/23/26 (a) | 8,000 | 8,639 |
| Simon Property Group LP | ||
| 3.38%, 06/15/27 (a) | 49,000 | 53,496 |
| South Jersey Industries Inc. | ||
| 5.02%, 04/15/31 (a) | 106,000 | 115,560 |
| Southern California Edison Co. | ||
| 2.40%, 02/01/22 (a) | 37,000 | 37,119 |
| 4.00%, 04/01/47 (a) | 42,000 | 44,930 |
| 4.20%, 03/01/29 (a) | 28,000 | 31,482 |
| Southern Company Gas Capital Corp. | ||
| 3.95%, 10/01/46 (a) | 30,000 | 33,304 |
| 4.40%, 05/30/47 (a) | 9,000 | 10,594 |
| Southwest Airlines Co. | ||
| 2.63%, 02/10/30 (a) | 49,000 | 49,714 |
| Southwestern Electric Power Co. | ||
| 2.75%, 10/01/26 (a) | 17,000 | 17,894 |
| Spectra Energy Partners LP | ||
| 3.38%, 10/15/26 (a) | 4,000 | 4,334 |
| 4.50%, 03/15/45 (a) | 2,000 | 2,338 |
| Standard Chartered PLC (2.68% fixed rate until 06/29/31; 1.20% + 1 year CMT Rate thereafter) | ||
| 2.68%, 06/29/32 (a)(b)(g) | 203,000 | 201,967 |
| Standard Chartered PLC (2.82% fixed rate until 01/30/25; 1.21% + 3 month USD LIBOR thereafter) | ||
| 2.82%, 01/30/26 (a)(b)(g) | 203,000 | 211,167 |
| Starbucks Corp. | ||
| 4.00%, 11/15/28 (a) | 14,000 | 15,924 |
| STERIS Irish FinCo UnLtd Co. | ||
| 2.70%, 03/15/31 (a) | 120,000 | 122,633 |
| Stryker Corp. | ||
| 1.95%, 06/15/30 (a) | 65,000 | 64,170 |
| 2.90%, 06/15/50 (a) | 29,000 | 28,931 |
| Sumitomo Mitsui Financial Group Inc. | ||
| 4.44%, 04/02/24 (a)(g) | 292,000 | 315,486 |
| Sumitomo Mitsui Trust Bank Ltd. | ||
| 1.35%, 09/16/26 (g) | 302,000 | 301,302 |
| Suncor Energy Inc. | ||
| 4.00%, 11/15/47 (a) | 3,000 | 3,328 |
| State Street Active Core Bond Fund | 53 |
| Principal Amount | Fair Value | |
| Svenska Handelsbanken AB (1.42% fixed rate until 06/11/26; 0.63% + 1 year CMT Rate thereafter) | ||
| 1.42%, 06/11/27 (a)(b)(g) | $ 250,000 | $ 249,030 |
| Sysco Corp. | ||
| 3.25%, 07/15/27 (a) | 14,000 | 15,132 |
| 5.95%, 04/01/30 (a) | 20,000 | 25,455 |
| 6.60%, 04/01/50 (a) | 6,000 | 9,457 |
| Tampa Electric Co. | ||
| 2.40%, 03/15/31 (a) | 73,000 | 74,217 |
| 3.45%, 03/15/51 | 55,000 | 59,343 |
| 4.35%, 05/15/44 (a) | 32,000 | 38,596 |
| Tapestry Inc. | ||
| 4.13%, 07/15/27 (a) | 26,000 | 28,445 |
| 4.25%, 04/01/25 (a) | 285,000 | 308,453 |
| Target Corp. | ||
| 2.50%, 04/15/26 (a) | 18,000 | 19,218 |
| Teck Resources Ltd. | ||
| 3.90%, 07/15/30 (a) | 136,000 | 147,708 |
| Texas Instruments Inc. | ||
| 3.88%, 03/15/39 (a) | 17,000 | 20,045 |
| The Allstate Corp. (5.75% fixed rate until 08/15/23; 2.94% + 3 month USD LIBOR thereafter) | ||
| 5.75%, 08/15/53 (a)(b) | 40,000 | 43,192 |
| The Bank of New York Mellon Corp. (4.63% fixed rate until 09/20/26; 3.13% + 3 month USD LIBOR thereafter) | ||
| 4.63%, 12/29/49 (a)(b) | 78,000 | 84,616 |
| The Bank of Nova Scotia (4.65% fixed rate until 10/12/22; 2.65% + 3 month USD LIBOR thereafter) | ||
| 4.65%, 12/31/99 (a)(b) | 109,000 | 109,244 |
| The Boeing Co. | ||
| 2.20%, 02/04/26 (a) | 166,000 | 167,318 |
| 2.70%, 02/01/27 (a) | 143,000 | 148,141 |
| 2.95%, 02/01/30 (a) | 9,000 | 9,169 |
| 3.25%, 03/01/28 (a) | 13,000 | 13,603 |
| 3.55%, 03/01/38 (a) | 14,000 | 14,190 |
| 3.75%, 02/01/50 (a) | 28,000 | 28,388 |
| 5.04%, 05/01/27 (a) | 234,000 | 268,955 |
| 5.15%, 05/01/30 (a) | 84,000 | 98,623 |
| 5.81%, 05/01/50 (a) | 54,000 | 72,180 |
| The Charles Schwab Corp. (4.00% fixed rate until 12/01/30; 3.08% + 10 year CMT Rate thereafter) | ||
| 4.00%, 12/31/99 (b) | 92,000 | 94,457 |
| The Cleveland Electric Illuminating Co. | ||
| 4.55%, 11/15/30 (a)(g) | 52,000 | 60,373 |
| Principal Amount | Fair Value | |
| The Clorox Co. | ||
| 1.80%, 05/15/30 (a) | $ 82,000 | $ 80,082 |
| The Coca-Cola Co. | ||
| 2.60%, 06/01/50 (a) | 60,000 | 57,451 |
| 2.75%, 06/01/60 (a) | 24,000 | 23,201 |
| The Dow Chemical Co. | ||
| 2.10%, 11/15/30 (a) | 94,000 | 93,112 |
| 3.60%, 11/15/50 (a) | 39,000 | 41,461 |
| 4.25%, 10/01/34 (a) | 14,000 | 16,067 |
| 5.55%, 11/30/48 (a) | 11,000 | 15,097 |
| The Estee Lauder Companies Inc. | ||
| 2.38%, 12/01/29 (a) | 59,000 | 61,241 |
| The George Washington University | ||
| 4.13%, 09/15/48 (a) | 84,000 | 102,451 |
| The Goldman Sachs Group Inc. | ||
| 3.50%, 04/01/25 - 11/16/26 (a) | 172,000 | 185,813 |
| 3.85%, 01/26/27 (a) | 180,000 | 197,759 |
| 4.25%, 10/21/25 (a) | 184,000 | 203,855 |
| 5.15%, 05/22/45 (a) | 52,000 | 68,090 |
| The Goldman Sachs Group Inc. (1.54% fixed rate until 09/10/26; 0.82% + SOFR thereafter) | ||
| 1.54%, 09/10/27 (a)(b) | 71,000 | 70,791 |
| The Goldman Sachs Group Inc. (1.99% fixed rate until 01/27/31; 1.09% + SOFR thereafter) | ||
| 1.99%, 01/27/32 (a)(b) | 92,000 | 88,632 |
| The Goldman Sachs Group Inc. (2.38% fixed rate until 07/21/31; 1.25% + SOFR thereafter) | ||
| 2.38%, 07/21/32 (a)(b) | 41,000 | 40,614 |
| The Goldman Sachs Group Inc. (2.91% fixed rate until 07/21/41; 1.47% + SOFR thereafter) | ||
| 2.91%, 07/21/42 (a)(b) | 32,000 | 31,629 |
| The Goldman Sachs Group Inc. (3.21% fixed rate until 04/22/41; 1.51% + SOFR thereafter) | ||
| 3.21%, 04/22/42 (a)(b) | 50,000 | 51,694 |
| The Goldman Sachs Group Inc. (3.81% fixed rate until 04/23/28; 1.16% + 3 month USD LIBOR thereafter) | ||
| 3.81%, 04/23/29 (a)(b) | 86,000 | 95,101 |
| 54 | State Street Active Core Bond Fund |
| Principal Amount | Fair Value | |
| The Goldman Sachs Group Inc. (4.02% fixed rate until 10/31/37; 1.37% + 3 month USD LIBOR thereafter) | ||
| 4.02%, 10/31/38 (a)(b) | $ 36,000 | $ 41,366 |
| The Hartford Financial Services Group Inc. | ||
| 2.80%, 08/19/29 (a) | 47,000 | 49,095 |
| The Hartford Financial Services Group Inc. (2.25% fixed rate until 11/01/21; 2.13% + 3 month USD LIBOR thereafter) | ||
| 2.25%, 02/12/67 (a)(b)(g) | 70,000 | 67,259 |
| The Home Depot Inc. | ||
| 2.70%, 04/15/30 (a) | 39,000 | 41,271 |
| 3.35%, 04/15/50 (a) | 34,000 | 36,790 |
| 3.50%, 09/15/56 (a) | 15,000 | 16,748 |
| 3.90%, 12/06/28 - 06/15/47 (a) | 49,000 | 56,770 |
| 4.50%, 12/06/48 (a) | 28,000 | 35,969 |
| The Kroger Co. | ||
| 2.20%, 05/01/30 (a) | 30,000 | 30,104 |
| 4.65%, 01/15/48 (a) | 8,000 | 9,825 |
| The Northwestern Mutual Life Insurance Co. | ||
| 3.45%, 03/30/51 (a)(g) | 53,000 | 56,882 |
| The Southern Co. | ||
| 3.25%, 07/01/26 (a) | 4,000 | 4,306 |
| The Travelers Companies Inc. | ||
| 2.55%, 04/27/50 (a) | 89,000 | 84,779 |
| The Walt Disney Co. | ||
| 2.65%, 01/13/31 (a) | 47,000 | 49,124 |
| 3.38%, 11/15/26 (a) | 5,000 | 5,483 |
| 3.60%, 01/13/51 (a) | 28,000 | 31,293 |
| 4.75%, 11/15/46 (a) | 3,000 | 3,899 |
| 6.65%, 11/15/37 (a) | 24,000 | 35,756 |
| The Williams Companies Inc. | ||
| 3.75%, 06/15/27 (a) | 4,000 | 4,410 |
| 4.85%, 03/01/48 (a) | 10,000 | 12,223 |
| 4.90%, 01/15/45 (a) | 38,000 | 45,614 |
| 5.40%, 03/04/44 (a) | 2,000 | 2,525 |
| Thermo Fisher Scientific Inc. | ||
| 2.80%, 10/15/41 (a) | 45,000 | 44,874 |
| 4.13%, 03/25/25 (a) | 3,000 | 3,302 |
| 4.50%, 03/25/30 (a) | 10,000 | 11,819 |
| Time Warner Cable LLC | ||
| 6.55%, 05/01/37 (a) | 12,000 | 16,224 |
| T-Mobile USA Inc. | ||
| 3.50%, 04/15/25 (a) | 55,000 | 59,208 |
| 3.75%, 04/15/27 (a) | 74,000 | 81,530 |
| 3.88%, 04/15/30 (a) | 59,000 | 65,183 |
| 4.50%, 04/15/50 (a) | 29,000 | 33,873 |
| Principal Amount | Fair Value | |
| Total Capital International S.A. | ||
| 3.46%, 02/19/29 (a) | $ 39,000 | $ 43,139 |
| Trane Technologies Luxembourg Finance S.A. | ||
| 3.55%, 11/01/24 (a) | 26,000 | 27,935 |
| 3.80%, 03/21/29 (a) | 47,000 | 52,520 |
| TransCanada PipeLines Ltd. | ||
| 4.25%, 05/15/28 (a) | 28,000 | 31,883 |
| 4.88%, 01/15/26 (a) | 6,000 | 6,850 |
| Transcanada Trust (5.63% fixed rate until 05/20/25; 3.53% + 3 month USD LIBOR thereafter) | ||
| 5.63%, 05/20/75 (a)(b) | 85,000 | 91,688 |
| Transcontinental Gas Pipe Line Company LLC | ||
| 4.00%, 03/15/28 (a) | 11,000 | 12,284 |
| Truist Financial Corp. (4.80% fixed rate until 09/01/24; 3.00% + 5 year CMT Rate thereafter) | ||
| 4.80%, 12/31/99 (a)(b) | 83,000 | 88,100 |
| TSMC Global Ltd. | ||
| 0.75%, 09/28/25 (a)(g) | 247,000 | 241,420 |
| TWDC Enterprises 18 Corp. | ||
| 4.13%, 06/01/44 (a) | 3,000 | 3,570 |
| Tyco Electronics Group S.A. | ||
| 3.13%, 08/15/27 (a) | 21,000 | 23,002 |
| Tyson Foods Inc. | ||
| 4.00%, 03/01/26 (a) | 72,000 | 80,050 |
| 4.55%, 06/02/47 (a) | 2,000 | 2,448 |
| UDR Inc. | ||
| 2.10%, 08/01/32 (a) | 40,000 | 38,496 |
| 3.00%, 08/15/31 (a) | 19,000 | 19,893 |
| Union Pacific Corp. | ||
| 3.55%, 05/20/61 (a) | 45,000 | 48,682 |
| 3.60%, 09/15/37 (a) | 5,000 | 5,561 |
| 3.80%, 04/06/71 (a)(g) | 19,000 | 21,400 |
| 4.10%, 09/15/67 (a) | 16,000 | 18,893 |
| UnitedHealth Group Inc. | ||
| 2.00%, 05/15/30 (a) | 52,000 | 52,155 |
| 4.45%, 12/15/48 (a) | 13,000 | 16,468 |
| 4.75%, 07/15/45 (a) | 5,000 | 6,550 |
| Vale S.A. | ||
| 5.63%, 09/11/42 (a) | 19,000 | 23,352 |
| Valero Energy Corp. | ||
| 2.85%, 04/15/25 (a) | 43,000 | 45,286 |
| 4.00%, 04/01/29 (a) | 19,000 | 20,902 |
| Ventas Realty LP | ||
| 3.25%, 10/15/26 (a) | 65,000 | 69,607 |
| VEREIT Operating Partnership LP | ||
| 2.85%, 12/15/32 (a) | 33,000 | 34,274 |
| State Street Active Core Bond Fund | 55 |
| Principal Amount | Fair Value | |
| Verizon Communications Inc. | ||
| 2.10%, 03/22/28 (a) | $ 78,000 | $ 79,186 |
| 2.36%, 03/15/32 (g) | 106,000 | 104,947 |
| 2.55%, 03/21/31 (a) | 73,000 | 74,059 |
| 3.00%, 03/22/27 (a) | 220,000 | 236,128 |
| 3.40%, 03/22/41 (a) | 55,000 | 57,393 |
| 3.55%, 03/22/51 (a) | 39,000 | 41,063 |
| 3.70%, 03/22/61 (a) | 50,000 | 52,854 |
| 4.40%, 11/01/34 (a) | 175,000 | 207,249 |
| 4.52%, 09/15/48 (a) | 31,000 | 37,946 |
| 4.67%, 03/15/55 (a) | 43,000 | 53,976 |
| 5.25%, 03/16/37 (a) | 11,000 | 14,262 |
| ViacomCBS Inc. | ||
| 2.90%, 01/15/27 (a) | 14,000 | 14,860 |
| 3.70%, 06/01/28 (a) | 28,000 | 30,997 |
| 5.25%, 04/01/44 (a) | 2,000 | 2,510 |
| Virginia Electric & Power Co. | ||
| 4.00%, 11/15/46 (a) | 31,000 | 36,281 |
| Visa Inc. | ||
| 2.00%, 08/15/50 (a) | 20,000 | 17,295 |
| 2.05%, 04/15/30 (a) | 33,000 | 33,555 |
| 2.70%, 04/15/40 (a) | 35,000 | 35,664 |
| Viterra Finance BV | ||
| 2.00%, 04/21/26 (a)(g) | 230,000 | 231,649 |
| VMware Inc. | ||
| 2.20%, 08/15/31 (a) | 55,000 | 53,842 |
| Vodafone Group PLC | ||
| 4.38%, 05/30/28 (a) | 36,000 | 41,354 |
| 5.25%, 05/30/48 (a) | 16,000 | 20,731 |
| Volkswagen Group of America Finance LLC | ||
| 1.63%, 11/24/27 (a)(g) | 201,000 | 198,962 |
| Vontier Corp. | ||
| 2.40%, 04/01/28 (a)(g) | 106,000 | 104,850 |
| 2.95%, 04/01/31 (a)(g) | 82,000 | 81,588 |
| Vornado Realty LP | ||
| 2.15%, 06/01/26 (a) | 96,000 | 97,585 |
| 3.40%, 06/01/31 (a) | 36,000 | 37,262 |
| 3.50%, 01/15/25 (a) | 14,000 | 14,897 |
| Vulcan Materials Co. | ||
| 3.90%, 04/01/27 (a) | 10,000 | 11,209 |
| Walgreens Boots Alliance Inc. | ||
| 4.10%, 04/15/50 (a) | 5,000 | 5,554 |
| Walmart Inc. | ||
| 1.80%, 09/22/31 | 50,000 | 49,539 |
| 2.50%, 09/22/41 | 50,000 | 49,822 |
| 2.65%, 09/22/51 | 25,000 | 24,885 |
| Waste Connections Inc. | ||
| 2.20%, 01/15/32 | 70,000 | 69,028 |
| 2.95%, 01/15/52 | 70,000 | 68,532 |
| WEC Energy Group Inc. | ||
| 3.55%, 06/15/25 (a) | 25,000 | 27,047 |
| Principal Amount | Fair Value | |
| Wells Fargo & Co. | ||
| 4.15%, 01/24/29 (a) | $ 60,000 | $ 68,114 |
| 4.75%, 12/07/46 (a) | 89,000 | 111,332 |
| Wells Fargo & Co. (1.65% fixed rate until 06/02/23; 1.60% + SOFR thereafter) | ||
| 1.65%, 06/02/24 | 55,000 | 55,000 |
| Wells Fargo & Co. (2.39% fixed rate until 06/02/27; 2.10% + SOFR thereafter) | ||
| 2.39%, 06/02/28 (a)(b) | 311,000 | 320,762 |
| Wells Fargo & Co. (3.07% fixed rate until 04/30/40; 2.53% + SOFR thereafter) | ||
| 3.07%, 04/30/41 (a)(b) | 70,000 | 72,049 |
| Wells Fargo & Co. (3.20% fixed rate until 06/17/26; 1.17% + 3 month USD LIBOR thereafter) | ||
| 3.20%, 06/17/27 (a)(b) | 357,000 | 383,343 |
| Wells Fargo & Co. (5.88% fixed rate until 06/15/25; 3.99% + 3 month USD LIBOR thereafter) | ||
| 5.88%, 12/29/49 (a)(b) | 117,000 | 130,790 |
| Westlake Chemical Corp. | ||
| 2.88%, 08/15/41 (a) | 25,000 | 23,847 |
| 3.13%, 08/15/51 (a) | 30,000 | 28,295 |
| 3.38%, 08/15/61 (a) | 45,000 | 42,299 |
| Westpac Banking Corp. (2.89% fixed rate until 02/04/25; 1.35% + 5 year CMT Rate thereafter) | ||
| 2.89%, 02/04/30 (a)(b) | 33,000 | 34,171 |
| Westpac Banking Corp. (4.11% fixed rate until 07/24/29; 2.00% + 5 year CMT Rate thereafter) | ||
| 4.11%, 07/24/34 (a)(b) | 24,000 | 26,070 |
| Willis North America Inc. | ||
| 3.60%, 05/15/24 (a) | 75,000 | 79,975 |
| 3.88%, 09/15/49 (a) | 33,000 | 36,628 |
| WPP Finance 2010 | ||
| 3.75%, 09/19/24 (a) | 19,000 | 20,617 |
| WRKCo Inc. | ||
| 3.00%, 09/15/24 (a) | 19,000 | 20,115 |
| Xcel Energy Inc. | ||
| 3.40%, 06/01/30 (a) | 40,000 | 43,702 |
| Yamana Gold Inc. | ||
| 2.63%, 08/15/31 (a)(g) | 79,000 | 76,991 |
| Zoetis Inc. | ||
| 3.00%, 09/12/27 (a) | 5,000 | 5,380 |
| 3.90%, 08/20/28 (a) | 15,000 | 16,859 |
| 52,143,935 |
| 56 | State Street Active Core Bond Fund |
| Principal Amount | Fair Value | |
| Non-Agency Collateralized Mortgage Obligations - 6.8% | ||
| BANK 2017-BNK7 | ||
| 3.18%, 09/15/60 (a) | $ 1,168,000 | $ 1,255,970 |
| BANK 2018-BNK15 | ||
| 4.41%, 11/15/61 (a)(b) | 487,000 | 563,656 |
| Benchmark 2019-B12 Mortgage Trust | ||
| 3.12%, 08/15/52 (a) | 140,000 | 151,076 |
| Benchmark 2019-B9 Mortgage Trust | ||
| 4.02%, 03/15/52 (a) | 1,000,000 | 1,136,632 |
| Cantor Commercial Real Estate Lending 2019-CF3 | ||
| 3.01%, 01/15/53 (a) | 222,000 | 237,188 |
| CD 2019-CD8 Mortgage Trust | ||
| 2.91%, 08/15/57 (a) | 827,000 | 876,319 |
| Citigroup Commercial Mortgage Trust 2015-GC35 | ||
| 4.61%, 11/10/48 (a)(b) | 278,000 | 270,892 |
| Citigroup Commercial Mortgage Trust 2016-P6 | ||
| 3.72%, 12/10/49 (a)(b) | 126,803 | 140,053 |
| COMM 2012-CCRE3 Mortgage Trust | ||
| 3.92%, 10/15/45 (a)(g) | 107,000 | 105,588 |
| GS Mortgage Securities Trust 2012-GCJ9 | ||
| 2.08%, 11/10/45 (a)(b)(d) | 668,840 | 8,405 |
| GS Mortgage Securities Trust 2014-GC22 | ||
| 4.85%, 06/10/47 (a)(b) | 174,000 | 181,173 |
| GS Mortgage Securities Trust 2015-GS1 | ||
| 4.57%, 11/10/48 (a)(b) | 213,000 | 187,821 |
| GS Mortgage Securities Trust 2019-GC42 | ||
| 2.75%, 09/01/52 (a) | 773,000 | 805,537 |
| GS Mortgage Securities Trust 2019-GSA1 | ||
| 3.05%, 11/10/52 (a) | 1,526,000 | 1,630,654 |
| JP Morgan Chase Commercial Mortgage Securities Trust 2012-LC9 | ||
| 1.54%, 12/15/47 (a)(b)(d) | 567,667 | 6,767 |
| JPMBB Commercial Mortgage Securities Trust 2015-C32 | ||
| 4.80%, 11/15/48 (a)(b) | 494,000 | 408,821 |
| MASTR Alternative Loan Trust 2003-5 | ||
| 5.00%, 08/25/18 (d) | 1,093 | 12 |
| Morgan Stanley Bank of America Merrill Lynch Trust 2013-C7 | ||
| 4.26%, 02/15/46 (a)(b) | 223,000 | 216,076 |
| Principal Amount | Fair Value | |
| Morgan Stanley Bank of America Merrill Lynch Trust 2015-C21 | ||
| 1.01%, 03/15/48 (a)(b)(d) | $ 3,400,158 | $ 80,005 |
| UBS-Barclays Commercial Mortgage Trust 2013-C6 | ||
| 3.88%, 04/10/46 (a)(b)(g) | 535,000 | 541,933 |
| Wells Fargo Commercial Mortgage Trust 2014-LC16 | ||
| 4.32%, 08/15/50 (a) | 534,000 | 499,594 |
| Wells Fargo Commercial Mortgage Trust 2015-C26 | ||
| 1.35%, 02/15/48 (a)(b)(d) | 2,605,713 | 87,716 |
| WFRBS Commercial Mortgage Trust 2014-LC14 | ||
| 4.35%, 03/15/47 (a)(b) | 544,000 | 582,277 |
| 9,974,165 | ||
| Sovereign Bonds - 0.6% | ||
| Government of Chile | ||
| 2.55%, 01/27/32 (a) | 203,000 | 201,550 |
| Government of Mexico | ||
| 4.60%, 02/10/48 (a) | 202,000 | 208,947 |
| Government of Peru | ||
| 1.86%, 12/01/32 (a) | 75,000 | 68,443 |
| 2.78%, 12/01/60 (a) | 125,000 | 105,694 |
| 5.63%, 11/18/50 (a) | 113,000 | 153,630 |
| Government of Uruguay | ||
| 5.10%, 06/18/50 (a) | 117,568 | 149,784 |
| 888,048 | ||
| Municipal Bonds and Notes - 0.4% | ||
| American Municipal Power Inc. | ||
| 6.27%, 02/15/50 (a) | 105,000 | 148,494 |
| Board of Regents of the University of Texas System | ||
| 3.35%, 08/15/47 (a) | 95,000 | 108,972 |
| State of California | ||
| 4.60%, 04/01/38 | 165,000 | 191,240 |
| State of Illinois | ||
| 5.10%, 06/01/33 | 100,000 | 116,555 |
| 565,261 | ||
| Total Bonds and Notes (Cost $140,629,194) | 142,727,143 | |
| State Street Active Core Bond Fund | 57 |
| Number of Shares | Fair Value | |
| Domestic Equity - 0.2% | ||
| Preferred Stock - 0.2% | ||
| Wells Fargo & Co. 5.85%, 3.09% + 3 month USD LIBOR (Cost $214,450) (b) | 8,578 | $ 234,608 |
| Total Investments in Securities (Cost $140,843,644) | 142,961,751 | |
| Short-Term Investments - 13.4% | ||
| State Street Institutional U.S. Government Money Market Fund - Class G Shares 0.03% (a)(h)(i) (Cost $19,853,320) | 19,853,320 | 19,853,320 |
| Total Investments (Cost $160,696,964) | 162,815,071 | |
| Liabilities in Excess of Other Assets, net - (10.4)% | (15,402,203) | |
| NET ASSETS - 100.0% | $ 147,412,868 | |
| Centrally Cleared Credit Default Swaps |
| Reference Entity | Counterparty | Notional Amount (000s omitted) | Contract Annual Fixed Rate/ Payment Frequency | Termination Date | Market Value | Unamortized Upfront Payments Received (Paid) | Unrealized Appreciation (Depreciation) |
| Sell Protection | |||||||
| Markit CDX North America High Yield Index | Intercontinental Exchange | $3,171 | 5.00%/ Quarterly | 06/20/26 | $294,197 | $308,345 | $(14,148) |
| The Fund had the following long futures contracts open at September 30, 2021: |
| Description | Expiration Date | Number of Contracts | Notional Amount | Value | Unrealized Appreciation (Depreciation) |
| U.S. Long Bond Futures | December 2021 | 14 | $ 2,287,935 | $ 2,229,062 | $ (58,873) |
| Ultra Long-Term U.S. Treasury Bond Futures | December 2021 | 23 | 4,562,888 | 4,394,438 | (168,450) |
| 2 Yr. U.S. Treasury Notes Futures | December 2021 | 73 | 16,074,397 | 16,063,992 | (10,405) |
| 5 Yr. U.S. Treasury Notes Futures | December 2021 | 64 | 7,862,450 | 7,855,500 | (6,950) |
| $ (244,678) |
| 58 | State Street Active Core Bond Fund |
| The Fund had the following short futures contracts open at September 30, 2021: |
| Description | Expiration date | Number of Contracts | Notional Amount | Value | Unrealized Appreciation (Depreciation) |
| 10 Yr. U.S. Treasury Ultra Futures | December 2021 | 32 | $ (4,739,442) | $ (4,648,000) | $ 91,442 |
| 10 Yr. U.S. Treasury Notes Futures | December 2021 | 54 | (7,197,000) | (7,106,906) | 90,094 |
| $ 181,536 | |||||
| $ (63,142) |
| During the fiscal year ended September 30, 2021, average notional values related to derivative contracts were as follows: | ||||||||
| Purchased Put Options | Purchased Call Options | Written Put Options | Written Call Options | Long Futures Contracts | Short Futures Contracts | Credit Default Swap Contracts | Interest Rate Swap Contracts | |
| Average Notional Value | $— | $— | $— | $— | $21,781,955 | $16,395,901 | $3,854,876 | $— |
| (a) | At September 30, 2021, all or a portion of this security was pledged to cover collateral requirements for futures, swaps and/or TBAs. |
| (b) | Variable Rate Security - Interest rate shown is rate in effect at September 30, 2021. For securities based on a published reference rate and spread, the reference rate and spread are indicated in the description above. |
| (c) | Settlement is on a delayed delivery or when-issued basis with final maturity to be announced ("TBA") in the future. |
| (d) | Interest only security. These securities represent the right to receive the monthly interest payments on an underlying pool of mortgages. Payments of principal on the pool reduce the value of the "interest only" holding. |
| (e) | Principal only security. These securities represent the right to receive the monthly principal payments on an underlying pool of mortgages. No payments of interest on the pool are passed through to the "principal only" holder. |
| (f) | Step coupon bond. |
| (g) | Pursuant to Rule 144A of the Securities Act of 1933, as amended, these securities may be resold in transactions exempt from registration, normally to qualified institutional buyers. At September 30, 2021, these securities amounted to $7,768,969 or 5.27% of the net assets of the State Street Active Core Bond Fund. These securities have been determined to be liquid using procedures established by the Fund's Board of Trustees. |
| (h) | Sponsored by SSGA Funds Management, Inc., the Fund’s investment adviser and administrator, and an affiliate of State Street Bank & Trust Co., the Fund’s sub-administrator, custodian and accounting agent. |
| (i) | Coupon amount represents effective yield. |
| † | Percentages are based on net assets as of September 30, 2021. |
| ** | Amount is less than $0.50. |
| Abbreviations: |
| CMT - Constant Maturity Treasury |
| LIBOR - London Interbank Offered Rate |
| REMIC - Real Estate Mortgage Investment Conduit |
| SOFR - Secured Overnight Financing Rate |
| STRIPS - Separate Trading of Registered Interest and Principal of Security |
| TBA - To Be Announced |
| State Street Active Core Bond Fund | 59 |
| Investments | Level 1 | Level 2 | Level 3 | Total | |||
| Investments in Securities | |||||||
| U.S. Treasuries | $ — | $ 38,692,849 | $ — | $ 38,692,849 | |||
| Agency Mortgage Backed | — | 38,768,637 | — | 38,768,637 | |||
| Agency Collateralized Mortgage Obligations | — | 569,169 | — | 569,169 | |||
| Asset Backed | — | 1,125,079 | — | 1,125,079 | |||
| Corporate Notes | — | 52,143,935 | — | 52,143,935 | |||
| Non-Agency Collateralized Mortgage Obligations | — | 9,974,165 | — | 9,974,165 | |||
| Sovereign Bonds | — | 888,048 | — | 888,048 | |||
| Municipal Bonds and Notes | — | 565,261 | — | 565,261 | |||
| Preferred Stock | 234,608 | — | — | 234,608 | |||
| Short-Term Investments | 19,853,320 | — | — | 19,853,320 | |||
| Total Investments in Securities | $ 20,087,928 | $ 142,727,143 | $ — | $ 162,815,071 | |||
| Other Financial Instruments | |||||||
| Credit Default Swap Contracts - Unrealized Depreciation | $ — | $ (14,148) | $ — | $ (14,148) | |||
| Long Futures Contracts - Unrealized Depreciation | (244,678) | — | — | (244,678) | |||
| Short Futures Contracts - Unrealized Appreciation | 181,536 | — | — | 181,536 | |||
| Total Other Financial Instruments | $ (63,142) | $ (14,148) | $ — | $ (77,290) |
| Affiliate Table |
| Number of Shares Held at 9/30/20 | Value at 9/30/20 | Cost of Purchases | Proceeds from Shares Sold | Realized Gain (Loss) | Change in Unrealized Appreciation (Depreciation) | Number of Shares Held at 9/30/21 | Value at 9/30/21 | Dividend Income | |
| State Street Institutional U.S. Government Money Market Fund - Class G Shares | 9,155,711 | $9,155,711 | $90,407,236 | $79,709,627 | $— | $— | 19,853,320 | $19,853,320 | $6,159 |
| 60 | State Street Active Core Bond Fund |
| Investment Class | |||||||||
| 9/30/21 | 9/30/20 | 9/30/19 | 9/30/18 | 9/30/17 | |||||
| Inception date | 11/25/97 | ||||||||
| Net asset value, beginning of period | $ 13.97 | $ 12.30 | $ 13.74 | $ 14.95 | $ 13.50 | ||||
| Income/(loss) from investment operations: | |||||||||
| Net investment income | 0.13 (a) | 0.14 (a) | 0.15 (a) | 0.16 (a) | 0.18 (a) | ||||
| Net realized and unrealized gains/(losses) on investments | 3.86 (a) | 2.35 (a) | 0.05 (a) | 1.95 (a) | 2.16 (a) | ||||
| Total income from investment operations | 3.99 | 2.49 | 0.20 | 2.11 | 2.34 | ||||
| Less distributions from: | |||||||||
| Net investment income | 0.14 | 0.16 | 0.18 | 0.21 | 0.21 | ||||
| Net realized gains | 0.56 | 0.66 | 1.46 | 3.11 | 0.68 | ||||
| Total distributions | 0.70 | 0.82 | 1.64 | 3.32 | 0.89 | ||||
| Net asset value, end of period | $ 17.26 | $ 13.97 | $ 12.30 | $ 13.74 | $ 14.95 | ||||
| Total Return(b) | 29.41% | 20.77% | 4.43% | 16.72% | 18.29% | ||||
| Ratios/Supplemental Data: | |||||||||
| Net assets, end of period (in thousands) | $572,329 | $461,624 | $419,296 | $522,658 | $461,828 | ||||
| Ratios to average net assets: | |||||||||
| Net expenses | 0.37% | 0.37% | 0.38% | 0.37% | 0.37% | ||||
| Gross expenses | 0.37% | 0.37% | 0.38% | 0.37% | 0.37% | ||||
| Net investment income | 0.81% | 1.12% | 1.29% | 1.21% | 1.29% | ||||
| Portfolio turnover rate | 35% | 38% | 35% | 48% | 80% | ||||
| Notes to Financial Highlights | |
| (a) | Per share values have been calculated using the average share method. |
| (b) | Total returns are historical and assume changes in share price and reinvestment of dividends and capital gains distributions. |
| Financial Highlights | 61 |
| Service Class | |||||||||
| 9/30/21 | 9/30/20 | 9/30/19 | 9/30/18 | 9/30/17 | |||||
| Inception date | 1/3/01 | ||||||||
| Net asset value, beginning of period | $15.21 | $13.32 | $14.70 | $15.77 | $14.18 | ||||
| Income/(loss) from investment operations: | |||||||||
| Net investment income | 0.10 (a) | 0.12 (a) | 0.14 (a) | 0.14 (a) | 0.15 (a) | ||||
| Net realized and unrealized gains/(losses) on investments | 4.21 (a) | 2.54 (a) | 0.09 (a) | 2.08 (a) | 2.29 (a) | ||||
| Total income from investment operations | 4.31 | 2.66 | 0.23 | 2.22 | 2.44 | ||||
| Less distributions from: | |||||||||
| Net investment income | 0.10 | 0.11 | 0.15 | 0.18 | 0.17 | ||||
| Net realized gains | 0.56 | 0.66 | 1.46 | 3.11 | 0.68 | ||||
| Total distributions | 0.66 | 0.77 | 1.61 | 3.29 | 0.85 | ||||
| Net asset value, end of period | $18.86 | $15.21 | $13.32 | $14.70 | $15.77 | ||||
| Total Return(b) | 29.10% | 20.52% | 4.23% | 16.35% | 18.07% | ||||
| Ratios/Supplemental Data: | |||||||||
| Net assets, end of period (in thousands) | $ 268 | $ 58 | $ 48 | $ 104 | $ 95 | ||||
| Ratios to average net assets: | |||||||||
| Net expenses | 0.62% | 0.62% | 0.63% | 0.62% | 0.62% | ||||
| Gross expenses | 0.62% | 0.62% | 0.63% | 0.62% | 0.62% | ||||
| Net investment income | 0.56% | 0.87% | 1.06% | 0.95% | 1.04% | ||||
| Portfolio turnover rate | 35% | 38% | 35% | 48% | 80% | ||||
| Notes to Financial Highlights | |
| (a) | Per share values have been calculated using the average share method. |
| (b) | Total returns are historical and assume changes in share price and reinvestment of dividends and capital gains distributions. |
| 62 | Financial Highlights |
| Investment Class | |||||||||
| 9/30/21 | 9/30/20 | 9/30/19 | 9/30/18 | 9/30/17 | |||||
| Inception date | 10/29/99 | ||||||||
| Net asset value, beginning of period | $ 10.72 | $ 15.51 | $ 17.49 | $ 15.69 | $ 14.23 | ||||
| Income/(loss) from investment operations: | |||||||||
| Net investment income | 0.02 (a) | 0.05 (a) | 0.09 (a) | 0.11 (a) | 0.13 (a) | ||||
| Net realized and unrealized gains/(losses) on investments | 2.55 (a) | 3.89 (a) | (0.03) (a) | 2.82 (a) | 2.60 (a) | ||||
| Total income from investment operations | 2.57 | 3.94 | 0.06 | 2.93 | 2.73 | ||||
| Less distributions from: | |||||||||
| Net investment income | 0.01 | 0.09 | 0.11 | 0.13 | 0.12 | ||||
| Net realized gains | 1.29 | 8.64 | 1.93 | 1.00 | 1.15 | ||||
| Total distributions | 1.30 | 8.73 | 2.04 | 1.13 | 1.27 | ||||
| Net asset value, end of period | $ 11.99 | $ 10.72 | $ 15.51 | $ 17.49 | $ 15.69 | ||||
| Total Return(b) | 25.85% | 39.25% | 3.57% | 19.64% | 21.18% | ||||
| Ratios/Supplemental Data: | |||||||||
| Net assets, end of period (in thousands) | $85,331 | $73,933 | $192,144 | $365,078 | $360,416 | ||||
| Ratios to average net assets: | |||||||||
| Net expenses | 0.45% | 0.42% | 0.39% | 0.38% | 0.38% | ||||
| Gross expenses | 0.45% | 0.42% | 0.39% | 0.38% | 0.38% | ||||
| Net investment income | 0.16% | 0.40% | 0.59% | 0.68% | 0.88% | ||||
| Portfolio turnover rate | 27% | 28% | 27% | 21% | 24% | ||||
| Notes to Financial Highlights | |
| (a) | Per share values have been calculated using the average share method. |
| (b) | Total returns are historical and assume changes in share price and reinvestment of dividends and capital gains distributions. |
| Financial Highlights | 63 |
| Service Class | |||||||||
| 9/30/21 | 9/30/20 | 9/30/19 | 9/30/18 | 9/30/17 | |||||
| Inception date | 1/3/01 | ||||||||
| Net asset value, beginning of period | $10.40 | $15.27 | $17.24 | $ 15.48 | $ 14.06 | ||||
| Income/(loss) from investment operations: | |||||||||
| Net investment income (loss) | (0.01) (a) | 0.01 (a) | 0.05 (a) | 0.07 (a) | 0.09 (a) | ||||
| Net realized and unrealized gains/(losses) on investments | 2.47 (a) | 3.80 (a) | (0.02) (a) | 2.78 (a) | 2.57 (a) | ||||
| Total income from investment operations | 2.46 | 3.81 | 0.03 | 2.85 | 2.66 | ||||
| Less distributions from: | |||||||||
| Net investment income | — | 0.04 | 0.07 | 0.09 | 0.09 | ||||
| Net realized gains | 1.29 | 8.64 | 1.93 | 1.00 | 1.15 | ||||
| Total distributions | 1.29 | 8.68 | 2.00 | 1.09 | 1.24 | ||||
| Net asset value, end of period | $11.57 | $10.40 | $15.27 | $ 17.24 | $ 15.48 | ||||
| Total Return(b) | 25.58% | 38.83% | 3.32% | 19.37% | 20.84% | ||||
| Ratios/Supplemental Data: | |||||||||
| Net assets, end of period (in thousands) | $9,784 | $8,832 | $9,609 | $17,298 | $16,136 | ||||
| Ratios to average net assets: | |||||||||
| Net expenses | 0.70% | 0.69% | 0.64% | 0.63% | 0.63% | ||||
| Gross expenses | 0.70% | 0.69% | 0.64% | 0.63% | 0.63% | ||||
| Net investment income (loss) | (0.09)% | 0.08% | 0.34% | 0.43% | 0.62% | ||||
| Portfolio turnover rate | 27% | 28% | 27% | 21% | 24% | ||||
| Notes to Financial Highlights | |
| (a) | Per share values have been calculated using the average share method. |
| (b) | Total returns are historical and assume changes in share price and reinvestment of dividends and capital gains distributions. |
| 64 | Financial Highlights |
| Investment Class | |||||||||
| 9/30/21 | 9/30/20 | 9/30/19 | 9/30/18 | 9/30/17 | |||||
| Inception date | 8/3/98 | ||||||||
| Net asset value, beginning of period | $ 15.55 | $ 17.04 | $ 21.94 | $ 20.79 | $ 17.96 | ||||
| Income/(loss) from investment operations: | |||||||||
| Net investment income | 0.02 (a) | 0.05 (a) | 0.06 (a) | 0.03 (a) | 0.05 (a) | ||||
| Net realized and unrealized gains/(losses) on investments | 7.19 (a) | (0.45) (a) | (2.06) (a) | 2.95 (a) | 3.42 (a) | ||||
| Total income/(loss) from investment operations | 7.21 | (0.40) | (2.00) | 2.98 | 3.47 | ||||
| Less distributions from: | |||||||||
| Net investment income | 0.04 | 0.07 | 0.04 | 0.04 | 0.04 | ||||
| Net realized gains | 0.57 | 1.02 | 2.86 | 1.79 | 0.60 | ||||
| Total distributions | 0.61 | 1.09 | 2.90 | 1.83 | 0.64 | ||||
| Net asset value, end of period | $ 22.15 | $ 15.55 | $ 17.04 | $ 21.94 | $ 20.79 | ||||
| Total Return(b) | 46.98% | (3.03)% | (6.21)% | 15.47% | 19.65% | ||||
| Ratios/Supplemental Data: | |||||||||
| Net assets, end of period (in thousands) | $1,308,410 | $973,165 | $1,255,899 | $1,528,575 | $1,464,018 | ||||
| Ratios to average net assets: | |||||||||
| Net expenses | 0.88% | 0.89% | 0.88% | 0.88% | 0.88% | ||||
| Gross expenses | 0.88% | 0.89% | 0.88% | 0.88% | �� | 0.88% | |||
| Net investment income | 0.10% | 0.33% | 0.37% | 0.14% | 0.27% | ||||
| Portfolio turnover rate | 42% | 31% | 29% | 38% | 34% | ||||
| Notes to Financial Highlights | |
| (a) | Per share values have been calculated using the average share method. |
| (b) | Total returns are historical and assume changes in share price and reinvestment of dividends and capital gains distributions. |
| Financial Highlights | 65 |
| Service Class | |||||||||
| 9/30/21 | 9/30/20 | 9/30/19 | 9/30/18 | 9/30/17 | |||||
| Inception date | 9/30/05 | ||||||||
| Net asset value, beginning of period | $15.53 | $17.02 | $21.93 | $20.79 | $17.98 | ||||
| Income/(loss) from investment operations: | |||||||||
| Net investment income (loss) | (0.03) (a) | 0.01 (a) | 0.02 (a) | (0.02) (a) | 0.01 (a) | ||||
| Net realized and unrealized gains/(losses) on investments | 7.18 (a) | (0.46) (a) | (2.05) (a) | 2.95 (a) | 3.41 (a) | ||||
| Total income/(loss) from investment operations | 7.15 | (0.45) | (2.03) | 2.93 | 3.42 | ||||
| Less distributions from: | |||||||||
| Net investment income | — | 0.02 | 0.02 | — | 0.01 | ||||
| Net realized gains | 0.57 | 1.02 | 2.86 | 1.79 | 0.60 | ||||
| Total distributions | 0.57 | 1.04 | 2.88 | 1.79 | 0.61 | ||||
| Net asset value, end of period | $22.11 | $15.53 | $17.02 | $21.93 | $20.79 | ||||
| Total Return(b) | 46.60% | 3.30% | (6.44)% | 15.14% | 19.38% | ||||
| Ratios/Supplemental Data: | |||||||||
| Net assets, end of period (in thousands) | $2,078 | $1,750 | $1,937 | $2,671 | $2,373 | ||||
| Ratios to average net assets: | |||||||||
| Net expenses | 1.13% | 1.14% | 1.13% | 1.13% | 1.13% | ||||
| Gross expenses | 1.13% | 1.14% | 1.13% | 1.13% | 1.13% | ||||
| Net investment income (loss) | (0.14)% | 0.08% | 0.12% | (0.11)% | 0.03% | ||||
| Portfolio turnover rate | 42% | 31% | 29% | 38% | 34% | ||||
| Notes to Financial Highlights | |
| (a) | Per share values have been calculated using the average share method. |
| (b) | Total returns are historical and assume changes in share price and reinvestment of dividends and capital gains distributions. |
| 66 | Financial Highlights |
| Investment Class | |||||||||
| 9/30/21 | 9/30/20 | 9/30/19 | 9/30/18 | 9/30/17 | |||||
| Inception date | 11/25/97 | ||||||||
| Net asset value, beginning of period | $ 14.26 | $ 13.42 | $ 13.37 | $ 13.42 | $ 11.83 | ||||
| Income/(loss) from investment operations: | |||||||||
| Net investment income | 0.45 (a) | 0.32 (a) | 0.15 (a) | 0.23 (a) | 0.17 (a) | ||||
| Net realized and unrealized gains/(losses) on investments | 3.01 (a) | 0.79 (a) | 0.22 (a) | (0.09) (a) | 1.63 (a) | ||||
| Total income from investment operations | 3.46 | 1.11 | 0.37 | 0.14 | 1.80 | ||||
| Less distributions from: | |||||||||
| Net investment income | 0.31 | 0.27 | 0.32 | 0.19 | 0.21 | ||||
| Total distributions | 0.31 | 0.27 | 0.32 | 0.19 | 0.21 | ||||
| Net asset value, end of period | $ 17.41 | $ 14.26 | $ 13.42 | $ 13.37 | $ 13.42 | ||||
| Total Return(b) | 24.53% | 8.28% | 3.18% | 1.01% | 15.58% | ||||
| Ratios/Supplemental Data: | |||||||||
| Net assets, end of period (in thousands) | $101,247 | $83,672 | $73,060 | $1,095,253 | $1,213,757 | ||||
| Ratios to average net assets: | |||||||||
| Net expenses | 0.55% | 0.55% | 0.56% | 0.57% | 0.57% | ||||
| Gross expenses | 0.66% | 0.69% | 0.63% | 0.57% | 0.57% | ||||
| Net investment income | 2.68% | 2.39% | 1.15% | 1.68% | 1.40% | ||||
| Portfolio turnover rate | 18% | 25% | 20% | 24% | 30% | ||||
| Notes to Financial Highlights | |
| (a) | Per share values have been calculated using the average share method. |
| (b) | Total returns are historical and assume changes in share price and reinvestment of dividends and capital gains distributions. |
| Financial Highlights | 67 |
| Service Class | |||||||||
| 9/30/21 | 9/30/20 | 9/30/19 | 9/30/18 | 9/30/17 | |||||
| Inception date | 1/3/01 | ||||||||
| Net asset value, beginning of period | $ 14.21 | $ 13.37 | $ 13.28 | $ 13.34 | $ 11.76 | ||||
| Income/(loss) from investment operations: | |||||||||
| Net investment income | 0.40 (a) | 0.29 (a) | 0.22 (a) | 0.20 (a) | 0.14 (a) | ||||
| Net realized and unrealized gains/(losses) on investments | 3.01 (a) | 0.79 (a) | 0.13 (a) | (0.10) (a) | 1.63 (a) | ||||
| Total income from investment operations | 3.41 | 1.08 | 0.35 | 0.10 | 1.77 | ||||
| Less distributions from: | |||||||||
| Net investment income | 0.28 | 0.24 | 0.26 | 0.16 | 0.19 | ||||
| Total distributions | 0.28 | 0.24 | 0.26 | 0.16 | 0.19 | ||||
| Net asset value, end of period | $ 17.34 | $ 14.21 | $ 13.37 | $ 13.28 | $ 13.34 | ||||
| Total Return(b) | 24.17% | 7.96% | 3.03% | 0.75% | 15.33% | ||||
| Ratios/Supplemental Data: | |||||||||
| Net assets, end of period (in thousands) | $12,957 | $11,201 | $13,228 | $17,820 | $18,687 | ||||
| Ratios to average net assets: | |||||||||
| Net expenses | 0.80% | 0.80% | 0.81% | 0.82% | 0.82% | ||||
| Gross expenses | 0.91% | 0.94% | 0.94% | 0.82% | 0.82% | ||||
| Net investment income | 2.39% | 2.19% | 1.80% | 1.44% | 1.14% | ||||
| Portfolio turnover rate | 18% | 25% | 20% | 24% | 30% | ||||
| Notes to Financial Highlights | |
| (a) | Per share values have been calculated using the average share method. |
| (b) | Total returns are historical and assume changes in share price and reinvestment of dividends and capital gains distributions. |
| 68 | Financial Highlights |
| Investment Class | |||||||||
| 9/30/21 | 9/30/20 | 9/30/19 | 9/30/18 | 9/30/17 | |||||
| Inception date | 11/21/97 | ||||||||
| Net asset value, beginning of period | $ 9.88 | $ 9.66 | $ 9.07 | $ 9.52 | $ 9.67 | ||||
| Income/(loss) from investment operations: | |||||||||
| Net investment income | 0.15 (a) | 0.21 (a) | 0.27 (a) | 0.26 (a) | 0.24 (a) | ||||
| Net realized and unrealized gains/(losses) on investments | (0.13) (a) | 0.44 (a) | 0.60 (a) | (0.38) (a) | (0.15) (a) | ||||
| Total income/(loss) from investment operations | 0.02 | 0.65 | 0.87 | (0.12) | 0.09 | ||||
| Less distributions from: | |||||||||
| Net investment income | 0.21 | 0.29 | 0.28 | 0.27 | 0.23 | ||||
| Net realized gains | 0.13 | 0.14 | — | 0.06 | 0.01 | ||||
| Total distributions | 0.34 | 0.43 | 0.28 | 0.33 | 0.24 | ||||
| Net asset value, end of period | $ 9.56 | $ 9.88 | $ 9.66 | $ 9.07 | $ 9.52 | ||||
| Total Return(b) | 0.27% | 6.92% | 9.76% | (1.35)% | 0.98% | ||||
| Ratios/Supplemental Data: | |||||||||
| Net assets, end of period (in thousands) | $147,293 | $133,793 | $115,089 | $221,201 | $220,157 | ||||
| Ratios to average net assets: | |||||||||
| Net expenses | 0.27% | 0.28% | 0.26% | 0.25% | 0.24% | ||||
| Gross expenses | 0.27% | 0.29% | 0.26% | 0.25% | 0.24% | ||||
| Net investment income | 1.54% | 2.20% | 2.92% | 2.83% | 2.56% | ||||
| Portfolio turnover rate | 69% (c) | 120% (d) | 438% | 181% | 326% | ||||
| Notes to Financial Highlights | |
| (a) | Per share values have been calculated using the average share method. |
| (b) | Total returns are historical and assume changes in share price and reinvestment of dividends and capital gains distributions. |
| (c) | The portfolio turnover calculated for the period ended 9/30/21 did not include To-Be-Announced transactions and, if it had, the portfolio turnover would have been 171%. |
| (d) | The portfolio turnover calculated for the period ended 9/30/20 did not include To-Be-Announced transactions and, if it had, the portfolio turnover would have been 405%. |
| Financial Highlights | 69 |
| Service Class | |||||||||
| 9/30/21 | 9/30/20 | 9/30/19 | 9/30/18 | 9/30/17 | |||||
| Inception date | 9/30/05 | ||||||||
| Net asset value, beginning of period | $10.14 | $ 9.89 | $9.28 | $ 9.73 | $ 9.89 | ||||
| Income/(loss) from investment operations: | |||||||||
| Net investment income | 0.12 (a) | 0.19 (a) | 0.25 (a) | 0.24 (a) | 0.22 (a) | ||||
| Net realized and unrealized gains/(losses) on investments | (0.12) (a) | 0.45 (a) | 0.62 (a) | (0.38) (a) | (0.16) (a) | ||||
| Total income/(loss) from investment operations | — | 0.64 | 0.87 | (0.14) | 0.06 | ||||
| Less distributions from: | |||||||||
| Net investment income | 0.19 | 0.25 | 0.26 | 0.25 | 0.21 | ||||
| Net realized gains | 0.13 | 0.14 | — | 0.06 | 0.01 | ||||
| Total distributions | 0.32 | 0.39 | 0.26 | 0.31 | 0.22 | ||||
| Net asset value, end of period | $ 9.82 | $10.14 | $9.89 | $ 9.28 | $ 9.73 | ||||
| Total Return(b) | 0.06% | 6.63% | 9.56% | (1.51)% | 0.65% | ||||
| Ratios/Supplemental Data: | |||||||||
| Net assets, end of period (in thousands) | $ 120 | $ 362 | $ 86 | $ 80 | $ 90 | ||||
| Ratios to average net assets: | |||||||||
| Net expenses | 0.52% | 0.54% | 0.51% | 0.50% | 0.49% | ||||
| Gross expenses | 0.52% | 0.54% | 0.51% | 0.50% | 0.49% | ||||
| Net investment income | 1.22% | 1.94% | 2.65% | 2.57% | 2.28% | ||||
| Portfolio turnover rate | 69% (c) | 120% (d) | 438% | 181% | 326% | ||||
| Notes to Financial Highlights | |
| (a) | Per share values have been calculated using the average share method. |
| (b) | Total returns are historical and assume changes in share price and reinvestment of dividends and capital gains distributions. |
| (c) | The portfolio turnover calculated for the period ended 9/30/21 did not include To-Be-Announced transactions and, if it had, the portfolio turnover would have been 171%. |
| (d) | The portfolio turnover calculated for the period ended 9/30/20 did not include To-Be-Announced transactions and, if it had, the portfolio turnover would have been 405%. |
| 70 | Financial Highlights |
| State Street Institutional U.S. Equity Fund | State Street Institutional Premier Growth Equity Fund | State Street Institutional Small-Cap Equity Fund | |||
| Assets | |||||
| Investments in securities, at fair value (cost $347,985,138; $43,394,100; $870,996,384; $82,460,060 and $140,843,644, respectively) | $ 562,662,687 | $ 89,727,395 | $ 1,259,877,083 | ||
| Investments in affiliated securities, at fair value (cost $0; $2,751,098; $0; $0 and $0, respectively) | — | 3,127,271 | — | ||
| Short-term affiliated investments, at fair value | 9,885,922 | 1,877,600 | 49,748,651 | ||
| Cash | 16,223 | — | 143,701 | ||
| Net cash collateral on deposit with broker for future contracts | 610,459 | 125,923 | 2,668,623 | ||
| Foreign currency (cost $0; $0; $0; $57,451 and $0, respectively) | — | — | — | ||
| Receivable for investments sold | 3,029,572 | 245,666 | 5,148,157 | ||
| Income receivables | 457,977 | 11,158 | 641,671 | ||
| Receivable for fund shares sold | 29,713 | 189,400 | 28,358 | ||
| Income receivable from affiliated investments | 269 | 58 | 1,104 | ||
| Receivable for accumulated variation margin on swap contracts | — | — | — | ||
| Total assets | 576,692,822 | 95,304,471 | 1,318,257,348 | ||
| Liabilities | |||||
| Distribution payable to shareholders | — | — | — | ||
| Due to custodian | — | — | — | ||
| Net cash collateral on swap contracts due to broker | — | — | — | ||
| Payable for investments purchased | 3,727,756 | 94,705 | 6,286,730 | ||
| Payable for fund shares redeemed | — | 1,872 | 362,409 | ||
| Payable for accumulated variation margin on futures contracts | 189,977 | 55,610 | 149,295 | ||
| Payable to the Adviser | 177,820 | 35,060 | 969,868 | ||
| Accrued other expenses | 212 | 277 | 463 | ||
| Distribution and service fees | 56 | 2,086 | 433 | ||
| Total liabilities | 4,095,821 | 189,610 | 7,769,198 | ||
| Net Assets | $ 572,597,001 | $ 95,114,861 | $ 1,310,488,150 | ||
| Net Assets Consist of: | |||||
| Capital paid in | $ 297,742,553 | $ 37,981,927 | $ 760,420,966 | ||
| Total distributable earnings (loss) | 274,854,448 | 57,132,934 | 550,067,184 | ||
| Net Assets | $ 572,597,001 | $ 95,114,861 | $ 1,310,488,150 | ||
| Investment Class: | |||||
| Net Assets | $ 572,329,479 | $ 85,331,082 | $ 1,308,410,237 | ||
| Shares outstanding ($0.001 par value, unlimited shares authorized) | 33,156,795 | 7,115,013 | 59,083,015 | ||
| Net asset value, offering and redemption price per share | $ 17.26 | $ 11.99 | $ 22.15 | ||
| Service Class: | |||||
| Net Assets | $ 267,522 | $ 9,783,779 | $ 2,077,913 | ||
| Shares outstanding ($0.001 par value, unlimited shares authorized) | 14,183 | 845,868 | 93,973 | ||
| Net asset value, offering and redemption price per share | $ 18.86 | $ 11.57 | $ 22.11 | ||
| 72 | Statements of Assets and Liabilities |
| State Street Institutional International Equity Fund | State Street Active Core Bond Fund | |
| $ 111,901,943 | $ 142,961,751 | |
| — | — | |
| 1,174,330 | 19,853,320 | |
| — | — | |
| 45,667 | 54,731 | |
| 57,375 | — | |
| — | 2,283 | |
| 1,088,288 | 651,780 | |
| 12,640 | 16,161 | |
| 32 | 400 | |
| — | 298,620 | |
| 114,280,275 | 163,839,046 | |
| — | 31 | |
| — | 51,828 | |
| — | 299,510 | |
| — | 15,965,612 | |
| 103 | 12,200 | |
| 20,700 | 62,679 | |
| 52,269 | 33,845 | |
| 463 | 448 | |
| 2,784 | 25 | |
| 76,319 | 16,426,178 | |
| $ 114,203,956 | $ 147,412,868 | |
| $ 78,318,032 | $ 145,509,398 | |
| 35,885,924 | 1,903,470 | |
| $ 114,203,956 | $ 147,412,868 | |
| $ 101,247,291 | $ 147,292,972 | |
| 5,816,717 | 15,406,869 | |
| $ 17.41 | $ 9.56 | |
| $ 12,956,665 | $ 119,897 | |
| 747,264 | 12,210 | |
| $ 17.34 | $ 9.82 | |
| Statements of Assets and Liabilities | 73 |
| State Street Institutional U.S. Equity Fund | State Street Institutional Premier Growth Equity Fund | State Street Institutional Small-Cap Equity Fund | |||
| Investment Income | |||||
| Income | |||||
| Dividend | $ 6,456,726 | $ 550,204 | $ 12,392,077 | ||
| Interest | — | — | — | ||
| Income from affiliated investments | 3,566 | 16,217 | 21,519 | ||
| Less: Foreign taxes withheld | (3,454) | — | (33,225) | ||
| Total income | 6,456,838 | 566,421 | 12,380,371 | ||
| Expenses | |||||
| Advisory and administration fees | 2,000,025 | 400,880 | 11,084,633 | ||
| Distribution and service fees | |||||
| Service Class | 333 | 23,541 | 5,010 | ||
| Trustees' fees | 22,786 | 19,917 | 27,424 | ||
| Total expenses before waivers | 2,023,144 | 444,338 | 11,117,067 | ||
| Less: Expenses waived or borne by the adviser | — | — | — | ||
| Total expenses | 2,023,144 | 444,338 | 11,117,067 | ||
| Net investment income | $ 4,433,694 | $ 122,083 | $ 1,263,304 | ||
| Net Realized and Unrealized Gain (Loss) on Investments | |||||
| Realized gain (loss) on: | |||||
| Unaffiliated investments | $ 61,292,210 | $ 12,192,566 | $ 183,255,219 | ||
| Affiliated investments | — | 226,659 | — | ||
| Futures | 730,226 | 467,541 | 6,737,912 | ||
| Swap contracts | — | — | — | ||
| Foreign currency transactions | — | — | — | ||
| Increase (decrease) in unrealized appreciation/depreciation on: | |||||
| Unaffiliated investments | 70,425,533 | 7,845,588 | 249,008,630 | ||
| Affiliated investments | — | 137,533 | — | ||
| Futures | (190,629) | (52,776) | (89,938) | ||
| Swap contracts | — | — | — | ||
| Foreign currency translations | — | — | — | ||
| Net realized and unrealized gain (loss) on investments | 132,257,340 | 20,817,111 | 438,911,823 | ||
| Net Increase in Net Assets Resulting from Operations | $ 136,691,034 | $ 20,939,194 | $ 440,175,127 |
| 74 | Statements of Operations |
| State Street Institutional International Equity Fund | State Street Active Core Bond Fund | |
| $ 4,054,244 | $ 12,043 | |
| — | 2,597,545 | |
| 488 | 6,159 | |
| (507,086) | — | |
| 3,547,646 | 2,615,747 | |
| 704,197 | 376,610 | |
| 31,796 | 333 | |
| 20,409 | 20,506 | |
| 756,402 | 397,449 | |
| (120,409) | (5,493) | |
| 635,993 | 391,956 | |
| $ 2,911,653 | $ 2,223,791 | |
| $ 5,759,262 | $ 652,754 | |
| — | — | |
| 118,420 | 216,591 | |
| — | 685,648 | |
| 46,479 | — | |
| 14,114,168 | (3,078,328) | |
| — | — | |
| (12,000) | (71,278) | |
| — | (411,747) | |
| (47,029) | — | |
| 19,979,300 | (2,006,360) | |
| $ 22,890,953 | $ 217,431 |
| Statements of Operations | 75 |
| State Street Institutional U.S. Equity Fund | State Street Institutional Premier Growth Equity Fund | ||||||
| Year Ended September 30, 2021 | Year Ended September 30, 2020 | Year Ended September 30, 2021 | Year Ended September 30, 2020 | ||||
| Increase (Decrease) in Net Assets | |||||||
| Operations: | |||||||
| Net investment income | $ 4,433,694 | $ 4,753,464 | $ 122,083 | $ 513,482 | |||
| Net realized gain (loss) on investments, futures, swap contracts and foreign currency transactions | 62,022,436 | 19,852,700 | 12,886,766 | 67,955,212 | |||
| Net increase (decrease) in unrealized appreciation/depreciation on investments, futures, swap contracts and foreign currency translations | 70,234,904 | 57,146,335 | 7,930,345 | (31,617,714) | |||
| Net increase (decrease) from operations | 136,691,034 | 81,752,499 | 20,939,194 | 36,850,980 | |||
| Distributions to shareholders: | |||||||
| Total distributions | |||||||
| Investment Class | (23,406,981) | (26,072,740) | (8,735,337) | (122,991,014) | |||
| Service Class | (2,531) | (2,748) | (1,048,868) | (4,866,436) | |||
| Total distributions | (23,409,512) | (26,075,488) | (9,784,205) | (127,857,450) | |||
| Increase (decrease) in assets from operations and distributions | 113,281,522 | 55,677,011 | 11,154,989 | (91,006,470) | |||
| Share transactions: | |||||||
| Proceeds from sale of shares | |||||||
| Investment Class | 22,603,685 | 21,263,774 | 2,801,546 | 14,487,775 | |||
| Service Class | 214,086 | 20,082 | 1,531,472 | 1,885,268 | |||
| Value of distributions reinvested | |||||||
| Investment Class | 23,158,592 | 25,797,811 | 8,735,201 | 122,990,094 | |||
| Service Class | 2,531 | 2,748 | 1,048,868 | 4,866,436 | |||
| Cost of shares redeemed | |||||||
| Investment Class | (48,319,146) | (60,403,984) | (10,268,082) | (166,783,898) | |||
| Service Class | (26,642) | (19,074) | (2,653,742) | (5,426,873) | |||
| Net increase (decrease) from share transactions | (2,366,894) | (13,338,643) | 1,195,263 | (27,981,198) | |||
| Total increase (decrease) in net assets | 110,914,628 | 42,338,368 | 12,350,252 | (118,987,668) | |||
| Net Assets | |||||||
| Beginning of year | 461,682,373 | 419,344,005 | 82,764,609 | 201,752,277 | |||
| End of year | $ 572,597,001 | $ 461,682,373 | $ 95,114,861 | $ 82,764,609 | |||
| Changes in Fund Shares | |||||||
| Investment Class | |||||||
| Shares sold | 1,450,198 | 1,658,150 | 246,456 | 1,177,997 | |||
| Issued for distributions reinvested | 1,580,791 | 2,034,528 | 846,434 | 12,292,292 | |||
| Shares redeemed | (2,928,886) | (4,713,446) | (874,337) | (18,958,505) | |||
| Net increase (decrease) in fund shares | 102,103 | (1,020,768) | 218,553 | (5,488,216) | |||
| Service Class | |||||||
| Shares sold | 11,659 | 1,303 | 139,140 | 183,138 | |||
| Issued for distributions reinvested | 158 | 199 | 105,097 | 494,189 | |||
| Shares redeemed | (1,453) | (1,264) | (247,671) | (457,284) | |||
| Net increase (decrease) in fund shares | 10,364 | 238 | (3,434) | 220,043 | |||
| 76 | Statements of Changes in Net Assets |
| State Street Institutional Small-Cap Equity Fund | State Street Institutional International Equity Fund | State Street Active Core Bond Fund | ||||||||
| Year Ended September 30, 2021 | Year Ended September 30, 2020 | Year Ended September 30, 2021 | Year Ended September 30, 2020 | Year Ended September 30, 2021 | Year Ended September 30, 2020 | |||||
| $ 1,263,304 | $ 3,612,084 | $ 2,911,653 | $ 2,019,931 | $ 2,223,791 | $ 2,611,100 | |||||
| 189,993,131 | 31,647,245 | 5,924,161 | 1,363,129 | 1,554,993 | 3,113,931 | |||||
| 248,918,692 | (76,678,453) | 14,055,139 | 3,446,769 | (3,561,353) | 2,066,799 | |||||
| 440,175,127 | (41,419,124) | 22,890,953 | 6,829,829 | 217,431 | 7,791,830 | |||||
| (36,826,282) | (77,013,163) | (1,798,730) | (1,417,916) | (5,181,996) | (5,180,419) | |||||
| (53,141) | (109,788) | (215,008) | (230,486) | (4,121) | (5,910) | |||||
| (36,879,423) | (77,122,951) | (2,013,738) | (1,648,402) | (5,186,117) | (5,186,329) | |||||
| 403,295,704 | (118,542,075) | 20,877,215 | 5,181,427 | (4,968,686) | 2,605,501 | |||||
| 67,272,135 | 55,256,413 | 1,196,174 | 8,611,083 | 16,303,707 | 30,031,206 | |||||
| 300,585 | 301,847 | 61,753 | 182,631 | 6,135 | 292,572 | |||||
| 36,808,062 | 77,013,163 | 1,798,165 | 1,417,425 | 5,181,903 | 5,170,345 | |||||
| 53,141 | 109,787 | 215,008 | 230,375 | 4,120 | 5,882 | |||||
| (171,456,650) | (296,634,844) | (3,862,097) | (3,933,169) | (3,020,399) | (19,099,938) | |||||
| (699,980) | (424,254) | (954,978) | (3,104,945) | (248,176) | (26,421) | |||||
| (67,722,707) | (164,377,888) | (1,545,975) | 3,403,400 | 18,227,290 | 16,373,646 | |||||
| 335,572,997 | (282,919,963) | 19,331,240 | 8,584,827 | 13,258,604 | 18,979,147 | |||||
| 974,915,153 | 1,257,835,116 | 94,872,716 | 86,287,889 | 134,154,264 | 115,175,117 | |||||
| $ 1,310,488,150 | $ 974,915,153 | $ 114,203,956 | $ 94,872,716 | $ 147,412,868 | $ 134,154,264 | |||||
| 3,105,436 | 3,511,521 | 71,856 | 604,371 | 1,649,677 | 3,070,585 | |||||
| 1,909,132 | 4,426,044 | 114,314 | 98,982 | 533,191 | 536,343 | |||||
| (8,531,351) | (19,031,357) | (237,337) | (279,919) | (313,587) | (1,980,172) | |||||
| (3,516,783) | (11,093,792) | (51,167) | 423,434 | 1,869,281 | 1,626,756 | |||||
| 13,863 | 18,676 | 3,710 | 13,765 | 617 | 29,044 | |||||
| 2,755 | 6,306 | 13,695 | 16,121 | 412 | 589 | |||||
| (35,326) | (26,081) | (58,606) | (230,777) | (24,478) | (2,694) | |||||
| (18,708) | (1,099) | (41,201) | (200,891) | (23,449) | 26,939 | |||||
| Statements of Changes in Net Assets | 77 |
| • | Equity investments (including preferred stocks and registered investment companies that are exchange-traded funds) traded on a recognized securities exchange for which market quotations are readily available are valued at the last sale price or official closing price, as applicable, on the primary market or exchange on which they trade. Equity investments traded on a recognized exchange for which there were no sales on that day are valued at the last published sale price or at fair value. |
| • | Investments in registered investment companies (including money market funds) or other unitized pooled investment vehicles that are not traded on an exchange are valued at that day’s published net asset value (“NAV”) per share or unit. |
| 78 | Notes to Financial Statements |
| • | Rights and warrants are valued at the last reported sale price obtained from independent pricing services or brokers on the valuation date. If no price is obtained from pricing services or brokers, valuation will be based upon the intrinsic value pursuant to the valuation policy and procedures approved by the Board. |
| • | Government and municipal fixed income securities are generally valued using quotations from independent pricing services or brokers. Certain government inflation-indexed securities may require a calculated fair valuation as the cumulative inflation is contained within the price provided by the pricing service or broker. For these securities, the inflation component of the price is “cleaned” from the pricing service or broker price utilizing the published inflation factors in order to ensure proper accrual of income. |
| • | Debt obligations (including short term investments and convertible debt securities) are valued using quotations from independent pricing services or brokers or are generally valued at the last reported evaluated prices. |
| • | Exchange-traded futures contracts are valued at the closing settlement price on the primary market on which they are traded most extensively. Exchange-traded futures contracts traded on a recognized exchange for which there were no sales on that day are valued at the last reported sale price obtained from independent pricing services or brokers or at fair value. |
| • | Swap agreements are valued daily based upon prices supplied by Board approved pricing vendors or through brokers. Depending on the product and terms of the transaction, the value of agreements is determined using a series of techniques including valuation models that incorporate a number of market data factors, such as discounted cash flows, yields, curves, trades and values of the underlying reference instruments. In the event SSGA Funds Management, Inc. (the “Adviser” or “SSGA FM”) is unable to obtain an independent, third-party valuation the agreements will be fair valued. |
| • | Level 1 — Unadjusted quoted prices in active markets for an identical asset or liability; |
| • | Level 2 — Inputs other than quoted prices included within Level 1 that are observable for the asset or liability either directly or indirectly, including quoted prices for similar assets or liabilities in active markets, quoted prices for identical or similar assets or liabilities in markets that are not considered to be active, inputs other than quoted prices that are observable for the asset or liability (such as exchange rates, financing terms, interest rates, yield curves, volatilities, prepayment speeds, loss severities, credit risks and default rates) or other market-corroborated inputs; and |
| Notes to Financial Statements | 79 |
| • | Level 3 — Unobservable inputs for the asset or liability, including the Committee’s assumptions used in determining the fair value of investments. |
| 80 | Notes to Financial Statements |
| Notes to Financial Statements | 81 |
| Fund | Strategies |
| State Street Institutional U.S. Equity Fund | Equitization of Cash |
| State Street Institutional Premier Growth Equity Fund | Equitization of Cash |
| State Street Institutional Small-Cap Equity Fund | Equitization of Cash |
| State Street Institutional International Equity Fund | Equitization of Cash |
| State Street Active Core Bond Fund | Management of Interest Rate Risk |
| 82 | Notes to Financial Statements |
| Asset Derivatives | ||||||
| Interest Rate Contracts Risk | Foreign Exchange Contracts Risk | Credit Contracts Risk | Equity Contracts Risk | Commodity Contracts Risk | Total | |
| State Street Active Core Bond Fund | ||||||
| Swap Contracts | $ — | $ — | $ 298,620 | $ — | $ — | $ 298,620 |
| Liability Derivatives | ||||||
| Interest Rate Contracts Risk | Foreign Exchange Contracts Risk | Credit Contracts Risk | Equity Contracts Risk | Commodity Contracts Risk | Total | |
| State Street Institutional U.S. Equity Fund | ||||||
| Futures Contracts | $ — | $ — | $ — | (189,977) | $ — | $ (189,977) |
| State Street Institutional Premier Growth Equity Fund | ||||||
| Futures Contracts | $ — | $ — | $ — | $ (55,610) | $ — | $ (55,610) |
| State Street Institutional Small-Cap Equity Fund | ||||||
| Futures Contracts | $ — | $ — | $ — | (149,295) | $ — | $ (149,295) |
| State Street Institutional International Equity Fund | ||||||
| Futures Contracts | $ — | $ — | $ — | $ (20,700) | $ — | $ (20,700) |
| State Street Active Core Bond Fund | ||||||
| Futures Contracts | $ (62,679) | $ — | $ — | $ — | $ — | $ (62,679) |
| Notes to Financial Statements | 83 |
| Realized Gain/Loss | ||||||
| Interest Rate Contracts Risk | Foreign Exchange Contracts Risk | Credit Contracts Risk | Equity Contracts Risk | Commodity Contracts Risk | Total | |
| State Street Institutional U.S. Equity Fund | ||||||
| Futures Contracts | $ — | $ — | $ — | $ 730,226 | $ — | $ 730,226 |
| State Street Institutional Premier Growth Equity Fund | ||||||
| Futures Contracts | $ — | $ — | $ — | $ 467,541 | $ — | $ 467,541 |
| State Street Institutional Small-Cap Equity Fund | ||||||
| Futures Contracts | $ — | $ — | $ — | 6,737,912 | $ — | $ 6,737,912 |
| State Street Institutional International Equity Fund | ||||||
| Futures Contracts | $ — | $ — | $ — | $ 118,420 | $ — | $ 118,420 |
| State Street Active Core Bond Fund | ||||||
| Futures Contracts | $ 216,591 | $ — | $ — | $ — | $ — | $ 216,591 |
| Swap Contracts | (1,258) | — | 686,906 | — | — | 685,648 |
| Net Change in Unrealized Appreciation (Depreciation) | ||||||
| Interest Rate Contracts Risk | Foreign Exchange Contracts Risk | Credit Contracts Risk | Equity Contracts Risk | Commodity Contracts Risk | Total | |
| State Street Institutional U.S. Equity Fund | ||||||
| Futures Contracts | $ — | $ — | $ — | (190,629) | $ — | $ (190,629) |
| State Street Institutional Premier Growth Equity Fund | ||||||
| Futures Contracts | $ — | $ — | $ — | $ (52,776) | $ — | $ (52,776) |
| State Street Institutional Small-Cap Equity Fund | ||||||
| Futures Contracts | $ — | $ — | $ — | $ (89,938) | $ — | $ (89,938) |
| State Street Institutional International Equity Fund | ||||||
| Futures Contracts | $ — | $ — | $ — | $ (12,000) | $ — | $ (12,000) |
| State Street Active Core Bond Fund | ||||||
| Futures Contracts | $ (71,278) | $ — | $ — | $ — | $ — | $ (71,278) |
| Swap Contracts | — | — | (411,747) | — | — | (411,747) |
| 84 | Notes to Financial Statements |
| Fund | Average Daily Net Assets of the Fund | Management Fee |
| State Street Institutional U.S. Equity Fund | First $25 million | 0.55% |
| Next $25 million | 0.45% | |
| Over $50 million | 0.35% | |
| State Street Institutional Premier Growth Equity Fund | First $25 million | 0.55% |
| Next $25 million | 0.45% | |
| Over $50 million | 0.35% | |
| State Street Institutional Small-Cap Equity Fund | First $250 million | 0.95% |
| Next $250 million | 0.90% | |
| Over $500 million | 0.85% | |
| State Street Institutional International Equity Fund | First $25 million | 0.75% |
| Next $50 million | 0.65% | |
| Over $75 million | 0.55% | |
| State Street Active Core Bond Fund | First $25 million | 0.35% |
| Next $25 million | 0.30% | |
| Next $50 million | 0.25% | |
| Over $100 million | 0.20% |
| Notes to Financial Statements | 85 |
| U.S. Government Obligations | Other Securities | ||||
| Fund | Purchases | Sales | Purchases | Sales | |
| State Street Institutional U.S. Equity Fund | $ — | $ — | $185,154,545 | $209,662,390 | |
| State Street Institutional Premier Growth Equity Fund | — | — | 23,796,896 | 33,100,090 | |
| State Street Institutional Small-Cap Equity Fund | — | — | 491,222,366 | 581,736,360 | |
| State Street Institutional International Equity Fund | — | — | 18,442,546 | 18,632,113 | |
| State Street Active Core Bond Fund | 55,540,068 | 44,554,837 | 38,520,618 | 40,857,923 | |
| 86 | Notes to Financial Statements |
| Fund | Ordinary Income | Long-Term Capital Gains | Total |
| State Street Institutional U.S. Equity Fund | $6,558,470 | $16,851,042 | $23,409,512 |
| State Street Institutional Premier Growth Equity Fund | 374,542 | 9,409,663 | 9,784,205 |
| State Street Institutional Small-Cap Equity Fund | 4,283,820 | 32,595,603 | 36,879,423 |
| State Street Institutional International Equity Fund | 2,013,738 | — | 2,013,738 |
| State Street Active Core Bond Fund | 5,186,117 | — | 5,186,117 |
| Fund | Ordinary Income | Long-Term Capital Gains | Total |
| State Street Institutional U.S. Equity Fund | $5,521,133 | $ 20,554,355 | $ 26,075,488 |
| State Street Institutional Premier Growth Equity Fund | 4,048,192 | 123,809,258 | 127,857,450 |
| State Street Institutional Small-Cap Equity Fund | 4,644,123 | 72,478,828 | 77,122,951 |
| State Street Institutional International Equity Fund | 1,648,402 | — | 1,648,402 |
| State Street Active Core Bond Fund | 5,186,329 | — | 5,186,329 |
| Fund | Undistributed Ordinary Income | Tax Exempt Income | Capital Loss Carryforwards | Undistributed long term gain | Net Unrealized Gains (Losses) | Qualified Late-Year Losses | Total |
| State Street Institutional U.S. Equity Fund | $ 8,781,133 | $— | $— | $ 53,204,500 | $212,868,815 | $— | $274,854,448 |
| State Street Institutional Premier Growth Equity Fund | 240,135 | — | — | 10,732,356 | 46,160,443 | — | 57,132,934 |
| State Street Institutional Small-Cap Equity Fund | 57,480,540 | — | — | 120,023,958 | 372,562,686 | — | 550,067,184 |
| State Street Institutional International Equity Fund | 3,413,428 | — | — | 3,499,085 | 28,973,411 | — | 35,885,924 |
| State Street Active Core Bond Fund | 276,510 | — | — | 122,381 | 1,504,610 | — | 1,903,501 |
| Notes to Financial Statements | 87 |
| Fund | Tax Cost | Gross Unrealized Appreciation | Gross Unrealized Depreciation | Net Unrealized Appreciation (Depreciation) |
| State Street Institutional U.S. Equity Fund | $359,679,794 | $217,165,429 | $ 4,296,614 | $212,868,815 |
| State Street Institutional Premier Growth Equity Fund | 48,516,197 | 46,806,806 | 646,363 | 46,160,443 |
| State Street Institutional Small-Cap Equity Fund | 936,913,425 | 403,747,405 | 31,184,719 | 372,562,686 |
| State Street Institutional International Equity Fund | 84,079,307 | 31,846,253 | 2,869,999 | 28,976,254 |
| State Street Active Core Bond Fund | 161,233,171 | 2,629,686 | 1,125,076 | 1,504,610 |
| 88 | Notes to Financial Statements |
| Notes to Financial Statements | 89 |

| 90 | Report of Independent Registered Public Accounting Firm |
| Amount | |
| State Street Institutional U.S. Equity Fund | $16,851,042 |
| State Street Institutional Premier Growth Equity Fund | 9,409,663 |
| State Street Institutional Small-Cap Equity Fund | 32,595,603 |
| Amount | |
| State Street Institutional International Equity Fund | $69,780 |
| Amount | |
| State Street Institutional International Equity Fund | $4,054,802 |
| Other Information | 91 |
| 92 | Other Information |
| • | A report prepared by an independent third-party provider of investment company data, which includes for each Fund: |
| ○ | Comparisons of the Fund’s performance over the past one-, three-, five- and ten-year periods ended December 31, 2020, to the performance of an appropriate benchmark constructed by Broadridge Financial Solutions, Inc., the successor to Lipper Inc. (“Broadridge”) for the Fund (the “Lipper Index”) and/or a universe of other mutual funds with similar investment objectives and policies (the “Performance Group” and/or the “Performance Universe”); |
| ○ | Comparisons of the Fund’s expense ratio (with detail of component expenses) to the expense ratios of a group of comparable mutual funds selected by the independent third-party data provider (the “Expense Group” and/or “Expense Universe”); |
| ○ | A chart showing the Fund’s historical average net assets relative to its total expenses, management fees, and non-management expenses over the past five calendar years; and |
| ○ | Comparisons of the Fund’s contractual management fee to the contractual management fees of comparable mutual funds at different asset levels. |
| • | Comparative information concerning fees charged by the Adviser and Sub-Advisers for managing institutional accounts using investment strategies and techniques similar to those used in managing the Funds, as applicable; and |
| • | Profitability analyses for (a) the Adviser and Sub-Advisers with respect to each applicable Fund and (b) affiliates of SSGA FM that provide services to the Funds (“Affiliated Service Providers”). |
| • | Descriptions of the investment management services provided by the Adviser and Sub-Advisers, including their investment strategies and processes; |
| • | Information concerning the allocation of brokerage; and |
| • | Information regarding the procedures and processes used to value the assets of the Funds. |
| • | Reports detailing the financial results and condition of SSGA FM and its affiliates, as well as of the Sub-Advisers; |
| • | Descriptions of the qualifications, education and experience of the individual investment and other professionals responsible for managing the portfolios of the Funds and for Fund operations; |
| • | Information relating to compliance with and the administration of the Codes of Ethics adopted by the Adviser and Sub-Advisers; |
| • | Information about the Adviser’s and each Sub-Adviser’s proxy voting policies and procedures and information regarding the Adviser’s and each Sub-Adviser’s practices for overseeing proxy vendors; |
| • | Information concerning the resources devoted by the Adviser and Sub-Advisers to overseeing compliance by the Funds and their service providers, including information concerning compliance with investment policies and restrictions and other operating policies of the Funds; |
| • | A description of the adequacy and sophistication of the Adviser’s and Sub-Advisers’ technology and systems with respect to investment and administrative matters and a description of any material improvements or changes in technology or systems in the past year; |
| • | A description of the business continuity and disaster recovery plans of the Adviser and Sub-Advisers; and |
| • | Information regarding the Adviser’s and Sub-Advisers’ risk management processes. |
| Other Information | 93 |
| • | Information concerning the nature, extent, quality and cost of services provided to the Funds by SSGA FM in its capacity as the Fund’s administrator (the “Administrator”); |
| • | Information concerning the nature, extent, quality and cost of various non-investment management services provided to the Funds by affiliates of the Adviser, including the custodian, sub-administrator and fund accountant of the Funds, as applicable, and the role of the Adviser in managing the Funds’ relationship with these service providers; |
| • | Copies of the Advisory Agreement and Sub-Advisory Agreements and agreements with other service providers of the Funds; |
| • | Responses to a letter from independent legal counsel to the Independent Trustees (“Independent Counsel”), reviewed prior to such date by Independent Counsel, requesting specific information from each of: |
| ○ | SSGA FM, in its capacity as the Funds’ Adviser and Administrator, with respect to its operations relating to the Funds and its approximate profit margins from such operations for the calendar year ended December 31, 2020; and the relevant operations of other Affiliated Service Providers to the Funds, together with their approximate profit margins from such relevant operations for the calendar year ended December 31, 2020; |
| ○ | The Sub-Advisers, with respect to their operations relating to the Institutional Small-Cap Equity Fund and their approximate profitability from such operations for the calendar year ended December 31, 2020; |
| ○ | State Street Bank and Trust Company (“State Street”), the sub-administrator, custodian, and fund accountant for the Funds, with respect to its operations relating to the Funds; and |
| ○ | State Street Global Advisors Funds Distributors, LLC, the principal underwriter and distributor of the shares of the Funds (the “Distributor”), with respect to its operations relating to the Funds, together with the Funds’ related distribution plans and arrangements under Rule 12b-1 of the 1940 Act; |
| • | Information from SSGA FM, State Street, the Distributor and the Sub-Advisers with respect to the Funds, as applicable, providing any material changes to the previous information supplied in response to the letter from Independent Counsel prior to the executive session of the Board on May 24-25, 2021; |
| • | Materials provided by Broadridge, circulated to the Independent Trustees and to Independent Counsel; and |
| • | A summary of the foregoing materials prepared by Independent Counsel. |
| 94 | Other Information |
| Other Information | 95 |
| 96 | Other Information |
| Other Information | 97 |
| 98 | Other Information |
| • | Performance information for the strategy proposed to be used by the Sub-Adviser for its sleeve of the Fund; |
| • | Information comparing the Fund’s investment advisory fee and total expense ratio, of which the Sub-Adviser’s fee is a part, to a relevant peer group, including comparative fee and expense data provided by Broadridge Financial Solutions, Inc., an independent third-party provider of mutual fund data; |
| • | Comparative information regarding fees charged by the Sub-Adviser for managing other accounts using investment strategies and techniques similar to those used in managing the Fund, as applicable; and |
| • | A profitability estimate provided by the Sub-Adviser with respect to its anticipated management of the Fund. |
| • | Descriptions of the investment management services to be provided by the Sub-Adviser, including its investment strategies and processes; and |
| • | Information concerning the allocation of brokerage. |
| • | Reports detailing the financial results and condition of the Sub-Adviser; |
| • | Descriptions of the qualifications, education and experience of the individual investment and other professionals responsible for managing the portfolio of the Fund and for Fund operations; |
| • | Information relating to compliance with and the administration of the Code of Ethics adopted by the Sub-Adviser; |
| • | Information about the Sub-Adviser’s proxy voting policies and procedures; |
| Other Information | 99 |
| • | Information concerning the resources to be devoted by the Sub-Adviser to overseeing compliance by the Fund, including information concerning compliance with investment policies and restrictions and other operating policies of the Fund; |
| • | A description of the adequacy and sophistication of the Sub-Adviser’s technology and systems; |
| • | A description of the business continuity and disaster recovery plans of the Sub-Adviser; and |
| • | Information regarding the Sub-Adviser’s risk management processes. |
| • | A copy of the proposed Sub-Advisory Agreement. |
| 100 | Other Information |
| Other Information | 101 |
| Name, Address, and Year of Birth | Position(s) Held with Trust | Term of Office and Length of Time Served | Principal Occupation During Past Five Years and Relevant Experience | Number of Funds in Fund Complex Overseen by Trustee† | Other Directorships Held by Trustee During Past Five Years |
| INDEPENDENT TRUSTEES | |||||
| Michael F. Holland c/o SSGA Funds Management, Inc. One Iron Street Boston, MA 02210 YOB: 1944 | Trustee and Co-Chairperson of the Board | Term: Until successor is elected and qualified Elected: 1/19 | Chairman, Holland & Company L.L.C. (investment adviser) (1995 – present). | 62 | Director, the Holland Series Fund, Inc.; Director, The China Fund, Inc. (1992 – 2017); Director, The Taiwan Fund, Inc. (2007 – 2017); Director, Reaves Utility Income Fund, Inc.; and Director, Blackstone/ GSO Loans (and Real Estate) Funds. |
| Patrick J. Riley c/o SSGA Funds Management, Inc. One Iron Street Boston, MA 02210 YOB: 1948 | Trustee and Co-Chairperson of the Board | Term: Until successor is elected and qualified Elected: 1/19 | 2002 to May 2010, Associate Justice of the Superior Court, Commonwealth of Massachusetts; 1985 to 2002, Partner, Riley, Burke & Donahue, L.L.P. (law firm); 1998 to Present, Independent Director, State Street Global Advisers Ireland, Ltd. (investment company); 1998 to Present, Independent Director, SSGA Liquidity plc (formerly, SSGA Cash Management Fund plc); January 2009 to Present, Independent Director, SSGA Fixed Income plc; and January 2009 – 2019, Independent Director, SSGA Qualified Funds PLC. | 62 | Board Director and Chairman, SPDR Europe 1PLC Board (2011 – Present); Board Director and Chairman, SPDR Europe II, PLC (2013 – Present). |
| John R. Costantino c/o SSGA Funds Management, Inc. One Iron Street Boston, MA 02210 YOB: 1946 | Trustee and Chairperson of the Qualified Legal Compliance Committee | Term: Until successor is elected and qualified Elected: 1997 | Senior Advisor to NGN Capital LLC (December 2019 – Present); Managing General Partner, NGN Capital LLC (2006 – December 2019); and Managing Director, Vice President of Walden Capital Management (1996 – present). | 62 | Director of Kleinfeld Bridal Corp. (March 2016 – present); Trustee of Neuroscience Research Institute (1986 – present); Trustee of Fordham University (1989 – 1995 and 2001 – 2007) and Trustee Emeritus (2007 – present); Trustee of GE Funds (1993 – February 2011); Director of Artes Medical (2006 – 2008); and Trustee of Gregorian University Foundation (1992 – 2007). |
| 102 | Other Information |
| Name, Address, and Year of Birth | Position(s) Held with Trust | Term of Office and Length of Time Served | Principal Occupation During Past Five Years and Relevant Experience | Number of Funds in Fund Complex Overseen by Trustee† | Other Directorships Held by Trustee During Past Five Years |
| INDEPENDENT TRUSTEES (continued) | |||||
| Donna M. Rapaccioli c/o SSGA Funds Management, Inc. One Iron Street Boston, MA 02210 YOB: 1962 | Trustee and Chairperson of the Audit Committee | Term: Until successor is elected and qualified Appointed: 1/12 Elected: 6/16 | Dean of the Gabelli School of Business (2007 – present) and Accounting Professor (1987 – present) at Fordham University. | 62 | Director- Graduate Management Admissions Council (2015 – present); Trustee of Emmanuel College (2010 – 2019). |
| Richard D. Shirk c/o SSGA Funds Management, Inc. One Iron Street Boston, MA 02210 YOB: 1945 | Trustee and Chairperson of the Nominating Committee Chairperson of the Governance Committee | Term: Until successor is elected and qualified Elected: 1/19 | March 2001 to April 2002, Chairman (1996 to March 2001, President and Chief Executive Officer), Cerulean Companies, Inc. (holding company) (Retired); 1992 to March 2001, President and Chief Executive Officer, Blue Cross Blue Shield of Georgia (health insurer, managed healthcare). | 62 | 1998 to December 2008, Chairman, Board Member and December 2008 to Present, Investment Committee Member, Healthcare Georgia Foundation (private foundation); September 2002 to 2012, Lead Director and Board Member, Amerigroup Corp. (managed health care); 1999 to 2013, Board Member and (since 2001) Investment Committee Member, Woodruff Arts Center; and 2003 to 2009, Trustee, Gettysburg College; Board member, Aerocare Holdings, Regenesis Biomedical Inc. |
| Michael A. Jessee c/o SSGA Funds Management, Inc. One Iron Street Boston, MA 02210 YOB: 1946 | Trustee and Chairperson of the Valuation Committee | Term: Until successor is elected and qualified Elected: 1/19 | Retired; formerly, President and Chief Executive Officer of the Federal Home Loan Bank of Boston (1989 – 2009); Trustee, Randolph-Macon College (2004 – 2016). | 62 | None. |
| INTERESTED TRUSTEES(1) | |||||
| Ellen M. Needham(2) SSGA Funds Management, Inc. One Iron Street Boston, MA 02210 YOB: 1967 | Trustee and President | Term: Until successor is elected and qualified Elected: 1/19 | Chairman, SSGA Funds Management, Inc. (March 2020 – present); President and Director, SSGA Funds Management, Inc. (2001 – present)*; Senior Managing Director, State Street Global Advisors (1992 – present)*; Director, State Street Global Advisors Funds Distributors, LLC (May 2017 – present).* | 62 | None. |
| Other Information | 103 |
| Name, Address, and Year of Birth | Position(s) Held with Trust | Term of Office and Length of Time Served | Principal Occupation During Past Five Years and Relevant Experience | Number of Funds in Fund Complex Overseen by Trustee† | Other Directorships Held by Trustee During Past Five Years |
| INTERESTED TRUSTEES(1) (continued) | |||||
| Jeanne M. La Porta(2) SSGA Funds Management, Inc. 1600 Summer St. Stamford, CT 06905 YOB: 1965 | Trustee | Term: Until successor is elected and qualified Appointed: 3/14 Elected: 6/16 | Senior Managing Director at State Street Global Advisors (July 2010- present); Manager of State Street Global Advisors Funds Distributors, LLC (May 2017 – present); Director of SSGA Funds Management, Inc. (March 2020 – present); President of GE Retirement Savings Plan Funds (July 2016 – September 2018); Senior Vice President and Commercial Operations Leader at GE Asset Management Incorporated (“GEAM”) (March 2014 – July 2016); President of State Street Institutional Funds and State Street Variable Insurance Series Funds, Inc. (April 2014 – March 2020); President and Trustee of GEAM’s UCITs Funds (March 2014 – November 2014); Senior Vice President and Commercial Administrative Officer at GEAM (April 2010 – March 2014); Vice President of State Street Institutional Funds (July 2003 – April 2014); Vice President of Elfun Funds and GE Retirement Savings Plan Funds (October 2003 – July 2016). | 18 | None. |
| (1) | The individuals listed below are Trustees who are “interested persons,” as defined in the 1940 Act, of the Trust (“Interested Trustees”). |
| (2) | Ms. Needham and Ms. La Porta are Interested Trustees because of their employment by SSGA FM, an affiliate of the Trust. |
| * | Served in various capacities and/or with various affiliated entities during noted time period. |
| † | For the purpose of determining the number of portfolios overseen by the Trustees, “Fund Complex” comprises registered investment companies for which SSGA FM serves as investment adviser. |
| 104 | Other Information |
| Name, Address, and Year of Birth | Position(s) Held with Trust | Term of Office and Length of Time Served | Principal Occupation During Past Five Years |
| OFFICERS: | |||
| Ellen M. Needham SSGA Funds Management, Inc. One Iron Street Boston, MA 02210 YOB: 1967 | President and Trustee | Term: Indefinite Elected: 4/20 | Chairman, SSGA Funds Management, Inc. (March 2020 – present); President and Director, SSGA Funds Management, Inc. (2001 – present)*; Senior Managing Director, State Street Global Advisors (1992 – present)*; Manager, State Street Global Advisors Funds Distributors, LLC (May 2017 – present).* |
| Bruce S. Rosenberg SSGA Funds Management, Inc. One Iron Street Boston, MA 02210 YOB: 1961 | Treasurer | Term: Indefinite Elected: 4/19 | Managing Director, State Street Global Advisors and SSGA Funds Management, Inc. (July 2015 – present); Director, Credit Suisse (April 2008 – July 2015). |
| Ann M. Carpenter SSGA Funds Management, Inc. One Iron Street Boston, MA 02210 YOB: 1966 | Vice President and Deputy Treasurer | Term: Indefinite Elected: 4/19 | Chief Operating Officer, SSGA Funds Management, Inc. (April 2005 – present)*; Managing Director, State Street Global Advisors (2005 – present).* |
| Chad C. Hallett SSGA Funds Management, Inc. One Iron Street Boston, MA 02210 YOB: 1969 | Deputy Treasurer | Term: Indefinite Elected: 4/19 | Vice President, State Street Global Advisors and SSGA Funds Management, Inc. (November 2014 – present); Vice President, State Street Bank and Trust Company (2001 – November 2014).* |
| Darlene Anderson-Vasquez SSGA Funds Management, Inc. One Iron Street Boston, MA 02210 YOB: 1968 | Deputy Treasurer | Term: Indefinite Elected: 4/19 | Managing Director, State Street Global Advisors and SSGA Funds Management, Inc. (May 2016 – present); Senior Vice President, John Hancock Investments (September 2007 – May 2016). |
| Arthur A. Jensen SSGA Funds Management, Inc. 1600 Summer Street Stamford, CT 06905 YOB: 1966 | Deputy Treasurer | Term: Indefinite Elected: 4/19 | Vice President, State Street Global Advisors and SSGA Funds Management, Inc. (July 2016 – present); Mutual Funds Controller of GE Asset Management Incorporated (April 2011 – July 2016). |
| David K. Lancaster SSGA Funds Management, Inc. One Iron Street Boston, MA 02210 YOB: 1971 | Assistant Treasurer | Term: Indefinite Elected: 11/20 | Vice President, State Street Global Advisors and SSGA Funds Management, Inc. (July 2017 – present); Assistant Vice President, State Street Bank and Trust Company (November 2011 – July 2017). |
| Other Information | 105 |
| Name, Address, and Year of Birth | Position(s) Held with Trust | Term of Office and Length of Time Served | Principal Occupation During Past Five Years |
| OFFICERS: (continued) | |||
| Brian Harris SSGA Funds Management, Inc. One Iron Street Boston, MA 02210 YOB: 1973 | Chief Compliance Officer, Anti-Money Laundering Officer and Code of Ethics Compliance Officer | Term: Indefinite Elected: 6/16 Term: Indefinite Elected: 4/19 | Managing Director, State Street Global Advisors and SSGA Funds Management, Inc. (June 2013 – Present).* |
| Sean O’Malley SSGA Funds Management, Inc. One Iron Street Boston, MA 02210 YOB: 1969 | Chief Legal Officer | Term: Indefinite Elected: 8/19 | Senior Vice President and Deputy General Counsel, State Street Global Advisors (November 2013 – present). |
| David Barr SSGA Funds Management, Inc. One Iron Street Boston, MA 02210 YOB: 1974 | Secretary | Term: Indefinite Elected: 9/20 | Vice President and Senior Counsel, State Street Global Advisors (October 2019 – present); Vice President at Eaton Vance Corp. (October 2010 – October 2019). |
| David Urman SSGA Funds Management, Inc. One Iron Street Boston, MA 02210 YOB: 1985 | Assistant Secretary | Term: Indefinite Elected: 8/19 | Vice President and Senior Counsel, State Street Global Advisors (April 2019 – present); Vice President and Counsel, State Street Global Advisors (August 2015 – April 2019); Associate, Ropes & Gray LLP (November 2012 – August 2015). |
| Timothy Collins SSGA Funds Management, Inc. One Iron Street Boston, MA 02210 YOB: 1967 | Assistant Secretary | Term: Indefinite Elected: 9/21 | Vice President and Senior Counsel, State Street Global Advisors (August 2021 - present); Vice President and Managing Counsel, State Street Corporation (March 2020 - August 2021); Vice President and Senior Counsel (April 2018 - March 2020); Counsel, Sutton Place Investments (January 2010-March 2018). |
| * | Served in various capacities and/or with various affiliated entities during noted time period. |
| 106 | Other Information |
(b) Not Applicable.
Item 2. Code of Ethics.
As of the end of the period covered by this report, State Street Institutional Funds (the “Trust,” “Fund Entity” or “Registrant”) has adopted a code of ethics, as defined in Item 2(b) of Form N-CSR, that applies to the Registrant’s principal executive officer, principal financial officer, principal accounting officer or controller, or persons performing similar functions, regardless of whether these individuals are employed by the Registrant or a third party (the “Code”). That Code comprises written standards that are reasonably designed to deter wrongdoing and to promote: (1) honest and ethical conduct, including the ethical handling of actual or apparent conflicts of interest between personal and professional relationships; (2) full, fair, accurate, timely and understandable disclosure in reports and documents that the Registrant files with, or submits to, the U.S. Securities Exchange Commission (the “SEC”) and in other public communications made by the Registrant; (3) compliance with applicable laws and governmental rules and regulations; (4) the prompt internal reporting to an appropriate person or persons identified in the Code of violations of the Code; and (5) accountability for adherence to the Code. For the period covered by the report, the Code was combined with other mutual funds advised by SSGA Funds Management, Inc. (“SSGA FM” or the “Adviser”). The Registrant has not made any amendments to the Code that relates to any element of the code of ethics definition set forth in Item 2(b) of Form N-CSR during the covered period. The Registrant has not granted any waivers from any provisions of the Code during the covered period. A copy of the Code is filed as Exhibit 13(a)(1) to this Form N-CSR.
Item 3. Audit Committee Financial Expert.
The Trust’s Board of Trustees (the “Board”) has determined that the Trust has the following “audit committee financial experts” as defined in Item 3(b) of Form N-CSR serving on its audit committee (the “Audit Committee”): Messrs. Michael F. Holland, Richard D. Shirk and John R. Costantino and Ms. Donna M. Rapaccioli. Each of the “audit committee financial experts” is “independent” as that term is defined in Item 3(a)(2) of Form N-CSR.
An “audit committee financial expert” is not an “expert” for any purpose, including for purposes of Section 11 of the Securities Act of 1933, as amended, as a result of being designated as an “audit committee financial expert.” Further, the designation of a person as an “audit committee financial expert” does not mean that the person has any greater duties, obligations, or liability than those imposed on the person without the “audit committee financial expert” designation. Similarly, the designation of a person as an “audit committee financial expert” does not affect the duties, obligations, or liability of any other member of the Audit Committee or the Board.
Item 4. Principal Accountant Fees and Services.
(a) Audit Fees
For the fiscal years ended September 30, 2021 and September 30, 2020, the aggregate audit fees billed for professional services rendered by Ernst & Young LLP (“E&Y”), the Trust’s principal accountant, for the audit of the Trust’s annual financial statements or services normally provided by E&Y in connection with the Trust’s statutory and regulatory filings and engagements were $128,971 and $128,971, respectively.
(b) Audit-Related Fees
For the fiscal years ended September 30, 2021 and September 30, 2020, there were no fees for assurance and related services by E&Y reasonably related to the performance of the audit of the Trust’s financial statements that were not reported under paragraph (a) of this Item.
(c) Tax Fees
For the fiscal years ended September 30, 2021 and September 30, 2020, the aggregate tax fees billed for professional services rendered by E&Y for tax compliance, tax advice, and tax planning in the form of preparation of excise filings and income tax returns were $28,526 and $40,754, respectively.
(d) All Other Fees
For the fiscal years ended September 30, 2021 and September 30, 2020, there were no fees billed for professional services rendered by E&Y for products and services provided by E&Y to the Trust, other than the services reported in paragraphs (a) through (c).
For the fiscal years ended September 30, 2021 and September 30, 2020, the aggregate fees for professional services rendered by E&Y for products and services provided by E&Y to the Adviser and any entity controlling, controlled by, or under common control with the Adviser that provides ongoing services to the Trust that (i) relate directly to the operations and financial reporting of the Trust and (ii) were pre-approved by the Audit Committee were approximately $8,904,469 and $7,019,005, respectively.
(e)(1) Audit Committee Pre-Approval Policies and Procedures
The Trust’s Audit Committee Charter states the following with respect to pre-approval procedures:
The Audit Committee shall have the following duties and powers:
| • | To pre-approve engagements by a Fund Entity’s independent auditor for non-audit services to be rendered to the Fund’s investment adviser (not including any subadviser whose role is primarily portfolio management and is subcontracted with or overseen by another investment adviser), and any entity controlling, controlled by, or under common control with the investment adviser that provides ongoing services to the Fund, if the engagement relates directly to the operations and financial reporting of the Fund; |
| • | To establish, if deemed necessary or appropriate as an alternative to Audit Committee pre-approval of services to be provided by the independent auditor as required by paragraph (b) above, policies and procedures to permit such services to be pre-approved by other means, such as by action of a designated member or members of the Audit Committee, subject to the requirement that the decision of any member to whom authority is delegated to pre-approve an activity shall be presented to the full Audit Committee at its next scheduled meeting; |
Alternate Pre-Approval Procedure:
| • | The Chairperson, or a Co-Chairperson, of the Audit Committee is authorized to pre-approve any engagement involving the Fund Entity’s independent auditors to the same extent as the Audit Committee. Any pre-approval decision by the Chairperson, or a Co-Chairperson, under the foregoing authority shall be presented to the Audit Committee at its next scheduled meeting. |
(e)(2) Percentages of Services
None of the services described in paragraphs (b) through (d) of this Item were performed in reliance on paragraph (c)(7)(i)(C) of Rule 2-01 of Regulation S-X during the period of time for which such rule was effective.
(f) Not applicable.
(g) Total Fees Paid By Adviser and Certain Affiliates
The aggregate non-audit fees billed for by E&Y for services rendered to the Trust and the Adviser and any entity controlling, controlled by, or under common control with the Adviser that provided ongoing services to the Trust were as follows:
| FY 2021 (in millions) | FY 2020 (in millions) | |||||||
Non audit services billed to: | ||||||||
Registrant: | See Item 4 | (c) | See Item 4 | (c) | ||||
Investment Adviser: | — | — | ||||||
Other entities in the Investment Company | ||||||||
Audit Related Fees | $ | 18.4 | $ | 15.2 | ||||
Tax Fees | $ | 4.4 | $ | 5.8 | ||||
All Other Fees | $ | 14.5 | $ | 14.2 | ||||
| (1) | Information is for the calendar years 2021 and 2020, respectively. |
| (2) | Services under the caption Audit-Related Fees consisted principally of reports on the processing of transactions by servicing organizations, audits of employee benefit plan, non-statutory audits and due diligence procedures. Services under the caption Tax Fees consisted principally of expatriate, compliance and corporate tax advisory services. Services under the caption All Other Fees primarily related to statutory and financial statement audits and the requirement to opine on the design and operating effectiveness of internal control over financial reporting. |
(h) E&Y notified the Trust’s Audit Committee of all non-audit services that were rendered by E&Y to the Adviser and any entity controlling, controlled by, or under common control with the Adviser that provides services to the Trust, which services were not required to be pre-approved pursuant to paragraph (c)(7)(ii) of Rule 2-01 of Regulation S-X, allowing the Trust’s Audit Committee to consider whether such services were compatible with maintaining E&Y’s independence.
(i) Not applicable.
(j) Not applicable.
Item 5. Audit Committee of Listed Registrants.
Not applicable to the Registrant.
Item 6. Investments.
| (a) | Schedules of Investments are included as part of the reports to shareholders filed under Item 1 of this Form N-CSR. |
| (b) | Not applicable to the Registrant. |
Item 7. Disclosure of Proxy Voting Policies and Procedures for Closed-End Management Investment Companies.
Not applicable to the Registrant.
Item 8. Portfolio Managers of Closed-End Management Investment Companies.
Not applicable to the Registrant.
Item 9. Purchases of Equity Securities by Closed-End Management Investment Company and Affiliated Purchasers.
Not applicable to the Registrant.
Item 10. Submission of Matters to a Vote of Security Holders.
There were no material changes to the procedures by which shareholders may recommend nominees to the Board.
Item 11. Controls and Procedures.
(a) The Trust’s principal executive officer and principal financial officer have concluded that the Trust’s disclosure controls and procedures (as defined in Rule 30a-3(c) under the Investment Company Act of 1940, as amended (the “1940 Act”)) are effective to provide reasonable assurance that information required to be disclosed by the Registrant on Form N-CSR is recorded, processed, summarized and reported as of a date within 90 days of the filing date of this report, based on their evaluation of these controls and procedures required by Rule 30a-3(b) under the 1940 Act and Rules 13a-15(b) or 15d-15(b) under the Securities Exchange Act of 1934, as amended.
(b) There were no changes in the Trust’s internal control over financial reporting (as defined in Rule 30a-3(d) under the 1940 Act) that occurred during the period covered by this report that have materially affected, or are reasonably likely to materially affect, the Trust’s internal control over financial reporting.
Item 12. Disclosure of Securities Lending Activities for Closed-End Management Investment Companies.
(a) Not applicable to the Registrant.
(b) Not applicable to the Registrant.
Item 13. Exhibits.
SIGNATURES
Pursuant to the requirements of the Securities Exchange Act of 1934 and the Investment Company Act of 1940, the Registrant has duly caused this report to be signed on its behalf by the undersigned, thereunto duly authorized.
| Registrant: STATE STREET INSTITUTIONAL FUNDS | ||
| By: | /s/ Ellen M. Needham | |
| Ellen M. Needham | ||
| President | ||
Date: December 3, 2021
Pursuant to the requirements of the Securities Exchange Act of 1934 and the Investment Company Act of 1940, this report has been signed below by the following persons on behalf of the Registrant and in the capacities and on the dates indicated.
| By: | /s/ Ellen M. Needham | |
| Ellen M. Needham | ||
| President (Principal Executive Officer) | ||
| Date: December 3, 2021 | ||
| By: | /s/ Bruce S. Rosenberg | |
| Bruce S. Rosenberg | ||
| Treasurer (Principal Financial and Accounting Officer) | ||
Date: December 3, 2021