UNITED STATES
SECURITIES AND EXCHANGE COMMISSION
Washington, D.C. 20549
SCHEDULE 14A
Proxy Statement Pursuant to Section 14(a) of the
Securities Exchange Act of 1934
Filed by the Registrant ¨ Filed by a Party other than the Registrant x
Check the appropriate box:
| | |
| ¨ | | Preliminary Proxy Statement |
| |
| ¨ | | Confidential, for Use of the Commission Only (as permitted by Rule 14a-6(e)(2)) |
| |
| ¨ | | Definitive Proxy Statement |
| |
| x | | Definitive Additional Materials |
| |
| ¨ | | Soliciting Material Under Rule 14a-12 |
SOTHEBY’S
(Name of the Registrant as Specified in its Charter)
THIRD POINT LLC
THIRD POINT OFFSHORE MASTER FUND L.P.
THIRD POINT ULTRA MASTER FUND L.P.
THIRD POINT PARTNERS L.P.
THIRD POINT PARTNERS QUALIFIED L.P.
THIRD POINT REINSURANCE CO. LTD.
LYXOR/THIRD POINT FUND LIMITED
THIRD POINT ADVISORS LLC
THIRD POINT ADVISORS II LLC
DANIEL S. LOEB
HARRY J. WILSON
OLIVIER REZA
(Name of Person(s) Filing Proxy Statement, if Other than the Registrant)
Payment of Filing Fee (Check the appropriate box):
| | | | |
| |
| x | | No fee required. |
| |
| ¨ | | Fee computed on table below per Exchange Act Rules 14a-6(i)(1) and 0-11. |
| | |
| | (1) | | Title of each class of securities to which transaction applies: |
| | (2) | | Aggregate number of securities to which transaction applies: |
| | (3) | | Per unit price or other underlying value of transaction computed pursuant to Exchange Act Rule 0-11 (set forth the amount on which the filing fee is calculated and state how it was determined): |
| | (4) | | Proposed maximum aggregate value of transaction: |
| | (5) | | Total fee paid: |
| |
| ¨ | | Fee paid previously with preliminary materials. |
| |
| ¨ | | Check box if any part of the fee is offset as provided by Exchange Act Rule 0-11(a)(2) and identify the filing for which the offsetting fee was paid previously. Identify the previous filing by registration statement number, or the Form or Schedule and the date of its filing. |
| | |
| | (1) | | Amount Previously Paid: |
| | (2) | | Form, Schedule or Registration Statement No.: |
| | (3) | | Filing Party: |
| | (4) | | Date Filed: |
This filing contains an investor presentation slide posted to www.ValueSothebys.com by Third Point LLC (“Third Point”) on April 16, 2014.
***
On March 28, 2014, Third Point, certain of its affiliates and associates, Mr. Harry J. Wilson, and Mr. Olivier Reza (the “Group”) filed with the Securities and Exchange Commission (the “SEC”) and began distributing to Sotheby’s stockholders a definitive proxy statement (the “Proxy Statement”) in connection with Sotheby’s 2014 annual meeting of stockholders. THIRD POINT STRONGLY ADVISES ALL STOCKHOLDERS OF SOTHEBY’S TO READ THE GROUP’S PROXY STATEMENT BECAUSE IT CONTAINS IMPORTANT INFORMATION, INCLUDING INFORMATION RELATING TO THE GROUP’S PARTICIPANTS IN SUCH PROXY SOLICITATION. THE GROUP’S PROXY STATEMENT, AS FILED, AND ANY FURTHER AMENDMENTS, SUPPLEMENTS OR OTHER RELEVANT PROXY SOLICITATION DOCUMENTS WILL BE AVAILABLE AT NO CHARGE ON THE SEC’S WEBSITE ATHTTP://WWW.SEC.GOV.
|
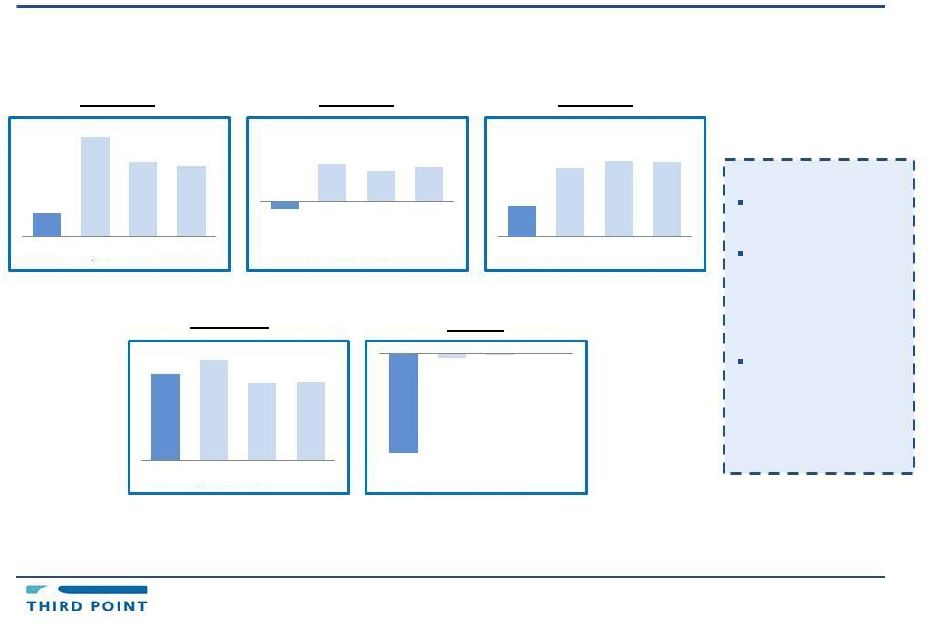
Total Shareholder Return: Take a Closer Look at This Picture Note: TSR = total shareholder return; market data as of April 15, 2014 Source: Third Point LLC; Bloomberg; Sotheby’s Investor Presentation from April 8, 2014 1-year TSR 93% 70% 67% Sotheby's S&P Global Luxury Index S&P Midcap 400 Russell 3000 4-year TSR (11%) 52% 42% 48% Sotheby's S&P Global Luxury Index S&P Midcap 400 Russell 3000 3-year TSR 18% 39% 42% 42% Sotheby's S&P Global Luxury Index S&P Midcap 400 Russell 3000 2-year TSR 24% 28% 22% 22% Sotheby's S&P Global Luxury Index S&P Midcap 400 Russell 3000 (19%) (1%) (0%) (0%) Sotheby's S&P Global Luxury Index S&P Midcap 400 Russell 3000 YTD TSR 22% Recessions combined with failures of leadership led stock price to collapse in 2008/2009 Current Board’s attempt to spin share price recovery from its nadir in 2009 as evidence of a "history of delivering shareholder value" over a 5-year period is misleading In fact, looking at post-crisis performance, Sotheby’s has under-performed relevant indices by a wide margin over 4-year, 3-year, 2-year and YTD periods Sotheby’s touted 5-year outperformance is largely attributable to its abysmal under-performance during the Financial Crisis. A closer look at the data shows Sotheby’s has consistently lagged its relevant benchmarks over the past 4 years. |