Sinopec Beijing Yanhua Petrochemical (BYH) Inactive
Filed: 20 Jan 05, 12:00am
Link to searchable text of slide shown above
Link to searchable text of slide shown above
Searchable text section of graphics shown above
Confidential Presentation to:
Independent Board Committee of Sinopec
Beijing Yanhua Petrochemical Co., Ltd
Project Shenzhou
December 29, 2004
[LOGO]
Table of Contents
Agenda
|
|
|
|
[LOGO]
Important Notice
Project GoldenBridge
• In arriving at our opinion (the “Opinion”) as set forth in this presentation, we have assumed and relied upon the accuracy and completeness of the financial and other information used by us without assuming any responsibility for independent verification of such information and have further relied upon the assurances of Sinopec Beijing Yanhua Petrochemical Company Ltd (“Beijing Yanhua”) that they are not aware of any facts or circumstances that would make such information inaccurate or misleading. With respect to the financial projections of Beijing Yanhua, upon advice of Beijing Yanhua we have assumed that such projections have been reasonably prepared on a basis reflecting the best currently available estimates and judgments of the management of Beijing Yanhua as to the future financial performance of Beijing Yanhua. In preparing this presentation, we have not conducted a physical inspection of the properties and facilities of Beijing Yanhua and have not made or obtained any evaluations or appraisals of the assets or liabilities of Beijing Yanhua. The Opinion set forth in this presentation necessarily is based upon market, economic and other conditions as they exist on, and can be evaluated as of, the date of this presentation.
• Beijing Yanhua has agreed to indemnify us for certain liabilities that may arise out of the rendering of the Opinion set forth in this presentation
• The Opinion set forth in this presentation and the presentation itself are for the use and benefit of the Independent Board Committee of Beijing Yanhua. The Opinion is rendered to the Independent Board Committee in connection with its consideration of the proposed offer by Beijing Feitian Petrochemical Company Ltd (“Beijing Feitian”) and China Petroleum & Chemical Corp (“Sinopec”). The Opinion set forth in this presentation and the presentation itself should be read in conjunction with the fairness opinion letter that is being provided by Lehman Brothers to the Independent Board Committee of Beijing Yanhua in relation to the Transaction. The Opinion set forth in this presentation is not intended to be and does not constitute a recommendation to any shareholder of Beijing Yanhua as to how such shareholder should vote with respect to the proposed transaction.
1
Introduction & Transaction Overview
Introduction
• Lehman Brothers has been appointed in principle by Beijing Yanhua to act as the Independent Financial Adviser (“IFA”) to the Independent Board Committee (the “IBC”) of Beijing Yanhua to advise whether the offer (as described below) made by Sinopec is fair and reasonable, from a financial point of view (“the Opinion”)
• We are honored to present our view on the fairness of the Transaction (as defined below) from a financial point of view to member of the IBC who are awaiting the confirmation of their independence by the Hong Kong Securities Future Commission (“SFC”)
• Sinopec is offering to buy out the remaining shares in Beijing Yanhua that is it does not already own and to privatize Beijing Yanhua by way of merger by absorption under Article 184 of the PRC Company Law (the “Transaction”)
• Independent Shareholders in Beijing Yanhua will receive cash in consideration of the cancellation of their shares upon the completion of the merger with Beijing Feitian, a vehicle established solely for the purpose of effecting the Transaction
• Merger Agreement needs to be approved by (i) the Board of Directors of both Sinopec and Beijing Yanhua and (ii) 2/3 of Beijing Yanhua’s shareholders casting votes in favor of the Merger at the Special General Meeting and (iii) 75% of the Independent Shareholders casting votes in favor of the Merger at Special General Meeting of the Independent Shareholders and not objected to by more than 10% of those voting shareholders
• We understand that the Transaction will be publicly announced on December 30th immediately after the announcement is approved by Beijing Yanhua’s Board of Directors today
• The Opinion is one of a number of considerations that the Independent Board Committee should take into account in making its recommendations to the Independent Shareholders
• The Opinion does not address the business rationale underlying the transaction
[LOGO] |
| Please refer to important notice on Page 1 |
2
Approach and Methodology
Key Information Sources
• In arriving at our Opinion we have the reviewed the following documents:
• Audited financial statements from 1998-2003
• Un-audited results for the six months ending 30 June, 2004
• Management projections for the period 2005 - 2009
• Historical information provided by management on product volume and prices and raw material volume and prices
• Materials contracts including the Raw Material and Services Supply Agreement between Beijing Yanhua and Sinopec
• Draft Merger Agreement dated December 16, 2004
• Draft announcement to the Stock Exchange of Hong Kong dated December 22, 2004
• Draft circular to Beijing Yanhua’s shareholders dated December 26, 2004
• Management letter from KPMG dated June 16, 2004
• Independent third party research studies
• During the course of our due diligence we have also had discussions with:
• Beijing Yanhua management regarding their business outlook, operations and financial projections
• Sinopec regarding their rationale for the transaction and plans for Beijing Yanhua
• Sinopec’s financial advisers regarding their financial projections and valuation methodology for Beijing Yanhua
• Beijing Yanhua’s auditors, KPMG
Methodologies Underlying the Opinion
• We have undertaken the following analyses to reach our Opinion:
• Historical share price performance
• Historical trading multiples
• Premium analysis for going private transactions
• Comparable company trading multiple analysis
• Comparable transaction multiple analysis
• Liquidity analysis
• We have also taken into consideration the likelihood of an alternative offer in determining whether the offer from Sinopec is fair and reasonable
3
Overview of Transaction Structure
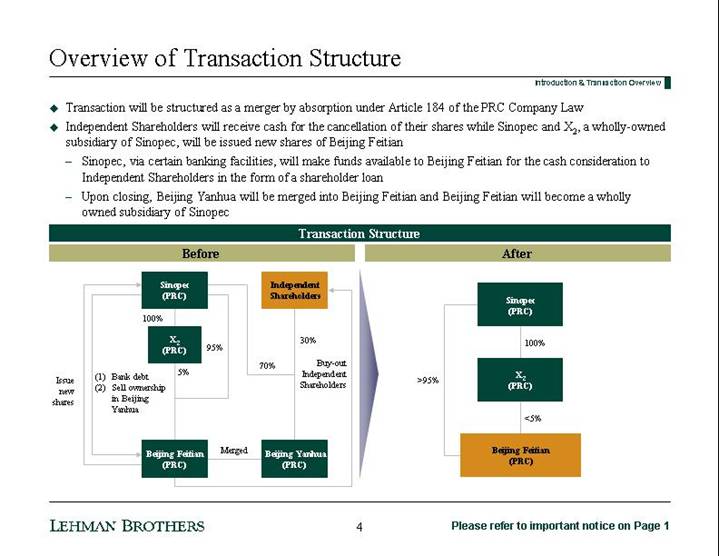
• Transaction will be structured as a merger by absorption under Article 184 of the PRC Company Law
• Independent Shareholders will receive cash for the cancellation of their shares while Sinopec and X2, a wholly-owned subsidiary of Sinopec, will be issued new shares of Beijing Feitian
• Sinopec, via certain banking facilities, will make funds available to Beijing Feitian for the cash consideration to Independent Shareholders in the form of a shareholder loan
• Upon closing, Beijing Yanhua will be merged into Beijing Feitian and Beijing Feitian will become a wholly owned subsidiary of Sinopec
Transaction Structure
Before
[CHART]
After
[CHART]
4
Rights & Actions Required of Independent Shareholders
|
| Actions Required |
| Considerations / Rights |
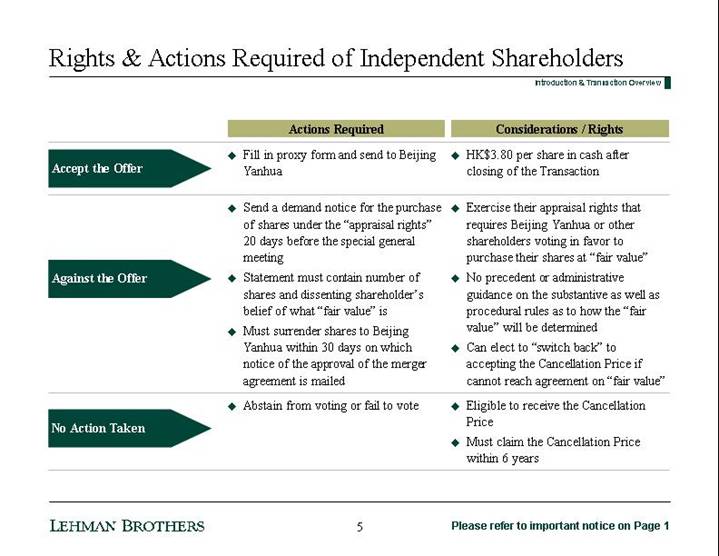
Accept the Offer |
| • Fill in proxy form and send to Beijing Yanhua |
| • HK $3.80 per share in cash after closing of the Transaction |
|
|
|
|
|
Against the Offer |
| • Send a demand notice for the purchase of shares under the “appraisal rights” 20 days before the special general meeting
• Statement must contain number of shares and dissenting shareholder’s belief of what “fair value” is
• Must surrender shares to Beijing Yanhua within 30 days on which notice of the approval of the merger agreement is mailed |
| • Exercise their appraisal rights that requires Beijing Yanhua or other shareholders voting in favor to purchase their shares at “fair value”
• No precedent or administrative guidance on the substantive as well as procedural rules as to how the “fair value” will be determined
• Can elect to “switch back” to accepting the Cancellation Price if cannot reach agreement on “fair value” |
|
|
|
|
|
No Action Taken |
| • Abstain from voting or fail to vote |
| • Eligible to receive the Cancellation Price
• Must claim the Cancellation Price within 6 years |
5
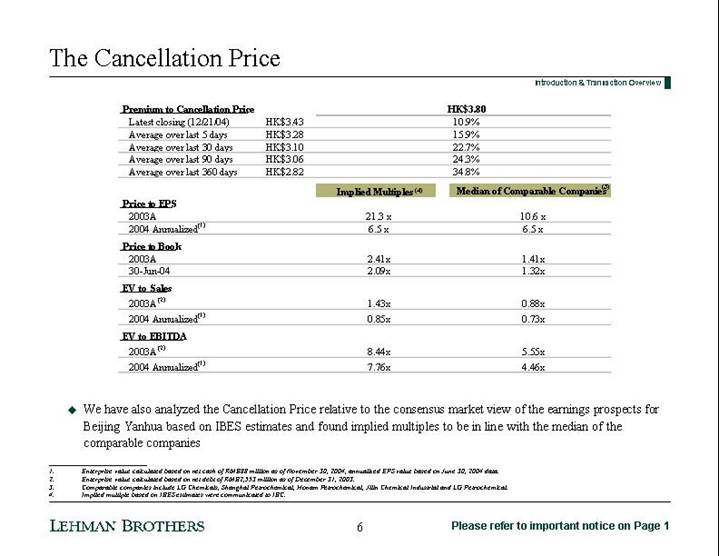
The Cancellation Price
Introduction & Transaction Overview
Premium to Cancellation Price |
|
|
| HK$3.80 |
| |
Latest closing (12/21/04) |
| HK$ | 3.43 |
| 10.9 | % |
Average over last 5 days |
| HK$ | 3.28 |
| 15.9 | % |
Average over last 30 days |
| HK$ | 3.10 |
| 22.7 | % |
Average over last 90 days |
| HK$ | 3.06 |
| 24.3 | % |
Average over last 360 days |
| HK$ | 2.82 |
| 34.8 | % |
|
| Implied Multiples (4) |
| Median of Comparable Companies (3) |
|
Price to EPS |
|
|
|
|
|
2003A |
| 21.3 | x | 10.6 | x |
2004 Annualized (1) |
| 6.5 | x | 6.5 | x |
|
|
|
|
|
|
Price to Book |
|
|
|
|
|
2003A |
| 2.41 | x | 1.41 | x |
30-Jun-04 |
| 2.09 | x | 1.32 | x |
|
|
|
|
|
|
EV to Sales |
|
|
|
|
|
2003A (2) |
| 1.43 | x | 0.88 | x |
2004 Annualized (1) |
| 0.85 | x | 0.73 | x |
|
|
|
|
|
|
EV to EBITDA |
|
|
|
|
|
2003A (2) |
| 8.44 | x | 5.55 | x |
2004 Annualized (1) |
| 7.76 | x | 4.46 | x |
• We have also analyzed the Cancellation Price relative to the consensus market view of the earnings prospects for Beijing Yanhua based on IBES estimates and found implied multiples to be in line with the median of the comparable companies
(1) Enterprise value calculated based on net cash of RMB88 million as of November 30, 2004, annualized EPS value based on June 30, 2004 data.
(2) Enterprise value calculated based on net debt of RMB2,553 million as of December 31, 2003.
(3) Comparable companies include LG Chemicals, Shanghai Petrochemical, Honam Petrochemical, Jilin Chemical Industrial and LG Petrochemical.
(4) Implied multiple based on IBES estimates were communicated to the IBC.
[LOGO] |
| Please refer to important notice on Page 1 |
6
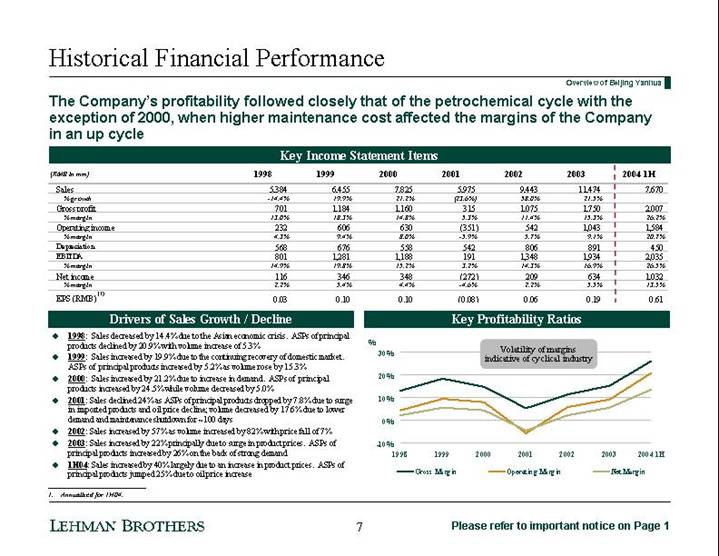
Historical Financial Performance
The Company’s profitability followed closely that of the petrochemical cycle with the exception of 2000, when higher maintenance cost affected the margins of the Company in an up cycle
Key Income Statement Items
(RMB in mm) |
| 1998 |
| 1999 |
| 2000 |
| 2001 |
| 2002 |
| 2003 |
| 2004 1H |
|
Sales |
| 5,384 |
| 6,455 |
| 7,825 |
| 5,975 |
| 9,443 |
| 11,474 |
| 7,670 |
|
% growth |
| -14.4 | % | 19.9 | % | 21.2 | % | (23.6 | )% | 58.0 | % | 21.5 | % |
|
|
Gross profit |
| 701 |
| 1,184 |
| 1,160 |
| 315 |
| 1,075 |
| 1,750 |
| 2,007 |
|
% margin |
| 13.0 | % | 18.3 | % | 14.8 | % | 5.3 | % | 11.4 | % | 15.3 | % | 26.2 | % |
Operating income |
| 232 |
| 606 |
| 630 |
| (351 | ) | 542 |
| 1,043 |
| 1,584 |
|
% margin |
| 4.3 | % | 9.4 | % | 8.0 | % | -5.9 | % | 5.7 | % | 9.1 | % | 20.7 | % |
Depreciation |
| 568 |
| 676 |
| 558 |
| 542 |
| 806 |
| 891 |
| 450 |
|
EBITDA |
| 801 |
| 1,281 |
| 1,188 |
| 191 |
| 1,348 |
| 1,934 |
| 2,035 |
|
% margin |
| 14.9 | % | 19.8 | % | 15.2 | % | 3.2 | % | 14.3 | % | 16.9 | % | 26.5 | % |
Net income |
| 116 |
| 346 |
| 348 |
| (272 | ) | 209 |
| 634 |
| 1,032 |
|
% margin |
| 2.2 | % | 5.4 | % | 4.4 | % | -4.6 | % | 2.2 | % | 5.5 | % | 13.5 | % |
EPS (RMB) (1) |
| 0.03 |
| 0.10 |
| 0.10 |
| (0.08 | ) | 0.06 |
| 0.19 |
| 0.61 |
|
Drivers of Sales Growth / Decline
• 1998: Sales decreased by 14.4% due to the Asian economic crisis. ASPs of principal products declined by 20.9% with volume increase of 5.3%
• 1999: Sales increased by 19.9% due to the continuing recovery of domestic market. ASPs of principal products increased by 5.2% as volume rose by 15.3%
• 2000: Sales increased by 21.2% due to increase in demand. ASPs of principal products increased by 24.5% while volume decreased by 5.0%
• 2001: Sales declined 24% as ASPs of principal products dropped by 7.8% due to surge in imported products and oil price decline; volume decreased by 17.6% due to lower demand and maintenance shutdown for ~100 days
• 2002: Sales increased by 57% as volume increased by 82% with price fall of 7%
• 2003: Sales increased by 22% principally due to surge in product prices. ASPs of principal products increased by 26% on the back of strong demand
• 1H04: Sales increased by 40% largely due to an increase in product prices. ASPs of principal products jumped 25% due to oil price increase
Key Profitability Ratios
[CHART]
(1) Annualized for 1H04.
7
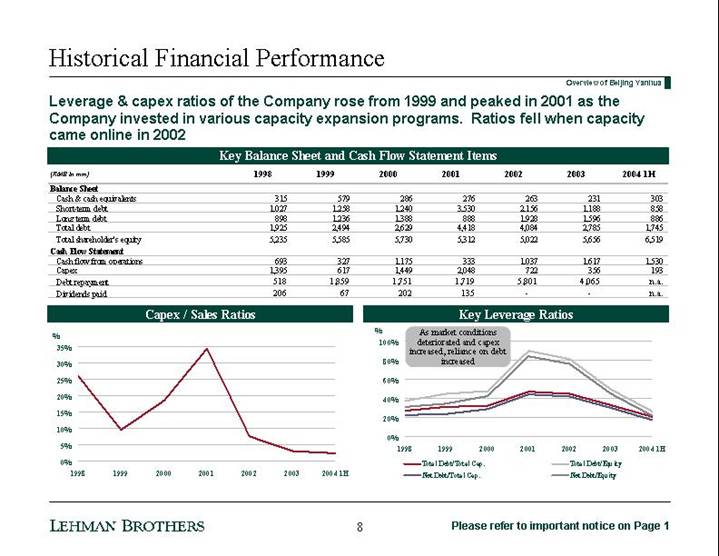
Leverage & capex ratios of the Company rose from 1999 and peaked in 2001 as the Company invested in various capacity expansion programs. Ratios fell when capacity came online in 2002
Key Balance Sheet and Cash Flow Statement Items
(RMB in mm) |
| 1998 |
| 1999 |
| 2000 |
| 2001 |
| 2002 |
| 2003 |
| 2004 1H |
|
Balance Sheet |
|
|
|
|
|
|
|
|
|
|
|
|
|
|
|
Cash & cash equivalents |
| 315 |
| 579 |
| 286 |
| 276 |
| 263 |
| 231 |
| 303 |
|
Short-term debt |
| 1,027 |
| 1,258 |
| 1,240 |
| 3,530 |
| 2,156 |
| 1,188 |
| 858 |
|
Long term debt |
| 898 |
| 1,236 |
| 1,388 |
| 888 |
| 1,928 |
| 1,596 |
| 886 |
|
Total debt |
| 1,925 |
| 2,494 |
| 2,629 |
| 4,418 |
| 4,084 |
| 2,785 |
| 1,745 |
|
Total shareholder’s equity |
| 5,235 |
| 5,585 |
| 5,730 |
| 5,312 |
| 5,022 |
| 5,656 |
| 6,519 |
|
Cash Flow Statement |
|
|
|
|
|
|
|
|
|
|
|
|
|
|
|
Cash flow from operations |
| 693 |
| 327 |
| 1,175 |
| 333 |
| 1,037 |
| 1,617 |
| 1,530 |
|
Capex |
| 1,395 |
| 617 |
| 1,449 |
| 2,048 |
| 722 |
| 356 |
| 193 |
|
Debt repayment |
| 518 |
| 1,859 |
| 1,751 |
| 1,719 |
| 5,801 |
| 4,065 |
| n.a. |
|
Dividends paid |
| 206 |
| 67 |
| 202 |
| 135 |
| — |
| — |
| n.a. |
|
Capex / Sales Ratios
[CHART]
Key Leverage Ratios
[CHART]
8
Business Outlook
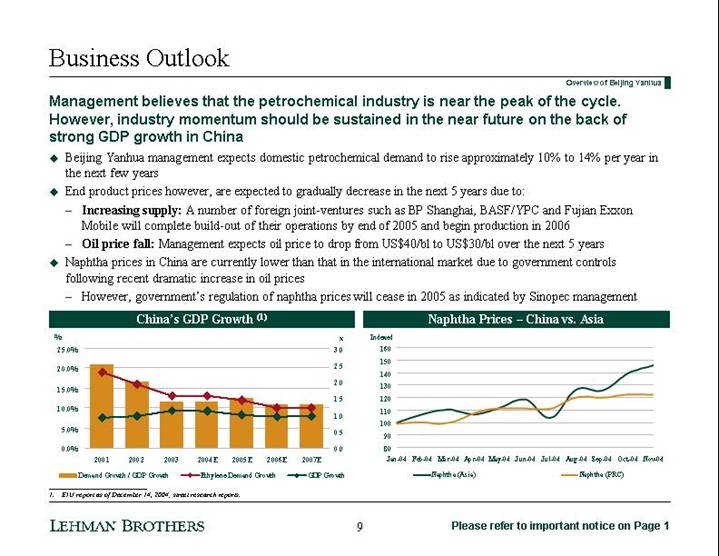
Management believes that the petrochemical industry is near the peak of the cycle. However, industry momentum should be sustained in the near future on the back of strong GDP growth in China
• Beijing Yanhua management expects domestic petrochemical demand to rise approximately 10% to 14% per year in the next few years
• End product prices however, are expected to gradually decrease in the next 5 years due to:
• Increasing supply: A number of foreign joint-ventures such as BP Shanghai, BASF/YPC and Fujian Exxon Mobile will complete build-out of their operations by end of 2005 and begin production in 2006
• Oil price fall: Management expects oil price to drop from US$40/bl to US$30/bl over the next 5 years
• Naphtha prices in China are currently lower than that in the international market due to government controls following recent dramatic increase in oil prices
• However, government’s regulation of naphtha prices will cease in 2005 as indicated by Sinopec management
China’s GDP Growth (1)
[CHART]
Naphtha Prices – China vs. Asia
[CHART]
(1) EIU report as of December 14, 2004; street research reports.
9
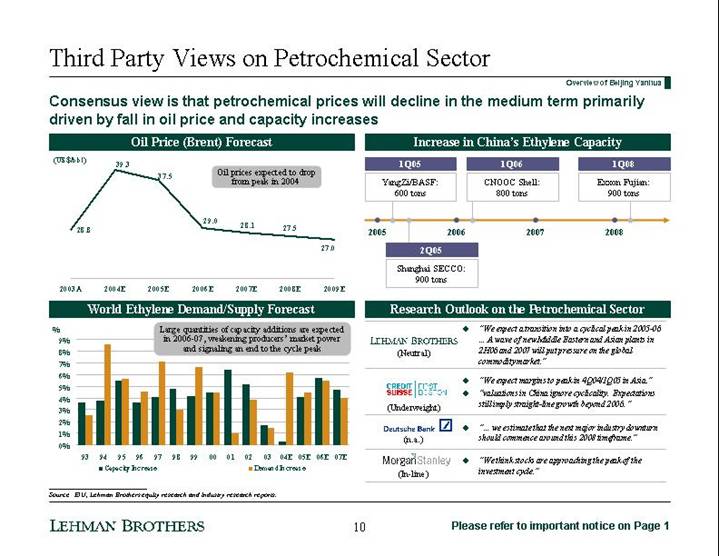
Third Party Views on Petrochemical Sector
Consensus view is that petrochemical prices will decline in the medium term primarily driven by fall in oil price and capacity increases
Oil Price (Brent) Forecast
[CHART]
Increase in China’s Ethylene Capacity
1Q05 |
| 1Q06 |
| 1Q08 | |||
YangZi/BASF: |
| CNOOC Shell: |
| Exxon Fujian: | |||
600 tons |
| 800 tons |
| 900 tons | |||
|
|
|
|
| |||
2005 | 2006 |
| 2007 |
| 2008 |
| |
|
|
|
|
| |||
2Q05 |
Shanghai SECCO: |
900 tons |
World Ethylene Demand/Supply Forecast
[CHART]
Research Outlook on the Petrochemical Sector
[LOGO] |
| • “We expect a transition into a cyclical peak in 2005-06 … A wave of new Middle Eastern and Asian plants in 2H06 and 2007 will put pressure on the global commodity market.” |
|
|
|
[LOGO] |
| • “We expect margins to peak in 4Q04/1Q05 in Asia.” |
(Underweight) |
| • “valuations in China ignore cyclicality. Expectations still imply straight-line growth beyond 2006. ” |
|
|
|
[LOGO] |
| • “… we estimate that the next major industry downturn should commence around this 2008 timeframe.” |
|
|
|
[LOGO] |
| • “We think stocks are approaching the peak of the investment cycle.” |
Source: EIU, Lehman Brothers equity research and industry research reports.
10
Next Phase of the Petrochemical Cycle
Record growth and profitability in 2004 unlikely to be repeated in near future
|
| 2005 & 2006 – Marginally Weaker than 2004 (1) |
|
|
| ||||
|
| • 2005-06 margins are expected to be weaker than in 2004: • Supply constraint issue in 2004 will be addressed by petrochemical producers • New capacity additions in China and in Middle East will ease demand shortage pressure • Some producers stocked up on raw materials in 2004 due to price increase. As oil price is expected to drop in 2005, destocking process should depress volume growth |
|
|
| ||||
|
|
|
|
|
|
|
|
|
|
2004 |
| 2005 |
| 2006 |
| 2007 |
| 2008 |
|
|
|
|
|
|
|
|
|
|
|
2004 – Near Peak of the Cycle (1) • Record volume growth, utilization and profitability due to: • Much stronger than expected demand growth • Supply constraint as most producers did not expect such high level of demand in 2004 • Shortage of refinery supply • Petrochemical companies were able to successfully pass on 100% of raw material cost increase to consumers
• China producers were even able to expand margins: • End product prices increased in line with international prices • Magnitude of raw material price rises less than that in the international market due to government control
|
|
|
|
|
| 2008 – The Next Cycle Downturn? (1) • Large influx of new capacity is expected to be introduced in the Middle East and China in 2008 • Estimated build-out of approximately 4 million tons of additional ethylene capacity |
| ||
(1) Summary of Industry Research.
11
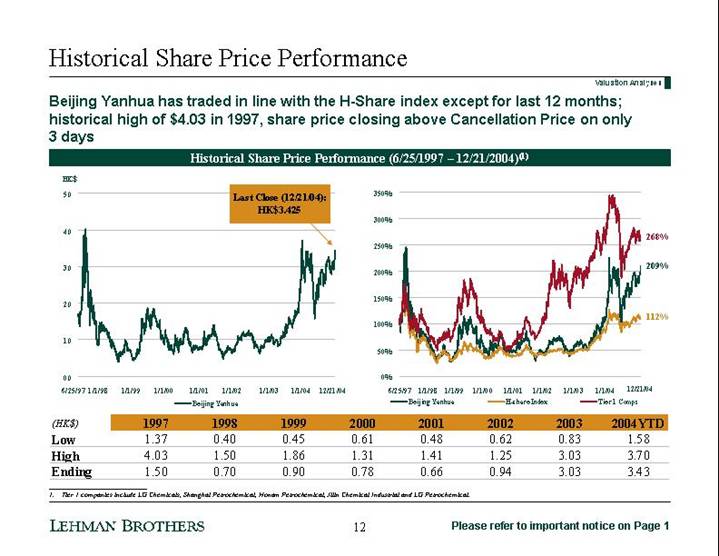
Historical Share Price Performance
Beijing Yanhua has traded in line with the H-Share index except for last 12 months; historical high of $4.03 in 1997, share price closing above Cancellation Price on only 3 days
Historical Share Price Performance (6/25/1997 – 12/21/2004)(1)
[CHART]
[CHART]
(HK$) |
| 1997 |
| 1998 |
| 1999 |
| 2000 |
| 2001 |
| 2002 |
| 2003 |
| 2004 YTD |
|
Low |
| 1.37 |
| 0.40 |
| 0.45 |
| 0.61 |
| 0.48 |
| 0.62 |
| 0.83 |
| 1.58 |
|
High |
| 4.03 |
| 1.50 |
| 1.86 |
| 1.31 |
| 1.41 |
| 1.25 |
| 3.03 |
| 3.70 |
|
Ending |
| 1.50 |
| 0.70 |
| 0.90 |
| 0.78 |
| 0.66 |
| 0.94 |
| 3.03 |
| 3.43 |
|
(1) Tier 1 companies include LG Chemicals, Shanghai Petrochemical, Honam Petrochemical, Jilin Chemical Industrial and LG Petrochemical.
12
Historical Trading Multiples
Valuation Analyses
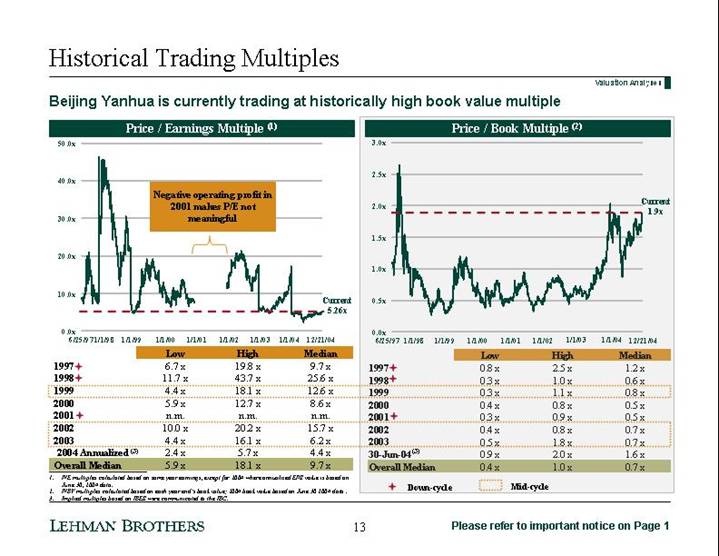
Beijing Yanhua is currently trading at historically high book value multiple
Price / Earnings Multiple (1)
[CHART]
|
| Low |
| High |
| Median |
|
1997+ |
| 6.7 | x | 19.8 | x | 9.7 | x |
1998+ |
| 11.7 | x | 43.7 | x | 25.6 | x |
1999++ |
| 4.4 | x | 18.1 | x | 12.6 | x |
2000 |
| 5.9 | x | 12.7 | x | 8.6 | x |
2001+ |
| n.m. |
| n.m. |
| n.m. |
|
2002++ |
| 10.0 | x | 20.2 | x | 15.7 | x |
2003++ |
| 4.4 | x | 16.1 | x | 6.2 | x |
2004 Annualized (3) |
| 2.4 | x | 5.7 | x | 4.4 | x |
Overall Median |
| 5.9 | x | 18.1 | x | 9.7 | x |
Price / Book Multiple (2)
[CHART]
|
| Low |
| High |
| Median |
|
1997+ |
| 0.8 | x | 2.5 | x | 1.2 | x |
1998+ |
| 0.3 | x | 1.0 | x | 0.6 | x |
1999++ |
| 0.3 | x | 1.1 | x | 0.8 | x |
2000 |
| 0.4 | x | 0.8 | x | 0.5 | x |
2001+ |
| 0.3 | x | 0.9 | x | 0.5 | x |
2002++ |
| 0.4 | x | 0.8 | x | 0.7 | x |
2003++ |
| 0.5 | x | 1.8 | x | 0.7 | x |
30-Jun-04 (3) |
| 0.9 | x | 2.0 | x | 1.6 | x |
Overall Median |
| 0.4 | x | 1.0 | x | 0.7 | x |
(1) P/E multiples calculated based on same year earnings, except for 2004 where annualized EPS value is based on June 30, 2004 data.
(2) P/BV multiples calculated based on each year end’s book value; 2004 book value based on June 30 2004 data .
(3) Implied multiple based on IBES estimates were communicated to the IBC.
+ Down-cycle
++ Mid-cycle
13
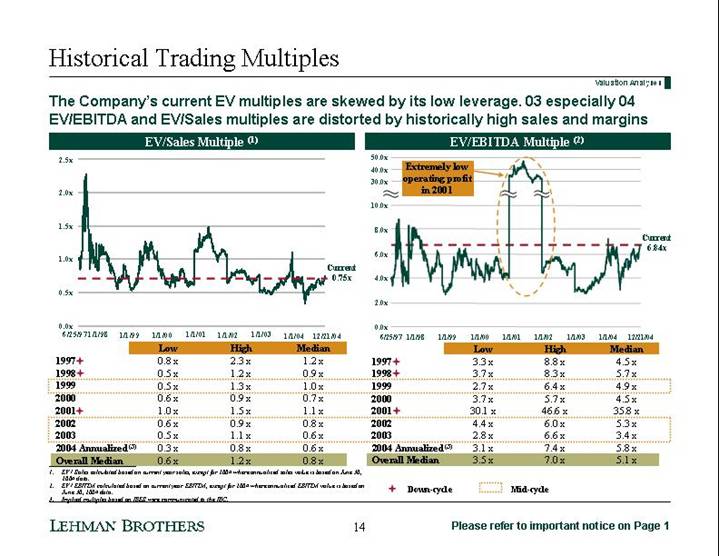
The Company’s current EV multiples are skewed by its low leverage. 03 especially 04 EV/EBITDA and EV/Sales multiples are distorted by historically high sales and margins
EV/Sales Multiple (1)
[CHART]
|
| Low |
| High |
| Median |
|
1997+ |
| 0.8 | x | 2.3 | x | 1.2 | x |
1998+ |
| 0.5 | x | 1.2 | x | 0.9 | x |
1999++ |
| 0.5 | x | 1.3 | x | 1.0 | x |
2000 |
| 0.6 | x | 0.9 | x | 0.7 | x |
2001+ |
| 1.0 | x | 1.5 | x | 1.1 | x |
2002++ |
| 0.6 | x | 0.9 | x | 0.8 | x |
2003++ |
| 0.5 | x | 1.1 | x | 0.6 | x |
2004 Annualized (3) |
| 0.3 | x | 0.8 | x | 0.6 | x |
Overall Median |
| 0.6 | x | 1.2 | x | 0.8 | x |
EV/EBITDA Multiple (2)
[CHART]
|
| Low |
| High |
| Median |
|
1997+ |
| 3.3 | x | 8.8 | x | 4.5 | x |
1998+ |
| 3.7 | x | 8.3 | x | 5.7 | x |
1999++ |
| 2.7 | x | 6.4 | x | 4.9 | x |
2000 |
| 3.7 | x | 5.7 | x | 4.5 | x |
2001+ |
| 30.1 | x | 46.6 | x | 35.8 | x |
2002++ |
| 4.4 | x | 6.0 | x | 5.3 | x |
2003++ |
| 2.8 | x | 6.6 | x | 3.4 | x |
2004 Annualized (2) |
| 3.1 | x | 7.4 | x | 5.8 | x |
Overall Median |
| 3.5 | x | 7.0 | x | 5.1 | x |
(1) EV / Sales calculated based on current year sales, except for 2004 where annualized sales value is based on June 30, 2004 data.
(2) EV / EBITDA calculated based on current year EBITDA, except for 2004 where annualized EBITDA value is based on June 30, 2004 data.
(3) Implied multiple based on IBES estimates were communicated to the IBC.
+ Down-cycle
++ Mid-cycle
14
EBIT Margin vs. Stock Price
Historically, investors have sold/bought the stock approximately 6 months before cycle peaks/troughs and buying/selling efforts were accelerated 2-3 months prior to earnings announcements
EBIT Margin – Stock Price Chart
[CHART]
|
| 1998 |
| 1999 |
| 2000 |
| 2001 |
| 2002 |
| 2003 |
| 2004 1H |
|
ASP |
| 20.9 | % | 5.2 | % | 24.5 | % | 24.0 | % | 7.0 | % | 26.0 | % | 25.4 | % |
Volume |
| 5.0 | % | 15.3 | % | 5.0 | % | 17.6 | % | 82.0 | % | 4.1 | % | n.a. |
|
Cycle |
| Down |
| Mid |
| Up |
| Down |
| Mid |
| Up |
| Up |
|
(1) ASP stands for average price of the top 8 petrochemical products of Beijing Yanhua.
15
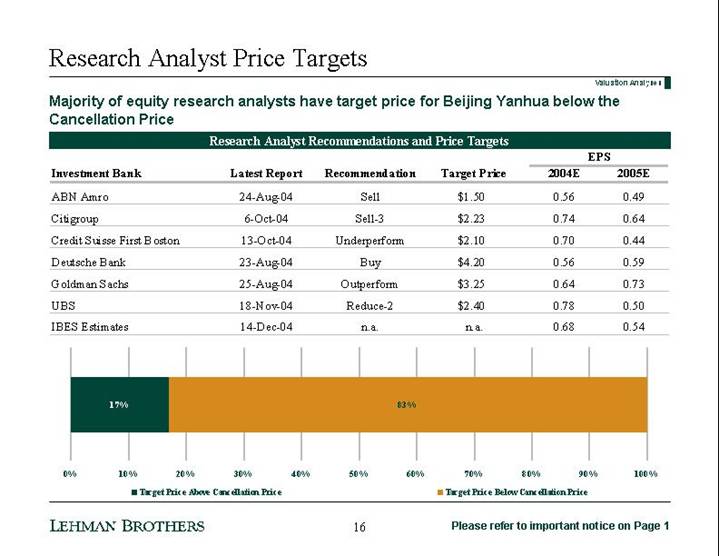
Research Analyst Price Targets
Majority of equity research analysts have target price for Beijing Yanhua below the Cancellation Price
Research Analyst Recommendations and Price Targets
|
|
|
|
|
|
|
| EPS |
| |||
Investment Bank |
| Latest Report |
| Recommendation |
| Target Price |
| 2004E |
| 2005E |
| |
ABN Amro |
| 24-Aug-04 |
| Sell |
| $ | 1.50 |
| 0.56 |
| 0.49 |
|
|
|
|
|
|
|
|
|
|
|
|
| |
Citigroup |
| 6-Oct-04 |
| Sell-3 |
| $ | 2.23 |
| 0.74 |
| 0.64 |
|
|
|
|
|
|
|
|
|
|
|
|
| |
Credit Suisse First Boston |
| 13-Oct-04 |
| Underperform |
| $ | 2.10 |
| 0.70 |
| 0.44 |
|
|
|
|
|
|
|
|
|
|
|
|
| |
Deutsche Bank |
| 23-Aug-04 |
| Buy |
| $ | 4.20 |
| 0.56 |
| 0.59 |
|
|
|
|
|
|
|
|
|
|
|
|
| |
Goldman Sachs |
| 25-Aug-04 |
| Outperform |
| $ | 3.25 |
| 0.64 |
| 0.73 |
|
|
|
|
|
|
|
|
|
|
|
|
| |
UBS |
| 18-Nov-04 |
| Reduce-2 |
| $ | 2.40 |
| 0.78 |
| 0.50 |
|
|
|
|
|
|
|
|
|
|
|
|
| |
IBES Estimates |
| 14-Dec-04 |
| n.a. |
| n.a. |
| 0.68 |
| 0.54 |
| |
[CHART]
16
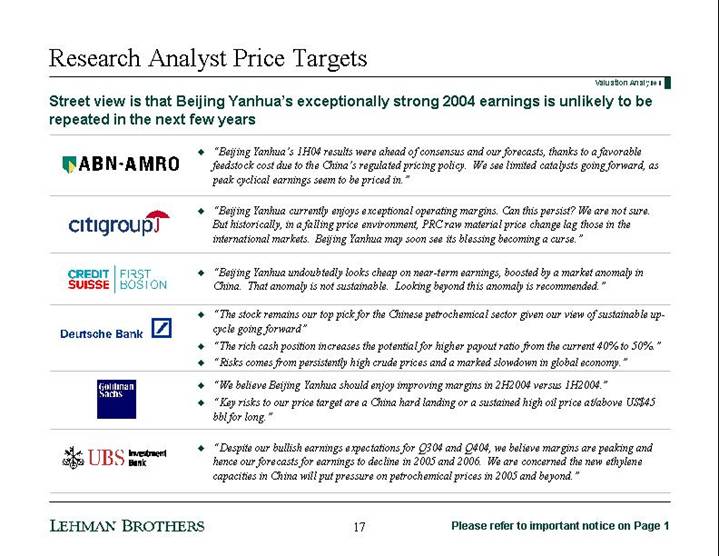
Street view is that Beijing Yanhua’s exceptionally strong 2004 earnings is unlikely to be repeated in the next few years
[GRAPHIC] |
| • |
| “Beijing Yanhua’s 1H04 results were ahead of consensus and our forecasts, thanks to a favorable feedstock cost due to the China’s regulated pricing policy. We see limited catalysts going forward, as peak cyclical earnings seem to be priced in.” |
|
|
|
|
|
[GRAPHIC] |
| • |
| “Beijing Yanhua currently enjoys exceptional operating margins. Can this persist? We are not sure. But historically, in a falling price environment, PRC raw material price change lag those in the international markets. Beijing Yanhua may soon see its blessing becoming a curse.” |
|
|
|
|
|
[GRAPHIC] |
| • |
| “Beijing Yanhua undoubtedly looks cheap on near-term earnings, boosted by a market anomaly in China. That anomaly is not sustainable. Looking beyond this anomaly is recommended.” |
|
|
|
|
|
[GRAPHIC] |
| • |
| “The stock remains our top pick for the Chinese petrochemical sector given our view of sustainable up-cycle going forward” |
|
| • |
| “The rich cash position increases the potential for higher payout ratio from the current 40% to 50%.” |
|
| • |
| “Risks comes from persistently high crude prices and a marked slowdown in global economy.” |
|
|
|
|
|
[GRAPHIC] |
| • |
| “We believe Beijing Yanhua should enjoy improving margins in 2H2004 versus 1H2004.” |
|
| • |
| “Key risks to our price target are a China hard landing or a sustained high oil price at/above US$45 bbl for long.” |
|
|
|
|
|
[GRAPHIC] |
| • |
| “Despite our bullish earnings expectations for Q304 and Q404, we believe margins are peaking and hence our forecasts for earnings to decline in 2005 and 2006. We are concerned the new ethylene capacities in China will put pressure on petrochemical prices in 2005 and beyond.” |
17
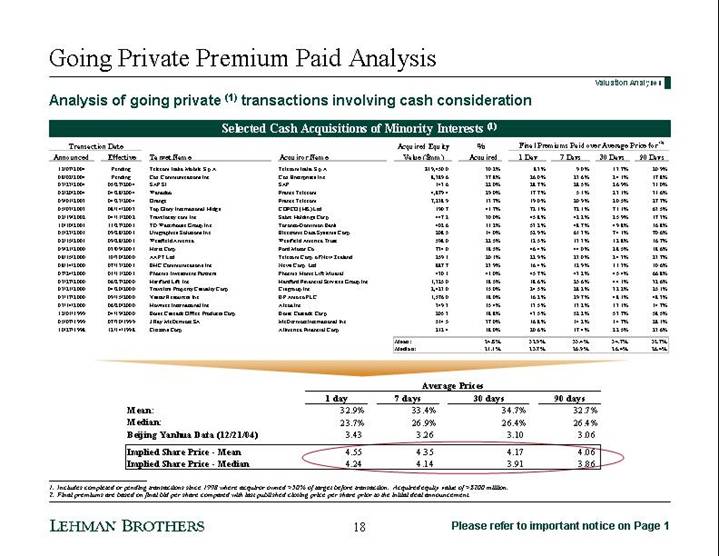
Going Private Premium Paid Analysis
Analysis of going private (1) transactions involving cash consideration
Selected Cash Acquisitions of Minority Interests (1)
Transaction Date |
|
|
|
|
| Acquired Equity |
| % |
| Final Premiums Paid over Average Price for (2) |
| |||||||||
Announced |
| Effective |
| Target Name |
| Acquiror Name |
| Value ($mm) |
| Acquired |
| 1 Day |
| 7 Days |
| 30 Days |
| 90 Days |
| |
12/07/2004 |
| Pending |
| Telecom Italia Mobile S.p.A. |
| Telecom Italia S.p.A. |
| $ | 19,450.0 |
| 30.2 | % | 8.3 | % | 9.0 | % | 13.7 | % | 20.9 | % |
08/02/2004 |
| Pending |
| Cox Communications Inc. |
| Cox Enterprises Inc. |
| 8,389.6 |
| 37.8 | % | 26.0 | % | 23.6 | % | 24.1 | % | 17.8 | % | |
03/23/2004 |
| 05/27/2004 |
| SAP SI |
| SAP |
| 143.6 |
| 22.0 | % | 28.7 | % | 28.5 | % | 26.9 | % | 31.0 | % | |
02/20/2004 |
| 04/28/2004 |
| Wanadoo |
| France Telecom |
| 4,879.4 |
| 29.0 | % | 17.7 | % | 5.1 | % | 23.1 | % | 31.6 | % | |
09/01/2003 |
| 04/23/2004 |
| Orange |
| France Telecom |
| 7,238.9 |
| 13.7 | % | 19.0 | % | 20.9 | % | 20.5 | % | 27.7 | % | |
05/03/2003 |
| 08/14/2003 |
| Top Glory International Hldgs |
| COFCO (HK) Ltd. |
| 190.7 |
| 41.7 | % | 72.1 | % | 72.1 | % | 71.1 | % | 63.5 | % | |
02/19/2002 |
| 04/11/2002 |
| Travelocity.com Inc. |
| Sabre Holdings Corp. |
| 447.2 |
| 30.0 | % | 45.8 | % | 42.2 | % | 25.9 | % | 17.3 | % | |
10/10/2001 |
| 11/27/2001 |
| TD Waterhouse Group Inc. |
| Toronto-Dominion Bank |
| 402.6 |
| 11.2 | % | 53.2 | % | 48.7 | % | 49.8 | % | 16.8 | % | |
05/23/2001 |
| 09/28/2001 |
| Unigraphics Solutions Inc. |
| Electronic Data Systems Corp. |
| 208.5 |
| 14.0 | % | 52.9 | % | 61.3 | % | 74.1 | % | 70.6 | % | |
02/15/2001 |
| 09/28/2001 |
| Westfield America |
| Westfield America Trust |
| 598.0 |
| 22.5 | % | 12.5 | % | 13.3 | % | 12.8 | % | 16.7 | % | |
09/21/2000 |
| 03/09/2001 |
| Hertz Corp. |
| Ford Motor Co. |
| 734.0 |
| 18.5 | % | 46.4 | % | 44.0 | % | 28.5 | % | 18.6 | % | |
08/15/2000 |
| 10/30/2000 |
| AAPT Ltd. |
| Telecom Corp. of New Zealand |
| 259.1 |
| 20.1 | % | 22.9 | % | 23.0 | % | 24.3 | % | 23.7 | % | |
08/14/2000 |
| 07/13/2001 |
| BHC Communications Inc. |
| News Corp. Ltd. |
| 887.7 |
| 23.9 | % | 16.4 | % | 12.9 | % | 11.3 | % | 10.6 | % | |
07/24/2000 |
| 01/11/2001 |
| Phoenix Investment Partners |
| Phoenix Home Life Mutual |
| 430.1 |
| 41.0 | % | 45.7 | % | 43.2 | % | 45.4 | % | 66.8 | % | |
03/27/2000 |
| 06/27/2000 |
| Hartford Life Inc. |
| Hartford Financial Services Group Inc. |
| 1,325.0 |
| 18.5 | % | 18.6 | % | 25.6 | % | 44.1 | % | 32.6 | % | |
03/21/2000 |
| 04/20/2000 |
| Travelers Property Casualty Corp. |
| Citigroup Inc. |
| 2,423.0 |
| 15.0 | % | 24.5 | % | 28.2 | % | 32.2 | % | 25.1 | % | |
03/17/2000 |
| 09/15/2000 |
| Vastar Resources Inc. |
| BP Amoco PLC |
| 1,576.0 |
| 18.0 | % | 16.2 | % | 29.7 | % | 48.1 | % | 48.3 | % | |
03/14/2000 |
| 06/20/2000 |
| Howmet International Inc. |
| Alcoa Inc. |
| 349.3 |
| 15.4 | % | 13.5 | % | 13.2 | % | 13.1 | % | 14.7 | % | |
12/01/1999 |
| 04/19/2000 |
| Boise Cascade Office Products Corp. |
| Boise Cascade Corp. |
| 205.3 |
| 18.8 | % | 43.5 | % | 52.2 | % | 53.7 | % | 58.5 | % | |
05/07/1999 |
| 07/30/1999 |
| J Ray McDermott SA |
| McDermott International Inc. |
| 514.5 |
| 37.0 | % | 16.8 | % | 14.2 | % | 14.7 | % | 28.1 | % | |
10/27/1998 |
| 12/14/1998 |
| Citizens Corp. |
| Allmerica Financial Corp. |
| 212.4 |
| 18.0 | % | 20.6 | % | 17.4 | % | 22.5 | % | 23.6 | % | |
|
|
|
|
|
|
|
| Mean: |
| 24.8 | % | 32.9 | % | 33.4 | % | 34.7 | % | 32.7 | % | |
|
|
|
|
|
|
|
| Median: |
| 21.1 | % | 23.7 | % | 26.9 | % | 26.4 | % | 26.4 | % | |
|
| Average Prices |
| ||||||
|
| 1 day |
| 7 days |
| 30 days |
| 90 days |
|
Mean: |
| 32.9 | % | 33.4 | % | 34.7 | % | 32.7 | % |
Median: |
| 23.7 | % | 26.9 | % | 26.4 | % | 26.4 | % |
Beijing Yanhua Data (12/21/04) |
| 3.43 |
| 3.26 |
| 3.10 |
| 3.06 |
|
Implied Share Price - Mean |
| 4.55 |
| 4.35 |
| 4.17 |
| 4.06 |
|
Implied Share Price - Median |
| 4.24 |
| 4.14 |
| 3.91 |
| 3.86 |
|
(1) Includes completed or pending transactions since 1998 where acquiror owned >50% of target before transaction. Acquired equity value of >$200 million.
(2) Final premiums are based on final bid per share compared with last published closing price per share prior to the initial deal announcement.
18
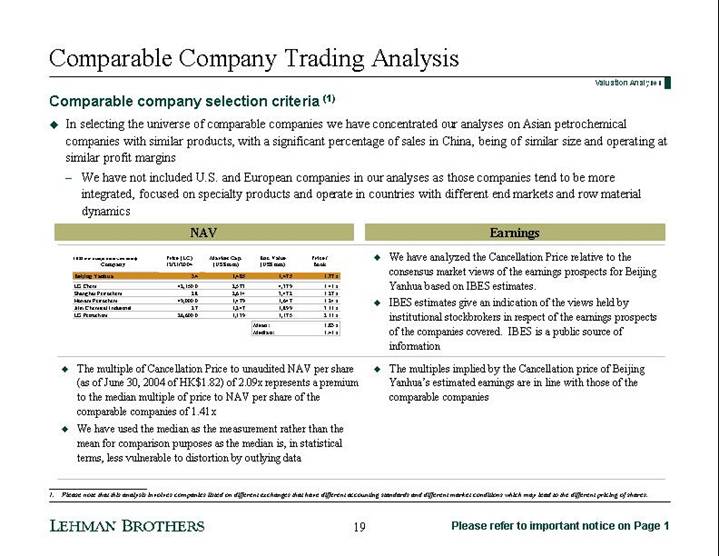
Comparable Company Trading Analysis
Comparable company selection criteria (1)
• In selecting the universe of comparable companies we have concentrated our analyses on Asian petrochemical companies with similar products, with a significant percentage of sales in China, being of similar size and operating at similar profit margins
• We have not included U.S. and European companies in our analyses as those companies tend to be more integrated, focused on specialty products and operate in countries with different end markets and row material dynamics
NAV
(US$ mm except otherwise noted) |
| Price (LC) |
| Market Cap. |
| Ent. Value |
| Price / |
|
Company |
| 12/21/2004 |
| (US$ mm) |
| (US$ mm) |
| Book |
|
Beijing Yanhua |
| 3.4 |
| 1,485 |
| 1,475 |
| 1.77 | x |
LG Chem |
| 42,150.0 |
| 2,573 |
| 4,379 |
| 1.41 | x |
Shanghai Petrochem |
| 2.8 |
| 2,614 |
| 3,472 |
| 1.27 | x |
Honam Petrochem |
| 49,000.0 |
| 1,479 |
| 1,647 |
| 1.24 | x |
Jilin Chemical Industrial |
| 2.7 |
| 1,247 |
| 1,899 |
| 3.11 | x |
LG Petrochem |
| 26,600.0 |
| 1,139 |
| 1,175 |
| 2.11 | x |
|
|
|
|
|
| Mean: |
| 1.83 | x |
|
|
|
|
|
| Median: |
| 1.41 | x |
• The multiple of Cancellation Price to unaudited NAV per share (as of June 30, 2004 of HK$1.82) of 2.09x represents a premium to the median multiple of price to NAV per share of the comparable companies of 1.41x
• We have used the median as the measurement rather than the mean for comparison purposes as the median is, in statistical terms, less vulnerable to distortion by outlying data
Earnings
• We have analyzed the Cancellation Price relative to the consensus market views of the earnings prospects for Beijing Yanhua based on IBES estimates.
• IBES estimates give an indication of the views held by institutional stockbrokers in respect of the earnings prospects of the companies covered. IBES is a public source of information
• The multiples implied by the Cancellation price of Beijing Yanhua’s estimated earnings are in line with those of the comparable companies
(1) Please note that this analysis involves companies listed on different exchanges that have different accounting standards and different market conditions which may lead to the different pricing of shares.
19
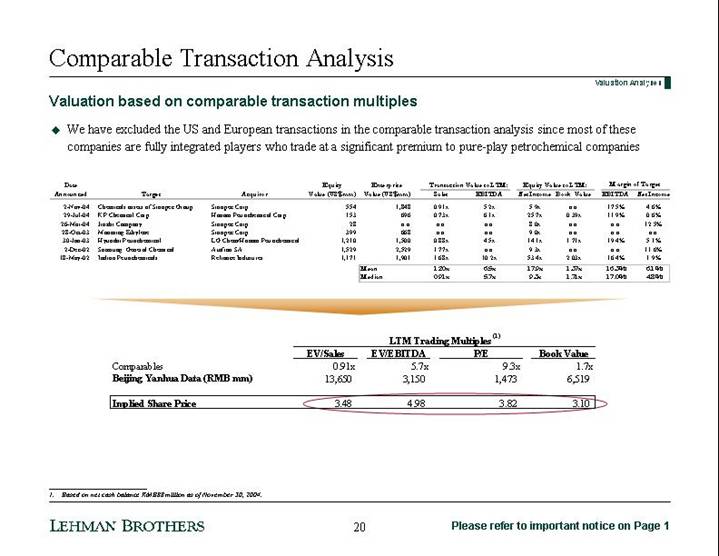
Comparable Transaction Analysis
Valuation based on comparable transaction multiples
• We have excluded the US and European transactions in the comparable transaction analysis since most of these companies are fully integrated players who trade at a significant premium to pure-play petrochemical companies
Date |
|
|
|
|
| Equity |
| Enterprise |
| Transaction Value to LTM: |
| Equity Value to LTM: |
| Margin of Target |
| ||||||
Announced |
| Target |
| Acquiror |
| Value (US$ mm) |
| Value (US$ mm) |
| Sales |
| EBITDA |
| Net Income |
| Book Value |
| EBITDA |
| Net Income |
|
2-Nov-04 |
| Chemicals assets of Sinopec Group |
| Sinopec Corp. |
| 554 |
| 1,848 |
| 0.91 | x | 5.2 | x | 5.9 | x | n.a. |
| 17.5 | % | 4.6 | % |
29-Jul-04 |
| KP Chemical Corp |
| Honam Petrochemical Corp |
| 153 |
| 696 |
| 0.73 | x | 6.1 | x | 25.7 | x | 0.39 | x | 11.9 | % | 0.6 | % |
26-Mar-04 |
| Jinzhi Company |
| Sinopec Corp. |
| 28 |
| n.a. |
| n.a. |
| n.a. |
| 8.0 | x | n.a. |
| n.a. |
| 12.5 | % |
28-Oct-03 |
| Maoming Ethylene |
| Sinopec Corp |
| 399 |
| 668 |
| n.a. |
| n.a. |
| 9.0 | x | n.a. |
| n.a. |
| n.a. |
|
30-Jan-03 |
| Hyundai Petrochemical |
| LG Chem/Honam Petrochemical |
| 1,210 |
| 1,500 |
| 0.88 | x | 4.5 | x | 14.1 | x | 1.71 | x | 19.4 | % | 5.1 | % |
2-Dec-02 |
| Samsung General Chemical |
| Atofina SA |
| 1,529 |
| 2,529 |
| 1.77 | x | n.a. |
| 9.3 | x | n.a. |
| n.a. |
| 11.6 | % |
18-May-02 |
| Indian Petrochemicals |
| Reliance Industries |
| 1,171 |
| 1,901 |
| 1.68 | x | 10.2 | x | 53.4 | x | 2.03 | x | 16.4 | % | 1.9 | % |
|
|
|
|
|
|
|
| Mean |
| 1.20 | x | 6.5 | x | 17.9 | x | 1.37 | x | 16.3 | % | 6.1 | % |
|
|
|
|
|
|
|
| Median |
| 0.91 | x | 5.7 | x | 9.3 | x | 1.71 | x | 17.0 | % | 4.8 | % |
|
| LTM Trading Multiples (1) |
| ||||||
|
| EV/Sales |
| EV/EBITDA |
| P/E |
| Book Value |
|
Comparables |
| 0.91 | x | 5.7 | x | 9.3 | x | 1.7 | x |
Beijing Yanhua Data (RMB mm) |
| 13,650 |
| 3,150 |
| 1,473 |
| 6,519 |
|
|
|
|
|
|
|
|
|
|
|
Implied Share Price |
| 3.48 |
| 4.98 |
| 3.82 |
| 3.10 |
|
(1) Based on net cash balance RMB88 million as of November 30, 2004.
20
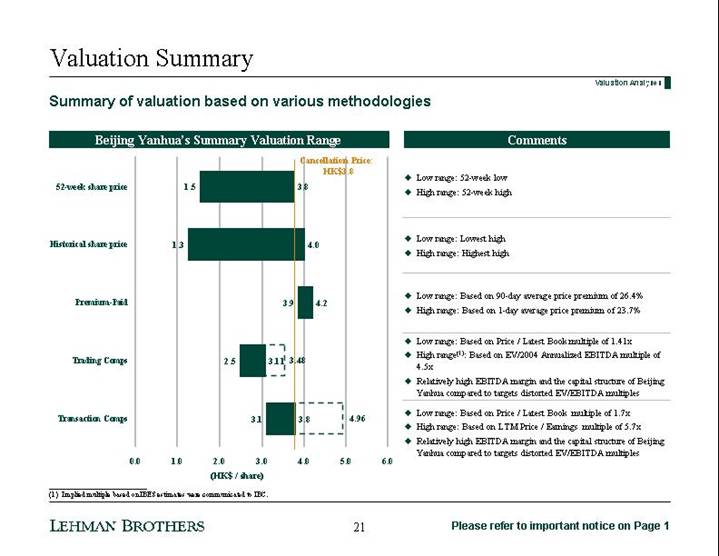
Valuation Summary
Summary of valuation based on various methodologies
Beijing Yanhua’s Summary Valuation Range
[CHART]
Comments
• Low range: 52-week low
• High range: 52-week high
• Low range: Lowest high
• High range: Highest high
• Low range: Based on 90-day average price premium of 26.4%
• High range: Based on 1-day average price premium of 23.7%
• Low range: Based on Price / Latest Book multiple of 1.41x
• High range(1): Based on EV/2004 Annualized EBITDA multiple of 4.5x
• Relatively high EBITDA margin and the capital structure of Beijing Yanhua compared to targets distorted EV/EBITDA multiples
• Low range: Based on Price / Latest Book multiple of 1.7x
• High range: Based on LTM Price / Earnings multiple of 5.7x
• Relatively high EBITDA margin and the capital structure of Beijing Yanhua compared to targets distorted EV/EBITDA multiples
(1) Implied multiple based on IBES estimates were communicated to IBC.
21
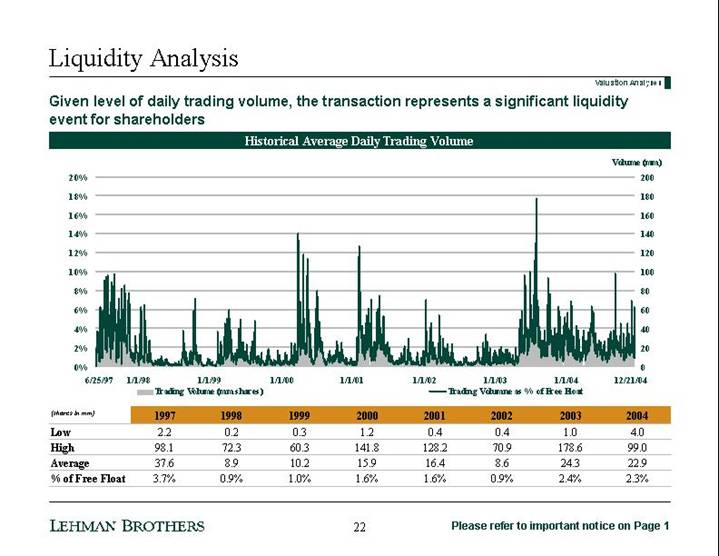
Liquidity Analysis
Given level of daily trading volume, the transaction represents a significant liquidity event for shareholders
Historical Average Daily Trading Volume
[CHART]
(shares in mm) |
| 1997 |
| 1998 |
| 1999 |
| 2000 |
| 2001 |
| 2002 |
| 2003 |
| 2004 |
|
Low |
| 2.2 |
| 0.2 |
| 0.3 |
| 1.2 |
| 0.4 |
| 0.4 |
| 1.0 |
| 4.0 |
|
High |
| 98.1 |
| 72.3 |
| 60.3 |
| 141.8 |
| 128.2 |
| 70.9 |
| 178.6 |
| 99.0 |
|
Average |
| 37.6 |
| 8.9 |
| 10.2 |
| 15.9 |
| 16.4 |
| 8.6 |
| 24.3 |
| 22.9 |
|
% of Free Float |
| 3.7 | % | 0.9 | % | 1.0 | % | 1.6 | % | 1.6 | % | 0.9 | % | 2.4 | % | 2.3 | % |
22
Prospect for Alternative Offer
Likelihood of alternative offers low
• Sinopec, as of December 29, 2004 has a 70% ownership in the issued share capital of Beijing Yanhua
• Only other substantial shareholder is J.P. Morgan Chase & Co. which owns 13.1% of total issued H-share capital, equivalent to 3.9% of total issued share capital; however, these shareholdings are only in J.P. Morgan’s capacity as investment manager and as a custodian/approved lending agent
• We understand that Beijing Yanhua has not contacted other potential bidders for alternative offers and we understand that no alternative proposals or offers have been made to Beijing Yanhua so far
• We believe that the prospect of an alternative offer is extremely low
• Sinopec’s interest in Beijing Yanhua is significant and strategic; it is highly unlikely that they would contemplate selling their interest in Beijing Yanhua to any third party
23
Conclusion
Lehman Brothers determines that the offer is fair and reasonable
• Lehman Brothers is of the opinion that the terms of the offer are fair and reasonable for the following reasons:
• Share price of Beijing Yanhua has only closed above the Cancellation Price on 3 days out of its trading history since 1997;
• Premium implied by the Cancellation Price to Beijing Yanhua’s recent share price history appears reasonable taking into the account the significant appreciation in share price that has been experienced over the last 12 months;
• NAV and earnings multiple implied by the Cancellation Price appears reasonable relative to selected comparable companies and comparable transactions;
• Survey of equity research analysts indicate that the consensus view is Beijing Yanhua’s current share price is fully valued;
• Given the low level of trading volume, the Merger represents a significant liquidity opportunity for the Independent Shareholders; and
• Sinopec’s significant and strategic interest in Beijing Yanhua makes the likelihood of any competing, higher bid extremely low
24
Confidential Presentation to:
Independent Board Committee of Sinopec
Beijing Yanhua Petrochemical Co., Ltd
Project Shenzhou
January 9, 2005
[LOGO]
DCF Analysis
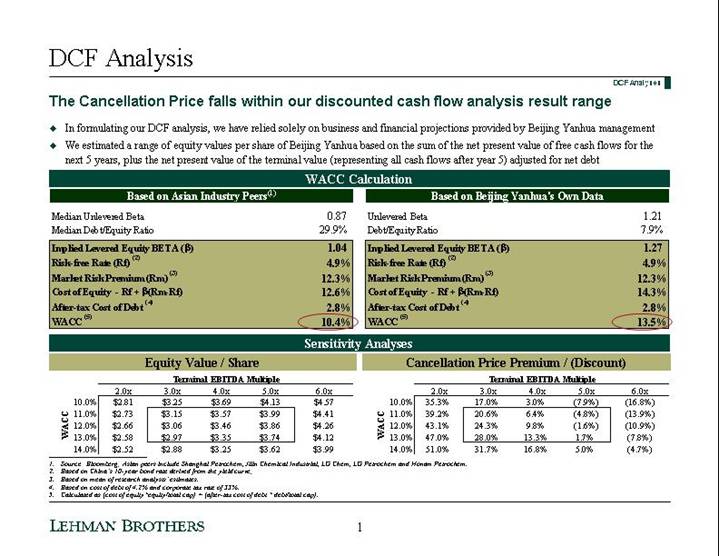
The Cancellation Price falls within our discounted cash flow analysis result range
• In formulating our DCF analysis, we have relied solely on business and financial projections provided by Beijing Yanhua management
• We estimated a range of equity values per share of Beijing Yanhua based on the sum of the net present value of free cash flows for the next 5 years, plus the net present value of the terminal value (representing all cash flows after year 5) adjusted for net debt
WACC Calculation
Based on Asian Industry Peers(1)
Median Unlevered Beta |
| 0.87 |
|
Median Debt/Equity Ratio |
| 29.9 | % |
Implied Levered Equity BETA (β) |
| 1.04 |
|
Risk-free Rate (Rf) (2) |
| 4.9 | % |
Market Risk Premium (Rm) (3) |
| 12.3 | % |
Cost of Equity - Rf + β(Rm-Rf) |
| 12.6 | % |
After-tax Cost of Debt (4) |
| 2.8 | % |
WACC (5) |
| 10.4 | % |
Based on Beijing Yanhua’s Own Data
Unlevered Beta |
| 1.21 |
|
Debt/Equity Ratio |
| 7.9 | % |
Implied Levered Equity BETA (β) |
| 1.27 |
|
Risk-free Rate (Rf) (2) |
| 4.9 | % |
Market Risk Premium (Rm) (3) |
| 12.3 | % |
Cost of Equity - Rf + β(Rm-Rf) |
| 14.3 | % |
After-tax Cost of Debt (4) |
| 2.8 | % |
WACC (5) |
| 13.5 | % |
Sensitivity Analyses
Equity Value / Share
|
| Terminal EBITDA Multiple |
| |||||||||||||
WACC |
| 2.0x |
| 3.0x |
| 4.0x |
| 5.0x |
| 6.0x |
| |||||
10.0% |
| $ | 2.81 |
| $ | 3.25 |
| $ | 3.69 |
| $ | 4.13 |
| $ | 4.57 |
|
11.0% |
| $ | 2.73 |
| $ | 3.15 |
| $ | 3.57 |
| $ | 3.99 |
| $ | 4.41 |
|
12.0% |
| $ | 2.66 |
| $ | 3.06 |
| $ | 3.46 |
| $ | 3.86 |
| $ | 4.26 |
|
13.0% |
| $ | 2.58 |
| $ | 2.97 |
| $ | 3.35 |
| $ | 3.74 |
| $ | 4.12 |
|
14.0% |
| $ | 2.52 |
| $ | 2.88 |
| $ | 3.25 |
| $ | 3.62 |
| $ | 3.99 |
|
Cancellation Price Premium / (Discount)
|
| Terminal EBITDA Multiple |
| ||||||||
WACC |
| 2.0x |
| 3.0x |
| 4.0x |
| 5.0x |
| 6.0x |
|
10.0% |
| 35.3 | % | 17.0 | % | 3.0 | % | (7.9 | )% | (16.8 | )% |
11.0% |
| 39.2 | % | 20.6 | % | 6.4 | % | (4.8 | )% | (13.9 | )% |
12.0% |
| 43.1 | % | 24.3 | % | 9.8 | % | (1.6 | )% | (10.9 | )% |
13.0% |
| 47.0 | % | 28.0 | % | 13.3 | % | 1.7 | % | (7.8 | )% |
14.0% |
| 51.0 | % | 31.7 | % | 16.8 | % | 5.0 | % | (4.7 | )% |
(1) Source: Bloomberg; Asian peers include Shanghai Petrochem, Jilin Chemical Industrial, LG Chem, LG Petrochem and Honam Petrochem.
(2) Based on China’s 10-year bond rate derived from the yield curve;
(3) Based on mean of research analysts’ estimates.
(4) Based on cost of debt of 4.2% and corporate tax rate of 33%.
(5) Calculated as (cost of equity*equity/total cap) + (after-tax cost of debt * debt/total cap).
[LOGO]
1