UNITED STATES
SECURITIES AND EXCHANGE COMMISSION
Washington, D.C. 20549
FORM 20-F
| ¨ | REGISTRATION STATEMENT PURSUANT TO SECTION 12(b) OR 12(g) OF THE SECURITIES EXCHANGE ACT OF 1934 |
OR
| x | ANNUAL REPORT PURSUANT TO SECTION 13 OR 15(d) OF THE SECURITIES EXCHANGE ACT OF 1934 |
For the fiscal year ended December 31, 2003
OR
| ¨ | TRANSITION REPORT PURSUANT TO SECTION 13 OR 15(d) OF THE SECURITIES EXCHANGE ACT OF 1934 |
For the transition period from to
Commission file number 1-14646
(Exact name of Registrant as specified in its charter)
Sinopec Beijing Yanhua Petrochemical Company Limited
(Translation of Registrant’s name into English)
The People’s Republic of China
(Jurisdiction of incorporation or organization)
No. 1 Beice, Yingfeng Erli, Yanshan, Fangshan District, Beijing 102500,
The People’s Republic of China
(Address of principal executive offices)
Securities registered or to be registered pursuant to Section 12(b) of the Act.
| | |
Title of Each Class
| | Name of Each Exchange on which Registered
|
American Depositary Shares | | New York Stock Exchange |
Overseas Listed Foreign Invested Shares, par value RMB1.00 per Share | | The Stock Exchange of Hong Kong Limited |
Securities registered or to be registered pursuant to Section 12(g) of the Act.
NONE
(Title of Class)
Securities for which there is a reporting obligation pursuant to Section 15(d) of the Act.
NONE
(Title of Classes)
Indicate the number of outstanding shares of each of the issuer’s classes of capital or common stock as of the close of the period covered by the annual report.
1,012,000,000 Overseas Listed Foreign Invested Shares
2,362,000,000 Domestic Invested Shares
Indicate by check mark whether the registrant: (1) has filed all reports required to be filed by Section 13 or 15(d) of the Securities Exchange Act of 1934 during the preceding 12 months (or for such shorter period that the registrant was required to file such reports), and (2) has been subject to such filing requirements for the past 90 days. Yes x No ¨
Indicate by check mark which financial statement item the registrant has elected to follow. Item 17 ¨ Item 18 x
Table of Contents
FORWARD-LOOKING STATEMENTS
This Annual Report includes forward-looking statements. All statements, other than statements of historical facts, included in this Annual Report that relates to developments or events that we expect will or may happen in the future are forward-looking statements. The words or phrases “will likely result,” “are expected to,” “will continue,” “is anticipated,” “estimate,” “project,” “believe” “intends to” or similar expressions identify “forward-looking statements” within the meaning of the Private Securities Reform Act of 1995. These forward-looking statements address, among others, issues such as:
| | • | the future price of crude oil; |
| | • | the future price and supply of cracking feedstock; |
| | • | fluctuation in the prices and demand for our products; |
| | • | expansion projects and capital expenditures; |
| | • | China’s regulation of its petrochemical industry; |
| | • | general economic, market and business conditions, including the cyclicality of the petrochemical market; and |
| | • | other risks and factors beyond our control. |
These statements are subject to risks and uncertainties that could cause our actual results to differ materially from historical results and those presently anticipated or projected. You should not place undue reliance on any such forward-looking statements, which speak only as of the date made.
OTHER CONVENTIONS
As used in this Annual Report, unless the context otherwise requires, the following expressions have the following meanings:
“Beijing Yanhua,” “we,” “our” and “us” refer to Sinopec Beijing Yanhua Petrochemical Company Limited, a PRC joint stock limited company, and prior to our formation, relate to the relevant businesses previously carried on by Yanshan Company.
“China” or “PRC” refers to the People’s Republic of China, excluding for the purposes of this Annual Report, Hong Kong, Macau and Taiwan.
“HK dollars” or “HK$” refers to Hong Kong dollars, the legal currency in Hong Kong.
“Industrial Value Added” means the final product, in monetary terms, of production activities of a particular industry throughout a given reporting period.
“Our predecessor” means Yanshan Company, as the operator of the businesses transferred to us in the Restructuring.
“Rated Capacity” is the annual output capacity of a given production unit or, where appropriate, the annual throughput capacity, calculated by estimating the number of days in a year that such a production unit is expected to operate, including downtime for regular maintenance, and multiplying that number by an amount equal to the unit’s optimal daily output or throughput, as the case may be.
1
“Renminbi” or “RMB” refers to Renminbi yuan, the legal currency of the PRC.
“Resins and plastics” include low density polyethylene (“LDPE”), high density polyethylene (“HDPE”), polyester chips, polypropylene and polystyrene. This category of products does not include synthetic fibers such as polyester fibers.
“Restructuring” means the transfer to us, effective as of April 23, 1997, the date of our incorporation, of the principal petrochemical businesses of our predecessor and certain assets and liabilities of our predecessor, together with certain other businesses, assets and liabilities.
“Sinopec”, “our parent” and “our parent company” refer to China Petroleum & Chemical Corporation, a subsidiary controlled by the Sinopec Group and our controlling shareholder since its establishment on February 25, 2000.
“Sinopec Group” means China Petrochemical Corporation, a Chinese state-owned enterprise organized in 1998 and our ultimate parent.
“State Prices” mean the price set by the National Development and Reform Commission (together with its predecessors, the former State Planning Commission and the former State Development and Planning Commission of China, the “NDRC”) and/or the Sinopec Group (the Sinopec Group, in its function of setting State Prices, and the NDRC are collectively referred to as the “State Planning Commission”) of certain products, including light industrial oil, cracking wax oil and hydrogenated raffinate oil.
“Tons” or “tons” refers to metric tons.
“US dollars” or “US$” refers to United States dollars, the legal currency of the United States of America.
“Yanshan Company” means Sinopec Group Beijing Yanshan Petrochemical Company Limited, a subsidiary of Sinopec Group and our controlling shareholder until February 25, 2000.
EXCHANGE RATES
We have translated certain amounts in this Annual Report from Renminbi to US dollars for your convenience. Except as otherwise noted, the translation was made at the exchange rate published by the People’s Bank of China (the “PBOC Rate”) on December 31, 2003 of US$ 1.00 = RMB 8.2767. We do not represent that the Renminbi amounts could have been or could be converted into US dollars at that rate or at any other rate. The noon buying rate in New York City for cable transfers in foreign currencies as certified for customs purposes by the Federal Reserve Bank of New York (the “Noon Buying Rate”) on December 31, 2003 was US$ 1.00 = RMB 8.2767.
2
PART I
ITEM 1. IDENTITY OF DIRECTORS, SENIOR MANAGEMENT AND ADVISORS
Not applicable.
ITEM 2. OFFER STATISTICS AND EXPECTED TIMETABLE
Not applicable.
ITEM 3. KEY INFORMATION
A. Selected Financial Data
The selected financial data for the years ended December 31, 2001, 2002 and 2003, and as of December 31, 2002 and 2003 were derived from and should be read in conjunction with our Financial Statements included in Item 18. Financial Statements, and the notes thereto, and Item 5. Operating and Financial Review and Prospects. The selected financial data for the years ended December 31, 1999 and 2000, and as of December 31, 1999, 2000 and 2001, were derived from our financial statements which are not included in this Annual Report. Our Financial Statements have been prepared in accordance with IFRS, which differ from US GAAP. For a discussion of the significant differences between IFRS and US GAAP, see Item 18. Financial Statements - Note 27.
3
Selected Financial Data
(in thousands, except per share data)
| | | | | | | | | | | | | |
| | | 1999
| | 2000
| | 2001
| | | 2002
| | 2003
| | 2003
|
| | | (RMB) | | (RMB) | | (RMB) | | | (RMB) | | (RMB) | | (US$)1 |
STATEMENT OF OPERATION DATA | | | | | | | | | | | | | |
IFRS | | | | | | | | | | | | | |
Sales | | 6,489,746 | | 7,852,913 | | 5,975,255 | | | 9,443,061 | | 11,473,928 | | 1,386,292 |
Gross profit | | 1,219,154 | | 1,188,820 | | 315,064 | | | 1,075,032 | | 1,750,366 | | 211,481 |
Operating income/(loss) | | 631,839 | | 623,056 | | (350,644 | ) | | 541,558 | | 1,043,043 | | 126,021 |
Net financing costs | | 98,417 | | 97,893 | | 59,579 | | | 210,830 | | 165,936 | | 20,049 |
Income/(loss) before income tax | | 533,422 | | 525,163 | | (410,223 | ) | | 330,728 | | 877,107 | | 105,972 |
Net income/(loss) | | 357,393 | | 358,731 | | (272,467 | ) | | 209,099 | | 633,885 | | 76,587 |
Basic earnings/(loss) per share(2) | | 0.11 | | 0.11 | | (0.08 | ) | | 0.06 | | 0.19 | | 0.02 |
Basic earnings/(loss) per ADS(2) | | 5.30 | | 5.32 | | (4.04 | ) | | 3.10 | | 9.39 | | 1.13 |
| | | | | | |
US GAAP | | | | | | | | | | | | | |
Gross profit | | 1,325,823 | | 1,244,337 | | 240,730 | | | 1,124,647 | | 1,797,885 | | 217,222 |
Operating income/(loss) | | 734,845 | | 674,909 | | (428,642 | ) | | 587,509 | | 1,086,898 | | 131,320 |
Net financing costs | | 98,417 | | 98,455 | | 60,929 | | | 212,420 | | 167,280 | | 20,211 |
Income/(loss) before income tax | | 636,428 | | 609,630 | | (643,320 | ) | | 379,279 | | 954,411 | | 115,313 |
Net income/(loss) | | 433,471 | | 405,507 | | (440,306 | ) | | 229,864 | | 673,223 | | 81,340 |
Basic earnings/(loss) per share(2) | | 0.13 | | 0.12 | | (0.13 | ) | | 0.07 | | 0.20 | | 0.02 |
Basic earnings/(loss) per ADS(2) | | 6.42 | | 6.01 | | (6.52 | ) | | 3.41 | | 9.98 | | 1.21 |
| | | | | | |
CASH FLOW DATA | | | | | | | | | | | | | |
IFRS | | | | | | | | | | | | | |
Net cash from operating activities | | 327,462 | | 1,174,930 | | 381,268 | | | 1,037,119 | | 1,616,596 | | 195,319 |
Depreciation | | 636,092 | | 508,282 | | 525,410 | | | 806,124 | | 890,779 | | 107,625 |
Capital expenditures | | 617,113 | | 1,399,580 | | 2,048,217 | | | 722,492 | | 356,334 | | 43,053 |
| | | | | | |
BALANCE SHEET DATA | | | | | | | | | | | | | |
IFRS | | | | | | | | | | | | | |
Current assets | | 2,777,281 | | 2,173,453 | | 1,909,987 | | | 2,028,367 | | 1,823,024 | | 220,260 |
Property, plant and equipment, net | | 5,300,403 | | 6,204,983 | | 8,362,192 | | | 7,900,990 | | 7,388,120 | | 892,641 |
Other non-current assets | | 254,052 | | 271,390 | | 486,017 | | | 330,450 | | 334,167 | | 40,374 |
| | |
| |
| |
|
| |
| |
| |
|
Total assets | | 8,331,736 | | 8,649,826 | | 10,758,196 | | | 10,259,807 | | 9,545,311 | | 1,153,275 |
| | |
| |
| |
|
| |
| |
| |
|
Current liabilities | | 1,602,722 | | 1,786,561 | | 4,755,442 | | | 3,024,160 | | 2,046,927 | | 247,312 |
Long-term bank loans | | 1,235,905 | | 1,388,063 | | 869,811 | | | 1,927,543 | | 1,596,359 | | 192,874 |
Other long-term liabilities | | 429,125 | | 254,927 | | 320,095 | | | 286,157 | | 246,193 | | 29,745 |
Shareholders’ equity | | 5,063,984 | | 5,220,275 | | 4,812,848 | | | 5,021,947 | | 5,655,832 | | 683,344 |
| | |
| |
| |
|
| |
| |
| |
|
Total liabilities and shareholders’ equity | | 8,331,736 | | 8,649,826 | | 10,758,196 | | | 10,259,807 | | 9,545,311 | | 1,153,275 |
| | |
| |
| |
|
| |
| |
| |
|
US GAAP | | | | | | | | | | | | | |
Current assets | | 2,791,936 | | 2,173,453 | | 1,917,315 | | | 2,032,031 | | 1,823,024 | | 220,260 |
Property, plant and equipment, net | | 4,632,464 | | 5,625,737 | | 7,812,191 | | | 7,404,794 | | 6,974,236 | | 842,635 |
Other non-current assets | | 254,052 | | 271,390 | | 486,017 | | | 330,450 | | 334,167 | | 40,374 |
| | |
| |
| |
|
| |
| |
| |
|
Total assets | | 7,678,452 | | 8,070,580 | | 10,215,523 | | | 9,767,275 | | 9,131,427 | | 1,103,269 |
| | |
| |
| |
|
| |
| |
| |
|
Current liabilities | | 1,602,722 | | 1,775,569 | | 4,755,442 | | | 3,024,160 | | 2,046,927 | | 247,312 |
Long-term bank loans | | 1,235,905 | | 1,388,063 | | 869,811 | | | 1,927,543 | | 1,596,359 | | 192,874 |
Other long-term liabilities | | 155,339 | | 19,017 | | 104,291 | | | 98,664 | | 97,110 | | 11,733 |
Shareholders’ equity | | 4,684,486 | | 4,887,931 | | 4,485,979 | | | 4,716,908 | | 5,391,031 | | 651,350 |
| | |
| |
| |
|
| |
| |
| |
|
Total liabilities and shareholders’ equity | | 7,678,452 | | 8,070,580 | | 10,215,523 | | | 9,767,275 | | 9,131,427 | | 1,103,269 |
| | |
| |
| |
|
| |
| |
| |
|
OTHER FINANCIAL DATA | | | | | | | | | | | | | |
IFRS AND US GAAP | | | | | | | | | | | | | |
Dividend declared per share | | 0.06 | | 0.04 | | — | | | — | | 0.05 | | 0.006 |
Number of ordinary shares in (in thousands) | | 3,374,000 | | 3,374,000 | | 3,374,000 | | | 3,374,000 | | 3,374,000 | | 3,374,000 |
| /1/ | Converted into US dollars solely for convenience of readers based on the exchange rate published by the People’s Bank of China on December 31, 2003 of US$ 1.00 = RMB 8.2767. See below for information on exchange rates quoted by the Federal Reserve Bank of New York. |
4
| /2/ | Basic earnings/(loss) per share and per ADS have been computed by dividing net income/(loss) by the weighted average number of ordinary shares in issue. |
Dividends
Our Board of Directors has resolved to recommend the distribution of a dividend, subject to any unpredictable circumstances, at RMB 0.05 per share for the fiscal year ended December 31, 2003. Our Board of Directors intends that such final dividends will be distributed on or before July 2, 2004.
| | |
Dividend Period
| | Dividend per Share
|
January 1, 1999 — December 31, 1999 | | RMB 0.06 (US$ 0.007) |
January 1, 2000 — December 31, 2000 | | RMB 0.04 (US$ 0.005) |
January 1, 2001 — December 31, 2001 | | None |
January 1, 2002 — December 31, 2002 | | None |
January 1, 2003 — December 31, 2003 | | RMB 0.05 (US$ 0.006) |
No other dividends have been paid or declared in the last five years. See Item 18. Financial Statements - Note 20.
Exchange Rate Information
The Chinese government imposes control over its foreign currency reserves in part through direct regulation of the conversion of Renminbi into foreign exchange and through restrictions on foreign trade. See Item 10. Additional Information - Exchange Controls.
The following table sets forth information concerning exchange rates between Renminbi and US dollars for the periods indicated:
| | | | | | | | |
| | | | | Noon Buying Rate
|
Period
| | Period End
| | Average (1)
| | High
| | Low
|
| | | | | (expressed in RMB per US$) |
1999 | | 8.2795 | | 8.2785 | | 8.2800 | | 8.2770 |
2000 | | 8.2774 | | 8.2784 | | 8.2799 | | 8.2768 |
2001 | | 8.2766 | | 8.2772 | | 8.2786 | | 8.2676 |
2002 | | 8.2800 | | 8.2772 | | 8.2800 | | 8.2669 |
2003 | | 8.2767 | | 8.2771 | | 8.2800 | | 8.2766 |
December, 2003 | | 8.2767 | | N/A | | 8.2772 | | 8.2765 |
January, 2004 | | 8.2768 | | N/A | | 8.2772 | | 8.2767 |
February, 2004 | | 8.2769 | | N/A | | 8.2773 | | 8.2769 |
March, 2004 | | 8.2770 | | N/A | | 8.2774 | | 8.2767 |
April, 2004 | | 8.2771 | | N/A | | 8.2772 | | 8.2768 |
May, 2004 | | 8.2771 | | N/A | | 8.2773 | | 8.2768 |
Latest Practicable Date, May 28, 2004 | | 8.2769 | | N/A | | N/A | | N/A |
| Source: | | The Noon Buying Rate in New York for cable transfers payable in foreign currencies as certified for customs purposes by the Federal Reserve Bank of New York. |
| /(1)/ | Determined by averaging the rates on the last day of each month during the respective periods. |
5
B. Capitalization and Indebtedness
Not Applicable.
C. Reasons for the Offer and Use of Proceeds
Not Applicable.
D. Risk Factors
You should consider carefully all of the information set out in this Annual Report and should, in particular, evaluate the following risks in connection with an investment in us. Certain of these risks are not typically associated with investing in the equity securities of companies from the United States or other economically developed jurisdictions. Our business, financial conditions, and/or operational results could be materially, adversely affected by any of these risks.
Risks Relating to Investments in Beijing Yanhua
Our parent’s (Sinopec’s) inability to supply cracking feedstock and other raw materials may adversely affect our operations.
We source, and expect to continue to source, substantially all of our cracking feedstock and significant amounts of other raw materials from Sinopec. In 2003, costs of cracking feedstock from Sinopec accounted for 73.2% of our total raw material costs and 51.2% of our total sales costs. Sinopec, through its own feedstock production capacity, can supply the amounts of feedstock we require at present and is expected to be able to supply the cracking feedstock we require after the completion of our current expansion plans. We have an exclusive right of first refusal to purchase various types of cracking feedstock Sinopec produces. In the past, we have been able to acquire sufficient cracking feedstock from Sinopec and Yanshan Company, our previous parent, for our operations. We cannot assure you, however, that Sinopec will continue to be able to supply us with sufficient amounts of cracking feedstock when we need it in the future.
We will access other viable alternative sources for cracking feedstock in the future, should any alternative sources present better prices or quality, or from time to time when Sinopec is unable to meet our demand. We will incur additional costs associated with transporting the cracking feedstock to the extent we purchase cracking feedstock from sources other than Sinopec. In 2003, we purchased limited amounts of cracking feedstock from third parties, incurring weighted average transportation costs of approximately RMB 122 per ton. We cannot assure you that if we choose or are required to purchase cracking feedstock from third parties in the future, transportation costs will remain at the level stated above.
We use light industrial oil, a type of refined oil, as our principal cracking feedstock. The prices for most types of refined oil sold within China are set at the State Prices. Prior to June 1998, the State Planning Commission determined the State Prices for light industrial oil guided by, among other factors, crude oil prices and prices of similar cracking feedstock products in the international market. The State Planning Commission generally had no fixed schedule for adjusting the State Prices. From June 1998 until October 2001, China implemented a different pricing scheme for oil, including crude oil, light industrial oil and naphtha. Under this pricing scheme, the State Planning Commission established, on a monthly basis, indicative State Prices for all grades of crude oil, light industrial oil and naphtha based on comparable international market prices as set by the Singaporean market. The Sinopec Group and China National Petroleum Corporation (“CNPC”) would then set the prices for different grades of domestic crude oil based on the relevant indicative State Prices. The prices for light industrial oil and naphtha were set by the Sinopec Group based on the indicative State Prices set by the State Planning Commission. However, in the event of significant fluctuations in international cracking feedstock prices, the State Prices may not have accurately reflected the international market prices. Consequently, there may have been periods during which we had to purchase light industrial oil or naphtha at prices that were significantly higher than the then current international market prices. This pricing scheme has been modified since October 2001 to include the New York and Rotterdam refined oil markets. Since this change, the prices for refined oil have been set by the Sinopec Group and CNPC within a range of plus or minus 8% of the weighted average of the refined oil prices in New York, Rotterdam and Singapore, and are subject to non-scheduled adjustments from time to time.
6
We purchase cracking feedstock from the Beijing Yanshan Branch of Sinopec (“Sinopec Yanshan”) and because Sinopec Yanshan’s refining facilities were designed and built to process certain types of crude oil, the origin and contents of the crude oil are important to their operation. In 2003, Daqing Oilfield in Heilongjiang Province supplied approximately 95.6% of Sinopec Yanshan’s crude oil, with the remaining 4.4% obtained through import from Russia. The mix of crude oil available to Sinopec Yanshan has been satisfactory for the production of our products. Additionally, in 2003 Sinopec Yanshan modified the production process at its refining facilities to refine a small portion of crude oil imported from Russia. Any modification of the source of crude oil beyond the capacity of Sinopec Yanshan’s refining facilities could have an adverse effect on Sinopec Yanshan’s ability to meet our cracking feedstock requirements and a corresponding effect on us.
Our business may be adversely affected by China’s entry into the WTO and increased overseas competition.
We compete mainly in China’s domestic market. In 2003, we derived approximately 98.7% of our revenues from sales within China. A substantial portion of China’s domestic market demand for our principal products, however, continues to be met by imported products.
China joined the WTO on December 11, 2001. As a condition to its membership, China has committed to eliminate some tariff and non-tariff barriers to foreign competition in the domestic petrochemical industry that benefited us in the past. In particular, China has committed to
| | • | permit increasing levels of foreign investment in the domestic petrochemical industry, allowing foreign investors to own up to 100% of a domestic petrochemical company by December 11, 2004, and allowing them to engage in the distribution of imported and domestically produced petrochemical products (including ownership of sales networks, distribution channels and storage facilities) by the same date; |
| | • | gradually eliminate import non-tariff barriers such as quotas based on amount and source; |
| | • | reduce tariffs on imported crude oil from 9% to 5% and reduce tariffs on various petrochemical products; |
| | • | gradually relax restrictions on the import of crude and refined oil by non-state companies; |
| | • | grant foreign-invested companies the right to import petrochemical products; and |
| | • | permit foreign companies to engage in wholesale distribution of crude oil, refined oil and chemical fertilizers and remove all restrictions on retail operations by December 11, 2006. |
As a result of these measures, we will likely face increased competition from foreign companies and imports in the near future and longer term. However, we believe that our products have competed and will continue to compete with imported products in China. We already compete with certain major overseas petrochemical competitors from South Korea, Taiwan and Japan, many of which have substantially greater overall financial, technical, marketing and distribution resources than we do. We compete with such companies in different products to various degrees on the basis of price, product quality, customer service, payment terms and distribution capability within China. As imports already constitute substantial portions of PRC domestic consumption for many of our principal products, in most cases we have already been adjusting our product prices taking into consideration international supply conditions, international pricing, tariffs for the relevant products, imports not subject to tariffs (such as imports into special economic zones for processing into products for export) and transportation costs.
7
Market cyclically and our high operational leverage may have a significant effect on our profitability.
Regional and global markets for many of our products are sensitive to changes in industry capacity and output levels, cyclical changes in regional and global economic conditions, the price and availability of substitute products and changes in consumer demand. Changes in these factors from time to time have had a significant impact on product prices in the regional and global markets. In the past, PRC markets for many of our principal products were insulated from many aspects of this cyclicality as a result of tariffs, import quotas, other trade restrictions and the Chinese government’s allocation and pricing control. With China’s entry into the WTO in December 2001, tariffs and other import restrictions are being reduced and the control of product allocation and pricing relaxed. Consequently, the domestic markets for many of our products will become increasingly subject to the cyclicality of regional and global markets. Between 1994 and 2003, the markets for many of our principal products experienced substantial price fluctuations. We cannot assure that future demand for our products will be sufficient to alleviate any existing or future conditions of excess industry capacity, overproduction, or other events.
Similar to other producers in the petrochemical industry and other bulk manufacturing industries, we are highly leveraged operationally. Because a significant portion of our expenses have either been fixed (as in the case of depreciation expense for a given piece of equipment) or have consisted of stable unit costs (as in the case of cracking feedstock), fluctuations in sales, particularly those caused by changes in product prices, have tended to cause disproportionately larger fluctuations in profitability. We expect this leverage and the effect on our profitability will continue for the foreseeable future.
Related party transactions; conflict of interest.
Sinopec owns 70.0% of our issued share capital and therefore is our controlling shareholder. Furthermore, Sinopec is an enterprise whose controlling shareholder is the Sinopec Group and has been authorized by the Sinopec Group to hold a controlling interest in us. Sinopec has controlling interests in many petrochemical enterprises that are our competitors. Sinopec has confirmed in writing that we will be treated no less favorably than the other enterprises directly or indirectly under its control in respect of all transactions between Sinopec and us on the one hand and Sinopec and its other subsidiaries on the other hand. Our articles of association provide that, in addition to any obligation imposed by law, a controlling shareholder shall not exercise its voting rights in a manner prejudicial to the interests of the shareholders generally, including voting with respect to certain enumerated matters of fundamental importance to shareholders. There has not been, however, any published report of judicial enforcement in China of such provisions by minority shareholders. Accordingly, Sinopec could take actions that favor its interests over our interests, and we cannot be sure that we or you have effective legal remedies.
Cost of compliance with PRC environmental protection regulation may adversely affect our business.
We are subject both to PRC national and local environmental protection regulations which currently impose a graduated schedule of fees for the discharge of waste substances, require the payment of fees for pollution and provide for the closure of any facility which fails to comply with orders requiring it to cease or rectify certain behavior causing environmental damage.
8
Utilizing our own and Yanshan Company’s environmental protection units, we have established a system to treat wastewater and materials in order to prevent pollution to the environment. Yanshan Company’s environmental protection units consist of an environmental compliance division and a number of facilities to treat wastewater, solid waste and waste gas. We use the wastewater treatment facilities that are part of our production facilities to conduct preliminary water treatment. Thereafter, we send the wastewater to Yanshan Company’s wastewater treatment plant for further treatment. The treated water is stored in Sinopec’s reservoir for further biochemical treatment. Yanshan Company charges us treatment fees based on its costs for the amount of wastewater and the quantity of polluted contents in the wastewater. We believe that the wastewater treatment facilities in our production plants have adequate capacity to conduct preliminary water treatment, and that Yanshan Company’s water treatment plant has sufficient capacity to treat all wastewater generated by Yanshan Company and us. All solid waste materials are either buried in a sealed disposal site or burned in a furnace, both of which are operated by Yanshan Company. We believe that the disposal site and the waste burning furnace comply with both the national and local environmental laws regarding the discharge or disposal of solid waste. However, we cannot assure you that Chinese national or local authorities will not impose additional regulations that would require additional expenditures on environmental matters in the future.
Our insurance coverage may not be sufficient to cover risks related to industry-related accidents.
Due to the nature of our business, we handle many highly flammable and explosive materials and operate many facilities under high pressure and high temperatures. As a result, similar to other companies in the petrochemical industry, we have experienced accidents that have caused property damage and personal injuries. We have implemented strict safety measures for the operation and maintenance procedures of our production facilities. Our operational results may nevertheless be adversely affected by losses incurred by or payments required of us for which we are not fully insured. See Item 4. Information on the Company - Business Overview - Insurance.
Our business may be adversely affected if we are unable to refinance our current short-term indebtedness with an equally favorable financing arrangement.
As of December 31, 2003, we had current liabilities of approximately RMB 2,047 million, including short-term bank loans of approximately RMB 1,070 million and current portion of long-term bank loans amounting to approximately RMB 18.4 million. As of the same date, we had long-term bank loans, net of current portion, of approximately RMB 1,596 million. We have found short-term loans to be an attractive source of funding relative to long-term loans because of, among other reasons, their easy accessibility and lower cost in China. We have been able to refinance our short-term loans in the past and believe that we will be able to do so in the future. However, no assurance can be given that it will not become more difficult for us to refinance our short-term loans or that such loans will remain attractive as compared to long-term loans. In addition, if the terms of such loans become less attractive, we may not be able to replace them with more attractive long-term financing. See Item 5. Operating and Financial Review and Prospects - Liquidity and Capital Resources.
Risks Relating to China
Currently, substantially all of our assets are located in China and our revenue is primarily derived from our operations in China. Accordingly, our financial condition and results of operations are subject to a significant degree to economic, political and legal developments in China.
Political and economic policies in China could affect our business in unpredictable ways.
The economy of China differs from the economies of most countries belonging to the Organization for Economic Co-operation and Development (“OECD”) in a number of respects, including:
9
| | • | level of government involvement; |
| | • | level of capital reinvestment; |
| | • | control of foreign exchange; and |
| | • | allocation of resources. |
Before its adoption of reform and open-door policies beginning in 1978, China was primarily a planned economy. Since that time, the Chinese government has been reforming the Chinese economic system, and has also begun reforming the government structure. These reforms have resulted in significant economic growth and social progress. Although the Chinese government still owns a significant portion of the productive assets in China, economic reform policies since the late 1970s have emphasized autonomous enterprises and the utilization of market mechanisms. We currently expect that the Chinese government will continue these reforms, further reduce government intervention and rely more heavily on market mechanisms to allocate resources. Although we believe these reforms will have a positive effect on our overall and long-term development, we cannot predict whether changes to China’s political, economic and social conditions, laws, regulations and policies will have any adverse effect on our current or future business or operational results.
If the Chinese government changed the current regulations that allow us to make payments in foreign currencies, we could have trouble making our foreign exchange payments.
The Renminbi currently is not a freely convertible currency. We receive most of our revenue in Renminbi. A portion of our Renminbi revenue must be converted into other currencies to meet our foreign currency obligations. We usually have substantial requirements for foreign currency, including debt service costs on foreign currency-denominated debt and payment of any dividends declared in respect of the H shares. We estimate that debt service costs on foreign currency-denominated debt will be approximately RMB 18.4 million (US$ 2.2 million) for the fiscal year 2004.
Under the existing foreign exchange regulations in China, we may undertake current account foreign exchange transactions, including the payment of dividends, without prior approval from the State Administration of Foreign Exchange by producing commercial documents evidencing the foreign exchange transactions, provided that they are processed through Chinese banks licensed to engage in foreign exchange transactions. The Chinese government has stated publicly that it intends to make the Renminbi freely convertible in the future. However, uncertainty exists as to whether the Chinese government may restrict access to foreign currency for current account transactions if foreign currency becomes scarce in China.
Foreign exchange transactions under the capital account (international revenues and expenditures that increase or decrease debt or equity, including principal payments on foreign currency-denominated obligations) continue to be subject to limitations and require the prior approval of the State Administration of Foreign Exchange. These limitations could affect our ability to obtain foreign exchange through debt financing, or to make capital expenditures in foreign currencies.
If the Chinese government restricts our ability to make payments in foreign exchange, we could have trouble making our foreign exchange payments and could even default on our obligations. See Item 10. Addition Information - Exchange Controls.
10
Fluctuation of the Renminbi could reduce our profits or our dividends.
Although the official exchange rate for the conversion of Renminbi to US dollars has been relatively stable since 1994, we cannot assure you of its future stability. The exchange rate of the Renminbi may become volatile against the US dollar or other currencies in the future.
Substantially all of our revenues and operating expenses are denominated in Renminbi, while some of our equipment purchases and debt repayment are denominated in foreign currencies. Accordingly, any future Renminbi devaluations could increase our cost in meeting these obligations, harming our profitability. In addition, any devaluation of the Renminbi may lower the amount of dividends payable on our H shares and ADSs in foreign currency terms.
Interpretation and enforcement of Chinese laws and regulations is uncertain.
The Chinese legal system is based on statutory law. Under this system, prior court decisions may be cited as persuasive authority, but do not have the binding effect of precedents. Since 1979, the Chinese government has been developing a comprehensive system of commercial laws and considerable progress has been made in the promulgation of laws and regulations dealing with economic matters, such as corporate organization and governance, foreign investment, commerce, taxation and trade. As these laws, regulations and legal requirements are relatively new, and because of the limited volume of published case law and judicial interpretations and the non-binding nature of prior court decisions, the interpretation and enforcement of these laws, regulations and legal requirements involve greater uncertainty than expected in more developed countries.
You may not enjoy shareholders’ protections that you would be entitled to in other jurisdictions.
Chinese legal provisions for the protection of shareholders’ rights and access to information, in particular, are different and less developed than those applicable to companies formed in the United States, Hong Kong, the United Kingdom and other developed countries or regions. You may not enjoy shareholders’ protections under Chinese law that you would be entitled to in other jurisdictions.
Chinese securities laws and regulations are still at an early stage of development and may not provide the legal protections you would be entitled to in other countries.
The regulatory framework for the securities market in China is still at an early stage of development. The China Securities Regulatory Commission is responsible for drafting regulations for, administering and regulating the national securities markets. The Chinese Company Law, the rules and regulations recently promulgated thereunder and laws relating to Chinese companies whose shares are offered overseas provide, to a limited extent, a legal framework governing the corporate behavior of companies such as ours, and their directors and shareholders. The Chinese Securities Law, which became effective on July 1, 1999, is the fundamental law comprehensively regulating the securities markets in China and applies to the issuance and trading of shares, company bonds and other securities in China designated by the State Council. However, these laws, rules, regulations and measures are still at an early stage of development and may not provide investors with the same extent of protection they may expect in the developed countries and regions.
You may have to pay Chinese tax on dividends and capital gains tax in the future.
Under current Chinese tax laws, regulations and rulings, dividends we pay to holders of H shares who are foreign individuals but not residents in China or which are foreign enterprises with no permanent establishment in China are not subject to Chinese withholding tax. In addition, gains realized by individuals or enterprises upon the sale or other disposition of H shares are not currently subject to Chinese capital gains tax. We cannot assure you, however, that withholding or capital gains taxes imposed by Chinese authorities will not become applicable to such dividends or gains in the future. Holders of H shares could, in the future, become subject to a withholding tax on dividends, which is currently imposed at the rate of 20% for individual and 10% for enterprises respectively unless reduced or eliminated by an applicable taxation treaty between China and the country in which the foreign individual or enterprise resides.
11
Our articles of association require you to submit your disputes with us and other persons to arbitration. You will have no legal right to a court proceeding.
Our articles of association require a holder of H shares and ADSs having a claim against, or a dispute with, us, our directors, supervisors, executive officers or a holder of our domestic shares relating to any rights or obligations conferred or imposed by our articles of association, the Chinese Company Law or any other Chinese laws or regulations and relating to our affairs, to submit the dispute or claim to the China International Economic and Trade Arbitration Commission or to the Hong Kong International Arbitration Center for arbitration. Our articles of association further provide that the arbitrator’s award shall be final and binding on all parties.
It may be difficult to effect service of process upon us or our directors, supervisors or executive officers who live in China or to enforce against them inside China any judgments obtained from non-Chinese courts.
We are a joint stock company incorporated in China with limited liability. All of our directors, supervisors and executive officers reside in China, and our assets and the assets of those persons are located inside China. Therefore, you may not be able to effect service of process upon us or those persons outside China or to enforce against them outside China any judgments obtained from non-Chinese courts. China does not have treaties or arrangements providing for the recognition and enforcement of judgments of the courts of the United States, the United Kingdom or most other Western countries. Therefore, recognition and enforcement in China of judgments obtained in these jurisdictions may be impossible.
ITEM 4. INFORMATION ON THE COMPANY
A. History and Development of the Company
History
We were established in the People’s Republic of China as a joint stock limited company under the Chinese Company Law on April 23, 1997 as Beijing Yanhua Petrochemical Company Limited. On December 8, 2000, we changed our name to Sinopec Beijing Yanhua Petrochemical Company Limited.
We are one of the largest producers of resins and plastics in China. We are also one of the largest producers of ethylene in China. In 2003, we accounted for approximately 11.8 % of China’s total ethylene production. See B. Business Overview – Completion. We use substantially all of the ethylene we produce to manufacture a broad range of downstream petrochemical products. We are a leading producer in China of
| | • | cis-polybutadiene rubber; |
12
Our executive offices are located at No. 1 Beice, Yingfeng Erli, Yanshan, Fangshan District, Beijing 102500, PRC. Our telephone number is (86) (10) 6934-5924.
Yanshan Company, our predecessor, was established in 1967 by the China Ministry of Petroleum. In 1969, our predecessor completed the construction of three principal refining facilities. Thereafter, between 1969 and 1973, our predecessor completed more than 25 petrochemical production facilities, including a cis-polybutadiene rubber facility, the technology for which was internally developed. In 1973, with technology from ABB Lummus Global Inc. of the United States (“ABB Lummus”), our predecessor began the construction of its ethylene facility, with an annual production capacity of 300,000 tons, as well as a number of other production facilities that would utilize products from the ethylene facility as their raw materials. In 1976, the ethylene facility began operating, establishing itself as the first facility in China with annual ethylene production capacity of 300,000 tons. In 1983, our predecessor came under the control of China National Petrochemical Corporation (“China Petrochemical”).
Our predecessor replaced and modified its production facilities from time to time in order to maintain its facilities in as advanced and efficient state as possible. As a result of these improvements, current production capacities of most of our major production facilities, including the ethylene facility, exceed their original design Rated Capacities.
In 1994, our predecessor expanded the Rated Capacity of its ethylene facility to 450,000 tons with technology from ABB Lummus, constructed its HDPE facility and expanded its polypropylene facilities. The renovated ethylene facility produced approximately 473,000 tons of ethylene in 1995, exceeding the design Rated Capacity of this facility. The successful expansion of the ethylene facility enabled our predecessor to achieve a substantial increase in its sales and profitability from 1994 to 1995.
In 2001, we continued the introduction of the technology from ABB Lummus, expanded the Rated Capacity of our ethylene facilities to 710,000 tons, and constructed a new LDPE facility with an expected annual production capacity of 200,000 tons. The expanded ethylene facility produced approximately 744,000 tons of ethylene in 2002 and 722,000 tons in 2003. Both figures exceeded the design Rated Capacity of this facility. The successful re-expansion of the ethylene facility enabled us to achieve substantial increases in 2002 and 2003 over the factory’s sales and profitability figures for 2001.
In the Restructuring, our predecessor, in return for transferring its petrochemical operations to us, received 100% of the equity interest in us in the form of domestic invested shares, par value RMB 1.00 per share (each a “Domestic Share” and, collectively, the “Domestic Shares”), becoming our controlling shareholder at that time. The Restructuring was carried out in preparation of an initial public offering of our securities that was completed in June 1997.
On February 25, 2000, as part of the reorganization of the Sinopec Group, Yanshan Company transferred to Sinopec all of its ownership interest in us, represented by 2,362,000,000 Domestic Shares constituting 70% of our entire issued capital stock, making Sinopec our controlling shareholder. On October 19, 2000, Sinopec completed an initial public offering of securities which are currently traded on the New York Stock Exchange, the Hong Kong Stock Exchange, and the London Stock Exchange. On July 16, 2001, Sinopec completed a public offering of 280,000,000 “A” shares, which are currently traded on the Shanghai Stock Exchange. Sinopec Group and Sinopec have confirmed that they will treat us no less favorably than the other enterprises directly or indirectly under their respective control.
13
Principal Capital Expenditures and Divestitures
China’s rapid growth in consumption of petrochemical products, driven by the broad-based expansion of China’s consumer, industrial and transportation sectors, presents us with a number of attractive market opportunities. From 2000 to 2003, we accelerated our capital expansion program to take advantage of these opportunities and maximize our long-term earnings growth. During this period, we invested approximately RMB 4,563 million in capital expansion programs, used mainly for technical renovation for expanding the Ethylene Rated Capacity to 710,000 tons and eliminating relevant production bottlenecks. The investment made in 2003 was approximately RMB 291 million and was mainly used for technical renovation for expanding the capacity of phenol-acetone and ethylene glycol. We have targeted selected products for future expansion for which we generally believe (i) our existing market position for such products or related products is strong and will be enhanced by such an expansion, (ii) China’s consumption is growing at a rapid rate, and (iii) China’s consumption will continue to outstrip domestic production capacity for the foreseeable future. Our capital expansion plans have been formulated in concert with those of Yanshan Company, our former parent, which in 1998 completed an expansion of its crude oil refining capacity that substantially increased its ability to supply us with cracking feedstock, propylene and isobutene.
The table below sets forth selected information on our major construction and expansion projects that have been completed between 2001 and 2003. We have no such projects in progress.
| | | | | | |
Projects
| | Original
Rated Capacity
| | New/expanded
Rated Capacity
| | Construction period
|
| | | (’000 tons) | | (’000 tons) | | |
Ethylene | | 450 | | 710 | | 1998-2001/ Completed |
LDPE | | 180 | | 380 | | 1998-2001/ Completed |
Acetonitrile extraction | | 35 | | 65 | | 1998-2001/ Completed |
Benzene production | | 70 | | 100 | | 1998-2001/ Completed |
Phenol-acetone | | 180 | | 240 | | 2003 / Completed |
Ethylene and LDPE Facilities
China’s ninth five-year plan for 1996-2000 called for substantial investment in the construction or expansion of six ethylene facilities in China and targeted the total production volume of ethylene in China to reach 4.2 million tons by the end of 2000, a 75.0% increase from that in 1995. Our ethylene expansion project (the “Ethylene Project”) was one of the six projects contemplated by this ninth five-year plan. After delays caused by the State Council’s temporary suspension of all ethylene and LDPE projects in China, we began work on the Ethylene Project in 1999 and completed it in November 2001, increasing our annual ethylene production Rated Capacity to 710,000 tons from 450,000 tons. As an integral part of the Ethylene Project, our LDPE facilities were also expanded, increasing their annual Rated Capacity from 180,000 tons to 380,000 tons. The expanded LDPE facility uses the ethylene produced by the expanded ethylene facility to produce LDPE, a high value-added resin and plastic product with a broad range of applications. Although China’s annual ethylene production had reached 6.11 million tons by the end of 2003, the Chinese government anticipates a continuation of a significant shortage of ethylene in China in the near term. As of December 31, 2003, the total actual investment in the Ethylene Project was RMB 3.16 billion, including RMB 1.01 billion in self-funded investment and RMB 2.15 billion in loans.
14
Polypropylene Facility
Our polypropylene facility was completed within our Polypropylene Unit in 1998. This 200,000-ton polypropylene project, with an estimated investment of RMB 1.39 billion, has an actual investment of RMB 772 million, all of which was self-funded. With the completion of the polypropylene facility and expansion of the ethylene facility, we increased the volume and variety of our polypropylene and also improved its quality. Based on our market study, we believe that in the year 2004 China will continue to experience a shortage of polypropylene, a product with a broad range of applications. We are a leading producer of polypropylene in China, both in terms of aggregate sales and production volume. In November 2001, to accelerate the pace of our technology renovation programs and to increase the overall efficiency of our production, we sold our oldest and the first polypropylene production unit to Yanshan Company on condition that Yanshan Company would not compete with us in its business. See Item 7.B. Major Shareholders and Related Party Transactions - Related Party Transactions.
Butyl Rubber Facility
In the last quarter of 1999, we completed the construction of the butyl rubber facility and commenced commercial production at the site. Only a limited number of butyl rubber producers exist worldwide and we are the first to produce the material in China. Butyl rubber is a high-performance product sought for its air-tight sealing capacity and resistance to oxidation under high temperature. We believe we can secure a domestic market share for butyl rubber. This project, with estimated investment of RMB 1.48 billion, currently has an actual investment of RMB 950 million, of which RMB 468 million is self-funded and RMB 482 million are loans.
Phenol-acetone
From September to November of 2003, we conducted and completed the upgrade and increase of the annual production capacity of the No. 1 phenol-acetone production unit from 100,000 tons to 160,000 tons, and our production volume of phenol-acetone was accordingly increased from 180,000 tons to 240,000 tons, strengthening our position as one of the largest producers of this type of product in China. While the products of phenol and acetone are widely used in China and the demand of such products is growing year by year, there is a great shortage of such products in China. We believe that the completion of the upgrade and capacity increase of the phenol-acetone facilities will aid in further increasing our performance. This project, which had an estimated investment of RMB 150 million, had an actual investment of RMB 110 million.
Other Facilities
As part of our continuing efforts to renew and remodel all of our production facilities to improve efficiency, in 1999 we began expanding and upgrading our styrene, acetonitrile extraction and benzene production facilities, and completed construction of the acetonitrile extraction and benzene production facilities as scheduled in 2001.Expansion and renovation of our styrene production facilities were suspended after they commenced in light of the subsequent change of our focus. There is no timetable for us to resume such expansion and renovation. In addition, after completing technical renovations of our PTA and PX facilities in 1999, we also began to produce PIA and MX. We believe that continuing expansion of these facilities will allow us to produce a greater number of higher-margin products with high market demand.
These projects have been partially funded by the proceeds from our June 1997 global initial public offering and partially from bank borrowings and funds generated by our operations. We believe sufficient additional funds will be available to complete these projects from Sinopec Group and various domestic and international banks.
15
B. Business Overview
We believe that we are one of China’s most efficient petrochemical producers in terms of raw material conversion and energy utilization, based on comparative production statistics compiled by the Sinopec Group. Many of our production facilities have been built or renovated with technologies imported from overseas companies. In 2001, we completed expansion of our ethylene production capacity and have constructed and expanded selected downstream production facilities to meet the growth of demand in China for petrochemical products.
In 2003, we had sales of approximately RMB 11,473.9 million (US$ 1,386.3 million) and a net profit of approximately RMB 633.9 million (US$ 76.6 million). In 2003, 98.7% of our sales were derived from PRC domestic sales. Of our 2003 sales, 55.2% consisted of resins and plastics, 23.5% consisted of basic organic chemical products, 16.8% consisted of synthetic rubber and the remaining 4.5% consisted of other petrochemical products and sales of other goods.
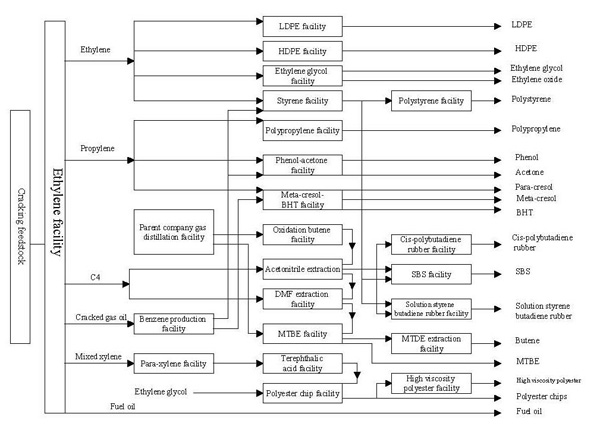
We are located in the Fangshan District, 50 kilometers southwest of downtown Beijing. Our facilities comprise five production units:
| | (i) | Chemical Works No. 1, which includes the ethylene facility, a number of facilities primarily utilizing ethylene as their raw material and other ancillary facilities; |
| | (ii) | Polypropylene Unit (formerly Chemical Works No. 2), comprising a number of facilities primarily utilizing propylene as their raw material and other ancillary facilities; |
| | (iii) | Chemical Product Unit, which includes a phenol-acetone and other ancillary facilities; |
| | (iv) | Synthetic Rubber Unit, comprising a number of synthetic rubber facilities, Butyl Rubber facilities and ancillary facilities; and |
| | (v) | Polyester Unit, which includes a number of polyester-production facilities and ancillary facilities. |
In addition, we own the Resin Application Research Unit, comprising research and development facilities, pilot facilities for developing new products and other ancillary facilities.
Our overseas listed foreign invested shares, par value RMB 1.00 per share (each an “H Share” and, collectively, the “H Shares”), are listed and traded on the Stock Exchange of Hong Kong Limited (the “Hong Kong Stock Exchange”). Our American Depositary Shares (“ADSs”), each ADS representing 50 H Shares held by the depositary, The Bank of New York (the “Depositary”), are listed and traded on the New York Stock Exchange under the symbol “BYH.” Sinopec is our controlling shareholder and holds 70.0% of our issued share capital.
Industry Background and Relevant Markets
The petrochemical industry in China is a basic industrial sector, and has been a major focus for development by the Chinese government. In 2003, the Industrial Value Added figure for China’s petrochemical industry (including petroleum processing and production of organic chemicals, resins and plastics, synthetic rubber, synthetic fibers and chemical fertilizers) amounted to approximately RMB 570.38 billion, accounting for approximately 13.9 % of China’s aggregate Industrial Value Added.
We believe that the growth of China’s economy has been the driving force for significant increase in demand for many consumer products that use our products as raw materials. In spite of this growth, per capita consumption of petrochemical products in China remains significantly lower than that in major OECD countries. We believe that as China’s economy undergoes further industrialization and its consumer markets further develop, demand for petrochemical products will continue to grow at a relatively high rate.
16
Industry Structure and Regulatory Environment
In the early 1970s, the Chinese government established a number of petroleum refining and petrochemical production and processing facilities in large complexes to permit integrated production of petroleum products, basic organic chemical products, resins and plastics, synthetic fibers and synthetic rubber. During this period, as part of the Chinese government’s policy to develop the raw material base for the petrochemical industry, the Chinese government purchased from overseas the first 300,000-ton Rated Capacity ethylene facility in China, which was installed in our Chemical Works No. 1.
Since the late 1980s, the Chinese government has implemented various economic liberalization measures which have materially affected China’s petrochemical industry in areas such as cost and allocation of raw materials, product pricing and marketing and distribution of products. Nevertheless, a portion of China’s petrochemical industry and certain of our products remain under the control of the Chinese government.
Central government agencies and their local or provincial level counterparts do not own or directly control production facilities. However, they exercise significant control over the petrochemical industry in areas such as pricing, quality standards, allocation of raw materials and selected finished products, allocation of foreign and domestic loans and allocation of Renminbi loans for capital construction projects, as well as setting national five-year state plans and ten-year development plans. We believe that China’s petrochemical industry will continue to evolve at a measured and gradual pace away from its history of state control. We expect, and are preparing for, liberalization measures to continue and a more competitive environment to develop.
China Petrochemical was established as a corporate entity by the Chinese government in 1983 and was authorized by the Chinese government to invest and hold controlling interests in a majority of the petrochemical enterprises in China. Following the Restructuring, until July 1998, Yanshan Company was a wholly-owned subsidiary of China Petrochemical.
In the first half of 1998, the Chinese government restructured and consolidated many of the then existing governmental agencies in the chemical and petrochemical industries in accordance with a plan approved by the State Council (the “Industry Restructuring”). Prior to the Industry Restructuring, various governmental agencies had responsibilities for administrative oversight of the chemical and petrochemical industries, including China’s Ministry of Chemical Industries (“MCI”), China Petrochemical, and China National Oil and Gas Corporation (“CNOGC”). Pursuant to the Industry Restructuring, the Chinese government created the State Oil and Chemical Industry Bureau (“SOCIB”) and transferred to SOCIB most of the responsibilities for national-level oversight then held by MCI, China Petrochemical and CNOGC. In July 1998, the Chinese government created from CNOGC and China Petrochemical, respectively, CNPC and the Sinopec Group, and our parent became a wholly-owned subsidiary of the Sinopec Group, a state owned entity authorized to conduct business in the petrochemical industry in the southern and eastern regions of China, including Beijing. On February 25, 2000, the Sinopec Group completed a restructuring and eventually established Sinopec, our current parent. In February 2001, SOCIB was dissolved upon the approval of the State Council and its responsibilities were transferred to the State Economic and Trade Commission (“SETC”). From February 2001 to March 2003, the SETC served as the supervising authority of China’s petrochemical and chemical industry. In March 2003, the State Council restructured certain governmental agencies. Accordingly, the State Assets Regulatory and Management Commission, the NDRC and the Ministry of Commerce each took over some of the SETC’s functions. We therefore currently are subject to industrial oversight of the three newly established governmental agencies in different spheres. Through our parent company, we are owned by the Sinopec Group.
17
Crude Oil and Cracking Feedstock
Our principal raw material, cracking feedstock, is derived from crude oil and supplied primarily by one of Sinopec’s refineries. Therefore, the supply and price of crude oil are key factors in determining the availability and pricing of cracking feedstock. The allocation and pricing of domestic onshore crude oil in China has generally been subject to state control. Prior to June 1998, the State Planning Commission established State Prices for domestic onshore crude oil which, except for some recent periods, have historically been below international market prices, and determined annual allocations of crude oil among all PRC crude oil refining enterprises. China Petrochemical then re-allocated crude oil allocated to it to enterprises under its control. In June 1998, as part of the Industry Restructuring, the Chinese government implemented a new pricing scheme to allow the prices of domestically produced crude oil to generally reflect and to fluctuate with the prevalent international market prices. In October 2001, this pricing scheme was modified to reflect a broader range of international market prices and to allow for more timely adjustments of PRC domestic prices. The Sinopec Group oversees the allocation of cracking feedstock among the enterprises under its control. Imports of cracking feedstock are subject to restrictions, including import quota controls and import/export licensing requirements. See “Raw Materials, Water and Energy Supply—Cracking Feedstock.”
Resins and Plastics
Resins and plastics have very broad applications. The level of demand in China for resins and plastics is significantly related to the development of the agricultural, industrial, construction-related and automobile industries and the consumption of consumer products such as housewares, household electric appliances, toys and packaging materials. Each of these industries utilizes specific types of resins and plastics based on the particular requirements of its products and depending on the hardness, plasticity, heat resistance, abrasion performance, elongation, cost and other characteristics of each type of resins and plastics. Beginning in 2002, resins and plastics were no longer subject to the Chinese government allocation and pricing controls in China.
Synthetic Rubber
The level of demand for synthetic rubber is significantly related to the development of the tire industry, as well as other industries such as housewares, shoes, toys and mining. Each of these industries utilizes specific types of synthetic rubber based on the particular requirements of its products and depending on the hardness, plasticity, heat resistance, abrasion performance, elongation and other characteristics of each type of synthetic rubber. Synthetic rubber in China is not subject to Chinese government allocation and pricing control.
Basic Organic Chemical Products
Ethylene is one of the most important petrochemical raw materials used in the production of downstream petrochemical products. The production of ethylene is a significant indicator of the development level of a country’s petrochemical industry. The Chinese government’s five-year plan for 2001-2005 identified ethylene as a priority product for further development and targeted annual domestic production of ethylene to increase to approximately 8.3 million tons by 2005. In 2002 and 2003, the actual PRC domestic ethylene production reached approximately 5.43 million tons and 6.11 million tons, respectively. This was achieved through development of large-scale ethylene facilities such as our Ethylene Project, completed in 2001. From 1996 through 2003, the production of ethylene derivatives, as well as co-products such as propylene, butadiene, toluene and xylene, also increased correspondingly. We use most of the ethylene we produce for the production of downstream products. From 2002, none of the ethylene produced by us was sold to third parties pursuant to Chinese government allocation and pricing controls.
18
Business Strategy
In view of the developments associated with China’s entry into the WTO, we intend to build on our position as one of the leading PRC petrochemical enterprises in order to develop our business to match the rapid rate of economic progress in China and achieve long-term earnings growth. We have refocused and adjusted our strategy along the following elements:
Expand Production Capacity
We will continue to expand our production capacity with respect to products for which we believe
| | (i) | our existing market position is strong and will be enhanced by such an expansion; |
| | (ii) | PRC consumption is growing at a rapid rate; and |
| | (iii) | PRC consumption will continue to outstrip domestic production capacity for the foreseeable future. |
In 1998, we upgraded and increased the Rated Capacity of our HDPE production facility from 140,000 tons to 160,000 tons, upgraded and increased the Rated Capacity of our ethylene glycol production facility from 60,000 tons to 80,000 tons, and upgraded and increased the Rated Capacity of our phenol-acetone production facility from 80,000 tons to 100,000 tons. Our existing SBS and solution styrene butadiene rubber production facilities were also upgraded, increasing each of their Rated Capacities from 10,000 tons to 30,000 tons. In addition, in 1998, we completed our third polypropylene facility with a Rated Capacity of 200,000 tons. In the last quarter of 1999, we completed construction of our principal butyl rubber facility with a Rated Capacity of 30,000 tons, and commenced commercial production at the site. In 2000, we accelerated the pace of our technology renovation program and completed certain technology improvement and capacity expansion projects as previously planned. This involved construction of two new cracking furnaces, each with an annual capacity of 100,000 tons, and the renovation of two existing cracking furnaces, each with a capacity of 60,000 tons. These facilities successfully began operation at the same time, laying a foundation for the completion of the Ethylene Project. To support the expansion of the production capacity of such products, in November 2001 we completed the Ethylene Project, thereby increasing our annual ethylene production from its previous Rated Capacity of 450,000 tons to 710,000 tons. In consideration of the market demand and the product economic benefits, in 2001 we turned our cresol and BHT facilities into the No.2 phenol-acetone unit, with a Rated Capacity of 80,000 tons. From September to November of 2003, we upgraded and increased the annual production capacity of the No. 1 phenol-acetone production facility from 100,000 tons to 160,000 tons, and our production volume of phenol-acetone was accordingly increased from 180,000 tons to 240,000 tons, strengthening our position as one of the largest producers of this type of product in China. We believe that the greater economies of scale achieved by completion of our capital expansion program will further strengthen our competitive position. We may also consider expansion through the acquisition of other PRC chemical enterprises should attractive opportunities arise.
Enhance Operating Efficiency
We will continue to focus on further enhancing our operating efficiency, which we believe is already one of the highest among PRC petrochemical producers in terms of raw material conversion and energy utilization. We have increased the cracking feedstock conversion rates of our ethylene facility in the past six years and continue to explore ways to improve use of feedstock and other raw materials. We have developed an ability to use vacuum gas oil (“VGO”), cracking wax oil and hydrogenated raffinate oil as alternative lower-cost cracking feedstock to light industrial oil. We have been using an increasing proportion of such alternative cracking feedstock in the past six years and intend to continue increasing its use to reduce costs in the future. We will continue to pursue measures to increase energy efficiency and equipment use. These measures include
| | (i) | importing and internally developing methods to improve production techniques, |
19
| | (ii) | upgrading certain of our cracking furnaces to permit the use of a wider variety of cracking feedstock, and |
| | (iii) | extending the period between scheduled maintenance shutdowns from the current two years to a longer period. |
Improve Product Mix
We will continue to gradually shift our product mix from general purpose petrochemicals toward more specialized products we produce. We believe that continuing to emphasize more specialized, higher margin petrochemical products will enhance our profitability and improve our competitive position. In line with this strategy, our research and development department will continue to work with our customers to develop new products and improve and customize to better meet our customers’ needs.
As part of this strategy, in 1999 we began to produce butyl rubber, MX and PIA. In the past several years, we have increased the sales of special resins and plastics, thus increasing the proportion of products with high profit margins within the resin and plastic product group. We intend to continue to target new products we believe are more technologically advanced, have more specialized applications and will carry higher profit margins than many of our current products. Our capital expansion program reflects this strategy. We have acquired the technology for such products and are considering acquisitions and strategic alliance inside and outside of China.
Strengthen Sales and Marketing Activities
As China increasingly evolves into a market driven economy, our sales and marketing efforts are focused on reinforcing our relationships with existing customers and gaining new customers. To achieve this, we intend to continue to expand our direct sales force in order to develop more direct sales to industrial customers and to reduce sales through intermediaries. In 2003, direct sales to industrial customers constituted 40.1% of our total sales. Sales to trading companies and sales made through Yanshan Company constituted 49.6% and 9.0% of our total sales, respectively. We will continue to strive to meet our customers’ needs by improving the marketing and customer support activities that we have developed over the past several years. These activities include conducting industry studies, surveys of potential applications for existing and new products and analyses of competitors’ product offerings, and expanding our after-sale customer services, including technical support and technology assistance. We are also making efforts to develop e-commerce as one of our methods to initiate sales activities. In 2003, we sold 353,300 tons of our products initiated through the Internet resulting in the revenue of approximately RMB 2.270 billion.
20
PRINCIPAL PRODUCTS
We produce over 40 types of products. Our production processes are highly integrated, and many of our products are consumed internally as feedstock for the production of our other products. The following table sets forth our principal products based on sales volume and sales in 2001, 2002 and 2003.
| | | | | | | | | | | | | | | | | | |
| | | 2001
| | 2002
| | 2003
|
Principal products
| | Sales
volume
| | Sales
| | Percentage
of sales
| | Sales
volume
| | Sales
| | Percentage
of sales
| | Sales
volume
| | Sales
| | Percentage
of sales
|
| | | (’000 tons) | | (RMB
millions) | | (%) | | (’000 tons) | | (RMB
millions) | | (%) | | (’000 tons) | | (RMB
millions) | | (%) |
| Resins and plastics | | | | | | | | | | | | | | | | | | |
LDPE | | 153.6 | | 969.4 | | 16.2 | | 413.4 | | 2,195.7 | | 23.3 | | 410.0 | | 2,658.5 | | 23.2 |
Polypropylene | | 205.2 | | 1,136.1 | | 18.8 | | 402.7 | | 2,133.0 | | 22.6 | | 366.4 | | 2,388.2 | | 20.8 |
HDPE | | 122.5 | | 719.8 | | 12.0 | | 164.4 | | 853.7 | | 9.0 | | 157.9 | | 949.2 | | 8.3 |
Polyester chips | | 38.9 | | 213.5 | | 3.6 | | 5.2 | | 31.6 | | 0.3 | | 0.3 | | 2.2 | | 0.0 |
Polystyrene | | 21.6 | | 164.4 | | 3.0 | | 51.9 | | 300.2 | | 3.2 | | 48.9 | | 334.2 | | 2.9 |
Sub-total | | 541.8 | | 3,203.2 | | 53.6 | | 1,037.6 | | 5,514.2 | | 58.4 | | 983.5 | | 6,332.3 | | 55.2 |
| Synthetic rubber | | | | | | | | | | | | | | | | | | |
Butyl rubber | | 8.2 | | 65.7 | | 1.1 | | 24.0 | | 289.2 | | 3.1 | | 29.5 | | 391.3 | | 3.4 |
Cis-polybutadiene | | 92.7 | | 529.3 | | 8.9 | | 118.0 | | 683.2 | | 7.2 | | 123.0 | | 1,028.5 | | 9.0 |
SBS | | 40.8 | | 330.5 | | 5.5 | | 60.3 | | 446.5 | | 4.7 | | 64.2 | | 504.0 | | 4.4 |
Sub-total | | 141.7 | | 925.5 | | 15.5 | | 202.3 | | 1,418.9 | | 15.0 | | 216.7 | | 1,923.8 | | 16.8 |
Basic organic chemical products | | | | | | | | | | | | | | | | | | |
Phenol | | 75.8 | | 375.6 | | 6.3 | | 120.4 | | 564.3 | | 6.0 | | 108.9 | | 712.9 | | 6.2 |
Ethylene glycol | | 50.5 | | 209.4 | | 3.5 | | 79.6 | | 301.9 | | 3.2 | | 76.8 | | 434.2 | | 3.8 |
Ethylene | | 30.7 | | 119.1 | | 2.0 | | 41.1 | | 140.7 | | 1.5 | | 51.4 | | 188.9 | | 1.6 |
Acetone | | 47.4 | | 167.8 | | 2.8 | | 73.4 | | 293.5 | | 3.1 | | 67.0 | | 347.4 | | 3.0 |
Others(1) | | N/A | | 501.3 | | 8.4 | | N/A | | 839.8 | | 8.9 | | N/A | | 1,016.6 | | 8.9 |
Sub-total | | N/A | | 1,373.2 | | 23.0 | | N/A | | 2,140.2 | | 22.7 | | N/A | | 2,700.0 | | 23.5 |
Others(1) | | N/A | | 473.4 | | 7.9 | | N/A | | 369.8 | | 3.9 | | N/A | | 517.8 | | 4.5 |
Total | | N/A | | 5,975.3 | | 100.0 | | N/A | | 9,443.1 | | 100.0 | | N/A | | 11,473.9 | | 100.0 |
| | |
| |
| |
| |
| |
| |
| |
| |
| |
|
| /(1)/ | No single chemical product in these categories comprised more than 2.0% of total sales. |
| N/A: | Information is not available. |
Product Pricing
We currently make pricing decisions for all of our products with reference to prices in the major chemical commodities markets in China. Prices for some of our products have experienced substantial fluctuations over the last few years primarily due to fluctuations in international prices for these products, especially in the Southeast Asian market. Because imports constitute a substantial portion of PRC domestic consumption for many of our principal products, prices for these products in China’s domestic markets fluctuate substantially in concert with international prices. We adjust our product prices by taking into consideration international supply conditions, international pricing, tariffs for the relevant products, imports not subject to tariffs (such as imports into special economic zones for processing into products for export) and transportation costs. Our sales and marketing department has access to domestic and international market information through our computerized data center, enabling us to closely monitor pricing developments in major international commodity markets, particularly in Southeast Asia. Due to brand recognition, reliability in supply and generally high and consistent product quality, we believe that we can implement a flexible pricing scheme for many of our products. See Item 5. Operating and Financial Review and Prospects.
21
All of our products are currently sold at prices set by the market. Until 2001, of the major products we produce, a limited amounts of ethylene was subject to a certain degree of state pricing control within a fixed range. Starting from 2002, ethylene was no longer subject to state pricing control.
Sales and Marketing
We have three principal distribution channels: (i) direct sales to large and medium-sized manufacturing enterprises, (ii) sales to large trading companies for resale, and (iii) distribution by Yanshan Company’s national sales network. In 2003, none of our principal products were subject to Chinese government allocation controls. We also export a small amount of our products. As of December 31, 2003, we had 311 employees whose primary responsibility was sales and marketing.
The following table sets out our sales through each of our distribution channels in 2003.
| | | | |
| | | 2003
|
Distribution channels
| | Sales
| | Percentage of
total sales
|
| | | (RMB millions) | | (%) |
Direct sales | | 4,601.0 | | 40.1 |
Trading companies | | 5,691.0 | | 49.6 |
Distribution through Yanshan Company’s sales network | | 1,032.7 | | 9.0 |
Sales subject to allocations | | None | | 0.0 |
Exports | | 149.2 | | 1.3 |
| | |
| |
|
Total | | 11,473.9 | | 100.0 |
| | |
| |
|
Direct sales to manufacturing enterprises accounted for approximately 40.1% of our total sales in 2003. The majority of these customers are enterprises engaged in the manufacture of a broad range of finished chemicals, plastics, fibers and synthetic rubber products. In 2003, we made direct sales to over 400 such manufacturing enterprises, of which the largest 10 customers accounted for 19.2% of 2003 total sales.
Sales to trading companies accounted for 49.6% of our 2003 sales. These customers are either large trading companies under provincial or municipal governments or small trading companies owned by individuals. Trading companies purchase our products for resale generally to medium and small-sized manufacturing companies throughout China.
Approximately 9.0% of our 2003 sales were derived from sales through Yanshan Company’s sales network. The network consists of 17 entities, seven of which are wholly-owned by Yanshan Company, seven of which are jointly owned by Yanshan Company and other companies and the remaining three of which are companies with which Yanshan Company has long-term cooperative relationships but in which Yanshan Company has no equity interests. These companies purchase our products for resale and cover 119 cities in 25 provinces. Yanshan Company plans to further expand this sales network to cover most of the major cities throughout China.
Since 2002, none of our product sales were subject to Chinese government allocation, compared with 2.5% and 2.0% of total sales in 2000 and 2001, respectively. In addition, until 1999, we had to sell a limited amount of LDPE at below market prices to customers designated by the Chinese government for production of agriculture-related products. Since the beginning of 1999, all LDPE we produce has been sold at market prices.
The credit terms we offer for major customers with well-established trading records are typically between 7 and 15 days. As of December 31, 2003, our accounts receivable and notes receivable represented in the aggregate
22
approximately 14 days of the 2003 sales, reflecting the continuing recovery of the petrochemical market. We have in place strict measures to minimize both the number and the adverse effect of doubtful accounts and write-offs on our operational results or financial condition.
In 2003, export sales accounted for 1.3% of our total sales. Export sales primarily consisted of sales of cis-polybutadiene rubber to Hong Kong, Indonesia, Malaysia, Germany and Belgium. In 2003, we conducted our export sales through China Yanshan United Foreign Trade, Ltd. (an entity in which Yanshan Company holds a 60.0% controlling interest).
Our sales and marketing department conducts routine customer visits and customer satisfaction surveys, the information from which, together with general market information, comprise our market data system. In addition, we have direct access to the Sinopec Group’s data center for domestic and international market information. Such information provides the basis for our customer relationship maintenance and new customer development. As part of our efforts to become more market-oriented, we also provide after-sale service, including technical support and technology assistance, to our customers. We believe that we have established long-term relationships with most of our large and medium-sized manufacturing enterprise customers and large trading companies. These relationships provide us with a generally dependable and stable customer base.
We are constantly seeking new customers. We hold annual trading conferences to market our products. A portion of our sales are arranged at such trading conferences pursuant to one-year sales contracts, which generally specify quantities of products to be provided but allow prices of such products to be determined from time to time according to market conditions.
In 2003, sales to our five largest customers (excluding Yanshan Company) accounted for 10.2% of our total sales. Yanshan Company and its subsidiaries accounted for 10.6% of our total sales and was our largest customer in 2003.
Domestic sales accounted for approximately 98.7% of our sales in 2003. Sales of our products are concentrated in Beijing and Hebei, Shandong, Jiangsu, Zhejiang, Henan, Shanxi, Shaanxi, Gansu and Hubei Provinces. The following table sets forth our sales by geographic region in each of 2001, 2002 and 2003:
| | | | | | | | | | | | |
| | | 2001
| | 2002
| | 2003
|
| | | Sales
| | Percentage of
total sales
| | Sales
| | Percentage of
total sales
| | Sales
| | Percentage of
total sales
|
| | | (RMB
millions) | | (%) | | (RMB
millions) | | (%) | | (RMB
millions) | | (%) |
Northeastern China(1) | | 167.3 | | 2.8 | | 160.5 | | 1.7 | | 218.0 | | 1.9 |
Northern China(2) | | 2,886.1 | | 48.3 | | 5,316.5 | | 56.3 | | 6,586.0 | | 57.4 |
Eastern China(3) | | 1,864.3 | | 31.2 | | 2,889.6 | | 30.6 | | 3,430.7 | | 29.9 |
Central-southern China(4) | | 657.3 | | 11.0 | | 47.2 | | 0.5 | | 814.6 | | 7.1 |
Southern China(5) | | 0.0 | | 0.0 | | 0.0 | | 0.0 | | 0.0 | | 0.0 |
Northwestern China(6) | | 41.8 | | 0.7 | | 198.3 | | 2.1 | | 22.9 | | 0.2 |
Southwestern China(7) | | 191.2 | | 3.2 | | 698.8 | | 7.4 | | 252.5 | | 2.2 |
Exports | | 167.3 | | 2.8 | | 132.2 | | 1.4 | | 149.2 | | 1.3 |
| | |
| |
| |
| |
| |
| |
|
Total | | 5,975.3 | | 100.0 | | 9,443.1 | | 100.0 | | 11,473.9 | | 100.0 |
| | |
| |
| |
| |
| |
| |
|
| /(1)/ | Includes Liaoning Province, Jilin Province, Heilongjiang Province. |
| /(2)/ | Includes Hebei Province, Shanxi Province, Inner Mongolia Autonomous Region, Tianjin and Beijing. |
| /(3)/ | Includes Shandong Province, Anhui Province, Jiangsu Province, Zhejiang Province, Jiangxi Province and Shanghai. |
| /(4)/ | Includes Hubei Province, Hunan Province and Henan Province. |
| /(5)/ | Includes Guangdong Province, Fujian Province, Jiangxi Province, Hainan Province and Guangxi Zhuang Autonomous Region. |
| /(6)/ | Includes Shaanxi Province, Qinghai Province, Ningxia Province, Xinjiang Province and Gansu Province. |
| /(7)/ | Includes Yunnan Province, Guizhou Province, Sichuan Province and Xizang Autonomous Region. |
23
Manufacturing and Quality Control
We continue to implement a quality assurance program in accordance with which
| | • | our research and development department uses information collected by our sales and marketing department to improve the quality of products and production processes; |
| | • | all our production units exercise strict quality control during the production process; |
| | • | our quality control unit conducts inspections of products; and |
| | • | our sales and marketing department conducts customer surveys to collect information regarding customers’ perceptions about our product quality. |
We maintain a quality control staff of over 1,200 engineers, technicians and other employees whose duty is to monitor design and production processes in order to ensure high quality. All of these personnel are subject to qualification requirements with respect to their educational background and working experience and are certified by the Sinopec Group after training and qualification tests.
We have received various awards for our product quality. For example, the quality of our cis-polybutadiene rubber has been awarded three State Excellent Product Gold Medals. We received ISO 9002 certifications for Chemical Works No. 1, the Polypropylene Unit and the Synthetic Rubber Unit in 1996, 1996 and 1997, respectively, recognizing the achievement of international quality control standards in management and manufacturing processes.
Product Transport
Our major customers are located throughout China. We principally use rail and road transport and pipelines to transport our products. While our sales policy requires our customers to pay the transportation costs for our products, timely delivery of our products is essential to our business.
In 2003, approximately 58.0% of our sales were transported by road. We own approximately 650 trucks. Our trucks are fully insured for any damages and third party liability.
Approximately 17.0% of our sales in 2003 were transported by rail. Pursuant to railway regulations, we are required to submit our estimated monthly rail transportation needs to the Beijing Railway Bureau to reserve sufficient railway capacity to transport our products. Our product transport is also subject to daily availability of adequate rail cars and rail capacity.
Currently, Yanshan Company’s railway transport unit has more than 660 rail cars, most of which are industrial chemical tank cars that can transport liquid products or raw materials, and 50.2 kilometers of railroad network connecting most of our production units and Yanshan Company. We own various storage areas and loading-unloading stations adjacent to our production units. We use Yanshan Company’s railroad and rail cars pursuant to a service agreement with Yanshan Company. To date, we have not experienced any material difficulty in transporting our products by rail.
24
Approximately 22% of our sales in 2003 were transported by pipelines. These products are in liquid form and are transported to Yanshan Company and to nearby established customers.
Production Processes
The following chart summarizes our existing production processes.
25
Our ethylene facility processes cracking feedstock into various petrochemicals, including ethylene, propylene, C4, various intermediate chemicals and by-products such as cracking oil and various types of carbon-fraction. We use most of the ethylene we produce to produce LDPE, HDPE, ethylene glycol and styrene. A portion of the styrene is further processed by our polystyrene, SBS and solution styrene butadiene rubber facilities, and the remainder of the styrene is sold to customers.
We use the propylene as a principal feedstock for the polypropylene facilities. We use the phenol-acetone facility and the meta-cresol facility to produce polypropylene, phenol, acetone, meta-cresol, para-cresol and BHT. A portion of the polypropylene is used by Yanshan Company’s chemical fiber carpet plant as the principal feedstock to produce polypropylene fiber carpets.
Our DMF extraction facility and acetonitrile extraction facility use the C4 produced by the ethylene facility to produce butadiene, 1-butene and liquified petroleum gas. The butadiene is used as a principal feedstock for our cis-polybutadiene rubber facility, polybutadiene facility and SBS facility to produce cis-polybutadiene rubber, solution styrene butadiene rubber and SBS. The 1-butene is used as feedstock by our MTBE facility to produce MTBE. The liquified petroleum gas is sold to customers.
Raw Materials, Water and Energy Supply
Cracking feedstock is our principal raw material. In 2003, the cost of cracking feedstock purchased from our parent accounted for 70.2% of our total raw material costs and 49.1% of our total sales costs. In addition to cracking feedstock, our parent also supplies us with other raw materials, including benzene, mixed-xylene, acrylonitride, 1-butene and toluene. The following table shows our raw materials, water and energy costs as percentages of total sales costs:
| | | | |
| | | Year Ended
December 31, 2003
|
| | | (RMB
millions) | | (%) |
Total cost of sales | | 9,723.6 | | 100.0 |
Cracking feedstock from our parent | | 4,769.4 | | 49.1 |
Other raw materials from our parent | | 1,057.2 | | 10.9 |
Cracking feedstock from third parties | | 206.2 | | 2.1 |
Other raw materials from third parties | | 763.0 | | 7.8 |
Water and energy | | 1,231.7 | | 12.7 |
Total raw materials, water and energy | | 8,027.5 | | 82.6 |
Cracking Feedstock
The cracking feedstock we use includes light industrial oil, naphtha, VGO, cracking wax oil and hydrogenated raffinate oil. Our primary cracking feedstock is light industrial oil. Cracking feedstock is derived from crude oil. Therefore, the supply and price of crude oil are key factors in determining the availability and pricing of the cracking feedstock we use. Prior to June 1998, the State Planning Commission determined the State Prices for light industrial oil guided by, among other factors, crude oil prices and prices of similar cracking feedstock products in the international markets. The State Planning Commission generally had no fixed schedule for adjusting the State Prices. From June 1998 to October 2001, as part of the Industry Restructuring, China implemented a different pricing scheme for oil, including crude oil, light industrial oil and naphtha. Under this pricing scheme, the State Planning Commission established, on a monthly basis, indicative State Prices for all grades of crude oil, light industrial oil and naphtha based on comparable international market prices, as set by the Singaporean market. The Sinopec Group and CNPC would then set the prices for different grades of domestic crude oil based on the relevant indicative State Prices. The prices for light industrial oil and naphtha were set by the Sinopec Group based on the indicative State Prices set by the State Planning Commission. However, in the state of
26
significant fluctuations in the international cracking feedstock prices, the State Prices may not have accurately reflected the international market prices. Consequently, there may have been periods during which we had to purchase light industrial oil or naphtha at prices that were significantly higher than the then current international market prices. In October 2001, this pricing scheme was modified to include the New York and Rotterdam refined oil markets. Since this change, the prices for refined oil have been set by the Sinopec Group and CNPC within a range of plus or minus 8% of the weighted average of the refined oil prices in New York, Rotterdam, and Singapore, and are subject to non-scheduled adjustments from time to time.
We began using VGO as a cracking feedstock in 1995. VGO is a petroleum product that has not been subject to state pricing control. We purchase all of our VGO from our parent.
Cracking wax oil and hydrogenated raffinate oil were developed by our research and development department as cracking feedstock alternatives for light industrial oil and VGO. Both materials are similar to light industrial oil in terms of production efficiency, and are produced by our parent. Neither of these alternative types of cracking feedstock is currently subject to state pricing control in China.
Light industrial oil accounted for approximately 39.6% of our total cracking feedstock consumption in 2003, an increase of 0.9% compared with 2002, with the remainder being naphtha, VGO, cracking wax oil and hydrogenated raffinate oil. In 2003, we purchased from our parent approximately 2,031,200 tons of various types of cracking feedstock. In 2003, we also purchased approximately 260,000 tons of naphtha from third parties. We keep enough cracking feedstock in our storage facilities to support 10 days of our production requirements.
The following tables set forth the average monthly State Prices for light industrial oil and naphtha from 2001 through April 2004. The prices for light industrial oil and naphtha during this period were identical:
Unit: RMB/ton, inclusive of 17% VAT
| | | | | | | | | | | | | | | | | | | | | | | | |
| | | Month
|
Year
| | 1
| | 2
| | 3
| | 4
| | 5
| | 6
| | 7
| | 8
| | 9
| | 10
| | 11
| | 12
|
2001 | | 2,430 | | 2,260 | | 2,540 | | 2,465 | | 2,520 | | 2,615 | | 2,575 | | 2,260 | | 2,190 | | 2,250 | | 1,800 | | 1,800 |
2002 | | 1,670 | | 1,795 | | 1,925 | | 2,185 | | 2,325 | | 2,325 | | 2,375 | | 2,375 | | 2,375 | | 2,575 | | 2,575 | | 2,575 |
2003 | | 2,575 | | 2,765 | | 2,765 | | 2,765 | | 2,475 | | 2,475 | | 2,475 | | 2,475 | | 2,475 | | 2,475 | | 2,475 | | 2,670 |
2004 | | 2,670 | | 2,670 | | 2,670 | | 2,670 | | | | | | | | | | | | | | | | |
In connection with the Restructuring, Yanshan Company, our controlling shareholder until February 25, 2000, had agreed to supply light industrial oil to us at State Prices. In addition, under a separate undertaking, Yanshan Company had agreed to provide substitutes to light industrial oil such as VGO, cracking wax oil and hydrogenated raffinate oil to us through 2001 at respective prices, exclusive of value added tax, of approximately RMB 220, RMB 430 and RMB 430 per ton, less than the prevailing State Prices for light industrial oil. These prices were determined with reference to market prices for similar products and costs of production. In 2000, our parent renovated its refining facilities, significantly improving the quality of cracking wax oil and hydrogenated raffinate oil it produces as a result. Subsequently, beginning 2001 our parent began to supply cracking wax oil and hydrogenated raffinate oil to us at the same price as the State Prices for light industrial oil, while continuing to supply VGO at a price approximately RMB 220 per ton (exclusive of value added tax) less than the prevailing State Prices for light industrial oil. We believe the use of improved cracking wax oil and hydrogenated raffinate oil will result in a higher conversion rate, increasing the amount of ethylene produced.
We believe that our parent has sufficient capacity to supply the amounts of cracking feedstock we currently require and will require after the completion of our current expansion plans. We have had no problems in acquiring sufficient cracking feedstock from our parent. Our parent has undertaken to give us the exclusive right of first refusal to purchase any or all of its cracking feedstock. In addition, we believe that there exist other viable alternative sources of cracking feedstock which we could and would access in the future, should any such alternative sources present better prices or quality, or if our demand exceeds the supply available from our parent. To the extent we purchase cracking feedstock from sources other than our parent, we will incur additional costs associated with transporting the cracking feedstock to us. In 2003, we purchased from third parties approximately 260,000 tons of cracking feedstock, less than 15% of the total cracking feedstock we purchased that year.
27
Other Raw Materials
The other principal raw materials we purchase from our parent include benzene, acrylonitride, mixed-xylene, 2-butene, 1-butene and toluene. Pursuant to the Restructuring, our parent has agreed to supply these raw materials to us at domestic market prices, which are adjusted by our parent from time to time to generally reflect the international market prices. This arrangement results in savings in transport costs for us due to our proximity to our parent. We have not experienced any difficulty in obtaining adequate supplies of these raw materials from our parent and we believe that there exist other viable alternative sources which we could and would access in the future, should any such alternative sources present better prices or quality, or if our demand exceeds the supply available from our parent.
The other principal raw materials which we purchase from third parties are benzene, toluene, butadiene, C4 and terephthalic acid. We have experienced no material disruption in the supply of these raw materials, and we believe that we will be able to obtain an adequate supply to meet our needs in the foreseeable future. In general, we transport these raw materials by rail or by road, and we store amounts sufficient to support 15 to 40 days of our production requirements.
Electricity, Steam and Water
Electricity is our main source of energy. We purchase electricity through Yanshan Company from China’s northern power grid. Our cost of electricity represents our share of the overall cost to us and Yanshan Company, after netting out the revenue generated from Yanshan Company’s sales to the grid of electricity it generates. In general, the price of electricity in China is set by the Chinese government. We have experienced no material disruption in electricity supply in recent years.
We produce approximately 70.0% of our steam requirements internally and purchase the remaining steam requirements from Yanshan Company. We have experienced no material disruption in water supply.
Trademark
Yanshan Company has agreed to our use of its registered trademark “yansan”. The detailed terms and conditions of this licensing arrangement are currently under discussion with Yanshan Company.
Competition
Since substantially all of our sales in 2003 were derived from domestic sales, our competition is mainly in the domestic market. We are a major competitor in every sector of the domestic market in which we operate. We believe that our primary competitive advantages are product quality, relatively low costs of production, brand recognition and location.
Prior to 1993, because distribution and pricing of our principal products were determined in accordance with the State Plan, our predecessor was generally not operating in a competitive environment. With the liberalization of control over pricing and product allocation by the Chinese government, competition in the domestic market continues to increase and is expected to intensify.
28
The following table summarizes the competitive position of our principal products in China’s domestic market in 2003:
| | | | | | |
| Principal products | | Our company’s share
of domestic
consumption (%)
| | Our company’s competitive ranking
in the PRC
| | Imports’ share of domestic
consumption(1) (%)
|
| Resins and plastics | | | | | | |
LDPE | | 11.9 | | 1 | | 71.7 |
HDPE | | 4.1 | | 3 | | 57.1 |
Polypropylene | | 5.1 | | 2 | | 38.3 |
Polystyrene | | 1.9 | | 8 | | 60.5 |
| | | |
| Synthetic rubber | | | | | | |
Cis-Polybutadiene | | 29.8 | | 1 | | 17.3 |
SBS | | 19.5 | | 2 | | 22.8 |
| | | |
| Basic organic chemical products | | | | | | |
Ethylene(2) | | 11.8 | | 2 | | 0.76 |
Phenol | | 17.9 | | 1 | | 52.9 |
Acetone | | 17.3 | | 1 | | 53.7 |
Ethylene glycol | | 2.2 | | 5 | | 72.2 |
| Sources: | The Year 2003 PRC Petrochemical Industry Statistical Annual Report (Sinopec Group) (2004), Petrochemical Statistic and Information (2004), Petrochemical Statistical Materials (2004), Petrochemical Products Import and Export Information (2004) |
| /(1)/ | Domestic consumption is based on the total production volume of the major PRC producers of the respective products plus imports and minus exports and increases in inventory (or plus decreases in inventory). |
| /(2)/ | Includes products sold to third party customers and used for internal consumption. Most producers of ethylene use ethylene as a raw material to produce other basic organic chemical products. |
In 2003, we ranked first in China in terms of aggregate sales volume of resins and plastics. In aggregate, sales of our resins and plastics accounted for approximately 5.8% of the total estimated PRC consumption of these products in 2003 with imports accounting for approximately 52.7%.
We were the largest PRC producer of cis-polybutadiene rubber and the second largest PRC SBS producer in 2003. The aggregate sales volume of our synthetic rubber accounted for approximately 25.3% of the total estimated PRC domestic synthetic rubber consumption in 2003. Our cis-polybutadiene rubber has been awarded three State Excellent Product Gold Medals for its quality.
We are one of the largest producers of basic organic chemical products in China. In 2003, the sales volume of our basic organic chemical products accounted for approximately 5.6% of the total PRC consumption of basic organic chemical products. We are one of the largest producers of ethylene in China, accounting for approximately 11.8% of China’s total ethylene production in 2003. We also ranked first in China in 2003 in terms of sales volumes of phenol and acetone.
29
China’s Accession to the WTO and Foreign Competition
China’s entry into the WTO on December 11, 2001 has and will continue to have a significant effect on the PRC petroleum and petrochemical industries. As part of its membership, China has committed to eliminate some tariff and non-tariff barriers to foreign competition in the domestic petrochemical industry that benefited us in the past. In particular, China has committed to:
| | • | permit increasing levels of foreign investment in the domestic petrochemical industry, allowing foreign investors to own up to 100% of a domestic petrochemical company by December 11, 2004, and allowing them to engage in the distribution of imported and domestically produced petrochemical products (including ownership of sales networks, distribution channels and storage facilities) by the same date; |
| | • | gradually eliminate import non-tariff barriers such as quotas based on amount and source; |
| | • | reduce tariffs on imported crude oil from 9% to 5% and reduce tariffs on various petrochemical products; |
| | • | gradually relax restrictions on the import of crude and refined oil by non-state companies; |
| | • | grant foreign-invested companies the right to import petrochemical products; and |
| | • | permit foreign companies to engage in wholesale distribution of crude oil, refined oil and chemical fertilizers and remove all restrictions on retail operations by December 11, 2006. |
As a result of these measures, we will likely face increased competition from foreign companies and imports in the near future and longer term. However, by refocusing and adjusting our business strategy, we believe we will be able to meet the challenges posed by China’s membership in the WTO and that our products will continue to be competitive with imported products.
We believe the general reduction of tariffs on petrochemical products that compete with our products will have a limited impact on our competitive position in the PRC market. In anticipation of its impending entry into the WTO, the Chinese government took early steps to reduce protection from import barriers. Tariffs have been gradually reduced beginning in 1997. Tariffs on petrochemical products which compete with our products ranged from 5.0% to 16% before China’s WTO entry and have now been reduced to 4% to 14.2% with further reductions planned until they reach 2% to 6.5%. Tariffs for synthetic rubber and carbamide will generally remain the same. Although tariffs for synthetic resin will decrease to approximately 6.5% from 16%, because most foreign-originated synthetic resins are currently imported in the form of raw materials that are processed in China into the final products, thus avoiding the relatively high existing tariffs on such goods, domestically-produced synthetic resin has already been competing against its imported counterpart that to a large extent already enjoys post-WTO “lower tariffs” rates. These realities and the early tariff reductions taken by the Chinese government have exposed us to international competition early and should help us meet increased competition as China’s WTO entry begins to affect our markets. In addition, we believe the Chinese government will continue its efforts to curb illegal imports, improve supervision of import of materials for processing, and implement anti-dumping measures against foreign competitors. Nevertheless, lower tariffs on foreign imports are likely to reduce the prices for domestic petrochemical products and may reduce our net sales.
In addition to tariff reductions, China will liberalize the import of crude oil and the distribution of refined oil and other petrochemical products. Import and export of crude oil has historically been limited to designated state-owned companies. China has agreed to allocate 7.2 million tons of crude oil to non-state traders in 2002 and to increase this amount by 15% each year for 10 years, at which time the growth rate will be reviewed by interested WTO member countries. Similarly, several categories of refined oil are also subject to state trading. China will allocate 4 million tons of refined oils to non-state traders and increase this amount by 15% annually for 10 years. Review of this amount by member countries will occur in 2004. In concurrent commitments, China has agreed that minority foreign-owned enterprises would receive trading rights by December 11, 2002, majority foreign-owned enterprises would receive trading rights by December 11, 2003 and wholly foreign-owned enterprises would receive trading rights by December 11, 2004. These changes could, in the long-term, open up alternative sources of cracking feedstock that are not available to us today. They will also, no doubt, create additional foreign investment in China’s petrochemical industry and additional competition for us. In this respect, we will also benefit from a tariff reduction on crude oil which will be eliminated by December 11, 2006.
30
Insurance
We currently maintain insurance coverage on our properties, facilities and inventory with Sinopec Group. The amount of coverage is determined on the basis of the book value of the covered assets. This insurance coverage is compulsory and applies to all enterprises controlled by the Sinopec Group, including us, pursuant to group guidelines, which were approved by the State Council. In accordance with standard practices for the entities controlled by the Sinopec Group, the amount of our insurance coverage is less than the replacement cost of the covered properties, facilities and inventory.
Consistent with what we believe to be the customary practice among PRC enterprises, we do not currently carry any third party liability insurance to cover claims in respect of personal injury, property or environmental damage arising from accidents on our property or relating to our operations other than third party liability insurance with respect to certain trucks and other vehicles. We also do not carry business interruption insurance, as such coverage is not customary in China. No assurance can be given that any losses incurred or payments required of us for which we are not fully insured will not have a material adverse effect on our financial condition.
C. Organizational Structure
Sinopec
We are a member of a group (defined as a parent and all its subsidiaries) for purposes of the disclosure rules of the Securities and Exchange Commission. The parent company of this group is Sinopec, our controlling shareholder. Sinopec is operated by separate management and, except for exercising its rights as a shareholder, has generally not sought to control or influence our day to day management or operations. We have extracted the following information regarding Sinopec primarily from its public filings.
Overview
Sinopec is an integrated energy and chemical company with upstream, midstream and downstream operations, and, based on the turnover in 2003, is the largest listed company in China and one of the largest petroleum and petrochemical companies in China and in Asia. Sinopec is a producer and distributor of gasoline, diesel, jet fuel and other major refined oil products in China and Asia. Sinopec is also the second largest producer of crude oil and natural gas in China.
31
Subsidiaries
Details of Sinopec’s principal subsidiaries are given in the table below. Except for Sinopec Kantons Holdings Limited, which is incorporated in Bermuda, all of the above principal subsidiaries are incorporated in China.
| | | | |
Name of company
| | Sinopec’s
attributable
equity interest %
| | Principal activities
|
Sinopec Beijing Yanhua Petrochemical Company Limited | | 70.01 | | Manufacturing of chemical products |
Sinopec Sales Company Limited | | 100.00 | | Marketing and distribution of refined petroleum products |
Sinopec Shengli Oilfield Company Limited | | 100.00 | | Exploration and production of crude oil and natural gas |
Sinopec Fujian Petrochemical Company Limited | | 50.00 | | Manufacturing of plastics, intermediate petrochemical products and petroleum products |
Sinopec Maoming Refining and Chemical Company Limited | | 99.81 | | Manufacturing of intermediate petrochemical products and petroleum products |
Sinopec Qilu Petrochemical Company Limited | | 82.05 | | Manufacturing of intermediate petrochemical products and petroleum products |
Sinopec Shanghai Petrochemical Company Limited | | 55.56 | | Manufacturing of synthetic fibres, resin and plastics, intermediate petrochemical products and petroleum products |
Sinopec Shijiazhuang Refining Chemical Company Limited | | 79.73 | | Manufacturing of intermediate petrochemical products and petroleum products |
Sinopec Kantons Holdings Limited | | 72.40 | | Trading of crude oil and petroleum products |
Sinopec Wuhan Petroleum Group Company Limited | | 46.25 | | Marketing and distribution of refined petroleum products |
Sinopec Wuhan Phoenix Company Limited | | 40.72 | | Manufacturing of petrochemical products and petroleum products |
Sinopec Yangzi Petrochemical Company Limited | | 84.98 | | Manufacturing of intermediate petrochemical products and petroleum products |
Sinopec Yizheng Chemical Fibre Company Limited | | 42.00 | | Production and sale of polyester chips and polyester fibres |
Sinopec Zhenhai Refining and Chemical Company Limited | | 71.32 | | Manufacturing of intermediate petrochemical products and petroleum products |
Sinopec Zhongyuan Petroleum Company Limited | | 70.85 | | Exploration and production of crude oil and natural gas |
China Petrochemical International Company Limited | | 100.00 | | Trading of crude oil and petrochemical products |
D. Property, Plants and Equipment
Material Tangible Fixed Assets
Our corporate headquarters and production and ancillary facilities occupy an area of approximately 50 square kilometers (approximately 3.8 square kilometers of which are covered by land use rights we hold) in Fangshan District in Beijing. The total gross floor area of our production and other facilities is approximately 632,830 square meters. We own all of the buildings and facilities on our premises. The land use rights for the land upon which our buildings and facilities are located have terms of 50 years for the land used for industrial purposes and 70 years for the land used for residential purposes. Such terms commenced in April 1997. The land grant contracts and related land use rights transferred to us do not contain any material restrictions except those relating to use for commercial or residential purposes and, accordingly, we may expand our current facilities or construct new facilities, subject to such zoning restrictions. The land use rights are freely transferable to all enterprises under the control of the Sinopec Group. Pursuant to relevant governmental approvals, the land grant contract between Yanshan Company and the relevant land administrative bureau and the land use rights transfer contracts between Yanshan Company and us, we may transfer such land use rights to parties other than enterprises under the control of the Sinopec Group only if (i) approval for such a transfer has been obtained from the State Land Bureau and (ii) we have paid to the Chinese government a land grant fee, if such a land grant fee is required, at the time of the transfer. Yanshan Company has undertaken to pay any such a land grant fee required in connection with a proposed transfer of land use rights by us.
32
Principal Production Facilities
The following table sets out our principal production facilities, including their original design Rated Capacity, actual production volume in 2003 and the sources of their technologies:
| | | | | | |
Facility(1)
| | Rated
Capacity
(‘000 tons)
| | Production
volume in 2003
(‘000 tons)
| | Source of technology
|
Chemical Works No.1 | | | | | | |
Ethylene | | 710 | | 722 | | ABB Lummus Global Inc. (USA) |
LDPE No. 1 | | 180 | | 204 | | Sumitomo Chemical Co., Ltd (Japan) |
LDPE No. 2 | | 200 | | 205 | | |
HDPE | | 140 | | 158 | | PRC |
Ethylene glycol | | 80 | | 76 | | Scientific Design Co., Inc (USA) |
Styrene | | 84 | | 81 | | ABB Lummus Global Inc./Monsanto (USA) |
Polystyrene | | 50 | | 49 | | The Dow Chemical Company (USA) |
Benzene production | | 110 | | 113 | | Air Products and Chemicals Inc. (USA) |
Meta-xylene(3) | | 35 | | 17 | | UOP (USA) |
| | | |
Polypropylene Unit | | | | | | |
First polypropylene(2) | | 115 | | 104 | | Mitsui Petrochemical Industries Ltd (Japan) |
Second polypropylene | | 40 | | 53 | | PRC |
Third polypropylene | | 200 | | 212 | | Amoco Corporation (USA) |
| | | |
Chemical Products Unit | | | | | | |
Phenol-acetone No. 1 | | 160 | | 87 | | Mitsui Petrochemical Industries Ltd (Japan) |
Phenol-acetone No. 2 | | 80 | | 88 | | PRC |
| | | |
Synthetic Rubber Unit | | | | | | |
DMF extraction | | 53 | | 71 | | Japanese Zeon Co., Ltd (Japan) |
Acetonitrile extraction | | 65 | | 56 | | PRC |
Cis-polybutadiene | | | | | | |
rubber polymerization | | 80 | | 122 | | PRC |
SBS | | 60 | | 62 | | PRC |
MTBE | | 150 | | 86 | | PRC |
Butyl Rubber | | 30 | | 27 | | PRC |
| | | |
Polyester Unit | | | | | | |
Isophthalic acid(3) | | 25 | | 16 | | PRC |
| /(1)/ | In order to make the production process more efficient and maximize facility utilization, in July 2000 we changed the names of Chemical Works No.2, Chemical Works No.3, Synthetic Rubber Plant and Polyester Plant to the current ones, i.e., Polypropylene Unit, Chemical Products Unit, Synthetic Rubber Unit and Polyester Unit, respectively. We also moved our phenol-acetone facility from the Polypropylene Unit to Chemical Products Unit. |
33
| /(2)/ | This unit was transferred by us to Yanshan Company on November 30, 2001. For details, please see Item 7. Major Shareholders and Related Party Transactions - Related Party Transaction. |
| /(3)/ | The original Para-xylene facilities began producing meta-xylene after renovation in 2000 with an expected annual production capacity of 35,000 tons. The original Terephthalic acid facilities began producing isophthalic acid in 2000 after renovation with an expected annual production capacity of 25,000 tons. The original two products are no longer in production. |
We have replaced production equipment and modified production facilities from time to time in order to maintain them in as advanced and efficient state as possible. In addition, we have carried out technological improvements to extend the continuous operational time of production facilities beyond the original design. As a result, production in most of our production facilities, including the ethylene facility, has exceeded original design Rated Capacities. In conjunction with the expansion of the ethylene facility to increase our Rated Capacity from 300,000 tons per year to 450,000 tons per year in 1994, we constructed a second polypropylene facility and a HDPE facility to process the additional propylene and ethylene, respectively, produced by the ethylene facility. In 1998, we completed upgrading some of our existing production facilities. As a result, the Rated Capacities of HDPE, ethylene glycol and phenol-acetone production facilities increased from 140,000 tons, 60,000 tons and 80,000 tons, respectively, to 160,000 tons, 80,000 tons and 100,000 tons. The Rated Capacities of each of SBS and solution styrene butadiene rubber production facilities increased from 10,000 tons to 30,000 tons. In 1998, we also completed the construction of a third polypropylene facility with a Rated Capacity of 200,000 tons. In 1999, we completed construction of our butyl rubber facilities with a rated capacity of 30,000 tons, becoming the first producer of butyl rubber in China. In 2000, we accelerated the pace of our technology renovation program and completed certain technology improvement and capacity expansion projects as previously planned. This involved construction of two new cracking furnaces, each with an annual capacity of 100,000 tons, and the renovation of two existing cracking furnaces, each with a capacity of 60,000 tons. These facilities successfully began operation at the same time, laying a foundation for the completion of the Ethylene Project. In addition, in 1999 we received approvals from the Chinese government for our ethylene expansion project and completed the project as planned in 2001. The completion of this project increased our annual ethylene production capacity from 450,000 tons to 710,000 tons and increased our annual LDPE production capacity from 180,000 tons to 380,000 tons. We are a leading producer of polypropylene in China, both in terms of aggregate sales and production volume. In November 2001, to accelerate the pace of our technology renovation programs and to increase the overall efficiency of our production, we sold our oldest and the first polypropylene production unit to Yanshan Company on condition that Yanshan Company would not compete with us in its business. In 2001, we, in consideration of the market demand and the product economic performance, turned our cresol and BHT facilities into Phenol-acetone No.2 unit, with the Rated Capacity of 80,000 tons. From September to November of 2003, we upgraded and increased the annual production capacity of Phenol-acetone No. 1 unit from 100,000 tons to 160,000 tons. Our production capacity of phenol and acetone has reached to 240,000 tons, which further strengthened our position as one of the largest producers of such kind of products in China. See Item 7.B. Major Shareholders and Related Party Transactions - Related Party Transactions.
In general, we believe that our principal production facilities are more technologically advanced than similar facilities of other companies in China. We developed many of our facilities, including the SBS facility, MTBE facility and facilities relating to the production of cis-polybutadiene rubber, with proprietary technologies. We further believe that, on the whole, our current and future production facilities are adequate for conducting our current and planned future business. See Item 4. Information on Company - Principal Capital Expenditures and Divestitures.
34
Environmental Protection
We are subject both to PRC national and local environmental protection regulations which currently impose a graduated schedule of fees for the discharge of waste substances, require the payment of fees for pollution and provide for closure of any facility which fails to comply with orders requiring it to cease or rectify certain behavior causing environmental damage.
Utilizing our own and Yanshan Company’s environmental protection units, we have established a system to treat waste water and materials in order to prevent pollution of the environment. Yanshan Company’s environmental protection units consist of an environmental compliance division and a number of facilities to treat wastewater, solid waste and waste gas. We use the wastewater treatment facilities that are part of our production facilities to conduct preliminary water treatment. Thereafter, the wastewater is sent to Yanshan Company’s waste water treatment plant for further treatment. The treated water is stored in Yanshan Company’s reservoir for further biochemical treatment. Yanshan Company charges us treatment fees based on the quantity and pollution content of the wastewater. We believe that the wastewater treatment facilities in our production plants have adequate capacity to conduct preliminary water treatment, and that Yanshan Company’s water treatment plant has sufficient capacity to treat all wastewater generated by us and Yanshan Company. All solid waste materials are either buried in a sealed disposal site or burned in a furnace, both of which are operated by Yanshan Company. We believe that the disposal site and the waste burning furnace comply with both the national and local environmental laws regarding the discharge or disposal of solid waste. However, there can be no assurance that national or local authorities will not impose additional regulations which would require additional expenditures on environmental matters in the future.
In 2001, 2002 and 2003, our environmental protection related expenses amounted to approximately RMB 52.34 million, RMB 44.62 million and RMB 50.39 million respectively, which expenses included equipment operating expenses and treatment fees paid to Yanshan Company and the Chinese government.
We believe that our environmental protection facilities and systems are adequate for us to comply with the existing national and local environmental protection regulations. However, there can be no assurance that China national or local authorities will not impose additional or more stringent regulations which would require additional expenditures on environmental matters or changes in our processes or systems.
Maintenance
The maintenance of our production facilities follows a scheduled maintenance program, which comprises routine daily, monthly and annual inspections and maintenance and, historically, a one-month major overhaul shutdown every two years. We had a major overhaul shutdown in 2000 and 2001 during which certain works were done in connection with the expansion of our ethylene facility. Our last major shutdown was in 2003 and lasted for approximately 30 days. It primarily served the purpose of eliminating certain technological bottlenecks in the ethylene unit relating to the upgrade and expansion of the ethylene facilities. We believe that shutdowns are necessary in order to maximize facility utilization rates, to increase production and to reduce costs. However, we expect that we will be able to reduce the frequency of major overhaul shutdowns through a combination of an improved maintenance program and new production processes. Each of our operating units has a designated maintenance team responsible for day-to-day maintenance and repair, and we retain Yanshan Company to conduct certain maintenance work, including major overhauls. Our next scheduled major shutdown is in 2005 and is expected to last 30 days.
35
ITEM 5. OPERATING AND FINANCIAL REVIEW AND PROSPECTS
General
This discussion should be read in conjunction with the information contained in Item 18. Financial Statements. For numerous reasons, including those relating to our combined offering of the H Shares and ADSs completed in June 1997 (the “Combined Offering”), the economic reform programs of the Chinese government, changes in Chinese government policies concerning crude oil supply and pricing, the introduction of new taxes or changes in existing taxes such as consumption tax, income tax and value added tax, and the revaluation of our assets, the Financial Statements may not be indicative of our future financial results.
Critical Accounting Policies
The following discussion and analysis is based on our financial statements, which have been prepared in accordance with IFRS. IFRS varies in certain material respects from accounting principles generally accepted in the United States of America. We have summarized these differences and their effect on our stockholders’ equity as of December 31, 2002 and 2003 and the results of our operations for each of the years in the three-year period ended December 31, 2003, in Note 27 to the financial statements. Our accounting policies are set out on pages F-8 to F-14 of our financial statements.
The preparation of financial statements in conformity with IFRS requires management to make estimates and assumptions that affect the reported amounts of assets and liabilities and disclosure of contingent assets and liabilities at the date of the financial statements and revenues and expenses during the years reported. We based our estimates on historical experience and on various other assumptions that are believed to be reasonable under the circumstances, the results of whom form the basis for making judgments about the carrying amounts of assets and liabilities that are not readily apparent from other sources. On an on-going basis, management evaluates its estimates. Actual results may differ from those estimates under different assumptions and conditions.
The fundamental objective of financial reporting is to provide useful information that allows a reader to comprehend our business activities. To aid in that understanding, our management has identified “critical accounting policies”. These policies have the potential to have a more significant impact on our financial statements, either because of the significance of the financial statement item to which they relate, or because they require judgment and estimation due to the uncertainty involved in measuring, at a specific point in time, events which are continuous in nature.
These critical accounting policies include:
Impairments
If circumstances indicate that the net book value of an asset may not be recoverable, this asset may be considered “impaired”, and an impairment loss may be recognized in accordance with IAS 36 “Impairment of Assets”. The carrying amounts of long-lived assets are reviewed periodically in order to assess whether the recoverable amounts have declined below the carrying amounts. These assets are tested for impairment whenever events or changes in circumstances indicate that their recorded carrying amounts may not be recoverable. When such a decline has occurred, the carrying amount is reduced to recoverable amount. The amount of impairment loss is the difference between the carrying amount of the asset and its recoverable amount. The recoverable amount is the greater of the net selling price and the value in use. It is difficult to precisely estimate selling price because quoted market prices for our assets are not readily available. In determining the value in use, expected cash flows generated by the asset are discounted to their present value, which requires significant judgment in relation to sales volume, selling price and amount of operating costs.
36
For the periods presented, no impairment loss was recognized or reversed in the statements of operations.
Depreciation
Property, plant and equipment are depreciated on a straight-line basis over the estimated useful lives of the assets disclosed in Note 2(c)(iii) to the financial statements, after taking into account their estimated residual value. We review the estimated useful lives of the assets regularly in order to determine the amount of depreciation expense to be recorded during any reporting period. The useful lives are estimated at the time the asset is acquired and are based on our historical experience with similar assets and taking into account anticipated technological changes. The depreciation expense for future periods is adjusted if there are significant changes from previous estimates.
Revaluation
As required by the relevant PRC rules and regulations, our property, plant and equipment were revalued in connection with our Restructuring. Subsequent to that revaluation, property, plant and equipment are carried at the revalued amount, being the fair value as at the date of the revaluation, less subsequent accumulated depreciation and impairment losses. Revaluations are performed periodically to ensure that the carrying amount does not differ materially from that which would be determined using fair value at the balance sheet date. The results of subsequent revaluations may have an impact on our future results to the extent the fair values of our property, plant and equipment change significantly.
Provision for Doubtful Debts
We maintain an allowance for doubtful accounts for estimated losses resulting from the failure of our customers to make the required payments. We base our estimates on the aging of our accounts receivable balance, customer credit-worthiness, and historical write-off experience.
Changes in provision for doubtful debts for each of the years in the three-year period ended December 31, 2003 are summarized as follows:
| | | | | | | | | |
| | | Years ended December 31,
| |
| | | 2001
| | | 2002
| | | 2003
| |
| | | RMB | | | RMB | | | RMB | |
At beginning of year | | 149,571 | | | 188,071 | | | 158,962 | |
Provision for the year | | 46,146 | | | 25,077 | | | 72,024 | |
Written-off/back | | (7,646 | ) | | (54,186 | ) | | (30,886 | ) |
| | |
|
| |
|
| |
|
|
At end of year | | 188,071 | | | 158,962 | | | 200,100 | |
| | |
|
| |
|
| |
|
|
If the financial condition of our customers were to deteriorate, actual write-offs might be higher than expected.
37
Overview of Our Operations
We are one of the largest producers of resins and plastics in China. The vast majority of our products fall within three principal product groups: (i) resins and plastics, (ii) synthetic rubber, and (iii) basic organic chemical products. We are also one of the largest producers of ethylene in China, accounting for approximately 11.8% of China’s total ethylene production in 2003. We use substantially all of the ethylene we produce to manufacture a broad range of downstream petrochemical products. We are a leading producer in China of LDPE, cis-polybutadiene rubber, butyl rubber, phenol, acetone, SBS and polypropylene.
Our principal raw material is cracking feedstock, mainly light industrial oil substantially all of which is purchased from our parent. Through a process which we developed, we also use naphtha, VGO, cracking wax oil, and hydrogenated raffinate oil as a substitute for light industrial oil. Since the establishment of the Sinopec Group in 1998, prices of light industrial oil and naphtha have been determined jointly by the NDRC of the PRC and the Sinopec Group. In 2003, the average State Prices of light industrial oil fluctuated in line with crude oil price and increased by 14.0% over the 2002 average State Prices. This increase has put pressure on our margin. See Item 4, Information on Company - Business Overview - Raw Materials, Water and Energy Supply - Cracking Feedstock.
Due to the fact that costs of raw materials are effectively beyond our control, we generally seek to increase profits by a combination of increased production volume, more efficient use of raw materials through more efficient procedures and technologies, shifting production into higher margin products, strengthening marketing efforts, and, in particular minimizing the lag between changes in customer demand and changes in our production. In 2003, we were able to turn the Severe Acute Respiratory Syndrome (“SARS”) epidemic to our advantage by completing a plant overhaul during the ensuing one-month shutdown. The shutdown did reduce production during 2003, but the overhaul eliminated production bottlenecks and resulted in increased production capacity without major capital investment. These factors, together with strong price increase for our products, more than offset the rise in raw material prices, and resulted in positive results for 2003.
In 2003, in spite of the influence of the war between the United States and Iraq and the SARS outbreak in China, China’s economy continued to grow at a high speed and the demand for petrochemicals remained strong. As a result of China’s accession to the WTO in December 2001, the cost for foreign enterprises to export petrochemicals into China has been reduced. China’s accession to the WTO has also had a significant impact on Chinese enterprises in terms of management mechanisms, as more foreign capital enters the Chinese market. Facing intensified market challenges, through calm observation and conscientious thinking, and adherence to the development path of “low input, high output”, we were able to cope with the situation, seize market opportunities, follow the established development strategies and accomplish the following tasks, and therefore significantly increased our results for the reporting period:
| | 1) | Vigorously carry out technical improvements and advancements to maintain the sustainable development of the enterprise. In June 2003, we initiated a one-month shutdown and overhaul of operations at the tail-end of the SARS outbreak in Beijing and further eliminated certain technological bottlenecks in the ethylene units via a technological upgrade of our ethylene units, which enable us to fully utilize the advantages gained from the increased production capacity and ensure that we would operate according to the business concept of “not for the largest, but for the best”. This business concept maintains sustainable development by increasing product quality as well as reducing consumption of materials and energy. Even with the one-month shutdown, our ethylene output in 2003 reached 722,000 tons, which exceeded the planned amount, and ensure our sustainable growth for the period. |
38
| | 2) | Enhance our core competence through further stripping of our non-core businesses. In 2003, we gave more prominence to our core businesses and increased the efficient use of our core assets by further stripping away our non-core businesses by transferring a couple of cafeterias and certain small chemical production facilities to certain third party entities, thereby enhancing our core competence. |
| | 3) | Increase production of products with high added value by adopting a market orientated approach. In 2003, through close cooperation between all of our departments, we continued to adjust our product mix to improve and strengthen our profitability. Based on the thorough market research that we conducted, we engaged in efforts to develop special-purpose materials with high market demand, high added value, and a domestic supply of which relies mainly on imports. As a result of these efforts, we further increased the sales proportion of special-purpose materials used for producing synthetic resin. |
| | 4) | Adhere to the policy of integrating supply, production, sales and research, and further improve our sales and marketing activities. In 2003, we continued to strengthen our sales and marketing activities based on our prior experiences, and further harmonized the operations of the supply, production, sales and research departments. Through close cooperation between those various departments, we adjusted our production plans in a timely manner in order to meet market changes and the different needs of customers and were rated as an enterprise “to the satisfaction of users throughout China” by the All China Users Committee of the China Quality Association. We also reinforced our efforts in conducting market analysis and improving our ability to meet market changes in order to avoid market risks and enhance economic efficiency by continuing to adopt the sales strategy of “follow the market, maintain a stable production-sales ratio, and obtain the highest sales price”, thus guaranteeing an increase in the economic benefits to us. |
Looking forward to 2004, since the international economic situation has had further improvements recently, the Board of Directors believes that internationalization will be an increasingly common phenomenon in the domestic market of China as a result of China’s accession to the WTO. The establishment and commencement of production of a number of joint venture petrochemical enterprises in China will not only intensify market competition, but will also exert significant influence on the production and operations of the petrochemical industry in China. Nevertheless, the Board of Directors is confident that the momentum of the continuous growth of China’s economy will further stimulate the increase in demand for petrochemical products. We plan to closely monitor the market’s development, seize market opportunities, make use of the advantages gained in the completion of the technology upgrading program, and further improve our operating results through continuous implementation of our development strategies. See Item 4. Information on Company - Business Overview - Business Strategy.
39
A. Operating Results
Overview
The following table sets forth our sales, net of value added tax, by principal product groups for the periods indicated.
| | | | | | | | | | | | |
| | | Year ended December 31
|
| | | 2001
| | 2002
| | 2003
|
| | | Net sales
| | % of
net sales
| | Net sales
| | % of
net sales
| | Net sales
| | % of
net sales
|
| | | (RMB
millions) | | (%) | | (RMB
millions) | | (%) | | (RMB
millions) | | (%) |
Resins and plastics | | 3,203.2 | | 53.6 | | 5,514.2 | | 58.4 | | 6,332.3 | | 55.2 |
Synthetic rubber | | 925.5 | | 15.5 | | 1,418.9 | | 15.0 | | 1,923.8 | | 16.8 |
Basic organic chemical products | | 1,373.2 | | 23.0 | | 2,140.2 | | 22.7 | | 2,700.0 | | 23.5 |
Others | | 473.4 | | 7.9 | | 369.8 | | 3.9 | | 517.8 | | 4.5 |
| | |
| |
| |
| |
| |
| |
|
Total | | 5,975.3 | | 100.0 | | 9,443.1 | | 100.0 | | 11,473.9 | | 100.0 |
| | |
| |
| |
| |
| |
| |
|
The following table sets forth as percentages of total sales the principal operating expenses associated with our business.
| | | | | | | | | |
| | | Year ended December 31
| |
| | | 2001 (%)
| | | 2002 (%)
| | | 2003 (%)
| |
Sales | | 100.0 | | | 100.0 | | | 100.0 | |
Raw materials | | (67.4 | ) | | (62.4 | ) | | (59.2 | ) |
Utility expenses | | (13.1 | ) | | (12.9 | ) | | (10.7 | ) |
Depreciation | | (8.8 | ) | | (8.5 | ) | | (7.8 | ) |
Wages and bonus | | (3.5 | ) | | (2.5 | ) | | (2.5 | ) |
Other overheads | | (2.7 | ) | | (2.9 | ) | | (5.1 | ) |
Selling, general and administrative expenses | | (8.7 | ) | | (5.0 | ) | | (5.7 | ) |
Other operating (expenses)/income, net | | (1.7 | ) | | (0.1 | ) | | 0.1 | |
| | |
|
| |
|
| |
|
|
Operating margin | | (5.9 | ) | | 5.7 | | | 9.1 | |
| | |
|
| |
|
| |
|
|
For the year ended December 31, 2003, our total sales increased by 21.5% from RMB 9,443.1 million in 2002 to RMB11,473.9 million in 2003, which was itself an increase of 92.0% from RMB 5,975.3 million in 2001. In 2003, due to a one-month shutdown and overhaul, the sales volume of our eight principal products decreased by 4.1%, as compared with 2002. However, due to strong market demand and an increase in the prices of raw materials, the prices of our principal products increased substantially, and our total sales and profit also increased. For 2003, we recorded a profit before taxation of RMB 877.1 million, an increase of RMB 546.4 million compared with our profit before taxation of RMB 330.7 million in 2002, an increase of RMB 1,287.3 million compared to our loss before taxation of RMB 410.2 million in 2001. In 2003, we recorded a net profit of RMB 633.9 million, an increase of RMB 424.8 million from our net profit of RMB 209.1 million in 2002, and an increase of RMB 906.4 from our net loss of RMB 272.5 million in 2001.
40
Raw material expenses were the largest component of the operating expenses. In 2001, 2002 and 2003, approximately 52.3%, 52.2% and 51.2% respectively of the cost of goods sold were expenses relating to purchases of cracking feedstock. In 2003, the total expense for purchasing cracking feedstock was RMB 4,976 million, as compared with RMB 4,366 million in 2002. This increase was largely because the prices of cracking feedstock increased in 2003 when compared with 2002 prices. The average price of the cracking feedstock in 2003 increased by 14.3% when compared with 2002 prices. In addition, the lower-priced cracking feedstock expense increased to 49.0% of the total cracking feedstock expense, as compared to 43.8% for year 2002.
Similar to other producers in the petrochemical industry and other bulk manufacturing industries, we are highly leveraged operationally. Because a significant portion of our expenses is either fixed (as in the case of depreciation expense for a given piece of equipment) or consists of stable unit costs (as in the case of cracking feedstock), fluctuations in sales, particularly those caused principally by changes in product prices, have tended to cause disproportionately larger fluctuations in profitability. In 2003, our operating margin increased to 9.1% from 5.7% in 2002 as a result of the large increase in the prices of our principal products and benefits from economies of scale.
Year ended December 31, 2003 compared with year ended December 31, 2002
Sales increased to RMB 11,473.9 million in 2003 from RMB 9,443.1 million in 2002, representing an increase of RMB 2,030.8 million, or 21.5%. The increase in sales was mainly due to the large increase in the prices of our principal products in 2003. Due to strong market demand and an increase in the prices of raw materials, petrochemical products in China maintained at a high price level in 2003, which resulted in an increase of 25.9% in the weighted average sales price of our eight principal products as compared to that of 2002 (the aggregate sales of the eight principal products representing 79.1% and 78.6% of the total sales for 2002 and 2003, respectively). The sales volume of our eight principal products decreased by approximately 4.1% in 2003 as compared with that of 2002 due to the one-month shutdown and overhaul; nevertheless, our sales revenue increased significantly.
Sales of resins and plastics, which accounted for 55.2% of our total sales, increased by 14.8% from RMB 5,514.1 million in 2002 to RMB 6,332.3 million in 2003. This increase was primarily attributable to the 21.2% increase of our weighted average price for resin and plastic products in 2003 as compared to that of 2002.
Sales of synthetic rubber, which accounted for 16.8% of our total sales, increased by approximately 35.6% from RMB 1,418.9 million in 2002 to RMB 1,923.8 million in 2003. The increase was primarily due to the 26.6 % increase in the sales price of synthetic rubber products in 2003 as compared to that of 2002.
In 2003, sales of basic organic chemical products, which accounted for 23.5% of our total sales, increased by 26.2% from RMB 2,140.2 million in 2002 to RMB 2,700.0 million in 2003. This increase was primarily a result of an increase in the price of our basic organic chemical products.
Sales of other products, which accounted for 4.5% of our total sales, increased by approximately 40.0% to RMB 517.8 million in 2003 from RMB 369.8 million in 2002.
Cost of sales increased by 16.2% to RMB 9,723.6 million in 2003, up from RMB 8,368.0 million in 2002. This increase was mainly due to the increase in the prices for raw materials and increased overhead costs resulting from normal shutdown and overhaul. Our gross profit increased by 62.8% from RMB 1,075.0 million in 2002 to RMB 1,750.4 million in 2003, as gross margin rose from 11.4% in 2002 to 15.3% in 2003.
Selling, general and administrative expenses increased by RMB 190.8 million (36.0%) to RMB 721.4 million in 2003 from RMB 530.6 million in 2002. This increase in selling, general and administrative expenses was primarily due to the increase in research and development expenses and other expenses.
41
Our profit from 2003 operations was RMB 1,043.0 million, representing an increase of 92.6% when compared with the RMB 541.6 million from 2002 operations. Our operating margin increased to 9.1% in 2003, as compared with 5.7% in 2002. The increase in operating margin reflects improvement of the market operating situation as well as a realization of the benefits from our economies of scale.
Net financing costs in 2003 decreased by RMB 44.9 million from RMB 210.8 million in 2002 to RMB 165.9 million 2003. This decrease was primarily due to the repayment of certain bank loans in 2003 along with the increase of cash generated from operating activities and the corresponding significant decrease in expenditure of loan interest.
In 2003, we recorded a profit before taxation of RMB 877.1 million, representing an increase of 165.2% when compared with the profit before taxation of RMB 330.7 million in 2002. Our net profit for 2002 was RMB 209.1 million, and the net profit for 2003 was RMB 633.9 million, representing an increase of 203.2% compared to that of 2002. The net profit margin for 2003 increased to 5.5%, compared to 2.2% for 2002.
Year ended December 31, 2002 compared with year ended December 31, 2001
Sales increased to RMB 9,443.1 million in 2002 from RMB 5,975.3 million in 2001, representing an increase of RMB 3,467.8 million or 58.0%, and this was mainly due to the large increase in the production and sales volume of our principal products upon expansion of production. Due to market conditions, the price of petrochemical products in China remained at a low level in the first half of 2002, and the weighted average sales price of our eight principal products, which accounted for 74.0% and 79.1%, respectively, of total sales revenue of 2001 and 2002, decreased by 7.0% in 2002. However, the sales volume of these eight principal products increased by 81.6% in 2002 as compared with that of 2001, and thus increased sales revenue by large margins.
Sales of resins and plastics, which accounted for 58.4% of our total sales, increased by approximately 72.1% from RMB 3,203.2 million in 2001 to RMB 5,514.1 million in 2002. This increase was principally attributable to the commencement of operation of our expanded ethylene facilities that enabled us to increase the output of resin and plastic products from 553,000 tons per year to 1,055,000 tons per year. Although the weighted average price of resin and plastic products decreased by 10.1% in 2002, as compared with that of 2001, the large increase in the sales volumes has nevertheless resulted in a large increase in sales revenue.
Sales of synthetic rubber, which accounted for 15.0% of total sales, increased by approximately 53.3% from RMB 925.5 million in 2001 to RMB 1,418.9 million in 2002. The increase was primarily due to an increase in both the sales volume and the sales price of synthetic rubber products in 2002.
Sales of basic organic chemical products, which accounted for 22.7% of total sales, increased by approximately 55.9% from RMB 1,373.2 million in 2001 to RMB 2,140.2 million in 2002, primarily as a result of an increase in the output after renovation of our phenol and acetone units as well as an increase in the sales price resulting from the restoration of market share.
Sales of other products, which accounted for 3.9% of total sales, decreased by approximately 21.9% to RMB 369.8 million in 2002 from RMB 473.4 million in 2001.
Cost of sales increased to RMB 8,368.0 million in 2002 from RMB 5,660.2 million in 2001. The increase was mainly due to an increase in output, which also resulted in an increase in the consumption of raw materials and an increase in depreciation of the units newly put into use. Our gross margin increased from RMB 315.1 million in 2001 to 1,075.0 million in 2002, as gross profit rate mounted up from 5.3% in 2001 to 11.4% in 2002.
42
Selling, general and administrative expenses decreased by RMB 34.8 million, or 6.2%, to RMB 530.6 million in 2002 from RMB 565.4 million in 2001. This decrease was primarily due to the substantial improvement in marketing efficiency and effectiveness, attained by the reorganization of our marketing system.
Our profit from operations in 2002 was RMB 541.6 million, compared with a loss of RMB 350.6 million in 2001. Our operating margin increased to 5.7% in 2002, as compared with -5.9% in 2001. The increase of operating margin has reflected the initial realization of benefits from the economies of scale upon completion of our expansion.
Net financing costs have seen a comparatively large increase to RMB 210.8 million in 2002 from RMB 59.6 million in 2001, primarily due to the capitalization of RMB 153.7 million loan interest during the period of constructions made under the Ethylene Project in 2001.
In 2002, we recorded a profit before taxation of RMB 330.7 million, as compared with a loss before taxation of RMB 410.2 million in 2001. Our net profit for 2002 was RMB 209.1 million, yielding a profit margin of 2.2%, as compared with our net loss of RMB 272.5 million and net profit margin of -4.6% in 2001.
US GAAP Reconciliation
Our accounting policies conform with IFRS, which differ in certain significant respects from US GAAP. See Item 18. Financial Statements - Note 27 for a discussion of the nature and effect of such differences. As a result of these differences and the tax effect therefrom:
| | • | Our US GAAP net income (loss) was lower by RMB 167.8 million in 2001, higher by RMB 20.8 million in 2002 and higher by RMB 39.3 million in 2003 than the corresponding IFRS net income (loss). |
| | • | Shareholders’ equity under US GAAP was lower by RMB 305.0 million at December 31, 2002 and lower by RMB 264.8 million at December 31, 2003 than shareholders’ equity under IFRS. |
Under IFRS, revaluation of property, plant and equipment is permitted and depreciation is based on the revalued amount. For the year ended December 31, 2003, additional depreciation arising from the revaluation of property, plant and equipment was approximately RMB 48 million for 2003, RMB 50 million for 2002, and RMB 50 million for 2001. Under US GAAP, property, plant and equipment is required to be stated at cost. Hence, no additional depreciation from the revaluation is recognized under US GAAP.
In 2001, we sold a polypropylene production facility of original cost of RMB 811.4 million and zero net book value to Yanshan Company, a related company, at a consideration of RMB 167.9 million, with a net gain of RMB 156.5 million. Under US GAAP, the gain from transfer of assets between entities under common control should be recorded as a capital transaction. See Item 7.B. Related Party Transactions.
In 2001, our parent bore staff redundancy cost of approximately RMB 100.8 million. Under US GAAP, the amount is treated as our expense with a corresponding increase in shareholders’ equity.
Currency Exchange
We have not historically received or utilized material amounts of foreign currency in our business operations, as substantially all of our sales are made in Renminbi and substantially all of our non-capital expenses are in the same currency. However, a significant portion of our capital expenditures, typically in connection with technology, machinery and equipment, are denominated in foreign currencies. In the past, we have satisfied our need for foreign exchange generally through foreign currency loans provided by PRC financial institutions (prior to the Restructuring, these loans were made through our then parent, Yanshan Company), and believe we will be able to continue to do so as necessary to meet our planned capital expenditure program.
43
Taxation
We have been subject to China’s uniform income tax rate of 33% for all domestic enterprises throughout the periods covered by the Financial Statements.
Inflation
We believe that inflation within China has had only a limited effect on our operational results. Prices for our products have risen and fallen from time to time in a manner consistent with global petrochemical prices, regardless of the rates of inflation prevailing in China. However, we do believe that inflation has had an effect on certain of our expenses, such as those for utilities. In addition, inflation may have macroeconomic effects in China, which affect not only the pricing of our products and materials, but also overall levels of demand. For example, while we could benefit from a reduced rate of inflation, corrective government measures aimed at controlling inflation could also have the effect of inhibiting economic activity in China, which could, in turn, lead to adverse effects on our operational results.
B. Liquidity and Capital Resources
Our liquidity is primarily dependent on the ability to maintain adequate cash inflow from operations to meet debt obligations as they become due, and on the ability to obtain adequate external financing to meet its committed future capital expenditures. See Item 3. Key Information — Risk Factors - “Market cyclically and our high operational leverage may have a significant effect on our profitability” and “Our business may be adversely affected if we are unable to refinance our current short-term indebtedness with an equally favorable financing arrangement”. As of December 31, 2003, we had approximately RMB 231.4 million in cash and cash equivalents, RMB 1,088.4 million in short-term bank loans and RMB 1,596.4 million in long-term bank loans. We believe that our working capital and available bank loans are sufficient for our present requirements.
Our net cash flow derived from operating activities is generally much higher than net profit, mainly due to substantial depreciation. In 2003, our net cash flow from operating activities was RMB 1,616.6 million, representing an increase of RMB 579.5 million from RMB 1,037.1 million in 2002, and primarily adjusted by (i) profit before taxation of RMB 877.1 million, (ii) depreciation expense of RMB 890.8 million, and (iii) interest expenditure of RMB 142.8 million.
In 2002, our net cash flow from operating activities was RMB 1,037.1 million, representing an increase of RMB 655.8 million from RMB 381.3 million in 2001, and primarily adjusted by (i) profit before taxation of RMB 330.7 million, (ii) depreciation expense of RMB 806.1 million, which is partly offset by (iii) an increase of inventories in the amount of RMB 247.3 million, and (iv) an increase in trade and bills receivables of RMB 104.0 million.
In 2001, our net cash flow from operating activities was RMB 381.3 million, primarily adjusted by (i) loss before taxation of RMB 410.2 million, (ii) depreciation expense of RMB 525.4 million and (iii) a net decrease of RMB 269.2 million in operating assets and a RMB 428.9 million net increase in operating liabilities. Cash flow from operating activities was also reduced due to the payment of interest in the amount of RMB 207.1 million and income tax paid of RMB 128.3 million.
44
Net cash used in investing activities were RMB 2,046.0 million, RMB 716.4 million and RMB 348.6 million in 2001, 2002 and 2003, respectively.
Our short-term and long-term loans are primarily obtained from PRC financial institutions. In 2003, we repaid RMB 3,065.1 million in short-term loans and RMB 719.8 million in long-term loans, and borrowed RMB 2,560.0 million in short-term loans and RMB 205.7 million in long-term loans. As of December 31, 2003, our total bank loans decreased by 27.5 % to RMB 2,684.8 million (including RMB 1,070.0 million in short-term loans and RMB 18.4 million in long-term loans due within one year) from RMB 3,703.9 million (including RMB 1,575.0 million in short-term loans, and RMB 201.4 million in long-term loans due within one year) as of December 31, 2002. As of December 31, 2003, our long-term bank loans of US$ 88.4 million were guaranteed by the Yanshan Company.
As of December 31, 2003, we were in compliance with the related financial covenants. There were no existing financial covenants that would impair our ability to undertake additional debt or equity financing. We believe that we will continue to comply with the financial covenants so that there will be no adverse effect on our ability to refinance funding from PRC financial institutions.
We believe that, based on our current estimates, our existing cash flow from operating activities will be sufficient to meet our financial requirements, including for our research and development activities and our anticipated capital expenditures.
C. Research and Development, Patents and Licenses, etc.
In 2003, we employed approximately 2,378 persons in research and development functions, of which 1,603 persons were engineering and technical personnel. We have a research and development department and a Resin Application Research Unit that focus on the development of product processing and new product applications. Each of our production units has a research team and pilot facilities, forming an integrated scientific research test system. In addition, our parent’s research and development unit provides us with research services in connection with new technologies, production processes and equipment for our business.
Our expenditures for research and development were approximately RMB 53.8 million, RMB 59.0 million and RMB 79.0 million in 2001, 2002 and 2003, respectively, accounting for approximately 0.9%, 0.6% and 0.7%, respectively, of our sales. We intend to increase our annual research and development budget as market needs require.
We continue to participate in a research and development program originally sponsored by China Petroleum and, subsequent to the Industry Restructuring, sponsored by the Sinopec Group, pursuant to which we typically pay an annual research and development fee in exchange for the right to utilize all new production processes, technologies, new products and new product applications developed by the Sinopec Group’s research institute for a nominal charge.
We use the trademark “yansan” which is owned by Yanshan Company. Yanshan Company has agreed to our use of this trademark. The detailed terms and conditions of the relevant licensing agreement are currently under discussion between Yanshan Company and us.
D. Trend Information
China’s market will become more internationalized as a result of China’s accession to the WTO. The establishment and commencement of production of a number of new joint venture petrochemical enterprises in the following years will further intensify market competition. The significant flotation in the prices of crude oil and petrochemical products in the international markets will also increase the difficulty in predicting the domestic market in the future.
45
Nevertheless, due to the completion and stable running of our ethylene facilities with the Rated Capacity of 710,000 tons, the production process of our major products have reached the international level. Benefits from scale are fully implemented. We are restructuring our internal operation process to further improve our management and enhance our core competence.
We are confident that the momentum of gradual recovery of the world economy and high speed growth of China’s economy will continue to stimulate the increase in demand for domestic petrochemical products. We will closely monitor the market’s development, seize market opportunities, make use of the advantages gained in the completion of the Ethylene Project to further improve our operating results through continuous implementation of its development strategies.
E. OFF-BALANCE SHEET ARRANGEMENT
As of December 31, 2003, we do not have any off-balance sheet arrangements that have or are reasonably likely to have an effect on our financial condition, revenues or expenses, results of operations or liquidity, and that are material to investors.
F. Contractual Obligations and Commercial Commitments
The following table sets forth our obligations and commitments to make future payments under contracts and under contingent commitments as of December 31, 2003.
| | | | | | | | | | |
| | | As of December 31, 2003 Payment due by period
|
| | | Total
| | 2004
| | 2005
| | 2006
| | 2007
|
| | | RMB in thousands |
Contractual obligations(1) | | | | | | | | | | |
Short-term debts | | 1,170,000 | | 1,170,000 | | — | | — | | — |
Long-term debts | | 1,614,760 | | 188,401 | | 709,193 | | 887,166 | | — |
| | |
| |
| |
| |
| | |
Total contractual obligations | | 2,784,760 | | 1,188,401 | | 709,193 | | 887,166 | | — |
| | |
| |
| |
| |
| | |
Other commercial commitments | | | | | | | | | | |
Operating lease commitment | | 12,978 | | 12,978 | | — | | — | | — |
Capital commitment | | 253,326 | | 253,326 | | — | | — | | — |
| | |
| |
| | | | | | |
Total commercial obligations | | 266,304 | | 266,304 | | — | | — | | — |
| | |
| |
| | | | | | |
| (1) | Contractual obligations represent on-balance sheet contractual liability as of the balance sheet date. |
We expect to incur capital expenditures of RMB 300 million, RMB 400 million and RMB 400 million in 2004, 2005 and 2006, respectively. Such capital expenditures will be used mainly for the technical improvement projects. We believe the cash flows from our operating activities and new bank loans will be sufficient to cover our expected capital expenditures for the above periods.
46
ITEM 6. DIRECTORS, SENIOR MANAGEMENT AND EMPLOYEES
A. Directors and Senior Management
The following table sets forth certain information concerning the directors, senior management and members of our board of supervisors (the “Board of Supervisors”) for the year ended December 31, 2003.
| | | | |
Name
| | Age
| | Position
|
Executive Directors | | | | |
| | |
DU Guosheng | | 47 | | Chairman |
YANG Qingyu | | 57 | | Director and Vice-chairman |
XU Hongxing | | 45 | | Director and General Manager |
| | |
Non-executive Directors | | | | |
| | |
WANG Yuying | | 57 | | Director |
WANG Yongjian | | 44 | | Director |
WANG Ruihua | | 56 | | Director |
CUI Guoqi | | 50 | | Director |
XIANG Hanyin | | 49 | | Director |
| | |
Independent Non-executive Directors | | | | |
| | |
ZHANG Haoruo | | 72 | | Independent Non-executive Director |
ZHANG Yanning | | 77 | | Independent Non-executive Director |
LIU Haiyan | | 62 | | Independent Non-executive Director |
YANG Xuefeng | | 65 | | Independent Non-executive Director |
| | |
Supervisors | | | | |
| | |
SHANG Bo | | 56 | | Chairman of the Board of Supervisors |
REN Jinxiang | | 56 | | Supervisor |
WANG Guifen | | 51 | | Supervisor |
WANG Shulan | | 49 | | Supervisor |
LIU Changwei | | 46 | | Supervisor |
RONG Guozhong | | 46 | | Supervisor |
ZHANG Jianjun | | 52 | | Supervisor |
GENG Dianming | | 57 | | Independent Supervisor |
ZHAO Shaohua | | 64 | | Independent Supervisor |
| | |
Other Executive Officers | | | | |
| | |
ZHAO Qichao | | 43 | | Deputy General Manager |
GUO Hong | | 40 | | Chief Financial Officer |
ZHOU Quansheng | | 35 | | Secretary of the Board |
Executive Directors
DU Guosheng,aged 47, is our Chairman of the Board of Directors. He joined Yanshan Company in 1982 and became the Chairman and General Manager of Yanshan Company in 1999. Mr. Du graduated from Fushun Petroleum Institute and received a master’s degree in Engineering Management from Shanghai Tongji University.
47
YANG Qingyu,aged 57, is the Vice-chairman of the Board of Directors. He joined Yanshan Company in 1970 and became Deputy General Manager of Yanshan Company in 1993. Mr. Yang graduated from Tianjin University.
XU Hongxing, aged 45, is our General Manager. He joined Yanshan Company in 1982 and has served various capacities including Deputy Director of the Synthetic Rubber Unit and Deputy General Manager of Yanshan Company. Mr. Xu graduated from Tianjin University and has a Master of Business Administration (“MBA”) degree from People’s University of China.
Non-executive Directors
WANG Yuying, aged 57, joined Yanshan Company in 1970 and has served in various capacities including Secretary of the Communist Party Committee and Vice-chairman of Yanshan Company. Ms. Wang graduated from People’s University of China with a master’s degree in administration of industrial enterprises.
WANG Yongjian, aged 44, joined Yanshan Company in 1982 and has served in various capacities including Director of the Chemical Product Unit and Deputy General Manager of Yanshan Company. Mr. Wang graduated from the East China Petroleum Institute and has an MBA degree from Dalian University of Science and Technology.
WANG Ruihua, aged 56, joined Yanshan Company in 1969 and became Chairman of the Trade Union and Deputy General Manager of Yanshan Company in 1996 and 1999, respectively. Mr. Wang graduated from Beijing Junior College of Chemical Engineering and Beijing Economics Institute.
CUI Guoqi, aged 50, joined Yanshan Company in 1969 and has served in various capacities including Chairman of the Trade Union of Yanshan Company. Mr. Cui graduated from the People’s University of China with an MBA degree.
XIANG Hanyin,aged 49, joined the Yizheng Chemical Fibre Company in 1982, and has served in various capacities. In 2000, Mr. Xiang joined the Chemicals Department of Sinopec as Deputy Director. Mr. Xiang graduated from Nanjing Chemical Institute.
Independent Non-executive Directors
ZHANG Haoruo,aged 72, has served in various capacities in a number of government bodies, including Vice Minister of the former Ministry of Foreign Trade and Economic Cooperation, Governor of Sichuan Province, Minister of the Ministry of Domestic Trade, Administrative Deputy Director of the former State Commission for Economic Restructuring, and member of the Standing Committee of the National People’s Congress. Mr. Zhang graduated from Tsinghua University.
ZHANG Yanning, aged 77, has served in various governmental offices, holding positions such as Vice Minister of the State Economic Commission, Deputy Director of the Production Committee of the State Council, Deputy Chief of the Economic and Trade Office of the State Council, member of the Finance and Economic Affairs Committee of the National People’s Congress, and Chairman of the All China Association of Enterprises. Mr. Zhang graduated from the Dalian Engineering Institute.
48
LIU Haiyan, aged 62, joined Yanshan Company in 1969 and has served in various capacities including Director of the Oil Refinery Plant and General Manager of Yanshan Company. Mr. Liu served as the Vice Mayor of the Beijing Municipality from 1998 to 2003 and the Chairman of the Board of Huaxia Bank since 2003. Mr. Liu graduated from Xi’an Petroleum Institute and has obtained a master’s degree from Beijing Petroleum Institute.
YANG Xuefeng, aged 65, joined Sinopec in 1984 and has served in various capacities including Deputy Director of the Department of Production Management and Deputy Director of the Planning Department. Mr. Yang graduated from the Beijing Petroleum Institute.
Supervisors
SHANG Bo,aged 56, is the Chairman of our Board of Supervisors. Mr. Shang joined Yanshan Company in 1969 and has served in various capacities, including Deputy Secretary of the Communist Party Committee of Yanshan Company. Mr. Shang graduated from Lanzhou Petroleum Institute and Beijing Municipal Management Executive Training School.
REN Jinxiang, aged 56, joined Yanshan Company in 1969 and has served in various capacities including Deputy Chairman of the Trade Union of Yanshan Company. Mr. Ren graduated from the Self-taught Examinations Program of Beijing Higher Education and majored in executive management.
WANG Guifen, aged 51, joined Yanshan Company in 1971 and has served in various capacities including Deputy Secretary of the Disciplinary Inspection Committee and Director of the Supervision Department of Yanshan Company. Ms. Wang graduated from the People‘s University of China.
WANG Shulan,aged 49, joined Yanshan Company in 1971 and has served in various capacities including Deputy Chief of the Accounting Department of the Company. Ms. Wang graduated from the People’s University of China.
LIU Changwei, aged 46, joined Yanshan Company in 1983 and has served in various capacities including Chief of the Management Committee of No. 1 Chemical Plant. Mr. Liu graduated from Fushun Petroleum Institute.
RONG Guozhong, aged 46, joined Yanshan Company in 1976 and has served in various capacities including Chairman of the Trade Union of the Polypropylene Department. Mr. Rong graduated from the People’s University of China.
ZHANG Jianjun, aged 52, joined Yanshan Company in 1971 and has served in various capacities including Deputy Secretary of the Disciplinary Inspection Committee of Yanshan Company and Deputy Director of the Supervision Department of Sinopec Group. Ms. Zhang graduated from Tianjin University.
GENG Dianming, aged 57, joined Yanshan Company in 1978 and has served consecutively as Chief Accountant in Beijing Zhongyan Accounting Firm and Zhonglei Accounting Firm Beijing Office since 1993. Mr. Geng graduated from the Graduate School of China Academy of Social Sciences.
ZHAO Shaohua, aged 64, joined Yanshan Company in 1970 and has served as Chief Accountant of Yanshan Company since 1996. Mr. Zhao graduated from Xuzhou Teachers’ College.
49
Other Executive Officers
ZHAO Qichao, aged 43, is our Deputy General Manager. He joined Yanshan Company in 1983 and has previously served as the Manager of our Polypropylene Department in 1997. Mr. Zhao graduated from the Second Branch of the Beijing Chemical Institute.
GUO Hong,aged 40, is our Chief Financial Officer. Mr. Guo joined Yanshan Company in 1982 and has served in various capacities including Deputy Director of the Financial Department of the Company. Mr. Guo graduated from Wuhan University of Industry with a master’s degree.
ZHOU Quansheng,aged 35, is our Secretary of the Board. Mr. Zhou joined Yanshan Company in 1990 and has served in various capacities such as Head of the Secretariat of the Board of Directors. Mr. Zhou graduated from Zhejiang University and obtained an MBA degree from the Dalian Institute of Technology.
Departure of an Independent Non-executive Director
Mr. Zhang Haoruo, one of our independent non-executive directors, passed away on March 27, 2004. We currently have no intention of making any arrangement to fill the resulting vacancy. The remaining three independent non-executive directors will continue to fulfill their roles as our independent non-executive directors. We do not expect that there will be any disruption to our operations due to Mr. Zhang’s unfortunate departure.
B. Compensation
The aggregate amount of cash remuneration paid to our directors, the members of the senior management and the Board of Supervisors during the year ended December 31, 2003 was RMB 1,233,480. During 2003, we set aside RMB 109,790 in non-cash remuneration (consisting solely of our contribution to retirement benefits) with respect to such individuals. In addition, directors who also act as our officers or employees receive certain other benefits in kind, such as subsidized or free health care services, housing management and transportation, customarily provided by enterprises in China to their employees. See “Employees.”
| | | | | | |
Name
| | Position
| | Annual salary and allowances
|
| | | | | (RMB) | | (US$) |
| Executive Directors | | | | | | |
| | | |
| DU Guosheng | | Chairman | | 235,609 | | 28,467 |
| YANG Qingyu | | Director
and Vice-
chairman | | 209,348 | | 25,294 |
| XU Hongxing | | Director
and General
Manager | | 207,625 | | 25,085 |
| | | |
| Non-executive Directors | | | | | | |
| | | |
| *WANG Yuying | | Director | | — | | — |
| *WANG Yongjian | | Director | | — | | — |
| *WANG Ruihua | | Director | | — | | — |
| *CUI Guoqi | | Director | | — | | — |
| *XIANG Hanyin | | Director | | — | | — |
| | | |
Independent Non-executive Directors | | | | | | |
| | | |
| *ZHANG Haoruo | | Independent
Non-
executive
Director | | — | | — |
| *ZHANG Yanning | | Independent
Non-
executive
Director | | — | | — |
| *LIU Haiyan | | Independent
Non-
executive
Director | | — | | — |
| *YANG Xuefeng | | Independent
Non-
executive
Director | | — | | — |
| | | |
| Supervisors | | | | | | |
| | | |
| **SHANG Bo | | Chairman
of the
Board of
Supervisors | | — | | — |
| **REN Jinxiang | | Supervisor | | — | | — |
| **WANG Guifen | | Supervisor | | — | | — |
| **WANG Shulan | | Supervisor | | — | | — |
| LIU Changwei | | Supervisor | | 130,362 | | 15,750 |
| RONG Guozhong | | Supervisor | | 116,694 | | 14,099 |
| *ZHANG Jianjun | | Supervisor | | — | | — |
| *GENG Dianming | | Independent
Supervisor | | — | | — |
| *ZHAO Shaohua | | Independent
Supervisor | | — | | — |
| | | |
| Other Executive Officers | | | | | | |
| ZHAO Qichao | | Deputy
General
Manager | | 198,435 | | 23,975 |
| GUO Hong | | Chief
Financial
Officer | | 137,520 | | 16,615 |
| ZHOU Quansheng | | Secretary of
the Board | | 107,677 | | 13,010 |
| * | Such persons did not receive any remuneration from us or the Yanshan Company in 2003. |
| ** | Such persons did not receive any remuneration from us in 2003. But they were compensated by the Yanshan Company in 2003. |
50
C. Board Practices
All of our current directors and members of the Board of Supervisors were elected in June 2003 and will serve terms of three years or until the election of their respective successors.
Each of the executive directors has entered into a service contract with us for a term of three years, subject to renewal by agreement for one or more consecutive terms of three years. Under such contracts each executive director will receive a salary and a discretionary year-end bonus, at such levels as are proposed by our Board of Directors and approved by shareholders in the general meeting. None of the directors are entitled to receive any benefits upon termination with us.
Board of Supervisors
The Board of Supervisors exists to supervise our directors and our senior officers to prevent them from abusing their positions and powers or infringing our rights and interests or those of our shareholders or employees. The Board of Supervisors has no power over the decisions or actions of our directors or officers except to compel them to correct any act harmful to our interests. The Board of Supervisors is currently composed of the nine members listed in Item 6A, each of whom was appointed for a three year term. It has the right to attend meetings of our Board of Directors, inspect our financial affairs and perform other supervisory functions. These powers and duties are contained in our Articles of Association; there is no other written term of reference for our Board of Supervisors.
51
Audit Committee
The Board of Directors established an audit committee in 2002. For the year ended December 31, 2003, the audit committee was composed of Mr. Zhang Haoruo, Mr. Zhang Yanning, Mr. Liu Haiyan, and Mr. Yang Xuefeng, who was elected as Chairman. The audit committee is responsible for the review and supervision of our financial reporting process and internal controls in order to meet the requirement of the Appendix 14 of the Listing Rules-the Code of Best Practice which was promulgated by the Hong Kong Stock Exchange. For the year ended December 31, 2003, the audit committee held two meetings. The audit committee, together with our management, has reviewed the accounting policies, principles and methods adopted by us, and has discussed about the contents of the auditing, internal controls and the financial statements.
Remuneration Committee
We do not have a remuneration or compensation committee.
D. Employees
The following table shows the approximate number of employees we had at the end of each of the last three years, organized by the principal business function they performed:
| | | | | | |
| | | December 31,
|
| | | 2001
| | 2002
| | 2003
|
Management and Administrative | | 1,159 | | 1,032 | | 1,003 |
Engineers and Technicians | | 2,147 | | 2,291 | | 2,378 |
Factory Personnel | | 5,675 | | 5,373 | | 5,215 |
Accounting, Marketing and Others | | 1,783 | | 1,673 | | 1,611 |
| | |
| |
| |
|
Total | | 10,764 | | 10,369 | | 10,207 |
| | |
| |
| |
|
Approximately 35% of our work force graduated from universities or technical colleges. All members of our work force are employed under employment contracts which specify the employee’s position, responsibilities, remuneration and grounds for termination.
We have a trade union that protects employees’ rights, aims to assist in the fulfillment of our economic objectives, encourages employee participation in management decisions and assists in mediating disputes between us and union members. Each of our operating units has a separate branch of the trade union. We have not been subjected to any strikes or other labor disturbances which have interfered with our operations, and we believe that our relations with our employees are good.
The remuneration package we offer our employees includes wages and bonuses. Employees and their families also receive certain social welfare benefits and education and health services through Yanshan Company. These benefits are subsidized in some cases by Yanshan Company, as required by PRC laws, rules and regulations. We reimburse Yanshan Company for such subsidies.
According to the housing reform policies of the PRC government, we may be required to pay a one-time subsidy to employees who joined us before December 31, 1998 and have not been able to buy housing at preferential prices under the previous scheme or have bought housing at preferential prices but with living areas less than the standard set by the municipal government. However, as of December 31, 2001, we had not completed a housing subsidy plan for submission to the municipal government for approval. Therefore, the amount of the one-time housing subsidy cannot be determined and no provision has been made in the financial statements. As detailed in our prospectus for the Combined Offering, Yanshan Company has undertaken to bear the cost of housing subsidies for our employees through the end of 1998. Therefore, we believe the implementation of the new government housing reform policy will not have a material effect on our financial condition.
52
We, together with our employees, participate in a pension plan managed by the Beijing municipal government, pursuant to which our employees and we each pay an annual contribution to the plan. The annual contribution we paid in 2002 and 2003 equals 19% and 20% respectively of aggregate annual employee compensation. Each employee paid in 2002 and 2003 equals 6% and 8% respectively of his or her salary as an additional contribution. Upon retirement, our employees are entitled to the payment of pensions from the plan.
We started to implement the new regulations issued by the Beijing Municipal Government for its employee’s basic medical insurance in September 2002. Prior to the implementation of such regulations, we have been carrying out relevant State regulations by drawing 14% of the employees’ total current wages as welfare fees to be used as the medical expenditure for employees. The welfare fees were included in our labor costs specified in the financial statements included in Item 18. After the implementation of the new regulations, the medical insurance fees to be paid represented 9% of total wages, and such amount shall be included in the 14% employee welfare fees to be drawn by us.
All employees who are unable to work due to illness or disability are entitled to receive certain benefits during the period of their absence from the workplace.
In 2001, we terminated the employment of approximately 2,320 employees under a voluntary termination plan. We paid approximately RMB 246.9 million in connection with the termination of these employees. We did not further reduce our overall workforce during 2002 and 2003.
E. Share Ownership
None of the directors, supervisors or senior management had, as of December 31, 2003, any interests in any our shares or debentures.
We have no employee share purchase plan, share option plan or other arrangement to involve our employees in our share capital.
There was no contract of significance to which we were a party existing during or at the end of the year under review in which a director, supervisor or senior management had a material interest.
ITEM 7. MAJOR SHAREHOLDERS AND RELATED PARTY TRANSACTIONS
A. Major Shareholders
At May 31, 2004, our parent owned 70.0% of our issued share capital and was able to exercise all the rights of a controlling shareholder, including the election of directors and voting on amendments to our articles of association. Our parent is an enterprise whose controlling shareholder is the Sinopec Group and is authorized by the Sinopec Group to hold a controlling interest in us. See “Related Party Transactions.”
The following table sets forth certain information regarding ownership of our capital stock as of May 31, 2004 by (i) all persons who are known to us to own beneficially more than five percent of our capital stock and (ii) the senior management, and our directors as a group.All of our shares carry the same voting rights. Accordingly, our shareholders also have the same voting rights, except as arise from the number, of shares held.
53
| | | | | | | |
Title of Class
| | Identity of Person or Group
| | Amount Owned
| | Percent of
Capital Stock
| |
Domestic Shares | | Our Directors and Senior Management | | 0 | | 0 | % |
| | | Our parent | | 2,362,000,000 | | 70.0 | % |
H Shares | | HKSCC Nominees Limited | | 995,727,709 | | 29.5 | % |
As of May 31, 2004, a total of 1,012,000,000 H Shares were outstanding, none of which were held by U.S. registered shareholders, and a total of 2,133,450 ADSs, representing the equivalent of 106,672,500 H Shares, were held by 42 U.S. holders of record. A total of 2,362,000,000 Domestic Shares were also outstanding. As Domestic Shares can only be held by PRC investors, there were no non-PRC holders of record.
On February 25, 2000, as part of the restructuring of the Sinopec Group, Yanshan Company transferred all of its 70.0% interest in our capital stock to Sinopec.
B. Related Party Transactions
The Restructuring was carried out in preparation for the Combined Offering and to enable us to focus on petrochemical production as our primary business. Prior to the Restructuring, our predecessor was an enterprise wholly owned by China Petrochemical. Pursuant to the Restructuring, we were established as a joint stock limited company under the PRC Company Law on April 23, 1997, and our predecessor received all of our Domestic Shares and became our sole shareholder in exchange for assets relating to the petrochemical business transferred to us by our predecessor. These assets included production and ancillary facilities in Chemical Works No.1, the Polypropylene Unit (formerly Chemical Works No.2), the Chemical Product Unit, the Synthetic Rubber Unit, the Polyester Unit and the Resin Application Research Unit, as well as certain other facilities necessary for us to carry out our business. Our predecessor retained the assets, liabilities and businesses not assumed by us, including a refinery, a chemical fiber carpet plant, a wastewater treatment plant, a power plant, a rail transport unit, certain construction units, and units providing certain social services such as health care, educational and public security services and other ancillary services. As a result of the Restructuring, our predecessor became our parent and remained so until February 25, 2000.
China Petrochemical was established as a corporate entity by the Chinese government in 1983 and, until the Industry Restructuring in the first half of 1998, was authorized by the Chinese government to invest and hold controlling interests in a majority of the petrochemical enterprises in China. Pursuant to the Industry Restructuring, the Chinese government created SOCIB and transferred to SOCIB most of the responsibilities for national-level oversight then held by MCI, Sinopec and CNOGC. In July 1998, the Chinese government created from CNOGC and China Petrochemical, respectively, CNPC and Sinopec Group. In February 2001, SOCIB was dissolved upon the approval of the State Council and its responsibilities were transferred to the SETC. CNPC and Sinopec Group currently responsible for operating all petrochemical and chemical facilities in China, subject to the oversight of SETC on the national level. Yanshan Company became a wholly-owned subsidiary of the Sinopec Group. On February 25, 2000, the Sinopec Group transferred the core petrochemical operations from certain of its upstream and downstream entities to a newly formed Sinopec, and caused Yanshan Company to transfer all of its 70% controlling interest in us to Sinopec. See Item 4. Information on the Company — Our History and Development.
The Sinopec Group and Sinopec have confirmed that they will treat us no less favorably than the other enterprises directly or indirectly under their respective control. The articles of association provide that, in addition to any obligation imposed by law, a controlling shareholder shall not exercise its voting rights in a manner prejudicial to the interests of the shareholders generally, including voting with respect to certain enumerated matters of fundamental importance to shareholders. There has not been, however, any published report of judicial enforcement in China of such provisions by minority shareholders.
54
Our parent supplies us with most of our feedstock. Yanshan Company provides us with utilities, wastewater and environmental treatment services and social services, and licenses certain trademarks to us, all on a contractual basis. We provide some raw materials and services to our parent and Yanshan Company, also on a contractual basis. Our parent and we each pay reasonable fees for the provision of relevant materials and services to each other.
We have agreed with our parent to provide mutual indemnities arising from or in respect of the various assets and liabilities transferred to or retained by the parties. The purpose of the indemnities is to ensure that neither we nor our parent will bear liabilities which we have not agreed to assume, even in cases where third parties have not consented to the division of liabilities among us and our parent and continue to make claims against an entity which has not assumed the relevant liability. Our parent has agreed to indemnify us against any and all claims arising from facts or events prior to the Restructuring as well as any and all claims against us in respect of assets and liabilities retained by our parent in the Restructuring.
We also have arrangements with the Sinopec Group (and its subsidiaries). The Sinopec Group arranges for insurance coverage on a consolidated basis for itself and its subsidiaries. We are obligated to pay on an annual basis (pursuant to regulations issued by the Sinopec Group) a percentage (prescribed from time to time - presently 0.4%) of the value of our fixed assets and inventory as insurance premiums. We and the Sinopec Group (and its subsidiaries) also have an arrangement with respect to the cross-supply of certain materials. We have no obligation to supply to or purchase from the Sinopec Group (or any of its subsidiaries) any of these materials, but if we do so, such supply or purchase will be at market price or, if applicable, State Prices.
We also participate in a pooled research and development program with the Sinopec Group and its subsidiaries. This program was sponsored by China Petroleum prior to the Industry Restructuring. According to the Sinopec Group’s requirements, we typically must pay an annual scientific development fee to the Sinopec Group in order to participate in this program and are thereby entitled to utilize all new production processes, technologies, new products and new product applications developed by the Sinopec Group’s research institute for a nominal charge. Our annual fees payable for participation in this program were waived for 1997, 1998 and 1999. In 2001, 2002 and 2003, we paid Sinopec Group’s research institute RMB 30 million in research fees for each year.
In 2001, in order to accelerate the pace of our technology renovation programs and to increase the overall efficiency of our production and increase the confidence of investors, we have decided to shut down our first and the oldest polypropylene production unit on a permanent basis. However, since the first polypropylene production unit can be modified and used in the production of fine petrochemical products, we sold it to Yanshan Company for RMB 167,850,000 under an asset purchase agreement executed November 20, 2001. The asset purchase agreement included the condition that Yanshan Company would not compete with us in its business. The principal activities of Yanshan Company are the manufacturing of fine petrochemical products.
Due to the completion of the ethylene expansion project, we faced a surplus of propylene in 2003. To handle the surplus, we rented the First Polypropylene Facility from Yanshan Company to produce polypropylene and the rental paid in this respect was RMB 12.98 million.
C. Interests of Experts and Counsel
Not applicable.
55
ITEM 8. FINANCIAL INFORMATION
A. Financial Statements and Other Financial Information
Financial Statements
Please see Item 18. Financial Statements.
Other Financial Information
Export Sales
In 2003, export sales accounted for 1.3% of our total sales.
Litigation
We have no legal or arbitration proceeding which may have, or has had in the recent past significant effects on our financial position or profitability, including known or pending government proceedings.
We have no material proceeding where a director or executive officer or an affiliate is party against us or our subsidiary or has an interest adverse to us or a subsidiary.
Policy on Dividend Distribution
Our articles of association require that cash dividends in respect of H Shares be declared in Renminbi and paid by us in HK dollars. The HK dollar dividend payments will be converted to HK dollars at the average of the closing HK dollar exchange rates as announced by the PBOC for the calendar week preceding the date on which such dividends are declared.
We may make dividend payments to our foreign shareholders with funds in our foreign exchange account after taxes have been paid in accordance with applicable law. We may purchase foreign exchange from certain State-designated banks if we do not have sufficient foreign currency. We expect to continue to meet our foreign currency requirements for dividend payments in foreign currency, although no assurance can be given that foreign currency for such payments will always be available or that the rates for conversion of Renminbi to foreign currencies will not decline.
The holders of the ADSs receive HK dollar dividend payments in US dollars at conversion rates related to market rates and subject to fees as set forth in the corresponding Deposit Agreement.
Dividend payments may be subject to PRC withholding tax. See Item 10. Additional Information — Taxation. See also, Item 3. Key Information — Selected Financial Data — Dividends.
B. Significant Changes
No significant change has occurred after the date of the financial statements included in this Annual Report.
56
ITEM 9. OFFER AND LISTING DETAILS
A. Offer and Listing Details
Information Regarding the Price of Our Stock
Set forth below is certain market information relating to our H Shares and ADSs for the periods commencing from June 24-25, 1997 of Combined Offering to May 31, 2004.
| | | | | | | | |
| | | Price per H Share
| | Price per ADS
|
| | | (HKD)
| | (US$)
|
| | | High
| | Low
| | High
| | Low
|
1999 | | 1.94 | | 0.45 | | 11.88 | | 3.00 |
| | | | |
2000 | | | | | | | | |
First Quarter | | 1.28 | | 0.67 | | 8.19 | | 4.25 |
Second Quarter | | 1.18 | | 0.61 | | 7.06 | | 3.81 |
Third Quarter | | 1.33 | | 0.83 | | 8.25 | | 5.38 |
Fourth Quarter | | 0.96 | | 0.63 | | 6.00 | | 4.25 |
| | | | |
2001 | | | | | | | | |
First Quarter | | 1.30 | | 0.73 | | 7.93 | | 4.59 |
Second Quarter | | 1.48 | | 0.95 | | 9.00 | | 5.81 |
Third Quarter | | 1.16 | | 0.475 | | 7.30 | | 3.18 |
Fourth Quarter | | 0.84 | | 0.61 | | 5.30 | | 3.70 |
| | | | |
2002 | | | | | | | | |
First Quarter | | 1.12 | | 0.66 | | 7.10 | | 4.59 |
Second Quarter | | 1.25 | | 0.93 | | 7.82 | | 6.20 |
Third Quarter | | 1.20 | | 0.71 | | 7.55 | | 4.25 |
Fourth Quarter | | 1.03 | | 0.62 | | 6.35 | | 3.90 |
| | | | |
2003 | | | | | | | | |
First Quarter | | 1.16 | | 0.85 | | 7.00 | | 5.75 |
Second Quarter | | 1.25 | | 0.82 | | 7.65 | | 5.20 |
Third Quarter | | 1.64 | | 1.06 | | 12.40 | | 7.05 |
Fourth Quarter | | 3.08 | | 1.46 | | 21.34 | | 9.39 |
| | | | |
The most recent six months | | | | | | | | |
December, 2003 | | 3.08 | | 1.88 | | 21.34 | | 12.20 |
January, 2004 | | 3.80 | | 2.65 | | 25.75 | | 17.03 |
February, 2004 | | 3.53 | | 2.50 | | 21.99 | | 15.90 |
March, 2004 | | 3.50 | | 2.78 | | 21.75 | | 17.85 |
April, 2004 | | 3.35 | | 2.15 | | 21.40 | | 14.05 |
May, 2004 | | 2.40 | | 2.15 | | 15.57 | | 10.19 |
B. Plan of Distribution
Not applicable.
C. Markets
The principal trading market for our H Shares is the Hong Kong Stock Exchange. The ADSs, each representing 50 H Shares, have been issued by The Bank of New York as Depositary and are listed on the New York Stock Exchange under the symbol “BYH.” Prior to our 1997 initial public offering and subsequent listings on the Hong Kong and New York Stock Exchanges on June 25, 1997 and June 24, 1997, respectively, there was no market for the H Shares or the ADSs. See Item 4. Information on the Company - Our History and Development.
57
D. Selling Shareholders
Not applicable.
E. Dilution
Not applicable.
F. Expenses of the Issue
Not applicable.
ITEM 10. ADDITIONAL INFORMATION
A. Share Capital
Not applicable.
B Memorandum and Articles of Association
Our Objects and Purposes
Our business objectives are described in Article 12 of our articles of association dated June 27, 2003 to include the development of our business into a leading, nationally and internationally renowned industrial petrochemical company.
Board of Directors
A resolution was adopted to amend the articles of association with respect to the composition of our Board of Directors in the annual general shareholders’ meeting held on June 27, 2003. According to the amended articles of association, our Board of Directors is currently comprised of twelve (12) directors, including a Chairman of the Board and a Vice-chairman of the Board.
Our articles of association place on each of our directors the fiduciary obligation not to place himself in a position where his duty to us and his interests may conflict, and the obligation not to cause a person or organization related or concerned to him in certain relationships enumerated in the articles of association to do what he himself is prohibited from doing. Furthermore, our articles of association do not allow our directors to vote on compensation to themselves or any members of their body. In this regard, our articles of association provide that contracts involving emoluments to our directors are subject to shareholder approval in a general meeting before execution.
Our articles of association do not provide independently exercisable powers to our directors to borrow from us. We are generally prohibited from making loans to our directors except in the following cases:
| | • | funds are provided to a director to meet an expenditure incurred or to be incurred by him for the purposes of our business or for the purpose of enabling him to properly perform his duties under a service contract approved by our shareholders in a general meeting; or |
58
| | • | loans are made in the ordinary course of our business on normal commercial terms where our ordinary course of business includes the lending of money or the giving of guarantees. |
Our articles of association do not set out an age limit requirement for the retirement or non-retirement of directors and our directors are not required to hold our shares to be qualified.
Board of Supervisors
A resolution was adopted to amend the articles of association with respect to the composition of Board of Supervisors in the annual general shareholders’ meeting held on June 27, 2003. According to the amended articles of association, our Board of Supervisors is composed of nine (9) members.
Our supervisors are appointed to oversee our directors, general manager and other senior officers to prevent such persons from abusing their authority or infringing upon interest of our business, our shareholders or our employees. They also verify accounting reports and other financial information presented at shareholders’ meetings. The powers of our Board of Supervisors are generally limited to investigating and reporting to our shareholders on the affairs of Beijing Yanhua and our management, and to calling extraordinary shareholder meetings.
At least one member of our Board of Supervisors must be an employee representative appointed by our employees. The remaining members must be appointed by our shareholders at a general meeting. Members of the Board of Supervisors may not be a director, general manager or financial controller with us. The term of office of each member of the Board of Supervisors is three years. We pay reasonable expenses incurred by the Board of Supervisors in carrying out its duties.
Rights, Preferences and Restrictions Attached to Our Shares
Differences between H Shares and Domestic Shares
Our shares consist of H Shares and Domestic Shares. Holders of H Shares and Domestic Shares, with minor exceptions, are entitled to the same economic and voting rights. However, our articles of association provide that holders of H Shares will receive dividends in HK dollars while holders of Domestic Shares will receive dividends in Renminbi. In addition, the H Shares can be traded only by investors from foreign countries and investors from Taiwan, Hong Kong and Macao, while the Domestic Shares may be traded only by PRC investors. Other differences between the H Shares and Domestic Shares relate primarily to restrictions placed on Domestic Shares and holders of Domestic Shares that are not applicable to H Shares or holders of H Shares.
Dividends and Liquidation Rights
Dividend distributions may be proposed at any time by our Board of Directors and approved by an ordinary resolution of the shareholders at a general meeting. We may distribute dividends or bonuses no more than once a year unless approved by an ordinary resolution of our shareholders. Our articles of association allow for distributions of cash dividends or shares. A distribution of shares, however, must be approved by special resolution of our shareholders.
59
We may distribute dividends only after allowance has been made for the following:
| | • | making up losses, if any; |
| | • | allocations to the statutory common reserve; |
| | • | allocations to the statutory public welfare fund; and |
| | • | allocations to a discretionary common reserve if approved by our shareholders. |
Our articles of association require us to appoint a receiving agent registered as a trust company under the Trustee Ordinance of Hong Kong to receive dividends we declare on the H Shares.
In the event of our liquidation, the H Shares will rank pari passu with the Domestic Shares, and payment of debts out of our remaining assets shall be made in the order of priority prescribed by applicable laws and regulation or, if no such laws exist, as the liquidation committee appointed either by us or the courts of China consider fair and proper.
Voting
Each of our shares is entitled to one vote on all matters submitted to a vote of our shareholders at all shareholder meetings, except for meetings of a special class of shareholders where only holders of shares of the affected class are entitled to vote on the basis of one vote per share of the affected class. Because our shares do not have cumulative voting rights, a holder of a majority of our shares is able to elect all of the directors.
Our articles of association provide that all differences or claims
| | • | between a holder of H Shares and us, |
| | • | between a holder of H Shares and any of our directors, supervisors, general managers or other senior officers; and |
| | • | between a holder of H Shares and a holder of Domestic Shares |
arising from any provision of our articles of association or any right or obligation conferred or imposed by the Company Law or any subsequently promulgated laws or regulations replacing the Company Law, concerning our affairs must, with certain exceptions, be referred to arbitration at either the China International Economic and Trade Arbitration Commission in China or the Hong Kong International Arbitration Center.
Restrictions on Large or Controlling Shareholders
Our articles of association provide that, in addition to any obligation imposed by law or required by any stock exchange on which our shares are listed, a controlling shareholder must not exercise his voting rights in a manner prejudicial to the interests of our shareholders generally or of some of our shareholders which has any of the following effects:
| | • | relieving our directors or supervisors from their duty to act honestly in our best interests; |
| | • | approving the expropriation by a director or supervisor of our assets, including our corporate opportunities; or |
60
| | • | approving the expropriation by a director or supervisor of the individual rights of other shareholders, including rights to distributions and voting rights (except in the case of a restructuring approved by our shareholders). |
A controlling shareholder is defined by our articles of association as any person who on his own or acting in concert with others has the power to elect more than half of our directors, exercises or controls the exercise of 30% or more of voting rights, holds 30% or more of issued and outstanding shares or in any other manner controls us in fact.
Modifications of Shareholder Rights
The rights of a class of our shareholders (holders of Domestic Shares and H Shares being separate classes for this purpose) may not be modified or abrogated, unless approved by a special resolution of all our shareholders at a general shareholders’ meeting and by a special resolution of our shareholders of that class of shares at a separate meeting. Our articles of association enumerate, without limitation, certain amendments which would be deemed to be a modification or abrogation of the rights of a class of shareholders, including increasing or decreasing the number of shares of a class disproportionate to increases or decreases of other classes of shares, removing or reducing rights to receive dividends in a particular currency or creating shares with voting or equity rights superior to shares of such class.
In addition, the Listing Agreement between us and the Hong Kong Stock Exchange provides that we may not permit amendments to certain sections of our articles of association which have been mandated by the Hong Kong Stock Exchange. These sections include provisions that relate to the following issues:
| | • | varying the rights of existing classes of shares, |
| | • | our power to purchase our own shares, |
| | • | rights of minority shareholders; and |
| | • | procedure on liquidation. |
In addition, certain amendments to our articles of association require the approval and consent of relevant PRC authorities.
Shareholders’ Meetings
Our Board of Directors must convene an annual general shareholders’ meeting within six months after the end of each financial year. Our Board of Directors must convene an extraordinary general shareholders’ meeting within two months of the following events:
| | • | the number of our directors falls below the minimum required by the Company Law or more than one-third of the seats on our Board become vacant, |
| | • | our accrued losses reach one-third of our total share capital, |
| | • | our Board of Directors consider it necessary or our Supervisory Board requests such a meeting; or |
61
| | • | two or more of our shareholders holding shares representing not less than one-tenth of the total number of shares entitled to vote at such a meeting make a written demand to convene such a meeting. |
Meetings of a special class of shareholders must be called in certain enumerated situations when the rights of the holders of such class of shares may be modified or adversely affected, as discussed below. Resolutions proposed by shareholders (including proxies) who hold five (5%) percent or more of the total number of shares must be included on the notice of meetings given and submitted to the meeting.
All our shareholders’ meetings must be convened by our Board of Directors by written notice given to shareholders not less than 45 days before the meeting (or, in the case of holders of Domestic Shares, by way of public notice issued 45-50 days prior to the meeting). Based on the written replies received by us 20 days before a shareholders’ meeting, we shall calculate the number of shares represented by shareholders who have indicated their intention to attend the meeting. Where the number of voting shares represented by those shareholders reaches half of the total number of such shares, we may convene the shareholders’ general meeting. Otherwise, we will, within five days, inform our shareholders again of the motions to be considered and the date and venue of the meeting by way of public announcement. After the announcement is made, the shareholders’ meeting may be convened. The accidental omission by us to give notice of a meeting to, or the non-receipt of notice of a meeting by, a shareholder will not invalidate the proceedings at that shareholders’ meeting.
Restrictions on Share Ownership
Our H Shares may be traded only by investors from foreign countries and investors from Taiwan, Hong Kong and Macao, and may not be sold to PRC investors. Our articles of association provide that PRC investors are not entitled to be registered as holders of H Shares. Our domestic Shares may be owned and traded only by PRC investors.
Restrictions Relating to Change of Control
Our articles of association state that a proposal for our merger or division must be proposed by our Board of Directors, and after it has been approved in accordance with the provisions of the Articles, it shall be submitted for review and approval according to law. Our shareholders who oppose the proposal have the right to require us or shareholders who are in favor of such proposal to purchase their shares at a fair price.
If we are involved in a merger, our articles of association further provide that the parties to the merger must enter into a merger agreement, and prepare balance sheets and lists of property. We are required to notify our creditors within a period of ten (10) days from the date of the resolution approving the merger and make at least three newspaper announcements of the merger within thirty (30) days of that date. Where there is a company division, the parties to the division are required to enter into a division agreement, and prepare balance sheets and lists of property. We are required to notify our creditors within a period of ten (10) days from the date of the resolution approving the division and make at least three newspaper announcements of the division within thirty (30) days from that date.
Enforceability of Shareholders’ Rights
There has not been any public disclosure in relation to the enforcement by H shareholders of their rights under constitutive documents of joint stock limited companies or the Company Law or in the application or interpretation of China or Hong Kong regulatory provisions applicable to PRC joint stock limited companies.
62
In most states of the United States, shareholders may sue a corporation “derivatively.” A derivative suit involves the commencement by a shareholder of a corporate cause of action against persons (including corporate officers, directors, or controlling shareholders) who have allegedly wronged the corporation, where the corporation itself has failed to enforce the claim against such persons directly. Such an action is brought based upon a primary right of the corporation, but is asserted by a shareholder on behalf of the corporation. Because the right to sue derivatively is not available under PRC law, our shareholders may be required to rely on agencies of the Chinese government to enforce the rights of shareholders through administrative proceedings.
Our articles of association are viewed in China as an agreement between us and our shareholders and between each of our shareholders. Our articles of association provide that all differences or claims
| | • | between a holder of H Shares and us; |
| | • | between a holder of H Shares and any of our directors, supervisors, general managers or other senior officers; and |
| | • | between a holder of H Shares and a holder of Domestic Shares, |
arising from any provision of our articles of association or any right or obligation conferred or imposed by the Company Law or any subsequently promulgated laws or regulations replacing the Company Law, concerning our affairs must, with certain exceptions, be referred to arbitration at either the China International Economic and Trade Arbitration Commission in China or the Hong Kong International Arbitration Center. Our articles of association provide that such arbitration will be final and conclusive. In June 1999, an arrangement was approved by the Supreme People’s Court of China and the courts of Hong Kong to mutually enforce arbitration rewards rendered in China and Hong Kong according to their respective laws. This new arrangement was approved by the Supreme People’s Court of China and the Hong Kong Legislative Council and became effective on February 1, 2000. We have provided an undertaking to the Commission that, at such time, if any, as all applicable laws and regulations of China and (unless our shares are no longer listed thereon) all applicable regulations of the Hong Kong Stock Exchange shall not prohibit, our Board of Directors shall propose an amendment to our articles of association which would permit our shareholders to adjudicate disputes arising between them and us, our directors, supervisors or officers by means of judicial proceedings. As far as we are aware, the Hong Kong Stock Exchange has no present intention to revise the applicable regulations.
The holders of our H Shares will not be able to bring actions on the basis of violations of the Listing Rules and must rely on the Hong Kong Stock Exchange to enforce its rules. The Securities (Disclosure of Interests) Ordinance establishes certain obligations in relation to disclosure of shareholder interests in Hong Kong listed companies, the violation of which is subject to prosecution by the Securities and Futures Commission in Hong Kong. The Hong Kong Takeovers and Repurchase Codes do not have the force of law and are only standards of commercial conduct considered acceptable for takeover and merger transactions and share repurchases in Hong Kong as established by the Securities and Futures Commission and the securities and futures industry in Hong Kong.
We have appointed Coudert Brothers LLP, New York, as our agent to receive service of process with respect to any action brought against us in certain courts in New York under US and New York securities laws. However, as China does not have treaties providing for the reciprocal recognition and enforcement of judgments of courts within the United States, the United Kingdom, Japan or most other OECD countries, administrative actions brought by regulatory authorities, such as the Commission, and other actions which result in foreign court judgments, could (assuming such actions are not required by PRC law and our articles of association to be arbitrated) only be enforced in China if such judgments or rulings do not violate the basic principles of the law of China or the sovereignty, security and public interest of the society of China, as determined by a people’s court of China which has the jurisdiction for recognition and enforcement of judgments. We have been advised by our PRC counsel, Haiwen & Partners, that there is doubt as to the enforceability in China of any actions to enforce judgments of United States courts arising out of or based on the ownership of H Shares or ADSs, including judgments arising out of or based on the civil liability provisions of United States federal or state securities laws.
63
Changes in Capital
Increases in Share Capital and Preemptive Rights
Our articles of association require that approval by a special resolution of our shareholders and by special resolution of holders of Domestic Shares and H Shares at separate shareholder class meetings be obtained prior to authorizing, allotting, issuing or granting shares, securities convertible into shares or options, warrants or similar rights to subscribe for any shares or such convertible securities. No such approval is required if, but only to the extent that, we issue Domestic Shares and H Shares, either separately or concurrently, in numbers not exceeding 20% of the number of Domestic Shares and H Shares then in issue, respectively, in any 12-month period, as approved by a special resolution of the shareholders.
New issues of shares must also be approved by the relevant PRC authorities.
Reduction of Share Capital and Purchase of Shares
We may reduce our registered capital only upon obtaining the approval of our shareholders and, in certain circumstances, of relevant PRC authorities. The number of H shares which may be purchased is subject to the Hong Kong Takeovers and Repurchase Codes. Our ability to repurchase any of our own shares is subject to approval by the relevant PRC authorities.
C. Material Contracts
Supply of Materials and Services Agreement with Sinopec and Yanshan Company
Effective August 14, 2000, we entered into a ten-year agreement with Sinopec and Yanshan Company to reflect new arrangements regarding mutual provision of certain materials and services following the establishment of Sinopec as a wholly-owned subsidiary of the Sinopec Group and the transfer of a 70% controlling interest in us by Yanshan Company to Sinopec on February 25, 2000. This agreement replaced the previous supply of materials and services agreement dated April 23, 1997 between us and Yanshan Company, our previous parent, and sets forth the materials, utilities and services to be provided by each party, the basis of charges, and the length of notice by which the provision of any particular material, utility or service may be terminated a party.
Under the terms of the agreement, Sinopec provides us with cracking feedstock, VGO, hydrogenated raffinate oil, heavy oil, mixed xylene, raffinate, benzene, toluene, 1-Butene and propylene. We provide to Sinopec and Yanshan Company propane, C7-C8, cracked heavy matte, styrene, polypropylene, residual by-products, testing and maintenance of measurement instruments and MTBE. We also provide to Yanshan Company LDPE, HDPE, polyoxyethylene, ethylene glycol, diethylene glycol, styrene, polypropylene (granules), polypropylene (powder), polyester tiles, polybutadiene rubber, SBS, phenylic acid and acetone.
Yanshan Company provides us with fresh water, electricity, steam, nitrogen and silver catalyst, and procures storage bags, white mineral oil, mineral oil, alchlor, BCH-Catalyst, 841-Catalyst, heavy packaging film for us. In addition, Yanshan Company provides us with certain ancillary services, including property management, employee benefits, passenger transport and road maintenance, training and education, domestic gas supply, media and communications, construction and installation, maintenance and manufacture of equipment, environmental services, purchasing and sales services, fire and security services, rail & road freight and storage services, and trademark licensing.
64
Each of Sinopec and Yanshan Company has an obligation to provide materials and services to us on a priority basis and has granted us a right of first refusal in respect of such materials and services. We may and would source such materials and services from third parties should such third parties be able to provide the same materials and services on more favorable terms. We may, but are not obligated to, provide materials and services to Sinopec or Yanshan Company.
The categories, scope, pricing mechanism and other details of the relevant materials utilities and services to be provided in each year are to be agreed towards the end of the preceding year in a supplementary agreement between the relevant parties. If the parties are unable to agree to such terms by the end of the preceding year, the terms of supply of materials, utilities and services in effect for the preceding year will continue to apply until the parties reach an agreement or the difference is resolved through mediation.
Sinopec and Yanshan Company will provide materials and services to us at State Prices or market or cost prices, depending on the service or the material. We will provide materials and services to them at market prices. See Item 4. Information on the Company - Business Overview - Raw Materials, Water and Energy Supply.
D. Exchange Controls
Our Articles of Association require that cash dividends on our H Shares be declared in Renminbi and paid in HK dollars. The Articles of Association further stipulate that such dividends must be converted to HK dollars at a rate equal to the average of the closing exchange rates for HK dollars as announced by the PBOC for the calendar week preceding the date on which such dividends are declared.
The Renminbi is currently not a freely convertible currency. The Chinese government imposes control over its foreign currency reserves in part through direct regulation of the conversion of Renminbi into foreign exchange, through control of foreign debts borrowed by domestic enterprises and through restrictions on foreign imports. The State Administration of Foreign Exchange (“SAFE”), under supervision of the PBOC, is responsible for matters relating to foreign exchange administration.
Foreign exchange transactions involving Renminbi must take place through financial institutions authorized to undertake foreign exchange conversion transactions, such as domestic Chinese banks and branches of foreign banks in China. Access to foreign exchange and the ability to remit foreign exchange abroad are regulated by Chinese government policies administered by the SAFE.
Effective January 1, 1994, a unitary, managed floating-rate system was introduced in China to replace the previous dual-track foreign exchange system consisting of two exchange rates. Under this system, the PBOC sets and publishes daily the PBOC Rate, with reference to the prior day’s Renminbi-US dollar trading price on the national inter-bank foreign exchange market, called the China Foreign Exchange Trading System (“CFETS”), established in April 1994. At present, certain State-designated banks, foreign banks and Chinese-funded, non-banking financial institutions, connected through a computer network, are the principal parties participating in the CFETS. The main function of the CFETS is to provide foreign exchange trading and settlement services among the participating members. Based on the PBOC Rate, each participating member sets its own exchange rate for the purpose of buying and selling foreign exchange from its customers. The CFETS is supervised and managed by the SAFE in accordance with PBOC policy.
65
As a result of the adoption of the unitary system, on January 1, 1994, the official exchange rate for Renminbi against the US dollar was revalued from approximately RMB 5.8 to US$ 1.00 to RMB 8.7 to US$ 1.00. As part of the system, the PBOC also publishes the Renminbi rate of exchange against other major currencies by reference of the price of the US dollar in international foreign exchange markets.
The Chinese government announced a policy in late December 1993 that, under the unitary system, the PBOC would try to balance the demand for and supply of foreign currencies in China and stabilize the Renminbi exchange rate mainly through macroeconomic measures, such as monetary policy and interest rates. Nonetheless, if necessary, Chinese government intervention is expected to be used to stabilize the PBOC Rate.
Domestic enterprises, which prior to 1994 had been permitted to retain a portion of their foreign currency earnings, are now required to sell their foreign currency earnings to State-designated banks at the rate used by the relevant CFETS member, which is based on the PBOC Rate, except for such items as the proceeds of foreign currency loans or the issuance of foreign currency-denominated bonds or shares. All international commercial loans borrowed by domestic enterprises have to be registered with the SAFE before the loans become effective. Under the new system, domestic enterprises and institutions are permitted to buy foreign exchange from State-designated banks at designated times upon presentation of appropriate documentation establishing the existence of import contracts or payment notes of overseas financial institutions. Such enterprises and institutions are also permitted under the new system to purchase foreign exchange for the import of certain products subject to quotas, import permits and registration controls. Domestic enterprises are permitted to apply to purchase foreign exchange for the payment of dividends that have been authorized as payable in foreign currency. Conversion and payment must be effected through certain documentation, including a written resolution on profit distribution and evidence that the enterprise has paid all required PRC taxes.
While the impact of the foregoing recent developments are not entirely clear, it appears that the trend in the Chinese government’s foreign exchange policy is moving toward easier convertibility of the Renminbi.
The holders of the ADSs will receive the HK dollar dividend payments in US dollars at conversion rates related to market rates and subject to fees as set forth in our Deposit Agreement with The Bank of New York, as Depositary. Since October 17, 1983, the HK dollar has been linked to the US dollar at the rate of HKD 7.80 = US$ 1.00, and the Hong Kong government has stated its intention to maintain the link at that rate, although there can be no guarantee that the link will be maintained.
E. Taxation
PRC Taxation
The following is a summary of those taxes, including withholding provisions, to which United States security holders are subject under existing laws and regulations of the PRC. The summary is subject to changes in PRC law, including changes that could have retroactive effect. The summary does not take into account or discuss the tax laws of any country other than the PRC, nor does it take into account the individual circumstances of a security holder. This summary does not purport to be a complete technical analysis or an examination of all potential tax effects under such laws and regulations.
66
Tax on Dividends
For an Individual Investor
According to the Individual Income Tax Law of the People’s Republic of China of October 31, 1993, as amended (the “Individual Income Tax Law”) dividends paid by PRC companies to foreign individuals not resident in the PRC are ordinarily subject PRC withholding tax at a flat rate of 20%.
However, pursuant to the Notice Concerning the Taxation of Gains on Transfer and Dividends from Shares (Equities) Received by Foreign Investment Enterprises, Foreign Enterprises and Foreign Individuals (the “Tax Notice”), issued by the PRC State Tax Bureau (now the State Administration of Taxation or “SAT”) on July 21, 1993, dividends paid by PRC companies, with respect to their shares listed on an overseas stock exchange (“Overseas Shares”), such as H Shares (including H Shares represented by ADSs), or on domestically-listed foreign invested shares (“B Shares”), to foreign individuals not resident in the PRC, are temporarily exempt from PRC withholding tax. The Tax Notice remains in force and the relevant tax authority has thus far not collected withholding tax on dividends paid by PRC companies, with respect to their Overseas Shares and B Shares, to foreign individuals not resident in the PRC.
In the event that the Tax Notice is withdrawn, a 20% withholding tax may be imposed in accordance with the Individual Income Tax Law and the Rate Reduction Notice, subject to reduction by an applicable income tax treaty.
For a Corporation
According to the Income Tax Law of the People’s Republic of China for Enterprises with Foreign Investment and Foreign Enterprises of April 9, 1991, as amended (the “Foreign Corporate Income Tax Law”), dividends paid by PRC companies to foreign corporations are ordinarily subject to PRC withholding tax at a flat rate of 20%. This flat rate was reduced to 10% for those dividends ordinarily subject to PRC withholding tax and paid after January 1, 2000 pursuant to the Notice on Questions Relating to Reduced Income Tax on Foreign Enterprise Income in China from Interest, etc., issued by the State Council on November 18, 2000 (the “Rate Reduction Notice”).
However, pursuant to the Tax Notice, dividends paid by PRC companies, with respect to their Overseas Shares and B Shares, to foreign corporations are temporarily exempt from PRC withholding tax. Again, the Tax Notice remains in force and the relevant tax authority has thus far not collected withholding tax on dividends paid by PRC companies, with respect to their Overseas Shares and B Shares, to foreign corporations.
In the event that the Tax Notice is withdrawn, a 10% withholding tax may be imposed in accordance with the Foreign Corporate Income Tax Law and the Rate Reduction Notice, subject to reduction by an applicable income tax treaty.
Capital Gains Tax
According to the Individual Income Tax Law, the Foreign Corporate Income Tax Law, their respective implementing regulations, and the Rate Reduction Notice, capital gains recognized by foreign individuals not resident in the PRC and foreign corporations, with respect to their sale of equity shares of PRC companies, are ordinarily subject to PRC tax, purportedly in the form of withholding tax, at a flat rate of 20% and 10% respectively.
However, pursuant to the Tax Notice, capital gains recognized by foreign individuals not resident in the PRC and foreign corporations, with respect to their sale of Overseas Shares and B Shares are temporarily exempt from PRC tax. As stated above, the Tax Notice remains in force and the relevant tax authority has thus far not sought to collect PRC tax on capital gains recognized by foreign individuals not resident in the PRC and foreign corporations with respect to their sale of Overseas Shares and B Shares.
67
In the event that the Tax Notice is withdrawn, PRC tax, at a rate of 20% for individuals or 10% for corporations may be imposed in accordance with the Individual Income Tax Law, the Corporate Income Tax Law, their respective implementing regulations and the Rate Reduction Notice, subject to reduction by an applicable income tax treaty.
Tax Treaties
The PRC has an income tax treaty with the United States that currently limits the rate of PRC withholding tax to 10% for dividends we pay to individuals and corporations that qualify for treaty protection. However, this treaty does not offer protection for capital gains. Since the Tax Notice remains in force to temporarily exempt dividends and capital gains from the above described PRC taxes, this treaty is not relevant at this time.
Stamp Tax
PRC stamp tax is not applicable to the acquisition or disposition of shares in a PRC company made outside of the PRC pursuant to the Provisional Regulations of the People’s Republic of China Concerning Stamp Tax effective on October 1, 1998.
Estate or Gift Tax
The PRC does not currently impose any estate or gift tax.
United States Taxation
The following is a summary of the material United States federal income tax considerations that are relevant to holders of H shares or ADSs. This summary is based upon existing United States federal income tax law, which is subject to change, possibly with retroactive effect. This summary does not discuss all aspects of United States federal income taxation that may be important to particular holders in light of their individual circumstances. In particular, this discussion does not address the potential application of the alternative minimum tax or the United States federal income tax consequences to US Holders (as defined below) that are subject to special tax rules, including US Holders that:
| | • | are financial institutions or financial services entities; |
| | • | are insurance companies or broker-dealers; |
| | • | are tax-exempt organizations; |
| | • | are partnerships or other flow-through entities; |
| | • | have elected mark-to-market accounting; |
| | • | own directly or by attribution 10% or more of the voting power of us; |
| | • | that hold H shares or ADSs as part of a straddle, hedge, conversion, or constructive sale transaction for United States federal income tax purposes; or |
| | • | that have a functional currency other than the United States dollar. |
In general, for United States federal income tax purposes and for purposes of the income tax treaty between China and the United States, beneficial owners of ADSs will be treated as the beneficial owners of the H shares represented by those ADSs. Accordingly, no gain or loss will be recognized for United States federal income tax purposes upon the exchange of ADSs for H shares. A US Holder’s tax basis in the withdrawn H shares will be the same as the tax basis in the ADSs surrendered therefor, and the holding period in the withdrawn H shares will include the period during which the holder held the surrendered ADSs.
68
For purposes of this summary, a US Holder is a beneficial owner of H shares or ADSs that is for United States federal income tax purposes:
| | • | an individual who is a citizen or resident of the United States; |
| | • | a corporation or other entity treated as a corporation that is created in or organized under the laws of the United States or any State or political subdivision thereof; |
| | • | an estate the income of which is includable in gross income for United States federal income tax purposes regardless of its source; |
| | • | a trust the administration of which is subject to the primary supervision of a United States court and which has one or more United States persons who have the authority to control all substantial decisions of the trust; |
| | • | a trust that was in existence on August 20, 1996, was treated as a United States person for United States federal income tax purposes on the previous day, and elected to continue to be so treated; or |
| | • | a person otherwise subject to United States federal income tax on its worldwide income. |
The treatment of a partner of a partnership (or of an entity treated as a partnership for United States federal income tax purposes) as a US Holder may depend upon the status of the partner as a US Holder (irrespective of the status of the partnership) and upon the nature and activities of the partnership. Partners of partnerships (or of entities treated as partnerships for United States federal income tax purposes) holding H shares or ADSs should consult their tax advisors as to the tax consequences of owning and disposing of such H shares or ADSs.
A beneficial owner of H shares or ADSs that is not a US Holder is referred to herein as a “Non-US Holder.” Certain material aspects of United States federal income tax relevant to Non-US Holders of H shares or ADSs are discussed below.
If we were to be classified as a “passive foreign investment company (a “PFIC”) in any taxable year, a US Holder would be subject to special rules generally intended to reduce or eliminate any benefits from the deferral of United States Federal income tax that a US Holder could derive from investing in a foreign company that does not distribute all of its earnings on a current basis. A foreign corporation will be treated as a PFIC for United States federal income tax purposes if 75% or more of its gross income consists of certain types of “passive” income or 50% or more of its assets are passive. We presently believe that we are not a PFIC and do not anticipate becoming a PFIC. This is, however, a factual determination made on an annual basis and is subject to change. The following discussion assumes that we will not be subject to treatment as a PFIC for United States federal income tax purposes.
Taxation of Dividends
For United States federal income tax purposes, the gross amount of a distribution made by us in respect of H shares or ADSs owned by a US Holder, including any amounts of PRC tax withheld on the distribution, will be treated as dividend income to such US Holder to the extent paid out of our current or accumulated earnings and profits, as determined for United States federal income tax purposes. Such dividend income will not be eligible for the dividends received deduction generally allowed to corporations under Section 243 of the United States Internal Revenue Code. To the extent the distribution exceeds the US Holder’s allocable share of our current and accumulated earnings and profits, the excess will be applied first to reduce the US Holder’s basis in his or her H shares or ADSs, and any remaining excess will constitute gain from the deemed sale or exchange of such H shares or ADSs. See “Sale or Other Disposition of H shares or ADSs” below.
69
Dividends that are paid by us in HK dollars will be included in the income of a US Holder in a US dollar amount calculated by reference to the exchange rate in effect on the date of receipt thereof by the depositary, in the case of ADSs, or by the US Holder, in the case of H shares held directly by such US Holder, regardless of whether the payment is in fact converted into US dollars. If the dividends paid in HK dollars are converted into US dollars on the date of receipt by the depositary, in the case of ADSs, or by the US Holder, in the case of H shares held directly by such US Holder, US Holders generally should not be required to recognize foreign currency gain or loss in respect of the dividend income. In the case of dividends paid in HK dollars that are not converted into US dollars on the date of receipt, the amount of HK dollars received will have a tax basis equal to their US dollar value at the time of receipt, and any gain or loss realized upon a subsequent conversion or other disposition of the HK dollar amount will be treated as ordinary income or loss from sources within the United States.
A US Holder may be eligible, subject to a number of complex limitations, to claim a foreign tax credit in respect of any PRC withholding taxes imposed on such dividends. US Holders who do not elect to claim a foreign tax credit for the amount of such withholdings may instead claim a deduction in respect of such withholding tax, but only for a year in which the US Holder elects to do so for all creditable foreign income taxes. As discussed in “PRC Taxation - Tax on Dividends,” dividends paid on the H shares and ADSs temporarily are exempt from PRC withholding tax, although such taxes could be imposed in the future. For purposes of computing the foreign tax credit, dividends received on H shares or ADSs would be considered foreign source income, and generally would be treated as “passive income” or, in the case of some US Holders, “financial services income,” which are treated separately from other types of income.
The Jobs and Growth Tax Relief Reconciliation Act of 2003 (P.L. 108-27, 117 Stat. 752) (the “2003 Act”), was enacted on May 28, 2003. The 2003 Act generally provides that “qualified dividend income” received by an individual shareholder from either a domestic corporation or a “qualified foreign corporation” is subject to tax at the reduced rates applicable to certain capital gains (15%; 5% for taxpayers in the lower bracket; zero for lower bracket taxpayers in 2008), provided that certain holding period requirements are satisfied and none of certain exceptions apply. A qualified foreign corporation includes a foreign corporation that, among other things, is (i) eligible for benefits of a comprehensive income tax treaty with the United States which the Secretary determines is satisfactory for purposes of this provision and which includes an exchange of information program, or (ii) whose stock is readily tradable on an established securities market in the United States.
The U.S. Internal Revenue Service has issued Notice 2003-69, 2003-42 I.R.B. 851, which provides the current list of the U.S. income tax treaties that meet these requirements. Included on the list of U.S. income tax treaties meeting these requirements is the income tax treaty between the United States and China. We are a resident of China for purposes of the treaty and should satisfy the requirements under the limitation on benefits provision contained in the treaty. Accordingly, we believe that dividends paid by us with respect to our shares or ADSs should constitute “qualified dividend income” for U.S. federal income tax purposes, provided that the holding period requirements are satisfied and that none of certain other special exceptions apply. As currently enacted, the 2003 Act’s reduced tax rates expire for tax years beginning after December 31, 2008.
Sale or Other Disposition of H shares or ADSs
A US Holder will recognize capital gain or loss upon the sale or other disposition of H shares or ADSs in an amount equal to the difference between the amount realized upon the disposition and the US Holder’s adjusted tax basis in such H shares or ADSs, as each is determined in US dollars. Any capital gain or loss will be long-term if the H shares or ADSs have been held for more than one year and generally will be United States source gain or loss for foreign tax credit limitation purposes. Capital gain of certain non-corporate U.S. Holders, including individuals, is generally taxed at a maximum rate of 15% pursuant to the 2003 Act when the property has been held for more than one year. The claim of a deduction in respect of a capital loss, for United States federal income tax purposes, may be subject to limitations.
70
Non-US Holders
Except as described in “Information Reporting and Backup Withholding” below, an investment in H shares or ADSs by a Non-US Holder generally will not give rise to any United States federal income tax consequences unless:
| | • | the dividends received or gain recognized on the sale of H shares or ADSs by such person are treated as effectively connected with the conduct of a trade or business by such person in the United States as determined under United States federal income tax law; or |
| | • | in the case of gains recognized on a sale of H shares or ADSs by an individual, such individual is present in the United States for 183 days or more and certain other conditions are met. |
Information Reporting and Backup Withholding
Proceeds from the sale, exchange or redemption of, and dividends on, H shares or ADSs paid within the United States or through certain US-related financial intermediaries to US Holders are subject to information reporting and may be subject to backup withholding at the rate of 28% unless the US Holder (1) is a corporation or other exempt recipient or (2) provides a taxpayer identification number and certifies that no loss of exemption from backup withholding has occurred.
Non-US Holders generally are not subject to information reporting or backup withholding on the proceeds from the sale, exchange or redemption of, or dividends on, the H shares or ADSs, provided they complete, and provide the payer with, an Internal Revenue Service Form W-8BEN, or other documentary evidence certifying that such Non-US Holder is an exempt foreign person.
Any amount withheld from a payment to a US Holder or Non-US Holder under the backup withholding rules will be allowable as a credit against such US Holder’s or Non-US Holder’s United States federal income tax liability, and may entitle the holder to a refund, provided that required information is furnished to the United States Internal Revenue Service.
Both US Holders and Non-US Holders should consult their own tax advisors as to the application to them of the United States federal information reporting and backup withholding requirements and their qualification, if any, for an exemption under these rules.
This discussion, which does not address any aspects of United States taxation other than United States federal income taxation relevant to the ownership and disposition of H shares and ADRs, is of a general nature only and is not intended to be, and should not be construed to be, legal or tax advice to any holder, and no representation with respect to the tax consequences to any particular holder is made. DUE TO THE INDIVIDUAL NATURE OF TAX CONSEQUENCES, BOTH US HOLDERS AND NON-US HOLDERS ARE URGED TO CONSULT THEIR OWN TAX ADVISORS WITH RESPECT TO THE PARTICULAR TAX CONSEQUENCES TO THEM OF OWNING AND DISPOSING OF H SHARES AND ADSs, INCLUDING THE EFFECTS OF UNITED STATES FEDERAL, ESTATE, GIFT, STATE, LOCAL, FOREIGN AND OTHER TAX CONSEQUENCES.
71
F. Dividends and Paying Agents
Not applicable.
G. Statement by Experts
Not applicable.
H. Documents on Display
We are subject to the informational requirements of the Securities Exchange Act of 1934, as amended (the “Exchange Act”). In accordance with these requirements, we file reports with and submit other information to the Securities and Exchange Commission. These materials, including this annual report and the exhibits hereto, may be inspected and copied at the Commission’s Public Reference Room at 450 Fifth Street, N.W., Washington, D.C. 20549 and at the Commission’s regional office at 233 Broadway, New York, NY 10279. Copies of the materials may be obtained from the Public Reference Room at prescribed rates. The public may obtain information on the operation of the Commission’s Public Reference Room by calling the Commission in the United States at 1-800-SEC-0330. Additionally, copies of this material may also be obtained from the Securities and Exchange Commission’s Internet site at http://www.sec.gov.
I. Subsidiary Information.
Not applicable.
ITEM 11. QUANTITATIVE AND QUALITATIVE DISCLOSURES ABOUT MARKET RISK
Our primary market risk exposures are to fluctuations in refined product and petrochemical prices, exchange rates and interest rates.
Commodity Price Risk
We are exposed to fluctuations in prices of refined products and petrochemicals whose prices are volatile. We purchase substantial volumes of refined products from domestic suppliers and sell substantial volumes of petrochemicals to domestic buyers. We do not enter into commodity derivative instruments or futures to hedge the potential price fluctuations of these products or for other purposes. Therefore, fluctuations of prices of refined products and petrochemicals have a significant effect on our operating expenses and net profits.
Foreign Exchange Rate Risk
A portion of our Renminbi revenues are converted into other currencies to meet foreign currency financial instrument obligations and to pay for imported materials and equipment.
The Renminbi is not a freely convertible currency. Actions taken by the PRC government could cause future exchange rates to vary significantly from current or historical exchange rates. Although the Renminbi to US dollar exchange rate has been relatively stable since 1994, we can neither predict nor give any assurance of its future stability. Fluctuations in exchange rates may adversely affect the value, translated or converted into US dollars or HK dollars, of our net assets, earnings and any declared dividends. We cannot give any assurance that any future movements in the exchange rate of the Renminbi against the US dollar and other foreign currencies will not adversely affect our results of operations and financial condition. However, we believe that significant depreciation in the Renminbi against major foreign currencies may have a material adverse impact on our capital expenditure program.
72
The following presents various market risk information regarding market-sensitive financial instruments that we held or issued as of December 31, 2003 and 2002. All financial instruments that we held or issued were for purposes other than trading purposes. We conduct our business primarily in Renminbi, which is also our functional and reporting currency.
As of December 31, 2003
Expected maturity
| | | | | | | | | | | | | | | | | |
| | | 2004
| | | 2005
| | | 2006
| | | 2007
| | 2008
| | Total
| | Fair value
|
| | | (RMB equivalent in thousands, except interest rate) |
| Assets | | | | | | | | | | | | | | | | | |
| | | | | | | |
Cash and cash equivalents | | | | | | | | | | | | | | | | | |
In US dollar | | 1,950 | | | — | | | — | | | — | | — | | 1,950 | | 1,950 |
In HK dollar | | 60 | | | — | | | — | | | — | | — | | 60 | | 60 |
| | | | | | | |
| Liabilities | | | | | | | | | | | | | | | | | |
| | | | | | | |
Debts in US$ | | | | | | | | | | | | | | | | | |
Variable rates | | 18,401 | | | 9,193 | | | 887,166 | | | — | | — | | 914,760 | | 914,760 |
Average interest rates(1) | | 2.19 | % | | 2.19 | % | | 2.87 | % | | — | | — | | | | |
| (1) | The average interest rates for variable loans are calculated based on the rates reported as of December 31, 2003. |
As of December 31, 2002
Expected maturity
| | | | | | | | | | | | | | | | |
| | | 2003
| | | 2004
| | | 2005
| | | 2006
| | | Total
| | Fair value
|
| | | (RMB equivalent in thousands, except interest rate) |
| Assets | | | | | | | | | | | | | | | | |
| | | | | | |
Cash and cash equivalents | | | | | | | | | | | | | | | | |
In US Dollar | | 2,691 | | | — | | | — | | | — | | | 2,691 | | 2,691 |
In HK dollar | | 61 | | | — | | | — | | | — | | | 61 | | 61 |
| | | | | | |
| Liabilities | | | | | | | | | | | | | | | | |
| | | | | | |
Debts in US Dollar | | | | | | | | | | | | | | | | |
Variable rates | | 201,402 | | | 18,393 | | | 9,203 | | | 699,947 | | | 928,945 | | 928,945 |
Average interest rates(1) | | 1.93 | % | | 2.38 | % | | 2.38 | % | | 3.63 | % | | | | |
| (1) | The average interest rates for variable loans are calculated based on the rates reported as of December 31, 2002. |
73
Interest Rate Risk
We are exposed to interest rate risk resulting from fluctuations in interest rates on our short and long-term debt. Upward fluctuations in interest rates increase the cost of new debt and the interest cost of outstanding floating rate borrowings.
Our debts consist of fixed and variable rate debt obligations with original maturities ranging from 1 to 5 years. Fluctuations in interest rates can lead to significant fluctuations in the fair values of our debt obligations.
The following tables present principal cash flows and related weighted average interest rates by expected maturity dates of our interest rate sensitive financial instruments as of December 31, 2003 and 2002.
As of December 31, 2003
Expected maturity
| | | | | | | | | | | | | | | | | |
| | | 2004
| | | 2005
| | | 2006
| | | 2007
| | 2008
| | Total
| | Fair value
|
| | | (RMB equivalent in thousands, except interest rates) |
| Assets | | | | | | | | | | | | | | | | | |
| | | | | | | |
Cash and cash equivalents | | | | | | | | | | | | | | | | | |
In RMB | | 229,437 | | | — | | | — | | | — | | — | | 229,437 | | 229,437 |
In US Dollar | | 1,950 | | | — | | | — | | | — | | — | | 1,950 | | 1,950 |
In HK Dollar | | 60 | | | — | | | — | | | — | | — | | 60 | | 60 |
| | | | | | | |
| Liabilities | | | | | | | | | | | | | | | | | |
| | | | | | | |
Debts in RMB | | | | | | | | | | | | | | | | | |
Fixed interest rates | | 1,100,000 | | | 700,000 | | | — | | | — | | — | | 1,800,000 | | 1,800,000 |
Average interest rates | | 4.60 | % | | 4.94 | % | | — | | | — | | — | | | | |
| | | | | | | |
Variable interest rates | | 70,000 | | | — | | | — | | | — | | — | | 70,000 | | 70,000 |
Average interest rates(1) | | 4.54 | % | | — | | | — | | | — | | — | | | | |
| | | | | | | |
Debts in US Dollar | | | | | | | | | | | | | | | | | |
Variable interest rates | | 18,401 | | | 9,193 | | | 887,166 | | | — | | — | | 914,760 | | 914,760 |
Average interest rates(1) | | 2.19 | % | | 2.19 | % | | 2.87 | % | | — | | — | | | | |
| (1) | The average interest rates for variable loans are calculated based on the rates reported as of December 31, 2003. |
74
As of December 31, 2002
Expected maturity
| | | | | | | | | | | | | | | | |
| | | 2003
| | | 2004
| | | 2005
| | | 2006
| | | Total
| | Fair value
|
| | | (RMB equivalent in thousands, except interest rates) |
| Assets | | | | | | | | | | | | | | | | |
| | | | | | |
Cash and cash equivalents | | | | | | | | | | | | | | | | |
In RMB | | 259,883 | | | — | | | — | | | — | | | 259,883 | | 259,883 |
In US Dollar | | 2,691 | | | — | | | — | | | — | | | 2,691 | | 2,691 |
In HK Dollar | | 61 | | | — | | | — | | | — | | | 61 | | 61 |
| | | | | | |
| Liabilities | | | | | | | | | | | | | | | | |
| | | | | | |
Debts in RMB | | | | | | | | | | | | | | | | |
Fixed rates | | 1,755,000 | | | — | | | 1,200,000 | | | — | | | 2,955,000 | | 2,955,000 |
Average interest rates | | 5.31 | % | | — | | | 4.94 | % | | — | | | | | |
Variable rates | | 200,000 | | | — | | | — | | | — | | | 200,000 | | 200,000 |
Average interest rates(1) | | 3.63 | % | | — | | | — | | | — | | | | | |
Debts in US Dollar | | | | | | | | | | | | | | | | |
Variable rates | | 201,402 | | | 18,393 | | | 9,203 | | | 699,947 | | | 928,945 | | 928,945 |
Average interest rates(1) | | 1.93 | % | | 2.38 | % | | 2.38 | % | | 3.63 | % | | | | |
| (1) | The average interest rates for variable loans are calculated based on the rates reported as of December 31, 2002. |
ITEM 12. DESCRIPTION OF SECURITIES OTHER THAN EQUITY SECURITIES
Not applicable.
75
PART II
ITEM 13. DEFAULTS, DIVIDEND ARREARAGES AND DELINQUENCES
We did not incur any material delinquency with respect to our liabilities, nor did we incur any default on the payment of dividends.
ITEM 14. MATERIAL MODIFICATIONS TO THE RIGHTS OF SECURITY HOLDERS AND USE OF PROCEEDS
There have been no such material modifications.
ITEM 15. CONTROLS AND PROCEDURES
The term “disclosure controls and procedures” is defined in Rules 13a-14(c) and 15d-14(c) of the Exchange Act. These rules refer to the controls and other procedures of a company that are designed to ensure that information required to be disclosed by a company in the reports that it files under the Exchange Act is recorded, processed, summarized and reported within required time periods. This includes controls and procedures designed to ensure that information required to be disclosed is accumulated and communicated to our management, including our principal executive officer or officers and principal financial officer or officers, to allow timely decisions regarding required disclosure.
The Board of Directors adopted a written policy in April 2003 that governs the collection, coordination and disclosure of information to our shareholders, the public and to governmental and other regulatory bodies. All such disclosures are coordinated by the Secretary of the Board and subject to execution by either the Chairman of the Board or, for disclosures by our Board of Supervisors, the Chairman of the Board of Supervisors. Under the policy, all material issues must be disclosed and our disclosures must be true, accurate, complete and timely without any false or misleading statements. Each of our departments and subsidiaries have their own supplemental policies which may be both written and unwritten.
Our chief executive officer and our chief financial officer have evaluated the effectiveness of our disclosure controls and procedures, and they have concluded that, as of the end of the period covered by this report based on such evaluation, such controls and procedures were effective at ensuring that required information will be disclosed on a timely basis in our reports filed under the Exchange Act.
We have not made any significant changes, including corrective actions based on these investigations with regard to significant deficiencies or material weaknesses, in our internal controls or in other factors that could significantly affect these controls.
Although we believe our existing disclosure controls and procedures are adequate to enable us to comply with our disclosure obligations, we do not expect that our disclosure controls and procedures or our other internal controls can prevent all errors and all fraud or that our evaluation of these controls and procedures can provide absolute assurance that all control issues and instances of fraud, if any, have been detected. The benefits of controls and procedures must be considered relative to their costs, and the design of any system of controls is based in part upon assumptions about the likelihood of future events. Over time, controls and procedures may become inadequate because of changes in conditions, or the degree of compliance with the policies or procedures may
76
deteriorate. Because of these and other inherent limitations in controls and procedures, misstatements or omissions due to error or fraud may occur and not be detected. In part to mitigate this risk, we plan to further refine our controls and procedures in light of developing practice in this area and emerging standards and mandatory rules.
We maintain a system of internal accounting controls that are designed to provide reasonable assurance that our books and records accurately reflect our transactions and that our established policies and procedures are carefully followed. For the year ended December 31, 2003, there were no significant changes to our internal controls or in other factors that could significantly affect our internal controls.
ITEM 16A. AUDIT COMMITTEE FINANCIAL EXPERT
In 2003, our Board of Directors has not determined that at least one “audit committee financial expert” serves on its audit committee. Due to the dual listings on the Hong Kong Stock Exchange and the New York Stock Exchange, we are looking for a financial expert who has good knowledge of and experience in both the accounting principles in Hong Kong and the U.S., and, if possible, is familiar with our business operation. It is extremely difficult to find such a financial expert in the mainland of the PRC. Therefore, it takes time to find such an expert from limited number of qualified candidates.
ITEM16B. CODE OF ETHICS
We have adopted a code of ethics that applies to our Chairman, General Manager, Chief Financial Officer and other senior officers. We have filed this code of ethics as an exhibit to this Annual Report.
ITEM 16C. PRINCIPAL AUDITORS’ FEES AND SERVICES
The following table sets forth the aggregate audit fees paid to our principal auditors for professional service for each of the past fiscal years 2002 and 2003. All such services were performed by full-time permanent employees.
| | | | | | | | |
| | | Audit Fees
| | Audit-Related Fees
| | Tax Fees
| | All Other Fees
|
2002 | | RMB 2.35million | | — | | — | | — |
2003 | | RMB 2.98million | | — | | — | | — |
Under current procedures, the audit committee must pre-approve all services to be performed by our auditors. Our audit committee granted such prior approval for all services rendered in 2003.
PART III
ITEM 17. FINANCIAL STATEMENTS
We have elected to provide the financial statements and related information specified in Item 18 in lieu of Item 17.
77
ITEM 18. FINANCIAL STATEMENTS
See pages F-1 to F-8 following Item 19.
ITEM 19. EXHIBITS
Report of independent public accounting firm
Balance sheets as of December 31, 2002 and 2003
Statements of operations for the years ended December 31, 2001, 2002 and 2003
Statements of cash flows for the years ended December 31, 2001, 2002 and 2003
Statements of shareholders’ equity for the years ended December 31, 2001, 2002 and 2003
Notes to financial statements
| B. | Exhibits to this Annual Report |
Exhibit Index
| | |
Exhibit
Number
| | Description of Document
|
| 1.1* | | The articles of association as approved by Beijing Yanhua on June 27, 2003. |
| |
| 2.1 | | Form of Deposit Agreement among Beijing Yanhua, The Bank of New York and owners from time to time of American Depositary Receipts issued thereunder, including the form of American Depositary Receipt, incorporated by reference to Exhibit 4.3 to our Registrations Statement on Form F-1 filed with the Securities and Exchange Commission on June 3, 1997 (File No.333-6994). |
| |
| 4.1 | | Supply of Materials and Services Agreement between Beijing Yanhua, Sinopec and Yanshan Company dated August 14, 2000, incorporated by reference to Exhibit 4.1 to our Annual Report on Form 20-F for the year ended December 31, 2000. |
| |
| 4.2 | | Form of Labor Contract between Beijing Yanhua and its specified directors, supervisors, and senior managers, incorporated by reference to Exhibit 4.2 to our Annual Report on Form 20-F for the year ended December 31, 2001. |
| |
| 11.1* | | Code of Ethics (English Translation) |
| |
| 12.1* | | Certification of the Chairman |
| |
| 12.2* | | Certification of the Chief Financial Officer |
78
| | | |
| 13.1 | * | | Certification of the Chairman pursuant to Rule 13 (a) – 14 (b) promulgated under the U.S. Securities Exchange Act |
| |
| 13.2 | * | | Certification of the Chief Financial Officer pursuant to Rule 13 (a) – 14 (b) promulgated under the U.S. Securities Exchange Act |
79
SIGNATURES
The registrant hereby certifies that it meets all of the requirements for filing on Form 20-F and that it has duly caused and authorized the undersigned to sign this annual report on its behalf.
| | |
SINOPEC BEIJING YANHUA PETROCHEMICAL COMPANY LIMITED |
| |
| By: | | /s/ DU GUOSHENG
|
| Name: | | Du Guosheng |
| Title: | | Chairman of the Board of Directors |
Dated: June 16, 2004
80
SINOPEC BEIJING YANHUA PETROCHEMICAL COMPANY LIMITED
INDEX TO FINANCIAL STATEMENTS
F-1
REPORT OF INDEPENDENT PUBLIC ACCOUNTING FIRM
The Board of Directors and Shareholders of
Sinopec Beijing Yanhua Petrochemical Company Limited:
We have audited the accompanying balance sheets of Sinopec Beijing Yanhua Petrochemical Company Limited (the “Company”) as of December 31, 2002 and 2003, and the related statements of operations, cash flows, and shareholders’ equity for each of the years in the three-year period ended December 31, 2003, all expressed in Renminbi. These financial statements are the responsibility of the Company’s management. Our responsibility is to express an opinion on these financial statements based on our audits.
We conducted our audits in accordance with the standards of the Public Company Accounting Oversight Board (United States). Those standards require that we plan and perform the audit to obtain reasonable assurance about whether the financial statements are free of material misstatement. An audit includes examining, on a test basis, evidence supporting the amounts and disclosures in the financial statements. An audit also includes assessing the accounting principles used and significant estimates made by management, as well as evaluating the overall financial statement presentation. We believe that our audits provide a reasonable basis for our opinion.
In our opinion, the financial statements referred to above present fairly, in all material respects, the financial position of Sinopec Beijing Yanhua Petrochemical Company Limited as of December 31, 2002 and 2003, and the results of its operations and its cash flows for each of the years in the three-year period ended December 31, 2003, in conformity with International Financial Reporting Standards promulgated by the International Accounting Standards Board.
International Financial Reporting Standards vary in certain significant respects from accounting principles generally accepted in the United States of America. Information relating to the nature and effect of such differences is presented in Note 27 to the financial statements.
The accompanying financial statements as of and for the year ended December 31, 2003 have been translated into United States dollars solely for the convenience of the readers. We have audited the translation, and in our opinion, the financial statements expressed in Renminbi have been translated into United States dollars on the basis set forth in Note 2(a) to the financial statements.
KPMG
Hong Kong, China
April 2, 2004
F-2
SINOPEC BEIJING YANHUA PETROCHEMICAL COMPANY LIMITED
BALANCE SHEETS
AS OF DECEMBER 31, 2002 AND 2003
(Amounts in thousands)
| | | | | | | | |
| | | | | December 31,
|
| | | | | 2002
| | 2003
| | 2003
|
| | | Note | | RMB | | RMB | | USD |
| Assets | | | | | | | | |
Current assets | | | | | | | | |
Cash and cash equivalents | | | | 262,635 | | 231,447 | | 27,964 |
Trade receivables, net | | 3 | | 285,594 | | 207,686 | | 25,093 |
Bills receivable | | 3 | | 232,609 | | 215,435 | | 26,029 |
Inventories | | 4 | | 985,119 | | 1,011,328 | | 122,190 |
Prepayments and other current assets | | 5 | | 262,410 | | 157,128 | | 18,984 |
| | | | |
| |
| |
|
Total current assets | | | | 2,028,367 | | 1,823,024 | | 220,260 |
| | | | |
| |
| |
|
Non-current assets | | | | | | | | |
Property, plant and equipment, net | | 6 | | 7,900,990 | | 7,388,120 | | 892,641 |
Deferred tax assets | | 7 | | 330,450 | | 334,167 | | 40,374 |
| | | | |
| |
| |
|
Total non-current assets | | | | 8,231,440 | | 7,722,287 | | 933,015 |
| | | | |
| |
| |
|
Total assets | | | | 10,259,807 | | 9,545,311 | | 1,153,275 |
| | | | |
| |
| |
|
| Liabilities and Shareholders’ Equity | | | | | | | | |
Current liabilities | | | | | | | | |
Short-term bank loans | | 10 | | 1,776,402 | | 1,088,401 | | 131,502 |
Loans from parent companies and fellow subsidiaries | | 11 | | 380,000 | | 100,000 | | 12,082 |
Trade payables | | 8 | | 150,185 | | 169,800 | | 20,515 |
Bills payable | | 8 | | 130,000 | | 30,000 | | 3,625 |
Accruals and other payables | | 9 | | 587,573 | | 529,762 | | 64,006 |
Income tax payable | | | | — | | 128,964 | | 15,582 |
| | | | |
| |
| |
|
Total current liabilities | | | | 3,024,160 | | 2,046,927 | | 247,312 |
| | | | |
| |
| |
|
Non-current liabilities | | | | | | | | |
Long-term bank loans | | 10 | | 1,927,543 | | 1,596,359 | | 192,874 |
Deferred tax liabilities | | 7 | | 286,157 | | 246,193 | | 29,745 |
| | | | |
| |
| |
|
Total non-current liabilities | | | | 2,213,700 | | 1,842,552 | | 222,619 |
| | | | |
| |
| |
|
Total liabilities | | | | 5,237,860 | | 3,889,479 | | 469,931 |
| | | | |
| |
| |
|
Shareholders’ equity | | | | | | | | |
Share capital | | 12 | | 3,374,000 | | 3,374,000 | | 407,650 |
Share premium | | | | 774,630 | | 774,630 | | 93,592 |
Reserves | | 13 | | 12,908 | | 82,567 | | 9,976 |
Retained earnings | | 13(e) | | 860,409 | | 1,424,635 | | 172,126 |
| | | | |
| |
| |
|
Total shareholders’ equity | | | | 5,021,947 | | 5,655,832 | | 683,344 |
| | | | |
| |
| |
|
Total liabilities and shareholders’ equity | | | | 10,259,807 | | 9,545,311 | | 1,153,275 |
| | | | |
| |
| |
|
See accompanying notes to financial statements.
F-3
SINOPEC BEIJING YANHUA PETROCHEMICAL COMPANY LIMITED
STATEMENTS OF OPERATIONS
FOR THE YEARS ENDED DECEMBER 31, 2001, 2002 AND 2003
(Amounts in thousands, except per share data)
| | | | | | | | | | | | | | |
| | | | | Years ended December 31,
| |
| | | | | 2001
| | | 2002
| | | 2003
| | | 2003
| |
| | | Note | | RMB | | | RMB | | | RMB | | | USD | |
Sales | | 14 | | 5,975,255 | | | 9,443,061 | | | 11,473,928 | | | 1,386,293 | |
Cost of sales | | | | (5,660,191 | ) | | (8,368,029 | ) | | (9,723,562 | ) | | (1,174,812 | ) |
| | | | |
|
| |
|
| |
|
| |
|
|
Gross profit | | | | 315,064 | | | 1,075,032 | | | 1,750,366 | | | 211,481 | |
Selling, general and administrative expenses | | | | (565,412 | ) | | (530,571 | ) | | (721,418 | ) | | (87,162 | ) |
Other operating income | | | | 30,053 | | | 55,979 | | | 73,196 | | | 8,844 | |
Other operating expenses | | | | (31,143 | ) | | (55,687 | ) | | (40,117 | ) | | (4,847 | ) |
Gain/(loss) on disposal of property, plant and equipment, net | | 16 | | 147,737 | | | (3,195 | ) | | (18,984 | ) | | (2,294 | ) |
Employee reduction expenses | | 17 | | (246,943 | ) | | — | | | — | | | — | |
| | | | |
|
| |
|
| |
|
| |
|
|
Operating (loss)/income | | | | (350,644 | ) | | 541,558 | | | 1,043,043 | | | 126,022 | |
Net financing costs | | 18 | | (59,579 | ) | | (210,830 | ) | | (165,936 | ) | | (20,049 | ) |
| | | | |
|
| |
|
| |
|
| |
|
|
(Loss)/income before income tax | | | | (410,223 | ) | | 330,728 | | | 877,107 | | | 105,973 | |
Income tax benefit/(expense) | | 19 | | 137,756 | | | (121,629 | ) | | (243,222 | ) | | (29,386 | ) |
| | | | |
|
| |
|
| |
|
| |
|
|
Net (loss)/income | | | | (272,467 | ) | | 209,099 | | | 633,885 | | | 76,587 | |
| | | | |
|
| |
|
| |
|
| |
|
|
Basic (loss)/earnings per share | | 21 | | (0.08 | ) | | 0.06 | | | 0.19 | | | 0.02 | |
| | | | |
|
| |
|
| |
|
| |
|
|
See accompanying notes to financial statements.
F-4
SINOPEC BEIJING YANHUA PETROCHEMICAL COMPANY LIMITED
STATEMENTS OF CASH FLOWS
FOR THE YEARS ENDED DECEMBER 31, 2001, 2002 AND 2003
(Amounts in thousands)
| | | | | | | | | | | | | | |
| | | | | Years ended December 31,
| |
| | | | | 2001
| | | 2002
| | | 2003
| | | 2003
| |
| | | Note | | RMB | | | RMB | | | RMB | | | USD | |
Cash flows from operating activities | | | | | | | | | | | | | | |
Cash generated from operations | | (a) | | 716,695 | | | 1,220,949 | | | 1,926,959 | | | 232,817 | |
Interest paid | | | | (207,091 | ) | | (220,918 | ) | | (152,424 | ) | | (18,416 | ) |
Income tax paid | | | | (128,336 | ) | | — | | | (157,939 | ) | | (19,082 | ) |
Income tax recovered | | | | — | | | 37,088 | | | — | | | — | |
| | | | |
|
| |
|
| |
|
| |
|
|
Net cash from operating activities | | | | 381,268 | | | 1,037,119 | | | 1,616,596 | | | 195,319 | |
| | | | |
|
| |
|
| |
|
| |
|
|
Cash flows from investing activities | | | | | | | | | | | | | | |
Capital expenditure | | | | (2,048,217 | ) | | (722,492 | ) | | (356,334 | ) | | (43,053 | ) |
Interest received | | | | 2,139 | | | 2,063 | | | 2,391 | | | 289 | |
Proceeds from disposal of property, plant and equipment | | | | 108 | | | 4,063 | | | 5,344 | | | 646 | |
| | | | |
|
| |
|
| |
|
| |
|
|
Net cash used in investing activities | | | | (2,045,970 | ) | | (716,366 | ) | | (348,599 | ) | | (42,118 | ) |
| | | | |
|
| |
|
| |
|
| |
|
|
Cash flows from financing activities | | | | | | | | | | | | | | |
Proceeds from bank loans | | | | 3,508,533 | | | 5,467,127 | | | 2,765,665 | | | 334,151 | |
Repayments of bank loans | | | | (1,718,868 | ) | | (5,801,385 | ) | | (3,784,850 | ) | | (457,290 | ) |
Repayments of loans from parent companies and fellow subsidiaries | | | | — | | | — | | | (280,000 | ) | | (33,830 | ) |
Dividends paid | | | | (134,960 | ) | | — | | | — | | | — | |
| | | | |
|
| |
|
| |
|
| |
|
|
Net cash from/(used in) financing activities | | | | 1,654,705 | | | (334,258 | ) | | (1,299,185 | ) | | (156,969 | ) |
| | | | |
|
| |
|
| |
|
| |
|
|
Net decrease in cash and cash equivalents | | | | (9,997 | ) | | (13,505 | ) | | (31,188 | ) | | (3,768 | ) |
| | | | | |
Cash and cash equivalents at beginning of year | | | | 286,137 | | | 276,140 | | | 262,635 | | | 31,732 | |
| | | | |
|
| |
|
| |
|
| |
|
|
Cash and cash equivalents at end of year | | | | 276,140 | | | 262,635 | | | 231,447 | | | 27,964 | |
| | | | |
|
| |
|
| |
|
| |
|
|
See accompanying notes to financial statements.
F-5
SINOPEC BEIJING YANHUA PETROCHEMICAL COMPANY LIMITED
NOTES TO STATEMENTS OF CASH FLOWS
FOR THE YEARS ENDED DECEMBER 31, 2001, 2002 AND 2003
(Amounts in thousands)
| (a) | Reconciliation of (loss)/income before income tax to cash generated from operations: |
| | | | | | | | | | | | |
| | | Years ended December 31,
| |
| | | 2001
| | | 2002
| | | 2003
| | | 2003
| |
| | | RMB | | | RMB | | | RMB | | | USD | |
(Loss)/income before income tax | | (410,223 | ) | | 330,728 | | | 877,107 | | | 105,973 | |
| | | | |
Adjustments for: | | | | | | | | | | | | |
Depreciation | | 525,410 | | | 806,124 | | | 890,779 | | | 107,625 | |
(Gain)/loss on disposal of property, plant and equipment, net | | (147,737 | ) | | 3,195 | | | 18,984 | | | 2,294 | |
Interest income | | (2,139 | ) | | (2,063 | ) | | (2,391 | ) | | (289 | ) |
Interest expense | | 53,347 | | | 195,113 | | | 142,824 | | | 17,256 | |
Decrease/(increase) in trade and bills receivables | | 106,183 | | | (103,994 | ) | | 95,082 | | | 11,488 | |
Decrease/(increase) in inventories | | 284,471 | | | (247,341 | ) | | (26,209 | ) | | (3,167 | ) |
(Increase)/decrease in prepayments and other current assets | | (121,486 | ) | | 182,362 | | | 105,282 | | | 12,720 | |
Decrease in trade and bills payables | | (11,099 | ) | | (32,160 | ) | | (80,385 | ) | | (9,712 | ) |
Increase/(decrease) in accruals and other payables | | 439,968 | | | 88,985 | | | (94,114 | ) | | (11,371 | ) |
| | |
|
| |
|
| |
|
| |
|
|
Cash generated from operations | | 716,695 | | | 1,220,949 | | | 1,926,959 | | | 232,817 | |
| | |
|
| |
|
| |
|
| |
|
|
See accompanying notes to financial statements.
F-6
SINOPEC BEIJING YANHUA PETROCHEMICAL COMPANY LIMITED
STATEMENTS OF SHAREHOLDERS’ EQUITY
FOR THE YEARS ENDED DECEMBER 31, 2001, 2002 AND 2003
(Amounts in thousands)
| | | | | | | | | | | | | | | |
| | | | | Share
capital
| | Share
premium
| | Reserves
| | | Retained
earnings
| | | Total
| |
| | | Note | | RMB | | RMB | | RMB | | | RMB | | | RMB | |
Balances at January 1, 2001 | | | | 3,374,000 | | 774,630 | | 120,677 | | | 950,968 | | | 5,220,275 | |
Net loss | | | | — | | — | | — | | | (272,467 | ) | | (272,467 | ) |
Dividend declared | | 20(b) | | — | | — | | — | | | (134,960 | ) | | (134,960 | ) |
Revaluation surplus realized | | | | — | | — | | (103,579 | ) | | 103,579 | | | — | |
| | | | |
| |
| |
|
| |
|
| |
|
|
Balances at December 31, 2001 | | | | 3,374,000 | | 774,630 | | 17,098 | | | 647,120 | | | 4,812,848 | |
Net income | | | | — | | — | | — | | | 209,099 | | | 209,099 | |
Revaluation surplus realized | | | | — | | — | | (4,190 | ) | | 4,190 | | | — | |
| | | | |
| |
| |
|
| |
|
| |
|
|
Balances at December 31, 2002 | | | | 3,374,000 | | 774,630 | | 12,908 | | | 860,409 | | | 5,021,947 | |
Net income | | | | — | | — | | — | | | 633,885 | | | 633,885 | |
Appropriations | | | | — | | — | | 104,452 | | | (104,452 | ) | | — | |
Revaluation surplus realized | | | | — | | — | | (34,793 | ) | | 34,793 | | | — | |
| | | | |
| |
| |
|
| |
|
| |
|
|
Balances at December 31, 2003 | | | | 3,374,000 | | 774,630 | | 82,567 | | | 1,424,635 | | | 5,655,832 | |
| | | | |
| |
| |
|
| |
|
| |
|
|
US Dollars equivalent | | | | 407,650 | | 93,592 | | 9,976 | | | 172,126 | | | 683,344 | |
| | | | |
| |
| |
|
| |
|
| |
|
|
See accompanying notes to financial statements.
F-7
SINOPEC BEIJING YANHUA PETROCHEMICAL COMPANY LIMITED
NOTES TO FINANCIAL STATEMENTS
(All amounts in thousands, except share data)
| 1. | ORGANIZATION AND PRINCIPAL ACTIVITIES |
Sinopec Beijing Yanhua Petrochemical Company Limited (the “Company”) was incorporated as a joint stock company with limited liability in the People’s Republic of China (the “PRC”) on April 23, 1997 as part of the reorganization (“Reorganization”) of Beijing Yanshan Petrochemical Corporation (“Yanshan Company”) in preparation for the listing of the Company’s shares. The Company’s shares and American Depository Shares (“ADSs”) were listed on the Hong Kong Stock Exchange and the New York Stock Exchange respectively in June 1997.
Upon the Reorganization, the Company became a subsidiary of Yanshan Company. On February 25, 2000, China Petrochemical Corporation (“Sinopec Group” or “Ultimate Parent Company”), underwent a reorganization, and formed a subsidiary, China Petroleum and Chemical Corporation (“Sinopec” or “Immediate Parent Company”). In accordance with the reorganization agreement, Yanshan Company, previously the Company’s parent company, transferred its 70% equity interest in the Company to Sinopec.
The principal activities of the Company are the manufacturing and sale of petrochemical products in the PRC.
| 2. | SIGNIFICANT ACCOUNTING POLICIES |
The accompanying financial statements have been prepared in accordance with International Financial Reporting Standards (“IFRS”) promulgated by the International Accounting Standards Board. IFRS includes International Accounting Standards (“IAS”) and related interpretations. Information relating to the nature and effect of the significant differences between IFRS and accounting principles generally accepted in the United States of America (“US GAAP”) are set forth in Note 27.
The accompanying financial statements are prepared on the historical cost basis as modified by the revaluation of certain property, plant and equipment as set forth in accounting policy (c).
The preparation of the financial statements requires management to make estimates and assumptions that affect the reported amounts of assets and liabilities and the disclosures of contingent assets and liabilities at the date of the financial statements and the reported amounts of revenues and expenses during the year. Actual results could differ from those estimates.
F-8
SINOPEC BEIJING YANHUA PETROCHEMICAL COMPANY LIMITED
NOTES TO FINANCIAL STATEMENTS
(All amounts in thousands, except share data)
| 2. | SIGNIFICANT ACCOUNTING POLICIES(Continued) |
| | (a) | Basis of preparation(Continued) |
The accompanying financial statements are expressed in Renminbi (“RMB”), the national currency of the PRC. Solely for the convenience of the reader, the December 31, 2003 financial statements have been translated into United States dollars (“USD”) at the exchange rate on December 31, 2003 published by the People’s Bank of China of USD 1.00=RMB 8.2767. No representation is made that the RMB could have been, or could be, converted into USD at that rate or at any other certain rate on December 31, 2003, or at any other certain date.
| | (b) | Translation of foreign currencies |
The functional and reporting currency of the Company is RMB. Transactions in foreign currencies are translated into RMB at the applicable exchange rates quoted by the People’s Bank of China (“PBOC rates”) prevailing on the transaction dates. Monetary assets and liabilities denominated in foreign currencies are translated into RMB at the applicable PBOC rates at the balance sheet date.
Foreign currency translation differences relating to funds borrowed to finance the construction of property, plant and equipment are capitalized during the construction period to the extent that they are regarded as an adjustment to interest costs. All other exchange differences are dealt with in the statements of operations.
| | (c) | Property, plant and equipment |
| | (i) | Property, plant and equipment are initially stated at cost less accumulated depreciation and impairment losses (refer to accounting policy (i)). The cost of an asset comprises its purchase price and any directly attributable costs of bringing the asset to working condition and location for its intended use. Subsequent to the revaluation (Note 6(a)), property, plant and equipment are carried at revalued amount, being the fair value at the date of the revaluation less any subsequent accumulated depreciation and impairment losses. Revaluations are performed periodically to ensure that the carrying amount does not differ materially from that which would be determined using fair value at the balance sheet date. Expenditure incurred after the asset has been put into operation is capitalized only when it increases the future economic benefits embodied in the item of property, plant and equipment. All other expenditure is charged to the statements of operations in the period in which it is incurred. |
F-9
SINOPEC BEIJING YANHUA PETROCHEMICAL COMPANY LIMITED
NOTES TO FINANCIAL STATEMENTS
(All amounts in thousands, except share data)
| 2. | SIGNIFICANT ACCOUNTING POLICIES(Continued) |
| | (c) | Property, plant and equipment(Continued) |
Construction in progress represents buildings, various plant and equipment under construction and pending installation, and is stated at cost less impairment losses (refer to accounting policy (i)). Cost comprises direct costs of construction as well as interest charges, and foreign exchange differences on related borrowed funds to the extent that they are regarded as an adjustment to interest charges during the periods of construction.
Capitalization of these borrowing costs ceases and the construction in progress is transferred to property, plant and equipment when the asset is substantially ready for its intended use.
For the periods presented, no foreign exchange differences were capitalized in the statements of operations.
| | (ii) | Gains or losses arising from the retirement or disposal of property, plant and equipment are determined as the difference between the net disposal proceeds and the carrying amount of the asset and are recognized as income or expense in the statements of operations on the date of retirement or disposal. On disposal of a revalued asset, the related revaluation surplus is transferred from the revaluation reserve to retained earnings. |
| | (iii) | Depreciation is charged to the statements of operations on a straight-line basis over the estimated useful lives of items of property, plant and equipment after taking into account the asset’s estimated residual value. The estimated useful lives are as follows: |
| | |
Buildings | | 20-40 years |
Plant, machinery and equipment | | 4-20 years |
Motor vehicles | | 8 years |
Office equipment and others | | 5-30 years |
No depreciation is provided in respect of construction in progress.
Total depreciation expense amounted to RMB 525,410, RMB 806,124 and RMB 890,779 for the years ended December 31, 2001, 2002 and 2003, respectively.
Inventories, other than spare parts and consumables, are stated at the lower of cost and net realizable value. Cost includes the cost of purchase computed using the weighted average method and, in the case of work in progress and finished goods, direct labour and an appropriate proportion of production overheads. Net realizable value is the estimated selling price in the ordinary course of business less the estimated costs of completion and the estimated costs necessary to make the sale.
Spare parts and consumables are stated at cost less any provision for obsolescence.
F-10
SINOPEC BEIJING YANHUA PETROCHEMICAL COMPANY LIMITED
NOTES TO FINANCIAL STATEMENTS
(All amounts in thousands, except share data)
| 2. | SIGNIFICANT ACCOUNTING POLICIES(Continued) |
| | (e) | Trade and other receivables |
Trade and other receivables are stated at cost less allowance for doubtful accounts. An allowance for doubtful accounts is provided based upon the evaluation of the recoverability of these accounts at the balance sheet date.
| | (f) | Cash and cash equivalents |
Cash equivalents consist of time deposits with financial institutions with an initial term of less than three months at time of purchase. Cash equivalents are stated at cost, which approximates fair value.
| | (g) | Provisions and contingent liabilities |
Provisions are recognized for liabilities of uncertain timing or amount when the Company has a legal or constructive obligation arising as a result of a past event, it is probable that an outflow of economic benefits will be required to settle the obligation and a reliable estimate can be made.
Where it is not probable that an outflow of economic benefits will be required, or the amount cannot be estimated reliably, the obligation is disclosed as a contingent liability, unless the probability of outflow of economic benefits is remote. Possible obligations, whose existence will only be confirmed by the occurrence or non-occurrence of one or more future events are also disclosed as contingent liabilities unless the probability of outflow of economic benefits is remote.
Revenue from the sale of goods is recognized in the statements of operations when the customer accepts the goods and the significant risks and rewards of the ownership and title have been transferred to the buyer. No revenue is recognized if there are significant uncertainties regarding recovery of the consideration due, the possible return of goods, or when the amount of revenue and the costs incurred or to be incurred in respect of the transaction cannot be measured reliably.
F-11
SINOPEC BEIJING YANHUA PETROCHEMICAL COMPANY LIMITED
NOTES TO FINANCIAL STATEMENTS
(All amounts in thousands, except share data)
| 2. | SIGNIFICANT ACCOUNTING POLICIES(Continued) |
The carrying amounts of long-lived assets are reviewed periodically in order to assess whether the recoverable amounts have declined below the carrying amounts. These assets are tested for impairment whenever events or changes in circumstances indicate that their recorded carrying amounts may not be recoverable. When such a decline has occurred, the carrying amount is reduced to the recoverable amount. The recoverable amount is the greater of the net selling price and the value in use. In determining the value in use, expected future cash flows generated by the asset are discounted to their present value. The amount of the reduction is recognized as an expense in the statements of operations unless the asset is carried at revalued amount for which an impairment loss is recognized directly against any related revaluation reserve to the extent that the impairment loss does not exceed the amount held in the revaluation reserve for that same asset.
The Company assesses at each balance sheet date whether there is any indication that an impairment loss recognized for an asset in prior years may no longer exist. An impairment loss is reversed if there has been a favorable change in the estimates used to determine the recoverable amount. A subsequent increase in the recoverable amount of an asset, when the circumstances and events that led to the write-down or write-off cease to exist, is recognized as income unless the asset is carried at revalued amount. Reversal of an impairment loss on a revalued asset is credited to the revaluation reserve except for impairment loss which was previously recognized as an expense in the statements of operations; a reversal of such impairment loss is recognized as income. The reversal is reduced by the amount that would have been recognized as depreciation had the write-down or write-off not occurred.
For the periods presented, no impairment loss was recognized or reversed in the statements of operations.
| | (j) | Research and development costs |
Research and development costs are recognized as expenses in the period in which they are incurred. Research and development costs amounted to RMB 53,781, RMB 59,028 and RMB 79,036 for the years ended December 31, 2001, 2002 and 2003, respectively.
Operating lease payments are charged to the statements of operations on a straight-line basis over the period of the respective leases. Operating lease charges amounted to RMB 8,925, RMB 16,024 and RMB 15,504 for the years ended December 31, 2001, 2002, and 2003, respectively.
F-12
SINOPEC BEIJING YANHUA PETROCHEMICAL COMPANY LIMITED
NOTES TO FINANCIAL STATEMENTS
(All amounts in thousands, except share data)
| 2. | SIGNIFICANT ACCOUNTING POLICIES(Continued) |
Net financing costs comprise interest expense on borrowings, interest income from bank deposits, foreign exchange gains and losses, and other related costs incurred in connection with borrowings.
Interest income from bank deposits is accrued on a time-apportioned basis on the principal outstanding and at the applicable rate.
Interest and other related costs incurred in connection with borrowings are expensed as incurred, except to the extent that they are capitalized as being directly attributable to the construction of an asset which necessarily takes a substantial period of time to get ready for its intended use.
| | (m) | Repairs and maintenance expenses |
Repairs and maintenance expenses, including cost of major overhaul, are expensed as incurred. Repairs and maintenance expenses amounted to RMB 147,699, RMB 283,491 and RMB 382,281 for the years ended December 31, 2001, 2002 and 2003, respectively.
The contributions payable under the Company’s retirement scheme are charged to the statements of operations according to the contribution determined by the scheme. Further information is set out in Note 22.
Income tax comprises current and deferred tax. Current tax is calculated on taxable income by applying the applicable tax rate. Deferred tax is provided using the balance sheet liability method on all temporary differences between the carrying amounts of assets and liabilities for financial reporting purposes and the amounts used for taxation purposes. Deferred tax is calculated on the basis of the enacted tax rates that are expected to apply in the period when the asset is realized or the liability is settled. The effect on deferred tax of any changes in tax rates is charged or credited to the statements of operations.
A deferred tax asset is recognized only to the extent that it is probable that future taxable profits will be available against which the asset can be utilized. Deferred tax assets are reduced to the extent that it is no longer probable that the related tax benefit will be realized.
F-13
SINOPEC BEIJING YANHUA PETROCHEMICAL COMPANY LIMITED
NOTES TO FINANCIAL STATEMENTS
(All amounts in thousands, except share data)
| 2. | SIGNIFICANT ACCOUNTING POLICIES(Continued) |
Dividends are recognized as liability in the period in which they are declared.
For the purposes of these financial statements, parties are considered to be related to the Company if the Company has the ability, directly or indirectly, to control the party or exercise significant influence over the party in making financial and operating decisions, or vice versa, or where the Company and the party are subject to common control or common significant influence. Related parties may be individuals or other entities.
A business segment is a distinguishable component of the Company that is engaged in providing products or services and is subject to risks and rewards that are different from those of other segments.
| 3. | TRADE RECEIVABLES, NET AND BILLS RECEIVABLE |
| | | | | | |
| | | December 31,
| |
| | | 2002
| | | 2003
| |
| | | RMB | | | RMB | |
Trade receivables, net | | | | | | |
—Third parties | | 346,615 | | | 309,071 | |
—Parent companies and fellow subsidiaries | | 97,941 | | | 98,715 | |
Less: Allowance for doubtful accounts | | (158,962 | ) | | (200,100 | ) |
| | |
|
| |
|
|
Subtotal | | 285,594 | | | 207,686 | |
| | |
|
| |
|
|
Bills receivable | | | | | | |
—Third parties | | 198,034 | | | 213,435 | |
—Parent companies and fellow subsidiaries | | 34,575 | | | 2,000 | |
| | |
|
| |
|
|
Subtotal | | 232,609 | | | 215,435 | |
| | |
|
| |
|
|
Total | | 518,203 | | | 423,121 | |
| | |
|
| |
|
|
Sales are generally on a cash term. Subject to negotiation, credit is generally only available for major customers with well-established trading records.
F-14
SINOPEC BEIJING YANHUA PETROCHEMICAL COMPANY LIMITED
NOTES TO FINANCIAL STATEMENTS
(All amounts in thousands, except share data)
| 3. | TRADE RECEIVABLES, NET AND BILLS RECEIVABLE(Continued) |
The allowance for doubtful accounts is analyzed as follows:
| | | | | | | | | |
| | | Years ended December 31,
| |
| | | 2001
| | | 2002
| | | 2003
| |
| | | RMB | | | RMB | | | RMB | |
At beginning of year | | (149,571 | ) | | (188,071 | ) | | (158,962 | ) |
Provision for the year | | (46,146 | ) | | (25,077 | ) | | (72,024 | ) |
Written-off/back | | 7,646 | | | 54,186 | | | 30,886 | |
| | |
|
| |
|
| |
|
|
At end of year | | (188,071 | ) | | (158,962 | ) | | (200,100 | ) |
| | |
|
| |
|
| |
|
|
| | | | | | |
| | | December 31,
| |
| | | 2002
| | | 2003
| |
| | | RMB | | | RMB | |
Raw materials | | 327,647 | | | 361,463 | |
Work in progress | | 208,545 | | | 207,272 | |
Finished goods | | 199,768 | | | 184,498 | |
Spare parts and consumables | | 348,351 | | | 322,955 | |
| | |
|
| |
|
|
| | | 1,084,311 | | | 1,076,188 | |
Less: Allowance for diminution in value of inventories | | (99,192 | ) | | (64,860 | ) |
| | |
|
| |
|
|
| | | 985,119 | | | 1,011,328 | |
| | |
|
| |
|
|
The allowance for diminution in value of inventories is analyzed as follows:
| | | | | | | | | |
| | | Years ended December 31,
| |
| | | 2001
| | | 2002
| | | 2003
| |
| | | RMB | | | RMB | | | RMB | |
At beginning of year | | (60,953 | ) | | (60,858 | ) | | (99,192 | ) |
Provision for the year | | (24,492 | ) | | (38,813 | ) | | — | |
Written-off/back | | 24,587 | | | 479 | | | 34,332 | |
| | |
|
| |
|
| |
|
|
At end of year | | (60,858 | ) | | (99,192 | ) | | (64,860 | ) |
| | |
|
| |
|
| |
|
|
As of December 31, 2002 and 2003, the Company had inventories carried at net realizable value with carrying amount of RMB 84,913 and RMB 70,320, respectively.
The cost of inventories recognized as an expense in the statements of operations amounted to RMB 5,660,191, RMB 8,368,029 and RMB 9,723,562 for the years ended December 31, 2001, 2002 and 2003, respectively.
F-15
SINOPEC BEIJING YANHUA PETROCHEMICAL COMPANY LIMITED
NOTES TO FINANCIAL STATEMENTS
(All amounts in thousands, except share data)
| 5. | PREPAYMENTS AND OTHER CURRENT ASSETS |
| | | | | | |
| | | December 31,
| |
| | | 2002
| | | 2003
| |
| | | RMB | | | RMB | |
Other receivables | | | | | | |
—Third parties | | 99,126 | | | 74,753 | |
—Parent companies and fellow subsidiaries | | 144,318 | | | 88,198 | |
Less: Allowance for doubtful accounts | | (14,758 | ) | | (35,633 | ) |
| | |
|
| |
|
|
Subtotal | | 228,686 | | | 127,318 | |
| | |
|
| |
|
|
Prepayments | | | | | | |
—Third parties | | 33,540 | | | 13,002 | |
—Parent companies and fellow subsidiaries | | 184 | | | 16,808 | |
| | |
|
| |
|
|
Subtotal | | 33,724 | | | 29,810 | |
| | |
|
| |
|
|
Total | | 262,410 | | | 157,128 | |
| | |
|
| |
|
|
The allowance for doubtful accounts is analyzed as follows:
| | | | | | | | | |
| | | Years ended December 31,
| |
| | | 2001
| | | 2002
| | | 2003
| |
| | | RMB | | | RMB | | | RMB | |
At beginning of year | | (2,037 | ) | | (8,989 | ) | | (14,758 | ) |
Provision for the year | | (7,424 | ) | | (5,769 | ) | | (20,926 | ) |
Written-off/back | | 472 | | | — | | | 51 | |
| | |
|
| |
|
| |
|
|
At end of year | | (8,989 | ) | | (14,758 | ) | | (35,633 | ) |
| | |
|
| |
|
| |
|
|
F-16
SINOPEC BEIJING YANHUA PETROCHEMICAL COMPANY LIMITED
NOTES TO FINANCIAL STATEMENTS
(All amounts in thousands, except share data)
| 6. | PROPERTY, PLANT AND EQUIPMENT, NET |
| | | | | | | | | | | | | | | | | | |
| | | Buildings
| | | Plant,
Machinery
and
Equipment
| | | Motor
Vehicles
| | | Office
Equipment
and Others
| | | Construction
in Progress
| | | Total
| |
| | | RMB | | | RMB | | | RMB | | | RMB | | | RMB | | | RMB | |
Cost or valuation: | | | | | | | | | | | | | | | | | | |
At January 1, 2003 | | 768,752 | | | 13,695,992 | | | 102,083 | | | 397,971 | | | 266,400 | | | 15,231,198 | |
Additions | | 17 | | | 41,795 | | | 1,971 | | | 4,907 | | | 353,547 | | | 402,237 | |
Transfer in/(out) | | — | | | 551,850 | | | — | | | 45 | | | (551,895 | ) | | — | |
Disposals | | (3,379 | ) | | (304,192 | ) | | (6,742 | ) | | (7,280 | ) | | — | | | (321,593 | ) |
Reclassification | | 306,832 | | | (791,219 | ) | | 22,937 | | | 461,450 | | | — | | | — | |
| | |
|
| |
|
| |
|
| |
|
| |
|
| |
|
|
At December 31, 2003 | | 1,072,222 | | | 13,194,226 | | | 120,249 | | | 857,093 | | | 68,052 | | | 15,311,842 | |
| | |
|
| |
|
| |
|
| |
|
| |
|
| |
|
|
Accumulated depreciation: | | | | | | | | | | | | | | | | | | |
At January 1, 2003 | | (316,769 | ) | | (6,637,863 | ) | | (62,421 | ) | | (313,155 | ) | | — | | | (7,330,208 | ) |
Depreciation for the year | | (46,344 | ) | | (781,641 | ) | | (12,070 | ) | | (50,724 | ) | | — | | | (890,779 | ) |
Written back on disposal | | 2,968 | | | 280,629 | | | 6,590 | | | 7,078 | | | — | | | 297,265 | |
Reclassification | | (57,906 | ) | | 145,555 | | | (1,478 | ) | | (86,171 | ) | | — | | | — | |
| | |
|
| |
|
| |
|
| |
|
| |
|
| |
|
|
At December 31, 2003 | | (418,051 | ) | | (6,993,320 | ) | | (69,379 | ) | | (442,972 | ) | | — | | | (7,923,722 | ) |
| | |
|
| |
|
| |
|
| |
|
| |
|
| |
|
|
Net book value: | | | | | | | | | | | | | | | | | | |
At December 31, 2003 | | 654,171 | | | 6,200,906 | | | 50,870 | | | 414,121 | | | 68,052 | | | 7,388,120 | |
| | |
|
| |
|
| |
|
| |
|
| |
|
| |
|
|
At December 31, 2002 | | 451,983 | | | 7,058,129 | | | 39,662 | | | 84,816 | | | 266,400 | | | 7,900,990 | |
| | |
|
| |
|
| |
|
| |
|
| |
|
| |
|
|
F-17
SINOPEC BEIJING YANHUA PETROCHEMICAL COMPANY LIMITED
NOTES TO FINANCIAL STATEMENTS
(All amounts in thousands, except share data)
| 6. | PROPERTY, PLANT AND EQUIPMENT, NET(Continued) |
| | (a) | The property, plant and equipment of the Company were valued by a firm of qualified independent valuers on April 23, 1997, using the depreciated replacement cost and open market value approach. The valuation was performed in compliance with the PRC laws and regulations as part of the Reorganization. As a result of the appraisal, an increase in value of the property, plant and equipment of approximately RMB 989 million was recorded as of April 23, 1997. The land use rights in respect of land located in the PRC granted in 1997 for a period of 50 years from the date of grant are stated at their historical costs less accumulated amortization and impairment losses. |
In accordance with IAS 16Property, Plant and Equipment, subsequent to this revaluation, property, plant and equipment are carried at revalued amount, being the fair value at the date of the revaluation less accumulated depreciation and impairment losses. Revaluation is performed periodically to ensure that the carrying amount does not differ materially from that which would be determined using fair value at the balance sheet date. Based on a revaluation performed as of September 30, 1999, which was based on depreciated replacement costs, the carrying amounts of property, plant and equipment did not differ materially from their fair values.
| 7. | DEFERRED TAX ASSETS AND LIABILITIES |
Deferred tax assets and liabilities are attributable to the items detailed in the table below:
| | | | | | |
| | | December 31,
| |
| | | 2002
| | | 2003
| |
| | | RMB | | | RMB | |
Deferred tax assets: | | | | | | |
Current | | | | | | |
Provision for receivables | | 57,327 | | | 77,793 | |
Provision for inventories | | 32,733 | | | 21,404 | |
Non-current | | | | | | |
Land use rights | | 240,390 | | | 234,970 | |
| | |
|
| |
|
|
| | | 330,450 | | | 334,167 | |
| | |
|
| |
|
|
Deferred tax liabilities: | | | | | | |
Non-current | | | | | | |
Property, plant and equipment | | (193,002 | ) | | (166,074 | ) |
Accelerated depreciation | | (69,768 | ) | | (55,581 | ) |
Interest capitalization | | (23,387 | ) | | (24,538 | ) |
| | |
|
| |
|
|
| | | (286,157 | ) | | (246,193 | ) |
| | |
|
| |
|
|
Net deferred tax assets | | 44,293 | | | 87,974 | |
| | |
|
| |
|
|
F-18
SINOPEC BEIJING YANHUA PETROCHEMICAL COMPANY LIMITED
NOTES TO FINANCIAL STATEMENTS
(All amounts in thousands, except share data)
| 7. | DEFERRED TAX ASSETS AND LIABILITIES(Continued) |
A valuation allowance on deferred tax assets is recorded if it is more likely than not that some portion or all of the deferred tax assets will not be realized through recovery of taxes previously paid and/or future taxable income. The allowance is subject to ongoing adjustments based on changes in circumstances that affect the Company’s assessment of the realizability of the deferred tax assets. The Company has reviewed its deferred tax assets as of December 31, 2001, 2002 and 2003. Based on the level of historical taxable income and projections for future taxable income over the periods which the deferred tax assets are deductible, management believes that it is more likely than not the Company will realize the benefits of these temporary differences. Therefore, no valuation allowances were provided for the years ended December 31, 2001, 2002 and 2003 in respect of deferred tax assets arising from temporary differences.
Movements in the deferred tax assets and liabilities are as follows:
| | | | | | | | | |
| | | Balance at
January 1,
2001
| | | Recognized
in statements
of operations
| | | Balance at
December 31,
2001
| |
| | | RMB | | | RMB | | | RMB | |
Current | | | | | | | | | |
Provision for receivables | | 49,008 | | | 17,579 | | | 66,587 | |
Provision for inventories | | 27,250 | | | (31 | ) | | 27,219 | |
Others | | 45,888 | | | (42,687 | ) | | 3,201 | |
| | | |
Non-current | | | | | | | | | |
Tax value of losses carried forward | | — | | | 143,134 | | | 143,134 | |
Land use rights | | 251,241 | | | (5,365 | ) | | 245,876 | |
Property, plant and equipment | | (246,858 | ) | | 26,928 | | | (219,930 | ) |
Accelerated depreciation | | (98,363 | ) | | 14,378 | | | (83,985 | ) |
Interest capitalization | | — | | | (16,180 | ) | | (16,180 | ) |
| | |
|
| |
|
| |
|
|
Net deferred tax assets | | 28,166 | | | 137,756 | | | 165,922 | |
| | |
|
| |
|
| |
|
|
F-19
SINOPEC BEIJING YANHUA PETROCHEMICAL COMPANY LIMITED
NOTES TO FINANCIAL STATEMENTS
(All amounts in thousands, except share data)
| 7. | DEFERRED TAX ASSETS AND LIABILITIES(Continued) |
| | | | | | | | | |
| | | Balance at
January 1,
2002
| | | Recognized
in statements
of operations
| | | Balance at
December 31,
2002
| |
| | | RMB | | | RMB | | | RMB | |
Current | | | | | | | | | |
Provision for receivables | | 66,587 | | | (9,260 | ) | | 57,327 | |
Provision for inventories | | 27,219 | | | 5,514 | | | 32,733 | |
Others | | 3,201 | | | (3,201 | ) | | — | |
| | | |
Non-current | | | | | | | | | |
Tax value of losses carried forward | | 143,134 | | | (143,134 | ) | | — | |
Land use rights | | 245,876 | | | (5,486 | ) | | 240,390 | |
Property, plant and equipment | | (219,930 | ) | | 26,928 | | | (193,002 | ) |
Accelerated depreciation | | (83,985 | ) | | 14,217 | | | (69,768 | ) |
Interest capitalization | | (16,180 | ) | | (7,207 | ) | | (23,387 | ) |
| | |
|
| |
|
| |
|
|
Net deferred tax assets | | 165,922 | | | (121,629 | ) | | 44,293 | |
| | |
|
| |
|
| |
|
|
| | | |
| | | Balance at
January 1, 2003
| | | Recognized
in statements
of operations
| | | Balance at
December 31,
2003
| |
| | | RMB | | | RMB | | | RMB | |
Current | | | | | | | | | |
Provision for receivables | | 57,327 | | | 20,466 | | | 77,793 | |
Provision for inventories | | 32,733 | | | (11,329 | ) | | 21,404 | |
| | | |
Non-current | | | | | | | | | |
Land use rights | | 240,390 | | | (5,420 | ) | | 234,970 | |
Property, plant and equipment | | (193,002 | ) | | 26,928 | | | (166,074 | ) |
Accelerated depreciation | | (69,768 | ) | | 14,187 | | | (55,581 | ) |
Interest capitalization | | (23,387 | ) | | (1,151 | ) | | (24,538 | ) |
| | |
|
| |
|
| |
|
|
Net deferred tax assets | | 44,293 | | | 43,681 | | | 87,974 | |
| | |
|
| |
|
| |
|
|
F-20
SINOPEC BEIJING YANHUA PETROCHEMICAL COMPANY LIMITED
NOTES TO FINANCIAL STATEMENTS
(All amounts in thousands, except share data)
| 8. | TRADE PAYABLES AND BILLS PAYABLE |
| | | | |
| | | December 31,
|
| | | 2002
| | 2003
|
| | | RMB | | RMB |
Trade payables | | | | |
—Third parties | | 56,665 | | 34,918 |
—Parent companies and fellow subsidiaries | | 93,520 | | 134,882 |
| | |
| |
|
Subtotal | | 150,185 | | 169,800 |
| | |
Bills payable | | | | |
—Parent companies and fellow subsidiaries | | 130,000 | | 30,000 |
| | |
| |
|
Total | | 280,185 | | 199,800 |
| | |
| |
|
| 9. | ACCRUALS AND OTHER PAYABLES |
| | | | |
| | | December 31,
|
| | | 2002
| | 2003
|
| | | RMB | | RMB |
Receipts in advance | | | | |
—Third parties | | 159,564 | | 143,003 |
—Parent companies and fellow subsidiaries | | 562 | | 3,099 |
| | |
| |
|
Subtotal | | 160,126 | | 146,102 |
| | |
Amounts due to parent companies and fellow subsidiaries | | 89,351 | | 38,827 |
Construction cost payable | | 70,150 | | 106,489 |
Accrued expenses | | 220,318 | | 195,667 |
Others | | 47,628 | | 42,677 |
| | |
| |
|
Total | | 587,573 | | 529,762 |
| | |
| |
|
F-21
SINOPEC BEIJING YANHUA PETROCHEMICAL COMPANY LIMITED
NOTES TO FINANCIAL STATEMENTS
(All amounts in thousands, except share data)
Short-term bank loans represent:
| | | | |
| | | December 31,
|
| | | 2002
| | 2003
|
| | | RMB | | RMB |
Current portion of long-term loans | | 201,402 | | 18,401 |
Short-term loans | | 1,575,000 | | 1,070,000 |
| | |
| |
|
| | | 1,776,402 | | 1,088,401 |
| | |
| |
|
Short-term loans are unsecured loans without guarantee and repayable in full when due. The Company’s weighted average interest rate on short-term loans was 4.82% as of December 31, 2003 (2002: 5.15%).
Long-term bank loans comprise:
| | | | | | | | |
| | | | | December 31,
| |
| | | | | 2002
| | | 2003
| |
| | | Interest rate | | RMB | | | RMB | |
USD denominated: | | | | | | | | |
Due in 2003 | | Libor+0.5% | | 183,009 | | | — | |
Due in 2006 | | Libor+0.5% ~ Floating rate quoted by the PBOC | | 699,947 | | | 887,166 | |
Payable semi-annually through 2005 | | Libor+1% | | 45,989 | | | 27,594 | |
| | | |
RMB denominated: | | | | | | | | |
Due in 2005 | | Fixed at 4.94% | | 1,200,000 | | | 700,000 | |
| | | | |
|
| |
|
|
Total long-term loans outstanding | | | | 2,128,945 | | | 1,614,760 | |
Less: Amounts due within one year | | | | (201,402 | ) | | (18,401 | ) |
| | | | |
|
| |
|
|
Amounts due after one year | | | | 1,927,543 | | | 1,596,359 | |
| | | | |
|
| |
|
|
The aggregate maturities of long-term bank loans subsequent to December 31, 2003 are as follows:
| | |
| | | RMB
|
2004 | | 18,401 |
2005 | | 709,193 |
2006 | | 887,166 |
| | |
|
| | | 1,614,760 |
| | |
|
F-22
SINOPEC BEIJING YANHUA PETROCHEMICAL COMPANY LIMITED
NOTES TO FINANCIAL STATEMENTS
(All amounts in thousands, except share data)
| 11. | LOANS FROM PARENT COMPANIES AND FELLOW SUBSIDIARIES |
Loans from parent companies and fellow subsidiaries are unsecured and are repayable on demand as follows:
| | | | | | | | |
| | | December 31,
|
| | | | | 2002
| | | | 2003
|
| | | Interest rate | | RMB | | Interest rate | | RMB |
Loan from Sinopec | | Interest free | | 30,000 | | Interest free | | 30,000 |
| | | | |
Loan from Sinopec | | 4.536% | | 150,000 | | — | | — |
| | | | |
Loan from Sinopec Group | | Floating rate
quoted by the
PBOC | | 200,000 | | Floating rate
quoted by the
PBOC | | 70,000 |
| | | | |
| | | |
|
| | | | | 380,000 | | | | 100,000 |
| | | | |
| | | |
|
| | | | |
| | | December 31,
|
| | | 2002
| | 2003
|
| | | RMB | | RMB |
Registered, issued and fully paid | | | | |
2,362,000,000 domestic shares of RMB 1.00 each | | 2,362,000 | | 2,362,000 |
1,012,000,000 H shares of RMB 1.00 each | | 1,012,000 | | 1,012,000 |
| | |
| |
|
| | | 3,374,000 | | 3,374,000 |
| | |
| |
|
All the H shares and domestic shares rank pari passu in all material respects. Domestic shares are those issued to Yanshan Company in the PRC for the net assets transferred to the Company in connection with the Reorganization. H shares are those issued to investors outside the PRC and traded on the Stock Exchange of Hong Kong and, in the form of ADSs, on the New York Stock Exchange.
F-23
SINOPEC BEIJING YANHUA PETROCHEMICAL COMPANY LIMITED
NOTES TO FINANCIAL STATEMENTS
(All amounts in thousands, except share data)
| | | | | | | | | | | | | |
| | | Statutory
surplus
reserve
| | Statutory
public
welfare fund
| | Capital
reserve
| | | Revaluation
reserve
| | | Total
| |
| | | RMB | | RMB | | RMB | | | RMB | | | RMB | |
| | | Note (b) | | Note (c) | | Note (d) | | | | | | | |
At January 1, 2002 | | 111,909 | | 111,908 | | (951,146 | ) | | 744,427 | | | 17,098 | |
Revaluation surplus realized | | — | | — | | — | | | (4,190 | ) | | (4,190 | ) |
| | |
| |
| |
|
| |
|
| |
|
|
At December 31, 2002 | | 111,909 | | 111,908 | | (951,146 | ) | | 740,237 | | | 12,908 | |
| | |
| |
| |
|
| |
|
| |
|
|
At January 1, 2003 | | 111,909 | | 111,908 | | (951,146 | ) | | 740,237 | | | 12,908 | |
Appropriations | | 52,226 | | 52,226 | | — | | | — | | | 104,452 | |
Revaluation surplus realized | | — | | — | | — | | | (34,793 | ) | | (34,793 | ) |
| | |
| |
| |
|
| |
|
| |
|
|
At December 31, 2003 | | 164,135 | | 164,134 | | (951,146 | ) | | 705,444 | | | 82,567 | |
| | |
| |
| |
|
| |
|
| |
|
|
| | (a) | According to the Company’s Articles of Association, the net income for the year can only be appropriated after offsetting the previous years’ losses, if any, as determined in accordance with the PRC Accounting Rules and Regulations. |
| | (b) | According to the Company’s Articles of Association, the Company is required to transfer 10% of its net income (subject to Note (a) described above), as determined in accordance with the PRC Accounting Rules and Regulations, to statutory surplus reserve until the reserve balance reaches 50% of the registered capital. The transfer to this reserve must be made before distribution of a dividend to shareholders. |
The statutory surplus reserve can be used to make good previous years’ losses, if any, and may be converted into share capital by the issue of new shares to shareholders in proportion to their existing shareholdings or by increasing the par value of the shares currently held by them, provided that the balance after such issue is not less than 25% of the registered capital.
For the year ended 31 December 2003, the Company transferred RMB 52,226, being 10% of the current year’s net income after offsetting the previous years’ losses determined in accordance with the PRC Accounting Rules and Regulations, to this reserve. At 31 December 2002, because the Company had accumulated losses of RMB 91,024, being the amount determined in accordance with the PRC Accounting Rules and Regulations, no appropriation was made to the statutory surplus reserve for the year ended 31 December 2002.
F-24
SINOPEC BEIJING YANHUA PETROCHEMICAL COMPANY LIMITED
NOTES TO FINANCIAL STATEMENTS
(All amounts in thousands, except share data)
| | (c) | According to the Company’s Articles of Association, the Company is required to transfer 5% to 10% of its net income (subject to Note (a) described above), as determined in accordance with the PRC Accounting Rules and Regulations, to the statutory public welfare fund. This fund can only be utilized on capital items for the collective benefits of the Company’s employees such as the construction of dormitories, canteen and other staff welfare facilities. This fund is non-distributable other than in liquidation. The transfer to this fund must be made before distribution of a dividend to shareholders. |
For the year ended 31 December 2003, the directors authorized a transfer of RMB 52,226, subject to shareholders’ approval, being 10% of the current year’s net income after offsetting the previous years’ losses determined in accordance with the PRC Accounting Rules and Regulations, to this fund. At 31 December 2002, because the Company had accumulated losses of RMB 91,024, being the amount determined in accordance with the PRC Accounting Rules and Regulations, no appropriation was made to the statutory welfare fund for the year ended 31 December 2002.
| | (d) | The capital reserve represents the difference between the total amount of the par value of shares issued to Yanshan Company and the amount of the net assets received from Yanshan Company in connection with the Reorganization. |
| | (e) | According to the Company’s Articles of Association, the retained earnings available for distribution to shareholders of the Company is the lower of the amount determined in accordance with the PRC Accounting Rules and Regulations and the amount determined in accordance with IFRS. At 31 December 2003, the amount of retained profits available for distribution was RMB 417,808 (2002: Accumulated losses of RMB 91,024), being the amount determined in accordance with the PRC Accounting Rules and Regulations. Final dividend of RMB 168,700 (2002: Nil) proposed after the balance sheet date has not been recognized as a liability at the balance sheet date. |
Sales represents revenue from sales of goods to customers, net of value added tax.
Personnel expenses represent:
| | | | | | |
| | | Years ended December 31,
|
| | | 2001
| | 2002
| | 2003
|
| | | RMB | | RMB | | RMB |
Wages and salaries | | 207,173 | | 233,718 | | 286,408 |
Staff welfare | | 28,515 | | 32,721 | | 40,097 |
Contribution to retirement scheme | | 44,154 | | 40,654 | | 42,674 |
Social security contributions | | 7,318 | | 8,529 | | 8,116 |
| | |
| |
| |
|
| | | 287,160 | | 315,622 | | 377,295 |
| | |
| |
| |
|
F-25
SINOPEC BEIJING YANHUA PETROCHEMICAL COMPANY LIMITED
NOTES TO FINANCIAL STATEMENTS
(All amounts in thousands, except share data)
| 16. | GAIN/(LOSS) ON DISPOSAL OF PROPERTY, PLANT AND EQUIPMENT, NET |
On November 20, 2001, the Company sold a polypropylene production facility to Yanshan Company and recorded a gain on disposal of RMB 156,546. The consideration of the transaction was determined based on a report issued by an independent qualified valuer issued on November 17, 2001.
| 17. | EMPLOYEE REDUCTION EXPENSES |
In accordance with Sinopec’s voluntary employee reduction plan, the Company recorded employee reduction expenses of RMB 246,943 during the year ended December 31, 2001. In addition, Sinopec made an additional payment of RMB 100,782 to the Company’s staff in connection with this voluntary employee reduction plan. No employee reduction expenses were recorded during the years ended December 31, 2002 and 2003.
| | | | | | | | | |
| | | Years ended December 31,
| |
| | | 2001
| | | 2002
| | | 2003
| |
| | | RMB | | | RMB | | | RMB | |
Interest expense | | 207,091 | | | 220,918 | | | 152,424 | |
Less: Amount capitalized as construction in progress* | | (153,744 | ) | | (25,805 | ) | | (9,600 | ) |
| | |
|
| |
|
| |
|
|
Interest expense, net | | 53,347 | | | 195,113 | | | 142,824 | |
Interest income | | (2,139 | ) | | (2,063 | ) | | (2,391 | ) |
Foreign exchange loss, net | | 452 | | | 142 | | | 8 | |
Others | | 7,919 | | | 17,638 | | | 25,495 | |
| | |
|
| |
|
| |
|
|
| | | 59,579 | | | 210,830 | | | 165,936 | |
| | |
|
| |
|
| |
|
|
| * | Borrowing costs have been capitalized at a rate of between 1.67% to 5.31% (2002: 3.31% to 5.31%; 2001: 5.73% to 6.15%) per annum for construction in progress. |
F-26
SINOPEC BEIJING YANHUA PETROCHEMICAL COMPANY LIMITED
NOTES TO FINANCIAL STATEMENTS
(All amounts in thousands, except share data)
| 19. | INCOME TAX BENEFIT/(EXPENSE) |
Income tax benefit/(expense) in the statements of operations represents:
| | | | | | | | |
| | | Years ended December 31,
| |
| | | 2001
| | 2002
| | | 2003
| |
| | | RMB | | RMB | | | RMB | |
Provision for PRC income tax for the year | | — | | — | | | (286,903 | ) |
Deferred taxation (Note 7) | | 137,756 | | (121,629 | ) | | 43,681 | |
| | |
| |
|
| |
|
|
| | | 137,756 | | (121,629 | ) | | (243,222 | ) |
| | |
| |
|
| |
|
|
The provision for PRC income tax is calculated at the rate of 33% on the estimated assessable income of the Company determined in accordance with relevant income tax rules and regulations of the PRC during each of the years in the three-year period ended December 31, 2003. The Company did not carry on business overseas or in Hong Kong and therefore did not incur overseas and Hong Kong income taxes.
A reconciliation of the expected income tax with the actual income tax is as follows:
| | | | | | | | | |
| | | Years ended December 31,
| |
| | | 2001
| | | 2002
| | | 2003
| |
| | | RMB | | | RMB | | | RMB | |
(Loss)/income before income tax | | (410,223 | ) | | 330,728 | | | 877,107 | |
| | |
|
| |
|
| |
|
|
Expected PRC income tax at a statutory tax rate of 33% | | 135,374 | | | (109,140 | ) | | (289,445 | ) |
Non-deductible expenses | | — | | | (25,013 | ) | | (240 | ) |
Tax credit for capital expenditure (Note (a)) | | — | | | 11,834 | | | 36,858 | |
Non-taxable items | | 2,382 | | | 690 | | | 9,605 | |
| | |
|
| |
|
| |
|
|
Income tax benefit/(expense) | | 137,756 | | | (121,629 | ) | | (243,222 | ) |
| | |
|
| |
|
| |
|
|
| | Note (a): | Pursuant to the document “Cai Shui Zi (1999) No. 290” issued by the Ministry of Finance and the State Administration of Taxation of the PRC on December 8, 1999, the Company was entitled to an income tax credit of RMB 11,834 and RMB 36,858 during the years 2002 and 2003, respectively, which are determined based on a percentage of the purchased amount of equipment produced in the PRC for technological improvements. |
F-27
SINOPEC BEIJING YANHUA PETROCHEMICAL COMPANY LIMITED
NOTES TO FINANCIAL STATEMENTS
(All amounts in thousands, except share data)
| | (a) | Dividends attributable to the year represent: |
| | | | | | |
| | | Years ended December 31,
|
| | | 2001
| | 2002
| | 2003
|
| | | RMB | | RMB | | RMB |
Final dividend proposed after the balance sheet date of RMB 0.05 (2002: Nil; 2001: Nil) per share | | — | | — | | 168,700 |
| | |
| |
| |
|
Pursuant to a resolution passed at the Director’s meeting on April 2, 2004, a final dividend of RMB 0.05 (2002: Nil; 2001: Nil) per share totaling, RMB 168,700 (2002: Nil; 2001: Nil) was proposed for shareholders’ approval at the forthcoming Annual General Meeting. The final dividend proposed after the balance sheet date has not been recognized as a liability at the balance sheet date.
| | (b) | Dividend attributable to the previous financial year, approved and paid during the year: |
| | | | | | |
| | | Years ended December 31,
|
| | | 2001
| | 2002
| | 2003
|
| | | RMB | | RMB | | RMB |
Final dividend in respect of the previous financial years, approved and paid during the year, of Nil (2002: Nil; 2001: RMB 0.04 per share) | | 134,960 | | — | | — |
| | |
| |
| |
|
| 21. | BASIC (LOSS)/EARNINGS PER SHARE |
The calculation of basic (loss)/earnings per share is based on the net (loss)/income of RMB (272,467), RMB 209,099 and RMB 633,885 and the weighted average number of shares of 3,374,000,000 during each of the years in the three-year period ended December 31, 2003.
Diluted earnings per share is not presented as there were no dilutive potential ordinary shares in existence for each of the years in the three-year period ended December 31, 2003.
The Company’s full-time employees are covered by a state-sponsored pension scheme, and are entitled to an annual pension equal to a fixed proportion of their basic salaries at their retirement dates. The PRC government is responsible for the pension liability to these retired employees. The Company is required to make contributions to the retirement scheme at a rate of 20% and 19% of the employees’ salaries for the year ended December 31, 2003 and each of the years in the two-year period ended December 31, 2002, respectively. The Company provides no retirement benefits other than the contributions described above. The Company’s contributions for the years ended December 31, 2001, 2002 and 2003 were RMB 44,154, RMB 40,654 and RMB 42,674, respectively.
F-28
SINOPEC BEIJING YANHUA PETROCHEMICAL COMPANY LIMITED
NOTES TO FINANCIAL STATEMENTS
(All amounts in thousands, except share data)
| 23. | RELATED PARTY TRANSACTIONS |
A significant portion of the transactions undertaken by the Company is with, and on terms determined by Sinopec Group and Sinopec and its affiliates.
The following is a summary of significant related party transactions with Sinopec Group and Sinopec and its affiliates:
| | | | | | |
| | | Years ended December 31,
|
| | | 2001
| | 2002
| | 2003
|
| | | RMB | | RMB | | RMB |
Sale of goods | | 1,549,640 | | 1,089,502 | | 1,594,649 |
Sale of equipment | | 167,850 | | — | | — |
Purchase of inventories | | 3,727,319 | | 5,147,244 | | 6,226,765 |
Utilities provided to the Company | | 767,548 | | 1,002,831 | | 1,025,145 |
Social services (environmental protection, employee housing, health care, education, public security and other ancillary services) provided to the Company | | 153,618 | | 108,482 | | 115,093 |
Construction and repair services provided to the Company | | 9,961 | | 42,398 | | 52,776 |
Loans provided to the Company | | 185,000 | | — | | — |
Interest expense paid | | 8,833 | | 17,968 | | 5,528 |
Interest income received | | 201 | | 119 | | 218 |
Technological development expenses paid | | 30,000 | | 30,000 | | 30,000 |
Technological development fees received | | 48,472 | | 44,984 | | 23,130 |
Insurance premium paid | | 30,181 | | 18,981 | | 40,030 |
Insurance premium received | | 15,886 | | 5,724 | | 8,735 |
In accordance with the supply agreement, Sinopec and its affiliates provide materials and services to the Company at state or market prices, and the Company provides products to Sinopec and its affiliates at state or market prices.
Interest income received represents interest received from deposits placed with Sinopec Group and its affiliates. The applicable interest rate is determined in accordance with the prevailing saving deposit rate. The balance of deposits as of December 31, 2002 and 2003 was RMB 13,781 and RMB 865, respectively.
The Company maintains insurance coverage on its properties, facilities and inventories with Sinopec Group. Insurance premium is paid on a semi-annual basis and is determined on a percentage of the book value of the covered assets. The Company has no obligations to the insurance scheme maintained by Sinopec Group other than the payment of insurance premiums.
As of December 31, 2003, the Company’s long-term bank loans of USD 88,413 were guaranteed by Sinopec and its affiliates. (2002: USD 106,672; 2001: USD 77,427 and RMB 1,450,000).
Amounts due from/to parent companies and fellow subsidiaries are unsecured and interest free with no fixed repayment terms.
The directors of the Company are of the opinion that the above transactions were entered into in the normal course of business and on normal commercial terms or in accordance with the agreements governing such transactions, all of which have been reviewed and approved by the non-executive directors.
F-29
SINOPEC BEIJING YANHUA PETROCHEMICAL COMPANY LIMITED
NOTES TO FINANCIAL STATEMENTS
(All amounts in thousands, except share data)
All of the Company’s production and sales operations are conducted in the PRC.
The Company’s reportable business segments include resins and plastics, synthetic rubber, basic organic chemical products and others. The resins and plastics unit manufactures and sells petrochemical products including LDPE, polypropylene, HDPE, polyester chips and polystyrene. The synthetic rubber unit manufactures and sells cis-polybutadiene and SBS rubber. The basic organic chemical products unit manufactures and sells organic chemical products including phenol, acetone, ethylene glycol, ethylene and propylene. The others segment includes miscellaneous petrochemical products not classified in the above three business segments.
The reportable business segments are each managed separately because they manufacture and/or distribute distinct products with different production processes and due to their distinct operating and gross margin characteristics. In view of the fact that Company operates mainly in the PRC, no geographical segmental information is presented.
The Company evaluates the performance and allocates resources to its operating segments on a gross profit basis. The accounting policies of the Company’s segments are the same as those described in the Significant Accounting Policies (see Note 2).
F-30
SINOPEC BEIJING YANHUA PETROCHEMICAL COMPANY LIMITED
NOTES TO FINANCIAL STATEMENTS
(All amounts in thousands, except share data)
| 24. | SEGMENT INFORMATION(Continued) |
| | | | | | | | | |
| | | Years ended December 31,
| |
| | | 2001
| | | 2002
| | | 2003
| |
| | | RMB | | | RMB | | | RMB | |
External sales | | | | | | | | | |
| | | |
Resins and Plastics | | 3,203,189 | | | 5,514,147 | | | 6,332,332 | |
Synthetic Rubber | | 925,512 | | | 1,418,899 | | | 1,923,773 | |
Basic Organic Chemical Products | | 1,373,201 | | | 2,140,185 | | | 2,700,036 | |
Others | | 473,353 | | | 369,830 | | | 517,787 | |
| | |
|
| |
|
| |
|
|
Total external sales | | 5,975,255 | | | 9,443,061 | | | 11,473,928 | |
| | |
|
| |
|
| |
|
|
Cost of sales | | | | | | | | | |
| | | |
Resins and Plastics | | (3,004,017 | ) | | (4,943,357 | ) | | (5,575,377 | ) |
Synthetic Rubber | | (900,588 | ) | | (1,189,480 | ) | | (1,474,901 | ) |
Basic Organic Chemical Products | | (1,237,069 | ) | | (1,877,542 | ) | | (2,172,872 | ) |
Others | | (518,517 | ) | | (357,650 | ) | | (500,412 | ) |
| | |
|
| |
|
| |
|
|
Total cost of sales | | (5,660,191 | ) | | (8,368,029 | ) | | (9,723,562 | ) |
| | |
|
| |
|
| |
|
|
Segment gross profit | | | | | | | | | |
| | | |
Resins and Plastics | | 199,172 | | | 570,790 | | | 756,955 | |
Synthetic Rubber | | 24,924 | | | 229,419 | | | 448,872 | |
Basic Organic Chemical Products | | 136,132 | | | 262,643 | | | 527,164 | |
Others | | (45,164 | ) | | 12,180 | | | 17,375 | |
| | |
|
| |
|
| |
|
|
Total segment gross profit | | 315,064 | | | 1,075,032 | | | 1,750,366 | |
| | |
|
| |
|
| |
|
|
F-31
SINOPEC BEIJING YANHUA PETROCHEMICAL COMPANY LIMITED
NOTES TO FINANCIAL STATEMENTS
(All amounts in thousands, except share data)
| 24. | SEGMENT INFORMATION(Continued) |
| | | | | | | | | |
| | | Years ended December 31,
| |
| | | 2001
| | | 2002
| | | 2003
| |
| | | RMB | | | RMB | | | RMB | |
Total segment gross profit | | 315,064 | | | 1,075,032 | | | 1,750,366 | |
| | |
|
| |
|
| |
|
|
Selling, general and administrative expenses | | (565,412 | ) | | (530,571 | ) | | (721,418 | ) |
Net financing costs | | (59,579 | ) | | (210,830 | ) | | (165,936 | ) |
Other operating income | | 30,053 | | | 55,979 | | | 73,196 | |
Other operating expenses | | (31,143 | ) | | (55,687 | ) | | (40,117 | ) |
Gain/(loss) on disposal of property, plant and equipment, net | | 147,737 | | | (3,195 | ) | | (18,984 | ) |
Employee reduction expenses | | (246,943 | ) | | — | | | — | |
| | |
|
| |
|
| |
|
|
(Loss)/income before income tax | | (410,223 | ) | | 330,728 | | | 877,107 | |
Income tax benefit/(expense) | | 137,756 | | | (121,629 | ) | | (243,222 | ) |
| | |
|
| |
|
| |
|
|
Net (loss)/income | | (272,467 | ) | | 209,099 | | | 633,885 | |
| | |
|
| |
|
| |
|
|
Assets and liabilities dedicated to a particular segment’s operations are included in that segment’s total assets and liabilities. Assets which benefit more than one segment or are considered to be corporate assets are not allocated. “Unallocated assets” consists primarily of cash and cash equivalents, deferred tax assets and office equipment. “Unallocated liabilities” consists primarily of bank loans, loans from parent companies and fellow subsidiaries, income tax payable and deferred tax liabilities.
F-32
SINOPEC BEIJING YANHUA PETROCHEMICAL COMPANY LIMITED
NOTES TO FINANCIAL STATEMENTS
(All amounts in thousands, except share data)
| 24. | SEGMENT INFORMATION(Continued) |
| | | | | | |
| | | December 31,
|
| | | 2001
| | 2002
| | 2003
|
| | | RMB | | RMB | | RMB |
Segment assets | | | | | | |
| | | |
Resins and Plastics | | 5,647,626 | | 5,512,788 | | 4,918,531 |
Synthetic Rubber | | 1,697,593 | | 1,428,220 | | 1,289,174 |
Basic Organic Chemical Products | | 2,004,892 | | 2,073,242 | | 2,154,306 |
Others | | 396,716 | | 470,947 | | 431,422 |
| | |
| |
| |
|
Total segment assets | | 9,746,827 | | 9,485,197 | | 8,793,433 |
Unallocated assets | | 1,011,369 | | 774,610 | | 751,878 |
| | |
| |
| |
|
Total assets | | 10,758,196 | | 10,259,807 | | 9,545,311 |
| | |
| |
| |
|
Segment liabilities | | | | | | |
| | | |
Resins and Plastics | | 509,916 | | 310,253 | | 232,731 |
Synthetic Rubber | | 113,576 | | 74,251 | | 58,355 |
Basic Organic Chemical Products | | 186,819 | | 106,322 | | 98,095 |
Others | | 38,621 | | 25,174 | | 18,139 |
| | |
| |
| |
|
Total segment liabilities | | 848,932 | | 516,000 | | 407,320 |
Unallocated liabilities | | 5,096,416 | | 4,721,860 | | 3,482,159 |
| | |
| |
| |
|
Total liabilities | | 5,945,348 | | 5,237,860 | | 3,889,479 |
| | |
| |
| |
|
|
| Segment capital expenditure is the total cost incurred during the year to acquire segment assets that are expected to be used for more than one year. |
| | | |
Capital expenditure | | | | | | |
| | | |
Resins and Plastics | | 1,499,554 | | 207,862 | | 230,628 |
Synthetic Rubber | | 438,483 | | 50,016 | | 61,013 |
Basic Organic Chemical Products | | 619,538 | | 78,948 | | 90,281 |
Others | | 114,459 | | 15,354 | | 20,315 |
| | |
| |
| |
|
| | | 2,672,034 | | 352,180 | | 402,237 |
| | |
| |
| |
|
Depreciation | | | | | | |
| | | |
Resins and Plastics | | 294,861 | | 475,786 | | 510,740 |
Synthetic Rubber | | 86,220 | | 114,484 | | 135,116 |
Basic Organic Chemical Products | | 121,822 | | 180,709 | | 199,934 |
Others | | 22,507 | | 35,145 | | 44,989 |
| | |
| |
| |
|
| | | 525,410 | | 806,124 | | 890,779 |
| | |
| |
| |
|
F-33
SINOPEC BEIJING YANHUA PETROCHEMICAL COMPANY LIMITED
NOTES TO FINANCIAL STATEMENTS
(All amounts in thousands, except share data)
| 25. | COMMITMENTS AND CONTINGENT LIABILITIES |
| | (a) | Operating lease commitments |
The Company leases machinery and equipment through non-cancelable operating leases. These operating leases do not contain provisions for contingent lease rentals. None of these operating lease agreements contain escalation provisions that may require higher future rental payments.
As of December 31, 2003, the future minimum lease payments under non-cancelable operating leases are payable as follows:
| | |
| | | RMB |
Within one year | | 12,978 |
| | |
|
As of December 31, 2003, the Company had capital commitments as follows:
| | |
| | | RMB |
Authorized and contracted for | | 56,996 |
Authorized but not contracted for | | 196,330 |
| | |
|
| | | 253,326 |
| | |
|
These capital commitments relate to the purchase or construction of production facilities.
| | (c) | Guarantee arrangements |
As of December 31, 2002 and 2003, the Company has not entered into any guarantee, standby letters of credit or indemnification arrangements.
F-34
SINOPEC BEIJING YANHUA PETROCHEMICAL COMPANY LIMITED
NOTES TO FINANCIAL STATEMENTS
(All amounts in thousands, except share data)
Financial assets of the Company include cash and cash equivalents, trade receivables, bills receivable and other receivables. Financial liabilities of the Company include bank loans, trade payables, bills payable, other payables and loans from parent companies and fellow subsidiaries. The Company had no positions in derivative contracts that qualified or were designated as hedging instruments as of December 31, 2002 and 2003.
The interest rates and terms of repayment of loans of the Company are disclosed in Notes 10 and 11.
The carrying amounts of cash and cash equivalents, trade and bills receivables, and other receivables represent the Company’s maximum exposure to credit risk in relation to financial assets.
The majority of the Company’s trade receivables relate to sales of chemical products to related parties and third parties operating in the chemical industries. The Company performs ongoing credit evaluations of its customers’ financial condition and generally does not require collateral on trade receivables. The Company maintains an allowance for doubtful accounts and actual losses have been within management’s expectations. No single customer accounted for greater than 10% of total revenues.
No other financial assets carry a significant exposure to credit risk.
Substantially all of the revenue generating operations of the Company are transacted in RMB, which is not fully convertible into foreign currencies. On January 1, 1994, the PRC government abolished the dual rate system and introduced a single rate of exchange as quoted by the PBOC. However, the unification of the exchange rate does not imply convertibility of RMB into USD or other foreign currencies. All foreign exchange transactions continue to take place either through the PBOC or other banks authorized to buy or sell foreign currencies at the exchange rates quoted by the PBOC. Approval of foreign currency payments by the PBOC or other institutions requires submitting a payment application form together with suppliers’ invoices, shipping documents and signed contracts.
F-35
SINOPEC BEIJING YANHUA PETROCHEMICAL COMPANY LIMITED
NOTES TO FINANCIAL STATEMENTS
(All amounts in thousands, except share data)
| 26. | FINANCIAL INSTRUMENTS(Continued) |
The following disclosure of the estimated fair value of financial instruments is made in accordance with requirements of IAS 32 and IAS 39. Fair value estimates, methods and assumptions, set forth below for the Company’s financial instruments, are made to comply with the requirements of IAS 32 and IAS 39 and should be read in conjunction with the Company’s financial statements and related notes. The estimated fair value amounts have been determined by the Company using market information and valuation methodologies considered appropriate. However, considerable judgement is required to interpret market data to develop the estimates of fair value. Accordingly, the estimates presented herein are not necessarily indicative of the amounts the Company could realize in a current market exchange. The use of different market assumptions and/or estimation methodologies may have a material effect on the estimated fair value amounts.
The following table represents the carrying amounts and fair values of the Company’s long-term bank loans as of December 31, 2002 and 2003.
| | | | | | | | |
| | | 2002
| | 2003
|
| | | Carrying
amount | | Fair value | | Carrying
amount | | Fair value |
| | | RMB | | RMB | | RMB | | RMB |
Long-term bank loans | | 1,927,543 | | 1,927,543 | | 1,596,359 | | 1,596,359 |
| | |
| |
| |
| |
|
The fair values of long-term bank loans are estimated by discounting future cash flows thereon using current market interest rates offered to the Company for debts with substantially the same characteristics and maturities.
The fair values of other financial instruments approximate their carrying amounts due to the short-term maturity of these instruments.
| 27. | SIGNIFICANT DIFFERENCES BETWEEN IFRS AND US GAAP |
The Company’s accounting policies conform with IFRS which differ in certain significant respects from US GAAP. Information relating to the nature and effect of such differences are set out below.
| | (a) | Revaluation of property, plant and equipment |
As required by the relevant PRC regulations with respect to the Reorganization, the property, plant and equipment of the Company were revalued in 1997. Under IFRS, such revaluations result in an increase in shareholders’ equity with respect to the increase in carrying amount of certain property, plant and equipment above their historical bases. In addition, a deferred tax liability related to the non-tax deductibility of certain revaluation surplus has been recorded under IFRS.
F-36
SINOPEC BEIJING YANHUA PETROCHEMICAL COMPANY LIMITED
NOTES TO FINANCIAL STATEMENTS
(All amounts in thousands, except share data)
| 27. | SIGNIFICANT DIFFERENCES BETWEEN IFRS AND US GAAP(Continued) |
| | (a) | Revaluation of property, plant and equipment(Continued) |
Under US GAAP, property, plant and equipment are stated at their historical cost less accumulated depreciation.
In addition, under IFRS, on disposal of a revalued asset, the related revaluation surplus is transferred from the revaluation reserve to retained earnings. Under US GAAP, the gain or loss on disposal of an asset is determined with reference to the asset’s historical carrying amount and included in current earnings.
| | (b) | Depreciation for facilities under renovation |
During 2001, the Company’s butyl rubber plant was suspended for production for a renovation project. Under US GAAP, temporarily idle facilities should continue to be depreciated.
| | (c) | Sale of property, plant and equipment |
On November 20, 2001, the Company sold a polypropylene production facility to Yanshan Company and recorded a gain of RMB 156,546. Under US GAAP, as the parties to the transaction are entities under common control, the excess of the consideration over the net book value of the asset is accounted for as a credit to shareholders’ equity.
| | (d) | Employee reduction expenses |
As described in Note 17 to the financial statements, Sinopec made additional payments of RMB 100,782 to the Company’s staff in connection with the Sinopec’s voluntary employee reduction plan during 2001. Under IFRS, the payment made by Sinopec was not recorded in current earnings. Under US GAAP, such payment made by Sinopec is charged to current earnings with a corresponding increase in shareholders’ equity. The payment made by Sinopec was tax deductible in the consolidated tax return of Sinopec, which includes the results of the Company.
F-37
SINOPEC BEIJING YANHUA PETROCHEMICAL COMPANY LIMITED
NOTES TO FINANCIAL STATEMENTS
(All amounts in thousands, except share data)
| 27. | SIGNIFICANT DIFFERENCES BETWEEN IFRS AND US GAAP(Continued) |
Others mainly represent certain expenses of the Company that were borne by Sinopec Group. Under US GAAP, such payments made by Sinopec Group were charged to current earnings with a corresponding increase in shareholders’ equity.
| | (f) | Related party transactions |
Under IFRS, transactions of state-controlled enterprises with other state-controlled enterprises are not required to be disclosed as related party transactions. Furthermore, government departments and agencies are deemed not to be related parties to the extent that such dealings are in the normal course of business. Therefore, related party transactions as disclosed in Note 23 only refer to transactions with enterprises over which Sinopec Group and Sinopec are able to exercise significant influence.
Under US GAAP, there are no similar exemptions. Although the majority of the Company’s activities are with PRC government authorities and affiliates and other PRC state-owned enterprises, the Company believes that it has provided meaningful disclosure of related party transactions in Note 23.
| | (g) | Recently issued accounting standards |
SFAS No. 150
In May 2003, the Financial Accounting Standards Board (“FASB”) issued Statement of Financial Accounting Standards (“SFAS”) No. 150, “Accounting for Certain Financial Instruments with Characteristics of both Liabilities and Equity”. SFAS No. 150 establishes standards for the classification and measurement of certain financial instruments with characteristics of both liabilities and equity. It also includes required disclosures for financial instruments within its scope. For the Company, SFAS No. 150 was effective for instruments entered into or modified after May 31, 2003 and otherwise will be effective at the beginning of the first financial year beginning after June 15, 2003. FASB Staff Provision No. FAS150-3 deferred certain provisions of SFAS No. 150 for certain mandatorily redeemable non-controlling interests. The Company currently does not have any financial instruments that are within the scope of SFAS No. 150.
F-38
SINOPEC BEIJING YANHUA PETROCHEMICAL COMPANY LIMITED
NOTES TO FINANCIAL STATEMENTS
(All amounts in thousands, except share data)
| 27. | SIGNIFICANT DIFFERENCES BETWEEN IFRS AND US GAAP(Continued) |
| | (g) | Recently issued accounting standards(Continued) |
FIN No. 46R
In December 2003, the FASB issued Interpretation No. 46 (revised December 2003), “Consolidation of Variable Interest Entities” (FIN 46R), which addresses how a business enterprise should evaluate whether it has a controlling financial interest in an entity through means other than voting rights and accordingly should consolidate the entity. FIN 46R replaces FASB Interpretation No. 46, “Consolidation of Variable Interest Entities”, which was issued in January 2003. The Company will be required to apply FIN 46R to variable interests in Variable Interest Entities (“VIEs”) created after December 31, 2003. For variable interests in VIEs created before January 1, 2004, the Interpretation will be applied beginning on January 1, 2005. For any VIEs that must be consolidated under FIN 46R that were created before January 1, 2004, the assets, liabilities and non-controlling interests of the VIE initially would be measured at their carrying amounts with any difference between the net amount added to the balance sheet and any previously recognized interest being recognized as the cumulative effect of an accounting change. If determining the carrying amounts is not practicable, fair value at the date FIN 46R first applies may be used to measure the assets, liabilities and non-controlling interest of the VIE. The Company does not expect the application of this Interpretation will have a material impact on its financial statements.
F-39
SINOPEC BEIJING YANHUA PETROCHEMICAL COMPANY LIMITED
NOTES TO FINANCIAL STATEMENTS
(All amounts in thousands, except share data)
| 27. | SIGNIFICANT DIFFERENCES BETWEEN IFRS AND US GAAP(Continued) |
| | (h) | Reconciliation of net (loss)/income and shareholders’ equity under IFRS to US GAAP |
The effect on net (loss)/income and shareholders’ equity of significant differences between IFRS and US GAAP is as follows:
| | | | | | | | | | | | | | | | | | | | | | | | |
| | | | | | Net (loss)/income for the years ended December 31,
| | | Shareholders’ equity as of December 31,
| |
| | | Note | | | 2001
| | | 2002
| | | 2003
| | | 2003
| | | 2002
| | | 2003
| | | 2003
| |
| | | | | | RMB | | | RMB | | | RMB | | | USD | | | RMB | | | RMB | | | USD | |
As reported under IFRS | | | | | (272,467 | ) | | 209,099 | | | 633,885 | | | 76,587 | | | 5,021,947 | | | 5,655,832 | | | 683,344 | |
| | | | | | | | |
US GAAP adjustments: | | | | | | | | | | | | | | | | | | | | | | | | |
| | | | | | | | |
Revaluation of property, plant and equipment | | (a | ) | | — | | | — | | | — | | | — | | | (988,872 | ) | | (988,872 | ) | | (119,477 | ) |
Depreciation on revalued property, plant and equipment | | (a | ) | | 49,918 | | | 49,615 | | | 47,519 | | | 5,741 | | | 475,983 | | | 523,502 | | | 63,250 | |
Disposal of revalued property, plant and equipment | | (a | ) | | 103,579 | | | 4,190 | | | 34,793 | | | 4,204 | | | 140,945 | | | 175,738 | | | 21,233 | |
Depreciation for facilities under renovation | | (b | ) | | (124,252 | ) | | — | | | — | | | — | | | (124,252 | ) | | (124,252 | ) | | (15,012 | ) |
Sale of property, plant and equipment | | (c | ) | | (156,546 | ) | | — | | | — | | | — | | | — | | | — | | | — | |
Employee reduction expenses | | (d | ) | | (100,782 | ) | | — | | | — | | | — | | | — | | | — | | | — | |
Others | | (e | ) | | (5,014 | ) | | (5,254 | ) | | (5,008 | ) | | (605 | ) | | 3,664 | | | — | | | — | |
Effect of the above adjustments on taxation | | | | | 65,258 | | | (27,786 | ) | | (37,966 | ) | | (4,587 | ) | | 187,493 | | | 149,083 | | | 18,012 | |
| | | | | |
|
| |
|
| |
|
| |
|
| |
|
| |
|
| |
|
|
As reported under US GAAP | | | | | (440,306 | ) | | 229,864 | | | 673,223 | | | 81,340 | | | 4,716,908 | | | 5,391,031 | | | 651,350 | |
| | | | | |
|
| |
|
| |
|
| |
|
| |
|
| |
|
| |
|
|
Basic (loss)/earnings per share under US GAAP | | | | | (RMB 0.13 | ) | | RMB 0.07 | | | RMB 0.20 | | | USD 0.02 | | | | | | | | | | |
| | | | | |
|
| |
|
| |
|
| |
|
| | | | | | | | | |
Basic (loss)/earnings per ADS under US GAAP (Note 1) | | | | | (RMB 6.53 | ) | | RMB 3.41 | | | RMB 9.98 | | | USD 1.21 | | | | | | | | | | |
| | | | | |
|
| |
|
| |
|
| |
|
| | | | | | | | | |
| | Note 1: Basic | (loss)/earnings per ADS is calculated on the basis that one ADS is equivalent to 50 shares. |
F-40
Exhibit Index
| | |
Exhibit Number
| | Description of Document
|
| 1.1* | | The articles of association as approved by Beijing Yanhua on June 27, 2003. |
| |
| 2.1 | | Form of Deposit Agreement among Beijing Yanhua, The Bank of New York and owners from time to time of American Depositary Receipts issued thereunder, including the form of American Depositary Receipt, incorporated by reference to Exhibit 4.3 to our Registrations Statement on Form F-1 filed with the Securities and Exchange Commission on June 3, 1997 (File No.333-6994). |
| |
| 4.1 | | Supply of Materials and Services Agreement between Beijing Yanhua, Sinopec and Yanshan Company dated August 14, 2000, incorporated by reference to Exhibit 4.1 to our Annual Report on Form 20-F for the year ended December 31, 2000. |
| |
| 4.2 | | Form of Labor Contract between Beijing Yanhua and its specified directors, supervisors, and senior managers, incorporated by reference to Exhibit 4.2 to our Annual Report on Form 20-F for the year ended December 31, 2001. |
| |
| 11.1* | | Code of Ethics (English Translation) |
| |
| 12.1* | | Certification of the Chairman. |
| |
| 12.2* | | Certification of the Chief Financial Officer. |
| |
| 13.1* | | Certification of the Chairman pursuant to Rule 13 (a) – 14 (b) promulgated under the U.S. Securities Exchange Act |
| |
| 13.2* | | Certification of the Chief Financial Officer pursuant to Rule 13 (a) – 14 (b) promulgated under the U.S. Securities Exchange Act |